| OMB APPROVAL |
OMB Number: 3235-0570 Expires: September 30, 2007 Estimated average burden hours per response: 19.4 |
UNITED STATES
SECURITIES AND EXCHANGE COMMISSION
Washington, D.C. 20549
FORM N-CSRS
CERTIFIED SHAREHOLDER REPORT OF REGISTERED MANAGEMENT INVESTMENT COMPANIES
Investment Company Act file number 811-08415
Evergreen Fixed Income Trust
_____________________________________________________________
(Exact name of registrant as specified in charter)
200 Berkeley Street Boston, Massachusetts 02116
_____________________________________________________________
(Address of principal executive offices) (Zip code)
Michael H. Koonce, Esq. 200 Berkeley Street Boston, Massachusetts 02116
____________________________________________________________
(Name and address of agent for service)
Registrant's telephone number, including area code: (617) 210-3200
Date of fiscal year end: Registrant is making a semi-annual filing for October 31, 2007 of its series, Evergreen High Income Fund, Evergreen U.S Government Fund, Evergreen Institutional Mortgage Portfolio, Evergreen Diversified Income Builder Fund, Evergreen Core Plus Bond Fund for the six months ended October 31, 2007.
Theses 5 series have an April 30th fiscal year end.
Date of reporting period: October 31, 2007
Item 1 - Reports to Stockholders.
Evergreen High Income Fund
| | | table of contents |
| 1 | | LETTER TO SHAREHOLDERS |
| 4 | | FUND AT A GLANCE |
| 6 | | ABOUT YOUR FUND’S EXPENSES |
| 7 | | FINANCIAL HIGHLIGHTS |
| 11 | | SCHEDULE OF INVESTMENTS |
| 24 | | STATEMENT OF ASSETS AND LIABILITIES |
| 25 | | STATEMENT OF OPERATIONS |
| 26 | | STATEMENTS OF CHANGES IN NET ASSETS |
| 27 | | NOTES TO FINANCIAL STATEMENTS |
| 35 | | ADDITIONAL INFORMATION |
| 44 | | TRUSTEES AND OFFICERS |
This semiannual report must be preceded or accompanied by a prospectus of the Evergreen fund contained herein. The prospectus contains more complete information, including fees and expenses, and should be read carefully before investing or sending money.The fund will file its complete schedule of portfolio holdings with the SEC for the first and third quarters of each fiscal year on Form N-Q. The fund’s Form N-Q will be available on the SEC’s Web site at http://www.sec.gov. In addition, the fund’s Form N-Q may be reviewed and copied at the SEC’s Public Reference Room in Washington, D.C. Information on the operation of the Public Reference Room may be obtained by calling 800.SEC.0330.
A description of the fund’s proxy voting policies and procedures, as well as information regarding how the fund voted proxies relating to portfolio securities during the most recent 12-month period ended June 30, is available by visiting our Web site at EvergreenInvestments.com or by visiting the SEC’s Web site at http://www.sec.gov. The fund’s proxy voting policies and procedures are also available without charge, upon request, by calling 800.343.2898.
| Mutual Funds: | | | | |
| NOT FDIC INSURED | | MAY LOSE VALUE | | NOT BANK GUARANTEED |
Evergreen InvestmentsSM is a service mark of Evergreen Investment Management Company, LLC.
Copyright 2007, Evergreen Investment Management Company, LLC.Evergreen Investment Management Company, LLC is a subsidiary of Wachovia Corporation and is an affiliate of Wachovia Corporation’s other Broker Dealer subsidiaries.
Evergreen mutual funds are distributed by Evergreen Investment Services, Inc.
200 Berkeley Street, Boston, MA 02116
LETTER TO SHAREHOLDERS
December 2007

Dennis H. Ferro
President and Chief
Executive Officer
Dear Shareholder:
We are pleased to provide the Semiannual Report for Evergreen High Income Fund for the six-month period ended October 31, 2007.
The U.S. fixed income market delivered modest, but positive, returns during the six-month period, despite widening concerns about credit quality stemming from weakness in U.S. housing and growing problems in the subprime mortgage market. The period saw a general flight to quality as investors sought out the highest quality debt, especially U.S. Treasuries. As prices of Treasuries and other high-grade securities rose, their yields trended down, leading to outperformance by longer-maturity securities. At the same time, higher-yielding, lower-rated corporate bonds experienced some price erosion during the period after outperforming high-grade securities for several years. Concerns about the credit markets prompted the U.S. Federal Reserve Board (the “Fed”) and other major central banks to intervene and inject additional liquidity into the capital markets. While these steps in the closing three months of the period restored some measure of confidence, investors continued to watch warily for signs of economic weakness. Stocks of U.S. companies produced generally healthy returns, despite increasing market volatility. Investors began to favor larger companies with more consistent earnings, while the growth style of investing led the market after several years of outperformance by value stocks.
Despite the problems in housing and subprime mortgages, the domestic economy maintained its growth trajectory. Solid increases in exports and in business investment helped
1
LETTER TO SHAREHOLDERS continued
offset declining residential values. At the same time, steadily rising employment levels and moderately improving wages increased prospects that healthy consumer spending patterns would be sustained. Substantially exceeding expectations, U.S. Gross Domestic Product grew at an annual rate of 4.9% in the third quarter of 2007, significantly higher than the brisk 3.8% rate of the previous quarter. However, some signs of emerging economic weakness began to appear. Operating earnings of companies in the S&P 500 Index declined in the third quarter, principally because of dramatic write-downs taken by major corporations, predominately in the financials sector. Moreover, surging prices for oil, gold and most commodities, combined with the declining U.S. dollar, suggested some increased potential for rising inflation.
During the six-month period, managers of Evergreen’s intermediate and long-term bond fund teams focused on the issues influencing both the opportunities and challenges in managing specific portfolios. The teams managing the higher-quality portfolios, including Evergreen Core Bond Fund, Evergreen Core Plus Bond Fund, Evergreen U.S. Government Fund and Evergreen Institutional Mortgage Portfolio, assessed factors such as employment and inflationary trends, Fed policy and interest-rate expectations. At the same time, the managers supervising Evergreen High Income Fund and Evergreen Select High Yield Bond Fund tended to position their credit-sensitive portfolios relatively conservatively during a period of increasing volatility. The managers of Evergreen Diversified Income Builder Fund, meanwhile, repositioned their
2
LETTER TO SHAREHOLDERS continued
portfolio, maintaining an emphasis on better-quality, high-yield corporate bonds while also increasing the exposure to dividend-paying stocks.
As always, we encourage investors to maintain diversified investment portfolios in pursuit of their long-term investment goals.
Please visit us at EvergreenInvestments.com for more information about our funds and other investment products available to you. Thank you for your continued support of Evergreen Investments.
Sincerely,

Dennis H. Ferro
President and Chief Executive Officer
Evergreen Investment Company, Inc.
Special Notice to Shareholders:
Please visit our Web site at EvergreenInvestments.com for statements from President and Chief Executive Officer, Dennis Ferro, regarding the firm’s recent settlement with the Securities and Exchange Commission (SEC) and prior settlement with the National Association of Securities Dealers (NASD).
3
FUND AT A GLANCE
as of October 31, 2007
MANAGEMENT TEAM
Investment Advisor:
• Evergreen Investment Management Company, LLC
Sub-Advisor:
• Tattersall Advisory Group, Inc.
Portfolio Manager:
• Andrew Cestone
CURRENT INVESTMENT STYLE

Source: Morningstar, Inc.
Morningstar’s style box is based on a portfolio date as of 9/30/2007.
The Fixed Income style box placement is based on a fund’s average effective maturity or duration and the average credit rating of the bond portfolio.
PERFORMANCE AND RETURNS
Portfolio inception date: 9/11/1935
| | | Class A | | Class B | | Class C | | Class I |
| Class inception date | | 1/20/1998 | | 9/11/1935 | | 1/21/1998 | | 4/14/1998 |
|
| Nasdaq symbol | | EKHAX | | EKHBX | | EKHCX | | EKHYX |
|
| 6-month return with sales charge | | -4.23% | | -4.67% | | -0.79% | | N/A |
|
| 6-month return w/o sales charge | | 0.56% | | 0.18% | | 0.18% | | 0.69% |
|
| Average annual return* | | | | | | | | |
|
| 1-year with sales charge | | 2.39% | | 1.57% | | 5.57% | | N/A |
|
| 1-year w/o sales charge | | 7.36% | | 6.57% | | 6.57% | | 7.63% |
|
| 5-year | | 8.56% | | 8.55% | | 8.84% | | 9.93% |
|
| 10-year | | 4.94% | | 4.70% | | 4.70% | | 5.71% |
|
| Maximum sales charge | | 4.75% | | 5.00% | | 1.00% | | N/A |
| | | Front-end | | CDSC | | CDSC | | |
|
* Adjusted for maximum applicable sales charge, unless noted.Past performance is no guarantee of future results. The performance quoted represents past performance and current performance may be lower or higher. The investment return and principal value of an investment will fluctuate so that investors’ shares, when redeemed, may be worth more or less than their original cost. To obtain performance information current to the most recent month-end for Classes A, B, C or I, please go to EvergreenInvestments.com/fundperformance. The performance of each class may vary based on differences in loads, fees and expenses paid by the shareholders investing in each class. Performance includes the reinvestment of income dividends and capital gain distributions. Performance shown does not reflect the deduction of taxes that a shareholder would pay on fund distributions or the redemption of fund shares.
Historical performance shown for Classes A, C and I prior to their inception is based on the performance of Class B, the original class offered. The historical returns for Classes A and I have not been adjusted to reflect the effect of each class’ 12b-1 fee. These fees are 0.30% for Class A and 1.00% for Classes B and C. Class I does not pay a 12b-1 fee. If these fees had been reflected, returns for Classes A and I would have been higher.
The advisor is reimbursing a portion of the 12b-1 fee for Class A. Had the fee not been reimbursed, returns for Class A would have been lower. Returns reflect expense limits previously in effect for all classes, without which returns would have been lower.
4
FUND AT A GLANCE continued
LONG-TERM GROWTH

Comparison of a $10,000 investment in the Evergreen High Income Fund Class A shares versus a similar investment in the Merrill Lynch High Yield Master Index† (MLHYMI) and the Consumer Price Index (CPI).
The MLHYMI is an unmanaged market index and does not include transaction costs associated with buying and selling securities, any mutual fund fees or expenses or any taxes. The CPI is a commonly used measure of inflation and does not represent an investment return. It is not possible to invest directly in an index.
Class I shares are only offered in the following manner: (1) to investment advisory clients of Evergreen Investment Management Company, LLC (or its advisory affiliates) when purchased by such advisor(s) on behalf of its clients, (2) to certain mutual fund wrap program clients of Wachovia Securities and of third-party broker/dealers when purchased through a clearing relationship with Wachovia Securities or an affiliate providing mutual fund clearing services, (3) through arrangements entered into on behalf of the Evergreen funds with certain financial services firms, (4) to certain institutional investors, and (5) to persons who owned Class Y shares in registered name in an Evergreen fund on or before December 31, 1994 or who owned shares of any SouthTrust fund in registered name as of March 18, 2005 or who owned shares of Vestaur Securities Fund as of May 20, 2005.
Class I shares are only available to institutional shareholders with a minimum of $1 million investment, which may be waived in certain situations.
The fund’s investment objective may be changed without a vote of the fund’s shareholders.
Foreign investments may contain more risk due to the inherent risks associated with changing political climates, foreign market instability and foreign currency fluctuations.
Derivatives involve additional risks including interest rate risk, credit risk, the risk of improper valuation and the risk of non-correlation to the relevant instruments they are designed to hedge or to closely track.
High yield, lower-rated bonds may contain more risk due to the increased possibility of default.
The return of principal is not guaranteed due to fluctuation in the fund’s NAV caused by changes in the price of individual bonds held by the fund and the buying and selling of bonds by the fund. Bond funds have the same inflation, interest rate and credit risks as individual bonds. Generally, the value of bond funds rises when prevailing interest rates fall, and falls when interest rates rise.
† Copyright 2007. Merrill Lynch, Pierce, Fenner & Smith Incorporated. All rights reserved.
All data is as of October 31, 2007, and subject to change.
5
ABOUT YOUR FUND’S EXPENSES
The Example below is intended to describe the fees and expenses borne by shareholders and the impact of those costs on your investment.
Example
As a shareholder of the fund, you incur two types of costs: (1) transaction costs, including sales charges (loads), redemption fees and exchange fees; and (2) ongoing costs, including management fees, distribution (12b-1) fees and other fund expenses. This Example is intended to help you understand your ongoing costs (in dollars) of investing in the fund and to compare these costs with the ongoing costs of investing in other mutual funds. The Example is based on an investment of $1,000 invested at the beginning of the period and held for the entire period from May 1, 2007 to October 31, 2007.
The example illustrates your fund’s costs in two ways:
• Actual expenses
The section in the table under the heading “Actual” provides information about actual account values and actual expenses. You may use the information in these columns, together with the amount you invested, to estimate the expenses that you paid over the period. Simply divide your account value by $1,000 (for example, an $8,600 account value divided by $1,000 = 8.6), then multiply the result by the number in the appropriate column for your share class, in the column entitled “Expenses Paid During Period” to estimate the expenses you paid on your account during this period.
• Hypothetical example for comparison purposes
The section in the table under the heading “Hypothetical (5% return before expenses)” provides information about hypothetical account values and hypothetical expenses based on the fund’s actual expense ratio and an assumed rate of return of 5% per year before expenses, which is not the fund’s actual return. The hypothetical account values and expenses may not be used to estimate the actual ending account balance or expenses you paid for the period. You may use this information to compare the ongoing costs of investing in the fund and other funds. To do so, compare this 5% hypothetical example with the 5% hypothetical examples that appear in the shareholder reports of the other funds.
Please note that the expenses shown in the table are meant to highlight your ongoing costs only and do not reflect any transactional costs, such as sales charges (loads), redemption fees or exchange fees. Therefore, the section in the table under the heading “Hypothetical (5% return before expenses)” is useful in comparing ongoing costs only, and will not help you determine the relative total costs of owning different funds. In addition, if these transactional costs were included, your costs would have been higher.
| | | Beginning | | Ending | | |
| | | Account | | Account | | Expenses |
| | | Value | | Value | | Paid During |
| | | 5/1/2007 | | 10/31/2007 | | Period* |
|
| Actual | | | | | | |
| Class A | | $ 1,000.00 | | $ 1,005.57 | | $ 5.34 |
| Class B | | $ 1,000.00 | | $ 1,001.83 | | $ 9.11 |
| Class C | | $ 1,000.00 | | $ 1,001.83 | | $ 9.11 |
| Class I | | $ 1,000.00 | | $ 1,006.89 | | $ 4.09 |
| Hypothetical | | | | | | |
| (5% return | | | | | | |
| before expenses) | | | | | | |
| Class A | | $ 1,000.00 | | $ 1,019.81 | | $ 5.38 |
| Class B | | $ 1,000.00 | | $ 1,016.04 | | $ 9.17 |
| Class C | | $ 1,000.00 | | $ 1,016.04 | | $ 9.17 |
| Class I | | $ 1,000.00 | | $ 1,021.06 | | $ 4.12 |
|
| * | For each class of the Fund, expenses are equal to the annualized expense ratio of each class
(1.06% for Class A, 1.81% for Class B, 1.81% for Class C and 0.81% for Class I), multiplied by
the average account value over the period, multiplied by 184 / 366 days. |
6
FINANCIAL HIGHLIGHTS
(For a share outstanding throughout each period)
| | | Six Months Ended | | Year Ended April 30, |
| | October 31, 2007 | |
|
| CLASS A | | (unaudited)�� | | 2007 | | 2006 | | 2005 | | 2004 | | 2003 |
|
| Net asset value, beginning of period | | | | $ 3.40 | | $ 3.31 | | $ 3.32 | | | | $ 3.43 | | $ 3.30 | | $ 3.29 |
|
| Income from investment operations | | | | | | | | | | | | | | | | |
| Net investment income (loss) | | | | 0.11 | | 0.241 | | 0.23 | | | | 0.24 | | 0.25 | | 0.271 |
| Net realized and unrealized gains or losses | | | | | | | | | | | | | | | | |
| on investments | | | | (0.09) | | 0.09 | | 0 | | | | (0.10) | | 0.14 | | 0.01 |
| |
| |
| |
| |
| |
| |
|
| Total from investment operations | | | | 0.02 | | 0.33 | | 0.23 | | | | 0.14 | | 0.39 | | 0.28 |
|
| Distributions to shareholders from | | | | | | | | | | | | | | | | |
| Net investment income | | | | (0.12) | | (0.24) | | (0.24) | | | | (0.25) | | (0.26) | | (0.27) |
|
| Net asset value, end of period | | | | $ 3.30 | | $ 3.40 | | $ 3.31 | | | | $ 3.32 | | $ 3.43 | | $ 3.30 |
|
| Total return2 | | | | 0.56% | | 10.35% | | 7.01% | | | | 4.14% | | 12.25% | | 9.42% |
|
| Ratios and supplemental data | | | | | | | | | | | | | | | | |
| Net assets, end of period (thousands) | | $305,652 | | $335,411 | | $388,523 | | $467,714 | | $530,526 | | $484,346 |
| Ratios to average net assets | | | | | | | | | | | | | | | | |
| Expenses including waivers/reimbursements | | | | | | | | | | | | | | | | |
| but excluding expense reductions | | | | 1.06%3 | | 1.06% | | 1.04% | | | | 1.04% | | 1.01% | | 1.11% |
| Expenses excluding waivers/reimbursements | | | | | | | | | | | | | | | | |
| and expense reductions | | | | 1.11%3 | | 1.10% | | 1.05% | | | | 1.04% | | 1.02% | | 1.11% |
| Net investment income (loss) | | | | 7.31%3 | | 7.19% | | 6.95% | | | | 7.16% | | 7.42% | | 8.70% |
| Portfolio turnover rate | | | | 60% | | 48% | | 67% | | | | 65% | | 71% | | 80% |
|
1 Net investment income (loss) per share is based on average shares outstanding during the period.2 Excluding applicable sales charges
3 Annualized
See Notes to Financial Statements
7
FINANCIAL HIGHLIGHTS
(For a share outstanding throughout each period)
| | | Six Months Ended | | Year Ended April 30, |
| | October 31, 2007 | |
|
| CLASS B | | (unaudited) | | 2007 | | 2006 | | 2005 | | 2004 | | 2003 |
|
| Net asset value, beginning of period | | | | $ 3.40 | | $ 3.31 | | $ 3.32 | | | | $ 3.43 | | $ 3.30 | | $ 3.29 |
|
| Income from investment operations | | | | | | | | | | | | | | | | |
| Net investment income (loss) | | | | 0.10 | | 0.211 | | 0.211 | | | | 0.22 | | 0.231 | | 0.251 |
| Net realized and unrealized gains or losses | | | | | | | | | | | | | | | | |
| on investments | | | | (0.10) | | 0.09 | | (0.01)2 | | | | (0.10) | | 0.14 | | 0.01 |
| |
| |
| |
| |
| |
| |
|
| Total from investment operations | | | | 0 | | 0.30 | | 0.20 | | | | 0.12 | | 0.37 | | 0.26 |
|
| Distributions to shareholders from | | | | | | | | | | | | | | | | |
| Net investment income | | | | (0.10) | | (0.21) | | (0.21) | | | | (0.23) | | (0.24) | | (0.25) |
|
| Net asset value, end of period | | | | $ 3.30 | | $ 3.40 | | $ 3.31 | | | | $ 3.32 | | $ 3.43 | | $ 3.30 |
|
| Total return3 | | | | 0.18% | | 9.55% | | 6.27% | | | | 3.42% | | 11.46% | | 8.61% |
|
| Ratios and supplemental data | | | | | | | | | | | | | | | | |
| Net assets, end of period (thousands) | | $129,395 | | $150,609 | | $176,663 | | $211,950 | | $247,741 | | $173,002 |
| Ratios to average net assets | | | | | | | | | | | | | | | | |
| Expenses including waivers/reimbursements | | | | | | | | | | | | | | | | |
| but excluding expense reductions | | | | 1.81%4 | | 1.80% | | 1.75% | | | | 1.74% | | 1.72% | | 1.84% |
| Expenses excluding waivers/reimbursements | | | | | | | | | | | | | | | | |
| and expense reductions | | | | 1.81%4 | | 1.80% | | 1.75% | | | | 1.74% | | 1.72% | | 1.84% |
| Net investment income (loss) | | | | 6.56%4 | | 6.46% | | 6.25% | | | | 6.46% | | 6.71% | | 7.99% |
| Portfolio turnover rate | | | | 60% | | 48% | | 67% | | | | 65% | | 71% | | 80% |
|
1 Net investment income (loss) per share is based on average shares outstanding during the period.2 The per share net realized and unrealized gains or losses is not in accord with the net realized and unrealized gains or losses for the period due to the timing of sales and redemptions of Fund shares in relation to fluctuating market values for the portfolio .
3 Excluding applicable sales charges
4 Annualized
See Notes to Financial Statements
8
FINANCIAL HIGHLIGHTS
(For a share outstanding throughout each period)
| | | Six Months Ended | | Year Ended April 30, |
| | October 31, 2007 | |
|
| CLASS C | | (unaudited) | | 2007 | | 2006 | | 2005 | | 2004 | | 2003 |
|
| Net asset value, beginning of period | | | | $ 3.40 | | $ 3.31 | | $ 3.32 | | | | $ 3.43 | | $ 3.30 | | $ 3.29 |
|
| Income from investment operations | | | | | | | | | | | | | | | | |
| Net investment income (loss) | | | | 0.10 | | 0.211 | | 0.21 | | | | 0.22 | | 0.23 | | 0.251 |
| Net realized and unrealized gains or losses | | | | | | | | | | | | | | | | |
| on investments | | | | (0.10) | | 0.09 | | (0.01)2 | | | | (0.10) | | 0.14 | | 0.01 |
| |
| |
| |
| |
| |
| |
|
| Total from investment operations | | | | 0 | | 0.30 | | 0.20 | | | | 0.12 | | 0.37 | | 0.26 |
|
| Distributions to shareholders from | | | | | | | | | | | | | | | | |
| Net investment income | | | | (0.10) | | (0.21) | | (0.21) | | | | (0.23) | | (0.24) | | (0.25) |
|
| Net asset value, end of period | | | | $ 3.30 | | $ 3.40 | | $ 3.31 | | | | $ 3.32 | | $ 3.43 | | $ 3.30 |
|
| Total return3 | | | | 0.18% | | 9.55% | | 6.27% | | | | 3.42% | | 11.46% | | 8.61% |
|
| Ratios and supplemental data | | | | | | | | | | | | | | | | |
| Net assets, end of period (thousands) | | $137,643 | | $161,941 | | $201,975 | | $281,810 | | $381,525 | | $290,914 |
| Ratios to average net assets | | | | | | | | | | | | | | | | |
| Expenses including waivers/reimbursements | | | | | | | | | | | | | | | | |
| but excluding expense reductions | | | | 1.81%4 | | 1.80% | | 1.75% | | | | 1.74% | | 1.72% | | 1.85% |
| Expenses excluding waivers/reimbursements | | | | | | | | | | | | | | | | |
| and expense reductions | | | | 1.81%4 | | 1.80% | | 1.75% | | | | 1.74% | | 1.72% | | 1.85% |
| Net investment income (loss) | | | | 6.56%4 | | 6.46% | | 6.25% | | | | 6.47% | | 6.72% | | 7.98% |
| Portfolio turnover rate | | | | 60% | | 48% | | 67% | | | | 65% | | 71% | | 80% |
|
1 Net investment income (loss) per share is based on average shares outstanding during the period.2 The per share net realized and unrealized gains or losses is not in accord with the net realized and unrealized gains or losses for the period due to the timing of sales and redemptions of Fund shares in relation to fluctuating market values for the portfolio .
3 Excluding applicable sales charges
4 Annualized
See Notes to Financial Statements
9
FINANCIAL HIGHLIGHTS
(For a share outstanding throughout each period)
| | | Six Months Ended | | Year Ended April 30, |
| | October 31, 2007 | |
|
| CLASS I | | (unaudited) | | 2007 | | 2006 | | 2005 | | 2004 | | 2003 |
|
| Net asset value, beginning of period | | | | $ 3.40 | | $ 3.31 | | $ 3.32 | | | | $ 3.43 | | $ 3.30 | | $ 3.29 |
|
| Income from investment operations | | | | | | | | | | | | | | | | |
| Net investment income (loss) | | | | 0.12 | | 0.251 | | 0.24 | | | | 0.26 | | 0.26 | | 0.281 |
| Net realized and unrealized gains or losses | | | | | | | | | | | | | | | | |
| on investments | | | | (0.10) | | 0.09 | | 0 | | | | (0.11) | | 0.14 | | 0.01 |
| |
| |
| |
| |
| |
| |
|
| Total from investment operations | | | | 0.02 | | 0.34 | | 0.24 | | | | 0.15 | | 0.40 | | 0.29 |
|
| Distributions to shareholders from | | | | | | | | | | | | | | | | |
| Net investment income | | | | (0.12) | | (0.25) | | (0.25) | | | | (0.26) | | (0.27) | | (0.28) |
|
| Net asset value, end of period | | | | $ 3.30 | | $ 3.40 | | $ 3.31 | | | | $ 3.32 | | $ 3.43 | | $ 3.30 |
|
| Total return | | | | 0.69% | | 10.65% | | 7.33% | | | | 4.45% | | 12.58% | | 9.69% |
|
| Ratios and supplemental data | | | | | | | | | | | | | | | | |
| Net assets, end of period (thousands) | | $35,010 | | $27,147 | | $50,365 | | $60,412 | | $37,894 | | $49,370 |
| Ratios to average net assets | | | | | | | | | | | | | | | | |
| Expenses including waivers/reimbursements | | | | | | | | | | | | | | | | |
| but excluding expense reductions | | | | 0.81%2 | | 0.80% | | 0.75% | | | | 0.74% | | 0.72% | | 0.84% |
| Expenses excluding waivers/reimbursements | | | | | | | | | | | | | | | | |
| and expense reductions | | | | 0.81%2 | | 0.80% | | 0.75% | | | | 0.74% | | 0.72% | | 0.84% |
| Net investment income (loss) | | | | 7.59%2 | | 7.42% | | 7.23% | | | | 7.46% | | 7.73% | | 9.05% |
| Portfolio turnover rate | | | | 60% | | 48% | | 67% | | | | 65% | | 71% | | 80% |
|
1 Net investment income (loss) per share is based on average shares outstanding during the period.2 Annualized
See Notes to Financial Statements
10
SCHEDULE OF INVESTMENTS
October 31, 2007 (unaudited)
| | | Principal | | | | |
| | | Amount | | | | Value |
|
| CORPORATE BONDS 87.6% | | | | | | |
| CONSUMER DISCRETIONARY 22.8% | | | | | | |
| Auto Components 2.3% | | | | | | |
| Cooper Tire & Rubber Co., 7.625%, 03/15/2027 | | $ 2,715,000 | | | $ | 2,511,375 |
| Goodyear Tire & Rubber Co.: | | | | | | |
| 9.00%, 07/01/2015 (p) | | 3,269,000 | | | | 3,591,814 |
| 11.25%, 03/01/2011 | | 1,925,000 | | | | 2,069,375 |
| Metaldyne Corp.: | | | | | | |
| 10.00%, 11/01/2013 | | 1,850,000 | | | | 1,729,750 |
| 11.00%, 06/15/2012 (p) | | 4,647,000 | | | | 3,996,420 |
| | | | | |
|
| | | | | | | 13,898,734 |
| | | | | |
|
| Automobiles 2.1% | | | | | | |
| Ford Motor Co.: | | | | | | |
| 5.80%, 01/12/2009 | | 1,225,000 | | | | 1,182,153 |
| 7.45%, 07/16/2031 (p) | | 2,485,000 | | | | 1,975,575 |
| 7.70%, 05/15/2097 | | 1,955,000 | | | | 1,456,475 |
| 7.875%, 06/15/2010 | | 2,770,000 | | | | 2,671,909 |
| General Motors Corp.: | | | | | | |
| 7.20%, 01/15/2011 (p) | | 4,030,000 | | | | 3,868,800 |
| 8.25%, 07/15/2023 | | 1,310,000 | | | | 1,188,825 |
| 8.375%, 07/15/2033 (p) | | 655,000 | | | | 599,325 |
| | | | | |
|
| | | | | | | 12,943,062 |
| | | | | |
|
| Diversified Consumer Services 0.2% | | | | | | |
| Education Management, LLC, 10.25%, 06/01/2016 (p) | | 940,000 | | | | 991,700 |
| Service Corporation International, 6.75%, 04/01/2015 | | 355,000 | | | | 355,888 |
| | | | | |
|
| | | | | | | 1,347,588 |
| | | | | |
|
| Hotels, Restaurants & Leisure 5.9% | | | | | | |
| Caesars Entertainment, Inc.: | | | | | | |
| 7.875%, 03/15/2010 | | 1,625,000 | | | | 1,690,000 |
| 8.125%, 05/15/2011 | | 590,000 | | | | 601,800 |
| Fontainebleau Las Vegas Holdings, LLC, 10.25%, 06/15/2015 144A | | 4,597,000 | | | | 4,321,180 |
| Indianapolis Downs, LLC, 11.00%, 11/01/2012 144A | | 365,000 | | | | 368,650 |
| Inn of the Mountain Gods Resort & Casino, 12.00%, 11/15/2010 | | 5,855,000 | | | | 6,206,300 |
| Isle of Capri Casinos, Inc., 7.00%, 03/01/2014 | | 7,310,000 | | | | 6,524,175 |
| Outback Steakhouse, Inc., 10.00%, 06/15/2015 144A (p) | | 610,000 | | | | 527,650 |
| Pokagon Gaming Authority, 10.375%, 06/15/2014 144A (p) | | 3,210,000 | | | | 3,563,100 |
| Seneca Gaming Corp., 7.25%, 05/01/2012 | | 950,000 | | | | 961,875 |
| Shingle Springs Tribal Gaming Authority, 9.375%, 06/15/2015 144A (p) | | 2,665,000 | | | | 2,691,650 |
| Six Flags, Inc.: | | | | | | |
| 8.875%, 02/01/2010 (p) | | 660,000 | | | | 565,950 |
| 9.625%, 06/01/2014 (p) | | 2,525,000 | | | | 1,991,594 |
| Trump Entertainment Resorts, Inc., 8.50%, 06/01/2015 (p) | | 4,420,000 | | | | 3,768,050 |
| Universal City Development Partners, Ltd., 11.75%, 04/01/2010 | | 810,000 | | | | 852,525 |
| Wheeling Island Gaming, Inc., 10.125%, 12/15/2009 | | 1,065,000 | | | | 1,067,662 |
| | | | | |
|
| | | | | | | 35,702,161 |
| | | | | |
|
See Notes to Financial Statements11
SCHEDULE OF INVESTMENTS continued
October 31, 2007 (unaudited)
| | | | | Principal | | | | |
| | | | | Amount | | | | Value |
|
| CORPORATE BONDS continued | | | | | | | | |
| CONSUMER DISCRETIONARY continued | | | | | | | | |
| Household Durables 1.1% | | | | | | | | |
| Hovnanian Enterprises, Inc.: | | | | | | | | |
| 6.00%, 01/15/2010 (p) | | | $ | 480,000 | | | $ | 369,600 |
| 6.50%, 01/15/2014 | | | | 1,074,000 | | | | 848,460 |
| Libbey, Inc., FRN, 12.38%, 06/01/2011 | | | | 1,940,000 | | | | 2,119,450 |
| Meritage Homes Corp.: | | | | | | | | |
| 6.25%, 03/15/2015 | | | | 560,000 | | | | 445,200 |
| 7.00%, 05/01/2014 | | | | 1,525,000 | | | | 1,250,500 |
| Pulte Homes, Inc., 4.875%, 07/15/2009 | | | | 710,000 | | | | 665,625 |
| Standard Pacific Corp.: | | | | | | | | |
| 5.125%, 04/01/2009 (p) | | | | 925,000 | | | | 772,375 |
| 6.50%, 08/15/2010 (p) | | | | 290,000 | | | | 221,850 |
| | | | | | | |
|
| | | | | | | | | 6,693,060 |
| | | | | | | |
|
| Media 8.5% | | | | | | | | |
| Cablevision Systems Corp., Ser. B, 8.00%, 04/15/2012 | | | | 3,425,000 | | | | 3,365,062 |
| CCH I, LLC, 11.00%, 10/01/2015 (p) | | | | 4,255,000 | | | | 4,145,875 |
| CSC Holdings, Inc., 7.625%, 04/01/2011 | | | | 1,040,000 | | | | 1,042,600 |
| Dex Media East, LLC: | | | | | | | | |
| 9.875%, 11/15/2009 | | | | 6,000,000 | | | | 6,165,000 |
| 12.125%, 11/15/2012 | | | | 410,000 | | | | 437,163 |
| Dex Media West, LLC, 8.50%, 08/15/2010 | | | | 5,770,000 | | | | 5,950,312 |
| Lamar Media Corp.: | | | | | | | | |
| 6.625%, 08/15/2015 | | | | 7,240,000 | | | | 6,986,600 |
| Ser. C, 6.625%, 08/15/2015 144A | | | | 785,000 | | | | 755,563 |
| Mediacom Broadband, LLC, 8.50%, 10/15/2015 (p) | | | | 380,000 | | | | 376,200 |
| Mediacom Communications Corp., 9.50%, 01/15/2013 | | | | 5,335,000 | | | | 5,361,675 |
| Paxson Communications Corp., FRN, 11.49%, 01/15/2013 144A | | | | 3,865,000 | | | | 3,942,300 |
| R.H. Donnelley Corp., Ser. A-4, 8.875%, 10/15/2017 144A | | | | 5,150,000 | | | | 5,150,000 |
| Sinclair Broadcast Group, Inc., 8.00%, 03/15/2012 | | | | 480,000 | | | | 495,600 |
| Sirius Satellite Radio, Inc., 9.625%, 08/01/2013 | | | | 1,525,000 | | | | 1,523,094 |
| XM Satellite Radio Holdings, Inc., 9.75%, 05/01/2014 (p) | | | | 2,170,000 | | | | 2,202,550 |
| Young Broadcasting, Inc., 8.75%, 01/15/2014 | | | | 4,045,000 | | | | 3,509,037 |
| | | | | | | |
|
| | | | | | | | | 51,408,631 |
| | | | | | | |
|
| Multi-line Retail 0.4% | | | | | | | | |
| Neiman Marcus Group, Inc., 9.00%, 10/15/2015 | | | | 2,205,000 | | | | 2,337,300 |
| | | | | | | |
|
| Specialty Retail 0.8% | | | | | | | | |
| Home Depot, Inc., 5.875%, 12/16/2036 | | | | 374,000 | | | | 327,591 |
| Michaels Stores, Inc., 10.00%, 11/01/2014 | | | | 1,365,000 | | | | 1,382,063 |
| Payless ShoeSource, Inc., 8.25%, 08/01/2013 | | | | 3,335,000 | | | | 3,314,156 |
| | | | | | | |
|
| | | | | | | | | 5,023,810 |
| | | | | | | |
|
See Notes to Financial Statements12
SCHEDULE OF INVESTMENTS continued
October 31, 2007 (unaudited)
| | | | | Principal | | | | |
| | | | | Amount | | | | Value |
|
| CORPORATE BONDS continued | | | | | | | | |
| CONSUMER DISCRETIONARY continued | | | | | | | | |
| Textiles, Apparel & Luxury Goods 1.5% | | | | | | | | |
| Norcross Safety Products, LLC, Ser. B, 9.875%, 08/15/2011 | | | $ | 535,000 | | | $ | 556,400 |
| Oxford Industries, Inc., 8.875%, 06/01/2011 | | | | 4,105,000 | | | | 4,125,525 |
| Unifi, Inc., 11.50%, 05/15/2014 | | | | 915,000 | | | | 866,963 |
| Warnaco Group, Inc., 8.875%, 06/15/2013 | | | | 3,135,000 | | | | 3,315,262 |
| | | | | | | |
|
| | | | | | | | | 8,864,150 |
| | | | | | | |
|
| CONSUMER STAPLES 1.6% | | | | | | | | |
| Food & Staples Retailing 0.1% | | | | | | | | |
| Ingles Markets, Inc., 8.875%, 12/01/2011 | | | | 450,000 | | | | 462,375 |
| SUPERVALU, Inc., 7.50%, 11/15/2014 | | | | 190,000 | | | | 196,175 |
| | | | | | | |
|
| | | | | | | | | 658,550 |
| | | | | | | |
|
| Food Products 0.7% | | | | | | | | |
| Del Monte Foods Co.: | | | | | | | | |
| 6.75%, 02/15/2015 (p) | | | | 2,450,000 | | | | 2,394,875 |
| 8.625%, 12/15/2012 | | | | 1,410,000 | | | | 1,445,250 |
| Pilgrim’s Pride Corp., 8.375%, 05/01/2017 | | | | 175,000 | | | | 177,188 |
| Smithfield Foods, Inc., 7.75%, 07/01/2017 (p) | | | | 355,000 | | | | 367,425 |
| | | | | | | |
|
| | | | | | | | | 4,384,738 |
| | | | | | | |
|
| Household Products 0.3% | | | | | | | | |
| Church & Dwight Co., 6.00%, 12/15/2012 | | | | 1,740,000 | | | | 1,703,025 |
| | | | | | | |
|
| Personal Products 0.5% | | | | | | | | |
| Central Garden & Pet Co., 9.125%, 02/01/2013 | | | | 3,065,000 | | | | 2,942,400 |
| | | | | | | |
|
| ENERGY 14.1% | | | | | | | | |
| Electric Utilities 1.7% | | | | | | | | |
| Energy Future Holdings Corp.: | | | | | | | | |
| 10.875%, 11/01/2017 144A | | | | 3,440,000 | | | | 3,495,900 |
| 11.25%, 11/01/2017 144A | | | | 2,290,000 | | | | 2,330,075 |
| Texas Competitive Electric Holdings Co., LLC, 10.25%, 11/01/2015 144A | | | | 4,585,000 | | | | 4,630,850 |
| | | | | | | |
|
| | | | | | | | | 10,456,825 |
| | | | | | | |
|
| Energy Equipment & Services 3.4% | | | | | | | | |
| Bristow Group, Inc.: | | | | | | | | |
| 6.125%, 06/15/2013 | | | | 180,000 | | | | 176,850 |
| 7.50%, 09/15/2017 144A | | | | 1,160,000 | | | | 1,200,600 |
| Dresser-Rand Group, Inc., 7.375%, 11/01/2014 | | | | 3,574,000 | | | | 3,614,207 |
| GulfMark Offshore, Inc., 7.75%, 07/15/2014 | | | | 3,025,000 | | | | 3,055,250 |
| Hornbeck Offshore Services, Inc., Ser. B, 6.125%, 12/01/2014 | | | | 5,385,000 | | | | 5,156,137 |
| Parker Drilling Co., 9.625%, 10/01/2013 | | | | 2,215,000 | | | | 2,375,588 |
| PHI, Inc., 7.125%, 04/15/2013 | | | | 5,070,000 | | | | 4,943,250 |
| | | | | | | |
|
| | | | | | | | | 20,521,882 |
| | | | | | | |
|
See Notes to Financial Statements13
SCHEDULE OF INVESTMENTS continued
October 31, 2007 (unaudited)
| | | Principal | | | | |
| | | Amount | | | | Value |
|
| CORPORATE BONDS continued | | | | | | |
| ENERGY continued | | | | | | |
| Oil, Gas & Consumable Fuels 9.0% | | | | | | |
| Chesapeake Energy Corp., 6.875%, 01/15/2016 | | $ 5,035,000 | | | $ | 5,035,000 |
| Cimarex Energy Co., 7.125%, 05/01/2017 | | 365,000 | | | | 366,369 |
| Clayton Williams Energy, Inc., 7.75%, 08/01/2013 | | 2,035,000 | | | | 1,917,988 |
| Delta Petroleum Corp., 7.00%, 04/01/2015 | | 2,070,000 | | | | 1,800,900 |
| El Paso Corp., 7.00%, 06/15/2017 (p) | | 1,025,000 | | | | 1,032,218 |
| Encore Acquisition Co.: | | | | | | |
| 6.00%, 07/15/2015 | | 4,200,000 | | | | 3,822,000 |
| 6.25%, 04/15/2014 | | 720,000 | | | | 673,200 |
| Energy Partners, Ltd., 9.75%, 04/15/2014 144A | | 725,000 | | | | 721,375 |
| Exco Resources, Inc., 7.25%, 01/15/2011 | | 2,940,000 | | | | 2,917,950 |
| Forest Oil Corp.: | | | | | | |
| 7.25%, 06/15/2019 144A (p) | | 1,280,000 | | | | 1,286,400 |
| 7.75%, 05/01/2014 | | 80,000 | | | | 81,200 |
| Frontier Oil Corp., 6.625%, 10/01/2011 (p) | | 550,000 | | | | 550,000 |
| Griffin Coal Mining Co., Ltd., 9.50%, 12/01/2016 144A | | 4,845,000 | | | | 4,820,775 |
| Mariner Energy, Inc., 8.00%, 05/15/2017 | | 622,000 | | | | 617,335 |
| Overseas Shipholding Group, Inc., 8.25%, 03/15/2013 | | 4,215,000 | | | | 4,373,062 |
| Peabody Energy Corp.: | | | | | | |
| 5.875%, 04/15/2016 | | 3,580,000 | | | | 3,427,850 |
| 6.875%, 03/15/2013 | | 540,000 | | | | 545,400 |
| Plains Exploration & Production Co., 7.75%, 06/15/2015 | | 1,000,000 | | | | 1,000,000 |
| Regency Energy Partners, LP, 8.375%, 12/15/2013 | | 2,945,000 | | | | 3,114,337 |
| Sabine Pass LNG, LP, 7.25%, 11/30/2013 | | 4,065,000 | | | | 4,004,025 |
| Targa Resources, Inc., 8.50%, 11/01/2013 144A | | 2,685,000 | | | | 2,725,275 |
| Tesoro Corp., Ser. B: | | | | | | |
| 6.50%, 06/01/2017 144A (p) | | 2,400,000 | | | | 2,382,000 |
| 6.625%, 11/01/2015 | | 845,000 | | | | 842,888 |
| W&T Offshore, Inc., 8.25%, 06/15/2014 144A | | 600,000 | | | | 585,000 |
| Williams Cos., 8.125%, 03/15/2012 (p) | | 5,570,000 | | | | 6,029,525 |
| | | | | |
|
| | | | | | | 54,672,072 |
| | | | | |
|
| FINANCIALS 11.6% | | | | | | |
| Capital Markets 0.2% | | | | | | |
| Nuveen Investments, Inc., 10.50%, 11/15/2015 # | | 1,150,000 | | | | 1,150,000 |
| | | | | |
|
| Consumer Finance 6.6% | | | | | | |
| CCH II Capital Corp., 10.25%, 09/15/2010 | | 9,405,000 | | | | 9,637,238 |
| Ford Motor Credit Co., LLC: | | | | | | |
| 5.70%, 01/15/2010 | | 3,630,000 | | | | 3,368,517 |
| 7.375%, 10/28/2009 | | 5,805,000 | | | | 5,601,169 |
| 9.75%, 09/15/2010 | | 2,140,000 | | | | 2,132,335 |
See Notes to Financial Statements14
SCHEDULE OF INVESTMENTS continued
October 31, 2007 (unaudited)
| | | | | Principal | | | | |
| | | | | Amount | | | | Value |
|
| CORPORATE BONDS continued | | | | | | | | |
| FINANCIALS continued | | | | | | | | |
| Consumer Finance continued | | | | | | | | |
| General Motors Acceptance Corp., LLC: | | | | | | | | |
| 5.625%, 05/15/2009 | | | $ | 320,000 | | | $ | 304,967 |
| 6.81%, 05/15/2009 | | | | 2,400,000 | | | | 2,258,928 |
| 6.875%, 09/15/2011 | | | | 2,615,000 | | | | 2,411,995 |
| 6.875%, 08/28/2012 | | | | 10,175,000 | | | | 9,181,767 |
| 7.75%, 01/19/2010 | | | | 1,620,000 | | | | 1,568,876 |
| 8.00%, 11/01/2031 | | | | 2,470,000 | | | | 2,288,848 |
| Qwest Capital Funding, Inc., 6.50%, 11/15/2018 | | | | 1,715,000 | | | | 1,530,637 |
| | | | | | | |
|
| | | | | | | | | 40,285,277 |
| | | | | | | |
|
| Diversified Financial Services 0.7% | | | | | | | | |
| Leucadia National Corp., 8.125%, 09/15/2015 | | | | 4,185,000 | | | | 4,242,544 |
| | | | | | | |
|
| Insurance 0.3% | | | | | | | | |
| Crum & Forster Holdings Corp., 7.75%, 05/01/2017 | | | | 1,635,000 | | | | 1,630,912 |
| | | | | | | |
|
| Real Estate Investment Trusts 2.6% | | | | | | | | |
| Host Marriott Corp.: | | | | | | | | |
| 7.125%, 11/01/2013 (p) | | | | 2,530,000 | | | | 2,580,600 |
| Ser. O, 6.375%, 03/15/2015 (p) | | | | 815,000 | | | | 808,888 |
| Ser. Q, 6.75%, 06/01/2016 | | | | 3,135,000 | | | | 3,150,675 |
| Omega Healthcare Investors, Inc.: | | | | | | | | |
| 7.00%, 04/01/2014 | | | | 4,105,000 | | | | 4,156,312 |
| 7.00%, 01/15/2016 | | | | 3,790,000 | | | | 3,818,425 |
| Thornburg Mortgage, Inc., 8.00%, 05/15/2013 (p) | | | | 656,000 | | | | 574,000 |
| Ventas, Inc., 7.125%, 06/01/2015 | | | | 540,000 | | | | 553,500 |
| | | | | | | |
|
| | | | | | | | | 15,642,400 |
| | | | | | | |
|
| Real Estate Management & Development 0.0% | | | | | | | | |
| Realogy Corp.: | | | | | | | | |
| 10.50%, 04/15/2014 144A | | | | 110,000 | | | | 91,713 |
| 12.375%, 04/15/2015 144A (p) | | | | 220,000 | | | | 161,150 |
| | | | | | | |
|
| | | | | | | | | 252,863 |
| | | | | | | |
|
| Thrifts & Mortgage Finance 1.2% | | | | | | | | |
| Residential Capital, LLC: | | | | | | | | |
| 7.125%, 11/21/2008 | | | | 1,065,000 | | | | 897,467 |
| 7.375%, 06/30/2010 | | | | 8,975,000 | | | | 6,622,697 |
| | | | | | | |
|
| | | | | | | | | 7,520,164 |
| | | | | | | |
|
| HEALTH CARE 3.5% | | | | | | | | |
| Health Care Equipment & Supplies 0.3% | | | | | | | | |
| Bausch & Lomb, Inc., 9.875%, 11/01/2015 144A | | | | 655,000 | | | | 676,288 |
| Universal Hospital Services, Inc., 8.50%, 06/01/2015 144A (p) | | | | 1,464,000 | | | | 1,496,940 |
| | | | | | | |
|
| | | | | | | | | 2,173,228 |
| | | | | | | |
|
See Notes to Financial Statements15
SCHEDULE OF INVESTMENTS continued
October 31, 2007 (unaudited)
| | | Principal | | | | |
| | | Amount | | | | Value |
|
| CORPORATE BONDS continued | | | | | | |
| HEALTH CARE continued | | | | | | |
| Health Care Providers & Services 3.2% | | | | | | |
| HCA, Inc.: | | | | | | |
| 6.375%, 01/15/2015 | | $ 1,900,000 | | | $ | 1,631,625 |
| 6.50%, 02/15/2016 (p) | | 2,270,000 | | | | 1,949,362 |
| 8.75%, 09/01/2010 | | 1,500,000 | | | | 1,533,750 |
| 9.25%, 11/15/2016 | | 8,050,000 | | | | 8,492,750 |
| HealthSouth Corp., 10.75%, 06/15/2016 (p) | | 2,140,000 | | | | 2,268,400 |
| Omnicare, Inc.: | | | | | | |
| 6.125%, 06/01/2013 | | 1,640,000 | | | | 1,549,800 |
| 6.875%, 12/15/2015 | | 1,980,000 | | | | 1,910,700 |
| | | | | |
|
| | | | | | | 19,336,387 |
| | | | | |
|
| INDUSTRIALS 6.4% | | | | | | |
| Aerospace & Defense 3.6% | | | | | | |
| Alliant Techsystems, Inc., 6.75%, 04/01/2016 (p) | | 580,000 | | | | 580,000 |
| DRS Technologies, Inc.: | | | | | | |
| 6.625%, 02/01/2016 | | 1,625,000 | | | | 1,616,875 |
| 7.625%, 02/01/2018 (p) | | 1,540,000 | | | | 1,582,350 |
| Hexcel Corp., 6.75%, 02/01/2015 | | 625,000 | | | | 617,187 |
| L-3 Communications Holdings, Inc.: | | | | | | |
| 5.875%, 01/15/2015 (p) | | 10,985,000 | | | | 10,765,300 |
| 6.375%, 10/15/2015 | | 5,965,000 | | | | 5,994,825 |
| Vought Aircraft Industries, Inc., 8.00%, 07/15/2011 | | 700,000 | | | | 699,125 |
| | | | | |
|
| | | | | | | 21,855,662 |
| | | | | |
|
| Commercial Services & Supplies 1.0% | | | | | | |
| Browning-Ferris Industries, Inc.: | | | | | | |
| 7.40%, 09/15/2035 | | 2,285,000 | | | | 2,159,325 |
| 9.25%, 05/01/2021 | | 2,360,000 | | | | 2,537,000 |
| Corrections Corporation of America, 6.25%, 03/15/2013 | | 275,000 | | | | 274,670 |
| Geo Group, Inc., 8.25%, 07/15/2013 | | 200,000 | | | | 203,500 |
| Mobile Mini, Inc., 6.875%, 05/01/2015 | | 705,000 | | | | 673,275 |
| | | | | |
|
| | | | | | | 5,847,770 |
| | | | | |
|
| Machinery 1.1% | | | | | | |
| Commercial Vehicle Group, Inc., 8.00%, 07/01/2013 | | 5,000,000 | | | | 4,825,000 |
| Manitowoc Co., 7.125%, 11/01/2013 | | 1,675,000 | | | | 1,675,000 |
| | | | | |
|
| | | | | | | 6,500,000 |
| | | | | |
|
| Road & Rail 0.5% | | | | | | |
| Avis Budget Group, Inc., 7.75%, 05/15/2016 | | 2,510,000 | | | | 2,484,900 |
| Hertz Global Holdings, Inc.: | | | | | | |
| 8.875%, 01/01/2014 | | 760,000 | | | | 786,600 |
| 10.50%, 01/01/2016 | | 95,000 | | | | 102,600 |
| | | | | |
|
| | | | | | | 3,374,100 |
| | | | | |
|
See Notes to Financial Statements16
SCHEDULE OF INVESTMENTS continued
October 31, 2007 (unaudited)
| | | | | | | Principal | | | | |
| | | | | | | Amount | | | | Value |
|
| CORPORATE BONDS continued | | | | | | | | | | |
| INDUSTRIALS continued | | | | | | | | | | |
| Trading Companies & Distributors 0.2% | | | | | | | | | | |
| Neff Corp., 10.00%, 06/01/2015 (p) | | | | | $ | 240,000 | | | $ | 174,000 |
| United Rentals, Inc., 6.50%, 02/15/2012 | | | | | | 890,000 | | | | 925,600 |
| | | | | | | | | |
|
| | | | | | | | | | | 1,099,600 |
| | | | | | | | | |
|
| INFORMATION TECHNOLOGY 2.0% | | | | | | | | | | |
| Electronic Equipment & Instruments 0.6% | | | | | | | | | | |
| Da-Lite Screen Co., Inc., 9.50%, 05/15/2011 | | | | | | 1,610,000 | | | | 1,692,512 |
| Sanmina-SCI Corp., FRN: | | | | | | | | | | |
| 8.44%, 06/15/2010 144A (p) | | | | | | 1,085,000 | | | | 1,090,425 |
| 8.44%, 06/15/2014 144A (p) | | | | | | 570,000 | | | | 555,750 |
| | | | | | | | | |
|
| | | | | | | | | | | 3,338,687 |
| | | | | | | | | |
|
| IT Services 0.9% | | | | | | | | | | |
| First Data Corp., 9.875%, 09/24/2015 144A | | | | | | 1,305,000 | | | | 1,251,169 |
| ipayment, Inc., 9.75%, 05/15/2014 | | | | | | 2,200,000 | | | | 2,123,000 |
| SunGard Data Systems, Inc.: | | | | | | | | | | |
| 4.875%, 01/15/2014 | | | | | | 1,170,000 | | | | 1,038,375 |
| 10.25%, 08/15/2015 (p) | | | | | | 245,000 | | | | 256,638 |
| Unisys Corp., 7.875%, 04/01/2008 | | | | | | 1,010,000 | | | | 1,006,212 |
| | | | | | | | | |
|
| | | | | | | | | | | 5,675,394 |
| | | | | | | | | |
|
| Semiconductors & Semiconductor Equipment 0.2% | | | | | | | | |
| Freescale Semiconductor, Inc., 8.875%, 12/15/2014 | | | | | | 1,590,000 | | | | 1,512,488 |
| | | | | | | | | |
|
| Software 0.3% | | | | | | | | | | |
| Activant Solutions, Inc., 9.50%, 05/01/2016 | | | | | | 1,495,000 | | | | 1,371,662 |
| Harland Clarke Holdings Corp., 9.50%, 05/15/2015 | | | | | | 326,000 | | | | 298,290 |
| | | | | | | | | |
|
| | | | | | | | | | | 1,669,952 |
| | | | | | | | | |
|
| MATERIALS 11.8% | | | | | | | | | | |
| Chemicals 5.4% | | | | | | | | | | |
| ARCO Chemical Co.: | | | | | | | | | | |
| 9.80%, 02/01/2020 | | | | | | 1,150,000 | | | | 1,132,750 |
| 10.25%, 11/01/2010 | | | | | | 190,000 | | | | 201,400 |
| Equistar Chemicals, LP, 10.625%, 05/01/2011 | | | | | | 250,000 | | | | 262,500 |
| Koppers Holdings, Inc.: | | | | | | | | | | |
| 9.875%, 10/15/2013 | | | | | | 225,000 | | | | 239,062 |
| Sr. Disc. Note, Step Bond, 0.00%, 11/15/2014 † | | | | | | 2,070,000 | | | | 1,785,375 |
| Lyondell Chemical Co.: | | | | | | | | | | |
| 6.875%, 06/15/2017 (p) | | | | | | 3,105,000 | | | | 3,431,025 |
| 10.50%, 06/01/2013 | | | | | | 8,850,000 | | | | 9,580,125 |
| MacDermid, Inc., 9.50%, 04/15/2017 144A (p) | | | | | | 3,506,000 | | | | 3,365,760 |
| Millenium America, Inc., 7.625%, 11/15/2026 | | | | | | 1,700,000 | | | | 1,470,500 |
| Momentive Performance Materials, Inc.: | | | | | | | | | | |
| 9.75%, 12/01/2014 144A | | | | | | 2,700,000 | | | | 2,646,000 |
| 10.125%, 12/01/2014 144A | | | | | | 360,000 | | | | 349,200 |
See Notes to Financial Statements
17
SCHEDULE OF INVESTMENTS continued
October 31, 2007 (unaudited)
| | | Principal | | | | |
| | | Amount | | | | Value |
|
| CORPORATE BONDS continued | | | | | | |
| MATERIALS continued | | | | | | |
| Chemicals continued | | | | | | |
| Mosaic Co.: | | | | | | |
| 7.30%, 01/15/2028 | | $ 1,325,000 | | | $ | 1,318,375 |
| 7.625%, 12/01/2016 144A | | 1,990,000 | | | | 2,154,175 |
| Tronox Worldwide, LLC, 9.50%, 12/01/2012 (p) | | 4,739,000 | | | | 4,596,830 |
| | | | | |
|
| | | | | | | 32,533,077 |
| | | | | |
|
| Construction Materials 0.6% | | | | | | |
| CPG International, Inc., 10.50%, 07/01/2013 | | 3,135,000 | | | | 3,150,675 |
| Dayton Superior Corp., 13.00%, 06/15/2009 (p) | | 775,000 | | | | 771,125 |
| | | | | |
|
| | | | | | | 3,921,800 |
| | | | | |
|
| Containers & Packaging 2.2% | | | | | | |
| Berry Plastics Holding Corp., 8.875%, 09/15/2014 | | 1,080,000 | | | | 1,112,400 |
| Exopack Holding Corp., 11.25%, 02/01/2014 | | 2,820,000 | | | | 2,869,350 |
| Graham Packaging Co., 9.875%, 10/15/2014 (p) | | 2,305,000 | | | | 2,293,475 |
| Graphic Packaging International, Inc.: | | | | | | |
| 8.50%, 08/15/2011 (p) | | 580,000 | | | | 591,600 |
| 9.50%, 08/15/2013 | | 2,680,000 | | | | 2,827,400 |
| Smurfit-Stone Container Corp., 8.375%, 07/01/2012 (p) | | 3,840,000 | | | | 3,859,200 |
| | | | | |
|
| | | | | | | 13,553,425 |
| | | | | |
|
| Metals & Mining 1.5% | | | | | | |
| Dayton Superior Corp., 10.75%, 09/15/2008 | | 540,000 | | | | 549,450 |
| Freeport-McMoRan Copper & Gold, Inc.: | | | | | | |
| 6.875%, 02/01/2014 (p) | | 3,865,000 | | | | 4,000,275 |
| 8.375%, 04/01/2017 | | 2,470,000 | | | | 2,710,825 |
| Indalex Holdings Corp., 11.50%, 02/01/2014 | | 1,870,000 | | | | 1,748,450 |
| | | | | |
|
| | | | | | | 9,009,000 |
| | | | | |
|
| Paper & Forest Products 2.1% | | | | | | |
| Bowater, Inc., 9.375%, 12/15/2021 | | 1,610,000 | | | | 1,352,400 |
| Buckeye Technologies, Inc., 8.50%, 10/01/2013 | | 1,070,000 | | | | 1,107,450 |
| Georgia Pacific Corp.: | | | | | | |
| 8.00%, 01/15/2024 (p) | | 1,870,000 | | | | 1,851,300 |
| 8.875%, 05/15/2031 | | 1,920,000 | | | | 1,929,600 |
| Glatfelter, 7.125%, 05/01/2016 | | 3,255,000 | | | | 3,238,725 |
| Verso Paper Holdings, LLC, 11.375%, 08/01/2016 (p) | | 2,817,000 | | | | 3,000,105 |
| | | | | |
|
| | | | | | | 12,479,580 |
| | | | | |
|
| TELECOMMUNICATION SERVICES 5.0% | | | | | | |
| Diversified Telecommunication Services 2.1% | | | | | | |
| Citizens Communications Co., 7.875%, 01/15/2027 | | 675,000 | | | | 666,563 |
| Consolidated Communications, Inc., 9.75%, 04/01/2012 | | 3,856,000 | | | | 3,962,040 |
| Qwest Communications International, Inc.: | | | | | | |
| 7.875%, 09/01/2011 | | 3,340,000 | | | | 3,540,400 |
| 8.875%, 03/15/2012 | | 1,365,000 | | | | 1,501,500 |
| West Corp., 11.00%, 10/15/2016 (p) | | 2,770,000 | | | | 2,915,425 |
| | | | | |
|
| | | | | | | 12,585,928 |
| | | | | |
|
See Notes to Financial Statements18
SCHEDULE OF INVESTMENTS continued
October 31, 2007 (unaudited)
| | | | | Principal | | | | |
| | | | | Amount | | | | Value |
|
| CORPORATE BONDS continued | | | | | | | | |
| TELECOMMUNICATION SERVICES continued | | | | | | | | |
| Wireless Telecommunication Services 2.9% | | | | | | | | |
| Centennial Communications Corp.: | | | | | | | | |
| 8.125%, 02/01/2014 (p) | | | | $ 5,200,000 | | | $ | 5,330,000 |
| 10.125%, 06/15/2013 | | | | 200,000 | | | | 213,500 |
| Cricket Communications, Inc., 9.375%, 11/01/2014 | | | | 2,815,000 | | | | 2,807,962 |
| Dobson Cellular Systems, Inc., 9.875%, 11/01/2012 | | | | 3,850,000 | | | | 4,186,875 |
| MetroPCS Wireless, Inc., 9.25%, 11/01/2014 144A (p) | | | | 3,880,000 | | | | 3,870,300 |
| Rural Cellular Corp., 8.25%, 03/15/2012 (p) | | | | 1,535,000 | | | | 1,607,913 |
| | | | | | | |
|
| | | | | | | | | 18,016,550 |
| | | | | | | |
|
| UTILITIES 8.8% | | | | | | | | |
| Electric Utilities 6.3% | | | | | | | | |
| Allegheny Energy Supply Co., 8.25%, 04/15/2012 144A | | | | 4,045,000 | | | | 4,409,050 |
| Aquila, Inc., 14.875%, 07/01/2012 | | | | 5,510,000 | | | | 6,970,150 |
| CMS Energy Corp.: | | | | | | | | |
| 6.55%, 07/17/2017 | | | | 300,000 | | | | 292,703 |
| 8.50%, 04/15/2011 | | | | 530,000 | | | | 570,940 |
| Edison Mission Energy: | | | | | | | | |
| 7.00%, 05/15/2017 144A | | | | 1,220,000 | | | | 1,198,650 |
| 7.20%, 05/15/2019 144A | | | | 1,470,000 | | | | 1,444,275 |
| Mirant Americas Generation, LLC: | | | | | | | | |
| 8.30%, 05/01/2011 | | | | 650,000 | | | | 660,563 |
| 8.50%, 10/01/2021 | | | | 705,000 | | | | 696,188 |
| Mirant North America, LLC, 7.375%, 12/31/2013 (p) | | | | 5,530,000 | | | | 5,633,687 |
| NRG Energy, Inc., 7.375%, 02/01/2016 | | | | 4,460,000 | | | | 4,460,000 |
| Orion Power Holdings, Inc., 12.00%, 05/01/2010 | | | | 5,100,000 | | | | 5,661,000 |
| PSEG Energy Holdings, LLC, 10.00%, 10/01/2009 | | | | 535,000 | | | | 572,432 |
| Reliant Energy, Inc.: | | | | | | | | |
| 6.75%, 12/15/2014 | | | | 5,486,000 | | | | 5,609,435 |
| 7.875%, 06/15/2017 (p) | | | | 90,000 | | | | 91,238 |
| | | | | | | |
|
| | | | | | | | | 38,270,311 |
| | | | | | | |
|
| Gas Utilities 1.0% | | | | | | | | |
| SEMCO Energy, Inc., 7.75%, 05/15/2013 | | | | 5,810,000 | | | | 6,148,746 |
| | | | | | | |
|
| Independent Power Producers & Energy Traders 1.5% | | | | | | | | |
| AES Corp.: | | | | | | | | |
| 8.00%, 10/15/2017 144A | | | | 2,930,000 | | | | 2,970,288 |
| 8.75%, 05/15/2013 144A | | | | 3,185,000 | | | | 3,384,062 |
| Dynegy, Inc., 7.50%, 06/01/2015 144A | | | | 2,730,000 | | | | 2,620,800 |
| | | | | | | |
|
| | | | | | | | | 8,975,150 |
| | | | | | | |
|
| Total Corporate Bonds (cost $531,652,845) | | | | | | | | 532,158,983 |
| | | | | | | |
|
See Notes to Financial Statements19
SCHEDULE OF INVESTMENTS continued
October 31, 2007 (unaudited)
| | | | | Principal | | | | |
| | | | | Amount | | | | Value |
|
| YANKEE OBLIGATIONS - CORPORATE 7.2% | | | | | | |
| ENERGY 0.8% | | | | | | | | |
| Oil, Gas & Consumable Fuels 0.8% | | | | | | | | |
| OPTI Canada, Inc.: | | | | | | | | |
| 7.875%, 12/15/2014 144A (p) | | | | $ 3,170,000 | | | $ | 3,162,075 |
| 8.25%, 12/15/2014 144A | | | | 1,965,000 | | | | 1,979,737 |
| | | | | | | |
|
| | | | | | | | | 5,141,812 |
| | | | | | | |
|
| FINANCIALS 1.5% | | | | | | | | |
| Consumer Finance 0.8% | | | | | | | | |
| Avago Technologies Finance, Ltd., 10.125%, 12/01/2013 | | 880,000 | | | | 954,800 |
| NXP Funding, LLC, 7.875%, 10/15/2014 | | 170,000 | | | | 166,813 |
| Petroplus Finance, Ltd., 6.75%, 05/01/2014 144A | | 710,000 | | | | 678,050 |
| Virgin Media Finance plc, 9.125%, 08/15/2016 (p) | | 2,625,000 | | | | 2,782,500 |
| | | | | |
|
| | | | | | | | | 4,582,163 |
| | | | | | | |
|
| Diversified Financial Services 0.7% | | | | | | | | |
| Preferred Term Securities XII, Ltd., FRN, 10.00%, 12/24/2033 | | 720,000 | | | | 545,573 |
| Ship Finance International, Ltd., 8.50%, 12/15/2013 | | 3,635,000 | | | | 3,734,962 |
| | | | | |
|
| | | | | | | | | 4,280,535 |
| | | | | | | |
|
| INDUSTRIALS 0.9% | | | | | | | | |
| Road & Rail 0.9% | | | | | | | | |
| Kansas City Southern de Mexico: | | | | | | | | |
| 7.375%, 06/01/2014 144A (p) | | | | 2,605,000 | | | | 2,611,512 |
| 9.375%, 05/01/2012 | | | | 2,923,000 | | | | 3,112,995 |
| | | | | | | |
|
| | | | | | | | | 5,724,507 |
| | | | | | | |
|
| INFORMATION TECHNOLOGY 0.8% | | | | | | | | |
| Communications Equipment 0.8% | | | | | | | | |
| Nortel Networks Corp., 10.125%, 07/15/2013 144A | | 4,460,000 | | | | 4,571,500 |
| | | | | |
|
| Semiconductors & Semiconductor Equipment 0.0% | | | | | | |
| Sensata Technologies, Inc., 8.00%, 05/01/2014 | | 180,000 | | | | 177,525 |
| | | | | |
|
| MATERIALS 2.3% | | | | | | | | |
| Metals & Mining 2.0% | | | | | | | | |
| Novelis, Inc., 7.25%, 02/15/2015 (p) | | 12,520,000 | | | | 12,081,800 |
| | | | | |
|
| Paper & Forest Products 0.3% | | | | | | |
| Abitibi-Consolidated, Inc., 8.375%, 04/01/2015 | | 495,000 | | | | 386,100 |
| Corporacion Durango SAB de CV, 10.50%, 10/05/2017 144A | | 1,435,000 | | | | 1,391,950 |
| | | | | |
|
| | | | | | | | | 1,778,050 |
| | | | | | | |
|
| TELECOMMUNICATION SERVICES 0.7% | | | | | | |
| Wireless Telecommunication Services 0.7% | | | | | | |
| Inmarsat plc, Sr. Disc. Note, Step Bond, 0.00%, 11/15/2012 † | | 1,270,000 | | | | 1,231,900 |
| Intelsat, Ltd.: | | | | | | | | |
| 9.25%, 06/15/2016 (p) | | | | 1,025,000 | | | | 1,068,563 |
| 11.25%, 06/15/2016 | | | | 1,660,000 | | | | 1,792,800 |
| | | | | | | |
|
| | | | | | | | | 4,093,263 |
| | | | | | | |
|
See Notes to Financial Statements20
SCHEDULE OF INVESTMENTS continued
October 31, 2007 (unaudited)
| | | | | Principal | | | | |
| | | | | Amount | | | | Value |
|
| YANKEE OBLIGATIONS - CORPORATE continued | | | | | | | | |
| UTILITIES 0.2% | | | | | | | | |
| Electric Utilities 0.2% | | | | | | | | |
| InterGen NV, 9.00%, 06/30/2017 (p) 144A | | | $ | 970,000 | | | $ | 1,030,625 |
| | | | | | | |
|
| Total Yankee Obligations - Corporate (cost $43,968,362) | | | | | | | | 43,461,780 |
| | | | | | | | |
|
| |
| | | | | Shares | | | | Value |
|
| COMMON STOCKS 0.2% | | | | | | | | |
| CONSUMER DISCRETIONARY 0.0% | | | | | | | | |
| Media 0.0% | | | | | | | | |
| Comcast Corp., Class A * | | | | 6,589 | | | | 138,699 |
| | | | | | | |
|
| INDUSTRIALS 0.1% | | | | | | | | |
| Airlines 0.1% | | | | | | | | |
| Delta Air Lines, Inc., 0.00% | | | | 14,338 | | | | 298,230 |
| | | | | | | |
|
| MATERIALS 0.1% | | | | | | | | |
| Chemicals 0.0% | | | | | | | | |
| Tronox, Inc. Class A | | | | 32,830 | | | | 279,383 |
| | | | | | | |
|
| Containers & Packaging 0.1% | | | | | | | | |
| Smurfit-Stone Container Corp. * | | | | 27,400 | | | | 331,814 |
| | | | | | | |
|
| UTILITIES 0.0% | | | | | | | | |
| Gas Utilities 0.0% | | | | | | | | |
| SEMCO Energy, Inc. * | | | | 4,777 | | | | 38,789 |
| | | | | | | |
|
| Total Common Stocks (cost $1,117,483) | | | | | | | | 1,086,915 |
| | | | | | | |
|
| WARRANTS 0.0% | | | | | | | | |
| CONSUMER DISCRETIONARY 0.0% | | | | | | | | |
| Media 0.0% | | | | | | | | |
| Metricom, Inc., Expiring 02/15/2010 * + (h) (cost $318,090) | | | | 1,500 | | | | 0 |
| | | | | | | | |
|
| |
| | | | | Principal | | | | |
| | | | | Amount | | | | Value |
|
| BANK LOANS 2.3% | | | | | | | | |
| CONSUMER DISCRETIONARY 0.0% | | | | | | | | |
| Catalina Marketing Corp., FRN, 8.07%, 10/11/2014 | | | $ | 210,000 | | | | 206,533 |
| | | | | | | |
|
| ENERGY 1.3% | | | | | | | | |
| Blue Grass Energy Corp., FRN, 10.13%, 12/30/2013 | | | | 7,000,000 | | | | 6,997,060 |
| Saint Acquisition Corp., FRN, 8.81%, 06/05/2014 | | | | 725,000 | | | | 649,230 |
| | | | | | | |
|
| | | | | | | | | 7,646,290 |
| | | | | | | |
|
| HEALTH CARE 0.1% | | | | | | | | |
| HealthSouth Corp., 7.63%, 01/16/2011 | | | | 858,529 | | | | 857,310 |
| | | | | | | |
|
| INDUSTRIALS 0.1% | | | | | | | | |
| Neff Corp. 2nd Lien, FRN, 9.19%, 11/30/2014 | | | | 620,000 | | | | 556,791 |
| | | | | | | |
|
See Notes to Financial Statements21
SCHEDULE OF INVESTMENTS continued
October 31, 2007 (unaudited)
| | | | | Principal | | | | |
| | | | | Amount | | | | Value |
|
| BANK LOANS continued | | | | | | |
| INFORMATION TECHNOLOGY 0.6% | | | | | | |
| First Data Corp., 8.00%, 09/24/2014 | | $ 2,240,000 | | | $ | 2,153,557 |
| Flextonics International, Ltd., 7.33%, 10/01/2014 | | 1,550,000 | | | | 1,534,531 |
| | | | | |
|
| | | | | | | | | 3,688,088 |
| | | | | | | |
|
| TELECOMMUNICATION SERVICES 0.2% | | | | | | |
| Telesat, FRN, 8.21%, 09/01/2014 | | 1,630,000 | | | | 1,609,087 |
| | | | | |
|
| Total Bank Loans (cost $14,552,776) | | | | | | 14,564,099 |
| | | | | |
|
| INVESTMENTS OF CASH COLLATERAL FROM SECURITIES LOANED 12.2% | | | | | | |
| CORPORATE BONDS 0.9% | | | | | | | | |
| Commercial Banks 0.4% | | | | | | | | |
| First Tennessee Bank, FRN, 5.05%, 08/15/2008 | | 2,500,001 | | | | 2,500,001 |
| | | | | |
|
| Insurance 0.5% | | | | | | | | |
| Metropolitan Life Global Funding, FRN, 4.99%, 08/21/2008 | | 2,750,000 | | | | 2,750,000 |
| | | | | |
|
| REPURCHASE AGREEMENTS (v) 11.3% | | | | | | |
| Bank of America Corp., 4.93%, dated 10/31/2007, maturing 11/01/2007, | | | | | | |
| maturity value $50,006,847 | | 50,000,000 | | | | 50,000,000 |
| Barclays Capital, Inc., 4.92%, dated 10/31/2007, maturing 11/01/2007, maturity | | | | |
| value $10,001,367 | | | | 10,000,000 | | | | 10,000,000 |
| Lehman Brothers, Inc., 4.93%, dated 10/31/2007, maturing 11/01/2007, maturity | | | | |
| value $8,896,453 | | | | 8,895,235 | | | | 8,895,235 |
| | | | | | | |
|
| | | | | | | | | 68,895,235 |
| | | | | | | |
|
| Total Investments of Cash Collateral from Securities Loaned (cost $74,145,236) | | | | 74,145,236 |
| | | | |
|
| |
| | | | | Shares | | | | Value |
|
| SHORT-TERM INVESTMENTS 1.4% | | | | | | |
| MUTUAL FUND SHARES 1.4% | | | | | | |
| Evergreen Institutional Money Market Fund, Class I, 5.03% ## q ø | | | | | | |
| (cost $8,724,374) | | 8,724,374 | | | | 8,724,374 |
| | | | | |
|
| Total Investments (cost $674,479,166) 110.9% | | | | | | 674,141,387 |
| Other Assets and Liabilities (10.9%) | | | | | | (66,441,286) |
| | | | | |
|
| Net Assets 100.0% | | | | | | | $ | 607,700,101 |
| | | | | | | |
|
See Notes to Financial Statements22
SCHEDULE OF INVESTMENTS continued
October 31, 2007 (unaudited)
| (p) | | All or a portion of this security is on loan. |
| 144A | | Security that may be sold to qualified institutional buyers under Rule 144A of the Securities Act of 1933, as amended. |
| | | This security has been determined to be liquid under guidelines established by the Board of Trustees, unless otherwise |
| | | noted. |
| # | | When-issued or delayed delivery security |
| † | | Security initially issued in zero coupon form which converts to coupon form at a specified rate and date. An effective |
| | | interest rate is applied to recognize interest income daily for the bond. This rate is based on total expected interest to be |
| | | earned over the life of the bond which consists of the aggregate coupon-interest payments and discount at acquisition. |
| | | The rate shown is the stated rate at the current period end. |
| * | | Non-income producing security |
| + | | Security is deemed illiquid. |
| (h) | | Security is valued at fair value as determined by the investment advisor in good faith, according to procedures approved |
| | | by the Board of Trustees. |
| (v) | | Collateralized by U.S. government agency obligations at period end. |
| ## | | All or a portion of this security has been segregated for when-issued or delayed delivery securities. |
| q | | Rate shown is the 7-day annualized yield at period end. |
| ø | | Evergreen Investment Management Company, LLC is the investment advisor to both the Fund and the money market |
| | | fund. |
| Summary of Abbreviations |
| FRN | Floating Rate Note |
The following table shows the percent of total investments (excluding equity positions, collateral from securities on loan and segregated cash and cash equivalents) by credit quality based on Moody’s and Standard & Poor’s ratings as of October 31, 2007:
| AAA | | 1.0% |
| BBB | | 3.0% |
| BB | | 28.2% |
| B | | 52.0% |
| CCC | | 14.9% |
| NR | | 0.9% |
| |
|
| | | 100.0% |
| | |
|
The following table shows the percent of total investments (excluding equity positions, collateral from securities on loan and segregated cash and cash equivalents) based on effective maturity as of October 31, 2007:
| Less than 1 year | | 5.8% |
| 1 to 3 year(s) | | 16.3% |
| 3 to 5 years | | 14.9% |
| 5 to 10 years | | 56.6% |
| 10 to 20 years | | 4.2% |
| 20 to 30 years | | 1.9% |
| Greater than 30 years | | 0.3% |
| |
|
| | | 100.0% |
| | |
|
See Notes to Financial Statements
23
STATEMENT OF ASSETS AND LIABILITIES
October 31, 2007 (unaudited)
|
| Assets | | | | |
| Investments in securities, at value (cost $665,754,792) including $72,444,518 of | | | | |
| securities loaned | | $ | | 665,417,013 |
| Investments in affiliated money market fund, at value (cost $8,724,374) | | | | 8,724,374 |
|
| Total investments | | | | 674,141,387 |
| Cash | | | | 846 |
| Receivable for securities sold | | | | 3,704,501 |
| Receivable for Fund shares sold | | | | 261,924 |
| Interest receivable | | | | 14,194,173 |
| Receivable for securities lending income | | | | 10,727 |
| Receivable for credit default swap payments | | | | 55 |
| Prepaid expenses and other assets | | | | 115,170 |
|
| Total assets | | | | 692,428,783 |
|
| Liabilities | | | | |
| Dividends payable | | | | 1,452,778 |
| Payable for securities purchased | | | | 7,299,121 |
| Payable for Fund shares redeemed | | | | 1,497,314 |
| Unrealized losses on credit default swap transactions | | | | 3,618 |
| Deferred swap discount | | | | 105,477 |
| Payable for securities on loan | | | | 74,145,236 |
| Advisory fee payable | | | | 4,311 |
| Due to other related parties | | | | 95,668 |
| Accrued expenses and other liabilities | | | | 125,159 |
|
| Total liabilities | | | | 84,728,682 |
|
| Net assets | | $ | | 607,700,101 |
|
| Net assets represented by | | | | |
| Paid-in capital | | $ | | 744,047,889 |
| Overdistributed net investment income | | | | (1,973,676) |
| Accumulated net realized losses on investments | | | | (134,032,715) |
| Net unrealized losses on investments | | | | (341,397) |
|
| Total net assets | | $ | | 607,700,101 |
|
| Net assets consists of | | | | |
| Class A | | $ | | 305,651,851 |
| Class B | | | | 129,395,440 |
| Class C | | | | 137,643,060 |
| Class I | | | | 35,009,750 |
|
| Total net assets | | $ | | 607,700,101 |
|
| Shares outstanding (unlimited number of shares authorized) | | | | |
| Class A | | | | 92,730,062 |
| Class B | | | | 39,257,950 |
| Class C | | | | 41,761,236�� |
| Class I | | | | 10,622,013 |
|
| Net asset value per share | | | | |
| Class A | | $ | | 3.30 |
| Class A — Offering price (based on sales charge of 4.75%) | | $ | | 3.46 |
| Class B | | $ | | 3.30 |
| Class C | | $ | | 3.30 |
| Class I | | $ | | 3.30 |
|
See Notes to Financial Statements24
STATEMENT OF OPERATIONS
Six Months Ended October 31, 2007 (unaudited)
|
| Investment income | | | | |
| Interest (net of foreign withholding taxes of $619) | | $ | | 26,172,532 |
| Income from affiliate | | | | 451,426 |
| Securities lending | | | | 71,022 |
| Dividends | | | | 10,944 |
|
| Total investment income | | | | 26,705,924 |
|
| Expenses | | | | |
| Advisory fee | | | | 1,425,005 |
| Distribution Plan expenses | | | | |
| Class A | | | | 471,511 |
| Class B | | | | 695,284 |
| Class C | | | | 743,101 |
| Administrative services fee | | | | 317,207 |
| Transfer agent fees | | | | 617,948 |
| Trustees’ fees and expenses | | | | 5,436 |
| Printing and postage expenses | | | | 39,765 |
| Custodian and accounting fees | | | | 104,184 |
| Registration and filing fees | | | | 34,424 |
| Professional fees | | | | 23,098 |
| Other | | | | 10,005 |
|
| Total expenses | | | | 4,486,968 |
| Less: Expense reductions | | | | (22,154) |
| Expense reimbursements | | | | (78,585) |
|
| Net expenses | | | | 4,386,229 |
|
| Net investment income | | | | 22,319,695 |
|
| Net realized and unrealized gains or losses on investments | | | | |
| Net realized gains or losses on: | | | | |
| Securities | | | | 4,307,839 |
| Credit default swap transactions | | | | (1,382) |
|
| Net realized gains on investments | | | | 4,306,457 |
| Net change in unrealized gains or losses on investments | | | | (26,561,713) |
|
| Net realized and unrealized gains or losses on investments | | | | (22,255,256) |
|
| Net increase in net assets resulting from operations | | $ | | 64,439 |
|
See Notes to Financial Statements25
STATEMENTS OF CHANGES IN NET ASSETS
| | | Six Months Ended | | | | |
| | | October 31, 2007 | | Year Ended |
| | | (unaudited) | | April 30, 2007 |
|
| Operations | | | | | | | | |
| Net investment income | | | $ | 22,319,695 | | | $ | 50,178,085 |
| Net realized gains on investments | | | | 4,306,457 | | | | 2,935,671 |
| Net change in unrealized gains or | | | | | | | | |
| losses on investments | | | | (26,561,713) | | | | 14,090,164 |
|
| Net increase in net assets resulting | | | | | | | | |
| from operations | | | | 64,439 | | | | 67,203,920 |
|
| Distributions to shareholders from | | | | | | | | |
| Net investment income | | | | | | | | |
| Class A | | | | (11,058,448) | | | | (25,511,393) |
| Class B | | | | (4,375,972) | | | | (10,353,425) |
| Class C | | | | (4,676,948) | | | | (11,450,486) |
| Class I | | | | (1,341,291) | | | | (2,935,746) |
|
| Total distributions to shareholders | | | | (21,452,659) | | | | (50,251,050) |
|
| | | Shares | | | | Shares | | |
| Capital share transactions | | | | | | | | |
| Proceeds from shares sold | | | | | | | | |
| Class A | | 6,389,122 | | 21,058,141 | | 8,872,464 | | 29,361,786 |
| Class B | | 1,085,639 | | 3,618,871 | | 2,878,309 | | 9,532,702 |
| Class C | | 1,161,670 | | 3,843,338 | | 3,575,958 | | 11,831,397 |
| Class I | | 6,857,409 | | 23,216,755 | | 2,598,618 | | 8,626,874 |
|
| | | | | 51,737,105 | | | | 59,352,759 |
|
| Net asset value of shares issued in | | | | | | | | |
| reinvestment of distributions | | | | | | | | |
| Class A | | 2,228,145 | | 7,352,701 | | 5,100,535 | | 16,899,566 |
| Class B | | 627,256 | | 2,070,004 | | 1,480,905 | | 4,906,603 |
| Class C | | 727,107 | | 2,399,597 | | 1,774,970 | | 5,879,356 |
| Class I | | 149,993 | | 495,204 | | 418,042 | | 1,382,768 |
|
| | | | | 12,317,506 | | | | 29,068,293 |
|
| Automatic conversion of Class B | | | | | | | | |
| shares to Class A shares | | | | | | | | |
| Class A | | 404,969 | | 1,341,386 | | 1,001,277 | | 3,327,267 |
| Class B | | (404,969) | | (1,341,386) | | (1,001,277) | | (3,327,267) |
|
| | | | | 0 | | | | 0 |
|
| Payment for shares redeemed | | | | | | | | |
| Class A | | (14,891,957) | | (49,354,433) | | (33,580,433) | | (111,126,729) |
| Class B | | (6,324,961) | | (20,880,045) | | (12,379,615) | | (40,950,431) |
| Class C | | (7,734,934) | | (25,501,402) | | (18,676,545) | | (61,740,275) |
| Class I | | (4,366,672) | | (14,336,774) | | (10,228,849) | | (33,976,494) |
|
| | | | | (110,072,654) | | | | (247,793,929) |
|
| Net decrease in net assets resulting | | | | | | | | |
| from capital share transactions | | | | (46,018,043) | | | | (159,372,877) |
|
| Total decrease in net assets | | | | (67,406,263) | | | | (142,420,007) |
| Net assets | | | | | | | | |
| Beginning of period | | | | 675,106,364 | | | | 817,526,371 |
|
| End of period | | | $ | 607,700,101 | | | $ | 675,106,364 |
|
| Overdistributed net investment | | | | | | | | |
| income | | | $ | (1,973,676) | | | $ | (955,531) |
|
See Notes to Financial Statements26
NOTES TO FINANCIAL STATEMENTS (unaudited)
1. ORGANIZATION
Evergreen High Income Fund (the “Fund”) (formerly, Evergreen High Yield Bond Fund) is a diversified series of Evergreen Fixed Income Trust (the “Trust”), a Delaware statutory trust organized on September 18, 1997. The Trust is an open-end management investment company registered under the Investment Company Act of 1940, as amended (the “1940 Act”).
The Fund offers Class A, Class B, Class C and Class I shares. Class A shares are sold with a front-end sales charge. However, Class A share investments of $1 million or more are not subject to a front-end sales charge but are subject to a contingent deferred sales charge of 1.00% upon redemption within 18 months. Class B shares are sold without a front-end sales charge but are subject to a contingent deferred sales charge that is payable upon redemption and decreases depending on how long the shares have been held. Class C shares are sold without a front-end sales charge but are subject to a contingent deferred sales charge that is payable upon redemption within one year. Class I shares are sold without a front-end sales charge or contingent deferred sales charge. Each class of shares, except Class I shares, pays an ongoing distribution fee.
2. SIGNIFICANT ACCOUNTING POLICIES
The following is a summary of significant accounting policies consistently followed by the Fund in the preparation of its financial statements. The policies are in conformity with generally accepted accounting principles in the United States of America, which require management to make estimates and assumptions that affect amounts reported herein. Actual results could differ from these estimates.
a. Valuation of investments
Portfolio debt securities acquired with more than 60 days to maturity are fair valued using matrix pricing methods determined by an independent pricing service which takes into consideration such factors as similar security prices, yields, maturities, liquidity and ratings. Securities for which valuations are not readily available from an independent pricing service may be valued by brokers which use prices provided by market makers or estimates of market value obtained from yield data relating to investments or securities with similar characteristics.
Listed equity securities are usually valued at the last sales price or official closing price on the national securities exchange where the securities are principally traded.
Foreign securities traded on an established exchange are valued at the last sales price on the exchange where the security is primarily traded. If there has been no sale, the securities are valued at the mean between bid and asked prices. Foreign securities may be valued at fair value according to procedures approved by the Board of Trustees if the closing price is not reflective of current market values due to trading or events occurring in the foreign markets between the close of the established exchange and the valuation time of the Fund. In addition, substantial changes in
27
NOTES TO FINANCIAL STATEMENTS (unaudited) continued
values in the U.S. markets subsequent to the close of a foreign market may also affect the values of securities traded in the foreign market. The value of foreign securities may be adjusted if such movements in the U.S. market exceed a specified threshold.
Short-term securities with remaining maturities of 60 days or less at the time of purchase are valued at amortized cost, which approximates market value.
Investments in other mutual funds are valued at net asset value. Securities for which market quotations are not readily available or not reflective of current market value are valued at fair value as determined by the investment advisor in good faith, according to procedures approved by the Board of Trustees.
b. Repurchase agreements
Securities pledged as collateral for repurchase agreements are held by the custodian bank or in a segregated account in the Fund’s name until the agreements mature. Collateral for certain tri-party repurchase agreements is held at the counterparty’s custodian in a segregated account for the benefit of the Fund and the counterparty. Each agreement requires that the market value of the collateral be sufficient to cover payments of interest and principal. However, in the event of default or bankruptcy by the other party to the agreement, retention of the collateral may be subject to legal proceedings. The Fund will enter into repurchase agreements with banks and other financial institutions, which are deemed by the investment advisor to be creditworthy pursuant to guidelines established by the Board of Trustees. In certain instances, the Fund’s securities lending agent may provide collateral in the form of repurchase agreements.
c. When-issued and delayed delivery transactions
The Fund records when-issued or delayed delivery securities as of trade date and maintains security positions such that sufficient liquid assets will be available to make payment for the securities purchased. Securities purchased on a when-issued or delayed delivery basis are marked-to-market daily and begin earning interest on the settlement date. Losses may occur on these transactions due to changes in market conditions or the failure of counterparties to perform under the contract.
d. Securities lending
The Fund may lend its securities to certain qualified brokers in order to earn additional income. The Fund receives compensation in the form of fees or interest earned on the investment of any cash collateral received. The Fund also continues to receive interest and dividends on the securities loaned. The Fund receives collateral in the form of cash or securities with a market value at least equal to the market value of the securities on loan, including accrued interest. In the event of default or bankruptcy by the borrower, the Fund could experience delays and costs in recovering the loaned securities or in gaining access to the collateral. The Fund has the right under the lending agreement to recover the securities from the borrower on demand.
28
NOTES TO FINANCIAL STATEMENTS (unaudited) continued
e. Credit default swaps
The Fund may enter into credit default swaps. Credit default swaps involve an exchange of a fixed rate premium for protection against the loss in value of an underlying debt instrument in the event of default or bankruptcy. Under the terms of the swap, one party acts as a “guarantor” and receives a periodic stream of payments that is a fixed percentage applied to a notional principal amount over the term of the swap. In return, the party agrees to purchase the notional amount of the underlying instrument, at par, if a credit event occurs during the term of the swap. Periodic payments are recorded as realized gains or losses. Any premiums or discounts received on the transactions are recorded as an asset or liability on the Statement of Assets and Liabilities and amortized. The Fund may enter into credit default swaps as either the guarantor or the counter-party.
Swaps are marked-to-market daily based on quotations from market makers and any change in value is recorded as an unrealized gain or loss. Payments received or made as a result of a credit event or termination of the contract are recognized as realized gains or losses. The Fund could be exposed to risks if the counterparty defaults on its obligation to perform, or if there are unfavorable changes in the fluctuation of interest rates or in the price of the underlying security.
f. Security transactions and investment income
Security transactions are recorded on trade date. Realized gains and losses are computed using the specific cost of the security sold. Interest income is recorded on the accrual basis and includes accretion of discounts and amortization of premiums. Dividend income is recorded on the ex-dividend date. Foreign income and capital gains realized on some securities may be subject to foreign taxes, which are accrued as applicable.
g. Federal taxes
The Fund intends to continue to qualify as a regulated investment company and distribute all of its taxable income, including any net capital gains (which have already been offset by available capital loss carryovers). Accordingly, no provision for federal taxes is required.
h. Distributions
Distributions to shareholders from net investment income are accrued daily and paid monthly. Distributions from net realized gains, if any, are recorded on the ex-dividend date. Such distributions are determined in conformity with income tax regulations, which may differ from generally accepted accounting principles.
i. Class allocations
Income, common expenses and realized and unrealized gains and losses are allocated to the classes based on the relative net assets of each class. Distribution fees, if any, are calculated daily at the class level based on the appropriate net assets of each class and the specific expense rates applicable to each class.
29
NOTES TO FINANCIAL STATEMENTS (unaudited) continued
3. ADVISORY FEE AND OTHER TRANSACTIONS WITH AFFILIATES
Evergreen Investment Management Company, LLC (“EIMC”), an indirect, wholly-owned subsidiary of Wachovia Corporation (“Wachovia”), is the investment advisor to the Fund and is paid a fee at an annual rate of 2% of the Fund’s gross investment income plus an amount determined by applying percentage rates to the average daily net assets of the Fund, starting at 0.31% and declining to 0.16% as average daily net assets increase. For the six months ended October 31, 2007, the advisory fee was equivalent to 0.45% of the Fund’s average daily net assets (on an annualized basis).
Tattersall Advisory Group, Inc. (“TAG”), an indirect, wholly-owned subsidiary of Wachovia, is the investment sub-advisor to the Fund and is paid by EIMC for its services to the Fund.
From time to time, EIMC may voluntarily or contractually waive its fee and/or reimburse expenses in order to limit operating expenses. During the six months ended October 31, 2007, EIMC voluntarily reimbursed Distribution Plan expenses (see Note 4) relating to Class A shares in the amount of $78,585.
The Fund may invest in Evergreen-managed money market funds, which are also advised by EIMC. Income earned on these investments is included in income from affiliate on the Statement of Operations.
Evergreen Investment Services, Inc. (“EIS”), an indirect, wholly-owned subsidiary of Wachovia, is the administrator to the Fund. As administrator, EIS provides the Fund with facilities, equipment and personnel and is paid an annual rate determined by applying percentage rates to the aggregate average daily net assets of the Evergreen funds (excluding money market funds and Evergreen Institutional Enhanced Income Fund), starting at 0.10% and declining to 0.05% as the aggregate average daily net assets of the Evergreen funds (excluding money market funds and Evergreen Institutional Enhanced Income Fund) increase.
Evergreen Service Company, LLC (“ESC”), an indirect, wholly-owned subsidiary of Wachovia, is the transfer and dividend disbursing agent for the Fund. ESC receives account fees that vary based on the type of account held by the shareholders in the Fund. For the six months ended October 31, 2007, the transfer agent fees were equivalent to an annual rate of 0.19% of the Fund’s average daily net assets.
The Fund has placed a portion of its portfolio transactions with brokerage firms that are affiliates of Wachovia. During the six months ended October 31, 2007, the Fund paid brokerage commissions of $1,699 to Wachovia Securities, LLC.
30
NOTES TO FINANCIAL STATEMENTS (unaudited) continued
4. DISTRIBUTION PLANS
EIS also serves as distributor of the Fund’s shares. The Fund has adopted Distribution Plans, as allowed by Rule 12b-1 of the 1940 Act, for each class of shares, except Class I. Under the Distribution Plans, distribution fees are paid at an annual rate of 0.30% of the average daily net assets for Class A shares and 1.00% of the average daily net assets for each of Class B and Class C shares.
For the six months ended October 31, 2007, EIS received $7,658 from the sale of Class A shares and $178,897 and $2,913 in contingent deferred sales charges from redemptions of Class B and Class C shares, respectively.
5. INVESTMENT TRANSACTIONS
Cost of purchases and proceeds from sales of investment securities (excluding short-term securities) were $363,764,153 and $365,310,096, respectively, for the six months ended October 31, 2007.
During the six months ended October 31, 2007, the Fund loaned securities to certain brokers. At October 31, 2007, the value of securities on loan and the total value of collateral received for securities loaned amounted to $72,444,518 and $74,145,236, respectively.
At October 31, 2007, the Fund had the following open credit default swap contracts outstanding:
| | | | | | | | | Fixed | | | | |
| | | | | | | | | Payments | | Frequency | | |
| | | | | Reference | | Notional | | Made by | | of Payments | | Unrealized |
| Expiration | | Counterparty | | Index | | Amount | | the Fund | | Made | | Loss |
|
| 12/13/2049 | | Goldman Sachs | | CMBX | | $1,050,000 | | 0.27% | | Quarterly | | $3,618 |
| | | | | North America | | | | | | | | |
| | | | | Index | | | | | | | | |
|
On October 31, 2007, the aggregate cost of securities for federal income tax purposes was $675,326,576. The gross unrealized appreciation and depreciation on securities based on tax cost was $9,422,272 and $10,607,461, respectively, with a net unrealized depreciation of $1,185,189.As of April 30, 2007, the Fund had $137,359,520 in capital loss carryovers for federal income tax purposes expiring as follows:
| Expiration |
|
| 2008 | | 2009 | | 2010 | | 2011 | | 2014 | | 2015 |
|
| $19,168,229 | | $38,451,200 | | $57,513,490 | | $15,936,101 | | $1,353,885 | | $4,936,615 |
|
For income tax purposes, capital losses incurred after October 31 within the Fund’s fiscal year are deemed to arise on the first business day of the following fiscal year. As of April 30, 2007, the Fund incurred and elected to defer post-October losses of $58,231.31
NOTES TO FINANCIAL STATEMENTS (unaudited) continued
6. INTERFUND LENDING
Pursuant to an Exemptive Order issued by the SEC, the Fund may participate in an interfund lending program with certain funds in the Evergreen fund family. This program allows the Fund to borrow from, or lend money to, other participating funds. During the six months ended October 31, 2007, the Fund did not participate in the interfund lending program.
7. EXPENSE REDUCTIONS
Through expense offset arrangements with ESC and the Fund’s custodian, a portion of fund expenses has been reduced.
8. DEFERRED TRUSTEES’ FEES
Each Trustee of the Fund may defer any or all compensation related to performance of his or her duties as a Trustee. The Trustees’ deferred balances are allocated to deferral accounts, which are included in the accrued expenses for the Fund. The investment performance of the deferral accounts is based on the investment performance of certain Evergreen funds. Any gains earned or losses incurred in the deferral accounts are reported in the Fund’s Trustees’ fees and expenses. At the election of the Trustees, the deferral account will be paid either in one lump sum or in quarterly installments for up to ten years.
9. FINANCING AGREEMENT
The Fund and certain other Evergreen funds share in an unsecured revolving credit commitment for temporary and emergency purposes, including the funding of redemptions, as permitted by each participating fund’s borrowing restrictions. Borrowings under this facility bear interest at 0.50% per annum above the Federal Funds rate. All of the participating funds are charged an annual commitment fee on the unused balance, which is allocated pro rata. The credit facility is for $100 million with an annual commitment fee of 0.08% . During the six months ended October 31, 2007, the Fund had no borrowings.
10. REGULATORY MATTERS AND LEGAL PROCEEDINGS
Pursuant to an administrative order issued by the SEC on September 19, 2007, EIMC, EIS, ESC (collectively, the “Evergreen Entities”), Wachovia Securities, LLC and the SEC have entered into an agreement settling allegations of (i) improper short-term trading arrangements in effect prior to May 2003 involving former officers and employees of EIMC and certain broker-dealers, (ii) insufficient systems for monitoring exchanges and enforcing exchange limitations as stated in certain funds’ prospectuses, and (iii) inadequate e-mail retention practices. Under the settlement, the Evergreen Entities were censured and will pay approximately $32 million in disgorgement and penalties. This amount, along with a fine assessed by the SEC against Wachovia Securities, LLC will be distributed pursuant to a plan to be developed by an independent distribution
32
NOTES TO FINANCIAL STATEMENTS (unaudited) continued
consultant and approved by the SEC. The Evergreen Entities neither admitted nor denied the allegations and findings set forth in its settlement with the SEC.
EIS has entered into an agreement with the NASD (now known as the Financial Industry Regulatory Authority (“FINRA”)) settling allegations that EIS (i) arranged for Evergreen fund portfolio trades to be directed to Wachovia Securities, LLC, an affiliate of EIS that sold Evergreen fund shares, during the period of January 2001 to December 2003 and (ii) provided non-cash compensation by sponsoring offsite meetings attended by Wachovia Securities, LLC brokers during that period, where the eligibility of a broker to attend the meetings depended upon the broker meeting certain sales targets of Evergreen fund shares. Pursuant to the settlement agreement, EIS has agreed to a censure and a fine of $4,200,000. EIS neither admitted nor denied the allegations and findings set forth in its agreement with the NASD.
In addition, the Evergreen funds and EIMC and certain of its affiliates are involved in various legal actions, including private litigation and class action lawsuits. EIMC does not expect that any of such legal actions currently pending or threatened will have a material adverse impact on the financial position or operations of any of the Evergreen funds or on EIMC’s ability to provide services to the Evergreen funds.
Although EIMC believes that none of the matters discussed above will have a material adverse impact on the Evergreen funds, there can be no assurance that these matters and any publicity surrounding or resulting from them will not result in reduced sales or increased redemptions of Evergreen fund shares, which could increase Evergreen fund transaction costs or operating expenses, or that they will not have other adverse consequences on the Evergreen funds.
11. NEW ACCOUNTING PRONOUNCEMENTS
In June 2006, the Financial Accounting Standards Board (“FASB”) issued FASB Interpretation No. 48, Accounting for Uncertainty in Income Taxes — an interpretation of FASB statement 109 (“FIN 48”). FIN 48 supplements FASB 109 by prescribing a recognition threshold and measurement attribute for the financial statement recognition and measurement of a tax position taken or expected to be taken in a tax return. The Fund’s financial statements have not been impacted by the adoption of FIN 48. However, the conclusions regarding FIN 48 may be subject to review and adjustment at a later date based on factors including, but not limited to, further implementation guidance expected from FASB, and on-going analysis of tax laws, regulations, and interpretations thereof.
In September 2006, FASB issued Statement of Financial Accounting Standards No. 157, Fair Value Measurements (“FAS 157”). FAS 157 establishes a single authoritative definition of fair value, establishes a framework for measuring fair value and expands disclosures about fair value
33
NOTES TO FINANCIAL STATEMENTS (unaudited) continued
measurements. FAS 157 applies to fair value measurements already required or permitted by existing standards. The change to current generally accepted accounting principles from the application of FAS 157 relates to the definition of fair value, the methods used to measure fair value, and the expanded disclosures about fair value measurements. Management of the Fund does not believe the adoption of FAS 157 will materially impact the financial statement amounts, however, additional disclosures may be required about the inputs used to develop the measurements and the effect of certain of the measurements on changes in net assets for the period. FAS 157 is effective for financial statements issued for fiscal years beginning after November 15, 2007 and interim periods within those fiscal years.
34
ADDITIONAL INFORMATION (unaudited)
INFORMATION ABOUT THE REVIEW AND APPROVAL OF THE FUND’S INVESTMENT
ADVISORY AGREEMENT
Each year, the Fund’s Board of Trustees is required to consider whether to continue in place the Fund’s investment advisory agreements. In September 2007, the Trustees, including a majority of the Trustees who are not interested persons (as that term is defined in the 1940 Act) of the Fund, TAG (the “Sub-Advisor”), or EIMC, approved the continuation of the Fund’s investment advisory agreements. (References below to the “Fund” are to Evergreen High Income Fund; references to the “funds” are to the Evergreen funds generally.)
At the same time, the Trustees considered the continuation of the investment advisory agreements for all of the funds, and the description below refers in many cases to the Trustees’ process and conclusions in connection with their consideration of this matter for all of the funds. (See “Certain Fund-Specific Considerations” below for a discussion regarding certain factors considered by the Trustees relating specifically to the Fund.) In all of its deliberations, the Board of Trustees and the disinterested Trustees were advised by independent counsel to the disinterested Trustees and counsel to the funds.
The review process. The 1940 Act requires that the Board of Trustees request and evaluate, and that EIMC and any sub-advisors furnish, such information as may reasonably be necessary to evaluate the terms of a fund’s advisory agreements. The review process began at the time of the last advisory contract-renewal process in September 2006. In the course of that process, the Trustees identified a number of funds that had experienced either short-term or longer-term performance issues. During the following months, the Trustees reviewed information relating to any changes in the performance of those funds and/or any changes in the investment process or the investment teams responsible for the management of the funds. In addition, during the course of the year, the Trustees reviewed information regarding the investment performance of all of the funds and identified additional funds that they believed warranted further attention based on performance since September 2006.
In spring 2007, a committee of the Board of Trustees (the “Committee”), working with EIMC management, determined generally the types of information the Board would review and set a timeline detailing the information required and the dates for its delivery to the Trustees. The independent data provider Keil Fiduciary Strategies LLC (“Keil”) was engaged to provide fund-specific and industry-wide data to the Board containing information of a nature and in a format generally prescribed by the Committee, and the Committee worked with Keil and EIMC to develop appropriate groups of peer funds for each fund. The Committee also identified a number of expense, performance, and other issues and requested specific information as to those issues.
The Trustees reviewed, with the assistance of an independent industry consultant retained by the disinterested Trustees, the information provided by EIMC and the Sub-Advisor in response to the Committee’s requests and the information provided by Keil. The Trustees formed small committees to review individual funds in greater detail. In addition, the Trustees requested information regarding, among other things, brokerage practices of the funds, the use of derivatives by the funds, strategic planning for the funds, analyst and research support available to the portfolio
35
ADDITIONAL INFORMATION (unaudited) continued
management teams, and information regarding the various fall-out benefits received directly and indirectly by EIMC and its affiliates from the funds. The Trustees requested and received additional information following that review.
The Committee met several times by telephone to consider the information provided by EIMC. The Committee met with representatives of EIMC in early September. At a meeting of the full Board of Trustees later in September, the Committee reported the results of its discussions with EIMC, and the full Board met with representatives of EIMC, engaged in further review of the materials provided to them, and approved the continuation of each of the advisory and sub-advisory agreements.
The disinterested Trustees discussed the continuation of the funds’ advisory agreements with representatives of EIMC and in multiple private sessions with legal counsel at which no personnel of EIMC were present. In considering the continuation of the agreements, the Trustees did not identify any particular information or consideration that was all-important or controlling, and each Trustee attributed different weights to various factors. The Trustees evaluated information provided to them both in terms of the Evergreen mutual funds generally and with respect to each fund, including the Fund, specifically as they considered appropriate; although the Trustees considered the continuation of the agreements as part of the larger process of considering the continuation of the advisory contracts for all of the funds, their determination to continue the advisory agreements for each of the funds was ultimately made on a fund-by-fund basis.
This summary describes a number of the most important, but not necessarily all, of the factors considered by the Board and the disinterested Trustees.
Information reviewed. The Board of Trustees and committees of the Board of Trustees meet periodically during the course of the year. At those meetings, the Board receives a wide variety of information regarding the services performed by EIMC, the investment performance of the funds, and other aspects of the business and operations of the funds. At those meetings, and in the process of considering the continuation of the agreements, the Trustees considered information regarding, for example, the funds’ investment results; the portfolio management teams for the funds and the experience of the members of those teams, and any recent changes in the membership of the teams; portfolio trading practices; compliance by the funds, EIMC, and the Sub-Advisor with applicable laws and regulations and with the funds’ and EIMC’s compliance policies and procedures; risk evaluation and oversight procedures at EIMC; services provided by affiliates of EIMC to the funds and shareholders of the funds; and other information relating to the nature, extent, and quality of services provided by EIMC and the Sub-Advisor. The Trustees considered a number of changes in portfolio management personnel at EIMC and its advisory affiliates in the year since September 2006, and recent changes in compliance personnel at EIMC, including the appointment of a new Chief Compliance Officer for the funds.
The Trustees considered the rates at which the funds pay investment advisory fees, and the efforts generally by EIMC and its affiliates as sponsors of the funds. The data provided by Keil showed the management fees paid by each fund in comparison to the management fees of other peer
36
ADDITIONAL INFORMATION (unaudited) continued
mutual funds, in addition to data regarding the investment performance of the funds in comparison to other peer mutual funds. The Trustees were assisted by the independent industry consultant in reviewing the information presented to them.
The Trustees considered the transfer agency fees paid by the funds to an affiliate of EIMC. They reviewed information presented to them showing that the transfer agency fees charged to the funds were generally consistent with industry norms.
The Trustees also considered that EIS, an affiliate of EIMC, serves as administrator to the funds and receives a fee for its services as administrator. In their comparison of the advisory fee paid by the funds with those paid by other mutual funds, the Trustees took into account administrative fees paid by the funds and those other mutual funds. The Board considered that EIS serves as distributor to the funds generally and receives fees from the funds for those services. They considered other so-called “fall-out” benefits to EIMC and its affiliates due to their other relationships with the funds, including, for example, soft-dollar services received by EIMC attributable to transactions entered into by EIMC for the benefit of the funds and brokerage commissions received by Wachovia Securities, LLC, an affiliate of EIMC, from transactions effected by it for the funds. The Trustees also noted that the funds pay sub-transfer agency fees to various financial institutions who hold fund shares in omnibus accounts, and that Wachovia Securities, LLC and its affiliates receive such payments from the funds in respect of client accounts they hold in omnibus arrangements, and that an affiliate of EIMC receives fees for administering the sub-transfer agency payment program. They also considered that Wachovia Securities, LLC and its affiliates receive distribution-related fees and shareholder servicing payments (including amounts derived from payments under the funds’ Rule 12b-1 plans) in respect of shares sold or held through it. The Trustees also noted that an affiliate of EIMC receives compensation for serving as a securities lending agent for the funds.
Nature and quality of the services provided. The Trustees considered that EIMC and its affili-ates generally provide a comprehensive investment management service to the funds. They noted that EIMC and the Sub-Advisor formulate and implement an investment program for the Fund. They noted that EIMC makes its personnel available to serve as officers of the funds, and concluded that the reporting and management functions provided by EIMC with respect to the funds were generally satisfactory. The Trustees considered the investment philosophy of the Fund’s portfolio management team, and considered the in-house research capabilities of EIMC and its affiliates, as well as other resources available to EIMC, including research services available to it from third parties. The Board considered the managerial and financial resources available to EIMC and its affiliates, and the commitment that the Wachovia organization has made to the funds generally. On the basis of these factors, they determined that the nature and scope of the services provided by EIMC and the Sub-Advisor were consistent with their respective duties under the investment advisory agreements and appropriate and consistent with the investment programs and best interests of the funds.
The Trustees noted the resources EIMC and its affiliates have committed to the regulatory, compliance, accounting, tax and oversight of tax reporting, and shareholder servicing functions,
37
ADDITIONAL INFORMATION (unaudited) continued
and the number and quality of staff committed to those functions, which they concluded were appropriate and generally in line with EIMC’s responsibilities to the Fund and to the funds generally. The Board and the disinterested Trustees concluded, within the context of their overall conclusions regarding the funds’ advisory agreements, that they were generally satisfied with the nature, extent, and quality of the services provided by the Sub-Advisor and EIMC, including services provided by EIS under its administrative services agreements with the funds.
Investment performance. The Trustees considered the investment performance of each fund, both by comparison to other comparable mutual funds and to broad market indices. The Trustees emphasized that the continuation of the investment advisory agreement for a fund should not be taken as any indication that the Trustees did not believe investment performance for any specific fund might not be improved, and they noted that they would continue to monitor closely the investment performance of the funds going forward.
Advisory and administrative fees. The Trustees recognized that EIMC does not seek to provide the lowest cost investment advisory service, but to provide a high quality, full-service investment management product at a reasonable price. They also noted that EIMC has in many cases sought to set its investment advisory fees at levels consistent with industry norms. The Trustees noted that, in certain cases, a fund’s management fees were higher than many or most other mutual funds in the same Keil peer group. However, in each case, the Trustees determined on the basis of the information presented that the level of management fees was not excessive.
Certain Fund-specific considerations. The Trustees noted that, for the one-, three-, five-, and ten-year periods ended December 31, 2006, the Fund’s Class B shares (the Fund’s oldest share class) had underperformed the Fund’s benchmark index, the Merrill Lynch High-Yield Master Index, and underperformed a majority of the funds against which the Trustees compared the Fund’s performance for the one- and three-year periods ended December 31, 2006. The Trustees also noted that the Fund’s Class B shares performed in the third and second quintiles of the funds against which the Trustees compared the Fund’s performance for the five- and ten-year periods ended December 31, 2006, respectively. The Trustees noted that the Fund’s portfolio management team had recently changed and that the Fund’s performance had improved on a year-to-date basis.
The Trustees noted that the Fund’s management fee was lower than the management fees paid by a majority of the funds against which the Trustees compared the Fund’s management fee, and that the level of profitability realized by EIMC in respect of the fee did not appear excessive.
Economies of scale. The Trustees noted that economies of scale would likely be achieved by EIMC in managing the funds as the funds grow. The Trustees noted that the Fund had implemented breakpoints in its advisory fee structure. The Trustees noted that they would continue to review the appropriate levels of breakpoints in the future, but concluded that the breakpoints as implemented appeared to be a reasonable step toward the realization of economies of scale by the Fund.
38
ADDITIONAL INFORMATION (unaudited) continued
Profitability. The Trustees considered information provided to them regarding the profitability to the EIMC organization of the investment advisory, administration, and transfer agency (with respect to the open-end funds only) fees paid to EIMC and its affiliates by each of the funds. They considered that the information provided to them was necessarily estimated, and that the profitability information provided to them, especially on a fund-by-fund basis, did not necessarily provide a definitive tool for evaluating the appropriateness of each fund’s advisory fee. They noted that the levels of profitability of the funds to EIMC varied widely, depending on among other things the size and type of fund. They considered the profitability of the funds in light of such factors as, for example, the information they had received regarding the relation of the fees paid by the funds to those paid by other mutual funds, the investment performance of the funds, and the amount of revenues involved. In light of these factors, the Trustees concluded that the profitability of any of the funds, individually or in the aggregate, should not prevent the Trustees from approving the continuation of the agreements.
39
This page left intentionally blank
40
This page left intentionally blank
41
This page left intentionally blank
42
This page left intentionally blank
43
TRUSTEES AND OFFICERS
|
| TRUSTEES1 | | |
| Charles A. Austin III | | Investment Counselor, Anchor Capital Advisors, LLC. (investment advice); Director, The Andover |
| Trustee | | Companies (insurance); Trustee, Arthritis Foundation of New England; Former Director, The |
| DOB: 10/23/1934 | | Francis Ouimet Society (scholarship program); Former Director, Executive Vice President and |
| Term of office since: 1991 | | Treasurer, State Street Research & Management Company (investment advice) |
| Other directorships: None | | |
|
| K. Dun Gifford | | Chairman and President, Oldways Preservation and Exchange Trust (education); Trustee, |
| Trustee | | Treasurer and Chairman of the Finance Committee, Cambridge College |
| DOB: 10/23/1938 | | |
| Term of office since: 1974 | | |
| Other directorships: None | | |
|
| Dr. Leroy Keith, Jr. | | Managing Director, Almanac Capital Management (commodities firm); Trustee, Phoenix |
| Trustee | | Fund Complex; Director, Diversapack Co. (packaging company); Former Partner, Stonington |
| DOB: 2/14/1939 | | Partners, Inc. (private equity fund); Former Director, Obagi Medical Products Co.; Former |
| Term of office since: 1983 | | Director, Lincoln Educational Services |
| Other directorships: Trustee, | | |
| Phoenix Fund Complex (consisting | | |
| of 60 portfolios as of 12/31/2006) | | |
|
| Gerald M. McDonnell | | Manager of Commercial Operations, CMC Steel (steel producer) |
| Trustee | | |
| DOB: 7/14/1939 | | |
| Term of office since: 1988 | | |
| Other directorships: None | | |
|
| Patricia B. Norris | | President and Director of Buckleys of Kezar Lake, Inc. (real estate company); Former President |
| Trustee | | and Director of Phillips Pond Homes Association (home community); Former Partner, |
| DOB: 4/9/1948 | | PricewaterhouseCoopers, LLP (independent registered public accounting firm) |
| Term of office since: 2006 | | |
| Other directorships: None | | |
|
| William Walt Pettit | | Partner and Vice President, Kellam & Pettit, P.A. (law firm); Director, Superior Packaging Corp. |
| Trustee | | (packaging company); Member, Superior Land, LLC (real estate holding company), Member, |
| DOB: 8/26/1955 | | K&P Development, LLC (real estate development); Former Director, National Kidney Foundation |
| Term of office since: 1988 | | of North Carolina, Inc. (non-profit organization) |
| Other directorships: None | | |
|
| David M. Richardson | | President, Richardson, Runden LLC (executive recruitment business development/consulting |
| Trustee | | company); Consultant, Kennedy Information, Inc. (executive recruitment information and |
| DOB: 9/19/1941 | | research company); Consultant, AESC (The Association of Executive Search Consultants); |
| Term of office since: 1982 | | Director, J&M Cumming Paper Co. (paper merchandising); Former Trustee, NDI Technologies, LLP |
| Other directorships: None | | (communications) |
|
| Dr. Russell A. Salton III | | President/CEO, AccessOne MedCard, Inc.; Former Medical Director, Healthcare Resource |
| Trustee | | Associates, Inc. |
| DOB: 6/2/1947 | | |
| Term of office since: 1984 | | |
| Other directorships: None | | |
|
| Michael S. Scofield | | Retired Attorney, Law Offices of Michael S. Scofield; Former Director and Chairman, Branded |
| Trustee | | Media Corporation (multi-media branding company) |
| DOB: 2/20/1943 | | |
| Term of office since: 1984 | | |
| Other directorships: None | | |
|
44
TRUSTEES AND OFFICERS continued
| Richard J. Shima | | Independent Consultant; Director, Hartford Hospital; Trustee, Greater Hartford YMCA; Former |
| Trustee | | Director, Trust Company of CT; Former Director, Old State House Association; Former Trustee, |
| DOB: 8/11/1939 | | Saint Joseph College (CT) |
| Term of office since: 1993 | | |
| Other directorships: None | | |
|
| Richard K. Wagoner, CFA2 | | Member and Former President, North Carolina Securities Traders Association; Member, Financial |
| Trustee | | Analysts Society |
| DOB: 12/12/1937 | | |
| Term of office since: 1999 | | |
| Other directorships: None | | |
|
| |
| OFFICERS | | |
| |
| Dennis H. Ferro3 | | Principal occupations: President and Chief Executive Officer, Evergreen Investment Company, |
| President | | Inc. and Executive Vice President, Wachovia Bank, N.A.; former Chief Investment Officer, |
| DOB: 6/20/1945 | | Evergreen Investment Company, Inc. |
| Term of office since: 2003 | | |
|
| Kasey Phillips4 | | Principal occupations: Senior Vice President, Evergreen Investment Services, Inc.; Former Vice |
| Treasurer | | President, Evergreen Investment Services, Inc.; Former Assistant Vice President, Evergreen |
| DOB: 12/12/1970 | | Investment Services, Inc. |
| Term of office since: 2005 | | |
|
| Michael H. Koonce4 | | Principal occupations: Senior Vice President and General Counsel, Evergreen Investment |
| Secretary | | Services, Inc.; Secretary, Senior Vice President and General Counsel, Evergreen Investment |
| DOB: 4/20/1960 | | Management Company, LLC and Evergreen Service Company, LLC; Senior Vice President and |
| Term of office since: 2000 | | Assistant General Counsel, Wachovia Corporation |
|
| Robert Guerin4, 5 | | Principal occupations: Chief Compliance Officer, Evergreen Funds and Senior Vice President of |
| Chief Compliance Officer | | Evergreen Investments Co, Inc; Former Managing Director and Senior Compliance Officer, |
| DOB: 9/20/1965 | | Babson Capital Management LLC; Former Principal and Director, Compliance and Risk |
| Term of office since: 2007 | | Management, State Street Global Advisors; Former Vice President and Manager, Sales Practice |
| | | Compliance, Deutsche Asset Management. |
|
| 1 Each Trustee, except Ms. Norris, serves until a successor is duly elected or qualified or until his death, resignation, retirement or |
| removal from office. As a new Trustee, Ms. Norris’ initial term ends June 30, 2009, at which time she may be re-elected by Trustees |
| to serve until a successor is duly elected or qualified or until her death, resignation, retirement or removal from office by the Trustees. |
| Each Trustee oversees 91 Evergreen funds. Correspondence for each Trustee may be sent to Evergreen Board of Trustees, |
| P.O. Box 20083, Charlotte, NC 28202. |
| 2 Mr. Wagoner is an “interested person” of the Fund because of his ownership of shares in Wachovia Corporation, the parent to the |
| Fund’s investment advisor. |
| 3 The address of the Officer is 401 S. Tryon Street, 20th Floor, Charlotte, NC 28288. |
| 4 The address of the Officer is 200 Berkeley Street, Boston, MA 02116. |
| 5 Mr. Guerin’s information is as of June 14, 2007, the effective date of his approval by the Board of Trustees as Chief Compliance Officer |
| of the Evergreen funds. |
Additional information about the Fund’s Board of Trustees and Officers can be found in the Statement of Additional Information (SAI) and
is available upon request without charge by calling 800.343.2898.45
564355 rv5 12/2007
Evergreen U.S. Government Fund

| table of contents |
| 1 | | LETTER TO SHAREHOLDERS |
| 4 | | FUND AT A GLANCE |
| 6 | | ABOUT YOUR FUND’S EXPENSES |
| 7 | | FINANCIAL HIGHLIGHTS |
| 11 | | SCHEDULE OF INVESTMENTS |
| 20 | | STATEMENT OF ASSETS AND LIABILITIES |
| 21 | | STATEMENT OF OPERATIONS |
| 22 | | STATEMENTS OF CHANGES IN NET ASSETS |
| 23 | | STATEMENT OF CASH FLOWS |
| 24 | | NOTES TO FINANCIAL STATEMENTS |
| 32 | | ADDITIONAL INFORMATION |
| 36 | | TRUSTEES AND OFFICERS |
This semiannual report must be preceded or accompanied by a prospectus of the Evergreen fund contained herein. The prospectus contains more complete information, including fees and expenses, and should be read carefully before investing or sending money.
The fund will file its complete schedule of portfolio holdings with the SEC for the first and third quarters of each fiscal year on Form N-Q. The fund’s Form N-Q will be available on the SEC’s Web site at http://www.sec.gov. In addition, the fund’s Form N-Q may be reviewed and copied at the SEC’s Public Reference Room in Washington, D.C. Information on the operation of the Public Reference Room may be obtained by calling 800.SEC.0330.
A description of the fund’s proxy voting policies and procedures, as well as information regarding how the fund voted proxies relating to portfolio securities during the most recent 12-month period ended June 30, is available by visiting our Web site at EvergreenInvestments.com or by visiting the SEC’s Web site at http://www.sec.gov. The fund’s proxy voting policies and procedures are also available without charge, upon request, by calling 800.343.2898.
| Mutual Funds: | | | | |
| NOT FDIC INSURED | | MAY LOSE VALUE | | NOT BANK GUARANTEED |
Evergreen InvestmentsSM is a service mark of Evergreen Investment Management Company, LLC.
Copyright 2007, Evergreen Investment Management Company, LLC.
Evergreen Investment Management Company, LLC is a subsidiary of Wachovia Corporation and is an affiliate of Wachovia Corporation’s other Broker Dealer subsidiaries.
Evergreen mutual funds are distributed by Evergreen Investment Services, Inc.
200 Berkeley Street, Boston, MA 02116
LETTER TO SHAREHOLDERS
December 2007

Dennis H. Ferro
President and Chief Executive Officer
Dear Shareholder:
We are pleased to provide the Semiannual Report for Evergreen U.S. Government Fund for the six-month period ended October 31, 2007.
The U.S. fixed income market delivered modest, but positive, returns during the six-month period, despite widening concerns about credit quality stemming from weakness in U.S. housing and growing problems in the subprime mortgage market. The period saw a general flight to quality as investors sought out the highest quality debt, especially U.S. Treasuries. As prices of Treasuries and other high-grade securities rose, their yields trended down, leading to outperformance by longer-maturity securities. At the same time, higher-yielding, lower-rated corporate bonds experienced some price erosion during the period after outperforming high-grade securities for several years. Concerns about the credit markets prompted the U.S. Federal Reserve Board (the “Fed”) and other major central banks to intervene and inject additional liquidity into the capital markets. While these steps in the closing three months of the period restored some measure of confidence, investors continued to watch warily for signs of economic weakness. Stocks of U.S. companies produced generally healthy returns, despite increasing market volatility. Investors began to favor larger companies with more consistent earnings, while the growth style of investing led the market after several years of outperformance by value stocks.
Despite the problems in housing and subprime mortgages, the domestic economy maintained its growth trajectory. Solid increases in exports and in business investment helped
1
LETTER TO SHAREHOLDERS continued
offset declining residential values. At the same time, steadily rising employment levels and moderately improving wages increased prospects that healthy consumer spending patterns would be sustained. Substantially exceeding expectations, U.S. Gross Domestic Product grew at an annual rate of 4.9% in the third quarter of 2007, significantly higher than the brisk 3.8% rate of the previous quarter. However, some signs of emerging economic weakness began to appear. Operating earnings of companies in the S&P 500 Index declined in the third quarter, principally because of dramatic write-downs taken by major corporations, predominately in the financials sector. Moreover, surging prices for oil, gold and most commodities, combined with the declining U.S. dollar, suggested some increased potential for rising inflation.
During the six-month period, managers of Evergreen’s intermediate and long-term bond fund teams focused on the issues influencing both the opportunities and challenges in managing specific portfolios. The teams managing the higher-quality portfolios, including Evergreen Core Bond Fund, Evergreen Core Plus Bond Fund, Evergreen U.S. Government Fund and Evergreen Institutional Mortgage Portfolio, assessed factors such as employment and inflationary trends, Fed policy and interest-rate expectations. At the same time, the managers supervising Evergreen High Income Fund and Evergreen Select High Yield Bond Fund tended to position their credit-sensitive portfolios relatively conservatively during a period of increasing volatility. The managers of Evergreen Diversified Income Builder Fund, meanwhile, repositioned their
2
LETTER TO SHAREHOLDERS continued
portfolio, maintaining an emphasis on better-quality, high-yield corporate bonds while also increasing the exposure to dividend-paying stocks.
As always, we encourage investors to maintain diversified investment portfolios in pursuit of their long-term investment goals.
Please visit us at EvergreenInvestments.com for more information about our funds and other investment products available to you. Thank you for your continued support of Evergreen Investments.
Sincerely,

Dennis H. Ferro
President and Chief Executive Officer
Evergreen Investment Company, Inc.
Special Notice to Shareholders:
Please visit our Web site at EvergreenInvestments.com for statements from President and Chief Executive Officer, Dennis Ferro, regarding the firm’s recent settlement with the Securities and Exchange Commission (SEC) and prior settlement with the National Association of Securities Dealers (NASD).
3
FUND AT A GLANCE
as of October 31, 2007
MANAGEMENT TEAM
Investment Advisor:
• Evergreen Investment Management Company, LLC
Sub-Advisor:
• Tattersall Advisory Group, Inc.
Portfolio Managers:
• Lisa Brown-Premo
• Karen DiMeglio
CURRENT INVESTMENT STYLE

Source: Morningstar, Inc.
Morningstar’s style box is based on a portfolio date as of 9/30/2007.
The Fixed Income style box placement is based on a fund’s average effective maturity or duration and the average credit rating of the bond portfolio.
PERFORMANCE AND RETURNS
Portfolio inception date: 1/11/1993
| | | Class A | | Class B | | Class C | | Class I |
| Class inception date | | 1/11/1993 | | 1/11/1993 | | 9/2/1994 | | 9/2/1993 |
|
| Nasdaq symbol | | EUSAX | | EUSBX | | EUSCX | | EUSYX |
|
| 6-month return with sales charge | | -2.49% | | -2.97% | | 1.02% | | N/A |
|
| 6-month return w/o sales charge | | 2.40% | | 2.02% | | 2.02% | | 2.54% |
|
| Average annual return* | | | | | | | | |
|
| 1-year with sales charge | | 0.04% | | -0.71% | | 3.29% | | N/A |
|
| 1-year w/o sales charge | | 5.06% | | 4.29% | | 4.29% | | 5.33% |
|
| 5-year | | 2.41% | | 2.31% | | 2.67% | | 3.69% |
|
| 10-year | | 4.44% | | 4.19% | | 4.19% | | 5.23% |
|
| Maximum sales charge | | 4.75% | | 5.00% | | 1.00% | | N/A�� |
| | | Front-end | | CDSC | | CDSC | | |
|
* Adjusted for maximum applicable sales charge, unless noted.
Past performance is no guarantee of future results. The performance quoted represents past performance and current performance may be lower or higher. The investment return and principal value of an investment will fluctuate so that investors’ shares, when redeemed, may be worth more or less than their original cost. To obtain performance information current to the most recent month-end for Classes A, B, C or I, please go to EvergreenInvestments.com/fundperformance. The performance of each class may vary based on differences in loads, fees and expenses paid by the shareholders investing in each class. Performance includes the reinvestment of income dividends and capital gain distributions. Performance shown does not reflect the deduction of taxes that a shareholder would pay on fund distributions or the redemption of fund shares.
The fund incurs a 12b-1 fee of 0.30% for Class A and 1.00% for Classes B and C. Class I does not pay a 12b-1 fee.
The advisor is reimbursing a portion of the 12b-1 fee for Class A. Had the fee not been reimbursed, returns for Class A would have been lower. Returns reflect expense limits previously in effect for all classes, without which returns would have been lower.
4
FUND AT A GLANCE continued
LONG-TERM GROWTH
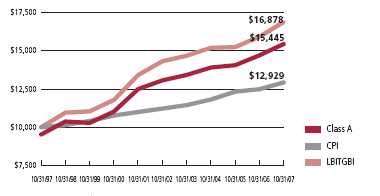
Comparison of a $10,000 investment in the Evergreen U.S. Government Fund Class A shares versus a similar investment in the Lehman Brothers Intermediate Term Government Bond Index (LBITGBI) and the Consumer Price Index (CPI).
The LBITGBI is an unmanaged market index and does not include transaction costs associated with buying and selling securities, any mutual fund fees or expenses or any taxes. The CPI is a commonly used measure of inflation and does not represent an investment return. It is not possible to invest directly in an index.
Class I shares are only offered in the following manner: (1) to investment advisory clients of Evergreen Investment Management Company, LLC (or its advisory affiliates) when purchased by such advisor(s) on behalf of its clients, (2) to certain mutual fund wrap program clients of Wachovia Securities and of third-party broker/dealers when purchased through a clearing relationship with Wachovia Securities or an affiliate providing mutual fund clearing services, (3) through arrangements entered into on behalf of the Evergreen funds with certain financial services firms, (4) to certain institutional investors, and (5) to persons who owned Class Y shares in registered name in an Evergreen fund on or before December 31, 1994 or who owned shares of any SouthTrust fund in registered name as of March 18, 2005 or who owned shares of Vestaur Securities Fund as of May 20, 2005.
Class I shares are only available to institutional shareholders with a minimum of $1 million investment, which may be waived in certain situations.
The fund’s investment objective may be changed without a vote of the fund’s shareholders.
Asset-backed and mortgage-backed securities are generally subject to higher prepayment risks than other types of debt securities, which can limit the potential for gain in a declining interest rate environment and increase the potential for loss in a rising interest rate environment. Mortgage-backed securities may also be structured so that they are particularly sensitive to interest rates.
Derivatives involve additional risks including interest rate risk, credit risk, the risk of improper valuation and the risk of non-correlation to the relevant instruments they are designed to hedge or to closely track.
The return of principal is not guaranteed due to fluctuation in the fund’s NAV caused by changes in the price of individual bonds held by the fund and the buying and selling of bonds by the fund. Bond funds have the same inflation, interest rate and credit risks as individual bonds. Generally, the value of bond funds rises when prevailing interest rates fall, and falls when interest rates rise.
U.S. government guarantees apply only to certain securities held in the fund’s portfolio and not to the fund’s shares.
Leverage may disproportionately increase a fund’s portfolio losses and reduce opportunities for gain when interest rates, stock prices, or currency rates are changing.
All data is as of October 31, 2007, and subject to change.
5
ABOUT YOUR FUND’S EXPENSES
The Example below is intended to describe the fees and expenses borne by shareholders and the impact of those costs on your investment.
Example
As a shareholder of the fund, you incur two types of costs: (1) transaction costs, including sales charges (loads), redemption fees and exchange fees; and (2) ongoing costs, including management fees, distribution (12b-1) fees and other fund expenses. This Example is intended to help you understand your ongoing costs (in dollars) of investing in the fund and to compare these costs with the ongoing costs of investing in other mutual funds. The Example is based on an investment of $1,000 invested at the beginning of the period and held for the entire period from May 1, 2007 to October 31, 2007.
The example illustrates your fund’s costs in two ways:
- Actual expenses
The section in the table under the heading “Actual” provides information about actual account values and actual expenses. You may use the information in these columns, together with the amount you invested, to estimate the expenses that you paid over the period. Simply divide your account value by $1,000 (for example, an $8,600 account value divided by $1,000 = 8.6), then multiply the result by the number in the appropriate column for your share class, in the column entitled “Expenses Paid During Period” to estimate the expenses you paid on your account during this period. - Hypothetical example for comparison purposes
The section in the table under the heading “Hypothetical (5% return before expenses)” provides information about hypothetical account values and hypothetical expenses based on the fund’s actual expense ratio and an assumed rate of return of 5% per year before expenses, which is not the fund’s actual return. The hypothetical account values and expenses may not be used to estimate the actual ending account balance or expenses you paid for the period. You may use this information to compare the ongoing costs of investing in the fund and other funds. To do so, compare this 5% hypothetical example with the 5% hypothetical examples that appear in the shareholder reports of the other funds.
Please note that the expenses shown in the table are meant to highlight your ongoing costs only and do not reflect any transactional costs, such as sales charges (loads), redemption fees or exchange fees. Therefore, the section in the table under the heading “Hypothetical (5% return before expenses)” is useful in comparing ongoing costs only, and will not help you determine the relative total costs of owning different funds. In addition, if these transactional costs were included, your costs would have been higher.
| | | Beginning | | Ending | | |
| | | Account | | Account | | Expenses |
| | | Value | | Value | | Paid During |
| | | 5/1/2007 | | 10/31/2007 | | Period* |
|
| Actual | | | | | | |
| Class A | | $ 1,000.00 | | $ 1,024.02 | | $ 4.63 |
| Class B | | $ 1,000.00 | | $ 1,020.22 | | $ 8.43 |
| Class C | | $ 1,000.00 | | $ 1,020.22 | | $ 8.48 |
| Class I | | $ 1,000.00 | | $ 1,025.36 | | $ 3.41 |
| Hypothetical | | | | | | |
| (5% return | | | | | | |
| before expenses) | | | | | | |
| Class A | | $ 1,000.00 | | $ 1,020.56 | | $ 4.62 |
| Class B | | $ 1,000.00 | | $ 1,016.79 | | $ 8.42 |
| Class C | | $ 1,000.00 | | $ 1,016.74 | | $ 8.47 |
| Class I | | $ 1,000.00 | | $ 1,021.77 | | $ 3.40 |
|
* For each class of the Fund, expenses are equal to the annualized expense ratio of each class (0.91% for Class A, 1.66% for Class B, 1.67% for Class C and 0.67% for Class I), multiplied by the average account value over the period, multiplied by 184 / 366 days.
6
FINANCIAL HIGHLIGHTS
(For a share outstanding throughout each period)
| | | | | | | | | | | | | |
| | | Six Months Ended | | Year Ended April 30, |
| | October 31, 2007 | |
|
| CLASS A | | (unaudited) | | 2007 | | 2006 | | 2005 | | 2004 | | 2003 |
|
| Net asset value, beginning of period | | $ 9.97 | | $ 9.81 | | $ 10.09 | | $ 9.96 | | $ 10.22 | | $ 9.75 |
|
| Income from investment operations | | | | | | | | | | | | |
| Net investment income (loss) | | 0.24 | | 0.44 | | 0.321 | | 0.241 | | 0.191 | | 0.39 |
Net realized and unrealized gains
or losses on investments | | (0.01)2 | | 0.17 | | (0.24) | | 0.19 | | (0.16) | | 0.43 |
| |
|
| Total from investment operations | | 0.23 | | 0.61 | | 0.08 | | 0.43 | | 0.03 | | 0.82 |
|
| Distributions to shareholders from | | | | | | | | | | | | |
| Net investment income | | (0.24) | | (0.45) | | (0.36) | | (0.30) | | (0.29) | | (0.35) |
|
| Net asset value, end of period | | $ 9.96 | | $ 9.97 | | $ 9.81 | | $ 10.09 | | $ 9.96 | | $ 10.22 |
|
| Total return3 | | 2.40% | | 6.37% | | 0.82% | | 4.37% | | 0.30% | | 8.50% |
|
| Ratios and supplemental data | | | | | | | | | | | | |
| Net assets, end of period (thousands) | | $216,441 | | $73,875 | | $77,581 | | $93,826 | | $109,172 | | $146,427 |
| Ratios to average net assets | | | | | | | | | | | | |
| Expenses including waivers/reimbursements | | | | | | | | | | | | |
| but excluding expense reductions | | 0.91%4 | | 0.95% | | 0.98% | | 1.00% | | 1.01% | | 0.95% |
| Expenses excluding waivers/reimbursements | | | | | | | | | | | | |
| and expense reductions | | 0.96%4 | | 0.99% | | 0.99% | | 1.00% | | 1.01% | | 0.95% |
| Net investment income (loss) | | 4.79%4 | | 4.60% | | 3.18% | | 2.38% | | 1.86% | | 3.81% |
| Portfolio turnover rate | | 48% | | 97% | | 53% | | 110% | | 55% | | 129% |
|
1 Net investment income (loss) per share is based on average shares outstanding during the period.
2 The per share net realized and unrealized gains or losses is not in accord with the net realized and unrealized gains or losses for the period due to timing of sales and redemptions of Fund shares in relation to fluctuating market values for the portfolio .
3 Excluding applicable sales charges
4 Annualized
See Notes to Financial Statements
7
FINANCIAL HIGHLIGHTS
(For a share outstanding throughout each period)
| | | | | | | | | | | | | |
| | | Six Months Ended | | Year Ended April 30, |
| | October 31, 2007 | |
|
| CLASS B | | (unaudited) | | 2007 | | 2006 | | 2005 | | 2004 | | 2003 |
|
| Net asset value, beginning of period | | $ $9.97 | | $ 9.81 | | $ 10.09 | | $ 9.96 | | $ 10.22 | | $ 9.75 |
|
| Income from investment operations | | | | | | | | | | | | |
| Net investment income (loss) | | 0.20 | | 0.381 | | 0.241 | | 0.171 | | 0.121 | | 0.31 |
Net realized and unrealized gains
or losses on investments | | 0 | | 0.16 | | (0.23) | | 0.19 | | (0.16) | | 0.43 |
| |
|
| Total from investment operations | | 0.20 | | 0.54 | | 0.01 | | 0.36 | | (0.04) | | 0.74 |
|
| Distributions to shareholders from | | | | | | | | | | | | |
| Net investment income | | (0.21) | | (0.38) | | (0.29) | | (0.23) | | (0.22) | | (0.27) |
|
| Net asset value, end of period | | $ 9.96 | | $ 9.97 | | $ 9.81 | | $ 10.09 | | $ 9.96 | | $ 10.22 |
|
| Total return2 | | 2.02% | | 5.60% | | 0.12% | | 3.64% | | (0.40%) | | 7.69% |
|
| Ratios and supplemental data | | | | | | | | | | | | |
| Net assets, end of period (thousands) | | $11,181 | | $12,653 | | $16,747 | | $25,452 | | $37,270 | | $59,362 |
| Ratios to average net assets | | | | | | | | | | | | |
| Expenses including waivers/reimbursements | | | | | | | | | | | | |
| but excluding expense reductions | | 1.66%3 | | 1.69% | | 1.69% | | 1.70% | | 1.71% | | 1.70% |
| Expenses excluding waivers/reimbursements | | | | | | | | | | | | |
| and expense reductions | | 1.66%3 | | 1.69% | | 1.69% | | 1.70% | | 1.71% | | 1.70% |
| Net investment income (loss) | | 4.06%3 | | 3.83% | | 2.45% | | 1.67% | | 1.16% | | 3.04% |
| Portfolio turnover rate | | 48% | | 97% | | 53% | | 110% | | 55% | | 129% |
|
1 Net investment income (loss) per share is based on average shares outstanding during the period.
2 Excluding applicable sales charges
3 Annualized
See Notes to Financial Statements
8
FINANCIAL HIGHLIGHTS
(For a share outstanding throughout each period)
| | | | | | | | | | | | | |
| | | Six Months Ended | | Year Ended April 30, |
| | October 31, 2007 | |
|
| CLASS C | | (unaudited) | | 2007 | | 2006 | | 2005 | | 2004 | | 2003 |
|
| Net asset value, beginning of period | | $ 9.97 | | $ 9.81 | | $10.09 | | $ 9.96 | | $ 10.22 | | $ 9.75 |
|
| Income from investment operations | | | | | | | | | | | | |
| Net investment income (loss) | | 0.21 | | 0.381 | | 0.251 | | 0.171 | | 0.121 | | 0.31 |
Net realized and unrealized gains
or losses on investments | | (0.01)2 | | 0.16 | | (0.24) | | 0.19 | | (0.16) | | 0.43 |
| |
|
| Total from investment operations | | 0.20 | | 0.54 | | 0.01 | | 0.36 | | (0.04) | | 0.74 |
|
| Distributions to shareholders from | | | | | | | | | | | | |
| Net investment income | | (0.21) | | (0.38) | | (0.29) | | (0.23) | | (0.22) | | (0.27) |
|
| Net asset value, end of period | | $ 9.96 | | $ 9.97 | | $ 9.81 | | $10.09 | | $ 9.96 | | $ 10.22 |
|
| Total return3 | | 2.02% | | 5.60% | | 0.12% | | 3.64% | | (0.40%) | | 7.69% |
|
| Ratios and supplemental data | | | | | | | | | | | | |
| Net assets, end of period (thousands) | | $8,965 | | $7,669 | | $7,973 | | $9,820 | | $14,207 | | $26,013 |
| Ratios to average net assets | | | | | | | | | | | | |
| Expenses including waivers/reimbursements | | | | | | | | | | | | |
| but excluding expense reductions | | 1.67%4 | | 1.69% | | 1.69% | | 1.70% | | 1.71% | | 1.70% |
| Expenses excluding waivers/reimbursements | | | | | | | | | | | | |
| and expense reductions | | 1.67%4 | | 1.69% | | 1.69% | | 1.70% | | 1.71% | | 1.70% |
| Net investment income (loss) | | 4.07%4 | | 3.86% | | 2.47% | | 1.67% | | 1.17% | | 2.99% |
| Portfolio turnover rate | | 48% | | 97% | | 53% | | 110% | | 55% | | 129% |
|
1 Net investment income (loss) per share is based on average shares outstanding during the period.
2 The per share net realized and unrealized gains or losses is not in accord with the net realized and unrealized gains or losses for the period due to timing of sales and redemptions of Fund shares in relation to fluctuating market values for the portfolio .
3 Excluding applicable sales charges
4 Annualized
See Notes to Financial Statements
9
FINANCIAL HIGHLIGHTS
(For a share outstanding throughout each period)
| | | | | | | | | | | | | |
| | | Six Months Ended | | Year Ended April 30, |
| | October 31, 2007 | |
|
| CLASS I | | (unaudited) | | 2007 | | 2006 | | 2005 | | 2004 | | 2003 |
|
| Net asset value, beginning of period | | $ 9.97 | | $ 9.81 | | $ 10.09 | | $ 9.96 | | $ 10.22 | | $ 9.75 |
|
| Income from investment operations | | | | | | | | | | | | |
| Net investment income (loss) | | 0.25 | | 0.47 | | 0.351 | | 0.271 | | 0.221 | | 0.41 |
Net realized and unrealized gains
or losses on investments | | 0 | | 0.17 | | (0.24) | | 0.19 | | (0.16) | | 0.43 |
| |
|
| Total from investment operations | | 0.25 | | 0.64 | | 0.11 | | 0.46 | | 0.06 | | 0.84 |
|
| Distributions to shareholders from | | | | | | | | | | | | |
| Net investment income | | (0.26) | | (0.48) | | (0.39) | | (0.33) | | (0.32) | | (0.37) |
|
| Net asset value, end of period | | $ 9.96 | | $ 9.97 | | $ 9.81 | | $ 10.09 | | $ 9.96 | | $ 10.22 |
|
| Total return | | 2.54% | | 6.66% | | 1.12% | | 4.68% | | 0.60% | | 8.77% |
|
| Ratios and supplemental data | | | | | | | | | | | | |
| Net assets, end of period (thousands) | | $621,983 | | $479,015 | | $436,890 | | $436,431 | | $427,356 | | $489,565 |
| Ratios to average net assets | | | | | | | | | | | | |
| Expenses including waivers/reimbursements | | | | | | | | | | | | |
| but excluding expense reductions | | 0.67%2 | | 0.69% | | 0.69% | | 0.70% | | 0.71% | | 0.70% |
| Expenses excluding waivers/reimbursements | | | | | | | | | | | | |
| and expense reductions | | 0.67%2 | | 0.69% | | 0.69% | | 0.70% | | 0.71% | | 0.70% |
| Net investment income (loss) | | 5.07%2 | | 4.88% | | 3.48% | | 2.69% | | 2.15% | | 4.02% |
| Portfolio turnover rate | | 48% | | 97% | | 53% | | 110% | | 55% | | 129% |
|
1 Net investment income (loss) per share is based on average shares outstanding during the period.
2 Annualized
See Notes to Financial Statements
10
SCHEDULE OF INVESTMENTS
October 31, 2007 (unaudited)
| | | | | Principal | | |
| | | | | Amount | | Value |
|
| |
| AGENCY COMMERCIAL MORTGAGE-BACKED SECURITIES 12.7% | | | | |
| FIXED-RATE 11.6% | | | | | | |
| FNMA: | | | | | | |
| 4.75%, 07/01/2012 | | | | $ 970,367 | | $ 966,495 |
| 5.08%, 02/01/2016 - 03/01/2016 | | | | 11,288,719 | | 11,151,868 |
| 5.15%, 11/01/2017 | | | | 4,186,209 | | 4,131,899 |
| 5.31%, 04/01/2016 | | | | 3,200,000 | | 3,200,438 |
| 5.37%, 12/01/2024 | | | | 917,025 | | 916,520 |
| 5.48%, 04/01/2010 | | | | 1,021,476 | | 1,038,372 |
| 5.50%, 04/01/2016 | | | | 7,680,000 | | 7,738,061 |
| 5.55%, 05/01/2016 | | | | 3,300,000 | | 3,346,487 |
| 5.64%, 12/01/2013 | | | | 3,000,000 | | 3,041,791 |
| 5.65%, 08/01/2022 | | | | 1,599,735 | | 1,624,323 |
| 5.66%, 12/01/2016 | | | | 1,732,000 | | 1,762,604 |
| 5.67%, 03/01/2016 - 11/01/2021 | | | | 12,729,989 | | 12,985,480 |
| 5.68%, 08/01/2016 ## | | | | 12,197,977 | | 12,488,626 |
| 5.68%, 04/01/2021 | | | | 555,997 | | 566,144 |
| 5.70%, 03/01/2016 | | | | 1,037,203 | | 1,060,752 |
| 5.75%, 05/01/2021 | | | | 3,911,913 | | 4,009,182 |
| 5.95%, 06/01/2024 | | | | 1,970,706 | | 2,031,502 |
| 6.07%, 09/01/2013 | | | | 3,122,509 | | 3,258,900 |
| 6.08%, 01/01/2019 | | | | 7,252,011 | | 7,472,255 |
| 6.18%, 06/01/2013 | | | | 9,421,721 | | 9,865,767 |
| 6.32%, 08/01/2012 | | | | 2,954,117 | | 3,099,902 |
| 6.35%, 08/01/2009 - 10/01/2009 | | | | 1,092,984 | | 1,114,234 |
| 6.95%, 04/01/2017 | | | | 424,029 | | 424,029 |
| 6.99%, 09/01/2014 | | | | 336,762 | | 344,241 |
| 7.48%, 01/01/2025 | | | | 1,158,855 | | 1,256,442 |
| Ser. 2002-M1, Class C, 6.17%, 02/25/2016 | | | | 920,724 | | 948,116 |
| |
|
| | | | | | | 99,844,430 |
| |
|
| FLOATING-RATE 1.1% | | | | | | |
| FHLMC, 5.82%, 03/01/2037 ## | | | | 9,157,522 | | 9,317,321 |
| |
|
| Total Agency Commercial Mortgage-Backed Securities | | | | | | |
| (cost $109,297,005) | | | | | | 109,161,751 |
| |
|
| AGENCY MORTGAGE-BACKED COLLATERALIZED MORTGAGE | | | | |
| OBLIGATIONS 27.5% | | | | | | |
| FIXED-RATE 3.2% | | | | | | |
| FHLMC: | | | | | | |
| Ser. 0243, Class 6, IO, 6.00%, 12/15/2032 | | | | 359,478 | | 85,067 |
| Ser. 1807, Class C, 6.00%, 12/15/2008 | | | | 73,883 | | 74,084 |
| Ser. 2043, Class ZP, 6.50%, 04/15/2028 | | | | 562,358 | | 579,611 |
| Ser. 2046, Class G, 6.50%, 04/15/2028 | | | | 334,605 | | 345,656 |
| Ser. 2058, Class TE, 6.50%, 05/15/2028 | | | | 342,077 | | 353,229 |
| Ser. 2072, Class A, 6.50%, 07/15/2028 | | | | 1,250,169 | | 1,287,987 |
| Ser. 2078, Class PE, 6.50%, 08/15/2028 | | | | 649,695 | | 670,528 |
| Ser. 2173, Class Z, 6.50%, 07/15/2029 | | | | 741,867 | | 767,893 |
| Ser. 2262, Class Z, 7.50%, 10/15/2030 | | | | 284,421 | | 300,613 |
See Notes to Financial Statements
11
SCHEDULE OF INVESTMENTS continued
October 31, 2007 (unaudited)
| | | Principal | | |
| | | Amount | | Value |
|
| |
| AGENCY MORTGAGE-BACKED COLLATERALIZED MORTGAGE | | | | |
| OBLIGATIONS continued | | | | |
| FIXED-RATE continued | | | | |
| FHLMC: | | | | |
| Ser. 2326, Class ZP, 6.50%, 06/15/2031 | | $ 28,641 | | $ 29,507 |
| Ser. 2367, Class BC, 6.00%, 04/15/2016 | | 17,221 | | 17,217 |
| Ser. 2461 Class PZ, 6.50%, 06/15/2032 | | 678,963 | | 699,678 |
| Ser. 3098, Class KI, IO, 5.50%, 11/15/2024 | | 1,134,499 | | 80,286 |
| FNMA: | | | | |
| Ser. 0342, Class 2, IO, 6.00%, 09/01/2033 | | 132,566 | | 32,472 |
| Ser. 1993-215, Class ZQ, 6.50%, 11/25/2023 | | 675,248 | | 694,054 |
| Ser. 1999, Class LH, 6.50%, 11/25/2029 | | 421,725 | | 437,463 |
| Ser. 2001-82, Class ZA, 6.50%, 01/25/2032 | | 289,343 | | 295,934 |
| Ser. 2002-09, Class PC, 6.00%, 03/25/2017 | | 722,620 | | 738,287 |
| Ser. 2002-56, Class KW, 6.00%, 04/25/2023 | | 1,190,000 | | 1,202,233 |
| Ser. 2002-W4, Class A4, 6.25%, 05/25/2042 | | 2,632,086 | | 2,691,811 |
| Ser. 2002-W5, Class A7, 6.25%, 08/25/2030 | | 2,313,224 | | 2,316,112 |
| Ser. 2003-033, Class IA, IO, 6.50%, 05/25/2033 | | 350,135 | | 82,516 |
| Ser. 2003-046, Class IH, IO, 5.50%, 06/25/2033 | | 3,142,029 | | 668,215 |
| Ser. 2003-084, Class PW, 3.00%, 06/25/2022 | | 314,293 | | 311,933 |
| Ser. 2005-071, Class DB, 4.50%, 08/25/2025 | | 4,000,000 | | 3,749,160 |
| Ser. 2006-093, Class PK, 5.50%, 04/25/2036 | | 7,966,289 | | 7,997,106 |
| GNMA: | | | | |
| Ser. 2002-025, Class B, 6.21%, 03/16/2021 | | 188,742 | | 190,093 |
| Ser. 2002-026, Class C, FRN, 5.99%, 02/16/2024 | | 398,204 | | 403,038 |
| |
|
| | | | | 27,101,783 |
| |
|
| FLOATING-RATE 24.3% | | | | |
| FHLMC: | | | | |
| Ser. 06, Class B, 5.48%, 03/25/2023 | | 706,327 | | 712,825 |
| Ser. 1220, Class A, 5.48%, 02/15/2022 | | 319,646 | | 320,368 |
| Ser. 1370, Class JA, 6.28%, 09/15/2022 | | 264,484 | | 271,737 |
| Ser. 1498, Class I, 6.28%, 04/15/2023 | | 167,361 | | 172,124 |
| Ser. 1533, Class FA, 6.23%, 06/15/2023 | | 58,574 | | 60,123 |
| Ser. 1616, Class FB, 5.26%, 11/15/2008 | | 369,568 | | 368,673 |
| Ser. 1671, Class TA, 5.625%, 02/15/2024 | | 555,794 | | 558,783 |
| Ser. 1687, Class FA, 5.41%, 02/15/2009 | | 1,760,336 | | 1,755,901 |
| Ser. 1699, Class FB, 6.125%, 03/15/2024 | | 998,989 | | 1,025,343 |
| Ser. 1939, Class FB, 6.125%, 04/15/2027 | | 404,491 | | 415,133 |
| Ser. 2005-S001, Class 1A2, 5.02%, 09/25/2035 | | 3,601,838 | | 3,528,684 |
| Ser. 2030, Class F, 5.59%, 02/15/2028 | | 840,910 | | 846,720 |
| Ser. 2181, Class PF, 5.49%, 05/15/2029 | | 403,723 | | 405,060 |
| Ser. 2315, Class FD, 5.59%, 04/15/2027 | | 296,976 | | 299,043 |
| Ser. 2334, Class FO, 6.06%, 07/15/2031 ## | | 11,481,143 | | 11,671,737 |
| Ser. 2380, Class FL, 5.69%, 11/15/2031 ## | | 13,341,627 | | 13,499,591 |
| Ser. 2388, Class FG, 5.59%, 12/31/2031 | | 2,769,823 | | 2,811,063 |
| Ser. 2395, Class FD, 5.69%, 05/15/2029 | | 3,451,138 | | 3,505,080 |
| Ser. 2399, Class XF, 6.04%, 01/15/2032 ## | | 13,458,502 | | 13,642,456 |
| Ser. 2401, CL FA, 5.74%, 07/15/2029 | | 1,199,169 | | 1,216,643 |
| Ser. 2481, Class FE, 6.09%, 03/15/2032 ## | | 11,564,225 | | 11,911,383 |
See Notes to Financial Statements
12
SCHEDULE OF INVESTMENTS continued
October 31, 2007 (unaudited)
| | | | | Principal | | |
| | | | | Amount | | Value |
|
| |
| AGENCY MORTGAGE-BACKED COLLATERALIZED MORTGAGE | | | | |
| OBLIGATIONS continued | | | | |
| FLOATING-RATE continued | | | | |
| FHLMC: | | | | | | |
| Ser. 2504, Class FP, 5.59%, 03/15/2032 | | $ 584,414 | | $ 591,084 |
| Ser. 2515, Class FP, 5.49%, 10/15/2032 | | 2,197,226 | | 2,212,424 |
| Ser. 2691, Class FC, 5.79%, 10/15/2033 | | 2,089,583 | | 2,136,055 |
| Ser. T-66, Class 2A1, 7.75%, 01/25/2036 ## | | 28,719,188 | | 30,126,098 |
| Ser. T-67, Class 1A1C, 7.86%, 03/25/2036 ## | | 30,065,641 | | 32,385,813 |
| Ser. T-67, Class 2A1C, 7.80%, 03/25/2036 ## | | 8,941,411 | | 9,575,005 |
| FNMA: | | | | | | |
| Ser. 1991, Class F: | | | | | | |
| 5.73%, 05/25/2021 | | 645,092 | | 664,555 |
| 6.18%, 11/25/2021 | | 146,003 | | 150,736 |
| Ser. 1991 Class FA, 5.78%, 04/25/2021 | | 25,529 | | 25,745 |
| Ser. 1993-221, Class FH, FRN, 5.97%, 12/25/2008 | | 938,721 | | 943,537 |
| Ser. 1994, Class F, 5.48%, 02/25/2024 | | 480,614 | | 485,896 |
| Ser. 1997-34, Class | | F, 5.53%, 10/25/2023 | | 2,936,426 | | 2,973,866 |
| Ser. 1997-49, Class | | F, 5.56%, 06/17/2027 | | 413,712 | | 416,844 |
| Ser. 1999-49, Class | | F, 5.27%, 05/25/2018 | | 834,362 | | 839,279 |
| Ser. 2000-32, Class | | FM, 5.49%, 10/18/2030 | | 438,528 | | 442,498 |
| Ser. 2001-53, Class | | CF, 5.27%, 10/25/2031 | | 57,109 | | 57,154 |
| Ser. 2002-07, Class | | FB, 5.27%, 02/25/2028 | | 277,699 | | 280,897 |
| Ser. 2002-13, Class | | FE, 5.77%, 02/27/2031 | | 3,779,890 | | 3,865,013 |
| Ser. 2002-41, Class | | F, 5.42%, 07/25/2032 | | 3,254,671 | | 3,297,146 |
| Ser. 2002-67, Class | | FA, 5.87%, 11/25/2032 ## | | 9,020,253 | | 9,293,025 |
| Ser. 2002-68, Class | | FN, 5.49%, 10/18/2032 | | 4,041,004 | | 4,061,169 |
| Ser. 2002-77, Class | | F, 5.47%, 12/25/2032 ## | | 14,183,173 | | 14,365,143 |
| Ser. 2002-77, Class | | FA, 6.04%, 10/18/2030 | | 6,792,624 | | 6,997,626 |
| Ser. 2002-77, Class | | FG, 5.59%, 12/18/2032 | | 1,446,934 | | 1,458,452 |
| Ser. 2002-W5, Class A27, 5.37%, 11/25/2030 | | 2,390,391 | | 2,400,065 |
| Ser. 2003-11, Class | | DF, 5.32%, 02/25/2033 | | 2,556,617 | | 2,567,937 |
| Ser. 2003-11, Class | | FE, 5.37%, 12/25/2033 | | 575,726 | | 580,055 |
| Ser. 2003-24, Class | | FL, 5.32%, 04/25/2018 | | 2,857,459 | | 2,888,823 |
| Ser. G93, Class FH, 6.03%, 04/25/2023 | | 141,556 | | 145,650 |
| GNMA: | | | | | | |
| Ser. 1999, Class FA, 5.51%, 11/16/2029 | | 1,011,982 | | 1,020,158 |
| Ser. 1999-40, Class | | FL, 5.65%, 02/17/2029 | | 208,802 | | 211,020 |
| Ser. 2000-36, Class | | FG, 5.50%, 11/20/2030 | | 376,143 | | 378,885 |
| Ser. 2001-21, Class | | FB, 5.46%, 01/16/2027 | | 510,436 | | 511,952 |
| Ser. 2001-22, Class | | FG, 5.41%, 05/16/2031 | | 842,121 | | 845,583 |
| Ser. 2002-15, Class | | F, 5.61%, 02/16/2032 | | 654,250 | | 660,138 |
| Ser. 2006-47, Class | | SA, IO, 1.74%, 08/16/2036 | | 1,554,533 | | 93,431 |
| |
|
| | | | | | | 208,947,227 |
| |
|
| Total Agency Mortgage-Backed Collateralized Mortgage Obligations | | | | |
| (cost $234,388,647) | | | | 236,049,010 |
| |
|
See Notes to Financial Statements
13
SCHEDULE OF INVESTMENTS continued
October 31, 2007 (unaudited)
| | | | | Principal | | |
| | | | | Amount | | Value |
|
| |
| AGENCY MORTGAGE-BACKED PASS THROUGH SECURITIES 74.3% | | | | |
| FIXED-RATE 56.4% | | | | | | |
| FHLMC: | | | | | | |
| 6.00%, 05/01/2018 - 10/01/2032 | | | | $ 3,135,951 | | $ 3,189,890 |
| 6.50%, 04/01/2018 - 07/01/2031 | | | | 2,768,206 | | 2,849,675 |
| 7.00%, 12/01/2023 - 05/01/2029 | | | | 219,624 | | 229,827 |
| 7.50%, 04/01/2023 - 08/01/2028 | | | | 1,348,237 | | 1,426,199 |
| 8.00%, 08/01/2023 - 11/01/2028 | | | | 479,260 | | 508,419 |
| 8.50%, 07/01/2022 - 08/01/2026 | | | | 76,664 | | 82,400 |
| 9.00%, 01/01/2017 - 10/01/2024 | | | | 197,543 | | 211,097 |
| 9.50%, 09/01/2016 - 05/01/2021 | | | | 65,171 | | 70,278 |
| 10.00%, 08/01/2017 - 08/01/2020 | | | | 2,378 | | 2,653 |
| 10.50%, 02/01/2019 - 05/01/2020 | | | | 161,320 | | 184,165 |
| FHLMC 15 year: | | | | | | |
| 4.50%, TBA # | | | | 12,000,000 | | 11,606,256 |
| 6.00%, TBA # | | | | 9,750,000 | | 9,913,010 |
| FHLMC 30 year: | | | | | | |
| 5.50%, TBA # | | | | 88,125,000 | | 86,761,794 |
| 6.00%, TBA # | | | | 140,340,000 | | 141,239,018 |
| 6.50%, TBA # | | | | 64,800,000 | | 66,268,109 |
| FNMA: | | | | | | |
| 4.12%, 09/01/2010 | | | | 1,410,674 | | 1,393,715 |
| 4.98%, 01/01/2020 | | | | 961,431 | | 941,193 |
| 5.00%, 06/01/2033 - 03/01/2034 | | | | 6,850,437 | | 6,609,477 |
| 5.12%, 01/01/2016 | | | | 2,516,681 | | 2,525,523 |
| 5.24%, 12/01/2012 | | | | 800,126 | | 807,847 |
| 5.39%, 01/01/2024 | | | | 3,792,576 | | 3,773,917 |
| 5.50%, 05/01/2024 | | | | 8,689,294 | | 8,831,798 |
| 5.50%, 05/01/2037 ## | | | | 34,956,965 | | 34,109,193 |
| 5.55%, 09/01/2019 | | | | 6,666,376 | | 6,674,842 |
| 5.70%, 09/01/2017 | | | | 1,450,718 | | 1,467,213 |
| 5.75%, 02/01/2009 | | | | 1,761,124 | | 1,792,789 |
| 6.00%, 02/01/2008 - 04/01/2033 | | | | 5,734,537 | | 5,802,528 |
| 6.00%, 11/01/2032 ## | | | | 17,173,271 | | 17,393,704 |
| 6.50%, 06/01/2017 - 07/01/2047 | | | | 11,638,769 | | 11,838,309 |
| 7.00%, 11/01/2026 - 10/01/2047 | | | | 18,165,541 | | 18,635,919 |
| 7.50%, 12/01/2017 - 01/01/2033 | | | | 2,313,762 | | 2,447,482 |
| 8.00%, 08/01/2020 - 02/01/2030 | | | | 2,300,779 | | 2,442,634 |
| 8.50%, 08/01/2014 - 08/01/2029 | | | | 413,409 | | 444,130 |
| 9.00%, 06/01/2021 - 04/01/2025 | | | | 269,902 | | 293,826 |
| 9.50%, 10/01/2020 - 02/01/2023 | | | | 38,731 | | 42,043 |
| 11.00%, 01/01/2016 | | | | 35,815 | | 38,150 |
| 11.25%, 02/01/2016 | | | | 88,976 | | 99,540 |
| FNMA 30 year, 5.00%, TBA # | | | | 24,700,000 | | 23,692,709 |
| GNMA: | | | | | | |
| 6.00%, 02/15/2009 - 08/20/2034 | | | | 4,230,333 | | 4,472,818 |
| 6.50%, 12/15/2025 - 09/20/2033 | | | | 597,772 | | 615,420 |
| 7.00%, 12/15/2022 - 05/15/2032 | | | | 479,938 | | 505,717 |
See Notes to Financial Statements
14
SCHEDULE OF INVESTMENTS continued
October 31, 2007 (unaudited)
| | | | | Principal | | |
| | | | | Amount | | Value |
|
| |
| AGENCY MORTGAGE-BACKED PASS THROUGH SECURITIES continued | | | | |
| FIXED-RATE continued | | | | | | |
| GNMA: | | | | | | |
| 7.34%, 10/20/2021 - 09/20/2022 | | | | $ 575,201 | | $ 604,228 |
| 7.50%, 02/15/2022 - 06/15/2032 | | | | 894,318 | | 945,934 |
| 8.00%, 04/15/2023 - 06/15/2025 | | | | 94,202 | | 100,206 |
| 8.50%, 07/15/2016 | | | | 2,287 | | 2,450 |
| 9.00%, 03/15/2009 - 04/15/2021 | | | | 110,198 | | 118,866 |
| 10.00%, 12/15/2018 | | | | 66,641 | | 75,783 |
| 14.00%, 02/15/2012 - 06/15/2012 | | | | 224,803 | | 259,208 |
| |
|
| | | | | | | 484,341,901 |
| |
|
| FLOATING-RATE 17.9% | | | | | | |
| FHLMC: | | | | | | |
| 5.86%, 12/01/2036 ## | | | | 12,403,426 | | 12,631,774 |
| 5.89%, 02/01/2037 ## | | | | 12,593,468 | | 12,830,981 |
| Ser. T-75, Class A1, 4.91%, 11/25/2036 ## | | | | 17,889,678 | | 17,805,417 |
| FNMA: | | | | | | |
| 4.125%, 12/25/2025 ## | | | | 18,054,952 | | 17,894,985 |
| 5.53%, 07/01/2032 | | | | 4,180,464 | | 4,289,671 |
| 5.54%, 11/01/2030 | | | | 610,704 | | 625,217 |
| 5.57%, 01/01/2038 | | | | 2,195,772 | | 2,194,564 |
| 6.04%, 11/01/2033 | | | | 3,450,434 | | 3,512,628 |
| 6.18%, 04/01/2029 - 10/01/2041 | | | | 6,168,268 | | 6,273,687 |
| 6.23%, 09/01/2041 | | | | 8,497,737 | | 8,511,289 |
| 6.375%, 06/01/2040 - 01/01/2041 | | | | 9,970,750 | | 10,351,439 |
| 7.00%, 01/01/2011 | | | | 16,244 | | 16,470 |
| 7.20%, 11/01/2018 | | | | 292,877 | | 308,326 |
| 7.23%, 07/01/2025 | | | | 347,204 | | 362,565 |
| 7.37%, 05/01/2030 | | | | 310,717 | | 323,801 |
| 7.40%, 04/01/2036 ## | | | | 28,316,845 | | 30,494,410 |
| SBA: | | | | | | |
| 5.08%, 08/25/2031 | | | | 1,020,347 | | 1,035,367 |
| 5.10%, 09/25/2030 - 11/25/2030 | | | | 1,613,005 | | 1,636,262 |
| 5.125%, 03/25/2027 - 03/25/2035 | | | | 3,509,283 | | 3,567,454 |
| 5.16%, 10/25/2029 - 11/25/2029 | | | | 11,672,691 | | 11,892,677 |
| 5.18%, 10/25/2031 | | | | 7,353,808 | | 7,488,162 |
| |
|
| | | | | | | 154,047,146 |
| |
|
| Total Agency Mortgage-Backed Pass Through Securities | | | | | | |
| (cost $633,931,858) | | | | | | 638,389,047 |
| |
|
| AGENCY REPERFORMING MORTGAGE-BACKED PASS THROUGH | | | | |
| SECURITIES 2.5% | | | | | | |
| FHLMC, Ser. T-60, Class 1A-1, 6.50%, 03/25/2044 | | | | 1,118,141 | | 1,155,733 |
| FNMA: | | | | | | |
| Ser. 2002-T1, Class A3, 7.50%, 11/25/2031 | | | | 2,405,884 | | 2,546,869 |
| Ser. 2002-T16, Class A1, 6.50%, 07/25/2042 | | | | 3,826,660 | | 4,000,314 |
| Ser. 2002-W3, Class A5, 7.50%, 01/25/2028 | | | | 402,023 | | 423,619 |
| Ser. 2002-W8, Class A4, 7.00%, 06/25/2017 | | | | 1,202,223 | | 1,246,837 |
See Notes to Financial Statements
15
SCHEDULE OF INVESTMENTS continued
October 31, 2007 (unaudited)
| | | Principal | | |
| | | Amount | | Value |
|
| |
| AGENCY REPERFORMING MORTGAGE-BACKED PASS THROUGH | | | | |
| SECURITIES continued | | | | |
| FNMA: | | | | |
| Ser. 2003-W1, Class 1A-1, 6.50%, 12/25/2042 | | $ 1,982,046 | | $ 2,039,199 |
| Ser. 2004-T1, Class 1A-2, 6.50%, 01/25/2044 | | 1,751,766 | | 1,792,162 |
| FHLMC: | | | | |
| Ser. 2406, Class FP, 6.07%, 01/15/2032 | | 3,985,230 | | 4,039,752 |
| Ser. 2406, Class PF, 6.07%, 12/15/2031 | | 3,804,427 | | 3,891,086 |
| |
|
| Total Agency Reperforming Mortgage-Backed Pass Through Securities | | | | |
| (cost $21,207,183) | | | | 21,135,571 |
| |
|
| ASSET-BACKED SECURITIES 1.0% | | | | |
| Argent Securities Inc., Ser. 2004-W8, Class A2, FRN, 5.35%, 05/25/2034 | | 778,579 | | 776,967 |
| CitiBank Credit Card Issuance Trust, Ser. 2003-A3, Class A3, 6.875%, 11/16/2009 . | | 1,365,000 | | 1,365,789 |
| Countrywide Asset-Backed Certificates: | | | | |
| Ser. 2005-16, Class 2AF2, 5.38%, 02/25/2030 | | 370,000 | | 368,213 |
| Ser. 2005-17, Class 1AF2, 5.36%, 05/25/2036 | | 250,000 | | 248,793 |
| HSBC Home Equity Loan Trust, Ser. 2005-3, Class A1, FRN, 5.26%, 01/20/2035 | | 386,737 | | 381,748 |
| Lehman XS Trust: | | | | |
| Ser. 2005-2, Class 2A1B, 5.18%, 08/25/2035 | | 345,169 | | 344,665 |
| Ser. 2005-4, Class 2A1B, 5.17%, 10/25/2035 | | 275,796 | | 274,284 |
| Ser. 2005-10, Class 2A3B, 5.55%, 01/25/2036 | | 409,617 | | 408,093 |
| NovaStar ABS CDO, Ltd., Ser. 2007-1A, Class A2, FRN, 5.82%, 02/08/2047 144A | | 4,000,000 | | 3,683,760 |
| Popular Mtge. Trust, Ser. 2005-A, Class B3, 5.68%, 01/25/2036 | | 380,000 | | 379,187 |
| Residential Asset Mortgage Products, Inc., Ser. 2004-RS7, Class AI3, 4.45%, | | | | |
| 07/25/2028 | | 76,692 | | 76,383 |
| Susquehanna Auto Lease Trust, Ser. 2006-1, Class A2, 5.20%, 05/14/2008 144A | | 190,715 | | 190,712 |
| |
|
| Total Asset-Backed Securities (cost $8,822,956) | | | | 8,498,594 |
| |
|
| COMMERCIAL MORTGAGE-BACKED SECURITIES 2.0% | | | | |
| FIXED-RATE 0.8% | | | | |
| Banc of America Comml. Mtge. Securities, Inc., Ser. 2006-05, Class A2, 5.32%, | | | | |
| 10/10/2011 | | 1,025,000 | | 1,038,530 |
| GE Capital Comml. Mtge. Corp., Ser. 2005-C3, Class A2, 4.85%, 07/10/2045 | | 660,000 | | 658,957 |
| JPMorgan Chase & Co. Comml. Mtge. Securities Corp., Ser. 2005-LDP4, Class A2, | | | | |
| 4.79%, 10/15/2042 | | 950,000 | | 947,074 |
| LB-UBS Comml. Mtge. Trust, Ser. 2005-C5, Class A2, 4.89%, 09/15/2030 | | 790,000 | | 791,714 |
| Prima Capital Securitization, Ltd., Ser. 2006, Class D, 5.88%, 12/28/2048 | | 3,618,000 | | 3,660,620 |
| |
|
| | | | | 7,096,895 |
| |
|
| FLOATING-RATE 1.2% | | | | |
| Credit Suisse First Boston Mtge. Securities: | | | | |
| Ser. 2004-TF2A, Class H, 5.79%, 11/15/2019 144A | | 1,900,000 | | 1,904,465 |
| Ser. 2004-TF2A, Class J, 6.04%, 11/15/2019 144A | | 1,828,000 | | 1,821,920 |
| Ser. 2005-TFLA, Class J, 6.04%, 02/15/2020 (h) | | 961,000 | | 961,000 |
| Merrill Lynch Floating Trust, Ser. 2006-1, Class A1, 5.16%, 06/15/2022 144A | | 5,618,739 | | 5,589,227 |
| |
|
| | | | | 10,276,612 |
| |
|
| Total Commercial Mortgage-Backed Securities (cost $17,293,509) | | | | 17,373,507 |
| |
|
See Notes to Financial Statements
16
SCHEDULE OF INVESTMENTS continued
October 31, 2007 (unaudited)
| | | Principal | | |
| | | Amount | | Value |
|
| |
| U.S. GOVERNMENT & AGENCY OBLIGATIONS 2.0% | | | | |
| FHLB, 5.33%, 07/16/2008 ## (cost $17,000,000) | | $ 17,000,000 | | $ 17,027,404 |
| |
|
| U.S. TREASURY OBLIGATIONS 4.3% | | | | |
| U.S. Treasury Notes: | | | | |
| 4.00%, 02/15/2014 (p) | | 14,500,000 | | 14,317,619 |
| 4.75%, 12/31/2008 - 08/15/2017 (p) | | 22,500,000 | | 22,885,865 |
| |
|
| Total U.S. Treasury Obligations (cost $36,917,429) | | | | 37,203,484 |
| |
|
| WHOLE LOAN MORTGAGE-BACKED COLLATERALIZED MORTGAGE | | | | |
| OBLIGATIONS 6.4% | | | | |
| FIXED-RATE 4.2% | | | | |
| Citigroup Mtge. Loan Trust Inc., Ser. 2003-HE2, Class M6, 5.54%, 03/25/2036 | | 250,000 | | 248,650 |
| Countrywide Alternative Loan Trust: | | | | |
| Ser. 2004-1T1, Class A6, 5.75%, 02/25/2034 | | 5,000,000 | | 5,048,450 |
| Ser. 2005-46CB, Class A14, 5.50%, 10/25/2035 | | 10,000,000 | | 9,534,500 |
| Countrywide Home Loans, Inc., Ser. 2006-18, Class 2A5, 6.00%, 12/25/2036 | | 4,050,000 | | 3,979,299 |
| Credit Suisse Mtge. Capital Cert., Ser. 2006-9, Class 4A1, 6.00%, 11/25/2036 | | 10,778,457 | | 10,489,486 |
| Residential Accredit Loans, Inc.: | | | | |
| Ser. 2006-QS4, Class A4, 6.00%, 04/25/2036 | | 5,000,000 | | 4,956,550 |
| Ser. 2006-QS5, Class A2, 6.00%, 05/25/2036 | | 634,430 | | 633,523 |
| Residential Asset Securitization Trust, Ser. 2006-A9CB, Class A5, 6.00%, | | | | |
| 07/25/2036 | | 1,022,322 | | 1,022,782 |
| |
|
| | | | | 35,913,240 |
| |
|
| FLOATING-RATE 2.2% | | | | |
| Countrywide Home Loans, Inc., Ser. 2004-29, Class 3A1, 6.17%, 02/25/2035 | | 9,790,835 | | 9,872,491 |
| Credit Suisse First Boston Mtge. Securities Corp., Ser. 2003 AR2, 5.35%, | | | | |
| 02/25/2033 | | 8,166,714 | | 8,091,334 |
| Deutsche Securities, Inc.: | | | | |
| Ser. 2006-AB2, Class A7, 5.96%, 06/25/2036 | | 513,687 | | 511,339 |
| Ser. 2006-AB3, Class A7, 6.36%, 07/25/2036 | | 152,153 | | 151,622 |
| Washington Mutual, Inc., Ser. 2005-AR8, Class 2AB1, 5.12%, 07/25/2045 | | 55,933 | | 55,863 |
| |
|
| | | | | 18,682,649 |
| |
|
| Total Whole Loan Mortgage-Backed Collateralized Mortgage Obligations | | | | |
| (cost $55,101,519) | | | | 54,595,889 |
| |
|
| WHOLE LOAN SUBORDINATE COLLATERALIZED MORTGAGE | | | | |
| OBLIGATIONS 1.3% | | | | |
| FIXED-RATE 1.3% | | | | |
| Countrywide Alternative Loan Trust, Ser. 2004-2CB, Class M, 5.67%, | | | | |
| 03/25/2034 ## (cost $11,047,929) | | 11,080,825 | | 10,799,704 |
| |
|
See Notes to Financial Statements
17
SCHEDULE OF INVESTMENTS continued
October 31, 2007 (unaudited)
| | | | | | | Principal | | |
| | | | | | | Amount | | Value |
|
| |
| YANKEE OBLIGATIONS - CORPORATE 3.7% | | | | | | |
| FINANCIALS 3.7% | | | | | | | | |
| Diversified Financial Services 3.7% | | | | | | |
| Preferred Term Securities IV, Ltd., FRN, 7.94%, 12/23/2031 144A (h) | | $ 4,312,610 | | $ 4,318,001 |
| Preferred Term Securities V, Ltd., FRN, 7.30%, 04/03/2032 144A | | | | 5,323,800 | | 5,379,966 |
| Preferred Term Securities VI, Ltd., FRN, 7.00%, 07/03/2032 144A (h) | | | | 1,102,776 | | 1,104,154 |
| Preferred Term Securities XII, Ltd., FRN, 7.31%, 12/24/2033 144A | | | | 5,000,000 | | 5,066,650 |
| Preferred Term Securities XIV, Ltd., FRN: | | | | | | |
| 6.29%, 06/24/2034 144A | | | | | | 1,050,000 | | 1,054,378 |
| 7.26%, 06/24/2034 144A | | | | | | 12,500,000 | | 12,653,875 |
| Trapeza CDO, LLC, Ser. 2004-7A, Class B1, FRN, 6.63%, 01/25/2035 144A | | | | 2,200,000 | | 2,206,468 |
| |
|
| Total Yankee Obligations - Corporate (cost $31,650,031) | | | | | | 31,783,492 |
| |
|
| INVESTMENTS OF CASH COLLATERAL FROM SECURITIES LOANED 2.6% | | | | |
| REPURCHASE AGREEMENT ^ 2.6% | | | | | |
| Lehman Brothers, Inc., 4.93%, dated 10/31/2007, maturing 11/01/2007, | | | | | | |
| maturity value $22,596,782 | | (cost $22,593,688) | | | | 22,593,688 | | 22,593,688 |
| |
|
| SHORT-TERM INVESTMENTS 1.3% | | | | | | |
|
| | | | | | | Shares | | Value |
|
| |
| MUTUAL FUND SHARES 1.3% | | | | | | |
| Evergreen Institutional U.S. Government Money Market Fund, Class I, | | | | | | |
| 4.60% q ø ## (cost $10,847,442) | | | | 10,847,442 | | 10,847,442 |
| |
|
| Total Investments (cost $1,210,099,196) 141.6% | | | | | | 1,215,458,583 |
| Other Assets and Liabilities (41.6%) | | | | | | (356,888,349) |
| |
|
| Net Assets 100.0% | | | | | | | | $ 858,570,234 |
| |
|
| ## | | All or a portion of this security has been segregated for when-issued or delayed delivery securities. |
| # | | When-issued or delayed delivery security |
| 144A | | Security that may be sold to qualified institutional buyers under Rule 144A of the Securities Act of 1933, as amended. |
| | | This security has been determined to be liquid under guidelines established by the Board of Trustees, unless otherwise |
| | | noted. |
| (h) | | Security is valued at fair value as determined by the investment advisor in good faith, according to procedures approved |
| | | by the Board of Trustees. |
| (p) | | All or a portion of this security is on loan. |
| ^ | | Collateral is pooled with the collateral of other Evergreen funds and allocated on a pro-rata basis into 104 issues of |
| | | high grade short-term securities such that sufficient collateral is applied to the respective repurchase agreement. |
| q | | Rate shown is the 7-day annualized yield at period end. |
| ø | | Evergreen Investment Management Company, LLC is the investment advisor to both the Fund and the money market |
| | | fund. |
See Notes to Financial Statements
18
SCHEDULE OF INVESTMENTS continued
October 31, 2007 (unaudited)
| Summary of Abbreviations |
| |
| CDO | | Collateralized Debt Obligation |
| FHLB | | Federal Home Loan Bank |
| FHLMC | | Federal Home Loan Mortgage Corp. |
| FNMA | | Federal National Mortgage Association |
| FRN | | Floating Rate Note |
| IO | | Interest Only |
| GNMA | | Government National Mortgage Association |
| SBA | | Small Business Administration |
| TBA | | To Be Announced |
| The following table shows the percent of total investments (excluding segregated cash and cash equivalents and collateral from |
| securities on loan) based on effective maturity as of October 31, 2007: |
| |
| Less than 1 year | | 8.6% | |
| 1 to 3 year(s) | | 9.4% | |
| 3 to 5 years | | 36.4% | |
| 5 to 10 years | | 42.7% | |
| 10 to 20 years | | 2.3% | |
| Greater than 30 years | | 0.6% | |
| |
| |
| | | 100.0% | |
| | |
| |
| |
| |
| The following table shows the percent of total investments (excluding segregated cash and cash equivalents and collateral from |
| securities on loan) by credit quality based on Moody’s and Standard & Poor’s ratings as of October 31, 2007: |
| |
| AAA | | 95.0% | |
| AA | | 0.9% | |
| A | | 4.1% | |
| |
| |
| | | 100.0% | |
| | |
| |
See Notes to Financial Statements
19
STATEMENT OF ASSETS AND LIABILITIES
October 31, 2007 (unaudited)
| Assets | | |
| Investments in securities, at value (cost $1,199,251,754) including $34,240,386 | | |
| of securities loaned | | $ 1,204,611,141 |
| Investments in affiliated money market fund, at value (cost $10,847,442) | | 10,847,442 |
|
| Total investments | | 1,215,458,583 |
| Receivable for securities sold | | 90,438,457 |
| Principal paydown receivable | | 80,773 |
| Receivable for Fund shares sold | | 2,375,365 |
| Interest receivable | | 5,265,778 |
| Receivable for securities lending income | | 9,716 |
| Receivable for credit default swap payments | | 2,775 |
| Prepaid expenses and other assets | | 46,117 |
|
| Total assets | | 1,313,677,564 |
|
| Liabilities | | |
| Dividends payable | | 1,165,299 |
| Payable for securities purchased | | 428,778,083 |
| Payable for Fund shares redeemed | | 1,101,745 |
| Unrealized losses on total return swap transactions | | 356,035 |
| Unrealized losses on credit default swap transactions | | 450,342 |
| Deferred swap discount | | 588,658 |
| Payable for securities on loan | | 22,593,688 |
| Advisory fee payable | | 2,288 |
| Due to other related parties | | 3,429 |
| Accrued expenses and other liabilities | | 67,763 |
|
| Total liabilities | | 455,107,330 |
|
| Net assets | | $ 858,570,234 |
|
| Net assets represented by | | |
| Paid-in capital | | $ 872,583,523 |
| Overdistributed net investment income | | (892,604) |
| Accumulated net realized losses on investments | | (17,673,695) |
| Net unrealized gains on investments | | 4,553,010 |
|
| Total net assets | | $ 858,570,234 |
|
| Net assets consists of | | |
| Class A | | $ 216,441,414 |
| Class B | | 11,180,917 |
| Class C | | 8,964,863 |
| Class I | | 621,983,040 |
|
| Total net assets | | $ 858,570,234 |
|
| Shares outstanding (unlimited number of shares authorized) | | |
| Class A | | 21,731,534 |
| Class B | | 1,122,546 |
| Class C | | 900,081 |
| Class I | | 62,446,965 |
|
| Net asset value per share | | |
| Class A | | $ 9.96 |
| Class A — Offering price (based on sales charge of 4.75%) | | $ 10.46 |
| Class B | | $ 9.96 |
| Class C | | $ 9.96 |
| Class I | | $ 9.96 |
|
See Notes to Financial Statements
20
STATEMENT OF OPERATIONS
Six Months Ended October 31, 2007 (unaudited)
| Investment income | | |
| Interest | | $ 21,462,846 |
| Income from affiliate | | 781,095 |
| Securities lending | | 43,134 |
|
| Total investment income | | 22,287,075 |
|
| Expenses | | |
| Advisory fee | | 1,541,427 |
| Distribution Plan expenses | | |
| Class A | | 321,126 |
| Class B | | 58,972 |
| Class C | | 41,020 |
| Administrative services fee | | 386,834 |
| Transfer agent fees | | 435,216 |
| Trustees’ fees and expenses | | 13,960 |
| Printing and postage expenses | | 24,444 |
| Custodian and accounting fees | | 126,447 |
| Registration and filing fees | | 15,976 |
| Professional fees | | 20,768 |
| Interest expense | | 17,754 |
| Other | | 6,887 |
|
| Total expenses | | 3,010,831 |
| Less: Expense reductions | | (11,990) |
| Expense reimbursements | | (53,521) |
|
| Net expenses | | 2,945,320 |
|
| Net investment income | | 19,341,755 |
|
| Net realized and unrealized gains or losses on investments | | |
| Net realized losses on: | | |
| Securities | | (1,703,357) |
| Total return swap transactions | | (441,608) |
|
| Net realized losses on investments | | (2,144,965) |
| Net change in unrealized gains or losses on investments | | 4,468,935 |
|
| Net realized and unrealized gains or losses on investments | | 2,323,970 |
|
| Net increase in net assets resulting from operations | | $ 21,665,725 |
|
See Notes to Financial Statements
21
STATEMENTS OF CHANGES IN NET ASSETS
| | | Six Months Ended | | | | |
| | | October 31, 2007 | | Year Ended |
| | | (unaudited) | | April 30, 2007 |
|
| Operations | | | | | | | | |
| Net investment income | | $ 19,341,755 | | $ 26,183,752 |
| Net realized losses on investments | | | | (2,144,965) | | | | (415,925) |
| Net change in unrealized gains or losses | | | | | | | | |
| on investments | | | | 4,468,935 | | | | 9,001,559 |
|
| Net increase in net assets resulting from | | | | | | | | |
| operations | | | | 21,665,725 | | | | 34,769,386 |
|
| Distributions to shareholders from | | | | | | | | |
| Net investment income | | | | | | | | |
| Class A | | | | (5,279,658) | | | | (3,445,960) |
| Class B | | | | (247,412) | | | | (564,283) |
| Class C | | | | (172,488) | | | | (294,916) |
| Class I | | | | (14,189,544) | | | | (21,740,316) |
|
| Total distributions to shareholders | | | | (19,889,102) | | | | (26,045,475) |
|
| | | Shares | | | | Shares | | |
| Capital share transactions | | | | | | | | |
| Proceeds from shares sold | | | | | | | | |
| Class A | | 570,642 | | 5,604,692 | | 859,580 | | 8,489,247 |
| Class B | | 86,359 | | 851,568 | | 228,197 | | 2,246,261 |
| Class C | | 219,251 | | 2,160,365 | | 170,228 | | 1,688,996 |
| Class I | | 20,099,741 | | 198,195,956 | | 12,147,068 | | 120,215,524 |
|
| | | | | 206,812,581 | | | | 132,640,028 |
|
| Net asset value of shares issued in | | | | | | | | |
| reinvestment of distributions | | | | | | | | |
| Class A | | 404,899 | | 3,997,632 | | 263,381 | | 2,608,321 |
| Class B | | 16,866 | | 166,493 | | 39,575 | | 391,753 |
| Class C | | 11,683 | | 115,381 | | 19,966 | | 197,719 |
| Class I | | 1,016,425 | | 10,037,601 | | 1,642,616 | | 16,271,000 |
|
| | | | | 14,317,107 | | | | 19,468,793 |
|
| Automatic conversion of Class B shares | | | | | | | | |
| to Class A shares | | | | | | | | |
| Class A | | 33,560 | | 331,395 | | 109,899 | | 1,083,270 |
| Class B | | (33,560) | | (331,395) | | (109,899) | | (1,083,270) |
|
| | | | | 0 | | | | 0 |
|
| Payment for shares redeemed | | | | | | | | |
| Class A | | (6,924,491) | | (68,204,320) | | (1,728,671) | | (17,088,408) |
| Class B | | (216,849) | | (2,137,450) | | (595,371) | | (5,881,001) |
| Class C | | (100,326) | | (987,055) | | (233,476) | | (2,306,414) |
| Class I | | (6,734,473) | | (66,420,589) | | (10,262,151) | | (101,536,649) |
|
| | | | | (137,749,414) | | | | (126,812,472) |
|
| Net asset value of shares issued in | | | | | | | | |
| acquisition | | | | | | | | |
| Class A | | 20,234,248 | | 200,202,084 | | 0 | | 0 |
|
| Net increase in net assets resulting from | | | | | | | | |
| capital share transactions | | | | 283,582,358 | | | | 25,296,349 |
|
| Total increase in net assets | | | | 285,358,981 | | | | 34,020,260 |
| Net assets | | | | | | | | |
| Beginning of period | | | | 573,211,253 | | | | 539,190,993 |
|
| End of period | | $ 858,570,234 | | $ 573,211,253 |
|
| Overdistributed net investment income | | $ (892,604) | | $ (345,257) |
|
See Notes to Financial Statements
22
STATEMENT OF CASH FLOWS
Period Ended October 31, 2007
| Increase in Cash | | |
| Cash Flows from Operating Activities: | | |
| Net increase in net assets from operations | | $ 21,665,725 |
| Adjustments to reconcile net increase in net assets from | | |
| Operations to net cash provided by operating activities: | | |
| Purchase of investment securities (including mortgage dollar rolls) | | (2,064,749,806) |
| Proceeds from disposition of investment securities (including mortgage dollar rolls) | | 1,624,093,144 |
| Sales of short-term investment securities, net | | 23,850,030 |
| Increase in interest receivable | | (2,056,535) |
| Decrease in receivable for securities sold | | 72,986,629 |
| Increase in receivable for Fund shares sold | | (1,453,037) |
| Increase in other assets | | (36,140) |
| Increase in payable for securities purchased | | 60,536,024 |
| Increase in payable for Fund shares redeemed | | 126,311 |
| Decrease in accrued expenses | | (41,480) |
| Unrealized appreciation on investments | | (4,468,935) |
| Net realized loss from investments | | 2,909,300 |
|
| Net cash provided by operating activities | | (266,638,770) |
|
| Cash Flows from Financing Activities: | | |
| Increase in additional paid-in capital | | 271,626,081 |
| Cash distributions paid | | (4,987,311) |
|
| Net cash used in financing activities | | 266,638,770 |
|
| Net increase in cash | | $ 0 |
|
| Cash: | | |
| Beginning of period | | $ 0 |
|
| End of period | | $ 0 |
|
See Notes to Financial Statements
23
NOTES TO FINANCIAL STATEMENTS (unaudited)
1. ORGANIZATION
Evergreen U.S. Government Fund (the “Fund”) is a diversified series of Evergreen Fixed Income Trust (the “Trust”), a Delaware statutory trust organized on September 18, 1997. The Trust is an open-end management investment company registered under the Investment Company Act of 1940, as amended (the “1940 Act”).
The Fund offers Class A, Class B, Class C and Class I shares. Class A shares are sold with a front-end sales charge. However, Class A share investments of $1 million or more are not subject to a front-end sales charge but are subject to a contingent deferred sales charge of 1.00% upon redemption within 18 months. Class B shares are sold without a front-end sales charge but are subject to a contingent deferred sales charge that is payable upon redemption and decreases depending on how long the shares have been held. Class C shares are sold without a front-end sales charge but are subject to a contingent deferred sales charge that is payable upon redemption within one year. Class I shares are sold without a front-end sales charge or contingent deferred sales charge. Each class of shares, except Class I shares, pays an ongoing distribution fee.
2. SIGNIFICANT ACCOUNTING POLICIES
The following is a summary of significant accounting policies consistently followed by the Fund in the preparation of its financial statements. The policies are in conformity with generally accepted accounting principles in the United States of America, which require management to make estimates and assumptions that affect amounts reported herein. Actual results could differ from these estimates.
a. Valuation of investments
Portfolio debt securities acquired with more than 60 days to maturity are fair valued using matrix pricing methods determined by an independent pricing service which takes into consideration such factors as similar security prices, yields, maturities, liquidity and ratings. Securities for which valuations are not readily available from an independent pricing service may be valued by brokers which use prices provided by market makers or estimates of market value obtained from yield data relating to investments or securities with similar characteristics.
Short-term securities with remaining maturities of 60 days or less at the time of purchase are valued at amortized cost, which approximates market value.
Investments in other mutual funds are valued at net asset value. Securities for which market quotations are not readily available or not reflective of current market value are valued at fair value as determined by the investment advisor in good faith, according to procedures approved by the Board of Trustees.
b. Repurchase agreements
Securities pledged as collateral for repurchase agreements are held by the custodian bank or in a segregated account in the Fund’s name until the agreements mature. Collateral for certain tri-party repurchase agreements is held at the counterparty’s custodian in a segregated account for the benefit of the Fund and the counterparty. Each agreement requires that the market value of the
24
NOTES TO FINANCIAL STATEMENTS (unaudited) continued
collateral be sufficient to cover payments of interest and principal. However, in the event of default or bankruptcy by the other party to the agreement, retention of the collateral may be subject to legal proceedings. The Fund will enter into repurchase agreements with banks and other financial institutions, which are deemed by the investment advisor to be creditworthy pursuant to guidelines established by the Board of Trustees. In certain instances, the Fund’s securities lending agent may provide collateral in the form of repurchase agreements.
c. Reverse repurchase agreements
To obtain short-term financing, the Fund may enter into reverse repurchase agreements with banks and other financial institutions, which are deemed by the investment advisor to be credit-worthy. At the time the Fund enters into a reverse repurchase agreement, it will establish a segregated account with the custodian containing qualified assets having a value not less than the repurchase price, including accrued interest. If the counterparty to the transaction is rendered insolvent, the Fund may be delayed or limited in the repurchase of the collateral securities.
d. When-issued and delayed delivery transactions
The Fund records when-issued or delayed delivery securities as of trade date and maintains security positions such that sufficient liquid assets will be available to make payment for the securities purchased. Securities purchased on a when-issued or delayed delivery basis are marked-to-market daily and begin earning interest on the settlement date. Losses may occur on these transactions due to changes in market conditions or the failure of counterparties to perform under the contract.
e. Securities lending
The Fund may lend its securities to certain qualified brokers in order to earn additional income. The Fund receives compensation in the form of fees or interest earned on the investment of any cash collateral received. The Fund also continues to receive interest and dividends on the securities loaned. The Fund receives collateral in the form of cash or securities with a market value at least equal to the market value of the securities on loan, including accrued interest. In the event of default or bankruptcy by the borrower, the Fund could experience delays and costs in recovering the loaned securities or in gaining access to the collateral. The Fund has the right under the lending agreement to recover the securities from the borrower on demand.
f. Dollar roll transactions
The Fund may enter into dollar roll transactions with respect to mortgage-backed securities. In a dollar roll transaction, the Fund sells mortgage-backed securities to financial institutions and simultaneously agrees to accept substantially similar (same type, coupon and maturity) securities at a later date at an agreed upon price. The Fund will use the proceeds generated from the transactions to invest in short-term investments, which may enhance the Fund’s current yield and total return. The Fund accounts for dollar roll transactions as purchases and sales. The Fund could be exposed to risks if the counterparty defaults on its obligation to perform under the terms of the agreement, if the Fund receives inferior securities in comparison to what was sold to the counter-party at redelivery or if there are variances in paydown speed between the mortgage-related pools.
25
NOTES TO FINANCIAL STATEMENTS (unaudited) continued
g. Credit default swaps
The Fund may enter into credit default swaps. Credit default swaps involve an exchange of a fixed rate premium for protection against the loss in value of an underlying debt instrument in the event of default or bankruptcy. Under the terms of the swap, one party acts as a “guarantor” and receives a periodic stream of payments that is a fixed percentage applied to a notional principal amount over the term of the swap. In return, the party agrees to purchase the notional amount of the underlying instrument, at par, if a credit event occurs during the term of the swap. Periodic payments are recorded as realized gains or losses. Any premiums or discounts received on the transactions are recorded as an asset or liability on the Statement of Assets and Liabilities and amortized. The Fund may enter into credit default swaps as either the guarantor or the counterparty.
h. Total return swaps
The Fund may enter into total return swaps. Total return swaps involve commitments to pay interest in exchange for a market linked return, both based on notional amounts. To the extent the total return of the security or index underlying the transaction exceeds or falls short of the offsetting interest rate obligation, the Fund will receive a payment from, or make a payment to, the counterparty. The value of the swap agreements is marked-to-market daily based upon quotations from market makers and any change in value is recorded as an unrealized gain or loss. The Fund could be exposed to risks if the counterparty defaults on its obligation to perform, or if there are unfavorable changes in the fluctuation of interest rates or in the price of the underlying security.
i. Security transactions and investment income
Security transactions are recorded on trade date. Realized gains and losses are computed using the specific cost of the security sold. Interest income is recorded on the accrual basis and includes accretion of discounts and amortization of premiums.
j. Federal taxes
The Fund intends to continue to qualify as a regulated investment company and distribute all of its taxable income, including any net capital gains (which have already been offset by available capital loss carryovers). Accordingly, no provision for federal taxes is required.
k. Distributions
Distributions to shareholders from net investment income are accrued daily and paid monthly. Distributions from net realized gains, if any, are recorded on the ex-dividend date. Such distributions are determined in conformity with income tax regulations, which may differ from generally accepted accounting principles.
l. Class allocations
Income, common expenses and realized and unrealized gains and losses are allocated to the classes based on the relative net assets of each class. Distribution fees, if any, are calculated daily at the class level based on the appropriate net assets of each class and the specific expense rates applicable to each class.
26
NOTES TO FINANCIAL STATEMENTS (unaudited) continued
3. ADVISORY FEE AND OTHER TRANSACTIONS WITH AFFILIATES
Evergreen Investment Management Company, LLC (“EIMC”), an indirect, wholly-owned subsidiary of Wachovia Corporation (“Wachovia”), is the investment advisor to the Fund and is paid an annual fee starting at 0.42% and declining to 0.35% as average daily net assets increase. For the six months ended October 31, 2007, the advisory fee was equivalent to 0.40% of the Fund’s average daily net assets (on an annualized basis).
Tattersall Advisory Group, Inc. (“TAG”), an indirect, wholly-owned subsidiary of Wachovia, is the investment sub-advisor to the Fund and is paid by EIMC for its services to the Fund.
From time to time, EIMC may voluntarily or contractually waive its fee and/or reimburse expenses in order to limit operating expenses. During the six months ended October 31, 2007, EIMC voluntarily reimbursed Distribution Plan expenses (see Note 4) relating to Class A shares in the amount of $53,521.
The Fund may invest in Evergreen-managed money market funds, which are also advised by EIMC. Income earned on these investments is included in income from affiliate on the Statement of Operations.
Evergreen Investment Services, Inc. (“EIS”), an indirect, wholly-owned subsidiary of Wachovia, is the administrator to the Fund. As administrator, EIS provides the Fund with facilities, equipment and personnel and is paid an annual rate determined by applying percentage rates to the aggregate average daily net assets of the Evergreen funds (excluding money market funds and Evergreen Institutional Enhanced Income Fund), starting at 0.10% and declining to 0.05% as the aggregate average daily net assets of the Evergreen funds (excluding money market funds and Evergreen Institutional Enhanced Income Fund) increase.
Evergreen Service Company, LLC (“ESC”), an indirect, wholly-owned subsidiary of Wachovia, is the transfer and dividend disbursing agent for the Fund. ESC receives account fees that vary based on the type of account held by the shareholders in the Fund. For the six months ended October 31, 2007, the transfer agent fees were equivalent to an annual rate of 0.11% of the Fund’s average daily net assets.
4. DISTRIBUTION PLANS
EIS also serves as distributor of the Fund’s shares. The Fund has adopted Distribution Plans, as allowed by Rule 12b-1 of the 1940 Act, for each class of shares, except Class I. Under the Distribution Plans, distribution fees are paid at an annual rate of 0.30% of the average daily net assets for Class A shares and 1.00% of the average daily net assets for each of Class B and Class C shares.
27
NOTES TO FINANCIAL STATEMENTS (unaudited) continued
For the six months ended October 31, 2007, EIS received $2,274 from the sale of Class A shares and $13,877 and $106 in contingent deferred sales charges from redemptions of Class B and Class C shares, respectively.
5. ACQUISITION
Effective at the close of business on May 18, 2007, the Fund acquired the net assets of Atlas U.S. Government and Mortgage Securities Fund in a tax-free exchange for Class A shares of the Fund. Shares were issued to shareholders of Atlas U.S. Government and Mortgage Securities Fund at an exchange ratio of 1.00 for Class A of the Fund. The acquired net assets consisted primarily of portfolio securities with unrealized appreciation of $2,360,830. The aggregate net assets of the Fund and Atlas U.S. Government and Mortgage Securities Fund immediately prior to the acquisition were $570,150,705 and $200,202,084, respectively. The aggregate net assets of the Fund immediately after the acquisition were $770,352,789.
6. INVESTMENT TRANSACTIONS
Cost of purchases and proceeds from sales of investment securities (excluding short-term securities) were as follows for the six months ended October 31, 2007:
| Cost of Purchases | | Proceeds from Sales |
|
| U.S. | | Non-U.S. | | U.S. | | Non-U.S. |
| Government | | Government | | Government | | Government |
|
| $ 832,983,391 | | $ 134,522,842 | | $ 414,598,890 | | $ 63,500,928 |
|
During the six months ended October 31, 2007, the Fund loaned securities to certain brokers. At October 31, 2007, the value of securities on loan and the total value of collateral received for securities loaned amounted to $34,240,386 and $35,064,062, respectively. Of the total value of the collateral received for securities on loan, $12,470,374 represents the market value of U.S. government agency obligations received as non-cash collateral.
At October 31, 2007, the Fund had the following open credit default swap contracts outstanding:
| | | | | | | | | Fixed | | Frequency | | |
| | | | | Reference | | Notional | | Payments | | of Payments | | Unrealized |
| Expiration | | Counterparty | | Index | | Amount | | Made | | Made | | Loss |
|
| 12/13/2049 | | Goldman Sachs | | Dow Jones | | $1,157,762 | | 0.27% | | Quarterly | | $450,342 |
| | | Group, Inc. | | CDX, North | | | | | | | | |
| | | | | America | | | | | | | | |
| | | | | Investment | | | | | | | | |
| | | | | Grade Index | | | | | | | | |
|
28
NOTES TO FINANCIAL STATEMENTS (unaudited) continued
At October 31, 2007, the Fund had the following open total return swap agreements:
| | | Notional | | | | | | Unrealized |
| Expiration | | Amount | | Swap Description | | Counterparty | | Loss |
|
| 11/01/2007 | | $10,000,000 | | Agreement dated 05/11/2007 to receive 31 basis | | Lehman Brothers | | $118,762 |
| | | | | points and to receive the positive spread return or | | Holdings, Inc | | |
| | | | | pay the negative spread return on the Lehman | | | | |
| | | | | Brothers CMBS AAA 8.5+yr Index which are | | | | |
| | | | | multiplied by the notional amount. | | | | |
| 02/01/2008 | | 10,000,000 | | Agreement dated 07/17/2007 to receive 30 basis | | CitiBank, Inc. | | 118,845 |
| | | | | points and to receive the positive spread return or | | | | |
| | | | | pay the negative spread return on the Lehman | | | | |
| | | | | Brothers CMBS AAA 8.5+yr Index which are | | | | |
| | | | | multiplied by the notional amount. | | | | |
| 02/01/2008 | | 10,000,000 | | Agreement dated 08/03/2007 to receive 35 basis | | JPMorgan Chase | | 118,428 |
| | | | | points and to receive the positive spread return or | | & Co. | | |
| | | | | pay the negative spread return on the Lehman | | | | |
| | | | | Brothers CMBS AAA 8.5+yr Index which are | | | | |
| | | | | multiplied by the notional amount. | | | | |
|
On October 31, 2007, the aggregate cost of securities for federal income tax purposes was $1,210,232,474. The gross unrealized appreciation and depreciation on securities based on tax cost was $9,022,200 and $3,796,091, respectively, with a net unrealized appreciation of $5,226,109.
As of April 30, 2007, the Fund had $15,528,730 in capital loss carryovers for federal income tax purposes expiring as follows:
| Expiration |
|
| 2008 | | 2009 | | 2010 | | 2014 | | 2015 |
|
| $4,853,705 | | $ 437,595 | | $ 1,202 | | $ 3,241,214 | | $ 6,995,014 |
|
7. INTERFUND LENDING
Pursuant to an Exemptive Order issued by the SEC, the Fund may participate in an interfund lending program with certain funds in the Evergreen fund family. This program allows the Fund to borrow from, or lend money to, other participating funds. During the six months ended October 31, 2007, the Fund did not participate in the interfund lending program.
8. EXPENSE REDUCTIONS
Through expense offset arrangements with ESC and the Fund’s custodian, a portion of fund expenses has been reduced.
9. DEFERRED TRUSTEES’ FEES
Each Trustee of the Fund may defer any or all compensation related to performance of his or her duties as a Trustee. The Trustees’ deferred balances are allocated to deferral accounts, which are included in the accrued expenses for the Fund. The investment performance of the deferral accounts is based on the investment performance of certain Evergreen funds. Any gains earned or losses incurred in the deferral accounts are reported in the Fund’s Trustees’ fees and expenses. At
29
NOTES TO FINANCIAL STATEMENTS (unaudited) continued
the election of the Trustees, the deferral account will be paid either in one lump sum or in quarterly installments for up to ten years.
10. FINANCING AGREEMENT AND OTHER BORROWINGS
The Fund and certain other Evergreen funds share in an unsecured revolving credit commitment for temporary and emergency purposes, including the funding of redemptions, as permitted by each participating fund’s borrowing restrictions. Borrowings under this facility bear interest at 0.50% per annum above the Federal Funds rate. All of the participating funds are charged an annual commitment fee on the unused balance, which is allocated pro rata. The credit facility is for $100 million with an annual commitment fee of 0.08% .
During the six months ended October 31, 2007, the Fund entered into reverse repurchase agreements that had an average daily balance outstanding of $405,350 with a weighted average interest rate of 4.38% and paid interest of $17,754 of the Fund’s average daily net assets (on an annualized basis).
11. REGULATORY MATTERS AND LEGAL PROCEEDINGS
Pursuant to an administrative order issued by the SEC on September 19, 2007, EIMC, EIS, ESC (collectively, the “Evergreen Entities”), Wachovia Securities, LLC and the SEC have entered into an agreement settling allegations of (i) improper short-term trading arrangements in effect prior to May 2003 involving former officers and employees of EIMC and certain broker-dealers, (ii) insufficient systems for monitoring exchanges and enforcing exchange limitations as stated in certain funds’ prospectuses, and (iii) inadequate e-mail retention practices. Under the settlement, the Evergreen Entities were censured and will pay approximately $32 million in disgorgement and penalties. This amount, along with a fine assessed by the SEC against Wachovia Securities, LLC will be distributed pursuant to a plan to be developed by an independent distribution consultant and approved by the SEC. The Evergreen Entities neither admitted nor denied the allegations and findings set forth in its settlement with the SEC.
EIS has entered into an agreement with the NASD (now known as the Financial Industry Regulatory Authority (“FINRA”)) settling allegations that EIS (i) arranged for Evergreen fund portfolio trades to be directed to Wachovia Securities, LLC, an affiliate of EIS that sold Evergreen fund shares, during the period of January 2001 to December 2003 and (ii) provided non-cash compensation by sponsoring offsite meetings attended by Wachovia Securities, LLC brokers during that period, where the eligibility of a broker to attend the meetings depended upon the broker meeting certain sales targets of Evergreen fund shares. Pursuant to the settlement agreement, EIS has agreed to a censure and a fine of $4,200,000. EIS neither admitted nor denied the allegations and findings set forth in its agreement with the NASD.
In addition, the Evergreen funds and EIMC and certain of its affiliates are involved in various legal actions, including private litigation and class action lawsuits. EIMC does not expect that any of such legal actions currently pending or threatened will have a material adverse impact on the
30
NOTES TO FINANCIAL STATEMENTS (unaudited) continued
financial position or operations of any of the Evergreen funds or on EIMC’s ability to provide services to the Evergreen funds.
Although EIMC believes that none of the matters discussed above will have a material adverse impact on the Evergreen funds, there can be no assurance that these matters and any publicity surrounding or resulting from them will not result in reduced sales or increased redemptions of Evergreen fund shares, which could increase Evergreen fund transaction costs or operating expenses, or that they will not have other adverse consequences on the Evergreen funds.
12. NEW ACCOUNTING PRONOUNCEMENTS
In June 2006, the Financial Accounting Standards Board (“FASB”) issued FASB Interpretation No. 48, Accounting for Uncertainty in Income Taxes — an interpretation of FASB statement 109 (“FIN 48”). FIN 48 supplements FASB 109 by prescribing a recognition threshold and measurement attribute for the financial statement recognition and measurement of a tax position taken or expected to be taken in a tax return. The Fund’s financial statements have not been impacted by the adoption of FIN 48. However, the conclusions regarding FIN 48 may be subject to review and adjustment at a later date based on factors including, but not limited to, further implementation guidance expected from FASB, and on-going analysis of tax laws, regulations, and interpretations thereof.
In September 2006, FASB issued Statement of Financial Accounting Standards No. 157, Fair Value Measurements (“FAS 157”). FAS 157 establishes a single authoritative definition of fair value, establishes a framework for measuring fair value and expands disclosures about fair value measurements. FAS 157 applies to fair value measurements already required or permitted by existing standards. The change to current generally accepted accounting principles from the application of FAS 157 relates to the definition of fair value, the methods used to measure fair value, and the expanded disclosures about fair value measurements. Management of the Fund does not believe the adoption of FAS 157 will materially impact the financial statement amounts, however, additional disclosures may be required about the inputs used to develop the measurements and the effect of certain of the measurements on changes in net assets for the period. FAS 157 is effective for financial statements issued for fiscal years beginning after November 15, 2007 and interim periods within those fiscal years.
31
ADDITIONAL INFORMATION (unaudited)
INFORMATION ABOUT THE REVIEW AND APPROVAL OF THE FUND’S INVESTMENT ADVISORY AGREEMENT
Each year, the Fund’s Board of Trustees is required to consider whether to continue in place the Fund’s investment advisory agreements. In September 2007, the Trustees, including a majority of the Trustees who are not interested persons (as that term is defined in the 1940 Act) of the Fund, TAG (the “Sub-Advisor”), or EIMC, approved the continuation of the Fund’s investment advisory agreements. (References below to the “Fund” are to Evergreen U.S. Government Fund; references to the “funds” are to the Evergreen funds generally.)
At the same time, the Trustees considered the continuation of the investment advisory agreements for all of the funds, and the description below refers in many cases to the Trustees’ process and conclusions in connection with their consideration of this matter for all of the funds. (See “Certain Fund-Specific Considerations” below for a discussion regarding certain factors considered by the Trustees relating specifically to the Fund.) In all of its deliberations, the Board of Trustees and the disinterested Trustees were advised by independent counsel to the disinterested Trustees and counsel to the funds.
The review process. The 1940 Act requires that the Board of Trustees request and evaluate, and that EIMC and any sub-advisors furnish, such information as may reasonably be necessary to evaluate the terms of a fund’s advisory agreements. The review process began at the time of the last advisory contract-renewal process in September 2006. In the course of that process, the Trustees identified a number of funds that had experienced either short-term or longer-term performance issues. During the following months, the Trustees reviewed information relating to any changes in the performance of those funds and/or any changes in the investment process or the investment teams responsible for the management of the funds. In addition, during the course of the year, the Trustees reviewed information regarding the investment performance of all of the funds and identified additional funds that they believed warranted further attention based on performance since September 2006.
In spring 2007, a committee of the Board of Trustees (the “Committee”), working with EIMC management, determined generally the types of information the Board would review and set a timeline detailing the information required and the dates for its delivery to the Trustees. The independent data provider Keil Fiduciary Strategies LLC (“Keil”) was engaged to provide fund-specific and industry-wide data to the Board containing information of a nature and in a format generally prescribed by the Committee, and the Committee worked with Keil and EIMC to develop appropriate groups of peer funds for each fund. The Committee also identified a number of expense, performance, and other issues and requested specific information as to those issues.
The Trustees reviewed, with the assistance of an independent industry consultant retained by the disinterested Trustees, the information provided by EIMC and the Sub-Advisor in response to the Committee’s requests and the information provided by Keil. The Trustees formed small committees to review individual funds in greater detail. In addition, the Trustees requested information regarding, among other things, brokerage practices of the funds, the use of derivatives by the funds, strategic planning for the funds, analyst and research support available to the portfolio management teams, and information regarding the various fall-out benefits received directly and indirectly by EIMC and its affiliates from the funds. The Trustees requested and received additional information following that review.
32
ADDITIONAL INFORMATION (unaudited) continued
The Committee met several times by telephone to consider the information provided by EIMC. The Committee met with representatives of EIMC in early September. At a meeting of the full Board of Trustees later in September, the Committee reported the results of its discussions with EIMC, and the full Board met with representatives of EIMC, engaged in further review of the materials provided to them, and approved the continuation of each of the advisory and sub-advisory agreements.
The disinterested Trustees discussed the continuation of the funds’ advisory agreements with representatives of EIMC and in multiple private sessions with legal counsel at which no personnel of EIMC were present. In considering the continuation of the agreements, the Trustees did not identify any particular information or consideration that was all-important or controlling, and each Trustee attributed different weights to various factors. The Trustees evaluated information provided to them both in terms of the Evergreen mutual funds generally and with respect to each fund, including the Fund, specifically as they considered appropriate; although the Trustees considered the continuation of the agreements as part of the larger process of considering the continuation of the advisory contracts for all of the funds, their determination to continue the advisory agreements for each of the funds was ultimately made on a fund-by-fund basis.
This summary describes a number of the most important, but not necessarily all, of the factors considered by the Board and the disinterested Trustees.
Information reviewed. The Board of Trustees and committees of the Board of Trustees meet periodically during the course of the year. At those meetings, the Board receives a wide variety of information regarding the services performed by EIMC, the investment performance of the funds, and other aspects of the business and operations of the funds. At those meetings, and in the process of considering the continuation of the agreements, the Trustees considered information regarding, for example, the funds’ investment results; the portfolio management teams for the funds and the experience of the members of those teams, and any recent changes in the membership of the teams; portfolio trading practices; compliance by the funds, EIMC, and the Sub-Advisor with applicable laws and regulations and with the funds’ and EIMC’s compliance policies and procedures; risk evaluation and oversight procedures at EIMC; services provided by affiliates of EIMC to the funds and shareholders of the funds; and other information relating to the nature, extent, and quality of services provided by EIMC and the Sub-Advisor. The Trustees considered a number of changes in portfolio management personnel at EIMC and its advisory affiliates in the year since September 2006, and recent changes in compliance personnel at EIMC, including the appointment of a new Chief Compliance Officer for the funds.
The Trustees considered the rates at which the funds pay investment advisory fees, and the efforts generally by EIMC and its affiliates as sponsors of the funds. The data provided by Keil showed the management fees paid by each fund in comparison to the management fees of other peer mutual funds, in addition to data regarding the investment performance of the funds in comparison to other peer mutual funds. The Trustees were assisted by the independent industry consultant in reviewing the information presented to them.
The Trustees considered the transfer agency fees paid by the funds to an affiliate of EIMC. They reviewed information presented to them showing that the transfer agency fees charged to the funds were generally consistent with industry norms.
33
ADDITIONAL INFORMATION (unaudited) continued
The Trustees also considered that EIS, an affiliate of EIMC, serves as administrator to the funds and receives a fee for its services as administrator. In their comparison of the advisory fee paid by the funds with those paid by other mutual funds, the Trustees took into account administrative fees paid by the funds and those other mutual funds. The Board considered that EIS serves as distributor to the funds generally and receives fees from the funds for those services. They considered other so-called “fall-out” benefits to EIMC and its affiliates due to their other relationships with the funds, including, for example, soft-dollar services received by EIMC attributable to transactions entered into by EIMC for the benefit of the funds and brokerage commissions received by Wachovia Securities, LLC, an affiliate of EIMC, from transactions effected by it for the funds. The Trustees also noted that the funds pay sub-transfer agency fees to various financial institutions who hold fund shares in omnibus accounts, and that Wachovia Securities, LLC and its affiliates receive such payments from the funds in respect of client accounts they hold in omnibus arrangements, and that an affiliate of EIMC receives fees for administering the sub-transfer agency payment program. They also considered that Wachovia Securities, LLC and its affiliates receive distribution-related fees and shareholder servicing payments (including amounts derived from payments under the funds’ Rule 12b-1 plans) in respect of shares sold or held through it. The Trustees also noted that an affiliate of EIMC receives compensation for serving as a securities lending agent for the funds.
Nature and quality of the services provided. The Trustees considered that EIMC and its affili-ates generally provide a comprehensive investment management service to the funds. They noted that EIMC and the Sub-Advisor formulate and implement an investment program for the Fund. They noted that EIMC makes its personnel available to serve as officers of the funds, and concluded that the reporting and management functions provided by EIMC with respect to the funds were generally satisfactory. The Trustees considered the investment philosophy of the Fund’s portfolio management team, and considered the in-house research capabilities of EIMC and its affiliates, as well as other resources available to EIMC, including research services available to it from third parties. The Board considered the managerial and financial resources available to EIMC and its affiliates, and the commitment that the Wachovia organization has made to the funds generally. On the basis of these factors, they determined that the nature and scope of the services provided by EIMC and the Sub-Advisor were consistent with their respective duties under the investment advisory agreements and appropriate and consistent with the investment programs and best interests of the funds.
The Trustees noted the resources EIMC and its affiliates have committed to the regulatory, compliance, accounting, tax and oversight of tax reporting, and shareholder servicing functions, and the number and quality of staff committed to those functions, which they concluded were appropriate and generally in line with EIMC’s responsibilities to the Fund and to the funds generally. The Board and the disinterested Trustees concluded, within the context of their overall conclusions regarding the funds’ advisory agreements, that they were generally satisfied with the nature, extent, and quality of the services provided by the Sub-Advisor and EIMC, including services provided by EIS under its administrative services agreements with the funds.
Investment performance. The Trustees considered the investment performance of each fund, both by comparison to other comparable mutual funds and to broad market indices. The Trustees emphasized that the continuation of the investment advisory agreement for a fund should not be taken as any indication that the Trustees did not believe investment performance for any specific
34
ADDITIONAL INFORMATION (unaudited) continued
fund might not be improved, and they noted that they would continue to monitor closely the investment performance of the funds going forward.
Advisory and administrative fees. The Trustees recognized that EIMC does not seek to provide the lowest cost investment advisory service, but to provide a high quality, full-service investment management product at a reasonable price. They also noted that EIMC has in many cases sought to set its investment advisory fees at levels consistent with industry norms. The Trustees noted that, in certain cases, a fund’s management fees were higher than many or most other mutual funds in the same Keil peer group. However, in each case, the Trustees determined on the basis of the information presented that the level of management fees was not excessive.
Certain Fund-specific considerations. The Trustees noted that, for the one- and three-year periods ended December 31, 2006, the Fund’s Class A shares had outperformed the Fund’s benchmark index, the Lehman Brothers Intermediate Term Government Bond Index, and a majority of the funds against which the Trustees compared the Fund’s performance. The Trustees also noted that, for the five- and ten-year periods ended December 31, 2006, the Fund’s Class A shares had underperformed the Fund’s benchmark index. The Trustees noted that the Fund’s Class A shares performance was in the fourth quintile for the five-year period ended December 31, 2006, and in the third quintile for the ten-year period ended December 31, 2006, of the funds against which the Trustees compared the Fund’s performance.
The Trustees noted that the management fee paid by the Fund was lower than most of the funds against which the Trustees compared the Fund’s performance, but near the median of that group, and that the level of profitability realized by EIMC in respect of the fee did not appear excessive.
Economies of scale. The Trustees noted that economies of scale would likely be achieved by EIMC in managing the funds as the funds grow. The Trustees noted that the Fund had implemented breakpoints in its advisory fee structure. The Trustees noted that they would continue to review the appropriate levels of breakpoints in the future, but concluded that the breakpoints as implemented appeared to be a reasonable step toward the realization of economies of scale by the Fund.
Profitability. The Trustees considered information provided to them regarding the profitability to the EIMC organization of the investment advisory, administration, and transfer agency (with respect to the open-end funds only) fees paid to EIMC and its affiliates by each of the funds. They considered that the information provided to them was necessarily estimated, and that the profitability information provided to them, especially on a fund-by-fund basis, did not necessarily provide a definitive tool for evaluating the appropriateness of each fund’s advisory fee. They noted that the levels of profitability of the funds to EIMC varied widely, depending on among other things the size and type of fund. They considered the profitability of the funds in light of such factors as, for example, the information they had received regarding the relation of the fees paid by the funds to those paid by other mutual funds, the investment performance of the funds, and the amount of revenues involved. In light of these factors, the Trustees concluded that the profitability of any of the funds, individually or in the aggregate, should not prevent the Trustees from approving the continuation of the agreements.
35
TRUSTEES AND OFFICERS
TRUSTEES1
| Charles A. Austin III | | Investment Counselor, Anchor Capital Advisors, LLC. (investment advice); Director, The Andover |
| Trustee | | Companies (insurance); Trustee, Arthritis Foundation of New England; Former Director, The |
| DOB: 10/23/1934 | | Francis Ouimet Society (scholarship program); Former Director, Executive Vice President and |
| Term of office since: 1991 | | Treasurer, State Street Research & Management Company (investment advice) |
| Other directorships: None | | |
|
| |
| K. Dun Gifford | | Chairman and President, Oldways Preservation and Exchange Trust (education); Trustee, |
| Trustee | | Treasurer and Chairman of the Finance Committee, Cambridge College |
| DOB: 10/23/1938 | | |
| Term of office since: 1974 | | |
| Other directorships: None | | |
|
| |
| Dr. Leroy Keith, Jr. | | Managing Director, Almanac Capital Management (commodities firm); Trustee, Phoenix |
| Trustee | | Fund Complex; Director, Diversapack Co. (packaging company); Former Partner, Stonington |
| DOB: 2/14/1939 | | Partners, Inc. (private equity fund); Former Director, Obagi Medical Products Co.; Former |
| Term of office since: 1983 | | Director, Lincoln Educational Services |
| Other directorships: Trustee, | | |
| Phoenix Fund Complex (consisting | | |
| of 60 portfolios as of 12/31/2006) | | |
|
| |
| Gerald M. McDonnell | | Manager of Commercial Operations, CMC Steel (steel producer) |
| Trustee | | |
| DOB: 7/14/1939 | | |
| Term of office since: 1988 | | |
| Other directorships: None | | |
|
| |
| Patricia B. Norris | | President and Director of Buckleys of Kezar Lake, Inc. (real estate company); Former President |
| Trustee | | and Director of Phillips Pond Homes Association (home community); Former Partner, |
| DOB: 4/9/1948 | | PricewaterhouseCoopers, LLP (independent registered public accounting firm) |
| Term of office since: 2006 | | |
| Other directorships: None | | |
|
| |
| William Walt Pettit | | Partner and Vice President, Kellam & Pettit, P.A. (law firm); Director, Superior Packaging Corp. |
| Trustee | | (packaging company); Member, Superior Land, LLC (real estate holding company), Member, |
| DOB: 8/26/1955 | | K&P Development, LLC (real estate development); Former Director, National Kidney Foundation |
| Term of office since: 1988 | | of North Carolina, Inc. (non-profit organization) |
| Other directorships: None | | |
|
| |
| David M. Richardson | | President, Richardson, Runden LLC (executive recruitment business development/consulting |
| Trustee | | company); Consultant, Kennedy Information, Inc. (executive recruitment information and |
| DOB: 9/19/1941 | | research company); Consultant, AESC (The Association of Executive Search Consultants); |
| Term of office since: 1982 | | Director, J&M Cumming Paper Co. (paper merchandising); Former Trustee, NDI Technologies, LLP |
| | | (communications) |
| Other directorships: None | | |
|
| |
| Dr. Russell A. Salton III | | President/CEO, AccessOne MedCard, Inc.; Former Medical Director, Healthcare Resource |
| Trustee | | Associates, Inc. |
| DOB: 6/2/1947 | | |
| Term of office since: 1984 | | |
| Other directorships: None | | |
|
| |
| Michael S. Scofield | | Retired Attorney, Law Offices of Michael S. Scofield; Former Director and Chairman, Branded |
| Trustee | | Media Corporation (multi-media branding company) |
| DOB: 2/20/1943 | | |
| Term of office since: 1984 | | |
| Other directorships: None | | |
|
36
TRUSTEES AND OFFICERS continued
| Richard J. Shima | | Independent Consultant; Director, Hartford Hospital; Trustee, Greater Hartford YMCA; Former |
| Trustee | | Director, Trust Company of CT; Former Director, Old State House Association; Former Trustee, |
| DOB: 8/11/1939 | | Saint Joseph College (CT) |
| Term of office since: 1993 | | |
| Other directorships: None | | |
|
| |
| Richard K. Wagoner, CFA2 | | Member and Former President, North Carolina Securities Traders Association; Member, Financial |
| Trustee | | Analysts Society |
| DOB: 12/12/1937 | | |
| Term of office since: 1999 | | |
| Other directorships: None | | |
|
| |
| |
| OFFICERS | | |
| |
| Dennis H. Ferro3 | | Principal occupations: President and Chief Executive Officer, Evergreen Investment Company, |
| President | | Inc. and Executive Vice President, Wachovia Bank, N.A.; former Chief Investment Officer, |
| DOB: 6/20/1945 | | Evergreen Investment Company, Inc. |
| Term of office since: 2003 | | |
|
| |
| Kasey Phillips4 | | Principal occupations: Senior Vice President, Evergreen Investment Services, Inc.; Former Vice |
| Treasurer | | President, Evergreen Investment Services, Inc.; Former Assistant Vice President, Evergreen |
| DOB: 12/12/1970 | | Investment Services, Inc. |
| Term of office since: 2005 | | |
|
| |
| Michael H. Koonce4 | | Principal occupations: Senior Vice President and General Counsel, Evergreen Investment |
| Secretary | | Services, Inc.; Secretary, Senior Vice President and General Counsel, Evergreen Investment |
| DOB: 4/20/1960 | | Management Company, LLC and Evergreen Service Company, LLC; Senior Vice President and |
| Term of office since: 2000 | | Assistant General Counsel, Wachovia Corporation |
|
| |
| Robert Guerin4, 5 | | Principal occupations: Chief Compliance Officer, Evergreen Funds and Senior Vice President of |
| Chief Compliance Officer | | Evergreen Investments Co, Inc; Former Managing Director and Senior Compliance Officer, |
| DOB: 9/20/1965 | | Babson Capital Management LLC; Former Principal and Director, Compliance and Risk |
| Term of office since: 2007 | | Management, State Street Global Advisors; Former Vice President and Manager, Sales Practice |
| | | Compliance, Deutsche Asset Management. |
|
1 Each Trustee, except Ms. Norris, serves until a successor is duly elected or qualified or until his death, resignation, retirement or removal from office. As a new Trustee, Ms. Norris’ initial term ends June 30, 2009, at which time she may be re-elected by Trustees to serve until a successor is duly elected or qualified or until her death, resignation, retirement or removal from office by the Trustees. Each Trustee oversees 91 Evergreen funds. Correspondence for each Trustee may be sent to Evergreen Board of Trustees, P.O. Box 20083, Charlotte, NC 28202.
2 Mr. Wagoner is an “interested person” of the Fund because of his ownership of shares in Wachovia Corporation, the parent to the Fund’s investment advisor.
3 The address of the Officer is 401 S. Tryon Street, 20th Floor, Charlotte, NC 28288.
4 The address of the Officer is 200 Berkeley Street, Boston, MA 02116.
5 Mr. Guerin’s information is as of June 14, 2007, the effective date of his approval by the Board of Trustees as Chief Compliance Officer of the Evergreen funds.
Additional information about the Fund’s Board of Trustees and Officers can be found in the Statement of Additional Information (SAI) and is available upon request without charge by calling 800.343.2898.
37

564359 rv5 12/2007
Evergreen Institutional Mortgage Portfolio

| table of contents |
| 1 | | LETTER TO SHAREHOLDERS |
| 4 | | FUND AT A GLANCE |
| 6 | | ABOUT YOUR FUND’S EXPENSES |
| 7 | | FINANCIAL HIGHLIGHTS |
| 8 | | SCHEDULE OF INVESTMENTS |
| 13 | | STATEMENT OF ASSETS AND LIABILITIES |
| 14 | | STATEMENT OF OPERATIONS |
| 15 | | STATEMENTS OF CHANGES IN NET ASSETS |
| 16 | | NOTES TO FINANCIAL STATEMENTS |
| 23 | | ADDITIONAL INFORMATION |
| 28 | | TRUSTEES AND OFFICERS |
This semiannual report must be preceded or accompanied by a prospectus of the Evergreen fund contained herein. The prospectus contains more complete information, including fees and expenses, and should be read carefully before investing or sending money.
The fund will file its complete schedule of portfolio holdings with the SEC for the first and third quarters of each fiscal year on Form N-Q. The fund’s Form N-Q will be available on the SEC’s Web site at http://www.sec.gov. In addition, the fund’s Form N-Q may be reviewed and copied at the SEC’s Public Reference Room in Washington, D.C. Information on the operation of the Public Reference Room may be obtained by calling 800.SEC.0330.
A description of the fund’s proxy voting policies and procedures, as well as information regarding how the fund voted proxies relating to portfolio securities during the most recent 12-month period ended June 30, is available by visiting our Web site at EvergreenInvestments.com or by visiting the SEC’s Web site at http://www.sec.gov.
The fund’s proxy voting policies and procedures are also available without charge, upon request, by calling 800.343.2898.
| Mutual Funds: | | | | |
| NOT FDIC INSURED | | MAY LOSE VALUE | | NOT BANK GUARANTEED |
Evergreen InvestmentsSM is a service mark of Evergreen Investment Management Company, LLC.
Copyright 2007, Evergreen Investment Management Company, LLC.
Evergreen Investment Management Company, LLC is a subsidiary of Wachovia Corporation and is an affiliate of Wachovia Corporation’s other Broker Dealer subsidiaries.
Evergreen mutual funds are distributed by Evergreen Investment Services, Inc.
200 Berkeley Street, Boston, MA 02116
LETTER TO SHAREHOLDERS
December 2007

Dennis H. Ferro
President and Chief Executive Officer
Dear Shareholder:
We are pleased to provide the Semiannual Report for Evergreen Institutional Mortgage Portfolio for the six-month period ended October 31, 2007.
The U.S. fixed income market delivered modest, but positive, returns during the six-month period, despite widening concerns about credit quality stemming from weakness in U.S. housing and growing problems in the subprime mortgage market. The period saw a general flight to quality as investors sought out the highest quality debt, especially U.S. Treasuries. As prices of Treasuries and other high-grade securities rose, their yields trended down, leading to outperformance by longer-maturity securities. At the same time, higher-yielding, lower-rated corporate bonds experienced some price erosion during the period after outperforming high-grade securities for several years. Concerns about the credit markets prompted the U.S. Federal Reserve Board (the “Fed”) and other major central banks to intervene and inject additional liquidity into the capital markets. While these steps in the closing three months of the period restored some measure of confidence, investors continued to watch warily for signs of economic weakness. Stocks of U.S. companies produced generally healthy returns, despite increasing market volatility. Investors began to favor larger companies with more consistent earnings, while the growth style of investing led the market after several years of outperformance by value stocks.
Despite the problems in housing and subprime mortgages, the domestic economy maintained its growth trajectory. Solid increases in exports and in business investment helped
1
LETTER TO SHAREHOLDERS continued
offset declining residential values. At the same time, steadily rising employment levels and moderately improving wages increased prospects that healthy consumer spending patterns would be sustained. Substantially exceeding expectations, U.S. Gross Domestic Product grew at an annual rate of 4.9% in the third quarter of 2007, significantly higher than the brisk 3.8% rate of the previous quarter. However, some signs of emerging economic weakness began to appear. Operating earnings of companies in the S&P 500 Index declined in the third quarter, principally because of dramatic write-downs taken by major corporations, predominately in the financials sector. Moreover, surging prices for oil, gold and most commodities, combined with the declining U.S. dollar, suggested some increased potential for rising inflation.
During the six-month period, managers of Evergreen’s intermediate and long-term bond fund teams focused on the issues influencing both the opportunities and challenges in managing specific portfolios. The teams managing the higher-quality portfolios, including Evergreen Core Bond Fund, Evergreen Core Plus Bond Fund, Evergreen U.S. Government Fund and Evergreen Institutional Mortgage Portfolio, assessed factors such as employment and inflationary trends, Fed policy and interest-rate expectations. At the same time, the managers supervising Evergreen High Income Fund and Evergreen Select High Yield Bond Fund tended to position their credit-sensitive portfolios relatively conservatively during a period of increasing volatility. The managers of Evergreen Diversified Income Builder Fund, meanwhile, repositioned their
2
LETTER TO SHAREHOLDERS continued
portfolio, maintaining an emphasis on better-quality, high-yield corporate bonds while also increasing the exposure to dividend-paying stocks.
As always, we encourage investors to maintain diversified investment portfolios in pursuit of their long-term investment goals.
Please visit us at EvergreenInvestments.com for more information about our funds and other investment products available to you. Thank you for your continued support of Evergreen Investments.
Sincerely,

Dennis H. Ferro
President and Chief Executive Officer
Evergreen Investment Company, Inc.
Special Notice to Shareholders:
Please visit our Web site at EvergreenInvestments.com for statements from President and Chief Executive Officer, Dennis Ferro, regarding the firm’s recent settlement with the Securities and Exchange Commission (SEC) and prior settlement with the National Association of Securities Dealers (NASD).
3
FUND AT A GLANCE
as of October 31, 2007
MANAGEMENT TEAM
Investment Advisor:
• Evergreen Investment Management Company, LLC
Sub-Advisor:
• Tattersall Advisory Group, Inc.
Portfolio Managers:
• Robert A. Calhoun, CFA
• Mehmet Camurdan, CFA
• Todd C. Kuimjian, CFA
CURRENT INVESTMENT STYLE

Source: Morningstar, Inc.
Morningstar’s style box is based on a portfolio date as of 9/30/2007.
The Fixed Income style box placement is based on a fund’s average effective maturity or duration and the average credit rating of the bond portfolio.
PERFORMANCE AND RETURNS
Portfolio inception date: 6/19/2002
| | | Class I |
| Class inception date | | 6/19/2002 |
|
| Nasdaq symbol | | EMSFX |
|
| 6-month return | | 2.12% |
|
| Average annual return | | |
|
| 1-year | | 5.15% |
|
| 5-year | | 4.00% |
|
| Since portfolio inception | | 4.42% |
|
Past performance is no guarantee of future results. The performance quoted represents past performance and current performance may be lower or higher. The investment return and principal value of an investment will fluctuate so that investors’ shares, when redeemed, may be worth more or less than their original cost. To obtain performance information current to the most recent month-end, please go to EvergreenInvestments.com/fundperformance.
Performance includes the reinvestment of income dividends and capital gain distributions. Performance shown does not reflect the deduction of taxes that a shareholder would pay on fund distributions or the redemption of fund shares.
The advisor is reimbursing the fund for a portion of other expenses. Had expenses not been reimbursed, returns would have been lower.
4
FUND AT A GLANCE continued
LONG-TERM GROWTH
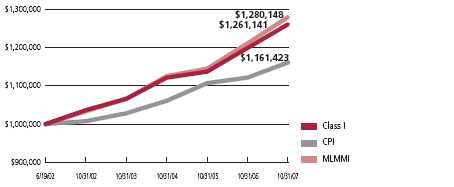
Comparison of a $1,000,000 investment in the Evergreen Institutional Mortgage Portfolio Class I shares versus a similar investment in the Merrill Lynch Mortgage Master Index† (MLMMI) and the Consumer Price Index (CPI).
The MLMMI is an unmanaged market index and does not include transaction costs associated with buying and selling securities, any mutual fund fees or expenses or any taxes. The CPI is a commonly used measure of inflation and does not represent an investment return. It is not possible to invest directly in an index.
Class I shares are only offered to investment advisory clients of an investment advisor of an Evergreen fund (or its advisory affiliates) and through special arrangements entered into on behalf of Evergreen funds with certain financial services firms.
Class I shares are only available to institutional shareholders with a minimum of $1 million investment, which may be waived in certain situations.
The fund’s investment objective may be changed without a vote of the fund’s shareholders.
Asset-backed and mortgage-backed securities are generally subject to higher prepayment risks than other types of debt securities, which can limit the potential for gain in a declining interest rate environment and increase the potential for loss in a rising interest rate environment. Mortgage-backed securities may also be structured so that they are particularly sensitive to interest rates. A high rate of defaults on the mortgages held by a mortgage pool may limit the pool’s ability to make payments to the fund if the fund holds securities that are subordinate to other interest in the same mortgage pool; the risk of such defaults is generally higher in mortgage pools that include subprime mortgages.
Derivatives involve additional risks including interest rate risk, credit risk, the risk of improper valuation and the risk of non-correlation to the relevant instruments they are designed to hedge or to closely track.
The return of principal is not guaranteed due to fluctuation in the fund’s NAV caused by changes in the price of individual bonds held by the fund and the buying and selling of bonds by the fund. Bond funds have the same inflation, interest rate and credit risks as individual bonds. Generally, the value of bond funds rises when prevailing interest rates fall, and falls when interest rates rise.
U.S. government guarantees apply only to certain securities held in the fund’s portfolio and not to the fund’s shares.
† Copyright 2007. Merrill Lynch, Pierce, Fenner & Smith Incorporated. All rights reserved.
All data is as of October 31, 2007, and subject to change.
5
ABOUT YOUR FUND’S EXPENSES
The Example below is intended to describe the fees and expenses borne by shareholders and the impact of those costs on your investment.
Example
As a shareholder of the fund, you incur two types of costs: (1) transaction costs, including sales charges (loads), redemption fees and exchange fees; and (2) ongoing costs, including management fees, distribution (12b-1) fees and other fund expenses. This Example is intended to help you understand your ongoing costs (in dollars) of investing in the fund and to compare these costs with the ongoing costs of investing in other mutual funds. The Example is based on an investment of $1,000 invested at the beginning of the period and held for the entire period from May 1, 2007 to October 31, 2007.
The example illustrates your fund’s costs in two ways:
- Actual expenses
The section in the table under the heading “Actual” provides information about actual account values and actual expenses. You may use the information in these columns, together with the amount you invested, to estimate the expenses that you paid over the period. Simply divide your account value by $1,000 (for example, an $8,600 account value divided by $1,000 = 8.6), then multiply the result by the number in the appropriate column for your share class, in the column entitled “Expenses Paid During Period” to estimate the expenses you paid on your account during this period. - Hypothetical example for comparison purposes
The section in the table under the heading “Hypothetical (5% return before expenses)” provides information about hypothetical account values and hypothetical expenses based on the fund’s actual expense ratio and an assumed rate of return of 5% per year before expenses, which is not the fund’s actual return. The hypothetical account values and expenses may not be used to estimate the actual ending account balance or expenses you paid for the period. You may use this information to compare the ongoing costs of investing in the fund and other funds. To do so, compare this 5% hypothetical example with the 5% hypothetical examples that appear in the shareholder reports of the other funds.
Please note that the expenses shown in the table are meant to highlight your ongoing costs only and do not reflect any transactional costs, such as sales charges (loads), redemption fees or exchange fees. Therefore, the section in the table under the heading “Hypothetical (5% return before expenses)” is useful in comparing ongoing costs only, and will not help you determine the relative total costs of owning different funds. In addition, if these transactional costs were included, your costs would have been higher.
| | | Beginning | | Ending | | |
| | | Account | | Account | | Expenses |
| | | Value | | Value | | Paid During |
| | | 5/1/2007 | | 10/31/2007 | | Period* |
|
| Actual | | | | | | |
| Class I | | $ 1,000.00 | | $ 1,021.20 | | $ 1.02 |
| Hypothetical | | | | | | |
| (5% return | | | | | | |
| before expenses) | | | | | | |
| Class I | | $ 1,000.00 | | $ 1,024.13 | | $ 1.02 |
|
* Expenses are equal to the Fund’s annualized expense ratio (0.20% for Class I), multiplied by the average account value over the period, multiplied by 184 / 366 days.
6
FINANCIAL HIGHLIGHTS
(For a share outstanding throughout each period)
| | | | | | | | | | | | | |
| | | Six Months Ended | | Year Ended April 30, |
| | October 31, 2007 | |
|
| CLASS I | | (unaudited) | | 2007 | | 2006 | | 2005 | | 2004 | | 20031 |
|
| Net asset value, beginning of period | | $ 9.78 | | $ 9.57 | | $ 9.89 | | $ 9.89 | | $ 10.18 | | $ 10.00 |
|
| Income from investment operations | | | | | | | | | | | | |
| Net investment income (loss) | | 0.24 | | 0.48 | | 0.43 | | 0.35 | | 0.35 | | 0.40 |
Net realized and unrealized gains
or losses on investments | | (0.04) | | 0.22 | | (0.29) | | 0.10 | | (0.18) | | 0.23 |
| |
|
| Total from investment operations | | 0.20 | | 0.70 | | 0.14 | | 0.45 | | 0.17 | | 0.63 |
|
| Distributions to shareholders from | | | | | | | | | | | | |
| Net investment income | | (0.25) | | (0.49) | | (0.46) | | (0.45) | | (0.45) | | (0.40) |
| Net realized gains | | 0 | | 0 | | 0 | | 0 | | (0.01) | | (0.05) |
| |
|
| Total distributions to shareholders | | (0.25) | | (0.49) | | (0.46) | | (0.45) | | (0.46) | | (0.45) |
|
| Net asset value, end of period | | $ 9.73 | | $ 9.78 | | $ 9.57 | | $ 9.89 | | $ 9.89 | | $ 10.18 |
|
| Total return | | 2.12% | | 7.51% | | 1.45% | | 4.66% | | 1.63% | | 6.45% |
|
| Ratios and supplemental data | | | | | | | | | | | | |
| Net assets, end of period (thousands) | | $55,084 | | $62,263 | | $58,552 | | $45,997 | | $48,032 | | $28,423 |
| Ratios to average net assets | | | | | | | | | | | | |
| Expenses including waivers/reimbursements | | | | | | | | | | | | |
| but excluding expense reductions | | 0.20%2 | | 0.20% | | 0.20% | | 0.20% | | 0.20% | | 0.12%2 |
| Expenses excluding waivers/reimbursements | | | | | | | | | | | | |
| and expense reductions | | 0.23%2 | | 0.23% | | 0.21% | | 0.24% | | 0.28% | | 0.45%2 |
| Net investment income (loss) | | 5.03%2 | | 4.97% | | 4.37% | | 3.44% | | 3.33% | | 4.74%2 |
| Portfolio turnover rate | | 257% | | 131% | | 121% | | 177% | | 327% | | 148% |
|
1 For the period from June 19, 2002 (commencement of operations), to April 30, 2003.
2 Annualized
See Notes to Financial Statements
7
SCHEDULE OF INVESTMENTS
October 31, 2007 (unaudited)
| | | | | Principal | | |
| | | | | Amount | | Value |
|
| |
| AGENCY COMMERCIAL MORTGAGE-BACKED SECURITIES 5.4% | | | | |
| FIXED-RATE 4.1% | | | | | | |
| FHLMC: | | | | | | |
| 6.90%, 12/01/2010 ## | | $ 545,000 | | $ 581,450 |
| 6.98%, 10/01/2020 ## | | | | 436,416 | | 459,716 |
| FNMA: | | | | | | |
| 6.01%, 02/01/2012 | | | | 318,333 | | 327,713 |
| 6.79%, 07/01/2009 | | | | 89,905 | | 91,664 |
| 6.91%, 07/01/2009 | | | | 274,282 | | 280,044 |
| 7.09%, 07/01/2009 | | | | 270,361 | | 276,619 |
| 7.59%, 04/01/2010 | | | | 222,093 | | 231,823 |
| |
|
| | | | | | | 2,249,029 |
| |
|
| FLOATING-RATE 1.3% | | | | | | |
| FNMA: | | | | | | |
| 5.93%, 11/01/2036 | | | | 505,549 | | 509,389 |
| 7.18%, 12/01/2010 | | | | 230,060 | | 240,781 |
| |
|
| | | | | | | 750,170 |
| |
|
| Total Agency Commercial Mortgage-Backed Securities (cost $3,156,064) | | | | 2,999,199 |
| |
|
| AGENCY MORTGAGE-BACKED COLLATERALIZED MORTGAGE OBLIGATIONS 16.2% | | |
| FIXED-RATE 16.2% | | | | | | |
| FHLMC: | | | | | | |
| Ser. 2656, Class BG, 5.00%, 10/15/2032 | | | | 840,000 | | 821,469 |
| Ser. 2748, Class LE, 4.50%, 12/15/2017 | | | | 710,000 | | 693,287 |
| Ser. 2941, Class XC, 5.00%, 12/15/2030 | | | | 550,000 | | 540,963 |
| Ser. 2991, Class QD, 5.00%, 08/15/2034 | | | | 465,000 | | 457,206 |
| Ser. 3015, Class EM, 5.00%, 10/15/2033 | | | | 515,000 | | 493,841 |
| Ser. 3036, Class NC, 5.00%, 03/15/2031 | | | | 740,000 | | 726,975 |
| Ser. 3072, Class NK, 5.00%, 05/15/2031 | | | | 360,515 | | 357,832 |
| Ser. 3079, Class MD, 5.00%, 03/15/2034 | | | | 550,000 | | 527,998 |
| Ser. 3082, Class PJ, 5.00%, 09/15/2034 | | | | 550,000 | | 527,271 |
| Ser. 3096, Class LD, 5.00%, 01/15/2034 | | | | 605,000 | | 579,889 |
| Ser. 3104, Class QD, 5.00%, 05/15/2034 | | | | 550,000 | | 526,827 |
| FNMA: | | | | | | |
| Ser. 2001-71, Class QE, 6.00%, 12/25/2016 | | | | 231,346 | | 237,880 |
| Ser. 2003-092, Class KH, 5.00%, 03/25/2032 | | | | 570,000 | | 554,715 |
| Ser. 2004-90, Class LH, 5.00%, 04/25/2034 | | | | 590,000 | | 569,567 |
| Ser. 2005-20, Class QE, 5.00%, 10/25/2030 | | | | 730,000 | | 716,530 |
| Ser. 2005-38, Class QJ, 5.50%, 03/25/2033 | | | | 594,521 | | 592,243 |
| |
|
| Total Agency Mortgage-Backed Collateralized Mortgage Obligations | | | | |
| (cost $8,822,771) | | | | | | 8,924,493 |
| |
|
See Notes to Financial Statements
8
SCHEDULE OF INVESTMENTS continued
October 31, 2007 (unaudited)
| | | Principal | | |
| | | Amount | | Value |
|
| |
| AGENCY MORTGAGE-BACKED PASS THROUGH SECURITIES 34.2% | | | | |
| FIXED-RATE 30.7% | | | | |
| FHLMC: | | | | |
| 4.50%, 04/01/2035 | | $ 1,124,685 | | $ 1,048,428 |
| 5.00%, 04/01/2021 | | 756,776 | | 746,067 |
| 6.50%, 09/01/2019 | | 379,334 | | 390,386 |
| FHLMC 30 year: | | | | |
| 5.00%, TBA # | | 1,120,000 | | 1,074,325 |
| 5.50%, TBA # | | 5,270,000 | | 5,186,831 |
| FNMA: | | | | |
| 4.06%, 06/01/2013 | | 588,000 | | 560,186 |
| 4.50%, 04/01/2019 | | 327,761 | | 317,711 |
| 4.83%, 03/01/2013 | | 656,226 | | 648,397 |
| 5.78%, 11/01/2011 | | 776,089 | | 793,089 |
| 5.88%, 09/01/2012 | | 401,415 | | 413,250 |
| 6.01%, 05/01/2011 | | 374,495 | | 384,207 |
| 6.09%, 05/01/2011 | | 527,917 | | 542,722 |
| 6.15%, 05/01/2011 | | 220,370 | | 226,673 |
| 6.22%, 04/01/2008 | | 496,176 | | 494,583 |
| 7.00%, 05/01/2032 | | 49,391 | | 51,692 |
| 7.27%, 02/01/2010 | | 477,155 | | 494,439 |
| 7.50%, 11/01/2029 - 10/01/2031 | | 553,307 | | 585,433 |
| FNMA 15 year: | | | | |
| 5.00%, TBA # | | 555,000 | | 546,068 |
| 5.50%, TBA # | | 1,110,000 | | 1,111,214 |
| FNMA 30 year, 6.00%, TBA # | | 1,160,000 | | 1,167,431 |
| GNMA, 5.625%, 07/20/2030 | | 135,497 | | 136,607 |
| |
|
| | | | | 16,919,739 |
| |
|
| FLOATING-RATE 3.5% | | | | |
| FNMA: | | | | |
| 5.41%, 04/01/2036 | | 600,117 | | 604,271 |
| 5.44%, 01/01/2036 | | 690,130 | | 692,324 |
| 5.85%, 07/01/2036 | | 610,841 | | 615,259 |
| |
|
| | | | | 1,911,854 |
| |
|
| Total Agency Mortgage-Backed Pass Through Securities (cost $18,962,960) | | 18,831,593 |
| |
|
| AGENCY REPERFORMING MORTGAGE-BACKED COLLATERALIZED MORTGAGE | | |
| OBLIGATIONS 0.8% | | | | |
| FNMA, Ser. 2003-W19, Class 1A5, 5.50%, 11/25/2033 (cost $458,024) | | 439,689 | | 438,277 |
| |
|
| ASSET-BACKED SECURITIES 2.0% | | | | |
| Deutsche Securities, Inc.: | | | | |
| Ser. 2005-03, Class 4A5, 5.25%, 06/25/2035 | | 190,000 | | 188,693 |
| Ser. 2006-AB2, Class A3, 6.27%, 06/25/2036 | | 575,000 | | 572,539 |
| Morgan Stanley Mtge. Trust, Ser. 2006-2, Class 5A3, 5.50%, 02/25/2036 | | 290,000 | | 278,581 |
| Vanderbilt Mtge. & Fin., Inc., Ser. 2002-B, Class A3, 4.70%, 10/17/2018 | | 70,506 | | 70,348 |
| |
|
| Total Asset-Backed Securities (cost $1,119,604) | | | | 1,110,161 |
| |
|
See Notes to Financial Statements
9
SCHEDULE OF INVESTMENTS continued
October 31, 2007 (unaudited)
| | | Principal | | |
| | | Amount | | Value |
|
| |
| COMMERCIAL MORTGAGE-BACKED SECURITIES 22.6% | | | | |
| FIXED-RATE 16.4% | | | | |
| Banc of America Comml. Mtge. Securities, Inc.: | | | | |
| Ser. 2004-04, Class A6, 4.88%, 07/10/2042 | | $ 1,000,000 | | $ 966,749 |
| Ser. 2006-4, Class AM, 5.68%, 07/10/2046 | | 460,000 | | 459,007 |
| Ser. 2007-02, Class A2, 5.63%, 04/10/2049 | | 800,000 | | 807,064 |
| Credit Suisse First Boston Mtge. Securities Corp.: | | | | |
| Ser. 2003-C3, Class A2, 2.84%, 05/15/2038 | | 425,000 | | 420,290 |
| Ser. 2003-C3, Class A5, 3.94%, 05/15/2038 | | 855,000 | | 797,565 |
| GMAC Comml. Mtge. Securities, Inc., Ser. 2004-C2, Class A4, 5.30%, | | | | |
| 08/10/2038 | | 760,000 | | 753,418 |
| JPMorgan Chase & Co. Comml. Mtge. Securities Corp.: | | | | |
| Ser. 2004-CB8, Class A4, 4.40%, 01/12/2039 | | 840,000 | | 792,321 |
| Ser. 2006-LDP9, Class A3, 5.34%, 05/15/2047 | | 400,000 | | 390,996 |
| Ser. 2007-LD12, Class A2, 5.83%, 02/15/2051 | | 570,000 | | 578,513 |
| Ser. 2007-LD12, Class A4, 5.88%, 02/15/2051 | | 560,000 | | 568,462 |
| LB-UBS Comml. Mtge. Trust, Ser. 2003-C3, Class A4, 4.17%, 05/15/2032 | | 440,000 | | 414,899 |
| Merrill Lynch/Countrywide Comml. Mtge. Trust, Ser. 2006-4, Class A3, 5.17%, | | | | |
| 12/12/2049 | | 672,000 | | 650,879 |
| Morgan Stanley, Ser. 2002-LQ3, Class A4, 5.08%, 09/15/2037 | | 1,205,000 | | 1,191,247 |
| Wachovia Bank Comml. Mtge. Trust, Ser. 2003-C8, Class A1, 3.44%, 11/15/2035 | | 217,872 | | 214,772 |
| |
|
| | | | | 9,006,182 |
| |
|
| FLOATING-RATE 6.2% | | | | |
| GE Comml. Mtge. Corp., Ser. 2007-C1, Class A4, 5.54%, 12/10/2049 | | 555,000 | | 550,528 |
| GS Mtge. Securities Corp., Ser. 2007-GG10, Class A4, 5.80%, 08/10/2045 (p) | | 955,000 | | 969,328 |
| JPMorgan Chase & Co. Comml. Mtge. Securities Corp.: | | | | |
| Ser. 2007-CB19, Class A4, 5.75%, 02/12/2049 | | 830,000 | | 841,138 |
| Ser. 2007-LD11, Class A4, 5.82%, 06/15/2049 | | 490,000 | | 497,590 |
| Morgan Stanley Capital I, Inc., Ser. 2007-IQ15, Class A4, 5.88%, 06/11/2049 | | 570,000 | | 582,740 |
| |
|
| | | | | 3,441,324 |
| |
|
| Total Commercial Mortgage-Backed Securities (cost $12,392,049) | | | | 12,447,506 |
| |
|
| WHOLE LOAN MORTGAGE-BACKED COLLATERALIZED MORTGAGE | | | | |
| OBLIGATIONS 3.9% | | | | |
| FLOATING-RATE 3.9% | | | | |
| Banc of America Mtge. Securities, Inc., Ser. 2005-D, Class 2A6, 4.78%, | | | | |
| 05/25/2035 | | 230,000 | | 228,086 |
| Deutsche Securities, Inc., Ser. 2007-OA2, Class A1, 5.08%, 04/25/2047 | | 280,210 | | 275,304 |
| Washington Mutual, Inc.: | | | | |
| Ser. 2005-AR5, Class A5, 4.67%, 05/25/2035 | | 690,000 | | 679,470 |
| Ser. 2006-0A3, Class 4AB, 5.70%, 04/25/2047 | | 412,045 | | 402,498 |
| Wells Fargo Mtge. Backed Securities Trust, Ser. 2006-AR07, Class 2A5, 5.61%, | | | | |
| 05/25/2036 | | 560,000 | | 564,709 |
| |
|
| Total Whole Loan Mortgage-Backed Collateralized Mortgage Obligations | | | | |
| (cost $2,133,201) | | | | 2,150,067 |
| |
|
See Notes to Financial Statements
10
SCHEDULE OF INVESTMENTS continued
October 31, 2007 (unaudited)
| | | | | Principal | | |
| | | | | Amount | | Value |
|
| |
| WHOLE LOAN MORTGAGE-BACKED PASS THROUGH SECURITIES 17.5% | | | | |
| FIXED-RATE 6.1% | | | | | | |
| Banc of America Funding Corp., Ser. 2007-8, Class 2A1, 7.00%, 10/25/2037 (h) | | $ 553,748 | | $ 557,624 |
| Countrywide Alternative Loan Trust, Inc., Ser. 2007-24, Class A11, 7.00%, | | | | | | |
| 10/25/2037 | | | | 199,437 | | 196,773 |
| First Horizon Mtge. Pass Through Trust, Ser. 2007-AR2, Class 2A1, 5.89%, | | | | | | |
| 07/25/2037 | | | | 616,933 | | 617,859 |
| GSAA Home Equity Trust, Ser. 2007-09, Class A1A, 6.00%, 10/01/2037 | | | | 314,660 | | 314,070 |
| IndyMac INDX Mtge. Loan Trust, Ser. 2007-AR7, Class 2A1, 5.81%, 06/25/2037 | | | | 584,830 | | 583,360 |
| Morgan Stanley Capital I, Inc., Ser. 2007-13, Class 5A1, 5.50%, 10/25/2037 (h) | | | | 679,368 | | 653,213 |
| PHH Alternative Mtge. Trust, Ser. 2007-01, Class 21A, 6.00%, 02/25/2037 # | | | | 200,144 | | 196,362 |
| Residential Accredited Loans, Inc., Ser. 2007-QS10, Class A1, 6.50%, | | | | | | |
| 09/25/2037 # | | | | 234,554 | | 233,896 |
| |
|
| | | | | | | 3,353,157 |
| |
|
| FLOATING-RATE 11.4% | | | | | | |
| Bear Stearns Adjustable Rate Mtge. Trust, Ser. 2007-5, Class 1A1, 5.83%, | | | | | | |
| 08/25/2047 | | | | 366,251 | | 367,819 |
| Countrywide Alternative Loan Trust, Inc., Ser. 2007-A2, Class 1A1, 5.82%, | | | | | | |
| 03/25/2047 | | | | 590,639 | | 579,930 |
| IndyMac INDX Mtge. Loan Trust, Ser. 2006-AR11, Class 3A1, 5.83%, | | | | | | |
| 06/25/2036 | | | | 485,935 | | 491,130 |
| MASTR Reperforming Loan Trust, Ser. 2006-2, Class 1A1, 5.90%, | | | | | | |
| 05/25/2046 144A | | | | 451,293 | | 453,577 |
| Residential Funding Mtge. Securities, Ser. 2006-SA2, Class 2A1, 5.86%, | | | | | | |
| 08/25/2036 | | | | 489,847 | | 498,370 |
| Structured Adjustable Rate Mtge. Loan Trust, Ser. 2007-3, Class 3A1, 5.73%, | | | | | | |
| 04/25/2037 | | | | 503,775 | | 503,004 |
| Washington Mutual, Inc. Mtge. Pass-Through Cert., Ser. 2007-HY7, Class 3A2, | | | | | | |
| 5.92%, 07/25/2037 | | | | 545,881 | | 546,978 |
| Washington Mutual, Inc.: | | | | | | |
| Ser. 2006-AR12, Class 2A3, 5.76%, 10/25/2036 | | | | 501,493 | | 501,001 |
| Ser. 2006-AR17, Class 1A1B, 5.74%, 12/25/2046 | | | | 545,191 | | 534,816 |
| Ser. 2007-OA5, Class 1A1B, 5.68%, 06/25/2047 | | | | 823,021 | | 809,038 |
| Ser. 2007-OA6, Class 1A, 5.74%, 07/25/2047 | | | | 611,911 | | 598,180 |
| Wells Fargo Mtge. Backed Securities Trust, Ser. 2006-AR10, Class 5A1, 5.60%, | | | | | | |
| 07/25/2036 | | | | 373,245 | | 373,480 |
| |
|
| | | | | | | 6,257,323 |
| |
|
| Total Whole Loan Mortgage-Backed Pass Through Securities (cost $9,555,680) | | | | 9,610,480 |
| |
|
| INVESTMENTS OF CASH COLLATERAL FROM SECURITIES LOANED 1.8% | | | | |
| REPURCHASE AGREEMENT ^ 1.8% | | | | | | |
| Lehman Brothers, Inc., 4.93%, dated 10/31/2007, maturing 11/01/2007, maturity | | | | |
| value $997,067 (cost $996,930) | | | | 996,930 | | 996,930 |
| |
|
See Notes to Financial Statements
11
SCHEDULE OF INVESTMENTS continued
October 31, 2007 (unaudited)
| | | | | Shares | | Value |
|
| SHORT-TERM INVESTMENTS 14.8% | | | | |
| MUTUAL FUND SHARES 14.8% | | | | |
| Evergreen Institutional Money Market Fund, Class I, 5.03% q ø ## | | | | |
| (cost $8,128,702) | | | | 8,128,702 | | $ 8,128,702 |
| |
|
| Total Investments (cost $65,725,985) 119.2% | | | | 65,637,408 |
| Other Assets and Liabilities (19.2%) | | | | (10,553,337) |
| |
|
| Net Assets 100.0% | | | | | | $ 55,084,071 |
| |
|
| ## | | All or a portion of this security has been segregated for when-issued or delayed delivery securities. |
| # | | When-issued or delayed delivery security |
| (p) | | All or a portion of this security is on loan. |
| (h) | | Security is valued at fair value as determined by the investment advisor in good faith, according to procedures approved |
| | | by the Board of Trustees. |
| 144A | | Security that may be sold to qualified institutional buyers under Rule 144A of the Securities Act of 1933, as amended. |
| | | This security has been determined to be liquid under guidelines established by the Board of Trustees, unless otherwise |
| | | noted. |
| ^ | | Collateralized by U.S. government agency obligations at period end. |
| q | | Rate shown is the 7-day annualized yield at period end. |
| ø | | Evergreen Investment Management Company, LLC is the investment advisor to both the Fund and the money market |
| | | fund. |
| |
| Summary of Abbreviations |
| FHLMC | | Federal Home Loan Mortgage Corp. |
| FNMA | | Federal National Mortgage Association |
| GNMA | | Government National Mortgage Association |
| MASTR | | Mortgage Asset Securitization Transactions, Inc. |
| TBA | | To Be Announced |
| The following table shows the percent of total investments (excluding collateral from securities on loan and segregated cash and |
| cash equivalents) by credit quality based on Moody’s and Standard & Poor’s ratings as of October 31, 2007: |
| |
| AAA | | 100% | |
| |
| |
| |
| |
| The following table shows the percent of total investments (excluding collateral from securities on loan and segregated cash and |
| cash equivalents) based on effective maturity as of October 31, 2007: |
| |
| Less than 1 year | | 3.3% | |
| 1 to 3 year(s) | | 6.3% | |
| 3 to 5 years | | 35.5% | |
| 5 to 10 years | | 54.4% | |
| 10 to 20 years | | 0.5% | |
| |
| |
| | | 100.0% | |
| | |
| |
See Notes to Financial Statements
12
STATEMENT OF ASSETS AND LIABILITIES
October 31, 2007 (unaudited)
| Assets | | |
| Investments in securities, at value (cost $57,597,283) including $966,430 of securities loaned | | $ 57,508,706 |
| Investments in affiliated money market fund, at value (cost $8,128,702) | | 8,128,702 |
|
| Total investments | | 65,637,408 |
| Receivable for securities sold | | 13,987,156 |
| Interest receivable | | 284,975 |
| Prepaid expenses and other assets | | 3,396 |
|
| Total assets | | 79,912,935 |
|
| Liabilities | | |
| Dividends payable | | 190,999 |
| Payable for securities purchased | | 23,479,547 |
| Payable for Fund shares redeemed | | 28,261 |
| Unrealized losses on total return swap transactions | | 124,633 |
| Payable for securities on loan | | 996,930 |
| Due to related parties | | 549 |
| Accrued expenses and other liabilities | | 7,945 |
|
| Total liabilities | | 24,828,864 |
|
| Net assets | | $ 55,084,071 |
|
| Net assets represented by | | |
| Paid-in capital | | $ 56,971,560 |
| Overdistributed net investment income | | (180,354) |
| Accumulated net realized losses on investments | | (1,493,925) |
| Net unrealized losses on investments | | (213,210) |
|
| Total net assets | | $ 55,084,071 |
|
| Shares outstanding (unlimited number of shares authorized) | | |
| Class I | | 5,659,688 |
|
| Net asset value per share | | |
| Class I | | $ 9.73 |
|
See Notes to Financial Statements
13
STATEMENT OF OPERATIONS
Six Months Ended October 31, 2007 (unaudited)
| Investment income | | |
| Interest | | $ 1,143,171 |
| Income from affiliate | | 362,639 |
| Securities lending | | 328 |
|
| Total investment income | | 1,506,138 |
|
| Expenses | | |
| Administrative services fee | | 28,588 |
| Transfer agent fees | | 1,763 |
| Trustees’ fees and expenses | | 1,461 |
| Printing and postage expenses | | 10,256 |
| Custodian and accounting fees | | 9,506 |
| Registration and filing fees | | 4,254 |
| Professional fees | | 11,250 |
| Other | | 1,017 |
|
| Total expenses | | 68,095 |
| Less: Expense reductions | | (899) |
| Expense reimbursements | | (9,633) |
|
| Net expenses | | 57,563 |
|
| Net investment income | | 1,448,575 |
|
| Net realized and unrealized gains or losses on investments | | |
| Securities | | (229,509) |
| Total return swap transactions | | (64,869) |
|
| Net realized losses on investments | | (294,378) |
| Net change in unrealized gains or losses on investments | | (6,431) |
|
| Net realized and unrealized gains or losses on investments | | (300,809) |
|
| Net increase in net assets resulting from operations | | $ 1,147,766 |
|
See Notes to Financial Statements
14
STATEMENTS OF CHANGES IN NET ASSETS
| | | Six Months Ended | | | | |
| | | October 31, 2007 | | Year Ended |
| | | (unaudited) | | April 30, 2007 |
|
| Operations | | | | | | | | |
| Net investment income | | $ 1,448,575 | | $ 2,961,541 |
| Net realized gains or losses on | | | | | | | | |
| investments | | | | (294,378) | | | | 294,672 |
| Net change in unrealized gains or losses | | | | | | | | |
| on investments | | | | (6,431) | | | | 1,150,448 |
|
| Net increase in net assets resulting from | | | | | | | | |
| operations | | | | 1,147,766 | | | | 4,406,661 |
|
| Distributions to shareholders from | | | | | | | | |
| Net investment income | | | | (1,498,691) | | | | (3,032,386) |
|
| | | Shares | | | | Shares | | |
| Capital share transactions | | | | | | | | |
| Proceeds from shares sold | | 684,248 | | 6,593,146 | | 3,261,841 | | 31,539,512 |
| Net asset value of shares issued in | | | | | | | | |
| reinvestment of distributions | | 40,200 | | 388,479 | | 82,713 | | 802,545 |
| Payment for shares redeemed | | (1,428,684) | | (13,809,366) | | (3,097,034) | | (30,005,109) |
|
| Net increase (decrease) in net assets | | | | | | | | |
| resulting from capital share | | | | | | | | |
| transactions | | | | (6,827,741) | | | | 2,336,948 |
|
| Total increase (decrease) in net assets | | | | (7,178,666) | | | | 3,711,223 |
| Net assets | | | | | | | | |
| Beginning of period | | | | 62,262,737 | | | | 58,551,514 |
|
| End of period | | $ 55,084,071 | | $ 62,262,737 |
|
| Overdistributed net investment income | | $ (180,354) | | $ (130,238) |
|
See Notes to Financial Statements
15
NOTES TO FINANCIAL STATEMENTS (unaudited)
1. ORGANIZATION
Evergreen Institutional Mortgage Portfolio (the “Fund”) is a diversified series of Evergreen Fixed Income Trust (the “Trust”), a Delaware statutory trust organized on September 18, 1997. The Trust is an open-end management investment company registered under the Investment Company Act of 1940, as amended (the “1940 Act”).
The Fund offers Class I shares. Class I shares are sold without a front-end sales charge or contingent deferred sales charge.
2. SIGNIFICANT ACCOUNTING POLICIES
The following is a summary of significant accounting policies consistently followed by the Fund in the preparation of its financial statements. The policies are in conformity with generally accepted accounting principles in the United States of America, which require management to make estimates and assumptions that affect amounts reported herein. Actual results could differ from these estimates.
a. Valuation of investments
Portfolio debt securities acquired with more than 60 days to maturity are fair valued using matrix pricing methods determined by an independent pricing service which takes into consideration such factors as similar security prices, yields, maturities, liquidity and ratings. Securities for which valuations are not readily available from an independent pricing service may be valued by brokers which use prices provided by market makers or estimates of market value obtained from yield data relating to investments or securities with similar characteristics.
Short-term securities with remaining maturities of 60 days or less at the time of purchase are valued at amortized cost, which approximates market value.
Investments in other mutual funds are valued at net asset value. Securities for which market quotations are not readily available or not reflective of current market value are valued at fair value as determined by the investment advisor in good faith, according to procedures approved by the Board of Trustees.
b. Repurchase agreements
Securities pledged as collateral for repurchase agreements are held by the custodian bank or in a segregated account in the Fund’s name until the agreements mature. Collateral for certain tri-party repurchase agreements is held at the counterparty’s custodian in a segregated account for the benefit of the Fund and the counterparty. Each agreement requires that the market value of the collateral be sufficient to cover payments of interest and principal. However, in the event of default or bankruptcy by the other party to the agreement, retention of the collateral may be subject to legal proceedings. The Fund will enter into repurchase agreements with banks and other financial institutions, which are deemed by the investment advisor to be creditworthy pursuant to guidelines established by the Board of Trustees. In certain instances, the Fund’s securities lending agent may provide collateral in the form of repurchase agreements.
16
NOTES TO FINANCIAL STATEMENTS (unaudited) continued
c. When-issued and delayed delivery transactions
The Fund records when-issued or delayed delivery securities as of trade date and maintains security positions such that sufficient liquid assets will be available to make payment for the securities purchased. Securities purchased on a when-issued or delayed delivery basis are marked-to-market daily and begin earning interest on the settlement date. Losses may occur on these transactions due to changes in market conditions or the failure of counterparties to perform under the contract.
d. Securities lending
The Fund may lend its securities to certain qualified brokers in order to earn additional income. The Fund receives compensation in the form of fees or interest earned on the investment of any cash collateral received. The Fund also continues to receive interest and dividends on the securities loaned. The Fund receives collateral in the form of cash or securities with a market value at least equal to the market value of the securities on loan, including accrued interest. In the event of default or bankruptcy by the borrower, the Fund could experience delays and costs in recovering the loaned securities or in gaining access to the collateral. The Fund has the right under the lending agreement to recover the securities from the borrower on demand.
e. Dollar roll transactions
The Fund may enter into dollar roll transactions with respect to mortgage-backed securities. In a dollar roll transaction, the Fund sells mortgage-backed securities to financial institutions and simultaneously agrees to accept substantially similar (same type, coupon and maturity) securities at a later date at an agreed upon price. The Fund will use the proceeds generated from the transactions to invest in short-term investments, which may enhance the Fund’s current yield and total return. The Fund accounts for dollar roll transactions as purchases and sales. The Fund could be exposed to risks if the counterparty defaults on its obligation to perform under the terms of the agreement, if the Fund receives inferior securities in comparison to what was sold to the coun-terparty at redelivery or if there are variances in paydown speed between the mortgage-related pools.
f. Total return swaps
The Fund may enter into total return swaps. Total return swaps involve commitments to pay interest in exchange for a market linked return, both based on notional amounts. To the extent the total return of the security or index underlying the transaction exceeds or falls short of the offsetting interest rate obligation, the Fund will receive a payment from, or make a payment to, the counterparty. The value of the swap agreements is marked-to-market daily based upon quotations from market makers and any change in value is recorded as an unrealized gain or loss. The Fund could be exposed to risks if the counterparty defaults on its obligation to perform, or if there are unfavorable changes in the fluctuation of interest rates or in the price of the underlying security.
17
NOTES TO FINANCIAL STATEMENTS (unaudited) continued
g. Security transactions and investment income
Security transactions are recorded on trade date. Realized gains and losses are computed using the specific cost of the security sold. Interest income is recorded on the accrual basis and includes accretion of discounts and amortization of premiums.
h. Federal taxes
The Fund intends to continue to qualify as a regulated investment company and distribute all of its taxable income, including any net capital gains (which have already been offset by available capital loss carryovers). Accordingly, no provision for federal taxes is required.
i. Distributions
Distributions to shareholders from net investment income are accrued daily and paid monthly. Distributions from net realized gains, if any, are recorded on the ex-dividend date. Such distributions are determined in conformity with income tax regulations, which may differ from generally accepted accounting principles.
3. ADVISORY FEE AND OTHER TRANSACTIONS WITH AFFILIATES
Evergreen Investment Management Company, LLC (“EIMC”), an indirect, wholly-owned subsidiary of Wachovia Corporation (“Wachovia”), is the investment advisor to the Fund. The Fund does not pay a fee for the investment advisory service.
Tattersall Advisory Group, Inc. (“TAG”), an indirect, wholly-owned subsidiary of Wachovia, is the investment sub-advisor to the Fund and is paid by EIMC for its services to the Fund.
From time to time, EIMC may voluntarily or contractually waive its fee and/or reimburse expenses in order to limit operating expenses. During the six months ended October 31, 2007, EIMC voluntarily reimbursed other expenses in the amount of $9,633.
The Fund may invest in Evergreen-managed money market funds, which are also advised by EIMC. Income earned on these investments is included in income from affiliate on the Statement of Operations.
Evergreen Investment Services, Inc. (“EIS”), an indirect, wholly-owned subsidiary of Wachovia, is the administrator to the Fund. As administrator, EIS provides the Fund with facilities, equipment and personnel and is paid an annual rate determined by applying percentage rates to the aggregate average daily net assets of the Evergreen funds (excluding money market funds and Evergreen Institutional Enhanced Income Fund), starting at 0.10% and declining to 0.05% as the aggregate average daily net assets of the Evergreen funds (excluding money market funds and Evergreen Institutional Enhanced Income Fund) increase.
Evergreen Service Company, LLC (“ESC”), an indirect, wholly-owned subsidiary of Wachovia, is the transfer and dividend disbursing agent for the Fund. ESC receives account fees that vary based on the type of account held by the shareholders in the Fund.
18
NOTES TO FINANCIAL STATEMENTS (unaudited) continued
4. INVESTMENT TRANSACTIONS
Cost of purchases and proceeds from sales of investment securities (excluding short-term securities) were as follows for the six months ended October 31, 2007:
| Cost of Purchases | | Proceeds from Sales |
|
| | | Non-U.S | | | | Non-U.S. |
| U.S. Government | | Government | | U.S. Government | | Government |
|
| $116,381,641 | | $31,850,395 | | $129,984,528 | | $19,024,697 |
|
During the six months ended October 31, 2007, the Fund loaned securities to certain brokers. At October 31, 2007, the value of securities on loan and the total value of collateral received for securities loaned amounted to $966,430 and $996,930, respectively.
At October 31, 2007, the Fund had the following open total return swap agreements:
| | | Notional | | | | | | Unrealized |
| Expiration | | Amount | | Swap Description | | Counterparty | | Loss |
|
| 11/1/2007 | | $1,000,000 | | Agreement dated 4/23/2007 to | | Lehman Brothers | | $11,843 |
| | | | | receive 35 basis points and to | | | | |
| | | | | receive the positive spread return | | | | |
| | | | | or pay the negative spread return | | | | |
| | | | | on the Lehman Brothers CMBS AAA | | | | |
| | | | | 8.5+yr Index which are multiplied | | | | |
| | | | | by the notional amount. | | | | |
| 11/1/2007 | | 1,000,000 | | Agreement dated 5/11/2007 to | | Lehman Brothers | | 11,876 |
| | | | | receive 31 basis points and to | | | | |
| | | | | receive the positive spread return | | | | |
| | | | | or pay the negative spread return | | | | |
| | | | | on the Lehman Brothers CMBS AAA | | | | |
| | | | | 8.5+yr Index which are multiplied | | | | |
| | | | | by the notional amount. | | | | |
| 1/2/2008 | | 1,000,000 | | Agreement dated 6/25/2007 to | | Lehman Brothers | | 11,843 |
| | | | | receive 35 basis points and to | | | | |
| | | | | receive the positive spread return | | | | |
| | | | | or pay the negative spread return | | | | |
| | | | | on the Lehman Brothers CMBS AAA | | | | |
| | | | | 8.5+yr Index which are multiplied | | | | |
| | | | | by the notional amount. | | Lehman Brothers | | 11,968 |
| 1/2/2008 | | 1,000,000 | | Agreement dated 6/29/2007 to | | | | |
| | | | | receive 20 basis points and to | | | | |
| | | | | receive the positive spread return | | | | |
| | | | | or pay the negative spread return | | | | |
| | | | | on the Lehman Brothers CMBS AAA | | | | |
| | | | | 8.5+yr Index which are multiplied | | | | |
| | | | | by the notional amount. | | | | |
| 1/2/2008 | | 1,000,000 | | Agreement dated 7/11/2007 to | | Lehman Brothers | | 11,905 |
| | | | | receive 27.5 basis points and to | | | | |
| | | | | receive the positive spread return | | | | |
| | | | | or pay the negative spread return | | | | |
| | | | | on the Lehman Brothers CMBS AAA | | | | |
| | | | | 8.5+yr Index which are multiplied | | | | |
| | | | | by the notional amount. | | | | |
| 2/1/2008 | | 1,000,000 | | Agreement dated 7/17/2007 to | | CitiBank | | 11,885 |
| | | | | receive 30 basis points and to | | | | |
| | | | | receive the positive spread return | | | | |
| | | | | or pay the negative spread return | | | | |
| | | | | on the Lehman Brothers CMBS AAA | | | | |
| | | | | 8.5+yr Index which are multiplied | | | | |
| | | | | by the notional amount. | | | | |
|
19
NOTES TO FINANCIAL STATEMENTS (unaudited) continued
| | | Notional | | | | | | Unrealized |
| Expiration | | Amount | | Swap Description | | Counterparty | | Loss |
|
| 2/1/2008 | | $1,000,000 | | Agreement dated 8/7/2007 to | | Lehman Brothers | | $11,926 |
| | | | | receive 25 basis points and to | | | | |
| | | | | receive the positive spread return | | | | |
| | | | | or pay the negative spread return | | | | |
| | | | | on the Lehman Brothers CMBS AAA | | | | |
| | | | | 8.5+yr Index which are multiplied | | | | |
| | | | | by the notional amount. | | | | |
| 3/1/2008 | | 1,000,000 | | Agreement dated 8/15/2007 to | | Lehman Brothers | | 12,135 |
| | | | | receive 0 basis points and to receive | | | | |
| | | | | the positive spread return or pay | | | | |
| | | | | the negative spread return on the | �� | | | |
| | | | | Lehman Brothers CMBS AAA 8.5+yr | | | | |
| | | | | Index which are multiplied by the | | | | |
| | | | | notional amount. | | | | |
| 3/1/2008 | | 1,000,000 | | Agreement dated 8/31/2007 to | | Lehman Brothers | | 12,405 |
| | | | | receive 32.5 basis points and to | | | | |
| | | | | receive the positive spread return | | | | |
| | | | | or pay the negative spread return | | | | |
| | | | | on the Lehman Brothers CMBS AAA | | | | |
| | | | | 8.5+yr Index which are multiplied | | | | |
| | | | | by the notional amount. | | | | |
| 5/1/2008 | | 1,000,000 | | Agreement dated 10/22/2007 to | | Goldman Sachs | | 4,196 |
| | | | | receive 0 basis points and to receive | | | | |
| | | | | the positive spread return or pay | | | | |
| | | | | the negative spread return on the | | | | |
| | | | | Lehman Brothers CMBS AAA 8.5+yr | | | | |
| | | | | Index which are multiplied by the | | | | |
| | | | | notional amount. | | | | |
| 10/1/2008 | | 1,000,000 | | Agreement dated 10/1/2007 to | | Lehman Brothers | | 12,651 |
| | | | | receive 62 basis points and to | | | | |
| | | | | receive the positive spread return | | | | |
| | | | | or pay the negative spread return | | | | |
| | | | | on the Lehman Brothers CMBS AAA | | | | |
| | | | | 8.5+yr Index which are multiplied | | | | |
| | | | | by the notional amount. | | | | |
|
On October 31, 2007, the aggregate cost of securities for federal income tax purposes was $65,736,727. The gross unrealized appreciation and depreciation on securities based on tax cost was $371,758 and $471,077, respectively, with a net unrealized depreciation of $99,319.
As of April 30, 2007, the Fund had $1,196,658 in capital loss carryovers for federal income tax purposes expiring as follows:
| Expiration |
|
| 2012 | | 2013 | | | | 2014 | | 2015 |
|
| $512,937 | | $77,895 | | | | $392,403 | | $213,423 |
|
5. INTERFUND LENDING
Pursuant to an Exemptive Order issued by the SEC, the Fund may participate in an interfund lending program with certain funds in the Evergreen fund family. This program allows the Fund to borrow from, or lend money to, other participating funds. During the six months ended October 31, 2007, the Fund did not participate in the interfund lending program.
20
NOTES TO FINANCIAL STATEMENTS (unaudited) continued
6. EXPENSE REDUCTIONS
Through expense offset arrangements with ESC and the Fund’s custodian, a portion of fund expenses has been reduced.
7. DEFERRED TRUSTEES’ FEES
Each Trustee of the Fund may defer any or all compensation related to performance of his or her duties as a Trustee. The Trustees’ deferred balances are allocated to deferral accounts, which are included in the accrued expenses for the Fund. The investment performance of the deferral accounts is based on the investment performance of certain Evergreen funds. Any gains earned or losses incurred in the deferral accounts are reported in the Fund’s Trustees’ fees and expenses. At the election of the Trustees, the deferral account will be paid either in one lump sum or in quarterly installments for up to ten years.
8. FINANCING AGREEMENT
The Fund and certain other Evergreen funds share in an unsecured revolving credit commitment for temporary and emergency purposes, including the funding of redemptions, as permitted by each participating fund’s borrowing restrictions. Borrowings under this facility bear interest at 0.50% per annum above the Federal Funds rate. All of the participating funds are charged an annual commitment fee on the unused balance, which is allocated pro rata. The credit facility is for $100 million with an annual commitment fee of 0.08% . During the six months ended October 31, 2007, the Fund had no borrowings.
9. REGULATORY MATTERS AND LEGAL PROCEEDINGS
Pursuant to an administrative order issued by the SEC on September 19, 2007, EIMC, EIS, ESC (collectively, the “Evergreen Entities”), Wachovia Securities, LLC and the SEC have entered into an agreement settling allegations of (i) improper short-term trading arrangements in effect prior to May 2003 involving former officers and employees of EIMC and certain broker-dealers, (ii) insufficient systems for monitoring exchanges and enforcing exchange limitations as stated in certain funds’ prospectuses, and (iii) inadequate e-mail retention practices. Under the settlement, the Evergreen Entities were censured and will pay approximately $32 million in disgorgement and penalties. This amount, along with a fine assessed by the SEC against Wachovia Securities, LLC will be distributed pursuant to a plan to be developed by an independent distribution consultant and approved by the SEC. The Evergreen Entities neither admitted nor denied the allegations and findings set forth in its settlement with the SEC.
EIS has entered into an agreement with the NASD (now known as the Financial Industry Regulatory Authority (“FINRA”)) settling allegations that EIS (i) arranged for Evergreen fund portfolio trades to be directed to Wachovia Securities, LLC, an affiliate of EIS that sold Evergreen fund shares, during the period of January 2001 to December 2003 and (ii) provided non-cash compensation by sponsoring offsite meetings attended by Wachovia Securities, LLC brokers during that period, where the eligibility of a broker to attend the meetings depended upon the broker meeting certain sales targets of Evergreen fund shares. Pursuant to the settlement agree-
21
NOTES TO FINANCIAL STATEMENTS (unaudited) continued
ment, EIS has agreed to a censure and a fine of $4,200,000. EIS neither admitted nor denied the allegations and findings set forth in its agreement with the NASD.
In addition, the Evergreen funds and EIMC and certain of its affiliates are involved in various legal actions, including private litigation and class action lawsuits. EIMC does not expect that any of such legal actions currently pending or threatened will have a material adverse impact on the financial position or operations of any of the Evergreen funds or on EIMC’s ability to provide services to the Evergreen funds.
Although EIMC believes that none of the matters discussed above will have a material adverse impact on the Evergreen funds, there can be no assurance that these matters and any publicity surrounding or resulting from them will not result in reduced sales or increased redemptions of Evergreen fund shares, which could increase Evergreen fund transaction costs or operating expenses, or that they will not have other adverse consequences on the Evergreen funds.
10. NEW ACCOUNTING PRONOUNCEMENTS
In June 2006, the Financial Accounting Standards Board (“FASB”) issued FASB Interpretation No. 48, Accounting for Uncertainty in Income Taxes — an interpretation of FASB statement 109 (“FIN 48”). FIN 48 supplements FASB 109 by prescribing a recognition threshold and measurement attribute for the financial statement recognition and measurement of a tax position taken or expected to be taken in a tax return. The Fund’s financial statements have not been impacted by the adoption of FIN 48. However, the conclusions regarding FIN 48 may be subject to review and adjustment at a later date based on factors including, but not limited to, further implementation guidance expected from FASB, and on-going analysis of tax laws, regulations, and interpretations thereof.
In September 2006, FASB issued Statement of Financial Accounting Standards No. 157, Fair Value Measurements (“FAS 157”). FAS 157 establishes a single authoritative definition of fair value, establishes a framework for measuring fair value and expands disclosures about fair value measurements. FAS 157 applies to fair value measurements already required or permitted by existing standards. The change to current generally accepted accounting principles from the application of FAS 157 relates to the definition of fair value, the methods used to measure fair value, and the expanded disclosures about fair value measurements. Management of the Fund does not believe the adoption of FAS 157 will materially impact the financial statement amounts, however, additional disclosures may be required about the inputs used to develop the measurements and the effect of certain of the measurements on changes in net assets for the period. FAS 157 is effective for financial statements issued for fiscal years beginning after November 15, 2007 and interim periods within those fiscal years.
22
ADDITIONAL INFORMATION (unaudited)
INFORMATION ABOUT THE REVIEW AND APPROVAL OF THE FUND’S INVESTMENT ADVISORY AGREEMENT
Each year, the Fund’s Board of Trustees is required to consider whether to continue in place the Fund’s investment advisory agreements. In September 2007, the Trustees, including a majority of the Trustees who are not interested persons (as that term is defined in the 1940 Act) of the Fund, TAG (the “Sub-Advisor”), or EIMC, approved the continuation of the Fund’s investment advisory agreements. (References below to the “Fund” are to Evergreen Institutional Mortgage Portfolio; references to the “funds” are to the Evergreen funds generally.)
At the same time, the Trustees considered the continuation of the investment advisory agreements for all of the funds, and the description below refers in many cases to the Trustees’ process and conclusions in connection with their consideration of this matter for all of the funds. (See “Certain Fund-Specific Considerations” below for a discussion regarding certain factors considered by the Trustees relating specifically to the Fund.) In all of its deliberations, the Board of Trustees and the disinterested Trustees were advised by independent counsel to the disinterested Trustees and counsel to the funds.
The review process. The 1940 Act requires that the Board of Trustees request and evaluate, and that EIMC and any sub-advisors furnish, such information as may reasonably be necessary to evaluate the terms of a fund’s advisory agreements. The review process began at the time of the last advisory contract-renewal process in September 2006. In the course of that process, the Trustees identified a number of funds that had experienced either short-term or longer-term performance issues. During the following months, the Trustees reviewed information relating to any changes in the performance of those funds and/or any changes in the investment process or the investment teams responsible for the management of the funds. In addition, during the course of the year, the Trustees reviewed information regarding the investment performance of all of the funds and identified additional funds that they believed warranted further attention based on performance since September 2006.
In spring 2007, a committee of the Board of Trustees (the “Committee”), working with EIMC management, determined generally the types of information the Board would review and set a timeline detailing the information required and the dates for its delivery to the Trustees. The independent data provider Keil Fiduciary Strategies LLC (“Keil”) was engaged to provide fund-specific and industry-wide data to the Board containing information of a nature and in a format generally prescribed by the Committee, and the Committee worked with Keil and EIMC to develop appropriate groups of peer funds for each fund. The Committee also identified a number of expense, performance, and other issues and requested specific information as to those issues.
The Trustees reviewed, with the assistance of an independent industry consultant retained by the disinterested Trustees, the information provided by EIMC and the Sub-Advisor in response to the Committee's requests and the information provided by Keil. The Trustees formed small committees to review individual funds in greater detail. In addition, the Trustees requested information regarding, among other things, brokerage practices of the funds, the use of derivatives by the funds, strategic planning for the funds, analyst and research support available to the portfolio management teams, and information regarding the various fall-out benefits received directly and
23
ADDITIONAL INFORMATION (unaudited) continued
indirectly by EIMC and its affiliates from the funds. The Trustees requested and received additional information following that review.
The Committee met several times by telephone to consider the information provided by EIMC. The Committee met with representatives of EIMC in early September. At a meeting of the full Board of Trustees later in September, the Committee reported the results of its discussions with EIMC, and the full Board met with representatives of EIMC, engaged in further review of the materials provided to them, and approved the continuation of each of the advisory and sub-advisory agreements.
The disinterested Trustees discussed the continuation of the funds’ advisory agreements with representatives of EIMC and in multiple private sessions with legal counsel at which no personnel of EIMC were present. In considering the continuation of the agreements, the Trustees did not identify any particular information or consideration that was all-important or controlling, and each Trustee attributed different weights to various factors. The Trustees evaluated information provided to them both in terms of the Evergreen mutual funds generally and with respect to each fund, including the Fund, specifically as they considered appropriate; although the Trustees considered the continuation of the agreements as part of the larger process of considering the continuation of the advisory contracts for all of the funds, their determination to continue the advisory agreements for each of the funds was ultimately made on a fund-by-fund basis.
This summary describes a number of the most important, but not necessarily all, of the factors considered by the Board and the disinterested Trustees.
Information reviewed. The Board of Trustees and committees of the Board of Trustees meet periodically during the course of the year. At those meetings, the Board receives a wide variety of information regarding the services performed by EIMC, the investment performance of the funds, and other aspects of the business and operations of the funds. At those meetings, and in the process of considering the continuation of the agreements, the Trustees considered information regarding, for example, the funds’ investment results; the portfolio management teams for the funds and the experience of the members of those teams, and any recent changes in the membership of the teams; portfolio trading practices; compliance by the funds, EIMC, and the Sub-Advisor with applicable laws and regulations and with the funds’ and EIMC’s compliance policies and procedures; risk evaluation and oversight procedures at EIMC; services provided by affiliates of EIMC to the funds and shareholders of the funds; and other information relating to the nature, extent, and quality of services provided by EIMC and the Sub-Advisor. The Trustees considered a number of changes in portfolio management personnel at EIMC and its advisory affiliates in the year since September 2006, and recent changes in compliance personnel at EIMC, including the appointment of a new Chief Compliance Officer for the funds.
The Trustees considered the rates at which the funds pay investment advisory fees, and the efforts generally by EIMC and its affiliates as sponsors of the funds. The data provided by Keil showed the management fees paid by each fund in comparison to the management fees of other peer mutual funds, in addition to data regarding the investment performance of the funds in comparison to other peer mutual funds. The Trustees were assisted by the independent industry consultant in reviewing the information presented to them.
24
ADDITIONAL INFORMATION (unaudited) continued
The Trustees considered the transfer agency fees paid by the funds to an affiliate of EIMC. They reviewed information presented to them showing that the transfer agency fees charged to the funds were generally consistent with industry norms.
The Trustees also considered that EIS, an affiliate of EIMC, serves as administrator to the funds and receives a fee for its services as administrator. In their comparison of the advisory fee paid by the funds with those paid by other mutual funds, the Trustees took into account administrative fees paid by the funds and those other mutual funds. The Board considered that EIS serves as distributor to the funds generally and receives fees from the funds for those services. They considered other so-called “fall-out” benefits to EIMC and its affiliates due to their other relationships with the funds, including, for example, soft-dollar services received by EIMC attributable to transactions entered into by EIMC for the benefit of the funds and brokerage commissions received by Wachovia Securities, LLC, an affiliate of EIMC, from transactions effected by it for the funds. The Trustees also noted that the funds pay sub-transfer agency fees to various financial institutions who hold fund shares in omnibus accounts, and that Wachovia Securities, LLC and its affiliates receive such payments from the funds in respect of client accounts they hold in omnibus arrangements, and that an affiliate of EIMC receives fees for administering the sub-transfer agency payment program. They also considered that Wachovia Securities, LLC and its affiliates receive distribution-related fees and shareholder servicing payments (including amounts derived from payments under the funds’ Rule 12b-1 plans) in respect of shares sold or held through it. The Trustees also noted that an affiliate of EIMC receives compensation for serving as a securities lending agent for the funds.
Nature and quality of the services provided. The Trustees considered that EIMC and its affili-ates generally provide a comprehensive investment management service to the funds. They noted that EIMC and the Sub-Advisor formulate and implement an investment program for the Fund. They noted that EIMC makes its personnel available to serve as officers of the funds, and concluded that the reporting and management functions provided by EIMC with respect to the funds were generally satisfactory. The Trustees considered the investment philosophy of the Fund’s portfolio management team, and considered the in-house research capabilities of EIMC and its affiliates, as well as other resources available to EIMC, including research services available to it from third parties. The Board considered the managerial and financial resources available to EIMC and its affiliates, and the commitment that the Wachovia organization has made to the funds generally. On the basis of these factors, they determined that the nature and scope of the services provided by EIMC and the Sub-Advisor were consistent with their respective duties under the investment advisory agreements and appropriate and consistent with the investment programs and best interests of the funds.
The Trustees noted the resources EIMC and its affiliates have committed to the regulatory, compliance, accounting, tax and oversight of tax reporting, and shareholder servicing functions, and the number and quality of staff committed to those functions, which they concluded were appropriate and generally in line with EIMC’s responsibilities to the Fund and to the funds generally. The Board and the disinterested Trustees concluded, within the context of their overall conclusions regarding the funds’ advisory agreements, that they were generally satisfied with the nature, extent, and quality of the services provided by the Sub-Advisor and EIMC, including services provided by EIS under its administrative services agreements with the funds.
25
ADDITIONAL INFORMATION (unaudited) continued
Investment performance. The Trustees considered the investment performance of each fund, both by comparison to other comparable mutual funds and to broad market indices. The Trustees emphasized that the continuation of the investment advisory agreement for a fund should not be taken as any indication that the Trustees did not believe investment performance for any specific fund might not be improved, and they noted that they would continue to monitor closely the investment performance of the funds going forward.
Advisory and administrative fees. The Trustees recognized that EIMC does not seek to provide the lowest cost investment advisory service, but to provide a high quality, full-service investment management product at a reasonable price. They also noted that EIMC has in many cases sought to set its investment advisory fees at levels consistent with industry norms. The Trustees noted that, in certain cases, a fund’s management fees were higher than many or most other mutual funds in the same Keil peer group. However, in each case, the Trustees determined on the basis of the information presented that the level of management fees was not excessive.
Certain Fund-specific considerations. The Trustees noted that, for the one- and three-year periods ended December 31, 2006, the Fund’s Class I shares had underperformed the Fund’s benchmark index, the Merrill Lynch Mortgage Master Index, but had outperformed a majority of the funds against which the Trustees compared the Fund’s performance.
The Trustees noted that the management fee paid by the Fund was lower than the management fees paid by all of the other funds against which the Trustees compared the Fund’s management fee, and that the level of profitability realized by EIMC in respect of the fee did not appear excessive.
Economies of scale. The Trustees noted that economies of scale would likely be achieved by EIMC in managing the funds as the funds grow. The Trustees noted that the Fund had implemented breakpoints in its advisory fee structure. The Trustees noted that they would continue to review the appropriate levels of breakpoints in the future, but concluded that the breakpoints as implemented appeared to be a reasonable step toward the realization of economies of scale by the Fund.
Profitability. The Trustees considered information provided to them regarding the profitability to the EIMC organization of the investment advisory, administration, and transfer agency (with respect to the open-end funds only) fees paid to EIMC and its affiliates by each of the funds. They considered that the information provided to them was necessarily estimated, and that the profitability information provided to them, especially on a fund-by-fund basis, did not necessarily provide a definitive tool for evaluating the appropriateness of each fund’s advisory fee. They noted that the levels of profitability of the funds to EIMC varied widely, depending on among other things the size and type of fund. They considered the profitability of the funds in light of such factors as, for example, the information they had received regarding the relation of the fees paid by the funds to those paid by other mutual funds, the investment performance of the funds, and the amount of revenues involved. In light of these factors, the Trustees concluded that the profitability of any of the funds, individually or in the aggregate, should not prevent the Trustees from approving the continuation of the agreements.
26
This page left intentionally blank
27
TRUSTEES AND OFFICERS
TRUSTEES1
| Charles A. Austin III | | Investment Counselor, Anchor Capital Advisors, LLC. (investment advice); Director, The Andover |
| Trustee | | Companies (insurance); Trustee, Arthritis Foundation of New England; Former Director, The |
| DOB: 10/23/1934 | | Francis Ouimet Society (scholarship program); Former Director, Executive Vice President and |
| Term of office since: 1991 | | Treasurer, State Street Research & Management Company (investment advice) |
| Other directorships: None | | |
|
| |
| K. Dun Gifford | | Chairman and President, Oldways Preservation and Exchange Trust (education); Trustee, |
| Trustee | | Treasurer and Chairman of the Finance Committee, Cambridge College |
| DOB: 10/23/1938 | | |
| Term of office since: 1974 | | |
| Other directorships: None | | |
|
| |
| Dr. Leroy Keith, Jr. | | Managing Director, Almanac Capital Management (commodities firm); Trustee, Phoenix |
| Trustee | | Fund Complex; Director, Diversapack Co. (packaging company); Former Partner, Stonington |
| DOB: 2/14/1939 | | Partners, Inc. (private equity fund); Former Director, Obagi Medical Products Co.; Former |
| Term of office since: 1983 | | Director, Lincoln Educational Services |
| Other directorships: Trustee, | | |
| Phoenix Fund Complex (consisting | | |
| of 60 portfolios as of 12/31/2006) | | |
|
| |
| Gerald M. McDonnell | | Manager of Commercial Operations, CMC Steel (steel producer) |
| Trustee | | |
| DOB: 7/14/1939 | | |
| Term of office since: 1988 | | |
| Other directorships: None | | |
|
| |
| Patricia B. Norris | | President and Director of Buckleys of Kezar Lake, Inc. (real estate company); Former President |
| Trustee | | and Director of Phillips Pond Homes Association (home community); Former Partner, |
| DOB: 4/9/1948 | | PricewaterhouseCoopers, LLP (independent registered public accounting firm) |
| Term of office since: 2006 | | |
| Other directorships: None | | |
|
| |
| William Walt Pettit | | Partner and Vice President, Kellam & Pettit, P.A. (law firm); Director, Superior Packaging Corp. |
| Trustee | | (packaging company); Member, Superior Land, LLC (real estate holding company), Member, |
| DOB: 8/26/1955 | | K&P Development, LLC (real estate development); Former Director, National Kidney Foundation |
| Term of office since: 1988 | | of North Carolina, Inc. (non-profit organization) |
| Other directorships: None | | |
|
| |
| David M. Richardson | | President, Richardson, Runden LLC (executive recruitment business development/consulting |
| Trustee | | company); Consultant, Kennedy Information, Inc. (executive recruitment information and |
| DOB: 9/19/1941 | | research company); Consultant, AESC (The Association of Executive Search Consultants); |
| Term of office since: 1982 | | Director, J&M Cumming Paper Co. (paper merchandising); Former Trustee, NDI Technologies, LLP |
| | | (communications) |
| Other directorships: None | | |
|
| |
| Dr. Russell A. Salton III | | President/CEO, AccessOne MedCard, Inc.; Former Medical Director, Healthcare Resource |
| Trustee | | Associates, Inc. |
| DOB: 6/2/1947 | | |
| Term of office since: 1984 | | |
| Other directorships: None | | |
|
| |
| Michael S. Scofield | | Retired Attorney, Law Offices of Michael S. Scofield; Former Director and Chairman, Branded |
| Trustee | | Media Corporation (multi-media branding company) |
| DOB: 2/20/1943 | | |
| Term of office since: 1984 | | |
| Other directorships: None | | |
|
28
TRUSTEES AND OFFICERS continued
| Richard J. Shima | | Independent Consultant; Director, Hartford Hospital; Trustee, Greater Hartford YMCA; Former |
| Trustee | | Director, Trust Company of CT; Former Director, Old State House Association; Former Trustee, |
| DOB: 8/11/1939 | | Saint Joseph College (CT) |
| Term of office since: 1993 | | |
| Other directorships: None | | |
|
| |
| Richard K. Wagoner, CFA2 | | Member and Former President, North Carolina Securities Traders Association; Member, Financial |
| Trustee | | Analysts Society |
| DOB: 12/12/1937 | | |
| Term of office since: 1999 | | |
| Other directorships: None | | |
|
| |
| |
| OFFICERS | | |
| |
| Dennis H. Ferro3 | | Principal occupations: President and Chief Executive Officer, Evergreen Investment Company, |
| President | | Inc. and Executive Vice President, Wachovia Bank, N.A.; former Chief Investment Officer, |
| DOB: 6/20/1945 | | Evergreen Investment Company, Inc. |
| Term of office since: 2003 | | |
|
| |
| Kasey Phillips4 | | Principal occupations: Senior Vice President, Evergreen Investment Services, Inc.; Former Vice |
| Treasurer | | President, Evergreen Investment Services, Inc.; Former Assistant Vice President, Evergreen |
| DOB: 12/12/1970 | | Investment Services, Inc. |
| Term of office since: 2005 | | |
|
| |
| Michael H. Koonce4 | | Principal occupations: Senior Vice President and General Counsel, Evergreen Investment |
| Secretary | | Services, Inc.; Secretary, Senior Vice President and General Counsel, Evergreen Investment |
| DOB: 4/20/1960 | | Management Company, LLC and Evergreen Service Company, LLC; Senior Vice President and |
| Term of office since: 2000 | | Assistant General Counsel, Wachovia Corporation |
|
| |
| Robert Guerin4, 5 | | Principal occupations: Chief Compliance Officer, Evergreen Funds and Senior Vice President of |
| Chief Compliance Officer | | Evergreen Investments Co, Inc; Former Managing Director and Senior Compliance Officer, |
| DOB: 9/20/1965 | | Babson Capital Management LLC; Former Principal and Director, Compliance and Risk |
| Term of office since: 2007 | | Management, State Street Global Advisors; Former Vice President and Manager, Sales Practice |
| | | Compliance, Deutsche Asset Management. |
|
1 Each Trustee, except Ms. Norris, serves until a successor is duly elected or qualified or until his death, resignation, retirement or removal from office. As a new Trustee, Ms. Norris’ initial term ends June 30, 2009, at which time she may be re-elected by Trustees to serve until a successor is duly elected or qualified or until her death, resignation, retirement or removal from office by the Trustees. Each Trustee oversees 91 Evergreen funds. Correspondence for each Trustee may be sent to Evergreen Board of Trustees, P.O. Box 20083, Charlotte, NC 28202.
2 Mr. Wagoner is an “interested person” of the Fund because of his ownership of shares in Wachovia Corporation, the parent to the Fund’s investment advisor.
3 The address of the Officer is 401 S. Tryon Street, 20th Floor, Charlotte, NC 28288.
4 The address of the Officer is 200 Berkeley Street, Boston, MA 02116.
5 Mr. Guerin’s information is as of June 14, 2007, the effective date of his approval by the Board of Trustees as Chief Compliance Officer of the Evergreen funds.
Additional information about the Fund’s Board of Trustees and Officers can be found in the Statement of Additional Information (SAI) and is available upon request without charge by calling 800.343.2898.
29

571812 rv3 12/2007
Evergreen Diversified Income Builder Fund
| table of contents |
| 1 | | LETTER TO SHAREHOLDERS |
| 4 | | FUND AT A GLANCE |
| 6 | | ABOUT YOUR FUND’S EXPENSES |
| 7 | | FINANCIAL HIGHLIGHTS |
| 11 | | SCHEDULE OF INVESTMENTS |
| 20 | | STATEMENT OF ASSETS AND LIABILITIES |
| 21 | | STATEMENT OF OPERATIONS |
| 22 | | STATEMENTS OF CHANGES IN NET ASSETS |
| 23 | | NOTES TO FINANCIAL STATEMENTS |
| 30 | | ADDITIONAL INFORMATION |
| 36 | | TRUSTEES AND OFFICERS |
This semiannual report must be preceded or accompanied by a prospectus of the Evergreen fund contained herein. The prospectus contains more complete information, including fees and expenses, and should be read carefully before investing or sending money.
The fund will file its complete schedule of portfolio holdings with the SEC for the first and third quarters of each fiscal year on Form N-Q. The fund’s Form N-Q will be available on the SEC’s Web site at http://www.sec.gov. In addition, the fund’s Form N-Q may be reviewed and copied at the SEC’s Public Reference Room in Washington, D.C. Information on the operation of the Public Reference Room may be obtained by calling 800.SEC.0330.
A description of the fund’s proxy voting policies and procedures, as well as information regarding how the fund voted proxies relating to portfolio securities during the most recent 12-month period ended June 30, is available by visiting our Web site at EvergreenInvestments.com or by visiting the SEC’s Web site at http://www.sec.gov. The fund’s proxy voting policies and procedures are also available without charge, upon request, by calling 800.343.2898.
| Mutual Funds: | | | | |
| NOT FDIC INSURED | | MAY LOSE VALUE | | NOT BANK GUARANTEED |
Evergreen InvestmentsSM is a service mark of Evergreen Investment Management Company, LLC.
Copyright 2007, Evergreen Investment Management Company, LLC.
Evergreen Investment Management Company, LLC is a subsidiary of Wachovia Corporation and is an affiliate of Wachovia Corporation’s other Broker Dealer subsidiaries.
Evergreen mutual funds are distributed by Evergreen Investment Services, Inc.
200 Berkeley Street, Boston, MA 02116
LETTER TO SHAREHOLDERS
December 2007

Dennis H. Ferro
President and Chief
Executive Officer
Dear Shareholder:
We are pleased to provide the Semiannual Report for Evergreen Diversified Income Builder Fund for the six-month period ended October 31, 2007.
The U.S. fixed income market delivered modest, but positive, returns during the six-month period, despite widening concerns about credit quality stemming from weakness in U.S. housing and growing problems in the subprime mortgage market. The period saw a general flight to quality as investors sought out the highest quality debt, especially U.S. Treasuries. As prices of Treasuries and other high-grade securities rose, their yields trended down, leading to outperformance by longer-maturity securities. At the same time, higher-yielding, lower-rated corporate bonds experienced some price erosion during the period after outperforming high-grade securities for several years. Concerns about the credit markets prompted the U.S. Federal Reserve Board (the “Fed”) and other major central banks to intervene and inject additional liquidity into the capital markets. While these steps in the closing three months of the period restored some measure of confidence, investors continued to watch warily for signs of economic weakness. Stocks of U.S. companies produced generally healthy returns, despite increasing market volatility. Investors began to favor larger companies with more consistent earnings, while the growth style of investing led the market after several years of outperformance by value stocks.
Despite the problems in housing and subprime mortgages, the domestic economy maintained its growth trajectory. Solid increases in exports and in business investment helped
1
LETTER TO SHAREHOLDERS continued
offset declining residential values. At the same time, steadily rising employment levels and moderately improving wages increased prospects that healthy consumer spending patterns would be sustained. Substantially exceeding expectations, U.S. Gross Domestic Product grew at an annual rate of 4.9% in the third quarter of 2007, significantly higher than the brisk 3.8% rate of the previous quarter. However, some signs of emerging economic weakness began to appear. Operating earnings of companies in the S&P 500 Index declined in the third quarter, principally because of dramatic write-downs taken by major corporations, predominately in the financials sector. Moreover, surging prices for oil, gold and most commodities, combined with the declining U.S. dollar, suggested some increased potential for rising inflation.
During the six-month period, managers of Evergreen’s intermediate and long-term bond fund teams focused on the issues influencing both the opportunities and challenges in managing specific portfolios. The teams managing the higher-quality portfolios, including Evergreen Core Bond Fund, Evergreen Core Plus Bond Fund, Evergreen U.S. Government Fund and Evergreen Institutional Mortgage Portfolio, assessed factors such as employment and inflationary trends, Fed policy and interest-rate expectations. At the same time, the managers supervising Evergreen High Income Fund and Evergreen Select High Yield Bond Fund tended to position their credit-sensitive portfolios relatively conservatively during a period of increasing volatility. The managers of Evergreen Diversified Income Builder Fund, meanwhile, repositioned their
2
LETTER TO SHAREHOLDERS continued
portfolio, maintaining an emphasis on better-quality, high-yield corporate bonds while also increasing the exposure to dividend-paying stocks.
As always, we encourage investors to maintain diversified investment portfolios in pursuit of their long-term investment goals.
Please visit us at EvergreenInvestments.com for more information about our funds and other investment products available to you. Thank you for your continued support of Evergreen Investments.
Sincerely,

Dennis H. Ferro
President and Chief Executive Officer
Evergreen Investment Company, Inc.
Special Notice to Shareholders:
Please visit our Web site at EvergreenInvestments.com for statements from President and Chief Executive Officer, Dennis Ferro, regarding the firm’s recent settlement with the Securities and Exchange Commission (SEC) and prior settlement with the National Association of Securities Dealers (NASD).
3
FUND AT A GLANCE
as of October 31, 2007
MANAGEMENT TEAM
Investment Advisor:
• Evergreen Investment Management Company, LLC
Portfolio Manager:
• Margaret D. Patel
CURRENT INVESTMENT STYLE
Source: Morningstar, Inc.
Morningstar’s style box is based on a portfolio date as of 9/30/2007.
The Equity style box placement is based on 10 growth and valuation measures for each fund holding and the median size of the companies in which the fund invests.
The Fixed Income style box placement is based on a fund’s average effective maturity or duration and the average credit rating of the bond portfolio.
| PERFORMANCE AND RETURNS |
|
| Portfolio inception date: 4/14/1987 |
| | | Class A | | Class B | | Class C | | Class I |
| Class inception date | | 4/14/1987 | | 2/1/1993 | | 2/1/1993 | | 1/13/1997 |
|
| Nasdaq symbol | | EKSAX | | EKSBX | | EKSCX | | EKSYX |
|
| 6-month return with sales charge | | -3.06% | | -3.57% | | 0.42% | | N/A |
|
| 6-month return w/o sales charge | | 1.79% | | 1.41% | | 1.41% | | 1.91% |
|
| Average annual return* |
|
| 1-year with sales charge | | 1.19% | | 0.38% | | 4.39% | | N/A |
|
| 1-year w/o sales charge | | 6.17% | | 5.38% | | 5.39% | | 6.46% |
|
| 5-year | | 6.40% | | 6.38% | | 6.69% | | 7.76% |
|
| 10-year | | 5.39% | | 5.12% | | 5.12% | | 6.28% |
|
| Maximum sales charge | | 4.75% | | 5.00% | | 1.00% | | N/A |
| | | Front-end | | CDSC | | CDSC | | |
|
* Adjusted for maximum applicable sales charge, unless noted.Past performance is no guarantee of future results. The performance quoted represents past performance and current performance may be lower or higher. The investment return and principal value of an investment will fluctuate so that investors’ shares, when redeemed, may be worth more or less than their original cost. To obtain performance information current to the most recent month-end for Classes A, B, C or I, please go to EvergreenInvestments.com/fundperformance. The performance of each class may vary based on differences in loads, fees and expenses paid by the shareholders investing in each class. Performance includes the reinvestment of income dividends and capital gain distributions. Performance shown does not reflect the deduction of taxes that a shareholder would pay on fund distributions or the redemption of fund shares.
The fund incurs a 12b-1 fee of 0.30% for Class A and 1.00% for Classes B and C. Class I does not pay a 12b-1 fee.
The advisor is reimbursing a portion of the 12b-1 fee for Class A. Had the fee not been reimbursed, returns for Class A would have been lower. Returns reflect expense limits previously in effect for all classes, without which returns would have been lower.
4
FUND AT A GLANCE continued
LONG-TERM GROWTH

Comparison of a $10,000 investment in the Evergreen Diversified Income Builder Fund Class A shares versus a similar investment in the Evergreen Diversified Income Builder Blended Index (EDIBBI), the JPMorgan Global Government Bond Index Excluding U.S. (JPMGXUS), the Lehman Brothers Aggregate Bond Index (LBABI), the Merrill Lynch High Yield Master Index† (MLHYMI) and the Consumer Price Index (CPI).
The EDIBBI, the JPMGXUS, the LBABI and the MLHYMI are unmanaged market indexes and do not include transaction costs associated with buying and selling securities, any mutual fund fees or expenses or any taxes. The CPI is a commonly used measure of inflation and does not represent an investment return. It is not possible to invest directly in an index.
Class I shares are only offered in the following manner: (1) to investment advisory clients of Evergreen Investment Management Company, LLC (or its advisory affiliates) when purchased by such advisor(s) on behalf of its clients, (2) to certain mutual fund wrap program clients of Wachovia Securities and of third-party broker/dealers when purchased through a clearing relationship with Wachovia Securities or an affiliate providing mutual fund clearing services, (3) through arrangements entered into on behalf of the Evergreen funds with certain financial services firms, (4) to certain institutional investors, and (5) to persons who owned Class Y shares in registered name in an Evergreen fund on or before December 31, 1994 or who owned shares of any SouthTrust fund in registered name as of March 18, 2005 or who owned shares of Vestaur Securities Fund as of May 20, 2005.
Class I shares are only available to institutional shareholders with a minimum of $1 million investment, which may be waived in certain situations.
The fund’s investment objective may be changed without a vote of the fund’s shareholders.
Foreign investments may contain more risk due to the inherent risks associated with changing political climates, foreign market instability and foreign currency fluctuations. Risks of international investing are magnified in emerging or developing markets.
Asset-backed and mortgage-backed securities are generally subject to higher prepayment risks than other types of debt securities, which can limit the potential for gain in a declining interest rate environment and increase the potential for loss in a rising interest rate environment. Mortgage-backed securities may also be structured so that they are particularly sensitive to interest rates.
Derivatives involve additional risks including interest rate risk, credit risk, the risk of improper valuation and the risk of non-correlation to the relevant instruments they are designed to hedge or to closely track.
High yield, lower-rated bonds may contain more risk due to the increased possibility of default.
The return of principal is not guaranteed due to fluctuation in the fund’s NAV caused by changes in the price of individual bonds held by the fund and the buying and selling of bonds by the fund. Bond funds have the same inflation, interest rate and credit risks as individual bonds. Generally, the value of bond funds rises when prevailing interest rates fall, and falls when interest rates rise.
U.S. government guarantees apply only to certain securities held in the fund’s portfolio and not to the fund’s shares.
Leverage may disproportionately increase a fund’s portfolio losses and reduce opportunities for gain when interest rates, stock prices, or currency rates are changing.
The Evergreen Diversified Income Builder Blended Index is composed of the following indexes: MLHYMI (50%), JPMGXUS (25%) and LBABI (25%).
Copyright 2007. Merrill Lynch, Pierce, Fenner & Smith Incorporated. All rights reserved.
All data is as of October 31, 2007, and subject to change.
5
ABOUT YOUR FUND’S EXPENSES
The Example below is intended to describe the fees and expenses borne by shareholders and the impact of those costs on your investment.
Example
As a shareholder of the fund, you incur two types of costs: (1) transaction costs, including sales charges (loads), redemption fees and exchange fees; and (2) ongoing costs, including management fees, distribution (12b-1) fees and other fund expenses. This Example is intended to help you understand your ongoing costs (in dollars) of investing in the fund and to compare these costs with the ongoing costs of investing in other mutual funds. The Example is based on an investment of $1,000 invested at the beginning of the period and held for the entire period from May 1, 2007 to October 31, 2007.
The example illustrates your fund’s costs in two ways:
• Actual expenses
The section in the table under the heading “Actual” provides information about actual account values and actual expenses. You may use the information in these columns, together with the amount you invested, to estimate the expenses that you paid over the period. Simply divide your account value by $1,000 (for example, an $8,600 account value divided by $1,000 = 8.6), then multiply the result by the number in the appropriate column for your share class, in the column entitled “Expenses Paid During Period” to estimate the expenses you paid on your account during this period.
• Hypothetical example for comparison purposes
The section in the table under the heading “Hypothetical (5% return before expenses)” provides information about hypothetical account values and hypothetical expenses based on the fund’s actual expense ratio and an assumed rate of return of 5% per year before expenses, which is not the fund’s actual return. The hypothetical account values and expenses may not be used to estimate the actual ending account balance or expenses you paid for the period. You may use this information to compare the ongoing costs of investing in the fund and other funds. To do so, compare this 5% hypothetical example with the 5% hypothetical examples that appear in the shareholder reports of the other funds.
Please note that the expenses shown in the table are meant to highlight your ongoing costs only and do not reflect any transactional costs, such as sales charges (loads), redemption fees or exchange fees. Therefore, the section in the table under the heading “Hypothetical (5% return before expenses)” is useful in comparing ongoing costs only, and will not help you determine the relative total costs of owning different funds. In addition, if these transactional costs were included, your costs would have been higher.
| | | Beginning | | Ending | | |
| | Account | | Account | | Expenses |
| | Value | | Value | | Paid During |
| | 5/1/2007 | | 10/31/2007 | | Period* |
|
| Actual |
| Class A | | $ 1,000.00 | | $ 1,017.88 | | $ 5.73 |
| Class B | | $ 1,000.00 | | $ 1,014.11 | | $ 9.57 |
| Class C | | $ 1,000.00 | | $ 1,014.11 | | $ 9.52 |
| Class I | | $ 1,000.00 | | $ 1,019.14 | | $ 4.47 |
| Hypothetical | | |
| (5% return | |
| before expenses) | |
| Class A | | $ 1,000.00 | | $ 1,019.46 | | $ 5.74 |
| Class B | | $ 1,000.00 | | $ 1,015.63 | | $ 9.58 |
| Class C | | $ 1,000.00 | | $ 1,015.69 | | $ 9.53 |
| Class I | | $ 1,000.00 | | $ 1,020.71 | | $ 4.47 |
|
* For each class of the Fund, expenses are equal to the annualized expense ratio of each class (1.13% for Class A, 1.89% for Class B, 1.88% for Class C and 0.88% for Class I), multiplied by the average account value over the period, multiplied by 184 / 366 days.6
| FINANCIAL HIGHLIGHTS |
|
| (For a share outstanding throughout each period) |
| | | Six Months Ended | | Year Ended April 30, |
| October 31, 2007 | |
|
| CLASS A | | (unaudited) | | 2007 | | 2006 | | 2005 | | 2004 | | 2003 |
|
| Net asset value, beginning of period | | $ 6.40 | | $ 6.32 | | $ 6.53 | | $ 6.38 | | $ 6.50 | | $ 5.83 |
|
| Income from investment operations |
| Net investment income (loss) | | 0.14 | | 0.331 | | 0.291 | | 0.33 | | 0.341 | | 0.381 |
Net realized and unrealized gains
or losses on investments | | (0.03) | | 0.08 | | (0.19) | | 0.19 | | 0.07 | | 0.68 |
| |
|
| Total from investment operations | | 0.11 | | 0.41 | | 0.10 | | 0.52 | | 0.41 | | 1.06 |
|
| Distributions to shareholders from |
| Net investment income | | (0.14) | | (0.31) | | (0.31) | | (0.35) | | (0.37) | | (0.39) |
| Net realized gains | | 0 | | 0 | | 0 | | (0.02) | | (0.16) | | 0 |
| Tax basis return of capital | | 0 | | (0.02) | | 0 | | 0 | | 0 | | 0 |
| |
|
| Total distributions to shareholders | | (0.14) | | (0.33) | | (0.31) | | (0.37) | | (0.53) | | (0.39) |
|
| Net asset value, end of period | | $ 6.37 | | $ 6.40 | | $ 6.32 | | $ 6.53 | | $ 6.38 | | $ 6.50 |
|
| Total return2 | | 1.79% | | 6.71% | | 1.59% | | 8.22% | | 6.24% | | 18.79% |
|
| Ratios and supplemental data |
| Net assets, end of period (thousands) | | $160,010 | | $170,804 | | $199,501 | | $214,776 | | $202,017 | | $173,842 |
| Ratios to average net assets |
| Expenses including waivers/reimbursements | | |
| but excluding expense reductions | | 1.13%3 | | 1.16% | | 1.17% | | 1.12% | | 1.21% | | 1.19% |
| Expenses excluding waivers/reimbursements | | |
| and expense reductions | | 1.18%3 | | 1.20% | | 1.18% | | 1.12% | | 1.21% | | 1.19% |
| Net investment income (loss) | | 4.57%3 | | 5.17% | | 4.57% | | 5.03% | | 5.10% | | 6.31% |
| Portfolio turnover rate | | 103% | | 128% | | 100% | | 130% | | 129% | | 129% |
|
1 Net investment income (loss) per share is based on average shares outstanding during the period.
2 Excluding applicable sales charges
3 Annualized
See Notes to Financial Statements
7
| FINANCIAL HIGHLIGHTS |
|
| (For a share outstanding throughout each period) |
| | | Six Months Ended | | Year Ended April 30, |
| October 31, 2007 | |
|
| CLASS B | | (unaudited) | | 2007 | | 2006 | | 2005 | | 2004 | | 2003 |
|
| Net asset value, beginning of period | | $ 6.42 | | $ 6.34 | | $ 6.55 | | $ 6.40 | | $ 6.52 | | $ 5.85 |
|
| Income from investment operations |
| Net investment income (loss) | | 0.13 | | 0.281 | | 0.251 | | 0.29 | | 0.291 | | 0.34 |
Net realized and unrealized gains
or losses on investments | | (0.04) | | 0.09 | | (0.19) | | 0.19 | | 0.07 | | 0.67 |
| |
|
| Total from investment operations | | 0.09 | | 0.37 | | 0.06 | | 0.48 | | 0.36 | | 1.01 |
|
| Distributions to shareholders from |
| Net investment income | | (0.12) | | (0.27) | | (0.27) | | (0.31) | | (0.32) | | (0.34) |
| Net realized gains | | 0 | | 0 | | 0 | | (0.02) | | (0.16) | | 0 |
| Tax basis return of capital | | 0 | | (0.02) | | 0 | | 0 | | 0 | | 0 |
| |
|
| Total distributions to shareholders | | (0.12) | | (0.29) | | (0.27) | | (0.33) | | (0.48) | | (0.34) |
|
| Net asset value, end of period | | $ 6.39 | | $ 6.42 | | $ 6.34 | | $ 6.55 | | $ 6.40 | | $ 6.52 |
|
| Total return2 | | 1.41% | | 5.94% | | 0.89% | | 7.46% | | 5.49% | | 17.87% |
|
| Ratios and supplemental data |
| Net assets, end of period (thousands) | | $46,983 | | $54,955 | | $71,860 | | $98,852 | | $113,115 | | $107,968 |
| Ratios to average net assets |
| Expenses including waivers/reimbursements | | |
| but excluding expense reductions | | 1.89%3 | | 1.90% | | 1.87% | | 1.83% | | 1.91% | | 1.94% |
| Expenses excluding waivers/reimbursements | | |
| and expense reductions | | 1.89%3 | | 1.90% | | 1.87% | | 1.83% | | 1.91% | | 1.94% |
| Net investment income (loss) | | 3.84%3 | | 4.43% | | 3.85% | | 4.34% | | 4.40% | | 5.54% |
| Portfolio turnover rate | | 103% | | 128% | | 100% | | 130% | | 129% | | 129% |
|
1 Net investment income (loss) per share is based on average shares outstanding during the period.
2 Excluding applicable sales charges
3 Annualized
See Notes to Financial Statements
8
| FINANCIAL HIGHLIGHTS |
|
| (For a share outstanding throughout each period) |
| | | Six Months Ended | | Year Ended April 30, |
| October 31, 2007 | |
|
| CLASS C | | (unaudited) | | 2007 | | 2006 | | 2005 | | 2004 | | 2003 |
|
| Net asset value, beginning of period | | $ 6.41 | | $ 6.33 | | $ 6.54 | | $ 6.39 | | $ 6.51 | | $ 5.84 |
|
| Income from investment operations |
| Net investment income (loss) | | 0.12 | | 0.281 | | 0.251 | | 0.29 | | 0.291 | | 0.341 |
Net realized and unrealized gains
or losses on investments | | (0.03) | | 0.09 | | (0.19) | | 0.19 | | 0.07 | | 0.67 |
| |
|
| Total from investment operations | | 0.09 | | 0.37 | | 0.06 | | 0.48 | | 0.36 | | 1.01 |
|
| Distributions to shareholders from |
| Net investment income | | (0.12) | | (0.27) | | (0.27) | | (0.31) | | (0.32) | | (0.34) |
| Net realized gains | | 0 | | 0 | | 0 | | (0.02) | | (0.16) | | 0 |
| Tax basis return of capital | | 0 | | (0.02) | | 0 | | 0 | | 0 | | 0 |
| |
|
| Total distributions to shareholders | | (0.12) | | (0.29) | | (0.27) | | (0.33) | | (0.48) | | (0.34) |
|
| Net asset value, end of period | | $ 6.38 | | $ 6.41 | | $ 6.33 | | $ 6.54 | | $ 6.39 | | $ 6.51 |
|
| Total return2 | | 1.41% | | 5.94% | | 0.88% | | 7.46% | | 5.49% | | 17.89% |
|
| Ratios and supplemental data |
| Net assets, end of period (thousands) | | $61,540 | | $55,110 | | $65,322 | | $79,539 | | $89,236 | | $68,207 |
| Ratios to average net assets |
| Expenses including waivers/reimbursements | | |
| but excluding expense reductions | | 1.88%3 | | 1.90% | | 1.88% | | 1.83% | | 1.91% | | 1.93% |
| Expenses excluding waivers/reimbursements | | |
| and expense reductions | | 1.88%3 | | 1.90% | | 1.88% | | 1.83% | | 1.91% | | 1.93% |
| Net investment income (loss) | | 3.78%3 | | 4.43% | | 3.86% | | 4.34% | | 4.40% | | 5.66% |
| Portfolio turnover rate | | 103% | | 128% | | 100% | | 130% | | 129% | | 129% |
|
1 Net investment income (loss) per share is based on average shares outstanding during the period.
2 Excluding applicable sales charges
3 Annualized
See Notes to Financial Statements
9
| FINANCIAL HIGHLIGHTS |
|
| (For a share outstanding throughout each period) |
| | | Six Months Ended | | Year Ended April 30, |
| October 31, 2007 | |
|
| CLASS I | | (unaudited) | | 2007 | | 2006 | | 2005 | | 2004 | | 2003 |
|
| Net asset value, beginning of period | | $ 6.30 | | $ 6.22 | | $ 6.43 | | $ 6.28 | | $ 6.40 | | $ 5.74 |
|
| Income from investment operations |
| Net investment income (loss) | | 0.151 | | 0.341 | | 0.311 | | 0.34 | | 0.351 | | 0.411 |
Net realized and unrealized gains
or losses on investments | | (0.03) | | 0.08 | | (0.19) | | 0.19 | | 0.07 | | 0.64 |
| |
|
| Total from investment operations | | 0.12 | | 0.42 | | 0.12 | | 0.53 | | 0.42 | | 1.05 |
|
| Distributions to shareholders from |
| Net investment income | | (0.15) | | (0.32) | | (0.33) | | (0.36) | | (0.38) | | (0.39) |
| Net realized gains | | 0 | | 0 | | 0 | | (0.02) | | (0.16) | | 0 |
| Tax basis return of capital | | 0 | | (0.02) | | 0 | | 0 | | 0 | | 0 |
| |
|
| Total distributions to shareholders | | (0.15) | | (0.34) | | (0.33) | | (0.38) | | (0.54) | | (0.39) |
|
| Net asset value, end of period | | $ 6.27 | | $ 6.30 | | $ 6.22 | | $ 6.43 | | $ 6.28 | | $ 6.40 |
|
| Total return | | 1.91% | | 7.02% | | 1.84% | | 8.58% | | 6.56% | | 19.09% |
|
| Ratios and supplemental data |
| Net assets, end of period (thousands) | | $14,197 | | $17,861 | | $20,424 | | $19,216 | | $26,711 | | $13,406 |
| Ratios to average net assets |
| Expenses including waivers/reimbursements | | |
| but excluding expense reductions | | 0.88%2 | | 0.90% | | 0.88% | | 0.82% | | 0.91% | | 0.94% |
| Expenses excluding waivers/reimbursements | | |
| and expense reductions | | 0.88%2 | | 0.90% | | 0.88% | | 0.82% | | 0.91% | | 0.94% |
| Net investment income (loss) | | 4.84%2 | | 5.43% | | 4.88% | | 5.33% | | 5.42% | | 6.75% |
| Portfolio turnover rate | | 103% | | 128% | | 100% | | 130% | | 129% | | 129% |
|
1 Net investment income (loss) per share is based on average shares outstanding during the period.
2 Annualized
See Notes to Financial Statements
10
| SCHEDULE OF INVESTMENTS |
|
| October 31, 2007 (unaudited) | | Principal | | | | |
| | | Amount | | | | Value |
|
| ASSET-BACKED SECURITIES 1.3% |
| NovaStar ABS CDO, Ltd., Ser. 2007-1A, Class A2, FRN, 5.82%, 02/08/2047 144A | | |
| (cost $3,988,000) | | $ 4,000,000 | | $ 3,683,760 |
| |
|
| CORPORATE BONDS 52.8% |
| CONSUMER DISCRETIONARY 2.9% |
| Auto Components 0.2% |
| Goodyear Tire & Rubber Co.: |
| 9.00%, 07/01/2015 (r) | | | | 500,000 | | | | 549,375 |
| FRN, 11.25%, 03/01/2011 | | | | 110,000 | | | | 118,250 |
| |
|
| | | | | 667,625 |
| |
|
| Household Durables 0.2% |
| Libbey, Inc., FRN, 12.38%, 06/01/2011 | | | | 550,000 | | | | 600,875 |
| |
|
| Media 2.2% |
| AMC Entertainment, Inc., Ser. B, 8.625%, 08/15/2012 | | | | 1,500,000 | | | | 1,563,750 |
| Dex Media East, LLC, 9.875%, 11/15/2009 | | | | 1,025,000 | | | | 1,053,187 |
| Lamar Media Corp., 6.625%, 08/15/2015 | | | | 1,250,000 | | | | 1,206,250 |
| Mediacom Broadband, LLC, 8.50%, 10/15/2015 | | | | 550,000 | | | | 544,500 |
| Mediacom Communications Corp., 9.50%, 01/15/2013 | | | | 1,750,000 | | | | 1,758,750 |
| |
|
| | | | | 6,126,437 |
| |
|
| Multi-line Retail 0.2% |
| Neiman Marcus Group, Inc., 9.00%, 10/15/2015 | | | | 500,000 | | | | 530,000 |
| |
|
| Textiles, Apparel & Luxury Goods 0.1% |
| Oxford Industries, Inc., 8.875%, 06/01/2011 | | | | 400,000 | | | | 402,000 |
| |
|
| CONSUMER STAPLES 0.1% |
| Household Products 0.1% |
| Church & Dwight Co., 6.00%, 12/15/2012 (r) | | | | 165,000 | | | | 161,494 |
| |
|
| ENERGY 6.1% |
| Energy Equipment & Services 1.9% |
| Bristow Group, Inc., 7.50%, 09/15/2017 144A | | | | 4,430,000 | | | | 4,585,050 |
| Dresser-Rand Group, Inc., 7.375%, 11/01/2014 | | | | 692,000 | | | | 699,785 |
| |
|
| | | | | 5,284,835 |
| |
|
| Oil, Gas & Consumable Fuels 4.2% |
| Overseas Shipholding Group, Inc., 8.25%, 03/15/2013 | | | | 750,000 | | | | 778,125 |
| Peabody Energy Corp.: |
| 5.875%, 04/15/2016 | | | | 4,565,000 | | | | 4,370,987 |
| 6.875%, 03/15/2013 | | | | 440,000 | | | | 444,400 |
| Sabine Pass LNG, LP, 7.25%, 11/30/2013 | | | | 700,000 | | | | 689,500 |
| Tesoro Corp., Ser. B, 6.50%, 06/01/2017 144A | | | | 3,690,000 | | | | 3,662,325 |
| Williams Cos.: |
| 7.50%, 01/15/2031 | | | | 925,000 | | | | 980,500 |
| 8.125%, 03/15/2012 | | | | 1,000,000 | | | | 1,082,500 |
| |
|
| | | | | 12,008,337 |
| |
|
See Notes to Financial Statements11
| SCHEDULE OF INVESTMENTS continued |
|
| October 31, 2007 (unaudited) | | Principal | | | | |
| | | Amount | | | | Value |
|
| CORPORATE BONDS continued |
| FINANCIALS 9.6% |
| Consumer Finance 0.8% |
| General Motors Acceptance Corp., LLC, 6.875%, 08/28/2012 | | $ 1,500,000 | | $ 1,353,578 |
| Qwest Capital Funding, Inc., 6.50%, 11/15/2018 | | | | 1,100,000 | | | | 981,750 |
| |
|
| | | | | 2,335,328 |
| |
|
| Real Estate Investment Trusts 7.1% |
| Host Marriott Corp.: |
| 7.125%, 11/01/2013 | | | | 750,000 | | | | 765,000 |
| Ser. Q, 6.75%, 06/01/2016 | | | | 7,638,000 | | | | 7,676,190 |
| Omega Healthcare Investors, Inc., 7.00%, 04/01/2014 | | | | 1,000,000 | | | | 1,012,500 |
| Rouse Co., LP, 6.75%, 05/01/2013 144A (r) | | | | 7,621,000 | | | | 7,540,499 |
| Saul Centers, Inc., 7.50%, 03/01/2014 | | | | 3,000,000 | | | | 2,932,500 |
| |
|
| | | | | 19,926,689 |
| |
|
| Real Estate Management & Development 1.7% |
| Forest City Enterprises, Inc., 6.50%, 02/01/2017 | | | | 5,310,000 | | | | 4,938,300 |
| |
|
| INDUSTRIALS 9.9% |
| Aerospace & Defense 2.3% |
| DRS Technologies, Inc.: |
| 6.625%, 02/01/2016 | | | | 1,000,000 | | | | 995,000 |
| 7.625%, 02/01/2018 (r) | | | | 1,000,000 | | | | 1,027,500 |
| L-3 Communications Holdings, Inc.: | | | | | | | | |
| 5.875%, 01/15/2015 | | | | 3,400,000 | | | | 3,332,000 |
| 6.375%, 10/15/2015 | | | | 1,000,000 | | | | 1,005,000 |
| |
|
| | | | | 6,359,500 |
| |
|
| Commercial Services & Supplies 2.7% |
| Allied Waste North America, Inc., 6.875%, 06/01/2017 (r) | | | | 7,635,000 | | | | 7,673,175 |
| |
|
| Electrical Equipment 2.6% |
| Baldor Electric Co., 8.625%, 02/15/2017 (r) | | | | 5,700,000 | | | | 5,970,750 |
| General Cable Corp., 7.125%, 04/01/2017 (r) | | | | 1,500,000 | | | | 1,507,500 |
| |
|
| | | | | 7,478,250 |
| |
|
| Machinery 2.3% |
| Actuant Corp., 6.875%, 06/15/2017 144A | | | | 4,655,000 | | | | 4,678,275 |
| Commercial Vehicle Group, Inc., 8.00%, 07/01/2013 | | | | 875,000 | | | | 844,375 |
| RBS Global, Inc., 11.75%, 08/01/2016 (r) | | | | 1,000,000 | | | | 1,065,000 |
| |
|
| | | | | 6,587,650 |
| |
|
| INFORMATION TECHNOLOGY 5.9% |
| Electronic Equipment & Instruments 0.3% |
| Anixter International, Inc., 5.95%, 03/01/2015 | | | | 1,000,000 | | | | 920,000 |
| |
|
| IT Services 2.1% |
| Iron Mountain, Inc., 6.625%, 01/01/2016 (r) | | | | 6,100,000 | | | | 5,825,500 |
| |
|
See Notes to Financial Statements12
| SCHEDULE OF INVESTMENTS continued |
|
| October 31, 2007 (unaudited) | | Principal | | | | |
| | | Amount | | | | Value |
|
| CORPORATE BONDS continued |
| INFORMATION TECHNOLOGY continued |
| Semiconductors & Semiconductor Equipment 3.5% |
| Freescale Semiconductor, Inc., 8.875%, 12/15/2014 | | $ 10,357,000 | | $ 9,852,096 |
| |
|
| MATERIALS 4.9% |
| Chemicals 0.7% |
| Huntsman International, LLC, 7.375%, 01/01/2015 (r) | | 575,000 | | | | 610,938 |
| Lyondell Chemical Co., 10.50%, 06/01/2013 | | 800,000 | | | | 866,000 |
| MacDermid, Inc., 9.50%, 04/15/2017 144A | | 291,000 | | | | 279,360 |
| Millenium America, Inc., 7.625%, 11/15/2026 | | 140,000 | | | | 121,100 |
| |
|
| | | | | 1,877,398 |
| |
|
| Construction Materials 0.0% |
| Dayton Superior Corp., 13.00%, 06/15/2009 | | 90,000 | | | | 89,550 |
| |
|
| Containers & Packaging 4.0% |
| Ball Corp., 6.625%, 03/15/2018 | | 7,635,000 | | | | 7,577,736 |
| Crown Holdings, Inc., 7.75%, 11/15/2015 (r) | | 1,000,000 | | | | 1,035,000 |
| Greif Brothers Corp., Inc., 6.75%, 02/01/2017 (r) | | 1,540,000 | | | | 1,536,150 |
| Smurfit-Stone Container Corp., 8.375%, 07/01/2012 | | 1,075,000 | | | | 1,080,375 |
| |
|
| | | | | 11,229,261 |
| |
|
| Metals & Mining 0.1% |
| Freeport-McMoRan Copper & Gold, Inc.: |
| 8.25%, 04/01/2015 | | 130,000 | | | | 140,725 |
| 8.375%, 04/01/2017 | | 120,000 | | | | 131,700 |
| |
|
| | | | | 272,425 |
| |
|
| Paper & Forest Products 0.1% |
| P.H. Glatfelter Co., 7.125%, 05/01/2016 | | 400,000 | | | | 398,000 |
| |
|
| TELECOMMUNICATION SERVICES 2.0% |
| Diversified Telecommunication Services 0.4% |
| Qwest Communications International, Inc., 7.875%, 09/01/2011 | | 1,200,000 | | | | 1,272,000 |
| |
|
| Wireless Telecommunication Services 1.6% |
| Centennial Communications Corp.: |
| 8.125%, 02/01/2014 | | 959,000 | | | | 982,975 |
| 10.00%, 01/01/2013 (r) | | 1,175,000 | | | | 1,251,375 |
| Dobson Communications Corp., 8.875%, 10/01/2013 | | 1,175,000 | | | | 1,254,313 |
| MetroPCS Wireless, Inc., 9.25%, 11/01/2014 144A | | 500,000 | | | | 498,750 |
| Rural Cellular Corp., 8.25%, 03/15/2012 | | 450,000 | | | | 471,375 |
| |
|
| | | | | 4,458,788 |
| |
|
| UTILITIES 11.4% |
| Electric Utilities 8.7% |
| Edison Mission Energy, 7.00%, 05/15/2017 144A | | 7,620,000 | | | | 7,486,650 |
| Mirant North America, LLC, 7.375%, 12/31/2013 (r) | | 750,000 | | | | 764,063 |
See Notes to Financial Statements13
| SCHEDULE OF INVESTMENTS continued |
|
| October 31, 2007 (unaudited) | | Principal | | | | |
| | | Amount | | | | Value |
|
| CORPORATE BONDS continued |
| UTILITIES continued |
| Electric Utilities continued |
| NRG Energy, Inc.: |
| 7.375%, 02/01/2016 | | $ 1,500,000 | | $ 1,500,000 |
| 7.375%, 01/15/2017 | | | | 7,635,000 | | | | 7,615,912 |
| Reliant Energy, Inc.: |
| 6.75%, 12/15/2014 | | | | 1,075,000 | | | | 1,099,188 |
| 7.625%, 06/15/2014 (r) | | | | 6,015,000 | | | | 6,097,706 |
| |
|
| | | | | 24,563,519 |
| |
|
| Gas Utilities 0.5% |
| SEMCO Energy, Inc., 7.75%, 05/15/2013 | | | | 1,350,000 | | | | 1,428,710 |
| |
|
| Independent Power Producers & Energy Traders 2.2% |
| AES Corp., 7.75%, 03/01/2014 | | | | 1,000,000 | | | | 1,005,000 |
| Dynegy, Inc.: |
| 7.125%, 05/15/2018 | | | | 3,815,000 | | | | 3,457,344 |
| 8.375%, 05/01/2016 (r) | | | | 1,350,000 | | | | 1,360,125 |
| Tenaska, Inc., 7.00%, 06/30/2021 144A (r) | | | | 326,702 | | | | 329,996 |
| |
|
| | | | | 6,152,465 |
| |
|
| Total Corporate Bonds (cost $151,163,350) | | | | 149,420,207 |
| |
|
| WHOLE LOAN SUBORDINATE COLLATERALIZED MORTGAGE | | |
| OBLIGATIONS 0.0% | |
| FIXED-RATE 0.0% |
| MASTR Resecuritization Trust, Ser. 2005-2, 4.75%, 03/28/2034 (cost $12,846) | | | | 13,090 | | | | 12,886 |
| |
|
| YANKEE OBLIGATIONS - CORPORATE 2.0% |
| FINANCIALS 0.7% |
| Consumer Finance 0.4% |
| Virgin Media Finance plc, 9.125%, 08/15/2016 | | | | 1,000,000 | | | | 1,060,000 |
| |
|
| Diversified Financial Services 0.3% |
| Preferred Term Securities XII, Ltd., FRN, 10.00%, 12/24/2033 | | | | 105,000 | | | | 79,563 |
| Ship Finance International, Ltd., 8.50%, 12/15/2013 | | | | 865,000 | | | | 888,787 |
| |
|
| | | | | 968,350 |
| |
|
| MATERIALS 0.4% |
| Metals & Mining 0.4% |
| Novelis, Inc., 7.25%, 02/15/2015 (r) | | | | 1,065,000 | | | | 1,027,725 |
| |
|
| TELECOMMUNICATION SERVICES 0.9% |
| Diversified Telecommunication Services 0.4% |
| Nordic Telecom Holdings Co., 8.875%, 05/01/2016 144A | | | | 1,000,000 | | | | 1,062,500 |
| |
|
See Notes to Financial Statements14
| SCHEDULE OF INVESTMENTS continued |
|
| October 31, 2007 (unaudited) | | Principal | | | | |
| | | Amount | | | | Value |
|
| YANKEE OBLIGATIONS - CORPORATE continued |
| TELECOMMUNICATION SERVICES continued |
| Wireless Telecommunication Services 0.5% |
| Intelsat, Ltd.: |
| 9.25%, 06/15/2016 | | $ 500,000 | | $ 521,250 |
| 11.25%, 06/15/2016 | | | | 375,000 | | | | 405,000 |
| Rogers Wireless, Inc., 6.375%, 03/01/2014 | | | | 465,000 | | | | 475,631 |
| |
|
| | | | | 1,401,881 |
| |
|
| Total Yankee Obligations - Corporate (cost $5,398,849) | | | | 5,520,456 |
| |
|
|
| | | | Shares | | | | Value |
|
| COMMON STOCKS 29.1% |
| ENERGY 5.0% |
| Energy Equipment & Services 2.1% |
| Grant Prideco, Inc | | | 45,000 | | | | 2,212,200 |
| Halliburton Co | | | 35,000 | | | | 1,379,700 |
| Pride International, Inc. | | | 60,000 | | | | 2,214,000 |
| |
|
| | | | | 5,805,900 |
| |
|
| Oil, Gas & Consumable Fuels 2.9% |
| Marathon Oil Corp. | | | 35,000 | | | | 2,069,550 |
| Peabody Energy Corp. (r) | | | 40,000 | | | | 2,230,000 |
| Tesoro Corp. (r) | | | 35,000 | | | | 2,118,550 |
| Valero Energy Corp. | | | 25,000 | | | | 1,760,750 |
| |
|
| | | | | 8,178,850 |
| |
|
| FINANCIALS 4.9% |
| Capital Markets 0.3% |
| Lazard, Ltd. (r) | | | 17,800 | | | | 893,560 |
| |
|
| Real Estate Investment Trusts 4.6% |
| General Growth Properties, Inc. | | | 18,000 | | | | 978,480 |
| Host Hotels & Resorts, Inc. | | | 147,300 | | | | 3,264,168 |
| Macerich Co. (r) | | | 11,000 | | | | 942,810 |
| Mack-Cali Realty Corp. (r) | | | 45,000 | | | | 1,781,550 |
| Plum Creek Timber Co., Inc. (r) | | | 100,000 | | | | 4,467,000 |
| Simon Property Group, Inc. | | | 15,000 | | | | 1,561,650 |
| |
|
| | | | | 12,995,658 |
| |
|
| HEALTH CARE 2.2% |
| Life Sciences Tools & Services 2.2% |
| Millipore Corp. * | | | 15,000 | | | | 1,164,750 |
| PerkinElmer, Inc. | | | 90,000 | | | | 2,476,800 |
| Thermo Fisher Scientific, Inc. * | | | 45,000 | | | | 2,646,450 |
| |
|
| | | | | 6,288,000 |
| |
|
See Notes to Financial Statements15
| SCHEDULE OF INVESTMENTS continued |
|
| October 31, 2007 (unaudited) |
| | | Shares | | | | Value |
|
| COMMON STOCKS continued |
| INDUSTRIALS 11.4% |
| Aerospace & Defense 1.6% |
| Boeing Co. | | 15,200 | | $ 1,498,568 |
| DRS Technologies, Inc. (r) | | 27,000 | | | | 1,550,880 |
| Raytheon Co. | | 22,000 | | | | 1,399,420 |
| |
|
| | | | | 4,448,868 |
| |
|
| Building Products 0.8% |
| Lennox International, Inc. (r) | | 60,000 | | | | 2,142,000 |
| |
|
| Electrical Equipment 4.8% |
| Ametek, Inc. | | 36,000 | | | | 1,692,000 |
| Cooper Industries, Inc. | | 60,000 | | | | 3,143,400 |
| Emerson Electric Co. | | 55,000 | | | | 2,874,850 |
| General Cable Corp. * (r) | | 50,000 | | | | 3,599,500 |
| Rockwell Automation, Inc. | | 15,000 | | | | 1,033,200 |
| Roper Industries, Inc. (r) | | 16,500 | | | | 1,168,365 |
| |
|
| | | | | 13,511,315 |
| |
|
| Machinery 3.1% |
| Danaher Corp. | | 15,000 | | | | 1,285,050 |
| Donaldson Co., Inc. (r) | | 26,100 | | | | 1,118,646 |
| Dover Corp. | | 25,000 | | | | 1,150,000 |
| IDEX Corp. (r) | | 37,000 | | | | 1,310,540 |
| Kennametal, Inc. | | 12,500 | | | | 1,140,125 |
| Pall Corp. | | 35,000 | | | | 1,402,450 |
| Parker Hannifin Corp. | | 16,800 | | | | 1,350,216 |
| |
|
| | | | | 8,757,027 |
| |
|
| Road & Rail 0.8% |
| Norfolk Southern Corp. | | 45,000 | | | | 2,324,250 |
| |
|
| Trading Companies & Distributors 0.3% |
| Wesco International, Inc. * (r) | | 19,600 | | | | 914,340 |
| |
|
| INFORMATION TECHNOLOGY 2.3% |
| Communications Equipment 0.4% |
| CommScope, Inc. * (r) | | 25,000 | | | | 1,179,250 |
| |
|
| Electronic Equipment & Instruments 1.9% |
| Agilent Technologies, Inc. * | | 25,000 | | | | 921,250 |
| Amphenol Corp., Class A | | 100,000 | | | | 4,427,000 |
| |
|
| | | | | 5,348,250 |
| |
|
| MATERIALS 1.7% |
| Chemicals 0.7% |
| FMC Corp. | | 26,000 | | | | 1,495,000 |
| Huntsman Corp. | | 19,570 | | | | 515,670 |
| |
|
| | | | | 2,010,670 |
| |
|
See Notes to Financial Statements16
| SCHEDULE OF INVESTMENTS continued |
|
| October 31, 2007 (unaudited) |
| | | Shares | | | | Value |
|
| COMMON STOCKS continued |
| MATERIALS continued |
| Construction Materials 0.4% |
| Texas Industries, Inc. (r) | | 15,200 | | $ 1,110,512 |
| |
|
| Metals & Mining 0.4% |
| Freeport-McMoRan Copper & Gold, Inc. | | 10,000 | | | | 1,176,800 |
| |
|
| Paper & Forest Products 0.2% |
| Louisiana-Pacific Corp. (r) | | 37,000 | | | | 609,020 |
| |
|
| UTILITIES 1.6% |
| Electric Utilities 0.8% |
| Duke Energy Corp. | | 15,000 | | | | 287,550 |
| NRG Energy, Inc. * (r) | | 40,000 | | | | 1,826,400 |
| Progress Energy, Inc. | | 5,000 | | | | 240,000 |
| |
|
| | | | | 2,353,950 |
| |
|
| Gas Utilities 0.8% |
| Questar Corp. | | 18,000 | | | | 1,027,440 |
| Southern Union Co. | | 40,000 | | | | 1,260,000 |
| |
|
| | | | | 2,287,440 |
| |
|
| Total Common Stocks (cost $81,537,801) | | | | 82,335,660 |
| |
|
|
| | | Principal | | | | |
| | Amount | | | | Value |
|
| CONVERTIBLE DEBENTURES 9.7% |
| FINANCIALS 0.9% |
| Real Estate Investment Trusts 0.9% |
| Alexandria Real Estate Equities, Inc., 3.70%, 01/15/2027 144A | | $ 2,500,000 | | | | 2,556,250 |
| |
|
| HEALTH CARE 5.9% |
| Health Care Equipment & Supplies 5.3% |
| Inverness Medical Innovations, Inc., 3.00%, 05/15/2016 144A | | 10,800,000 | | | | 14,958,000 |
| |
|
| Life Sciences Tools & Services 0.6% |
| Millipore Corp., 3.75%, 06/01/2026 | | 1,500,000 | | | | 1,653,750 |
| |
|
| INDUSTRIALS 2.9% |
| Electrical Equipment 2.9% |
| General Cable Corp., 1.00%, 10/15/2012 144A | | 7,640,000 | | | | 8,356,250 |
| |
|
| Total Convertible Debentures (cost $22,835,247) | | | | 27,524,250 |
| |
|
See Notes to Financial Statements17
| SCHEDULE OF INVESTMENTS continued |
|
| October 31, 2007 (unaudited) | | Principal | | | | |
| | | Amount | | | | Value |
|
| INVESTMENTS OF CASH COLLATERAL FROM SECURITIES LOANED 15.6% |
| REPURCHASE AGREEMENTS ^ 15.6% |
| Credit Suisse, LLC, 4.94%, dated 10/31/2007, maturing 11/01/2007, | | |
| maturity value $25,003,431 | | $ 25,000,000 | | $ 25,000,000 |
| Lehman Brothers, Inc., 4.93%, dated 10/31/2007, maturing 11/01/2007, | | |
| maturity value $18,976,111 | | 18,973,513 | | | | 18,973,513 |
| |
|
| Total Investments of Cash Collateral from Securities Loaned | | |
| (cost $43,973,513) | | | | 43,973,513 |
| |
|
|
| | | Shares | | | | Value |
|
| SHORT-TERM INVESTMENTS 1.9% |
| MUTUAL FUND SHARES 1.9% |
| Evergreen Institutional Money Market Fund, Class I, 5.03% ø q | | |
| (cost $5,387,864) | | 5,387,864 | | | | 5,387,864 |
| |
|
| Total Investments (cost $314,297,470) 112.4% | | | | 317,858,596 |
| Other Assets and Liabilities (12.4%) | | | | (35,128,288) |
| |
|
| Net Assets 100.0% | | $ 282,730,308 |
| |
|
| 144A | | Security that may be sold to qualified institutional buyers under Rule 144A of the Securities Act of 1933, as amended. |
| | | This security has been determined to be liquid under guidelines established by the Board of Trustees, unless otherwise |
| | | noted. |
| (r) | | All or a portion of this security is on loan. |
| * | | Non-income producing security |
| ^ | | Collateralized by U.S. government agency obligations at period end. |
| ø | | Evergreen Investment Management Company, LLC is the investment advisor to both the Fund and the money market |
| | | fund. |
| q | | Rate shown is the 7-day annualized yield at period end. |
Summary of Abbreviations
| CDO | | Collateralized Debt Obligation |
| FRN | | Floating Rate Note |
| MASTR | | Mortgage Asset Securitization Transactions, Inc. |
The following table shows the percent of total investments (excluding equity positions, segregated cash and cash equivalents and collateral from securities on loan) by credit quality based on Moody’s and Standard & Poor’s ratings as of October 31, 2007:
| AAA | | 9.7% |
| BBB | | 0.8% |
| BB | | 39.8% |
| B | | 45.3% |
| CCC | | 3.2% |
| NR | | 1.2% |
| |
|
| | | 100.0% |
| | |
|
See Notes to Financial Statements18
SCHEDULE OF INVESTMENTS continued
October 31, 2007 (unaudited)
The following table shows the percent of total investments (excluding equity positions, segregated cash and cash equivalents and collateral from securities on loan) based on effective maturity as of October 31, 2007:
| Less than 1 year | | 10.9% |
| 1 to 3 year(s) | | 2.1% |
| 3 to 5 years | | 9.9% |
| 5 to 10 years | | 68.4% |
| 10 to 20 years | | 6.4% |
| 20 to 30 years | | 0.5% |
| Greater than 30 years | | 1.8% |
| |
|
| | | 100.0% |
| | |
|
See Notes to Financial Statements
19
| STATEMENT OF ASSETS AND LIABILITIES |
|
| October 31, 2007 (unaudited) |
|
| Assets |
| Investments in securities, at value (cost $264,936,093) including $43,226,242 of securities | | |
| loaned | | $ 268,497,219 |
| Investments in affiliated money market fund, at value (cost $5,387,864) | | 5,387,864 |
| Investments in repurchase agreements, at value (cost $43,973,513) | | 43,973,513 |
|
| Total investments | | 317,858,596 |
| Foreign currency, at value (cost $5,174,199) | | 5,305,857 |
| Receivable for Fund shares sold | | 602,061 |
| Dividends and interest receivable | | 4,088,124 |
| Receivable for securities lending income | | 3,147 |
| Prepaid expenses and other assets | | 14,916,101 |
|
| Total assets | | 342,773,886 |
|
| Liabilities |
| Dividends payable | | 272,877 |
| Payable for Fund shares redeemed | | 828,595 |
| Payable for securities on loan | | 43,973,513 |
| Demand note payable | | 14,877,209 |
| Advisory fee payable | | 570 |
| Due to other related parties | | 3,846 |
| Accrued expenses and other liabilities | | 86,968 |
|
| Total liabilities | | 60,043,578 |
|
| Net assets | | $ 282,730,308 |
|
| Net assets represented by |
| Paid-in capital | | $ 329,333,157 |
| Overdistributed net investment income | | (283,283) |
| Accumulated net realized losses on investments | | (50,012,350) |
| Net unrealized gains on investments | | 3,692,784 |
|
| Total net assets | | $ 282,730,308 |
|
| Net assets consists of |
| Class A | | $ 160,010,095 |
| Class B | | 46,983,188 |
| Class C | | 61,540,118 |
| Class I | | 14,196,907 |
|
| Total net assets | | $ 282,730,308 |
|
| Shares outstanding (unlimited number of shares authorized) |
| Class A | | 25,127,342 |
| Class B | | 7,354,599 |
| Class C | | 9,648,621 |
| Class I | | 2,265,268 |
|
| Net asset value per share |
| Class A | | $ 6.37 |
| Class A — Offering price (based on sales charge of 4.75%) | | $ 6.69 |
| Class B | | $ 6.39 |
| Class C | | $ 6.38 |
| Class I | | $ 6.27 |
|
See Notes to Financial Statements20
| STATEMENT OF OPERATIONS |
|
| Six Months Ended October 31, 2007 (unaudited) |
|
| Investment income |
| Interest | | $ 7,168,778 |
| Income from affiliate | | 551,974 |
| Dividends | | 417,970 |
| Securities lending | | 20,151 |
|
| Total investment income | | 8,158,873 |
|
| Expenses |
| Advisory fee | | 609,419 |
| Distribution Plan expenses |
| Class A | | 244,580 |
| Class B | | 250,795 |
| Class C | | 285,855 |
| Administrative services fee | | 142,181 |
| Transfer agent fees | | 326,498 |
| Trustees’ fees and expenses | | 7,172 |
| Printing and postage expenses | | 26,121 |
| Custodian and accounting fees | | 101,039 |
| Registration and filing fees | | 27,155 |
| Professional fees | | 19,598 |
| Interest expense | | 1,921 |
| Other | | 5,252 |
|
| Total expenses | | 2,047,586 |
| Less: Expense reductions | | (4,539) |
| Expense reimbursements | | (40,764) |
|
| Net expenses | | 2,002,283 |
|
| Net investment income | | 6,156,590 |
|
| Net realized and unrealized gains or losses on investments |
| Net realized gains or losses on: |
| Securities | | 2,826,331 |
| Foreign currency related transactions | | (934,128) |
|
| Net realized gains on investments | | 1,892,203 |
| Net change in unrealized gains or losses on investments | | (4,280,905) |
|
| Net realized and unrealized gains or losses on investments | | (2,388,702) |
|
| Net increase in net assets resulting from operations | | $ 3,767,888 |
|
See Notes to Financial Statements21
| STATEMENTS OF CHANGES IN NET ASSETS |
|
| | | Six Months Ended | | |
| | October 31, 2007 | | Year Ended |
| | (unaudited) | | April 30, 2007 |
|
| Operations |
| Net investment income | | $ 6,156,590 | | $ 15,923,558 |
| Net realized gains or losses on | | |
| investments | | 1,892,203 | | (3,220,142) |
| Net change in unrealized gains or | | |
| losses on investments | | (4,280,905) | | 7,133,625 |
|
| Net increase in net assets resulting | | |
| from operations | | 3,767,888 | | 19,837,041 |
|
| Distributions to shareholders from |
| Net investment income |
| Class A | | (3,653,875) | | (9,094,484) |
| Class B | | (941,880) | | (2,627,449) |
| Class C | | (1,057,562) | | (2,528,220) |
| Class I | | (379,535) | | (1,045,572) |
| Tax basis return of capital |
| Class A | | 0 | | (519,958) |
| Class B | | 0 | | (175,306) |
| Class C | | 0 | | (168,861) |
| Class I | | 0 | | (57,606) |
|
| Total distributions to shareholders | | (6,032,852) | | (16,217,456) |
|
| | | Shares | | Shares |
| Capital share transactions |
| Proceeds from shares sold |
| Class A | | 2,165,775 | | 13,544,339 | | 2,802,341 | | 17,655,099 |
| Class B | | 316,120 | | 1,996,862 | | 662,966 | | 4,199,618 |
| Class C | | 2,183,175 | | 13,608,537 | | 935,756 | | 5,896,227 |
| Class I | | 148,490 | | 905,116 | | 724,245 | | 4,513,577 |
|
| | | 30,054,854 | | 32,264,521 |
|
| Net asset value of shares issued in | | |
| reinvestment of distributions | |
| Class A | | 423,968 | | 2,641,990 | | 1,101,527 | | 6,947,693 |
| Class B | | 83,541 | | 522,358 | | 242,976 | | 1,537,222 |
| Class C | | 93,359 | | 582,810 | | 233,170 | | 1,473,134 |
| Class I | | 41,309 | | 253,262 | | 86,125 | | 534,959 |
|
| | | 4,000,420 | | 10,493,008 |
|
| Automatic conversion of Class B shares | | |
| to Class A shares | |
| Class A | | 275,927 | | 1,716,631 | | 878,428 | | 5,528,422 |
| Class B | | (275,111) | | (1,716,631) | | (875,646) | | (5,528,422) |
|
| | | 0 | | 0 |
|
| Payment for shares redeemed |
| Class A | | (4,408,125) | | (27,347,522) | | (9,675,630) | | (60,907,111) |
| Class B | | (1,324,362) | | (8,258,820) | | (2,810,537) | | (17,750,836) |
| Class C | | (1,220,737) | | (7,628,194) | | (2,894,878) | | (18,242,199) |
| Class I | | (758,069) | | (4,555,694) | | (1,260,417) | | (7,853,118) |
|
| | | (47,790,230) | | (104,753,264) |
|
| Net decrease in net assets resulting | | |
| from capital share transactions | | (13,734,956) | | (61,995,735) |
|
| Total decrease in net assets | | (15,999,920) | | (58,376,150) |
| Net assets |
| Beginning of period | | 298,730,228 | | 357,106,378 |
|
| End of period | | $ 282,730,308 | | $ 298,730,228 |
|
| Undistributed (overdistributed) net | | |
| investment income (loss) | | $ (283,283) | | $ 267,621 |
|
See Notes to Financial Statements22
NOTES TO FINANCIAL STATEMENTS (unaudited)
1. ORGANIZATION
Evergreen Diversified Income Builder Fund (the “Fund”) is a diversified series of Evergreen Fixed Income Trust (the “Trust”), a Delaware statutory trust organized on September 18, 1997. The Trust is an open-end management investment company registered under the Investment Company Act of 1940, as amended (the “1940 Act”).
The Fund offers Class A, Class B, Class C and Class I. Class A shares are sold with a front-end sales charge. However, Class A share investments of $1 million or more are not subject to a front-end sales charge but are subject to a contingent deferred sales charge of 1.00% upon redemption within 18 months. Class B shares are sold without a front-end sales charge but are subject to a contingent deferred sales charge that is payable upon redemption and decreases depending on how long the shares have been held. Class C shares are sold without a front-end sales charge but are subject to a contingent deferred sales charge that is payable upon redemption within one year. Class I shares are sold without a front-end sales charge or contingent deferred sales charge. Each class of shares, except Class I shares, pays an ongoing distribution fee.
2. SIGNIFICANT ACCOUNTING POLICIES
The following is a summary of significant accounting policies consistently followed by the Fund in the preparation of its financial statements. The policies are in conformity with generally accepted accounting principles in the United States of America, which require management to make estimates and assumptions that affect amounts reported herein. Actual results could differ from these estimates.
a. Valuation of Investments
Portfolio debt securities acquired with more than 60 days to maturity are fair valued using matrix pricing methods determined by an independent pricing service which takes into consideration such factors as similar security prices, yields, maturities, liquidity and ratings. Securities for which valuations are not readily available from an independent pricing service may be valued by brokers which use prices provided by market makers or estimates of market value obtained from yield data relating to investments or securities with similar characteristics.
Listed equity securities are usually valued at the last sales price or official closing price on the national securities exchange where the securities are principally traded.
Short-term securities with remaining maturities of 60 days or less at the time of purchase are valued at amortized cost, which approximates market value.
Investments in other mutual funds are valued at net asset value. Securities for which market quotations are not readily available or not reflective of current market value are valued at fair value as determined by the investment advisor in good faith, according to procedures approved by the Board of Trustees.
23
NOTES TO FINANCIAL STATEMENTS (unaudited) continued
b. Repurchase agreements
Securities pledged as collateral for repurchase agreements are held by the custodian bank or in a segregated account in the Fund’s name until the agreements mature. Collateral for certain tri-party repurchase agreements is held at the counterparty’s custodian in a segregated account for the benefit of the Fund and the counterparty. Each agreement requires that the market value of the collateral be sufficient to cover payments of interest and principal. However, in the event of default or bankruptcy by the other party to the agreement, retention of the collateral may be subject to legal proceedings. The Fund will enter into repurchase agreements with banks and other financial institutions, which are deemed by the investment advisor to be creditworthy pursuant to guidelines established by the Board of Trustees. In certain instances, the Fund’s securities lending agent may provide collateral in the form of repurchase agreements.
c. Foreign currency translation
All assets and liabilities denominated in foreign currencies are translated into U.S. dollar amounts at the date of valuation. Purchases and sales of portfolio securities and income items denominated in foreign currencies are translated into U.S. dollar amounts on the respective dates of such transactions. The Fund does not separately account for that portion of the results of operations resulting from changes in foreign exchange rates on investments and the fluctuations arising from changes in market prices of securities held. Such fluctuations are included with the net realized and unrealized gains or losses on investments.
d. Forward foreign currency contracts
A forward foreign currency contract is an agreement between two parties to purchase or sell a specific currency for an agreed-upon price at a future date. The Fund enters into forward foreign currency contracts to facilitate transactions in foreign-denominated securities and to attempt to minimize the risk to the Fund from adverse changes in the relationship between currencies. Forward foreign currency contracts are recorded at the forward rate and marked-to-market daily. When the contracts are closed, realized gains and losses arising from such transactions are recorded as realized gains or losses on foreign currency related transactions. The Fund could be exposed to risks if the counterparties to the contracts are unable to meet the terms of their contracts or if the value of the foreign currency changes unfavorably.
e. When-issued and delayed delivery transactions
The Fund records when-issued or delayed delivery securities as of trade date and maintains security positions such that sufficient liquid assets will be available to make payment for the securities purchased. Securities purchased on a when-issued or delayed delivery basis are marked-to-market daily and begin earning interest on the settlement date. Losses may occur on these transactions due to changes in market conditions or the failure of counterparties to perform under the contract.
f. Securities lending
The Fund may lend its securities to certain qualified brokers in order to earn additional income. The Fund receives compensation in the form of fees or interest earned on the investment of any cash collateral received. The Fund also continues to receive interest and dividends on the securities loaned. The Fund receives collateral in the form of cash or securities with a market value at
24
NOTES TO FINANCIAL STATEMENTS (unaudited) continued
least equal to the market value of the securities on loan, including accrued interest. In the event of default or bankruptcy by the borrower, the Fund could experience delays and costs in recovering the loaned securities or in gaining access to the collateral. The Fund has the right under the lending agreement to recover the securities from the borrower on demand.
g. Dollar roll transactions
The Fund may enter into dollar roll transactions with respect to mortgage-backed securities. In a dollar roll transaction, the Fund sells mortgage-backed securities to financial institutions and simultaneously agrees to accept substantially similar (same type, coupon and maturity) securities at a later date at an agreed upon price. The Fund will use the proceeds generated from the transactions to invest in short-term investments, which may enhance the Fund’s current yield and total return. The Fund accounts for dollar roll transactions as purchases and sales. The Fund could be exposed to risks if the counterparty defaults on its obligation to perform under the terms of the agreement, if the Fund receives inferior securities in comparison to what was sold to the counterparty at redelivery or if there are variances in paydown speed between the mortgage-related pools.
h. Security transactions and investment income
Security transactions are recorded on trade date. Realized gains and losses are computed using the specific cost of the security sold. Interest income is recorded on the accrual basis and includes accretion of discounts and amortization of premiums. Dividend income is recorded on the ex-dividend date or in the case of some foreign securities, on the date when the Fund is made aware of the dividend.
i. Federal taxes
The Fund intends to continue to qualify as a regulated investment company and distribute all of its taxable income, including any net capital gains (which have already been offset by available capital loss carryovers). Accordingly, no provision for federal taxes is required.
j. Distributions
Distributions to shareholders from net investment income are accrued daily and paid monthly. Distributions from net realized gains, if any, are recorded on the ex-dividend date. Such distributions are determined in conformity with income tax regulations, which may differ from generally accepted accounting principles.
k. Class allocations
Income, common expenses and realized and unrealized gains and losses are allocated to the classes based on the relative net assets of each class. Distribution fees, if any, are calculated daily at the class level based on the appropriate net assets of each class and the specific expense rates applicable to each class.
3. ADVISORY FEE AND OTHER TRANSACTIONS WITH AFFILIATES
Evergreen Investment Management Company, LLC (“EIMC”), an indirect, wholly-owned subsidiary of Wachovia Corporation (“Wachovia”), is the investment advisor to the Fund and is
25
NOTES TO FINANCIAL STATEMENTS (unaudited) continued
paid a fee at an annual rate of 2% of the Fund’s gross investment income plus an amount determined by applying percentage rates to the aggregate average daily net assets of the Fund, and its variable annuity counterpart, VA Diversified Income Builder Fund, starting at 0.31% and declining to 0.16% as aggregate average daily net assets increase. For the six months ended October 31, 2007, the advisory fee was equivalent to 0.43% of the Fund’s average daily net assets (on an annualized basis).
Prior to June 1, 2007, Tattersall Advisory Group, Inc., an indirect, wholly-owned subsidiary of Wachovia, served as the investment sub-advisor to the Fund and was paid by EIMC for its services to the Fund.
Also, prior to June 1, 2007, First International Advisors, Inc. d/b/a Evergreen International Advisors, an indirect, wholly-owned subsidiary of Wachovia, served as the investment sub-advisor to the Fund and was paid by EIMC for its services to the Fund.
From time to time, EIMC may voluntarily or contractually waive its fee and/or reimburse expenses in order to limit operating expenses. During the six months ended October 31, 2007, EIMC voluntarily reimbursed Distribution Plan expenses (see Note 4) relating to Class A shares in the amount of $40,764.
The Fund may invest in Evergreen-managed money market funds, which are also advised by EIMC. Income earned on these investments is included in income from affiliate on the Statement of Operations.
Evergreen Investment Services, Inc. (“EIS”), an indirect, wholly-owned subsidiary of Wachovia, is the administrator to the Fund. As administrator, EIS provides the Fund with facilities, equipment and personnel and is paid an annual rate determined by applying percentage rates to the aggregate average daily net assets of the Evergreen funds (excluding money market funds and Evergreen Institutional Enhanced Income Fund), starting at 0.10% and declining to 0.05% as the aggregate average daily net assets of the Evergreen funds (excluding money market funds and Evergreen Institutional Enhanced Income Fund) increase.
Evergreen Service Company, LLC (“ESC”), an indirect, wholly-owned subsidiary of Wachovia, is the transfer and dividend disbursing agent for the Fund. ESC receives account fees that vary based on the type of account held by the shareholders in the Fund. For the six months ended October 31, 2007 the transfer agent fees were equivalent to an annual rate of 0.23% of the Fund’s average daily net assets.
The Fund has placed a portion of its portfolio transactions with brokerage firms that are affiliates of Wachovia. During the six months ended October 31, 2007, the Fund paid brokerage commissions of $9,635 to Wachovia Securities, LLC.
4. DISTRIBUTION PLANS
EIS also serves as distributor of the Fund’s shares. The Fund has adopted Distribution Plans, as allowed by Rule 12b-1 of the 1940 Act, for each class of shares, except Class I. Under the
26
NOTES TO FINANCIAL STATEMENTS (unaudited) continued
Distribution Plans, distribution fees are paid at an annual rate of 0.30% of the average daily net assets for Class A shares and 1.00% of the average daily net assets for each of Class B and Class C shares.
For the six months ended October 31, 2007 EIS received $14,438 from the sale of Class A shares and $61,646 and $1,626 in contingent deferred sales charges from redemptions of Class B and Class C shares, respectively.
5. INVESTMENT TRANSACTIONS
Cost of purchases and proceeds from sales of investment securities (excluding short-term securities) were as follows for the six months ended October 31, 2007:
| Cost of Purchases | | Proceeds from Sales |
|
| | | Non-U.S. | | | | Non-U.S. |
| U.S. Government | | Government | | U.S. Government | | Government |
|
| $53,553,389 | | $233,554,554 | | $143,434,777 | | $199,738,199 |
|
During the six months ended October 31, 2007, the Fund loaned securities to certain brokers. At October 31, 2007, the value of securities on loan and the total value of collateral received for securities loaned amounted to $43,226,242 and $43,973,513, respectively.
On October 31, 2007, the aggregate cost of securities for federal income tax purposes was $314,506,916. The gross unrealized appreciation and depreciation on securities based on tax cost was $10,147,967 and $6,796,287, respectively, with a net unrealized appreciation of $3,351,680.
As of April 30, 2007, the Fund had $51,449,266 in capital loss carryovers for federal income tax purposes expiring as follows:
| Expiration |
|
| 2008 | | 2009 | | 2010 | | 2015 |
|
| $6,306,504 | | $ 14,759,243 | | $ 27,292,961 | | $ 3,090,558 |
|
Certain portions of the capital loss carryovers of the Fund were assumed as a result of acquisitions. These losses are subject to certain limitations prescribed by the Internal Revenue Code.
For income tax purposes, capital losses incurred after October 31 within the Fund’s fiscal year are deemed to arise on the first business day of the following fiscal year. As of April 30, 2007, the Fund incurred and elected to defer post-October losses of $307,781.
6. INTERFUND LENDING
Pursuant to an Exemptive Order issued by the SEC, the Fund may participate in an interfund lending program with certain funds in the Evergreen fund family. This program allows the Fund to borrow from, or lend money to, other participating funds. During the six months ended October 31, 2007, the Fund did not participate in the interfund lending program.
27
NOTES TO FINANCIAL STATEMENTS (unaudited) continued
7. EXPENSE REDUCTIONS
Through expense offset arrangements with ESC and the Fund’s custodian, a portion of fund expenses has been reduced.
8. DEFERRED TRUSTEES’ FEES
Each Trustee of the Fund may defer any or all compensation related to performance of his or her duties as a Trustee. The Trustees’ deferred balances are allocated to deferral accounts, which are included in the accrued expenses for the Fund. The investment performance of the deferral accounts is based on the investment performance of certain Evergreen funds. Any gains earned or losses incurred in the deferral accounts are reported in the Fund’s Trustees’ fees and expenses. At the election of the Trustees, the deferral account will be paid either in one lump sum or in quarterly installments for up to ten years.
9. FINANCING AGREEMENT
The Fund and certain other Evergreen funds share in an unsecured revolving credit commitment for temporary and emergency purposes, including the funding of redemptions, as permitted by each participating fund’s borrowing restrictions. Borrowings under this facility bear interest at 0.50% per annum above the Federal Funds rate. All of the participating funds are charged an annual commitment fee on the unused balance, which is allocated pro rata. The credit facility is for $100 million with an annual commitment fee of 0.08% . During the six months ended October 31, 2007, the Fund had average borrowings outstanding of $32,285, (on an annualized basis) at an average rate of 5.95% and paid interest of $1,921.
10. REGULATORY MATTERS AND LEGAL PROCEEDINGS
Pursuant to an administrative order issued by the SEC on September 19, 2007, EIMC, EIS, ESC (collectively, the “Evergreen Entities”), Wachovia Securities, LLC and the SEC have entered into an agreement settling allegations of (i) improper short-term trading arrangements in effect prior to May 2003 involving former officers and employees of EIMC and certain broker-dealers, (ii) insufficient systems for monitoring exchanges and enforcing exchange limitations as stated in certain funds’ prospectuses, and (iii) inadequate e-mail retention practices. Under the settlement, the Evergreen Entities were censured and will pay approximately $32 million in disgorgement and penalties. This amount, along with a fine assessed by the SEC against Wachovia Securities, LLC will be distributed pursuant to a plan to be developed by an independent distribution consultant and approved by the SEC. The Evergreen Entities neither admitted nor denied the allegations and findings set forth in its settlement with the SEC.
EIS has entered into an agreement with the NASD (now known as the Financial Industry Regulatory Authority (“FINRA”)) settling allegations that EIS (i) arranged for Evergreen fund portfolio trades to be directed to Wachovia Securities, LLC, an affiliate of EIS that sold Evergreen fund shares, during the period of January 2001 to December 2003 and (ii) provided non-cash compensation by sponsoring offsite meetings attended by Wachovia Securities, LLC brokers during that period, where the eligibility of a broker to attend the meetings depended upon the
28
NOTES TO FINANCIAL STATEMENTS (unaudited) continued
broker meeting certain sales targets of Evergreen fund shares. Pursuant to the settlement agreement, EIS has agreed to a censure and a fine of $4,200,000. EIS neither admitted nor denied the allegations and findings set forth in its agreement with the NASD.
In addition, the Evergreen funds and EIMC and certain of its affiliates are involved in various legal actions, including private litigation and class action lawsuits. EIMC does not expect that any of such legal actions currently pending or threatened will have a material adverse impact on the financial position or operations of any of the Evergreen funds or on EIMC’s ability to provide services to the Evergreen funds.
Although EIMC believes that none of the matters discussed above will have a material adverse impact on the Evergreen funds, there can be no assurance that these matters and any publicity surrounding or resulting from them will not result in reduced sales or increased redemptions of Evergreen fund shares, which could increase Evergreen fund transaction costs or operating expenses, or that they will not have other adverse consequences on the Evergreen funds.
11. NEW ACCOUNTING PRONOUNCEMENTS
In June 2006, the Financial Accounting Standards Board (“FASB”) issued FASB Interpretation No. 48, Accounting for Uncertainty in Income Taxes — an interpretation of FASB statement 109 (“FIN 48”). FIN 48 supplements FASB 109 by prescribing a recognition threshold and measurement attribute for the financial statement recognition and measurement of a tax position taken or expected to be taken in a tax return. The Fund’s financial statements have not been impacted by the adoption of FIN 48. However, the conclusions regarding FIN 48 may be subject to review and adjustment at a later date based on factors including, but not limited to, further implementation guidance expected from FASB, and on-going analysis of tax laws, regulations, and interpretations thereof.
In September 2006, FASB issued Statement of Financial Accounting Standards No. 157, Fair Value Measurements (“FAS 157”). FAS 157 establishes a single authoritative definition of fair value, establishes a framework for measuring fair value and expands disclosures about fair value measurements. FAS 157 applies to fair value measurements already required or permitted by existing standards. The change to current generally accepted accounting principles from the application of FAS 157 relates to the definition of fair value, the methods used to measure fair value, and the expanded disclosures about fair value measurements. Management of the Fund does not believe the adoption of FAS 157 will materially impact the financial statement amounts, however, additional disclosures may be required about the inputs used to develop the measurements and the effect of certain of the measurements on changes in net assets for the period. FAS 157 is effective for financial statements issued for fiscal years beginning after November 15, 2007 and interim periods within those fiscal years.
29
ADDITIONAL INFORMATION (unaudited)
INFORMATION ABOUT THE REVIEW AND APPROVAL OF THE FUND’S INVESTMENT ADVISORY AGREEMENT
Each year, the Fund’s Board of Trustees is required to consider whether to continue in place the Fund’s investment advisory agreement. In September 2007, the Trustees, including a majority of the Trustees who are not interested persons (as that term is defined in the 1940 Act) of the Fund or of EIMC, approved the continuation of the Fund’s investment advisory agreement. (References below to the “Fund” are to Evergreen Diversified Income Builder Fund; references to the “funds” are to the Evergreen funds generally.)
At the same time, the Trustees considered the continuation of the investment advisory agreements for all of the funds, and the description below refers in many cases to the Trustees’ process and conclusions in connection with their consideration of this matter for all of the funds. (See “Certain Fund-Specific Considerations” below for a discussion regarding certain factors considered by the Trustees relating specifically to the Fund.) In all of its deliberations, the Board of Trustees and the disinterested Trustees were advised by independent counsel to the disinterested Trustees and counsel to the funds.
The review process. The 1940 Act requires that the Board of Trustees request and evaluate, and that EIMC and any sub-advisors furnish, such information as may reasonably be necessary to evaluate the terms of a fund’s advisory agreement. The review process began at the time of the last advisory contract-renewal process in September 2006. In the course of that process, the Trustees identified a number of funds that had experienced either short-term or longer-term performance issues. During the following months, the Trustees reviewed information relating to any changes in the performance of those funds and/or any changes in the investment process or the investment teams responsible for the management of the funds. In addition, during the course of the year, the Trustees reviewed information regarding the investment performance of all of the funds and identified additional funds that they believed warranted further attention based on performance since September 2006.
In spring 2007, a committee of the Board of Trustees (the “Committee”), working with EIMC management, determined generally the types of information the Board would review and set a timeline detailing the information required and the dates for its delivery to the Trustees. The independent data provider Keil Fiduciary Strategies LLC (“Keil”) was engaged to provide fund-specific and industry-wide data to the Board containing information of a nature and in a format generally prescribed by the Committee, and the Committee worked with Keil and EIMC to develop appropriate groups of peer funds for each fund. The Committee also identified a number of expense, performance, and other issues and requested specific information as to those issues.
The Trustees reviewed, with the assistance of an independent industry consultant retained by the disinterested Trustees, the information provided by EIMC in response to the Committee’s requests and the information provided by Keil. The Trustees formed small committees to review individual funds in greater detail. In addition, the Trustees requested information regarding,
30
ADDITIONAL INFORMATION (unaudited) continued
among other things, brokerage practices of the funds, the use of derivatives by the funds, strategic planning for the funds, analyst and research support available to the portfolio management teams, and information regarding the various fall-out benefits received directly and indirectly by EIMC and its affiliates from the funds. The Trustees requested and received additional information following that review.
The Committee met several times by telephone to consider the information provided by EIMC. The Committee met with representatives of EIMC in early September. At a meeting of the full Board of Trustees later in September, the Committee reported the results of its discussions with EIMC, and the full Board met with representatives of EIMC, engaged in further review of the materials provided to them, and approved the continuation of each of the advisory and sub-advisory agreements.
The disinterested Trustees discussed the continuation of the funds’ advisory agreements with representatives of EIMC and in multiple private sessions with legal counsel at which no personnel of EIMC were present. In considering the continuation of the agreement, the Trustees did not identify any particular information or consideration that was all-important or controlling, and each Trustee attributed different weights to various factors. The Trustees evaluated information provided to them both in terms of the Evergreen mutual funds generally and with respect to each fund, including the Fund, specifically as they considered appropriate; although the Trustees considered the continuation of the agreement as part of the larger process of considering the continuation of the advisory contracts for all of the funds, their determination to continue the advisory agreement for each of the funds was ultimately made on a fund-by-fund basis.
This summary describes a number of the most important, but not necessarily all, of the factors considered by the Board and the disinterested Trustees.
Information reviewed. The Board of Trustees and committees of the Board of Trustees meet periodically during the course of the year. At those meetings, the Board receives a wide variety of information regarding the services performed by EIMC, the investment performance of the funds, and other aspects of the business and operations of the funds. At those meetings, and in the process of considering the continuation of the agreements, the Trustees considered information regarding, for example, the funds’ investment results; the portfolio management teams for the funds and the experience of the members of those teams, and any recent changes in the membership of the teams; portfolio trading practices; compliance by the funds and EIMC with applicable laws and regulations and with the funds’ and EIMC’s compliance policies and procedures; risk evaluation and oversight procedures at EIMC; services provided by affiliates of EIMC to the funds and shareholders of the funds; and other information relating to the nature, extent, and quality of services provided by EIMC. The Trustees considered a number of changes in portfolio management personnel at EIMC and its advisory affiliates in the year since September 2006, and recent changes in compliance personnel at EIMC, including the appointment of a new Chief Compliance Officer for the funds.
31
ADDITIONAL INFORMATION (unaudited) continued
The Trustees considered the rates at which the funds pay investment advisory fees, and the efforts generally by EIMC and its affiliates as sponsors of the funds. The data provided by Keil showed the management fees paid by each fund in comparison to the management fees of other peer mutual funds, in addition to data regarding the investment performance of the funds in comparison to other peer mutual funds. The Trustees were assisted by the independent industry consultant in reviewing the information presented to them.
The Trustees considered the transfer agency fees paid by the funds to an affiliate of EIMC. They reviewed information presented to them showing that the transfer agency fees charged to the funds were generally consistent with industry norms.
The Trustees also considered that EIS, an affiliate of EIMC, serves as administrator to the funds and receives a fee for its services as administrator. In their comparison of the advisory fee paid by the funds with those paid by other mutual funds, the Trustees took into account administrative fees paid by the funds and those other mutual funds. The Board considered that EIS serves as distributor to the funds generally and receives fees from the funds for those services. They considered other so-called “fall-out” benefits to EIMC and its affiliates due to their other relationships with the funds, including, for example, soft-dollar services received by EIMC attributable to transactions entered into by EIMC for the benefit of the funds and brokerage commissions received by Wachovia Securities, LLC, an affiliate of EIMC, from transactions effected by it for the funds. The Trustees also noted that the funds pay sub-transfer agency fees to various financial institutions who hold fund shares in omnibus accounts, and that Wachovia Securities, LLC and its affiliates receive such payments from the funds in respect of client accounts they hold in omnibus arrangements, and that an affiliate of EIMC receives fees for administering the sub-transfer agency payment program. They also considered that Wachovia Securities, LLC and its affiliates receive distribution-related fees and shareholder servicing payments (including amounts derived from payments under the funds’ Rule 12b-1 plans) in respect of shares sold or held through it. The Trustees also noted that an affiliate of EIMC receives compensation for serving as a securities lending agent for the funds.
Nature and quality of the services provided. The Trustees considered that EIMC and its affili-ates generally provide a comprehensive investment management service to the funds. They noted that EIMC makes its personnel available to serve as officers of the funds, and concluded that the reporting and management functions provided by EIMC with respect to the funds were generally satisfactory. The Trustees considered the investment philosophy of the Fund’s portfolio management team, and considered the in-house research capabilities of EIMC and its affiliates, as well as other resources available to EIMC, including research services available to it from third parties. The Board considered the managerial and financial resources available to EIMC and its affiliates, and the commitment that the Wachovia organization has made to the funds generally. On the basis of these factors, they determined that the nature and scope of the services provided by EIMC were consistent with its duties under the investment advisory agreements and appropriate and consistent with the investment programs and best interests of the funds.
32
ADDITIONAL INFORMATION (unaudited) continued
The Trustees noted the resources EIMC and its affiliates have committed to the regulatory, compliance, accounting, tax and oversight of tax reporting, and shareholder servicing functions, and the number and quality of staff committed to those functions, which they concluded were appropriate and generally in line with EIMC’s responsibilities to the Fund and to the funds generally. The Board and the disinterested Trustees concluded, within the context of their overall conclusions regarding the funds’ advisory agreements, that they were generally satisfied with the nature, extent, and quality of the services provided by EIMC, including services provided by EIS under its administrative services agreements with the funds.
Investment performance. The Trustees considered the investment performance of each fund, both by comparison to other comparable mutual funds and to broad market indices. The Trustees emphasized that the continuation of the investment advisory agreement for a fund should not be taken as any indication that the Trustees did not believe investment performance for any specific fund might not be improved, and they noted that they would continue to monitor closely the investment performance of the funds going forward.
Advisory and administrative fees. The Trustees recognized that EIMC does not seek to provide the lowest cost investment advisory service, but to provide a high quality, full-service investment management product at a reasonable price. They also noted that EIMC has in many cases sought to set its investment advisory fees at levels consistent with industry norms. The Trustees noted that, in certain cases, a fund’s management fees were higher than many or most other mutual funds in the same Keil peer group. However, in each case, the Trustees determined on the basis of the information presented that the level of management fees was not excessive.
Certain Fund-specific considerations. The Trustees noted that, for the one-, three-, five-, and ten-year periods ended December 31, 2006, the Fund’s Class A shares had underperformed the broad-based securities index against which the Trustees compared the Fund’s performance and a majority of the funds against which the Trustees compared the Fund’s performance. The Trustees noted that the Fund’s portfolio management team had recently changed and that the new team’s performance record with the Fund was too short to allow for useful comparison to peers. The Trustees noted, however, that the Fund’s relative performance had improved since the appointment of the new portfolio management team.
The Trustees noted that the Fund’s management fee was lower than the management fees paid by a majority of the funds against which the Trustees compared the Fund’s management fee, and that the level of profitability realized by EIMC in respect of the fee did not appear excessive.
Economies of scale. The Trustees noted that economies of scale would likely be achieved by EIMC in managing the funds as the funds grow. The Trustees noted that the Fund had implemented breakpoints in its advisory fee structure. The Trustees noted that they would continue to review the appropriate levels of breakpoints in the future, but concluded that the breakpoints as implemented appeared to be a reasonable step toward the realization of economies of scale by the Fund.
33
ADDITIONAL INFORMATION (unaudited) continued
Profitability. The Trustees considered information provided to them regarding the profitability to the EIMC organization of the investment advisory, administration, and transfer agency (with respect to the open-end funds only) fees paid to EIMC and its affiliates by each of the funds. They considered that the information provided to them was necessarily estimated, and that the profitability information provided to them, especially on a fund-by-fund basis, did not necessarily provide a definitive tool for evaluating the appropriateness of each fund’s advisory fee. They noted that the levels of profitability of the funds to EIMC varied widely, depending on among other things the size and type of fund. They considered the profitability of the funds in light of such factors as, for example, the information they had received regarding the relation of the fees paid by the funds to those paid by other mutual funds, the investment performance of the funds, and the amount of revenues involved. In light of these factors, the Trustees concluded that the profitability of any of the funds, individually or in the aggregate, should not prevent the Trustees from approving the continuation of the agreements.
34
This page left intentionally blank
35
| TRUSTEES AND OFFICERS |
|
| TRUSTEES1 |
| Charles A. Austin III | | Investment Counselor, Anchor Capital Advisors, LLC. (investment advice); Director, The Andover |
| Trustee | | Companies (insurance); Trustee, Arthritis Foundation of New England; Former Director, The |
| DOB: 10/23/1934 | | Francis Ouimet Society (scholarship program); Former Director, Executive Vice President and |
| Term of office since: 1991 | | Treasurer, State Street Research & Management Company (investment advice) |
| Other directorships: None | | |
|
| K. Dun Gifford | | Chairman and President, Oldways Preservation and Exchange Trust (education); Trustee, |
| Trustee | | Treasurer and Chairman of the Finance Committee, Cambridge College |
| DOB: 10/23/1938 | | |
| Term of office since: 1974 | |
| Other directorships: None | |
|
| Dr. Leroy Keith, Jr. | | Managing Director, Almanac Capital Management (commodities firm); Trustee, Phoenix |
| Trustee | | Fund Complex; Director, Diversapack Co. (packaging company); Former Partner, Stonington |
| DOB: 2/14/1939 | | Partners, Inc. (private equity fund); Former Director, Obagi Medical Products Co.; Former |
| Term of office since: 1983 | | Director, Lincoln Educational Services |
| Other directorships: Trustee, | | |
| Phoenix Fund Complex (consisting | |
| of 60 portfolios as of 12/31/2006) | |
|
| Gerald M. McDonnell | | Manager of Commercial Operations, CMC Steel (steel producer) |
| Trustee | | |
| DOB: 7/14/1939 | |
| Term of office since: 1988 | |
| Other directorships: None | |
|
| Patricia B. Norris | | President and Director of Buckleys of Kezar Lake, Inc. (real estate company); Former President |
| Trustee | | and Director of Phillips Pond Homes Association (home community); Former Partner, |
| DOB: 4/9/1948 | | PricewaterhouseCoopers, LLP (independent registered public accounting firm) |
| Term of office since: 2006 | | |
| Other directorships: None | |
|
| William Walt Pettit | | Partner and Vice President, Kellam & Pettit, P.A. (law firm); Director, Superior Packaging Corp. |
| Trustee | | (packaging company); Member, Superior Land, LLC (real estate holding company), Member, |
| DOB: 8/26/1955 | | K&P Development, LLC (real estate development); Former Director, National Kidney Foundation |
| Term of office since: 1988 | | of North Carolina, Inc. (non-profit organization) |
| Other directorships: None | | |
|
| David M. Richardson | | President, Richardson, Runden LLC (executive recruitment business development/consulting |
| Trustee | | company); Consultant, Kennedy Information, Inc. (executive recruitment information and |
| DOB: 9/19/1941 | | research company); Consultant, AESC (The Association of Executive Search Consultants); |
| Term of office since: 1982 | | Director, J&M Cumming Paper Co. (paper merchandising); Former Trustee, NDI Technologies, LLP |
| Other directorships: None | | (communications) |
|
| Dr. Russell A. Salton III | | President/CEO, AccessOne MedCard, Inc.; Former Medical Director, Healthcare Resource |
| Trustee | | Associates, Inc. |
| DOB: 6/2/1947 | | |
| Term of office since: 1984 | | |
| Other directorships: None | | |
|
| Michael S. Scofield | | Retired Attorney, Law Offices of Michael S. Scofield; Former Director and Chairman, Branded |
| Trustee | | Media Corporation (multi-media branding company) |
| DOB: 2/20/1943 | | |
| Term of office since: 1984 | |
| Other directorships: None | |
|
36
| TRUSTEES AND OFFICERS continued |
|
| Richard J. Shima | | Independent Consultant; Director, Hartford Hospital; Trustee, Greater Hartford YMCA; Former |
| Trustee | | Director, Trust Company of CT; Former Director, Old State House Association; Former Trustee, |
| DOB: 8/11/1939 | | Saint Joseph College (CT) |
| Term of office since: 1993 | | |
| Other directorships: None | |
|
| Richard K. Wagoner, CFA2 | | Member and Former President, North Carolina Securities Traders Association; Member, Financial |
| Trustee | | Analysts Society |
| DOB: 12/12/1937 | | |
| Term of office since: 1999 | |
| Other directorships: None | |
|
| OFFICERS |
| Dennis H. Ferro3 | | Principal occupations: President and Chief Executive Officer, Evergreen Investment Company, |
| President | | Inc. and Executive Vice President, Wachovia Bank, N.A.; former Chief Investment Officer, |
| DOB: 6/20/1945 | | Evergreen Investment Company, Inc. |
| Term of office since: 2003 | | |
|
| Kasey Phillips4 | | Principal occupations: Senior Vice President, Evergreen Investment Services, Inc.; Former Vice |
| Treasurer | | President, Evergreen Investment Services, Inc.; Former Assistant Vice President, Evergreen |
| DOB: 12/12/1970 | | Investment Services, Inc. |
| Term of office since: 2005 | | |
|
| Michael H. Koonce4 | | Principal occupations: Senior Vice President and General Counsel, Evergreen Investment |
| Secretary | | Services, Inc.; Secretary, Senior Vice President and General Counsel, Evergreen Investment |
| DOB: 4/20/1960 | | Management Company, LLC and Evergreen Service Company, LLC; Senior Vice President and |
| Term of office since: 2000 | | Assistant General Counsel, Wachovia Corporation |
|
| Robert Guerin4, 5 | | Principal occupations: Chief Compliance Officer, Evergreen Funds and Senior Vice President of |
| Chief Compliance Officer | | Evergreen Investments Co, Inc; Former Managing Director and Senior Compliance Officer, |
| DOB: 9/20/1965 | | Babson Capital Management LLC; Former Principal and Director, Compliance and Risk |
| Term of office since: 2007 | | Management, State Street Global Advisors; Former Vice President and Manager, Sales Practice |
| | | Compliance, Deutsche Asset Management. |
|
1 Each Trustee, except Ms. Norris, serves until a successor is duly elected or qualified or until his death, resignation, retirement or removal from office. As a new Trustee, Ms. Norris’ initial term ends June 30, 2009, at which time she may be re-elected by Trustees to serve until a successor is duly elected or qualified or until her death, resignation, retirement or removal from office by the Trustees. Each Trustee oversees 91 Evergreen funds. Correspondence for each Trustee may be sent to Evergreen Board of Trustees, P.O. Box 20083, Charlotte, NC 28202.
2 Mr. Wagoner is an “interested person” of the Fund because of his ownership of shares in Wachovia Corporation, the parent to the Fund’s investment advisor.
3 The address of the Officer is 401 S. Tryon Street, 20th Floor, Charlotte, NC 28288.
4 The address of the Officer is 200 Berkeley Street, Boston, MA 02116.
5 Mr. Guerin’s information is as of June 14, 2007, the effective date of his approval by the Board of Trustees as Chief Compliance Officer of the Evergreen funds.
Additional information about the Fund’s Board of Trustees and Officers can be found in the Statement of Additional Information (SAI) and is available upon request without charge by calling 800.343.2898.
37
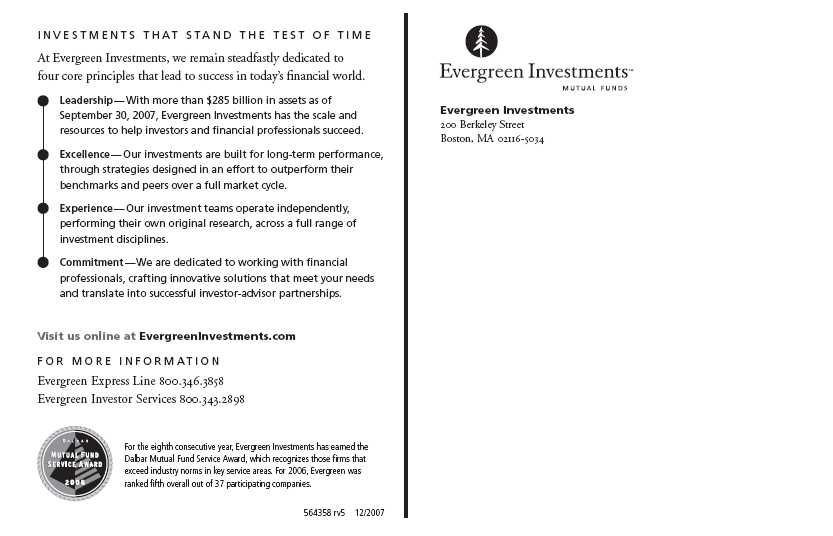
564358 rv5 12/2007
Evergreen Core Plus Bond Fund

| table of contents |
| 1 | | LETTER TO SHAREHOLDERS |
| 4 | | FUND AT A GLANCE |
| 6 | | ABOUT YOUR FUND’S EXPENSES |
| 7 | | FINANCIAL HIGHLIGHTS |
| 11 | | SCHEDULE OF INVESTMENTS |
| 30 | | STATEMENT OF ASSETS AND LIABILITIES |
| 31 | | STATEMENT OF OPERATIONS |
| 32 | | STATEMENTS OF CHANGES IN NET ASSETS |
| 33 | | NOTES TO FINANCIAL STATEMENTS |
| 43 | | ADDITIONAL INFORMATION |
| 52 | | TRUSTEES AND OFFICERS |
This semiannual report must be preceded or accompanied by a prospectus of the Evergreen fund contained herein. The prospectus contains more complete information, including fees and expenses, and should be read carefully before investing or sending money.
The fund will file its complete schedule of portfolio holdings with the SEC for the first and third quarters of each fiscal year on Form N-Q. The fund’s Form N-Q will be available on the SEC’s Web site at http://www.sec.gov. In addition, the fund’s Form N-Q may be reviewed and copied at the SEC’s Public Reference Room in Washington, D.C. Information on the operation of the Public Reference Room may be obtained by calling 800.SEC.0330.
A description of the fund’s proxy voting policies and procedures, as well as information regarding how the fund voted proxies relating to portfolio securities during the most recent 12-month period ended June 30, is available by visiting our Web site at EvergreenInvestments.com or by visiting the SEC’s Web site at http://www.sec.gov. The fund’s proxy voting policies and procedures are also available without charge, upon request, by calling 800.343.2898.
| Mutual Funds: | | | | |
| NOT FDIC INSURED | | MAY LOSE VALUE | | NOT BANK GUARANTEED |
Evergreen InvestmentsSM is a service mark of Evergreen Investment Management Company, LLC.
Copyright 2007, Evergreen Investment Management Company, LLC.
Evergreen Investment Management Company, LLC is a subsidiary of Wachovia Corporation and is an affiliate of Wachovia Corporation’s other Broker Dealer subsidiaries.
Evergreen mutual funds are distributed by Evergreen Investment Services, Inc.
200 Berkeley Street, Boston, MA 02116
LETTER TO SHAREHOLDERS
December 2007

Dennis H. Ferro
President and Chief Executive Officer
Dear Shareholder:
We are pleased to provide the Semiannual Report for Evergreen Core Plus Bond Fund for the six-month period ended October 31, 2007.
The U.S. fixed income market delivered modest, but positive, returns during the six-month period, despite widening concerns about credit quality stemming from weakness in U.S. housing and growing problems in the subprime mortgage market. The period saw a general flight to quality as investors sought out the highest quality debt, especially U.S. Treasuries. As prices of Treasuries and other high-grade securities rose, their yields trended down, leading to outperformance by longer-maturity securities. At the same time, higher-yielding, lower-rated corporate bonds experienced some price erosion during the period after outperforming high-grade securities for several years. Concerns about the credit markets prompted the U.S. Federal Reserve Board (the “Fed”) and other major central banks to intervene and inject additional liquidity into the capital markets. While these steps in the closing three months of the period restored some measure of confidence, investors continued to watch warily for signs of economic weakness. Stocks of U.S. companies produced generally healthy returns, despite increasing market volatility. Investors began to favor larger companies with more consistent earnings, while the growth style of investing led the market after several years of outperformance by value stocks.
Despite the problems in housing and subprime mortgages, the domestic economy maintained its growth trajectory. Solid increases in exports and in business investment helped
1
LETTER TO SHAREHOLDERS continued
offset declining residential values. At the same time, steadily rising employment levels and moderately improving wages increased prospects that healthy consumer spending patterns would be sustained. Substantially exceeding expectations, U.S. Gross Domestic Product grew at an annual rate of 4.9% in the third quarter of 2007, significantly higher than the brisk 3.8% rate of the previous quarter. However, some signs of emerging economic weakness began to appear. Operating earnings of companies in the S&P 500 Index declined in the third quarter, principally because of dramatic write-downs taken by major corporations, predominately in the financials sector. Moreover, surging prices for oil, gold and most commodities, combined with the declining U.S. dollar, suggested some increased potential for rising inflation.
During the six-month period, managers of Evergreen’s intermediate and long-term bond fund teams focused on the issues influencing both the opportunities and challenges in managing specific portfolios. The teams managing the higher-quality portfolios, including Evergreen Core Bond Fund, Evergreen Core Plus Bond Fund, Evergreen U.S. Government Fund and Evergreen Institutional Mortgage Portfolio, assessed factors such as employment and inflationary trends, Fed policy and interest-rate expectations. At the same time, the managers supervising Evergreen High Income Fund and Evergreen Select High Yield Bond Fund tended to position their credit-sensitive portfolios relatively conservatively during a period of increasing volatility. The managers of Evergreen Diversified Income Builder Fund, meanwhile, repositioned their
2
LETTER TO SHAREHOLDERS continued
portfolio, maintaining an emphasis on better-quality, high-yield corporate bonds while also increasing the exposure to dividend-paying stocks.
As always, we encourage investors to maintain diversified investment portfolios in pursuit of their long-term investment goals.
Please visit us at EvergreenInvestments.com for more information about our funds and other investment products available to you. Thank you for your continued support of Evergreen Investments.
Sincerely,

Dennis H. Ferro
President and Chief Executive Officer
Evergreen Investment Company, Inc.
Special Notice to Shareholders:
Please visit our Web site at EvergreenInvestments.com for statements from President and Chief Executive Officer, Dennis Ferro, regarding the firm’s recent settlement with the Securities and Exchange Commission (SEC) and prior settlement with the National Association of Securities Dealers (NASD).
3
FUND AT A GLANCE
as of October 31, 2007
MANAGEMENT TEAM
Investment Advisor:
• Evergreen Investment Management Company, LLC
Sub-Advisors:
• Evergreen International Advisors
• Tattersall Advisory Group, Inc.
Portfolio Managers:
• Robert A. Calhoun, CFA
• Michael Lee
• Anthony Norris
• Alex Perrin
• Peter Wilson
• Parham M. Behrooz, CFA
• Lisa Brown-Premo
• Mehmet Camurdan, CFA
• Andrew Cestone
• Eric R. Harper, CFA
• Todd C. Kuimjian, CFA
• Robert D. Rowe
CURRENT INVESTMENT STYLE

Source: Morningstar, Inc.
Morningstar’s style box is based on a portfolio date as of 9/30/2007.
The Fixed Income style box placement is based on a fund’s average effective maturity or duration and the average credit rating of the bond portfolio.
PERFORMANCE AND RETURNS
Portfolio inception date: 11/30/1972
| | | Class A | | Class B | | Class C | | Class I |
| Class inception date | | 5/20/2005 | | 5/20/2005 | | 5/20/2005 | | 11/30/1972 |
|
| Nasdaq symbol | | EKDLX | | EKDMX | | EKDCX | | EKDYX |
|
| 6-month return with sales charge | | -2.66% | | -3.17% | | 0.82% | | N/A |
|
| 6-month return w/o sales charge | | 2.20% | | 1.81% | | 1.81% | | 2.33% |
|
| Average annual return* | | | | | | | | |
|
| 1-year with sales charge | | 0.54% | | -0.20% | | 3.79% | | N/A |
|
| 1-year w/o sales charge | | 5.57% | | 4.79% | | 4.79% | | 5.84% |
|
| 5-year | | 5.87% | | 6.23% | | 6.54% | | 7.07% |
|
| 10-year | | 5.37% | | 5.70% | | 5.70% | | 5.96% |
|
| Maximum sales charge | | 4.75% | | 5.00% | | 1.00% | | N/A |
| | | Front-end | | CDSC | | CDSC | | |
|
* Adjusted for maximum applicable sales charge, unless noted.
Past performance is no guarantee of future results. The performance quoted represents past performance and current performance may be lower or higher. The investment return and principal value of an investment will fluctuate so that investors’ shares, when redeemed, may be worth more or less than their original cost. To obtain performance information current to the most recent month-end for Classes A, B, C or I, please go to EvergreenInvestments.com/fundperformance. The performance of each class may vary based on differences in loads, fees and expenses paid by the shareholders investing in each class. Performance includes the reinvestment of income dividends and capital gain distributions. Performance shown does not reflect the deduction of taxes that a shareholder would pay on fund distributions or the redemption of fund shares.
Historical performance shown for Class I prior to 5/23/2005 is based on the performance of the fund’s predecessor closed-end fund, Vestaur Securities Fund. Historical performance shown for Classes A, B and C prior to their inception is based on the performance of Class I. The historical returns for Classes A, B and C have not been adjusted to reflect the effect of each class’ 12b-1 fee. These fees are 0.30% for Class A and 1.00% for Classes B and C. Class I does not, and Vestaur Securities Fund did not, pay a 12b-1 fee. If these fees had been reflected, returns for Classes A, B and C would have been lower.
The advisor is waiving a portion of its advisory fee and reimbursing a portion of the 12b-1 fee for Class A. Had the fees not been waived or reimbursed, returns would have been lower.
4
FUND AT A GLANCE continued
LONG-TERM GROWTH^
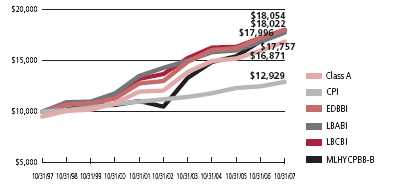
Comparison of a $10,000 investment in the Evergreen Core Plus Bond Fund Class A shares versus a similar investment in the Evergreen Diversified Bond Blended Index (EDBBI), the Lehman Brothers Aggregate Bond Index (LBABI), the Lehman Brothers Corporate Bond Index (LBCBI), the Merrill Lynch High Yield, Cash Pay, BB-B Index† (MLHYCPBB-B) and the Consumer Price Index (CPI).
The EDBBI, the LBABI, the LBCBI and the MLHYCPBB-B are unmanaged market indexes and do not include transaction costs associated with buying and selling securities, any mutual fund fees or expenses or any taxes. The CPI is a commonly used measure of inflation and does not represent an investment return. It is not possible to invest directly in an index.
^ The fund has previously compared its performance to the EDBBI, LBCBI and the MLHYCPBB-B. Given recent changes to the fund’s principal investment strategies, the Fund believes that the LBABI is a more appropriate benchmark than the the EDBBI, LBCBI and the MLHYCPBB-B. In future periods, the fund will compare its performance to the LBABI.
Class I shares are only offered in the following manner: (1) to investment advisory clients of Evergreen Investment Management Company, LLC (or its advisory affiliates) when purchased by such advisor(s) on behalf of its clients, (2) to certain mutual fund wrap program clients of Wachovia Securities and of third-party broker/dealers when purchased through a clearing relationship with Wachovia Securities or an affiliate providing mutual fund clearing services, (3) through arrangements entered into on behalf of the Evergreen funds with certain financial services firms, (4) to certain institutional investors, and (5) to persons who owned Class Y shares in registered name in an Evergreen fund on or before December 31, 1994 or who owned shares of any SouthTrust fund in registered name as of March 18, 2005 or who owned shares of Vestaur Securities Fund as of May 20, 2005.
Class I shares are only available to institutional shareholders with a minimum of $1 million investment, which may be waived in certain situations.
The fund’s investment objective may be changed without a vote of the fund’s shareholders.
Foreign investments may contain more risk due to the inherent risks associated with changing political climates, foreign market instability and foreign currency fluctuations.
Asset-backed and mortgage-backed securities are generally subject to higher prepayment risks than other types of debt securities, which can limit the potential for gain in a declining interest rate environment and increase the potential for loss in a rising interest rate environment. Mortgage-backed securities may also be structured so that they are particularly sensitive to interest rates. A high rate of defaults on the mortgages held by a mortgage pool may limit the pool’s ability to make payments to the fund if the fund holds securities that are subordinate to other interest in the same mortgage pool; the risk of such defaults is generally higher in mortgage pools that include subprime mortgages.
Derivatives involve additional risks including interest rate risk, credit risk, the risk of improper valuation and the risk of non-correlation to the relevant instruments they are designed to hedge or to closely track.
High yield, lower-rated bonds may contain more risk due to the increased possibility of default.
The return of principal is not guaranteed due to fluctuation in the fund’s NAV caused by changes in the price of individual bonds held by the fund and the buying and selling of bonds by the fund. Bond funds have the same inflation, interest rate and credit risks as individual bonds. Generally, the value of bond funds rises when prevailing interest rates fall, and falls when interest rates rise.
U.S. government guarantees apply only to certain securities held in the fund’s portfolio and not to the fund’s shares.
The Evergreen Diversified Bond Blended Index is composed of the following indexes: LBCBI (80%) AND MLHYCPBB-B (20%).
† Copyright 2007. Merrill Lynch, Pierce, Fenner & Smith Incorporated. All rights reserved.
All data is as of October 31, 2007, and subject to change.
5
ABOUT YOUR FUND’S EXPENSES
The Example below is intended to describe the fees and expenses borne by shareholders and the impact of those costs on your investment.
Example
As a shareholder of the fund, you incur two types of costs: (1) transaction costs, including sales charges (loads), redemption fees and exchange fees; and (2) ongoing costs, including management fees, distribution (12b-1) fees and other fund expenses. This Example is intended to help you understand your ongoing costs (in dollars) of investing in the fund and to compare these costs with the ongoing costs of investing in other mutual funds. The Example is based on an investment of $1,000 invested at the beginning of the period and held for the entire period from May 1, 2007 to October 31, 2007.
The example illustrates your fund’s costs in two ways:
- Actual expenses
The section in the table under the heading “Actual” provides information about actual account values and actual expenses. You may use the information in these columns, together with the amount you invested, to estimate the expenses that you paid over the period. Simply divide your account value by $1,000 (for example, an $8,600 account value divided by $1,000 = 8.6), then multiply the result by the number in the appropriate column for your share class, in the column entitled “Expenses Paid During Period” to estimate the expenses you paid on your account during this period. - Hypothetical example for comparison purposes
The section in the table under the heading “Hypothetical (5% return before expenses)” provides information about hypothetical account values and hypothetical expenses based on the fund’s actual expense ratio and an assumed rate of return of 5% per year before expenses, which is not the fund’s actual return. The hypothetical account values and expenses may not be used to estimate the actual ending account balance or expenses you paid for the period. You may use this information to compare the ongoing costs of investing in the fund and other funds. To do so, compare this 5% hypothetical example with the 5% hypothetical examples that appear in the shareholder reports of the other funds.
Please note that the expenses shown in the table are meant to highlight your ongoing costs only and do not reflect any transactional costs, such as sales charges (loads), redemption fees or exchange fees. Therefore, the section in the table under the heading “Hypothetical (5% return before expenses)” is useful in comparing ongoing costs only, and will not help you determine the relative total costs of owning different funds. In addition, if these transactional costs were included, your costs would have been higher.
| | | Beginning | | Ending | | |
| | | Account | | Account | | Expenses |
| | | Value | | Value | | Paid During |
| | | 5/1/2007 | | 10/31/2007 | | Period* |
|
| Actual | | | | | | |
| Class A | | $ 1,000.00 | | $ 1,021.95 | | $ 4.68 |
| Class B | | $ 1,000.00 | | $ 1,018.14 | | $ 8.47 |
| Class C | | $ 1,000.00 | | $ 1,018.14 | | $ 8.47 |
| Class I | | $ 1,000.00 | | $ 1,023.26 | | $ 3.41 |
| Hypothetical | | | | | | |
| (5% return | | | | | | |
| before expenses) | | | | | | |
| Class A | | $ 1,000.00 | | $ 1,020.51 | | $ 4.67 |
| Class B | | $ 1,000.00 | | $ 1,016.74 | | $ 8.47 |
| Class C | | $ 1,000.00 | | $ 1,016.74 | | $ 8.47 |
| Class I | | $ 1,000.00 | | $ 1,021.77 | | $ 3.40 |
|
* For each class of the Fund, expenses are equal to the annualized expense ratio of each class (0.92% for Class A, 1.67% for Class B, 1.67% for Class C and 0.67% for Class I), multiplied by the average account value over the period, multiplied by 184 / 366 days.
6
FINANCIAL HIGHLIGHTS
(For a share outstanding throughout each period)
| | | | | | | | | |
| | | Six Months Ended | | Year Ended April 30, | | Year Ended |
| | October 31, 2007 | |
| | November 30, |
| CLASS A | | (unaudited) | | 2007 | | 20061 | | 20052,3 |
|
| Net asset value, beginning of period | | $ 14.45 | | $ 14.25 | | $ 14.53 | | $ 14.83 |
|
| Income from investment operations | | | | | | | | |
| Net investment income (loss) | | 0.30 | | 0.81 | | 0.33 | | 0.414 |
Net realized and unrealized gains
or losses on investments | | 0.01 | | 0.23 | | (0.27) | | (0.28) |
| |
|
| Total from investment operations | | 0.31 | | 1.04 | | 0.06 | | 0.13 |
|
| Distributions to shareholders from | | | | | | | | |
| Net investment income | | (0.37) | | (0.83) | | (0.34) | | (0.43) |
| Net realized gains | | 0 | | (0.01) | | 0 | | 0 |
| |
|
| Total distributions to shareholders | | (0.37) | | (0.84) | | (0.34) | | (0.43) |
|
| Net asset value, end of period | | $ 14.39 | | $ 14.45 | | $ 14.25 | | $ 14.53 |
|
| Total return5 | | 2.20% | | 7.49% | | 0.43% | | 0.89% |
|
| Ratios and supplemental data | | | | | | | | |
| Net assets, end of period (thousands) | | $188,284 | | $199,442 | | $213,268 | | $226,450 |
| Ratios to average net assets | | | | | | | | |
Expenses including waivers/reimbursements
but excluding expense reductions | | 0.92%6 | | 0.94% | | 0.96%6 | | 0.97%6 |
Expenses excluding waivers/reimbursements
and expense reductions | | 1.12%6 | | 1.16% | | 1.19%6 | | 1.15%6 |
| Net investment income (loss) | | 4.21%6 | | 5.65% | | 5.43%6 | | 5.28%6 |
| Portfolio turnover rate | | 281% | | 70% | | 30% | | 55% |
|
1 For the five months ended April 30, 2006. The Fund changed its fiscal year end from November 30 to April 30, effective April 30, 2006.
2 For the period from May 20, 2005 (commencement of class operations), to November 30, 2005.
3 Effective at the close of business on May 20, 2005, the Fund acquired the net assets of Vestaur Securities Fund. Vestaur Securities Fund became the accounting and performance survivor in this transaction . Class A shares of Vestaur Securities Fund did not exist prior to the transaction . As a result, accounting and performance information for Class A shares commenced on May 20, 2005.
4 Net investment income (loss) per share is based on average shares outstanding during the period.
5 Excluding applicable sales charges
6 Annualized
See Notes to Financial Statements
7
FINANCIAL HIGHLIGHTS
(For a share outstanding throughout each period)
| | | | | | | | | |
| | | Six Months Ended | | Year Ended April 30, | | Year Ended |
| | October 31, 2007 | |
| | November 30, |
| CLASS B | | (unaudited) | | 2007 | | 20061 | | 20052,3 |
|
| Net asset value, beginning of period | | $ 14.45 | | $ 14.25 | | $ 14.53 | | $ 14.83 |
|
| Income from investment operations | | | | | | | | |
| Net investment income (loss) | | 0.25 | | 0.70 | | 0.28 | | 0.364 |
Net realized and unrealized gains
or losses on investments | | 0.01 | | 0.23 | | (0.26) | | (0.28) |
| |
|
| Total from investment operations | | 0.26 | | 0.93 | | 0.02 | | 0.08 |
|
| Distributions to shareholders from | | | | | | | | |
| Net investment income | | (0.32) | | (0.72) | | (0.30) | | (0.38) |
| Net realized gains | | 0 | | (0.01) | | 0 | | 0 |
| |
|
| Total distributions to shareholders | | (0.32) | | (0.73) | | (0.30) | | (0.38) |
|
| Net asset value, end of period | | $ 14.39 | | $ 14.45 | | $ 14.25 | | $ 14.53 |
|
| Total return5 | | 1.81% | | 6.71% | | 0.14% | | 0.52% |
|
| Ratios and supplemental data | | | | | | | | |
| Net assets, end of period (thousands) | | $15,230 | | $16,102 | | $18,277 | | $20,439 |
| Ratios to average net assets | | | | | | | | |
Expenses including waivers/reimbursements
but excluding expense reductions | | 1.67%6 | | 1.67% | | 1.67%6 | | 1.67%6 |
Expenses excluding waivers/reimbursements
and expense reductions | | 1.82%6 | | 1.85% | | 1.89%6 | | 1.85%6 |
| Net investment income (loss) | | 3.48%6 | | 4.91% | | 4.72%6 | | 4.58%6 |
| Portfolio turnover rate | | 281% | | 70% | | 30% | | 55% |
|
1 For the five months ended April 30, 2006. The Fund changed its fiscal year end from November 30 to April 30, effective April 30, 2006.
2 For the period from May 20, 2005 (commencement of class operations), to November 30, 2005.
3 Effective at the close of business on May 20, 2005, the Fund acquired the net assets of Vestaur Securities Fund. Vestaur Securities Fund became the accounting and performance survivor in this transaction . Class B shares of Vestaur Securities Fund did not exist prior to the transaction . As a result, accounting and performance information for Class B shares commenced on May 20, 2005.
4 Net investment income (loss) per share is based on average shares outstanding during the period.
5 Excluding applicable sales charges
6 Annualized
See Notes to Financial Statements
8
FINANCIAL HIGHLIGHTS
(For a share outstanding throughout each period)
| | | | | | | | | |
| | | Six Months Ended | | Year Ended April 30, | | Year Ended |
| | October 31, 2007 | |
| | November 30, |
| CLASS C | | (unaudited) | | 2007 | | 20061 | | 20052,3 |
|
| Net asset value, beginning of period | | $ 14.45 | | $ 14.25 | | $ 14.53 | | $ 14.83 |
|
| Income from investment operations | | | | | | | | |
| Net investment income (loss) | | 0.25 | | 0.70 | | 0.28 | | 0.364 |
Net realized and unrealized gains
or losses on investments | | 0.01 | | 0.23 | | (0.26) | | (0.28) |
| |
|
| Total from investment operations | | 0.26 | | 0.93 | | 0.02 | | 0.08 |
|
| Distributions to shareholders from | | | | | | | | |
| Net investment income | | (0.32) | | (0.72) | | (0.30) | | (0.38) |
| Net realized gains | | 0 | | (0.01) | | 0 | | 0 |
| |
|
| Total distributions to shareholders | | (0.32) | | (0.73) | | (0.30) | | (0.38) |
|
| Net asset value, end of period | | $ 14.39 | | $ 14.45 | | $ 14.25 | | $ 14.53 |
|
| Total return5 | | 1.81% | | 6.71% | | 0.14% | | 0.52% |
|
| Ratios and supplemental data | | | | | | | | |
| Net assets, end of period (thousands) | | $24,224 | | $24,157 | | $25,972 | | $27,764 |
| Ratios to average net assets | | | | | | | | |
Expenses including waivers/reimbursements
but excluding expense reductions | | 1.67%6 | | 1.67% | | 1.67%6 | | 1.67%6 |
Expenses excluding waivers/reimbursements
and expense reductions | | 1.82%6 | | 1.85% | | 1.89%6 | | 1.85%6 |
| Net investment income (loss) | | 3.47%6 | | 4.91% | | 4.72%6 | | 4.58%6 |
| Portfolio turnover rate | | 281% | | 70% | | 30% | | 55% |
|
1 For the five months ended April 30, 2006. The Fund changed its fiscal year end from November 30 to April 30, effective April 30, 2006.
2 For the period from May 20, 2005 (commencement of class operations), to November 30, 2005.
3 Effective at the close of business on May 20, 2005, the Fund acquired the net assets of Vestaur Securities Fund. Vestaur Securities Fund became the accounting and performance survivor in this transaction . Class C shares of Vestaur Securities Fund did not exist prior to the transaction. As a result, accounting and performance information for Class C shares commenced on May 20, 2005.
4 Net investment income (loss) per share is based on average shares outstanding during the period.
5 Excluding applicable sales charges
6 Annualized
See Notes to Financial Statements
9
FINANCIAL HIGHLIGHTS
(For a share outstanding throughout each period)
| | | Six Months | | | | | | | | | | | | |
| | | Ended | | Year Ended April 30, | | Year Ended November 30, |
| | October 31, 2007 | |
| |
|
| CLASS I | | (unaudited) | | 2007 | | 20061 | | 20052 | | 20042 | | 20032 | | 20022,3 |
|
| Net asset value, beginning of period | | $ 14.45 | | $ 14.25 | | $ 14.53 | | $ 15.14 | | $ 15.14 | | $ 14.27 | | $ 14.88 |
|
| Income from investment operations | | | | | | | | | | | | | | |
| Net investment income (loss) | | 0.31 | | 0.83 | | 0.34 | | 0.794 | | 0.934 | | 0.95 | | 1.00 |
| Net realized and unrealized gains | | | | | | | | | | | | | | |
| or losses on investments | | 0.02 | | 0.25 | | (0.26) | | (0.41) | | 0.02 | | 0.91 | | (0.56) |
| |
|
| Total from investment operations | | 0.33 | | 1.08 | | 0.08 | | 0.38 | | 0.95 | | 1.86 | | 0.44 |
|
| Distributions to shareholders from | | | | | | | | | | | | | | |
| Net investment income | | (0.39) | | (0.87) | | (0.36) | | (0.86) | | (0.95) | | (0.99) | | (1.05) |
| Tax basis return of capital | | 0 | | (0.01) | | 0 | | (0.13)5 | | 0 | | 0 | | 0 |
| |
|
| Total distributions to shareholders | | (0.39) | | (0.88) | | (0.36) | | (0.99) | | (0.95) | | (0.99) | | (1.05) |
|
| Net asset value, end of period | | $ 14.39 | | $ 14.45 | | $ 14.25 | | $ 14.53 | | $ 15.14 | | $ 15.14 | | $ 14.27 |
|
| Total return | | 2.33% | | 7.78% | | 0.55% | | 2.82% | | 6.47% | | 13.43% | | 3.06% |
|
| Ratios and supplemental data | | | | | | | | | | | | | | |
| Net assets, end of period (thousands) | | $53,665 | | $56,478 | | $61,711 | | $65,893 | | $97,235 | | $97,277 | | $91,666 |
| Ratios to average net assets | | | | | | | | | | | | | | |
| Expenses including waivers/reimbursements | | | | | | | | | | | | | | |
| but excluding expense reductions | | 0.67%6 | | 0.67% | | 0.67%6 | | 0.79% | | 0.94% | | 0.91% | | 1.01% |
| Expenses excluding waivers/reimbursements | | | | | | | | | | | | | | |
| and expense reductions | | 0.82%6 | | 0.85% | | 0.89%6 | | 0.88% | | 0.97% | | 0.94% | | 1.01% |
| Net investment income (loss) | | 4.47%6 | | 5.91% | | 5.72%6 | | 5.50% | | 6.10% | | 6.43% | | 6.96% |
| Portfolio turnover rate | | 281% | | 70% | | 30% | | 55% | | 23% | | 45% | | 40% |
|
1 For the five months ended April 30, 2006. The Fund changed its fiscal year end from November 30 to April 30, effective April 30, 2006.
2 Effective at the close of business on May 20, 2005, the Fund acquired the net assets of Vestaur Securities Fund. Vestaur Securities Fund became the accounting and performance survivor in this transaction . The financial highlights for the periods prior to May 23, 2005 are those of Vestaur Securities Fund. The per share information has been restated to give effect to this transaction. Total return performance reflects the total return of Vestaur Securities Fund based on its net asset value.
3 As required, effective December 1, 2001, the Fund has adopted the provisions of the AICPA Audit and Accounting Guide, Audits of Investment Companies, and began amortizing premium and accreting discount on its fixed-income securities. The effects of this change for the year ended November 30, 2002 were a decrease in net investment income per share of $0.03; an increase in net realized gains or losses per share of $0.03; and a decrease in the ratio of net investment income to average net assets of 0.25%.
4 Net investment income (loss) per share is based on average shares outstanding during the period.
5 Return on capital relates to former Vestaur Securities Fund shareholders and is based on average shares outstanding from December 1, 2004 through May 20, 2005.
6 Annualized
See Notes to Financial Statements
10
SCHEDULE OF INVESTMENTS
October 31, 2007 (unaudited)
| | | | | Principal | | |
| | | | | Amount | | Value |
|
| |
| AGENCY COMMERCIAL MORTGAGE-BACKED SECURITIES 1.4% | | | | |
| FIXED-RATE 1.4% | | | | | | |
| FHLMC, Ser. M009, Class A, 5.40%, 10/15/2021 (cost $3,900,318) | | | | $ 3,896,422 | | $ 3,960,089 |
| |
|
| AGENCY MORTGAGE-BACKED COLLATERALIZED MORTGAGE | | | | | | |
| OBLIGATIONS 10.0% | | | | | | |
| FIXED-RATE 10.0% | | | | | | |
| FHLMC: | | | | | | |
| Ser. 2594, Class QE, 5.00%, 08/15/2031 | | | | 2,395,000 | | 2,337,174 |
| Ser. 2647, Class PC, 5.00%, 11/15/2031 | | | | 2,500,000 | | 2,444,738 |
| Ser. 2656, Class BG, 5.00%, 10/15/2032 | | | | 2,175,000 | | 2,127,017 |
| Ser. 2695, Class BG, 4.50%, 04/15/2032 | | | | 950,000 | | 898,151 |
| Ser. 2778, Class JD, 5.00%, 12/15/2032 | | | | 450,000 | | 436,121 |
| Ser. 2857, Class Al, 5.00%, 12/15/2032 | | | | 1,995,000 | | 1,930,029 |
| Ser. 2979, Class QB, 4.50%, 03/15/2018 | | | | 2,067,000 | | 2,029,804 |
| Ser. 2991, Class QD, 5.00%, 08/15/2034 | | | | 2,550,000 | | 2,507,261 |
| Ser. 3036, Class NC, 5.00%, 03/15/2031 | | | | 1,740,000 | | 1,709,374 |
| Ser. 3059, Class CD, 5.00%, 04/15/2031 | | | | 2,400,000 | | 2,354,409 |
| Ser. 3068, Class AK, 4.50%, 03/15/2027 | | | | 335,000 | | 319,195 |
| Ser. 3072, Class NK, 5.00%, 05/15/2031 | | | | 292,417 | | 290,242 |
| Ser. 3082, Class PJ, 5.00%, 09/15/2034 | | | | 335,000 | | 321,156 |
| FNMA: | | | | | | |
| Ser. 2002-T12, Class A3, 7.50%, 05/25/2042 | | | | 18,969 | | 20,005 |
| Ser. 2002-T19, Class A3, 7.50%, 07/25/2042 | | | | 304,745 | | 320,315 |
| Ser. 2003-129, Class PW, 4.50%, 07/25/2033 | | | | 2,800,000 | | 2,765,077 |
| Ser. 2003-W4, Class 4A, 7.50%, 10/25/2042 | | | | 199,395 | | 209,811 |
| Ser. 2005-20, Class QE, 5.00%, 10/25/2030 | | | | 615,000 | | 603,652 |
| Ser. 2005-38, Class QJ, 5.50%, 03/25/2033 | | | | 1,949,250 | | 1,941,781 |
| Ser. 2007-65, Class GV, 5.00%, 07/25/2018 | | | | 2,613,143 | | 2,575,134 |
| |
|
| Total Agency Mortgage-Backed Collateralized Mortgage Obligations | | | | |
| (cost $27,549,455) | | | | | | 28,140,446 |
| |
|
| AGENCY MORTGAGE-BACKED PASS THROUGH SECURITIES 10.5% | | | | |
| FIXED-RATE 10.5% | | | | | | |
| FHLMC: | | | | | | |
| 5.00%, 09/15/2028 | | | | 210,000 | | 208,357 |
| 6.00%, 01/01/2032 | | | | 6,249 | | 6,318 |
| 6.50%, 09/25/2043 | | | | 115,517 | | 118,819 |
| 7.50%, 09/01/2013 - 08/25/2042 | | | | 180,143 | | 187,868 |
| 9.00%, 12/01/2016 | | | | 137,156 | | 146,337 |
| 9.50%, 12/01/2022 | | | | 20,120 | | 21,853 |
| FHLMC 30 year: | | | | | | |
| 5.00%, TBA # | | | | 2,635,000 | | 2,527,542 |
| 5.50%, TBA # | | | | 2,105,000 | | 2,071,122 |
See Notes to Financial Statements
11
SCHEDULE OF INVESTMENTS continued
October 31, 2007 (unaudited)
| | | Principal | | |
| | | Amount | | Value |
|
| |
| AGENCY MORTGAGE-BACKED PASS THROUGH SECURITIES continued | | | | |
| FIXED-RATE continued | | | | |
| FNMA: | | | | |
| 5.70%, 11/01/2011 | | $ 6,498,498 | | $ 6,655,372 |
| 6.06%, 05/01/2012 | | 1,385,015 | | 1,427,593 |
| 6.09%, 03/01/2012 ## | | 2,300,812 | | 2,374,954 |
| 6.27%, 02/01/2011 | | 3,359,201 | | 3,463,319 |
| 6.45%, 09/01/2016 | | 1,763,870 | | 1,853,445 |
| 6.80%, 08/01/2009 | | 3,001,350 | | 3,065,067 |
| 7.87%, 07/01/2026 | | 3,038,136 | | 3,493,176 |
| 9.00%, 02/01/2025 - 09/01/2030 | | 217,542 | | 235,914 |
| 10.00%, 09/01/2010 - 04/01/2021 | | 93,683 | | 104,983 |
| FNMA 15 year, 5.00%, TBA # | | 1,270,000 | | 1,249,561 |
| GNMA: | | | | |
| 8.00%, 03/15/2022 - 08/15/2024 | | 60,189 | | 63,997 |
| 8.25%, 05/15/2020 | | 60,435 | | 64,728 |
| 8.50%, 09/15/2024 - 01/15/2027 | | 82,518 | | 89,365 |
| 9.00%, 12/15/2019 | | 59,669 | | 64,472 |
| 9.50%, 09/15/2019 | | 17,750 | | 19,439 |
| 10.00%, 01/15/2019 - 03/15/2020 | | 34,126 | | 38,952 |
| |
|
| Total Agency Mortgage-Backed Pass Through Securities | | | | |
| (cost $29,210,590) | | | | 29,552,553 |
| |
|
| AGENCY REPERFORMING MORTGAGE-BACKED COLLATERALIZED | | | | |
| MORTGAGE OBLIGATIONS 0.2% | | | | |
| FNMA: | | | | |
| Ser. 2003-W02, Class 2A9, 5.90%, 07/25/2042 | | 173,924 | | 176,729 |
| Ser. 2003-W12, Class 1A8, 4.55%, 06/25/2043 | | 350,000 | | 341,805 |
| |
|
| Total Agency Reperforming Mortgage-Backed Collateralized Mortgage | | | | |
| Obligations (cost $503,642) | | | | 518,534 |
| |
|
| ASSET-BACKED SECURITIES 4.6% | | | | |
| Acacia CDO, Ltd., Ser. 10A, Class C, FRN, 7.02%, 09/07/2046 144A | | 1,000,000 | | 944,880 |
| American Home Mtge. Backed Investment Trust, Ser. 2005-2, Class 5A4C, 5.41%, | | | | |
| 09/25/2035 | | 2,000,000 | | 1,881,580 |
| Deutsche Securities, Inc., Ser. 2006-AB2, Class A3, 6.27%, 06/25/2036 | | 2,000,000 | | 1,991,440 |
| Deutsche Securities, Inc., NIM, Ser. 2007-0A1, Class N1, 6.50%, 02/25/2047 | | | | |
| 144A | | 971,307 | | 963,692 |
| MASTR Asset Backed Securities Trust, Ser. 2005-AB1, Class A4, 5.65%, | | | | |
| 10/25/2032 | | 2,500,000 | | 2,411,025 |
| Nautilus RMBS CDO, Ltd., Ser. 2005-1A, Class A3, FRN, 6.74%, 07/07/2040 | | | | |
| 144A | | 2,938,025 | | 2,802,141 |
| Nomura Asset Acceptance Corp., Ser. 2006-AP1, Class A2, 5.52%, 01/25/2036 | | 2,078,000 | | 2,045,261 |
| |
|
| Total Asset-Backed Securities (cost $13,099,026) | | | | 13,040,019 |
| |
|
See Notes to Financial Statements
12
SCHEDULE OF INVESTMENTS continued
October 31, 2007 (unaudited)
| | | Principal | | |
| | | Amount | | Value |
|
| |
| COMMERCIAL MORTGAGE-BACKED SECURITIES 14.5% | | | | |
| FIXED-RATE 8.8% | | | | |
| Banc of America Comml. Mtge., Inc., Ser. 2000-2, Class F, 7.92%, 09/15/2032 | | $ 3,000,000 | | $ 3,168,567 |
| Banc of America Mtge. Securities, Inc., Ser. 2003-7, Class B6, 4.75%, | | | | |
| 09/25/2018 | | 238,163 | | 139,302 |
| Citigroup Comml. Mtge. Trust, Ser. 2007-C6, Class C, 5.70%, 07/10/2017 | | 855,000 | | 802,455 |
| Commercial Mtge. Pass-Through Cert., Ser. 2007-C9, Class B, 5.82%, | | | | |
| 12/10/2049 | | 910,000 | | 867,499 |
| Crown Castle Towers, LLC, Ser. 2006-1A, Class C, 5.47%, 11/15/2036 144A | | 1,920,000 | | 1,872,691 |
| GE Capital Comml. Mtge. Corp., Ser. 2007-C1, Class C, 5.70%, 12/10/2049 | | 2,500,000 | | 2,342,652 |
| GS Mtge. Securities Corp., Ser. 2007-GG10, Class AM, 5.80%, 08/10/2045 | | 2,700,000 | | 2,724,208 |
| JPMorgan Chase & Co. Comml. Mtge. Securities Corp.: | | | | |
| Ser. 2004-CB9, Class A1, 3.48%, 06/12/2041 | | 4,242,088 | | 4,169,677 |
| Ser. 2006-LDP8, Class B, 5.52%, 05/15/2045 | | 1,000,000 | | 923,264 |
| Ser. 2006-LDP9, Class A3, 5.34%, 05/15/2047 | | 2,360,000 | | 2,306,876 |
| Ser. 2007-LD12, Class A2, 5.83%, 02/15/2051 | | 3,045,000 | | 3,090,479 |
| MASTR Reperforming Loan Trust, Ser. 2006-2, Class B3, 5.90%, 05/25/2036 | | | | |
| 144A | | 431,331 | | 256,491 |
| Morgan Stanley Capital I, Inc., Ser. 2001-TOP5, Class G, 6.00%, 10/15/2035 | | | | |
| 144A | | 1,042,000 | | 977,925 |
| Prima Capital Securitization, Ltd., Ser. 2006, Class D, 5.88%, 12/28/2048 | | 1,085,000 | | 1,097,781 |
| |
|
| | | | | 24,739,867 |
| |
|
| FLOATING-RATE 5.7% | | | | |
| Capmark, Ltd., Ser. 2006-7A, Class B, 5.46%, 08/20/2036 144A | | 500,000 | | 482,020 |
| Credit Suisse Mtge. Capital Cert., Ser. 2006-C1, Class AM, 5.55%, 02/15/2039 | | 2,835,000 | | 2,820,806 |
| Greenwich Capital Comml. Funding Corp., Ser. 2004-GG1, Class A7, 5.32%, | | | | |
| 06/10/2036 | | 4,000,000 | | 3,969,247 |
| GS Mtge. Securities Corp., Ser. 2007-GG10, Class A2, 5.78%, 08/10/2045 | | 3,665,000 | | 3,716,030 |
| JPMorgan Chase & Co. Comml. Mtge. Securities Corp., Ser. 2007-CB19, | | | | |
| Class A4, 5.75%, 02/12/2049 | | 2,105,000 | | 2,133,249 |
| Morgan Stanley Capital I, Inc., Ser. 2007-IQ15, Class A4, 5.88%, 06/11/2049 | | 2,750,000 | | 2,811,467 |
| |
|
| | | | | 15,932,819 |
| |
|
| Total Commercial Mortgage-Backed Securities (cost $40,842,419) | | | | 40,672,686 |
| |
|
| CORPORATE BONDS 22.8% | | | | |
| CONSUMER DISCRETIONARY 2.7% | | | | |
| Auto Components 0.1% | | | | |
| Cooper Tire & Rubber Co., 7.625%, 03/15/2027 | | 110,000 | | 101,750 |
| Goodyear Tire & Rubber Co.: | | | | |
| 9.00%, 07/01/2015 (p) | | 140,000 | | 153,825 |
| 11.25%, 03/01/2011 | | 85,000 | | 91,375 |
| |
|
| | | | | 346,950 |
| |
|
| Diversified Consumer Services 0.0% | | | | |
| Service Corporation International, 6.75%, 04/01/2015 | | 15,000 | | 15,038 |
| |
|
See Notes to Financial Statements
13
SCHEDULE OF INVESTMENTS continued
October 31, 2007 (unaudited)
| | | | | Principal | | |
| | | | | Amount | | Value |
|
| |
| CORPORATE BONDS continued | | | | |
| CONSUMER DISCRETIONARY continued | | | | |
| Hotels, Restaurants & Leisure 0.3% | | | | |
| Caesars Entertainment, Inc.: | | | | | | |
| 7.875%, 03/15/2010 | | | | $ 70,000 | | $ 72,800 |
| 8.125%, 05/15/2011 | | | | 20,000 | | 20,400 |
| Indianapolis Downs, LLC, 11.00%, 11/01/2012 144A | | 15,000 | | 15,150 |
| Inn of the Mountain Gods Resort & Casino, 12.00%, 11/15/2010 | | 35,000 | | 37,100 |
| Isle of Capri Casinos, Inc., 7.00%, 03/01/2014 (p) | | 305,000 | | 272,212 |
| Pokagon Gaming Authority, 10.375%, 06/15/2014 144A | | 85,000 | | 94,350 |
| Seneca Gaming Corp., 7.25%, 05/01/2012 | | 20,000 | | 20,250 |
| Shingle Springs Tribal Gaming Authority, 9.375%, 06/15/2015 144A | | 110,000 | | 111,100 |
| Universal City Development Partners, Ltd., 11.75%, 04/01/2010 | | 30,000 | | 31,575 |
| Wheeling Island Gaming, Inc., 10.125%, 12/15/2009 | | 40,000 | | 40,100 |
| |
|
| | | | | | | 715,037 |
| |
|
| Household Durables 0.1% | | | | | | |
| Hovnanian Enterprises, Inc.: | | | | | | |
| 6.00%, 01/15/2010 (p) | | | | 20,000 | | 15,400 |
| 6.50%, 01/15/2014 | | | | 25,000 | | 19,750 |
| Libbey, Inc., FRN, 12.38%, 06/01/2011 | | 80,000 | | 87,400 |
| Meritage Homes Corp., 6.25%, 03/15/2015 (p) | | 20,000 | | 15,900 |
| Pulte Homes, Inc., 4.875%, 07/15/2009 | | 25,000 | | 23,437 |
| Standard Pacific Corp.: | | | | | | |
| 5.125%, 04/01/2009 (p) | | | | 10,000 | | 8,350 |
| 6.50%, 08/15/2010 (p) | | | | 30,000 | | 22,950 |
| |
|
| | | | | | | 193,187 |
| |
|
| Media 0.8% | | | | | | |
| Cablevision Systems Corp., Ser. B, 8.00%, 04/15/2012 | | 110,000 | | 108,075 |
| CSC Holdings, Inc., 7.625%, 04/01/2011 | | 150,000 | | 150,375 |
| Lamar Media Corp.: | | | | | | |
| 6.625%, 08/15/2015 | | | | 315,000 | | 303,975 |
| Ser. C, 6.625%, 08/15/2015 144A | | 25,000 | | 24,063 |
| Mediacom Broadband, LLC, 8.50%, 10/15/2015 (p) | | 10,000 | | 9,900 |
| Mediacom Communications Corp., 9.50%, 01/15/2013 (p) | | 225,000 | | 226,125 |
| R.H. Donnelley Corp., Ser. A-4, 8.875%, 10/15/2017 144A (p) | | 170,000 | | 170,000 |
| Sinclair Broadcast Group, Inc., Class A, 8.00%, 03/15/2012 (p) | | 20,000 | | 20,650 |
| Time Warner, Inc., 7.625%, 04/15/2031 | | 1,100,000 | | 1,227,404 |
| |
|
| | | | | | | 2,240,567 |
| |
|
| Multi-line Retail 0.8% | | | | | | |
| Federated Department Stores Co., 7.45%, 09/15/2011 | | 500,000 | | 523,823 |
| Federated Retail Holdings, Inc., 6.375%, 03/15/2037 | | 700,000 | | 637,260 |
| Kohl’s Corp., 6.875%, 12/15/2037 | | | | 575,000 | | 583,585 |
| Neiman Marcus Group, Inc., 9.00%, 10/15/2015 | | 75,000 | | 79,500 |
| Target Corp., 6.50%, 10/15/2037 | | | | 450,000 | | 457,431 |
| |
|
| | | | | | | 2,281,599 |
| |
|
See Notes to Financial Statements
14
SCHEDULE OF INVESTMENTS continued
October 31, 2007 (unaudited)
| | | Principal | | |
| | | Amount | | Value |
|
| |
| CORPORATE BONDS continued | | | | |
| CONSUMER DISCRETIONARY continued | | | | |
| Specialty Retail 0.5% | | | | |
| Home Depot, Inc., 5.875%, 12/16/2036 | | $ 1,514,000 | | $ 1,326,131 |
| Payless ShoeSource, Inc., 8.25%, 08/01/2013 | | 140,000 | | 139,125 |
| |
|
| | | | | 1,465,256 |
| |
|
| Textiles, Apparel & Luxury Goods 0.1% | | | | |
| Norcross Safety Products, LLC, Ser. B, 9.875%, 08/15/2011 | | 15,000 | | 15,600 |
| Oxford Industries, Inc., 8.875%, 06/01/2011 | | 180,000 | | 180,900 |
| Warnaco Group, Inc., 8.875%, 06/15/2013 | | 135,000 | | 142,762 |
| |
|
| | | | | 339,262 |
| |
|
| CONSUMER STAPLES 0.6% | | | | |
| Food & Staples Retailing 0.4% | | | | |
| Ingles Markets, Inc., 8.875%, 12/01/2011 | | 140,000 | | 143,850 |
| Rite Aid Corp., 8.125%, 05/01/2010 | | 140,000 | | 141,575 |
| SUPERVALU, Inc., 7.50%, 11/15/2014 | | 50,000 | | 51,625 |
| Wal-Mart Stores, Inc., 6.50%, 08/15/2037 | | 675,000 | | 712,284 |
| |
|
| | | | | 1,049,334 |
| |
|
| Food Products 0.2% | | | | |
| Dean Foods Co., 6.625%, 05/15/2009 (p) | | 250,000 | | 250,000 |
| Del Monte Foods Co.: | | | | |
| 6.75%, 02/15/2015 (p) | | 180,000 | | 175,950 |
| 8.625%, 12/15/2012 | | 60,000 | | 61,500 |
| Pilgrim’s Pride Corp., 8.375%, 05/01/2017 | | 5,000 | | 5,063 |
| Smithfield Foods, Inc., 7.75%, 07/01/2017 (p) | | 15,000 | | 15,525 |
| |
|
| | | | | 508,038 |
| |
|
| Household Products 0.0% | | | | |
| Church & Dwight Co., 6.00%, 12/15/2012 (p) | | 100,000 | | 97,875 |
| |
|
| Personal Products 0.0% | | | | |
| Central Garden & Pet Co., 9.125%, 02/01/2013 (p) | | 120,000 | | 115,200 |
| |
|
| ENERGY 2.1% | | | | |
| Energy Equipment & Services 0.2% | | | | |
| Bristow Group, Inc., 6.125%, 06/15/2013 | | 80,000 | | 78,600 |
| Dresser-Rand Group, Inc., 7.375%, 11/01/2014 | | 20,000 | | 20,225 |
| Hornbeck Offshore Services, Inc., Ser. B, 6.125%, 12/01/2014 | | 155,000 | | 148,412 |
| Parker Drilling Co., 9.625%, 10/01/2013 | | 85,000 | | 91,163 |
| PHI, Inc., 7.125%, 04/15/2013 | | 175,000 | | 170,625 |
| |
|
| | | | | 509,025 |
| |
|
See Notes to Financial Statements
15
SCHEDULE OF INVESTMENTS continued
October 31, 2007 (unaudited)
| | | Principal | | |
| | | Amount | | Value |
|
| |
| CORPORATE BONDS continued | | | | |
| ENERGY continued | | | | |
| Oil, Gas & Consumable Fuels 1.9% | | | | |
| Chesapeake Energy Corp., 6.875%, 01/15/2016 | | $ 220,000 | | $ 220,000 |
| Cimarex Energy Co., 7.125%, 05/01/2017 (p) | | 15,000 | | 15,056 |
| El Paso Corp., 7.00%, 06/15/2017 (p) | | 20,000 | | 20,141 |
| EnCana Corp., 6.625%, 08/15/2037 | | 1,225,000 | | 1,298,134 |
| Encore Acquisition Co.: | | | | |
| 6.00%, 07/15/2015 (p) | | 55,000 | | 50,050 |
| 6.25%, 04/15/2014 | | 30,000 | | 28,050 |
| Exco Resources, Inc., 7.25%, 01/15/2011 | | 120,000 | | 119,100 |
| Forest Oil Corp., 7.75%, 05/01/2014 | | 95,000 | | 96,425 |
| Frontier Oil Corp., 6.625%, 10/01/2011 (p) | | 20,000 | | 20,000 |
| Griffin Coal Mining Co., Ltd., 9.50%, 12/01/2016 144A | | 210,000 | | 208,950 |
| Kinder Morgan Energy Partners, LP, 7.40%, 03/15/2031 | | 1,125,000 | | 1,222,105 |
| Mariner Energy, Inc., 8.00%, 05/15/2017 | | 25,000 | | 24,813 |
| Overseas Shipholding Group, Inc., 8.25%, 03/15/2013 | | 140,000 | | 145,250 |
| Peabody Energy Corp.: | | | | |
| 5.875%, 04/15/2016 | | 10,000 | | 9,575 |
| 6.875%, 03/15/2013 | | 195,000 | | 196,950 |
| Plains Exploration & Production Co., 7.75%, 06/15/2015 (p) | | 20,000 | | 20,000 |
| Regency Energy Partners, LP, 8.375%, 12/15/2013 (p) | | 115,000 | | 121,613 |
| Sabine Pass LNG, LP, 7.25%, 11/30/2013 | | 180,000 | | 177,300 |
| Sunoco, Inc., 9.00%, 11/01/2024 | | 500,000 | | 618,827 |
| Targa Resources, Inc., 8.50%, 11/01/2013 144A | | 100,000 | | 101,500 |
| Tesoro Corp., Ser. B, 6.625%, 11/01/2015 | | 300,000 | | 299,250 |
| W&T Offshore, Inc., 8.25%, 06/15/2014 144A | | 10,000 | | 9,750 |
| Williams Cos., 7.125%, 09/01/2011 | | 150,000 | | 156,375 |
| Williams Partners, LP, 7.25%, 02/01/2017 | | 185,000 | | 191,706 |
| |
|
| | | | | 5,370,920 |
| |
|
| FINANCIALS 12.4% | | | | |
| Capital Markets 3.4% | | | | |
| American Capital Strategies, Ltd., Ser. A, 5.92%, 09/01/2009 (h) + | | 3,500,000 | | 3,483,690 |
| Goldman Sachs Group, Inc.: | | | | |
| 5.30%, 02/14/2012 (p) | | 1,200,000 | | 1,201,472 |
| 6.75%, 10/01/2037 | | 1,125,000 | | 1,132,868 |
| Lehman Brothers Holdings, Inc., 6.00%, 07/19/2012 | | 900,000 | | 913,397 |
| Merrill Lynch & Co., Inc., 6.05%, 08/15/2012 | | 1,325,000 | | 1,345,997 |
| Morgan Stanley, 5.625%, 01/09/2012 | | 1,425,000 | | 1,446,629 |
| Nuveen Investments, Inc., 10.50%, 11/15/2015 # | | 35,000 | | 35,000 |
| |
|
| | | | | 9,559,053 |
| |
|
| Commercial Banks 2.9% | | | | |
| BankAmerica Capital II, 8.00%, 12/15/2026 | | 1,000,000 | | 1,040,819 |
| FBOP Corp., 10.00%, 01/15/2009 144A | | 4,000,000 | | 4,232,320 |
| National City Corp., 5.80%, 06/07/2017 | | 1,700,000 | | 1,694,081 |
| SunTrust Banks, Inc., 6.00%, 09/11/2017 | | 1,300,000 | | 1,322,264 |
| |
|
| | | | | 8,289,484 |
| |
|
See Notes to Financial Statements
16
SCHEDULE OF INVESTMENTS continued
October 31, 2007 (unaudited)
| | | Principal | | |
| | | Amount | | Value |
|
| |
| CORPORATE BONDS continued | | | | |
| FINANCIALS continued | | | | |
| Consumer Finance 2.2% | | | | |
| American Water Capital Corp., 6.09%, 10/15/2017 144A | | $ 850,000 | | $ 858,191 |
| Daimler Financial Services AG, 4.875%, 06/15/2010 | | 100,000 | | 99,523 |
| Ford Motor Credit Co., LLC: | | | | |
| 5.70%, 01/15/2010 | | 35,000 | | 32,479 |
| 7.375%, 10/28/2009 | | 640,000 | | 617,527 |
| General Motors Acceptance Corp., LLC: | | | | |
| 5.625%, 05/15/2009 | | 40,000 | | 38,121 |
| 6.81%, 05/15/2009 | | 105,000 | | 98,828 |
| 6.875%, 09/15/2011 | | 525,000 | | 484,244 |
| 7.75%, 01/19/2010 | | 65,000 | | 62,949 |
| 8.00%, 11/01/2031 | | 100,000 | | 92,666 |
| MBNA Corp., Ser. A, 8.28%, 12/01/2026 | | 1,750,000 | | 1,818,103 |
| Qwest Capital Funding, Inc., 6.50%, 11/15/2018 | | 70,000 | | 62,475 |
| Sprint Capital Corp., 6.875%, 11/15/2028 | | 2,000,000 | | 1,921,082 |
| |
|
| | | | | 6,186,188 |
| |
|
| Diversified Financial Services 0.3% | | | | |
| Citigroup, Inc., 5.50%, 08/27/2012 (p) | | 650,000 | | 658,676 |
| Leucadia National Corp., 8.125%, 09/15/2015 | | 180,000 | | 182,475 |
| |
|
| | | | | 841,151 |
| |
|
| Insurance 0.5% | | | | |
| Crum & Forster Holdings Corp., 7.75%, 05/01/2017 | | 70,000 | | 69,825 |
| Prudential Financial, Inc., 6.10%, 06/15/2017 | | 1,200,000 | | 1,214,485 |
| |
|
| | | | | 1,284,310 |
| |
|
| Real Estate Investment Trusts 3.0% | | | | |
| BRE Properties, Inc., 5.50%, 03/15/2017 | | 2,400,000 | | 2,275,138 |
| Camden Property Trust, 5.00%, 06/15/2015 | | 3,500,000 | | 3,238,518 |
| Colonial Realty, Ltd., 6.25%, 06/15/2014 | | 1,370,000 | | 1,366,067 |
| ERP Operating, LP, 5.75%, 06/15/2017 | | 1,000,000 | | 969,935 |
| Host Marriott Corp.: | | | | |
| 7.125%, 11/01/2013 (p) | | 100,000 | | 102,000 |
| Ser. O, 6.375%, 03/15/2015 | | 25,000 | | 24,812 |
| Ser. Q, 6.75%, 06/01/2016 | | 135,000 | | 135,675 |
| Omega Healthcare Investors, Inc.: | | | | |
| 7.00%, 04/01/2014 | | 10,000 | | 10,125 |
| 7.00%, 01/15/2016 | | 50,000 | | 50,375 |
| Ventas, Inc., 7.125%, 06/01/2015 | | 250,000 | | 256,250 |
| |
|
| | | | | 8,428,895 |
| |
|
| Thrifts & Mortgage Finance 0.1% | | | | |
| Residential Capital, LLC: | | | | |
| 7.125%, 11/21/2008 | | 40,000 | | 33,708 |
| 7.375%, 06/30/2010 | | 325,000 | | 239,819 |
| |
|
| | | | | 273,527 |
| |
|
See Notes to Financial Statements
17
SCHEDULE OF INVESTMENTS continued
October 31, 2007 (unaudited)
| | | Principal | | |
| | | Amount | | Value |
|
| |
| CORPORATE BONDS continued | | | | |
| HEALTH CARE 1.9% | | | | |
| Biotechnology 0.6% | | | | |
| Amgen, Inc., 6.375%, 06/01/2037 144A | | $ 1,500,000 | | $ 1,521,995 |
| |
|
| Health Care Equipment & Supplies 0.0% | | | | |
| Universal Hospital Services, Inc., 8.50%, 06/01/2015 144A | | 58,000 | | 59,305 |
| |
|
| Health Care Providers & Services 1.0% | | | | |
| HCA, Inc., 9.25%, 11/15/2016 | | 330,000 | | 348,150 |
| Omnicare, Inc.: | | | | |
| 6.125%, 06/01/2013 | | 165,000 | | 155,925 |
| 6.875%, 12/15/2015 | | 70,000 | | 67,550 |
| UnitedHealth Group, Inc., 5.375%, 03/15/2016 | | 1,000,000 | | 992,629 |
| WellPoint, Inc., 6.375%, 06/15/2037 (p) | | 1,300,000 | | 1,326,104 |
| |
|
| | | | | 2,890,358 |
| |
|
| Pharmaceuticals 0.3% | | | | |
| Abbott Laboratories, 5.875%, 05/15/2016 | | 850,000 | | 873,486 |
| |
|
| INDUSTRIALS 0.6% | | | | |
| Aerospace & Defense 0.3% | | | | |
| Alliant Techsystems, Inc., 6.75%, 04/01/2016 (p) | | 25,000 | | 25,000 |
| DRS Technologies, Inc.: | | | | |
| 6.625%, 02/01/2016 | | 50,000 | | 49,750 |
| 7.625%, 02/01/2018 (p) | | 40,000 | | 41,100 |
| Hexcel Corp., 6.75%, 02/01/2015 (p) | | 25,000 | | 24,687 |
| L-3 Communications Holdings, Inc.: | | | | |
| 5.875%, 01/15/2015 | | 410,000 | | 401,800 |
| 6.375%, 10/15/2015 | | 355,000 | | 356,775 |
| |
|
| | | | | 899,112 |
| |
|
| Commercial Services & Supplies 0.2% | | | | |
| Browning-Ferris Industries, Inc.: | | | | |
| 7.40%, 09/15/2035 | | 100,000 | | 94,500 |
| 9.25%, 05/01/2021 | | 95,000 | | 102,125 |
| Corrections Corporation of America, 6.25%, 03/15/2013 | | 160,000 | | 159,808 |
| Geo Group, Inc., 8.25%, 07/15/2013 | | 175,000 | | 178,063 |
| Mobile Mini, Inc., 6.875%, 05/01/2015 144A | | 30,000 | | 28,650 |
| |
|
| | | | | 563,146 |
| |
|
| Machinery 0.1% | | | | |
| Commercial Vehicle Group, Inc., 8.00%, 07/01/2013 | | 100,000 | | 96,500 |
| Manitowoc Co., 7.125%, 11/01/2013 | | 65,000 | | 65,000 |
| |
|
| | | | | 161,500 |
| |
|
See Notes to Financial Statements
18
SCHEDULE OF INVESTMENTS continued
October 31, 2007 (unaudited)
| | | | | Principal | | |
| | | | | Amount | | Value |
|
| |
| CORPORATE BONDS continued | | | | | | |
| INDUSTRIALS continued | | | | | | |
| Road & Rail 0.0% | | | | | | |
| Avis Budget Group, Inc., 7.75%, 05/15/2016 | | | | $ 45,000 | | $ 44,550 |
| Avis Car Rental, LLC, 7.625%, 05/15/2014 | | | | 55,000 | | 54,725 |
| Hertz Global Holdings, Inc.: | | | | | | |
| 8.875%, 01/01/2014 | | | | 35,000 | | 36,225 |
| 10.50%, 01/01/2016 (p) | | | | 5,000 | | 5,400 |
| |
|
| | | | | | | 140,900 |
| |
|
| Trading Companies & Distributors 0.0% | | | | | | |
| United Rentals, Inc., 6.50%, 02/15/2012 | | | | 40,000 | | 41,600 |
| |
|
| INFORMATION TECHNOLOGY 0.2% | | | | | | |
| Electronic Equipment & Instruments 0.1% | | | | | | |
| Da-Lite Screen Co., Inc., 9.50%, 05/15/2011 | | | | 70,000 | | 73,588 |
| Sanmina-SCI Corp., FRN: | | | | | | |
| 8.44%, 06/15/2010 144A | | | | 40,000 | | 40,200 |
| 8.44%, 06/15/2014 144A | | | | 25,000 | | 24,375 |
| |
|
| | | | | | | 138,163 |
| |
|
| IT Services 0.1% | | | | | | |
| First Data Corp., 9.875%, 09/24/2015 144A | | | | 45,000 | | 43,144 |
| SunGard Data Systems, Inc., 4.875%, 01/15/2014 (p) | | | | 235,000 | | 208,562 |
| Unisys Corp., 7.875%, 04/01/2008 | | | | 40,000 | | 39,850 |
| |
|
| | | | | | | 291,556 |
| |
|
| Semiconductors & Semiconductor Equipment 0.0% | | | | |
| Freescale Semiconductor, Inc., 8.875%, 12/15/2014 | | | | 60,000 | | 57,075 |
| |
|
| MATERIALS 0.8% | | | | | | |
| Chemicals 0.4% | | | | | | |
| ARCO Chemical Co.: | | | | | | |
| 9.80%, 02/01/2020 | | | | 50,000 | | 49,250 |
| 10.25%, 11/01/2010 | | | | 10,000 | | 10,600 |
| Equistar Chemicals, LP, 10.625%, 05/01/2011 | | | | 133,000 | | 139,650 |
| Koppers Holdings, Inc.: | | | | | | |
| 9.875%, 10/15/2013 | | | | 10,000 | | 10,625 |
| Sr. Disc. Note, Step Bond, 0.00%, 11/15/2014 † | | | | 85,000 | | 73,312 |
| Lyondell Chemical Co.: | | | | | | |
| 6.875%, 06/15/2017 (p) | | | | 70,000 | | 77,350 |
| 10.50%, 06/01/2013 | | | | 300,000 | | 324,750 |
| Millenium America, Inc., 7.625%, 11/15/2026 | | | | 70,000 | | 60,550 |
| Momentive Performance Materials, Inc.: | | | | | | |
| 9.75%, 12/01/2014 144A | | | | 115,000 | | 112,700 |
| 10.125%, 12/01/2014 144A | | | | 15,000 | | 14,550 |
See Notes to Financial Statements
19
SCHEDULE OF INVESTMENTS continued
October 31, 2007 (unaudited)
| | | Principal | | |
| | | Amount | | Value |
|
| |
| CORPORATE BONDS continued | | | | |
| MATERIALS continued | | | | |
| Chemicals continued | | | | |
| Mosaic Co.: | | | | |
| 7.30%, 01/15/2028 | | $ 55,000 | | $ 54,725 |
| 7.625%, 12/01/2016 144A | | 80,000 | | 86,600 |
| Tronox Worldwide, LLC, 9.50%, 12/01/2012 | | 230,000 | | 223,100 |
| |
|
| | | | | 1,237,762 |
| |
|
| Construction Materials 0.0% | | | | |
| CPG International, Inc., 10.50%, 07/01/2013 | | 140,000 | | 140,700 |
| |
|
| Containers & Packaging 0.1% | | | | |
| Berry Plastics Holding Corp., 8.875%, 09/15/2014 (p) | | 43,000 | | 44,290 |
| Exopack Holding Corp., 11.25%, 02/01/2014 | | 110,000 | | 111,925 |
| Graphic Packaging International, Inc.: | | | | |
| 8.50%, 08/15/2011 (p) | | 10,000 | | 10,200 |
| 9.50%, 08/15/2013 | | 55,000 | | 58,025 |
| |
|
| | | | | 224,440 |
| |
|
| Metals & Mining 0.1% | | | | |
| Dayton Superior Corp., 10.75%, 09/15/2008 | | 20,000 | | 20,350 |
| Freeport-McMoRan Copper & Gold, Inc.: | | | | |
| 6.875%, 02/01/2014 | | 40,000 | | 41,400 |
| 8.375%, 04/01/2017 | | 130,000 | | 142,675 |
| |
|
| | | | | 204,425 |
| |
|
| Paper & Forest Products 0.2% | | | | |
| Buckeye Technologies, Inc., 8.50%, 10/01/2013 | | 38,000 | | 39,330 |
| Georgia Pacific Corp.: | | | | |
| 8.00%, 01/15/2024 (p) | | 80,000 | | 79,200 |
| 8.875%, 05/15/2031 | | 85,000 | | 85,425 |
| Glatfelter, 7.125%, 05/01/2016 | | 140,000 | | 139,300 |
| Verso Paper Holdings, LLC, 9.125%, 08/01/2014 | | 95,000 | | 98,563 |
| |
|
| | | | | 441,818 |
| |
|
| TELECOMMUNICATION SERVICES 0.9% | | | | |
| Diversified Telecommunication Services 0.2% | | | | |
| Citizens Communications Co., 7.875%, 01/15/2027 | | 140,000 | | 138,250 |
| Consolidated Communications, Inc., 9.75%, 04/01/2012 | | 60,000 | | 61,650 |
| Qwest Communications International, Inc.: | | | | |
| 6.50%, 06/01/2017 144A | | 50,000 | | 49,500 |
| 7.875%, 09/01/2011 | | 145,000 | | 153,700 |
| 8.875%, 03/15/2012 | | 60,000 | | 66,000 |
| |
|
| | | | | 469,100 |
| |
|
See Notes to Financial Statements
20
SCHEDULE OF INVESTMENTS continued
October 31, 2007 (unaudited)
| | | | | Principal | | |
| | | | | Amount | | Value |
|
| |
| CORPORATE BONDS continued | | | | |
| TELECOMMUNICATION SERVICES continued | | | | |
| Wireless Telecommunication Services 0.7% | | | | |
| AT&T Wireless, 8.125%, 05/01/2012 | | $ 1,600,000 | | $ 1,786,096 |
| Dobson Cellular Systems, Inc.: | | | | | | |
| 8.375%, 11/01/2011 | | | | 50,000 | | 53,250 |
| 9.875%, 11/01/2012 | | | | 70,000 | | 76,125 |
| Rural Cellular Corp., 8.25%, 03/15/2012 | | 60,000 | | 62,850 |
| |
|
| | | | | | | 1,978,321 |
| |
|
| UTILITIES 0.6% | | | | | | |
| Electric Utilities 0.5% | | | | | | |
| Allegheny Energy Supply Co., 8.25%, 04/15/2012 144A | | 165,000 | | 179,850 |
| Aquila, Inc., 14.875%, 07/01/2012 | | 238,000 | | 301,070 |
| CMS Energy Corp.: | | | | | | |
| 6.55%, 07/17/2017 | | | | 10,000 | | 9,757 |
| 8.50%, 04/15/2011 | | | | 20,000 | | 21,545 |
| Edison Mission Energy: | | | | | | |
| 7.00%, 05/15/2017 144A | | | | 30,000 | | 29,475 |
| 7.20%, 05/15/2019 144A | | | | 70,000 | | 68,775 |
| Mirant North America, LLC, 7.375%, 12/31/2013 (p) | | 225,000 | | 229,219 |
| NRG Energy, Inc., 7.375%, 02/01/2016 | | 185,000 | | 185,000 |
| Orion Power Holdings, Inc., 12.00%, 05/01/2010 | | 85,000 | | 94,350 |
| PSEG Energy Holdings, LLC, 10.00%, 10/01/2009 | | 20,000 | | 21,399 |
| Reliant Energy, Inc.: | | | | | | |
| 6.75%, 12/15/2014 | | | | 230,000 | | 235,175 |
| 7.875%, 06/15/2017 (p) | | | | 5,000 | | 5,069 |
| |
|
| | | | | | | 1,380,684 |
| |
|
| Gas Utilities 0.0% | | | | | | |
| SEMCO Energy, Inc., 7.75%, 05/15/2013 | | 40,000 | | 42,332 |
| |
|
| Independent Power Producers & Energy Traders 0.1% | | | | |
| AES Corp.: | | | | | | |
| 8.00%, 10/15/2017 144A | | | | 120,000 | | 121,650 |
| 8.75%, 05/15/2013 144A | | | | 135,000 | | 143,437 |
| Dynegy, Inc., 7.50%, 06/01/2015 144A (p) | | 110,000 | | 105,600 |
| |
|
| | | | | | | 370,687 |
| |
|
| Total Corporate Bonds (cost $62,755,475) | | | | 64,238,361 |
| |
|
| FOREIGN BONDS - CORPORATE (PRINCIPAL AMOUNT DENOMINATED | | | | |
| IN CURRENCY INDICATED) 4.1% | | | | |
| CONSUMER DISCRETIONARY 0.1% | | | | |
| Media 0.1% | | | | | | |
| Central European Media Enterprise, Ltd., 8.25%, 05/15/2012 EUR | | 170,000 | | 257,456 |
| |
|
See Notes to Financial Statements
21
SCHEDULE OF INVESTMENTS continued
October 31, 2007 (unaudited)
| | | Principal | | |
| | | Amount | | Value |
|
| |
| FOREIGN BONDS - CORPORATE (PRINCIPAL AMOUNT DENOMINATED | | | | |
| IN CURRENCY INDICATED) continued | | | | |
| CONSUMER STAPLES 0.2% | | | | |
| Beverages 0.0% | | | | |
| Canandaigua Brands, Inc., 8.50%, 11/15/2009 GBP | | 50,000 | | $ 106,286 |
| |
|
| Food & Staples Retailing 0.2% | | | | |
| Carrefour SA, 3.625%, 05/06/2013 EUR | | 350,000 | | 478,058 |
| |
|
| ENERGY 0.1% | | | | |
| GAZPROM OAO, 6.58%, 10/31/2013 GBP | | 65,000 | | 132,091 |
| |
|
| FINANCIALS 3.4% | | | | |
| Capital Markets 0.2% | | | | |
| Ahold Finance USA, Inc., 6.50%, 03/14/2017 GBP | | 65,000 | | 132,767 |
| Morgan Stanley, 5.375%, 11/14/2013 GBP | | 270,000 | | 536,591 |
| |
|
| | | | | 669,358 |
| |
|
| Commercial Banks 1.1% | | | | |
| Bayerische Landesbank, 10.00%, 03/31/2010 PLN | | 270,000 | | 117,313 |
| HBOS plc, 4.125%, 01/25/2010 CAD | | 900,000 | | 933,301 |
| Kreditanstalt f¸r Wiederaufbau: | | | | |
| 4.95%, 10/14/2014 CAD | | 670,000 | | 716,712 |
| 6.00%, 07/15/2009 NZD | | 730,000 | | 540,059 |
| Landwirtschaftliche Rentenbank, 5.75%, 01/21/2015 AUD | | 1,000,000 | | 862,063 |
| |
|
| | | | | 3,169,448 |
| |
|
| Consumer Finance 0.6% | | | | |
| ABB International Finance, Ltd., 6.50%, 11/30/2011 EUR | | 350,000 | | 536,587 |
| BMW Finance Corp., 4.25%, 01/22/2014 EUR | | 500,000 | | 699,974 |
| Toyota Motor Credit Corp., 5.125%, 01/17/2012 GBP | | 205,000 | | 417,725 |
| Virgin Media Finance plc, 9.75%, 04/15/2014 GBP | | 50,000 | | 104,727 |
| |
|
| | | | | 1,759,013 |
| |
|
| Diversified Financial Services 0.8% | | | | |
| European Investment Bank: | | | | |
| 5.50%, 12/07/2011 GBP | | 130,000 | | 270,696 |
| 6.00%, 07/15/2009 NZD | | 1,100,000 | | 814,506 |
| General Electric Capital Corp.: | | | | |
| 3.375%, 02/08/2012 EUR | | 500,000 | | 689,667 |
| 6.125%, 05/17/2012 GBP | | 130,000 | | 272,066 |
| Lighthouse Group plc, 8.00%, 04/30/2014 EUR | | 70,000 | | 105,540 |
| |
|
| | | | | 2,152,475 |
| |
|
| Insurance 0.2% | | | | |
| AIG SunAmerica, Inc., 5.625%, 02/01/2012 GBP | | 270,000 | | 548,603 |
| |
|
| Thrifts & Mortgage Finance 0.5% | | | | |
| Nykredit, 5.00%, 10/01/2038 DKK | | 4,582,004 | | 851,665 |
| Totalkredit, FRN, 4.90%, 01/01/2015 DKK | | 2,450,826 | | 482,769 |
| |
|
| | | | | 1,334,434 |
| |
|
See Notes to Financial Statements
22
SCHEDULE OF INVESTMENTS continued
October 31, 2007 (unaudited)
| | | Principal | | |
| | | Amount | | Value |
|
| |
| FOREIGN BONDS - CORPORATE (PRINCIPAL AMOUNT DENOMINATED | | | | |
| IN CURRENCY INDICATED) continued | | | | |
| INDUSTRIALS 0.1% | | | | |
| Aerospace & Defense 0.1% | | | | |
| Bombardier, Inc., 7.25%, 11/15/2016 EUR | | 70,000 | | $ 103,596 |
| |
|
| Machinery 0.0% | | | | |
| Savcio Holdings, Ltd., 8.00%, 02/15/2013 EUR | | 50,000 | | 73,325 |
| |
|
| MATERIALS 0.0% | | | | |
| Containers & Packaging 0.0% | | | | |
| Owens-Illinois European Group BV, 6.875%, 03/31/2017 EUR | | 70,000 | | 98,528 |
| |
|
| TELECOMMUNICATION SERVICES 0.2% | | | | |
| Diversified Telecommunication Services 0.2% | | | | |
| France Telecom, 7.50%, 03/14/2011 GBP | | 270,000 | | 587,558 |
| |
|
| Total Foreign Bonds - Corporate (Principal Amount Denominated in | | | | |
| Currency Indicated) (cost $10,793,022) | | | | 11,470,229 |
| |
|
| FOREIGN BONDS - GOVERNMENT (PRINCIPAL AMOUNT DENOMINATED | | | | |
| IN CURRENCY INDICATED) 6.3% | | | | |
| Austrailia: | | | | |
| 6.00%, 06/14/2011 AUD | | 1,000,000 | | 897,102 |
| 6.00%, 05/01/2012 AUD | | 1,330,000 | | 1,182,693 |
| Brazil, 10.25%, 01/10/2028 BRL | | 350,000 | | 202,790 |
| Canada, 4.60%, 09/15/2011 CAD | | 505,000 | | 534,695 |
| Denmark, 4.00%, 11/15/2017 DKK | | 7,600,000 | | 1,436,740 |
| France, 4.25%, 04/25/2019 EUR | | 715,000 | | 1,022,424 |
| Germany, 3.75%, 01/04/2017 EUR | | 900,000 | | 1,259,497 |
| Hong Kong, 4.23%, 03/21/2011 HKD | | 5,850,000 | | 778,629 |
| International Bank for Reconstruction and Development, 5.75%, 06/25/2010 | | | | |
| RUB # | | 5,100,000 | | 206,018 |
| Mexico: | | | | |
| 5.50%, 02/17/2020 EUR | | 280,000 | | 420,399 |
| 8.00%, 12/07/2023 MXN | | 8,450,000 | | 798,087 |
| 10.00%, 12/05/2024 MXN | | 1,800,000 | | 201,416 |
| Morocco, 5.375%, 06/27/2017 EUR | | 65,000 | | 94,871 |
| Netherlands, 4.00%, 07/15/2016 EUR | | 1,850,000 | | 2,619,475 |
| Norway, 5.00%, 05/15/2015 NOK | | 7,900,000 | | 1,477,128 |
| Philippines, 6.25%, 03/15/2016 EUR | | 200,000 | | 292,850 |
| South Africa, 5.25%, 05/16/2013 EUR | | 100,000 | | 146,519 |
| Sweden, 5.50%, 10/08/2012 SEK | | 16,000,000 | | 2,648,485 |
| Turkey, 4.75%, 07/06/2012 EUR | | 340,000 | | 480,138 |
| Ukraine, 4.95%, 10/13/2015 EUR | | 50,000 | | 67,683 |
| United Kingdom, 5.00%, 03/07/2012 GBP | | 420,000 | | 874,469 |
| |
|
| Total Foreign Bonds - Government (Principal Amount Denominated in | | | | |
| Currency Indicated) (cost $16,616,573) | | | | 17,642,108 |
| |
|
See Notes to Financial Statements
23
SCHEDULE OF INVESTMENTS continued
October 31, 2007 (unaudited)
| | | Principal | | |
| | | Amount | | Value |
|
| |
| WHOLE LOAN MORTGAGE-BACKED COLLATERALIZED MORTGAGE | | | | |
| OBLIGATIONS 2.1% | | | | |
| FIXED-RATE 1.0% | | | | |
| Harborview NIM Corp.: | | | | |
| Ser. 2006-12, Class N1, 6.41%, 12/19/2036 144A | | $ 686,045 | | $ 684,598 |
| Ser. 2006-14, Class N1, 6.41%, 12/19/2036 144A | | 441,651 | | 440,264 |
| Ser. 2006-14, Class N2, 8.35%, 12/19/2036 144A | | 1,000,000 | | 986,530 |
| Sharps SP I, LLC NIM Trust, Ser. 2006-OA1N, Class N1, 7.00%, 02/25/2047 | | | | |
| 144A | | 618,108 | | 615,258 |
| |
|
| | | | | 2,726,650 |
| |
|
| FLOATING-RATE 1.1% | | | | |
| Banc of America Mtge. Securities, Inc., Ser. 2005-D, Class 2A6, 4.78%, | | | | |
| 05/25/2035 | | 3,255,000 | | 3,227,918 |
| |
|
| Total Whole Loan Mortgage-Backed Collateralized Mortgage Obligations | | | | |
| (cost $5,909,039) | | | | 5,954,568 |
| |
|
| WHOLE LOAN MORTGAGE-BACKED PASS THROUGH SECURITIES 15.9% | | | | |
| FIXED-RATE 6.9% | | | | |
| Alternative Loan Trust, Ser. 2007-14T2, Class 2, 6.00%, 07/25/2037 | | 1,710,681 | | 1,679,509 |
| Countrywide Alternative Loan Trust, Inc., Ser. 2007-24, Class A11, 7.00%, | | | | |
| 10/25/2037 | | 963,133 | | 950,272 |
| First Horizon Mtge. Pass Through Trust, Ser. 2007-AR2, Class 2A1, 5.89%, | | | | |
| 07/25/2037 | | 3,005,699 | | 3,010,207 |
| GSAA Home Equity Trust, Ser. 2007-10, Class A1A, 6.00%, 11/25/2037 (h) # | | 1,375,000 | | 1,341,038 |
| GSR Mtge. Loan Trust, Ser. 2006-8F, Class 4A3, 6.50%, 09/25/2036 | | 580,000 | | 561,432 |
| Morgan Stanley Capital I, Inc., Ser. 2007-13, Class 5A1, 5.50%, 10/25/2037 (h) # | | 3,471,772 | | 3,338,109 |
| PHH Alternative Mtge. Trust, Ser. 2007-01, Class 21A, 6.00%, 02/25/2037 | | 809,886 | | 794,580 |
| Residential Accredited Loans, Inc., Ser. 2007-QS10, Class A1, 6.50%, | | | | |
| 09/25/2037 # | | 948,199 | | 945,536 |
| Residential Funding Mtge. Securities, Ser. 2007-SA3, Class 2A1, 5.79%, | | | | |
| 07/27/2037 | | 3,698,209 | | 3,710,302 |
| Washington Mutual, Inc., Ser. 2005-AR3, Class A1, 4.64%, 03/25/2035 | | 3,218,204 | | 3,190,283 |
| |
|
| | | | | 19,521,268 |
| |
|
| FLOATING-RATE 9.0% | | | | |
| Citigroup Mtge. Loan Trust, Inc., Ser. 2005-7, Class 2A3A, 5.18%, 09/25/2035 | | 3,160,176 | | 3,127,760 |
| CSMC Mtge. Backed Trust, Ser. 2007-4R, Class 1A1, 5.69%, 10/26/2036 (h) | | 405,000 | | 395,037 |
| MASTR Reperforming Loan Trust, Ser. 2006-2, Class 1A1, 5.90%, 05/25/2046 | | | | |
| 144A | | 2,685,217 | | 2,698,804 |
| Merrill Lynch Countrywide Comml. Mtge. Trust, Ser. 2007-8,Class A3, 5.96%, | | | | |
| 07/12/2017 | | 3,530,000 | | 3,625,573 |
| Structured Adjustable Rate Mtge. Loan Trust, Ser. 2007-3, Class 3A1, 5.73%, | | | | |
| 04/25/2037 | | 2,550,361 | | 2,546,459 |
| Washington Mutual, Inc. Mtge. Pass-Through Cert., Ser. 2007-HY7, Class 3A2, | | | | |
| 5.92%, 07/25/2037 | | 3,021,843 | | 3,027,917 |
See Notes to Financial Statements
24
SCHEDULE OF INVESTMENTS continued
October 31, 2007 (unaudited)
| | | Principal | | |
| | | Amount | | Value |
|
| |
| WHOLE LOAN MORTGAGE-BACKED PASS THROUGH SECURITIES | | continued | | |
| FLOATING-RATE continued | | | | |
| Washington Mutual, Inc.: | | | | |
| Ser. 2006-AR17, Class 1A1B, 5.74%, 12/25/2046 | | $ 2,661,816 | | $ 2,611,162 |
| Ser. 2007-OA5, Class 1A, 5.68%, 06/25/2047 | | 2,483,146 | | 2,440,958 |
| Ser. 2007-OA5, Class 1A1B, 5.68%, 06/25/2047 | | 2,240,710 | | 2,202,640 |
| Wells Fargo Mtge. Backed Securities Trust, Ser. 2006-AR10, Class 5A1, 5.60%, | | |
| 07/25/2036 | | 2,616,774 | | 2,618,417 |
| |
|
| | | | | 25,294,727 |
| |
|
| Total Whole Loan Mortgage-Backed Pass Through Securities | | | | |
| (cost $44,355,215) | | | | 44,815,995 |
| |
|
| WHOLE LOAN SUBORDINATE COLLATERALIZED MORTGAGE | | | | |
| OBLIGATIONS 1.4% | | | | |
| FIXED-RATE 0.2% | | | | |
| Financial Asset Securitization, Inc., Ser. 1997-NAM2, Class B-2, 7.88%, | | | | |
| 07/25/2027 | | 408,811 | | 407,155 |
| |
|
| FLOATING-RATE 1.2% | | | | |
| Harborview Mtge. Loan Trust: | | | | |
| Ser. 2004-7, Class B4, 6.33%, 11/19/2034 | | 2,902,784 | | 2,351,255 |
| Ser. 2005-8, Class 2B3, 7.28%, 02/19/2035 | | 1,124,222 | | 1,125,425 |
| |
|
| | | | | 3,476,680 |
| |
|
| Total Whole Loan Subordinate Collateralized Mortgage Obligations | | |
| (cost $3,800,959) | | | | 3,883,835 |
| |
|
| U.S. TREASURY OBLIGATIONS 0.2% | | | | |
| U.S. Treasury Bonds, 6.00%, 02/15/2026 (p) | | 110,000 | | 125,984 |
| U.S. Treasury Notes, 4.75%, 08/15/2017 | | 415,000 | | 424,273 |
| |
|
| Total U.S. Treasury Obligations (cost $538,755) | | | | 550,257 |
| |
|
| YANKEE OBLIGATIONS - CORPORATE 2.9% | | | | |
| CONSUMER STAPLES 0.1% | | | | |
| Beverages 0.1% | | | | |
| Companhia Brasileira de Bebidas, 8.75%, 09/15/2013 | | 115,000 | | 132,399 |
| |
|
| Food Products 0.0% | | | | |
| Sadia Overseas, Ltd., 6.875%, 05/24/2017 144A | | 100,000 | | 98,750 |
| |
|
| ENERGY 0.1% | | | | |
| Oil, Gas & Consumable Fuels 0.1% | | | | |
| OAO Gazprom, 9.625%, 03/01/2013 | | 190,000 | | 220,082 |
| OPTI Canada, Inc., 7.875%, 12/15/2014 144A | | 210,000 | | 209,475 |
| |
|
| | | | | 429,557 |
| |
|
| FINANCIALS 0.8% | | | | |
| Commercial Banks 0.1% | | | | |
| Bank of Moscow, 7.34%, 05/13/2013 | | 100,000 | | 98,940 |
| JSC Halyk Bank, 8.125%, 10/07/2009 | | 100,000 | | 102,495 |
| VTB Capital SA, 7.50%, 10/12/2011 | | 120,000 | | 124,218 |
| |
|
| | | | | 325,653 |
| |
|
See Notes to Financial Statements
25
SCHEDULE OF INVESTMENTS continued
October 31, 2007 (unaudited)
| | | | | Principal | | |
| | | | | Amount | | Value |
|
| |
| YANKEE OBLIGATIONS - CORPORATE continued | | | | |
| FINANCIALS continued | | | | | | |
| Consumer Finance 0.1% | | | | | | |
| Avago Technologies Finance Private, Ltd., 10.125%, 12/01/2013 | | $ 35,000 | | $ 37,975 |
| NXP Funding, LLC, 7.875%, 10/15/2014 | | 5,000 | | 4,906 |
| Petroplus Finance, Ltd., 6.75%, 05/01/2014 144A | | 30,000 | | 28,650 |
| Virgin Media Finance plc, 9.125%, 08/15/2016 (p) | | 92,000 | | 97,520 |
| |
|
| | | | | | | 169,051 |
| |
|
| Diversified Financial Services 0.6% | | | | |
| Preferred Term Securities XII, Ltd., FRN, 10.00%, 12/24/2033 | | 1,000,000 | | 757,740 |
| Ship Finance International, Ltd., 8.50%, 12/15/2013 | | 150,000 | | 154,125 |
| Trapeza CDO, LLC, Ser. 2004-7A, Class B1, FRN, 6.63%, 01/25/2035 144A | | 1,000,000 | | 1,002,940 |
| |
|
| | | | | | | 1,914,805 |
| |
|
| INDUSTRIALS 0.1% | | | | | | |
| Road & Rail 0.1% | | | | | | |
| Kansas City Southern de Mexico: | | | | | | |
| 7.375%, 06/01/2014 144A | | | | 100,000 | | 100,250 |
| 9.375%, 05/01/2012 | | | | 120,000 | | 127,800 |
| |
|
| | | | | | | 228,050 |
| |
|
| INFORMATION TECHNOLOGY 0.1% | | | | |
| Communications Equipment 0.1% | | | | |
| Nortel Networks Corp., 10.125%, 07/15/2013 144A (p) | | 175,000 | | 179,375 |
| |
|
| Semiconductors & Semiconductor Equipment 0.0% | | | | |
| Sensata Technologies, Inc., 8.00%, 05/01/2014 (p) | | 10,000 | | 9,863 |
| |
|
| MATERIALS 0.2% | | | | | | |
| Metals & Mining 0.2% | | | | | | |
| Novelis, Inc., 7.25%, 02/15/2015 | | | | 540,000 | | 521,100 |
| |
|
| Paper & Forest Products 0.0% | | | | |
| Corporacion Durango SAB de CV, 10.50%, 10/05/2017 144A (p) | | 55,000 | | 53,350 |
| |
|
| TELECOMMUNICATION SERVICES 1.3% | | | | |
| Diversified Telecommunication Services 0.5% | | | | |
| Telecom Italia SpA, 6.20%, 07/18/2011 | | 200,000 | | 206,049 |
| Telefonica Emisiones, 7.05%, 06/20/2036 (p) | | 1,000,000 | | 1,101,962 |
| Telefonos De Mexico SAB de CV, 4.75%, 01/27/2010 | | 100,000 | | 99,700 |
| |
|
| | | | | | | 1,407,711 |
| |
|
| Wireless Telecommunication Services 0.8% | | | | |
| Inmarsat plc, Sr. Disc. Note, Step Bond, 10.375%, 11/15/2012 † | | 30,000 | | 29,100 |
| Intelsat, Ltd., 9.25%, 06/15/2016 (p) | | 40,000 | | 41,700 |
| Vimpel Communications, 8.25%, 05/23/2016 | | 200,000 | | 207,680 |
| Vodafone Group plc: | | | | | | |
| 5.625%, 02/27/2017 | | | | 1,200,000 | | 1,190,552 |
| 7.75%, 02/15/2010 | | | | 700,000 | | 740,662 |
| |
|
| | | | | | | 2,209,694 |
| |
|
See Notes to Financial Statements
26
SCHEDULE OF INVESTMENTS continued
October 31, 2007 (unaudited)
| | | | | Principal | | |
| | | | | Amount | | Value |
|
| |
| YANKEE OBLIGATIONS - CORPORATE continued | | | | |
| UTILITIES 0.2% | | | | | | |
| Electric Utilities 0.1% | | | | | | |
| Enersis SA, 7.375%, 01/15/2014 | | | | $ 115,000 | | $ 122,309 |
| InterGen NV, 9.00%, 06/30/2017 144A | | | | 40,000 | | 42,500 |
| |
|
| | | | | | | 164,809 |
| |
|
| Multi-Utilities 0.1% | | | | | | |
| National Power Corp.: | | | | | | |
| 6.875%, 11/02/2016 | | | | 200,000 | | 202,876 |
| FRN, 9.74%, 08/23/2011 | | | | 130,000 | | 142,648 |
| |
|
| | | | | | | 345,524 |
| |
|
| Total Yankee Obligations - Corporate (cost $8,199,050) | | | | 8,189,691 |
| | |
|
|
| | | | | Shares | | Value |
|
| |
| PREFERRED STOCKS 0.0% | | | | | | |
| FINANCIALS 0.0% | | | | | | |
| Diversified Financial Services 0.0% | | | | | | |
| First Republic Capital Corp., 10.50% 144A (cost $55,855) | | 50 | | 57,750 |
| | |
|
|
| | | | | Principal | | |
| | | | | Amount | | Value |
|
| |
| YANKEE OBLIGATIONS - GOVERNMENT 1.1% | | | | |
| Argentina, 12.25%, 06/19/2018 | | | | $ 159,188 | | 56,353 |
| Brazil: | | | | | | |
| 7.125%, 01/20/2037 | | | | 370,000 | | 428,275 |
| 8.25%, 01/20/2034 | | | | 350,000 | | 454,475 |
| Colombia: | | | | | | |
| 7.375%, 01/27/2017 | | | | 100,000 | | 110,600 |
| 8.125%, 05/21/2024 | | | | 175,000 | | 211,312 |
| Emirates of Abu Dhabi, 5.50%, 08/02/2012 | | | | 200,000 | | 203,950 |
| Indonesia, 6.75%, 03/10/2014 | | | | 90,000 | | 93,600 |
| Jamaica, 11.75%, 05/15/2011 | | | | 40,000 | | 49,200 |
| Mexico: | | | | | | |
| 8.375%, 01/14/2011 | | | | 185,000 | | 205,812 |
| 11.375%, 09/15/2016 | | | | 10,000 | | 14,350 |
| Peru: | | | | | | |
| 8.375%, 05/03/2016 | | | | 35,000 | | 41,388 |
| 8.75%, 11/21/2033 | | | | 35,000 | | 46,900 |
| 9.125%, 01/15/2008 | | | | 110,000 | | 111,375 |
| Russia: | | | | | | |
| 11.00%, 07/24/2018 | | | | 55,000 | | 78,050 |
| Sr. Disc. Note, Step Bond, 7.50%, 03/31/2030 † | | 148,500 | | 167,679 |
| Turkey, 7.00%, 09/26/2016 | | | | 200,000 | | 210,260 |
See Notes to Financial Statements
27
SCHEDULE OF INVESTMENTS continued
October 31, 2007 (unaudited)
| | | | | | | Principal | | |
| | | | | | | Amount | | Value |
|
| |
| YANKEE OBLIGATIONS - GOVERNMENT continued | | | | | | |
| Ukraine, 6.58%, 11/21/2016 | | | | | | $ 100,000 | | $ 101,525 |
| Venezuela: | | | | | | | | |
| 7.65%, 04/21/2025 | | | | | | 115,000 | | 109,043 |
| 8.50%, 10/08/2014 | | | | | | 110,000 | | 113,300 |
| 10.75%, 09/19/2013 | | | | | | 180,000 | | 201,780 |
| |
|
| Total Yankee Obligations - Government (cost $2,948,651) | | | | | | 3,009,227 |
| | |
|
|
| | | | | | | Shares | | Value |
|
| |
| MUTUAL FUND SHARES 1.7% | | | | | | |
| Blackrock Core Bond Trust | | | | | | 50,000 | | 611,500 |
| Blackrock Income Trust (p) | | | | | | 100,200 | | 582,162 |
| Blackrock North American Government Income Trust (p) | | | | 61,000 | | 621,590 |
| MFS Intermediate Income Trust | | | | | | 151,100 | | 942,864 |
| MFS Multimarket Income Trust | | | | | | 100,000 | | 584,000 |
| Putnam Premier Income Trust | | | | | | 115,000 | | 710,700 |
| Western Asset/Claymore U.S. Treasury Inflation Protected Securities Fund 2 | | 50,000 | | 588,500 |
| |
|
| Total Mutual Fund Shares (cost $4,506,387) | | | | | | 4,641,316 |
| | |
|
|
| | | | | | | Principal | | |
| | | | | | | Amount | | Value |
|
| |
| LOANS 0.1% | | | | | | | | |
| INFORMATION TECHNOLOGY 0.1% | | | | | | |
| First Data Corp., 7.98%, 09/24/2014 | | | | $ 90,000 | | 86,510 |
| Flextonics International, Ltd., 7.47%, 10/01/2014 | | | | 100,000 | | 99,002 |
| |
|
| | | | | | | | | 185,512 |
| |
|
| TELECOMMUNICATION SERVICES 0.0% | | | | | | |
| Telesat, FRN, 8.21%, 09/01/2014 | | | | 100,000 | | 98,717 |
| |
|
| Total Loans (cost $283,429) | | | | | | 284,229 |
| |
|
| INVESTMENTS OF CASH COLLATERAL FROM SECURITIES LOANED 2.5% | | | | |
| REPURCHASE AGREEMENT^ 2.5% | | | | | | |
| Lehman Brothers, Inc., 4.93%, dated 10/31/2007, maturing 11/01/2007, | | | | | | |
| maturity value $7,129,142 (cost $7,128,166) | | | | 7,128,166 | | 7,128,166 |
| | |
|
|
| | | | | | | Shares | | Value |
|
| |
| SHORT-TERM INVESTMENTS 2.7% | | | | | | |
| MUTUAL FUND SHARES 2.7% | | | | | | |
| Evergreen Institutional Money Market Fund, Class I, 5.03% q ø ## | | | | | | |
| (cost $7,735,646) | | | | | | 7,735,646 | | 7,735,646 |
| |
|
| Total Investments (cost $290,731,671) 105.0% | | | | | | 295,485,705 |
| Other Assets and Liabilities (5.0%) | | | | | | (14,082,983) |
| |
|
| Net Assets 100.0% | | | | | | | | $ 281,402,722 |
| |
|
See Notes to Financial Statements
28
SCHEDULE OF INVESTMENTS continued
October 31, 2007 (unaudited)
| ## | | All or a portion of this security has been segregated for when-issued or delayed delivery securities. |
| # | | When-issued or delayed delivery security |
| 144A | | Security that may be sold to qualified institutional buyers under Rule 144A of the Securities Act of 1933, as amended. This |
| | | security has been determined to be liquid under guidelines established by the Board of Trustees, unless otherwise noted. |
| (p) | | All or a portion of this security is on loan. |
| (h) | | Security is valued at fair value as determined by the investment advisor in good faith, according to procedures approved |
| | | by the Board of Trustees. |
| + | | Security is deemed illiquid. |
| † | | Security initially issued in zero coupon form which converts to coupon form at a specified rate and date. An effective |
| | | interest rate is applied to recognize interest income daily for the bond. This rate is based on total expected interest to be |
| | | earned over the life of the bond which consists of the aggregate coupon-interest payments and discount at |
| | | acquisition. The rate shown is the stated rate at the current period end. |
| ^ | | Collateralized by U.S. Government Agency Obligations at period end. |
| q | | Rate shown is the 7-day annualized yield at period end. |
| ø | | Evergreen Investment Management Company, LLC is the investment advisor to both the Fund and the money market fund. |
| Summary of Abbreviations | | | | |
| AUD | | Australian Dollar | | HKD | | Hong Kong Dollar |
| BRL | | Brazil Real | | MASTR | | Mortgage Asset Securitization Transactions, Inc. |
| CAD | | Canadian Dollar | | MXN | | Mexican Peso |
| CDO | | Collateralized Debt Obligation | | NIM | | Net Interest Margin |
| DKK | | Danish Krone | | NOK | | Norwegian Krone |
| EUR | | Euro | | NZD | | New Zealand Dollar |
| FHLMC | | Federal Home Loan Mortgage Corp. | | PLN | | Polish Zloty |
| FNMA | | Federal National Mortgage Association | | RUB | | Russian Ruble |
| FRN | | Floating Rate Note | | SEK | | Swedish Krona |
| GBP | | Great British Pound | | TBA | | To Be Announced |
| GNMA | | Government National Mortgage Association | | | | |
| The following table shows the percent of total investments (excluding equity positions, segregated cash and cash equivalents |
| and collateral from securities on loan) by credit quality based on Moody’s and Standard & Poor’s ratings as of October 31, 2007: |
| |
| AAA | | 63.9% | |
| AA | | 7.6% | |
| A | | 10.3% | |
| BBB | | 9.8% | |
| BB | | 4.5% | |
| B | | 3.7% | |
| NR | | 0.2% | |
| |
| |
| | | 100.0% | |
| | |
| |
| |
| The following table shows the percent of total investments (excluding equity positions, segregated cash and cash equivalents |
| and collateral from securities on loan) by effective maturity as of October 31, 2007: |
| |
| Less than 1 year | | 2.9% | |
| 1 to 3 year(s) | | 12.1% | |
| 3 to 5 years | | 27.4% | |
| 5 to 10 years | | 47.4% | |
| 10 to 20 years | | 4.2% | |
| 20 to 30 years | | 5.8% | |
| Greater than 30 years | | 0.2% | |
| |
| |
| | | 100.0% | |
| | |
| |
See Notes to Financial Statements
29
STATEMENT OF ASSETS AND LIABILITIES
October 31, 2007 (unaudited)
| Assets | | |
| Investments in securities, at value (cost $282,996,025) including $6,967,284 of securities loaned | | $ 287,750,059 |
| Investments in affiliated money market fund, at value (cost $7,735,646) | | 7,735,646 |
|
| Total investments | | 295,485,705 |
| Foreign currency, at value (cost $304,795) | | 311,167 |
| Receivable for securities sold | | 33,683,465 |
| Principal paydown receivable | | 8,750 |
| Receivable for Fund shares sold | | 122,230 |
| Dividends and interest receivable | | 2,973,797 |
| Receivable for securities lending income | | 597 |
| Receivable for credit default swap payments | | 7,148 |
| Unrealized gains on credit default swap transactions | | 1,127,266 |
| Unrealized gains on open forward foreign currency exchange contracts | | 84,063 |
| Deferred swap premium | | 354,027 |
| Receivable from investment advisor | | 3,453 |
| Prepaid expenses and other assets | | 187,377 |
|
| Total assets | | 334,349,045 |
|
| Liabilities | | |
| Dividends payable | | 406,804 |
| Payable for securities purchased | | 42,501,397 |
| Payable for Fund shares redeemed | | 485,651 |
| Unrealized losses on open forward foreign currency exchange contracts | | 193,814 |
| Unrealized losses on credit default swap transactions | | 1,066,282 |
| Unrealized losses on total return swap transactions | | 589,534 |
| Payable for closed forward foreign currency exchange contracts | | 317,559 |
| Payable for securities on loan | | 7,128,166 |
| Payable for credit default swap payments | | 6,141 |
| Deferred swap discount | | 213,434 |
| Due to related parties | | 2,180 |
| Accrued expenses and other liabilities | | 35,361 |
|
| Total liabilities | | 52,946,323 |
|
| Net assets | | $ 281,402,722 |
|
| Net assets represented by | | |
| Paid-in capital | | $ 334,508,530 |
| Overdistributed net investment income | | (1,772,072) |
| Accumulated net realized losses on investments | | (54,557,414) |
| Net unrealized gains on investments | | 3,223,678 |
|
| Total net assets | | $ 281,402,722 |
|
| Net assets consists of | | |
| Class A | | $ 188,284,158 |
| Class B | | 15,229,799 |
| Class C | | 24,223,959 |
| Class I | | 53,664,806 |
|
| Total net assets | | $ 281,402,722 |
|
| Shares outstanding (unlimited number of shares authorized) | | |
| Class A | | 13,086,251 |
| Class B | | 1,058,509 |
| Class C | | 1,683,627 |
| Class I | | 3,729,859 |
|
| Net asset value per share | | |
| Class A | | $ 14.39 |
| Class A — Offering price (based on sales charge of 4.75%) | | $ 15.11 |
| Class B | | $ 14.39 |
| Class C | | $ 14.39 |
| Class I | | $ 14.39 |
|
See Notes to Financial Statements
30
STATEMENT OF OPERATIONS
Six Months Ended October 31, 2007 (unaudited)
| Investment income | | |
| Interest | | $ 8,030,786 |
| Income from affiliate | | 480,339 |
| Dividends | | 126,900 |
| Securities lending | | 12,049 |
|
| Total investment income | | 8,650,074 |
|
| Expenses | | |
| Advisory fee | | 618,788 |
| Distribution Plan expenses | | |
| Class A | | 289,288 |
| Class B | | 76,631 |
| Class C | | 120,220 |
| Administrative services fee | | 142,538 |
| Transfer agent fees | | 242,963 |
| Trustees’ fees and expenses | | 3,564 |
| Printing and postage expenses | | 34,588 |
| Custodian and accounting fees | | 91,752 |
| Registration and filing fees | | 27,304 |
| Professional fees | | 17,543 |
| Other | | 5,104 |
|
| Total expenses | | 1,670,283 |
| Less: Expense reductions | | (5,844) |
| Fee waivers and expense reimbursements | | (265,046) |
|
| Net expenses | | 1,399,393 |
|
| Net investment income | | 7,250,681 |
|
| Net realized and unrealized gains or losses on investments | | |
| Net realized gains or losses on: | | |
| Securities | | (4,124,924) |
| Foreign currency related transactions | | (192,328) |
| Futures contracts | | (80,021) |
| Credit default swap transactions | | 12,614 |
|
| Net realized losses on investments | | (4,384,659) |
| Net change in unrealized gains or losses on investments | | 3,108,520 |
|
| Net realized and unrealized gains or losses on investments | | (1,276,139) |
|
| Net increase in net assets resulting from operations | | $ 5,974,542 |
|
See Notes to Financial Statements
31
STATEMENTS OF CHANGES IN NET ASSETS
| | | Six Months Ended | | | | |
| | | October 31, 2007 | | Year Ended |
| | | (unaudited) | | April 30, 2007 |
|
| Operations | | | | | | | | |
| Net investment income | | $ 7,250,681 | | $ 17,061,576 |
| Net realized losses on investments | | | | (4,384,659) | | | | (1,553,243) |
| Net change in unrealized gains or | | | | | | | | |
| losses on investments | | | | 3,108,520 | | | | 6,403,394 |
|
| Net increase in net assets resulting | | | | | | | | |
| from operations | | | | 5,974,542 | | | | 21,911,727 |
|
| Distributions to shareholders from | | | | | | | | |
| Net investment income | | | | | | | | |
| Class A | | | | (4,981,618) | | | | (11,787,049) |
| Class B | | | | (338,971) | | | | (852,703) |
| Class C | | | | (530,815) | | | | (1,242,068) |
| Class I | | | | (1,484,706) | | | | (3,565,742) |
| Tax return of capital | | | | | | | | |
| Class A | | | | 0 | | | | (165,900) |
| Class B | | | | 0 | | | | (13,740) |
| Class C | | | | 0 | | | | (19,998) |
| Class I | | | | 0 | | | | (47,948) |
|
| Total distributions to shareholders | | | | (7,336,110) | | | | (17,695,148) |
|
| | | Shares | | | | Shares | | |
| Capital share transactions | | | | | | | | |
| Proceeds from shares sold | | | | | | | | |
| Class A | | 370,305 | | 5,260,071 | | 579,848 | | 8,326,359 |
| Class B | | 98,871 | | 1,407,929 | | 169,920 | | 2,430,882 |
| Class C | | 138,996 | | 1,977,220 | | 190,704 | | 2,730,653 |
| Class I | | 21,664 | | 308,489 | | 44,267 | | 639,034 |
|
| | | | | 8,953,709 | | | | 14,126,928 |
|
| Net asset value of shares issued in | | | | | | | | |
| reinvestment of distributions | | | | | | | | |
| Class A | | 232,285 | | 3,310,200 | | 552,035 | | 7,905,712 |
| Class B | | 14,597 | | 208,022 | | 35,341 | | 506,013 |
| Class C | | 22,732 | | 323,964 | | 56,461 | | 808,431 |
| Class I | | 55,740 | | 794,350 | | 130,689 | | 1,871,835 |
|
| | | | | 4,636,536 | | | | 11,091,991 |
|
| Automatic conversion of Class B shares to | | | | | | | | |
| Class A shares | | | | | | | | |
| Class A | | 20,790 | | 295,543 | | 69,131 | | 988,636 |
| Class B | | (20,790) | | (295,543) | | (69,131) | | (988,636) |
|
| | | | | 0 | | | | 0 |
|
| Payment for shares redeemed | | | | | | | | |
| Class A | | (1,340,173) | | (19,100,311) | | (2,368,618) | | (33,880,260) |
| Class B | | (148,612) | | (2,115,642) | | (304,671) | | (4,352,055) |
| Class C | | (149,905) | | (2,137,341) | | (398,516) | | (5,692,232) |
| Class I | | (256,275) | | (3,651,440) | | (598,099) | | (8,560,870) |
|
| | | | | (27,004,734) | | | | (52,485,417) |
|
| Net decrease in net assets resulting from | | | | | | | | |
| capital share transactions | | | | (13,414,489) | | | | (27,266,498) |
|
| Total decrease in net assets | | | | (14,776,057) | | | | (23,049,919) |
| Net assets | | | | | | | | |
| Beginning of period | | | | 296,178,779 | | | | 319,228,698 |
|
| End of period | | $ 281,402,722 | | $ 296,178,779 |
|
| Overdistributed net investment income | | $ (1,772,072) | | $ (416,859) |
|
See Notes to Financial Statements
32
NOTES TO FINANCIAL STATEMENTS (unaudited)
1. ORGANIZATION
Evergreen Core Bond Plus Fund (the “Fund”) (formerly, Evergreen Diversified Bond Fund) is a diversified series of Evergreen Fixed Income Trust (the “Trust”), a Delaware statutory trust organized on September 18, 1997. The Trust is an open-end management investment company registered under the Investment Company Act of 1940, as amended (the “1940 Act”).
The Fund offers Class A, Class B, Class C and Class I shares. Class A shares are sold with a front-end sales charge. However, Class A share investments of $1 million or more are not subject to a front-end sales charge but are subject to a contingent deferred sales charge of 1.00% upon redemption within 18 months. Class B shares are sold without a front-end sales charge but are subject to a contingent deferred sales charge that is payable upon redemption and decreases depending on how long the shares have been held. Class C shares are sold without a front-end sales charge but are subject to a contingent deferred sales charge that is payable upon redemption within one year. Class I shares are sold without a front-end sales charge or contingent deferred sales charge. Each class of shares, except Class I shares, pays an ongoing distribution fee.
2. SIGNIFICANT ACCOUNTING POLICIES
The following is a summary of significant accounting policies consistently followed by the Fund in the preparation of its financial statements. The policies are in conformity with generally accepted accounting principles in the United States of America, which require management to make estimates and assumptions that affect amounts reported herein. Actual results could differ from these estimates.
a. Valuation of investments
Portfolio debt securities acquired with more than 60 days to maturity are fair valued using matrix pricing methods determined by an independent pricing service which takes into consideration such factors as similar security prices, yields, maturities, liquidity and ratings. Securities for which valuations are not readily available from an independent pricing service may be valued by brokers which use prices provided by market makers or estimates of market value obtained from yield data relating to investments or securities with similar characteristics.
Listed equity securities are usually valued at the last sales price or official closing price on the national securities exchange where the securities are principally traded.
Short-term securities with remaining maturities of 60 days or less at the time of purchase are valued at amortized cost, which approximates market value.
Investments in other mutual funds are valued at net asset value. Securities for which market quotations are not readily available or not reflective of current market value are valued at fair value as determined by the investment advisor in good faith, according to procedures approved by the Board of Trustees.
b. Repurchase agreements
Securities pledged as collateral for repurchase agreements are held by the custodian bank or in a segregated account in the Fund’s name until the agreements mature. Collateral for certain tri-
33
NOTES TO FINANCIAL STATEMENTS (unaudited) continued
party repurchase agreements is held at the counterparty’s custodian in a segregated account for the benefit of the Fund and the counterparty. Each agreement requires that the market value of the collateral be sufficient to cover payments of interest and principal. However, in the event of default or bankruptcy by the other party to the agreement, retention of the collateral may be subject to legal proceedings. The Fund will enter into repurchase agreements with banks and other financial institutions, which are deemed by the investment advisor to be creditworthy pursuant to guidelines established by the Board of Trustees. In certain instances, the Fund’s securities lending agent may provide collateral in the form of repurchase agreements.
c. Foreign currency translation
All assets and liabilities denominated in foreign currencies are translated into U.S. dollar amounts at the date of valuation. Purchases and sales of portfolio securities and income items denominated in foreign currencies are translated into U.S. dollar amounts on the respective dates of such transactions. The Fund does not separately account for that portion of the results of operations resulting from changes in foreign exchange rates on investments and the fluctuations arising from changes in market prices of securities held. Such fluctuations are included with the net realized and unrealized gains or losses on investments.
d. Futures contracts
In order to gain exposure to, or protect against changes in, security values, the Fund may buy and sell futures contracts. The primary risks associated with the use of futures contracts are the imperfect correlation between changes in market values of securities held by the Fund and the prices of futures contracts, and the possibility of an illiquid market.
Futures contracts are valued based upon their quoted daily settlement prices. The aggregate principal amounts of the contracts are not recorded in the financial statements. Fluctuations in the value of the contracts are recorded in the Statement of Assets and Liabilities as an asset or liability and in the Statement of Operations as unrealized gains or losses until the contracts are closed, at which point they are recorded as net realized gains or losses on futures contracts.
e. When-issued and delayed delivery transactions
The Fund records when-issued or delayed delivery securities as of trade date and maintains security positions such that sufficient liquid assets will be available to make payment for the securities purchased. Securities purchased on a when-issued or delayed delivery basis are marked-to-market daily and begin earning interest on the settlement date. Losses may occur on these transactions due to changes in market conditions or the failure of counterparties to perform under the contract.
f. Securities lending
The Fund may lend its securities to certain qualified brokers in order to earn additional income. The Fund receives compensation in the form of fees or interest earned on the investment of any cash collateral received. The Fund also continues to receive interest and dividends on the securities loaned. The Fund receives collateral in the form of cash or securities with a market value at least equal to the market value of the securities on loan, including accrued interest. In the event
34
NOTES TO FINANCIAL STATEMENTS (unaudited) continued
of default or bankruptcy by the borrower, the Fund could experience delays and costs in recovering the loaned securities or in gaining access to the collateral. The Fund has the right under the lending agreement to recover the securities from the borrower on demand.
g. Dollar roll transactions
The Fund may enter into dollar roll transactions with respect to mortgage-backed securities. In a dollar roll transaction, the Fund sells mortgage-backed securities to financial institutions and simultaneously agrees to accept substantially similar (same type, coupon and maturity) securities at a later date at an agreed upon price. The Fund will use the proceeds generated from the transactions to invest in short-term investments, which may enhance the Fund’s current yield and total return. The Fund accounts for dollar roll transactions as purchases and sales. The Fund could be exposed to risks if the counterparty defaults on its obligation to perform under the terms of the agreement, if the Fund receives inferior securities in comparison to what was sold to the coun-terparty at redelivery or if there are variances in paydown speed between the mortgage-related pools.
h. Credit default swaps
The Fund may enter into credit default swaps. Credit default swaps involve an exchange of a fixed rate premium for protection against the loss in value of an underlying debt instrument in the event of default or bankruptcy. Under the terms of the swap, one party acts as a “guarantor” and receives a periodic stream of payments that is a fixed percentage applied to a notional principal amount over the term of the swap. In return, the party agrees to purchase the notional amount of the underlying instrument, at par, if a credit event occurs during the term of the swap. Periodic payments are recorded as realized gains or losses. Any premiums or discounts received on the transactions are recorded as an asset or liability on the Statement of Assets and Liabilities and amortized. The Fund may enter into credit default swaps as either the guarantor or the counter-party.
Swaps are marked-to-market daily based on quotations from market makers and any change in value is recorded as an unrealized gain or loss. Payments received or made as a result of a credit event or termination of the contract are recognized as realized gains or losses. The Fund could be exposed to risks if the counterparty defaults on its obligation to perform, or if there are unfavorable changes in the fluctuation of interest rates or in the price of the underlying security.
i. Total return swaps
The Fund may enter into total return swaps. Total return swaps involve commitments to pay interest in exchange for a market linked return, both based on notional amounts. To the extent the total return of the security or index underlying the transaction exceeds or falls short of the offsetting interest rate obligation, the Fund will receive a payment from, or make a payment to, the counterparty. The value of the swap agreements is marked-to-market daily based upon quotations from market makers and any change in value is recorded as an unrealized gain or loss. The Fund could be exposed to risks if the counterparty defaults on its obligation to perform, or if there are unfavorable changes in the fluctuation of interest rates or in the price of the underlying security.
35
NOTES TO FINANCIAL STATEMENTS (unaudited) continued
j. Security transactions and investment income
Security transactions are recorded on trade date. Realized gains and losses are computed using the specific cost of the security sold. Interest income is recorded on the accrual basis and includes accretion of discounts and amortization of premiums. Dividend income is recorded on the ex-dividend date.
k. Federal taxes
The Fund intends to continue to qualify as a regulated investment company and distribute all of its taxable income, including any net capital gains (which have already been offset by available capital loss carryovers). Accordingly, no provision for federal taxes is required.
l. Distributions
Distributions to shareholders from net investment income are accrued daily and paid monthly. Distributions from net realized gains, if any, are recorded on the ex-dividend date. Such distributions are determined in conformity with income tax regulations, which may differ from generally accepted accounting principles.
m. Class allocations
Income, common expenses and realized and unrealized gains and losses are allocated to the classes based on the relative net assets of each class. Distribution fees, if any, are calculated daily at the class level based on the appropriate net assets of each class and the specific expense rates applicable to each class.
3. ADVISORY FEE AND OTHER TRANSACTIONS WITH AFFILIATES
Evergreen Investment Management Company, LLC (“EIMC”), an indirect, wholly-owned subsidiary of Wachovia Corporation (“Wachovia”), is the investment advisor to the Fund and is paid a fee at an annual rate of 2% of the Fund’s gross investment income plus an amount determined by applying percentage rates to the average daily net assets of the Fund, starting at 0.31% and declining to 0.16% as average daily net assets increase. For the six months ended October 31, 2007, the advisory fee was equivalent to 0.43% of the Fund’s average daily net assets (on an annualized basis).
Tattersall Advisory Group, Inc. (“TAG”), an indirect, wholly-owned subsidiary of Wachovia, is the investment sub-advisor to the Fund and is paid by EIMC for its services to the Fund.
Effective October 1, 2007, First International Advisors, Inc. d/b/a Evergreen International Advisors (“FIA”), an indirect, wholly-owned subsidiary of Wachovia, became the investment sub-advisor to the Fund and is paid by EIMC for its services to the Fund.
From time to time, EIMC may voluntarily or contractually waive its fee and/or reimburse expenses in order to limit operating expenses. During the six months ended October 31, 2007, EIMC contractually and voluntarily waived its advisory fee in the amount of $23,147 and $193,684, respectively, and reimbursed Distribution Plan expenses (see Note 4) relating to Class A shares in the amount of $48,215.
36
NOTES TO FINANCIAL STATEMENTS (unaudited) continued
The Fund may invest in Evergreen-managed money market funds, which are also advised by EIMC. Income earned on these investments is included in income from affiliate on the Statement of Operations.
Evergreen Investment Services, Inc. (“EIS”), an indirect, wholly-owned subsidiary of Wachovia, is the administrator to the Fund. As administrator, EIS provides the Fund with facilities, equipment and personnel and is paid an annual rate determined by applying percentage rates to the aggregate average daily net assets of the Evergreen funds (excluding money market funds and Evergreen Institutional Enhanced Income Fund), starting at 0.10% and declining to 0.05% as the aggregate average daily net assets of the Evergreen funds (excluding money market funds and Evergreen Institutional Enhanced Income Fund) increase.
Evergreen Service Company, LLC (“ESC”), an indirect, wholly-owned subsidiary of Wachovia, is the transfer and dividend disbursing agent for the Fund. ESC receives account fees that vary based on the type of account held by the shareholders in the Fund. For the six months ended October 31, 2007, the transfer agent fees were equivalent to an annual rate of 0.17% of the Fund’s average daily net assets.
4. DISTRIBUTION PLANS
EIS also serves as distributor of the Fund’s shares. The Fund has adopted Distribution Plans, as allowed by Rule 12b-1 of the 1940 Act, for each class of shares, except Class I. Under the Distribution Plans, distribution fees are paid at an annual rate of 0.30% of the average daily net assets for Class A shares and 1.00% of the average daily net assets for each of Class B and Class C shares.
For the six months ended October 31, 2007, EIS received $1,378 from the sale of Class A shares and $19,813 and $281 in contingent deferred sales charges from redemptions of Class B and Class C shares, respectively.
5. INVESTMENT TRANSACTIONS
Cost of purchases and proceeds from sales of investment securities (excluding short-term securities) were as follows for the six months ended October 31, 2007:
| Cost of Purchases | | Proceeds from Sales |
|
| U.S. | | Non-U.S. | | U.S. | | Non-U.S. |
| Government | | Government | | Government | | Government |
|
| $ 497,825,298 | | $ 317,345,744 | | $ 439,355,022 | | $ 377,032,754 |
|
At October 31, 2007, the Fund had forward foreign currency exchange contracts outstanding as follows:
Forward Foreign Currency Exchange Contracts to Buy:
| Exchange | | Contracts to | | U.S. Value at | | In Exchange | | Unrealized |
| Date | | Receive | | October 31, 2007 | | for U.S. $ | | Gain |
|
| 12/10/2007 | | 474,065 EUR | | $ 686,188 | | $ 650,000 | | $ 36,188 |
|
37
NOTES TO FINANCIAL STATEMENTS (unaudited) continued
| | | | | U.S. Value at | | | | U.S. Value at | | |
| Exchange | | Contracts to | | October 31, | | | | October 31, | | Unrealized |
| Date | | Receive | | 2007 | | In Exchange for | | 2007 | | Gain (Loss) |
|
| 12/10/2007 | | 1,006,687 EUR | | $ 1,457,133 | | 685,000 GBP | | $ 1,422,257 | | $ 34,876 |
| 12/10/2007 | | 313,560,000 JPY | | 2,734,854 | | 2,010,000 EUR | | 2,909,384 | | (174,530) |
| 1/16/2008 | | 243,568,220 JPY | | 2,133,258 | | 1,030,000 GBP | | 2,135,872 | | (2,614) |
| 1/16/2008 | | 88,779,280 JPY | | 777,561 | | 5,920,000 HKD | | 764,562 | | 12,999 |
| 1/22/2008 | | 154,712,415 JPY | | 1,355,899 | | 1,303,500 CAD | | 1,372,569 | | (16,670) |
|
During the six months ended October 31, 2007, the Fund loaned securities to certain brokers. At October 31, 2007, the value of securities on loan and the total value of collateral received for securities loaned amounted to $6,967,284 and $7,128,166, respectively.
At October 31, 2007, the Fund had the following open credit default swap contracts outstanding:
| | | | | | | | | Fixed Payments | | Frequency | | |
| | | | | Reference Debt | | Notional | | Made by | | of Payments | | Unrealized |
| Expiration | | Counterparty | | Obligation/Index | | Amount | | the Fund | | Made | | Gain (loss) |
|
| 09/20/2012 | | UBS AG | | E.I. DuPont de | | $1,00,0000 | | 0.22% | | Quarterly | | $ (466) |
| | | | | Nemours & Co., | | | | | | | | |
| | | | | 4.875%, 04/30/2014 | | | | | | | | |
| 09/20/2012 | | Goldman Sachs | | PPG Industries, Inc., | | 500,000 | | 0.22% | | Quarterly | | (186) |
| | | Group, Inc. | | 7.05%, 09/20/2012 | | | | | | | | |
| 12/20/2012 | | Morgan | | UnitedHealth | | 500,000 | | 0.26% | | Quarterly | | 2,051 |
| | | Stanley | | Group, Inc., | | | | | | | | |
| | | | | 4.875%, 04/01/201 | | | | | | | | |
| 03/15/2049 | | Morgan | | CMBX North America | | 5,000,000 | | 1.65% | | Quarterly | | 1,121,473 |
| | | Stanley | | Index | | | | | | | | |
|
| |
| | | | | | | | | Fixed Payments | | Frequency | | |
| | | | | Reference Debt | | Notional | | Received by | | of Payments | | Unrealized |
| Expiration | | Counterparty | | Obligation/Index | | Amount | | the Fund | | Received | | Gain (Loss) |
|
| 09/20/2008 | | CitiBank, NA | | Lehman Brothers | | $ 500,000 | | 1.00% | | Quarterly | | $ 10 |
| | | | | Holdings, Inc., | | | | | | | | |
| | | | | 6.625%, 01/18/2012 | | | | | | | | |
| 09/20/2008 | | JPMorgan | | Merril Lynch & Co., Inc., | | | | | | | | |
| | | Chase & Co. | | 5.00%, 01/15/2015 | | 500,000 | | 0.80% | | Quarterly | | (168) |
| 09/20/2008 | | JPMorgan | | Lehman Brothers | | 500,000 | | 1.25% | | Quarterly | | 1,111 |
| | | Chase & Co. | | Holdings, Inc., | | | | | | | | |
| | | | | 6.625%, 01/18/2012 | | | | | | | | |
| 12/20/2008 | | Lehman | | Lehman Brothers | | 500,000 | | 0.85% | | Quarterly | | (650) |
| | | Brothers | | Holdings, Inc., | | | | | | | | |
| | | Holdings, Inc. | | 6.625%, 01/18/2012 | | | | | | | | |
| 09/20/2010 | | Goldman Sachs | | Duke Realty, Ltd., | | 500,000 | | 0.75% | | Quarterly | | 2,173 |
| | | Group, Inc. | | 5.40%, 08/15/2014 | | | | | | | | |
| 01/01/2012 | | CitiBank, NA | | Goldman Sachs | | 500,000 | | 0.70% | | Quarterly | | 448 |
| | | | | Group, Inc., | | | | | | | | |
| | | | | 6.60%, 01/01/2012 | | | | | | | | |
| 06/20/2012 | | Morgan | | Dow Jones CDX, | | 1,000,000 | | 0.45% | | Quarterly | | (6,573) |
| | | Stanley | | North American | | | | | | | | |
| | | | | Investment Grade | | | | | | | | |
| | | | | Index | | | | | | | | |
| 09/20/2012 | | Morgan | | Duke Realty, Ltd., | | 500,000 | | 0.90% | | Quarterly | | (394) |
| | | Stanley | | 5.40%, 08/15/2014 | | | | | | | | |
|
38
NOTES TO FINANCIAL STATEMENTS (unaudited) continued
| | | | | | | | | Fixed Payments | | Frequency | | |
| | | | | Reference Debt | | Notional | | Received by | | of Payments | | Unrealized |
| Expiration | | Counterparty | | Obligation/Index | | Amount | | the Fund | | Received | | Gain (Loss) |
|
| 12/20/2012 | | Morgan | | WellPoint, Inc., | | $ 500,000 | | 0.41% | | Quarterly | | $ (224) |
| | | Stanley | | 6.80%, 08/01/2012 | | | | | | | | |
| 12/13/2049 | | Morgan | | CMBX North America | | 5,000,000 | | 2.625% | | Quarterly | | (1,057,621) |
| | | Stanley | | Index | | | | | | | | |
|
At October 31, 2007, the Fund had the following open total return swap agreements:
| | | Notional | | | | | | Unrealized |
| Expiration | | Amount | | Swap Description | | Counterparty | | Loss |
|
| 01/01/2008 | | $ 5,000,000 | | Agreement dated 06/25/2007 to receive 28.5 basis | | Lehman Brothers | | $59,214 |
| | | | | points and to receive the positive spread return or | | Holdings, Inc. | | |
| | | | | pay the negative spread return on the Lehman | | | | |
| | | | | Brothers CMBS AAA 8.5+yr Index which are | | | | |
| | | | | multiplied by the notional amount. | | | | |
| 01/01/2008 | | 5,000,000 | | Agreement dated 06/29/2007 to receive 20 basis | | Lehman Brothers | | 59,839 |
| | | | | points and to receive the positive spread return or | | Holdings, Inc. | | |
| | | | | pay the negative spread return on the Lehman | | | | |
| | | | | Brothers CMBS AAA 8.5+yr Index which are | | | | |
| | | | | multiplied by the notional amount. | | | | |
| 01/01/2008 | | 5,000,000 | | Agreement dated 07/11/2007 to receive 27.5 | | Lehman Brothers | | 59,527 |
| | | | | basis points and to receive the positive spread | | Holdings, Inc. | | |
| | | | | return or pay the negative spread return on the | | | | |
| | | | | Lehman Brothers CMBS AAA 8.5+yr Index which | | | | |
| | | | | are multiplied by the notional amount. | | | | |
| 01/31/2008 | | 6,000,000 | | Agreement dated 07/30/2007 to receive 50 basis | | Morgan Stanley | | 69,663 |
| | | | | points and to receive the positive spread return or | | | | |
| | | | | pay the negative spread return on the Lehman | | | | |
| | | | | Brothers CMBS AAA 8.5+yr Index which are | | | | |
| | | | | multiplied by the notional amount. | | | | |
| 02/01/2008 | | 3,000,000 | | Agreement dated 07/17/2007 to receive 30 basis | | CitiBank, NA | | 35,654 |
| | | | | points and to receive the positive spread return or | | | | |
| | | | | pay the negative spread return on the Lehman | | | | |
| | | | | Brothers CMBS AAA 8.5+yr Index which are | | | | |
| | | | | multiplied by the notional amount. | | | | |
| 02/01/2008 | | 6,000,000 | | Agreement dated 07/24/2007 to receive 50 basis | | Morgan Stanley | | 69,663 |
| | | | | points and to receive the positive spread return or | | | | |
| | | | | pay the negative spread return on the Lehman | | | | |
| | | | | Brothers CMBS AAA 8.5+yr Index which are | | | | |
| | | | | multiplied by the notional amount. | | | | |
| 02/01/2008 | | 3,000,000 | | Agreement dated 08/07/2007 to receive 25 basis | | Lehman Brothers | | 35,779 |
| | | | | points and to receive the positive spread return or | | Holdings, Inc. | | |
| | | | | pay the negative spread return on the Lehman | | | | |
| | | | | Brothers CMBS AAA 8.5+yr Index which are | | | | |
| | | | | multiplied by the notional amount. | | | | |
| 03/01/2008 | | 3,000,000 | | Agreement dated 08/15/2007 to receive 0 basis | | Lehman Brothers | | 36,404 |
| | | | | points and to receive the positive spread return or | | Holdings, Inc. | | |
| | | | | pay the negative spread return on the Lehman | | | | |
| | | | | Brothers CMBS AAA 8.5+yr Index which are | | | | |
| | | | | multiplied by the notional amount. | | | | |
| 03/01/2008 | | 5,000,000 | | Agreement dated 08/31/2007 to receive 30 basis | | Lehman Brothers | | 63,381 |
| | | | | points and to receive the positive spread return or | | Holdings, Inc. | | |
| | | | | pay the negative spread return on the Lehman | | | | |
| | | | | Brothers CMBS AAA 8.5+yr Index which are | | | | |
| | | | | multiplied by the notional amount. | | | | |
|
39
NOTES TO FINANCIAL STATEMENTS (unaudited) continued
| | | Notional | | | | | | Unrealized |
| Expiration | | Amount | | Swap Description | | Counterparty | | Loss |
|
| 03/01/2008 | | $ 3,000,000 | | Agreement dated 08/31/2007 to receive 30 basis | | JPMorgan Chase | | $37,154 |
| | | | | points and to receive the positive spread return or | | & Co. | | |
| | | | | pay the negative spread return on the Lehman | | | | |
| | | | | Brothers CMBS AAA 8.5+yr Index which are | | | | |
| | | | | multiplied by the notional amount. | | | | |
| 10/01/2008 | | 5,000,000 | | Agreement dated 10/01/2007 to receive 62 basis | | Lehman Brothers | | 63,256 |
| | | | | points and to receive the positive spread return or | | Holdings, Inc. | | |
| | | | | pay the negative spread return on the Lehman | | | | |
| | | | | Brothers CMBS AAA 8.5+yr Index which are | | | | |
| | | | | multiplied by the notional amount. | | | | |
|
On October 31, 2007, the aggregate cost of securities for federal income tax purposes was $290,810,545. The gross unrealized appreciation and depreciation on securities based on tax cost was $6,575,895 and $1,900,735, respectively, with a net unrealized appreciation of $4,675,160.
As of April 30, 2007, the Fund had $50,023,800 in capital loss carryovers for federal income tax purposes expiring as follows:
| Expiration |
|
| 2008 | | 2009 | | 2010 | | 2013 | | 2015 |
|
| $22,702,312 | | $14,769,764 | | $4,586,980 | | $4,295,612 | | $3,669,132 |
|
Certain portions of the capital loss carryovers of the Fund were assumed as a result of acquisitions. These losses are subject to certain limitations prescribed by the Internal Revenue Code. Utilization of these capital loss carryovers was limited during the year ended April 30, 2007 in accordance with income tax regulations.
6. INTERFUND LENDING
Pursuant to an Exemptive Order issued by the SEC, the Fund may participate in an interfund lending program with certain funds in the Evergreen fund family. This program allows the Fund to borrow from, or lend money to, other participating funds. During the six months ended October 31, 2007, the Fund did not participate in the interfund lending program.
7. EXPENSE REDUCTIONS
Through expense offset arrangements with ESC and the Fund’s custodian, a portion of fund expenses has been reduced.
8. DEFERRED TRUSTEES’ FEES
Each Trustee of the Fund may defer any or all compensation related to performance of his or her duties as a Trustee. The Trustees’ deferred balances are allocated to deferral accounts, which are included in the accrued expenses for the Fund. The investment performance of the deferral accounts is based on the investment performance of certain Evergreen funds. Any gains earned or losses incurred in the deferral accounts are reported in the Fund’s Trustees’ fees and expenses. At the election of the Trustees, the deferral account will be paid either in one lump sum or in quarterly installments for up to ten years.
40
NOTES TO FINANCIAL STATEMENTS (unaudited) continued
9. FINANCING AGREEMENT
The Fund and certain other Evergreen funds share in an unsecured revolving credit commitment for temporary and emergency purposes, including the funding of redemptions, as permitted by each participating fund’s borrowing restrictions. Borrowings under this facility bear interest at 0.50% per annum above the Federal Funds rate. All of the participating funds are charged an annual commitment fee on the unused balance, which is allocated pro rata. The credit facility is for $100 million with an annual commitment fee of 0.08% . During the six months ended October 31, 2007, the Fund had no borrowings.
10. REGULATORY MATTERS AND LEGAL PROCEEDINGS
Pursuant to an administrative order issued by the SEC on September 19, 2007, EIMC, EIS, ESC (collectively, the “Evergreen Entities”), Wachovia Securities, LLC and the SEC have entered into an agreement settling allegations of (i) improper short-term trading arrangements in effect prior to May 2003 involving former officers and employees of EIMC and certain broker-dealers, (ii) insufficient systems for monitoring exchanges and enforcing exchange limitations as stated in certain funds’ prospectuses, and (iii) inadequate e-mail retention practices. Under the settlement, the Evergreen Entities were censured and will pay approximately $32 million in disgorgement and penalties. This amount, along with a fine assessed by the SEC against Wachovia Securities, LLC will be distributed pursuant to a plan to be developed by an independent distribution consultant and approved by the SEC. The Evergreen Entities neither admitted nor denied the allegations and findings set forth in its settlement with the SEC.
EIS has entered into an agreement with the NASD (now known as the Financial Industry Regulatory Authority (“FINRA”)) settling allegations that EIS (i) arranged for Evergreen fund portfolio trades to be directed to Wachovia Securities, LLC, an affiliate of EIS that sold Evergreen fund shares, during the period of January 2001 to December 2003 and (ii) provided non-cash compensation by sponsoring offsite meetings attended by Wachovia Securities, LLC brokers during that period, where the eligibility of a broker to attend the meetings depended upon the broker meeting certain sales targets of Evergreen fund shares. Pursuant to the settlement agreement, EIS has agreed to a censure and a fine of $4,200,000. EIS neither admitted nor denied the allegations and findings set forth in its agreement with the NASD.
In addition, the Evergreen funds and EIMC and certain of its affiliates are involved in various legal actions, including private litigation and class action lawsuits. EIMC does not expect that any of such legal actions currently pending or threatened will have a material adverse impact on the financial position or operations of any of the Evergreen funds or on EIMC’s ability to provide services to the Evergreen funds.
Although EIMC believes that none of the matters discussed above will have a material adverse impact on the Evergreen funds, there can be no assurance that these matters and any publicity surrounding or resulting from them will not result in reduced sales or increased redemptions of Evergreen fund shares, which could increase Evergreen fund transaction costs or operating expenses, or that they will not have other adverse consequences on the Evergreen funds.
41
NOTES TO FINANCIAL STATEMENTS (unaudited) continued
11. NEW ACCOUNTING PRONOUNCEMENTS
In June 2006, the Financial Accounting Standards Board (“FASB”) issued FASB Interpretation No. 48, Accounting for Uncertainty in Income Taxes — an interpretation of FASB statement 109 (“FIN 48”). FIN 48 supplements FASB 109 by prescribing a recognition threshold and measurement attribute for the financial statement recognition and measurement of a tax position taken or expected to be taken in a tax return. The Fund’s financial statements have not been impacted by the adoption of FIN 48. However, the conclusions regarding FIN 48 may be subject to review and adjustment at a later date based on factors including, but not limited to, further implementation guidance expected from FASB, and on-going analysis of tax laws, regulations, and interpretations thereof.
In September 2006, FASB issued Statement of Financial Accounting Standards No. 157, Fair Value Measurements (“FAS 157”). FAS 157 establishes a single authoritative definition of fair value, establishes a framework for measuring fair value and expands disclosures about fair value measurements. FAS 157 applies to fair value measurements already required or permitted by existing standards. The change to current generally accepted accounting principles from the application of FAS 157 relates to the definition of fair value, the methods used to measure fair value, and the expanded disclosures about fair value measurements. Management of the Fund does not believe the adoption of FAS 157 will materially impact the financial statement amounts, however, additional disclosures may be required about the inputs used to develop the measurements and the effect of certain of the measurements on changes in net assets for the period. FAS 157 is effective for financial statements issued for fiscal years beginning after November 15, 2007 and interim periods within those fiscal years.
42
ADDITIONAL INFORMATION (unaudited)
MEETING OF SHAREHOLDERS
On September 21, 2007, a Meeting of Shareholders for the Fund was held to consider a proposal. On July 31, 2007, the record date for the meeting, the Fund had $283,761,406 of net assets outstanding of which $151,282,349 (53.31%) of net assets were represented at the meeting.
Proposal 1— To consider a sub-advisory agreement with First International Advisors, LLC d/b/a/ Evergreen International Advisors
| $137,662,613 | | voted “For” |
| 5,699,230 | | voted “Against” |
| 7,920,506 | | voted “Abstain” |
43
ADDITIONAL INFORMATION (unaudited) continued
INFORMATION ABOUT THE REVIEW AND APPROVAL OF THE FUND’S INVESTMENT ADVISORY AGREEMENT
Each year, the Fund’s Board of Trustees is required to consider whether to continue in place the Fund’s investment advisory agreements. In September 2007, the Trustees, including a majority of the Trustees who are not interested persons (as that term is defined in the 1940 Act) of the Fund, TAG and FIA (together with TAG, the “Sub-Advisors”), or EIMC, approved the continuation of the Fund’s investment advisory agreements. (References below to the “Fund” are to Evergreen Core Plus Bond Fund; references to the “funds” are to the Evergreen funds generally.)
At the same time, the Trustees considered the continuation of the investment advisory agreements for all of the funds, and the description below refers in many cases to the Trustees’ process and conclusions in connection with their consideration of this matter for all of the funds. (See “Certain Fund-Specific Considerations” below for a discussion regarding certain factors considered by the Trustees relating specifically to the Fund.) In all of its deliberations, the Board of Trustees and the disinterested Trustees were advised by independent counsel to the disinterested Trustees and counsel to the funds.
The review process. The 1940 Act requires that the Board of Trustees request and evaluate, and that EIMC and any sub-advisors furnish, such information as may reasonably be necessary to evaluate the terms of a fund’s advisory agreements. The review process began at the time of the last advisory contract-renewal process in September 2006. In the course of that process, the Trustees identified a number of funds that had experienced either short-term or longer-term performance issues. During the following months, the Trustees reviewed information relating to any changes in the performance of those funds and/or any changes in the investment process or the investment teams responsible for the management of the funds. In addition, during the course of the year, the Trustees reviewed information regarding the investment performance of all of the funds and identified additional funds that they believed warranted further attention based on performance since September 2006.
In spring 2007, a committee of the Board of Trustees (the “Committee”), working with EIMC management, determined generally the types of information the Board would review and set a timeline detailing the information required and the dates for its delivery to the Trustees. The independent data provider Keil Fiduciary Strategies LLC (“Keil”) was engaged to provide fund-specific and industry-wide data to the Board containing information of a nature and in a format generally prescribed by the Committee, and the Committee worked with Keil and EIMC to develop appropriate groups of peer funds for each fund. The Committee also identified a number of expense, performance, and other issues and requested specific information as to those issues.
The Trustees reviewed, with the assistance of an independent industry consultant retained by the disinterested Trustees, the information provided by EIMC and the Sub-Advisors in response to the Committee’s requests and the information provided by Keil. The Trustees formed small committees to review individual funds in greater detail. In addition, the Trustees requested information regarding, among other things, brokerage practices of the funds, the use of deriva-
44
ADDITIONAL INFORMATION (unaudited) continued
tives by the funds, strategic planning for the funds, analyst and research support available to the portfolio management teams, and information regarding the various fall-out benefits received directly and indirectly by EIMC and its affiliates from the funds. The Trustees requested and received additional information following that review.
The Committee met several times by telephone to consider the information provided by EIMC. The Committee met with representatives of EIMC in early September. At a meeting of the full Board of Trustees later in September, the Committee reported the results of its discussions with EIMC, and the full Board met with representatives of EIMC, engaged in further review of the materials provided to them, and approved the continuation of each of the advisory and sub-advisory agreements.
The disinterested Trustees discussed the continuation of the funds’ advisory agreements with representatives of EIMC and in multiple private sessions with legal counsel at which no personnel of EIMC were present. In considering the continuation of the agreements, the Trustees did not identify any particular information or consideration that was all-important or controlling, and each Trustee attributed different weights to various factors. The Trustees evaluated information provided to them both in terms of the Evergreen mutual funds generally and with respect to each fund, including the Fund, specifically as they considered appropriate; although the Trustees considered the continuation of the agreements as part of the larger process of considering the continuation of the advisory contracts for all of the funds, their determination to continue the advisory agreements for each of the funds was ultimately made on a fund-by-fund basis.
This summary describes a number of the most important, but not necessarily all, of the factors considered by the Board and the disinterested Trustees.
Information reviewed. The Board of Trustees and committees of the Board of Trustees meet periodically during the course of the year. At those meetings, the Board receives a wide variety of information regarding the services performed by EIMC, the investment performance of the funds, and other aspects of the business and operations of the funds. At those meetings, and in the process of considering the continuation of the agreements, the Trustees considered information regarding, for example, the funds’ investment results; the portfolio management teams for the funds and the experience of the members of those teams, and any recent changes in the membership of the teams; portfolio trading practices; compliance by the funds, EIMC, and the Sub-Advisors with applicable laws and regulations and with the funds’ and EIMC’s compliance policies and procedures; risk evaluation and oversight procedures at EIMC; services provided by affiliates of EIMC to the funds and shareholders of the funds; and other information relating to the nature, extent, and quality of services provided by EIMC and the Sub-Advisors. The Trustees considered a number of changes in portfolio management personnel at EIMC and its advisory affiliates in the year since September 2006, and recent changes in compliance personnel at EIMC, including the appointment of a new Chief Compliance Officer for the funds.
The Trustees considered the rates at which the funds pay investment advisory fees, and the efforts generally by EIMC and its affiliates as sponsors of the funds. The data provided by Keil showed
45
ADDITIONAL INFORMATION (unaudited) continued
the management fees paid by each fund in comparison to the management fees of other peer mutual funds, in addition to data regarding the investment performance of the funds in comparison to other peer mutual funds. The Trustees were assisted by the independent industry consultant in reviewing the information presented to them.
The Trustees considered the transfer agency fees paid by the funds to an affiliate of EIMC. They reviewed information presented to them showing that the transfer agency fees charged to the funds were generally consistent with industry norms.
The Trustees also considered that EIS, an affiliate of EIMC, serves as administrator to the funds and receives a fee for its services as administrator. In their comparison of the advisory fee paid by the funds with those paid by other mutual funds, the Trustees took into account administrative fees paid by the funds and those other mutual funds. The Board considered that EIS serves as distributor to the funds generally and receives fees from the funds for those services. They considered other so-called “fall-out” benefits to EIMC and its affiliates due to their other relationships with the funds, including, for example, soft-dollar services received by EIMC attributable to transactions entered into by EIMC for the benefit of the funds and brokerage commissions received by Wachovia Securities, LLC, an affiliate of EIMC, from transactions effected by it for the funds. The Trustees also noted that the funds pay sub-transfer agency fees to various financial institutions who hold fund shares in omnibus accounts, and that Wachovia Securities, LLC and its affiliates receive such payments from the funds in respect of client accounts they hold in omnibus arrangements, and that an affiliate of EIMC receives fees for administering the sub-transfer agency payment program. They also considered that Wachovia Securities, LLC and its affiliates receive distribution-related fees and shareholder servicing payments (including amounts derived from payments under the funds’ Rule 12b-1 plans) in respect of shares sold or held through it. The Trustees also noted that an affiliate of EIMC receives compensation for serving as a securities lending agent for the funds.
Nature and quality of the services provided. The Trustees considered that EIMC and its affili-ates generally provide a comprehensive investment management service to the funds. They noted that EIMC and the Sub-Advisors formulate and implement an investment program for the Fund. They noted that EIMC makes its personnel available to serve as officers of the funds, and concluded that the reporting and management functions provided by EIMC with respect to the funds were generally satisfactory. The Trustees considered the investment philosophy of the Fund’s portfolio management team, and considered the in-house research capabilities of EIMC and its affiliates, as well as other resources available to EIMC, including research services available to it from third parties. The Board considered the managerial and financial resources available to EIMC and its affiliates, and the commitment that the Wachovia organization has made to the funds generally. On the basis of these factors, they determined that the nature and scope of the services provided by EIMC and the Sub-Advisors were consistent with their respective duties under the investment advisory agreements and appropriate and consistent with the investment programs and best interests of the funds.
46
ADDITIONAL INFORMATION (unaudited) continued
The Trustees noted the resources EIMC and its affiliates have committed to the regulatory, compliance, accounting, tax and oversight of tax reporting, and shareholder servicing functions, and the number and quality of staff committed to those functions, which they concluded were appropriate and generally in line with EIMC’s responsibilities to the Fund and to the funds generally. The Board and the disinterested Trustees concluded, within the context of their overall conclusions regarding the funds’ advisory agreements, that they were generally satisfied with the nature, extent, and quality of the services provided by the Sub-Advisors and EIMC, including services provided by EIS under its administrative services agreements with the funds.
Investment performance. The Trustees considered the investment performance of each fund, both by comparison to other comparable mutual funds and to broad market indices. The Trustees emphasized that the continuation of the investment advisory agreement for a fund should not be taken as any indication that the Trustees did not believe investment performance for any specific fund might not be improved, and they noted that they would continue to monitor closely the investment performance of the funds going forward.
Advisory and administrative fees. The Trustees recognized that EIMC does not seek to provide the lowest cost investment advisory service, but to provide a high quality, full-service investment management product at a reasonable price. They also noted that EIMC has in many cases sought to set its investment advisory fees at levels consistent with industry norms. The Trustees noted that, in certain cases, a fund’s management fees were higher than many or most other mutual funds in the same Keil peer group. However, in each case, the Trustees determined on the basis of the information presented that the level of management fees was not excessive.
Certain Fund-specific considerations. The Trustees noted that, for the one-, three-, five-, and ten-year periods ended December 31, 2006, the Fund’s Class I shares (the Fund’s oldest share class) had underperformed the broad-based securities index against which the Trustees compared the Fund’s performance and had performed in the third quintile of the funds against which the Trustees compared the Fund’s performance. The Trustees also noted that the Fund’s management fee was lower than the management fees paid by a majority of the funds against which the Trustees compared the Fund’s management fee, and that the level of profitability realized by EIMC in respect of the fee did not appear excessive.
Economies of scale. The Trustees noted that economies of scale would likely be achieved by EIMC in managing the funds as the funds grow. The Trustees noted that the Fund had implemented breakpoints in its advisory fee structure. The Trustees noted that they would continue to review the appropriate levels of breakpoints in the future, but concluded that the breakpoints as implemented appeared to be a reasonable step toward the realization of economies of scale by the Fund.
Profitability. The Trustees considered information provided to them regarding the profitability to the EIMC organization of the investment advisory, administration, and transfer agency (with respect to the open-end funds only) fees paid to EIMC and its affiliates by each of the funds. They considered that the information provided to them was necessarily estimated, and that the
47
ADDITIONAL INFORMATION (unaudited) continued
profitability information provided to them, especially on a fund-by-fund basis, did not necessarily provide a definitive tool for evaluating the appropriateness of each fund’s advisory fee. They noted that the levels of profitability of the funds to EIMC varied widely, depending on among other things the size and type of fund. They considered the profitability of the funds in light of such factors as, for example, the information they had received regarding the relation of the fees paid by the funds to those paid by other mutual funds, the investment performance of the funds, and the amount of revenues involved. In light of these factors, the Trustees concluded that the profitability of any of the funds, individually or in the aggregate, should not prevent the Trustees from approving the continuation of the agreements.
48
This page left intentionally blank
49
This page left intentionally blank
50
This page left intentionally blank
51
TRUSTEES AND OFFICERS
TRUSTEES1
| Charles A. Austin III | | Investment Counselor, Anchor Capital Advisors, LLC. (investment advice); Director, The Andover |
| Trustee | | Companies (insurance); Trustee, Arthritis Foundation of New England; Former Director, The |
| DOB: 10/23/1934 | | Francis Ouimet Society (scholarship program); Former Director, Executive Vice President and |
| Term of office since: 1991 | | Treasurer, State Street Research & Management Company (investment advice) |
| Other directorships: None | | |
|
| |
| K. Dun Gifford | | Chairman and President, Oldways Preservation and Exchange Trust (education); Trustee, |
| Trustee | | Treasurer and Chairman of the Finance Committee, Cambridge College |
| DOB: 10/23/1938 | | |
| Term of office since: 1974 | | |
| Other directorships: None | | |
|
| |
| Dr. Leroy Keith, Jr. | | Managing Director, Almanac Capital Management (commodities firm); Trustee, Phoenix |
| Trustee | | Fund Complex; Director, Diversapack Co. (packaging company); Former Partner, Stonington |
| DOB: 2/14/1939 | | Partners, Inc. (private equity fund); Former Director, Obagi Medical Products Co.; Former |
| Term of office since: 1983 | | Director, Lincoln Educational Services |
| Other directorships: Trustee, | | |
| Phoenix Fund Complex (consisting | | |
| of 60 portfolios as of 12/31/2006) | | |
|
| |
| Gerald M. McDonnell | | Manager of Commercial Operations, CMC Steel (steel producer) |
| Trustee | | |
| DOB: 7/14/1939 | | |
| Term of office since: 1988 | | |
| Other directorships: None | | |
|
| |
| Patricia B. Norris | | President and Director of Buckleys of Kezar Lake, Inc. (real estate company); Former President |
| Trustee | | and Director of Phillips Pond Homes Association (home community); Former Partner, |
| DOB: 4/9/1948 | | PricewaterhouseCoopers, LLP (independent registered public accounting firm) |
| Term of office since: 2006 | | |
| Other directorships: None | | |
|
| |
| William Walt Pettit | | Partner and Vice President, Kellam & Pettit, P.A. (law firm); Director, Superior Packaging Corp. |
| Trustee | | (packaging company); Member, Superior Land, LLC (real estate holding company), Member, |
| DOB: 8/26/1955 | | K&P Development, LLC (real estate development); Former Director, National Kidney Foundation |
| Term of office since: 1988 | | of North Carolina, Inc. (non-profit organization) |
| Other directorships: None | | |
|
| |
| David M. Richardson | | President, Richardson, Runden LLC (executive recruitment business development/consulting |
| Trustee | | company); Consultant, Kennedy Information, Inc. (executive recruitment information and |
| DOB: 9/19/1941 | | research company); Consultant, AESC (The Association of Executive Search Consultants); |
| Term of office since: 1982 | | Director, J&M Cumming Paper Co. (paper merchandising); Former Trustee, NDI Technologies, LLP |
| Other directorships: None | | (communications) |
|
| |
| Dr. Russell A. Salton III | | President/CEO, AccessOne MedCard, Inc.; Former Medical Director, Healthcare Resource |
| Trustee | | Associates, Inc. |
| DOB: 6/2/1947 | | |
| Term of office since: 1984 | | |
| Other directorships: None | | |
|
| |
| Michael S. Scofield | | Retired Attorney, Law Offices of Michael S. Scofield; Former Director and Chairman, Branded |
| Trustee | | Media Corporation (multi-media branding company) |
| DOB: 2/20/1943 | | |
| Term of office since: 1984 | | |
| Other directorships: None | | |
|
52
TRUSTEES AND OFFICERS continued
| Richard J. Shima | | Independent Consultant; Director, Hartford Hospital; Trustee, Greater Hartford YMCA; Former |
| Trustee | | Director, Trust Company of CT; Former Director, Old State House Association; Former Trustee, |
| DOB: 8/11/1939 | | Saint Joseph College (CT) |
| Term of office since: 1993 | | |
| Other directorships: None | | |
|
| |
| Richard K. Wagoner, CFA2 | | Member and Former President, North Carolina Securities Traders Association; Member, Financial |
| Trustee | | Analysts Society |
| DOB: 12/12/1937 | | |
| Term of office since: 1999 | | |
| Other directorships: None | | |
|
| |
| |
| OFFICERS | | |
| |
| Dennis H. Ferro3 | | Principal occupations: President and Chief Executive Officer, Evergreen Investment Company, |
| President | | Inc. and Executive Vice President, Wachovia Bank, N.A.; former Chief Investment Officer, |
| DOB: 6/20/1945 | | Evergreen Investment Company, Inc. |
| Term of office since: 2003 | | |
|
| |
| Kasey Phillips4 | | Principal occupations: Senior Vice President, Evergreen Investment Services, Inc.; Former Vice |
| Treasurer | | President, Evergreen Investment Services, Inc.; Former Assistant Vice President, Evergreen |
| DOB: 12/12/1970 | | Investment Services, Inc. |
| Term of office since: 2005 | | |
|
| |
| Michael H. Koonce4 | | Principal occupations: Senior Vice President and General Counsel, Evergreen Investment |
| Secretary | | Services, Inc.; Secretary, Senior Vice President and General Counsel, Evergreen Investment |
| DOB: 4/20/1960 | | Management Company, LLC and Evergreen Service Company, LLC; Senior Vice President and |
| Term of office since: 2000 | | Assistant General Counsel, Wachovia Corporation |
|
| |
| Robert Guerin4, 5 | | Principal occupations: Chief Compliance Officer, Evergreen Funds and Senior Vice President of |
| Chief Compliance Officer | | Evergreen Investments Co, Inc; Former Managing Director and Senior Compliance Officer, |
| DOB: 9/20/1965 | | Babson Capital Management LLC; Former Principal and Director, Compliance and Risk |
| Term of office since: 2007 | | Management, State Street Global Advisors; Former Vice President and Manager, Sales Practice |
| | | Compliance, Deutsche Asset Management. |
|
1 Each Trustee, except Ms. Norris, serves until a successor is duly elected or qualified or until his death, resignation, retirement or removal from office. As a new Trustee, Ms. Norris’ initial term ends June 30, 2009, at which time she may be re-elected by Trustees to serve until a successor is duly elected or qualified or until her death, resignation, retirement or removal from office by the Trustees. Each Trustee oversees 91 Evergreen funds. Correspondence for each Trustee may be sent to Evergreen Board of Trustees, P.O. Box 20083, Charlotte, NC 28202.
2 Mr. Wagoner is an “interested person” of the Fund because of his ownership of shares in Wachovia Corporation, the parent to the Fund’s investment advisor.
3 The address of the Officer is 401 S. Tryon Street, 20th Floor, Charlotte, NC 28288.
4 The address of the Officer is 200 Berkeley Street, Boston, MA 02116.
5 Mr. Guerin’s information is as of June 14, 2007, the effective date of his approval by the Board of Trustees as Chief Compliance Officer of the Evergreen funds.
Additional information about the Fund’s Board of Trustees and Officers can be found in the Statement of Additional Information (SAI) and is available upon request without charge by calling 800.343.2898.
53
564353 rv5 12/2007
Item 2 - Code of Ethics
Not required for this semi-annual filing.
Item 3 - Audit Committee Financial Expert
Not required for this semi-annual filing.
Items 4 – Principal Accountant Fees and Services
Not required for this semi-annual filing.
Items 5 – Audit Committee of Listed Registrants
Not applicable.
Item 6 – Schedule of Investments
Please see schedule of investments contained in the Report to Stockholders included under Item 1 of this Form N-CSR.
Item 7 – Disclosure of Proxy Voting Policies and Procedures for Closed-End Management Investment Companies.
Not applicable.
Item 8 – Portfolio Managers of Closed-End Management Investment Companies.
Not applicable.
Item 9 – Purchases of Equity Securities by Closed-End Management Investment Company and Affiliated Purchasers.
Not applicable.
Item 10 – Submission of Matters to a Vote of Security Holders
There have been no material changes to the procedures by which shareholders may recommend nominees to the Registrant’s board of trustees that have been implemented since the Registrant last provided disclosure in response to the requirements of this Item.
Item 11 - Controls and Procedures
(a) The Registrant's principal executive officer and principal financial officer have evaluated the Registrant's disclosure controls and procedures (as defined in Rule 30a-3(c) under the Investment Company Act of 1940) within 90 days of this filing and have concluded that the Registrant's disclosure controls and procedures were effective, as of that date, in ensuring that information required to be disclosed by the Registrant in this Form N-CSR was recorded, processed, summarized, and reported timely.
(b) There has been no changes in the Registrant's internal controls over financial reporting (as defined in Rule 30a-3(d) under the Investment Company Act of 1940) that occurred during the second fiscal quarter of the period covered by this report that has materially affected, or is reasonable likely to affect, the Registrant’s internal control over financial reporting .
Item 12 - Exhibits
File the exhibits listed below as part of this Form. Letter or number the exhibits in the sequence indicated.
(a) Any code of ethics, or amendment thereto, that is the subject of the disclosure required by Item 2, to the extent that the Registrant intends to satisfy the Item 2 requirements through filing of an exhibit.
(b)(1) Separate certifications for the Registrant's principal executive officer and principal financial officer, as required by Section 302 of the Sarbanes-Oxley Act of 2002 and Rule 30a-2(a) under the Investment Company Act of 1940, are attached as EX99.CERT.
(b)(2) Separate certifications for the Registrant's principal executive officer and principal financial officer, as required by Section 1350 of Title 18 of United States Code, as adopted pursuant to Section 906 of the Sarbanes-Oxley Act of 2002, and Rule 30a-2(b) under the Investment Company Act of 1940, are attached as EX99.906CERT. The certifications furnished pursuant to this paragraph are not deemed to be "filed" for purposes of Section 18 of the Securities Exchange Act of 1934, or otherwise subject to the liability of that section. Such certifications are not deemed to be incorporated by reference into any filing under the Securities Act of 1933 or the Securities Exchange Act of 1934, except to the extent that the Registrant specifically incorporates them by reference.
Pursuant to the requirements of the Securities Exchange Act of 1934 and the Investment Company Act of 1940, the Registrant has duly caused this report to be signed on its behalf by the undersigned, thereunto duly authorized.
Evergreen Fixed Income Trust
By: _______________________
Dennis H. Ferro,
Principal Executive Officer
Date: December 28, 2007
Pursuant to the requirements of the Securities Exchange Act of 1934 and the Investment Company Act of 1940, this report has been signed below by the following persons on behalf of the Registrant and in the capacities and on the dates indicated.
By: _______________________
Dennis H. Ferro,
Principal Executive Officer
Date: December 28, 2007
By:
________________________
Kasey Phillips
Principal Financial Officer
Date: December 28, 2007