| OMB APPROVAL |
OMB Number: 3235-0570 Expires: September 30, 2007 Estimated average burden hours per response: 19.4 |
UNITED STATES
SECURITIES AND EXCHANGE COMMISSION
Washington, D.C. 20549
FORM N-CSRS
CERTIFIED SHAREHOLDER REPORT OF REGISTERED MANAGEMENT INVESTMENT COMPANIES
Investment Company Act file number 811-08415
Evergreen Fixed Income Trust
_____________________________________________________________
(Exact name of registrant as specified in charter)
200 Berkeley Street Boston, Massachusetts 02116
_____________________________________________________________
(Address of principal executive offices) (Zip code)
Michael H. Koonce, Esq. 200 Berkeley Street Boston, Massachusetts 02116
____________________________________________________________
(Name and address of agent for service)
Registrant's telephone number, including area code: (617) 210-3200
Date of fiscal year end: Registrant is making a semi-annual filing for one of its series, Evergreen Ultra Short Opportunities Fund, for the six months ended December 31, 2007. This series has a June 30 fiscal year end.
Date of reporting period: December 31, 2007
Item 1 - Reports to Stockholders.
Evergreen Ultra Short Opportunities Fund

| | | table of contents |
| 1 | | LETTER TO SHAREHOLDERS |
| 4 | | FUND AT A GLANCE |
| 6 | | ABOUT YOUR FUND’S EXPENSES |
| 7 | | FINANCIAL HIGHLIGHTS |
| 11 | | SCHEDULE OF INVESTMENTS |
| 21 | | STATEMENT OF ASSETS AND LIABILITIES |
| 22 | | STATEMENT OF OPERATIONS |
| 23 | | STATEMENTS OF CHANGES IN NET ASSETS |
| 24 | | NOTES TO FINANCIAL STATEMENTS |
| 32 | | ADDITIONAL INFORMATION |
| 40 | | TRUSTEES AND OFFICERS |
This semiannual report must be preceded or accompanied by a prospectus of the Evergreen fund contained herein. The prospectus contains more complete information, including fees and expenses, and should be read carefully before investing or sending money.
The fund will file its complete schedule of portfolio holdings with the SEC for the first and third quarters of each fiscal year on Form N-Q. The fund’s Form N-Q will be available on the SEC’s Web site at http://www.sec.gov. In addition, the fund’s Form N-Q may be reviewed and copied at the SEC’s Public Reference Room in Washington, D.C. Information on the operation of the Public Reference Room may be obtained by calling 800.SEC.0330.
A description of the fund’s proxy voting policies and procedures, as well as information regarding how the fund voted proxies relating to portfolio securities during the most recent 12-month period ended June 30, is available by visiting our Web site at EvergreenInvestments.com or by visiting the SEC’s Web site at http://www.sec.gov. The fund’s proxy voting policies and procedures are also available without charge, upon request, by calling 800.343.2898.
| Mutual Funds: | | | | |
| NOT FDIC INSURED | | MAY LOSE VALUE | | NOT BANK GUARANTEED |
Evergreen InvestmentsSM is a service mark of Evergreen Investment Management Company, LLC.
Copyright 2008, Evergreen Investment Management Company, LLC.
Evergreen Investment Management Company, LLC is a subsidiary of Wachovia Corporation and is an affiliate of Wachovia Corporation’s other Broker Dealer subsidiaries.
Evergreen mutual funds are distributed by Evergreen Investment Services, Inc.
200 Berkeley Street, Boston, MA 02116
LETTER TO SHAREHOLDERS
February 2008

Dennis H. Ferro
President and Chief
Executive Officer
Dear Shareholder:
We are pleased to provide the Semiannual Report for Evergreen Ultra Short Opportunities Fund for the six-month period ended December 31, 2007.
Investors in the domestic fixed income market faced an increasingly challenging environment in the final half of 2007. Problems that first surfaced in the weakening housing and subprime mortgage markets led to a tightening of credit which, in turn, contributed to widening fears of a dramatic deceleration in the economy’s expansion. Against this backdrop, investors sought the highest-quality securities and avoided credit risk. Longer-maturity Treasuries were the strongest-performing sector in the fixed income market. Meanwhile, prices of corporate bonds and many asset-backed securities began falling as the yield spreads between Treasuries and lower-rated securities widened. At the same time, the equity market experienced increasing turbulence as investors scrutinized each new economic report for any evidence of a deceleration in the economy’s expansion or slowing of corporate profit growth. In this unstable environment, large capitalization stocks tended to be preferred over smaller cap stocks, while growth stocks held a clear performance edge over value stocks. Most domestic equity benchmarks posted negative returns for the final quarter of the year.
The U.S. economy slowed noticeably in the closing months of the year. While Gross Domestic Product grew by approximately 2.5% in 2007, growth slowed to an annual rate of 0.6% in the fourth quarter. The combination of mortgage-related weakness, higher
1
LETTER TO SHAREHOLDERS continued
energy prices and tighter lending standards limited both consumer spending and business investment. Operating earnings of companies in the S&P 500 declined in the third quarter of the year and were expected to fall again in the final quarter. Massive write-downs of assets by major corporations, most notably in the Financials sector, were a principal factor contributing to the slowing of profit growth. Faced with growing evidence of the economy’s slowing, the Federal Reserve Board (the “Fed”) began adding liquidity to the nation’s financial system, cutting the target fed funds rate from 5.25% to 4.25% in the final months of 2007. The Fed acted even more forcefully during the first month of 2008, cutting another 1.25 percentage points off the influential target rate in two separate actions within just eight days of each other. The White House and Congress, meanwhile, negotiated over a fiscal package to re-invigorate the economy through tax cuts and other fiscal actions.
Over the six-month period, the management teams of Evergreen’s short- and intermediate-term bond funds pursued strategies based on each fund’s objective. The team managing Evergreen Short Intermediate Bond Fund, for example, focused on the higher-quality tiers of the markets while keeping duration — or price sensitivity to changes in interest rates — close to neutral to the market. At the same time, managers of Evergreen Adjustable Rate Fund continued to emphasize AAA-rated adjustable rate mortgages with relatively stable cash flows. The team supervising Evergreen Ultra Short Opportunities Fund, meanwhile, maintained a portfolio of shorter-maturity, higher-quality securities. Managers of Evergreen Institutional Enhanced Income Fund maintained a conservative strategy designed to
2
LETTER TO SHAREHOLDERS continued
seek a higher yield than a money market fund with only minimal price variability.
We believe the experiences in the investment markets during the past six months have underscored the value of a well-diversified, long-term investment strategy to help soften the effects of volatility in any one market or asset class. As always, we encourage investors to maintain diversified investment portfolios in pursuit of their long-term investment goals.
Please visit us at EvergreenInvestments.com for more information about our funds and other investment products available to you. Thank you for your continued support of Evergreen Investments.
Sincerely,

Dennis H. Ferro
President and Chief Executive Officer
Evergreen Investment Company, Inc.
Special Notice to Shareholders:
Please visit our Web site at EvergreenInvestments.com for statements from President and Chief Executive Officer, Dennis Ferro, regarding the firm’s recent settlement with the Securities and Exchange Commission (SEC) and prior settlement with the Financial Industry Regulatory Authority (FINRA).
3
FUND AT A GLANCE
as of December 31, 2007
MANAGEMENT TEAM
Investment Advisor:
• Evergreen Investment Management Company, LLC
Sub-Advisor:
• Tattersall Advisory Group, Inc.
Portfolio Managers:
• Lisa Brown-Premo
• Robert D. Rowe
CURRENT INVESTMENT STYLE
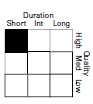
Source: Morningstar, Inc.
Morningstar’s style box is based on a portfolio date as of 12/31/2007.
The Fixed Income style box placement is based on a fund’s average effective maturity or duration and the average credit rating of the bond portfolio.
PERFORMANCE AND RETURNS
Portfolio inception date: 5/29/2003
| | | Class A | | Class B | | Class C | | Class I |
| Class inception date | | 5/29/2003 | | 5/29/2003 | | 5/29/2003 | | 5/29/2003 |
|
| Nasdaq symbol | | EUBAX | | EUBBX | | EUBCX | | EUBIX |
|
| 6-month return with sales charge | | -1.17% | | -1.28% | | -0.29% | | N/A |
|
| 6-month return w/o sales charge | | 1.06% | | 0.69% | | 0.69% | | 1.19% |
|
| Average annual return* | | | | | | | | |
|
| 1-year with sales charge | | 1.16% | | 0.73% | | 1.70% | | N/A |
|
| 1-year w/o sales charge | | 3.44% | | 2.68% | | 2.68% | | 3.71% |
|
| Since portfolio inception | | 3.00% | | 2.79% | | 2.79% | | 3.81% |
|
| Maximum sales charge | | 2.25% | | 2.00% | | 1.00% | | N/A |
| | | Front-end | | CDSC | | CDSC | | |
|
* Adjusted for maximum applicable sales charge, unless noted.
Past performance is no guarantee of future results. The performance quoted represents past performance and current performance may be lower or higher. The investment return and principal value of an investment will fluctuate so that investors’ shares, when redeemed, may be worth more or less than their original cost. To obtain performance information current to the most recent month-end for Classes A, B, C or I, please go to EvergreenInvestments.com/fundperformance. The performance of each class may vary based on differences in loads, fees and expenses paid by the shareholders investing in each class. Performance includes the reinvestment of income dividends and capital gain distributions. Performance shown does not reflect the deduction of taxes that a shareholder would pay on fund distributions or the redemption of fund shares.
The fund incurs a 12b-1 fee of 0.30% for Class A and 1.00% for Classes B and C. Class I does not pay a 12b-1 fee.
The advisor is waiving a portion of its advisory fee and reimbursing a portion of the 12b-1 fee for Class A. Had the fees not been waived or reimbursed, returns would have been lower.
4
FUND AT A GLANCE continued
LONG-TERM GROWTH
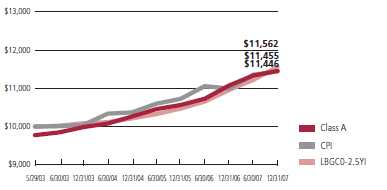
Comparison of a $10,000 investment in the Evergreen Ultra Short Opportunities Fund Class A shares versus a similar investment in the Lehman Brothers Government/Credit 0-2.5 Year Index (LBGC0-2.5YI) and the Consumer Price Index (CPI).
The LBGC0-2.5YI is an unmanaged market index and does not include transaction costs associated with buying and selling securities, any mutual fund fees or expenses or any taxes. The CPI is a commonly used measure of inflation and does not represent an investment return. It is not possible to invest directly in an index.
Class I shares are only offered in the following manner: (1) to investment advisory clients of Evergreen Investment Management Company, LLC (or its advisory affiliates) when purchased by such advisor(s) on behalf of its clients, (2) to certain mutual fund wrap program clients of Wachovia Securities and of third-party broker/dealers when purchased through a clearing relationship with Wachovia Securities or an affiliate providing mutual fund clearing services, (3) through arrangements entered into on behalf of the Evergreen funds with certain financial services firms, (4) to certain institutional investors, and (5) to persons who owned Class Y shares in registered name in an Evergreen fund on or before December 31, 1994 or who owned shares of any SouthTrust fund in registered name as of March 18, 2005 or who owned shares of Vestaur Securities Fund as of May 20, 2005.
Class I shares are only available to institutional shareholders with a minimum of $1 million investment, which may be waived in certain situations.
The fund’s investment objective may be changed without a vote of the fund’s shareholders.
Foreign investments may contain more risk due to the inherent risks associated with changing political climates, foreign market instability and foreign currency fluctuations.
Asset-backed and mortgage-backed securities are generally subject to higher prepayment risks than other types of debt securities, which can limit the potential for gain in a declining interest rate environment and increase the potential for loss in a rising interest rate environment. Mortgage-backed securities may also be structured so that they are particularly sensitive to interest rates.
Derivatives involve additional risks including interest rate risk, credit risk, the risk of improper valuation and the risk of non-correlation to the relevant instruments they are designed to hedge or to closely track.
The return of principal is not guaranteed due to fluctuation in the fund’s NAV caused by changes in the price of individual bonds held by the fund and the buying and selling of bonds by the fund. Bond funds have the same inflation, interest rate and credit risks as individual bonds. Generally, the value of bond funds rises when prevailing interest rates fall, and falls when interest rates rise.
U.S. government guarantees apply only to certain securities held in the fund’s portfolio and not to the fund’s shares.
All data is as of December 31, 2007, and subject to change.
5
ABOUT YOUR FUND’S EXPENSES
The Example below is intended to describe the fees and expenses borne by shareholders and the impact of those costs on your investment.
Example
As a shareholder of the fund, you incur two types of costs: (1) transaction costs, including sales charges (loads), redemption fees and exchange fees; and (2) ongoing costs, including management fees, distribution (12b-1) fees and other fund expenses. This Example is intended to help you understand your ongoing costs (in dollars) of investing in the fund and to compare these costs with the ongoing costs of investing in other mutual funds. The Example is based on an investment of $1,000 invested at the beginning of the period and held for the entire period from July 1, 2007 to December 31, 2007.
The example illustrates your fund’s costs in two ways:
• Actual expenses
The section in the table under the heading “Actual” provides information about actual account values and actual expenses. You may use the information in these columns, together with the amount you invested, to estimate the expenses that you paid over the period. Simply divide your account value by $1,000 (for example, an $8,600 account value divided by $1,000 = 8.6), then multiply the result by the number in the appropriate column for your share class, in the column entitled “Expenses Paid During Period” to estimate the expenses you paid on your account during this period.
• Hypothetical example for comparison purposes
The section in the table under the heading “Hypothetical (5% return before expenses)” provides information about hypothetical account values and hypothetical expenses based on the fund’s actual expense ratio and an assumed rate of return of 5% per year before expenses, which is not the fund’s actual return. The hypothetical account values and expenses may not be used to estimate the actual ending account balance or expenses you paid for the period. You may use this information to compare the ongoing costs of investing in the fund and other funds. To do so, compare this 5% hypothetical example with the 5% hypothetical examples that appear in the shareholder reports of the other funds.
Please note that the expenses shown in the table are meant to highlight your ongoing costs only and do not reflect any transactional costs, such as sales charges (loads), redemption fees or exchange fees. Therefore, the section in the table under the heading “Hypothetical (5% return before expenses)” is useful in comparing ongoing costs only, and will not help you determine the relative total costs of owning different funds. In addition, if these transactional costs were included, your costs would have been higher.
| | | Beginning | | Ending | | |
| | | Account | | Account | | Expenses |
| | | Value | | Value | | Paid During |
| | | 7/1/2007 | | 12/31/2007 | | Period* |
|
| Actual | | | | | | |
| Class A | | $ 1,000.00 | | $ 1,010.62 | | $ 4.95 |
| Class B | | $ 1,000.00 | | $ 1,006.87 | | $ 8.73 |
| Class C | | $ 1,000.00 | | $ 1,006.87 | | $ 8.73 |
| Class I | | $ 1,000.00 | | $ 1,011.94 | | $ 3.64 |
| Hypothetical | | | | | | |
| (5% return | | | | | | |
| before expenses) | | | | | | |
| Class A | | $ 1,000.00 | | $ 1,020.21 | | $ 4.98 |
| Class B | | $ 1,000.00 | | $ 1,016.44 | | $ 8.77 |
| Class C | | $ 1,000.00 | | $ 1,016.44 | | $ 8.77 |
| Class I | | $ 1,000.00 | | $ 1,021.52 | | $ 3.66 |
|
* For each class of the Fund, expenses are equal to the annualized expense ratio of each class (0.98% for Class A, 1.73% for Class B, 1.73% for Class C and 0.72% for Class I), multiplied by the average account value over the period, multiplied by 184 / 366 days.
6
FINANCIAL HIGHLIGHTS
(For a share outstanding throughout each period)
| | | Six Months Ended | | Year Ended June 30, |
| | | December 31, 2007 | |
|
| CLASS A | | (unaudited) | | 2007 | | 2006 | | 2005 | | 2004 | | 20031 |
|
| Net asset value, beginning of period | | $ 9.72 | | $ 9.72 | | $ 9.93 | | $ 9.96 | | $ 10.05 | | $ 10.00 |
|
| Income from investment operations | | | | | | | | | | | | | | | | |
| Net investment income (loss) | | | | 0.29 | | 0.53 | | 0.45 | | | | 0.35 | | 0.26 | | 0.02 |
| Net realized and unrealized gains or losses on investments | | | | (0.19) | | 0.01 | | (0.19) | | | | 0.01 | | (0.03) | | 0.05 |
| |
|
| Total from investment operations | | | | 0.10 | | 0.54 | | 0.26 | | | | 0.36 | | 0.23 | | 0.07 |
|
| Distributions to shareholders from | | | | | | | | | | | | | | | | |
| Net investment income | | | | (0.28) | | (0.54) | | (0.47) | | | | (0.39) | | (0.32) | | (0.02) |
|
| Net asset value, end of period | | $ 9.54 | | $ 9.72 | | $ 9.72 | | $ 9.93 | | $ 9.96 | | $ 10.05 |
|
| Total return2 | | | | 1.06% | | 5.66% | | 2.71% | | | | 3.73% | | 2.35% | | 0.75% |
|
| Ratios and supplemental data | | | | | | | | | | | | | | | | |
| Net assets, end of period (thousands) | | $87,393 | | $88,764 | | $94,787 | | $124,221 | | $104,999 | | $17,872 |
| Ratios to average net assets | | | | | | | | | | | | | | | | |
| Expenses including waivers/reimbursements and | | | | | | | | | | | | | | | | |
| interest and fee expense but excluding expense reductions | | | | 0.98%3 | | 1.03% | | 0.86% | | | | 0.77% | | 0.92% | | 0.32%3 |
| Expenses including interest and fee expense but | | | | | | | | | | | | | | | | |
| excluding waivers/reimbursements and expense reductions | | | | 1.06%3 | | 1.12% | | 0.90% | | | | 0.87% | | 0.98% | | 2.93%3 |
| Expenses including waivers/reimbursements but excluding | | | | | | | | | | | | | | | | |
| expense reductions and interest and fee expense | | | | 0.75%3 | | 0.78% | | 0.81% | | | | 0.77% | | 0.92% | | 0.32%3 |
| Interest and fee expense4 | | | | 0.23%3 | | 0.25% | | 0.05% | | | | 0.00% | | 0.00% | | 0.00%3 |
| Net investment income (loss) | | | | 5.89%3 | | 5.38% | | 4.57% | | | | 3.46% | | 2.58% | | 2.76%3 |
| Portfolio turnover rate | | | | 54% | | 40% | | 31% | | | | 25% | | 44% | | 0% |
|
1 For the period from May 29, 2003 (commencement of class operations), to June 30, 2003.
2 Excluding applicable sales charges
3 Annualized
4 Interest and fee expense ratio relates to interest and fees associated with borrowings and/or leverage transactions.
See Notes to Financial Statements
7
FINANCIAL HIGHLIGHTS
(For a share outstanding throughout each period)
| | | Six Months Ended | | Year Ended June 30, |
| | | December 31, 2007 | |
|
| CLASS B | | (unaudited) | | 2007 | | 2006 | | 2005 | | 2004 | | 20031 |
|
| Net asset value, beginning of period | | $ 9.72 | | $ 9.72 | | $ 9.93 | | $ 9.96 | | $ 10.05 | | $ 10.00 |
|
| Income from investment operations | | | | | | | | | | | | | | | | |
| Net investment income (loss) | | | | 0.25 | | 0.46 | | 0.38 | | 0.272 | | 0.192 | | 0.02 |
| Net realized and unrealized gains or losses on investments | | | | (0.18) | | 0.01 | | (0.19) | | | | 0.02 | | (0.03) | | 0.05 |
| |
|
| Total from investment operations | | | | 0.07 | | 0.47 | | 0.19 | | | | 0.29 | | 0.16 | | 0.07 |
|
| Distributions to shareholders from | | | | | | | | | | | | | | | | |
| Net investment income | | | | (0.25) | | (0.47) | | (0.40) | | | | (0.32) | | (0.25) | | (0.02) |
|
| Net asset value, end of period | | $ 9.54 | | $ 9.72 | | $ 9.72 | | $ 9.93 | | $ 9.96 | | $ 10.05 |
|
| Total return3 | | | | 0.69% | | 4.89% | | 1.99% | | | | 3.01% | | 1.65% | | 0.70% |
|
| Ratios and supplemental data | | | | | | | | | | | | | | | | |
| Net assets, end of period (thousands) | | $20,828 | | $19,321 | | $19,633 | | $20,052 | | $16,029 | | $3,213 |
| Ratios to average net assets | | | | | | | | | | | | | | | | |
| Expenses including waivers/reimbursements and | | | | | | | | | | | | | | | | |
| interest and fee expense but excluding expense reductions | | | | 1.73%4 | | 1.78% | | 1.58% | | | | 1.47% | | 1.62% | | 1.12%4 |
| Expenses including interest and fee expense but | | | | | | | | | | | | | | | | |
| excluding waivers/reimbursements and expense reductions | | | | 1.76%4 | | 1.83% | | 1.61% | | | | 1.57% | | 1.68% | | 5.19%4 |
| Expenses including waivers/reimbursements but excluding | | | | | | | | | | | | | | | | |
| expense reductions and interest and fee expense | | | | 1.50%4 | | 1.53% | | 1.53% | | | | 1.47% | | 1.62% | | 1.12%4 |
| Interest and fee expense5 | | | | 0.23%4 | | 0.25% | | 0.05% | | | | 0.00% | | 0.00% | | 0.00%4 |
| Net investment income (loss) | | | | 5.15%4 | | 4.67% | | 3.88% | | | | 2.75% | | 1.90% | | 1.76%4 |
| Portfolio turnover rate | | | | 54% | | 40% | | 31% | | | | 25% | | 44% | | 0% |
|
1 For the period from May 29, 2003 (commencement of class operations), to June 30, 2003.
2 Net investment income (loss) per share is based on average shares outstanding during the period.
3 Excluding applicable sales charges
4 Annualized
5 Interest and fee expense ratio relates to interest and fees associated with borrowings and/or leverage transactions.
See Notes to Financial Statements
8
FINANCIAL HIGHLIGHTS
(For a share outstanding throughout each period)
| | | Six Months Ended | | Year Ended June 30, |
| | | December 31, 2007 | |
|
| CLASS C | | (unaudited) | | 2007 | | 2006 | | 2005 | | 2004 | | 20031 |
|
| Net asset value, beginning of period | | $ 9.72 | | $ 9.72 | | $ 9.93 | | $ 9.96 | | $ 10.05 | | $ 10.00 |
|
| Income from investment operations | | | | | | | | | | | | | | | | |
| Net investment income (loss) | | | | 0.25 | | 0.46 | | 0.38 | | | | 0.27 | | 0.192 | | 0.02 |
| Net realized and unrealized gains or losses on investments | | | | (0.18) | | 0.01 | | (0.19) | | | | 0.02 | | (0.03) | | 0.05 |
| |
|
| Total from investment operations | | | | 0.07 | | 0.47 | | 0.19 | | | | 0.29 | | 0.16 | | 0.07 |
|
| Distributions to shareholders from | | | | | | | | | | | | | | | | |
| Net investment income | | | | (0.25) | | (0.47) | | (0.40) | | | | (0.32) | | (0.25) | | (0.02) |
|
| Net asset value, end of period | | $ 9.54 | | $ 9.72 | | $ 9.72 | | $ 9.93 | | $ 9.96 | | $ 10.05 |
|
| Total return3 | | | | 0.69% | | 4.89% | | 1.99% | | | | 3.01% | | 1.65% | | 0.70% |
|
| Ratios and supplemental data | | | | | | | | | | | | | | | | |
| Net assets, end of period (thousands) | | $82,706 | | $78,612 | | $82,184 | | $115,248 | | $135,412 | | $17,820 |
| Ratios to average net assets | | | | | | | | | | | | | | | | |
| Expenses including waivers/reimbursements and | | | | | | | | | | | | | | | | |
| interest and fee expense but excluding expense reductions | | | | 1.73%4 | | 1.78% | | 1.57% | | | | 1.47% | | 1.62% | | 1.02%4 |
| Expenses including interest and fee expense but | | | | | | | | | | | | | | | | |
| excluding waivers/reimbursements and expense reductions | | | | 1.76%4 | | 1.83% | | 1.60% | | | | 1.57% | | 1.68% | | 3.69%4 |
| Expenses including waivers/reimbursements but excluding | | | | | | | | | | | | | | | | |
| expense reductions and interest and fee expense | | | | 1.50%4 | | 1.53% | | 1.52% | | | | 1.47% | | 1.62% | | 1.02%4 |
| Interest and fee expense5 | | | | 0.23%4 | | 0.25% | | 0.05% | | | | 0.00% | | 0.00% | | 0.00%4 |
| Net investment income (loss) | | | | 5.14%4 | | 4.67% | | 3.86% | | | | 2.73% | | 1.88% | | 2.09%4 |
| Portfolio turnover rate | | | | 54% | | 40% | | 31% | | | | 25% | | 44% | | 0% |
|
1 For the period from May 29, 2003 (commencement of class operations), to June 30, 2003.
2 Net investment income (loss) per share is based on average shares outstanding during the period.
3 Excluding applicable sales charges
4 Annualized
5 Interest and fee expense ratio relates to interest and fees associated with borrowings and/or leverage transactions.
See Notes to Financial Statements
9
FINANCIAL HIGHLIGHTS
(For a share outstanding throughout each period)
| | | Six Months Ended | | Year Ended June 30, |
| | | December 31, 2007 | |
|
| CLASS I | | (unaudited) | | 2007 | | 2006 | | 2005 | | 2004 | | 20031 |
|
| Net asset value, beginning of period | | $ 9.72 | | $ 9.72 | | $ 9.93 | | $ 9.96 | | $ 10.05 | | $10.00 |
|
| Income from investment operations | | | | | | | | | | | | | | | | |
| Net investment income (loss) | | | | 0.30 | | 0.55 | | 0.48 | | | | 0.382 | | 0.292 | | 0.03 |
| Net realized and unrealized gains or losses on investments | | | | (0.19) | | 0.01 | | (0.19) | | | | 0.01 | | (0.03) | | 0.05 |
| |
|
| Total from investment operations | | | | 0.11 | | 0.56 | | 0.29 | | | | 0.39 | | 0.26 | | 0.08 |
|
| Distributions to shareholders from | | | | | | | | | | | | | | | | |
| Net investment income | | | | (0.29) | | (0.56) | | (0.50) | | | | (0.42) | | (0.35) | | (0.03) |
|
| Net asset value, end of period | | $ 9.54 | | $ 9.72 | | $ 9.72 | | $ 9.93 | | $ 9.96 | | $10.05 |
|
| Total return | | | | 1.19% | | 5.93% | | 3.02% | | | | 4.05% | | 2.67% | | 0.77% |
|
| Ratios and supplemental data | | | | | | | | | | | | | | | | |
| Net assets, end of period (thousands) | | $550,682 | | $577,454 | | $474,373 | | $381,760 | | $215,930 | | $2,343 |
| Ratios to average net assets | | | | | | | | | | | | | | | | |
| Expenses including waivers/reimbursements and | | | | | | | | | | | | | | | | |
| interest and fee expense but excluding expense reductions | | | | 0.72%3 | | 0.76% | | 0.58% | | | | 0.47% | | 0.62% | | 0.07%3 |
| Expenses including interest and fee expense but | | | | | | | | | | | | | | | | |
| excluding waivers/reimbursements and expense reductions | | | | 0.75%3 | | 0.81% | | 0.61% | | | | 0.57% | | 0.68% | | 3.89%3 |
Expenses including waivers/reimbursements but
excluding expense reductions and interest and fee expense | | | | 0.49%3 | | 0.51% | | 0.53% | | | | 0.47% | | 0.62% | | 0.07%3 |
| Interest and fee expense4 | | | | 0.23%3 | | 0.25% | | 0.05% | | | | 0.00% | | 0.00% | | 0.00%3 |
| Net investment income (loss) | | | | 6.12%3 | | 5.68% | | 4.90% | | | | 3.80% | | 2.91% | | 2.95%3 |
| Portfolio turnover rate | | | | 54% | | 40% | | 31% | | | | 25% | | 44% | | 0% |
|
1 For the period from May 29, 2003 (commencement of class operations), to June 30, 2003.
2 Net investment income (loss) per share is based on average shares outstanding during the period.
3 Annualized
4 Interest and fee expense ratio relates to interest and fees associated with borrowings and/or leverage transactions.
See Notes to Financial Statements
10
SCHEDULE OF INVESTMENTS
December 31, 2007 (unaudited)
| | | | | | | Principal | | | | |
| | | | | | | Amount | | | | Value |
|
| |
| AGENCY MORTGAGE-BACKED COLLATERALIZED MORTGAGE | | | | | | | | | | |
| OBLIGATIONS 8.2% | | | | | | | | | | |
| FIXED-RATE 0.5% | | | | | | | | | | |
| FHLMC: | | | | | | | | | | |
| Ser. 1650, Class J, 6.50%, 06/15/2023 ## | | | | $ | | 693,021 | | $ | | 696,188 |
| Ser. 1758, Class G, 5.50%, 10/15/2009 | | | | | | 19,380 | | | | 19,382 |
| Ser. 2106, Class ZD, 6.00%, 12/15/2028 | | | | | | 1,085,493 | | | | 1,128,241 |
| Ser. 2728, IO, 6.00%, 04/15/2032 | | | | | | 8,901,333 | | | | 1,359,889 |
| Ser. 2912, Class MI, IO, 5.50%, 12/15/2020 | | | | | | 314,131 | | | | 32 |
| FNMA, Ser. 2004-T3, Class 1A3, 7.00%, 02/25/2044 | | | | | | 495,293 | | | | 525,261 |
| |
|
| | | | | | | | | | | 3,728,993 |
| |
|
| FLOATING-RATE 7.7% | | | | | | | | | | |
| FHLMC: | | | | | | | | | | |
| Ser. 1476, Class F, 4.98%, 02/15/2008 | | | | | | 540 | | | | 539 |
| Ser. 1607, Class FA, 4.78%, 10/15/2013 | | | | | | 12,763 | | | | 12,777 |
| Ser. 1625, Class FC, 5.13%, 12/15/2008 | | | | | | 33,068 | | | | 33,036 |
| Ser. T-66, Class 2A1, 7.71%, 01/25/2036 ## | | | | | | 20,572,541 | | | | 21,712,180 |
| Ser. T-67, Class 1A1C, 7.83%, 03/25/2036 ## | | | | | | 30,890,352 | | | | 33,429,230 |
| FNMA: | | | | | | | | | | |
| Ser. 1993-179, Class FB, 5.58%, 10/25/2023 | | | | | | 142,672 | | | | 144,238 |
| Ser. 2006-72, Class GS, 10.83%, 08/25/2036 | | | | | | 1,271,116 | | | | 1,377,758 |
| |
|
| | | | | | | | | | | 56,709,758 |
| |
|
| Total Agency Mortgage-Backed Collateralized Mortgage Obligations | | | | | | | | |
| (cost $58,611,637) | | | | | | | | | | 60,438,751 |
| |
|
| AGENCY MORTGAGE-BACKED PASS THROUGH SECURITIES 16.6% | | | | | | | | |
| FIXED-RATE 11.3% | | | | | | | | | | |
| FHLMC 30 year, 6.50%, TBA # | | | | | | 77,000,000 | | | | 79,153,613 |
| FNMA: | | | | | | | | | | |
| 6.50%, 08/01/2010 | | | | | | 12,157 | | | | 12,329 |
| 7.00%, 08/01/2033 - 11/01/2033 ƒ | | | | | | 2,564,246 | | | | 2,690,082 |
| 7.50%, 01/01/2031 - 08/01/2033 | | | | | | 1,940,899 | | | | 2,072,933 |
| 8.00%, 12/01/2008 | | | | | | 507 | | | | 507 |
| GNMA, 6.50%, 12/15/2008 - 10/15/2010 | | | | | | 22,316 | | | | 22,542 |
| |
|
| | | | | | | | | | | 83,952,006 |
| |
|
| FLOATING-RATE 5.3% | | | | | | | | | | |
| FHLMC: | | | | | | | | | | |
| 6.18%, 05/01/2037 | | | | | | 1,360,440 | | | | 1,396,437 |
| 6.22%, 10/01/2020 | | | | | | 868,251 | | | | 884,487 |
| 6.71%, 10/01/2037 | | | | | | 9,476,720 | | | | 9,841,194 |
| 7.35%, 04/01/2032 | | | | | | 1,031,560 | | | | 1,074,948 |
| FNMA: | | | | | | | | | | |
| 4.52%, 03/01/2034 | | | | | | 41,432 | | | | 40,915 |
| 5.55%, 03/01/2035 | | | | | | 1,018,020 | | | | 1,034,053 |
| 6.22%, 11/01/2032 ## | | | | | | 1,053,446 | | | | 1,064,990 |
| 6.50%, 01/01/2018 | | | | | | 2,953 | | | | 3,023 |
See Notes to Financial Statements
11
SCHEDULE OF INVESTMENTS continued
December 31, 2007 (unaudited)
| | | | | Principal | | | | |
| | | | | Amount | | | | Value |
|
| |
| AGENCY MORTGAGE-BACKED PASS THROUGH SECURITIES continued | | | | | | | | |
| FLOATING-RATE continued | | | | | | | | |
| FNMA: | | | | | | | | |
| 6.93%, 01/01/2036 ## | | $ | | 5,496,971 | | $ | | 5,658,543 |
| 7.27%, 04/01/2036 ## | | | | 17,104,859 | | | | 18,281,160 |
| GNMA, 6.50%, 01/20/2019 | | | | 200,445 | | | | 204,991 |
| |
|
| | | | | | | | | 39,484,741 |
| |
|
| Total Agency Mortgage-Backed Pass Through Securities | | | | | | | | |
| (cost $122,199,164) | | | | | | | | 123,436,747 |
| |
|
| AGENCY REPERFORMING MORTGAGE-BACKED PASS THROUGH | | | | | | | | |
| SECURITIES 1.0% | | | | | | | | |
| FNMA: | | | | | | | | |
| Ser. 2001-T4, Class A1, 7.50%, 07/25/2041 | | | | 1,259,391 | | | | 1,320,081 |
| Ser. 2002-D12, Class A5, FRN, 6.31%, 10/25/2041 | | | | 1,128,661 | | | | 1,159,059 |
| Ser. 2002-W8, Class A4, 7.00%, 06/25/2017 | | | | 42,358 | | | | 44,993 |
| Ser. 2003-W2, Class 1A3, 7.50%, 07/25/2042 | | | | 859,698 | | | | 917,168 |
| Ser. 2005-S001: | | | | | | | | |
| Class 1B2, FRN, 5.72%, 09/25/2035 | | | | 1,961,995 | | | | 1,675,289 |
| Class 1B3, FRN, 6.07%, 09/25/2035 | | | | 2,942,992 | | | | 2,654,491 |
| |
|
| Total Agency Reperforming Mortgage-Backed Pass Through Securities | | | | | | | | |
| (cost $8,308,266) | | | | | | | | 7,771,081 |
| |
|
| ASSET-BACKED SECURITIES 15.7% | | | | | | | | |
| Acacia CDO, Ltd.: | | | | | | | | |
| Ser. 08A, Class C, FRN, 6.09%, 08/10/2045 144A | | | | 4,000,000 | | | | 3,606,400 |
| Ser. 10A: | | | | | | | | |
| Class C, FRN, 6.45%, 09/07/2046 144A | | | | 10,000,000 | | | | 9,299,000 |
| Class D, FRN, 8.15%, 09/07/2046 144A | | | | 5,000,000 | | | | 3,391,450 |
| Altius Funding, Ltd., Ser. 2006-3A, Class C, FRN, 6.06%, 12/02/2041 144A (h) + | | | | 3,896,741 | | | | 2,702,755 |
| American Gen. Mtge. Loan Trust, Ser. 2003-1, Class M2, 4.69%, 04/25/2033 | | | | 3,131,910 | | | | 2,603,494 |
| Brascan Real Estate CDO, Ser. 2005-2A, Class D, FRN, 6.63%, 12/20/2040 144A | | | | 4,000,000 | | | | 3,646,120 |
| C-Bass, Ltd.: | | | | | | | | |
| Ser. 11A, Class C, FRN, 6.34%, 09/15/2039 144A | | | | 5,000,000 | | | | 5,000,000 |
| Ser. 11A, Class D, FRN, 7.69%, 09/15/2039 144A | | | | 3,612,500 | | | | 3,612,500 |
| Ser. 13A, Class C, FRN, 6.07%, 03/17/2040 144A | | | | 1,500,000 | | | | 1,457,985 |
| Ser. 13A, Class D, FRN, 7.34%, 03/17/2040 144A | | | | 3,530,000 | | | | 3,402,426 |
| Ser. 15A, Class C, FRN, 6.13%, 02/16/2041 144A + | | | | 4,500,000 | | | | 4,165,110 |
| Concord Real Estate CDO, Ltd., Ser. 2006-1A, Class A2, FRN, 5.21%, 12/25/2046 | | | | | | | | |
| 144A | | | | 4,250,000 | | | | 4,063,425 |
| Credit-Based Asset Servicing and Securitization, LLC, Ser. 2003-CB3, Class AF1, | | | | | | | | |
| 2.88%, 12/25/2032 | | | | 506,793 | | | | 498,379 |
| Empire Funding Home Loan Owner Trust, Ser. 1998-2, Class M2, 7.93%, | | | | | | | | |
| 06/25/2024 | | | | 415,155 | | | | 413,640 |
| First Franklin Mtge. Loan NIM Corp., Ser. 2004-FFH3, Class N3, 8.00%, | | | | | | | | |
| 12/25/2034 144A + | | | | 2,686,056 | | | | 824,270 |
| Legg Mason Real Estate CDO, Ltd., Ser. 2006-1A, Class E, FRN, 5.70%, | | | | | | | | |
| 03/25/2038 144A | | | | 1,299,000 | | | | 1,210,434 |
See Notes to Financial Statements
12
SCHEDULE OF INVESTMENTS continued
December 31, 2007 (unaudited)
| | | | | Principal | | | | |
| | | | | Amount | | | | Value |
|
| |
| ASSET-BACKED SECURITIES continued | | | | | | | | |
| Long Beach Asset Holdings Corp.: | | | | | | | | |
| Ser. 2005-WL1, Class N1, 5.19%, 06/25/2045 144A | | $ | | 20,328 | | $ | | 17,192 |
| Ser. 2005-WL1, Class N2, 7.39%, 06/25/2046 144A | | | | 7,000,000 | | | | 5,412,610 |
| Ser. 2006-1, Class N1, 6.00%, 02/25/2046 144A + | | | | 3,091,845 | | | | 1,098,563 |
| Ser. 2006-2, Class N1, 5.78%, 04/25/2046 144A + | | | | 1,579,207 | | | | 909,529 |
| Ser. 2006-2, Class N2, 7.63%, 04/25/2046 144A + | | | | 3,000,000 | | | | 549,840 |
| MASTR Asset Backed Securities Trust, Ser. 2005-AB1, Class A1B, 5.14%, 11/25/2035 | | | | 455,659 | | | | 453,597 |
| Merritt Funding Trust, Ser. 2005-1, Class A2, FRN, 5.47%, 04/15/2016 144A | | | | 6,620,424 | | | | 6,529,856 |
| Nautilus RMBS CDO, Ltd.: | | | | | | | | |
| Ser. 2005-1A, Class A2, FRN, 5.94%, 07/07/2040 144A | | | | 4,197,179 | | | | 4,000,331 |
| Ser. 2005-1A, Class A3, FRN, 6.74%, 05/24/2035 144A | | | | 13,011,254 | | | | 12,303,962 |
| Ser. 2005-2A, Class A3, FRN, 6.37%, 11/05/2040 144A | | | | 8,079,202 | | | | 7,480,614 |
| NovaStar ABS CDO, Ltd., Ser. 2007-1A, Class A2, FRN, 5.36%, 02/08/2047 144A + | | | | 13,000,000 | | | | 11,825,970 |
| Oakwood Mtge. Investors, Inc., Ser. 1996-C, Class A5, 7.35%, 04/15/2027 | | | | 60,948 | | | | 60,821 |
| Option One CTS Adjustable Rate Mtge. Trust, Ser. 1996-1, Class A1, 6.90%, | | | | | | | | |
| 04/25/2026 | | | | 102,370 | | | | 102,560 |
| Renaissance Home Equity Loan Trust, Ser. 2006-2, Class N, 6.29%, 08/25/2036 | | | | | | | | |
| 144A | | | | 1,284,045 | | | | 1,218,378 |
| Residential Asset Mtge. Products, Inc., Ser. 2001-RS1, Class AI4, 7.51%, | | | | | | | | |
| 03/25/2031 | | | | 1,180,611 | | | | 1,178,767 |
| Sandelman Realty Comml. Real Estate CDO, Ser. 2007-1A, Class A2, FRN, 5.30%, | | | | | | | | |
| 03/23/2010 144A | | | | 10,000,000 | | | | 9,936,300 |
| Telos CLO, Ltd., Ser. 2006-1A, Class D, FRN, 6.95%, 10/11/2021 144A | | | | 4,000,000 | | | | 3,287,000 |
| |
|
| Total Asset-Backed Securities (cost $133,572,351) | | | | | | | | 116,263,278 |
| |
|
| COMMERCIAL MORTGAGE-BACKED SECURITIES 7.9% | | | | | | | | |
| FIXED-RATE 2.1% | | | | | | | | |
| Bank of America Comml. Mtge., Inc., Ser. 2006-2, Class A1, 5.61%, 05/10/2045 | | | | 2,425,410 | | | | 2,452,510 |
| Commercial Mtge. Acceptance Corp., Ser. 1999-C1, Class H, 6.79%, 06/15/2031 | | | | | | | | |
| 144A | | | | 1,500,000 | | | | 1,535,778 |
| First Union-Chase Comml. Mtge., Ser. 1999-C2, Class F, 7.14%, 06/15/2031 | | | | 1,600,000 | | | | 1,655,492 |
| Lehman Brothers Small Balance Comml., Ser. 2007-2A, Class 2A1, 5.91%, | | | | | | | | |
| 06/25/2037 144A | | | | 9,676,169 | | | | 9,783,478 |
| |
|
| | | | | | | | | 15,427,258 |
| |
|
| FLOATING-RATE 5.8% | | | | | | | | |
| Banc of America Large Loan Trust, Ser. 2007-BMB1, Class A2, 5.78%, | | | | | | | | |
| 07/15/2009 144A µ | | | | 14,000,000 | | | | 14,100,660 |
| Bank of America Comml. Mtge., Inc., Ser. 2007-3, Class A, 5.52%, 06/10/2049 | | | | | | | | |
| 144A | | | | 10,000,000 | | | | 9,244,750 |
| Capmark, Ltd., Ser. 2006-7A, Class B, 5.40%, 08/15/2036 144A | | | | 4,500,000 | | | | 4,102,290 |
| Commercial Mtge. Pass-Through Cert.: | | | | | | | | |
| Ser. 2007 FL14, Class AOA2, 5.72%, 06/15/2022 144A | | | | 2,000,000 | | | | 1,870,192 |
| Ser. 2007-FL14, Class MKL2, 5.87%, 06/15/2022 144A | | | | 5,000,000 | | | | 4,935,650 |
| MSCI, Inc., Ser. 2006, Class E, 5.32%, 07/15/2019 144A | | | | 6,473,000 | | | | 6,396,927 |
| Sorin Real Estate CDO, Ltd., 7.33%, 01/03/2041 144A (h) | | | | 2,530,000 | | | | 2,288,463 |
| |
|
| | | | | | | | | 42,938,932 |
| |
|
| Total Commercial Mortgage-Backed Securities (cost $59,391,240) | | | | | | | | 58,366,190 |
| |
|
See Notes to Financial Statements
13
SCHEDULE OF INVESTMENTS continued
December 31, 2007 (unaudited)
| | | | | Principal | | | | |
| | | | | Amount | | | | Value |
|
| |
| CORPORATE BONDS 2.2% | | | | | | | | |
| FINANCIALS 2.2% | | | | | | | | |
| Capital Markets 0.0% | | | | | | | | |
| Goldman Sachs Group, Inc., 6.50%, 02/25/2009 144A | | $ | | 25,000 | | $ | | 25,547 |
| Morgan Stanley, 3.875%, 01/15/2009 | | | | 70,000 | | | | 69,297 |
| |
|
| | | | | | | | | 94,844 |
| |
|
| Commercial Banks 0.2% | | | | | | | | |
| First Republic Bank, 7.75%, 09/15/2012 | | | | 1,515,000 | | | | 1,613,475 |
| NCNB Corp., 9.375%, 09/15/2009 | | | | 20,000 | | | | 21,511 |
| Norwest Financial, Inc., 6.85%, 07/15/2009 | | | | 25,000 | | | | 25,903 |
| |
|
| | | | | | | | | 1,660,889 |
| |
|
| Diversified Financial Services 2.0% | | | | | | | | |
| Emigrant Capital Trust I, FRN, 6.44%, 12/10/2033 144A µ | | | | 14,500,000 | | | | 14,703,870 |
| |
|
| Total Corporate Bonds (cost $16,323,403) | | | | | | | | 16,459,603 |
| |
|
| FOREIGN BONDS - CORPORATE (PRINCIPAL AMOUNT DENOMINATED IN | | | | | | | | |
| CURRENCY INDICATED) 1.1% | | | | | | | | |
| WHOLE LOAN MORTGAGE-BACKED PASS THROUGH SECURITIES 1.1% | | | | | | | | |
| Floating-rate 1.1% | | | | | | | | |
| Crusade Global Trust, Ser. 2006-2, Class A3, 7.43%, 11/15/2037 AUD | | | | | | | | |
| (cost $7,350,583) | | | | 9,771,461 | | | | 8,510,569 |
| |
|
| WHOLE LOAN MORTGAGE-BACKED COLLATERALIZED MORTGAGE | | | | | | | | |
| OBLIGATIONS 23.2% | | | | | | | | |
| FIXED-RATE 11.1% | | | | | | | | |
| ChaseFlex Trust, Ser. 2005-2, Class 5A2, 5.50%, 06/25/2035 | | | | 281,100 | | | | 280,707 |
| Countrywide Home Loans, Inc., Ser. 2006-J1, Class 1A5, 5.75%, 02/25/2036 | | | | 1,740,000 | | | | 1,673,010 |
| DLJ Mtge. Acceptance Corp., Ser. 1993-19, Class A7, 6.75%, 01/25/2024 | | | | 1,907,439 | | | | 1,906,676 |
| DSLA NIM Corp., Ser. 2007-AR1, Class N2, 8.35%, 03/19/2037 144A | | | | 2,500,000 | | | | 2,463,225 |
| First Horizon Mtge. Trust, Ser. 2007-5, Class A1, 6.25%, 11/25/2037 | | | | 9,887,446 | | | | 10,156,833 |
| GS Mtge. Securities Corp., Ser. 2007-NIM1, Class N1, 6.25%, 08/25/2046 144A | | | | 1,175,180 | | | | 1,147,998 |
| GSMPS Mtge. Loan Trust: | | | | | | | | |
| Ser. 2001-2, Class A, 7.50%, 06/19/2032 144A | | | | 3,507,071 | | | | 3,696,488 |
| Ser. 2004-4, Class 1A2, 7.50%, 10/25/2044 144A | | | | 2,815,323 | | | | 3,030,061 |
| GSR Mtge. Loan Trust, Ser. 2003-3F, Class 2A1, 4.50%, 04/25/2033 | | | | 785,618 | | | | 772,514 |
| Harborview NIM Corp.: | | | | | | | | |
| Ser. 2006-07A, Class N2, 8.35%, 09/19/2036 144A | | | | 3,164,144 | | | | 3,218,630 |
| Ser. 2006-09A, Class N1, 6.41%, 11/19/2036 144A | | | | 510,625 | | | | 510,053 |
| Ser. 2006-12, Class N2, 8.35%, 12/19/2036 144A | | | | 14,080,000 | | | | 13,873,165 |
| Ser. 2006-14, Class N1, 6.41%, 12/19/2036 144A | | | | 597,376 | | | | 595,966 |
| Ser. 2006-14, Class N1, 6.41%, 03/19/2037 144A | | | | 1,807,108 | | | | 1,800,874 |
| Ser. 2006-14, Class N2, 8.35%, 12/19/2036 144A | | | | 11,000,000 | | | | 10,872,840 |
| Ser. 2006-SB1, Class N1, 6.41%, 12/19/2036 144A | | | | 4,177,670 | | | | 4,144,165 |
| Ser. 2006-SB1, Class N2, 8.35%, 12/19/2036 144A | | | | 1,271,000 | | | | 1,251,388 |
| Ser. 2007-01A, Class N2, 8.35%, 03/19/2037 144A | | | | 13,700,000 | | | | 13,813,847 |
See Notes to Financial Statements
14
SCHEDULE OF INVESTMENTS continued
December 31, 2007 (unaudited)
| | | | | Principal | | | | |
| | | | | Amount | | | | Value |
|
| |
| WHOLE LOAN MORTGAGE-BACKED COLLATERALIZED MORTGAGE | | | | | | | | |
| OBLIGATIONS continued | | | | | | | | |
| FIXED-RATE continued | | | | | | | | |
| Residential Accredit Loans, Inc. NIM Corp.: | | | | | | | | |
| Ser. 2006-Q04, Class N1, 6.05%, 05/25/2046 144A | | $ | | 243,214 | | $ | | 242,998 |
| Ser. 2006-Q04, Class N2, 7.63%, 04/25/2046 144A | | | | 1,650,000 | | | | 1,677,869 |
| Sharps SP I, LLC NIM Trust: | | | | | | | | |
| Ser. 2006-AHM3, Class N1, 7.00%, 10/25/2046 144A (h) | | | | 1,448,688 | | | | 1,442,621 |
| Ser. 2006-AHM5, Class N1, 6.75%, 11/25/2046 144A | | | | 3,010,365 | | | | 2,999,950 |
| Washington Mutual Mtge. Securities Corp., Ser. 2003-MS4, Class 2A3, 5.00%, | | | | | | | | |
| 02/25/2033 | | | | 1,105,629 | | | | 1,104,844 |
| |
|
| | | | | | | | | 82,676,722 |
| |
|
| FLOATING-RATE 12.1% | | | | | | | | |
| Adjustable Rate Mtge. Trust: | | | | | | | | |
| Ser. 2005-9, Class 4A2, 5.35%, 11/25/2035 | | | | 6,361,882 | | | | 6,318,158 |
| Ser. 2006-3, Class 2A1, 5.91%, 08/25/2036 | | | | 8,298,438 | | | | 8,419,263 |
| Banc of America Funding Corp., Ser. 2006-D, Class 2A1, 5.78%, 05/20/2036 | | | | 3,564,303 | | | | 3,574,842 |
| Citigroup Mtge. Loan Trust, Ser. 2006-AR6, Class 1A1, 6.06%, 08/25/2036 | | | | 6,466,171 | | | | 6,543,995 |
| Countrywide Home Loans, Inc.: | | | | | | | | |
| Ser. 2004-29, Class 3A1, 6.19%, 02/25/2035 µ | | | | 23,294,728 | | | | 23,666,279 |
| Ser. 2004-HYB8, Class 1-M1, 7.13%, 01/20/2035 | | | | 3,918,252 | | | | 3,810,812 |
| Credit Suisse First Boston Mtge. Securities Corp., Ser. 2004-AR5, Class 4A1, | | | | | | | | |
| 5.52%, 06/25/2034 | | | | 12,744,648 | | | | 12,721,708 |
| First Horizon Alternative Mtge. Securities, Ser. 2005-AA10, Class 2A1, 5.76%, | | | | | | | | |
| 12/25/2035 | | | | 2,349,851 | | | | 2,326,283 |
| GSR Mtge. Loan Trust, Ser. 2004-3F, Class 2A10, 4.50%, 02/25/2035 | | | | 1,487,419 | | | | 1,435,062 |
| Harborview Mtge. Loan Trust: | | | | | | | | |
| Ser. 2004-6, Class 1A, 6.96%, 08/19/2034 | | | | 2,715,309 | | | | 2,783,326 |
| Ser. 2005-7, Class 1A2, 6.38%, 06/19/2045 | | | | 11,320,887 | | | | 11,378,654 |
| Residential Accredit Loans, Inc., Ser. 2002, Class A7A, 5.27%, 09/25/2017 | | | | 218,081 | | | | 212,372 |
| Structured Asset Securities Corp., Ser. 2006-RF3, Class 2A, 6.07%, 10/25/2036 | | | | | | | | |
| 144A | | | | 4,134,116 | | | | 4,166,900 |
| Washington Mutual, Inc., Ser. 2004-AR6, Class B2, 5.91%, 05/25/2044 | | | | 2,219,569 | | | | 2,216,537 |
| |
|
| | | | | | | | | 89,574,191 |
| |
|
| Total Whole Loan Mortgage-Backed Collateralized Mortgage Obligations | | | | | | | | |
| (cost $171,263,475) | | | | | | | | 172,250,913 |
| |
|
| WHOLE LOAN MORTGAGE-BACKED PASS THROUGH SECURITIES 11.6% | | | | | | | | |
| FIXED-RATE 1.4% | | | | | | | | |
| EquiFirst, Inc., Ser. 2004-2, Class N3, 7.87%, 10/25/2034 144A + | | | | 1,208,378 | | | | 212,989 |
| First Horizon Mtge. Pass-Through Trust, Ser. 2005-2, Class 3A2, 16.36%, | | | | | | | | |
| 10/25/2032 | | | | 1,304,974 | | | | 1,937,922 |
| MASTR Adjustable Rate Mtge. Trust, Ser. 2003-1, Class 2A3, 4.65%, 12/25/2032 | | | | 55,026 | | | | 54,357 |
| MASTR Alternative Loan Trust, Ser. 2003-5, Class 1A1, 6.50%, 07/25/2033 | | | | 14,230 | | | | 14,261 |
| Nomura Asset Acceptance Corp. Reperforming Loan Trust, Ser. 2004-R2, Class A2, | | | | | | | | |
| 7.00%, 10/25/2034 144A | | | | 2,478,274 | | | | 2,623,819 |
See Notes to Financial Statements
15
SCHEDULE OF INVESTMENTS continued
December 31, 2007 (unaudited)
| | | Principal | | | | |
| | | Amount | | | | Value |
|
| |
| WHOLE LOAN MORTGAGE-BACKED PASS THROUGH SECURITIES continued | | | | |
| FIXED-RATE continued | | | | | | |
| RBSGC Mtge. Loan Trust, Ser. 2005-RP1, Class 1B2, 5.79%, 12/25/2034 144A | | $ 1,184,823 | | $ | | 1,130,903 |
| Structured Asset Securities Corp., Ser. 2006-RF4, Class 2A2, 6.00%, 10/25/2036 | | | | | | |
| 144A | | 4,710,510 | | | | 4,773,914 |
| |
|
| | | | | | | 10,748,165 |
| |
|
| FLOATING-RATE 10.2% | | | | | | |
| Banc of America Mtge. Securities, Inc., Ser. 2002-E, Class A1, 7.33%, 06/20/2031 | | 1,311,323 | | | | 1,288,972 |
| Bear Stearns Alternative Loan Trust, Ser. 2003-6, Class 4A, 5.66%, 01/25/2034 | | 1,879,216 | | | | 1,903,308 |
| Countrywide Home Loans, Inc.: | | | | | | |
| Ser. 2004-23, Class A, 7.15%, 11/25/2034 | | 5,328,242 | | | | 5,498,799 |
| Ser. 2004-HYB8, Class 5A1, 6.60%, 01/20/2035 | | 2,301,250 | | | | 2,315,588 |
| Credit Suisse First Boston Mtge. Securities Corp.: | | | | | | |
| Ser. 2002-AR17, Class 2A1, 7.20%, 12/19/2039 | | 93,836 | | | | 97,558 |
| Ser. 2003-AR20, Class A4, 4.68%, 08/25/2033 | | 2,586,041 | | | | 2,601,835 |
| Ser. 2004-AR02, Class 3A1, 5.16%, 03/25/2034 | | 749,294 | | | | 746,079 |
| Ser. 2004-TF2A, Class G, 5.58%, 11/15/2019 144A | | 1,473,225 | | | | 1,470,146 |
| DSLA Mtge. Loan Trust: | | | | | | |
| Ser. 2005-AR1, Class X2, IO, 0.78%, 03/19/2045 | | 47,711,327 | | | | 2,370,776 |
| Ser. 2005-AR2, Class X2, IO, 0.79%, 03/19/2045 | | 100,429,513 | | | | 4,871,836 |
| Housing Securities, Inc., Ser. 92-Sl, Class A2, 7.40%, 05/25/2016 | | 149,418 | | | | 153,233 |
| IndyMac INDX Mtge. Loan Trust: | | | | | | |
| Ser. 2004-AR14, Class AX2, IO, 0.72%, 01/25/2035 | | 44,941,036 | | | | 1,699,221 |
| Ser. 2005-AR3, Class 4A1, 5.45%, 04/25/2035 | | 3,194,849 | | | | 3,208,906 |
| Ser. 2005-AR8, Class AX2, IO, 1.75%, 04/25/2035 | | 80,587,055 | | | | 3,173,518 |
| Ser. 2006-AR4, Class M6, 6.62%, 05/25/2046 | | 4,000,000 | | | | 3,385,000 |
| MASTR Adjustable Rate Mtge. Trust: | | | | | | |
| Ser. 2004-1, Class 4A1, 6.13%, 01/25/2034 | | 2,191,980 | | | | 2,120,687 |
| Ser. 2004-8, Class 7A1, 5.43%, 09/25/2034 | | 4,443,373 | | | | 4,477,320 |
| MASTR Reperforming Loan Trust, Ser. 2006-2, Class 1A1, 5.89%, 05/25/2046 | | | | | | |
| 144A µ | | 18,952,245 | | | | 19,168,869 |
| Merrill Lynch Mtge. Investors, Inc., Ser. 2003-A4, Class 4A, 5.45%, 06/25/2033 | | 4,520,742 | | | | 4,517,216 |
| Structured Adjustable Rate Mtge. Loan Trust, Ser. 2005-7, Class 7AX, IO, 0.96%, | | | | | | |
| 03/25/2035 | | 30,462,089 | | | | 485,490 |
| Structured Asset Securities Corp.: | | | | | | |
| Ser. 2003-37A, Class 7A, 7.56%, 12/25/2033 | | 31,069 | | | | 32,096 |
| Ser. 2003-40A, Class 5A, 5.53%, 01/25/2034 | | 3,923,472 | | | | 3,959,490 |
| Washington Mutual, Inc., Ser. 2004-RP1, Class 2A, 6.50%, 01/25/2034 144A | | 5,805,349 | | | | 5,964,003 |
| |
|
| | | | | | | 75,509,946 |
| |
|
| Total Whole Loan Mortgage-Backed Pass Through Securities | | | | | | |
| (cost $96,103,513) | | | | | | 86,258,111 |
| |
|
See Notes to Financial Statements
16
SCHEDULE OF INVESTMENTS continued
December 31, 2007 (unaudited)
| | | | | Principal | | | | |
| | | | | Amount | | | | Value |
|
| |
| WHOLE LOAN SUBORDINATE COLLATERALIZED MORTGAGE | | | | | | | | |
| OBLIGATIONS 29.0% | | | | | | | | |
| FIXED-RATE 8.9% | | | | | | | | |
| Countrywide Alternative Loan Trust: | | | | | | | | |
| Ser. 2002-07, Class M, 7.00%, 08/25/2032 | | $ | | 7,671,035 | | $ | | 7,916,090 |
| Ser. 2002-16, Class B1, 6.00%, 12/25/2032 | | | | 2,475,686 | | | | 2,474,722 |
| Ser. 2002-18, Class M, 6.00%, 02/25/2033 | | | | 5,469,583 | | | | 5,627,654 |
| Ser. 2002-28, Class M, 6.50%, 10/25/2032 | | | | 4,334,838 | | | | 4,352,917 |
| Countrywide Home Loans, Inc., Ser. 2002-22, Class M, 6.25%, 10/25/2032 | | | | 2,761,010 | | | | 2,911,098 |
| Credit Suisse First Boston Mtge. Securities Corp., Ser. 2003-1, Class DB3, 6.56%, | | | | | | | | |
| 02/25/2033 | | | | 2,659,858 | | | | 2,628,001 |
| MASTR Resecuritization Trust: | | | | | | | | |
| Ser. 2004-1, 4.75%, 07/01/2033 | | | | 4,351,755 | | | | 4,393,923 |
| Ser. 2004-2, 5.25%, 03/25/2034 | | | | 10,051,881 | | | | 10,180,645 |
| Ser. 2004-3, 5.00%, 03/25/2034 | | | | 6,231,527 | | | | 6,213,892 |
| Ser. 2005-2, 4.75%, 03/28/2034 | | | | 7,448,898 | | | | 7,443,312 |
| Structured Asset Securities Corp.: | | | | | | | | |
| Ser. 2002-04H, Class B2, 6.75%, 02/25/2032 | | | | 2,125,521 | | | | 2,151,368 |
| Ser. 2002-17, Class B1, 6.10%, 09/25/2032 | | | | 1,528,653 | | | | 1,529,977 |
| Ser. 2002-17, Class B2, 6.10%, 09/25/2032 | | | | 3,187,430 | | | | 3,174,424 |
| Ser. 2003-8, Class 1B1, 5.00%, 04/25/2018 | | | | 451,044 | | | | 426,405 |
| Ser. 2003-8, Class 2A3, 5.00%, 04/25/2033 | | | | 368,804 | | | | 343,349 |
| Ser. 2005-RM1, Class A, IO, 5.00%, 03/25/2045 144A | | | | 13,642,723 | | | | 2,469,333 |
| Washington Mutual, Inc., Ser. 2002-S5, Class B3, 6.39%, 09/25/2032 | | | | 1,735,738 | | | | 1,846,617 |
| |
|
| | | | | | | | | 66,083,727 |
| |
|
| FLOATING-RATE 20.1% | | | | | | | | |
| Banc of America Funding Corp.: | | | | | | | | |
| Ser. 2005-E, Class DB1, 7.34%, 06/20/2035 | | | | 10,314,347 | | | | 10,773,851 |
| Ser. 2005-E, Class DB2, 7.34%, 06/20/2035 | | | | 3,409,983 | | | | 3,553,646 |
| Banc of America Mtge. Securities, Inc.: | | | | | | | | |
| Ser. 2002-G, Class 2B3, 7.42%, 07/20/2032 | | | | 330,382 | | | | 326,995 |
| Ser. 2002-K, Class B4, 6.55%, 10/20/2032 144A | | | | 284,740 | | | | 271,614 |
| Ser. 2004-G, Class B3, 4.80%, 08/25/2034 | | | | 4,262,539 | | | | 4,264,382 |
| Ser. 2004-H, Class B2, 4.83%, 09/25/2034 | | | | 3,445,907 | | | | 3,485,526 |
| Ser. 2004-H, Class B3, 4.83%, 09/25/2035 | | | | 1,855,013 | | | | 1,747,422 |
| Ser. 2004-I, Class B3, 4.87%, 10/25/2035 | | | | 1,770,286 | | | | 1,657,660 |
| Countrywide Home Loans, Inc.: | | | | | | | | |
| Ser. 2004-HYB8, Class 1B1, 7.13%, 01/20/2035 | | | | 2,664,715 | | | | 2,594,471 |
| Ser. 2004-HYB8, Class 1B2, 7.13%, 01/20/2035 | | | | 2,037,947 | | | | 2,025,801 |
| Ser. 2004-HYB8, Class 1M2, 7.13%, 01/20/2035 | | | | 3,448,492 | | | | 3,308,051 |
| Credit Suisse First Boston Mtge. Securities Corp.: | | | | | | | | |
| Ser. 2003-AR05, Class 1A2, 7.19%, 01/25/2033 | | | | 40,284 | | | | 41,492 |
| Ser. 2003-AR05, Class 2A3, 5.66%, 01/25/2033 | | | | 198,032 | | | | 204,246 |
| Ser. 2003-AR09, Class 1A3, 7.19%, 03/25/2033 | | | | 10,839 | | | | 11,160 |
| Ser. 2003-AR15, Class 2A2, 4.78%, 06/25/2033 | | | | 785,558 | | | | 787,546 |
| Ser. 2003-AR18, Class 2A4, 4.92%, 07/25/2033 | | | | 355,577 | | | | 361,337 |
| Ser. 2003-AR24, Class 2A4, 5.87%, 09/25/2033 | | | | 4,660,800 | | | | 4,678,138 |
See Notes to Financial Statements
17
SCHEDULE OF INVESTMENTS continued
December 31, 2007 (unaudited)
| | | | | Principal | | | | |
| | | | | Amount | | | | Value |
|
| |
| WHOLE LOAN SUBORDINATE COLLATERALIZED MORTGAGE | | | | | | | | |
| OBLIGATIONS continued | | | | | | | | |
| FLOATING-RATE continued | | | | | | | | |
| Credit Suisse First Boston Mtge. Securities Corp.: | | | | | | | | |
| Ser. 2003-AR26, Class 9M1, 5.72%, 10/25/2033 | | $ | | 4,090,991 | | $ | | 4,097,987 |
| Ser. 2003-AR28, Class 6M1, 5.72%, 12/25/2033 | | | | 8,281,000 | | | | 8,285,265 |
| Harborview Mtge. Loan Trust: | | | | | | | | |
| Ser. 2004-7, Class 2A2, 6.81%, 11/19/2034 | | | | 735,081 | | | | 746,203 |
| Ser. 2004-7, Class B2, 6.25%, 11/19/2034 | | | | 1,419,878 | | | | 1,440,852 |
| Ser. 2004-7, Class B3, 6.25%, 11/19/2034 | | | | 3,669,917 | | | | 3,708,747 |
| Ser. 2005-8, Class 2B3, 7.14%, 02/19/2035 | | | | 8,148,842 | | | | 8,319,153 |
| Ser. 2005-8, Class 2B4, 7.14%, 02/19/2035 | | | | 5,361,568 | | | | 5,356,153 |
| Lehman Structured Securities Corp.: | | | | | | | | |
| Ser. 2004-2, Class M-2, 6.70%, 02/28/2033 144A | | | | 2,762,750 | | | | 2,635,462 |
| Ser. 2004-2, Class M-3, 6.70%, 02/28/2033 144A | | | | 3,463,031 | | | | 3,304,477 |
| MASTR Adjustable Rate Mtge. Trust: | | | | | | | | |
| Ser. 2004-1, Class B3, 5.90%, 02/25/2034 | | | | 1,962,313 | | | | 1,888,353 |
| Ser. 2004-15, Class B3, 5.96%, 12/25/2034 | | | | 3,379,310 | | | | 3,194,699 |
| Merrill Lynch Mtge. Investors, Inc., Ser. 2006-AF1, Class AV1B, 6.16%, | | | | | | | | |
| 09/25/2036 | | | | 3,759,942 | | | | 3,819,913 |
| MLCC Mtge. Investors Trust, Ser. 2003-G, Class B1, 6.91%, 01/25/2029 144A | | | | 1,071,660 | | | | 1,087,327 |
| MortgageIT Trust: | | | | | | | | |
| Ser. 2005-4, Class B1, 5.97%, 10/25/2035 | | | | 705,459 | | | | 563,084 |
| Ser. 2005-4, Class B2, 6.62%, 10/25/2035 | | | | 705,459 | | | | 490,795 |
| Ser. 2005-4, Class M3, 5.44%, 10/25/2035 | | | | 2,116,378 | | | | 1,884,169 |
| Ser. 2005-4, Class M4, 5.52%, 10/25/2035 | | | | 1,132,968 | | | | 993,556 |
| Structured Adjustable Rate Mtge. Loan Trust: | | | | | | | | |
| Ser. 2004-08, Class B3, 5.15%, 07/25/2034 | | | | 7,685,835 | | | | 7,257,162 |
| Ser. 2004-14, Class B6, 5.44%, 10/25/2034 | | | | 5,296,747 | | | | 4,994,462 |
| Ser. 2004-16, Class 1A, 7.38%, 11/25/2034 | | | | 11,345,846 | | | | 11,528,106 |
| Ser. 2004-16, Class B6, 5.94%, 11/25/2034 | | | | 6,473,937 | | | | 6,482,353 |
| Ser. 2004-16, Class 1A3, 7.38%, 11/25/2034 | | | | 840,433 | | | | 846,627 |
| Ser. 2004-18, Class 3A2, 5.37%, 12/25/2034 | | | | 6,390,907 | | | | 6,351,886 |
| Ser. 2005-12, Class B4, 5.56%, 06/25/2035 | | | | 2,721,193 | | | | 2,612,481 |
| Ser. 2005-12, Class B6, 5.56%, 06/25/2035 | | | | 2,853,667 | | | | 2,637,986 |
| Ser. 2006-7, Class 1A2, 5.81%, 08/25/2036 | | | | 4,673,427 | | | | 4,717,011 |
| Structured Asset Mtge. Investments, Inc., Ser. 2003-AR2, Class B1, 5.97%, | | | | | | | | |
| 12/19/2033 | | | | 1,140,617 | | | | 1,141,933 |
| Structured Asset Securities Corp.: | | | | | | | | |
| Ser. 2002-8A, Class B1, 7.75%, 05/25/2032 | | | | 99,838 | | | | 99,243 |
| Ser. 2004-2AC, Class B, 4.99%, 02/25/2034 | | | | 613,765 | | | | 595,832 |
| Washington Mutual, Inc.: | | | | | | | | |
| Ser. 2004-AR2, Class B1, 6.19%, 04/25/2044 | | | | 3,700,575 | | | | 3,735,488 |
| Ser. 2004-AR2, Class B2, 6.19%, 04/25/2044 | | | | 3,382,401 | | | | 3,304,240 |
See Notes to Financial Statements
18
SCHEDULE OF INVESTMENTS continued
December 31, 2007 (unaudited)
| | | | | | | Principal | | | | |
| | | | | | | Amount | | | | Value |
|
| |
| WHOLE LOAN SUBORDINATE COLLATERALIZED MORTGAGE | | | | | | | | |
| OBLIGATIONS continued | | | | | | | | | | |
| FLOATING-RATE continued | | | | | | | | | | |
| Wells Fargo Mtge. Backed Securities Trust, Ser. 2003-B, Class B1, 5.15%, | | | | | | | | |
| 02/25/2033 | | | | $ | | 510,590 | | $ | | 509,252 |
| |
|
| | | | | | | | | | | 148,723,595 |
| |
|
| Total Whole Loan Subordinate Collateralized Mortgage Obligations | | | | | | | | |
| (cost $214,863,191) | | | | | | | | | | 214,807,322 |
| |
|
| YANKEE OBLIGATIONS - CORPORATE 11.1% | | | | | | | | |
| FINANCIALS 11.1% | | | | | | | | | | |
| Diversified Financial Services 11.1% | | | | | | | | |
| MMCAPS Funding XIX, Ltd., FRN, 6.89%, 01/12/2038 144A | | | | 1,000,000 | | | | 863,750 |
| Preferred Term Securities VIII, Ltd., FRN, 7.10%, 01/03/2033 144A | | | | 10,000,000 | | | | 10,000,600 |
| Preferred Term Securities XI, Ltd., FRN, 5.30%, 09/24/2033 144A | | | | 500,000 | | | | 483,970 |
| Preferred Term Securities XII, Ltd., FRN, 6.61%, 12/24/2033 144A | | | | 20,900,000 | | | | 20,506,035 |
| Preferred Term Securities XIII, Ltd., FRN, 6.56%, 03/24/2034 144A | | | | 6,000,000 | | | | 5,951,940 |
| Preferred Term Securities XIV, Ltd., FRN, 6.56%, 06/24/2034 144A | | | | 8,820,000 | | | | 8,808,622 |
| Preferred Term Securities XXIII, Ltd., FRN: | | | | | | | | |
| 5.19%, 12/22/2036 144A | | | | | | 5,806,739 | | | | 5,368,446 |
| 6.59%, 12/22/2036 144A | | | | | | 11,452,044 | | | | 10,266,529 |
| Regional Diversified Funding, FRN, 6.40%, 01/25/2036 144A | | | | 5,000,000 | | | | 4,550,300 |
| Trapeza CDO, LLC, Ser. 2004-7A, Class B1, FRN, 6.63%, 01/25/2035 144A | | | | 16,000,000 | | | | 15,411,200 |
| |
|
| Total Yankee Obligations - Corporate (cost $84,416,745) | | | | | | | | 82,211,392 |
| | |
|
|
| | | | | | | Shares | | | | Value |
|
| |
| PREFERRED STOCKS 1.6% | | | | | | | | | | |
| FINANCIALS 1.6% | | | | | | | | | | |
| Thrifts & Mortgage Finance 1.6% | | | | | | | | |
| Fannie Mae, Ser. O, Var. Rate Pfd. (p) (cost $14,009,000) | | | | 250,000 | | | | 11,875,000 |
| |
|
| SHORT-TERM INVESTMENTS 0.4% | | | | | | | | |
| MUTUAL FUND SHARES 0.4% | | | | | | | | |
| Evergreen Institutional Money Market Fund, Class I, 4.89% q ø (pp) | | | | | | | | |
| (cost $2,725,929) | | | | | | 2,725,929 | | | | 2,725,929 |
| |
|
| Total Investments (cost $989,138,497) 129.6% | | | | | | | | 961,374,886 |
| Other Assets and Liabilities (29.6%) | | | | | | | | (219,766,237) |
| |
|
| Net Assets 100.0% | | | | | | | | $ | | 741,608,649 |
| |
|
| ## | | All or a portion of this security has been segregated for when-issued or delayed delivery securities. |
| # | | When-issued or delayed delivery security |
| ƒ | | All or a portion of this security was pledged to cover initial margin requirements for open futures contracts. |
| 144A | | Security that may be sold to qualified institutional buyers under Rule 144A of the Securities Act of 1933, as amended. |
| | | This security has been determined to be liquid under guidelines established by the Board of Trustees, unless otherwise |
| | | noted. |
See Notes to Financial Statements
19
SCHEDULE OF INVESTMENTS continued
December 31, 2007 (unaudited)
| (h) | | Security is valued at fair value as determined by the investment advisor in good faith, according to procedures approved |
| | | by the Board of Trustees. |
| + | | Security is deemed illiquid and is valued using market quotations when readily available, unless otherwise noted. |
| µ | | All or a portion of this security has been segregated as collateral for reverse repurchase agreements. |
| (p) | | All or a portion of this security is on loan. |
| q | | Rate shown is the 7-day annualized yield at period end. |
| ø | | Evergreen Investment Management Company, LLC is the investment advisor to both the Fund and the money market |
| | | fund. |
| (pp) | | All or a portion of this security represents investment of cash collateral received from securities on loan. |
| Summary of Abbreviations |
| AUD | | Australian Dollar |
| CDO | | Collateralized Debt Obligation |
| CLO | | Collateralized Loan Obligation |
| FHLMC | | Federal Home Loan Mortgage Corp. |
| FNMA | | Federal National Mortgage Association |
| FRN | | Floating Rate Note |
| GNMA | | Government National Mortgage Association |
| IO | | Interest Only |
| MASTR | | Mortgage Asset Securitization Transactions, Inc. |
| NIM | | Net Interest Margin |
| TBA | | To Be Announced |
The following table shows the percent of total investments (excluding equity positions, cash equivalents and collateral from securities on loan) by credit quality based on Moody’s and Standard and Poor’s ratings as of December 31, 2007:
| AAA | | 49.3% |
| AA | | 10.6% |
| A | | 17.1% |
| BBB | | 22.1% |
| BB | | 0.5% |
| B | | 0.2% |
| CCC | | 0.1% |
| Less than CCC | | 0.1% |
| |
|
| | | 100.0% |
| | |
|
| | |
The following table shows the percent of total investments (excluding equity positions, cash equivalents and collateral from securities on loan) based on effective maturity as of December 31, 2007:
| Less than 1 year | | 5.1% |
| 1 to 3 year(s) | | 60.2% |
| 3 to 5 years | | 23.9% |
| 5 to 10 years | | 10.2% |
| 10 to 20 years | | 0.2% |
| 20 to 30 years | | 0.4% |
| |
|
| | | 100.0% |
| | |
|
| | |
See Notes to Financial Statements
20
STATEMENT OF ASSETS AND LIABILITIES
December 31, 2007 (unaudited)
| Assets | | | | |
| Investments in securities, at value (cost $986,412,568) including $13,828 of securities loaned | | $ | | 958,648,957 |
| Investments in affiliated money market fund, at value (cost $2,725,929) | | | | 2,725,929 |
|
| Total investments | | | | 961,374,886 |
| Receivable for securities sold | | | | 4,852,625 |
| Principal paydown receivable | | | | 1,513,148 |
| Receivable for Fund shares sold | | | | 1,175,959 |
| Interest receivable | | | | 6,682,005 |
| Receivable for daily variation margin on open futures contracts | | | | 42,813 |
| Receivable for securities lending income | | | | 673 |
| Premiums paid on swap transactions | | | | 146,031 |
| Unrealized gains on credit default swap transactions | | | | 1,023,676 |
| Prepaid expenses and other assets | | | | 107,972 |
|
| Total assets | | | | 976,919,788 |
|
| Liabilities | | | | |
| Dividends payable | | | | 1,161,304 |
| Payable for securities purchased | | | | 79,172,728 |
| Payable for Fund shares redeemed | | | | 1,627,546 |
| Unrealized losses on credit default swap transactions | | | | 1,295,735 |
| Payable for reverse repurchase agreements | | | | 65,921,381 |
| Payable for securities on loan | | | | 14,250 |
| Demand note payable | | | | 86,000,000 |
| Advisory fee payable | | | | 12,956 |
| Distribution Plan expenses payable | | | | 2,947 |
| Due to other related parties | | | | 5,201 |
| Accrued expenses and other liabilities | | | | 97,091 |
|
| Total liabilities | | | | 235,311,139 |
|
| Net assets | | $ | | 741,608,649 |
|
| Net assets represented by | | | | |
| Paid-in capital | | $ | | 778,361,672 |
| Undistributed net investment income | | | | 106,856 |
| Accumulated net realized losses on investments | | | | (8,906,598) |
| Net unrealized losses on investments | | | | (27,953,281) |
|
| Total net assets | | $ | | 741,608,649 |
|
| Net assets consists of | | | | |
| Class A | | $ | | 87,393,293 |
| Class B | | | | 20,828,075 |
| Class C | | | | 82,705,662 |
| Class I | | | | 550,681,619 |
|
| Total net assets | | $ | | 741,608,649 |
|
| Shares outstanding (unlimited number of shares authorized) | | | | |
| Class A | | | | 9,164,571 |
| Class B | | | | 2,184,193 |
| Class C | | | | 8,673,046 |
| Class I | | | | 57,750,599 |
|
| Net asset value per share | | | | |
| Class A | | $ | | 9.54 |
| Class A — Offering price (based on sales charge of 2.25%) | | $ | | 9.76 |
| Class B | | $ | | 9.54 |
| Class C | | $ | | 9.54 |
| Class I | | $ | | 9.54 |
|
See Notes to Financial Statements
21
STATEMENT OF OPERATIONS
Six Months Ended December 31, 2007 (unaudited)
| Investment income | | | | |
| Interest | | $ | | 27,939,096 |
| Dividends | | | | 387,842 |
| Income from affiliate | | | | 21,711 |
| Securities lending | | | | 762 |
|
| Total investment income | | | | 28,349,411 |
|
| Expenses | | | | |
| Advisory fee | | | | 1,430,281 |
| Distribution Plan expenses | | | | |
| Class A | | | | 139,551 |
| Class B | | | | 101,814 |
| Class C | | | | 407,811 |
| Administrative services fee | | | | 411,740 |
| Transfer agent fees | | | | 106,205 |
| Trustees’ fees and expenses | | | | 9,358 |
| Printing and postage expenses | | | | 21,984 |
| Custodian and accounting fees | | | | 147,274 |
| Registration and filing fees | | | | 28,697 |
| Professional fees | | | | 20,613 |
| Interest expense | | | | 933,592 |
| Other | | | | 5,197 |
|
| Total expenses | | | | 3,764,117 |
| Less: Expense reductions | | | | (12,375) |
| Fee waivers and expense reimbursements | | | | (138,926) |
|
| Net expenses | | | | 3,612,816 |
|
| Net investment income | | | | 24,736,595 |
|
| Net realized and unrealized gains or losses on investments | | | | |
| Net realized gains on: | | | | |
| Securities | | | | 624,346 |
| Foreign currency related transactions | | | | 82,805 |
| Futures contracts | | | | 295,164 |
| Credit default swap transactions | | | | 16,390 |
|
| Net realized gains on investments | | | | 1,018,705 |
| Net change in unrealized gains or losses on investments | | | | (16,135,062) |
|
| Net realized and unrealized gains or losses on investments | | | | (15,116,357) |
|
| Net increase in net assets resulting from operations | | $ | | 9,620,238 |
|
See Notes to Financial Statements
22
STATEMENTS OF CHANGES IN NET ASSETS
| | | Six Months Ended | | | | |
| | | December 31, 2007 | | Year Ended |
| | | (unaudited) | | June 30, 2007 |
|
| Operations | | | | | | | | |
| Net investment income | | $ | | 24,736,595 | | $ | | 37,351,999 |
| Net realized gains or losses on investments | | | | 1,018,705 | | | | (2,150,269) |
| Net change in unrealized gains or losses | | | | | | | | |
| on investments | | | | (16,135,062) | | | | 2,211,004 |
|
| Net increase in net assets resulting from | | | | | | | | |
| operations | | | | 9,620,238 | | | | 37,412,734 |
|
| Distributions to shareholders from | | | | | | | | |
| Net investment income | | | | | | | | |
| Class A | | | | (2,709,314) | | | | (5,026,094) |
| Class B | | | | (517,815) | | | | (929,400) |
| Class C | | | | (2,071,870) | | | | (3,661,855) |
| Class I | | | | (19,180,251) | | | | (28,501,925) |
|
| Total distributions to shareholders | | | | (24,479,250) | | | | (38,119,274) |
|
| | | Shares | | | | Shares | | |
| Capital share transactions | | | | | | | | |
| Proceeds from shares sold | | | | | | | | |
| Class A | | 2,663,049 | | 25,632,713 | | 4,160,620 | | 40,608,052 |
| Class B | | 143,318 | | 1,382,579 | | 479,135 | | 4,672,914 |
| Class C | | 1,331,295 | | 12,835,275 | | 2,286,444 | | 22,316,937 |
| Class I | | 9,434,785 | | 91,074,398 | | 36,822,331 | | 359,486,540 |
|
| | | | | 130,924,965 | | | | 427,084,443 |
|
| Net asset value of shares issued in | | | | | | | | |
| reinvestment of distributions | | | | | | | | |
| Class A | | 207,361 | | 1,995,644 | | 374,264 | | 3,653,039 |
| Class B | | 34,159 | | 328,665 | | 60,830 | | 593,724 |
| Class C | | 121,498 | | 1,169,046 | | 226,488 | | 2,210,571 |
| Class I | | 1,541,864 | | 14,836,768 | | 2,332,365 | | 22,762,521 |
|
| | | | | 18,330,123 | | | | 29,219,855 |
|
| Automatic conversion of Class B | | | | | | | | |
| shares to Class A shares | | | | | | | | |
| Class A | | 14,577 | | 140,622 | | 26,675 | | 260,110 |
| Class B | | (14,577) | | (140,622) | | (26,675) | | (260,110) |
|
| | | | | 0 | | | | 0 |
|
| Payment for shares redeemed | | | | | | | | |
| Class A | | (3,747,773) | | (35,996,275) | | (5,178,293) | | (50,555,439) |
| Class B | | (338,091) | | (3,256,722) | | (544,802) | | (5,316,627) |
| Class C | | (1,474,442) | | (14,208,825) | | (2,878,549) | | (28,096,336) |
| Class I | | (35,841,255) | | (344,206,013) | | (28,536,484) | | (278,455,227) |
|
| | | | | (397,667,835) | | | | (362,423,629) |
|
| Net asset value of shares issued in | | | | | | | | |
| acquisition | | | | | | | | |
| Class A | | 893,055 | | 8,578,482 | | 0 | | 0 |
| Class B | | 371,097 | | 3,564,663 | | 0 | | 0 |
| Class C | | 604,986 | | 5,811,388 | | 0 | | 0 |
| Class I | | 23,192,174 | | 222,774,399 | | 0 | | 0 |
|
| | | | | 240,728,932 | | | | 0 |
|
| Net increase (decrease) in net assets | | | | | | | | |
| resulting from capital share transactions | | | | (7,683,815) | | | | 93,880,669 |
|
| Total increase (decrease) in net assets | | | | (22,542,827) | | | | 93,174,129 |
| Net assets | | | | | | | | |
| Beginning of period | | | | 764,151,476 | | | | 670,977,347 |
|
| End of period | | $ 741,608,649 | | $ 764,151,476 |
|
| Undistributed (overdistributed) net | | | | | | | | |
| investment income | | $ 106,856 | | $ (150,489) |
|
See Notes to Financial Statements
23
NOTES TO FINANCIAL STATEMENTS (unaudited)
1. ORGANIZATION
Evergreen Ultra Short Opportunities Fund (the “Fund”) is a diversified series of Evergreen Fixed Income Trust (the “Trust”), a Delaware statutory trust organized on September 18, 1997. The Trust is an open-end management investment company registered under the Investment Company Act of 1940, as amended (the “1940 Act”).
The Fund offers Class A, Class B, Class C and Class I shares. Class A shares are sold with a front-end sales charge. However, Class A share investments of $1 million or more are not subject to a front-end sales charge but are subject to a contingent deferred sales charge of 1.00% upon redemption within 18 months. Class B shares are sold without a front-end sales charge but are subject to a contingent deferred sales charge that is payable upon redemption and decreases depending on how long the shares have been held. Class C shares are sold without a front-end sales charge but are subject to a contingent deferred sales charge that is payable upon redemption within one year. Class I shares are sold without a front-end sales charge or contingent deferred sales charge. Each class of shares, except Class I shares, pays an ongoing distribution fee.
2. SIGNIFICANT ACCOUNTING POLICIES
The following is a summary of significant accounting policies consistently followed by the Fund in the preparation of its financial statements. The policies are in conformity with generally accepted accounting principles in the United States of America, which require management to make estimates and assumptions that affect amounts reported herein. Actual results could differ from these estimates.
a. Valuation of investments
Portfolio debt securities acquired with more than 60 days to maturity are fair valued using matrix pricing methods determined by an independent pricing service which takes into consideration such factors as similar security prices, yields, maturities, liquidity and ratings. Securities for which valuations are not readily available from an independent pricing service may be valued by brokers which use prices provided by market makers or estimates of market value obtained from yield data relating to investments or securities with similar characteristics.
Listed equity securities are usually valued at the last sales price or official closing price on the national securities exchange where the securities are principally traded.
Short-term securities with remaining maturities of 60 days or less at the time of purchase are valued at amortized cost, which approximates market value.
Investments in open-end mutual funds are valued at net asset value. Securities for which market quotations are not readily available or not reflective of current market value are valued at fair value as determined by the investment advisor in good faith, according to procedures approved by the Board of Trustees.
b. Reverse repurchase agreements
To obtain short-term financing, the Fund may enter into reverse repurchase agreements with banks and other financial institutions, which are deemed by the investment advisor to be credit-
24
NOTES TO FINANCIAL STATEMENTS (unaudited) continued
worthy. At the time the Fund enters into a reverse repurchase agreement, it will establish a segregated account with the custodian containing qualified assets having a value not less than the repurchase price, including accrued interest. If the counterparty to the transaction is rendered insolvent, the Fund may be delayed or limited in the repurchase of the collateral securities.
c. Foreign currency translation
All assets and liabilities denominated in foreign currencies are translated into U.S. dollar amounts at the date of valuation. Purchases and sales of portfolio securities and income items denominated in foreign currencies are translated into U.S. dollar amounts on the respective dates of such transactions. The Fund does not separately account for that portion of the results of operations resulting from changes in foreign exchange rates on investments and the fluctuations arising from changes in market prices of securities held. Such fluctuations are included with the net realized and unrealized gains or losses on investments.
d. Futures contracts
In order to gain exposure to, or protect against changes in, security values, the Fund may buy and sell futures contracts. The primary risks associated with the use of futures contracts are the imperfect correlation between changes in market values of securities held by the Fund and the prices of futures contracts, and the possibility of an illiquid market.
Futures contracts are valued based upon their quoted daily settlement prices. The aggregate principal amounts of the contracts are not recorded in the financial statements. Fluctuations in the value of the contracts are recorded in the Statement of Assets and Liabilities as an asset or liability and in the Statement of Operations as unrealized gains or losses until the contracts are closed, at which point they are recorded as net realized gains or losses on futures contracts.
e. When-issued and delayed delivery transactions
The Fund records when-issued or delayed delivery securities as of trade date and maintains security positions such that sufficient liquid assets will be available to make payment for the securities purchased. Securities purchased on a when-issued or delayed delivery basis are marked-to-market daily and begin earning interest on the settlement date. Losses may occur on these transactions due to changes in market conditions or the failure of counterparties to perform under the contract.
f. Securities lending
The Fund may lend its securities to certain qualified brokers in order to earn additional income. The Fund receives compensation in the form of fees or interest earned on the investment of any cash collateral received. The Fund also continues to receive interest and dividends on the securities loaned. The Fund receives collateral in the form of cash or securities with a market value at least equal to the market value of the securities on loan, including accrued interest. In the event of default or bankruptcy by the borrower, the Fund could experience delays and costs in recovering the loaned securities or in gaining access to the collateral. The Fund has the right under the lending agreement to recover the securities from the borrower on demand.
25
NOTES TO FINANCIAL STATEMENTS (unaudited) continued
g. Dollar roll transactions
The Fund may enter into dollar roll transactions with respect to mortgage-backed securities. In a dollar roll transaction, the Fund sells mortgage-backed securities to financial institutions and simultaneously agrees to accept substantially similar (same type, coupon and maturity) securities at a later date at an agreed upon price. The Fund will use the proceeds generated from the transactions to invest in short-term investments, which may enhance the Fund’s current yield and total return. The Fund accounts for dollar roll transactions as purchases and sales. The Fund could be exposed to risks if the counterparty defaults on its obligation to perform under the terms of the agreement, if the Fund receives inferior securities in comparison to what was sold to the coun-terparty at redelivery or if there are variances in paydown speed between the mortgage-related pools.
h. Credit default swaps
The Fund may enter into credit default swaps. Credit default swaps involve an exchange of a fixed rate premium for protection against the loss in value of an underlying debt instrument in the event of default or bankruptcy. Under the terms of the swap, one party acts as a “guarantor” and receives a periodic stream of payments that is a fixed percentage applied to a notional principal amount over the term of the swap. In return, the party agrees to purchase the notional amount of the underlying instrument, at par, if a credit event occurs during the term of the swap. Periodic payments are recorded as realized gains or losses. Any premiums paid or received on the transactions are recorded as an asset or liability on the Statement of Assets and Liabilities and amortized. The Fund may enter into credit default swaps as either the guarantor or the counterparty.
Swaps are marked-to-market daily based on quotations from market makers and any change in value is recorded as an unrealized gain or loss. Payments received or made as a result of a credit event or termination of the contract are recognized as realized gains or losses. The Fund could be exposed to risks if the counterparty defaults on its obligation to perform, or if there are unfavorable changes in the fluctuation of interest rates or in the price of the underlying security.
i. Security transactions and investment income
Security transactions are recorded on trade date. Realized gains and losses are computed using the specific cost of the security sold. Interest income is recorded on the accrual basis and includes accretion of discounts and amortization of premiums. Dividend income is recorded on the ex-dividend date.
j. Federal taxes
The Fund intends to continue to qualify as a regulated investment company and distribute all of its taxable income, including any net capital gains (which have already been offset by available capital loss carryovers). Accordingly, no provision for federal taxes is required.
k. Distributions
Distributions to shareholders from net investment income are accrued daily and paid monthly. Distributions from net realized gains, if any, are recorded on the ex-dividend date. Such distributions are determined in conformity with income tax regulations, which may differ from generally accepted accounting principles.
26
NOTES TO FINANCIAL STATEMENTS (unaudited) continued
l. Class allocations
Income, common expenses and realized and unrealized gains and losses are allocated to the classes based on the relative net assets of each class. Distribution fees, if any, are calculated daily at the class level based on the appropriate net assets of each class and the specific expense rates applicable to each class.
3. ADVISORY FEE AND OTHER TRANSACTIONS WITH AFFILIATES
Evergreen Investment Management Company, LLC (“EIMC”), an indirect, wholly-owned subsidiary of Wachovia Corporation (“Wachovia”), is the investment advisor to the Fund and is paid an annual fee starting at 0.40% and declining to 0.25% as average daily net assets increase. For the six months ended December 31, 2007, the advisory fee was equivalent to 0.35% of the Fund’s average daily net assets (on an annualized basis).
Tattersall Advisory Group, Inc., an indirect, wholly-owned subsidiary of Wachovia, is an investment sub-advisor to the Fund and is paid by EIMC for its services to the Fund.
From time to time, EIMC may voluntarily or contractually waive its fee and/or reimburse expenses in order to limit operating expenses. During the six months ended December 31, 2007, EIMC contractually and voluntarily waived its advisory fee and reimbursed Distribution Plan expenses (see Note 4) relating to Class A shares as follows:
| | | Contractual waiver/ | | Voluntary waiver/ |
| | | reimbursement | | reimbursement |
|
| Advisory fees | | $ 93,409 | | $ 22,258 |
| Distribution Plan expenses | | 10,297 | | 12,962 |
|
The Fund may invest in Evergreen-managed money market funds, which are also advised by EIMC. Income earned on these investments is included in income from affiliate on the Statement of Operations.
Evergreen Investment Services, Inc. (“EIS”), an indirect, wholly-owned subsidiary of Wachovia, is the administrator to the Fund. As administrator, EIS provides the Fund with facilities, equipment and personnel and is paid an annual rate determined by applying percentage rates to the aggregate average daily net assets of the Evergreen funds (excluding money market funds and Evergreen Institutional Enhanced Income Fund), starting at 0.10% and declining to 0.05% as the aggregate average daily net assets of the Evergreen funds (excluding money market funds and Evergreen Institutional Enhanced Income Fund) increase.
Evergreen Service Company, LLC (“ESC”), an indirect, wholly-owned subsidiary of Wachovia, is the transfer and dividend disbursing agent for the Fund. ESC receives account fees that vary based on the type of account held by the shareholders in the Fund.
4. DISTRIBUTION PLANS
EIS also serves as distributor of the Fund’s shares. The Fund has adopted Distribution Plans, as allowed by Rule 12b-1 of the 1940 Act, for each class of shares, except Class I. Under the
27
NOTES TO FINANCIAL STATEMENTS (unaudited) continued
Distribution Plans, distribution fees are paid at an annual rate of 0.30% of the average daily net assets for Class A shares and 1.00% of the average daily net assets for each of Class B and Class C shares.
For the six months ended December 31, 2007, EIS received $4,734 from the sale of Class A shares and $2,523, $31,082 and $6,585 in contingent deferred sales charges from redemptions of Class A, Class B and Class C shares, respectively.
5. ACQUISITION
Effective at the close of business on October 12, 2007, the Fund acquired the net assets of Evergreen Limited Duration Fund in a tax-free exchange for Class A, Class B, Class C and Class I shares of the Fund. Shares were issued to Class A, Class B, Class C, Class I and Class IS shareholders of Evergreen Limited Duration Fund at an exchange ratio of 1.04 for Class A, Class B, Class C, Class I and Class A shares, respectively, of the Fund. The acquired net assets consisted primarily of portfolio securities with unrealized depreciation of $797,225. The aggregate net assets of the Fund and Evergreen Limited Duration Fund immediately prior to the acquisition were $716,191,450 and $240,728,932, respectively. The aggregate net assets of the Fund immediately after the acquisition were $956,920,382.
6. INVESTMENT TRANSACTIONS
Cost of purchases and proceeds from sales of investment securities (excluding short-term securities) were as follows for the six months ended December 31, 2007:
| Cost of Purchases | | Proceeds from Sales |
|
| U.S. | | Non-U.S. | | U.S. | | Non-U.S. |
| Government | | Government | | Government | | Government |
|
| $417,710,264 | | $75,143,186 | | $384,501,415 | | $116,983,657 |
|
At December 31, 2007, the Fund had open long futures contracts outstanding as follows:
| | | | | Initial | | Value at | | |
| | | | | Contract | | December 31, | | Unrealized |
| Expiration | | Contracts | | Amount | | 2007 | | Gain |
|
| | | 200 U.S. Treasury Notes | | | | | | |
| March 2008 | | 2 Year Futures | | $41,932,050 | | $42,050,000 | | $117,950 |
|
At December 31, 2007, the Fund had open short futures contracts outstanding as follows:
| | | | | Initial | | Value at | | |
| | | | | Contract | | December 31, | | Unrealized |
| Expiration | | Contracts | | Amount | | 2007 | | Loss |
|
| | | 60 U.S. Treasury Notes | | | | | | |
| March 2008 | | 5 Year Futures | | $6,581,010 | | $6,616,875 | | $35,865 |
|
During the six months ended December 31, 2007, the Fund loaned securities to certain brokers. Any affiliated income relating to securities lending activity is included in securities lending on the
28
NOTES TO FINANCIAL STATEMENTS (unaudited) continued
Statement of Operations. At December 31, 2007, the value of securities on loan and the total value of collateral received for securities loaned amounted to $13,828 and $14,250, respectively.
At December 31, 2007, the Fund had the following open credit default swap contracts outstanding:
| | | | | | | | | Fixed | | | | |
| | | | | | | | | Payments | | Frequency | | |
| | | | | Reference | | Notional | | Received by | | of Payments | | Unrealized |
| Expiration | | Counterparty | | Index | | Amount | | the Fund | | Received | | Loss |
|
| | | Morgan | | CMBX North | | | | | | | | |
| 12/13/2049 | | Stanley | | America Index | | $5,000,000 | | 2.625% | | Quarterly | | $1,295,735 |
|
| | | | | | | | | Fixed | | | | |
| | | | | | | | | Payments | | Frequency | | |
| | | | | Reference | | Notional | | Made by | | of Payments | | Unrealized |
| Expiration | | Counterparty | | Index | | Amount | | the Fund | | Made | | Gain |
|
| | | Morgan | | CMBX North | | | | | | | | |
| 03/15/2049 | | Stanley | | America Index | | $5,000,000 | | 1.65% | | Quarterly | | $1,023,676 |
|
On December 31, 2007, the aggregate cost of securities for federal income tax purposes was $989,277,543. The gross unrealized appreciation and depreciation on securities based on tax cost was $10,868,692 and $38,771,349, respectively, with a net unrealized depreciation of $27,902,657.
As of June 30, 2007, the Fund had $7,999,971 in capital loss carryovers for federal income tax purposes expiring as follows:
| Expiration |
|
| 2012 | | 2013 | | | | 2014 | | 2015 |
|
| $452,371 | | $2,333,655 | | | | $2,691,836 | | $2,522,109 |
|
For income tax purposes, capital and currency losses incurred after October 31 within the Fund’s fiscal year are deemed to arise on the first business day of the following fiscal year. As of June 30, 2007, the Fund incurred and elected to defer post-October capital and currency losses of $1,907,405 and $332,954, respectively.
7. INTERFUND LENDING
Pursuant to an Exemptive Order issued by the SEC, the Fund may participate in an interfund lending program with certain funds in the Evergreen fund family. This program allows the Fund to borrow from, or lend money to, other participating funds. During the six months ended December 31, 2007, the Fund did not participate in the interfund lending program.
8. EXPENSE REDUCTIONS
Through expense offset arrangements with ESC and the Fund’s custodian, a portion of fund expenses has been reduced.
29
NOTES TO FINANCIAL STATEMENTS (unaudited) continued
9. DEFERRED TRUSTEES’ FEES
Each Trustee of the Fund may defer any or all compensation related to performance of his or her duties as a Trustee. The Trustees’ deferred balances are allocated to deferral accounts, which are included in the accrued expenses for the Fund. The investment performance of the deferral accounts is based on the investment performance of certain Evergreen funds. Any gains earned or losses incurred in the deferral accounts are reported in the Fund’s Trustees’ fees and expenses. At the election of the Trustees, the deferral account will be paid either in one lump sum or in quarterly installments for up to ten years.
10. FINANCING AGREEMENT AND OTHER BORROWINGS
The Fund and certain other Evergreen funds share in an unsecured revolving credit commitment for temporary and emergency purposes, including the funding of redemptions, as permitted by each participating fund’s borrowing restrictions. Borrowings under this facility bear interest at 0.50% per annum above the Federal Funds rate. All of the participating funds are charged an annual commitment fee on the unused balance, which is allocated pro rata. The credit facility is for $100 million with an annual commitment fee of 0.08%.
During the six months ended December 31, 2007, the Fund had average borrowings outstanding of $471,500 (on an annualized basis) at an average rate of 4.56% and paid interest of $21,500.
During the six months ended December 31, 2007, the Fund entered into reverse repurchase agreements that had an average daily balance outstanding of $17,676,202 with a weighted average interest rate of 5.16% and paid interest of $912,092 representing 0.23% of the Fund’s average daily net assets (on an annualized basis). The maximum amount outstanding under reverse repurchase agreements during the six months ended December 31, 2007 was $107,559,373 (including accrued interest). At December 31, 2007, reverse repurchase agreements outstanding were as follows:
| | | Repurchase | | | | | | Maturity |
| | | Amount | | Counterparty | | Interest Rate | | Date |
|
| | $ | 17,314,900 | | Goldman Sachs | | 5.04% | | 01/02/2008 |
| | | 48,606,481 | | Goldman Sachs | | 5.15% | | 01/02/2008 |
|
11. REGULATORY MATTERS AND LEGAL PROCEEDINGS
Pursuant to an administrative order issued by the SEC on September 19, 2007, EIMC, EIS, ESC (collectively, the “Evergreen Entities”), Wachovia Securities, LLC and the SEC have entered into an agreement settling allegations of (i) improper short-term trading arrangements in effect prior to May 2003 involving former officers and employees of EIMC and certain broker-dealers, (ii) insufficient systems for monitoring exchanges and enforcing exchange limitations as stated in certain funds’ prospectuses, and (iii) inadequate e-mail retention practices. Under the settlement, the Evergreen Entities were censured and paid approximately $32 million in disgorgement and penalties. This amount, along with a fine assessed by the SEC against Wachovia Securities, LLC will be distributed pursuant to a plan to be developed by an independent distribution consultant
30
NOTES TO FINANCIAL STATEMENTS (unaudited) continued
and approved by the SEC. The Evergreen Entities neither admitted nor denied the allegations and findings set forth in its settlement with the SEC.
In addition, the Evergreen funds and EIMC and certain of its affiliates are involved in various legal actions, including private litigation and class action lawsuits. EIMC does not expect that any of such legal actions currently pending or threatened will have a material adverse impact on the financial position or operations of any of the Evergreen funds or on EIMC’s ability to provide services to the Evergreen funds.
Although EIMC believes that none of the matters discussed above will have a material adverse impact on the Evergreen funds, there can be no assurance that these matters and any publicity surrounding or resulting from them will not result in reduced sales or increased redemptions of Evergreen fund shares, which could increase Evergreen fund transaction costs or operating expenses, or that they will not have other adverse consequences on the Evergreen funds.
12. NEW ACCOUNTING PRONOUNCEMENTS
In June 2006, the Financial Accounting Standards Board (“FASB”) issued FASB Interpretation No. 48, Accounting for Uncertainty in Income Taxes — an interpretation of FASB statement 109 (“FIN 48”). FIN 48 supplements FASB 109 by prescribing a recognition threshold and measurement attribute for the financial statement recognition and measurement of a tax position taken or expected to be taken in a tax return. The Fund’s financial statements have not been impacted by the adoption of FIN 48. However, the conclusions regarding FIN 48 may be subject to review and adjustment at a later date based on factors including, but not limited to, further implementation guidance expected from FASB, and on-going analysis of tax laws, regulations, and interpretations thereof.
In September 2006, FASB issued Statement of Financial Accounting Standards No. 157, Fair Value Measurements (“FAS 157”). FAS 157 establishes a single authoritative definition of fair value, establishes a framework for measuring fair value and expands disclosures about fair value measurements. FAS 157 applies to fair value measurements already required or permitted by existing standards. The change to current generally accepted accounting principles from the application of FAS 157 relates to the definition of fair value, the methods used to measure fair value, and the expanded disclosures about fair value measurements. Management of the Fund does not believe the adoption of FAS 157 will materially impact the financial statement amounts, however, additional disclosures may be required about the inputs used to develop the measurements and the effect of certain of the measurements on changes in net assets for the period. FAS 157 is effective for financial statements issued for fiscal years beginning after November 15, 2007 and interim periods within those fiscal years.
31
ADDITIONAL INFORMATION (unaudited)
INFORMATION ABOUT THE REVIEW AND APPROVAL OF THE FUND’S INVESTMENT ADVISORY AGREEMENT
Each year, the Fund’s Board of Trustees is required to consider whether to continue in place the Fund’s investment advisory agreements. In September 2007, the Trustees, including a majority of the Trustees who are not interested persons (as that term is defined in the 1940 Act) of the Fund, TAG (the “Sub-Advisor”), or EIMC, approved the continuation of the Fund’s investment advisory agreements. (References below to the “Fund” are to Evergreen Ultra Short Opportunities Fund; references to the “funds” are to the Evergreen funds generally.)
At the same time, the Trustees considered the continuation of the investment advisory agreements for all of the funds, and the description below refers in many cases to the Trustees’ process and conclusions in connection with their consideration of this matter for all of the funds. (See “Certain Fund-Specific Considerations” below for a discussion regarding certain factors considered by the Trustees relating specifically to the Fund.) In all of its deliberations, the Board of Trustees and the disinterested Trustees were advised by independent counsel to the disinterested Trustees and counsel to the funds.
The review process. The 1940 Act requires that the Board of Trustees request and evaluate, and that EIMC and any sub-advisors furnish, such information as may reasonably be necessary to evaluate the terms of a fund’s advisory agreements. The review process began at the time of the last advisory contract-renewal process in September 2006. In the course of that process, the Trustees identified a number of funds that had experienced either short-term or longer-term performance issues. During the following months, the Trustees reviewed information relating to any changes in the performance of those funds and/or any changes in the investment process or the investment teams responsible for the management of the funds. In addition, during the course of the year, the Trustees reviewed information regarding the investment performance of all of the funds and identified additional funds that they believed warranted further attention based on performance since September 2006.
In spring 2007, a committee of the Board of Trustees (the “Committee”), working with EIMC management, determined generally the types of information the Board would review and set a timeline detailing the information required and the dates for its delivery to the Trustees. The independent data provider Keil Fiduciary Strategies LLC (“Keil”) was engaged to provide fund-specific and industry-wide data to the Board containing information of a nature and in a format generally prescribed by the Committee, and the Committee worked with Keil and EIMC to develop appropriate groups of peer funds for each fund. The Committee also identified a number of expense, performance, and other issues and requested specific information as to those issues.
The Trustees reviewed, with the assistance of an independent industry consultant retained by the disinterested Trustees, the information provided by EIMC and the Sub-Advisor in response to the Committee’s requests and the information provided by Keil. The Trustees formed small committees to review individual funds in greater detail. In addition, the Trustees requested information regarding, among other things, brokerage practices of the funds, the use of derivatives by the
32
ADDITIONAL INFORMATION (unaudited) continued
funds, strategic planning for the funds, analyst and research support available to the portfolio management teams, and information regarding the various fall-out benefits received directly and indirectly by EIMC and its affiliates from the funds. The Trustees requested and received additional information following that review.
The Committee met several times by telephone to consider the information provided by EIMC. The Committee met with representatives of EIMC in early September. At a meeting of the full Board of Trustees later in September, the Committee reported the results of its discussions with EIMC, and the full Board met with representatives of EIMC, engaged in further review of the materials provided to them, and approved the continuation of each of the advisory and sub-advisory agreements.
The disinterested Trustees discussed the continuation of the funds’ advisory agreements with representatives of EIMC and in multiple private sessions with legal counsel at which no personnel of EIMC were present. In considering the continuation of the agreements, the Trustees did not identify any particular information or consideration that was all-important or controlling, and each Trustee attributed different weights to various factors. The Trustees evaluated information provided to them both in terms of the Evergreen mutual funds generally and with respect to each fund, including the Fund, specifically as they considered appropriate; although the Trustees considered the continuation of the agreements as part of the larger process of considering the continuation of the advisory contracts for all of the funds, their determination to continue the advisory agreements for each of the funds was ultimately made on a fund-by-fund basis.
This summary describes a number of the most important, but not necessarily all, of the factors considered by the Board and the disinterested Trustees.
Information reviewed. The Board of Trustees and committees of the Board of Trustees meet periodically during the course of the year. At those meetings, the Board receives a wide variety of information regarding the services performed by EIMC, the investment performance of the funds, and other aspects of the business and operations of the funds. At those meetings, and in the process of considering the continuation of the agreements, the Trustees considered information regarding, for example, the funds’ investment results; the portfolio management teams for the funds and the experience of the members of those teams, and any recent changes in the membership of the teams; portfolio trading practices; compliance by the funds, EIMC, and the Sub-Advisor with applicable laws and regulations and with the funds’ and EIMC’s compliance policies and procedures; risk evaluation and oversight procedures at EIMC; services provided by affiliates of EIMC to the funds and shareholders of the funds; and other information relating to the nature, extent, and quality of services provided by EIMC and the Sub-Advisor. The Trustees considered a number of changes in portfolio management personnel at EIMC and its advisory affiliates in the year since September 2006, and recent changes in compliance personnel at EIMC, including the appointment of a new Chief Compliance Officer for the funds.
The Trustees considered the rates at which the funds pay investment advisory fees, and the efforts generally by EIMC and its affiliates as sponsors of the funds. The data provided by Keil showed
33
ADDITIONAL INFORMATION (unaudited) continued
the management fees paid by each fund in comparison to the management fees of other peer mutual funds, in addition to data regarding the investment performance of the funds in comparison to peer mutual funds. The Trustees were assisted by the independent industry consultant in reviewing the information presented to them.
The Trustees considered the transfer agency fees paid by the funds to an affiliate of EIMC. They reviewed information presented to them showing that the transfer agency fees charged to the funds were generally consistent with industry norms.
The Trustees also considered that EIS, an affiliate of EIMC, serves as administrator to the funds and receives a fee for its services as administrator. In their comparison of the advisory fee paid by the funds with those paid by other mutual funds, the Trustees took into account administrative fees paid by the funds and those other mutual funds. The Board considered that EIS serves as distributor to the funds generally and receives fees from the funds for those services. They considered other so-called “fall-out” benefits to EIMC and its affiliates due to their other relationships with the funds, including, for example, soft-dollar services received by EIMC attributable to transactions entered into by EIMC for the benefit of the funds and brokerage commissions received by Wachovia Securities, LLC, an affiliate of EIMC, from transactions effected by it for the funds. The Trustees also noted that the funds pay sub-transfer agency fees to various financial institutions who hold fund shares in omnibus accounts, and that Wachovia Securities, LLC and its affiliates receive such payments from the funds in respect of client accounts they hold in omnibus arrangements, and that an affiliate of EIMC receives fees for administering the sub-transfer agency payment program. They also considered that Wachovia Securities, LLC and its affiliates receive distribution-related fees and shareholder servicing payments (including amounts derived from payments under the funds’ Rule 12b-1 plans) in respect of shares sold or held through it. The Trustees also noted that an affiliate of EIMC receives compensation for serving as a securities lending agent for the funds.
Nature and quality of the services provided. The Trustees considered that EIMC and its affili-ates generally provide a comprehensive investment management service to the funds. They noted that EIMC and the Sub-Advisor formulate and implement an investment program for the Fund. They noted that EIMC makes its personnel available to serve as officers of the funds, and concluded that the reporting and management functions provided by EIMC with respect to the funds were generally satisfactory. The Trustees considered the investment philosophy of the Fund’s portfolio management team, and considered the in-house research capabilities of EIMC and its affiliates, as well as other resources available to EIMC, including research services available to it from third parties. The Board considered the managerial and financial resources available to EIMC and its affiliates, and the commitment that the Wachovia organization has made to the funds generally. On the basis of these factors, they determined that the nature and scope of the services provided by EIMC and the Sub-Advisor were consistent with their respective duties under the investment advisory agreements and appropriate and consistent with the investment programs and best interests of the funds.
34
ADDITIONAL INFORMATION (unaudited) continued
The Trustees noted the resources EIMC and its affiliates have committed to the regulatory, compliance, accounting, tax and oversight of tax reporting, and shareholder servicing functions, and the number and quality of staff committed to those functions, which they concluded were appropriate and generally in line with EIMC’s responsibilities to the Fund and to the funds generally. The Board and the disinterested Trustees concluded, within the context of their overall conclusions regarding the funds’ advisory agreements, that they were generally satisfied with the nature, extent, and quality of the services provided by the Sub-Advisor and EIMC, including services provided by EIS under its administrative services agreements with the funds.
Investment performance. The Trustees considered the investment performance of each fund, both by comparison to other comparable mutual funds and to broad market indices. The Trustees emphasized that the continuation of the investment advisory agreement for a fund should not be taken as any indication that the Trustees did not believe investment performance for any specific fund might not be improved, and they noted that they would continue to monitor closely the investment performance of the funds going forward.
Advisory and administrative fees. The Trustees recognized that EIMC does not seek to provide the lowest cost investment advisory service, but to provide a high quality, full-service investment management product at a reasonable price. They also noted that EIMC has in many cases sought to set its investment advisory fees at levels consistent with industry norms. The Trustees noted that, in certain cases, a fund’s management fees were higher than many or most other mutual funds in the same Keil peer group. However, in each case, the Trustees determined on the basis of the information presented that the level of management fees was not excessive.
Certain Fund-specific considerations. The Trustees noted that, for the one- and three-year periods ended December 31, 2006, the Fund’s Class A shares had outperformed the Fund’s benchmark index, the Lehman Brothers Government/Credit 0-2.5 Year Index, and a majority of the funds against which the Trustees compared the Fund’s performance.
The Trustees noted that the management fee paid by the Fund was higher than the management fees paid by the other funds against which the Trustees compared the Fund’s management fee, but noted that the level of profitability realized by EIMC in respect of the fee did not appear excessive.
The Trustees considered information regarding the rates at which other clients pay advisory fees to EIMC or its affiliates for advisory services that are comparable to the advisory services they provide to the Fund. Fees charged by EIMC to those other clients were generally lower than those charged to the Fund. EIMC explained that compliance, reporting, and other legal burdens of providing investment advice to mutual funds generally exceed those required to provide advisory services to non-mutual fund clients such as retirement or pension plans. In addition, EIMC pointed out that there is substantially greater legal and other risk to EIMC and its affiliates from managing public mutual funds than in managing private accounts.
The Trustees considered information regarding the rates at which other non-Evergreen mutual funds pay advisory fees to EIMC or its affiliates for sub-advisory services that are comparable to
35
ADDITIONAL INFORMATION (unaudited) continued
the advisory services EIMC or its affiliates provide to the Fund. Fees charged by EIMC to those other clients were generally lower than those charged to the Fund. EIMC explained that the services and resources required of EIMC where it sub-advises mutual funds sponsored by others are substantially less than in the case of the funds, since many of the compliance and regulatory responsibilities related to the management function are retained by the primary adviser.
Economies of scale. The Trustees noted that economies of scale would likely be achieved by EIMC in managing the funds as the funds grow. The Trustees noted that the Fund had implemented breakpoints in its advisory fee structure. The Trustees noted that they would continue to review the appropriate levels of breakpoints in the future, but concluded that the breakpoints as implemented appeared to be a reasonable step toward the realization of economies of scale by the Fund.
Profitability. The Trustees considered information provided to them regarding the profitability to the EIMC organization of the investment advisory, administration, and transfer agency (with respect to the open-end funds only) fees paid to EIMC and its affiliates by each of the funds. They considered that the information provided to them was necessarily estimated, and that the profitability information provided to them, especially on a fund-by-fund basis, did not necessarily provide a definitive tool for evaluating the appropriateness of each fund’s advisory fee. They noted that the levels of profitability of the funds to EIMC varied widely, depending on among other things the size and type of fund. They considered the profitability of the funds in light of such factors as, for example, the information they had received regarding the relation of the fees paid by the funds to those paid by other mutual funds, the investment performance of the funds, and the amount of revenues involved. In light of these factors, the Trustees concluded that the profitability of any of the funds, individually or in the aggregate, should not prevent the Trustees from approving the continuation of the agreements.
36
This page left intentionally blank
37
This page left intentionally blank
38
This page left intentionally blank
39
TRUSTEES AND OFFICERS
TRUSTEES1
| Charles A. Austin III | | Investment Counselor, Anchor Capital Advisors, LLC. (investment advice); Director, The Andover |
| Trustee | | Companies (insurance); Trustee, Arthritis Foundation of New England; Former Director, The |
| DOB: 10/23/1934 | | Francis Ouimet Society (scholarship program); Former Director, Executive Vice President and |
| Term of office since: 1991 | | Treasurer, State Street Research & Management Company (investment advice) |
| Other directorships: None | | |
|
| |
| K. Dun Gifford | | Chairman and President, Oldways Preservation and Exchange Trust (education); Trustee, |
| Trustee | | Treasurer and Chairman of the Finance Committee, Cambridge College |
| DOB: 10/23/1938 | | |
| Term of office since: 1974 | | |
| Other directorships: None | | |
|
| |
| Dr. Leroy Keith, Jr. | | Managing Director, Almanac Capital Management (commodities firm); Trustee, Phoenix |
| Trustee | | Fund Complex; Director, Diversapack Co. (packaging company); Former Partner, Stonington |
| DOB: 2/14/1939 | | Partners, Inc. (private equity fund); Former Director, Obagi Medical Products Co.; Former |
| Term of office since: 1983 | | Director, Lincoln Educational Services |
| Other directorships: Trustee, | | |
| Phoenix Fund Complex (consisting | | |
| of 60 portfolios as of 12/31/2006) | | |
|
| |
| Carol A. Kosel1 | | Former Consultant to the Evergreen Boards of Trustees; Former Senior Vice President, |
| Trustee | | Evergreen Investments, Inc.; Former Treasurer, Evergreen Funds; Former Treasurer, Vestaur |
| DOB: 12/25/1963 | | Securities Fund |
| Term of office since: 2008 | | |
| Other directorships: None | | |
|
| |
| Gerald M. McDonnell | | Former Manager of Commercial Operations, CMC Steel (steel producer) |
| Trustee | | |
| DOB: 7/14/1939 | | |
| Term of office since: 1988 | | |
| Other directorships: None | | |
|
| |
| Patricia B. Norris | | President and Director of Buckleys of Kezar Lake, Inc. (real estate company); Former President |
| Trustee | | and Director of Phillips Pond Homes Association (home community); Former Partner, |
| DOB: 4/9/1948 | | PricewaterhouseCoopers, LLP (independent registered public accounting firm) |
| Term of office since: 2006 | | |
| Other directorships: None | | |
|
| |
| William Walt Pettit | | Partner and Vice President, Kellam & Pettit, P.A. (law firm); Director, Superior Packaging Corp. |
| Trustee | | (packaging company); Member, Superior Land, LLC (real estate holding company), Member, |
| DOB: 8/26/1955 | | K&P Development, LLC (real estate development); Former Director, National Kidney Foundation |
| Term of office since: 1988 | | of North Carolina, Inc. (non-profit organization) |
| Other directorships: None | | |
|
| |
| David M. Richardson | | President, Richardson, Runden LLC (executive recruitment business development/consulting |
| Trustee | | company); Consultant, Kennedy Information, Inc. (executive recruitment information and |
| DOB: 9/19/1941 | | research company); Consultant, AESC (The Association of Executive Search Consultants); |
| Term of office since: 1982 | | Director, J&M Cumming Paper Co. (paper merchandising); Former Trustee, NDI Technologies, LLP |
| Other directorships: None | | (communications) |
|
| |
| Dr. Russell A. Salton III | | President/CEO, AccessOne MedCard, Inc.; Former Medical Director, Healthcare Resource |
| Trustee | | Associates, Inc. |
| DOB: 6/2/1947 | | |
| Term of office since: 1984 | | |
| Other directorships: None | | |
|
40
TRUSTEES AND OFFICERS continued
| Michael S. Scofield | | Retired Attorney, Law Offices of Michael S. Scofield; Former Director and Chairman, Branded |
| Trustee | | Media Corporation (multi-media branding company) |
| DOB: 2/20/1943 | | |
| Term of office since: 1984 | | |
| Other directorships: None | | |
|
| |
| Richard J. Shima | | Independent Consultant; Director, Hartford Hospital; Trustee, Greater Hartford YMCA; Former |
| Trustee | | Director, Trust Company of CT; Former Director, Old State House Association; Former Trustee, |
| DOB: 8/11/1939 | | Saint Joseph College (CT) |
| Term of office since: 1993 | | |
| Other directorships: None | | |
|
| |
| Richard K. Wagoner, CFA2 | | Member and Former President, North Carolina Securities Traders Association; Member, Financial |
| Trustee | | Analysts Society |
| DOB: 12/12/1937 | | |
| Term of office since: 1999 | | |
| Other directorships: None | | |
|
| |
| |
| OFFICERS | | |
| |
| Dennis H. Ferro3 | | Principal occupations: President and Chief Executive Officer, Evergreen Investment Company, |
| President | | Inc. and Executive Vice President, Wachovia Bank, N.A.; former Chief Investment Officer, |
| DOB: 6/20/1945 | | Evergreen Investment Company, Inc. |
| Term of office since: 2003 | | |
|
| |
| Kasey Phillips4 | | Principal occupations: Senior Vice President, Evergreen Investment Management Company, LLC; |
| Treasurer | | Former Vice President, Evergreen Investment Services, Inc.; Former Assistant Vice President, |
| DOB: 12/12/1970 | | Evergreen Investment Services, Inc. |
| Term of office since: 2005 | | |
|
| |
| Michael H. Koonce4 | | Principal occupations: Senior Vice President and General Counsel, Evergreen Investment |
| Secretary | | Services, Inc.; Secretary, Senior Vice President and General Counsel, Evergreen Investment |
| DOB: 4/20/1960 | | Management Company, LLC and Evergreen Service Company, LLC; Senior Vice President and |
| Term of office since: 2000 | | Assistant General Counsel, Wachovia Corporation |
|
| |
| Robert Guerin4 | | Principal occupations: Chief Compliance Officer, Evergreen Funds and Senior Vice President of |
| Chief Compliance Officer | | Evergreen Investments Co, Inc; Former Managing Director and Senior Compliance Officer, |
| DOB: 9/20/1965 | | Babson Capital Management LLC; Former Principal and Director, Compliance and Risk |
| Term of office since: 2007 | | Management, State Street Global Advisors; Former Vice President and Manager, Sales Practice |
| | | Compliance, Deutsche Asset Management. |
|
1 Each Trustee, except Mses. Kosel and Norris, serves until a successor is duly elected or qualified or until his or her death, resignation, retirement or removal from office. As new Trustees, Ms. Kosel’s and Ms. Norris’ initial terms end December 31, 2010 and June 30, 2009, respectively, at which times they may be re-elected by Trustees to serve until a successor is duly elected or qualified or until her death, resignation, retirement or removal from office by the Trustees. Each Trustee, except Ms. Kosel, oversaw 93 Evergreen funds as of December 31, 2007. Ms. Kosel became a Trustee on January 1, 2008. Correspondence for each Trustee may be sent to Evergreen Board of Trustees, P.O. Box 20083, Charlotte, NC 28202.
2 Mr. Wagoner is an “interested person” of the Fund because of his ownership of shares in Wachovia Corporation, the parent to the Fund’s investment advisor.
3 The address of the Officer is 401 S. Tryon Street, 20th Floor, Charlotte, NC 28288.
4 The address of the Officer is 200 Berkeley Street, Boston, MA 02116.
Additional information about the Fund’s Board of Trustees and Officers can be found in the Statement of Additional Information (SAI) and is available upon request without charge by calling 800.343.2898.
41
568639 rv4 2/2008
Item 2 - Code of Ethics
Not required for this semi-annual filing.
Item 3 - Audit Committee Financial Expert
Not required for this semi-annual filing.
Items 4 – Principal Accountant Fees and Services
Not required for this semi-annual filing.
Items 5 – Audit Committee of Listed Registrants
Not applicable.
Item 6 – Schedule of Investments
Please see schedule of investments contained in the Report to Stockholders included under Item 1 of this Form N-CSR.
Item 7 – Disclosure of Proxy Voting Policies and Procedures for Closed-End Management Investment Companies.
Not applicable.
Item 8 – Portfolio Managers of Closed-End Management Investment Companies.
Not applicable.
Item 9 – Purchases of Equity Securities by Closed-End Management Investment Company and Affiliated Purchasers.
Not applicable.
Item 10 – Submission of Matters to a Vote of Security Holders
There have been no material changes to the procedures by which shareholders may recommend nominees to the Registrant’s board of trustees that have been implemented since the Registrant last provided disclosure in response to the requirements of this Item.
Item 11 - Controls and Procedures
(a) The Registrant's principal executive officer and principal financial officer have evaluated the Registrant's disclosure controls and procedures (as defined in Rule 30a-3(c) under the Investment Company Act of 1940) within 90 days of this filing and have concluded that the Registrant's disclosure controls and procedures were effective, as of that date, in ensuring that information required to be disclosed by the Registrant in this Form N-CSR was recorded, processed, summarized, and reported timely.
(b) There has been no changes in the Registrant's internal controls over financial reporting (as defined in Rule 30a-3(d) under the Investment Company Act of 1940) that occurred during the second fiscal quarter of the period covered by this report that has materially affected, or is reasonable likely to affect, the Registrant’s internal control over financial reporting .
Item 12 - Exhibits
File the exhibits listed below as part of this Form. Letter or number the exhibits in the sequence indicated.
(a) Any code of ethics, or amendment thereto, that is the subject of the disclosure required by Item 2, to the extent that the Registrant intends to satisfy the Item 2 requirements through filing of an exhibit.
(b)(1) Separate certifications for the Registrant's principal executive officer and principal financial officer, as required by Section 302 of the Sarbanes-Oxley Act of 2002 and Rule 30a-2(a) under the Investment Company Act of 1940, are attached as EX99.CERT.
(b)(2) Separate certifications for the Registrant's principal executive officer and principal financial officer, as required by Section 1350 of Title 18 of United States Code, as adopted pursuant to Section 906 of the Sarbanes-Oxley Act of 2002, and Rule 30a-2(b) under the Investment Company Act of 1940, are attached as EX99.906CERT. The certifications furnished pursuant to this paragraph are not deemed to be "filed" for purposes of Section 18 of the Securities Exchange Act of 1934, or otherwise subject to the liability of that section. Such certifications are not deemed to be incorporated by reference into any filing under the Securities Act of 1933 or the Securities Exchange Act of 1934, except to the extent that the Registrant specifically incorporates them by reference.
Pursuant to the requirements of the Securities Exchange Act of 1934 and the Investment Company Act of 1940, the Registrant has duly caused this report to be signed on its behalf by the undersigned, thereunto duly authorized.
Evergreen Fixed Income Trust
By: _______________________
Dennis H. Ferro,
Principal Executive Officer
Date: February 29, 2008
Pursuant to the requirements of the Securities Exchange Act of 1934 and the Investment Company Act of 1940, this report has been signed below by the following persons on behalf of the Registrant and in the capacities and on the dates indicated.
By: _______________________
Dennis H. Ferro,
Principal Executive Officer
Date: February 29, 2008
By: ________________________
Kasey Phillips
Principal Financial Officer
Date: February 29, 2008