| OMB APPROVAL |
OMB Number: 3235-0570 Expires: September 30, 2007 Estimated average burden hours per response: 19.4 |
UNITED STATES
SECURITIES AND EXCHANGE COMMISSION
Washington, D.C. 20549
FORM N-CSRS
CERTIFIED SHAREHOLDER REPORT OF REGISTERED MANAGEMENT INVESTMENT COMPANIES
Investment Company Act file number 811-08415
Evergreen Fixed Income Trust
_____________________________________________________________
(Exact name of registrant as specified in charter)
200 Berkeley Street Boston, Massachusetts 02116
_____________________________________________________________
(Address of principal executive offices) (Zip code)
Michael H. Koonce, Esq. 200 Berkeley Street Boston, Massachusetts 02116
____________________________________________________________
(Name and address of agent for service)
Registrant's telephone number, including area code: (617) 210-3200
Date of fiscal year end: Registrant is making a semi-annual filing for five of its series, Evergreen High Yield Bond Fund, Evergreen Institutional Mortgage Portfolio Fund, Evergreen U.S. Government Fund, Evergreen Diversified Bond Fund and Evergreen Strategic Income Fund, for the six months ended October 31, 2006. These five series have an April 30 fiscal year end.
Date of reporting period: October 31, 2006
Item 1 - Reports to Stockholders.
Evergreen High Yield Bond Fund

| table of contents |
| 1 | | LETTER TO SHAREHOLDERS |
| 6 | | FUND AT A GLANCE |
| 8 | | ABOUT YOUR FUND’S EXPENSES |
| 9 | | FINANCIAL HIGHLIGHTS |
| 13 | | SCHEDULE OF INVESTMENTS |
| 21 | | STATEMENT OF ASSETS AND LIABILITIES |
| 22 | | STATEMENT OF OPERATIONS |
| 23 | | STATEMENTS OF CHANGES IN NET ASSETS |
| 24 | | NOTES TO FINANCIAL STATEMENTS |
| 31 | | ADDITIONAL INFORMATION |
| 40 | | TRUSTEES AND OFFICERS |
This semiannual report must be preceded or accompanied by a prospectus of the Evergreen fund contained herein. The prospectus contains more complete information, including fees and expenses, and should be read carefully before investing or sending money.
The fund will file its complete schedule of portfolio holdings with the SEC for the first and third quarters of each fiscal year on Form N-Q. The fund’s Form N-Q will be available on the SEC’s Web site at http://www.sec.gov. In addition, the fund’s Form N-Q may be reviewed and copied at the SEC’s Public Reference Room in Washington, D.C. Information on the operation of the Public Reference Room may be obtained by calling 800.SEC.0330.
A description of the fund’s proxy voting policies and procedures, as well as information regarding how the fund voted proxies relating to portfolio securities during the most recent 12-month period ended June 30, is available by visiting our Web site at EvergreenInvestments.com or by visiting the SEC’s Web site at http://www.sec.gov. The fund’s proxy voting policies and procedures are also available without charge, upon request, by calling 800.343.2898.
| Mutual Funds: | | | | |
| NOT FDIC INSURED | | MAY LOSE VALUE | | NOT BANK GUARANTEED |
Evergreen InvestmentsSM is a service mark of Evergreen Investment Management Company, LLC.
Copyright 2006, Evergreen Investment Management Company, LLC.
Evergreen Investment Management Company, LLC is a subsidiary of Wachovia Corporation
and is an affiliate of Wachovia Corporation’s other Broker Dealer subsidiaries.
Evergreen mutual funds are distributed by Evergreen Investment Services, Inc.
200 Berkeley Street, Boston, MA 02116
LETTER TO SHAREHOLDERS
December 2006

Dennis H. Ferro
President and Chief Executive Officer
Dear Shareholder:
We are pleased to provide the semi-annual report for the Evergreen High Yield Bond Fund, covering the six-month period ended October 31, 2006.
Domestic capital markets, both equity and fixed income, faced a wide range of sometimes inconsistent influences during the past six months. In the first two months of the period, investors worried about rapidly rising oil and commodity prices and the effects of the Federal Reserve Board’s persistent efforts to raise short-term interest rates to slow the economy. However, in the final four months, declining oil and commodity prices offered more encouragement to investors willing to take on risk, especially after the Federal Reserve paused in its cycle of credit tightening. Throughout the period, investors warily watched for signs that specific pockets of weakness might lead to a deceleration of growth in the general economy.
Evidence of economic deceleration did appear in the second and third quarters of 2006 — a year which began with a particularly robust rise in Gross Domestic Product (GDP) of more than 5% in the first quarter. GDP growth then slowed to annualized rates of approximately 2.5% and an estimated 2.2% in the second and third quarters, respectively, with weakening most evident in the housing and automotive industries. Yet healthy
1
LETTER TO SHAREHOLDERS continued
growth levels in personal consumption and business investment enabled demand to grow at more historically average rates, enabling the overall economy to absorb the problems in the housing and automobile areas. In addition, energy prices fell dramatically in the waning months of the fiscal period, boosting consumer confidence and raising hopes for lower inflation in the months ahead. However, officials at the Federal Reserve indicated they continued to be concerned about the possibility of rising inflationary pressures.
Over the six-month period, the domestic fixed income market delivered generally positive results, with high-yield corporate debt maintaining a performance edge over investment grade securities, including government bonds.
In managing Evergreen’s fixed income funds, managers focused on interest rate changes, particularly in higher-grade portfolios including the Evergreen Institutional Mortgage Portfolio, the Evergreen U.S. Government Fund and the Evergreen Core Bond Fund. The teams managing the Evergreen High Yield Bond Fund and the Evergreen Select High Yield Bond Fund paid particularly close attention to credit analysis, analyzing factors such as cash flow and corporations’ abilities to meet their debt obligations. Managers of more diversified funds, including the Evergreen Diversified Bond Fund and the Evergreen Strategic Income Fund, also considered factors such as interest rate expectations and yield spreads in making allocations to different sectors within the fixed income market.
2
LETTER TO SHAREHOLDERS continued
As always, we encourage investors to maintain diversified investment portfolios, including allocations to fixed income funds, in pursuit of their long-term investment goals.
Please visit our Web site, EvergreenInvestments.com, for more information about our funds and other investment products available to you. Thank you for your continued support of Evergreen Investments.
Sincerely,

Dennis H. Ferro
President and Chief Executive Officer
Evergreen Investment Company, Inc.
Notice to Shareholders:
Effective October 1, 2006, Tattersall Advisory Group, Inc., an indirect, wholly-owned subsidiary of Wachovia, became the investment sub-advisor to the Fund and is paid by EIMC for its services to the Fund.
Special Notice to Shareholders:
Please visit our Web site at EvergreenInvestments.com for a statement from President and Chief Executive Officer, Dennis Ferro, addressing NASD actions involving Evergreen Investment Services, Inc. (EIS), Evergreen’s mutual fund distributor or statements from Dennis Ferro and Chairman of the Board of the Evergreen funds, Michael S. Scofield, addressing SEC actions involving the Evergreen funds.
3
Notification of Investment Strategy Change:
Effective February 1, 2007, the Fund may, but will not necessarily, use a variety of derivative instruments, such as futures contracts, options, and swaps, including, for example, index futures, Treasury futures, Eurodollar futures, interest rate swap agreements, credit default swaps, and total return swaps. The Fund may use derivatives both for hedging and non-hedging purposes, including for purposes of enhancing returns. The Fund’s use of derivative instruments involves risks different from, or possibly greater than, the risks associated with other types of investments. For example, the use of derivatives involves the risk of loss due to the failure of another party to the contract (typically referred to as a “counterparty”) to make required payments or otherwise to comply with the contract’s terms. Derivative transactions can create investment leverage and may be highly volatile and may be illiquid or difficult to price. Derivatives are highly specialized instruments, and involve the risk that an investment adviser may not accurately predict the performance of a derivative under all market conditions. When the Fund uses a derivative instrument, it could lose more than the principal amount invested. The various derivative instruments that the Fund may use may change from time to time as new derivative products become available to the Fund. More information about derivatives and the risks associated with them can be found in the Fund’s prospectus and statement of additional information, which may be obtained by calling 1.800.343.2898 or visiting our website at EvergreenInvestments.com.
4
Notice to Shareholders:
| The Fund’s prospectus has been amended to make the following change to the Fund’s short-term trading policy effective April 2, 2007: |
| |
| | To limit the negative effects of short-term trading on the Fund, the Fund��s Board of Trustees has adopted certain restrictions on trading by investors. If an investor redeems more than $5,000 (including redemptions that are a part of an exchange transaction) from an Evergreen Fund, that investor is “blocked” from purchasing shares of the Fund (including purchases that are a part of an exchange transaction) for 30 calendar days after the redemption. The short- term trading policy does not apply to: |
| |
| | | Money market funds; |
| |
| | | Evergreen Institutional Enhanced Income Fund; Evergreen Adjustable Rate Fund; and Evergreen Ultra Short Opportunities Fund; |
| |
| | | Systematic investments or exchanges where Evergreen or the financial intermediary maintaining the shareholder account identifies to Evergreen the transaction as a systematic redemption or purchase at the time of the transaction; |
| |
| | | Rebalancing transactions within certain asset allocation or “wrap” programs where Evergreen or the financial intermediary is able to identify the transaction as part of a firm-approved asset allocation program; |
| |
| | | Purchases by a “fund of funds” into the underlying fund vehicle and purchases by 529 Plans: |
| |
| | | Certain transactions involving participants in employer-sponsored retirement plans, including: participant withdrawals due to mandatory distributions, rollovers and hardships; withdrawals of shares acquired by participants through payroll deductions; and, shares acquired or sold by a participant in connection with plan loans; and |
| |
| | | Purchases below $5,000 (including purchases that are a part of an exchange transaction). |
| |
| | There are certain limitations on the Fund’s ability to detect and prevent short- term trading. For example, while the Fund has access to trading information relating to investors who trade and hold their shares directly with the Fund, the Fund may not have immediate access to such information for investors who trade through financial intermediaries such as broker dealers and financial advisors or through retirement plans. Certain financial intermediaries and retirement plans hold their shares or those of their clients through omnibus accounts maintained with the Fund. The Fund may be unable to compel financial intermediaries to apply the Fund’s short-term trading policy described above. The Fund reserves the right, in its sole discretion, to allow financial intermediaries to apply alternative short-term trading policies. The Fund will use reasonable diligence to confirm that such intermediary is applying the Fund’s short-term trading policy or an acceptable alternative. Consult the disclosure provided by your financial intermediary for any alternative short-term trading policies that may apply to your account. It is possible that excessive short-term trading or trading in violation of the Fund’s trading restrictions may occur despite the Fund’s efforts to prevent them. |
| |
| Effective April 2, 2007, the “Reinstatement Privileges” described in the Fund’s prospectus are eliminated. |
| |
5
FUND AT A GLANCE
as of October 31, 2006
MANAGEMENT TEAM
Investment Advisor:
• Evergreen Investment Management Company, LLC
Sub-Advisor:
• Tattersall Advisory Group, Inc.
Portfolio Manager:
• Gary Pzegeo, CFA
CURRENT INVESTMENT STYLE
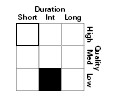
Source: Morningstar, Inc.
Morningstar’s style box is based on a portfolio date as of 9/30/2006.
The Fixed income style box placement is based on a fund’s average effective maturity or duration and the average credit rating of the bond portfolio.
PERFORMANCE AND RETURNS
Portfolio inception date: 9/11/1935
| | | Class A | | Class B | | Class C | | Class I |
| Class inception date | | 1/20/1998 | | 9/11/1935 | | 1/21/1998 | | 4/14/1998 |
|
| Nasdaq symbol | | EKHAX | | EKHBX | | EKHCX | | EKHYX |
|
| 6-month return with sales charge | | -1.69% | | -1.99% | | 1.99% | | N/A |
|
| 6-month return w/o sales charge | | 3.36% | | 2.99% | | 2.99% | | 3.51% |
|
| Average annual return* | | | | | | | | |
|
| 1-year with sales charge | | 2.49% | | 1.71% | | 5.71% | | N/A |
|
| 1-year w/o sales charge | | 7.46% | | 6.71% | | 6.71% | | 7.77% |
|
| 5-year | | 7.69% | | 7.69% | | 7.98% | | 9.06% |
|
| 10-year | | 5.52% | | 5.36% | | 5.36% | | 6.27% |
|
| Maximum sales charge | | 4.75% | | 5.00% | | 1.00% | | N/A |
| | | Front-end | | CDSC | | CDSC | | |
|
* Adjusted for maximum applicable sales charge, unless noted.
Past performance is no guarantee of future results. The performance quoted represents past performance and current performance may be lower or higher. The investment return and principal value of an investment will fluctuate so that investors’ shares, when redeemed, may be worth more or less than their original cost. To obtain performance information current to the most recent month-end for Classes A, B, C or I, please go to EvergreenInvestments.com/fundperformance. The performance of each class may vary based on differences in loads, fees and expenses paid by the shareholders investing in each class. Performance includes the reinvestment of income dividends and capital gain distributions. Performance shown does not reflect the deduction of taxes that a shareholder would pay on fund distributions or the redemption of fund shares.
Historical performance shown for Classes A, C and I prior to their inception is based on the performance of Class B, the original class offered. The historical returns for Classes A and I have not been adjusted to reflect the effect of each class’ 12b-1 fee. These fees are 0.30% for Class A and 1.00% for Classes B and C. Class I does not pay a 12b-1 fee. If these fees had been reflected, returns for Classes A and I would have been higher.
The advisor is reimbursing a portion of the 12b-1 fee for Class A. Had the fee not been reimbursed, returns for Class A would have been lower. Returns reflect expense limits previously in effect for all classes, without which returns would have been lower.
6
FUND AT A GLANCE continued
LONG-TERM GROWTH
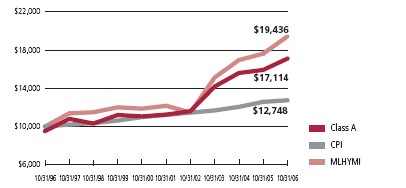
Comparison of a $10,000 investment in the Evergreen High Yield Bond Fund Class A shares versus a similar investment in the Merrill Lynch High Yield Master Index† (MLHYMI) and the Consumer Price Index (CPI).
The MLHYMI is an unmanaged market index and does not include transaction costs associated with buying and selling securities, any mutual fund fees or expenses or any taxes. The CPI is a commonly used measure of inflation and does not represent an investment return. It is not possible to invest directly in an index.
Class I shares are only offered in the following manner: (1) to investment advisory clients of Evergreen Investment Management Company, LLC (or its advisory affiliates) when purchased by such advisor(s) on behalf of its clients, (2) through arrangements entered into on behalf of the Evergreen funds with certain financial services firms, (3) to certain institutional investors and (4) to persons who owned Class Y shares in registered name in an Evergreen fund on or before December 31, 1994 or who owned shares of any SouthTrust fund in registered name as of March 18, 2005 or shares of Vestaur Securities Fund as of May 20, 2005.
Class I shares are only available to institutional shareholders with a minimum of $1 million investment, which may be waived in certain situations.
The fund’s investment objective may be changed without a vote of the fund’s shareholders.
Foreign investments may contain more risk due to the inherent risks associated with changing political climates, foreign market instability and foreign currency fluctuations.
Derivatives involve additional risks including interest rate risk, credit risk, the risk of improper valuation and the risk of non-correlation to the relevant instruments they are designed to hedge or to closely track.
High yield, lower-rated bonds may contain more risk due to the increased possibility of default.
The return of principal is not guaranteed due to fluctuation in the fund’s NAV caused by changes in the price of individual bonds held by the fund and the buying and selling of bonds by the fund. Bond funds have the same inflation, interest rate and credit risks as individual bonds. Generally, the value of bond funds rise when prevailing interest rates fall, and fall when interest rates rise.
† Copyright 2006. Merrill Lynch, Pierce, Fenner & Smith Incorporated. All rights reserved.
All data is as of October 31, 2006, and subject to change.
7
ABOUT YOUR FUND’S EXPENSES
The Example below is intended to describe the fees and expenses borne by shareholders and the impact of those costs on your investment.
Example
As a shareholder of the fund, you incur two types of costs: (1) transaction costs, including sales charges (loads), redemption fees and exchange fees; and (2) ongoing costs, including management fees, distribution (12b-1) fees and other fund expenses. This Example is intended to help you understand your ongoing costs (in dollars) of investing in the fund and to compare these costs with the ongoing costs of investing in other mutual funds. The Example is based on an investment of $1,000 invested at the beginning of the period and held for the entire period from May 1, 2006 to October 31, 2006.
The example illustrates your fund’s costs in two ways:
- Actual expenses
The section in the table under the heading “Actual” provides information about actual account values and actual expenses. You may use the information in these columns, together with the amount you invested, to estimate the expenses that you paid over the period. Simply divide your account value by $1,000 (for example, an $8,600 account value divided by $1,000 = 8.6), then multiply the result by the number in the appropriate column for your share class, in the column entitled “Expenses Paid During Period” to estimate the expenses you paid on your account during this period. - Hypothetical example for comparison purposes
The section in the table under the heading “Hypothetical (5% return before expenses)” provides information about hypothetical account values and hypothetical expenses based on the fund’s actual expense ratio and an assumed rate of return of 5% per year before expenses, which is not the fund’s actual return. The hypothetical account values and expenses may not be used to estimate the actual ending account balance or expenses you paid for the period. You may use this information to compare the ongoing costs of investing in the fund and other funds. To do so, compare this 5% hypothetical example with the 5% hypothetical examples that appear in the shareholder reports of the other funds.
Please note that the expenses shown in the table are meant to highlight your ongoing costs only and do not reflect any transactional costs, such as sales charges (loads), redemption fees or exchange fees. Therefore, the section in the table under the heading “Hypothetical (5% return before expenses)” is useful in comparing ongoing costs only, and will not help you determine the relative total costs of owning different funds. In addition, if these transactional costs were included, your costs would have been higher.
| | | Beginning | | Ending | | |
| | | Account | | Account | | Expenses |
| | | Value | | Value | | Paid During |
| | | 5/1/2006 | | 10/31/2006 | | Period* |
|
| Actual | | | | | | |
| Class A | | $ 1,000.00 | | $ 1,033.63 | | $ 5.43 |
| Class B | | $ 1,000.00 | | $ 1,029.91 | | $ 9.16 |
| Class C | | $ 1,000.00 | | $ 1,029.91 | | $ 9.16 |
| Class I | | $ 1,000.00 | | $ 1,035.09 | | $ 4.05 |
| Hypothetical | | | | | | |
| (5% return | | | | | | |
| before expenses) | | | | | | |
| Class A | | $ 1,000.00 | | $ 1,019.86 | | $ 5.40 |
| Class B | | $ 1,000.00 | | $ 1,016.18 | | $ 9.10 |
| Class C | | $ 1,000.00 | | $ 1,016.18 | | $ 9.10 |
| Class I | | $ 1,000.00 | | $ 1,021.22 | | $ 4.02 |
|
* For each class of the Fund, expenses are equal to the annualized expense ratio of each class (1.06% for Class A, 1.79% for Class B, 1.79% for Class C and 0.79% for Class I), multiplied by the average account value over the period, multiplied by 184 / 365 days.
8
FINANCIAL HIGHLIGHTS
(For a share outstanding throughout each period)
| | | | | | | | | | | | | |
| | | Six Months Ended | | Year Ended April 30, |
| | October 31, 2006 | |
|
| CLASS A | | (unaudited) | | 2006 | | 2005 | | 2004 | | 2003 | | 20021 |
|
| Net asset value, beginning of period | | $ 3.31 | | $ 3.32 | | $ 3.43 | | $ 3.30 | | $ 3.29 | | $ 3.39 |
|
| Income from investment operations | | | | | | | | | | | | |
| Net investment income (loss) | | 0.12 | | 0.23 | | 0.24 | | 0.25 | | 0.272 | | 0.27 |
Net realized and unrealized gains
or losses on investments | | (0.01) | | 0 | | (0.10) | | 0.14 | | 0.01 | | (0.09) |
| |
|
| Total from investment operations | | 0.11 | | 0.23 | | 0.14 | | 0.39 | | 0.28 | | 0.18 |
|
| Distributions to shareholders from | | | | | | | | | | | | |
| Net investment income | | (0.12) | | (0.24) | | (0.25) | | (0.26) | | (0.27) | | (0.28) |
|
| Net asset value, end of period | | $ 3.30 | | $ 3.31 | | $ 3.32 | | $ 3.43 | | $ 3.30 | | $ 3.29 |
|
| Total return3 | | 3.36% | | 7.01% | | 4.14% | | 12.25% | | 9.42% | | 5.77% |
|
| Ratios and supplemental data | | | | | | | | | | | | |
| Net assets, end of period (thousands) | | $352,463 | | $388,523 | | $467,714 | | $530,526 | | $484,346 | | $321,830 |
| Ratios to average net assets | | | | | | | | | | | | |
| Expenses including waivers/reimbursements | | | | | | | | | | | | |
| but excluding expense reductions | | 1.06%4 | | 1.04% | | 1.04% | | 1.01% | | 1.11% | | 1.19% |
| Expenses excluding waivers/reimbursements | | | | | | | | | | | | |
| and expense reductions | | 1.09%4 | | 1.05% | | 1.04% | | 1.02% | | 1.11% | | 1.21% |
| Net investment income (loss) | | 7.02%4 | | 6.95% | | 7.16% | | 7.42% | | 8.70% | | 8.27% |
| Portfolio turnover rate | | 29% | | 67% | | 65% | | 71% | | 80% | | 138% |
|
1 As required, effective May 1, 2001, the Fund has adopted the provisions of the AICPA Audit and Accounting Guide, Audits of Investment Companies, and began amortizing premium on its fixed-income securities . The effects of this change for the year ended April 30, 2002 were a decrease in net investmen t income per share of $0.00; an increase in net realized gains or losses per share of $0.00; and a decrease to the ratio of net investment income to average net assets of 0.13%.
2 Net investment income (loss) per share is based on average shares outstanding during the period.
3 Excluding applicable sales charges
4 Annualized
See Notes to Financial Statements
9
FINANCIAL HIGHLIGHTS
(For a share outstanding throughout each period)
| | | | | | | | | | | | | |
| | | Six Months Ended | | Year Ended April 30, |
| | October 31, 2006 | |
|
| CLASS B | | (unaudited) | | 2006 | | 2005 | | 2004 | | 2003 | | 20021 |
|
| Net asset value, beginning of period | | $ 3.31 | | $ 3.32 | | $ 3.43 | | $ 3.30 | | $ 3.29 | | $ 3.39 |
|
| Income from investment operations | | | | | | | | | | | | |
| Net investment income (loss) | | 0.10 | | 0.212 | | 0.22 | | 0.232 | | 0.252 | | 0.242 |
Net realized and unrealized gains
or losses on investments | | 0 | | (0.01)3 | | (0.10) | | 0.14 | | 0.01 | | (0.08) |
| |
|
| Total from investment operations | | 0.10 | | 0.20 | | 0.12 | | 0.37 | | 0.26 | | 0.16 |
|
| Distributions to shareholders from | | | | | | | | | | | | |
| Net investment income | | (0.11) | | (0.21) | | (0.23) | | (0.24) | | (0.25) | | (0.26) |
|
| Net asset value, end of period | | $ 3.30 | | $ 3.31 | | $ 3.32 | | $ 3.43 | | $ 3.30 | | $ 3.29 |
|
| Total return3 | | 2.99% | | 6.27% | | 3.42% | | 11.46% | | 8.61% | | 4.98% |
|
| Ratios and supplemental data | | | | | | | | | | | | |
| Net assets, end of period (thousands) | | $159,001 | | $176,663 | | $211,950 | | $247,741 | | $173,002 | | $54,537 |
| Ratios to average net assets | | | | | | | | | | | | |
| Expenses including waivers/reimbursements | | | | | | | | | | | | |
| but excluding expense reductions | | 1.79%4 | | 1.75% | | 1.74% | | 1.72% | | 1.84% | | 1.92% |
| Expenses excluding waivers/reimbursements | | | | | | | | | | | | |
| and expense reductions | | 1.79%4 | | 1.75% | | 1.74% | | 1.72% | | 1.84% | | 1.95% |
| Net investment income (loss) | | 6.30%4 | | 6.25% | | 6.46% | | 6.71% | | 7.99% | | 7.49% |
| Portfolio turnover rate | | 29% | | 67% | | 65% | | 71% | | 80% | | 138% |
|
1 As required, effective May 1, 2001, the Fund has adopted the provisions of the AICPA Audit and Accounting Guide, Audits of Investment Companies, and began amortizing premium on its fixed-income securities . The effects of this change for the year ended April 30, 2002 were a decrease in net investmen t income per share of $0.01; an increase in net realized gains or losses per share of $0.01; and a decrease to the ratio of net investment income to average net assets of 0.13%.
2 Net investment income (loss) per share is based on average shares outstanding during the period.
3 Excluding applicable sales charges
4 Annualized
See Notes to Financial Statements
10
FINANCIAL HIGHLIGHTS
(For a share outstanding throughout each period)
| | | | | | | | | | | | | |
| | | Six Months Ended | | Year Ended April 30, |
| | October 31, 2006 | |
|
| CLASS C | | (unaudited) | | 2006 | | 2005 | | 2004 | | 2003 | | 20021 |
|
| Net asset value, beginning of period | | $ 3.31 | | $ 3.32 | | $ 3.43 | | $ 3.30 | | $ 3.29 | | $ 3.39 |
|
| Income from investment operations | | | | | | | | | | | | |
| Net investment income (loss) | | 0.10 | | 0.21 | | 0.22 | | 0.23 | | 0.252 | | 0.26 |
Net realized and unrealized gains
or losses on investments | | 0 | | (0.01)3 | | (0.10) | | 0.14 | | 0.01 | | (0.10) |
| |
|
| Total from investment operations | | 0.10 | | 0.20 | | 0.12 | | 0.37 | | 0.26 | | 0.16 |
|
| Distributions to shareholders from | | | | | | | | | | | | |
| Net investment income | | (0.11) | | (0.21) | | (0.23) | | (0.24) | | (0.25) | | (0.26) |
|
| Net asset value, end of period | | $ 3.30 | | $ 3.31 | | $ 3.32 | | $ 3.43 | | $ 3.30 | | $ 3.29 |
|
| Total return4 | | 2.99% | | 6.27% | | 3.42% | | 11.46% | | 8.61% | | 4.98% |
|
| Ratios and supplemental data | | | | | | | | | | | | |
| Net assets, end of period (thousands) | | $175,707 | | $201,975 | | $281,810 | | $381,525 | | $290,914 | | $105,753 |
| Ratios to average net assets | | | | | | | | | | | | |
| Expenses including waivers/reimbursements | | | | | | | | | | | | |
| but excluding expense reductions | | 1.79%5 | | 1.75% | | 1.74% | | 1.72% | | 1.85% | | 1.93% |
| Expenses excluding waivers/reimbursements | | | | | | | | | | | | |
| and expense reductions | | 1.79%5 | | 1.75% | | 1.74% | | 1.72% | | 1.85% | | 1.95% |
| Net investment income (loss) | | 6.30%5 | | 6.25% | | 6.47% | | 6.72% | | 7.98% | | 7.52% |
| Portfolio turnover rate | | 29% | | 67% | | 65% | | 71% | | 80% | | 138% |
|
1 As required, effective May 1, 2001, the Fund has adopted the provisions of the AICPA Audit and Accounting Guide, Audits of Investment Companies, and began amortizing premium on its fixed-income securities . The effects of this change for the year ended April 30, 2002 were a decrease in net investmen t income per share of $0.00; an increase in net realized gains or losses per share of $0.00; and a decrease to the ratio of net investment income to average net assets of 0.13%.
2 Net investment income (loss) per share is based on average shares outstanding during the period.
3 The per share net realized and unrealized gains or losses is not in accord with the net realized and unrealized gains or losses for the period due to the timing of sales and redemptions of Fund shares in relation to fluctuating market values for the portfolio .
4 Excluding applicable sales charges
5 Annualized
See Notes to Financial Statements
11
FINANCIAL HIGHLIGHTS
(For a share outstanding throughout each period)
| | | | | | | | | | | | | |
| | | Six Months Ended | | Year Ended April 30, |
| | October 31, 2006 | |
|
| CLASS I1 | | (unaudited) | | 2006 | | 2005 | | 2004 | | 2003 | | 20022 |
|
| Net asset value, beginning of period | | $ 3.31 | | $ 3.32 | | $ 3.43 | | $ 3.30 | | $ 3.29 | | $ 3.39 |
|
| Income from investment operations | | | | | | | | | | | | |
| Net investment income (loss) | | 0.12 | | 0.24 | | 0.26 | | 0.26 | | 0.283 | | 0.29 |
Net realized and unrealized gains
or losses on investments | | (0.01) | | 0 | | (0.11) | | 0.14 | | 0.01 | | (0.10) |
| |
|
| Total from investment operations | | 0.11 | | 0.24 | | 0.15 | | 0.40 | | 0.29 | | 0.19 |
|
| Distributions to shareholders from | | | | | | | | | | | | |
| Net investment income | | (0.12) | | (0.25) | | (0.26) | | (0.27) | | (0.28) | | (0.29) |
|
| Net asset value, end of period | | $ 3.30 | | $ 3.31 | | $ 3.32 | | $ 3.43 | | $ 3.30 | | $ 3.29 |
|
| Total return | | 3.51% | | 7.33% | | 4.45% | | 12.58% | | 9.69% | | 6.04% |
|
| Ratios and supplemental data | | | | | | | | | | | | |
| Net assets, end of period (thousands) | | $43,336 | | $50,365 | | $60,412 | | $37,894 | | $49,370 | | $10,011 |
| Ratios to average net assets | | | | | | | | | | | | |
| Expenses including waivers/reimbursements | | | | | | | | | | | | |
| but excluding expense reductions | | 0.79%4 | | 0.75% | | 0.74% | | 0.72% | | 0.84% | | 0.92% |
| Expenses excluding waivers/reimbursements | | | | | | | | | | | | |
| and expense reductions | | 0.79%4 | | 0.75% | | 0.74% | | 0.72% | | 0.84% | | 0.94% |
| Net investment income (loss) | | 7.29%4 | | 7.23% | | 7.46% | | 7.73% | | 9.05% | | 8.53% |
| Portfolio turnover rate | | 29% | | 67% | | 65% | | 71% | | 80% | | 138% |
|
1 Effective at the close of business on May 11, 2001, Class Y shares were renamed as Class I shares.
2 As required, effective May 1, 2001, the Fund has adopted the provisions of the AICPA Audit and Accounting Guide, Audits of Investment Companies, and began amortizing premium on its fixed-income securities . The effects of this change for the year ended April 30, 2002 were a decrease in net investmen t income per share of $0.00; an increase in net realized gains or losses per share of $0.00; and a decrease to the ratio of net investment income to average net assets of 0.13%.
3 Net investment income (loss) per share is based on average shares outstanding during the period.
4 Annualized
See Notes to Financial Statements
12
SCHEDULE OF INVESTMENTS
October 31, 2006 (unaudited)
| | | Principal | | |
| | | Amount | | Value |
|
| CORPORATE BONDS 86.1% | | | | |
| CONSUMER DISCRETIONARY 24.2% | | | | |
| Auto Components 2.2% | | | | |
| Accuride Corp., 8.50%, 02/01/2015 | | $ 4,750,000 | | $ 4,631,250 |
| American Axle & Manufacturing Holdings, Inc., 5.25%, 02/11/2014 (p) | | 10,000,000 | | 8,425,000 |
| ArvinMeritor, Inc., 6.80%, 02/15/2009 | | 543,000 | | 524,674 |
| Goodyear Tire & Rubber Co., 9.00%, 07/01/2015 (p) | | 2,000,000 | | 2,032,500 |
| |
|
| | | | | 15,613,424 |
| |
|
| Automobiles 1.2% | | | | |
| Ford Motor Co.: | | | | |
| 5.80%, 01/12/2009 | | 1,225,000 | | 1,170,658 |
| 7.45%, 07/16/2031 (p) | | 3,000,000 | | 2,366,250 |
| General Motors Corp., 8.375%, 07/15/2033 (p) | | 6,000,000 | | 5,370,000 |
| |
|
| | | | | 8,906,908 |
| |
|
| Diversified Consumer Services 1.5% | | | | |
| Education Management Corp., 8.75%, 06/01/2014 144A | | 2,100,000 | | 2,163,000 |
| Service Corporation International, 8.00%, 06/15/2017 144A | | 9,000,000 | | 8,730,000 |
| |
|
| | | | | 10,893,000 |
| |
|
| Hotels, Restaurants & Leisure 4.2% | | | | |
| Festival Fun Parks, LLC, 10.875%, 04/15/2014 | | 3,750,000 | | 3,703,125 |
| Inn of the Mountain Gods Resort & Casino, 12.00%, 11/15/2010 (p) | | 7,000,000 | | 7,525,000 |
| Isle of Capri Casinos, Inc., 7.00%, 03/01/2014 | | 5,500,000 | | 5,307,500 |
| Las Vegas Sands Corp., 6.375%, 02/15/2015 (p) | | 4,070,000 | | 3,846,150 |
| Mandalay Resort Group, Ser. B, 10.25%, 08/01/2007 | | 6,000,000 | | 6,202,500 |
| Pokagon Gaming Authority, 10.375%, 06/15/2014 144A | | 3,800,000 | | 4,094,500 |
| |
|
| | | | | 30,678,775 |
| |
|
| Household Durables 1.1% | | | | |
| Jarden Corp., 9.75%, 05/01/2012 (p) | | 3,570,000 | | 3,793,125 |
| Libbey, Inc., FRN, 12.44%, 06/01/2011 144A | | 4,000,000 | | 4,260,000 |
| |
|
| | | | | 8,053,125 |
| |
|
| Media 8.3% | | | | |
| Cablevision Systems Corp., Ser. B, 8.00%, 04/15/2012 | | 7,521,000 | | 7,342,376 |
| CCH I, LLC, 11.00%, 10/01/2015 | | 4,700,000 | | 4,553,125 |
| Cinemark USA, Inc., 9.00%, 02/01/2013 | | 2,440,000 | | 2,552,850 |
| Dex Media East, LLC, 9.875%, 11/15/2009 | | 6,000,000 | | 6,337,500 |
| Houghton Mifflin Co.: | | | | |
| 8.25%, 02/01/2011 | | 5,000,000 | | 5,175,000 |
| FRN, 12.03%, 05/15/2011 144A | | 5,000,000 | | 5,300,000 |
| Lamar Media Corp., 6.625%, 08/15/2015 | | 8,675,000 | | 8,393,063 |
| Mediacom Broadband, LLC, 8.50%, 10/15/2015 144A | | 3,000,000 | | 3,011,250 |
| Mediacom Communications Corp., 9.50%, 01/15/2013 (p) | | 11,250,000 | | 11,601,562 |
| Paxson Communications Corp., FRN, 11.62%, 01/15/2013 144A | | 5,500,000 | | 5,534,375 |
| Sirius Satellite Radio, Inc., 9.625%, 08/01/2013 (p) | | 1,068,000 | | 1,046,640 |
| |
|
| | | | | 60,847,741 |
| |
|
See Notes to Financial Statements
13
SCHEDULE OF INVESTMENTS continued
October 31, 2006 (unaudited)
| | | Principal | | |
| | | Amount | | Value |
|
| CORPORATE BONDS continued | | | | |
| CONSUMER DISCRETIONARY continued | | | | |
| Multi-line Retail 0.5% | | | | |
| Neiman Marcus Group, Inc., 9.00%, 10/15/2015 | | $ 3,500,000 | | $ 3,771,250 |
| |
|
| Specialty Retail 3.2% | | | | |
| Baker & Taylor, Inc., 11.50%, 07/01/2013 144A | | 4,500,000 | | 4,522,500 |
| Linens ‘n Things, Inc., 11.00%, 01/15/2014 (p) | | 4,000,000 | | 3,940,000 |
| Michaels Stores, Inc.: | | | | |
| 10.00%, 11/01/2014 144A | | 2,500,000 | | 2,515,625 |
| 11.375%, 11/01/2016 144A (p) | | 1,850,000 | | 1,861,563 |
| Payless ShoeSource, Inc., 8.25%, 08/01/2013 | | 6,500,000 | | 6,662,500 |
| United Auto Group, Inc., 9.625%, 03/15/2012 | | 3,650,000 | | 3,864,437 |
| |
|
| | | | | 23,366,625 |
| |
|
| Textiles, Apparel & Luxury Goods 2.0% | | | | |
| Levi Strauss & Co., 9.75%, 01/15/2015 (p) | | 3,650,000 | | 3,887,250 |
| Oxford Industries, Inc., 8.875%, 06/01/2011 | | 4,000,000 | | 4,125,000 |
| Unifi, Inc., 11.50%, 05/15/2014 144A | | 3,500,000 | | 3,307,500 |
| Warnaco Group, Inc., 8.875%, 06/15/2013 | | 3,000,000 | | 3,150,000 |
| |
|
| | | | | 14,469,750 |
| |
|
| ENERGY 13.0% | | | | |
| Energy Equipment & Services 2.1% | | | | |
| Dresser-Rand Group, Inc., 7.375%, 11/01/2014 | | 4,154,000 | | 4,128,037 |
| GulfMark Offshore, Inc., 7.75%, 07/15/2014 (p) | | 3,025,000 | | 3,055,250 |
| Hornbeck Offshore Services, Inc., Ser. B, 6.125%, 12/01/2014 | | 5,575,000 | | 5,219,594 |
| Parker Drilling Co., 9.625%, 10/01/2013 (p) | | 2,830,000 | | 3,091,775 |
| |
|
| | | | | 15,494,656 |
| |
|
| Oil, Gas & Consumable Fuels 10.9% | | | | |
| ANR Pipeline Co., 8.875%, 03/15/2010 | | 1,650,000 | | 1,741,563 |
| Chesapeake Energy Corp., 6.875%, 01/15/2016 | | 9,145,000 | | 9,122,138 |
| Clayton Williams Energy, Inc., 7.75%, 08/01/2013 | | 5,450,000 | | 5,054,875 |
| El Paso Corp.: | | | | |
| 7.75%, 06/01/2013 | | 7,755,000 | | 7,987,650 |
| 7.875%, 06/15/2012 (p) | | 10,000,000 | | 10,475,000 |
| Encore Acquisition Co., 6.25%, 04/15/2014 | | 9,250,000 | | 8,648,750 |
| Exco Resources, Inc., 7.25%, 01/15/2011 | | 8,650,000 | | 8,368,875 |
| Overseas Shipholding Group, Inc., 8.25%, 03/15/2013 | | 4,400,000 | | 4,642,000 |
| Peabody Energy Corp.: | | | | |
| 5.875%, 04/15/2016 | | 4,275,000 | | 4,039,875 |
| 6.875%, 03/15/2013 | | 2,380,000 | | 2,427,600 |
| Plains Exploration & Production Co.: | | | | |
| 7.125%, 06/15/2014 | | 1,445,000 | | 1,556,988 |
| 8.75%, 07/01/2012 (p) | | 2,730,000 | | 2,914,275 |
| Targa Resources, Inc., 8.50%, 11/01/2013 144A | | 4,500,000 | | 4,511,250 |
| Williams Cos., 8.125%, 03/15/2012 (p) | | 7,250,000 | | 7,811,875 |
| |
|
| | | | | 79,302,714 |
| |
|
See Notes to Financial Statements
14
SCHEDULE OF INVESTMENTS continued
October 31, 2006 (unaudited)
| | | | | Principal | | |
| | | | | Amount | | Value |
|
| CORPORATE BONDS continued | | | | |
| FINANCIALS 9.0% | | | | | | |
| Consumer Finance 5.9% | | | | |
| CCH II Capital Corp., 10.25%, 09/15/2010 | | $ 8,250,000 | | $ 8,559,375 |
| Ford Motor Credit Co., 5.70%, 01/15/2010 (p) | | 3,350,000 | | 3,104,572 |
| General Motors Acceptance Corp., 6.875%, 08/28/2012 | | 11,275,000 | | 11,318,657 |
| NXP Funding, LLC, 7.875%, 10/15/2014 144A | | 5,500,000 | | 5,610,000 |
| Qwest Capital Funding, Inc., 6.50%, 11/15/2018 | | 10,500,000 | | 9,660,000 |
| Terra Capital, Inc., 11.50%, 06/01/2010 | | 4,750,000 | | 5,177,500 |
| |
|
| | | | | | | 43,430,104 |
| |
|
| Real Estate Investment Trusts 3.1% | | | | |
| Host Marriott Corp.: | | | | | | |
| Ser. G, 9.25%, 10/01/2007 | | 4,000,000 | | 4,140,000 |
| Ser. J, 7.125%, 11/01/2013 | | 4,000,000 | | 4,065,000 |
| Omega Healthcare Investors, Inc.: | | | | |
| 7.00%, 04/01/2014 | | 4,450,000 | | 4,477,812 |
| 7.00%, 01/15/2016 | | 3,850,000 | | 3,854,813 |
| Thornburg Mortgage, Inc., 8.00%, 05/15/2013 | | 6,325,000 | | 6,261,750 |
| |
|
| | | | | | | 22,799,375 |
| |
|
| HEALTH CARE 0.9% | | | | |
| Health Care Providers & Services 0.9% | | | | |
| HCA, Inc., 6.375%, 01/15/2015 | | 5,955,000 | | 4,778,888 |
| HealthSouth Corp., 10.75%, 06/15/2016 144A (p) | | 2,000,000 | | 2,060,000 |
| |
|
| | | | | | | 6,838,888 |
| |
|
| INDUSTRIALS 8.1% | | | | |
| Aerospace & Defense 0.7% | | | | |
| DRS Technologies, Inc., 7.625%, 02/01/2018 | | 5,000,000 | | 5,137,500 |
| |
|
| Air Freight & Logistics 0.9% | | | | |
| PHI, Inc., 7.125%, 04/15/2013 144A | | 7,000,000 | | 6,650,000 |
| |
|
| Commercial Services & Supplies 0.5% | | | | |
| West Corp., 11.00%, 10/15/2016 144A | | 3,750,000 | | 3,778,125 |
| |
|
| Machinery 2.8% | | | | | | |
| Case New Holland, Inc., 9.25%, 08/01/2011 | | 3,650,000 | | 3,891,812 |
| Commercial Vehicle Group, Inc., 8.00%, 07/01/2013 | | 5,120,000 | | 4,992,000 |
| ITT Corp., 7.375%, 11/15/2015 | | 4,395,000 | | 4,460,925 |
| RBS Global, Inc.: | | | | | | |
| 9.50%, 08/01/2014 144A | | 4,750,000 | | 4,940,000 |
| 11.75%, 08/01/2016 144A | | 1,900,000 | | 1,985,500 |
| |
|
| | | | | | | 20,270,237 |
| |
|
| Marine 0.7% | | | | | | |
| Horizon Lines, LLC, Sr. Disc. Note, Step Bond, 0.00%, 04/01/2013 † | | 5,303,000 | | 4,812,473 |
| |
|
| Road & Rail 1.3% | | | | | | |
| Avis Rent-A-Car, Inc., 7.75%, 05/15/2016 144A | | 9,500,000 | | 9,310,000 |
| |
|
See Notes to Financial Statements
15
SCHEDULE OF INVESTMENTS continued
October 31, 2006 (unaudited)
| | | Principal | | |
| | | Amount | | Value |
|
| CORPORATE BONDS continued | | | | |
| INDUSTRIALS continued | | | | |
| Trading Companies & Distributors 1.2% | | | | |
| Ashtead Group plc, 9.00%, 08/15/2016 144A | | $ 4,500,000 | | $ 4,758,750 |
| United Rentals, Inc., 7.00%, 02/15/2014 (p) | | 4,500,000 | | 4,331,250 |
| |
|
| | | | | 9,090,000 |
| |
|
| INFORMATION TECHNOLOGY 3.2% | | | | |
| Electronic Equipment & Instruments 0.3% | | | | |
| Compucom Systems, Inc., 12.00%, 11/01/2014 144A | | 2,500,000 | | 2,528,125 |
| |
|
| IT Services 1.4% | | | | |
| iPayment, Inc., 9.75%, 05/15/2014 144A | | 2,850,000 | | 2,942,625 |
| SunGard Data Systems, Inc., 9.125%, 08/15/2013 | | 7,400,000 | | 7,714,500 |
| |
|
| | | | | 10,657,125 |
| |
|
| Semiconductors & Semiconductor Equipment 0.3% | | | | |
| Spansion, LLC, 11.25%, 01/15/2016 144A (p) | | 1,850,000 | | 1,933,250 |
| |
|
| Software 1.2% | | | | |
| Activant Solutions, Inc., 9.50%, 05/01/2016 144A | | 3,800,000 | | 3,553,000 |
| UGS Capital Corp. II, 10.38%, 06/01/2011 144A | | 4,750,000 | | 4,928,125 |
| |
|
| | | | | 8,481,125 |
| |
|
| MATERIALS 11.7% | | | | |
| Chemicals 4.6% | | | | |
| Hexion Specialty Chemicals, Inc., 9.75%, 11/15/2014 144A # | | 3,500,000 | | 3,508,750 |
| Huntsman International, LLC: | | | | |
| 8.375%, 01/01/2015 144A (p) | | 4,000,000 | | 3,970,000 |
| 11.50%, 07/15/2012 | | 6,105,000 | | 6,944,437 |
| Lyondell Chemical Co., 10.50%, 06/01/2013 | | 11,600,000 | | 12,818,000 |
| Tronox Worldwide, LLC, 9.50%, 12/01/2012 (p) | | 6,150,000 | | 6,380,625 |
| |
|
| | | | | 33,621,812 |
| |
|
| Containers & Packaging 3.2% | | | | |
| Berry Plastics Corp., 8.875%, 09/15/2014 144A | | 4,000,000 | | 4,060,000 |
| Crown Americas, Inc., 7.75%, 11/15/2015 (p) | | 8,000,000 | | 8,250,000 |
| Owens-Brockway Glass Containers, Inc., 6.75%, 12/01/2014 (p) | | 6,500,000 | | 6,272,500 |
| Smurfit-Stone Container Corp., 8.375%, 07/01/2012 | | 4,500,000 | | 4,410,000 |
| |
|
| | | | | 22,992,500 |
| |
|
| Metals & Mining 2.5% | | | | |
| Freeport-McMoRan Copper & Gold, Inc., 6.875%, 02/01/2014 (p) | | 7,050,000 | | 7,050,000 |
| United States Steel Corp., 10.75%, 08/01/2008 (p) | | 10,526,000 | | 11,394,395 |
| |
|
| | | | | 18,444,395 |
| |
|
| Paper & Forest Products 1.4% | | | | |
| Bowater, Inc., 6.50%, 06/15/2013 (p) | | 3,000,000 | | 2,677,500 |
| Verso Paper Holdings, LLC: | | | | |
| 9.125%, 08/01/2014 144A | | 2,250,000 | | 2,295,000 |
| 11.375%, 08/01/2016 144A (p) | | 5,250,000 | | 5,355,000 |
| |
|
| | | | | 10,327,500 |
| |
|
See Notes to Financial Statements
16
SCHEDULE OF INVESTMENTS continued
October 31, 2006 (unaudited)
| | | Principal | | |
| | | Amount | | Value |
|
| CORPORATE BONDS continued | | | | |
| TELECOMMUNICATION SERVICES 6.7% | | | | |
| Diversified Telecommunication Services 2.6% | | | | |
| Consolidated Communications, Inc., 9.75%, 04/01/2012 | | $ 4,579,000 | | $ 4,876,635 |
| Level 3 Communications, Inc., 6.375%, 10/15/2015 | | 8,625,000 | | 8,538,750 |
| Qwest Communications International, Inc., 7.875%, 09/01/2011 | | 5,425,000 | | 5,770,844 |
| |
|
| | | | | 19,186,229 |
| |
|
| Wireless Telecommunication Services 4.1% | | | | |
| Centennial Communications Corp.: | | | | |
| 8.125%, 02/01/2014 (p) | | 4,750,000 | | 4,779,687 |
| 10.00%, 01/01/2013 (p) | | 4,800,000 | | 5,004,000 |
| Cricket Communications, Inc., 9.375%, 11/01/2014 144A (p) | | 3,500,000 | | 3,587,500 |
| Dobson Communications Corp., 8.875%, 10/01/2013 (p) | | 3,850,000 | | 3,869,250 |
| Horizon PCS, Inc., 11.375%, 07/15/2012 | | 3,655,000 | | 4,121,012 |
| Metropcs Wireless, Inc., 9.25%, 11/01/2014 144A # | | 3,200,000 | | 3,244,000 |
| Rural Cellular Corp.: | | | | |
| 8.25%, 03/15/2012 (p) | | 1,170,000 | | 1,209,488 |
| 9.75%, 01/15/2010 (p) | | 3,750,000 | | 3,815,625 |
| |
|
| | | | | 29,630,562 |
| |
|
| UTILITIES 9.3% | | | | |
| Electric Utilities 4.2% | | | | |
| Mirant North America, LLC, 7.375%, 12/31/2013 | | 6,575,000 | | 6,681,844 |
| NRG Energy, Inc., 7.375%, 02/01/2016 | | 13,675,000 | | 13,863,031 |
| Reliant Energy, Inc., 6.75%, 12/15/2014 | | 10,250,000 | | 9,827,187 |
| |
|
| | | | | 30,372,062 |
| |
|
| Gas Utilities 1.1% | | | | |
| SEMCO Energy, Inc.: | | | | |
| 7.125%, 05/15/2008 | | 3,500,000 | | 3,504,690 |
| 7.75%, 05/15/2013 | | 4,500,000 | | 4,531,856 |
| |
|
| | | | | 8,036,546 |
| |
|
| Independent Power Producers & Energy Traders 4.0% | | | | |
| AES Corp., 7.75%, 03/01/2014 (p) | | 8,460,000 | | 8,904,150 |
| Dynegy, Inc., 8.375%, 05/01/2016 (p) | | 12,250,000 | | 12,648,125 |
| Orion Power Holdings, Inc., 12.00%, 05/01/2010 | | 5,100,000 | | 5,814,000 |
| Tenaska, Inc., 7.00%, 06/30/2021 144A | | 2,083,779 | | 2,073,012 |
| |
|
| | | | | 29,439,287 |
| |
|
| Total Corporate Bonds (cost $623,094,574) | | | | 629,165,188 |
| |
|
| YANKEE OBLIGATIONS - CORPORATE 6.7% | | | | |
| CONSUMER DISCRETIONARY 1.5% | | | | |
| Media 1.5% | | | | |
| IMAX Corp., 9.625%, 12/01/2010 (p) | | 7,800,000 | | 7,293,000 |
| National Cable plc, 9.125%, 08/15/2016 | | 3,800,000 | | 4,013,750 |
| |
|
| | | | | 11,306,750 |
| |
|
See Notes to Financial Statements
17
SCHEDULE OF INVESTMENTS continued
October 31, 2006 (unaudited)
| | | Principal | | |
| | | Amount | | Value |
|
| YANKEE OBLIGATIONS - CORPORATE continued | | | | |
| FINANCIALS 0.7% | | | | |
| Diversified Financial Services 0.7% | | | | |
| Ship Finance International, Ltd., 8.50%, 12/15/2013 | | $ 4,915,000 | | $ 4,816,700 |
| |
|
| MATERIALS 2.0% | | | | |
| Chemicals 0.7% | | | | |
| Ineos Group Holdings plc, 8.50%, 02/15/2016 144A | | 5,000,000 | | 4,837,500 |
| |
|
| Metals & Mining 0.8% | | | | |
| Novelis, Inc., FRN, 8.25%, 02/15/2015 144A | | 5,940,000 | | 5,702,400 |
| |
|
| Paper & Forest Products 0.5% | | | | |
| Abitibi-Consolidated, Inc., 8.375%, 04/01/2015 (p) | | 4,250,000 | | 3,724,063 |
| |
|
| TELECOMMUNICATION SERVICES 2.5% | | | | |
| Diversified Telecommunication Services 0.7% | | | | |
| Nordic Telecom Holdings Co., 8.875%, 05/01/2016 144A | | 4,750,000 | | 4,999,375 |
| |
|
| Wireless Telecommunication Services 1.8% | | | | |
| Intelsat, Ltd.: | | | | |
| 9.25%, 06/15/2016 144A | | 3,500,000 | | 3,753,750 |
| 11.25%, 06/15/2016 144A | | 2,600,000 | | 2,843,750 |
| Rogers Wireless, Inc.: | | | | |
| 6.375%, 03/01/2014 (p) | | 2,790,000 | | 2,803,950 |
| 9.625%, 05/01/2011 | | 3,475,000 | | 3,952,812 |
| |
|
| | | | | 13,354,262 |
| |
|
| Total Yankee Obligations - Corporate (cost $48,332,149) | | | | 48,741,050 |
| | |
|
|
| | | Shares | | Value |
|
| COMMON STOCKS 1.0% | | | | |
| CONSUMER DISCRETIONARY 0.2% | | | | |
| Media 0.2% | | | | |
| Charter Communications, Inc., Class A * (p) | | 425,000 | | 977,500 |
| Comcast Corp., Class A * (p) | | 17,500 | | 711,725 |
| |
|
| | | | | 1,689,225 |
| |
|
| MATERIALS 0.5% | | | | |
| Chemicals 0.2% | | | | |
| Huntsman Corp. * + | | 88,065 | | 1,520,882 |
| |
|
| Containers & Packaging 0.3% | | | | |
| Smurfit-Stone Container Corp. * (p) | | 185,000 | | 1,972,100 |
| |
|
| UTILITIES 0.3% | | | | |
| Electric Utilities 0.3% | | | | |
| Mirant Corp. * | | 80,000 | | 2,365,600 |
| |
|
| Total Common Stocks (cost $6,306,723) | | | | 7,547,807 |
| |
|
See Notes to Financial Statements
18
SCHEDULE OF INVESTMENTS continued
October 31, 2006 (unaudited)
| | | | | | | Shares | | Value |
|
| WARRANTS 0.0% | | | | | | | | |
| CONSUMER DISCRETIONARY 0.0% | | | | |
| Media 0.0% | | | | | | | | |
| Metricom, Inc., Expiring 02/15/2010 * (h) + | | 1,500 | | $ 0 |
| |
|
| FINANCIALS 0.0% | | | | | | | | |
| Diversified Financial Services 0.0% | | | | |
| Asat Finance, LLC, Expiring 11/01/2006 * 144A (h) + | | 4,000 | | 0 |
| |
|
| Total Warrants (cost $558,090) | | | | 0 |
| | |
|
|
| | | | | | | Principal | | |
| | | | | | | Amount | | Value |
|
| DEBT OBLIGATIONS 2.5% | | | | | | |
| Blue Grass Energy Corp. Loan, FRN, 10.33%, 12/30/2013 | | $ 7,000,000 | | 7,071,680 |
| Commonwealth Brands, Inc. Loan, 7.75%, 12/01/2035 | | 4,451,938 | | 4,472,906 |
| Georgia-Pacific Corp. Loan, 8.39%, 12/23/2013 | | 5,000,000 | | 5,057,450 |
| HealthSouth Corp. Loan, 8.58%, 01/16/2011 | | 1,995,000 | | 2,001,065 |
| |
|
| Total Debt Obligations (cost $18,453,671) | | | | 18,603,101 |
| | |
|
|
| | | | | | | Shares | | Value |
|
| SHORT-TERM INVESTMENTS 20.9% | | | | |
| MUTUAL FUND SHARES 20.9% | | | | |
| Evergreen Institutional Money Market Fund ø ## | | 17,759,437 | | 17,759,437 |
| Navigator Prime Portfolio (pp) | | | | 134,644,303 | | 134,644,303 |
| |
|
| Total Short-Term Investments (cost $152,403,740) | | | | 152,403,740 |
| |
|
| Total Investments (cost $849,148,947) 117.2% | | | | 856,460,886 |
| Other Assets and Liabilities (17.2%) | | | | (125,954,221) |
| |
|
| Net Assets 100.0% | | | | | | | | $ 730,506,665 |
| |
|
| (p) | | All or a portion of this security is on loan. |
| 144A | | Security that may be sold to qualified institutional buyers under Rule 144A of the Securities Act of 1933, as amended. |
| | | This security has been determined to be liquid under guidelines established by the Board of Trustees, unless otherwise |
| | | noted. |
| † | | Security initially issued in zero coupon form which converts to coupon form at a specified rate and date. An effective |
| | | interest rate is applied to recognize interest income daily for the bond. This rate is based on total expected interest to |
| | | be earned over the life of the bond which consists of the aggregate coupon-interest payments and discount at |
| | | acquisition. The rate shown is the stated rate at the current period end. |
| # | | When-issued or delayed delivery security |
| * | | Non-income producing security |
| + | | Security is deemed illiquid and is valued using market quotations when readily available. |
| (h) | | Security is valued at fair value as determined by the investment advisor in good faith, according to procedures approved |
| | | by the Board of Trustees. |
| ø | | Evergreen Investment Management Company, LLC is the investment advisor to both the Fund and the money market |
| | | fund. |
| ## | | All or a portion of this security has been segregated for when-issued or delayed delivery securities. |
| (pp) | | Represents investment of cash collateral received from securities on loan. |
See Notes to Financial Statements
19
SCHEDULE OF INVESTMENTS continued
October 31, 2006 (unaudited)
| Summary of Abbreviations | | | |
| FRN Floating Rate Note | | | |
| |
| The following table shows the percent of total investments (excluding equity positions and collateral from securities on loan) by |
| credit quality based on Moody’s and Standard & Poor’s ratings as of October 31, 2006: |
| AAA | | 2.0% | |
| BBB | | 0.6% | |
| BB | | 24.2% | |
| B | | 60.1% | |
| CCC | | 13.1% | |
| |
| |
| | | 100.0% | |
| | |
| |
| |
| The following table shows the percent of total investments (excluding equity positions and collateral from securities on loan) |
| based on effective maturity as of October 31, 2006: |
| Less than 1 year | | 3.5% | |
| 1 to 3 year(s) | | 2.3% | |
| 3 to 5 years | | 13.6% | |
| 5 to 10 years | | 75.6% | |
| 10 to 20 years | | 3.9% | |
| 20 to 30 years | | 1.1% | |
| |
| |
| | | 100.0% | |
| | |
| |
See Notes to Financial Statements
20
STATEMENT OF ASSETS AND LIABILITIES
October 31, 2006 (unaudited)
| Assets | | |
| Investments in securities, at value (cost $831,389,510) including $132,029,271 of | | |
| securities loaned | | $ 838,701,449 |
| Investments in affiliated money market fund, at value (cost $17,759,437) | | 17,759,437 |
|
| Total investments | | 856,460,886 |
| Receivable for securities sold | | 2,399,764 |
| Receivable for Fund shares sold | | 260,636 |
| Interest receivable | | 16,433,092 |
| Receivable for securities lending income | | 19,567 |
| Prepaid expenses and other assets | | 146,279 |
|
| Total assets | | 875,720,224 |
|
| Liabilities | | |
| Dividends payable | | 1,770,962 |
| Payable for securities purchased | | 6,705,756 |
| Payable for Fund shares redeemed | | 1,970,004 |
| Payable for securities on loan | | 134,644,303 |
| Advisory fee payable | | 8,651 |
| Distribution Plan expenses payable | | 160 |
| Due to other related parties | | 2,259 |
| Accrued expenses and other liabilities | | 111,464 |
|
| Total liabilities | | 145,213,559 |
|
| Net assets | | $ 730,506,665 |
|
| Net assets represented by | | |
| Paid-in capital | | $ 866,368,385 |
| Overdistributed net investment income | | (4,843,694) |
| Accumulated net realized losses on investments | | (138,329,965) |
| Net unrealized gains on investments | | 7,311,939 |
|
| Total net assets | | $ 730,506,665 |
|
| Net assets consists of | | |
| Class A | | $ 352,463,011 |
| Class B | | 159,000,875 |
| Class C | | 175,706,545 |
| Class I | | 43,336,234 |
|
| Total net assets | | $ 730,506,665 |
|
| Shares outstanding (unlimited number of shares authorized) | | |
| Class A | | 106,725,104 |
| Class B | | 48,145,170 |
| Class C | | 53,204,033 |
| Class I | | 13,122,698 |
|
| Net asset value per share | | |
| Class A | | $ 3.30 |
| Class A — Offering price (based on sales charge of 4.75%) | | $ 3.46 |
| Class B | | $ 3.30 |
| Class C | | $ 3.30 |
| Class I | | $ 3.30 |
|
See Notes to Financial Statements
21
STATEMENT OF OPERATIONS
Six Months Ended October 31, 2006 (unaudited)
| Investment income | | |
| Interest (net of foreign withholding taxes of $838) | | $ 29,826,764 |
| Income from affiliate | | 820,451 |
| Securities lending | | 309,271 |
| Dividends | | 27,000 |
|
| Total investment income | | 30,983,486 |
|
| Expenses | | |
| Advisory fee | | 1,643,481 |
| Distribution Plan expenses | | |
| Class A | | 550,396 |
| Class B | | 831,897 |
| Class C | | 932,808 |
| Administrative services fee | | 381,824 |
| Transfer agent fees | | 756,674 |
| Trustees’ fees and expenses | | 5,436 |
| Printing and postage expenses | | 44,765 |
| Custodian and accounting fees | | 111,112 |
| Registration and filing fees | | 58,085 |
| Professional fees | | 17,198 |
| Other | | 11,545 |
|
| Total expenses | | 5,345,221 |
| Less: Expense reductions | | (18,268) |
| Expense reimbursements | | (51,447) |
|
| Net expenses | | 5,275,506 |
|
| Net investment income | | 25,707,980 |
|
| Net realized gains on investments | | 1,527,235 |
| Net change in unrealized gains or losses on investments | | (4,866,028) |
|
| Net realized and unrealized gains or losses on investments | | (3,338,793) |
|
| Net increase in net assets resulting from operations | | $ 22,369,187 |
|
See Notes to Financial Statements
22
STATEMENTS OF CHANGES IN NET ASSETS
| | | Six Months Ended | | | | |
| | | October 31, 2006 | | Year Ended |
| | | (unaudited) | | April 30, 2006 |
|
| Operations | | | | | | | | |
| Net investment income | | $ 25,707,980 | | $ 62,351,931 |
| Net realized gains or losses on | | | | | | | | |
| investments | | | | 1,527,235 | | | | (8,091,668) |
| Net change in unrealized gains or | | | | | | | | |
| losses on investments | | | | (4,866,028) | | | | 9,546,925 |
|
| Net increase in net assets resulting | | | | | | | | |
| from operations | | | | 22,369,187 | | | | 63,807,188 |
|
| Distributions to shareholders from | | | | | | | | |
| Net investment income | | | | | | | | |
| Class A | | | | (13,170,929) | | | | (31,245,428) |
| Class B | | | | (5,371,656) | | | | (12,543,324) |
| Class C | | | | (6,032,093) | | | | (15,403,177) |
| Class I | | | | (1,743,791) | | | | (4,575,274) |
|
| Total distributions to shareholders | | | | (26,318,469) | | | | (63,767,203) |
|
| | | Shares | | | | Shares | | |
| Capital share transactions | | | | | | | | |
| Proceeds from shares sold | | | | | | | | |
| Class A | | 4,849,764 | | 15,848,811 | | 24,776,857 | | 83,068,682 |
| Class B | | 1,497,016 | | 4,890,331 | | 4,135,694 | | 13,808,738 |
| Class C | | 1,970,393 | | 6,436,634 | | 4,431,167 | | 14,748,116 |
| Class I | | 1,311,609 | | 4,294,589 | | 9,285,824 | | 31,101,831 |
|
| | | | | 31,470,365 | | | | 142,727,367 |
|
| Net asset value of shares issued in | | | | | | | | |
| reinvestment of distributions | | | | | | | | |
| Class A | | 2,680,240 | | 8,754,936 | | 6,413,132 | | 21,422,043 |
| Class B | | 778,753 | | 2,543,768 | | 1,806,924 | | 6,033,111 |
| Class C | | 947,437 | | 3,094,720 | | 2,451,404 | | 8,188,773 |
| Class I | | 240,109 | | 784,311 | | 494,768 | | 1,650,619 |
|
| | | | | 15,177,735 | | | | 37,294,546 |
|
| Automatic conversion of Class B | | | | | | | | |
| shares to Class A shares | | | | | | | | |
| Class A | | 418,845 | | 1,371,678 | | 1,188,644 | | 3,971,959 |
| Class B | | (418,845) | | (1,371,678) | | (1,188,644) | | (3,971,959) |
|
| | | | | 0 | | | | 0 |
|
| Payment for shares redeemed | | | | | | | | |
| Class A | | (18,429,685) | | (60,195,508) | | (56,163,187) | | (187,595,502) |
| Class B | | (7,008,417) | | (22,899,325) | | (15,347,963) | | (51,155,220) |
| Class C | | (10,646,807) | | (34,766,661) | | (30,896,580) | | (102,833,318) |
| Class I | | (3,622,492) | | (11,857,030) | | (12,796,893) | | (42,836,974) |
|
| | | | | (129,718,524) | | | | (384,421,014) |
|
| Net decrease in net assets resulting | | | | | | | | |
| from capital share transactions | | | | (83,070,424) | | | | (204,399,101) |
|
| Total decrease in net assets | | | | (87,019,706) | | | | (204,359,116) |
| Net assets | | | | | | | | |
| Beginning of period | | | | 817,526,371 | | | | 1,021,885,487 |
|
| End of period | | $ 730,506,665 | | $ 817,526,371 |
|
| Overdistributed net investment income | | $ (4,843,694) | | $ (1,742,300) |
|
See Notes to Financial Statements
23
NOTES TO FINANCIAL STATEMENTS (unaudited)
1. ORGANIZATION
Evergreen High Yield Bond Fund (the “Fund”) is a diversified series of Evergreen Fixed Income Trust (the “Trust”), a Delaware statutory trust organized on September 18, 1997. The Trust is an open-end management investment company registered under the Investment Company Act of 1940, as amended (the “1940 Act”).
The Fund offers Class A, Class B, Class C and Class I shares. Class A shares are sold with a front-end sales charge. However, Class A share investments of $1 million or more are not subject to a front-end sales charge but will be subject to a contingent deferred sales charge of 1.00% upon redemption within one year. Class B shares are sold without a front-end sales charge but are subject to a contingent deferred sales charge that is payable upon redemption and decreases depending on how long the shares have been held. Class C shares are sold without a front-end sales charge but are subject to a contingent deferred sales charge that is payable upon redemption within one year. Class I shares are sold without a front-end sales charge or contingent deferred sales charge. Each class of shares, except Class I shares, pays an ongoing distribution fee.
2. SIGNIFICANT ACCOUNTING POLICIES
The following is a summary of significant accounting policies consistently followed by the Fund in the preparation of its financial statements. The policies are in conformity with generally accepted accounting principles in the United States of America, which require management to make estimates and assumptions that affect amounts reported herein. Actual results could differ from these estimates.
a. Valuation of investments
Portfolio debt securities acquired with more than 60 days to maturity are fair valued using matrix pricing methods determined by an independent pricing service which takes into consideration such factors as similar security prices, yields, maturities, liquidity and ratings. Securities for which valuations are not readily available from an independent pricing service may be valued by brokers which use prices provided by market makers or estimates of market value obtained from yield data relating to investments or securities with similar characteristics.
Listed equity securities are usually valued at the last sales price or official closing price on the national securities exchange where the securities are principally traded.
Foreign securities traded on an established exchange are valued at the last sales price on the exchange where the security is primarily traded. If there has been no sale, the securities are valued at the mean between bid and asked prices. Foreign securities may be valued at fair value according to procedures approved by the Board of Trustees if the closing price is not reflective of current market values due to trading or events occurring in the foreign markets between the close of the established exchange and the valuation time of the Fund. In addition, substantial changes in values in the U.S. markets subsequent to the close of a foreign market may also affect the values of securities traded in the foreign market. The value of foreign securities may be adjusted if such movements in the U.S. market exceed a specified threshold.
24
NOTES TO FINANCIAL STATEMENTS (unaudited) continued
Short-term securities with remaining maturities of 60 days or less at the time of purchase are valued at amortized cost, which approximates market value.
Investments in other mutual funds are valued at net asset value. Securities for which market quotations are not readily available or not reflective of current market value are valued at fair value as determined by the investment advisor in good faith, according to procedures approved by the Board of Trustees.
b. Foreign currency translation
All assets and liabilities denominated in foreign currencies are translated into U.S. dollar amounts at the date of valuation. Purchases and sales of portfolio securities and income items denominated in foreign currencies are translated into U.S. dollar amounts on the respective dates of such transactions. The Fund does not separately account for that portion of the results of operations resulting from changes in foreign exchange rates on investments and the fluctuations arising from changes in market prices of securities held. Such fluctuations are included with the net realized and unrealized gains or losses on investments.
c. When-issued and delayed delivery transactions
The Fund records when-issued or delayed delivery securities as of trade date and maintains security positions such that sufficient liquid assets will be available to make payment for the securities purchased. Securities purchased on a when-issued or delayed delivery basis are marked-to-market daily and begin earning interest on the settlement date. Losses may occur on these transactions due to changes in market conditions or the failure of counterparties to perform under the contract.
d. Securities lending
The Fund may lend its securities to certain qualified brokers in order to earn additional income. The Fund receives compensation in the form of fees or interest earned on the investment of any cash collateral received. The Fund also continues to receive interest and dividends on the securities loaned. The Fund receives collateral in the form of cash or securities with a market value at least equal to the market value of the securities on loan, including accrued interest. In the event of default or bankruptcy by the borrower, the Fund could experience delays and costs in recovering the loaned securities or in gaining access to the collateral. The Fund has the right under the lending agreement to recover the securities from the borrower on demand.
e. Security transactions and investment income
Security transactions are recorded on trade date. Realized gains and losses are computed using the specific cost of the security sold. Interest income is recorded on the accrual basis and includes accretion of discounts and amortization of premiums. Dividend income is recorded on the ex-dividend date. Foreign income and capital gains realized on some securities may be subject to foreign taxes, which are accrued as applicable.
25
NOTES TO FINANCIAL STATEMENTS (unaudited) continued
f. Federal taxes
The Fund intends to continue to qualify as a regulated investment company and distribute all of its taxable income, including any net capital gains (which have already been offset by available capital loss carryovers). Accordingly, no provision for federal taxes is required.
g. Distributions
Distributions to shareholders from net investment income are accrued daily and paid monthly. Distributions from net realized gains, if any, are recorded on the ex-dividend date. Such distributions are determined in conformity with income tax regulations, which may differ from generally accepted accounting principles.
h. Class allocations
Income, common expenses and realized and unrealized gains and losses are allocated to the classes based on the relative net assets of each class. Distribution fees, if any, are calculated daily at the class level based on the appropriate net assets of each class and the specific expense rates applicable to each class.
3. ADVISORY FEE AND OTHER TRANSACTIONS WITH AFFILIATES
Evergreen Investment Management Company, LLC (“EIMC”), an indirect, wholly-owned subsidiary of Wachovia Corporation (“Wachovia”), is the investment advisor to the Fund and is paid a fee at an annual rate of 2% of the Fund’s gross investment income plus an amount determined by applying percentage rates to the average daily net assets of the Fund, starting at 0.31% and declining to 0.16% as average daily net assets increase.
Effective October 1, 2006, Tattersall Advisory Group, Inc. (“TAG”), an indirect, wholly-owned subsidiary of Wachovia, became the investment sub-advisor to the Fund and is paid by EIMC for its services to the Fund.
From time to time, EIMC may voluntarily or contractually waive its fee and/or reimburse expenses in order to limit operating expenses. During the six months ended October 31, 2006, EIMC reimbursed Distribution Plan expenses (see Note 4) relating to Class A shares in the amount of $51,447.
The Fund may invest in Evergreen-managed money market funds, which are also advised by EIMC. Income earned on these investments is included in income from affiliate on the Statement of Operations.
Evergreen Investment Services, Inc. (“EIS”), an indirect, wholly-owned subsidiary of Wachovia, is the administrator to the Fund. As administrator, EIS provides the Fund with facilities, equipment and personnel and is paid an annual rate determined by applying percentage rates to the aggregate average daily net assets of the Evergreen funds (excluding money market funds and Evergreen Institutional Enhanced Income Fund), starting at 0.10% and declining to 0.05% as the aggregate average daily net assets of the Evergreen funds (excluding money market funds and Evergreen Institutional Enhanced Income Fund) increase.
26
NOTES TO FINANCIAL STATEMENTS (unaudited) continued
Evergreen Service Company, LLC (“ESC”), an indirect, wholly-owned subsidiary of Wachovia, is the transfer and dividend disbursing agent for the Fund. ESC receives account fees that vary based on the type of account held by the shareholders in the Fund. For the six months ended October 31, 2006, the transfer agent fees were equivalent to an annual rate of 0.20% of the Fund’s average daily net assets.
4. DISTRIBUTION PLANS
EIS also serves as distributor of the Fund’s shares. The Fund has adopted Distribution Plans, as allowed by Rule 12b-1 of the 1940 Act, for each class of shares, except Class I. Under the Distribution Plans, distribution fees are paid at an annual rate of 0.30% of the average daily net assets for Class A shares and 1.00% of the average daily net assets for each of Class B and Class C shares.
For the six months ended October 31, 2006, EIS received $12,138 from the sale of Class A shares and $275,009 and $1,156 in contingent deferred sales charges from redemptions of Class B and Class C shares, respectively.
5. SECURITIES TRANSACTIONS
Cost of purchases and proceeds from sales of investment securities (excluding short-term securities) were $212,696,472 and $282,072,374, respectively, for the six months ended October 31, 2006.
During the six months ended October 31, 2006, the Fund loaned securities to certain brokers. At October 31, 2006, the value of securities on loan and the value of collateral (including accrued interest) amounted to $132,029,271 and $134,644,303, respectively.
On October 31, 2006, the aggregate cost of securities for federal income tax purposes was $849,184,902. The gross unrealized appreciation and depreciation on securities based on tax cost was $19,107,554 and $11,831,570, respectively, with a net unrealized appreciation of $7,275,984.
As of April 30, 2006, the Fund had $132,422,905 in capital loss carryovers for federal income tax purposes expiring as follows:
| Expiration |
|
| 2008 | | 2009 | | 2010 | | 2011 | | 2014 |
|
| $19,168,229 | | $38,451,200 | | $57,513,490 | | $15,936,101 | | $1,353,885 |
|
For income tax purposes, capital losses incurred after October 31 within the Fund’s fiscal year are deemed to arise on the first business day of the following fiscal year. As of April 30, 2006, the Fund incurred and elected to defer post-October losses of $7,422,177.
27
NOTES TO FINANCIAL STATEMENTS (unaudited) continued
6. INTERFUND LENDING
Pursuant to an Exemptive Order issued by the SEC, the Fund may participate in an interfund lending program with certain funds in the Evergreen fund family. This program allows the Fund to borrow from, or lend money to, other participating funds. During the six months ended October 31, 2006, the Fund did not participate in the interfund lending program.
7. EXPENSE REDUCTIONS
Through expense offset arrangements with ESC and the Fund’s custodian, a portion of fund expenses has been reduced.
8. DEFERRED TRUSTEES’ FEES
Each Trustee of the Fund may defer any or all compensation related to performance of their duties as Trustees. The Trustees’ deferred balances are allocated to deferral accounts, which are included in the accrued expenses for the Fund. The investment performance of the deferral accounts is based on the investment performance of certain Evergreen funds. Any gains earned or losses incurred in the deferral accounts are reported in the Fund’s Trustees’ fees and expenses. At the election of the Trustees, the deferral account will be paid either in one lump sum or in quarterly installments for up to ten years.
9. FINANCING AGREEMENT
The Fund and certain other Evergreen funds share in an unsecured revolving credit commitment for temporary and emergency purposes, including the funding of redemptions, as permitted by each participating fund’s borrowing restrictions. Borrowings under this facility bear interest at 0.50% per annum above the Federal Funds rate. All of the participating funds are charged an annual commitment fee on the unused balance, which is allocated pro rata. The credit facility is for $100 million with an annual commitment fee of 0.08% . Prior to July 3, 2006, the credit facility was for $150 million with an annual commitment fee of 0.09% . During the six months ended October 31, 2006, the Fund had no borrowings.
10. CONCENTRATION OF RISK
The Fund may invest a substantial portion of its assets in an industry or sector and, therefore, may be more affected by changes in that industry or sector than would be a comparable mutual fund that is not heavily weighted in any industry or sector.
11. REGULATORY MATTERS AND LEGAL PROCEEDINGS
Since September 2003, governmental and self-regulatory authorities have instituted numerous ongoing investigations of various practices in the mutual fund industry, including investigations relating to revenue sharing, market-timing, late trading and record retention, among other things. The investigations cover investment advisors, distributors and transfer agents to mutual funds, as well as other firms. EIMC, EIS and ESC (collectively, “Evergreen”) have received subpoenas and other requests for documents and testimony relating to these investigations, are endeavoring to comply with those requests, and are cooperating with the investigations. Evergreen is continuing
28
NOTES TO FINANCIAL STATEMENTS (unaudited) continued
its own internal review of policies, practices, procedures and personnel, and is taking remedial action where appropriate.
In connection with one of these investigations, on July 28, 2004, the staff of the Securities and Exchange Commission (“SEC”) informed Evergreen that the staff intends to recommend to the SEC that it institute an enforcement action against Evergreen. The SEC staff’s proposed allegations relate to (i) an arrangement pursuant to which a broker at one of EIMC’s affiliated broker-dealers had been authorized, apparently by an EIMC officer (who is no longer with EIMC), to engage in short-term trading, on behalf of a client, in Evergreen Mid Cap Growth Fund (formerly Evergreen Emerging Growth Fund and prior to that, known as Evergreen Small Company Growth Fund) during the period from December 2000 through April 2003, in excess of the limitations set forth in the fund’s prospectus, (ii) short-term trading from September 2001 through January 2003, by a former Evergreen portfolio manager of Evergreen Precious Metals Fund, a fund he managed at the time, (iii) the sufficiency of systems for monitoring exchanges and enforcing exchange limitations as stated in the funds’ prospectuses, and (iv) the adequacy of e-mail retention practices. In connection with the activity in Evergreen Mid Cap Growth Fund, EIMC reimbursed the fund $378,905, plus an additional $25,242, representing what EIMC calculated at that time to be the client’s net gain and the fees earned by EIMC and the expenses incurred by this fund on the client’s account. In connection with the activity in Evergreen Precious Metals Fund, EIMC reimbursed the fund $70,878, plus an additional $3,075, representing what EIMC calculated at that time to be the portfolio manager’s net gain and the fees earned by EIMC and expenses incurred by the fund on the portfolio manager’s account. Evergreen is currently engaged in discussions with the staff of the SEC concerning its recommendation.
The staff of the National Association of Securities Dealers (“NASD”) had notified EIS that it has made a preliminary determination to recommend that disciplinary action be brought against EIS for certain violations of the NASD’s rules. The recommendation relates principally to allegations that EIS (i) arranged for fund portfolio trades to be directed to broker-dealers (including Wachovia Securities, LLC, an affiliate of EIS) that sold Evergreen fund shares during the period of January 2001 to December 2003 and (ii) provided non-cash compensation by sponsoring offsite meetings attended by Wachovia Securities, LLC brokers during that period. EIS is cooperating with the NASD staff in its review of these matters.
Any resolution of these matters with regulatory authorities may include, but not be limited to, sanctions, penalties or injunctions regarding Evergreen, restitution to mutual fund shareholders and/or other financial penalties and structural changes in the governance or management of Evergreen’s mutual fund business. Any penalties or restitution will be paid by Evergreen and not by the Evergreen funds.
In addition, the Evergreen funds and EIMC and certain of its affiliates are involved in various legal actions, including private litigation and class action lawsuits. EIMC does not expect that any of such legal actions currently pending or threatened will have a material adverse impact on the
29
NOTES TO FINANCIAL STATEMENTS (unaudited) continued
financial position or operations of any of the Evergreen funds or on EIMC’s ability to provide services to the Evergreen funds.
Although Evergreen believes that neither the foregoing investigations described above nor any pending or threatened legal actions will have a material adverse impact on the Evergreen funds, there can be no assurance that these matters and any publicity surrounding or resulting from them will not result in reduced sales or increased redemptions of Evergreen fund shares, which could increase Evergreen fund transaction costs or operating expenses, or that they will not have other adverse consequences on the Evergreen funds.
12. NEW ACCOUNTING PRONOUNCEMENTS
In June 2006, the Financial Accounting Standards Board (“FASB”) issued FASB Interpretation No. 48, Accounting for Uncertainty in Income Taxes — an interpretation of FASB statement 109 (“FIN 48”). FIN 48 supplements FASB 109 by prescribing a recognition threshold and measurement attribute for the financial statement recognition and measurement of a tax position taken or expected to be taken in a tax return. The adoption of FIN 48 will require financial statements to be adjusted to reflect only those tax positions that are more likely than not to be sustained as of the adoption date. Management of the Fund is currently evaluating the impact that the adoption of FIN 48 will have on the financial statements. FIN 48 will become effective for fiscal years beginning after December 15, 2006.
In September 2006, FASB issued Statement of Financial Accounting Standards No. 157, Fair Value Measurements (“FAS 157”). FAS 157 establishes a single authoritative definition of fair value, establishes a framework for measuring fair value and expands disclosures about fair value measurements. FAS 157 applies to fair value measurements already required or permitted by existing standards. The change to current generally accepted accounting principles from the application of FAS 157 relates to the definition of fair value, the methods used to measure fair value, and the expanded disclosures about fair value measurements. Management of the Fund does not believe the adoption of FAS 157 will materially impact the financial statement amounts, however, additional disclosures may be required about the inputs used to develop the measurements and the effect of certain of the measurements on changes in net assets for the period. FAS 157 is effective for financial statements issued for fiscal years beginning after November 15, 2007 and interim periods within those fiscal years.
30
ADDITIONAL INFORMATION (unaudited)
INFORMATION ABOUT THE REVIEW AND APPROVAL OF THE FUND’S INVESTMENT ADVISORY AGREEMENT
Each year, the Fund’s Board of Trustees is required to consider whether to continue in place the Fund’s investment advisory agreement. In September 2006, the Trustees, including a majority of the Trustees who are not interested persons (as that term is defined in the 1940 Act) of the Fund or of EIMC, approved the continuation of the Fund’s investment advisory agreement. (References below to the “Fund” are to Evergreen High Yield Bond Fund; references to the “funds” are to the Evergreen funds generally.)
At the same time, the Trustees considered the continuation of the investment advisory agreements for all of the funds, and the description below refers in many cases to the Trustees’ process and conclusions in connection with their consideration of this matter for all of the funds. In all of its deliberations, the Board of Trustees and the disinterested Trustees were advised by independent counsel to the disinterested Trustees and counsel to the funds.
Effective October 1, 2006, certain advisory personnel of EIMC were consolidated at TAG. In connection with the consolidation, the Board of Trustees approved a sub-advisory agreement with TAG. In approving that contract, the Trustees considered the factors described below, that the services previously provided by EIMC to the Fund would be provided by EIMC and TAG going forward, and that there would be no related change in the personnel managing the Fund or in the advisory fees paid by the Fund.
The review process. The 1940 Act requires that the Board of Trustees request and evaluate, and that EIMC furnish, such information as may reasonably be necessary to evaluate the terms of a fund’s advisory agreement. The review process began at the time of the last advisory contract-renewal process in September 2005. In the course of that process, the Trustees identified a number of funds that had experienced either short-term or longer-term performance issues. During the following months, the Trustees reviewed information relating to any changes in the performance of those funds and/or any changes in the investment process or the investment teams responsible for the management of the funds. In addition, during the course of the year, the Trustees reviewed information regarding the investment performance of all of the funds and identified additional funds that they believed warranted further attention based on performance since September 2005.
In spring 2006, a committee of the Board of Trustees (the “Committee”), working with EIMC management, determined generally the types of information the Board would review and set a timeline detailing the information required and the dates for its delivery to the Trustees. The independent data provider Lipper Inc. (“Lipper”) was engaged to provide fund-specific and industry-wide data to the Board containing information of a nature and in a format generally prescribed by the Committee. The Committee also identified a number of expense, performance, and other issues and requested specific information as to those issues.
The Trustees reviewed, with the assistance of an independent industry consultant retained by the disinterested Trustees, the information provided by EIMC in response to the Committee’s requests and the information provided by Lipper. In certain instances, the Trustees formed small
31
ADDITIONAL INFORMATION (unaudited) continued
committees to review individual funds in greater detail. In addition, the Trustees requested information regarding brokerage practices of the funds, information regarding closed-end fund discounts to net asset value, and information regarding the various fall-out benefits received directly and indirectly by EIMC and its affiliates from the funds. The Trustees requested and received additional information following that review.
The Committee met several times by telephone to consider the information provided by EIMC. The Committee met in person with representatives of EIMC in early September. At a meeting of the full Board of Trustees later in September, the Committee reported the results of its discussions with EIMC, and the full Board met with representatives of EIMC, engaged in further review of the materials provided to them, and approved the continuation of each of the advisory and sub-advisory agreements.
The disinterested Trustees discussed the continuation of the funds’ advisory agreements with representatives of EIMC and in multiple private sessions with legal counsel at which no personnel of EIMC were present. In considering the continuation of the agreement, the Trustees did not identify any particular information or consideration that was all-important or controlling, and each Trustee attributed different weights to various factors. The Trustees evaluated information provided to them both in terms of the Evergreen mutual funds generally and with respect to each fund, including the Fund, specifically as they considered appropriate; although the Trustees considered the continuation of the agreement as part of the larger process of considering the continuation of the advisory contracts for all of the funds, their determination to continue the advisory agreement for each of the funds was ultimately made on a fund-by-fund basis.
This summary describes a number of the most important, but not necessarily all, of the factors considered by the Board and the disinterested Trustees.
Information reviewed. The Board of Trustees and committees of the Board of Trustees meet periodically during the course of the year. At those meetings, the Board receives a wide variety of information regarding the services performed by EIMC, the investment performance of the funds, and other aspects of the business and operations of the funds. At those meetings, and in the process of considering the continuation of the agreements, the Trustees considered information regarding, for example, the funds’ investment results; the portfolio management teams for the funds and the experience of the members of those teams, and any recent changes in the membership of the teams; portfolio trading practices; compliance by the funds and EIMC with applicable laws and regulations and with the funds’ and EIMC’s compliance policies and procedures; services provided by affiliates of EIMC to the funds and shareholders of the funds; and other information relating to the nature, extent, and quality of services provided by EIMC. The Trustees considered the rates at which the funds pay investment advisory fees, the total expense ratios of the funds, and the efforts generally by EIMC and its affiliates as sponsors of the funds. The data provided by Lipper showed the fees paid by each fund and each fund’s total expense ratio in comparison to other similar mutual funds, in addition to data regarding the investment performance by the funds in comparison to other similar mutual funds. The Trustees were assisted by the independent industry consultant in reviewing the information presented to them.
32
ADDITIONAL INFORMATION (unaudited) continued
Where EIMC or its affiliates provide to other clients advisory services that are comparable to the advisory services provided to a fund, the Trustees considered information regarding the rates at which those other clients pay advisory fees. Fees charged by EIMC to those other clients were generally lower than those charged to the funds. EIMC explained that compliance, reporting, and other legal burdens of providing investment advice to mutual funds greatly exceed those required to provide advisory services to non-mutual fund clients such as retirement or pension plans. In addition, EIMC pointed out that there is substantially greater legal and other risk to EIMC and its affiliates from managing public mutual funds than in managing private accounts. The Trustees also considered the investment performance of other accounts managed by EIMC and its affiliates.
The Trustees considered the transfer agency fees paid by the funds to an affiliate of EIMC and noted that the funds’ transfer agent had received Dalbar’s Mutual Fund Service Award for services provided to shareholders and Dalbar’s Financial Intermediary Service Quality Evaluation Award for services to broker-dealer representatives on a post-sale support basis. They reviewed information presented to them showing generally that the transfer agency fees charged to the funds were generally consistent with industry norms, and that transfer agency fees for a number of the funds had recently declined, or were expected to in the near future.
The Trustees also considered that EIS, an affiliate of EIMC, serves as administrator to the funds and receives a fee for its services as administrator. In their comparison of the advisory fee paid by the funds with those paid by other mutual funds, the Trustees took into account administrative fees paid by the funds and those other mutual funds. The Board considered that EIS serves as distributor to the funds (other than the closed-end funds) and receives fees from the funds for those services. They considered other so-called “fall-out” benefits to EIMC and its affiliates due to their other relationships with the funds, including, for example, soft-dollar services received by EIMC attributable to transactions entered into by EIMC for the benefit of the funds and brokerage commissions received by Wachovia Securities LLC, an affiliate of EIMC, from transactions effected by it for the funds.
Nature and quality of the services provided. The Trustees considered that EIMC and its affili-ates provide a comprehensive investment management service to the fund. They noted that EIMC formulates and implements an investment program for the fund. They noted that EIMC makes its personnel available to serve as officers of the funds, and concluded that the reporting and management functions provided by EIMC with respect to the funds were generally satisfactory. The Trustees considered the investment philosophy of each fund’s portfolio management team, and considered the in-house research capabilities of EIMC and its affiliates, as well as other resources available to EIMC, including research services available to it from third parties. The Board considered the managerial and financial resources available to EIMC and its affiliates, and the commitment that the Wachovia organization has made to the funds generally. On the basis of these factors, they determined that the nature and scope of the services provided by EIMC were consistent with its duties under the investment advisory agreements and appropriate and consistent with the investment programs and best interests of the funds.
33
ADDITIONAL INFORMATION (unaudited) continued
The Trustees noted the resources EIMC and its affiliates have committed to the regulatory, compliance, accounting, tax and oversight of tax reporting, and shareholder servicing functions, and the number and quality of staff committed to those functions, which they concluded were appropriate and generally in line with EIMC’s responsibilities to the Fund and to the funds generally. They noted that recent enhancements to those functions appeared generally appropriate, but considered that the enhancement process is an on-going one and that they would continue to monitor developments in these functions in coming periods for appropriateness and consistency with regulatory and industry developments. The Board and the disinterested Trustees concluded, within the context of their overall conclusions regarding the funds’ advisory agreements, that they were satisfied with the nature, extent, and quality of the services provided by EIMC, including services provided by EIS under its administrative services agreements with the funds.
Investment performance. The Trustees considered the investment performance of each fund, both by comparison to other comparable mutual funds and to broad market indices. The Trustees emphasized that the continuation of the investment advisory agreement for a fund should not be taken as any indication that the Trustees did not believe investment performance for any specific fund might not be improved, and they noted that they would continue to monitor closely the investment performance of the funds going forward.
EIMC noted to the Trustees that EIMC’s high-yield portfolio management team had generally maintained a relatively high-quality bias in that asset class. EIMC reported to the Trustees that, in recent periods, funds with a high-quality bias like the Fund had generally underperformed other investment products investing in lower-quality issuers, contributing substantially to the Fund’s relative underperformance.
In the course of the Trustees’ review of advisory arrangements for the various funds managed exclusively or in part by the high-yield team at EIMC, representatives of EIMC noted that a number of members of the team had recently resigned from EIMC. Representatives of EIMC described the steps that EIMC had taken to continue effective management of the affected funds without interruption, including the steps taken to ensure additional members of the team would be retained and the appointment of a principal portfolio manager of the team with substantial experience in the high-yield space. The Trustees determined that the steps EIMC had taken to date appeared appropriate under the circumstances and approved the continuation of the various advisory agreements in question with the understanding that they would evaluate carefully the capabilities and performance of the high yield team going forward and following the hiring of the additional personnel.
Advisory and administrative fees. The Trustees recognized that EIMC does not seek to provide the lowest cost investment advisory service, but to provide a high quality, full-service investment management product at a reasonable price. They also noted that EIMC has in many cases sought to set its investment advisory fees at levels consistent with industry norms. The Trustees noted that, in certain cases, a fund’s advisory fees and/or its total expense ratio were higher than many
34
ADDITIONAL INFORMATION (unaudited) continued
or most other mutual funds in the same Lipper peer group. However, in each case, the Trustees determined that the level of fees was not such as to prevent the continuation of the advisory agreement.
Economies of scale. The Trustees noted that economies of scale would likely be achieved by EIMC in managing the funds as the funds grow. The Trustees noted that the Fund had implemented breakpoints in its advisory fee structure. The Trustees noted that they would continue to review the appropriate levels of breakpoints in the future, but concluded that the breakpoints as implemented appeared to be a reasonable step toward the realization of economies of scale by the Fund.
Profitability. The Trustees considered information provided to them regarding the profitability to the EIMC organization of the investment advisory, administration, and transfer agency (with respect to the open-end funds only) fees paid to EIMC and its affiliates by each of the funds. They considered that the information provided to them was necessarily estimated, and that the profitability information provided to them, especially on a fund-by-fund basis, did not necessarily provide a definitive tool for evaluating the appropriateness of each fund’s advisory fee. They noted that the levels of profitability of the funds to EIMC varied widely, depending on among other things the size and type of fund. They considered the profitability of the funds in light of such factors as, for example, the information they had received regarding the relation of the fees paid by the funds to those paid by other mutual funds, the investment performance of the funds, and the amount of revenues involved. In light of these factors, the Trustees concluded that the profitability of any of the funds, individually or in the aggregate, should not prevent the Trustees from approving the continuation of the agreements.
35
This page left intentionally blank
36
This page left intentionally blank
37
This page left intentionally blank
38
This page left intentionally blank
39
TRUSTEES AND OFFICERS
TRUSTEES1
| Charles A. Austin III | | Investment Counselor, Anchor Capital Advisors, Inc. (investment advice); Director, The Andover |
| Trustee | | Companies (insurance); Trustee, Arthritis Foundation of New England; Former Director, The |
| DOB: 10/23/1934 | | Francis Ouimet Society; Former Trustee, Mentor Funds and Cash Resource Trust; Former |
| Term of office since: 1991 | | Investment Counselor, Appleton Partners, Inc. (investment advice); Former Director, Executive |
| | | Vice President and Treasurer, State Street Research & Management Company (investment |
| Other directorships: None | | advice) |
|
| Shirley L. Fulton* | | Partner, Tin, Fulton, Greene & Owen, PLLC (law firm); Former Partner, Helms, Henderson & |
| Trustee | | Fulton, P.A. (law firm); Retired Senior Resident Superior Court Judge, 26th Judicial District, |
| DOB: 1/10/1952 | | Charlotte, NC |
| Term of office since: 2004 | | |
| Other directorships: None | | |
|
| K. Dun Gifford | | Chairman and President, Oldways Preservation and Exchange Trust (education); Trustee, |
| Trustee | | Treasurer and Chairman of the Finance Committee, Cambridge College; Former Trustee, Mentor |
| DOB: 10/23/1938 | | Funds and Cash Resource Trust |
| Term of office since: 1974 | | |
| Other directorships: None | | |
|
| Dr. Leroy Keith, Jr. | | Partner, Stonington Partners, Inc. (private equity fund); Trustee, Phoenix Funds Family; Director, |
| Trustee | | Diversapack Co.; Director, Obagi Medical Products Co.; Former Director, Lincoln Educational |
| DOB: 2/14/1939 | | Services; Former Trustee, Mentor Funds and Cash Resource Trust |
| Term of office since: 1983 | | |
| Other directorships: Trustee, The | | |
| Phoenix Group of Mutual Funds | | |
|
| Gerald M. McDonnell | | Manager of Commercial Operations, SMI Steel Co. – South Carolina (steel producer); Former |
| Trustee | | Sales and Marketing Manager, Nucor Steel Company; Former Trustee, Mentor Funds and Cash |
| DOB: 7/14/1939 | | Resource Trust |
| Term of office since: 1988 | | |
| Other directorships: None | | |
|
| Patricia B. Norris2 | | Former Partner, PricewaterhouseCoopers LLP |
| Trustee | | |
| DOB: 4/9/1948 | | |
| Term of office since: 2006 | | |
| Other directorships: None | | |
|
| William Walt Pettit | | Vice President, Kellam & Pettit, P.A. (law firm); Director, Superior Packaging Corp.; Director, |
| Trustee | | National Kidney Foundation of North Carolina, Inc.; Former Trustee, Mentor Funds and Cash |
| DOB: 8/26/1955 | | Resource Trust |
| Term of office since: 1984 | | |
| Other directorships: None | | |
|
| David M. Richardson | | President, Richardson, Runden LLC (executive recruitment business development/consulting |
| Trustee | | company); Consultant, Kennedy Information, Inc. (executive recruitment information and |
| DOB: 9/19/1941 | | research company); Consultant, AESC (The Association of Executive Search Consultants); |
| Term of office since: 1982 | | Director, J&M Cumming Paper Co. (paper merchandising); Former Trustee, NDI Technologies, LLP |
| | | (communications); Former Trustee, Mentor Funds and Cash Resource Trust |
| Other directorships: None | | |
|
| Dr. Russell A. Salton III | | President/CEO, AccessOne MedCard; Former Medical Director, Healthcare Resource Associates, |
| Trustee | | Inc.; Former Medical Director, U.S. Health Care/Aetna Health Services; Former Trustee, Mentor |
| DOB: 6/2/1947 | | Funds and Cash Resource Trust |
| Term of office since: 1984 | | |
| Other directorships: None | | |
|
40
TRUSTEES AND OFFICERS continued
| Michael S. Scofield | | Retired Attorney, Law Offices of Michael S. Scofield; Director and Chairman, Branded Media |
| Trustee | | Corporation (multi-media branding company); Former Trustee, Mentor Funds and Cash |
| DOB: 2/20/1943 | | Resource Trust |
| Term of office since: 1984 | | |
| Other directorships: None | | |
|
| Richard J. Shima | | Independent Consultant; Trustee, Saint Joseph College (CT); Director, Hartford Hospital; Trustee, |
| Trustee | | Greater Hartford YMCA; Former Director, Trust Company of CT; Former Director, Enhance |
| DOB: 8/11/1939 | | Financial Services, Inc.; Former Director, Old State House Association; Former Trustee, Mentor |
| Term of office since: 1993 | | Funds and Cash Resource Trust |
| Other directorships: None | | |
|
| Richard K. Wagoner, CFA3 | | Member and Former President, North Carolina Securities Traders Association; Member, Financial |
| Trustee | | Analysts Society; Former Consultant to the Boards of Trustees of the Evergreen funds; Former |
| DOB: 12/12/1937 | | Trustee, Mentor Funds and Cash Resource Trust |
| Term of office since: 1999 | | |
| Other directorships: None | | |
|
| OFFICERS | | |
| Dennis H. Ferro4 | | Principal occupations: President and Chief Executive Officer, Evergreen Investment Company, |
| President | | Inc. and Executive Vice President, Wachovia Bank, N.A.; former Chief Investment Officer, |
| DOB: 6/20/1945 | | Evergreen Investment Company, Inc. |
| Term of office since: 2003 | | |
|
| Kasey Phillips5 | | Principal occupations: Senior Vice President, Evergreen Investment Services, Inc.; Former Vice |
| Treasurer | | President, Evergreen Investment Services, Inc.; Former Assistant Vice President, Evergreen |
| DOB: 12/12/1970 | | Investment Services, Inc. |
| Term of office since: 2005 | | |
|
| Michael H. Koonce5 | | Principal occupations: Senior Vice President and General Counsel, Evergreen Investment |
| Secretary | | Services, Inc.; Senior Vice President and Assistant General Counsel, Wachovia Corporation |
| DOB: 4/20/1960 | | |
| Term of office since: 2000 | | |
|
| James Angelos5 | | Principal occupations: Chief Compliance Officer and Senior Vice President, Evergreen Funds; |
| Chief Compliance Officer | | Former Director of Compliance, Evergreen Investment Services, Inc. |
| DOB: 9/2/1947 | | |
| Term of office since: 2004 | | |
|
1 Each Trustee serves until a successor is duly elected or qualified or until his/her death, resignation, retirement or removal from office. Each Trustee oversees 91 Evergreen funds. Correspondence for each Trustee may be sent to Evergreen Board of Trustees, P.O. Box 20083, Charlotte, NC 28202.
2 Ms. Norris’ information is as of July 1, 2006, the effective date of her trusteeship.
3 Mr. Wagoner is an “interested person” of the Fund because of his ownership of shares in Wachovia Corporation, the parent to the Fund’s investment advisor.
4 The address of the Officer is 401 S. Tryon Street, 20th Floor, Charlotte, NC 28288.
5 The address of the Officer is 200 Berkeley Street, Boston, MA 02116.
* Shirley L. Fulton served as Trustee through November 20, 2006.
Additional information about the Fund’s Board of Trustees and Officers can be found in the Statement of Additional Information (SAI) and is available upon request without charge by calling 800.343.2898.
41
564355 rv4 12/2006
Evergreen Institutional Mortgage Portfolio

| table of contents |
| 1 | | LETTER TO SHAREHOLDERS |
| 6 | | FUND AT A GLANCE |
| 8 | | ABOUT YOUR FUND’S EXPENSES |
| 9 | | FINANCIAL HIGHLIGHTS |
| 10 | | SCHEDULE OF INVESTMENTS |
| 15 | | STATEMENT OF ASSETS AND LIABILITIES |
| 16 | | STATEMENT OF OPERATIONS |
| 17 | | STATEMENTS OF CHANGES IN NET ASSETS |
| 18 | | NOTES TO FINANCIAL STATEMENTS |
| 24 | | ADDITIONAL INFORMATION |
| 28 | | TRUSTEES AND OFFICERS |
This semiannual report must be preceded or accompanied by a prospectus of the Evergreen fund contained herein. The prospectus contains more complete information, including fees and expenses, and should be read carefully before investing or sending money.
The fund will file its complete schedule of portfolio holdings with the SEC for the first and third quarters of each fiscal year on Form N-Q. The fund’s Form N-Q will be available on the SEC’s Web site at http://www.sec.gov. In addition, the fund’s Form N-Q may be reviewed and copied at the SEC’s Public Reference Room in Washington, D.C. Information on the operation of the Public Reference Room may be obtained by calling 800.SEC.0330.
A description of the fund’s proxy voting policies and procedures, as well as information regarding how the fund voted proxies relating to portfolio securities during the most recent 12-month period ended June 30, is available by visiting our Web site at EvergreenInvestments.com or by visiting the SEC’s Web site at http://www.sec.gov. The fund’s proxy voting policies and procedures are also available without charge, upon request, by calling 800.343.2898.
| Mutual Funds: | | | | |
| NOT FDIC INSURED | MAY LOSE VALUE | NOT BANK GUARANTEED |
Evergreen InvestmentsSM is a service mark of Evergreen Investment Management Company, LLC.
Copyright 2006, Evergreen Investment Management Company, LLC.
Evergreen Investment Management Company, LLC is a subsidiary of Wachovia Corporation
and is an affiliate of Wachovia Corporation’s other Broker Dealer subsidiaries.
Evergreen mutual funds are distributed by Evergreen Investment Services, Inc.
200 Berkeley Street, Boston, MA 02116
LETTER TO SHAREHOLDERS
December 2006

Dennis H. Ferro
President and Chief
Executive Officer
Dear Shareholder:
We are pleased to provide the semi-annual report for the Evergreen Institutional Mortgage Portfolio, covering the six-month period ended October 31, 2006.
Domestic capital markets, both equity and fixed income, faced a wide range of sometimes inconsistent influences during the past six months. In the first two months of the period, investors worried about rapidly rising oil and commodity prices and the effects of the Federal Reserve Board’s persistent efforts to raise short-term interest rates to slow the economy. However, in the final four months, declining oil and commodity prices offered more encouragement to investors willing to take on risk, especially after the Federal Reserve paused in its cycle of credit tightening. Throughout the period, investors warily watched for signs that specific pockets of weakness might lead to a deceleration of growth in the general economy.
Evidence of economic deceleration did appear in the second and third quarters of 2006 — a year which began with a particularly robust rise in Gross Domestic Product (GDP) of more than 5% in the first quarter. GDP growth then slowed to annualized rates of approximately 2.5% and an estimated 2.2% in the second and third quarters, respectively, with weakening most evident in the housing and automotive industries. Yet healthy
1
LETTER TO SHAREHOLDERS continued
growth levels in personal consumption and business investment enabled demand to grow at more historically average rates, enabling the overall economy to absorb the problems in the housing and automobile areas. In addition, energy prices fell dramatically in the waning months of the fiscal period, boosting consumer confidence and raising hopes for lower inflation in the months ahead. However, officials at the Federal Reserve indicated they continued to be concerned about the possibility of rising inflationary pressures.
Over the six-month period, the domestic fixed income market delivered generally positive results, with high-yield corporate debt maintaining a performance edge over investment grade securities, including government bonds.
In managing Evergreen’s fixed income funds, managers focused on interest rate changes, particularly in higher-grade portfolios including the Evergreen Institutional Mortgage Portfolio, the Evergreen U.S. Government Fund and the Evergreen Core Bond Fund. The teams managing the Evergreen High Yield Bond Fund and the Evergreen Select High Yield Bond Fund paid particularly close attention to credit analysis, analyzing factors such as cash flow and corporations’ abilities to meet their debt obligations. Managers of more diversified funds, including the Evergreen Diversified Bond Fund and the Evergreen Strategic Income Fund, also considered factors such as interest rate expectations and yield spreads in making allocations to different sectors within the fixed income market.
2
LETTER TO SHAREHOLDERS continued
As always, we encourage investors to maintain diversified investment portfolios, including allocations to fixed income funds, in pursuit of their long-term investment goals.
Please visit our Web site, EvergreenInvestments.com, for more information about our funds and other investment products available to you. Thank you for your continued support of Evergreen Investments.
Sincerely,

Dennis H. Ferro
President and Chief Executive Officer
Evergreen Investment Company, Inc.
Special Notice to Shareholders:
Please visit our Web site at EvergreenInvestments.com for a statement from President and Chief Executive Officer, Dennis Ferro, addressing NASD actions involving Evergreen Investment Services, Inc. (EIS), Evergreen’s mutual fund distributor or statements from Dennis Ferro and Chairman of the Board of the Evergreen funds, Michael S. Scofield, addressing SEC actions involving the Evergreen funds.
3
Notification of Investment Strategy Change:
Effective February 1, 2007, the Fund may, but will not necessarily, use a variety of derivative instruments, such as futures contracts, options, and swaps, including, for example, index futures, Treasury futures, Eurodollar futures, interest rate swap agreements, credit default swaps, and total return swaps. The Fund may use derivatives both for hedging and non-hedging purposes, including for purposes of enhancing returns. The Fund’s use of derivative instruments involves risks different from, or possibly greater than, the risks associated with other types of investments. For example, the use of derivatives involves the risk of loss due to the failure of another party to the contract (typically referred to as a “counterparty”) to make required payments or otherwise to comply with the contract’s terms. Derivative transactions can create investment leverage and may be highly volatile and may be illiquid or difficult to price. Derivatives are highly specialized instruments, and involve the risk that an investment adviser may not accurately predict the performance of a derivative under all market conditions. When the Fund uses a derivative instrument, it could lose more than the principal amount invested. The various derivative instruments that the Fund may use may change from time to time as new derivative products become available to the Fund. More information about derivatives and the risks associated with them can be found in the Fund’s prospectus and statement of additional information, which may be obtained by calling 1.800.343.2898 or visiting our website at EvergreenInvestments.com.
4
Notice to Shareholders:
• The Fund’s prospectus has been amended to make the following change to the Fund’s short-term trading policy effective April 2, 2007:
To limit the negative effects of short-term trading on the Fund, the Fund’s Board of Trustees has adopted certain restrictions on trading by investors. If an investor redeems more than $5,000 (including redemptions that are a part of an exchange transaction) from an Evergreen Fund, that investor is “blocked” from purchasing shares of the Fund (including purchases that are a part of an exchange transaction) for 30 calendar days after the redemption. The short-term trading policy does not apply to:
- Money market funds;
- Evergreen Institutional Enhanced Income Fund; Evergreen Adjustable Rate Fund; and Evergreen Ultra Short Opportunities Fund;
- Systematic investments or exchanges where Evergreen or the financial intermediary maintaining the shareholder account identifies to Evergreen the transaction as a systematic redemption or purchase at the time of the transaction;
- Rebalancing transactions within certain asset allocation or “wrap” programs where Evergreen or the financial intermediary is able to identify the transaction as part of a firm-approved asset allocation program;
- Purchases by a “fund of funds” into the underlying fund vehicle and purchases by 529 Plans:
- Certain transactions involving participants in employer-sponsored retirement plans, including: participant withdrawals due to mandatory distributions, rollovers and hardships; withdrawals of shares acquired by participants through payroll deductions; and, shares acquired or sold by a participant in connection with plan loans; and
- Purchases below $5,000 (including purchases that are a part of an exchange transaction).
There are certain limitations on the Fund’s ability to detect and prevent short-term trading. For example, while the Fund has access to trading information relating to investors who trade and hold their shares directly with the Fund, the Fund may not have immediate access to such information for investors who trade through financial intermediaries such as broker dealers and financial advisors or through retirement plans. Certain financial intermediaries and retirement plans hold their shares or those of their clients through omnibus accounts maintained with the Fund. The Fund may be unable to compel financial intermediaries to apply the Fund’s short-term trading policy described above. The Fund reserves the right, in its sole discretion, to allow financial intermediaries to apply alternative short-term trading policies. The Fund will use reasonable diligence to confirm that such intermediary is applying the Fund’s short-term trading policy or an acceptable alternative. Consult the disclosure provided by your financial intermediary for any alternative short-term trading policies that may apply to your account. It is possible that excessive short-term trading or trading in violation of the Fund’s trading restrictions may occur despite the Fund’s efforts to prevent them.
• Effective April 2, 2007, the “Reinstatement Privileges” described in the Fund’s prospectus are eliminated.
5
FUND AT A GLANCE
as of October 31, 2006
MANAGEMENT TEAM
Investment Advisor:
• Evergreen Investment Management Company, LLC
Sub-Advisor:
• Tattersall Advisory Group, Inc.
Portfolio Managers:
• Robert Calhoun, CFA
• Mehmet Camurdan, CFA Todd C. Kuimjian, CFA
CURRENT INVESTMENT STYLE
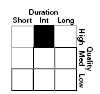
Source: Morningstar, Inc.
Morningstar’s style box is based on a portfolio date as of 9/30/2006.
The Fixed income style box placement is based on a fund’s average effective maturity or duration and the average credit rating of the bond portfolio.
| PERFORMANCE AND RETURNS | | |
|
| |
| Portfolio inception date: 6/19/2002 | | |
| | | Class I |
| Class inception date | | 6/19/2002 |
|
| Nasdaq symbol | | EMSFX |
|
| 6-month return | | 4.41% |
|
| Average annual return | | |
|
| 1-year | | 5.45% |
|
| Since portfolio inception | | 4.25% |
|
| Past performance is no guarantee of future results. The performance quoted represents |
| past performance and current performance may be lower or higher. The investment return and |
| principal value of an investment will fluctuate so that investors’ shares, when redeemed, may be |
| worth more or less than their original cost. To obtain performance information current to the |
| most recent month-end, please go to EvergreenInvestments.com/fundperformance. Performance |
| includes the reinvestment of income dividends and capital gain distributions. Performance shown does not |
| reflect the deduction of taxes that a shareholder would pay on fund distributions or the redemption of fund |
| shares. | | |
| The advisor is reimbursing the fund for a portion of other expenses. Had expenses not been reimbursed, |
| returns would have been lower. | | |
6
FUND AT A GLANCE continued
LONG-TERM GROWTH
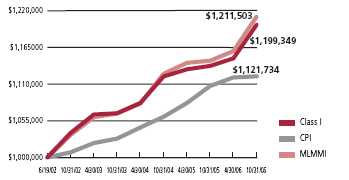
Comparison of a $1,000,000 investment in the Evergreen Institutional Mortgage Portfolio Class I shares versus a similar investment in the Merrill Lynch Mortgage Master Index† (MLMMI) and the Consumer Price Index (CPI).
The MLMMI is an unmanaged market index and does not include transaction costs associated with buying and selling securities, any mutual fund fees or expenses or any taxes. The CPI is a commonly used measure of inflation and does not represent an investment return. It is not possible to invest directly in an index.
Class I shares are only offered to investment advisory clients of an investment advisor of an Evergreen fund (or its advisory affiliates) and through special arrangements entered into on behalf of Evergreen funds with certain financial services firms.
Class I shares are only available to institutional shareholders with a minimum of $1 million investment, which may be waived in certain situations.
The fund’s investment objective may be changed without a vote of the fund’s shareholders.
The return of principal is not guaranteed due to fluctuation in the fund’s NAV caused by changes in the price of individual bonds held by the fund and the buying and selling of bonds by the fund. Bond funds have the same inflation, interest rate and credit risks as individual bonds. Generally, the value of bond funds rise when prevailing interest rates fall, and fall when interest rates rise.
U.S. government guarantees apply only to certain securities held in the fund’s portfolio and not to the fund’s shares.
†Copyright 2006. Merrill Lynch, Pierce, Fenner & Smith Incorporated. All rights reserved.
All data is as of October 31, 2006, and subject to change.
7
ABOUT YOUR FUND’S EXPENSES
The Example below is intended to describe the fees and expenses borne by shareholders and the impact of those costs on your investment.
Example
As a shareholder of the fund, you incur two types of costs: (1) transaction costs, including sales charges (loads), redemption fees and exchange fees; and (2) ongoing costs, including management fees, distribution (12b-1) fees and other fund expenses. This Example is intended to help you understand your ongoing costs (in dollars) of investing in the fund and to compare these costs with the ongoing costs of investing in other mutual funds. The Example is based on an investment of $1,000 invested at the beginning of the period and held for the entire period from May 1, 2006 to October 31, 2006.
The example illustrates your fund’s costs in two ways:
• Actual expenses
The section in the table under the heading “Actual” provides information about actual account values and actual expenses. You may use the information in these columns, together with the amount you invested, to estimate the expenses that you paid over the period. Simply divide your account value by $1,000 (for example, an $8,600 account value divided by $1,000 = 8.6), then multiply the result by the number in the appropriate column for your share class, in the column entitled “Expenses Paid During Period” to estimate the expenses you paid on your account during this period.
• Hypothetical example for comparison purposes
The section in the table under the heading “Hypothetical (5% return before expenses)” provides information about hypothetical account values and hypothetical expenses based on the fund’s actual expense ratio and an assumed rate of return of 5% per year before expenses, which is not the fund’s actual return. The hypothetical account values and expenses may not be used to estimate the actual ending account balance or expenses you paid for the period. You may use this information to compare the ongoing costs of investing in the fund and other funds. To do so, compare this 5% hypothetical example with the 5% hypothetical examples that appear in the shareholder reports of the other funds.
Please note that the expenses shown in the table are meant to highlight your ongoing costs only and do not reflect any transactional costs, such as sales charges (loads), redemption fees or exchange fees. Therefore, the section in the table under the heading “Hypothetical (5% return before expenses)” is useful in comparing ongoing costs only, and will not help you determine the relative total costs of owning different funds. In addition, if these transactional costs were included, your costs would have been higher.
| | | Beginning | | Ending | | |
| | | Account | | Account | | Expenses |
| | | Value | | Value | | Paid During |
| | | 5/1/2006 | | 10/31/2006 | | Period* |
|
| Actual | | | | | | |
| Class I | | $ 1,000.00 | | $ 1,044.09 | | $ 1.03 |
| Hypothetical | | | | | | |
| (5% return | | | | | | |
| before expenses) | | | | | | |
| Class I | | $ 1,000.00 | | $ 1,024.20 | | $ 1.02 |
|
* Expenses are equal to the Fund’s annualized expense ratio (0.20% for Class I), multiplied by the average account value over the period, multiplied by 184 / 365 days.
8
FINANCIAL HIGHLIGHTS
(For a share outstanding throughout each period)
| | | Six Months Ended | | Year Ended April 30, |
| | | October 31, 2006 | |
|
| CLASS I | | (unaudited) | | 2006 | | 2005 | | 2004 | | 20031 |
|
| Net asset value, beginning of period | | $ | | 9.57 | | $ 9.89 | | $ 9.89 | | $ 10.18 | | $ 10.00 |
|
| Income from investment operations | | | | | | | | | | | | |
| Net investment income (loss) | | | | 0.24 | | 0.43 | | 0.35 | | 0.35 | | 0.40 |
Net realized and unrealized gains
or losses on investments | | | | 0.18 | | (0.29) | | 0.10 | | (0.18) | | 0.23 |
| |
|
| Total from investment operations | | | | 0.42 | | 0.14 | | 0.45 | | 0.17 | | 0.63 |
|
| Distributions to shareholders from | | | | | | | | | | | | |
| Net investment income | | | | (0.25) | | (0.46) | | (0.45) | | (0.45) | | (0.40) |
| Net realized gains | | | | 0 | | 0 | | 0 | | (0.01) | | (0.05) |
| |
|
| Total distributions to shareholders | | | | (0.25) | | (0.46) | | (0.45) | | (0.46) | | (0.45) |
|
| Net asset value, end of period | | $ | | 9.74 | | $ 9.57 | | $ 9.89 | | $ 9.89 | | $ 10.18 |
|
| Total return | | | | 4.41% | | 1.45% | | 4.66% | | 1.63% | | 6.45% |
|
| Ratios and supplemental data | | | | | | | | | | | | |
| Net assets, end of period (thousands) | | $62,816 | | $58,552 | | $45,997 | | $48,032 | | $28,423 |
| Ratios to average net assets | | | | | | | | | | | | |
Expenses including waivers/reimbursements
but excluding expense reductions | | | | 0.20%2 | | 0.20% | | 0.20% | | 0.20% | | 0.12%2 |
Expenses excluding waivers/reimbursements
and expense reductions | | | | 0.21%2 | | 0.21% | | 0.24% | | 0.28% | | 0.45%2 |
| Net investment income (loss) | | | | 4.98%2 | | 4.37% | | 3.44% | | 3.33% | | 4.74%2 |
| Portfolio turnover rate | | | | 132% | | 121% | | 177% | | 327% | | 148% |
|
1 For the period from June 19, 2002 (commencement of operations), to April 30, 2003.
2 Annualized
See Notes to Financial Statements
9
SCHEDULE OF INVESTMENTS
October 31, 2006 (unaudited)
| | | | | | | Principal | | | | |
| | | | | | | Amount | | | | Value |
|
| |
| AGENCY COMMERCIAL MORTGAGE-BACKED SECURITIES 13.0% | | | | | | | | |
| FIXED-RATE 13.0% | | | | | | | | | | |
| FHLMC: | | | | | | | | | | |
| 6.90%, 12/01/2010 | | | | $ | | 545,000 | | $ | | 578,599 |
| 6.98%, 10/01/2020 | | | | | | 441,600 | | | | 468,405 |
| FNMA: | | | | | | | | | | |
| 4.06%, 06/01/2013 # | | | | | | 588,000 | | | | 552,131 |
| 4.83%, 03/01/2013 | | | | | | 666,826 | | | | 656,932 |
| 5.65%, 02/01/2009 | | | | | | 235,767 | | | | 238,469 |
| 5.78%, 11/01/2011 | | | | | | 787,750 | | | | 806,983 |
| 6.01%, 02/01/2012 | | | | | | 322,792 | | | | 334,168 |
| 6.02%, 05/01/2011 | | | | | | 452,851 | | | | 466,857 |
| 6.09%, 05/01/2011 | | | | | | 536,668 | | | | 553,072 |
| 6.15%, 05/01/2011 | | | | | | 225,913 | | | | 232,985 |
| 6.19%, 09/01/2008 | | | | | | 446,249 | | | | 449,904 |
| 6.22%, 04/01/2008 | | | | | | 513,378 | | | | 515,452 |
| 6.65%, 12/01/2007 | | | | | | 221,371 | | | | 222,143 |
| 6.79%, 07/01/2009 | | | | | | 91,391 | | | | 93,980 |
| 6.91%, 07/01/2009 | | | | | | 278,367 | | | | 286,947 |
| 7.09%, 07/01/2009 | | | | | | 275,023 | | | | 284,707 |
| 7.21%, 05/01/2007 | | | | | | 134,343 | | | | 134,044 |
| 7.26%, 12/01/2010 | | | | | | 277,289 | | | | 295,937 |
| 7.27%, 06/01/2007 - 02/01/2010 | | | | | | 711,529 | | | | 733,899 |
| 7.57%, 04/01/2010 | | | | | | 247,778 | | | | 262,512 |
| |
|
| Total Agency Commercial Mortgage-Backed Securities | | | | | | | | | | |
| (cost $8,488,871) | | | | | | | | | | 8,168,126 |
| |
|
| AGENCY MORTGAGE-BACKED COLLATERALIZED | | | | | | | | | | |
| MORTGAGE OBLIGATIONS 20.8% | | | | | | | | | | |
| FIXED-RATE 20.8% | | | | | | | | | | |
| FHLMC: | | | | | | | | | | |
| Ser. 2656, Class BG, 5.00%, 10/15/2032 | | | | | | 840,000 | | | | 820,038 |
| Ser. 2748, Class LE, 4.50%, 12/15/2017 | | | | | | 710,000 | | | | 688,489 |
| Ser. 2841, Class PC, 5.50%, 07/15/2030 | | | | | | 870,000 | | | | 870,833 |
| Ser. 2856, Class PC, 5.50%, 08/15/2030 | | | | | | 565,000 | | | | 563,481 |
| Ser. 2941, Class XC, 5.00%, 12/15/2030 | | | | | | 550,000 | | | | 539,907 |
| Ser. 3015, Class EM, 5.00%, 10/15/2033 | | | | | | 515,000 | | | | 494,563 |
| Ser. 3072, Class NK, 5.00%, 05/15/2031 | | | | | | 407,014 | | | | 402,616 |
| Ser. 3079, Class MD, 5.00%, 03/15/2034 | | | | | | 550,000 | | | | 528,168 |
| Ser. 3082, Class PJ, 5.00%, 09/15/2034 | | | | | | 550,000 | | | | 527,640 |
| Ser. 3096, Class LD, 5.00%, 01/15/2034 | | | | | | 605,000 | | | | 580,117 |
| Ser. 3098, Class PE, 5.00%, 06/15/2034 | | | | | | 550,000 | | | | 527,828 |
| Ser. 3102, Class PJ, 5.00%, 05/15/2034 | | | | | | 300,000 | | | | 288,385 |
| Ser. 3104, Class QD, 5.00%, 05/15/2034 | | | | | | 550,000 | | | | 528,703 |
| Ser. 3138, Class PC, 5.50%, 06/15/2032 | | | | | | 1,325,000 | | | | 1,318,063 |
| Ser. 3187, Class JA, 5.00%, 02/15/2032 | | | | | | 715,223 | | | | 702,814 |
See Notes to Financial Statements
10
SCHEDULE OF INVESTMENTS continued
October 31, 2006 (unaudited)
| | | | | | | Principal | | | | |
| | | | | | | Amount | | | | Value |
|
| |
| AGENCY MORTGAGE-BACKED COLLATERALIZED | | | | | | | | | | |
| MORTGAGE OBLIGATIONS continued | | | | | | | | | | |
| FIXED-RATE continued | | | | | | | | | | |
| FNMA: | | | | | | | | | | |
| Ser. 2001-71, Class QE, 6.00%, 12/25/2016 | | | | $ | | 294,876 | | $ | | 299,603 |
| Ser. 2004-26, Class PA, 4.50%, 09/25/2025 | | | | | | 1,527,129 | | | | 1,506,725 |
| Ser. 2005-20, Class QE, 5.00%, 10/25/2030 | | | | | | 730,000 | | | | 714,904 |
| Ser. 2005-38, Class QJ, 5.50%, 03/25/2033 | | | | | | 600,969 | | | | 597,827 |
| Ser. 2006-26, Class QC, 5.50%, 02/25/2032 | | | | | | 580,000 | | | | 576,116 |
| |
|
| Total Agency Mortgage-Backed Collateralized Mortgage Obligations | | | | | | | | |
| (cost $12,986,587) | | | | | | | | | | 13,076,820 |
| |
|
| AGENCY MORTGAGE-BACKED PASS THROUGH SECURITIES 39.7% | | | | | | | | |
| FIXED-RATE 37.4% | | | | | | | | | | |
| FHLMC: | | | | | | | | | | |
| 4.50%, 04/01/2035 | | | | | | 1,208,350 | | | | 1,134,543 |
| 5.00%, 04/01/2021 - 12/01/2035 | | | | | | 3,766,955 | | | | 3,658,213 |
| 6.50%, 09/01/2019 | | | | | | 521,442 | | | | 532,910 |
| FNMA: | | | | | | | | | | |
| 4.50%, 04/01/2019 | | | | | | 368,707 | | | | 357,184 |
| 5.43%, 04/01/2036 | | | | | | 645,226 | | | | 638,916 |
| 5.46%, 01/01/2036 | | | | | | 803,168 | | | | 802,555 |
| 5.50%, 02/01/2035 - 09/01/2035 | | | | | | 4,403,046 | | | | 4,358,207 |
| 5.51%, 02/01/2036 - 03/01/2036 | | | | | | 1,275,578 | | | | 1,268,579 |
| 5.87%, 07/01/2036 | | | | | | 696,542 | | | | 699,789 |
| 5.94%, 11/01/2036 | | | | | | 575,000 | | | | 583,418 |
| 7.00%, 05/01/2032 | | | | | | 69,125 | | | | 71,362 |
| 7.50%, 11/01/2029 - 12/01/2029 | | | | | | 24,863 | | | | 25,972 |
| FNMA 15 year, 5.00%, TBA # | | | | | | 3,435,000 | | | | 3,383,475 |
| FNMA 30 year: | | | | | | | | | | |
| 5.50%, TBA # | | | | | | 645,000 | | | | 637,542 |
| 6.00%, TBA # | | | | | | 5,105,000 | | | | 5,136,906 |
| GNMA, 5.50%, 07/20/2030 | | | | | | 222,904 | | | | 224,262 |
| |
|
| | | | | | | | | | | 23,513,833 |
| |
|
| FLOATING-RATE 2.3% | | | | | | | | | | |
| FHLMC, 5.33%, 12/01/2035 | | | | | | 539,178 | | | | 537,512 |
| FNMA: | | | | | | | | | | |
| 5.33%, 09/01/2035 | | | | | | 384,455 | | | | 380,558 |
| 5.48%, 01/01/2036 | | | | | | 493,346 | | | | 490,553 |
| |
|
| | | | | | | | | | | 1,408,623 |
| |
|
| Total Agency Mortgage-Backed Pass Through Securities | | | | | | | | | | |
| (cost $24,950,906) | | | | | | | | | | 24,922,456 |
| |
|
See Notes to Financial Statements
11
SCHEDULE OF INVESTMENTS continued
October 31, 2006 (unaudited)
| | | | | Principal | | | | |
| | | | | Amount | | | | Value |
|
| |
| AGENCY REPERFORMING MORTGAGE-BACKED COLLATERALIZED | | | | | | | | |
| MORTGAGE OBLIGATIONS 1.4% | | | | | | | | |
| FNMA, Ser. 2003-W19, Class 1A5, 5.50%, 11/25/2033 (cost $949,443) | | $ | | 911,436 | | $ | | 906,378 |
| ASSET-BACKED SECURITIES 2.1% | | | | | | | | |
| Deutsche Securities, Inc.: | | | | | | | | |
| Ser. 2005-3, Class 4A5, 5.25%, 06/25/2035 | | | | 190,000 | | | | 188,042 |
| Ser. 2006-AB2, Class A3, 6.27%, 06/25/2036 | | | | 575,000 | | | | 583,981 |
| Morgan Stanley Mtge. Trust, Ser. 2006-2, Class 5A3, 5.50%, 02/25/2036 | | | | 290,000 | | | | 282,453 |
| Vanderbilt Mtge. & Fin., Inc., Ser. 2002-B, Class A3, 4.70%, 10/17/2018 | | | | 259,069 | | | | 257,294 |
| |
|
| Total Asset-Backed Securities (cost $1,307,009) | | | | | | | | 1,311,770 |
| |
|
| COMMERCIAL MORTGAGE-BACKED SECURITIES 13.3% | | | | | | | | |
| FIXED-RATE 13.3% | | | | | | | | |
| Banc of America Comml. Mtge. Securities, Inc.: | | | | | | | | |
| Ser. 2004-1, Class A4, 4.76%, 11/10/2039 | | | | 535,000 | | | | 519,635 |
| Ser. 2004-4, Class A6, 4.88%, 07/10/2042 | | | | 1,000,000 | | | | 975,724 |
| Bear Stearns Comml. Mtge. Securities, Inc., Ser. 2003-T12, | | | | | | | | |
| Class A4, 4.68%, 08/13/2039 | | | | 570,000 | | | | 553,539 |
| Credit Suisse First Boston Mtge. Securities Corp., Ser. 2003-C5, | | | | | | | | |
| Class A4, 4.90%, 12/15/2036 | | | | 200,000 | | | | 196,066 |
| Goldman Sachs Mtge. Securities Corp. II: | | | | | | | | |
| Ser. 2003-C1, Class A1, 2.90%, 01/10/2040 | | | | 368,775 | | | | 362,073 |
| Ser. 2004-GG2, Class A6, 5.40%, 08/10/2038 | | | | 1,000,000 | | | | 1,008,214 |
| JPMorgan Chase & Co. Comml. Mtge. Securities Corp.: | | | | | | | | |
| Ser. 2004-CB8, Class A4, 4.40%, 01/12/2039 | | | | 840,000 | | | | 796,241 |
| Ser. 2004-PNC1, Class A4, 5.37%, 06/12/2041 | | | | 605,000 | | | | 612,723 |
| LB-UBS Comml. Mtge. Trust: | | | | | | | | |
| Ser. 2003-C3, Class A4, 4.17%, 05/15/2032 | | | | 440,000 | | | | 415,600 |
| Ser. 2004-C2, Class A4, 4.37%, 03/15/2036 | | | | 1,500,000 | | | | 1,421,838 |
| Ser. 2004-C7, Class A6, 4.79%, 10/15/2029 | | | | 545,000 | | | | 529,443 |
| Morgan Stanley Capital I, Inc.: | | | | | | | | |
| Ser. 1998-XL1, Class A2, 6.45%, 06/03/2030 | | | | 8,348 | | | | 8,350 |
| Ser. 2003-T11, Class A4, 5.15%, 06/13/2041 | | | | 670,000 | | | | 667,748 |
| Wachovia Bank Comml. Mtge. Trust, Ser. 2003-C8, | | | | | | | | |
| Class A1, 3.44%, 11/15/2035 | | | | 268,803 | | | | 261,704 |
| |
|
| Total Commercial Mortgage-Backed Securities (cost $8,311,234) | | | | | | | | 8,328,898 |
| |
|
| U.S. TREASURY OBLIGATIONS 0.6% | | | | | | | | |
| U.S. Treasury Notes: | | | | | | | | |
| 3.00%, 02/15/2008 | | | | 140,000 | | | | 136,888 |
| 4.25%, 08/15/2015 | | | | 265,000 | | | | 258,417 |
| |
|
| Total U.S. Treasury Obligations (cost $391,643) | | | | | | | | 395,305 |
| |
|
See Notes to Financial Statements
12
SCHEDULE OF INVESTMENTS continued
October 31, 2006 (unaudited)
| | | | | | | Principal | | | | |
| | | | | | | Amount | | | | Value |
|
| |
| WHOLE LOAN MORTGAGE-BACKED COLLATERALIZED | | | | | | | | | | |
| MORTGAGE OBLIGATIONS 5.9% | | | | | | | | | | |
| FIXED-RATE 4.7% | | | | | | | | | | |
| Wells Fargo Mtge. Backed Securities Trust: | | | | | | | | | | |
| Ser. 2006-AR7, Class 2A5, 5.62%, 05/25/2036 | | | | $ | | 560,000 | | $ | | 567,302 |
| Ser. 2006-AR10, Class 5A1, 5.61%, 07/25/2036 | | | | | | 441,935 | | | | 445,449 |
| |
|
| | | | | | | | | | | 1,012,751 |
| |
|
| FLOATING-RATE 1.2% | | | | | | | | | | |
| Banc of America Mtge. Securities, Inc., Ser. 2005-D, | | | | | | | | | | |
| Class 2A6, 4.78%, 05/25/2035 | | | | | | 230,000 | | | | 224,978 |
| IndyMac INDX Mtge. Loan Trust, Ser. 2006-AR11, | | | | | | | | | | |
| Class 3A1, 5.88%, 06/25/2036 | | | | | | 570,411 | | | | 569,630 |
| Washington Mutual, Inc.: | | | | | | | | | | |
| Ser. 2005-AR5, Class A5, 4.67%, 05/25/2035 | | | | | | 690,000 | | | | 675,102 |
| Ser. 2006-AR10, Class 1A1, 5.98%, 09/25/2036 | | | | | | 1,231,325 | | | | 1,244,993 |
| |
|
| | | | | | | | | | | 2,714,703 |
| |
|
| Total Whole Loan Mortgage-Backed Collateralized Mortgage Obligations | | | | | | | | |
| (cost $3,698,737) | | | | | | | | | | 3,727,454 |
| |
|
| WHOLE LOAN MORTGAGE-BACKED PASS THROUGH SECURITIES 1.0% | | | | | | | | |
| FIXED-RATE 1.0% | | | | | | | | | | |
| Residential Funding Mtge. Securities, Ser. 2006-SA2, Class 2A1, 5.89%, | | | | | | | | | | |
| 08/25/2036 (cost $595,166) | | | | | | 595,073 | | | | 597,156 |
|
| |
| | | | | | | Shares | | | | Value |
|
| |
| SHORT-TERM INVESTMENTS 17.2% | | | | | | | | | | |
| MUTUAL FUND SHARES 17.2% | | | | | | | | | | |
| Evergreen Institutional Money Market Fund ø ## (cost $10,824,146) | | | | | | 10,824,146 | | | | 10,824,146 |
| |
|
| Total Investments (cost $72,503,742) 115.0% | | | | | | | | | | 72,258,509 |
| Other Assets and Liabilities (15.0%) | | | | | | | | | | (9,442,748) |
| |
|
| Net Assets 100.0% | | | | | | | | $ | | 62,815,761 |
| |
|
| # | | When-issued or delayed delivery security |
| ø | | Evergreen Investment Management Company, LLC is the investment advisor to both the Fund and the money market |
| | | fund. |
| ## | | All or a portion of this security has been segregated for when-issued or delayed delivery securities. |
Summary of Abbreviations
| FHLMC | | Federal Home Loan Mortgage Corp. |
| FNMA | | Federal National Mortgage Association |
| GNMA | | Government National Mortgage Association |
| TBA | | To Be Announced |
See Notes to Financial Statements
13
SCHEDULE OF INVESTMENTS continued
October 31, 2006 (unaudited)
The following table shows the percent of total investments (excluding segregated cash and cash equivalents) by credit quality based on Moody’s and Standard & Poor’s ratings as of October 31, 2006:
The following table shows the percent of total investments (excluding cash and cash equivalents) by maturity as of October 31, 2006:
| Less than 1 year | | 4.7% |
| 1 to 3 year(s) | | 7.5% |
| 3 to 5 years | | 25.5% |
| 5 to 10 years | | 57.5% |
| 10 to 20 years | | 4.8% |
| |
|
| | | 100.0% |
| | |
|
See Notes to Financial Statements
14
STATEMENT OF ASSETS AND LIABILITIES
October 31, 2006 (unaudited)
| Assets | | | | |
| Investments in securities, at value (cost $61,679,596) | | $ | | 61,434,363 |
| Investments in affiliated money market fund, at value (cost $10,824,146) | | | | 10,824,146 |
|
| Total investments | | | | 72,258,509 |
| Receivable for securities sold | | | | 1,243,661 |
| Principal paydown receivable | | | | 17,559 |
| Interest receivable | | | | 304,752 |
| Receivable from investment advisor | | | | 20 |
| Prepaid expenses and other assets | | | | 4,328 |
|
| Total assets | | | | 73,828,829 |
|
| Liabilities | | | | |
| Dividends payable | | | | 198,355 |
| Payable for securities purchased | | | | 10,214,245 |
| Payable for Fund shares redeemed | | | | 589,169 |
| Due to related parties | | | | 584 |
| Accrued expenses and other liabilities | | | | 10,715 |
|
| Total liabilities | | | | 11,013,068 |
|
| Net assets | | $ | | 62,815,761 |
|
| Net assets represented by | | | | |
| Paid-in capital | | $ | | 64,531,961 |
| Overdistributed net investment income | | | | (112,405) |
| Accumulated net realized losses on investments | | | | (1,358,562) |
| Net unrealized losses on investments | | | | (245,233) |
|
| Total net assets | | $ | | 62,815,761 |
|
| Shares outstanding (unlimited number of shares authorized) | | | | |
| Class I | | | | 6,446,935 |
|
| Net asset value per share | | | | |
| Class I | | $ | | 9.74 |
|
See Notes to Financial Statements
15
STATEMENT OF OPERATIONS
Six Months Ended October 31, 2006 (unaudited)
| Investment income | | | | |
| Interest | | $ | | 1,259,841 |
| Income from affiliate | | | | 320,409 |
|
| Total investment income | | | | 1,580,250 |
|
| Expenses | | | | |
| Administrative services fee | | | | 30,367 |
| Transfer agent fees | | | | 604 |
| Trustees’ fees and expenses | | | | 461 |
| Printing and postage expenses | | | | 8,377 |
| Custodian and accounting fees | | | | 11,025 |
| Registration and filing fees | | | | 5,102 |
| Professional fees | | | | 8,470 |
| Other | | | | 742 |
|
| Total expenses | | | | 65,148 |
| Less: Expense reductions | | | | (971) |
| Expense reimbursement | | | | (3,214) |
|
| Net expenses | | | | 60,963 |
|
| Net investment income | | | | 1,519,287 |
|
| Net realized and unrealized gains or losses on investments | | | | |
| Net realized gains on investments | | | | 116,176 |
| Net change in unrealized gains or losses on investments | | | | 1,111,994 |
|
| Net realized and unrealized gains or losses on investments | | | | 1,228,170 |
|
| Net increase in net assets resulting from operations | | $ | | 2,747,457 |
|
See Notes to Financial Statements
16
STATEMENTS OF CHANGES IN NET ASSETS
| | | Six Months Ended | | | | |
| | | October 31, 2006 | | Year Ended |
| | | (unaudited) | | April 30, 2006 |
|
| Operations | | | | | | | | |
| Net investment income | | $ | | 1,519,287 | | $ | | 2,281,754 |
| Net realized gains or losses | | | | | | | | |
| on investments | | | | 116,176 | | | | (620,215) |
| Net change in unrealized gains or losses | | | | | | | | |
| on investments | | | | 1,111,994 | | | | (989,569) |
|
| Net increase in net assets resulting | | | | | | | | |
| from operations | | | | 2,747,457 | | | | 671,970 |
|
| Distributions to shareholders from | | | | | | | | |
| net investment income | | | | (1,552,818) | | | | (2,474,782) |
|
| | | Shares | | | | Shares | | |
| Capital share transactions | | | | | | | | |
| Proceeds from shares sold | | 1,655,074 | | 15,816,882 | | 3,547,339 | | 34,596,127 |
| Net asset value of shares issued in | | | | | | | | |
| reinvestment of distributions | | 38,715 | | 372,890 | | 73,142 | | 713,879 |
| Payment for shares redeemed | | (1,363,258) | | (13,120,164) | | (2,153,232) | | (20,953,110) |
|
| Net increase in net assets resulting | | | | | | | | |
| from capital share transactions | | | | 3,069,608 | | | | 14,356,896 |
|
| Total increase in net assets resulting | | | | | | | | |
| from capital share transactions | | | | 4,264,247 | | | | 12,554,084 |
| Net assets | | | | | | | | |
| Beginning of period | | | | 58,551,514 | | | | 45,997,430 |
|
| End of period | | $ | | 62,815,761 | | $ | | 58,551,514 |
|
| Overdistributed net investment income | | $ | | (112,405) | | $ | | (78,874) |
|
See Notes to Financial Statements
17
NOTES TO FINANCIAL STATEMENTS (unaudited)
1. ORGANIZATION
Evergreen Institutional Mortgage Portfolio Fund (the “Fund”) is a diversified series of Evergreen Fixed Income Trust (the “Trust”), a Delaware statutory trust organized on September 18, 1997. The Trust is an open-end management investment company registered under the Investment Company Act of 1940, as amended (the “1940 Act”).
The Fund offers Class I shares. Class I shares are sold without a front-end sales charge or contingent deferred sales charge.
2. SIGNIFICANT ACCOUNTING POLICIES
The following is a summary of significant accounting policies consistently followed by the Fund in the preparation of its financial statements. The policies are in conformity with generally accepted accounting principles in the United States of America, which require management to make estimates and assumptions that affect amounts reported herein. Actual results could differ from these estimates.
a. Valuation of investments
Portfolio debt securities acquired with more than 60 days to maturity are fair valued using matrix pricing methods determined by an independent pricing service which takes into consideration such factors as similar security prices, yields, maturities, liquidity and ratings. Securities for which valuations are not readily available from an independent pricing service may be valued by brokers which use prices provided by market makers or estimates of market value obtained from yield data relating to investments or securities with similar characteristics.
Short-term securities with remaining maturities of 60 days or less at the time of purchase are valued at amortized cost, which approximates market value.
Investments in other mutual funds are valued at net asset value. Securities for which market quotations are not readily available or not reflective of current market value are valued at fair value as determined by the investment advisor in good faith, according to procedures approved by the Board of Trustees.
b. When-issued and delayed delivery transactions
The Fund records when-issued or delayed delivery securities as of trade date and maintains security positions such that sufficient liquid assets will be available to make payment for the securities purchased. Securities purchased on a when-issued or delayed delivery basis are marked-to-market daily and begin earning interest on the settlement date. Losses may occur on these transactions due to changes in market conditions or the failure of counterparties to perform under the contract.
c. Dollar roll transactions
The Fund may enter into dollar roll transactions with respect to mortgage-backed securities. In a dollar roll transaction, the Fund sells mortgage-backed securities to financial institutions and simultaneously agrees to accept substantially similar (same type, coupon and maturity) securities at a later date at an agreed upon price. The Fund will use the proceeds generated from the trans-
18
NOTES TO FINANCIAL STATEMENTS (unaudited) continued
actions to invest in short-term investments, which may enhance the Fund’s current yield and total return. The Fund accounts for dollar roll transactions as purchases and sales. The Fund could be exposed to risks if the counterparty defaults on its obligation to perform under the terms of the agreement, if the Fund receives inferior securities in comparison to what was sold to the counter-party at redelivery or if there are variances in paydown speed between the mortgage-related pools.
d. Security transactions and investment income
Security transactions are recorded on trade date. Realized gains and losses are computed using the specific cost of the security sold. Interest income is recorded on the accrual basis and includes accretion of discounts and amortization of premiums.
e. Federal taxes
The Fund intends to continue to qualify as a regulated investment company and distribute all of its taxable income, including any net capital gains (which have already been offset by available capital loss carryovers). Accordingly, no provision for federal taxes is required.
f. Distributions
Distributions to shareholders from net investment income are accrued daily and paid monthly. Distributions from net realized gains, if any, are recorded on the ex-dividend date. Such distributions are determined in conformity with income tax regulations, which may differ from generally accepted accounting principles.
3. ADVISORY FEE AND OTHER TRANSACTIONS WITH AFFILIATES
Evergreen Investment Management Company, LLC (“EIMC”), an indirect, wholly-owned subsidiary of Wachovia Corporation (“Wachovia”), is the investment advisor to the Fund. The Fund does not pay a fee for the investment advisory service.
Tattersall Advisory Group, Inc. (“TAG”), an indirect, wholly-owned subsidiary of Wachovia, is the investment sub-advisor to the Fund and is paid by EIMC for its services to the Fund.
From time to time, EIMC may voluntarily or contractually waive its fee and/or reimburse expenses in order to limit operating expenses. During the six months ended October 31, 2006, EIMC reimbursed other expenses in the amount of $3,214.
The Fund may invest in Evergreen-managed money market funds, which are also advised by EIMC. Income earned on these investments is included in income from affiliate on the Statement of Operations.
Evergreen Investment Services, Inc. (“EIS”), an indirect, wholly-owned subsidiary of Wachovia, is the administrator to the Fund. As administrator, EIS provides the Fund with facilities, equipment and personnel and is paid an annual rate determined by applying percentage rates to the aggregate average daily net assets of the Evergreen funds (excluding money market funds and Evergreen Institutional Enhanced Income Fund), starting at 0.10% and declining to 0.05% as the aggregate average daily net assets of the Evergreen funds (excluding money market funds and Evergreen Institutional Enhanced Income Fund) increase.
19
NOTES TO FINANCIAL STATEMENTS (unaudited) continued
Evergreen Service Company, LLC (“ESC”), an indirect, wholly-owned subsidiary of Wachovia, is the transfer and dividend disbursing agent for the Fund. ESC receives account fees that vary based on the type of account held by the shareholders in the Fund.
4. SECURITIES TRANSACTIONS
Cost of purchases and proceeds from sales of investment securities (excluding short-term securities and mortgage dollar roll transactions) were as follows for the six months ended October 31, 2006:
| Cost of Purchases | | Proceeds from Sales |
|
| | | Non-U.S | | | | Non-U.S. |
| U.S. Government | | Government | | U.S. Government | | Government |
|
| $ 43,782,502 | | $5,453,716 | | $43,588,475 | | $2,984,747 |
|
On October 31, 2006, the aggregate cost of securities for federal income tax purposes was $72,505,539. The gross unrealized appreciation and depreciation on securities based on tax cost was $398,035 and $645,065, respectively, with a net unrealized depreciation of $247,030.
As of April 30, 2006, the Fund had $983,235 in capital loss carryovers for federal income tax purposes with $512,937 expiring in 2012, $77,895 expiring in 2013 and $392,403 expiring in 2014.
For income tax purposes, capital losses incurred after October 31 within the Fund’s fiscal year are deemed to arise on the first business day of the following fiscal year. As of April 30, 2006, the Fund incurred and elected to defer post-October losses of $489,670.
5. INTERFUND LENDING
Pursuant to an Exemptive Order issued by the SEC, the Fund may participate in an interfund lending program with certain funds in the Evergreen fund family. This program allows the Fund to borrow from, or lend money to, other participating funds. During the six months ended October 31, 2006, the Fund did not participate in the interfund lending program.
6. EXPENSE REDUCTIONS
Through expense offset arrangements with ESC and the Fund’s custodian, a portion of fund expenses has been reduced.
7. DEFERRED TRUSTEES’ FEES
Each Trustee of the Fund may defer any or all compensation related to performance of their duties as Trustees. The Trustees’ deferred balances are allocated to deferral accounts, which are included in the accrued expenses for the Fund. The investment performance of the deferral accounts is based on the investment performance of certain Evergreen funds. Any gains earned or losses incurred in the deferral accounts are reported in the Fund’s Trustees’ fees and expenses. At the election of the Trustees, the deferral account will be paid either in one lump sum or in quarterly installments for up to ten years.
20
NOTES TO FINANCIAL STATEMENTS (unaudited) continued
8. FINANCING AGREEMENT
The Fund and certain other Evergreen funds share in an unsecured revolving credit commitment for temporary and emergency purposes, including the funding of redemptions, as permitted by each participating fund’s borrowing restrictions. Borrowings under this facility bear interest at 0.50% per annum above the Federal Funds rate. All of the participating funds are charged an annual commitment fee on the unused balance, which is allocated pro rata. The credit facility is for $100 million with an annual commitment fee of 0.08% . Prior to July 3, 2006, the credit facility was for $150 million with an annual commitment fee of 0.09% . During the six months ended October 31, 2006, the Fund had no borrowings.
9. REGULATORY MATTERS AND LEGAL PROCEEDINGS
Since September 2003, governmental and self-regulatory authorities have instituted numerous ongoing investigations of various practices in the mutual fund industry, including investigations relating to revenue sharing, market-timing, late trading and record retention, among other things. The investigations cover investment advisors, distributors and transfer agents to mutual funds, as well as other firms. EIMC, EIS and ESC (collectively, “Evergreen”) have received subpoenas and other requests for documents and testimony relating to these investigations, are endeavoring to comply with those requests, and are cooperating with the investigations. Evergreen is continuing its own internal review of policies, practices, procedures and personnel, and is taking remedial action where appropriate.
In connection with one of these investigations, on July 28, 2004, the staff of the Securities and Exchange Commission (“SEC”) informed Evergreen that the staff intends to recommend to the SEC that it institute an enforcement action against Evergreen. The SEC staff’s proposed allegations relate to (i) an arrangement pursuant to which a broker at one of EIMC’s affiliated broker-dealers had been authorized, apparently by an EIMC officer (who is no longer with EIMC), to engage in short-term trading, on behalf of a client, in Evergreen Mid Cap Growth Fund (formerly Evergreen Emerging Growth Fund and prior to that, known as Evergreen Small Company Growth Fund) during the period from December 2000 through April 2003, in excess of the limitations set forth in the fund’s prospectus, (ii) short-term trading from September 2001 through January 2003, by a former Evergreen portfolio manager of Evergreen Precious Metals Fund, a fund he managed at the time, (iii) the sufficiency of systems for monitoring exchanges and enforcing exchange limitations as stated in the funds’ prospectuses, and (iv) the adequacy of e-mail retention practices. In connection with the activity in Evergreen Mid Cap Growth Fund, EIMC reimbursed the fund $378,905, plus an additional $25,242, representing what EIMC calculated at that time to be the client’s net gain and the fees earned by EIMC and the expenses incurred by this fund on the client’s account. In connection with the activity in Evergreen Precious Metals Fund, EIMC reimbursed the fund $70,878, plus an additional $3,075, representing what EIMC calculated at that time to be the portfolio manager’s net gain and the fees earned by EIMC and expenses incurred by the fund on the portfolio manager’s account. Evergreen is currently engaged in discussions with the staff of the SEC concerning its recommendation.
21
NOTES TO FINANCIAL STATEMENTS (unaudited) continued
The staff of the National Association of Securities Dealers (“NASD”) had notified EIS that it has made a preliminary determination to recommend that disciplinary action be brought against EIS for certain violations of the NASD’s rules. The recommendation relates principally to allegations that EIS (i) arranged for fund portfolio trades to be directed to broker-dealers (including Wachovia Securities, LLC, an affiliate of EIS) that sold Evergreen fund shares during the period of January 2001 to December 2003 and (ii) provided non-cash compensation by sponsoring offsite meetings attended by Wachovia Securities, LLC brokers during that period. EIS is cooperating with the NASD staff in its review of these matters.
Any resolution of these matters with regulatory authorities may include, but not be limited to, sanctions, penalties or injunctions regarding Evergreen, restitution to mutual fund shareholders and/or other financial penalties and structural changes in the governance or management of Evergreen’s mutual fund business. Any penalties or restitution will be paid by Evergreen and not by the Evergreen funds.
In addition, the Evergreen funds and EIMC and certain of its affiliates are involved in various legal actions, including private litigation and class action lawsuits. EIMC does not expect that any of such legal actions currently pending or threatened will have a material adverse impact on the financial position or operations of any of the Evergreen funds or on EIMC’s ability to provide services to the Evergreen funds.
Although Evergreen believes that neither the foregoing investigations described above nor any pending or threatened legal actions will have a material adverse impact on the Evergreen funds, there can be no assurance that these matters and any publicity surrounding or resulting from them will not result in reduced sales or increased redemptions of Evergreen fund shares, which could increase Evergreen fund transaction costs or operating expenses, or that they will not have other adverse consequences on the Evergreen funds.
10. NEW ACCOUNTING PRONOUNCEMENTS
In June 2006, the Financial Accounting Standards Board (“FASB”) issued FASB Interpretation No. 48, Accounting for Uncertainty in Income Taxes — an interpretation of FASB statement 109 (“FIN 48”). FIN 48 supplements FASB 109 by prescribing a recognition threshold and measurement attribute for the financial statement recognition and measurement of a tax position taken or expected to be taken in a tax return. The adoption of FIN 48 will require financial statements to be adjusted to reflect only those tax positions that are more likely than not to be sustained as of the adoption date. Management of the Fund is currently evaluating the impact that the adoption of FIN 48 will have on the financial statements. FIN 48 will become effective for fiscal years beginning after December 15, 2006.
22
NOTES TO FINANCIAL STATEMENTS (unaudited) continued
In September 2006, FASB issued Statement of Financial Accounting Standards No. 157, Fair Value Measurements (“FAS 157”). FAS 157 establishes a single authoritative definition of fair value, establishes a framework for measuring fair value and expands disclosures about fair value measurements. FAS 157 applies to fair value measurements already required or permitted by existing standards. The change to current generally accepted accounting principles from the application of FAS 157 relates to the definition of fair value, the methods used to measure fair value, and the expanded disclosures about fair value measurements. Management of the Fund does not believe the adoption of FAS 157 will materially impact the financial statement amounts, however, additional disclosures may be required about the inputs used to develop the measurements and the effect of certain of the measurements on changes in net assets for the period. FAS 157 is effective for financial statements issued for fiscal years beginning after November 15, 2007 and interim periods within those fiscal years.
23
ADDITIONAL INFORMATION (unaudited) continued
INFORMATION ABOUT THE REVIEW AND APPROVAL OF THE FUND’S INVESTMENT
ADVISORY AGREEMENT
Each year, the Fund’s Board of Trustees is required to consider whether to continue in place the Fund’s investment advisory agreements. In September 2006, the Trustees, including a majority of the Trustees who are not interested persons (as that term is defined in the 1940 Act) of the Fund, of TAG or of EIMC, approved the continuation of the Fund’s investment advisory agreements. (References below to the “Fund” are to Evergreen Institutional Mortgage Portfolio; references to the “funds” are to the Evergreen funds generally.)
At the same time, the Trustees considered the continuation of the investment advisory agreements for all of the funds, and the description below refers in many cases to the Trustees’ process and conclusions in connection with their consideration of this matter for all of the funds. In all of its deliberations, the Board of Trustees and the disinterested Trustees were advised by independent counsel to the disinterested Trustees and counsel to the funds.
The review process. The 1940 Act requires that the Board of Trustees request and evaluate, and that EIMC furnish, such information as may reasonably be necessary to evaluate the terms of a fund’s advisory agreements. The review process began at the time of the last advisory contract-renewal process in September 2005. In the course of that process, the Trustees identified a number of funds that had experienced either short-term or longer-term performance issues. During the following months, the Trustees reviewed information relating to any changes in the performance of those funds and/or any changes in the investment process or the investment teams responsible for the management of the funds. In addition, during the course of the year, the Trustees reviewed information regarding the investment performance of all of the funds and identified additional funds that they believed warranted further attention based on performance since September 2005.
In spring 2006, a committee of the Board of Trustees (the “Committee”), working with EIMC management, determined generally the types of information the Board would review and set a timeline detailing the information required and the dates for its delivery to the Trustees. The independent data provider Lipper Inc. (“Lipper”) was engaged to provide fund-specific and industry-wide data to the Board containing information of a nature and in a format generally prescribed by the Committee. The Committee also identified a number of expense, performance, and other issues and requested specific information as to those issues.
The Trustees reviewed, with the assistance of an independent industry consultant retained by the disinterested Trustees, the information provided by EIMC in response to the Committee’s requests and the information provided by Lipper. In certain instances, the Trustees formed small committees to review individual funds in greater detail. In addition, the Trustees requested information regarding brokerage practices of the funds, information regarding closed-end fund discounts to net asset value, and information regarding the various fall-out benefits received directly and indirectly by EIMC and its affiliates from the funds. The Trustees requested and received additional information following that review.
24
ADDITIONAL INFORMATION (unaudited) continued
The Committee met several times by telephone to consider the information provided by EIMC. The Committee met in person with representatives of EIMC in early September. At a meeting of the full Board of Trustees later in September, the Committee reported the results of its discussions with EIMC, and the full Board met with representatives of EIMC, engaged in further review of the materials provided to them, and approved the continuation of each of the advisory and sub-advisory agreements.
The disinterested Trustees discussed the continuation of the funds’ advisory agreements with representatives of EIMC and in multiple private sessions with legal counsel at which no personnel of EIMC were present. In considering the continuation of the agreements, the Trustees did not identify any particular information or consideration that was all-important or controlling, and each Trustee attributed different weights to various factors. The Trustees evaluated information provided to them both in terms of the Evergreen mutual funds generally and with respect to each fund, including the Fund, specifically as they considered appropriate; although the Trustees considered the continuation of the agreements as part of the larger process of considering the continuation of the advisory contracts for all of the funds, their determination to continue the advisory agreements for each of the funds was ultimately made on a fund-by-fund basis.
This summary describes a number of the most important, but not necessarily all, of the factors considered by the Board and the disinterested Trustees.
Information reviewed. The Board of Trustees and committees of the Board of Trustees meet periodically during the course of the year. At those meetings, the Board receives a wide variety of information regarding the services performed by EIMC and TAG, the investment performance of the funds, and other aspects of the business and operations of the funds. At those meetings, and in the process of considering the continuation of the agreements, the Trustees considered information regarding, for example, the funds’ investment results; the portfolio management teams for the funds and the experience of the members of those teams, and any recent changes in the membership of the teams; portfolio trading practices; compliance by the funds, TAG and EIMC with applicable laws and regulations and with the funds’ and EIMC’s compliance policies and procedures; services provided by affiliates of EIMC to the funds and shareholders of the funds; and other information relating to the nature, extent, and quality of services provided by EIMC and TAG. The Trustees considered the rates at which the funds pay investment advisory fees, the total expense ratios of the funds, and the efforts generally by EIMC and its affiliates as sponsors of the funds. The data provided by Lipper showed the fees paid by each fund and each fund’s total expense ratio in comparison to other similar mutual funds, in addition to data regarding the investment performance by the funds in comparison to other similar mutual funds. The Trustees were assisted by the independent industry consultant in reviewing the information presented to them.
Where EIMC or its affiliates provide to other clients advisory services that are comparable to the advisory services provided to a fund, the Trustees considered information regarding the rates at which those other clients pay advisory fees. Fees charged by EIMC to those other clients were generally lower than those charged to the funds. EIMC explained that compliance, reporting, and
25
ADDITIONAL INFORMATION (unaudited) continued
other legal burdens of providing investment advice to mutual funds greatly exceed those required to provide advisory services to non-mutual fund clients such as retirement or pension plans. In addition, EIMC pointed out that there is substantially greater legal and other risk to EIMC and its affiliates from managing public mutual funds than in managing private accounts. The Trustees also considered the investment performance of other accounts managed by EIMC and its affiliates.
The Trustees considered the transfer agency fees paid by the funds to an affiliate of EIMC and noted that the funds’ transfer agent had received Dalbar’s Mutual Fund Service Award for services provided to shareholders and Dalbar’s Financial Intermediary Service Quality Evaluation Award for services to broker-dealer representatives on a post-sale support basis. They reviewed information presented to them showing generally that the transfer agency fees charged to the funds were generally consistent with industry norms, and that transfer agency fees for a number of the funds had recently declined, or were expected to in the near future.
The Trustees also considered that EIS, an affiliate of EIMC, serves as administrator to the funds and receives a fee for its services as administrator. In their comparison of the advisory fee paid by the funds with those paid by other mutual funds, the Trustees took into account administrative fees paid by the funds and those other mutual funds. The Board considered that EIS serves as distributor to the funds (other than the closed-end funds) and receives fees from the funds for those services. They considered other so-called “fall-out” benefits to EIMC and its affiliates due to their other relationships with the funds, including, for example, soft-dollar services received by EIMC attributable to transactions entered into by EIMC for the benefit of the funds and brokerage commissions received by Wachovia Securities LLC, an affiliate of EIMC, from transactions effected by it for the funds.
Nature and quality of the services provided. The Trustees considered that EIMC, TAG and EIMC’s affiliates provide a comprehensive investment management service to the fund. They noted that EIMC and TAG formulate and implement an investment program for the fund. They noted that EIMC makes its personnel available to serve as officers of the funds, and concluded that the reporting and management functions provided by EIMC with respect to the funds were generally satisfactory. The Trustees considered the investment philosophy of each fund’s portfolio management team, and considered the in-house research capabilities of EIMC and its affiliates, as well as other resources available to EIMC, including research services available to it from third parties. The Board considered the managerial and financial resources available to EIMC and its affiliates, and the commitment that the Wachovia organization has made to the funds generally. On the basis of these factors, they determined that the nature and scope of the services provided by EIMC and TAG were consistent with their respective duties under the investment advisory agreements and appropriate and consistent with the investment programs and best interests of the funds.
The Trustees noted the resources EIMC and its affiliates have committed to the regulatory, compliance, accounting, tax and oversight of tax reporting, and shareholder servicing functions, and the number and quality of staff committed to those functions, which they concluded were appropriate and generally in line with EIMC’s responsibilities to the Fund and to the funds generally.
26
ADDITIONAL INFORMATION (unaudited) continued
They noted that recent enhancements to those functions appeared generally appropriate, but considered that the enhancement process is an on-going one and that they would continue to monitor developments in these functions in coming periods for appropriateness and consistency with regulatory and industry developments. The Board and the disinterested Trustees concluded, within the context of their overall conclusions regarding the funds’ advisory agreements, that they were satisfied with the nature, extent, and quality of the services provided by EIMC and TAG, including services provided by EIS under its administrative services agreements with the funds.
Investment performance. The Trustees considered the investment performance of each fund, both by comparison to other comparable mutual funds and to broad market indices. The Trustees emphasized that the continuation of the investment advisory agreement for a fund should not be taken as any indication that the Trustees did not believe investment performance for any specific fund might not be improved, and they noted that they would continue to monitor closely the investment performance of the funds going forward.
Advisory and administrative fees. The Trustees recognized that EIMC does not seek to provide the lowest cost investment advisory service, but to provide a high quality, full-service investment management product at a reasonable price. They also noted that EIMC has in many cases sought to set its investment advisory fees at levels consistent with industry norms. The Trustees noted that, in certain cases, a fund’s advisory fees and/or its total expense ratio were higher than many or most other mutual funds in the same Lipper peer group. However, in each case, the Trustees determined that the level of fees was not such as to prevent the continuation of the advisory agreement.
Economies of scale. The Trustees noted that economies of scale would likely be achieved by EIMC in managing the funds as the funds grow. The Trustees noted that the Fund had implemented breakpoints in its advisory fee structure. The Trustees noted that they would continue to review the appropriate levels of breakpoints in the future, but concluded that the breakpoints as implemented appeared to be a reasonable step toward the realization of economies of scale by the Fund.
Profitability. The Trustees considered information provided to them regarding the profitability to the EIMC organization of the investment advisory, administration, and transfer agency (with respect to the open-end funds only) fees paid to EIMC and its affiliates by each of the funds. They considered that the information provided to them was necessarily estimated, and that the profitability information provided to them, especially on a fund-by-fund basis, did not necessarily provide a definitive tool for evaluating the appropriateness of each fund's advisory fee. They noted that the levels of profitability of the funds to EIMC varied widely, depending on among other things the size and type of fund. They considered the profitability of the funds in light of such factors as, for example, the information they had received regarding the relation of the fees paid by the funds to those paid by other mutual funds, the investment performance of the funds, and the amount of revenues involved. In light of these factors, the Trustees concluded that the profitability of any of the funds, individually or in the aggregate, should not prevent the Trustees from approving the continuation of the agreements.
27
TRUSTEES AND OFFICERS
| TRUSTEES1 | | |
| Charles A. Austin III | | Investment Counselor, Anchor Capital Advisors, Inc. (investment advice); Director, The Andover |
| Trustee | | Companies (insurance); Trustee, Arthritis Foundation of New England; Former Director, The |
| DOB: 10/23/1934 | | Francis Ouimet Society; Former Trustee, Mentor Funds and Cash Resource Trust; Former |
| Term of office since: 1991 | | Investment Counselor, Appleton Partners, Inc. (investment advice); Former Director, Executive |
| Other directorships: None | | Vice President and Treasurer, State Street Research & Management Company (investment |
| | | advice) |
|
| |
| Shirley L. Fulton* | | Partner, Tin, Fulton, Greene & Owen, PLLC (law firm); Former Partner, Helms, Henderson & |
| Trustee | | Fulton, P.A. (law firm); Retired Senior Resident Superior Court Judge, 26th Judicial District, |
| DOB: 1/10/1952 | | Charlotte, NC |
| Term of office since: 2004 | | |
| Other directorships: None | | |
|
| |
| K. Dun Gifford | | Chairman and President, Oldways Preservation and Exchange Trust (education); Trustee, |
| Trustee | | Treasurer and Chairman of the Finance Committee, Cambridge College; Former Trustee, Mentor |
| DOB: 10/23/1938 | | Funds and Cash Resource Trust |
| Term of office since: 1974 | | |
| Other directorships: None | | |
|
| |
| Dr. Leroy Keith, Jr. | | Partner, Stonington Partners, Inc. (private equity fund); Trustee, Phoenix Funds Family; Director, |
| Trustee | | Diversapack Co.; Director, Obagi Medical Products Co.; Former Director, Lincoln Educational |
| DOB: 2/14/1939 | | Services; Former Trustee, Mentor Funds and Cash Resource Trust |
| Term of office since: 1983 | | |
| Other directorships: Trustee, The | | |
| Phoenix Group of Mutual Funds | | |
|
| |
| Gerald M. McDonnell | | Manager of Commercial Operations, SMI Steel Co. – South Carolina (steel producer); Former |
| Trustee | | Sales and Marketing Manager, Nucor Steel Company; Former Trustee, Mentor Funds and Cash |
| DOB: 7/14/1939 | | Resource Trust |
| Term of office since: 1988 | | |
| Other directorships: None | | |
|
| |
| Patricia B. Norris2 | | Former Partner, PricewaterhouseCoopers LLP |
| Trustee | | |
| DOB: 4/9/1948 | | |
| Term of office since: 2006 | | |
| Other directorships: None | | |
|
| |
| William Walt Pettit | | Vice President, Kellam & Pettit, P.A. (law firm); Director, Superior Packaging Corp.; Director, |
| Trustee | | National Kidney Foundation of North Carolina, Inc.; Former Trustee, Mentor Funds and Cash |
| DOB: 8/26/1955 | | Resource Trust |
| Term of office since: 1984 | | |
| Other directorships: None | | |
|
| |
| David M. Richardson | | President, Richardson, Runden LLC (executive recruitment business development/consulting |
| Trustee | | company); Consultant, Kennedy Information, Inc. (executive recruitment information and |
| DOB: 9/19/1941 | | research company); Consultant, AESC (The Association of Executive Search Consultants); |
| Term of office since: 1982 | | Director, J&M Cumming Paper Co. (paper merchandising); Former Trustee, NDI Technologies, LLP |
| Other directorships: None | | (communications); Former Trustee, Mentor Funds and Cash Resource Trust |
|
| |
| Dr. Russell A. Salton III | | President/CEO, AccessOne MedCard; Former Medical Director, Healthcare Resource Associates, |
| Trustee | | Inc.; Former Medical Director, U.S. Health Care/Aetna Health Services; Former Trustee, Mentor |
| DOB: 6/2/1947 | | Funds and Cash Resource Trust |
| Term of office since: 1984 | | |
| Other directorships: None | | |
|
28
TRUSTEES AND OFFICERS continued
| Michael S. Scofield | | Retired Attorney, Law Offices of Michael S. Scofield; Director and Chairman, Branded Media |
| Trustee | | Corporation (multi-media branding company); Former Trustee, Mentor Funds and Cash |
| DOB: 2/20/1943 | | Resource Trust |
| Term of office since: 1984 | | |
| Other directorships: None | | |
|
| |
| Richard J. Shima | | Independent Consultant; Trustee, Saint Joseph College (CT); Director, Hartford Hospital; Trustee, |
| Trustee | | Greater Hartford YMCA; Former Director, Trust Company of CT; Former Director, Enhance |
| DOB: 8/11/1939 | | Financial Services, Inc.; Former Director, Old State House Association; Former Trustee, Mentor |
| Term of office since: 1993 | | Funds and Cash Resource Trust |
| Other directorships: None | | |
|
| |
| Richard K. Wagoner, CFA3 | | Member and Former President, North Carolina Securities Traders Association; Member, Financial |
| Trustee | | Analysts Society; Former Consultant to the Boards of Trustees of the Evergreen funds; Former |
| DOB: 12/12/1937 | | Trustee, Mentor Funds and Cash Resource Trust |
| Term of office since: 1999 | | |
| Other directorships: None | | |
|
| |
| |
| OFFICERS | | |
| |
| Dennis H. Ferro4 | | Principal occupations: President and Chief Executive Officer, Evergreen Investment Company, |
| President | | Inc. and Executive Vice President, Wachovia Bank, N.A.; former Chief Investment Officer, |
| DOB: 6/20/1945 | | Evergreen Investment Company, Inc. |
| Term of office since: 2003 | | |
|
| |
| Kasey Phillips5 | | Principal occupations: Senior Vice President, Evergreen Investment Services, Inc.; Former Vice |
| Treasurer | | President, Evergreen Investment Services, Inc.; Former Assistant Vice President, Evergreen |
| DOB: 12/12/1970 | | Investment Services, Inc. |
| Term of office since: 2005 | | |
|
| |
| Michael H. Koonce5 | | Principal occupations: Senior Vice President and General Counsel, Evergreen Investment |
| Secretary | | Services, Inc.; Senior Vice President and Assistant General Counsel, Wachovia Corporation |
| DOB: 4/20/1960 | | |
| Term of office since: 2000 | | |
|
| |
| James Angelos5 | | Principal occupations: Chief Compliance Officer and Senior Vice President, Evergreen Funds; |
| Chief Compliance Officer | | Former Director of Compliance, Evergreen Investment Services, Inc. |
| DOB: 9/2/1947 | | |
| Term of office since: 2004 | | |
|
1 Each Trustee serves until a successor is duly elected or qualified or until his/her death, resignation, retirement or removal from office. Each Trustee oversees 91 Evergreen funds. Correspondence for each Trustee may be sent to Evergreen Board of Trustees, P.O. Box 20083, Charlotte, NC 28202.
2 Ms. Norris’ information is as of July 1, 2006, the effective date of her trusteeship.
3 Mr. Wagoner is an “interested person” of the Fund because of his ownership of shares in Wachovia Corporation, the parent to the Fund’s investment advisor.
4 The address of the Officer is 401 S. Tryon Street, 20th Floor, Charlotte, NC 28288.
5 The address of the Officer is 200 Berkeley Street, Boston, MA 02116.
* Shirley L. Fulton served as Trustee through November 20, 2006.
Additional information about the Fund’s Board of Trustees and Officers can be found in the Statement of Additional Information (SAI) and is available upon request without charge by calling 800.343.2898.
29
571812 rv2 12/2006
Evergreen U.S. Government Fund

| table of contents |
| 1 | | LETTER TO SHAREHOLDERS |
| 6 | | FUND AT A GLANCE |
| 8 | | ABOUT YOUR FUND’S EXPENSES |
| 9 | | FINANCIAL HIGHLIGHTS |
| 13 | | SCHEDULE OF INVESTMENTS |
| 19 | | STATEMENT OF ASSETS AND LIABILITIES |
| 20 | | STATEMENT OF OPERATIONS |
| 21 | | STATEMENTS OF CHANGES IN NET ASSETS |
| 22 | | STATEMENT OF CASH FLOWS |
| 23 | | NOTES TO FINANCIAL STATEMENTS |
| 30 | | ADDITIONAL INFORMATION |
| 40 | | TRUSTEES AND OFFICERS |
This semiannual report must be preceded or accompanied by a prospectus of the Evergreen fund contained herein. The prospectus contains more complete information, including fees and expenses, and should be read carefully before investing or sending money.
The fund will file its complete schedule of portfolio holdings with the SEC for the first and third quarters of each fiscal year on Form N-Q. The fund’s Form N-Q will be available on the SEC’s Web site at http://www.sec.gov. In addition, the fund’s Form N-Q may be reviewed and copied at the SEC’s Public Reference Room in Washington, D.C. Information on the operation of the Public Reference Room may be obtained by calling 800.SEC.0330.
A description of the fund’s proxy voting policies and procedures, as well as information regarding how the fund voted proxies relating to portfolio securities during the most recent 12-month period ended June 30, is available by visiting our Web site at EvergreenInvestments.com or by visiting the SEC’s Web site at http://www.sec.gov. The fund’s proxy voting policies and procedures are also available without charge, upon request, by calling 800.343.2898.
| Mutual Funds: | | | | |
| NOT FDIC INSURED | | MAY LOSE VALUE | | NOT BANK GUARANTEED |
Evergreen InvestmentsSM is a service mark of Evergreen Investment Management Company, LLC.
Copyright 2006, Evergreen Investment Management Company, LLC.
Evergreen Investment Management Company, LLC is a subsidiary of Wachovia Corporation
and is an affiliate of Wachovia Corporation’s other Broker Dealer subsidiaries.
Evergreen mutual funds are distributed by Evergreen Investment Services, Inc.
200 Berkeley Street, Boston, MA 02116
LETTER TO SHAREHOLDERS
December 2006

Dennis H. Ferro
President and Chief Executive Officer
Dear Shareholder:
We are pleased to provide the semi-annual report for the Evergreen U.S. Government Fund, covering the six-month period ended October 31, 2006.
Domestic capital markets, both equity and fixed income, faced a wide range of sometimes inconsistent influences during the past six months. In the first two months of the period, investors worried about rapidly rising oil and commodity prices and the effects of the Federal Reserve Board’s persistent efforts to raise short-term interest rates to slow the economy. However, in the final four months, declining oil and commodity prices offered more encouragement to investors willing to take on risk, especially after the Federal Reserve (“Fed”) paused in its cycle of credit tightening. Throughout the period, investors warily watched for signs that specific pockets of weakness might lead to a deceleration of growth in the general economy.
Evidence of economic deceleration did appear in the second and third quarters of 2006 — a year which began with a particularly robust rise in Gross Domestic Product (GDP) of more than 5% in the first quarter. GDP growth then slowed to annualized rates of approximately 2.5% and an estimated 2.2% in the second and third quarters, respectively, with weakening most evident in the housing and automotive industries. Yet healthy
1
LETTER TO SHAREHOLDERS continued
growth levels in personal consumption and business investment enabled demand to grow at more historically average rates, enabling the overall economy to absorb the problems in the housing and automobile areas. In addition, energy prices fell dramatically in the waning months of the fiscal period, boosting consumer confidence and raising hopes for lower inflation in the months ahead. However, officials at the Fed indicated they continued to be concerned about the possibility of rising inflationary pressures.
Over the six-month period, the domestic fixed income market delivered generally positive results, with high-yield corporate debt maintaining a performance edge over investment grade securities, including government bonds.
In managing Evergreen’s fixed income funds, managers focused on interest rate changes, particularly in higher-grade portfolios including the Evergreen Institutional Mortgage Portfolio, the Evergreen U.S. Government Fund and the Evergreen Core Bond Fund. The teams managing the Evergreen High Yield Bond Fund and the Evergreen Select High Yield Bond Fund paid particularly close attention to credit analysis, analyzing factors such as cash flow and corporations’ abilities to meet their debt obligations. Managers of more diversified funds, including the Evergreen Diversified Bond Fund and the Evergreen Strategic Income Fund, also considered factors such as interest rate expectations and yield spreads in making allocations to different sectors within the fixed income market.
2
LETTER TO SHAREHOLDERS continued
As always, we encourage investors to maintain diversified investment portfolios, including allocations to fixed income funds, in pursuit of their long-term investment goals.
Please visit our Web site, EvergreenInvestments.com, for more information about our funds and other investment products available to you. Thank you for your continued support of Evergreen Investments.
Sincerely,

Dennis H. Ferro
President and Chief Executive Officer
Evergreen Investment Company, Inc.
Notice to Shareholders:
Effective October 1, 2006, Tattersall Advisory Group, Inc., an indirect, wholly-owned subsidiary of Wachovia, became the investment sub-advisor to the Fund and is paid by EIMC for its services to the Fund.
Special Notice to Shareholders:
Please visit our Web site at EvergreenInvestments.com for a statement from President and Chief Executive Officer, Dennis Ferro, addressing NASD actions involving Evergreen Investment Services, Inc. (EIS), Evergreen’s mutual fund distributor or statements from Dennis Ferro and Chairman of the Board of the Evergreen funds, Michael S. Scofield, addressing SEC actions involving the Evergreen funds.
3
Notification of Investment Strategy Change:
Effective February 1, 2007, the Fund may, but will not necessarily, use a variety of derivative instruments, such as futures contracts, options, and swaps, including, for example, index futures, Treasury futures, Eurodollar futures, interest rate swap agreements, credit default swaps, and total return swaps. The Fund may use derivatives both for hedging and non-hedging purposes, including for purposes of enhancing returns. The Fund’s use of derivative instruments involves risks different from, or possibly greater than, the risks associated with other types of investments. For example, the use of derivatives involves the risk of loss due to the failure of another party to the contract (typically referred to as a “counterparty”) to make required payments or otherwise to comply with the contract’s terms. Derivative transactions can create investment leverage and may be highly volatile and may be illiquid or difficult to price. Derivatives are highly specialized instruments, and involve the risk that an investment adviser may not accurately predict the performance of a derivative under all market conditions. When the Fund uses a derivative instrument, it could lose more than the principal amount invested. The various derivative instruments that the Fund may use may change from time to time as new derivative products become available to the Fund. More information about derivatives and the risks associated with them can be found in the Fund’s prospectus and statement of additional information, which may be obtained by calling 1.800.343.2898 or visiting our website at EvergreenInvestments.com.
4
Notice to Shareholders:
| The Fund’s prospectus has been amended to make the following change to the Fund’s short-term trading policy effective April 2, 2007: |
| |
| | To limit the negative effects of short-term trading on the Fund, the Fund’s Board of Trustees has adopted certain restrictions on trading by investors. If an investor redeems more than $5,000 (including redemptions that are a part of an exchange transaction) from an Evergreen Fund, that investor is “blocked” from purchasing shares of the Fund (including purchases that are a part of an exchange transaction) for 30 calendar days after the redemption. The short- term trading policy does not apply to: |
| |
| | | Money market funds; |
| |
| | | Evergreen Institutional Enhanced Income Fund; Evergreen Adjustable Rate Fund; and Evergreen Ultra Short Opportunities Fund; |
| |
| | | Systematic investments or exchanges where Evergreen or the financial intermediary maintaining the shareholder account identifies to Evergreen the transaction as a systematic redemption or purchase at the time of the transaction; |
| |
| | | Rebalancing transactions within certain asset allocation or “wrap” programs where Evergreen or the financial intermediary is able to identify the transaction as part of a firm-approved asset allocation program; |
| |
| | | Purchases by a “fund of funds” into the underlying fund vehicle and purchases by 529 Plans: |
| |
| | | Certain transactions involving participants in employer-sponsored retirement plans, including: participant withdrawals due to mandatory distributions, rollovers and hardships; withdrawals of shares acquired by participants through payroll deductions; and, shares acquired or sold by a participant in connection with plan loans; and |
| |
| | | Purchases below $5,000 (including purchases that are a part of an exchange transaction). |
| |
| | There are certain limitations on the Fund’s ability to detect and prevent short- term trading. For example, while the Fund has access to trading information relating to investors who trade and hold their shares directly with the Fund, the Fund may not have immediate access to such information for investors who trade through financial intermediaries such as broker dealers and financial advisors or through retirement plans. Certain financial intermediaries and retirement plans hold their shares or those of their clients through omnibus accounts maintained with the Fund. The Fund may be unable to compel financial intermediaries to apply the Fund’s short-term trading policy described above. The Fund reserves the right, in its sole discretion, to allow financial intermediaries to apply alternative short-term trading policies. The Fund will use reasonable diligence to confirm that such intermediary is applying the Fund’s short-term trading policy or an acceptable alternative. Consult the disclosure provided by your financial intermediary for any alternative short-term trading policies that may apply to your account. It is possible that excessive short-term trading or trading in violation of the Fund’s trading restrictions may occur despite the Fund’s efforts to prevent them. |
| |
| Effective April 2, 2007, the “Reinstatement Privileges” described in the Fund’s prospectus are eliminated. |
| |
5
FUND AT A GLANCE
as of October 31, 2006
MANAGEMENT TEAM
Investment Advisor:
• Evergreen Investment Management Company, LLC
Sub-Advisor:
• Tattersall Advisory Group, Inc.
Portfolio Managers:
• Lisa Brown-Premo
• Karen DiMeglio
CURRENT INVESTMENT STYLE

Source: Morningstar, Inc.
Morningstar’s style box is based on a portfolio date as of 9/30/2006.
The Fixed income style box placement is based on a fund’s average effective maturity or duration and the average credit rating of the bond portfolio.
PERFORMANCE AND RETURNS
Portfolio inception date: 1/11/1993
| | | Class A | | Class B | | Class C | | Class I |
| Class inception date | | 1/11/1993 | | 1/11/1993 | | 9/2/1994 | | 9/2/1993 |
|
| Nasdaq symbol | | EUSAX | | EUSBX | | EUSCX | | EUSYX |
|
| 6-month return with sales charge | | -1.25% | | -1.69% | | 2.31% | | N/A |
|
| 6-month return w/o sales charge | | 3.68% | | 3.31% | | 3.31% | | 3.82% |
|
| Average annual return* | | | | | | | | |
|
| 1-year with sales charge | | -0.35% | | -1.16% | | 2.84% | | N/A |
|
| 1-year w/o sales charge | | 4.57% | | 3.84% | | 3.84% | | 4.88% |
|
| 5-year | | 2.31% | | 2.21% | | 2.57% | | 3.60% |
|
| 10-year | | 4.71% | | 4.46% | | 4.46% | | 5.51% |
|
| Maximum sales charge | | 4.75% | | 5.00% | | 1.00% | | N/A |
| | | Front-end | | CDSC | | CDSC | | |
|
* Adjusted for maximum applicable sales charge, unless noted.
Past performance is no guarantee of future results. The performance quoted represents past performance and current performance may be lower or higher. The investment return and principal value of an investment will fluctuate so that investors’ shares, when redeemed, may be worth more or less than their original cost. To obtain performance information current to the most recent month-end for Classes A, B, C or I, please go to EvergreenInvestments.com/fundperformance. The performance of each class may vary based on differences in loads, fees and expenses paid by the shareholders investing in each class. Performance includes the reinvestment of income dividends and capital gain distributions. Performance shown does not reflect the deduction of taxes that a shareholder would pay on fund distributions or the redemption of fund shares.
The fund incurs a 12b-1 fee of 0.30% for Class A and 1.00% for Classes B and C. Class I does not pay a 12b-1 fee.
The advisor is reimbursing a portion of the 12b-1 fee for Class A. Had the fee not been reimbursed, returns for Class A would have been lower. Returns reflect expense limits previously in effect for all classes, without which returns would have been lower.
6
FUND AT A GLANCE continued
LONG-TERM GROWTH
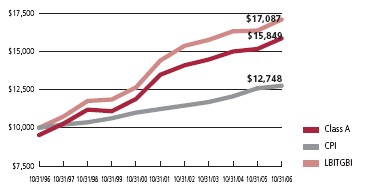
Comparison of a $10,000 investment in the Evergreen U.S. Government Fund Class A shares versus a similar investment in the Lehman Brothers Intermediate Term Government Bond Index (LBITGBI) and the Consumer Price Index (CPI).
The LBITGBI is an unmanaged market index and does not include transaction costs associated with buying and selling securities, any mutual fund fees or expenses or any taxes. The CPI is a commonly used measure of inflation and does not represent an investment return. It is not possible to invest directly in an index.
Class I shares are only offered in the following manner: (1) to investment advisory clients of Evergreen Investment Management Company, LLC (or its advisory affiliates) when purchased by such advisor(s) on behalf of its clients, (2) through arrangements entered into on behalf of the Evergreen funds with certain financial services firms, (3) to certain institutional investors and (4) to persons who owned Class Y shares in registered name in an Evergreen fund on or before December 31, 1994 or who owned shares of any SouthTrust fund in registered name as of March 18, 2005 or shares of Vestaur Securities Fund as of May 20, 2005.
Class I shares are only available to institutional shareholders with a minimum of $1 million investment, which may be waived in certain situations.
The fund’s investment objective may be changed without a vote of the fund’s shareholders.
Asset-backed and mortgage-backed securities are generally subject to higher prepayment risks than other types of debt securities, which can limit the potential for gain in a declining interest rate environment and increase the potential for loss in a rising interest rate environment. Mortgage-backed securities may also be structured so that they are particularly sensitive to interest rates.
Derivatives involve additional risks including interest rate risk, credit risk, the risk of improper valuation and the risk of non-correlation to the relevant instruments they are designed to hedge or to closely track.
The return of principal is not guaranteed due to fluctuation in the fund’s NAV caused by changes in the price of individual bonds held by the fund and the buying and selling of bonds by the fund. Bond funds have the same inflation, interest rate and credit risks as individual bonds. Generally, the value of bond funds rise when prevailing interest rates fall, and fall when interest rates rise.
U.S. government guarantees apply only to certain securities held in the fund’s portfolio and not to the fund’s shares.
Leverage may disproportionately increase a fund’s portfolio losses and reduce opportunities for gain when interest rates, stock prices, or currency rates are changing.
All data is as of October 31, 2006, and subject to change.
7
ABOUT YOUR FUND’S EXPENSES
The Example below is intended to describe the fees and expenses borne by shareholders and the impact of those costs on your investment.
Example
As a shareholder of the fund, you incur two types of costs: (1) transaction costs, including sales charges (loads), redemption fees and exchange fees; and (2) ongoing costs, including management fees, distribution (12b-1) fees and other fund expenses. This Example is intended to help you understand your ongoing costs (in dollars) of investing in the fund and to compare these costs with the ongoing costs of investing in other mutual funds. The Example is based on an investment of $1,000 invested at the beginning of the period and held for the entire period from May 1, 2006 to October 31, 2006.
The example illustrates your fund’s costs in two ways:
- Actual expenses
The section in the table under the heading “Actual” provides information about actual account values and actual expenses. You may use the information in these columns, together with the amount you invested, to estimate the expenses that you paid over the period. Simply divide your account value by $1,000 (for example, an $8,600 account value divided by $1,000 = 8.6), then multiply the result by the number in the appropriate column for your share class, in the column entitled “Expenses Paid During Period” to estimate the expenses you paid on your account during this period. - Hypothetical example for comparison purposes
The section in the table under the heading “Hypothetical (5% return before expenses)” provides information about hypothetical account values and hypothetical expenses based on the fund’s actual expense ratio and an assumed rate of return of 5% per year before expenses, which is not the fund’s actual return. The hypothetical account values and expenses may not be used to estimate the actual ending account balance or expenses you paid for the period. You may use this information to compare the ongoing costs of investing in the fund and other funds. To do so, compare this 5% hypothetical example with the 5% hypothetical examples that appear in the shareholder reports of the other funds.
Please note that the expenses shown in the table are meant to highlight your ongoing costs only and do not reflect any transactional costs, such as sales charges (loads), redemption fees or exchange fees. Therefore, the section in the table under the heading “Hypothetical (5% return before expenses)” is useful in comparing ongoing costs only, and will not help you determine the relative total costs of owning different funds. In addition, if these transactional costs were included, your costs would have been higher.
| | | Beginning | | Ending | | |
| | | Account | | Account | | Expenses |
| | | Value | | Value | | Paid During |
| | | 5/1/2006 | | 10/31/2006 | | Period* |
|
| Actual | | | | | | |
| Class A | | $ 1,000.00 | | $ 1,036.78 | | $ 4.93 |
| Class B | | $ 1,000.00 | | $ 1,033.05 | | $ 8.66 |
| Class C | | $ 1,000.00 | | $ 1,033.05 | | $ 8.66 |
| Class I | | $ 1,000.00 | | $ 1,038.24 | | $ 3.54 |
| Hypothetical | | | | | | |
| (5% return | | | | | | |
| before expenses) | | | | | | |
| Class A | | $ 1,000.00 | | $ 1,020.37 | | $ 4.89 |
| Class B | | $ 1,000.00 | | $ 1,016.69 | | $ 8.59 |
| Class C | | $ 1,000.00 | | $ 1,016.69 | | $ 8.59 |
| Class I | | $ 1,000.00 | | $ 1,021.73 | | $ 3.52 |
|
* For each class of the Fund, expenses are equal to the annualized expense ratio of each class (0.96% for Class A, 1.69% for Class B, 1.69% for Class C and 0.69% for Class I), multiplied by the average account value over the period, multiplied by 184 / 365 days.
8
FINANCIAL HIGHLIGHTS
(For a share outstanding throughout each period)
| | | Six Months | | | | | | | | | | |
| | | Ended | | Year Ended April 30, |
| | October 31, 2006 | |
|
| CLASS A | | (unaudited) | | 2006 | | 2005 | | 2004 | | 2003 | | 20021 |
|
| Net asset value, beginning of period | | $ 9.81 | | $ 10.09 | | $ 9.96 | | $ 10.22 | | $ 9.75 | | $ 9.59 |
|
| Income from investment operations | | | | | | | | | | | | |
| Net investment income (loss) | | 0.212 | | 0.322 | | 0.242 | | 0.192 | | 0.39 | | 0.48 |
Net realized and unrealized gains
or losses on investments | | 0.15 | | (0.24) | | 0.19 | | (0.16) | | 0.43 | | 0.16 |
| |
|
| Total from investment operations | | 0.36 | | 0.08 | | 0.43 | | 0.03 | | 0.82 | | 0.64 |
|
| Distributions to shareholders from | | | | | | | | | | | | |
| Net investment income | | (0.22) | | (0.36) | | (0.30) | | (0.29) | | (0.35) | | (0.48) |
|
| Net asset value, end of period | | $ 9.95 | | $ 9.81 | | $ 10.09 | | $ 9.96 | | $ 10.22 | | $ 9.75 |
|
| Total return3 | | 3.68% | | 0.82% | | 4.37% | | 0.30% | | 8.50% | | 6.76% |
|
| Ratios and supplemental data | | | | | | | | | | | | |
| Net assets, end of period (thousands) | | $75,904 | | $77,581 | | $93,826 | | $109,172 | | $146,427 | | $141,838 |
| Ratios to average net assets | | | | | | | | | | | | |
| Expenses including waivers/reimbursements | | | | | | | | | | | | |
| but excluding expense reductions | | 0.96%4 | | 0.98% | | 1.00% | | 1.01% | | 0.95% | | 0.96% |
| Expenses excluding waivers/reimbursements | | | | | | | | | | | | |
| and expense reductions | | 0.99%4 | | 0.99% | | 1.00% | | 1.01% | | 0.95% | | 0.96% |
| Net investment income (loss) | | 4.30%4 | | 3.18% | | 2.38% | | 1.86% | | 3.81% | | 4.91% |
| Portfolio turnover rate | | 40% | | 53% | | 110% | | 55% | | 129% | | 121% |
|
1 As required, effective May 1, 2001, the Fund adopted the provisions of the AICPA Audit and Accounting Guide, Audits of Investment Companies, and began amortizing premium on its fixed-income securities . The effects of this change for the year ended April 30, 2002 were a decrease in net investment income per share of $0.02; an increase in net realized gains or losses per share of $0.02; and a decrease to the ratio of net investment income to average net assets of 0.22%.
2 Net investment income (loss) per share is based on average shares outstanding during the period.
3 Excluding applicable sales charges
4 Annualized
See Notes to Financial Statements
9
FINANCIAL HIGHLIGHTS
(For a share outstanding throughout each period)
| | | Six Months | | | | | | | | | | |
| | | Ended | | Year Ended April 30, |
| | October 31, 2006 | |
|
| CLASS B | | (unaudited) | | 2006 | | 2005 | | 2004 | | 2003 | | 20021 |
|
| Net asset value, beginning of period | | $ 9.81 | | $ 10.09 | | $ 9.96 | | $ 10.22 | | $ 9.75 | | $ 9.59 |
|
| Income from investment operations | | | | | | | | | | | | |
| Net investment income (loss) | | 0.182 | | 0.242 | | 0.172 | | 0.122 | | 0.31 | | 0.42 |
Net realized and unrealized gains
or losses on investments | | 0.14 | | (0.23) | | 0.19 | | (0.16) | | 0.43 | | 0.15 |
| |
|
| Total from investment operations | | 0.32 | | 0.01 | | 0.36 | | (0.04) | | 0.74 | | 0.57 |
|
| Distributions to shareholders from | | | | | | | | | | | | |
| Net investment income | | (0.18) | | (0.29) | | (0.23) | | (0.22) | | (0.27) | | (0.41) |
|
| Net asset value, end of period | | $ 9.95 | | $ 9.81 | | $ 10.09 | | $ 9.96 | | $ 10.22 | | $ 9.75 |
|
| Total return3 | | 3.31% | | 0.12% | | 3.64% | | (0.40%) | | 7.69% | | 5.97% |
|
| Ratios and supplemental data | | | | | | | | | | | | |
| Net assets, end of period (thousands) | | $14,809 | | $16,747 | | $25,452 | | $37,270 | | $59,362 | | $47,016 |
| Ratios to average net assets | | | | | | | | | | | | |
| Expenses including waivers/reimbursements | | | | | | | | | | | | |
| but excluding expense reductions | | 1.69%4 | | 1.69% | | 1.70% | | 1.71% | | 1.70% | | 1.71% |
| Expenses excluding waivers/reimbursements | | | | | | | | | | | | |
| and expense reductions | | 1.69%4 | | 1.69% | | 1.70% | | 1.71% | | 1.70% | | 1.71% |
| Net investment income (loss) | | 3.57%4 | | 2.45% | | 1.67% | | 1.16% | | 3.04% | | 4.18% |
| Portfolio turnover rate | | 40% | | 53% | | 110% | | 55% | | 129% | | 121% |
|
1 As required, effective May 1, 2001, the Fund adopted the provisions of the AICPA Audit and Accounting Guide, Audits of Investment Companies, and began amortizing premium on its fixed-income securities . The effects of this change for the year ended April 30, 2002 were a decrease in net investment income per share of $0.01; an increase in net realized gains or losses per share of $0.01; and a decrease to the ratio of net investment income to average net assets of 0.22%.
2 Net investment income (loss) per share is based on average shares outstanding during the period.
3 Excluding applicable sales charges
4 Annualized
See Notes to Financial Statements
10
FINANCIAL HIGHLIGHTS
(For a share outstanding throughout each period)
| | | Six Months | | | | | | | | | | |
| | | Ended | | Year Ended April 30, |
| | October 31, 2006 | |
|
| CLASS C | | (unaudited) | | 2006 | | 2005 | | 2004 | | 2003 | | 20021 |
|
| Net asset value, beginning of period | | $ 9.81 | | $10.09 | | $ 9.96 | | $ 10.22 | | $ 9.75 | | $ 9.59 |
|
| Income from investment operations | | | | | | | | | | | | |
| Net investment income (loss) | | 0.182 | | 0.252 | | 0.172 | | 0.122 | | 0.31 | | 0.41 |
Net realized and unrealized gains
or losses on investments | | 0.14 | | (0.24) | | 0.19 | | (0.16) | | 0.43 | | 0.16 |
| |
|
| Total from investment operations | | 0.32 | | 0.01 | | 0.36 | | (0.04) | | 0.74 | | 0.57 |
|
| Distributions to shareholders from | | | | | | | | | | | | |
| Net investment income | | (0.18) | | (0.29) | | (0.23) | | (0.22) | | (0.27) | | (0.41) |
|
| Net asset value, end of period | | $ 9.95 | | $ 9.81 | | $10.09 | | $ 9.96 | | $ 10.22 | | $ 9.75 |
|
| Total return3 | | 3.31% | | 0.12% | | 3.64% | | (0.40%) | | 7.69% | | 5.97% |
|
| Ratios and supplemental data | | | | | | | | | | | | |
| Net assets, end of period (thousands) | | $7,493 | | $7,973 | | $9,820 | | $14,207 | | $26,013 | | $14,212 |
| Ratios to average net assets | | | | | | | | | | | | |
| Expenses including waivers/reimbursements but | | | | | | | | | | | | |
| excluding expense reductions | | 1.69%4 | | 1.69% | | 1.70% | | 1.71% | | 1.70% | | 1.71% |
| Expenses excluding waivers/reimbursements | | | | | | | | | | | | |
| and expense reductions | | 1.69%4 | | 1.69% | | 1.70% | | 1.71% | | 1.70% | | 1.71% |
| Net investment income (loss) | | 3.57%4 | | 2.47% | | 1.67% | | 1.17% | | 2.99% | | 4.15% |
| Portfolio turnover rate | | 40% | | 53% | | 110% | | 55% | | 129% | | 121% |
|
1 As required, effective May 1, 2001, the Fund adopted the provisions of the AICPA Audit and Accounting Guide, Audits of Investment Companies, and began amortizing premium on its fixed-income securities . The effects of this change for the year ended April 30, 2002 were a decrease in net investment income per share of $0.02; an increase in net realized gains or losses per share of $0.02; and a decrease to the ratio of net investment income to average net assets of 0.22%.
2 Net investment income (loss) per share is based on average shares outstanding during the period.
3 Excluding applicable sales charges
4 Annualized
See Notes to Financial Statements
11
FINANCIAL HIGHLIGHTS
(For a share outstanding throughout each period)
| | | Six Months | | | | | | | | | | |
| | | Ended | | Year Ended April 30, |
| | October 31, 2006 | |
|
| CLASS I1 | | (unaudited) | | 2006 | | 2005 | | 2004 | | 2003 | | 20022 |
|
| Net asset value, beginning of period | | $ 9.81 | | $ 10.09 | | $ 9.96 | | $ 10.22 | | $ 9.75 | | $ 9.59 |
|
| Income from investment operations | | | | | | | | | | | | |
| Net investment income (loss) | | 0.233 | | 0.353 | | 0.273 | | 0.223 | | 0.41 | | 0.50 |
Net realized and unrealized gains
or losses on investments | | 0.14 | | (0.24) | | 0.19 | | (0.16) | | 0.43 | | 0.16 |
| |
|
| Total from investment operations | | 0.37 | | 0.11 | | 0.46 | | 0.06 | | 0.84 | | 0.66 |
|
| Distributions to shareholders from | | | | | | | | | | | | |
| Net investment income | | (0.23) | | (0.39) | | (0.33) | | (0.32) | | (0.37) | | (0.50) |
|
| Net asset value, end of period | | $ 9.95 | | $ 9.81 | | $ 10.09 | | $ 9.96 | | $ 10.22 | | $ 9.75 |
|
| Total return | | 3.82% | | 1.12% | | 4.68% | | 0.60% | | 8.77% | | 7.02% |
|
| Ratios and supplemental data | | | | | | | | | | | | |
| Net assets, end of period (thousands) | | $450,057 | | $436,890 | | $436,431 | | $427,356 | | $489,565 | | $327,753 |
| Ratios to average net assets | | | | | | | | | | | | |
| Expenses including waivers/reimbursements | | | | | | | | | | | | |
| but excluding expense reductions | | 0.69%4 | | 0.69% | | 0.70% | | 0.71% | | 0.70% | | 0.71% |
| Expenses excluding waivers/reimbursements | | | | | | | | | | | | |
| and expense reductions | | 0.69%4 | | 0.69% | | 0.70% | | 0.71% | | 0.70% | | 0.71% |
| Net investment income (loss) | | 4.57%4 | | 3.48% | | 2.69% | | 2.15% | | 4.02% | | 5.16% |
| Portfolio turnover rate | | 40% | | 53% | | 110% | | 55% | | 129% | | 121% |
|
1 Effective at the close of business on May 11, 2001, Class Y shares were renamed as Class I shares.
2 As required, effective May 1, 2001, the Fund adopted the provisions of the AICPA Audit and Accounting Guide, Audits of Investment Companies, and began amortizing premium on its fixed-income securities . The effects of this change for the year ended April 30, 2002 were a decrease in net investment income per share of $0.02; an increase in net realized gains or losses per share of $0.02; and a decrease to the ratio of net investment income to average net assets of 0.22%.
3 Net investment income (loss) per share is based on average shares outstanding during the period.
4 Annualized
See Notes to Financial Statements
12
SCHEDULE OF INVESTMENTS
October 31, 2006 (unaudited)
| | | | | Principal | | |
| | | | | Amount | | Value |
|
| AGENCY COMMERCIAL MORTGAGE-BACKED SECURITIES 17.3% | | | | |
| FIXED-RATE 17.3% | | | | | | |
| FNMA: | | | | | | |
| 3.72%, 05/01/2008 ## | | | | $ 3,205,000 | | $ 3,151,002 |
| 4.36%, 05/01/2012 | | | | 670,924 | | 653,733 |
| 4.75%, 07/01/2012 | | | | 984,046 | | 968,692 |
| 5.08%, 02/01/2016 - 03/01/2016 ## | | | | 11,356,314 | | 11,265,087 |
| 5.15%, 11/01/2017 | | | | 4,259,670 | | 4,253,792 |
| 5.31%, 04/01/2016 | | | | 3,200,000 | | 3,242,912 |
| 5.50%, 04/01/2016 | | | | 7,680,000 | | 7,871,002 |
| 5.54%, 04/01/2026 ## | | | | 12,338,296 | | 12,642,434 |
| 5.55%, 05/01/2016 | | | | 3,300,000 | | 3,402,201 |
| 5.58%, 06/01/2011 ## | | | | 9,000,000 | | 9,199,350 |
| 5.67%, 03/01/2016 -11/01/2021 ## | | | | 12,801,665 | | 13,240,218 |
| 5.75%, 05/01/2021 | | | | 3,958,000 | | 4,139,528 |
| 6.07%, 09/01/2013 | | | | 1,461,212 | | 1,527,814 |
| 6.18%, 06/01/2013 | | | | 6,974,279 | | 7,306,324 |
| 6.20%, 06/01/2007 | | | | 241,841 | | 241,271 |
| 6.22%, 08/01/2012 | | | | 2,990,555 | | 3,144,868 |
| 6.35%, 08/01/2009 -10/01/2009 | | | | 1,166,461 | | 1,196,039 |
| 6.80%, 04/01/2017 | | | | 620,076 | | 633,154 |
| 7.07%, 09/01/2014 | | | | 1,060,210 | | 1,082,570 |
| 7.35%, 07/01/2007 | | | | 71,708 | | 71,960 |
| 7.48%, 01/01/2025 | | | | 1,186,339 | | 1,268,683 |
| Ser. 2002-M1, Class C, 6.17%, 02/25/2016 | | | | 1,111,183 | | 1,126,117 |
| FNMA 30 year, 5.64%, TBA # | | | | 3,000,000 | | 3,081,562 |
| |
|
| Total Agency Commercial Mortgage-Backed Securities (cost $93,538,438) | | | | 94,710,313 |
| |
|
| AGENCY MORTGAGE-BACKED COLLATERALIZED MORTGAGE | | | | |
| OBLIGATIONS 20.2% | | | | | | |
| FIXED-RATE 2.2% | | | | | | |
| FHLMC: | | | | | | |
| Ser. 2262, Class Z, 7.50%, 10/15/2030 | | | | 142,152 | | 150,059 |
| Ser. 2367, Class BC, 6.00%, 04/15/2016 | | | | 59,350 | | 59,328 |
| Ser. H012, Class A2, 2.50%, 11/15/2008 | | | | 1,456,276 | | 1,434,228 |
| FNMA: | | | | | | |
| Ser. 2002-W4, Class A4, 6.25%, 05/25/2042 | | | | 3,282,424 | | 3,338,225 |
| Ser. 2002-W5, Class A7, 6.25%, 08/25/2030 | | | | 7,281,015 | | 7,303,442 |
| |
|
| | | | | | | 12,285,282 |
| |
|
| FLOATING-RATE 18.0% | | | | | | |
| FHLMC: | | | | | | |
| Ser. 6 Class B, 5.98%, 03/25/2023 | | | | 856,276 | | 863,704 |
| Ser. 1220, Class A, 5.73%, 02/15/2022 | | | | 442,859 | | 443,149 |
| Ser. 1370, Class JA, 6.53%, 09/15/2022 | | | | 321,841 | | 322,303 |
| Ser. 1498, Class I, 6.53%, 04/15/2023 | | | | 203,962 | | 207,182 |
| Ser. 1533, Class FA, 6.48%, 06/15/2023 | | | | 70,640 | | 72,211 |
| Ser. 1616, Class FB, 5.18%, 11/15/2008 | | | | 933,952 | | 931,439 |
| Ser. 1671, Class TA, 5.88%, 02/15/2024 | | | | 828,225 | | 833,970 |
See Notes to Financial Statements
13
SCHEDULE OF INVESTMENTS continued
October 31, 2006 (unaudited)
| | | Principal | | |
| | | Amount | | Value |
|
| AGENCY MORTGAGE-BACKED COLLATERALIZED MORTGAGE | | | | |
| OBLIGATIONS continued | | | | |
| FLOATING-RATE continued | | | | |
| FHLMC: | | | | |
| Ser. 1687, Class FA, 5.33%, 02/15/2009 | | $ 4,054,431 | | $ 4,043,241 |
| Ser. 1699, Class FB, 6.38%, 03/15/2024 | | 1,188,456 | | 1,219,142 |
| Ser. 1939, Class FB, 6.38%, 04/15/2027 | | 516,459 | | 527,023 |
| Ser. 2005-S001, Class 1A2, 5.47%, 09/25/2035 | | 6,043,229 | | 6,100,821 |
| Ser. 2030, Class F, 5.82%, 02/15/2028 | | 1,031,951 | | 1,040,289 |
| Ser. 2181, Class PF, 5.72%, 05/15/2029 | | 484,060 | | 487,248 |
| Ser. 2315, Class FD, 5.82%, 04/15/2027 | | 362,107 | | 364,422 |
| Ser. 2380, Class FL, 5.92%, 11/15/2031 ## | | 15,539,445 | | 15,878,981 |
| Ser. 2388, Class FG, 5.82%, 12/31/2031 | | 806,146 | | 832,200 |
| Ser. 2395, Class FD, 5.92%, 05/15/2029 | | 1,534,453 | | 1,590,430 |
| Ser. 2481, Class FE, 6.32%, 03/15/2032 | | 2,725,885 | | 2,801,583 |
| Ser. 2691, Class FC, 6.02%, 10/15/2033 | | 2,421,022 | | 2,418,407 |
| FNMA: | | | | |
| Ser. 1991, Class F, 6.64%, 11/25/2021 | | 177,882 | | 182,718 |
| Ser. 1991, Class F, 6.19%, 05/25/2021 | | 774,362 | | 787,255 |
| Ser. 1991 Class FA, 6.24%, 04/25/2021 | | 36,694 | | 36,960 |
| Ser. 1993-221, Class FH, 6.44%, 12/25/2008 | | 2,253,635 | | 2,272,428 |
| Ser. 1994, Class F, 5.94%, 02/25/2024 | | 507,583 | | 517,825 |
| Ser. 1997-34, Class F, 5.99%, 10/25/2023 | | 3,483,259 | | 3,565,220 |
| Ser. 1997-49, Class F, 5.84%, 06/17/2027 | | 525,034 | | 530,525 |
| Ser. 1999-49, Class F, 5.72%, 05/25/2018 | | 1,063,199 | | 1,071,272 |
| Ser. 2000-32, Class FM, 5.77%, 10/18/2030 | | 537,198 | | 542,439 |
| Ser. 2001-53, Class CF, 5.72%, 10/25/2031 | | 110,660 | | 110,805 |
| Ser. 2002, Class FB, 5.72%, 02/25/2028 | | 336,481 | | 340,307 |
| Ser. 2002-13, Class FE, 6.22%, 02/27/2031 | | 1,419,610 | | 1,475,628 |
| Ser. 2002-41, Class F, 5.87%, 07/25/2032 | | 3,897,654 | | 3,947,177 |
| Ser. 2002-67, Class FA, 6.32%, 11/25/2032 ## | | 7,833,843 | | 8,154,247 |
| Ser. 2002-68, Class FN, 5.77%, 10/18/2032 | | 5,089,812 | | 5,168,959 |
| Ser. 2002-77, Class F, 5.92%, 12/25/2032 ## | | 7,855,801 | | 8,058,716 |
| Ser. 2002-77, Class FA, 6.32%, 10/18/2030 ## | | 7,870,902 | | 8,164,093 |
| Ser. 2002-W5, Class A27, 5.82%, 11/25/2030 | | 4,004,106 | | 4,057,361 |
| Ser. 2003, Class FL, 5.77%, 04/25/2018 | | 3,341,876 | | 3,368,868 |
| Ser. 2003-118, Class FE, 5.82%, 12/25/2033 | | 656,594 | | 661,482 |
| Ser. G93, Class FH, 6.49%, 04/25/2023 | | 169,866 | | 175,114 |
| GNMA: | | | | |
| Ser. 1999, Class FA, 5.77%, 11/16/2029 | | 1,264,973 | | 1,273,512 |
| Ser. 1999-40, Class FL, 5.92%, 02/17/2029 | | 247,572 | | 250,633 |
| Ser. 2000-36, Class FG, 5.82%, 11/20/2030 | | 485,354 | | 489,532 |
| Ser. 2001, Class FB, 5.72%, 01/16/2027 | | 636,715 | | 640,484 |
| Ser. 2001-22, Class FG, 5.67%, 05/16/2031 | | 1,065,359 | | 1,071,801 |
| Ser. 2002-15, Class F, 5.87%, 02/16/2032 | | 751,844 | | 759,234 |
| |
|
| | | | | 98,652,340 |
| |
|
| Total Agency Mortgage-Backed Collateralized Mortgage Obligations | | | | |
| (cost $110,167,846) | | | | 110,937,622 |
| |
|
See Notes to Financial Statements
14
SCHEDULE OF INVESTMENTS continued
October 31, 2006 (unaudited)
| | | | | Principal | | |
| | | | | Amount | | Value |
|
| AGENCY MORTGAGE-BACKED PASS THROUGH SECURITIES 71.7% | | | | |
| FIXED-RATE 51.2% | | | | | | |
| FHLMC: | | | | | | |
| 6.50%, 04/01/2022 - 09/01/2028 | | | | $ 1,236,955 | | $ 1,273,326 |
| 7.50%, 05/01/2027 - 08/01/2028 | | | | 856,519 | | 895,090 |
| 8.00%, 08/01/2023 - 11/01/2028 | | | | 283,099 | | 297,507 |
| 9.00%, 01/01/2017 | | | | 88,518 | | 94,386 |
| 9.50%, 09/01/2020 | | | | 60,032 | | 64,894 |
| 10.50%, 12/01/2019 | | | | 156,615 | | 175,205 |
| FHLMC 15 year, 5.50%, TBA # | | | | 40,555,000 | | 40,580,347 |
| FHLMC 30 year: | | | | | | |
| 5.50%, TBA # | | | | 39,300,000 | | 38,870,137 |
| 6.00%, TBA # | | | | 25,000,000 | | 25,171,875 |
| 6.50%, TBA # | | | | 40,775,000 | | 41,577,778 |
| 7.00%, TBA # | | | | 18,250,000 | | 18,768,993 |
| FNMA: | | | | | | |
| 4.00%, 10/01/2018 ## | | | | 9,103,659 | | 8,650,025 |
| 4.12%, 09/01/2010 | | | | 1,432,687 | | 1,396,752 |
| 4.98%, 01/01/2020 | | | | 1,014,218 | | 1,003,751 |
| 5.12%, 01/01/2016 | | | | 2,559,395 | | 2,553,073 |
| 5.39%, 01/01/2024 | | | | 3,925,877 | | 3,960,935 |
| 5.55%, 09/01/2019 | | | | 6,990,277 | | 7,003,978 |
| 5.70%, 03/01/2016 - 09/01/2017 | | | | 2,522,369 | | 2,610,881 |
| 5.75%, 02/01/2009 | | | | 1,796,426 | | 1,812,792 |
| 6.00%, 02/01/2008 | | | | 53,363 | | 53,321 |
| 6.50%, 01/01/2024 | | | | 171,530 | | 175,958 |
| 7.00%, 11/01/2026 - 02/01/2032 | | | | 209,937 | | 216,987 |
| 7.50%, 07/01/2023 - 06/01/2031 | | | | 1,873,440 | | 1,957,767 |
| 8.00%, 08/01/2020 - 02/01/2030 | | | | 1,424,604 | | 1,508,165 |
| 8.50%, 07/01/2029 - 08/01/2029 | | | | 70,038 | | 75,366 |
| 9.50%, 02/01/2023 | | | | 48,923 | | 52,960 |
| 11.00%, 01/01/2016 | | | | 68,975 | | 74,414 |
| 11.25%, 02/01/2016 | | | | 95,639 | | 105,261 |
| FNMA 15 year: | | | | | | |
| 4.50%, TBA # | | | | 10,000,000 | | 9,675,000 |
| 6.00%, TBA # | | | | 29,750,000 | | 30,214,844 |
| FNMA 30 year: | | | | | | |
| 5.50%, TBA # | | | | 20,000,000 | | 19,768,760 |
| 6.50%, TBA # | | | | 11,190,000 | | 11,406,806 |
| GNMA: | | | | | | |
| 6.00%, 02/15/2009 - 08/20/2034 | | | | 5,643,320 | | 5,709,266 |
| 6.50%, 12/15/2025 - 09/20/2033 | | | | 750,528 | | 771,570 |
| 7.00%, 12/15/2022 - 05/15/2032 | | | | 662,835 | | 685,570 |
| 7.34%, 10/20/2021 - 09/20/2022 | | | | 644,559 | | 675,712 |
| 7.50%, 02/15/2022 - 06/15/2032 | | | | 599,859 | | 625,545 |
| 10.00%, 12/15/2018 | | | | 71,505 | | 79,606 |
| |
|
| | | | | | | 280,594,603 |
| |
|
See Notes to Financial Statements
15
SCHEDULE OF INVESTMENTS continued
October 31, 2006 (unaudited)
| | | Principal | | |
| | | Amount | | Value |
|
| AGENCY MORTGAGE-BACKED PASS THROUGH SECURITIES continued | | | | |
| FLOATING-RATE 20.5% | | | | |
| FHLMC, 7.53%, 03/25/2036 | | $ 10,971,608 | | $ 11,563,417 |
| FNMA: | | | | |
| 4.25%, 11/01/2033 | | 7,526,176 | | 7,751,886 |
| 5.19%, 10/01/2035 | | 3,508,895 | | 3,461,560 |
| 5.40%, 07/01/2032 | | 5,115,011 | | 5,197,480 |
| 5.45%, 11/01/2030 | | 753,208 | | 765,593 |
| 5.51%, 06/01/2030 | | 3,067,317 | | 3,077,470 |
| 5.86%, 02/01/2032 - 07/01/2044 ## | | 22,980,634 | | 23,145,713 |
| 5.91%, 09/01/2041 ## | | 11,653,885 | | 11,741,307 |
| 6.06%, 06/01/2040 - 01/01/2041 ## | | 14,902,952 | | 15,134,264 |
| SBA: | | | | |
| 5.625%, 03/25/2027 - 03/25/2035 | | 4,546,286 | | 4,549,769 |
| 5.66%, 10/25/2029 - 11/25/2029 ## | | 17,365,097 | | 17,478,905 |
| 5.68%, 10/25/2031 ## | | 8,556,376 | | 8,583,115 |
| |
|
| | | | | 112,450,479 |
| |
|
| Total Agency Mortgage-Backed Pass Through Securities (cost $391,919,215) | | 393,045,082 |
| |
|
| AGENCY REPERFORMING MORTGAGE-BACKED PASS THROUGH | | | | |
| SECURITIES 5.8% | | | | |
| FHLMC, Ser. T-60, Class 1A-1, 6.50%, 03/25/2044 | | 1,394,636 | | 1,423,603 |
| FNMA: | | | | |
| Ser. 2002-T1, Class A3, 7.50%, 11/25/2031 | | 2,943,658 | | 3,075,564 |
| Ser. 2002-T16, Class A1, 6.50%, 07/25/2042 | | 4,703,246 | | 4,823,790 |
| Ser. 2002-W3, Class A5, 7.50%, 01/25/2028 | | 502,137 | | 525,074 |
| Ser. 2002-W8, Class A4, 7.00%, 06/25/2017 | | 1,705,177 | | 1,761,738 |
| Ser. 2003-W1, Class 1A-1, 6.50%, 12/25/2042 | | 2,073,726 | | 2,127,000 |
| Ser. 2003-W6, Class F, 5.67%, 09/25/2042 ## | | 15,649,788 | | 16,228,048 |
| Ser. 2004-T1, Class 1A-2, 6.50%, 01/25/2044 | | 1,795,307 | | 1,836,978 |
| |
|
| Total Agency Reperforming Mortgage-Backed Pass Through Securities | | | | |
| (cost $31,548,804) | | | | 31,801,795 |
| |
|
| COMMERCIAL MORTGAGE-BACKED SECURITIES 4.2% | | | | |
| FIXED-RATE 4.2% | | | | |
| Credit Suisse Mtge. Capital Cert., Ser. 2006-CL4, Class A1, 6.50%, | | | | |
| 11/25/2036 # | | 19,570,000 | | 19,551,663 |
| LB-UBS Comml. Mtge. Trust, Ser. 2000-C4, Class A1, 7.18%, 09/15/2019 | | 70,172 | | 70,396 |
| Morgan Stanley Capital I, Inc., Ser. 1998-XL1, Class A2, 6.45%, 06/03/2030 | | 10,686 | | 10,688 |
| Prima Capital Securitization, Ltd., Ser. 2006, Class D, 6.29%, 10/03/2048 # | | 3,618,000 | | 3,617,911 |
| |
|
| Total Commercial Mortgage-Backed Securities (cost $23,166,914) | | | | 23,250,658 |
| |
|
| CORPORATE BONDS 0.9% | | | | |
| FINANCIALS 0.9% | | | | |
| Capital Markets 0.9% | | | | |
| Goldman Sachs Capital I, 6.35%, 02/15/2034 (cost $5,185,000) | | 5,000,000 | | 5,122,265 |
| |
|
See Notes to Financial Statements
16
SCHEDULE OF INVESTMENTS continued
October 31, 2006 (unaudited)
| | | Principal | | |
| | | Amount | | Value |
|
| U.S. GOVERNMENT & AGENCY OBLIGATIONS 15.4% | | | | |
| FHLB: | | | | |
| 5.35%, 10/12/2007 ## | | $ 12,000,000 | | $ 11,999,712 |
| 5.625%, 08/14/2008 | | 37,000,000 | | 37,040,996 |
| FHLMC: | | | | |
| 2.85%, 02/23/2007 | | 8,000,000 | | 7,938,704 |
| 5.05%, 03/30/2007 ## | | 14,000,000 | | 13,975,262 |
| FNMA: | | | | |
| 6.08%, 01/01/2019 ## | | 9,097,615 | | 9,301,310 |
| 7.125%, 03/15/2007 | | 3,856,000 | | 3,880,652 |
| |
|
| Total U.S. Government & Agency Obligations (cost $84,235,003) | | | | 84,136,636 |
| |
|
| U.S. TREASURY OBLIGATIONS 1.1% | | | | |
| U.S. Treasury Notes: | | | | |
| 4.75%, 05/15/2014 (p) | | 1,250,000 | | 1,262,891 |
| 4.875%, 08/15/2016 (p) | | 4,700,000 | | 4,799,142 |
| |
|
| Total U.S. Treasury Obligations (cost $6,043,680) | | | | 6,062,033 |
| |
|
| WHOLE LOAN MORTGAGE-BACKED COLLATERALIZED MORTGAGE | | | | |
| OBLIGATIONS 3.6% | | | | |
| FIXED-RATE 3.6% | | | | |
| Countrywide Alternative Loan Trust: | | | | |
| Ser. 2004-1T1, Class A6, 5.75%, 02/25/2034 | | 5,000,000 | | 4,971,600 |
| Ser. 2005-46CB, Class A14, 5.50%, 10/25/2035 ## | | 10,000,000 | | 9,793,500 |
| Residential Accredit Loans, Inc., Ser. 2006-QS4, Class A4, 6.00%, 04/25/2036 | | 5,000,000 | | 5,065,950 |
| |
|
| Total Whole Loan Mortgage-Backed Collateralized Mortgage Obligations | | | | |
| (cost $20,000,814) | | | | 19,831,050 |
| |
|
| WHOLE LOAN SUBORDINATE COLLATERALIZED MORTGAGE | | | | |
| OBLIGATIONS 2.1% | | | | |
| FIXED-RATE 2.1% | | | | |
| Countrywide Alternative Loan Trust, Ser. 2004-2CB, Class M, 5.67%, | | | | |
| 03/25/2034 ## (cost $11,325,493) | | 11,359,216 | | 11,195,303 |
| |
|
| YANKEE OBLIGATIONS-CORPORATE 0.7% | | | | |
| FINANCIALS 0.7% | | | | |
| Diversified Financial Services 0.7% | | | | |
| Preferred Term Securities, Ltd., FRN, 7.47%, 04/03/2032 144A | | | | |
| (cost $4,034,289) | | 3,990,000 | | 4,012,982 |
| | |
|
|
| | | Shares | | Value |
|
| SHORT-TERM INVESTMENTS 4.1% | | | | |
| MUTUAL FUND SHARES 4.1% | | | | |
| Evergreen Institutional U.S. Government Money Market Fund ø ## | | 16,300,517 | | 16,300,517 |
| Navigator Prime Portfolio (pp) | | 6,228,087 | | 6,228,087 |
| |
|
| Total Short-Term Investments (cost $22,528,604) | | | | 22,528,604 |
| |
|
See Notes to Financial Statements
17
SCHEDULE OF INVESTMENTS continued
October 31, 2006 (unaudited)
| | | Shares | | Value |
|
| Total Investments (cost $803,694,100) 147.1% | | | | $ 806,634,343 |
| Other Assets and Liabilities (47.1%) | | | | (258,370,950) |
| |
|
| Net Assets 100.0% | | | | $ 548,263,393 |
| |
|
| ## | | All or a portion of this security has been segregated for when-issued or delayed delivery securities. |
| # | | When-issued or delayed delivery security |
| (p) | | All or a portion of this security is on loan. |
| 144A | | Security that may be sold to qualified institutional buyers under Rule 144A of the Securities Act of 1933, as amended. |
| | | This security has been determined to be liquid under guidelines established by the Board of Trustees, unless otherwise |
| | | noted. |
| ø | | Evergreen Investment Management Company, LLC is the investment advisor to both the Fund and the money market |
| | | fund. |
| (pp) | | Represents investment of cash collateral received from securities on loan. |
| |
| Summary of Abbreviations |
| FHLB | | Federal Home Loan Bank |
| FHLMC | | Federal Home Loan Mortgage Corp. |
| FNMA | | Federal National Mortgage Association |
| FRN | | Floating Rate Note |
| GNMA | | Government National Mortgage Association |
| SBA | | Small Business Administration |
| TBA | | To Be Announced |
| The following table shows the percent of total investments (excluding segregated cash and cash equivalents) by credit quality |
| based on Moody’s and Standard & Poor’s ratings as of October 31, 2006: |
| AAA | | 96.4% | |
| AA | | 1.4% | |
| A | | 2.2% | |
| |
| |
| | | 100.0% | |
| | |
| |
| The following table shows the percent of total investments (excluding segregated cash and cash equivalents) based on effective |
| maturity as of October 31, 2006: | | | |
| Less than 1 year | | 9.5% | |
| 1 to 3 year(s) | | 17.8% | |
| 3 to 5 years | | 29.1% | |
| 5 to 10 years | | 36.3% | |
| 10 to 20 years | | 5.1% | |
| 20 to 30 years | | 2.2% | |
| |
| |
| | | 100.0% | |
| | |
| |
See Notes to Financial Statements
18
STATEMENT OF ASSETS AND LIABILITIES
October 31, 2006 (unaudited)
| Assets | | |
| Investments in securities, at value (cost $787,393,583) including $6,138,780 of securities | | |
| loaned | | $ 790,333,826 |
| Investments in affiliated money market fund, at value (cost $16,300,517) | | 16,300,517 |
|
| Total investments | | 806,634,343 |
| Principal paydown receivable | | 512 |
| Receivable for Fund shares sold | | 866,898 |
| Interest receivable | | 3,429,240 |
| Receivable for securities lending income | | 2,471 |
| Prepaid expenses and other assets | | 38,855 |
|
| Total assets | | 810,972,319 |
|
| Liabilities | | |
| Dividends payable | | 551,063 |
| Payable for securities purchased | | 252,428,207 |
| Payable for Fund shares redeemed | | 3,413,289 |
| Payable for securities on loan | | 6,228,087 |
| Advisory fee payable | | 4,802 |
| Due to other related parties | | 3,642 |
| Accrued expenses and other liabilities | | 79,836 |
|
| Total liabilities | | 262,708,926 |
|
| Net assets | | $ 548,263,393 |
|
| Net assets represented by | | |
| Paid-in capital | | $ 563,875,744 |
| Overdistributed net investment income | | (1,109,442) |
| Accumulated net realized losses on investments | | (17,446,428) |
| Net unrealized gains on investments | | 2,943,519 |
|
| Total net assets | | $ 548,263,393 |
|
| Net assets consists of | | |
| Class A | | $ 75,903,967 |
| Class B | | 14,809,284 |
| Class C | | 7,492,716 |
| Class I | | 450,057,426 |
|
| Total net assets | | $ 548,263,393 |
|
| Shares outstanding (unlimited number of shares authorized) | | |
| Class A | | 7,626,693 |
| Class B | | 1,488,002 |
| Class C | | 752,848 |
| Class I | | 45,221,450 |
|
| Net asset value per share | | |
| Class A | | $ 9.95 |
| Class A — Offering price (based on sales charge of 4.75%) | | $ 10.45 |
| Class B | | $ 9.95 |
| Class C | | $ 9.95 |
| Class I | | $ 9.95 |
|
See Notes to Financial Statements
19
STATEMENT OF OPERATIONS
Six Months Ended October 31, 2006 (unaudited)
| Investment income | | |
| Interest | | $ 13,777,527 |
| Income from affiliate | | 476,999 |
| Securities lending | | 11,421 |
|
| Total investment income | | 14,265,947 |
|
| Expenses | | |
| Advisory fee | | 1,104,349 |
| Distribution Plan expenses | | |
| Class A | | 114,532 |
| Class B | | 79,450 |
| Class C | | 39,209 |
| Administrative services fee | | 270,198 |
| Transfer agent fees | | 322,110 |
| Trustees’ fees and expenses | | 13,642 |
| Printing and postage expenses | | 14,444 |
| Custodian and accounting fees | | 90,088 |
| Registration and filing fees | | 32,235 |
| Professional fees | | 13,311 |
| Other | | 6,683 |
|
| Total expenses | | 2,100,251 |
| Less: Expense reductions | | (4,718) |
| Expense reimbursements | | (10,753) |
|
| Net expenses | | 2,084,780 |
|
| Net investment income | | 12,181,167 |
|
| Net realized and unrealized gains or losses on investments | | |
| Net realized losses on investments | | (1,456,470) |
|
| Net change in unrealized gains or losses on investments | | 9,494,629 |
|
| Net realized and unrealized gains or losses on investments | | 8,038,159 |
|
| Net increase in net assets resulting from operations | | $ 20,219,326 |
|
See Notes to Financial Statements
20
STATEMENTS OF CHANGES IN NET ASSETS
| | | Six Months Ended | | | | |
| | | October 31, 2006 | | Year Ended |
| | | (unaudited) | | April 30, 2006 |
|
| Operations | | | | | | | | |
| Net investment income | | $ 12,181,167 | | $ 18,621,898 |
| Net realized losses on investments | | | | (1,456,470) | | | | (4,671,940) |
| Net change in unrealized gains or | | | | | | | | |
| losses on investments | | | | 9,494,629 | | | | (8,160,401) |
|
| Net increase in net assets resulting | | | | | | | | |
| from operations | | | | 20,219,326 | | | | 5,789,557 |
|
| Distributions to shareholders from | | | | | | | | |
| Net investment income | | | | | | | | |
| Class A | | | | (1,670,628) | | | | (3,120,195) |
| Class B | | | | (290,217) | | | | (614,218) |
| Class C | | | | (143,330) | | | | (255,138) |
| Class I | | | | (10,296,126) | | | | (17,139,364) |
|
| Total distributions to shareholders | | | | (12,400,301) | | | | (21,128,915) |
|
| | | Shares | | | | Shares | | |
| Capital share transactions | | | | | | | | |
| Proceeds from shares sold | | | | | | | | |
| Class A | | 480,649 | | 4,724,961 | | 507,784 | | 5,065,300 |
| Class B | | 169,823 | | 1,665,778 | | 109,329 | | 1,090,670 |
| Class C | | 57,150 | | 561,808 | | 90,706 | | 901,624 |
| Class I | | 5,085,455 | | 50,040,659 | | 9,381,313 | | 93,471,908 |
|
| | | | | 56,993,206 | | | | 100,529,502 |
|
| Net asset value of shares issued in | | | | | | | | |
| reinvestment of distributions | | | | | | | | |
| Class A | | 128,520 | | 1,266,271 | | 235,117 | | 2,344,733 |
| Class B | | 20,656 | | 203,479 | | 43,251 | | 431,481 |
| Class C | | 9,618 | | 94,748 | | 17,962 | | 179,149 |
| Class I | | 776,605 | | 7,652,928 | | 1,305,273 | | 13,012,139 |
|
| | | | | 9,217,426 | | | | 15,967,502 |
|
| Automatic conversion of Class B shares | | | | | | | | |
| to Class A shares | | | | | | | | |
| Class A | | 68,828 | | 674,981 | | 193,273 | | 1,926,643 |
| Class B | | (68,828) | | (674,981) | | (193,273) | | (1,926,643) |
|
| | | | | 0 | | | | 0 |
|
| Payment for shares redeemed | | | | | | | | |
| Class A | | (959,791) | | (9,438,472) | | (2,329,972) | | (23,251,180) |
| Class B | | (340,877) | | (3,352,292) | | (775,496) | | (7,741,833) |
| Class C | | (126,675) | | (1,246,918) | | (269,482) | | (2,692,909) |
| Class I | | (5,178,349) | | (50,919,575) | | (9,418,352) | | (93,809,678) |
|
| | | | | (64,957,257) | | | �� | (127,495,600) |
|
| Net increase (decrease) in net assets | | | | | | | | |
| resulting from capital share | | | | | | | | |
| transactions | | | | 1,253,375 | | | | (10,998,596) |
|
| Total increase (decrease) in net assets | | | | 9,072,400 | | | | (26,337,954) |
| Net assets | | | | | | | | |
| Beginning of period | | | | 539,190,993 | | | | 565,528,947 |
|
| End of period | | $ 548,263,393 | | $ 539,190,993 |
|
| Overdistributed net investment income | | $ (1,109,442) | | $ (112,583) |
|
See Notes to Financial Statements
21
STATEMENT OF CASH FLOWS
Six Months Ended October 31, 2006 (unaudited)
| Increase in Cash | | |
| Cash Flows from Operating Activities: | | |
| Net increase in net assets from operations | | $ 20,219,326 |
| Adjustments to reconcile net increase in net assets from operations to net cash | | |
| provided by operating activities: | | |
| Purchase of investment securities (including mortgage dollar rolls) | | (1,735,320,301) |
| Proceeds from disposition of investment securities (including mortgage dollar rolls) | | 1,660,333,338 |
| Sales of short-term investment securities | | 88,474,340 |
| Increase in interest receivable | | (210,920) |
| Decrease in receivable for securities sold | | 11,124 |
| Decrease in receivable for Fund shares sold | | 777,241 |
| Decrease in other assets | | 8,349 |
| Decrease in payable for securities purchased | | (18,144,633) |
| Increase in payable for Fund shares redeemed | | 2,969,865 |
| Decrease in accrued expenses | | (28,993) |
| Unrealized appreciation on investments | | (9,494,629) |
| Net realized loss from investments | | 1,456,470 |
|
| Net cash provided by operating activities | | 11,050,577 |
|
| Cash Flows from Financing Activities: | | |
| Decrease in additional paid-in capital | | (7,964,051) |
| Cash distributions paid | | (3,086,526) |
|
| Net cash used in financing activities | | (11,050,577) |
|
| Net increase in cash | | $ 0 |
|
| Cash: | | |
| Beginning of period | | $ 0 |
|
| End of period | | $ 0 |
|
See Notes to Financial Statements
22
NOTES TO FINANCIAL STATEMENTS (unaudited)
1. ORGANIZATION
Evergreen U.S. Government Fund (the “Fund”) is a diversified series of Evergreen Fixed Income Trust (the “Trust”), a Delaware statutory trust organized on September 18, 1997. The Trust is an open-end management investment company registered under the Investment Company Act of 1940, as amended (the “1940 Act”).
The Fund offers Class A, Class B, Class C and Class I shares. Class A shares are sold with a front-end sales charge. However, Class A share investments of $1 million or more are not subject to a front-end sales charge but will be subject to a contingent deferred sales charge of 1.00% upon redemption within one year. Class B shares are sold without a front-end sales charge but are subject to a contingent deferred sales charge that is payable upon redemption and decreases depending on how long the shares have been held. Class C shares are sold without a front-end sales charge but are subject to a contingent deferred sales charge that is payable upon redemption within one year. Class I shares are sold without a front-end sales charge or contingent deferred sales charge. Each class of shares, except Class I shares, pays an ongoing distribution fee.
2. SIGNIFICANT ACCOUNTING POLICIES
The following is a summary of significant accounting policies consistently followed by the Fund in the preparation of its financial statements. The policies are in conformity with generally accepted accounting principles in the United States of America, which require management to make estimates and assumptions that affect amounts reported herein. Actual results could differ from these estimates.
a. Valuation of investments
Portfolio debt securities acquired with more than 60 days to maturity are fair valued using matrix pricing methods determined by an independent pricing service which takes into consideration such factors as similar security prices, yields, maturities, liquidity and ratings. Securities for which valuations are not readily available from an independent pricing service may be valued by brokers which use prices provided by market makers or estimates of market value obtained from yield data relating to investments or securities with similar characteristics.
Short-term securities with remaining maturities of 60 days or less at the time of purchase are valued at amortized cost, which approximates market value.
Investments in other mutual funds are valued at net asset value. Securities for which market quotations are not readily available or not reflective of current market value are valued at fair value as determined by the investment advisor in good faith, according to procedures approved by the Board of Trustees.
b. When-issued and delayed delivery transactions
The Fund records when-issued or delayed delivery securities as of trade date and maintains security positions such that sufficient liquid assets will be available to make payment for the securities purchased. Securities purchased on a when-issued or delayed delivery basis are marked-to-market daily and begin earning interest on the settlement date. Losses may occur on these transactions
23
NOTES TO FINANCIAL STATEMENTS (unaudited) continued
due to changes in market conditions or the failure of counterparties to perform under the contract.
c. Securities lending
The Fund may lend its securities to certain qualified brokers in order to earn additional income. The Fund receives compensation in the form of fees or interest earned on the investment of any cash collateral received. The Fund also continues to receive interest and dividends on the securities loaned. The Fund receives collateral in the form of cash or securities with a market value at least equal to the market value of the securities on loan, including accrued interest. In the event of default or bankruptcy by the borrower, the Fund could experience delays and costs in recovering the loaned securities or in gaining access to the collateral. The Fund has the right under the lending agreement to recover the securities from the borrower on demand.
d. Dollar roll transactions
The Fund may enter into dollar roll transactions with respect to mortgage-backed securities. In a dollar roll transaction, the Fund sells mortgage-backed securities to financial institutions and simultaneously agrees to accept substantially similar (same type, coupon and maturity) securities at a later date at an agreed upon price. The Fund will use the proceeds generated from the transactions to invest in short-term investments, which may enhance the Fund’s current yield and total return. The Fund accounts for dollar roll transactions as purchases and sales. The Fund could be exposed to risks if the counterparty defaults on its obligation to perform under the terms of the agreement, if the Fund receives inferior securities in comparison to what was sold to the coun-terparty at redelivery or if there are variances in paydown speed between the mortgage-related pools.
e. Security transactions and investment income
Security transactions are recorded on trade date. Realized gains and losses are computed using the specific cost of the security sold. Interest income is recorded on the accrual basis and includes accretion of discounts and amortization of premiums.
f. Federal taxes
The Fund intends to continue to qualify as a regulated investment company and distribute all of its taxable income, including any net capital gains (which have already been offset by available capital loss carryovers). Accordingly, no provision for federal taxes is required.
g. Distributions
Distributions to shareholders from net investment income are accrued daily and paid monthly. Distributions from net realized gains, if any, are recorded on the ex-dividend date. Such distributions are determined in conformity with income tax regulations, which may differ from generally accepted accounting principles.
h. Class allocations
Income, common expenses and realized and unrealized gains and losses are allocated to the classes based on the relative net assets of each class. Distribution fees, if any, are calculated daily at the
24
NOTES TO FINANCIAL STATEMENTS (unaudited) continued
class level based on the appropriate net assets of each class and the specific expense rates applicable to each class.
3. ADVISORY FEE AND OTHER TRANSACTIONS WITH AFFILIATES
Evergreen Investment Management Company, LLC (“EIMC”), an indirect, wholly-owned subsidiary of Wachovia Corporation (“Wachovia”), is the investment advisor to the Fund and is paid an annual fee starting at 0.42% and declining to 0.35% as average daily net assets increase.
From time to time, EIMC may voluntarily or contractually waive its fee and/or reimburse expenses in order to limit operating expenses. During the six months ended October 31, 2006, EIMC reimbursed Distribution Plan expenses (see Note 4) relating to Class A shares in the amount of $10,753.
The Fund may invest in Evergreen-managed money market funds, which are also advised by EIMC. Income earned on these investments is included in income from affiliate on the Statement of Operations.
Evergreen Investment Services, Inc. (“EIS”), an indirect, wholly-owned subsidiary of Wachovia, is the administrator to the Fund. As administrator, EIS provides the Fund with facilities, equipment and personnel and is paid an annual rate determined by applying percentage rates to the aggregate average daily net assets of the Evergreen funds (excluding money market funds and Evergreen Institutional Enhanced Income Fund), starting at 0.10% and declining to 0.05% as the aggregate average daily net assets of the Evergreen funds (excluding money market funds and Evergreen Institutional Enhanced Income Fund) increase.
Evergreen Service Company, LLC (“ESC”), an indirect, wholly-owned subsidiary of Wachovia, is the transfer and dividend disbursing agent for the Fund. ESC receives account fees that vary based on the type of account held by the shareholders in the Fund. For the six months ended October 31, 2006, the transfer agent fees were equivalent to an annual rate of 0.12% of the Fund’s average daily net assets.
4. DISTRIBUTION PLANS
EIS also serves as distributor of the Fund’s shares. The Fund has adopted Distribution Plans, as allowed by Rule 12b-1 of the 1940 Act, for each class of shares, except Class I. Under the Distribution Plans, distribution fees are paid at an annual rate of 0.30% of the average daily net assets for Class A shares and 1.00% of the average daily net assets for each of Class B and Class C shares.
For the six months ended October 31, 2006, EIS received $1,930 from the sale of Class A shares and $36,336 and $603 in contingent deferred sales charges from redemptions of Class B and Class C shares, respectively.
25
NOTES TO FINANCIAL STATEMENTS (unaudited) continued
5. SECURITIES TRANSACTIONS
Cost of purchases and proceeds from sales of investment securities (excluding short-term securities and mortgage dollar roll transactions were as follows for the six months ended October 31, 2006:
| Cost of Purchases | | Proceeds from Sales |
|
| U.S. | | Non-U.S. | | U.S. | | Non-U.S. |
| Government | | Government | | Government | | Government |
|
| $ 367,436,540 | | $ 50,424,360 | | $ 63,339,483 | | $ 354,249,167 |
|
During the six months ended October 31, 2006, the Fund loaned securities to certain brokers. At October 31, 2006, the value of securities on loan and the value of collateral (including accrued interest) amounted to $6,138,780 and $6,228,087, respectively.
On October 31, 2006, the aggregate cost of securities for federal income tax purposes was $803,762,340. The gross unrealized appreciation and depreciation on securities based on tax cost was $4,832,929 and $1,960,926, respectively, with a net unrealized appreciation of $2,872,003.
As of April 30, 2006, the Fund had $9,812,099 in capital loss carryovers for federal income tax purposes expiring as follows:
| Expiration |
|
| 2007 | | 2008 | | 2009 | | 2010 | | 2014 |
|
| $1,278,383 | | $4,853,705 | | $437,595 | | $1,202 | | $3,241,214 |
|
6. INTERFUND LENDING
Pursuant to an Exemptive Order issued by the SEC, the Fund may participate in an interfund lending program with certain funds in the Evergreen fund family. This program allows the Fund to borrow from, or lend money to, other participating funds. During the six months ended October 31, 2006, the Fund did not participate in the interfund lending program.
7. EXPENSE REDUCTIONS
Through expense offset arrangements with ESC and the Fund’s custodian, a portion of fund expenses has been reduced.
8. DEFERRED TRUSTEES’ FEES
Each Trustee of the Fund may defer any or all compensation related to performance of their duties as Trustees. The Trustees’ deferred balances are allocated to deferral accounts, which are included in the accrued expenses for the Fund. The investment performance of the deferral accounts is based on the investment performance of certain Evergreen funds. Any gains earned or losses incurred in the deferral accounts are reported in the Fund’s Trustees’ fees and expenses. At the election of the Trustees, the deferral account will be paid either in one lump sum or in quarterly installments for up to ten years.
26
NOTES TO FINANCIAL STATEMENTS (unaudited) continued
9. FINANCING AGREEMENT
The Fund and certain other Evergreen funds share in an unsecured revolving credit commitment for temporary and emergency purposes, including the funding of redemptions, as permitted by each participating fund’s borrowing restrictions. Borrowings under this facility bear interest at 0.50% per annum above the Federal Funds rate. All of the participating funds are charged an annual commitment fee on the unused balance, which is allocated pro rata. The credit facility is for $100 million with an annual commitment fee of 0.08% . Prior to July 3, 2006, the credit facility was for $150 million with an annual commitment fee of 0.09% . During the six months ended October 31, 2006, the Fund had no borrowings.
10. CONCENTRATION OF RISK
The Fund may invest a substantial portion of its assets in an industry or sector and, therefore, may be more affected by changes in that industry or sector than would be a comparable mutual fund that is not heavily weighted in any industry or sector.
11. REGULATORY MATTERS AND LEGAL PROCEEDINGS
Since September 2003, governmental and self-regulatory authorities have instituted numerous ongoing investigations of various practices in the mutual fund industry, including investigations relating to revenue sharing, market-timing, late trading and record retention, among other things. The investigations cover investment advisors, distributors and transfer agents to mutual funds, as well as other firms. EIMC, EIS and ESC (collectively, “Evergreen”) have received subpoenas and other requests for documents and testimony relating to these investigations, are endeavoring to comply with those requests, and are cooperating with the investigations. Evergreen is continuing its own internal review of policies, practices, procedures and personnel, and is taking remedial action where appropriate.
In connection with one of these investigations, on July 28, 2004, the staff of the Securities and Exchange Commission (“SEC”) informed Evergreen that the staff intends to recommend to the SEC that it institute an enforcement action against Evergreen. The SEC staff’s proposed allegations relate to (i) an arrangement pursuant to which a broker at one of EIMC’s affiliated broker-dealers had been authorized, apparently by an EIMC officer (who is no longer with EIMC), to engage in short-term trading, on behalf of a client, in Evergreen Mid Cap Growth Fund (formerly Evergreen Emerging Growth Fund and prior to that, known as Evergreen Small Company Growth Fund) during the period from December 2000 through April 2003, in excess of the limitations set forth in the fund’s prospectus, (ii) short-term trading from September 2001 through January 2003, by a former Evergreen portfolio manager of Evergreen Precious Metals Fund, a fund he managed at the time, (iii) the sufficiency of systems for monitoring exchanges and enforcing exchange limitations as stated in the funds’ prospectuses, and (iv) the adequacy of e-mail retention practices. In connection with the activity in Evergreen Mid Cap Growth Fund, EIMC reimbursed the fund $378,905, plus an additional $25,242, representing what EIMC calculated at that time to be the client’s net gain and the fees earned by EIMC and the expenses incurred by this fund on the client’s account. In connection with the activity in Evergreen Precious Metals Fund, EIMC reimbursed the fund $70,878, plus an additional $3,075, representing what EIMC
27
NOTES TO FINANCIAL STATEMENTS (unaudited) continued
calculated at that time to be the portfolio manager’s net gain and the fees earned by EIMC and expenses incurred by the fund on the portfolio manager’s account. Evergreen is currently engaged in discussions with the staff of the SEC concerning its recommendation.
The staff of the National Association of Securities Dealers (“NASD”) had notified EIS that it has made a preliminary determination to recommend that disciplinary action be brought against EIS for certain violations of the NASD’s rules. The recommendation relates principally to allegations that EIS (i) arranged for fund portfolio trades to be directed to broker-dealers (including Wachovia Securities, LLC, an affiliate of EIS) that sold Evergreen fund shares during the period of January 2001 to December 2003 and (ii) provided non-cash compensation by sponsoring offsite meetings attended by Wachovia Securities, LLC brokers during that period. EIS is cooperating with the NASD staff in its review of these matters.
Any resolution of these matters with regulatory authorities may include, but not be limited to, sanctions, penalties or injunctions regarding Evergreen, restitution to mutual fund shareholders and/or other financial penalties and structural changes in the governance or management of Evergreen’s mutual fund business. Any penalties or restitution will be paid by Evergreen and not by the Evergreen funds.
In addition, the Evergreen funds and EIMC and certain of its affiliates are involved in various legal actions, including private litigation and class action lawsuits. EIMC does not expect that any of such legal actions currently pending or threatened will have a material adverse impact on the financial position or operations of any of the Evergreen funds or on EIMC’s ability to provide services to the Evergreen funds.
Although Evergreen believes that neither the foregoing investigations described above nor any pending or threatened legal actions will have a material adverse impact on the Evergreen funds, there can be no assurance that these matters and any publicity surrounding or resulting from them will not result in reduced sales or increased redemptions of Evergreen fund shares, which could increase Evergreen fund transaction costs or operating expenses, or that they will not have other adverse consequences on the Evergreen funds.
12. NEW ACCOUNTING PRONOUNCEMENTS
In June 2006, the Financial Accounting Standards Board (“FASB”) issued FASB Interpretation No. 48, Accounting for Uncertainty in Income Taxes — an interpretation of FASB statement 109 (“FIN 48”). FIN 48 supplements FASB 109 by prescribing a recognition threshold and measurement attribute for the financial statement recognition and measurement of a tax position taken or expected to be taken in a tax return. The adoption of FIN 48 will require financial statements to be adjusted to reflect only those tax positions that are more likely than not to be sustained as of the adoption date. Management of the Fund is currently evaluating the impact that the adoption of FIN 48 will have on the financial statements. FIN 48 will become effective for fiscal years beginning after December 15, 2006.
28
NOTES TO FINANCIAL STATEMENTS (unaudited) continued
In September 2006, FASB issued Statement of Financial Accounting Standards No. 157, Fair Value Measurements (“FAS 157”). FAS 157 establishes a single authoritative definition of fair value, establishes a framework for measuring fair value and expands disclosures about fair value measurements. FAS 157 applies to fair value measurements already required or permitted by existing standards. The change to current generally accepted accounting principles from the application of FAS 157 relates to the definition of fair value, the methods used to measure fair value, and the expanded disclosures about fair value measurements. Management of the Fund does not believe the adoption of FAS 157 will materially impact the financial statement amounts, however, additional disclosures may be required about the inputs used to develop the measurements and the effect of certain of the measurements on changes in net assets for the period. FAS 157 is effective for financial statements issued for fiscal years beginning after November 15, 2007 and interim periods within those fiscal years.
29
ADDITIONAL INFORMATION (unaudited)
INFORMATION ABOUT THE REVIEW AND APPROVAL OF THE FUND’S INVESTMENT ADVISORY AGREEMENT
Each year, the Fund’s Board of Trustees is required to consider whether to continue in place the Fund’s investment advisory agreement. In September 2006, the Trustees, including a majority of the Trustees who are not interested persons (as that term is defined in the 1940 Act) of the Fund or of EIMC, approved the continuation of the Fund’s investment advisory agreement. (References below to the “Fund” are to Evergreen U.S. Government Fund; references to the “funds” are to the Evergreen funds generally.)
At the same time, the Trustees considered the continuation of the investment advisory agreements for all of the funds, and the description below refers in many cases to the Trustees’ process and conclusions in connection with their consideration of this matter for all of the funds. In all of its deliberations, the Board of Trustees and the disinterested Trustees were advised by independent counsel to the disinterested Trustees and counsel to the funds.
Effective October 1, 2006, certain advisory personnel of EIMC were consolidated at TAG. In connection with the consolidation, the Board of Trustees approved a sub-advisory agreement with TAG. In approving that contract, the Trustees considered the factors described below, that the services previously provided by EIMC to the Fund would be provided by EIMC and TAG going forward, and that there would be no related change in the personnel managing the Fund or in the advisory fees paid by the Fund.
The review process. The 1940 Act requires that the Board of Trustees request and evaluate, and that EIMC furnish, such information as may reasonably be necessary to evaluate the terms of a fund’s advisory agreement. The review process began at the time of the last advisory contract-renewal process in September 2005. In the course of that process, the Trustees identified a number of funds that had experienced either short-term or longer-term performance issues. During the following months, the Trustees reviewed information relating to any changes in the performance of those funds and/or any changes in the investment process or the investment teams responsible for the management of the funds. In addition, during the course of the year, the Trustees reviewed information regarding the investment performance of all of the funds and identified additional funds that they believed warranted further attention based on performance since September 2005.
In spring 2006, a committee of the Board of Trustees (the “Committee”), working with EIMC management, determined generally the types of information the Board would review and set a timeline detailing the information required and the dates for its delivery to the Trustees. The independent data provider Lipper Inc. (“Lipper”) was engaged to provide fund-specific and industry-wide data to the Board containing information of a nature and in a format generally prescribed by the Committee. The Committee also identified a number of expense, performance, and other issues and requested specific information as to those issues.
The Trustees reviewed, with the assistance of an independent industry consultant retained by the disinterested Trustees, the information provided by EIMC in response to the Committee’s requests
30
ADDITIONAL INFORMATION (unaudited) continued
and the information provided by Lipper. In certain instances, the Trustees formed small committees to review individual funds in greater detail. In addition, the Trustees requested information regarding brokerage practices of the funds, information regarding closed-end fund discounts to net asset value, and information regarding the various fall-out benefits received directly and indirectly by EIMC and its affiliates from the funds. The Trustees requested and received additional information following that review.
The Committee met several times by telephone to consider the information provided by EIMC. The Committee met in person with representatives of EIMC in early September. At a meeting of the full Board of Trustees later in September, the Committee reported the results of its discussions with EIMC, and the full Board met with representatives of EIMC, engaged in further review of the materials provided to them, and approved the continuation of each of the advisory and sub-advisory agreements.
The disinterested Trustees discussed the continuation of the funds’ advisory agreements with representatives of EIMC and in multiple private sessions with legal counsel at which no personnel of EIMC were present. In considering the continuation of the agreement, the Trustees did not identify any particular information or consideration that was all-important or controlling, and each Trustee attributed different weights to various factors. The Trustees evaluated information provided to them both in terms of the Evergreen mutual funds generally and with respect to each fund, including the Fund, specifically as they considered appropriate; although the Trustees considered the continuation of the agreement as part of the larger process of considering the continuation of the advisory contracts for all of the funds, their determination to continue the advisory agreement for each of the funds was ultimately made on a fund-by-fund basis.
This summary describes a number of the most important, but not necessarily all, of the factors considered by the Board and the disinterested Trustees.
Information reviewed. The Board of Trustees and committees of the Board of Trustees meet periodically during the course of the year. At those meetings, the Board receives a wide variety of information regarding the services performed by EIMC, the investment performance of the funds, and other aspects of the business and operations of the funds. At those meetings, and in the process of considering the continuation of the agreements, the Trustees considered information regarding, for example, the funds’ investment results; the portfolio management teams for the funds and the experience of the members of those teams, and any recent changes in the membership of the teams; portfolio trading practices; compliance by the funds and EIMC with applicable laws and regulations and with the funds’ and EIMC’s compliance policies and procedures; services provided by affiliates of EIMC to the funds and shareholders of the funds; and other information relating to the nature, extent, and quality of services provided by EIMC. The Trustees considered the rates at which the funds pay investment advisory fees, the total expense ratios of the funds, and the efforts generally by EIMC and its affiliates as sponsors of the funds. The data provided by Lipper showed the fees paid by each fund and each fund’s total expense ratio in comparison to other similar mutual funds, in addition to data regarding the investment
31
ADDITIONAL INFORMATION (unaudited) continued
performance by the funds in comparison to other similar mutual funds. The Trustees were assisted by the independent industry consultant in reviewing the information presented to them.
Where EIMC or its affiliates provide to other clients advisory services that are comparable to the advisory services provided to a fund, the Trustees considered information regarding the rates at which those other clients pay advisory fees. Fees charged by EIMC to those other clients were generally lower than those charged to the funds. EIMC explained that compliance, reporting, and other legal burdens of providing investment advice to mutual funds greatly exceed those required to provide advisory services to non-mutual fund clients such as retirement or pension plans. In addition, EIMC pointed out that there is substantially greater legal and other risk to EIMC and its affiliates from managing public mutual funds than in managing private accounts. The Trustees also considered the investment performance of other accounts managed by EIMC and its affiliates.
The Trustees considered the transfer agency fees paid by the funds to an affiliate of EIMC and noted that the funds’ transfer agent had received Dalbar’s Mutual Fund Service Award for services provided to shareholders and Dalbar’s Financial Intermediary Service Quality Evaluation Award for services to broker-dealer representatives on a post-sale support basis. They reviewed information presented to them showing generally that the transfer agency fees charged to the funds were generally consistent with industry norms, and that transfer agency fees for a number of the funds had recently declined, or were expected to in the near future.
The Trustees also considered that EIS, an affiliate of EIMC, serves as administrator to the funds and receives a fee for its services as administrator. In their comparison of the advisory fee paid by the funds with those paid by other mutual funds, the Trustees took into account administrative fees paid by the funds and those other mutual funds. The Board considered that EIS serves as distributor to the funds (other than the closed-end funds) and receives fees from the funds for those services. They considered other so-called “fall-out” benefits to EIMC and its affiliates due to their other relationships with the funds, including, for example, soft-dollar services received by EIMC attributable to transactions entered into by EIMC for the benefit of the funds and brokerage commissions received by Wachovia Securities LLC, an affiliate of EIMC, from transactions effected by it for the funds.
Nature and quality of the services provided. The Trustees considered that EIMC and its affili-ates provide a comprehensive investment management service to the fund. They noted that EIMC formulates and implements an investment program for the fund. They noted that EIMC makes its personnel available to serve as officers of the funds, and concluded that the reporting and management functions provided by EIMC with respect to the funds were generally satisfactory. The Trustees considered the investment philosophy of each fund’s portfolio management team, and considered the in-house research capabilities of EIMC and its affiliates, as well as other resources available to EIMC, including research services available to it from third parties. The Board considered the managerial and financial resources available to EIMC and its affiliates, and the commitment that the Wachovia organization has made to the funds generally. On the basis of these factors, they determined that the nature and scope of the services provided by EIMC were
32
ADDITIONAL INFORMATION (unaudited) continued
consistent with its duties under the investment advisory agreements and appropriate and consistent with the investment programs and best interests of the funds.
The Trustees noted the resources EIMC and its affiliates have committed to the regulatory, compliance, accounting, tax and oversight of tax reporting, and shareholder servicing functions, and the number and quality of staff committed to those functions, which they concluded were appropriate and generally in line with EIMC’s responsibilities to the Fund and to the funds generally. They noted that recent enhancements to those functions appeared generally appropriate, but considered that the enhancement process is an on-going one and that they would continue to monitor developments in these functions in coming periods for appropriateness and consistency with regulatory and industry developments. The Board and the disinterested Trustees concluded, within the context of their overall conclusions regarding the funds’ advisory agreements, that they were satisfied with the nature, extent, and quality of the services provided by EIMC, including services provided by EIS under its administrative services agreements with the funds.
Investment performance. The Trustees considered the investment performance of each fund, both by comparison to other comparable mutual funds and to broad market indices. The Trustees emphasized that the continuation of the investment advisory agreement for a fund should not be taken as any indication that the Trustees did not believe investment performance for any specific fund might not be improved, and they noted that they would continue to monitor closely the investment performance of the funds going forward.
Advisory and administrative fees. The Trustees recognized that EIMC does not seek to provide the lowest cost investment advisory service, but to provide a high quality, full-service investment management product at a reasonable price. They also noted that EIMC has in many cases sought to set its investment advisory fees at levels consistent with industry norms. The Trustees noted that, in certain cases, a fund’s advisory fees and/or its total expense ratio were higher than many or most other mutual funds in the same Lipper peer group. However, in each case, the Trustees determined that the level of fees was not such as to prevent the continuation of the advisory agreement.
Economies of scale. The Trustees noted that economies of scale would likely be achieved by EIMC in managing the funds as the funds grow. The Trustees noted that the Fund had implemented breakpoints in its advisory fee structure. The Trustees noted that they would continue to review the appropriate levels of breakpoints in the future, but concluded that the breakpoints as implemented appeared to be a reasonable step toward the realization of economies of scale by the Fund.
Profitability. The Trustees considered information provided to them regarding the profitability to the EIMC organization of the investment advisory, administration, and transfer agency (with respect to the open-end funds only) fees paid to EIMC and its affiliates by each of the funds. They considered that the information provided to them was necessarily estimated, and that the profitability information provided to them, especially on a fund-by-fund basis, did not necessarily provide a definitive tool for evaluating the appropriateness of each fund’s advisory fee. They noted that the levels of profitability of the funds to EIMC varied widely, depending on among other
33
ADDITIONAL INFORMATION (unaudited) continued
things the size and type of fund. They considered the profitability of the funds in light of such factors as, for example, the information they had received regarding the relation of the fees paid by the funds to those paid by other mutual funds, the investment performance of the funds, and the amount of revenues involved. In light of these factors, the Trustees concluded that the profitability of any of the funds, individually or in the aggregate, should not prevent the Trustees from approving the continuation of the agreements.
34
This page left intentionally blank
35
This page left intentionally blank
36
This page left intentionally blank
37
This page left intentionally blank
38
This page left intentionally blank
39
TRUSTEES AND OFFICERS
TRUSTEES1
| Charles A. Austin III | | Investment Counselor, Anchor Capital Advisors, Inc. (investment advice); Director, The Andover |
| Trustee | | Companies (insurance); Trustee, Arthritis Foundation of New England; Former Director, The |
| DOB: 10/23/1934 | | Francis Ouimet Society; Former Trustee, Mentor Funds and Cash Resource Trust; Former |
| Term of office since: 1991 | | Investment Counselor, Appleton Partners, Inc. (investment advice); Former Director, Executive |
| Other directorships: None | | Vice President and Treasurer, State Street Research & Management Company (investment |
| | | advice) |
|
| Shirley L. Fulton* | | Partner, Tin, Fulton, Greene & Owen, PLLC (law firm); Former Partner, Helms, Henderson & |
| Trustee | | Fulton, P.A. (law firm); Retired Senior Resident Superior Court Judge, 26th Judicial District, |
| DOB: 1/10/1952 | | Charlotte, NC |
| Term of office since: 2004 | | |
| Other directorships: None | | |
|
| K. Dun Gifford | | Chairman and President, Oldways Preservation and Exchange Trust (education); Trustee, |
| Trustee | | Treasurer and Chairman of the Finance Committee, Cambridge College; Former Trustee, Mentor |
| DOB: 10/23/1938 | | Funds and Cash Resource Trust |
| Term of office since: 1974 | | |
| Other directorships: None | | |
|
| Dr. Leroy Keith, Jr. | | Partner, Stonington Partners, Inc. (private equity fund); Trustee, Phoenix Funds Family; Director, |
| Trustee | | Diversapack Co.; Director, Obagi Medical Products Co.; Former Director, Lincoln Educational |
| DOB: 2/14/1939 | | Services; Former Trustee, Mentor Funds and Cash Resource Trust |
| Term of office since: 1983 | | |
| Other directorships: Trustee, The | | |
| Phoenix Group of Mutual Funds | | |
|
| Gerald M. McDonnell | | Manager of Commercial Operations, SMI Steel Co. – South Carolina (steel producer); Former |
| Trustee | | Sales and Marketing Manager, Nucor Steel Company; Former Trustee, Mentor Funds and Cash |
| DOB: 7/14/1939 | | Resource Trust |
| Term of office since: 1988 | | |
| Other directorships: None | | |
|
| Patricia B. Norris2 | | Former Partner, PricewaterhouseCoopers LLP |
| Trustee | | |
| DOB: 4/9/1948 | | |
| Term of office since: 2006 | | |
| Other directorships: None | | |
|
| William Walt Pettit | | Vice President, Kellam & Pettit, P.A. (law firm); Director, Superior Packaging Corp.; Director, |
| Trustee | | National Kidney Foundation of North Carolina, Inc.; Former Trustee, Mentor Funds and Cash |
| DOB: 8/26/1955 | | Resource Trust |
| Term of office since: 1984 | | |
| Other directorships: None | | |
|
| David M. Richardson | | President, Richardson, Runden LLC (executive recruitment business development/consulting |
| Trustee | | company); Consultant, Kennedy Information, Inc. (executive recruitment information and |
| DOB: 9/19/1941 | | research company); Consultant, AESC (The Association of Executive Search Consultants); |
| Term of office since: 1982 | | Director, J&M Cumming Paper Co. (paper merchandising); Former Trustee, NDI Technologies, LLP |
| Other directorships: None | | (communications); Former Trustee, Mentor Funds and Cash Resource Trust |
| | | |
|
| Dr. Russell A. Salton III | | President/CEO, AccessOne MedCard; Former Medical Director, Healthcare Resource Associates, |
| Trustee | | Inc.; Former Medical Director, U.S. Health Care/Aetna Health Services; Former Trustee, Mentor |
| DOB: 6/2/1947 | | Funds and Cash Resource Trust |
| Term of office since: 1984 | | |
| Other directorships: None | | |
|
40
TRUSTEES AND OFFICERS continued
| Michael S. Scofield | | Retired Attorney, Law Offices of Michael S. Scofield; Director and Chairman, Branded Media |
| Trustee | | Corporation (multi-media branding company); Former Trustee, Mentor Funds and Cash |
| DOB: 2/20/1943 | | Resource Trust |
| Term of office since: 1984 | | |
| Other directorships: None | | |
|
| Richard J. Shima | | Independent Consultant; Trustee, Saint Joseph College (CT); Director, Hartford Hospital; Trustee, |
| Trustee | | Greater Hartford YMCA; Former Director, Trust Company of CT; Former Director, Enhance |
| DOB: 8/11/1939 | | Financial Services, Inc.; Former Director, Old State House Association; Former Trustee, Mentor |
| Term of office since: 1993 | | Funds and Cash Resource Trust |
| Other directorships: None | | |
|
| Richard K. Wagoner, CFA3 | | Member and Former President, North Carolina Securities Traders Association; Member, Financial |
| Trustee | | Analysts Society; Former Consultant to the Boards of Trustees of the Evergreen funds; Former |
| DOB: 12/12/1937 | | Trustee, Mentor Funds and Cash Resource Trust |
| Term of office since: 1999 | | |
| Other directorships: None | | |
|
| OFFICERS | | |
| Dennis H. Ferro4 | | Principal occupations: President and Chief Executive Officer, Evergreen Investment Company, |
| President | | Inc. and Executive Vice President, Wachovia Bank, N.A.; former Chief Investment Officer, |
| DOB: 6/20/1945 | | Evergreen Investment Company, Inc. |
| Term of office since: 2003 | | |
|
| Kasey Phillips5 | | Principal occupations: Senior Vice President, Evergreen Investment Services, Inc.; Former Vice |
| Treasurer | | President, Evergreen Investment Services, Inc.; Former Assistant Vice President, Evergreen |
| DOB: 12/12/1970 | | Investment Services, Inc. |
| Term of office since: 2005 | | |
|
| Michael H. Koonce5 | | Principal occupations: Senior Vice President and General Counsel, Evergreen Investment |
| Secretary | | Services, Inc.; Senior Vice President and Assistant General Counsel, Wachovia Corporation |
| DOB: 4/20/1960 | | |
| Term of office since: 2000 | | |
|
| James Angelos5 | | Principal occupations: Chief Compliance Officer and Senior Vice President, Evergreen Funds; |
| Chief Compliance Officer | | Former Director of Compliance, Evergreen Investment Services, Inc. |
| DOB: 9/2/1947 | | |
| Term of office since: 2004 | | |
|
1 Each Trustee serves until a successor is duly elected or qualified or until his/her death, resignation, retirement or removal from office. Each Trustee oversees 91 Evergreen funds. Correspondence for each Trustee may be sent to Evergreen Board of Trustees, P.O. Box 20083, Charlotte, NC 28202.
2 Ms. Norris’ information is as of July 1, 2006, the effective date of her trusteeship.
3 Mr. Wagoner is an “interested person” of the Fund because of his ownership of shares in Wachovia Corporation, the parent to the Fund’s investment advisor.
4 The address of the Officer is 401 S. Tryon Street, 20th Floor, Charlotte, NC 28288.
5 The address of the Officer is 200 Berkeley Street, Boston, MA 02116.
* Shirley L. Fulton served as Trustee through November 20, 2006.
Additional information about the Fund’s Board of Trustees and Officers can be found in the Statement of Additional Information (SAI) and is available upon request without charge by calling 800.343.2898.
41
564359 rv4 12/2006
Evergreen Diversified Bond Fund

| table of contents |
| 1 | | LETTER TO SHAREHOLDERS |
| 6 | | FUND AT A GLANCE |
| 8 | | ABOUT YOUR FUND’S EXPENSES |
| 9 | | FINANCIAL HIGHLIGHTS |
| 13 | | SCHEDULE OF INVESTMENTS |
| 25 | | STATEMENT OF ASSETS AND LIABILITIES |
| 26 | | STATEMENT OF OPERATIONS |
| 27 | | STATEMENTS OF CHANGES IN NET ASSETS |
| 29 | | NOTES TO FINANCIAL STATEMENTS |
| 37 | | ADDITIONAL INFORMATION |
| 44 | | TRUSTEES AND OFFICERS |
This semiannual report must be preceded or accompanied by a prospectus of the Evergreen fund contained herein. The prospectus contains more complete information, including fees and expenses, and should be read carefully before investing or sending money.
The fund will file its complete schedule of portfolio holdings with the SEC for the first and third quarters of each fiscal year on Form N-Q. The fund’s Form N-Q will be available on the SEC’s Web site at http://www.sec.gov. In addition, the fund’s Form N-Q may be reviewed and copied at the SEC’s Public Reference Room in Washington, D.C. Information on the operation of the Public Reference Room may be obtained by calling 800.SEC.0330.
A description of the fund’s proxy voting policies and procedures, as well as information regarding how the fund voted proxies relating to portfolio securities during the most recent 12-month period ended June 30, is available by visiting our Web site at EvergreenInvestments.com or by visiting the SEC’s Web site at http://www.sec.gov. The fund’s proxy voting policies and procedures are also available without charge, upon request, by calling 800.343.2898.
| Mutual Funds: | | | | |
| NOT FDIC INSURED | | MAY LOSE VALUE | | NOT BANK GUARANTEED |
Evergreen InvestmentsSM is a service mark of Evergreen Investment Management Company, LLC.
Copyright 2006, Evergreen Investment Management Company, LLC.
Evergreen Investment Management Company, LLC is a subsidiary of Wachovia Corporation
and is an affiliate of Wachovia Corporation’s other Broker Dealer subsidiaries.
Evergreen mutual funds are distributed by Evergreen Investment Services, Inc.
200 Berkeley Street, Boston, MA 02116
LETTER TO SHAREHOLDERS
December 2006

Dennis H. Ferro
President and Chief
Executive Officer
Dear Shareholder:
We are pleased to provide the semi-annual report for the Evergreen Diversified Bond Fund, covering the six-month period ended October 31, 2006.
Domestic capital markets, both equity and fixed income, faced a wide range of sometimes inconsistent influences during the past six months. In the first two months of the period, investors worried about rapidly rising oil and commodity prices and the effects of the Federal Reserve Board’s persistent efforts to raise short-term interest rates to slow the economy. However, in the final four months, declining oil and commodity prices offered more encouragement to investors willing to take on risk, especially after the Federal Reserve paused in its cycle of credit tightening. Throughout the period, investors warily watched for signs that specific pockets of weakness might lead to a deceleration of growth in the general economy.
Evidence of economic deceleration did appear in the second and third quarters of 2006 — a year which began with a particularly robust rise in Gross Domestic Product (GDP) of more than 5% in the first quarter. GDP growth then slowed to annualized rates of approximately 2.5% and an estimated 2.2% in the second and third quarters, respectively, with weakening most evident in the housing and automotive industries. Yet healthy
1
LETTER TO SHAREHOLDERS continued
growth levels in personal consumption and business investment enabled demand to grow at more historically average rates, enabling the overall economy to absorb the problems in the housing and automobile areas. In addition, energy prices fell dramatically in the waning months of the fiscal period, boosting consumer confidence and raising hopes for lower inflation in the months ahead. However, officials at the Federal Reserve indicated they continued to be concerned about the possibility of rising inflationary pressures.
Over the six-month period, the domestic fixed income market delivered generally positive results, with high-yield corporate debt maintaining a performance edge over investment grade securities, including government bonds.
In managing Evergreen’s fixed income funds, managers focused on interest rate changes, particularly in higher-grade portfolios including the Evergreen Institutional Mortgage Portfolio, the Evergreen U.S. Government Fund and the Evergreen Core Bond Fund. The teams managing the Evergreen High Yield Bond Fund and the Evergreen Select High Yield Bond Fund paid particularly close attention to credit analysis, analyzing factors such as cash flow and corporations’ abilities to meet their debt obligations. Managers of more diversified funds, including the Evergreen Diversified Bond Fund and the Evergreen Strategic Income Fund, also considered factors such as interest rate expectations and yield spreads in making allocations to different sectors within the fixed income market.
2
LETTER TO SHAREHOLDERS continued
As always, we encourage investors to maintain diversified investment portfolios, including allocations to fixed income funds, in pursuit of their long-term investment goals.
Please visit our Web site, EvergreenInvestments.com, for more information about our funds and other investment products available to you. Thank you for your continued support of Evergreen Investments.
Sincerely,

Dennis H. Ferro
President and Chief Executive Officer
Evergreen Investment Company, Inc.
Notice to Shareholders:
Effective October 1, 2006, Tattersall Advisory Group, Inc., an indirect, wholly-owned subsidiary of Wachovia, became the investment sub-advisor to the Fund and is paid by EIMC for its services to the Fund.
Special Notice to Shareholders:
Please visit our Web site at EvergreenInvestments.com for a statement from President and Chief Executive Officer, Dennis Ferro, addressing NASD actions involving Evergreen Investment Services, Inc. (EIS), Evergreen’s mutual fund distributor or statements from Dennis Ferro and Chairman of the Board of the Evergreen funds, Michael S. Scofield, addressing SEC actions involving the Evergreen funds.
3
Notification of Investment Strategy Change:
Effective February 1, 2007, the Fund may, but will not necessarily, use a variety of derivative instruments, such as futures contracts, options, and swaps, including, for example, index futures, Treasury futures, Eurodollar futures, interest rate swap agreements, credit default swaps, and total return swaps. The Fund may use derivatives both for hedging and non-hedging purposes, including for purposes of enhancing returns. The Fund’s use of derivative instruments involves risks different from, or possibly greater than, the risks associated with other types of investments. For example, the use of derivatives involves the risk of loss due to the failure of another party to the contract (typically referred to as a “counterparty”) to make required payments or otherwise to comply with the contract’s terms. Derivative transactions can create investment leverage and may be highly volatile and may be illiquid or difficult to price. Derivatives are highly specialized instruments, and involve the risk that an investment adviser may not accurately predict the performance of a derivative under all market conditions. When the Fund uses a derivative instrument, it could lose more than the principal amount invested. The various derivative instruments that the Fund may use may change from time to time as new derivative products become available to the Fund. More information about derivatives and the risks associated with them can be found in the Fund’s prospectus and statement of additional information, which may be obtained by calling 1.800.343.2898 or visiting our website at EvergreenInvestments.com.
4
Notice to Shareholders:
• The Fund’s prospectus has been amended to make the following change to the Fund’s short-term trading policy effective April 2, 2007:
To limit the negative effects of short-term trading on the Fund, the Fund’s Board of Trustees has adopted certain restrictions on trading by investors. If an investor redeems more than $5,000 (including redemptions that are a part of an exchange transaction) from an Evergreen Fund, that investor is “blocked” from purchasing shares of the Fund (including purchases that are a part of an exchange transaction) for 30 calendar days after the redemption. The short-term trading policy does not apply to:
• Money market funds;
• Evergreen Institutional Enhanced Income Fund; Evergreen Adjustable Rate Fund; and Evergreen Ultra Short Opportunities Fund;
• Systematic investments or exchanges where Evergreen or the financial intermediary maintaining the shareholder account identifies to Evergreen the transaction as a systematic redemption or purchase at the time of the transaction;
• Rebalancing transactions within certain asset allocation or “wrap” programs where Evergreen or the financial intermediary is able to identify the transaction as part of a firm-approved asset allocation program;
• Purchases by a “fund of funds” into the underlying fund vehicle and purchases by 529 Plans:
• Certain transactions involving participants in employer-sponsored retirement plans, including: participant withdrawals due to mandatory distributions, rollovers and hardships; withdrawals of shares acquired by participants through payroll deductions; and, shares acquired or sold by a participant in connection with plan loans; and
• Purchases below $5,000 (including purchases that are a part of an exchange transaction).
There are certain limitations on the Fund’s ability to detect and prevent short-term trading. For example, while the Fund has access to trading information relating to investors who trade and hold their shares directly with the Fund, the Fund may not have immediate access to such information for investors who trade through financial intermediaries such as broker dealers and financial advisors or through retirement plans. Certain financial intermediaries and retirement plans hold their shares or those of their clients through omnibus accounts maintained with the Fund. The Fund may be unable to compel financial intermediaries to apply the Fund’s short-term trading policy described above. The Fund reserves the right, in its sole discretion, to allow financial intermediaries to apply alternative short-term trading policies. The Fund will use reasonable diligence to confirm that such intermediary is applying the Fund’s short-term trading policy or an acceptable alternative. Consult the disclosure provided by your financial intermediary for any alternative short-term trading policies that may apply to your account. It is possible that excessive short-term trading or trading in violation of the Fund’s trading restrictions may occur despite the Fund’s efforts to prevent them.
• Effective April 2, 2007, the “Reinstatement Privileges” described in the Fund’s prospectus are eliminated.
5
FUND AT A GLANCE
as of October 31, 2006
MANAGEMENT TEAM
Investment Advisor:
• Evergreen Investment Management Company, LLC
Sub-Advisor:
• Tattersall Advisory Group, Inc.
Portfolio Managers:
• Gary Pzegeo, CFA
• Douglas Williams, CFA
• Noel McElreath, CFA
CURRENT INVESTMENT STYLE

Source: Morningstar, Inc.
Morningstar’s style box is based on a portfolio date as of 9/30/2006.
The Fixed income style box placement is based on a fund’s average effective maturity or duration and the average credit rating of the bond portfolio.
PERFORMANCE AND RETURNS
Portfolio inception date: 11/30/1972
| | | Class A | | Class B | | Class C | | Class I |
| Class inception date | | 5/20/2005 | | 5/20/2005 | | 5/20/2005 | | 11/30/1972 |
|
| Nasdaq symbol | | EKDLX | | EKDMX | | EKDCX | | EKDYX |
|
| 6-month return with sales charge | | -0.88% | | -1.32% | | 2.68% | | N/A |
|
| 6-month return w/o sales charge | | 4.05% | | 3.68% | | 3.68% | | 4.20% |
|
| Average annual return* | | | | | | | | |
|
| 1-year with sales charge | | 0.11% | | -0.63% | | 3.34% | | N/A |
|
| 1-year w/o sales charge | | 5.07% | | 4.33% | | 4.33% | | 5.37% |
|
| 5-year | | 4.92% | | 5.42% | | 5.73% | | 6.04% |
|
| 10-year | | 5.81% | | 6.22% | | 6.22% | | 6.38% |
|
| Maximum sales charge | | 4.75% | | 5.00% | | 1.00% | | N/A |
| | | Front-end | | CDSC | | CDSC | | |
|
* Adjusted for maximum applicable sales charge, unless noted.
Past performance is no guarantee of future results. The performance quoted represents past performance and current performance may be lower or higher. The investment return and principal value of an investment will fluctuate so that investors’ shares, when redeemed, may be worth more or less than their original cost. To obtain performance information current to the most recent month-end for Classes A, B, C or I, please go to EvergreenInvestments.com/fundperformance. The performance of each class may vary based on differences in loads, fees and expenses paid by the shareholders investing in each class. Performance includes the reinvestment of income dividends and capital gain distributions. Performance shown does not reflect the deduction of taxes that a shareholder would pay on fund distributions or the redemption of fund shares.
Historical performance shown for Class I prior to 5/23/2005 is based on the performance of the fund’s predecessor closed-end fund, Vestaur Securities Fund. Historical performance shown for Classes A, B and C prior to their inception is based on the performance of Class I. The historical returns for Classes A, B and C have not been adjusted to reflect the effect of each class’ 12b-1 fee. These fees are 0.30% for Class A and 1.00% for Classes B and C. Class I does not, and Vestaur Securities Fund did not, pay a 12b-1 fee. If these fees had been reflected, returns for Classes A, B and C would have been lower.
The advisor is waiving a portion of its advisory fee and reimbursing a portion of the 12b-1 fee for Class A. Had the fees not been waived or reimbursed, returns would have been lower.
6
FUND AT A GLANCE continued
LONG-TERM GROWTH
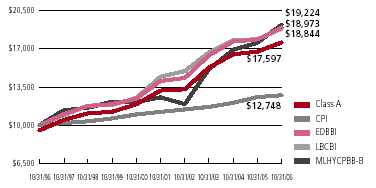
Comparison of a $10,000 investment in the Evergreen Diversified Bond Fund Class A shares versus a similar investment in the Evergreen Diversified Bond Blended Index (EDBBI), the Lehman Brothers Corporate Bond Index (LBCBI), the Merrill Lynch High Yield, Cash Pay, BB-B Index† (MLHYCPBB-B) and the Consumer Price Index (CPI).
The EDBBI, the LBCBI and the MLHYCPBB-B are unmanaged market indexes and do not include transaction costs associated with buying and selling securities, any mutual fund fees or expenses or any taxes. The CPI is a commonly used measure of inflation and does not represent an investment return. It is not possible to invest directly in an index.
Class I shares are only offered in the following manner: (1) to investment advisory clients of Evergreen Investment Management Company, LLC (or its advisory affiliates) when purchased by such advisor(s) on behalf of its clients, (2) through arrangements entered into on behalf of the Evergreen funds with certain financial services firms, (3) to certain institutional investors and (4) to persons who owned Class Y shares in registered name in an Evergreen fund on or before December 31, 1994 or who owned shares of any SouthTrust fund in registered name as of March 18, 2005 or shares of Vestaur Securities Fund as of May 20, 2005.
Class I shares are only available to institutional shareholders with a minimum of $1 million investment, which may be waived in certain situations.
The fund’s investment objective may be changed without a vote of the fund’s shareholders.
Foreign investments may contain more risk due to the inherent risks associated with changing political climates, foreign market instability and foreign currency fluctuations.
Asset-backed and mortgage-backed securities are generally subject to higher prepayment risks than other types of debt securities, which can limit the potential for gain in a declining interest rate environment and increase the potential for loss in a rising interest rate environment. Mortgage-backed securities may also be structured so that they are particularly sensitive to interest rates.
Derivatives involve additional risks including interest rate risk, credit risk, the risk of improper valuation and the risk of non-correlation to the relevant instruments they are designed to hedge or to closely track.
High yield, lower-rated bonds may contain more risk due to the increased possibility of default.
The return of principal is not guaranteed due to fluctuation in the fund’s NAV caused by changes in the price of individual bonds held by the fund and the buying and selling of bonds by the fund. Bond funds have the same inflation, interest rate and credit risks as individual bonds. Generally, the value of bond funds rise when prevailing interest rates fall, and fall when interest rates rise.
U.S. government guarantees apply only to certain securities held in the fund’s portfolio and not to the fund’s shares.
The Evergreen Diversified Bond Blended Index is composed of the following indexes: LBCBI (80%) and MLHYCPBB-B (20%).
† Copyright 2006. Merrill Lynch, Pierce, Fenner & Smith Incorporated. All rights reserved.
All data is as of October 31, 2006, and subject to change.
7
ABOUT YOUR FUND’S EXPENSES
The Example below is intended to describe the fees and expenses borne by shareholders and the impact of those costs on your investment.
Example
As a shareholder of the fund, you incur two types of costs: (1) transaction costs, including sales charges (loads), redemption fees and exchange fees; and (2) ongoing costs, including management fees, distribution (12b-1) fees and other fund expenses. This Example is intended to help you understand your ongoing costs (in dollars) of investing in the fund and to compare these costs with the ongoing costs of investing in other mutual funds. The Example is based on an investment of $1,000 invested at the beginning of the period and held for the entire period from May 1, 2006 to October 31, 2006.
The example illustrates your fund’s costs in two ways:
• Actual expenses
The section in the table under the heading “Actual” provides information about actual account values and actual expenses. You may use the information in these columns, together with the amount you invested, to estimate the expenses that you paid over the period. Simply divide your account value by $1,000 (for example, an $8,600 account value divided by $1,000 = 8.6), then multiply the result by the number in the appropriate column for your share class, in the column entitled “Expenses Paid During Period” to estimate the expenses you paid on your account during this period.
• Hypothetical example for comparison purposes
The section in the table under the heading “Hypothetical (5% return before expenses)” provides information about hypothetical account values and hypothetical expenses based on the fund’s actual expense ratio and an assumed rate of return of 5% per year before expenses, which is not the fund’s actual return. The hypothetical account values and expenses may not be used to estimate the actual ending account balance or expenses you paid for the period. You may use this information to compare the ongoing costs of investing in the fund and other funds. To do so, compare this 5% hypothetical example with the 5% hypothetical examples that appear in the shareholder reports of the other funds.
Please note that the expenses shown in the table are meant to highlight your ongoing costs only and do not reflect any transactional costs, such as sales charges (loads), redemption fees or exchange fees. Therefore, the section in the table under the heading “Hypothetical (5% return before expenses)” is useful in comparing ongoing costs only, and will not help you determine the relative total costs of owning different funds. In addition, if these transactional costs were included, your costs would have been higher.
| | | Beginning | | Ending | | |
| | | Account | | Account | | Expenses |
| | | Value | | Value | | Paid During |
| | | 5/1/2006 | | 10/31/2006 | | Period* |
|
| Actual | | | | | | |
| Class A | | $ 1,000.00 | | $ 1,040.54 | | $ 4.89 |
| Class B | | $ 1,000.00 | | $ 1,036.80 | | $ 8.57 |
| Class C | | $ 1,000.00 | | $ 1,036.80 | | $ 8.57 |
| Class I | | $ 1,000.00 | | $ 1,042.00 | | $ 3.45 |
| Hypothetical | | | | | | |
| (5% return | | | | | | |
| before expenses) | | | | | | |
| Class A | | $ 1,000.00 | | $ 1,020.42 | | $ 4.84 |
| Class B | | $ 1,000.00 | | $ 1,016.79 | | $ 8.49 |
| Class C | | $ 1,000.00 | | $ 1,016.79 | | $ 8.49 |
| Class I | | $ 1,000.00 | | $ 1,021.83 | | $ 3.41 |
|
* For each class of the Fund, expenses are equal to the annualized expense ratio of each class (0.95% for Class A, 1.67% for Class B, 1.67% for Class C and 0.67% for Class I), multiplied by the average account value over the period, multiplied by 184 / 365 days.
8
FINANCIAL HIGHLIGHTS
| (For a share outstanding throughout each period) | | | | | | | | | | |
| | | Six Months Ended | | Year Ended | | Year Ended |
| | | October 31, 2006 | | April 30, | | November 30, |
| CLASS A | | (unaudited) | | 20061 | | | | 20052,3 |
|
| Net asset value, beginning of period | | $ | | 14.25 | | $ 14.53 | | $ | | 14.83 |
|
| Income from investment operations | | | | | | | | | | |
| Net investment income (loss) | | | | 0.39 | | 0.33 | | | | 0.414 |
Net realized and unrealized gains or losses
on investments | | | | 0.18 | | (0.27) | | | | (0.28) |
| |
|
| Total from investment operations | | | | 0.57 | | 0.06 | | | | 0.13 |
|
| Distributions to shareholders from | | | | | | | | | | |
| Net investment income | | | | (0.42) | | (0.34) | | | | (0.43) |
|
| Net asset value, end of period | | $ | | 14.40 | | $ 14.25 | | $ | | 14.53 |
|
| Total return5 | | | | 4.05% | | 0.43% | | | | 0.89% |
|
| Ratios and supplemental data | | | | | | | | | | |
| Net assets, end of period (thousands) | | $205,276 | | $213,268 | | $226,450 |
| Ratios to average net assets | | | | | | | | | | |
Expenses including waivers/reimbursements
but excluding expense reductions | | | | 0.95%6 | | 0.96%6 | | | | 0.97%6 |
Expenses excluding waivers/reimbursements
and expense reductions | | | | 1.17%6 | | 1.19%6 | | | | 1.15%6 |
| Net investment income (loss) | | | | 5.51%6 | | 5.43%6 | | | | 5.28%6 |
| Portfolio turnover rate | | | | 21% | | 30% | | | | 55% |
|
1 For the five months ended April 30, 2006. The Fund changed its fiscal year end from November 30 to April 30, effective April 30, 2006.
2 Effective at the close of business on May 20, 2005, the Fund acquired the net assets of Vestaur Securities Fund. Vestaur Securities Fund became the accounting and performance survivor in this transaction . Class A shares of Vestaur Securities Fund did not exist prior to the transaction. As a result, accounting and performance information for Class A shares commenced on May 20, 2005.
3 For the period from May 20, 2005 (commencement of class operations), to November 30, 2005.
4 Net investment income (loss) per share is based on average shares outstanding during the period.
5 Excluding applicable sales charges
6 Annualized
See Notes to Financial Statements
9
FINANCIAL HIGHLIGHTS
(For a share outstanding throughout each period)
| | | Six Months Ended | | Year Ended | | Year Ended |
| | | October 31, 2006 | | April 30, | | November 30, |
| CLASS B | | (unaudited) | | 20061 | | 20052,3 |
|
| Net asset value, beginning of period | | $ | | 14.25 | | $ | | 14.53 | | $ | | 14.83 |
|
| Income from investment operations | | | | | | | | | | | | |
| Net investment income (loss) | | | | 0.34 | | | | 0.28 | | | | 0.364 |
Net realized and unrealized gains or losses
on investments | | | | 0.18 | | | | (0.26) | | | | (0.28) |
| |
|
| Total from investment operations | | | | 0.52 | | | | 0.02 | | | | 0.08 |
|
| Distributions to shareholders from | | | | | | | | | | | | |
| Net investment income | | | | (0.37) | | | | (0.30) | | | | (0.38) |
|
| Net asset value, end of period | | $ | | 14.40 | | $ | | 14.25 | | $ | | 14.53 |
|
| Total return5 | | | | 3.68% | | | | 0.14% | | | | 0.52% |
|
| Ratios and supplemental data | | | | | | | | | | | | |
| Net assets, end of period (thousands) | | $16,899 | | $18,277 | | $20,439 |
| Ratios to average net assets | | | | | | | | | | | | |
Expenses including waivers/reimbursements
but excluding expense reductions | | | | 1.67%6 | | | | 1.67%6 | | | | 1.67%6 |
Expenses excluding waivers/reimbursements
and expense reductions | | | | 1.86%6 | | | | 1.89%6 | | | | 1.85%6 |
| Net investment income (loss) | | | | 4.78%6 | | | | 4.72%6 | | | | 4.58%6 |
| Portfolio turnover rate | | | | 21% | | | | 30% | | | | 55% |
|
1 For the five months ended April 30, 2006. The Fund changed its fiscal year end from November 30 to April 30, effective April 30, 2006.
2 Effective at the close of business on May 20, 2005, the Fund acquired the net assets of Vestaur Securities Fund. Vestaur Securities Fund became the accounting and performance survivor in this transaction . Class B shares of Vestaur Securities Fund did not exist prior to the transaction . As a result, accounting and performance information for Class B shares commenced on May 20, 2005.
3 For the period from May 20, 2005 (commencement of class operations), to November 30, 2005.
4 Net investment income (loss) per share is based on average shares outstanding during the period.
5 Excluding applicable sales charges
6 Annualized
See Notes to Financial Statements
10
FINANCIAL HIGHLIGHTS
(For a share outstanding throughout each period)
| | | Six Months Ended | | Year Ended | | Year Ended |
| | | October 31, 2006 | | April 30, | | November 30, |
| CLASS C | | (unaudited) | | 20061 | | 20052,3 |
|
| Net asset value, beginning of period | | $ | | 14.25 | | $ | | 14.53 | | $ | | 14.83 |
|
| Income from investment operations | | | | | | | | | | | | |
| Net investment income (loss) | | | | 0.34 | | | | 0.28 | | | | 0.364 |
Net realized and unrealized gains or losses
on investments | | | | 0.18 | | | | (0.26) | | | | (0.28) |
| |
|
| Total from investment operations | | | | 0.52 | | | | 0.02 | | | | 0.08 |
|
| Distributions to shareholders from | | | | | | | | | | | | |
| Net investment income | | | | (0.37) | | | | (0.30) | | | | (0.38) |
|
| Net asset value, end of period | | $ | | 14.40 | | $ | | 14.25 | | $ | | 14.53 |
|
| Total return5 | | | | 3.68% | | | | 0.14% | | | | 0.52% |
|
| Ratios and supplemental data | | | | | | | | | | | | |
| Net assets, end of period (thousands) | | $24,788 | | $25,972 | | $27,764 |
| Ratios to average net assets | | | | | | | | | | | | |
Expenses including waivers/reimbursements
but excluding expense reductions | | | | 1.67%6 | | | | 1.67%6 | | | | 1.67%6 |
Expenses excluding waivers/reimbursements
and expense reductions | | | | 1.86%6 | | | | 1.89%6 | | | | 1.85%6 |
| Net investment income (loss) | | | | 4.79%6 | | | | 4.72%6 | | | | 4.58%6 |
| Portfolio turnover rate | | | | 21% | | | | 30% | | | | 55% |
|
1 For the five months ended April 30, 2006. The Fund changed its fiscal year end from November 30 to April 30, effective April 30, 2006.
2 Effective at the close of business on May 20, 2005, the Fund acquired the net assets of Vestaur Securities Fund. Vestaur Securities Fund became the accounting and performance survivor in this transaction. Class C shares of Vestaur Securities Fund did not exist prior to the transaction. As a result, accounting and performance information for Class C shares commenced on May 20, 2005.
3 For the period from May 20, 2005 (commencement of class operations), to November 30, 2005.
4 Net investment income (loss) per share is based on average shares outstanding during the period.
5 Excluding applicable sales charges
6 Annualized
See Notes to Financial Statements
11
FINANCIAL HIGHLIGHTS
(For a share outstanding throughout each period)
| | | Six Months
Ended | | Year Ended | | Year Ended November 30, |
| | October 31, 2006 | | April 30, | |
|
| CLASS I | | (unaudited) | | 20061 | | 20052 | | 20042 | | 20032 | | 20022,3 | | 20012 |
|
| Net asset value, beginning of period | | $ | | 14.25 | | $ | | 14.53 | | $ 15.14 | | $ 15.14 | | $ | | 14.27 | | $ 14.88 | | $ 14.50 |
|
| Income from investment operations | | | | | | | | | | | | | | | | | | | | |
| Net investment income (loss) | | | | 0.414 | | | | 0.34 | | 0.794 | | 0.93 | | | | 0.95 | | 1.00 | | 1.10 |
| Net realized and unrealized gains or losses | | | | | | | | | | | | | | | | | | | | |
| on investments | | | | 0.18 | | | | (0.26) | | (0.41) | | 0.02 | | | | 0.91 | | (0.56) | | 0.39 |
| |
|
| Total from investment operations | | | | 0.59 | | | | 0.08 | | 0.38 | | 0.95 | | | | 1.86 | | 0.44 | | 1.49 |
|
| Distributions to shareholders from | | | | | | | | | | | | | | | | | | | | |
| Net investment income | | | | (0.44) | | | | (0.36) | | (0.86) | | (0.95) | | | | (0.99) | | (1.05) | | (1.11) |
| Tax basis return of capital | | | | 0 | | | | 0 | | (0.13)5 | | 0 | | | | 0 | | 0 | | 0 |
| |
|
| Total distributions to shareholders | | | | (0.44) | | | | (0.36) | | (0.99) | | (0.95) | | | | (0.99) | | (1.05) | | (1.11) |
|
| Net asset value, end of period | | $ | | 14.40 | | $ | | 14.25 | | $ 14.53 | | $ 15.14 | | $ | | 15.14 | | $ 14.27 | | $ 14.88 |
|
| Total return | | | | 4.20% | | | | 0.55% | | 2.82% | | 6.47% | | | | 13.43% | | 3.06% | | 10.67% |
|
| Ratios and supplemental data | | | | | | | | | | | | | | | | | | | | |
| Net assets, end of period (thousands) | | $58,956 | | $61,711 | | $65,893 | | $97,235 | | $97,277 | | $91,666 | | $94,577 |
| Ratios to average net assets | | | | | | | | | | | | | | | | | | | | |
| Expenses including waivers/reimbursements | | | | | | | | | | | | | | | | | | | | |
| but excluding expense reductions | | | | 0.67%6 | | | | 0.67%6 | | 0.79% | | 0.94% | | | | 0.91% | | 1.01% | | 0.98% |
| Expenses excluding waivers/reimbursements | | | | | | | | | | | | | | | | | | | | |
| and expense reductions | | | | 0.86%6 | | | | 0.89%6 | | 0.88% | | 0.97% | | | | 0.94% | | 1.01% | | 0.98% |
| Net investment income (loss) | | | | 5.78%6 | | | | 5.72%6 | | 5.50% | | 6.10% | | | | 6.43% | | 6.96% | | 7.43% |
| Portfolio turnover rate | | | | 21% | | | | 30% | | 55% | | 23% | | | | 45% | | 40% | | 63% |
|
1 For the five months ended April 30, 2006. The Fund changed its fiscal year end from November 30 to April 30, effective April 30, 2006.
2 Effective at the close of business on May 20, 2005, the Fund acquired the net assets of Vestaur Securities Fund. Vestaur Securities Fund became the accounting and performance survivor in this transaction . The financial highlights for the periods prior to May 23, 2005 are those of Vestaur Securities Fund. The per share information has been restated to give effect to this transaction . Total return performance reflects the total return of Vestaur Securities Fund based on its net asset value.
3 As required, effective December 1, 2001, the Fund has adopted the provisions of the AICPA Audit and Accounting Guide, Audits of Investment Companies, and began amortizing premium and accreting discount on its fixed-income securities. The effects of this change for the year ended November 30, 2002 were a decrease in net investment income per share of $0.03; an increase in net realized gains or losses per share of $0.03; and a decrease in the ratio of net investment income to average net assets of 0.25%. The above per share information, ratios and supplemental data for the period prior to December 1, 2001 have not been restated to reflect this change in presentation.
4 Net investment income (loss) per share is based on average shares outstanding during the period.
5 Return on capital relates to former Vestaur Securities Fund shareholders and is based on average shares outstanding from December 1, 2004 through May 20, 2005.
6 Annualized
See Notes to Financial Statements
12
SCHEDULE OF INVESTMENTS
October 31, 2006 (unaudited)
| | | Principal | | | | |
| | | Amount | | | | Value |
|
| |
| AGENCY COMMERCIAL MORTGAGE-BACKED SECURITIES 1.5% | | | | | | |
| FIXED-RATE 1.5% | | | | | | |
| FHLMC, Ser. M009, Class A, 5.40%, 10/15/2021 ## (cost $4,629,399) | | $ 4,624,774 | | $ | | 4,649,517 |
| |
|
| AGENCY MORTGAGE-BACKED COLLATERALIZED MORTGAGE | | | | | | |
| OBLIGATIONS 0.2% | | | | | | |
| FIXED-RATE 0.2% | | | | | | |
| FNMA: | | | | | | |
| Ser. 2002-T12, Class A3, 7.50%, 05/25/2042 | | 23,573 | | | | 24,593 |
| Ser. 2002-T19, Class A3, 7.50%, 07/25/2042 | | 378,275 | | | | 394,535 |
| Ser. 2003-W4, Class 4A, 7.50%, 10/25/2042 | | 257,279 | | | | 267,576 |
| |
|
| Total Agency Mortgage-Backed Collateralized Mortgage Obligations | | | | | | |
| (cost $709,996) | | | | | | 686,704 |
| |
|
| AGENCY MORTGAGE-BACKED PASS THROUGH SECURITIES 0.5% | | | | | | |
| FIXED-RATE 0.5% | | | | | | |
| FHLMC: | | | | | | |
| 6.00%, 01/01/2032 | | 7,687 | | | | 7,765 |
| 6.50%, 09/25/2043 | | 149,723 | | | | 152,642 |
| 7.50%, 09/01/2013 - 08/25/2042 | | 238,269 | | | | 247,713 |
| 9.00%, 12/01/2016 | | 166,435 | | | | 177,011 |
| 9.50%, 12/01/2022 | | 26,241 | | | | 28,367 |
| FNMA: | | | | | | |
| 9.00%, 02/01/2025 - 09/01/2030 | | 255,285 | | | | 275,810 |
| 10.00%, 09/01/2010 - 04/01/2021 | | 117,217 | | | | 129,173 |
| GNMA: | | | | | | |
| 8.00%, 03/15/2022 - 08/15/2024 | | 89,512 | | | | 94,827 |
| 8.25%, 05/15/2020 | | 73,639 | | | | 78,492 |
| 8.50%, 09/15/2024 - 01/15/2027 | | 85,285 | | | | 92,074 |
| 9.00%, 12/15/2019 | | 62,194 | | | | 66,899 |
| 9.50%, 09/15/2019 | | 24,806 | | | | 27,117 |
| 10.00%, 01/15/2019 - 03/15/2020 | | 43,346 | | | | 48,296 |
| |
|
Total Agency Mortgage-Backed Pass Through Securities
(cost $1,398,799) | | | | | | 1,426,186 |
| |
|
| AGENCY REPERFORMING MORTGAGE-BACKED PASS THROUGH | | | | | | |
| SECURITIES 0.2% | | | | | | |
| FNMA: | | | | | | |
| Ser. 2003-W1, Class 2A, 7.50%, 12/25/2042 | | 381,115 | | | | 398,143 |
| Ser. 2003-W2, Class 1A3, 7.50%, 07/25/2042 | | 131,101 | | | | 137,084 |
| |
|
| Total Agency Reperforming Mortgage-Backed Pass Through Securities | | | | | | |
| (cost $549,533) | | | | | | 535,227 |
| |
|
| ASSET-BACKED SECURITIES 2.7% | | | | | | |
| Capmark, Ltd., Ser 2006-7A, Class B, 5.82%, 08/15/2036 144A | | 500,000 | | | | 501,915 |
| Credit Suisse First Boston Mtge. Securities Corp., Ser. 1996-2, | | | | | | |
| Class A-6, 7.18%, 02/25/2018 | | 74,622 | | | | 74,353 |
| GE Capital Mtge. Svcs., Inc., Ser. 1999-H, Class A-7, 6.27%, 04/25/2029 | | 307,972 | | | | 308,862 |
| Nautilus RMBS CDO, Ltd., Ser. 2005-1A, Class A3, FRN, 6.87%, | | | | | | |
| 07/07/2040 144A | | 3,299,905 | | | | 3,308,319 |
| Oakwood Mtge. Investors, Inc., Ser. 1996-C, Class A5, 7.35%, 04/15/2027 | | 617,475 | | | | 618,279 |
See Notes to Financial Statements
13
SCHEDULE OF INVESTMENTS continued
October 31, 2006 (unaudited)
| | | Principal | | | | |
| | | Amount | | | | Value |
|
| |
| ASSET-BACKED SECURITIES continued | | | | | | |
| Railcar Leasing, LLC, Ser. 1, Class A-2, 7.125%, 01/15/2013 144A | | $ 2,375,440 | | $ | | 2,484,247 |
| Trapeza CDO, LLC, Ser. 2004-7A, Class B1, FRN, 6.93%, 01/25/2035 144A | | 1,000,000 | | | | 1,015,500 |
| |
|
| Total Asset-Backed Securities (cost $8,419,109) | | | | | | 8,311,475 |
| |
|
| COMMERCIAL MORTGAGE-BACKED SECURITIES 4.9% | | | | | | |
| FIXED-RATE 4.9% | | | | | | |
| Banc of America Comml. Mtge., Inc., Ser. 2000-2, Class F, 7.92%, 09/15/2032 | | 3,000,000 | | | | 3,269,728 |
| Banc of America Mtge. Securities, Inc., Ser. 2003-7, Class B6, 4.75%, | | | | | | |
| 09/25/2018 | | 255,249 | | | | 139,090 |
| JPMorgan Chase & Co. Comml. Mtge. Securities Corp., Ser. 2001-CIBC, Class C, | | | | | | |
| 6.63%, 03/15/2033 | | 5,000,000 | | | | 5,272,687 |
| LB-UBS Comml. Mtge. Trust, Ser. 2001-C2, Class C, 6.975%, 09/15/2034 | | 4,000,000 | | | | 4,282,987 |
| Morgan Stanley Capital I, Inc., Ser. 2001-TOP5, Class G, 6.00%, | | | | | | |
| 10/15/2035 144A | | 1,042,000 | | | | 1,074,469 |
| Prima Capital Securitization, Ltd., Ser. 2006, Class D, 6.29%, 10/03/2048 # | | 1,085,000 | | | | 1,084,973 |
| |
|
| Total Commercial Mortgage-Backed Securities (cost $14,081,166) | | | | | | 15,123,934 |
| |
|
| CORPORATE BONDS 72.7% | | | | | | |
| CONSUMER DISCRETIONARY 8.0% | | | | | | |
| Automobiles 0.3% | | | | | | |
| DaimlerChrysler AG, 7.45%, 03/01/2027 | | 939,000 | | | | 1,011,534 |
| |
|
| Diversified Consumer Services 0.2% | | | | | | |
| Service Corporation International: | | | | | | |
| 7.70%, 04/15/2009 | | 250,000 | | | | 265,778 |
| 8.00%, 06/15/2017 144A | | 300,000 | | | | 291,000 |
| |
|
| | | | | | | 556,778 |
| |
|
| Hotels, Restaurants & Leisure 2.0% | | | | | | |
| Darden Restaurants, Inc., 7.125%, 02/01/2016 | | 500,000 | | | | 536,289 |
| Festival Fun Parks, LLC, 10.875%, 04/15/2014 | | 150,000 | | | | 148,125 |
| Isle of Capri Casinos, Inc., 7.00%, 03/01/2014 | | 300,000 | | | | 289,500 |
| Las Vegas Sands Corp., 6.375%, 02/15/2015 | | 300,000 | | | | 283,500 |
| McDonald’s Corp., 7.31%, 09/15/2027 | | 4,200,000 | | | | 4,265,171 |
| MGM MIRAGE, 5.875%, 02/27/2014 | | 300,000 | | | | 276,375 |
| Seneca Gaming Corp., 7.25%, 05/01/2012 | | 200,000 | | | | 202,250 |
| Town Sports International, Inc., 9.625%, 04/15/2011 | | 160,000 | | | | 169,600 |
| |
|
| | | | | | | 6,170,810 |
| |
|
| Household Durables 0.3% | | | | | | |
| Centex Corp., 7.875%, 02/01/2011 | | 500,000 | | | | 542,085 |
| Hovnanian Enterprises, Inc., 6.50%, 01/15/2014 | | 300,000 | | | | 284,625 |
| |
|
| | | | | | | 826,710 |
| |
|
| Media 3.5% | | | | | | |
| Comcast Corp., 5.90%, 03/15/2016 | | 2,000,000 | | | | 2,016,578 |
| Cox Communications, Inc., 7.875%, 08/15/2009 | | 2,000,000 | | | | 2,125,018 |
| CSC Holdings, Inc., 7.625%, 04/01/2011 | | 150,000 | | | | 152,062 |
| Lamar Media Corp., 6.625%, 08/15/2015 | | 500,000 | | | | 483,750 |
| Lin TV Corp., 6.50%, 05/15/2013 | | 250,000 | | | | 238,437 |
See Notes to Financial Statements
14
SCHEDULE OF INVESTMENTS continued
October 31, 2006 (unaudited)
| | | | | Principal | | | | |
| | | | | Amount | | | | Value |
|
| |
| CORPORATE BONDS continued | | | | | | | | |
| CONSUMER DISCRETIONARY continued | | | | | | | | |
| Media continued | | | | | | | | |
| Mediacom Broadband, LLC, 8.50%, 10/15/2015 144A | | $ | | 100,000 | | $ | | 100,375 |
| Mediacom Communications Corp., 9.50%, 01/15/2013 | | | | 300,000 | | | | 309,375 |
| MediaNews Group, Inc., 6.375%, 04/01/2014 | | | | 300,000 | | | | 265,875 |
| News America Holdings, Inc., 7.70%, 10/30/2025 | | | | 2,000,000 | | | | 2,253,720 |
| R.H. Donnelley Corp., 10.875%, 12/15/2012 | | | | 300,000 | | | | 329,625 |
| Shaw Communications, Inc., Class B, 7.20%, 12/15/2011 | | | | 75,000 | | | | 77,438 |
| Time Warner, Inc., 9.125%, 01/15/2013 (h) | | | | 2,000,000 | | | | 2,338,150 |
| |
|
| | | | | | | | | 10,690,403 |
| |
|
| Multi-line Retail 0.0% | | | | | | | | |
| Neiman Marcus Group, Inc., 9.00%, 10/15/2015 | | | | 100,000 | | | | 107,750 |
| |
|
| Specialty Retail 1.4% | | | | | | | | |
| Central Garden & Pet Co., 9.125%, 02/01/2013 | | | | 300,000 | | | | 315,000 |
| Home Depot, Inc., 5.40%, 03/01/2016 (p) | | | | 3,500,000 | | | | 3,500,987 |
| Payless ShoeSource, Inc., 8.25%, 08/01/2013 | | | | 300,000 | | | | 307,500 |
| United Auto Group, Inc., 9.625%, 03/15/2012 | | | | 300,000 | | | | 317,625 |
| |
|
| | | | | | | | | 4,441,112 |
| |
|
| Textiles, Apparel & Luxury Goods 0.3% | | | | | | | | |
| Levi Strauss & Co., 9.75%, 01/15/2015 | | | | 250,000 | | | | 266,250 |
| Oxford Industries, Inc., 8.875%, 06/01/2011 | | | | 250,000 | | | | 257,813 |
| Warnaco Group, Inc., 8.875%, 06/15/2013 | | | | 275,000 | | | | 288,750 |
| |
|
| | | | | | | | | 812,813 |
| |
|
| CONSUMER STAPLES 4.0% | | | | | | | | |
| Beverages 0.3% | | | | | | | | |
| Anheuser-Busch Companies, Inc., 6.80%, 01/15/2031 | | | | 500,000 | | | | 561,372 |
| Panamerican Beverages, Inc., 7.25%, 07/01/2009 | | | | 500,000 | | | | 521,250 |
| |
|
| | | | | | | | | 1,082,622 |
| |
|
| Food & Staples Retailing 1.1% | | | | | | | | |
| Alimentation Couche-Tard, Inc., 7.50%, 12/15/2013 | | | | 500,000 | | | | 515,000 |
| Ingles Markets, Inc., 8.875%, 12/01/2011 | | | | 300,000 | | | | 314,250 |
| Rite Aid Corp., 8.125%, 05/01/2010 | | | | 300,000 | | | | 304,500 |
| Safeway, Inc., 7.25%, 02/01/2031 (p) | | | | 1,500,000 | | | | 1,652,790 |
| SUPERVALU, Inc., 7.50%, 11/15/2014 | | | | 250,000 | | | | 255,542 |
| Wal-Mart Stores, Inc., 8.85%, 01/02/2015 | | | | 300,000 | | | | 352,881 |
| |
|
| | | | | | | | | 3,394,963 |
| |
|
| Food Products 1.1% | | | | | | | | |
| B&G Foods Holdings Corp., 8.00%, 10/01/2011 | | | | 300,000 | | | | 306,750 |
| Corn Products International, Inc., 8.45%, 08/15/2009 | | | | 2,000,000 | | | | 2,149,054 |
| Dean Foods Co., 6.625%, 05/15/2009 | | | | 500,000 | | | | 506,250 |
| Del Monte Foods Co., 6.75%, 02/15/2015 | | | | 300,000 | | | | 295,125 |
| |
|
| | | | | | | | | 3,257,179 |
| |
|
See Notes to Financial Statements
15
SCHEDULE OF INVESTMENTS continued
October 31, 2006 (unaudited)
| | | | | | | Principal | | | | |
| | | | | | | Amount | | | | Value |
|
| |
| CORPORATE BONDS continued | | | | | | | | |
| CONSUMER STAPLES continued | | | | | | | | |
| Household Products 1.5% | | | | | | | | |
| Church & Dwight Co., Inc., 6.00%, 12/15/2012 | | $ | | 300,000 | | $ | | 288,375 |
| Procter & Gamble Co., 6.875%, 09/15/2009 | | | | 4,000,000 | | | | 4,192,232 |
| |
|
| | | | | | | | | | | 4,480,607 |
| |
|
| ENERGY 6.2% | | | | | | | | | | |
| Energy Equipment & Services 0.2% | | | | | | | | |
| Hornbeck Offshore Services, Inc., Ser. B, 6.125%, 12/01/2014 | | | | 450,000 | | | | 421,312 |
| Offshore Logistics, Inc., 6.125%, 06/15/2013 | | | | 300,000 | | | | 279,750 |
| |
|
| | | | | | | | | | | 701,062 |
| |
|
| Oil, Gas & Consumable Fuels 6.0% | | | | | | | | |
| Canadian Natural Resources, Ltd., 6.50%, 02/15/2037 | | | | 2,000,000 | | | | 2,060,426 |
| Chesapeake Energy Corp., 6.875%, 01/15/2016 | | | | 300,000 | | | | 299,250 |
| El Paso Corp., 7.75%, 06/01/2013 | | | | 300,000 | | | | 309,000 |
| Exco Resources, Inc., 7.25%, 01/15/2011 | | | | 300,000 | | | | 290,250 |
| Ferrellgas Partners, LP, 6.75%, 05/01/2014 | | | | 160,000 | | | | 156,800 |
| Forest Oil Corp., 7.75%, 05/01/2014 | | | | 175,000 | | | | 176,750 |
| Kinder Morgan Energy Partners, LP, 5.125%, 11/15/2014 | | | | 2,500,000 | | | | 2,390,475 |
| New Grade Energy, Inc., 10.05%, 08/31/2007 | | | | 1,460,109 | | | | 1,500,262 |
| Occidental Petroleum Corp., 8.45%, 02/15/2029 | | | | 2,150,000 | | | | 2,865,511 |
| Peabody Energy Corp., 6.875%, 03/15/2013 | | | | 300,000 | | | | 306,000 |
| Pennzoil Co., 10.125%, 11/15/2009 | | | | 1,500,000 | | | | 1,687,932 |
| Plains All American Pipeline, LP, 7.75%, 10/15/2012 | | | | 4,000,000 | | | | 4,409,588 |
| Plains Exploration & Production Co., 8.75%, 07/01/2012 | | | | 400,000 | | | | 427,000 |
| Sunoco, Inc., 9.00%, 11/01/2024 | | | | 500,000 | | | | 669,421 |
| Targa Resources, Inc., 8.50%, 11/01/2013 144A | | | | 100,000 | | | | 100,250 |
| Tesoro Corp., 6.625%, 11/01/2015 144A | | | | 300,000 | | | | 293,625 |
| Williams Cos., 7.125%, 09/01/2011 | | | | 300,000 | | | | 311,250 |
| |
|
| | | | | | | | | | | 18,253,790 |
| |
|
| FINANCIALS 32.8% | | | | | | | | | | |
| Capital Markets 5.6% | | | | | | | | |
| Allied Capital Corp., 6.15%, 10/13/2010 (h) + | | | | 4,000,000 | | | | 3,963,200 |
| American Capital Strategies, Ltd., Ser. A, 5.92%, 09/01/2009 (h) + | | | | 3,500,000 | | | | 3,424,050 |
| Goldman Sachs Group, Inc., 5.35%, 01/15/2016 (p) | | | | 4,000,000 | | | | 3,958,584 |
| Mellon Capital II, Ser. B, 8.00%, 01/15/2027 | | | | 3,500,000 | | | | 3,650,006 |
| Morgan Stanley Group, Inc., 6.75%, 04/15/2011 | | | | 2,000,000 | | | | 2,118,162 |
| |
|
| | | | | | | | | | | 17,114,002 |
| |
|
| Commercial Banks 6.3% | | | | | | | | |
| BankAmerica Capital II, 8.00%, 12/15/2026 | | | | 1,000,000 | | | | 1,041,205 |
| BT Capital Trust, Ser. B, 7.90%, 01/15/2027 | | | | 271,000 | | | | 281,087 |
| Citicorp Lease Trust, 8.04%, 12/15/2019 144A | | | | 3,500,000 | | | | 4,165,294 |
| FBOP Corp., 10.00%, 01/15/2009 144A (h) | | | | 4,000,000 | | | | 4,280,000 |
| First Empire Capital Trust I, 8.23%, 02/01/2027 | | | | 4,300,000 | | | | 4,495,775 |
| First Tennessee Capital II, Ser. B, 6.30%, 04/15/2034 | | | | 500,000 | | | | 487,563 |
See Notes to Financial Statements
16
SCHEDULE OF INVESTMENTS continued
October 31, 2006 (unaudited)
| | | | | Principal | | | | |
| | | | | Amount | | | | Value |
|
| |
| CORPORATE BONDS continued | | | | | | | | |
| FINANCIALS continued | | | | | | | | |
| Commercial Banks continued | | | | | | | | |
| Firstar Capital Trust I, Ser. B, 8.32%, 12/15/2026 | | $ | | 500,000 | | $ | | 522,223 |
| Investors Capital Trust I, Ser. B, 9.77%, 02/01/2027 | | | | 885,000 | | | | 963,038 |
| TD Banknorth, Inc., 7.625%, 06/15/2011 | | | | 1,000,000 | | | | 1,094,765 |
| Zions Bancorp., 6.00%, 09/15/2015 | | | | 2,000,000 | | | | 2,054,730 |
| |
|
| | | | | | | | | 19,385,680 |
| |
|
| Consumer Finance 8.2% | | | | | | | | |
| Capital One Financial Corp., 6.25%, 11/15/2013 | | | | 500,000 | | | | 521,481 |
| Duke Capital, LLC., 6.25%, 02/15/2013 | | | | 2,000,000 | | | | 2,076,394 |
| Ford Motor Credit Co.: | | | | | | | | |
| 6.50%, 01/25/2007 (p) | | | | 2,000,000 | | | | 1,998,140 |
| 7.375%, 10/28/2009 | | | | 2,000,000 | | | | 1,948,020 |
| General Motors Acceptance Corp., 6.875%, 09/15/2011 | | | | 300,000 | | | | 302,368 |
| HSBC American Capital Trust I, 7.81%, 12/15/2026 144A | | | | 2,000,000 | | | | 2,081,554 |
| HSBC Finance Corp., 7.00%, 05/15/2012 | | | | 2,500,000 | | | | 2,709,355 |
| International Lease Finance Corp., 5.00%, 04/15/2010 | | | | 3,000,000 | | | | 2,978,769 |
| MBNA Corp., Ser. A, 8.28%, 12/01/2026 | | | | 1,750,000 | | | | 1,825,012 |
| Ohio National Financial Services, Inc., 6.35%, 04/01/2013 144A | | | | 5,000,000 | | | | 5,196,140 |
| Qwest Capital Funding, Inc., 6.50%, 11/15/2018 | | | | 300,000 | | | | 276,000 |
| Sprint Capital Corp., 8.75%, 03/15/2032 | | | | 2,500,000 | | | | 3,097,530 |
| |
|
| | | | | | | | | 25,010,763 |
| |
|
| Diversified Financial Services 4.2% | | | | | | | | |
| Arch Western Finance, LLC, 6.75%, 07/01/2013 | | | | 250,000 | | | | 242,500 |
| BT Institutional Capital Trust, Ser. A, 8.09%, 12/01/2026 144A | | | | 1,000,000 | | | | 1,041,976 |
| ERAC USA Finance Co., 8.00%, 01/15/2011 144A | | | | 2,165,000 | | | | 2,373,394 |
| National Rural Utilities Cooperative Finance Corp., 7.25%, 03/01/2012 | | | | 500,000 | | | | 547,286 |
| Pemex Project Funding Master Trust, 9.25%, 03/30/2018 (p) | | | | 600,000 | | | | 748,500 |
| Prudential Holdings, LLC, Ser. C, 8.70%, 12/18/2023 144A | | | | 3,000,000 | | | | 3,709,869 |
| Zurich Regcaps Funding Trust V, 8.38%, 06/01/2037 144A | | | | 4,000,000 | | | | 4,203,704 |
| |
|
| | | | | | | | | 12,867,229 |
| |
|
| Insurance 3.4% | | | | | | | | |
| Crum & Forster Holdings Corp., 10.375%, 06/15/2013 | | | | 300,000 | | | | 312,750 |
| Nationwide Financial Services, Inc., 8.00%, 03/01/2027 | | | | 500,000 | | | | 521,845 |
| North Front Passthru Trust, 5.81%, 12/15/2024 144A | | | | 4,500,000 | | | | 4,478,715 |
| Oil Insurance, Ltd., Ser. A, 7.56%, 12/29/2049 144A | | | | 3,000,000 | | | | 3,131,094 |
| Transatlantic Holdings, Inc., 5.75%, 12/14/2015 | | | | 2,000,000 | | | | 1,987,968 |
| |
|
| | | | | | | | | 10,432,372 |
| |
|
| Real Estate Investment Trusts 3.9% | | | | | | | | |
| Camden Property Trust, 5.00%, 06/15/2015 | | | | 3,500,000 | | | | 3,364,746 |
| Colonial Realty, Ltd., 6.25%, 06/15/2014 | | | | 500,000 | | | | 511,793 |
| FelCor Lodging Trust, Inc., 7.625%, 10/01/2007 | | | | 300,000 | | | | 306,000 |
| Health Care Property Investors, Inc., 6.00%, 03/01/2015 | | | | 4,000,000 | | | | 4,000,052 |
| HRPT Properties Trust, 6.40%, 02/15/2015 | | | | 500,000 | | | | 521,315 |
See Notes to Financial Statements
17
SCHEDULE OF INVESTMENTS continued
October 31, 2006 (unaudited)
| | | Principal | | | | |
| | | Amount | | | | Value |
|
| |
| CORPORATE BONDS continued | | | | | | |
| FINANCIALS continued | | | | | | |
| Real Estate Investment Trusts continued | | | | | | |
| iStar Financial, Inc., 5.70%, 03/01/2014 | | $ 2,500,000 | | $ | | 2,493,622 |
| Thornburg Mortgage, Inc., 8.00%, 05/15/2013 | | 605,000 | | | | 598,950 |
| Ventas, Inc., 7.125%, 06/01/2015 | | 250,000 | | | | 258,438 |
| |
|
| | | | | | | 12,054,916 |
| |
|
| Real Estate Management & Development 0.7% | | | | | | |
| CB Richard Ellis Group, Inc., 9.75%, 05/15/2010 | | 130,000 | | | | 139,100 |
| Westfield Group Australia, 5.70%, 10/01/2016 144A | | 2,000,000 | | | | 2,006,942 |
| |
|
| | | | | | | 2,146,042 |
| |
|
| Thrifts & Mortgage Finance 0.5% | | | | | | |
| Dime Capital Trust I, 9.33%, 05/06/2027 | | 500,000 | | | | 531,968 |
| Washington Mutual Capital I, 8.375%, 06/01/2027 | | 850,000 | | | | 894,822 |
| |
|
| | | | | | | 1,426,790 |
| |
|
| HEALTH CARE 5.1% | | | | | | |
| Health Care Providers & Services 2.8% | | | | | | |
| CIGNA Corp., 8.30%, 01/15/2033 | | 500,000 | | | | 613,499 |
| HCA, Inc., 6.375%, 01/15/2015 | | 210,000 | | | | 168,525 |
| Laboratory Corp. of America Holdings, 5.625%, 12/15/2015 | | 2,000,000 | | | | 1,983,008 |
| Omnicare, Inc., 6.125%, 06/01/2013 | | 125,000 | | | | 119,687 |
| Triad Hospitals, Inc., 7.00%, 11/15/2013 | | 450,000 | | | | 439,875 |
| UnitedHealth Group, Inc., 5.25%, 03/15/2011 | | 2,000,000 | | | | 1,998,710 |
| Universal Health Services, Inc., 7.125%, 06/30/2016 | | 3,000,000 | | | | 3,191,205 |
| |
|
| | | | | | | 8,514,509 |
| |
|
| Pharmaceuticals 2.3% | | | | | | |
| Abbott Laboratories, 5.60%, 05/15/2011 | | 5,000,000 | | | | 5,100,955 |
| Teva Pharmaceutical, LLC, 5.55%, 02/01/2016 | | 2,000,000 | | | | 1,972,414 |
| |
|
| | | | | | | 7,073,369 |
| |
|
| INDUSTRIALS 2.7% | | | | | | |
| Aerospace & Defense 0.2% | | | | | | |
| Lockheed Martin Corp., 8.20%, 12/01/2009 | | 500,000 | | | | 543,450 |
| |
|
| Air Freight & Logistics 0.8% | | | | | | |
| FedEx Corp., 9.65%, 06/15/2012 | | 1,800,000 | | | | 2,167,898 |
| PHI, Inc., 7.125%, 04/15/2013 144A | | 350,000 | | | | 332,500 |
| |
|
| | | | | | | 2,500,398 |
| |
|
| Airlines 0.5% | | | | | | |
| Continental Airlines, Inc., Ser. 2000-2, Class A1, 7.71%, 04/02/2021 | | 745,675 | | | | 805,795 |
| Northwest Airlines Corp., 6.84%, 10/01/2012 (h) | | 850,000 | | | | 843,094 |
| |
|
| | | | | | | 1,648,889 |
| |
|
| Commercial Services & Supplies 0.4% | | | | | | |
| Adesa, Inc., 7.625%, 06/15/2012 | | 200,000 | | | | 199,500 |
| Corrections Corporation of America, 6.25%, 03/15/2013 | | 300,000 | | | | 294,000 |
See Notes to Financial Statements
18
SCHEDULE OF INVESTMENTS continued
October 31, 2006 (unaudited)
| | | Principal | | | | |
| | | Amount | | | | Value |
|
| |
| CORPORATE BONDS continued | | | | | | |
| INDUSTRIALS continued | | | | | | |
| Commercial Services & Supplies continued | | | | | | |
| Geo Group, Inc., 8.25%, 07/15/2013 | | $ 450,000 | | $ | | 455,625 |
| Mobile Mini, Inc., 9.50%, 07/01/2013 | | 162,000 | | | | 174,555 |
| |
|
| | | | | | | 1,123,680 |
| |
|
| Machinery 0.4% | | | | | | |
| Case New Holland, Inc., 9.25%, 08/01/2011 | | 300,000 | | | | 319,875 |
| Manitowoc Co., Inc., 7.125%, 11/01/2013 | | 200,000 | | | | 201,000 |
| Terex Corp., 7.375%, 01/15/2014 | | 100,000 | | | | 102,000 |
| Toro Co., 7.80%, 06/15/2027 | | 500,000 | | | | 573,509 |
| |
|
| | | | | | | 1,196,384 |
| |
|
| Road & Rail 0.3% | | | | | | |
| Avis Budget Car Rental, LLC, 7.625%, 05/15/2014 144A | | 300,000 | | | | 294,750 |
| Union Pacific Corp., 6.625%, 02/01/2029 | | 500,000 | | | | 551,799 |
| |
|
| | | | | | | 846,549 |
| |
|
| Trading Companies & Distributors 0.1% | | | | | | |
| United Rentals, Inc., 6.50%, 02/15/2012 | | 300,000 | | | | 294,000 |
| |
|
| INFORMATION TECHNOLOGY 0.2% | | | | | | |
| IT Services 0.2% | | | | | | |
| Iron Mountain, Inc., 8.625%, 04/01/2013 | | 200,000 | | | | 207,000 |
| SunGard Data Systems, Inc., 4.875%, 01/15/2014 | | 250,000 | | | | 216,250 |
| Unisys Corp., 8.00%, 10/15/2012 | | 300,000 | | | | 287,250 |
| |
|
| | | | | | | 710,500 |
| |
|
| MATERIALS 3.1% | | | | | | |
| Chemicals 0.6% | | | | | | |
| Equistar Chemicals, LP, 10.625%, 05/01/2011 | | 600,000 | | | | 645,000 |
| Lyondell Chemical Co., 10.50%, 06/01/2013 | | 300,000 | | | | 331,500 |
| Scotts Co., 6.625%, 11/15/2013 | | 300,000 | | | | 297,750 |
| Tronox Worldwide, LLC, 9.50%, 12/01/2012 | | 300,000 | | | | 311,250 |
| Westlake Chemical Corp., 6.625%, 01/15/2016 | | 300,000 | | | | 288,750 |
| |
|
| | | | | | | 1,874,250 |
| |
|
| Containers & Packaging 0.3% | | | | | | |
| Crown Americas, Inc., 7.75%, 11/15/2015 | | 300,000 | | | | 309,375 |
| Sealed Air Corp., 6.875%, 07/15/2033 144A | | 500,000 | | | | 504,829 |
| |
|
| | | | | | | 814,204 |
| |
|
| Metals & Mining 0.2% | | | | | | |
| United States Steel Corp., 10.75%, 08/01/2008 | | 424,000 | | | | 458,980 |
| |
|
| Paper & Forest Products 2.0% | | | | | | |
| Boise Cascade, LLC, 7.125%, 10/15/2014 | | 300,000 | | | | 284,250 |
| Bowater, Inc., 6.50%, 06/15/2013 | | 150,000 | | | | 133,875 |
| Buckeye Technologies, Inc., 8.50%, 10/01/2013 | | 450,000 | | | | 460,125 |
See Notes to Financial Statements
19
SCHEDULE OF INVESTMENTS continued
October 31, 2006 (unaudited)
| | | | | Principal | | | | |
| | | | | Amount | | | | Value |
|
| |
| CORPORATE BONDS continued | | | | | | | | |
| MATERIALS continued | | | | | | | | |
| Paper & Forest Products continued | | | | | | | | |
| International Paper Co.: | | | | | | | | |
| 6.875%, 04/15/2029 (p) | | $ | | 790,000 | | $ | | 823,265 |
| 7.35%, 11/01/2025 | | | | 2,000,000 | | | | 2,175,878 |
| Plum Creek Timber Co., Inc., 5.875%, 11/15/2015 | | | | 1,500,000 | | | | 1,486,515 |
| Verso Paper Holdings, LLC: | | | | | | | | |
| 9.125%, 08/01/2014 144A | | | | 175,000 | | | | 178,500 |
| 11.375%, 08/01/2016 144A | | | | 100,000 | | | | 102,000 |
| Weyerhaeuser Co., 7.95%, 03/15/2025 | | | | 547,000 | | | | 588,437 |
| |
|
| | | | | | | | | 6,232,845 |
| |
|
| TELECOMMUNICATION SERVICES 3.9% | | | | | | | | |
| Diversified Telecommunication Services 2.6% | | | | | | | | |
| AT&T, Inc., 5.30%, 11/15/2010 | | | | 3,000,000 | | | | 3,007,161 |
| Citizens Communications Co., 6.25%, 01/15/2013 | | | | 300,000 | | | | 294,000 |
| GTE Corp., 7.90%, 02/01/2027 | | | | 1,000,000 | | | | 1,043,265 |
| Insight Midwest, LP, 10.50%, 11/01/2010 | | | | 300,000 | | | | 311,250 |
| Level 3 Communications, Inc., 6.375%, 10/15/2015 | | | | 300,000 | | | | 297,000 |
| Qwest Communications International, Inc., 7.875%, 09/01/2011 | | | | 300,000 | | | | 319,125 |
| Telus Corp., 8.00%, 06/01/2011 | | | | 500,000 | | | | 552,010 |
| Verizon Communications, Inc., 6.125%, 01/15/2013 (p) | | | | 2,000,000 | | | | 2,035,008 |
| |
|
| | | | | | | | | 7,858,819 |
| |
|
| Wireless Telecommunication Services 1.3% | | | | | | | | |
| Cingular Wireless, 8.125%, 05/01/2012 | | | | 800,000 | | | | 903,955 |
| Nextel Partners, Inc., 8.125%, 07/01/2011 (h) | | | | 3,000,000 | | | | 3,165,000 |
| |
|
| | | | | | | | | 4,068,955 |
| |
|
| UTILITIES 6.7% | | | | | | | | |
| Electric Utilities 3.2% | | | | | | | | |
| AEP Texas Central Co., 5.50%, 02/15/2013 | | | | 3,000,000 | | | | 3,112,350 |
| Edison International, 7.73%, 06/15/2009 | | | | 300,000 | | | | 313,500 |
| El Paso Electric Co., 7.80%, 08/01/2031 | | | | 175,000 | | | | 183,313 |
| NRG Energy, Inc., 7.25%, 02/01/2014 | | | | 300,000 | | | | 304,125 |
| PPL Electric Utilities Corp., 4.30%, 06/01/2013 | | | | 535,000 | | | | 503,805 |
| Progress Energy, Inc., 6.85%, 04/15/2012 | | | | 3,000,000 | | | | 3,215,607 |
| Reliant Energy, Inc., 6.75%, 12/15/2014 | | | | 300,000 | | | | 287,625 |
| Southern Co., 4.875%, 07/15/2015 | | | | 2,000,000 | | | | 1,900,654 |
| |
|
| | | | | | | | | 9,820,979 |
| |
|
| Independent Power Producers & Energy Traders 0.3% | | | | | | | | |
| AES Corp., 7.75%, 03/01/2014 | | | | 300,000 | | | | 315,750 |
| Dynegy, Inc., 8.375%, 05/01/2016 | | | | 300,000 | | | | 309,750 |
| Tenaska, Inc., 7.00%, 06/30/2021 144A | | | | 290,760 | | | | 289,258 |
| |
|
| | | | | | | | | 914,758 |
| |
|
See Notes to Financial Statements
20
SCHEDULE OF INVESTMENTS continued
October 31, 2006 (unaudited)
| | | | | Principal | | | | |
| | | | | Amount | | | | Value |
|
| |
| CORPORATE BONDS continued | | | | | | | | |
| UTILITIES continued | | | | | | | | |
| Multi-Utilities 3.2% | | | | | | | | |
| CMS Energy Corp., 7.50%, 01/15/2009 | | | | $ 300,000 | | $ | | 309,750 |
| Dominion Resources Capital Trust I, 7.83%, 12/01/2027 | | 500,000 | | | | 520,905 |
| Dominion Resources, Inc., 5.95%, 06/15/2035 | | 3,000,000 | | | | 2,973,291 |
| MidAmerican Energy Holdings Co., 8.48%, 09/15/2028 | | 3,000,000 | | | | 3,857,703 |
| NiSource, Inc., 7.875%, 11/15/2010 | | | | 2,000,000 | | | | 2,164,086 |
| |
|
| | | | | | | | | 9,825,735 |
| |
|
| Total Corporate Bonds (cost $222,329,685) | | | | | | 222,547,180 |
| |
|
| FOREIGN BONDS - GOVERNMENT (PRINCIPAL AMOUNT DENOMINATED | | | | | | |
| IN CURRENCY INDICATED) 1.8% | | | | | | | | |
| Mexico, 8.00%, 12/07/2023 MXN | | | | 27,500,000 | | | | 2,516,400 |
| Sweden, 5.00%, 01/28/2009 SEK | | | | 21,700,000 | | | | 3,100,094 |
| |
|
| Total Foreign Bonds - Government (Principal Amount Denominated in | | | | | | |
| Currency Indicated) (cost $5,536,623) | | | | | | 5,616,494 |
| |
|
| COLLATERALIZED MORTGAGE OBLIGATIONS 0.1% | | | | | | |
| Mastr Reperforming Loan Trust, Ser. 2006-2, Class B3, 5.89%, 05/25/2036 144A | | | | | | |
| (cost $414,332) | | | | $ 440,413 | | | | 418,313 |
| |
|
| MUNICIPAL OBLIGATIONS 0.2% | | | | | | | | |
| HOUSING 0.2% | | | | | | | | |
| Virginia HDA RB, Ser. J, 6.75%, 12/01/2021 (cost $538,378) | | 500,000 | | | | 531,450 |
| |
|
| U.S. TREASURY OBLIGATIONS 0.1% | | | | | | | | |
| U.S. Treasury Notes, 4.875%, 08/15/2016 (p) (cost $200,063) | | 200,000 | | | | 204,219 |
| |
|
| WHOLE LOAN SUBORDINATE COLLATERALIZED MORTGAGE | | | | | | |
| OBLIGATIONS 0.2% | | | | | | | | |
| Financial Asset Securitization, Inc., Ser. 1997-NAM2, Class B-2, 7.88%, | | | | | | |
| 07/25/2027 (cost $474,187) | | | | 461,601 | | | | 460,485 |
| |
|
| YANKEE OBLIGATIONS - CORPORATE 10.7% | | | | | | |
| CONSUMER DISCRETIONARY 0.1% | | | | | | | | |
| Media 0.1% | | | | | | | | |
| National Cable plc, 9.125%, 08/15/2016 | | | | 107,000 | | | | 113,019 |
| Rogers Cable, Inc., 5.50%, 03/15/2014 | | | | 300,000 | | | | 283,500 |
| |
|
| | | | | | | | | 396,519 |
| |
|
| FINANCIALS 6.8% | | | | | | | | |
| Commercial Banks 5.2% | | | | | | | | |
| Banco Bradesco SA, 8.75%, 10/24/2013 (p) | | | | 750,000 | | | | 855,000 |
| Barclays Bank plc, 8.55%, 09/29/2049 144A | | | | 4,000,000 | | | | 4,511,812 |
| BOI Capital Funding, 5.57%, 02/01/2049 144A | | 1,000,000 | | | | 977,943 |
| Royal Bank of Scotland Group plc, 9.12%, 03/31/2049 | | 5,000,000 | | | | 5,572,420 |
| Standard Chartered plc, FRN, 5.56%, 07/29/2049 | | 5,000,000 | | | | 4,137,500 |
| |
|
| | | | | | | | | 16,054,675 |
| |
|
See Notes to Financial Statements
21
SCHEDULE OF INVESTMENTS continued
October 31, 2006 (unaudited)
| | | | | | | Principal | | | | |
| | | | | | | Amount | | | | Value |
|
| YANKEE OBLIGATIONS - CORPORATE continued | | | | | | | | |
| FINANCIALS continued | | | | | | | | |
| Consumer Finance 0.1% | | | | | | | | |
| NXP Funding, LLC, 7.875%, 10/15/2014 144A | | $ | | 200,000 | | $ | | 204,000 |
| |
|
| Diversified Financial Services 1.5% | | | | | | | | |
| ING Groep NV, 5.78%, 12/29/2049 | | | | 1,500,000 | | | | 1,495,921 |
| Preferred Term Securities, Ltd., FRN: | | | | | | | | |
| 6.96%, 06/24/2034 144A | | | | 2,000,000 | | | | 2,041,420 |
| 6.99%, 12/22/2036 144A | | | | 1,000,000 | | | | 1,002,690 |
| |
|
| | | | | | | | | | | 4,540,031 |
| |
|
| INDUSTRIALS 0.2% | | | | | | | | |
| Industrial Conglomerates 0.2% | | | | | | | | |
| Tyco International Group SA, 6.375%, 10/15/2011 | | | | 500,000 | | | | 525,445 |
| |
|
| MATERIALS 0.8% | | | | | | | | | | |
| Chemicals 0.1% | | | | | | | | | | |
| NOVA Chemicals Corp., 6.50%, 01/15/2012 | | | | 300,000 | | | | 283,500 |
| |
|
| Metals & Mining 0.7% | | | | | | | | |
| Alcan, Inc., 6.125%, 12/15/2033 | | | | 2,000,000 | | | | 1,994,060 |
| Novelis, Inc., FRN, 8.25%, 02/15/2015 144A | | | | 300,000 | | | | 288,000 |
| |
|
| | | | | | | | | | | 2,282,060 |
| |
|
| TELECOMMUNICATION SERVICES 2.8% | | | | | | | | |
| Diversified Telecommunication Services 2.5% | | | | | | | | |
| British Telecommunications plc, 8.875%, 12/15/2030 | | | | 750,000 | | | | 1,019,064 |
| France Telecom SA, 8.50%, 03/01/2031 | | | | 1,000,000 | | | | 1,332,644 |
| Telecom Italia Capital Corp.: | | | | | | | | |
| Ser. B, 5.25%, 11/15/2013 | | | | 500,000 | | | | 478,920 |
| Ser. C, 6.375%, 11/15/2033 | | | | 2,100,000 | | | | 2,003,904 |
| Telefonos De Mexico SA, 5.50%, 01/27/2015 | | | | 3,000,000 | | | | 2,937,705 |
| |
|
| | | | | | | | | | | 7,772,237 |
| |
|
| Wireless Telecommunication Services 0.3% | | | | | | | | |
| Vodafone Group plc, 7.75%, 02/15/2010 | | | | 700,000 | | | | 751,785 |
| |
|
| Total Yankee Obligations - Corporate (cost $33,451,214) | | | | | | | | 32,810,252 |
| | |
|
|
| | | | | | | Shares | | | | Value |
|
| |
| PREFERRED STOCKS 3.1% | | | | | | | | |
| FINANCIALS 2.0% | | | | | | | | | | |
| Consumer Finance 1.0% | | | | | | | | |
| General Electric Capital Corp. | | | | 120,000 | | | | 3,086,400 |
| |
|
| Thrifts & Mortgage Finance 1.0% | | | | | | | | |
| Fannie Mae, Ser. O | | | | | | 55,000 | | | | 2,987,187 |
| |
|
See Notes to Financial Statements
22
SCHEDULE OF INVESTMENTS continued
October 31, 2006 (unaudited)
| | | | | Shares | | | | Value |
|
| PREFERRED STOCKS continued | | | | | | |
| TELECOMMUNICATION SERVICES 1.1% | | | | | | |
| Diversified Telecommunication Services 1.1% | | | | | | |
| Centaur Funding Corp. | | | | 2,880 | | $ | | 3,391,200 |
| |
|
| Total Preferred Stocks (cost $9,904,851) | | | | | | 9,464,787 |
| | |
|
|
| | | | | Principal | | | | |
| | | | | Amount | | | | Value |
|
| |
| SHORT-TERM INVESTMENTS 3.3% | | | | | | |
| U.S. TREASURY OBLIGATIONS 0.1% | | | | | | |
| U.S. Treasury Bills: | | | | | | | | |
| 4.78%, 11/16/2006 † ƒ | | | | $ 50,000 | | | | 49,900 |
| 4.80%, 11/16/2006 † ƒ | | | | 25,000 | | | | 24,950 |
| 4.94%, 03/15/2007 † ƒ | | | | 100,000 | | | | 98,186 |
| |
|
| | | | | | | | | 173,036 |
| | |
|
|
| | | | | Shares | | | | Value |
|
| |
| MUTUAL FUND SHARES 3.2% | | | | | | |
| Navigator Prime Portfolio (p)(p) | | | | 9,771,515 | | | | 9,771,515 |
| |
|
| Total Short-Term Investments (cost $9,944,551) | | | | | | 9,944,551 |
| |
|
| Total Investments (cost $312,581,886) 102.2% | | | | | | 312,730,774 |
| Other Assets and Liabilities (2.2%) | | | | | | (6,812,148) |
| |
|
| Net Assets 100.0% | | | | | | $ | | 305,918,626 |
| |
|
## All or a portion of this security has been segregated for when-issued or delayed delivery securities.
144A Security that may be sold to qualified institutional buyers under Rule 144A of the Securities Act of 1933, as amended. This security has been determined to be liquid under guidelines established by the Board of Trustees, unless otherwise noted.
# When-issued or delayed delivery security
(p) All or a portion of this security is on loan.
(h) Security is valued at fair value as determined by the investment advisor in good faith, according to procedures approved by the Board of Trustees.
+ Security is deemed illiquid and is valued using market quotations when readily available.
† Rate shown represents the yield to maturity at date of purchase.
ƒ All or a portion of this security was pledged to cover initial margin requirements for open futures contracts.
(p)(p) Represents investment of cash collateral received from securities on loan.
See Notes to Financial Statements
23
SCHEDULE OF INVESTMENTS continued
October 31, 2006 (unaudited)
Summary of Abbreviations
| CDO | | Collateralized Debt Obligation |
| FHLMC | | Federal Home Loan Mortgage Corp. |
| FNMA | | Federal National Mortgage Association |
| FRN | | Floating Rate Note |
| GNMA | | Government National Mortgage Association |
| HDA | | Housing Development Authority |
| MXN | | Mexican Peso |
| RB | | Revenue Bond |
| SEK | | Swedish Krona |
The following table shows the percent of total investment (excluding equity positions) by credit quality based on Moody’s and Standard & Poor’s ratings as of October 31, 2006:
| AAA | | 5.2% |
| AA | | 11.1% |
| A | | 29.9% |
| BBB | | 38.6% |
| BB | | 4.2% |
| B | | 6.7% |
| NR | | 4.3% |
| |
|
| | | 100.0% |
| | |
|
The following table shows the percentage of total investments (excluding equity positions) based on effective maturity as of October 31, 2006:
| Less than 1 year | | 1.3% |
| 1 to 3 year(s) | | 7.9% |
| 3 to 5 years | | 16.6% |
| 5 to 10 years | | 35.0% |
| 10 to 20 years | | 9.4% |
| 20 to 30 years | | 23.0% |
| Greater than 30 years | | 6.8% |
| |
|
| | | 100.0% |
| | |
|
See Notes to Financial Statements
24
STATEMENT OF ASSETS AND LIABILITIES
October 31, 2006 (unaudited)
| Assets | | | | |
| Investments in securities, at value (cost $312,581,886), including $9,604,792 of | | | | |
| securities loaned | | $ | | 312,730,774 |
| Cash | | | | 592,404 |
| Receivable for securities sold | | | | 1,999,032 |
| Principal paydown receivable | | | | 906 |
| Receivable for Fund shares sold | | | | 61,108 |
| Interest receivable | | | | 4,901,216 |
| Receivable for daily variation margin on open futures contracts | | | | 72,188 |
| Receivable for securities lending income | | | | 1,421 |
| Receivable from advisor | | | | 1,923 |
| Prepaid expenses and other assets | | | | 170,516 |
|
| Total assets | | | | 320,531,488 |
|
| Liabilities | | | | |
| Dividends payable | | | | 533,398 |
| Payable for securities purchased | | | | 3,125,992 |
| Payable for Fund shares redeemed | | | | 1,118,593 |
| Payable for securities on loan | | | | 9,771,515 |
| Due to related parties | | | | 2,639 |
| Accrued expenses and other liabilities | | | | 60,725 |
|
| Total liabilities | | | | 14,612,862 |
|
| Net assets | | $ | | 305,918,626 |
|
| Net assets represented by | | | | |
| Paid-in capital | | $ | | 366,143,540 |
| Overdistributed net investment income | | | | (2,322,966) |
| Accumulated net realized losses on investments | | | | (58,242,401) |
| Net unrealized gains on investments | | | | 340,453 |
|
| Total net assets | | $ | | 305,918,626 |
|
| Net assets consists of | | | | |
| Class A | | $ | | 205,275,912 |
| Class B | | | | 16,898,814 |
| Class C | | | | 24,787,711 |
| Class I | | | | 58,956,189 |
|
| Total net assets | | $ | | 305,918,626 |
|
| Shares outstanding (unlimited number of shares authorized) | | | | |
| Class A | | | | 14,259,159 |
| Class B | | | | 1,173,860 |
| Class C | | | | 1,721,837 |
| Class I | | | | 4,094,636 |
|
| Net asset value per share | | | | |
| Class A | | $ | | 14.40 |
| Class A — Offering price (based on sales charge of 4.75%) | | $ | | 15.12 |
| Class B | | $ | | 14.40 |
| Class C | | $ | | 14.40 |
| Class I | | $ | | 14.40 |
|
See Notes to Financial Statements
25
STATEMENT OF OPERATIONS
Six Months Ended October 31, 2006 (unaudited)
| Investment income | | | | |
| Interest (net of foreign withholding taxes of $7,368) | | $ | | 9,684,476 |
| Dividends | | | | 305,847 |
| Income from affiliate | | | | 32,749 |
| Securities lending | | | | 10,271 |
|
| Total investment income | | | | 10,033,343 |
|
| Expenses | | | | |
| Advisory fee | | | | 693,447 |
| Distribution Plan expenses | | | | |
| Class A | | | | 311,808 |
| Class B | | | | 87,880 |
| Class C | | | | 125,925 |
| Administrative services fee | | | | 154,992 |
| Transfer agent fees | | | | 346,066 |
| Trustees’ fees and expenses | | | | 4,595 |
| Printing and postage expenses | | | | 32,918 |
| Custodian and accounting fees | | | | 55,210 |
| Registration and filing fees | | | | 35,132 |
| Professional fees | | | | 9,075 |
| Other | | | | 7,409 |
|
| Total expenses | | | | 1,864,457 |
| Less: Expense reductions | | | | (5,532) |
| Expense reimbursements | | | | (320,153) |
|
| Net expenses | | | | 1,538,772 |
|
| Net investment income | | | | 8,494,571 |
|
| Net realized and unrealized gains or losses on investments | | | | |
| Net realized gains or losses on: | | | | |
| Securities | | | | (2,542,153) |
| Foreign currency related transactions | | | | (758,895) |
| Futures contracts | | | | 306,024 |
|
| Net realized losses on investments | | | | (2,995,024) |
| Net change in unrealized gains or losses on investments | | | | 6,628,689 |
|
| Net realized and unrealized gains or losses on investments | | | | 3,633,665 |
|
| Net increase in net assets resulting from operations | | $ | | 12,128,236 |
|
See Notes to Financial Statements
26
STATEMENTS OF CHANGES IN NET ASSETS
| | | Six Months Ended | | | | |
| | | October 31, 2006 | | Year Ended |
| | | (unaudited) | | April 30, 2006 (a) |
|
| Operations | | | | | | | | |
| Net investment income | | | $ | 8,494,571 | | | $ | 7,394,482 |
| Net realized losses on investments | | | | (2,995,024) | | | | (227,633) |
| Net change in unrealized gains or losses | | | | | | | | |
| on investments | | | | 6,628,689 | | | | (5,662,815) |
|
| Net increase in net assets resulting from | | | | | | | | |
| operations | | | | 12,128,236 | | | | 1,504,034 |
|
| Distributions to shareholders from | | | | | | | | |
| Net investment income | | | | | | | | |
| Class A | | | | (6,063,973) | | | | (5,253,477) |
| Class B | | | | (449,346) | | | | (404,443) |
| Class C | | | | (644,879) | | | | (562,616) |
| Class I | | | | (1,850,877) | | | | (1,600,305) |
|
| Total distributions to shareholders | | | | (9,009,075) | | | | (7,820,841) |
|
| | | Shares | | | | Shares | | |
| Capital share transactions | | | | | | | | |
| Proceeds from shares sold | | | | | | | | |
| Class A | | 184,392 | | 2,619,439 | | 144,276 | | 2,070,261 |
| Class B | | 86,661 | | 1,228,860 | | 100,885 | | 1,459,444 |
| Class C | | 94,307 | | 1,339,178 | | 58,582 | | 844,966 |
| Class I | | 22,765 | | 327,456 | | 18,562 | | 258,081 |
|
| | | | | 5,514,933 | | | | 4,632,752 |
|
| Net asset value of shares issued in | | | | | | | | |
| reinvestment of distributions | | | | | | | | |
| Class A | | 282,434 | | 4,014,509 | | 239,055 | | 3,455,450 |
| Class B | | 18,252 | | 259,373 | | 16,371 | | 236,663 |
| Class C | | 29,359 | | 417,261 | | 25,591 | | 369,920 |
| Class I | | 66,010 | | 938,329 | | 55,761 | | 806,034 |
|
| | | | | 5,629,472 | | | | 4,868,067 |
|
| Automatic conversion of Class B shares | | | | | | | | |
| to Class A shares | | | | | | | | |
| Class A | | 40,329 | | 573,346 | | 61,125 | | 886,081 |
| Class B | | (40,329) | | (573,346) | | (61,125) | | (886,081) |
|
| | | | | 0 | | | | 0 |
|
| Payment for shares redeemed | | | | | | | | |
| Class A | | (1,218,644) | | (17,287,152) | | (1,062,385) | | (15,375,165) |
| Class B | | (173,708) | | (2,461,733) | | (180,144) | | (2,605,437) |
| Class C | | (224,984) | | (3,189,045) | | (172,278) | | (2,493,838) |
| Class I | | (326,012) | | (4,635,708) | | (278,405) | | (4,026,585) |
|
| | | | | (27,573,638) | | | | (24,501,025) |
|
| Net decrease in net assets resulting | | | | | | | | |
| from capital share transactions | | | | (16,429,233) | | | | (15,000,206) |
|
| Total decrease in net assets | | | | (13,310,072) | | | | (21,317,013) |
| Net assets | | | | | | | | |
| Beginning of period | | | | 319,228,698 | | | | 340,545,711 |
|
| End of period | | $ 305,918,626 | | $ 319,228,698 |
|
| Overdistributed net investment income | | | $ | (2,322,966) | | | $ | (394,223) |
|
(a) For the five months ended April 30, 2006. The Fund changed its fiscal year end from November 30 to April 30, effective April 30, 2006.
See Notes to Financial Statements
27
STATEMENTS OF CHANGES IN NET ASSETS continued
| | | Year Ended |
| | | November 30, 2005 (a) (b) |
|
| Operations | | | | |
| Net investment income | | | $ | 12,472,236 |
| Net realized gains on investments | | | | 158,052 |
| Net change in unrealized gains or losses on investments | | | | (7,406,911) |
|
| Net increase in net assets resulting from operations | | | | 5,223,377 |
|
| Distributions to shareholders from | | | | |
| Net investment income | | | | |
| Class A | | | | (6,953,533) |
| Class B | | | | (543,738) |
| Class C | | | | (757,969) |
| Class I | | | | (5,026,549) |
| Tax return of capital | | | | |
| Class I | | | | (881,232) |
|
| Total distributions to shareholders | | | | (14,163,021) |
|
| | | Shares | | |
| Capital share transactions | | | | |
| Proceeds from shares sold | | | | |
| Class A | | 113,587 | | 1,676,634 |
| Class B | | 115,193 | | 1,706,735 |
| Class C | | 55,353 | | 827,909 |
| Class I | | 27,527 | | 416,249 |
|
| | | | | 4,627,527 |
|
| Net asset value of shares issued in reinvestment of distributions | | | | |
| Class A | | 339,379 | | 5,028,431 |
| Class B | | 24,321 | | 360,292 |
| Class C | | 37,763 | | 559,591 |
| Class I | | 72,438 | | 1,072,180 |
|
| | | | | 7,020,494 |
|
| Automatic conversion of Class B shares to Class A shares | | | | |
| Class A | | 49,845 | | 737,264 |
| Class B | | (49,845) | | (737,264) |
|
| | | | | 0 |
|
| Payment for shares redeemed | | | | |
| Class A | | (1,351,925) | | (20,009,362) |
| Class B | | (123,613) | | (1,824,435) |
| Class C | | (267,045) | | (3,957,574) |
| Class I | | (2,177,521) | | (32,439,871) |
|
| | | | | (58,231,242) |
|
| Net asset value of shares issued in acquisition | | | | |
| Class A | | 16,437,691 | | 243,734,394 |
| Class B | | 1,440,941 | | 21,365,593 |
| Class C | | 2,085,189 | | 30,912,915 |
| Class I | | 190,270 | | 2,821,118 |
|
| | | | | 298,834,020 |
|
| Net increase in net assets resulting from capital share transactions | | | | 252,250,799 |
|
| Total increase in net assets | | | | 243,311,155 |
| Net assets | | | | |
| Beginning of period | | | | 97,234,556 |
|
| End of period | | | $ | 340,545,711 |
|
| Overdistributed net investment income | | | $ | (189,584) |
|
(a) For Class A, B, and C shares, for the period from May 20, 2005 (commencement of class operations), to November 30, 2005.
(b) Effective at the close of business on May 20, 2005, the Fund acquired the net assets of Vestaur Securities Fund. Vestaur Securities Fund became the accounting and performance survivor in this transaction. The information above for the period prior to May 23, 2005 is that of Vestaur Securities Fund.
See Notes to Financial Statements
28
NOTES TO FINANCIAL STATEMENTS (unaudited)
1. ORGANIZATION
Evergreen Diversified Bond Fund (the “Fund”) is a diversified series of Evergreen Fixed Income Trust (the “Trust”), a Delaware statutory trust organized on September 18, 1997. The Trust is an open-end management investment company registered under the Investment Company Act of 1940, as amended (the “1940 Act”).
The Fund offers Class A, Class B, Class C and Class I shares. Class A shares are sold with a front-end sales charge. However, Class A share investments of $1 million or more are not subject to a front-end sales charge but will be subject to a contingent deferred sales charge of 1.00% upon redemption within one year. Class B shares are sold without a front-end sales charge but are subject to a contingent deferred sales charge that is payable upon redemption and decreases depending on how long the shares have been held. Class C shares are sold without a front-end sales charge but are subject to a contingent deferred sales charge that is payable upon redemption within one year. Class I shares are sold without a front-end sales charge or contingent deferred sales charge. Each class of shares, except Class I shares, pays an ongoing distribution fee.
2. SIGNIFICANT ACCOUNTING POLICIES
The following is a summary of significant accounting policies consistently followed by the Fund in the preparation of its financial statements. The policies are in conformity with generally accepted accounting principles in the United States of America, which require management to make estimates and assumptions that affect amounts reported herein. Actual results could differ from these estimates.
a. Valuation of investments
Portfolio debt securities acquired with more than 60 days to maturity are fair valued using matrix pricing methods determined by an independent pricing service which takes into consideration such factors as similar security prices, yields, maturities, liquidity and ratings. Securities for which valuations are not readily available from an independent pricing service may be valued by brokers which use prices provided by market makers or estimates of market value obtained from yield data relating to investments or securities with similar characteristics.
Listed equity securities are usually valued at the last sales price or official closing price on the national securities exchange where the securities are principally traded.
Short-term securities with remaining maturities of 60 days or less at the time of purchase are valued at amortized cost, which approximates market value.
Investments in other mutual funds are valued at net asset value. Securities for which market quotations are not readily available or not reflective of current market value are valued at fair value as determined by the investment advisor in good faith, according to procedures approved by the Board of Trustees.
b. Foreign currency translation
All assets and liabilities denominated in foreign currencies are translated into U.S. dollar amounts at the date of valuation. Purchases and sales of portfolio securities and income items denominated
29
NOTES TO FINANCIAL STATEMENTS (unaudited) continued
in foreign currencies are translated into U.S. dollar amounts on the respective dates of such transactions. The Fund does not separately account for that portion of the results of operations resulting from changes in foreign exchange rates on investments and the fluctuations arising from changes in market prices of securities held. Such fluctuations are included with the net realized and unrealized gains or losses on investments.
c. Futures contracts
In order to gain exposure to or protect against changes in security values, the Fund may buy and sell futures contracts. The primary risks associated with the use of futures contracts are the imperfect correlation between changes in market values of securities held by the Fund and the prices of futures contracts, and the possibility of an illiquid market.
Futures contracts are valued based upon their quoted daily settlement prices. The aggregate principal amounts of the contracts are not recorded in the financial statements. Fluctuations in the value of the contracts are recorded in the Statement of Assets and Liabilities as an asset or liability and in the Statement of Operations as unrealized gains or losses until the contracts are closed, at which point they are recorded as net realized gains or losses on futures contracts.
d. When-issued and delayed delivery transactions
The Fund records when-issued or delayed delivery securities as of trade date and maintains security positions such that sufficient liquid assets will be available to make payment for the securities purchased. Securities purchased on a when-issued or delayed delivery basis are marked-to-market daily and begin earning interest on the settlement date. Losses may occur on these transactions due to changes in market conditions or the failure of counterparties to perform under the contract.
e. Securities lending
The Fund may lend its securities to certain qualified brokers in order to earn additional income. The Fund receives compensation in the form of fees or interest earned on the investment of any cash collateral received. The Fund also continues to receive interest and dividends on the securities loaned. The Fund receives collateral in the form of cash or securities with a market value at least equal to the market value of the securities on loan, including accrued interest. In the event of default or bankruptcy by the borrower, the Fund could experience delays and costs in recovering the loaned securities or in gaining access to the collateral. The Fund has the right under the lending agreement to recover the securities from the borrower on demand.
f. Credit default swaps
The Fund may enter into credit default swaps. Credit default swaps involve an exchange of a fixed rate premium for protection against the loss in value of an underlying debt instrument in the event of default or bankruptcy. Under the terms of the swap, one party acts as a “guarantor” and receives a periodic stream of payments that is a fixed percentage applied to a notional principal amount over the term of the swap. In return, the party agrees to purchase the notional amount of the underlying instrument, at par, if a credit event occurs during the term of the swap. Periodic
30
NOTES TO FINANCIAL STATEMENTS (unaudited) continued
payments are recorded as realized gains or losses. The Fund may enter into credit default swaps as either the guarantor or the counterparty.
Swaps are marked-to-market daily based on quotations from market makers and any change in value is recorded as an unrealized gain or loss. Payments received or made as a result of a credit event or termination of the contract are recognized as realized gains or losses. The Fund could be exposed to risks if the counterparty defaults on its obligation to perform, or if there are unfavorable changes in the fluctuation of interest rates or in the price of the underlying security.
g. Security transactions and investment income
Security transactions are recorded on trade date. Realized gains and losses are computed using the specific cost of the security sold. Interest income is recorded on the accrual basis and includes accretion of discounts and amortization of premiums. Dividend income is recorded on the ex-dividend date. Foreign income and capital gains realized on some securities may be subject to foreign taxes, which are accrued as applicable.
h. Federal taxes
The Fund intends to continue to qualify as a regulated investment company and distribute all of its taxable income, including any net capital gains (which have already been offset by available capital loss carryovers). Accordingly, no provision for federal taxes is required.
i. Distributions
Distributions to shareholders from net investment income are accrued daily and paid monthly. Distributions from net realized gains, if any, are recorded on the ex-dividend date. Such distributions are determined in conformity with income tax regulations, which may differ from generally accepted accounting principles.
j. Class allocations
Income, common expenses and realized and unrealized gains and losses are allocated to the classes based on the relative net assets of each class. Distribution fees, if any, are calculated daily at the class level based on the appropriate net assets of each class and the specific expense rates applicable to each class.
3. ADVISORY FEE AND OTHER TRANSACTIONS WITH AFFILIATES
Evergreen Investment Management Company, LLC (“EIMC”), an indirect, wholly-owned subsidiary of Wachovia Corporation (“Wachovia”), is the investment advisor to the Fund and is paid a fee at an annual rate of 2% of the Fund’s gross investment income plus an amount determined by applying percentage rates to the average daily net assets of the Fund, starting at 0.31% and declining to 0.16% as average daily net assets increase.
Effective October 1, 2006, Tattersall Advisory Group, Inc., an indirect, wholly-owned subsidiary of Wachovia, became the investment sub-advisor to the Fund and is paid by EIMC for its services to the Fund.
31
NOTES TO FINANCIAL STATEMENTS (unaudited) continued
From time to time, EIMC may voluntarily or contractually waive its fee and/or reimburse expenses in order to limit operating expenses. During the six months ended October 31, 2006, EIMC reimbursed other expenses in the amount of $290,903 and Distribution Plan expenses (see Note 4) relating to Class A shares in the amount of $29,250.
The Fund may invest in Evergreen-managed money market funds, which are also advised by EIMC. Income earned on these investments is included in income from affiliate on the Statement of Operations.
Evergreen Investment Services, Inc. (“EIS”), an indirect, wholly-owned subsidiary of Wachovia, is the administrator to the Fund. As administrator, EIS provides the Fund with facilities, equipment and personnel and is paid an annual rate determined by applying percentage rates to the aggregate average daily net assets of the Evergreen funds (excluding money market funds and Evergreen Institutional Enhanced Income Fund), starting at 0.10% and declining to 0.05% as the aggregate average daily net assets of the Evergreen funds (excluding money market funds and Evergreen Institutional Enhanced Income Fund) increase.
Evergreen Service Company, LLC (“ESC”), an indirect, wholly-owned subsidiary of Wachovia, is the transfer and dividend disbursing agent for the Fund. ESC receives account fees that vary based on the type of account held by the shareholders in the Fund. For the six months ended October 31, 2006, the transfer agent fees were equivalent to an annual rate of 0.22% of the Fund’s average daily net assets.
4. DISTRIBUTION PLANS
EIS also serves as distributor of the Fund’s shares. The Fund has adopted Distribution Plans, as allowed by Rule 12b-1 of the 1940 Act, for each class of shares, except Class I. Under the Distribution Plans, distribution fees are paid at an annual rate of 0.30% of the average daily net assets for Class A shares, and 1.00% of the average daily net assets for each of Class B and Class C shares.
For the six months ended October 31, 2006, EIS received $3,524 from the sale of Class A and $19,195 and $1 in contingent deferred sales charges from redemption of Class B shares and Class C shares.
5. ACQUISITION
Effective at the close of business on May 20, 2005, the Fund acquired the net assets of Vestaur Securities Fund in a tax-free exchange for Class I shares of the Fund at an exchange ratio of 0.93. The acquired net assets consisted primarily of portfolio securities with unrealized appreciation of $49,458. The aggregate net assets of the Fund and Vestaur Securities Fund immediately prior to the acquisition were $298,834,020 and $95,236,951, respectively. The aggregate net assets of the Fund immediately after the acquisition were $394,070,971. Vestaur Securities Fund was the accounting and performance survivor in this transaction.
32
NOTES TO FINANCIAL STATEMENTS (unaudited) continued
6. SECURITIES TRANSACTIONS
Cost of purchases and proceeds from sales of investment securities (excluding short-term securities) were as follows for the six months ended October 31, 2006:
| Cost of Purchases | | Proceeds from Sales |
|
| U.S. | | Non-U.S. | | U.S. | | Non-U.S. |
| Government | | Government | | Government | | Government |
|
| $ 7,490,703 | | $ 57,527,403 | | $11,470,197 | | $ 65,157,213 |
|
At October 31, 2006, the Fund had open long futures contracts outstanding as follows:
| | | | | Initial Contract | | Value at | | |
| Expiration | | Contracts | | Amount | | October 31, 2006 | | Unrealized Gain |
|
| December 2006 | | 65 U.S. Treasury | | $ 7,187,045 | | $ 7,322,656 | | $ 135,611 |
| | | Bonds Futures | | | | | | |
| December 2006 | | 50 U.S. Treasury | | 5,336,970 | | 5,410,938 | | 73,968 |
| | | Notes Futures | | | | | | |
|
During the six months ended October 30, 2006, the Fund loaned securities to certain brokers. At October 30, 2006, the value of securities on loan and the value of collateral (including accrued interest) amounted to $9,604,792 and $9,771,515, respectively.
At October 31, 2006, the Fund had the following open credit default swap contracts outstanding:
| | | | | | | | | Fixed | | |
| | | | | Reference Debt | | Notional | | Payments | | Frequency of |
| Expiration | | Counterparty | | Obligation | | Amount | | Made | | Payments Made |
|
| 9/15/2009 | | Morgan Stanley | | Home Depot, Inc. | | $ 3,000,000 | | 0.24% | | Quarterly |
| 4/15/2011 | | JPMorgan | | Yum Brands, Inc. | | 3,000,000 | | 0.28% | | Quarterly |
|
| | | | | | | | | Fixed | | |
| | | | | Reference Debt | | Notional | | Payments | | Frequency of |
| Expiration | | Counterparty | | Obligation | | Amount | | Received | | Payments Made |
|
| 12/20/2011 | | Morgan Stanley | | JC Penny | | $ 3,000,000 | | 0.44% | | Quarterly |
|
On October 31, 2006, the aggregate cost of securities for federal income tax purposes was $312,581,886. The gross unrealized appreciation and depreciation on securities based on tax cost was $6,557,406 and $6,408,518, respectively, with a net unrealized appreciation of $148,888.
As of April 30, 2006, the Fund had $53,490,338 in capital loss carryovers for federal income tax purposes expiring as follows:
| Expiration |
|
| 2007 | | 2008 | | 2009 | | 2010 | | 2013 |
|
| $ 7,135,670 | | $ 22,702,312 | | $ 14,769,764 | | $ 4,586,980 | | $ 4,295,612 |
|
Certain portions of the capital loss carryovers of the Fund were assumed as a result of acquisitions. Utilization of these capital loss carryovers were limited during the the five months ended April 30, 2006 in accordance with income tax regulations.
33
NOTES TO FINANCIAL STATEMENTS (unaudited) continued
For income tax purposes, capital and currency losses incurred after October 31 within the Fund’s fiscal year are deemed to arise on the first business day of the following fiscal year. As of April 30, 2006, the Fund incurred and elected to defer post-October capital and currency losses of $1,562,415 and $192,958, respectively.
7. INTERFUND LENDING
Pursuant to an Exemptive Order issued by the SEC, the Fund may participate in an interfund lending program with certain funds in the Evergreen fund family. This program allows the Fund to borrow from, or lend money to, other participating funds. During the six months ended October 31, 2006, the Fund did not participate in the interfund lending program.
8. EXPENSE REDUCTIONS
Through expense offset arrangements with ESC and the Fund’s custodian, a portion of fund expenses has been reduced.
9. DEFERRED TRUSTEES’ FEES
Each Trustee of the Fund may defer any or all compensation related to performance of their duties as Trustees. The Trustees’ deferred balances are allocated to deferral accounts, which are included in the accrued expenses for the Fund. The investment performance of the deferral accounts is based on the investment performance of certain Evergreen funds. Any gains earned or losses incurred in the deferral accounts are reported in the Fund’s Trustees’ fees and expenses. At the election of the Trustees, the deferral account will be paid either in one lump sum or in quarterly installments for up to ten years.
10. FINANCING AGREEMENT
The Fund and certain other Evergreen funds share in an unsecured revolving credit commitment for temporary and emergency purposes, including the funding of redemptions, as permitted by each participating fund’s borrowing restrictions. Borrowings under this facility bear interest at 0.50% per annum above the Federal Funds rate. All of the participating funds are charged an annual commitment fee on the unused balance, which is allocated pro rata. The credit facility is for $100 million with an annual commitment fee of 0.08% . Prior to July 3, 2006, the credit facility was for $150 million with an annual commitment fee of 0.09% . During the six months ended October 31, 2006, the Fund had no borrowings.
11. CONCENTRATION OF RISK
The Fund may invest a substantial portion of its assets in an industry or sector and, therefore, may be more affected by changes in that industry or sector than would be a comparable mutual fund that is not heavily weighted in any industry or sector.
12. REGULATORY MATTERS AND LEGAL PROCEEDINGS
Since September 2003, governmental and self-regulatory authorities have instituted numerous ongoing investigations of various practices in the mutual fund industry, including investigations
34
NOTES TO FINANCIAL STATEMENTS (unaudited) continued
relating to revenue sharing, market-timing, late trading and record retention, among other things. The investigations cover investment advisors, distributors and transfer agents to mutual funds, as well as other firms. EIMC, EIS and ESC (collectively, “Evergreen”) have received subpoenas and other requests for documents and testimony relating to these investigations, are endeavoring to comply with those requests, and are cooperating with the investigations. Evergreen is continuing its own internal review of policies, practices, procedures and personnel, and is taking remedial action where appropriate.
In connection with one of these investigations, on July 28, 2004, the staff of the Securities and Exchange Commission (“SEC”) informed Evergreen that the staff intends to recommend to the SEC that it institute an enforcement action against Evergreen. The SEC staff’s proposed allegations relate to (i) an arrangement pursuant to which a broker at one of EIMC’s affiliated broker-dealers had been authorized, apparently by an EIMC officer (who is no longer with EIMC), to engage in short-term trading, on behalf of a client, in Evergreen Mid Cap Growth Fund (formerly Evergreen Emerging Growth Fund and prior to that, known as Evergreen Small Company Growth Fund) during the period from December 2000 through April 2003, in excess of the limitations set forth in the fund’s prospectus, (ii) short-term trading from September 2001 through January 2003, by a former Evergreen portfolio manager of Evergreen Precious Metals Fund, a fund he managed at the time, (iii) the sufficiency of systems for monitoring exchanges and enforcing exchange limitations as stated in the funds’ prospectuses, and (iv) the adequacy of e-mail retention practices. In connection with the activity in Evergreen Mid Cap Growth Fund, EIMC reimbursed the fund $378,905, plus an additional $25,242, representing what EIMC calculated at that time to be the client’s net gain and the fees earned by EIMC and the expenses incurred by this fund on the client’s account. In connection with the activity in Evergreen Precious Metals Fund, EIMC reimbursed the fund $70,878, plus an additional $3,075, representing what EIMC calculated at that time to be the portfolio manager’s net gain and the fees earned by EIMC and expenses incurred by the fund on the portfolio manager’s account. Evergreen is currently engaged in discussions with the staff of the SEC concerning its recommendation.
The staff of the National Association of Securities Dealers (“NASD”) had notified EIS that it has made a preliminary determination to recommend that disciplinary action be brought against EIS for certain violations of the NASD’s rules. The recommendation relates principally to allegations that EIS (i) arranged for fund portfolio trades to be directed to broker-dealers (including Wachovia Securities, LLC, an affiliate of EIS) that sold Evergreen fund shares during the period of January 2001 to December 2003 and (ii) provided non-cash compensation by sponsoring offsite meetings attended by Wachovia Securities, LLC brokers during that period. EIS is cooperating with the NASD staff in its review of these matters.
Any resolution of these matters with regulatory authorities may include, but not be limited to, sanctions, penalties or injunctions regarding Evergreen, restitution to mutual fund shareholders and/or other financial penalties and structural changes in the governance or management of
35
NOTES TO FINANCIAL STATEMENTS (unaudited) continued
Evergreen’s mutual fund business. Any penalties or restitution will be paid by Evergreen and not by the Evergreen funds.
In addition, the Evergreen funds and EIMC and certain of its affiliates are involved in various legal actions, including private litigation and class action lawsuits. EIMC does not expect that any of such legal actions currently pending or threatened will have a material adverse impact on the financial position or operations of any of the Evergreen funds or on EIMC’s ability to provide services to the Evergreen funds.
Although Evergreen believes that neither the foregoing investigations described above nor any pending or threatened legal actions will have a material adverse impact on the Evergreen funds, there can be no assurance that these matters and any publicity surrounding or resulting from them will not result in reduced sales or increased redemptions of Evergreen fund shares, which could increase Evergreen fund transaction costs or operating expenses, or that they will not have other adverse consequences on the Evergreen funds.
13. NEW ACCOUNTING PRONOUNCEMENTS
In June 2006, the Financial Accounting Standards Board (“FASB”) issued FASB Interpretation No. 48, Accounting for Uncertainty in Income Taxes — an interpretation of FASB statement 109 (“FIN 48”). FIN 48 supplements FASB 109 by prescribing a recognition threshold and measurement attribute for the financial statement recognition and measurement of a tax position taken or expected to be taken in a tax return. The adoption of FIN 48 will require financial statements to be adjusted to reflect only those tax positions that are more likely than not to be sustained as of the adoption date. Management of the Fund is currently evaluating the impact that the adoption of FIN 48 will have on the financial statements. FIN 48 will become effective for fiscal years beginning after December 15, 2006.
In September 2006, FASB issued Statement of Financial Accounting Standards No. 157, Fair Value Measurements (“FAS 157”). FAS 157 establishes a single authoritative definition of fair value, establishes a framework for measuring fair value and expands disclosures about fair value measurements. FAS 157 applies to fair value measurements already required or permitted by existing standards. The change to current generally accepted accounting principles from the application of FAS 157 relates to the definition of fair value, the methods used to measure fair value, and the expanded disclosures about fair value measurements. Management of the Fund does not believe the adoption of FAS 157 will materially impact the financial statement amounts, however, additional disclosures may be required about the inputs used to develop the measurements and the effect of certain of the measurements on changes in net assets for the period. FAS 157 is effective for financial statements issued for fiscal years beginning after November 15, 2007 and interim periods within those fiscal years.
36
ADDITIONAL INFORMATION (unaudited)
INFORMATION ABOUT THE REVIEW AND APPROVAL OF THE FUND’S INVESTMENT ADVISORY AGREEMENT
Each year, the Fund’s Board of Trustees is required to consider whether to continue in place the Fund’s investment advisory agreement. In September 2006, the Trustees, including a majority of the Trustees who are not interested persons (as that term is defined in the 1940 Act) of the Fund or of EIMC, approved the continuation of the Fund’s investment advisory agreement. (References below to the “Fund” are to Evergreen Diversified Bond Fund; references to the “funds” are to the Evergreen funds generally.)
At the same time, the Trustees considered the continuation of the investment advisory agreements for all of the funds, and the description below refers in many cases to the Trustees’ process and conclusions in connection with their consideration of this matter for all of the funds. In all of its deliberations, the Board of Trustees and the disinterested Trustees were advised by independent counsel to the disinterested Trustees and counsel to the funds.
Effective October 1, 2006, certain advisory personnel of EIMC were consolidated at TAG. In connection with the consolidation, the Board of Trustees approved a sub-advisory agreement with TAG. In approving that contract, the Trustees considered the factors described below, that the services previously provided by EIMC to the Fund would be provided by EIMC and TAG going forward, and that there would be no related change in the personnel managing the Fund or in the advisory fees paid by the Fund.
The review process. The 1940 Act requires that the Board of Trustees request and evaluate, and that EIMC furnish, such information as may reasonably be necessary to evaluate the terms of a fund’s advisory agreement. The review process began at the time of the last advisory contract-renewal process in September 2005. In the course of that process, the Trustees identified a number of funds that had experienced either short-term or longer-term performance issues. During the following months, the Trustees reviewed information relating to any changes in the performance of those funds and/or any changes in the investment process or the investment teams responsible for the management of the funds. In addition, during the course of the year, the Trustees reviewed information regarding the investment performance of all of the funds and identified additional funds that they believed warranted further attention based on performance since September 2005.
In spring 2006, a committee of the Board of Trustees (the “Committee”), working with EIMC management, determined generally the types of information the Board would review and set a timeline detailing the information required and the dates for its delivery to the Trustees. The independent data provider Lipper Inc. (“Lipper”) was engaged to provide fund-specific and industry-wide data to the Board containing information of a nature and in a format generally prescribed by the Committee. The Committee also identified a number of expense, performance, and other issues and requested specific information as to those issues.
The Trustees reviewed, with the assistance of an independent industry consultant retained by the disinterested Trustees, the information provided by EIMC in response to the Committee’s
37
ADDITIONAL INFORMATION (unaudited) continued
requests and the information provided by Lipper. In certain instances, the Trustees formed small committees to review individual funds in greater detail. In addition, the Trustees requested information regarding brokerage practices of the funds, information regarding closed-end fund discounts to net asset value, and information regarding the various fall-out benefits received directly and indirectly by EIMC and its affiliates from the funds. The Trustees requested and received additional information following that review.
The Committee met several times by telephone to consider the information provided by EIMC. The Committee met in person with representatives of EIMC in early September. At a meeting of the full Board of Trustees later in September, the Committee reported the results of its discussions with EIMC, and the full Board met with representatives of EIMC, engaged in further review of the materials provided to them, and approved the continuation of each of the advisory and sub-advisory agreements.
The disinterested Trustees discussed the continuation of the funds’ advisory agreements with representatives of EIMC and in multiple private sessions with legal counsel at which no personnel of EIMC were present. In considering the continuation of the agreement, the Trustees did not identify any particular information or consideration that was all-important or controlling, and each Trustee attributed different weights to various factors. The Trustees evaluated information provided to them both in terms of the Evergreen mutual funds generally and with respect to each fund, including the Fund, specifically as they considered appropriate; although the Trustees considered the continuation of the agreement as part of the larger process of considering the continuation of the advisory contracts for all of the funds, their determination to continue the advisory agreement for each of the funds was ultimately made on a fund-by-fund basis.
This summary describes a number of the most important, but not necessarily all, of the factors considered by the Board and the disinterested Trustees.
Information reviewed. The Board of Trustees and committees of the Board of Trustees meet periodically during the course of the year. At those meetings, the Board receives a wide variety of information regarding the services performed by EIMC, the investment performance of the funds, and other aspects of the business and operations of the funds. At those meetings, and in the process of considering the continuation of the agreements, the Trustees considered information regarding, for example, the funds’ investment results; the portfolio management teams for the funds and the experience of the members of those teams, and any recent changes in the membership of the teams; portfolio trading practices; compliance by the funds and EIMC with applicable laws and regulations and with the funds’ and EIMC’s compliance policies and procedures; services provided by affiliates of EIMC to the funds and shareholders of the funds; and other information relating to the nature, extent, and quality of services provided by EIMC. The Trustees considered the rates at which the funds pay investment advisory fees, the total expense ratios of the funds, and the efforts generally by EIMC and its affiliates as sponsors of the funds. The data provided by Lipper showed the fees paid by each fund and each fund’s total expense ratio
38
ADDITIONAL INFORMATION (unaudited) continued
in comparison to other similar mutual funds, in addition to data regarding the investment performance by the funds in comparison to other similar mutual funds. The Trustees were assisted by the independent industry consultant in reviewing the information presented to them.
Where EIMC or its affiliates provide to other clients advisory services that are comparable to the advisory services provided to a fund, the Trustees considered information regarding the rates at which those other clients pay advisory fees. Fees charged by EIMC to those other clients were generally lower than those charged to the funds. EIMC explained that compliance, reporting, and other legal burdens of providing investment advice to mutual funds greatly exceed those required to provide advisory services to non-mutual fund clients such as retirement or pension plans. In addition, EIMC pointed out that there is substantially greater legal and other risk to EIMC and its affiliates from managing public mutual funds than in managing private accounts. The Trustees also considered the investment performance of other accounts managed by EIMC and its affiliates.
The Trustees considered the transfer agency fees paid by the funds to an affiliate of EIMC and noted that the funds’ transfer agent had received Dalbar’s Mutual Fund Service Award for services provided to shareholders and Dalbar’s Financial Intermediary Service Quality Evaluation Award for services to broker-dealer representatives on a post-sale support basis. They reviewed information presented to them showing generally that the transfer agency fees charged to the funds were generally consistent with industry norms, and that transfer agency fees for a number of the funds had recently declined, or were expected to in the near future.
The Trustees also considered that EIS, an affiliate of EIMC, serves as administrator to the funds and receives a fee for its services as administrator. In their comparison of the advisory fee paid by the funds with those paid by other mutual funds, the Trustees took into account administrative fees paid by the funds and those other mutual funds. The Board considered that EIS serves as distributor to the funds (other than the closed-end funds) and receives fees from the funds for those services. They considered other so-called “fall-out” benefits to EIMC and its affiliates due to their other relationships with the funds, including, for example, soft-dollar services received by EIMC attributable to transactions entered into by EIMC for the benefit of the funds and brokerage commissions received by Wachovia Securities LLC, an affiliate of EIMC, from transactions effected by it for the funds.
Nature and quality of the services provided. The Trustees considered that EIMC and its affili-ates provide a comprehensive investment management service to the fund. They noted that EIMC formulates and implements an investment program for the fund. They noted that EIMC makes its personnel available to serve as officers of the funds, and concluded that the reporting and management functions provided by EIMC with respect to the funds were generally satisfactory. The Trustees considered the investment philosophy of each fund’s portfolio management team, and considered the in-house research capabilities of EIMC and its affiliates, as well as other resources available to EIMC, including research services available to it from third parties. The Board considered the managerial and financial resources available to EIMC and its affiliates, and
39
ADDITIONAL INFORMATION (unaudited) continued
the commitment that the Wachovia organization has made to the funds generally. On the basis of these factors, they determined that the nature and scope of the services provided by EIMC were consistent with its duties under the investment advisory agreements and appropriate and consistent with the investment programs and best interests of the funds.
The Trustees noted the resources EIMC and its affiliates have committed to the regulatory, compliance, accounting, tax and oversight of tax reporting, and shareholder servicing functions, and the number and quality of staff committed to those functions, which they concluded were appropriate and generally in line with EIMC’s responsibilities to the Fund and to the funds generally. They noted that recent enhancements to those functions appeared generally appropriate, but considered that the enhancement process is an on-going one and that they would continue to monitor developments in these functions in coming periods for appropriateness and consistency with regulatory and industry developments. The Board and the disinterested Trustees concluded, within the context of their overall conclusions regarding the funds’ advisory agreements, that they were satisfied with the nature, extent, and quality of the services provided by EIMC, including services provided by EIS under its administrative services agreements with the funds.
Investment performance. The Trustees considered the investment performance of each fund, both by comparison to other comparable mutual funds and to broad market indices. The Trustees emphasized that the continuation of the investment advisory agreement for a fund should not be taken as any indication that the Trustees did not believe investment performance for any specific fund might not be improved, and they noted that they would continue to monitor closely the investment performance of the funds going forward.
Advisory and administrative fees. The Trustees recognized that EIMC does not seek to provide the lowest cost investment advisory service, but to provide a high quality, full-service investment management product at a reasonable price. They also noted that EIMC has in many cases sought to set its investment advisory fees at levels consistent with industry norms. The Trustees noted that, in certain cases, a fund’s advisory fees and/or its total expense ratio were higher than many or most other mutual funds in the same Lipper peer group. However, in each case, the Trustees determined that the level of fees was not such as to prevent the continuation of the advisory agreement.
Economies of scale. The Trustees noted that economies of scale would likely be achieved by EIMC in managing the funds as the funds grow. The Trustees noted that the Fund had implemented breakpoints in its advisory fee structure. The Trustees noted that they would continue to review the appropriate levels of breakpoints in the future, but concluded that the breakpoints as implemented appeared to be a reasonable step toward the realization of economies of scale by the Fund.
Profitability. The Trustees considered information provided to them regarding the profitability to the EIMC organization of the investment advisory, administration, and transfer agency (with respect to the open-end funds only) fees paid to EIMC and its affiliates by each of the funds. They considered that the information provided to them was necessarily estimated, and that the prof-
40
ADDITIONAL INFORMATION (unaudited) continued
itability information provided to them, especially on a fund-by-fund basis, did not necessarily provide a definitive tool for evaluating the appropriateness of each fund’s advisory fee. They noted that the levels of profitability of the funds to EIMC varied widely, depending on among other things the size and type of fund. They considered the profitability of the funds in light of such factors as, for example, the information they had received regarding the relation of the fees paid by the funds to those paid by other mutual funds, the investment performance of the funds, and the amount of revenues involved. In light of these factors, the Trustees concluded that the profitability of any of the funds, individually or in the aggregate, should not prevent the Trustees from approving the continuation of the agreements.
41
This page left intentionally blank
42
This page left intentionally blank
43
TRUSTEES AND OFFICERS
TRUSTEES1
| Charles A. Austin III | | Investment Counselor, Anchor Capital Advisors, Inc. (investment advice); Director, The Andover |
| Trustee | | Companies (insurance); Trustee, Arthritis Foundation of New England; Former Director, The |
| DOB: 10/23/1934 | | Francis Ouimet Society; Former Trustee, Mentor Funds and Cash Resource Trust; Former |
| Term of office since: 1991 | | Investment Counselor, Appleton Partners, Inc. (investment advice); Former Director, Executive |
| Other directorships: None | | Vice President and Treasurer, State Street Research & Management Company (investment |
| | | advice) |
|
| |
| Shirley L. Fulton* | | Partner, Tin, Fulton, Greene & Owen, PLLC (law firm); Former Partner, Helms, Henderson & |
| Trustee | | Fulton, P.A. (law firm); Retired Senior Resident Superior Court Judge, 26th Judicial District, |
| DOB: 1/10/1952 | | Charlotte, NC |
| Term of office since: 2004 | | |
| Other directorships: None | | |
|
| |
| K. Dun Gifford | | Chairman and President, Oldways Preservation and Exchange Trust (education); Trustee, |
| Trustee | | Treasurer and Chairman of the Finance Committee, Cambridge College; Former Trustee, Mentor |
| DOB: 10/23/1938 | | Funds and Cash Resource Trust |
| Term of office since: 1974 | | |
| Other directorships: None | | |
|
| |
| Dr. Leroy Keith, Jr. | | Partner, Stonington Partners, Inc. (private equity fund); Trustee, Phoenix Funds Family; Director, |
| Trustee | | Diversapack Co.; Director, Obagi Medical Products Co.; Former Director, Lincoln Educational |
| DOB: 2/14/1939 | | Services; Former Trustee, Mentor Funds and Cash Resource Trust |
| Term of office since: 1983 | | |
| Other directorships: Trustee, The | | |
| Phoenix Group of Mutual Funds | | |
|
| |
| Gerald M. McDonnell | | Manager of Commercial Operations, SMI Steel Co. – South Carolina (steel producer); Former |
| Trustee | | Sales and Marketing Manager, Nucor Steel Company; Former Trustee, Mentor Funds and Cash |
| DOB: 7/14/1939 | | Resource Trust |
| Term of office since: 1988 | | |
| Other directorships: None | | |
|
| |
| Patricia B. Norris2 | | Former Partner, PricewaterhouseCoopers LLP |
| Trustee | | |
| DOB: 4/9/1948 | | |
| Term of office since: 2006 | | |
| Other directorships: None | | |
|
| |
| William Walt Pettit | | Vice President, Kellam & Pettit, P.A. (law firm); Director, Superior Packaging Corp.; Director, |
| Trustee | | National Kidney Foundation of North Carolina, Inc.; Former Trustee, Mentor Funds and Cash |
| DOB: 8/26/1955 | | Resource Trust |
| Term of office since: 1984 | | |
| Other directorships: None | | |
|
| |
| David M. Richardson | | President, Richardson, Runden LLC (executive recruitment business development/consulting |
| Trustee | | company); Consultant, Kennedy Information, Inc. (executive recruitment information and |
| DOB: 9/19/1941 | | research company); Consultant, AESC (The Association of Executive Search Consultants); |
| Term of office since: 1982 | | Director, J&M Cumming Paper Co. (paper merchandising); Former Trustee, NDI Technologies, LLP |
| Other directorships: None | | (communications); Former Trustee, Mentor Funds and Cash Resource Trust |
| | | |
|
| |
| Dr. Russell A. Salton III | | President/CEO, AccessOne MedCard; Former Medical Director, Healthcare Resource Associates, |
| Trustee | | Inc.; Former Medical Director, U.S. Health Care/Aetna Health Services; Former Trustee, Mentor |
| DOB: 6/2/1947 | | Funds and Cash Resource Trust |
| Term of office since: 1984 | | |
| Other directorships: None | | |
|
44
TRUSTEES AND OFFICERS continued
| Michael S. Scofield | | Retired Attorney, Law Offices of Michael S. Scofield; Director and Chairman, Branded Media |
| Trustee | | Corporation (multi-media branding company); Former Trustee, Mentor Funds and Cash |
| DOB: 2/20/1943 | | Resource Trust |
| Term of office since: 1984 | | |
| Other directorships: None | | |
|
| |
| Richard J. Shima | | Independent Consultant; Trustee, Saint Joseph College (CT); Director, Hartford Hospital; Trustee, |
| Trustee | | Greater Hartford YMCA; Former Director, Trust Company of CT; Former Director, Enhance |
| DOB: 8/11/1939 | | Financial Services, Inc.; Former Director, Old State House Association; Former Trustee, Mentor |
| Term of office since: 1993 | | Funds and Cash Resource Trust |
| Other directorships: None | | |
|
| |
| Richard K. Wagoner, CFA3 | | Member and Former President, North Carolina Securities Traders Association; Member, Financial |
| Trustee | | Analysts Society; Former Consultant to the Boards of Trustees of the Evergreen funds; Former |
| DOB: 12/12/1937 | | Trustee, Mentor Funds and Cash Resource Trust |
| Term of office since: 1999 | | |
| Other directorships: None | | |
|
| |
| |
| OFFICERS | | |
| |
| Dennis H. Ferro4 | | Principal occupations: President and Chief Executive Officer, Evergreen Investment Company, |
| President | | Inc. and Executive Vice President, Wachovia Bank, N.A.; former Chief Investment Officer, |
| DOB: 6/20/1945 | | Evergreen Investment Company, Inc. |
| Term of office since: 2003 | | |
|
| |
| Kasey Phillips5 | | Principal occupations: Senior Vice President, Evergreen Investment Services, Inc.; Former Vice |
| Treasurer | | President, Evergreen Investment Services, Inc.; Former Assistant Vice President, Evergreen |
| DOB: 12/12/1970 | | Investment Services, Inc. |
| Term of office since: 2005 | | |
|
| |
| Michael H. Koonce5 | | Principal occupations: Senior Vice President and General Counsel, Evergreen Investment |
| Secretary | | Services, Inc.; Senior Vice President and Assistant General Counsel, Wachovia Corporation |
| DOB: 4/20/1960 | | |
| Term of office since: 2000 | | |
|
| |
| James Angelos5 | | Principal occupations: Chief Compliance Officer and Senior Vice President, Evergreen Funds; |
| Chief Compliance Officer | | Former Director of Compliance, Evergreen Investment Services, Inc. |
| DOB: 9/2/1947 | | |
| Term of office since: 2004 | | |
|
1 Each Trustee serves until a successor is duly elected or qualified or until his/her death, resignation, retirement or removal from office. Each Trustee oversees 91 Evergreen funds. Correspondence for each Trustee may be sent to Evergreen Board of Trustees, P.O. Box 20083, Charlotte, NC 28202.
2 Ms. Norris’ information is as of July 1, 2006, the effective date of her trusteeship.
3 Mr. Wagoner is an “interested person” of the Fund because of his ownership of shares in Wachovia Corporation, the parent to the Fund’s investment advisor.
4 The address of the Officer is 401 S. Tryon Street, 20th Floor, Charlotte, NC 28288.
5 The address of the Officer is 200 Berkeley Street, Boston, MA 02116.
* Shirley L. Fulton served as Trustee through November 20, 2006.
Additional information about the Fund’s Board of Trustees and Officers can be found in the Statement of Additional Information (SAI) and is available upon request without charge by calling 800.343.2898.
45

564353 rv4 12/2006
Evergreen Strategic Income Fund

| table of contents |
| 1 | | LETTER TO SHAREHOLDERS |
| 6 | | FUND AT A GLANCE |
| 8 | | ABOUT YOUR FUND’S EXPENSES |
| 9 | | FINANCIAL HIGHLIGHTS |
| 13 | | SCHEDULE OF INVESTMENTS |
| 27 | | STATEMENT OF ASSETS AND LIABILITIES |
| 28 | | STATEMENT OF OPERATIONS |
| 29 | | STATEMENTS OF CHANGES IN NET ASSETS |
| 30 | | NOTES TO FINANCIAL STATEMENTS |
| 38 | | ADDITIONAL INFORMATION |
| 44 | | TRUSTEES AND OFFICERS |
This semiannual report must be preceded or accompanied by a prospectus of the Evergreen fund contained herein. The prospectus contains more complete information, including fees and expenses, and should be read carefully before investing or sending money.
The fund will file its complete schedule of portfolio holdings with the SEC for the first and third quarters of each fiscal year on Form N-Q. The fund’s Form N-Q will be available on the SEC’s Web site at http://www.sec.gov. In addition, the fund’s Form N-Q may be reviewed and copied at the SEC’s Public Reference Room in Washington, D.C. Information on the operation of the Public Reference Room may be obtained by calling 800.SEC.0330.
A description of the fund’s proxy voting policies and procedures, as well as information regarding how the fund voted proxies relating to portfolio securities during the most recent 12-month period ended June 30, is available by visiting our Web site at EvergreenInvestments.com or by visiting the SEC’s Web site at http://www.sec.gov. The fund’s proxy voting policies and procedures are also available without charge, upon request, by calling 800.343.2898.
| Mutual Funds: | | | | |
| NOT FDIC INSURED | | MAY LOSE VALUE | | NOT BANK GUARANTEED |
Evergreen InvestmentsSM is a service mark of Evergreen Investment Management Company, LLC.
Copyright 2006, Evergreen Investment Management Company, LLC.
Evergreen Investment Management Company, LLC is a subsidiary of Wachovia Corporation
and is an affiliate of Wachovia Corporation’s other Broker Dealer subsidiaries.
Evergreen mutual funds are distributed by Evergreen Investment Services, Inc.
200 Berkeley Street, Boston, MA 02116
LETTER TO SHAREHOLDERS
December 2006

Dennis H. Ferro
President and Chief
Executive Officer
Dear Shareholder,
We are pleased to provide the semi-annual report for the Evergreen Strategic Income Fund, covering the six-month period ended October 31, 2006.
Domestic capital markets, both equity and fixed income, faced a wide range of sometimes inconsistent influences during the past six months. In the first two months of the period, investors worried about rapidly rising oil and commodity prices and the effects of the Federal Reserve Board’s persistent efforts to raise short-term interest rates to slow the economy. However, in the final four months, declining oil and commodity prices offered more encouragement to investors willing to take on risk, especially after the Federal Reserve paused in its cycle of credit tightening. Throughout the period, investors warily watched for signs that specific pockets of weakness might lead to a deceleration of growth in the general economy.
Evidence of economic deceleration did appear in the second and third quarters of 2006 — a year which began with a particularly robust rise in Gross Domestic Product (GDP) of more than 5% in the first quarter. GDP growth then slowed to annualized rates of approximately 2.5% and an estimated 2.2% in the second and third quarters, respectively, with weakening most evident in the housing and automotive industries. Yet
1
LETTER TO SHAREHOLDERS continued
healthy growth levels in personal consumption and business investment enabled demand to grow at more historically average rates, enabling the overall economy to absorb the problems in the housing and automobile areas. In addition, energy prices fell dramatically in the waning months of the fiscal period, boosting consumer confidence and raising hopes for lower inflation in the months ahead. However, officials at the Federal Reserve indicated they continued to be concerned about the possibility of rising inflationary pressures.
Over the six-month period, the domestic fixed income market delivered generally positive results, with high-yield corporate debt maintaining a performance edge over investment grade securities, including government bonds.
In managing Evergreen’s fixed income funds, managers focused on interest rate changes, particularly in higher-grade portfolios including the Evergreen Institutional Mortgage Portfolio, the Evergreen U.S. Government Fund and the Evergreen Core Bond Fund. The teams managing the Evergreen High Yield Bond Fund and the Evergreen Select High Yield Bond Fund paid particularly close attention to credit analysis, analyzing factors such as cash flow and corporations’ abilities to meet their debt obligations. Managers of more diversified funds, including the Evergreen Diversified Bond Fund and the Evergreen Strategic Income Fund, also considered factors such as interest rate expectations and yield spreads in making allocations to different sectors within the fixed income market.
2
LETTER TO SHAREHOLDERS continued
As always, we encourage investors to maintain diversified investment portfolios, including allocations to fixed income funds, in pursuit of their long-term investment goals.
Please visit our Web site, EvergreenInvestments.com, for more information about our funds and other investment products available to you. Thank you for your continued support of Evergreen Investments.
Sincerely,

Dennis H. Ferro
President and Chief Executive Officer
Evergreen Investment Company, Inc.
Notice to Shareholders:
Effective October 1, 2006, Tattersall Advisory Group, Inc., an indirect, wholly-owned subsidiary of Wachovia, became the investment sub-advisor to the Fund and is paid by EIMC for its services to the Fund.
Special Notice to Shareholders:
Please visit our Web site at EvergreenInvestments.com for a statement from President and Chief Executive Officer, Dennis Ferro, addressing NASD actions involving Evergreen Investment Services, Inc. (EIS), Evergreen’s mutual fund distributor or statements from Dennis Ferro and Chairman of the Board of the Evergreen funds, Michael S. Scofield, addressing SEC actions involving the Evergreen funds.
3
Notification of Investment Strategy Change:
Effective February 1, 2007, the Fund may, but will not necessarily, use a variety of derivative instruments, such as futures contracts, options, and swaps, including, for example, index futures, Treasury futures, Eurodollar futures, interest rate swap agreements, credit default swaps, and total return swaps. The Fund may use derivatives both for hedging and non-hedging purposes, including for purposes of enhancing returns. The Fund’s use of derivative instruments involves risks different from, or possibly greater than, the risks associated with other types of investments. For example, the use of derivatives involves the risk of loss due to the failure of another party to the contract (typically referred to as a “counterparty”) to make required payments or otherwise to comply with the contract’s terms. Derivative transactions can create investment leverage and may be highly volatile and may be illiquid or difficult to price. Derivatives are highly specialized instruments, and involve the risk that an investment adviser may not accurately predict the performance of a derivative under all market conditions. When the Fund uses a derivative instrument, it could lose more than the principal amount invested. The various derivative instruments that the Fund may use may change from time to time as new derivative products become available to the Fund. More information about derivatives and the risks associated with them can be found in the Fund’s prospectus and statement of additional information, which may be obtained by calling 1.800.343.2898 or visiting our website at EvergreenInvestments.com.
4
Notice to Shareholders:
• The Fund’s prospectus has been amended to make the following change to the Fund’s short-term trading policy effective April 2, 2007:
To limit the negative effects of short-term trading on the Fund, the Fund’s Board of Trustees has adopted certain restrictions on trading by investors. If an investor redeems more than $5,000 (including redemptions that are a part of an exchange transaction) from an Evergreen Fund, that investor is “blocked” from purchasing shares of the Fund (including purchases that are a part of an exchange transaction) for 30 calendar days after the redemption. The short-term trading policy does not apply to:
• Money market funds;
• Evergreen Institutional Enhanced Income Fund; Evergreen Adjustable Rate Fund; and Evergreen Ultra Short Opportunities Fund;
• Systematic investments or exchanges where Evergreen or the financial intermediary maintaining the shareholder account identifies to Evergreen the transaction as a systematic redemption or purchase at the time of the transaction;
• Rebalancing transactions within certain asset allocation or “wrap” programs where Evergreen or the financial intermediary is able to identify the transaction as part of a firm-approved asset allocation program;
• Purchases by a “fund of funds” into the underlying fund vehicle and purchases by 529 Plans:
• Certain transactions involving participants in employer-sponsored retirement plans, including: participant withdrawals due to mandatory distributions, rollovers and hardships; withdrawals of shares acquired by participants through payroll deductions; and, shares acquired or sold by a participant in connection with plan loans; and
• Purchases below $5,000 (including purchases that are a part of an exchange transaction).
There are certain limitations on the Fund’s ability to detect and prevent short-term trading. For example, while the Fund has access to trading information relating to investors who trade and hold their shares directly with the Fund, the Fund may not have immediate access to such information for investors who trade through financial intermediaries such as broker dealers and financial advisors or through retirement plans. Certain financial intermediaries and retirement plans hold their shares or those of their clients through omnibus accounts maintained with the Fund. The Fund may be unable to compel financial intermediaries to apply the Fund’s short-term trading policy described above. The Fund reserves the right, in its sole discretion, to allow financial intermediaries to apply alternative short-term trading policies. The Fund will use reasonable diligence to confirm that such intermediary is applying the Fund’s short-term trading policy or an acceptable alternative. Consult the disclosure provided by your financial intermediary for any alternative short-term trading policies that may apply to your account. It is possible that excessive short-term trading or trading in violation of the Fund’s trading restrictions may occur despite the Fund’s efforts to prevent them.
• Effective April 2, 2007, the “Reinstatement Privileges” described in the Fund’s prospectus are eliminated.
5
FUND AT A GLANCE
as of October 31, 2006
MANAGEMENT TEAM
Investment Advisor:
• Evergreen Investment Management Company, LLC
Sub-Advisors:
• Evergreen International Advisors
• Tattersall Advisory Group, Inc.
Portfolio Managers:
• Anthony Norris
• Lisa Brown-Premo
• Gary Pzegeo, CFA
• Michael Lee
• Alex Perrin
• Peter Wilson
CURRENT INVESTMENT STYLE

Source: Morningstar, Inc.
Morningstar’s style box is based on a portfolio date as of 9/30/2006.
The Fixed income style box placement is based on a fund’s average effective maturity or duration and the average credit rating of the bond portfolio.
PERFORMANCE AND RETURNS
Portfolio inception date: 4/14/1987
| | | Class A | | Class B | | Class C | | Class I |
| Class inception date | | 4/14/1987 | | 2/1/1993 | | 2/1/1993 | | 1/13/1997 |
|
| Nasdaq symbol | | EKSAX | | EKSBX | | EKSCX | | EKSYX |
|
| 6-month return with sales charge | | -2.62% | | -3.04% | | 0.95% | | N/A |
|
| 6-month return w/o sales charge | | 2.31% | | 1.94% | | 1.94% | | 2.45% |
|
| Average annual return* | | | | | | | | |
|
| 1-year with sales charge | | -0.65% | | -1.34% | | 2.63% | | N/A |
|
| 1-year w/o sales charge | | 4.35% | | 3.62% | | 3.62% | | 4.64% |
|
| 5-year | | 7.43% | | 7.38% | | 7.68% | | 8.77% |
|
| 10-year | | 5.72% | | 5.44% | | 5.44% | | 6.33% |
|
| Maximum sales charge | | 4.75% | | 5.00% | | 1.00% | | N/A |
| | | Front-end | | CDSC | | CDSC | | |
|
* Adjusted for maximum applicable sales charge, unless noted.
Past performance is no guarantee of future results. The performance quoted represents past performance and current performance may be lower or higher. The investment return and principal value of an investment will fluctuate so that investors’ shares, when redeemed, may be worth more or less than their original cost. To obtain performance information current to the most recent month-end for Classes A, B, C or I, please go to EvergreenInvestments.com/fundperformance. The performance of each class may vary based on differences in loads, fees and expenses paid by the shareholders investing in each class. Performance includes the reinvestment of income dividends and capital gain distributions. Performance shown does not reflect the deduction of taxes that a shareholder would pay on fund distributions or the redemption of fund shares.
Historical performance shown for Class I prior to its inception is based on the performance of Class A, the original class offered. These historical returns for Class I reflect the 0.25% 12b-1 fee in effect for Class A at that time. Class I does not pay a 12b-1 fee. If this fee had not been reflected, returns for Class I would have been higher. The fund incurs a 12b-1 fee of 0.30% for Class A and 1.00% for Classes B and C.
The advisor is reimbursing a portion of the 12b-1 fee for Class A. Had the fee not been reimbursed, returns for Class A would have been lower. Returns reflect expense limits previously in effect for all classes, without which returns would have been lower.
6
FUND AT A GLANCE continued
LONG-TERM GROWTH
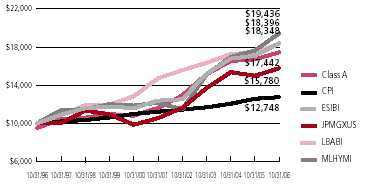
Comparison of a $10,000 investment in the Evergreen Strategic Income Fund Class A shares versus a similar investment in the the Evergreen Strategic Income Blended Index (ESIBI), the JPMorgan Global Government Bond Index excluding U.S. (JPMGXUS), the Lehman Brothers Aggregate Bond Index (LBABI), the Merrill Lynch High Yield Master Index† (MLHYMI), and the Consumer Price Index (CPI).
The ESIBI, the JPMGXUS, the LBABI and the MLHYMI are unmanaged market indexes and do not include transaction costs associated with buying and selling securities, any mutual fund fees or expenses or any taxes. The CPI is a commonly used measure of inflation and does not represent an investment return. It is not possible to invest directly in an index.
Class I shares are only offered in the following manner: (1) to investment advisory clients of Evergreen Investment Management Company, LLC (or its advisory affiliates) when purchased by such advisor(s) on behalf of its clients, (2) through arrangements entered into on behalf of the Evergreen funds with certain financial services firms, (3) to certain institutional investors and (4) to persons who owned Class Y shares in registered name in an Evergreen fund on or before December 31, 1994 or who owned shares of any SouthTrust fund in registered name as of March 18, 2005 or shares of Vestaur Securities Fund as of May 20, 2005.
Class I shares are only available to institutional shareholders with a minimum of $1 million investment, which may be waived in certain situations.
The fund’s investment objective may be changed without a vote of the fund’s shareholders.
Foreign investments may contain more risk due to the inherent risks associated with changing political climates, foreign market instability and foreign currency fluctuations. Risks of international investing are magnified in emerging or developing markets.
Asset-backed and mortgage-backed securities are generally subject to higher prepayment risks than other types of debt securities, which can limit the potential for gain in a declining interest rate environment and increase the potential for loss in a rising interest rate environment. Mortgage-backed securities may also be structured so that they are particularly sensitive to interest rates.
Derivatives involve additional risks including interest rate risk, credit risk, the risk of improper valuation and the risk of non-correlation to the relevant instruments they are designed to hedge or to closely track.
High yield, lower-rated bonds may contain more risk due to the increased possibility of default.
The return of principal is not guaranteed due to fluctuation in the fund’s NAV caused by changes in the price of individual bonds held by the fund and the buying and selling of bonds by the fund. Bond funds have the same inflation, interest rate and credit risks as individual bonds. Generally, the value of bond funds rise when prevailing interest rates fall, and fall when interest rates rise.
U.S. government guarantees apply only to certain securities held in the fund’s portfolio and not to the fund’s shares.
Leverage may disproportionately increase a fund’s portfolio losses and reduce opportunities for gain when interest rates, stock prices, or currency rates are changing.
The Evergreen Strategic Income Blended Index is composed of the following indexes: MLHYMI (50%), JPMGXUS (25%) and LBABI (25%).
† Copyright 2006. Merrill Lynch, Pierce, Fenner & Smith Incorporated. All rights reserved.
All data is as of October 31, 2006, and subject to change.
7
ABOUT YOUR FUND’S EXPENSES
The Example below is intended to describe the fees and expenses borne by shareholders and the impact of those costs on your investment.
Example
As a shareholder of the fund, you incur two types of costs: (1) transaction costs, including sales charges (loads), redemption fees and exchange fees; and (2) ongoing costs, including management fees, distribution (12b-1) fees and other fund expenses. This Example is intended to help you understand your ongoing costs (in dollars) of investing in the fund and to compare these costs with the ongoing costs of investing in other mutual funds. The Example is based on an investment of $1,000 invested at the beginning of the period and held for the entire period from May 1, 2006 to October 31, 2006.
The example illustrates your fund’s costs in two ways:
• Actual expenses
The section in the table under the heading “Actual” provides information about actual account values and actual expenses. You may use the information in these columns, together with the amount you invested, to estimate the expenses that you paid over the period. Simply divide your account value by $1,000 (for example, an $8,600 account value divided by $1,000 = 8.6), then multiply the result by the number in the appropriate column for your share class, in the column entitled “Expenses Paid During Period” to estimate the expenses you paid on your account during this period.
• Hypothetical example for comparison purposes
The section in the table under the heading “Hypothetical (5% return before expenses)” provides information about hypothetical account values and hypothetical expenses based on the fund’s actual expense ratio and an assumed rate of return of 5% per year before expenses, which is not the fund’s actual return. The hypothetical account values and expenses may not be used to estimate the actual ending account balance or expenses you paid for the period. You may use this information to compare the ongoing costs of investing in the fund and other funds. To do so, compare this 5% hypothetical example with the 5% hypothetical examples that appear in the shareholder reports of the other funds.
Please note that the expenses shown in the table are meant to highlight your ongoing costs only and do not reflect any transactional costs, such as sales charges (loads), redemption fees or exchange fees. Therefore, the section in the table under the heading “Hypothetical (5% return before expenses)” is useful in comparing ongoing costs only, and will not help you determine the relative total costs of owning different funds. In addition, if these transactional costs were included, your costs would have been higher.
| | | Beginning | | Ending | | |
| | | Account | | Account | | Expenses |
| | | Value | | Value | | Paid During |
| | | 5/1/2006 | | 10/31/2006 | | Period* |
|
| Actual | | | | | | |
| Class A | | $ 1,000.00 | | $ 1,023.10 | | $ 5.92 |
| Class B | | $ 1,000.00 | | $ 1,019.42 | | $ 9.62 |
| Class C | | $ 1,000.00 | | $ 1,019.42 | | $ 9.62 |
| Class I | | $ 1,000.00 | | $ 1,024.49 | | $ 4.54 |
| Hypothetical | | | | | | |
| (5% return | | | | | | |
| before expenses) | | | | | | |
| Class A | | $ 1,000.00 | | $ 1,019.36 | | $ 5.90 |
| Class B | | $ 1,000.00 | | $ 1,015.68 | | $ 9.60 |
| Class C | | $ 1,000.00 | | $ 1,015.68 | | $ 9.60 |
| Class I | | $ 1,000.00 | | $ 1,020.72 | | $ 4.53 |
|
* For each class of the Fund, expenses are equal to the annualized expense ratio of each class (1.16% for Class A, 1.89% for Class B, 1.89% for Class C and 0.89% for Class I), multiplied by the average account value over the period, multiplied by 184 / 365 days.
8
FINANCIAL HIGHLIGHTS
(For a share outstanding throughout each period)
| | | Six Months Ended | | Year Ended April 30, |
| | October 31, 2006 | |
|
| CLASS A | | (unaudited) | | 2006 | | 2005 | | 2004 | | 2003 | | 20021 |
|
| Net asset value, beginning of period | | $ | | 6.32 | | $ 6.53 | | $ 6.38 | | $ | | 6.50 | | $ 5.83 | | $ 5.74 |
|
| Income from investment operations | | | | | | | | | | | | | | | | |
| Net investment income (loss) | | | | 0.152 | | 0.292 | | 0.33 | | | | 0.342 | | 0.382 | | 0.35 |
Net realized and unrealized gains or losses
on investments | | | | (0.01) | | (0.19) | | 0.19 | | | | 0.07 | | 0.68 | | 0.16 |
| |
|
| Total from investment operations | | | | 0.14 | | 0.10 | | 0.52 | | | | 0.41 | | 1.06 | | 0.51 |
|
| Distributions to shareholders from | | | | | | | | | | | | | | | | |
| Net investment income | | | | (0.16) | | (0.31) | | (0.35) | | | | (0.37) | | (0.39) | | (0.32) |
| Net realized gains | | | | 0 | | 0 | | (0.02) | | | | (0.16) | | 0 | | 0 |
| Tax basis return of capital | | | | 0 | | 0 | | 0 | | | | 0 | | 0 | | (0.10) |
| |
|
| Total distributions to shareholders | | | | (0.16) | | (0.31) | | (0.37) | | | | (0.53) | | (0.39) | | (0.42) |
|
| Net asset value, end of period | | $ | | 6.30 | | $ 6.32 | | $ 6.53 | | $ | | 6.38 | | $ 6.50 | | $ 5.83 |
|
| Total return3 | | | | 2.31% | | 1.59% | | 8.22% | | | | 6.24% | | 18.79% | | 9.37% |
|
| Ratios and supplemental data | | | | | | | | | | | | | | | | |
| Net assets, end of period (thousands) | | $181,360 | | $199,501 | | $214,776 | | $202,017 | | $173,842 | | $130,934 |
| Ratios to average net assets | | | | | | | | | | | | | | | | |
| Expenses including waivers/reimbursements | | | | | | | | | | | | | | | | |
| but excluding expense reductions | | | | 1.16%4 | | 1.17% | | 1.12% | | | | 1.21% | | 1.19% | | 1.23% |
| Expenses excluding waivers/reimbursements | | | | | | | | | | | | | | | | |
| and expense reductions | | | | 1.19%4 | | 1.18% | | 1.12% | | | | 1.21% | | 1.19% | | 1.24% |
| Net investment income (loss) | | | | 5.21%4 | | 4.57% | | 5.03% | | | | 5.10% | | 6.31% | | 6.02% |
| Portfolio turnover rate | | | | 63% | | 100% | | 130% | | | | 129% | | 129% | | 304% |
|
1 As required, effective May 1, 2001, the Fund adopted the provisions of the AICPA Audit and Accounting, Companies Guide, Audits of Investment and began amortizing premium on its fixed-income securities. The effects of this change for the year ended April 30, 2002 was a decrease in net investment income per share of $0.02; an increase in net realized gains or losses per share of $0.02; and a decrease to the ratio of net investment income to average net assets of 0.45%.
2 Net investment income (loss) per share is based on average shares outstanding during the period.
3 Excluding applicable sales charges
4 Annualized
See Notes to Financial Statements
9
FINANCIAL HIGHLIGHTS
(For a share outstanding throughout each period)
| | | Six Months Ended | | Year Ended April 30, |
| | October 31, 2006 | |
|
| CLASS B | | (unaudited) | | 2006 | | 2005 | | 2004 | | 2003 | | 20021 |
|
| Net asset value, beginning of period | | $ | | 6.34 | | $ 6.55 | | $ 6.40 | | $ | | 6.52 | | $ 5.85 | | $ 5.75 |
|
| Income from investment operations | | | | | | | | | | | | | | | | |
| Net investment income (loss) | | | | 0.132 | | 0.252 | | 0.29 | | | | 0.292 | | 0.34 | | 0.29 |
Net realized and unrealized gains or losses
on investments | | | | (0.01) | | (0.19) | | 0.19 | | | | 0.07 | | 0.67 | | 0.19 |
| |
|
| Total from investment operations | | | | 0.12 | | 0.06 | | 0.48 | | | | 0.36 | | 1.01 | | 0.48 |
|
| Distributions to shareholders from | | | | | | | | | | | | | | | | |
| Net investment income | | | | (0.14) | | (0.27) | | (0.31) | | | | (0.32) | | (0.34) | | (0.28) |
| Net realized gains | | | | 0 | | 0 | | (0.02) | | | | (0.16) | | 0 | | 0 |
| Tax basis return of capital | | | | 0 | | 0 | | 0 | | | | 0 | | 0 | | (0.10) |
| |
|
| Total distributions to shareholders | | | | (0.14) | | (0.27) | | (0.33) | | | | (0.48) | | (0.34) | | (0.38) |
|
| Net asset value, end of period | | $ | | 6.32 | | $ 6.34 | | $ 6.55 | | $ | | 6.40 | | $ 6.52 | | $ 5.85 |
|
| Total return3 | | | | 1.94% | | 0.89% | | 7.46% | | | | 5.49% | | 17.87% | | 8.74% |
|
| Ratios and supplemental data | | | | | | | | | | | | | | | | |
| Net assets, end of period (thousands) | | $61,657 | | $71,860 | | $98,852 | | $113,115 | | $107,968 | | $77,471 |
| Ratios to average net assets | | | | | | | | | | | | | | | | |
| Expenses including waivers/reimbursements | | | | | | | | | | | | | | | | |
| but excluding expense reductions | | | | 1.89%4 | | 1.87% | | 1.83% | | | | 1.91% | | 1.94% | | 1.98% |
| Expenses excluding waivers/reimbursements | | | | | | | | | | | | | | | | |
| and expense reductions | | | | 1.89%4 | | 1.87% | | 1.83% | | | | 1.91% | | 1.94% | | 1.99% |
| Net investment income (loss) | | | | 4.48%4 | | 3.85% | | 4.34% | | | | 4.40% | | 5.54% | | 5.27% |
| Portfolio turnover rate | | | | 63% | | 100% | | 130% | | | | 129% | | 129% | | 304% |
|
1 As required, effective May 1, 2001, the Fund adopted the provisions of the AICPA Audit and Accounting, Companies Guide, Audits of Investment and began amortizing premium on its fixed-income securities. The effects of this change for the year ended April 30, 2002 was a decrease in net investment income per share of $0.03; an increase in net realized gains or losses per share of $0.03; and a decrease to the ratio of net investment income to average net assets of 0.45%.
2 Net investment income (loss) per share is based on average shares outstanding during the period.
3 Excluding applicable sales charges
4 Annualized
See Notes to Financial Statements
10
FINANCIAL HIGHLIGHTS
(For a share outstanding throughout each period)
| | | Six Months Ended | | Year Ended April 30, |
| | October 31, 2006 | |
|
| CLASS C | | (unaudited) | | 2006 | | 2005 | | 2004 | | 2003 | | 20021 |
|
| Net asset value, beginning of period | | $ | | 6.33 | | $ 6.54 | | $ 6.39 | | $ | | 6.51 | | $ 5.84 | | $ 5.75 |
|
| Income from investment operations | | | | | | | | | | | | | | | | |
| Net investment income (loss) | | | | 0.132 | | 0.252 | | 0.29 | | | | 0.292 | | 0.342 | | 0.32 |
Net realized and unrealized gains or losses
on investments | | | | (0.01) | | (0.19) | | 0.19 | | | | 0.07 | | 0.67 | | 0.15 |
| |
|
| Total from investment operations | | | | 0.12 | | 0.06 | | 0.48 | | | | 0.36 | | 1.01 | | 0.47 |
|
| Distributions to shareholders from | | | | | | | | | | | | | | | | |
| Net investment income | | | | (0.14) | | (0.27) | | (0.31) | | | | (0.32) | | (0.34) | | (0.28) |
| Net realized gains | | | | 0 | | 0 | | (0.02) | | | | (0.16) | | 0 | | 0 |
| Tax basis return of capital | | | | 0 | | 0 | | 0 | | | | 0 | | 0 | | (0.10) |
| | |
|
| Total distributions to shareholders | | | | (0.14) | | (0.27) | | (0.33) | | | | (0.48) | | (0.34) | | (0.38) |
|
| Net asset value, end of period | | $ | | 6.31 | | $ 6.33 | | $ 6.54 | | $ | | 6.39 | | $ 6.51 | | $ 5.84 |
|
| Total return3 | | | | 1.94% | | 0.88% | | 7.46% | | | | 5.49% | | 17.89% | | 8.56% |
|
| Ratios and supplemental data | | | | | | | | | | | | | | | | |
| Net assets, end of period (thousands) | | $59,150 | | $65,322 | | $79,539 | | $89,236 | | $68,207 | | $22,554 |
| Ratios to average net assets | | | | | | | | | | | | | | | | |
| Expenses including waivers/reimbursements | | | | | | | | | | | | | | | | |
| but excluding expense reductions | | | | 1.89%4 | | 1.88% | | 1.83% | | | | 1.91% | | 1.93% | | 1.98% |
| Expenses excluding waivers/reimbursements | | | | | | | | | | | | | | | | |
| and expense reductions | | | | 1.89%4 | | 1.88% | | 1.83% | | | | 1.91% | | 1.93% | | 1.98% |
| Net investment income (loss) | | | | 4.48%4 | | 3.86% | | 4.34% | | | | 4.40% | | 5.66% | | 5.25% |
| Portfolio turnover rate | | | | 63% | | 100% | | 130% | | | | 129% | | 129% | | 304% |
|
1 As required, effective May 1, 2001, the Fund adopted the provisions of the AICPA Audit and Accounting, Companies Guide, Audits of Investment and began amortizing premium on its fixed-income securities . The effects of this change for the year ended April 30, 2002 was a decrease in net investment income per share of $0.02; an increase in net realized gains or losses per share of $0.02; and a decrease to the ratio of net investment income to average net assets of 0.45%.
2 Net investment income (loss) per share is based on average shares outstanding during the period.
3 Excluding applicable sales charges
4 Annualized
See Notes to Financial Statements
11
FINANCIAL HIGHLIGHTS
(For a share outstanding throughout each period)
| | | Six Months Ended | | Year Ended April 30, |
| | October 31, 2006 | |
|
| CLASS I1 | | (unaudited) | | 2006 | | 2005 | | 2004 | | 2003 | | 20022 |
|
| Net asset value, beginning of period | | $ | | 6.22 | | $ 6.43 | | $ 6.28 | | $ | | 6.40 | | $ 5.74 | | $ 5.65 |
|
| Income from investment operations | | | | | | | | | | | | | | | | |
| Net investment income (loss) | | | | 0.163 | | 0.313 | | 0.34 | | | | 0.353 | | 0.413 | | 0.35 |
Net realized and unrealized gains or losses
on investments | | | | (0.01) | | (0.19) | | 0.19 | | | | 0.07 | | 0.64 | | 0.17 |
| |
|
| Total from investment operations | | | | 0.15 | | 0.12 | | 0.53 | | | | 0.42 | | 1.05 | | 0.52 |
|
| Distributions to shareholders from | | | | | | | | | | | | | | | | |
| Net investment income | | | | (0.17) | | (0.33) | | (0.36) | | | | (0.38) | | (0.39) | | (0.33) |
| Net realized gains | | | | 0 | | 0 | | (0.02) | | | | (0.16) | | 0 | | 0 |
| Tax basis return of capital | | | | 0 | | 0 | | 0 | | | | 0 | | 0 | | (0.10) |
| |
|
| Total distributions to shareholders | | | | (0.17) | | (0.33) | | (0.38) | | | | (0.54) | | (0.39) | | (0.43) |
|
| Net asset value, end of period | | $ | | 6.20 | | $ 6.22 | | $ 6.43 | | $ | | 6.28 | | $ 6.40 | | $ 5.74 |
|
| Total return | | | | 2.45% | | 1.84% | | 8.58% | | | | 6.56% | | 19.09% | | 9.67% |
|
| Ratios and supplemental data | | | | | | | | | | | | | | | | |
| Net assets, end of period (thousands) | | $19,295 | | $20,424 | | $19,216 | | $26,711 | | $13,406 | | $1,779 |
| Ratios to average net assets | | | | | | | | | | | | | | | | |
| Expenses including waivers/reimbursements | | | | | | | | | | | | | | | | |
| but excluding expense reductions | | | | 0.89%4 | | 0.88% | | 0.82% | | | | 0.91% | | 0.94% | | 0.98% |
| Expenses excluding waivers/reimbursements | | | | | | | | | | | | | | | | |
| and expense reductions | | | | 0.89%4 | | 0.88% | | 0.82% | | | | 0.91% | | 0.94% | | 0.99% |
| Net investment income (loss) | | | | 5.47%4 | | 4.88% | | 5.33% | | | | 5.42% | | 6.75% | | 6.27% |
| Portfolio turnover rate | | | | 63% | | 100% | | 130% | | | | 129% | | 129% | | 304% |
|
1 Effective at the close of business on May 11, 2001, Class Y shares were renamed as Class I shares.
2 As required, effective May 1, 2001, the Fund adopted the provisions of the AICPA Audit and Accounting , Companies Guide, Audits of Investment and began amortizing premium on its fixed-income securities . The effects of this change for the year ended April 30, 2002 was a decrease in net investment income per share of $0.03; an increase in net realized gains or losses per share of $0.03; and a decrease to the ratio of net investment income to average net assets of 0.45%.
3 Net investment income (loss) per share is based on average shares outstanding during the period.
4 Annualized
See Notes to Financial Statements
12
SCHEDULE OF INVESTMENTS
October 31, 2006 (unaudited)
| | | | | | | Principal | | | | |
| | | | | | | Amount | | | | Value |
|
| |
| AGENCY COMMERCIAL MORTGAGE-BACKED SECURITIES 4.5% | | | | | | | | |
| FIXED-RATE 4.5% | | | | | | | | | | |
| FNMA: | | | | | | | | | | |
| 4.44%, 04/01/2014 | | | | $ | | 409,341 | | $ | | 392,967 |
| 5.24%, 07/01/2035 ## | | | | | | 3,151,832 | | | | 3,146,253 |
| 6.07%, 09/01/2013 | | | | | | 1,438,164 | | | | 1,503,716 |
| 6.18%, 06/01/2013 | | | | | | 1,406,487 | | | | 1,473,450 |
| 6.50%, 04/01/2017 | | | | | | 687,965 | | | | 752,317 |
| 7.50%, 07/01/2010 | | | | | | 766,851 | | | | 822,655 |
| Ser. 1998-M5, Class D, 6.35%, 06/25/2020 | | | | | | 1,760,000 | | | | 1,823,618 |
| Ser. 2002-M1, Class C, 6.17%, 02/25/2016 | | | | | | 1,427,033 | | | | 1,446,212 |
| Ser. 2003-M1, Class B, 4.91%, 07/25/2020 ## | | | | | | 3,000,000 | | | | 2,924,160 |
| |
|
| | | | | | | | | | | 14,285,348 |
| |
|
| FLOATING-RATE 0.0% | | | | | | | | | | |
| FNMA, 6.70%, 04/01/2011 | | | | | | 68,639 | | | | 71,623 |
| |
|
| Total Agency Commercial Mortgage-Backed Securities | | | | | | | | | | |
| (cost $14,633,054) | | | | | | | | | | 14,356,971 |
| |
|
| AGENCY MORTGAGE-BACKED COLLATERALIZED MORTGAGE | | | | | | | | |
| OBLIGATIONS 2.2% | | | | | | | | | | |
| FLOATING-RATE 2.2% | | | | | | | | | | |
| FHLMC: | | | | | | | | | | |
| Ser. 1307, Class A, 5.98%, 06/15/2007 | | | | | | 41,038 | | | | 41,069 |
| Ser. 2710, Class FY, 5.72%, 10/15/2018 | | | | | | 355,641 | | | | 357,110 |
| FNMA: | | | | | | | | | | |
| Ser. 2001-61, Class FH, 5.92%, 11/18/2031 | | | | | | 458,456 | | | | 465,582 |
| Ser. 2002-67, Class FA, 6.32%, 11/25/2032 | | | | | | 2,290,259 | | | | 2,383,931 |
| Ser. 2002-77, Class FA, 6.32%, 10/18/2030 ## | | | | | | 3,373,243 | | | | 3,498,896 |
| Ser. 2004-W2, Class 2A2, 7.00%, 02/25/2044 | | | | | | 273,782 | | | | 285,533 |
| Ser. 2004-W2, Class 5A, 7.50%, 03/25/2044 | | | | | | 192,044 | | | | 202,328 |
| |
|
| Total Agency Mortgage-Backed Collateralized Mortgage Obligations | | | | | | | | |
| (cost $7,138,177) | | | | | | | | | | 7,234,449 |
| |
|
| AGENCY MORTGAGE-BACKED PASS THROUGH SECURITIES 13.5% | | | | | | | | |
| FIXED-RATE 12.4% | | | | | | | | | | |
| FHLMC: | | | | | | | | | | |
| 5.875%, 09/15/2007 | | | | | | 16,691 | | | | 16,701 |
| 6.00%, 04/01/2036 ## | | | | | | 3,382,221 | | | | 3,406,333 |
| 7.50%, 05/01/2009 | | | | | | 221,986 | | | | 225,198 |
| FHLMC 15 year, 5.50%, TBA # | | | | | | 1,285,000 | | | | 1,285,803 |
| FHLMC 30 year: | | | | | | | | | | |
| 5.50%, TBA # | | | | | | 5,215,000 | | | | 5,157,958 |
| 6.00%, TBA # | | | | | | 5,820,000 | | | | 5,860,013 |
| 6.50%, TBA # | | | | | | 2,250,000 | | | | 2,294,298 |
| FNMA 15 year | | | | | | | | | | |
| 4.50%, TBA # | | | | | | 3,975,000 | | | | 3,845,813 |
| 6.00%, TBA # | | | | | | 1,175,000 | | | | 1,193,359 |
See Notes to Financial Statements
13
SCHEDULE OF INVESTMENTS continued
October 31, 2006 (unaudited)
| | | | | Principal | | | | |
| | | | | Amount | | | | Value |
|
| |
| AGENCY MORTGAGE-BACKED PASS THROUGH SECURITIES continued | | | | | | |
| FIXED-RATE continued | | | | | | | | |
| FNMA 30 year: | | | | | | | | |
| 5.50%, TBA # | | $ | | 6,500,000 | | $ | | 6,424,847 |
| 6.00%, TBA # | | | | 3,700,000 | | | | 3,723,125 |
| 6.50%, TBA # | | | | 2,465,000 | | | | 2,512,759 |
| GNMA: | | | | | | | | |
| 5.50%, 06/15/2035 ## | | | | 3,825,996 | | | | 3,812,209 |
| 6.00%, 06/15/2031 - 09/15/2031 | | | | 98,539 | | | | 100,102 |
| 7.50%, 12/15/2030 | | | | 35,560 | | | | 37,088 |
| 8.00%, 10/15/2030 | | | | 1,725 | | | | 1,829 |
| |
|
| | | | | | | | | 39,897,435 |
| |
|
| FLOATING-RATE 1.1% | | | | | | | | |
| FHLMC, 7.53%, 03/25/2036 | | | | 1,554,311 | | | | 1,638,151 |
| FNMA: | | | | | | | | |
| 4.99%, 05/01/2035 | | | | 1,083,558 | | | | 1,085,985 |
| 5.76%, 07/01/2044 | | | | 642,321 | | | | 646,118 |
| |
|
| | | | | | | | | 3,370,254 |
| |
|
| Total Agency Mortgage-Backed Pass Through Securities | | | | | | | | |
| (cost $43,082,334) | | | | | | | | 43,267,689 |
| |
|
| AGENCY REPERFORMING MORTGAGE-BACKED PASS | | | | | | | | |
| THROUGH SECURITIES 0.1% | | | | | | | | |
| FNMA, Ser. 2003-W1, Class 2A, 7.50%, 12/25/2042 | | | | 314,371 | | | | 328,417 |
| FNMA, Ser. 2003-W6, Class F, 5.67%, 09/25/2042 | | | | 90,987 | | | | 94,349 |
| |
|
| Total Agency Reperforming Mortgage-Backed Pass Through Securities | | | | | | |
| (cost $416,321) | | | | | | | | 422,766 |
| |
|
| ASSET-BACKED SECURITIES 1.6% | | | | | | | | |
| C-Bass, Ltd., Ser. 11A, Class C, FRN, 6.74%, 09/15/2039 144A | | | | 4,315,000 | | | | 4,338,301 |
| Trapeza CDO, LLC, Ser. 2004-7A, Class B1, FRN, 7.04%, 01/25/2035 144A | | 875,000 | | | | 888,563 |
| |
|
| Total Asset-Backed Securities (cost $5,190,000) | | | | | | | | 5,226,864 |
| |
|
| COMMERCIAL MORTGAGE-BACKED SECURITIES 1.0% | | | | | | | | |
| FIXED-RATE 0.5% | | | | | | | | |
| Credit Suisse Mtge. Capital Cert., Ser. 2006-CL4, Class A1, 6.00%, | | | | | | | | |
| 11/25/2036 | | | | 1,600,000 | | | | 1,598,501 |
| |
|
| FLOATING-RATE 0.5% | | | | | | | | |
| Banc of America Loan, Inc., Ser. 2005-BBA6, Class G, 5.74%, | | | | | | | | |
| 01/15/2019 144A | | | | 1,540,000 | | | | 1,541,556 |
| |
|
| Total Commercial Mortgage-Backed Securities (cost $3,133,045) | | | | | | 3,140,057 |
| |
|
| CORPORATE BONDS 32.1% | | | | | | | | |
| CONSUMER DISCRETIONARY 9.2% | | | | | | | | |
| Auto Components 1.0% | | | | | | | | |
| Accuride Corp., 8.50%, 02/01/2015 | | | | 1,000,000 | | | | 975,000 |
| American Axle & Manufacturing Holdings, Inc., 5.25%, 02/11/2014 | | | | 2,000,000 | | | | 1,685,000 |
See Notes to Financial Statements
14
SCHEDULE OF INVESTMENTS continued
October 31, 2006 (unaudited)
| | | | | Principal | | | | |
| | | | | Amount | | | | Value |
|
| |
| CORPORATE BONDS continued | | | | | | | | |
| CONSUMER DISCRETIONARY continued | | | | | | | | |
| Auto Components continued | | | | | | | | |
| ArvinMeritor, Inc., 6.80%, 02/15/2009 | | $ | | 81,000 | | $ | | 78,266 |
| Goodyear Tire & Rubber Co., 9.00%, 07/01/2015 (p) | | | | 500,000 | | | | 508,125 |
| |
|
| | | | | | | | | 3,246,391 |
| |
|
| Automobiles 0.5% | | | | | | | | |
| Ford Motor Co., 7.45%, 07/16/2031 (p) | | | | 500,000 | | | | 394,375 |
| General Motors Corp., 8.375%, 07/15/2033 (p) | | | | 1,250,000 | | | | 1,118,750 |
| |
|
| | | | | | | | | 1,513,125 |
| |
|
| Diversified Consumer Services 0.5% | | | | | | | | |
| Education Management Corp., 8.75%, 06/01/2014 144A | | | | 300,000 | | | | 309,000 |
| Service Corporation International, 6.75%, 04/01/2016 | | | | 1,525,000 | | | | 1,479,250 |
| |
|
| | | | | | | | | 1,788,250 |
| |
|
| Hotels, Restaurants & Leisure 0.9% | | | | | | | | |
| Isle of Capri Casinos, Inc., 7.00%, 03/01/2014 | | | | 1,000,000 | | | | 965,000 |
| Las Vegas Sands Corp., 6.375%, 02/15/2015 | | | | 900,000 | | | | 850,500 |
| Mandalay Resort Group, Ser. B, 10.25%, 08/01/2007 | | | | 1,000,000 | | | | 1,033,750 |
| |
|
| | | | | | | | | 2,849,250 |
| |
|
| Household Durables 0.7% | | | | | | | | |
| Jarden Corp., 9.75%, 05/01/2012 (p) | | | | 1,525,000 | | | | 1,620,313 |
| Libbey, Inc., FRN, 12.44%, 06/01/2011 144A | | | | 550,000 | | | | 585,750 |
| |
|
| | | | | | | | | 2,206,063 |
| |
|
| Media 3.7% | | | | | | | | |
| AMC Entertainment, Inc., Ser. B, 8.625%, 08/15/2012 | | | | 1,500,000 | | | | 1,554,375 |
| American Media Operations, Inc., Ser. B, 10.25%, 05/01/2009 | | | | 1,225,000 | | | | 1,166,812 |
| Cablevision Systems Corp., Ser. B, 8.00%, 04/15/2012 | | | | 676,000 | | | | 659,945 |
| CCH I, LLC, 11.00%, 10/01/2015 | | | | 325,000 | | | | 314,844 |
| Cinemark USA, Inc., 9.00%, 02/01/2013 | | | | 650,000 | | | | 680,063 |
| Dex Media East, LLC, 9.875%, 11/15/2009 | | | | 1,025,000 | | | | 1,082,656 |
| Houghton Mifflin Co.: | | | | | | | | |
| 8.25%, 02/01/2011 | | | | 1,000,000 | | | | 1,035,000 |
| Sr. Disc. Note, Step Bond, 0.00%, 10/15/2013 † | | | | 1,250,000 | | | | 1,134,375 |
| Lamar Media Corp., 6.625%, 08/15/2015 | | | | 1,250,000 | | | | 1,209,375 |
| Mediacom Broadband, LLC, 8.50%, 10/15/2015 144A | | | | 550,000 | | | | 552,063 |
| Mediacom Communications Corp., 9.50%, 01/15/2013 (p) | | | | 1,750,000 | | | | 1,804,687 |
| Paxson Communications Corp., FRN, 11.62%, 01/15/2013 144A | | | | 850,000 | | | | 855,312 |
| |
|
| | | | | | | | | 12,049,507 |
| |
|
| Multi-line Retail 0.2% | | | | | | | | |
| Neiman Marcus Group, Inc., 9.00%, 10/15/2015 | | | | 500,000 | | | | 538,750 |
| |
|
| Specialty Retail 1.0% | | | | | | | | |
| Baker & Taylor, Inc., 11.50%, 07/01/2013 144A | | | | 600,000 | | | | 603,000 |
| Payless ShoeSource, Inc., 8.25%, 08/01/2013 | | | | 1,425,000 | | | | 1,460,625 |
| United Auto Group, Inc., 9.625%, 03/15/2012 | | | | 1,000,000 | | | | 1,058,750 |
| |
|
| | | | | | | | | 3,122,375 |
| |
|
See Notes to Financial Statements
15
SCHEDULE OF INVESTMENTS continued
October 31, 2006 (unaudited)
| | | | | Principal | | | | |
| | | | | Amount | | | | Value |
|
| |
| CORPORATE BONDS continued | | | | | | | | |
| CONSUMER DISCRETIONARY continued | | | | | | | | |
| Textiles, Apparel & Luxury Goods 0.7% | | | | | | | | |
| Levi Strauss & Co., 9.75%, 01/15/2015 | | $ | | 775,000 | | $ | | 825,375 |
| Oxford Industries, Inc., 8.875%, 06/01/2011 | | | | 400,000 | | | | 412,500 |
| Unifi, Inc., 11.50%, 05/15/2014 144A | | | | 500,000 | | | | 472,500 |
| Warnaco Group, Inc., 8.875%, 06/15/2013 | | | | 385,000 | | | | 404,250 |
| |
|
| | | | | | | | | 2,114,625 |
| |
|
| CONSUMER STAPLES 0.2% | | | | | | | | |
| Food & Staples Retailing 0.2% | | | | | | | | |
| Wal-Mart Stores, Inc., 4.75%, 01/29/2013 | | | | 300,000 | | | | 562,706 |
| |
|
| ENERGY 4.5% | | | | | | | | |
| Energy Equipment & Services 0.7% | | | | | | | | |
| Dresser-Rand Group, Inc., 7.375%, 11/01/2014 | | | | 692,000 | | | | 687,675 |
| GulfMark Offshore, Inc., 7.75%, 07/15/2014 (p) | | | | 525,000 | | | | 530,250 |
| Hornbeck Offshore Services, Inc., Ser. B, 6.125%, 12/01/2014 | | | | 620,000 | | | | 580,475 |
| Parker Drilling Co., 9.625%, 10/01/2013 | | | | 450,000 | | | | 491,625 |
| |
|
| | | | | | | | | 2,290,025 |
| |
|
| Oil, Gas & Consumable Fuels 3.8% | | | | | | | | |
| ANR Pipeline Co., 8.875%, 03/15/2010 | | | | 270,000 | | | | 284,983 |
| Chesapeake Energy Corp., 6.875%, 01/15/2016 | | | | 1,350,000 | | | | 1,346,625 |
| Clayton Williams Energy, Inc., 7.75%, 08/01/2013 | | | | 725,000 | | | | 672,437 |
| El Paso Corp., 7.875%, 06/15/2012 (p) | | | | 1,500,000 | | | | 1,571,250 |
| El Paso Production Holding Co., 7.75%, 06/01/2013 | | | | 1,000,000 | | | | 1,030,000 |
| Encore Acquisition Co., 6.25%, 04/15/2014 | | | | 1,000,000 | | | | 935,000 |
| Exco Resources, Inc., 7.25%, 01/15/2011 | | | | 1,000,000 | | | | 967,500 |
| Overseas Shipholding Group, Inc., 8.25%, 03/15/2013 | | | | 750,000 | | | | 791,250 |
| Peabody Energy Corp.: | | | | | | | | |
| 5.875%, 04/15/2016 | | | | 750,000 | | | | 708,750 |
| 6.875%, 03/15/2013 (p) | | | | 440,000 | | | | 448,800 |
| Plains Exploration & Production Co.: | | | | | | | | |
| 7.125%, 06/15/2014 | | | | 39,600 | | | | 42,669 |
| 8.75%, 07/01/2012 | | | | 1,000,000 | | | | 1,067,500 |
| Targa Resources, Inc., 8.50%, 11/01/2013 144A | | | | 250,000 | | | | 250,625 |
| Williams Cos.: | | | | | | | | |
| 7.50%, 01/15/2031 | | | | 925,000 | | | | 943,500 |
| 8.125%, 03/15/2012 (p) | | | | 1,000,000 | | | | 1,077,500 |
| |
|
| | | | | | | | | 12,138,389 |
| |
|
| FINANCIALS 5.3% | | | | | | | | |
| Capital Markets 0.8% | | | | | | | | |
| Goldman Sachs Group, Inc., 6.875%, 01/15/2011 | | | | 2,325,000 | | | | 2,468,246 |
| |
|
| Consumer Finance 2.4% | | | | | | | | |
| CCH II Capital Corp., 10.25%, 09/15/2010 | | | | 1,500,000 | | | | 1,556,250 |
| Ford Motor Credit Co., 5.70%, 01/15/2010 | | | | 1,000,000 | | | | 926,738 |
See Notes to Financial Statements
16
SCHEDULE OF INVESTMENTS continued
October 31, 2006 (unaudited)
| | | | | Principal | | | | |
| | | | | Amount | | | | Value |
|
| |
| CORPORATE BONDS continued | | | | | | | | |
| FINANCIALS continued | | | | | | | | |
| Consumer Finance continued | | | | | | | | |
| General Electric Capital Corp., 6.125%, 02/22/2011 | | $ | | 1,190,000 | | $ | | 1,236,490 |
| General Motors Acceptance Corp.: | | | | | | | | |
| 6.875%, 08/28/2012 | | | | 1,500,000 | | | | 1,505,808 |
| FRN, 6.27%, 01/16/2007 | | | | 700,000 | | | | 699,943 |
| NXP Funding, LLC, 7.875%, 10/15/2014 144A | | | | 800,000 | | | | 816,000 |
| Qwest Capital Funding, Inc., 6.50%, 11/15/2018 | | | | 1,100,000 | | | | 1,012,000 |
| |
|
| | | | | | | | | 7,753,229 |
| |
|
| Diversified Financial Services 0.6% | | | | | | | | |
| TRAINS, Ser. HY-2006-1, 7.33%, 05/01/2016 144A (p) | | | | 1,940,400 | | | | 1,964,341 |
| |
|
| Insurance 0.4% | | | | | | | | |
| Crum & Forster Holdings Corp., 10.375%, 06/15/2013 (p) | | | | 1,300,000 | | | | 1,355,250 |
| |
|
| Real Estate Investment Trusts 1.1% | | | | | | | | |
| Host Marriott Corp.: | | | | | | | | |
| Ser. G, 9.25%, 10/01/2007 | | | | 750,000 | | | | 776,250 |
| Ser. J, 7.125%, 11/01/2013 | | | | 750,000 | | | | 762,187 |
| Omega Healthcare Investors, Inc., 7.00%, 04/01/2014 | | | | 1,000,000 | | | | 1,006,250 |
| Thornburg Mortgage, Inc., 8.00%, 05/15/2013 | | | | 1,000,000 | | | | 990,000 |
| |
|
| | | | | | | | | 3,534,687 |
| |
|
| HEALTH CARE 0.7% | | | | | | | | |
| Health Care Equipment & Supplies 0.4% | | | | | | | | |
| Universal Hospital Services, Inc., 10.125%, 11/01/2011 | | | | 1,300,000 | | | | 1,381,250 |
| |
|
| Health Care Providers & Services 0.3% | | | | | | | | |
| HCA, Inc., 6.375%, 01/15/2015 | | | | 725,000 | | | | 581,812 |
| HealthSouth Corp., 10.75%, 06/15/2016 144A (p) | | | | 300,000 | | | | 309,000 |
| Tenet Healthcare Corp., 7.375%, 02/01/2013 | | | | 50,000 | | | | 44,563 |
| |
|
| | | | | | | | | 935,375 |
| |
|
| INDUSTRIALS 1.7% | | | | | | | | |
| Aerospace & Defense 0.3% | | | | | | | | |
| DRS Technologies, Inc., 7.625%, 02/01/2018 | | | | 1,000,000 | | | | 1,027,500 |
| |
|
| Machinery 0.8% | | | | | | | | |
| Commercial Vehicle Group, Inc., 8.00%, 07/01/2013 | | | | 875,000 | | | | 853,125 |
| ITT Corp., 7.375%, 11/15/2015 | | | | 735,000 | | | | 746,025 |
| RBS Global, Inc., 11.75%, 08/01/2016 144A | | | | 1,000,000 | | | | 1,045,000 |
| |
|
| | | | | | | | | 2,644,150 |
| |
|
| Trading Companies & Distributors 0.6% | | | | | | | | |
| Ashtead Group plc, 9.00%, 08/15/2016 144A | | | | 700,000 | | | | 740,250 |
| United Rentals, Inc., 7.00%, 02/15/2014 (p) | | | | 1,250,000 | | | | 1,203,125 |
| |
|
| | | | | | | | | 1,943,375 |
| |
|
See Notes to Financial Statements
17
SCHEDULE OF INVESTMENTS continued
October 31, 2006 (unaudited)
| | | | | Principal | | | | |
| | | | | Amount | | | | Value |
|
| |
| CORPORATE BONDS continued | | | | | | | | |
| INFORMATION TECHNOLOGY 0.8% | | | | | | | | |
| Electronic Equipment & Instruments 0.1% | | | | | | | | |
| Compucom Systems, Inc., 12.00%, 11/01/2014 144A | | $ | | 400,000 | | $ | | 404,500 |
| |
|
| IT Services 0.7% | | | | | | | | |
| SunGard Data Systems, Inc.: | | | | | | | | |
| 9.125%, 08/15/2013 | | | | 1,675,000 | | | | 1,746,187 |
| 10.25%, 08/15/2015 (p) | | | | 400,000 | | | | 421,000 |
| |
|
| | | | | | | | | 2,167,187 |
| |
|
| MATERIALS 4.0% | | | | | | | | |
| Chemicals 1.7% | | | | | | | | |
| Hexion Specialty Chemicals, Inc., 9.75%, 11/15/2014 144A # | | | | 600,000 | | | | 601,500 |
| Huntsman International, LLC: | | | | | | | | |
| 8.375%, 01/01/2015 144A (p) | | | | 575,000 | | | | 570,688 |
| 11.50%, 07/15/2012 | | | | 924,000 | | | | 1,051,050 |
| Lyondell Chemical Co.: | | | | | | | | |
| 9.50%, 12/15/2008 (p) | | | | 1,231,000 | | | | 1,269,469 |
| 10.50%, 06/01/2013 | | | | 800,000 | | | | 884,000 |
| Tronox Worldwide, LLC, 9.50%, 12/01/2012 | | | | 975,000 | | | | 1,011,562 |
| |
|
| | | | | | | | | 5,388,269 |
| |
|
| Containers & Packaging 1.2% | | | | | | | | |
| Berry Plastics Corp., 8.875%, 09/15/2014 144A | | | | 600,000 | | | | 609,000 |
| Crown Americas, Inc., 7.75%, 11/15/2015 | | | | 1,000,000 | | | | 1,031,250 |
| Owens-Brockway Glass Containers, Inc., 6.75%, 12/01/2014 (p) | | | | 1,200,000 | | | | 1,158,000 |
| Smurfit-Stone Container Corp., 8.375%, 07/01/2012 | | | | 1,075,000 | | | | 1,053,500 |
| |
|
| | | | | | | | | 3,851,750 |
| |
|
| Metals & Mining 0.7% | | | | | | | | |
| Freeport-McMoRan Copper & Gold, Inc., 10.125%, 02/01/2010 | | | | 1,000,000 | | | | 1,063,750 |
| United States Steel Corp., 10.75%, 08/01/2008 (p) | | | | 1,000,000 | | | | 1,082,500 |
| |
|
| | | | | | | | | 2,146,250 |
| |
|
| Paper & Forest Products 0.4% | | | | | | | | |
| Bowater, Inc., 6.50%, 06/15/2013 (p) | | | | 500,000 | | | | 446,250 |
| Verso Paper Holdings, LLC, 11.375%, 08/01/2016 144A (p) | | | | 1,000,000 | | | | 1,020,000 |
| |
|
| | | | | | | | | 1,466,250 |
| |
|
| TELECOMMUNICATION SERVICES 2.5% | | | | | | | | |
| Diversified Telecommunication Services 0.7% | | | | | | | | |
| Level 3 Communications, Inc., 6.375%, 10/15/2015 | | | | 1,000,000 | | | | 990,000 |
| Qwest Communications International, Inc., 7.875%, 09/01/2011 | | | | 1,200,000 | | | | 1,276,500 |
| |
|
| | | | | | | | | 2,266,500 |
| |
|
| Wireless Telecommunication Services 1.8% | | | | | | | | |
| Centennial Communications Corp.: | | | | | | | | |
| 8.125%, 02/01/2014 (p) | | | | 959,000 | | | | 964,994 |
| 10.00%, 01/01/2013 (p) | | | | 1,175,000 | | | | 1,224,937 |
| Dobson Communications Corp., 8.875%, 10/01/2013 (p) | | | | 1,175,000 | | | | 1,180,875 |
See Notes to Financial Statements
18
SCHEDULE OF INVESTMENTS continued
October 31, 2006 (unaudited)
| | | | | | | | | Principal | | | | |
| | | | | | | | | Amount | | | | Value |
|
| |
| CORPORATE BONDS continued | | | | | | | | | | |
| TELECOMMUNICATION SERVICES continued | | | | | | | | | | |
| Wireless Telecommunication Services continued | | | | | | | | | | |
| Horizon PCS, Inc., 11.375%, 07/15/2012 | | | | $ | | 550,000 | | $ | | 620,125 |
| Metropcs Wireless, Inc., 9.25%, 11/01/2014 144A # | | | | | | 500,000 | | | | 506,875 |
| Rural Cellular Corp.: | | | | | | | | | | | | |
| 8.25%, 03/15/2012 | | | | | | | | 450,000 | | | | 465,188 |
| 9.75%, 01/15/2010 (p) | | | | | | | | 850,000 | | | | 864,875 |
| |
|
| | | | | | | | | | | | | 5,827,869 |
| |
|
| UTILITIES 3.2% | | | | | | | | | | | | |
| Electric Utilities 1.3% | | | | | | | | | | | | |
| Mirant North America, LLC, 7.375%, 12/31/2013 | | | | | | 750,000 | | | | 762,188 |
| NRG Energy, Inc., 7.375%, 02/01/2016 | | | | | | 1,750,000 | | | | 1,774,062 |
| Reliant Energy, Inc., 6.75%, 12/15/2014 | | | | | | 1,575,000 | | | | 1,510,031 |
| |
|
| | | | | | | | | | | | | 4,046,281 |
| |
|
| Gas Utilities 0.4% | | | | | | | | | | | | |
| SEMCO Energy, Inc., 7.75%, 05/15/2013 | | | | | | 1,350,000 | | | | 1,359,557 |
| |
|
| Independent Power Producers & Energy Traders 1.5% | | | | | | | | |
| AES Corp., 7.75%, 03/01/2014 (p) | | | | | | 1,500,000 | | | | 1,578,750 |
| Dynegy, Inc., 8.375%, 05/01/2016 (p) | | | | | | 1,850,000 | | | | 1,910,125 |
| Orion Power Holdings, Inc., 12.00%, 05/01/2010 | | | | | | 800,000 | | | | 912,000 |
| Tenaska, Inc., 7.00%, 06/30/2021 144A | | | | | | 339,212 | | | | 337,459 |
| |
|
| | | | | | | | | | | | | 4,738,334 |
| |
|
| Total Corporate Bonds (cost $102,131,332) | | | | | | | | | | 103,089,606 |
| |
|
| FOREIGN BONDS - CORPORATE (PRINCIPAL AMOUNT | | | | | | |
| DENOMINATED IN CURRENCY INDICATED) 13.1% | | | | | | | | | | |
| CONSUMER DISCRETIONARY 0.2% | | | | | | | | | | |
| Household Durables 0.1% | | | | | | | | | | | | |
| Taylor Woodrow plc, 6.625%, 02/07/2012 GBP | | | | | | 100,000 | | | | 197,105 |
| |
|
| Media 0.1% | | | | | | | | | | | | |
| Central European Media Enterprise, Ltd., 8.25%, 05/15/2012 EUR | | | | 400,000 | | | | 561,506 |
| |
|
| CONSUMER STAPLES 1.0% | | | | | | | | | | | | |
| Food & Staples Retailing 0.4% | | | | | | | | | | |
| Tesco plc, 3.875%, 03/24/2011 EUR | | | | | | 1,020,000 | | | | 1,293,668 |
| |
|
| Tobacco 0.6% | | | | | | | | | | | | |
| British American Tobacco plc, 5.75%, 12/09/2013 GBP | | | | | | 1,000,000 | | | | 1,928,720 |
| |
|
| ENERGY 0.4% | | | | | | | | | | | | |
| Oil, Gas & Consumable Fuels 0.4% | | | | | | | | | | |
| Transco plc, 7.00%, 12/15/2008 AUD | | | | | | 1,500,000 | | | | 1,168,861 |
| |
|
| FINANCIALS 10.2% | | | | | | | | | | | | |
| Capital Markets 0.9% | | | | | | | | | | | | |
| Goldman Sachs Group, Inc., 5.25%, 12/15/2015 GBP | | | | | | 1,000,000 | | | | 1,898,096 |
| Morgan Stanley, 5.33%, 11/14/2013 GBP | | | | | | 460,000 | | | | 882,950 |
| |
|
| | | | | | | | | | | | | 2,781,046 |
| |
|
| See Notes to Financial Statements | | | | | | | | | | |
19
SCHEDULE OF INVESTMENTS continued
October 31, 2006 (unaudited)
| | | | | Principal | | | | |
| | | | | Amount | | | | Value |
|
| |
| FOREIGN BONDS - CORPORATE (PRINCIPAL AMOUNT DENOMINATED | | | | | | |
| IN CURRENCY INDICATED) continued | | | | | | |
| FINANCIALS continued | | | | | | |
| Commercial Banks 4.2% | | | | | | |
| Australia & New Zealand Banking Group, Ltd.: | | | | | | |
| 4.875%, 12/22/2008 GBP | | 450,000 | | $ | | 850,023 |
| 6.00%, 03/01/2010 AUD | | 2,500,000 | | | | 1,904,357 |
| Eurofima, 5.50%, 09/15/2009 AUD | | 55,000 | | | | 41,728 |
| European Investment Bank: | | | | | | |
| 4.00%, 04/15/2009 SEK | | 5,000,000 | | | | 698,138 |
| 4.50%, 01/14/2013 GBP | | 589,000 | | | | 1,094,556 |
| 5.75%, 09/15/2009 AUD | | 100,000 | | | | 76,465 |
| 6.75%, 11/17/2008 NZD | | 5,057,000 | | | | 3,359,332 |
| Kommunalbanken AS, 6.00%, 02/02/2007 NZD | | 550,000 | | | | 367,003 |
| Kreditanstalt für Wiederaufbau: | | | | | | |
| 3.00%, 11/15/2007 EUR | | 1,900,000 | | | | 2,406,621 |
| 4.95%, 10/14/2014 CAD | | 940,000 | | | | 874,217 |
| National Australia Bank, Ltd., 5.50%, 01/15/2010 AUD | | 1,500,000 | | | | 1,126,778 |
| NV Bank Nerderlandse Gemeenten, 5.00%, 07/16/2010 AUD | | 880,000 | | | | 652,688 |
| |
|
| | | | | | | | | 13,451,906 |
| |
|
| Consumer Finance 1.1% | | | | | | |
| General Electric Capital Corp., 5.25%, 12/10/2013 GBP | | 570,000 | | | | 1,089,035 |
| KfW International Finance, Inc., 6.25%, 12/17/2007 NZD | | 3,900,000 | | | | 2,581,588 |
| |
|
| | | | | | | | | 3,670,623 |
| |
|
| Diversified Financial Services 0.3% | | | | | | |
| Citigroup, Inc., 6.00%, 02/23/2009 AUD | | 1,354,000 | | | | 1,037,595 |
| |
|
| Thrifts & Mortgage Finance 3.7% | | | | | | |
| Nykredit, 5.00%, 10/01/2035 DKK | | 31,342,282 | | | | 5,360,728 |
| Realkredit Danmark, 4.00%, 10/01/2035 DKK | | 22,910,000 | | | | 3,657,645 |
| Totalkredit, FRN, 3.71%, 01/01/2015 DKK | | 17,151,381 | | | | 2,968,486 |
| |
|
| | | | | | | | | 11,986,859 |
| |
|
| INDUSTRIALS 0.1% | | | | | | |
| Machinery 0.1% | | | | | | |
| Savcio Holdings, 8.00%, 02/15/2013 EUR | | 150,000 | | | | 198,601 |
| |
|
| TELECOMMUNICATION SERVICES 0.6% | | | | | | |
| Diversified Telecommunication Services 0.6% | | | | | | |
| France Telecom, 7.50%, 03/14/2011 GBP | | 900,000 | | | | 1,851,873 |
| |
|
| UTILITIES 0.6% | | | | | | |
| Water Utilities 0.6% | | | | | | |
| GIE SUEZ Alliance, 4.25%, 06/24/2010 EUR | | 1,520,000 | | | | 1,956,430 |
| |
|
| Total Foreign Bonds - Corporate (Principal Amount Denominated in | | | | | | |
| Currency Indicated) (cost $41,206,706) | | | | | | 42,084,793 |
| |
|
See Notes to Financial Statements
20
SCHEDULE OF INVESTMENTS continued
October 31, 2006 (unaudited)
| | | | | Principal | | | | |
| | | | | Amount | | | | Value |
|
| |
| FOREIGN BONDS - GOVERNMENT (PRINCIPAL AMOUNT DENOMINATED | | | | | | | | |
| IN CURRENCY INDICATED) 21.3% | | | | | | | | |
| Australia, 6.00%, 02/15/2017 AUD | | | | 7,800,000 | | $ | | 6,198,674 |
| Brazil, 9.50%, 10/05/2007 EUR | | | | 120,000 | | | | 160,519 |
| Canada: | | | | | | | | |
| 4.25%, 12/01/2026 CAD | | | | 4,600,736 | | | | 5,853,136 |
| 4.60%, 09/15/2011 CAD | | | | 1,550,000 | | | | 1,413,426 |
| 4.75%, 07/27/2011 CAD | | | | 960,000 | | | | 873,480 |
| 5.00%, 06/01/2014 CAD | | | | 5,785,000 | | | | 5,487,662 |
| 5.25%, 11/30/2011 CAD | | | | 1,100,000 | | | | 1,024,087 |
| China, 4.25%, 10/28/2014 EUR | | | | 240,000 | | | | 309,385 |
| Hong Kong, 4.23%, 03/21/2011 HKD | | | | 27,650,000 | | | | 3,618,921 |
| Korea: | | | | | | | | |
| 4.75%, 06/10/2009 KRW | | | | 2,314,000,000 | | | | 2,459,154 |
| 5.25%, 09/10/2015 KRW | | | | 1,100,000,000 | | | | 1,197,454 |
| Mexico: | | | | | | | | |
| 5.50%, 02/17/2020 EUR | | | | 1,120,000 | | | | 1,522,263 |
| 10.00%, 12/05/2024 MXN | | | | 33,550,000 | | | | 3,663,651 |
| Norway: | | | | | | | | |
| 4.25%, 05/19/2017 NOK | | | | 3,510,000 | | | | 538,968 |
| 5.00%, 05/15/2015 NOK | | | | 31,900,000 | | | | 5,161,765 |
| Philippines, 6.25%, 03/15/2016 EUR | | | | 850,000 | | | | 1,134,083 |
| Poland, 4.25%, 05/24/2011 PLN | | | | 10,970,000 | | | | 3,503,567 |
| Romania, 8.50%, 05/08/2012 EUR | | | | 115,000 | | | | 177,444 |
| Singapore, 3.625%, 07/01/2014 SGD | | | | 5,400,000 | | | | 3,573,566 |
| South Africa, 5.25%, 05/16/2013 EUR | | | | 235,000 | | | | 312,506 |
| Sweden: | | | | | | | | |
| 3.00%, 07/12/2016 SEK | | | | 48,240,000 | | | | 6,323,444 |
| 5.50%, 10/08/2012 SEK | | | | 34,250,000 | | | | 5,201,462 |
| Turkey, 5.50%, 09/21/2009 EUR | | | | 645,000 | | | | 844,723 |
| United Kingdom: | | | | | | | | |
| 1.25%, 11/22/2017 GBP | | | | 2,516,494 | | | | 4,741,030 |
| 5.00%, 03/07/2012 GBP | | | | 850,000 | | | | 1,642,583 |
| FRN, 5.52%, 08/16/2013 GBP | | | | 300,000 | | | | 1,331,772 |
| Venezuela, 7.00%, 03/16/2015 EUR | | | | 190,000 | | | | 260,169 |
| |
|
| Total Foreign Bonds - Government (Principal Amount Denominated in | | | | | | | | |
| Currency Indicated) (cost $66,975,649) | | | | | | | | 68,528,894 |
| |
|
| U.S. TREASURY OBLIGATIONS 3.0% | | | | | | | | |
| U.S. Treasury Bonds: | | | | | | | | |
| 4.50%, 02/15/2036 (p) | | $ | | 1,030,000 | | | | 994,433 |
| 6.25%, 08/15/2023 (p) | | | | 4,615,000 | | | | 5,372,151 |
| U.S. Treasury Notes, 2.00%, 01/15/2016 ## | | | | 3,491,562 | | | | 3,393,089 |
| |
|
| Total U.S. Treasury Obligations (cost $9,791,088) | | | | | | | | 9,759,673 |
| |
|
See Notes to Financial Statements
21
SCHEDULE OF INVESTMENTS continued
October 31, 2006 (unaudited)
| | | | | Principal | | | | |
| | | | | Amount | | | | Value |
|
| |
| WHOLE LOAN MORTGAGE-BACKED COLLATERALIZED MORTGAGE | | | | | | | | |
| OBLIGATIONS 1.8% | | | | | | | | |
| FIXED-RATE 1.4% | | | | | | | | |
| Countrywide Home Loans, Inc., Ser. 2006-J1, Class 1A5, 5.75%, 02/25/2036 | | $ | | 1,400,000 | | $ | | 1,380,092 |
| Credit Suisse First Boston Mtge. Securities Corp., Ser. 2002-26, Class 4A1, | | | | | | | | |
| 7.00%, 10/25/2017 | | | | 389,704 | | | | 396,621 |
| Structured Asset Securities Corp.: | | | | | | | | |
| Ser. 2004-20, Class 5A-1, 6.25%, 11/25/2034 | | | | 1,787,534 | | | | 1,795,355 |
| Ser. 2005-RM1, Class A, IO, 5.00%, 03/25/2045 144A | | | | 4,361,520 | | | | 959,111 |
| |
|
| | | | | | | | | 4,531,179 |
| |
|
| FLOATING-RATE 0.4% | | | | | | | | |
| MASTR Adjustable Rate Mtge. Trust, Ser. 2005-1, Class 7A3, 4.87%, | | | | | | | | |
| 02/25/2035 | | | | 1,133,421 | | | | 1,125,884 |
| |
|
| Total Whole Loan Mortgage-Backed Collateralized Mortgage Obligations | | | | | | |
| (cost $5,673,476) | | | | | | | | 5,657,063 |
| |
|
| WHOLE LOAN MORTGAGE-BACKED PASS THROUGH SECURITIES 0.2% | | | | | | |
| FLOATING-RATE 0.2% | | | | | | | | |
| Bear Stearns Adjustable Rate Mtge. Trust, Ser. 2004-10, Class 12A3, 4.66%, | | | | | | | | |
| 01/25/2035 (cost $620,469) | | | | 620,760 | | | | 613,883 |
| |
|
| WHOLE LOAN SUBORDINATE COLLATERALIZED MORTGAGE | | | | | | | | |
| OBLIGATIONS 0.7% | | | | | | | | |
| FIXED-RATE 0.4% | | | | | | | | |
| MASTR Resecuritization Trust: | | | | | | | | |
| Ser. 2004-3, 5.00%, 03/25/2034 | | | | 595,602 | | | | 574,023 |
| Ser. 2005-2, 4.75%, 03/28/2034 | | | | 640,453 | | | | 623,090 |
| |
|
| | | | | | | | | 1,197,113 |
| |
|
| FLOATING-RATE 0.3% | | | | | | | | |
| Harborview Mtge. Loan Trust, Ser. 2005-8, Class 2B3, 7.01%, 02/19/2035 | | | | 1,003,122 | | | | 1,007,074 |
| |
|
| Total Whole Loan Subordinate Collateralized Mortgage Obligations | | | | | | | | |
| (cost $2,226,453) | | | | | | | | 2,204,187 |
| |
|
| YANKEE OBLIGATIONS - CORPORATE 4.1% | | | | | | | | |
| CONSUMER DISCRETIONARY 0.7% | | | | | | | | |
| Media 0.7% | | | | | | | | |
| IMAX Corp., 9.625%, 12/01/2010 (p) | | | | 1,270,000 | | | | 1,187,450 |
| National Cable plc, 9.125%, 08/15/2016 | | | | 1,000,000 | | | | 1,056,250 |
| |
|
| | | | | | | | | 2,243,700 |
| |
|
| CONSUMER STAPLES 0.1% | | | | | | | | |
| Beverages 0.1% | | | | | | | | |
| Companhia Brasileira de Bebidas, 8.75%, 09/15/2013 | | | | 430,000 | | | | 503,100 |
| |
|
| ENERGY 0.1% | | | | | | | | |
| Oil, Gas & Consumable Fuels 0.1% | | | | | | | | |
| GAZPROM OAO, 9.625%, 03/01/2013 | | | | 160,000 | | | | 190,496 |
| |
|
See Notes to Financial Statements
22
SCHEDULE OF INVESTMENTS continued
October 31, 2006 (unaudited)
| | | | | | | Principal | | | | |
| | | | | | | Amount | | | | Value |
|
| |
| YANKEE OBLIGATIONS - CORPORATE continued | | | | | | | | |
| FINANCIALS 1.0% | | | | | | | | | | |
| Commercial Banks 0.2% | | | | | | | | | | |
| Kazkommerts International BV, 7.00%, 11/03/2009 | | $ | | 350,000 | | $ | | 352,800 |
| Kuznetski Capital, 7.34%, 05/13/2013 | | | | | | 200,000 | | | | 205,560 |
| |
|
| | | | | | | | | | | 558,360 |
| |
|
| Diversified Financial Services 0.8% | | | | | | | | | | |
| Preferred Term Securities, Ltd., FRN: | | | | | | | | | | |
| 5.99%, 06/24/2034 144A | | | | | | 875,000 | | | | 879,629 |
| 6.96%, 06/24/2034 144A | | | | | | 220,000 | | | | 224,556 |
| 7.47%, 04/03/2032 144A | | | | | | 655,000 | | | | 658,773 |
| Ship Finance International, Ltd., 8.50%, 12/15/2013 | | | | 865,000 | | | | 847,700 |
| |
|
| | | | | | | | | | | 2,610,658 |
| |
|
| MATERIALS 0.7% | | | | | | | | | | |
| Chemicals 0.2% | | | | | | | | | | |
| Ineos Group Holdings plc, 8.50%, 02/15/2016 144A (p) | | | | 750,000 | | | | 725,625 |
| |
|
| Metals & Mining 0.3% | | | | | | | | | | |
| Novelis, Inc., FRN, 8.25%, 02/15/2015 144A | | | | | | 1,065,000 | | | | 1,022,400 |
| |
|
| Paper & Forest Products 0.2% | | | | | | | | | | |
| Abitibi-Consolidated, Inc., 8.375%, 04/01/2015 (p) | | | | 650,000 | | | | 569,562 |
| |
|
| TELECOMMUNICATION SERVICES 1.0% | | | | | | | | |
| Diversified Telecommunication Services 0.3% | | | | | | | | |
| Nordic Telecom Holdings Co., 8.875%, 05/01/2016 144A | | | | 1,000,000 | | | | 1,052,500 |
| |
|
| Wireless Telecommunication Services 0.7% | | | | | | | | |
| Intelsat, Ltd.: | | | | | | | | | | |
| 9.25%, 06/15/2016 144A | | | | | | 500,000 | | | | 536,250 |
| 11.25%, 06/15/2016 144A | | | | | | 375,000 | | | | 410,156 |
| Rogers Wireless, Inc.: | | | | | | | | | | |
| 6.375%, 03/01/2014 (p) | | | | | | 465,000 | | | | 467,325 |
| 9.625%, 05/01/2011 | | | | | | 745,000 | | | | 847,438 |
| |
|
| | | | | | | | | | | 2,261,169 |
| |
|
| UTILITIES 0.5% | | | | | | | | | | |
| Electric Utilities 0.1% | | | | | | | | | | |
| Enersis SA, 7.375%, 01/15/2014 | | | | | | 475,000 | | | | 511,007 |
| |
|
| Gas Utilities 0.2% | | | | | | | | | | |
| Gazprom, 9.625%, 03/01/2013 144A | | | | | | 430,000 | | | | 511,700 |
| |
|
| Multi-Utilities 0.2% | | | | | | | | | | |
| National Power Corp., 9.65%, 08/23/2011 | | | | | | 500,000 | | | | 562,983 |
| |
|
| Total Yankee Obligations - Corporate (cost $13,011,256) | | | | | | | | 13,323,260 |
| |
|
See Notes to Financial Statements
23
SCHEDULE OF INVESTMENTS continued
October 31, 2006 (unaudited)
| | | | | Principal | | | | |
| | | | | Amount | | | | Value |
|
| |
| YANKEE OBLIGATIONS - GOVERNMENT 5.1% | | | | | | | | |
| Argentina, 12.25%, 06/19/2018 · | | $ | | 615,525 | | $ | | 187,735 |
| Brazil: | | | | | | | | |
| 7.125%, 01/20/2037 | | | | 1,200,000 | | | | 1,246,200 |
| 8.25%, 01/20/2034 | | | | 2,385,000 | | | | 2,794,027 |
| Colombia: | | | | | | | | |
| 7.375%, 01/27/2017 | | | | 290,000 | | | | 308,415 |
| 8.125%, 05/21/2024 | | | | 470,000 | | | | 531,335 |
| Ecuador, 9.375%, 12/15/2015 144A | | | | 210,000 | | | | 226,695 |
| Egypt, 8.75%, 07/11/2011 | | | | 440,000 | | | | 496,078 |
| Jamaica, 11.75%, 05/15/2011 | | | | 145,000 | | | | 181,613 |
| Mexico: | | | | | | | | |
| 6.375%, 01/16/2013 | | | | 1,150,000 | | | | 1,211,525 |
| 8.375%, 01/14/2011 | | | | 830,000 | | | | 930,845 |
| Panama, 9.625%, 02/08/2011 | | | | 450,000 | | | | 516,375 |
| Peru: | | | | | | | | |
| 8.75%, 11/21/2033 | | | | 520,000 | | | | 661,700 |
| 9.125%, 01/15/2008 | | | | 425,000 | | | | 446,250 |
| Philippines, 8.00%, 01/15/2016 | | | | 918,000 | | | | 1,024,718 |
| Russia: | | | | | | | | |
| 11.00%, 07/24/2018 | | | | 750,000 | | | | 1,084,578 |
| Sr. Disc. Note, Step Bond, 5.00%, 03/31/2030 † | | | | 1,050,000 | | | | 1,177,995 |
| Turkey, 9.00%, 06/30/2011 | | | | 280,000 | | | | 309,400 |
| Ukraine, 7.65%, 06/11/2013 | | | | 450,000 | | | | 482,985 |
| Uruguay, 7.50%, 03/15/2015 | | | | 410,000 | | | | 439,725 |
| Venezuela: | | | | | | | | |
| 8.50%, 10/08/2014 | | | | 900,000 | | | | 1,002,150 |
| 10.75%, 09/19/2013 | | | | 800,000 | | | | 984,000 |
| |
|
| Total Yankee Obligations - Government (cost $15,583,122) | | | | | | | | 16,244,344 |
| | |
|
|
| | | | | Shares | | | | Value |
|
| |
| COMMON STOCKS 0.1% | | | | | | | | |
| MATERIALS 0.1% | | | | | | | | |
| Chemicals 0.1% | | | | | | | | |
| Huntsman Corp. * (cost $137,985) | | | | 19,570 | | | | 337,974 |
| | |
|
|
| | | | | Principal | | | | |
| | | | | Amount | | | | Value |
|
| |
| SHORT-TERM INVESTMENTS 14.2% | | | | | | | | |
| COMMERCIAL PAPER 4.2% | | | | | | | | |
| Giro Balanced Funding Corp., 5.35%, 11/13/2006 ## | | $ | | 3,350,000 | | | | 3,344,115 |
| Park Granada, LLC, 5.34%, 11/13/2006 ## | | | | 3,350,000 | | | | 3,344,126 |
| Sheffield Receivables Corp., 5.33%, 11/13/2006 ## | | | | 3,350,000 | | | | 3,344,132 |
| Stratford Receivables Co., LLC, 5.36%, 11/13/2006 ## | | | | 3,350,000 | | | | 3,344,104 |
| |
|
| | | | | | | | | 13,376,477 |
| |
|
See Notes to Financial Statements
24
SCHEDULE OF INVESTMENTS continued
October 31, 2006 (unaudited)
| | | | | Shares | | | | Value |
|
| SHORT-TERM INVESTMENTS continued | | | | | | | | |
| MUTUAL FUND SHARES 10.0% | | | | | | | | |
| Evergreen Institutional Money Market Fund ø | | | | 1,174,827 | | $ | | 1,174,827 |
| Navigator Prime Portfolio (p)(p) | | | | 31,163,770 | | | | 31,163,770 |
| |
|
| | | | | | | | | 32,338,597 |
| |
|
| Total Short-Term Investments (cost $45,715,074) | | | | | | 45,715,074 |
| |
|
| Total Investments (cost $376,665,541) 118.6% | | | | | | 381,207,547 |
| Other Assets and Liabilities (18.6%) | | | | | | | | (59,745,301) |
| |
|
| Net Assets 100.0% | | | | | | $ | | 321,462,246 |
| |
|
| ## | | All or a portion of this security has been segregated for when-issued or delayed delivery securities. |
| # | | When-issued or delayed delivery security |
| 144A | | Security that may be sold to qualified institutional buyers under Rule 144A of the Securities Act of 1933, as amended. |
| | | This security has been determined to be liquid under guidelines established by the Board of Trustees, unless otherwise |
| | | noted. |
| (p) | | All or a portion of this security is on loan. |
| † | | Security initially issued in zero coupon form which converts to coupon form at a specified rate and date. An effective |
| | | interest rate is applied to recognize interest income daily for the bond. This rate is based on total expected interest to |
| | | be earned over the life of the bond which consists of the aggregate coupon-interest payments and discount at |
| | | acquisition. The rate shown is the stated rate at the current period end. |
| * | | Non-income producing security |
| · | | Security which has defaulted on payment of interest and/or principal. The Fund has stopped accruing interest on this |
| | | security. |
| ø | | Evergreen Investment Management Company, LLC is the investment advisor to both the Fund and the money market |
| | | fund. |
| | | Zero coupon bond. Rate shown represents the yield to maturity at date of purchase |
| (p)(p) | | Represents investment of cash collateral received from securities on loan. |
| Summary of Abbreviations | | | | |
| AUD | | Australian Dollar | | IO | | Interest Only |
| CAD | | Canadian Dollar | | KRW | | Republic of Korea Won |
| CDO | | Collateralized Debt Obligation | | MASTR | | Mortgage Asset Securitization Transactions, Inc. |
| DKK | | Danish Krone | | MXN | | Mexican Peso |
| EUR | | Euro | | NOK | | Norwegian Krone |
| FHLMC | | Federal Home Loan Mortgage Corp. | | NZD | | New Zealand Dollar |
| FNMA | | Federal National Mortgage Association | | PLN | | Polish Zloty |
| FRN | | Floating Rate Note | | SEK | | Swedish Krona |
| GBP | | Great British Pound | | SGD | | Singapore Dollar |
| GNMA | | Government National Mortgage Association | | TBA | | To Be Announced |
| HKD | | Hong Kong Dollar | | TRAINS | | Targeted Return Index Securities Trust |
See Notes to Financial Statements
25
SCHEDULE OF INVESTMENTS continued
October 31, 2006 (unaudited)
The following table shows the percent of total investments (excluding equity positions, collateral from securities on loan and segregated cash and cash equivalents) by credit quality based on Moody’s and Standard & Poor’s ratings as of October 31, 2006:
| AAA | | 49.1% |
| AA | | 4.4% |
| A | | 7.9% |
| BBB | | 3.4% |
| BB | | 11.4% |
| B | | 19.3% |
| CCC | | 4.4% |
| Less than CCC | | 0.1% |
| |
|
| | | 100.0% |
| | |
|
The following table shows the percent of total investments (excluding equity positions, collateral from securities on loan and segregated cash and cash equivalents) based on effective maturity as of October 31, 2006:
| Less than 1 year | | 5.6% |
| 1 to 3 year(s) | | 7.3% |
| 3 to 5 years | | 17.9% |
| 5 to 10 years | | 51.1% |
| 10 to 20 years | | 8.9% |
| Greater than 30 years | | 9.2% |
| |
|
| | | 100.0% |
| | |
|
See Notes to Financial Statements
26
STATEMENT OF ASSETS AND LIABILITIES
October 31, 2006 (unaudited)
| Assets | | | | |
| Investments in securities, at value (cost $375,490,714) including $30,638,874 of securities loaned | | $ | | 380,032,720 |
| Investments in affiliated money market fund, at value (cost $1,174,827) | | | | 1,174,827 |
|
| Total investments | | | | 381,207,547 |
| Cash | | | | 669,892 |
| Foreign currency, at value (cost $609,386) | | | | 600,191 |
| Receivable for securities sold | | | | 526,200 |
| Receivable for Fund shares sold | | | | 154,432 |
| Receivable for closed forward foreign currency exchange contracts | | | | 58,750 |
| Interest receivable | | | | 5,231,536 |
| Unrealized gains on forward foreign currency exchange contracts | | | | 798 |
| Receivable for securities lending income | | | | 9,153 |
| Prepaid expenses and other assets | | | | 50,703 |
|
| Total assets | | | | 388,509,202 |
|
| Liabilities | | | | |
| Dividends payable | | | | 461,740 |
| Payable for securities purchased | | | | 33,395,816 |
| Payable for Fund shares redeemed | | | | 1,058,690 |
| Payable for closed forward foreign currency exchange contracts | | | | 217,828 |
| Unrealized losses on forward foreign currency exchange contracts | | | | 679,009 |
| Payable for securities on loan | | | | 31,163,770 |
| Advisory fee payable | | | | 2,516 |
| Due to other related parties | | | | 1,243 |
| Accrued expenses and other liabilities | | | | 66,344 |
|
| Total liabilities | | | | 61,046,956 |
|
| Net assets | | $ | | 321,462,246 |
|
| Net assets represented by | | | | |
| Paid-in capital | | $ | | 371,879,945 |
| Undistributed net investment income | | | | 1,578,126 |
| Accumulated net realized losses on investments | | | | (55,879,581) |
| Net unrealized gains on investments | | | | 3,883,756 |
|
| Total net assets | | $ | | 321,462,246 |
|
| Net assets consists of | | | | |
| Class A | | $ | | 181,360,329 |
| Class B | | | | 61,657,004 |
| Class C | | | | 59,149,836 |
| Class I | | | | 19,295,077 |
|
| Total net assets | | $ | | 321,462,246 |
|
| Shares outstanding (unlimited number of shares authorized) | | | | |
| Class A | | | | 28,796,189 |
| Class B | | | | 9,758,934 |
| Class C | | | | 9,378,345 |
| Class I | | | | 3,113,412 |
|
| Net asset value per share | | | | |
| Class A | | $ | | 6.30 |
| Class A — Offering price (based on sales charge of 4.75%) | | $ | | 6.61 |
| Class B | | $ | | 6.32 |
| Class C | | $ | | 6.31 |
| Class I | | $ | | 6.20 |
|
See Notes to Financial Statements
27
STATEMENT OF OPERATIONS
Six Months Ended October 31, 2006 (unaudited)
| Investment income | | | | |
| Interest (net of foreign withholding taxes of $12,126) | | $ | | 10,449,514 |
| Income from affiliate | | | | 321,300 |
| Securities lending | | | | 57,802 |
|
| Total investment income | | | | 10,828,616 |
|
| Expenses | | | | |
| Advisory fee | | | | 757,886 |
| Distribution Plan expenses | | | | |
| Class A | | | | 287,875 |
| Class B | | | | 330,348 |
| Class C | | | | 311,892 |
| Administrative services fee | | | | 169,558 |
| Transfer agent fees | | | | 386,591 |
| Trustees’ fees and expenses | | | | 7,172 |
| Printing and postage expenses | | | | 28,524 |
| Custodian and accounting fees | | | | 99,535 |
| Registration and filing fees | | | | 35,506 |
| Professional fees | | | | 15,598 |
| Other | | | | 17,615 |
|
| Total expenses | | | | 2,448,100 |
| Less: Expense reductions | | | | (14,481) |
| Expense reimbursements | | | | (26,907) |
|
| Net expenses | | | | 2,406,712 |
|
| Net investment income | | | | 8,421,904 |
|
| Net realized and unrealized gains or losses on investments | | | | |
| Net realized losses on: | | | | |
| Securities | | | | (970,027) |
| Foreign currency related transactions | | | | (3,649,966) |
|
| Net realized losses on investments | | | | (4,619,993) |
| Net change in unrealized gains or losses on investments | | | | 3,043,691 |
|
| Net realized and unrealized gains or losses on investments | | | | (1,576,302) |
|
| Net increase in net assets resulting from operations | | $ | | 6,845,602 |
|
See Notes to Financial Statements
28
STATEMENTS OF CHANGES IN NET ASSETS
| | | Six Months Ended | | | | |
| | | October 31, 2006 | | Year Ended |
| | | (unaudited) | | April 30, 2006 |
|
| Operations | | | | | | | | |
| Net investment income | | $ | | 8,421,904 | | $ | | 16,841,934 |
| Net realized losses on investments | | | | (4,619,993) | | | | (2,684,856) |
| Net change in unrealized gains or losses | | | | | | | | |
| on investments | | | | 3,043,691 | | | | (9,450,598) |
|
| Net increase in net assets resulting from | | | | | | | | |
| operations | | | | 6,845,602 | | | | 4,706,480 |
|
| Distributions to shareholders from | | | | | | | | |
| Net investment income | | | | | | | | |
| Class A | | | | (4,967,952) | | | | (10,259,354) |
| Class B | | | | (1,474,801) | | | | (3,600,563) |
| Class C | | | | (1,393,431) | | | | (3,058,183) |
| Class I | | | | (547,916) | | | | (1,005,662) |
|
| Total distributions to shareholders | | | | (8,384,100) | | | | (17,923,762) |
|
| | | Shares | | | | Shares | | |
| Capital share transactions | | | | | | | | |
| Proceeds from shares sold | | | | | | | | |
| Class A | | 1,368,719 | | 8,552,194 | | 5,909,652 | | 38,042,740 |
| Class B | | 387,805 | | 2,450,436 | | 1,455,763 | | 9,426,705 |
| Class C | | 523,775 | | 3,278,654 | | 1,747,244 | | 11,243,339 |
| Class I | | 219,365 | | 1,351,710 | | 1,006,362 | | 6,306,547 |
|
| | | | | 15,632,994 | | | | 65,019,331 |
|
| Net asset value of shares issued in | | | | | | | | |
| reinvestment of distributions | | | | | | | | |
| Class A | | 573,977 | | 3,592,657 | | 1,157,135 | | 7,418,556 |
| Class B | | 128,389 | | 806,210 | | 316,069 | | 2,034,399 |
| Class C | | 120,505 | | 755,509 | | 254,695 | | 1,636,184 |
| Class I | | 41,488 | | 255,542 | | 70,747 | | 446,231 |
|
| | | | | 5,409,918 | | | | 11,535,370 |
|
| Automatic conversion of Class B shares | | | | | | | | |
| to Class A shares | | | | | | | | |
| Class A | | 596,029 | | 3,737,200 | | 1,206,997 | | 7,694,908 |
| Class B | | (594,133) | | (3,737,200) | | (1,203,221) | | (7,694,908) |
|
| | | | | 0 | | | | 0 |
|
| Payment for shares redeemed | | | | | | | | |
| Class A | | (5,305,667) | | (33,177,267) | | (9,585,798) | | (61,312,812) |
| Class B | | (1,497,779) | | (9,394,958) | | (4,319,432) | | (27,783,628) |
| Class C | | (1,584,711) | | (9,917,246) | | (3,838,291) | | (24,601,769) |
| Class I | | (431,026) | | (2,659,075) | | (780,011) | | (4,915,699) |
|
| | | | | (55,148,546) | | | | (118,613,908) |
|
| Net decrease in net assets resulting | | | | | | | | |
| from capital share transactions | | | | (34,105,634) | | | | (42,059,207) |
|
| Total decrease in net assets | | | | (35,644,132) | | | | (55,276,489) |
| Net assets | | | | | | | | |
| Beginning of period | | | | 357,106,378 | | | | 412,382,867 |
|
| End of period | | $ 321,462,246 | | $ 357,106,378 |
|
| Undistributed net investment income | | $ 1,578,126 | | $ 2,095,367 |
|
See Notes to Financial Statements
29
NOTES TO FINANCIAL STATEMENTS (unaudited)
1. ORGANIZATION
Evergreen Strategic Income Fund (the “Fund”) is a diversified series of Evergreen Fixed Income Trust (the “Trust”), a Delaware statutory trust organized on September 18, 1997. The Trust is an open-end management investment company registered under the Investment Company Act of 1940, as amended (the “1940 Act”).
The Fund offers Class A, Class B, Class C and Class I shares. Class A shares are sold with a front-end sales charge. However, Class A share investments of $1 million or more are not subject to a front-end sales charge but will be subject to a contingent deferred sales charge of 1.00% upon redemption within one year. Class B shares are sold without a front-end sales charge but are subject to a contingent deferred sales charge that is payable upon redemption and decreases depending on how long the shares have been held. Class C shares are sold without a front-end sales charge but are subject to a contingent deferred sales charge that is payable upon redemption within one year. Class I shares are sold without a front-end sales charge or contingent deferred sales charge. Each class of shares, except Class I shares, pays an ongoing distribution fee.
2. SIGNIFICANT ACCOUNTING POLICIES
The following is a summary of significant accounting policies consistently followed by the Fund in the preparation of its financial statements. The policies are in conformity with generally accepted accounting principles in the United States of America, which require management to make estimates and assumptions that affect amounts reported herein. Actual results could differ from these estimates.
a. Valuation of investments
Portfolio debt securities acquired with more than 60 days to maturity are fair valued using matrix pricing methods determined by an independent pricing service which takes into consideration such factors as similar security prices, yields, maturities, liquidity and ratings. Securities for which valuations are not readily available from an independent pricing service may be valued by brokers which use prices provided by market makers or estimates of market value obtained from yield data relating to investments or securities with similar characteristics.
Listed equity securities are usually valued at the last sales price or official closing price on the national securities exchange where the securities are principally traded.
Short-term securities with remaining maturities of 60 days or less at the time of purchase are valued at amortized cost, which approximates market value.
Investments in other mutual funds are valued at net asset value. Securities for which market quotations are not readily available or not reflective of current market value are valued at fair value as determined by the investment advisor in good faith, according to procedures approved by the Board of Trustees.
30
NOTES TO FINANCIAL STATEMENTS (unaudited) continued
b. Foreign currency translation
All assets and liabilities denominated in foreign currencies are translated into U.S. dollar amounts at the date of valuation. Purchases and sales of portfolio securities and income items denominated in foreign currencies are translated into U.S. dollar amounts on the respective dates of such transactions. The Fund does not separately account for that portion of the results of operations resulting from changes in foreign exchange rates on investments and the fluctuations arising from changes in market prices of securities held. Such fluctuations are included with the net realized and unrealized gains or losses on investments.
c. Forward foreign currency contracts
A forward foreign currency contract is an agreement between two parties to purchase or sell a specific currency for an agreed-upon price at a future date. The Fund enters into forward foreign currency contracts to facilitate transactions in foreign-denominated securities and to attempt to minimize the risk to the Fund from adverse changes in the relationship between currencies. Forward foreign currency contracts are recorded at the forward rate and marked-to-market daily. When the contracts are closed, realized gains and losses arising from such transactions are recorded as realized gains or losses on foreign currency related transactions. The Fund could be exposed to risks if the counterparties to the contracts are unable to meet the terms of their contracts or if the value of the foreign currency changes unfavorably.
d. When-issued and delayed delivery transactions
The Fund records when-issued or delayed delivery securities as of trade date and maintains security positions such that sufficient liquid assets will be available to make payment for the securities purchased. Securities purchased on a when-issued or delayed delivery basis are marked-to-market daily and begin earning interest on the settlement date. Losses may occur on these transactions due to changes in market conditions or the failure of counterparties to perform under the contract.
e. Securities lending
The Fund may lend its securities to certain qualified brokers in order to earn additional income. The Fund receives compensation in the form of fees or interest earned on the investment of any cash collateral received. The Fund also continues to receive interest and dividends on the securities loaned. The Fund receives collateral in the form of cash or securities with a market value at least equal to the market value of the securities on loan, including accrued interest. In the event of default or bankruptcy by the borrower, the Fund could experience delays and costs in recovering the loaned securities or in gaining access to the collateral. The Fund has the right under the lending agreement to recover the securities from the borrower on demand.
f. Dollar roll transactions
The Fund may enter into dollar roll transactions with respect to mortgage-backed securities. In a dollar roll transaction, the Fund sells mortgage-backed securities to financial institutions and simultaneously agrees to accept substantially similar (same type, coupon and maturity) securities at a later date at an agreed upon price. The Fund will use the proceeds generated from the transactions to invest in short-term investments, which may enhance the Fund’s current yield and total
31
NOTES TO FINANCIAL STATEMENTS (unaudited) continued
return. The Fund accounts for dollar roll transactions as purchases and sales. The Fund could be exposed to risks if the counterparty defaults on its obligation to perform under the terms of the agreement, if the Fund receives inferior securities in comparison to what was sold to the coun-terparty at redelivery or if there are variances in paydown speed between the mortgage-related pools.
g. Security transactions and investment income
Security transactions are recorded on trade date. Realized gains and losses are computed using the specific cost of the security sold. Interest income is recorded on the accrual basis and includes accretion of discounts and amortization of premiums. Foreign income and capital gains realized on some securities may be subject to foreign taxes, which are accrued as applicable.
h. Federal taxes
The Fund intends to continue to qualify as a regulated investment company and distribute all of its taxable income, including any net capital gains (which have already been offset by available capital loss carryovers). Accordingly, no provision for federal taxes is required.
i. Distributions
Distributions to shareholders from net investment income are accrued daily and paid monthly. Distributions from net realized gains, if any, are recorded on the ex-dividend date. Such distributions are determined in conformity with income tax regulations, which may differ from generally accepted accounting principles.
j. Class allocations
Income, common expenses and realized and unrealized gains and losses are allocated to the classes based on the relative net assets of each class. Distribution fees, if any, are calculated daily at the class level based on the appropriate net assets of each class and the specific expense rates applicable to each class.
3. ADVISORY FEE AND OTHER TRANSACTIONS WITH AFFILIATES
Evergreen Investment Management Company, LLC (“EIMC”), an indirect, wholly-owned subsidiary of Wachovia Corporation (“Wachovia”), is the investment advisor to the Fund and is paid a fee at an annual rate of 2% of the Fund’s gross investment income plus an amount determined by applying percentage rates to the aggregate average daily net assets of the Fund and its variable annuity counterpart, Evergreen VA Strategic Income Fund, starting at 0.31% and declining to 0.16% as the aggregate average daily net assets increase.
Tattersall Advisory Group, Inc., an indirect, wholly-owned subsidiary of Wachovia, is the investment sub-advisor to the fixed income portion of the Fund and is paid by EIMC for its services to the Fund.
First International Advisors, Inc. d/b/a Evergreen International Advisors (“FIA”), an indirect, wholly-owned subsidiary of Wachovia, is the investment sub-advisor to the Fund and is paid by EIMC for its services to the Fund.
32
NOTES TO FINANCIAL STATEMENTS (unaudited) continued
From time to time, EIMC may voluntarily or contractually waive its fee and/or reimburse expenses in order to limit operating expenses. During the six months ended October 31, 2006, EIMC reimbursed Distribution Plan expenses (see Note 4) relating to Class A shares in the amount of $26,907.
The Fund may invest in Evergreen-managed money market funds, which are also advised by EIMC. Income earned on these investments is included in income from affiliate on the Statement of Operations.
Evergreen Investment Services, Inc. (“EIS”), an indirect, wholly-owned subsidiary of Wachovia, is the administrator to the Fund. As administrator, EIS provides the Fund with facilities, equipment and personnel and is paid an annual rate determined by applying percentage rates to the aggregate average daily net assets of the Evergreen funds (excluding money market funds and Evergreen Institutional Enhanced Income Fund), starting at 0.10% and declining to 0.05% as the aggregate average daily net assets of the Evergreen funds (excluding money market funds and Evergreen Institutional Enhanced Income Fund) increase.
Evergreen Service Company, LLC (“ESC”), an indirect, wholly-owned subsidiary of Wachovia, is the transfer and dividend disbursing agent for the Fund. ESC receives account fees that vary based on the type of account held by the shareholders in the Fund. For the six months ended October 31, 2006, the transfer agent fees were equivalent to an annual rate of 0.23% of the Fund’s average daily net assets.
4. DISTRIBUTION PLANS
EIS also serves as distributor of the Fund’s shares. The Fund has adopted Distribution Plans, as allowed by Rule 12b-1 of the 1940 Act, for each class of shares, except Class I. Under the Distribution Plans, distribution fees are paid at an annual rate of 0.30% of the average daily net assets for Class A shares and 1.00% of the average daily net assets for each of Class B and Class C shares.
For the six months ended October 31, 2006, EIS received $5,578 from the sale of Class A shares and $93,757 and $1,497 in contingent deferred sales charges from redemptions of Class B and Class C shares, respectively.
5. SECURITIES TRANSACTIONS
Cost of purchases and proceeds from sales of investment securities (excluding short-term securities and mortgage dollar roll transactions) were as follows for the six months ended October 31, 2006:
| Cost of Purchases | | Proceeds from Sales |
|
| U.S. | | Non-U.S. | | U.S. | | Non-U.S. |
| Government | | Government | | Government | | Government |
|
| $82,013,602 | | $132,359,455 | | $88,936,073 | | $127,092,273 |
|
33
NOTES TO FINANCIAL STATEMENTS (unaudited) continued
During the six months ended October 31, 2006, the Fund loaned securities to certain brokers. At October 31, 2006, the value of securities on loan and the value of collateral amounted to $30,638,874 and $31,163,770, respectively.
At October 31, 2006, the Fund had forward foreign currency exchange contracts outstanding as follows:
Forward Foreign Currency Exchange Contracts to Buy:
| Exchange | | Contracts | | U.S. Value at | | In Exchange | | U.S. Value at | | Unrealized |
| Date | | to Receive | | October 31, 2006 | | for | | October 31, 2006 | | Gain (Loss) |
|
| 11/30/2006 | | 670,087,000 JPY | | $ 5,756,636 | | 41,489,400 SEK | | $ 5,756,380 | | $ | | 256 |
| 11/30/2006 | | 35,539,000 JPY | | 305,311 | | 2,196,640 SEK | | 304,769 | | | | 542 |
| 12/21/2006 | | 1,137,264,000 JPY | | 9,798,124 | | 57,328,998 DKK | | 9,840,076 | | | | (41,952) |
| 12/27/2006 | | 1,580,000,000 JPY | | 13,623,693 | | 7,220,019 GBP | | 13,776,438 | | (152,745) |
|
Forward Foreign Currency Exchange Contracts to Sell:
| Exchange | | Contracts | | U.S. Value at | | In Exchange | | Unrealized |
| Date | | to Deliver | | October 31, 2006 | | for U.S. $ | | Loss |
|
| 01/11/2007 | | 16,000,000 AUD | | $ 12,368,792 | | $ 11,884,480 | | $ 484,312 |
|
On October 31, 2006, the aggregate cost of securities for federal income tax purposes was $376,665,541. The gross unrealized appreciation and depreciation on securities based on tax cost was $7,315,830 and $2,773,824, respectively, with a net unrealized appreciation of $4,542,006.
As of April 30, 2006, the Fund had $48,358,708 in capital loss carryovers for federal income tax purposes with $6,306,504 expiring in 2008, $14,759,243 expiring in 2009 and $27,292,961 expiring in 2010.
For income tax purposes, capital losses incurred after October 31 within the Fund’s fiscal year are deemed to arise on the first business day of the following fiscal year. As of April 30, 2006, the Fund incurred and elected to defer post-October losses of $2,493,273.
6. INTERFUND LENDING
Pursuant to an Exemptive Order issued by the SEC, the Fund may participate in an interfund lending program with certain funds in the Evergreen fund family. This program allows the Fund to borrow from, or lend money to, other participating funds. During the six months ended October 31, 2006, the Fund did not participate in the interfund lending program.
7. EXPENSE REDUCTIONS
Through expense offset arrangements with ESC and the Fund’s custodian, a portion of fund expenses has been reduced.
8. DEFERRED TRUSTEES’ FEES
Each Trustee of the Fund may defer any or all compensation related to performance of their duties as Trustees. The Trustees’ deferred balances are allocated to deferral accounts, which are included
34
NOTES TO FINANCIAL STATEMENTS (unaudited) continued
in the accrued expenses for the Fund. The investment performance of the deferral accounts is based on the investment performance of certain Evergreen funds. Any gains earned or losses incurred in the deferral accounts are reported in the Fund’s Trustees’ fees and expenses. At the election of the Trustees, the deferral account will be paid either in one lump sum or in quarterly installments for up to ten years.
9. FINANCING AGREEMENT
The Fund and certain other Evergreen funds share in an unsecured revolving credit commitment for temporary and emergency purposes, including the funding of redemptions, as permitted by each participating fund’s borrowing restrictions. Borrowings under this facility bear interest at 0.50% per annum above the Federal Funds rate. All of the participating funds are charged an annual commitment fee on the unused balance, which is allocated pro rata. The credit facility is for $100 million with an annual commitment fee of 0.08% . Prior to July 3, 2006, the credit facility was for $150 million with an annual commitment fee of 0.09% . During the six months ended October 31, 2006, the Fund had no borrowings.
10. REGULATORY MATTERS AND LEGAL PROCEEDINGS
Since September 2003, governmental and self-regulatory authorities have instituted numerous ongoing investigations of various practices in the mutual fund industry, including investigations relating to revenue sharing, market-timing, late trading and record retention, among other things. The investigations cover investment advisors, distributors and transfer agents to mutual funds, as well as other firms. EIMC, EIS and ESC (collectively, “Evergreen”) have received subpoenas and other requests for documents and testimony relating to these investigations, are endeavoring to comply with those requests, and are cooperating with the investigations. Evergreen is continuing its own internal review of policies, practices, procedures and personnel, and is taking remedial action where appropriate.
In connection with one of these investigations, on July 28, 2004, the staff of the Securities and Exchange Commission (“SEC”) informed Evergreen that the staff intends to recommend to the SEC that it institute an enforcement action against Evergreen. The SEC staff’s proposed allegations relate to (i) an arrangement pursuant to which a broker at one of EIMC’s affiliated broker-dealers had been authorized, apparently by an EIMC officer (who is no longer with EIMC), to engage in short-term trading, on behalf of a client, in Evergreen Mid Cap Growth Fund (formerly Evergreen Emerging Growth Fund and prior to that, known as Evergreen Small Company Growth Fund) during the period from December 2000 through April 2003, in excess of the limitations set forth in the fund’s prospectus, (ii) short-term trading from September 2001 through January 2003, by a former Evergreen portfolio manager of Evergreen Precious Metals Fund, a fund he managed at the time, (iii) the sufficiency of systems for monitoring exchanges and enforcing exchange limitations as stated in the funds’ prospectuses, and (iv) the adequacy of e-mail retention practices. In connection with the activity in Evergreen Mid Cap Growth Fund, EIMC reimbursed the fund $378,905, plus an additional $25,242, representing what EIMC calculated at that time to be the client’s net gain and the fees earned by EIMC and the expenses
35
NOTES TO FINANCIAL STATEMENTS (unaudited) continued
incurred by this fund on the client’s account. In connection with the activity in Evergreen Precious Metals Fund, EIMC reimbursed the fund $70,878, plus an additional $3,075, representing what EIMC calculated at that time to be the portfolio manager’s net gain and the fees earned by EIMC and expenses incurred by the fund on the portfolio manager’s account. Evergreen is currently engaged in discussions with the staff of the SEC concerning its recommendation.
The staff of the National Association of Securities Dealers (“NASD”) had notified EIS that it has made a preliminary determination to recommend that disciplinary action be brought against EIS for certain violations of the NASD’s rules. The recommendation relates principally to allegations that EIS (i) arranged for fund portfolio trades to be directed to broker-dealers (including Wachovia Securities, LLC, an affiliate of EIS) that sold Evergreen fund shares during the period of January 2001 to December 2003 and (ii) provided non-cash compensation by sponsoring offsite meetings attended by Wachovia Securities, LLC brokers during that period. EIS is cooperating with the NASD staff in its review of these matters.
Any resolution of these matters with regulatory authorities may include, but not be limited to, sanctions, penalties or injunctions regarding Evergreen, restitution to mutual fund shareholders and/or other financial penalties and structural changes in the governance or management of Evergreen’s mutual fund business. Any penalties or restitution will be paid by Evergreen and not by the Evergreen funds.
In addition, the Evergreen funds and EIMC and certain of its affiliates are involved in various legal actions, including private litigation and class action lawsuits. EIMC does not expect that any of such legal actions currently pending or threatened will have a material adverse impact on the financial position or operations of any of the Evergreen funds or on EIMC’s ability to provide services to the Evergreen funds.
Although Evergreen believes that neither the foregoing investigations described above nor any pending or threatened legal actions will have a material adverse impact on the Evergreen funds, there can be no assurance that these matters and any publicity surrounding or resulting from them will not result in reduced sales or increased redemptions of Evergreen fund shares, which could increase Evergreen fund transaction costs or operating expenses, or that they will not have other adverse consequences on the Evergreen funds.
11. NEW ACCOUNTING PRONOUNCEMENTS
In June 2006, the Financial Accounting Standards Board (“FASB”) issued FASB Interpretation No. 48, Accounting for Uncertainty in Income Taxes — an interpretation of FASB statement 109 (“FIN 48”). FIN 48 supplements FASB 109 by prescribing a recognition threshold and measurement attribute for the financial statement recognition and measurement of a tax position taken or expected to be taken in a tax return. The adoption of FIN 48 will require financial statements to be adjusted to reflect only those tax positions that are more likely than not to be sustained as
36
NOTES TO FINANCIAL STATEMENTS (unaudited) continued
of the adoption date. Management of the Fund is currently evaluating the impact that the adoption of FIN 48 will have on the financial statements. FIN 48 will become effective for fiscal years beginning after December 15, 2006.
In September 2006, FASB issued Statement of Financial Accounting Standards No. 157, Fair Value Measurements (“FAS 157”). FAS 157 establishes a single authoritative definition of fair value, establishes a framework for measuring fair value and expands disclosures about fair value measurements. FAS 157 applies to fair value measurements already required or permitted by existing standards. The change to current generally accepted accounting principles from the application of FAS 157 relates to the definition of fair value, the methods used to measure fair value, and the expanded disclosures about fair value measurements. Management of the Fund does not believe the adoption of FAS 157 will materially impact the financial statement amounts, however, additional disclosures may be required about the inputs used to develop the measurements and the effect of certain of the measurements on changes in net assets for the period. FAS 157 is effective for financial statements issued for fiscal years beginning after November 15, 2007 and interim periods within those fiscal years.
37
ADDITIONAL INFORMATION (unaudited)
INFORMATION ABOUT THE REVIEW AND APPROVAL OF THE FUND’S INVESTMENT
ADVISORY AGREEMENT
Each year, the Fund’s Board of Trustees is required to consider whether to continue in place the Fund’s investment advisory agreements. In September 2006, the Trustees, including a majority of the Trustees who are not interested persons (as that term is defined in the 1940 Act) of the Fund, of FIA or of EIMC, approved the continuation of the Fund’s investment advisory agreements. (References below to the “Fund” are to Evergreen Strategic Income Fund; references to the “funds” are to the Evergreen funds generally.)
At the same time, the Trustees considered the continuation of the investment advisory agreements for all of the funds, and the description below refers in many cases to the Trustees’ process and conclusions in connection with their consideration of this matter for all of the funds. In all of its deliberations, the Board of Trustees and the disinterested Trustees were advised by independent counsel to the disinterested Trustees and counsel to the funds.
Effective October 1, 2006, certain advisory personnel of EIMC were consolidated at TAG. In connection with the consolidation, the Board of Trustees approved a sub-advisory agreement with TAG. In approving that contract, the Trustees considered the factors described below, that the services previously provided by EIMC to the Fund would be provided by EIMC and TAG going forward, and that there would be no related change in the personnel managing the Fund or in the advisory fees paid by the Fund.
The review process. The 1940 Act requires that the Board of Trustees request and evaluate, and that EIMC furnish, such information as may reasonably be necessary to evaluate the terms of a fund’s advisory agreements. The review process began at the time of the last advisory contract-renewal process in September 2005. In the course of that process, the Trustees identified a number of funds that had experienced either short-term or longer-term performance issues. During the following months, the Trustees reviewed information relating to any changes in the performance of those funds and/or any changes in the investment process or the investment teams responsible for the management of the funds. In addition, during the course of the year, the Trustees reviewed information regarding the investment performance of all of the funds and identified additional funds that they believed warranted further attention based on performance since September 2005.
In spring 2006, a committee of the Board of Trustees (the “Committee”), working with EIMC management, determined generally the types of information the Board would review and set a timeline detailing the information required and the dates for its delivery to the Trustees. The independent data provider Lipper Inc. (“Lipper”) was engaged to provide fund-specific and industry-wide data to the Board containing information of a nature and in a format generally prescribed by the Committee. The Committee also identified a number of expense, performance, and other issues and requested specific information as to those issues.
The Trustees reviewed, with the assistance of an independent industry consultant retained by the disinterested Trustees, the information provided by EIMC in response to the Committee’s
38
ADDITIONAL INFORMATION (unaudited) continued
requests and the information provided by Lipper. In certain instances, the Trustees formed small committees to review individual funds in greater detail. In addition, the Trustees requested information regarding brokerage practices of the funds, information regarding closed-end fund discounts to net asset value, and information regarding the various fall-out benefits received directly and indirectly by EIMC and its affiliates from the funds. The Trustees requested and received additional information following that review.
The Committee met several times by telephone to consider the information provided by EIMC. The Committee met in person with representatives of EIMC in early September. At a meeting of the full Board of Trustees later in September, the Committee reported the results of its discussions with EIMC, and the full Board met with representatives of EIMC, engaged in further review of the materials provided to them, and approved the continuation of each of the advisory and sub-advisory agreements.
The disinterested Trustees discussed the continuation of the funds’ advisory agreements with representatives of EIMC and in multiple private sessions with legal counsel at which no personnel of EIMC were present. In considering the continuation of the agreements, the Trustees did not identify any particular information or consideration that was all-important or controlling, and each Trustee attributed different weights to various factors. The Trustees evaluated information provided to them both in terms of the Evergreen mutual funds generally and with respect to each fund, including the Fund, specifically as they considered appropriate; although the Trustees considered the continuation of the agreements as part of the larger process of considering the continuation of the advisory contracts for all of the funds, their determination to continue the advisory agreements for each of the funds was ultimately made on a fund-by-fund basis.
This summary describes a number of the most important, but not necessarily all, of the factors considered by the Board and the disinterested Trustees.
Information reviewed. The Board of Trustees and committees of the Board of Trustees meet periodically during the course of the year. At those meetings, the Board receives a wide variety of information regarding the services performed by EIMC and FIA, the investment performance of the funds, and other aspects of the business and operations of the funds. At those meetings, and in the process of considering the continuation of the agreements, the Trustees considered information regarding, for example, the funds’ investment results; the portfolio management teams for the funds and the experience of the members of those teams, and any recent changes in the membership of the teams; portfolio trading practices; compliance by the funds, FIA and EIMC with applicable laws and regulations and with the funds’ and EIMC’s compliance policies and procedures; services provided by affiliates of EIMC to the funds and shareholders of the funds; and other information relating to the nature, extent, and quality of services provided by EIMC and FIA. The Trustees considered the rates at which the funds pay investment advisory fees, the total expense ratios of the funds, and the efforts generally by EIMC and its affiliates as sponsors of the funds. The data provided by Lipper showed the fees paid by each fund and each fund’s total expense ratio in comparison to other similar mutual funds, in addition to data regarding the
39
ADDITIONAL INFORMATION (unaudited) continued
investment performance by the funds in comparison to other similar mutual funds. The Trustees were assisted by the independent industry consultant in reviewing the information presented to them.
Where EIMC or its affiliates provide to other clients advisory services that are comparable to the advisory services provided to a fund, the Trustees considered information regarding the rates at which those other clients pay advisory fees. Fees charged by EIMC to those other clients were generally lower than those charged to the funds. EIMC explained that compliance, reporting, and other legal burdens of providing investment advice to mutual funds greatly exceed those required to provide advisory services to non-mutual fund clients such as retirement or pension plans. In addition, EIMC pointed out that there is substantially greater legal and other risk to EIMC and its affiliates from managing public mutual funds than in managing private accounts. The Trustees also considered the investment performance of other accounts managed by EIMC and its affiliates.
The Trustees considered the transfer agency fees paid by the funds to an affiliate of EIMC and noted that the funds’ transfer agent had received Dalbar’s Mutual Fund Service Award for services provided to shareholders and Dalbar’s Financial Intermediary Service Quality Evaluation Award for services to broker-dealer representatives on a post-sale support basis. They reviewed information presented to them showing generally that the transfer agency fees charged to the funds were generally consistent with industry norms, and that transfer agency fees for a number of the funds had recently declined, or were expected to in the near future.
The Trustees also considered that EIS, an affiliate of EIMC, serves as administrator to the funds and receives a fee for its services as administrator. In their comparison of the advisory fee paid by the funds with those paid by other mutual funds, the Trustees took into account administrative fees paid by the funds and those other mutual funds. The Board considered that EIS serves as distributor to the funds (other than the closed-end funds) and receives fees from the funds for those services. They considered other so-called “fall-out” benefits to EIMC and its affiliates due to their other relationships with the funds, including, for example, soft-dollar services received by EIMC attributable to transactions entered into by EIMC for the benefit of the funds and brokerage commissions received by Wachovia Securities LLC, an affiliate of EIMC, from transactions effected by it for the funds.
Nature and quality of the services provided. The Trustees considered that EIMC, FIA and EIMC’s affiliates provide a comprehensive investment management service to the fund. They noted that EIMC and FIA formulate and implement an investment program for the fund. They noted that EIMC makes its personnel available to serve as officers of the funds, and concluded that the reporting and management functions provided by EIMC with respect to the funds were generally satisfactory. The Trustees considered the investment philosophy of each fund’s portfolio management team, and considered the in-house research capabilities of EIMC and its affiliates, as well as other resources available to EIMC, including research services available to it from third parties. The Board considered the managerial and financial resources available to EIMC and its affiliates, and the commitment that the Wachovia organization has made to the funds generally.
40
ADDITIONAL INFORMATION (unaudited) continued
On the basis of these factors, they determined that the nature and scope of the services provided by EIMC and FIA were consistent with their respective duties under the investment advisory agreements and appropriate and consistent with the investment programs and best interests of the funds.
The Trustees noted the resources EIMC and its affiliates have committed to the regulatory, compliance, accounting, tax and oversight of tax reporting, and shareholder servicing functions, and the number and quality of staff committed to those functions, which they concluded were appropriate and generally in line with EIMC’s responsibilities to the Fund and to the funds generally. They noted that recent enhancements to those functions appeared generally appropriate, but considered that the enhancement process is an on-going one and that they would continue to monitor developments in these functions in coming periods for appropriateness and consistency with regulatory and industry developments. The Board and the disinterested Trustees concluded, within the context of their overall conclusions regarding the funds’ advisory agreements, that they were satisfied with the nature, extent, and quality of the services provided by EIMC and FIA, including services provided by EIS under its administrative services agreements with the funds.
Investment performance. The Trustees considered the investment performance of each fund, both by comparison to other comparable mutual funds and to broad market indices. The Trustees emphasized that the continuation of the investment advisory agreement for a fund should not be taken as any indication that the Trustees did not believe investment performance for any specific fund might not be improved, and they noted that they would continue to monitor closely the investment performance of the funds going forward.
The Trustees noted that the Fund experienced relative underperformance for the one- and three-year periods ended May 31, 2006. The Trustees noted that the Fund’s longer-term performance remained favorable and that EIMC had represented that it had improved the Fund’s asset allocation process and strengthened the Fund’s analyst support in the emerging markets sector. The Trustees also noted that EIMC represented that it remained confident in the Fund’s investment approach and its newly appointed management team.
EIMC noted to the Trustees that EIMC’s high-yield portfolio management team responsible for managing the Fund’s high-yield investments had generally maintained a relatively high-quality bias in that asset class. EIMC reported to the Trustees that, in recent periods, portfolios with a high-quality bias had generally underperformed other investment products investing in lower-quality issuers, contributing to the Fund’s relative underperformance.
In the course of the Trustees’ review of advisory arrangements for the various funds managed exclusively or in part by the high-yield team at EIMC, representatives of EIMC noted that a number of members of the team had recently resigned from EIMC. Representatives of EIMC described the steps that EIMC had taken to continue effective management of the affected funds without interruption, including the steps taken to ensure additional members of the team would be retained and the appointment of a principal portfolio manager of the team with substantial experience in the high-yield space. The Trustees determined that the steps EIMC had taken to
41
ADDITIONAL INFORMATION (unaudited) continued
date appeared appropriate under the circumstances and approved the continuation of the various advisory agreements in question with the understanding that they would evaluate carefully the capabilities and performance of the high yield team going forward and following the hiring of the additional personnel.
Advisory and administrative fees. The Trustees recognized that EIMC does not seek to provide the lowest cost investment advisory service, but to provide a high quality, full-service investment management product at a reasonable price. They also noted that EIMC has in many cases sought to set its investment advisory fees at levels consistent with industry norms. The Trustees noted that, in certain cases, a fund’s advisory fees and/or its total expense ratio were higher than many or most other funds in the same Lipper peer group. However, in each case, the Trustees determined that the level of fees was not such as to prevent the continuation of the advisory agreement.
Economies of scale. The Trustees noted that economies of scale would likely be achieved by EIMC in managing the funds as the funds grow. The Trustees noted that the Fund had implemented breakpoints in its advisory fee structure. The Trustees noted that they would continue to review the appropriate levels of breakpoints in the future, but concluded that the breakpoints as implemented appeared to be a reasonable step toward the realization of economies of scale by the Fund.
Profitability. The Trustees considered information provided to them regarding the profitability to the EIMC organization of the investment advisory, administration, and transfer agency (with respect to the open-end funds only) fees paid to EIMC and its affiliates by each of the funds. They considered that the information provided to them was necessarily estimated, and that the profitability information provided to them, especially on a fund-by-fund basis, did not necessarily provide a definitive tool for evaluating the appropriateness of each fund’s advisory fee. They noted that the levels of profitability of the funds to EIMC varied widely, depending on among other things the size and type of fund. They considered the profitability of the funds in light of such factors as, for example, the information they had received regarding the relation of the fees paid by the funds to those paid by other mutual funds, the investment performance of the funds, and the amount of revenues involved. In light of these factors, the Trustees concluded that the profitability of any of the funds, individually or in the aggregate, should not prevent the Trustees from approving the continuation of the agreements.
42
This page left intentionally blank
43
TRUSTEES AND OFFICERS
TRUSTEES1
| Charles A. Austin III | | Investment Counselor, Anchor Capital Advisors, Inc. (investment advice); Director, The Andover |
| Trustee | | Companies (insurance); Trustee, Arthritis Foundation of New England; Former Director, The |
| DOB: 10/23/1934 | | Francis Ouimet Society; Former Trustee, Mentor Funds and Cash Resource Trust; Former |
| Term of office since: 1991 | | Investment Counselor, Appleton Partners, Inc. (investment advice); Former Director, Executive |
| Other directorships: None | | Vice President and Treasurer, State Street Research & Management Company (investment |
| | | advice) |
|
| |
| Shirley L. Fulton* | | Partner, Tin, Fulton, Greene & Owen, PLLC (law firm); Former Partner, Helms, Henderson & |
| Trustee | | Fulton, P.A. (law firm); Retired Senior Resident Superior Court Judge, 26th Judicial District, |
| DOB: 1/10/1952 | | Charlotte, NC |
| Term of office since: 2004 | | |
| Other directorships: None | | |
|
| |
| K. Dun Gifford | | Chairman and President, Oldways Preservation and Exchange Trust (education); Trustee, |
| Trustee | | Treasurer and Chairman of the Finance Committee, Cambridge College; Former Trustee, Mentor |
| DOB: 10/23/1938 | | Funds and Cash Resource Trust |
| Term of office since: 1974 | | |
| Other directorships: None | | |
|
| |
| Dr. Leroy Keith, Jr. | | Partner, Stonington Partners, Inc. (private equity fund); Trustee, Phoenix Funds Family; Director, |
| Trustee | | Diversapack Co.; Director, Obagi Medical Products Co.; Former Director, Lincoln Educational |
| DOB: 2/14/1939 | | Services; Former Trustee, Mentor Funds and Cash Resource Trust |
| Term of office since: 1983 | | |
| Other directorships: Trustee, The | | |
| Phoenix Group of Mutual Funds | | |
|
| |
| Gerald M. McDonnell | | Manager of Commercial Operations, SMI Steel Co. – South Carolina (steel producer); Former |
| Trustee | | Sales and Marketing Manager, Nucor Steel Company; Former Trustee, Mentor Funds and Cash |
| DOB: 7/14/1939 | | Resource Trust |
| Term of office since: 1988 | | |
| Other directorships: None | | |
|
| |
| Patricia B. Norris2 | | Former Partner, PricewaterhouseCoopers LLP |
| Trustee | | |
| DOB: 4/9/1948 | | |
| Term of office since: 2006 | | |
| Other directorships: None | | |
|
| |
| William Walt Pettit | | Vice President, Kellam & Pettit, P.A. (law firm); Director, Superior Packaging Corp.; Director, |
| Trustee | | National Kidney Foundation of North Carolina, Inc.; Former Trustee, Mentor Funds and Cash |
| DOB: 8/26/1955 | | Resource Trust |
| Term of office since: 1984 | | |
| Other directorships: None | | |
|
| |
| David M. Richardson | | President, Richardson, Runden LLC (executive recruitment business development/consulting |
| Trustee | | company); Consultant, Kennedy Information, Inc. (executive recruitment information and |
| DOB: 9/19/1941 | | research company); Consultant, AESC (The Association of Executive Search Consultants); |
| Term of office since: 1982 | | Director, J&M Cumming Paper Co. (paper merchandising); Former Trustee, NDI Technologies, LLP |
| | | (communications); Former Trustee, Mentor Funds and Cash Resource Trust |
| Other directorships: None | | |
|
| |
| Dr. Russell A. Salton III | | President/CEO, AccessOne MedCard; Former Medical Director, Healthcare Resource Associates, |
| Trustee | | Inc.; Former Medical Director, U.S. Health Care/Aetna Health Services; Former Trustee, Mentor |
| DOB: 6/2/1947 | | Funds and Cash Resource Trust |
| Term of office since: 1984 | | |
| Other directorships: None | | |
|
44
TRUSTEES AND OFFICERS continued
| Michael S. Scofield | | Retired Attorney, Law Offices of Michael S. Scofield; Director and Chairman, Branded Media |
| Trustee | | Corporation (multi-media branding company); Former Trustee, Mentor Funds and Cash |
| DOB: 2/20/1943 | | Resource Trust |
| Term of office since: 1984 | | |
| Other directorships: None | | |
|
| |
| Richard J. Shima | | Independent Consultant; Trustee, Saint Joseph College (CT); Director, Hartford Hospital; Trustee, |
| Trustee | | Greater Hartford YMCA; Former Director, Trust Company of CT; Former Director, Enhance |
| DOB: 8/11/1939 | | Financial Services, Inc.; Former Director, Old State House Association; Former Trustee, Mentor |
| Term of office since: 1993 | | Funds and Cash Resource Trust |
| Other directorships: None | | |
|
| |
| Richard K. Wagoner, CFA3 | | Member and Former President, North Carolina Securities Traders Association; Member, Financial |
| Trustee | | Analysts Society; Former Consultant to the Boards of Trustees of the Evergreen funds; Former |
| DOB: 12/12/1937 | | Trustee, Mentor Funds and Cash Resource Trust |
| Term of office since: 1999 | | |
| Other directorships: None | | |
|
| |
| |
| OFFICERS | | |
| |
| Dennis H. Ferro4 | | Principal occupations: President and Chief Executive Officer, Evergreen Investment Company, |
| President | | Inc. and Executive Vice President, Wachovia Bank, N.A.; former Chief Investment Officer, |
| DOB: 6/20/1945 | | Evergreen Investment Company, Inc. |
| Term of office since: 2003 | | |
|
| |
| Kasey Phillips5 | | Principal occupations: Senior Vice President, Evergreen Investment Services, Inc.; Former Vice |
| Treasurer | | President, Evergreen Investment Services, Inc.; Former Assistant Vice President, Evergreen |
| DOB: 12/12/1970 | | Investment Services, Inc. |
| Term of office since: 2005 | | |
|
| |
| Michael H. Koonce5 | | Principal occupations: Senior Vice President and General Counsel, Evergreen Investment |
| Secretary | | Services, Inc.; Senior Vice President and Assistant General Counsel, Wachovia Corporation |
| DOB: 4/20/1960 | | |
| Term of office since: 2000 | | |
|
| |
| James Angelos5 | | Principal occupations: Chief Compliance Officer and Senior Vice President, Evergreen Funds; |
| Chief Compliance Officer | | Former Director of Compliance, Evergreen Investment Services, Inc. |
| DOB: 9/2/1947 | | |
| Term of office since: 2004 | | |
|
1 Each Trustee serves until a successor is duly elected or qualified or until his/her death, resignation, retirement or removal from office. Each Trustee oversees 91 Evergreen funds. Correspondence for each Trustee may be sent to Evergreen Board of Trustees, P.O. Box 20083, Charlotte, NC 28202.
2 Ms. Norris’ information is as of July 1, 2006, the effective date of her trusteeship.
3 Mr. Wagoner is an “interested person” of the Fund because of his ownership of shares in Wachovia Corporation, the parent to the Fund’s investment advisor.
4 The address of the Officer is 401 S. Tryon Street, 20th Floor, Charlotte, NC 28288.
5 The address of the Officer is 200 Berkeley Street, Boston, MA 02116.
* Shirley L. Fulton served as Trustee through November 20, 2006.
Additional information about the Fund’s Board of Trustees and Officers can be found in the Statement of Additional Information (SAI) and is available upon request without charge by calling 800.343.2898.
45
564358 rv4 12/2006
Item 2 - Code of Ethics
Not required for this semi-annual filing.
Item 3 - Audit Committee Financial Expert
Not required for this semi-annual filing.
Items 4 – Principal Accountant Fees and Services
Not required for this semi-annual filing.
Items 5 – Audit Committee of Listed Registrants
Not applicable.
Item 6 – Schedule of Investments
Please see schedule of investments contained in the Report to Stockholders included under Item 1 of this Form N-CSR.
Item 7 – Disclosure of Proxy Voting Policies and Procedures for Closed-End Management Investment Companies.
Not applicable.
Item 8 – Portfolio Managers of Closed-End Management Investment Companies.
Not applicable.
Item 9 – Purchases of Equity Securities by Closed-End Management Investment Company and Affiliated Purchasers.
Not applicable.
Item 10 – Submission of Matters to a Vote of Security Holders
There have been no material changes to the procedures by which shareholders may recommend nominees to the Registrant’s board of trustees that have been implemented since the Registrant last provided disclosure in response to the requirements of this Item.
Item 11 - Controls and Procedures
(a) The Registrant's principal executive officer and principal financial officer have evaluated the Registrant's disclosure controls and procedures (as defined in Rule 30a-3(c) under the Investment Company Act of 1940) within 90 days of this filing and have concluded that the Registrant's disclosure controls and procedures were effective, as of that date, in ensuring that information required to be disclosed by the Registrant in this Form N-CSR was recorded, processed, summarized, and reported timely.
(b) There has been no changes in the Registrant's internal controls over financial reporting (as defined in Rule 30a-3(d) under the Investment Company Act of 1940) that occurred during the second fiscal quarter of the period covered by this report that has materially affected, or is reasonable likely to affect, the Registrant’s internal control over financial reporting .
Item 12 - Exhibits
File the exhibits listed below as part of this Form. Letter or number the exhibits in the sequence indicated.
(a) Any code of ethics, or amendment thereto, that is the subject of the disclosure required by Item 2, to the extent that the Registrant intends to satisfy the Item 2 requirements through filing of an exhibit.
(b)(1) Separate certifications for the Registrant's principal executive officer and principal financial officer, as required by Section 302 of the Sarbanes-Oxley Act of 2002 and Rule 30a-2(a) under the Investment Company Act of 1940, are attached as EX99.CERT.
(b)(2) Separate certifications for the Registrant's principal executive officer and principal financial officer, as required by Section 1350 of Title 18 of United States Code, as adopted pursuant to Section 906 of the Sarbanes-Oxley Act of 2002, and Rule 30a-2(b) under the Investment Company Act of 1940, are attached as EX99.906CERT. The certifications furnished pursuant to this paragraph are not deemed to be "filed" for purposes of Section 18 of the Securities Exchange Act of 1934, or otherwise subject to the liability of that section. Such certifications are not deemed to be incorporated by reference into any filing under the Securities Act of 1933 or the Securities Exchange Act of 1934, except to the extent that the Registrant specifically incorporates them by reference.
Pursuant to the requirements of the Securities Exchange Act of 1934 and the Investment Company Act of 1940, the Registrant has duly caused this report to be signed on its behalf by the undersigned, thereunto duly authorized.
Evergreen Fixed Income Trust
By: _______________________
Dennis H. Ferro,
Principal Executive Officer
Date: December 26, 2006
Pursuant to the requirements of the Securities Exchange Act of 1934 and the Investment Company Act of 1940, this report has been signed below by the following persons on behalf of the Registrant and in the capacities and on the dates indicated.
By: _______________________
Dennis H. Ferro,
Principal Executive Officer
Date: December 26, 2006
By: ________________________
Kasey Phillips
Principal Financial Officer
Date: December 26, 2006