| OMB APPROVAL |
OMB Number: 3235-0570 Expires: Oct. 31, 2006 Estimated average burden hours per response: 19.3 |
UNITED STATES
SECURITIES AND EXCHANGE COMMISSION
Washington, D.C. 20549
FORM N-CSR
CERTIFIED SHAREHOLDER REPORT OF REGISTERED MANAGEMENT INVESTMENT COMPANIES
Investment Company Act file number 811-08415
Evergreen Fixed Income Trust
_____________________________________________________________
(Exact name of registrant as specified in charter)
200 Berkeley Street Boston, Massachusetts 02116
_____________________________________________________________
(Address of principal executive offices) (Zip code)
Michael H. Koonce, Esq. 200 Berkeley Street Boston, Massachusetts 02116
____________________________________________________________
(Name and address of agent for service)
Registrant's telephone number, including area code: (617) 210-3200
Date of fiscal year end: Registrant is making an semiannual filing for one of its series, Evergreen Diversified Bond Fund, for the year ended May 31, 2005. This one series has a November 30 fiscal year end.
Date of reporting period: May 31, 2005
Item 1 - Reports to Stockholders.
Evergreen Diversified Bond Fund

| table of contents |
| 1 | | LETTER TO SHAREHOLDERS |
| 4 | | FUND AT A GLANCE |
| 6 | | ABOUT YOUR FUND’S EXPENSES |
| 7 | | FINANCIAL HIGHLIGHTS |
| 11 | | SCHEDULE OF INVESTMENTS |
| 23 | | STATEMENT OF ASSETS AND LIABILITIES |
| 24 | | STATEMENT OF OPERATIONS |
| 25 | | STATEMENTS OF CHANGES IN NET ASSETS |
| 26 | | NOTES TO FINANCIAL STATEMENTS |
| 33 | | ADDITIONAL INFORMATION |
| 36 | | TRUSTEES AND OFFICERS |
This semiannual report must be preceded or accompanied by a prospectus of the Evergreen fund contained herein. The prospectus contains more complete information, including fees and expenses, and should be read carefully before investing or sending money.
The fund will file its complete schedule of portfolio holdings with the SEC for the first and third quarters of each fiscal year on Form N-Q. The fund’s Form N-Q will be available on the SEC’s Web site at http://www.sec.gov. In addition, the fund’s Form N-Q may be reviewed and copied at the SEC’s Public Reference Room in Washington, D.C. Information on the operation of the Public Reference Room may be obtained by calling 800.SEC.0330.
A description of the fund’s proxy voting policies and procedures, as well as information regarding how the fund voted proxies relating to portfolio securities during the most recent 12-month period ended June 30, is available by visiting our Web site at EvergreenInvestments.com or by visiting the SEC’s Web site at http://www.sec.gov. The fund’s proxy voting policies and procedures are also available without charge, upon request, by calling 800.343.2898.
| Mutual Funds: | | | | |
| NOT FDIC INSURED | | MAY LOSE VALUE | | NOT BANK GUARANTEED |
Evergreen InvestmentsSM is a service mark of Evergreen Investment Management Company, LLC.
Copyright 2005, Evergreen Investment Management Company, LLC.
Evergreen mutual funds are distributed by Evergreen Investment Services, Inc.
200 Berkeley Street, Boston, MA 02116
LETTER TO SHAREHOLDERS
July 2005
Dennis H. Ferro
President and Chief Executive Officer
Dear Shareholder,
We are pleased to provide the semiannual report for the Evergreen Diversified Bond Fund, which covers the six-month period ended May 31, 2005.
Over the past six months, investors in the U.S. fixed income markets experienced an extraordinary period. Moderating economic growth, tighter monetary policy, higher oil prices, reduced credit ratings in the auto sector and declining long-term interest rates were just a few of the challenges that the markets had to confront. Throughout it all, the portfolio managers of Evergreen Diversified Bond Fund employed a defensive, “barbell” strategy with an emphasis on income while attempting to navigate the stormy seas within the fixed income markets. We believe that this commitment to fundamentals will continue to provide our investors with the tools necessary for successful, long-term performance.
Economic growth had begun to moderate towards the end of 2004 and monthly reports were sending mixed signals to investors. For example, solid retail sales would be accompanied by weakness in consumer confidence, often in the same month! While the markets were sometimes perplexed by these incongruities, our investment strategy committee believed that this phenomenon was characteristic of the economy’s transition from recovery to expansion. Despite this moderation in demand, the Federal Reserve (Fed) continued to raise its target for the federal funds rate. After three years of monetary stimulus, policymakers were on the path towards more moderate levels of economic growth. At times, the fixed income markets viewed the Fed with suspicion, fearing that monetary policy would ultimately constrain growth, yet we maintained our belief that the Fed’s policy stance would continue to be one of less stimulation, rather than more restriction.
During the periods of volatility within the fixed income markets, monetary policymakers seemingly went out of their way to assuage market angst. Fed Chairman Alan Greenspan was especially transparent in his public statements, yet market interest rates remained quite volatile,
1
LETTER TO SHAREHOLDERS continued
only to begin a gradual descent for yields in the last few months of the investment period. As the long-end of the Treasury yield curve continued to decline, a debate ensued as to whether it signaled poor times ahead or the market’s belief that inflation was under control. In addition, Chairman Greenspan’s biggest concern appeared to be the fact that despite the Fed’s tighter stance, long-term market yields continued to decline. In testimony to congressional banking committees, he noted that it was a “conundrum” and warned of “complacency” within the fixed income markets. The infamous wordsmith achieved his desired objective for only a short while, though, and long-term yields once again resumed their decline. We believe there are several factors contributing to the latest downward move at the long-end of the curve, including short covering, increased demand for long-duration assets from mortgage portfolios and pension funds, a flight to quality after the credit reductions at GM and Ford, and the global savings glut that has created capital seeking the perceived safety of U.S Treasuries.
In this environment, our portfolio managers for the Diversified Bond Fund used a “barbell” strategy, attempting to maximize returns at both ends of the maturity spectrum. The extent of the yield curve surprised the markets, and our analysts endeavored to identify issues with the best quality available for the portfolio. In addition, the team worked towards increasing current yield for the fund, as the days appear to be numbered for the de-leveraging of Corporate America. Indeed, as the shareholder friendly trends such as leveraged share repurchases gathered momentum, the managers repositioned the portfolio with higher rated names in some of the more regulated sectors, such as financials, which appeared reasonably priced relative to many of the industrial-related issues on the market.
We continue to recommend that investors maintain a diversified fixed income strategy within their long-term portfolios.
Please visit our Web site, EvergreenInvestments.com, for more information about our funds and other investment products available to you. Thank you for your continued support of Evergreen Investments.
Sincerely,

Dennis H. Ferro
President and Chief Executive Officer
Evergreen Investment Company, Inc.
2
LETTER TO SHAREHOLDERS continued
Important Information About Your Fund
Effective at the close of business on May 20, 2005, Vestaur Securities Fund merged into Class I shares of the Fund. The Fund adopted the performance and accounting history of Vestaur Securities Fund as a result of the merger. Therefore, you will notice some differences in the reporting of historic information for the Fund.
Notification of Investment Strategy Change:
Effective August 1, 2005, the Fund’s prospectus will be amended to make the following change to the Fund’s principal investment strategy:
The Fund may invest a portion of its assets in derivative instruments, such as Treasury futures, Eurodollar futures and interest rate swap agreements in order to manage its exposure to interest rate risk. Derivatives are financial contracts whose value depends on, or is derived from, the value of one or more underlying assets, reference rates or indexes. The various derivative instruments that the Fund may use are described in more detail under “Additional Information on Securities and Investment Practices” in the Statement of Additional Information. The Fund typically uses derivatives as a substitute for taking a position in the underlying asset and/or as part of a strategy designed to reduce exposure to other risks, such as interest rate or currency risk. The Fund’s use of derivative instruments involves risks different from, or possibly greater than, the risks associated with investing directly in securities and other traditional investments. Derivatives are subject to a number of risks such as liquidity risk, interest rate risk, market risk, credit risk and management risk.
The Fund’s prospectus will be supplemented to include this change.
Special Notice to Shareholders:
Please visit our Web site at EvergreenInvestments.com for statements from President and Chief Executive Officer, Dennis Ferro, and Chairman of the Board of the Evergreen Funds, Michael S. Scofield, addressing SEC actions involving the Evergreen Funds.
3
FUND AT A GLANCE
as of May 31, 2005
MANAGEMENT TEAM

Douglas Williams, CFA
Customized Fixed Income Team Lead Manager

Richard M. Cryan
High Yield Bond Team Lead Manager
CURRENT INVESTMENT STYLE

Source: Morningstar, Inc.
Morningstar’s style box is based on a portfolio date as of 3/31/2005.
The Fixed income style box placement is based on a fund’s average effective maturity or duration and the average credit rating of the bond portfolio.
PERFORMANCE AND RETURNS
Portfolio inception date: 11/30/1972
| | | Class A | | Class B | | Class C | | Class I |
| Class inception date | | 5/20/2005 | | 5/20/2005 | | 5/20/2005 | | 11/30/1972 |
|
| Nasdaq symbol | | EKDLX | | EKDMX | | EKDCX | | EKDYX |
|
| 6-month return with sales charge | | -2.05% | | -2.12% | | 1.84% | | N/A |
|
| 6-month return w/o sales charge | | 2.84% | | 2.82% | | 2.82% | | 2.86% |
|
| Average annual return* | | | | | | | | |
|
| 1-year with sales charge | | 3.57% | | 3.69% | | 7.69% | | N/A |
|
| 1-year w/o sales charge | | 8.71% | | 8.69% | | 8.69% | | 8.73% |
|
| 5-year | | 7.19% | | 7.94% | | 8.23% | | 8.24% |
|
| 10-year | | 6.34% | | 6.86% | | 6.86% | | 6.86% |
|
| Maximum sales charge | | 4.75% | | 5.00% | | 1.00% | | N/A |
| | | Front-end | | CDSC | | CDSC | | |
|
* Adjusted for maximum applicable sales charge, unless noted.
Past performance is no guarantee of future results. The performance quoted represents past performance and current performance may be lower or higher. The investment return and principal value of an investment will fluctuate so that investors’ shares, when redeemed, may be worth more or less than their original cost. To obtain performance information current to the most recent month-end for Classes A, B, C or I, please go to EvergreenInvestments.com/fundperformance. The performance of each class may vary based on differences in loads, fees and expenses paid by the shareholders investing in each class. Performance includes the reinvestment of income dividends and capital gain distributions. Performance shown does not reflect the deduction of taxes that a shareholder would pay on fund distributions or the redemption of fund shares.
Historical performance shown for Class I prior to 5/23/2005 is based on the performance of the fund’s predecessor fund, Vestaur Securities Fund. Historical performance shown for Classes A, B and C prior to their inception is based on the performance of Class I. The historical returns for Classes A, B and C have not been adjusted to reflect the effect of each class’ 12b-1 fee. These fees are 0.30% for Class A and 1.00% for Classes B and C. Class I shares do not, and Vestaur Securities Fund did not, pay a 12b-1 fee. If these fees had been reflected, returns for Classes A, B and C would have been lower.
The advisor is waiving a portion of its advisory fee. Had the fee not been waived, returns would have been lower.
4
FUND AT A GLANCE continued
LONG-TERM GROWTH
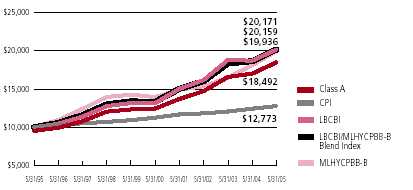
Comparison of a $10,000 investment in the Evergreen Diversified Bond Fund Class A shares, versus a similar investment in the Lehman Brothers Corporate Bond Index (LBCBI), the Merrill Lynch High Yield, Cash-Pay, BB-B Index† (MLHYCPBB-B), the LBCBI/MLHYCPBB-B Blend Index and the Consumer Price Index (CPI).
The LBCBI, the MLHYCPBB-B and the LBCBI/MLHYCPBB-B are unmanaged market indexes and do not include transaction costs associated with buying and selling securities, any mutual fund expenses or any taxes. The CPI is a commonly used measure of inflation and does not represent an investment return. It is not possible to invest directly in an index.
Class I shares are only offered in the following manner: (1) to investment advisory clients of Evergreen Investment Management Company, LLC (or its advisory affiliates) when purchased by such advisor(s) on behalf of its clients, (2) through arrangements entered into on behalf of the Evergreen funds with certain financial services firms, (3) to certain institutional investors and (4) to persons who owned Class Y shares in registered name in an Evergreen fund on or before December 31, 1994 or who owned shares of any SouthTrust fund in registered name as of March 18, 2005 or shares of Vestaur Securities Fund as of May 20, 2005. Class I shares are only available to institutional shareholders with a minimum of $1 million investment, which may be waived in certain situations.
The fund’s investment objective is nonfundamental and may be changed without the vote of the fund’s shareholders.
Funds that invest in high yield, lower-rated bonds may contain more risk due to the increased possibility of default.
Foreign investments may contain more risk due to the inherent risks associated with changing political climates, foreign market instability and foreign currency fluctuations.
U.S. government guarantees apply only to certain securities held in the fund’s portfolio and not to the fund’s shares.
The return of principal is not guaranteed due to fluctuation in the NAV of the fund caused by changes in the price of the individual bonds held by the fund and the buying and selling of bonds by the fund. Bond funds have the same inflation, interest rate and credit risks that are associated with the individual bonds held by the fund. Generally, the value of bonds rise when prevailing interest rates fall and fall when interest rates rise.
† Copyright 2005. Merrill Lynch, Pierce, Fenner & Smith Incorporated. All rights reserved.
All data is as of May 31, 2005, and subject to change.
5
ABOUT YOUR FUND’S EXPENSES
The Example below is intended to describe the fees and expenses borne by shareholders and the impact of those costs on your investment.
Example
As a shareholder of the fund, you incur two types of costs: (1) transaction costs, including sales charges (loads), redemption fees and exchange fees; and (2) ongoing costs, including management fees, distribution (12b-1) fees and other fund expenses. This Example is intended to help you understand your ongoing costs (in dollars) of investing in the fund and to compare these costs with the ongoing costs of investing in other mutual funds. The actual expense Example for Class A, Class B and Class C is based on an investment of $1,000 invested at the beginning of the period and held for the entire period from May 20, 2005 (commencement of class operations) to May 31, 2005. The actual expense Example for Class I is based on an investment of $1,000 invested at the beginning of the period and held for the entire period from December 1, 2004 to May 31, 2005. The hypothetical expense Example for each class is based on an investment of $1,000 invested at the beginning of the period and held for the entire period from December 1, 2004 to May 31, 2005.
The example illustrates your fund’s costs in two ways:
• Actual expenses
The section in the table under the heading “Actual” provides information about actual account values and actual expenses. You may use the information in these columns, together with the amount you invested, to estimate the expenses that you paid over the period. Simply divide your account value by $1,000 (for example, an $8,600 account value divided by $1,000 = 8.6), then multiply the result by the number in the appropriate column for your share class, in the column entitled “Expenses Paid During Period” to estimate the expenses you paid on your account during this period.
• Hypothetical example for comparison purposes
The section in the table under the heading “Hypothetical (5% return before expenses)” provides information about hypothetical account values and hypothetical expenses based on the fund’s actual expense ratio and an assumed rate of return of 5% per year before expenses, which is not the fund’s actual return. The hypothetical account values and expenses may not be used to estimate the actual ending account balance or expenses you paid for the period. You may use this information to compare the ongoing costs of investing in the fund and other funds. To do so, compare this 5% hypothetical example with the 5% hypothetical examples that appear in the shareholder reports of the other funds.
Please note that the expenses shown in the table are meant to highlight your ongoing costs only and do not reflect any transactional costs, such as sales charges (loads), redemption fees or exchange fees. Therefore, the section in the table under the heading “Hypothetical (5% return before expenses)” is useful in comparing ongoing costs only, and will not help you determine the relative total costs of owning different funds. In addition, if these transactional costs were included, your costs would have been higher.
| | | | | Ending | | |
| | | Beginning | | Account | | Expenses |
| | | Account | | Value | | Paid During |
| | | Value | | 5/31/2005 | | Period |
|
| Actual | | | | | | |
| Class A | | $ 1,000.00 | | $ 1,010.78 | | $ 0.24* |
| Class B | | $ 1,000.00 | | $ 1,010.61 | | $ 0.41* |
| Class C | | $ 1,000.00 | | $ 1,010.61 | | $ 0.41* |
| Class I | | $ 1,000.00 | | $ 1,028.60 | | $ 4.45** |
| Hypothetical | | | | | | |
| (5% return | | | | | | |
| before expenses) | | | | | | |
| Class A | | $ 1,000.00 | | $ 1,020.09 | | $ 4.89** |
| Class B | | $ 1,000.00 | | $ 1,016.60 | | $ 8.40** |
| Class C | | $ 1,000.00 | | $ 1,016.60 | | $ 8.40** |
| Class I | | $ 1,000.00 | | $ 1,020.54 | | $ 4.43** |
|
* For Class A, Class B and Class C shares of the Fund, expenses are equal to the annualized expense ratio of each class (0.97% for Class A, 1.67% for Class B and 1.67% for Class C), multiplied by the average account value over the period since each class’ commencement of operations (May 20, 2005), multiplied by 9 / 365 days.
**For each class of the Fund, expenses are equal to the annualized expense ratio of each class (0.97% for Class A, 1.67% for Class B, 1.67% for Class C and 0.88% for Class I), multiplied by the average account value over the period, multiplied by 182 / 365 days.
6
FINANCIAL HIGHLIGHTS
(For a share outstanding throughout the period)
| | | Period Ended |
| | | May 31, 2005 |
| CLASS A | | (unaudited)1,2 |
|
| Net asset value, beginning of period | | $ | | 14.83 |
|
| Income from investment operations | | | | |
| Net investment income (loss) | | | | 0.013 |
| Net realized and unrealized gains or losses on investments | | | | 0.15 |
| |
|
| Total from investment operations | | | | 0.16 |
|
| Distributions to shareholders from | | | | |
| Net investment income | | | | (0.02) |
|
| Net asset value, end of period | | $ | | 14.97 |
|
| Total return4 | | | | 1.08% |
|
| Ratios and supplemental data | | | | |
| Net assets, end of period (thousands) | | $246,002 |
| Ratios to average net assets | | | | |
| Expenses including waivers/reimbursements but excluding expense reductions | | | | 0.97%5 |
| Expenses excluding waivers/reimbursements and expense reductions | | | | 1.09%5 |
| Net investment income (loss) | | | | 1.77%5 |
| Portfolio turnover rate | | | | 16% |
|
1 Effective at the close of business on May 20, 2005, the Fund acquired the net assets of Vestaur Securities Fund. Vestaur Securities Fund became the accounting and performance survivor in this transaction . Class A shares of Vestaur Securities Fund did not exist prior to the transaction . As a result, accounting and performance information for Class A shares commenced on May 20, 2005.
2 For the period from May 20, 2005 (commencement of class operations), to May 31, 2005.
3 Net investment income (loss) per share is based on average shares outstanding during the period.
4 Excluding applicable sales charges
5 Annualized
See Notes to Financial Statements
7
FINANCIAL HIGHLIGHTS
(For a share outstanding throughout the period)
| | | Period Ended |
| | | May 31, 2005 |
| CLASS B | | (unaudited)1,2 |
|
| Net asset value, beginning of period | | $ | | 14.83 |
|
| Income from investment operations | | | | |
| Net investment income (loss) | | | | 03 |
| Net realized and unrealized gains or losses on investments | | | | 0.16 |
| |
|
| Total from investment operations | | | | 0.16 |
|
| Distributions to shareholders from | | | | |
| Net investment income | | | | (0.02) |
|
| Net asset value, end of period | | $ | | 14.97 |
|
| Total return4 | | | | 1.06% |
|
| Ratios and supplemental data | | | | |
| Net assets, end of period (thousands) | | $21,648 |
| Ratios to average net assets | | | | |
| Expenses including waivers/reimbursements but excluding expense reductions | | | | 1.67%5 |
| Expenses excluding waivers/reimbursements and expense reductions | | | | 1.79%5 |
| Net investment income (loss) | | | | 1.07%5 |
| Portfolio turnover rate | | | | 16% |
|
1 Effective at the close of business on May 20, 2005, the Fund acquired the net assets of Vestaur Securities Fund. Vestaur Securities Fund became the accounting and performance survivor in this transaction . Class B shares of Vestaur Securities Fund did not exist prior to the transaction . As a result, accounting and performance information for Class B shares commenced on May 20, 2005.
2 For the period from May 20, 2005 (commencement of class operations), to May 31, 2005.
3 Net investment income (loss) per share is based on average shares outstanding during the period.
4 Excluding applicable sales charges
5 Annualized
See Notes to Financial Statements
8
FINANCIAL HIGHLIGHTS
(For a share outstanding throughout the period)
| | | Period Ended |
| | | May 31, 2005 |
| CLASS C | | (unaudited)1,2 |
|
| Net asset value, beginning of period | | $ | | 14.83 |
|
| Income from investment operations | | | | |
| Net investment income (loss) | | | | 03 |
| Net realized and unrealized gains or losses on investments | | | | 0.16 |
| |
|
| Total from investment operations | | | | 0.16 |
|
| Distributions to shareholders from | | | | |
| Net investment income | | | | (0.02) |
|
| Net asset value, end of period | | $ | | 14.97 |
|
| Total return4 | | | | 1.06% |
|
| Ratios and supplemental data | | | | |
| Net assets, end of period (thousands) | | $31,117 |
| Ratios to average net assets | | | | |
| Expenses including waivers/reimbursements but excluding expense reductions | | | | 1.67%5 |
| Expenses excluding waivers/reimbursements and expense reductions | | | | 1.79%5 |
| Net investment income (loss) | | | | 1.07%5 |
| Portfolio turnover rate | | | | 16% |
|
1 Effective at the close of business on May 20, 2005, the Fund acquired the net assets of Vestaur Securities Fund. Vestaur Securities Fund became the accounting and performance survivor in this transaction . Class C shares of Vestaur Securities Fund did not exist prior to the transaction. As a result, accounting and performance information for Class C shares commenced on May 20, 2005.
2 For the period from May 20, 2005 (commencement of class operations), to May 31, 2005.
3 Net investment income (loss) per share is based on average shares outstanding during the period.
4 Excluding applicable sales charges
5 Annualized
See Notes to Financial Statements
9
FINANCIAL HIGHLIGHTS
(For a share outstanding throughout each period)
| | | Six Months | | | | | | | | | | | | |
| | | Ended | | Year Ended November 30, |
| | May 31, 2005 | |
|
| CLASS I | | (unaudited)1 | | 20041 | | 20031 | | 20021,2 | | 20011 | | 20001 |
|
| Net asset value, beginning of period | | $ | | 15.14 | | $ 15.14 | | $ 14.27 | | $ | | 14.88 | | $ 14.50 | | $ 14.98 |
|
| Income from investment operations | | | | | | | | | | | | | | | | |
| Net investment income (loss) | | | | 0.403 | | 0.93 | | 0.95 | | | | 1.00 | | 1.10 | | 1.15 |
Net realized and unrealized gains
or losses on investments | | | | (0.02) | | 0.02 | | 0.91 | | | | (0.56) | | 0.39 | | (0.51) |
| |
|
| Total from investment operations | | | | 0.38 | | 0.95 | | 1.86 | | | | 0.44 | | 1.49 | | 0.64 |
|
| Distributions to shareholders from | | | | | | | | | | | | | | | | |
| Net investment income | | | | (0.42) | | (0.95) | | (0.99) | | | | (1.05) | | (1.11) | | (1.12) |
| Tax basis return of capital | | | | (0.13) | | 0 | | 0 | | | | 0 | | 0 | | 0 |
| |
|
| Total distributions to shareholders | | | | (0.55) | | (0.95) | | (0.99) | | | | (1.05) | | (1.11) | | (1.12) |
|
| Net asset value, end of period | | $ | | 14.97 | | $ 15.14 | | $ 15.14 | | $ | | 14.27 | | $ 14.88 | | $ 14.50 |
|
| Total return | | | | 2.86% | | 6.47% | | 13.43% | | | | 3.06% | | 10.67% | | 4.54% |
|
| Ratios and supplemental data | | | | | | | | | | | | | | | | |
| Net assets, end of period (thousands) | | $63,573 | | $97,235 | | $97,277 | | $91,666 | | $94,577 | | $91,334 |
| Ratios to average net assets | | | | | | | | | | | | | | | | |
| Expenses including waivers/reimbursements | | | | | | | | | | | | | | | | |
| but excluding expense reductions | | | | 0.88%4 | | 0.94% | | 0.91% | | | | 1.01% | | 0.98% | | 0.99% |
| Expenses excluding waivers/reimbursements | | | | | | | | | | | | | | | | |
| and expense reductions | | | | 0.90%4 | | 0.97% | | 0.94% | | | | 1.01% | | 0.98% | | 0.99% |
| Net investment income (loss) | | | | 5.74%4 | | 6.10% | | 6.43% | | | | 6.96% | | 7.43% | | 7.89% |
| Portfolio turnover rate | | | | 16% | | 23% | | 45% | | | | 40% | | 63% | | 21% |
|
1 Effective at the close of business on May 20, 2005, the Fund acquired the net assets of Vestaur Securities Fund. Vestaur Securities Fund became the accounting and performance survivor in this transaction . The financial highlights for the periods prior to May 23, 2005 are those of Vestaur Securities Fund. The per share information has been restated to give effect to this transaction . Total return performance reflects the total return of Vestaur Securities Fund based on its net asset value.
2 As required, effective December 1, 2001, the Fund has adopted the provisions of the AICPA Audit and Accounting Guide, Audits of Investment Companies, and began amortizing premium and accreting discount on its fixed-income securities . The effects of this change for the year ended November 30, 2002 were a decrease in net investment income per share of $0.03; an increase in net realized gains or losses per share of $0.03; and a decrease in the ratio of net investment income to average net assets of 0.25%. The above per share information, ratios and supplemental data for the periods prior to December 1, 2001 have not been restated to reflect this change in presentation .
3 Net investment income (loss) per share is based on average shares outstanding during the period.
4 Annualized
See Notes to Financial Statements
10
SCHEDULE OF INVESTMENTS
May 31, 2005 (unaudited)
| | | | | Principal | | | | |
| | | | | Amount | | | | Value |
|
| AGENCY MORTGAGE-BACKED COLLATERALIZED | | | | | | | | |
| MORTGAGE OBLIGATIONS 0.3% | | | | | | | | |
| FIXED-RATE 0.3% | | | | | | | | |
| FNMA: | | | | | | | | |
| Ser. 2002-T12, Class A3, 7.50%, 05/25/2042 | | $ | | 38,907 | | $ | | 41,057 |
| Ser. 2002-T19, Class A3, 7.50%, 07/25/2042 | | | | 576,467 | | | | 614,788 |
| Ser. 2003-W4, Class 4A, 7.50%, 10/25/2042 | | | | 415,861 | | | | 441,480 |
| |
|
| Total Agency Mortgage-Backed Collateralized Mortgage Obligations | | | | | | | | |
| (cost $1,110,848) | | | | | | | | 1,097,325 |
| |
|
| AGENCY MORTGAGE-BACKED PASS THROUGH SECURITIES 0.6% | | | | | | | | |
| FIXED-RATE 0.6% | | | | | | | | |
| FHLMC: | | | | | | | | |
| 6.00%, 01/01/2032 | | | | 11,220 | | | | 11,545 |
| 6.50%, 09/25/2043 | | | | 248,828 | | | | 258,004 |
| 7.50%, 09/01/2013 - 08/25/2042 | | | | 374,171 | | | | 395,968 |
| 9.00%, 12/01/2016 | | | | 323,774 | | | | 351,412 |
| 9.50%, 12/01/2022 | | | | 40,201 | | | | 44,327 |
| FNMA: | | | | | | | | |
| 9.00%, 02/01/2025 - 09/01/2030 | | | | 294,451 | | | | 324,319 |
| 10.00%, 09/01/2010 - 04/01/2021 | | | | 227,195 | | | | 255,078 |
| GNMA: | | | | | | | | |
| 8.00%, 03/15/2022 - 08/15/2024 | | | | 121,898 | | | | 132,071 |
| 8.25%, 05/15/2020 | | | | 109,566 | | | | 119,378 |
| 8.50%, 09/15/2024 - 01/15/2027 | | | | 94,033 | | | | 103,618 |
| 9.00%, 12/15/2019 - 03/15/2021 | | | | 67,916 | | | | 74,608 |
| 9.50%, 09/15/2019 | | | | 78,026 | | | | 86,917 |
| 10.00%, 01/15/2019 - 03/15/2020 | | | | 64,506 | | | | 73,445 |
| |
|
| Total Agency Mortgage-Backed Pass Through Securities (cost $2,152,944) | | | | | | | | 2,230,690 |
| |
|
| AGENCY REPERFORMING MORTGAGE-BACKED | | | | | | | | |
| PASS THROUGH SECURITIES 0.2% | | | | | | | | |
| FNMA: | | | | | | | | |
| Ser. 2003-W1, Class 2A, 7.50%, 12/25/2042 | | | | 627,442 | | | | 669,858 |
| Ser. 2003-W2, Class 1A3, 7.50%, 07/25/2042 | | | | 208,825 | | | | 223,586 |
| |
|
| Total Agency Reperforming Mortgage-Backed Pass Through Securities | | | | | | | | |
| (cost $897,234) | | | | | | | | 893,444 |
| |
|
| ASSET-BACKED SECURITIES 3.3% | | | | | | | | |
| Credit Suisse First Boston Mtge. Securities Corp., Ser. 1996-2, Class A-6, 7.18%, | | | | | | | | |
| 02/25/2018 | | | | 243,339 | | | | 242,845 |
| GE Capital Mtge. Svcs., Inc., Ser. 1999-H, Class A-7, 6.27%, 04/25/2029 | | | | 781,290 | | | | 797,552 |
| Nautilus RMBS CDO, Ltd., Ser. 2005-1A, Class A3, 4.89%, 05/24/2035 144A | | | | 3,500,000 | | | | 3,500,547 |
| Oakwood Mtge. Investors, Inc., Ser. 1996-C, Class A5, 7.35%, 04/15/2027 | | | | 1,459,498 | | | | 1,496,139 |
| Railcar Leasing LLC, Ser. 1, Class A-2, 7.125%, 01/15/2013 144A | | | | 2,500,000 | | | | 2,732,838 |
| Trapeza CDO LLC, Ser. 2004-7A, Class B1, FRN, 4.71%, 01/25/2035 144A | | | | 3,000,000 | | | | 3,018,030 |
| |
|
| Total Asset-Backed Securities (cost $11,735,276) | | | | | | | | 11,787,951 |
| |
|
See Notes to Financial Statements
11
SCHEDULE OF INVESTMENTS continued
May 31, 2005 (unaudited)
| | | Principal | | | | |
| | | Amount | | | | Value |
|
| COMMERCIAL MORTGAGE-BACKED SECURITIES 1.6% | | | | | | |
| FIXED-RATE 0.8% | | | | | | |
| Commercial Mtge. Pass-Through Certificates, Ser. 2001-ZC1A, Class A, 6.36%, | | | | | | |
| 06/14/2006 144A (h) | | $ 2,845,099 | | $ | | 2,894,087 |
| |
|
| FLOATING-RATE 0.8% | | | | | | |
| Midland Realty Acceptance Corp., Ser. 1996-C1, Class E, 8.27%, 08/25/2028 | | 2,784,000 | | | | 2,903,567 |
| |
|
| Total Commercial Mortgage-Backed Securities (cost $5,765,363) | | | | | | 5,797,654 |
| |
|
| CORPORATE BONDS 81.9% | | | | | | |
| CONSUMER DISCRETIONARY 15.1% | | | | | | |
| Auto Components 0.2% | | | | | | |
| American Axle & Manufacturing, Inc., 5.25%, 02/11/2014 | | 500,000 | | | | 418,184 |
| Dura Operating Corp., Ser. B, 8.625%, 04/15/2012 | | 450,000 | | | | 407,250 |
| |
|
| | | | | | | 825,434 |
| |
|
| Automobiles 1.5% | | | | | | |
| Daimler Chrysler Holdings: | | | | | | |
| 7.45%, 03/01/2027 | | 939,000 | | | | 1,039,023 |
| 8.50%, 01/18/2031 | | 2,000,000 | | | | 2,459,238 |
| FRN, 4.23%, 08/08/2006 | | 2,000,000 | | | | 2,010,690 |
| |
|
| | | | | | | 5,508,951 |
| |
|
| Diversified Consumer Services 0.1% | | | | | | |
| Service Corp. International, 7.70%, 04/15/2009 | | 250,000 | | | | 265,313 |
| |
|
| Hotels, Restaurants & Leisure 2.5% | | | | | | |
| Ameristar Casinos, Inc., 10.75%, 02/15/2009 | | 200,000 | | | | 219,500 |
| Chumash Casino & Resort Enterprise, 9.00%, 07/15/2010 144A | | 425,000 | | | | 461,125 |
| Darden Restaurants, Inc., 7.125%, 02/01/2016 | | 500,000 | | | | 587,614 |
| Isle of Capri Casinos, Inc., 7.00%, 03/01/2014 | | 200,000 | | | | 197,500 |
| John Q. Hammons Hotels LP, Ser. B, 8.875%, 05/15/2012 | | 435,000 | | | | 475,238 |
| Las Vegas Sands Corp., 6.375%, 02/15/2015 144A | | 285,000 | | | | 275,738 |
| McDonald’s Corp., 7.31%, 09/15/2027 | | 4,000,000 | | | | 4,242,536 |
| MGM MIRAGE, Inc., 5.875%, 02/27/2014 | | 200,000 | | | | 193,500 |
| Seneca Gaming Corp., 7.25%, 05/01/2012 | | 200,000 | | | | 203,000 |
| Starwood Hotels & Resorts, Inc., 7.375%, 05/01/2007 | | 200,000 | | | | 209,500 |
| Station Casinos, Inc., 6.50%, 02/01/2014 | | 900,000 | | | | 915,750 |
| Town Sports International, Inc., 9.625%, 04/15/2011 | | 250,000 | | | | 257,500 |
| Wynn Resorts, Ltd., 6.625%, 12/01/2014 144A | | 950,000 | | | | 916,750 |
| |
|
| | | | | | | 9,155,251 |
| |
|
| Household Durables 3.5% | | | | | | |
| Centex Corp., 7.875%, 02/01/2011 | | 500,000 | | | | 570,722 |
| Hovnanian Enterprises, Inc.: | | | | | | |
| 6.50%, 01/15/2014 | | 750,000 | | | | 753,750 |
| 10.50%, 10/01/2007 | | 250,000 | | | | 277,500 |
| Lennar Corp., FRN, 3.80%, 03/19/2009 | | 4,000,000 | | | | 4,024,756 |
| M/I Homes, Inc., 6.875%, 04/01/2012 144A | | 900,000 | | | | 864,000 |
| Meritage Homes Corp., 6.25%, 03/15/2015 144A | | 275,000 | | | | 258,500 |
See Notes to Financial Statements
12
SCHEDULE OF INVESTMENTS continued
May 31, 2005 (unaudited)
| | | Principal | | | | |
| | | Amount | | | | Value |
|
| CORPORATE BONDS continued | | | | | | |
| CONSUMER DISCRETIONARY continued | | | | | | |
| Household Durables continued | | | | | | |
| Pulte Homes, Inc., 7.875%, 08/01/2011 | | $ 3,950,000 | | $ | | 4,542,741 |
| Technical Olympic USA, Inc., 7.50%, 01/15/2015 | | 650,000 | | | | 598,000 |
| WCI Communities, Inc., 9.125%, 05/01/2012 | | 660,000 | | | | 689,700 |
| |
|
| | | | | | | 12,579,669 |
| |
|
| Media 6.3% | | | | | | |
| Cox Communications, Inc., 7.875%, 08/15/2009 | | 4,000,000 | | | | 4,471,276 |
| CSC Holdings, Inc., 7.625%, 04/01/2011 | | 450,000 | | | | 479,250 |
| Dex Media West LLC, 5.875%, 11/15/2011 | | 950,000 | | | | 945,250 |
| Lenfest Communications, Inc., 8.375%, 11/01/2005 | | 1,150,000 | | | | 1,171,246 |
| LIN TV Corp., 6.50%, 05/15/2013 | | 200,000 | | | | 195,000 |
| Mediacom LLC, 9.50%, 01/15/2013 | | 1,050,000 | | | | 1,047,375 |
| MediaNews Group, Inc., 6.375%, 04/01/2014 | | 425,000 | | | | 401,625 |
| News America Holdings, Inc., 9.50%, 07/15/2024 | | 4,000,000 | | | | 5,455,420 |
| R.H. Donnelley Corp., 10.875%, 12/15/2012 | | 575,000 | | | | 668,437 |
| Time Warner, Inc.: | | | | | | |
| 8.375%, 07/15/2033 | | 3,500,000 | | | | 4,650,545 |
| 9.125%, 01/15/2013 | | 2,700,000 | | | | 3,423,373 |
| |
|
| | | | | | | 22,908,797 |
| |
|
| Multi-line Retail 0.3% | | | | | | |
| J.C. Penney Co., Inc., 7.375%, 08/15/2008 | | 900,000 | | | | 963,000 |
| |
|
| Specialty Retail 0.5% | | | | | | |
| Central Garden & Pet Co., 9.125%, 02/01/2013 | | 650,000 | | | | 695,500 |
| Group 1 Automotive, Inc., 8.25%, 08/15/2013 | | 900,000 | | | | 909,000 |
| Payless ShoeSource, Inc., 8.25%, 08/01/2013 | | 275,000 | | | | 286,688 |
| |
|
| | | | | | | 1,891,188 |
| |
|
| Textiles, Apparel & Luxury Goods 0.2% | | | | | | |
| Oxford Industries, Inc., 8.875%, 06/01/2011 | | 250,000 | | | | 260,000 |
| The Warnaco Group, Inc., 8.875%, 06/15/2013 | | 275,000 | | | | 301,125 |
| |
|
| | | | | | | 561,125 |
| |
|
| CONSUMER STAPLES 3.0% | | | | | | |
| Beverages 0.3% | | | | | | |
| Anheuser-Busch Companies, Inc., 6.80%, 01/15/2031 | | 500,000 | | | | 620,336 |
| Panamerican Beverages, Inc., 7.25%, 07/01/2009 | | 500,000 | | | | 545,625 |
| |
|
| | | | | | | 1,165,961 |
| |
|
| Food & Staples Retailing 2.1% | | | | | | |
| Albertsons, Inc., 7.45%, 08/01/2029 | | 4,000,000 | | | | 4,404,748 |
| Alimentation Couche-Tard, Inc., 7.50%, 12/15/2013 | | 740,000 | | | | 773,300 |
| Ingles Markets, Inc., 8.875%, 12/01/2011 | | 200,000 | | | | 202,250 |
| NeighborCare, Inc., 6.875%, 11/15/2013 | | 45,000 | | | | 46,125 |
| Rite Aid Corp., 8.125%, 05/01/2010 | | 175,000 | | | | 173,687 |
See Notes to Financial Statements
13
SCHEDULE OF INVESTMENTS continued
May 31, 2005 (unaudited)
| | | | | | | Principal | | | | |
| | | | | | | Amount | | | | Value |
|
| CORPORATE BONDS continued | | | | | | | | |
| CONSUMER STAPLES continued | | | | | | | | |
| Food & Staples Retailing continued | | | | | | | | |
| Roundy’s, Inc., Ser. B, 8.875%, 06/15/2012 | | $ | | 450,000 | | $ | | 465,750 |
| Safeway, Inc., 7.25%, 02/01/2031 | | | | 1,000,000 | | | | 1,143,074 |
| Wal-Mart Stores, Inc., 8.85%, 01/02/2015 | | | | 300,000 | | | | 379,310 |
| |
|
| | | | | | | | | | | 7,588,244 |
| |
|
| Food Products 0.4% | | | | | | | | | | |
| B&G Foods Holdings Corp., 8.00%, 10/01/2011 | | | | 450,000 | | | | 468,000 |
| Chiquita Brands International, Inc., 7.50%, 11/01/2014 | | | | 265,000 | | | | 253,075 |
| Del Monte Foods Co.: | | | | | | | | | | |
| 6.75%, 02/15/2015 144A | | | | 500,000 | | | | 501,250 |
| 8.625%, 12/15/2012 | | | | 19,000 | | | | 20,805 |
| |
|
| | | | | | | | | | | 1,243,130 |
| |
|
| Household Products 0.1% | | | | | | | | |
| Church & Dwight Co., Inc., 6.00%, 12/15/2012 144A | | | | 450,000 | | | | 452,250 |
| |
|
| Personal Products 0.1% | | | | | | | | |
| Alderwoods Group, Inc., 7.75%, 09/15/2012 144A | | | | 300,000 | | | | 315,000 |
| |
|
| ENERGY 9.0% | | | | | | | | | | |
| Energy Equipment & Services 0.6% | | | | | | | | |
| Dresser, Inc., 9.375%, 04/15/2011 | | | | 1,075,000 | | | | 1,126,062 |
| Hanover Compressor Co., 9.00%, 06/01/2014 | | | | 105,000 | | | | 109,200 |
| Hornbeck Offshore Services, Ser. B, 6.125%, 12/01/2014 | | | | 450,000 | | | | 451,125 |
| Offshore Logistics, Inc., 6.125%, 06/15/2013 | | | | 200,000 | | | | 188,500 |
| Parker Drilling Co., 9.625%, 10/01/2013 | | | | 145,000 | | | | 163,850 |
| Superior Energy Services, Inc. 8.875%, 05/15/2011 | | | | 250,000 | | | | 263,750 |
| |
|
| | | | | | | | | | | 2,302,487 |
| |
|
| Oil, Gas & Consumable Fuels 8.4% | | | | | | | | |
| Amerada Hess Corp., 7.30%, 08/15/2031 | | | | 4,000,000 | | | | 4,667,224 |
| Atlantic Richfield Co., 10.875%, 07/15/2005 | | | | 750,000 | | | | 756,247 |
| Chesapeake Energy Corp., 6.875%, 01/15/2016 | | | | 635,000 | | | | 666,750 |
| Exco Resources, Inc., 7.25%, 01/15/2011 | | | | 605,000 | | | | 592,900 |
| Ferrellgas Partners LP, 6.75%, 05/01/2014 | | | | 160,000 | | | | 149,600 |
| Forest Oil Corp., 7.75%, 05/01/2014 | | | | 175,000 | | | | 189,000 |
| Frontier Oil Corp., 6.625%, 10/01/2011 | | | | 100,000 | | | | 101,000 |
| Husky Energy, Inc., 6.15%, 06/15/2019 | | | | 4,000,000 | | | | 4,320,728 |
| Magellan Midstream Partners LP, 6.45%, 06/01/2014 | | | | 3,000,000 | | | | 3,302,892 |
| New Grade Energy, Inc., 10.50%, 08/31/2007 # | | | | 3,398,593 | | | | 3,658,007 |
| Occidental Petroleum Corp., 8.45%, 02/15/2029 | | | | 2,150,000 | | | | 3,029,789 |
| Pennzoil Co., 10.125%, 11/15/2009 | | | | 1,500,000 | | | | 1,824,283 |
| Plains All American Pipeline LP, 7.75%, 10/15/2012 | | | | 4,000,000 | | | | 4,658,136 |
| Plains Exploration & Production Co., 8.75%, 07/01/2012 | | | | 900,000 | | | | 985,500 |
| Sunoco, Inc., 9.00%, 11/01/2024 | | | | 500,000 | | | | 683,077 |
| The Williams Companies, Inc., 7.125%, 09/01/2011 | | | | 650,000 | | | | 698,750 |
| |
|
| | | | | | | | | | | 30,283,883 |
| |
|
See Notes to Financial Statements
14
SCHEDULE OF INVESTMENTS continued
May 31, 2005 (unaudited)
| | | Principal | | | | |
| | | Amount | | | | Value |
|
| CORPORATE BONDS continued | | | | | | |
| FINANCIALS 36.3% | | | | | | |
| Capital Markets 1.4% | | | | | | |
| Goldman Sachs Capital I, 6.35%, 02/15/2034 | | $ 1,100,000 | | $ | | 1,181,254 |
| Mellon Capital II, Ser. B, 8.00%, 01/15/2027 | | 3,500,000 | | | | 3,829,969 |
| |
|
| | | | | | | 5,011,223 |
| |
|
| Commercial Banks 6.5% | | | | | | |
| BankAmerica Capital II, 8.00%, 12/15/2026 | | 1,000,000 | | | | 1,091,250 |
| BT Capital Trust, Ser. B, 7.90%, 01/15/2027 | | 271,000 | | | | 295,315 |
| Citicorp Lease Trust, Ser.1999-1, Class A2, 8.04%, 12/15/2019 144A | | 3,500,000 | | | | 4,305,413 |
| FBOP Corp., 10.00%, 01/15/2009 144A (h) | | 4,000,000 | | | | 4,480,000 |
| First Empire Capital Trust I, 8.23%, 02/01/2027 ## | | 4,300,000 | | | | 4,762,168 |
| First Tennessee Capital II, Ser. B, 6.30%, 04/15/2034 | | 500,000 | | | | 524,523 |
| Firstar Capital Trust I, Ser. B, 8.32%, 12/15/2026 | | 500,000 | | | | 554,222 |
| Huntington National Bank, 4.375%, 01/15/2010 | | 4,000,000 | | | | 3,996,352 |
| Investors Capital Trust I, Ser. B, 9.77%, 02/01/2027 | | 885,000 | | | | 1,002,732 |
| Keycorp Capital III, 7.75%, 07/15/2029 | | 1,240,000 | | | | 1,538,242 |
| TD Banknorth, Inc., 7.625%, 06/15/2011 | | 1,000,000 | | | | 1,166,149 |
| |
|
| | | | | | | 23,716,366 |
| |
|
| Consumer Finance 7.6% | | | | | | |
| American General Finance Corp., 4.00%, 03/15/2011 | | 2,000,000 | | | | 1,929,542 |
| Capital One Financial Corp., 6.25%, 11/15/2013 | | 500,000 | | | | 534,556 |
| Ford Motor Credit Co.: | | | | | | |
| 6.50%, 01/25/2007 | | 2,000,000 | | | | 2,004,018 |
| 7.00%, 10/01/2013 | | 2,000,000 | | | | 1,865,800 |
| GMAC, 6.875%, 09/15/2011 | | 4,000,000 | | | | 3,492,640 |
| HSBC American Capital Trust I, 7.81%, 12/15/2026 144A | | 2,000,000 | | | | 2,180,188 |
| HSBC Finance Corp.: | | | | | | |
| 7.35%, 06/15/2022 | | 2,105,000 | | | | 2,176,892 |
| 7.875%, 03/01/2007 | | 500,000 | | | | 531,896 |
| MBNA Capital, Ser. A, 8.28%, 12/01/2026 | | 1,750,000 | | | | 1,872,955 |
| Ohio National Financial Services, Inc., 6.35%, 04/01/2013 144A | | 5,000,000 | | | | 5,450,130 |
| Sprint Capital Corp.: | | | | | | |
| 6.875%, 11/15/2028 | | 500,000 | | | | 568,963 |
| 8.75%, 03/15/2032 | | 3,500,000 | | | | 4,826,707 |
| |
|
| | | | | | | 27,434,287 |
| |
|
| Diversified Financial Services 5.7% | | | | | | |
| Arch Western Finance LLC, 6.75%, 07/01/2013 | | 200,000 | | | | 205,000 |
| BT Institutional Capital Trust, Ser. A, 8.09%, 12/01/2026 144A | | 1,000,000 | | | | 1,090,554 |
| ERAC USA Finance Co., 8.00%, 01/15/2011 144A | | 165,000 | | | | 191,372 |
| GE Capital Corp., 6.75%, 03/15/2032 | | 500,000 | | | | 614,230 |
| Hutchison Whampoa Financial Services, Ltd., 7.45%, 08/01/2017 144A | | 4,500,000 | | | | 5,311,570 |
| National Rural Utilities Cooperative Finance, 7.25%, 03/01/2012 | | 500,000 | | | | 579,144 |
| Pemex Project Funding Master Trust: | | | | | | |
| 7.375%, 12/15/2014 | | 400,000 | | | | 449,200 |
| 8.625%, 02/01/2022 | | 4,000,000 | | | | 4,860,000 |
| 9.25%, 03/30/2018 144A | | 600,000 | | | | 762,000 |
See Notes to Financial Statements
15
SCHEDULE OF INVESTMENTS continued
May 31, 2005 (unaudited)
| | | Principal | | | | |
| | | Amount | | | | Value |
|
| CORPORATE BONDS continued | | | | | | |
| FINANCIALS continued | | | | | | |
| Diversified Financial Services continued | | | | | | |
| Prudential Holdings LLC, Ser. C, 8.70%, 12/18/2023 144A | | $ 5,000,000 | | $ | | 6,602,185 |
| |
|
| | | | | | | 20,665,255 |
| |
|
| Insurance 7.9% | | | | | | |
| Assurant, Inc., 6.75%, 02/15/2034 | | 4,000,000 | | | | 4,586,424 |
| Axis Capital Holdings, Ltd., 5.75%, 12/01/2014 | | 4,000,000 | | | | 4,117,588 |
| Crum & Forster Holdings Corp., 10.375%, 06/15/2013 | | 1,075,000 | | | | 1,155,625 |
| Fund American Companies, Inc., 5.875%, 05/15/2013 | | 4,250,000 | | | | 4,414,220 |
| Markel Corp., 7.35%, 08/15/2034 | | 4,000,000 | | | | 4,429,300 |
| Nationwide Financial Services, Inc., 8.00%, 03/01/2027 | | 500,000 | | | | 556,997 |
| North Front Passthru Trust, 5.81%, 12/15/2024 144A | | 4,500,000 | | | | 4,759,542 |
| RLI Corp., 5.95%, 01/15/2014 | | 4,500,000 | | | | 4,599,563 |
| |
|
| | | | | | | 28,619,259 |
| |
|
| Real Estate 5.7% | | | | | | |
| Arden Realty LP, REIT, 5.20%, 09/01/2011 | | 4,500,000 | | | | 4,568,994 |
| CarrAmerica Realty Corp., REIT, 7.125%, 01/15/2012 | | 500,000 | | | | 555,440 |
| CB Richard Ellis Group, Inc., 9.75%, 05/15/2010 | | 130,000 | | | | 145,763 |
| Colonial Realty, Ltd., REIT, 6.25%, 06/15/2014 | | 500,000 | | | | 527,881 |
| Health Care Property, Inc., REIT, 6.00%, 03/01/2015 | | 5,000,000 | | | | 5,281,790 |
| Host Marriott Corp., Ser. J, REIT, 7.125%, 11/01/2013 | | 675,000 | | | | 698,625 |
| HRPT Properties Trust, REIT, 6.40%, 02/15/2015 | | 500,000 | | | | 543,262 |
| iStar Financial, Inc., REIT, 5.15%, 03/01/2012 | | 4,000,000 | | | | 3,957,732 |
| La Quinta Properties, Inc., 7.00%, 08/15/2012 | | 275,000 | | | | 282,906 |
| Omega Healthcare Investors, Inc., REIT, 7.00%, 04/01/2014 | | 55,000 | | | | 55,138 |
| Pan Pacific Retail Properties, Inc., REIT, 7.95%, 04/15/2011 | | 3,250,000 | | | | 3,762,473 |
| Thornburg Mortgage, Inc., REIT, 8.00%, 05/15/2013 | | 425,000 | | | | 425,000 |
| |
|
| | | | | | | 20,805,004 |
| |
|
| Thrifts & Mortgage Finance 1.5% | | | | | | |
| Dime Capital Trust I, 9.33%, 05/06/2027 | | 500,000 | | | | 567,500 |
| Independence Community Bank Corp., 3.75%, 04/01/2014 | | 4,000,000 | | | | 3,852,084 |
| Washington Mutual Capital I, 8.375%, 06/01/2027 | | 850,000 | | | | 938,148 |
| |
|
| | | | | | | 5,357,732 |
| |
|
| HEALTH CARE 2.1% | | | | | | |
| Health Care Providers & Services 2.1% | | | | | | |
| CIGNA Corp., 8.30%, 01/15/2033 | | 500,000 | | | | 653,633 |
| Coventry Health Care, Inc., 6.125%, 01/15/2015 | | 600,000 | | | | 600,000 |
| Extendicare, Inc.: | | | | | | |
| 6.875%, 05/01/2014 | | 725,000 | | | | 706,875 |
| 9.50%, 07/01/2010 | | 250,000 | | | | 271,250 |
| HCA, Inc., 6.375%, 01/15/2015 | | 950,000 | | | | 973,050 |
| Omnicare, Inc., 6.125%, 06/01/2013 | | 125,000 | | | | 123,438 |
| Triad Hospitals, Inc., 7.00%, 11/15/2013 | | 450,000 | | | | 457,875 |
| UnitedHealth Group, Inc., 5.00%, 08/15/2014 | | 3,750,000 | | | | 3,859,815 |
| |
|
| | | | | | | 7,645,936 |
| |
|
See Notes to Financial Statements
16
SCHEDULE OF INVESTMENTS continued
May 31, 2005 (unaudited)
| | | | | | | Principal | | | | |
| | | | | | | Amount | | | | Value |
|
| CORPORATE BONDS continued | | | | | | | | |
| INDUSTRIALS 6.3% | | | | | | | | | | |
| Aerospace & Defense 0.4% | | | | | | | | |
| Aviall, Inc., 7.625%, 07/01/2011 | | $ | | 155,000 | | $ | | 162,362 |
| DRS Technologies, Inc., 6.875%, 11/01/2013 | | | | 700,000 | | | | 717,500 |
| Lockheed Martin Corp., 8.20%, 12/01/2009 | | | | 500,000 | | | | 580,232 |
| |
|
| | | | | | | | | | | 1,460,094 |
| |
|
| Air Freight & Logistics 0.6% | | | | | | | | |
| FedEx Corp., 9.65%, 06/15/2012 | | | | 1,800,000 | | | | 2,344,318 |
| |
|
| Airlines 0.4% | | | | | | | | | | |
| Continental Airlines, Inc., Ser. 2000-2, Class A1, 7.71%, 04/02/2021 | | | | 801,403 | | | | 790,449 |
| Northwest Airlines, Inc.: | | | | | | | | | | |
| Ser. 1999-2, Class C, 8.30%, 09/01/2010 | | | | 599,723 | | | | 463,995 |
| Ser. 2001-1, Class 1C, 7.63%, 04/01/2010 | | | | 267,187 | | | | 188,829 |
| |
|
| | | | | | | | | | | 1,443,273 |
| |
|
| Commercial Services & Supplies 2.7% | | | | | | | | |
| Adesa, Inc., 7.625%, 06/15/2012 | | | | 200,000 | | | | 200,000 |
| Allied Waste North America, Inc., 6.375%, 04/15/2011 | | | | 900,000 | | | | 864,000 |
| Corrections Corporation of America, 6.25%, 03/15/2013 144A | | | | 550,000 | | | | 534,875 |
| Deluxe Corp.: | | | | | | | | | | |
| 5.00%, 12/15/2012 | | | | | | 2,000,000 | | | | 1,963,316 |
| 5.125%, 10/01/2014 | | | | 1,000,000 | | | | 963,310 |
| Geo Group, Inc., 8.25%, 07/15/2013 | | | | 450,000 | | | | 435,375 |
| Mobile Mini, Inc., 9.50%, 07/01/2013 | | | | 250,000 | | | | 273,750 |
| NationsRent West, Inc., 9.50%, 10/15/2010 | | | | 425,000 | | | | 457,938 |
| Oakmont Asset Trust, 4.51%, 12/22/2008 144A | | | | 4,000,000 | | | | 4,006,776 |
| |
|
| | | | | | | | | | | 9,699,340 |
| |
|
| Machinery 0.7% | | | | | | | | | | |
| Case New Holland, Inc., 9.25%, 08/01/2011 144A | | | | 650,000 | | | | 689,000 |
| Manitowoc Co., Inc., 7.125%, 11/01/2013 | | | | 200,000 | | | | 208,000 |
| Navistar International Corp., 6.25%, 03/01/2012 144A | | | | 450,000 | | | | 429,750 |
| Terex Corp., 7.375%, 01/15/2014 | | | | 430,000 | | | | 442,900 |
| Toro Co., 7.80%, 06/15/2027 | | | | 500,000 | | | | 600,527 |
| |
|
| | | | | | | | | | | 2,370,177 |
| |
|
| Road & Rail 0.4% | | | | | | | | | | |
| Progress Rail Services Corp., 7.75%, 04/01/2012 144A | | | | 850,000 | | | | 845,750 |
| Union Pacific Corp., 6.625%, 02/01/2029 | | | | 500,000 | | | | 577,195 |
| |
|
| | | | | | | | | | | 1,422,945 |
| |
|
| Trading Companies & Distributors 1.1% | | | | | | | | |
| Hughes Supply, Inc., 5.50%, 10/15/2014 144A | | | | 4,000,000 | | | | 4,004,060 |
| |
|
| INFORMATION TECHNOLOGY 0.3% | | | | | | | | |
| IT Services 0.3% | | | | | | | | | | |
| Unisys Corp., 6.875%, 03/15/2010 | | | | 950,000 | | | | 935,750 |
| |
|
See Notes to Financial Statements
17
SCHEDULE OF INVESTMENTS continued
May 31, 2005 (unaudited)
| | | Principal | | | | |
| | | Amount | | | | Value |
|
| CORPORATE BONDS continued | | | | | | |
| MATERIALS 3.7% | | | | | | |
| Chemicals 1.2% | | | | | | |
| Equistar Chemicals LP, 10.625%, 05/01/2011 | | $ 1,100,000 | | $ | | 1,218,250 |
| Huntsman Advanced Materials LLC: | | | | | | |
| 11.00%, 07/15/2010 144A | | 288,000 | | | | 329,760 |
| 11.625%, 10/15/2010 | | 231,000 | | | | 266,805 |
| Lyondell Chemical Co.: | | | | | | |
| 9.50%, 12/15/2008 | | 395,000 | | | | 421,662 |
| 10.50%, 06/01/2013 | | 450,000 | | | | 515,813 |
| Millenium America, Inc., 9.25%, 06/15/2008 | | 950,000 | | | | 1,028,375 |
| Scotts Co., 6.625%, 11/15/2013 | | 700,000 | | | | 710,500 |
| |
|
| | | | | | | 4,491,165 |
| |
|
| Containers & Packaging 0.6% | | | | | | |
| Jefferson Smurfit Corp., 7.50%, 06/01/2013 | | 200,000 | | | | 188,000 |
| Owens-Brockway Glass Containers, Inc., 6.75%, 12/01/2014 | | 450,000 | | | | 456,750 |
| Plastipak Holdings, Inc., 10.75%, 09/01/2011 | | 375,000 | | | | 411,563 |
| Rock-Tenn Co., 8.20%, 08/15/2011 | | 500,000 | | | | 505,000 |
| Sealed Air Corp., 6.875%, 07/15/2033 144A | | 500,000 | | | | 542,846 |
| |
|
| | | | | | | 2,104,159 |
| |
|
| Metals & Mining 0.8% | | | | | | |
| Alaska Steel Corp., 7.75%, 06/15/2012 | | 900,000 | | | | 821,250 |
| Century Aluminum Co., 7.50%, 08/15/2014 | | 450,000 | | | | 443,250 |
| Foundation Pennsylvania Coal Co., 7.25%, 08/01/2014 | | 300,000 | | | | 310,500 |
| Freeport-McMoRan Copper & Gold, Inc., 10.125%, 02/01/2010 | | 400,000 | | | | 444,000 |
| United States Steel Corp., 10.75%, 08/01/2008 | | 924,000 | | | | 1,048,740 |
| |
|
| | | | | | | 3,067,740 |
| |
|
| Paper & Forest Products 1.1% | | | | | | |
| Boise Cascade LLC, 7.125%, 10/15/2014 144A | | 730,000 | | | | 698,975 |
| Bowater, Inc., 6.50%, 06/15/2013 | | 400,000 | | | | 382,000 |
| Buckeye Technologies, Inc., 8.50%, 10/01/2013 | | 450,000 | | | | 468,000 |
| Georgia Pacific Corp., 8.125%, 05/15/2011 | | 700,000 | | | | 792,750 |
| International Paper Co., 6.875%, 04/15/2029 | | 790,000 | | | | 896,155 |
| Weyerhaeuser Co., 7.95%, 03/15/2025 | | 547,000 | | | | 656,237 |
| |
|
| | | | | | | 3,894,117 |
| |
|
| TELECOMMUNICATION SERVICES 3.7% | | | | | | |
| Diversified Telecommunication Services 3.4% | | | | | | |
| BellSouth Corp., 4.75%, 11/15/2012 | | 4,000,000 | | | | 4,017,092 |
| Citizens Communications Co., 6.25%, 01/15/2013 | | 950,000 | | | | 921,500 |
| GTE Corp., 7.90%, 02/01/2027 | | 1,000,000 | | | | 1,088,702 |
| Insight Midwest LP, 10.50%, 11/01/2010 | | 575,000 | | | | 615,250 |
| New York Telephone Co., 6.70%, 11/01/2023 | | 4,000,000 | | | | 4,196,328 |
| Qwest Communications International, Inc., 7.875%, 09/01/2011 144A | | 415,000 | | | | 432,637 |
| Telus Corp., 8.00%, 06/01/2011 | | 500,000 | | | | 583,881 |
| Verizon Communications, Inc., 6.875%, 10/01/2023 | | 400,000 | | | | 408,302 |
| |
|
| | | | | | | 12,263,692 |
| |
|
See Notes to Financial Statements
18
SCHEDULE OF INVESTMENTS continued
May 31, 2005 (unaudited)
| | | | | | | | | Principal | | | | |
| | | | | | | | | Amount | | | | Value |
|
| CORPORATE BONDS continued | | | | | | | | |
| TELECOMMUNICATION SERVICES continued | | | | | | | | |
| Wireless Telecommunication Services 0.3% | | | | | | | | |
| Cingular Wireless, 8.125%, 05/01/2012 | | $ | | 800,000 | | $ | | 958,426 |
| Nextel Communications, Inc., 5.95%, 03/15/2014 | | | | 200,000 | | | | 205,500 |
| Rural Cellular Co., 8.25%, 03/15/2012 | | | | 35,000 | | | | 35,963 |
| |
|
| | | | | | | | | | | | | 1,199,889 |
| |
|
| UTILITIES 2.4% | | | | | | | | | | | | |
| Electric Utilities 1.0% | | | | | | | | | | | | |
| Niagara Mohawk Power Corp., 9.75%, 11/01/2005 | | | | 2,494,000 | | | | 2,553,829 |
| Progress Energy, Inc., 6.85%, 04/15/2012 | | | | 500,000 | | | | 551,607 |
| Reliant Energy, Inc., 6.75%, 12/15/2014 | | | | 450,000 | | | | 430,875 |
| |
|
| | | | | | | | | | | | | 3,536,311 |
| |
|
| Independent Power Producers & Energy Traders 0.2% | | | | | | | | |
| Black Hills Corp., 6.50%, 05/15/2013 | | | | 500,000 | | | | 526,041 |
| NRG Energy, Inc., 8.00%, 12/15/2013 144A | | | | 137,000 | | | | 145,220 |
| |
|
| | | | | | | | | | | | | 671,261 |
| |
|
| Multi-Utilities 1.2% | | | | | | | | | | | | |
| Dominion Resources Capital Trust I, 7.83%, 12/01/2027 | | | | 500,000 | | | | 560,649 |
| Dominion Resources Capital Trust III, 8.40%, 01/15/2031 | | | | 3,000,000 | | | | 3,973,485 |
| |
|
| | | | | | | | | | | | | 4,534,134 |
| |
|
| Total Corporate Bonds (cost $287,554,696) | | | | | | | | 296,707,170 |
| |
|
| MUNICIPAL OBLIGATIONS 0.2% | | | | | | | | |
| HOUSING 0.2% | | | | | | | | | | | | |
| Virginia HDA RB, Ser. J, 6.75%, 12/01/2021 (cost $538,378) | | | | 500,000 | | | | 544,870 |
| |
|
| WHOLE LOAN SUBORDINATE COLLATERALIZED | | | | | | | | |
| MORTGAGE OBLIGATIONS 0.2% | | | | | | | | |
| Financial Asset Securitization, Inc., Ser. 1997-NAM2, Class B-2, 7.88%, | | | | | | | | |
| 07/25/2027 (cost $831,279) | | | | | | | | 809,215 | | | | 808,858 |
| |
|
| YANKEE OBLIGATIONS - CORPORATE 14.0% | | | | | | | | |
| CONSUMER DISCRETIONARY 0.3% | | | | | | | | |
| Hotels, Restaurants & Leisure 0.1% | | | | | | | | |
| Intrawest Corp., 7.50%, 10/15/2013 | | | | 450,000 | | | | 456,750 |
| |
|
| Media 0.2% | | | | | | | | | | | | |
| Rogers Cable, Inc., 5.50%, 03/15/2014 | | | | 750,000 | | | | 708,750 |
| |
|
| CONSUMER STAPLES 1.3% | | | | | | | | | | |
| Beverages 1.2% | | | | | | | | | | | | |
| Companhia Brasileira De Bebidas, 10.50%, 12/15/2011 | | | | 3,500,000 | | | | 4,296,250 |
| |
|
| Food & Staples Retailing 0.1% | | | | | | | | |
| The Jean Coutu Group (PJC), Inc., 8.50%, 08/01/2014 | | | | 375,000 | | | | 366,562 |
| |
|
See Notes to Financial Statements
19
SCHEDULE OF INVESTMENTS continued
May 31, 2005 (unaudited)
| | | | | Principal | | | | |
| | | | | Amount | | | | Value |
|
| YANKEE OBLIGATIONS - CORPORATE continued | | | | | | | | |
| FINANCIALS 7.3% | | | | | | | | |
| Commercial Banks 5.2% | | | | | | | | |
| Banco Bradesco SA, 8.75%, 10/24/2013 | | $ | | 750,000 | | $ | | 817,500 |
| Barclays Bank plc, 8.55%, 09/29/2049 144A | | | | 4,000,000 | | | | 4,812,208 |
| Royal Bank of Scotland Group plc: | | | | | | | | |
| 2.94%, 12/29/2049 FRN | | | | 4,000,000 | | | | 3,517,616 |
| 9.12%, 03/31/2049 | | | | 5,000,000 | | | | 5,984,205 |
| Standard Chartered plc, 3.625%, 07/29/2049 | | | | 5,000,000 | | | | 3,895,750 |
| |
|
| | | | | | | | | 19,027,279 |
| |
|
| Diversified Financial Services 0.6% | | | | | | | | |
| Preferred Term Securities, Ltd., FRN, 4.60%, 06/24/2034 144A | | | | 2,000,000 | | | | 2,026,760 |
| |
|
| Insurance 1.5% | | | | | | | | |
| Montpelier Re Holdings, Ltd., 6.125%, 08/15/2013 | | | | 5,000,000 | | | | 5,276,095 |
| |
|
| INDUSTRIALS 0.3% | | | | | | | | |
| Industrial Conglomerates 0.3% | | | | | | | | |
| Tyco International Group SA: | | | | | | | | |
| 6.375%, 10/15/2011 | | | | 500,000 | | | | 549,338 |
| 7.00%, 06/15/2028 | | | | 500,000 | | | | 599,118 |
| |
|
| | | | | | | | | 1,148,456 |
| |
|
| INFORMATION TECHNOLOGY 0.1% | | | | | | | | |
| Electronic Equipment & Instruments 0.1% | | | | | | | | |
| Celestica, Inc., 7.875%, 07/01/2011 | | | | 210,000 | | | | 219,450 |
| |
|
| MATERIALS 0.4% | | | | | | | | |
| Containers & Packaging 0.2% | | | | | | | | |
| Norampac, Inc., 6.75%, 06/01/2013 | | | | 650,000 | | | | 643,500 |
| |
|
| Metals & Mining 0.2% | | | | | | | | |
| Novelis, Inc., 7.25%, 02/15/2015 144A | | | | 865,000 | | | | 852,025 |
| |
|
| Paper & Forest Products 0.0% | | | | | | | | |
| Millar Western Forest Products, Ltd., 7.75%, 11/15/2013 | | | | 45,000 | | | | 41,175 |
| |
|
| TELECOMMUNICATION SERVICES 3.1% | | | | | | | | |
| Diversified Telecommunication Services 2.9% | | | | | | | | |
| British Telecommunications plc, 8.375%, 12/15/2010 | | | | 750,000 | | | | 887,396 |
| Deutsche Telekom, 8.50%, 06/15/2010 | | | | 4,000,000 | | | | 4,666,780 |
| France Telecom SA, 8.75%, 03/01/2031 | | | | 1,000,000 | | | | 1,394,833 |
| Telecom Italia Capital Corp., Ser. B, 5.25%, 11/15/2013 | | | | 500,000 | | | | 507,104 |
| Telefonos De Mexico SA, 5.50%, 01/27/2015 144A | | | | 3,000,000 | | | | 2,995,935 |
| |
|
| | | | | | | | | 10,452,048 |
| |
|
| Wireless Telecommunication Services 0.2% | | | | | | | | |
| Rogers Wireless, Inc., 6.375%, 03/01/2014 | | | | 175,000 | | | | 175,000 |
| Vodafone Group plc, 7.75%, 02/15/2010 | | | | 700,000 | | | | 799,224 |
| |
|
| | | | | | | | | 974,224 |
| |
|
See Notes to Financial Statements
20
SCHEDULE OF INVESTMENTS continued
May 31, 2005 (unaudited)
| | | | | | | Principal | | | | |
| | | | | | | Amount | | | | Value |
|
| YANKEE OBLIGATIONS - CORPORATE continued | | | | | | |
| UTILITIES 1.2% | | | | | | | | | | |
| Electric Utilities 1.2% | | | | | | | | | | |
| Transalta Corp., 5.75%, 12/15/2013 | | | | $ 3,962,591 | | $ | | 4,197,460 |
| |
|
| Total Yankee Obligations-Corporate (cost $49,535,060) | | | | | | 50,686,784 |
| | |
|
|
| | | | | | | Shares | | | | Value |
|
| PREFERRED STOCKS 4.1% | | | | | | | | | | |
| FINANCIALS 3.3% | | | | | | | | | | |
| Capital Markets 1.4% | | | | | | | | | | |
| Lehman Brothers, Inc. | | | | | | 200,000 | | | | 5,043,760 |
| |
|
| Diversified Financial Services 1.1% | | | | | | | | |
| Zurich Regcaps Funding Trust V | | | | | | 4,000 | | | | 3,903,750 |
| |
|
| Thrifts & Mortgage Finance 0.8% | | | | | | | | |
| Fannie Mae | | | | | | 55,000 | | | | 3,088,596 |
| |
|
| TELECOMMUNICATION SERVICES 0.2% | | | | | | |
| Diversified Telecommunication Services 0.2% | | | | | | |
| Centaur Funding Corp. | | | | | | 500 | | | | 678,125 |
| |
|
| UTILITIES 0.6% | | | | | | | | | | |
| Electric Utilities 0.6% | | | | | | | | | | |
| Southern California Edison | | | | | | 20,000 | | | | 2,034,376 |
| |
|
| Total Preferred Stocks (cost $14,489,933) | | | | | | 14,748,607 |
| | |
|
|
| | | | | | | Principal | | | | |
| | | | | | | Amount | | | | Value |
|
| SHORT-TERM INVESTMENTS 0.1% | | | | | | | | |
| U.S. TREASURY OBLIGATIONS 0.1% | | | | | | | | |
| U.S. Treasury Bills, 3.09%, 11/10/2005 + ƒ (cost $493,048) | | $ 500,000 | | | | 493,048 |
| |
|
| Total Investments (cost $375,104,059) 106.5% | | | | | | 385,796,401 |
| Other Assets and Liabilities (6.5%) | | | | | | | | (23,455,914) |
| |
|
| Net Assets 100.0% | | | | | | | | $ | | 362,340,487 |
| |
|
| 144A | | Security that may be sold to qualified institutional buyers under Rule 144A of the Securities Act of 1933, as amended. |
| | | This security has been determined to be liquid under guidelines established by the Board of Trustees, unless otherwise |
| | | noted. |
| (h) | | Security is valued at fair value as determined in good faith under procedures established by the Board of Trustees. |
| # | | When-issued or delayed delivery security |
| ## | | All or a portion of this security has been segregated for when-issued or delayed delivery securities. |
| + | | Rate shown represents the yield to maturity at date of purchase. |
| ƒ | | All or a portion of this security was pledged to cover initial margin requirements for open futures contracts. |
See Notes to Financial Statements
21
SCHEDULE OF INVESTMENTS continued
May 31, 2005 (unaudited)
| Summary of Abbreviations |
| CDO | | Collateralized Debt Obligation |
| FHLMC | | Federal Home Loan Mortgage Corp. |
| FNMA | | Federal National Mortgage Association |
| FRN | | Floating Rate Note |
| GNMA | | Government National Mortgage Association |
| HDA | | Housing Development Authority |
| RB | | Revenue Bond |
| REIT | | Real Estate Investment Trust |
| The following table shows the percent of total bonds by credit quality based on Moody’s and Standard & Poor’s ratings as of |
| May 31, 2005: | | | |
| AAA | | 2.7% | |
| AA | | 3.0% | |
| A | | 26.5% | |
| BBB | | 45.7% | |
| BB | | 8.9% | |
| B | | 8.9% | |
| NR | | 4.3% | |
| |
| |
| | | 100.0% | |
| | |
| |
| |
| The following table shows the percent of total bonds by maturity as of May 31, 2005: |
| Less than 1 year | | 3.5% | |
| 1 to 3 year(s) | | 4.9% | |
| 3 to 5 years | | 9.9% | |
| 5 to 10 years | | 46.0% | |
| 10 to 20 years | | 11.3% | |
| 20 to 30 years | | 21.7% | |
| 30+ years | | 2.7% | |
| |
| |
| | | 100.0% | |
| | |
| |
See Notes to Financial Statements
22
STATEMENT OF ASSETS AND LIABILITIES
May 31, 2005 (unaudited)
| Assets | | | | |
| Investments in securities, at value (cost $375,104,059) | | $ | | 385,796,401 |
| Principal paydown receivable | | | | 1,790 |
| Receivable for Fund shares sold | | | | 106,753 |
| Interest receivable | | | | 6,990,879 |
| Receivable for securities lending income | | | | 558 |
| Prepaid expenses and other assets | | | | 199,717 |
|
| Total assets | | | | 393,096,098 |
|
| Liabilities | | | | |
| Dividends payable | | | | 554,736 |
| Payable for securities purchased | | | | 3,676,672 |
| Payable for Fund shares redeemed | | | | 24,111,858 |
| Payable for daily variation margin on open futures contracts | | | | 78,750 |
| Due to custodian bank | | | | 2,201,434 |
| Advisory fee payable | | | | 2,050 |
| Distribution Plan expenses payable | | | | 3,446 |
| Due to other related parties | | | | 1,907 |
| Accrued expenses and other liabilities | | | | 124,758 |
|
| Total liabilities | | | | 30,755,611 |
|
| Net assets | | $ | | 362,340,487 |
|
| Net assets represented by | | | | |
| Paid-in capital | | $ | | 362,592,611 |
| Overdistributed net investment income | | | | (2,165,276) |
| Accumulated net realized losses on investments | | | | (8,608,134) |
| Net unrealized gains on investments | | | | 10,521,286 |
|
| Total net assets | | $ | | 362,340,487 |
|
| Net assets consists of | | | | |
| Class A | | $ | | 246,002,280 |
| Class B | | | | 21,648,430 |
| Class C | | | | 31,117,006 |
| Class I | | | | 63,572,771 |
|
| Total net assets | | $ | | 362,340,487 |
|
| Shares outstanding (unlimited number of shares authorized) | | | | |
| Class A | | | | 16,432,665 |
| Class B | | | | 1,446,115 |
| Class C | | | | 2,078,971 |
| Class I | | | | 4,247,012 |
|
| Net asset value per share | | | | |
| Class A | | $ | | 14.97 |
| Class A — Offering price (based on sales charge of 4.75%) | | $ | | 15.72 |
| Class B | | $ | | 14.97 |
| Class C | | $ | | 14.97 |
| Class I | | $ | | 14.97 |
|
See Notes to Financial Statements
23
STATEMENT OF OPERATIONS
Six Months Ended May 31, 2005 (unaudited)
| Investment income | | | | |
| Interest (net of foreign withholding taxes of $273) | | $ | | 3,376,859 |
| Dividends | | | | 19,150 |
| Income from affiliates | | | | 5,802 |
|
| Total investment income | | | | 3,401,811 |
|
| Expenses | | | | |
| Advisory fee | | | | 351,036 |
| Distribution Plan expenses | | | | |
| Class A | | | | 18,077 |
| Class B | | | | 5,294 |
| Class C | | | | 7,629 |
| Administrative services fee | | | | 9,675 |
| Transfer agent fees | | | | 17,800 |
| Trustees’ fees and expenses | | | | 33,622 |
| Printing and postage expenses | | | | 24,701 |
| Custodian and accounting fees | | | | 15,679 |
| Registration and filing fees | | | | 917 |
| Professional fees | | | | 33,522 |
| Other | | | | 7,458 |
|
| Total expenses | | | | 525,410 |
| Less: Expense reductions | | | | (579) |
| Fee waivers | | | | (21,129) |
|
| Net expenses | | | | 503,702 |
|
| Net investment income | | | | 2,898,109 |
|
| Net realized and unrealized gains or losses on investments | | | | |
| Net realized gains or losses on: | | | | |
| Securities | | | | 53,691 |
| Futures contracts | | | | (376,175) |
|
| Net realized losses on investments | | | | (322,484) |
| Net change in unrealized gains or losses on investments | | | | 3,327,024 |
|
| Net realized and unrealized gains or losses on investments | | | | 3,004,540 |
|
| Net increase in net assets resulting from operations | | $ | | 5,902,649 |
|
See Notes to Financial Statements
24
STATEMENTS OF CHANGES IN NET ASSETS
| | | Six Months Ended | | | | |
| | | May 31, 2005 | | Year Ended |
| | | (unaudited) (a) | | November 30, 2004 (a) |
|
| Operations | | | | | | | | |
| Net investment income | | $ | | 2,898,109 | | $ | | 5,927,000 |
| Net realized gains or losses on | | | | | | | | |
| investments | | | | (322,484) | | | | 650,032 |
| Net change in unrealized gains or losses | | | | | | | | |
| on investments | | | | 3,327,024 | | | | (519,723) |
|
| Net increase in net assets resulting | | | | | | | | |
| from operations | | | | 5,902,649 | | | | 6,057,309 |
|
| Distributions to shareholders from | | | | | | | | |
| Net investment income | | | | | | | | |
| Class A | | | | (326,102) | | | | 0 |
| Class B | | | | (24,973) | | | | 0 |
| Class C | | | | (36,015) | | | | 0 |
| Class I | | | | (2,889,404) | | | | (6,100,208) |
| Tax basis return of capital | | | | | | | | |
| Class I | | | | (920,323) | | | | 0 |
|
| Total distributions to shareholders | | | | (4,196,817) | | | | (6,100,208) |
|
| | | Shares | | | | Shares | | |
| Capital share transactions | | | | | | | | |
| Proceeds from shares sold | | | | | | | | |
| Class A | | 30,573 | | 457,294 | | 0 | | 0 |
| Class B | | 4,807 | | 71,716 | | 0 | | 0 |
| Class C | | 4,447 | | 66,447 | | 0 | | 0 |
| Class I | | 6,718 | | 100,518 | | 0 | | 0 |
|
| | | | | 695,975 | | | | 0 |
|
| Net asset value of shares issued in | | | | | | | | |
| reinvestment of distributions | | | | | | | | |
| Class A | | 21,784 | | 326,102 | | 0 | | 0 |
| Class B | | 1,668 | | 24,973 | | 0 | | 0 |
| Class C | | 2,405 | | 36,015 | | 0 | | 0 |
| Class I | | 3,173 | | 47,509 | | 0 | | 0 |
|
| | | | | 434,599 | | | | 0 |
|
| Payment for shares redeemed | | | | | | | | |
| Class A | | (57,383) | | (855,034) | | 0 | | 0 |
| Class B | | (1,301) | | (19,411) | | 0 | | 0 |
| Class C | | (13,070) | | (194,637) | | 0 | | 0 |
| Class I | | (2,376,390) | | (35,495,413) | | 0 | | 0 |
|
| | | | | (36,564,495) | | | | 0 |
|
| Net asset value of shares issued in | | | | | | | | |
| acquisition | | | | | | | | |
| Class A | | 16,437,691 | | 243,734,394 | | 0 | | 0 |
| Class B | | 1,440,941 | | 21,365,593 | | 0 | | 0 |
| Class C | | 2,085,189 | | 30,912,915 | | 0 | | 0 |
| Class I | | 190,270 | | 2,821,118 | | 0 | | 0 |
|
| | | | | 298,834,020 | | | | 0 |
|
| Net increase in net assets resulting from | | | | | | | | |
| capital share transactions | | | | 263,400,099 | | | | 0 |
|
| Total increase (decrease) in net assets | | | | 265,105,931 | | | | (42,899) |
| Net assets | | | | | | | | |
| Beginning of period | | | | 97,234,556 | | | | 97,277,455 |
|
| End of period | | $ 362,340,487 | | $ | | 97,234,556 |
|
| Undistributed (overdistributed) | | | | | | | | |
| net investment income | | $ | | (2,165,276) | | $ | | 0 |
|
(a) Effective at the close of business on May 20, 2005, the Fund acquired the net assets of Vestaur Securities Fund. Vestaur Securities Fund became the accounting and performance survivor in this transaction. The information above for the periods prior to May 23, 2005 is that of Vestaur Securities Fund. The capital share activity for Class I has been restated to give effect to this transaction.
See Notes to Financial Statements
25
NOTES TO FINANCIAL STATEMENTS (unaudited)
1. ORGANIZATION
Evergreen Diversified Bond Fund (the “Fund”) is a diversified series of Evergreen Fixed Income Trust (the “Trust”), a Delaware statutory trust organized on September 18, 1997. The Trust is an open-end management investment company registered under the Investment Company Act of 1940, as amended (the “1940 Act”).
The Fund offers Class A, Class B, Class C and Institutional (“Class I”) shares. Class A shares are sold with a front-end sales charge. However, Class A share investments of $1 million or more are not subject to a front-end sales charge but will be subject to a contingent deferred sales charge of 1.00% upon redemption within one year. Class B shares are sold without a front-end sales charge but are subject to a contingent deferred sales charge that is payable upon redemption and decreases depending on how long the shares have been held. Class C shares are sold without a front-end sales charge but are subject to a contingent deferred sales charge that is payable upon redemption within one year. Class I shares are sold without a front-end sales charge or contingent deferred sales charge. Each class of shares, except Class I shares, pays an ongoing distribution fee.
Effective at the close of business on May 20, 2005, the Fund acquired the net assets of Vestaur Securities Fund, a diversified closed-end management investment company, in a tax-free exchange for Class I shares of the Fund. Vestaur Securities Fund became the accounting and performance survivor in this transaction. As a result, the accounting and performance history of Vestaur Securities Fund has been carried forward in the financial statements herein. In addition, since Class A, Class B and Class C shares of Vestaur Securities Fund did not exist prior to the reorganization, the accounting and performance information of these respective classes of shares of the Fund reflects the commencement of operations on May 20, 2005.
2. SIGNIFICANT ACCOUNTING POLICIES
The following is a summary of significant accounting policies consistently followed by the Fund in the preparation of its financial statements. The policies are in conformity with generally accepted accounting principles in the United States of America, which require management to make estimates and assumptions that affect amounts reported herein. Actual results could differ from these estimates.
a. Valuation of investments
Portfolio debt securities acquired with more than 60 days to maturity are fair valued using matrix pricing methods determined by an independent pricing service which takes into consideration such factors as similar security prices, yields, maturities, liquidity and ratings. Securities for which valuations are not readily available from an independent pricing service may be valued by brokers which use prices provided by market makers or estimates of market value obtained from yield data relating to investments or securities with similar characteristics.
Listed equity securities are usually valued at the last sales price or official closing price on the national securities exchange where the securities are principally traded.
26
NOTES TO FINANCIAL STATEMENTS (unaudited) continued
Short-term securities with remaining maturities of 60 days or less at the time of purchase are valued at amortized cost, which approximates market value.
Investments in other mutual funds are valued at net asset value. Securities for which market quotations are not readily available or not reflective of current market value are valued at fair value as determined in good faith, according to procedures approved by the Board of Trustees.
b. Repurchase agreements
Securities pledged as collateral for repurchase agreements are held by the custodian bank or in a segregated account in the Fund’s name until the agreements mature. Each agreement requires that the market value of the collateral be sufficient to cover payments of interest and principal. However, in the event of default or bankruptcy by the other party to the agreement, retention of the collateral may be subject to legal proceedings. The Fund will only enter into repurchase agreements with banks and other financial institutions, which are deemed by the investment advisor to be creditworthy pursuant to guidelines established by the Board of Trustees.
c. Foreign currency translation
All assets and liabilities denominated in foreign currencies are translated into U.S. dollar amounts at the date of valuation. Purchases and sales of portfolio securities and income items denominated in foreign currencies are translated into U.S. dollar amounts on the respective dates of such transactions. The Fund does not separately account for that portion of the results of operations resulting from changes in foreign exchange rates on investments and the fluctuations arising from changes in market prices of securities held. Such fluctuations are included with the net realized and unrealized gains or losses on securities.
d. Futures contracts
In order to gain exposure to or protect against changes in security values, the Fund may buy and sell futures contracts. The primary risks associated with the use of futures contracts are the imperfect correlation between changes in market values of securities held by the Fund and the prices of futures contracts, and the possibility of an illiquid market.
Futures contracts are valued based upon their quoted daily settlement prices. The aggregate principal amounts of the contracts are not recorded in the financial statements. Fluctuations in the value of the contracts are recorded in the Statement of Assets and Liabilities as an asset or liability and in the Statement of Operations as unrealized gains or losses until the contracts are closed, at which point they are recorded as net realized gains or losses on futures contracts.
e. When-issued and delayed delivery transactions
The Fund records when-issued or delayed delivery securities as of trade date and maintains security positions such that sufficient liquid assets will be available to make payment for the securities purchased. Securities purchased on a when-issued or delayed delivery basis are marked-to-market daily and begin earning interest on the settlement date. Losses may occur on these transactions due to changes in market conditions or the failure of counterparties to perform under the contract.
27
NOTES TO FINANCIAL STATEMENTS (unaudited) continued
f. Securities lending
The Fund may lend its securities to certain qualified brokers in order to earn additional income. The Fund receives compensation in the form of fees or interest earned on the investment of any cash collateral received. The Fund also continues to receive interest and dividends on the securities loaned. The Fund receives collateral in the form of cash or securities with a market value at least equal to the market value of the securities on loan, including accrued interest. In the event of default or bankruptcy by the borrower, the Fund could experience delays and costs in recovering the loaned securities or in gaining access to the collateral. The Fund has the right under the lending agreement to recover the securities from the borrower on demand.
g. Security transactions and investment income
Security transactions are recorded on trade date. Realized gains and losses are computed using the specific cost of the security sold. Interest income is recorded on the accrual basis and includes accretion of discounts and amortization of premiums. Dividend income is recorded on the ex-dividend date. Foreign income and capital gains realized on some securities may be subject to foreign taxes, which are accrued as applicable.
h. Federal taxes
The Fund intends to continue to qualify as a regulated investment company and distribute all of its taxable income, including any net capital gains (which have already been offset by available capital loss carryovers). Accordingly, no provision for federal taxes is required.
i. Distributions
Distributions to shareholders from net investment income are accrued daily and paid monthly. Distributions from net realized gains, if any, are recorded on the ex-dividend date. Such distributions are determined in conformity with income tax regulations, which may differ from generally accepted accounting principles.
j. Class allocations
Income, common expenses and realized and unrealized gains and losses are allocated to the classes based on the relative net assets of each class. Distribution fees, if any, are calculated daily at the class level based on the appropriate net assets of each class and the specific expense rates applicable to each class.
3. ADVISORY FEE AND OTHER TRANSACTIONS WITH AFFILIATES
Evergreen Investment Management Company, LLC (“EIMC”), an indirect, wholly-owned subsidiary of Wachovia Corporation (“Wachovia”), is the investment advisor to the Fund and is paid a fee at an annual rate of 2% of the Fund’s gross investment income plus an amount determined by applying percentage rates to the average daily net assets of the Fund, starting at 0.31% and declining to 0.16% as average daily net assets increase. Prior to May 23, 2005, Vestaur Securities Fund, the accounting and performance survivor, paid EIMC an annual fee of 0.50% of its average monthly net assets plus 2.50% of its investment income.
28
NOTES TO FINANCIAL STATEMENTS (unaudited) continued
From time to time, EIMC may voluntarily or contractually waive its fee and/or reimburse expenses in order to limit operating expenses. During the six months ended May 31, 2005, EIMC waived its advisory fee in the amount of $21,129 which represents 0.04% of the Fund’s average daily net assets on an annualized basis.
Evergreen Investment Services, Inc. (“EIS”), an indirect, wholly-owned subsidiary of Wachovia, is the administrator to the Fund. As administrator, EIS provides the Fund with facilities, equipment and personnel and is paid an annual rate determined by applying percentage rates to the aggregate average daily net assets of the Evergreen funds (excluding money market funds), starting at 0.10% and declining to 0.05% as the aggregate average daily net assets of the Evergreen funds (excluding money market funds) increase.
Evergreen Service Company, LLC (“ESC”), an indirect, wholly-owned subsidiary of Wachovia, is the transfer and dividend disbursing agent for the Fund. ESC receives account fees that vary based on the type of account held by the shareholders in the Fund.
4. DISTRIBUTION PLANS
EIS also serves as distributor of the Fund’s shares. The Fund has adopted Distribution Plans, as allowed by Rule 12b-1 of the 1940 Act, for each class of shares, except Class I. Under the Distribution Plans, distribution fees are paid at an annual rate of 0.30% of the average daily net assets for Class A shares and 1.00% of the average daily net assets for each of Class B and Class C shares.
For the period ended May 31, 2005, EIS received $108 from the sale of Class A shares and $14,049 and $255 in contingent deferred sales charges from redemptions of Class B and Class C shares, respectively.
5. ACQUISITION
Effective at the close of business on May 20, 2005, the Fund acquired the net assets of Vestaur Securities Fund in a tax-free exchange for Class I shares of the Fund at an exchange ratio of 0.93. The acquired net assets consisted primarily of portfolio securities with unrealized appreciation of $49,458. The aggregate net assets of the Fund and Vestaur Securities Fund immediately prior to the acquisition were $298,834,020 and $95,236,951, respectively. The aggregate net assets of the Fund immediately after the acquisition were $394,070,971. Vestaur Securities Fund was the accounting and performance survivor in this transaction.
6. SECURITIES TRANSACTIONS
Cost of purchases and proceeds from sales of investment securities (excluding short-term securities) were as follows for the six months ended May 31, 2005:
| | | Cost of Purchases | | | | Proceeds from Sales |
|
| | | U.S. | | Non-U.S. | | | | U.S. | | Non-U.S. |
| | | Government | | Government | | | | Government | | Government |
|
| $ | | 620,111 | | $ 28,567,328 | | $ | | 0 | | $ 21,468,488 |
|
29
NOTES TO FINANCIAL STATEMENTS (unaudited) continued
At May 31, 2005, the Fund had open short futures contracts outstanding as follows:
| | | | | Initial Contract | | Value at | | Unrealized |
| Expiration | | Contracts | | Amount | | May 31, 2005 | | Loss |
| |
|
| July 2005 | | 180 U.S. Treasury | | $ 20,216,756 | | $ 20,387,812 | | $ 171,056 |
| | | Notes Futures | | | | | | |
|
On May 31, 2005, the aggregate cost of securities for federal income tax purposes was $375,246,262. The gross unrealized appreciation and depreciation on securities based on tax cost was $13,998,556 and $3,448,417, respectively, with a net unrealized appreciation of $10,550,139.
As of November 30, 2004, the Fund had $8,229,814 in capital loss carryovers for federal income tax purposes expiring as follows:
| Expiration |
|
| | | 2007 | | | | 2008 | | | | 2009 | | 2010 |
|
| $ | | 297,773 | | $ | | 1,451,536 | | $ | | 3,049,670 | | $ 3,430,835 |
|
7. INTERFUND LENDING
Pursuant to an Exemptive Order issued by the SEC, the Fund may participate in an interfund lending program with certain funds in the Evergreen fund family. This program allows the Fund to borrow from, or lend money to, other participating funds. During the six months ended May 31, 2005, the Fund did not participate in the interfund lending program.
8. EXPENSE REDUCTIONS
Through expense offset arrangements with ESC and the Fund’s custodian, a portion of fund expenses has been reduced.
9. DEFERRED TRUSTEES’ FEES
Each Trustee of the Fund may defer any or all compensation related to performance of their duties as Trustees. The Trustees’ deferred balances are allocated to deferral accounts, which are included in the accrued expenses for the Fund. The investment performance of the deferral accounts are based on the investment performance of certain Evergreen funds. Any gains earned or losses incurred in the deferral accounts are reported in the Fund’s Trustees’ fees and expenses. At the election of the Trustees, the deferral account will be paid either in one lump sum or in quarterly installments for up to ten years.
10. FINANCING AGREEMENT
The Fund and certain other Evergreen funds share in a $150 million unsecured revolving credit commitment for temporary and emergency purposes, including the funding of redemptions, as permitted by each participating fund’s borrowing restrictions. Borrowings under this facility bear interest at 0.50% per annum above the Federal Funds rate. All of the participating funds are charged an annual commitment fee of 0.09% of the unused balance, which is allocated pro rata. During the six months ended May 31, 2005, the Fund had no borrowings under this agreement.
30
NOTES TO FINANCIAL STATEMENTS (unaudited) continued
11. CONCENTRATION OF RISK
The Fund may invest a substantial portion of its assets in an industry or sector and, therefore, may be more affected by changes in that industry or sector than would be a comparable mutual fund that is not heavily weighted in any industry or sector.
12. REGULATORY MATTERS AND LEGAL PROCEEDINGS
Since September 2003, governmental and self-regulatory authorities have instituted numerous ongoing investigations of various practices in the mutual fund industry, including investigations relating to revenue sharing, market-timing, late trading and record retention, among other things. The investigations cover investment advisors, distributors and transfer agents to mutual funds, as well as other firms. EIMC, EIS and ESC (collectively, “Evergreen”) have received subpoenas and other requests for documents and testimony relating to these investigations, are endeavoring to comply with those requests, and are cooperating with the investigations. Evergreen is continuing its own internal review of policies, practices, procedures and personnel, and is taking remedial action where appropriate.
In connection with one of these investigations, on July 28, 2004, the staff of the Securities and Exchange Commission (“SEC”) informed Evergreen that the staff intends to recommend to the SEC that it institute an enforcement action against Evergreen. The SEC staff’s proposed allegations relate to (i) an arrangement pursuant to which a broker at one of EIMC’s affiliated broker-dealers had been authorized, apparently by an EIMC officer (no longer with EIMC), to engage in short-term trading, on behalf of a client, in Evergreen Mid Cap Growth Fund (formerly Evergreen Emerging Growth Fund and prior to that, known as Evergreen Small Company Growth Fund) during the period from December 2000 through April 2003, in excess of the limitations set forth in the fund’s prospectus, (ii) short-term trading from September 2001 through January 2003, by a former Evergreen portfolio manager, of Evergreen Precious Metals Fund, a fund he managed at the time, (iii) the sufficiency of systems for monitoring exchanges and enforcing exchange limitations as stated in the fund’s prospectuses, and (iv) the adequacy of e-mail retention practices. In connection with the activity in Evergreen Mid Cap Growth Fund, EIMC reimbursed the fund $378,905, plus an additional $25,242, representing what EIMC calculated at that time to be the client’s net gain and the fees earned by EIMC and the expenses incurred by this fund on the client’s account. In connection with the activity in Evergreen Precious Metals Fund, EIMC reimbursed the fund $70,878, plus an additional $3,075, representing what EIMC calculated at that time to be the portfolio manager’s net gain and the fees earned by EIMC and expenses incurred by the fund on the portfolio manager’s account. Evergreen is currently engaged in discussions with the staff of the SEC concerning its recommendation.
Any resolution of these matters with regulatory authorities may include, but not be limited to, sanctions, penalties or injunctions regarding Evergreen, restitution to mutual fund shareholders and/or other financial penalties and structural changes in the governance or management of Evergreen’s mutual fund business. Any penalties or restitution will be paid by Evergreen and not by the Evergreen funds.
31
NOTES TO FINANCIAL STATEMENTS (unaudited) continued
In addition, the Evergreen funds and EIMC and certain of its affiliates are involved in various legal actions, including private litigation and class action lawsuits. EIMC does not expect that any of such legal actions currently pending or threatened will have a material adverse impact on the financial position or operations of any of the Evergreen funds or on EIMC’s ability to provide services to the Evergreen funds.
Although Evergreen believes that neither the foregoing investigations nor any pending or threatened legal actions will have a material adverse impact on the Evergreen funds, there can be no assurance that these matters and any publicity surrounding or resulting from them will not result in reduced sales or increased redemptions of Evergreen fund shares, which could increase Evergreen fund transaction costs or operating expenses, or have other adverse consequences on the Evergreen funds.
32
ADDITIONAL INFORMATION (unaudited)
On May 20, 2005, Vestaur Securities Fund merged with the Fund. Vestaur Securities Fund became the accounting and performance survivor in this transaction. Prior to the merger, Vestaur Securities Fund paid a distribution of $0.21 per share to its shareholders of record on March 31, 2005, of which $0.188 was from net income and $0.022 was from paid-in capital. In addition, Vestaur Securities Fund paid a distribution of $0.11 per share to its shareholders of record on May 6, 2005, all of which was from paid-in capital. If you were a shareholder of Vestaur Securities Fund at the time of either of these distributions, you will receive in early 2006 a Form 1099-DIV from Vestaur Securities Fund that will inform you of the tax character of these distributions.
33
This page left intentionally blank
34
This page left intentionally blank
35
TRUSTEES AND OFFICERS
TRUSTEES1
| Charles A. Austin III | | Principal occupations: Investment Counselor, Anchor Capital Advisors, Inc. (investment advice); |
| Trustee | | Director, The Andover Companies (insurance); Trustee, Arthritis Foundation of New England; |
| DOB: 10/23/1934 | | Director, The Francis Ouimet Society; Former Director, Health Development Corp. |
| Term of office since: 1991 | | (fitness-wellness centers); Former Director, Mentor Income Fund, Inc.; Former Trustee, |
| | | Mentor Funds and Cash Resource Trust; Former Investment Counselor, Appleton Partners, Inc. |
| Other directorships: None | | (investment advice); Former Director, Executive Vice President and Treasurer, State Street |
| | | Research & Management Company (investment advice) |
|
| Shirley L. Fulton | | Principal occupations: Partner, Tin, Fulton, Greene & Owen, PLLC (law firm); Former Partner, |
| Trustee | | Helms, Henderson & Fulton, P.A. (law firm); Retired Senior Resident Superior Court Judge, |
| DOB: 1/10/1952 | | 26th Judicial District, Charlotte, NC |
| Term of office since: 2004 | | |
| Other directorships: None | | |
|
| K. Dun Gifford | | Principal occupations: Chairman and President, Oldways Preservation and Exchange Trust |
| Trustee | | (education); Trustee, Treasurer and Chairman of the Finance Committee, Cambridge College; |
| DOB: 10/23/1938 | | Former Chairman of the Board, Director, and Executive Vice President, The London Harness |
| Term of office since: 1974 | | Company (leather goods purveyor); Former Director, Mentor Income Fund, Inc.; Former Trustee, |
| | | Mentor Funds and Cash Resource Trust |
| Other directorships: None | | |
|
| Dr. Leroy Keith, Jr. | | Principal occupations: Partner, Stonington Partners, Inc. (private equity firm); Trustee, |
| Trustee | | The Phoenix Group of Mutual Funds; Director, Obagi Medical Products Co.; Director, |
| DOB: 2/14/1939 | | Diversapack Co.; Former Director, Lincoln Educational Services; Former Chairman of the Board |
| Term of office since: 1983 | | and Chief Executive Officer, Carson Products Company (manufacturing); Former Director, |
| | | Mentor Income Fund, Inc.; Former Trustee, Mentor Funds and Cash Resource Trust |
| Other directorships: Trustee, The | | |
| Phoenix Group of Mutual Funds | | |
|
| Gerald M. McDonnell | | Principal occupations: Manager of Commercial Operations, SMI Steel Co. – South Carolina |
| Trustee | | (steel producer); Former Sales and Marketing Manager, Nucor Steel Company; Former Director, |
| DOB: 7/14/1939 | | Mentor Income Fund, Inc.; Former Trustee, Mentor Funds and Cash Resource Trust |
| Term of office since: 1988 | | |
| Other directorships: None | | |
|
| William Walt Pettit | | Principal occupations: Vice President, Kellam & Pettit, P.A. (law firm); Director, Superior |
| Trustee | | Packaging Corp.; Director, National Kidney Foundation of North Carolina, Inc.; Former Director, |
| DOB: 8/26/1955 | | Mentor Income Fund, Inc.; Former Trustee, Mentor Funds and Cash Resource Trust |
| Term of office since: 1984 | | |
| Other directorships: None | | |
|
| David M. Richardson | | Principal occupations: President, Richardson, Runden LLC (executive recruitment business |
| Trustee | | development/consulting company); Consultant, Kennedy Information, Inc. (executive |
| DOB: 9/19/1941 | | recruitment information and research company); Consultant, AESC (The Association of |
| Term of office since: 1982 | | Executive Search Consultants); Director, J&M Cumming Paper Co. (paper merchandising); |
| | | Former Trustee, NDI Technologies, LLP (communications); Former Vice Chairman, DHR |
| Other directorships: None | | International, Inc. (executive recruitment); Former Director, Mentor Income Fund, Inc.; |
| | | Former Trustee, Mentor Funds and Cash Resource Trust |
|
| Dr. Russell A. Salton III | | Principal occupations: President/CEO, AccessOne MedCard; Former Medical Director, |
| Trustee | | Healthcare Resource Associates, Inc.; Former Medical Director, U.S. Health Care/Aetna Health |
| DOB: 6/2/1947 | | Services; Former Director, Mentor Income Fund, Inc.; Former Trustee, Mentor Funds and |
| Term of office since: 1984 | | Cash Resource Trust |
| Other directorships: None | | |
|
36
TRUSTEES AND OFFICERS continued
| Michael S. Scofield | | Principal occupations: Director, Branded Media Corporation (multi-media branding company); |
| Trustee | | Attorney, Law Offices of Michael S. Scofield; Former Director, Mentor Income Fund, Inc.; |
| DOB: 2/20/1943 | | Former Trustee, Mentor Funds and Cash Resource Trust |
| Term of office since: 1984 | | |
| Other directorships: None | | |
|
| Richard J. Shima | | Principal occupations: Independent Consultant; Director, Trust Company of CT; Trustee, |
| Trustee | | Saint Joseph College (CT); Director, Hartford Hospital; Trustee, Greater Hartford YMCA; |
| DOB: 8/11/1939 | | Former Director, Enhance Financial Services, Inc.; Former Director, Old State House Association; |
| Term of office since: 1993 | | Former Director of CTG Resources, Inc. (natural gas); Former Director, Mentor Income Fund, Inc.; |
| Other directorships: None | | Former Trustee, Mentor Funds and Cash Resource Trust |
|
| Richard K. Wagoner, CFA2 | | Principal occupations: Member and Former President, North Carolina Securities Traders |
| Trustee | | Association; Member, Financial Analysts Society; Former Consultant to the Boards of Trustees |
| DOB: 12/12/1937 | | of the Evergreen funds; Former Trustee, Mentor Funds and Cash Resource Trust |
| Term of office since: 1999 | | |
| Other directorships: None | | |
|
| OFFICERS | | |
| Dennis H. Ferro3 | | Principal occupations: President and Chief Executive Officer, Evergreen Investment Company, |
| President | | Inc. and Executive Vice President, Wachovia Bank, N.A.; former Chief Investment Officer, |
| DOB: 6/20/1945 | | Evergreen Investment Company, Inc. |
| Term of office since: 2003 | | |
|
| Carol Kosel4 | | Principal occupations: Senior Vice President, Evergreen Investment Services, Inc. |
| Treasurer | | |
| DOB: 12/25/1963 | | |
| Term of office since: 1999 | | |
|
| Michael H. Koonce4 | | Principal occupations: Senior Vice President and General Counsel, Evergreen Investment |
| Secretary | | Services, Inc.; Senior Vice President and Assistant General Counsel, Wachovia Corporation |
| DOB: 4/20/1960 | | |
| Term of office since: 2000 | | |
|
| James Angelos4 | | Principal occupations: Chief Compliance Officer and Senior Vice President, Evergreen Funds; |
| Chief Compliance Officer | | Former Director of Compliance, Evergreen Investment Services, Inc. |
| DOB: 9/2/1947 | | |
| Term of office since: 2004 | | |
|
1 Each Trustee serves until a successor is duly elected or qualified or until his death, resignation, retirement or removal from office. Each Trustee oversees 89 Evergreen funds. Correspondence for each Trustee may be sent to Evergreen Board of Trustees, P.O. Box 20083, Charlotte, NC 28202.
2 Mr. Wagoner is an “interested person” of the Fund because of his ownership of shares in Wachovia Corporation, the parent to the Fund’s investment advisor.
3 The address of the Officer is 401 S. Tryon Street, 20th Floor, Charlotte, NC 28288.
4 The address of the Officer is 200 Berkeley Street, Boston, MA 02116.
Additional information about the Fund’s Board of Trustees and Officers can be found in the Statement of Additional Information (SAI) and is available upon request without charge by calling 800.343.2898.
37
564353 rv3 7/2005
Item 2 - Code of Ethics
(a) The Registrant has adopted a code of ethics that applies to the Registrant's principal executive officer and principal financial officer.
(b) During the period covered by this report, there were no amendments to the provisions of the code of ethics adopted in 2.(a) above.
(c) During the period covered by this report, there were no implicit or explicit waivers to the provisions of the code of ethics adopted in 2.(a) above.
Item 3 - Audit Committee Financial Expert
Charles A. Austin III and K. Dun Gifford have been determined by the Registrant's Board of Trustees to be audit committee financial experts within the meaning of Section 407 of the Sarbanes-Oxley Act. These financial experts are independent of management.
Items 4 – Principal Accountant Fees and Services
Applicable for annual reports only.
Items 5 – Audit Committee of Listed Registrants
If applicable, not applicable at this time. Applicable for annual reports covering periods ending on or after the compliance date for the listing standards applicable to the particular issuer. Listed issuers must be in compliance with the new listing rules by the earlier of the registrant’s first annual shareholders meeting after January 15, 2004 or October 31, 2004.
Item 6 – Schedule of Investments
Please see schedule of investments contained in the Report to Stockholders included under Item 1 of this Form N-CSR.
Item 7 – Disclosure of Proxy Voting Policies and Procedures for Closed-End Management Investment Companies.
If applicable, not applicable at this time. Applicable for annual reports filed on or after July 1, 2003.
Item 8 - Controls and Procedures
(a) The Registrant's Principal Executive Officer and Principal Financial Officer have evaluated the Registrant's disclosure controls and procedures within 90 days of this filing and have concluded that the Registrant's disclosure controls and procedures were effective, as of that date, in ensuring that information required to be disclosed by the Registrant in this Form N-CSR was recorded, processed, summarized, and reported timely.
(b) There were no significant changes in the Registrant's internal controls or other factors that could significantly affect these controls subsequent to the date of their evaluation, including any corrective actions with regard to significant deficiencies and material weaknesses.
Item 9 - Exhibits
File the exhibits listed below as part of this Form. Letter or number the exhibits in the sequence indicated.
(a) Any code of ethics, or amendment thereto, that is the subject of the disclosure required by Item 2, to the extent that the registrant intends to satisfy the Item 2 requirements through filing of an exhibit.
(b)(1) Separate certifications for the Registrant's principal executive officer and principal financial officer, as required by Section 302 of the Sarbanes-Oxley Act of 2002 and Rule 30a-2(a) under the Investment Company Act of 1940, are attached as EX99.CERT.
(b)(2) Separate certifications for the Registrant's principal executive officer and principal financial officer, as required by Section 1350 of Title 18 of United States Code, as adopted pursuant to Section 906 of the Sarbanes-Oxley Act of 2002, and Rule 30a-2(b) under the Investment Company Act of 1940, are attached as EX99.906CERT. The certifications furnished pursuant to this paragraph are not deemed to be "filed" for purposes of Section 18 of the Securities Exchange Act of 1934, or otherwise subject to the liability of that section. Such certifications are not deemed to be incorporated by reference into any filing under the Securities Act of 1933 or the Securities Exchange Act of 1934, except to the extent that the Registrant specifically incorporates them by reference.
Pursuant to the requirements of the Securities Exchange Act of 1934 and the Investment Company Act of 1940, the Registrant has duly caused this report to be signed on its behalf by the undersigned, thereunto duly authorized.
Evergreen Fixed Income Trust
By: _______________________
Dennis H. Ferro,
Principal Executive Officer
Date: 8/5/2005
Pursuant to the requirements of the Securities Exchange Act of 1934 and the Investment Company Act of 1940, this report has been signed below by the following persons on behalf of the Registrant and in the capacities and on the dates indicated.
By: _______________________
Dennis H. Ferro,
Principal Executive Officer
Date: 8/5/2005
By: ________________________
Carol A. Kosel
Principal Financial Officer
Date: 8/5/2005