| OMB APPROVAL |
OMB Number: 3235-0570
Expires: Oct. 31, 2006
Estimated average
burden hours per
response: 19.3 |
UNITED STATES
SECURITIES AND EXCHANGE COMMISSION
Washington, D.C. 20549
FORM N-CSR
CERTIFIED SHAREHOLDER REPORT OF REGISTERED MANAGEMENT INVESTMENT
COMPANIES
Investment Company Act file number 811-08415
Fixed Income Trust
_____________________________________________________________
(Exact name of registrant as specified in charter)
200 Berkeley Street Boston, Massachusetts 02116
_____________________________________________________________
(Address of principal executive offices) (Zip code)
Michael H. Koonce, Esq.
200 Berkeley Street Boston, Massachusetts 02116
____________________________________________________________
(Name and address of agent for service)
Registrant's telephone number, including area code: (617) 210-3200
Date of fiscal year end: Registrant is making a semiannual filing for 1 of its series, Evergreen Ultra Short Bond Fund for the year ended December 31, 2004. This 1 series has a June 30 fiscal year end.
Date of reporting period: December 31, 2004
Item 1 - Reports to Stockholders.
Evergreen Ultra Short Bond Fund

| | |
| table of contents |
| 1 | | L E T T E R T O S H A R E H O L D E R S |
| 4 | | F U N D AT A G L A N C E |
| 6 | | A B O U T Y O U R F U N D ' S E X P E N S E S |
| 7 | | F I N A N C I A L H I G H L I G H T S |
| 11 | | S C H E D U L E O F I N V E S T M E N T S |
| 18 | | S TAT E M E N T O F A S S E T S A N D L I A B I L I T I E S |
| 19 | | S TAT E M E N T O F O P E R AT I O N S |
| 20 | | S TAT E M E N T S O F C H A N G E S I N N E T A S S E T S |
| 21 | | N O T E S T O F I N A N C I A L S TAT E M E N T S |
| 28 | | T R U S T E E S A N D O F F I C E R S |
This semiannual report must be preceded or accompanied by a prospectus of the Evergreen fund contained herein. The prospectus contains more complete information, including fees and expenses, and should be read carefully before investing or sending money.
The fund will file its complete schedule of portfolio holdings with the SEC for the first and third quarters of each fiscal year on Form N-Q. The fund's Form N-Q will be available on the SEC's Web site at http://www.sec.gov. In addition, the fund's Form N-Q may be reviewed and copied at the SEC's Public Reference Room in Washington, D.C. Information on the operation of the Public Reference Room may be obtained by calling 800.SEC.0330.
A description of the fund's proxy voting policies and procedures is available without charge, upon request, by calling 800.343.2898, by visiting our Web site at EvergreenInvestments.com or by visiting the SEC's Web site at http://www.sec.gov.
Information relating to how the fund voted proxies relating to portfolio securities during the most recent 12-month period ended June 30 is available by visiting our Web site at EvergreenInvestments.com or by visiting the SEC's Web site at http://www.sec.gov.
| | | | |
| Mutual Funds: | | | | |
| NOT FDIC INSURED | | MAY LOSE VALUE | | NOT BANK GUARANTEED |
Evergreen InvestmentsSM is a service mark of Evergreen Investment Management Company, LLC. Copyright 2005, Evergreen Investment Management Company, LLC.
Evergreen mutual funds are distributed by Evergreen Investment Services, Inc. 200 Berkeley Street, Boston, MA 02116
LETTER TO SHAREHOLDERS
February 2005

Dennis H. Ferro
President and Chief Executive Officer
Dear Shareholder,
We are pleased to provide the semiannual report for the Evergreen Ultra Short Bond Fund, which covers the six-month period ended December 31, 2004.
As we entered the investment period, our fixed income portfolio management teams had to make decisions against the backdrop of a softening economy and a Federal Reserve ("Fed") that seemed determined to raise interest rates. While economic growth and payroll increases were coming in below expectations, energy prices were climbing and various measures of consumer inflation began to experience upward pressures. Monetary policymakers had been clear in their intentions to gradually raise interest rates, and they delivered with a largely expected 25 basis point increase in the federal funds rate on June 30th. After more than three years of excessive policy accommodation, interest rates were finally headed higher. The question for the markets was no longer the direction of interest rates, but rather the degree to which they would rise.
Considering the moderation in Gross Domestic Product ("GDP") and the fact that the federal funds rate was below the inflation rate, we based our decisions on a gradual tightening of monetary policy.
The period began with a mixed message on the economy. After having climbed by more than 5% over the previous twelve months, GDP was off to a slower start in the second half of 2004. Yet the surge in payrolls during the spring had placed upward pressure on market yields. The bond market had obviously sent investors a message: be careful what you wish for. After having fretted for months about a jobless recovery, the sudden large number of jobs being created and the threat of higher wage
1
LETTER TO SHAREHOLDERS continued
inflation had sent market yields dramatically higher. Additionally, monetary policymakers began the period with a new "spin" on their message to the public, stating that they would remain "measured" in their removal of policy accommodation. Despite these attempts at improved clarity from the Fed, interest rate concerns were exacerbated by the rise in gasoline prices and the potential impact on future inflation.
As it turned out, the advent of the Fed's gradual tightening cycle proved to be the tonic that the fixed income markets needed. As with many issues confronting investors in recent years, clarity bested uncertainty, and the bond market responded favorably as the investment period progressed to the prospects of only slightly higher interest rates. Fed officials had also been making the rounds in speeches reiterating their intentions to remain "measured" in their approach to monetary policy. The pace of GDP and employment growth had also moderated, and the inflation fears of early summer had begun to dissipate. Indeed, despite the rise in oil prices, inflation reports were less threatening, suggesting that oil would ultimately prove a drag on economic growth. In addition, other factors helped drive market yields lower. The uncertain geopolitical environment resulted in higher demand for fixed income securities, and "safe haven" investing enabled prices to firm for many U.S. Treasuries and other fixed income securities. Foreign central bank intervention, in defense of their currencies, also helped drive market yields lower during the investment period.
The combination of these factors resulted in a flattening of the yield curve, with short rates rising faster than those for longer dated maturities. Our fixed income portfolio teams maintained neutral to defensive strategies throughout the investment period, emphasizing fundamentals such as duration, credit quality, and security selection when making portfolio decisions.
2
LETTER TO SHAREHOLDERS continued
As always, we encourage our investors to maintain their long-term diversification strategies within their overall investment portfolios.
Please visit our Web site, EvergreenInvestments.com, for more information about our funds and other investment products available to you. Thank you for your continued support of Evergreen Investments.
Sincerely,

Dennis H. Ferro
President and Chief Executive Officer
Evergreen Investment Company, Inc.
Special Notice to Shareholders:
Please visit our Web site at EvergreenInvestments.com for statements from President and Chief Executive Officer, Dennis Ferro, and Chairman of the Board of the Evergreen Funds, Michael S. Scofield, addressing recent SEC actions involving the Evergreen Funds.
3
FUND AT A GLANCE
as of December 31, 2004
M A N A G E M E N T T E A M

Lisa Brown-Premo
Customized Fixed Income Team Lead Manager
C U R R E N T I N V E S T M E N T S T Y L E

Source: Morningstar, Inc.
Morningstar's style box is based on a portfolio date as of 12/31/2004.
The fixed income style box placement is based on a fund's average effective maturity or duration and the average credit rating of the bond portfolio.
P E R F O R M A N C E A N D R E T U R N S
Portfolio inception date: 5/29/2003
| | | | | | | | |
| | | Class A | | Class B | | Class C | | Class I |
| Class inception date | | 5/29/2003 | | 5/29/2003 | | 5/29/2003 | | 5/29/2003 |
|
| Nasdaq symbol | | EUBAX | | EUBBX | | EUBCX | | EUBIX |
|
| 6-month return with sales charge | | -1.44% | | -3.53% | | 0.47% | | N/A |
|
| 6-month return w/o sales charge | | 1.82% | | 1.47% | | 1.47% | | 1.98% |
|
| Average annual return* | | | | | | | | |
|
| 1-year with sales charge | | -0.59% | | -2.89% | | 1.08% | | N/A |
|
| 1-year w/o sales charge | | 2.78% | | 2.07% | | 2.07% | | 3.10% |
|
| Since portfolio inception | | 0.97% | | -0.08% | | 2.41% | | 3.43% |
|
* Adjusted for maximum applicable sales charge, unless noted.Past performance is no guarantee of future results. The performance quoted represents past performance and current performance may be lower or higher. The investment return and principal value of an investment will fluctuate so that investors' shares, when redeemed, may be worth more or less than their original cost. To obtain performance information current to the most recent month-end for Class A, B, C, or I shares, please go to EvergreenInvestments.com/fundperformance. The performance of each class may vary based on differences in loads, fees and expenses paid by the shareholders investing in each class. The maximum applicable sales charge for each class of shares is as follows: 3.25% for Class A, 5.00% for Class B and 1.00% for Class C. Class I is not subject to a sales charge. Performance includes the reinvestment of income dividends and capital gain distributions. Performance shown does not reflect the deduction of taxes that a shareholder would pay on fund distributions or the redemption of fund shares.
The fund incurs a 12b-1 fee of 0.30% for Class A and 1.00% for Classes B and C. Class I does not pay a 12b-1 fee.
The advisor is waiving a portion of its advisory fee. Had the fee not been waived, returns would have been lower.
4
FUND AT A GLANCE continued
L O N G - T E R M G R O W T H
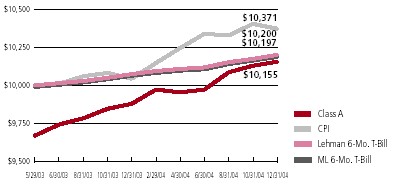
Comparison of a $10,000 investment in the Evergreen Ultra Short Bond Fund Class A shares, versus a similar investment in the Merrill Lynch 6-Month Treasury Bill Index1 (ML 6-Mo. T-Bill), the Lehman 6-Month Treasury Bill Index** (Lehman 6-Mo. T-Bill) and the Consumer Price Index (CPI).
The ML 6-Mo. T-Bill and the Lehman 6-Mo. T-Bill are unmanaged market indexes and do not include transaction costs associated with buying and selling securities, any mutual fund expenses or any taxes. The CPI is a commonly used measure of inflation and does not represent an investment return. It is not possible to invest directly in an index.
** The Fund's index was changed to reflect that of the Lehman 6-Month Treasury Bill Index (Lehman 6-Mo. T-Bill) from the Merrill Lynch 6-Month Treasury Bill Index (ML 6-Mo. T-Bill). The investment advisor believes that the Lehman 6-Mo. T-Bill is a more accurate reflection of the 6-month treasury environment than the ML 6-Mo. T-Bill.
Class I shares are only offered to investment advisory clients of an investment advisor of an Evergreen fund (or its advisory affiliates), through special arrangements entered into on behalf of Evergreen funds with certain financial services firms, certain institutional investors and persons who owned Class Y shares in registered name in an Evergreen fund on or before December 31, 1994. Class I shares are only available to institutional shareholders with a minimum $1 million investment.
The fund's investment objective is nonfundamental and may be changed without the vote of the fund's shareholders.
U.S. government guarantees apply only to certain securities held in the fund's portfolio and not to the fund's shares.
Asset-backed and mortgage-backed securities are generally subject to higher prepayment risks than other types of debt securities, which can limit the potential for gain in a declining interest rate environment and increase the potential for loss in a rising interest rate environment. Mortgage-backed securities may also be structured so that they are particularly sensitive to interest rates.
The return of principal is not guaranteed due to fluctuation in the NAV of the fund caused by changes in the price of the individual bonds held by the fund and the buying and selling of bonds by the fund. Bond funds have the same inflation, interest rate and credit risks that are associated with the individual bonds held by the fund.
All data is as of December 31, 2004, and subject to change.
1 Copyright 2004. Merrill Lynch, Pierce, Fenner & Smith Incorporated. All rights reserved.
5
ABOUT YOUR FUND'S EXPENSES
The Example below is intended to describe the fees and expenses borne by shareholders and the impact of those costs on your investment.
Example
As a shareholder of the fund, you incur two types of costs: (1) transaction costs, including sales charges (loads), redemption fees and exchange fees; and (2) ongoing costs, including management fees, distribution (12b-1) fees and other fund expenses. This Example is intended to help you understand your ongoing costs (in dollars) of investing in the fund and to compare these costs with the ongoing costs of investing in other mutual funds. The Example is based on an investment of $1,000 invested at the beginning of the period and held for the entire period from July 1, 2004 to December 31, 2004.
The example illustrates your fund's costs in two ways:
• Actual expenses
The section in the table under the heading "Actual" provides information about actual account values and actual expenses. You may use the information in these columns, together with the amount you invested, to estimate the expenses that you paid over the period. Simply divide your account value by $1,000 (for example, an $8,600 account value divided by $1,000 = 8.6), then multiply the result by the number in the appropriate column for your share class, in the column entitled "Expenses Paid During Period" to estimate the expenses you paid on your account during this period.
• Hypothetical example for comparison purposes
The section in the table under the heading "Hypothetical (5% return before expenses)" provides information about hypothetical account values and hypothetical expenses based on the fund's actual expense ratio and an assumed rate of return of 5% per year before expenses, which is not the fund's actual return. The hypothetical account values and expenses may not be used to estimate the actual ending account balance or expenses you paid for the period. You may use this information to compare the ongoing costs of investing in the fund and other funds. To do so, compare this 5% hypothetical example with the 5% hypothetical examples that appear in the shareholder reports of the other funds.
Please note that the expenses shown in the table are meant to highlight your ongoing costs only and do not reflect any transactional costs, such as sales charges (loads), redemption fees or exchange fees. Therefore, the section in the table under the heading "Hypothetical (5% return before expenses)" is useful in comparing ongoing costs only, and will not help you determine the relative total costs of owning different funds. In addition, if these transactional costs were included, your costs would have been higher.
| | | | | | |
| | | Beginning | | Ending | | |
| | | Account | | Account | | Expenses |
| | | Value | | Value | | Paid During |
| | | 7/1/2004 | | 12/31/2004 | | Period* |
|
| Actual | | | | | | |
| Class A | | $ 1,000.00 | | $ 1,018.23 | | $ 3.92 |
| Class B | | $ 1,000.00 | | $ 1,014.70 | | $ 7.46 |
| Class C | | $ 1,000.00 | | $ 1,014.70 | | $ 7.46 |
| Class I | | $ 1,000.00 | | $ 1,019.82 | | $ 2.39 |
| Hypothetical | | | | | | |
| (5% return | | | | | | |
| before expenses) | | | | | | |
| Class A | | $ 1,000.00 | | $ 1,021.32 | | $ 3.92 |
| Class B | | $ 1,000.00 | | $ 1,017.80 | | $ 7.48 |
| Class C | | $ 1,000.00 | | $ 1,017.80 | | $ 7.48 |
| Class I | | $ 1,000.00 | | $ 1,022.84 | | $ 2.40 |
|
* For each class of the Fund, expenses are equal to the annualized expense ratio of each class (0.77% for Class A, 1.47% for Class B, 1.47% for Class C and 0.47% for Class I), multiplied by the average account value over the period, multiplied by 184 / 365 days.6
FINANCIAL HIGHLIGHTS
(For a share outstanding throughout each period)
| | | | | | | | |
| | | Six Months Ended | | Year Ended June 30, |
| | December 31, 2004 | |
|
| CLASS A | | (unaudited) | | 2004 | | 2003 1 |
|
| Net asset value, beginning of period | | $ | | 9.96 | | $ 10.05 | | $ 10.00 |
|
| Income from investment operations | | | | | | | | |
| Net investment income | | | | 0.16 | | 0.26 | | 0.02 |
Net realized and unrealized gains
or losses on securities | | | | 0.02 | | (0.03 ) | | 0.05 |
| | �� | | |
| |
| |
|
| Total from investment operations | | | | 0.18 | | 0.23 | | 0.07 |
|
| Distributions to shareholders from | | | | | | | | |
| Net investment income | | | | (0.19 ) | | (0.32 ) | | (0.02 ) |
|
| Net asset value, end of period | | $ | | 9.95 | | $ 9.96 | | $ 10.05 |
|
| Total return 2 | | | | 1.82% | | 2.35% | | 0.75% |
|
| Ratios and supplemental data | | | | | | | | |
| Net assets, end of period (thousands) | | $115,915 | | $104,999 | | $17,872 |
| Ratios to average net assets | | | | | | | | |
| Expenses 3 | | | | 0.77 % 4 | | 0.92 % | | 0.32 % 4 |
| Net investment income | | | | 3.26% 4 | | 2.58% | | 2.76% 4 |
| Portfolio turnover rate | | | | 42% | | 44% | | 0% |
|
1 For the period from May 29, 2003 (commencement of class operations), to June 30, 2003.
2 Excluding applicable sales charges
3 The ratio of expenses to average net assets excludes expense reductions but includes fee waivers and/or expense reimbursements.
4 Annualized
See Notes to Financial Statements
7
FINANCIAL HIGHLIGHTS
(For a share outstanding throughout each period)
| | | | | | |
| | | Six Months Ended | | Year Ended June 30, |
| | December 31, 2004 | |
|
| CLASS B | | (unaudited) | | 2004 | | 2003 1 |
|
| Net asset value, beginning of period | | $ 9.96 | | $ 10.05 | | $10.00 |
|
| Income from investment operations | | | | | | |
| Net investment income | | 0.13 | | 0.19 2 | | 0.02 |
Net realized and unrealized gains
or losses on securities | | 0.02 | | (0.03 ) | | 0.05 |
| |
| |
| |
|
| Total from investment operations | | 0.15 | | 0.16 | | 0.07 |
|
| Distributions to shareholders from | | | | | | |
| Net investment income | | (0.16 ) | | (0.25 ) | | (0.02 ) |
|
| Net asset value, end of period | | $ 9.95 | | $ 9.96 | | $10.05 |
|
| Total return 3 | | 1.47% | | 1.65% | | 0.70% |
|
| Ratios and supplemental data | | | | | | |
| Net assets, end of period (thousands) | | $18,080 | | $16,029 | | $3,213 |
| Ratios to average net assets | | | | | | |
| Expenses 4 | | 1.47 % 5 | | 1.62 % | | 1.12 % 5 |
| Net investment income | | 2.56% 5 | | 1.90% | | 1.76% 5 |
| Portfolio turnover rate | | 42% | | 44% | | 0% |
|
1 For the period from May 29, 2003 (commencement of class operations), to June 30, 2003.
2 Net investment income (loss) per share is based on average shares outstanding during the period.
3 Excluding applicable sales charges
4 The ratio of expenses to average net assets excludes expense reductions but includes fee waivers and/or expense reimbursements.
5 Annualized
See Notes to Financial Statements
8
FINANCIAL HIGHLIGHTS
(For a share outstanding throughout each period)
| | | | | | | | |
| | | | | | | |
| | | Six Months Ended | | Year Ended June 30, |
| | December 31, 2004 | |
|
| CLASS C | | (unaudited) | | 2004 | | 2003 1 |
| |
| |
| |
|
| Net asset value, beginning of period | | $ | | 9.96 | | $ 10.05 | | $ 10.00 |
|
| Income from investment operations | | | | | | | | |
| Net investment income | | | | 0.13 | | 0.19 2 | | 0.02 |
Net realized and unrealized gains
or losses on securities | | | | 0.02 | | (0.03 ) | | 0.05 |
| | | | |
| |
| |
|
| Total from investment operations | | | | 0.15 | | 0.16 | | 0.07 |
|
| Distributions to shareholders from | | | | | | | | |
| Net investment income | | | | (0.16 ) | | (0.25 ) | | (0.02 ) |
|
| Net asset value, end of period | | $ | | 9.95 | | $ 9.96 | | $ 10.05 |
|
| Total return 3 | | | | 1.47% | | 1.65% | | 0.70% |
|
| Ratios and supplemental data | | | | | | | | |
| Net assets, end of period (thousands) | | $121,717 | | $135,412 | | $17,820 |
| Ratios to average net assets | | | | | | | | |
| Expenses 4 | | | | 1.47 % 5 | | 1.62 % | | 1.02 % 5 |
| Net investment income | | | | 2.56% 5 | | 1.88% | | 2.09% 5 |
| Portfolio turnover rate | | | | 42% | | 44% | | 0% |
|
1 For the period from May 29, 2003 (commencement of class operations), to June 30, 2003.
2 Net investment income (loss) per share is based on average shares outstanding during the period.
3 Excluding applicable sales charges
4 The ratio of expenses to average net assets excludes expense reductions but includes fee waivers and/or expense reimbursements.
5 Annualized
See Notes to Financial Statements
9
FINANCIAL HIGHLIGHTS
(For a share outstanding throughout each period)
| | | | | | | | |
| | | Six Months Ended | | Year Ended June 30, |
| | December 31, 2004 | |
|
| CLASS I | | (unaudited) | | 2004 | | 2003 1 |
|
| Net asset value, beginning of period | | $ | | 9.96 | | $ 10.05 | | $10.00 |
|
| Income from investment operations | | | | | | | | |
| Net investment income | | | | 0.18 | | 0.29 2 | | 0.03 |
Net realized and unrealized gains
or losses on securities | | | | 0.02 | | (0.03 ) | | 0.05 |
| | | | |
| |
| |
|
| Total from investment operations | | | | 0.20 | | 0.26 | | 0.08 |
|
| Distributions to shareholders from | | | | | | | | |
| Net investment income | | | | (0.21 ) | | (0.35 ) | | (0.03 ) |
|
| Net asset value, end of period | | $ | | 9.95 | | $ 9.96 | | $10.05 |
|
| Total return | | | | 1.98% | | 2.67% | | 0.77% |
|
| Ratios and supplemental data | | | | | | | | |
| Net assets, end of period (thousands) | | $252,813 | | $215,930 | | $2,343 |
| Ratios to average net assets | | | | | | | | |
| Expenses 3 | | | | 0.47 % 4 | | 0.62 % | | 0.07 % 4 |
| Net investment income | | | | 3.56% 4 | | 2.91% | | 2.95% 4 |
| Portfolio turnover rate | | | | 42% | | 44% | | 0% |
|
1 For the period from May 29, 2003 (commencement of class operations), to June 30, 2003.
2 Net investment income (loss) per share is based on average shares outstanding during the period.
3 The ratio of expenses to average net assets excludes expense reductions but includes fee waivers and/or expense reimbursements.
4 Annualized
See Notes to Financial Statements
10
SCHEDULE OF INVESTMENTS
December 31, 2004 (unaudited)
| | | | | | |
| | | Principal | | | | |
| | | Amount | | | | Value |
|
| |
| AGENCY MORTGAGE-BACKED COLLATERALIZED | | | | | | |
| MORTGAGE OBLIGATIONS 2.7% | | | | | | |
| FIXED-RATE 1.5% | | | | | | |
| FHLMC: | | | | | | |
| Ser. 1650, Class J, 6.50%, 06/15/2023 | | $ 2,800,000 | | $ | | 2,892,924 |
| Ser. 2106, Class ZD, 6.00%, 12/15/2028 | | 1,822,992 | | | | 1,915,908 |
| Ser. 2174, Class PM, 6.50%, 01/15/2028 | | 66,380 | | | | 66,435 |
| Ser. 2480, Class EH, 6.00%, 11/15/2031 | | 2,675,043 | | | | 2,706,866 |
| Ser. 2541, Class LU, 4.00%, 12/15/2027 | | 126,326 | | | | 126,494 |
| | | | | |
|
| | | | | | | 7,708,627 |
| | | | | |
|
| FLOATING-RATE 1.2% | | | | | | |
| FHLMC: | | | | | | |
| Ser. 1476, Class F, 2.71%, 02/15/2008 | | 65,510 | | | | 65,566 |
| Ser. 1606, Class FC, 2.86%, 11/15/2008 | | 368,257 | | | | 369,584 |
| Ser. 1607, Class FA, 2.51%, 10/15/2013 | | 19,597 | | | | 19,584 |
| Ser. 1625, Class FC, 2.86%, 12/15/2008 | | 94,311 | | | | 94,956 |
| Ser. 2395, Class FA, 2.69%, 06/15/2029 | | 581,880 | | | | 586,187 |
| Ser. 2431, Class F, 2.59%, 03/15/2032 | | 6,750 | | | | 6,803 |
| Ser. 2826, Class SC, 10.20%, 06/15/2034 | | 4,782,689 | | | | 4,776,300 |
| FNMA, Ser. 1993-179, Class FB, 3.31%, 10/25/2023 | | 287,512 | | | | 292,941 |
| | | | | |
|
| | | | | | | 6,211,921 |
| | | | | |
|
| Total Agency Mortgage-Backed Collateralized Mortgage Obligations | | | | | | |
| (cost $13,958,694) | | | | | | 13,920,548 |
| | | | | |
|
| AGENCY MORTGAGE-BACKED PASS THROUGH SECURITIES 9.4% | | | | | | |
| FIXED-RATE 6.9% | | | | | | |
| FHLMC: | | | | | | |
| 5.50%, TBA # | | 9,625,000 | | | | 9,940,815 |
| 6.00%, TBA # | | 9,500,000 | | | | 9,814,687 |
| FNMA: | | | | | | |
| 7.00%, 08/01/2033 - 11/01/2033 | | 7,450,891 | | | | 7,917,959 |
| 7.50%, 01/01/2031 - 08/01/2033 | | 6,345,194 | | | | 6,832,976 |
| 8.00%, 12/01/2008 | | 16,143 | | | | 16,838 |
| 10.00%, 05/01/2030 - 02/01/2031 | | 265,545 | | | | 296,914 |
| GNMA, 7.50%, 03/15/2007 - 04/15/2007 | | 137,175 | | | | 142,302 |
| | | | | |
|
| | | | | | | 34,962,491 |
| | | | | |
|
| FLOATING-RATE 2.5% | | | | | | |
| FHLMC, 5.37%, 12/01/2033 | | 10,192,053 | | | | 10,420,989 |
| FNMA: | | | | | | |
| 4.06%, 03/01/2035 | | 1,798,880 | | | | 1,865,420 |
| 4.80%, 01/01/2018 | | 13,118 | | | | 13,202 |
| GNMA, 4.00%, 01/20/2019 | | 361,341 | | | | 368,016 |
| | | | | |
|
| | | | | | | 12,667,627 |
| | | | | |
|
| Total Agency Mortgage-Backed Pass Through Securities | | | | | | |
| (cost $47,751,094) | | | | | | 47,630,118 |
| | | | | |
|
See Notes to Financial Statements
11
SCHEDULE OF INVESTMENTS continued
December 31, 2004 (unaudited)
| | | | | | | | |
| | | | | Principal | | | | |
| | | | | Amount | | | | Value |
|
| |
| AGENCY REPERFORMING MORTGAGE-BACKED PASS | | | | | | |
| THROUGH SECURITIES 0.8% | | | | | | |
| FIXED-RATE 0.8% | | | | | | |
| FNMA: | | | | | | |
| Ser. 2001-T4, Class A1, 7.50%, 07/25/2041 | | $ 1,474,639 | | $ | | 1,577,083 |
| Ser. 2002-W8, Class A4, 7.00%, 06/25/2017 | | 228,582 | | | | 242,368 |
| Ser. 2003-W2, Class 1A3, 7.50%, 07/25/2042 | | 1,887,270 | | | | 2,021,389 |
| | | | | |
|
| Total Agency Reperforming Mortgage-Backed Pass Through Securities | | | | | | |
| (cost $3,886,439) | | | | | | 3,840,840 |
| | | | | |
|
| ASSET-BACKED SECURITIES 4.5% | | | | | | |
| Bear Stearns Asset Backed Securities, Inc., Ser. 2003-AC3, Class A1, 4.00%, | | | | | | |
| 07/25/2033 | | 925,113 | | | | 914,808 |
| C-Bass, Ltd., Ser. 11A, Class D, 4.58%, 09/15/2039 144A h | | 4,800,000 | | | | 4,800,000 |
| Emergent Home Equity Loan Trust, Ser. 1997-4, Class A-5, 7.08%, 12/15/2028 | | 616,618 | | | | 629,484 |
| Equivantage Home Equity Loan Trust, Ser. 1997-4, Class A-3, 7.05%, 12/25/2028 | | 567,103 | | | | 572,257 |
| Newcastle Investment Corp., Ser. 3A, Class 2FL, 3.41%, 09/24/2038 144A h | | 10,000,000 | | | | 10,086,130 |
| Ocean Star plc, Ser. 2004-A, Class C, 3.36%, 11/12/2018 144A h | | 5,800,000 | | | | 5,800,742 |
| Option One Mortgage Corp., Ser. 1996-1, Class A1, 6.90%, 04/25/2026 | | 264,337 | | | | 264,074 |
| | | | | |
|
| Total Asset-Backed Securities (cost $23,029,121) | | | | | | 23,067,495 |
| | | | | |
|
| COMMERCIAL MORTGAGE-BACKED SECURITIES 10.9% | | | | | | |
| FIXED-RATE 4.5% | | | | | | |
| Bank of America Structural Security Trust, Ser. 2002-X1, Class A3, 5.44%, | | | | | | |
| 10/11/2033 144A | | 500,000 | | | | 521,976 |
| GE Capital Mall Finance Corp., Ser. 1998-1A, Class R2, 7.50%, | | | | | | |
| 09/13/2028 144A | | 14,500,000 | | | | 15,895,263 |
| GSR Mortgage Loan Trust, Ser. 2003-3F, Class 2A1, 4.50%, 04/25/2033 | | 1,598,449 | | | | 1,575,483 |
| Sawgrass Mills Trust, Ser. 2001-SGMA, Class E, 6.71%, 07/11/2011 144A | | 5,000,000 | | | | 5,201,929 |
| | | | | |
|
| | | | | | | | | 23,194,651 |
| | | | | | | |
|
| FLOATING-RATE 6.4% | | | | | | |
| Bear Stearns Commercial Mortgage, Ser. 2004-BBA, Class E, 2.86%, | | | | | | |
| 09/15/2019 # h | | 9,704,991 | | | | 9,704,956 |
| GMAC Commercial Mortgage Asset Corp., Ser. 2003-SNFA, Class A, 2.91%, | | | | | | |
| 01/01/2018 144A | | 8,470,946 | | | | 8,494,678 |
| Pure Mortgage plc: | | | | | | |
| Ser. 2004-CRD, Class B, 2.75%, 02/28/2034 144A h | | 6,050,000 | | | | 6,050,000 |
| Ser. 2004-LKD, Class C, 2.75%, 02/28/2034 144A h | | 8,150,000 | | | | 8,150,000 |
| | | | | |
|
| | | | | | | | | 32,399,634 |
| | | | | | | |
|
| Total Commercial Mortgage-Backed Securities (cost $55,932,341) | | | | | | 55,594,285 |
| | | | | |
|
| CORPORATE BONDS 2.0% | | | | | | |
| FINANCIALS 2.0% | | | | | | |
| Diversified Financial Services 2.0% | | | | | | |
| Trapeza CDO LLC, Ser. 2004-7A, Class B1, 3.62%, 01/25/2035 144A h | | | | | | |
| (cost $10,000,000) | | 10,000,000 | | | | 10,000,000 |
| | | | | |
|
See Notes to Financial Statements
12
SCHEDULE OF INVESTMENTS continued
December 31, 2004 (unaudited)
| | | | | | |
| | | Principal | | | | |
| | | Amount | | | | Value |
|
| |
| REPERFORMING MORTGAGE-BACKED PASS THROUGH | | | | | | |
| SECURITIES 4.0% | | | | | | |
| GS Mortgage Securities Corp.: | | | | | | |
| Ser. 2001-2, Class A, 7.50%, 06/19/2032 144A | | $ 6,788,681 | | $ | | 7,229,715 |
| Ser. 2004-4, Class 1A2, 7.50%, 10/25/2044 144A | | 6,605,912 | | | | 7,077,195 |
| Nomura Asset Acceptance Corp. Reperforming Loan Trust, Ser. 2004-R2, | | | | | | |
| Class A2, 7.00%, 10/25/2034 144A | | 5,835,797 | | | | 6,178,743 |
| | | | | |
|
| Total Reperforming Mortgage-Backed Pass Through Securities | | | | | | |
| (cost $20,690,829) | | | | | | 20,485,653 |
| | | | | |
|
| WHOLE LOAN MORTGAGE-BACKED COLLATERALIZED | | | | | | |
| MORTGAGE OBLIGATIONS 3.9% | | | | | | |
| FIXED-RATE 3.8% | | | | | | |
| ABN AMRO Mortgage Corp., Ser. 2003-3, Class A 13, 5.00%, 02/25/2033 | | 747,665 | | | | 750,713 |
| Credit Suisse First Boston Mortgage Securities Corp., Ser. 2002-26, Class 3A4, | | | | | | |
| 5.85%, 10/25/2032 | | 4,122,000 | | | | 4,150,279 |
| DLJ Mortgage Acceptance Corp., Ser. 1993-19, Class A7, 6.75%, 01/25/2024 | | 4,114,785 | | | | 4,110,597 |
| PaineWebber Mortgage Acceptance Corp., Ser. 1996-M1, Class E, 7.66%, | | | | | | |
| 01/02/2012 144A | | 2,250,000 | | | | 2,393,926 |
| Residential Accredit Loans, Inc., Ser. 1997, Class A9, 7.25%, 06/25/2027 | | 717 | | | | 716 |
| Residential Funding Mortgage Securities, Inc., Ser. 2002-S19, Class 2, 6.00%, | | | | | | |
| 12/25/2032 | | 701,066 | | | | 702,347 |
| Structured Asset Securities Corp.: | | | | | | |
| Ser. 2002-19, Class A1, 4.20%, 10/25/2032 | | 81,656 | | | | 81,709 |
| Ser. 2003-1, Class 1A3, 5.25%, 02/25/2018 | | 2,150,000 | | | | 2,171,360 |
| Ser. 2003-8, Class 2A3, 5.00%, 04/25/2033 | | 1,082,662 | | | | 1,081,693 |
| Ser. 2003-8, Class B1I, 5.00%, 04/25/2018 | | 550,882 | | | | 557,631 |
| Ser. 2003-14, Class 1A3, 5.50%, 05/25/2033 | | 1,000,031 | | | | 1,010,585 |
| Washington Mutual Mortgage Securities Corp., Ser. 2003-MS4, Class LLA3, | | | | | | |
| 5.00%, 02/25/2033 | | 2,434,021 | | | | 2,436,969 |
| | | | | |
|
| | | | | | | 19,448,525 |
| | | | | |
|
| FLOATING-RATE 0.1% | | | | | | |
| Residential Accredit Loans, Inc., Ser. 2002, Class A7A, 2.58%, 09/25/2017 | | 522,382 | | | | 520,287 |
| | | | | |
|
| Total Whole Loan Mortgage-Backed Collateralized Mortgage Obligations | | | | | | |
| (cost $20,263,870) | | | | | | 19,968,812 |
| | | | | |
|
| WHOLE LOAN MORTGAGE-BACKED PASS THROUGH | | | | | | |
| SECURITIES 26.8% | | | | | | |
| FIXED RATE 0.0% | | | | | | |
| MASTR Alternative Loan Trust, Ser. 2003-5, Class 1A1, 6.50%, 07/25/2033 | | 79,327 | | | | 80,770 |
| | | | | |
|
| FLOATING-RATE 26.8% | | | | | | |
| Bear Stearns Adjustable Rate Mortgage Trust, Ser. 2002-9, Class 2A, 5.27%, | | | | | | |
| 10/25/2032 | | 143,894 | | | | 144,383 |
| Bear Stearns Alternative Loan Trust: | | | | | | |
| Ser. 2003-5, Class 42A2, 4.50%, 12/25/2033 | | 4,152,866 | | | | 4,157,761 |
| Ser. 2003-6, Class 4A, 5.61%, 01/25/2034 | | 3,598,487 | | | | 3,656,704 |
See Notes to Financial Statements
13
SCHEDULE OF INVESTMENTS continued
December 31, 2004 (unaudited)
| | | | | | |
| | | Principal | | | | |
| | | Amount | | | | Value |
|
| |
| WHOLE LOAN MORTGAGE-BACKED PASS THROUGH | | | | | | |
| SECURITIES continued | | | | | | |
| FLOATING-RATE continued | | | | | | |
| Countrywide Home Loans: | | | | | | |
| Ser. 2004-2, Class 2A1, 5.33%, 02/25/2034 ## | | $ 6,249,293 | | $ | | 6,313,993 |
| Ser. 2004-23, Class A, 2.94%, 11/25/2034 ## | | 23,309,705 | | | | 24,018,103 |
| Credit Suisse First Boston Mortgage Securities Corp.: | | | | | | |
| Ser. 2002-AR17, Class 2A1, 4.94%, 12/19/2039 | | 210,035 | | | | 210,807 |
| Ser. 2002-AR33, Class 4A1, 5.22%, 12/25/2032 | | 14,536,707 | | | | 14,701,783 |
| Ser. 2003-AR20, Class A4, 4.68%, 08/25/2033 | | 5,863,959 | | | | 5,880,820 |
| Ser. 2004-AR2, Class 3A1, 5.22%, 03/25/2034 | | 3,678,363 | | | | 3,715,298 |
| Guardian Savings & Loan Association, Ser. 1990-4W, Class A, 6.64%, | | | | | | |
| 05/25/2020 h | | 176,006 | | | | 175,951 |
| Housing Securities, Inc., Ser. 92-Sl, Class A2, 3.91%, 05/25/2016 | | 357,983 | | | | 358,546 |
| MASTR Adjustable Rate Mortgage Trust: | | | | | | |
| Ser. 2003-1, Class 2A3, 4.65%, 12/25/2032 | | 430,879 | | | | 434,340 |
| Ser. 2004-1, Class 4A1, 6.20%, 01/25/2034 | | 8,389,222 | | | | 8,595,732 |
| Ser. 2004-8, Class 7A1, 5.56%, 09/25/2034 | | 6,901,731 | | | | 6,996,629 |
| Merrill Lynch Mortgage Investors, Inc., Ser. 2003-A4, Class 4A, 5.45%, | | | | | | |
| 06/25/2033 | | 4,654,338 | | | | 4,710,994 |
| Residential Funding Securities Corp., Ser. 2001-RM, Class A, 6.18%, 12/25/2029 | | 661,063 | | | | 660,508 |
| Structured Asset Securities Corp.: | | | | | | |
| Ser. 2003-15, Class 4A, 5.62%, 04/25/2033 | | 18,935,283 | | | | 19,228,189 |
| Ser. 2003-34A, Class 3A1, 4.96%, 11/25/2033 | | 3,285,698 | | | | 3,296,048 |
| Ser. 2003-34A, Class 6A, 5.11%, 11/25/2033 | | 8,401,790 | | | | 8,475,806 |
| Ser. 2003-37A, Class 5A, 5.07%, 12/25/2033 | | 9,360,909 | | | | 9,434,102 |
| Ser. 2003-37A, Class 7A, 4.88%, 12/25/2033 | | 307,768 | | | | 311,178 |
| Ser. 2003-40A, Class 5A, 5.54%, 01/25/2034 | | 7,719,323 | | | | 7,829,672 |
| Ser. 2004-4, Class 5A, 5.47%, 04/25/2034 | | 2,719,143 | | | | 2,758,706 |
| | | | | |
|
| | | | | | | 136,066,053 |
| | | | | |
|
| Total Whole Loan Mortgage-Backed Pass Through Securities | | | | | | |
| (cost $137,147,781) | | | | | | 136,146,823 |
| | | | | |
|
| WHOLE LOAN SUBORDINATE COLLATERALIZED | | | | | | |
| MORTGAGE OBLIGATIONS 31.4% | | | | | | |
| FIXED-RATE 9.7% | | | | | | |
| Countrywide Alternative Loan Trust: | | | | | | |
| Ser. 2002-7, Class M, 7.00%, 08/25/2032 | | 4,784,733 | | | | 4,930,094 |
| Ser. 2002-16, Class B1, 6.00%, 12/25/2032 | | 2,633,918 | | | | 2,666,267 |
| Ser. 2002-18, Class M, 6.00%, 02/25/2033 | | 4,718,145 | | | | 4,818,764 |
| Countrywide Funding Corp., Ser. 2002-28, Class M, 6.50%, 10/25/2032 | | 385,310 | | | | 399,952 |
| Countrywide Home Loans, Ser. 2002-22, Class M, 6.25%, 10/25/2032 | | 2,922,467 | | | | 2,990,091 |
| GMAC Mortgage Corp. Loan Trust, Ser. 2002-J2, Class M2, 6.25%, 05/25/2032 | | 241,904 | | | | 242,881 |
| MASTR Resecuritization Trust: | | | | | | |
| Ser. 2003-3, 4.25%, 01/30/2033 144A h | | 1,438,320 | | | | 1,419,892 |
| Ser. 2004-1, 4.75%, 07/01/2033 144A h | | 2,967,199 | | | | 2,887,456 |
| Ser. 2004-2, 5.25%, 03/25/2034 144A h | | 12,387,550 | | | | 12,062,377 |
| Ser. 2004-3, 5.00%, 03/25/2034 144A h | | 9,472,250 | | | | 9,220,643 |
See Notes to Financial Statements
14
SCHEDULE OF INVESTMENTS continued
December 31, 2004 (unaudited)
| | | | | | |
| | | Principal | | | | |
| | | Amount | | | | Value |
|
| |
| WHOLE LOAN SUBORDINATE COLLATERALIZED | | | | | | |
| MORTGAGE OBLIGATIONS continued | | | | | | |
| FIXED-RATE continued | | | | | | |
| Structured Asset Securities Corp.: | | | | | | |
| Ser. 2002-17, Class B1, 6.07%, 09/25/2032 | | $ 1,731,780 | | $ | | 1,764,343 |
| Ser. 2002-17, Class B2, 6.07%, 09/25/2032 | | 3,544,767 | | | | 3,603,792 |
| Washington Mutual, Inc.: | | | | | | |
| Ser. 2002-S1, Class 3B3, 6.00%, 01/25/2017 | | 427,424 | | | | 434,166 |
| Ser. 2002-S5, Class B3, 6.39%, 09/25/2032 | | 1,889,169 | | | | 1,922,514 |
| | | | | |
|
| | | | | | | 49,363,232 |
| | | | | |
|
| FLOATING-RATE 21.7% | | | | | | |
| Bank of America Mortgage Securities, Inc.: | | | | | | |
| Ser. 2004-G, Class B3, 4.64%, 08/25/2034 | | 4,548,564 | | | | 4,382,662 |
| Ser. 2004-H, Class B2, 4.53%, 09/25/2034 | | 3,892,843 | | | | 3,786,358 |
| Credit Suisse First Boston Mortgage Securities Corp.: | | | | | | |
| Ser. 2003-AR5, Class 1A2, 4.84%, 01/25/2033 | | 315,969 | | | | 316,923 |
| Ser. 2003-AR5, Class 2A3, 5.19%, 01/25/2033 | | 794,141 | | | | 791,778 |
| Ser. 2003-AR9, Class 1A3, 4.94%, 03/25/2033 | | 359,691 | | | | 362,623 |
| Ser. 2003-AR15, Class 2A2, 4.85%, 06/25/2033 | | 2,407,096 | | | | 2,421,234 |
| Ser. 2003-AR18, Class 2A4, 4.81%, 07/25/2033 | | 1,048,844 | | | | 1,049,752 |
| Ser. 2003-AR24, Class 2A4, 3.18%, 09/25/2033 | | 4,660,800 | | | | 4,695,160 |
| Ser. 2003-AR26, Class 9M1, 2.78%, 10/25/2033 | | 4,648,500 | | | | 4,677,124 |
| Ser. 2003-AR28, Class 6M1, 3.03%, 12/25/2033 | | 8,281,000 | | | | 8,318,026 |
| Harborview Mortgage Loan Trust: | | | | | | |
| Ser. 2004-7, Class B2, 5.17%, 11/19/2034 | | 2,243,049 | | | | 2,248,588 |
| Ser. 2004-7, Class B3, 5.17%, 11/19/2034 | | 5,797,543 | | | | 5,786,007 |
| Lehman Structured Securities Corp.: | | | | | | |
| Ser. 2004-2, Class M-2, 5.21%, 02/28/2033 144A | | 10,615,092 | | | | 10,646,795 |
| Ser. 2004-2, Class M-3, 5.21%, 02/28/2033 144A | | 13,305,729 | | | | 13,211,288 |
| MASTR Adjustable Rate Mortgage Trust, Ser. 2004-1, Class B3, 5.47%, | | | | | | |
| 02/25/2034 | | 4,414,122 | | | | 4,432,656 |
| Structured Asset Mortgage Investments, Inc., Ser. 2003-AR2, Class B1, 3.13%, | | | | | | |
| 12/19/2033 | | 3,000,000 | | | | 3,050,071 |
| Structured Asset Securities Corp.: | | | | | | |
| Ser. 2002-8A, Class B1, 4.22%, 05/25/2032 | | 10,721,286 | | | | 11,073,019 |
| Ser. 2003-22A, Class B1, 5.13%, 06/25/2033 | | 12,870,710 | | | | 13,052,221 |
| Washington Mutual Mortgage Securities Corp.: | | | | | | |
| Ser. 2004-AR2, Class B1, 2.92%, 04/25/2044 | | 8,024,098 | | | | 8,045,924 |
| Ser. 2004-AR2, Class B2, 2.92%, 04/25/2044 | | 6,953,290 | | | | 6,876,247 |
| Wells Fargo Mortgage Backed Securities Trust, Ser. 2003-B, Class B1, 5.16%, | | | | | | |
| 02/25/2033 | | 876,367 | | | | 887,422 |
| | | | | |
|
| | | | | | | 110,111,878 |
| | | | | |
|
| Total Whole Loan Subordinate Collateralized Mortgage Obligations | | | | | | |
| (cost $160,013,055) | | | | | | 159,475,110 |
| | | | | |
|
See Notes to Financial Statements
15
SCHEDULE OF INVESTMENTS continued
December 31, 2004 (unaudited)
| | | | | | |
| | | Principal | | | | |
| | | Amount | | | | Value |
|
| YANKEE OBLIGATIONS-CORPORATE 4.9% | | | | | | |
| FINANCIALS 4.9% | | | | | | |
| Diversified Financial Services 4.9% | | | | | | |
| Preferred Term Securities, Ltd.: | | | | | | |
| 3.51%, 06/24/2034 144A h | | $ 10,000,000 | | $ | | 10,033,579 |
| FRN, 3.56%, 12/24/2033 144A h | | 14,900,000 | | | | 14,963,467 |
| | | | | |
|
| Total Yankee Obligations-Corporate (cost $24,905,614) | | | | | | 24,997,046 |
| | | | | | |
|
|
| | | Shares | | | | Value |
|
| |
| PREFERRED STOCKS 0.8% | | | | | | |
| FINANCIALS 0.8% | | | | | | |
| Thrifts & Mortgage Finance 0.8% | | | | | | |
| Fannie Mae (cost $3,902,500) | | 70,000 | | | | 3,985,625 |
| | | | | |
|
| SHORT-TERM INVESTMENTS 1.9% | | | | | | |
| MUTUAL FUND SHARES 1.9% | | | | | | |
| Evergreen Institutional Money Market Fund ø (cost $9,710,139) | | 9,710,139 | | | | 9,710,139 |
| | | | | |
|
| Total Investments (cost $531,191,477) 104.0% | | | | | | 528,822,494 |
| Other Assets and Liabilities (4.0%) | | | | | | (20,297,284) |
| | | | | |
|
| Net Assets 100.0% | | | | $ | | 508,525,210 |
| | | | | |
|
| | |
| The portfolio consists primarily of high quality securities with a short duration. |
| |
| 144A | | Security that may be sold to qualified institutional buyers under Rule 144A of the Securities Act of 1933, as amended. |
| | | This security has been determined to be liquid under guidelines established by the Board of Trustees. |
| h | | Security is valued at fair value as determined in good faith under procedures established by the Board of Trustees. |
| # | | When-issued or delayed delivery securities |
| ## | | All or a portion of these securities have been segregated for when-issued or delayed delivery securities. |
| ø | | Evergreen Investment Management Company, LLC is the investment advisor to both the Fund and the money market |
| | | fund. |
| |
| Summary of Abbreviations |
| FHLMC | | Federal Home Loan Mortgage Corp. |
| FNMA | | Federal National Mortgage Association |
| FRN | | Floating Rate Note |
| GNMA | | Government National Mortgage Association |
| MASTR | | Mortgage Asset Securitization Transactions, Inc |
| TBA | | To Be Announced |
See Notes to Financial Statements
16
SCHEDULE OF INVESTMENTS continued
December 31, 2004 (unaudited)
| | | |
| The following table shows the percent of total bonds by credit quality based on Moody's |
| and Standard & Poor's ratings as of December 31, 2004: |
| |
| AAA | | 50.1% | |
| AA | | 16.6% | |
| A | | 17.9% | |
| BBB | | 15.4% | |
| |
| |
| | | 100.0% | |
| | |
| |
| |
| The following table shows the percent of total bonds by maturity as of December 31, 2004: |
| |
| Less than 1 year | | 3.2% | |
| 1 to 3 year(s) | | 49.1% | |
| 3 to 5 years | | 34.2% | |
| 5 to 10 years | | 11.6% | |
| 10 to 20 years | | 1.9% | |
| |
| |
| | | 100.0% | |
| | |
| |
See Notes to Financial Statements
17
STATEMENT OF ASSETS AND LIABILITIES
December 31, 2004 (unaudited)
| | | | |
| Assets | | | | |
| Investments in securities, at value (cost $531,191,477) | | $ | | 528,822,494 |
| Receivable for securities sold | | | | 2,770,282 |
| Principal paydown receivable | | | | 485,520 |
| Receivable for Fund shares sold | | | | 9,426,271 |
| Interest receivable | | | | 2,219,905 |
| Prepaid expenses and other assets | | | | 22,602 |
|
| Total assets | | | | 543,747,074 |
|
| Liabilities | | | | |
| Dividends payable | | | | 600,263 |
| Payable for securities purchased | | | | 33,401,796 |
| Payable for Fund shares redeemed | | | | 1,133,749 |
| Advisory fee payable | | | | 11,278 |
| Distribution Plan expenses payable | | | | 14,128 |
| Due to other related parties | | | | 4,591 |
| Accrued expenses and other liabilities | | | | 56,059 |
|
| Total liabilities | | | | 35,221,864 |
|
| Net assets | | $ | | 508,525,210 |
|
| Net assets represented by | | | | |
| Paid-in capital | | $ | | 513,799,307 |
| Overdistributed net investment income | | | | (1,461,591) |
| Accumulated net realized losses on securities | | | | (1,443,523) |
| Net unrealized losses on securities | | | | (2,368,983) |
|
| Total net assets | | $ | | 508,525,210 |
|
| Net assets consists of | | | | |
| Class A | | $ | | 115,914,841 |
| Class B | | | | 18,080,397 |
| Class C | | | | 121,716,916 |
| Class I | | | | 252,813,056 |
|
| Total net assets | | $ | | 508,525,210 |
|
| Shares outstanding | | | | |
| Class A | | | | 11,648,456 |
| Class B | | | | 1,816,965 |
| Class C | | | | 12,231,397 |
| Class I | | | | 25,405,678 |
|
| Net asset value per share | | | | |
| Class A | | $ | | 9.95 |
| Class A - Offering price (based on sales charge of 3.25%) | | $ | | 10.28 |
| Class B | | $ | | 9.95 |
| Class C | | $ | | 9.95 |
| Class I | | $ | | 9.95 |
|
See Notes to Financial Statements
18
STATEMENT OF OPERATIONS
Six Months Ended December 31, 2004 (unaudited)
| | | | |
| Investment income | | | | |
| Interest | | $ | | 10,072,317 |
|
| Expenses | | | | |
| Advisory fee | | | | 936,409 |
| Distribution Plan expenses | | | | |
| Class A | | | | 170,903 |
| Class B | | | | 86,591 |
| Class C | | | | 658,255 |
| Administrative services fee | | | | 249,394 |
| Transfer agent fees | | | | 104,018 |
| Trustees' fees and expenses | | | | 3,855 |
| Printing and postage expenses | | | | 18,406 |
| Custodian and accounting fees | | | | 53,065 |
| Registration and filing fees | | | | 42,388 |
| Professional fees | | | | 12,064 |
| Interest expense | | | | 4,079 |
| Other | | | | 2,938 |
|
| Total expenses | | | | 2,342,365 |
| Less: Expense reductions | | | | (2,331) |
| Fee waivers | | | | (249,647) |
|
| Net expenses | | | | 2,090,387 |
|
| Net investment income | | | | 7,981,930 |
|
| Net realized and unrealized gains or losses on securities | | | | |
| Net realized gains on securities | | | | 887,506 |
| Net change in unrealized gains or losses on securities | | | | (186,696) |
|
| Net realized and unrealized gains or losses on securities | | | | 700,810 |
|
| Net increase in net assets resulting from operations | | $ | | 8,682,740 |
|
See Notes to Financial Statements
19
STATEMENTS OF CHANGES IN NET ASSETS
| | | | | | | | |
| | | Six Months Ended | | | | |
| | | December 31, 2004 | | Year Ended |
| | | (unaudited) | | June 30, 2004 |
|
| Operations | | | | | | | | |
| Net investment income | | | | $ 7,981,930 | | | | $ 8,929,872 |
| Net realized gains or losses on securities | | | | 887,506 | | | | (40,431) |
| Net change in unrealized gains or losses | | | | | | | | |
| on securities | | | | (186,696) | | | | (2,203,785) |
|
| Net increase in net assets resulting from | | | | | | | | |
| operations | | | | 8,682,740 | | | | 6,685,656 |
|
| Distributions to shareholders from | | | | | | | | |
| Net investment income | | | | | | | | |
| Class A | | | | (2,159,528) | | | | (3,159,335) |
| Class B | | | | (268,646) | | | | (263,289) |
| Class C | | | | (2,039,639) | | | | (2,711,106) |
| Class I | | | | (4,859,942) | | | | (5,198,360) |
|
| Total distributions to shareholders | | | | (9,327,755) | | | | (11,332,090) |
|
| | | Shares | | | | Shares | | |
| Capital share transactions | | | | | | | | |
| Proceeds from shares sold | | | | | | | | |
| Class A | | 5,503,060 | | 54,904,259 | | 18,597,550 | | 186,845,372 |
| Class B | | 373,998 | | 3,731,077 | | 1,785,997 | | 17,923,679 |
| Class C | | 1,617,352 | | 16,144,967 | | 15,485,102 | | 155,565,593 |
| Class I | | 6,243,653 | | 62,325,317 | | 30,458,938 | | 306,116,793 |
|
| | | | | 137,105,620 | | | | 666,451,437 |
|
| Net asset value of shares issued in | | | | | | | | |
| reinvestment of distributions | | | | | | | | |
|
| Class A | | 149,175 | | 1,487,860 | | 223,052 | | 2,237,082 |
| Class B | | 18,603 | | 185,541 | | 18,599 | | 186,415 |
| Class C | | 147,403 | | 1,470,286 | | 203,980 | | 2,045,100 |
| Class I | | 300,778 | | 2,999,487 | | 329,565 | | 3,303,608 |
|
| | | | | 6,143,174 | | | | 7,772,205 |
|
| Automatic conversion of Class B shares | | | | | | | | |
| to Class A shares | | | | | | | | |
| Class A | | 2,940 | | 29,341 | | 2,879 | | 28,903 |
| Class B | | (2,940) | | (29,341) | | (2,879) | | (28,903) |
|
| | | | | 0 | | | | 0 |
|
| Payment for shares redeemed | | | | | | | | |
| Class A | | (4,548,420) | | (45,345,804) | | (10,059,793) | | (100,825,325) |
| Class B | | (181,900) | | (1,815,592) | | (512,264) | | (5,142,484) |
| Class C | | (3,127,678) | | (31,203,542) | | (3,867,781) | | (38,778,555) |
| Class I | | (2,816,538) | | (28,083,279) | | (9,343,889) | | (93,709,951) |
|
| | | | | (106,448,217) | | | | (238,456,315) |
|
| Net increase in net assets resulting from | | | | | | | | |
| capital share transactions | | | | 36,800,577 | | | | 435,767,327 |
|
| Total increase in net assets | | | | 36,155,562 | | | | 431,120,893 |
| Net assets | | | | | | | | |
| Beginning of period | | | | 472,369,648 | | | | 41,248,755 |
|
| End of period | | | | $ 508,525,210 | | | | $ 472,369,648 |
|
| Overdistributed net investment income | | | | $ (1,461,591) | | | | $ (115,766) |
|
See Notes to Financial Statements
20
NOTES TO FINANCIAL STATEMENTS (unaudited)
1 . O R G A N I Z AT I O N
Evergreen Ultra Short Bond Fund (the "Fund") is a diversified series of Evergreen Fixed Income Trust (the "Trust"), a Delaware statutory trust organized on September 18, 1997. The Trust is an open-end management investment company registered under the Investment Company Act of 1940, as amended (the "1940 Act").
The Fund offers Class A, Class B, Class C and Institutional ("Class I") shares. Class A shares are sold with a front-end sales charge. However, Class A share investments of $1 million or more are not subject to a front-end sales charge but will be subject to a contingent deferred sales charge of 1.00% upon redemption within one year. Class B shares are sold without a front-end sales charge but are subject to a contingent deferred sales charge that is payable upon redemption and decreases depending on how long the shares have been held. Class C shares are no longer sold with a front-end sales charge but are still subject to a contingent deferred sales charge that is payable upon redemption within one year. Class I shares are sold without a front-end sales charge or contingent deferred sales charge. Each class of shares, except Class I shares, pays an ongoing distribution fee.
2 . S I G N I F I C A N T A C C O U N T I N G P O L I C I E S
The following is a summary of significant accounting policies consistently followed by the Fund in the preparation of its financial statements. The policies are in conformity with generally accepted accounting principles in the United States of America, which require management to make estimates and assumptions that affect amounts reported herein. Actual results could differ from these estimates.
a. Valuation of investments
Portfolio debt securities acquired with more than 60 days to maturity are valued at prices obtained from an independent pricing service which takes into consideration such factors as similar security prices, yields, maturities, liquidity and ratings. Securities for which valuations are not readily available from an independent pricing service may be valued by brokers which use prices provided by market makers or estimates of market value obtained from yield data relating to investments or securities with similar characteristics.
Short-term securities with remaining maturities of 60 days or less at the time of purchase are valued at amortized cost, which approximates market value.
Investments in other mutual funds are valued at net asset value. Securities for which market quotations are not readily available or not reflective of current market value are valued at fair value as determined in good faith, according to procedures approved by the Board of Trustees.
b. Reverse repurchase agreements
To obtain short-term financing, the Fund may enter into reverse repurchase agreements with banks and other financial institutions, which are deemed by the investment advisor to be credit-worthy. At the time the Fund enters into a reverse repurchase agreement, it will establish a segregated account with the custodian containing qualified assets having a value not less than the
21
NOTES TO FINANCIAL STATEMENTS (unaudited) continued
repurchase price, including accrued interest. If the counterparty to the transaction is rendered insolvent, the Fund may be delayed or limited in the repurchase of the collateral securities.
c. When-issued and delayed delivery transactions
The Fund records when-issued or delayed delivery securities as of trade date and maintains security positions such that sufficient liquid assets will be available to make payment for the securities purchased. Securities purchased on a when-issued or delayed delivery basis are marked-to-market daily and begin earning interest on the settlement date. Losses may occur on these transactions due to changes in market conditions or the failure of counterparties to perform under the contract.
d. Security transactions and investment income
Security transactions are recorded on trade date. Realized gains and losses are computed using the specific cost of the security sold. Interest income is recorded on the accrual basis and includes accretion of discounts and amortization of premiums.
e. Federal taxes
The Fund intends to continue to qualify as a regulated investment company and distribute all of its taxable income, including any net capital gains (which have already been offset by available capital loss carryovers). Accordingly, no provision for federal taxes is required.
f. Distributions
Distributions to shareholders from net investment income are accrued daily and paid monthly. Distributions from net realized gains, if any, are recorded on the ex-dividend date. Such distributions are determined in conformity with income tax regulations, which may differ from generally accepted accounting principles.
g. Class allocations
Income, common expenses and realized and unrealized gains and losses are allocated to the classes based on the relative net assets of each class. Distribution fees, if any, are calculated daily at the class level based on the appropriate net assets of each class and the specific expense rates applicable to each class.
3 . A D V I S O RY F E E A N D O T H E R T R A N S A C T I O N S W I T H A F F I L I AT E S
Evergreen Investment Management Company, LLC ("EIMC"), an indirect, wholly-owned subsidiary of Wachovia Corporation ("Wachovia"), is the investment advisor to the Fund and is paid an annual fee starting at 0.40% and declining to 0.25% as average daily net assets increase.
From time to time, EIMC may voluntarily or contractually waive its fee and/or reimburse expenses in order to limit operating expenses. For fee waivers and/or reimbursements made after January 1, 2003, EIMC may recoup certain amounts waived and/or reimbursed up to a period of three years following the end of the fiscal year in which the fee waivers and/or reimbursements were made. During the six months ended December 31, 2004, EIMC waived its fee in the
22
NOTES TO FINANCIAL STATEMENTS (unaudited) continued
amount of $249,647 which represents 0.10% of the Fund's average daily net assets (on an annualized basis). As of December 31, 2004 the Fund had $505,661 in advisory fee waivers subject to recoupment.
Evergreen Investment Services, Inc. ("EIS"), an indirect, wholly-owned subsidiary of Wachovia, is the administrator to the Fund. As administrator, EIS provides the Fund with facilities, equipment and personnel and is paid an annual rate determined by applying percentage rates to the aggregate average daily net assets of the Evergreen funds (excluding money market funds), starting at 0.10% and declining to 0.05% as the aggregate average daily net assets of the Evergreen funds (excluding money market funds) increase.
Evergreen Service Company, LLC ("ESC"), an indirect, wholly-owned subsidiary of Wachovia, is the transfer and dividend disbursing agent for the Fund. ESC receives account fees that vary based on the type of account held by the shareholders in the Fund.
4 . D I S T R I B U T I O N P L A N S
EIS also serves as distributor of the Fund's shares. The Fund has adopted Distribution Plans, as allowed by Rule 12b-1 of the 1940 Act, for each class of shares, except Class I. Under the Distribution Plans, distribution fees are paid at an annual rate of 0.30% of the average daily net assets for Class A shares and 1.00% of the average daily net assets for each of Class B and Class C shares.
For the six months ended December 31, 2004, EIS received $8,875 from the sale of Class A shares and $22,063 and $37,253 in contingent deferred sales charges from redemptions of Class B and Class C shares, respectively.
5 . S E C U R I T I E S T R A N S A C T I O N S
Cost of purchases and proceeds from sales of investment securities (excluding short-term securities) were as follows for the six months ended December 31, 2004:
| | | | | | |
| Cost of Purchases | | Proceeds from Sales |
|
| U.S. | | Non-U.S. | | U.S. | | Non-U.S. |
| Government | | Government | | Government | | Government |
|
| $ 124,173,015 | | $ 175,533,193 | | $128,527,755 | | $ 82,054,123 |
|
During the six months ended December 31, 2004, the Fund entered into reverse repurchase agreements. The average daily balance of reverse repurchase agreements outstanding during the six months ended December 31, 2004 was approximately $173,402 (on an annualized basis) at a weighted average interest rate of 2.16% . The maximum amount outstanding under reverse repurchase agreements during the six months ended December 31, 2004 was $5,425,258 (including accrued interest). During the six months ended December 31, 2004, the Fund paid $3,745 in interest expense. There were no reverse repurchase agreements outstanding at December 31, 2004.
23
NOTES TO FINANCIAL STATEMENTS (unaudited) continued
On December 31, 2004, the aggregate cost of securities for federal income tax purposes was $531,191,477. The gross unrealized appreciation and depreciation on securities based on tax cost was $879,665 and $3,248,648 respectively, with a net unrealized depreciation of $2,368,983.
As of June 30, 2004, the Fund had $452,371 in capital loss carryovers for federal income tax purposes expiring in 2012.
For income tax purposes, capital losses incurred after October 31 within the Fund's fiscal year are deemed to arise on the first business day of the following fiscal year. As of June 30, 2004, the Fund incurred and elected to defer post-October losses of $1,878,658.
6 . I N T E R F U N D L E N D I N G
Pursuant to an Exemptive Order issued by the SEC, the Fund may participate in an interfund lending program with certain funds in the Evergreen fund family. This program allows the Fund to borrow from, or lend money to, other participating funds. During the six months ended December 31, 2004, the Fund did not participate in the interfund lending program.
7 . E X P E N S E R E D U C T I O N S
Through expense offset arrangements with ESC and the Fund's custodian, a portion of fund expenses has been reduced.
8 . D E F E R R E D T R U S T E E S ' F E E S
Each Trustee of the Fund may defer any or all compensation related to performance of their duties as Trustees. The Trustees' deferred balances are allocated to deferral accounts, which are included in the accrued expenses for the Fund. The investment performance of the deferral accounts are based on the investment performance of certain Evergreen funds. Any gains earned or losses incurred in the deferral accounts are reported in the Fund's Trustees' fees and expenses. At the election of the Trustees, the deferral account will be paid either in one lump sum or in quarterly installments for up to ten years.
9 . F I N A N C I N G A G R E E M E N T
The Fund and certain other Evergreen funds share in a $150 million unsecured revolving credit commitment for temporary and emergency purposes, including the funding of redemptions, as permitted by each participating fund's borrowing restrictions. Borrowings under this facility bear interest at 0.50% per annum above the Federal Funds rate. All of the participating funds are charged an annual commitment fee of 0.09% of the unused balance, which is allocated pro rata.
During the six months ended December 31, 2004, the Fund had average borrowings outstanding of $11,871 on an annualized basis at an average rate of 2.81% and paid interest of $334.
24
NOTES TO FINANCIAL STATEMENTS (unaudited) continued
1 0 . L I T I G AT I O N
From time to time, the Fund and EIMC are involved in various legal actions in the normal course of business. In EIMC's opinion, based upon the opinions of counsel, the Fund is not involved in any legal action that will have a material effect on the Fund's financial position and results of operations.
1 1 . R E G U L AT O RY M AT T E R S
Since September 2003, governmental and self-regulatory authorities have instituted numerous ongoing investigations of various practices in the mutual fund industry, including investigations relating to revenue sharing, market-timing, late trading and record retention, among other things. The investigations cover investment advisors, distributors and transfer agents to mutual funds, as well as other firms. EIMC, EIS and ESC (collectively, "Evergreen") have received subpoenas and other requests for documents and testimony relating to these investigations, are endeavoring to comply with those requests, and are cooperating with the investigations. Evergreen is continuing its own internal review of policies, practices, procedures and personnel, and is taking remedial action where appropriate.
In connection with one of these investigations, on July 28, 2004, the staff of the Securities and Exchange Commission ("SEC") informed Evergreen that the staff intends to recommend to the SEC that it institute an enforcement action against Evergreen. The SEC staff's proposed allegations relate to (i) an arrangement pursuant to which a broker at one of EIMC's affiliated broker-dealers had been authorized, apparently by an EIMC officer (no longer with EIMC), to engage in short-term trading, on behalf of a client, in Evergreen Mid Cap Growth Fund (formerly Evergreen Small Company Growth Fund and prior to that, known as Evergreen Emerging Growth Fund) during the period from December 2000 through April 2003, in excess of the limitations set forth in the fund's prospectus, (ii) short-term trading from September 2001 through January 2003, by a former Evergreen portfolio manager, of Evergreen Precious Metals Fund, a fund he managed at the time, (iii) the sufficiency of systems for monitoring exchanges and enforcing exchange limitations as stated in the fund's prospectuses, and (iv) the adequacy of e-mail retention practices. In connection with the activity in Evergreen Mid Cap Growth Fund, EIMC reimbursed the fund $378,905, plus an additional $25,242, representing what EIMC calculated at that time to be the client's net gain and the fees earned by EIMC and the expenses incurred by this fund on the client's account. In connection with the activity in Evergreen Precious Metals Fund, EIMC reimbursed the fund $70,878, plus an additional $3,075, representing what EIMC calculated at that time to be the portfolio manager's net gain and the fees earned by EIMC and expenses incurred by the fund on the portfolio manager's account. Evergreen is currently engaged in discussions with the staff of the SEC concerning its recommendation.
Any resolution of these matters with regulatory authorities may include, but not be limited to, sanctions, penalties or injunctions regarding Evergreen, restitution to mutual fund shareholders and/or other financial penalties and structural changes in the governance or management of Evergreen's mutual fund business. Any penalties or restitution will be paid by Evergreen and not by the Evergreen funds.
25
NOTES TO FINANCIAL STATEMENTS (unaudited) continued
In addition, the Evergreen funds and EIMC and certain of its affiliates are involved in various legal actions, including private litigation and class action lawsuits. EIMC does not expect that any of such legal actions currently pending or threatened will have a material adverse impact on the financial position or operations of any of the Evergreen funds or on EIMC's ability to provide services to the Evergreen funds.
Although Evergreen believes that neither the foregoing investigations nor any pending or threatened legal actions will have a material adverse impact on the Evergreen funds, there can be no assurance that these matters and any publicity surrounding or resulting from them will not result in reduced sales or increased redemptions of Evergreen fund shares, which could increase Evergreen fund transaction costs or operating expenses, or have other adverse consequences on the Evergreen funds.
26
This page left intentionally blank
27
TRUSTEES AND OFFICERS
TRUSTEES1
| | |
| Charles A. Austin III | | Principal occupations: Investment Counselor, Anchor Capital Advisors, Inc. (investment advice); |
| Trustee | | Director, The Andover Companies (insurance); Trustee, Arthritis Foundation of New England; |
| DOB: 10/23/1934 | | Director, The Francis Ouimet Society; Former Director, Health Development Corp. |
| Term of office since: 1991 | | (fitness-wellness centers); Former Director, Mentor Income Fund, Inc.; Former Trustee, |
| | | Mentor Funds and Cash Resource Trust; Former Investment Counselor, Appleton Partners, Inc. |
| Other directorships: None | | (investment advice); Former Director, Executive Vice President and Treasurer, State Street |
| | | Research & Management Company (investment advice) |
|
| |
| Shirley L. Fulton | | Principal occupations: Partner, Tin, Fulton, Greene & Owen, PLLC (law firm); Former Partner, |
| Trustee | | Helms, Henderson & Fulton, P.A. (law firm); Retired Senior Resident Superior Court Judge, |
| DOB: 1/10/1952 | | 26th Judicial District, Charlotte, NC |
| Term of office since: 2004 | | |
| Other directorships: None | | |
|
| |
| K. Dun Gifford | | Principal occupations: Chairman and President, Oldways Preservation and Exchange Trust |
| Trustee | | (education); Trustee, Treasurer and Chairman of the Finance Committee, Cambridge College; |
| DOB: 10/23/1938 | | Former Chairman of the Board, Director, and Executive Vice President, The London Harness |
| Term of office since: 1974 | | Company (leather goods purveyor); Former Director, Mentor Income Fund, Inc.; Former Trustee, |
| | | Mentor Funds and Cash Resource Trust |
| Other directorships: None | | |
|
| |
| Dr. Leroy Keith, Jr. | | Principal occupations: Partner, Stonington Partners, Inc. (private equity firm); Trustee, |
| Trustee | | The Phoenix Group of Mutual Funds; Director, Obagi Medical Products Co.; Director, |
| DOB: 2/14/1939 | | Diversapack Co.; Former Director, Lincoln Educational Services; Former Chairman of the Board |
| Term of office since: 1983 | | and Chief Executive Officer, Carson Products Company (manufacturing); Former Director, |
| | | Mentor Income Fund, Inc.; Former Trustee, Mentor Funds and Cash Resource Trust |
| Other directorships: Trustee, The | | |
| Phoenix Group of Mutual Funds | | |
|
| |
| Gerald M. McDonnell | | Principal occupations: Manager of Commercial Operations, SMI Steel Co. – South Carolina |
| Trustee | | (steel producer); Former Sales and Marketing Manager, Nucor Steel Company; Former Director, |
| DOB: 7/14/1939 | | Mentor Income Fund, Inc.; Former Trustee, Mentor Funds and Cash Resource Trust |
| Term of office since: 1988 | | |
| Other directorships: None | | |
|
| |
| William Walt Pettit | | Principal occupations: Vice President, Kellam & Pettit, P.A. (law firm); Director, Superior |
| Trustee | | Packaging Corp.; Director, National Kidney Foundation of North Carolina, Inc.; Former Director, |
| DOB: 8/26/1955 | | Mentor Income Fund, Inc.; Former Trustee, Mentor Funds and Cash Resource Trust |
| Term of office since: 1984 | | |
| Other directorships: None | | |
|
| |
| David M. Richardson | | Principal occupations: President, Richardson, Runden LLC (executive recruitment business |
| Trustee | | development/consulting company); Consultant, Kennedy Information, Inc. (executive |
| DOB: 9/19/1941 | | recruitment information and research company); Consultant, AESC (The Association of |
| Term of office since: 1982 | | Executive Search Consultants); Director, J&M Cumming Paper Co. (paper merchandising); |
| | | Former Trustee, NDI Technologies, LLP (communications); Former Vice Chairman, DHR |
| Other directorships: None | | International, Inc. (executive recruitment); Former Director, Mentor Income Fund, Inc.; |
| | | Former Trustee, Mentor Funds and Cash Resource Trust |
|
| |
| Dr. Russell A. Salton III | | Principal occupations: President/CEO, AccessOne MedCard; Former Medical Director, |
| Trustee | | Healthcare Resource Associates, Inc.; Former Medical Director, U.S. Health Care/Aetna Health |
| DOB: 6/2/1947 | | Services; Former Director, Mentor Income Fund, Inc.; Former Trustee, Mentor Funds and |
| Term of office since: 1984 | | Cash Resource Trust |
| Other directorships: None | | |
|
28
TRUSTEES AND OFFICERS continued
| | |
| Michael S. Scofield | | Principal occupations: Attorney, Law Offices of Michael S. Scofield; Former Director, |
| Trustee | | Mentor Income Fund, Inc.; Former Trustee, Mentor Funds and Cash Resource Trust |
| DOB: 2/20/1943 | | |
| Term of office since: 1984 | | |
| Other directorships: None | | |
|
| |
| Richard J. Shima | | Principal occupations: Independent Consultant; Director, Trust Company of CT; Trustee, |
| Trustee | | Saint Joseph College (CT); Director, Hartford Hospital; Trustee, Greater Hartford YMCA; |
| DOB: 8/11/1939 | | Former Director, Enhance Financial Services, Inc.; Former Director, Old State House Association; |
| Term of office since: 1993 | | Former Director of CTG Resources, Inc. (natural gas); Former Director, Mentor Income Fund, Inc.; |
| | | Former Trustee, Mentor Funds and Cash Resource Trust |
| Other directorships: None | | |
|
| |
| Richard K. Wagoner, CFA 2 | | Principal occupations: Member and Former President, North Carolina Securities Traders |
| Trustee | | Association; Member, Financial Analysts Society; Former Consultant to the Boards of Trustees |
| DOB: 12/12/1937 | | of the Evergreen funds; Former Trustee, Mentor Funds and Cash Resource Trust |
| Term of office since: 1999 | | |
| Other directorships: None | | |
|
| |
| |
| OFFICERS | | |
| |
| Dennis H. Ferro 3 | | Principal occupations: President and Chief Executive Officer, Evergreen Investment Company, |
| President | | Inc. and Executive Vice President, Wachovia Bank, N.A.; former Chief Investment Officer, |
| DOB: 6/20/1945 | | Evergreen Investment Company, Inc. |
| Term of office since: 2003 | | |
|
| |
| Carol Kosel4 | | Principal occupations: Senior Vice President, Evergreen Investment Services, Inc. |
| Treasurer | | |
| DOB: 12/25/1963 | | |
| Term of office since: 1999 | | |
|
| |
| Michael H. Koonce 4 | | Principal occupations: Senior Vice President and General Counsel, Evergreen Investment |
| Secretary | | Services, Inc.; Senior Vice President and Assistant General Counsel, Wachovia Corporation |
| DOB: 4/20/1960 | | |
| Term of office since: 2000 | | |
|
| |
| James Angelos4 | | Principal occupations: Chief Compliance Officer and Senior Vice President, Evergreen Funds; |
| Chief Compliance Officer | | Former Director of Compliance, Evergreen Investment Services, Inc. |
| DOB: 9/2/1947 | | |
| Term of office since: 2004 | | |
|
1 Each Trustee serves until a successor is duly elected or qualified or until his death, resignation, retirement or removal from office. Each Trustee oversees 93 Evergreen funds. Correspondence for each Trustee may be sent to Evergreen Board of Trustees, P.O. Box 20083, Charlotte, North Carolina 28202.
2 Mr. Wagoner is an "interested person" of the Fund because of his ownership of shares in Wachovia Corporation, the parent to the Fund's investment advisor.
3 The address of the Officer is 401 S. Tryon Street, 20th Floor, Charlotte, NC 28288.
4 The address of the Officer is 200 Berkeley Street, Boston, MA 02116.
Additional information about the Fund's Board of Trustees and Officers can be found in the Statement of Additional Information (SAI) and is available upon request without charge by calling 800.343.2898.
29
568639 rv1 2/2005
Item 2 - Code of Ethics
(a) The Registrant has adopted a code of ethics that applies to the Registrant's principal executive officer and principal financial officer.
(b) During the period covered by this report, there were no amendments to the provisions of the code of ethics adopted in 2.(a) above.
(c) During the period covered by this report, there were no implicit or explicit waivers to the provisions of the code of ethics adopted in 2.(a) above.
Item 3 - Audit Committee Financial Expert
Charles A. Austin III and K. Dun Gifford have been determined by the Registrant's Board of Trustees to be audit committee financial experts within the meaning of Section 407 of the Sarbanes-Oxley Act. These financial experts are independent of management.
Items 4 – Principal Accountant Fees and Services
Applicable for annual reports only
Items 5 – Audit Committee of Listed Registrants
If applicable, not applicable at this time. Applicable for annual reports covering periods ending on or after the compliance date for the listing standards applicable to the particular issuer. Listed issuers must be in compliance with the new listing rules by the earlier of the registrant's first annual shareholders meeting after January 15, 2004 or October 31, 2004.
Item 6 – Schedule of Investments
Please see schedule of investments contained in the Report to Stockholders included under Item 1 of this Form N-CSR.
Item 7 – Disclosure of Proxy Voting Policies and Procedures for Closed-End Management Investment Companies.
If applicable, not applicable at this time. Applicable for annual reports filed on or after July 1, 2003.
Item 8 – Purchases of Equity Securities by Closed-End Management Investment Company and Affiliated Purchasers
Not applicable at this time. Applicable for closed-end funds only.
Item 9 – Submission of Matters to a Vote of Security Holders
If applicable, not applicable at this time.
Item 10 - Controls and Procedures
(a) The Registrant's Principal Executive Officer and Principal Financial Officer have evaluated the Registrant's disclosure controls and procedures within 90 days of this filing and have concluded that the Registrant's disclosure controls and procedures were effective, as of that date, in ensuring that information required to be disclosed by the Registrant in this Form N-CSR was recorded, processed, summarized, and reported timely.
(b) There were no significant changes in the Registrant's internal controls or other factors that could significantly affect these controls subsequent to the date of their evaluation, including any corrective actions with regard to significant deficiencies and material weaknesses.
Item 11 - Exhibits
File the exhibits listed below as part of this Form. Letter or number the exhibits in the sequence indicated.
(a) Any code of ethics, or amendment thereto, that is the subject of the disclosure required by Item 2, to the extent that the registrant intends to satisfy the Item 2 requirements through filing of an exhibit.
(b)(1) Separate certifications for the Registrant's principal executive officer and principal financial officer, as required by Section 302 of the Sarbanes-Oxley Act of 2002 and Rule 30a-2(a) under the Investment Company Act of 1940, are attached as EX99.CERT.
(b)(2) Separate certifications for the Registrant's principal executive officer and principal financial officer, as required by Section 1350 of Title 18 of United States Code, as adopted pursuant to Section 906 of the Sarbanes-Oxley Act of 2002, and Rule 30a-2(b) under the Investment Company Act of 1940, are attached as EX99.906CERT. The certifications furnished pursuant to this paragraph are not deemed to be "filed" for purposes of Section 18 of the Securities Exchange Act of 1934, or otherwise subject to the liability of that section. Such certifications are not deemed to be incorporated by reference into any filing under the Securities Act of 1933 or the Securities Exchange Act of 1934, except to the extent that the Registrant specifically incorporates them by reference.
Pursuant to the requirements of the Securities Exchange Act of 1934 and the Investment Company Act of 1940, the Registrant has duly caused this report to be signed on its behalf by the undersigned, thereunto duly authorized.
Evergreen Fixed Income Trust
By: _______________________
Dennis H. Ferro,
Principal Executive Officer
Date: March 3, 2005
Pursuant to the requirements of the Securities Exchange Act of 1934 and the Investment Company Act of 1940, this report has been signed below by the following persons on behalf of the Registrant and in the capacities and on the dates indicated.
By: _______________________
Dennis H. Ferro,
Principal Executive Officer
Date: March 3, 2005
By: ________________________
Carol A. Kosel
Principal Financial Officer
Date: March 3, 2005