|
| OMB APPROVAL | ||
|
| OMB Number: | 3235-0570 | |
|
| Expires: | October 31, 2006 | |
| UNITED STATES | Estimated average burden hours per response. . . . . . . . . . . . . . . . .19.3 | ||
| SECURITIES AND EXCHANGE COMMISSION |
| ||
| Washington, D.C. 20549 |
| ||
FORM N-CSR
CERTIFIED SHAREHOLDER REPORT OF REGISTERED
MANAGEMENT INVESTMENT COMPANIES
Investment Company Act file number | 811-08895 | ||||||||
| |||||||||
ING Funds Trust | |||||||||
(Exact name of registrant as specified in charter) | |||||||||
| |||||||||
7337 E. Doubletree Ranch Rd., Scottsdale, AZ |
| 85258 | |||||||
(Address of principal executive offices) |
| (Zip code) | |||||||
| |||||||||
The Corporation Trust Company, | |||||||||
(Name and address of agent for service) | |||||||||
| |||||||||
Registrant’s telephone number, including area code: | 1-800-992-0180 |
| |||||||
| |||||||||
Date of fiscal year end: | March 31 |
| |||||||
| |||||||||
Date of reporting period: | April 1, 2004 to September 30, 2004 |
| |||||||
ITEM 1. REPORTS TO STOCKHOLDERS.
The following is a copy of the report transmitted to stockholders pursuant to Rule 30e-1 under the Act (17 CFR 270.30e-1):
Funds
SEMI-ANNUAL REPORT

Semi-Annual Report
September 30, 2004
Classes A, B, C, M, O and R
Fixed Income Funds
n ING GNMA Income Fund
n ING High Yield Bond Fund
n ING High Yield Opportunity Fund
n ING Intermediate Bond Fund
n ING National Tax-Exempt Bond Fund
Money Market Funds
n ING Classic Money Market Fund
n ING Money Market Fund
n ING Lexington Money Market Trust
This report is submitted for general information to shareholders of the ING Funds. It is not authorized for distribution to prospective shareholders unless accompanied or preceded by a prospectus which includes details regarding the funds' investment objectives, risks, charges, expenses and other information. This information should be read carefully.

TABLE OF CONTENTS
(THIS PAGE INTENTIONALLY LEFT BLANK)

JAMES M. HENNESSY
Dear Shareholder:
As we complete another six months of serving the needs of investors, we are pleased to see that the conclusion of the recent presidential election appears to have had a positive impact on major U.S. stock markets. With moderately low interest rates being controlled by the Federal Reserve Board, rising corporate earnings, and an increasingly optimistic job outlook, we are hopeful that the economy will continue to prosper through the end of the year.
As always, we continue to look for ways to make investing with our company more pleasant and efficient. When our clients complete a transaction with ING Funds, first and foremost, we want them to have peace of mind.
We are eager to meet these goals and we look forward to continuing to do business with you in the coming year.
Sincerely,

James M. Hennessy
President
ING Funds
November 9, 2004
1
MARKET PERSPECTIVE: SIX MONTHS ENDED SEPTEMBER 30, 2004
Be careful what you wish for, the ancient Chinese proverb goes, you just might get it. On the second day of the six months under review, April 2, 2004, investors received the good news they were so eagerly seeking; however, after a few days of euphoria they spent the rest of a nervous second calendar quarter wondering why the solution to one problem so often seems to usher in a new set. The news in question was, at last, a very bullish U.S. employment report, the final piece in the economic puzzle to sustain the recovery. But as the job market tightens, inflation picks up and rising interest rates cannot be far away. This kept a lid on stocks and gave bond investors one of their worst quarters in years. Then, in the third calendar quarter, rising oil prices, sagging growth, the sense that the party was drawing to a close, central banks with tightening on their minds and some distinctly odd dyna mics in the Treasury market, all conspired to give investors a memorable quarter with not all memories pleasant.
Initially, as might be expected, investment grade U.S. fixed income classes bore the brunt of fears of a new cycle of rising interest rates. April's strong employment report, plus another two after that, set the tone, to the steady drumbeat of evidence that inflation was on the rise. Oil prices were surging. With the Federal Funds rate at just 1%, real interest rates were becoming more negative, an increasingly untenable situation. Federal Open Market Committee ("FOMC") Chairman Greenspan confirmed that interest rates were likely to rise close, albeit at a "measured" pace. This practically telegraphed a 0.25% Federal Funds rate increase at the FOMC meeting on June 30, 2004. When it duly arrived, bond markets recovered modestly. But the damage had been done. By the middle of our six months ended September 30, 2004, investment grade bonds had given back practically all of their gains for 2004. And yet in the week before the increase the wind seemed to shift again. First quarter gross domestic product ("GDP") growth was revised down. Durable goods orders fell. Retailers and auto companies complained of slack sales. The Chicago Purchasing Managers' Index(1) had its largest drop in 30 years. Perhaps Greenspan's "measured" policy was right; but perhaps something else was wrong. All eyes were therefore on the employment report to be published on July 2, 2004. The report was weak and by the end of the month few doubted that the economy had stumbled. August's shocking employment report showed that just 32,000 jobs were created in July and the figures for prior months were revised down by 61,000. By now sentiment about the economy had reversed itself from the earlier optimism. Comforting words from Chairman Greenspan that the slow down was only temporary were not universally accepted. Most commentators felt it more likely that the economy had now settled down to a lower, if still positive level of activity. In a mirror image of the first few months, investment grade bonds benefited richly from perceptions of a decelerating economy with inflation in check. That was no surprise. What did surprise, however, was that this played out as the FOMC raised the Federal Funds rate twice more. Ten-year Treasury yields slipped back to early April levels, but yields on 13-week Treasury Bills followed the Federal Funds rate up. On September 22, 2004, the "spread" between the yields on Bonds and Bills reached the lowest point since June 2003. In the third calendar quarter, the Lehman Brothers Aggregate Bond Index(2) of investment grade bonds had its best quarter's return in two years. But for the six months as a whole, the Lehman Brothers Aggregate Bond Index gained just 0.67%. The shrinking of the Treasury risk premium was carried through to high yield bonds, which performed better than the investment grade. The Lehman Brothers U.S. Corporate High Yield Bond Index(3) returned 3.84% during the semi-annual period. By the end of September, the yield curve was markedly flatter. The yield on 10-year Treasury Notes rose by 0.28% to 4.12% while the yield on 13-week Treasury Bills almost doubled, rising 0.75% to 1.67%.
Global equities had two major dips, one in each quarter, but by the six months they had lost only 0.14%, according to the MSCI World Index(4) in dollars including net reinvested dividends. Among currencies, the euro gained just under 1.0% while the pound lost nearly 2.0% as the interest rate tightening cycle in the United Kingdom seemed to be ending. The yen was the weakest of the majors, losing 5.3% against the dollar, as Japan's economic recovery decelerated sharply. In addition, sharply rising oil prices weighed on the yen, since Japan imports all of its oil, as did the prospect of slower growth in China.
The U.S. equities market showed a pattern similar to international stocks, dipping in each quarter, but with a practically neutral end result. For the six months, the Standard & Poor's ("S&P") 500 Index(5) returned -0.18% including dividends. At just over 1,100, the S&P 500 Index was trading at a price to earnings level of around 15.25 times 2005 earnings. Equities were affected by all the developments described above in the context of fixed income. Optimism on improving business conditions gave way to fears of rising interest rates
2
MARKET PERSPECTIVE: SIX MONTHS ENDED SEPTEMBER 30, 2004
and then further concerns about a stalled economy. In addition, stock prices were increasingly held back by soaring oil prices, which on the futures contract were reaching new records almost daily by the end of September. Corporate profits were still increasing, but the days of year over year growth above 20% were nearly over.
(1) The Chicago Purchasing Managers' Index measures manufacturing activity in the industrial Midwest.
(2) The Lehman Brothers Aggregate Bond Index is composed of securities from the Lehman Brothers Government/Corporate Bond Index, Mortgage-Backed Securities Index, and the Asset-Backed Securities Index. Total return comprises price appreciation/depreciation and income as a percentage of the original investment.
(3) The Lehman Brothers U.S. Corporate High Yield Bond Index is generally representative of corporate bonds rated below investment-grade.
(4) The MSCI World Index reflects the stock markets of 22 countries, including the United States, Europe, Canada, Australia, New Zealand and the Far East - comprising approximately 1,500 securities - with values expressed in U.S. dollars.
(5) The Standard & Poor's 500 Index is a capitalization-weighted index of 500 stocks designed to measure performance of the broad domestic economy through changes in the aggregate market value of 500 stocks representing all major industries.
All indices are unmanaged and investors cannot invest directly in an index.
Past performance does not guarantee future results. The performance quoted represents past performance. Investment return and principal value of an investment will fluctuate, and shares, when redeemed, may be worth more or less than their original cost. The Funds' performance is subject to change since the period's end and may be lower or higher than the performance data shown. Please call (800) 992-0180 or log on to www.ingfunds.com to obtain performance data current to the most recent month-end.
Market Perspective reflects the views of the Chief Investment Risk Officer only through the end of the period, and is subject to change based on market and other conditions.
3
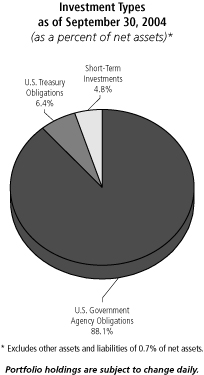
ING GNMA INCOME FUND
The ING GNMA Income Fund (the "Fund") seeks to generate a high level of current income, consistent with liquidity and safety of principal, through investment primarily in Government National Mortgage Association ("Ginnie Mae", "GNMA") mortgage-backed securities (also known as GNMA Certificates) that are guaranteed as to the timely payment of principal and interest by the U.S. Government. The Fund is managed by Denis P. Jamison, CFA and Roseann G. McCarthy, ING Investment Management Co. (formerly, Aeltus Investment Management, Inc.) - the Sub-Adviser.
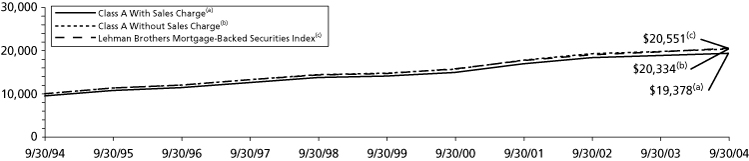
Performance: For the six months ended September 30, 2004, the Fund's Class A shares, excluding sales charges, provided a total return of 0.39% compared to 1.45% for the Lehman Brothers Mortgage-Backed Securities Index(5).
Portfolio Specifics: The last six months ended September 30, 2004 included two periods as different as spring and summer. From mid-March until mid-June 2004, investors were focused on the economy's strong growth - real gross domestic product was growing 4.5% plus - and the Federal Reserve's plan to raise short- term interest rates. Ten-year Treasury bond yields rose nearly 100 basis points to 4.9% by the middle of June 2004. Then, the economy crossed what many described as a "soft patch" of slow employment growth and consumer spending. Moreover, speculators began to realize that the Federal Reserve's stated plan of "measured" increases in money rates would provide easy profits from arbitraging the wide spread between the yield on short-term notes and long-term Treasu ry bonds. Not only did ten-year bond yields decline, from 4.9% to just under 4.0%, but the yield curve flattened as short-term interest rates rose and longer bond yields fell.
Whether it was spring or summer, however, the Fund underperformed its benchmark by about 50 basis points in each quarter of the reporting period. The common thread that held back performance was our project loans. In April, a large multi-family loan unexpectedly prepaid at face value. This clipped 20 basis points from our total return. During the bond rally in August and September, our project loans failed to keep pace, and the spread between the yield of these securities and that of the five-year Treasury note widened from plus 125 basis points to plus 150 basis points. This reduced our return by another 30 basis points. Our $80 million plus U.S. Treasury bill and note investment was another drag, especially in the September quarter. The two-year notes returned only 1.0% compared with a 6.4% increase for long-term Treasury bonds and 2.6% for the Lehman Mortgage Index.
Current Strategy and Outlook: Wide interest rate swings and low absolute returns characterized the first half of the Fund's current fiscal year. This may not be the best period to gauge the effectiveness of our fundamental investment strategy. We plan to continue to focus on mortgages with features that reduce their prepayment sensitivity to changes in interest rates. Moreover, we will seek to only put money to work in these securities when they can be bought at prices that should result in greater returns than of those projected for generic mortgage securities.
We expected a prolonged, gradual rise in interest rates as long as the economy continues to grow. Short- and intermediate-term bond yields appear too low given the current period of 3% to 4% business expansion. Commodity prices are likely to remain in the spotlight as new demand from China and India outstrips new supply. A subsequent rise in the inflation rate will remain a concern. These factors justify caution and a somewhat defensive stance toward interest rate risk. Accordingly, we will continue to emphasize higher coupon mortgage securities and keep a greater than normal percentage of the Fund's assets in short-term U.S. Treasury securities.
4
PORTFOLIO MANAGERS' REPORT
ING GNMA INCOME FUND
| Average Annual Total Returns for the Periods Ended September 30, 2004 | |||||||||||||||||||||||||||
1 Year | 5 Year | 10 Year | Since Inception of Class B October 6, 2000 | Since Inception of Class C October 13, 2000 | Since Inception of Class M February 23, 2001 | ||||||||||||||||||||||
| Including Sales Charge: | |||||||||||||||||||||||||||
| Class A(1) | (2.05 | )% | 5.54 | % | 6.83 | % | - | - | - | ||||||||||||||||||
| Class B(2) | (2.82 | )% | - | - | 5.32 | % | - | - | |||||||||||||||||||
| Class C(3) | 1.08 | % | - | - | - | 5.88 | % | - | |||||||||||||||||||
| Class M(4) | (0.93 | )% | - | - | - | - | 4.35 | % | |||||||||||||||||||
| Excluding Sales Charge: | |||||||||||||||||||||||||||
| Class A | 2.84 | % | 6.57 | % | 7.35 | % | - | - | - | ||||||||||||||||||
| Class B | 2.07 | % | - | - | 5.96 | % | - | - | |||||||||||||||||||
| Class C | 2.06 | % | - | - | - | 5.88 | % | - | |||||||||||||||||||
| Class M | 2.40 | % | - | - | - | - | 5.31 | % | |||||||||||||||||||
| Lehman Brothers Mortgage-Backed | |||||||||||||||||||||||||||
| Securities Index(5) | 4.36 | % | 6.95 | % | 7.47 | % | 6.84%(6) | 6.84%(6) | 5.90%(7) | ||||||||||||||||||
Based on a $10,000 initial investment, the graph and table above illustrate the total return of ING GNMA Income Fund against the Lehman Brothers Mortgage-Backed Securities Index. The Index is unmanaged and has no cash in its portfolio, imposes no sales charges and incurs no operating expenses. An investor cannot invest directly in an index. The Fund's performance is shown both with and without the imposition of sales charges.
The performance graph and table do not reflect the deduction of taxes that a shareholder will pay on Fund distributions or the redemption of Fund shares.
Total returns reflect the fact that the Investment Adviser has waived certain fees and expenses otherwise payable by the Fund. Total returns would have been lower had there been no waiver to the Fund.
Performance data represents past performance and is no assurance of future results. Investment return and principal value of an investment in the Fund will ßuctuate. Shares, when sold, may be worth more or less than their original cost. The Fund's performance may be lower or higher than the performance data shown. Please log on to www.ingfunds.com or call (800) 992-0180 to get performance through the most recent month end.
This report contains statements that may be "forward-looking" statements. Actual results may differ materially from those projected in the "forward-looking" statements.
The views expressed in this report reßect those of the portfolio managers, only through the end of the period as stated on the cover. The portfolio managers' views are subject to change at any time based on market and other conditions.
(1) Reflects deduction of the maximum Class A sales charge of 4.75%.
(2) Reflects deduction of the Class B deferred sales charge of 5% and 3%, respectively, for the 1 year and since inception returns.
(3) Reflects deduction of the Class C deferred sales charge of 1% for the 1 year return.
(4) Reflects deduction of the maximum Class M sales charge of 3.25%.
(5) The Lehman Brothers Mortgage-Backed Securities Index is an unmanaged index composed of fixed income security mortgage pools sponsored by GNMA, FNMA and FHLMC, including GNMA Graduated Payment Mortgages.
(6) Since inception performance for index is shown from October 1, 2000.
(7) Since inception performance for index is shown from March 1, 2001.
5
ING HIGH YIELD BOND FUND
PORTFOLIO MANAGERS' REPORT
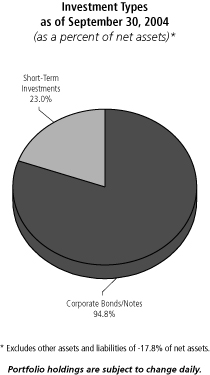
The ING High Yield Bond Fund (the "Fund") seeks to provide investors with a high level of current income and total return by investing at least 80% of its assets in high yield (high risk) bonds, which are commonly referred to as "Junk Bonds," that are unrated or rated below investment grade. The Fund is managed by a team of investment professionals led by Greg Jacobs, CFA and Kurt Kringelis, CFA, CPA, ING Investment Management Co. (formerly, Aeltus Investment Management, Inc.) - the Sub-Adviser.
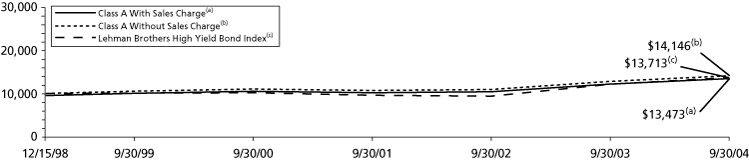
Performance: For the six months ended September 30, 2004, the Fund's Class A shares, excluding sales charges, provided a total return of 3.38% compared to 3.84% for the Lehman Brothers High Yield Bond Index(4).
Portfolio Specifics: Volatility in the Treasury market had a mixed impact on the portfolio during the past six months ended September 30, 2004. During the second calendar quarter, indications of an acceleration in economic growth led to expectations of an initial move by the Federal Reserve ("Fed") to raise interest rates. As the Treasury market began to sell off, investors sought to reduce exposure to the more interest-rate-sensitive segment of the high yield universe by selling higher quality securities. Lower quality securities rebounded in the third calendar quarter, as economic data released from July 2004 onward that pointed to a slowing of growth that alleviated at least some concerns of imminently and potentially significantly higher interest rates. During the past six mont hs, Moody's Caa-rated securities delivered the best returns, followed by B-rated securities, and then Ba-rated securities. Credit quality refers to the Fund's underlying investments, not to the stability or safety of the Fund. The Fund benefited from a concentration in mid-tier securities and experienced lower volatility than the market during this period.
Sector differentiation proved to be an important factor during the period as the transportation sector significantly underperformed the index while the basic industry sectors modestly outperformed the index. Fund performance was positively impacted by an underweight in transportation, which significantly underperformed the index, and an underweight in technology, which also underperformed the index. Performance was also positively impacted by an overweight in the basic industry sectors, which collectively outperformed the index. Performance was hurt by an underweight in utilities, which outperformed the index, and an overweight in wireless, which underperformed the index.
Current Strategy and Outlook: From a fundamental standpoint, the outlook continues to be favorable for the high yield market. At the macro level, economic strength and declining default rates should continue to make the sector attractive compared to other asset classes. On an issuer level, earnings continue to show solid growth year-over-year. However, growth slowed modestly during the second quarter and earnings missed became a bit more prevalent. We believe that sector selection will become even more important in the months ahead. In general, we still expect the improving economy to translate into higher cash flow and lower balance sheet leverage for most high yield issuers, which should bode well for the high yield market. Despite the broad fundamental market strength, we expect to remain underweight the Caa-rated securities and distressed part of the high yield market. We believe that this part of the high yield market is fully valued and that continued Fed tightening and declining liquidity will begin to negatively impact many of these issuers.
Top Ten Industries
as of September 30, 2004
(as a percent of net assets)
Corporate Bonds/Notes
| Media | 10.3 | % | |||||
| Telecommunications | 7.3 | % | |||||
| Lodging | 6.7 | % | |||||
| Electric | 6.4 | % | |||||
| Diversified Financial Services | 6.3 | % | |||||
| Oil and Gas | 4.8 | % | |||||
| Chemicals | 4.6 | % | |||||
| Packaging and Containers | 4.6 | % | |||||
| Retail | 4.2 | % | |||||
| Pipelines | 4.2 | % | |||||
Short-Term Investments
| Securities Lending Collateral | 18.7 | % | |||||
| Repurchase Agreement | 4.3 | % | |||||
Portfolio holdings are subject to change daily.
6
ING HIGH YIELD BOND FUND
PORTFOLIO MANAGERS' REPORT
| Average Annual Total Returns for the Periods Ended September 30, 2004 | |||||||||||||||
1 Year | 5 Year | Since Inception December 15, 1998 | |||||||||||||
| Including Sales Charge: | |||||||||||||||
| Class A(1) | 5.04 | % | 5.00 | % | 5.27 | % | |||||||||
| Class B(2) | 4.49 | % | 4.98 | % | 5.26 | % | |||||||||
| Class C(3) | 8.50 | % | 5.26 | % | 5.40 | % | |||||||||
| Excluding Sales Charge: | |||||||||||||||
| Class A | 10.28 | % | 6.02 | % | 6.16 | % | |||||||||
| Class B | 9.49 | % | 5.27 | % | 5.38 | % | |||||||||
| Class C | 9.50 | % | 5.26 | % | 5.40 | % | |||||||||
| Lehman Brothers High Yield Bond Index(4) | 12.55 | % | 6.36 | % | 5.58%(5) | ||||||||||
Based on a $10,000 initial investment, the graph and table above illustrate the total return of ING High Yield Bond Fund against the Lehman Brothers High Yield Bond Index. The Index is unmanaged and has no cash in its portfolio, imposes no sales charges and incurs no operating expenses. An investor cannot invest directly in an index. The Fund's performance is shown both with and without the imposition of sales charges.
The performance graph and table do not reflect the deduction of taxes that a shareholder will pay on Fund distributions or the redemption of Fund shares.
Total returns reflect the fact that the Investment Adviser has waived certain fees and expenses otherwise payable by the Fund. Total returns would have been lower had there been no waiver to the Fund.
Performance data represents past performance and is no assurance of future results. Investment return and principal value of an investment in the Fund will ßuctuate. Shares, when sold, may be worth more or less than their original cost. The Fund's performance may be lower or higher than the performance data shown. Please log on to www.ingfunds.com or call (800) 992-0180 to get performance through the most recent month end.
This report contains statements that may be "forward-looking" statements. Actual results may differ materially from those projected in the "forward-looking" statements.
The views expressed in this report reflect those of the portfolio managers, only through the end of the period as stated on the cover. The portfolio managers' views are subject to change at any time based on market and other conditions.
Fund holdings are subject to change daily.
(1) Reflects deduction of the maximum Class A sales charge of 4.75%.
(2) Reflects deduction of the Class B deferred sales charge of 5%, 2% and 1%, respectively, for the 1 year, 5 year and since inception returns.
(3) Reflects deduction of the Class C deferred sales charge of 1% for the 1 year return.
(4) The Lehman Brothers High Yield Bond Index is an unmanaged index that measures the performance of fixed-income securities that are similar, but not identical, to those in the Fund's portfolio.
(5) Since inception performance for index is shown from December 1, 1998.
7
ING HIGH YIELD OPPORTUNITY FUND
PORTFOLIO MANAGERS' REPORT
The ING High Yield Opportunity Fund+ (the "Fund") seeks a high level of current income and capital growth primarily through investments in high yield (high risk) debt securities, which are commonly referred to as "Junk Bonds", including those in the lowest ratings. The Fund is managed by a team of investment professionals led by Greg Jacobs, CFA and Kurt Kringelis, CFA, CPA, ING Investment Management Co. (formerly, Aeltus Investment Management, Inc.) - the Sub-Adviser.
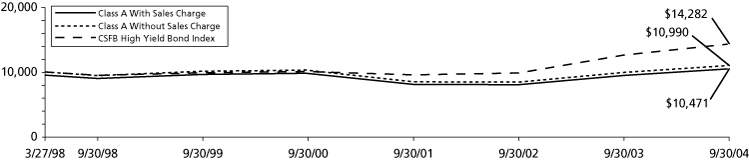
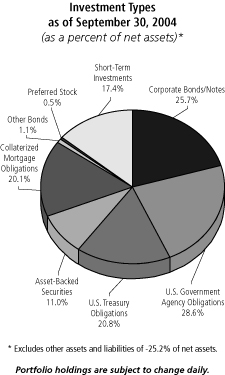
Performance: For the six months ended September 30, 2004, the Fund's Class A shares, excluding sales charges, provided a total return of 3.73% compared to 4.29% for the Credit Suisse First Boston ("CSFB") High Yield Bond Index(5).
Portfolio Specifics: Volatility in the Treasury market had a mixed impact on the portfolio during the past six months ended September 30, 2004. During the second calendar quarter, indications of an acceleration in economic growth led to expectations of an initial move by the Federal Reserve ("Fed") to raise interest rates. As the Treasury market began to sell off, investors sought to reduce exposure to the more interest-rate-sensitive segment of the high yield universe by selling higher quality securities. Lower quality securities rebounded in the third calendar quarter, as economic data released from July 2004 onward that pointed to a slowing of growth that alleviated at least some concerns of imminently and potentially significantly higher interest rates. During the past six mont hs, Moody's Caa-rated securities delivered the best returns, followed by B-rated securities, and then Ba-rated securities. Credit quality refers to the Fund's underlying investments, not to the stability or safety of the Fund. The Fund benefited from a concentration in mid-tier securities and experienced lower volatility than the market during this period.
Sector differentiation proved to be an important factor during the period as the transportation sector significantly underperformed the index while the basic industry sectors modestly outperformed the index. Fund performance was positively impacted by an underweight in transportation, which significantly underperformed the index, and an underweight in technology, which also underperformed the index. Performance was also positively impacted by an overweight in the basic industry sectors, which collectively outperformed the index. Performance was hurt by an underweight in utilities, which outperformed the index, and an overweight in wireless, which underperformed the index.
Current Strategy and Outlook: From a fundamental standpoint, the outlook continues to be favorable for the high yield market. At the macro level, economic strength and declining default rates should continue to make the sector attractive compared to other asset classes. On an issuer level, earnings continue to show solid growth year-over-year. However, growth slowed modestly during the second quarter and earnings missed became a bit more prevalent. We believe that sector selection will become even more important in the months ahead. In general, we still expect the improving economy to translate into higher cash flow and lower balance sheet leverage for most high yield issuers, which should bode well for the high yield market. Despite the broad fundamental market strength, we expect to remain underweight the Caa-rated securities and distressed part of the high yield market. We believe that this part of the high yield market is fully valued and that continued Fed tightening and declining liquidity will begin to negatively impact many of these issuers.

Top Ten Industries
as of September 30, 2004
(as a percent of net assets)
Corporate Bonds/Notes
| Media | 10.4 | % | |||||
| Telecommunications | 7.7 | % | |||||
| Electric | 6.8 | % | |||||
| Lodging | 6.7 | % | |||||
| Diversified Financial Services | 6.7 | % | |||||
| Pipelines | 5.0 | % | |||||
| Oil and Gas | 4.9 | % | |||||
| Packaging and Containers | 4.8 | % | |||||
| Retail | 4.6 | % | |||||
| Chemicals | 4.4 | % | |||||
Short-Term Investments
| Securities Lending Collateral | 22.6 | % | |||||
Portfolio holdings are subject to change daily.
+ On October 7, 2004, the shareholders of ING High Yield Opportunity Fund approved the reorganization with and merger into the ING High Yield Bond Fund. The reorganization was completed on October 25, 2004. Accordingly, the ING High Yield Opportunity Fund is no longer offering its shares.
8
ING HIGH YIELD OPPORTUNITY FUND
PORTFOLIO MANAGERS' REPORT
| Average Annual Total Returns for the Periods Ended September 30, 2004 | |||||||||||||||||||
| 1 Year | 5 Year | Since Inception of Class A, B and C March 27, 1998 | Since Inception of Class M May 17, 2002 | ||||||||||||||||
| Including Sales Charge: | |||||||||||||||||||
| Class A(1) | 5.31 | % | 0.68 | % | 0.70 | % | - | ||||||||||||
| Class B(2) | 4.78 | % | 0.81 | % | 0.84 | % | - | ||||||||||||
| Class C(3) | 8.78 | % | 1.05 | % | 0.85 | % | - | ||||||||||||
| Class M(4) | 6.46 | % | - | - | 4.55 | % | |||||||||||||
| Excluding Sales Charge: | |||||||||||||||||||
| Class A | 10.56 | % | 1.66 | % | 1.46 | % | - | ||||||||||||
| Class B | 9.78 | % | 1.07 | % | 0.84 | % | - | ||||||||||||
| Class C | 9.78 | % | 1.05 | % | 0.85 | % | - | ||||||||||||
| Class M | 10.04 | % | - | - | 6.02 | % | |||||||||||||
| CSFB High Yield Bond Index(5) | 13.32 | % | 7.65 | % | 5.64%(6) | 14.12%(7) | |||||||||||||
Based on a $10,000 initial investment, the graph and table above illustrate the total return of ING High Yield Opportunity Fund against the Credit Suisse First Boston High Yield Bond Index. The Index is unmanaged and has no cash in its portfolio, imposes no sales charges and incurs no operating expenses. An investor cannot invest directly in an index. The Fund's performance is shown both with and without the imposition of sales charges.
The performance graph and table do not reflect the deduction of taxes that a shareholder will pay on Fund distributions or the redemption of Fund shares.
Total returns reflect the fact that the Investment Adviser has waived certain fees and expenses otherwise payable by the Fund. Total returns would have been lower had there been no waiver to the Fund.
Performance data represents past performance and is no assurance of future results. Investment return and principal value of an investment in the Fund will ßuctuate. Shares, when sold, may be worth more or less than their original cost. The Fund's performance may be lower or higher than the performance data shown. Please log on to www.ingfunds.com or call (800) 992-0180 to get performance through the most recent month end.
This report contains statements that may be "forward-looking" statements. Actual results may differ materially from those projected in the "forward-looking" statements.
The views expressed in this report reflect those of the portfolio managers, only through the end of the period as stated on the cover. The portfolio managers' views are subject to change at any time based on market and other conditions.
Fund holdings are subject to change daily.
(1) Reflects deduction of the maximum Class A sales charge of 4.75%.
(2) Reflects deduction of the Class B deferred sales charge of 5% and 2%, respectively, for the 1 year and 5 year returns.
(3) Reflects deduction of the Class C deferred sales charge of 1% for the 1 year return.
(4) Reflects deduction of the maximum Class M sales charge of 3.25%.
(5) The CSFB High Yield Bond Index is an unmanaged index that measures the performance of fixed income securities similar, but not identical, to those in the Fund's portfolio.
(6) Since inception performance for index is shown from April 1, 1998.
(7) Since inception performance for index is shown from June 1, 2002.
9
ING INTERMEDIATE BOND FUND
PORTFOLIO MANAGERS' REPORT
The ING Intermediate Bond Fund (the "Fund") seeks to provide investors with a high level of current income, consistent with the preservation of capital and liquidity by investing at least 80% of its assets in investment grade debt securities. The Fund is managed by a team of investment professionals led by James B. Kauffmann, ING Investment Management Co. (formerly, Aeltus Investment Management, Inc.) - the Sub-Adviser.
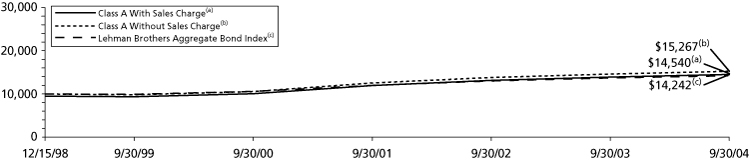
Performance: For the six months ended September 30, 2004, the Fund's Class A shares, excluding sales charges, provided a total return of 0.73% compared to 0.67% for the Lehman Brothers Aggregate Bond Index(4).
Portfolio Specifics: While our short duration stance was helpful in the first three months of this reporting period, by the end it was a source of underperformance relative to the benchmark, especially since we concentrated our underweight in shorter maturities, which proved to be the more resilient part of the yield curve. During the first half of the fiscal year ended September 30, 2004, we reduced our exposure to longer-dated and lower-rated corporates in the face of stretched valuations. In fact, our exposure to credit-sensitive sectors is now below the Lehman Brothers Aggregate Bond Index; consequently, the Fund's yield is slightly less than the Index.
We continue to actively manage our sector allocation and security selection exposures. For the six-month period ended September 30, 2004, we estimate that we generated 24 basis points of excess return from security selection, 21 basis points from sector allocation, but only 15 basis points from maturity and duration decisions due to our shorter duration during the second half of the reporting period. The Fund is overweight utilities, insurance, consumer non-cyclical and the real estate investment trust (REIT) sector. Exposure to emerging markets debt enhanced returns.
Current Strategy and Outlook: Uncertainties about the geopolitical situation and the level and direction of energy costs present portfolio managers with quite a set of wildcards; nevertheless, most measures of volatility remain very low. While the bond market continues to focus on the spate of mixed or softer economic releases, we do not believe that the yields on shorter maturity Treasuries fully reflect the future pace of economic activity and the rise in a number of inflation measures.
Tactically, the Fund is still short in duration in anticipation of improving global economic fundamentals despite the recent "soft patch" of slow employment growth and consumer spending. The Fund is underweight home mortgages, overweight asset-backed and commercial mortgage-backed securities, and underweight the intermediate and shorter-term part of the yield curve, which appears most vulnerable in a tightening cycle. We are also underweight U.S. Government Agency securities, which have witnessed some regulatory criticism. Stretched valuations in investment-grade credit issues still warrant caution. Indeed, we are beginning to see more shareholder friendly - read, bondholder unfriendly - actions by companies. We retain some exposure to emerging markets debt as many developing economies benefit from strong commodities and energy markets.
10
ING INTERMEDIATE BOND FUND
PORTFOLIO MANAGERS' REPORT
| Average Annual Total Returns for the Periods Ended September 30, 2004 | |||||||||||||||||||||||
| 1 Year | 5 Year | Since Inception of Class A, B and C December 15, 1998 | Since Inception of Class O August 16, 2004 | Since Inception of Class R March 16, 2004 | |||||||||||||||||||
| Including Sales Charge: | |||||||||||||||||||||||
| Class A(1) | (0.78 | )% | 8.08 | % | 6.66 | % | - | - | |||||||||||||||
| Class B(2) | (1.53 | )% | 8.00 | % | 6.60 | % | - | - | |||||||||||||||
| Class C(3) | 2.41 | % | 8.33 | % | 6.77 | % | - | - | |||||||||||||||
| Class O | - | - | - | 0.97 | % | - | |||||||||||||||||
| Class R | - | - | - | - | 0.53 | % | |||||||||||||||||
| Excluding Sales Charge: | |||||||||||||||||||||||
| Class A | 4.17 | % | 9.13 | % | 7.56 | % | - | - | |||||||||||||||
| Class B | 3.39 | % | 8.29 | % | 6.73 | % | - | - | |||||||||||||||
| Class C | 3.39 | % | 8.33 | % | 6.77 | % | - | - | |||||||||||||||
| Class O | - | - | - | 0.97 | % | - | |||||||||||||||||
| Class R | - | - | - | - | 0.53 | % | |||||||||||||||||
| Lehman Brothers Aggregate Bond Index(4) | 3.68 | % | 7.48 | % | 6.30 | %(5) | 0.27 | %(6) | 0.67 | %(7) | |||||||||||||
Based on a $10,000 initial investment, the graph and table above illustrate the total return of ING Intermediate Bond Fund against the Lehman Brothers Aggregate Bond Index. The Index is unmanaged and has no cash in its portfolio, imposes no sales charges and incurs no operating expenses. An investor cannot invest directly in an index. The Fund's performance is shown both with and without the imposition of sales charges.
The performance graph and table do not reflect the deduction of taxes that a shareholder will pay on Fund distributions or the redemption of Fund shares.
Total returns reflect the fact that the Investment Adviser has waived certain fees and expenses otherwise payable by the Fund. Total returns would have been lower had there been no waiver to the Fund.
Performance data represents past performance and is no assurance of future results. Investment return and principal value of an investment in the Fund will ßuctuate. Shares, when sold, may be worth more or less than their original cost. The Fund's performance may be lower or higher than the performance data shown. Please log on to www.ingfunds.com or call (800) 992-0180 to get performance through the most recent month end.
This report contains statements that may be "forward-looking" statements. Actual results may differ materially from those projected in the "forward-looking" statements.
The views expressed in this report reßect those of the portfolio managers, only through the end of the period as stated on the cover. The portfolio managers' views are subject to change at any time based on market and other conditions.
Fund holdings are subject to change daily.
(1) Reflects deduction of the maximum Class A sales charge of 4.75%.
(2) Reflects deduction of the Class B deferred sales charge of 5%, 2% and 1%, respectively, for the 1 year, 5 year and since inception returns.
(3) Reflects deduction of the Class C deferred sales charge of 1% for the 1 year return.
(4) The Lehman Brothers Aggregate Bond Index is a widely recognized, unmanaged index of publicly issued investment grade U.S. Government, mortgage-backed, asset-backed and corporate debt securities.
(5) Since inception performance for index is shown from December 1, 1998.
(6) Since inception performance for index is shown from September 1, 2004.
(7) Since inception performance for index is shown from April 1, 2004.
11
ING NATIONAL TAX-EXEMPT BOND FUND
PORTFOLIO MANAGERS' REPORT
The ING National-Tax Exempt Bond Fund (the "Fund") seeks to provide investors with a high level of current income that is exempt from federal income taxes, consistent with preservation of capital. The Fund is managed by Robert Schonbrunn, Managing Director and Portfolio Manager, Karen Cronk, Managing Director and Portfolio Manager, Mark Iannarelli, Assistant Portfolio Manager, ING Investment Management Co. (formerly, Aeltus Investment Management, Inc.) - the Sub-Adviser.
Performance: For the six months ended September 30, 2004, the Fund's Class A shares, excluding sales charges, returned 0.74% compared to 1.44% for the Lehman Brothers Municipal Bond Index(4) and 0.67% for the Lehman Brothers Aggregate Bond Index(5).
Portfolio Specifics: In the past six months ended September 30, 2004, there were two significant interest rate trends that veered in opposite directions. These trends resulted in an insignificant net change for the period, which affected the Fund's performance. During the second calendar quarter, rates increased as the economy strengthened and investors anticipated that the Federal Reserve ("Fed") would raise the Fed Funds rate. Rates declined during the third calendar quarter, as the expected economic recovery stalled and oil prices rose significantly above expectations. Yields on 10-year AAA General Obligation Municipal bonds rose from 3.49% on March 31, 2004 to 4.02% on June 30, 2004, and then fell back to 3.48% on September 30, 2004.
The Fund has been defensively postured with a lower sensitivity to interest rate change, high coupons that sell at premiums, and high quality issues. This strategy worked well in the beginning of the period in the second quarter when rates were rising, but not as well at the end of the reporting period when rates declined. The Fund has an overweighted position in shorter maturities and cash equivalents, which are beginning to benefit from rising short-term rates, but do not fully participate when longer-term rates decline. The intermediate- and longer-term part of the Fund has done well as rates have decreased. The Fund is earning a high current yield and has not had any bonds called by the issuers. The Fund's emphasis on quality has been slightly negative, as lower quality issues have outperformed recently.
Current Strategy and Outlook: In the economic environment of continued slow growth and relatively low inflation, it is anticipated that better investment opportunities lie ahead in the municipal bond market. Although the Fund will likely retain its overall defensive characteristics, there may be shifts from some of the intermediate-term issues into a combination of shorter- and longer-term issues to improve our position relative to a flatter yield curve. Select opportunities in longer maturity, higher yielding bonds and some lower quality issues will be continually evaluated. Going forward interest rate movement may not play as significant a role as it has in the past six months.
Looking ahead, the manager believes that the economic recovery will continue. The economy is currently experiencing a mid-period slowdown, which will alter the cycle, but will not end it. Although oil prices and some other commodity prices are high, overall inflation is expected to remain low based on productivity gains and worldwide competition. In this environment, the trend of interest rates will likely be higher than current levels; however, rate increases are not expected to be substantial in the near future.
12
PORTFOLIO MANAGERS' REPORT
ING NATIONAL TAX-EXEMPT BOND FUND
| Average Annual Total Returns for the Periods Ended September 30, 2004 | |||||||||||
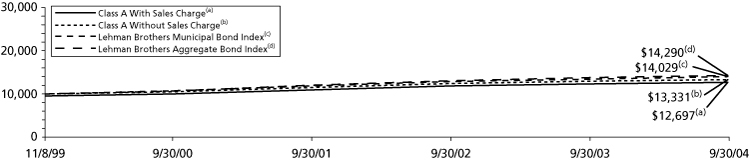
1 Year | Since Inception November 8, 1999 | ||||||||||
| Including Sales Charge: | |||||||||||
| Class A(1) | (1.94 | )% | 4.99 | % | |||||||
| Class B(2) | (2.72 | )% | 4.90 | % | |||||||
| Class C(3) | 1.22 | % | 5.25 | % | |||||||
| Excluding Sales Charge: | |||||||||||
| Class A | 2.95 | % | 6.04 | % | |||||||
| Class B | 2.18 | % | 5.23 | % | |||||||
| Class C | 2.20 | % | 5.25 | % | |||||||
| Lehman Brothers Municipal Bond Index(4) | 4.60 | % | 7.13%(6) | ||||||||
| Lehman Brothers Aggregate Bond Index(5) | 3.68 | % | 7.53%(6) | ||||||||
Based on a $10,000 initial investment, the graph and table above illustrate the total return of ING National Tax-Exempt Bond Fund against the Lehman Brothers Municipal Bond Index and the Lehman Brothers Aggregate Bond Index. The Indices are unmanaged and have no cash in their portfolios, impose no sales charges and incur no operating expenses. An investor cannot invest directly in an index. The Fund's performance is shown both with and without the imposition of sales charges.
The performance graph and table do not reflect the deduction of taxes that a shareholder will pay (if any) on Fund distributions or the redemption of Fund shares.
Total returns reflect the fact that the Investment Adviser has waived certain fees and expenses otherwise payable by the Fund. Total returns would have been lower had there been no waiver to the Fund.
Performance data represents past performance and is no assurance of future results. Investment return and principal value of an investment in the Fund will fluctuate. Shares, when sold, may be worth more or less than their original cost. The Fund's performance may be lower or higher than the performance data shown. Please log on to www.ingfunds.com or call (800) 992-0180 to get performance through the most recent month end.
This report contains statements that may be "forward-looking" statements. Actual results may differ materially from those projected in the "forward-looking" statements.
The views expressed in this report reflect those of the portfolio managers, only through the end of the period as stated on the cover. The portfolio managers' views are subject to change at any time based on market and other conditions.
Fund holdings are subject to change daily.
(1) Reflects deduction of the maximum Class A sales charge of 4.75%.
(2) Reflects deduction of the Class B deferred sales charge of 5% and 2%, respectively, for the 1 year and since inception returns.
(3) Reflects deduction of the Class C deferred sales charge of 1% for the 1 year return.
(4) The Lehman Brothers Municipal Bond Index is an unmanaged index of approximately 1,100 investment grade tax-exempt bonds classified into four sectors: general obligation, revenue, insured and pre-refunded.
(5) The Lehman Brothers Aggregate Bond Index is a widely recognized, unmanaged index of publicly issued investment grade U.S. Government, mortgage-backed, asset-backed and corporate debt securities.
(6) Since inception performance for index is shown from November 1, 1999.
13
ING CLASSIC MONEY MARKET FUND, ING MONEY MARKET FUND
AND ING LEXINGTON MONEY MARKET TRUST(1) PORTFOLIO MANAGERS' REPORT
The ING Classic Money Market Fund, the ING Money Market Fund and the ING Lexington Money Market Fund (the "Funds") seek to provide a high level of current income, consistent with preservation of capital and liquidity. The Funds are managed by a team of fixed income specialists led by Jennifer J. Thompson(2), CFA, ING Investment Management Co. (formerly, Aeltus Investment Management, Inc.) - the Sub-Adviser.
Portfolio Specifics: During the six months ended September 30, 2004, the economic recovery was strong enough to convince the Federal Reserve Board ("Fed") that it could begin the process of gradually removing its highly accommodative monetary policy stance. Accordingly, it increased its Fed Funds target rate from 1.00% to 1.75%. The first move of 25 basis points came at the June 30, 2004 Federal Open Market Committee meeting ("FOMC") followed by two consecutive 25 basis point tightenings at the August and September meetings. The Fed began this tightening cycle due to a contemporaneous spike in job growth and inflation in late spring that convinced it of two things: the economic recovery reached a point that a negative shock would not derail it and that it needed to keep i nflation and inflation expectations from spiraling out of control.
Though the economy hit a summer "soft patch" of slow employment growth and consumer spending, the FOMC remained bullish on the economic outlook and continued to increase rates. Economists currently estimate third-quarter real gross domestic product rebounded to approximately 4% from 3.3% in the second calendar quarter. However, by the end of the period, the persistent uptrend in oil prices raised the specter of decelerating growth going forward. Though many market participants think this will cause the FOMC to slow the pace of Fed Funds rate increases, there is little indication publicly by Fed members to support this view. The Fed Funds target rate remains low by historical standards and is still providing significant support to the economy. Going forward, however, we expect the flow of economic data to play a larger role in future FOMC meeting decisions.
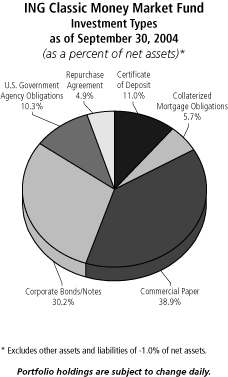
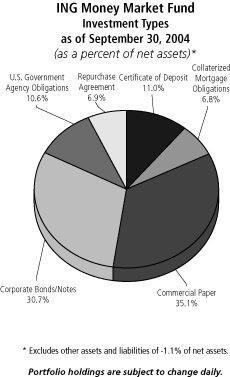
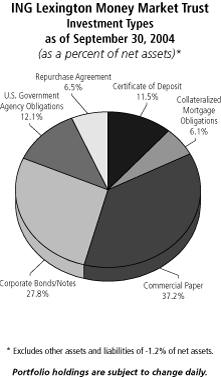
To position for a rising rate environment, the Funds shifted from a barbell strategy to investing to each successive FOMC meeting date through the purchase of short-term commercial paper or floating rate notes. This strategy allowed the Funds to hedge against any underperformance associated with an unexpected increase in the size or pace of tightening. Accordingly, the Funds' weighted average maturity significantly declined and ended the period at 48 days for ING Classic Money Market, 49 days for ING Money Market Fund, and 51 days for ING Lexington Money Market Trust, compared to the benchmark's weighted average maturity of 42 days. However, securities purchased early in the six-month period when the Funds utilized a barbell strategy (and had a weighted average maturity significantly longer than the peer group) increasingly weighed on performance as the Fed raised rates.
Current Strategy and Outlook: Underlying core inflation appears moderate and monetary policy still remains highly accommodative for an economy growing at a healthy pace. Nevertheless, the near-term impact on growth from higher oil prices may cause the Fed to keep its Fed Funds target rate stable for a period of time. The impact of oil prices notwithstanding, we believe the economy is fundamentally strong
14
ING CLASSIC MONEY MARKET FUND, ING MONEY MARKET FUND
PORTFOLIO MANAGERS' REPORT AND ING LEXINGTON MONEY MARKET TRUST(1)
enough to maintain trend growth, allowing the FOMC to raise its Fed Funds target rate at a "measured pace." As a result, the Funds will likely maintain its current strategy of investing in short maturity securities and opportunistically investing in longer maturities to the extent it makes sense under various Fed Funds rate scenarios.
Principal Risk Factor(s): An investment in the Funds is not insured or guaranteed by the Federal Deposit Insurance Corporation or any other government agency. Although the Funds seek to preserve the value of your investment at $1.00 per share, it is possible to lose money by investing in the Funds.
The views expressed in this report reflect those of the portfolio managers only through the end of the period as stated on the cover. The portfolio managers' views are subject to change at any time based on market and other conditions.
Fund holdings are subject to change daily.
This report contains statements that may be "forward-looking" statements. Actual results may differ materially from those projected in the "forward-looking" statements.
(1) On September 2, 2004, the Board of Trustees of ING Funds Trust approved a proposal to reorganize the ING Money Market Fund and the ING Lexington Money Market Trust (the "Disappearing Funds") into the ING Classic Money Market Fund (the "Reorganization"). The proposed Reorganization is subject to approval by shareholders of the Disappearing Funds. If shareholder approval is obtained, it is expected that the Reorganization would take place during the first quarter of 2005.
(2) Subsequent to period end, David S. Yealy, Senior Portfolio Manager, replaced Jennifer J. Thompson as lead of the management team of the Funds.
15
SHAREHOLDER EXPENSE EXAMPLES (Unaudited)
As a shareholder of a Fund, you incur two types of costs: (1) transaction costs, including sales charges (loads) on purchase payments, reinvested dividends, or other distributions; redemption fees; and exchange fees; and (2) ongoing costs, including management fees; distribution [and/or service] (12b–1) fees; and other Fund expenses. These Examples are intended to help you understand your ongoing costs (in dollars) of investing in a Fund and to compare these costs with the ongoing costs of investing in other mutual funds.
The Examples are based on an investment of $1,000 invested at the beginning of the period and held for the entire period from April 1, 2004 to September 30, 2004.
Actual Expenses
The first section of the table shown, "Actual Fund Return," provides information about actual account values and actual expenses. You may use the information in this section, together with the amount you invested, to estimate the expenses that you paid over the period. Simply divide your account value by $1,000 (for example, an $8,600 account value divided by $1,000 = 8.6), then multiply the result by the number in the first section under the heading entitled "Expenses Paid During Period" to estimate the expenses you paid on your account during this period.
Hypothetical Example for Comparison Purposes
The second section of the table shown, "Hypothetical 5% Return," provides information about hypothetical account values and hypothetical expenses based on the Fund's actual expense ratio and an assumed rate of return of 5% per year before expenses, which is not the Fund's actual return. The hypothetical account values and expenses may not be used to estimate the actual ending account balance or expenses you paid for the period. You may use this information to compare the ongoing costs of investing in the Fund and other funds. To do so, compare this 5% hypothetical example with the 5% hypothetical examples that appear in the shareholder reports of the other funds.
Please note that the expenses shown in the table are meant to highlight your ongoing costs only and do not reflect any transactional costs, such as sales charges (loads), redemption fees, or exchange fees. Therefore, the hypothetical lines of the table are useful in comparing ongoing costs only, and will not help you determine the relative total costs of owning different funds. In addition, if these transactional costs were included, your costs would have been higher.
ING GNMA Income Fund
Expense Analysis of an investment of $1,000
| Total Return Without Sales Charges | Beginning Account Value April 1, 2004 | Ending Account Value September 30, 2004 | Annualized Expense Ratio | Expenses Paid During the Six Months Ended September 30, 2004* | |||||||||||||||||||
| Actual Fund Return | |||||||||||||||||||||||
| Class A | 0.39 | % | $ | 1,000.00 | $ | 1,003.90 | 0.98 | % | $ | 4.92 | |||||||||||||
| Class B | 0.01 | 1,000.00 | 1,000.10 | 1.73 | 8.67 | ||||||||||||||||||
| Class C | 0.01 | 1,000.00 | 1,000.10 | 1.73 | 8.67 | ||||||||||||||||||
| Class M | 0.24 | 1,000.00 | 1,002.40 | 1.48 | 7.43 | ||||||||||||||||||
| Hypothetical (Excluding Expenses) | |||||||||||||||||||||||
| Class A | 5.00 | % | $ | 1,000.00 | $ | 1,020.16 | 0.98 | % | $ | 4.96 | |||||||||||||
| Class B | 5.00 | 1,000.00 | 1,016.39 | 1.73 | 8.74 | ||||||||||||||||||
| Class C | 5.00 | 1,000.00 | 1,016.39 | 1.73 | 8.74 | ||||||||||||||||||
| Class M | 5.00 | 1,000.00 | 1,017.65 | 1.48 | 7.49 | ||||||||||||||||||
16
SHAREHOLDER EXPENSE EXAMPLES (Unaudited)
ING High Yield Bond Fund
Expense Analysis of an investment of $1,000
| Total Return Without Sales Charges | Beginning Account Value April 1, 2004 | Ending Account Value September 30, 2004 | Annualized Expense Ratio | Expenses Paid During the Six Months Ended September 30, 2004* | |||||||||||||||||||
| Actual Fund Return | |||||||||||||||||||||||
| Class A | 3.38 | % | $ | 1,000.00 | $ | 1,033.80 | 1.30 | % | $ | 6.63 | |||||||||||||
| Class B | 3.00 | 1,000.00 | 1,030.00 | 2.05 | 10.43 | ||||||||||||||||||
| Class C | 3.12 | 1,000.00 | 1,031.20 | 2.05 | 10.44 | ||||||||||||||||||
| Hypothetical (Excluding Expenses) | |||||||||||||||||||||||
| Class A | 5.00 | % | $ | 1,000.00 | $ | 1,018.55 | 1.30 | % | $ | 6.58 | |||||||||||||
| Class B | 5.00 | 1,000.00 | 1,014.79 | 2.05 | 10.35 | ||||||||||||||||||
| Class C | 5.00 | 1,000.00 | 1,014.79 | 2.05 | 10.35 | ||||||||||||||||||
ING High Yield Opportunity Fund
Expense Analysis of an investment of $1,000
| Total Return Without Sales Charges | Beginning Account Value April 1, 2004 | Ending Account Value September 30, 2004 | Annualized Expense Ratio | Expenses Paid During the Six Months Ended September 30, 2004* | |||||||||||||||||||
| Actual Fund Return | |||||||||||||||||||||||
| Class A | 3.73 | % | $ | 1,000.00 | $ | 1,037.30 | 1.30 | % | $ | 6.64 | |||||||||||||
| Class B | 3.37 | 1,000.00 | 1,033.70 | 1.95 | 9.94 | ||||||||||||||||||
| Class C | 3.52 | 1,000.00 | 1,035.20 | 1.95 | 9.95 | ||||||||||||||||||
| Class M | 3.53 | 1,000.00 | 1,035.30 | 1.70 | 8.67 | ||||||||||||||||||
| Hypothetical (Excluding Expenses) | |||||||||||||||||||||||
| Class A | 5.00 | % | $ | 1,000.00 | $ | 1,018.55 | 1.30 | % | $ | 6.58 | |||||||||||||
| Class B | 5.00 | 1,000.00 | 1,015.29 | 1.95 | 9.85 | ||||||||||||||||||
| Class C | 5.00 | 1,000.00 | 1,015.29 | 1.95 | 9.85 | ||||||||||||||||||
| Class M | 5.00 | 1,000.00 | 1,016.55 | 1.70 | 8.59 | ||||||||||||||||||
ING Intermediate Bond Fund
Expense Analysis of an investment of $1,000
| Total Return Without Sales Charges | Beginning Account Value April 1, 2004 | Ending Account Value September 30, 2004 | Annualized Expense Ratio | Expenses Paid During the Six Months Ended September 30, 2004* | |||||||||||||||||||
| Actual Fund Return | |||||||||||||||||||||||
| Class A | 0.73 | % | $ | 1,000.00 | $ | 1,007.30 | 0.99 | % | $ | 4.98 | |||||||||||||
| Class B | 0.34 | 1,000.00 | 1,003.40 | 1.74 | 8.74 | ||||||||||||||||||
| Class C | 0.44 | 1,000.00 | 1,004.40 | 1.74 | 8.74 | ||||||||||||||||||
| Class O(1) | 0.97 | 1,000.00 | 1,009.70 | 0.91 | 4.58 | ||||||||||||||||||
| Class R | 0.83 | 1,000.00 | 1,008.30 | 1.17 | 5.89 | ||||||||||||||||||
| Hypothetical (Excluding Expenses) | |||||||||||||||||||||||
| Class A | 5.00 | % | $ | 1,000.00 | $ | 1,020.10 | 0.99 | % | $ | 5.01 | |||||||||||||
| Class B | 5.00 | 1,000.00 | 1,016.34 | 1.74 | 8.80 | ||||||||||||||||||
| Class C | 5.00 | 1,000.00 | 1,016.34 | 1.74 | 8.80 | ||||||||||||||||||
| Class O(1) | 5.00 | 1,000.00 | 995.44 | 0.91 | 4.61 | ||||||||||||||||||
| Class R | 5.00 | 1,000.00 | 994.13 | 1.17 | 5.92 | ||||||||||||||||||
(1) Class commenced operations on August 16, 2004.
17
SHAREHOLDER EXPENSE EXAMPLES (Unaudited)
ING National Tax-Exempt Bond Fund
Expense Analysis of an investment of $1,000
| Total Return Without Sales Charges | Beginning Account Value April 1, 2004 | Ending Account Value September 30, 2004 | Annualized Expense Ratio | Expenses Paid During the Six Months Ended September 30, 2004* | |||||||||||||||||||
| Actual Fund Return | |||||||||||||||||||||||
| Class A | 0.74 | % | $ | 1,000.00 | $ | 1,007.40 | 1.15 | % | $ | 5.79 | |||||||||||||
| Class B | 0.37 | 1,000.00 | 1,003.70 | 1.90 | 9.54 | ||||||||||||||||||
| Class C | 0.38 | 1,000.00 | 1,003.80 | 1.90 | 9.54 | ||||||||||||||||||
| Hypothetical (Excluding Expenses) | |||||||||||||||||||||||
| Class A | 5.00 | % | $ | 1,000.00 | $ | 1,019.30 | 1.15 | % | $ | 5.82 | |||||||||||||
| Class B | 5.00 | 1,000.00 | 1,015.54 | 1.90 | 9.60 | ||||||||||||||||||
| Class C | 5.00 | 1,000.00 | 1,015.54 | 1.90 | 9.60 | ||||||||||||||||||
ING Classic Money Market Fund
Expense Analysis of an investment of $1,000
| Total Return Without Sales Charges | Beginning Account Value April 1, 2004 | Ending Account Value September 30, 2004 | Annualized Expense Ratio | Expenses Paid During the Six Months Ended September 30, 2004* | |||||||||||||||||||
| Actual Fund Return | |||||||||||||||||||||||
| Class A | 0.28 | % | $ | 1,000.00 | $ | 1,002.80 | 0.77 | % | $ | 3.87 | |||||||||||||
| Class B | 0.13 | 1,000.00 | 1,001.30 | 1.08 | 5.42 | ||||||||||||||||||
| Class C | 0.13 | 1,000.00 | 1,001.30 | 1.08 | 5.42 | ||||||||||||||||||
| Hypothetical (Excluding Expenses) | |||||||||||||||||||||||
| Class A | 5.00 | % | $ | 1,000.00 | $ | 1,021.21 | 0.77 | % | $ | 3.90 | |||||||||||||
| Class B | 5.00 | 1,000.00 | 1,019.65 | 1.08 | 5.47 | ||||||||||||||||||
| Class C | 5.00 | 1,000.00 | 1,019.65 | 1.08 | 5.47 | ||||||||||||||||||
ING Money Market Fund
Expense Analysis of an investment of $1,000
| Total Return Without Sales Charges | Beginning Account Value April 1, 2004 | Ending Account Value September 30, 2004 | Annualized Expense Ratio | Expenses Paid During the Six Months Ended September 30, 2004* | |||||||||||||||||||
| Actual Fund Return | |||||||||||||||||||||||
| Class A | 0.40 | % | $ | 1,000.00 | $ | 1,004.00 | 0.60 | % | $ | 3.01 | |||||||||||||
| Class B | - | 1,000.00 | 1,000.00 | 1.34 | 6.70 | ||||||||||||||||||
| Class C | - | 1,000.00 | 1,000.00 | 1.33 | 6.65 | ||||||||||||||||||
| Hypothetical (Excluding Expenses) | |||||||||||||||||||||||
| Class A | 5.00 | % | $ | 1,000.00 | $ | 1,022.06 | 0.60 | % | $ | 3.04 | |||||||||||||
| Class B | 5.00 | 1,000.00 | 1,018.35 | 1.34 | 6.78 | ||||||||||||||||||
| Class C | 5.00 | 1,000.00 | 1,018.40 | 1.33 | 6.73 | ||||||||||||||||||
18
SHAREHOLDER EXPENSE EXAMPLES (Unaudited)
ING Lexington Money Market Trust
Expense Analysis of an investment of $1,000
| Total Return Without Sales Charges | Beginning Account Value April 1, 2004 | Ending Account Value September 30, 2004 | Annualized Expense Ratio | Expenses Paid During the Six Months Ended September 30, 2004* | |||||||||||||||||||
| Actual Fund Return | |||||||||||||||||||||||
| Class A | 0.27 | % | $ | 1,000.00 | $ | 998.69 | 0.80 | % | $ | 4.01 | |||||||||||||
| Hypothetical (Excluding Expenses) | |||||||||||||||||||||||
| Class A | 5.00 | % | $ | 1,000.00 | $ | 1,021.06 | 0.80 | % | $ | 4.05 | |||||||||||||
* Expenses are equal to the Fund's annualized expense ratios multiplied by the average account value over the period, multiplied by 183/365 (to reflect the one-half year period).
19
STATEMENTS OF ASSETS AND LIABILITIES as of September 30, 2004 (Unaudited)
| ING GNMA Income Fund | ING High Yield Bond Fund | ING High Yield Opportunities Fund | ING Intermediate Bond Fund | ||||||||||||||||
| ASSETS: | |||||||||||||||||||
| Investments in securities at value+* | $ | 684,352,366 | $ | 68,865,850 | $ | 231,552,889 | $ | 648,414,533 | |||||||||||
| Short-term investments** | 34,406,057 | 13,534,319 | 53,825,247 | 73,409,156 | |||||||||||||||
| Repurchase agreement | - | 3,087,000 | 4,490,000 | 31,211,000 | |||||||||||||||
| Cash | 2,250,769 | 27,314 | 82,464 | 3,268 | |||||||||||||||
| Cash collateral for futures | - | - | - | 612,539 | |||||||||||||||
| Receivables: | |||||||||||||||||||
| Investment securities sold | 24,841,797 | 390,294 | 1,282,394 | 15,896,467 | |||||||||||||||
| Fund shares sold | 258,251 | 110,035 | 28,419 | 1,135,126 | |||||||||||||||
| Dividends and interest | 3,205,496 | 1,471,669 | 5,703,963 | 4,138,983 | |||||||||||||||
| Prepaid expenses | 51,090 | 18,238 | 36,879 | 67,596 | |||||||||||||||
| Total assets | 749,365,826 | 87,504,719 | 297,002,255 | 774,888,668 | |||||||||||||||
| LIABILITIES: | |||||||||||||||||||
| Payable for investment securities purchased | 24,433,594 | 842,337 | 2,733,409 | 97,927,318 | |||||||||||||||
| Payable for fund shares redeemed | 348,802 | 98,503 | 264,824 | 172,667 | |||||||||||||||
| Payable for futures variation margin | - | - | - | 4,281 | |||||||||||||||
| Payable upon receipt of securities loaned | - | 13,534,319 | 53,825,247 | 73,409,156 | |||||||||||||||
| Income distribution payable | - | 329,083 | 892,974 | 1,494,694 | |||||||||||||||
| Payable to affiliates | 604,233 | 102,154 | 358,165 | 486,763 | |||||||||||||||
| Payable for trustee fees | 60,357 | 1,260 | 8,120 | 4,590 | |||||||||||||||
| Other accrued expenses and liabilities | 328,237 | 42,791 | 236,730 | 130,382 | |||||||||||||||
| Total liabilities | 25,775,223 | 14,950,447 | 58,319,469 | 173,629,851 | |||||||||||||||
| NET ASSETS | $ | 723,590,603 | $ | 72,554,272 | $ | 238,682,786 | $ | 601,258,817 | |||||||||||
| NET ASSETS WERE COMPRISED OF: | |||||||||||||||||||
| Paid-in capital | $ | 715,347,382 | $ | 75,494,813 | $ | 693,109,611 | $ | 596,466,391 | |||||||||||
| Undistributed net investment income (accumulated net investment loss) | (278,257 | ) | (58,991 | ) | (2,417,562 | ) | 11,828 | ||||||||||||
| Accumulated net realized gain (loss) on investments and futures | (13,650,460 | ) | (6,016,541 | ) | (444,834,499 | ) | 1,940,991 | ||||||||||||
| Net unrealized appreciation (depreciation) on investments, translation of assets in foreign currencies and futures | 22,171,938 | 3,134,991 | (7,174,764 | ) | 2,839,607 | ||||||||||||||
| NET ASSETS | $ | 723,590,603 | $ | 72,554,272 | $ | 238,682,786 | $ | 601,258,817 | |||||||||||
| + Including securities loaned at value | $ | - | $ | 13,534,319 | $ | 52,503,115 | $ | 71,399,389 | |||||||||||
| * Cost of investments in securities | $ | 662,179,666 | $ | 65,730,859 | $ | 238,786,261 | $ | 645,698,895 | |||||||||||
| ** Cost of short-term investments | $ | 34,406,819 | $ | 13,534,319 | $ | 53,825,247 | $ | 73,409,156 | |||||||||||
See Accompanying Notes to Financial Statements
20
STATEMENTS OF ASSETS AND LIABILITIES as of September 30, 2004 (Unaudited)
| ING GNMA Income Fund | ING High Yield Bond Fund | ING High Yield Opportunities Fund | ING Intermediate Bond Fund | ||||||||||||||||
| Class A: | |||||||||||||||||||
| Net assets | $ | 550,980,509 | $ | 43,026,467 | $ | 83,163,144 | $ | 398,784,516 | |||||||||||
| Shares authorized | unlimited | unlimited | unlimited | unlimited | |||||||||||||||
| Par value | $ | 0.001 | $ | 0.001 | $ | 0.001 | $ | 0.001 | |||||||||||
| Shares outstanding | 63,242,809 | 4,833,685 | 11,550,597 | 38,145,862 | |||||||||||||||
| Net asset value and redemption price per share | $ | 8.71 | $ | 8.90 | $ | 7.20 | $ | 10.45 | |||||||||||
| Maximum offering price per share (4.75%)(1) | $ | 9.14 | $ | 9.34 | $ | 7.56 | $ | 10.97 | |||||||||||
| Class B: | |||||||||||||||||||
| Net assets | $ | 111,541,672 | $ | 18,357,380 | $ | 134,809,272 | $ | 66,824,402 | |||||||||||
| Shares authorized | unlimited | unlimited | unlimited | unlimited | |||||||||||||||
| Par value | $ | 0.001 | $ | 0.001 | $ | 0.001 | $ | 0.001 | |||||||||||
| Shares outstanding | 12,862,919 | 2,062,910 | 18,616,576 | 6,404,411 | |||||||||||||||
| Net asset value and redemption price per share(2) | $ | 8.67 | $ | 8.90 | $ | 7.24 | $ | 10.43 | |||||||||||
| Maximum offering price per share | $ | 8.67 | $ | 8.90 | $ | 7.24 | $ | 10.43 | |||||||||||
| Class C: | |||||||||||||||||||
| Net assets | $ | 51,293,264 | $ | 11,170,425 | $ | 18,172,286 | $ | 68,717,151 | |||||||||||
| Shares authorized | unlimited | unlimited | unlimited | unlimited | |||||||||||||||
| Par value | $ | 0.001 | $ | 0.001 | $ | 0.001 | $ | 0.001 | |||||||||||
| Shares outstanding | 5,907,779 | 1,254,660 | 2,510,740 | 6,581,217 | |||||||||||||||
| Net asset value and redemption price per share(2) | $ | 8.68 | $ | 8.90 | $ | 7.24 | $ | 10.44 | |||||||||||
| Maximum offering price per share | $ | 8.68 | $ | 8.90 | $ | 7.24 | $ | 10.44 | |||||||||||
| Class I: | |||||||||||||||||||
| Net assets | $ | 9,460,052 | n/a | n/a | $ | 39,249,219 | |||||||||||||
| Shares authorized | unlimited | n/a | n/a | unlimited | |||||||||||||||
| Par value | $ | 0.001 | n/a | n/a | $ | 0.001 | |||||||||||||
| Shares outstanding | 1,084,864 | n/a | n/a | 3,754,152 | |||||||||||||||
| Net asset value and redemption price per share | $ | 8.72 | n/a | n/a | $ | 10.45 | |||||||||||||
| Maximum offering price per share | $ | 8.72 | n/a | n/a | $ | 10.45 | |||||||||||||
| Class M: | |||||||||||||||||||
| Net assets | $ | 212,198 | n/a | $ | 2,538,084 | n/a | |||||||||||||
| Shares authorized | unlimited | n/a | unlimited | n/a | |||||||||||||||
| Par value | $ | 0.001 | n/a | $ | 0.001 | n/a | |||||||||||||
| Shares outstanding | 24,318 | n/a | 353,017 | n/a | |||||||||||||||
| Net asset value and redemption price per share | $ | 8.73 | n/a | $ | 7.19 | n/a | |||||||||||||
| Maximum offering price per share (3.25%)(3) | $ | 9.02 | n/a | $ | 7.43 | n/a | |||||||||||||
| Class Q: | |||||||||||||||||||
| Net assets | $ | 102,908 | n/a | n/a | n/a | ||||||||||||||
| Shares authorized | unlimited | n/a | n/a | n/a | |||||||||||||||
| Par value | $ | 0.001 | n/a | n/a | n/a | ||||||||||||||
| Shares outstanding | 11,798 | n/a | n/a | n/a | |||||||||||||||
| Net asset value and redemption price per share | $ | 8.72 | n/a | n/a | n/a | ||||||||||||||
| Maximum offering price per share | $ | 8.72 | n/a | n/a | n/a | ||||||||||||||
| Class O: | |||||||||||||||||||
| Net assets | n/a | n/a | n/a | $ | 27,548,424 | ||||||||||||||
| Shares authorized | n/a | n/a | n/a | unlimited | |||||||||||||||
| Par value | n/a | n/a | n/a | $ | 0.001 | ||||||||||||||
| Shares outstanding | n/a | n/a | n/a | 2,635,169 | |||||||||||||||
| Net asset value and redemption price per share | n/a | n/a | n/a | $ | 10.45 | ||||||||||||||
| Maximum offering price per share | n/a | n/a | n/a | $ | 10.45 | ||||||||||||||
| Class R: | |||||||||||||||||||
| Net assets | n/a | n/a | n/a | $ | 135,105 | ||||||||||||||
| Shares authorized | n/a | n/a | n/a | unlimited | |||||||||||||||
| Par value | n/a | n/a | n/a | $ | 0.001 | ||||||||||||||
| Shares outstanding | n/a | n/a | n/a | 12,907 | |||||||||||||||
| Net asset value and redemption price per share | n/a | n/a | n/a | $ | 10.47 | ||||||||||||||
| Maximum offering price per share | n/a | n/a | n/a | $ | 10.47 | ||||||||||||||
(1) Maximum offering price is computed at 100/95.25 of net asset value. On purchases of $50,000 or more, the offering price is reduced.
(2) Redemption price per share may be reduced for any applicable contingent deferred sales charges.
(3) Maximum offering price is computed at 100/96.75 of net asset value. On purchases of $50,000 or more, the offering price is reduced.
See Accompanying Notes to Financial Statements
21
STATEMENTS OF ASSETS AND LIABILITIES as of September 30, 2004 (Unaudited)
| ING National Tax-Exempt Bond Fund | ING Classic Money Market Fund | ING Money Market Fund | ING Lexington Money Market Trust | ||||||||||||||||
| ASSETS: | |||||||||||||||||||
| Investments in securities at value* | $ | 26,088,320 | $ | - | $ | - | $ | - | |||||||||||
| Short-term investments at amortized cost | - | 411,501,112 | 40,510,517 | 40,734,823 | |||||||||||||||
| Repurchase agreement | - | 20,873,000 | 2,976,000 | 2,770,000 | |||||||||||||||
| Cash | 2,112,008 | 12,159 | 1,061 | 1,375 | |||||||||||||||
| Receivables: | |||||||||||||||||||
| Fund shares sold | - | 45,887 | 343 | - | |||||||||||||||
| Interest | 347,519 | 864,591 | 67,354 | 74,471 | |||||||||||||||
| Prepaid expenses | 15,634 | 124,906 | 23,804 | 11,553 | |||||||||||||||
| Reimbursement due from manager | - | - | 4,002 | - | |||||||||||||||
| Total assets | 28,563,481 | 433,421,655 | 43,583,081 | 43,592,222 | |||||||||||||||
| LIABILITIES: | |||||||||||||||||||
| Payable for investment securities purchased | - | 4,300,000 | 400,000 | 400,000 | |||||||||||||||
| Payable for fund shares redeemed | 16 | 31,016 | 10,875 | - | |||||||||||||||
| Income distribution payable | 72,051 | 310,494 | 10,615 | 30,656 | |||||||||||||||
| Payable to affiliates | 35,444 | 227,977 | 40,411 | 59,390 | |||||||||||||||
| Payable for trustee fees | 625 | 12,223 | 2,424 | 37,858 | |||||||||||||||
| Other accrued expenses and liabilities | 32,790 | 426,815 | 104,452 | 59,684 | |||||||||||||||
| Total liabilities | 140,926 | 5,308,525 | 568,777 | 587,588 | |||||||||||||||
| NET ASSETS | $ | 28,422,555 | $ | 428,113,130 | $ | 43,014,304 | $ | 43,004,634 | |||||||||||
| NET ASSETS WERE COMPRISED OF: | |||||||||||||||||||
| Paid-in capital | $ | 26,809,440 | $ | 428,232,878 | $ | 42,991,167 | $ | 43,014,847 | |||||||||||
| Undistributed net investment income (accumulated net investment loss) | (10,681 | ) | - | 34,160 | - | ||||||||||||||
| Accumulated net realized gain (loss) on investments | 178,348 | (119,748 | ) | (11,023 | ) | (10,213 | ) | ||||||||||||
| Net unrealized appreciation on investments | 1,445,448 | - | - | - | |||||||||||||||
| NET ASSETS | $ | 28,422,555 | $ | 428,113,130 | $ | 43,014,304 | $ | 43,004,634 | |||||||||||
| * Cost of investments in securities | $ | 24,642,872 | $ | - | $ | - | $ | - | |||||||||||
See Accompanying Notes to Financial Statements
22
STATEMENTS OF ASSETS AND LIABILITIES as of September 30, 2004 (Unaudited)
| ING National Tax-Exempt Bond Fund | ING Classic Money Market Fund | ING Money Market Fund | ING Lexington Money Market Trust | ||||||||||||||||
| Class A: | |||||||||||||||||||
| Net assets | $ | 23,828,909 | $ | 426,901,693 | $ | 17,377,426 | $ | 43,004,634 | |||||||||||
| Shares authorized | unlimited | unlimited | unlimited | unlimited | |||||||||||||||
| Par value | $ | 0.001 | $ | 0.001 | $ | 0.001 | $ | 0.001 | |||||||||||
| Shares outstanding | 2,230,116 | 427,042,564 | 17,391,337 | 43,014,860 | |||||||||||||||
| Net asset value and redemption price per share | $ | 10.69 | $ | 1.00 | $ | 1.00 | $ | 1.00 | |||||||||||
| Maximum offering price per share | $ | 11.22 | (1) | $ | 1.00 | $ | 1.00 | $ | 1.00 | ||||||||||
| Class B: | |||||||||||||||||||
| Net assets | $ | 2,833,048 | $ | 695,560 | $ | 20,384,336 | n/a | ||||||||||||
| Shares authorized | unlimited | unlimited | unlimited | n/a | |||||||||||||||
| Par value | $ | 0.001 | $ | 0.001 | $ | 0.001 | n/a | ||||||||||||
| Shares outstanding | 265,276 | 696,183 | 20,391,589 | n/a | |||||||||||||||
| Net asset value and redemption price per share(2) | $ | 10.68 | $ | 1.00 | $ | 1.00 | n/a | ||||||||||||
| Maximum offering price per share | $ | 10.68 | $ | 1.00 | $ | 1.00 | n/a | ||||||||||||
| Class C: | |||||||||||||||||||
| Net assets | $ | 1,760,598 | $ | 515,877 | $ | 5,252,542 | n/a | ||||||||||||
| Shares authorized | unlimited | unlimited | unlimited | n/a | |||||||||||||||
| Par value | $ | 0.001 | $ | 0.001 | $ | 0.001 | n/a | ||||||||||||
| Shares outstanding | 164,735 | 515,854 | 5,256,776 | n/a | |||||||||||||||
| Net asset value and redemption price per share(2) | $ | 10.69 | $ | 1.00 | $ | 1.00 | n/a | ||||||||||||
| Maximum offering price per share | $ | 10.69 | $ | 1.00 | $ | 1.00 | n/a | ||||||||||||
(1) Maximum offering price (4.75%) is computed at 100/95.25 of net asset value. On purchases of $50,000 or more, the offering price is reduced.
(2) Redemption price per share may be reduced for any applicable contingent deferred sales charges.
See Accompanying Notes to Financial Statements
23
STATEMENTS OF OPERATIONS for the six months ended September 30, 2004 (Unaudited)
| ING GNMA Income Fund | ING High Yield Bond Fund | ING High Yield Opportunities Fund | ING Intermediate Bond Fund | ||||||||||||||||
| INVESTMENT INCOME: | |||||||||||||||||||
| Dividends, net of foreign taxes withheld* | $ | 924 | $ | 137,268 | $ | 502,647 | $ | 26,401 | |||||||||||
| Interest | 19,347,578 | 2,459,252 | 8,835,483 | 9,518,837 | |||||||||||||||
| Securities lending income | - | 20,987 | 77,831 | 77,944 | |||||||||||||||
| Total investment income | 19,348,502 | 2,617,507 | 9,415,961 | 9,623,182 | |||||||||||||||
| EXPENSES: | |||||||||||||||||||
| Investment management fees | 1,851,822 | 242,010 | 743,055 | 1,171,650 | |||||||||||||||
| Distribution and service fees: | |||||||||||||||||||
| Class A | 700,833 | 74,319 | 138,901 | 544,574 | |||||||||||||||
| Class B | 589,622 | 87,094 | 731,375 | 323,826 | |||||||||||||||
| Class C | 285,312 | 52,009 | 96,455 | 338,668 | |||||||||||||||
| Class M | 940 | - | 10,110 | - | |||||||||||||||
| Class O | - | - | - | 8,392 | |||||||||||||||
| Class Q | 138 | - | - | - | |||||||||||||||
| Class R | - | - | - | 315 | |||||||||||||||
| Transfer agent fees: | |||||||||||||||||||
| Class A | 196,498 | 12,033 | 34,976 | 130,034 | |||||||||||||||
| Class B | 41,591 | 4,961 | 64,106 | 27,929 | |||||||||||||||
| Class C | 20,280 | 2,967 | 8,473 | 29,316 | |||||||||||||||
| Class I | 580 | - | - | 1,030 | |||||||||||||||
| Class M | 91 | - | 1,184 | - | |||||||||||||||
| Class Q | 6 | - | - | - | |||||||||||||||
| Administrative service fees | 372,517 | 35,144 | 123,841 | 235,509 | |||||||||||||||
| Shareholder reporting expense | 80,215 | 8,520 | 38,550 | 49,480 | |||||||||||||||
| Registration fees | 42,566 | 21,847 | 44,568 | 46,129 | |||||||||||||||
| Professional fees | 38,560 | 4,839 | 11,958 | 19,958 | |||||||||||||||
| Custody and accounting expense | 44,130 | 11,151 | 15,525 | 29,529 | |||||||||||||||
| Trustee fees | 9,300 | 1,521 | 5,490 | 5,490 | |||||||||||||||
| Miscellaneous expense | 25,233 | 3,415 | 18,853 | 10,864 | |||||||||||||||
| Total expenses | 4,300,234 | 561,830 | 2,087,420 | 2,972,693 | |||||||||||||||
| Less: | |||||||||||||||||||
| Net waived and reimbursed (recouped) fees | - | (195 | ) | (70,000 | ) | 182,670 | |||||||||||||
| Net expenses | 4,300,234 | 562,025 | 2,157,420 | 2,790,023 | |||||||||||||||
| Net investment income | 15,048,268 | 2,055,482 | 7,258,541 | 6,833,159 | |||||||||||||||
| REALIZED AND UNREALIZED GAIN (LOSS) ON INVESTMENTS AND FUTURES: | |||||||||||||||||||
| Net realized gain (loss) on: | |||||||||||||||||||
| Investments | (1,687,373 | ) | 561,547 | (6,198,108 | ) | 1,896,793 | |||||||||||||
| Futures | - | - | - | 631,047 | |||||||||||||||
| Net realized gain (loss) on investments and futures | (1,687,373 | ) | 561,547 | (6,198,108 | ) | 2,527,840 | |||||||||||||
| Net change in unrealized appreciation or depreciation on: | |||||||||||||||||||
| Investments | (12,399,611 | ) | (440,795 | ) | 6,550,450 | (3,308,099 | ) | ||||||||||||
| Translation of assets in foreign currency | - | - | (11,117 | ) | - | ||||||||||||||
| Futures | - | - | - | 194,909 | |||||||||||||||
| Net change in unrealized appreciation or depreciation on investments, translation of assets in foreign currency and futures | (12,399,611 | ) | (440,795 | ) | 6,539,333 | (3,113,190 | ) | ||||||||||||
| Net realized and unrealized gain (loss) on investments, translation of assets in foreign currency and futures | (14,086,984 | ) | 120,752 | 341,225 | (585,350 | ) | |||||||||||||
| Increase in net assets resulting from operations | $ | 961,284 | $ | 2,176,234 | $ | 7,599,766 | $ | 6,247,809 | |||||||||||
| * Foreign taxes | $ | - | $ | - | $ | - | $ | 2,231 | |||||||||||
See Accompanying Notes to Financial Statements
24
STATEMENTS OF OPERATIONS for the six months ended September 30, 2004 (Unaudited)
| ING National Tax-Exempt Bond Fund | ING Classic Money Market Fund | ING Money Market Fund | ING Lexington Money Market Trust | ||||||||||||||||
| INVESTMENT INCOME: | |||||||||||||||||||
| Interest | $ | 585,495 | $ | 2,863,675 | $ | 297,065 | $ | 294,917 | |||||||||||
| Total investment income | 585,495 | 2,863,675 | 297,065 | 294,917 | |||||||||||||||
| EXPENSES: | |||||||||||||||||||
| Investment management fees | 69,363 | 534,095 | 77,447 | 110,689 | |||||||||||||||
| Distribution and service fees: | |||||||||||||||||||
| Class A | 41,402 | 1,597,505 | 22,230 | - | |||||||||||||||
| Class B | 13,514 | 3,670 | 105,056 | - | |||||||||||||||
| Class C | 6,919 | 2,703 | 27,304 | - | |||||||||||||||
| Transfer agent fees: | |||||||||||||||||||
| Class A | 2,759 | 17,713 | 10,115 | 23,712 | |||||||||||||||
| Class B | 306 | 33 | 11,999 | - | |||||||||||||||
| Class C | 136 | 26 | 3,115 | - | |||||||||||||||
| Administrative service fees | 13,873 | - | 22,128 | 22,119 | |||||||||||||||
| Shareholder reporting expense | 2,258 | 59,246 | 9,562 | 1,098 | |||||||||||||||
| Registration fees | 19,184 | 103,349 | 20,064 | 6,387 | |||||||||||||||
| Professional fees | 1,552 | 27,819 | 6,326 | 1,786 | |||||||||||||||
| Custody and accounting expense | 604 | 26,731 | 3,059 | 2,745 | |||||||||||||||
| Trustee fees | 549 | 8,967 | 1,281 | 7,045 | |||||||||||||||
| Miscellaneous expense | 1,230 | 13,903 | 4,040 | 1,410 | |||||||||||||||
| Total expenses | 173,649 | 2,395,760 | 323,726 | 176,991 | |||||||||||||||
| Less: | |||||||||||||||||||
| Net waived and reimbursed (recouped) fees | (971 | ) | 750,704 | 93,487 | - | ||||||||||||||
| Net expenses | 174,620 | 1,645,056 | 230,239 | 176,991 | |||||||||||||||
| Net investment income | 410,875 | 1,218,619 | 66,826 | 117,926 | |||||||||||||||
| REALIZED AND UNREALIZED GAIN (LOSS) ON INVESTMENTS: | |||||||||||||||||||
| Net realized gain (loss) on investments | 17,794 | (84,386 | ) | (9,292 | ) | (9,613 | ) | ||||||||||||
| Net change in unrealized appreciation or depreciation on investments | (229,829 | ) | - | - | - | ||||||||||||||
| Net realized and unrealized loss on investments | (212,035 | ) | (84,386 | ) | (9,292 | ) | (9,613 | ) | |||||||||||
| Increase in net assets resulting from operations | $ | 198,840 | $ | 1,134,233 | $ | 57,534 | $ | 108,313 | |||||||||||
See Accompanying Notes to Financial Statements
25
STATEMENTS OF CHANGES IN NET ASSETS (Unaudited)
| ING GNMA Income Fund | ING High Yield Bond Fund | ||||||||||||||||||
| Six Months Ended September 30, 2004 | Year Ended March 31, 2004 | Six Months Ended September 30, 2004 | Year Ended March 31, 2004 | ||||||||||||||||
| FROM OPERATIONS: | |||||||||||||||||||
| Net investment income | $ | 15,048,268 | $ | 28,917,044 | $ | 2,055,482 | $ | 4,553,434 | |||||||||||
| Net realized gain (loss) on investments | (1,687,373 | ) | 8,427,554 | 561,547 | 2,675,633 | ||||||||||||||
| Net change in unrealized appreciation or depreciation on investments | (12,399,611 | ) | (8,582,732 | ) | (440,795 | ) | 1,950,137 | ||||||||||||
| Net increase in net assets resulting from operations | 961,284 | 28,761,866 | 2,176,234 | 9,179,204 | |||||||||||||||
| FROM DISTRIBUTIONS TO SHAREHOLDERS: | |||||||||||||||||||
| Net investment income: | |||||||||||||||||||
| Class A | (14,920,325 | ) | (29,836,564 | ) | (1,318,134 | ) | (3,048,684 | ) | |||||||||||
| Class B | (2,729,419 | ) | (5,789,107 | ) | (474,988 | ) | (1,015,389 | ) | |||||||||||
| Class C | (1,321,943 | ) | (3,227,764 | ) | (283,789 | ) | (530,989 | ) | |||||||||||
| Class I | (252,125 | ) | (416,717 | ) | - | - | |||||||||||||
| Class M | (6,109 | ) | (26,359 | ) | - | - | |||||||||||||
| Class Q | (2,979 | ) | (7,768 | ) | - | - | |||||||||||||
| Class T | - | (101,868 | ) | - | - | ||||||||||||||
| Total distributions | (19,232,900 | ) | (39,406,147 | ) | (2,076,911 | ) | (4,595,062 | ) | |||||||||||
| FROM CAPITAL SHARE TRANSACTIONS: | |||||||||||||||||||
| Net proceeds from sale of shares | 66,888,632 | 287,964,697 | 13,226,531 | 46,425,856 | |||||||||||||||
| Dividends reinvested | 15,713,341 | 31,631,178 | 592,774 | 1,821,615 | |||||||||||||||
| 82,601,973 | 319,595,875 | 13,819,305 | 48,247,471 | ||||||||||||||||
| Cost of shares redeemed | (138,111,709 | ) | (434,339,499 | ) | (14,907,139 | ) | (39,529,207 | ) | |||||||||||
| Net increase (decrease) in net assets resulting from capital share transactions | (55,509,736 | ) | (114,743,624 | ) | (1,087,834 | ) | 8,718,264 | ||||||||||||
| Net increase (decrease) in net assets | (73,781,352 | ) | (125,387,905 | ) | (988,511 | ) | 13,302,406 | ||||||||||||
| NET ASSETS: | |||||||||||||||||||
| Beginning of period | 797,371,955 | 922,759,860 | 73,542,783 | 60,240,377 | |||||||||||||||
| End of period | $ | 723,590,603 | $ | 797,371,955 | $ | 72,554,272 | $ | 73,542,783 | |||||||||||
| Undistributed net investment income (accumulated net investment loss) at end of period | $ | (278,257 | ) | $ | 3,906,376 | $ | (58,991 | ) | $ | (37,562 | ) | ||||||||
See Accompanying Notes to Financial Statements
26
STATEMENTS OF CHANGES IN NET ASSETS (Unaudited)
| ING High Yield Opportunities Fund | ING Intermediate Bond Fund | ||||||||||||||||||
| Six Months Ended September 30, | Year Ended March 31, | Six Months Ended September 30, | Year Ended March 31, | ||||||||||||||||
| 2004 | 2004(1) | 2004 | 2004 | ||||||||||||||||
| FROM OPERATIONS: | |||||||||||||||||||
| Net investment income | $ | 7,258,541 | $ | 20,077,919 | $ | 6,833,159 | $ | 9,001,504 | |||||||||||
| Net realized gain (loss) on investments and futures | (6,198,108 | ) | (14,923,804 | ) | 2,527,840 | 7,562,532 | |||||||||||||
| Net change in unrealized appreciation or depreciation on investments, translation of assets in foreign currencies and futures | 6,539,333 | 38,538,709 | (3,113,190 | ) | 2,601,836 | ||||||||||||||
| Net increase in net assets resulting from operations | 7,599,766 | 43,692,824 | 6,247,809 | 19,165,872 | |||||||||||||||
| FROM DISTRIBUTIONS TO SHAREHOLDERS: | |||||||||||||||||||
| Net investment income: | |||||||||||||||||||
| Class A | (2,141,990 | ) | (6,620,497 | ) | (4,821,627 | ) | (6,168,955 | ) | |||||||||||
| Class B | (3,453,177 | ) | (11,285,739 | ) | (757,564 | ) | (1,586,935 | ) | |||||||||||
| Class C | (455,514 | ) | (1,496,050 | ) | (793,415 | ) | (1,555,446 | ) | |||||||||||
| Class I | - | - | (350,305 | ) | (511,108 | ) | |||||||||||||
| Class M | (67,681 | ) | (204,182 | ) | - | - | |||||||||||||
| Class O | - | - | (108,408 | ) | - | ||||||||||||||
| Class Q | - | (36,698 | ) | - | - | ||||||||||||||
| Class R | - | - | (1,840 | ) | - | ||||||||||||||
| Class T | - | (73,152 | ) | - | - | ||||||||||||||
| Net realized gains: | |||||||||||||||||||
| Class A | - | (415,880 | ) | (3,756,043 | ) | (2,667,645 | ) | ||||||||||||
| Class B | - | (708,817 | ) | (792,658 | ) | (868,923 | ) | ||||||||||||
| Class C | - | (93,977 | ) | (825,959 | ) | (885,962 | ) | ||||||||||||
| Class I | - | - | (173,614 | ) | (179,026 | ) | |||||||||||||
| Class M | - | (12,826 | ) | - | - | ||||||||||||||
| Class Q | - | (2,305 | ) | - | - | ||||||||||||||
| Class R | - | - | (1,681 | ) | - | ||||||||||||||
| Class T | - | (4,595 | ) | - | - | ||||||||||||||
| Total distributions | (6,118,362 | ) | (20,954,718 | ) | (12,383,114 | ) | (14,424,000 | ) | |||||||||||
| FROM CAPITAL SHARE TRANSACTIONS: | |||||||||||||||||||
| Net proceeds from sale of shares | 19,039,843 | 123,188,175 | 121,088,499 | 324,797,722 | |||||||||||||||
| Net proceeds from shares issued in merger | - | - | 137,658,413 | - | |||||||||||||||
| Dividends reinvested | 2,331,392 | 8,268,482 | 7,708,659 | 9,795,000 | |||||||||||||||
| 21,371,235 | 131,456,657 | 266,455,571 | 334,592,722 | ||||||||||||||||
| Cost of shares redeemed | (54,895,182 | ) | (213,103,859 | ) | (81,325,207 | ) | (193,289,159 | ) | |||||||||||
| Net increase (decrease) in net assets resulting from capital share transactions | (33,523,947 | ) | (81,647,202 | ) | 185,130,364 | 141,303,563 | |||||||||||||
| Net increase (decrease) in net assets | (32,042,543 | ) | (58,909,096 | ) | 178,995,059 | 146,045,435 | |||||||||||||
| NET ASSETS: | |||||||||||||||||||
| Beginning of period | 270,725,329 | 329,634,425 | 422,263,758 | 276,218,323 | |||||||||||||||
| End of period | $ | 238,682,786 | $ | 270,725,329 | $ | 601,258,817 | $ | 422,263,758 | |||||||||||
| Undistributed net investment income (accumulated net investment loss) at end of period | $ | (2,417,562 | ) | $ | (3,557,741 | ) | $ | 11,828 | $ | 11,828 | |||||||||
(1) Effective June 2, 2003, Class "T" shares converted into the corresponding Class "A" shares within this portfolio
See Accompanying Notes to Financial Statements
27
STATEMENTS OF CHANGES IN NET ASSETS (Unaudited)
| ING National Tax-Exempt Bond Fund | ING Classic Money Market Fund | ||||||||||||||||||
| Six Months Ended September 30, | Year Ended March 31, | Six Months Ended September 30, | Year Ended March 31, | ||||||||||||||||
| 2004 | 2004 | 2004 | 2004 | ||||||||||||||||
| FROM OPERATIONS: | |||||||||||||||||||
| Net investment income | $ | 410,875 | $ | 881,001 | $ | 1,218,619 | $ | 1,908,765 | |||||||||||
| Net realized gain (loss) on investments | 17,794 | 378,972 | (84,386 | ) | 6 | ||||||||||||||
| Net change in unrealized appreciation or depreciation on investments | (229,829 | ) | (82,998 | ) | - | - | |||||||||||||
| Net increase in net assets resulting from operations | 198,840 | 1,176,975 | 1,134,233 | 1,908,771 | |||||||||||||||
| FROM DISTRIBUTIONS TO SHAREHOLDERS: | |||||||||||||||||||
| Net investment income: | |||||||||||||||||||
| Class A | (372,670 | ) | (784,309 | ) | (1,217,023 | ) | (1,906,546 | ) | |||||||||||
| Class B | (32,482 | ) | (68,265 | ) | (919 | ) | (1,441 | ) | |||||||||||
| Class C | (16,664 | ) | (28,427 | ) | (677 | ) | (778 | ) | |||||||||||
| Net realized gains: | |||||||||||||||||||
| Class A | - | (453,096 | ) | - | - | ||||||||||||||
| Class B | - | (50,176 | ) | - | - | ||||||||||||||
| Class C | - | (22,936 | ) | - | - | ||||||||||||||
| Total distributions | (421,816 | ) | (1,407,209 | ) | (1,218,619 | ) | (1,908,765 | ) | |||||||||||
| FROM CAPITAL SHARE TRANSACTIONS: | |||||||||||||||||||
| Net proceeds from sale of shares | 1,601,946 | 5,900,197 | 168,499,093 | 419,717,782 | |||||||||||||||
| Dividends reinvested | 50,710 | 373,543 | 1,041,958 | 1,883,934 | |||||||||||||||
| 1,652,656 | 6,273,740 | 169,541,051 | 421,601,716 | ||||||||||||||||
| Cost of shares redeemed | (836,965 | ) | (5,716,470 | ) | (141,702,210 | ) | (481,887,854 | ) | |||||||||||
| Net increase (decrease) in net assets resulting from capital share transactions | 815,691 | 557,270 | 27,838,841 | (60,286,138 | ) | ||||||||||||||
| Net increase (decrease) in net assets | 592,715 | 327,036 | 27,754,455 | (60,286,132 | ) | ||||||||||||||
| NET ASSETS: | |||||||||||||||||||
| Beginning of period | 27,829,840 | 27,502,804 | 400,358,675 | 460,644,807 | |||||||||||||||
| End of period | $ | 28,422,555 | $ | 27,829,840 | $ | 428,113,130 | $ | 400,358,675 | |||||||||||
| Undistributed net investment income (accumulated net investment loss) at end of period | $ | (10,681 | ) | $ | 260 | $ | - | $ | - | ||||||||||
See Accompanying Notes to Financial Statements
28
STATEMENTS OF CHANGES IN NET ASSETS (Unaudited)
| ING Money Market Fund | ING Lexington Money Market Trust | ||||||||||||||||||
| Six Months Ended September 30, 2004 | Year Ended March 31, 2004 | Six Months Ended September 30, 2004 | Year Ended March 31, 2004 | ||||||||||||||||
| FROM OPERATIONS: | |||||||||||||||||||
| Net investment income | $ | 66,826 | $ | 130,259 | $ | 117,926 | $ | 179,988 | |||||||||||
| Net realized gain (loss) on investments | (9,292 | ) | 5 | (9,613 | ) | 8 | |||||||||||||
| Net increase in net assets resulting from operations | 57,534 | 130,264 | 108,313 | 179,996 | |||||||||||||||
| FROM DISTRIBUTIONS TO SHAREHOLDERS: | |||||||||||||||||||
| Net investment income: | |||||||||||||||||||
| Class A | (67,181 | ) | (132,963 | ) | (117,926 | ) | (179,988 | ) | |||||||||||
| Class B | - | (90 | ) | - | - | ||||||||||||||
| Class C | - | (15 | ) | - | - | ||||||||||||||
| Total distributions | (67,181 | ) | (133,068 | ) | (117,926 | ) | (179,988 | ) | |||||||||||
| FROM CAPITAL SHARE TRANSACTIONS: | |||||||||||||||||||
| Net proceeds from sale of shares | 26,079,616 | 63,158,828 | 6,891,506 | 18,239,101 | |||||||||||||||
| Dividends reinvested | 61,762 | 120,732 | 84,090 | 173,405 | |||||||||||||||
| 26,141,378 | 63,279,560 | 6,975,596 | 18,412,506 | ||||||||||||||||
| Cost of shares redeemed | (24,383,060 | ) | (83,349,898 | ) | (10,163,842 | ) | (22,362,541 | ) | |||||||||||
| Net increase (decrease) in net assets resulting from capital share transactions | 1,758,318 | (20,070,338 | ) | (3,188,246 | ) | (3,950,035 | ) | ||||||||||||
| Net increase (decrease) in net assets | 1,748,671 | (20,073,142 | ) | (3,197,859 | ) | (3,950,027 | ) | ||||||||||||
| NET ASSETS: | |||||||||||||||||||
| Beginning of period | 41,265,633 | 61,338,775 | 46,202,493 | 50,152,520 | |||||||||||||||
| End of period | $ | 43,014,304 | $ | 41,265,633 | $ | 43,004,634 | $ | 46,202,493 | |||||||||||
| Undistributed net investment income at end of period | $ | 34,160 | $ | 34,515 | $ | - | $ | - | |||||||||||
See Accompanying Notes to Financial Statements
29
ING GNMA INCOME FUND (UNAUDITED) FINANCIAL HIGHLIGHTS
Selected data for a share of beneficial interest outstanding throughout each period.
| Class A | |||||||||||||||||||||||||||||||
| Six Months Ended September 30, | Year Ended March 31, | Three Months Ended March 31, | Year Ended December 31, | ||||||||||||||||||||||||||||
| 2004 | 2004 | 2003 | 2002 | 2001(1) | 2000(2) | 1999 | |||||||||||||||||||||||||
| Per Share Operating Performance: | |||||||||||||||||||||||||||||||
| Net asset value, beginning of period | $ | 8.91 | 9.00 | 8.53 | 8.63 | 8.41 | 8.08 | 8.53 | |||||||||||||||||||||||
| Income (loss) from investment operations: | |||||||||||||||||||||||||||||||
| Net investment income | $ | 0.19 | 0.32 | 0.42 | 0.46 | 0.12 | 0.54 | 0.50 | |||||||||||||||||||||||
| Net realized and unrealized gain (loss) | |||||||||||||||||||||||||||||||
| on investments | $ | (0.16 | ) | 0.02 | 0.49 | (0.09 | ) | 0.22 | 0.27 | (0.45 | ) | ||||||||||||||||||||
| Total from investment operations | $ | 0.03 | 0.34 | 0.91 | 0.37 | 0.34 | 0.81 | 0.05 | |||||||||||||||||||||||
| Less distributions from: | |||||||||||||||||||||||||||||||
| Net investment income | $ | 0.23 | 0.43 | 0.44 | 0.47 | 0.12 | 0.48 | 0.50 | |||||||||||||||||||||||
| Total distributions | $ | 0.23 | 0.43 | 0.44 | 0.47 | 0.12 | 0.48 | 0.50 | |||||||||||||||||||||||
| Net asset value, end of period | $ | 8.71 | 8.91 | 9.00 | 8.53 | 8.63 | 8.41 | 8.08 | |||||||||||||||||||||||
| Total Return(3) | % | 0.39 | 3.88 | 10.82 | 4.38 | 4.09 | 10.36 | 0.58 | |||||||||||||||||||||||
| Ratios and Supplemental Data: | |||||||||||||||||||||||||||||||
| Net assets, end of period (000's) | $ | 550,981 | 592,066 | 666,433 | 535,903 | 449,460 | 368,615 | 376,580 | |||||||||||||||||||||||
| Ratios to average net assets: | |||||||||||||||||||||||||||||||
| Expenses(4) | % | 0.98 | 1.04 | 1.13 | 1.22 | 1.16 | 1.06 | 0.99 | |||||||||||||||||||||||
| Net investment income(4) | % | 4.21 | 3.57 | 4.78 | 5.32 | 5.75 | 6.54 | 6.04 | |||||||||||||||||||||||
| Portfolio turnover rate | % | 19 | 128 | 75 | 76 | 33 | 65 | 25 | |||||||||||||||||||||||
| Class B | |||||||||||||||||||||||||||
| Six Months Ended September 30, | Year Ended March 31, | Three Months Ended March 31, | October 6, 2000(5) to December 31, | ||||||||||||||||||||||||
| 2004 | 2004 | 2003 | 2002 | 2001(1) | 2000 | ||||||||||||||||||||||
| Per Share Operating Performance: | |||||||||||||||||||||||||||
| Net asset value, beginning of period | $ | 8.87 | 8.96 | 8.50 | 8.61 | 8.40 | 8.20 | ||||||||||||||||||||
| Income (loss) from investment operations: | |||||||||||||||||||||||||||
| Net investment income | $ | 0.15 | 0.25 | 0.35 | 0.39 | 0.13 | 0.09 | ||||||||||||||||||||
| Net realized and unrealized gain (loss) on investments | $ | (0.15 | ) | 0.02 | 0.48 | (0.09 | ) | 0.19 | 0.18 | ||||||||||||||||||
| Total from investment operations | $ | - | 0.27 | 0.83 | 0.30 | 0.32 | 0.27 | ||||||||||||||||||||
| Less distributions from: | |||||||||||||||||||||||||||
| Net investment income | $ | 0.20 | 0.36 | 0.37 | 0.41 | 0.11 | 0.07 | ||||||||||||||||||||
| Total distributions | $ | 0.20 | 0.36 | 0.37 | 0.41 | 0.11 | 0.07 | ||||||||||||||||||||
| Net asset value, end of period | $ | 8.67 | 8.87 | 8.96 | 8.50 | 8.61 | 8.40 | ||||||||||||||||||||
| Total Return(3) | % | 0.01 | 3.12 | 9.95 | 3.53 | 3.70 | 3.32 | ||||||||||||||||||||
| Ratios and Supplemental Data: | |||||||||||||||||||||||||||
| Net assets, end of period (000's) | $ | 111,542 | 130,339 | 150,549 | 79,302 | 47,406 | 866 | ||||||||||||||||||||
| Ratios to average net assets: | |||||||||||||||||||||||||||
| Expenses(4) | % | 1.73 | 1.79 | 1.88 | 1.98 | 1.90 | 1.81 | ||||||||||||||||||||
| Net investment income(4) | % | 3.46 | 2.84 | 3.98 | 4.55 | 4.88 | 5.79 | ||||||||||||||||||||
| Portfolio turnover rate | % | 19 | 128 | 75 | 76 | 33 | 65 | ||||||||||||||||||||
(1) The Fund changed its fiscal year end to March 31.
(2) Effective July 26, 2000, ING Investments, LLC became the Investment Manager of the Fund.
(3) Total return is calculated assuming reinvestment of all dividends and capital gain distributions at net asset value and excluding the deduction of sales charges. Total return for less than one year is not annualized.
(4) Annualized for periods less than one year.
(5) Commencement of operations.
See Accompanying Notes to Financial Statements.
30
ING GNMA INCOME FUND (UNAUDITED) (CONTINUED) FINANCIAL HIGHLIGHTS
Selected data for a share of beneficial interest outstanding throughout each period.
| Class C | |||||||||||||||||||||||||||
| Six Months Ended September 30, | Year Ended March 31, | Three Months Ended March 31, | October 13, 2000(2) to December 31, | ||||||||||||||||||||||||
| 2004 | 2004 | 2003 | 2002 | 2001(1) | 2000 | ||||||||||||||||||||||
| Per Share Operating Performance: | |||||||||||||||||||||||||||
| Net asset value, beginning of period | $ | 8.88 | 8.97 | 8.51 | 8.61 | 8.40 | 8.24 | ||||||||||||||||||||
| Income (loss) from investment operations: | |||||||||||||||||||||||||||
| Net investment income | $ | 0.15 | 0.25 | 0.36 | 0.40 | 0.11 | 0.09 | ||||||||||||||||||||
| Net realized and unrealized gain (loss) on investments | $ | (0.15 | ) | 0.02 | 0.47 | (0.09 | ) | 0.21 | 0.14 | ||||||||||||||||||
| Total from investment operations | $ | - | 0.27 | 0.83 | 0.31 | 0.32 | 0.23 | ||||||||||||||||||||
| Less distributions from: | |||||||||||||||||||||||||||
| Net investment income | $ | 0.20 | 0.36 | 0.37 | 0.41 | 0.11 | 0.07 | ||||||||||||||||||||
| Total distributions | $ | 0.20 | 0.36 | 0.37 | 0.41 | 0.11 | 0.07 | ||||||||||||||||||||
| Net asset value, end of period | $ | 8.68 | 8.88 | 8.97 | 8.51 | 8.61 | 8.40 | ||||||||||||||||||||
| Total Return(3) | % | 0.01 | 3.11 | 9.95 | 3.65 | 3.69 | 2.82 | ||||||||||||||||||||
| Ratios and Supplemental Data: | |||||||||||||||||||||||||||
| Net assets, end of period (000's) | $ | 51,293 | 65,762 | 87,970 | 37,193 | 13,744 | 1,833 | ||||||||||||||||||||
| Ratios to average net assets: | |||||||||||||||||||||||||||
| Expenses(4) | % | 1.73 | 1.79 | 1.88 | 1.99 | 1.93 | 1.81 | ||||||||||||||||||||
| Net investment income(4) | % | 3.46 | 2.92 | 3.97 | 4.52 | 4.87 | 5.79 | ||||||||||||||||||||
| Portfolio turnover rate | % | 19 | 128 | 75 | 76 | 33 | 65 | ||||||||||||||||||||
| Class M | |||||||||||||||||||||||
| Six Months Ended September 30, | Year Ended March 31, | February 23, 2001(2) to March 31, | |||||||||||||||||||||
| 2004 | 2004 | 2003 | 2002 | 2001 | |||||||||||||||||||
| Per Share Operating Performance: | |||||||||||||||||||||||
| Net asset value, beginning of period | $ | 8.92 | 9.01 | 8.54 | 8.63 | 8.51 | |||||||||||||||||
| Income (loss) from investment operations: | |||||||||||||||||||||||
| Net investment income | $ | 0.23 | 0.31 | 0.37 | 0.41 | 0.04 | |||||||||||||||||
| Net realized and unrealized gain (loss) on investments | $ | (0.21 | ) | (0.02 | ) | 0.49 | (0.07 | ) | 0.08 | ||||||||||||||
| Total from investment operations | $ | 0.02 | 0.29 | 0.86 | 0.34 | 0.12 | |||||||||||||||||
| Less distributions from: | |||||||||||||||||||||||
| Net investment income | $ | 0.21 | 0.38 | 0.39 | 0.43 | - | |||||||||||||||||
| Total distributions | $ | 0.21 | 0.38 | 0.39 | 0.43 | - | |||||||||||||||||
| Net asset value, end of period | $ | 8.73 | 8.92 | 9.01 | 8.54 | 8.63 | |||||||||||||||||
| Total Return(3) | % | 0.24 | 3.30 | 10.29 | 4.03 | 1.41 | |||||||||||||||||
| Ratios and Supplemental Data: | |||||||||||||||||||||||
| Net assets, end of period (000's) | $ | 212 | 312 | 1,111 | 495 | 247 | |||||||||||||||||
| Ratios to average net assets: | |||||||||||||||||||||||
| Expenses(4) | % | 1.48 | 1.54 | 1.62 | 1.73 | 1.61 | |||||||||||||||||
| Net investment income(4) | % | 3.71 | 3.23 | 4.19 | 4.81 | 4.88 | |||||||||||||||||
| Portfolio turnover rate | % | 19 | 128 | 75 | 76 | 33 | |||||||||||||||||
(1) The Fund changed its fiscal year end to March 31.
(2) Commencement of operations.
(3) Total return is calculated assuming reinvestment of all dividends and capital gain distributions at net asset value and excluding the deduction of sales charges. Total return for less than one year is not annualized.
(4) Annualized for periods less than one year.
See Accompanying Notes to Financial Statements.
31
ING HIGH YIELD BOND FUND (UNAUDITED) FINANCIAL HIGHLIGHTS
Selected data for a share of beneficial interest outstanding throughout each period.
| Class A | |||||||||||||||||||||||||||||||
| Six Months Ended September 30, | Year Ended March 31, | Five Months Ended March 31, | Year Ended October 31, | December 15, 1998(2) to October 31, | |||||||||||||||||||||||||||
| 2004 | 2004 | 2003 | 2002 | 2001(1) | 2000 | 1999 | |||||||||||||||||||||||||
| Per Share Operating Performance: | |||||||||||||||||||||||||||||||
| Net asset value, beginning of period | $ | 8.88 | 8.29 | 8.74 | 9.36 | 9.24 | 9.96 | 10.00 | |||||||||||||||||||||||
| Income (loss) from investment operations: | |||||||||||||||||||||||||||||||
| Net investment income | $ | 0.27 | 0.59 | 0.61 | 0.78 | 0.39 | 0.85 | 0.67 | |||||||||||||||||||||||
| Net realized and unrealized gain (loss) | |||||||||||||||||||||||||||||||
| on investments | $ | 0.02 | 0.60 | (0.45 | ) | (0.62 | ) | 0.12 | (0.65 | ) | (0.04 | ) | |||||||||||||||||||
| Total from investment operations | $ | 0.29 | 1.19 | 0.16 | 0.16 | 0.51 | 0.20 | 0.63 | |||||||||||||||||||||||
| Less distributions from: | |||||||||||||||||||||||||||||||
| Net investment income | $ | 0.27 | 0.60 | 0.61 | 0.78 | 0.39 | 0.86 | 0.67 | |||||||||||||||||||||||
| Net realized gain on investments | $ | - | - | - | - | - | 0.06 | - | |||||||||||||||||||||||
| Total distributions | $ | 0.27 | 0.60 | 0.61 | 0.78 | 0.39 | 0.92 | 0.67 | |||||||||||||||||||||||
| Net asset value, end of period | $ | 8.90 | 8.88 | 8.29 | 8.74 | 9.36 | 9.24 | 9.96 | |||||||||||||||||||||||
| Total Return(3) | % | 3.38 | 14.70 | 2.24 | 1.94 | 5.61 | 1.89 | 6.37 | |||||||||||||||||||||||
| Ratios and Supplemental Data: | |||||||||||||||||||||||||||||||
| Net assets, end of period (000's) | $ | 43,026 | 44,009 | 43,375 | 38,525 | 33,459 | 33,220 | 30,537 | |||||||||||||||||||||||
| Ratios to average net assets: | |||||||||||||||||||||||||||||||
| Net expenses after expense | |||||||||||||||||||||||||||||||
| reimbursement/recoupment(4)(5) | % | 1.30 | 1.29 | 1.30 | 1.30 | 1.09 | 1.04 | 1.00 | |||||||||||||||||||||||
| Gross expenses prior to expense | |||||||||||||||||||||||||||||||
| reimbursement/recoupment(4) | % | 1.34 | 1.33 | 1.43 | 1.79 | 1.63 | 2.16 | 2.32 | |||||||||||||||||||||||
| Net investment income after expense | |||||||||||||||||||||||||||||||
| reimbursement/recoupment(4)(5) | % | 6.15 | 6.81 | 7.48 | 8.67 | 10.24 | 8.75 | 7.53 | |||||||||||||||||||||||
| Portfolio turnover rate | % | 48 | 105 | 122 | 344 | 253 | 481 | 756 | |||||||||||||||||||||||
| Class B | |||||||||||||||||||||||||||||||
| Six Months Ended September 30, | Year Ended March 31, | Five Months Ended March 31, | Year Ended October 31, | December 15, 1998(2) to October 31, | |||||||||||||||||||||||||||
| 2004 | 2004 | 2003 | 2002 | 2001(1) | 2000 | 1999 | |||||||||||||||||||||||||
| Per Share Operating Performance: | |||||||||||||||||||||||||||||||
| Net asset value, beginning of period | $ | 8.88 | 8.28 | 8.74 | 9.36 | 9.23 | 9.96 | 10.00 | |||||||||||||||||||||||
| Income (loss) from investment operations: | |||||||||||||||||||||||||||||||
| Net investment income | $ | 0.24 | 0.53 | 0.55 | 0.72 | 0.36 | 0.78 | 0.60 | |||||||||||||||||||||||
| Net realized and unrealized gain (loss) | |||||||||||||||||||||||||||||||
| on investments | $ | 0.02 | 0.60 | (0.46 | ) | (0.62 | ) | 0.14 | (0.66 | ) | (0.05 | ) | |||||||||||||||||||
| Total from investment operations | $ | 0.26 | 1.13 | 0.09 | 0.10 | 0.50 | 0.12 | 0.55 | |||||||||||||||||||||||
| Less distributions from: | |||||||||||||||||||||||||||||||
| Net investment income | $ | 0.24 | 0.53 | 0.55 | 0.72 | 0.37 | 0.79 | 0.59 | |||||||||||||||||||||||
| Net realized gain on investments | $ | - | - | - | - | - | 0.06 | - | |||||||||||||||||||||||
| Total distributions | $ | 0.24 | 0.53 | 0.55 | 0.72 | 0.37 | 0.85 | 0.59 | |||||||||||||||||||||||
| Net asset value, end of period | $ | 8.90 | 8.88 | 8.28 | 8.74 | 9.36 | 9.23 | 9.96 | |||||||||||||||||||||||
| Total Return(3) | % | 3.00 | 14.01 | 1.37 | 1.29 | 5.43 | 1.02 | 5.57 | |||||||||||||||||||||||
| Ratios and Supplemental Data: | |||||||||||||||||||||||||||||||
| Net assets, end of period (000's) | $ | 18,357 | 18,753 | 11,584 | 6,673 | 5,025 | 3,702 | 2,374 | |||||||||||||||||||||||
| Ratios to average net assets: | |||||||||||||||||||||||||||||||
| Net expenses after expense | |||||||||||||||||||||||||||||||
| reimbursement/recoupment(4)(5) | % | 2.05 | 2.04 | 2.05 | 2.05 | 1.84 | 1.79 | 1.72 | |||||||||||||||||||||||
| Gross expenses prior to expense | |||||||||||||||||||||||||||||||
| reimbursement/recoupment(4) | % | 1.99 | 1.98 | 2.07 | 2.44 | 2.28 | 2.41 | 2.64 | |||||||||||||||||||||||
| Net investment income after expense | |||||||||||||||||||||||||||||||
| reimbursement/recoupment(4)(5) | % | 5.40 | 6.04 | 6.73 | 7.85 | 9.49 | 7.99 | 6.90 | |||||||||||||||||||||||
| Portfolio turnover rate | % | 48 | 105 | 122 | 344 | 253 | 481 | 756 | |||||||||||||||||||||||
(1) The Fund changed its fiscal year end to March 31.
(2) Commencement of operations.
(3) Total return is calculated assuming reinvestment of all dividends and capital gain distributions at net asset value and excluding the deduction of sales charges. Total return for less than one year is not annualized.
(4) Annualized for periods less than one year.
(5) The Investment Manager has agreed to limit expenses (excluding interest, taxes, brokerage and extraordinary expenses) subject to possible recoupment by ING Investments, LLC within three years.
See Accompanying Notes to Financial Statements.
32
ING HIGH YIELD BOND FUND (UNAUDITED) (CONTINUED) FINANCIAL HIGHLIGHTS
Selected data for a share of beneficial interest outstanding throughout each period.
| Class C | |||||||||||||||||||||||||||||||
| Six Months Ended September 30, | Year Ended March 31, | Five Months Ended March 31, | Year Ended October 31, | December 15, 1998(2) to October 31, | |||||||||||||||||||||||||||
| 2004 | 2004 | 2003 | 2002 | 2001(1) | 2000 | 1999 | |||||||||||||||||||||||||
| Per Share Operating Performance: | |||||||||||||||||||||||||||||||
| Net asset value, beginning of period | $ | 8.88 | 8.28 | 8.74 | 9.36 | 9.23 | 9.96 | 10.00 | |||||||||||||||||||||||
| Income (loss) from investment operations: | |||||||||||||||||||||||||||||||
| Net investment income | $ | 0.24 | 0.53 | 0.56 | 0.71 | 0.37 | 0.78 | 0.62 | |||||||||||||||||||||||
| Net realized and unrealized gain (loss) | |||||||||||||||||||||||||||||||
| on investments | $ | 0.02 | 0.60 | (0.46 | ) | (0.61 | ) | 0.12 | (0.66 | ) | (0.06 | ) | |||||||||||||||||||
| Total from investment operations | $ | 0.26 | 1.13 | 0.10 | 0.10 | 0.49 | 0.12 | 0.56 | |||||||||||||||||||||||
| Less distributions from: | |||||||||||||||||||||||||||||||
| Net investment income | $ | 0.24 | 0.53 | 0.56 | 0.72 | 0.36 | 0.79 | 0.60 | |||||||||||||||||||||||
| Net realized gain on investments | $ | - | - | - | - | - | 0.06 | - | |||||||||||||||||||||||
| Total distributions | $ | 0.24 | 0.53 | 0.56 | 0.72 | 0.36 | 0.85 | 0.60 | |||||||||||||||||||||||
| Net asset value, end of period | $ | 8.90 | 8.88 | 8.28 | 8.74 | 9.36 | 9.23 | 9.96 | |||||||||||||||||||||||
| Total Return(3) | % | 3.00 | 14.03 | 1.43 | 1.21 | 5.39 | 1.02 | 5.67 | |||||||||||||||||||||||
| Ratios and Supplemental Data: | |||||||||||||||||||||||||||||||
| Net assets, end of period (000's) | $ | 11,170 | 10,780 | 5,281 | 1,633 | 1,314 | 1,578 | 776 | |||||||||||||||||||||||
| Ratios to average net assets: | |||||||||||||||||||||||||||||||
| Net expenses after expense | |||||||||||||||||||||||||||||||
| reimbursement/recoupment(4)(5) | % | 2.05 | 2.04 | 2.04 | 2.05 | 1.84 | 1.79 | 1.73 | |||||||||||||||||||||||
| Gross expenses prior to expense | |||||||||||||||||||||||||||||||
| reimbursement/recoupment(4) | % | 1.99 | 1.98 | 2.06 | 2.44 | 2.29 | 2.40 | 2.66 | |||||||||||||||||||||||
| Net investment income after expense | |||||||||||||||||||||||||||||||
| reimbursement/recoupment(4)(5) | % | 5.40 | 6.04 | 6.72 | 7.92 | 9.42 | 7.98 | 7.01 | |||||||||||||||||||||||
| Portfolio turnover rate | % | 48 | 105 | 122 | 344 | 253 | 481 | 756 | |||||||||||||||||||||||
(1) The Fund changed its fiscal year end to March 31.
(2) Commencement of operations.
(3) Total return is calculated assuming reinvestment of all dividends and capital gain distributions at net asset value and excluding the deduction of sales charges. Total return for less than one year is not annualized.
(4) Annualized for periods less than one year.
(5) The Investment Manager has agreed to limit expenses, (excluding interest, taxes, brokerage and extraordinary expenses) subject to possible recoupment by ING Investments, LLC within three years
See Accompanying Notes to Financial Statements.
33
ING HIGH YIELD OPPORTUNITY FUND (UNAUDITED) FINANCIAL HIGHLIGHTS
Selected data for a share of beneficial interest outstanding throughout each period.
| Class A | |||||||||||||||||||||||||||||||
Six Months Ended September 30, | Year Ended March 31, | Nine Months Ended March 31, | Year Ended June 30, | Three Months Ended June 30, | |||||||||||||||||||||||||||
| 2004 | 2004 | 2003 | 2002 | 2001(1) | 2000 | 1999(2) | |||||||||||||||||||||||||
| Per Share Operating Performance: | |||||||||||||||||||||||||||||||
| Net asset value, beginning of period | $ | 7.14 | 6.66 | 7.51 | 8.69 | 10.80 | 11.57 | 11.66 | |||||||||||||||||||||||
| Income (loss) from investment operations: | |||||||||||||||||||||||||||||||
| Net investment income | $ | 0.22 | 0.43 | 0.78 | 0.88 | 0.84 | 1.18 | 0.28 | |||||||||||||||||||||||
| Net realized and unrealized gain (loss) on investments | $ | 0.03 | 0.54 | (0.84 | ) | (1.07 | ) | (2.09 | ) | (0.75 | ) | (0.09 | ) | ||||||||||||||||||
| Total from investment operations | $ | 0.25 | 0.97 | (0.06 | ) | (0.19 | ) | (1.25 | ) | 0.43 | 0.19 | ||||||||||||||||||||
| Less distributions from: | |||||||||||||||||||||||||||||||
| Net investment income | $ | 0.19 | 0.46 | 0.79 | 0.99 | 0.86 | 1.20 | 0.28 | |||||||||||||||||||||||
| Return of Capital | $ | - | 0.03 | - | - | - | - | - | |||||||||||||||||||||||
| Total distributions | $ | 0.19 | 0.49 | 0.79 | 0.99 | 0.86 | 1.20 | 0.28 | |||||||||||||||||||||||
| Net asset value, end of period | $ | 7.20 | 7.14 | 6.66 | 7.51 | 8.69 | 10.80 | 11.57 | |||||||||||||||||||||||
| Total Return(3) | % | 3.73 | 14.94 | (0.40 | ) | (1.84 | ) | (11.87 | ) | 3.96 | 1.60 | ||||||||||||||||||||
| Ratios and Supplemental Data: | |||||||||||||||||||||||||||||||
| Net assets, end of period (000's) | $ | 83,163 | 81,082 | 101,603 | 53,122 | 55,230 | 34,416 | 16,795 | |||||||||||||||||||||||
| Ratios to average net assets: | |||||||||||||||||||||||||||||||
| Net expenses after expense | |||||||||||||||||||||||||||||||
| reimbursement/recoupment(4)(5) | % | 1.30 | 1.32 | 1.13 | 1.17 | 1.10 | 1.18 | 1.10 | |||||||||||||||||||||||
| Gross expenses prior to expense reimbursement/recoupment(4) | % | 1.25 | 1.34 | 1.47 | 1.45 | 1.32 | 1.37 | 1.37 | |||||||||||||||||||||||
| Net investment income after expense | |||||||||||||||||||||||||||||||
| reimbursement/recoupment(4)(5) | % | 6.31 | 6.81 | 10.14 | 11.02 | 11.43 | 10.63 | 9.68 | |||||||||||||||||||||||
| Portfolio turnover rate | % | 46 | 130 | 131 | 102 | 113 | 113 | 44 | |||||||||||||||||||||||
| Class B | |||||||||||||||||||||||||||||||
| Six Months Ended September 30, | Year Ended March 31, | Nine Months Ended March 31, | Year Ended June 30, | Three Months Ended June 30, | |||||||||||||||||||||||||||
| 2004 | 2004 | 2003 | 2002 | 2001(1) | 2000 | 1999(2) | |||||||||||||||||||||||||
| Per Share Operating Performance: | |||||||||||||||||||||||||||||||
| Net asset value, beginning of period | $ | 7.18 | 6.69 | 7.54 | 8.71 | 10.81 | 11.58 | 11.66 | |||||||||||||||||||||||
| Income (loss) from investment operations: | |||||||||||||||||||||||||||||||
| Net investment income | $ | 0.18 | 0.40 | 0.70 | 0.81 | 0.81 | 1.11 | 0.27 | |||||||||||||||||||||||
| Net realized and unrealized gain (loss) on investments | $ | 0.05 | 0.53 | (0.81 | ) | (1.05 | ) | (2.10 | ) | (0.75 | ) | (0.09 | ) | ||||||||||||||||||
| Total from investment operations | $ | 0.23 | 0.93 | (0.11 | ) | (0.24 | ) | (1.29 | ) | 0.36 | 0.18 | ||||||||||||||||||||
| Less distributions from: | |||||||||||||||||||||||||||||||
| Net investment income | $ | 0.17 | 0.41 | 0.74 | 0.93 | 0.81 | 1.13 | 0.26 | |||||||||||||||||||||||
| Return of Capital | $ | - | 0.03 | - | - | - | - | - | |||||||||||||||||||||||
| Total distributions | $ | 0.17 | 0.44 | 0.74 | 0.93 | 0.81 | 1.13 | 0.26 | |||||||||||||||||||||||
| Net asset value, end of period | $ | 7.24 | 7.18 | 6.69 | 7.54 | 8.71 | 10.81 | 11.58 | |||||||||||||||||||||||
| Total Return(3) | % | 3.37 | 14.30 | (1.07 | ) | (2.49 | ) | (12.22 | ) | 3.28 | 1.53 | ||||||||||||||||||||
| Ratios and Supplemental Data: | |||||||||||||||||||||||||||||||
| Net assets, end of period (000's) | $ | 134,809 | 165,296 | 192,643 | 143,742 | 181,175 | 103,246 | 41,882 | |||||||||||||||||||||||
| Ratios to average net assets: | |||||||||||||||||||||||||||||||
| Net expenses after expense | |||||||||||||||||||||||||||||||
| reimbursement/recoupment(4)(5) | % | 1.95 | 1.97 | 1.78 | 1.82 | 1.75 | 1.83 | 1.75 | |||||||||||||||||||||||
| Gross expenses prior to expense reimbursement/recoupment(4) | % | 1.90 | 1.99 | 2.12 | 2.10 | 1.97 | 2.02 | 2.02 | |||||||||||||||||||||||
| Net investment income after expense | |||||||||||||||||||||||||||||||
| reimbursement/recoupment(4)(5) | % | 5.65 | 6.13 | 9.56 | 10.48 | 10.97 | 9.98 | 9.03 | |||||||||||||||||||||||
| Portfolio turnover rate | % | 46 | 130 | 131 | 102 | 113 | 113 | 44 | |||||||||||||||||||||||
(1) The Fund changed its fiscal year end to March 31.
(2) Effective May 24, 1999, ING Investments, LLC, became the Investment Manager of the Fund and the Fund changed its year end to June 30.
(3) Total return is calculated assuming reinvestment of all dividends and capital gain distributions at net asset value and excluding the deduction of sales charges. Total return for less than one year is not annualized.
(4) Annualized for periods less than one year.
(5) The Investment Manager has agreed to limit expenses, (excluding interest, taxes, brokerage and extraordinary expenses) subject to possible recoupment by ING Investments, LLC within three years.
See Accompanying Notes to Financial Statements.
34
ING HIGH YIELD OPPORTUNITY FUND (UNAUDITED) (CONTINUED) FINANCIAL HIGHLIGHTS
Selected data for a share of beneficial interest outstanding throughout each period.
| Class C | |||||||||||||||||||||||||||||||
Six Months Ended September 30, | Year Ended March 31, | Nine Months Ended March 31, | Year Ended June 30, | Three Months Ended June 30, | |||||||||||||||||||||||||||
| 2004 | 2004 | 2003 | 2002 | 2001(1) | 2000 | 1999(2) | |||||||||||||||||||||||||
| Per Share Operating Performance: | |||||||||||||||||||||||||||||||
| Net asset value, beginning of period | $ | 7.17 | 6.69 | 7.53 | 8.71 | 10.81 | 11.58 | 11.66 | |||||||||||||||||||||||
| Income (loss) from investment operations: | |||||||||||||||||||||||||||||||
| Net investment income | $ | 0.18 | 0.39 | 0.69 | 0.80 | 0.81 | 1.10 | 0.27 | |||||||||||||||||||||||
| Net realized and unrealized gain (loss) on investments | $ | 0.06 | 0.53 | (0.79 | ) | (1.05 | ) | (2.10 | ) | (0.74 | ) | (0.09 | ) | ||||||||||||||||||
| Total from investment operations | $ | 0.24 | 0.92 | (0.10 | ) | (0.25 | ) | (1.29 | ) | 0.36 | 0.18 | ||||||||||||||||||||
| Less distributions from: | |||||||||||||||||||||||||||||||
| Net investment income | $ | 0.17 | 0.41 | 0.74 | 0.93 | 0.81 | 1.13 | 0.26 | |||||||||||||||||||||||
| Return of Capital | $ | - | 0.03 | - | - | - | - | - | |||||||||||||||||||||||
| Total distributions | $ | 0.17 | 0.44 | 0.74 | 0.93 | 0.81 | 1.13 | 0.26 | |||||||||||||||||||||||
| Net asset value, end of period | $ | 7.24 | 7.17 | 6.69 | 7.53 | 8.71 | 10.81 | 11.58 | |||||||||||||||||||||||
| Total Return(3) | % | 3.52 | 14.14 | (0.96 | ) | (2.60 | ) | (12.22 | ) | 3.28 | 1.53 | ||||||||||||||||||||
| Ratios and Supplemental Data: | |||||||||||||||||||||||||||||||
| Net assets, end of period (000's) | $ | 18,172 | 21,195 | 26,163 | 24,674 | 33,463 | 23,324 | 18,618 | |||||||||||||||||||||||
| Ratios to average net assets: | |||||||||||||||||||||||||||||||
| Net expenses after expense | |||||||||||||||||||||||||||||||
| reimbursement/recoupment(4)(5) | % | 1.95 | 1.97 | 1.78 | 1.81 | 1.75 | 1.83 | 1.75 | |||||||||||||||||||||||
| Gross expenses prior to expense reimbursement/recoupment(4) | % | 1.90 | 1.99 | 2.13 | 2.09 | 1.97 | 2.02 | 2.02 | |||||||||||||||||||||||
| Net investment income after expense | |||||||||||||||||||||||||||||||
| reimbursement/recoupment(4)(5) | % | 5.65 | 6.13 | 9.61 | 10.47 | 10.93 | 9.98 | 9.03 | |||||||||||||||||||||||
| Portfolio turnover rate | % | 46 | 130 | 131 | 102 | 113 | 113 | 44 | |||||||||||||||||||||||
| Class M | |||||||||||||||
| Six Months Ended September 30, 2004 | Year Ended March 31, 2004 | May 17, 2002(6) to March 31, 2003 | |||||||||||||
| Per Share Operating Performance: | |||||||||||||||
| Net asset value, beginning of period | $ | 7.13 | 6.65 | 7.58 | |||||||||||
| Income (loss) from investment operations: | |||||||||||||||
| Net investment income | $ | 0.21 | 0.42 | 0.54 | |||||||||||
| Net realized and unrealized gain (loss) on investments | $ | 0.03 | 0.52 | (0.81 | ) | ||||||||||
| Total from investment operations | $ | 0.24 | 0.94 | (0.27 | ) | ||||||||||
| Less distributions from: | |||||||||||||||
| Net investment income | $ | 0.18 | 0.43 | 0.66 | |||||||||||
| Return of Capital | $ | - | 0.03 | - | |||||||||||
| Total distributions | $ | 0.18 | 0.46 | 0.66 | |||||||||||
| Net asset value, end of period | $ | 7.19 | 7.13 | 6.65 | |||||||||||
| Total Return(3) | % | 3.53 | 14.58 | (3.16 | ) | ||||||||||
| Ratios and Supplemental Data: | |||||||||||||||
| Net assets, end of period (000's) | $ | 2,538 | 2,981 | 3,353 | |||||||||||
| Ratios to average net assets: | |||||||||||||||
| Net expenses after expense reimbursement/recoupment(4)(5) | % | 1.70 | 1.72 | 1.52 | |||||||||||
| Gross expenses prior to expense reimbursement/recoupment(4) | % | 1.65 | 1.74 | 1.82 | |||||||||||
| Net investment income after expense reimbursement/recoupment(4)(5) | % | 5.90 | 6.38 | 9.41 | |||||||||||
| Portfolio turnover rate | % | 46 | 130 | 131 | |||||||||||
(1) The Fund changed its fiscal year end to March 31.
(2) Effective May 24, 1999, ING Investments, LLC, became the Investment Manager of the Fund and the Fund changed its year end to June 30.
(3) Total return is calculated assuming reinvestment of all dividends and capital gain distributions at net asset value and excluding the deduction of sales charges. Total return for less than one year is not annualized.
(4) Annualized for periods less than one year.
(5) The Investment Manager has agreed to limit expenses, (excluding interest, taxes, brokerage and extraordinary expenses) subject to possible recoupment by ING Investments, LLC within three years.
(6) Commencement of operations.
See Accompanying Notes to Financial Statements.
35
ING INTERMEDIATE BOND FUND (UNAUDITED) FINANCIAL HIGHLIGHTS
Selected data for a share of beneficial interest outstanding throughout each period.
| Class A | |||||||||||||||||||||||||||||||
| Six Months Ended September 30, | Year Ended March 31, | Five Months Ended March 31, | Year Ended October 31, | December 15, 1998(2) to October 31, | |||||||||||||||||||||||||||
| 2004 | 2004 | 2003 | 2002 | 2001(1) | 2000 | 1999 | |||||||||||||||||||||||||
| Per Share Operating Performance: | |||||||||||||||||||||||||||||||
| Net asset value, beginning of period | $ | 10.67 | 10.51 | 9.91 | 10.18 | 9.52 | 9.40 | 10.00 | |||||||||||||||||||||||
| Income (loss) from investment operations: | |||||||||||||||||||||||||||||||
| Net investment income | $ | 0.16 | 0.31 | 0.35 | 0.51 | 0.28 | 0.61 | 0.45 | |||||||||||||||||||||||
| Net realized and unrealized gain (loss) on investments | $ | (0.09 | ) | 0.32 | 0.77 | 0.42 | 0.66 | 0.12 | (0.60 | ) | |||||||||||||||||||||
| Total from investment operations | $ | 0.07 | 0.63 | 1.12 | 0.93 | 0.94 | 0.73 | (0.15 | ) | ||||||||||||||||||||||
| Less distributions from: | |||||||||||||||||||||||||||||||
| Net investment income | $ | 0.16 | 0.33 | 0.37 | 0.53 | 0.28 | 0.61 | 0.45 | |||||||||||||||||||||||
| Net realized gain on investments | $ | 0.13 | 0.14 | 0.15 | 0.67 | - | - | - | |||||||||||||||||||||||
| Total distributions | $ | 0.29 | 0.47 | 0.52 | 1.20 | 0.28 | 0.61 | 0.45 | |||||||||||||||||||||||
| Net asset value, end of period | $ | 10.45 | 10.67 | 10.51 | 9.91 | 10.18 | 9.52 | 9.40 | |||||||||||||||||||||||
| Total Return(3) | % | 0.73 | 6.16 | 11.48 | 9.27 | 10.01 | 8.11 | (1.46 | ) | ||||||||||||||||||||||
| Ratios and Supplemental Data: | |||||||||||||||||||||||||||||||
| Net assets, end of period (000's) | $ | 398,785 | 268,086 | 146,649 | 41,503 | 33,597 | 29,893 | 32,013 | |||||||||||||||||||||||
| Ratios to average net assets: | |||||||||||||||||||||||||||||||
| Net expenses after expense | |||||||||||||||||||||||||||||||
| reimbursement(4)(5) | % | 0.99 | 1.10 | 1.14 | 1.15 | 1.13 | 1.00 | 0.96 | |||||||||||||||||||||||
| Gross expenses prior to expense reimbursement(4) | % | 1.10 | 1.18 | 1.24 | 1.36 | 1.53 | 2.08 | 2.12 | |||||||||||||||||||||||
| Net investment income after expense | |||||||||||||||||||||||||||||||
| reimbursement(4)(5) | % | 3.10 | 2.91 | 3.21 | 4.93 | 6.94 | 6.48 | 5.38 | |||||||||||||||||||||||
| Portfolio turnover rate | % | 203 | 475 | 639 | 1,216 | * | 838 | 733 | 432 | ||||||||||||||||||||||
| Class B | |||||||||||||||||||||||||||||||
| Six Months Ended September 30, | Year Ended March 31, | Five Months Ended March 31, | Year Ended October 31, | December 15, 1998(2) to October 31, | |||||||||||||||||||||||||||
| 2004 | 2004 | 2003 | 2002 | 2001(1) | 2000 | 1999 | |||||||||||||||||||||||||
| Per Share Operating Performance: | |||||||||||||||||||||||||||||||
| Net asset value, beginning of period | $ | 10.65 | 10.50 | 9.90 | 10.18 | 9.52 | 9.40 | 10.00 | |||||||||||||||||||||||
| Income (loss) from investment operations: | |||||||||||||||||||||||||||||||
| Net investment income | $ | 0.12 | 0.23 | 0.28 | 0.44 | 0.26 | 0.53 | 0.40 | |||||||||||||||||||||||
| Net realized and unrealized gain (loss) on investments | $ | (0.09 | ) | 0.31 | 0.76 | 0.40 | 0.66 | 0.13 | (0.61 | ) | |||||||||||||||||||||
| Total from investment operations | $ | 0.03 | 0.54 | 1.04 | 0.84 | 0.92 | 0.66 | (0.21 | ) | ||||||||||||||||||||||
| Less distributions from: | |||||||||||||||||||||||||||||||
| Net investment income | $ | 0.12 | 0.25 | 0.29 | 0.45 | 0.26 | 0.54 | 0.39 | |||||||||||||||||||||||
| Net realized gain on investments | $ | 0.13 | 0.14 | 0.15 | 0.67 | - | - | - | |||||||||||||||||||||||
| Total distributions | $ | 0.25 | 0.39 | 0.44 | 1.12 | 0.26 | 0.54 | 0.39 | |||||||||||||||||||||||
| Net asset value, end of period | $ | 10.43 | 10.65 | 10.50 | 9.90 | 10.18 | 9.52 | 9.40 | |||||||||||||||||||||||
| Total Return(3) | % | 0.34 | 5.28 | 10.64 | 8.37 | 9.74 | 7.30 | (2.13 | ) | ||||||||||||||||||||||
| Ratios and Supplemental Data: | |||||||||||||||||||||||||||||||
| Net assets, end of period (000's) | $ | 66,824 | 67,402 | 61,544 | 11,216 | 2,807 | 1,523 | 1,958 | |||||||||||||||||||||||
| Ratios to average net assets: | |||||||||||||||||||||||||||||||
| Net expenses after expense | |||||||||||||||||||||||||||||||
| reimbursement/recoupment(4)(5) | % | 1.74 | 1.85 | 1.89 | 1.90 | 1.88 | 1.74 | 1.70 | |||||||||||||||||||||||
| Gross expenses prior to expense reimbursement/recoupment(4) | % | 1.75 | 1.83 | 1.89 | 2.01 | 2.18 | 2.33 | 2.39 | |||||||||||||||||||||||
| Net investment income after expense | |||||||||||||||||||||||||||||||
| reimbursement/recoupment(4)(5) | % | 2.34 | 2.16 | 2.39 | 4.09 | 6.20 | 5.71 | 4.83 | |||||||||||||||||||||||
| Portfolio turnover rate | % | 203 | 475 | 639 | 1,216 | * | 838 | 733 | 432 | ||||||||||||||||||||||
(1) The Fund changed its fiscal year end to March 31.
(2) Commencement of operations.
(3) Total return is calculated assuming reinvestment of all dividends and capital gain distributions at net asset value and excluding the deduction of sales charges. Total return for less than one year is not annualized.
(4) Annualized for periods less than one year.
(5) The Investment Manager has agreed to limit expenses, (excluding interest, taxes, brokerage and extraordinary expenses) subject to possible recoupment by ING Investments LLC within three years.
* Portfolio turnover was greater than expected during this period due to active trading undertaken in response to market conditions that existed at that time.
See Accompanying Notes to Financial Statements.
36
ING INTERMEDIATE BOND FUND (UNAUDITED) (CONTINUED) FINANCIAL HIGHLIGHTS
Selected data for a share of beneficial interest outstanding throughout each period.
| Class C | |||||||||||||||||||||||||||||||
| Six Months Ended September 30, | Year Ended March 31, | Five Months Ended March 31, | Year Ended October 31, | December 15, 1998(2) to October 31, | |||||||||||||||||||||||||||
| 2004 | 2004 | 2003 | 2002 | 2001(1) | 2000 | 1999 | |||||||||||||||||||||||||
| Per Share Operating Performance: | |||||||||||||||||||||||||||||||
| Net asset value, beginning of period | $ | 10.65 | 10.50 | 9.90 | 10.19 | 9.52 | 9.40 | 10.00 | |||||||||||||||||||||||
| Income (loss) from investment operations: | |||||||||||||||||||||||||||||||
| Net investment income | $ | 0.12 | 0.23 | 0.28 | 0.44 | 0.26 | 0.54 | 0.42 | |||||||||||||||||||||||
| Net realized and unrealized gain (loss) on investments | $ | (0.08 | ) | 0.31 | 0.76 | 0.39 | 0.67 | 0.12 | (0.63 | ) | |||||||||||||||||||||
| Total from investment operations | $ | 0.04 | 0.54 | 1.04 | 0.83 | 0.93 | 0.66 | (0.21 | ) | ||||||||||||||||||||||
| Less distributions from: | |||||||||||||||||||||||||||||||
| Net investment income | $ | 0.12 | 0.25 | 0.29 | 0.45 | 0.26 | 0.54 | 0.39 | |||||||||||||||||||||||
| Net realized gain on investments | $ | 0.13 | 0.14 | 0.15 | 0.67 | - | - | - | |||||||||||||||||||||||
| Total distributions | $ | 0.25 | 0.39 | 0.44 | 1.12 | 0.26 | 0.54 | 0.39 | |||||||||||||||||||||||
| Net asset value, end of period | $ | 10.44 | 10.65 | 10.50 | 9.90 | 10.19 | 9.52 | 9.40 | |||||||||||||||||||||||
| Total Return(3) | % | 0.44 | 5.28 | 10.68 | 8.24 | 9.86 | 7.32 | (2.10 | ) | ||||||||||||||||||||||
| Ratios and Supplemental Data: | |||||||||||||||||||||||||||||||
| Net assets, end of period (000's) | $ | 68,717 | 71,228 | 52,979 | 6,382 | 4,470 | 5,248 | 1,082 | |||||||||||||||||||||||
| Ratios to average net assets: | |||||||||||||||||||||||||||||||
| Net expenses after expense | |||||||||||||||||||||||||||||||
| reimbursement/recoupment(4)(5) | % | 1.74 | 1.85 | 1.90 | 1.90 | 1.85 | 1.73 | 1.71 | |||||||||||||||||||||||
| Gross expenses prior to expense reimbursement/recoupment(4) | % | 1.75 | 1.83 | 1.90 | 2.01 | 2.18 | 2.32 | 2.44 | |||||||||||||||||||||||
| Net investment income after expense | |||||||||||||||||||||||||||||||
| reimbursement/recoupment(4)(5) | % | 2.34 | 2.16 | 2.36 | 4.20 | 6.37 | 5.74 | 4.94 | |||||||||||||||||||||||
| Portfolio turnover rate | % | 203 | 475 | 639 | 1,216 | * | 838 | 733 | 432 | ||||||||||||||||||||||
| Class O | Class R | ||||||||||||||
| August 16, 2004(2) to September 30, 2004 | Six Months Ended September 30, 2004 | March 16, 2004(2) to March 31, 2004 | |||||||||||||
| Per Share Operating Performance: | |||||||||||||||
| Net asset value, beginning of period | $ | 10.39 | 10.67 | 10.71 | |||||||||||
| Income (loss) from investment operations: | |||||||||||||||
| Net investment income | $ | 0.00 | ** | 0.02 | 0.01 | ||||||||||
| Net realized and unrealized gain (loss) on investments | $ | 0.06 | (0.22 | ) | (0.05 | ) | |||||||||
| Total from investment operations | $ | 0.06 | (0.20 | ) | (0.04 | ) | |||||||||
| Net asset value, end of period | $ | 10.45 | 10.47 | 10.67 | |||||||||||
| Total Return(3) | % | 0.97 | 0.83 | (0.37 | ) | ||||||||||
| Ratios and Supplemental Data: | |||||||||||||||
| Net assets, end of period (000's) | $ | 27,548 | 135 | 1 | |||||||||||
| Ratios to average net assets: | |||||||||||||||
| Net expenses after expense reimbursement(4)(5) | % | 0.91 | 1.17 | 1.25 | |||||||||||
| Gross expenses prior to expense reimbursement(4) | % | 0.91 | 1.17 | 1.25 | |||||||||||
| Net investment income after expense reimbursement(4)(5) | % | 3.23 | 2.92 | 3.20 | |||||||||||
| Portfolio turnover rate | % | 203 | 203 | 475 | |||||||||||
(1) The Fund changed its fiscal year end to March 31.
(2) Commencement of operations.
(3) Total return is calculated assuming reinvestment of all dividends and capital gain distributions at net asset value and excluding the deduction of sales charges. Total return for less than one year is not annualized.
(4) Annualized for periods less than one year.
(5) The Investment Manager has agreed to limit expenses, (excluding interest, taxes, brokerage and extraordinary expenses) subject to possible recoupment by ING Investments, LLC within three years.
* Portfolio turnover was greater than expected during this period due to active trading undertaken in response to market conditions that existed at that time.
** Amount is less than $0.01 per share.
See Accompanying Notes to Financial Statements.
37
ING NATIONAL TAX-EXEMPT BOND FUND (UNAUDITED) FINANCIAL HIGHLIGHTS
Selected data for a share of beneficial interest outstanding throughout each period.
| Class A | |||||||||||||||||||||||||||
| Six Months Ended September 30, | Year Ended March 31, | Five Months Ended March 31, | November 8, 1999(2) to October 31, | ||||||||||||||||||||||||
| 2004 | 2004 | 2003 | 2002 | 2001(1) | 2000 | ||||||||||||||||||||||
| Per Share Operating Performance: | |||||||||||||||||||||||||||
| Net asset value, beginning of period | $ | 10.78 | 10.87 | 10.32 | 10.50 | 10.11 | 10.00 | ||||||||||||||||||||
| Income (loss) from investment operations: | |||||||||||||||||||||||||||
| Net investment income | $ | 0.17 | 0.35 | 0.39 | 0.41 | 0.19 | 0.48 | ||||||||||||||||||||
| Net realized and unrealized gain (loss) on investments | $ | (0.09 | ) | 0.12 | 0.67 | (0.18 | ) | 0.39 | 0.11 | ||||||||||||||||||
| Total from investment operations | $ | 0.08 | 0.47 | 1.06 | 0.23 | 0.58 | 0.59 | ||||||||||||||||||||
| Less distributions from: | |||||||||||||||||||||||||||
| Net investment income | $ | 0.17 | 0.35 | 0.39 | 0.41 | 0.19 | 0.48 | ||||||||||||||||||||
| Net realized gain on investments | $ | - | 0.21 | 0.12 | - | - | - | ||||||||||||||||||||
| Total distributions | $ | 0.17 | 0.56 | 0.51 | 0.41 | 0.19 | 0.48 | ||||||||||||||||||||
| Net asset value, end of period | $ | 10.69 | 10.78 | 10.87 | 10.32 | 10.50 | 10.11 | ||||||||||||||||||||
| Total Return(3) | % | 0.74 | 4.41 | 10.44 | 2.25 | 5.79 | 6.09 | ||||||||||||||||||||
| Ratios and Supplemental Data: | |||||||||||||||||||||||||||
| Net assets, end of period (000's) | $ | 23,829 | 24,082 | 23,647 | 22,868 | 22,074 | 21,592 | ||||||||||||||||||||
| Ratios to average net assets: | |||||||||||||||||||||||||||
| Net expenses after | |||||||||||||||||||||||||||
| expense reimbursement/recoupment(4)(5) | % | 1.15 | 1.15 | 1.15 | 1.10 | 1.06 | 0.95 | ||||||||||||||||||||
| Gross expenses prior to expense reimbursement/recoupment(4) | % | 1.16 | 1.27 | 1.28 | 1.52 | 1.50 | 2.12 | ||||||||||||||||||||
| Net investment income after expense | |||||||||||||||||||||||||||
| reimbursement/recoupment(4)(5) | % | 3.07 | 3.23 | 3.64 | 3.97 | 4.45 | 4.92 | ||||||||||||||||||||
| Portfolio turnover rate | % | 8 | 31 | 22 | 27 | 7 | 50 | ||||||||||||||||||||
| Class B | |||||||||||||||||||||||||||
| Six Months Ended September 30, | Year Ended March 31, | Five Months Ended March 31, | November 8, 1999(2) to October 31, | ||||||||||||||||||||||||
| 2004 | 2004 | 2003 | 2002 | 2001(1) | 2000 | ||||||||||||||||||||||
| Per Share Operating Performance: | |||||||||||||||||||||||||||
| Net asset value, beginning of period | $ | 10.77 | 10.86 | 10.31 | 10.48 | 10.09 | 10.00 | ||||||||||||||||||||
| Income (loss) from investment operations: | |||||||||||||||||||||||||||
| Net investment income | $ | 0.13 | 0.27 | 0.31 | 0.34 | 0.17 | 0.38 | ||||||||||||||||||||
| Net realized and unrealized gain (loss) on investments | $ | (0.09 | ) | 0.12 | 0.67 | (0.17 | ) | 0.39 | 0.11 | ||||||||||||||||||
| Total from investment operations | $ | 0.04 | 0.39 | 0.98 | 0.17 | 0.56 | 0.49 | ||||||||||||||||||||
| Less distributions from: | |||||||||||||||||||||||||||
| Net investment income | $ | 0.13 | 0.27 | 0.31 | 0.34 | 0.17 | 0.40 | ||||||||||||||||||||
| Net realized gain on investments | $ | - | 0.21 | 0.12 | - | - | - | ||||||||||||||||||||
| Total distributions | $ | 0.13 | 0.48 | 0.43 | 0.34 | 0.17 | 0.40 | ||||||||||||||||||||
| Net asset value, end of period | $ | 10.68 | 10.77 | 10.86 | 10.31 | 10.48 | 10.09 | ||||||||||||||||||||
| Total Return(3) | % | 0.37 | 3.63 | 9.65 | 1.59 | 5.54 | 5.02 | ||||||||||||||||||||
| Ratios and Supplemental Data: | |||||||||||||||||||||||||||
| Net assets, end of period (000's) | $ | 2,833 | 2,643 | 2,792 | 1,265 | 588 | 311 | ||||||||||||||||||||
| Ratios to average net assets: | |||||||||||||||||||||||||||
| Net expenses after | |||||||||||||||||||||||||||
| expense reimbursement/recoupment(4)(5) | % | 1.90 | 1.90 | 1.90 | 1.84 | 1.83 | 1.67 | ||||||||||||||||||||
| Gross expenses prior to expense | |||||||||||||||||||||||||||
| reimbursement/recoupment(4) | % | 1.81 | 1.92 | 1.94 | 2.16 | 2.17 | 2.32 | ||||||||||||||||||||
| Net investment income after | |||||||||||||||||||||||||||
| expense reimbursement/recoupment(4)(5) | % | 2.32 | 2.48 | 2.86 | 3.22 | 3.69 | 3.93 | ||||||||||||||||||||
| Portfolio turnover rate | % | 8 | 31 | 22 | 27 | 7 | 50 | ||||||||||||||||||||
(1) The Fund changed its fiscal year end to March 31.
(2) Commencement of operations.
(3) Total return is calculated assuming reinvestment of all dividends and capital gain distributions at net asset value and excluding the deduction of sales charges. Total return for less than one year is not annualized.
(4) Annualized for periods less than one year.
(5) The Investment Manager has agreed to limit expenses, (excluding interest, taxes, brokerage and extraordinary expenses) subject to possible recoupment by ING Investments, LLC within three years.
See Accompanying Notes to Financial Statements.
38
ING NATIONAL TAX-EXEMPT BOND FUND (UNAUDITED) (CONTINUED) FINANCIAL HIGHLIGHTS
Selected data for a share of beneficial interest outstanding throughout each period.
| Class C | |||||||||||||||||||||||||||
| Six Months Ended September 30, | Year Ended March 31, | Five Months Ended March 31, | November 8, 1999(3) to October 31, | ||||||||||||||||||||||||
| 2004 | 2004 | 2003 | 2002 | 2001(2) | 2000 | ||||||||||||||||||||||
| Per Share Operating Performance: | |||||||||||||||||||||||||||
| Net asset value, beginning of period | $ | 10.78 | 10.87 | 10.33 | 10.49 | 10.11 | 10.00 | ||||||||||||||||||||
| Income (loss) from investment operations: | |||||||||||||||||||||||||||
| Net investment income | $ | 0.13 | 0.27 | 0.31 | 0.34 | 0.16 | 0.39 | ||||||||||||||||||||
| Net realized and unrealized gain (loss) on investments | $ | (0.09 | ) | 0.12 | 0.66 | (0.16 | ) | 0.38 | 0.12 | ||||||||||||||||||
| Total from investment operations | $ | 0.04 | 0.39 | 0.97 | 0.18 | 0.54 | 0.51 | ||||||||||||||||||||
| Less distributions from: | |||||||||||||||||||||||||||
| Net investment income | $ | 0.13 | 0.27 | 0.31 | 0.34 | 0.16 | 0.40 | ||||||||||||||||||||
| Net realized gains on investments | $ | - | 0.21 | 0.12 | - | - | - | ||||||||||||||||||||
| Total distributions | $ | 0.13 | 0.48 | 0.43 | 0.34 | 0.16 | 0.40 | ||||||||||||||||||||
| Net asset value, end of period | $ | 10.69 | 10.78 | 10.87 | 10.33 | 10.49 | 10.11 | ||||||||||||||||||||
| Total Return(3) | % | 0.38 | 3.63 | 9.56 | 1.69 | 5.34 | 5.29 | ||||||||||||||||||||
| Ratios and Supplemental Data: | |||||||||||||||||||||||||||
| Net assets, end of period (000's) | $ | 1,761 | 1,104 | 1,065 | 271 | 440 | 439 | ||||||||||||||||||||
| Ratios to average net assets: | |||||||||||||||||||||||||||
| Net expenses after expense | |||||||||||||||||||||||||||
| reimbursement/recoupment(4)(5) | % | 1.90 | 1.90 | 1.90 | 1.83 | 1.81 | 1.68 | ||||||||||||||||||||
| Gross expenses prior to expense | |||||||||||||||||||||||||||
| reimbursement/recoupment(4) | % | 1.81 | 1.92 | 1.94 | 2.18 | 2.16 | 2.33 | ||||||||||||||||||||
| Net investment income after expense | |||||||||||||||||||||||||||
| reimbursement/recoupment(4)(5) | % | 2.32 | 2.49 | 2.84 | 3.21 | 3.70 | 4.00 | ||||||||||||||||||||
| Portfolio turnover rate | % | 8 | 31 | 22 | 27 | 7 | 50 | ||||||||||||||||||||
(1) The Fund changed its fiscal year end to March 31.
(2) Commencement of operations.
(3) Total return is calculated assuming reinvestment of all dividends and capital gain distributions at net asset value and excluding the deduction of sales charges. Total return for less than one year is not annualized.
(4) Annualized for periods less than one year.
(5) The Investment Manager has agreed to limit expenses, (excluding interest, taxes, brokerage and extraordinary expenses) subject to possible recoupment by ING Investments, LLC within three years.
See Accompanying Notes to Financial Statements.
39
ING CLASSIC MONEY MARKET FUND (UNAUDITED) FINANCIAL HIGHLIGHTS
Selected data for a share of beneficial interest outstanding throughout each period.
| Class A | |||||||||||||||||||||||||||||||
| Six Months Ended September 30, | Year Ended March 31, | Five Months Ended March 31, | Year Ended October 31, | December 15, 1998(2) to October 31, | |||||||||||||||||||||||||||
| 2004 | 2004 | 2003 | 2002 | 2001(1) | 2000 | 1999 | |||||||||||||||||||||||||
| Per Share Operating Performance: | |||||||||||||||||||||||||||||||
| Net asset value, beginning of period | $ | 1.00 | 1.00 | 1.00 | 1.00 | 1.00 | 1.00 | 1.00 | |||||||||||||||||||||||
| Income from investment operations: | |||||||||||||||||||||||||||||||
| Net investment income | $ | 0.00 | * | 0.00 | * | 0.01 | 0.03 | 0.02 | 0.06 | 0.04 | |||||||||||||||||||||
| Total from investment operations | $ | 0.00 | * | 0.00 | * | 0.01 | 0.03 | 0.02 | 0.06 | 0.04 | |||||||||||||||||||||
| Less distributions from: | |||||||||||||||||||||||||||||||
| Net investment income | $ | 0.00 | * | 0.00 | * | 0.01 | 0.03 | 0.02 | 0.06 | 0.04 | |||||||||||||||||||||
| Total distributions | $ | 0.00 | * | 0.00 | * | 0.01 | 0.03 | 0.02 | 0.06 | 0.04 | |||||||||||||||||||||
| Net asset value, end of period | $ | 1.00 | 1.00 | 1.00 | 1.00 | 1.00 | 1.00 | 1.00 | |||||||||||||||||||||||
| Total Return(3) | % | 0.28 | 0.44 | 1.06 | 2.83 | 2.36 | 5.70 | 3.98 | |||||||||||||||||||||||
| Ratios and Supplemental Data: | |||||||||||||||||||||||||||||||
| Net assets, end of period (000's) | $ | 426,902 | 398,997 | 458,964 | 549,999 | 515,651 | 440,651 | 228,124 | |||||||||||||||||||||||
| Ratios to average net assets: | |||||||||||||||||||||||||||||||
| Net expenses after expense | |||||||||||||||||||||||||||||||
| reimbursement(4)(5) | % | 0.77 | 0.77 | 0.77 | 0.77 | 0.77 | 0.74 | 0.73 | |||||||||||||||||||||||
| Gross expenses prior to expense | |||||||||||||||||||||||||||||||
| reimbursement(4) | % | 1.12 | 1.16 | 1.27 | 1.27 | 1.30 | 1.42 | 1.67 | |||||||||||||||||||||||
| Net investment income after expense | |||||||||||||||||||||||||||||||
| reimbursement(4)(5) | % | 0.57 | 0.44 | 1.06 | 2.75 | 5.61 | 5.59 | 4.59 | |||||||||||||||||||||||
| Class B | |||||||||||||||||||||||||||||||
| Six Months Ended September 30, | Year Ended March 31, | Five Months Ended March 31, | Year Ended October 31, | December 15, 1998(2) to October 31, | |||||||||||||||||||||||||||
| 2004 | 2004 | 2003 | 2002 | 2001(1) | 2000 | 1999 | |||||||||||||||||||||||||
| Per Share Operating Performance: | |||||||||||||||||||||||||||||||
| Net asset value, beginning of period | $ | 1.00 | 1.00 | 1.00 | 1.00 | 1.00 | 1.00 | 1.00 | |||||||||||||||||||||||
| Income from investment operations: | |||||||||||||||||||||||||||||||
| Net investment income | $ | 0.00 | * | 0.00 | * | 0.00 | * | 0.02 | 0.02 | 0.05 | 0.03 | ||||||||||||||||||||
| Total from investment operations | $ | 0.00 | * | 0.00 | * | 0.00 | * | 0.02 | 0.02 | 0.05 | 0.03 | ||||||||||||||||||||
| Less distributions from: | |||||||||||||||||||||||||||||||
| Net investment income | $ | 0.00 | * | 0.00 | * | 0.00 | * | 0.02 | 0.02 | 0.05 | 0.03 | ||||||||||||||||||||
| Total distributions | $ | 0.00 | * | 0.00 | * | 0.00 | * | 0.02 | 0.02 | 0.05 | 0.03 | ||||||||||||||||||||
| Net asset value, end of period | $ | 1.00 | 1.00 | 1.00 | 1.00 | 1.00 | 1.00 | 1.00 | |||||||||||||||||||||||
| Total Return(3) | % | 0.13 | 0.15 | 0.43 | 2.21 | 2.11 | 5.03 | 3.31 | |||||||||||||||||||||||
| Ratios and Supplemental Data: | |||||||||||||||||||||||||||||||
| Net assets, end of period (000's) | $ | 696 | 816 | 1,156 | 1,987 | 2,714 | 2,706 | 1,173 | |||||||||||||||||||||||
| Ratios to average net assets: | |||||||||||||||||||||||||||||||
| Net expenses after expense | |||||||||||||||||||||||||||||||
| reimbursement(4)(5) | % | 1.08 | 1.07 | 1.40 | 1.37 | 1.41 | 1.38 | 1.41 | |||||||||||||||||||||||
| Gross expenses prior to expense reimbursement(4) | % | 1.37 | 1.41 | 1.52 | 1.53 | 1.55 | 1.67 | 1.79 | |||||||||||||||||||||||
| Net investment income after expense | |||||||||||||||||||||||||||||||
| reimbursement(4)(5) | % | 0.25 | 0.15 | 0.46 | 2.27 | 5.10 | 4.93 | 3.85 | |||||||||||||||||||||||
(1) The Fund changed its fiscal year end to March 31.
(2) Commencement of operations.
(3) Total return is calculated assuming reinvestment of all dividends and capital gain distributions at net asset value and excluding the deduction of sales charges. Total return for less than one year is not annualized.
(4) Annualized for periods less than one year.
(5) The Investment Manager has agreed to limit expenses, (excluding interest, taxes, brokerage and extraordinary expenses) subject to possible recoupment by ING Investments, LLC within three years.
* Amount is less than $0.01 per share.
See Accompanying Notes to Financial Statements.
40
ING CLASSIC MONEY MARKET FUND (UNAUDITED) (CONTINUED) FINANCIAL HIGHLIGHTS
Selected data for a share of beneficial interest outstanding throughout each period.
| Class C | |||||||||||||||||||||||||||||||
| Six Months Ended September 30, | Year Ended March 31, | Five Months Ended March 31, | Year Ended October 31, | December 15, 1998(2) to October 31, | |||||||||||||||||||||||||||
| 2004 | 2004 | 2003 | 2002 | 2001(1) | 2000 | 1999 | |||||||||||||||||||||||||
| Per Share Operating Performance: | |||||||||||||||||||||||||||||||
| Net asset value, beginning of period | $ | 1.00 | 1.00 | 1.00 | 1.00 | 1.00 | 1.00 | 1.00 | |||||||||||||||||||||||
| Income from investment operations: | |||||||||||||||||||||||||||||||
| Net investment income | $ | 0.00 | * | 0.00 | * | 0.00 | * | 0.02 | 0.02 | 0.05 | 0.03 | ||||||||||||||||||||
| Total from investment operations | $ | 0.00 | * | 0.00 | * | 0.00 | * | 0.02 | 0.02 | 0.05 | 0.03 | ||||||||||||||||||||
| Less distributions from: | |||||||||||||||||||||||||||||||
| Net investment income | $ | 0.00 | * | 0.00 | * | 0.00 | * | 0.02 | 0.02 | 0.05 | 0.03 | ||||||||||||||||||||
| Total distributions | $ | 0.00 | * | 0.00 | * | 0.00 | * | 0.02 | 0.02 | 0.05 | 0.03 | ||||||||||||||||||||
| Net asset value, end of period | $ | 1.00 | 1.00 | 1.00 | 1.00 | 1.00 | 1.00 | 1.00 | |||||||||||||||||||||||
| Total Return(3) | % | 0.13 | 0.14 | 0.42 | 2.20 | 2.08 | 5.03 | 3.30 | |||||||||||||||||||||||
| Ratios and Supplemental Data: | |||||||||||||||||||||||||||||||
| Net assets, end of period (000's) | $ | 516 | 546 | 524 | 590 | 2,583 | 2,035 | 444 | |||||||||||||||||||||||
| Ratios to average net assets: | |||||||||||||||||||||||||||||||
| Net expenses after expense | |||||||||||||||||||||||||||||||
| reimbursement(4)(5) | % | 1.08 | 1.07 | 1.40 | 1.38 | 1.40 | 1.39 | 1.41 | |||||||||||||||||||||||
| Gross expenses prior to expense | |||||||||||||||||||||||||||||||
| reimbursement(4) | % | 1.37 | 1.41 | 1.52 | 1.53 | 1.55 | 1.67 | 1.78 | |||||||||||||||||||||||
| Net investment income after expense | |||||||||||||||||||||||||||||||
| reimbursement(4)(5) | % | 0.25 | 0.15 | 0.42 | 2.44 | 5.00 | 5.03 | 3.89 | |||||||||||||||||||||||
(1) The Fund changed its fiscal year end to March 31.
(2) Commencement of operations.
(3) Total return is calculated assuming reinvestment of all dividends and capital gain distributions at net asset value and excluding the deduction of sales charges. Total return for less than one year is not annualized.
(4) Annualized for periods less than one year.
(5) The Investment Manager has agreed to limit expenses, (excluding interest, taxes, brokerage and extraordinary expenses) subject to possible recoupment by ING Investments, LLC within three years.
* Amount is less than $0.01 per share.
See Accompanying Notes to Financial Statements.
41
ING MONEY MARKET FUND (UNAUDITED) FINANCIAL HIGHLIGHTS
Selected data for a share of beneficial interest outstanding throughout each period.
| Class A | |||||||||||||||||||||||||||
| Six Months Ended September 30, | Year Ended March 31, | Nine Months Ended March 31, | November 24, 1999(3) to June 30, | ||||||||||||||||||||||||
| 2004 | 2004 | 2003 | 2002(1) | 2001(2) | 2000 | ||||||||||||||||||||||
| Per Share Operating Performance: | |||||||||||||||||||||||||||
| Net asset value, beginning of period | $ | 1.00 | 1.00 | 1.00 | 1.00 | 1.00 | 1.00 | ||||||||||||||||||||
| Income from investment operations: | |||||||||||||||||||||||||||
| Net investment income | $ | 0.00 | † | 0.01 | 0.01 | 0.02 | * | 0.04 | * | 0.02 | * | ||||||||||||||||
| Total from investment operations | $ | 0.00 | † | 0.01 | 0.01 | 0.02 | 0.04 | 0.02 | |||||||||||||||||||
| Less distributions from: | |||||||||||||||||||||||||||
| Net investment income | $ | 0.00 | † | 0.01 | 0.01 | 0.02 | 0.04 | 0.02 | |||||||||||||||||||
| Total distributions | $ | 0.00 | † | 0.01 | 0.01 | 0.02 | 0.04 | 0.02 | |||||||||||||||||||
| Net asset value, end of period | $ | 1.00 | 1.00 | 1.00 | 1.00 | 1.00 | 1.00 | ||||||||||||||||||||
| Total Return(4) | % | 0.40 | 0.75 | 0.76 | 2.10 | 3.86 | 3.58 | ||||||||||||||||||||
| Ratios and Supplemental Data: | |||||||||||||||||||||||||||
| Net assets, end of period (000's) | $ | 17,377 | 16,331 | 16,127 | 28,668 | 73,290 | 75,430 | ||||||||||||||||||||
| Ratios to average net assets: | |||||||||||||||||||||||||||
| Net expenses after expense | |||||||||||||||||||||||||||
| reimbursement(5)(6) | % | 0.60 | 0.46 | 0.92 | 0.93 | ** | 0.91 | ** | 0.85 | ** | |||||||||||||||||
| Gross expenses prior to expense | |||||||||||||||||||||||||||
| reimbursement(5) | % | 1.01 | 1.08 | 1.14 | 0.99 | 0.74 | 2.28 | ||||||||||||||||||||
| Net investment income after expense | |||||||||||||||||||||||||||
| reimbursement(5)(6) | % | 0.75 | 0.75 | 0.77 | 2.26 | 5.23 | 5.18 | ||||||||||||||||||||
| Class B | |||||||||||||||||||||||||||
| Six Months Ended September 30, | Year Ended March 31, | Nine Months Ended March 31, | July 12, 1999(3) to June 30, | ||||||||||||||||||||||||
| 2004 | 2004 | 2003 | 2002(1) | 2001(2) | 2000 | ||||||||||||||||||||||
| Per Share Operating Performance: | |||||||||||||||||||||||||||
| Net asset value, beginning of period | $ | 1.00 | 1.00 | 1.00 | 1.00 | 1.00 | 1.00 | ||||||||||||||||||||
| Income from investment operations: | |||||||||||||||||||||||||||
| Net investment income | $ | 0.00 | † | 0.00 | † | 0.00 | † | 0.01 | * | 0.03 | * | 0.03 | * | ||||||||||||||
| Total from investment operations | $ | 0.00 | † | 0.00 | † | 0.00 | † | 0.01 | 0.03 | 0.03 | |||||||||||||||||
| Less distributions from: | |||||||||||||||||||||||||||
| Net investment income | $ | 0.00 | † | 0.00 | † | 0.00 | † | 0.01 | 0.03 | 0.03 | |||||||||||||||||
| Total distributions | $ | 0.00 | † | 0.00 | † | 0.00 | † | 0.01 | 0.03 | 0.03 | |||||||||||||||||
| Net asset value, end of period | $ | 1.00 | 1.00 | 1.00 | 1.00 | 1.00 | 1.00 | ||||||||||||||||||||
| Total Return(4) | %0.00†† | 0.00 | †† | 0.00 | †† | 1.38 | 3.34 | 3.60 | |||||||||||||||||||
| Ratios and Supplemental Data: | |||||||||||||||||||||||||||
| Net assets, end of period (000's) | $ | 20,384 | 19,760 | 34,548 | 30,241 | 32,117 | 12,035 | ||||||||||||||||||||
| Ratios to average net assets: | |||||||||||||||||||||||||||
| Net expenses after expense | |||||||||||||||||||||||||||
| reimbursement(5)(6) | % | 1.34 | 1.21 | 1.61 | 1.70 | ** | 1.64 | ** | 1.60 | ** | |||||||||||||||||
| Gross expenses prior to expense | |||||||||||||||||||||||||||
| reimbursement(5) | % | 1.77 | 1.84 | 1.91 | 1.75 | 1.50 | 3.03 | ||||||||||||||||||||
| Net investment income after expense | |||||||||||||||||||||||||||
| reimbursement(5)(6) | % | 0.00 | †† | 0.00 | †† | 0.01 | 1.26 | 4.31 | 3.96 | ||||||||||||||||||
(1) Effective May 21, 2001, ING Investments, LLC took over direct management of the Fund.
(2) The Fund changed its fiscal year end to March 31.
(3) Commencement of operations.
(4) Total return is calculated assuming reinvestment of all dividends and capital gain distributions at net asset value and excluding the deduction of sales charges. Total return for less than one year is not annualized.
(5) Annualized for periods less than one year.
(6) The Investment Manager has agreed to limit expenses, (excluding interest, taxes, brokerage and extraordinary expenses) subject to possible recoupment by ING Investments, LLC within three years.
* Recognition of net investment income by the Fund was affected by the timing of the declaration of dividends by the underlying investment company in which the Fund invested.
** Does not include expenses of the investment company in which the Fund invested prior to May 2001.
† Amount is less than $0.01 per share.
†† Amount is less than 0.01% per share.
See Accompanying Notes to Financial Statements.
42
ING MONEY MARKET FUND (UNAUDITED) (CONTINUED) FINANCIAL HIGHLIGHTS
Selected data for a share of beneficial interest outstanding throughout each period.
| Class C | |||
| Six Months Ended September 30, | Year Ended March 31, | Nine Months Ended March 31, | July 12, 1999(3) to June 30, | ||||||||||||||||||||||||
| 2004 | 2004 | 2003 | 2002(1) | 2001(2) | 2000 | ||||||||||||||||||||||
| Per Share Operating Performance: | |||||||||||||||||||||||||||
| Net asset value, beginning of period | $ | 1.00 | 1.00 | 1.00 | 1.00 | 1.00 | 1.00 | ||||||||||||||||||||
| Income from investment operations: | |||||||||||||||||||||||||||
| Net investment income | $ | 0.00 | † | 0.00 | † | 0.00 | † | 0.01 | * | 0.03 | * | 0.02 | * | ||||||||||||||
| Total from investment operations | $ | 0.00 | † | 0.00 | † | 0.00 | † | 0.01 | 0.03 | 0.02 | |||||||||||||||||
| Less distributions from: | |||||||||||||||||||||||||||
| Net investment income | $ | 0.00 | † | 0.00 | † | 0.00 | † | 0.01 | 0.03 | 0.02 | |||||||||||||||||
| Total distributions | $ | 0.00 | † | 0.00 | † | 0.00 | † | 0.01 | 0.03 | 0.02 | |||||||||||||||||
| Net asset value, end of period | $ | 1.00 | 1.00 | 1.00 | 1.00 | 1.00 | 1.00 | ||||||||||||||||||||
| Total Return(4) | % | 0.00 | †† | 0.00 | †† | 0.01 | 1.33 | 3.34 | 3.58 | ||||||||||||||||||
| Ratios and Supplemental Data: | |||||||||||||||||||||||||||
| Net assets, end of period (000's) | $ | 5,253 | 5,174 | 10,664 | 10,403 | 27,404 | 5,431 | ||||||||||||||||||||
| Ratios to average net assets: | |||||||||||||||||||||||||||
| Net expenses after expense | |||||||||||||||||||||||||||
| reimbursement(5)(6) | % | 1.34 | 1.21 | 1.62 | 1.68 | ** | 1.59 | ** | 1.60 | ** | |||||||||||||||||
| Gross expenses prior to expense | |||||||||||||||||||||||||||
| reimbursement(5) | % | 1.77 | 1.84 | 1.90 | 1.71 | 1.49 | 3.03 | ||||||||||||||||||||
| Net investment income after expense | |||||||||||||||||||||||||||
| reimbursement(5)(6) | % | 0.00 | †† | 0.00 | †† | 0.01 | 1.60 | 4.36 | 3.96 | ||||||||||||||||||
(1) Effective May 21, 2001, ING Investments, LLC took over direct management of the Fund.
(2) The Fund changed its fiscal year end to March 31.
(3) Commencement of operations.
(4) Total return is calculated assuming reinvestment of all dividends and capital gain distributions at net asset value and excluding the deduction of sales charges. Total return for less than one year is not annualized.
(5) Annualized for periods less than one year.
(6) The Investment Manager has agreed to limit expenses, (excluding interest, taxes, brokerage and extraordinary expenses) subject to possible recoupment by ING Investments, LLC within three years.
* Recognition of net investment income by the Fund was affected by the timing of the declaration of dividends by the underlying investment company in which the Fund invested.
** Does not include expenses of the investment company in which the Fund invested prior to May 2001.
† Amount is less than $0.01 per share.
†† Amount is less than 0.01% per share.
See Accompanying Notes to Financial Statements.
43
ING LEXINGTON MONEY MARKET TRUST (UNAUDITED) FINANCIAL HIGHLIGHTS
Selected data for a share of beneficial interest outstanding throughout each period.
| Six Months Ended September 30, | Year Ended March 31, | Three Months Ended March 31, | Year Ended December 31, | ||||||||||||||||||||||||||||
| 2004 | 2004 | 2003 | 2002 | 2001(1) | 2000(2) | 1999 | |||||||||||||||||||||||||
| Per Share Operating Performance: | |||||||||||||||||||||||||||||||
| Net asset value, beginning of period | $ | 1.00 | 1.00 | 1.00 | 1.00 | 1.00 | 1.00 | 1.00 | |||||||||||||||||||||||
| Income from investment operations: | |||||||||||||||||||||||||||||||
| Net investment income | $ | 0.00 | * | 0.00 | * | 0.01 | 0.02 | 0.01 | 0.05 | 0.04 | |||||||||||||||||||||
| Total from investment operations | $ | 0.00 | * | 0.00 | * | 0.01 | 0.02 | 0.01 | 0.05 | 0.04 | |||||||||||||||||||||
| Less distributions from: | |||||||||||||||||||||||||||||||
| Net investment income | $ | 0.00 | * | 0.00 | * | 0.01 | 0.02 | 0.01 | 0.05 | 0.04 | |||||||||||||||||||||
| Total distributions | $ | 0.00 | * | 0.00 | * | 0.01 | 0.02 | 0.01 | 0.05 | 0.04 | |||||||||||||||||||||
| Net asset value, end of period | $ | 1.00 | 1.00 | 1.00 | 1.00 | 1.00 | 1.00 | 1.00 | |||||||||||||||||||||||
| Total Return(3) | % | 0.27 | 0.38 | 0.69 | 2.11 | 1.22 | 5.57 | 4.34 | |||||||||||||||||||||||
| Ratios and Supplemental Data: | |||||||||||||||||||||||||||||||
| Net assets, end of period (000's) | $ | 43,005 | 46,202 | 50,153 | 55,222 | 63,177 | 62,859 | 97,850 | |||||||||||||||||||||||
| Ratios to average net assets: | |||||||||||||||||||||||||||||||
| Net expenses after expense | |||||||||||||||||||||||||||||||
| reimbursement(4)(5) | % | 0.80 | 0.82 | 0.92 | 0.98 | 0.92 | 1.00 | 1.00 | |||||||||||||||||||||||
| Gross expenses prior to expense | |||||||||||||||||||||||||||||||
| reimbursement(4) | % | 0.80 | 0.82 | 0.92 | 1.08 | 0.92 | 1.08 | 1.01 | |||||||||||||||||||||||
| Net investment income after expense | |||||||||||||||||||||||||||||||
| reimbursement(4)(5) | % | 0.53 | 0.38 | 0.69 | 2.15 | 4.85 | 5.53 | 4.26 | |||||||||||||||||||||||
(1) The Trust changed its fiscal year end to March 31.
(2) Effective July 26, 2000 ING Investments, LLC became the Investment Manager of the Trust.
(3) Total return is calculated assuming reinvestment of all dividends and capital gain distributions at net asset value and excluding the deduction of sales charges. Total return for less than one year is not annualized.
(4) The Investment Manager has agreed to limit expenses, (excluding interest, taxes, brokerage and extraordinary expenses) subject to possible recoupment by ING Investments, LLC within three years.
(5) Annualized for periods less than one year.
See Accompanying Notes to Financial Statements.
44
NOTES TO FINANCIAL STATEMENTS as of September 30, 2004 (Unaudited)
NOTE 1 - ORGANIZATION
Organization. ING Funds Trust ("Trust") is a Delaware business trust registered as an open-end management investment company. The Trust was organized on July 30, 1998. It consists of eight separately managed series: ING GNMA Income Fund ("GNMA Fund"), ING High Yield Bond Fund ("High Yield Bond Fund"), ING High Yield Opportunity Fund ("High Yield Opportunity Fund"), ING Intermediate Bond Fund ("Intermediate Bond Fund"), ING National Tax-Exempt Bond Fund ("National Tax-Exempt Bond Fund"), ING Classic Money Market Fund ("Classic Money Market Fund"), ING Money Market Fund ("Money Market Fund") and ING Lexington Money Market Trust ("Money Market Trust").
The investment objective of each Fund is described in each Fund's prospectus.
Each Fund offers at least three of the following classes of shares: Class A, Class B, Class C, Class I, Class M, Class O, Class Q and Class R, except for Money Market Trust, which only offers Class A Shares. The separate classes of shares differ principally in the applicable sales charges (if any), transfer agent fees, distribution fees and shareholder servicing fees. Shareholders of each class also bear certain expenses that pertain to that particular class. All shareholders bear the common expenses of the Fund and earn income and realized gains/losses from the portfolio pro rata based on the average daily net assets of each class, without distinction between share classes. No class has preferential dividend rights. Differences in per share dividend rates generally result from the relative weighting of pro rata income and realized gain allocati ons and from differences in separate class expenses, including distribution, and shareholder servicing fees. Class B shares, along with their pro rata reinvested dividend shares, automatically convert to Class A shares approximately eight years after purchase.
ING Investments, LLC ("ING Investments"), serves as the Investment Manager to the Funds. ING Investments has engaged ING Investment Management Co. (formerly, Aeltus Investment Management, Inc., "ING IM"), to serve as the Sub-Adviser to the Funds. ING Funds Distributor, LLC (the "Distributor") is the principal underwriter of the Funds. The Distributor, ING Investments and ING IM are indirect wholly-owned subsidiaries of ING Groep N.V. ("ING Groep"). ING Groep is a global financial institution active in banking, insurance and asset management.
NOTE 2 - SIGNIFICANT ACCOUNTING POLICIES
The following significant accounting policies are consistently followed by the Funds in the preparation of their financial statements, and such policies are in conformity with accounting principles generally accepted in the United States of America for investment companies.
A. Security Valuation. Investments in equity securities traded on a national securities exchange are valued at the last reported sale price. Securities reported by NASDAQ will be valued at the NASDAQ official closing prices. Securities traded on an exchange or NASDAQ for which there has been no sale and securities traded in the over-the-counter-market are valued at the mean between the last reported bid and ask prices. All investments quoted in foreign currencies will be valued daily in U.S. dollars on the basis of the foreign currency exchange rates prevailing at the time such valuation is determined by each Fund's custodian. Debt securities are valued at prices obtained from independent services or from one or more dealers making markets in the securities and may be adjusted based on the Fund's valuation procedures. U.S. Government obligations are valued by using market quotations or independent pricing services that use prices provided by market-makers or estimates of market values obtained from yield data relating to instruments or securities with similar characteristics. Securities for which market quotations are not readily available are valued at their respective fair values as determined in good faith and in accordance with policies set by the Board of Trustees ("Board") of the Funds. Among elements of analysis, the Board has authorized the use of one or more research services to assist with the determination of the fair value of foreign securities. Research services use statistical analyses and quantitative models to help determine fair value as of the time a Fund calculates its net asset value. Investments in securities maturing in 60 days or less are valued at amortize d cost, which, when combined with accrued interest approximates market value.
Classic Money Market Fund, Money Market Fund and Money Market Trust use the amortized cost method to value their portfolios securities. The amortized cost method involves valuing a security at its cost and amortizing any discount or premium over the period until maturity.
45
NOTES TO FINANCIAL STATEMENTS as of September 30, 2004 (Unaudited) (continued)
NOTE 2 - SIGNIFICANT ACCOUNTING POLICIES (continued)
B. Security Transactions and Revenue Recognition. Securities transactions are accounted for on the trade date. Realized gains and losses are reported on the basis of identified cost of securities sold. Interest income is recorded on an accrual basis. Dividend income is recorded on the ex-dividend date, or for certain foreign securities, when the information becomes available to the funds. Premium amortization and discount accretion are determined by the effective yield method.
C. Foreign Currency Translation. The books and records of the Funds are maintained in U.S. dollars. Any foreign currency amounts are translated into U.S. dollars on the following basis:
(1) Market value of investment securities, other assets and liabilities - at the exchange rates prevailing at the end of the day.
(2) Purchases and sales of investment securities, income and expenses - at the rates of exchange prevailing on the respective dates of such transactions.
Although the net assets and the market values are presented at the foreign exchange rates at the end of the day, the Funds do not isolate the portion of the results of operations resulting from changes in foreign exchange rates on investments from the fluctuations arising from changes in market prices of securities held. Such fluctuations are included with the net realized and unrealized gains or losses from investments. For securities that are subject to foreign withholding tax upon disposition, liabilities are recorded on the Statements of Assets and Liabilities for the estimated tax withholding based on the securities' current market values. Upon disposition, realized gains or losses on such securities are recorded net of foreign withholding tax.
Reported net realized foreign exchange gains or losses arise from sales of foreign currencies, currency gains or losses realized between the trade and settlement dates on securities transactions, the difference between the amounts of dividends, interest, and foreign withholding taxes recorded on the Funds' books, and the U.S. dollar equivalent of the amounts actually received or paid. Net unrealized foreign exchange gains and losses arise from changes in the value of assets and liabilities other than investments in securities at fiscal year end, resulting from changes in the exchange rate. Foreign security and currency transactions may involve certain considerations and risks not typically associated with investing in U.S. companies and U.S. Government securities. These risks include, but are not limited to revaluation of currencies and future adverse political and economic developments which could cause securities and their markets to be less liquid and prices more volatile than those of comparable U.S. companies and U.S. Government securities.
D. Foreign Currency Transactions and Futures Contracts. The High Yield Bond, High Yield Opportunity, Intermediate Bond and National Tax-Exempt Bond Funds may enter into foreign currency exchange transactions to convert to and from different foreign currencies and to and from the U.S. dollar in connection with the planned purchases or sales of securities. The Funds either enter into these transactions on a spot basis at the spot rate prevailing in the foreign currency exchange market or use forward foreign currency contracts to purchase or sell foreign currencies. When the contract is fulfilled or closed, gains or losses are realized. Until then, the gain or loss is includ ed in unrealized appreciation or depreciation. Risks may arise upon entering into forward contracts from the potential inability of counterparties to meet the terms of their forward contracts and from the potential inability of counterparties to meet the terms of their forward contracts and from unanticipated movements in the value of foreign currencies relative to the U.S. dollar.
The High Yield Bond, High Yield Opportunity and Intermediate Bond Funds may enter into futures contracts involving foreign currency, interest rates, securities and securities indices. A futures contract obligates the seller of the contract to deliver and the purchaser of the contract to take delivery of the type of foreign currency, financial instrument or security called for in the contract at a specified future time for a specified price. Upon entering into such a contract, a Fund is required to deposit and maintain as collateral such initial margin as required by the exchange on which the contract is traded. Pursuant to the contract, a Fund agrees to receive from or pay to the broker an amount equal to the daily fluctuations in the value of the contract. Such receipts or payments are known as variation margins and are recorded as unrealized gains or losses by the Fund. When the contract is closed, the Fund records a realized gain or loss equal to the difference between the value of the
46
NOTES TO FINANCIAL STATEMENTS as of September 30, 2004 (Unaudited) (continued)
NOTE 2 - SIGNIFICANT ACCOUNTING POLICIES (continued)
contract at the time it was opened and the value at the time it was closed.
E. Distributions to Shareholders. The Funds record distributions to their shareholders on the ex-dividend date. National Tax-Exempt Bond Fund, Intermediate Bond Fund, High Yield Opportunity Fund, High Yield Bond Fund, Classic Money Market Fund, Money Market Fund and Money Market Trust declare and become ex-dividend daily and pay dividends monthly. GNMA Fund declares and becomes ex-dividend monthly and pays dividends monthly. The Funds may make distributions on a more frequent basis to comply with the distribution requirements of the Internal Revenue Code. The characteristics of income and gains to be distributed are determined in accordance with income tax regulations, which m ay differ from accounting principles generally accepted in the United States of America for investment companies.
F. Federal Income Taxes. It is the policy of the Funds to comply with subchapter M of the Internal Revenue Code and related excise tax provisions applicable to regulated investment companies and to distribute substantially all of their net investment income and any net realized capital gains to their shareholders. Therefore, no federal income tax provision is required. No capital gain distributions shall be made until any capital loss carryforwards have been fully utilized or expired.
G. Use of Estimates. Management of the Funds has made certain estimates and assumptions relating to the reporting of assets, liabilities, income, and expenses to prepare these financial statements in conformity with accounting principles generally accepted in the United States of America for investment companies. Actual results could differ from these estimates.
H. Repurchase Agreements. Each Fund may invest in repurchase agreements only with government securities dealers recognized by the Board of Governors of the Federal Reserve System. Under such agreements, the seller of the security agrees to repurchase it at a mutually agreed upon time and price. The resale price is in excess of the purchase price and reflects an agreed upon interest rate for the period of time the agreement is outstanding. The period of the repurchase agreements is usually short, from overnight to one week, while the underlying securities generally have longer maturities. Each Fund will receive as collateral securities acceptable to it whose market value is equal to at least 100% of the carrying amount of the repurchase agreements, plus accrued interest, being invested by the Fund. The underlying collateral is valued daily on a mark to market basis to assure that the value, including accrued interest is at least equal to the repurchase price. If the seller defaults, a Fund might incur a loss or delay in the realization of proceeds if the value of the collateral securing the repurchase agreement declines, and it might incur disposition costs in liquidating the collateral.
I. Securities Lending. Each Fund (except GNMA Fund) has the option to temporarily loan up to 30% of its total assets to brokers, dealers or other financial institutions in exchange for a negotiated lender's fee. The borrower is required to fully collateralize the loans with cash or U.S. Government securities. Generally, in the event of counterparty default, the Fund has the right to use collateral to offset losses incurred. There would be potential loss to the Fund in the event the Fund is delayed or prevented from exercising its right to dispose of the collateral. The Fund bears the risk of loss with respect to the investment of collateral. Engaging in securities lending coul d have a leveraging effect, which may intensify the credit, market and other risks associated with investing in a Fund.
J. Illiquid and Restricted Securities. GNMA Fund may not invest in illiquid securities. Money Market Trust may not invest more than 5% of its net assets, in illiquid securities, Classic Money Market Fund and Money Market Fund may not invest more than 10% of their net assets in illiquid securities and all other Funds may not invest more than 15% of their net assets in illiquid securities. Illiquid securities are not readily marketable. Disposing of illiquid investments may involve time-consuming negotiation and legal expenses, and it may be difficult or impossible for the Funds to sell them promptly at an acceptable price. Restricted securities are those sold under Rule&nb sp;144A of the Securities Act of 1933 ("1933 Act") or are securities offered pursuant to Section 4(2) of the 1933 Act, and are subject to legal or contractual restrictions on resale and may not be publicly sold without registration under the 1933 Act. Certain restricted securities may be considered liquid pursuant to procedures adopted by the Board or may be deemed illiquid because they may not be readily marketable. Illiquid and restricted securities are valued using market
47
NOTES TO FINANCIAL STATEMENTS as of September 30, 2004 (Unaudited) (continued)
NOTE 2 - SIGNIFICANT ACCOUNTING POLICIES (continued)
quotations when readily available. In the absence of market quotations, the securities are valued based upon their fair value determined under procedures approved by the Board.
K. Delayed Delivery Transaction. The Funds may purchase or sell securities on a when-issued or forward commitment basis. The price of the underlying securities and date when the securities will be delivered and paid for are fixed at the time the transaction is negotiated. The market value of such is identified in the Funds' Portfolio of Investments. Losses may arise due to changes in the market value of the securities or from the inability of counterparties to meet the terms of the contract. In connection with such purchases, the Funds are required to hold liquid assets as collateral with the Funds' custodian sufficient to cover the purchase price.
L. Mortgage Dollar Roll Transactions. Each Fund (except National Tax-Exempt Bond Fund and Money Market Trust) may engage in dollar roll transactions with respect to mortgage-backed securities issued by Government National Mortgage Association, Federal National Mortgage Association and Federal Home Loan Mortgage Corp. In a dollar roll transaction, a Fund sells a mortgage-backed security to a financial institution, such as a bank or broker/dealer, and simultaneously agrees to repurchase a substantially similar (i.e., same type, coupon, and maturity) security from the institution on a delayed delivery basis at an agreed upon price. The mortgage-backed securities th at are repurchased will bear the same interest rate as those sold, but generally will be collateralized by different pools of mortgages with different prepayment histories. The Funds account for dollar roll transactions as purchases and sales.
M. Options Contracts. The High Yield Bond, High Yield Opportunity and Intermediate Bond Funds may purchase put and call options and may write (sell) put options and covered call options. The Funds may engage in option transactions as a hedge against adverse movements in the value of portfolio holdings or to increase market exposure. Option contracts are valued daily and unrealized gains or losses are recorded based upon the last sales price on the principal exchange on which the options are traded. The Funds will realize a gain or loss upon the expiration or closing of the option contract. When an option is exercised, the proceeds on sales of the underlying security for a written call option, the purchase cost of the security for a written put option, or the cost of the security for a purchased put or call option is adjusted by the amount of premium received or paid. Realized and unrealized gains or losses on option contracts are reflected in the accompanying financial statements. The risk in writing a call option is that the Funds give up the opportunity for profit if the market price of the security increases and the option is exercised. The risk in writing a put option is that the Funds may incur a loss if the market price of the security decreases and the option is exercised. The risk in buying an option is that the Funds pay a premium whether or not the option is exercised. Risks may also arise from an illiquid secondary market or from the inability of counterparties to meet the terms of the contract.
N. Construction Loan Securities (GNMA Fund). The GNMA Fund may purchase construction loan securities, which are issued to finance building costs. The funds are disbursed as needed or in accordance with a prearranged plan. The securities provide for the timely payment to the registered holder of interest at the specified rate plus scheduled installments of principal. Upon completion of the construction phase, the construction loan securities are terminated and project loan securities are issued. It is the Fund's policy to record these GNMA certificates on trade date, and to segregate assets to cover its commitments on trade date as well.
NOTE 3 - INVESTMENT TRANSACTIONS
For the six months ended September 30, 2004, the cost of purchases and proceeds from the sales of securities, excluding short-term securities, were as follows:
| Purchases | Sales | ||||||||||
| High Yield Bond Fund | $ | 33,477,955 | $ | 34,212,179 | |||||||
| High Yield Opportunity Fund | 110,392,072 | 137,840,490 | |||||||||
| Intermediate Bond Fund | 210,133,746 | 202,261,265 | |||||||||
| National Tax-Exempt Bond Fund | 2,199,730 | 2,389,290 | |||||||||
U.S. Government securities not included above were as follows:
| Purchases | Sales | ||||||||||
| GNMA Fund | $ | 141,024,305 | $ | 178,294,693 | |||||||
| Intermediate Bond Fund | 1,117,520,786 | 941,915,787 | |||||||||
48
NOTES TO FINANCIAL STATEMENTS as of September 30, 2004 (Unaudited) (continued)
NOTE 4 - INVESTMENT MANAGEMENT AND ADMINISTRATIVE FEES
All Funds in this report have an Investment Management Agreement with ING Investments, LLC (the "Investment Manager"). The Investment Management Agreements compensate the Investment Manager with a fee, computed daily and payable monthly, based on the average daily net assets of each Fund, at the following annual rates:
For GNMA Fund - 0.60% of the first $150 million, 0.50% of the next $250 million, 0.45% of the next $400 million and 0.40% in excess of $800 million; for National Tax-Exempt Bond - 0.50%; for High Yield Opportunity Fund - 0.60%; for High Yield Bond Fund - 0.65% of the first $250 million, 0.60% of the next $250 million and 0.55% in excess of $500 million; for Classic Money Market Fund - 0.25%; for Money Market Fund - 0.35%; for Money Market Trust - 0.50% of the first $500 million and 0.45% in excess of $500 million; for Intermediate Bond - 0.50% of the first $500 million, 0.45% of the next $500 million, 0.425% of the next $1 billion and 0.40% in excess of $2 billion.
The Investment Manager has entered into a Sub-Advisory Agreement with ING IM. Subject to such policies as the Board or the Investment Manager may determine, ING IM manages the Funds' assets in accordance with the Funds' investment objectives, policies, and limitations.
ING Funds Services, LLC ("IFS"), a wholly-owned subsidiary of ING Groep, acts as administrator and provides certain administrative and shareholder services necessary for Fund operations and is responsible for the supervision of other service providers. For its services, IFS is entitled to receive from the GNMA Fund, High Yield Bond Fund, High Yield Opportunity Fund, Intermediate Bond Fund, National Tax-Exempt Bond Fund, Money Market Fund and Money Market Trust a fee at an annual rate of 0.10% of its average daily net assets.
NOTE 5 - DISTRIBUTION AND SERVICE FEES
Each share class of the Funds (except as noted below) has adopted a Distribution Plan pursuant to Rule 12b-1 under the 1940 Act (the "12b-1 Plans"), whereby the Distributor is reimbursed or compensated (depending on the class of shares) by the Funds for expenses incurred in the distribution of each Fund's shares ("Distribution Fees"). Pursuant to the 12b-1 Plans, the Distributor is entitled to payment each month for actual expenses incurred in the distribution and promotion of each Fund's shares, including expenses incurred in printing prospectuses and reports used for sales purposes, expenses incurred in preparing and printing sales literature and other such distribution related expenses, including any distribution or shareholder servicing fees ("Service Fees") paid to securities deale rs who have executed a distribution agreement with the Distributor. Under the 12b-1 Plans, each class of shares of the Fund pays the Distributor a Distribution and/or Service Fee based on average daily net assets at the following annual rates:
| Class A | Class B | Class C | Class M | Class O | Class Q | Class R | |||||||||||||||||||||||||
| GNMA Fund | 0.25 | % | 1.00 | % | 1.00 | % | 0.75 | % | N/A | 0.25 | % | N/A | |||||||||||||||||||
| High Yield Bond Fund | 0.35 | % | 1.00 | % | 1.00 | % | N/A | N/A | N/A | N/A | |||||||||||||||||||||
| High Yield Opportunity Fund | 0.35 | % | 1.00 | % | 1.00 | % | 0.75 | % | N/A | 0.25 | % | N/A | |||||||||||||||||||
| Intermediate Bond Fund | 0.35 | % | 1.00 | % | 1.00 | % | N/A | 0.25 | % | N/A | 0.50 | % | |||||||||||||||||||
| National Tax-Exempt Bond Fund | 0.35 | % | 1.00 | % | 1.00 | % | N/A | N/A | N/A | N/A | |||||||||||||||||||||
| Classic Money Market Fund | 0.75 | % | 1.00 | % | 1.00 | % | N/A | N/A | N/A | N/A | |||||||||||||||||||||
| Money Market Fund | 0.25 | % | 1.00 | % | 1.00 | % | N/A | N/A | N/A | N/A | |||||||||||||||||||||
During the six months ended September 30, 2004, the Distributor waived 0.10% of the Class A Distribution fee for High Yield Bond Fund, Intermediate Bond and National Tax-Exempt Bond Fund.
During the six months ended September 30, 2004, the Distributor voluntarily waived Distribution and Service Fees of $748,818, $1,085 and $801 for the Classic Money Market Fund for Class A, Class B and Class C, respectively.
The Distributor also receives the proceeds of initial sales charge paid by shareholders upon the purchase of Class A and Class M shares, and the contingent deferred sales charge paid by shareholders upon certain redemptions for Class A, Class B, and Class C shares. For the six months ended September 30, 2004, the Distributor retained the following amounts in sales charges:
| Class A Shares | Class B Shares | Class C Shares | Class M Shares | ||||||||||||||||
| Initial Sales Charges | $ | 42,041 | N/A | N/A | $ | 10 | |||||||||||||
| Contingent Deferred Sales Charges | 31,612 | N/A | $ | 21,091 | N/A | ||||||||||||||
49
NOTES TO FINANCIAL STATEMENTS as of September 30, 2004 (Unaudited) (continued)
NOTE 6 - OTHER TRANSACTIONS WITH AFFILIATES AND RELATED PARTIES
At September 30, 2004, the Funds had the following amounts recorded in payable to affiliates on the accompanying Statements of Assets and Liabilities (see Notes 4 and 5):
| Accrued Investment Management Fees | Accrued Administrative Fees | Accrued Shareholder Services and Distribution Fees | Total | ||||||||||||||||
| GNMA Fund | $ | 296,513 | $ | 59,496 | $ | 248,224 | $ | 604,233 | |||||||||||
| High Yield Bond Fund | 59,949 | 5,926 | 36,279 | 102,154 | |||||||||||||||
| High Yield Opportunity Fund | 156,962 | 19,492 | 181,712 | 358,166 | |||||||||||||||
| Intermediate Bond Fund | 241,182 | 47,958 | 197,623 | 486,763 | |||||||||||||||
| National Tax-Exempt Bond Fund | 24,467 | 2,333 | 8,644 | 35,444 | |||||||||||||||
| Classic Money Market Fund | 89,751 | - | 138,226 | 227,977 | |||||||||||||||
| Money Market Fund | 12,379 | 3,537 | 24,495 | 40,411 | |||||||||||||||
| Money Market Trust | 55,843 | 3,547 | - | 59,390 | |||||||||||||||
At September 30, 2004, ING Life Insurance and Annuity Co., a wholly-owned indirect subsidiary of ING Groep N.V., held 7.44%, 36.38%, 17.30% and 73.29% of the shares outstanding of GNMA Fund, High Yield Bond Fund, Intermediate Bond Fund and National Tax-Exempt Bond Fund, respectively. Control is defined by the Investment Company Act of 1940 ("1940 Act") as the beneficial ownership, either directly or through one or more controlled companies, of more than 25% of the voting securities of a company. The 1940 Act defines affiliates as companies that are under common control. Therefore, because High Yield Bond and National Tax-Exempt Bond have a common owner that owns over 25% of the outstanding securities of each of them, the two Funds may be deemed to be affiliates of each other.
Each Fund has adopted a Retirement Policy covering all independent trustees of the Fund who will have served as an independent trustee for at least five years at the time of retirement. Benefits under this plan are based on an annual rate as defined in the plan agreement.
NOTE 7 - EXPENSE LIMITATIONS
For the following Funds, pursuant to written Expense Limitation Agreements, the Investment Manager has agreed to limit expenses, excluding interest, taxes, brokerage and extraordinary expenses to the following annual expenses to average daily net assets ratios:
| Class A | Class B | Class C | Class I | Class M | Class O | Class Q | Class R | ||||||||||||||||||||||||||||
| GNMA Fund | 1.29 | % | 2.04 | % | 2.04 | % | 1.04 | % | 1.79 | % | N/A | 1.29 | % | N/A | |||||||||||||||||||||
| High Yield Bond Fund | 1.20 | % | 1.95 | % | 1.95 | % | N/A | N/A | N/A | N/A | N/A | ||||||||||||||||||||||||
| High Yield Opportunity Fund | 1.30 | % | 1.95 | % | 1.95 | % | N/A | 1.70 | % | N/A | N/A | N/A | |||||||||||||||||||||||
| Intermediate Bond Fund(1) | 1.00 | % | 1.75 | % | 1.75 | % | 0.75 | % | N/A | 1.00 | % | N/A | 1.25 | % | |||||||||||||||||||||
| National Tax- Exempt Bond Fund | 1.15 | % | 1.90 | % | 1.90 | % | N/A | N/A | N/A | N/A | N/A | ||||||||||||||||||||||||
| Classic Money Market Fund | 0.77 | % | 1.41 | % | 1.41 | % | N/A | N/A | N/A | N/A | N/A | ||||||||||||||||||||||||
| Money Market Fund | 1.50 | % | 2.25 | % | 2.25 | % | N/A | N/A | N/A | N/A | N/A | ||||||||||||||||||||||||
| Money Market Trust | 1.00 | % | N/A | N/A | N/A | N/A | N/A | N/A | N/A | ||||||||||||||||||||||||||
(1) Prior to February 1, 2004, the expense limitation rates for Class A, Class B, Class C, Class I and Class O were 1.15%, 1.90%, 1.90%, 0.90%, 1.40% and 1.15% respectively.
The Investment Manager may at a later date recoup from a Fund for management fees waived and other expenses assumed by the Investment Manager during the previous 36 months, but only if, after such recoupment, the Fund's expense ratio does not exceed the percentage described above. Waived and reimbursed fees net of any recoupment by the Investment Manager of such waived and reimbursed fees are reflected on the accompanying Statements of Operations for each Fund. Amounts payable by the Investment Manager are reflected on the accompanying Statements of Assets and Liabilities for each Fund.
During the six months ended September 30, 2004, the Investment Manager voluntarily reimbursed Class A, Class B and Class C of the Money Market Fund $37,032, $44,615 and $11,840, respectively. These voluntary reimbursements were in addition to any contractual obligations under the Expense Limitation Agreement.
As of September 30, 2004, the amounts of reimbursed fees that are subject to possible recoupment by the Investment Manager, and the related expiration dates are as follows:
| September 30, | |||||||||||||||||||
| 2005 | 2006 | 2007 | Total | ||||||||||||||||
| High Yield Bond Fund | $ | 134,098 | $ | - | $ | - | $ | 134,098 | |||||||||||
| High Yield Opportunity Fund | 1,169,540 | 544,983 | - | 1,714,523 | |||||||||||||||
| Intermediate Bond Fund | - | - | 31,024 | 31,024 | |||||||||||||||
| National Tax-Exempt Bond Fund | 49,422 | 4,294 | - | 53,716 | |||||||||||||||
| Classic Money Market Fund | 682,854 | 215,345 | - | 898,199 | |||||||||||||||
| Money Market Fund | 54,749 | 448,918 | 221,103 | 724,770 | |||||||||||||||
50
NOTES TO FINANCIAL STATEMENTS as of September 30, 2004 (Unaudited) (continued)
NOTE 7 - EXPENSE LIMITATIONS (continued)
The Expense Limitation Agreements are contractual and shall renew automatically for one-year terms unless ING Investments provides written notice of the termination of the Expense Limitation Agreement within 90 days of the end of the then current term.
NOTE 8 - LINE OF CREDIT
All of the Funds included in this report with the exception of GNMA Fund, in addition to certain other funds managed by the Investment Manager, have entered into an unsecured committed revolving line of credit agreement (the "Credit Agreement") with The Bank of New York for an aggregate amount of $125,000,000. The proceeds may be used only to: (1) temporarily finance the purchase and sale of securities; (2) finance the redemption of shares of an investor in the Funds; and (3) enable the Funds to meet other emergency expenses as defined in the Credit Agreement. The Funds to which the line of credit is available pay a commitment fee equal to 0.09% per annum on the daily unused portion of the committed line amount payable quarterly in arrears.
During the six months ended September 30, 2004 the High Yield Opportunity Fund utilized the line of credit for 20 days with an approximate average daily balance of $939,500 and an approximate weighted average interest rate of 1.96%.
NOTE 9 - CAPITAL SHARES
Transactions in capital shares and dollars were as follows:
| Class A Shares | Class B Shares | Class C Shares | |||||||||||||||||||||||||
| Six Months Ended September 30, 2004 | Year Ended March 31, 2004 | Six Months Ended September 30, 2004 | Year Ended March 31, 2004 | Six Months Ended September 30, 2004 | Year Ended March 31, 2004 | ||||||||||||||||||||||
| GNMA Income Fund (Number of Shares) | |||||||||||||||||||||||||||
| Shares sold | 6,428,008 | 25,619,769 | 627,523 | 3,701,108 | 431,088 | 3,267,282 | |||||||||||||||||||||
| Dividends reinvested | 1,490,911 | 2,892,954 | 201,633 | 412,142 | 89,972 | 221,048 | |||||||||||||||||||||
| Shares redeemed | (11,123,868 | ) | (36,101,757 | ) | (2,661,900 | ) | (6,217,595 | ) | (2,019,363 | ) | (5,888,039 | ) | |||||||||||||||
| Net decrease in shares outstanding | (3,204,949 | ) | (7,589,034 | ) | (1,832,744 | ) | (2,104,345 | ) | (1,498,303 | ) | (2,399,709 | ) | |||||||||||||||
| GNMA Income Fund ($) | |||||||||||||||||||||||||||
| Shares sold | $ | 55,725,223 | $ | 220,712,735 | $ | 5,423,696 | $ | 32,777,068 | $ | 3,726,186 | $ | 29,016,572 | |||||||||||||||
| Dividends reinvested | 12,933,167 | 25,548,426 | 1,742,794 | 3,633,981 | 778,431 | 1,940,307 | |||||||||||||||||||||
| Shares redeemed | (96,250,971 | ) | (313,803,016 | ) | (22,933,093 | ) | (54,830,946 | ) | (17,429,252 | ) | (51,944,184 | ) | |||||||||||||||
| Net decrease | $ | (27,592,581 | ) | $ | (67,541,855 | ) | $ | (15,766,603 | ) | $ | (18,419,897 | ) | $ | (12,924,635 | ) | $ | (20,987,305 | ) | |||||||||
| Class I Shares | Class M Shares | Class Q Shares | |||||||||||||||||||||||||
| Six Months Ended September 30, 2004 | Year Ended March 31, 2004 | Six Months Ended September 30, 2004 | Year Ended March 31, 2004 | Six Months Ended September 30, 2004 | Year Ended March 31, 2004 | ||||||||||||||||||||||
| GNMA Income Fund (Number of Shares) | |||||||||||||||||||||||||||
| Shares sold | 231,830 | 608,292 | - | 3,037 | - | - | |||||||||||||||||||||
| Dividends reinvested | 29,046 | 47,173 | 484 | 2,172 | 296 | 610 | |||||||||||||||||||||
| Shares redeemed | (158,262 | ) | (444,235 | ) | (11,099 | ) | (93,627 | ) | (3,468 | ) | (5,994 | ) | |||||||||||||||
| Net increase (decrease) in shares outstanding | 102,614 | 211,230 | (10,615 | ) | (88,418 | ) | (3,172 | ) | (5,384 | ) | |||||||||||||||||
| GNMA Income Fund ($) | |||||||||||||||||||||||||||
| Shares sold | $ | 2,013,527 | $ | 5,431,127 | $ | - | $ | 27,195 | $ | - | $ | - | |||||||||||||||
| Dividends reinvested | 252,171 | 416,747 | 4,208 | 19,277 | 2,570 | 5,396 | |||||||||||||||||||||
| Shares redeemed | (1,372,421 | ) | (3,934,648 | ) | (96,145 | ) | (831,602 | ) | (29,827 | ) | (52,619 | ) | |||||||||||||||
| Net increase (decrease) | $ | 893,277 | $ | 1,913,226 | $ | (91,937 | ) | $ | (785,130 | ) | $ | (27,257 | ) | $ | (47,223 | ) | |||||||||||
51
NOTES TO FINANCIAL STATEMENTS as of September 30, 2004 (Unaudited) (continued)
NOTE 9 - CAPITAL SHARES (continued)
| Class T Shares | |||||||
| Year Ended March 31, 2004(1) | |||||||
| GNMA Income Fund (Number of Shares) | |||||||
| Dividends reinvested | 7,490 | ||||||
| Shares redeemed | (1,070,267 | ) | |||||
| Net decrease in shares outstanding | (1,062,777 | ) | |||||
| GNMA Income Fund ($) | |||||||
| Dividends reinvested | $ | 67,044 | |||||
| Shares redeemed | (8,942,484 | ) | |||||
| Net decrease | $ | (8,875,440 | ) | ||||
| Class A Shares | Class B Shares | Class C Shares | |||||||||||||||||||||||||
| Six Months Ended September 30, 2004 | Year Ended March 31, 2004 | Six Months Ended September 30, 2004 | Year Ended March 31, 2004 | Six Months Ended September 30, 2004 | Year Ended March 31, 2004 | ||||||||||||||||||||||
| High Yield Bond Fund (Number of Shares) | |||||||||||||||||||||||||||
| Shares sold | 930,942 | 3,014,354 | 327,109 | 1,477,608 | 251,678 | 913,884 | |||||||||||||||||||||
| Dividends reinvested | 33,539 | 129,183 | 19,957 | 53,496 | 14,684 | 28,230 | |||||||||||||||||||||
| Shares redeemed | (1,086,646 | ) | (3,423,033 | ) | (396,679 | ) | (817,189 | ) | (225,925 | ) | (365,555 | ) | |||||||||||||||
| Net increase (decrease) in shares outstanding | (122,165 | ) | (279,496 | ) | (49,613 | ) | 713,915 | 40,437 | 576,559 | ||||||||||||||||||
| High Yield Bond Fund ($) | |||||||||||||||||||||||||||
| Shares sold | $ | 8,156,118 | $ | 25,756,838 | $ | 2,861,324 | $ | 12,764,015 | $ | 2,209,089 | $ | 7,905,003 | |||||||||||||||
| Dividends reinvested | 291,957 | 1,110,915 | 173,136 | 464,713 | 127,681 | 245,987 | |||||||||||||||||||||
| Shares redeemed | (9,513,942 | ) | (29,267,363 | ) | (3,434,229 | ) | (7,104,046 | ) | (1,958,968 | ) | (3,157,798 | ) | |||||||||||||||
| Net increase (decrease) | $ | (1,065,867 | ) | $ | (2,399,610 | ) | $ | (399,769 | ) | $ | 6,124,682 | $ | 377,802 | $ | 4,993,192 | ||||||||||||
| Class A Shares | Class B Shares | Class C Shares | |||||||||||||||||||||||||
| Six Months Ended September 30, 2004 | Year Ended March 31, 2004 | Six Months Ended September 30, 2004 | Year Ended March 31, 2004 | Six Months Ended September 30, 2004 | Year Ended March 31, 2004 | ||||||||||||||||||||||
| High Yield Opportunity Fund (Number of Shares) | |||||||||||||||||||||||||||
| Shares sold | 2,452,039 | 14,744,281 | 157,980 | 2,176,865 | 76,532 | 1,026,957 | |||||||||||||||||||||
| Dividends reinvested | 125,379 | 438,411 | 178,629 | 631,217 | 23,024 | 90,317 | |||||||||||||||||||||
| Shares redeemed | (2,390,527 | ) | (19,073,909 | ) | (4,754,107 | ) | (8,548,854 | ) | (544,078 | ) | (2,071,835 | ) | |||||||||||||||
| Net increase (decrease) in shares outstanding | 186,891 | (3,891,217 | ) | (4,417,498 | ) | (5,740,772 | ) | (444,522 | ) | (954,561 | ) | ||||||||||||||||
| High Yield Opportunity Fund ($) | |||||||||||||||||||||||||||
| Shares sold | $ | 17,372,736 | $ | 100,648,682 | $ | 1,118,112 | $ | 15,182,882 | $ | 543,528 | $ | 7,068,956 | |||||||||||||||
| Dividends reinvested | 879,841 | 3,043,945 | 1,260,355 | 4,403,736 | 162,302 | 629,027 | |||||||||||||||||||||
| Shares redeemed | (16,763,907 | ) | (131,654,284 | ) | (33,634,970 | ) | (60,143,344 | ) | (3,834,510 | ) | (14,398,323 | ) | |||||||||||||||
| Net increase (decrease) | $ | 1,488,670 | $ | (27,961,657 | ) | $ | (31,256,503 | ) | $ | (40,556,726 | ) | $ | (3,128,680 | ) | $ | (6,700,340 | ) | ||||||||||
| Class M Shares | Class Q Shares | Class T Shares | |||||||||||||||||||||||||
| Six Months Ended September 30, 2004 | Year Ended March 31, 2004 | Six Months Ended September 30, 2004 | Year Ended March 31, 2004 | Year Ended March 31, 2004(1) | |||||||||||||||||||||||
| High Yield Opportunity Fund (Number of Shares) | |||||||||||||||||||||||||||
| Shares sold | 792 | 779 | - | 41,144 | - | ||||||||||||||||||||||
| Dividends reinvested | 3,767 | 13,615 | 357 | 5,660 | 8,554 | ||||||||||||||||||||||
| Shares redeemed | (69,808 | ) | (100,308 | ) | (24,245 | ) | (159,316 | ) | (751,809 | ) | |||||||||||||||||
| Net decrease in shares outstanding | (65,249 | ) | (85,914 | ) | (23,888 | ) | (112,512 | ) | (743,255 | ) | |||||||||||||||||
| High Yield Opportunity Fund ($) | |||||||||||||||||||||||||||
| Shares sold | $ | 5,467 | $ | 5,361 | $ | - | $ | 282,294 | $ | - | |||||||||||||||||
| Dividends reinvested | 26,396 | 94,295 | 2,498 | 38,994 | 58,485 | ||||||||||||||||||||||
| Shares redeemed | (490,654 | ) | (700,303 | ) | (171,141 | ) | (1,081,123 | ) | (5,126,482 | ) | |||||||||||||||||
| Net decrease | $ | (458,791 | ) | $ | (600,647 | ) | $ | (168,643 | ) | $ | (759,835 | ) | $ | (5,067,997 | ) | ||||||||||||
(1) Effective June 2, 2003, Class "T" shares converted into the corresponding Class "A" shares within this Fund. Class "T" shares are no longer offered.
52
NOTES TO FINANCIAL STATEMENTS as of September 30, 2004 (Unaudited) (continued)
NOTE 9 - CAPITAL SHARES (continued)
| Class A Shares | Class B Shares | Class C Shares | |||||||||||||||||||||||||
| Six Months Ended September 30, 2004 | Year Ended March 31, 2004 | Six Months Ended September 30, 2004 | Year Ended March 31, 2004 | Six Months Ended September 30, 2004 | Year Ended March 31, 2004 | ||||||||||||||||||||||
| Intermediate Bond Fund (Number of Shares) | |||||||||||||||||||||||||||
| Shares sold | 9,573,820 | 23,789,274 | 653,290 | 2,574,476 | 1,033,528 | 4,087,450 | |||||||||||||||||||||
| Shares issued in merger | 7,719,739 | - | 279,541 | - | 177,974 | - | |||||||||||||||||||||
| Dividends reinvested | 537,508 | 601,543 | 86,249 | 143,583 | 76,355 | 119,937 | |||||||||||||||||||||
| Shares redeemed | (4,912,055 | ) | (13,118,758 | ) | (945,539 | ) | (2,250,151 | ) | (1,392,354 | ) | (2,567,915 | ) | |||||||||||||||
| Net increase (decrease) in shares outstanding | 12,919,012 | 11,272,059 | 73,541 | 467,908 | (104,497 | ) | 1,639,472 | ||||||||||||||||||||
| Intermediate Bond Fund ($) | |||||||||||||||||||||||||||
| Shares sold | $ | 97,025,370 | $ | 249,408,518 | $ | 6,775,541 | $ | 27,153,069 | $ | 10,749,595 | $ | 43,266,790 | |||||||||||||||
| Shares issued in merger | 81,024,830 | - | 2,925,680 | - | 1,860,336 | - | |||||||||||||||||||||
| Dividends reinvested | 5,581,978 | 6,335,065 | 893,743 | 1,509,025 | 791,966 | 1,260,697 | |||||||||||||||||||||
| Shares redeemed | (50,912,547 | ) | (136,162,176 | ) | (9,790,894 | ) | (23,726,034 | ) | (14,433,697 | ) | (27,040,140 | ) | |||||||||||||||
| Net increase (decrease) | $ | 132,719,631 | $ | 119,581,407 | $ | 804,070 | $ | 4,936,060 | $ | (1,031,800 | ) | $ | 17,487,347 | ||||||||||||||
| Class I Shares | Class O Shares | Class R Shares | |||||||||||||||||||||
| Six Months Ended September 30, 2004 | Year Ended March 31, 2004 | August 16, 2004(1) to September 30, 2004 | Six Months Ended September 30, 2004 | Year Ended March 31, 2004 | |||||||||||||||||||
| Intermediate Bond Fund (Number of Shares) | |||||||||||||||||||||||
| Shares sold | 250,507 | 476,004 | 386,814 | 13,129 | 48 | ||||||||||||||||||
| Shares issued in merger | 2,441,606 | - | 2,497,900 | - | - | ||||||||||||||||||
| Dividends reinvested | 39,239 | 65,475 | 3,181 | - | - | ||||||||||||||||||
| Shares redeemed | (340,976 | ) | (609,124 | ) | (252,726 | ) | (269 | ) | (1 | ) | |||||||||||||
| Net increase (decrease) in shares outstanding | 2,390,376 | (67,645 | ) | 2,635,169 | 12,860 | 47 | |||||||||||||||||
| Intermediate Bond Fund ($) | |||||||||||||||||||||||
| Shares sold | $ | 1,748,376 | $ | 4,968,831 | $ | 4,651,212 | $ | 138,405 | $ | 514 | |||||||||||||
| Shares issued in merger | 25,636,140 | - | 26,211,427 | - | - | ||||||||||||||||||
| Dividends reinvested | 407,702 | 690,213 | 33,270 | - | - | ||||||||||||||||||
| Shares redeemed | (3,548,890 | ) | (6,360,799 | ) | (2,636,359 | ) | (2,820 | ) | (10 | ) | |||||||||||||
| Net increase (decrease) | $ | 24,243,328 | $ | (701,755 | ) | $ | 28,259,550 | $ | 135,585 | $ | 504 | ||||||||||||
| Class A Shares | Class B Shares | Class C Shares | |||||||||||||||||||||||||
| Six Months Ended September 30, 2004 | Year Ended March 31, 2004 | Six Months Ended September 30, 2004 | Year Ended March 31, 2004 | Six Months Ended September 30, 2004 | Year Ended March 31, 2004 | ||||||||||||||||||||||
| National Tax-Exempt Bond Fund (Number of Shares) | |||||||||||||||||||||||||||
| Shares sold | 16,310 | 456,328 | 49,930 | 57,806 | 85,874 | 28,257 | |||||||||||||||||||||
| Dividends reinvested | 2,635 | 25,856 | 1,331 | 5,368 | 838 | 3,304 | |||||||||||||||||||||
| Shares redeemed | (23,551 | ) | (423,168 | ) | (31,391 | ) | (74,750 | ) | (24,442 | ) | (27,023 | ) | |||||||||||||||
| Net increase (decrease) in shares outstanding | (4,606 | ) | 59,016 | 19,870 | (11,576 | ) | 62,270 | 4,538 | |||||||||||||||||||
| National Tax-Exempt Bond Fund ($) | |||||||||||||||||||||||||||
| Shares sold | $ | 171,543 | $ | 4,960,064 | $ | 525,676 | $ | 629,452 | $ | 904,727 | $ | 310,681 | |||||||||||||||
| Dividends reinvested | 27,837 | 280,211 | 14,014 | 57,744 | 8,859 | 35,588 | |||||||||||||||||||||
| Shares redeemed | (249,124 | ) | (4,618,660 | ) | (329,980 | ) | (807,779 | ) | (257,861 | ) | (290,031 | ) | |||||||||||||||
| Net increase (decrease) | $ | (49,744 | ) | $ | 621,615 | $ | 209,710 | $ | (120,583 | ) | $ | 655,725 | $ | 56,238 | |||||||||||||
(1) Commencement of operations.
53
NOTES TO FINANCIAL STATEMENTS as of September 30, 2004 (Unaudited) (continued)
NOTE 9 - CAPITAL SHARES (continued)
| Class A Shares | Class B Shares | Class C Shares | |||||||||||||||||||||||||
| Six Months Ended September 30, 2004 | Year Ended March 31, 2004 | Six Months Ended September 30, 2004 | Year Ended March 31, 2004 | Six Months Ended September 30, 2004 | Year Ended March 31, 2004 | ||||||||||||||||||||||
| Classic Money Market Fund (Number of Shares) | |||||||||||||||||||||||||||
| Shares sold | 168,435,405 | 420,747,212 | 22,516 | 157,965 | 41,172 | 62,057 | |||||||||||||||||||||
| Dividends reinvested | 1,040,612 | 1,881,730 | 772 | 1,415 | 574 | 776 | |||||||||||||||||||||
| Shares redeemed | (141,487,503 | ) | (482,594,852 | ) | (143,186 | ) | (500,061 | ) | (71,521 | ) | (41,138 | ) | |||||||||||||||
| Net increase (decrease) in shares outstanding | 27,988,514 | (59,965,910 | ) | (119,898 | ) | (340,681 | ) | (29,775 | ) | 21,695 | |||||||||||||||||
| Classic Money Market Fund ($) | |||||||||||||||||||||||||||
| Shares sold | $ | 168,435,405 | $ | 419,497,760 | $ | 22,516 | $ | 157,965 | $ | 41,172 | $ | 62,057 | |||||||||||||||
| Dividends reinvested | 1,040,612 | 1,881,743 | 772 | 1,415 | 574 | 776 | |||||||||||||||||||||
| Shares redeemed | (141,487,503 | ) | (481,346,654 | ) | (143,186 | ) | (500,062 | ) | (71,521 | ) | (41,138 | ) | |||||||||||||||
| Net increase (decrease) | $ | 27,988,514 | $ | (59,967,151 | ) | $ | (119,898 | ) | $ | (340,682 | ) | $ | (29,775 | ) | $ | 21,695 | |||||||||||
| Class A Shares | Class B Shares | Class C Shares | |||||||||||||||||||||||||
| Six Months Ended September 30, 2004 | Year Ended March 31, 2004 | Six Months Ended September 30, 2004 | Year Ended March 31, 2004 | Six Months Ended September 30, 2004 | Year Ended March 31, 2004 | ||||||||||||||||||||||
| Money Market Fund (Number of Shares) | |||||||||||||||||||||||||||
| Shares sold | 13,705,047 | 6,884,008 | 8,814,357 | 36,486,332 | 3,560,211 | 19,788,430 | |||||||||||||||||||||
| Dividends reinvested | 61,762 | 120,683 | - | 47 | - | 2 | |||||||||||||||||||||
| Shares redeemed | (12,716,735 | ) | (6,797,296 | ) | (8,185,761 | ) | (51,274,207 | ) | (3,480,559 | ) | (25,277,969 | ) | |||||||||||||||
| Net increase (decrease) in shares outstanding | 1,050,074 | 207,395 | 628,596 | (14,787,828 | ) | 79,652 | (5,489,537 | ) | |||||||||||||||||||
| Money Market Fund ($) | |||||||||||||||||||||||||||
| Shares sold | $ | 13,705,047 | $ | 6,884,017 | $ | 8,814,357 | $ | 36,486,351 | $ | 3,560,212 | $ | 19,788,460 | |||||||||||||||
| Dividends reinvested | 61,762 | 120,683 | - | 47 | - | 2 | |||||||||||||||||||||
| Shares redeemed | (12,716,740 | ) | (6,797,671 | ) | (8,185,761 | ) | (51,274,207 | ) | (3,480,559 | ) | (25,278,020 | ) | |||||||||||||||
| Net increase (decrease) | $ | 1,050,069 | $ | 207,029 | $ | 628,596 | $ | (14,787,809 | ) | $ | 79,653 | $ | (5,489,558 | ) | |||||||||||||
| Class A Shares | |||||||||||
| Six Months Ended September 30, 2004 | Year Ended March 31, 2004 | ||||||||||
| Money Market Trust (Number of Shares) | |||||||||||
| Shares sold | 6,891,506 | 18,239,103 | |||||||||
| Dividends reinvested | 84,091 | 173,405 | |||||||||
| Shares redeemed | (10,163,832 | ) | (22,362,541 | ) | |||||||
| Net decrease in shares outstanding | (3,188,235 | ) | (3,950,033 | ) | |||||||
| Money Market Trust ($) | |||||||||||
| Shares sold | $ | 6,891,506 | $ | 18,239,101 | |||||||
| Dividends reinvested | 84,090 | 173,405 | |||||||||
| Shares redeemed | (10,163,842 | ) | (22,362,541 | ) | |||||||
| Net decrease | $ | (3,188,246 | ) | $ | (3,950,035 | ) | |||||
54
NOTES TO FINANCIAL STATEMENTS as of September 30, 2004 (Unaudited) (continued)
NOTE 10 - CREDIT RISK AND DEFAULTED SECURITIES
Although each Fund has a diversified portfolio, High Yield Opportunity Fund and High Yield Bond Fund invest substantially in lower rated and comparable quality unrated high yield securities. Investments in high yield securities are accompanied by a greater degree of credit risk and such lower rated securities tend to be more sensitive to economic conditions than higher rated securities. The risk of loss due to default by the issuer may be significantly greater for the holders of high yielding securities, because such securities are generally unsecured and are often subordinated to other creditors of the issuer.
Funds that held defaulted securities at September 30, 2004 were as follows:
| Fund | Security | Market Value | |||||||||
| High Yield Opportunity Fund | Adelphia Business Solutions | $ | 6 | ||||||||
| ICG Services, Inc. | 4 | ||||||||||
| Intl. Utility Structures, Inc. | 2 | ||||||||||
| Source Media, Inc. | 1 | ||||||||||
| WinStar Communications, Inc. | 625 | ||||||||||
| $ | 638 | ||||||||||
For financial reporting purposes, it is each Fund's accounting practice to discontinue the accrual of income and to provide an estimate for probable losses due to unpaid interest income on defaulted bonds for the current reporting period.
NOTE 11 - FEDERAL INCOME TAXES
The amount of distributions from net investment income and net realized capital gains are determined in accordance with federal income tax regulations, which may differ from accounting principles generally accepted in the United States of America for investment companies. These book/tax differences may be either temporary or permanent. Permanent differences are reclassified within the capital accounts based on their federal tax-basis treatment; temporary differences are not reclassified. Key differences include the treatment of short-term capital gains, foreign currency transactions, and wash sale deferrals.
Distributions in excess of net investment income and/or net realized capital gains for tax purposes are reported as distributions of paid-in capital.
For tax purposes, the Funds may designate as net investment income dividends or capital gain distributions the earnings and profits distributed to shareholders on the redemption of fund shares during the year.
Dividends paid by the Funds from net investment income and distribution of net realized short-term capital gains are, for federal income tax purposes, taxable as ordinary income to shareholders.
The tax composition of dividends and distributions to shareholders for the six months ended September 30, 2004 and the year ended March 31, 2004 were as follows:
| Six Months Ended September 30, 2004 | Ordinary Income | Long-Term Capital Gains | Short-Term Capital Gains | ||||||||||||
| GNMA Income Fund | $ | 19,232,900 | $ | - | $ | - | |||||||||
| High Yield Bond Fund | 2,076,911 | - | - | ||||||||||||
| High Yield Opportunity Fund | 6,118,362 | - | - | ||||||||||||
| Intermediate Bond Fund | 6,833,159 | 372,253 | 5,177,702 | ||||||||||||
| National Tax-Exempt Bond Fund | 421,816 | - | - | ||||||||||||
| Classic Money Market Fund | 1,218,619 | - | - | ||||||||||||
| Money Market Fund | 67,181 | - | - | ||||||||||||
| Money Market Trust | 117,926 | - | - | ||||||||||||
| Year Ended March 31, 2004 | Ordinary Income | Tax-Exempt Income | Long-Term Capital Gains | Dividends Paid Deduction on Redemptions | Return of Capital | ||||||||||||||||||
| GNMA Fund | $ | 39,406,147 | $ | - | $ | - | $ | - | $ | - | |||||||||||||
| High Yield Bond Fund | 4,595,062 | - | - | - | - | ||||||||||||||||||
| High Yield Opportunity Fund | 19,716,315 | - | - | - | 1,238,403 | ||||||||||||||||||
| Intermediate Bond Fund | 14,424,000 | - | - | 432,360 | - | ||||||||||||||||||
| National Tax-Exempt Bond Fund | 62,260 | 870,059 | 474,890 | - | - | ||||||||||||||||||
| Classic Money Market Fund | 1,908,765 | - | - | - | - | ||||||||||||||||||
| Money Market Fund | 133,068 | - | - | 42,157 | - | ||||||||||||||||||
| Money Market Trust | 179,988 | - | - | - | - | ||||||||||||||||||
55
NOTES TO FINANCIAL STATEMENTS as of September 30, 2004 (Unaudited) (continued)
NOTE 11 - FEDERAL INCOME TAXES (continued)
The tax-basis components of distributable earnings and the expiration dates of the capital loss carryforwards which may be used to offset future realized capital gains for federal income tax purposes as of March 31, 2004 were as follows:
| Undistributed Ordinary Income | Undistributed Tax-Exempt Income | Undistributed Long-Term Capital Gains | Unrealized Appreciation/ (Depreciation) | Post-October Losses Deferred | Capital Loss Carryforwards | Expiration Dates | |||||||||||||||||||||||||
| GNMA Fund | $ | 3,906,376 | $ | - | $ | - | $ | 34,571,547 | $ | (1,394,075 | ) | $ | (4,473,153 | ) | 2006 | ||||||||||||||||
| (1,688,098 | ) | 2007 | |||||||||||||||||||||||||||||
| (2,870,184 | ) | 2008 | |||||||||||||||||||||||||||||
| (527,639 | ) | 2010 | |||||||||||||||||||||||||||||
| (1,009,937 | ) | 2012 | |||||||||||||||||||||||||||||
| $ | (10,569,011 | ) | |||||||||||||||||||||||||||||
| High Yield Bond Fund | $ | 209,732 | $ | - | $ | - | $ | 3,523,101 | $ | - | $ | (3,445,507 | ) | 2010 | |||||||||||||||||
| (3,079,896 | ) | 2011 | |||||||||||||||||||||||||||||
| $ | (6,525,403 | ) | |||||||||||||||||||||||||||||
| High Yield Opportunity Fund | $ | - | $ | - | $ | - | $ | (14,323,521 | ) | $ | - | $ | (23,109,629 | ) | 2006 | ||||||||||||||||
| (47,276,599 | ) | 2007 | |||||||||||||||||||||||||||||
| (27,206,911 | ) | 2008 | |||||||||||||||||||||||||||||
| (78,500,574 | ) | 2009 | |||||||||||||||||||||||||||||
| (115,139,658 | ) | 2010 | |||||||||||||||||||||||||||||
| (79,792,137 | ) | 2011 | |||||||||||||||||||||||||||||
| (67,125,769 | ) | 2012 | |||||||||||||||||||||||||||||
| $ | (438,151,277 | ) | |||||||||||||||||||||||||||||
| Intermediate Bond Fund | $ | 5,501,924 | $ | - | $ | 370,548 | $ | 5,369,966 | $ | - | $ | - | - | ||||||||||||||||||
| National Tax-Exempt Bond Fund | $ | - | $ | 57,926 | $ | 160,554 | $ | 1,675,277 | $ | - | $ | - | - | ||||||||||||||||||
| Classic Money Market Fund | $ | 227 | $ | - | $ | - | $ | - | $ | - | $ | (35,311 | ) | 2011 | |||||||||||||||||
| (51 | ) | 2012 | |||||||||||||||||||||||||||||
| $ | (35,362 | ) | |||||||||||||||||||||||||||||
| Money Market Fund | $ | 34,888 | $ | - | $ | - | $ | - | $ | - | $ | (1,279 | ) | 2011 | |||||||||||||||||
| (451 | ) | 2012 | |||||||||||||||||||||||||||||
| $ | (1,730 | ) | |||||||||||||||||||||||||||||
| Money Market Trust | $ | 466 | $ | - | $ | - | $ | - | $ | - | $ | (164 | ) | 2011 | |||||||||||||||||
| (436 | ) | 2012 | |||||||||||||||||||||||||||||
| $ | (600 | ) | |||||||||||||||||||||||||||||
NOTE 12 - REORGANIZATIONS
On August 16, 2004, ING Intermediate Bond Fund as listed below ("Acquiring Fund"), acquired the assets and certain liabilities of the ING Bond Fund, also listed below ("Acquired Fund"), in a tax-free reorganization in exchange for shares of the Acquiring Fund, pursuant to a plan of reorganization approved by the Acquired Fund's shareholders. The number and value of shares issued by the Acquiring Fund are presented in Note 9 - Capital Shares. Net assets and unrealized appreciation as of the reorganization dates were as follows:
| Acquiring Fund | Acquired Fund | Total Net Assets of Acquired Fund (000) | Total Net Assets of Acquiring Fund (000) | Acquired Fund Unrealized Appreciation (000) | Conversion Ratio | ||||||||||||||||||
| ING Intermediate Bond Fund | ING Bond Fund | $ | 137,658 | $ | 448,460 | $ | 1,594 | 1.01 | |||||||||||||||
The net assets of the ING Intermediate Bond Fund after the acquisition were approximately $586,118,000.
On June 3, 2004, the Board approved a proposal to reorganize the High Yield Opportunity Fund, the "Disappearing Fund", into the High Yield Bond Fund (the "Reorganization"). The proposed Reorganization is subject to approval by shareholders of the Disappearing Funds. If shareholder approval is obtained, it is expected that the Reorganization would take place during the third quarter of 2004.
56
NOTES TO FINANCIAL STATEMENTS as of September 30, 2004 (Unaudited) (continued)
NOTE 12 - REORGANIZATIONS (continued)
On September 2, 2004, the Board approved a proposal to reorganize the Money Market Fund and Money Market Trust, the "Disappearing Funds", into the Classic Money Market Fund (the "Reorganization"). The proposed Reorganization is subject to approval by shareholders of the Disappearing Funds. If shareholder approval is obtained, it is expected that the Reorganization would take place during the first quarter of 2005.
NOTE 13 - ILLIQUID SECURITIES
Pursuant to guidelines adopted by the Funds' Board of Trustees, the following securities have been deemed to be illiquid. The Funds currently limit investment in illiquid securities to 15% (10% for Classic Money Market Fund and Money Market Fund and 5% for Money Market Trust) of the Fund's net assets, at market value, at time of purchase.
| Fund | Security | Principal Amount/ Shares | Initial Acquisition Date | Cost | Value | Percent of Net Assets | |||||||||||||||||||||
| High Yield Bond Fund | GT Group Telecom, Inc. | 500 | 3/19/03 | $ | - | $ | - | 0.00 | % | ||||||||||||||||||
| O Sullivan Industries, Inc. | 373 | 3/19/03 | - | - | 0.00 | % | |||||||||||||||||||||
| O Sullivan Industries, Inc. | 1,000 | 3/19/03 | - | - | 0.00 | % | |||||||||||||||||||||
| $ | - | $ | - | 0.00 | % | ||||||||||||||||||||||
| High Yield Opportunity Fund | Adelphia Business Solutions | 61,806 | 7/20/00 | $ | - | $ | 6 | 0.00 | % | ||||||||||||||||||
| Comforce Corp. | 92,950 | 12/23/98 | - | 930 | 0.00 | % | |||||||||||||||||||||
| Dayton Superior Corp. | 3,100 | 8/10/00 | - | 31 | 0.00 | % | |||||||||||||||||||||
| ICG Communications, Inc. | 6,600 | 8/3/95 | - | 1 | 0.00 | % | |||||||||||||||||||||
| ICG Services, Inc., 0.000%, due 02/15/08 | 3,600,000 | 3/6/00 | 3,200,065 | 4 | 0.00 | % | |||||||||||||||||||||
| Intl. Utility Structures, Inc., 0.000%, due 02/01/08 | 2,456,000 | 8/1/01 | 1,154,358 | 2 | 0.00 | % | |||||||||||||||||||||
| Intl. Wireless Communications Holdings, Inc. | 483,445 | 8/9/96 | 8,404,221 | 48 | 0.00 | % | |||||||||||||||||||||
| Jordan Telecommunications | 2,350 | 1/31/00 | - | 65,511 | 0.02 | % | |||||||||||||||||||||
| North Atlantic Trading Co. | 17,906 | 3/23/04 | 210,182 | 18 | 0.00 | % | |||||||||||||||||||||
| Russell-Stanley Holdings, Inc. | 100,000 | 11/28/00 | 346,704 | 10 | 0.00 | % | |||||||||||||||||||||
| Source Media, Inc., 0.000%, due 11/01/04 | 623,056 | 7/25/03 | - | 1 | 0.00 | % | |||||||||||||||||||||
| WinStar Communications, Inc., 0.000%, due 04/15/10 | 6,250,000 | 1/12/01 | 4,337,809 | 625 | 0.00 | % | |||||||||||||||||||||
| $ | 25,920,788 | $ | 184,585 | 0.06 | % | ||||||||||||||||||||||
| Intermediate Bond Fund | Apine III, 2.261%, due 08/16/14 | 434,000 | 8/04/04 | $ | 434,000 | $ | 434,000 | 0.07 | % | ||||||||||||||||||
| Apine III, 2.661%, due 08/16/15 | 434,000 | 8/04/04 | 434,000 | 434,000 | 0.07 | % | |||||||||||||||||||||
| Apine III, 4.461%, due 08/16/16 | 276,000 | 8/04/04 | 276,000 | 276,000 | 0.05 | % | |||||||||||||||||||||
| Apine III, 7.711%, due 08/16/17 | 669,000 | 8/16/04 | 669,000 | 669,000 | 0.11 | % | |||||||||||||||||||||
| $ | 1,813,000 | $ | 1,813,000 | 0.30 | % | ||||||||||||||||||||||
| Classic Money Market Fund | Goldman Sachs Group, Inc., 1.280%, due 10/27/04 | 4,100,000 | 1/28/04 | $ | 4,100,000 | $ | 4,100,000 | 0.96 | % | ||||||||||||||||||
| Money Market Trust Series A, 1.835%, due 10/07/05 | 9,200,000 | 3/12/03 | 9,200,000 | 9,200,000 | 2.15 | % | |||||||||||||||||||||
| Newcastle CDO I Ltd., 1.870%, due 09/24/38 | 4,500,000 | 10/23/03 | 4,500,000 | 4,500,000 | 1.05 | % | |||||||||||||||||||||
| $ | 17,800,000 | $ | 17,800,000 | 4.16 | % | ||||||||||||||||||||||
| Money Market Fund | Goldman Sachs Group, Inc., 1.280%, due 10/27/04 | 600,000 | 1/28/04 | $ | 300,000 | $ | 300,000 | 0.70 | % | ||||||||||||||||||
| Money Market Trust Series A, 1.835%, due 10/07/05 | 1,300,000 | 9/24/03 | 1,300,000 | 1,300,000 | 3.02 | % | |||||||||||||||||||||
| Newcastle CDO I Ltd., 1.870%, due 09/24/38 | 600,000 | 10/23/03 | 600,000 | 600,000 | 1.39 | % | |||||||||||||||||||||
| $ | 2,200,000 | $ | 2,200,000 | 5.12 | % | ||||||||||||||||||||||
| Money Market Trust | Goldman Sachs Group, Inc., 1.280%, due 10/27/04 | 300,000 | 1/28/04 | $ | 300,000 | $ | 300,000 | 0.70 | % | ||||||||||||||||||
| Money Market Trust Series A, 1.835%, due 10/07/05 | 1,000,000 | 4/30/03 | 1,000,000 | 1,000,000 | 2.33 | % | |||||||||||||||||||||
| Newcastle CDO I Ltd., 1.870%, due 09/24/38 | 300,000 | 10/23/03 | 300,000 | 300,000 | 0.70 | % | |||||||||||||||||||||
| $ | 1,600,000 | $ | 1,600,000 | 3.72 | % | ||||||||||||||||||||||
NOTE 14 - SECURITIES LENDING
Under an agreement with The Bank of New York ("BNY"), the Funds (except GNMA Fund) can lend their securities to approved brokers, dealers and other financial institutions. Loans are collateralized by cash and U.S. Government securities. The collateral must be in an amount equal to at least 105% of the market value of non-U.S. securities loaned and 102% of the market value of U.S. securities loaned. The cash collateral received is invested in approved investments as defined in the Securities Lending Agreement with BNY (the "Agreement").
57
NOTES TO FINANCIAL STATEMENTS as of September 30, 2004 (Unaudited) (continued)
NOTE 14 - SECURITIES LENDING (continued)
The securities purchased with cash collateral received are reflected in the Portfolio of Investments. Generally, in the event of counterparty default, the Funds have the right to use the collateral to offset losses incurred. The Agreement contains certain guarantees by BNY in the event of counterparty default and/or a borrower's failure to return a loaned security; however, there would be a potential loss to the Funds in the event the Funds are delayed or prevented from exercising their right to dispose of the collateral. The Funds bear the risk of loss with respect to the investment of collateral. Engaging in securities lending could have a leveraging effect, which may intensify the credit, market and other risks associated with investing in a Fund. At September 30, 2004, the following Funds had securities on loan with the following market values:
| Portfolio | Value of Securities Loaned | Value of Collateral | |||||||||
| High Yield Bond Fund | $ | 13,534,319 | $ | 13,189,322 | |||||||
| High Yield Opportunity Fund | 52,503,115 | 53,825,247 | |||||||||
| Intermediate Bond Fund | 71,399,389 | 73,409,156 | |||||||||
NOTE 15 - SUBSEQUENT EVENTS
Dividends. Subsequent to September 30, 2004 the following Funds declared dividends from net investment income of:
| Per Share Amount | Payable Date | Record Date | |||||||||||||
| GNMA Income Fund | |||||||||||||||
| Class A | $ | 0.0375 | October 5, 2004 | September 30, 2004 | |||||||||||
| Class B | $ | 0.0321 | October 5, 2004 | September 30, 2004 | |||||||||||
| Class C | $ | 0.0320 | October 5, 2004 | September 30, 2004 | |||||||||||
| Class I | $ | 0.0396 | October 5, 2004 | September 30, 2004 | |||||||||||
| Class M | $ | 0.0338 | October 5, 2004 | September 30, 2004 | |||||||||||
| Class Q | $ | 0.0377 | October 5, 2004 | September 30, 2004 | |||||||||||
| Class A | $ | 0.0375 | November 3, 2004 | October 29, 2004 | |||||||||||
| Class B | $ | 0.0320 | November 3, 2004 | October 29, 2004 | |||||||||||
| Class C | $ | 0.0319 | November 3, 2004 | October 29, 2004 | |||||||||||
| Class I | $ | 0.0397 | November 3, 2004 | October 29, 2004 | |||||||||||
| Class M | $ | 0.0337 | November 3, 2004 | October 29, 2004 | |||||||||||
| Class Q | $ | 0.0358 | November 3, 2004 | October 29, 2004 | |||||||||||
| Per Share Amount | Payable Date | Record Date | |||||||||||||
| High Yield Bond Fund | |||||||||||||||
| Class A | $ | 0.0401 | November 1, 2004 | Daily | |||||||||||
| Class B | $ | 0.0344 | November 1, 2004 | Daily | |||||||||||
| Class C | $ | 0.0346 | November 1, 2004 | Daily | |||||||||||
| Intermediate Bond Fund | |||||||||||||||
| Class A | $ | 0.0291 | November 1, 2004 | Daily | |||||||||||
| Class B | $ | 0.0223 | November 1, 2004 | Daily | |||||||||||
| Class C | $ | 0.0224 | November 1, 2004 | Daily | |||||||||||
| Class I | $ | 0.0318 | November 1, 2004 | Daily | |||||||||||
| Class O | $ | 0.0293 | November 1, 2004 | Daily | |||||||||||
| Class R | $ | 0.0275 | November 1, 2004 | Daily | |||||||||||
| National Tax-Exempt Bond Fund | |||||||||||||||
| Class A | $ | 0.0238 | November 1, 2004 | Daily | |||||||||||
| Class B | $ | 0.0172 | November 1, 2004 | Daily | |||||||||||
| Class C | $ | 0.0179 | November 1, 2004 | Daily | |||||||||||
| Classic Money Market Fund | |||||||||||||||
| Class A | $ | 0.0009 | November 1, 2004 | Daily | |||||||||||
| Class B | $ | 0.0003 | November 1, 2004 | Daily | |||||||||||
| Class C | $ | 0.0003 | November 1, 2004 | Daily | |||||||||||
| Money Market Fund | |||||||||||||||
| Class A | $ | 0.0007 | November 1, 2004 | Daily | |||||||||||
| Class B | $ | 0.0000 | November 1, 2004 | Daily | |||||||||||
| Class C | $ | 0.0000 | November 1, 2004 | Daily | |||||||||||
| Money Market Trust | |||||||||||||||
| Class A | $ | 0.0009 | November 1, 2004 | Daily | |||||||||||
On October 7, 2004, the shareholders of ING High Yield Opportunity Fund approved the reorganization with and merger into the ING High Yield Bond Fund. The reorganization was completed on October 25, 2004. Accordingly, the ING High Yield Opportunity Fund is no longer offering its shares.
58
PORTFOLIO OF INVESTMENTS
ING GNMA INCOME FUND as of September 30, 2004 (Unaudited)
| Principal Amount | | Value | |||||||||
| U.S. GOVERNMENT AGENCY OBLIGATIONS: 88.1% | |||||||||||
| Federal Home Loan Mortgage Corporation: 0.2% | |||||||||||
| $ | 259,261 | 7.000%, due 11/01/14 | $ | 275,076 | |||||||
| 817,102 | 7.500%, due 12/01/14 | 869,056 | |||||||||
| 231,184 | 7.500%, due 01/01/30 | 248,292 | |||||||||
| 237,720 | 8.000%, due 01/01/30 | 258,759 | |||||||||
| 1,651,183 | |||||||||||
| Federal National Mortgage Association: 0.2% | |||||||||||
| 171,891 | 6.500%, due 06/01/14 | 182,277 | |||||||||
| 226,527 | 7.000%, due 03/01/15 | 240,514 | |||||||||
| 302,319 | 7.500%, due 05/01/28 | 324,214 | |||||||||
| 320,721 | 8.500%, due 08/01/11 | 342,994 | |||||||||
| 93,748 | 8.500%, due 05/01/15 | 101,147 | |||||||||
| 70,547 | 8.500%, due 08/01/15 | 76,115 | |||||||||
| 305,772 | 8.500%, due 09/01/15 | 329,903 | |||||||||
| 1,597,164 | |||||||||||
| Government National Mortgage Association: 87.7% | |||||||||||
| 9,844,313 | 3.750%, due 05/20/34 | 9,778,016 | |||||||||
| 39,148,386 | 5.000%, due 05/15/33-04/15/34 | 39,058,129 | |||||||||
| 134,352,100 | 5.500%, due 04/20/29-08/20/34 | 136,952,578 | |||||||||
| 544,076 | 5.650%, due 07/15/29 | 568,704 | |||||||||
| 132,662,694 | 6.000%, due 07/15/28-07/20/34 | 137,779,576 | |||||||||
| 925,550 | 6.250%, due 04/15/26-04/15/28 | 972,648 | |||||||||
| 133,209 | 6.340%, due 02/15/29 | 127,985 | |||||||||
| 5,771,548 | 6.400%, due 10/15/33-08/15/38 | 6,014,458 | |||||||||
| 1,157,729 | 6.470%, due 09/15/33 | 1,209,086 | |||||||||
| 32,114,571 | 6.500%, due 02/15/22-02/15/40 | 34,260,618 | |||||||||
| 14,455,015 | 6.625%, due 01/15/34-01/15/40 | 15,817,663 | |||||||||
| 4,078,970 | 6.650%, due 10/15/14-09/15/32 | 4,396,547 | |||||||||
| 3,503,816 | 6.670%, due 01/15/40 | 3,890,918 | |||||||||
| 6,172,541 | 6.687%, due 07/15/40 | 6,914,837 | |||||||||
| 272,207 | 6.700%, due 12/15/14 | 280,782 | |||||||||
| 4,292,083 | 6.745%, due 10/15/39 | 4,729,524 | |||||||||
| 12,812,893 | 6.750%, due 06/15/13-01/15/41 | 14,120,611 | |||||||||
| 2,836,308 | 6.810%, due 07/15/39 | 3,165,792 | |||||||||
| 4,045,857 | 6.820%, due 05/15/27-04/15/34 | 4,327,377 | |||||||||
| 9,789,391 | 6.840%, due 10/15/36 | 11,088,762 | |||||||||
| 1,795,177 | 6.870%, due 03/15/39 | 2,012,774 | |||||||||
| 3,254,808 | 6.875%, due 02/15/40 | 3,647,164 | |||||||||
| 2,161,133 | 6.900%, due 01/15/32 | 2,454,448 | |||||||||
| 2,866,007 | 6.950%, due 12/15/29 | 2,969,166 | |||||||||
| 58,097,023 | 7.000%, due 07/15/22-12/15/35 | 61,958,597 | |||||||||
| 8,933,730 | 7.010%, due 02/15/37 | 10,186,524 | |||||||||
| 5,537,732 | 7.100%, due 11/15/39 | 6,313,992 | |||||||||
| 8,914,777 | 7.125%, due 09/15/39 | 10,064,357 | |||||||||
| 3,326,807 | 7.150%, due 07/15/36 | 3,804,289 | |||||||||
| 3,672,609 | 7.250%, due 08/15/22-09/15/31 | 3,952,094 | |||||||||
| 2,939,899 | 7.300%, due 08/15/36 | 3,313,268 | |||||||||
| 4,741,764 | 7.500%, due 12/15/19-09/15/32 | 5,099,004 | |||||||||
| 4,991,230 | 7.600%, due 08/15/31 | 5,585,798 | |||||||||
| 9,407,739 | 7.625%, due 07/15/38 | 10,135,285 | |||||||||
| 74,403 | 7.650%, due 12/15/12 | 77,670 | |||||||||
| 460,757 | 7.700%, due 08/15/13 | 481,936 | |||||||||
| 9,374,118 | 7.750%, due 06/15/14-12/15/35 | 10,237,856 | |||||||||
| 1,038,351 | 7.800%, due 05/15/19-01/15/42 | 1,170,629 | |||||||||
| 9,808,372 | 7.875%, due 09/15/29-04/15/38 | 10,473,704 | |||||||||
| 11,459,430 | 8.000%, due 12/15/14-11/15/38 | 12,473,234 | |||||||||
| 129,987 | 8.050%, due 07/15/19-04/15/21 | 142,651 | |||||||||
| 1,252,488 | 8.100%, due 06/15/12-07/15/12 | 1,316,093 | |||||||||
| Principal Amount | | Value | |||||||||
| $ | 4,968,928 | 8.125%, due 05/15/38 | $ | 5,489,671 | |||||||
| 4,934,413 | 8.150%, due 12/15/11-09/15/15 | 5,200,630 | |||||||||
| 5,187,323 | 8.200%, due 10/15/11-05/15/13 | 5,418,439 | |||||||||
| 2,037,798 | 8.250%, due 10/15/24-03/15/41 | 2,249,326 | |||||||||
| 6,947,665 | 8.500%, due 12/15/29-10/15/31 | 7,479,848 | |||||||||
| 117,096 | 8.750%, due 10/15/23-06/15/27 | 118,426 | |||||||||
| 2,814,818 | 9.000%, due 05/15/20-12/15/34 | 2,897,319 | |||||||||
| 1,366,073 | 9.250%, due 06/15/30 | 1,459,764 | |||||||||
| 972,291 | 10.250%, due 08/15/29 | 1,063,950 | |||||||||
| 634,702,517 | |||||||||||
| Total U.S. Government Agency Obligations (Cost $615,601,535) | 637,950,864 | ||||||||||
| U.S. TREASURY OBLIGATIONS: 6.4% | |||||||||||
| U.S. Treasury Notes: 6.4% | |||||||||||
| 47,000,000 | 1.500%, due 03/31/06 | 46,401,502 | |||||||||
| Total U.S. Treasury Obligations (Cost $46,578,131) | 46,401,502 | ||||||||||
| Total Long-Term Investments (Cost $662,179,666) | 684,352,366 | ||||||||||
| SHORT-TERM INVESTMENTS: 4.8% | |||||||||||||||
| U.S. Treasury Bills: 4.8% | |||||||||||||||
| 34,500,000 | 1.560%, due 12/02/04 | 34,406,057 | |||||||||||||
| Total Short-Term Investments (Cost $34,406,819) | 34,406,057 | ||||||||||||||
| Total Investments in Securities (Cost $696,586,485)* | 99.3 | % | $718,758,423 | ||||||||||||
| Other Assets and Liabilities-Net | 0.7 | % | 4,832,180 | ||||||||||||
| Net Assets | 100.0 | % | $ | 723,590,603 | |||||||||||
Government National Mortgage Association ("GNMA") manages a program of Mortgage-backed securities in order to attract funds for secondary mortgages and provide liquidity for existing mortgage securities. GNMA is a quasi-government agency.
Federal Home Loan Mortgage Corporation ("FHLMC") purchase mortgages from a mortgage originator and holds them as investments in its portfolio, or securitizes them. FHLMC is a private corporation.
* Cost for federal income tax purposes is the same as for financial statement purposes. Net unrealized appreciation consists of:
| Gross Unrealized Appreciation | $ | 26,393,117 | |||||
| Gross Unrealized Depreciation | (4,221,179 | ) | |||||
| Net Unrealized Appreciation | $ | 22,171,938 | |||||
See Accompanying Notes to Financial Statements
59
PORTFOLIO OF INVESTMENTS
ING HIGH YIELD BOND FUND as of September 30, 2004 (Unaudited)
| Principal Amount | Value | ||||||||||||||
| CORPORATE BONDS/NOTES: 94.8% | |||||||||||||||
| Advertising: 0.6% | |||||||||||||||
| $ | 105,000 | RH Donnelley Finance Corp., 8.875%, due 12/15/10 | $ | 119,175 | |||||||||||
| 160,000 | Vertis, Inc., 9.750%, due 04/01/09 | 172,800 | |||||||||||||
| 75,000 | L | Vertis, Inc., 10.875%, due 06/15/09 | 81,000 | ||||||||||||
| 70,000 | # | Vertis, Inc., 13.500%, due 12/07/09 | 70,350 | ||||||||||||
| 443,325 | |||||||||||||||
| Aerospace/Defense: 1.2% | |||||||||||||||
| 190,000 | DRS Technologies, Inc., 6.875%, due 11/01/13 | 198,550 | |||||||||||||
| 140,000 | L-3 Communications Corp., 6.125%, due 07/15/13 | 142,450 | |||||||||||||
| 270,000 | L-3 Communications Corp., 7.625%, due 06/15/12 | 298,350 | |||||||||||||
| 215,000 | Sequa Corp., 9.000%, due 08/01/09 | 237,575 | |||||||||||||
| 876,925 | |||||||||||||||
| Apparel: 0.9% | |||||||||||||||
| 300,000 | Phillips-Van Heusen, 8.125%, due 05/01/13 | 322,500 | |||||||||||||
| 315,000 | Russell Corp., 9.250%, due 05/01/10 | 343,350 | |||||||||||||
| 665,850 | |||||||||||||||
| Auto Parts and Equipment: 1.8% | |||||||||||||||
| 205,000 | ArvinMeritor, Inc., 6.625%, due 06/15/07 | 214,738 | |||||||||||||
| 60,000 | Dana Corp., 9.000%, due 08/15/11 | 72,750 | |||||||||||||
| 145,000 | Dana Corp., 10.125%, due 03/15/10 | 165,300 | |||||||||||||
| 5,000 | Eagle-Picher Industries, Inc., 9.750%, due 09/01/13 | 5,125 | |||||||||||||
| 170,000 | Rexnord Corp., 10.125%, due 12/15/12 | 192,950 | |||||||||||||
| 235,000 | L | Tenneco Automotive, Inc., 10.250%, due 07/15/13 | 269,075 | ||||||||||||
| 301,000 | TRW Automotive, Inc., 11.000%, due 02/15/13 | 359,695 | |||||||||||||
| 1,279,633 | |||||||||||||||
| Building Materials: 0.5% | |||||||||||||||
| 100,000 | # | Ply Gem Industries, Inc., 9.000%, due 02/15/12 | 100,250 | ||||||||||||
| 135,000 | # | THL Buildco, Inc., 8.500%, due 09/01/14 | 142,088 | ||||||||||||
| 100,000 | US Concrete, Inc., 8.375%, due 04/01/14 | 105,000 | |||||||||||||
| 347,338 | |||||||||||||||
| Chemicals: 4.6% | |||||||||||||||
| 215,000 | Equistar Funding Corp., 10.625%, due 05/01/11 | 246,175 | |||||||||||||
| 370,000 | IMC Global, Inc., 10.875%, due 06/01/08 | 450,475 | |||||||||||||
| 710,000 | L | Lyondell Chemical Co., 9.625%, due 05/01/07 | 776,563 | ||||||||||||
| Principal Amount | Value | ||||||||||||||
| $ | 730,000 | Nalco Co., 7.750%, due 11/15/11 | $ | 777,450 | |||||||||||
| 590,000 | L | PolyOne Corp., 8.875%, due 05/01/12 | 604,750 | ||||||||||||
| 470,000 | Rockwood Specialties Group, Inc., 10.625%, due 05/15/11 | 519,350 | |||||||||||||
| 3,374,763 | |||||||||||||||
| Commercial Services: 0.8% | |||||||||||||||
| 350,000 | Corrections Corp. of America, 7.500%, due 05/01/11 | 371,437 | |||||||||||||
| 245,000 | United Rentals North America, Inc., 6.500%, due 02/15/12 | 237,038 | |||||||||||||
| 608,475 | |||||||||||||||
| Distribution/Wholesale: 0.5% | |||||||||||||||
| 325,000 | Aviall, Inc., 7.625%, due 07/01/11 | 352,625 | |||||||||||||
| 352,625 | |||||||||||||||
| Diversified Financial Services: 6.3% | |||||||||||||||
| 420,000 | @@,# | BCP Caylux Holdings Luxembourg SCA, 9.625%, due 06/15/14 | 455,700 | ||||||||||||
| 320,000 | Bluewater Finance Ltd., 10.250%, due 02/15/12 | 348,800 | |||||||||||||
| 280,000 | #,L | Crystal US Holdings 3 LLC, 5.310%, due 10/01/14 | 168,700 | ||||||||||||
| 1,040,000 | #,L | Dow Jones CDX NA HY, 8.000%, due 12/29/09 | 1,043,249 | ||||||||||||
| 240,000 | # | Global Cash Finance Corp., 8.750%, due 03/15/12 | 255,600 | ||||||||||||
| 586,796 | # | Hollinger Participation Trust, 0.000%, due 11/15/10 | 673,348 | ||||||||||||
| 320,000 | L | Nexstar Finance, Inc., 12.000%, due 04/01/08 | 353,600 | ||||||||||||
| 305,000 | # | PanAmSat Holding Corp., 5.320%, due 11/01/14 | 179,569 | ||||||||||||
| 230,000 | # | Rainbow National Services LLC, 8.750%, due 09/01/12 | 239,775 | ||||||||||||
| 210,000 | # | Rainbow National Services LLC, 10.375%, due 09/01/14 | 221,025 | ||||||||||||
| 240,000 | Universal City Development Partners, 11.750%, due 04/01/10 | 280,800 | |||||||||||||
| 345,000 | # | Vanguard Health Holding Co II LLC, 9.000%, due 10/01/14 | 347,588 | ||||||||||||
| 4,567,754 | |||||||||||||||
| Electric: 6.4% | |||||||||||||||
| 375,000 | #,L | AES Corp., 8.750%, due 05/15/13 | 424,688 | ||||||||||||
| 365,000 | AES Corp., 8.875%, due 02/15/11 | 407,888 | |||||||||||||
| 395,000 | # | Allegheny Energy Supply Statutory Trust 2001, 10.250%, due 11/15/07 | 454,250 | ||||||||||||
| 15,000 | # | Allegheny Energy Supply Statutory Trust 2001, 13.000%, due 11/15/07 | 15,825 | ||||||||||||
| 200,000 | #,L | Calpine Corp., 8.750%, due 07/15/13 | 152,000 | ||||||||||||
| 214,882 | Homer City Funding LLC, 8.734%, due 10/01/26 | 241,742 | |||||||||||||
See Accompanying Notes to Financial Statements
60
PORTFOLIO OF INVESTMENTS
ING HIGH YIELD BOND FUND as of September 30, 2004 (Unaudited) (continued)
| Principal Amount | Value | ||||||||||||||
| Electric (continued) | |||||||||||||||
| $ | 100,000 | Illinois Power Co., 7.500%, due 07/15/25 | $ | 103,000 | |||||||||||
| 250,000 | Illinois Power Co., 11.500%, due 12/15/10 | 297,500 | |||||||||||||
| 835,000 | Midwest Generation LLC, 8.300%, due 07/02/09 | 877,271 | |||||||||||||
| 695,000 | Nevada Power Co., 10.875%, due 10/15/09 | 808,805 | |||||||||||||
| 340,000 | # | NRG Energy, Inc., 8.000%, due 12/15/13 | 365,925 | ||||||||||||
| 370,000 | L | Reliant Energy, Inc., 9.250%, due 07/15/10 | 399,138 | ||||||||||||
| 75,000 | TECO Energy, Inc., 7.500%, due 06/15/10 | 81,375 | |||||||||||||
| 4,629,407 | |||||||||||||||
| Electrical Components and Equipment: 0.2% | |||||||||||||||
| 110,000 | @@ | FIMEP SA, 10.500%, due 02/15/13 | 129,250 | ||||||||||||
| 129,250 | |||||||||||||||
| Electronics: 0.7% | |||||||||||||||
| 300,000 | Fisher Scientific Intl., 8.000%, due 09/01/13 | 337,500 | |||||||||||||
| 85,000 | Sanmina-SCI Corp., 10.375%, due 01/15/10 | 97,644 | |||||||||||||
| 90,000 | Stoneridge, Inc., 11.500%, due 05/01/12 | 102,375 | |||||||||||||
| 537,519 | |||||||||||||||
| Entertainment: 2.6% | |||||||||||||||
| 530,000 | # | American Casino & Entertainment Properties LLC, 7.850%, due 02/01/12 | 559,149 | ||||||||||||
| 220,000 | Argosy Gaming Co., 9.000%, due 09/01/11 | 248,050 | |||||||||||||
| 205,000 | Carmike Cinemas, Inc., 7.500%, due 02/15/14 | 208,588 | |||||||||||||
| 250,000 | L | Cinemark USA, Inc., 9.000%, due 02/01/13 | 280,625 | ||||||||||||
| 165,000 | # | LCE Acquisition Corp., 9.000%, due 08/01/14 | 171,188 | ||||||||||||
| 140,000 | #,L | Marquee, Inc., 8.625%, due 08/15/12 | 149,100 | ||||||||||||
| 245,000 | # | Warner Music Group, 7.375%, due 04/15/14 | 254,800 | ||||||||||||
| 1,871,500 | |||||||||||||||
| Environmental Control: 1.6% | |||||||||||||||
| 1,075,000 | Allied Waste North America, 8.500%, due 12/01/08 | 1,171,750 | |||||||||||||
| 1,171,750 | |||||||||||||||
| Food: 4.1% | |||||||||||||||
| 370,000 | Del Monte Corp., 8.625%, due 12/15/12 | 413,475 | |||||||||||||
| 445,000 | Delhaize America, Inc., 8.125%, due 04/15/11 | 510,426 | |||||||||||||
| 335,000 | Dole Food Co., 8.625%, due 05/01/09 | 366,825 | |||||||||||||
| 545,000 | # | Land O' Lakes, Inc., 9.000%, due 12/15/10 | 570,206 | ||||||||||||
| Principal Amount | Value | ||||||||||||||
| $ | 210,000 | Roundy's Inc., 8.875%, due 06/15/12 | $ | 227,325 | |||||||||||
| 320,000 | Smithfield Foods, Inc., 7.750%, due 05/15/13 | 348,800 | |||||||||||||
| 350,000 | Swift & Co., 10.125%, due 10/01/09 | 385,875 | |||||||||||||
| 150,000 | Swift & Co., 12.500%, due 01/01/10 | 166,500 | |||||||||||||
| 2,989,432 | |||||||||||||||
| Forest Products and Paper: 4.1% | |||||||||||||||
| 660,000 | Abitibi-Consolidated Finance LP, 7.875%, due 08/01/09 | 691,350 | |||||||||||||
| 560,000 | # | Appleton Papers, Inc., 8.125%, due 06/15/11 | 579,600 | ||||||||||||
| 435,000 | L | Georgia-Pacific Corp., 8.125%, due 05/15/11 | 504,600 | ||||||||||||
| 180,000 | Georgia-Pacific Corp., 8.875%, due 02/01/10 | 211,500 | |||||||||||||
| 275,000 | Georgia-Pacific Corp., 9.375%, due 02/01/13 | 325,188 | |||||||||||||
| 255,000 | @@ | Millar Western Forest Products Ltd., 7.750%, due 11/15/13 | 269,025 | ||||||||||||
| 350,000 | @@ | Norske Skog Canada Ltd., 7.375%, due 03/01/14 | 367,500 | ||||||||||||
| 2,948,763 | |||||||||||||||
| Healthcare-Products: 0.6% | |||||||||||||||
| 60,000 | # | Medical Device Manufacturing, 10.000%, due 07/15/12 | 63,900 | ||||||||||||
| 375,000 | # | VWR Intl., Inc., 8.000%, due 04/15/14 | 398,438 | ||||||||||||
| 462,338 | |||||||||||||||
| Healthcare-Services: 2.5% | |||||||||||||||
| 200,000 | # | Beverly Enterprises, Inc., 7.875%, due 06/15/14 | 215,000 | ||||||||||||
| 515,000 | Genesis HealthCare Corp, 8.000%, due 10/15/13 | 563,926 | |||||||||||||
| 430,000 | HCA, Inc., 7.875%, due 02/01/11 | 486,907 | |||||||||||||
| 450,000 | HCA, Inc., 8.750%, due 09/01/10 | 528,106 | |||||||||||||
| 1,793,939 | |||||||||||||||
| Home Builders: 2.5% | |||||||||||||||
| 155,000 | DR Horton, Inc., 7.875%, due 08/15/11 | 179,994 | |||||||||||||
| 225,000 | # | KB Home, 6.375%, due 08/15/11 | 237,375 | ||||||||||||
| 175,000 | Meritage Corp., 9.750%, due 06/01/11 | 197,313 | |||||||||||||
| 445,000 | Technical Olympic USA, Inc., 9.000%, due 07/01/10 | 489,499 | |||||||||||||
| 95,000 | Technical Olympic USA, Inc., 10.375%, due 07/01/12 | 106,875 | |||||||||||||
| 250,000 | WCI Communities, Inc., 10.625%, due 02/15/11 | 283,125 | |||||||||||||
| 130,000 | William Lyon Homes, Inc., 7.500%, due 02/15/14 | 133,250 | |||||||||||||
| 145,000 | William Lyon Homes, Inc., 10.750%, due 04/01/13 | 168,200 | |||||||||||||
| 1,795,631 | |||||||||||||||
See Accompanying Notes to Financial Statements
61
PORTFOLIO OF INVESTMENTS
ING HIGH YIELD BOND FUND as of September 30, 2004 (Unaudited) (continued)
| Principal Amount | Value | ||||||||||||||
| Home Furnishings: 0.4% | |||||||||||||||
| $ | 260,000 | # | Norcraft Finance Corp., 9.000%, due 11/01/11 | $ | 284,700 | ||||||||||
| 50,000 | #,L | Norcraft Holdings LP, 4.010%, due 09/01/12 | 36,500 | ||||||||||||
| 321,200 | |||||||||||||||
| Household Products/Wares: 0.6% | |||||||||||||||
| 385,000 | #,L | American Achievement Corp., 8.250%, due 04/01/12 | 406,175 | ||||||||||||
| 406,175 | |||||||||||||||
| Iron/Steel: 1.3% | |||||||||||||||
| 530,000 | L | AK Steel Corp., 7.875%, due 02/15/09 | 528,675 | ||||||||||||
| 330,000 | United States Steel Corp., 9.750%, due 05/15/10 | 379,500 | |||||||||||||
| 908,175 | |||||||||||||||
| Leisure Time: 1.3% | |||||||||||||||
| 270,000 | # | NCL Corp., 10.625%, due 07/15/14 | 284,175 | ||||||||||||
| 165,000 | Royal Caribbean Cruises Ltd., 7.500%, due 10/15/27 | 172,425 | |||||||||||||
| 435,000 | Royal Caribbean Cruises Ltd., 8.000%, due 05/15/10 | 492,094 | |||||||||||||
| 948,694 | |||||||||||||||
| Lodging: 6.7% | |||||||||||||||
| 540,000 | Ameristar Casinos, Inc., 10.750%, due 02/15/09 | 615,599 | |||||||||||||
| 100,000 | Aztar Corp., 9.000%, due 08/15/11 | 111,250 | |||||||||||||
| 325,000 | Caesars Entertainment, Inc., 9.375%, due 02/15/07 | 363,188 | |||||||||||||
| 490,000 | Harrah's Operating Co., Inc., 8.000%, due 02/01/11 | 569,485 | |||||||||||||
| 460,000 | L | Hilton Hotels Corp., 7.625%, due 12/01/12 | 537,050 | ||||||||||||
| 255,000 | L | John Q Hammons Hotels LP, 8.875%, due 05/15/12 | 285,600 | ||||||||||||
| 50,000 | L | Mandalay Resort Group, 6.500%, due 07/31/09 | 52,125 | ||||||||||||
| 290,000 | Mandalay Resort Group, 9.500%, due 08/01/08 | 334,950 | |||||||||||||
| 220,000 | L | MGM Mirage, 8.375%, due 02/01/11 | 243,925 | ||||||||||||
| 385,000 | L | MGM Mirage, 8.500%, due 09/15/10 | 439,381 | ||||||||||||
| 250,000 | MGM Mirage, 9.750%, due 06/01/07 | 279,063 | |||||||||||||
| 135,000 | L | Station Casinos, Inc., 6.000%, due 04/01/12 | 139,050 | ||||||||||||
| 190,000 | L | Station Casinos, Inc., 6.500%, due 02/01/14 | 194,275 | ||||||||||||
| 290,000 | Venetian Casino Resort LLC, 11.000%, due 06/15/10 | 337,125 | |||||||||||||
| 275,000 | L | Wynn Las Vegas Capital Corp., 12.000%, due 11/01/10 | 345,125 | ||||||||||||
| 4,847,191 | |||||||||||||||
| Principal Amount | Value | ||||||||||||||
| Machinery-Construction and Mining: 0.5% | |||||||||||||||
| $ | 335,000 | Terex Corp., 7.375%, due 01/15/14 | $ | 353,425 | |||||||||||
| 353,425 | |||||||||||||||
| Machinery-Diversified: 0.3% | |||||||||||||||
| 180,000 | L | Cummins, Inc., 9.500%, due 12/01/10 | 208,800 | ||||||||||||
| 208,800 | |||||||||||||||
| Media: 10.3% | |||||||||||||||
| 110,000 | American Media Operation, Inc., 10.250%, due 05/01/09 | 116,325 | |||||||||||||
| 175,000 | Block Communications, Inc., 9.250%, due 04/15/09 | 185,938 | |||||||||||||
| 70,000 | @@ | CanWest Media, Inc., 7.625%, due 04/15/13 | 75,600 | ||||||||||||
| 245,000 | @@ | CanWest Media, Inc., 10.625%, due 05/15/11 | 279,913 | ||||||||||||
| 195,000 | Charter Communications Holdings Capital Corp., 9.625%, due 11/15/09 | 154,538 | |||||||||||||
| 350,000 | # | Charter Communications Operating Capital Corp., 8.000%, due 04/30/12 | 350,874 | ||||||||||||
| 235,000 | CSC Holdings, Inc., 7.625%, due 04/01/11 | 248,806 | |||||||||||||
| 325,000 | CSC Holdings, Inc., 7.875%, due 12/15/07 | 346,531 | |||||||||||||
| 225,000 | CSC Holdings, Inc., 8.125%, due 07/15/09 | 240,188 | |||||||||||||
| 85,000 | CSC Holdings, Inc., 10.500%, due 05/15/16 | 96,900 | |||||||||||||
| 90,000 | Dex Media East Finance Co., 9.875%, due 11/15/09 | 103,950 | |||||||||||||
| 120,000 | Dex Media East Finance Co., 12.125%, due 11/15/12 | 150,000 | |||||||||||||
| 100,000 | Dex Media Finance Co., 8.500%, due 08/15/10 | 114,000 | |||||||||||||
| 304,000 | L | Dex Media Finance Co., 9.875%, due 08/15/13 | 358,719 | ||||||||||||
| 565,000 | DirecTV Holdings LLC, 8.375%, due 03/15/13 | 645,512 | |||||||||||||
| 200,000 | Echostar DBS Corp., 5.750%, due 10/01/08 | 202,000 | |||||||||||||
| 105,000 | # | Echostar DBS Corp., 6.625%, due 10/01/14 | 104,869 | ||||||||||||
| 175,000 | L | Emmis Operating Co., 6.875%, due 05/15/12 | 182,438 | ||||||||||||
| 230,000 | Entravision Communications Corp., 8.125%, due 03/15/09 | 245,525 | |||||||||||||
| 125,000 | Granite Broadcasting Corp., 9.750%, due 12/01/10 | 116,250 | |||||||||||||
| 380,000 | Gray Television, Inc., 9.250%, due 12/15/11 | 428,449 | |||||||||||||
| 135,000 | Houghton Mifflin Co., 8.250%, due 02/01/11 | 141,750 | |||||||||||||
| 155,000 | +,L | Insight Communications Co., Inc., .000%, due 02/15/11 | 145,700 | ||||||||||||
| 210,000 | @@,# | Kabel Deutschland GmbH, 10.625%, due 07/01/14 | 229,950 | ||||||||||||
| 110,000 | Nexstar Finance Holdings, Inc., 3.080%, due 04/01/13 | 84,838 | |||||||||||||
See Accompanying Notes to Financial Statements
62
PORTFOLIO OF INVESTMENTS
ING HIGH YIELD BOND FUND as of September 30, 2004 (Unaudited) (continued)
| Principal Amount | Value | ||||||||||||||
| Media (continued) | |||||||||||||||
| $ | 105,000 | + | Nexstar Finance, Inc., 7.000%, due 01/15/14 | $ | 103,950 | ||||||||||
| 195,000 | Paxson Communications Corp., 10.750%, due 07/15/08 | 196,950 | |||||||||||||
| 65,000 | @@ | Quebecor Media, Inc., 13.050%, due 07/15/11 | 63,050 | ||||||||||||
| 345,000 | @@,+ | Quebecor Media, Inc., 11.125%, due 07/15/11 | 400,199 | ||||||||||||
| 175,000 | Reader's Digest Association, Inc., 6.500%, due 03/01/11 | 181,125 | |||||||||||||
| 25,000 | @@ | Rogers Cable, Inc., 5.500%, due 03/15/14 | 23,125 | ||||||||||||
| 35,000 | Salem Communications Corp., 7.750%, due 12/15/10 | 37,100 | |||||||||||||
| 172,000 | Salem Communications Holding Corp., 9.000%, due 07/01/11 | 189,200 | |||||||||||||
| 135,000 | @@,L | Shaw Communications, Inc., 7.200%, due 12/15/11 | 147,488 | ||||||||||||
| 195,000 | L | Sinclair Broadcast Group, Inc., 8.750%, due 12/15/11 | 212,550 | ||||||||||||
| 215,000 | Spanish Broadcasting System, 9.625%, due 11/01/09 | 226,288 | |||||||||||||
| 250,000 | Young Broadcasting, Inc., 8.500%, due 12/15/08 | 266,875 | |||||||||||||
| 133,000 | L | Young Broadcasting, Inc., 10.000%, due 03/01/11 | 137,655 | ||||||||||||
| 7,535,118 | |||||||||||||||
| Miscellaneous Manufacturing: 0.9% | |||||||||||||||
| 185,000 | Koppers, Inc., 9.875%, due 10/15/13 | 205,350 | |||||||||||||
| 365,000 | #,L | Samsonite Corp., 8.875%, due 06/01/11 | 383,250 | ||||||||||||
| 80,000 | SPX Corp., 7.500%, due 01/01/13 | 81,700 | |||||||||||||
| 670,300 | |||||||||||||||
| Office/Business Equipment: 0.6% | |||||||||||||||
| 165,000 | Xerox Corp., 6.875%, due 08/15/11 | 173,250 | |||||||||||||
| 50,000 | Xerox Corp., 7.625%, due 06/15/13 | 54,250 | |||||||||||||
| 150,000 | L | Xerox Corp., 9.750%, due 01/15/09 | 175,500 | ||||||||||||
| 403,000 | |||||||||||||||
| Oil and Gas: 4.8% | |||||||||||||||
| 745,000 | Chesapeake Energy Corp., 7.500%, due 09/15/13 | 819,499 | |||||||||||||
| 350,000 | L | Energy Partners Ltd., 8.750%, due 08/01/10 | 381,500 | ||||||||||||
| 285,000 | #,L | Newfield Exploration Co., 6.625%, due 09/01/14 | 298,538 | ||||||||||||
| 335,000 | # | Parker Drilling Co., 6.540%, due 09/01/10 | 337,513 | ||||||||||||
| 220,000 | Swift Energy Co., 7.625%, due 07/15/11 | 236,500 | |||||||||||||
| 525,000 | Swift Energy Co., 9.375%, due 05/01/12 | 590,625 | |||||||||||||
| 550,000 | @@ | Western Oil Sands, Inc., 8.375%, due 05/01/12 | 636,624 | ||||||||||||
| Principal Amount | Value | ||||||||||||||
| $ | 170,000 | Whiting Petroleum Corp., 7.250%, due 05/01/12 | $ | 172,550 | |||||||||||
| 3,473,349 | |||||||||||||||
| Oil and Gas Services: 2.2% | |||||||||||||||
| 175,000 | Grant Prideco Escrow Corp., 9.000%, due 12/15/09 | 196,438 | |||||||||||||
| 500,000 | Grant Prideco, Inc., 9.625%, due 12/01/07 | 566,250 | |||||||||||||
| 300,000 | Hanover Compressor Co., 9.000%, due 06/01/14 | 330,750 | |||||||||||||
| 435,000 | L | Hanover Equipment Trust, 8.500%, due 09/01/08 | 469,800 | ||||||||||||
| 1,563,238 | |||||||||||||||
| Packaging and Containers: 4.6% | |||||||||||||||
| 295,000 | BWAY Corp., 10.000%, due 10/15/10 | 324,500 | |||||||||||||
| 645,000 | @@,L | Crown European Holdings SA, 10.875%, due 03/01/13 | 753,037 | ||||||||||||
| 645,000 | Jefferson Smurfit Corp., 8.250%, due 10/01/12 | 714,338 | |||||||||||||
| 685,000 | Owens-Brockway, 8.250%, due 05/15/13 | 732,950 | |||||||||||||
| 600,000 | Owens-Brockway, 8.875%, due 02/15/09 | 655,500 | |||||||||||||
| 160,000 | L | Solo Cup Co., 8.500%, due 02/15/14 | 158,400 | ||||||||||||
| 3,338,725 | |||||||||||||||
| Pharmaceuticals: 0.7% | |||||||||||||||
| 485,000 | AmerisourceBergen Corp., 8.125%, due 09/01/08 | 540,775 | |||||||||||||
| 540,775 | |||||||||||||||
| Pipelines: 4.2% | |||||||||||||||
| 265,000 | L | ANR Pipeline Co., 8.875%, due 03/15/10 | 299,450 | ||||||||||||
| 380,000 | L | El Paso Corp., 7.875%, due 06/15/12 | 379,050 | ||||||||||||
| 430,000 | El Paso Natural Gas Co., 7.625%, due 08/01/10 | 462,250 | |||||||||||||
| 82,000 | GulfTerra Energy Finance Corp., 10.625%, due 12/01/12 | 103,320 | |||||||||||||
| 144,000 | GulfTerra Energy Partners LP, 8.500%, due 06/01/10 | 168,300 | |||||||||||||
| 210,000 | Southern Natural Gas Co., 8.000%, due 03/01/32 | 217,875 | |||||||||||||
| 355,000 | Transcontinental Gas Pipe LN, 7.250%, due 12/01/26 | 371,863 | |||||||||||||
| 855,000 | Transcontinental Gas Pipe LN, 8.875%, due 07/15/12 | 1,044,168 | |||||||||||||
| 3,046,276 | |||||||||||||||
| Real Estate Investment Trusts: 1.3% | |||||||||||||||
| 49,000 | Felcor Lodging LP, 10.000%, due 09/15/08 | 51,695 | |||||||||||||
| 280,000 | Host Marriott LP, 7.125%, due 11/01/13 | 295,400 | |||||||||||||
| 145,000 | iStar Financial, Inc., 5.125%, due 04/01/11 | 145,408 | |||||||||||||
| 410,000 | MeriStar Hospitality Finance Corp., 10.500%, due 06/15/09 | 451,000 | |||||||||||||
| 943,503 | |||||||||||||||
See Accompanying Notes to Financial Statements
63
PORTFOLIO OF INVESTMENTS
ING HIGH YIELD BOND FUND as of September 30, 2004 (Unaudited) (continued)
| Principal Amount | Value | ||||||||||||||
| Retail: 4.2% | |||||||||||||||
| $ | 145,000 | # | Denny's Corp., 10.000%, due 10/01/12 | $ | 146,269 | ||||||||||
| 180,000 | L | Denny's Corp., 11.250%, due 01/15/08 | 187,650 | ||||||||||||
| 400,000 | Dollar General Corp., 8.625%, due 06/15/10 | 462,000 | |||||||||||||
| 170,000 | Domino's, Inc., 8.250%, due 07/01/11 | 184,875 | |||||||||||||
| 205,000 | #,L | Duane Reade, Inc., 9.750%, due 08/01/11 | 194,750 | ||||||||||||
| 285,000 | L | Gap, Inc., 10.300%, due 12/15/08 | 350,550 | ||||||||||||
| 435,000 | General Nutrition Centers, Inc., 8.500%, due 12/01/10 | 446,963 | |||||||||||||
| 455,000 | JC Penney Co., Inc., 8.000%, due 03/01/10 | 520,406 | |||||||||||||
| 200,000 | Rite Aid Corp., 8.125%, due 05/01/10 | 211,000 | |||||||||||||
| 325,000 | Star Gas Finance Co., 10.250%, due 02/15/13 | 357,500 | |||||||||||||
| 3,061,963 | |||||||||||||||
| Semiconductors: 0.1% | |||||||||||||||
| 58,000 | ON Semiconductor Corp., 13.000%, due 05/15/08 | 65,250 | |||||||||||||
| 65,250 | |||||||||||||||
| Telecommunications: 7.3% | |||||||||||||||
| 535,000 | L | American Tower Corp., 9.375%, due 02/01/09 | 569,774 | ||||||||||||
| 365,000 | American Towers, Inc., 7.250%, due 12/01/11 | 381,425 | |||||||||||||
| 95,000 | # | Centennial Communications Corp., 8.125%, due 02/01/14 | 91,081 | ||||||||||||
| 210,000 | Centennial Communications Corp., 10.125%, due 06/15/13 | 222,075 | |||||||||||||
| 140,000 | L | Cincinnati Bell, Inc., 7.250%, due 07/15/13 | 135,450 | ||||||||||||
| 105,000 | L | Citizens Communications Co., 7.625%, due 08/15/08 | 110,775 | ||||||||||||
| 265,000 | L | Crown Castle Intl. Corp., 7.500%, due 12/01/13 | 278,913 | ||||||||||||
| 135,000 | L | Crown Castle Intl. Corp., 9.375%, due 08/01/11 | 155,925 | ||||||||||||
| 240,000 | L | Crown Castle Intl. Corp., 10.750%, due 08/01/11 | 268,200 | ||||||||||||
| 110,000 | @@,# | Inmarsat Finance PLC, 7.625%, due 06/30/12 | 109,725 | ||||||||||||
| 225,000 | Insight Capital, Inc., 10.500%, due 11/01/10 | 247,500 | |||||||||||||
| 75,000 | L | Lucent Technologies, Inc., 5.500%, due 11/15/08 | 75,375 | ||||||||||||
| 170,000 | L | Lucent Technologies, Inc., 7.250%, due 07/15/06 | 181,050 | ||||||||||||
| 50,000 | MetroPCS, Inc., 10.750%, due 10/01/11 | 54,000 | |||||||||||||
| 5,000 | Nextel Communications, Inc, 6.875%, due 10/31/13 | 5,225 | |||||||||||||
| 515,000 | Nextel Communications, Inc., 7.375%, due 08/01/15 | 556,199 | |||||||||||||
| 90,000 | L | Nextel Partners, Inc., 8.125%, due 07/01/11 | 95,850 | ||||||||||||
| Principal Amount | Value | ||||||||||||||
| $ | 110,000 | Nextel Partners, Inc., 12.500%, due 11/15/09 | $ | 127,600 | |||||||||||
| 195,000 | #,L | PanAmSat Corp., 9.000%, due 08/15/14 | 203,775 | ||||||||||||
| 105,000 | Qwest Capital Funding, Inc., 7.750%, due 08/15/06 | 105,919 | |||||||||||||
| 70,000 | # | Qwest Corp., 7.875%, due 09/01/11 | 72,975 | ||||||||||||
| 60,000 | # | Qwest Corp., 9.125%, due 03/15/12 | 66,300 | ||||||||||||
| 290,000 | # | Qwest Services Corp., 13.500%, due 12/15/07 | 331,325 | ||||||||||||
| 175,000 | # | Qwest Services Corp., 14.000%, due 12/15/10 | 205,188 | ||||||||||||
| 110,000 | @@ | Rogers Wireless Communications, Inc., 9.625%, due 05/01/11 | 123,200 | ||||||||||||
| 95,000 | # | Rural Cellular Corp., 8.250%, due 03/15/12 | 97,138 | ||||||||||||
| 140,000 | L | SBA Communications Corp., 9.750%, due 12/15/11 | 114,100 | ||||||||||||
| 95,000 | Spectrasite, Inc., 8.250%, due 05/15/10 | 102,600 | |||||||||||||
| 265,000 | Western Wireless Corp., 9.250%, due 07/15/13 | 271,625 | |||||||||||||
| 5,360,287 | |||||||||||||||
| Total Corporate Bonds/Notes (Cost $65,715,518) | 68,841,661 | ||||||||||||||
| Shares | Value | ||||||||||||||
| PREFERRED STOCK: 0.0% | |||||||||||||||
| Media: 0.0% | |||||||||||||||
| 96 | @,L | Paxson Communications Corp. | 7,224 | ||||||||||||
| 7,224 | |||||||||||||||
| Telecommunications: 0.0% | |||||||||||||||
| 373 | @@,I,X | O Sullivan Industries, Inc. | - | ||||||||||||
| - | |||||||||||||||
| Total Preferred Stock (Cost $8,664) | 7,224 | ||||||||||||||
| WARRANTS: 0.0% | |||||||||||||||
| 90 | @,# | American Tower Corp. | 16,965 | ||||||||||||
| 500 | @@,I,X | GT Group Telecom, Inc. | - | ||||||||||||
| 1,000 | @@,I,X | O Sullivan Industries, Inc. | - | ||||||||||||
| Total Warrants (Cost $6,677) | 16,965 | ||||||||||||||
| Total Long-Term Investments (Cost $65,730,859) | 68,865,850 | ||||||||||||||
See Accompanying Notes to Financial Statements
64
PORTFOLIO OF INVESTMENTS
ING HIGH YIELD BOND FUND as of September 30, 2004 (Unaudited) (continued)
| Principal Amount | Value | ||||||||||||||||||
| SHORT-TERM INVESTMENTS: 23.0% | |||||||||||||||||||
| Securities Lending CollateralCC: 18.7% | |||||||||||||||||||
| $ | 13,534,319 | The Bank of New York Institutional Cash Reserves Fund | $ | 13,534,319 | |||||||||||||||
| Total Securities Lending Collateral (Cost $13,534,319) | 13,534,319 | ||||||||||||||||||
| Repurchase Agreement: 4.3% | |||||||||||||||||||
| 3,087,000 | S | Morgan Stanley Repurchase Agreement dated 09/30/04, 1.850%, due 10/01/04, $3,087,159 to be received upon repurchase (Collateralized by Federal Home Loan Bank, 5.375%, Market value plus accrued interest $3,151,695, due 05/15/06) | 3,087,000 | ||||||||||||||||
| Total Repurchase Agreement (Cost $3,087,000) | 3,087,000 | ||||||||||||||||||
| Total Short-Term Investments (Cost $16,621,319) | 16,621,319 | ||||||||||||||||||
| Total Investments in Securities (Cost $82,352,178)* | 117.8 | % | $85,487,169 | ||||||||||||||||
| Other Assets and Liabilities-Net | (17.8 | ) | (12,932,897) | ||||||||||||||||
| Net Assets | 100.0 | % | $ | 72,554,272 | |||||||||||||||
@ Non-income producing security
@@ Foreign issuer
+ Step-up basis bonds. Interest rates shown reflect current and future coupon rates.
# Securities with purchases pursuant to Rule 144A, under the Securities Act of 1933 and may not be resold subject to that rule except to qualified institutional buyers. These securities have been determined to be liquid under the guidelines established by the Funds' Board of Directors/Trustees.
cc Securities purchased with cash collateral for securities loaned.
S Segregated securities for futures, when-issued or delayed delivery securities held at September 30, 2004.
L Loaned security, a portion or all of the security is on loan at September 30, 2004.
X Fair value determined by ING Funds Valuation Committee appointed by the Funds' Board of Directors/Trustees.
* Cost for federal income tax purposes is $82,404,864. Net unrealized appreciation consists of:
| Gross Unrealized Appreciation | $ | 3,220,406 | |||||
| Gross Unrealized Depreciation | (138,101 | ) | |||||
| Net Unrealized Appreciation | $ | 3,082,305 | |||||
See Accompanying Notes to Financial Statements
65
PORTFOLIO OF INVESTMENTS
ING HIGH YIELD OPPORTUNITY FUND as of September 30, 2004 (Unaudited)
| Principal Amount | Value | ||||||||||||||
| CORPORATE BONDS/NOTES: 96.9% | |||||||||||||||
| Advertising: 0.6% | |||||||||||||||
| $ | 335,000 | RH Donnelley Finance Corp., 8.875%, due 12/15/10 | $ | 380,225 | |||||||||||
| 565,000 | Vertis, Inc., 9.750%, due 04/01/09 | 610,200 | |||||||||||||
| 250,000 | L | Vertis, Inc., 10.875%, due 06/15/09 | 270,000 | ||||||||||||
| 235,000 | #,L | Vertis, Inc., 13.500%, due 12/07/09 | 236,175 | ||||||||||||
| 1,496,600 | |||||||||||||||
| Aerospace/Defense: 1.4% | |||||||||||||||
| 690,000 | DRS Technologies, Inc., 6.875%, due 11/01/13 | 721,050 | |||||||||||||
| 495,000 | L | L-3 Communications Corp., 6.125%, due 07/15/13 | 503,663 | ||||||||||||
| 970,000 | L | L-3 Communications Corp., 7.625%, due 06/15/12 | 1,071,850 | ||||||||||||
| 825,000 | Sequa Corp., 8.875%, due 04/01/08 | 899,250 | |||||||||||||
| 50,000 | Sequa Corp., 9.000%, due 08/01/09 | 55,250 | |||||||||||||
| 3,251,063 | |||||||||||||||
| Apparel: 1.0% | |||||||||||||||
| 1,225,000 | Phillips-Van Heusen, 8.125%, due 05/01/13 | 1,316,875 | |||||||||||||
| 1,050,000 | Russell Corp., 9.250%, due 05/01/10 | 1,144,500 | |||||||||||||
| 2,461,375 | |||||||||||||||
| Auto Parts and Equipment: 1.9% | |||||||||||||||
| 735,000 | ArvinMeritor, Inc., 6.625%, due 06/15/07 | 769,913 | |||||||||||||
| 205,000 | Dana Corp., 9.000%, due 08/15/11 | 248,563 | |||||||||||||
| 550,000 | L | Dana Corp., 10.125%, due 03/15/10 | 627,000 | ||||||||||||
| 25,000 | Eagle-Picher Industries, Inc., 9.750%, due 09/01/13 | 25,625 | |||||||||||||
| 690,000 | Rexnord Corp., 10.125%, due 12/15/12 | 783,150 | |||||||||||||
| 780,000 | L | Tenneco Automotive, Inc., 10.250%, due 07/15/13 | 893,100 | ||||||||||||
| 1,025,000 | TRW Automotive, Inc., 11.000%, due 02/15/13 | 1,224,874 | |||||||||||||
| 4,572,225 | |||||||||||||||
| Building Materials: 0.5% | |||||||||||||||
| 335,000 | # | Ply Gem Industries, Inc., 9.000%, due 02/15/12 | 335,838 | ||||||||||||
| 445,000 | # | THL Buildco, Inc., 8.500%, due 09/01/14 | 468,362 | ||||||||||||
| 335,000 | US Concrete, Inc., 8.375%, due 04/01/14 | 351,750 | |||||||||||||
| 1,155,950 | |||||||||||||||
| Chemicals: 4.4% | |||||||||||||||
| 755,000 | L | Equistar Funding Corp., 10.625%, due 05/01/11 | 864,475 | ||||||||||||
| 1,245,000 | IMC Global, Inc., 10.875%, due 06/01/08 | 1,515,788 | |||||||||||||
| Principal Amount | Value | ||||||||||||||
| $ | 1,895,000 | L | Lyondell Chemical Co., 9.625%, due 05/01/07 | $ | 2,072,656 | ||||||||||
| 2,260,000 | Nalco Co., 7.750%, due 11/15/11 | 2,406,900 | |||||||||||||
| 1,720,000 | L | PolyOne Corp., 8.875%, due 05/01/12 | 1,763,000 | ||||||||||||
| 1,700,000 | Rockwood Specialties Group, Inc., 10.625%, due 05/15/11 | 1,878,500 | |||||||||||||
| 10,501,319 | |||||||||||||||
| Commercial Services: 0.9% | |||||||||||||||
| 1,250,000 | Corrections Corp. of America, 7.500%, due 05/01/11 | 1,326,562 | |||||||||||||
| 815,000 | United Rentals North America, Inc., 6.500%, due 02/15/12 | 788,513 | |||||||||||||
| 2,115,075 | |||||||||||||||
| Distribution/Wholesale: 0.5% | |||||||||||||||
| 1,100,000 | L | Aviall, Inc., 7.625%, due 07/01/11 | 1,193,500 | ||||||||||||
| 1,193,500 | |||||||||||||||
| Diversified Financial Services: 6.7% | |||||||||||||||
| 1,505,000 | @@,# | BCP Caylux Holdings Luxembourg SCA, 9.625%, due 06/15/14 | 1,632,925 | ||||||||||||
| 1,130,000 | Bluewater Finance Ltd., 10.250%, due 02/15/12 | 1,231,700 | |||||||||||||
| 905,000 | # | Crystal US Holdings 3 LLC, 5.130%, due 10/01/14 | 545,263 | ||||||||||||
| 3,785,000 | #,L | Dow Jones CDX NA HY, 8.000%, due 12/29/09 | 3,796,827 | ||||||||||||
| 700,000 | # | Global Cash Finance Corp., 8.750%, due 03/15/12 | 745,500 | ||||||||||||
| 2,194,530 | # | Hollinger Participation Trust, 0.000%, due 11/15/10 | 2,518,223 | ||||||||||||
| 1,230,000 | Nexstar Finance, Inc., 12.000%, due 04/01/08 | 1,359,150 | |||||||||||||
| 985,000 | # | PanAmSat Holding Corp., 5.320%, due 11/01/14 | 579,919 | ||||||||||||
| 715,000 | # | Rainbow National Services LLC, 8.750%, due 09/01/12 | 745,388 | ||||||||||||
| 675,000 | # | Rainbow National Services LLC, 10.375%, due 09/01/14 | 710,438 | ||||||||||||
| 860,000 | Universal City Development Partners, 11.750%, due 04/01/10 | 1,006,200 | |||||||||||||
| 1,130,000 | # | Vanguard Health Holding Co. II LLC, 9.000%, due 10/01/14 | 1,138,475 | ||||||||||||
| 16,010,008 | |||||||||||||||
| Electric: 6.8% | |||||||||||||||
| 1,320,000 | # | AES Corp., 8.750%, due 05/15/13 | 1,494,900 | ||||||||||||
| 1,010,000 | L | AES Corp., 8.875%, due 02/15/11 | 1,128,675 | ||||||||||||
| 1,500,000 | # | Allegheny Energy Supply Statutory Trust 2001, 10.250%, due 11/15/07 | 1,725,000 | ||||||||||||
| 60,000 | # | Allegheny Energy Supply Statutory Trust 2001, 13.000%, due 11/15/07 | 63,300 | ||||||||||||
See Accompanying Notes to Financial Statements
66
PORTFOLIO OF INVESTMENTS
ING HIGH YIELD OPPORTUNITY FUND as of September 30, 2004 (Unaudited) (continued)
| Principal Amount | Value | ||||||||||||||
| Electric (continued) | |||||||||||||||
| $ | 670,000 | #,L | Calpine Corp., 8.750%, due 07/15/13 | $ | 509,200 | ||||||||||
| 1,064,414 | Homer City Funding LLC, 8.734%, due 10/01/26 | 1,197,466 | |||||||||||||
| 475,000 | Illinois Power Co., 7.500%, due 07/15/25 | 489,250 | |||||||||||||
| 1,200,000 | Illinois Power Co., 11.500%, due 12/15/10 | 1,428,000 | |||||||||||||
| 2,990,000 | Midwest Generation LLC, 8.300%, due 07/02/09 | 3,141,368 | |||||||||||||
| 2,145,000 | Nevada Power Co., 10.875%, due 10/15/09 | 2,496,243 | |||||||||||||
| 955,000 | # | NRG Energy, Inc., 8.000%, due 12/15/13 | 1,027,819 | ||||||||||||
| 1,210,000 | L | Reliant Energy, Inc., 9.250%, due 07/15/10 | 1,305,288 | ||||||||||||
| 260,000 | TECO Energy, Inc., 7.500%, due 06/15/10 | 282,100 | |||||||||||||
| 16,288,609 | |||||||||||||||
| Electrical Components and Equipment: 0.2% | |||||||||||||||
| 365,000 | @@ | Lengrand Holdings SA, 10.500%, due 02/15/13 | 428,875 | ||||||||||||
| 428,875 | |||||||||||||||
| Electronics: 0.8% | |||||||||||||||
| 1,045,000 | Fisher Scientific Intl., 8.000%, due 09/01/13 | 1,175,625 | |||||||||||||
| 280,000 | Sanmina-SCI Corp., 10.375%, due 01/15/10 | 321,650 | |||||||||||||
| 295,000 | Stoneridge, Inc., 11.500%, due 05/01/12 | 335,563 | |||||||||||||
| 1,832,838 | |||||||||||||||
| Entertainment: 2.6% | |||||||||||||||
| 1,605,000 | # | American Casino & Entertainment Properties LLC, 7.850%, due 02/01/12 | 1,693,275 | ||||||||||||
| 790,000 | Argosy Gaming Co., 9.000%, due 09/01/11 | 890,725 | |||||||||||||
| 740,000 | Carmike Cinemas, Inc., 7.500%, due 02/15/14 | 752,950 | |||||||||||||
| 890,000 | L | Cinemark USA, Inc., 9.000%, due 02/01/13 | 999,025 | ||||||||||||
| 560,000 | # | LCE Acquisition Corp., 9.000%, due 08/01/14 | 581,000 | ||||||||||||
| 460,000 | #,L | Marquee, Inc., 8.625%, due 08/15/12 | 489,900 | ||||||||||||
| 850,000 | # | Warner Music Group, 7.375%, due 04/15/14 | 884,000 | ||||||||||||
| 6,290,875 | |||||||||||||||
| Environmental Control: 1.0% | |||||||||||||||
| 2,135,000 | Allied Waste North America, 8.500%, due 12/01/08 | 2,327,150 | |||||||||||||
| 2,327,150 | |||||||||||||||
| Food: 3.7% | |||||||||||||||
| 1,330,000 | Del Monte Corp., 8.625%, due 12/15/12 | 1,486,275 | |||||||||||||
| 730,000 | Delhaize America, Inc., 8.125%, due 04/15/11 | 837,328 | |||||||||||||
| Principal Amount | Value | ||||||||||||||
| $ | 895,000 | Dole Food Co., 8.625%, due 05/01/09 | $ | 980,025 | |||||||||||
| 1,450,000 | # | Land O' Lakes, Inc., 9.000%, due 12/15/10 | 1,517,062 | ||||||||||||
| 690,000 | Roundy's Inc., 8.875%, due 06/15/12 | 746,925 | |||||||||||||
| 1,235,000 | Smithfield Foods, Inc., 7.750%, due 05/15/13 | 1,346,150 | |||||||||||||
| 1,145,000 | L | Swift & Co., 10.125%, due 10/01/09 | 1,262,363 | ||||||||||||
| 595,000 | Swift & Co., 12.500%, due 01/01/10 | 660,450 | |||||||||||||
| 8,836,578 | |||||||||||||||
| Forest Products and Paper: 4.4% | |||||||||||||||
| 2,190,000 | Abitibi-Consolidated Finance LP, 7.875%, due 08/01/09 | 2,294,025 | |||||||||||||
| 1,840,000 | #,L | Appleton Papers, Inc., 8.125%, due 06/15/11 | 1,904,400 | ||||||||||||
| 1,460,000 | L | Georgia-Pacific Corp., 8.125%, due 05/15/11 | 1,693,600 | ||||||||||||
| 930,000 | Georgia-Pacific Corp., 8.875%, due 02/01/10 | 1,092,750 | |||||||||||||
| 980,000 | Georgia-Pacific Corp., 9.375%, due 02/01/13 | 1,158,850 | |||||||||||||
| 920,000 | @@ | Millar Western Forest Products Ltd., 7.750%, due 11/15/13 | 970,600 | ||||||||||||
| 1,265,000 | @@ | Norske Skog Canada Ltd., 7.375%, due 03/01/14 | 1,328,250 | ||||||||||||
| 10,442,475 | |||||||||||||||
| Healthcare-Products: 0.7% | |||||||||||||||
| 210,000 | # | Medical Device Manufacturing, 10.000%, due 07/15/12 | 223,650 | ||||||||||||
| 1,365,000 | # | VWR Intl., Inc., 8.000%, due 04/15/14 | 1,450,313 | ||||||||||||
| 1,673,963 | |||||||||||||||
| Healthcare-Services: 1.9% | |||||||||||||||
| 700,000 | # | Beverly Enterprises, Inc., 7.875%, due 06/15/14 | 752,500 | ||||||||||||
| 1,865,000 | Genesis HealthCare Corp., 8.000%, due 10/15/13 | 2,042,175 | |||||||||||||
| 1,555,000 | HCA, Inc., 7.875%, due 02/01/11 | 1,760,793 | |||||||||||||
| 4,555,468 | |||||||||||||||
| Home Builders: 2.6% | |||||||||||||||
| 505,000 | DR Horton, Inc., 7.875%, due 08/15/11 | 586,431 | |||||||||||||
| 735,000 | #,L | KB Home, 6.375%, due 08/15/11 | 775,425 | ||||||||||||
| 625,000 | Meritage Corp., 9.750%, due 06/01/11 | 704,688 | |||||||||||||
| 1,495,000 | Technical Olympic USA, Inc., 9.000%, due 07/01/10 | 1,644,499 | |||||||||||||
| 345,000 | Technical Olympic USA, Inc., 10.375%, due 07/01/12 | 388,125 | |||||||||||||
| 855,000 | L | WCI Communities, Inc., 10.625%, due 02/15/11 | 968,288 | ||||||||||||
| 445,000 | William Lyon Homes, Inc., 7.500%, due 02/15/14 | 456,125 | |||||||||||||
See Accompanying Notes to Financial Statements
67
PORTFOLIO OF INVESTMENTS
ING HIGH YIELD OPPORTUNITY FUND as of September 30, 2004 (Unaudited) (continued)
| Principal Amount | Value | ||||||||||||||
| Home Builders (continued) | |||||||||||||||
| $ | 520,000 | William Lyon Homes, Inc., 10.750%, due 04/01/13 | $ | 603,200 | |||||||||||
| 6,126,781 | |||||||||||||||
| Home Furnishings: 0.5% | |||||||||||||||
| 170,000 | #,L | Norcraft Holdings LP, 4.010%, due 09/01/12 | 124,100 | ||||||||||||
| 940,000 | # | Norcraft Finance Corp., 9.000%, due 11/01/11 | 1,029,300 | ||||||||||||
| 1,153,400 | |||||||||||||||
| Household Products/Wares: 0.6% | |||||||||||||||
| 1,390,000 | #,L | American Achievement Corp., 8.250%, due 04/01/12 | 1,466,450 | ||||||||||||
| 1,466,450 | |||||||||||||||
| Iron/Steel: 1.4% | |||||||||||||||
| 1,895,000 | L | AK Steel Corp., 7.875%, due 02/15/09 | 1,890,263 | ||||||||||||
| 1,175,000 | United States Steel Corp., 9.750%, due 05/15/10 | 1,351,250 | |||||||||||||
| 3,241,513 | |||||||||||||||
| Leisure Time: 1.2% | |||||||||||||||
| 645,000 | # | NCL Corp., 10.625%, due 07/15/14 | 678,863 | ||||||||||||
| 595,000 | Royal Caribbean Cruises Ltd., 7.500%, due 10/15/27 | 621,775 | |||||||||||||
| 1,355,000 | Royal Caribbean Cruises Ltd., 8.000%, due 05/15/10 | 1,532,843 | |||||||||||||
| 2,833,481 | |||||||||||||||
| Lodging: 6.7% | |||||||||||||||
| 2,170,000 | Ameristar Casinos, Inc., 10.750%, due 02/15/09 | 2,473,799 | |||||||||||||
| 350,000 | Aztar Corp., 9.000%, due 08/15/11 | 389,375 | |||||||||||||
| 770,000 | Caesars Entertainment, Inc., 9.375%, due 02/15/07 | 860,475 | |||||||||||||
| 1,695,000 | Harrah's Operating Co., Inc., 8.000%, due 02/01/11 | 1,969,956 | |||||||||||||
| 1,500,000 | L | Hilton Hotels Corp., 7.625%, due 12/01/12 | 1,751,250 | ||||||||||||
| 740,000 | John Q Hammons Hotels LP, 8.875%, due 05/15/12 | 828,800 | |||||||||||||
| 185,000 | L | Mandalay Resort Group, 6.500%, due 07/31/09 | 192,863 | ||||||||||||
| 960,000 | Mandalay Resort Group, 9.500%, due 08/01/08 | 1,108,800 | |||||||||||||
| 800,000 | L | MGM Mirage, 8.375%, due 02/01/11 | 887,000 | ||||||||||||
| 1,375,000 | L | MGM Mirage, 8.500%, due 09/15/10 | 1,569,219 | ||||||||||||
| 885,000 | MGM Mirage, 9.750%, due 06/01/07 | 987,881 | |||||||||||||
| 500,000 | L | Station Casinos, Inc., 6.500%, due 02/01/14 | 511,250 | ||||||||||||
| 1,155,000 | Venetian Casino Resort LLC, 11.000%, due 06/15/10 | 1,342,688 | |||||||||||||
| 952,000 | L | Wynn Las Vegas Capital Corp., 12.000%, due 11/01/10 | 1,194,760 | ||||||||||||
| 16,068,116 | |||||||||||||||
| Principal Amount | Value | ||||||||||||||
| Machinery-Construction and Mining: 0.5% | |||||||||||||||
| $ | 1,185,000 | Terex Corp., 7.375%, due 01/15/14 | $ | 1,250,175 | |||||||||||
| 1,250,175 | |||||||||||||||
| Machinery-Diversified: 0.3% | |||||||||||||||
| 635,000 | Cummins, Inc., 9.500%, due 12/01/10 | 736,600 | |||||||||||||
| 736,600 | |||||||||||||||
| Media: 10.4% | |||||||||||||||
| 350,000 | American Media Operation, Inc., 10.250%, due 05/01/09 | 370,125 | |||||||||||||
| 630,000 | Block Communications, Inc., 9.250%, due 04/15/09 | 669,375 | |||||||||||||
| 220,000 | @@ | CanWest Media, Inc., 7.625%, due 04/15/13 | 237,600 | ||||||||||||
| 875,000 | @@ | CanWest Media, Inc., 10.625%, due 05/15/11 | 999,688 | ||||||||||||
| 1,160,000 | # | Charter Communications Operating Capital Corp., 8.000%, due 04/30/12 | 1,162,900 | ||||||||||||
| 675,000 | Charter Communications Holdings Capital Corp., 9.625%, due 11/15/09 | 534,938 | |||||||||||||
| 775,000 | CSC Holdings, Inc., 7.625%, due 04/01/11 | 820,531 | |||||||||||||
| 1,045,000 | CSC Holdings, Inc., 7.875%, due 12/15/07 | 1,114,231 | |||||||||||||
| 775,000 | CSC Holdings, Inc., 8.125%, due 07/15/09 | 827,313 | |||||||||||||
| 295,000 | L | CSC Holdings, Inc., 10.500%, due 05/15/16 | 336,300 | ||||||||||||
| 295,000 | Dex Media East Finance Co., 9.875%, due 11/15/09 | 340,725 | |||||||||||||
| 455,000 | Dex Media East Finance Co., 12.125%, due 11/15/12 | 568,750 | |||||||||||||
| 340,000 | Dex Media Finance Co., 8.500%, due 08/15/10 | 387,600 | |||||||||||||
| 1,060,000 | L | Dex Media Finance Co., 9.875%, due 08/15/13 | 1,250,799 | ||||||||||||
| 1,900,000 | DirecTV Holdings LLC, 8.375%, due 03/15/13 | 2,170,749 | |||||||||||||
| 745,000 | Echostar DBS Corp., 5.750%, due 10/01/08 | 752,450 | |||||||||||||
| 340,000 | # | Echostar DBS Corp., 6.625%, due 10/01/14 | 339,575 | ||||||||||||
| 595,000 | L | Emmis Operating Co., 6.875%, due 05/15/12 | 620,288 | ||||||||||||
| 840,000 | Entravision Communications Corp., 8.125%, due 03/15/09 | 896,700 | |||||||||||||
| 425,000 | Granite Broadcasting Corp., 9.750%, due 12/01/10 | 395,250 | |||||||||||||
| 1,385,000 | Gray Television, Inc., 9.250%, due 12/15/11 | 1,561,587 | |||||||||||||
| 445,000 | Houghton Mifflin Co., 8.250%, due 02/01/11 | 467,250 | |||||||||||||
| 500,000 | +,L | Insight Communications Co., Inc., 0.970%, due 02/15/11 | 470,000 | ||||||||||||
| 750,000 | @@,# | Kabel Deutschland GmbH, 10.625%, due 07/01/14 | 821,250 | ||||||||||||
| 350,000 | L | Nexstar Finance Holdings, Inc., 3.080%, due 04/01/13 | 269,938 | ||||||||||||
See Accompanying Notes to Financial Statements
68
PORTFOLIO OF INVESTMENTS
ING HIGH YIELD OPPORTUNITY FUND as of September 30, 2004 (Unaudited) (continued)
| Principal Amount | Value | ||||||||||||||
| Media (continued) | |||||||||||||||
| $ | 380,000 | + | Nexstar Finance, Inc., 7.000%, due 01/15/14 | $ | 376,200 | ||||||||||
| 655,000 | L | Paxson Communications Corp., 10.750%, due 07/15/08 | 661,550 | ||||||||||||
| 225,000 | @@ | Quebecor Media, Inc., 13.750%, due 07/15/11 | 218,250 | ||||||||||||
| 1,205,000 | @@,+ | Quebecor Media, Inc., 11.125%, due 07/15/11 | 1,397,799 | ||||||||||||
| 615,000 | Reader's Digest Association, Inc., 6.500%, due 03/01/11 | 636,525 | |||||||||||||
| 85,000 | @@ | Rogers Cable, Inc., 5.500%, due 03/15/14 | 78,625 | ||||||||||||
| 115,000 | Salem Communications Corp., 7.750%, due 12/15/10 | 121,900 | |||||||||||||
| 622,000 | Salem Communications Holding Corp., 9.000%, due 07/01/11 | 684,200 | |||||||||||||
| 455,000 | @@,L | Shaw Communications, Inc., 7.200%, due 12/15/11 | 497,088 | ||||||||||||
| 635,000 | L | Sinclair Broadcast Group, Inc., 8.750%, due 12/15/11 | 692,150 | ||||||||||||
| 623,056 | I,**,X | Source Media, Inc., 0.000%, due 11/01/04 | 1 | ||||||||||||
| 30,000 | Spanish Broadcasting System, 9.625%, due 11/01/09 | 31,575 | |||||||||||||
| 840,000 | Young Broadcasting, Inc., 8.500%, due 12/15/08 | 896,700 | |||||||||||||
| 440,000 | L | Young Broadcasting, Inc., 10.000%, due 03/01/11 | 455,400 | ||||||||||||
| 25,133,875 | |||||||||||||||
| Metal Fabricate/Hardware: 0.0% | |||||||||||||||
| 2,456,000 | @@,I,**,X | International Utility Structures, Inc., 0.000%, due 02/01/08 | 2 | ||||||||||||
| 2 | |||||||||||||||
| Miscellaneous Manufacturing: 0.9% | |||||||||||||||
| 745,000 | Koppers, Inc., 9.875%, due 10/15/13 | 826,950 | |||||||||||||
| 1,065,000 | #,L | Samsonite Corp., 8.875%, due 06/01/11 | 1,118,250 | ||||||||||||
| 265,000 | SPX Corp., 7.500%, due 01/01/13 | 270,631 | |||||||||||||
| 2,215,831 | |||||||||||||||
| Office/Business Equipment: 0.6% | |||||||||||||||
| 555,000 | Xerox Corp., 6.875%, due 08/15/11 | 582,750 | |||||||||||||
| 150,000 | Xerox Corp., 7.625%, due 06/15/13 | 162,750 | |||||||||||||
| 500,000 | L | Xerox Corp., 9.750%, due 01/15/09 | 585,000 | ||||||||||||
| 1,330,500 | |||||||||||||||
| Oil and Gas: 4.9% | |||||||||||||||
| 2,465,000 | L | Chesapeake Energy Corp., 7.500%, due 09/15/13 | 2,711,500 | ||||||||||||
| 980,000 | L | Energy Partners Ltd., 8.750%, due 08/01/10 | 1,068,200 | ||||||||||||
| 610,000 | #,L | Newfield Exploration Co., 6.625%, due 09/01/14 | 638,975 | ||||||||||||
| 1,110,000 | # | Parker Drilling Co., 6.540%, due 09/01/10 | 1,118,325 | ||||||||||||
| Principal Amount | Value | ||||||||||||||
| $ | 725,000 | Swift Energy Co., 7.625%, due 07/15/11 | $ | 779,375 | |||||||||||
| 1,890,000 | Swift Energy Co., 9.375%, due 05/01/12 | 2,126,250 | |||||||||||||
| 2,250,000 | @@ | Western Oil Sands, Inc., 8.375%, due 05/01/12 | 2,604,375 | ||||||||||||
| 605,000 | Whiting Petroleum Corp., 7.250%, due 05/01/12 | 614,075 | |||||||||||||
| 11,661,075 | |||||||||||||||
| Oil and Gas Services: 2.6% | |||||||||||||||
| 2,950,000 | Grant Prideco Escrow Corp., 9.000%, due 12/15/09 | 3,311,375 | |||||||||||||
| 1,070,000 | L | Hanover Compressor Co., 9.000%, due 06/01/14 | 1,179,675 | ||||||||||||
| 1,390,000 | L | Hanover Equipment Trust, 8.500%, due 09/01/08 | 1,501,200 | ||||||||||||
| 250,000 | Hanover Equipment Trust, 8.750%, due 09/01/11 | 274,375 | |||||||||||||
| 6,266,625 | |||||||||||||||
| Packaging and Containers: 4.8% | |||||||||||||||
| 955,000 | BWAY Corp., 10.000%, due 10/15/10 | 1,050,500 | |||||||||||||
| 2,275,000 | @@,L | Crown European Holdings SA, 10.875%, due 03/01/13 | 2,656,062 | ||||||||||||
| 2,310,000 | Jefferson Smurfit Corp., 8.250%, due 10/01/12 | 2,558,325 | |||||||||||||
| 2,175,000 | L | Owens-Brockway, 8.250%, due 05/15/13 | 2,327,250 | ||||||||||||
| 2,145,000 | Owens-Brockway, 8.875%, due 02/15/09 | 2,343,413 | |||||||||||||
| 540,000 | L | Solo Cup Co., 8.500%, due 02/15/14 | 534,600 | ||||||||||||
| 11,470,150 | |||||||||||||||
| Pharmaceuticals: 0.3% | |||||||||||||||
| 550,000 | AmerisourceBergen Corp., 8.125%, due 09/01/08 | 613,250 | |||||||||||||
| �� | 613,250 | ||||||||||||||
| Pipelines: 5.0% | |||||||||||||||
| 1,110,000 | L | ANR Pipeline Co., 8.875%, due 03/15/10 | 1,254,300 | ||||||||||||
| 1,375,000 | L | El Paso Corp., 7.875%, due 06/15/12 | 1,371,563 | ||||||||||||
| 1,545,000 | El Paso Natural Gas Co., 7.625%, due 08/01/10 | 1,660,875 | |||||||||||||
| 1,384,000 | GulfTerra Energy Partners LP, 8.500%, due 06/01/10 | 1,617,550 | |||||||||||||
| 600,000 | Southern Natural Gas Co., 8.000%, due 03/01/32 | 622,500 | |||||||||||||
| 1,425,000 | Transcontinental Gas Pipe LN, 7.250%, due 12/01/26 | 1,492,688 | |||||||||||||
| 3,155,000 | Transcontinental Gas Pipe LN, 8.875%, due 07/15/12 | 3,853,043 | |||||||||||||
| 11,872,519 | |||||||||||||||
| Real Estate Investment Trusts: 1.2% | |||||||||||||||
| 785,000 | Host Marriott LP, 7.125%, due 11/01/13 | 828,175 | |||||||||||||
| 530,000 | iStar Financial, Inc., 5.125%, due 04/01/11 | 531,490 | |||||||||||||
| 1,380,000 | L | MeriStar Hospitality Finance Corp., 10.500%, due 06/15/09 | 1,518,000 | ||||||||||||
| 2,877,665 | |||||||||||||||
See Accompanying Notes to Financial Statements
69
PORTFOLIO OF INVESTMENTS
ING HIGH YIELD OPPORTUNITY FUND as of September 30, 2004 (Unaudited) (continued)
| Principal Amount | Value | ||||||||||||||
| Retail: 4.6% | |||||||||||||||
| $ | 465,000 | #,L | Denny's Corp., 10.000%, due 10/01/12 | $ | 469,069 | ||||||||||
| 625,000 | Denny's Corp., 11.250%, due 01/15/08 | 651,563 | |||||||||||||
| 1,365,000 | Dollar General Corp., 8.625%, due 06/15/10 | 1,576,575 | |||||||||||||
| 660,000 | Domino's, Inc., 8.250%, due 07/01/11 | 717,750 | |||||||||||||
| 705,000 | #,L | Duane Reade, Inc., 9.750%, due 08/01/11 | 669,750 | ||||||||||||
| 1,105,000 | L | Gap, Inc., 10.300%, due 12/15/08 | 1,359,150 | ||||||||||||
| 1,560,000 | L | General Nutrition Centers, Inc., 8.500%, due 12/01/10 | 1,602,900 | ||||||||||||
| 1,645,000 | JC Penney Co., Inc., 8.000%, due 03/01/10 | 1,881,468 | |||||||||||||
| 700,000 | Rite Aid Corp., 8.125%, due 05/01/10 | 738,500 | |||||||||||||
| 1,120,000 | Star Gas Finance Co., 10.250%, due 02/15/13 | 1,232,000 | |||||||||||||
| 10,898,725 | |||||||||||||||
| Semiconductors: 0.1% | |||||||||||||||
| 207,000 | ON Semiconductor Corp., 13.000%, due 05/15/08 | 232,875 | |||||||||||||
| 232,875 | |||||||||||||||
| Telecommunications: 7.7% | |||||||||||||||
| 1,902,000 | L | American Tower Corp., 9.375%, due 02/01/09 | 2,025,629 | ||||||||||||
| 1,200,000 | American Towers, Inc., 7.250%, due 12/01/11 | 1,253,999 | |||||||||||||
| 280,000 | # | Centennial Communications Corp., 8.125%, due 02/01/14 | 268,450 | ||||||||||||
| 680,000 | Centennial Communications Corp., 10.125%, due 06/15/13 | 719,100 | |||||||||||||
| 530,000 | L | Cincinnati Bell, Inc., 7.250%, due 07/15/13 | 512,775 | ||||||||||||
| 345,000 | L | Citizens Communications Co., 7.625%, due 08/15/08 | 363,975 | ||||||||||||
| 865,000 | L | Crown Castle Intl. Corp., 7.500%, due 12/01/13 | 910,413 | ||||||||||||
| 450,000 | L | Crown Castle Intl. Corp., 9.375%, due 08/01/11 | 519,750 | ||||||||||||
| 865,000 | L | Crown Castle Intl. Corp., 10.750%, due 08/01/11 | 966,638 | ||||||||||||
| 3,600,000 | +,I,**,X | ICG Services, Inc., 0.000%, due 02/15/08 | 4 | ||||||||||||
| 370,000 | @@,# | Inmarsat Finance PLC, 7.625%, due 06/30/12 | 369,075 | ||||||||||||
| 795,000 | Insight Capital, Inc., 10.500%, due 11/01/10 | 874,500 | |||||||||||||
| 255,000 | L | Lucent Technologies, Inc., 5.500%, due 11/15/08 | 256,275 | ||||||||||||
| 590,000 | L,S | Lucent Technologies, Inc., 7.250%, due 07/15/06 | 628,350 | ||||||||||||
| 175,000 | MetroPCS, Inc., 10.750%, due 10/01/11 | 189,000 | |||||||||||||
| 5,000 | Nextel Communications, Inc, 6.875%, due 10/31/13 | 5,225 | |||||||||||||
| 1,785,000 | Nextel Communications, Inc., 7.375%, due 08/01/15 | 1,927,799 | |||||||||||||
| 320,000 | L | Nextel Partners, Inc., 8.125%, due 07/01/11 | 340,800 | ||||||||||||
| Principal Amount | Value | ||||||||||||||
| $ | 555,000 | Nextel Partners, Inc., 12.500%, due 11/15/09 | $ | 643,800 | |||||||||||
| 645,000 | #,L | PanAmSat Corp., 9.000%, due 08/15/14 | 674,025 | ||||||||||||
| 350,000 | Qwest Capital Funding, Inc., 7.750%, due 08/15/06 | 353,063 | |||||||||||||
| 225,000 | # | Qwest Corp., 7.875%, due 09/01/11 | 234,563 | ||||||||||||
| 200,000 | # | Qwest Corp., 9.125%, due 03/15/12 | 221,000 | ||||||||||||
| 995,000 | #,L | Qwest Services Corp., 13.500%, due 12/15/07 | 1,136,787 | ||||||||||||
| 614,000 | # | Qwest Services Corp., 14.000%, due 12/15/10 | 719,915 | ||||||||||||
| 365,000 | @@ | Rogers Wireless Communications, Inc., 9.625%, due 05/01/11 | 408,800 | ||||||||||||
| 315,000 | # | Rural Cellular Corp., 8.250%, due 03/15/12 | 322,088 | ||||||||||||
| 465,000 | L | SBA Communications Corp., 2.860%, due 12/15/11 | 378,975 | ||||||||||||
| 345,000 | Spectrasite, Inc., 8.250%, due 05/15/10 | 372,600 | |||||||||||||
| 885,000 | Western Wireless Corp., 9.250%, due 07/15/13 | 907,125 | |||||||||||||
| 6,250,000 | I,**,X | WinStar Communications, Inc., 12.750%, due 04/15/10 | 625 | ||||||||||||
| 18,505,123 | |||||||||||||||
| Total Corporate Bonds/Notes (Cost $229,780,531) | 231,388,677 | ||||||||||||||
| Shares | Value | ||||||||||||||
| COMMON STOCK: 0.0% | |||||||||||||||
| Diversified Financial Services: 0.0% | |||||||||||||||
| 17,906 | I,##,X | North Atlantic Trading Co. | 18 | ||||||||||||
| 18 | |||||||||||||||
| Packaging and Containers: 0.0% | |||||||||||||||
| 100,000 | I,X | Russell-Stanley Holdings, Inc. | 10 | ||||||||||||
| 10 | |||||||||||||||
| Telecommunications: 0.0% | |||||||||||||||
| 61,806 | I,**,X | Adelphia Business Solutions | 6 | ||||||||||||
| 132 | Completel Europe NV | 4,236 | |||||||||||||
| 1,481 | ICG Communications, Inc. | 1,038 | |||||||||||||
| 483,445 | I,X | International Wireless Communications Holdings, Inc. | 48 | ||||||||||||
| 2,350 | I,X | Jordan Telecommunications | 65,511 | ||||||||||||
| 15 | Mpower Holding Corp. | 19 | |||||||||||||
| 70,858 | |||||||||||||||
| Total Common Stock (Cost $8,965,004) | 70,886 | ||||||||||||||
| WARRANT: 0.0% | |||||||||||||||
| 490 | American Tower Corp. | 92,364 | |||||||||||||
| 92,950 | I,X | Comforce Corp. | 930 | ||||||||||||
| 3,100 | #,I | Dayton Superior Corp. | 31 | ||||||||||||
| 6,600 | #,I,X | ICG Communications, Inc. | 1 | ||||||||||||
| Total Warrants (Cost $40,726) | 93,326 | ||||||||||||||
| Total Long-Term Investments (Cost $238,786,261) | 231,552,889 | ||||||||||||||
See Accompanying Notes to Financial Statements
70
PORTFOLIO OF INVESTMENTS
ING HIGH YIELD OPPORTUNITY FUND as of September 30, 2004 (Unaudited) (continued)
| Principal Amount | Value | ||||||||||||||||||
| SHORT-TERM INVESTMENTS: 24.5% | |||||||||||||||||||
| Securities Lending CollateralCC: 22.6% | |||||||||||||||||||
| $ | 53,825,247 | The Bank of New York Institutional Cash Reserves Fund | $ | 53,825,247 | |||||||||||||||
| Total Securities Lending Collateral (Cost $53,825,247) | 53,825,247 | ||||||||||||||||||
| Repurchase Agreement: 1.9% | |||||||||||||||||||
| 4,490,000 | S | Morgan Stanley Repurchase Agreement dated 09/30/04, 1.850% due 10/01/04, $4,490,231 to be received upon repurchase (Collateralized by $4,310,000 Federal Home Loan Bank, 5.375%, Market value plus accrued interest $4,581,385, due 05/15/06) | 4,490,000 | ||||||||||||||||
| Total Repurchase Agreement (Cost $4,490,000) | 4,490,000 | ||||||||||||||||||
| Total Short-Term Investments (Cost $58,315,247) | 58,315,247 | ||||||||||||||||||
| Total Investments in Securities (Cost $297,101,508)* | 121.4 | % | $289,868,136 | ||||||||||||||||
| Other Assets and Liabilities-Net | (21.4 | ) | (51,185,350) | ||||||||||||||||
| Net Assets | 100.0 | % | $ | 238,682,786 | |||||||||||||||
@ Non-income producing security
@@ Foreign issuer
STRIP Separate Trading of Registered Interest and Principal of Securities
+ Step-up basis bonds. Interest rates shown reflect current and future coupon rates.
# Securities with purchases pursuant to Rule 144A, under the Securities Act of 1933 and may not be resold subject to that rule except to qualified institutional buyers. These securities have been determined to be liquid under the guidelines established by the Funds' Board of Directors/Trustees.
## Illiquid and restricted securities
cc Securities purchased with cash collateral for securities loaned.
S Segregated securities for futures, when-issued or delayed delivery securities held at September 30, 2004.
I Illiquid security
L Loaned security, a portion or all of the security is on loan at September 30, 2004.
** Defaulted security
X Fair value determined by ING Funds Valuation Committee appointed by the Funds' Board of Directors/Trustees.
* Cost for federal income tax purposes is $297,710,932. Net unrealized depreciation consists of:
| Gross Unrealized Appreciation | $ | 10,438,533 | |||||
| Gross Unrealized Depreciation | (18,281,329 | ) | |||||
| Net Unrealized Depreciation | $ | (7,842,796 | ) | ||||
See Accompanying Notes to Financial Statements
71
PORTFOLIO OF INVESTMENTS
ING INTERMEDIATE BOND FUND as of September 30, 2004 (Unaudited)
| Principal Amount | Value | ||||||||||||||
| CORPORATE BONDS/NOTES: 25.7% | |||||||||||||||
| Airlines: 0.3% | |||||||||||||||
| $ | 430,000 | American Airlines, Inc., 7.250%, due 02/05/09 | $ | 397,750 | |||||||||||
| 1,846,000 | American Airlines, Inc., 7.324%, due 10/15/09 | 1,463,437 | |||||||||||||
| 1,861,187 | |||||||||||||||
| Auto Manufacturers: 0.3% | |||||||||||||||
| 473,000 | L | Ford Motor Co., 6.625%, due 10/01/28 | 429,431 | ||||||||||||
| 1,069,000 | General Motors Corp., 8.375%, due 07/15/33 | 1,138,237 | |||||||||||||
| 1,567,668 | |||||||||||||||
| Banks: 5.4% | |||||||||||||||
| 660,000 | Australia & New Zealand Banking Group Ltd., 1.494%, due 10/29/49 | 568,003 | |||||||||||||
| 1,073,000 | @@,# | Banco Bradesco SA/Cayman Islands, 8.750%, due 10/24/13 | 1,121,285 | ||||||||||||
| 2,421,000 | @@,L | Banco Santander Chile SA, 7.375%, due 07/18/12 | 2,772,873 | ||||||||||||
| 490,000 | Bank of Nova Scotia, 2.115%, due 08/31/85 | 409,156 | |||||||||||||
| 1,136,000 | BankAmerica Capital II, 8.000%, due 12/15/26 | 1,267,549 | |||||||||||||
| 997,000 | @@,# | Danske Bank A/S, 5.914%, due 12/29/49 | 1,050,596 | ||||||||||||
| 440,000 | Den Norske Bank ASA, 2.125%, due 08/29/49 | 364,650 | |||||||||||||
| 1,994,000 | # | Dresdner Funding Trust I, 8.151%, due 06/30/31 | 2,416,981 | ||||||||||||
| 1,198,000 | FBS Capital I, 8.090%, due 11/15/26 | 1,348,629 | |||||||||||||
| 1,059,000 | @@,#,L | HBOS Capital Funding LP, 6.071%, due 06/30/49 | 1,121,699 | ||||||||||||
| 1,590,000 | Lloyds TSB Bank PLC, 2.090%, due 08/29/49 | 1,380,455 | |||||||||||||
| 1,570,000 | Lloyds TSB Bank PLC, 2.188%, due 06/29/49 | 1,381,090 | |||||||||||||
| 1,614,000 | M&T Bank Corp., 3.850%, due 04/01/13 | 1,609,562 | |||||||||||||
| 1,142,000 | Mellon Capital I, 7.720%, due 12/01/26 | 1,270,226 | |||||||||||||
| 510,000 | National Australia Bank Ltd., 1.463%, due 10/29/49 | 439,059 | |||||||||||||
| 1,710,000 | @@ | National Westminster Bank PLC, 1.938%, due 11/29/49 | 1,455,882 | ||||||||||||
| 1,338,000 | #,L | Rabobank Capital Funding II, 5.260%, due 12/29/49 | 1,352,252 | ||||||||||||
| 1,640,000 | @@ | Royal Bank of Canada, 1.750%, due 06/29/85 | 1,415,755 | ||||||||||||
| 780,000 | @@ | Royal Bank of Scotland Group PLC, 2.063%, due 12/29/49 | 678,478 | ||||||||||||
| 420,000 | @@ | Societe Generale, 1.688%, due 11/29/49 | 354,928 | ||||||||||||
| 3,460,000 | @@ | Standard Chartered PLC, 1.800%, due 11/29/49 | 2,780,472 | ||||||||||||
| 2,470,000 | @@ | Standard Chartered PLC, 2.070%, due 12/29/49 | 1,982,175 | ||||||||||||
| 1,103,000 | Wells Fargo Capital I, 7.960%, due 12/15/26 | 1,253,023 | |||||||||||||
| Principal Amount | Value | ||||||||||||||
| $ | 590,000 | Westpac Banking Corp, 2.338%, due 09/29/49 | $ | 503,560 | |||||||||||
| 2,420,000 | # | Westpac Capital Trust IV, 5.256%, due 12/29/49 | 2,383,320 | ||||||||||||
| 32,681,658 | |||||||||||||||
| Beverages: 1.0% | |||||||||||||||
| 3,262,000 | @@ | Cia Brasileira de Bebidas, 8.750%, due 09/15/13 | 3,702,369 | ||||||||||||
| 217,000 | @@ | Cia Brasileira de Bebidas, 10.500%, due 12/15/11 | 268,538 | ||||||||||||
| 1,806,000 | # | Miller Brewing Co., 4.250%, due 08/15/08 | 1,837,504 | ||||||||||||
| 5,808,411 | |||||||||||||||
| Chemicals: 0.1% | |||||||||||||||
| 434,000 | L | Dow Chemical Co., 5.750%, due 11/15/09 | 466,257 | ||||||||||||
| 397,000 | @@,# | Sociedad Quimica y Minera de Chile SA, 7.700%, due 09/15/06 | 427,728 | ||||||||||||
| 893,985 | |||||||||||||||
| Diversified Financial Services: 4.1% | |||||||||||||||
| 434,000 | #,I,XX | Alpine III, 2.261%, due 08/16/14 | 434,000 | ||||||||||||
| 434,000 | #,I,XX | Alpine III, 2.661%, due 08/16/14 | 434,000 | ||||||||||||
| 276,000 | #,I,XX | Alpine III, 4.461%, due 08/16/14 | 276,000 | ||||||||||||
| 669,000 | #,I,XX | Alpine III, 7.711%, due 08/16/14 | 669,000 | ||||||||||||
| 339,471 | # | Arcel Finance Ltd., 5.984%, due 02/01/09 | 355,409 | ||||||||||||
| 901,000 | # | Arcel Finance Ltd., 6.361%, due 05/01/12 | 910,863 | ||||||||||||
| 512,000 | # | Arcel Finance Ltd., 7.048%, due 09/01/11 | 538,426 | ||||||||||||
| 1,508,000 | L | Boeing Capital Corp., 7.375%, due 09/27/10 | 1,754,183 | ||||||||||||
| 2,015,000 | @@,# | Brazilian Merchant Voucher Receivables Ltd., 5.911%, due 06/15/11 | 1,999,888 | ||||||||||||
| 1,153,000 | Citigroup Capital II, 7.750%, due 12/01/36 | 1,276,258 | |||||||||||||
| 1,135,000 | # | Corestates Capital Trust I, 8.000%, due 12/15/26 | 1,259,546 | ||||||||||||
| 2,066,000 | # | Farmers Exchange Capital, 7.200%, due 07/15/48 | 2,097,797 | ||||||||||||
| 570,000 | Financiere CSFB NV, 2.125%, due 03/29/49 | 465,397 | |||||||||||||
| 1,271,000 | General Motors Acceptance Corp., 7.750%, due 01/19/10 | 1,398,174 | |||||||||||||
| 7,367 | # | Hollinger Participation Trust, 0.000%, due 11/15/10 | 8,454 | ||||||||||||
| 611,000 | # | HVB Funding Trust III, 9.000%, due 10/22/31 | 788,584 | ||||||||||||
| 662,000 | JPM Capital Trust I, 7.540%, due 01/15/27 | 708,492 | |||||||||||||
| 522,000 | JPM Capital Trust II, 7.950%, due 02/01/27 | 582,855 | |||||||||||||
| 3,559,000 | # | Mangrove Bay Pass-Through Trust, 6.102%, due 07/15/33 | 3,634,315 | ||||||||||||
See Accompanying Notes to Financial Statements
72
PORTFOLIO OF INVESTMENTS
ING INTERMEDIATE BOND FUND as of September 30, 2004 (Unaudited) (continued)
| Principal Amount | Value | ||||||||||||||
| Diversified Financial Services (continued) | |||||||||||||||
| $ | 1,285,084 | @@,# | PF Export Receivables Master Trust, 3.748%, due 06/01/13 | $ | 1,260,661 | ||||||||||
| 1,714,036 | @@,# | PF Export Receivables Master Trust, 6.436%, due 06/01/15 | 1,721,021 | ||||||||||||
| 2,058,000 | L | UFJ Finance Aruba AEC, 8.750%, due 11/29/49 | 2,274,437 | ||||||||||||
| 15,000 | Universal City Development Partners, 11.750%, due 04/01/10 | 17,550 | |||||||||||||
| 24,865,310 | |||||||||||||||
| Electric: 5.0% | |||||||||||||||
| 1,057,000 | @@,#,L | AES Gener SA, 7.500%, due 03/25/14 | 1,067,570 | ||||||||||||
| 1,517,715 | # | Allegheny Energy Supply Statutory Trust 2001, 10.250%, due 11/15/07 | 1,745,372 | ||||||||||||
| 160,042 | # | Allegheny Energy Supply Statutory Trust 2001, 13.000%, due 11/15/07 | 168,844 | ||||||||||||
| 1,854,160 | CE Generation LLC, 7.416%, due 12/15/18 | 1,925,332 | |||||||||||||
| 1,839,000 | L | Consumers Energy Co., 4.250%, due 04/15/08 | 1,871,841 | ||||||||||||
| 1,444,000 | DTE Energy Co., 2.740%, due 06/01/07 | 1,444,637 | |||||||||||||
| 2,635,000 | @@,L | Empresa Nacional de Electricidad SA/Chile, 7.750%, due 07/15/08 | 2,887,989 | ||||||||||||
| 3,551,000 | Enserch Capital I, 2.950%, due 07/01/28 | 3,499,318 | |||||||||||||
| 2,110,000 | Enterprise Capital Trust II, 3.195%, due 06/30/28 | 2,005,211 | |||||||||||||
| 1,511,000 | # | Monongahela Power Co., 6.700%, due 06/15/14 | 1,645,085 | ||||||||||||
| 2,384,000 | Ohio Power Co., 6.375%, due 07/15/33 | 2,467,173 | |||||||||||||
| 4,105,000 | PG&E Corp., 6.875%, due 07/15/08 | 4,464,187 | |||||||||||||
| 209,472 | # | Power Contract Financing LLC, 5.200%, due 02/01/06 | 212,526 | ||||||||||||
| 1,068,000 | # | Power Contract Financing LLC, 6.256%, due 02/01/10 | 1,113,074 | ||||||||||||
| 384,092 | PPL Montana LLC, 8.903%, due 07/02/20 | 426,583 | |||||||||||||
| 896,000 | Sithe/Independence Funding, 9.000%, due 12/30/13 | 1,017,591 | |||||||||||||
| 623,000 | # | Tenaska Virginia Partners LP, 6.119%, due 03/30/24 | 653,253 | ||||||||||||
| 1,301,000 | TXU Corp., 4.446%, due 11/16/06 | 1,326,865 | |||||||||||||
| 29,942,451 | |||||||||||||||
| Engineering and Construction: 0.1% | |||||||||||||||
| 970,000 | @@ | Dong Ah Construction, 2.160%, due 12/29/49 | 830,459 | ||||||||||||
| 830,459 | |||||||||||||||
| Food: 0.9% | |||||||||||||||
| 831,000 | Kroger Co., 7.250%, due 06/01/09 | 938,041 | |||||||||||||
| Principal Amount | Value | ||||||||||||||
| $ | 1,478,000 | Safeway, Inc., 4.800%, due 07/16/07 | $ | 1,520,291 | |||||||||||
| 987,000 | L | Supervalu, Inc., 7.875%, due 08/01/09 | 1,133,474 | ||||||||||||
| 1,947,000 | Tyson Foods, Inc., 7.250%, due 10/01/06 | 2,088,972 | |||||||||||||
| 5,680,778 | |||||||||||||||
| Gas: 0.2% | |||||||||||||||
| 1,343,000 | # | Williams Gas Pipelines Central, Inc., 7.375%, due 11/15/06 | 1,452,119 | ||||||||||||
| 1,452,119 | |||||||||||||||
| Home Builders: 0.3% | |||||||||||||||
| 1,579,000 | DR Horton, Inc., 5.625%, due 09/15/14 | 1,579,000 | |||||||||||||
| 54,000 | Technical Olympic USA, Inc., 9.000%, due 07/01/10 | 59,400 | |||||||||||||
| 1,638,400 | |||||||||||||||
| Insurance: 0.7% | |||||||||||||||
| 380,000 | # | Farmers Insurance Exchange, 6.000%, due 08/01/14 | 387,168 | ||||||||||||
| 977,000 | # | Farmers Insurance Exchange, 8.625%, due 05/01/24 | 1,156,886 | ||||||||||||
| 1,244,000 | # | Monumental Global Funding II, 3.850%, due 03/03/08 | 1,264,623 | ||||||||||||
| 1,083,000 | Prudential Financial, Inc., 4.104%, due 11/15/06 | 1,101,570 | |||||||||||||
| 3,910,247 | |||||||||||||||
| Machinery-Diversified: 0.5% | |||||||||||||||
| 3,200,000 | @@ | Inficon Holding AG, 1.971%, due 06/29/49 | 2,733,251 | ||||||||||||
| 2,733,251 | |||||||||||||||
| Media: 0.4% | |||||||||||||||
| 64,000 | L | Comcast Cable Communications, 7.125%, due 06/15/13 | 72,504 | ||||||||||||
| 1,029,000 | Time Warner Entertainment Co. LP, 8.875%, due 10/01/12 | 1,267,276 | |||||||||||||
| 691,000 | L | Time Warner, Inc., 6.875%, due 05/01/12 | 772,085 | ||||||||||||
| 2,111,865 | |||||||||||||||
| Mining: 0.5% | |||||||||||||||
| 1,068,000 | @@,# | Corp Nacional del Cobre de Chile, 5.500%, due 10/15/13 | 1,114,361 | ||||||||||||
| 1,684,000 | Vale Overseas Ltd., 8.625%, due 03/08/07 | 1,869,240 | |||||||||||||
| 2,983,601 | |||||||||||||||
| Miscellaneous Manufacturing: 0.0% | |||||||||||||||
| 5,000 | SPX Corp., 7.500%, due 01/01/13 | 5,106 | |||||||||||||
| 5,106 | |||||||||||||||
| Multi-National: 0.5% | |||||||||||||||
| 2,576,000 | @@ | Corp Andina de Fomento CAF, 6.875%, due 03/15/12 | 2,902,212 | ||||||||||||
| 2,902,212 | |||||||||||||||
See Accompanying Notes to Financial Statements
73
PORTFOLIO OF INVESTMENTS
ING INTERMEDIATE BOND FUND as of September 30, 2004 (Unaudited) (continued)
| Principal Amount | Value | ||||||||||||||
| Oil and Gas: 2.0% | |||||||||||||||
| $ | 1,099,000 | L | Amerada Hess Corp., 6.650%, due 08/15/11 | $ | 1,215,094 | ||||||||||
| 1,586,000 | Amerada Hess Corp., 7.875%, due 10/01/29 | 1,839,457 | |||||||||||||
| 1,518,000 | @@,# | Empresa Nacional de Petroleo, 4.875%, due 03/15/14 | 1,499,427 | ||||||||||||
| 20,000 | L | Energy Partners Ltd., 8.750%, due 08/01/10 | 21,800 | ||||||||||||
| 1,478,000 | @@,#,L | Gazprom Intl. SA, 7.201%, due 02/01/20 | 1,500,170 | ||||||||||||
| 1,110,000 | @@,# | Morgan Stanley Bank AG for OAO Gazprom, 9.625%, due 03/01/13 | 1,237,650 | ||||||||||||
| 3,227,000 | #,L | Pemex Project Funding Master Trust, 3.180%, due 06/15/10 | 3,268,952 | ||||||||||||
| 905,000 | Valero Energy Corp., 8.750%, due 06/15/30 | 1,183,183 | |||||||||||||
| 11,765,733 | |||||||||||||||
| Packaging and Containers: 0.5% | |||||||||||||||
| 642,000 | # | Sealed Air Corp., 5.375%, due 04/15/08 | 670,866 | ||||||||||||
| 1,843,000 | # | Sealed Air Corp., 6.950%, due 05/15/09 | 2,043,174 | ||||||||||||
| 2,714,040 | |||||||||||||||
| Pipelines: 0.0% | |||||||||||||||
| 18,000 | GulfTerra Energy Finance Corp., 10.625%, due 12/01/12 | 22,680 | |||||||||||||
| 20,000 | Transcontinental Gas Pipe LN, 8.875%, due 07/15/12 | 24,425 | |||||||||||||
| 47,105 | |||||||||||||||
| Real Estate: 0.6% | |||||||||||||||
| 1,636,000 | EOP Operating LP, 7.750%, due 11/15/07 | 1,828,072 | |||||||||||||
| 209,000 | Liberty Property-LP, 6.375%, due 08/15/12 | 227,465 | |||||||||||||
| 163,000 | Liberty Property-LP, 6.950%, due 12/01/06 | 176,394 | |||||||||||||
| 1,406,000 | Liberty Property-LP, 7.750%, due 04/15/09 | 1,607,996 | |||||||||||||
| 3,839,927 | |||||||||||||||
| Real Estate Investment Trusts: 0.8% | |||||||||||||||
| 657,000 | Rouse Co., 3.625%, due 03/15/09 | 614,036 | |||||||||||||
| 657,000 | Rouse Co., 5.375%, due 11/26/13 | 627,707 | |||||||||||||
| 1,205,000 | Simon Property Group LP, 4.875%, due 03/18/10 | 1,229,405 | |||||||||||||
| 2,134,000 | Simon Property Group LP, 6.375%, due 11/15/07 | 2,309,560 | |||||||||||||
| 4,780,708 | |||||||||||||||
| Retail: 0.0% | |||||||||||||||
| 39,000 | Dollar General Corp., 8.625%, due 06/15/10 | 45,045 | |||||||||||||
| 45,045 | |||||||||||||||
| Principal Amount | Value | ||||||||||||||
| Savings and Loans: 0.2% | |||||||||||||||
| $ | 1,104,000 | Great Western Financial, 8.206%, due 02/01/27 | $ | 1,250,902 | |||||||||||
| 1,250,902 | |||||||||||||||
| Telecommunications: 1.2% | |||||||||||||||
| 1,480,000 | BellSouth Corp., 4.200%, due 09/15/09 | 1,490,157 | |||||||||||||
| 1,439,000 | @@ | Cia de Telecomunicaciones de Chile SA, 7.625%, due 07/15/06 | 1,532,762 | ||||||||||||
| 819,000 | + | Sprint Capital Corp., 4.780%, due 08/17/06 | 842,363 | ||||||||||||
| 628,000 | Sprint Capital Corp., 8.375%, due 03/15/12 | 761,684 | |||||||||||||
| 1,415,000 | Verizon Florida, Inc., 6.125%, due 01/15/13 | 1,512,403 | |||||||||||||
| 1,177,000 | Verizon Virginia, Inc., 4.625%, due 03/15/13 | 1,151,303 | |||||||||||||
| 7,290,672 | |||||||||||||||
| Transportation: 0.1% | |||||||||||||||
| 853,000 | @@,# | MISC Capital Ltd., 5.000%, due 07/01/09 | 881,475 | ||||||||||||
| 881,475 | |||||||||||||||
| Total Corporate Bonds/Notes (Cost $151,173,979) | 154,484,315 | ||||||||||||||
| U.S. GOVERNMENT AGENCY OBLIGATIONS: 28.6% | |||||||||||||||
| Federal Home Loan Mortgage Corporation: 9.1% | |||||||||||||||
| 1,306,797 | 1.740%, due 05/25/31 | 1,307,363 | |||||||||||||
| 992,722 | 1.755%, due 04/25/30 | 993,235 | |||||||||||||
| 459,262 | 1.765%, due 01/25/32 | 459,763 | |||||||||||||
| 1,033,538 | 1.950%, due 02/15/32 | 1,035,609 | |||||||||||||
| 2,248,613 | 2.250%, due 04/15/32 | 2,259,751 | |||||||||||||
| 11,845,000 | 2.700%, due 03/16/07 | 11,769,252 | |||||||||||||
| 5,160,000 | 2.750%, due 02/09/07 | 5,139,716 | |||||||||||||
| 3,534,796 | 4.500%, due 04/01/14 | 3,544,035 | |||||||||||||
| 2,000,000 | 5.500%, due 11/15/18 | 2,061,250 | |||||||||||||
| 2,071,000 | 5.875%, due 03/21/11 | 2,251,247 | |||||||||||||
| 3,216,000 | 6.000%, due 01/15/28 | 3,319,461 | |||||||||||||
| 3,669,423 | 6.000%, due 01/15/29 | 3,819,997 | |||||||||||||
| 3,151,436 | 6.000%, due 01/15/29 | 3,282,392 | |||||||||||||
| 2,277,000 | 6.000%, due 01/15/29 | 2,383,742 | |||||||||||||
| 7,465,000 | 6.500%, due 10/15/34 | 7,831,248 | |||||||||||||
| 3,309,000 | 7.000%, due 10/15/34 | 3,509,608 | |||||||||||||
| 16,956 | 7.500%, due 11/01/28 | 18,232 | |||||||||||||
| 54,985,901 | |||||||||||||||
| Federal National Mortgage Association: 19.2% | |||||||||||||||
| 250,240 | 1.815%, due 11/25/32 | 249,461 | |||||||||||||
| 902,019 | 1.900%, due 10/25/33 | 905,906 | |||||||||||||
| 828,720 | 2.000%, due 04/18/28 | 833,297 | |||||||||||||
| 269,480 | 2.065%, due 12/25/29 | 270,408 | |||||||||||||
| 2,669,860 | 2.090%, due 08/25/33 | 2,682,362 | |||||||||||||
| 782,357 | 2.165%, due 01/25/32 | 781,580 | |||||||||||||
| 1,037,187 | 2.859%, due 12/26/29 | 1,040,585 | |||||||||||||
| 6,050,000 | 2.875%, due 05/19/08 | 5,916,422 | |||||||||||||
| 2,489,000 | 4.500%, due 10/15/18 | 2,480,443 | |||||||||||||
| 2,187,000 | 4.750%, due 12/25/42 | 2,205,536 | |||||||||||||
| 41,165,000 | 5.000%, due 11/15/34 | 40,624,708 | |||||||||||||
| 14,650,000 | 5.000%, due 11/01/18 | 14,846,867 | |||||||||||||
See Accompanying Notes to Financial Statements
74
PORTFOLIO OF INVESTMENTS
ING INTERMEDIATE BOND FUND as of September 30, 2004 (Unaudited) (continued)
| Principal Amount | Value | ||||||||||||||
| Federal National Mortgage Association (continued) | |||||||||||||||
| $ | 2,755,000 | 5.250%, due 08/01/12 | $ | 2,867,746 | |||||||||||
| 2,679,980 | 5.500%, due 11/15/18 | 2,762,893 | |||||||||||||
| 6,172,975 | 5.898%, due 02/17/29 | 636,171 | |||||||||||||
| 2,290,975 | 6.000%, due 04/25/31 | 2,384,718 | |||||||||||||
| 1,854,594 | 6.000%, due 08/01/33 | 1,922,757 | |||||||||||||
| 1,269,000 | 6.000%, due 10/15/34 | 1,312,622 | |||||||||||||
| 114,838 | 6.000%, due 08/01/16 | 120,534 | |||||||||||||
| 10,100 | 6.000%, due 12/01/16 | 10,601 | |||||||||||||
| 358,644 | 6.000%, due 03/01/17 | 376,431 | |||||||||||||
| 3,241,295 | 6.000%, due 09/01/17 | 3,401,929 | |||||||||||||
| 231,077 | 6.000%, due 11/01/17 | 242,537 | |||||||||||||
| 3,702,274 | 6.000%, due 07/25/29 | 3,850,417 | |||||||||||||
| 1,573,193 | 6.000%, due 07/25/29 | 1,636,631 | |||||||||||||
| 940,632 | 6.500%, due 04/01/30 | 988,801 | |||||||||||||
| 4,736 | 6.500%, due 06/01/31 | 4,973 | |||||||||||||
| 1,188,224 | 6.500%, due 07/01/31 | 1,250,654 | |||||||||||||
| 21,272 | 6.500%, due 09/01/31 | 22,335 | |||||||||||||
| 3,897 | 6.500%, due 09/01/31 | 4,092 | |||||||||||||
| 6,619,000 | 6.500%, due 10/01/31 | 6,943,741 | |||||||||||||
| 434,136 | 6.500%, due 11/01/31 | 455,826 | |||||||||||||
| 267,427 | 6.500%, due 04/01/32 | 280,793 | |||||||||||||
| 103,594 | 6.500%, due 07/01/32 | 108,771 | |||||||||||||
| 135,244 | 6.500%, due 08/01/32 | 142,003 | |||||||||||||
| 128,963 | 6.500%, due 08/01/32 | 135,408 | |||||||||||||
| 23,143 | 6.500%, due 08/01/32 | 24,299 | |||||||||||||
| 324,405 | 6.500%, due 11/01/32 | 340,618 | |||||||||||||
| 358,436 | 6.500%, due 01/01/33 | 376,350 | |||||||||||||
| 266,694 | 6.500%, due 02/01/33 | 280,068 | |||||||||||||
| 1,363,324 | 6.500%, due 12/01/33 | 1,431,690 | |||||||||||||
| 86,634 | 6.500%, due 07/01/29 | 91,070 | |||||||||||||
| 353,098 | 6.500%, due 08/01/29 | 371,180 | |||||||||||||
| 2,515,000 | 6.625%, due 11/15/10 | 2,864,193 | |||||||||||||
| 34,777 | 7.000%, due 01/01/30 | 36,946 | |||||||||||||
| 168,004 | 7.000%, due 01/01/30 | 178,264 | |||||||||||||
| 12,008 | 7.000%, due 03/01/30 | 12,757 | |||||||||||||
| 445,074 | 7.000%, due 06/01/31 | 473,091 | |||||||||||||
| 4,194 | 7.500%, due 09/01/30 | 4,496 | |||||||||||||
| 16,935 | 7.500%, due 10/01/30 | 18,156 | |||||||||||||
| 21,209 | 7.500%, due 10/01/30 | 22,739 | |||||||||||||
| 9,502 | 7.500%, due 11/01/30 | 10,188 | |||||||||||||
| 162,388 | 7.500%, due 02/01/32 | 174,155 | |||||||||||||
| 1,288,285 | 7.500%, due 06/25/32 | 1,394,853 | |||||||||||||
| 850,607 | 7.500%, due 12/25/41 | 922,369 | |||||||||||||
| 1,693,003 | 7.500%, due 01/25/48 | 1,829,629 | |||||||||||||
| 115,558,070 | |||||||||||||||
| Government National Mortgage Association: 0.3% | |||||||||||||||
| 20,570 | 4.375%, due 04/20/28 | 20,836 | |||||||||||||
| 1,744,011 | 6.471%, due 06/16/31 | 205,895 | |||||||||||||
| 6,787 | 6.500%, due 03/15/31 | 7,171 | |||||||||||||
| 47,473 | 6.500%, due 08/15/31 | 50,161 | |||||||||||||
| 101,150 | 6.500%, due 10/15/31 | 106,878 | |||||||||||||
| 55,732 | 6.500%, due 11/15/31 | 58,887 | |||||||||||||
| 55,037 | 6.500%, due 07/15/32 | 58,144 | |||||||||||||
| 404,041 | 6.500%, due 09/15/32 | 426,852 | |||||||||||||
| 69,464 | 7.000%, due 05/15/32 | 74,114 | |||||||||||||
| 98,736 | 7.000%, due 04/15/26 | 105,659 | |||||||||||||
| 926 | 7.500%, due 11/15/30 | 998 | |||||||||||||
| 45,458 | 7.500%, due 12/15/30 | 48,995 | |||||||||||||
| 89,688 | 7.500%, due 12/15/31 | 96,660 | |||||||||||||
| 96,115 | 7.500%, due 05/15/32 | 103,545 | |||||||||||||
| 66,914 | 7.500%, due 05/15/32 | 72,087 | |||||||||||||
| Principal Amount | Value | ||||||||||||||
| $ | 158,700 | 7.500%, due 12/15/22 | $ | 171,900 | |||||||||||
| 16,341 | 7.500%, due 10/15/26 | 17,654 | |||||||||||||
| 82,443 | 7.500%, due 07/15/29 | 88,877 | |||||||||||||
| 1,715,313 | |||||||||||||||
| Total U.S. Government Agency Obligations (Cost $172,089,579) | 172,259,284 | ||||||||||||||
| U.S. TREASURY OBLIGATIONS: 20.8% | |||||||||||||||
| U.S. Treasury Bonds: 10.0% | |||||||||||||||
| 9,745,000 | L | 4.250%, due 08/15/14 | 9,850,071 | ||||||||||||
| 21,136,000 | L | 5.375%, due 02/15/31 | 22,648,555 | ||||||||||||
| 8,493,000 | L | 6.250%, due 08/15/23 | 9,920,223 | ||||||||||||
| 7,109,000 | 10.375%, due 11/15/12 | 8,660,767 | |||||||||||||
| 6,152,000 | 13.250%, due 05/15/14 | 8,747,375 | |||||||||||||
| 59,826,991 | |||||||||||||||
| U.S. Treasury Notes: 10.1% | |||||||||||||||
| 34,993,000 | L | 1.625%, due 01/31/05 | 34,979,352 | ||||||||||||
| 11,130,000 | L | 2.375%, due 08/31/06 | 11,092,180 | ||||||||||||
| 4,500,000 | L | 2.750%, due 08/15/07 | 4,489,106 | ||||||||||||
| 3,816,000 | S | 3.250%, due 08/15/08 | 3,835,233 | ||||||||||||
| 6,694,000 | L | 3.375%, due 09/15/09 | 6,697,401 | ||||||||||||
| 61,093,272 | |||||||||||||||
| U.S. Treasury STRIP: 0.7% | |||||||||||||||
| 6,710,000 | 2.090%, due 05/15/16 | 3,928,336 | |||||||||||||
| 3,928,336 | |||||||||||||||
| Total U.S. Treasury Obligations (Cost $126,153,234) | 124,848,599 | ||||||||||||||
| ASSET-BACKED SECURITIES: 11.0% | |||||||||||||||
| Automobile Asset-Backed Securities: 1.1% | |||||||||||||||
| 2,500,000 | Capital Auto Receivables Asset Trust, 2.750%, due 04/16/07 | 2,505,497 | |||||||||||||
| 200,000 | Capital One Auto Finance Trust, 3.180%, due 09/15/10 | 199,768 | |||||||||||||
| 1,300,000 | Household Automotive Trust, 2.310%, due 04/17/08 | 1,296,473 | |||||||||||||
| 1,250,000 | Nissan Auto Receivables Owner Trust, 2.050%, due 03/16/09 | 1,225,619 | |||||||||||||
| 1,370,000 | L | Nissan Auto Receivables Owner Trust, 2.610%, due 07/15/08 | 1,364,927 | ||||||||||||
| 200,000 | USAA Auto Owner Trust, 2.040%, due 02/16/10 | 197,472 | |||||||||||||
| 6,789,756 | |||||||||||||||
| Commercial Mortgage-Backed Securities: 5.3% | |||||||||||||||
| 1,527,000 | Bear Stearns Commercial Mortgage Securities, 4.170%, due 01/12/41 | 1,545,397 | |||||||||||||
| 672,000 | L | Capco America Securitization Corp., 6.260%, due 10/15/30 | 732,860 | ||||||||||||
| 1,950,000 | Chase Manhattan Bank-First Union National Bank, 7.439%, due 08/15/31 | 2,233,335 | |||||||||||||
See Accompanying Notes to Financial Statements
75
PORTFOLIO OF INVESTMENTS
ING INTERMEDIATE BOND FUND as of September 30, 2004 (Unaudited) (continued)
| Principal Amount | Value | ||||||||||||||
| Commercial Mortgage-Backed Securities (continued) | |||||||||||||||
| $ | 1,810,000 | COMM, 3.600%, due 03/10/39 | $ | 1,794,142 | |||||||||||
| 1,052,838 | Credit Suisse First Boston Mortgage Securities Corp., 3.727%, due 03/15/35 | 1,043,289 | |||||||||||||
| 1,000,000 | DLJ Commercial Mortgage Corp, 6.460%, due 03/10/32 | 1,103,066 | |||||||||||||
| 688,000 | DLJ Commercial Mortgage Corp., 7.300%, due 06/10/32 | 783,704 | |||||||||||||
| 3,033,278 | GE Capital Commercial Mortgage Corp., 3.752%, due 07/10/39 | 3,053,227 | |||||||||||||
| 1,050,000 | GE Capital Commercial Mortgage Corp., 5.994%, due 12/10/35 | 1,136,906 | |||||||||||||
| 1,774,930 | JPMorgan Chase Commercial Mortgage Securities Corp., 4.275%, due 01/12/37 | 1,792,949 | |||||||||||||
| 2,960,000 | JPMorgan Chase Commercial Mortgage Securities Corp., 6.244%, due 04/15/35 | 3,194,011 | |||||||||||||
| 2,961,000 | LB-UBS Commercial Mortgage Trust, 6.226%, due 03/15/26 | 3,249,064 | |||||||||||||
| 1,703,000 | LB-UBS Commercial Mortgage Trust, 7.370%, due 08/15/26 | 1,970,736 | |||||||||||||
| 400,000 | Morgan Stanley Capital I, 7.020%, due 03/15/32 | 450,758 | |||||||||||||
| 2,960,000 | Mortgage Capital Funding, Inc., 6.663%, due 03/18/30 | 3,213,736 | |||||||||||||
| 4,089,485 | Prudential Commercial Mortgage Trust, 3.669%, due 02/11/36 | 4,046,120 | |||||||||||||
| 400,000 | Salomon Brothers Mortgage Securities VII, 7.520%, due 12/18/09 | 460,025 | |||||||||||||
| 31,803,325 | |||||||||||||||
| Credit Card Asset-Backed Securities: 0.9% | |||||||||||||||
| 560,000 | Bank One Issuance Trust, 4.540%, due 09/15/10 | 572,513 | |||||||||||||
| 530,000 | Capital One Master Trust, 4.900%, due 03/15/10 | 553,630 | |||||||||||||
| 800,000 | Citibank Credit Card Issuance Trust, 3.100%, due 03/10/10 | 791,707 | |||||||||||||
| 2,285,000 | Citibank Credit Card Issuance Trust, 5.650%, due 06/16/08 | 2,392,890 | |||||||||||||
| 1,020,000 | Fleet Credit Card Master Trust II, 2.400%, due 07/15/08 | 1,017,762 | |||||||||||||
| 5,328,502 | |||||||||||||||
| Home Equity Asset-Backed Securities: 3.3% | |||||||||||||||
| 1,199,716 | Argent Securities, Inc., 2.160%, due 03/25/34 | 1,200,126 | |||||||||||||
| 873,877 | Asset Backed Funding Certificates, 2.120%, due 11/25/33 | 874,231 | |||||||||||||
| 742,575 | XX | Bayview Financial Acquisition Trust, 2.340%, due 12/28/34 | 743,652 | ||||||||||||
| 1,146,878 | Centex Home Equity, 2.120%, due 01/25/34 | 1,148,672 | |||||||||||||
| Principal Amount | Value | ||||||||||||||
| $ | 4,851,000 | XX | GSAA Trust, 5.242%, due 05/25/35 | $ | 4,811,602 | ||||||||||
| 543,316 | Merrill Lynch Mortgage Investors, Inc., 2.200%, due 07/25/34 | 544,489 | |||||||||||||
| 716,773 | New Century Home Equity Loan Trust, 1.890%, due 06/20/31 | 717,588 | |||||||||||||
| 570,551 | New Century Home Equity Loan Trust, 1.895%, due 07/25/30 | 571,351 | |||||||||||||
| 3,795,785 | New Century Home Equity Loan Trust, 2.090%, due 04/25/34 | 3,798,156 | |||||||||||||
| 183,169 | Residential Asset Mortgage Products, Inc., 2.150%, due 06/25/33 | 182,937 | |||||||||||||
| 456,597 | Residential Asset Securities Corp., 1.845%, due 09/25/31 | 457,329 | |||||||||||||
| 740,585 | Residential Asset Securities Corp., 1.915%, due 06/25/32 | 742,634 | |||||||||||||
| 731,351 | Residential Asset Securities Corp., 2.150%, due 12/25/33 | 733,058 | |||||||||||||
| 762,000 | Residential Funding Mortgage Securities II, 3.450%, due 01/25/16 | 764,956 | |||||||||||||
| 2,300,000 | Saxon Asset Securities Trust, 3.960%, due 06/25/33 | 2,322,770 | |||||||||||||
| 19,613,551 | |||||||||||||||
| Other Asset-Backed Securities: 0.4% | |||||||||||||||
| 686,795 | Ameriquest Mortgage Securities, Inc., 2.140%, due 02/25/34 | 687,224 | |||||||||||||
| 182,605 | XX | Amortizing Residential Collateral Trust, 2.090%, due 05/25/32 | 182,491 | ||||||||||||
| 250,000 | Chase Funding Mortgage Loan Asset-Backed Certificates, 2.140%, due 07/25/33 | 250,289 | |||||||||||||
| 25,000 | Chase Funding Mortgage Loan Asset-Backed Certificates, 2.734%, due 09/25/24 | 24,919 | |||||||||||||
| 15,000 | Chase Funding Mortgage Loan Asset-Backed Certificates, 4.045%, due 05/25/33 | 15,183 | |||||||||||||
| 939,816 | Equity One ABS, Inc., 2.976%, due 09/25/33 | 940,606 | |||||||||||||
| 355,000 | Residential Asset Mortgage Products, Inc., 2.140%, due 02/25/30 | 353,196 | |||||||||||||
| 2,453,908 | |||||||||||||||
| Total Asset-Backed Securities (Cost $65,993,140) | 65,989,042 | ||||||||||||||
See Accompanying Notes to Financial Statements
76
PORTFOLIO OF INVESTMENTS
ING INTERMEDIATE BOND FUND as of September 30, 2004 (Unaudited) (continued)
| Principal Amount | Value | ||||||||||||||
| COLLATERALIZED MORTGAGE OBLIGATIONS: 20.1% | |||||||||||||||
| Agency Collateral CMO: 0.2% | |||||||||||||||
| $ | 1,208,759 | Vendee Mortgage Trust, 5.845%, due 09/15/23 | $ | 1,223,511 | |||||||||||
| 1,223,511 | |||||||||||||||
| Whole Loan Collateral PAC: 1.7% | |||||||||||||||
| 197,013 | Countrywide Alternative Loan Trust, 2.015%, due 02/25/33 | 197,117 | |||||||||||||
| 699,724 | GSR Mortgage Loan Trust, 2.240%, due 10/25/32 | 699,993 | |||||||||||||
| 1,122,850 | MASTR Alternative Loans Trust, 2.240%, due 11/25/33 | 1,123,031 | |||||||||||||
| 2,017,696 | MASTR Alternative Loans Trust, 8.500%, due 05/25/33 | 2,061,876 | |||||||||||||
| 1,032,253 | Residential Funding Mtg Sec I, 2.015%, due 11/25/17 | 1,029,065 | |||||||||||||
| 2,950,000 | Residential Funding Securities Corp., 4.750%, due 02/25/33 | 2,964,466 | |||||||||||||
| 823,577 | Residential Funding Securities Corp., 8.500%, due 05/25/33 | 901,880 | |||||||||||||
| 971,338 | Washington Mutual, 2.240%, due 03/25/34 | 971,945 | |||||||||||||
| 9,949,373 | |||||||||||||||
| Whole Loan Collateralized Mortgage Obligations: 18.0% | |||||||||||||||
| 678,532 | ABN Amro Mortgage Corp., 2.115%, due 03/25/18 | 679,959 | |||||||||||||
| 4,235,413 | Banc of America Funding Corp., 5.750%, due 09/20/34 | 4,382,880 | |||||||||||||
| 2,012,715 | Bank of America Alternative Loan Trust, 2.290%, due 12/25/33 | 2,015,978 | |||||||||||||
| 1,638,261 | Bank of America Alternative Loan Trust, 5.500%, due 02/25/33 | 1,678,558 | |||||||||||||
| 677,498 | Bank of America Mortgage Securities, 2.290%, due 12/25/33 | 678,461 | |||||||||||||
| 2,318,796 | Bank of America Mortgage Securities, 5.000%, due 06/25/33 | 2,337,275 | |||||||||||||
| 2,313,159 | Bank of America Mortgage Securities, 5.000%, due 12/25/18 | 2,365,028 | |||||||||||||
| 3,156,431 | Bear Stearns Alt-A Trust, 2.160%, due 07/25/34 | 3,155,532 | |||||||||||||
| 2,000,740 | Bear Stearns Asset Backed Securities, Inc., 5.625%, due 11/25/32 | 2,004,380 | |||||||||||||
| 533,626 | Citicorp Mortgage Securities, Inc., 2.065%, due 03/25/33 | 534,364 | |||||||||||||
| 554,854 | Citicorp Mortgage Securities, Inc., 2.340%, due 10/25/33 | 549,524 | |||||||||||||
| 25,064 | Citicorp Mortgage Securities, Inc., 6.250%, due 11/25/16 | 25,050 | |||||||||||||
| 2,131,580 | Countrywide Alternative Loan Trust, 2.165%, due 04/25/33 | 2,136,038 | |||||||||||||
| 325,428 | Countrywide Alternative Loan Trust, 2.240%, due 07/25/18 | 325,631 | |||||||||||||
| 2,272,915 | Countrywide Alternative Loan Trust, 5.000%, due 10/25/18 | 2,298,750 | |||||||||||||
| Principal Amount | Value | ||||||||||||||
| $ | 1,166,155 | Countrywide Alternative Loan Trust, 5.000%, due 08/25/19 | $ | 1,188,273 | |||||||||||
| 4,374,699 | Countrywide Home Loan Mortgage Pass Through Trust, 2.015%, due 08/25/18 | 4,353,095 | |||||||||||||
| 943,124 | Countrywide Home Loan Mortgage Pass Through Trust, 2.115%, due 04/25/18 | 945,924 | |||||||||||||
| 2,356,097 | Countrywide Home Loan Mortgage Pass Through Trust, 5.000%, due 11/25/18 | 2,365,549 | |||||||||||||
| 2,111,000 | XX | Countrywide Home Loan Mortgage Pass Through Trust, 6.000%, due 10/25/34 | 2,183,566 | ||||||||||||
| 5,150,000 | Credit Suisse First Boston Mortgage Securities Corp., 4.170%, due 10/25/33 | 5,072,668 | |||||||||||||
| 2,103,434 | First Horizon Alternative Mortgage Securities, 4.870%, due 06/25/34 | 2,128,505 | |||||||||||||
| 588,439 | First Horizon Alternative Mortgage Securities, 5.375%, due 09/25/34 | 602,627 | |||||||||||||
| 2,819,622 | GMAC Mortgage Corp Loan Trust, 5.250%, due 04/25/34 | 2,875,030 | |||||||||||||
| 3,982,000 | GMAC Mortgage Corp Loan Trust, 5.500%, due 01/25/34 | 4,123,840 | |||||||||||||
| 579,000 | GSR Mortgage Loan Trust, 4.500%, due 08/25/19 | 587,854 | |||||||||||||
| 2,816,147 | GSR Mortgage Loan Trust, 6.500%, due 01/25/34 | 2,921,479 | |||||||||||||
| 2,088,140 | Homebanc Mortgage Trust, 2.270%, due 08/25/29 | 2,092,665 | |||||||||||||
| 2,317,000 | MASTR Alternative Loans Trust, 5.750%, due 09/25/34 | 2,415,111 | |||||||||||||
| 4,081,820 | MASTR Alternative Loans Trust, 6.000%, due 09/25/34 | 4,240,191 | |||||||||||||
| 999,745 | MASTR Alternative Loans Trust, 6.500%, due 05/25/33 | 1,015,695 | |||||||||||||
| 457,075 | MASTR Asset Securitization Trust, 2.290%, due 11/25/33 | 454,428 | |||||||||||||
| 2,100,000 | MASTR Asset Securitization Trust, 5.500%, due 09/25/34 | 2,114,764 | |||||||||||||
| 750,977 | MASTR Asset Securitization Trust, 8.000%, due 06/25/33 | 794,084 | |||||||||||||
| 3,620,552 | MLCC Mortgage Investors, Inc., 1.935%, due 10/25/28 | 3,622,814 | |||||||||||||
| 2,761,165 | MLCC Mortgage Investors, Inc., 2.200%, due 04/25/29 | 2,768,074 | |||||||||||||
| 2,390,554 | Prime Mortgage Trust, 2.240%, due 02/25/34 | 2,391,150 | |||||||||||||
| 676,525 | Residential Accredit Loans, Inc., 2.290%, due 03/25/18 | 678,160 | |||||||||||||
| 267,564 | Residential Accredit Loans, Inc., 7.750%, due 05/25/27 | 267,347 | |||||||||||||
| 2,109,000 | XX | Residential Asset Securitization Trust, 5.500%, due 11/25/34 | 2,127,454 | ||||||||||||
| 6,697,238 | Residential Funding Mtg Sec I, 2.065%, due 11/25/18 | 6,696,407 | |||||||||||||
| 3,061,000 | XX | Residential Funding Mtg Sec I, 5.750%, due 09/25/34 | 3,142,787 | ||||||||||||
| 831,492 | Sequoia Mortgage Trust, 2.121%, due 11/20/33 | 832,525 | |||||||||||||
See Accompanying Notes to Financial Statements
77
PORTFOLIO OF INVESTMENTS
ING INTERMEDIATE BOND FUND as of September 30, 2004 (Unaudited) (continued)
| Principal Amount | Value | ||||||||||||||
| Whole Loan Collateralized Mortgage Obligations (continued) | |||||||||||||||
| $ | 3,300,000 | Structured Asset Securities Corp., 6.000%, due 03/25/34 | $ | 3,412,596 | |||||||||||
| 1,758,859 | Thornburg Mortgage Securities Trust, 2.190%, due 12/25/33 | 1,758,749 | |||||||||||||
| 4,760,161 | Washington Mutual, 5.000%, due 06/25/18 | 4,864,996 | |||||||||||||
| 3,079,350 | Washington Mutual, 6.000%, due 06/25/34 | 3,162,272 | |||||||||||||
| 1,456,092 | Washington Mutual MSC Mortgage Pass-Through CTFS, 2.115%, due 01/25/18 | 1,457,399 | |||||||||||||
| 1,158,746 | Washington Mutual MSC Mortgage Pass-Through CTFS, 2.215%, due 03/25/33 | 1,161,251 | |||||||||||||
| 764,498 | Wells Fargo Mortgage Backed Securities Trust, 2.340%, due 02/25/34 | 763,507 | |||||||||||||
| 2,160,000 | Wells Fargo Mortgage Backed Securities Trust, 4.500%, due 08/25/18 | 2,093,534 | |||||||||||||
| 108,843,778 | |||||||||||||||
| Whole Loan Collateralized Support CMO: 0.2% | |||||||||||||||
| 1,153,023 | Bank of America Mortgage Securities, 5.500%, due 11/25/33 | 1,162,201 | |||||||||||||
| 1,162,201 | |||||||||||||||
| Total Collateralized Mortgage Obligations (Cost $120,973,852) | 121,178,863 | ||||||||||||||
| OTHER BONDS: 1.1% | |||||||||||||||
| Sovereign: 1.1% | |||||||||||||||
| 442,000 | @@ | Brazilian Government Intl. Bond, 12.250%, due 03/06/30 | 548,080 | ||||||||||||
| 722,000 | @@ | Colombia Government Intl. Bond, 10.000%, due 01/23/12 | 803,586 | ||||||||||||
| 1,004,000 | @@ | Dominican Republic Intl. Bond, 9.040%, due 01/23/13 | 793,160 | ||||||||||||
| 498,000 | @@ | Ecuador Government Intl. Bond, 8.000%, due 08/15/30 | 405,248 | ||||||||||||
| 488,471 | @@ | Federal Republic of Brazil, 2.125%, due 04/15/12 | 455,589 | ||||||||||||
| 1,340,000 | @@,L | Russia Government Intl. Bond, 5.000%, due 03/31/30 | 1,292,295 | ||||||||||||
| 586,000 | @@,L | Turkey Government Intl. Bond, 12.375%, due 06/15/09 | 732,500 | ||||||||||||
| 458,000 | @@ | Ukraine Government Intl. Bond, 5.330%, due 08/05/09 | 465,853 | ||||||||||||
| 462,000 | @@,# | Ukraine Government Intl. Bond, 7.650%, due 06/11/13 | 464,310 | ||||||||||||
| 840,678 | @@,XX | Uruguay Government Intl. Bond, 10.500%, due 10/20/06 | 946,839 | ||||||||||||
| Total Other Bonds (Cost $6,551,997) | 6,907,460 | ||||||||||||||
| Shares | Value | ||||||||||||||
| PREFERRED STOCK: 0.5% | |||||||||||||||
| Banks: 0.5% | |||||||||||||||
| 254 | #,XX | DG Funding Trust | $ | 2,743,200 | |||||||||||
| Total Preferred Stock (Cost $2,761,612) | 2,743,200 | ||||||||||||||
| WARRANT: 0.0% | |||||||||||||||
| 20 | American Tower Corp. | 3,770 | |||||||||||||
| Total Warrant (Cost $1,502) | 3,770 | ||||||||||||||
| Total Long-Term Investments (Cost $645,698,895) | 648,414,533 | ||||||||||||||
| Principal Amount | Value | ||||||||||||||||||
| SHORT-TERM INVESTMENTS: 17.4% | |||||||||||||||||||
| Securities Lending CollateralCC: 12.2% | |||||||||||||||||||
| $ | 73,409,156 | The Bank of New York Institutional Cash Reserves Fund | 73,409,156 | ||||||||||||||||
| Total Securities Lending Collateral (Cost $73,409,156) | 73,409,156 | ||||||||||||||||||
| Repurchase Agreement: 5.2% | |||||||||||||||||||
| 31,211,000 | S | Goldman Sachs Repurchase Agreement dated 09/30/04, 1.860%, due 10/01/04 $31,212,613 to be received upon repurchase (Collateralized by $30,899,000 U.S. Treasury Note, 7.500%, Market value plus accrued interest $31,835,703, due 02/15/05) | 31,211,000 | ||||||||||||||||
| Total Repurchase Agreement (Cost $31,211,000) | 31,211,000 | ||||||||||||||||||
| Total Short-Term Investments (Cost $104,620,156) | 104,620,156 | ||||||||||||||||||
| Total Investments in Securities (Cost $750,319,051)* | 125.2 | % | $753,034,689 | ||||||||||||||||
| Other Assets and Liabilities-Net | (25.2 | ) | (151,775,872) | ||||||||||||||||
| Net Assets | 100.0 | % | $ | 601,258,817 | |||||||||||||||
See Accompanying Notes to Financial Statements
78
PORTFOLIO OF INVESTMENTS
ING INTERMEDIATE BOND FUND as of September 30, 2004 (Unaudited) (continued)
@ Non-income producing security
@@ Foreign issuer
STRIP Separate Trading of Registered Interest and Principal of Securities
+ Step-up basis bonds. Interest rates shown reflect current and future coupon rates.
# Securities with purchases pursuant to Rule 144A, under the Securities Act of 1933 and may not be resold subject to that rule except to qualified institutional buyers. These securities have been determined to be liquid under the guidelines established by the Funds' Board of Directors/Trustees.
cc Securities purchased with cash collateral for securities loaned.
S Segregated securities for futures, when-issued or delayed delivery securities held at September 30, 2004.
I Illiquid security
L Loaned security, a portion or all of the security is on loan at September 30, 2004.
XX Value of securities obtained from one or more dealers making markets in the securities in accordance with the Fund's valuation procedures.
* Cost for federal income tax purposes is $750,972,821. Net unrealized appreciation consists of:
| Gross Unrealized Appreciation | $ | 5,699,754 | |||||
| Gross Unrealized Depreciation | (3,637,886 | ) | |||||
| Net Unrealized Appreciation | $ | 2,061,868 | |||||
Information concerning open futures contracts for the Intermediate Bond Fund at September 30, 2004 is shown below:
| Short Contracts | No. of Contracts | Notional Market Value | Expiration Date | Unrealized Gain (Loss) | |||||||||||||||
| U.S. 5 Year Treasury Note | 160 | $ | (17,720,000 | ) | 12/20/2004 | $ | 23,919 | ||||||||||||
| Long Contracts | |||||||||||||||||||
| U.S. Long Bond | 115 | 12,905,156 | 12/30/2004 | 100,050 | |||||||||||||||
| $(4,814,844) | $ | 123,969 | |||||||||||||||||
See Accompanying Notes to Financial Statements
79
PORTFOLIO OF INVESTMENTS
ING NATIONAL TAX EXEMPT BOND FUND as of September 30, 2004 (Unaudited)
| Principal Amount | Ratings(1) | Value | |||||||||||||
| MUNICIPAL BONDS: 91.8% | |||||||||||||||
| California: 13.8% | |||||||||||||||
| $ | 330,000 | California State Department of Veterans Affairs, 4.700%, due 12/01/09 | AA2/AA- | $ | 348,737 | ||||||||||
| 1,000,000 | California State Department of Water Resources, 5.500%, due 05/01/07 | A3/BBB+ | 1,081,950 | ||||||||||||
| 200,000 | Los Angeles County Metropolitan Transportation Authority, 6.000%, due 07/01/08 | A1/A+ | 225,184 | ||||||||||||
| 1,000,000 | Pleasant Valley School District- Ventura County, Reference Series A, 5.850%, due 08/01/31 | AAA/AAA | 1,193,050 | ||||||||||||
| 1,000,000 | State of California, 5.000%, due 01/01/08 | AAA/AAA | 1,085,270 | ||||||||||||
| 3,934,191 | |||||||||||||||
| Colorado: 3.9% | |||||||||||||||
| 1,000,000 | Interlocken Metropolitan District Colorado Reference, Series A, 5.750%, due 12/15/19 | NR/AA | 1,095,990 | ||||||||||||
| 1,095,990 | |||||||||||||||
| Illinois: 10.6% | |||||||||||||||
| 1,000,000 | Chicago Illinois Skyway Toll Bridge, 5.500%, due 01/01/31 | Aaa/AAA | 1,076,770 | ||||||||||||
| 25,000 | Chicago Illinois Tax Increment Redevelopment Project, Series A, 5.000%, due 11/15/10 | NR/A | 26,615 | ||||||||||||
| 500,000 | Chicago O'Hare International Airport Revenue, 4.900%, due 01/01/07 | AAA/AAA | 511,150 | ||||||||||||
| 1,250,000 | De Kalb-Ogle Etc. Counties Community College District No 523, FSA Insured, 5.750%, due 02/01/11 | Aaa/NR | 1,409,075 | ||||||||||||
| 3,023,610 | |||||||||||||||
| Massachusetts: 11.4% | |||||||||||||||
| 1,000,000 | Massachusetts Development Finance Agency Revenue, Boston University, Series P, 6.000%, due 05/15/59 | A3/BBB+ | 1,134,200 | ||||||||||||
| 1,000,000 | Massachusetts Housing Finance Agency, 3.700%, due 12/01/09 | Aa3/AA- | 1,020,700 | ||||||||||||
| 1,000,000 | Massachusetts State Port Authority, 5.750%, due 07/01/29 | Aa3/A+ | 1,091,710 | ||||||||||||
| 3,246,610 | |||||||||||||||
| Michigan: 3.5% | |||||||||||||||
| 1,000,000 | Michigan State University, Series A-2, 1.650%, due 08/15/22 | Aa2/AA | 1,000,000 | ||||||||||||
| 1,000,000 | |||||||||||||||
| Principal Amount | Ratings(1) | Value | |||||||||||||
| Nevada: 4.0% | |||||||||||||||
| $ | 1,100,000 | Washoe County Nevada Gas & Water Facilities, 6.300%, due 12/01/14 | Aaa/AAA | $ | 1,129,590 | ||||||||||
| 1,129,590 | |||||||||||||||
| New York: 17.8% | |||||||||||||||
| 945,000 | Albany Industrial Development Agency 7.750%, due 01/01/10 | NR/NR | 1,062,955 | ||||||||||||
| 750,000 | New York City Industrial Development Agency, 6.250%, due 11/15/06 | Aaa/AAA | 769,373 | ||||||||||||
| 1,000,000 | New York NY, General Obligation, Series B, 5.000%, due 08/01/07 | A2/A | 1,072,920 | ||||||||||||
| 1,000,000 | New York State Dormitory Authority Revenue, Series C, 5.500%, due 07/01/15 | Aaa/AAA | 1,107,260 | ||||||||||||
| 1,000,000 | Tobacco Settlement Financing Authority, 5.000%, due 06/01/10 | NR/AA- | 1,023,310 | ||||||||||||
| 5,035,818 | |||||||||||||||
| North Carolina: 1.2% | |||||||||||||||
| 295,000 | New Hanover County NC, 5.750%, due 11/01/12 | Aa2/AA | 342,418 | ||||||||||||
| 342,418 | |||||||||||||||
| Ohio: 1.1% | |||||||||||||||
| 225,000 | Euclid City School District, 5.200%, due 12/01/10 | Aaa/AAA | 238,045 | ||||||||||||
| 55,000 | Lakota Local School District, School Improvement, 7.000%, due 12/01/10 | AAA/AAA | 67,141 | ||||||||||||
| 305,186 | |||||||||||||||
| Oklahoma: 8.1% | |||||||||||||||
| 1,000,000 | Oklahoma State Industrial Authority Revenue Reference, Health System Obligation Group, Series A, 6.000%, due 08/15/19 | Aaa/AAA | 1,132,770 | ||||||||||||
| 1,000,000 | Payne County Oklahoma Economic Development Authority, Student Housing Revenue, Collegiate Housing Foundation, Series A, 6.375%, due 06/01/30 | Baa/NR | 1,182,350 | ||||||||||||
| 2,315,120 | |||||||||||||||
| Pennsylvania: 3.6% | |||||||||||||||
| 1,000,000 | Philadelphia Pennsylvania Hospitals & Higher Education Facilities Authority Revenue, Jefferson Health System, 5.000%, due 05/15/18 | A1/AA- | 1,031,930 | ||||||||||||
| 1,031,930 | |||||||||||||||
See Accompanying Notes to Financial Statements
80
PORTFOLIO OF INVESTMENTS
ING NATIONAL TAX EXEMPT BOND FUND as of September 30, 2004 (Unaudited) (continued)
| Principal Amount | Ratings(1) | Value | |||||||||||||
| Rhode Island: 0.7% | |||||||||||||||
| $ | 35,000 | Dunns Corner Fire District, 7.900%, due 06/01/05 | NR/NR | $36,338 | |||||||||||
| 35,000 | Dunns Corner Fire District, 7.950%, due 06/01/06 | NR/NR | 38,164 | ||||||||||||
| 35,000 | Dunns Corner Fire District, 8.000%, due 06/01/07 | NR/NR | 39,779 | ||||||||||||
| 35,000 | Dunns Corner Fire District, 8.050%, due 06/01/08 | NR/NR | 41,056 | ||||||||||||
| 35,000 | Dunns Corner Fire District, 8.100%, due 06/01/09 | NR/NR | 42,225 | ||||||||||||
| 197,562 | |||||||||||||||
| Texas: 12.1% | |||||||||||||||
| 1,000,000 | Harris County Health Facilities Development Authority Revenue, Series B, 5.750%, due 07/01/27 | Aa3/AAA | 1,163,580 | ||||||||||||
| 1,000,000 | Laredo Independent School District, 5.500%, due 08/01/20 | Aaa/AAA | 1,094,600 | ||||||||||||
| 1,050,000 | San Felipe-Del Rio Consolidated Independent School District, 5.500%, due 08/15/19 | Aaa/AAA | 1,172,115 | ||||||||||||
| 3,430,295 | |||||||||||||||
| Total Municipal Bonds (Cost $24,642,872) | 26,088,320 | ||||||||||||||
| Total Investments in Securities (Cost $24,642,872)* | 91.8 | % | $26,088,320 | ||||||||||||
| Other Assets and Liabilities-Net | 8.2 | % | 2,354,235 | ||||||||||||
| Net Assets | 100.0 | % | $ | 28,422,555 | |||||||||||
* Cost for federal income tax purposes is the same as for financial statement purposes. Net unrealized appreciation consists of:
| Gross Unrealized Appreciation | $ | 1,501,931 | |||||
| Gross Unrealized Depreciation | (56,483 | ) | |||||
| Net Unrealized Appreciation | $ | 1,445,448 | |||||
(1) Credit ratings are provided by Moody's Investor Service, Inc. and Standard and Poor's Rating Group (Unaudited)
See Accompanying Notes to Financial Statements
81
PORTFOLIO OF INVESTMENTS
ING CLASSIC MONEY MARKET FUND(1) as of September 30, 2004 (Unaudited)
| Principal Amount | Value | ||||||||||||||
| CERTIFICATE OF DEPOSIT: 11.0% | |||||||||||||||
| $ | 4,100,000 | ABN Amro Bank NV, 1.736%, due 03/18/05 | $ | 4,099,623 | |||||||||||
| 3,900,000 | ABN Amro Bank NV, 1.768%, due 10/29/04 | 3,899,844 | |||||||||||||
| 1,300,000 | Barclays Bank PLC, 1.600%, due 12/03/04 | 1,299,894 | |||||||||||||
| 6,600,000 | @@ | Barclays Bank PLC, 1.913%, due 02/03/05 | 6,600,118 | ||||||||||||
| 4,000,000 | Dexia Bank, 1.508%, due 12/07/04 | 4,000,055 | |||||||||||||
| 2,000,000 | HSBC Bank, 1.555%, due 04/22/05 | 2,000,000 | |||||||||||||
| 4,000,000 | Royal Bank of Canada, 1.770%, due 03/30/05 | 3,999,691 | |||||||||||||
| 4,500,000 | @@ | Royal Bank of Scotland Group PLC, 1.400%, due 10/21/04 | 4,499,975 | ||||||||||||
| 4,000,000 | UBS AG, 1.195%, due 12/06/04 | 4,000,036 | |||||||||||||
| 4,100,000 | Washington Mutual Bank, 1.300%, due 12/27/04 | 4,100,000 | |||||||||||||
| 4,400,000 | Washington Mutual Bank, 1.650%, due 11/12/04 | 4,399,896 | |||||||||||||
| 4,400,000 | Washington Mutual Bank, 1.670%, due 11/01/04 | 4,400,000 | |||||||||||||
| Total Certificate of Deposit (Cost $47,299,132) | 47,299,132 | ||||||||||||||
| COLLATERALIZED MORTGAGE OBLIGATIONS: 5.7% | |||||||||||||||
| 3,900,000 | # | Blue Heron Funding Ltd., 1.850%, due 05/18/05 | 3,900,000 | ||||||||||||
| 4,000,000 | # | Blue Heron Funding Ltd., 1.858%, due 03/18/05 | 4,000,000 | ||||||||||||
| 3,900,000 | # | Blue Heron Funding Ltd., 1.870%, due 02/23/05 | 3,900,000 | ||||||||||||
| 4,500,000 | #,I | Newcastle CDO I Ltd., 1.870%, due 09/24/38 | 4,500,000 | ||||||||||||
| 4,600,000 | # | Putnam Structured Product CDO, 1.780%, due 10/15/38 | 4,600,000 | ||||||||||||
| 3,400,000 | # | Whitehawk CDO Funding Ltd., 1.805%, due 03/15/05 | 3,400,000 | ||||||||||||
| Total Collateralized Mortgage Obligations (Cost $24,300,000) | 24,300,000 | ||||||||||||||
| COMMERCIAL PAPER: 38.9% | |||||||||||||||
| 4,200,000 | Archer-Daniels-Midland Co., 1.420%, due 10/05/04 | 4,199,169 | |||||||||||||
| 1,430,000 | Barton Capital Corp., 1.520%, due 10/07/04 | 1,429,577 | |||||||||||||
| 2,500,000 | Barton Capital Corp., 1.680%, due 10/18/04 | 2,497,899 | |||||||||||||
| 2,300,000 | Blue Ridge Asset Funding, 1.680%, due 10/18/04 | 2,298,067 | |||||||||||||
| 4,250,000 | Bristol-Myers Squibb Co., 1.520%, due 10/07/04 | 4,248,746 | |||||||||||||
| 6,200,000 | # | Concord Minutemen Cap, 1.710%, due 10/19/04 | 6,194,420 | ||||||||||||
| 3,400,000 | # | Concord Minutemen Cap, 1.730%, due 10/10/05 | 3,400,000 | ||||||||||||
| 4,000,000 | # | Concord Minutemen Cap, 1.740%, due 10/12/05 | 4,000,000 | ||||||||||||
| 6,200,000 | # | Concord Minutemen Cap, 1.740%, due 10/14/05 | 6,200,000 | ||||||||||||
| 4,000,000 | Crown Point Capital Co., 1.000%, due 10/06/04 | 3,999,333 | |||||||||||||
| Principal Amount | Value | ||||||||||||||
| $ | 13,500,000 | Crown Point Capital Co., 2.050%, due 03/08/05 | $ | 13,378,967 | |||||||||||
| 2,000,000 | Delaware Funding Corp., 1.680%, due 10/18/04 | 1,998,319 | |||||||||||||
| 4,100,000 | #,I | Goldman Sachs Group, 1.280%, due 10/27/04 | 4,100,000 | ||||||||||||
| 4,400,000 | # | Goldman Sachs Group, 1.810%, due 07/29/05 | 4,400,000 | ||||||||||||
| 4,400,000 | Greenwich Capital Holdings, 1.718%, due 01/14/05 | 4,400,000 | |||||||||||||
| 4,300,000 | Household Finance Corp., 1.260%, due 10/06/04 | 4,299,098 | |||||||||||||
| 2,300,000 | Jupiter Securitization, 1.340%, due 10/04/04 | 2,299,659 | |||||||||||||
| 4,000,000 | LaSalle Bank Note, 1.160%, due 12/17/04 | 4,000,000 | |||||||||||||
| 3,900,000 | LaSalle Bank Note, 1.210%, due 11/05/04 | 3,900,000 | |||||||||||||
| 6,600,000 | Monument Gardens Funding LLC, 1.760%, due 12/01/04 | 6,580,094 | |||||||||||||
| 3,300,000 | Monument Gardens Funding LLC, 1.880%, due 12/20/04 | 3,286,067 | |||||||||||||
| 7,000,000 | Morgan Stanley, 1.650%, due 10/14/04 | 6,995,501 | |||||||||||||
| 4,400,000 | Morgan Stanley, 1.660%, due 10/15/04 | 4,396,954 | |||||||||||||
| 2,500,000 | Old Line Funding Corp., 1.650%, due 10/14/04 | 2,498,393 | |||||||||||||
| 3,800,000 | Old Line Funding Corp., 1.710%, due 11/02/04 | 3,794,055 | |||||||||||||
| 4,450,000 | Preferred Receivable Funding Corp., 0.000%, due 10/01/04 | 4,450,000 | |||||||||||||
| 13,200,000 | Preferred Receivable Funding Corp., 1.260%, due 10/04/04 | 13,198,152 | |||||||||||||
| 3,300,000 | Preferred Receivable Funding Corp., 1.350%, due 10/05/04 | 3,299,380 | |||||||||||||
| 4,300,000 | SBC Communications, 1.680%, due 10/18/04 | 4,296,386 | |||||||||||||
| 4,200,000 | # | St. Germain Holdings, . 1.510%, due 10/08/04 | 4,198,595 | ||||||||||||
| 4,400,000 | # | St. Germain Holdings, 1.510%, due 10/13/04 | 4,397,609 | ||||||||||||
| 4,000,000 | # | St. Germain Holdings, 1.880%, due 12/13/04 | 3,984,589 | ||||||||||||
| 6,876,000 | Thunder Bay Funding, Inc., 1.510%, due 11/08/04 | 6,863,516 | |||||||||||||
| 1,300,000 | Tulip Funding Corp., 0.000%, due 10/01/04 | 1,300,000 | |||||||||||||
| 8,000,000 | # | Verizon Global Funding, 1.990%, due 10/14/05 | 8,000,000 | ||||||||||||
| 3,600,000 | Windmill Funding Corp., 1.630%, due 10/12/04 | 3,598,042 | |||||||||||||
| Total Commercial Paper (Cost $166,380,587) | 166,380,587 | ||||||||||||||
| CORPORATE BONDS/NOTES: 30.2% | |||||||||||||||
| 4,950,000 | Associates Corp. NA, 2.050%, due 06/27/05 | 4,954,840 | |||||||||||||
| 2,000,000 | Bank One NA, 1.894%, due 11/01/04 | 2,000,401 | |||||||||||||
| 5,300,000 | Bank One NA, 1.980%, due 07/26/05 | 5,307,807 | |||||||||||||
| 4,800,000 | Bear Stearns Cos., Inc., 1.716%, due 10/05/05 | 4,800,000 | |||||||||||||
| 4,300,000 | Bear Stearns Cos., Inc., 1.850%, due 10/28/09 | 4,300,000 | |||||||||||||
See Accompanying Notes to Financial Statements
82
PORTFOLIO OF INVESTMENTS
ING CLASSIC MONEY MARKET FUND(1) as of September 30, 2004 (Unaudited) (continued)
| Principal Amount | Value | ||||||||||||||
| CORPORATE BONDS/NOTES (continued) | |||||||||||||||
| $ | 5,000,000 | BellSouth Corp., 1.880%, due 01/04/05 | $ | 5,000,000 | |||||||||||
| 3,300,000 | Credit Suisse First Boston USA, Inc., 2.010%, due 02/08/05 | 3,303,409 | |||||||||||||
| 4,700,000 | Credit Suisse First Boston USA, Inc., 2.050%, due 01/14/05 | 4,705,922 | |||||||||||||
| 1,250,000 | Fleet National Bank, 1.840%, due 11/22/04 | 1,250,235 | |||||||||||||
| 6,000,000 | General Electric Capital Corp., 1.838%, due 10/07/05 | 6,000,000 | |||||||||||||
| 5,600,000 | General Electric Capital Corp., 2.005%, due 03/15/05 | 5,604,737 | |||||||||||||
| 4,400,000 | # | Goldman Sachs Group LP, 1.769%, due 10/15/05 | 4,400,000 | ||||||||||||
| 3,000,000 | @@,# | HBOS Treasury Services PLC, 1.640%, due 11/01/05 | 3,000,000 | ||||||||||||
| 6,100,000 | @@,# | HBOS Treasury Services PLC, 1.961%, due 10/24/05 | 6,100,000 | ||||||||||||
| 2,500,000 | JPMorgan Chase & Co., 2.190%, due 03/29/05 | 2,503,066 | |||||||||||||
| 4,400,000 | Merrill Lynch & Co., Inc., 1.550%, due 01/05/05 | 4,400,130 | |||||||||||||
| 9,200,000 | #, I | Money Market Trust Series A, 1.835%, due 10/07/05 | 9,200,000 | ||||||||||||
| 4,700,000 | Morgan Stanley, 1.880%, due 08/15/05 | 4,705,302 | |||||||||||||
| 1,400,000 | PNC Bank NA, 1.920%, due 05/18/05 | 1,402,134 | |||||||||||||
| 2,750,000 | # | The Bank of New York Co., Inc., 1.860%, due 10/27/05 | 2,750,000 | ||||||||||||
| 3,300,000 | Toyota Motor Credit Corp., 1.700%, due 02/07/05 | 3,300,523 | |||||||||||||
| 3,300,000 | Wachovia Corp., 2.230%, due 03/31/05 | 3,306,611 | |||||||||||||
| 5,000,000 | Wachovia Corp, 6.950%, due 11/01/04 | 5,021,549 | |||||||||||||
| 11,300,000 | Wal-Mart Stores, Inc., 1.698%, due 02/22/05 | 11,300,990 | |||||||||||||
| 8,800,000 | Wells Fargo & Co., 1.619%, due 10/01/04 | 8,800,000 | |||||||||||||
| 3,800,000 | Wells Fargo & Co., 1.690%, due 11/02/05 | 3,800,096 | |||||||||||||
| 5,450,000 | Wells Fargo & Co., 2.000%, due 09/29/05 | 5,453,641 | |||||||||||||
| 2,700,000 | Westpac Banking Corp., 1.850%, due 10/11/05 | 2,700,000 | |||||||||||||
| Total Corporate Bonds/Notes (Cost $129,371,393) | 129,371,393 | ||||||||||||||
| U.S. GOVERNMENT AGENCY OBLIGATIONS: 10.3% | |||||||||||||||
| Federal Home Loan Bank: 6.4% | |||||||||||||||
| 4,350,000 | 1.400%, due 02/25/05 | 4,350,000 | |||||||||||||
| 4,000,000 | 1.425%, due 04/04/05 | 4,000,000 | |||||||||||||
| 2,700,000 | 1.470%, due 02/28/05 | 2,700,000 | |||||||||||||
| 4,400,000 | 1.500%, due 12/07/04 | 4,400,000 | |||||||||||||
| 2,700,000 | 1.500%, due 03/01/05 | 2,700,000 | |||||||||||||
| 2,700,000 | 1.510%, due 12/08/04 | 2,700,000 | |||||||||||||
| 4,000,000 | 1.600%, due 03/01/05 | 4,000,000 | |||||||||||||
| 2,500,000 | 1.600%, due 05/16/05 | 2,500,000 | |||||||||||||
| 27,350,000 | |||||||||||||||
| Federal Home Loan Mortgage Corporation: 0.9% | |||||||||||||||
| 4,000,000 | 1.500%, due 02/14/05 | 4,000,000 | |||||||||||||
| 4,000,000 | |||||||||||||||
| Principal Amount | Value | ||||||||||||||
| Federal National Mortgage Association: 3.0% | |||||||||||||||
| $ | 4,200,000 | 1.400%, due 02/25/05 | $ | 4,200,000 | |||||||||||
| 4,000,000 | 1.550%, due 05/04/05 | 4,000,000 | |||||||||||||
| 1,900,000 | 1.610%, due 05/13/05 | 1,900,000 | |||||||||||||
| 2,700,000 | 1.630%, due 01/03/05 | 2,700,000 | |||||||||||||
| 12,800,000 | |||||||||||||||
| Total U.S. Government Agency Obligations (Cost $44,150,000) | 44,150,000 | ||||||||||||||
| REPURCHASE AGREEMENT: 4.9% | |||||||||||||||
| 20,873,000 | S | Goldman Sachs Repurchase Agreement ]dated 09/30/04, 1.860%, due 10/01/04, $20,874,078 to be received upon repurchase (Collateralized by $42,778,509 various U.S. Treasury Obligations, 0.000-0.000%, Market value plus accrued interest $21,499,190, due 11/15/12-08/15/23) | 20,873,000 | ||||||||||||
| Total Repurchase Agreement (Cost $20,873,000) | 20,873,000 | ||||||||||
| Total Investments in Securities (Cost $432,374,112)* | 101.0 | % | $432,374,112 | ||||||||
| Other Assets and Liabilities-Net | (1.0 | ) | (4,260,982 | ) | |||||||
| Net Assets | 100.0 | % | $ | 428,113,130 | |||||||
(1) All securities with a maturity date greater than 13 months have either a variable rate, demand feature, prerefunded, optional or mandatory put resulting in an effective maturity of one year or less. Rate shown reflects current rate.
@@ Foreign Issuer
# Securities with purchases pursuant to Rule 144A, under the Securities Act of 1933 and may not be resold subject to that rule except to qualified institutional buyers. These securities have been determined to be liquid under the guidelines established by the Funds' Board of Directors. At September 30, 2004, these securities totaled $98,625,213, or 23.0% of net assets.
S Segregated securities for futures, when-issued or delayed delivery securities held at September 30, 2004.
I Illiquid security
* Cost for federal income tax purposes is the same as for financial statement purposes.
| Industry | Percentage of Net Assets | ||||||
| Commercial Banks Non - U.S. | 4.5 | % | |||||
| Commercial Banks - Central U.S. | 5.4 | ||||||
| Commercial Banks - Eastern U.S. | 3.9 | ||||||
| Diversified Financial Services | 3.8 | ||||||
| Federal and Federally Sponsored Credit Agencies | 10.3 | ||||||
| Fiduciary Banks | 0.6 | ||||||
| Finance - Auto Loans | 0.8 | ||||||
| Finance - Investment Banker/Broker | 11.0 | ||||||
| Finance - Other Services | 0.5 | ||||||
| Food - Flour and Grain | 1.0 | ||||||
| Investment Companies | 1.9 | ||||||
| Medical - Drugs | 1.0 | ||||||
| Money Center Banks | 3.1 | ||||||
| Retail | 2.6 | ||||||
| S&L/Thrifts - Western U.S. | 3.0 | ||||||
| Special Purpose Entity | 34.5 | ||||||
| Super - Regional Banks - U.S. | 6.1 | ||||||
| Telephone - Integrated | 2.2 | ||||||
| Repurchase Agreement | 4.8 | ||||||
| Other Assets and Liabilities, Net | (1.0 | ) | |||||
| Net Assets | 100.0 | % | |||||
See Accompanying Notes to Financial Statements
83
PORTFOLIO OF INVESTMENTS
ING MONEY MARKET FUND(1) as of September 30, 2004 (Unaudited)
| Principal Amount | Value | ||||||||||||||
| CERTIFICATE OF DEPOSIT: 11.0% | |||||||||||||||
| $ | 400,000 | ABN Amro Bank NV, 1.736%, due 03/18/05 | $ | 399,963 | |||||||||||
| 300,000 | ABN Amro Bank NV, 1.768%, due 10/29/04 | 299,988 | |||||||||||||
| 100,000 | Barclays Bank PLC, 1.600%, due 12/03/04 | 99,992 | |||||||||||||
| 650,000 | @@ | Barclays Bank PLC, 1.913%, due 02/03/05 | 650,012 | ||||||||||||
| 400,000 | Dexia Bank, 1.508%, due 12/07/04 | 400,005 | |||||||||||||
| 200,000 | HSBC Bank, 1.555%, due 04/22/05 | 200,000 | |||||||||||||
| 400,000 | Royal Bank of Canada, 1.770%, due 03/30/05 | 399,969 | |||||||||||||
| 500,000 | @@ | Royal Bank of Scotland Group PLC, 1.400%, due 10/21/04 | 499,997 | ||||||||||||
| 400,000 | UBS AG, 1.195%, due 12/06/04 | 400,004 | |||||||||||||
| 500,000 | Washington Mutual Bank, 1.300%, due 12/27/04 | 500,000 | |||||||||||||
| 450,000 | Washington Mutual Bank, 1.650%, due 11/12/04 | 449,989 | |||||||||||||
| 450,000 | Washington Mutual Bank, 1.670%, due 11/01/04 | 450,000 | |||||||||||||
| Total Certificate of Deposit (Cost $4,749,919) | 4,749,919 | ||||||||||||||
| COLLATERALIZED MORTGAGE OBLIGATIONS: 6.8% | |||||||||||||||
| 500,000 | # | Blue Heron Funding Ltd., 1.850%, due 05/18/05 | 500,000 | ||||||||||||
| 500,000 | # | Blue Heron Funding Ltd., 1.858%, due 03/18/05 | 500,000 | ||||||||||||
| 500,000 | # | Blue Heron Funding Ltd., 1.870%, due 02/23/05 | 500,000 | ||||||||||||
| 600,000 | #,I | Newcastle CDO I Ltd., 1.870%, due 09/24/38 | 600,000 | ||||||||||||
| 500,000 | # | Putnam Structured Product CDO, 1.780%, due 10/15/38 | 500,000 | ||||||||||||
| 325,000 | # | Whitehawk CDO Funding Ltd., 1.805%, due 03/15/05 | 325,000 | ||||||||||||
| Total Collateralized Mortgage Obligations (Cost $2,925,000) | 2,925,000 | ||||||||||||||
| COMMERCIAL PAPER: 35.1% | |||||||||||||||
| 350,000 | Archer-Daniels-Midland Co., 1.420%, due 10/05/04 | 349,931 | |||||||||||||
| 250,000 | Barton Capital Corp., 1.520%, due 10/07/04 | 249,926 | |||||||||||||
| 250,000 | Barton Capital Corp., 1.680%, due 10/18/04 | 249,790 | |||||||||||||
| 250,000 | Blue Ridge Asset Funding, 1.680%, due 10/18/04 | 249,790 | |||||||||||||
| 350,000 | Bristol-Myers Squibb Co., 1.520%, due 10/07/04 | 349,897 | |||||||||||||
| 600,000 | # | Concord Minutemen Cap, 1.710%, due 10/19/04 | 599,460 | ||||||||||||
| 400,000 | # | Concord Minutemen Cap, 1.730%, due 10/10/05 | 400,000 | ||||||||||||
| 400,000 | # | Concord Minutemen Cap, 1.740%, due 10/12/05 | 400,000 | ||||||||||||
| 600,000 | # | Concord Minutemen Cap, 1.740%, due 10/14/05 | 600,000 | ||||||||||||
| Principal Amount | Value | ||||||||||||||
| $ | 300,000 | Crown Point Capital Co., 1.000%, due 10/06/04 | $ | 299,950 | |||||||||||
| 1,300,000 | Crown Point Capital Co., 2.050%, due 03/08/05 | 1,288,347 | |||||||||||||
| 250,000 | Delaware Funding Corp., 1.680%, due 10/18/04 | 249,790 | |||||||||||||
| 300,000 | #,I | Goldman Sachs Group, 1.280%, due 10/27/04 | 300,000 | ||||||||||||
| 400,000 | # | Goldman Sachs Group, 1.810%, due 07/29/05 | 400,000 | ||||||||||||
| 500,000 | Greenwich Capital Holdings, 1.718%, due 01/14/05 | 500,000 | |||||||||||||
| 500,000 | Household Finance Corp., 1.260%, due 10/06/04 | 499,895 | |||||||||||||
| 250,000 | Jupiter Securitization, 1.340%, due 10/04/04 | 249,963 | |||||||||||||
| 300,000 | LaSalle Bank Note, 1.160%, due 12/17/04 | 300,000 | |||||||||||||
| 650,000 | Monument Gardens Funding LLC, 1.760%, due 12/01/04 | 648,040 | |||||||||||||
| 325,000 | Monument Gardens Funding LLC, 1.880%, due 12/20/04 | 323,628 | |||||||||||||
| 400,000 | Morgan Stanley, 1.650%, due 10/14/04 | 399,743 | |||||||||||||
| 500,000 | Morgan Stanley, 1.660%, due 10/15/04 | 499,653 | |||||||||||||
| 450,000 | Morgan Stanley, 1.880%, due 08/15/05 | 450,508 | |||||||||||||
| 250,000 | Old Line Funding Corp., 1.650%, due 10/14/04 | 249,839 | |||||||||||||
| 375,000 | Old Line Funding Corp., 1.710%, due 11/02/04 | 374,413 | |||||||||||||
| 450,000 | Preferred Receivable Funding Corp., 0.000%, due 10/01/04 | 450,000 | |||||||||||||
| 450,000 | Preferred Receivable Funding Corp., 1.260%, due 10/04/04 | 449,937 | |||||||||||||
| 325,000 | Preferred Receivable Funding Corp., 1.350%, due 10/05/04 | 324,939 | |||||||||||||
| 400,000 | SBC Communications, 1.680%, due 10/18/04 | 399,664 | |||||||||||||
| 400,000 | # | St. Germain Holdings, 1.510%, due 10/08/04 | 399,866 | ||||||||||||
| 450,000 | # | St. Germain Holdings, 1.510%, due 10/13/04 | 449,756 | ||||||||||||
| 400,000 | # | St. Germain Holdings, 1.880%, due 12/13/04 | 398,459 | ||||||||||||
| 250,000 | Tulip Funding Corp., 0.000%, due 10/01/04 | 250,000 | |||||||||||||
| 1,150,000 | # | Verizon Global Funding, 1.990%, due 10/14/05 | 1,149,999 | ||||||||||||
| 350,000 | Windmill Funding Corp., 1.630%, due 10/12/04 | 349,810 | |||||||||||||
| Total Commercial Paper (Cost $15,104,993) | 15,104,993 | ||||||||||||||
| CORPORATE BONDS/NOTES: 30.7% | |||||||||||||||
| 500,000 | Associates Corp. NA, 2.050%, due 06/27/05 | 500,489 | |||||||||||||
| 200,000 | Bank One NA, 1.894%, due 11/01/04 | 200,040 | |||||||||||||
| 600,000 | Bank One NA, 1.980%, due 07/26/05 | 600,884 | |||||||||||||
See Accompanying Notes to Financial Statements
84
PORTFOLIO OF INVESTMENTS
ING MONEY MARKET FUND(1) as of September 30, 2004 (Unaudited) (continued)
| Principal Amount | Value | ||||||||||||||
| CORPORATE BONDS/NOTES (continued) | |||||||||||||||
| $ | 500,000 | Bear Stearns Cos., Inc., 1.716%, due 10/05/05 | $ | 500,000 | |||||||||||
| 400,000 | Bear Stearns Cos., Inc., 1.850%, due 10/28/09 | 400,000 | |||||||||||||
| 325,000 | Credit Suisse First Boston USA, Inc., 2.010%, due 02/08/05 | 325,336 | |||||||||||||
| 450,000 | Credit Suisse First Boston USA, Inc., 2.050%, due 01/14/05 | 450,567 | |||||||||||||
| 250,000 | Fleet National Bank, 1.840%, due 11/22/04 | 250,047 | |||||||||||||
| 1,000,000 | General Electric Capital Corp., 1.838%, due 10/07/05 | 1,000,000 | |||||||||||||
| 600,000 | General Electric Capital Corp., 2.005%, due 03/15/05 | 600,507 | |||||||||||||
| 500,000 | # | Goldman Sachs Group LP, 1.769%, due 10/15/05 | 500,000 | ||||||||||||
| 700,000 | @@,# | HBOS Treasury Services PLC, 1.640%, due 11/01/05 | 700,000 | ||||||||||||
| 800,000 | @@,# | HBOS Treasury Services PLC, 1.961%, due 10/24/05 | 800,000 | ||||||||||||
| 250,000 | JPMorgan Chase & Co., 2.190%, due 03/29/05 | 250,307 | |||||||||||||
| 500,000 | Merrill Lynch & Co., Inc., 1.550%, due 01/05/05 | 500,015 | |||||||||||||
| 1,300,000 | #,I | Money Market Trust Series A, 1.835%, due 10/07/05 | 1,300,000 | ||||||||||||
| 150,000 | PNC Bank NA, 1.920%, due 05/18/05 | 150,229 | |||||||||||||
| 500,000 | # | The Bank of New York Co., Inc., 1.860%, due 10/27/05 | 500,000 | ||||||||||||
| 350,000 | Toyota Motor Credit Corp., 1.700%, due 02/07/05 | 350,055 | |||||||||||||
| 800,000 | Wachovia Corp., 2.230%, due 03/31/05 | 801,581 | |||||||||||||
| 1,400,000 | Wal-Mart Stores, Inc., 1.698%, due 02/22/05 | 1,400,118 | |||||||||||||
| 300,000 | Wells Fargo & Co., 1.690%, due 11/02/05 | 300,096 | |||||||||||||
| 500,000 | Wells Fargo & Co., 2.000%, due 09/29/05 | 500,334 | |||||||||||||
| 300,000 | Westpac Banking Corp., 1.850%, due 10/11/05 | 300,000 | |||||||||||||
| Total Corporate Bonds/Notes (Cost $13,180,605) | 13,180,605 | ||||||||||||||
| U.S. GOVERNMENT AGENCY OBLIGATIONS: 10.6% | |||||||||||||||
| Federal Home Loan Bank: 6.6% | |||||||||||||||
| 450,000 | 1.400%, due 02/25/05 | 450,000 | |||||||||||||
| 500,000 | 1.425%, due 04/04/05 | 500,000 | |||||||||||||
| 300,000 | 1.470%, due 02/28/05 | 300,000 | |||||||||||||
| 400,000 | 1.500%, due 12/07/04 | 400,000 | |||||||||||||
| 300,000 | 1.500%, due 03/01/05 | 300,000 | |||||||||||||
| 300,000 | 1.510%, due 12/08/04 | 300,000 | |||||||||||||
| 400,000 | 1.600%, due 03/01/05 | 400,000 | |||||||||||||
| 200,000 | 1.600%, due 05/16/05 | 200,000 | |||||||||||||
| 2,850,000 | |||||||||||||||
| Federal Home Loan Mortgage Corporation: 1.1% | |||||||||||||||
| 450,000 | 1.500%, due 02/14/05 | 450,000 | |||||||||||||
| 450,000 | |||||||||||||||
| Principal Amount | Value | ||||||||||||||
| Federal National Mortgage Association: 2.9% | |||||||||||||||
| $ | 450,000 | 1.400%, due 02/25/05 | $ | 450,000 | |||||||||||
| 400,000 | 1.550%, due 05/04/05 | 400,000 | |||||||||||||
| 200,000 | 1.610%, due 05/13/05 | 200,000 | |||||||||||||
| 200,000 | 1.630%, due 01/03/05 | 200,000 | |||||||||||||
| 1,250,000 | |||||||||||||||
| Total U.S. Government Agency Obligations (Cost $4,550,000) | 4,550,000 | ||||||||||||||
| REPURCHASE AGREEMENT: 6.9% | |||||||||||||||
| 2,976,000 | S | Goldman Sachs Repurchase Agreement dated 09/30/04, 1.860%, due 10/01/04, $2,976,154 to be received upon repurchase (Collateralized by $3,299,087 U.S. Treasury Note, 0.000%, Market value plus accrued interest $3,065,281, due 05/15/07) | 2,976,000 | ||||||||||||
| Total Repurchase Agreement (Cost $2,976,000) | 2,976,000 | ||||||||||
| Total Investments in Securities (Cost $43,486,517)* | 101.1 | % | $43,486,517 | ||||||||
| Other Assets and Liabilities-Net | (1.1 | ) | (472,213) | ||||||||
| Net Assets | 100.0 | % | $ | 43,014,304 | |||||||
(1) All securities with a maturity date greater than 13 months have either a variable rate, demand feature, prerefunded, optional or mandatory put resulting in an effective maturity of one year or less. Rate shown reflects current rate.
@@ Foreign Issuer
# Securities with purchases pursuant to Rule 144A, under the Securities Act of 1933 and may not be resold subject to that rule except to qualified institutional buyers. These securities have been determined to be liquid under the guidelines established by the Funds' Board of Directors. At September 30, 2004, these securities totaled $11,822,540, or 27.5% of net assets.
S Segregated securities for futures, when-issued or delayed delivery securities held at September 30, 2004.
I Illiquid security
* Cost for federal income tax purposes is the same as for financial statement purposes.
| Industry | Percentage of Net Assets | ||||||
| Commercial Banks Non - U.S. | 4.7 | % | |||||
| Commercial Banks - Central U.S. | 4.1 | ||||||
| Commercial Banks - Eastern U.S. | 4.1 | ||||||
| Diversified Financial Services | 4.8 | ||||||
| Federal and Federally Sponsored Credit Agencies | 10.6 | ||||||
| Fiduciary Banks | 1.1 | ||||||
| Finance - Auto Loans | 0.8 | ||||||
| Finance - Investment Banker/Broker | 9.7 | ||||||
| Finance - Other Services | 0.6 | ||||||
| Food - Flour and Grain | 0.8 | ||||||
| Investment Companies | 1.8 | ||||||
| Medical - Drugs | 0.8 | ||||||
| Money Center Banks | 4.8 | ||||||
| Retail | 3.2 | ||||||
| S&L/Thrifts - Western U.S. | 3.2 | ||||||
| Special Purpose Entity | 34.6 | ||||||
| Super - Regional Banks - U.S. | 3.7 | ||||||
| Telephone - Integrated | 0.9 | ||||||
| Repurchase Agreement | 6.8 | ||||||
| Other Assets and Liabilities, Net | (1.1 | ) | |||||
| Net Assets | 100.0 | % | |||||
See Accompanying Notes to Financial Statements
85
PORTFOLIO OF INVESTMENTS
ING LEXINGTON MONEY MARKET TRUST(1) as of September 30, 2004 (Unaudited)
| Principal Amount | Value | ||||||||||||||
| CERTIFICATE OF DEPOSIT: 11.5% | |||||||||||||||
| $ | 400,000 | ABN Amro Bank NV, 1.736%, due 03/18/05 | $ | 399,963 | |||||||||||
| 300,000 | ABN Amro Bank NV, 1.768%, due 10/29/04 | 299,988 | |||||||||||||
| 100,000 | Barclays Bank PLC, 1.600%, due 12/03/04 | 99,992 | |||||||||||||
| 650,000 | @@ | Barclays Bank PLC, 1.913%, due 02/03/05 | 650,012 | ||||||||||||
| 400,000 | Dexia Bank, 1.508%, due 12/07/04 | 400,005 | |||||||||||||
| 200,000 | HSBC Bank, 1.555%, due 04/22/05 | 200,000 | |||||||||||||
| 500,000 | Royal Bank of Canada, 1.770%, due 03/30/05 | 499,961 | |||||||||||||
| 500,000 | @@ | Royal Bank of Scotland Group PLC, 1.400%, due 10/21/04 | 499,997 | ||||||||||||
| 500,000 | UBS AG, 1.195%, due 12/06/04 | 500,005 | |||||||||||||
| 500,000 | Washington Mutual Bank, 1.300%, due 12/27/04 | 500,000 | |||||||||||||
| 450,000 | Washington Mutual Bank, 1.650%, due 11/12/04 | 449,989 | |||||||||||||
| 450,000 | Washington Mutual Bank, 1.670%, due 11/01/04 | 450,000 | |||||||||||||
| Total Certificate of Deposit (Cost $4,949,912) | 4,949,912 | ||||||||||||||
| COLLATERALIZED MORTGAGE OBLIGATIONS: 6.1% | |||||||||||||||
| 500,000 | # | Blue Heron Funding Ltd., 1.850%, due 05/18/05 | 500,000 | ||||||||||||
| 500,000 | # | Blue Heron Funding Ltd., 1.858%, due 03/18/05 | 500,000 | ||||||||||||
| 500,000 | # | Blue Heron Funding Ltd., 1.870%, due 02/23/05 | 500,000 | ||||||||||||
| 300,000 | #,I | Newcastle CDO I Ltd., 1.870%, due 09/24/38 | 300,000 | ||||||||||||
| 500,000 | # | Putnam Structured Product CDO, 1.780%, due 10/15/38 | 500,000 | ||||||||||||
| 325,000 | # | Whitehawk CDO Funding Ltd., 1.805%, due 03/15/05 | 325,000 | ||||||||||||
| Total Collateralized Mortgage Obligations (Cost $2,625,000) | 2,625,000 | ||||||||||||||
| COMMERCIAL PAPER: 37.2% | |||||||||||||||
| 350,000 | Archer-Daniels-Midland Co., 1.420%, due 10/05/04 | 349,931 | |||||||||||||
| 250,000 | Barton Capital Corp., 1.520%, due 10/07/04 | 249,926 | |||||||||||||
| 250,000 | Barton Capital Corp., 1.680%, due 10/18/04 | 249,790 | |||||||||||||
| 250,000 | Blue Ridge Asset Funding, 1.680%, due 10/18/04 | 249,790 | |||||||||||||
| 350,000 | Bristol-Myers Squibb Co., 1.520%, due 10/07/04 | 349,897 | |||||||||||||
| 500,000 | # | Concord Minutemen Cap, 1.710%, due 10/19/04 | 499,550 | ||||||||||||
| 400,000 | # | Concord Minutemen Cap, 1.730%, due 10/10/05 | 400,000 | ||||||||||||
| 500,000 | # | Concord Minutemen Cap, 1.740%, due 10/12/05 | 500,000 | ||||||||||||
| 500,000 | # | Concord Minutemen Cap, 1.740%, due 10/14/05 | 500,000 | ||||||||||||
| Principal Amount | Value | ||||||||||||||
| $ | 450,000 | Crown Point Capital Co., 1.000%, due 10/06/04 | $ | 449,925 | |||||||||||
| 1,300,000 | Crown Point Capital Co., 2.050%, due 03/08/05 | 1,288,347 | |||||||||||||
| 250,000 | Delaware Funding Corp., 1.680%, due 10/18/04 | 249,790 | |||||||||||||
| 300,000 | #,I | Goldman Sachs Group, 1.280%, due 10/27/04 | 300,000 | ||||||||||||
| 400,000 | # | Goldman Sachs Group, 1.810%, due 07/29/05 | 400,000 | ||||||||||||
| 500,000 | Greenwich Capital Holdings, 1.718%, due 01/14/05 | 500,000 | |||||||||||||
| 500,000 | Household Finance Corp., 1.260%, due 10/06/04 | 499,895 | |||||||||||||
| 250,000 | Jupiter Securitization, 1.340%, due 10/04/04 | 249,963 | |||||||||||||
| 500,000 | LaSalle Bank Note, 1.160%, due 12/17/04 | 500,000 | |||||||||||||
| 500,000 | LaSalle Bank Note, 1.210%, due 11/05/04 | 500,000 | |||||||||||||
| 650,000 | Monument Gardens Funding LLC, 1.760%, due 12/01/04 | 648,040 | |||||||||||||
| 325,000 | Monument Gardens Funding LLC, 1.880%, due 12/20/04 | 323,628 | |||||||||||||
| 400,000 | Morgan Stanley, 1.650%, due 10/14/04 | 399,743 | |||||||||||||
| 500,000 | Morgan Stanley, 1.660%, due 10/15/04 | 499,653 | |||||||||||||
| 250,000 | Old Line Funding Corp., 1.650%, due 10/14/04 | 249,839 | |||||||||||||
| 375,000 | Old Line Funding Corp., 1.710%, due 11/02/04 | 374,413 | |||||||||||||
| 450,000 | Preferred Receivable Funding Corp., 0.000%, due 10/01/04 | 450,000 | |||||||||||||
| 1,350,000 | Preferred Receivable Funding Corp., 1.260%, due 10/04/04 | 1,349,810 | |||||||||||||
| 325,000 | Preferred Receivable Funding Corp., 1.350%, due 10/05/04 | 324,939 | |||||||||||||
| 400,000 | SBC Communications, 1.680%, due 10/18/04 | 399,664 | |||||||||||||
| 400,000 | # | St. Germain Holdings, 1.510%, due 10/08/04 | 399,866 | ||||||||||||
| 450,000 | # | St. Germain Holdings, 1.510%, due 10/13/04 | 449,756 | ||||||||||||
| 400,000 | # | St. Germain Holdings, 1.880%, due 12/13/04 | 398,459 | ||||||||||||
| 250,000 | Tulip Funding Corp., 0.000%, due 10/01/04 | 250,000 | |||||||||||||
| 850,000 | # | Verizon Global Funding, 1.990%, due 10/14/05 | 850,000 | ||||||||||||
| 350,000 | Windmill Funding Corp., 1.630%, due 10/12/04 | 349,810 | |||||||||||||
| Total Commercial Paper (Cost $16,004,424) | 16,004,424 | ||||||||||||||
| CORPORATE BONDS/NOTES: 27.8% | |||||||||||||||
| 500,000 | Associates Corp. NA, 2.050%, due 06/27/05 | 500,489 | |||||||||||||
| 200,000 | Bank One NA, 1.894%, due 11/01/04 | 200,040 | |||||||||||||
| 500,000 | Bank One NA, 1.980%, due 07/26/05 | 500,737 | |||||||||||||
See Accompanying Notes to Financial Statements
86
PORTFOLIO OF INVESTMENTS
ING LEXINGTON MONEY MARKET TRUST(1) as of September 30, 2004 (Unaudited) (continued)
| Principal Amount | Value | ||||||||||||||
| CORPORATE BONDS/NOTES (continued) | |||||||||||||||
| $ | 500,000 | Bear Stearns Cos., Inc., 1.716%, due 10/05/05 | $ | 500,000 | |||||||||||
| 400,000 | Bear Stearns Cos., Inc., 1.850%, due 10/28/09 | 400,000 | |||||||||||||
| 325,000 | Credit Suisse First Boston USA, Inc., 2.010%, due 02/08/05 | 325,336 | |||||||||||||
| 450,000 | Credit Suisse First Boston USA, Inc., 2.050%, due 01/14/05 | 450,567 | |||||||||||||
| 250,000 | Fleet National Bank, 1.840%, due 11/22/04 | 250,047 | |||||||||||||
| 900,000 | General Electric Capital Corp., 2.005%, due 03/15/05 | 900,761 | |||||||||||||
| 400,000 | # | Goldman Sachs Group LP, 1.769%, due 10/15/05 | 400,000 | ||||||||||||
| 500,000 | @@,# | HBOS Treasury Services PLC, 1.640%, due 11/01/05 | 500,000 | ||||||||||||
| 700,000 | @@,# | HBOS Treasury Services PLC, 1.961%, due 10/24/05 | 700,000 | ||||||||||||
| 250,000 | JPMorgan Chase & Co., 2.190%, due 03/29/05 | 250,307 | |||||||||||||
| 500,000 | Merrill Lynch & Co., Inc., 1.550%, due 01/05/05 | 500,015 | |||||||||||||
| 1,000,000 | #,I | Money Market Trust Series A, 1.835%, due 10/07/05 | 1,000,000 | ||||||||||||
| 450,000 | Morgan Stanley, 1.880%, due 08/15/05 | 450,508 | |||||||||||||
| 150,000 | PNC Bank NA, 1.920%, due 05/18/05 | 150,229 | |||||||||||||
| 500,000 | # | The Bank of New York Co., Inc., 1.860%, due 10/27/05 | 500,000 | ||||||||||||
| 350,000 | Toyota Motor Credit Corp., 1.700%, due 02/07/05 | 350,055 | |||||||||||||
| 400,000 | Wachovia Corp., 2.230%, due 03/31/05 | 400,801 | |||||||||||||
| 1,525,000 | Wal-Mart Stores, Inc., 1.698%, due 02/22/05 | 1,525,132 | |||||||||||||
| 400,000 | Wells Fargo & Co., 1.690%, due 11/02/05 | 400,128 | |||||||||||||
| 500,000 | Wells Fargo & Co., 2.000%, due 09/29/05 | 500,335 | |||||||||||||
| 300,000 | Westpac Banking Corp., 1.850%, due 10/11/05 | 300,000 | |||||||||||||
| Total Corporate Bonds/Notes (Cost $11,955,487) | 11,955,487 | ||||||||||||||
| U.S. GOVERNMENT AGENCY OBLIGATIONS: 12.1% | |||||||||||||||
| Federal Home Loan Bank: 7.7% | |||||||||||||||
| 500,000 | 1.400%, due 02/25/05 | 500,000 | |||||||||||||
| 500,000 | 1.425%, due 04/04/05 | 500,000 | |||||||||||||
| 400,000 | 1.470%, due 02/28/05 | 400,000 | |||||||||||||
| 400,000 | 1.500%, due 12/07/04 | 400,000 | |||||||||||||
| 400,000 | 1.500%, due 03/01/05 | 400,000 | |||||||||||||
| 300,000 | 1.510%, due 12/08/04 | 300,000 | |||||||||||||
| 500,000 | 1.600%, due 03/01/05 | 500,000 | |||||||||||||
| 300,000 | 1.600%, due 05/16/05 | 300,000 | |||||||||||||
| 3,300,000 | |||||||||||||||
| Federal Home Loan Mortgage Corporation: 1.0% | |||||||||||||||
| 450,000 | 1.500%, due 02/14/05 | 450,000 | |||||||||||||
| 450,000 | |||||||||||||||
| Principal Amount | Value | ||||||||||||||
| Federal National Mortgage Association: 3.4% | |||||||||||||||
| $ | 350,000 | 1.400%, due 02/25/05 | $ | 350,000 | |||||||||||
| 500,000 | 1.550%, due 05/04/05 | 500,000 | |||||||||||||
| 300,000 | 1.610%, due 05/13/05 | 300,000 | |||||||||||||
| 300,000 | 1.630%, due 01/03/05 | 300,000 | |||||||||||||
| 1,450,000 | |||||||||||||||
| Total U.S. Government Agency Obligations (Cost $5,200,000) | 5,200,000 | ||||||||||||||
| REPURCHASE AGREEMENT: 6.5% | |||||||||||||||
| 2,770,000 | S | Goldman Sachs Repurchase Agreement dated 09/30/04, 1.860%, due 10/01/04, $2,770,143 to be received upon repurchase (Collateralized by $2,922,000 Federal National Mortgage Association, 4.000%, Market value plus accrued interest $2,825,574, due 06/12/13) | 2,770,000 | ||||||||||||
| Total Repurchase Agreement (Cost $2,770,000) | 2,770,000 | ||||||||||||||
| Total Investments in Securities (Cost $43,504,823)* | 101.2 | % | $43,504,823 | ||||||||||||
| Other Assets and | Liabilities-Net | (1.2 | ) | (500,189) | |||||||||||
| Net Assets | 100.0 | % | $ | 43,004,634 | |||||||||||
(1) All securities with a maturity date greater than 13 months have either a variable rate, demand feature, prerefunded, optional or mandatory put resulting in an effective maturity of one year or less. Rate shown reflects current rate.
@@ Foreign Issuer
# Securities with purchases pursuant to Rule 144A, under the Securities Act of 1933 and may not be resold subject to that rule except to qualified institutional buyers. These securities have been determined to be liquid under the guidelines established by the Funds' Board of Directors. At September 30, 2004, these securities totaled $10,422,631, or 24.2% of net assets.
S Segregated securities for futures, when-issued or delayed delivery securities held at September 30, 2004.
I Illiquid security
* Cost for federal income tax purposes is the same as for financial statement purposes.
| Industry | Percentage of Net Assets | ||||||
| Commercial Banks Non - U.S. | 4.7 | % | |||||
| Commercial Banks - Central U.S. | 5.6 | ||||||
| Commercial Banks - Eastern U.S. | 4.6 | ||||||
| Diversified Financial Services | 3.3 | ||||||
| Federal and Federally Sponsored Credit Agencies | 12.1 | ||||||
| Fiduciary Banks | 1.1 | ||||||
| Finance - Auto Loans | 0.8 | ||||||
| Finance - Investment Banker/Broker | 9.4 | ||||||
| Finance - Other Services | 0.6 | ||||||
| Food - Flour and Grain | 0.8 | ||||||
| Investment Companies | 1.8 | ||||||
| Medical - Drugs | 0.8 | ||||||
| Money Center Banks | 3.9 | ||||||
| Retail | 3.5 | ||||||
| S&L/Thrifts - Western U.S. | 3.2 | ||||||
| Special Purpose Entity | 34.7 | ||||||
| Super - Regional Banks - U.S. | 3.0 | ||||||
| Telephone - Integrated | 0.9 | ||||||
| Repurchase Agreement | 6.4 | ||||||
| Other Assets and Liabilities, Net | (1.2 | ) | |||||
| Net Assets | 100.0 | % | |||||
See Accompanying Notes to Financial Statements
87
SHAREHOLDER MEETING INFORMATION (Unaudited)
A special meeting of shareholders of the Funds was held October 7, 2004, at the offices of ING Funds, 7337 East Doubletree Ranch Road, Scottsdale, AZ 85258.
A brief description of each matter voted upon as well as the results are outlined below:
Matters:
1. To approve an Agreement and Plan of Reorganization (the "Reorganization Agreement") by and among High Yield Opportunity Fund and ING High Yield Bond Fund ("High Yield Bond Fund"), providing for the merger of High Yield Opportunity Fund with and into High Yield Bond Fund;
2. To transact such other business, not currently contemplated, that may properly come before the Special Meeting or any adjournment(s) thereof in the discretion of the proxies or their substitutes.
Results:
| Proposal | Shares voted for | Shares voted against or withheld | Shares abstained | Broker non-vote | Total shares voted | ||||||||||||||||||||||
| ING High Yield Opportunity Fund | 1 | 16,002,433 | 387,660 | 1,417,667 | - | 17,807,760 | |||||||||||||||||||||
| 2 | 15,641,997 | 588,738 | 1,577,025 | - | 17,807,760 | ||||||||||||||||||||||
88
(THIS PAGE INTENTIONALLY LEFT BLANK)
ING Funds Distributor, LLC offers the funds listed below. Before investing in a fund, shareholders should carefully review the fund's prospectus. Investors may obtain a copy of a prospectus of any ING Fund by calling (800) 992-0180.
Domestic Equity and Income Funds
ING Balanced Fund
ING Convertible Fund
ING Equity and Bond Fund
ING Equity Income Fund
ING Real Estate Fund
Domestic Equity Growth Funds
ING Disciplined LargeCap Fund
ING Growth Fund
ING LargeCap Growth Fund
ING MidCap Opportunities Fund
ING SmallCap Opportunities Fund
ING Small Company Fund
Domestic Equity Index Funds
ING Index Plus LargeCap Fund
ING Index Plus MidCap Fund
ING Index Plus SmallCap Fund
Domestic Equity Value Funds
ING Financial Services Fund
ING LargeCap Value Fund
ING MagnaCap Fund
ING MidCap Value Fund
ING SmallCap Value Fund
ING Value Opportunity Fund
International Equity Funds
ING Emerging Countries Fund
ING Foreign Fund
ING International Fund
ING International Growth Fund
ING International SmallCap Growth Fund
ING International Value Fund
ING Precious Metals Fund
ING Russia Fund
Global Equity Funds
ING Global Equity Dividend Fund
ING Global Real Estate Fund
ING Global Science and Technology Fund
ING Worldwide Growth Fund
Fixed Income Funds
ING GNMA Income Fund
ING Government Fund
ING High Yield Bond Fund
ING Intermediate Bond Fund
ING National Tax Exempt Bond Fund
Strategic Allocation Funds
ING Strategic Allocation Balanced Fund
ING Strategic Allocation Growth Fund
ING Strategic Allocation Income Fund
Loan Participation Fund
ING Senior Income Fund
Money Market Funds*
ING Aeltus Money Market Fund
ING Classic Money Market Fund
ING Lexington Money Market Trust
ING Money Market Fund
* An investment in the Fund is not insured or guaranteed by the Federal Deposit Insurance Corporation or any other government agency. Although the Fund seeks to preserve the value of your investment at $1.00 per share, it is possible to lose money by investing in the Fund.
Investment Manager
ING Investments, LLC
7337 E. Doubletree Ranch Road
Scottsdale, Arizona 85258
Administrator
ING Funds Services, LLC
7337 E. Doubletree Ranch Road
Scottsdale, Arizona 85258
Distributor
ING Funds Distributor, LLC
7337 E. Doubletree Ranch Road
Scottsdale, Arizona 85258
1-800-334-3444
Transfer Agent
DST Systems, Inc.
P.O. Box 419368
Kansas City, Missouri 64141
Custodian
The Bank of New York
100 Colonial Center Parkway, Suite 300
Lake Mary, FL 32746
Legal Counsel
Dechert
1775 I Street, N.W.
Washington, D.C. 20006
Independent Registered Public Accounting Firm
KPMG LLP
99 High Street
Boston, MA 02110
For more complete information, or to obtain a prospectus on any ING fund, please call your Investment Professional or ING Funds Distributor, LLC at (800) 992-0180 or log on to www.ingfunds.com. The prospectus should be read carefully before investing. Consider the fund's investment objectives, risks, charges and expenses carefully before investing. The prospectus contains this information and other information about the fund. Information regarding how the Funds voted proxies related to portfolio securities during the most recent 12-month period ended June 30 is available without charge on the Funds' website at www.ingfunds.com and on the SEC's website at www.sec.gov.

PRSAR-UFFIABCMOR (0904-112904)
Funds
SEMI-ANNUAL REPORT

Semi-Annual Report
September 30, 2004
Classes I and Q
Fixed Income Funds
n ING GNMA Income Fund
n ING Intermediate Bond Fund
This report is submitted for general information to shareholders of the ING Funds. It is not authorized for distribution to prospective shareholders unless accompanied or preceded by a prospectus which includes details regarding the funds' investment objectives, risks, charges, expenses and other information. This information should be read carefully.

TABLE OF CONTENTS
(THIS PAGE INTENTIONALLY LEFT BLANK)

JAMES M. HENNESSY
Dear Shareholder:
As we complete another six months of serving the needs of investors, we are pleased to see that the conclusion of the recent presidential election appears to have had a positive impact on major U.S. stock markets. With moderately low interest rates being controlled by the Federal Reserve Board, rising corporate earnings, and an increasingly optimistic job outlook, we are hopeful that the economy will continue to prosper through the end of the year.
As always, we continue to look for ways to make investing with our company more pleasant and efficient. When our clients complete a transaction with ING Funds, first and foremost, we want them to have peace of mind.
We are eager to meet these goals and we look forward to continuing to do business with you in the coming year.
Sincerely,

James M. Hennessy
President
ING Funds
November 9, 2004
1
MARKET PERSPECTIVE: SIX MONTHS ENDED SEPTEMBER 30, 2004
Be careful what you wish for, the ancient Chinese proverb goes, you just might get it. On the second day of the six months under review, April 2, 2004, investors received the good news they were so eagerly seeking; however, after a few days of euphoria they spent the rest of a nervous second calendar quarter wondering why the solution to one problem so often seems to usher in a new set. The news in question was, at last, a very bullish U.S. employment report, the final piece in the economic puzzle to sustain the recovery. But as the job market tightens, inflation picks up and rising interest rates cannot be far away. This kept a lid on stocks and gave bond investors one of their worst quarters in years. Then, in the third calendar quarter, rising oil prices, sagging growth, the sense that the party was drawing to a close, central banks with tightening on their minds and some distinctly odd dyna mics in the Treasury market, all conspired to give investors a memorable quarter with not all memories pleasant.
Initially, as might be expected, investment grade U.S. fixed income classes bore the brunt of fears of a new cycle of rising interest rates. April's strong employment report, plus another two after that, set the tone, to the steady drumbeat of evidence that inflation was on the rise. Oil prices were surging. With the Federal Funds rate at just 1%, real interest rates were becoming more negative, an increasingly untenable situation. Federal Open Market Committee ("FOMC") Chairman Greenspan confirmed that interest rates were likely to rise close, albeit at a "measured" pace. This practically telegraphed a 0.25% Federal Funds rate increase at the FOMC meeting on June 30, 2004. When it duly arrived, bond markets recovered modestly. But the damage had been done. By the middle of our six months ended September 30, 2004 , investment grade bonds had given back practically all of their gains for 2004. And yet in the week before the increase the wind seemed to shift again. First quarter gross domestic product ("GDP") growth was revised down. Durable goods orders fell. Retailers and auto companies complained of slack sales. The Chicago Purchasing Managers' Index(1) had its largest drop in 30 years. Perhaps Greenspan's "measured" policy was right; but perhaps something else was wrong. All eyes were therefore on the employment report to be published on July 2, 2004. The report was weak and by the end of the month few doubted that the economy had stu mbled. August's shocking employment report showed that just 32,000 jobs were created in July and the figures for prior months were revised down by 61,000. By now sentiment about the economy had reversed itself from the earlier optimism. Comforting words from Chairman Greenspan that the slow down was only temporary were not universally accepted. Most commentators felt it more likely that the economy had now settled down to a lower, if still positive level of activity. In a mirror image of the first few months, investment grade bonds benefited richly from perceptions of a decelerating economy with inflation in check. That was no surprise. What did surprise, however, was that this played out as the FOMC raised the Federal Funds rate twice more. Ten-year Treasury yields slipped back to early April levels, but yields on 13-week Treasury Bills followed the Federal Funds rate up. On September 22, 2004, the "spread" between the yields on Bonds and Bills reached the lowest point since June 2003. I n the third calendar quarter, the Lehman Brothers Aggregate Bond Index(2) of investment grade bonds had its best quarter's return in two years. But for the six months as a whole, the Lehman Brothers Aggregate Bond Index gained just 0.67%. The shrinking of the Treasury risk premium was carried through to high yield bonds, which performed better than the investment grade. The Lehman Brothers U.S. Corporate High Yield Bond Index(3) returned 3.84% during the semi-annual period. By the end of September, the yield curve was markedly flatter. The yield on 1 0-year Treasury Notes rose by 0.28% to 4.12% while the yield on 13-week Treasury Bills almost doubled, rising 0.75% to 1.67%.
Global equities had two major dips, one in each quarter, but by the six months they had lost only 0.14%, according to the MSCI World Index(4) in dollars including net reinvested dividends. Among currencies, the euro gained just under 1.0% while the pound lost nearly 2.0% as the interest rate tightening cycle in the United Kingdom seemed to be ending. The yen was the weakest of the majors, losing 5.3% against the dollar, as Japan's economic recovery decelerated sharply. In addition, sharply rising oil prices weighed on the yen, since Japan imports all of its oil, as did the prospect of slower growth in China.
The U.S. equities market showed a pattern similar to international stocks, dipping in each quarter, but with a practically neutral end result. For the six months, the Standard & Poor's ("S&P") 500 Index(5) returned -0.18% including dividends. At just over 1,100, the S&P 500 Index was trading at a price to earnings level of around 15.25 times 2005 earnings. Equities were affected by all the developments described above in the contex t of fixed income. Optimism on improving business conditions gave way to fears of rising interest
2
MARKET PERSPECTIVE: SIX MONTHS ENDED SEPTEMBER 30, 2004
rates and then further concerns about a stalled economy. In addition, stock prices were increasingly held back by soaring oil prices, which on the futures contract were reaching new records almost daily by the end of September. Corporate profits were still increasing, but the days of year over year growth above 20% were nearly over.
(1) The Chicago Purchasing Managers' Index measures manufacturing activity in the industrial Midwest.
(2) The Lehman Brothers Aggregate Bond Index is composed of securities from the Lehman Brothers Government/Corporate Bond Index, Mortgage-Backed Securities Index, and the Asset-Backed Securities Index. Total return comprises price appreciation/depreciation and income as a percentage of the original investment.
(3) The Lehman Brothers U.S. Corporate High Yield Bond Index is generally representative of corporate bonds rated below investment-grade.
(4) The MSCI World Index reflects the stock markets of 22 countries, including the United States, Europe, Canada, Australia, New Zealand and the Far East - comprising approximately 1,500 securities - with values expressed in U.S. dollars.
(5) The Standard & Poor's 500 Index is a capitalization-weighted index of 500 stocks designed to measure performance of the broad domestic economy through changes in the aggregate market value of 500 stocks representing all major industries.
All indices are unmanaged and investors cannot invest directly in an index.
Past performance does not guarantee future results. The performance quoted represents past performance. Investment return and principal value of an investment will fluctuate, and shares, when redeemed, may be worth more or less than their original cost. The Funds' performance is subject to change since the period's end and may be lower or higher than the performance data shown. Please call (800) 992-0180 or log on to www.ingfunds.com to obtain performance data current to the most recent month-end.
Market Perspective reflects the views of the Chief Investment Risk Officer only through the end of the period, and is subject to change based on market and other conditions.
3
ING GNMA INCOME FUND
The ING GNMA Income Fund (the "Fund") seeks to generate a high level of current income, consistent with liquidity and safety of principal, through investment primarily in Government National Mortgage Association ("Ginnie Mae", "GNMA") mortgage-backed securities (also known as GNMA Certificates) that are guaranteed as to the timely payment of principal and interest by the U.S. Government. The Fund is managed by Denis P. Jamison, CFA and Roseann G. McCarthy, ING Investment Management Co. (formerly, Aeltus Investment Management, Inc.) - the Sub-Adviser.
Performance: For the six months ended September 30, 2004, the Fund's Class Q shares provided a total return of 0.42% compared to 1.45% for the Lehman Brothers Mortgage-Backed Securities Index(1).
Portfolio Specifics: The last six months ended September 30, 2004 included two periods as different as spring and summer. From mid-March until mid-June 2004, investors were focused on the economy's strong growth - real gross domestic product was growing 4.5% plus - and the Federal Reserve's plan to raise short- term interest rates. Ten-year Treasury bond yields rose nearly 100 basis points to 4.9% by the middle of June 2004. Then, the economy crossed what many described as a "soft patch" of slow employment growth and consumer spending. Moreover, speculators began to realize that the Federal Reserve's stated plan of "measured" increases in money rates would provide easy profits from arbitraging the wide spread between the yield on short-term notes and long-term Treasu ry bonds. Not only did ten-year bond yields decline, from 4.9% to just under 4.0%, but the yield curve flattened as short-term interest rates rose and longer bond yields fell.
Whether it was spring or summer, however, the Fund underperformed its benchmark by about 50 basis points in each quarter of the reporting period. The common thread that held back performance was our project loans. In April, a large multi-family loan unexpectedly prepaid at face value. This clipped 20 basis points from our total return. During the bond rally in August and September, our project loans failed to keep pace, and the spread between the yield of these securities and that of the five-year Treasury note widened from plus 125 basis points to plus 150 basis points. This reduced our return by another 30 basis points. Our $80 million plus U.S. Treasury bill and note investment was another drag, especially in the September quarter. The two-year notes returned only 1.0% compared with a 6.4% increase for long-term Treasury bonds and 2.6% for the Lehman Mortgage Index.
Current Strategy and Outlook: Wide interest rate swings and low absolute returns characterized the first half of the Fund's current fiscal year. This may not be the best period to gauge the effectiveness of our fundamental investment strategy. We plan to continue to focus on mortgages with features that reduce their prepayment sensitivity to changes in interest rates. Moreover, we will seek to only put money to work in these securities when they can be bought at prices that should result in greater returns than of those projected for generic mortgage securities.
We expected a prolonged, gradual rise in interest rates as long as the economy continues to grow. Short- and intermediate-term bond yields appear too low given the current period of 3% to 4% business expansion. Commodity prices are likely to remain in the spotlight as new demand from China and India outstrips new supply. A subsequent rise in the inflation rate will remain a concern. These factors justify caution and a somewhat defensive stance toward interest rate risk. Accordingly, we will continue to emphasize higher coupon mortgage securities and keep a greater than normal percentage of the Fund's assets in short-term U.S. Treasury securities.

4
ING GNMA INCOME FUND
PORTFOLIO MANAGERS' REPORT
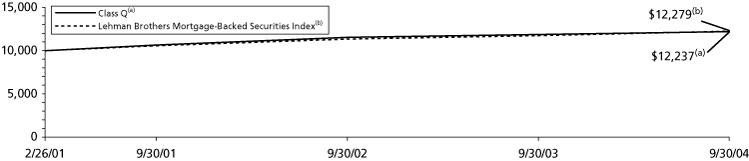
| Average Annual Total Returns for the Periods Ended September 30, 2004 | |||||||||||||||
1 Year | Since Inception of Class I January 7, 2002 | Since Inception of Class Q February 26, 2001 | |||||||||||||
| Class I | 3.17 | % | 5.77 | % | - | ||||||||||
| Class Q | 2.90 | % | - | 5.84 | % | ||||||||||
| Lehman Brothers Mortgage-Backed | |||||||||||||||
| Securities Index(1) | 4.36 | % | 5.51 | %(2) | 5.90 | %(3) | |||||||||
Based on a $10,000 initial investment, the graph and table above illustrate the total return of ING GNMA Income Fund against the Lehman Brothers Mortgage-Backed Securities Index. The Index is unmanaged and has no cash in its portfolio, imposes no sales charges and incurs no operating expenses. An investor cannot invest directly in an index. The Fund's performance is shown both with and without the imposition of sales charges.
The performance graph and table do not reflect the deduction of taxes that a shareholder will pay on Fund distributions or the redemption of Fund shares.
Total returns reßect the fact that the Investment Adviser has waived certain fees and expenses otherwise payable by the Fund. Total returns would have been lower had there been no waiver to the Fund.
Performance data represents past performance and is no assurance of future results. Investment return and principal value of an investment in the Fund will ßuctuate. Shares, when sold, may be worth more or less than their original cost. The Fund's performance may be lower or higher than the performance data shown. Please log on to www.ingfunds.com or call
(800) 992-0180 to get performance through the most recent month end.
This report contains statements that may be "forward-looking" statements. Actual results may differ materially from those projected in the "forward-looking" statements.
The views expressed in this report reßect those of the portfolio managers, only through the end of the period as stated on the cover. The portfolio managers' views are subject to change at any time based on market and other conditions.
(1) The Lehman Brothers Mortgage-Backed Securities Index is an unmanaged index composed of fixed income security mortgage pools sponsored by GNMA, FNMA and FHLMC, including GNMA Graduated Payment Mortgages.
(2) Since inception performance for index is shown from January 1, 2002.
(3) Since inception performance for index is shown from March 1, 2001.
5
ING INTERMEDIATE BOND FUND
PORTFOLIO MANAGERS' REPORT
The ING Intermediate Bond Fund (the "Fund") seeks to provide investors with a high level of current income, consistent with the preservation of capital and liquidity by investing at least 80% of its assets in investment grade debt securities. The Fund is managed by a team of investment professionals led by James B. Kauffmann, ING Investment Management Co. (formerly, Aeltus Investment Management, Inc.) - the Sub-Adviser.
Performance: For the six months ended September 30, 2004, the Fund's Class I shares provided a total return of 0.89% compared to 0.67% for the Lehman Brothers Aggregate Bond Index(1).
Portfolio Specifics: While our short duration stance was helpful in the first three months of this reporting period, by the end it was a source of underperformance relative to the benchmark, especially since we concentrated our underweight in shorter maturities, which proved to be the more resilient part of the yield curve. During the first half of the fiscal year ended September 30, 2004, we reduced our exposure to longer-dated and lower-rated corporates in the face of stretched valuations. In fact, our exposure to credit-sensitive sectors is now below the Lehman Brothers Aggregate Bond Index; consequently, the Fund's yield is slightly less than the Index.
We continue to actively manage our sector allocation and security selection exposures. For the six-month period ended September 30, 2004, we estimate that we generated 24 basis points of excess return from security selection, 21 basis points from sector allocation, but only 15 basis points from maturity and duration decisions due to our shorter duration during the second half of the reporting period. The Fund is overweight utilities, insurance, consumer non-cyclical and the real estate investment trust (REIT) sector. Exposure to emerging markets debt enhanced returns.
Current Strategy and Outlook: Uncertainties about the geopolitical situation and the level and direction of energy costs present portfolio managers with quite a set of wildcards; nevertheless, most measures of volatility remain very low. While the bond market continues to focus on the spate of mixed or softer economic releases, we do not believe that the yields on shorter maturity Treasuries fully reflect the future pace of economic activity and the rise in a number of inflation measures.
Tactically, the Fund is still short in duration in anticipation of improving global economic fundamentals despite the recent "soft patch" of slow employment growth and consumer spending. The Fund is underweight home mortgages, overweight asset-backed and commercial mortgage-backed securities, and underweight the intermediate and shorter-term part of the yield curve, which appears most vulnerable in a tightening cycle. We are also underweight U.S. Government Agency securities, which have witnessed some regulatory criticism. Stretched valuations in investment-grade credit issues still warrant caution. Indeed, we are beginning to see more shareholder friendly - read, bondholder unfriendly - actions by companies. We retain some exposure to emerging markets debt as many developing economies benefit from strong commodities and energy markets.

6
ING INTERMEDIATE BOND FUND
PORTFOLIO MANAGERS' REPORT
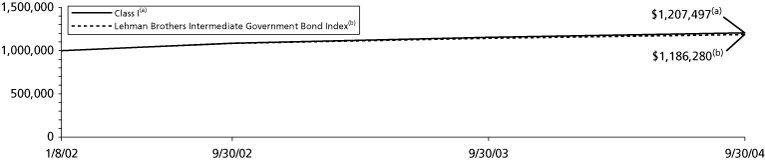
| Average Annual Total Returns for the Periods Ended September 30, 2004 | |||||||||||
| 1 Year | Since Inception of Class I January 8, 2002 | ||||||||||
| Class I | 4.54 | % | 7.15 | % | |||||||
| Lehman Brothers Aggregate Bond Index(1) | 3.68 | % | 6.41 | %(2) | |||||||
Based on a $1,000,000 initial investment, the graph and table above illustrate the total return of ING Intermediate Bond Fund against the Lehman Brothers Aggregate Bond Index. The Index is unmanaged and has no cash in its portfolio, imposes no sales charges and incurs no operating expenses. An investor cannot invest directly in an index. The Fund's performance is shown both with and without the imposition of sales charges.
The performance graph and table do not reflect the deduction of taxes that a shareholder will pay on Fund distributions or the redemption of Fund shares.
Total returns reßect the fact that the Investment Adviser has waived certain fees and expenses otherwise payable by the Fund. Total returns would have been lower had there been no waiver to the Fund.
Performance data represents past performance and is no assurance of future results. Investment return and principal value of an investment in the Fund will ßuctuate. Shares, when sold, may be worth more or less than their original cost. The Fund's performance may be lower or higher than the performance data shown.
Please log on to www.ingfunds.com or call
(800) 992-0180 to get performance through the most recent month end.
This report contains statements that may be "forward-looking" statements. Actual results may differ materially from those projected in the "forward-looking" statements.
The views expressed in this report reßect those of the portfolio managers, only through the end of the period as stated on the cover. The portfolio managers' views are subject to change at any time based on market and other conditions.
Fund holdings are subject to change daily.
(1) The Lehman Brothers Aggregate Bond Index is a widely recognized, unmanaged index of publicly issued investment grade U.S. Government, mortgage-backed, asset-backed and corporate debt securities.
(2) Since inception performance for index is shown from January 1, 2002.
7
SHAREHOLDER EXPENSE EXAMPLES (Unaudited)
As a shareholder of a Fund, you incur two types of costs: (1) transaction costs, including sales charges (loads) on purchase payments, reinvested dividends, or other distributions; redemption fees; and exchange fees; and (2) ongoing costs, including management fees; distribution [and/or service] (12b–1) fees; and other Fund expenses. These Examples are intended to help you understand your ongoing costs (in dollars) of investing in a Fund and to compare these costs with the ongoing costs of investing in other mutual funds.
The Examples are based on an investment of $1,000 invested at the beginning of the period and held for the entire period from April 1, 2004 to September 30, 2004.
Actual Expenses
The first section of the table shown, "Actual Fund Return," provides information about actual account values and actual expenses. You may use the information in this section, together with the amount you invested, to estimate the expenses that you paid over the period. Simply divide your account value by $1,000 (for example, an $8,600 account value divided by $1,000 = 8.6), then multiply the result by the number in the first section under the heading entitled "Expenses Paid During Period" to estimate the expenses you paid on your account during this period.
Hypothetical Example for Comparison Purposes
The second section of the table shown, "Hypothetical 5% Return," provides information about hypothetical account values and hypothetical expenses based on the Fund's actual expense ratio and an assumed rate of return of 5% per year before expenses, which is not the Fund's actual return. The hypothetical account values and expenses may not be used to estimate the actual ending account balance or expenses you paid for the period. You may use this information to compare the ongoing costs of investing in the Fund and other funds. To do so, compare this 5% hypothetical example with the 5% hypothetical examples that appear in the shareholder reports of the other funds.
Please note that the expenses shown in the table are meant to highlight your ongoing costs only and do not reflect any transactional costs, such as sales charges (loads), redemption fees, or exchange fees. Therefore, the hypothetical lines of the table are useful in comparing ongoing costs only, and will not help you determine the relative total costs of owning different funds. In addition, if these transactional costs were included, your costs would have been higher.
ING GNMA Income Fund
Expense Analysis of an investment of $1,000
| Total Return Without Sales Charges | Beginning Account Value April 1, 2004 | Ending Account Value September 30, 2004 | Annualized Expense Ratio | Expenses Paid During the Six Months Ended September 30, 2004* | |||||||||||||||||||
| Actual Fund Return | |||||||||||||||||||||||
| Class I | 0.55 | % | $ | 1,000.00 | $ | 1,005.50 | 0.67 | % | $ | 3.37 | |||||||||||||
| Class Q | 0.42 | 1,000.00 | 1,004.20 | 0.92 | 4.62 | ||||||||||||||||||
| Hypothetical (Excluding Expenses) | |||||||||||||||||||||||
| Class I | 5.00 | % | $ | 1,000.00 | $ | 1,021.17 | 0.67 | % | $ | 3.40 | |||||||||||||
| Class Q | 5.00 | 1,000.00 | 1,020.46 | 0.92 | 4.66 | ||||||||||||||||||
8
SHAREHOLDER EXPENSE EXAMPLES (Unaudited)
ING Intermediate Bond Fund
Expense Analysis of an investment of $1,000
| Total Return Without Sales Charges | Beginning Account Value April 1, 2004 | Ending Account Value September 30, 2004 | Annualized Expense Ratio | Expenses Paid During the Six Months Ended September 30, 2004* | |||||||||||||||||||
| Actual Fund Return | |||||||||||||||||||||||
| Class I | 0.89 | % | $ | 1,000.00 | $ | 1,008.90 | 0.66 | % | $ | 3.32 | |||||||||||||
| Hypothetical (Excluding Expenses) | |||||||||||||||||||||||
| Class I | 5.00 | % | $ | 1,000.00 | $ | 1,021.76 | 0.66 | % | $ | 3.35 | |||||||||||||
* Expenses are equal to the Fund's annualized expense ratios multiplied by the average account value over the period, multiplied by 183/365 (to reflect the one-half year period).
9
STATEMENTS OF ASSETS AND LIABILITIES as of September 30, 2004 (Unaudited)
| ING GNMA Income Fund | ING Intermediate Bond Fund | ||||||||||
| ASSETS: | |||||||||||
| Investments in securities at value+* | $ | 684,352,366 | $ | 648,414,533 | |||||||
| Short-term investments** | 34,406,057 | 73,409,156 | |||||||||
| Repurchase agreement | - | 31,211,000 | |||||||||
| Cash | 2,250,769 | 3,268 | |||||||||
| Cash collateral for futures | - | 612,539 | |||||||||
| Receivables: | |||||||||||
| Investment securities sold | 24,841,797 | 15,896,467 | |||||||||
| Fund shares sold | 258,251 | 1,135,126 | |||||||||
| Dividends and interest | 3,205,496 | 4,138,983 | |||||||||
| Prepaid expenses | 51,090 | 67,596 | |||||||||
| Total assets | 749,365,826 | 774,888,668 | |||||||||
| LIABILITIES: | |||||||||||
| Payable for investment securities purchased | 24,433,594 | 97,927,318 | |||||||||
| Payable for fund shares redeemed | 348,802 | 172,667 | |||||||||
| Payable for futures variation margin | - | 4,281 | |||||||||
| Payable upon receipt of securities loaned | - | 73,409,156 | |||||||||
| Income distribution payable | - | 1,494,694 | |||||||||
| Payable to affiliates | 604,233 | 486,763 | |||||||||
| Payable for trustee fees | 60,357 | 4,590 | |||||||||
| Other accrued expenses and liabilities | 328,237 | 130,382 | |||||||||
| Total liabilities | 25,775,223 | 173,629,851 | |||||||||
| NET ASSETS | $ | 723,590,603 | $ | 601,258,817 | |||||||
| NET ASSETS WERE COMPRISED OF: | |||||||||||
| Paid-in capital | $ | 715,347,382 | $ | 596,466,391 | |||||||
| Undistributed net investment income (accumulated net investment loss) | (278,257 | ) | 11,828 | ||||||||
| Accumulated net realized gain (loss) on investments and futures | (13,650,460 | ) | 1,940,991 | ||||||||
| Net unrealized appreciation on investments, translation of assets in foreign currencies and futures | 22,171,938 | 2,839,607 | |||||||||
| NET ASSETS | $ | 723,590,603 | $ | 601,258,817 | |||||||
| + Including securities loaned at value | $ | - | $ | 71,399,389 | |||||||
| * Cost of investments in securities | $ | 662,179,666 | $ | 645,698,895 | |||||||
| ** Cost of short-term investments | $ | 34,406,819 | $ | 73,409,156 | |||||||
See Accompanying Notes to Financial Statements
10
STATEMENTS OF ASSETS AND LIABILITIES as of September 30, 2004 (Unaudited)
| ING GNMA Income Fund | ING Intermediate Bond Fund | ||||||||||
| Class A: | |||||||||||
| Net assets | $ | 550,980,509 | $ | 398,784,516 | |||||||
| Shares authorized | unlimited | unlimited | |||||||||
| Par value | $ | 0.001 | $ | 0.001 | |||||||
| Shares outstanding | 63,242,809 | 38,145,862 | |||||||||
| Net asset value and redemption price per share | $ | 8.71 | $ | 10.45 | |||||||
| Maximum offering price per share (4.75%)(1) | $ | 9.14 | $ | 10.97 | |||||||
| Class B: | |||||||||||
| Net assets | $ | 111,541,672 | $ | 66,824,402 | |||||||
| Shares authorized | unlimited | unlimited | |||||||||
| Par value | $ | 0.001 | $ | 0.001 | |||||||
| Shares outstanding | 12,862,919 | 6,404,411 | |||||||||
| Net asset value and redemption price per share(2) | $ | 8.67 | $ | 10.43 | |||||||
| Maximum offering price per share | $ | 8.67 | $ | 10.43 | |||||||
| Class C: | |||||||||||
| Net assets | $ | 51,293,264 | $ | 68,717,151 | |||||||
| Shares authorized | unlimited | unlimited | |||||||||
| Par value | $ | 0.001 | $ | 0.001 | |||||||
| Shares outstanding | 5,907,779 | 6,581,217 | |||||||||
| Net asset value and redemption price per share(2) | $ | 8.68 | $ | 10.44 | |||||||
| Maximum offering price per share | $ | 8.68 | $ | 10.44 | |||||||
| Class I: | |||||||||||
| Net assets | $ | 9,460,052 | $ | 39,249,219 | |||||||
| Shares authorized | unlimited | unlimited | |||||||||
| Par value | $ | 0.001 | $ | 0.001 | |||||||
| Shares outstanding | 1,084,864 | 3,754,152 | |||||||||
| Net asset value and redemption price per share | $ | 8.72 | $ | 10.45 | |||||||
| Maximum offering price per share | $ | 8.72 | $ | 10.45 | |||||||
| Class M: | |||||||||||
| Net assets | $ | 212,198 | n/a | ||||||||
| Shares authorized | unlimited | n/a | |||||||||
| Par value | $ | 0.001 | n/a | ||||||||
| Shares outstanding | 24,318 | n/a | |||||||||
| Net asset value and redemption price per share | $ | 8.73 | n/a | ||||||||
| Maximum offering price per share (3.25%)(3) | $ | 9.02 | n/a | ||||||||
| Class Q: | |||||||||||
| Net assets | $ | 102,908 | n/a | ||||||||
| Shares authorized | unlimited | n/a | |||||||||
| Par value | $ | 0.001 | n/a | ||||||||
| Shares outstanding | 11,798 | n/a | |||||||||
| Net asset value and redemption price per share | $ | 8.72 | n/a | ||||||||
| Maximum offering price per share | $ | 8.72 | n/a | ||||||||
| Class O: | |||||||||||
| Net assets | n/a | $ | 27,548,424 | ||||||||
| Shares authorized | n/a | unlimited | |||||||||
| Par value | n/a | $ | 0.001 | ||||||||
| Shares outstanding | n/a | 2,635,169 | |||||||||
| Net asset value and redemption price per share | n/a | $ | 10.45 | ||||||||
| Maximum offering price per share | n/a | $ | 10.45 | ||||||||
| Class R: | |||||||||||
| Net assets | n/a | $ | 135,105 | ||||||||
| Shares authorized | n/a | unlimited | |||||||||
| Par value | n/a | $ | 0.001 | ||||||||
| Shares outstanding | n/a | 12,907 | |||||||||
| Net asset value and redemption price per share | n/a | $ | 10.47 | ||||||||
| Maximum offering price per share | n/a | $ | 10.47 | ||||||||
(1) Maximum offering price is computed at 100/95.25 of net asset value. On purchases of $50,000 or more, the offering price is reduced.
(2) Redemption price per share may be reduced for any applicable contingent deferred sales charges.
(3) Maximum offering price is computed at 100/96.75 of net asset value. On purchases of $50,000 or more, the offering price is reduced.
See Accompanying Notes to Financial Statements
11
STATEMENTS OF OPERATIONS for the six months ended September 30, 2004 (Unaudited)
| ING GNMA Income Fund | ING Intermediate Bond Fund | ||||||||||
| INVESTMENT INCOME: | |||||||||||
| Dividends, net of foreign taxes withheld* | $ | 924 | $ | 26,401 | |||||||
| Interest | 19,347,578 | 9,518,837 | |||||||||
| Securities lending income | - | 77,944 | |||||||||
| Total investment income | 19,348,502 | 9,623,182 | |||||||||
| EXPENSES: | |||||||||||
| Investment management fees | 1,851,822 | 1,171,650 | |||||||||
| Distribution and service fees: | |||||||||||
| Class A | 700,833 | 544,574 | |||||||||
| Class B | 589,622 | 323,826 | |||||||||
| Class C | 285,312 | 338,668 | |||||||||
| Class M | 940 | - | |||||||||
| Class O | - | 8,392 | |||||||||
| Class Q | 138 | - | |||||||||
| Class R | - | 315 | |||||||||
| Transfer agent fees: | |||||||||||
| Class A | 196,498 | 130,034 | |||||||||
| Class B | 41,591 | 27,929 | |||||||||
| Class C | 20,280 | 29,316 | |||||||||
| Class I | 580 | 1,030 | |||||||||
| Class M | 91 | - | |||||||||
| Class Q | 6 | - | |||||||||
| Administrative service fees | 372,517 | 235,509 | |||||||||
| Shareholder reporting expense | 80,215 | 49,480 | |||||||||
| Registration fees | 42,566 | 46,129 | |||||||||
| Professional fees | 38,560 | 19,958 | |||||||||
| Custody and accounting expense | 44,130 | 29,529 | |||||||||
| Trustee fees | 9,300 | 5,490 | |||||||||
| Miscellaneous expense | 25,233 | 10,864 | |||||||||
| Total expenses | 4,300,234 | 2,972,693 | |||||||||
| Less: | |||||||||||
| Net waived and reimbursed fees | - | 182,670 | |||||||||
| Net expenses | 4,300,234 | 2,790,023 | |||||||||
| Net investment income | 15,048,268 | 6,833,159 | |||||||||
| REALIZED AND UNREALIZED GAIN (LOSS) ON INVESTMENTS AND FUTURES: | |||||||||||
| Net realized gain (loss) on: | |||||||||||
| Investments | (1,687,373 | ) | 1,896,793 | ||||||||
| Futures | - | 631,047 | |||||||||
| Net realized gain (loss) on investments and futures | (1,687,373 | ) | 2,527,840 | ||||||||
| Net change in unrealized appreciation or depreciation on: | |||||||||||
| Investments | (12,399,611 | ) | (3,308,099 | ) | |||||||
| Futures | - | 194,909 | |||||||||
| Net change in unrealized appreciation or depreciation on investments and futures | (12,399,611 | ) | (3,113,190 | ) | |||||||
| Net realized and unrealized loss on investments and futures | (14,086,984 | ) | (585,350 | ) | |||||||
| Increase in net assets resulting from operations | $ | 961,284 | $ | 6,247,809 | |||||||
| * Foreign taxes | $ | - | $ | 2,231 | |||||||
See Accompanying Notes to Financial Statements
12
STATEMENTS OF CHANGES IN NET ASSETS (Unaudited)
| ING GNMA Income Fund | |||||||||||
| Six Months Ended September 30, 2004 | Year Ended March 31, 2004 | ||||||||||
| FROM OPERATIONS: | |||||||||||
| Net investment income | $ | 15,048,268 | $ | 28,917,044 | |||||||
| Net realized gain (loss) on investments | (1,687,373 | ) | 8,427,554 | ||||||||
| Net change in unrealized appreciation or depreciation on investments | (12,399,611 | ) | (8,582,732 | ) | |||||||
| Net increase in net assets resulting from operations | 961,284 | 28,761,866 | |||||||||
| FROM DISTRIBUTIONS TO SHAREHOLDERS: | |||||||||||
| Net investment income: | |||||||||||
| Class A | (14,920,325 | ) | (29,836,564 | ) | |||||||
| Class B | (2,729,419 | ) | (5,789,107 | ) | |||||||
| Class C | (1,321,943 | ) | (3,227,764 | ) | |||||||
| Class I | (252,125 | ) | (416,717 | ) | |||||||
| Class M | (6,109 | ) | (26,359 | ) | |||||||
| Class Q | (2,979 | ) | (7,768 | ) | |||||||
| Class T | - | (101,868 | ) | ||||||||
| Total distributions | (19,232,900 | ) | (39,406,147 | ) | |||||||
| FROM CAPITAL SHARE TRANSACTIONS: | |||||||||||
| Net proceeds from sale of shares | 66,888,632 | 287,964,697 | |||||||||
| Dividends reinvested | 15,713,341 | 31,631,178 | |||||||||
| 82,601,973 | 319,595,875 | ||||||||||
| Cost of shares redeemed | (138,111,709 | ) | (434,339,499 | ) | |||||||
| Net decrease in net assets resulting from capital share transactions | (55,509,736 | ) | (114,743,624 | ) | |||||||
| Net decrease in net assets | (73,781,352 | ) | (125,387,905 | ) | |||||||
| NET ASSETS: | |||||||||||
| Beginning of period | 797,371,955 | 922,759,860 | |||||||||
| End of period | $ | 723,590,603 | $ | 797,371,955 | |||||||
| Undistributed net investment income (accumulated net investment loss) at end of period | $ | (278,257 | ) | $ | 3,906,376 | ||||||
See Accompanying Notes to Financial Statements
13
STATEMENTS OF CHANGES IN NET ASSETS (Unaudited)
| ING Intermediate Bond Fund | |||||||||||
| Six Months Ended September 30, | Year Ended March 31, | ||||||||||
| 2004 | 2004 | ||||||||||
| FROM OPERATIONS: | |||||||||||
| Net investment income | $ | 6,833,159 | $ | 9,001,504 | |||||||
| Net realized gain on investments and futures | 2,527,840 | 7,562,532 | |||||||||
| Net change in unrealized appreciation or depreciation on investments and futures | (3,113,190 | ) | 2,601,836 | ||||||||
| Net increase in net assets resulting from operations | 6,247,809 | 19,165,872 | |||||||||
| FROM DISTRIBUTIONS TO SHAREHOLDERS: | |||||||||||
| Net investment income: | |||||||||||
| Class A | (4,821,627 | ) | (6,168,955 | ) | |||||||
| Class B | (757,564 | ) | (1,586,935 | ) | |||||||
| Class C | (793,415 | ) | (1,555,446 | ) | |||||||
| Class I | (350,305 | ) | (511,108 | ) | |||||||
| Class O | (108,408 | ) | - | ||||||||
| Class R | (1,840 | ) | - | ||||||||
| Net realized gains: | |||||||||||
| Class A | (3,756,043 | ) | (2,667,645 | ) | |||||||
| Class B | (792,658 | ) | (868,923 | ) | |||||||
| Class C | (825,959 | ) | (885,962 | ) | |||||||
| Class I | (173,614 | ) | (179,026 | ) | |||||||
| Class R | (1,681 | ) | - | ||||||||
| Total distributions | (12,383,114 | ) | (14,424,000 | ) | |||||||
| FROM CAPITAL SHARE TRANSACTIONS: | |||||||||||
| Net proceeds from sale of shares | 121,088,499 | 324,797,722 | |||||||||
| Net proceeds from shares issued in merger | 137,658,413 | - | |||||||||
| Dividends reinvested | 7,708,659 | 9,795,000 | |||||||||
| 266,455,571 | 334,592,722 | ||||||||||
| Cost of shares redeemed | (81,325,207 | ) | (193,289,159 | ) | |||||||
| Net increase in net assets resulting from capital share transactions | 185,130,364 | 141,303,563 | |||||||||
| Net increase in net assets | 178,995,059 | 146,045,435 | |||||||||
| NET ASSETS: | |||||||||||
| Beginning of period | 422,263,758 | 276,218,323 | |||||||||
| End of period | $ | 601,258,817 | $ | 422,263,758 | |||||||
| Undistributed net investment income at end of period | $ | 11,828 | $ | 11,828 | |||||||
See Accompanying Notes to Financial Statements
14
ING GNMA INCOME FUND (UNAUDITED) FINANCIAL HIGHLIGHTS
Selected data for a share of beneficial interest outstanding throughout each period.
| Class I | |||||||||||||||||||
| Six Months Ended | January 7, 2002(1) to | ||||||||||||||||||
| September 30, | Year Ended March 31, | March 31, | |||||||||||||||||
| 2004 | 2004 | 2003 | 2002 | ||||||||||||||||
| Per Share Operating Performance: | |||||||||||||||||||
| Net asset value, beginning of period | $ | 8.92 | 9.01 | 8.54 | 8.61 | ||||||||||||||
| Income (loss) from investment operations: | |||||||||||||||||||
| Net investment income | $ | 0.20 | 0.35 | 0.44 | 0.10 | ||||||||||||||
| Net realized and unrealized gain (loss) on investments | $ | (0.15 | ) | 0.01 | 0.50 | (0.10 | ) | ||||||||||||
| Total from investment operations | $ | 0.05 | 0.36 | 0.94 | 0.00 | ||||||||||||||
| Less distributions from: | |||||||||||||||||||
| Net investment income | $ | 0.25 | 0.45 | 0.47 | 0.07 | ||||||||||||||
| Total distributions | $ | 0.25 | 0.45 | 0.47 | 0.07 | ||||||||||||||
| Net asset value, end of period | $ | 8.72 | 8.92 | 9.01 | 8.54 | ||||||||||||||
| Total Return(2) | % | 0.55 | 4.21 | 11.18 | 0.04 | ||||||||||||||
| Ratios and Supplemental Data: | |||||||||||||||||||
| Net assets, end of period (000's) | $ | 9,460 | 8,760 | 6,946 | 1,615 | ||||||||||||||
| Ratios to average net assets: | |||||||||||||||||||
| Expenses(3) | % | 0.67 | 0.71 | 0.78 | 0.88 | ||||||||||||||
| Net investment income(3) | % | 4.53 | 3.94 | 5.00 | 5.83 | ||||||||||||||
| Portfolio turnover rate | % | 19 | 128 | 75 | 76 | ||||||||||||||
| Class Q | |||||||||||||||||||||||
| Six Months Ended | February 26, 2001(1) to | ||||||||||||||||||||||
| September 30, | Year Ended March 31, | March 31, | |||||||||||||||||||||
| 2004 | 2004 | 2003 | 2002 | 2001 | |||||||||||||||||||
| Per Share Operating Performance: | |||||||||||||||||||||||
| Net asset value, beginning of period | $ | 8.92 | 9.01 | 8.54 | 8.63 | 8.51 | |||||||||||||||||
| Income (loss) from investment operations: | |||||||||||||||||||||||
| Net investment income | $ | 0.20 | 0.32 | 0.44 | 0.39 | 0.04 | |||||||||||||||||
| Net realized and unrealized gain (loss) on investments | $ | (0.17 | ) | 0.02 | 0.47 | (0.01 | ) | 0.08 | |||||||||||||||
| Total from investment operations | $ | 0.03 | 0.34 | 0.91 | 0.38 | 0.12 | |||||||||||||||||
| Less distributions from: | |||||||||||||||||||||||
| Net investment income | $ | 0.23 | 0.43 | 0.44 | 0.47 | - | |||||||||||||||||
| Total distributions | $ | 0.23 | 0.43 | 0.44 | 0.47 | - | |||||||||||||||||
| Net asset value, end of period | $ | 8.72 | 8.92 | 9.01 | 8.54 | 8.63 | |||||||||||||||||
| Total Return(2) | % | 0.42 | 3.94 | 10.90 | 4.50 | 1.41 | |||||||||||||||||
| Ratios and Supplemental Data: | |||||||||||||||||||||||
| Net assets, end of period (000's) | $ | 103 | 134 | 183 | 204 | 476 | |||||||||||||||||
| Ratios to average net assets: | |||||||||||||||||||||||
| Expenses(3) | % | 0.92 | 0.96 | 1.04 | 1.12 | 1.14 | |||||||||||||||||
| Net investment income(3) | % | 4.27 | 3.62 | 4.89 | 5.35 | 5.42 | |||||||||||||||||
| Portfolio turnover rate | % | 19 | 128 | 75 | 76 | 33 | |||||||||||||||||
(1) Commencement of operations.
(2) Total return is calculated assuming reinvestment of all dividends and capital gain distributions at net asset value.
Total return for less than one year is not annualized.
(3) Annualized for periods less than one year.
See Accompanying Notes to Financial Statements.
15
ING INTERMEDIATE BOND FUND (UNAUDITED) FINANCIAL HIGHLIGHTS
Selected data for a share of beneficial interest outstanding throughout each period.
| Class I | |||||||||||||||||||
| Six Months Ended | January 8, 2002(1) to | ||||||||||||||||||
| September 30, | Year Ended March 31, | March 31, | |||||||||||||||||
| 2004 | 2004 | 2003 | 2002 | ||||||||||||||||
| Per Share Operating Performance: | |||||||||||||||||||
| Net asset value, beginning of period | $ | 10.67 | 10.51 | 9.91 | 9.99 | ||||||||||||||
| Income (loss) from investment operations: | |||||||||||||||||||
| Net investment income | $ | 0.15 | 0.35 | 0.39 | 0.11 | ||||||||||||||
| Net realized and unrealized gain (loss) on investments | $ | (0.06 | ) | 0.33 | 0.76 | (0.07 | ) | ||||||||||||
| Total from investment operations | $ | 0.09 | 0.68 | 1.15 | 0.04 | ||||||||||||||
| Less distributions from: | |||||||||||||||||||
| Net investment income | $ | 0.18 | 0.38 | 0.40 | 0.12 | ||||||||||||||
| Net realized gain on investments | $ | 0.13 | 0.14 | 0.15 | - | ||||||||||||||
| Total distributions | $ | 0.31 | 0.52 | 0.55 | 0.12 | ||||||||||||||
| Net asset value, end of period | $ | 10.45 | 10.67 | 10.51 | 9.91 | ||||||||||||||
| Total Return(2) | % | 0.89 | 6.60 | 11.88 | 0.36 | ||||||||||||||
| Ratios and Supplemental Data: | |||||||||||||||||||
| Net assets, end of period (000's) | $ | 39,249 | 14,548 | 15,046 | 9,800 | ||||||||||||||
| Ratios to average net assets: | |||||||||||||||||||
| Net expenses after expense reimbursement/recoupment(3)(4) | % | 0.66 | 0.71 | 0.73 | 0.82 | ||||||||||||||
| Gross expenses prior to expense reimbursement/recoupment(3) | % | 0.67 | 0.68 | 0.73 | 0.90 | ||||||||||||||
| Net investment income after expense reimbursement/recoupment(3)(4) | % | 3.43 | 3.30 | 3.70 | 0.05 | ||||||||||||||
| Portfolio turnover rate | % | 203 | 475 | 639 | 1,216 | * | |||||||||||||
(1) Commencement of operations.
(2) Total return is calculated assuming reinvestment of all dividends and capital gain distributions at net asset value. Total return for less than one year is not annualized.
(3) Annualized for periods less than one year.
(4) The Investment Manager has agreed to limit expenses, (excluding interest, taxes, brokerage and extraordinary expenses) subject to possible recoupment by ING Investments, LLC within three years.
* Portfolio turnover was greater than expected during this period due to active trading undertaken in response to market conditions that existed at that time.
See Accompanying Notes to Financial Statements.
16
NOTES TO FINANCIAL STATEMENTS as of September 30, 2004 (Unaudited)
NOTE 1 - ORGANIZATION
Organization. ING Funds Trust ("Trust") is a Delaware business trust registered as an open-end management investment company. The Trust was organized on July 30, 1998. It consists of eight separately managed series. Two of the funds in this report are: ING GNMA Income Fund ("GNMA Fund") and ING Intermediate Bond Fund ("Intermediate Bond Fund").
The investment objective of each Fund is described in each Fund's prospectus.
Each Fund offers at least three of the following classes of shares: Class A, Class B, Class C, Class I, Class M, Class O, Class Q and Class R. The separate classes of shares differ principally in the applicable sales charges (if any), transfer agent fees, distribution fees and shareholder servicing fees. Shareholders of each class also bear certain expenses that pertain to that particular class. All shareholders bear the common expenses of the Fund and earn income and realized gains/losses from the portfolio pro rata based on the average daily net assets of each class, without distinction between share classes. No class has preferential dividend rights. Differences in per share dividend rates generally result from the relative weighting of pro rata income and realized gain allocations and from differences in separate class expenses, including distrib ution, and shareholder servicing fees. Class B shares, along with their pro rata reinvested dividend shares, automatically convert to Class A shares approximately eight years after purchase.
ING Investments, LLC ("ING Investments"), serves as the Investment Manager to the Funds. ING Investments has engaged ING Investment Management Co. (formerly, Aeltus Investment Management, Inc., "ING IM"), to serve as the Sub-Adviser to the Funds. ING Funds Distributor, LLC (the "Distributor") is the principal underwriter of the Funds. The Distributor, ING Investments and ING IM are indirect wholly-owned subsidiaries of ING Groep N.V. ("ING Groep"). ING Groep is a global financial institution active in banking, insurance and asset management.
NOTE 2 - SIGNIFICANT ACCOUNTING POLICIES
The following significant accounting policies are consistently followed by the Funds in the preparation of their financial statements, and such policies are in conformity with accounting principles generally accepted in the United States of America for investment companies.
A. Security Valuation. Investments in equity securities traded on a national securities exchange are
valued at the last reported sale price. Securities reported by NASDAQ will be valued at the NASDAQ official closing prices. Securities traded on an exchange or NASDAQ for which there has been no sale and securities traded in the over-the-counter-market are valued at the mean between the last reported bid and ask prices. All investments quoted in foreign currencies will be valued daily in U.S. dollars on the basis of the foreign currency exchange rates prevailing at the time such valuation is determined by each Fund's custodian. Debt securities are valued at prices obtained from independent services or from one or more dealers making markets in the securities and may be adjusted based on the Fund's valuation procedures. U.S. Government obligations are valued by using market quotations or independent pricing services that use prices provided by market-makers or estimates of market values obtained from yiel d data relating to instruments or securities with similar characteristics. Securities for which market quotations are not readily available are valued at their respective fair values as determined in good faith and in accordance with policies set by the Board of Trustees ("Board") of the Funds. Among elements of analysis, the Board has authorized the use of one or more research services to assist with the determination of the fair value of foreign securities. Research services use statistical analyses and quantitative models to help determine fair value as of the time a Fund calculates its net asset value. Investments in securities maturing in 60 days or less are valued at amortized cost, which, when combined with accrued interest approximates market value.
B. Security Transactions and Revenue Recognition. Securities transactions are accounted for on the trade date. Realized gains and losses are reported on the basis of identified cost of securities sold. Interest income is recorded on an accrual basis. Dividend income is recorded on the ex-dividend date, or for certain foreign securities, when the information becomes available to the funds. Premium amortization and discount accretion are determined by the effective yield method.
C. Foreign Currency Translation. The books and records of the Funds are maintained in U.S. dollars. Any foreign currency amounts are translated into U.S. dollars on the following basis:
(1) Market value of investment securities, other assets and liabilities - at the exchange rates prevailing at the end of the day.
17
NOTES TO FINANCIAL STATEMENTS as of September 30, 2004 (Unaudited) (continued)
NOTE 2 - SIGNIFICANT ACCOUNTING POLICIES (continued)
(2) Purchases and sales of investment securities, income and expenses - at the rates of exchange prevailing on the respective dates of such transactions.
Although the net assets and the market values are presented at the foreign exchange rates at the end of the day, the Funds do not isolate the portion of the results of operations resulting from changes in foreign exchange rates on investments from the fluctuations arising from changes in market prices of securities held. Such fluctuations are included with the net realized and unrealized gains or losses from investments. For securities that are subject to foreign withholding tax upon disposition, liabilities are recorded on the Statements of Assets and Liabilities for the estimated tax withholding based on the securities' current market values. Upon disposition, realized gains or losses on such securities are recorded net of foreign withholding tax.
Reported net realized foreign exchange gains or losses arise from sales of foreign currencies, currency gains or losses realized between the trade and settlement dates on securities transactions, the difference between the amounts of dividends, interest, and foreign withholding taxes recorded on the Funds' books, and the U.S. dollar equivalent of the amounts actually received or paid. Net unrealized foreign exchange gains and losses arise from changes in the value of assets and liabilities other than investments in securities at fiscal year end, resulting from changes in the exchange rate. Foreign security and currency transactions may involve certain considerations and risks not typically associated with investing in U.S. companies and U.S. Government securities. These risks include, but are not limited to revaluation of currencies and future adverse political and economic developments which could cause securities and their markets to be less liquid and prices more volatile than those of comparable U.S. companies and U.S. Government securities.
D. Foreign Currency Transactions and Futures Contracts. Intermediate Bond Fund may enter into foreign currency exchange transactions to convert to and from different foreign currencies and to and from the U.S. dollar in connection with the planned purchases or sales of securities. The Fund either enters into these transactions on a spot basis at the spot rate prevailing in the foreign currency exchange market or uses forward foreign currency
contracts to purchase or sell foreign currencies. When the contract is fulfilled or closed, gains or losses are realized. Until then, the gain or loss is included in unrealized appreciation or depreciation. Risks may arise upon entering into forward contracts from the potential inability of counterparties to meet the terms of their forward contracts and from the potential inability of counterparties to meet the terms of their forward contracts and from unanticipated movements in the value of foreign currencies relative to the U.S. dollar.
Intermediate Bond Fund may enter into futures contracts involving foreign currency, interest rates, securities and securities indices. A futures contract obligates the seller of the contract to deliver and the purchaser of the contract to take delivery of the type of foreign currency, financial instrument or security called for in the contract at a specified future time for a specified price. Upon entering into such a contract, the Fund is required to deposit and maintain as collateral such initial margin as required by the exchange on which the contract is traded. Pursuant to the contract, the Fund agrees to receive from or pay to the broker an amount equal to the daily fluctuations in the value of the contract. Such receipts or payments are known as variation margins and are recorded as unrealized gains or losses by the Fund. When the contract is closed, the Fund records a realized gain or loss equal t o the difference between the value of the contract at the time it was opened and the value at the time it was closed.
E. Distributions to Shareholders. The Funds record distributions to their shareholders on the ex-dividend date. Intermediate Bond Fund declares and becomes ex-dividend daily and pays dividends monthly. GNMA Fund declares and becomes ex-dividend monthly and pays dividends monthly. The Funds may make distributions on a more frequent basis to comply with the distribution requirements of the Internal Revenue Code. The characteristics of income and gains to be distributed are determined in accordance with income tax regulations, which may differ from accounting principles generally accepted in the United States of America for investment companies.
F. Federal Income Taxes. It is the policy of the Funds to comply with subchapter M of the Internal Revenue Code and related excise tax provisions applicable to regulated investment companies and to distribute substantially all of their net investment income and any net realized capital gains to their shareholders. Therefore, no federal
18
NOTES TO FINANCIAL STATEMENTS as of September 30, 2004 (Unaudited) (continued)
NOTE 2 - SIGNIFICANT ACCOUNTING POLICIES (continued)
income tax provision is required. No capital gain distributions shall be made until any capital loss carryforwards have been fully utilized or expired.
G. Use of Estimates. Management of the Funds has made certain estimates and assumptions relating to the reporting of assets, liabilities, income, and expenses to prepare these financial statements in conformity with accounting principles generally accepted in the United States of America for investment companies. Actual results could differ from these estimates.
H. Repurchase Agreements. Each Fund may invest in repurchase agreements only with government securities dealers recognized by the Board of Governors of the Federal Reserve System. Under such agreements, the seller of the security agrees to repurchase it at a mutually agreed upon time and price. The resale price is in excess of the purchase price and reflects an agreed upon interest rate for the period of time the agreement is outstanding. The period of the repurchase agreements is usually short, from overnight to one week, while the underlying securities generally have longer maturities. Each Fund will receive as collateral securities acceptable to it whose market value is equ al to at least 100% of the carrying amount of the repurchase agreements, plus accrued interest, being invested by the Fund. The underlying collateral is valued daily on a mark to market basis to assure that the value, including accrued interest is at least equal to the repurchase price. If the seller defaults, a Fund might incur a loss or delay in the realization of proceeds if the value of the collateral securing the repurchase agreement declines, and it might incur disposition costs in liquidating the collateral.
I. Securities Lending. Intermediate Bond Fund has the option to temporarily loan up to 30% of its total assets to brokers, dealers or other financial institutions in exchange for a negotiated lender's fee. The borrower is required to fully collateralize the loans with cash or U.S. Government securities. Generally, in the event of counterparty default, the Fund has the right to use collateral to offset losses incurred. There would be potential loss to the Fund in the event the Fund is delayed or prevented from exercising its right to dispose of the collateral. The Fund bears the risk of loss with respect to the investment of collateral. Engaging in securities lending could have a leveraging effect, which may intensify the credit, market and other risks associated with investing in a Fund.
J. Illiquid and Restricted Securities. GNMA Fund may not invest in illiquid securities. Intermediate Bond Fund may not invest more than 15% of its net assets in illiquid securities. Illiquid securities are not readily marketable. Disposing of illiquid investments may involve time-consuming negotiation and legal expenses, and it may be difficult or impossible for the Funds to sell them promptly at an acceptable price. Restricted securities are those sold under Rule 144A of the Securities Act of 1933 ("1933 Act") or are securities offered pursuant to Section 4(2) of the 1933 Act, and are subject to legal or contractual restrictions on resale and may not be publicly sol d without registration under the 1933 Act. Certain restricted securities may be considered liquid pursuant to procedures adopted by the Board or may be deemed illiquid because they may not be readily marketable. Illiquid and restricted securities are valued using market quotations when readily available. In the absence of market quotations, the securities are valued based upon their fair value determined under procedures approved by the Board.
K. Delayed Delivery Transaction. The Funds may purchase or sell securities on a when-issued or forward commitment basis. The price of the underlying securities and date when the securities will be delivered and paid for are fixed at the time the transaction is negotiated. The market value of such is identified in the Funds' Portfolio of Investments. Losses may arise due to changes in the market value of the securities or from the inability of counterparties to meet the terms of the contract. In connection with such purchases, the Funds are required to hold liquid assets as collateral with the Funds' custodian sufficient to cover the purchase price.
L. Mortgage Dollar Roll Transactions. Each Fund may engage in dollar roll transactions with respect to mortgage-backed securities issued by Government National Mortgage Association, Federal National Mortgage Association and Federal Home Loan Mortgage Corp. In a dollar roll transaction, a Fund sells a mortgage-backed security to a financial institution, such as a bank or broker/dealer, and simultaneously agrees to repurchase a substantially similar (i.e., same type, coupon, and maturity) security from the institution on a delayed delivery basis at an agreed upon price. The mortgage-backed securities that are repurchased will bear the same interest rate as those sold, but genera lly will be collateralized by different pools of mortgages with different prepayment histories. The Funds account for dollar roll transactions as purchases and sales.
19
NOTES TO FINANCIAL STATEMENTS as of September 30, 2004 (Unaudited) (continued)
NOTE 2 - SIGNIFICANT ACCOUNTING POLICIES (continued)
M. Options Contracts. Intermediate Bond Fund may purchase put and call options and may write (sell) put options and covered call options. The Fund may engage in option transactions as a hedge against adverse movements in the value of portfolio holdings or to increase market exposure. Option contracts are valued daily and unrealized gains or losses are recorded based upon the last sales price on the principal exchange on which the options are traded. The Fund will realize a gain or loss upon the expiration or closing of the option contract. When an option is exercised, the proceeds on sales of the underlying security for a written call option, the purchase cost of the secu rity for a written put option, or the cost of the security for a purchased put or call option is adjusted by the amount of premium received or paid. Realized and unrealized gains or losses on option contracts are reflected in the accompanying financial statements. The risk in writing a call option is that the Fund gives up the opportunity for profit if the market price of the security increases and the option is exercised. The risk in writing a put option is that the Fund may incur a loss if the market price of the security decreases and the option is exercised. The risk in buying an option is that the Fund pay a premium whether or not the option is exercised. Risks may also arise from an illiquid secondary market or from the inability of counterparties to meet the terms of the contract.
N. Construction Loan Securities (GNMA Fund). The GNMA Fund may purchase construction loan securities, which are issued to finance building costs. The funds are disbursed as needed or in accordance with a prearranged plan. The securities provide for the timely payment to the registered holder of interest at the specified rate plus scheduled installments of principal. Upon completion of the construction phase, the construction loan securities are terminated and project loan securities are issued. It is the Fund's policy to record these GNMA certificates on trade date, and to segregate assets to cover its commitments on trade date as well.
NOTE 3 - INVESTMENT TRANSACTIONS
For the six months ended September 30, 2004, the cost of purchases and proceeds from the sales of securities, excluding short-term securities, were as follows:
| Purchases | Sales | ||||||||||
| Intermediate Bond Fund | $ | 210,133,746 | $ | 202,261,265 | |||||||
U.S. Government securities not included above were as follows:
| Purchases | Sales | ||||||||||
| GNMA Fund | $ | 141,024,305 | $ | 178,294,693 | |||||||
| Intermediate Bond Fund | 1,117,520,786 | 941,915,787 | |||||||||
NOTE 4 - INVESTMENT MANAGEMENT AND ADMINISTRATIVE FEES
The Funds in this report have an Investment Management Agreement with ING Investments, LLC (the "Investment Manager"). The Investment Management Agreements compensate the Investment Manager with a fee, computed daily and payable monthly, based on the average daily net assets of each Fund, at the following annual rates:
For GNMA Fund - 0.60% of the first $150 million, 0.50% of the next $250 million, 0.45% of the next $400 million and 0.40% in excess of $800 million and for Intermediate Bond - 0.50% of the first $500 million, 0.45% of the next $500 million, 0.425% of the next $1 billion and 0.40% in excess of $2 billion.
The Investment Manager has entered into a Sub-Advisory Agreement with ING IM. Subject to such policies as the Board or the Investment Manager may determine, ING IM manages the Funds' assets in accordance with the Funds' investment objectives, policies, and limitations.
ING Funds Services, LLC ("IFS"), a wholly-owned subsidiary of ING Groep N.V., acts as administrator and provides certain administrative and shareholder services necessary for Fund operations and is responsible for the supervision of other service providers. For its services, IFS is entitled to receive from GNMA Fund and Intermediate Bond Fund a fee at an annual rate of 0.10% of its average daily net assets.
NOTE 5 - DISTRIBUTION AND SERVICE FEES
Each share class of the Funds (except as noted below) has adopted a Distribution Plan pursuant to Rule 12b-1 under the 1940 Act (the "12b-1 Plans"), whereby the Distributor is reimbursed or compensated (depending on the class of shares) by the Funds for expenses incurred in the distribution of each Fund's shares ("Distribution Fees"). Pursuant to the 12b-1 Plans, the Distributor is entitled to payment each month for actual expenses incurred in the distribution and promotion of each Fund's shares, including expenses incurred in printing prospectuses and reports used for sales purposes, expenses incurred in preparing and printing sales literature and other such distribution related expenses, including any distribution or shareholder servicing fees ("Service Fees") paid to
20
NOTES TO FINANCIAL STATEMENTS as of September 30, 2004 (Unaudited) (continued)
NOTE 5 - DISTRIBUTION AND SERVICE FEES (continued)
securities dealers who have executed a distribution agreement with the Distributor. Under the 12b-1 Plans, each class of shares of the Fund pays the Distributor a Distribution and/or Service Fee based on average daily net assets at the following annual rates:
| Class A | Class B | Class C | Class M | Class O | Class Q | Class R | |||||||||||||||||||||||||
| GNMA Fund | 0.25 | % | 1.00 | % | 1.00 | % | 0.75 | % | N/A | 0.25 | % | N/A | |||||||||||||||||||
| Intermediate Bond Fund | 0.35 | % | 1.00 | % | 1.00 | % | N/A | 0.25 | % | N/A | 0.50 | % | |||||||||||||||||||
During the six months ended September 30, 2004, the Distributor waived 0.10% of the Class A Distribution fee for Intermediate Bond Fund.
The Distributor also receives the proceeds of initial sales charge paid by shareholders upon the purchase of Class A and Class M shares, and the contingent deferred sales charge paid by shareholders upon certain redemptions for Class A, Class B, and Class C shares. For the six months ended September 30, 2004, the Distributor retained the following amounts in sales charges:
| Class A Shares | Class B Shares | Class C Shares | Class M Shares | ||||||||||||||||
| Initial Sales Charges | $ | 37,796 | N/A | N/A | N/A | ||||||||||||||
| Contingent Deferred Sales Charges | 27,715 | N/A | $ | 21,091 | N/A | ||||||||||||||
NOTE 6 - OTHER TRANSACTIONS WITH AFFILIATES AND RELATED PARTIES
At September 30, 2004, the Funds had the following amounts recorded in payable to affiliates on the accompanying Statements of Assets and Liabilities (see Notes 4 and 5):
| Accrued Investment Management Fees | Accrued Administrative Fees | Accrued Shareholder Services and Distribution Fees | Total | ||||||||||||||||
| GNMA Fund | $ | 296,513 | $ | 59,496 | $ | 248,224 | $ | 604,233 | |||||||||||
| Intermediate Bond Fund | 241,182 | 47,958 | 197,623 | 486,763 | |||||||||||||||
At September 30, 2004, ING Life Insurance and Annuity Co., an indirect wholly-owned subsidiary of ING Groep, held 7.44% and 17.30% of the shares outstanding of GNMA Fund and Intermediate Bond Fund, respectively.
Each Fund has adopted a Retirement Policy covering all independent trustees of the Fund who will have served as an independent trustee for at least five years at the time of retirement. Benefits under this plan are based on an annual rate as defined in the plan agreement.
NOTE 7 - EXPENSE LIMITATIONS
Pursuant to written Expense Limitation Agreements, the Investment Manager has agreed to limit expenses, excluding interest, taxes, brokerage and extraordinary
expenses to the following annual expenses to average daily net assets ratios:
| Class A | Class B | Class C | Class I | Class M | Class O | Class Q | Class R | ||||||||||||||||||||||||||||
| GNMA Fund | 1.29 | % | 2.04 | % | 2.04 | % | 1.04 | % | 1.79 | % | N/A | 1.29 | % | N/A | |||||||||||||||||||||
| Intermediate Bond Fund(1) | 1.00 | % | 1.75 | % | 1.75 | % | 0.75 | % | N/A | 1.00 | % | N/A | 1.25 | % | |||||||||||||||||||||
(1) Prior to February 1, 2004, the expense limitation rates for Class A, Class B, Class C, Class I and Class O were 1.15%, 1.90%, 1.90%, 0.90%, 1.40% and 1.15% respectively.
The Investment Manager may at a later date recoup from a Fund for management fees waived and other expenses assumed by the Investment Manager during the previous 36 months, but only if, after such recoupment, the Fund's expense ratio does not exceed the percentage described above. Waived and reimbursed fees net of any recoupment by the Investment Manager of such waived and reimbursed fees are reflected on the accompanying Statements of Operations for each Fund. Amounts payable by the Investment Manager are reflected on the accompanying Statements of Assets and Liabilities for each Fund.
As of September 30, 2004, the Intermediate Bond Fund had $31,024 of reimbursed fees subject to possible recoupment by the Investment Manager, expiring September 30, 2007.
The Expense Limitation Agreements are contractual and shall renew automatically for one-year terms unless ING Investments provides written notice of the termination of the Expense Limitation Agreement within 90 days of the end of the then current term.
NOTE 8 - LINE OF CREDIT
Intermediate Bond Fund, in addition to certain other funds managed by the Investment Manager, has entered into an unsecured committed revolving line of credit agreement (the "Credit Agreement") with The Bank of New York for an aggregate amount of $125,000,000. The proceeds may be used only to: (1) temporarily finance the purchase and sale of securities; (2) finance the redemption of shares of an investor in the Funds; and (3) enable the Funds to meet other emergency expenses as defined in the Credit Agreement. The Funds to which the line of credit is available pay a commitment fee equal to 0.09% per annum on the daily unused portion of the committed line amount payable quarterly in arrears. During the six months ended September 30, 2004, the Fund did not have any loans outstanding under the line of credit.
21
NOTES TO FINANCIAL STATEMENTS as of September 30, 2004 (Unaudited) (continued)
NOTE 9 - CAPITAL SHARES
Transactions in capital shares and dollars were as follows:
| Class A Shares | Class B Shares | Class C Shares | |||||||||||||||||||||||||
| Six Months Ended September 30, 2004 | Year Ended March 31, 2004 | Six Months Ended September 30, 2004 | Year Ended March 31, 2004 | Six Months Ended September 30, 2004 | Year Ended March 31, 2004 | ||||||||||||||||||||||
| GNMA Income Fund (Number of Shares) | |||||||||||||||||||||||||||
| Shares sold | 6,428,008 | 25,619,769 | 627,523 | 3,701,108 | 431,088 | 3,267,282 | |||||||||||||||||||||
| Dividends reinvested | 1,490,911 | 2,892,954 | 201,633 | 412,142 | 89,972 | 221,048 | |||||||||||||||||||||
| Shares redeemed | (11,123,868 | ) | (36,101,757 | ) | (2,661,900 | ) | (6,217,595 | ) | (2,019,363 | ) | (5,888,039 | ) | |||||||||||||||
| Net decrease in shares outstanding | (3,204,949 | ) | (7,589,034 | ) | (1,832,744 | ) | (2,104,345 | ) | (1,498,303 | ) | (2,399,709 | ) | |||||||||||||||
| GNMA Income Fund ($) | |||||||||||||||||||||||||||
| Shares sold | $ | 55,725,223 | $ | 220,712,735 | $ | 5,423,696 | $ | 32,777,068 | $ | 3,726,186 | $ | 29,016,572 | |||||||||||||||
| Dividends reinvested | 12,933,167 | 25,548,426 | 1,742,794 | 3,633,981 | 778,431 | 1,940,307 | |||||||||||||||||||||
| Shares redeemed | (96,250,971 | ) | (313,803,016 | ) | (22,933,093 | ) | (54,830,946 | ) | (17,429,252 | ) | (51,944,184 | ) | |||||||||||||||
| Net decrease | $ | (27,592,581 | ) | $ | (67,541,855 | ) | $ | (15,766,603 | ) | $ | (18,419,897 | ) | $ | (12,924,635 | ) | $ | (20,987,305 | ) | |||||||||
| Class I Shares | Class M Shares | Class Q Shares | |||||||||||||||||||||||||
| Six Months Ended September 30, 2004 | Year Ended March 31, 2004 | Six Months Ended September 30, 2004 | Year Ended March 31, 2004 | Six Months Ended September 30, 2004 | Year Ended March 31, 2004 | ||||||||||||||||||||||
| GNMA Income Fund (Number of Shares) | |||||||||||||||||||||||||||
| Shares sold | 231,830 | 608,292 | - | 3,037 | - | - | |||||||||||||||||||||
| Dividends reinvested | 29,046 | 47,173 | 484 | 2,172 | 296 | 610 | |||||||||||||||||||||
| Shares redeemed | (158,262 | ) | (444,235 | ) | (11,099 | ) | (93,627 | ) | (3,468 | ) | (5,994 | ) | |||||||||||||||
| Net increase (decrease) in shares outstanding | 102,614 | 211,230 | (10,615 | ) | (88,418 | ) | (3,172 | ) | (5,384 | ) | |||||||||||||||||
| GNMA Income Fund ($) | |||||||||||||||||||||||||||
| Shares sold | $ | 2,013,527 | $ | 5,431,127 | $ | - | $ | 27,195 | $ | - | $ | - | |||||||||||||||
| Dividends reinvested | 252,171 | 416,747 | 4,208 | 19,277 | 2,570 | 5,396 | |||||||||||||||||||||
| Shares redeemed | (1,372,421 | ) | (3,934,648 | ) | (96,145 | ) | (831,602 | ) | (29,827 | ) | (52,619 | ) | |||||||||||||||
| Net increase (decrease) | $ | 893,277 | $ | 1,913,226 | $ | (91,937 | ) | $ | (785,130 | ) | $ | (27,257 | ) | $ | (47,223 | ) | |||||||||||
| Class T Shares | |||||||
| Year Ended March 31, 2004(1) | |||||||
| GNMA Income Fund (Number of Shares) | |||||||
| Dividends reinvested | 7,490 | ||||||
| Shares redeemed | (1,070,267 | ) | |||||
| Net decrease in shares outstanding | (1,062,777 | ) | |||||
| GNMA Income Fund ($) | |||||||
| Dividends reinvested | $ | 67,044 | |||||
| Shares redeemed | (8,942,484 | ) | |||||
| Net decrease | $ | (8,875,440 | ) | ||||
(1) Effective June 2, 2003, Class "T" shares converted into the corresponding Class "A" shares within this Fund. Class "T" shares are no longer offered.
22
NOTES TO FINANCIAL STATEMENTS as of September 30, 2004 (Unaudited) (continued)
NOTE 9 - CAPITAL SHARES (continued)
| Class A Shares | Class B Shares | Class C Shares | |||||||||||||||||||||||||
| Six Months Ended September 30, 2004 | Year Ended March 31, 2004 | Six Months Ended September 30, 2004 | Year Ended March 31, 2004 | Six Months Ended September 30, 2004 | Year Ended March 31, 2004 | ||||||||||||||||||||||
| Intermediate Bond Fund (Number of Shares) | |||||||||||||||||||||||||||
| Shares sold | 9,573,820 | 23,789,274 | 653,290 | 2,574,476 | 1,033,528 | 4,087,450 | |||||||||||||||||||||
| Shares issued in merger | 7,719,739 | - | 279,541 | - | 177,974 | - | |||||||||||||||||||||
| Dividends reinvested | 537,508 | 601,543 | 86,249 | 143,583 | 76,355 | 119,937 | |||||||||||||||||||||
| Shares redeemed | (4,912,055 | ) | (13,118,758 | ) | (945,539 | ) | (2,250,151 | ) | (1,392,354 | ) | (2,567,915 | ) | |||||||||||||||
| Net increase (decrease) in shares outstanding | 12,919,012 | 11,272,059 | 73,541 | 467,908 | (104,497 | ) | 1,639,472 | ||||||||||||||||||||
| Intermediate Bond Fund ($) | |||||||||||||||||||||||||||
| Shares sold | $ | 97,025,370 | $ | 249,408,518 | $ | 6,775,541 | $ | 27,153,069 | $ | 10,749,595 | $ | 43,266,790 | |||||||||||||||
| Shares issued in merger | 81,024,830 | - | 2,925,680 | - | 1,860,336 | - | |||||||||||||||||||||
| Dividends reinvested | 5,581,978 | 6,335,065 | 893,743 | 1,509,025 | 791,966 | 1,260,697 | |||||||||||||||||||||
| Shares redeemed | (50,912,547 | ) | (136,162,176 | ) | (9,790,894 | ) | (23,726,034 | ) | (14,433,697 | ) | (27,040,140 | ) | |||||||||||||||
| Net increase (decrease) | $ | 132,719,631 | $ | 119,581,407 | $ | 804,070 | $ | 4,936,060 | $ | (1,031,800 | ) | $ | 17,487,347 | ||||||||||||||
| Class I Shares | Class O Shares | Class R Shares | |||||||||||||||||||||||||
| Six Months Ended September 30, 2004 | Year Ended March 31, 2004 | August 16, 2004(1) to September 30, 2004 | Six Months Ended September 30, 2004 | Year Ended March 31, 2004 | |||||||||||||||||||
| Intermediate Bond Fund (Number of Shares) | |||||||||||||||||||||||
| Shares sold | 250,507 | 476,004 | 386,814 | 13,129 | 48 | ||||||||||||||||||
| Shares issued in merger | 2,441,606 | - | 2,497,900 | - | - | ||||||||||||||||||
| Dividends reinvested | 39,239 | 65,475 | 3,181 | - | - | ||||||||||||||||||
| Shares redeemed | (340,976 | ) | (609,124 | ) | (252,726 | ) | (269 | ) | (1 | ) | |||||||||||||
| Net increase (decrease) in shares outstanding | 2,390,376 | (67,645 | ) | 2,635,169 | 12,860 | 47 | |||||||||||||||||
| Intermediate Bond Fund ($) | |||||||||||||||||||||||
| Shares sold | $ | 1,748,376 | $ | 4,968,831 | $ | 4,651,212 | $ | 138,405 | $ | 514 | |||||||||||||
| Shares issued in merger | 25,636,140 | - | 26,211,427 | - | - | ||||||||||||||||||
| Dividends reinvested | 407,702 | 690,213 | 33,270 | - | - | ||||||||||||||||||
| Shares redeemed | (3,548,890 | ) | (6,360,799 | ) | (2,636,359 | ) | (2,820 | ) | (10 | ) | |||||||||||||
| Net increase (decrease) | $ | 24,243,328 | $ | (701,755 | ) | $ | 28,259,550 | $ | 135,585 | $ | 504 | ||||||||||||
(1) Commencement of operations.
NOTE 10 - FEDERAL INCOME TAXES
The amount of distributions from net investment income and net realized capital gains are determined in accordance with federal income tax regulations, which may differ from accounting principles generally accepted in the United States of America for investment companies. These book/tax differences may be either temporary or permanent. Permanent differences are reclassified within the capital accounts based on their federal tax-basis treatment; temporary differences are not reclassified. Key differences include the treatment of short-term capital gains, foreign currency transactions, and wash sale deferrals. Distributions in excess of net investment income and/or net realized capital gains for tax purposes are reported as distributions of paid-in capital.
For tax purposes, the Funds may designate as net investment income dividends or capital gain distributions
the earnings and profits distributed to shareholders on the redemption of fund shares during the year.
Dividends paid by the Funds from net investment income and distribution of net realized short-term capital gains are, for federal income tax purposes, taxable as ordinary income to shareholders.
The tax composition of dividends and distributions to shareholders for the six months ended September 30, 2004 and the year ended March 31, 2004 were as follows:
| Six Months Ended September 30, 2004 | Ordinary Income | Long-Term Capital Gains | Short-Term Capital Gains | ||||||||||||
| GNMA Income Fund | $ | 19,232,900 | $ | - | $ | - | |||||||||
| Intermediate Bond Fund | 6,833,159 | 372,253 | 5,177,702 | ||||||||||||
| Year Ended March 31, 2004 | Ordinary Income | Dividends Paid Deduction on Redemptions | |||||||||||||
| GNMA Fund | $39,406,147 | $- | |||||||||||||
| Intermediate Bond Fund | 14,424,000 | 432,360 | |||||||||||||
23
NOTES TO FINANCIAL STATEMENTS as of September 30, 2004 (Unaudited) (continued)
NOTE 10 - FEDERAL INCOME TAXES (continued)
The tax-basis components of distributable earnings and the expiration dates of the capital loss carryforwards which may be used to offset future realized capital gains for federal income tax purposes as of March 31, 2004 were as follows:
| Undistributed Ordinary Income | Undistributed Long-Term Capital Gains | Unrealized Appreciation/ (Depreciation) | Post-October Losses Deferred | Capital Loss Carryforwards | Expiration Dates | ||||||||||||||||||||||
| GNMA Fund | $ | 3,906,376 | $ | - | $ | 34,571,547 | $ | (1,394,075 | ) | $ | (4,473,153 | ) | 2006 | ||||||||||||||
| (1,688,098 | ) | 2007 | |||||||||||||||||||||||||
| (2,870,184 | ) | 2008 | |||||||||||||||||||||||||
| (527,639 | ) | 2010 | |||||||||||||||||||||||||
| (1,009,937 | ) | 2012 | |||||||||||||||||||||||||
| $ | (10,569,011 | ) | |||||||||||||||||||||||||
| Intermediate Bond Fund | 5,501,924 | 370,548 | 5,369,966 | - | - | - | |||||||||||||||||||||
NOTE 11 - REORGANIZATIONS
On August 16, 2004, ING Intermediate Bond Fund as listed below ("Acquiring Fund"), acquired the assets and certain liabilities of the ING Bond Fund, also listed below ("Acquired Fund"), in a tax-free reorganization in exchange for shares of the Acquiring Fund, pursuant to a plan of reorganization approved by the Acquired Fund's shareholders. The number and value of shares issued by the Acquiring Fund are presented in Note 9 - Capital Shares. Net assets and unrealized appreciation as of the reorganization dates were as follows:
| Acquiring Fund | Acquired Fund | Total Net Assets of Acquired Fund (000) | Total Net Assets of Acquiring Fund (000) | Acquired Fund Unrealized Appreciation (000) | Conversion Ratio | ||||||||||||||||||
| ING Intermediate Bond Fund | ING Bond Fund | $ | 137,658 | $ | 448,460 | $ | 1,594 | 1.01 | |||||||||||||||
The net assets of the ING Intermediate Bond Fund after the acquisition were approximately $586,118,000.
NOTE 12 - ILLIQUID SECURITIES
Pursuant to guidelines adopted by the Funds' Board of Trustees, the following securities have been deemed to be illiquid. Intermediate Bond Fund currently limits investment in illiquid securities to 15% of the Fund's net assets, at market value, at time of purchase.
| Fund | Security | Principal Amount/ Shares | Initial Acquisition Date | Cost | Value | Percent of Net Assets | |||||||||||||||||||||
| Intermediate Bond Fund | Apine III, 2.261%, due 08/16/14 | 434,000 | 8/04/04 | $ | 434,000 | $ | 434,000 | 0.07 | % | ||||||||||||||||||
| Apine III, 2.661%, due 08/16/15 | 434,000 | 8/04/04 | 434,000 | 434,000 | 0.07 | % | |||||||||||||||||||||
| Apine III, 4.461%, due 08/16/16 | 276,000 | 8/04/04 | 276,000 | 276,000 | 0.05 | % | |||||||||||||||||||||
| Apine III, 7.711%, due 08/16/17 | 669,000 | 8/16/04 | 669,000 | 669,000 | 0.11 | % | |||||||||||||||||||||
| $ | 1,813,000 | $ | 1,813,000 | 0.30 | % | ||||||||||||||||||||||
NOTE 13 - SECURITIES LENDING
Under an agreement with The Bank of New York ("BNY"), Intermediate Bond Fund can lend its securities to approved brokers, dealers and other financial institutions. Loans are collateralized by cash and U.S. Government securities. The collateral must be in an amount equal to at least 105% of the market value of non-U.S. securities loaned and 102% of the market value of U.S. securities loaned. The cash collateral received is invested in approved investments as defined in the Securities Lending Agreement with BNY (the "Agreement"). The securities purchased with cash collateral received are reflected in the Portfolio of Investments. Generally, in the event of counterparty default, the Funds have the right to use the collateral to offset losses incurred. The Agreement contains certain guarantees by BNY in the event of counterparty default and/or a borrower's failure to return a loaned security; however, t here would be a potential loss to the Fund in the event the Fund is delayed or prevented from exercising its right to dispose of the collateral. The Fund bears the risk of loss with respect to the investment of collateral. Engaging in securities lending could have a leveraging effect, which may intensify the
24
NOTES TO FINANCIAL STATEMENTS as of September 30, 2004 (Unaudited) (continued)
NOTE 13 - SECURITIES LENDING (continued)
credit, market and other risks associated with investing in the Fund. At September 30, 2004, the Fund had securities on loan with the following market values:
| Portfolio | Value of Securities Loaned | Value of Collateral | |||||||||
| Intermediate Bond Fund | $ | 71,399,389 | $ | 73,409,156 | |||||||
NOTE 14 - SUBSEQUENT EVENTS
Dividends. Subsequent to September 30, 2004 the following Funds declared dividends from net investment income of:
| Per Share Amount | Payable Date | Record Date | |||||||||||||
| GNMA Income Fund | |||||||||||||||
| Class A | $ | 0.0375 | October 5, 2004 | September 30, 2004 | |||||||||||
| Class B | $ | 0.0321 | October 5, 2004 | September 30, 2004 | |||||||||||
| Class C | $ | 0.0320 | October 5, 2004 | September 30, 2004 | |||||||||||
| Class I | $ | 0.0396 | October 5, 2004 | September 30, 2004 | |||||||||||
| Class M | $ | 0.0338 | October 5, 2004 | September 30, 2004 | |||||||||||
| Class Q | $ | 0.0377 | October 5, 2004 | September 30, 2004 | |||||||||||
| Class A | $ | 0.0375 | November 3, 2004 | October 29, 2004 | |||||||||||
| Class B | $ | 0.0320 | November 3, 2004 | October 29, 2004 | |||||||||||
| Class C | $ | 0.0319 | November 3, 2004 | October 29, 2004 | |||||||||||
| Class I | $ | 0.0397 | November 3, 2004 | October 29, 2004 | |||||||||||
| Class M | $ | 0.0337 | November 3, 2004 | October 29, 2004 | |||||||||||
| Class Q | $ | 0.0358 | November 3, 2004 | October 29, 2004 | |||||||||||
| Intermediate Bond Fund | |||||||||||||||
| Class A | $ | 0.0291 | November 1, 2004 | Daily | |||||||||||
| Class B | $ | 0.0223 | November 1, 2004 | Daily | |||||||||||
| Class C | $ | 0.0224 | November 1, 2004 | Daily | |||||||||||
| Class I | $ | 0.0318 | November 1, 2004 | Daily | |||||||||||
| Class O | $ | 0.0293 | November 1, 2004 | Daily | |||||||||||
| Class R | $ | 0.0275 | November 1, 2004 | Daily | |||||||||||
25
PORTFOLIO OF INVESTMENTS
ING GNMA INCOME FUND as of September 30, 2004 (Unaudited)
| Principal Amount | Value | ||||||||||||||
| U.S. GOVERNMENT AGENCY OBLIGATIONS: 88.1% | |||||||||||||||
| Federal Home Loan Mortgage Corporation: 0.2% | |||||||||||||||
| $ | 259,261 | 7.000%, due 11/01/14 | $ | 275,076 | |||||||||||
| 817,102 | 7.500%, due 12/01/14 | 869,056 | |||||||||||||
| 231,184 | 7.500%, due 01/01/30 | 248,292 | |||||||||||||
| 237,720 | 8.000%, due 01/01/30 | 258,759 | |||||||||||||
| 1,651,183 | |||||||||||||||
| Federal National Mortgage Association: 0.2% | |||||||||||||||
| 171,891 | 6.500%, due 06/01/14 | 182,277 | |||||||||||||
| 226,527 | 7.000%, due 03/01/15 | 240,514 | |||||||||||||
| 302,319 | 7.500%, due 05/01/28 | 324,214 | |||||||||||||
| 320,721 | 8.500%, due 08/01/11 | 342,994 | |||||||||||||
| 93,748 | 8.500%, due 05/01/15 | 101,147 | |||||||||||||
| 70,547 | 8.500%, due 08/01/15 | 76,115 | |||||||||||||
| 305,772 | 8.500%, due 09/01/15 | 329,903 | |||||||||||||
| �� | 1,597,164 | ||||||||||||||
| Government National Mortgage Association: 87.7% | |||||||||||||||
| 9,844,313 | 3.750%, due 05/20/34 | 9,778,016 | |||||||||||||
| 39,148,386 | 5.000%, due 05/15/33-04/15/34 | 39,058,129 | |||||||||||||
| 134,352,100 | 5.500%, due 04/20/29-08/20/34 | 136,952,578 | |||||||||||||
| 544,076 | 5.650%, due 07/15/29 | 568,704 | |||||||||||||
| 132,662,694 | 6.000%, due 07/15/28-07/20/34 | 137,779,576 | |||||||||||||
| 925,550 | 6.250%, due 04/15/26-04/15/28 | 972,648 | |||||||||||||
| 133,209 | 6.340%, due 02/15/29 | 127,985 | |||||||||||||
| 5,771,548 | 6.400%, due 10/15/33-08/15/38 | 6,014,458 | |||||||||||||
| 1,157,729 | 6.470%, due 09/15/33 | 1,209,086 | |||||||||||||
| 32,114,571 | 6.500%, due 02/15/22-02/15/40 | 34,260,618 | |||||||||||||
| 14,455,015 | 6.625%, due 01/15/34-01/15/40 | 15,817,663 | |||||||||||||
| 4,078,970 | 6.650%, due 10/15/14-09/15/32 | 4,396,547 | |||||||||||||
| 3,503,816 | 6.670%, due 01/15/40 | 3,890,918 | |||||||||||||
| 6,172,541 | 6.687%, due 07/15/40 | 6,914,837 | |||||||||||||
| 272,207 | 6.700%, due 12/15/14 | 280,782 | |||||||||||||
| 4,292,083 | 6.745%, due 10/15/39 | 4,729,524 | |||||||||||||
| 12,812,893 | 6.750%, due 06/15/13-01/15/41 | 14,120,611 | |||||||||||||
| 2,836,308 | 6.810%, due 07/15/39 | 3,165,792 | |||||||||||||
| 4,045,857 | 6.820%, due 05/15/27-04/15/34 | 4,327,377 | |||||||||||||
| 9,789,391 | 6.840%, due 10/15/36 | 11,088,762 | |||||||||||||
| 1,795,177 | 6.870%, due 03/15/39 | 2,012,774 | |||||||||||||
| 3,254,808 | 6.875%, due 02/15/40 | 3,647,164 | |||||||||||||
| 2,161,133 | 6.900%, due 01/15/32 | 2,454,448 | |||||||||||||
| 2,866,007 | 6.950%, due 12/15/29 | 2,969,166 | |||||||||||||
| 58,097,023 | 7.000%, due 07/15/22-12/15/35 | 61,958,597 | |||||||||||||
| 8,933,730 | 7.010%, due 02/15/37 | 10,186,524 | |||||||||||||
| 5,537,732 | 7.100%, due 11/15/39 | 6,313,992 | |||||||||||||
| 8,914,777 | 7.125%, due 09/15/39 | 10,064,357 | |||||||||||||
| 3,326,807 | 7.150%, due 07/15/36 | 3,804,289 | |||||||||||||
| 3,672,609 | 7.250%, due 08/15/22-09/15/31 | 3,952,094 | |||||||||||||
| 2,939,899 | 7.300%, due 08/15/36 | 3,313,268 | |||||||||||||
| 4,741,764 | 7.500%, due 12/15/19-09/15/32 | 5,099,004 | |||||||||||||
| 4,991,230 | 7.600%, due 08/15/31 | 5,585,798 | |||||||||||||
| 9,407,739 | 7.625%, due 07/15/38 | 10,135,285 | |||||||||||||
| 74,403 | 7.650%, due 12/15/12 | 77,670 | |||||||||||||
| 460,757 | 7.700%, due 08/15/13 | 481,936 | |||||||||||||
| 9,374,118 | 7.750%, due 06/15/14-12/15/35 | 10,237,856 | |||||||||||||
| 1,038,351 | 7.800%, due 05/15/19-01/15/42 | 1,170,629 | |||||||||||||
| 9,808,372 | 7.875%, due 09/15/29-04/15/38 | 10,473,704 | |||||||||||||
| 11,459,430 | 8.000%, due 12/15/14-11/15/38 | 12,473,234 | |||||||||||||
| 129,987 | 8.050%, due 07/15/19-04/15/21 | 142,651 | |||||||||||||
| 1,252,488 | 8.100%, due 06/15/12-07/15/12 | 1,316,093 | |||||||||||||
| Principal Amount | Value | ||||||||||||||
| $ | 4,968,928 | 8.125%, due 05/15/38 | $ | 5,489,671 | |||||||||||
| 4,934,413 | 8.150%, due 12/15/11-09/15/15 | 5,200,630 | |||||||||||||
| 5,187,323 | 8.200%, due 10/15/11-05/15/13 | 5,418,439 | |||||||||||||
| 2,037,798 | 8.250%, due 10/15/24-03/15/41 | 2,249,326 | |||||||||||||
| 6,947,665 | 8.500%, due 12/15/29-10/15/31 | 7,479,848 | |||||||||||||
| 117,096 | 8.750%, due 10/15/23-06/15/27 | 118,426 | |||||||||||||
| 2,814,818 | 9.000%, due 05/15/20-12/15/34 | 2,897,319 | |||||||||||||
| 1,366,073 | 9.250%, due 06/15/30 | 1,459,764 | |||||||||||||
| 972,291 | 10.250%, due 08/15/29 | 1,063,950 | |||||||||||||
| 634,702,517 | |||||||||||||||
| Total U.S. Government Agency Obligations (Cost $615,601,535) | | 637,950,864 | |||||||||||||
| U.S. TREASURY OBLIGATIONS: 6.4% | |||||||||||||||
| U.S. Treasury Notes: 6.4% | |||||||||||||||
| 47,000,000 | 1.500%, due 03/31/06 | 46,401,502 | |||||||||||||
| Total U.S. Treasury Obligations (Cost $46,578,131) | 46,401,502 | ||||||||||||||
| Total Long-Term Investments (Cost $662,179,666) | 684,352,366 | ||||||||||||||
| SHORT-TERM INVESTMENTS: 4.8% | |||||||||||||||
| U.S. Treasury Bills: 4.8% | |||||||||||||||
| 34,500,000 | 1.560%, due 12/02/04 | 34,406,057 | |||||||||||||
| Total Short-Term Investments (Cost $34,406,819) | 34,406,057 | ||||||||||||||
| Total Investments in Securities (Cost $696,586,485)* | 99.3% | $718,758,423 | |||||||||||||
| Other Assets and Liabilities-Net | 0.7 | % | 4,832,180 | ||||||||||||
| Net Assets | 100.0 | % | $ | 723,590,603 | |||||||||||
Government National Mortgage Association ("GNMA") manages a program of Mortgage-backed securities in order to attract funds for secondary mortgages and provide liquidity for existing mortgage securities. GNMA is a quasi-government agency.
Federal Home Loan Mortgage Corporation ("FHLMC") purchase mortgages from a mortgage originator and holds them as investments in its portfolio, or securitizes them. FHLMC is a private corporation.
* Cost for federal income tax purposes is the same as for financial statement purposes. Net unrealized appreciation consists of:
| Gross Unrealized Appreciation | $ | 26,393,117 | |||||
| Gross Unrealized Depreciation | (4,221,179 | ) | |||||
| Net Unrealized Appreciation | $ | 22,171,938 | |||||
See Accompanying Notes to Financial Statements
26
PORTFOLIO OF INVESTMENTS
ING INTERMEDIATE BOND FUND as of September 30, 2004 (Unaudited)
| Principal Amount | Value | ||||||||||||||
| CORPORATE BONDS/NOTES: 25.7% | |||||||||||||||
| Airlines: 0.3% | |||||||||||||||
| $ | 430,000 | American Airlines, Inc., 7.250%, due 02/05/09 | $ | 397,750 | |||||||||||
| 1,846,000 | American Airlines, Inc., 7.324%, due 10/15/09 | 1,463,437 | |||||||||||||
| 1,861,187 | |||||||||||||||
| Auto Manufacturers: 0.3% | |||||||||||||||
| 473,000 | L | Ford Motor Co., 6.625%, due 10/01/28 | 429,431 | ||||||||||||
| 1,069,000 | General Motors Corp., 8.375%, due 07/15/33 | 1,138,237 | |||||||||||||
| 1,567,668 | |||||||||||||||
| Banks: 5.4% | |||||||||||||||
| 660,000 | Australia & New Zealand Banking Group Ltd., 1.494%, due 10/29/49 | 568,003 | |||||||||||||
| 1,073,000 | @@,# | Banco Bradesco SA/Cayman Islands, 8.750%, due 10/24/13 | 1,121,285 | ||||||||||||
| 2,421,000 | @@,L | Banco Santander Chile SA, 7.375%, due 07/18/12 | 2,772,873 | ||||||||||||
| 490,000 | Bank of Nova Scotia, 2.115%, due 08/31/85 | 409,156 | |||||||||||||
| 1,136,000 | BankAmerica Capital II, 8.000%, due 12/15/26 | 1,267,549 | |||||||||||||
| 997,000 | @@,# | Danske Bank A/S, 5.914%, due 12/29/49 | 1,050,596 | ||||||||||||
| 440,000 | Den Norske Bank ASA, 2.125%, due 08/29/49 | 364,650 | |||||||||||||
| 1,994,000 | # | Dresdner Funding Trust I, 8.151%, due 06/30/31 | 2,416,981 | ||||||||||||
| 1,198,000 | FBS Capital I, 8.090%, due 11/15/26 | 1,348,629 | |||||||||||||
| 1,059,000 | @@,#,L | HBOS Capital Funding LP, 6.071%, due 06/30/49 | 1,121,699 | ||||||||||||
| 1,590,000 | Lloyds TSB Bank PLC, 2.090%, due 08/29/49 | 1,380,455 | |||||||||||||
| 1,570,000 | Lloyds TSB Bank PLC, 2.188%, due 06/29/49 | 1,381,090 | |||||||||||||
| 1,614,000 | M&T Bank Corp., 3.850%, due 04/01/13 | 1,609,562 | |||||||||||||
| 1,142,000 | Mellon Capital I, 7.720%, due 12/01/26 | 1,270,226 | |||||||||||||
| 510,000 | National Australia Bank Ltd., 1.463%, due 10/29/49 | 439,059 | |||||||||||||
| 1,710,000 | @@ | National Westminster Bank PLC, 1.938%, due 11/29/49 | 1,455,882 | ||||||||||||
| 1,338,000 | #,L | Rabobank Capital Funding II, 5.260%, due 12/29/49 | 1,352,252 | ||||||||||||
| 1,640,000 | @@ | Royal Bank of Canada, 1.750%, due 06/29/85 | 1,415,755 | ||||||||||||
| 780,000 | @@ | Royal Bank of Scotland Group PLC, 2.063%, due 12/29/49 | 678,478 | ||||||||||||
| 420,000 | @@ | Societe Generale, 1.688%, due 11/29/49 | 354,928 | ||||||||||||
| 3,460,000 | @@ | Standard Chartered PLC, 1.800%, due 11/29/49 | 2,780,472 | ||||||||||||
| 2,470,000 | @@ | Standard Chartered PLC, 2.070%, due 12/29/49 | 1,982,175 | ||||||||||||
| 1,103,000 | Wells Fargo Capital I, 7.960%, due 12/15/26 | 1,253,023 | |||||||||||||
| Principal Amount | Value | ||||||||||||||
| $ | 590,000 | Westpac Banking Corp, 2.338%, due 09/29/49 | $ | 503,560 | |||||||||||
| 2,420,000 | # | Westpac Capital Trust IV, 5.256%, due 12/29/49 | 2,383,320 | ||||||||||||
| 32,681,658 | |||||||||||||||
| Beverages: 1.0% | |||||||||||||||
| 3,262,000 | @@ | Cia Brasileira de Bebidas, 8.750%, due 09/15/13 | 3,702,369 | ||||||||||||
| 217,000 | @@ | Cia Brasileira de Bebidas, 10.500%, due 12/15/11 | 268,538 | ||||||||||||
| 1,806,000 | # | Miller Brewing Co., 4.250%, due 08/15/08 | 1,837,504 | ||||||||||||
| 5,808,411 | |||||||||||||||
| Chemicals: 0.1% | |||||||||||||||
| 434,000 | L | Dow Chemical Co., 5.750%, due 11/15/09 | 466,257 | ||||||||||||
| 397,000 | @@,# | Sociedad Quimica y Minera de Chile SA, 7.700%, due 09/15/06 | 427,728 | ||||||||||||
| 893,985 | |||||||||||||||
| Diversified Financial Services: 4.1% | |||||||||||||||
| 434,000 | #,I,XX | Alpine III, 2.261%, due 08/16/14 | 434,000 | ||||||||||||
| 434,000 | #,I,XX | Alpine III, 2.661%, due 08/16/14 | 434,000 | ||||||||||||
| 276,000 | #,I,XX | Alpine III, 4.461%, due 08/16/14 | 276,000 | ||||||||||||
| 669,000 | #,I,XX | Alpine III, 7.711%, due 08/16/14 | 669,000 | ||||||||||||
| 339,471 | # | Arcel Finance Ltd., 5.984%, due 02/01/09 | 355,409 | ||||||||||||
| 901,000 | # | Arcel Finance Ltd., 6.361%, due 05/01/12 | 910,863 | ||||||||||||
| 512,000 | # | Arcel Finance Ltd., 7.048%, due 09/01/11 | 538,426 | ||||||||||||
| 1,508,000 | L | Boeing Capital Corp., 7.375%, due 09/27/10 | 1,754,183 | ||||||||||||
| 2,015,000 | @@,# | Brazilian Merchant Voucher Receivables Ltd., 5.911%, due 06/15/11 | 1,999,888 | ||||||||||||
| 1,153,000 | Citigroup Capital II, 7.750%, due 12/01/36 | 1,276,258 | |||||||||||||
| 1,135,000 | # | Corestates Capital Trust I, 8.000%, due 12/15/26 | 1,259,546 | ||||||||||||
| 2,066,000 | # | Farmers Exchange Capital, 7.200%, due 07/15/48 | 2,097,797 | ||||||||||||
| 570,000 | Financiere CSFB NV, 2.125%, due 03/29/49 | 465,397 | |||||||||||||
| 1,271,000 | General Motors Acceptance Corp., 7.750%, due 01/19/10 | 1,398,174 | |||||||||||||
| 7,367 | # | Hollinger Participation Trust, 0.000%, due 11/15/10 | 8,454 | ||||||||||||
| 611,000 | # | HVB Funding Trust III, 9.000%, due 10/22/31 | 788,584 | ||||||||||||
| 662,000 | JPM Capital Trust I, 7.540%, due 01/15/27 | 708,492 | |||||||||||||
| 522,000 | JPM Capital Trust II, 7.950%, due 02/01/27 | 582,855 | |||||||||||||
| 3,559,000 | # | Mangrove Bay Pass-Through Trust, 6.102%, due 07/15/33 | 3,634,315 | ||||||||||||
See Accompanying Notes to Financial Statements
27
PORTFOLIO OF INVESTMENTS
ING INTERMEDIATE BOND FUND as of September 30, 2004 (Unaudited) (continued)
| Principal Amount | Value | ||||||||||||||
| Diversified Financial Services (continued) | |||||||||||||||
| $ | 1,285,084 | @@,# | PF Export Receivables Master Trust, 3.748%, due 06/01/13 | $ | 1,260,661 | ||||||||||
| 1,714,036 | @@,# | PF Export Receivables Master Trust, 6.436%, due 06/01/15 | 1,721,021 | ||||||||||||
| 2,058,000 | L | UFJ Finance Aruba AEC, 8.750%, due 11/29/49 | 2,274,437 | ||||||||||||
| 15,000 | Universal City Development Partners, 11.750%, due 04/01/10 | 17,550 | |||||||||||||
| 24,865,310 | |||||||||||||||
| Electric: 5.0% | |||||||||||||||
| 1,057,000 | @@,#,L | AES Gener SA, 7.500%, due 03/25/14 | 1,067,570 | ||||||||||||
| 1,517,715 | # | Allegheny Energy Supply Statutory Trust 2001, 10.250%, due 11/15/07 | 1,745,372 | ||||||||||||
| 160,042 | # | Allegheny Energy Supply Statutory Trust 2001, 13.000%, due 11/15/07 | 168,844 | ||||||||||||
| 1,854,160 | CE Generation LLC, 7.416%, due 12/15/18 | 1,925,332 | |||||||||||||
| 1,839,000 | L | Consumers Energy Co., 4.250%, due 04/15/08 | 1,871,841 | ||||||||||||
| 1,444,000 | DTE Energy Co., 2.740%, due 06/01/07 | 1,444,637 | |||||||||||||
| 2,635,000 | @@,L | Empresa Nacional de Electricidad SA/Chile, 7.750%, due 07/15/08 | 2,887,989 | ||||||||||||
| 3,551,000 | Enserch Capital I, 2.950%, due 07/01/28 | 3,499,318 | |||||||||||||
| 2,110,000 | Enterprise Capital Trust II, 3.195%, due 06/30/28 | 2,005,211 | |||||||||||||
| 1,511,000 | # | Monongahela Power Co., 6.700%, due 06/15/14 | 1,645,085 | ||||||||||||
| 2,384,000 | Ohio Power Co., 6.375%, due 07/15/33 | 2,467,173 | |||||||||||||
| 4,105,000 | PG&E Corp., 6.875%, due 07/15/08 | 4,464,187 | |||||||||||||
| 209,472 | # | Power Contract Financing LLC, 5.200%, due 02/01/06 | 212,526 | ||||||||||||
| 1,068,000 | # | Power Contract Financing LLC, 6.256%, due 02/01/10 | 1,113,074 | ||||||||||||
| 384,092 | PPL Montana LLC, 8.903%, due 07/02/20 | 426,583 | |||||||||||||
| 896,000 | Sithe/Independence Funding, 9.000%, due 12/30/13 | 1,017,591 | |||||||||||||
| 623,000 | # | Tenaska Virginia Partners LP, 6.119%, due 03/30/24 | 653,253 | ||||||||||||
| 1,301,000 | TXU Corp., 4.446%, due 11/16/06 | 1,326,865 | |||||||||||||
| 29,942,451 | |||||||||||||||
| Engineering and Construction: 0.1% | |||||||||||||||
| 970,000 | @@ | Dong Ah Construction, 2.160%, due 12/29/49 | 830,459 | ||||||||||||
| 830,459 | |||||||||||||||
| Food: 0.9% | |||||||||||||||
| 831,000 | Kroger Co., 7.250%, due 06/01/09 | 938,041 | |||||||||||||
| Principal Amount | Value | ||||||||||||||
| $ | 1,478,000 | Safeway, Inc., 4.800%, due 07/16/07 | $ | 1,520,291 | |||||||||||
| 987,000 | L | Supervalu, Inc., 7.875%, due 08/01/09 | 1,133,474 | ||||||||||||
| 1,947,000 | Tyson Foods, Inc., 7.250%, due 10/01/06 | 2,088,972 | |||||||||||||
| 5,680,778 | |||||||||||||||
| Gas: 0.2% | |||||||||||||||
| 1,343,000 | # | Williams Gas Pipelines Central, Inc., 7.375%, due 11/15/06 | 1,452,119 | ||||||||||||
| 1,452,119 | |||||||||||||||
| Home Builders: 0.3% | |||||||||||||||
| 1,579,000 | DR Horton, Inc., 5.625%, due 09/15/14 | 1,579,000 | |||||||||||||
| 54,000 | Technical Olympic USA, Inc., 9.000%, due 07/01/10 | 59,400 | |||||||||||||
| 1,638,400 | |||||||||||||||
| Insurance: 0.7% | |||||||||||||||
| 380,000 | # | Farmers Insurance Exchange, 6.000%, due 08/01/14 | 387,168 | ||||||||||||
| 977,000 | # | Farmers Insurance Exchange, 8.625%, due 05/01/24 | 1,156,886 | ||||||||||||
| 1,244,000 | # | Monumental Global Funding II, 3.850%, due 03/03/08 | 1,264,623 | ||||||||||||
| 1,083,000 | Prudential Financial, Inc., 4.104%, due 11/15/06 | 1,101,570 | |||||||||||||
| 3,910,247 | |||||||||||||||
| Machinery-Diversified: 0.5% | |||||||||||||||
| 3,200,000 | @@ | Inficon Holding AG, 1.971%, due 06/29/49 | 2,733,251 | ||||||||||||
| 2,733,251 | |||||||||||||||
| Media: 0.4% | |||||||||||||||
| 64,000 | L | Comcast Cable Communications, 7.125%, due 06/15/13 | 72,504 | ||||||||||||
| 1,029,000 | Time Warner Entertainment Co. LP, 8.875%, due 10/01/12 | 1,267,276 | |||||||||||||
| 691,000 | L | Time Warner, Inc., 6.875%, due 05/01/12 | 772,085 | ||||||||||||
| 2,111,865 | |||||||||||||||
| Mining: 0.5% | |||||||||||||||
| 1,068,000 | @@,# | Corp Nacional del Cobre de Chile, 5.500%, due 10/15/13 | 1,114,361 | ||||||||||||
| 1,684,000 | Vale Overseas Ltd., 8.625%, due 03/08/07 | 1,869,240 | |||||||||||||
| 2,983,601 | |||||||||||||||
| Miscellaneous Manufacturing: 0.0% | |||||||||||||||
| 5,000 | SPX Corp., 7.500%, due 01/01/13 | 5,106 | |||||||||||||
| 5,106 | |||||||||||||||
| Multi-National: 0.5% | |||||||||||||||
| 2,576,000 | @@ | Corp Andina de Fomento CAF, 6.875%, due 03/15/12 | 2,902,212 | ||||||||||||
| 2,902,212 | |||||||||||||||
See Accompanying Notes to Financial Statements
28
PORTFOLIO OF INVESTMENTS
ING INTERMEDIATE BOND FUND as of September 30, 2004 (Unaudited) (continued)
| Principal Amount | Value | ||||||||||||||
| Oil and Gas: 2.0% | |||||||||||||||
| $ | 1,099,000 | L | Amerada Hess Corp., 6.650%, due 08/15/11 | $ | 1,215,094 | ||||||||||
| 1,586,000 | Amerada Hess Corp., 7.875%, due 10/01/29 | 1,839,457 | |||||||||||||
| 1,518,000 | @@,# | Empresa Nacional de Petroleo, 4.875%, due 03/15/14 | 1,499,427 | ||||||||||||
| 20,000 | L | Energy Partners Ltd., 8.750%, due 08/01/10 | 21,800 | ||||||||||||
| 1,478,000 | @@,#,L | Gazprom Intl. SA, 7.201%, due 02/01/20 | 1,500,170 | ||||||||||||
| 1,110,000 | @@,# | Morgan Stanley Bank AG for OAO Gazprom, 9.625%, due 03/01/13 | 1,237,650 | ||||||||||||
| 3,227,000 | #,L | Pemex Project Funding Master Trust, 3.180%, due 06/15/10 | 3,268,952 | ||||||||||||
| 905,000 | Valero Energy Corp., 8.750%, due 06/15/30 | 1,183,183 | |||||||||||||
| 11,765,733 | |||||||||||||||
| Packaging and Containers: 0.5% | |||||||||||||||
| 642,000 | # | Sealed Air Corp., 5.375%, due 04/15/08 | 670,866 | ||||||||||||
| 1,843,000 | # | Sealed Air Corp., 6.950%, due 05/15/09 | 2,043,174 | ||||||||||||
| 2,714,040 | |||||||||||||||
| Pipelines: 0.0% | |||||||||||||||
| 18,000 | GulfTerra Energy Finance Corp., 10.625%, due 12/01/12 | 22,680 | |||||||||||||
| 20,000 | Transcontinental Gas Pipe LN, 8.875%, due 07/15/12 | 24,425 | |||||||||||||
| 47,105 | |||||||||||||||
| Real Estate: 0.6% | |||||||||||||||
| 1,636,000 | EOP Operating LP, 7.750%, due 11/15/07 | 1,828,072 | |||||||||||||
| 209,000 | Liberty Property-LP, 6.375%, due 08/15/12 | 227,465 | |||||||||||||
| 163,000 | Liberty Property-LP, 6.950%, due 12/01/06 | 176,394 | |||||||||||||
| 1,406,000 | Liberty Property-LP, 7.750%, due 04/15/09 | 1,607,996 | |||||||||||||
| 3,839,927 | |||||||||||||||
| Real Estate Investment Trusts: 0.8% | |||||||||||||||
| 657,000 | Rouse Co., 3.625%, due 03/15/09 | 614,036 | |||||||||||||
| 657,000 | Rouse Co., 5.375%, due 11/26/13 | 627,707 | |||||||||||||
| 1,205,000 | Simon Property Group LP, 4.875%, due 03/18/10 | 1,229,405 | |||||||||||||
| 2,134,000 | Simon Property Group LP, 6.375%, due 11/15/07 | 2,309,560 | |||||||||||||
| 4,780,708 | |||||||||||||||
| Retail: 0.0% | |||||||||||||||
| 39,000 | Dollar General Corp., 8.625%, due 06/15/10 | 45,045 | |||||||||||||
| 45,045 | |||||||||||||||
| Principal Amount | Value | ||||||||||||||
| Savings and Loans: 0.2% | |||||||||||||||
| $ | 1,104,000 | Great Western Financial, 8.206%, due 02/01/27 | $ | 1,250,902 | |||||||||||
| 1,250,902 | |||||||||||||||
| Telecommunications: 1.2% | |||||||||||||||
| 1,480,000 | BellSouth Corp., 4.200%, due 09/15/09 | 1,490,157 | |||||||||||||
| 1,439,000 | @@ | Cia de Telecomunicaciones de Chile SA, 7.625%, due 07/15/06 | 1,532,762 | ||||||||||||
| 819,000 | + | Sprint Capital Corp., 4.780%, due 08/17/06 | 842,363 | ||||||||||||
| 628,000 | Sprint Capital Corp., 8.375%, due 03/15/12 | 761,684 | |||||||||||||
| 1,415,000 | Verizon Florida, Inc., 6.125%, due 01/15/13 | 1,512,403 | |||||||||||||
| 1,177,000 | Verizon Virginia, Inc., 4.625%, due 03/15/13 | 1,151,303 | |||||||||||||
| 7,290,672 | |||||||||||||||
| Transportation: 0.1% | |||||||||||||||
| 853,000 | @@,# | MISC Capital Ltd., 5.000%, due 07/01/09 | 881,475 | ||||||||||||
| 881,475 | |||||||||||||||
| Total Corporate Bonds/Notes (Cost $151,173,979) | 154,484,315 | ||||||||||||||
| U.S. GOVERNMENT AGENCY OBLIGATIONS: 28.6% | |||||||||||||||
| Federal Home Loan Mortgage Corporation: 9.1% | |||||||||||||||
| 1,306,797 | 1.740%, due 05/25/31 | 1,307,363 | |||||||||||||
| 992,722 | 1.755%, due 04/25/30 | 993,235 | |||||||||||||
| 459,262 | 1.765%, due 01/25/32 | 459,763 | |||||||||||||
| 1,033,538 | 1.950%, due 02/15/32 | 1,035,609 | |||||||||||||
| 2,248,613 | 2.250%, due 04/15/32 | 2,259,751 | |||||||||||||
| 11,845,000 | 2.700%, due 03/16/07 | 11,769,252 | |||||||||||||
| 5,160,000 | 2.750%, due 02/09/07 | 5,139,716 | |||||||||||||
| 3,534,796 | 4.500%, due 04/01/14 | 3,544,035 | |||||||||||||
| 2,000,000 | 5.500%, due 11/15/18 | 2,061,250 | |||||||||||||
| 2,071,000 | 5.875%, due 03/21/11 | 2,251,247 | |||||||||||||
| 3,216,000 | 6.000%, due 01/15/28 | 3,319,461 | |||||||||||||
| 3,669,423 | 6.000%, due 01/15/29 | 3,819,997 | |||||||||||||
| 3,151,436 | 6.000%, due 01/15/29 | 3,282,392 | |||||||||||||
| 2,277,000 | 6.000%, due 01/15/29 | 2,383,742 | |||||||||||||
| 7,465,000 | 6.500%, due 10/15/34 | 7,831,248 | |||||||||||||
| 3,309,000 | 7.000%, due 10/15/34 | 3,509,608 | |||||||||||||
| 16,956 | 7.500%, due 11/01/28 | 18,232 | |||||||||||||
| 54,985,901 | |||||||||||||||
| Federal National Mortgage Association: 19.2% | |||||||||||||||
| 250,240 | 1.815%, due 11/25/32 | 249,461 | |||||||||||||
| 902,019 | 1.900%, due 10/25/33 | 905,906 | |||||||||||||
| 828,720 | 2.000%, due 04/18/28 | 833,297 | |||||||||||||
| 269,480 | 2.065%, due 12/25/29 | 270,408 | |||||||||||||
| 2,669,860 | 2.090%, due 08/25/33 | 2,682,362 | |||||||||||||
| 782,357 | 2.165%, due 01/25/32 | 781,580 | |||||||||||||
| 1,037,187 | 2.859%, due 12/26/29 | 1,040,585 | |||||||||||||
| 6,050,000 | 2.875%, due 05/19/08 | 5,916,422 | |||||||||||||
| 2,489,000 | 4.500%, due 10/15/18 | 2,480,443 | |||||||||||||
| 2,187,000 | 4.750%, due 12/25/42 | 2,205,536 | |||||||||||||
| 41,165,000 | 5.000%, due 11/15/34 | 40,624,708 | |||||||||||||
| 14,650,000 | 5.000%, due 11/01/18 | 14,846,867 | |||||||||||||
See Accompanying Notes to Financial Statements
29
PORTFOLIO OF INVESTMENTS
ING INTERMEDIATE BOND FUND as of September 30, 2004 (Unaudited) (continued)
| Principal Amount | Value | ||||||||||||||
| Federal National Mortgage Association (continued) | |||||||||||||||
| $ | 2,755,000 | 5.250%, due 08/01/12 | $ | 2,867,746 | |||||||||||
| 2,679,980 | 5.500%, due 11/15/18 | 2,762,893 | |||||||||||||
| 6,172,975 | 5.898%, due 02/17/29 | 636,171 | |||||||||||||
| 2,290,975 | 6.000%, due 04/25/31 | 2,384,718 | |||||||||||||
| 1,854,594 | 6.000%, due 08/01/33 | 1,922,757 | |||||||||||||
| 1,269,000 | 6.000%, due 10/15/34 | 1,312,622 | |||||||||||||
| 114,838 | 6.000%, due 08/01/16 | 120,534 | |||||||||||||
| 10,100 | 6.000%, due 12/01/16 | 10,601 | |||||||||||||
| 358,644 | 6.000%, due 03/01/17 | 376,431 | |||||||||||||
| 3,241,295 | 6.000%, due 09/01/17 | 3,401,929 | |||||||||||||
| 231,077 | 6.000%, due 11/01/17 | 242,537 | |||||||||||||
| 3,702,274 | 6.000%, due 07/25/29 | 3,850,417 | |||||||||||||
| 1,573,193 | 6.000%, due 07/25/29 | 1,636,631 | |||||||||||||
| 940,632 | 6.500%, due 04/01/30 | 988,801 | |||||||||||||
| 4,736 | 6.500%, due 06/01/31 | 4,973 | |||||||||||||
| 1,188,224 | 6.500%, due 07/01/31 | 1,250,654 | |||||||||||||
| 21,272 | 6.500%, due 09/01/31 | 22,335 | |||||||||||||
| 3,897 | 6.500%, due 09/01/31 | 4,092 | |||||||||||||
| 6,619,000 | 6.500%, due 10/01/31 | 6,943,741 | |||||||||||||
| 434,136 | 6.500%, due 11/01/31 | 455,826 | |||||||||||||
| 267,427 | 6.500%, due 04/01/32 | 280,793 | |||||||||||||
| 103,594 | 6.500%, due 07/01/32 | 108,771 | |||||||||||||
| 135,244 | 6.500%, due 08/01/32 | 142,003 | |||||||||||||
| 128,963 | 6.500%, due 08/01/32 | 135,408 | |||||||||||||
| 23,143 | 6.500%, due 08/01/32 | 24,299 | |||||||||||||
| 324,405 | 6.500%, due 11/01/32 | 340,618 | |||||||||||||
| 358,436 | 6.500%, due 01/01/33 | 376,350 | |||||||||||||
| 266,694 | 6.500%, due 02/01/33 | 280,068 | |||||||||||||
| 1,363,324 | 6.500%, due 12/01/33 | 1,431,690 | |||||||||||||
| 86,634 | 6.500%, due 07/01/29 | 91,070 | |||||||||||||
| 353,098 | 6.500%, due 08/01/29 | 371,180 | |||||||||||||
| 2,515,000 | 6.625%, due 11/15/10 | 2,864,193 | |||||||||||||
| 34,777 | 7.000%, due 01/01/30 | 36,946 | |||||||||||||
| 168,004 | 7.000%, due 01/01/30 | 178,264 | |||||||||||||
| 12,008 | 7.000%, due 03/01/30 | 12,757 | |||||||||||||
| 445,074 | 7.000%, due 06/01/31 | 473,091 | |||||||||||||
| 4,194 | 7.500%, due 09/01/30 | 4,496 | |||||||||||||
| 16,935 | 7.500%, due 10/01/30 | 18,156 | |||||||||||||
| 21,209 | 7.500%, due 10/01/30 | 22,739 | |||||||||||||
| 9,502 | 7.500%, due 11/01/30 | 10,188 | |||||||||||||
| 162,388 | 7.500%, due 02/01/32 | 174,155 | |||||||||||||
| 1,288,285 | 7.500%, due 06/25/32 | 1,394,853 | |||||||||||||
| 850,607 | 7.500%, due 12/25/41 | 922,369 | |||||||||||||
| 1,693,003 | 7.500%, due 01/25/48 | 1,829,629 | |||||||||||||
| 115,558,070 | |||||||||||||||
| Government National Mortgage Association: 0.3% | |||||||||||||||
| 20,570 | 4.375%, due 04/20/28 | 20,836 | |||||||||||||
| 1,744,011 | 6.471%, due 06/16/31 | 205,895 | |||||||||||||
| 6,787 | 6.500%, due 03/15/31 | 7,171 | |||||||||||||
| 47,473 | 6.500%, due 08/15/31 | 50,161 | |||||||||||||
| 101,150 | 6.500%, due 10/15/31 | 106,878 | |||||||||||||
| 55,732 | 6.500%, due 11/15/31 | 58,887 | |||||||||||||
| 55,037 | 6.500%, due 07/15/32 | 58,144 | |||||||||||||
| 404,041 | 6.500%, due 09/15/32 | 426,852 | |||||||||||||
| 69,464 | 7.000%, due 05/15/32 | 74,114 | |||||||||||||
| 98,736 | 7.000%, due 04/15/26 | 105,659 | |||||||||||||
| 926 | 7.500%, due 11/15/30 | 998 | |||||||||||||
| 45,458 | 7.500%, due 12/15/30 | 48,995 | |||||||||||||
| 89,688 | 7.500%, due 12/15/31 | 96,660 | |||||||||||||
| 96,115 | 7.500%, due 05/15/32 | 103,545 | |||||||||||||
| 66,914 | 7.500%, due 05/15/32 | 72,087 | |||||||||||||
| Principal Amount | Value | ||||||||||||||
| $ | 158,700 | 7.500%, due 12/15/22 | $ | 171,900 | |||||||||||
| 16,341 | 7.500%, due 10/15/26 | 17,654 | |||||||||||||
| 82,443 | 7.500%, due 07/15/29 | 88,877 | |||||||||||||
| 1,715,313 | |||||||||||||||
| Total U.S. Government Agency Obligations (Cost $172,089,579) | 172,259,284 | ||||||||||||||
| U.S. TREASURY OBLIGATIONS: 20.8% | |||||||||||||||
| U.S. Treasury Bonds: 10.0% | |||||||||||||||
| 9,745,000 | L | 4.250%, due 08/15/14 | 9,850,071 | ||||||||||||
| 21,136,000 | L | 5.375%, due 02/15/31 | 22,648,555 | ||||||||||||
| 8,493,000 | L | 6.250%, due 08/15/23 | 9,920,223 | ||||||||||||
| 7,109,000 | 10.375%, due 11/15/12 | 8,660,767 | |||||||||||||
| 6,152,000 | 13.250%, due 05/15/14 | 8,747,375 | |||||||||||||
| 59,826,991 | |||||||||||||||
| U.S. Treasury Notes: 10.1% | |||||||||||||||
| 34,993,000 | L | 1.625%, due 01/31/05 | 34,979,352 | ||||||||||||
| 11,130,000 | L | 2.375%, due 08/31/06 | 11,092,180 | ||||||||||||
| 4,500,000 | L | 2.750%, due 08/15/07 | 4,489,106 | ||||||||||||
| 3,816,000 | S | 3.250%, due 08/15/08 | 3,835,233 | ||||||||||||
| 6,694,000 | L | 3.375%, due 09/15/09 | 6,697,401 | ||||||||||||
| 61,093,272 | |||||||||||||||
| U.S. Treasury STRIP: 0.7% | |||||||||||||||
| 6,710,000 | 2.090%, due 05/15/16 | 3,928,336 | |||||||||||||
| 3,928,336 | |||||||||||||||
| Total U.S. Treasury Obligations (Cost $126,153,234) | 124,848,599 | ||||||||||||||
| ASSET-BACKED SECURITIES: 11.0% | |||||||||||||||
| Automobile Asset-Backed Securities: 1.1% | |||||||||||||||
| 2,500,000 | Capital Auto Receivables Asset Trust, 2.750%, due 04/16/07 | 2,505,497 | |||||||||||||
| 200,000 | Capital One Auto Finance Trust, 3.180%, due 09/15/10 | 199,768 | |||||||||||||
| 1,300,000 | Household Automotive Trust, 2.310%, due 04/17/08 | 1,296,473 | |||||||||||||
| 1,250,000 | Nissan Auto Receivables Owner Trust, 2.050%, due 03/16/09 | 1,225,619 | |||||||||||||
| 1,370,000 | L | Nissan Auto Receivables Owner Trust, 2.610%, due 07/15/08 | 1,364,927 | ||||||||||||
| 200,000 | USAA Auto Owner Trust, 2.040%, due 02/16/10 | 197,472 | |||||||||||||
| 6,789,756 | |||||||||||||||
| Commercial Mortgage-Backed Securities: 5.3% | |||||||||||||||
| 1,527,000 | Bear Stearns Commercial Mortgage Securities, 4.170%, due 01/12/41 | 1,545,397 | |||||||||||||
| 672,000 | L | Capco America Securitization Corp., 6.260%, due 10/15/30 | 732,860 | ||||||||||||
| 1,950,000 | Chase Manhattan Bank-First Union National Bank, 7.439%, due 08/15/31 | 2,233,335 | |||||||||||||
See Accompanying Notes to Financial Statements
30
PORTFOLIO OF INVESTMENTS
ING INTERMEDIATE BOND FUND as of September 30, 2004 (Unaudited) (continued)
| Principal Amount | Value | ||||||||||||||
| Commercial Mortgage-Backed Securities (continued) | |||||||||||||||
| $ | 1,810,000 | COMM, 3.600%, due 03/10/39 | $ | 1,794,142 | |||||||||||
| 1,052,838 | Credit Suisse First Boston Mortgage Securities Corp., 3.727%, due 03/15/35 | 1,043,289 | |||||||||||||
| 1,000,000 | DLJ Commercial Mortgage Corp, 6.460%, due 03/10/32 | 1,103,066 | |||||||||||||
| 688,000 | DLJ Commercial Mortgage Corp., 7.300%, due 06/10/32 | 783,704 | |||||||||||||
| 3,033,278 | GE Capital Commercial Mortgage Corp., 3.752%, due 07/10/39 | 3,053,227 | |||||||||||||
| 1,050,000 | GE Capital Commercial Mortgage Corp., 5.994%, due 12/10/35 | 1,136,906 | |||||||||||||
| 1,774,930 | JPMorgan Chase Commercial Mortgage Securities Corp., 4.275%, due 01/12/37 | 1,792,949 | |||||||||||||
| 2,960,000 | JPMorgan Chase Commercial Mortgage Securities Corp., 6.244%, due 04/15/35 | 3,194,011 | |||||||||||||
| 2,961,000 | LB-UBS Commercial Mortgage Trust, 6.226%, due 03/15/26 | 3,249,064 | |||||||||||||
| 1,703,000 | LB-UBS Commercial Mortgage Trust, 7.370%, due 08/15/26 | 1,970,736 | |||||||||||||
| 400,000 | Morgan Stanley Capital I, 7.020%, due 03/15/32 | 450,758 | |||||||||||||
| 2,960,000 | Mortgage Capital Funding, Inc., 6.663%, due 03/18/30 | 3,213,736 | |||||||||||||
| 4,089,485 | Prudential Commercial Mortgage Trust, 3.669%, due 02/11/36 | 4,046,120 | |||||||||||||
| 400,000 | Salomon Brothers Mortgage Securities VII, 7.520%, due 12/18/09 | 460,025 | |||||||||||||
| 31,803,325 | |||||||||||||||
| Credit Card Asset-Backed Securities: 0.9% | |||||||||||||||
| 560,000 | Bank One Issuance Trust, 4.540%, due 09/15/10 | 572,513 | |||||||||||||
| 530,000 | Capital One Master Trust, 4.900%, due 03/15/10 | 553,630 | |||||||||||||
| 800,000 | Citibank Credit Card Issuance Trust, 3.100%, due 03/10/10 | 791,707 | |||||||||||||
| 2,285,000 | Citibank Credit Card Issuance Trust, 5.650%, due 06/16/08 | 2,392,890 | |||||||||||||
| 1,020,000 | Fleet Credit Card Master Trust II, 2.400%, due 07/15/08 | 1,017,762 | |||||||||||||
| 5,328,502 | |||||||||||||||
| Home Equity Asset-Backed Securities: 3.3% | |||||||||||||||
| 1,199,716 | Argent Securities, Inc., 2.160%, due 03/25/34 | 1,200,126 | |||||||||||||
| 873,877 | Asset Backed Funding Certificates, 2.120%, due 11/25/33 | 874,231 | |||||||||||||
| 742,575 | XX | Bayview Financial Acquisition Trust, 2.340%, due 12/28/34 | 743,652 | ||||||||||||
| 1,146,878 | Centex Home Equity, 2.120%, due 01/25/34 | 1,148,672 | |||||||||||||
| Principal Amount | Value | ||||||||||||||
| $ | 4,851,000 | XX | GSAA Trust, 5.242%, due 05/25/35 | $ | 4,811,602 | ||||||||||
| 543,316 | Merrill Lynch Mortgage Investors, Inc., 2.200%, due 07/25/34 | 544,489 | |||||||||||||
| 716,773 | New Century Home Equity Loan Trust, 1.890%, due 06/20/31 | 717,588 | |||||||||||||
| 570,551 | New Century Home Equity Loan Trust, 1.895%, due 07/25/30 | 571,351 | |||||||||||||
| 3,795,785 | New Century Home Equity Loan Trust, 2.090%, due 04/25/34 | 3,798,156 | |||||||||||||
| 183,169 | Residential Asset Mortgage Products, Inc., 2.150%, due 06/25/33 | 182,937 | |||||||||||||
| 456,597 | Residential Asset Securities Corp., 1.845%, due 09/25/31 | 457,329 | |||||||||||||
| 740,585 | Residential Asset Securities Corp., 1.915%, due 06/25/32 | 742,634 | |||||||||||||
| 731,351 | Residential Asset Securities Corp., 2.150%, due 12/25/33 | 733,058 | |||||||||||||
| 762,000 | Residential Funding Mortgage Securities II, 3.450%, due 01/25/16 | 764,956 | |||||||||||||
| 2,300,000 | Saxon Asset Securities Trust, 3.960%, due 06/25/33 | 2,322,770 | |||||||||||||
| 19,613,551 | |||||||||||||||
| Other Asset-Backed Securities: 0.4% | |||||||||||||||
| 686,795 | Ameriquest Mortgage Securities, Inc., 2.140%, due 02/25/34 | 687,224 | |||||||||||||
| 182,605 | XX | Amortizing Residential Collateral Trust, 2.090%, due 05/25/32 | 182,491 | ||||||||||||
| 250,000 | Chase Funding Mortgage Loan Asset-Backed Certificates, 2.140%, due 07/25/33 | 250,289 | |||||||||||||
| 25,000 | Chase Funding Mortgage Loan Asset-Backed Certificates, 2.734%, due 09/25/24 | 24,919 | |||||||||||||
| 15,000 | Chase Funding Mortgage Loan Asset-Backed Certificates, 4.045%, due 05/25/33 | 15,183 | |||||||||||||
| 939,816 | Equity One ABS, Inc., 2.976%, due 09/25/33 | 940,606 | |||||||||||||
| 355,000 | Residential Asset Mortgage Products, Inc., 2.140%, due 02/25/30 | 353,196 | |||||||||||||
| 2,453,908 | |||||||||||||||
| Total Asset-Backed Securities (Cost $65,993,140) | 65,989,042 | ||||||||||||||
See Accompanying Notes to Financial Statements
31
PORTFOLIO OF INVESTMENTS
ING INTERMEDIATE BOND FUND as of September 30, 2004 (Unaudited) (continued)
| Principal Amount | Value | ||||||||||||||
| COLLATERALIZED MORTGAGE OBLIGATIONS: 20.1% | |||||||||||||||
| Agency Collateral CMO: 0.2% | |||||||||||||||
| $ | 1,208,759 | Vendee Mortgage Trust, 5.845%, due 09/15/23 | $ | 1,223,511 | |||||||||||
| 1,223,511 | |||||||||||||||
| Whole Loan Collateral PAC: 1.7% | |||||||||||||||
| 197,013 | Countrywide Alternative Loan Trust, 2.015%, due 02/25/33 | 197,117 | |||||||||||||
| 699,724 | GSR Mortgage Loan Trust, 2.240%, due 10/25/32 | 699,993 | |||||||||||||
| 1,122,850 | MASTR Alternative Loans Trust, 2.240%, due 11/25/33 | 1,123,031 | |||||||||||||
| 2,017,696 | MASTR Alternative Loans Trust, 8.500%, due 05/25/33 | 2,061,876 | |||||||||||||
| 1,032,253 | Residential Funding Mtg Sec I, 2.015%, due 11/25/17 | 1,029,065 | |||||||||||||
| 2,950,000 | Residential Funding Securities Corp., 4.750%, due 02/25/33 | 2,964,466 | |||||||||||||
| 823,577 | Residential Funding Securities Corp., 8.500%, due 05/25/33 | 901,880 | |||||||||||||
| 971,338 | Washington Mutual, 2.240%, due 03/25/34 | 971,945 | |||||||||||||
| 9,949,373 | |||||||||||||||
| Whole Loan Collateralized Mortgage Obligations: 18.0% | |||||||||||||||
| 678,532 | ABN Amro Mortgage Corp., 2.115%, due 03/25/18 | 679,959 | |||||||||||||
| 4,235,413 | Banc of America Funding Corp., 5.750%, due 09/20/34 | 4,382,880 | |||||||||||||
| 2,012,715 | Bank of America Alternative Loan Trust, 2.290%, due 12/25/33 | 2,015,978 | |||||||||||||
| 1,638,261 | Bank of America Alternative Loan Trust, 5.500%, due 02/25/33 | 1,678,558 | |||||||||||||
| 677,498 | Bank of America Mortgage Securities, 2.290%, due 12/25/33 | 678,461 | |||||||||||||
| 2,318,796 | Bank of America Mortgage Securities, 5.000%, due 06/25/33 | 2,337,275 | |||||||||||||
| 2,313,159 | Bank of America Mortgage Securities, 5.000%, due 12/25/18 | 2,365,028 | |||||||||||||
| 3,156,431 | Bear Stearns Alt-A Trust, 2.160%, due 07/25/34 | 3,155,532 | |||||||||||||
| 2,000,740 | Bear Stearns Asset Backed Securities, Inc., 5.625%, due 11/25/32 | 2,004,380 | |||||||||||||
| 533,626 | Citicorp Mortgage Securities, Inc., 2.065%, due 03/25/33 | 534,364 | |||||||||||||
| 554,854 | Citicorp Mortgage Securities, Inc., 2.340%, due 10/25/33 | 549,524 | |||||||||||||
| 25,064 | Citicorp Mortgage Securities, Inc., 6.250%, due 11/25/16 | 25,050 | |||||||||||||
| 2,131,580 | Countrywide Alternative Loan Trust, 2.165%, due 04/25/33 | 2,136,038 | |||||||||||||
| 325,428 | Countrywide Alternative Loan Trust, 2.240%, due 07/25/18 | 325,631 | |||||||||||||
| 2,272,915 | Countrywide Alternative Loan Trust, 5.000%, due 10/25/18 | 2,298,750 | |||||||||||||
| Principal Amount | Value | ||||||||||||||
| $ | 1,166,155 | Countrywide Alternative Loan Trust, 5.000%, due 08/25/19 | $ | 1,188,273 | |||||||||||
| 4,374,699 | Countrywide Home Loan Mortgage Pass Through Trust, 2.015%, due 08/25/18 | 4,353,095 | |||||||||||||
| 943,124 | Countrywide Home Loan Mortgage Pass Through Trust, 2.115%, due 04/25/18 | 945,924 | |||||||||||||
| 2,356,097 | Countrywide Home Loan Mortgage Pass Through Trust, 5.000%, due 11/25/18 | 2,365,549 | |||||||||||||
| 2,111,000 | XX | Countrywide Home Loan Mortgage Pass Through Trust, 6.000%, due 10/25/34 | 2,183,566 | ||||||||||||
| 5,150,000 | Credit Suisse First Boston Mortgage Securities Corp., 4.170%, due 10/25/33 | 5,072,668 | |||||||||||||
| 2,103,434 | First Horizon Alternative Mortgage Securities, 4.870%, due 06/25/34 | 2,128,505 | |||||||||||||
| 588,439 | First Horizon Alternative Mortgage Securities, 5.375%, due 09/25/34 | 602,627 | |||||||||||||
| 2,819,622 | GMAC Mortgage Corp Loan Trust, 5.250%, due 04/25/34 | 2,875,030 | |||||||||||||
| 3,982,000 | GMAC Mortgage Corp Loan Trust, 5.500%, due 01/25/34 | 4,123,840 | |||||||||||||
| 579,000 | GSR Mortgage Loan Trust, 4.500%, due 08/25/19 | 587,854 | |||||||||||||
| 2,816,147 | GSR Mortgage Loan Trust, 6.500%, due 01/25/34 | 2,921,479 | |||||||||||||
| 2,088,140 | Homebanc Mortgage Trust, 2.270%, due 08/25/29 | 2,092,665 | |||||||||||||
| 2,317,000 | MASTR Alternative Loans Trust, 5.750%, due 09/25/34 | 2,415,111 | |||||||||||||
| 4,081,820 | MASTR Alternative Loans Trust, 6.000%, due 09/25/34 | 4,240,191 | |||||||||||||
| 999,745 | MASTR Alternative Loans Trust, 6.500%, due 05/25/33 | 1,015,695 | |||||||||||||
| 457,075 | MASTR Asset Securitization Trust, 2.290%, due 11/25/33 | 454,428 | |||||||||||||
| 2,100,000 | MASTR Asset Securitization Trust, 5.500%, due 09/25/34 | 2,114,764 | |||||||||||||
| 750,977 | MASTR Asset Securitization Trust, 8.000%, due 06/25/33 | 794,084 | |||||||||||||
| 3,620,552 | MLCC Mortgage Investors, Inc., 1.935%, due 10/25/28 | 3,622,814 | |||||||||||||
| 2,761,165 | MLCC Mortgage Investors, Inc., 2.200%, due 04/25/29 | 2,768,074 | |||||||||||||
| 2,390,554 | Prime Mortgage Trust, 2.240%, due 02/25/34 | 2,391,150 | |||||||||||||
| 676,525 | Residential Accredit Loans, Inc., 2.290%, due 03/25/18 | 678,160 | |||||||||||||
| 267,564 | Residential Accredit Loans, Inc., 7.750%, due 05/25/27 | 267,347 | |||||||||||||
| 2,109,000 | XX | Residential Asset Securitization Trust, 5.500%, due 11/25/34 | 2,127,454 | ||||||||||||
| 6,697,238 | Residential Funding Mtg Sec I, 2.065%, due 11/25/18 | 6,696,407 | |||||||||||||
| 3,061,000 | XX | Residential Funding Mtg Sec I, 5.750%, due 09/25/34 | 3,142,787 | ||||||||||||
| 831,492 | Sequoia Mortgage Trust, 2.121%, due 11/20/33 | 832,525 | |||||||||||||
See Accompanying Notes to Financial Statements
32
PORTFOLIO OF INVESTMENTS
ING INTERMEDIATE BOND FUND as of September 30, 2004 (Unaudited) (continued)
| Principal Amount | Value | ||||||||||||||
| Whole Loan Collateralized Mortgage Obligations (continued) | |||||||||||||||
| $ | 3,300,000 | Structured Asset Securities Corp., 6.000%, due 03/25/34 | $ | 3,412,596 | |||||||||||
| 1,758,859 | Thornburg Mortgage Securities Trust, 2.190%, due 12/25/33 | 1,758,749 | |||||||||||||
| 4,760,161 | Washington Mutual, 5.000%, due 06/25/18 | 4,864,996 | |||||||||||||
| 3,079,350 | Washington Mutual, 6.000%, due 06/25/34 | 3,162,272 | |||||||||||||
| 1,456,092 | Washington Mutual MSC Mortgage Pass-Through CTFS, 2.115%, due 01/25/18 | 1,457,399 | |||||||||||||
| 1,158,746 | Washington Mutual MSC Mortgage Pass-Through CTFS, 2.215%, due 03/25/33 | 1,161,251 | |||||||||||||
| 764,498 | Wells Fargo Mortgage Backed Securities Trust, 2.340%, due 02/25/34 | 763,507 | |||||||||||||
| 2,160,000 | Wells Fargo Mortgage Backed Securities Trust, 4.500%, due 08/25/18 | 2,093,534 | |||||||||||||
| 108,843,778 | |||||||||||||||
| Whole Loan Collateralized Support CMO: 0.2% | |||||||||||||||
| 1,153,023 | Bank of America Mortgage Securities, 5.500%, due 11/25/33 | 1,162,201 | |||||||||||||
| 1,162,201 | |||||||||||||||
| Total Collateralized Mortgage Obligations (Cost $120,973,852) | 121,178,863 | ||||||||||||||
| OTHER BONDS: 1.1% | |||||||||||||||
| Sovereign: 1.1% | |||||||||||||||
| 442,000 | @@ | Brazilian Government Intl. Bond, 12.250%, due 03/06/30 | 548,080 | ||||||||||||
| 722,000 | @@ | Colombia Government Intl. Bond, 10.000%, due 01/23/12 | 803,586 | ||||||||||||
| 1,004,000 | @@ | Dominican Republic Intl. Bond, 9.040%, due 01/23/13 | 793,160 | ||||||||||||
| 498,000 | @@ | Ecuador Government Intl. Bond, 8.000%, due 08/15/30 | 405,248 | ||||||||||||
| 488,471 | @@ | Federal Republic of Brazil, 2.125%, due 04/15/12 | 455,589 | ||||||||||||
| 1,340,000 | @@,L | Russia Government Intl. Bond, 5.000%, due 03/31/30 | 1,292,295 | ||||||||||||
| 586,000 | @@,L | Turkey Government Intl. Bond, 12.375%, due 06/15/09 | 732,500 | ||||||||||||
| 458,000 | @@ | Ukraine Government Intl. Bond, 5.330%, due 08/05/09 | 465,853 | ||||||||||||
| 462,000 | @@,# | Ukraine Government Intl. Bond, 7.650%, due 06/11/13 | 464,310 | ||||||||||||
| 840,678 | @@,XX | Uruguay Government Intl. Bond, 10.500%, due 10/20/06 | 946,839 | ||||||||||||
| Total Other Bonds (Cost $6,551,997) | 6,907,460 | ||||||||||||||
| Shares | Value | ||||||||||||||
| PREFERRED STOCK: 0.5% | |||||||||||||||
| Banks: 0.5% | |||||||||||||||
| 254 | #,XX | DG Funding Trust | $ | 2,743,200 | # | ||||||||||
| Total Preferred Stock (Cost $2,761,612) | 2,743,200 | ||||||||||||||
| WARRANT: 0.0% | |||||||||||||||
| 20 | American Tower Corp. | 3,770 | |||||||||||||
| Total Warrant (Cost $1,502) | 3,770 | ||||||||||||||
| Total Long-Term Investments (Cost $645,698,895) | 648,414,533 | ||||||||||||||
| Principal Amount | Value | ||||||||||||||||||
| SHORT-TERM INVESTMENTS: 17.4% | |||||||||||||||||||
| Securities Lending CollateralCC: 12.2% | |||||||||||||||||||
| $ | 73,409,156 | The Bank of New York Institutional Cash Reserves Fund | 73,409,156 | ||||||||||||||||
| Total Securities Lending Collateral (Cost $73,409,156) | | 73,409,156 | |||||||||||||||||
| Repurchase Agreement: 5.2% | |||||||||||||||||||
| 31,211,000 | S | Goldman Sachs Repurchase Agreement dated 09/30/04, 1.860%, due 10/01/04 $31,212,613 to be received upon repurchase (Collateralized by $30,899,000 U.S. Treasury Note, 7.500%, Market value plus accrued interest $31,835,703, due 02/15/05) | | 31,211,000 | |||||||||||||||
| Total Repurchase Agreement (Cost $31,211,000) | 31,211,000 | ||||||||||||||||||
| Total Short-Term Investments (Cost $104,620,156) | 104,620,156 | ||||||||||||||||||
| Total Investments in Securities (Cost $750,319,051)* | 125.2% | $753,034,689 | |||||||||||||||||
| Other Assets and Liabilities-Net | (25.2 | ) | (151,775,872 | ) | |||||||||||||||
| Net Assets | 100.0 | % | $ | 601,258,817 | |||||||||||||||
See Accompanying Notes to Financial Statements
33
PORTFOLIO OF INVESTMENTS
ING INTERMEDIATE BOND FUND as of September 30, 2004 (Unaudited) (continued)
@ Non-income producing security
@@ Foreign issuer
STRIP Separate Trading of Registered Interest and Principal of Securities
+ Step-up basis bonds. Interest rates shown reflect current and future coupon rates.
# Securities with purchases pursuant to Rule 144A, under the Securities Act of 1933 and may not be resold subject to that rule except to qualified institutional buyers. These securities have been determined to be liquid under the guidelines established by the Funds' Board of Directors/Trustees.
cc Securities purchased with cash collateral for securities loaned.
S Segregated securities for futures, when-issued or delayed delivery securities held at September 30, 2004.
I Illiquid security
L Loaned security, a portion or all of the security is on loan at September 30, 2004.
XX Value of securities obtained from one or more dealers making markets in the securities in accordance with the Fund's valuation procedures.
* Cost for federal income tax purposes is $750,972,821. Net unrealized appreciation consists of:
| Gross Unrealized Appreciation | $ | 5,699,754 | |||||
| Gross Unrealized Depreciation | (3,637,886 | ) | |||||
| Net Unrealized Appreciation | $ | 2,061,868 | |||||
Information concerning open futures contracts for the Intermediate Bond Fund at September 30, 2004 is shown below:
| Short Contracts | No. of Contracts | Notional Market Value | Expiration Date | Unrealized Gain (Loss) | |||||||||||||||
| U.S. 5 Year Treasury Note | 160 | $ | (17,720,000 | ) | 12/20/2004 | $ | 23,919 | ||||||||||||
| Long Contracts | |||||||||||||||||||
| U.S. Long Bond | 115 | 12,905,156 | 12/30/2004 | 100,050 | |||||||||||||||
| $(4,814,844) | $ | 123,969 | |||||||||||||||||
See Accompanying Notes to Financial Statements
34
ING Funds Distributor, LLC offers the funds listed below. Before investing in a fund, shareholders should carefully review the fund's prospectus. Investors may obtain a copy of a prospectus of any ING Fund by calling (800) 992-0180.
Domestic Equity and Income Funds
ING Balanced Fund
ING Convertible Fund
ING Equity and Bond Fund
ING Equity Income Fund
ING Real Estate Fund
Domestic Equity Growth Funds
ING Disciplined LargeCap Fund
ING Growth Fund
ING LargeCap Growth Fund
ING MidCap Opportunities Fund
ING SmallCap Opportunities Fund
ING Small Company Fund
Domestic Equity Index Funds
ING Index Plus LargeCap Fund
ING Index Plus MidCap Fund
ING Index Plus SmallCap Fund
Domestic Equity Value Funds
ING Financial Services Fund
ING LargeCap Value Fund
ING MagnaCap Fund
ING MidCap Value Fund
ING SmallCap Value Fund
ING Value Opportunity Fund
International Equity Funds
ING Emerging Countries Fund
ING Foreign Fund
ING International Fund
ING International Growth Fund
ING International SmallCap Growth Fund
ING International Value Fund
ING Precious Metals Fund
ING Russia Fund
Global Equity Funds
ING Global Equity Dividend Fund
ING Global Real Estate Fund
ING Global Science and Technology Fund
ING Worldwide Growth Fund
Fixed Income Funds
ING GNMA Income Fund
ING Government Fund
ING High Yield Bond Fund
ING Intermediate Bond Fund
ING National Tax Exempt Bond Fund
Strategic Allocation Funds
ING Strategic Allocation Balanced Fund
ING Strategic Allocation Growth Fund
ING Strategic Allocation Income Fund
Loan Participation Fund
ING Senior Income Fund
Money Market Funds*
ING Aeltus Money Market Fund
ING Classic Money Market Fund
ING Lexington Money Market Trust
ING Money Market Fund
* An investment in the Fund is not insured or guaranteed by the Federal Deposit Insurance Corporation or any other government agency. Although the Fund seeks to preserve the value of your investment at $1.00 per share, it is possible to lose money by investing in the Fund.
Investment Manager
ING Investments, LLC
7337 E. Doubletree Ranch Road
Scottsdale, Arizona 85258
Administrator
ING Funds Services, LLC
7337 E. Doubletree Ranch Road
Scottsdale, Arizona 85258
Distributor
ING Funds Distributor, LLC
7337 E. Doubletree Ranch Road
Scottsdale, Arizona 85258
1-800-334-3444
Transfer Agent
DST Systems, Inc.
P.O. Box 419368
Kansas City, Missouri 64141
Custodian
The Bank of New York
100 Colonial Center Parkway, Suite 300
Lake Mary, FL 32746
Legal Counsel
Dechert
1775 I Street, N.W.
Washington, D.C. 20006
Independent Registered Public Accounting Firm
KPMG LLP
99 High Street
Boston, MA 02110
For more complete information, or to obtain a prospectus on any ING fund, please call your Investment Professional or ING Funds Distributor, LLC at (800) 992-0180 or log on to www.ingfunds.com. The prospectus should be read carefully before investing. Consider the fund's investment objectives, risks, charges and expenses carefully before investing. The prospectus contains this information and other information about the fund. Information regarding how the Funds voted proxies related to portfolio securities during the most recent 12-month period ended June 30 is available without charge on the Funds' website at www.ingfunds.com and on the SEC's website at www.sec.gov.

PRSAR-UFFIIQ (0904-112904)
ITEM 2. CODE OF ETHICS.
Not required for semi-annual filing.
ITEM 3. AUDIT COMMITTEE FINANCIAL EXPERT.
Not required for semi-annual filing.
ITEM 4. PRINCIPAL ACCOUNTANT FEES AND SERVICES.
Not required for semi-annual filing.
ITEM 5. AUDIT COMMITTEE OF LISTED REGISTRANTS.
Not required for semi-annual filing.
ITEM 6. SCHEDULE OF INVESTMENTS.
Schedule is included as part of the report to shareholders filed under Item 1 of
this Form.
ITEM 7. DISCLOSURE OF PROXY VOTING POLICIES AND PROCEDURES FOR CLOSED-END MANAGEMENT INVESTMENT COMPANIES.
Not required for semi-annual filing.
ITEM 8. PURCHASES OF EQUITY SECURITIES BY CLOSED-END MANAGEMENT INVESTMENT COMPANY AND AFFILIATED PURCHASERS.
Not applicable.
ITEM 9. SUBMISSION OF MATTERS TO A VOTE OF SECURITY HOLDERS.
The Board has a Nominating Committee for the purpose of considering and presenting to the Board candidates it proposes for nomination to fill Independent Trustee vacancies on the Board. The Committee currently consists of all Independent Trustees of the Board (6 individuals). The Nominating Committee operates pursuant to a Charter approved by the Board. The primary purpose of the Nominating Committee is to consider and present to the Board the candidates it proposes for nomination to fill vacancies on the Board. In evaluating candidates, the Nominating Committee may consider a variety of factors, but it has not at this time set any specific minimum qualifications that must be met. Specific qualifications of candidates for Board membership will be based on the needs of the Board at the time of nomination.
The Nominating Committee is willing to consider nominations received from shareholders and shall assess shareholder nominees in the same manner as it reviews its own nominees. A shareholder nominee for director should be submitted in writing to the Fund’s Secretary. Any such shareholder nomination should include at a minimum the following information as to each individual proposed for nomination as trustee: such individual’s written consent to be named in the proxy statement as a nominee (if nominated) and to serve as a trustee (if elected), and all information relating to such individual that is required to be disclosed in the solicitation of proxies for election of trustees, or is otherwise required, in each case under applicable federal securities laws, rules and regulations.
The Secretary shall submit all nominations received in a timely manner to the Nominating Committee. To be timely, any such submission must be delivered to the Fund’s Secretary not
earlier than the 90th day prior to such meeting and not later than the close of business on the later of the 60th day prior to such meeting or the 10th day following the day on which public announcement of the date of the meeting is first made, by either disclosure in a press release or in a document publicly filed by the Fund with the Securities and Exchange Commission.
ITEM 10. CONTROLS AND PROCEDURES.
(a) Based on our evaluation conducted within 90 days of the filing date, hereof, the design and operation of the registrant’s disclosure controls and procedures are effective to ensure that material information relating to the registrant is made known to the certifying officers by others within the appropriate entities, particularly during the period in which Forms N-CSR are being prepared, and the registrant’s disclosure controls and procedures allow timely preparation and review of the information for the registrant’s Form N-CSR and the officer certifications of such Form N-CSR.
(b) There were no significant changes in the registrant’s internal controls that occurred during the second fiscal quarter of the period covered by this report that has materially affected, or is reasonably likely to materially affect, the registrant’s internal control over financial reporting.
ITEM 11. EXHIBITS.
(a)(1) The Code of Ethics is not required for the semi-annual filing.
(a)(2) A separate certification for each principal executive officer and principal financial officer of the registrant as required by Rule 30a-2 under the Act (17 CFR 270.30a-2) is attached hereto as EX-99.CERT.
(a)(3) Not required for semi-annual filing.
(b) The officer certifications required by Section 906 of the Sarbanes-Oxley Act of 2002 are attached hereto as EX-99.906CERT
SIGNATURES
Pursuant to the requirements of the Securities Exchange Act of 1934 and the Investment Company Act of 1940, the registrant has duly caused this report to be signed on its behalf by the undersigned, thereunto duly authorized.
(Registrant): ING FUNDS TRUST
By | /s/ | James M. Hennessy |
| |
|
| James M. Hennessy | ||
|
| President and Chief Executive Officer | ||
|
| |||
|
| |||
Date: | December 7, 2004 |
| ||
Pursuant to the requirements of the Securities Exchange Act of 1934 and the Investment Company Act of 1940, this report has been signed below by the following persons on behalf of the registrant and in the capacities and on the dates indicated.
By | /s/ | James M. Hennessy |
| |||
|
| James M. Hennessy | ||||
|
| President and Chief Executive Officer | ||||
|
| |||||
Date: | December 7, 2004 |
| ||||
|
| |||||
|
| |||||
By | /s/ | Michael J. Roland |
| |||
|
| Michael J. Roland | ||||
|
| Executive Vice President and Chief Financial Officer | ||||
|
| |||||
|
| |||||
Date: | December 7, 2004 |
| ||||