| | |
OMB APPROVAL |
OMB Number: | | 3235-0570 |
Expires: | | April 30, 2008 |
Estimated average burden |
hours per response: | | 19.4 |
UNITED STATES
SECURITIES AND EXCHANGE COMMISSION
Washington, D.C. 20549
FORM N-CSR
CERTIFIED SHAREHOLDER REPORT OF REGISTERED
MANAGEMENT INVESTMENT COMPANIES
Investment Company Act file number: 811-08895
ING Funds Trust
(Exact name of registrant as specified in charter)
| | |
| 7337 E. Doubletree Ranch Rd., Scottsdale, AZ | | 85258 |
| (Address of principal executive offices) | | (Zip code) |
The Corporation Trust Company, 1209 Orange Street, Wilmington, DE 19801
(Name and address of agent for service)
Registrant’s telephone number, including area code: 1-800-992-0180
Date of fiscal year end: March 31
Date of reporting period: April l, 2007 to September 30, 2007

Funds
Semi-Annual Report
September 30, 2007
Classes A, B, C, I, O, Q and R
Fixed-Income Funds
| n | ING High Yield Bond Fund |
| n | ING Intermediate Bond Fund |
| n | ING National Tax-Exempt Bond Fund |
Money Market Funds
| n | ING Classic Money Market Fund |
| n | ING Institutional Prime Money Market Fund |
| | |
 | | E-Delivery Sign-up – details inside |
This report is submitted for general information to shareholders of the ING Funds. It is not authorized for distribution to prospective shareholders unless accompanied or preceded by a prospectus which includes details regarding the funds’ investment objectives, risks, charges, expenses and other information. This information should be read carefully.

| | | | |
| | | |
| | Go Paperless with E-Delivery! | | |
Sign up now for on-line prospectuses, fund reports, and proxy statements. In less than five minutes, you can help reduce paper mail and lower fund costs. Just go to www.ingfunds.com, click on the E-Delivery icon from the home page, follow the directions and complete the quick 5 Steps to Enroll. You will be notified by e-mail when these communications become available on the internet. Documents that are not available on the internet will continue to be sent by mail. |
PROXY VOTING INFORMATION
A description of the policies and procedures that the Funds use to determine how to vote proxies related to portfolio securities is available: (1) without charge, upon request, by calling Shareholder Services toll-free at (800) 992-0180; (2) on the Funds’ website at www.ingfunds.com; and (3) on the U.S. Securities and Exchange Commission’s (“SEC”) website at www.sec.gov. Information regarding how the Funds voted proxies related to portfolio securities during the most recent 12-month period ended June 30 is available without charge on the Funds’ website at www.ingfunds.com and on the SEC’s website at www.sec.gov.
QUARTERLY PORTFOLIO HOLDINGS
The Funds file their complete schedule of portfolio holdings with the SEC for the first and third quarters of each fiscal year on Form N-Q. The Funds’ Forms N-Q are available on the website at www.sec.gov. The Funds’ Forms N-Q may be reviewed and copied at the SEC’s Public Reference Room in Washington, DC, and information on the operation of the Public Reference Room may be obtained by calling (800) SEC-0330; and is available upon request from the Funds by calling Shareholder Services toll-free at (800) 992-0180.
TABLE OF CONTENTS
PRESIDENT’S LETTER

Dear Shareholder,
It is impossible to discuss the current market climate without acknowledging the recent turmoil brought on by problems in the sub-prime mortgage market. Clearly the excesses in this sector of the market and other segments of collateralized debt have created challenges throughout credit markets worldwide.
Amidst the volatility, we at ING Funds remind our shareholders that the creditworthiness and quality of our funds’ holdings is the ultimate priority to us — whether those holdings are part of our money market funds, fixed income funds or equity funds. No one can say for sure how the recent turbulence will impact investment portfolios over the long-term. Market volatility is part of investing and we believe the best way to manage it is to build a well-balanced, fully-diversified portfolio, which aligns with your goals and risk tolerance.
ING Funds remains committed to developing and offering a diverse array of mutual
funds designed to meet the goals of most investors. We urge you to work with your investment professional to make sure you are invested appropriately. Together, you can select the funds that will help you achieve your financial goals. We thank you for choosing ING Funds and look forward to continuing to serve you.
Sincerely,

Shaun P. Mathews
President
ING Funds
October 19, 2007
The views expressed in the President’s Letter reflect those of the President as of the date of the letter. Any such views are subject to change at any time based upon market or other conditions and ING Funds disclaims any responsibility to update such views. These views may not be relied on as investment advice and because investment decisions for an ING Fund are based on numerous factors, may not be relied on as an indication of investment intent on behalf of any ING Fund. Reference to specific company securities should not be construed as recommendations or investment advice.
For more complete information, or to obtain a prospectus for any ING Fund, please call your Investment Professional or ING Funds Distributor, LLC at (800) 992-0180 or log on to www.ingfunds.com. The prospectus should be read carefully before investing. Consider the fund’s investment objectives, risks, and charges and expenses carefully before investing. The prospectus contains this information and other information about the fund. Check with your Investment Professional to determine which funds are available for sale within their firm. Not all funds are available for sale at all firms.
1
MARKET PERSPECTIVE: SIX MONTHS ENDED SEPTEMBER 30, 2007
As our new fiscal year started, economic news had been dominated for months by the deteriorating housing market. In addition to the worries about rising inventories of unsold homes, declining prices, a negative wealth effect on demand and reduced construction activity there had been alarm in the sub-prime mortgage loan sector, where lax lending standards were sending foreclosure rates and default provisions soaring, and some lenders into bankruptcy. Furthermore, the huge volumes of securities backed by such loans were declining in value, if they could find a bid at all. Much of this exposure was held by hedge funds and structured investment vehicles, which financed their purchases with investors’ money and by issuing lower yielding short term commercial paper, a variant of the “carry trade”. If investors of either type lost confidence, the stricken securities would need to be sold at fire sale prices, unless a line of credit had been guaranteed by another financial institution, which would then effectively assume the risk. In June, investment bank Bear Stearns rescued two of its hedge funds in distress over holdings in mortgage bonds.
Yet even into July 2007, few observers believed that sub-prime mortgage problems might lead to recession, as other economic factors appeared robust.
But from mid-July, a series of shocks sent investors scurrying for cover. Federal Open Market Committee (“FOMC”) Chairman Bernanke himself had to acknowledge on July 18, 2007, the day that another set of woeful housing statistics was released, that the sub-prime mortgage situation had “significantly deteriorated.” Within weeks, a large mortgage lender, Countrywide, was reporting that the sub-prime default crisis had spread to other classes of mortgage loans and the securities derived from them. Worse, by month end American Home Mortgage, a lender not of sub-prime mortgages, but the supposedly safer “Alt-A” and adjustable rate loans, revealed that its creditors had initiated margin calls and that bankruptcy was a possibility. A week later it was fact.
Confirmation that the global asset backed commercial paper market was close to atrophy came on August 9, 2007, from an unlikely source when French bank BNP Paribas announced similar problems with its own U.S. mortgage-backed structured investment vehicles. Banks were by now reluctant to lend to each other because no-one could be sure where the exposure to tainted securities ultimately lay. Central banks responded by pouring billions into the inter-bank system. On August 17, 2007, the Federal Reserve Board cut the
discount rate, the rate at which it will lend to banks, by 50 basis points (0.50%), with the accompanying statement silent on inflation risks. This and some of Chairman Bernanke’s other comments signaled a possible cut in the federal funds rate at the FOMC meeting scheduled for September 18, 2007, prompting some to wonder whether he was responding to economic deterioration or the now slumping stock markets.
The matter became academic on September 7, 2007, when a shockingly weak employment report showed the first decline in non-farm payrolls in four years. The federal funds rate reduction duly arrived on September 18, 2007, by an unexpectedly soothing 50 basis points (0.50%), along with another cut in the discount rate by the same amount. Markets in risk assets breathed a collective sigh of relief, although asset-backed commercial paper did not seem that much easier to sell than it did a few weeks earlier.
For the six-month period ended September 30, 2007, U.S. fixed income markets saw a pronounced steepening of the Treasury yield curve. The scene had been set near the end of March when the FOMC removed its tightening bias while still citing inflation as the predominant concern. The yield on the ten-year Treasury Note rose into the summer and reached a five-year high in June 2007, while the yield on three-month Treasury Bill stayed fairly flat. But as confidence unraveled in late July 2007, Treasuries were preferred to other asset classes and, after a brief lag, short Treasuries to longer dated ones, so yields fell across the board, shorter more than longer. For the six-month period ended September 30, 2007, the yield on the ten-year Treasury Note fell 7 basis points (0.07%) to 4.58%, while the yield on the three-month Bill fell 119 basis points (1.19%) to 3.70%. During this time, the broad Lehman Brothers® Aggregate Bond Index(1) (“LBAB Index”) of investment grade bonds returned 2.31%. Not surprisingly given the risk aversion that took hold, the Lehman Brothers® High Yield Bond Index(2), consisting of corporate high yield bonds, returned just 0.56% for the six-month period ended September 30, 2007: in other words, income barely covered capital losses.
In currencies, the perception that European interest rates would rise relative to those in the U.S., along with the actual U.S. rate cut in September 2007, sent the euro to new highs against the dollar and the pound to its best level in over 25 years. The yen was initially dragged down by the “carry trade”, in which speculators borrow in yen at low interest and buy higher yielding securities
2
MARKET PERSPECTIVE: SIX MONTHS ENDED SEPTEMBER 30, 2007
in other currencies. But, these were unwound in the flight from risk. For the six-month period ended September 30, 2007, the dollar fell 5.9% against the euro, 3.4% against the pound and 2.2% on the yen.
U.S. equities, represented by the Standard & Poor’s 500® Composite Stock Price Index(3) (“S&P 500® Index”) gained 8.4% in the six-month period ended September 30, 2007, almost all of it before May 2007, as corporate earnings stood up well. A near 10% fall between mid-July and mid-August was mostly reclaimed by September 30, 2007.
International markets did not fare as well based on Morgan Stanley Capital International (“MSCI”) local currency indices, as central banks did not reduce local interest rates. During the period, the MSCI Japan® Index(4) lost 1.5% as deflation re-established itself and gross domestic product (“GDP”) contracted. For the six-month period ended September 30, 2007, the MSCI Europe ex UK® Index(5) and the MSCI UK® Index(6) markets rose 4.3% and 7.8%, respectively, as pre-crisis investors were encouraged by improved GDP growth and widespread, large-scale merger and acquisition activity.
(1) The LBAB Index is a widely recognized, unmanaged index of publicly issued investment grade U.S. Government, mortgage-backed, asset-backed and corporate debt securities.
(2) The Lehman Brothers® High Yield Bond Index is an unmanaged index that measures the performance of fixed-income securities generally representative of corporate bonds rated below investment-grade.
(3) The S&P 500® Index is an unmanaged index that measures the performance of securities of approximately 500 of the largest companies in the United States.
(4) The MSCI Japan® Index is a free float-adjusted market capitalization index that is designed to measure developed market equity performance in Japan.
(5) The MSCI Europe ex UK® Index is a free float rising adjusted market capitalization index that is designed to measure developed market equity performance in Europe, excluding the UK.
(6) The MSCI UK® Index is a free float-adjusted market capitalization index that is designed to measure developed market equity performance in the UK.
All indices are unmanaged and investors cannot invest directly in an index.
Past performance does not guarantee future results. The performance quoted represents past performance. Investment return and principal value of an investment will fluctuate, and shares, when redeemed, may be worth more or less than their original cost. The Funds’ performance is subject to change since the period’s end and may be lower or higher than the performance data shown. Please call (800) 992-0180 or log on to www.ingfunds.com to obtain performance data current to the most recent month end.
Market Perspective reflects the views of ING’s Chief Investment Risk Officer only through the end of the period, and is subject to change based on market and other conditions.
3
| | |
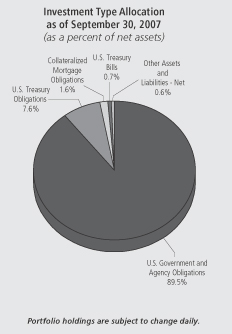
| ING GNMA INCOME FUND | | PORTFOLIO MANAGERS’ REPORT |
ING GNMA Income Fund (the “Fund”) seeks a high level of current income, consistent with liquidity and safety of principal, through investment primarily in Government National Mortgage Association (“GNMA”) mortgage-backed securities (also known as GNMA Certificates) that are guaranteed as to the timely payment of principal and interest by the U.S. government. The Fund is managed by Denis P. Jamison, CFA, Senior Vice President and Senior Portfolio Manager of ING Investment Management Co. — the Sub-Adviser.
Securities issued by the U.S. Treasury are backed by the full faith and credit of the federal government. Securities issued by individual agencies and organizations may be backed by the full faith and credit of the federal government as to principal or interest but are not direct obligations of the U.S. Treasury. Securities of some agencies and organizations are backed solely by the entity’s own resources or by the ability of the entity to borrow from the U.S. Treasury. Government securities also include certain mortgage-related securities that are sponsored by a U.S. government agency or organization and are not direct obligations of the U.S. government.
Performance: For the six months ended September 30, 2007, the Fund’s Class A shares, excluding sales charges, provided a total return of 1.62% compared to the Lehman Brothers® Mortgage-Backed Securities Index(1) (“Lehman MBS Index”), which returned 2.13% for the same period.
Portfolio Specifics: Rising market volatility was the dominant market theme during the six months ended September 30, 2007. The Merrill Lynch Option Volatility Index — the bond market’s equivalent of the
Chicago Board Options Volatility Index (“VIX”) more than doubled from a low of 0.51% in April to a high of 1.25% in August. This was likely triggered by the combination of rising credit spreads and the prospect of defaults in the sub-prime sector of the private mortgage market. While both Government National Mortgage Association (“GNMA”) and government agency-guaranteed mortgages are not subject to these risks, higher price volatility increases uncertainty regarding prepayments and mortgage cash flow. While Lehman Brothers Intermediate U.S. Treasury index rose 3.5% in the half-year ended September 30, the mortgage-backed securities index gained only 2.1%. Since the Federal Reserve Board’s (the “Fed”) rate cut, the Lehman MBS Index has outpaced Treasury market gains.
GNMA mortgages enjoyed slightly better returns than their agency-guaranteed counterparts during the spring and summer. This was especially true during the market sell-off in May and June. This probably reflects the higher coupon, more defensive bias of the GNMA sector. The Fund’s mortgage portfolio is constructed to mirror the characteristics of the GNMA index. At the close of the September quarter, mortgages represented 91.7% of the Fund portfolio.
In April, with 10-year bond yields at about 4.7%, we increased the Fund’s effective maturity against its peers and its benchmark with the purchase of $80 million of 10- and 30-year U.S. Treasury bonds. Subsequently, yields began to rise, peaking at 5.3% in mid-June. Having lost ground versus our peers and fearing a further increase, we sold half of this position. Yields promptly began to tumble, reaching a low of 4.3% in early September. Our original assumption regarding a slowing of the economy turned out to be correct; however, the May run-up in yields tested that conviction and we blinked. We continue to hold about $45 million worth of 10- and 30-year bonds and, as a result, remain slightly longer than our peers and our benchmark.
GNMA mortgages performed slightly better than agency backed securities during the period. The Fund’s 10-year government bond position (4.4%) also contributed to return over the period. Our purchase and subsequent sale of U.S. Treasury securities detracted from return for the period.
Current Strategy and Outlook: Since the cut in the federal funds rate in September, government bond yields have actually increased. This seemingly illogical outcome is not unusual, although we believe the reaction in the most recent episode has been quicker than normal. In our opinion, if the economy continues to slow, more rate cuts will be forthcoming and a bond rally will likely ensue. If, however, the Fed’s recent actions are merely a palliative to financial market problems and the housing weakness does spill over to the broader economy, then bonds and mortgages likely will post lackluster returns. At this juncture, we believe the former outcome is more probable and will maintain a more aggressive maturity stance than our benchmark and peers.
Portfolio holdings and characteristics are subject to change and may not be representative of current holdings and characteristics. The outlook for this Fund may differ from that presented for other ING Funds. Performance for the different classes of shares will vary based on differences in fees associated with each class.
The views expressed in this report reflect those of the portfolio managers only through the end of the period as stated on the cover. The portfolio managers’ views are subject to change at any time based on market and other conditions.
This report contains statements that may be “forward-looking” statements. Actual results may differ materially from those projected in the “forward-looking” statements.
(1) | | The Lehman MBS Index is an unmanaged index composed of fixed-income security mortgage pools sponsored by GNMA, FNMA and FHLMC, including GNMA Graduated Payment Mortgages. |
4
| | |
| PORTFOLIO MANAGERS’ REPORT | | ING HIGH YIELD BOND FUND |
ING High Yield Bond Fund (the “Fund”) seeks to provide investors with a high level of current income and total return. The Fund is managed by Randall Parrish, CFA and Portfolio Manager of ING Investment Management Co. — the Sub-Adviser.
Performance: For the six months ended September 30, 2007, the Fund’s Class A shares, excluding sales charges, provided a total return of 0.89% compared to the Lehman Brothers® High Yield Bond Index(1) and the Lehman Brothers® High Yield Bond — 2% Issuer Constrained Composite Index(2), which returned 0.56% and 1.12%, respectively, for the same period.
Portfolio Specifics: During the second quarter of 2007 — the latter days of which were marked by significant capital markets turmoil — the Fund benefited from its lower credit quality positioning, with an overweight in B-rated bonds, a slight overweight in bonds rated CCCs and a significant underweight in bonds rated BBs. BB-rated bonds were the worst performers, B-rated bonds gained slightly and CCC-rated bonds significantly outper-
Investment Type Allocation
as of September 30, 2007
(as a percent of net assets)
| | |
Corporate Bonds/Notes | | 98.1% |
Mutual Funds | | 2.1% |
Common Stock | | 0.1% |
Repurchase Agreement | | 0.1% |
Other Assets and Liabilities — Net | | (0.4)% |
| | |
Net Assets | | 100.0% |
| | |
Portfolio holdings are subject to change daily.
formed the index. The Fund benefited from an overweight in the wireless sector and underweights in technology and utilities. No industry positions significantly hurt the Fund’s performance in the quarter.
The Fund benefited from gains in a number of bonds, primarily related to actual or announced mergers and acquisitions. Contributors included VWR International, Inc. and Hawaiian Telecom, which added to outperformance when it announced a significant asset sale. The most noteworthy detractor was Advanced Medical Optics, Inc., which announced the recall of an eye-care solution, then made a bid to acquire Bausch & Lomb, Inc.
We entered the third quarter with a cautious short-term view, owing to the continuing volatility in risk assets. As a result, we pared back the risk in the Fund before the worst of the summer sell-off. The Fund remained underweight more Treasury-sensitive BB-rated bonds, which detracted from performance as rates moved sharply lower in July and August. On the other hand, we successfully avoided those market sectors hurt the most in the sell-off. Other than a position in Stanley-Martin Communities, LLC, a small Washington, DC-based homebuilder, the Fund has continued to avoid the homebuilding sector. The only other impactful sector position in the quarter was the avoidance of financial institutions, another sector that fared poorly through the financial market disruptions.
The Fund relied primarily on individual security selection to drive performance in a market that began once again to differentiate good credit from bad, and to require higher compensation for higher risk. Most impactful to performance was our avoidance of large negative returns. Of the 81 issuers that posted a negative return of more than 5% in the quarter, the Fund held meaningful positions in only four. We continue to hold positions in two of these — equipment rental firm Neff Corp. and homebuilder Stanley-Martin Communities, LLC, — where we believe prices have been overly beaten up relative to the companies’ underlying fundamentals and business outlooks.
We sold our position in amusement park operator Six Flags due to increasing concern that if consumer spending weakened it would hurt this highly discretionary business. The Fund benefited from the outperformance of a number of holdings, most notably in healthcare, retailers, and non-cable media. In addition, the Fund profited from positions in a number of bonds that traded higher on news of acquisition or take-out.
Current Strategy and Outlook: We expect slower economic growth over the next two to three quarters, but not severe slowing or recession. Corporate profit growth is clearly slowing, but in our opinion, balance sheets are generally in good shape with debt at manageable levels and ample liquidity. The significant spread widening of the third quarter was not accompanied by an increase in defaults or even a meaningful increase in default expectations.
In our opinion, the highly leveraged buyout financings of the past two years will eventually translate into an increase in defaults, but we believe this turn in the credit cycle is still at least a year or two away. The labor market remains an area of concern, as weakness there, we believe, could hurt consumer income and spending. More bad news from the mortgage market or the financial sector could cause another spike in volatility, though we believe current spreads provide compensation for these risks.
Top Ten Industries
as of September 30, 2007
(as a percent of net assets)
| | |
Diversified Financial Services | | 12.5% |
Media | | 11.8% |
Telecommunications | | 8.8% |
Healthcare-Services | | 6.0% |
Chemicals | | 5.5% |
Commercial Services | | 4.8% |
Oil & Gas | | 4.8% |
Retail | | 4.6% |
Forest Products & Paper | | 4.5% |
Electric | | 4.0% |
Portfolio holdings are subject to change daily.
We have selectively added risk over the past month in names we believe represent good value. The Fund remains underweight in BB-rated bonds and overweight in B-rated bonds, reflecting our view that default risk remains low for the foreseeable future. We remain cautious in cyclicals such as homebuilders and auto suppliers. We continue to focus Fund holdings on industries with strong internal cash generation capabilities, such as non-cable media, the largest sector overweight.
Portfolio holdings and characteristics are subject to change and may not be representative of current holdings and characteristics. The outlook for this Fund may differ from that presented for other ING Funds. Performance for the different classes of shares will vary based on differences in fees associated with each class.
The views expressed in this report reflect those of the portfolio managers only through the end of the period as stated on the cover. The portfolio managers’ views are subject to change at any time based on market and other conditions.
This report contains statements that may be “forward-looking” statements. Actual results may differ materially from those projected in the “forward-looking” statements.
(1) | | The Lehman Brothers® High Yield Bond Index is an unmanaged index that measures the performance of fixed-income securities generally representative of corporate bonds rated below investment grade. |
(2) | | The Lehman Brothers® High Yield Bond — 2% Issuer Constrained Composite Index is an unmanaged index that measures the performance of fixed-income securities. The Composite Index more closely tracks the types of securities in which the Fund invests than the Lehman Brothers® High Yield Bond Index. |
5
| | |
| ING INTERMEDIATE BOND FUND | | PORTFOLIO MANAGERS’ REPORT |
ING Intermediate Bond Fund (the “Fund”) seeks to provide investors with a high level of current income, consistent with the preservation of capital and liquidity. The Fund is managed by James B. Kauffmann, Portfolio Manager of ING Investment Management Co. — the Sub-Adviser.
Performance: For the six months ended September 30, 2007, the Fund’s Class A shares, excluding sales charges, provided a total return of 1.94% compared to Lehman Brothers® Aggregate Bond Index(1) (“LBAB Index”), which returned 2.31% for the same period.
Portfolio Specifics: The dramatic sell-off in risk-based assets during the summer of 2007 was the primary driver of performance for fixed income portfolio managers and sectors of the bond market. The duration of the portfolio varied over the period from neutral to greater than the index. At various points during the period the Fund’s occasional long duration (higher interest-rate risk) stance made a positive contribution. As markets began to anticipate aggressive Federal Reserve Board (“Fed”) easing and the potential for increasing inflation worries, longer-dated Treasuries lagged shorter-dated maturities in the rally. Since the Fund was overweight the shorter maturities, it benefited from the relative outperformance of those U.S. Treasuries. We also added Treasury Inflation-Protected Securities (“TIPS”) positions as a counterweight to a re-inflationary Fed policy. We implemented our current neutral duration stance shortly before the Fed rate cut when we perceived overbought conditions.
The use of credit default swaps and related derivative indices enabled the Fund to mitigate some of the negative effects of this historic market disruption. The Fund’s underweighting in corporate bonds benefited performance. On the other hand, the Fund’s allocation to floating rate notes and bonds issued by financial entities acted as a drag. Bonds purchased right after the volatility spike in early September — mainly issued by industrial companies — outperformed in September.
Investment Type Allocation
as of September 30, 2007
(as a percent of net assets)
| | |
Collateralized Mortgage Obligations | | 32.4% |
U.S. Treasury Obligations | | 24.4% |
Corporate Bonds/Notes | | 20.8% |
U.S. Government and Agency Obligations | | 20.2% |
Asset-Backed Securities | | 3.9% |
Preferred Stock | | 1.3% |
Mutual Fund | | 1.0% |
Municipal Bonds | | 0.5% |
Other Bonds | | 0.3% |
Purchased Options | | 0.1% |
Repurchase Agreement | | 0.1% |
Other Assets and Liabilities — Net* | | (5.0)% |
| | |
Net Assets | | 100.0% |
| | |
| | * | Includes securities lending collateral. |
Portfolio holdings are subject to change daily.
Mortgage market conditions were terrible; in fact, buyers shunned mortgage-backed securities (“MBS”) categorically for much of the period. While the Fund maintained a nearly neutral position in mortgages, most of its underperformance for the period came from MBS exposure. The vast majority of these mortgage holdings are rated AAA, and none is rated below AA. We continue to monitor and assess any developments in the market with regards to these specific holdings.
Current Outlook and Strategy: In our opinion, for most of the summer fear overcame greed, and now the autumn has witnessed a rebound from oversold conditions. Risk-based markets regained some of their lost ground at quarter-end; however, repercussions from the sub-prime lending crisis may be starting to show up in the real economy.
The Fund is now positioned for a yield curve steepening (that is, greater yield differences between shorter-term and longer-term maturities) as we expect the domestic economy to deteriorate further. Although market consensus suggests that the Fed will stop easing around 4.50%, we worry that the central bank may be compelled to go further. Accordingly, we maintain underweightings in financials, construction and other industries afflicted by the residential real estate market. Our outlook for the U.S. dollar remains negative.
Unease in the credit marketplace persists and we are comfortable with our current credit shorts or underweights. If the macro economy slows as we expect, the recent optimism around credit and new deals will abate. Collateralized debt obligations, collateralized loan obligations, structured investment vehicles and other levered entities were enablers of easy credit, allowing excessive availability of debt at low cost to sometimes feckless borrowers. Now that these vehicles are either liquidated or withering away, an entire base of buyers has been eliminated and this development has long-term implications.
The MBS team has maintained its near neutral posture to the sector as a whole. The team prefers hybrid adjustable-rate mortgages (“ARMs”) to 15-year mortgages. ARMs represent approximately 20% of our MBS allocation compared to an index weighting of nearly 9%. We continue to hold some special situation high-yield bonds despite our negative outlook for the sector. We will wait for more generalized price weakness or more compelling relative value before entering the either market in a large way.
Top Ten Industries
as of September 30, 2007
(as a percent of net assets)
| | |
Collateralized Mortgage Obligations | | 32.4% |
U.S. Treasury Notes | | 18.0% |
Federal Home Loan Mortgage Corporation | | 12.4% |
Federal National Mortgage Corporation | | 7.7% |
Diversified Financial Services | | 6.5% |
Banks | | 5.6% |
Treasury Inflation Indexed Protected Securities | | 3.8% |
U.S. Treasury Bonds | | 2.6% |
Other Asset-Backed Securities | | 1.9% |
Home Equity Asset-Backed Securities | | 1.8% |
Portfolio holdings are subject to change daily.
Portfolio holdings and characteristics are subject to change and may not be representative of current holdings and characteristics. The outlook for this Fund may differ from that presented for other ING Funds. Performance for the different classes of shares will vary based on differences in fees associated with each class.
The views expressed in this report reflect those of the portfolio managers only through the end of the period as stated on the cover. The portfolio managers’ views are subject to change at any time based on market and other conditions.
This report contains statements that may be “forward-looking” statements. Actual results may differ materially from those projected in the “forward-looking” statements.
(1) The | | LBAB Index is a widely recognized, unmanaged index of publicly issued investment grade U.S. Government, mortgage-backed, asset-backed and corporate debt securities. |
6
| | |
| PORTFOLIO MANAGERS’ REPORT | | ING NATIONAL TAX-EXEMPT BOND FUND |
ING National Tax-Exempt Bond Fund (the “Fund”) seeks to provide investors with a high level of current income that is exempt from federal income taxes, consistent with the preservation of capital. The Fund is managed by Robert Schonbrunn, Karen Cronk, and Richard Kilbride, Portfolio Managers of ING Investment Management Co. — the Sub-Adviser.
Performance: For the six months ended September 30, 2007, the Fund’s Class A shares, excluding sales charges, provided a total return of (0.22)% compared to the Lehman Brothers Municipal Bond Index(1) and the Lehman Brothers® Aggregate Bond Index(2) (“LBAB Index”), which returned 1.15% and 2.31%, respectively, for the same period.
Portfolio Specifics: The six months ended September 30, 2007 were a period of volatility and change in the municipal bond market. The sub-prime mortgage problem, which came to a head in the summer, was caused by an over-leveraged financial system chasing higher yields and had broad impact across the entire financial world, including municipal bonds. When interest rates were very low in 2003, some aggressive investors used leveraged vehicles to produce higher returns. As the yield curve flattened (short term rates were as high as long term rates), these arbitrageurs substituted municipals, which had a steeper yield curve, for taxable issues.
In a variation of what is known as the “carry trade,” arbitrageurs bought mostly longer-term municipals and borrowed at short-term taxable rates. This trade worked well and arbitrageurs became significant buyers of municipal bonds. The carry trade was a factor in the strong performance of longer term municipals for the two-year period prior to March 2007. At the same time, investors reaching for higher yields also bought lower quality issues, which compressed the “spread” or difference in yield between the highest-quality, AAA-rated issues and lower-quality issues. The sub-prime problem directly affected both of these trends.
As longer term interest rates rose in the second quarter and then fell in July and August, arbitrageurs were squeezed and their carry trades didn’t work. They stopped buying and tried to unwind their positions, selling into a weak bid, which caused an imbalance in long-term municipals. At the same time, investors became worried about potential credit problems, and sold lower-quality issues of all financial assets including municipal bonds.
Both of these developments hurt the Fund. Although rated AA/AA2 overall, the Fund held almost 12% in BBB-rated bonds, which were marked down significantly. In the expectation that interest rates would be declining, the Fund held approximately 30% in longer term issues and had a higher sensitivity to interest rate change than the benchmark. Interest rates declined in the third quarter, but longer term municipals did not benefit as much as comparable taxable issues because of the arbitrage selling pressure. The Fund’s three worst-performing holdings suffered both these conditions — the BBB markdown and the sell-off of long-duration bonds — and incurred losses as a result.
Top Ten Holdings
as of September 30, 2007
(as a percent of net assets)
| | |
Pleasant Valley School District, CA,
5.850%, due 08/01/31 | | 4.3% |
Harris County Health Facilities Development Corp., TX, 5.750%, due 07/01/27 | | 4.2% |
Port Authority of New York & New Jersey,
6.250%, due 12/01/11 | | 3.9% |
Payne County Economic Development Authority, OK, 6.375%, due 06/01/30 | | 3.9% |
New York State Dormitory Authority,
5.500%, due 07/01/15 | | 3.8% |
Oklahoma Industries Authority,
6.000%, due 08/15/19 | | 3.8% |
De Kalb-Ogle Etc. Counties Community College, IL District No. 523, 5.750%, due 02/01/11 | | 3.8% |
Interlocken Metropolitan District, CO,
5.750%, due 12/15/19 | | 3.8% |
Clovis Public Financing Authority, CA,
5.000%, due 08/01/26 | | 3.8% |
Lebanon County Health Facilities Authority, PA,
6.000%, due 11/15/35 | | 3.7% |
Portfolio holdings are subject to change daily.
The roughly 40% of the portfolio invested in issues due within five years performed well during the period. The Fund maintains a favorable yield and coupon advantage to the benchmark, with a yield to maturity of 4.70% versus 4.12% and a coupon of 5.38% compared to 5.00%.
Current Strategy and Outlook: We believe the residential housing market continues to be a drag on the economy and should eventually slow consumer spending. In our opinion, the negative repercussions from the sub-prime crisis should lessen as over-leveraged and serious credit problems are distinguished from areas such as municipals, where the fundamentals are sound. We believe that the wide spreads currently separating BBB credits from AAAs will narrow, allowing us to reevaluate their positions in the portfolio. The portfolio has a higher sensitivity to interest rate movement than the benchmark with the expectation that municipals will perform relatively better than taxable bonds in coming periods.
Portfolio holdings and characteristics are subject to change and may not be representative of current holdings and characteristics. The outlook for this Fund may differ from that presented for other ING Funds. Performance for the different classes of shares will vary based on differences in fees associated with each class.
The views expressed in this report reflect those of the portfolio managers only through the end of the period as stated on the cover. The portfolio managers’ views are subject to change at any time based on market and other conditions.
This report contains statements that may be “forward-looking” statements. Actual results may differ materially from those projected in the “forward-looking” statements.
(1) | The Lehman Brothers Municipal Bond Index is an unmanaged index of approximately 1,100 investment grade tax-exempt bonds classified into four sectors: general obligation, revenue, insured and pre-refunded. |
(2) | The LBAB Index is a widely recognized, unmanaged index of publicly issued investment grade U.S. Government, mortgage-backed, asset-backed and corporate debt securities. |
7
| | |
| ING CLASSIC MONEY MARKET FUND | | PORTFOLIO MANAGERS’ REPORT |
ING Classic Money Market Fund (the “Fund”) seeks to provide investors with a high level of current income, consistent with the preservation of capital and liquidity and the maintenance of a stable $1.00 net asset value per share. The Fund is managed by David S. Yealy, Portfolio Manager of ING Investment Management Co. — the Sub-Adviser.
Portfolio Specifics: The markets for short-term money market securities remained virtually unchanged during April and May. Longer-term money market rates increased in June, despite inflation data that should have given the markets and the Federal Open Market Committee (“FOMC”) some comfort. The latter half of the six-month period was challenging for money market and short-term investors. What started as a sub-prime, hedge fund and collateralized debt obligation (“CDO”) problem widened to affect most mortgage markets, money market securities and even interbank overnight lending. Commercial paper rates and LIBOR skyrocketed as there was a flight to quality as money market investors discounted the worst case scenario for their counterparties. Eventually the liquidity crisis verged on becoming a banking crisis.
In August, the Federal Reserve Board (the “Fed”) sought to calm overnight lending markets by flooding the banking system with cash and lowering the nearly forgotten discount rate 0.50%. The Fed made additional moves in August and early September to increase liquidity and improve investor confidence. When that failed to fully return the markets to normal, the FOMC practiced a little “shock and awe” by surprising most market observers with a 0.50% cut in the fed funds rate and the discount rate. Short-term liquidity and market confidence has improved steadily, albeit slowly, since the Fed took these steps.
During the first half of the period, the Fund took advantage of the swings in yields, buying securities in the six-month to thirteen-month maturity range when yields moved higher. The Fund was well positioned going into the liquidity crisis and we were able to
take advantage of the market dislocation. The Fund had over 40% of its assets in floating-rate securities tied to LIBOR. These securities saw their rates increase as the coupons reset based on the high level of LIBOR rates during this market disruption.
The Fund also maintained a weighted average maturity (“WAM”) in the 40-51 day range during the quarter, ending the quarter at 51 days. This was above the average WAM of our competitors, as measured by iMoneyNet, who were shortening during this period.
Current Strategy and Outlook: We expect liquidity and the overall market for money market securities to improve slowly over the next few weeks and months. Additional moves by the Fed will be determined by the continued market stress on certain assets classes, interbank market liquidity; as well as by economic growth, the job market and inflation. The market is expecting the Fed to ease another 0.25% or more by year-end. We see a risk that the effect from the deteriorating housing market and, to a lesser extent, a slowing in the job market could spill over into the economy and we believe push us toward a recession. This, we believe, is not now fully priced into the market.
Our current strategy is to continue to take advantage of the high LIBOR rates by buying additional floating-rate securities of highly rated issuers and selectively adding duration by buying longer-term fixed rate securities.
While the Fund’s yield will fluctuate with changes in general market rates for the types of assets it holds, we do not expect the recent events with sub-prime and other synthetic structures like CDOs to directly affect the performance of our money market funds.
Principal Risk Factor(s): An investment in the Fund is not insured or guaranteed by the Federal Deposit Insurance Corporation or any other government agency.
Although the Fund seeks to preserve the value of your investment at $1.00 per share, it is possible to lose money by investing in the Fund.
Portfolio holdings and characteristics are subject to change and may not be representative of current holdings and characteristics. The outlook for this Fund may differ from that presented for other ING Funds.
The views expressed in this report reflect those of the portfolio managers only through the end of the period as stated on the cover. The portfolio managers’ views are subject to change at any time based on market and other conditions.
Fund holdings are subject to change daily.
This report contains statements that may be “forward-looking” statements. Actual results may differ materially from those projected in the “forward-looking” statements.
8
| | |
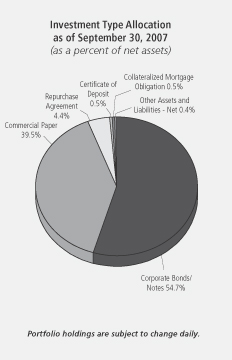
| PORTFOLIO MANAGERS’ REPORT | | ING INSTITUTIONAL PRIME MONEY MARKET FUND |
ING Institutional Prime Money Market Fund (the “Fund”) seeks to provide investors with a high level of current income, consistent with the preservation of capital and liquidity and the maintenance of a stable $1.00 net asset value per share. The Fund is managed by David S. Yealy, Portfolio Manager of ING Investment Management Co. — the Sub-Adviser.
Portfolio Specifics: The markets for short-term money market securities remained virtually unchanged during April and May. Longer-term money market rates increased in June, despite inflation data that should have given the markets and the Federal Open Market Committee (“FOMC”) some comfort. The latter half of the six-month period was challenging for money market and short-term investors. What started as a sub-prime, hedge fund and collateralized debt obligation (“CDO”) problem widened to affect most mortgage markets, money market securities and even interbank overnight lending. Commercial paper rates and LIBOR skyrocketed as there was a flight to quality as money market investors discounted the worst case scenario for their counterparties. Eventually the liquidity crisis verged on becoming a banking crisis.
Investment Type Allocation
as of September 30, 2007
(as a percent of net assets)
| | |
Corporate Bonds/Notes | | 60.6% |
Commercial Paper | | 34.6% |
Repurchase Agreement | | 5.6% |
Certificates of Deposit | | 1.4% |
Collateralized Mortgage Obligation | | 0.3% |
Other Assets and Liabilities — Net | | (2.5)% |
| | |
Net Assets | | 100.0% |
| | |
Portfolio holdings are subject to change daily.
In August, the Federal Reserve Board (the “Fed”) sought to calm overnight lending markets by flooding the banking system with cash and lowering the nearly forgotten discount rate 0.50%. The Fed made additional moves in August and early September to increase liquidity and improve investor confidence. When that failed to fully return the markets to normal, the FOMC practiced a little “shock and awe” by surprising most market observers with a 0.50% cut in the fed funds rate and the discount rate. Short-term liquidity and market confidence has improved steadily, albeit slowly, since the Fed took these steps.
During the first half of the period, the Fund took advantage of the swings in yields, buying securities in the six-month to thirteen-month maturity range when yields moved higher. The Fund was well positioned going into the liquidity crisis and we were able to take advantage of the market dislocation. The Fund had over 40% of its assets in floating-rate securities tied to LIBOR. These securities saw their rates increase as the coupons reset based on the high level of LIBOR rates during this market disruption.
The Fund also maintained a weighted average maturity (“WAM”) in the 36-52 day range during the quarter, ending the quarter at 49 days. This was above the average WAM of our competitors, as measured by iMoneyNet, who were shortening during this period.
Current Strategy and Outlook: We expect liquidity and the overall market for money market securities to improve slowly over the next few weeks and months. Additional moves by the Fed will be determined by the continued market stress on certain assets classes, interbank market liquidity; as well as by economic growth, the job market and inflation. The market is expecting the Fed to ease another 0.25% or more by year-end. We see a risk that the effect from the deteriorating housing market and, to a lesser extent, a slowing in the job market could spill over into the economy and we believe push us toward a recession. This, we believe, is not now fully priced into the market.
Our current strategy is to continue to take advantage of the high LIBOR rates by buying additional floating-rate securities of highly rated issuers and selectively adding duration by buying longer-term fixed rate securities.
While the Fund’s yield will fluctuate with changes in general market rates for the types of assets it holds, we do not expect the recent events with sub-prime and other synthetic structures like CDOs to directly affect the performance of our money market funds.
Principal Risk Factor(s): An investment in the Fund is not insured or guaranteed by the Federal Deposit Insurance Corporation or any other government agency.
Although the Fund seeks to preserve the value of your investment at $1.00 per share, it is possible to lose money by investing in the Fund.
Portfolio holdings and characteristics are subject to change and may not be representative of current holdings and characteristics. The outlook for this Fund may differ from that presented for other ING Funds.
The views expressed in this report reflect those of the portfolio managers only through the end of the period as stated on the cover. The portfolio managers’ views are subject to change at any time based on market and other conditions.
Fund holdings are subject to change daily.
This report contains statements that may be “forward-looking” statements. Actual results may differ materially from those projected in the “forward-looking” statements.
9
SHAREHOLDER EXPENSE EXAMPLES (UNAUDITED)
As a shareholder of a Fund, you incur two types of costs: (1) transaction costs, including sales charges (loads) on purchase payments, redemption fees, and exchange fees; and (2) ongoing costs, including management fees, distribution and/or service (12b-1) fees, and other Fund expenses. These Examples are intended to help you understand your ongoing costs (in dollars) of investing in a Fund and to compare these costs with the ongoing costs of investing in other mutual funds.
The Examples are based on an investment of $1,000 invested at the beginning of the period and held for the entire period from April 1, 2007 to September 30, 2007. The Funds’ expenses are shown without the imposition of any sales charges or fees. Expenses would have been higher if such charges were included.
Actual Expenses
The first section of the table shown, “Actual Fund Return,” provides information about actual account values and actual expenses. You may use the information in this section, together with the amount you invested, to estimate the expenses that you paid over the period. Simply divide your account value by $1,000 (for example, an $8,600 account value divided by $1,000 = 8.6), then multiply the result by the number in the first section under the heading entitled “Expenses Paid During Period” to estimate the expenses you paid on your account during this period.
Hypothetical Example for Comparison Purposes
The second section of the table shown, “Hypothetical 5% Return,” provides information about hypothetical account values and hypothetical expenses based on the Fund’s actual expense ratio and an assumed rate of return of 5% per year before expenses, which is not the Fund’s actual return. The hypothetical account values and expenses may not be used to estimate the actual ending account balance or expenses you paid for the period. You may use this information to compare the ongoing costs of investing in each Fund and other funds. To do so, compare this 5% hypothetical example with the 5% hypothetical examples that appear in the shareholder reports of the other funds.
Please note that the expenses shown in the table are meant to highlight your ongoing costs only and do not reflect any transactional costs, such as sales charges (loads), redemption fees, or exchange fees. Therefore, the hypothetical lines of the table are useful in comparing ongoing costs only, and will not help you determine the relative total costs of owning different funds. In addition, if these transactional costs were included, your costs would have been higher.
| | | | | | | | | | | | | | |
| | | | | | | | | | | | | | |
| | | ING GNMA Income Fund | | Beginning
Account
Value
April 1, 2007 | | Ending
Account
Value
September 30, 2007 | | Annualized
Expense
Ratio | | | Expenses Paid
During the
Period Ended
September 30, 2007* |
| | Actual Fund Return | | | | | | | | | | | | |
| | Class A | | $ | 1,000.00 | | $ | 1,016.20 | | 0.95 | % | | $ | 4.79 |
| | Class B | | | 1,000.00 | | | 1,013.60 | | 1.70 | | | | 8.56 |
| | Class C | | | 1,000.00 | | | 1,013.60 | | 1.70 | | | | 8.56 |
| | Class I | | | 1,000.00 | | | 1,018.70 | | 0.65 | | | | 3.28 |
| | Class Q | | | 1,000.00 | | | 1,016.70 | | 0.90 | | | | 4.54 |
| | Hypothetical (5% return before expenses) | | | | | | | | | | | | |
| | Class A | | $ | 1,000.00 | | $ | 1,020.25 | | 0.95 | % | | $ | 4.80 |
| | Class B | | | 1,000.00 | | | 1,016.50 | | 1.70 | | | | 8.57 |
| | Class C | | | 1,000.00 | | | 1,016.50 | | 1.70 | | | | 8.57 |
| | Class I | | | 1,000.00 | | | 1,021.75 | | 0.65 | | | | 3.29 |
| | Class Q | | | 1,000.00 | | | 1,020.50 | | 0.90 | | | | 4.55 |
| | | | | | | | | | | | | | |
| * | | Expenses are equal to each Fund’s respective annualized expense ratios multiplied by the average account value over the period, multiplied by 183/366 to reflect the most recent fiscal half-year. |
10
SHAREHOLDER EXPENSE EXAMPLES (UNAUDITED) (CONTINUED)
| | | | | | | | | | | | | | |
| | | ING High Yield Bond Fund | | Beginning
Account
Value
April 1, 2007 | | Ending
Account
Value
September 30, 2007 | | Annualized
Expense
Ratio | | | Expenses Paid
During the
Period Ended
September 30, 2007* |
| | Actual Fund Return | | | | | | | | | | | | |
| | Class A | | $ | 1,000.00 | | $ | 1,008.90 | | 1.10 | % | | $ | 5.52 |
| | Class B | | | 1,000.00 | | | 1,005.00 | | 1.85 | | | | 9.27 |
| | Class C | | | 1,000.00 | | | 1,005.00 | | 1.85 | | | | 9.27 |
| | Hypothetical (5% return before expenses) | | | | | | | | | | | | |
| | Class A | | $ | 1,000.00 | | $ | 1,019.50 | | 1.10 | % | | $ | 5.55 |
| | Class B | | | 1,000.00 | | | 1,015.75 | | 1.85 | | | | 9.32 |
| | Class C | | | 1,000.00 | | | 1,015.75 | | 1.85 | | | | 9.32 |
| | ING Intermediate Bond Fund | | | | | | | | | | | | |
| | Actual Fund Return | | | | | | | | | | | | |
| | Class A | | $ | 1,000.00 | | $ | 1,019.40 | | 0.69 | % | | $ | 3.48 |
| | Class B | | | 1,000.00 | | | 1,015.50 | | 1.44 | | | | 7.26 |
| | Class C | | | 1,000.00 | | | 1,015.50 | | 1.44 | | | | 7.26 |
| | Class I | | | 1,000.00 | | | 1,021.10 | | 0.35 | | | | 1.77 |
| | Class O | | | 1,000.00 | | | 1,019.40 | | 0.69 | | | | 3.48 |
| | Class R | | | 1,000.00 | | | 1,018.10 | | 0.94 | | | | 4.74 |
| | Hypothetical (5% return before expenses) | | | | | | | | | | | | |
| | Class A | | $ | 1,000.00 | | $ | 1,021.55 | | 0.69 | % | | $ | 3.49 |
| | Class B | | | 1,000.00 | | | 1,017.80 | | 1.44 | | | | 7.26 |
| | Class C | | | 1,000.00 | | | 1,017.80 | | 1.44 | | | | 7.26 |
| | Class I | | | 1,000.00 | | | 1,023.25 | | 0.35 | | | | 1.77 |
| | Class O | | | 1,000.00 | | | 1,021.55 | | 0.69 | | | | 3.49 |
| | Class R | | | 1,000.00 | | | 1,020.30 | | 0.94 | | | | 4.75 |
| | ING National Tax-Exempt Bond Fund | | | | | | | | | | | | |
| | Actual Fund Return | | | | | | | | | | | | |
| | Class A | | $ | 1,000.00 | | $ | 997.80 | | 0.87 | % | | $ | 4.35 |
| | Class B | | | 1,000.00 | | | 994.00 | | 1.62 | | | | 8.08 |
| | Class C | | | 1,000.00 | | | 994.10 | | 1.62 | | | | 8.08 |
| | Hypothetical (5% return before expenses) | | | | | | | | | | | | |
| | Class A | | $ | 1,000.00 | | $ | 1,020.65 | | 0.87 | % | | $ | 4.39 |
| | Class B | | | 1,000.00 | | | 1,016.90 | | 1.62 | | | | 8.17 |
| | Class C | | | 1,000.00 | | | 1,016.90 | | 1.62 | | | | 8.17 |
| | ING Classic Money Market Fund | | | | | | | | | | | | |
| | Actual Fund Return | | | | | | | | | | | | |
| | Class A | | $ | 1,000.00 | | $ | 1,023.60 | | 0.77 | % | | $ | 3.90 |
| | Class B | | | 1,000.00 | | | 1,020.40 | | 1.37 | | | | 6.92 |
| | Class C | | | 1,000.00 | | | 1,020.40 | | 1.37 | | | | 6.92 |
| | Hypothetical (5% return before expenses) | | | | | | | | | | | | |
| | Class A | | $ | 1,000.00 | | $ | 1,021.15 | | 0.77 | % | | $ | 3.89 |
| | Class B | | | 1,000.00 | | | 1,018.15 | | 1.37 | | | | 6.91 |
| | Class C | | | 1,000.00 | | | 1,018.15 | | 1.37 | | | | 6.91 |
| | ING Institutional Prime Money Market Fund | | | | | | | | | | | | |
| | Actual Fund Return | | $ | 1,000.00 | | $ | 1,026.90 | | 0.10 | % | | $ | 0.51 |
| | Hypothetical (5% return before expenses) | | $ | 1,000.00 | | $ | 1,024.50 | | 0.10 | % | | $ | 0.51 |
| | | | | | | | | | | | | | |
| * | Expenses are equal to each Fund’s respective annualized expense ratios multiplied by the average account value over the period, multiplied by 183/366 to reflect the most recent fiscal half-year. |
11
STATEMENTS OF ASSETS AND LIABILITIESASOF SEPTEMBER 30, 2007 (UNAUDITED)
| | | | | | | | | | | | |
| | | ING
GNMA
Income
Fund | | | ING
High Yield
Bond
Fund | | | ING
Intermediate
Bond
Fund | |
ASSETS: | | | | | | | | | | | | |
Investments in securities at value+* | | $ | 589,537,161 | | | $ | 139,444,789 | | | $ | 1,276,630,039 | |
Investments in affiliates** | | | — | | | | 725,145 | | | | — | |
Short-term investments*** | | | 3,960,552 | | | | — | | | | — | |
Short-term investments at amortized cost | | | — | | | | 150,000 | | | | 312,583,909 | |
Short-term investments in affiliates at amortized cost | | | — | | | | 2,300,000 | | | | 11,600,000 | |
Cash | | | 1,618,253 | | | | — | | | | 10,834,352 | |
Cash collateral for futures | | | — | | | | — | | | | 1,876,229 | |
Foreign currencies at value**** | | | — | | | | — | | | | 185,314 | |
Receivables: | | | | | | | | | | | | |
Investment securities sold | | | 204 | | | | 1,103,383 | | | | 107,769,607 | |
Fund shares sold | | | 766,176 | | | | 136,883 | | | | 3,418,864 | |
Dividends and interest | | | 2,895,531 | | | | 3,304,920 | | | | 9,350,088 | |
Variation margin receivable | | | — | | | | — | | | | 283,048 | |
Unrealized appreciation on forward foreign currency contracts | | | — | | | | — | | | | 184,407 | |
Upfront payments made on swap agreements | | | — | | | | 165,130 | | | | 3,917,919 | |
Unrealized appreciation on swap agreements | | | — | | | | 532,017 | | | | 4,889,254 | |
Prepaid expenses | | | 38,556 | | | | 22,505 | | | | 52,182 | |
Reimbursement due from manager | | | — | | | | 3,307 | | | | 30,198 | |
| | | | | | | | | | | | |
Total assets | | | 598,816,433 | | | | 147,888,079 | | | | 1,743,605,410 | |
| | | | | | | | | | | | |
LIABILITIES: | | | | | | | | | | | | |
Payable for investment securities purchased | | | — | | | | 1,805,626 | | | | 193,643,840 | |
Payable for fund shares redeemed | | | 1,239,458 | | | | 443,513 | | | | 2,481,098 | |
Payable for futures variation margin | | | — | | | | — | | | | 149,881 | |
Payable upon receipt of securities loaned | | | — | | | | — | | | | 311,352,909 | |
Unrealized depreciation on forward currency contracts | | | — | | | | — | | | | 207,847 | |
Upfront payments received on swap agreements | | | — | | | | 180,100 | | | | 1,490,078 | |
Unrealized depreciation on swap agreements | | | — | | | | 72,824 | | | | 3,257,297 | |
Income distribution payable | | | — | | | | 411,381 | | | | 814,265 | |
Payable to affiliates | | | 454,191 | | | | 126,619 | | | | 532,666 | |
Payable to custodian due to bank overdraft | | | — | | | | 2,690,757 | | | | — | |
Payable for trustee fees | | | 558 | | | | 5,694 | | | | 8,852 | |
Other accrued expenses and liabilities | | | 200,683 | | | | 85,172 | | | | 277,459 | |
Options written ***** | | | — | | | | — | | | | 571,425 | |
| | | | | | | | | | | | |
Total liabilities | | | 1,894,890 | | | | 5,821,686 | | | | 514,787,617 | |
| | | | | | | | | | | | |
NET ASSETS | | $ | 596,921,543 | | | $ | 142,066,393 | | | $ | 1,228,817,793 | |
| | | | | | | | | | | | |
NET ASSETS WERE COMPRISED OF: | | | | | | | | | | | | |
Paid-in capital | | $ | 617,635,234 | | | $ | 507,655,014 | | | $ | 1,248,726,525 | |
Undistributed net investment income (distributions in excess of net investment income) | | | 1,198,527 | | | | (49,988 | ) | | | 113,046 | |
Accumulated net realized loss on investments, foreign currency related transactions, futures, swaps, and written options | | | (16,938,173 | ) | | | (365,061,029 | ) | | | (9,439,388 | ) |
Net unrealized depreciation on investments, foreign currency related transactions, futures, swaps, and written options | | | (4,974,045 | ) | | | (477,604 | ) | | | (10,582,390 | ) |
| | | | | | | | | | | | |
NET ASSETS | | $ | 596,921,543 | | | $ | 142,066,393 | | | $ | 1,228,817,793 | |
| | | | | | | | | | | | |
| | | | | | | | | | | | |
+ Including securities loaned at value | | $ | — | | | $ | — | | | $ | 304,166,324 | |
* Cost of investments in securities | | $ | 594,510,402 | | | $ | 140,387,506 | | | $ | 1,289,192,962 | |
** Cost of investments in affiliates | | $ | — | | | $ | 719,225 | | | $ | — | |
*** Cost of short-term investments | | $ | 3,961,356 | | | $ | — | | | $ | — | |
****Cost of foreign currencies | | $ | — | | | $ | — | | | $ | 186,454 | |
*****Premiums received for options written | | $ | — | | | $ | — | | | $ | 316,790 | |
See Accompanying Notes to Financial Statements
12
STATEMENTS OF ASSETS AND LIABILITIESASOF SEPTEMBER 30, 2007 (UNAUDITED) (CONTINUED)
| | | | | | | | | |
| | | ING GNMA
Income Fund | | ING High Yield
Bond Fund | | ING
Intermediate
Bond Fund |
Class A: | | | | | | | | | |
Net assets | | $ | 497,444,649 | | $ | 97,202,321 | | $ | 739,452,339 |
Shares authorized | | | unlimited | | | unlimited | | | unlimited |
Par value | | $ | 0.001 | | $ | 0.001 | | $ | 0.001 |
Shares outstanding | | | 59,930,244 | | | 11,136,658 | | | 72,710,178 |
Net asset value and redemption price per share | | $ | 8.30 | | $ | 8.73 | | $ | 10.17 |
Maximum offering price per share (2.50%)(1) | | $ | 8.51 | | $ | 8.95 | | $ | 10.42 |
Class B: | | | | | | | | | |
Net assets | | $ | 49,478,033 | | $ | 33,159,578 | | $ | 44,411,280 |
Shares authorized | | | unlimited | | | unlimited | | | unlimited |
Par value | | $ | 0.001 | | $ | 0.001 | | $ | 0.001 |
Shares outstanding | | | 5,992,684 | | | 3,802,363 | | | 4,375,072 |
Net asset value and redemption price per share(2) | | $ | 8.26 | | $ | 8.72 | | $ | 10.15 |
Maximum offering price per share | | $ | 8.26 | | $ | 8.72 | | $ | 10.15 |
Class C: | | | | | | | | | |
Net assets | | $ | 34,919,021 | | $ | 11,704,494 | | $ | 76,975,593 |
Shares authorized | | | unlimited | | | unlimited | | | unlimited |
Par value | | $ | 0.001 | | $ | 0.001 | | $ | 0.001 |
Shares outstanding | | | 4,223,646 | | | 1,341,162 | | | 7,578,155 |
Net asset value and redemption price per share(2) | | $ | 8.27 | | $ | 8.73 | | $ | 10.16 |
Maximum offering price per share | | $ | 8.27 | | $ | 8.73 | | $ | 10.16 |
Class I: | | | | | | | | | |
Net assets | | $ | 15,031,644 | | | n/a | | $ | 304,307,008 |
Shares authorized | | | unlimited | | | n/a | | | unlimited |
Par value | | $ | 0.001 | | | n/a | | $ | 0.001 |
Shares outstanding | | | 1,809,187 | | | n/a | | | 29,915,652 |
Net asset value and redemption price per share | | $ | 8.31 | | | n/a | | $ | 10.17 |
Maximum offering price per share | | $ | 8.31 | | | n/a | | $ | 10.17 |
Class O: | | | | | | | | | |
Net assets | | | n/a | | | n/a | | $ | 52,415,771 |
Shares authorized | | | n/a | | | n/a | | | unlimited |
Par value | | | n/a | | | n/a | | $ | 0.001 |
Shares outstanding | | | n/a | | | n/a | | | 5,151,427 |
Net asset value and redemption price per share | | | n/a | | | n/a | | $ | 10.18 |
Maximum offering price per share | | | n/a | | | n/a | | $ | 10.18 |
Class Q: | | | | | | | | | |
Net assets | | $ | 48,196 | | | n/a | | | n/a |
Shares authorized | | | unlimited | | | n/a | | | n/a |
Par value | | $ | 0.001 | | | n/a | | | n/a |
Shares outstanding | | | 5,794 | | | n/a | | | n/a |
Net asset value and redemption price per share | | $ | 8.32 | | | n/a | | | n/a |
Maximum offering price per share | | $ | 8.32 | | | n/a | | | n/a |
Class R: | | | | | | | | | |
Net assets | | | n/a | | | n/a | | $ | 11,255,802 |
Shares authorized | | | n/a | | | n/a | | | unlimited |
Par value | | | n/a | | | n/a | | $ | 0.001 |
Shares outstanding | | | n/a | | | n/a | | | 1,105,045 |
Net asset value and redemption price per share | | | n/a | | | n/a | | $ | 10.19 |
Maximum offering price per share | | | n/a | | | n/a | | $ | 10.19 |
(1) | | Maximum offering price is computed at 100/97.50 of net asset value. On purchases of $100,000 or more, the offering price is reduced. |
(2) | | Redemption price per share may be reduced for any applicable contingent deferred sales charges. |
See Accompanying Notes to Financial Statements
13
STATEMENTS OF ASSETS AND LIABILITIESASOF SEPTEMBER 30, 2007 (UNAUDITED)
| | | | | | | | |
| | | ING
National Tax-
Exempt Bond
Fund | | | ING Classic
Money Market
Fund | |
ASSETS: | | | | | | | | |
Investments in securities at value* | | $ | 27,059,488 | | | $ | — | |
Short-term investments at amortized cost | | | — | | | | 1,096,911,518 | |
Cash | | | 422,719 | | | | 139,255 | |
Receivables: | | | | | | | | |
Fund shares sold | | | 2,755 | | | | 3,080,803 | |
Dividends and interest | | | 370,160 | | | | 4,019,804 | |
Prepaid expenses | | | 16,640 | | | | 252,470 | |
| | | | | | | | |
Total assets | | | 27,871,762 | | | | 1,104,403,850 | |
| | | | | | | | |
LIABILITIES: | | | | | | | | |
Payable for investment securities purchased | | | — | | | | 1,795,382 | |
Payable for fund shares redeemed | | | 186 | | | | 571,116 | |
Income distribution payable | | | 74,790 | | | | 23,160 | |
Payable to affiliates | | | 24,530 | | | | 598,457 | |
Payable for trustee fees | | | 1,546 | | | | 4,455 | |
Other accrued expenses and liabilities | | | 22,118 | | | | 114,558 | |
| | | | | | | | |
Total liabilities | | | 123,170 | | | | 3,107,128 | |
| | | | | | | | |
NET ASSETS | | $ | 27,748,592 | | | $ | 1,101,296,722 | |
| | | | | | | | |
NET ASSETS WERE COMPRISED OF: | | | | | | | | |
Paid-in capital | | $ | 27,784,779 | | | $ | 1,101,425,545 | |
Distributions in excess of net investment income | | | (1,192 | ) | | | (888 | ) |
Accumulated net realized loss on investments | | | (26,980 | ) | | | (127,935 | ) |
Net unrealized depreciation on investments | | | (8,015 | ) | | | — | |
| | | | | | | | |
NET ASSETS | | $ | 27,748,592 | | | $ | 1,101,296,722 | |
| | | | | | | | |
| | | | | | | | |
* Cost of investments in securities | | $ | 27,067,503 | | | $ | — | |
| | |
Class A: | | | | | | | | |
Net assets | | $ | 22,805,512 | | | $ | 1,066,350,429 | |
Shares authorized | | | unlimited | | | | unlimited | |
Par value | | $ | 0.001 | | | $ | 0.001 | |
Shares outstanding | | | 2,263,433 | | | | 1,066,451,318 | |
Net asset value and redemption price per share | | $ | 10.08 | | | $ | 1.00 | |
Maximum offering price per share (2.50%)(1) | | $ | 10.33 | | | $ | 1.00 | |
Class B: | | | | | | | | |
Net assets | | $ | 2,624,962 | | | $ | 22,344,177 | |
Shares authorized | | | unlimited | | | | unlimited | |
Par value | | $ | 0.001 | | | $ | 0.001 | |
Shares outstanding | | | 260,725 | | | | 22,365,719 | |
Net asset value and redemption price per share(2) | | $ | 10.07 | | | $ | 1.00 | |
Maximum offering price per share | | $ | 10.07 | | | $ | 1.00 | |
Class C: | | | | | | | | |
Net assets | | $ | 2,318,118 | | | $ | 12,602,116 | |
Shares authorized | | | unlimited | | | | unlimited | |
Par value | | $ | 0.001 | | | $ | 0.001 | |
Shares outstanding | | | 230,050 | | | | 12,609,110 | |
Net asset value and redemption price per share(2) | | $ | 10.08 | | | $ | 1.00 | |
Maximum offering price per share | | $ | 10.08 | | | $ | 1.00 | |
(1) | | Maximum offering price is computed at 100/97.50 of net asset value. On purchases of $100,000 or more, the offering price is reduced. |
(2) | | Redemption price per share may be reduced for any applicable contingent deferred sales charges. |
See Accompanying Notes to Financial Statements
14
STATEMENT OF ASSETS AND LIABILITIESASOF SEPTEMBER 30, 2007 (UNAUDITED)
| | | |
| | | ING
Institutional Prime
Money Market
Fund |
ASSETS: | | | |
Short-term investments at amortized cost | | $ | 856,010,976 |
Cash | | | 22,998 |
Receivables: | | | |
Fund shares sold | | | 35,495,000 |
Dividends and interest | | | 4,235,761 |
Prepaid expenses | | | 48,311 |
| | | |
Total assets | | | 895,813,046 |
| | | |
LIABILITIES: | | | |
Payable for fund shares redeemed | | | 56,449,000 |
Income distribution payable | | | 3,884,664 |
Payable to affiliates | | | 65,353 |
Other accrued expenses and liabilities | | | 6,336 |
| | | |
Total liabilities | | | 60,405,353 |
| | | |
NET ASSETS | | $ | 835,407,693 |
| | | |
NET ASSETS WERE COMPRISED OF: | | | |
Paid-in capital | | $ | 835,363,400 |
Undistributed net investment income | | | 31,120 |
Accumulated net realized gain on investments | | | 13,173 |
| | | |
NET ASSETS | | $ | 835,407,693 |
| | | |
| |
Net assets | | $ | 835,407,693 |
Shares authorized | | | unlimited |
Par value | | $ | 0.001 |
Shares outstanding | | | 835,392,436 |
Net asset value and redemption price per share | | $ | 1.00 |
See Accompanying Notes to Financial Statements
15
STATEMENTS OF OPERATIONSFORTHE SIX MONTHS ENDED SEPTEMBER 30, 2007 (UNAUDITED)
| | | | | | | | | | | | |
| | | ING GNMA
Income
Fund | | | ING
High Yield
Bond Fund | | | ING
Intermediate
Bond Fund | |
INVESTMENT INCOME: | | | | | | | | | | | | |
Dividends, net of foreign taxes withheld*(1) | | $ | — | | | $ | 53,858 | | | $ | 446,403 | |
Interest(2) | | | 16,983,303 | | | | 6,611,895 | | | | 34,266,953 | |
Securities lending income | | | — | | | | — | | | | 338,024 | |
| | | | | | | | | | | | |
Total investment income | | | 16,983,303 | | | | 6,665,753 | | | | 35,051,380 | |
| | | | | | | | | | | | |
EXPENSES: | | | | | | | | | | | | |
Investment management fees | | | 1,429,658 | | | | 387,686 | | | | 1,012,985 | |
Distribution and service fees: | | | | | | | | | | | | |
Class A | | | 631,175 | | | | 124,900 | | | | 892,228 | |
Class B | | | 267,877 | | | | 189,934 | | | | 232,105 | |
Class C | | | 177,123 | | | | 70,636 | | | | 381,665 | |
Class O | | | — | | | | — | | | | 66,015 | |
Class Q | | | 61 | | | | — | | | | — | |
Class R | | | — | | | | — | | | | 21,268 | |
Transfer agent fees: | | | | | | | | | | | | |
Class A | | | 159,330 | | | | 71,812 | | | | 476,445 | |
Class B | | | 16,905 | | | | 27,420 | | | | 30,986 | |
Class C | | | 11,178 | | | | 10,196 | | | | 50,952 | |
Class I | | | 1,582 | | | | — | | | | 60,243 | |
Class O | | | — | | | | — | | | | 35,252 | |
Class Q | | | 6 | | | | — | | | | — | |
Class R | | | — | | | | — | | | | 5,678 | |
Administrative service fees | | | 304,180 | | | | 76,016 | | | | 595,867 | |
Shareholder reporting expense | | | 58,257 | | | | 25,803 | | | | 118,004 | |
Registration fees | | | 42,565 | | | | 29,069 | | | | 58,700 | |
Professional fees | | | 24,705 | | | | 10,614 | | | | 51,554 | |
Custody and accounting expense | | | 41,025 | | | | 15,063 | | | | 112,728 | |
Trustee fees | | | 10,065 | | | | 915 | | | | 19,808 | |
Miscellaneous expense | | | 14,154 | | | | 8,294 | | | | 37,027 | |
Interest expense | | | — | | | | 1,792 | | | | 344 | |
| | | | | | | | | | | | |
Total expenses | | | 3,189,846 | | | | 1,050,150 | | | | 4,259,854 | |
Net waived and reimbursed fees | | | — | | | | (12,880 | ) | | | (164,136 | ) |
| | | | | | | | | | | | |
Net expenses | | | 3,189,846 | | | | 1,037,270 | | | | 4,095,718 | |
| | | | | | | | | | | | |
Net investment income | | | 13,793,457 | | | | 5,628,483 | | | | 30,955,662 | |
| | | | | | | | | | | | |
REALIZED AND UNREALIZED GAIN (LOSS) ON INVESTMENTS, | | | | | | | | | | | | |
FOREIGN CURRENCY RELATED TRANSACTIONS, FUTURES, WRITTEN OPTIONS, AND SWAPS: | | | | | | | | | | | | |
Net realized gain (loss) on: | | | | | | | | | | | | |
Investments | | | (2,215,766 | ) | | | 871,728 | | | | 1,568,291 | |
Foreign currency related transactions | | | — | | | | — | | | | (184,728 | ) |
Futures, swaps, and written options | | | — | | | | (210,212 | ) | | | 1,389,974 | |
| | | | | | | | | | | | |
Net realized gain (loss) on investments, foreign currency related transactions, futures, swaps, and written options | | | (2,215,766 | ) | | | 661,516 | | | | 2,773,537 | |
| | | | | | | | | | | | |
Net change in unrealized appreciation or depreciation on: | | | | | | | | | | | | |
Investments | | | (2,083,418 | ) | | | (5,712,621 | ) | | | (12,373,309 | ) |
Foreign currency related transactions | | | — | | | | — | | | | 17,881 | |
Futures, swaps, and written options | | | — | | | | 391,705 | | | | 1,634,985 | |
| | | | | | | | | | | | |
Net change in unrealized appreciation or depreciation on investments, foreign currency related transactions, futures, swaps, and written options | | | (2,083,418 | ) | | | (5,320,916 | ) | | | (10,720,443 | ) |
| | | | | | | | | | | | |
Net realized and unrealized loss on investments, foreign currency related transactions, futures, swaps, and written options | | | (4,299,184 | ) | | | (4,659,400 | ) | | | (7,946,906 | ) |
| | | | | | | | | | | | |
Increase in net assets resulting from operations | | $ | 9,494,273 | | | $ | 969,083 | | | $ | 23,008,756 | |
| | | | | | | | | | | | |
| | | | | | | | | | | | |
* Foreign taxes withheld | | $ | — | | | $ | — | | | $ | 761 | |
(1) Dividends at September 30, 2007 include dividends from affiliates of $50,268 for ING High Yield Bond Fund | | | | | | | | | | | | |
(2) Affiliated income | | $ | — | | | $ | 14,542 | | | $ | 1,392,767 | |
See Accompanying Notes to Financial Statements
16
STATEMENTS OF OPERATIONSFORTHE SIX MONTHS ENDED SEPTEMBER 30, 2007 (UNAUDITED)
| | | | | | | | | | | |
| | | ING
National Tax-
Exempt Bond
Fund | | | ING
Classic Money
Market Fund | | | ING
Institutional Prime
Money Market
Fund |
INVESTMENT INCOME: | | | | | | | | | | | |
Interest | | $ | 643,051 | | | $ | 26,887,333 | | | $ | 26,320,020 |
| | | | | | | | | | | |
Total investment income | | | 643,051 | | | | 26,887,333 | | | | 26,320,020 |
| | | | | | | | | | | |
EXPENSES: | | | | | | | | | | | |
Investment management fees | | | 40,653 | | | | 1,233,904 | | | | 387,502 |
Distribution and service fees: | | | | | | | | | | | |
Class A | | | 28,166 | | | | 3,594,493 | | | | — |
Class B | | | 13,101 | | | | 111,507 | | | | — |
Class C | | | 9,745 | | | | 35,293 | | | | — |
Transfer agent fees | | | — | | | | — | | | | 1,098 |
Class A | | | 2,028 | | | | 106,981 | | | | — |
Class B | | | 236 | | | | 2,494 | | | | — |
Class C | | | 175 | | | | 786 | | | | — |
Administrative service fees | | | 13,551 | | | | — | | | | — |
Shareholder reporting expense | | | 1,977 | | | | 94,062 | | | | 6,078 |
Registration fees | | | 24,668 | | | | 282,163 | | | | 29,699 |
Professional fees | | | 2,135 | | | | 33,966 | | | | 13,911 |
Custody and accounting expense | | | 615 | | | | 51,240 | | | | 22,065 |
Trustee fees | | | 549 | | | | 11,895 | | | | 4,773 |
Miscellaneous expense | | | 1,541 | | | | 24,465 | | | | 14,880 |
| | | | | | | | | | | |
Total expenses | | | 139,140 | | | | 5,583,249 | | | | 480,006 |
Net waived and reimbursed fees | | | (4,183 | ) | | | (1,688,775 | ) | | | — |
| | | | | | | | | | | |
Net expenses | | | 134,957 | | | | 3,894,474 | | | | 480,006 |
| | | | | | | | | | | |
Net investment income | | | 508,094 | | | | 22,992,859 | | | | 25,840,014 |
| | | | | | | | | | | |
REALIZED AND UNREALIZED GAIN (LOSS) ON INVESTMENTS: | | | | | | | | | | | |
Net realized gain (loss) on investments | | | (20,164 | ) | | | 3,411 | | | | 11,953 |
Net change in unrealized appreciation or depreciation on investments | | | (548,321 | ) | | | — | | | | — |
| | | | | | | | | | | |
Net realized and unrealized gain (loss) on investments | | | (568,485 | ) | | | 3,411 | | | | 11,953 |
| | | | | | | | | | | |
Increase (decrease) in net assets resulting from operations | | $ | (60,391 | ) | | $ | 22,996,270 | | | $ | 25,851,967 |
| | | | | | | | | | | |
See Accompanying Notes to Financial Statements
17
STATEMENTS OF CHANGES IN NET ASSETS (UNAUDITED)
| | | | | | | | | | | | | | | | |
| | | ING GNMA Income Fund | | | ING High Yield Bond Fund | |
| | | Six Months Ended
September 30,
2007 | | | Year Ended
March 31,
2007 | | | Six Months Ended
September 30,
2007 | | | Year Ended
March 31,
2007 | |
FROM OPERATIONS: | | | | | | | | | | | | | | | | |
Net investment income | | $ | 13,793,457 | | | $ | 27,084,773 | | | $ | 5,628,483 | | | $ | 11,582,825 | |
Net realized gain (loss) on investments and swaps | | | (2,215,766 | ) | | | 2,060,584 | | | | 661,516 | | | | (3,558,821 | ) |
Net change in unrealized appreciation or depreciation on investments and swaps | | | (2,083,418 | ) | | | 4,077,056 | | | | (5,320,916 | ) | | | 8,649,233 | |
| | | | | | | | | | | | | | | | |
Net increase in net assets resulting from operations | | | 9,494,273 | | | | 33,222,413 | | | | 969,083 | | | | 16,673,237 | |
| | | | | | | | | | | | | | | | |
FROM DISTRIBUTIONS TO SHAREHOLDERS: | | | | | | | | | | | | | | | | |
Net investment income: | | | | | | | | | | | | | | | | |
Class A | | | (11,153,388 | ) | | | (24,757,907 | ) | | | (3,810,814 | ) | | | (6,941,636 | ) |
Class B | | | (995,343 | ) | | | (2,891,035 | ) | | | (1,303,087 | ) | | | (3,496,316 | ) |
Class C | | | (651,943 | ) | | | (1,498,660 | ) | | | (485,676 | ) | | | (993,583 | ) |
Class I | | | (334,052 | ) | | | (915,994 | ) | | | — | | | | — | |
Class M(1) | | | — | | | | (5,358 | ) | | | — | | | | — | |
Class Q | | | (1,105 | ) | | | (3,646 | ) | | | — | | | | — | |
| | | | | | | | | | | | | | | | |
Total distributions | | | (13,135,831 | ) | | | (30,072,600 | ) | | | (5,599,577 | ) | | | (11,431,535 | ) |
| | | | | | | | | | | | | | | | |
FROM CAPITAL SHARE TRANSACTIONS: | | | | | | | | | | | | | | | | |
Net proceeds from sale of shares | | | 55,591,427 | | | | 122,343,215 | | | | 11,174,198 | | | | 35,632,305 | |
Dividends reinvested | | | 10,928,908 | | | | 24,814,234 | | | | 2,803,288 | | | | 5,505,836 | |
| | | | | | | | | | | | | | | | |
| | | 66,520,335 | | | | 147,157,449 | | | | 13,977,486 | | | | 41,138,141 | |
Cost of shares redeemed | | | (91,508,667 | ) | | | (161,872,015 | ) | | | (30,522,701 | ) | | | (75,810,714 | ) |
| | | | | | | | | | | | | | | | |
Net decrease in net assets resulting from capital share transactions | | | (24,988,332 | ) | | | (14,714,566 | ) | | | (16,545,215 | ) | | | (34,672,573 | ) |
| | | | | | | | | | | | | | | | |
Net decrease in net assets | | | (28,629,890 | ) | | | (11,564,753 | ) | | | (21,175,709 | ) | | | (29,430,871 | ) |
| | | | | | | | | | | | | | | | |
NET ASSETS: | | | | | | | | | | | | | | | | |
Beginning of period | | | 625,551,433 | | | | 637,116,186 | | | | 163,242,102 | | | | 192,672,973 | |
| | | | | | | | | | | | | | | | |
End of period | | $ | 596,921,543 | | | $ | 625,551,433 | | | $ | 142,066,393 | | | $ | 163,242,102 | |
| | | | | | | | | | | | | | | | |
Undistributed net investment income (distribution in excess of net investment income) at end of period | | $ | 1,198,527 | | | $ | 540,901 | | | $ | (49,988 | ) | | $ | (78,894 | ) |
| | | | | | | | | | | | | | | | |
(1) | | Effective January 2, 2007, Class M shareholders of ING GNMA Income Fund were converted to Class A shares of the Fund |
See Accompanying Notes to Financial Statements
18
STATEMENTS OF CHANGES IN NET ASSETS (UNAUDITED)
| | | | | | | | | | | | | | | | |
| | | ING Intermediate Bond Fund | | | ING National Tax-Exempt Bond Fund | |
| | | Six Months Ended
September 30,
2007 | | | Year Ended
March 31,
2007 | | | Six Months Ended
September 30,
2007 | | | Year Ended
March 31,
2007 | |
FROM OPERATIONS: | | | | | | | | | | | | | | | | |
Net investment income | | $ | 30,955,662 | | | $ | 49,892,208 | | | $ | 508,094 | | | $ | 1,009,715 | |
Net realized gain (loss) on investments, foreign currency related transactions, futures, swaps, and written options | | | 2,773,537 | | | | (4,772,417 | ) | | | (20,164 | ) | | | 199,698 | |
Net change in unrealized appreciation or depreciation on investments, foreign currency related transactions, futures, swaps, and written options | | | (10,720,443 | ) | | | 15,347,013 | | | | (548,321 | ) | | | 12,459 | |
| | | | | | | | | | | | | | | | |
Net increase (decrease) in net assets resulting from operations | | | 23,008,756 | | | | 60,466,804 | | | | (60,391 | ) | | | 1,221,872 | |
| | | | | | | | | | | | | | | | |
FROM DISTRIBUTIONS TO SHAREHOLDERS: | | | | | | | | | | | | | | | | |
Net investment income: | | | | | | | | | | | | | | | | |
Class A | | | (17,939,634 | ) | | | (31,032,270 | ) | | | (436,535 | ) | | | (869,673 | ) |
Class B | | | (991,957 | ) | | | (2,250,414 | ) | | | (40,946 | ) | | | (85,769 | ) |
Class C | | | (1,631,734 | ) | | | (3,109,875 | ) | | | (30,593 | ) | | | (54,285 | ) |
Class I | | | (7,890,986 | ) | | | (10,979,278 | ) | | | — | | | | — | |
Class O | | | (1,327,377 | ) | | | (2,394,701 | ) | | | — | | | | — | |
Class R | | | (202,602 | ) | | | (72,583 | ) | | | — | | | | — | |
Net realized gains: | | | | | | | | | | | | | | | | |
Class A | | | — | | | | — | | | | — | | | | (157,342 | ) |
Class B | | | — | | | | — | | | | — | | | | (19,212 | ) |
Class C | | | — | | | | — | | | | — | | | | (14,604 | ) |
| | | | | | | | | | | | | | | | |
Total distributions | | | (29,984,290 | ) | | | (49,839,121 | ) | | | (508,074 | ) | | | (1,200,885 | ) |
| | | | | | | | | | | | | | | | |
FROM CAPITAL SHARE TRANSACTIONS: | | | | | | | | | | | | | | | | |
Net proceeds from sale of shares | | | 203,952,024 | | | | 432,382,913 | | | | 2,803,626 | | | | 3,218,925 | |
Dividends reinvested | | | 24,192,340 | | | | 40,670,307 | | | | 62,040 | | | | 139,725 | |
| | | | | | | | | | | | | | | | |
| | | 228,144,364 | | | | 473,053,220 | | | | 2,865,666 | | | | 3,358,650 | |
Cost of shares redeemed | | | (147,794,887 | ) | | | (257,792,788 | ) | | | (1,677,170 | ) | | | (3,812,399 | ) |
| | | | | | | | | | | | | | | | |
Net increase (decrease) in net assets resulting from capital share transactions | | | 80,349,477 | | | | 215,260,432 | | | | 1,188,496 | | | | (453,749 | ) |
| | | | | | | | | | | | | | | | |
Net increase (decrease) in net assets | | | 73,373,943 | | | | 225,888,115 | | | | 620,031 | | | | (432,762 | ) |
| | | | | | | | | | | | | | | | |
NET ASSETS: | | | | | | | | | | | | | | | | |
Beginning of period | | | 1,155,443,850 | | | | 929,555,735 | | | | 27,128,561 | | | | 27,561,323 | |
| | | | | | | | | | | | | | | | |
End of period | | $ | 1,228,817,793 | | | $ | 1,155,443,850 | | | $ | 27,748,592 | | | $ | 27,128,561 | |
| | | | | | | | | | | | | | | | |
Undistributed net investment income (distribution in excess of net investment income) at end of period | | $ | 113,046 | | | $ | (858,326 | ) | | $ | (1,192 | ) | | $ | (1,212 | ) |
| | | | | | | | | | | | | | | | |
See Accompanying Notes to Financial Statements
19
STATEMENTS OF CHANGES IN NET ASSETS (UNAUDITED)
| | | | | | | | | | | | | | | | |
| | | ING Classic Money Market Fund | | | ING Institutional Prime Money
Market Fund | |
| | | Six Months
Ended
September 30,
2007 | | | Year Ended
March 31,
2007 | | | Six Months
Ended
September 30,
2007 | | | Year Ended
March 31, 2007 | |
FROM OPERATIONS: | | | | | | | | | | | | | | | | |
Net investment income | | $ | 22,992,859 | | | $ | 36,320,532 | | | $ | 25,840,014 | | | $ | 16,054,720 | |
Net realized gain on investments | | | 3,411 | | | | 59,824 | | | | 11,953 | | | | 9,378 | |
| | | | | | | | | | | | | | | | |
Net increase in net assets resulting from operations | | | 22,996,270 | | | | 36,380,356 | | | | 25,851,967 | | | | 16,064,098 | |
| | | | | | | | | | | | | | | | |
FROM DISTRIBUTIONS TO SHAREHOLDERS: | | | | | | | | | | | | | | | | |
Net investment income | | | — | | | | — | | | | (25,840,014 | ) | | | (16,054,400 | ) |
Class A | | | (22,394,367 | ) | | | (35,149,030 | ) | | | — | | | | — | |
Class B | | | (453,382 | ) | | | (952,278 | ) | | | — | | | | — | |
Class C | | | (144,409 | ) | | | (220,809 | ) | | | — | | | | — | |
| | | | | | | | | | | | | | | | |
Total distributions | | | (22,992,158 | ) | | | (36,322,117 | ) | | | (25,840,014 | ) | | | (16,054,400 | ) |
| | | | | | | | | | | | | | | | |
FROM CAPITAL SHARE TRANSACTIONS: | | | | | | | | | | | | | | | | |
Net proceeds from sale of shares | | | 397,124,690 | | | | 623,159,627 | | | | 6,703,258,494 | | | | 2,451,588,496 | |
Dividends reinvested | | | 22,770,603 | | | | 35,961,113 | | | | 5,475,425 | | | | 5,275,844 | |
| | | | | | | | | | | | | | | | |
| | | 419,895,293 | | | | 659,120,740 | | | | 6,708,733,919 | | | | 2,456,864,340 | |
Cost of shares redeemed | | | (267,903,793 | ) | | | (395,471,731 | ) | | | (6,597,667,988 | ) | | | (1,912,202,768 | ) |
| | | | | | | | | | | | | | | | |
Net increase in net assets resulting from capital share transactions | | | 151,991,500 | | | | 263,649,009 | | | | 111,065,931 | | | | 544,661,572 | |
| | | | | | | | | | | | | | | | |
Net increase in net assets | | | 151,995,612 | | | | 263,707,248 | | | | 111,077,884 | | | | 544,671,270 | |
| | | | | | | | | | | | | | | | |
NET ASSETS: | | | | | | | | | | | | | | | | |
Beginning of period | | | 949,301,110 | | | | 685,593,862 | | | | 724,329,809 | | | | 179,658,539 | |
| | | | | | | | | | | | | | | | |
End of period | | $ | 1,101,296,722 | | | $ | 949,301,110 | | | $ | 835,407,693 | | | $ | 724,329,809 | |
| | | | | | | | | | | | | | | | |
Undistributed net investment income (distribution in excess of net investment income) at end of period | | $ | (888 | ) | | $ | (1,589 | ) | | $ | 31,120 | | | $ | 31,120 | |
| | | | | | | | | | | | | | | | |
See Accompanying Notes to Financial Statements
20
| | |
| ING GNMA INCOME FUND (UNAUDITED) | | FINANCIAL HIGHLIGHTS |
Selected data for a share of beneficial interest outstanding throughout each period.
| | | | | | | | | | | | | | | | | |
| | | | | Six Months
Ended
September 30,
2007 | | | Class A |
| | | | | Year Ended March 31, |
| | | | | 2007 | | 2006 | | | 2005 | | | 2004 | | 2003 |
Per Share Operating Performance: | | | | | | | | | | | | | | | | | |
| Net asset value, beginning of period | | $ | | 8.35 | | | 8.30 | | 8.52 | | | 8.91 | | | 9.00 | | 8.53 |
| Income (loss) from investment operations: | | | | | | | | | | | | | | | | | |
| Net investment income | | $ | | 0.19 | | | 0.37 | | 0.40 | | | 0.37 | | | 0.32 | | 0.42 |
| Net realized and unrealized gain (loss) on investments | | $ | | (0.06 | ) | | 0.09 | | (0.19 | ) | | (0.31 | ) | | 0.02 | | 0.49 |
| Total from investment operations | | $ | | 0.13 | | | 0.46 | | 0.21 | | | 0.06 | | | 0.34 | | 0.91 |
| Lest distributions from: | | | | | | | | | | | | | | | | | |
| Net investment income | | $ | | 0.18 | | | 0.41 | | 0.43 | | | 0.45 | | | 0.43 | | 0.44 |
| Total distributions | | $ | | 0.18 | | | 0.41 | | 0.43 | | | 0.45 | | | 0.43 | | 0.44 |
| Net asset value, end of period | | $ | | 8.30 | | | 8.35 | | 8.30 | | | 8.52 | | | 8.91 | | 9.00 |
Total Return(1) | | % | | 1.62 | | | 5.72 | | 2.50 | | | 0.74 | | | 3.88 | | 10.82 |
Ratios and Supplemental Data: | | | | | | | | | | | | | | | | | |
| Net assets, end of period (000’s) | | $ | | 497,445 | | | 515,469 | | 504,734 | | | 521,688 | | | 592,066 | | 666,433 |
| Ratios to average net assets: | | | | | | | | | | | | | | | | | |
| Gross expenses prior to expense waiver(3) | | % | | 0.95 | | | 0.95 | | 0.99 | | | 0.98 | | | 1.04 | | 1.13 |
| Net expenses after expense waiver(2)(3) | | % | | 0.95 | | | 0.94 | | 0.98 | | | 0.98 | | | 1.04 | | 1.13 |
| Net investment income after expense waiver(2)(3) | | % | | 4.64 | | | 4.49 | | 4.70 | | | 4.27 | | | 3.57 | | 4.78 |
| Portfolio turnover rate | | % | | 16 | | | 99 | | 39 | | | 40 | | | 128 | | 75 |
| | | |
| | | | | Six Months
Ended
September 30,
2007 | | | Class B |
| | | | | Year Ended March 31, |
| | | | | 2007 | | 2006 | | | 2005 | | | 2004 | | 2003 |
Per Share Operating Performance: | | | | | | | | | | | | | | | | | |
| Net asset value, beginning of period | | $ | | 8.30 | | | 8.26 | | 8.48 | | | 8.87 | | | 8.96 | | 8.50 |
| Income (loss) from investment operations: | | | | | | | | | | | | | | | | | |
| Net investment income | | $ | | 0.16 | | | 0.30 | | 0.33 | | | 0.29 | | | 0.25 | | 0.35 |
| Net realized and unrealized gain (loss) on investments | | $ | | (0.05 | ) | | 0.09 | | (0.18 | ) | | (0.29 | ) | | 0.02 | | 0.48 |
| Total from investment operations | | $ | | 0.11 | | | 0.39 | | 0.15 | | | — | | | 0.27 | | 0.83 |
| Lest distributions from: | | | | | | | | | | | | | | | | | |
| Net investment income | | $ | | 0.15 | | | 0.35 | | 0.37 | | | 0.39 | | | 0.36 | | 0.37 |
| Total distributions | | $ | | 0.15 | | | 0.35 | | 0.37 | | | 0.39 | | | 0.36 | | 0.37 |
| Net asset value, end of period | | $ | | 8.26 | | | 8.30 | | 8.26 | | | 8.48 | | | 8.87 | | 8.96 |
Total Return(1) | | % | | 1.36 | | | 4.84 | | 1.75 | | | (0.02 | ) | | 3.12 | | 9.95 |
Ratios and Supplemental Data: | | | | | | | | | | | | | | | | | |
| Net assets, end of period (000’s) | | $ | | 49,478 | | | 58,568 | | 78,823 | | | 99,130 | | | 130,339 | | 150,549 |
| Ratios to average net assets: | | | | | | | | | | | | | | | | | |
| Gross expenses prior to expense waiver(3) | | % | | 1.70 | | | 1.70 | | 1.74 | | | 1.73 | | | 1.79 | | 1.88 |
| Net expenses after expense waiver(2)(3) | | % | | 1.70 | | | 1.69 | | 1.73 | | | 1.73 | | | 1.79 | | 1.88 |
| Net investment income after expense waiver(2)(3) | | % | | 3.88 | | | 3.73 | | 3.95 | | | 3.52 | | | 2.84 | | 3.98 |
| Portfolio turnover rate | | % | | 16 | | | 99 | | 39 | | | 40 | | | 128 | | 75 |
(1) | Total return is calculated assuming reinvestment of all dividends and capital gain distributions as net asset value and excluding the deduction of sales charges. Total return for less than one year is not annualized. |
(2) | The Investment Adviser has agreed to limit expenses (excluding interest, taxes, brokerage and extraordinary expenses) subject to possible recoupment by the Investment Adviser within three years of being incurred. |
(3) | Annualized for periods less than one year. |
See Accompanying Notes to Financial Statements
21
| | |
| ING GNMA INCOME FUND (UNAUDITED) (CONTINUED) | | FINANCIAL HIGHLIGHTS |
Selected data for a share of beneficial interest outstanding throughout each period.
| | | | | | | | | | | | | | | | | |
| | | | | Six Months
Ended
September 30,
2007 | | | Class C |
| | | | | Year Ended March 31, |
| | | | | 2007 | | 2006 | | | 2005 | | | 2004 | | 2003 |
Per Share Operating Performance: | | | | | | | | | | | | | | | | | |
| Net asset value, beginning of period | | $ | | 8.31 | | | 8.27 | | 8.49 | | | 8.88 | | | 8.97 | | 8.51 |
| Income (loss) from investment operations: | | | | | | | | | | | | | | | | | |
| Net investment income | | $ | | 0.16 | | | 0.31 | | 0.33 | | | 0.29 | | | 0.25 | | 0.36 |
| Net realized and unrealized gain (loss) on investments | | $ | | (0.05 | ) | | 0.08 | | (0.18 | ) | | (0.29 | ) | | 0.02 | | 0.47 |
| Total from investment operations | | $ | | 0.11 | | | 0.39 | | 0.15 | | | — | | | 0.27 | | 0.83 |
| Less distributions from: | | | | | | | | | | | | | | | | | |
| Net investment income | | $ | | 0.15 | | | 0.35 | | 0.37 | | | 0.39 | | | 0.36 | | 0.37 |
| Total distributions | | $ | | 0.15 | | | 0.35 | | 0.37 | | | 0.39 | | | 0.36 | | 0.37 |
| Net asset value, end of period | | $ | | 8.27 | | | 8.31 | | 8.27 | | | 8.49 | | | 8.88 | | 8.97 |
Total Return(1) | | % | | 1.36 | | | 4.85 | | 1.74 | | | (0.03 | ) | | 3.11 | | 9.95 |
Ratios and Supplemental Data: | | | | | | | | | | | | | | | | | |
| Net assets, end of period (000’s) | | $ | | 34,919 | | | 37,280 | | 34,997 | | | 43,094 | | | 65,762 | | 87,970 |
| Ratios to average net assets: | | | | | | | | | | | | | | | | | |
| Gross expenses prior to expense waiver(3) | | % | | 1.70 | | | 1.70 | | 1.74 | | | 1.73 | | | 1.79 | | 1.88 |
| Net expenses after expense waiver(2)(3) | | % | | 1.70 | | | 1.69 | | 1.73 | | | 1.73 | | | 1.79 | | 1.88 |
| Net investment income after expense waiver(2)(3) | | % | | 3.89 | | | 3.73 | | 3.95 | | | 3.51 | | | 2.92 | | 3.97 |
| Portfolio turnover rate | | % | | 16 | | | 99 | | 39 | | | 40 | | | 128 | | 75 |
| | | |
| | | | | Six Months
Ended
September 30,
2007 | | | Class I |
| | | | | Year Ended March 31, |
| | | | | 2007 | | 2006 | | | 2005 | | | 2004 | | 2003 |
Per Share Operating Performance: | | | | | | | | | | | | | | | | | |
| Net asset value, beginning of period | | $ | | 8.35 | | | 8.31 | | 8.53 | | | 8.92 | | | 9.01 | | 8.54 |
| Income (loss) from investment operations: | | | | | | | | | | | | | | | | | |
| Net investment income | | $ | | 0.20 | | | 0.40 | | 0.45 | | | 0.41 | | | 0.35 | | 0.44 |
| Net realized and unrealized gain (loss) on investments | | $ | | (0.05 | ) | | 0.08 | | (0.21 | ) | | (0.32 | ) | | 0.01 | | 0.50 |
| Total from investment operations | | $ | | 0.15 | | | 0.48 | | 0.24 | | | 0.09 | | | 0.36 | | 0.94 |
| Less distributions from: | | | | | | | | | | | | | | | | | |
| Net investment income | | $ | | 0.19 | | | 0.44 | | 0.46 | | | 0.48 | | | 0.45 | | 0.47 |
| Total distributions | | $ | | 0.19 | | | 0.44 | | 0.46 | | | 0.48 | | | 0.45 | | 0.47 |
| Net asset value, end of period | | $ | | 8.31 | | | 8.35 | | 8.31 | | | 8.53 | | | 8.92 | | 9.01 |
Total Return(1) | | % | | 1.87 | | | 5.92 | | 2.82 | | | 1.05 | | | 4.21 | | 11.18 |
Ratios and Supplemental Data: | | | | | | | | | | | | | | | | | |
| Net assets, end of period (000’s) | | $ | | 15,032 | | | 14,181 | | 18,287 | | | 10,539 | | | 8,760 | | 6,946 |
| Ratios to average net assets: | | | | | | | | | | | | | | | | | |
| Expenses(2)(3) | | % | | 0.65 | | | 0.65 | | 0.67 | | | 0.68 | | | 0.71 | | 0.78 |
| Net investment income(2)(3) | | % | | 4.93 | | | 4.77 | | 4.96 | | | 4.59 | | | 3.94 | | 5.00 |
| Portfolio turnover rate | | % | | 16 | | | 99 | | 39 | | | 40 | | | 128 | | 75 |
(1) | Total return is calculated assuming reinvestment of all dividends and capital gain distributions at net asset value and excluding the deduction of sales charges. Total return for less than one year is not annualized. |
(2) | The Investment Adviser has agreed to limit expenses (excluding interest, taxes, brokerage and extraordinary expenses) subject to possible recoupment by the Investment Adviser within three years of being incurred. |
(3) | Annualized for periods less than one year. |
See Accompanying Notes to Financial Statements
22
| | |
| ING GNMA INCOME FUND (UNAUDITED) (CONTINUED) | | FINANCIAL HIGHLIGHTS |
Selected data for a share of beneficial interest outstanding throughout each period.
| | | | | | | | | | | | | | | | | |
| | | | | Six Months
Ended
September 30,
2007 | | | Class Q |
| | | | | Year Ended March 31, |
| | | | | 2007 | | 2006 | | | 2005 | | | 2004 | | 2003 |
Per Share Operating Performance: | | | | | | | | | | | | | | | | | |
| Net asset value, beginning of period | | $ | | 8.37 | | | 8.32 | | 8.53 | | | 8.92 | | | 9.01 | | 8.54 |
| Income (loss) from investment operations: | | | | | | | | | | | | | | | | | |
| Net investment income | | $ | | 0.20 | | | 0.36 | | 0.40 | | | 0.39 | | | 0.32 | | 0.44 |
| Net realized and unrealized gain (loss) on investments | | $ | | (0.06 | ) | | 0.11 | | (0.18 | ) | | (0.33 | ) | | 0.02 | | 0.47 |
| Total from investment operations | | $ | | 0.14 | | | 0.47 | | 0.22 | | | 0.06 | | | 0.34 | | 0.91 |
| Less distributions from: | | | | | | | | | | | | | | | | | |
| Net investment income | | $ | | 0.19 | | | 0.42 | | 0.43 | | | 0.45 | | | 0.43 | | 0.44 |
| Total distributions | | $ | | 0.19 | | | 0.42 | | 0.43 | | | 0.45 | | | 0.43 | | 0.44 |
| Net asset value, end of period | | $ | | 8.32 | | | 8.37 | | 8.32 | | | 8.53 | | | 8.92 | | 9.01 |
Total Return(1) | | % | | 1.67 | | | 5.76 | | 2.65 | | | 0.76 | | | 3.94 | | 10.90 |
Ratios and Supplemental Data: | | | | | | | | | | | | | | | | | |
| Net assets, end of period (000’s) | | $ | | 48 | | | 53 | | 82 | | | 103 | | | 134 | | 183 |
| Ratios to average net assets: | | | | | | | | | | | | | | | | | |
| Expenses(2)(3) | | % | | 0.90 | | | 0.90 | | 0.92 | | | 0.93 | | | 0.96 | | 1.04 |
| Net investment income(2)(3) | | % | | 4.67 | | | 4.53 | | 4.77 | | | 4.32 | | | 3.62 | | 4.89 |
| Portfolio turnover rate | | % | | 16 | | | 99 | | 39 | | | 40 | | | 128 | | 75 |
(1) | Total return is calculated assuming reinvestment of all dividends and capital gain distributions as net asset value and excluding the deduction of sales charges. Total return for less than one year is not annualized. |
(2) | The Investment Adviser has agreed to limit expenses (excluding interest, taxes, brokerage and extraordinary expenses) subject to possible recoupment by the Investment Adviser within three years of being incurred. |
(3) | Annualized for periods less than one year. |
See Accompanying Notes to Financial Statements
23
| | |
| ING HIGH YIELD BOND FUND (UNAUDITED) | | FINANCIAL HIGHLIGHTS |
Selected data for a share of beneficial interest outstanding throughout each period.
| | | | | | | | | | | | | | | | | | |
| | | | | Six Months
Ended
September 30,
2007 | | | Class A | |
| | | | | | Year Ended March 31, | |
| | | | | | 2007 | | 2006 | | | 2005 | | | 2004 | | 2003 | |
Per Share Operating Performance: | | | | | | | | | | | | | | | | | | |
| Net asset value, beginning of period | | $ | | 8.99 | | | 8.71 | | 8.75 | | | 8.88 | | | 8.29 | | 8.74 | |
| Income (loss) from investment operations: | | | | | | | | | | | | | | | | | | |
| Net investment income | | $ | | 0.34 | | | 0.61 | | 0.55 | | | 0.54 | | | 0.59 | | 0.61 | |
| Net realized and unrealized gain (loss) on investments | | $ | | (0.26 | ) | | 0.27 | | (0.04 | ) | | (0.13 | ) | | 0.60 | | (0.45 | ) |
| Total from investment operations | | $ | | 0.08 | | | 0.88 | | 0.51 | | | 0.41 | | | 1.19 | | 0.16 | |
| Less distributions from: | | | | | | | | | | | | | | | | | | |
| Net investment income | | $ | | 0.34 | | | 0.60 | | 0.55 | | | 0.54 | | | 0.60 | | 0.61 | |
| Total distributions | | $ | | 0.34 | | | 0.60 | | 0.55 | | | 0.54 | | | 0.60 | | 0.61 | |
| Net asset value, end of period | | $ | | 8.73 | | | 8.99 | | 8.71 | | | 8.75 | | | 8.88 | | 8.29 | |
Total Return(1) | | % | | 0.89 | | | 10.54 | | 6.01 | | | 4.73 | | | 14.70 | | 2.24 | |
Ratios and Supplemental Data: | | | | | | | | | | | | | | | | | | |
| Net assets, end of period (000’s) | | $ | | 97,202 | | | 104,328 | | 99,178 | | | 110,683 | | | 44,009 | | 43,375 | |
| Ratios to average net assets: | | | | | | | | | | | | | | | | | | |
| Gross expenses prior to expense reimbursement/recoupment(3) | | % | | 1.12 | | | 1.11 | | 1.31 | | | 1.33 | | | 1.33 | | 1.43 | |
| Net expenses after expense reimbursement/recoupment(2)(3) | | % | | 1.10 | † | | 1.10 | | 1.18 | | | 1.22 | | | 1.29 | | 1.30 | |
| Net investment income after expense reimbursement/recoupment(2)(3) | | % | | 7.67 | † | | 6.98 | | 6.27 | | | 6.12 | | | 6.81 | | 7.48 | |
| Portfolio turnover rate | | % | | 36 | | | 122 | | 111 | | | 119 | | | 105 | | 122 | |
| | | |
| | | | | Six Months
Ended
September 30,
2007 | | | Class B | |
| | | | | | Year Ended March 31, | |
| | | | | | 2007 | | 2006 | | | 2005 | | | 2004 | | 2003 | |
Per Share Operating Performance: | | | | | | | | | | | | | | | | | | |
| Net asset value, beginning of period | | $ | | 8.98 | | | 8.70 | | 8.74 | | | 8.88 | | | 8.28 | | 8.74 | |
| Income (loss) from investment operations: | | | | | | | | | | | | | | | | | | |
| Net investment income | | $ | | 0.30 | | | 0.53 | | 0.47 | | | 0.48 | | | 0.53 | | 0.55 | |
| Net realized and unrealized gain (loss) on investments | | $ | | (0.26 | ) | | 0.29 | | (0.03 | ) | | (0.15 | ) | | 0.60 | | (0.46 | ) |
| Total from investment operations | | $ | | 0.04 | | | 0.82 | | 0.44 | | | 0.33 | | | 1.13 | | 0.09 | |
| Less distributions from: | | | | | | | | | | | | | | | | | | |
| Net investment income | | $ | | 0.30 | | | 0.54 | | 0.48 | | | 0.47 | | | 0.53 | | 0.55 | |
| Total distributions | | $ | | 0.30 | | | 0.54 | | 0.48 | | | 0.47 | | | 0.53 | | 0.55 | |
| Net asset value, end of period | | $ | | 8.72 | | | 8.98 | | 8.70 | | | 8.74 | | | 8.88 | | 8.28 | |
Total Return(1) | | % | | 0.50 | | | 9.72 | | 5.22 | | | 3.83 | | | 14.01 | | 1.37 | |
Ratios and Supplemental Data: | | | | | | | | | | | | | | | | | | |
| Net assets, end of period (000’s) | | $ | | 33,160 | | | 43,427 | | 75,940 | | | 125,603 | | | 18,753 | | 11,584 | |
| Ratios to average net assets: | | | | | | | | | | | | | | | | | | |
| Gross expenses prior to expense reimbursement/recoupment(3) | | % | | 1.87 | | | 1.86 | | 1.98 | | | 1.98 | | | 1.98 | | 2.07 | |
| Net expenses after expense reimbursement/recoupment(2)(3) | | % | | 1.85 | † | | 1.85 | | 1.94 | | | 1.97 | | | 2.04 | | 2.05 | |
| Net investment income after expense reimbursement/recoupment(2)(3) | | % | | 6.90 | † | | 6.18 | | 5.50 | | | 5.39 | | | 6.04 | | 6.73 | |
| Portfolio turnover rate | | % | | 36 | | | 122 | | 111 | | | 119 | | | 105 | | 122 | |
(1) | Total return is calculated assuming reinvestment of all dividends and capital gain distributions at net asset value and excluding the deduction of sales charges. Total return for less than one year is not annualized. |
(2) | The Investment Adviser has agreed to limit expenses (excluding interest, taxes, brokerage and extraordinary expenses) subject to |
| | possible recoupment by the Investment Adviser within three years of being incurred. |
(3) | Annualized for periods less than one year. |
| † | Impact of waiving the advisory fee for the ING Institutional Prime Money Market Fund holding has less than 0.01% impact on the expense ratio. |
See Accompanying Notes to Financial Statements
24
| | |
| ING HIGH YIELD BOND FUND (UNAUDITED) (CONTINUED) | | FINANCIAL HIGHLIGHTS |
Selected data for a share of beneficial interest outstanding throughout each period.
| | | | | | | | | | | | | | | | | | |
| | | | | Six Months
Ended
September 30,
2007 | | | Class C | |
| | | | | | Year Ended March 31, | |
| | | | | | 2007 | | 2006 | | | 2005 | | | 2004 | | 2003 | |
Per Share Operating Performance: | | | | | | | | | | | | | | | | | | |
| Net asset value, beginning of period | | $ | | 8.99 | | | 8.71 | | 8.75 | | | 8.88 | | | 8.28 | | 8.74 | |
| Income (loss) from investment operations: | | | | | | | | | | | | | | | | | | |
| Net investment income | | $ | | 0.30 | | | 0.54 | | 0.48 | | | 0.48 | | | 0.53 | | 0.56 | |
| Net realized and unrealized gain (loss) on investments | | $ | | (0.26 | ) | | 0.28 | | (0.03 | ) | | (0.13 | ) | | 0.60 | | (0.46 | ) |
| Total from investment operations | | $ | | 0.04 | | | 0.82 | | 0.45 | | | 0.35 | | | 1.13 | | 0.10 | |
| Less distributions from: | | | | | | | | | | | | | | | | | | |
| Net investment income | | $ | | 0.30 | | | 0.54 | | 0.49 | | | 0.48 | | | 0.53 | | 0.56 | |
| Total distributions | | $ | | 0.30 | | | 0.54 | | 0.49 | | | 0.48 | | | 0.53 | | 0.56 | |
| Net asset value, end of period | | $ | | 8.73 | | | 8.99 | | 8.71 | | | 8.75 | | | 8.88 | | 8.28 | |
Total Return(1) | | % | | 0.50 | | | 9.70 | | 5.22 | | | 3.96 | | | 14.03 | | 1.43 | |
Ratios and Supplemental Data: | | | | | | | | | | | | | | | | | | |
| Net assets, end of period (000’s) | | $ | | 11,704 | | | 15,487 | | 17,555 | | | 26,330 | | | 10,780 | | 5,281 | |
| Ratios to average net assets: | | | | | | | | | | | | | | | | | | |
| Gross expenses prior to expense reimbursement/recoupment(3) | | % | | 1.87 | | | 1.86 | | 1.98 | | | 1.98 | | | 1.98 | | 2.06 | |
| Net expenses after expense reimbursement/recoupment(2)(3) | | % | | 1.85 | † | | 1.85 | | 1.94 | | | 1.97 | | | 2.04 | | 2.04 | |
| Net investment income after expense reimbursement/recoupment(2)(3) | | % | | 6.91 | † | | 6.21 | | 5.51 | | | 5.37 | | | 6.04 | | 6.72 | |
| Portfolio turnover rate | | % | | 36 | | | 122 | | 111 | | | 119 | | | 105 | | 122 | |
(1) | Total return is calculated assuming reinvestment of all dividends and capital gain distributions at net asset value and excluding the deduction of sales charges. Total return for less than one year is not annualized. |
(2) | The Investment Adviser has agreed to limit expenses (excluding interest, taxes, brokerage and extraordinary expenses) subject to |
| | possible recoupment by the Investment Adviser within three years of being incurred. |
(3) | Annualized for periods less than one year. |
| † | Impact of waiving the advisory fee for the ING Institutional Prime Money Market Fund holding has less than 0.01% impact on the expense ratio. |
See Accompanying Notes to Financial Statements
25
| | |
| ING INTERMEDIATE BOND FUND (UNAUDITED) | | FINANCIAL HIGHLIGHTS |
Selected data for a share of beneficial interest outstanding throughout each period.
| | | | | | | | | | | | | | | | | | |
| | | | | Six Months
Ended
September 30,
2007 | | | Class A |
| | | | | | Year Ended March 31, |
| | | | | | 2007 | | | 2006 | | | 2005 | | | 2004 | | 2003 |
Per Share Operating Performance: | | | | | | | | | | | | | | | | | | |
| Net asset value, beginning of period | | $ | | 10.23 | | | 10.13 | | | 10.32 | | | 10.67 | | | 10.51 | | 9.91 |
| Income (loss) from investment operations: | | | | | | | | | | | | | | | | | | |
| Net investment income | | $ | | 0.26 | | | 0.50 | | | 0.41 | | | 0.32 | | | 0.31 | | 0.35 |
| Net realized and unrealized gain (loss) on investments | | $ | | (0.07 | ) | | 0.10 | | | (0.14 | ) | | (0.17 | ) | | 0.32 | | 0.77 |
| Total from investment operations | | $ | | 0.19 | | | 0.60 | | | 0.27 | | | 0.15 | | | 0.63 | | 1.12 |
| Less distributions from: | | | | | | | | | | | | | | | | | | |
| Net investment income | | $ | | 0.25 | | | 0.50 | | | 0.42 | | | 0.33 | | | 0.33 | | 0.37 |
| Net realized gains on investments | | $ | | — | | | — | | | 0.04 | | | 0.17 | | | 0.14 | | 0.15 |
| Total distributions | | $ | | 0.25 | | | 0.50 | | | 0.46 | | | 0.50 | | | 0.47 | | 0.52 |
| Net asset value, end of period | | $ | | 10.17 | | | 10.23 | | | 10.13 | | | 10.32 | | | 10.67 | | 10.51 |
Total Return(1) | | % | | 1.94 | | | 6.03 | | | 2.53 | | | 1.52 | | | 6.16 | | 11.48 |
Ratios and Supplemental Data: | | | | | | | | | | | | | | | | | | |
| Net assets, end of period (000’s) | | $ | | 739,452 | | | 698,537 | | | 572,196 | | | 459,850 | | | 268,086 | | 146,649 |
| Ratios to average net assets: | | | | | | | | | | | | | | | | | | |
| Gross expenses prior to expense reimbursement(3) | | % | | 0.72 | | | 0.73 | | | 1.02 | | | 1.14 | | | 1.18 | | 1.24 |
| Net expenses after expense reimbursement(2)(3) | | % | | 0.69 | † | | 0.69 | † | | 0.93 | | | 1.00 | | | 1.10 | | 1.14 |
| Net investment income after expense reimbursement(2)(3) | | % | | 5.19 | † | | 4.89 | † | | 3.92 | | | 3.08 | | | 2.91 | | 3.21 |
| Portfolio turnover rate | | % | | 194 | | | 367 | | | 469 | | | 417 | | | 475 | | 639 |
| | | |
| | | | | Six Months
Ended
September 30,
2007 | | | Class B |
| | | | | | Year Ended March 31, |
| | | | | | 2007 | | | 2006 | | | 2005 | | | 2004 | | 2003 |
Per Share Operating Performance: | | | | | | | | | | | | | | | | | | |
| Net asset value, beginning of period | | $ | | 10.21 | | | 10.11 | | | 10.30 | | | 10.65 | | | 10.50 | | 9.90 |
| Income (loss) from investment operations: | | | | | | | | | | | | | | | | | | |
| Net investment income | | $ | | 0.22 | | | 0.42 | | | 0.32 | | | 0.24 | | | 0.23 | | 0.28 |
| Net realized and unrealized gain (loss) on investments | | $ | | (0.07 | ) | | 0.10 | | | (0.13 | ) | | (0.17 | ) | | 0.31 | | 0.76 |
| Total from investment operations | | $ | | 0.15 | | | 0.52 | | | 0.19 | | | 0.07 | | | 0.54 | | 1.04 |
| Less distributions from: | | | | | | | | | | | | | | | | | | |
| Net investment income | | $ | | 0.21 | | | 0.42 | | | 0.34 | | | 0.25 | | | 0.25 | | 0.29 |
| Net realized gains on investments | | $ | | — | | | — | | | 0.04 | | | 0.17 | | | 0.14 | | 0.15 |
| Total distributions | | $ | | 0.21 | | | 0.42 | | | 0.38 | | | 0.42 | | | 0.39 | | 0.44 |
| Net asset value, end of period | | $ | | 10.15 | | | 10.21 | | | 10.11 | | | 10.30 | | | 10.65 | | 10.50 |
Total Return(1) | | % | | 1.55 | | | 5.23 | | | 1.76 | | | 0.75 | | | 5.28 | | 10.64 |
Ratios and Supplemental Data: | | | | | | | | | | | | | | | | | | |
| Net assets, end of period (000’s) | | $ | | 44,411 | | | 50,086 | | | 60,526 | | | 64,779 | | | 67,402 | | 61,544 |
| Ratios to average net assets: | | | | | | | | | | | | | | | | | | |
| Gross expenses prior to expense reimbursement/recoupment(3) | | % | | 1.47 | | | 1.48 | | | 1.70 | | | 1.79 | | | 1.83 | | 1.89 |
| Net expenses after expense reimbursement/recoupment(2)(3) | | % | | 1.44 | † | | 1.44 | † | | 1.69 | | | 1.75 | | | 1.85 | | 1.89 |
| Net investment income after expense reimbursement/recoupment(2)(3) | | % | | 4.44 | † | | 4.13 | † | | 3.14 | | | 2.31 | | | 2.16 | | 2.39 |
| Portfolio turnover rate | | % | | 194 | | | 367 | | | 469 | | | 417 | | | 475 | | 639 |
(1) | Total return is calculated assuming reinvestment of all dividends and capital gain distributions at net asset value and excluding the deduction of sales charges. Total return for less than one period is not annualized. |
(2) | The Investment Adviser has agreed to limit expenses, (excluding interest, taxes, brokerage and extraordinary expenses) subject to |
| | possible recoupment by the Investment Adviser within three years of being incurred. |
(3) | Annualized for periods less than one year. |
| † | Impact of waiving the advisory fee for the ING Institutional Prime Money Market Fund holding has less than 0.01% impact on the expense ratio. |
See Accompanying Notes to Financial Statements
26
| | |
| ING INTERMEDIATE BOND FUND (UNAUDITED) (CONTINUED) | | FINANCIAL HIGHLIGHTS |
Selected data for a share of beneficial interest outstanding throughout each period.
| | | | | | | | | | | | | | | | | | |
| | | | | Six Months
Ended
September 30,
2007 | | | Class C |
| | | | | | Year Ended March 31, |
| | | | | 2007 | | | 2006 | | | 2005 | | | 2004 | | 2003 |
Per Share Operating Performance: | | | | | | | | | | | | | | | | | | |
| Net asset value, beginning of period | | $ | | 10.22 | | | 10.12 | | | 10.31 | | | 10.65 | | | 10.50 | | 9.90 |
| Income (loss) from investment operations: | | | | | | | | | | | | | | | | | | |
| Net investment income | | $ | | 0.22 | | | 0.42 | | | 0.33 | | | 0.24 | | | 0.23 | | 0.28 |
| Net realized and unrealized gain (loss) on investments | | $ | | (0.07 | ) | | 0.10 | | | (0.14 | ) | | (0.16 | ) | | 0.31 | | 0.76 |
| Total from investment operations | | $ | | 0.15 | | | 0.52 | | | 0.19 | | | 0.08 | | | 0.54 | | 1.04 |
| Less distributions from: | | | | | | | | | | | | | | | | | | |
| Net investment income | | $ | | 0.21 | | | 0.42 | | | 0.34 | | | 0.25 | | | 0.25 | | 0.29 |
| Net realized gains on investments | | $ | | — �� | | | — | | | 0.04 | | | 0.17 | | | 0.14 | | 0.15 |
| Total distributions | | $ | | 0.21 | | | 0.42 | | | 0.38 | | | 0.42 | | | 0.39 | | 0.44 |
| Net asset value, end of period | | $ | | 10.16 | | | 10.22 | | | 10.12 | | | 10.31 | | | 10.65 | | 10.50 |
Total Return(1) | | % | | 1.55 | | | 5.24 | | | 1.77 | | | 0.86 | | | 5.28 | | 10.68 |
Ratios and Supplemental Data: | | | | | | | | | | | | | | | | | | |
| Net assets, end of period (000’s) | | $ | | 76,976 | | | 81,556 | | | 73,281 | | | 71,648 | | | 71,228 | | 52,979 |
| Ratios to average net assets: | | | | | | | | | | | | | | | | | | |
| Gross expenses prior to expense reimbursement/recoupment(3) | | % | | 1.47 | | | 1.48 | | | 1.70 | | | 1.79 | | | 1.83 | | 1.90 |
| Net expenses after expense reimbursement/recoupment(2)(3) | | % | | 1.44 | † | | 1.44 | † | | 1.69 | | | 1.75 | | | 1.85 | | 1.90 |
| Net investment income after expense reimbursement/recoupment(2)(3) | | % | | 4.44 | † | | 4.13 | † | | 3.15 | | | 2.31 | | | 2.16 | | 2.36 |
| Portfolio turnover rate | | % | | 194 | | | 367 | | | 469 | | | 417 | | | 475 | | 639 |
| | | |
| | | | | Six Months
Ended
September 30,
2007 | | | Class I |
| | | | | | Year Ended March 31, |
| | | | | 2007 | | | 2006 | | | 2005 | | | 2004 | | 2003 |
Per Share Operating Performance: | | | | | | | | | | | | | | | | | | |
| Net asset value, beginning of period | | $ | | 10.23 | | | 10.14 | | | 10.32 | | | 10.67 | | | 10.51 | | 9.91 |
| Income (loss) from investment operations: | | | | | | | | | | | | | | | | | | |
| Net investment income | | $ | | 0.28 | | | 0.53 | | | 0.44 | | | 0.36 | * | | 0.35 | | 0.39 |
| Net realized and unrealized gain (loss) on investments | | $ | | (0.07 | ) | | 0.09 | | | (0.13 | ) | | (0.17 | ) | | 0.33 | | 0.76 |
| Total from investment operations | | $ | | 0.21 | | | 0.62 | | | 0.31 | | | 0.19 | | | 0.68 | | 1.15 |
| Less distributions from: | | | | | | | | | | | | | | | | | | |
| Net investment income | | $ | | 0.27 | | | 0.53 | | | 0.45 | | | 0.37 | | | 0.38 | | 0.40 |
| Net realized gains on investments | | $ | | — | | | — | | | 0.04 | | | 0.17 | | | 0.14 | | 0.15 |
| Total distributions | | $ | | 0.27 | | | 0.53 | | | 0.49 | | | 0.54 | | | 0.52 | | 0.55 |
| Net asset value, end of period | | $ | | 10.17 | | | 10.23 | | | 10.14 | | | 10.32 | | | 10.67 | | 10.51 |
Total Return(1) | | % | | 2.11 | | | 6.26 | | | 2.94 | | | 1.85 | | | 6.60 | | 11.88 |
Ratios and Supplemental Data: | | | | | | | | | | | | | | | | | | |
| Net assets, end of period (000’s) | | $ | | 304,307 | | | 266,596 | | | 179,582 | | | 43,808 | | | 14,548 | | 15,046 |
| Ratios to average net assets: | | | | | | | | | | | | | | | | | | |
| Gross expenses prior to expense reimbursement/recoupment(3) | | % | | 0.38 | | | 0.40 | | | 0.61 | | | 0.72 | | | 0.68 | | 0.73 |
| Net expenses after expense reimbursement/recoupment(2)(3) | | % | | 0.35 | † | | 0.36 | † | | 0.60 | | | 0.68 | | | 0.71 | | 0.73 |
| Net investment income after expense reimbursement/recoupment(2)(3) | | % | | 5.53 | † | | 5.22 | † | | 4.40 | | | 3.43 | | | 3.30 | | 3.70 |
| Portfolio turnover rate | | % | | 194 | | | 367 | | | 469 | | | 417 | | | 475 | | 639 |
(1) | Total return is calculated assuming reinvestment of all dividends and capital gain distributions as net asset value and excluding the deduction of sales charges. Total return for less than one year is not annualized. |
(2) | The Investment Adviser has agreed to limit expenses, (excluding interest, taxes, brokerage and extraordinary expenses) subject to possible recoupment by the Investment Adviser within three years of being incurred. |
(3) | Annualized for periods less than one year. |
| † | Impact of waiving the advisory fee for the ING Institutional Prime Money Market Fund holding has less than 0.01% impact on the expense ratio. |
| * | Calculated using average number of shares outstanding throughout the period. |
See Accompanying Notes to Financial Statements
27
| | |
| ING INTERMEDIATE BOND FUND (UNAUDITED) (CONTINUED) | | FINANCIAL HIGHLIGHTS |
Selected data for a share of beneficial interest outstanding throughout each period.
| | | | | | | | | | | | | | |
| | | | | | | | Class O | |
| | | | | Six Months
Ended
September 30,
2007 | | | Year
Ended
March 31, | | | August 13,
2004(1) to
March 31,
2005 | |
| | | | | 2007 | | | 2006 | | |
Per Share Operating Performance: | | | | | | | | | | | | | | |
| Net asset value, beginning of period | | $ | | 10.24 | | | 10.14 | | | 10.32 | | | 10.41 | |
| Income (loss) from investment operations: | | | | | | | | | | | | | | |
| Net investment income | | $ | | 0.26 | | | 0.50 | | | 0.40 | | | 0.21 | |
| Net realized and unrealized gain (loss) on investments | | $ | | (0.07 | ) | | 0.09 | | | (0.13 | ) | | (0.04 | ) |
| Total from investment operations | | $ | | 0.19 | | | 0.59 | | | 0.27 | | | 0.17 | |
| Lest distributions from: | | | | | | | | | | | | | | |
| Net investment income | | $ | | 0.25 | | | 0.49 | | | 0.41 | | | 0.22 | |
| Net realized gains on investments | | $ | | — | | | — | | | 0.04 | | | 0.04 | |
| Total distributions | | $ | | 0.25 | | | 0.49 | | | 0.45 | | | 0.26 | |
| Net asset value, end of period | | $ | | 10.18 | | | 10.24 | | | 10.14 | | | 10.32 | |
Total Return(2) | | % | | 1.94 | | | 6.02 | | | 2.58 | | | 1.61 | |
Ratios and Supplemental Data: | | | | | | | | | | | | | | |
| Net assets, end of period (000’s) | | $ | | 52,416 | | | 53,096 | | | 43,171 | | | 33,997 | |
| Ratios to average net assets: | | | | | | | | | | | | | | |
| Gross expenses prior to expense reimbursement(3) | | % | | 0.72 | | | 0.73 | | | 0.95 | | | 1.00 | |
| Net expenses after expense reimbursement(3)(4) | | % | | 0.69 | † | | 0.69 | † | | 0.94 | | | 0.96 | |
| Net investment income after expense reimbursement(3)(4) | | % | | 5.19 | † | | 4.88 | † | | 3.91 | | | 3.19 | |
| Portfolio turnover rate | | % | | 194 | | | 367 | | | 469 | | | 417 | |
| | | | | | | | | | | | | | | | | |
| | | | | | | | Class R | |
| | | | | Six Months
Ended
September 30,
2007 | | | Year
Ended
March 31, | | | March 16,
2004(1) to
March 31,
2004 | |
| | | | | 2007 | | | 2006 | | | 2005 | | |
Per Share Operating Performance: | | | | | | | | | | | | | | | | | |
| Net asset value, beginning of period | | $ | | 10.25 | | | 10.15 | | | 10.34 | | | 10.67 | | | 10.71 | |
| Income (loss) from investment operations: | | | | | | �� | | | | | | | | | | | |
| Net investment income | | $ | | 0.25 | | | 0.47 | | | 0.38 | | | 0.33 | | | 0.01 | |
| Net realized and unrealized gain (loss) on investments | | $ | | (0.07 | ) | | 0.10 | | | (0.14 | ) | | (0.16 | ) | | (0.05 | ) |
| Total from investment operations | | $ | | 0.18 | | | 0.57 | | | 0.24 | | | 0.17 | | | (0.04 | ) |
| Lest distributions from: | | | | | | | | | | | | | | | | | |
| Net investment income | | $ | | 0.24 | | | 0.47 | | | 0.39 | | | 0.33 | | | — | |
| Net realized gains on investments | | $ | | — | | | — | | | 0.04 | | | 0.17 | | | — | |
| Total distributions | | $ | | 0.24 | | | 0.47 | | | 0.43 | | | 0.50 | | | — | |
| Net asset value, end of period | | $ | | 10.19 | | | 10.25 | | | 10.15 | | | 10.34 | | | 10.67 | |
Total Return(2) | | % | | 1.81 | | | 5.75 | | | 2.26 | | | 1.64 | | | (0.37 | ) |
Ratios and Supplemental Data: | | | | | | | | | | | | | | | | | |
| Net assets, end of period (000’s) | | $ | | 11,256 | | | 5,572 | | | 799 | | | 313 | | | 1 | |
| Ratios to average net assets: | | | | | | | | | | | | | | | | | |
| Gross expenses prior to expense reimbursement(3) | | % | | 0.97 | | | 0.98 | | | 1.17 | | | 1.21 | | | 1.25 | |
| Net expenses after expense reimbursement(3)(4) | | % | | 0.94 | † | | 0.94 | † | | 1.16 | | | 1.17 | | | 1.25 | |
| Net investment income after expense reimbursement(3)(4) | | % | | 4.93 | † | | 4.63 | † | | 3.79 | | | 2.96 | | | 3.20 | |
| Portfolio turnover rate | | % | | 194 | | | 367 | | | 469 | | | 417 | | | 475 | |
(1) | Commencement of operations. |
(2) | Total return is calculated assuming reinvestment of all dividends and capital gain distributions at net asset value. Total return for less than one year is not annualized. Total return for less than one year is not annualized. |
(3) | Annualized for periods less than one year. |
(4) | The Investment Adviser has agreed to limit expenses, (excluding interest, taxes, brokerage and extraordinary expenses) subject to possible recoupment by the Investment Adviser within three years of being incurred. |
| † | Impact of waiving the advisory fee for the ING Institutional Prime Money Market Fund holding has less than 0.01% impact on the expense ratio. |
See Accompanying Notes to Financial Statements
28
| | |
| ING NATIONAL TAX-EXEMPT BOND FUND (UNAUDITED) | | FINANCIAL HIGHLIGHTS |
Selected data for a share of beneficial interest outstanding throughout each period.
| | | | | | | | | | | | | | | | | |
| | | | | Six Months
Ended
September 30,
2007 | | | Class A |
| | | | | | Year Ended March 31, |
| | | | | | 2007 | | 2006 | | | 2005 | | | 2004 | | 2003 |
Per Share Operating Performance: | | | | | | | | | | | | | | | | | |
| Net asset value, beginning of period | | $ | | 10.30 | | | 10.28 | | 10.50 | | | 10.78 | | | 10.87 | | 10.32 |
| Income (loss) from investment operations: | | | | | | | | | | | | | | | | | |
| Net investment income | | $ | | 0.20 | | | 0.40 | | 0.37 | | | 0.34 | | | 0.35 | | 0.39 |
| Net realized and unrealized gain (loss) on investments | | $ | | (0.22 | ) | | 0.09 | | (0.11 | ) | | (0.21 | ) | | 0.12 | | 0.67 |
| Total from investment operations | | $ | | (0.02 | ) | | 0.49 | | 0.26 | | | 0.13 | | | 0.47 | | 1.06 |
| Less distributions from: | | | | | | | | | | | | | | | | | |
| Net investment income | | $ | | 0.20 | | | 0.40 | | 0.37 | | | 0.34 | | | 0.35 | | 0.39 |
| Net realized gains on investments | | $ | | — | | | 0.07 | | 0.11 | | | 0.07 | | | 0.21 | | 0.12 |
| Total distributions | | $ | | 0.20 | | | 0.47 | | 0.48 | | | 0.41 | | | 0.56 | | 0.51 |
| Net asset value, end of period | | $ | | 10.08 | | | 10.30 | | 10.28 | | | 10.50 | | | 10.78 | | 10.87 |
Total Return(1) | | % | | (0.22 | ) | | 4.83 | | 2.55 | | | 1.19 | | | 4.41 | | 10.44 |
Ratios and Supplemental Data: | | | | | | | | | | | | | | | | | |
| Net assets, end of period (000’s) | | $ | | 22,806 | | | 22,697 | | 22,864 | | | 23,296 | | | 24,082 | | 23,647 |
| Ratios to average net assets: | | | | | | | | | | | | | | | | | |
| Gross expenses prior to expense reimbursement/recoupment(3) | | % | | 0.90 | | | 0.95 | | 1.13 | | | 1.13 | | | 1.27 | | 1.28 |
| Net expenses after expense reimbursement/recoupment(2)(3) | | % | | 0.87 | | | 0.87 | | 1.06 | | | 1.10 | | | 1.15 | | 1.15 |
| Net investment income after expense reimbursement/recoupment(2)(3) | | % | | 3.87 | | | 3.83 | | 3.55 | | | 3.19 | | | 3.23 | | 3.64 |
| Portfolio turnover rate | | % | | 6 | | | 47 | | 32 | | | 22 | | | 31 | | 22 |
| | | |
| | | | | Six Months
Ended
September 30,
2007 | | | Class B |
| | | | | | Year Ended March 31, |
| | | | | | 2007 | | 2006 | | | 2005 | | | 2004 | | 2003 |
Per Share Operating Performance: | | | | | | | | | | | | | | | | | |
| Net asset value, beginning of period | | $ | | 10.29 | | | 10.27 | | 10.50 | | | 10.77 | | | 10.86 | | 10.31 |
| Income (loss) from investment operations: | | | | | | | | | | | | | | | | | |
| Net investment income | | $ | | 0.16 | | | 0.32 | | 0.29 | | | 0.26 | | | 0.27 | | 0.31 |
| Net realized and unrealized gain (loss) on investments | | $ | | (0.22 | ) | | 0.09 | | (0.12 | ) | | (0.20 | ) | | 0.12 | | 0.67 |
| Total from investment operations | | $ | | (0.06 | ) | | 0.41 | | 0.17 | | | 0.06 | | | 0.39 | | 0.98 |
| Less distributions from: | | | | | | | | | | | | | | | | | |
| Net investment income | | $ | | 0.16 | | | 0.32 | | 0.29 | | | 0.26 | | | 0.27 | | 0.31 |
| Net realized gains on investments | | $ | | — | | | 0.07 | | 0.11 | | | 0.07 | | | 0.21 | | 0.12 |
| Total distributions | | $ | | 0.16 | | | 0.39 | | 0.40 | | | 0.33 | | | 0.48 | | 0.43 |
| Net asset value, end of period | | $ | | 10.07 | | | 10.29 | | 10.27 | | | 10.50 | | | 10.77 | | 10.86 |
Total Return(1) | | % | | (0.60 | ) | | 4.05 | | 1.68 | | | 0.54 | | | 3.63 | | 9.65 |
Ratios and Supplemental Data: | | | | | | | | | | | | | | | | | |
| Net assets, end of period (000’s) | | $ | | 2,625 | | | 2,574 | | 3,032 | | | 3,041 | | | 2,643 | | 2,792 |
| Ratios to average net assets: | | | | | | | | | | | | | | | | | |
| Gross expenses prior to expense reimbursement/recoupment(3) | | % | | 1.65 | | | 1.70 | | 1.78 | | | 1.78 | | | 1.92 | | 1.94 |
| Net expenses after expense reimbursement/recoupment(2)(3) | | % | | 1.62 | | | 1.62 | | 1.81 | | | 1.85 | | | 1.90 | | 1.90 |
| Net investment income after expense reimbursement/recoupment(2)(3) | | % | | 3.13 | | | 3.09 | | 2.79 | | | 2.44 | | | 2.48 | | 2.86 |
| Portfolio turnover rate | | % | | 6 | | | 47 | | 32 | | | 22 | | | 31 | | 22 |
(1) | Total return is calculated assuming reinvestment of all dividends and capital gain distributions at net asset value and excluding the deduction of sales charges. Total return for less than one year is not annualized. |
(2) | The Investment Adviser has agreed to limit expenses, (excluding interest, taxes, brokerage and extraordinary expenses) subject to possible recoupment by the Investment Adviser within three years of being incurred. |
(3) | Annualized for periods less than one year. |
See Accompanying Notes to Financial Statements
29
| | |
| ING NATIONAL TAX-EXEMPT BOND FUND (UNAUDITED) (CONTINUED) | | FINANCIAL HIGHLIGHTS |
Selected data for a share of beneficial interest outstanding throughout each period.
| | | | | | | | | | | | | | | | | |
| | | | | Six Months
Ended
September 30,
2007 | | | Class C |
| | | | | | Year Ended March 31, |
| | | | | | 2007 | | 2006 | | | 2005 | | | 2004 | | 2003 |
Per Share Operating Performance: | | | | | | | | | | | | | | | | | |
| Net asset value, beginning of period | | $ | | 10.30 | | | 10.28 | | 10.50 | | | 10.78 | | | 10.87 | | 10.33 |
| Income (loss) from investment operations: | | | | | | | | | | | | | | | | | |
| Net investment income | | $ | | 0.16 | | | 0.32 | | 0.29 | | | 0.26 | | | 0.27 | | 0.31 |
| Net realized and unrealized gain (loss) on investments | | $ | | (0.22 | ) | | 0.09 | | (0.11 | ) | | (0.21 | ) | | 0.12 | | 0.66 |
| Total from investment operations | | $ | | (0.06 | ) | | 0.41 | | 0.18 | | | 0.05 | | | 0.39 | | 0.97 |
| Less distributions from: | | | | | | | | | | | | | | | | | |
| Net investment income | | $ | | 0.16 | | | 0.32 | | 0.29 | | | 0.26 | | | 0.27 | | 0.31 |
Net realized gains on investments | | $ | | — | | | 0.07 | | 0.11 | | | 0.07 | | | 0.21 | | 0.12 |
| Total distributions | | $ | | 0.16 | | | 0.39 | | 0.40 | | | 0.33 | | | 0.48 | | 0.43 |
| Net asset value, end of period | | $ | | 10.08 | | | 10.30 | | 10.28 | | | 10.50 | | | 10.78 | | 10.87 |
Total Return(1) | | % | | (0.59 | ) | | 4.04 | | 1.77 | | | 0.49 | | | 3.63 | | 9.56 |
Ratios and Supplemental Data: | | | | | | | | | | | | | | | | | |
| Net assets, end of period (000’s) | | $ | | 2,318 | | | 1,858 | | 1,665 | | | 1,806 | | | 1,104 | | 1,065 |
| Ratios to average net assets: | | | | | | | | | | | | | | | | | |
| Gross expenses prior to expense reimbursement/recoupment(3) | | % | | 1.65 | | | 1.70 | | 1.80 | | | 1.78 | | | 1.92 | | 1.94 |
| Net expenses after expense reimbursement/recoupment(2)(3) | | % | | 1.62 | | | 1.62 | | 1.81 | | | 1.85 | | | 1.90 | | 1.90 |
| Net investment income after expense reimbursement/recoupment(2)(3) | | % | | 3.14 | | | 3.07 | | 2.80 | | | 2.44 | | | 2.49 | | 2.84 |
| Portfolio turnover rate | | % | | 6 | | | 47 | | 32 | | | 22 | | | 31 | | 22 |
(1) | Total return is calculated assuming reinvestment of all dividends and capital gain distributions at net asset value and excluding the deduction of sales charges. Total return for less than one year is not annualized. |
(2) | The Investment Adviser has agreed to limit expenses, (excluding interest, taxes, brokerage and extraordinary expenses) subject to possible recoupment by the Investment Adviser within three years of being incurred. |
(3) | Annualized for periods less than one year. |
See Accompanying Notes to Financial Statements
30
| | |
| ING CLASSIC MONEY MARKET FUND (UNAUDITED) | | FINANCIAL HIGHLIGHTS |
Selected data for a share of beneficial interest outstanding throughout each period.
| | | | | | | | | | | | | | | | |
| | | | | Six Months
Ended
September 30,
2007 | | Class A | |
| | | | | | Year Ended March 31, | |
| | | | | | 2007 | | 2006 | | 2005 | | 2004 | | | 2003 | |
Per Share Operating Performance: | | | | | | | | | | | | | | | | |
| Net asset value, beginning of period | | $ | | 1.00 | | 1.00 | | 1.00 | | 1.00 | | 1.00 | | | 1.00 | |
| Income from investment operations: | | | | | | | | | | | | | | | | |
| Net investment income | | $ | | 0.02 | | 0.05 | | 0.03 | | 0.01 | | 0.00 | * | | 0.01 | |
| Total from investment operations | | $ | | 0.02 | | 0.05 | | 0.03 | | 0.01 | | 0.00 | * | | 0.01 | |
| Less distributions from: | | | | | | | | | | | | | | | | |
| Net investment income | | $ | | 0.02 | | 0.05 | | 0.03 | | 0.01 | | 0.00 | * | | 0.01 | |
| Total distributions | | $ | | 0.02 | | 0.05 | | 0.03 | | 0.01 | | 0.00 | * | | 0.01 | |
| Net asset value, end of period | | $ | | 1.00 | | 1.00 | | 1.00 | | 1.00 | | 1.00 | | | 1.00 | |
Total Return(1) | | % | | 2.36 | | 4.63 | | 3.07 | | 1.02 | | 0.44 | | | 1.06 | |
Ratios and Supplemental Data: | | | | | | | | | | | | | | | | |
| Net assets, end of period (000’s) | | $ | | 1,066,350 | | 921,623 | | 656,731 | | 550,091 | | 398,997 | | | 458,964 | |
| Ratios to average net assets: | | | | | | | | | | | | | | | | |
| Gross expenses prior to expense reimbursement(3) | | % | | 1.12 | | 1.11 | | 1.10 | | 1.08 | | 1.16 | | | 1.27 | |
| Net expenses after expense reimbursement(2)(3) | | % | | 0.77 | | 0.77 | | 0.77 | | 0.77 | | 0.77 | | | 0.77 | |
| Net investment income after expense reimbursement(2)(3) | | % | | 4.67 | | 4.55 | | 3.07 | | 1.06 | | 0.44 | | | 1.06 | |
| | | |
| | | | | Six Months
Ended
September 30,
2007 | | Class B | |
| | | | | | Year Ended March 31, | |
| | | | | | 2007 | | 2006 | | 2005 | | 2004 | | | 2003 | |
Per Share Operating Performance: | | | | | | | | | | | | | | | | |
| Net asset value, beginning of period | | $ | | 1.00 | | 1.00 | | 1.00 | | 1.00 | | 1.00 | | | 1.00 | |
| Income from investment operations: | | | | | | | | | | | | | | | | |
| Net investment income | | $ | | 0.02 | | 0.04 | | 0.02 | | 0.01 | | 0.00 | * | | 0.00 | * |
| Total from investment operations | | $ | | 0.02 | | 0.04 | | 0.02 | | 0.01 | | 0.00 | * | | 0.00 | * |
| Less distributions from: | | | | | | | | | | | | | | | | |
| Net investment income | | $ | | 0.02 | | 0.04 | | 0.02 | | 0.01 | | 0.00 | * | | 0.00 | * |
| Total distributions | | $ | | 0.02 | | 0.04 | | 0.02 | | 0.01 | | 0.00 | * | | 0.00 | * |
| Net asset value, end of period | | $ | | 1.00 | | 1.00 | | 1.00 | | 1.00 | | 1.00 | | | 1.00 | |
Total Return(1) | | % | | 2.04 | | 4.00 | | 2.46 | | 0.57 | | 0.15 | | | 0.43 | |
Ratios and Supplemental Data: | | | | | | | | | | | | | | | | |
| Net assets, end of period (000’s) | | $ | | 22,344 | | 23,333 | | 23,995 | | 26,941 | | 816 | | | 1,156 | |
| Ratios to average net assets: | | | | | | | | | | | | | | | | |
| Gross expenses prior to expense reimbursement(3) | | % | | 1.37 | | 1.36 | | 1.34 | | 1.33 | | 1.41 | | | 1.52 | |
| Net expenses after expense reimbursement(2)(3) | | % | | 1.37 | | 1.36 | | 1.34 | | 1.33 | | 1.07 | | | 1.40 | |
| Net investment income after expense reimbursement(2)(3) | | % | | 4.07 | | 3.95 | | 2.43 | | 0.94 | | 0.15 | | | 0.46 | |
(1) | Total return is calculated assuming reinvestment of all dividends and capital gain distributions at net asset value. Total return for less than one year is not annualized. |
(2) | The Investment Adviser has agreed to limit expenses, (excluding interest, taxes, brokerage and extraordinary expenses) subject to |
| | possible recoupment by the Investment Adviser within three years of being incurred. |
(3) | Annualized for periods less than one year. |
| * | Amount is less than $0.005. |
See Accompanying Notes to Financial Statements
31
| | |
| ING CLASSIC MONEY MARKET FUND (UNAUDITED) (CONTINUED) | | FINANCIAL HIGHLIGHTS |
Selected data for a share of beneficial interest outstanding throughout each period.
| | | | | | | | | | | | | | | | |
| | | | | Six Months
Ended
September 30,
2007 | | Class C | |
| | | | | | Year Ended March 31, | |
| | | | | | 2007 | | 2006 | | 2005 | | 2004 | | | 2003 | |
Per Share Operating Performance: | | | | | | | | | | | | | | | | |
| Net asset value, beginning of period | | $ | | 1.00 | | 1.00 | | 1.00 | | 1.00 | | 1.00 | | | 1.00 | |
| Income from investment operations: | | | | | | | | | | | | | | | | |
| Net investment income | | $ | | 0.02 | | 0.04 | | 0.02 | | 0.01 | | 0.00 | * | | 0.00 | * |
| Total from investment operations | | $ | | 0.02 | | 0.04 | | 0.02 | | 0.01 | | 0.00 | * | | 0.00 | * |
| Less distributions from: | | | | | | | | | | | | | | | | |
| Net investment income | | $ | | 0.02 | | 0.04 | | 0.02 | | 0.01 | | 0.00 | * | | 0.00 | * |
| Total distributions | | $ | | 0.02 | | 0.04 | | 0.02 | | 0.01 | | 0.00 | * | | 0.00 | * |
| Net asset value, end of period | | $ | | 1.00 | | 1.00 | | 1.00 | | 1.00 | | 1.00 | | | 1.00 | |
Total Return(1) | | % | | 2.04 | | 3.99 | | 2.46 | | 0.58 | | 0.14 | | | 0.42 | |
Ratios and Supplemental Data: | | | | | | | | | | | | | | | | |
| Net assets, end of period (000’s) | | $ | | 12,602 | | 4,345 | | 4,868 | | 3,932 | | 546 | | | 524 | |
| Ratios to average net assets: | | | | | | | | | | | | | | | | |
| Gross expenses prior to expense reimbursement(3) | | % | | 1.37 | | 1.36 | | 1.34 | | 1.33 | | 1.41 | | | 1.52 | |
| Net expenses after expense reimbursement(2)(3) | | % | | 1.37 | | 1.36 | | 1.34 | | 1.33 | | 1.07 | | | 1.40 | |
| Net investment income after expense reimbursement(2)(3) | | % | | 4.09 | | 3.96 | | 2.47 | | 0.78 | | 0.15 | | | 0.42 | |
(1) | Total return is calculated assuming reinvestment of all dividends and capital gain distributions at net asset value. Total return for less than one year is not annualized. |
(2) | The Investment Adviser has agreed to limit expenses, (excluding interest, taxes, brokerage and extraordinary expenses) subject |
| | to possible recoupment by the Investment Adviser within three years of being incurred. |
(3) | Annualized for periods less than one year. |
| * | Amount is less than $0.005. |
See Accompanying Notes to Financial Statements
32
| | |
| ING INSTITUTIONAL PRIME MONEY MARKET FUND (UNAUDITED) | | FINANCIAL HIGHLIGHTS |
Selected data for a share of beneficial interest outstanding throughout each period.
| | | | | | | | |
| | | | | Six Months
Ended
September 30,
2007 | | Year
Ended
March 31,
2007 | | July 29,
2005(1) to
March 31,
2006 |
Per Share Operating Performance: | | | | | | | | |
| Net asset value, beginning of period | | $ | | 1.00 | | 1.00 | | 1.00 |
| Income from investment operations: | | | | | | | | |
| Net investment income | | $ | | 0.03 | | 0.05 | | 0.03 |
| Total from investment operations | | $ | | 0.03 | | 0.05 | | 0.03 |
| Less distributions from: | | | | | | | | |
| Net investment income | | $ | | 0.03 | | 0.05 | | 0.03 |
| Total distributions | | $ | | 0.03 | | 0.05 | | 0.03 |
| Net asset value, end of period | | $ | | 1.00 | | 1.00 | | 1.00 |
Total Return(2) | | % | | 2.69 | | 5.25 | | 2.70 |
Ratios and Supplemental Data: | | | | | | | | |
| Net assets, end of period (000’s) | | $ | | 835,408 | | 724,330 | | 179,659 |
| Ratios to average net assets: | | | | | | | | |
| Gross expenses prior to expense reimbursement/recoupment(3) | | % | | 0.10 | | 0.16 | | 0.19 |
| Net expenses after expense reimbursement/recoupment(3)(4) | | % | | 0.10 | | 0.16 | | 0.17 |
| Net investment income after expense reimbursement/recoupment(3)(4) | | % | | 5.35 | | 5.17 | | 4.14 |
(1) | Commencement of operations. |
(2) | Total return is calculated assuming reinvestment of all dividends and capital gain distributions at net asset value. Total return for less than one year is not annualized. |
(3) | Annualized for periods less than one year. |
(4) | The Investment Adviser has agreed to limit expenses, (excluding interest taxes, brokerage and extraordinary expenses) subject to possible recoupment by the Investment Adviser within three years of being incurred. |
See Accompanying Notes to Financial Statements
33
NOTES TO FINANCIAL STATEMENTSASOF SEPTEMBER 30, 2007 (UNAUDITED)
NOTE 1 — ORGANIZATION
Organization. ING Funds Trust (“Trust”) is a Delaware statutory trust and is registered as an open-end management investment company under the Investment Company Act of 1940, as amended (“1940 Act”). The Trust was organized on August 6, 1998 and was established under a Trust Instrument dated July 30, 1998. It consists of six separately managed series: ING GNMA Income Fund (“GNMA Income”), ING High Yield Bond Fund (“High Yield Bond”), ING Intermediate Bond Fund (“Intermediate Bond”), ING National Tax-Exempt Bond Fund (“National Tax-Exempt Bond”), ING Classic Money Market Fund (“Classic Money Market”) and ING Institutional Prime Money Market Fund (“Institutional Money Market”) (each, a “Fund” and collectively, the “Funds”).
The investment objective of each Fund is described in each Fund’s prospectus.
Each Fund, except Institutional Money Market, offers at least three of the following classes of shares: Class A, Class B, Class C, Class I, Class O, Class Q and Class R. The separate classes of shares differ principally in the applicable sales charges (if any), transfer agent fees, distribution fees and shareholder servicing fees. Generally, shareholders of each class also bear certain expenses that pertain to that particular class. All shareholders bear the common expenses of a Fund and earn income and realized gains/losses from the portfolio pro rata based on the average daily net assets of each class, without distinction between share classes. Common expenses of the Funds (including custodial asset-based fees, legal and audit fees, printing and mailing expenses, transfer agency out-of-pocket expenses, and fees and expenses of the independent trustees) are allocated to each Fund in proportion to its relative daily net assets. Expenses directly attributable to a particular fund (including advisory, administration, custodial transaction-based, registration, other professional, distribution and/or service fees, certain taxes, and offering costs) are charged directly to that Fund. Differences in per share dividend rates generally result from the differences in separate class expenses, including distribution, and shareholder servicing fees. Class B shares, along with their pro rata reinvested dividend shares, automatically convert to Class A shares approximately eight years after purchase.
Class B shares of the Funds (except Classic Money Market) are closed to new investment, provided that (1) Class B shares of the Funds may be purchased through the reinvestment of dividends issued by Class B shares of a Fund; (2) subject to the terms and conditions
of relevant exchange privileges and as permitted under their respective prospectuses, Class B shares of the Funds may be acquired through exchange of Class B shares of other funds in the ING mutual funds complex; and (3) certain qualified retirement plans may purchase Class B shares of the Funds, where the Funds have received information reasonably satisfactory indicating that intermediaries maintaining these plans are unable for administrative reasons to effect the closure immediately.
Effective January 2, 2007, Class M shareholders of GNMA Income were converted to Class A shares of GNMA Income. In addition, GNMA Income does not impose any front-end sales charge (load) on purchases of Class A shares of the Fund by its former Class M shareholders.
NOTE 2 — SIGNIFICANT ACCOUNTING POLICIES
The following significant accounting policies are consistently followed by the Funds in the preparation of their financial statements, and such policies are in conformity with U.S. generally accepted accounting principles for investment companies.
| A. | Security Valuation. Investments in equity securities traded on a national securities exchange are valued at the last reported sale price. Securities reported by NASDAQ will be valued at the NASDAQ official closing prices. Securities traded on an exchange or NASDAQ for which there has been no sale and securities traded in the over-the- counter-market are valued at the mean between the last reported bid and ask prices. All investments quoted in foreign currencies will be valued daily in U.S. dollars on the basis of the foreign currency exchange rates prevailing at that time. Debt securities are valued at prices obtained from independent services or from one or more dealers making markets in the securities and may be adjusted based on the Funds’ valuation procedures. U.S. government obligations are valued by using market quotations or independent pricing services that use prices provided by marketmakers or estimates of market values obtained from yield data relating to instruments or securities with similar characteristics. |
Securities and assets for which market quotations are not readily available (which may include certain restricted securities which are subject to limitations as to their sale) are valued at their fair values as determined in good faith by or under the supervision of the Funds’ Board of Trustees (“Board”), in accordance with methods that are
34
NOTES TO FINANCIAL STATEMENTSASOF SEPTEMBER 30, 2007 (UNAUDITED) (CONTINUED)
specifically authorized by the Board. Securities traded on exchanges, including foreign exchanges, which close earlier than the time that a Fund calculates its net asset value (“NAV”) may also be valued at their fair values as determined in good faith by or under the supervision of a Fund’s Board, in accordance with methods that are specifically authorized by the Board. If an event occurs after the time at which the market for foreign securities held by a Fund closes but before the time that a Fund’s NAV is calculated, such event may cause the closing price on the foreign exchange to not represent a readily available reliable market value quotation for such securities at the time the Fund determines its NAV. In such a case, the Fund will use the fair value of such securities as determined under a Fund’s valuation procedures. Events after the close of trading on a foreign market that could require a Fund to fair value some or all of its foreign securities include, among others, securities trading in the U.S. and other markets, corporate announcements, natural and other disasters, and political and other events. Among other elements of analysis in the determination of a security’s fair value, the Board has authorized the use of one or more independent research services to assist with such determinations. An independent research service may use statistical analyses and quantitative models to help determine fair value as of the time a Fund calculates its NAV. There can be no assurance that such models accurately reflect the behavior of the applicable markets or the effect of the behavior of such markets on the fair value of securities, or that such markets will continue to behave in a fashion that is consistent with such models. Unlike the closing price of a security on an exchange, fair value determinations employ elements of judgment. Consequently, the fair value assigned to a security may not represent the actual value that a Fund could obtain if it were to sell the security at the time of the close of the NYSE. Pursuant to procedures adopted by the Board, a Fund is not obligated to use the fair valuations suggested by any research service, and valuation recommendations provided by such research services may be overridden if other events have occurred or if other fair valuations are determined in good faith to be more accurate. Unless an event is such that it causes a Fund to determine that the closing prices for one or more securities do not
represent readily available reliable market value quotations at the time a Fund determines its NAV, events that occur between the time of the close of the foreign market on which they are traded and the close of regular trading on the NYSE will not be reflected in a Fund’s NAV. Investments in securities maturing in 60 days or less from the date of acquisition are valued at amortized cost, which, when combined with accrued interest, approximates market value.
Classic Money Market and Institutional Money Market use the amortized cost method to value their portfolio securities, which approximates market value. The amortized cost method involves valuing a security at its cost and amortizing any discount or premium over the period until maturity regardless of the impact of fluctuating interest rates or the market value of the security.
| B. | Security Transactions and Revenue Recognition. Securities transactions are accounted for on the trade date. Realized gains and losses are reported on the basis of identified cost of securities sold. Interest income is recorded on an accrual basis. Dividend income is recorded on the ex-dividend date, or for certain foreign securities, when the information becomes available to the Funds. Premium amortization and discount accretion are determined by the effective yield method. |
| C. | Foreign Currency Translation. The books and records of the Funds are maintained in U.S. dollars. Any foreign currency amounts are translated into U.S. dollars on the following basis: |
| | (1) | Market value of investment securities, other assets and liabilities — at the exchange rates prevailing at the end of the day. |
| | (2) | Purchases and sales of investment securities, income and expenses — at the rates of exchange prevailing on the respective dates of such transactions. |
Although the net assets and the market values are presented at the foreign exchange rates at the end of the day, the Funds do not isolate the portion of the results of operations resulting from changes in foreign exchange rates on investments from the fluctuations arising from changes in market prices of securities held. Such fluctuations are included with the net realized and unrealized gains or losses from investments. For securities that are subject to foreign withholding tax upon disposition, liabilities are recorded on the Statements of Assets and
35
NOTE 2 — SIGNIFICANT ACCOUNTING POLICIES (continued)
NOTES TO FINANCIAL STATEMENTSASOF SEPTEMBER 30, 2007 (UNAUDITED) (CONTINUED)
Liabilities for the estimated tax withholding based on the securities’ current market values. Upon disposition, realized gains or losses on such securities are recorded net of foreign withholding tax.
Reported net realized foreign exchange gains or losses arise from sales of foreign currencies, currency gains or losses realized between the trade and settlement dates on securities transactions, the difference between the amounts of dividends, interest, and foreign withholding taxes recorded on the Funds’ books, and the U.S. dollar equivalent of the amounts actually received or paid. Net unrealized foreign exchange gains and losses arise from changes in the value of assets and liabilities other than investments in securities at fiscal year end, resulting from changes in the exchange rate. Foreign security and currency transactions may involve certain considerations and risks not typically associated with investing in U.S. companies and U.S. government securities. These risks include, but are not limited to revaluation of currencies and future adverse political and economic developments which could cause securities and their markets to be less liquid and prices more volatile than those of comparable U.S. companies and U.S. government securities.
| D. | Foreign Currency Transactions and Futures Contracts. High Yield Bond, Intermediate Bond and National Tax-Exempt Bond may enter into foreign currency exchange transactions to convert to and from different foreign currencies and to and from the U.S. dollar in connection with the planned purchases or sales of securities. The Funds either enter into these transactions on a spot basis at the spot rate prevailing in the foreign currency exchange market or use forward foreign currency contracts to purchase or sell foreign currencies. When the contract is fulfilled or closed, gains or losses are realized. Until then, the gain or loss is included in unrealized appreciation or depreciation. Risks may arise upon entering into forward contracts from the potential inability of counterparties to meet the terms of their forward contracts and from unanticipated movements in the value of foreign currencies relative to the U.S. dollar. |
High Yield Bond and Intermediate Bond may enter into futures contracts involving foreign currency, interest rates, securities and securities indices. A futures contract obligates the seller of the contract
to deliver and the purchaser of the contract to take delivery of the type of foreign currency, financial instrument or security called for in the contract at a specified future time for a specified price. Upon entering into such a contract, a Fund is required to deposit and maintain as collateral such initial margin as required by the exchange on which the contract is traded. Pursuant to the contract, a Fund agrees to receive from or pay to the broker an amount equal to the daily fluctuations in the value of the contract. Such receipts or payments are known as variation margins and are recorded as unrealized gains or losses by the Fund. When the contract is closed, the Fund records a realized gain or loss equal to the difference between the value of the contract at the time it was opened and the value at the time it was closed.
| E. | Distributions to Shareholders. The Funds record distributions to their shareholders on the ex-dividend date. All Funds, with the exception of GNMA Income, declare dividends daily and pay dividends monthly. GNMA Income declares and pays dividends monthly. The Funds may make distributions on a more frequent basis to comply with the distribution requirements of the Internal Revenue Code. The characteristics of income and gains to be distributed are determined in accordance with income tax regulations, which may differ from U.S. generally accepted accounting principles for investment companies. |
| F. | Federal Income Taxes. It is the policy of the Funds to comply with Subchapter M of the Internal Revenue Code and related excise tax provisions applicable to regulated investment companies and to distribute substantially all of their net investment income and any net realized capital gains to their shareholders. Therefore, no federal income tax provision is required. No capital gain distributions shall be made until any capital loss carryforwards have been fully utilized or expire. |
| G. | Use of Estimates. The preparation of financial statements in conformity with U.S. generally accepted accounting principles requires management to make estimates and assumptions that affect the reported amounts of assets and liabilities and disclosure of contingent assets and liabilities at the date of the financial statements and the reported amounts of increases and decreases in net assets from operations during the reporting period. Actual results could differ from those estimates. |
36
NOTE 2 — SIGNIFICANT ACCOUNTING POLICIES (continued)
NOTES TO FINANCIAL STATEMENTSASOF SEPTEMBER 30, 2007 (UNAUDITED) (CONTINUED)
| H. | Repurchase Agreements. Each Fund may invest in repurchase agreements only with government securities dealers recognized by the Board of Governors of the Federal Reserve System. Under such agreements, the seller of the security agrees to repurchase it at a mutually agreed upon time and price. The resale price is in excess of the purchase price and reflects an agreed upon interest rate for the period of time the agreement is outstanding. The period of the repurchase agreements is usually short, from overnight to one week, while the underlying securities generally have longer maturities. Each Fund will receive as collateral securities acceptable to it whose market value is equal to at least 100% of the carrying amount of the repurchase agreements, plus accrued interest, being invested by the Fund. The underlying collateral is valued daily on a mark to market basis to assure that the value, including accrued interest is at least equal to the repurchase price. There would be potential loss to the Fund in the event the Fund is delayed or prevented from exercising its right to dispose of the collateral, and it may incur disposition costs in liquidating the collateral. |
| I. | Securities Lending. Each Fund (except GNMA Income) has the option to temporarily loan up to 30% of its total assets to brokers, dealers or other financial institutions in exchange for a negotiated lender’s fee. The borrower is required to fully collateralize the loans with cash or U.S. government securities. Generally, in the event of counterparty default, a Fund has the right to use collateral to offset losses incurred. There would be potential loss to the Fund in the event the Fund is delayed or prevented from exercising its right to dispose of the collateral. The Fund bears the risk of loss with respect to the investment of collateral. Engaging in securities lending could have a leveraging effect, which may intensify the credit, market and other risks associated with investing in a Fund. |
| J. | Illiquid and Restricted Securities. Classic Money Market and Institutional Money Market Funds may not invest more than 10% of their net assets in illiquid securities and all other Funds may not invest more than 15% of their net assets in illiquid securities. Illiquid securities are not readily marketable. Disposing of illiquid investments may involve time-consuming negotiation and legal |
| | expenses, and it may be difficult or impossible for the Funds to sell them promptly at an acceptable price. Restricted securities are those sold under Rule 144A of the Securities Act of 1933 (“1933 Act”) or are securities offered pursuant to Section 4(2) of the 1933 Act, and are subject to legal or contractual restrictions on resale and may not be publicly sold without registration under the 1933 Act. Certain restricted securities may be considered liquid pursuant to procedures adopted by the Board or may be deemed illiquid because they may not be readily marketable. With the exception to the Classic Money Market and Institutional Money Market Funds, illiquid and restricted securities are valued using market quotations when readily available. In the absence of market quotations, the securities are valued based upon their fair value determined under procedures approved by the Board. |
| K. | Delayed-Delivery or When-Issued Transactions. The Funds may purchase or sell securities on a when-issued or a delayed delivery basis. Each Fund (except GNMA Income) may enter into forward commitments. The price of the underlying securities and date when the securities will be delivered and paid for are fixed at the time the transaction is negotiated. The market value of such is identified in the Funds’ Portfolio of investments. Losses may arise due to changes in the market value of the securities or from the inability of counterparties to meet the terms of the contract. In connection with such purchases, the Funds are required to segregate liquid assets with the Funds’ custodian sufficient to cover the purchase price. |
| L. | Mortgage Dollar Roll Transactions. Each Fund (except National Tax-Exempt Bond, Classic Money Market and Institutional Money Market) may engage in dollar roll transactions with respect to mortgage-backed securities issued or to be issued by Government National Mortgage Association, Federal National Mortgage Association and Federal Home Loan Mortgage Corp. In a dollar roll transaction, a Fund sells a mortgage-backed security to a financial institution, such as a bank or broker/dealer, and simultaneously agrees to repurchase a substantially similar (i.e., same type, coupon, and maturity) security from the institution on a delayed delivery basis at an agreed upon price. The mortgage-backed securities that are repurchased will bear the same interest rate as those sold, but generally will be collateralized by different pools of mortgages with different prepayment histories. The |
37
NOTE 2 — SIGNIFICANT ACCOUNTING POLICIES (continued)
NOTES TO FINANCIAL STATEMENTSASOF SEPTEMBER 30, 2007 (UNAUDITED) (CONTINUED)
| | Funds account for dollar roll transactions as purchases and sales. |
| M. | Options Contracts. High Yield Bond and Intermediate Bond may purchase put and call options and may write (sell) put options and covered call options. High Yield Bond and Intermediate Bond may engage in option transactions as a hedge against adverse movements in the value of portfolio holdings or to increase market exposure. Option contracts are valued daily and unrealized gains or losses are recorded based upon the last sales price on the principal exchange on which the options are traded. High Yield Bond and Intermediate Bond will realize a gain or loss upon the expiration or closing of the option contract. When an option is exercised, the proceeds on sales of the underlying security for a written call option, the purchase cost of the security for a written put option, or the cost of the security for a purchased put or call option is adjusted by the amount of premium received or paid. Realized and unrealized gains or losses on option contracts are reflected in the accompanying financial statements. The risk in writing a call option is that High Yield Bond and Intermediate Bond give up the opportunity for profit if the market price of the security increases and the option is exercised. The risk in writing a put option is that High Yield Bond and Intermediate Bond may incur a loss if the market price of the security decreases and the option is exercised. The risk in buying an option is that High Yield Bond and Intermediate Bond pay a premium whether or not the option is exercised. Risks may also arise from an illiquid secondary market or from the inability of counterparties to meet the terms of the contract. |
| N. | Swap Contracts. High Yield Bond, Intermediate Bond and National Tax-Exempt Bond may enter into interest rate swaps, currency swaps and other types of swap agreements, including swaps on securities and indices. A swap is an agreement between two parties pursuant to which each party agrees to make one or more payments to the other on regularly scheduled dates over a stated term, based on different interest rates, currency exchange rates, security prices, the prices or rates of other types of financial instruments or assets or the levels of specified indices. During the term of the swap, changes in the value of the swap are recognized by marking-to-market the value of the swap. |
| O. | Construction Loan Securities. GNMA Income may purchase construction loan securities, which are issued to finance building costs. The funds are disbursed as needed or in accordance with a prearranged plan. The securities provide for the timely payment to the registered holder of interest at the specified rate plus scheduled installments of principal. Upon completion of the construction phase, the construction loan securities are terminated and project loan securities are issued. It is GNMA Income’s policy to record these GNMA certificates on trade date, and to segregate assets to cover its commitments on trade date as well. |
| P. | Indemnifications. In the normal course of business, the Trust may enter into contracts that provide certain indemnifications. The Trust’s maximum exposure under these arrangements is dependent on future claims that may be made against the Funds and, therefore, cannot be estimated; however, based on experience, the risk of loss from such claims is considered remote. |
NOTE 3 — INVESTMENT TRANSACTIONS
For the six months ended September 30, 2007, the cost of purchases and proceeds from the sales of securities excluding short-term securities, were as follows:
| | | | | | |
| | | Purchases | | Sales |
GNMA Income | | $ | 9,715,090 | | $ | 221,839 |
High Yield Bond | | | 52,878,047 | | | 69,936,003 |
Intermediate Bond | | | 230,433,512 | | | 268,266,957 |
National Tax-Exempt Bond | | | 2,671,846 | | | 1,687,190 |
U.S. Government Securities not included above were as follows:
| | | | | | |
| | | Purchases | | Sales |
GNMA Income | | $ | 138,102,984 | | $ | 92,156,438 |
High Yield Bond | | | 292,254 | | | 293,484 |
Intermediate Bond | | | 2,238,092,364 | | | 2,131,614,234 |
NOTE 4 — TRANSACTIONS IN WRITTEN OPTIONS
Written option activity for Intermediate Bond for the six months ended September 30, 2007 was as follows:
| | | | | |
| | | Number of Contracts | | Premium |
Balance at 3/31/2007 | | — | | $ | — |
Options Written | | 1,604 | | | 316,790 |
| | | | | |
Balance at 9/30/2007 | | 1,604 | | $ | 316,790 |
| | | | | |
NOTE 5 — INVESTMENT MANAGEMENT AND ADMINISTRATIVE FEES
ING Investments, LLC (“ING Investments” or the ”Investment Adviser”), an Arizona limited liability
38
NOTE 2 — SIGNIFICANT ACCOUNTING POLICIES (continued)
NOTES TO FINANCIAL STATEMENTSASOF SEPTEMBER 30, 2007 (UNAUDITED) (CONTINUED)
NOTE 5 — INVESTMENT MANAGEMENT AND ADMINISTRATIVE FEES (continued)
company, serves as the investment adviser to the Funds. The Investment Adviser serves pursuant to an investment management agreement (“Management Agreement”) between the Investment Adviser and the Trust, on behalf of the Funds.
The Management Agreement compensates the Investment Adviser with a fee, computed daily and payable monthly, based on the average daily net assets of each Fund, at the following annual rates:
For GNMA Income — 0.47% on first $1 billion, 0.40% on next $4 billion and 0.35% on assets thereafter; for High Yield Bond — 0.51% on first $1 billion, 0.45% on next $4 billion and 0.40% on assets thereafter; for Intermediate Bond — 0.17%; for National Tax-Exempt Bond — 0.30%; for Classic Money Market — 0.25%; and for Institutional Money Market — 0.08%.
ING Investment Management Co. (“ING IM”), a Connecticut corporation, serves as the sub-adviser to the Funds. The Investment Adviser has entered into a sub-advisory agreement with ING IM. Subject to such policies as the Board or the Investment Adviser may determine, ING IM manages the Funds’ assets in accordance with the Funds’ investment objectives, policies, and limitations.
Effective November 1, 2006, certain ING Funds sub-advised by ING IM are permitted to invest end-of-day cash balances into Institutional Money Market. Investment management fees paid by the Funds will be reduced by an amount equal to the management fees paid indirectly to Institutional Money Market with respect to assets invested by the Funds. As of September 30, 2007, High Yield Bond and Intermediate Bond waived $209 and $20,983, respectively. These fees are not subject to recoupment.
ING Funds Services, LLC (“IFS”), acts as administrator and provides certain administrative and shareholder services necessary for Fund operations and is responsible for the supervision of other service providers. For its services, IFS is entitled to receive from each Fund, with the exception of Classic Money Market and Institutional Money Market, a fee at an annual rate of 0.10% of its average daily net assets.
ING Funds Distributor, LLC (the “Distributor” or “IFD”) is the principal underwriter of the Funds. The Distributor, IFS, ING Investments and ING IM are indirect, wholly-owned subsidiaries of ING Groep N.V. (“ING Groep”). ING Groep is one of the largest financial service organizations in the world, and offers an array of banking, insurance and asset management services to both individual and institutional investors.
NOTE 6 — DISTRIBUTION AND SERVICE FEES
Each share class of the Funds (except Class I and as otherwise noted below) has adopted a Distribution Plan pursuant to Rule 12b-1 under the 1940 Act and/or a Service Plan (the “Plans”), whereby the Distributor is reimbursed or compensated (depending on the class of shares) by certain of the Funds for expenses incurred in the distribution of each Fund’s shares (“Distribution Fees”). Pursuant to the Plans, the Distributor is entitled to payment each month for expenses incurred in the distribution and promotion of certain of each Fund’s shares, including expenses incurred in printing prospectuses and reports used for sales purposes, expenses incurred in preparing and printing sales literature and other such distribution related expenses, including any distribution or shareholder servicing fees (“Service Fees”) paid to securities dealers who have executed a distribution agreement with the Distributor. Under the Plans, each class of shares of the Fund pays the Distributor a Distribution and/or Service Fee based on average daily net assets at the following annual rates:
| | | | | | | | | | | | | | | | | | |
| | | Class A | | | Class B | | | Class C | | | Class O | | | Class Q | | | Class R | |
GNMA Income | | 0.25 | % | | 1.00 | % | | 1.00 | % | | N/A | | | 0.25 | % | | N/A | |
High Yield Bond | | 0.25 | % | | 1.00 | % | | 1.00 | % | | N/A | | | N/A | | | N/A | |
Intermediate Bond | | 0.25 | % | | 1.00 | % | | 1.00 | % | | 0.25 | % | | N/A | | | 0.50 | % |
National Tax-Exempt Bond | | 0.25 | % | | 1.00 | % | | 1.00 | % | | N/A | | | N/A | | | N/A | |
Classic Money Market(1) | | 0.75 | % | | 1.00 | % | | 1.00 | % | | N/A | | | N/A | | | N/A | |
Institutional Money Market | | N/A | | | N/A | | | N/A | | | N/A | | | N/A | | | N/A | |
| (1) | The Distributor has contractually agreed to waive a portion of the distribution fee for Class A of Classic Money Market to the extent necessary for expenses not to exceed 0.77%. The fee waiver will continue through at least August 1, 2008. There is no guarantee that this waiver will continue after that date. |
During the six months ended September 30, 2007, the Distributor voluntarily waived $1,688,775 of the Class A Distribution and Service Fees for Classic Money Market.
The Distributor also receives the proceeds of initial sales charge paid by shareholders upon the purchase of Class A shares of the Funds, and the contingent deferred sales charge paid by shareholders upon certain redemptions for Class A, Class B, and Class C shares. For the six months ended September 30, 2007, the Distributor retained the following amounts in sales charges:
| | | | | | |
| | | Class A
Shares | | Class C
Shares |
Initial Sales Charges | | | | | | |
GNMA Income | | $ | 11,743 | | | N/A |
High Yield Bond | | | 3,526 | | | N/A |
Intermediate Bond | | | 16,203 | | | N/A |
National Tax-Exempt Bond | | | 995 | | | N/A |
Contingent Deferred Sales Charge | | | | | | |
GNMA Income | | | 5,757 | | $ | 4,846 |
High Yield Bond | | | 9,532 | | | 490 |
Intermediate Bond | | | 3,065 | | | 5,293 |
National Tax-Exempt Bond | | | — | | | 192 |
Classic Money Market | | | 17 | | | 5,001 |
39
NOTES TO FINANCIAL STATEMENTSASOF SEPTEMBER 30, 2007 (UNAUDITED) (CONTINUED)
NOTE 7 — OTHER TRANSACTIONS WITH AFFILIATES AND RELATED PARTIES
At September 30, 2007, the Funds had the following amounts recorded in payable to affiliates on the accompanying Statements of Assets and Liabilities (see Notes 4 and 5):
| | | | | | | | | | | | | | | |
Fund | | Accrued
Investment
Management
Fees | | Accrued
Administrative
Fees | | Accrued
Shareholder
Service and
Distribution
Fees | | Accrued
Reimbursement | | Total |
GNMA Income | | $ | 231,904 | | $ | 49,341 | | $ | 172,946 | | $ | — | | $ | 454,191 |
High Yield Bond | | | 58,647 | | | 11,522 | | | 56,450 | | | — | | | 126,619 |
Intermediate Bond | | | 166,557 | | | 100,413 | | | 265,696 | | | — | | | 532,666 |
National Tax-Exempt Bond | | | 6,835 | | | 2,278 | | | 8,713 | | | 6,704 | | | 24,530 |
Classic Money Market | | | 221,193 | | | — | | | 377,264 | | | — | | | 598,457 |
Institutional Money Market | | | 65,353 | | | — | | | — | | | — | | | 65,353 |
At September 30, 2007, the following ING Portfolios or indirect, wholly-owned subsidiaries of ING Groep owned more than 5% of the following Funds:
| | | | |
| ING Life Insurance and Annuity Company | | — | | GNMA Income (18.02%); Intermediate Bond (20.80%); and National Tax-Exempt Bond (68.86%). |
| | |
| ING National Trust | | — | | GNMA Income (6.82%) and Intermediate Bond (17.52%). |
| | |
| ING VP Balanced | | — | | Institutional Money Market (5.74%). |
| | |
| ING VP Growth and Income | | — | | Institutional Money Market (10.63%). |
| | |
| ING VP Intermediate Bond | | — | | Institutional Money Market (5.23%). |
| | |
| Security Life Insurance of Denver | | — | | Institutional Money Market (5.84%). |
The Trust has adopted a Retirement Policy (“Policy”) covering all independent trustees of the Funds who will have served as an independent trustee for at least five years at the time of retirement. Benefits under this Policy are based on an annual rate as defined in the Policy.
The following is a summary of the transactions during the six months ended September 30, 2007 in which the issuer was an affiliate of the ING Family of Funds.
| | | | | | | | | | | |
High Yield Bond | | Shares | | Cost | | Value at
09/30/07 | | Unrealized
Gain on
Investment
Securities
at
09/30/07 |
ING Prime Rate Trust | | 103,150 | | $ | 719,225 | | $ | 725,145 | | $ | 5,920 |
The following Fund placed a portion of its portfolio transactions with brokerage firms which are affiliates of the investment adviser. The commissions paid to these affiliated firms were:
| | | | | |
| | | Affiliated Brokers | | Commissions
Received |
High Yield Bond | | ING Securities | | $ | 447 |
NOTE 8 — OTHER ACCRUED EXPENSES & LIABILITIES
At September 30, 2007, the Funds had the following payables included in Other Accrued Expenses and Liabilities on the Statements of Assets and Liabilities that exceeded 5% of total liabilities:
| | | | | |
Fund | | Expense | | Amount |
National Tax-Exempt Bond | | Postage Fees | | $ | 7,416 |
Classic Money Market | | Transfer Agent Fees | | | 82,237 |
NOTE 9 — EXPENSE LIMITATIONS
Pursuant to a written expense limitation agreement (“Expense Limitation Agreement”) with the Funds, the Investment Adviser has agreed to limit expenses of each Fund, excluding interest, taxes, brokerage and extraordinary expenses (and acquired fund fees and expenses) to the levels listed below:
| | | | | | | | | | | | | | | | | | | | | |
| | | Class A | | | Class B | | | Class C | | | Class I | | | Class O | | | Class Q | | | Class R | |
GNMA Income | | 0.97 | % | | 1.72 | % | | 1.72 | % | | 0.67 | % | | N/A | | | 0.92 | % | | N/A | |
High Yield Bond | | 1.10 | % | | 1.85 | % | | 1.85 | % | | N/A | | | N/A | | | N/A | | | N/A | |
Intermediate Bond | | 0.69 | % | | 1.44 | % | | 1.44 | % | | 0.38 | % | | 0.69 | % | | N/A | | | 0.94 | % |
National Tax-Exempt Bond | | 0.87 | % | | 1.62 | % | | 1.62 | % | | N/A | | | N/A | | | N/A | | | N/A | |
Classic Money Market | | 0.77 | % | | 1.41 | % | | 1.41 | % | | N/A | | | N/A | | | N/A | | | N/A | |
The Investment Adviser has agreed to limit expenses, excluding interest, taxes, brokerage, and extraordinary expenses to 0.17% of Institutional Money Market’s average daily net assets.
The Investment Adviser may at a later date recoup from a Fund for management fees waived and other expenses assumed by the Investment Adviser during the previous 36 months, but only if, after such recoupment, a Fund’s expense ratio does not exceed the percentage described above. Waived and reimbursed fees net of any recoupment by the Investment Adviser of such waived and reimbursed fees are reflected on the accompanying Statements of Operations for each Fund. Amounts payable by the Investment Adviser are reflected on the accompanying Statements of Assets and Liabilities for each Fund.
40
NOTES TO FINANCIAL STATEMENTSASOF SEPTEMBER 30, 2007 (UNAUDITED) (CONTINUED)
NOTE 9 — EXPENSE LIMITATIONS (continued)
As of September 30, 2007, the amounts of waived and reimbursed fees that are subject to possible recoupment by the Investment Adviser, and the related expiration dates are as follows:
| | | | | | | | | | | | |
| | | September 30, | | |
| | | 2008 | | 2009 | | 2010 | | Total |
High Yield Bond | | $ | 52,417 | | $ | 65,861 | | $ | 12,673 | | $ | 130,951 |
Intermediate Bond | | | 220,012 | | | 77,333 | | | 553,841 | | | 851,186 |
National Tax-Exempt Bond | | | 1,111 | | | 11,392 | | | 10,616 | | | 23,119 |
Institutional Money Market | | | — | | | 22,801 | | | — | | | 22,801 |
The Expense Limitation Agreement is contractual and shall renew automatically for one-year terms unless ING Investments or the Registrant provides written notice of the termination of the Expense Limitation Agreement within 90 days of the end of the then current term or upon termination of the Management Agreement.
NOTE 10 — LINE OF CREDIT
All of the Funds included in this report with the exception of GNMA Income, in addition to certain other funds managed by the Investment Adviser, have entered into an unsecured committed revolving line of credit agreement (the “Credit Agreement”) with The Bank of New York Mellon Corporation (“BNY”) for an aggregate amount of $125,000,000. The proceeds may be used only to: (1) temporarily finance the purchase and sale of securities; (2) finance the redemption of shares of an investor in the Funds; and (3) enable the Funds to meet other emergency expenses as defined in the Credit Agreement. The Funds to which the line of credit is available pay a commitment fee equal to 0.09% per annum on the daily unused portion of the committed line amount payable quarterly in arrears.
The following Funds utilized the line of credit during the six months ended September 30, 2007:
| | | | | | | | |
Fund | | Days Utilized | | Approximate
Average
Daily
Balance | | Approximate
Weighted
Average
Interest Rate | |
High Yield Bond | | 10 | | $ | 1,141,000 | | 5.73 | % |
Intermediate Bond | | 3 | | | 730,000 | | 5.74 | |
NOTE 11 — CAPITAL SHARES
Transactions in capital shares and dollars were as follows:
| | | | | | | | | | | | | | | | | | | | | | | | |
| | | Class A | | | Class B | | | Class C | |
| | | Six Months
Ended
September 30,
2007 | | | Year
Ended
March 31,
2007 | | | Six Months
Ended
September 30,
2007 | | | Year
Ended
March 31,
2007 | | | Six Months
Ended
September 30,
2007 | | | Year
Ended
March 31,
2007 | |
GNMA Income (Number of Shares) | | | | | | | | | | | | | | | | | | | | | | | | |
Shares sold | | | 5,746,454 | | | | 12,317,038 | | | | 169,906 | | | | 418,493 | | | | 654,978 | | | | 1,638,013 | |
Shares converted | | | — | | | | 16,260 | | | | — | | | | — | | | | — | | | | — | |
Dividends reinvested | | | 1,158,694 | | | | 2,562,078 | | | | 79,024 | | | | 219,336 | | | | 48,123 | | | | 110,704 | |
Shares redeemed | | | (8,739,738 | ) | | | (13,943,804 | ) | | | (1,311,098 | ) | | | (3,127,106 | ) | | | (964,125 | ) | | | (1,495,606 | ) |
| | | | | | | | | | | | | | | | | | | | | | | | |
Net increase (decrease) in shares outstanding | | | (1,834,590 | ) | | | 951,572 | | | | (1,062,168 | ) | | | (2,489,277 | ) | | | (261,024 | ) | | | 253,111 | |
| | | | | | | | | | | | | | | | | | | | | | | | |
GNMA Income ($) | | | | | | | | | | | | | | | | | | | | | | | | |
Shares sold | | $ | 47,449,346 | | | $ | 102,165,092 | | | $ | 1,391,725 | | | $ | 3,440,663 | | | $ | 5,382,074 | | | $ | 13,544,694 | |
Shares converted | | | — | | | | 135,446 | | | | — | | | | — | | | | — | | | | — | |
Dividends reinvested | | | 9,550,600 | | | | 21,176,600 | | | | 648,593 | | | | 1,803,444 | | | | 395,424 | | | | 912,233 | |
Shares redeemed | | | (72,045,433 | ) | | | (115,414,682 | ) | | | (10,753,533 | ) | | | (25,729,304 | ) | | | (7,928,492 | ) | | | (12,329,180 | ) |
| | | | | | | | | | | | | | | | | | | | | | | | |
Net increase (decrease) | | $ | (15,045,487 | ) | | $ | 8,062,456 | | | $ | (8,713,215 | ) | | $ | (20,485,197 | ) | | $ | (2,150,994 | ) | | $ | 2,127,747 | |
| | | | | | | | | | | | | | | | | | | | | | | | |
41
NOTE 11 — CAPITAL SHARES (continued)
NOTES TO FINANCIAL STATEMENTSASOF SEPTEMBER 30, 2007 (UNAUDITED) (CONTINUED)
| | | | | | | | | | | | | | | | | | | | | | | | |
| | | Class I | | | Class M(1) | | | Class Q | |
| | | Six Months
Ended
September 30,
2007 | | | Year
Ended
March 31,
2007 | | | Six Months
Ended
September 30,
2007 | | | Year
Ended
March 31,
2007 | | | Six Months
Ended
September 30,
2007 | | | Year
Ended
March 31,
2007 | |
GNMA Income (Number of Shares) | | | | | | | | | | | | | | | | | | | | | | | | |
Shares sold | | | 165,191 | | | | 388,666 | | | | — | | | | 21 | | | | — | | | | — | |
Shares converted | | | — | | | | — | | | | — | | | | (16,260 | ) | | | — | | | | — | |
Dividends reinvested | | | 40,404 | | | | 110,547 | | | | — | | | | 539 | | | | 129 | | | | 409 | |
Shares redeemed | | | (94,388 | ) | | | (1,002,531 | ) | | | — | | | | (7,596 | ) | | | (631 | ) | | | (3,921 | ) |
| | | | | | | | | | | | | | | | | | | | | | | | |
Net increase (decrease) in shares outstanding | | | 111,207 | | | | (503,318 | ) | | | — | | | | (23,296 | ) | | | (502 | ) | | | (3,512 | ) |
| | | | | | | | | | | | | | | | | | | | | | | | |
GNMA Income ($) | | | | | | | | | | | | | | | | | | | | | | | | |
Shares sold | | $ | 1,368,282 | | | $ | 3,217,751 | | | $ | — | | | $ | 183 | | | $ | — | | | $ | — | |
Shares converted | | | — | | | | — | | | | — | | | | (135,446 | ) | | | — | | | | — | |
Dividends reinvested | | | 333,226 | | | | 914,120 | | | | — | | | | 4,454 | | | | 1,065 | | | | 3,383 | |
Shares redeemed | | | (775,981 | ) | | | (8,303,394 | ) | | | — | | | | (87,845 | ) | | | (5,228 | ) | | | (32,778 | ) |
| | | | | | | | | | | | | | | | | | | | | | | | |
Net increase (decrease) | | $ | 925,527 | | | $ | (4,171,523 | ) | | $ | — | | | $ | (218,654 | ) | | $ | (4,163 | ) | | $ | (29,395 | ) |
| | | | | | | | | | | | | | | | | | | | | | | | |
| | | |
| | | Class A | | | Class B | | | Class C | |
| | | Six Months
Ended
September 30,
2007 | | | Year
Ended
March 31,
2007 | | | Six Months
Ended
September 30,
2007 | | | Year
Ended
March 31,
2007 | | | Six Months
Ended
September 30,
2007 | | | Year
Ended
March 31,
2007 | |
High Yield Bond (Number of Shares) | | | | | | | | | | | | | | | | | | | | | | | | |
Shares sold | | | 1,139,820 | | | | 3,615,770 | | | | 71,496 | | | | 266,421 | | | | 56,381 | | | | 191,105 | |
Dividends reinvested | | | 214,860 | | | | 378,969 | | | | 77,035 | | | | 195,187 | | | | 26,389 | | | | 53,837 | |
Shares redeemed | | | (1,820,311 | ) | | | (3,780,937 | ) | | | (1,179,566 | ) | | | (4,352,976 | ) | | | (463,784 | ) | | | (538,454 | ) |
| | | | | | | | | | | | | | | | | | | | | | | | |
Net increase (decrease) in shares outstanding | | | (465,631 | ) | | | 213,802 | | | | (1,031,035 | ) | | | (3,891,368 | ) | | | (381,014 | ) | | | (293,512 | ) |
| | | | | | | | | | | | | | | | | | | | | | | | |
High Yield Bond ($) | | | | | | | | | | | | | | | | | | | | | | | | |
Shares sold | | $ | 10,025,522 | | | $ | 31,635,027 | | | $ | 642,430 | | | $ | 2,319,953 | | | $ | 506,246 | | | $ | 1,677,325 | |
Dividends reinvested | | | 1,893,061 | | | | 3,326,451 | | | | 677,839 | | | | 1,707,325 | | | | 232,388 | | | | 472,060 | |
Shares redeemed | | | (16,066,817 | ) | | | (33,073,507 | ) | | | (10,430,506 | ) | | | (38,030,482 | ) | | | (4,025,378 | ) | | | (4,706,725 | ) |
| | | | | | | | | | | | | | | | | | | | | | | | |
Net increase (decrease) | | $ | (4,148,234 | ) | | $ | 1,887,971 | | | $ | (9,110,237 | ) | | $ | (34,003,204 | ) | | $ | (3,286,744 | ) | | $ | (2,557,340 | ) |
| | | | | | | | | | | | | | | | | | | | | | | | |
| | | |
| | | Class A | | | Class B | | | Class C | |
| | | Six Months
Ended
September 30,
2007 | | | Year
Ended
March 31,
2007 | | | Six Months
Ended
September 30,
2007 | | | Year
Ended
March 31,
2007 | | | Six Months
Ended
September 30,
2007 | | | Year
Ended
March 31,
2007 | |
Intermediate Bond (Number of Shares) | | | | | | | | | | | | | | | | | | | | | | | | |
Shares sold | | | 12,356,386 | | | | 25,965,894 | | | | 259,367 | | | | 656,261 | | | | 1,004,457 | | | | 2,984,740 | |
Dividends reinvested | | | 1,397,153 | | | | 2,435,262 | | | | 65,253 | | | | 147,555 | | | | 90,222 | | | | 168,367 | |
Shares redeemed | | | (9,312,248 | ) | | | (16,600,890 | ) | | | (854,123 | ) | | | (1,884,209 | ) | | | (1,496,943 | ) | | | (2,413,668 | ) |
| | | | | | | | | | | | | | | | | | | | | | | | |
Net increase (decrease) in shares outstanding | | | 4,441,291 | | | | 11,800,266 | | | | (529,503 | ) | | | (1,080,393 | ) | | | (402,264 | ) | | | 739,439 | |
| | | | | | | | | | | | | | | | | | | | | | | | |
Intermediate Bond ($) | | | | | | | | | | | | | | | | | | | | | | | | |
Shares sold | | $ | 125,225,345 | | | $ | 263,447,770 | | | $ | 2,627,909 | | | $ | 6,636,660 | | | $ | 10,179,022 | | | $ | 30,296,219 | |
Dividends reinvested | | | 14,167,876 | | | | 24,727,335 | | | | 660,573 | | | | 1,494,084 | | | | 913,941 | | | | 1,707,577 | |
Shares redeemed | | | (94,326,920 | ) | | | (168,607,669 | ) | | | (8,634,866 | ) | | | (19,047,257 | ) | | | (15,171,923 | ) | | | (24,468,594 | ) |
| | | | | | | | | | | | | | | | | | | | | | | | |
Net increase (decrease) | | $ | 45,066,301 | | | $ | 119,567,436 | | | $ | (5,346,384 | ) | | $ | (10,916,513 | ) | | $ | (4,078,960 | ) | | $ | 7,535,202 | |
| | | | | | | | | | | | | | | | | | | | | | | | |
(1) | Effective January 2, 2007, Class M shareholders of GNMA Income were converted to Class A shares of the Fund. |
42
NOTE 11 — CAPITAL SHARES (continued)
NOTES TO FINANCIAL STATEMENTSASOF SEPTEMBER 30, 2007 (UNAUDITED) (CONTINUED)
| | | | | | | | | | | | | | | | | | | | | | | | |
| | | Class I | | | Class O | | | Class R | |
| | | Six Months
Ended
September 30,
2007 | | | Year
Ended
March 31,
2007 | | | Six Months
Ended
September 30,
2007 | | | Year
Ended
March 31,
2007 | | | Six Months
Ended
September 30,
2007 | | | Year
Ended
March 31,
2007 | |
Intermediate Bond (Number of Shares) | | | | | | | | | | | | | | | | | | | | | | | | |
Shares sold | | | 5,187,240 | | | | 10,117,583 | | | | 664,476 | | | | 2,350,555 | | | | 632,173 | | | | 505,198 | |
Dividends reinvested | | | 692,748 | | | | 1,030,404 | | | | 122,649 | | | | 220,506 | | | | 17,777 | | | | 3,191 | |
Shares redeemed | | | (2,013,402 | ) | | | (2,816,154 | ) | | | (823,076 | ) | | | (1,642,376 | ) | | | (88,596 | ) | | | (43,432 | ) |
| | | | | | | | | | | | | | | | | | | | | | | | |
Net increase (decrease) in shares outstanding | | | 3,866,586 | | | | 8,331,833 | | | | (35,951 | ) | | | 928,685 | | | | 561,354 | | | | 464,957 | |
| | | | | | | | | | | | | | | | | | | | | | | | |
Intermediate Bond ($) | | | | | | | | | | | | | | | | | | | | | | | | |
Shares sold | | $ | 52,748,562 | | | $ | 103,002,028 | | | $ | 6,752,995 | | | $ | 23,813,433 | | | $ | 6,418,191 | | | $ | 5,186,803 | |
Dividends reinvested | | | 7,025,139 | | | | 10,468,517 | | | | 1,244,312 | | | | 2,240,145 | | | | 180,499 | | | | 32,649 | |
Shares redeemed | | | (20,409,315 | ) | | | (28,589,953 | ) | | | (8,352,695 | ) | | | (16,637,324 | ) | | | (899,168 | ) | | | (441,991 | ) |
| | | | | | | | | | | | | | | | | | | | | | | | |
Net increase (decrease) | | $ | 39,364,386 | | | $ | 84,880,592 | | | $ | (355,388 | ) | | $ | 9,416,254 | | | $ | 5,699,522 | | | $ | 4,777,461 | |
| | | | | | | | | | | | | | | | | | | | | | | | |
| | | |
| | | Class A | | | Class B | | | Class C | |
| | | Six Months
Ended
September 30,
2007 | | | Year
Ended
March 31,
2007 | | | Six Months
Ended
September 30,
2007 | | | Year
Ended
March 31,
2007 | | | Six Months Ended September 30,
2007 | | | Year
Ended March 31,
2007 | |
National Tax-Exempt Bond (Number of Shares) | | | | | | | | | | | | | | | | | | | | | | | | |
Shares sold | | | 123,756 | | | | 144,957 | | | | 78,309 | | | | 76,125 | | | | 76,294 | | | | 90,281 | |
Dividends reinvested | | | 3,313 | | | | 7,130 | | | | 1,969 | | | | 4,451 | | | | 846 | | | | 1,965 | |
Shares redeemed | | | (68,221 | ) | | | (172,352 | ) | | | (69,756 | ) | | | (125,551 | ) | | | (27,531 | ) | | | (73,821 | ) |
| | | | | | | | | | | | | | | | | | | | | | | | |
Net increase (decrease) in shares outstanding | | | 58,848 | | | | (20,265 | ) | | | 10,522 | | | | (44,975 | ) | | | 49,609 | | | | 18,425 | |
| | | | | | | | | | | | | | | | | | | | | | | | |
National Tax-Exempt Bond ($) | | | | | | | | | | | | | | | | | | | | | | | | |
Shares sold | | $ | 1,243,104 | | | $ | 1,495,877 | | | $ | 792,521 | | | $ | 785,282 | | | $ | 768,001 | | | $ | 937,766 | |
Dividends reinvested | | | 33,546 | | | | 73,567 | | | | 19,911 | | | | 45,884 | | | | 8,583 | | | | 20,274 | |
Shares redeemed | | | (692,811 | ) | | | (1,760,695 | ) | | | (705,701 | ) | | | (1,293,075 | ) | | | (278,658 | ) | | | (758,629 | ) |
| | | | | | | | | | | | | | | | | | | | | | | | |
Net increase (decrease) | | $ | 583,839 | | | $ | (191,251 | ) | | $ | 106,731 | | | $ | (461,909 | ) | | $ | 497,926 | | | $ | 199,411 | |
| | | | | | | | | | | | | | | | | | | | | | | | |
| | | |
| | | Class A | | | Class B | | | Class C | |
| | | Six Months
Ended
September 30,
2007 | | | Year
Ended
March 31,
2007 | | | Six Months
Ended
September 30,
2007 | | | Year
Ended
March 31,
2007 | | | Six Months
Ended September 30,
2007 | | | Year
Ended March 31,
2007 | |
Classic Money Market (Number of Shares) | | | | | | | | | | | | | | | | | | | | | | | | |
Shares sold | | | 378,706,488 | | | | 606,768,162 | | | | 6,152,317 | | | | 11,233,378 | | | | 12,265,885 | | | | 5,158,087 | |
Dividends reinvested | | | 22,254,016 | | | | 34,927,509 | | | | 396,099 | | | | 842,041 | | | | 120,488 | | | | 191,563 | |
Shares redeemed | | | (256,236,867 | ) | | | (376,859,280 | ) | | | (7,537,291 | ) | | | (12,739,589 | ) | | | (4,129,635 | ) | | | (5,872,862 | ) |
| | | | | | | | | | | | | | | | | | | | | | | | |
Net increase (decrease) in shares outstanding | | | 144,723,637 | | | | 264,836,391 | | | | (988,875 | ) | | | (664,170 | ) | | | 8,256,738 | | | | (523,212 | ) |
| | | | | | | | | | | | | | | | | | | | | | | | |
Classic Money Market ($) | | | | | | | | | | | | | | | | | | | | | | | | |
Shares sold | | $ | 378,706,488 | | | $ | 606,768,162 | | | $ | 6,152,317 | | | $ | 11,233,378 | | | $ | 12,265,885 | | | $ | 5,158,087 | |
Dividends reinvested | | | 22,254,016 | | | | 34,927,509 | | | | 396,099 | | | | 842,041 | | | | 120,488 | | | | 191,563 | |
Shares redeemed | | | (256,236,867 | ) | | | (376,859,280 | ) | | | (7,537,291 | ) | | | (12,739,589 | ) | | | (4,129,635 | ) | | | (5,872,862 | ) |
| | | | | | | | | | | | | | | | | | | | | | | | |
Net increase (decrease) | | $ | 144,723,637 | | | $ | 264,836,391 | | | $ | (988,875 | ) | | $ | (664,170 | ) | | $ | 8,256,738 | | | $ | (523,212 | ) |
| | | | | | | | | | | | | | | | | | | | | | | | |
43
NOTE 11 — CAPITAL SHARES (continued)
NOTES TO FINANCIAL STATEMENTSASOF SEPTEMBER 30, 2007 (UNAUDITED) (CONTINUED)
| | | | | | | | |
| | | Six Months
Ended September 30,
2007 | | | Year
Ended March 31,
2007 | |
Institutional Money Market (Number of Shares) | | | | | | | | |
Shares sold | | | 6,703,258,494 | | | | 2,451,588,496 | |
Dividends reinvested | | | 5,475,425 | | | | 5,275,844 | |
Shares redeemed | | | (6,597,667,988 | ) | | | (1,912,202,768 | ) |
| | | | | | | | |
Net increase in shares outstanding | | | 111,065,931 | | | | 544,661,572 | |
| | | | | | | | |
Institutional Money Market ($) | | | | | | | | |
Shares sold | | $ | 6,703,258,494 | | | $ | 2,451,588,496 | |
Dividends reinvested | | | 5,475,425 | | | | 5,275,844 | |
Shares redeemed | | | (6,597,667,988 | ) | | | (1,912,202,768 | ) |
| | | | | | | | |
Net increase | | $ | 111,065,931 | | | $ | 544,661,572 | |
| | | | | | | | |
NOTE 12 — CREDIT RISK AND DEFAULTED SECURITIES
Although each Fund has a diversified portfolio, High Yield Bond and Intermediate Bond may invest in lower rated and comparable quality unrated high yield securities. Investments in high-yield debt securities generally provide greater income and increased opportunity for capital appreciation than investments in higher quality debt securities, but they also typically entail greater potential price volatility and principal and income risk. High-yield debt securities are not considered investment grade, and are regarded as predominantly speculative with respect to the issuing company’s continuing ability to meet principal and interest payments. The prices of high-yield debt securities have been found to be less sensitive to interest rate changes than higher-rated investments, but more sensitive to adverse economic downturns or individual corporate developments. The risk of loss due to default by the issuer may be significantly greater for the holders of high yielding securities, because such securities are generally unsecured and are often subordinated to other creditors of the issuer. At September 30, 2007, the Funds did not hold any defaulted securities.
For financial reporting purposes, it is each Fund’s accounting practice to discontinue the accrual of income and to provide an estimate for probable losses due to unpaid interest income on defaulted bonds for the current reporting period.
NOTE 13 — CONCENTRATION OF INVESTMENT RISKS
Foreign Securities (High Yield Bond, Intermediate Bond, Classic Money Market and Institutional Money Market) There are certain risks in owning foreign securities, including those resulting from: fluctuations in currency
exchange rates; devaluation of currencies; political or economic developments and the possible imposition of currency exchange blockages or other foreign governmental laws or restrictions; reduced availability of public information concerning issuers; accounting, auditing and financial reporting standards or other regulatory practices and requirements that are not uniform when compared to those applicable to domestic companies; settlement and clearance procedures in some countries that may not be reliable and can result in delays in settlement; higher transaction and custody expenses than for domestic securities; and limitations on foreign ownership of equity securities. Also, securities of many foreign companies may be less liquid and the prices more volatile than those of domestic companies.
Emerging Markets Investments (High Yield Bond). Because of less developed markets and economies and, in some countries, less mature governments and governmental institutions, the risks of investing in foreign securities can be intensified in the case of investments in issuers domiciled or doing substantial business in emerging market countries. These risks include: high concentration of market capitalization and trading volume in a small number of issuers representing a limited number of industries, as well as a high concentration of investors and financial intermediaries; political and social uncertainties; overdependence on exports, especially with respect to primary commodities, making these economies vulnerable to changes in commodity prices; overburdened infrastructure and obsolete or unseasoned financial systems; environmental problems; less well-developed legal systems; and less reliable custodial services and settlement practices.
44
NOTES TO FINANCIAL STATEMENTSASOF SEPTEMBER 30, 2007 (UNAUDITED) (CONTINUED)
45
NOTE 14 — FEDERAL INCOME TAXES
The amount of distributions from net investment income and net realized capital gains are determined in accordance with federal income tax regulations, which may differ from U.S. generally accepted accounting principles for investment companies. These book/tax differences may be either temporary or permanent. Permanent differences are reclassified within the capital accounts based on their federal tax-basis treatment; temporary differences are not reclassified. Key differences include the treatment of short-term capital gains, foreign currency transactions, and wash sale deferrals. Distributions in excess of net investment income and/or net realized capital gains for tax purposes are reported as distributions of paid-in capital.
Dividends paid by the Funds from net investment income and distributions of net realized short-term capital gains are, for federal income tax purposes, taxable as ordinary income to shareholders.
The tax composition of dividends and distributions to shareholders was as follows:
| | | | | | | | | | | | |
| | | Six Months Ended
September 30, 2007 | | Year Ended March 31, 2007 |
| | | Ordinary
Income | | Ordinary
Income | | Tax-Exempt
Income | | Long-Term
Capital Gains |
GNMA Income | | $ | 13,135,831 | | $ | 30,072,600 | | $ | — | | $ | — |
High Yield Bond | | | 5,599,577 | | | 11,431,535 | | | — | | | — |
Intermediate Bond | | | 29,984,290 | | | 49,839,121 | | | — | | | — |
National Tax-Exempt Bond | | | 508,074 | | | 79,219 | | | 978,363 | | | 143,303 |
Classic Money Market | | | 22,992,158 | | | 36,322,117 | | | — | | | — |
Institutional Money Market | | | 25,840,014 | | | 16,054,400 | | | — | | | — |
The tax-basis components of distributable earnings and the expiration dates of the capital loss carryforwards which may be used to offset future realized capital gains for federal income tax purposes as of March 31, 2007 were:
| | | | | | | | | | | | | | | | | | | | | | | | |
| | | Undistributed
Ordinary
Income | | Undistributed
Tax-Exempt
Income | | Unrealized
Appreciation/
(Depreciation) | | | Post-October
Capital
Losses
Deferred | | | Post-October
Currency
Losses
Deferred | | | Capital Loss
Carryforwards | | | Expiration
Dates |
GNMA Income | | $ | 540,901 | | $ | — | | $ | (2,890,694 | ) | | $ | — | | | $ | — | | | $ | (2,870,184 | ) | | 2008 |
| | | | | | | | | | | | | | | | | | | | | (527,639 | ) | | 2010 |
| | | | | | | | | | | | | | | | | | | | | (1,081,784 | ) | | 2012 |
| | | | | | | | | | | | | | | | | | | | | (6,961,357 | ) | | 2013 |
| | | | | | | | | | | | | | | | | | | | | (3,281,376 | ) | | 2014 |
| | | | | | | | | | | | | | | | | | | | | | | | |
| | | | | | | | | | | | | | | | | | | | $ | (14,722,340 | ) | | |
| | | | | | | | | | | | | | | | | | | | | | | | |
High Yield Bond | | | 462,426 | | | — | | | 4,724,147 | | | | — | | | | — | | | | (78,500,574 | ) | | 2008 |
| | | | | | | | | | | | | | | | | | | | | (115,139,658 | ) | | 2009 |
| | | | | | | | | | | | | | | | | | | | | (79,792,137 | ) | | 2010 |
| | | | | | | | | | | | | | | | | | | | | (69,190,309 | ) | | 2011 |
| | | | | | | | | | | | | | | | | | | | | (6,099,584 | ) | | 2012 |
| | | | | | | | | | | | | | | | | | | | | (126,079 | ) | | 2014 |
| | | | | | | | | | | | | | | | | | | | | (16,822,526 | ) | | 2015 |
| | | | | | | | | | | | | | | | | | | | | | | | |
| | | | | | | | | | | | | | | | | | | | $ | (365,670,867 | ) | | |
| | | | | | | | | | | | | | | | | | | | | | | | |
Intermediate Bond | | | 1,487,586 | | | — | | | (736,876 | ) | | | (5,286,715 | ) | | | (754,213 | ) | | | (6,787,487 | ) | | 2015 |
National Tax-Exempt Bond | | | — | | | 73,436 | | | 540,306 | | | | (6,815 | ) | | | — | | | | — | | | |
Classic Money Market | | | 34,784 | | | — | | | — | | | | — | | | | — | | | | (6,927 | ) | | 2011 |
| | | | | | | | | | | | | | | | | | | | | (18,913 | ) | | 2012 |
| | | | | | | | | | | | | | | | | | | | | (63,053 | ) | | 2013 |
| | | | | | | | | | | | | | | | | | | | | (42,453 | ) | | 2014 |
| | | | | | | | | | | | | | | | | | | | | | | | |
| | | | | | | | | | | | | | | | | | | | $ | (131,346 | ) | | |
| | | | | | | | | | | | | | | | | | | | | | | | |
Institutional Money Market | | | 2,199,969 | | | — | | | — | | | | (2,265 | ) | | | — | | | | — | | | |
NOTES TO FINANCIAL STATEMENTSASOF SEPTEMBER 30, 2007 (UNAUDITED) (CONTINUED)
NOTE 15 — ILLIQUID SECURITIES
Pursuant to guidelines adopted by the Funds’ Board, the following securities have been deemed to be illiquid. Except for GNMA Income, the Funds may invest up to 15% (10% for Classic Money Market and Institutional Money Market) of their net assets in illiquid securities. Fair value for certain securities was determined by ING Funds Valuation Committee appointed by the Funds’ Board and in accordance with the methods specifically authorized by the Board.
| | | | | | | | | | | | | | | |
Fund | | Security | | Principal
Amount/
Shares | | Initial
Acquisition
Date | | Cost | | Value | | Percent of
Net Assets | |
High Yield Bond | | Comforce Corp. | | 92,950 | | 10/24/04 | | $ | — | | $ | 930 | | 0.0 | % |
| | Dayton Superior Corp. | | 3,100 | | 10/24/04 | | | — | | | 31 | | 0.0 | % |
| | GT Group Telecom, Inc. | | 500 | | 03/19/03 | | | — | | | — | | 0.0 | % |
| | Jordan Tellecommunications | | 2,350 | | 10/24/04 | | | — | | | 37,741 | | 0.0 | % |
| | North Atlantic Trading Co. | | 17,906 | | 10/24/04 | | | 210,181 | | | 18 | | 0.0 | % |
| | PetroHawk Energy Corp., 9.125%, due 07/15/13 | | 600,000 | | 11/22/06 | | | 621,140 | | | 636,000 | | 0.4 | % |
| | | | | | | | | | | | | | | |
| | | | | | | | $ | 831,321 | | $ | 674,720 | | 0.4 | % |
| | | | | | | | | | | | | | | |
Intermediate Bond | | Alpine III, 6.080%, due 08/16/14 | | 527,000 | | 08/04/04 | | $ | 527,183 | | $ | 528,755 | | 0.0 | % |
| | Alpine III, 6.480%, due 08/16/14 | | 527,000 | | 08/04/04 | | | 527,183 | | | 528,943 | | 0.0 | % |
| | Alpine III, 8.280%, due 08/16/14 | | 789,000 | | 08/04/04 | | | 796,191 | | | 794,483 | | 0.1 | % |
| | Alpine III, 11.530%, due 08/16/14 | | 1,348,000 | | 08/17/04 | | | 1,362,393 | | | 1,380,624 | | 0.1 | % |
| | Nordea Kredit Realkreditaktieselskab,
6.000%, due 07/01/29 | | 33 | | 04/16/04 | | | 6 | | | 6 | | 0.0 | % |
| | | | | | | | | | | | | | | |
| | | | | | | | $ | 3,212,956 | | $ | 3,232,811 | | 0.2 | % |
| | | | | | | | | | | | | | | |
Classic Money Market | | Goldman Sachs Group, Inc., 5.121%, due 04/11/08 | | 15,000,000 | | 04/12/07 | | $ | 15,000,000 | | $ | 15,000,000 | | 1.4 | % |
| | | | | | | | | | | | | | | |
| | | | | | | | $ | 15,000,000 | | $ | 15,000,000 | | 1.4 | % |
| | | | | | | | | | | | | | | |
Institutional Money Market | | Goldman Sachs Group, Inc., 5.121%, due 04/11/08 | | 10,000,000 | | 04/12/07 | | $ | 10,000,000 | | $ | 10,000,000 | | 1.2 | % |
| | | | | | | | | | | | | | | |
| | | | | | | | $ | 10,000,000 | | $ | 10,000,000 | | 1.2 | % |
| | | | | | | | | | | | | | | |
NOTE 16 — SECURITIES LENDING
Under an agreement with Bank of New York Mellon Corporation (“BNY”), the Funds (except GNMA Income) can lend their securities to approved brokers, dealers and other financial institutions. Loans are collateralized by cash and U.S. government securities. The collateral must be in an amount equal to at least 105% of the market value of non-U.S. securities loaned and 102% of the market value of U.S. securities loaned. The cash collateral received is invested in approved investments as defined in the Securities Lending Agreement with BNY (the “Agreement”). The securities purchased with cash collateral received are reflected in the Portfolio of Investments. Generally, in the event of counterparty default, the Funds have the right to use the collateral to offset losses incurred. The Agreement contains certain guarantees by BNY in the event of counterparty default and/or a borrower’s failure to return a loaned security; however, there would be a potential loss to the Funds in the event the Funds are delayed or
prevented from exercising their right to dispose of the collateral. The Funds bear the risk of loss with respect to the investment of collateral. Engaging in securities lending could have a leveraging effect, which may intensify the credit, market and other risks associated with investing in a Fund. At September 30, 2007, the following Fund had securities on loan and related collateral with the following values:
| | | | | | |
Fund | | Value of
Securities
Loaned | | Value of
Collateral |
Intermediate Bond | | $ | 304,166,324 | | $ | 311,352,909 |
46
NOTES TO FINANCIAL STATEMENTSASOF SEPTEMBER 30, 2007 (UNAUDITED) (CONTINUED)
NOTE 17 — SUBSEQUENT EVENTS
Subsequent to September 30, 2007, the following Funds declared dividends from net investment income:
| | | | | | | |
| | | Per Share
Amount | | Payable Date | | Record Date |
GNMA Income | | | | | | | |
Class A | | $ | 0.0325 | | October 3, 2007 | | September 28, 2007 |
Class B | | $ | 0.0274 | | October 3, 2007 | | September 28, 2007 |
Class C | | $ | 0.0274 | | October 3, 2007 | | September 28, 2007 |
Class I | | $ | 0.0345 | | October 3, 2007 | | September 28, 2007 |
Class Q | | $ | 0.0328 | | October 3, 2007 | | September 28, 2007 |
Class A | | $ | 0.0325 | | November 5, 2007 | | October 31, 2007 |
Class B | | $ | 0.0272 | | November 5, 2007 | | October 31, 2007 |
Class C | | $ | 0.0272 | | November 5, 2007 | | October 31, 2007 |
Class I | | $ | 0.0346 | | November 5, 2007 | | October 31, 2007 |
Class Q | | $ | 0.0327 | | November 5, 2007 | | October 31, 2007 |
High Yield Bond | | | | | | | |
Class A | | $ | 0.0568 | | November 1, 2007 | | Daily |
Class B | | $ | 0.0512 | | November 1, 2007 | | Daily |
Class C | | $ | 0.0514 | | November 1, 2007 | | Daily |
Intermediate Bond | | | | | | | |
Class A | | $ | 0.0377 | | November 1, 2007 | | Daily |
Class B | | $ | 0.0314 | | November 1, 2007 | | Daily |
Class C | | $ | 0.0313 | | November 1, 2007 | | Daily |
Class I | | $ | 0.0407 | | November 1, 2007 | | Daily |
Class R | | $ | 0.0357 | | November 1, 2007 | | Daily |
Class O | | $ | 0.0378 | | November 1, 2007 | | Daily |
National Tax-Exempt Bond | | | | | | | |
Class A | | $ | 0.0336 | | November 1, 2007 | | Daily |
Class B | | $ | 0.0271 | | November 1, 2007 | | Daily |
Class C | | $ | 0.0272 | | November 1, 2007 | | Daily |
Classic Money Market | | | | | | | |
Class A | | $ | 0.0039 | | November 1, 2007 | | Daily |
Class B | | $ | 0.0034 | | November 1, 2007 | | Daily |
Class C | | $ | 0.0034 | | November 1, 2007 | | Daily |
Institutional Money Market | | $ | 0.0045 | | November 1, 2007 | | Daily |
NOTE 18 — OTHER ACCOUNTING PRONOUNCEMENTS
In June 2006, the Financial Accounting Standards Board (“FASB”) issued FASB Interpretation No. 48 (“FIN 48”), “Accounting for Uncertainty in Income Taxes.” This standard defines the threshold for recognizing the benefits of tax-return positions in the financial statements as “more-likely-than-not” to be sustained upon challenge by the taxing authority and requires measurement of a tax position meeting the more-likely-than-not criterion, based on the largest benefit that is more than 50 percent likely to be realized. FIN 48 was effective for fiscal years beginning after December 15, 2006, with early application permitted if no interim financial statements have been issued.
However, acknowledging the unique issues that FIN 48 presents for investment companies that calculate NAVs, the SEC has indicated that they would not object if a fund implements FIN 48 in its NAV calculation as late as its last NAV calculation in the first required financial statement reporting period for its fiscal year beginning after December 15, 2006. For March year-end funds, the September 28, 2007 NAV and this semi-annual report are required to reflect the effects of FIN 48. At adoption, companies must adjust their financial statements to reflect only those tax positions that are more likely-than-not to be sustained as of the adoption date. Management of the Fund has analyzed the tax positions of the Fund. Upon adoption of FIN 48, we identified no uncertain tax positions that have not met the more likely-than-not standard.
On September 15, 2006, the FASB issued Statement of Financial Accounting Standards No. 157 (“SFAS No. 157”), “Fair Value Measurements.” The new accounting statement defines fair value, establishes a framework for measuring fair value in generally accepted accounting principles (“GAAP”), and expands disclosures about fair value measurements. SFAS No. 157 defines fair value as the price that would be received to sell an asset or paid to transfer a liability in an orderly transaction between market participants at the measurement date (an exit price). SFAS No. 157 also stipulates that, as a market-based measurement, fair value measurement should be determined based on the assumptions that market participants would use in pricing the asset or liability, and establishes a fair value hierarchy that distinguishes between (a) market participant assumptions developed based on market data obtained from sources independent of the reporting entity (observable inputs) and (b) the reporting entity’s own assumptions about market participant assumptions developed based on the best information available in the circumstances (unobservable inputs). SFAS No. 157 is effective for financial statements issued for fiscal years beginning after November 15, 2007. As of September 30, 2007, management of the Fund is currently assessing the impact, if any, that will result from adopting SFAS No. 157.
NOTE 19 — INFORMATION REGARDING TRADING OF ING’s U.S. MUTUAL FUNDS
As discussed in earlier supplements that were previously filed with the SEC, ING Investments, the adviser to the ING Funds, has reported to the Boards of Directors/Trustees (the “Boards”) of the ING Funds that, like many U.S. financial services companies, ING Investments and certain of its U.S. affiliates have received informal and formal requests for information
47
NOTES TO FINANCIAL STATEMENTSASOF SEPTEMBER 30, 2007 (UNAUDITED) (CONTINUED)
since September 2003 from various governmental and self-regulatory agencies in connection with investigations related to mutual funds and variable insurance products. ING Investments has advised the Boards that it and its affiliates have cooperated fully with each request.
In addition to responding to regulatory and governmental requests, ING Investments reported that management of U.S. affiliates of ING Groep N.V., including ING Investments (collectively, “ING”), on their own initiative, have conducted, through independent special counsel and a national accounting firm, an extensive internal review of trading in ING insurance, retirement, and mutual fund products. The goal of this review was to identify any instances of inappropriate trading in those products by third parties or by ING investment professionals and other ING personnel. ING’s internal review related to mutual fund trading is now substantially completed. ING has reported that, of the millions of customer relationships that ING maintains, the internal review identified several isolated arrangements allowing third parties to engage in frequent trading of mutual funds within ING’s variable insurance and mutual fund products, and identified other circumstances where frequent trading occurred, despite measures taken by ING intended to combat market timing. ING further reported that each of these arrangements has been terminated and fully disclosed to regulators. The results of the internal review were also reported to the independent members of the Boards.
ING Investments has advised the Boards that most of the identified arrangements were initiated prior to ING’s acquisition of the businesses in question in the U.S. ING Investments further reported that the companies in question did not receive special benefits in return for any of these arrangements, which have all been terminated.
Based on the internal review, ING Investments has advised the Boards that the identified arrangements do not represent a systemic problem in any of the companies that were involved.
Despite the extensive internal review conducted through independent special counsel and a national accounting firm, there can be no assurance that the instances of inappropriate trading reported to the Boards are the only instances of such trading respecting the ING Funds.
ING Investments reported to the Boards that ING is committed to conducting its business with the highest
standards of ethical conduct with zero tolerance for noncompliance. Accordingly, ING Investments advised the Boards that ING management was disappointed that its voluntary internal review identified these situations. Viewed in the context of the breadth and magnitude of its U.S. business as a whole, ING management does not believe that ING’s acquired companies had systemic ethical or compliance issues in these areas. Nonetheless, ING Investments reported that given ING’s refusal to tolerate any lapses, it has taken the steps noted below, and will continue to seek opportunities to further strengthen the internal controls of its affiliates.
| • | | ING has agreed with the ING Funds to indemnify and hold harmless the ING Funds from all damages resulting from wrongful conduct by ING or its employees or from ING’s internal investigation, any investigations conducted by any governmental or self-regulatory agencies, litigation or other formal proceedings, including any proceedings by the SEC. ING Investments reported to the Boards that ING management believes that the total amount of any indemnification obligations will not be material to ING or its U.S. business. |
| • | | ING updated its Code of Conduct for employees reinforcing its employees’ obligation to conduct personal trading activity consistent with the law, disclosed limits, and other requirements. |
Other Regulatory Matters
The New York Attorney General and other federal and state regulators are also conducting broad inquiries and investigations involving the insurance industry. These initiatives currently focus on, among other things, compensation and other sales incentives; potential conflicts of interest; potential anti-competitive activity; reinsurance; marketing practices (including suitability); specific product types (including group annuities and indexed annuities); fund selection for investment products and brokerage sales; and disclosure. It is likely that the scope of these industry investigations will further broaden before they conclude. ING has received formal and informal requests in connection with such investigations, and is cooperating fully with each request. In connection with one such investigation, affiliates of ING Investments were named in a petition for relief and cease and desist order filed by the New Hampshire Bureau of Securities Regulation concerning their administration of the New Hampshire state employees deferred compensation plan.
48
NOTES TO FINANCIAL STATEMENTSASOF SEPTEMBER 30, 2007 (UNAUDITED) (CONTINUED)
NOTE 19 — INFORMATION REGARDING TRADING OF ING’s U.S. MUTUAL FUNDS (continued)
Other federal and state regulators could initiate similar actions in this or other areas of ING’s businesses. These regulatory initiatives may result in new legislation and regulation that could significantly affect the financial services industry, including businesses in which ING is engaged. In light of these and other developments, ING continuously reviews whether modifications to its
business practices are appropriate. At this time, in light of the current regulatory factors, ING U.S. is actively engaged in reviewing whether any modifications in our practices are appropriate for the future.
There can be no assurance that these matters, or the adverse publicity associated with them, will not result in increased fund redemptions, reduced sale of fund shares, or other adverse consequences to ING Funds.
49
| | |
| ING GNMA INCOME FUND | | PORTFOLIO OF INVESTMENTS ASOF SEPTEMBER 30, 2007 (UNAUDITED) |
| | | | | | | | |
Principal
Amount | | | | | | Value |
| | | | | | | | |
| | U.S. GOVERNMENT AND AGENCY OBLIGATIONS: 89.5% |
| | Federal Home Loan Mortgage Corporation: 0.1% |
| $ | 89,410 | | | | 7.000%, due 11/01/14 | | $ | 92,600 |
| | 334,053 | | | | 7.500%, due 12/01/14 | | | 346,476 |
| | 87,630 | | | | 7.500%, due 01/01/30 | | | 91,854 |
| | 53,182 | | | | 8.000%, due 01/01/30 | | | 56,359 |
| | 39,639 | | | | 9.500%, due 07/01/20 | | | 43,273 |
| | | | | | | | |
| | | | | | | | 630,562 |
| | | | | | | | |
| | Federal National Mortgage Corporation: 0.3% |
| | 66,679 | | | | 6.500%, due 06/01/14 | | | 68,528 |
| | 526,326 | | | | 6.500%, due 02/01/29 | | | 540,256 |
| | 391,945 | | | | 6.600%, due 07/01/27 | | | 406,301 |
| | 175,155 | | | | 6.600%, due 09/01/27 | | | 181,596 |
| | 59,036 | | | | 6.600%, due 11/01/27 | | | 61,207 |
| | 119,651 | | | | 6.600%, due 03/01/28 | | | 124,051 |
| | 146,668 | | | | 6.600%, due 06/01/28 | | | 152,081 |
| | 83,033 | | | | 7.000%, due 03/01/15 | | | 85,944 |
| | 109,493 | | | | 7.500%, due 05/01/28 | | | 114,893 |
| | 78,904 | | | | 8.500%, due 08/01/11 | | | 82,208 |
| | 50,167 | | | | 8.500%, due 05/01/15 | | | 54,436 |
| | 32,985 | | | | 8.500%, due 08/01/15 | | | 35,792 |
| | 109,842 | | | | 8.500%, due 09/01/15 | | | 119,188 |
| | | | | | | | |
| | | | | | | | 2,026,481 |
| | | | | | | | |
| | Government National Mortgage Association: 89.1% |
| | 766,492 | | | | 4.000%, due 05/20/33 | | | 690,024 |
| | 912,918 | | | | 4.000%, due 01/15/34 | | | 826,592 |
| | 885,354 | | | | 4.000%, due 03/15/34 | | | 801,635 |
| | 1,450,520 | | | | 4.500%, due 01/20/34 | | | 1,350,623 |
| | 1,227,554 | | | | 4.500%, due 03/20/34 | | | 1,143,013 |
| | 328,905 | | | | 4.500%, due 05/20/34 | | | 306,254 |
| | 392,407 | | | | 4.500%, due 06/20/34 | | | 365,382 |
| | 2,103,762 | | | | 4.500%, due 10/20/34 | | | 1,964,027 |
| | 4,104,194 | | | | 4.500%, due 08/15/35 | | | 3,857,336 |
| | 546,217 | | | | 4.500%, due 09/15/35 | | | 513,363 |
| | 1,482,264 | | | | 4.500%, due 10/20/35 | | | 1,380,173 |
| | 4,311,603 | | | | 4.500%, due 11/15/35 | | | 4,052,270 |
| | 5,611,042 | | | | 4.750%, due 05/20/34 | | | 5,586,693 |
| | 802,981 | | | | 5.000%, due 05/15/18 | | | 791,179 |
| | 1,102,297 | | | | 5.000%, due 04/15/29 | | | 1,072,633 |
| | 1,249,015 | | | | 5.000%, due 04/15/30 | | | 1,214,157 |
| | 1,314,647 | | | | 5.000%, due 10/15/30 | | | 1,277,957 |
| | 914,737 | | | | 5.000%, due 05/15/33 | | | 886,631 |
| | 920,965 | | | | 5.000%, due 06/15/33 | | | 892,668 |
| | 2,107,162 | | | | 5.000%, due 07/15/33 | | | 2,042,419 |
| | 926,091 | | | | 5.000%, due 10/15/33 | | | 897,636 |
| | 1,392,286 | | | | 5.000%, due 10/20/33 | | | 1,335,005 |
| | 3,401,008 | | | | 5.000%, due 12/20/33 | | | 3,261,083 |
| | 1,047,720 | | | | 5.000%, due 02/20/34 | | | 1,004,138 |
| | 891,718 | | | | 5.000%, due 03/15/34 | | | 863,914 |
| | 2,802,366 | | | | 5.000%, due 04/15/34 | | | 2,711,396 |
| | 536,023 | | | | 5.000%, due 04/20/34 | | | 513,726 |
| | 1,296,157 | | | | 5.000%, due 06/20/34 | | | 1,242,241 |
| | 747,167 | | | | 5.000%, due 07/20/34 | | | 716,087 |
| | 400,002 | | | | 5.000%, due 09/20/34 | | | 383,364 |
| | 1,731,410 | | | | 5.000%, due 12/20/34 | | | 1,659,389 |
| | 1,573,385 | | | | 5.000%, due 03/15/35 | | | 1,523,516 |
| | 1,880,903 | | | | 5.000%, due 04/15/35 | | | 1,821,288 |
| | 735,569 | | | | 5.000%, due 05/15/35 | | | 712,256 |
| | 1,521,236 | | | | 5.000%, due 05/20/35 | | | 1,460,905 |
| | 874,443 | | | | 5.000%, due 06/15/35 | | | 846,728 |
| | 25,120,194 | | | | 5.000%, due 11/20/35 | | | 24,123,952 |
| | | | | | | | |
Principal
Amount | | | | | | Value |
| | | | | | | | |
| $ | 4,593,890 | | | | 5.000%, due 04/20/36 | | $ | 4,409,098 |
| | 4,323,870 | | | | 5.000%, due 05/20/36 | | | 4,149,940 |
| | 240,104 | | | | 5.450%, due 02/15/29 | | | 236,807 |
| | 103,339 | | | | 5.450%, due 10/15/29 | | | 101,920 |
| | 836,218 | | | | 5.500%, due 08/20/24 | | | 829,340 |
| | 34,163 | | | | 5.500%, due 04/20/29 | | | 33,660 |
| | 502,804 | | | | 5.500%, due 10/15/32 | | | 496,657 |
| | 1,571,548 | | | | 5.500%, due 12/15/32 | | | 1,552,335 |
| | 2,364,097 | | | | 5.500%, due 03/15/33 | | | 2,334,788 |
| | 2,323,560 | | | | 5.500%, due 04/15/33 | | | 2,294,754 |
| | 5,726,819 | | | | 5.500%, due 05/15/33 | | | 5,655,820 |
| | 2,706,232 | | | | 5.500%, due 06/15/33 | | | 2,672,681 |
| | 7,335,146 | | | | 5.500%, due 07/15/33 | | | 7,242,780 |
| | 522,691 | | | | 5.500%, due 09/15/33 | | | 516,210 |
| | 702,007 | | | | 5.500%, due 10/15/33 | | | 693,304 |
| | 10,314,601 | | | | 5.500%, due 11/15/33 | | | 10,183,114 |
| | 885,436 | | | | 5.500%, due 11/20/33 | | | 869,918 |
| | 2,133,044 | | | | 5.500%, due 12/15/33 | | | 2,105,651 |
| | 637,687 | | | | 5.500%, due 12/20/33 | | | 626,511 |
| | 2,888,483 | | | | 5.500%, due 01/15/34 | | | 2,848,876 |
| | 551,661 | | | | 5.500%, due 01/20/34 | | | 541,808 |
| | 3,362,245 | | | | 5.500%, due 02/15/34 | | | 3,316,141 |
| | 841,126 | | | | 5.500%, due 03/15/34 | | | 830,416 |
| | 1,164,410 | | | | 5.500%, due 03/20/34 | | | 1,143,612 |
| | 10,580,969 | | | | 5.500%, due 04/15/34 | | | 10,441,811 |
| | 928,253 | | | | 5.500%, due 04/20/34 | | | 912,453 |
| | 297,369 | | | | 5.500%, due 05/15/34 | | | 293,582 |
| | 1,620,666 | | | | 5.500%, due 06/15/34 | | | 1,600,030 |
| | 1,782,095 | | | | 5.500%, due 06/20/34 | | | 1,752,123 |
| | 1,540,097 | | | | 5.500%, due 07/15/34 | | | 1,520,487 |
| | 1,870,879 | | | | 5.500%, due 07/20/34 | | | 1,840,932 |
| | 8,624,781 | | | | 5.500%, due 08/15/34 | | | 8,514,962 |
| | 875,276 | | | | 5.500%, due 08/20/34 | | | 859,643 |
| | 8,090,584 | | | | 5.500%, due 09/15/34 | | | 7,987,567 |
| | 5,299,877 | | | | 5.500%, due 10/15/34 | | | 5,232,393 |
| | 188,393 | | | | 5.500%, due 12/15/34 | | | 185,994 |
| | 253,838 | | | | 5.500%, due 12/20/34 | | | 249,305 |
| | 5,198,520 | | | | 5.500%, due 01/15/35 | | | 5,130,205 |
| | 427,276 | | | | 5.500%, due 01/20/35 | | | 419,469 |
| | 3,223,507 | | | | 5.500%, due 02/15/35 | | | 3,181,146 |
| | 3,692,126 | | | | 5.500%, due 03/15/35 | | | 3,643,606 |
| | 2,326,113 | | | | 5.500%, due 04/15/35 | | | 2,295,544 |
| | 5,390,474 | | | | 5.500%, due 05/15/35 | | | 5,319,636 |
| | 1,364,468 | | | | 5.500%, due 05/20/35 | | | 1,342,069 |
| | 1,018,915 | | | | 5.500%, due 06/15/35 | | | 1,005,525 |
| | 909,314 | | | | 5.500%, due 06/20/35 | | | 894,387 |
| | 1,449,673 | | | | 5.500%, due 07/15/35 | | | 1,430,622 |
| | 1,363,730 | | | | 5.500%, due 09/20/35 | | | 1,341,344 |
| | 838,291 | | | | 5.500%, due 11/15/35 | | | 827,274 |
| | 3,093,072 | | | | 5.500%, due 03/15/36 | | | 3,050,874 |
| | 14,647,483 | | | | 5.500%, due 03/20/36 | | | 14,397,143 |
| | 908,339 | | | | 5.500%, due 04/15/36 | | | 895,947 |
| | 19,109,909 | | | | 5.500%, due 04/20/36 | | | 18,786,630 |
| | 2,291,551 | | | | 5.500%, due 05/15/36 | | | 2,260,288 |
| | 720,476 | | | | 5.500%, due 06/15/36 | | | 710,646 |
| | 25,139,815 | | | | 5.500%, due 06/20/36 | | | 24,714,529 |
| | 2,950,045 | | | | 5.500%, due 07/15/36 | | | 2,909,798 |
| | 622,321 | | | | 5.500%, due 08/15/36 | | | 613,831 |
| | 14,121,226 | | | | 5.500%, due 08/20/36 | | | 13,882,340 |
| | 906,422 | | | | 5.500%, due 09/15/36 | | | 894,056 |
| | 3,673,608 | | | | 5.500%, due 10/15/36 | | | 3,623,490 |
| | 3,428,544 | | | | 5.500%, due 11/15/36 | | | 3,381,769 |
| | 2,227,565 | | | | 5.500%, due 12/15/36 | | | 2,197,175 |
See Accompanying Notes to Financial Statements
50
| | |
| ING GNMA INCOME FUND | | PORTFOLIO OF INVESTMENTS ASOF SEPTEMBER 30, 2007 (UNAUDITED) (CONTINUED) |
| | | | | | | | |
Principal
Amount | | | | | | Value |
| | | | | | | | |
| | Government National Mortgage Association (continued) |
| $ | 5,313,831 | | | | 5.500%, due 01/15/37 | | $ | 5,240,968 |
| | 8,655,182 | | | | 5.500%, due 07/20/37 | | | 8,501,352 |
| | 221,598 | | | | 5.750%, due 11/20/27 | | | 221,499 |
| | 295,887 | | | | 5.750%, due 12/20/27 | | | 295,754 |
| | 106,531 | | | | 5.750%, due 02/20/28 | | | 106,422 |
| | 837,461 | | | | 5.750%, due 03/20/28 | | | 836,606 |
| | 323,640 | | | | 5.750%, due 04/20/28 | | | 323,310 |
| | 189,280 | | | | 5.750%, due 07/20/28 | | | 189,087 |
| | 204,787 | | | | 5.750%, due 01/20/29 | | | 204,489 |
| | 116,199 | | | | 5.750%, due 04/20/29 | | | 116,030 |
| | 613,564 | | | | 5.750%, due 07/20/29 | | | 612,670 |
| | 236,425 | | | | 6.000%, due 10/15/15 | | | 240,031 |
| | 693,386 | | | | 6.000%, due 10/15/25 | | | 701,093 |
| | 1,894,665 | | | | 6.000%, due 04/15/26 | | | 1,914,789 |
| | 698,152 | | | | 6.000%, due 07/15/28 | | | 705,198 |
| | 491,863 | | | | 6.000%, due 08/15/28 | | | 496,828 |
| | 946,564 | | | | 6.000%, due 09/15/28 | | | 956,117 |
| | 417,403 | | | | 6.000%, due 02/15/29 | | | 421,602 |
| | 319,745 | | | | 6.000%, due 04/15/29 | | | 322,877 |
| | 366,549 | | | | 6.000%, due 02/15/32 | | | 369,772 |
| | 1,731,644 | | | | 6.000%, due 07/15/32 | | | 1,746,870 |
| | 4,442,843 | | | | 6.000%, due 08/15/32 | | | 4,483,521 |
| | 9,076,541 | | | | 6.000%, due 09/15/32 | | | 9,156,354 |
| | 1,551,732 | | | | 6.000%, due 11/15/32 | | | 1,565,376 |
| | 1,153,205 | | | | 6.000%, due 12/15/32 | | | 1,163,345 |
| | 13,135,989 | | | | 6.000%, due 01/15/33 | | | 13,246,500 |
| | 1,329,088 | | | | 6.000%, due 02/15/33 | | | 1,340,270 |
| | 1,913,765 | | | | 6.000%, due 03/15/33 | | | 1,929,865 |
| | 503,591 | | | | 6.000%, due 04/15/33 | | | 507,827 |
| | 1,701,000 | | | | 6.000%, due 05/15/33 | | | 1,715,310 |
| | 3,571,344 | | | | 6.000%, due 09/15/33 | | | 3,601,388 |
| | 4,651,909 | | | | 6.000%, due 10/15/33 | | | 4,691,043 |
| | 1,192,187 | | | | 6.000%, due 12/15/33 | | | 1,202,217 |
| | 837,329 | | | | 6.000%, due 01/15/34 | | | 842,856 |
| | 851,786 | | | | 6.000%, due 01/20/34 | | | 855,849 |
| | 316,584 | | | | 6.000%, due 02/15/34 | | | 318,674 |
| | 1,539,292 | | | | 6.000%, due 02/20/34 | | | 1,546,636 |
| | 3,543,345 | | | | 6.000%, due 03/20/34 | | | 3,560,250 |
| | 526,955 | | | | 6.000%, due 04/20/34 | | | 529,469 |
| | 2,738,747 | | | | 6.000%, due 05/20/34 | | | 2,751,813 |
| | 165,566 | | | | 6.000%, due 06/20/34 | | | 166,356 |
| | 793,424 | | | | 6.000%, due 07/20/34 | | | 797,209 |
| | 2,707,765 | | | | 6.000%, due 08/20/34 | | | 2,720,682 |
| | 481,294 | | | | 6.000%, due 09/15/34 | | | 484,985 |
| | 906,308 | | | | 6.000%, due 10/15/34 | | | 913,259 |
| | 7,895,485 | | | | 6.000%, due 10/20/34 | | | 7,936,967 |
| | 8,991,391 | | | | 6.000%, due 11/20/34 | | | 9,034,285 |
| | 9,234,112 | | | | 6.000%, due 12/20/34 | | | 9,278,164 |
| | 2,396,848 | | | | 6.000%, due 01/20/35 | | | 2,406,632 |
| | 925,111 | | | | 6.000%, due 02/20/35 | | | 928,888 |
| | 1,597,495 | | | | 6.000%, due 03/20/35 | | | 1,604,017 |
| | 503,363 | | | | 6.000%, due 04/20/35 | | | 505,417 |
| | 252,693 | | | | 6.000%, due 06/20/35 | | | 253,725 |
| | 984,856 | | | | 6.000%, due 05/15/36 | | | 991,405 |
| | 1,975,291 | | | | 6.000%, due 06/15/36 | | | 1,988,426 |
| | 1,835,434 | | | | 6.000%, due 07/15/36 | | | 1,847,639 |
| | 1,290,953 | | | | 6.000%, due 08/15/36 | | | 1,299,537 |
| | 989,409 | | | | 6.000%, due 09/15/36 | | | 995,988 |
| | 1,740,519 | | | | 6.000%, due 10/15/36 | | | 1,752,092 |
| | 3,217,386 | | | | 6.000%, due 01/20/37 | | | 3,229,287 |
| | 4,942,345 | | | | 6.000%, due 03/15/37 | | | 4,974,964 |
| | 4,962,346 | | | | 6.000%, due 06/15/37 | | | 4,995,100 |
| | | | | | | | |
Principal
Amount | | | | | | Value |
| | | | | | | | |
| $ | 1,302,772 | | | | 6.000%, due 09/20/37 | | $ | 1,309,542 |
| | 136,876 | | | | 6.250%, due 03/15/28 | | | 139,199 |
| | 144,685 | | | | 6.250%, due 04/15/28 | | | 147,140 |
| | 400,393 | | | | 6.250%, due 09/15/29 | | | 406,897 |
| | 206,778 | | | | 6.280%, due 01/20/26 | | | 210,215 |
| | 553,304 | | | | 6.280%, due 05/20/26 | | | 562,499 |
| | 303,489 | | | | 6.500%, due 02/15/26 | | | 311,318 |
| | 242,035 | | | | 6.500%, due 03/15/28 | | | 248,402 |
| | 186,781 | | | | 6.500%, due 08/15/28 | | | 191,695 |
| | 1,902,229 | | | | 6.500%, due 11/15/28 | | | 1,952,275 |
| | 324,171 | | | | 6.500%, due 07/20/29 | | | 332,090 |
| | 30,246 | | | | 6.500%, due 05/15/31 | | | 31,004 |
| | 1,245,851 | | | | 6.500%, due 08/20/31 | | | 1,275,506 |
| | 333,813 | | | | 6.500%, due 09/15/31 | | | 342,187 |
| | 1,821,254 | | | | 6.500%, due 01/15/32 | | | 1,866,035 |
| | 929,263 | | | | 6.500%, due 02/15/32 | | | 952,112 |
| | 103,088 | | | | 6.500%, due 04/20/32 | | | 105,477 |
| | 371,569 | | | | 6.500%, due 07/20/32 | | | 380,180 |
| | 643,010 | | | | 6.500%, due 08/15/32 | | | 658,820 |
| | 2,125,621 | | | | 6.500%, due 11/15/33 | | | 2,175,168 |
| | 966,375 | | | | 6.500%, due 11/20/33 | | | 987,334 |
| | 524,606 | | | | 6.500%, due 01/20/34 | | | 535,428 |
| | 649,992 | | | | 6.500%, due 02/20/34 | | | 663,401 |
| | 386,868 | | | | 6.500%, due 03/20/34 | | | 394,849 |
| | 453,464 | | | | 6.500%, due 08/20/34 | | | 462,818 |
| | 1,664,470 | | | | 6.500%, due 09/20/34 | | | 1,698,808 |
| | 1,544,831 | | | | 6.500%, due 10/20/34 | | | 1,576,701 |
| | 1,524,601 | | | | 6.500%, due 11/20/34 | | | 1,556,054 |
| | 1,244,804 | | | | 6.500%, due 12/20/34 | | | 1,270,484 |
| | 554,956 | | | | 6.500%, due 03/20/35 | | | 565,832 |
| | 1,454,443 | | | | 6.500%, due 04/20/36 | | | 1,485,460 |
| | 1,190,964 | | | | 6.500%, due 05/15/36 | | | 1,217,814 |
| | 6,047,558 | | | | 6.500%, due 09/15/36 | | | 6,183,898 |
| | 3,296,585 | | | | 6.500%, due 11/15/36 | | | 3,370,905 |
| | 1,780,944 | | | | 6.500%, due 12/15/36 | | | 1,821,095 |
| | 15,634,189 | | | | 6.500%, due 01/15/37 | | | 15,984,699 |
| | 7,598,337 | | | | 6.500%, due 02/15/37 | | | 7,768,688 |
| | 1,401,672 | | | | 6.500%, due 02/20/37 | | | 1,431,476 |
| | 9,257,733 | | | | 6.500%, due 03/15/37 | | | 9,465,286 |
| | 280,673 | | | | 6.600%, due 10/20/26 | | | 289,934 |
| | 427,143 | | | | 6.600%, due 02/20/27 | | | 441,063 |
| | 111,610 | | | | 6.600%, due 05/20/27 | | | 115,247 |
| | 461,206 | | | | 6.600%, due 06/20/27 | | | 476,235 |
| | 400,754 | | | | 6.600%, due 07/20/27 | | | 413,814 |
| | 248,367 | | | | 6.600%, due 09/20/27 | | | 256,461 |
| | 331,719 | | | | 6.600%, due 10/20/27 | | | 342,529 |
| | 126,825 | | | | 6.600%, due 12/20/27 | | | 130,958 |
| | 335,823 | | | | 6.600%, due 02/20/28 | | | 346,544 |
| | 948,825 | | | | 6.600%, due 07/20/28 | | | 979,116 |
| | 16,185 | | | | 6.750%, due 08/15/28 | | | 16,833 |
| | 326,619 | | | | 6.750%, due 10/15/28 | | | 339,693 |
| | 59,749 | | | | 6.750%, due 11/15/28 | | | 62,140 |
| | 81,785 | | | | 7.000%, due 09/15/23 | | | 85,804 |
| | 22,240 | | | | 7.000%, due 12/15/23 | | | 23,333 |
| | 35,834 | | | | 7.000%, due 04/15/26 | | | 37,602 |
| | 233,558 | | | | 7.000%, due 01/15/27 | | | 245,025 |
| | 192,182 | | | | 7.000%, due 11/15/27 | | | 201,618 |
| | 313,440 | | | | 7.000%, due 07/15/28 | | | 328,621 |
| | 21,023 | | | | 7.000%, due 07/15/29 | | | 22,036 |
| | 53,938 | | | | 7.000%, due 10/15/30 | | | 56,519 |
| | 47,622 | | | | 7.000%, due 05/15/31 | | | 49,871 |
| | 633,704 | | | | 7.000%, due 06/15/31 | | | 664,022 |
| | 365,028 | | | | 7.000%, due 09/15/31 | | | 382,268 |
See Accompanying Notes to Financial Statements
51
| | |
| ING GNMA INCOME FUND | | PORTFOLIO OF INVESTMENTS ASOF SEPTEMBER 30, 2007 (UNAUDITED) (CONTINUED) |
| | | | | | | | |
Principal
Amount | | | | | | Value |
| | | | | | | | |
| | Government National Mortgage Association (continued) |
| $ | 198,712 | | | | 7.000%, due 11/15/31 | | $ | 206,092 |
| | 168,272 | | | | 7.000%, due 12/15/31 | | | 176,219 |
| | 2,110,877 | | | | 7.000%, due 01/15/32 | | | 2,210,648 |
| | 4,042,124 | | | | 7.000%, due 02/15/32 | | | 4,233,175 |
| | 2,693,516 | | | | 7.000%, due 03/15/32 | | | 2,820,825 |
| | 3,860,115 | | | | 7.000%, due 04/15/32 | | | 4,042,563 |
| | 3,425,476 | | | | 7.000%, due 05/15/32 | | | 3,587,380 |
| | 2,055,585 | | | | 7.000%, due 07/15/32 | | | 2,152,742 |
| | 1,012,639 | | | | 7.000%, due 08/20/36 | | | 1,046,299 |
| | 46,214 | | | | 7.250%, due 01/15/29 | | | 48,163 |
| | 86,222 | | | | 7.500%, due 08/20/27 | | | 90,259 |
| | 242,361 | | | | 7.500%, due 12/15/28 | | | 254,706 |
| | 380,935 | | | | 7.500%, due 10/15/30 | | | 399,794 |
| | 49,172 | | | | 7.500%, due 12/15/30 | | | 51,607 |
| | 92,507 | | | | 7.500%, due 01/15/31 | | | 97,053 |
| | 160,800 | | | | 7.500%, due 10/15/31 | | | 168,703 |
| | 89,843 | | | | 7.500%, due 01/15/32 | | | 94,156 |
| | 24,159 | | | | 7.800%, due 05/15/19 | | | 25,463 |
| | 33,932 | | | | 7.800%, due 07/15/19 | | | 35,764 |
| | 11,569 | | | | 8.000%, due 03/20/24 | | | 12,249 |
| | 37,643 | | | | 8.000%, due 11/15/25 | | | 40,023 |
| | 110,820 | | | | 8.000%, due 07/15/26 | | | 117,868 |
| | 144,018 | | | | 8.000%, due 09/15/26 | | | 153,177 |
| | 55,780 | | | | 8.000%, due 09/20/26 | | | 59,104 |
| | 39,993 | | | | 8.000%, due 12/15/26 | | | 42,536 |
| | 24,862 | | | | 8.000%, due 04/15/27 | | | 26,436 |
| | 63,740 | | | | 8.000%, due 06/15/27 | | | 67,776 |
| | 67,648 | | | | 8.000%, due 07/15/27 | | | 71,931 |
| | 26,963 | | | | 8.000%, due 03/15/28 | | | 28,677 |
| | 40,142 | | | | 8.050%, due 07/15/19 | | | 42,745 |
| | 42,769 | | | | 9.000%, due 05/15/16 | | | 45,909 |
| | 41,930 | | | | 9.000%, due 07/15/16 | | | 45,008 |
| | 10,840 | | | | 9.500%, due 11/15/21 | | | 11,843 |
| | | | | | | | |
| | | | | | | | 531,808,340 |
| | | | | | | | |
| | Small Business Administration: 0.0% |
| | 31,315 | | C | | 8.250%, due 11/01/11 | | | 31,887 |
| | | | | | | | |
| | | | | Total U.S. Government and Agency Obligations
(Cost $540,033,514) | | | 534,497,270 |
| | | | | | | | |
| | | | | | | | |
Principal
Amount | | | | | | Value |
| | | | | | | | |
| | U.S. TREASURY OBLIGATIONS: 7.6% |
| | U.S. Treasury Bonds: 7.6% |
| $ | 26,000,000 | | | | 4.625%, due 02/15/17 | | $ | 26,127,972 |
| | 18,000,000 | | | | 5.375%, due 02/15/31 | | | 19,274,076 |
| | | | | | | | |
| | | | | Total U.S. Treasury Obligations
(Cost $44,978,756 ) | | | 45,402,048 |
| | | | | | | | |
| | COLLATERALIZED MORTGAGE OBLIGATIONS: 1.6% |
| | 9,588,019 | | | | Ginnie Mae, 6.000%,
due 04/20/37 | | | 9,637,843 |
| | | | | | | | |
| | | | | Total Collateralized Mortgage Obligations
(Cost $9,498,132) | | | 9,637,843 |
| | | | | | | | |
| | | | | Total Long-Term Investments
(Cost $594,510,402) | | | 589,537,161 |
| | | | | | | | |
| | | | | | | | |
| SHORT-TERM INVESTMENTS: 0.7% | | | | |
| U.S. Treasury Bills: 0.7% | | | | | | |
| 4,000,000 | | 3.770%, due 01/03/08 | | | | | | 3,960,552 |
| | | | | | | | |
| | Total Short-Term Investments
(Cost $3,961,356 ) | | | | | | 3,960,552 |
| | | | | | | | |
| | Total Investments in Securities
(Cost $598,471,758)* | | 99.4 | % | | $ | 593,497,713 |
| | Other Assets and Liabilities -Net | | 0.6 | | | | 3,423,830 |
| | | | | | | | |
| | Net Assets | | 100.0 | % | | $ | 596,921,543 |
| | | | | | | | |
| C | Bond may be called prior to maturity date. |
| * | Cost for federal income tax purposes is $598,504,286. |
| | | | |
Net unrealized depreciation consists of: | | | | |
Gross Unrealized Appreciation | | $ | 2,511,416 | |
Gross Unrealized Depreciation | | | (7,517,989 | ) |
| | | | |
Net Unrealized Depreciation | | $ | (5,006,573 | ) |
| | | | |
See Accompanying Notes to Financial Statements
52
| | |
| ING HIGH YIELD BOND FUND | | PORTFOLIO OF INVESTMENTS ASOF SEPTEMBER 30, 2007 (UNAUDITED) |
| | | | | | | | |
Principal
Amount | | | | | | Value |
| | | | | | | | |
| | CORPORATE BONDS/NOTES: 98.1% |
| | Advertising: 2.1% |
| $ | 1,515,000 | | C | | RH Donnelley Corp., 6.875%, due 01/15/13 | | $ | 1,567,501 |
| | 565,000 | | #, C | | RH Donnelley Corp., 8.875%, due 10/15/17 | | | 576,300 |
| | 855,000 | | C | | Visant Corp., 7.625%, due 10/01/12 | | | 874,238 |
| | | | | | | | |
| | | | | | | | 3,018,039 |
| | | | | | | | |
| | Airlines: 1.0% |
| | 800,000 | | C | | AMR Corp., 8.608%, due 04/01/11 | | | 811,114 |
| | 612,444 | | C | | Continental Airlines, Inc., 7.461%, due 04/01/15 | | | 606,854 |
| | 515,000 | | | | United AirLines, Inc., 6.932%, due 09/01/11 | | | 607,216 |
| | | | | | | | |
| | | | | | | | 2,025,184 |
| | | | | | | | |
| | Auto Manufacturers: 2.8% |
| | 1,687,250 | | | | Ford Motor Co., 8.597%, due 11/29/13 | | | 1,640,382 |
| | 800,000 | | C | | General Motors Corp., 7.125%, due 07/15/13 | | | 736,000 |
| | 1,775,000 | | C | | General Motors Corp., 8.375%, due 07/15/33 | | | 1,564,219 |
| | | | | | | | |
| | | | | | | | 3,940,601 |
| | | | | | | | |
| | Auto Parts & Equipment: 0.2% |
| | 290,000 | | C | | United Components, Inc., 9.375%, due 06/15/13 | | | 295,800 |
| | | | | | | | |
| | | | | | | | 295,800 |
| | | | | | | | |
| | Beverages: 0.6% |
| | 790,000 | | #, C | | Constellation Brands, Inc., 7.250%, due 05/15/17 | | | 793,950 |
| | | | | | | | |
| | | | | | | | 793,950 |
| | | | | | | | |
| | Building Materials: 1.2% |
| | 675,000 | | C | | Goodman Global Holding Co., Inc., 7.875%, due 12/15/12 | | | 666,563 |
| | 205,000 | | C | | Goodman Global Holdings, Inc., 8.360%, due 06/15/12 | | | 203,463 |
| | 825,000 | | C | | Interline Brands, Inc., 8.125%, due 06/15/14 | | | 818,813 |
| | | | | | | | |
| | | | | | | | 1,688,839 |
| | | | | | | | |
| | Chemicals: 5.5% |
| | 123,000 | | C | | Equistar Chemicals LP, 10.625%, due 05/01/11 | | | 129,150 |
| | 750,000 | | C | | Huntsman International, LLC, 7.875%, due 11/15/14 | | | 802,500 |
| | 1,440,000 | | @@, #, C | | Ineos Group Holdings PLC, 8.500%, due 02/15/16 | | | 1,386,000 |
| | 340,000 | | C | | Lyondell Chemical Co., 8.000%, due 09/15/14 | | | 375,700 |
| | 1,075,000 | | C | | Lyondell Chemical Co., 8.250%, due 09/15/16 | | | 1,217,438 |
| | 605,000 | | #, C | | MacDermid, Inc., 9.500%, due 04/15/17 | | | 586,850 |
| | 760,000 | | #, C | | Momentive Performance Materials, Inc., 9.750%, due 12/01/14 | | | 756,200 |
| | 700,000 | | &, #, C | | Momentive Performance Materials, Inc., 10.125%, due 12/01/14 | | | 693,000 |
| | | | | | | | |
Principal
Amount | | | | | | Value |
| | | | | | | | |
| $ | 1,120,000 | | @@, C | | Nova Chemicals Corp., 8.484%, due 11/15/13 | | $ | 1,103,200 |
| | 800,000 | | C | | PolyOne Corp., 8.875%, due 05/01/12 | | | 828,000 |
| | | | | | | | |
| | | | | | | | 7,878,038 |
| | | | | | | | |
| | Commercial Services: 4.8% |
| | 710,000 | | C | | Alion Science and Technology Corp., 10.250%, due 02/01/15 | | | 647,875 |
| | 660,000 | | C | | Aramark Services, Inc., 8.500%, due 02/01/15 | | | 676,500 |
| | 440,000 | | C | | Aramark Services, Inc., 8.856%, due 02/01/15 | | | 446,600 |
| | 1,390,000 | | #, C | | Ashtead Capital, Inc., 9.000%, due 08/15/16 | | | 1,377,838 |
| | 730,000 | | C | | Avis Budget Car Rental LLC/Avis Budget Finance, Inc., 7.625%, due 05/15/14 | | | 720,875 |
| | 665,000 | | C | | Avis Budget Car Rental LLC/Avis Budget Finance, Inc., 7.750%, due 05/15/16 | | | 655,025 |
| | 680,000 | | C | | Hertz Corp., 8.875%, due 01/01/14 | | | 703,800 |
| | 680,000 | | C | | Hertz Corp., 10.500%, due 01/01/16 | | | 737,800 |
| | 1,100,000 | | C | | Neff Corp., 10.000%, due 06/01/15 | | | 786,500 |
| | | | | | | | |
| | | | | | | | 6,752,813 |
| | | | | | | | |
| | Computers: 0.6% |
| | 845,000 | | C | | Sungard Data Systems, Inc., 9.125%, due 08/15/13 | | | 883,025 |
| | | | | | | | |
| | | | | | | | 883,025 |
| | | | | | | | |
| | Diversified Financial Services: 12.5% |
| | 705,000 | | # | | Astoria Depositor Corp., 8.144%, due 05/01/21 | | | 743,775 |
| | 900,000 | | #, C | | Biomet, Inc., 10.000%, due 10/15/17 | | | 904,500 |
| | 600,000 | | #, C | | Biomet, Inc., 11.625%, due 10/15/17 | | | 585,000 |
| | 780,000 | | #, C | | Buffalo Thunder Development Authority, 9.375%, due 12/15/14 | | | 737,100 |
| | 265,000 | | | | Ford Motor Credit Co., 7.800%, due 06/01/12 | | | 252,334 |
| | 455,000 | | | | Ford Motor Credit Co., 8.110%, due 01/13/12 | | | 430,317 |
| | 1,030,000 | | | | Ford Motor Credit Co., 9.810%, due 04/15/12 | | | 1,067,011 |
| | 2,295,000 | | S | | Ford Motor Credit Co., 9.875%, due 08/10/11 | | | 2,326,368 |
| | 365,000 | | | | General Motors Acceptance Corp., 6.750%, due 12/01/14 | | | 331,281 |
| | 1,480,000 | | | | General Motors Acceptance Corp., 6.875%, due 09/15/11 | | | 1,409,651 |
| | 1,085,000 | | #, C | | Hawker Beechcraft Acquisition Co., LLC, 9.750%, due 04/01/17 | | | 1,112,125 |
| | 565,000 | | &, #, C | | Hawker Beechcraft Acquisition Co., LLC / Hawker Beechcraft Notes Co., 8.875%, due 04/01/15 | | | 570,650 |
| | 670,000 | | C | | Hexion US Finance Corp./Hexion Nova Scotia Finance ULC, 9.750%, due 11/15/14 | | | 740,350 |
See Accompanying Notes to Financial Statements
53
| | |
| ING HIGH YIELD BOND FUND | | PORTFOLIO OF INVESTMENTS ASOF SEPTEMBER 30, 2007 (UNAUDITED) (CONTINUED) |
| | | | | | | | |
Principal
Amount | | | | | | Value |
| | | | | | | | |
| | Diversified Financial Services: (continued) |
| $ | 535,000 | | #, C | | KAR Holdings, Inc., 8.750%, due 05/01/14 | | $ | 514,938 |
| | 1,180,000 | | &, #, C | | Local TV Finance, LLC, 9.250%, due 06/15/15 | | | 1,115,100 |
| | 1,075,369 | | #, C | | Piper Jaffray Equipment Trust Securities, 6.750%, due 04/01/11 | | | 1,037,731 |
| | 670,000 | | #, C | | PNA Intermediate Holding Corp., 12.558%, due 02/15/13 | | | 659,950 |
| | 755,000 | | #, C | | Rainbow National Services, LLC, 8.750%, due 09/01/12 | | | 787,088 |
| | 280,000 | | C | | Residential Capital Corp., 7.375%, due 06/30/10 | | | 232,536 |
| | 570,000 | | | | Residential Capital Corp., 7.800%, due 11/21/08 | | | 512,288 |
| | 730,000 | | #, C | | Snoqualmie Entertainment Authority, 9.125%, due 02/01/15 | | | 722,700 |
| | 950,000 | | C | | Universal City Florida Holding Co. I/II, 10.106%, due 05/01/10 | | | 964,250 |
| | | | | | | | |
| | | | | | | | 17,757,043 |
| | | | | | | | |
| | Electric: 4.0% |
| | 495,000 | | #, C | | AES Corp., 8.750%, due 05/15/13 | | | 520,369 |
| | 715,000 | | # | | Edison Mission Energy, 7.000%, due 05/15/17 | | | 707,850 |
| | 710,838 | | C | | Homer City Funding, LLC,
8.734%, due 10/01/26 | | | 796,138 |
| | 1,000,000 | | @@, #, C | | Intergen NV, 9.000%, due 06/30/17 | | | 1,055,000 |
| | 165,035 | | C | | Midwest Generation, LLC,
8.300%, due 07/02/09 | | | 167,923 |
| | 788,886 | | C | | Midwest Generation, LLC,
8.560%, due 01/02/16 | | | 844,108 |
| | 860,000 | | C | | Mirant North America, LLC,
7.375%, due 12/31/13 | | | 877,200 |
| | 350,000 | | C | | Reliant Energy, Inc.,
7.625%, due 06/15/14 | | | 354,375 |
| | 395,000 | | C | | Reliant Energy, Inc.,
7.875%, due 06/15/17 | | | 399,444 |
| | | | | | | | |
| | | | | | | | 5,722,407 |
| | | | | | | | |
| | Entertainment: 3.2% |
| | 570,000 | | C | | AMC Entertainment, Inc.,
8.625%, due 08/15/12 | | | 588,525 |
| | 1,125,000 | | C | | AMC Entertainment, Inc.,
11.000%, due 02/01/16 | | | 1,203,750 |
| | 640,000 | | #, C | | Pinnacle Entertainment, Inc.,
7.500%, due 06/15/15 | | | 608,800 |
| | 885,000 | | C | | Pinnacle Entertainment, Inc.,
8.250%, due 03/15/12 | | | 900,488 |
| | 640,000 | | #, C | | Shingle Springs Tribal
Gaming Authority,
9.375%, due 06/15/15 | | | 649,600 |
| | 670,000 | | C | | Warner Music Group — Old,
7.375%, due 04/15/14 | | | 586,250 |
| | | | | | | | |
| | | | | | | | 4,537,413 |
| | | | | | | | |
| | | | | | | | |
Principal
Amount | | | | | | Value |
| | | | | | | | |
| | Environmental Control: 1.5% |
| $ | 1,280,000 | | C | | Waste Services, Inc.,
9.500%, due 04/15/14 | | $ | 1,286,400 |
| | 865,000 | | C | | WCA Waste Corp.,
9.250%, due 06/15/14 | | | 895,275 |
| | | | | | | | |
| | | | | | | | 2,181,675 |
| | | | | | | | |
| | Food: 0.8% |
| | 770,000 | | C | | Albertson’s, Inc.,
7.450%, due 08/01/29 | | | 745,055 |
| | 425,000 | | C | | Stater Brothers Holdings,
8.125%, due 06/15/12 | | | 435,094 |
| | | | | | | | |
| | | | | | | | 1,180,149 |
| | | | | | | | |
| | Forest Products & Paper: 4.5% |
| | 433,000 | | C | | Abitibi-Consolidated Finance LP,
7.875%, due 08/01/09 | | | 387,535 |
| | 885,000 | | C | | Appleton Papers, Inc.,
8.125%, due 06/15/11 | | | 878,363 |
| | 505,000 | | @@, C | | Cascades, Inc.,
7.250%, due 02/15/13 | | | 497,425 |
| | 785,000 | | C | | Domtar, Inc.,
5.375%, due 12/01/13 | | | 722,200 |
| | 760,000 | | C | | Exopack Holding Corp.,
11.250%, due 02/01/14 | | | 798,000 |
| | 140,000 | | #, C | | Georgia-Pacific Corp.,
7.000%, due 01/15/15 | | | 137,200 |
| | 740,000 | | C | | Georgia-Pacific Corp.,
7.750%, due 11/15/29 | | | 706,700 |
| | 1,015,000 | | C | | NewPage Corp.,
12.000%, due 05/01/13 | | | 1,093,663 |
| | 270,000 | | C | | Verso Paper Holdings, LLC and Verson Paper, Inc.,
9.106%, due 08/01/14 | | | 272,700 |
| | 685,000 | | C | | Verso Paper Holdings, LLC and Verson Paper, Inc.,
9.125%, due 08/01/14 | | | 708,975 |
| | 250,000 | | C | | Verso Paper Holdings, LLC and Verson Paper, Inc.,
11.375%, due 08/01/16 | | | 264,375 |
| | | | | | | | |
| | | | | | | | 6,467,136 |
| | | | | | | | |
| | Healthcare — Products: 1.1% |
| | 1,190,000 | | C | | Accellent, Inc.,
10.500%, due 12/01/13 | | | 1,106,700 |
| | 520,000 | | C | | Advanced Medical Optics, Inc.,
7.500%, due 05/01/17 | | | 481,000 |
| | | | | | | | |
| | | | | | | | 1,587,700 |
| | | | | | | | |
| | Healthcare — Services: 6.0% |
| | 635,000 | | C | | Centene Corp.,
7.250%, due 04/01/14 | | | 625,475 |
| | 370,000 | | #, C | | Community Health Systems, Inc.,
8.875%, due 07/15/15 | | | 382,025 |
| | 665,000 | | C | | DaVita, Inc.,
7.250%, due 03/15/15 | | | 669,988 |
| | 1,915,000 | | #, C | | HCA, Inc., 9.250%, due 11/15/16 | | | 2,039,475 |
| | 1,090,000 | | &, #, C | | HCA, Inc., 9.625%, due 11/15/16 | | | 1,166,300 |
| | 830,000 | | C | | Psychiatric Solutions, Inc.,
7.750%, due 07/15/15 | | | 844,525 |
| | 795,000 | | #, C | | Sun Healthcare Group, Inc.,
9.125%, due 04/15/15 | | | 814,875 |
| | 530,000 | | C | | Tenet Healthcare Corp.,
6.375%, due 12/01/11 | | | 466,400 |
See Accompanying Notes to Financial Statements
54
| | |
| ING HIGH YIELD BOND FUND | | PORTFOLIO OF INVESTMENTS ASOF SEPTEMBER 30, 2007 (UNAUDITED) (CONTINUED) |
| | | | | | | | |
Principal
Amount | | | | | | Value |
| | | | | | | | |
| | Healthcare — Services: (continued) |
| $ | 725,000 | | C | | United Surgical Partners International, Inc.,
8.875%, due 05/01/17 | | $ | 735,875 |
| | 785,000 | | C | | United Surgical Partners International, Inc.,
9.250%, due 05/01/17 | | | 788,925 |
| | | | | | | | |
| | | | | | | | 8,533,863 |
| | | | | | | | |
| | Holding Companies — Diversified: 1.5% |
| | 750,000 | | C | | Atlantic Broadband Finance, LLC,
9.375%, due 01/15/14 | | | 731,250 |
| | 1,500,000 | | | | Travelport Holdings Ltd.,
12.350%, due 12/01/12 | | | 1,458,750 |
| | | | | | | | |
| | | | | | | | 2,190,000 |
| | | | | | | | |
| | Home Builders: 0.5% |
| | 892,000 | | C | | Stanley-Martin Communities, LLC,
9.750%, due 08/15/15 | | | 669,000 |
| | | | | | | | |
| | | | | | | | 669,000 |
| | | | | | | | |
| | Home Furnishings: 0.6% |
| | 795,000 | | C | | Norcraft Cos. LP,
9.000%, due 11/01/11 | | | 802,950 |
| | | | | | | | |
| | | | | | | | 802,950 |
| | | | | | | | |
| | Household Products/Wares: 1.2% |
| | 925,000 | | C | | American Achievement Corp.,
8.250%, due 04/01/12 | | | 925,000 |
| | 905,000 | | +, C | | Visant Holding Corp.,
0.000%, (Step rate 10.250%), due 12/01/13 | | | 846,175 |
| | | | | | | | |
| | | | | | | | 1,771,175 |
| | | | | | | | |
| | Iron/Steel: 0.2% |
| | 260,000 | | &, #, C | | Metals USA Holdings Corp.,
11.231%, due 07/01/12 | | | 243,100 |
| | | | | | | | |
| | | | | | | | 243,100 |
| | | | | | | | |
| | Leisure Time: 1.5% |
| | 1,005,000 | | @@, C | | NCL Corp.,
10.625%, due 07/15/14 | | | 1,017,563 |
| | 1,000,000 | | C | | Travelport, LLC,
11.875%, due 09/01/16 | | | 1,052,500 |
| | | | | | | | |
| | | | | | | | 2,070,063 |
| | | | | | | | |
| | Lodging: 2.4% |
| | 1,000,000 | | | | Green Valley Ranch Gaming,
8.610%, due 08/06/14 | | | 975,000 |
| | 785,000 | | | | Harrah’s Operating Co., Inc.,
6.500%, due 06/01/16 | | | 640,771 |
| | 700,000 | | #, C | | Seminole Hard Rock Entertainment, Inc.,
8.194%, due 03/15/14 | | | 686,875 |
| | 1,190,000 | | C | | Station Casinos, Inc.,
6.500%, due 02/01/14 | | | 1,053,150 |
| | | | | | | | |
| | | | | | | | 3,355,796 |
| | | | | | | | |
| | Media: 11.8% |
| | 1,000,000 | | C | | CBD Media, Inc.,
8.625%, due 06/01/11 | | | 1,045,630 |
| | | | | | | | |
Principal
Amount | | | | | | Value |
| | | | | | | | |
| $ | 528,000 | | C | | CCH I Holdings, LLC,
11.000%, due 10/01/15 | | $ | 543,840 |
| | 635,000 | | C | | CCH I, LLC,
11.000%, due 10/01/15 | | | 646,113 |
| | 1,084,000 | | C | | Charter Communications Holdings II, LLC,
10.250%, due 10/01/13 | | | 1,135,490 |
| | 525,000 | | #, C | | Charter Communications Operating, LLC,
8.375%, due 04/30/14 | | | 530,250 |
| | 445,000 | | | | CSC Holdings, Inc.,
7.625%, due 04/01/11 | | | 448,338 |
| | 10,000 | | | | CSC Holdings, Inc.,
8.125%, due 07/15/09 | | | 10,200 |
| | 1,074,000 | | C | | Dex Media West, LLC,
9.875%, due 08/15/13 | | | 1,147,838 |
| | 495,000 | | C | | Dex Media, Inc.,
8.000%, due 11/15/13 | | | 501,188 |
| | 1,480,000 | | C | | Idearc, Inc.,
8.000%, due 11/15/16 | | | 1,483,684 |
| | 995,000 | | +, C | | Insight Communications Co., Inc.,
12.250%, due 02/15/11 | | | 1,032,313 |
| | 1,105,000 | | #, C | | ION Media Networks, Inc.,
11.610%, due 01/15/13 | | | 1,129,863 |
| | 940,000 | | | | Liberty Media, LLC,
8.250%, due 02/01/30 | | | 925,900 |
| | 695,000 | | C | | Mediacom Broadband, LLC,
8.500%, due 10/15/15 | | | 700,213 |
| | 750,000 | | +, C | | Nexstar Finance Holdings, LLC,
0.000%, (Step rate 11.375%), due 04/01/13 | | | 742,500 |
| | 1,530,000 | | C | | Nexstar Finance, Inc.,
7.000%, due 01/15/14 | | | 1,476,450 |
| | 750,000 | | C | | Nielsen Finance LLC/Nielsen Finance Co.,
10.000%, due 08/01/14 | | | 796,875 |
| | 390,000 | | @@, #, C | | Quebecor Media, Inc.,
7.750%, due 03/15/16 | | | 373,913 |
| | 850,000 | | C | | Radio One, Inc.,
6.375%, due 02/15/13 | | | 756,500 |
| | 700,000 | | #, C | | TL Acquisitions, Inc.,
10.500%, due 01/15/15 | | | 687,750 |
| | 625,000 | | &, #, C | | Univision Communications, Inc.,
9.750%, due 03/15/15 | | | 612,500 |
| | | | | | | | |
| | | | | | | | 16,727,348 |
| | | | | | | | |
| Mining: 1.3%
| | | |
| | 954,000 | | C | | Freeport-McMoRan Copper & Gold, Inc.,
8.375%, due 04/01/17 | | | 1,044,630 |
| | 805,000 | | &, #, C | | Noranda Aluminium Acquisition Corp.,
9.360%, due 05/15/15 | | | 760,725 |
| | | | | | | | |
| | | | | | | | 1,805,355 |
| | | | | | | | |
| | Miscellaneous Manufacturing: 2.5% | | | |
| | 540,000 | | C | | Harland Clarke Holdings Corp.,
9.500%, due 05/15/15 | | | 480,600 |
| | 246,000 | | C | | Indalex Holding Corp.,
11.500%, due 02/01/14 | | | 232,470 |
See Accompanying Notes to Financial Statements
55
| | |
| ING HIGH YIELD BOND FUND | | PORTFOLIO OF INVESTMENTS ASOF SEPTEMBER 30, 2007 (UNAUDITED) (CONTINUED) |
| | | | | | | | |
Principal
Amount | | | | | | Value |
| | | | | | | | |
| | Miscellaneous Manufacturing: (continued) | | | |
| $ | 760,000 | | C | | RBS Global, Inc. and Rexnord Corp.,
9.500%, due 08/01/14 | | $ | 790,400 |
| | 835,000 | | | | Rexnord Corp.,
11.598%, due 03/02/13 | | | 786,988 |
| | 755,000 | | C | | Sally Holdings, LLC,
9.250%, due 11/15/14 | | | 766,325 |
| | 440,000 | | C | | Sally Holdings, LLC,
10.500%, due 11/15/16 | | | 442,200 |
| | | | | | | | |
| | | | | | | | 3,498,983 |
| | | | | | | | |
| | Oil & Gas: 4.8% | | | |
| | 440,000 | | #, C | | Chaparral Energy, Inc.,
8.875%, due 02/01/17 | | | 414,700 |
| | 900,000 | | C | | Chesapeake Energy Corp.,
6.625%, due 01/15/16 | | | 900,000 |
| | 405,000 | | C | | Denbury Resources, Inc.,
7.500%, due 12/15/15 | | | 417,150 |
| | 1,155,000 | | #, C | | Energy Partners Ltd.,
9.750%, due 04/15/14 | | | 1,114,575 |
| | 705,000 | | #, C | | Forest Oil Corp.,
7.250%, due 06/15/19 | | | 708,525 |
| | 815,000 | | @@, #, C | | Griffin Coal Mining Co. Pty Ltd., 9.500%, due 12/01/16 | | | 815,000 |
| | 870,000 | | @@, #, C | | OPTI Canada, Inc.,
8.250%, due 12/15/14 | | | 880,875 |
| | 600,000 | | C, I | | PetroHawk Energy Corp.,
9.125%, due 07/15/13 | | | 636,000 |
| | 150,000 | | C | | Sabine Pass LNG LP,
7.500%, due 11/30/16 | | | 148,500 |
| | 800,000 | | C | | Venoco, Inc.,
8.750%, due 12/15/11 | | | 802,000 |
| | | | | | | | |
| | | | | | | | 6,837,325 |
| | | | | | | | |
| | Packaging & Containers: 1.0% | | | |
| | 610,000 | | C | | Graham Packaging Co., Inc.,
8.500%, due 10/15/12 | | | 608,475 |
| | 775,000 | | C | | Jefferson Smurfit Corp.,
8.250%, due 10/01/12 | | | 780,813 |
| | | | | | | | |
| | | | | | | | 1,389,288 |
| | | | | | | | |
| | Pipelines: 0.5% | | | |
| | 715,000 | | C | | Williams Cos., Inc.,
7.500%, due 01/15/31 | | | 745,388 |
| | | | | | | | |
| | | | | | | | 745,388 |
| | | | | | | | |
| | Retail: 4.6% | | | |
| | 650,000 | | C | | Bon-Ton Stores, Inc.,
10.250%, due 03/15/14 | | | 611,000 |
| | 65,000 | | &, C, W | | General Nutrition Centers, Inc.,
10.009%, due 03/15/14 | | | 62,725 |
| | 1,065,000 | | #, C | | General Nutrition Centers, Inc.,
10.009%, due 03/15/14 | | | 1,027,725 |
| | 815,000 | | C | | GSC Holdings Corp.,
8.000%, due 10/01/12 | | | 851,675 |
| | 850,000 | | #, C | | Michaels Stores, Inc.,
10.000%, due 11/01/14 | | | 875,500 |
| | 815,000 | | &, C | | Neiman-Marcus Group, Inc.,
9.000%, due 10/15/15 | | | 872,050 |
| | 730,000 | | C | | NPC International, Inc.,
9.500%, due 05/01/14 | | | 667,950 |
| | | | | | | | |
Principal
Amount | | | | | | Value |
| | | | | | | | |
| $ | 775,000 | | C | | Rite Aid Corp.,
7.500%, due 03/01/17 | | $ | 733,344 |
| | 168,000 | | #, C | | Rite Aid Corp.,
9.375%, due 12/15/15 | | | 157,080 |
| | 717,000 | | #, C | | Rite Aid Corp.,
9.500%, due 06/15/17 | | | 673,980 |
| | | | | | | | |
| | | | | | | | 6,533,029 |
| | | | | | | | |
| | Semiconductors: 0.5% | | | |
| | 730,000 | | C | | Amkor Technology, Inc.,
9.250%, due 06/01/16 | | | 740,950 |
| | | | | | | | |
| | | | | | | | 740,950 |
| | | | | | | | |
| | Software: 1.2% | | | |
| | 810,000 | | #, C | | Open Solutions, Inc.,
9.750%, due 02/01/15 | | | 783,675 |
| | 945,000 | | #, C | | PGS Solutions, Inc.,
9.625%, due 02/15/15 | | | 885,938 |
| | | | | | | | |
| | | | | | | | 1,669,613 |
| | | | | | | | |
| | Telecommunications: 8.7% | | | |
| | 717,000 | | C | | Centennial Cellular Operating Co.,
10.125%, due 06/15/13 | | | 763,605 |
| | 390,000 | | C | | Centennial Communications Corp.,
10.000%, due 01/01/13 | | | 414,375 |
| | 545,000 | | C | | Cincinnati Bell, Inc.,
8.375%, due 01/15/14 | | | 546,363 |
| | 830,000 | | C | | Citizens Communications Co.,
9.000%, due 08/15/31 | | | 846,600 |
| | 885,000 | | #, C | | Cricket Communications, Inc.,
9.375%, due 11/01/14 | | | 902,700 |
| | 250,000 | | C | | Dobson Communications Corp.,
8.875%, due 10/01/13 | | | 267,500 |
| | 255,000 | | C | | Dobson Communications Corp.,
9.610%, due 10/15/12 | | | 260,738 |
| | 500,000 | | @@, C | | Intelsat Bermuda Ltd.,
8.886%, due 01/15/15 | | | 507,500 |
| | 1,185,000 | | @@, C | | Intelsat Bermuda Ltd.,
11.250%, due 06/15/16 | | | 1,275,356 |
| | 610,000 | | C | | Intelsat Corp.,
9.000%, due 06/15/16 | | | 631,350 |
| | 970,000 | | @@, C | | Intelsat Subsidiary Holding Co., Ltd.,
8.625%, due 01/15/15 | | | 994,250 |
| | 810,000 | | &, #, C | | iPCS, Inc., 8.606%, due 05/01/14 | | | 797,850 |
| | 790,000 | | #, C | | MetroPCS Wireless, Inc.,
9.250%, due 11/01/14 | | | 809,750 |
| | 1,455,000 | | #, C | | Rural Cellular Corp.,
8.621%, due 06/01/13 | | | 1,498,650 |
| | 950,000 | | C | | SunCom Wireless Holdings, Inc.,
8.500%, due 06/01/13 | | | 998,688 |
| | 300,000 | | C | | West Corp.,
9.500%, due 10/15/14 | | | 311,250 |
| | 570,000 | | C | | Windstream Corp.,
7.000%, due 03/15/19 | | | 558,600 |
| | | | | | | | |
| | | | | | | | 12,385,125 |
| | | | | | | | |
See Accompanying Notes to Financial Statements
56
| | |
| ING HIGH YIELD BOND FUND | | PORTFOLIO OF INVESTMENTS ASOF SEPTEMBER 30, 2007 (UNAUDITED) (CONTINUED) |
| | | | | | | | |
Principal
Amount | | | | | | Value |
| | | | | | | | |
| | Transportation: 0.5% | | | |
| $ | 690,000 | | #, C | | Bristow Group, Inc.,
7.500%, due 09/15/17 | | $ | 707,250 |
| | | | | | | | |
| | | | | | | | 707,250 |
| | | | | | | | |
| | | | | Total Corporate Bonds/Notes
(Cost $140,168,649) | | | 139,385,413 |
| | | | | | | | |
| | | |
| Shares | | | | | | Value |
| | COMMON STOCK: 0.1% |
| Agriculture: 0.0%
| | | |
| | 17,906 | | I, X | | North Atlantic Trading Co. | | $ | 18 |
| | | | | | | | |
| | | | | | | | 18 |
| | | | | | | | |
| | Telecommunications: 0.1% | | | |
| | 264 | | @, @@ | | Completel Europe NV | | | 13,326 |
| | 2,350 | | I, X | | Jordan Tellecommunications | | | 37,741 |
| | | | | | | | |
| | | | | | | | 51,067 |
| | | | | | | | |
| | | | | Total Common Stock
(Cost $210,181 ) | | | 51,085 |
| | | | | | | | |
| | MUTUAL FUNDS: 0.5% |
| | Closed-End Funds: 0.5% | | | |
| | 103,150 | | ** | | ING Prime Rate Trust | | | 725,145 |
| | | | | | | | |
| | | | | Total Mutual Funds
(Cost $719,225 ) | | | 725,145 |
| | | | | | | | |
| | PREFERRED STOCK: 0.0% |
| | Media: 0.0% | | | |
| | 1 | | &, P | | ION Media Networks, Inc. | | | 7,330 |
| | | | | | | | |
| | | | | Total Preferred Stock
(Cost $8,676 ) | | | 7,330 |
| | | | | | | | |
| | WARRANTS: 0.0% |
| | Building Materials: 0.0% | | | |
| | 3,100 | | @, #, I, X | | Dayton Superior Corp. | | | 31 |
| | | | | | | | |
| | | | | | | | 31 |
| | | | | | | | |
| | Healthcare — Services: 0.0% | | | |
| | 92,950 | | @, I, X | | Comforce Corp. | | | 930 |
| | | | | | | | |
| | | | | | | | 930 |
| | | | | | | | |
| | Telecommunications: 0.0% | | | |
| | 500 | | @, @@,
#, I, X | | GT Group Telecom, Inc. | | | — |
| | | | | | | | |
| | | | | | | | — |
| | | | | | | | |
| | | | | Total Warrants
(Cost $—) | | | 961 |
| | | | | | | | |
| | | | | Total Long-Term Investments (Cost $141,106,731 ) | | | 140,169,934 |
| | | | | | | | |
| | | | | | | | |
Principal
Amount | | | | | | Value |
| | | | | | | | |
| | SHORT-TERM INVESTMENTS: 1.7% |
| | Mutual Fund: 1.6% | | | |
| $ | 2,300,000 | | ** | | ING Institutional Prime Money Market Fund | | $ | 2,300,000 |
| | | | | | | | |
| | | | | Total Mutual Fund
(Cost $2,300,000 ) | | | 2,300,000 |
| | | | | | | | |
| | Repurchase Agreement: 0.1% |
| | 150,000 | | Goldman Sachs Repurchase
Agreement dated 09/28/07, 4.900%,
due 10/01/07, $150,061 to be
received upon repurchase
(Collateralized by $155,000 Federal
National Mortgage Association,
5.100%, Market Value plus accrued
interest $153,458, due 03/10/15) | | | 150,000 |
| | | | | | | | |
| | | Total Repurchase Agreement
(Cost $150,000) | | | 150,000 |
| | | | | | | | |
| | | Total Short-Term Investments
(Cost $2,450,000) | | | 2,450,000 |
| | | | | | | | |
| | | | | | | | | |
| | Total Investments in Securities
(Cost $143,556,731)* | | 100.4 | % | | $ | 142,619,934 | |
| | Other Assets and
Liabilities - Net | | (0.4 | ) | | | (553,541 | ) |
| | | | | | | | | |
| | Net Assets | | 100.0 | % | | $ | 142,066,393 | |
| | | | | | | | | |
| @ | Non-income producing security |
| + | Step-up basis bonds. Interest rates shown reflect current and next coupon rates. |
| # | Securities with purchases pursuant to Rule 144A or Section 4(2), under the Securities Act of 1933 and may not be resold subject to that rule except to qualified institutional buyers. Unless otherwise footnoted, these securities have been determined to be liquid under the guidelines established by the Funds' Board of Directors/Trustees. |
| C | Bond may be called prior to maturity date. |
| P | Preferred Stock may be called prior to convertible date. |
| W | When-issued or delayed delivery security |
| S | All or a portion of this security is segregated for certain derivatives, when-issued or delayed delivery securities and forward currency exchange contracts. |
| ** | Investment in affiliate |
| X | Fair value determined by ING Funds Valuation Committee appointed by the Funds’ Board of Directors/Trustees. |
| * | Cost for federal income tax purposes is $143,630,677. |
| | | | |
Net unrealized depreciation consists of: | | | | |
Gross Unrealized Appreciation | | $ | 2,105,185 | |
Gross Unrealized Depreciation | | | (3,115,928 | ) |
| | | | |
Net Unrealized Depreciation | | $ | (1,010,743 | ) |
| | | | |
See Accompanying Notes to Financial Statements
57
| | |
| ING HIGH YIELD BOND FUND | | PORTFOLIO OF INVESTMENTS ASOF SEPTEMBER 30, 2007 (UNAUDITED) (CONTINUED) |
ING High Yield Bond Fund Credit Default Swap Agreements Outstanding on September 30, 2007:
| | | | | | | | | | | | | | | | | |
Counterparty | | Reference Entity/Obligation | | Buy/Sell
Protection | | (Pay)/Receive
Fixed Rate (%) | | | Termination
Date | | | | Notional
Amount | | Unrealized
Appreciation/
(Depreciation) | |
UBS AG | | CDX.NA.HY.8 Index | | Buy | | (2.750 | ) | | 06/20/12 | | USD | | 3,750,000 | | $ | (65,817 | ) |
UBS AG | | Georgia-Pacific Corp.
7.750%, 11/15/29 | | Sell | | 3.000 | | | 09/20/12 | | USD | | 1,000,000 | | | 3,644 | |
Lehman Brothers Special Financing Inc. | | Harrah’s Operating Co., Inc.
5.625%, 06/01/15 | | Sell | | 0.600 | | | 03/20/08 | | USD | | 3,000,000 | | | (7,007 | ) |
Credit Suisse First Boston | | LCDX.NA.8 Index | | Sell | | 1.200 | | | 06/20/12 | | USD | | 3,000,000 | | | 270,900 | |
JPMorgan Chase Bank N.A., New York | | Norbord Inc.
7.250%, 07/01/12 | | Buy | | (1.380 | ) | | 06/20/14 | | USD | | 2,000,000 | | | 108,222 | |
Lehman Brothers Special Financing Inc. | | Radian Group Inc.
5.375%, 06/15/15 | | Sell | | 3.900 | | | 09/20/14 | | USD | | 900,000 | | | 18,747 | |
UBS AG | | Radian Group Inc.
5.375%, 06/15/15 | | Buy | | (0.850 | ) | | 09/20/14 | | USD | | 900,000 | | | 114,319 | |
Citibank N.A., New York | | Simon Property Group LP
6.350%, 08/28/12 | | Buy | | (0.380 | ) | | 09/20/12 | | USD | | 1,000,000 | | | 3,693 | |
Goldman Sachs International | | Temple-Inland Inc.
7.875%, 05/01/12 | | Buy | | (1.040 | ) | | 03/20/14 | | USD | | 900,000 | | | 12,492 | |
| | | | | | | | | | | | | | | | | |
| | | | | | | | | | | | | | | $ | 459,193 | |
| | | | | | | | | | | | | | | | | |
See Accompanying Notes to Financial Statements
58
| | |
| ING INTERMEDIATE BOND FUND | | PORTFOLIO OF INVESTMENTS ASOF SEPTEMBER 30, 2007 (UNAUDITED) |
| | | | | | | | |
Principal Amount | | | | | | Value |
| | | | | | | | |
| | CORPORATE BONDS/NOTES: 20.8% | | | |
| | Airlines: 0.6% | | | |
| $ | 5,679,000 | | C | | Delta Airlines, Inc.,
7.570%, due 11/18/10 | | $ | 5,829,694 |
| | 1,742,000 | | | | United AirLines, Inc.,
6.932%, due 09/01/11 | | | 2,053,922 |
| | | | | | | | |
| | | | | | | | 7,883,616 |
| | | | | | | | |
| | Auto Manufacturers: 0.2% | | | |
| | 2,749,225 | | | | Ford Motor Co.,
8.597%, due 11/29/13 | | | 2,672,857 |
| | | | | | | | |
| | | | | | | | 2,672,857 |
| | | | | | | | |
| | Banks: 5.6% | | | |
| | 3,050,000 | | @@, C | | Australia & New Zealand Banking Group Ltd.,
5.494%, due 12/31/49 | | | 2,626,062 |
| | 685,000 | | C | | BAC Capital Trust XIV,
5.630%, due 12/31/49 | | | 652,319 |
| | 349,076 | | @@, # | | Banco Itau SA,
5.720%, due 09/20/08 | | | 344,929 |
| | 3,476,000 | | @@, #, C | | Banco Mercantil del Norte SA,
6.135%, due 10/13/16 | | | 3,477,182 |
| | 1,190,000 | | @@, C | | Bank of Ireland,
5.500%, due 12/29/49 | | | 1,033,571 |
| | 540,000 | | @@, C, L | | Bank of Scotland,
5.625%, due 12/31/49 | | | 465,364 |
| | 177,000 | | C | | BankAmerica Capital II,
8.000%, due 12/15/26 | | | 184,025 |
| | 1,450,000 | | @@, C | | Barclays Bank PLC,
5.563%, due 12/31/49 | | | 1,263,326 |
| | 320,000 | | @@, C | | Barclays O/S Inv,
5.615%, due 11/19/07 | | | 273,462 |
| | 2,170,000 | | @@, C, L | | BNP Paribas,
5.238%, due 09/29/49 | | | 1,850,745 |
| | 4,070,000 | | @@, #, C | | Chuo Mitsui Trust & Banking Co., Ltd.,
5.506%, due 04/15/49 | | | 3,762,406 |
| | 1,100,000 | | @@, #, C | | Danske Bank A/S,
5.914%, due 12/29/49 | | | 1,058,175 |
| | 670,000 | | @@, C | | Den Norske Bank ASA,
5.813%, due 11/29/49 | | | 539,371 |
| | 2,584,000 | | #, C | | Dresdner Funding Trust I,
8.151%, due 06/30/31 | | | 2,810,384 |
| | 1,228,000 | | @@, #, C | | HBOS PLC,
5.375%, due 11/29/49 | | | 1,150,470 |
| | 3,370,000 | | @@, C | | Hongkong & Shanghai Banking Corp., Ltd.,
5.500%, due 07/29/49 | | | 2,645,450 |
| | 3,460,000 | | @@, C, L | | HSBC Bank PLC,
5.538%, due 06/29/49 | | | 2,756,467 |
| | 2,390,000 | | @@, C | | HSBC Bank PLC,
5.625%, due 06/29/49 | | | 1,898,059 |
| | 2,370,000 | | @@, C, L | | Lloyds TSB Bank PLC,
5.523%, due 08/29/49 | | | 1,884,150 |
| | 2,630,000 | | @@, C | | Lloyds TSB Bank PLC,
5.688%, due 06/29/49 | | | 2,222,729 |
| | 2,080,000 | | @@, C | | Lloyds TSB Bank PLC,
5.750%, due 11/29/49 | | | 1,806,507 |
| | 1,116,000 | | @@, #, C | | Lloyds TSB Group PLC,
6.267%, due 11/13/49 | | | 1,022,497 |
| | | | | | | | |
Principal Amount | | | | | | Value |
| | | | | | | | |
| $ | 2,575,000 | | @@,
C | | Mizuho Financial Group Cayman Ltd.,
8.375%, due 12/31/49 | | $ | 2,682,856 |
| | 590,000 | | @@,
C | | National Westminster Bank PLC,
5.563%, due 08/29/49 | | | 507,591 |
| | 320,000 | | @@,
C | | National Westminster Bank PLC,
5.688%, due 11/29/49 | | | 255,200 |
| | 1,975,000 | | #, C | | Rabobank Capital Funding II,
5.260%, due 12/29/49 | | | 1,869,946 |
| | 1,926,000 | | #, C | | Rabobank Capital Funding Trust,
5.254%, due 12/31/49 | | | 1,775,545 |
| | 1,767,000 | | C | | RBS Capital Trust I,
5.512%, due 12/31/49 | | | 1,655,617 |
| | 3,156,000 | | @@,
#,
C | | Resona Bank Ltd.,
5.850%, due 09/29/49 | | | 2,973,056 |
| | 4,330,000 | | @@,
C | | Royal Bank of Scotland Group PLC,
5.563%, due 12/29/49 | | | 3,697,508 |
| | 1,699,000 | | @@,
#,
C | | Royal Bank of Scotland Group PLC,
6.990%, due 10/05/17 | | | 1,474,064 |
| | 600,000 | | @@ | | Royal Bank of Scotland Group PLC,
7.640%, due 09/29/17 | | | 600,000 |
| | 1,090,000 | | @@,
C | | Societe Generale,
5.469%, due 11/29/49 | | | 910,569 |
| | 3,220,000 | | @@,
C | | Standard Chartered PLC,
5.500%, due 07/29/49 | | | 2,410,975 |
| | 520,000 | | @@,
C,
L | | Standard Chartered PLC,
5.588%, due 01/29/49 | | | 397,800 |
| | 1,060,000 | | @@,
C,
L | | Standard Chartered PLC,
5.588%, due 12/29/49 | | | 793,675 |
| | 5,150,000 | | @@,
C,
L | | Standard Chartered PLC,
5.625%, due 11/29/49 | | | 3,939,750 |
| | 2,777,000 | | @@,
C | | Sumitomo Mitsui Banking Corp.,
8.150%, due 08/01/49 | | | 2,840,757 |
| | 515,000 | | C | | SunTrust Preferred Capital I,
5.853%, due 12/31/49 | | | 505,795 |
| | 2,251,000 | | C | | Wachovia Capital Trust III,
5.800%, due 12/31/49 | | | 2,237,622 |
| | 1,340,000 | | @@,
C | | Westpac Banking Corp.,
5.306%, due 09/30/49 | | | 1,140,435 |
| | 1,108,000 | | #, C | | Westpac Capital Trust IV,
5.256%, due 12/29/49 | | | 965,560 |
| | | | | | | | |
| | | | | | | | 69,361,971 |
| | | | | | | | |
| | Beverages: 0.1% | | | |
| | BRL 3,283,000 | | @@,
#,
L | | Ambev International Finance Co., Ltd.,
9.500%, due 07/24/17 | | | 1,665,679 |
| | | | | | | | |
| | | | | | | | 1,665,679 |
| | | | | | | | |
See Accompanying Notes to Financial Statements
59
| | |
| ING INTERMEDIATE BOND FUND | | PORTFOLIO OF INVESTMENTS ASOF SEPTEMBER 30, 2007 (UNAUDITED) (CONTINUED) |
| | | | | | |
Principal Amount | | | | | | Value |
| | | | | | |
| Chemicals: 0.4% | | |
| $ 720,000 | | | | Stauffer Chemical,
4.950%, due 04/15/10 | | $ 636,746 |
| 1,510,000 | | | | Stauffer Chemical,
7.370%, due 04/15/17 | | 881,281 |
| 1,230,000 | | | | Stauffer Chemical,
5.840%, due 04/15/18 | | 676,365 |
| 3,081,000 | | | | Union Carbide Corp.,
7.750%, due 10/01/96 | | 3,264,665 |
| | | | | | |
| | | | | | 5,459,057 |
| | | | | | |
| Diversified: 0.4% | | |
| 1,146,000 | | C, L | | Istar Financial, Inc.,
5.150%, due 03/01/12 | | 1,061,414 |
| 348,000 | | C | | Istar Financial, Inc.,
5.500%, due 06/15/12 | | 325,160 |
| 930,000 | | C | | Istar Financial, Inc.,
5.850%, due 03/15/17 | | 824,215 |
| 444,000 | | C | | Liberty Property LP,
6.375%, due 08/15/12 | | 455,313 |
| 526,000 | | | | Liberty Property LP,
6.625%, due 10/01/17 | | 525,968 |
| 1,583,000 | | C | | Liberty Property LP,
7.750%, due 04/15/09 | | 1,631,308 |
| | | | | | |
| | | | | | 4,823,378 |
| | | | | | |
| Diversified Financial Services: 6.5% | | |
| 6,842,000 | | @@, #, C, L | | Aiful Corp.,
4.450%, due 02/16/10 | | 6,572,288 |
| 527,000 | | @@, #, I | | Alpine III,
6.080%, due 08/16/14 | | 528,755 |
| 527,000 | | @@, #, I | | Alpine III,
6.480%, due 08/16/14 | | 528,943 |
| 789,000 | | @@, #, I | | Alpine III,
8.280%, due 08/16/14 | | 794,483 |
| 1,348,000 | | @@, #, I | | Alpine III,
11.530%, due 08/16/14 | | 1,380,624 |
| 7,897,000 | | # | | Astoria Depositor Corp.,
8.144%, due 05/01/21 | | 8,331,335 |
| 2,340,000 | | #, C | | Corestates Capital Trust I, 8.000%, due 12/15/26 | | 2,424,792 |
| 2,130,000 | | @@ | | Eksportfinans A/S, 5.125%, due 10/26/11 | | 2,167,635 |
| 1,245,000 | | @@, C | | Financiere CSFB NV, 5.375%, due 03/29/49 | | 1,065,409 |
| 3,513,000 | | | | Ford Motor Credit Co., 8.000%, due 12/15/16 | | 3,291,614 |
| 1,512,000 | | | | Ford Motor Credit Co., 8.110%, due 01/13/12 | | 1,429,977 |
| 3,019,000 | | | | Ford Motor Credit Co., 9.810%, due 04/15/12 | | 3,127,482 |
| 2,538,000 | | C | | Fund American Cos., Inc., 5.875%, due 05/15/13 | | 2,505,318 |
| 3,243,000 | | C | | Goldman Sachs Group, Inc.,
5.793%, due 12/31/49 | | 3,071,750 |
| 1,818,000 | | #, C | | HVB Funding Trust III, 9.000%, due 10/22/31 | | 2,096,081 |
| 561,000 | | C | | Lehman Brothers Capital Trust VII, 5.857%, due 11/29/49 | | 535,007 |
| | | | | | |
Principal Amount | | | | | | Value |
| | | | | | |
| $ 2,661,000 | | C, L | | Lehman Brothers Holdings Capital Trust VIII, 6.371%, due 05/29/49 | | $ 2,500,840 |
| 3,618,000 | | #, C | | Mangrove Bay Pass-Through Trust, 6.102%, due 07/15/33 | | 3,366,907 |
| 3,178,000 | | @@, # | | Mantis Reef Ltd., 4.799%, due 11/03/09 | | 3,170,780 |
| 3,039,000 | | @@, C, L | | MUFG Capital Finance 1 Ltd., 6.346%, due 12/31/49 | | 2,893,538 |
| DKK 33 | | @@, I | | Nordea Kredit Realkreditaktieselskab, 6.000%, due 07/01/29 | | 6 |
| $ 1,296,000 | | @@, C | | Paribas, 5.375%, due 12/31/49 | | 1,097,967 |
| 570,167 | | @@, #, C | | Petroleum Export Ltd., 4.623%, due 06/15/10 | | 562,691 |
| 2,498,989 | | @@, #, C | | PF Export Receivables Master Trust, 6.436%, due 06/01/15 | | 2,519,856 |
| 4,088,362 | | #, C | | Piper Jaffray Equipment Trust Securities, 6.000%, due 09/10/11 | | 3,894,164 |
| 3,145,238 | | #, C | | Piper Jaffray Equipment Trust Securities, 6.750%, due 04/01/11 | | 3,035,155 |
| 367,150 | | # | | Power Receivable Finance, LLC,
6.290%, due 01/01/12 | | 378,425 |
| 2,457,000 | | C | | Residential Capital, LLC, 7.500%, due 04/17/13 | | 1,986,138 |
| 3,821,000 | | C | | Southern Star Central Corp.,
6.750%, due 03/01/16 | | 3,672,936 |
| 3,792,000 | | @@, # | | TNK-BP Finance SA, 7.500%, due 07/18/16 | | 3,775,315 |
| 13,940,228 | | Z, # | | Toll Road Investors Partnership II LP, 16.700%, due 02/15/45 | | 1,901,099 |
| 1,200,000 | | #, C | | Twin Reefs Pass-Through Trust, 6.122%, due 12/10/49 | | 952,488 |
| 2,695,000 | | @@, C | | UFJ Finance Aruba AEC, 8.750%, due 12/31/49 | | 2,787,005 |
| 1,085,000 | | #, C | | Wachovia Capital Trust V, 7.965%, due 06/01/27 | | 1,129,800 |
| | | | | | |
| | | | | | 79,476,603 |
| | | | | | |
| Electric: 1.8% | | |
| 5,316,000 | | C | | Commonwealth Edison Co., 6.950%, due 07/15/18 | | 5,495,415 |
| 657,000 | | @@, L | | Empresa Nacional de Electricidad SA, 8.625%, due 08/01/15 | | 752,171 |
| 3,724,000 | | @@, #, C | | Intergen NV, 9.000%, due 06/30/17 | | 3,928,820 |
| 655,235 | | #, C | | Juniper Generation, LLC, 6.790%, due 12/31/14 | | 664,799 |
| 2,475,000 | | C | | Nevada Power Co., 5.950%, due 03/15/16 | | 2,431,339 |
See Accompanying Notes to Financial Statements
60
| | |
| ING INTERMEDIATE BOND FUND | | PORTFOLIO OF INVESTMENTS ASOF SEPTEMBER 30, 2007 (UNAUDITED) (CONTINUED) |
| | | | | | |
Principal Amount | | | | | | Value |
| | | | | | |
| Electric: (continued) | | |
| $1,375,000 | | C | | Nevada Power Co., 6.750%, due 07/01/37 | | $ 1,389,083 |
| 3,845,000 | | C | | NorthWestern Corp., 5.875%, due 11/01/14 | | 3,753,885 |
| 3,224,000 | | C | | Sierra Pacific Power Co., 6.250%, due 04/15/12 | | 3,301,379 |
| | | | | | |
| | | | | | 21,716,891 |
| | | | | | |
| Energy — Alternate Sources: 0.5% | | |
| 1,800,000 | | | | Greater Ohio Ethanol, LLC, 8.864%, due 12/31/13 | | 1,764,000 |
| 2,200,000 | | | | Greater Ohio Ethanol, LLC, 12.630%, due 12/31/13 | | 2,164,250 |
| 1,653,000 | | # | | White Pine Hydro, LLC, 6.310%, due 07/10/17 | | 1,686,116 |
| | | | | | |
| | | | | | 5,614,366 |
| | | | | | |
| Gas: 0.8% | | |
| 2,984,000 | | @@,
#,
C | | Nakilat, Inc., 6.067%, due 12/31/33 | | 2,888,422 |
| 607,000 | | @@,
#,
C | | Nakilat, Inc., 6.267%, due 12/31/33 | | 591,033 |
| 6,691,000 | | C, L | | Southern Union Co., 7.200%, due 11/01/66 | | 6,754,959 |
| | | | | | |
| | | | | | 10,234,414 |
| | | | | | |
| Insurance: 0.5% | | |
| 4,124,000 | | @@,
C | | Aegon NV, 5.862%, due 12/31/49 | | 3,268,270 |
| 817,000 | | #, C | | North Front Pass-Through Trust, 5.810%, due 12/15/24 | | 796,139 |
| 2,720,000 | | @@,
C, L | | XL Capital, Ltd., 6.500%, due 12/15/49 | | 2,544,944 |
| | | | | | |
| | | | | | 6,609,353 |
| | | | | | |
| Media: 0.1% | | |
| 1,355,000 | | C | | Dex Media West, LLC, 9.875%, due 08/15/13 | | 1,448,156 |
| | | | | | |
| | | | | | 1,448,156 |
| | | | | | |
| Multi-National: 0.2% | | |
| 1,929,000 | | @@ | | Corp. Andina de Fomento CAF, 5.125%, due 05/05/15 | | 1,844,853 |
| | | | | | |
| | | | | | 1,844,853 |
| | | | | | |
| Oil & Gas: 0.8% | | |
| 1,193,000 | | @@, # | | Empresa Nacional de Petroleo ENAP,
4.875%, due 03/15/14 | | 1,130,963 |
| 796,000 | | @@, # | | Empresa Nacional de Petroleo ENAP,
6.750%, due 11/15/12 | | 837,185 |
| 777,000 | | C | | Marathon Oil Corp., 6.600%, due 10/01/37 | | 802,237 |
| 2,087,000 | | C | | Pemex Project Funding
Master Trust,
6.625%, due 06/15/35 | | 2,161,038 |
| 2,402,000 | | # | | Pemex Project Funding
Master Trust,
6.994%, due 06/15/10 | | 2,450,040 |
| | | | | | |
Principal Amount | | | | | | Value |
| | | | | | |
| $2,147,000 | | @@, #, C | | Ras Laffan Liquefied Natural Gas Co., Ltd. II, 5.298%, due 09/30/20 | | $ 2,053,277 |
| | | | | | |
| | | | | | 9,434,740 |
| | | | | | |
| Pipelines: 0.2% | | |
| 906,000 | | C, L | | Northwest Pipeline Corp., 7.000%, due 06/15/16 | | 945,638 |
| 1,262,000 | | C | | Transcontinental Gas Pipe Line Corp., 6.400%, due 04/15/16 | | 1,274,620 |
| | | | | | |
| | | | | | 2,220,258 |
| | | | | | |
| Real Estate Investment Trusts: 0.5% | | |
| 423,000 | | C | | Rouse Co., 7.200%, due 09/15/12 | | 426,535 |
| 6,041,000 | | #, C | | Rouse Co. LP/TRC Co.-Issuer, Inc., 6.750%, due 05/01/13 | | 5,956,021 |
| | | | | | |
| | | | | | 6,382,556 |
| | | | | | |
| Retail: 0.6% | | |
| 379,000 | | #, C | | Rite Aid Corp., 9.375%, due 12/15/15 | | 354,365 |
| 2,319,000 | | #, C, L | | Rite Aid Corp., 9.500%, due 06/15/17 | | 2,179,860 |
| 818,000 | | | | Wal-Mart Stores, Inc., 5.250%, due 09/01/35 | | 719,826 |
| 3,781,000 | | | | Wal-Mart Stores, Inc., 6.500%, due 08/15/37 | | 3,936,826 |
| | | | | | |
| | | | | | 7,190,877 |
| | | | | | |
| Savings & Loans: 0.1% | | |
| 600,000 | | #, C | | Washington Mutual Preferred Funding Delaware, 6.534%, due 12/31/49 | | 550,969 |
| | | | | | |
| | | | | | 550,969 |
| | | | | | |
Telecommunications: 0.6%
| | |
| 3,804,000 | | | | Bellsouth Telecommunications, Inc.,
7.000%, due 12/01/95 | | 3,879,247 |
| 1,937,000 | | @@, C | | Rogers Wireless, Inc.,
7.250%, due 12/15/12 | | 2,053,112 |
| 317,000 | | C | | Sprint Capital Corp.,
6.875%, due 11/15/28 | | 306,769 |
| 1,692,000 | | C | | Sprint Nextel Corp.,
6.000%, due 12/01/16 | | 1,628,017 |
| | | | | | |
| | | | | | 7,867,145 |
| | | | | | |
| Water: 0.3% | | | | |
| 1,195,000 | | # | | White Pine Hydro Portfolio, LLC,
6.960%, due 07/10/37 | | 1,220,185 |
| 1,764,000 | | # | | White Pine Hydro Portfolio, LLC,
7.260%, due 07/20/15 | | 1,810,619 |
| | | | | | |
| | | | | | 3,030,804 |
| | | | | | |
| | | | Total Corporate Bonds/Notes | | |
| | | | (Cost $261,604,616) | | 255,488,543 |
| | | | | | |
See Accompanying Notes to Financial Statements
61
| | |
| ING INTERMEDIATE BOND FUND | | PORTFOLIO OF INVESTMENTS ASOF SEPTEMBER 30, 2007 (UNAUDITED) (CONTINUED) |
| | | | | | |
Principal Amount | | | | | | Value |
| | | | | | |
| U.S. GOVERNMENT AND AGENCY OBLIGATIONS: 20.2% |
Federal Home Loan Mortgage Corporation: 12.4%
|
| $ 1,157,122 | | C, S | | 4.500%, due 12/15/16 | | $ 1,143,691 |
| 3,422,000 | | C, S | | 4.500%, due 02/15/20 | | 3,176,311 |
| 4,450,803 | | C, S | | 5.000%, due 08/15/16 | | 4,409,671 |
| 4,105,000 | | C, S | | 5.000%, due 12/15/17 | | 4,048,681 |
| 869,000 | | C, S | | 5.000%, due 05/15/20 | | 843,711 |
| 2,801,690 | | C, S | | 5.000%, due 08/15/21 | | 2,787,502 |
| 3,513,000 | | C, S | | 5.000%, due 04/15/23 | | 3,268,012 |
| 2,490,000 | | C, S | | 5.000%, due 09/15/31 | | 2,301,644 |
| 945,000 | | C, S | | 5.000%, due 02/15/32 | | 905,918 |
| 5,663,000 | | C, S | | 5.000%, due 03/15/32 | | 5,405,016 |
| 4,242,000 | | C, S | | 5.000%, due 04/15/32 | | 4,133,420 |
| 3,069,000 | | C, S | | 5.000%, due 08/15/32 | | 2,974,673 |
| 4,478,000 | | C, S | | 5.000%, due 12/15/32 | | 4,331,021 |
| 3,388,251 | | C, S | | 5.000%, due 02/15/35 | | 3,312,685 |
| 586,558 | | S | | 5.001%, due 04/01/35 | | 576,591 |
| 8,442,000 | | Z | | 5.066%, due 03/15/31 | | 2,517,100 |
| 6,406,000 | | C, S | | 5.250%, due 03/15/12 | | 6,444,820 |
| 10,734,653 | | C, S | | 5.500%, due 08/15/20 | | 10,160,296 |
| 1,663,000 | | C, S | | 5.500%, due 12/15/20 | | 1,652,844 |
| 6,362,000 | | C, S | | 5.500%, due 11/15/22 | | 6,333,204 |
| 3,931,000 | | C, S | | 5.500%, due 09/15/32 | | 3,856,824 |
| 996,000 | | C, S | | 5.500%, due 10/15/32 | | 975,792 |
| 887,000 | | C, S | | 5.500%, due 11/15/32 | | 878,564 |
| 2,872,000 | | C, S | | 5.500%, due 07/15/33 | | 2,832,604 |
| 18,827,000 | | W | | 5.500%, due 11/15/34 | | 18,429,863 |
| 1,195,182 | | S | | 5.500%, due 06/01/36 | | 1,158,726 |
| 7,040,855 | | C, S | | 6.000%, due 01/15/29 | | 7,147,227 |
| 28,016,000 | | W | | 6.000%, due 11/01/33 | | 28,029,140 |
| 337,457 | | C, S | | 6.103%, due 02/15/32 | | 337,925 |
| 8,281,192 | | C, S | | 6.103%, due 05/15/33 | | 8,219,541 |
| 9,716,000 | | W | | 6.500%, due 10/01/37 | | 9,890,587 |
| 7,837 | | S | | 7.500%, due 11/01/28 | | 8,223 |
| | | | | | |
| | | | | | 152,491,827 |
| | | | | | |
Federal National Mortgage Corporation: 7.7%
| | |
| 2,660,905 | | S, ^ | | 1.933%, due 02/17/29 | | 233,059 |
| 148,094 | | C, S | | 4.750%, due 12/25/42 | | 147,734 |
| 2,959,000 | | W | | 5.000%, due 10/15/18 | | 2,900,282 |
| 2,832,764 | | S | | 5.000%, due 02/25/29 | | 2,816,289 |
| 1,471,000 | | S | | 5.000%, due 10/25/33 | | 1,411,565 |
| 3,758,315 | | S | | 5.000%, due 08/01/35 | | 3,591,430 |
| 897,216 | | S | | 5.000%, due 10/01/35 | | 857,376 |
| 2,677,736 | | S | | 5.000%, due 03/01/37 | | 2,519,978 |
| 13,844,700 | | S | | 5.000%, due 08/01/37 | | 13,029,043 |
| 1,097,526 | | S | | 5.055%, due 07/01/35 | | 1,081,972 |
| 818,409 | | S | | 5.222%, due 08/01/35 | | 811,421 |
| 3,240,000 | | C | | 5.400%, due 03/26/12 | | 3,253,767 |
| 1,698,000 | | S | | 5.500%, due 05/25/30 | | 1,655,769 |
| 13,949,000 | | W | | 5.500%, due 11/13/33 | | 13,654,760 |
| 4,678,993 | | S | | 5.500%, due 01/25/36 | | 4,534,089 |
| 1,243,359 | | S | | 5.500%, due 07/01/36 | | 1,205,822 |
| 4,688,179 | | S | | 5.500%, due 12/25/36 | | 4,495,618 |
| 4,521,067 | | S | | 5.500%, due 02/25/37 | | 4,462,037 |
| 308,730 | | S | | 5.500%, due 06/01/37 | | 302,449 |
| 2,742,000 | | C | | 5.550%, due 03/29/10 | | 2,749,094 |
| 398,510 | | S | | 5.581%, due 10/25/33 | | 398,882 |
| | | | | | |
Principal Amount | | | | | | Value |
| | | | | | |
| $ 369,156 | | C, S | | 5.681%, due 01/25/32 | | $ 369,528 |
| 46,867 | | S | | 6.000%, due 08/01/16 | | 47,605 |
| 4,182 | | S | | 6.000%, due 12/01/16 | | 4,247 |
| 157,623 | | S | | 6.000%, due 03/01/17 | | 160,103 |
| 1,363,856 | | S | | 6.000%, due 09/01/17 | | 1,385,175 |
| 96,979 | | S | | 6.000%, due 11/01/17 | | 98,506 |
| 2,267,000 | | W | | 6.000%, due 10/15/20 | | 2,297,108 |
| 3,549,547 | | S | | 6.000%, due 07/25/29 | | 3,609,448 |
| 1,958,237 | | S | | 6.000%, due 04/25/31 | | 2,004,095 |
| 7,563,000 | | | | 6.000%, due 11/15/34 | | 7,566,547 |
| 325,439 | | S | | 6.014%, due 04/18/28 | | 327,039 |
| 40,514 | | S | | 6.500%, due 07/01/29 | | 41,587 |
| 153,871 | | S | | 6.500%, due 08/01/29 | | 157,945 |
| 452,241 | | S | | 6.500%, due 04/01/30 | | 464,217 |
| 1,866 | | S | | 6.500%, due 06/01/31 | | 1,913 |
| 340,074 | | S | | 6.500%, due 07/01/31 | | 349,952 |
| 10,225 | | S | | 6.500%, due 09/01/31 | | 10,482 |
| 6,723,000 | | | | 6.500%, due 10/01/31 | | 6,845,903 |
| 208,064 | | S | | 6.500%, due 11/01/31 | | 213,304 |
| 106,498 | | S | | 6.500%, due 04/01/32 | | 109,088 |
| 56,246 | | S | | 6.500%, due 07/01/32 | | 57,614 |
| 140,239 | | S | | 6.500%, due 08/01/32 | | 143,650 |
| 22,256 | | S | | 6.500%, due 11/01/32 | | 22,797 |
| 95,595 | | S | | 6.500%, due 01/01/33 | | 97,920 |
| 79,797 | | S | | 6.500%, due 02/01/33 | | 81,668 |
| 457,256 | | S | | 6.500%, due 12/01/33 | | 467,979 |
| 101,947 | | S | | 7.000%, due 01/01/30 | | 105,254 |
| 255,982 | | S | | 7.000%, due 06/01/31 | | 266,762 |
| 8,852 | | S | | 7.500%, due 10/01/30 | | 9,267 |
| 80,756 | | S | | 7.500%, due 02/01/32 | | 84,685 |
| 320,125 | | C, S | | 7.500%, due 12/25/41 | | 335,154 |
| 684,197 | | C, S | | 7.500%, due 01/25/48 | | 710,274 |
| | | | | | |
| | | | | | 94,559,252 |
| | | | | | |
| Government National Mortgage Association: 0.1% |
| 796,742 | | C, S, ^ | | 2.498%, due 06/16/31 | | 73,715 |
| 7,227 | | S | | 6.375%, due 04/20/28 | | 7,294 |
| 1,201 | | | | 6.500%, due 03/15/31 | | 1,231 |
| 17,796 | | S | | 6.500%, due 08/15/31 | | 18,243 |
| 36,464 | | S | | 6.500%, due 10/15/31 | | 37,379 |
| 17,809 | | S | | 6.500%, due 11/15/31 | | 18,256 |
| 14,802 | | S | | 6.500%, due 07/15/32 | | 15,166 |
| 79,682 | | S | | 6.500%, due 09/15/32 | | 81,641 |
| 50,866 | | S | | 7.000%, due 04/15/26 | | 53,377 |
| 22,734 | | S | | 7.000%, due 05/15/32 | | 23,808 |
| 59,089 | | S | | 7.500%, due 12/15/22 | | 62,023 |
| 5,724 | | S | | 7.500%, due 10/15/26 | | 6,016 |
| 9,268 | | S | | 7.500%, due 07/15/29 | | 9,731 |
| 129 | | | | 7.500%, due 11/15/30 | | 135 |
| 19,966 | | S | | 7.500%, due 12/15/30 | | 20,954 |
| 26,538 | | S | | 7.500%, due 12/15/31 | | 27,850 |
| 48,782 | | S | | 7.500%, due 05/15/32 | | 51,124 |
| | | | | | |
| | | | | | 507,943 |
| | | | | | |
| | | | Total U.S. Government and Agency Obligations (Cost $248,389,976) | | 247,559,022 |
| | | | | | |
See Accompanying Notes to Financial Statements
62
| | |
| ING INTERMEDIATE BOND FUND | | PORTFOLIO OF INVESTMENTS ASOF SEPTEMBER 30, 2007 (UNAUDITED) (CONTINUED) |
| | | | | | | | |
Principal Amount | | | | | | Value |
| | | | | | | | |
| | U.S. TREASURY OBLIGATIONS: 24.4% | | | |
| | U.S. Treasury Bonds: 2.6% | | | |
| $ | 18,492,000 | | L | | 4.750%, due 08/15/17 | | $ | 18,746,283 |
| | 13,059,000 | | L | | 4.750%, due 02/15/37 | | | 12,882,508 |
| | | | | | | | |
| | | | | | | | 31,628,791 |
| | | | | | | | |
| | U.S. Treasury Notes: 18.0% | | | |
| | 129,483,000 | | L | | 4.000%, due 08/31/09 | | | 129,614,556 |
| | 79,676,000 | | L | | 4.125%, due 08/31/12 | | | 79,377,295 |
| | 11,953,000 | | L | | 4.500%, due 05/15/10 | | | 12,107,086 |
| | | | | | | | |
| | | | | | | | 221,098,937 |
| | | | | | | | |
| | Treasury Inflation Indexed Protected Securities: 3.8% |
| | 5,956,621 | | L | | 2.375%, due 04/15/11 | | | 5,997,109 |
| | 5,877,201 | | L | | 2.375%, due 01/15/17 | | | 5,921,286 |
| | 24,023,787 | | L | | 2.375%, due 01/15/25 | | | 24,243,388 |
| | 10,360,369 | | L | | 3.875%, due 01/15/09 | | | 10,575,678 |
| | | | | | | | |
| | | | | | | | 46,737,461 |
| | | | | | | | |
| | | | | Total U.S. Treasury Obligations (Cost $298,408,417) | | | 299,465,189 |
| | | | | | | | |
| | ASSET-BACKED SECURITIES: 3.9% | | | |
| | Automobile Asset-Backed Securities: 0.0% | | | |
| | 199,452 | | C, S | | AmeriCredit Automobile Receivables Trust, 4.220%, due 07/06/09 | | | 198,771 |
| | | | | | | | |
| | | | | | | | 198,771 |
| | | | | | | | |
| | Credit Card Asset-Backed Securities: 0.2% | | | |
| | 560,000 | | C, S | | Bank One Issuance Trust, 4.540%, due 09/15/10 | | | 558,507 |
| | 1,685,000 | | C, S | | Citibank Credit Card Issuance Trust,
5.650%, due 09/20/19 | | | 1,679,209 |
| | | | | | | | |
| | | | | | | | 2,237,716 |
| | | | | | | | |
| | Home Equity Asset-Backed Securities: 1.8% | | | |
| | 392,886 | | C, S | | Freddie Mac Structured Pass-Through Securities, 5.381%, due 05/25/31 | | | 388,994 |
| | 100,914 | | C, S | | Freddie Mac Structured Pass-Through Securities, 5.431%, due 01/25/32 | | | 100,941 |
| | 4,851,000 | | C, S | | GSAA Trust, 5.242%, due 06/25/34 | | | 4,835,522 |
| | 2,117,000 | | C, S | | GSAA Trust, 5.882%, due 09/25/36 | | | 2,148,998 |
| | 6,608,000 | | C, S | | GSAA Trust, 6.040%, due 07/25/36 | | | 6,703,131 |
| | 1,384,000 | | #, C, S | | Irwin Home Equity, 5.960%, due 08/25/37 | | | 1,380,447 |
| | 40,848 | | C, S | | Merrill Lynch Mortgage Investors, Inc., 5.491%, due 07/25/34 | | | 39,621 |
| | 3,905,000 | | C, S | | Morgan Stanley Mortgage Loan Trust, 5.858%, due 01/25/47 | | | 3,868,364 |
| | 306,665 | | C, S | | Renaissance Home Equity Loan Trust, 4.456%, due 05/25/35 | | | 304,607 |
| | | | | | | | |
Principal Amount | | | | | | Value |
| | | | | | | | |
| $ | 521,359 | | C, S | | Renaissance Home Equity Loan Trust, 4.723%, due 11/25/35 | | $ | 519,153 |
| | 115,638 | | C, S | | Residential Asset Securities Corp., 5.731%, due 06/25/32 | | | 114,593 |
| | 1,411,000 | | C, S | | Residential Funding Mortgage Securities II, Inc., 5.890%, due 05/25/37 | | | 1,396,310 |
| | 640,176 | | C, S | | Wells Fargo Home Equity Trust, 3.970%, due 05/25/34 | | | 623,303 |
| | | | | | | | |
| | | | | | | | 22,423,984 |
| | | | | | | | |
| | Other Asset-Backed Securities: 1.9% | | | |
| | 32,634 | | C, S | | Amortizing Residential Collateral Trust, 5.631%, due 05/25/32 | | | 32,125 |
| | 75,975 | | C, S | | Caterpillar Financial Asset Trust,
5.590%, due 02/25/09 | | | 76,044 |
| | 7,607 | | C, S | | Chase Funding Mortgage Loan,
4.045%, due 05/25/33 | | | 7,452 |
| | 299,456 | | C, S | | Chase Funding Mortgage Loan,
5.431%, due 07/25/33 | | | 294,261 |
| | 340,574 | | C, S | | Countrywide Asset-Backed Certificates,
4.493%, due 02/25/36 | | | 339,228 |
| | 2,871,000 | | C, S | | Credit-Based Asset Servicing and Securitization, LLC,
4.831%, due 08/25/35 | | | 2,806,838 |
| | 2,831,000 | | C, S | | Credit-Based Asset Servicing and Securitization, LLC,
5.501%, due 12/25/36 | | | 2,808,453 |
| | 1,456,000 | | #, C, S | | Credit-Based Asset Servicing and Securitization, LLC,
5.746%, due 12/25/37 | | | 1,456,683 |
| | 1,188,000 | | #, C, S | | Credit-Based Asset Servicing and Securitization, LLC,
6.020%, due 12/25/37 | | | 1,171,294 |
| | 1,355,000 | | C, S | | Equity One, Inc.,
5.050%, due 09/25/33 | | | 1,294,140 |
| | 463,429 | | C, S | | Fannie Mae,
5.271%, due 04/25/35 | | | 463,444 |
| | 2,720,000 | | @@, #, C, S | | Hudson Mezzanine Funding,
6.454%, due 06/12/42 | | | 408,000 |
| | 1,404,809 | | C, S | | Lehman XS Trust,
5.411%, due 08/25/35 | | | 1,366,670 |
| | 1,867,695 | | C, S | | Long Beach Mortgage Loan Trust,
5.461%, due 01/25/46 | | | 1,760,785 |
| | 3,846,000 | | C, S | | Merrill Lynch Mortgage Investors, Inc.,
5.331%, due 01/25/37 | | | 3,779,730 |
See Accompanying Notes to Financial Statements
63
| | |
| ING INTERMEDIATE BOND FUND | | PORTFOLIO OF INVESTMENTS ASOF SEPTEMBER 30, 2007 (UNAUDITED) (CONTINUED) |
| | | | | | | | |
Principal Amount | | | | | | Value |
| | | | | | | | |
| | Other Asset-Backed Securities: (continued) | | | |
| $ | 989,000 | | C, S | | Merrill Lynch Mortgage Investors, Inc.,
5.609%, due 03/25/37 | | $ | 981,609 |
| | 191,330 | | C, S | | Popular Mortgage Pass-Through Trust,
4.000%, due 12/25/34 | | | 188,964 |
| | 633,541 | | C, S | | Popular Mortgage Pass-Through Trust,
4.596%, due 11/25/35 | | | 629,521 |
| | 698,000 | | C, S | | Renaissance Home Equity Loan Trust, 5.608%, due 05/25/36 | | | 692,999 |
| | 609,858 | | C, S | | Residential Asset Mortgage Products, Inc.,
5.401%, due 07/25/35 | | | 601,486 |
| | 12,566 | | C, S | | Residential Asset Mortgage Products, Inc.,
5.441%, due 06/25/33 | | | 12,471 |
| | 1,457,989 | | C, S | | Structured Asset Securities Corp.,
4.910%, due 06/25/33 | | | 1,442,429 |
| | 264,826 | | C, S | | Structured Asset Securities Corp.,
6.000%, due 03/25/34 | | | 264,930 |
| | | | | | | | |
| | | | | | | | 22,879,556 |
| | | | | | | | |
| | | | | Total Asset-Backed Securities
(Cost $50,329,032) | | | 47,740,027 |
| | | | | | | | |
| | COLLATERALIZED MORTGAGE OBLIGATIONS: 32.4% |
| | 359,739 | | C, S | | ABN Amro Mortgage Corp.,
5.631%, due 03/25/18 | | | 359,644 |
| | 4,096,959 | | C, S | | American Home Mortgage Assets,
5.903%, due 11/25/46 | | | 4,016,941 |
| | 2,389,663 | | C, S | | American Home Mortgage Assets,
5.983%, due 09/25/46 | | | 2,252,630 |
| | 5,245,274 | | C, S | | American Home Mortgage Investment Trust,
5.421%, due 11/25/45 | | | 5,094,119 |
| | 3,163,483 | | # | | Astoria Depositor Corp.,
7.902%, due 05/01/21 | | | 3,250,479 |
| | 5,012,091 | | C, S | | Banc of America Alternative Loan Trust,
6.288%, due 11/25/21 | | | 5,108,812 |
| | 3,546,583 | | C, S | | Banc of America Alternative Loan Trust,
6.496%, due 04/25/37 | | | 3,599,773 |
| | 58,603,707 | | C, S, ^ | | Banc of America Commercial Mortgage, Inc.,
0.465%, due 01/15/49 | | | 1,287,242 |
| | 323,000 | | C, S | | Banc of America Commercial Mortgage, Inc.,
4.161%, due 12/10/42 | | | 318,106 |
| | 110,000 | | C, S | | Banc of America Commercial Mortgage, Inc.,
4.429%, due 11/10/39 | | | 107,313 |
| | 1,609,000 | | C, S | | Banc of America Commercial Mortgage, Inc.,
4.502%, due 07/10/42 | | | 1,576,637 |
| | | | | | | | |
Principal Amount | | | | | | Value |
| | | | | | | | |
| $ | 1,114,000 | | C, S | | Banc of America Commercial Mortgage, Inc.,
4.764%, due 07/10/45 | | $ | 1,106,202 |
| | 1,813,171 | | C, S | | Banc of America Commercial Mortgage, Inc.,
4.772%, due 07/11/43 | | | 1,806,819 |
| | 2,210,000 | | C, S | | Banc of America Commercial Mortgage, Inc.,
4.891%, due 07/10/45 | | | 2,179,808 |
| | 1,470,000 | | C, S | | Banc of America Commercial Mortgage, Inc.,
5.463%, due 09/10/47 | | | 1,380,561 |
| | 270,000 | | C, S | | Banc of America Commercial Mortgage, Inc.,
6.186%, due 06/11/35 | | | 280,596 |
| | 5,283,607 | | C, S | | Banc of America Funding Corp.,
5.256%, due 09/20/35 | | | 5,098,062 |
| | 8,219,575 | | C, S | | Banc of America Funding Corp.,
5.652%, due 06/20/37 | | | 8,082,308 |
| | 4,574,638 | | C, S | | Banc of America Funding Corp.,
5.706%, due 06/20/47 | | | 4,475,368 |
| | 2,507,469 | | C, S | | Banc of America Funding Corp.,
5.750%, due 09/20/34 | | | 2,478,815 |
| | 2,228,750 | | C, S | | Banc of America Funding Corp.,
5.846%, due 05/20/36 | | | 2,229,408 |
| | 2,562,394 | | C, S | | Banc of America Mortgage Securities, Inc.,
5.177%, due 09/25/35 | | | 2,518,414 |
| | 912,468 | | C, S | | Banc of America Mortgage Securities, Inc.,
5.250%, due 11/25/19 | | | 904,490 |
| | 775,082 | | C, S | | Banc of America Mortgage Securities, Inc.,
5.500%, due 11/25/33 | | | 725,000 |
| | 1,616,869 | | C, S | | Banc of America Mortgage Securities, Inc.,
5.500%, due 06/25/35 | | | 1,615,930 |
| | 888,209 | | C, S | | Bank of America Alternative Loan Trust,
6.500%, due 04/25/36 | | | 899,543 |
| | 5,932,408 | | C, S | | Bank of America Alternative Loan Trust,
6.500%, due 05/25/46 | | | 6,033,103 |
| | 931,667 | | C, S | | Bear Stearns Alternative-A Trust, 5.451%, due 07/25/34 | | | 928,914 |
| | 391,000 | | C, S | | Bear Stearns Commercial Mortgage Securities,
4.030%, due 02/13/46 | | | 384,578 |
| | 696,000 | | C, S | | Bear Stearns Commercial Mortgage Securities,
4.565%, due 07/11/42 | | | 683,529 |
| | 2,537,000 | | S | | Bear Stearns Commercial Mortgage Securities,
5.660%, due 09/11/41 | | | 2,422,770 |
| | 625,230 | | C, S | | Capco America Securitization Corp.,
6.260%, due 10/15/30 | | | 629,884 |
| | 456,000 | | C, S | | Capco America Securitization Corp.,
6.460%, due 10/15/30 | | | 461,695 |
See Accompanying Notes to Financial Statements
64
| | |
| ING INTERMEDIATE BOND FUND | | PORTFOLIO OF INVESTMENTS ASOF SEPTEMBER 30, 2007 (UNAUDITED) (CONTINUED) |
| | | | | | | | |
Principal Amount | | | | | | Value |
| | | | | | | | |
| | COLLATERALIZED MORTGAGE OBLIGATIONS: (continued) |
| $ | 1,834,644 | | C, S | | Chase Manhattan Bank-First Union National Bank,
7.439%, due 08/15/31 | | $ | 1,901,790 |
| | 5,308,632 | | C, S | | Chase Mortgage Finance Corp.,
5.409%, due 12/25/35 | | | 5,232,301 |
| | 3,193,748 | | C, S | | Chase Mortgage Finance Corp.,
5.500%, due 11/25/35 | | | 3,188,631 |
| | 4,459,434 | | C, S | | Chaseflex Trust,
6.500%, due 02/25/37 | | | 4,528,717 |
| | 257,604 | | C, S | | Citicorp Mortgage Securities, Inc., 5.581%, due 03/25/33 | | | 254,639 |
| | 1,786,187 | | C, S | | Citigroup Mortgage Loan Trust, Inc.,
5.616%, due 04/25/37 | | | 1,757,999 |
| | 1,418,244 | | C, S, L | | Citigroup Mortgage Loan Trust, Inc.,
5.757%, due 08/25/47 | | | 1,414,033 |
| | 3,505,096 | | C, S | | Citigroup Mortgage Loan Trust, Inc.,
5.939%, due 06/25/36 | | | 3,530,272 |
| | 6,039,186 | | C, S | | Citigroup Mortgage Loan Trust, Inc.,
6.000%, due 11/25/35 | | | 6,046,859 |
| | 10,440,036 | | C, S | | Citigroup Mortgage Loan Trust, Inc.,
6.067%, due 08/25/36 | | | 10,463,612 |
| | 1,165,892 | | C, S | | Citigroup Mortgage Securities, Inc.,
5.500%, due 02/25/22 | | | 1,168,203 |
| | 1,093,000 | | C, S | | Commercial Mortgage Pass-Through Certificates,
3.600%, due 03/10/39 | | | 1,074,051 |
| | 6,777,005 | | C, S | | Countrywide Alternative Loan Trust,
5.413%, due 10/25/35 | | | 6,668,273 |
| | 260,895 | | C, S | | Countrywide Alternative Loan Trust,
5.431%, due 02/25/35 | | | 259,275 |
| | 2,800,734 | | C, S | | Countrywide Alternative Loan Trust,
5.500%, due 02/25/25 | | | 2,778,800 |
| | 63,795 | | C, S | | Countrywide Alternative Loan Trust,
5.531%, due 02/25/33 | | | 63,131 |
| | 613,434 | | C, S | | Countrywide Alternative Loan Trust,
5.681%, due 04/25/33 | | | 611,618 |
| | 3,036,588 | | C, S | | Countrywide Alternative Loan Trust,
5.831%, due 09/25/36 | | | 3,037,511 |
| | 2,836,092 | | C, S | | Countrywide Alternative Loan Trust,
5.863%, due 11/25/46 | | | 2,777,385 |
| | 1,509,879 | | C, S | | Countrywide Alternative Loan Trust,
6.000%, due 05/25/36 | | | 1,530,813 |
| | | | | | | | |
Principal Amount | | | | | | Value |
| | | | | | | | |
| $ | 1,763,913 | | C, S | | Countrywide Home Loan Mortgage Pass-Through Trust,
5.250%, due 10/25/35 | | $ | 1,666,878 |
| | 519,048 | | C, S | | Countrywide Home Loan Mortgage Pass-Through Trust,
5.631%, due 04/25/18 | | | 520,336 |
| | 446,109 | | C, S | | Countrywide Home Loan Mortgage Pass-Through Trust,
5.750%, due 07/25/37 | | | 447,334 |
| | 853,183 | | C, S | | Credit Suisse First Boston Mortgage Securities Corp.,
3.727%, due 03/15/35 | | | 835,518 |
| | 402,112 | | C, S | | Credit Suisse First Boston Mortgage Securities Corp.,
3.819%, due 05/15/36 | | | 389,532 |
| | 975,000 | | C, S | | Credit Suisse First Boston Mortgage Securities Corp.,
4.801%, due 03/15/36 | | | 954,001 |
| | 7,669,827 | | C, S | | Credit Suisse Mortgage Capital Certificates, 7.000%, due 08/25/36 | | | 7,887,432 |
| | 660,968 | | C, S | | DLJ Commercial Mortgage Corp.,
7.300%, due 06/10/32 | | | 681,414 |
| | 5,270,380 | | C, S | | First Horizon Alternative Mortgage Securities, 5.500%, due 08/25/35 | | | 5,171,276 |
| | 495,827 | | C, S | | First Horizon Asset Securities, Inc., 5.393%, due 10/25/35 | | | 496,403 |
| | 1,919,177 | | C, S | | First Horizon Asset Securities, Inc., 5.500%, due 12/25/35 | | | 1,914,376 |
| | 923,000 | | C, S | | First Horizon Asset Securities, Inc., 5.750%, due 02/25/36 | | | 915,083 |
| | 746,549 | | C, S | | Freddie Mac, 6.403%, due 04/15/32 | | | 753,000 |
| | 57,727,165 | | C, S, ^ | | GE Capital Commercial Mortgage Corp., 0.674%, due 06/10/48 | | | 961,665 |
| | 1,186,616 | | C, S | | GE Capital Commercial Mortgage Corp., 3.752%, due 07/10/39 | | | 1,171,372 |
| | 698,000 | | C, S | | GE Capital Commercial Mortgage Corp., 4.371%, due 01/10/38 | | | 688,490 |
| | 483,000 | | C, S | | GE Capital Commercial Mortgage Corp., 4.865%, due 07/10/39 | | | 478,790 |
| | 340,764 | | C, S | | GE Capital Commercial Mortgage Corp., 5.560%, due 06/10/38 | | | 344,310 |
| | 1,514,129 | | C, S | | GMAC Mortgage Corp. Loan Trust, 4.585%, due 10/19/33 | | | 1,485,239 |
| | 3,662,641 | | C, S | | GMAC Mortgage Corp. Loan Trust, 5.259%, due 03/18/35 | | | 3,534,019 |
| | 1,890,079 | | C, S | | GMAC Mortgage Corp. Loan Trust, 5.460%, due 11/19/35 | | | 1,853,933 |
See Accompanying Notes to Financial Statements
65
| | |
| ING INTERMEDIATE BOND FUND | | PORTFOLIO OF INVESTMENTS ASOF SEPTEMBER 30, 2007 (UNAUDITED) (CONTINUED) |
| | | | | | | | |
Principal Amount | | | | | | Value |
| | | | | | | | |
| | COLLATERALIZED MORTGAGE OBLIGATIONS: (continued) |
| $ | 46,246,531 | | #, C, S, ^ | | Greenwich Capital Commercial Funding Corp., 0.512%, due 03/10/39 | | $ | 1,051,974 |
| | 2,451,000 | | C, S | | Greenwich Capital Commercial Funding Corp., 5.117%, due 04/10/37 | | | 2,457,037 |
| | 1,393,000 | | C, S | | Greenwich Capital Commercial Funding Corp., 5.534%, due 03/10/39 | | | 1,310,028 |
| | 705,000 | | C, S | | Greenwich Capital Commercial Funding Corp., 5.554%, due 03/10/39 | | | 659,359 |
| | 564,000 | | C, S | | Greenwich Capital Commercial Funding Corp., 5.613%, due 03/10/39 | | | 513,532 |
| | 1,949,000 | | C, S | | GS Mortgage Securities Corp. II,
5.814%, due 04/10/38 | | | 1,826,781 |
| | 586,796 | | #, C, S | | GSMPS 2005-RP1 1AF, 5.481%, due 01/25/35 | | | 580,222 |
| | 585,502 | | C, S | | GSR Mortgage Loan Trust, 5.500%, due 06/25/35 | | | 572,783 |
| | 1,388,870 | | C, S | | GSR Mortgage Loan Trust, 5.500%, due 07/25/35 | | | 1,369,988 |
| | 766,824 | | C, S | | Harborview Mortgage Loan Trust, 5.853%, due 01/19/35 | | | 752,667 |
| | 379,986 | | C, S | | Homebanc Mortgage Trust,
5.561%, due 08/25/29 | | | 380,094 |
| | 264,023 | | S | | JPMorgan Alternative Loan Trust, 5.509%, due 01/25/36 | | | 264,062 |
| | 172,704,284 | | C, S, ^ | | JPMorgan Chase Commercial Mortgage Securities Corp., 0.090%, due 01/12/43 | | | 241,372 |
| | 352,569 | | C, S | | JPMorgan Chase Commercial Mortgage Securities Corp., 4.200%, due 07/12/35 | | | 347,032 |
| | 1,700,000 | | C, S | | JPMorgan Chase Commercial Mortgage Securities Corp., 4.223%, due 01/15/42 | | | 1,672,218 |
| | 1,293,924 | | C, S | | JPMorgan Chase Commercial Mortgage Securities Corp., 4.275%, due 01/12/37 | | | 1,274,131 |
| | 843,000 | | C, S | | JPMorgan Chase Commercial Mortgage Securities Corp., 4.865%, due 03/15/46 | | | 829,941 |
| | 433,000 | | C, S | | JPMorgan Chase Commercial Mortgage Securities Corp., 5.455%, due 05/15/47 | | | 413,380 |
| | | | | | | | |
Principal Amount | | | | | | Value |
| | | | | | | | |
| $ | 866,000 | | C, S | | JPMorgan Chase Commercial Mortgage Securities Corp., 5.495%, due 05/15/47 | | $ | 810,324 |
| | 4,263,000 | | C, S | | JPMorgan Chase Commercial Mortgage Securities Corp., 5.857%, due 10/12/35 | | | 4,377,239 |
| | 182,576 | | C, S | | JPMorgan Chase Commercial Mortgage Securities Corp., 6.024%, due 04/15/45 | | | 185,141 |
| | 1,226,000 | | C, S | | JPMorgan Chase Commercial Mortgage Securities Corp., 6.052%, due 04/15/45 | | | 1,257,092 |
| | 10,690,124 | | C, S | | JPMorgan Mortgage Trust, 5.405%, due 11/25/35 | | | 10,630,036 |
| | 11,968,449 | | C, S, ^ | | LB-UBS Commercial Mortgage Trust, 0.676%, due 02/15/40 | | | 395,828 |
| | 866,000 | | C, S | | LB-UBS Commercial Mortgage Trust, 3.992%, due 10/15/29 | | | 850,293 |
| | 2,230,000 | | C, S | | LB-UBS Commercial Mortgage Trust, 4.201%, due 12/15/29 | | | 2,197,074 |
| | 225,000 | | C, S | | LB-UBS Commercial Mortgage Trust, 4.310%, due 02/15/30 | | | 221,614 |
| | 695,000 | | C, S | | LB-UBS Commercial Mortgage Trust, 4.510%, due 12/15/29 | | | 679,444 |
| | 1,209,000 | | C, S | | LB-UBS Commercial Mortgage Trust, 4.567%, due 06/15/29 | | | 1,201,787 |
| | 958,678 | | C, S | | LB-UBS Commercial Mortgage Trust, 4.821%, due 04/15/30 | | | 955,352 |
| | 516,000 | | C, S | | LB-UBS Commercial Mortgage Trust, 4.836%, due 02/15/40 | | | 482,288 |
| | 520,000 | | C, S | | LB-UBS Commercial Mortgage Trust, 4.885%, due 09/15/30 | | | 518,797 |
| | 1,010,000 | | C, S | | LB-UBS Commercial Mortgage Trust, 4.998%, due 04/15/30 | | | 1,000,934 |
| | 1,469,000 | | C, S | | LB-UBS Commercial Mortgage Trust, 5.103%, due 11/15/30 | | | 1,472,686 |
| | 2,747,000 | | C, S | | LB-UBS Commercial Mortgage Trust, 5.403%, due 02/15/40 | | | 2,720,469 |
| | 1,845,000 | | C, S | | LB-UBS Commercial Mortgage Trust, 5.456%, due 04/15/40 | | | 1,719,179 |
| | 1,014,000 | | C, S | | LB-UBS Commercial Mortgage Trust, 5.516%, due 11/15/38 | | | 932,387 |
| | 721,000 | | C, S | | LB-UBS Commercial Mortgage Trust, 5.533%, due 02/15/40 | | | 674,235 |
| | 1,442,000 | | C, S | | LB-UBS Commercial Mortgage Trust, 5.563%, due 02/15/40 | | | 1,342,160 |
| | 6,432,000 | | C, S | | LB-UBS Commercial Mortgage Trust, 6.365%, due 12/15/28 | | | 6,719,070 |
| | 4,795,488 | | C, S | | LB-UBS Commercial Mortgage Trust, 7.370%, due 08/15/26 | | | 5,046,637 |
| | 1,618,000 | | C, S | | MASTR Alternative Loans Trust, 6.250%, due 07/25/36 | | | 1,627,005 |
| | 48,329 | | C, S | | MASTR Alternative Loans Trust, 6.500%, due 05/25/33 | | | 48,224 |
| | 334,574 | | C, S | | MASTR Alternative Loans Trust, 8.500%, due 05/25/33 | | | 338,139 |
| | 44,575,087 | | S, ^ | | Merrill Lynch Mortgage Trust, 0.216%, due 10/12/41 | | | 867,850 |
See Accompanying Notes to Financial Statements
66
| | |
| ING INTERMEDIATE BOND FUND | | PORTFOLIO OF INVESTMENTS ASOF SEPTEMBER 30, 2007 (UNAUDITED) (CONTINUED) |
| | | | | | | | |
Principal Amount | | | | | | Value |
| | | | | | | | |
| | COLLATERALIZED MORTGAGE OBLIGATIONS: (continued) |
| $ | 40,979,963 | | #, C, S, ^ | | Merrill Lynch Mortgage Trust, 0.358%, due 11/12/35 | | $ | 230,705 |
| | 981,000 | | C, S | | Merrill Lynch Mortgage Trust, 4.892%, due 02/12/42 | | | 971,421 |
| | 8,208,189 | | C, S, ^ | | Merrill Lynch/Countrywide Commercial Mortgage Trust, 0.735%, due 08/12/48 | | | 326,375 |
| | 625,000 | | C, S | | Merrill Lynch/Countrywide Commercial Mortgage Trust, 5.479%, due 08/12/48 | | | 581,041 |
| | 696,000 | | C, S | | Merrill Lynch/Countrywide Commercial Mortgage Trust, 5.509%, due 08/12/48 | | | 643,992 |
| | 1,052,529 | | C, S | | MLCC Mortgage Investors, Inc., 5.361%, due 04/25/29 | | | 1,042,904 |
| | 713,077 | | C, S | | MLCC Mortgage Investors, Inc.,
5.451%, due 10/25/28 | | | 709,998 |
| | 338,227 | | C, S | | MLCC Mortgage Investors, Inc.,
5.451%, due 01/25/29 | | | 336,667 |
| | 3,660,000 | | C, S | | Morgan Stanley Capital I, 5.007%, due 01/14/42 | | | 3,631,408 |
| | 160,440 | | C, S | | Morgan Stanley Capital I, 7.020%, due 03/15/32 | | | 162,878 |
| | 219,619 | | C, S | | Morgan Stanley Dean Witter Capital I, 4.180%, due 03/12/35 | | | 213,389 |
| | 315,790 | | C, S | | Mortgage Capital Funding, Inc.,
6.663%, due 03/18/30 | | | 315,544 |
| | 1,621,000 | | C, S | | New York Mortgage Trust, Inc.,
5.651%, due 05/25/36 | | | 1,634,291 |
| | 1,038,000 | | C, S | | Nomura Asset Securities Corp.,
6.690%, due 03/15/30 | | | 1,104,635 |
| | 1,836,000 | | | | PRLM FLT 09/28/37, 7.000%, due 09/28/37 | | | 1,831,961 |
| | 2,573,421 | | C, S | | Prudential Commercial Mortgage Trust, 3.669%, due 02/11/36 | | | 2,510,674 |
| | 5,291,605 | | C, S | | RAAC Series, 5.250%, due 09/25/34 | | | 5,202,847 |
| | 6,363,671 | | C, S | | Residential Accredit Loans, Inc., 5.500%, due 05/25/34 | | | 5,973,392 |
| | 3,462,687 | | C, S | | Residential Accredit Loans, Inc.,
5.783%, due 09/25/46 | | | 3,246,809 |
| | 505,632 | | C, S | | Residential Funding Mortgage Sec I, 5.531%, due 11/25/17 | | | 504,326 |
| | | | | | | | |
Principal Amount | | | | | | Value |
| | | | | | | | |
| $ | 399,866 | | C, S | | Salomon Brothers Mortgage Securities VII, 7.520%, due 12/18/09 | | $ | 416,509 |
| | 487,593 | | C, S | | Sequoia Mortgage Trust, 5.766%, due 01/20/35 | | | 485,545 |
| | 614,840 | | C, S | | Structured Adjustable Rate Mortgage Loan Trust, 5.441%, due 07/25/35 | | | 604,072 |
| | 995,687 | | C, S | | Structured Asset Mortgage Investments, Inc., 5.743%, due 04/19/35 | | | 991,772 |
| | 3,380,874 | | C, S | | Structured Asset Mortgage Investments, Inc., 7.647%, due 12/27/35 | | | 3,389,931 |
| | 651,137 | | C, S | | Thornburg Mortgage Securities Trust, 5.481%, due 12/25/33 | | | 646,897 |
| | 2,209,903 | | C, S | | Thornburg Mortgage Securities Trust, 5.501%, due 09/25/44 | | | 2,205,906 |
| | 190,000 | | C, S | | Wachovia Bank Commercial Mortgage Trust, 5.285%, due 07/15/42 | | | 190,871 |
| | 581,000 | | #, C, S | | Wachovia Bank Commercial Mortgage Trust, 5.385%, due 10/15/44 | | | 524,110 |
| | 4,930,000 | | C, S | | Wachovia Bank Commercial Mortgage Trust, 5.385%, due 10/15/44 | | | 4,534,142 |
| | 2,028,000 | | C, S | | Washington Mutual Mortgage Pass-Through Certificates, 3.798%, due 06/25/34 | | | 1,985,426 |
| | 532,657 | | C, S | | Washington Mutual Mortgage Pass-Through Certificates, 5.441%, due 01/25/45 | | | 523,407 |
| | 3,619,071 | | C, S | | Washington Mutual Mortgage Pass-Through Certificates, 5.497%, due 01/25/37 | | | 3,615,330 |
| | 1,046,228 | | C, S | | Washington Mutual Mortgage Pass-Through Certificates, 5.531%, due 08/25/45 | | | 1,027,088 |
| | 741,987 | | C, S | | Washington Mutual Mortgage Pass-Through Certificates, 5.631%, due 01/25/18 | | | 743,715 |
| | 444,663 | | C, S | | Washington Mutual Mortgage Pass-Through Certificates, 5.683%, due 02/25/47 | | | 434,797 |
| | 1,770,507 | | C, S | | Washington Mutual Mortgage Pass-Through Certificates, 5.683%, due 03/25/47 | | | 1,731,501 |
| | 6,847,299 | | C, S | | Washington Mutual Mortgage Pass-Through Certificates, 5.693%, due 06/25/37 | | | 6,824,393 |
| | 8,420,392 | | C, S | | Washington Mutual Mortgage Pass-Through Certificates, 5.704%, due 06/25/37 | | | 8,350,006 |
| | 347,231 | | C, S | | Washington Mutual Mortgage Pass-Through Certificates, 5.743%, due 04/25/47 | | | 331,172 |
| | 7,011,361 | | C, S | | Washington Mutual Mortgage Pass-Through Certificates, 5.750%, due 02/25/36 | | | 7,054,695 |
See Accompanying Notes to Financial Statements
67
| | |
| ING INTERMEDIATE BOND FUND | | PORTFOLIO OF INVESTMENTS ASOF SEPTEMBER 30, 2007 (UNAUDITED) (CONTINUED) |
| | | | | | | | |
Principal Amount | | | | | | Value |
| | | | | | | | |
| | COLLATERALIZED MORTGAGE OBLIGATIONS: (continued) |
| $ | 503,485 | | C, S | | Washington Mutual Mortgage Pass-Through Certificates, 5.753%, due 04/25/47 | | $ | 493,297 |
| | 9,487,250 | | C, S | | Washington Mutual Mortgage Pass-Through Certificates, 5.753%, due 05/25/47 | | | 9,252,347 |
| | 856,744 | | C, S | | Washington Mutual Mortgage Pass-Through Certificates, 5.777%, due 10/25/46 | | | 851,488 |
| | 1,688,753 | | C, S | | Washington Mutual Mortgage Pass-Through Certificates, 5.793%, due 07/25/47 | | | 1,614,343 |
| | 1,686,442 | | C, S | | Washington Mutual Mortgage Pass-Through Certificates, 5.823%, due 11/25/46 | | | 1,655,612 |
| | 2,806,000 | | C, S | | Washington Mutual Mortgage Pass-Through Certificates, 5.824%, due 10/25/36 | | | 2,804,928 |
| | 5,215,761 | | C | | Washington Mutual Mortgage Pass-Through Certificates, 5.876%, due 07/25/37 | | | 5,166,456 |
| | 5,694,217 | | C, S | | Washington Mutual Mortgage Pass-Through Certificates, 5.893%, due 07/25/37 | | | 5,779,433 |
| | 4,126,203 | | C, S | | Washington Mutual Mortgage Pass-Through Certificates, 5.920%, due 07/25/37 | | | 4,137,556 |
| | 2,986,256 | | C, S | | Washington Mutual Mortgage Pass-Through Certificates, 5.943%, due 09/25/46 | | | 2,941,579 |
| | 146,520 | | C, S | | Washington Mutual Mortgage Pass-Through Certificates, 5.953%, due 06/25/46 | | | 143,910 |
| | 568,488 | | C, S | | Washington Mutual Mortgage Pass-Through Certificates, 5.983%, due 06/25/44 | | | 560,739 |
| | 1,682,363 | | C, S | | Washington Mutual Mortgage Pass-Through Certificates, 6.000%, due 06/25/34 | | | 1,675,270 |
| | 3,008,603 | | C, S | | Washington Mutual Mortgage Pass-Through Certificates, 6.000%, due 07/25/36 | | | 3,029,698 |
| | 3,223,000 | | C, S | | Wells Fargo Mortgage-Backed Securities Trust,
3.500%, due 06/25/35 | | | 3,181,589 |
| | 2,160,000 | | C, S | | Wells Fargo Mortgage-Backed Securities Trust, 4.500%, due 08/25/18 | | | 2,075,981 |
| | 3,625,000 | | C, S | | Wells Fargo Mortgage-Backed Securities Trust, 4.785%, due 07/25/34 | | | 3,556,863 |
| | 1,901,908 | | C, S | | Wells Fargo Mortgage-Backed Securities Trust, 4.893%, due 08/25/34 | | | 1,873,300 |
| | 4,486,665 | | C, S | | Wells Fargo Mortgage-Backed Securities Trust, 5.111%, due 03/25/36 | | | 4,401,561 |
| | 5,989,772 | | C, S | | Wells Fargo Mortgage-Backed Securities Trust, 5.386%, due 08/25/35 | | | 5,908,991 |
| | | | | | |
Principal Amount | | | | | | Value |
| | | | | | |
| $ 2,645,031 | | C, S | | Wells Fargo Mortgage-Backed Securities Trust, 5.500%, due 12/25/35 | | $ 2,575,404 |
| 4,384,380 | | C, S | | Wells Fargo Mortgage-Backed Securities Trust, 5.500%, due 01/25/36 | | 4,256,597 |
| 8,886,724 | | C, S | | Wells Fargo Mortgage-Backed Securities Trust, 5.649%, due 12/25/36 | | 8,873,175 |
| 3,699,864 | | C, S | | Wells Fargo Mortgage-Backed Securities Trust, 5.941%, due 11/25/36 | | 3,705,145 |
| 3,275,975 | | C, S | | Wells Fargo Mortgage-Backed Securities Trust, 5.948%, due 10/25/36 | | 3,281,341 |
| 5,012,949 | | C, S | | Wells Fargo Mortgage-Backed Securities Trust, 6.000%, due 06/25/36 | | 5,037,049 |
| | | | | | |
| | | | Total Collateralized Mortgage Obligations (Cost $401,207,475) | | 398,143,886 |
| | | | | | |
| MUNICIPAL BONDS: 0.5% | | |
| California: 0.2% | | |
| 2,654,000 | | C | | City of San Diego, 7.125%, due 06/01/32 | | 2,596,939 |
| | | | | | |
| | | | | | 2,596,939 |
| | | | | | |
| Michigan: 0.3% | | |
| 4,160,000 | | | | Michigan Tobacco Settlement Finance Authority, 7.309%, due 06/01/34 | | 4,023,386 |
| | | | | | |
| | | | | | 4,023,386 |
| | | | | | |
| | | | Total Municipal Bonds (Cost $6,858,145) | | 6,620,325 |
| | | | | | |
| OTHER BONDS: 0.3% | | |
| Sovereign: 0.3% | | |
| MXN 24,180,000 | | @@ | | Mexican Bonos, 8.000%, due 12/17/15 | | 2,222,812 |
| $ 1,289,000 | | @@ | | Mexico Government International Bond, 6.750%, due 09/27/34 | | 1,405,010 |
| | | | | | |
| | | | Total Other Bonds (Cost $3,622,065) | | 3,627,822 |
| | | | | | |
| | | |
| Shares | | | | | | Value |
| PREFERRED STOCK: 1.3% | | |
| Banks: 0.2% | | |
| 105,400 | | @@, #, P | | Santander Finance Preferred SA Unipersonal | | $ 2,180,463 |
| | | | | | |
| | | | | | 2,180,463 |
| | | | | | |
| Diversified Financial Services: 0.4% | | |
| 76,000 | | P | | Deutsche Bank Capital Trust II | | 1,812,600 |
| 125,050 | | P | | Merrill Lynch & Co., Inc. | | 2,869,898 |
| | | | | | |
| | | | | | 4,682,498 |
| | | | | | |
See Accompanying Notes to Financial Statements
68
| | |
| ING INTERMEDIATE BOND FUND | | PORTFOLIO OF INVESTMENTS ASOF SEPTEMBER 30, 2007 (UNAUDITED) (CONTINUED) |
| | | | | | | |
Shares | | | | | | Value |
| | | | | | | |
| PREFERRED STOCK: (continued) | | | |
| Insurance: 0.6% | | | |
| 140,557 | | @@, P | | Aegon NV | | $ | 3,127,393 |
| 54,306 | | @@, P | | Aegon NV — Series 1 | | | 1,230,031 |
| 126,650 | | P | | Metlife, Inc. | | | 3,126,989 |
| | | | | | | |
| | | | | | | 7,484,413 |
| | | | | | | |
| Sovereign: 0.1% | | | |
| 85,000 | | P | | Fannie Mae | | | 2,125,000 |
| | | | | | | |
| | | | | | | 2,125,000 |
| | | | | | | |
| | | | Total Preferred Stock (Cost $17,899,889) | | | 16,472,374 |
| | | | | | | |
| WARRANTS: 0.0% | | | |
| Telecommunications: 0.0% | | | |
| 20 | | @ | | American Tower Corp. | | | 12,275 |
| | | | | | | |
| | | | Total Warrants (Cost $1,502) | | | 12,275 |
| | | | | | | |
| | | |
Number of
Contracts | | | | | | Value |
| | | | | | | |
| POSITIONS IN PURCHASED OPTIONS: 0.1% | | | |
| 344 | | | | Call Option CME - 90-Day Eurodollar Future 03/08 Strike @ $95.00 - Exp 03/17/08 | | $ | 475,150 |
| 200 | | | | Call Option CME - 90-Day Eurodollar Future 06/08 Strike @ $95.00 - Exp 06/16/08 | | | 353,750 |
| 802 | | | | Call Option CME - 90-Day Eurodollar Future 12/07 Strike @ $95.00 - Exp 12/17/07 | | | 536,338 |
| 802 | | | | Call Option CME - 90-Day Eurodollar Future 12/07 Strike @ $95.50 - Exp 12/17/07 | | | 135,338 |
| | | | | | | |
| | | | Total Purchased Options (Cost $871,845) | | | 1,500,576 |
| | | | | | | |
| | | | Total Long-Term Investments (Cost $1,289,192,962) | | | 1,276,630,039 |
| | | | | | | |
| | | |
| Shares | | | | | | Value |
| SHORT-TERM INVESTMENTS: 26.4% | | | |
| Mutual Fund: 1.0% | | | |
| 11,600,000 | | **, S | | ING Institutional Prime Money Market Fund | | | 11,600,000 |
| | | | | | | |
| | | | Total Mutual Fund (Cost $11,600,000) | | | 11,600,000 |
| | | | | | | |
| | | | | | | | | | |
Principal
Amount | | | | | | | Value | |
| | | | | | | | | | |
| | Repurchase Agreement: 0.1% | | | | | |
| $ | 1,231,000 | | Morgan Stanley Repurchase Agreement dated 09/28/07, 4.900%, due 10/01/07, $1,231,503 to be received upon repurchase (Collateralized by $1,265,000 Federal National Mortgage Association, Discount Note, Market Value $1,260,573, due 10/26/07) | | | $ | 1,231,000 | |
| | | | | | | | | | |
| | | Total Repurchase Agreement (Cost $1,231,000) | | | | 1,231,000 | |
| | | | | | | | | | |
| | Securities Lending Collateralcc: 25.3% | | | | | |
| | 311,352,909 | | Bank of New York Mellon Corp. Institutional Cash Reserves | | | | | | 311,352,909 | |
| | | | | | | | | | |
| | | Total Securities Lending Collateral (Cost $311,352,909) | | | | | | 311,352,909 | |
| | | | | | | | | | |
| | | Total Short-Term Investments (Cost $324,183,909) | | | | | | 324,183,909 | |
| | | | | | | | | | |
| | | Total Investments in Securities (Cost $1,613,376,871)* | | 130.3 | % | | $ | 1,600,813,948 | |
| | | Other Assets and Liabilities - Net | | (30.3 | ) | | | (371,992,851 | ) |
| | | | | | | | | | |
| | | Net Assets | | 100.0 | % | | $ | 1,228,821,097 | |
| | | | | | | | | | |
| @ | Non-income producing security |
| MASTR | Mortgage Asset Securitization Transaction, Inc. |
| Z | Indicates Zero Coupon Bond; rate shown reflects current effective yield. |
| # | Securities with purchases pursuant to Rule 144A or Section 4(2), under the Securities Act of 1933 and may not be resold subject to that rule except to qualified institutional buyers. Unless otherwise footnoted, these securities have been determined to be liquid under the guidelines established by the Funds' Board of Directors/Trustees. |
| C | Bond may be called prior to maturity date. |
| P | Preferred Stock may be called prior to convertible date. |
| cc | Securities purchased with cash collateral for securities loaned. |
| W | When-issued or delayed delivery security |
| S | All or a portion of this security is segregated for certain derivatives, when-issued or delayed delivery securities, forward currency exchange contracts and futures contracts. |
| L | Loaned security, a portion or all of the security is on loan at September 30, 2007. |
| ** | Investment in affiliate |
| ^ | Interest Only (IO) Security |
| * | Cost for federal income tax purposes is $1,613,571,386. |
| | | | |
Net unrealized depreciation consists of: | | | | |
Gross Unrealized Appreciation | | $ | 6,018,954 | |
Gross Unrealized Depreciation | | | (18,776,392 | ) |
| | | | |
Net Unrealized Depreciation | | $ | (12,757,438 | ) |
| | | | |
See Accompanying Notes to Financial Statements
69
| | |
| ING INTERMEDIATE BOND FUND | | PORTFOLIO OF INVESTMENTS ASOF SEPTEMBER 30, 2007 (UNAUDITED) (CONTINUED) |
At September 30, 2007 the following forward currency contracts were outstanding for the ING Intermediate Bond Fund:
| | | | | | | | | | | | |
Currency | | Buy/Sell | | Settlement Date | | In Exchange For | | Value | | Unrealized
Appreciation/
(Depreciation) | |
| | | | | | USD | | | | | | |
Switzerland Francs | | | | | | | | | | | | |
CHF 7,336,377 | | Buy | | 10/11/07 | | 6,122,500 | | 6,306,907 | | $ | 184,407 | |
| | | | | | | | | | | | |
| | | | | | | | | | $ | 184,407 | |
| | | | | | | | | | | | |
British Pound Sterling | | | | | | | | | | | | |
GBP 3,045,695 | | Sell | | 10/11/07 | | 6,146,000 | | 6,229,979 | | $ | (83,979 | ) |
British Pound Sterling | | | | | | | | | | | | |
GBP 3,065,196 | | Sell | | 10/11/07 | | 6,146,000 | | 6,269,868 | | | (123,868 | ) |
| | | | | | | | | | | | |
| | | | | | | | | | $ | (207,847 | ) |
| | | | | | | | | | | | |
ING Intermediate Bond Fund Open Futures Contracts on September 30, 2007:
| | | | | | | | | | | |
Contract Description | | Number
of
Contracts | | Notional
Market
Value ($) | | | Expiration
Date | | Unrealized
Appreciation/
(Depreciation) | |
Long Contracts | | | | | | | | | | | |
90-Day Eurodollar | | 306 | | 73,042,200 | | | 03/17/08 | | $ | (9,792 | ) |
90-Day Eurodollar | | 306 | | 73,202,850 | | | 09/15/08 | | | 49,365 | |
90-Day Sterling | | 608 | | 146,678,943 | | | 03/19/08 | | | 438,576 | |
Euro-Schatz | | 579 | | 85,336,223 | | | 12/06/07 | | | 70,190 | |
U.S. Treasury
2-Year Note | | 881 | | 182,408,301 | | | 12/31/07 | | | 247,721 | |
U.S. Treasury
5-Year Note | | 137 | | 14,663,281 | | | 12/31/07 | | | 31,767 | |
U.S. Treasury
10-Year Note | | 340 | | 37,155,625 | | | 12/19/07 | | | 31,025 | |
U.S. Treasury Long Bond | | 75 | | 8,350,781 | | | 12/19/07 | | | (21,281 | ) |
| | | | | | | | | | | |
| | | | | | | | | $ | 837,571 | |
| | | | | | | | | | | |
Short Contracts | | | | | | | | | | | |
90-Day Eurodollar | | 306 | | (73,145,475 | ) | | 03/16/09 | | $ | (139,612 | ) |
90-Day Eurodollar | | 306 | | (72,977,175 | ) | | 09/14/09 | | | (76,982 | ) |
| | | | | | | | | | | |
| | | | | | | | | $ | (216,594 | ) |
| | | | | | | | | | | |
See Accompanying Notes to Financial Statements
70
| | |
| ING INTERMEDIATE BOND FUND | | PORTFOLIO OF INVESTMENTS ASOF SEPTEMBER 30, 2007 (UNAUDITED) (CONTINUED) |
ING Intermediate Bond Fund Credit Default Swap Agreements Outstanding on September 30, 2007:
| | | | | | | | | | | | | | | | | |
Counterparty | | Reference Entity/Obligation | | Buy/Sell
Protection | | (Pay)/Receive
Fixed Rate (%) | | | Termination
Date | | | | Notional
Amount | | Unrealized
Appreciation/
(Depreciation) | |
Barclays Bank PLC | | Alcoa Inc. 5.375%, 01/15/13 | | Buy | | (0.390 | ) | | 09/20/12 | | USD | | 2,396,000 | | $ | 1,365 | |
JPMorgan Chase Bank N.A., New York | | Alcoa Inc. 5.375%, 01/15/13 | | Buy | | (0.430 | ) | | 09/20/12 | | USD | | 1,296,000 | | | (1,570 | ) |
Lehman Brothers Special
Financing Inc. | | Alcoa Inc. 5.375%, 01/15/13 | | Buy | | (0.400 | ) | | 09/20/12 | | USD | | 2,592,000 | | | 322 | |
UBS AG | | Australia & New Zealand Banking Group
4.450%, 02/05/15 | | Buy | | (0.350 | ) | | 09/20/17 | | USD | | 2,135,000 | | | 14,522 | |
Citibank N.A., New York | | Bank of Scotland
5.125%, 12/05/13 | | Buy | | (0.320 | ) | | 09/20/17 | | USD | | 2,744,000 | | | 64,416 | |
Citibank N.A., New York | | Bank of Scotland
5.125%, 12/05/13 | | Buy | | (0.660 | ) | | 09/20/17 | | USD | | 2,781,000 | | | (9,420 | ) |
Citibank N.A., New York | | Bank of Scotland
5.125%, 12/05/13 | | Buy | | (0.650 | ) | | 09/20/17 | | USD | | 1,294,000 | | | (3,361 | ) |
UBS AG | | Bank of Scotland
5.125%, 12/05/13 | | Buy | | (0.410 | ) | | 09/20/17 | | USD | | 2,135,000 | | | 34,938 | |
Citibank N.A., New York | | Belo Corp. 8.000%, 11/01/08 | | Buy | | (0.930 | ) | | 09/20/12 | | USD | | 1,436,000 | | | 8,964 | |
Citibank N.A., New York | | Belo Corp. 8.000%, 11/01/08 | | Buy | | (1.400 | ) | | 09/20/14 | | USD | | 1,438,000 | | | 158 | |
Citibank N.A., New York | | BNP Paribas 5.250%, 12/17/12 | | Buy | | (0.250 | ) | | 09/20/17 | | USD | | 2,744,000 | | | 40,969 | |
Citibank N.A., New York | | BNP Paribas 5.250%, 12/17/12 | | Buy | | (0.520 | ) | | 09/20/17 | | USD | | 574,000 | | | (3,649 | ) |
Citibank N.A., New York | | BNP Paribas 5.250%, 12/17/12 | | Buy | | (0.520 | ) | | 09/20/17 | | USD | | 1,294,000 | | | (8,537 | ) |
UBS AG | | Burlington Northern Santa Fe Corp.
4.300%, 07/01/13 | | Buy | | (0.350 | ) | | 09/20/12 | | USD | | 3,596,000 | | | (20,125 | ) |
Citibank N.A., New York | | CDX.EM.6 Index | | Buy | | (1.400 | ) | | 12/20/11 | | USD | | 3,865,000 | | | 22,987 | |
Citibank N.A., New York | | CDX.EM.7 Index | | Buy | | (1.250 | ) | | 06/20/12 | | USD | | 7,364,000 | | | (208,369 | ) |
Citibank N.A., New York | | CDX.EM.7 Index | | Buy | | (1.250 | ) | | 06/20/12 | | USD | | 7,399,000 | | | (276,660 | ) |
Citibank N.A., New York | | CDX.EM.7 Index | | Buy | | (1.250 | ) | | 06/20/12 | | USD | | 1,868,000 | | | (28,557 | ) |
UBS AG | | CDX.EM.7 Index | | Buy | | (1.250 | ) | | 06/20/12 | | USD | | 5,989,000 | | | (214,954 | ) |
UBS AG | | CDX.EM.7 Index | | Buy | | (1.250 | ) | | 06/20/12 | | USD | | 4,559,000 | | | (86,031 | ) |
UBS AG | | CDX.EM.7 Index | | Buy | | (1.250 | ) | | 06/20/12 | | USD | | 5,882,480 | | | (199,039 | ) |
UBS AG | | CDX.EM.7 Index | | Buy | | (1.250 | ) | | 06/20/12 | | USD | | 4,692,000 | | | (71,859 | ) |
UBS AG | | CDX.NA.HY.8 Index | | Buy | | (2.750 | ) | | 06/20/12 | | USD | | 4,495,000 | | | (78,892 | ) |
UBS AG | | CDX.NA.HY.8 Index | | Sell | | 2.750 | | | 06/20/12 | | USD | | 5,606,000 | | | 256,216 | |
UBS AG | | CDX.NA.HY.8 Index | | Buy | | (2.750 | ) | | 06/20/12 | | USD | | 5,711,000 | | | (133,469 | ) |
Citibank N.A., New York | | CDX.NA.HY.9 Index | | Buy | | (3.750 | ) | | 12/20/12 | | USD | | 33,545,000 | | | — | |
Lehman Brothers Special
Financing Inc. | | CDX.NA.IG.8 Index | | Buy | | (0.350 | ) | | 06/20/12 | | USD | | 25,750,000 | | | (177,277 | ) |
Lehman Brothers Special
Financing Inc. | | CDX.NA.IG.8 Index | | Buy | | (0.350 | ) | | 06/20/12 | | USD | | 25,750,000 | | | (155,911 | ) |
Lehman Brothers Special
Financing Inc. | | CDX.NA.IG.8 Index | | Buy | | (0.350 | ) | | 06/20/12 | | USD | | 11,581,000 | | | (71,494 | ) |
UBS AG | | CDX.NA.IG.8 Index | | Buy | | (0.350 | ) | | 06/20/12 | | USD | | 4,639,000 | | | (13,562 | ) |
Citibank N.A., New York | | Centurytel Inc.
7.875%, 08/15/12 | | Buy | | (0.730 | ) | | 09/20/12 | | USD | | 3,525,000 | | | (49,253 | ) |
Citibank N.A., New York | | Centurytel Inc.
7.875%, 08/15/12 | | Buy | | (0.720 | ) | | 09/20/12 | | USD | | 570,000 | | | (7,711 | ) |
Merrill Lynch International | | Centurytel Inc.
7.875%, 08/15/12 | | Buy | | (0.740 | ) | | 09/20/12 | | USD | | 1,342,000 | | | (19,348 | ) |
Citibank N.A., New York | | CMS Energy Corp.
6.875%, 12/15/15 | | Sell | | 0.820 | | | 03/20/12 | | USD | | 600,000 | | | (2,650 | ) |
Merrill Lynch International | | CMS Energy Corp.
6.875%, 12/15/15 | | Sell | | 0.840 | | | 03/20/12 | | USD | | 3,000,000 | | | (10,846 | ) |
See Accompanying Notes to Financial Statements
71
| | |
| ING INTERMEDIATE BOND FUND | | PORTFOLIO OF INVESTMENTS ASOF SEPTEMBER 30, 2007 (UNAUDITED) (CONTINUED) |
| | | | | | | | | | | | | | | | | |
Counterparty | | Reference Entity/Obligation | | Buy/Sell
Protection | | (Pay)/Receive
Fixed Rate (%) | | | Termination
Date | | | | Notional
Amount | | Unrealized
Appreciation/
(Depreciation) | |
Citibank N.A., New York | | Computer Sciences Corp.
5.000%, 02/15/13 | | Buy | | (0.780 | ) | | 09/20/17 | | USD | | 5,142,000 | | $ | (41,365 | ) |
Morgan Stanley Capital Services Inc. | | Domtar Inc. 7.875%, 10/15/11 | | Buy | | (2.650 | ) | | 09/20/11 | | USD | | 1,287,500 | | | (45,152 | ) |
UBS AG | | Domtar Inc. 7.875%, 10/15/11 | | Sell | | 2.600 | | | 09/20/11 | | USD | | 1,288,000 | | | 42,886 | |
Barclays Bank PLC | | Federative Republic of Brazil 12.250%, 03/06/30 | | Sell | | 0.240 | | | 06/20/08 | | USD | | 9,213,000 | | | (5,283 | ) |
Barclays Bank PLC | | Federative Republic of Brazil 12.250%, 03/06/30 | | Buy | | (0.725 | ) | | 06/20/12 | | USD | | 3,223,000 | | | 8,579 | |
Barclays Bank PLC | | Federative Republic of Brazil 12.250%, 03/06/30 | | Buy | | (1.600 | ) | | 08/20/12 | | USD | | 2,390,000 | | | (87,150 | ) |
Citibank N.A., New York | | Federative Republic of Brazil 12.250%, 03/06/30 | | Sell | | 0.240 | | | 07/20/08 | | USD | | 5,827,000 | | | (1,418 | ) |
Citibank N.A., New York | | Federative Republic of Brazil 12.250%, 03/06/30 | | Buy | | (0.740 | ) | | 07/20/12 | | USD | | 1,457,000 | | | 1,692 | |
Lehman Brothers Special
Financing Inc. | | Federative Republic of Brazil 12.250%, 03/06/30 | | Buy | | (0.800 | ) | | 07/20/12 | | USD | | 2,594,000 | | | (4,480 | ) |
UBS AG | | Federative Republic of Brazil 12.250%, 03/06/30 | | Buy | | (0.780 | ) | | 07/20/12 | | USD | | 5,987,500 | | | (3,525 | ) |
UBS AG | | Federative Republic of Brazil 12.250%, 03/06/30 | | Buy | | (0.860 | ) | | 08/20/12 | | USD | | 1,676,000 | | | (5,675 | ) |
UBS AG | | Federative Republic of Brazil 12.250%, 03/06/30 | | Buy | | (1.150 | ) | | 08/20/12 | | USD | | 4,104,000 | | | 12,820 | |
Citibank N.A., New York | | First Data Corp.
4.700%, 08/01/13 | | Buy | | (5.350 | ) | | 12/20/12 | | USD | | 2,892,000 | | | — | |
Citibank N.A., New York | | First Data Corp.
4.700%, 08/01/13 | | Buy | | (5.900 | ) | | 12/20/17 | | USD | | 1,635,000 | | | — | |
Lehman Brothers Special
Financing Inc. | | First Data Corp.
4.700%, 08/01/13 | | Buy | | (5.450 | ) | | 12/20/12 | | USD | | 2,374,000 | | | — | |
Merrill Lynch International | | First Data Corp.
4.700%, 08/01/13 | | Buy | | (5.450 | ) | | 12/20/12 | | USD | | 3,561,000 | | | — | |
Barclays Bank PLC | | Gannett Co. 6.375%, 04/01/12 | | Buy | | (0.780 | ) | | 09/20/14 | | USD | | 2,280,000 | | | (287 | ) |
Citibank N.A., New York | | Gannett Co. 6.375%, 04/01/12 | | Buy | | (0.690 | ) | | 06/20/14 | | USD | | 3,637,000 | | | 13,911 | |
Citibank N.A., New York | | Gannett Co. 6.375%, 04/01/12 | | Buy | | (0.860 | ) | | 09/20/14 | | USD | | 1,098,000 | | | (5,255 | ) |
Citibank N.A., New York | | Gannett Co. 6.375%, 04/01/12 | | Buy | | (0.770 | ) | | 09/20/14 | | USD | | 1,438,000 | | | 657 | |
Citibank N.A., New York | | Gannett Co. 6.375%, 04/01/12 | | Buy | | (0.810 | ) | | 09/20/14 | | USD | | 1,437,000 | | | (2,692 | ) |
Barclays Bank PLC | | Georgia-Pacific Corp.
7.750%, 11/15/29 | | Sell | | 3.000 | | | 09/20/12 | | USD | | 1,200,000 | | | 4,372 | |
Citibank N.A., New York | | Georgia-Pacific Corp.
7.750%, 11/15/29 | | Sell | | 4.200 | | | 09/20/12 | | USD | | 1,332,000 | | | 70,958 | |
UBS AG | | Georgia-Pacific Corp.
7.750%, 11/15/29 | | Sell | | 3.000 | | | 09/20/12 | | USD | | 460,000 | | | 1,676 | |
Lehman Brothers Special
Financing Inc. | | Harrah’s Operating Co., Inc.
5.625%, 06/01/15 | | Sell | | 0.600 | | | 03/20/08 | | USD | | 11,689,000 | | | (27,303 | ) |
UBS AG | | HSBC Bank PLC
4.250%, 03/18/16 | | Buy | | (0.400 | ) | | 09/20/17 | | USD | | 2,135,000 | | | 6,726 | |
UBS AG | | LCDX.NA.8 Index | | Sell | | 1.200 | | | 06/20/12 | | USD | | 22,807,308 | | | 523,808 | |
UBS AG | | LCDX.NA.8 Index | | Sell | | 1.200 | | | 06/20/12 | | USD | | 5,960,000 | | | 682,420 | |
UBS AG | | LCDX.NA.8 Index | | Buy | | (1.200 | ) | | 06/20/12 | | USD | | 11,403,654 | | | (810,420 | ) |
UBS AG | | LCDX.NA.8 Index | | Buy | | (1.200 | ) | | 06/20/12 | | USD | | 1,920,615 | | | (151,793 | ) |
Merrill Lynch International | | Lennar Corp. 5.950%, 03/01/13 | | Buy | | (2.300 | ) | | 09/20/12 | | USD | | 2,574,000 | | | 97,823 | |
UBS AG | | Lennar Corp. 5.950%, 03/01/13 | | Buy | | (1.230 | ) | | 09/20/12 | | USD | | 6,242,000 | | | 511,509 | |
UBS AG | | Lennar Corp. 5.950%, 03/01/13 | | Buy | | (1.400 | ) | | 09/20/12 | | USD | | 5,514,000 | | | 414,850 | |
Barclays Bank PLC | | Merrill Lynch & Co.
5.000%, 01/15/15 | | Buy | | (0.860 | ) | | 09/20/12 | | USD | | 6,310,000 | | | (67,721 | ) |
See Accompanying Notes to Financial Statements
72
| | |
| ING INTERMEDIATE BOND FUND | | PORTFOLIO OF INVESTMENTS ASOF SEPTEMBER 30, 2007 (UNAUDITED) (CONTINUED) |
| | | | | | | | | | | | | | | | | |
Counterparty | | Reference Entity/Obligation | | Buy/Sell
Protection | | (Pay)/Receive
Fixed Rate (%) | | | Termination
Date | | | | Notional
Amount | | Unrealized
Appreciation/
(Depreciation) | |
UBS AG | | Merrill Lynch & Co.
5.000%, 01/15/15 | | Buy | | (0.830 | ) | | 09/20/12 | | USD | | 1,140,000 | | $ | (10,727 | ) |
Citibank N.A., New York | | Norbord Inc. 7.250%, 07/01/12 | | Sell | | 2.200 | | | 06/20/12 | | USD | | 606,500 | | | 4,998 | |
Citibank N.A., New York | | Norbord Inc. 7.250%, 07/01/12 | | Buy | | (2.450 | ) | | 12/20/17 | | USD | | 3,377,000 | | | 58,089 | |
Credit Suisse International | | Norbord Inc. 7.250%, 07/01/12 | | Buy | | (1.450 | ) | | 06/20/14 | | USD | | 3,860,000 | | | 194,616 | |
UBS AG | | Norbord Inc. 7.250%, 07/01/12 | | Buy | | (1.500 | ) | | 06/20/12 | | USD | | 606,500 | | | 12,312 | |
UBS AG | | Norbord Inc. 7.250%, 07/01/12 | | Buy | | (2.400 | ) | | 12/20/17 | | USD | | 1,342,000 | | | 27,645 | |
UBS AG | | Norfolk Southern Corp. 7.700%, 05/15/17 | | Buy | | (0.400 | ) | | 09/20/12 | | USD | | 3,596,000 | | | (26,197 | ) |
Lehman Brothers Special
Financing Inc. | | Radian Group Inc.
5.375%, 06/15/15 | | Sell | | 3.900 | | | 09/20/14 | | USD | | 5,588,000 | | | 116,398 | |
UBS AG | | Radian Group Inc.
5.375%, 06/15/15 | | Buy | | (0.850 | ) | | 09/20/14 | | USD | | 5,588,000 | | | 709,794 | |
Citibank N.A., New York | | Royal Bank of Scotland PLC 6.000%, 05/10/13 | | Buy | | (0.290 | ) | | 09/20/17 | | USD | | 2,744,000 | | | 33,413 | |
UBS AG | | Royal Bank of Scotland PLC 6.000%, 05/10/13 | | Buy | | (0.400 | ) | | 09/20/17 | | USD | | 2,135,000 | | | 6,985 | |
Citibank N.A., New York | | Simon Property Group LP 6.350%, 08/28/12 | | Buy | | (0.380 | ) | | 09/20/12 | | USD | | 590,000 | | | 2,179 | |
Citibank N.A., New York | | Societe Generale
6.625%, 04/27/15 | | Buy | | (0.510 | ) | | 09/20/17 | | USD | | 574,000 | | | (2,258 | ) |
Citibank N.A., New York | | Societe Generale
6.625%, 04/27/15 | | Buy | | (0.510 | ) | | 09/20/17 | | USD | | 1,294,000 | | | (5,091 | ) |
UBS AG | | Societe Generale
6.625%, 04/27/15 | | Buy | | (0.380 | ) | | 09/20/17 | | USD | | 2,135,000 | | | 13,717 | |
Citibank N.A., New York | | Standard Chartered Bank 3.625%, 02/03/17 | | Buy | | (0.670 | ) | | 09/20/17 | | USD | | 574,000 | | | 3,421 | |
UBS AG | | Standard Chartered Bank 3.625%, 02/03/17 | | Buy | | (0.420 | ) | | 09/20/17 | | USD | | 2,135,000 | | | 54,643 | |
Goldman Sachs International | | Temple-Inland Inc.
7.875%, 05/01/12 | | Buy | | (1.040 | ) | | 03/20/14 | | USD | | 872,000 | | | 12,104 | |
JPMorgan Chase Bank N.A., New York | | Temple-Inland Inc.
7.875%, 05/01/12 | | Buy | | (0.890 | ) | | 03/20/14 | | USD | | 2,646,000 | | | 58,063 | |
JPMorgan Chase Bank N.A., New York | | Temple-Inland Inc.
7.875%, 05/01/12 | | Buy | | (1.020 | ) | | 03/20/14 | | USD | | 2,493,000 | | | 37,284 | |
Morgan Stanley Capital Services Inc. | | Temple-Inland Inc.
7.875%, 05/01/12 | | Buy | | (0.900 | ) | | 03/20/14 | | USD | | 2,318,000 | | | 50,344 | |
Morgan Stanley Capital Services Inc. | | Temple-Inland Inc.
7.875%, 05/01/12 | | Buy | | (1.600 | ) | | 09/20/17 | | USD | | 2,401,000 | | | 5,514 | |
UBS AG | | Temple-Inland Inc.
7.875%, 05/01/12 | | Buy | | (0.900 | ) | | 03/20/14 | | USD | | 2,476,000 | | | 53,002 | |
UBS AG | | Toll Bros Finance Corp. 6.875%, 11/15/12 | | Buy | | (1.000 | ) | | 06/20/12 | | USD | | 5,671,000 | | | 350,923 | |
UBS AG | | Union Pacific Corp.
6.625%, 02/01/29 | | Buy | | (0.410 | ) | | 09/20/12 | | USD | | 3,596,000 | | | (24,468 | ) |
Citibank N.A., New York | | United Mexican States 7.500%, 04/08/33 | | Sell | | 0.160 | | | 07/20/08 | | USD | | 8,830,000 | | | 2,696 | |
Citibank N.A., New York | | United Mexican States 7.500%, 04/08/33 | | Buy | | (0.355 | ) | | 07/20/12 | | USD | | 1,104,000 | | | 4,330 | |
UBS AG | | United Mexican States 7.500%, 04/08/33 | | Buy | | (0.620 | ) | | 08/20/12 | | USD | | 4,332,000 | | | (30,968 | ) |
Barclays Bank PLC | | UST Inc. 6.625%, 07/15/12 | | Buy | | (0.300 | ) | | 03/20/14 | | USD | | 2,416,000 | | | (3,282 | ) |
Bear Stearns Credit Products Inc. | | UST Inc. 6.625%, 07/15/12 | | Buy | | (0.280 | ) | | 03/20/14 | | USD | | 6,493,000 | | | (1,571 | ) |
Bear Stearns Credit Products Inc. | | UST Inc. 6.625%, 07/15/12 | | Buy | | (0.380 | ) | | 03/20/17 | | USD | | 5,195,000 | | | 4,022 | |
Morgan Stanley Capital Services Inc. | | UST Inc. 6.625%, 07/15/12 | | Buy | | (0.420 | ) | | 03/20/17 | | USD | | 2,416,000 | | | (5,382 | ) |
See Accompanying Notes to Financial Statements
73
| | |
| ING INTERMEDIATE BOND FUND | | PORTFOLIO OF INVESTMENTS ASOF SEPTEMBER 30, 2007 (UNAUDITED) (CONTINUED) |
| | | | | | | | | | | | | | | | | |
Counterparty | | Reference Entity/Obligation | | Buy/Sell
Protection | | (Pay)/Receive
Fixed Rate (%) | | | Termination
Date | | | | Notional
Amount | | Unrealized
Appreciation/
(Depreciation) | |
UBS AG | | UST Inc. 6.625%, 07/15/12 | | Buy | | (0.280 | ) | | 03/20/14 | | USD | | 344,000 | | $ | (83 | ) |
UBS AG | | UST Inc. 6.625%, 07/15/12 | | Buy | | (0.380 | ) | | 03/20/17 | | USD | | 422,000 | | | 327 | |
UBS AG | | Westpac Banking Corp. 5.875%, 04/29/18 | | Buy | | (0.350 | ) | | 09/20/17 | | USD | | 2,135,000 | | | 4,951 | |
Morgan Stanley Capital Services Inc. | | Weyerhaeuser Co.
6.750%, 03/15/12 | | Buy | | (0.880 | ) | | 03/20/17 | | USD | | 2,416,000 | | | 27,359 | |
Citibank N.A., New York | | Weyerhaeuser Co.
6.750%, 03/15/12 | | Buy | | (0.580 | ) | | 03/20/14 | | USD | | 461,000 | | | 5,128 | |
JPMorgan Chase Bank N.A., New York | | Weyerhaeuser Co.
6.750%, 03/15/12 | | Buy | | (0.640 | ) | | 03/20/14 | | USD | | 2,582,000 | | | 20,232 | |
Lehman Brothers Special Financing Inc. | | Weyerhaeuser Co.
6.750%, 03/15/12 | | Buy | | (0.570 | ) | | 03/20/14 | | USD | | 2,646,000 | | | 30,884 | |
Morgan Stanley Capital Services Inc. | | Weyerhaeuser Co.
6.750%, 03/15/12 | | Buy | | (0.600 | ) | | 03/20/14 | | USD | | 4,904,000 | | | 49,177 | |
Barclays Bank PLC | | Weyerhaeuser Co.
7.125%, 07/15/23 | | Sell | | 0.780 | | | 09/20/12 | | USD | | 2,478,000 | | | 16,725 | |
Lehman Brothers Special
Financing Inc. | | Weyerhaeuser Co.
7.125%, 07/15/23 | | Sell | | 0.780 | | | 09/20/12 | | USD | | 2,090,000 | | | 14,106 | |
Lehman Brothers Special
Financing Inc. | | Weyerhaeuser Co.
7.125%, 07/15/23 | | Sell | | 0.770 | | | 09/20/12 | | USD | | 5,225,000 | | | 32,954 | |
UBS AG | | Weyerhaeuser Co.
7.125%, 07/15/23 | | Sell | | 0.790 | | | 09/20/12 | | USD | | 1,718,000 | | | 12,355 | |
Citibank N.A., New York | | Williams Partners LP
7.500%, 06/15/11 | | Sell | | 1.030 | | | 03/20/12 | | USD | | 3,020,164 | | | 19,020 | |
UBS AG | | XL Capital Ltd.
5.250%, 09/15/14 | | Buy | | (0.610 | ) | | 09/20/16 | | USD | | 2,655,000 | | | (11,736 | ) |
UBS AG | | XL Capital Ltd.
5.250%, 09/15/14 | | Buy | | (0.610 | ) | | 09/20/16 | | USD | | 5,310,000 | | | (23,471 | ) |
| | | | | | | | | | | | | | | | | |
| | | | | | | | | | | | | | | $ | 1,631,957 | |
| | | | | | | | | | | | | | | | | |
Written Options Open on September 30, 2007:
| | | | | | | | | | | | | | | |
Description/Name of Issuer | | | | Exercise
Price | | Expiration
Date | | # of
Contracts | | Premium
Received | | Value | |
Call Option CME | | | | | | | | | | | | | | | |
90-Day Eurodollar Future 12/07 | | USD | | 95.250 | | 12/17/07 | | 1604 | | $ | 316,790 | | $ | (571,425 | ) |
| | | | | | | | | | | | | | | |
| | | | | | | | | | $ | 316,790 | | $ | (571,425 | ) |
| | | | | | | | | | | | | | | |
See Accompanying Notes to Financial Statements
74
| | |
ING NATIONAL
TAX-EXEMPT BOND FUND | | PORTFOLIO OF INVESTMENTS ASOF SEPTEMBER 30, 2007 (UNAUDITED) |
| | | | | | | | | |
Principal Amount | | | | | | Rating(1) | | Value |
| | | | | | | | | |
| MUNICIPAL BONDS: 97.5% | | | | | |
| Arizona: 3.6% | | | | | |
| $1,000,000 | | C | | Salt River Project Agricultural Improvement & Power District, 4.750%, due 01/01/35 | | Aa1/AA | | $ | 1,005,020 |
| | | | | | | | | |
| | | | | | | | | 1,005,020 |
| | | | | | | | | |
| California: 14.5% | | | | | |
| 350,000 | | C | | California Statewide Communities Development Authority, 5.500%, due 09/01/14 | | Aaa/AAA | | | 379,071 |
| 1,000,000 | | C | | Clovis Public Financing Authority, 5.000%, due 08/01/26 | | Aaa/NR | | | 1,042,400 |
| 1,000,000 | | C | | Golden State Tobacco Securitization Corp., 5.000%, due 06/01/33 | | Baa3/BBB | | | 884,660 |
| 1,000,000 | | | | Pleasant Valley School District, 5.850%, due 08/01/31 | | Aaa/AAA | | | 1,189,210 |
| 500,000 | | C | | San Marcos California Public Facility Authority Tax Allocation Reserve, 5.000%, due 08/01/21 | | Aaa/AAA | | | 522,480 |
| | | | | | | | | |
| | | | | | | | | 4,017,821 |
| | | | | | | | | |
| Colorado: 3.8% | | | | | |
| 1,000,000 | | C | | Interlocken Metropolitan District, 5.750%, due 12/15/19 | | NR/AA | | | 1,046,030 |
| | | | | | | | | |
| | | | | | | | | 1,046,030 |
| | | | | | | | | |
| Connecticut: 6.1% | | | | | |
| 185,000 | | | | City of New Britain, 6.000%, due 03/01/12 | | Aaa/AAA | | | 196,655 |
| 520,000 | | C | | Connecticut State Development Authority, 5.000%, due 10/15/23 | | Aaa/AAA | | | 543,364 |
| 890,000 | | C | | Connecticut State Health & Educational Facility Authority, 5.375%, due 07/01/25 | | NR/AAA | | | 899,363 |
| 60,000 | | | | State of Connecticut, 7.125%, due 06/01/10 | | Aaa/AA | | | 63,753 |
| | | | | | | | | |
| | | | | | | | | 1,703,135 |
| | | | | | | | | |
| Florida: 7.9% | | | | | |
| 750,000 | | C | | City of Gulf Breeze, 5.050%, due 12/01/20 | | Aaa/NR | | | 792,848 |
| 250,000 | | C | | City of Tallahassee, 6.375%, due 12/01/30 | | Baa2/NR | | | 259,250 |
| 100,000 | | C | | County of Orange, 5.250%, due 10/01/23 | | Aaa/AAA | | | 106,960 |
| 500,000 | | C | | Florida State Board of Education, 5.750%, due 06/01/22 | | Aa1/AAA | | | 529,200 |
| | | | | | | | | |
Principal Amount | | | | | | Rating(1) | | Value |
| | | | | | | | | |
| $ 500,000 | | C | | Tampa Housing Authority, 4.650%, due 07/01/22 | | NR/AAA | | $ | 503,725 |
| | | | | | | | | |
| | | | | | | | | 2,191,983 |
| | | | | | | | | |
| Illinois: 7.6% | | | | | |
| 1,000,000 | | C | | De Kalb-Ogle Etc Counties Community College District No. 523, 5.750%, due 02/01/11 | | Aaa/NR | | | 1,047,590 |
| 1,000,000 | | C | | Illinois Finance Authority, 5.000%, due 08/15/24 | | NR/NR | | | 930,320 |
| 100,000 | | | | State of Illinois, 6.250%, due 12/15/20 | | Aaa/AAA | | | 117,752 |
| | | | | | | | | |
| | | | | | | | | 2,095,662 |
| | | | | | | | | |
| Kentucky: 0.6% | | | | | |
| 300,000 | | | | Kentucky Economic Development Finance Authority, Discount Note, due 10/01/21 | | Aaa/AAA | | | 153,735 |
| | | | | | | | | |
| | | | | | | | | 153,735 |
| | | | | | | | | |
| Louisiana: 3.5% | | | | | |
| 1,000,000 | | C | | Louisiana Public Facilities Authority, 5.625%, due 12/15/32 | | Aaa/AAA | | | 978,900 |
| | | | | | | | | |
| | | | | | | | | 978,900 |
| | | | | | | | | |
| Massachusetts: 0.7% | | | | | |
| 200,000 | | | | Massachusetts Housing Finance Agency, 4.600%, due 12/01/14 | | Aa2/AA | | | 205,350 |
| | | | | | | | | |
| | | | | | | | | 205,350 |
| | | | | | | | | |
| New Hampshire: 2.6% | | | | | |
| 740,000 | | C | | New Hampshire Housing Finance Authority, 4.850%, due 07/01/26 | | Aaa/NR | | | 728,745 |
| | | | | | | | | |
| | | | | | | | | 728,745 |
| | | | | | | | | |
| New Jersey: 3.5% | | | | | |
| 1,000,000 | | C | | New Jersey St Housing & Mortgage Finance Agency, 4.550%, due 10/01/22 | | Aa2/AA | | | 964,040 |
| | | | | | | | | |
| | | | | | | | | 964,040 |
| | | | | | | | | |
| New York: 17.2% | | | | | |
| 525,000 | | | | Albany Industrial Development Agency, 7.750%, due 01/01/10 | | NR/NR | | | 550,268 |
| 1,000,000 | | C | | City of New York, 5.000%, due 08/01/24 | | Aa3/AA | | | 1,035,010 |
| 250,000 | | C | | Hudson Yards Infrastructure Corp., 5.000%, due 02/15/47 | | A3/A | | | 254,010 |
| 1,000,000 | | C | | New York State Dormitory Authority, 5.500%, due 07/01/15 | | Aaa/AAA | | | 1,062,630 |
See Accompanying Notes to Financial Statements
75
| | |
ING NATIONAL
TAX-EXEMPT BOND FUND | | PORTFOLIO OF INVESTMENTS ASOF SEPTEMBER 30, 2007 (UNAUDITED) (CONTINUED) |
| | | | | | | | | |
Principal Amount | | | | | | Rating(1) | | Value |
| | | | | | | | | |
| New York: (continued) | | | | | |
| $1,000,000 | | | | Port Authority of New York & New Jersey, 6.250%, due 12/01/11 | | Aaa/AAA | | $ | 1,095,318 |
| 775,000 | | C | | Westchester County Industrial Development Agency, 4.750%, due 07/01/20 | | NR/A | | | 761,492 |
| | | | | | | | | |
| | | | | | | | | 4,758,728 |
| | | | | | | | | |
| North Carolina: 3.8% | | | | | |
| 295,000 | | C | | New Hanover County, 5.750%, due 11/01/12 | | Aa1/AA | | | 316,795 |
| 710,000 | | C | | Raleigh North Carolina Certificates, 5.000%, due 02/01/24 | | Aa2/AA+ | | | 737,115 |
| | | | | | | | | |
| | | | | | | | | 1,053,910 |
| | | | | | | | | |
| North Dakota: 0.9% | | | | | |
| 250,000 | | C | | Oliver County, 5.300%, due 01/01/27 | | Aaa/AAA | | | 258,785 |
| | | | | | | | | |
| | | | | | | | | 258,785 |
| | | | | | | | | |
| Ohio: 0.2% | | | | | |
| 55,000 | | | | Lakota Local School District, 7.000%, due 12/01/10 | | Aaa/AAA | | | 60,673 |
| | | | | | | | | |
| | | | | | | | | 60,673 |
| | | | | | | | | |
| Oklahoma: 8.1% | | | | | |
| 1,000,000 | | C | | Oklahoma Industries Authority, 6.000%, due 08/15/19 | | Aaa/AAA | | | 1,050,737 |
| 100,000 | | C | | Oklahoma Student Loan Authority, 5.300%, due 12/01/32 | | Aaa/AAA | | | 102,182 |
| 1,000,000 | | C | | Payne County Economic Development Authority, 6.375%, due 06/01/30 | | Baa3/NR | | | 1,095,200 |
| | | | | | | | | |
| | | | | | | | | 2,248,119 |
| | | | | | | | | |
| Pennsylvania: 4.2% | | | | | |
| 130,000 | | C | | Allegheny County Hospital Development Authority, 5.300%, due 07/01/26 | | Aaa/AAA | | | 137,721 |
| 1,000,000 | | C | | Lebanon County Health Facilities Authority, 6.000%, due 11/15/35 | | Baa2/BBB | | | 1,038,010 |
| | | | | | | | | |
| | | | | | | | | 1,175,731 |
| | | | | | | | | |
| | | | | | | | | | | |
Principal Amount | | | | | | Rating(1) | | | Value |
| | | | | | | | | | |
| | Rhode Island: 0.3% | | | | | | |
| $ | 35,000 | | | | Dunns Corner Fire District, 8.050%, due 06/01/08 | | NR/NR | | | $ | 35,968 |
| | 35,000 | | | | Dunns Corner Fire District, 8.100%, due 06/01/09 | | NR/NR | | | | 37,384 |
| | | | | | | | | | | |
| | | | | | | | | | | 73,352 |
| | | | | | | | | | | |
| | Texas: 7.4% | | | | | | |
| | 500,000 | | C | | Alamo Community College District, 5.000%, due 02/15/24 | | Aaa/AAA | | | | 522,775 |
| | 200,000 | | C | | Cleburne 4B Economic Development Corp., 5.625%, due 02/15/27 | | Aaa/NR | | | | 213,070 |
| | 1,000,000 | | C | | Harris County Health Facilities Development Corp., 5.750%, due 07/01/27 | | Aa3/AAA | | | | 1,162,400 |
| | 165,000 | | C | | Harris County-Houston Sports Authority, 5.000%, due 11/15/28 | | Aaa/AAA | | | | 165,972 |
| | | | | | | | | | | |
| | | | | | | | | | | 2,064,217 |
| | | | | | | | | | | |
| | Virginia: 1.0% | | | | | | |
| | 290,000 | | C | | Virginia Housing Development Authority, 4.500%, due 04/01/24 | | Aaa/AAA | | | | 275,552 |
| | | | | | | | | | | |
| | | | | | | | | | | 275,552 |
| | | | | | | | | | | |
| | | | | Total Investments in Securities
(Cost $27,067,503)*
| | 97.5 | % | | $ | 27,059,488 |
| | | | | Other Assets and Liabilities - Net | | 2.5 | | | | 689,104 |
| | | | | | | | | | | |
| | | | | Net Assets | | 100.0 | % | | $ | 27,748,592 |
| | | | | | | | | | | |
(1) | Credit ratings are provided by Moody’s Investor’s Service, Inc. and Standard’s and Poor’s Rating Group. |
| C | Bond may be called prior to maturity date. |
| * | Cost for federal income tax purposes is the same as for financial statement purposes. |
| | | | |
Net unrealized depreciation consists of: | | | | |
Gross Unrealized Appreciation | | $ | 429,331 | |
Gross Unrealized Depreciation | | | (437,346 | ) |
| | | | |
Net Unrealized Depreciation | | $ | (8,015 | ) |
| | | | |
See Accompanying Notes to Financial Statements
76
| | |
| ING CLASSIC MONEY MARKET FUND(1) | | PORTFOLIO OF INVESTMENTS ASOF SEPTEMBER 30, 2007 (UNAUDITED) |
| | | | | | | | |
Principal
Amount | | | | | | Value |
| | | | | | | | |
| | CERTIFICATE OF DEPOSIT: 0.5% | | | |
| $ | 6,000,000 | | | | Canadian Imperial Bank of Commerce,
5.500%, due 10/26/07 | | $ | 5,998,515 |
| | | | | | | | |
| | | | | Total Certificate of Deposit (Cost $5,998,515) | | | 5,998,515 |
| | | | | | | | |
| | COLLATERALIZED MORTGAGE OBLIGATION: 0.5% |
| | 6,000,000 | | @@, #, C | | Cheyne High Grade CDO Ltd.,
5.390%, due 11/13/07 | | | 6,000,000 |
| | | | | | | | |
| | | | | Total Collateralized Mortgage Obligation (Cost $6,000,000) | | | 6,000,000 |
| | | | | | | | |
| | COMMERCIAL PAPER: 39.5% | | | |
| | 28,500,000 | | @@, # | | ASB Finance Ltd., 5.100%, due 01/25/08 | | | 28,302,909 |
| | 15,000,000 | | | | Barton Capital Corp., 6.100%, due 10/05/07 | | | 14,989,833 |
| | 33,100,000 | | | | Cafco LLC, 6.000%, due 10/12/07 | | | 32,866,809 |
| | 38,500,000 | | # | | Ciesco LP, 5.900%, due 12/14/07 | | | 37,941,311 |
| | 24,000,000 | | # | | Concord Minutemen Capital Co., LLC, 5.285%, due 10/18/07 | | | 23,940,103 |
| | 15,000,000 | | # | | Concord Minutemen Capital Co., LLC, 6.350%, due 10/02/07 | | | 14,958,018 |
| | 24,000,000 | | | | Crown Point Capital Corp.,
5.285%, due 10/18/07 | | | 23,940,103 |
| | 15,450,000 | | | | Crown Point Capital Corp.,
6.000%, due 03/14/08 | | | 15,128,671 |
| | 15,564,000 | | # | | Edison Asset Securitization Corp.,
6.000%, due 10/02/07 | | | 15,553,073 |
| | 10,000,000 | | # | | Jupiter Securitization Corp.,
6.350%, due 10/10/07 | | | 9,984,125 |
| | 15,500,000 | | | | Louis Dreyfus Corp., 6.200%, due 10/04/07 | | | 15,478,513 |
| | 34,282,000 | | | | Old Line Funding LLC, 6.000%, due 11/15/07 | | | 33,795,464 |
| | 18,232,000 | | | | Park Avenue Receivables Corp.,
5.550%, due 10/11/07 | | | 18,202,365 |
| | 41,080,000 | | # | | Thunder Bay Funding LLC, 6.000%, due 11/16/07 | | | 40,673,858 |
| | 18,000,000 | | @@, # | | Total Capital,
5.250%, due 11/23/07 | | | 17,860,875 |
| | 10,022,000 | | # | | Tulip Funding Corp., 5.300%, due 10/11/07 | | | 10,007,687 |
| | 16,000,000 | | | | Variable Funding Capital Corp.,
5.900%, due 11/16/07 | | | 15,879,378 |
| | 5,000,000 | | | | Westpac Securities New Zealand,
5.290%, due 10/22/07 | | | 4,984,571 |
| | 24,000,000 | | | | Windmill Funding,
6.220%, due 10/19/07 | | | 23,925,360 |
| | 36,374,000 | | # | | Yorktown Capital LLC.,
6.050%, due 12/14/07 | | | 36,132,890 |
| | | | | | | | |
| | | | | Total Commercial Paper (Cost $434,545,916) | | | 434,545,916 |
| | | | | | | | |
| | | | | | | | |
Principal
Amount | | | | | | Value |
| | | | | | | | |
| | CORPORATE BONDS/NOTES: 54.7% | | | |
| $ | 2,000,000 | | @@ | | Alliance & Leicester PLC,
5.435%, due 01/14/08 | | $ | 2,000,413 |
| | 4,000,000 | | | | Allstate Life Global Funding II, 5.129%, due 08/27/08 | | | 4,000,339 |
| | 3,000,000 | | | | Allstate Life Global Funding II, 5.476%, due 06/20/08 | | | 2,937,908 |
| | 4,945,000 | | | | American Express Bank FSB, 5.229%, due 11/21/07 | | | 4,945,684 |
| | 11,300,000 | | | | American Express Bank FSB, 5.763%, due 10/16/08 | | | 11,275,178 |
| | 3,250,000 | | | | American Express Centurion, 5.394%, due 05/16/08 | | | 3,203,115 |
| | 2,710,000 | | | | American Express Centurion, 5.833%, due 11/16/07 | | | 2,710,335 |
| | 6,000,000 | | | | American Express,
5.496%, due 08/20/08 | | | 6,000,093 |
| | 14,518,000 | | | | American General Finance Corp., 5.374%, due 11/15/07 | | | 14,503,713 |
| | 5,350,000 | | | | American General Finance Corp., 5.480%, due 01/18/08 | | | 5,352,209 |
| | 23,500,000 | | # | | American General Finance Corp., 5.803%, due 09/12/08 | | | 23,503,901 |
| | 3,000,000 | | # | | American Honda Finance Corp., 5.186%, due 02/04/08 | | | 3,000,864 |
| | 6,850,000 | | # | | American Honda Finance Corp., 5.360%, due 03/11/08 | | | 6,815,390 |
| | 700,000 | | # | | American International Group,
5.210%, due 06/23/08 | | | 700,102 |
| | 2,950,000 | | #,C | | American International Group,
5.530%, due 05/15/08 | | | 2,902,631 |
| | 1,800,000 | | @@, # | | ANZ National Bank,
5.302%, due 05/16/08 | | | 1,788,813 |
| | 4,600,000 | | @@, # | | Banco Santander Totta, 5.763%, due 08/15/08 | | | 4,600,182 |
| | 5,000,000 | | | | Bank of America N.A.,
4.815%, due 12/04/07 | | | 4,999,919 |
| | 3,750,000 | | # | | Bank of New York Mellon Corp., Inc.,
5.189%, due 05/27/08 | | | 3,750,000 |
| | 3,500,000 | | | | Bank One Corp., 5.384%, due 08/01/08 | | | 3,517,080 |
| | 5,725,000 | | | | Bear Stearns Cos., Inc., 5.189%, due 08/28/08 | | | 5,725,000 |
| | 5,800,000 | | | | Bear Stearns Cos., Inc., 5.225%, due 08/05/08 | | | 5,800,000 |
| | 7,400,000 | | | | Bear Stearns Cos., Inc., 5.298%, due 07/02/08 | | | 7,244,733 |
| | 8,235,000 | | | | Bear Stearns Cos., Inc., 5.400%, due 01/31/08 | | | 8,189,976 |
| | 6,260,000 | | | | Bear Stearns Cos., Inc., 5.510%, due 04/29/08 | | | 6,265,982 |
| | 2,000,000 | | | | Bear Stearns Cos., Inc., 5.853%, due 01/15/08 | | | 2,000,685 |
| | 8,700,000 | | | | Canadian Imperial Bank of Commerce, 4.860%, due 02/14/08 | | | 8,701,143 |
| | 4,000,000 | | | | Canadian Imperial Bank of Commerce, 5.136%, due 08/22/08 | | | 4,000,705 |
See Accompanying Notes to Financial Statements
77
| | |
| ING CLASSIC MONEY MARKET FUND(1) | | PORTFOLIO OF INVESTMENTS ASOF SEPTEMBER 30, 2007 (UNAUDITED) (CONTINUED) |
| | | | | | | | |
Principal
Amount | | | | | | Value |
| | | | | | | | |
| | CORPORATE BONDS/NOTES: (continued) | | | |
| $ | 1,000,000 | | | | Canadian Imperial Bank of Commerce, 5.545%, due 02/22/08 | | $ | 999,261 |
| | 8,000,000 | | | | Citigroup Funding, Inc., 4.860%, due 03/14/08 | | | 8,001,494 |
| | 13,500,000 | | | | Credit Suisse, 4.820%, due 03/14/08 | | | 13,499,730 |
| | 2,990,000 | | | | Credit Suisse, 5.731%, due 06/02/08 | | | 2,992,600 |
| | 1,650,000 | | | | Credit Suisse, 5.973%, due 10/29/07 | | | 1,650,484 |
| | 8,600,000 | | @@, # | | Danske Bank A/S, 5.466%, due 08/19/08 | | | 8,599,410 |
| | 22,000,000 | | @@ | | Deutsche Bank, 5.598%, due 06/19/08 | | | 22,004,010 |
| | 15,000,000 | | I | | Goldman Sachs Group, Inc., 5.121%, due 04/11/08 | | | 15,000,000 |
| | 9,300,000 | | # | | Goldman Sachs Group, Inc., 5.823%, due 09/12/08 | | | 9,301,684 |
| | 4,200,000 | | @@, # | | HBOS Treasury Services PLC, 5.198%, due 10/31/08 | | | 4,200,000 |
| | 16,085,000 | | @@, # | | HBOS Treasury Services PLC, 5.280%, due 06/24/08 | | | 16,085,000 |
| | 2,500,000 | | @@, # | | HBOS Treasury Services PLC, 5.335%, due 11/30/07 | | | 2,492,614 |
| | 10,300,000 | | | | HSBC Finance Corp., 5.312%, due 06/17/08 | | | 10,371,655 |
| | 6,189,000 | | | | HSBC Finance Corp., 5.316%, due 01/15/08 | | | 6,175,725 |
| | 3,900,000 | | | | HSBC Finance Corp., 5.368%, due 03/11/08 | | | 3,878,858 |
| | 1,475,000 | | | | JP Morgan Chase, 5.406%, due 06/30/08 | | | 1,445,371 |
| | 1,800,000 | | | | Lehman Brothers Holdings, Inc.,
5.260% due 04/02/08 | | | 1,799,358 |
| | 4,375,000 | | | | Lehman Brothers Holdings, Inc.,
5.420%, due 01/22/08 | | | 4,356,091 |
| | 4,286,000 | | | | Lehman Brothers Holdings, Inc.,
5.448%, due 08/07/08 | | | 4,217,472 |
| | 5,900,000 | | | | Lehman Brothers Holdings, Inc.,
5.900% due 02/01/08 | | | 5,927,116 |
| | 3,000,000 | | | | Marshall & Isley Bank, 5.528%, due 02/15/08 | | | 2,999,087 |
| | 4,000,000 | | # | | MBIA Global Funding LLC, 4.815%, due 03/14/08 | | | 4,000,000 |
| | 18,500,000 | | # | | MBIA Global Funding LLC, 4.850%, due 11/28/07 | | | 18,500,712 |
| | 11,000,000 | | # | | MBIA Global Funding LLC, 4.870%, due 02/15/08 | | | 11,001,575 |
| | 4,500,000 | | # | | MBIA Global Funding LLC, 5.186%, due 01/11/08 | | | 4,501,119 |
| | 3,400,000 | | | | MBNA Corp., 5.790%, due 05/05/08 | | | 3,408,875 |
| | 3,000,000 | | | | Merrill Lynch & Co., Inc., 5.021%, due 10/27/08 | | | 2,993,987 |
| | | | | | | | |
Principal
Amount | | | | | | Value |
| | | | | | | | |
| $ | 7,145,000 | | | | Merrill Lynch & Co., Inc., 5.325%, due 04/21/08 | | $ | 7,080,445 |
| | 16,500,000 | | | | Merrill Lynch & Co., Inc., 5.340%, due 08/22/08 | | | 16,500,000 |
| | 1,400,000 | | | | Merrill Lynch & Co., Inc., 5.449%, due 07/15/08 | | | 1,375,205 |
| | 5,000,000 | | | | Morgan Stanley, 5.206%, due 09/03/08 | | | 5,000,000 |
| | 12,000,000 | | | | Morgan Stanley, 5.219%, due 08/26/08 | | | 12,000,000 |
| | 5,000,000 | | | | Morgan Stanley, 5.246%, due 09/03/08 | | | 5,003,821 |
| | 6,000,000 | | | | Morgan Stanley, 5.390%, due 04/25/08 | | | 6,001,637 |
| | 2,840,000 | | | | Morgan Stanley, 5.485%, due 01/18/08 | | | 2,841,277 |
| | 11,000,000 | | | | Morgan Stanley, 5.770%, due 03/07/08 | | | 11,003,668 |
| | 8,500,000 | | | | Natixis SA, 4.810%, due 12/05/07 | | | 8,499,704 |
| | 7,000,000 | | | | PNC Funding Corp., 5.353%, due 03/10/08 | | | 6,964,781 |
| | 7,500,000 | | | | Royal Bank of Canada, 4.805%, due 04/02/08 | | | 7,499,509 |
| 20,000,000
| | | | Royal Bank of Canada, 4.380%, due 01/22/08 | | | 19,995,613 |
| | 9,000,000 | | @@, # | | Royal Bank of Scotland, 5.159%, due 08/20/08 | | | 9,001,973 |
| | 8,000,000 | | @@, # | | Santander US Debt SA, 5.298%, due 09/19/08 | | | 7,987,785 |
| | 23,000,000 | | @@, # | | Santander US Debt SA, 5.370%, due 02/06/08 | | | 23,002,266 |
| | 2,650,000 | | | | Suntrust Bank, 5.152%, due 10/15/08 | | | 2,619,406 |
| | 10,000,000 | | | | Suntrust Bank, 5.704%, due 06/12/08 | | | 9,998,021 |
| | 1,900,000 | | | | Toyota Motor Credit Corp., 4.350%, due 03/17/08 | | | 1,899,299 |
| | 2,700,000 | | | | Toyota Motor Credit Corp., 4.350%, due 03/24/08 | | | 2,698,946 |
| | 21,000,000 | | | | Toyota Motor Credit Corp., 4.840%, due 06/16/08 | | | 21,003,496 |
| | 5,750,000 | | | | Toyota Motor Credit Corp., 5.470%, due 10/12/07 | | | 5,749,856 |
| | 11,500,000 | | @@, C | | UBS AG,
5.437%, due 11/28/07 | | | 11,499,114 |
| | 675,000 | | | | US Bancorp, 5.396%, due 03/15/08 | | | 668,177 |
| | 18,000,000 | | | | Washington Mutual Bank, 5.390%, due 04/18/08 | | | 17,981,122 |
| | 15,000,000 | | | | Washington Mutual Bank, 5.570%, due 11/16/07 | | | 15,000,800 |
| | 9,000,000 | | # | | Wells Fargo and Co., 5.833%, due 09/12/08 | | | 9,003,996 |
| | 3,300,000 | | | | Westpac Banking Corp., 5.785%, due 07/11/08 | | | 3,300,000 |
| | | | | | | | |
| | | | | Total Corporate Bonds/Notes
(Cost $602,020,087) | | | 602,020,087 |
| | | | | | | | |
See Accompanying Notes to Financial Statements
78
| | |
| ING CLASSIC MONEY MARKET FUND(1) | | PORTFOLIO OF INVESTMENTS ASOF SEPTEMBER 30, 2007 (UNAUDITED) (CONTINUED) |
| | | | | | | | | |
| | Repurchase Agreement: 4.4% | | | | |
| $ | 48,347,000 | | Morgan Stanley Repurchase Agreement dated 09/28/07, 4.900%, due 10/01/07 $48,366,742 to be received upon repurchase (Collateralized by $45,495,000 Federal Home Loan Mortgage Corporation., (3.250%-6.250%) Market Value plus accrued interest $49,502,904, due 11/02/07-07/15/32). | | | | | $ | 48,347,000 |
| | | | | | | | | |
| | | Total Repurchase Agreement (Cost $48,347,000) | | | | | | 48,347,000 |
| | | | | | | | | |
| | | Total Investments in Securities (Cost $1,096,911,518)* | | 99.6 | % | | $ | 1,096,911,518 |
| | | Other Assets and Liabilities - Net | | 0.4 | | | | 4,385,204 |
| | | | | | | | | |
| | | Net Assets | | 100.0 | % | | $ | 1,101,296,722 |
| | | | | | | | | |
| (1) | All securities with a maturity date of greater than 13 months have either a variable rate, a demand feature, prerefunded, optional or mandatory put resulting in an effective maturity of 13 months or less. Rate shown reflects current rate. |
| CDO | Collateralized Debt Obligations |
| # | Securities with purchases pursuant to Rule 144A or Section 4(2), under the Securities Act of 1933 and may not be resold subject to that rule except to qualified institutional buyers. These securities have been determined to be liquid under the guidelines established by the Funds' Board of Directors/Trustees. |
| C | Bond may be called prior to maturity date. |
| * | Cost for federal income tax purposes is the same as for financial statement purposes. |
See Accompanying Notes to Financial Statements
79
| | |
ING INSTITUTIONAL PRIME
MONEY MARKET FUND(1) | | PORTFOLIO OF INVESTMENTS ASOF SEPTEMBER 30, 2007 (UNAUDITED) |
| | | | | | | | |
Principal Amount | | | | | | Value |
| | | | | | | | |
| | CERTIFICATES OF DEPOSIT: 1.4% | | | |
| $ | 6,500,000 | | | | Canadian Imperial Bank of Commerce, 5.350%, due 10/26/07 | | $ | 6,498,614 |
| | 1,000,000 | | | | Rabobank Nederland NV, 5.400%, due 01/16/08 | | | 999,641 |
| | 1,000,000 | | | | Royal Bank of Scotland, 5.400%, due 01/11/08 | | | 999,567 |
| | 1,000,000 | | | | Societe Generale, 5.400%, due 01/09/08 | | | 999,360 |
| | 1,000,000 | | | | Toronto Dominion Bank, 5.350%, due 10/26/07 | | | 999,969 |
| | 1,000,000 | | @@, C | | UBS AG, 5.400%, due 01/04/08 | | | 999,446 |
| | | | | | | | |
| | | | | Total Certificates of Deposit
(Cost $11,496,597) | | | 11,496,597 |
| | | | | | | | |
| | COLLATERALIZED MORTGAGE OBLIGATION: 0.3% |
| | 2,000,000 | | @@, #, C | | Cheyne High Grade CDO Ltd.,
5.390%, due 11/13/07 | | | 2,000,000 |
| | | | | | | | |
| | | | | Total Collateralized Mortgage Obligation
(Cost $2,000,000) | | | 2,000,000 |
| | | | | | | | |
| | COMMERCIAL PAPER: 34.6% | | | |
| | 19,000,000 | | | | ASB Finance Ltd., 5.225%, due 12/07/07 | | | 18,896,378 |
| | 1,122,000 | | # | | Barton Capital Corp., 5.500%, due 10/02/07 | | | 1,121,829 |
| | 35,000,000 | | | | Cafco LLC, 6.000%, due 10/12/07 | | | 34,643,278 |
| | 24,990,000 | | # | | Ciesco LLC, 5.900%, due 10/15/07 | | | 24,671,823 |
| | 5,000,000 | | | | Concord Minutemen Capital Co. LLC, 5.285%, due 10/18/07 | | | 4,987,522 |
| | 15,500,000 | | # | | Crown Point Capital Corp., 5.210%, due 11/08/07 | | | 15,295,661 |
| | 15,036,000 | | # | | Edison Asset Securitization Corp., 5.330%, due 10/26/07 | | | 14,888,420 |
| | 500,000 | | | | General Electric Capital Corp., 5.200%, due 01/29/08 | | | 491,333 |
| | 30,000,000 | | | | Louis Dreyfus Corp., 6.200%, due 10/04/07 | | | 29,939,570 |
| | 38,964,000 | | | | Old Line Funding LLC, 6.000%, due 11/15/07 | | | 38,792,281 |
| | 20,000,000 | | | | Park Avenue Receivables Corp., 6.050%, due 10/11/07 | | | 19,966,389 |
| | 4,000,000 | | | | Societe Generale, 5.210%, due 11/26/07 | | | 3,975,100 |
| | 36,075,000 | | # | | Thunder Bay Funding LLC, 6.000%, due 11/16/07 | | | 35,695,398 |
| | 25,000,000 | | | | Variable Funding Capital Corp., 5.900%, due 11/16/07 | | | 24,811,528 |
| | 5,000,000 | | @@, # | | Westpac Securities
New Zealand, 5.290%, due 10/22/07 | | | 4,984,571 |
| | | | | | | | |
Principal Amount | | | | | | Value |
| | | | | | | | |
| $ | 16,162,000 | | # | | Yorktown Capital LLC, 6.050%, due 10/01/07 | | $ | 16,162,000 |
| | | | | | | | |
| | | | | Total Commercial Paper
(Cost $289,323,081) | | | 289,323,081 |
| | | | | | | | |
| | CORPORATE BONDS/NOTES: 60.6% | | | |
| | 4,500,000 | | | | Allstate Life Global Funding II, 5.129%, due 08/27/08 | | | 4,500,578 |
| | 5,000,000 | | | | American Express Centurion, 5.496%, due 08/20/08 | | | 5,000,077 |
| | 1,350,000 | | | | American Express Centurion, 5.763%, due 01/15/08 | | | 1,350,036 |
| | 5,000,000 | | | | American Express Bank FSB, 5.763%, due 10/16/08 | | | 4,989,720 |
| | 1,300,000 | | | | American Express Credit Corp., 5.130%, due 12/12/07 | | | 1,300,051 |
| | 2,000,000 | | | | American Express Credit Corp., 5.394%, due 05/16/08 | | | 1,970,959 |
| | 4,350,000 | | | | American General Finance Corp., 5.292%, due 11/15/07 | | | 4,345,875 |
| | 21,000,000 | | # | | American General Finance Corp., 5.803%, due 09/12/08 | | | 21,005,632 |
| | 1,000,000 | | # | | American Honda Finance Corp., 5.470%, due 10/22/07 | | | 1,000,072 |
| | 8,025,000 | | C | | American International Group, 5.390%, due 05/15/08 | | | 7,899,362 |
| | 2,000,000 | | @@, # | | ANZ National Bank, 5.302%, due 05/16/08 | | | 1,987,570 |
| | 3,500,000 | | @@, # | | Banco Santander Totta, 5.763%, due 08/15/08 | | | 3,500,138 |
| | 2,020,000 | | | | Bank of New York Mellon Corporation., 5.411%, due 02/15/08 | | | 2,007,804 |
| | 3,750,000 | | | | Bank One Corp., 5.384%, due 08/01/08 | | | 3,768,300 |
| | 1,763,000 | | | | Bear Stearns Cos., Inc., 4.554%, due 07/02/08 | | | 1,729,905 |
| | 500,000 | | | | Bear Stearns Cos., Inc.,
5.189%, due 08/28/08 | | | 500,000 |
| | 16,095,000 | | | | Bear Stearns Cos., Inc.,
5.254%, due 01/31/08 | | | 16,022,134 |
| | 2,515,000 | | | | Bear Stearns Cos., Inc.,
5.510%, due 04/29/08 | | | 2,517,059 |
| | 10,000,000 | | | | Bear Stearns Cos., Inc.,
5.618%, due 12/15/07 | | | 10,022,229 |
| | 2,400,000 | | | | Bear Stearns Cos., Inc.,
5.853%, due 01/15/08 | | | 2,400,823 |
| | 3,600,000 | | | | BNP Paribas,
5.061%, due 07/03/08 | | | 3,597,825 |
| | 2,460,000 | | | | BNP Paribas,
5.660%, due 10/03/07 | | | 2,459,993 |
| | 10,000,000 | | | | Canadian Imperial Bank of Commerce,
4.860%, due 02/14/08 | | | 10,001,314 |
| | 10,000,000 | | | | Canadian Imperial Bank of Commerce,
5.136%, due 08/22/08 | | | 10,001,762 |
| | 1,000,000 | | | | Caterpillar Financial Services, 5.560%, due 02/11/08 | | | 1,000,286 |
| | 5,000,000 | | | | Citigroup Funding, Inc.,
4.860%, due 03/14/08 | | | 5,000,933 |
See Accompanying Notes to Financial Statements
80
| | |
ING INSTITUTIONAL PRIME
MONEY MARKET FUND(1) | | PORTFOLIO OF INVESTMENTS ASOF SEPTEMBER 30, 2007 (UNAUDITED) (CONTINUED) |
| | | | | | | | |
Principal Amount | | | | | | Value |
| | | | | | | | |
| | CORPORATE BONDS/NOTES: (continued) | | | |
| $ | 9,000,000 | | | | Credit Suisse,
4.820%, due 03/14/08 | | $ | 8,999,691 |
| | 10,000,000 | | @@, # | | Danske Bank A/S,
5.466%, due 08/19/08 | | | 9,999,323 |
| �� | 22,000,000 | | @@ | | Deutsche Bank,
5.598%, due 06/19/08 | | | 22,004,010 |
| | 2,000,000 | | | | General Electric Capital Corp., 5.100%, due 10/15/08 | | | 1,969,947 |
| | 3,547,000 | | | | General Electric Capital Corp., 5.290%, due 01/03/08 | | | 3,547,451 |
| | 10,000,000 | | I | | Goldman Sachs Group, Inc., 5.121%, due 04/11/08 | | | 10,000,000 |
| | 6,000,000 | | # | | Goldman Sachs Group, Inc., 5.823%, due 09/12/08 | | | 6,002,525 |
| | 1,500,000 | | | | Goldman Sachs Group, Inc., 5.935%, due 02/26/08 | | | 1,502,679 |
| | 1,500,000 | | @@, # | | HBOS Treasury Services PLC, 5.280%, due 06/24/08 | | | 1,500,000 |
| | 5,470,000 | | | | HSBC Finance Corp.,
5.132%, due 09/06/08 | | | 5,469,956 |
| | 9,500,000 | | | | HSBC Finance Corp.,
5.312%, due 06/17/08 | | | 9,566,644 |
| | 1,000,000 | | | | HSBC Finance Corp.,
5.316%, due 01/15/08 | | | 998,050 |
| | 4,300,000 | | | | HSBC Finance Corp.,
5.368%, due 03/11/08 | | | 4,276,690 |
| | 1,030,000 | | | | HSBC Finance Corp.,
5.913%, due 12/03/07 | | | 1,030,247 |
| | 2,000,000 | | | | JP Morgan Chase & Co.,
5.309%, due 05/01/08 | | | 1,980,848 |
| | 2,000,000 | | | | Lehman Brothers Holdings, Inc., 5.159%, due 05/29/08 | | | 2,000,579 |
| | 4,491,000 | | | | Lehman Brothers Holdings, Inc., 5.248%, due 01/22/08 | | | 4,473,875 |
| | 1,700,000 | | | | Lehman Brothers Holdings, Inc., 5.260%, due 04/02/08 | | | 1,699,394 |
| | 4,850,000 | | | | Lehman Brothers Holdings, Inc., 5.455%, due 08/07/08 | | | 4,772,343 |
| | 5,000,000 | | | | Lehman Brothers Holdings, Inc., 5.536%, due 05/29/08 | | | 5,001,269 |
| | 3,600,000 | | | | Lehman Brothers Holdings, Inc., 5.794%, due 02/01/08 | | | 3,613,502 |
| | 3,600,000 | | | | Marshall & Ilsley Bank,
5.528%, due 12/17/07 | | | 3,597,806 |
| | 2,000,000 | | # | | MBIA Global Funding LLC,
4.815%, due 03/14/08 | | | 2,000,000 |
| | 13,500,000 | | # | | MBIA Global Funding LLC,
4.850%, due 11/28/07 | | | 13,500,520 |
| | 5,000,000 | | # | | MBIA Global Funding LLC,
4.870%, due 02/15/08 | | | 5,000,762 |
| | 2,000,000 | | # | | MBIA Global Funding LLC,
5.186%, due 01/11/08 | | | 2,000,497 |
| | 4,066,000 | | | | MBNA Corp.,
5.790%, due 05/05/08 | | | 4,076,179 |
| | 4,500,000 | | | | Merrill Lynch & Co., Inc.,
5.323%, due 04/21/08 | | | 4,459,858 |
| | 18,500,000 | | | | Merrill Lynch & Co., Inc.,
5.340%, due 08/22/08 | | | 18,500,000 |
| | 5,000,000 | | | | Merrill Lynch & Co., Inc.,
5.485%, due 10/19/07 | | | 5,000,376 |
| | 13,000,000 | | | | Morgan Stanley,
5.206%, due 09/03/08 | | | 13,008,789 |
| | | | | | | | |
Principal Amount | | | | | | Value |
| | | | | | | | |
| $ | 6,200,000 | | | | Morgan Stanley,
5.246%, due 09/03/08 | | $ | 6,203,002 |
| | 5,000,000 | | | | Morgan Stanley,
5.390%, due 04/25/08 | | | 5,001,389 |
| | 4,870,000 | | | | Morgan Stanley,
5.485%, due 01/18/08 | | | 4,872,059 |
| | 4,500,000 | | | | Morgan Stanley,
5.975%, due 05/14/08 | | | 4,511,307 |
| | 10,000,000 | | | | Natixis SA.,
4.810%, due 12/05/07 | | | 9,999,652 |
| | 15,250,000 | | | | Royal Bank of Canada,
4.380%, due 01/22/08 | | | 15,245,613 |
| | 4,500,000 | | | | Royal Bank of Canada,
4.805%, due 04/02/08 | | | 4,499,705 |
| | 3,100,000 | | | | Royal Bank of Scotland,
5.061%, due 07/03/08 | | | 3,098,141 |
| | 9,000,000 | | @@, # | | Royal Bank of Scotland,
5.159%, due 08/20/08 | | | 9,001,968 |
| | 2,600,000 | | @@, # | | Royal Bank of Scotland,
5.238%, due 12/21/07 | | | 2,600,112 |
| | 2,300,000 | | @@, # | | Royal Bank of Scotland,
5.259%, due 04/11/08 | | | 2,300,346 |
| | 4,000,000 | | @@, # | | Santander US Debt SA,
5.298%, due 09/19/08 | | | 3,993,893 |
| | 22,000,000 | | @@, # | | Santander US Debt SA,
5.370%, due 02/06/08 | | | 22,002,091 |
| | 6,100,000 | | | | Societe Generale,
5.079%, due 03/26/08 | | | 6,098,858 |
| | 1,000,000 | | | | Suntrust Bank,
5.119%, due 01/28/08 | | | 1,000,005 |
| | 2,000,000 | | | | Suntrust Bank,
5.309%, due 04/02/08 | | | 2,001,060 |
| | 2,700,000 | | | | Suntrust Bank,
5.357%, due 06/01/08 | | | 2,714,605 |
| | 6,000,000 | | | | Suntrust Bank,
5.704%, due 06/12/08 | | | 5,998,812 |
| | 1,900,000 | | | | Toyota Motor Credit Corp., 4.350%, due 03/17/08 | | | 1,899,299 |
| | 2,700,000 | | | | Toyota Motor Credit Corp., 4.350%, due 03/24/08 | | | 2,698,946 |
| | 10,000,000 | | | | Toyota Motor Credit Corp., 4.840%, due 06/16/08 | | | 10,001,665 |
| | 5,000,000 | | | | Toyota Motor Credit Corp., 5.470%, due 10/12/07 | | | 4,999,875 |
| | 16,300,000 | | | | UBS AG,
5.411%, due 11/28/07 | | | 16,299,113 |
| | 2,655,000 | | | | US Bank,
5.358%, due 03/17/08 | | | 2,640,099 |
| | 10,000,000 | | | | US Bank,
5.390%, due 10/01/07 | | | 10,000,000 |
| | 2,000,000 | | | | Wachovia Bank,
5.186%, due 08/15/08 | | | 1,985,940 |
| | 14,000,000 | | | | Washington Mutual Bank, 5.390%, due 04/18/08 | | | 13,984,975 |
| | 7,000,000 | | | | Washington Mutual Bank, 5.570%, due 11/16/07 | | | 7,000,339 |
| | 1,100,000 | | C | | Wells Fargo & Co.,
5.301%, due 10/15/07 | | | 1,099,365 |
| | 9,000,000 | | # | | Wells Fargo & Co.,
5.833%, due 09/12/08 | | | 9,003,996 |
See Accompanying Notes to Financial Statements
81
| | |
ING INSTITUTIONAL PRIME
MONEY MARKET FUND(1) | | PORTFOLIO OF INVESTMENTS ASOF SEPTEMBER 30, 2007 (UNAUDITED) (CONTINUED) |
| | | | | | | | |
Principal Amount | | | | | | Value |
| | | | | | | | |
| | CORPORATE NOTES: (continued) | | | |
| $ | 2,000,000 | | | | Westpac Banking Corp.,
5.320%, due 01/15/08 | | $ | 1,999,821 |
| | | | | | | | |
| | | | | Total Corporate Bonds/Notes (Cost $506,190,298) | | | 506,190,298 |
| | | | | | | | |
| | | | | | | | | |
| REPURCHASE AGREEMENT: 5.6% | | | | | | | |
| 47,001,000 | | Deutsche Bank Repurchase Agreement date 09/28/07, 4.850%, due 10/01/07 $47,001,000 to be received upon repurchase (Collateralized by $47,649,000 various U.S. Government Agency obligations, 4.500% - 5.250%, Market value plus accrued interest $47,941,530, due 12/04/07-10/09/09). | | | | | | 47,001,000 | |
| | | | | | | | | |
| | Total Repurchase Agreement (Cost $47,001,000) | | | | | | 47,001,000 | |
| | | | | | | | | |
| | Total Investments in Securities (Cost $856,010,976)* | | 102.5 | % | | $ | 856,010,976 | |
| | Other Assets and Liabilities - Net | | (2.5 | ) | | | (20,603,283 | ) |
| | | | | | | | | |
| | Net Assets | | 100.0 | % | | $ | 835,407,693 | |
| | | | | | | | | |
| (1) | All securities with a maturity date of greater than 13 months have either a variable rate, a demand feature, prerefunded, optional or mandatory put resulting in an effective maturity of 13 months or less. Rate shown reflects current rate. |
| CDO | Collateralized Debt Obligation |
| # | Securities with purchases pursuant to Rule 144A or Section 4(2), under the Securities Act of 1933 and may not be resold subject to that rule except to qualified institutional buyers. These securities have been determined to be liquid under the guidelines established by the Funds’ Board of Directors/Trustees. |
| C | Bond may be called prior to maturity date. |
| * | Cost for federal income tax purposes is the same as for financial statement purposes. |
See Accompanying Notes to Financial Statements
82
ING Funds Distributor, LLC offers the funds listed below. Before investing in a fund, shareholders should carefully review the fund’s prospectus. Investors may obtain a copy of a prospectus of any ING Fund by calling (800) 992-0180 or by going to www.ingfunds.com.
| | |
Domestic Equity and Income Funds ING Balanced Fund ING Growth and Income Fund ING Real Estate Fund Domestic Equity Growth Funds ING 130/30 Fundamental Research Fund ING Disciplined LargeCap Fund ING Fundamental Research Fund ING Growth Fund ING LargeCap Growth Fund ING MidCap Opportunities Fund ING Opportunistic LargeCap Fund ING Small Company Fund ING SmallCap Opportunities Fund Domestic Equity Index Funds ING Index Plus LargeCap Fund ING Index Plus MidCap Fund ING Index Plus SmallCap Fund Domestic Equity Value Funds ING Financial Services Fund ING LargeCap Value Fund ING MagnaCap Fund ING SmallCap Value Choice Fund ING Value Choice Fund Fixed-lncome Funds ING GNMA lncome Fund ING High Yield Bond Fund ING Intermediate Bond Fund ING National Tax-Exempt Bond Fund Global Equity Funds ING Global Equity Dividend Fund ING Global Natural Resources Fund ING Global Real Estate Fund ING Global Science and Technology Fund ING Global Value Choice Fund | | International Equity Funds ING Disciplined International SmallCap Fund ING Emerging Countries Fund ING Foreign Fund ING Greater China Fund ING Index Plus International Equity Fund ING International Capital Appreciation Fund ING International Equity Fund ING International Equity Dividend Fund ING International Growth Opportunities Fund ING International Real Estate ING International SmallCap Fund ING International Value Fund ING International Value Choice Fund ING Russia Fund Global and International Fixed-Income Funds ING Emerging Markets Fixed Income Fund ING Global Bond Fund International Fund-of-Funds ING Diversified International Fund Loan Participation Fund ING Senior lncome Fund Money Market Funds* ING Money Market Fund ING Classic Money Market Fund Strategic Allocation Funds ING Strategic Allocation Conservative Fund ING Strategic Allocation Growth Fund ING Strategic Allocation Moderate Fund |
| * | An investment in the funds are not insured or guaranteed by the Federal Deposit Insurance Corporation or any other government agency. Although the funds seek to preserve the value of your investment at $1.00 per share, it is possible to lose money by investing in the funds. |
Investment Adviser
ING Investments, LLC
7337 East Doubletree Ranch Road
Scottsdale, Arizona 85258
Administrator
ING Funds Services, LLC
7337 East Doubletree Ranch Road
Scottsdale, Arizona 85258
Distributor
ING Funds Distributor, LLC
7337 East Doubletree Ranch Road
Scottsdale, Arizona 85258
Transfer Agent
DST Systems, Inc.
330 West 9th Street
Kansas City, Missouri 64105
Custodian
The Bank of New York Mellon Corporation
One Wall Street
New York, New York 10286
Legal Counsel
Dechert
1775 I Street, N.W.
Washington, D.C. 20006
For more complete information, or to obtain a prospectus on any ING fund, please call your Investment Professional or ING Funds Distributor, LLC at (800) 992-0180 or log on to www.ingfunds.com. The prospectus should be read carefully before investing. Consider the fund’s investment objectives, risks, charges and expenses carefully before investing. The prospectus contains this information and other information about the fund.

PRSAR-UFIALL (0907-113007)
SIGNATURES
Pursuant to the requirements of the Securities Exchange Act of 1934 and the Investment Company Act of 1940, the registrant has duly caused this report to be signed on its behalf by the undersigned, thereunto duly authorized.
| | |
| (Registrant): ING Funds Trust |
| |
| By | | /s/ Shaun P. Mathews |
| | Shaun P. Mathews |
| | President and Chief Executive Officer |
Date: December 4, 2007
Pursuant to the requirements of the Securities Exchange Act of 1934 and the Investment Company Act of 1940, this report has been signed below by the following persons on behalf of the registrant and in the capacities and on the dates indicated.
| | |
| By | | /s/ Shaun P. Mathews |
| | Shaun P. Mathews |
| | President and Chief Executive Officer |
Date: December 4, 2007
| | |
| By | | /s/ Todd Modic |
| | Todd Modic |
| | Senior Vice President and Chief Financial Officer |
Date: December 4, 2007