| | |
OMB APPROVAL |
OMB Number: | | 3235-0570 |
Expires: | | August 31, 2011 |
Estimated average burden |
hours per response: | | 18.9 |
UNITED STATES
SECURITIES AND EXCHANGE COMMISSION
Washington, D.C. 20549
FORM N-CSR
CERTIFIED SHAREHOLDER REPORT OF REGISTERED
MANAGEMENT INVESTMENT COMPANIES
Investment Company Act file number: 811-08895
ING Funds Trust
(Exact name of registrant as specified in charter)
| | |
| 7337 E. Doubletree Ranch Rd., Scottsdale, AZ | | 85258 |
| (Address of principal executive offices) | | (Zip code) |
The Corporation Trust Company, 1209 Orange Street, Wilmington, DE 19801
(Name and address of agent for service)
Registrant’s telephone number, including area code: 1-800-992-0180
Date of fiscal year end: March 31
Date of reporting period: April l, 2008 to September 30, 2008

Semi-Annual Report
September 30, 2008
Classes A, B, C, I, IS, O, Q, R and W
Fixed-Income Funds
| n | ING High Yield Bond Fund |
| n | ING Intermediate Bond Fund |
| n | ING National Tax-Exempt Bond Fund |
Money Market Funds
| n | ING Classic Money Market Fund |
| n | ING Institutional Prime Money Market Fund |
| | |
 | | E-Delivery Sign-up – details inside |
This report is submitted for general information to shareholders of the ING Funds. It is not authorized for distribution to prospective shareholders unless accompanied or preceded by a prospectus which includes details regarding the funds’ investment objectives, risks, charges, expenses and other information. This information should be read carefully.
F U N D S | 
|
TABLE OF CONTENTS
| | | | |
| | | |
 | | Go Paperless with E-Delivery! | | |
Sign up now for on-line prospectuses, fund reports, and proxy statements. In less than five minutes, you can help reduce paper mail and lower fund costs. Just go to www.ingfunds.com, click on the E-Delivery icon from the home page, follow the directions and complete the quick 5 Steps to Enroll. You will be notified by e-mail when these communications become available on the internet. Documents that are not available on the internet will continue to be sent by mail. |
PROXY VOTING INFORMATION
A description of the policies and procedures that the Funds use to determine how to vote proxies related to portfolio securities is available: (1) without charge, upon request, by calling Shareholder Services toll-free at (800) 992-0180; (2) on the Funds’ website at www.ingfunds.com; and (3) on the U.S. Securities and Exchange Commission’s (“SEC”) website at www.sec.gov. Information regarding how the Funds voted proxies related to portfolio securities during the most recent 12-month period ended June 30 is available without charge on the Funds’ website at www.ingfunds.com and on the SEC’s website at www.sec.gov.
QUARTERLY PORTFOLIO HOLDINGS
The Funds file their complete schedule of portfolio holdings with the SEC for the first and third quarters of each fiscal year on Form N-Q. The Funds’ Forms N-Q are available on the website at www.sec.gov. The Funds’ Forms N-Q may be reviewed and copied at the SEC’s Public Reference Room in Washington, DC, and information on the operation of the Public Reference Room may be obtained by calling (800) SEC-0330; and is available upon request from the Funds by calling Shareholder Services toll-free at (800) 992-0180.
PRESIDENT’S LETTER

Dear Shareholders,
We are in the midst of one of the most challenging periods ever faced by investors and we at ING Funds are aware of the anxiety that you may be feeling at this time.
I want to assure you that we are actively engaged in monitoring the situation and are committed to keeping you fully informed of how the rapidly unfolding events around us may impact your investments with our company.
We recognize that the confidence of many investors is being tested, perhaps as never before. It is understandable that some of you may be second guessing your investment strategy due to these recent events. We encourage you to work with your investment professional and seek out their advice about your portfolio in light of the current conditions. But we also urge investors not to make rash decisions. ING Funds still believes that a well-diversified, globally allocated portfolio remains the most effective investment strategy of all. We ask that investors not lose sight of their commitment to the long-term.
We thank you for your support and confidence and we look forward to continuing to do business with you in the future.
Sincerely,

Shaun Mathews,
President
ING Funds
October 17, 2008
The views expressed in the President’s Letter reflect those of the President as of the date of the letter. Any such views are subject to change at any time based upon market or other conditions and ING Funds disclaims any responsibility to update such views. These views may not be relied on as investment advice and because investment decisions for an ING Fund are based on numerous factors, may not be relied on as an indication of investment intent on behalf of any ING Fund. Reference to specific company securities should not be construed as recommendations or investment advice.
For more complete information, or to obtain a prospectus for any ING Fund, please call your investment professional or ING Funds Distributor, LLC at (800) 992-0180 or log on to www.ingfunds.com. The prospectus should be read carefully before investing. Consider the fund’s investment objectives, risks, and charges and expenses carefully before investing. The prospectus contains this information and other information about the fund. Check with your investment professional to determine which funds are available for sale within their firm. Not all funds are available for sale at all firms.
1
MARKET PERSPECTIVE: SIX MONTHS ENDED SEPTEMBER 30, 2008
For a while, as our new fiscal year got under way, it seemed as if the worst had passed. Bear Stearns’ forced sale to JP Morgan had proved that some market players were indeed too connected to fail. The Federal Reserve Board (the “Fed”), which had been reducing rates since August, had then cut the discount rate further, by 100 basis points to 2.5% and the federal funds rate by 75 basis points to 2.25%, following this up by opening the discount window to other primary dealers. The improved sentiment was sustained by another federal funds rate cut of 0.25%.
But what had really changed? The housing market continued its inexorable slide, with the Standard & Poor’s (“S&P”)/Case-Shiller National U.S. Home Price Index(1) of house prices in 20 major cities down a record 16.3%. New home sales were at the lowest level since early 1991 and one third of existing home sales were distressed. Banks continued to restrict credit and 30-year fixed mortgage rates reached a six-year high. By September, payrolls had declined for eight consecutive months and the unemployment rate rose to 6.1%, a five-year high.
And there were more fireworks in the financial sector.
Government sponsored mortgage lending agencies, specifically, the Federal National Mortgage Association (“Fannie Mae”) and the Federal Home Loan Mortgage Corporation (“Freddie Mac”), lightly capitalized for their trillions in liabilities, were by any rational assessment, insolvent. The systemic risk to the broader economy was obvious and with their stock prices in free-fall the Treasury took control of Fannie Mae and Freddie Mac on September 7, putting them into “conservatorship” and removing their CEOs.
Lehman Brothers and Merrill Lynch had both declared losses in the billions, due to mortgage securities write downs. The following weekend Lehman Brothers filed for Chapter 11 protection and Merrill Lynch, with official encouragement, was acquired by Bank of America.
Days later, global insurer AIG, in trouble because it insured enormous volumes of bonds (including mortgage related) through credit default swaps, was refused a massive loan from the government. But there was an additional dimension to the emergency, due to the fact that short-term Lehman Brothers and AIG paper was widely-held in money market funds. Fearing that such funds might now turn their backs on commercial credit, the government took a 79.9% stake in AIG, with an $85 billion loan on terms that threatened to wipe out shareholders.
So after more than one year of the credit crisis, nothing that had been tried had worked. The Administration was now in the position of choosing winners and losers among financial institutions. Credit markets faced systemic collapse. A systemic remedy was called for.
On Friday, September 19, 2008, Mr. Paulson proposed a Troubled Asset Relief Plan (“TARP”) under which a $700 billion fund would be set up to buy illiquid mortgage securities from financial institutions. The required new legislation was written with much wrangling in the ten days that followed.
This was a ten-day period with enough news in it to fill a quarter. The last two major independents: Morgan Stanley and Goldman Sachs abandoned the investment banking business model. Washington Mutual, in the biggest bank failure ever, was seized by the Office of Thrift Supervision. Wachovia agreed to sell almost all of its banking business to Citigroup.
On September 29, 2008, Congress sensationally voted down the TARP legislation and the quarter ended with credit markets in a state of atrophy, evidenced by record spreads between commercial interest rates and Treasury yields of comparable terms.
Market movements for the period were defined by the trauma of September.
In US fixed income markets, the Treasury yield curve steepened as investors sought ultimate safety. For the six months ended September 30, 2008, the Treasury Bill yield fell 37 basis points to 0.90%, while the ten-year Treasury Note rose 40 basis points to 3.83%, supported by headline consumer price inflation of 5.4% and increasing calls on the public purse. The Lehman Brothers® U.S. Aggregate Bond (“LBAB”) Index(2) of investment grade bonds returned (1.50)%. But high yield bonds, represented by the Lehman Brothers® High Yield Bond — 2% Issuer Constrained Composite Index(3) returned (6.77)%.
In currencies, the dollar at first continued its weakening trend against the euro. But the tide turned in mid-July and for the whole six months the dollar strengthened by 9.4%. The dollar gained 6.7% on the yen, and 9.8% against the pound.
U.S. equities, represented by the S&P 500® Composite Stock Price Index (“S&P 500® Index”)(4) including dividends, returned (10.90)% for the half-year. Profits for S&P 500® companies suffered their fourth straight quarter of decline, led down by the financials sector. On September 29, 2008, the day TARP legislation was voted down, the S&P 500® Index
2
MARKET PERSPECTIVE: SIX MONTHS ENDED SEPTEMBER 30, 2008
suffered the biggest drop since “Black Monday” in October 1987: 8.8%, before recovering about 60% of this the next day.
In international markets, the Morgan Stanley Capital International (“MSCI”) Japan Index(5) fell 10.0% for the six-month period. The export dependent economy suffered from slowing global demand, while high energy prices and political deadlock sapped domestic confidence. The longest postwar expansion came to an end as a dip in exports led to a decline in gross domestic product (“GDP”) of 0.70% in the second quarter of 2008. The MSCI Europe ex UK® Index(6) slumped 15.3%, beset by sharply falling economic activity and inflation at a 16-year high causing the European Central Bank to raise interest rates. In the final few days of September, governments had to throw life-lines to Belgian insurer Fortis, German property company Hypo and Franco-Belgian bank Dexia. In the UK, the MSCI UK® Index(7) fell 12.6%, as elsewhere lenders were tightening their rules and house price declines were accelerating. In the last two weeks of September the Bank of England force-marched Halifax Bank of Scotland into the arms of Lloyds TSB and nationalized mortgage lender Bradford and Bingley.
(1) The S&P/Case-Shiller National U.S. Home Price Index tracks the value of single-family housing within the United States. The index is a composite of single-family home price indices for the nine U.S. Census divisions and is calculated quarterly.
(2) The LBAB Index is an unmanaged index of publicly issued investment grade U.S. Government, mortgage-backed, asset-backed and corporate debt securities.
(3) The Lehman Brothers® High Yield Bond — 2% Issuer Constrained Composite Index is an
unmanaged index that measures the performance of fixed-income securities.
(4) The S&P 500® Index is an unmanaged index that measures the performance of securities of approximately 500 large-capitalization companies whose securities are traded on major U.S. stock markets.
(5) The MSCI Japan® Index is a free float-adjusted market capitalization index that is designed to measure developed market equity performance in Japan.
(6) The MSCI Europe ex UK® Index is a free float-adjusted market capitalization index that is designed to measure developed market equity performance in Europe, excluding the UK.
(7) The MSCI UK® Index is a free float-adjusted market capitalization index that is designed to measure developed market equity performance in the UK.
All indices are unmanaged and investors cannot invest directly in an index.
Past performance does not guarantee future results. The performance quoted represents past performance. Investment return and principal value of an investment will fluctuate, and shares, when redeemed, may be worth more or less than their original cost. The Funds’ performance is subject to change since the period’s end and may be lower or higher than the performance data shown. Please call (800) 992-0180 or log on to www.ingfunds.com to obtain performance data current to the most recent month end.
Market Perspective reflects the views of ING’s Chief Investment Risk Officer only through the end of the period, and is subject to change based on market and other conditions.
3
| | |
| ING GNMA INCOME FUND | | PORTFOLIO MANAGERS’ REPORT |
ING GNMA Income Fund (the “Fund”) seeks to generate a high level of current income, consistent with liquidity and safety of principal, through investment primarily in Government National Mortgage Association (“GNMA”) mortgage-backed securities (also known as GNMA Certificates) that are guaranteed as to the timely payment of principal and interest by the U.S. government. The Fund is managed by Denis P. Jamison, CFA, Senior Vice President and Senior Portfolio Manager of ING Investment Management Co. — the Sub-Adviser.
Securities issued by the U.S. Treasury are backed by the full faith and credit of the federal government. Securities issued by individual agencies and organizations may be backed by the full faith and credit of the federal government as to principal or interest but are not direct obligations of the U.S. Treasury. Securities of some agencies and organizations are backed solely by the entity’s own resources or by the ability of the entity to borrow from the U.S. Treasury. Government securities also include certain mortgage-related securities that are sponsored by a U.S. government agency or organization and are not direct obligations of the U.S. government.
Performance: For the six-month period ended September 30, 2008, the Fund’s Class A shares, excluding sales charges, provided a total return of 0.43% compared to the Lehman Brothers® U.S. Mortgage-Backed Securities (“MBS”) Index(1) which returned 1.37%, for the same period.
Portfolio Specifics: Mortgages performed relatively well over the last six months as the yield spread between these securities and U.S. Treasury obligations narrowed. In March, the markets were suffering from a flight to quality prompted by the collapse of Bear Stearns. Investors were worried about contagion to other financial firms and, in our opinion, this caused them to shun
mortgage securities. Of course, hindsight has shown these worries were well founded and we are now in the midst of turmoil again. This time around, however, investors seem better able to distinguish good quality, liquid securities such as government-guaranteed mortgages from those at greater risk. Accordingly, the yield spreads between current coupon government-guaranteed mortgages and U.S. Treasuries have not reverted to levels as high as those seen in March.
The various mortgage initiatives designed in Washington to mitigate defaults and widen the scope of government-guaranteed programs are producing new forms of GNMA securities. The FHA-Secure program is designed to help mortgage holders who cannot meet current obligations, while the GNMA JM program is available to borrowers who require loans larger than those formerly available under the Federal Housing Administration (“FHA”) programs. Because the new products are unfamiliar, they typically are priced slightly below standard GNMA offerings. Since the start of the year, the Fund has purchased about $50 million worth of securities issued under the new mandates. So far, these investments have provided modest price appreciation.
The Fund’s benchmark consists primarily of Federal National Mortgage Association (“FNMA”) and Federal Home Loan Mortgage Corporation (“FHLMC”) guaranteed mortgages. At least 80% of the Fund’s holdings must consist of GNMAs Certificates, which put the Fund at a relative disadvantage for the reporting period. FHLMC and FNMA securities returned 25 basis points (or 0.25%) and 40 basis points (or 0.40%), respectively, more than GNMAs during the last six months.
There were no individual positions that significantly enhanced results during the period. Detracting from results was the Fund’s 4%-plus position in low yielding cash and short-term securities. We felt this was necessary given the high level of market volatility. Normally, a significant portion of these non-GNMA holdings would have been invested in longer dated U.S. Treasury obligations, a segment of the market that returned nearly 5% in the quarter ended September.
Current Outlook and Strategy: We believe there is considerable risk that the current period of instability will continue into 2009. Also, the prospect of a significant reduction in the already low federal funds rate lingers over the market. It is our opinion, that in such an environment, U.S. Treasury securities and low coupon mortgages should continue to perform well. However, longer term, we believe the overriding advantage of mortgages is their high yield. Currently, the yield spread between GNMA mortgages priced at par and five-year U.S. Treasury notes exceeds 2.50%. Moreover, mortgage pools priced slightly above par provide a projected 0.40% excess yield to maturity over discount securities. We expect to continue buying higher coupon offerings instead of securities perceived to have better appreciation potential.
Portfolio holdings and characteristics are subject to change and may not be representative of current holdings and characteristics. The outlook for this Fund may differ from that presented for other ING Funds. Performance for the different classes of shares will vary based on differences in fees associated with each class.
(1) | | The Lehman Brothers® U.S. MBS Index is an unmanaged index composed of fixed-income security mortgage pools sponsored by GNMA, FNMA and FHLMC, including GNMA Graduated Payment Mortgages. |
4
| | |
| PORTFOLIO MANAGERS’ REPORT | | ING HIGH YIELD BOND FUND |
ING High Yield Bond Fund (the “Fund”) seeks to provide investors with a high level of current income and total return. The Fund is managed by Randall Parrish, CFA and Portfolio Manager of ING Investment Management Co. — the Sub-Adviser.
Performance: For the six-month period ended September 30, 2008, the Fund’s Class A shares, excluding sales charges, provided a total return of (7.30)% compared to the Lehman Brothers® High Yield Bond Index(1) and the Lehman Brothers® High Yield Bond — 2% Issuer Constrained Composite Index(2), which returned (7.28)% and (6.77)%, respectively, for the same period.
Portfolio Specifics: The Fund underperformed its benchmark, the Lehman Brothers® High Yield Bond — 2% Issuer Constrained Composite Index, for the six-month period ended September 30, 2008.
For generations to come, the reporting period will fill finance textbooks with case studies. During this time, the markets feared inflation, recession, depression, high oil prices, falling oil prices, hedge fund failures and systemic risk in the financial system. We saw the failure of banks and brokerage houses, government sponsored enterprises, insurance companies, money market funds and a wide range of non-financial companies. The federal government committed its resources to guarantee money market funds, purchase mortgages and commercial paper and invest directly in private financial institutions in an effort to break the freeze that has gripped financial markets here and abroad.
These events wreaked havoc across all risk asset classes. The S&P 500® Index (equities) lost 11.80%, the Lehman US Investment Grade Corporate Index (investment grade debt) lost 8.44% and the Lehman US High Yield Loan Index — a measure of high yield debt — lost 6.77%. Though defaults to date remain low by historical standards, the market priced in greater default risk, widening the performance differential between higher and lower quality bonds (BB-rated bonds: -3.83%, B-rated bonds: -6.08% and CCC-rated bonds: - -9.58%).
The reduction in cyclical risk benefited the Fund in the period. An underweight of BB-rated bonds detracted from performance. On the other hand, sector positioning helped. Overweight positions in the environmental, energy, healthcare and wireless sectors added to results, as did underweight positions in retailers, gaming and high-yield financials. An off-benchmark exposure to investment-grade bank hybrid capital issues hurt performance. These securities dropped sharply in price when the U.S. government failed to include the Federal National Mortgage Association (“FNMA”) and Federal Home Loan Mortgage Corporation (“FHLMC”) preferred issues in its rescue of the two mortgage giants.
Given the extent of the sell-off during the period, the “wins” in security selection generally came from the bonds we did not own. The Fund did not hold any bonds that defaulted, and successfully avoided a number of the largest losers. The largest negative impacts came from holdings in directories publishers Idearc, Inc. and RH Donnelley Corp. and holdings related to the planned Huntsman Corp. (“Huntsman”)/Hexion US Finance Corp. (“Hexion”) merger. In anticipation of the deal closing, the Fund held positions in the bonds and also a small position in Huntsman equity. When Hexion sued to get out of the deal, the prices of both the bonds and the stock declined significantly. Huntsman recently won an initial victory in court, and the Fund continues to hold these positions pending resolution of the outstanding lawsuits.
Current Outlook and Strategy: We have expected for several months that the tightening of credit would lead to an acceleration of the default rate. We continue to believe most high yield issuers are well positioned to weather the downturn, but risk has clearly increased for companies
with marginal financial profiles. With the United States and much of Europe now likely in recession, we believe the increase in defaults will be more severe than previously anticipated. There has been little liquidity in the market in recent weeks, but we have continued to work to concentrate our holdings in companies we believe are well positioned through the downturn. In our opinion, the market has clearly priced in a much worse outcome, and we believe the sell-off into early October leaves the market near a bottom as spreads now appear to offer attractive compensation even for a higher level of credit losses. Governments worldwide are acting aggressively to head off a worst-case outcome, but we await some sign of success before taking on additional credit risk.
Portfolio holdings and characteristics are subject to change and may not be representative of current holdings and characteristics. The outlook for this Fund may differ from that presented for other ING Funds. Performance for the different classes of shares will vary based on differences in fees associated with each class.
(1) | | The Lehman Brothers® High Yield Bond Index is an unmanaged index that measures the performance of fixed-income securities generally representative of corporate bonds rated below investment grade. |
(2) | | The Lehman Brothers® High Yield Bond — 2% Issuer Constrained Composite Index is an unmanaged index that measures the performance of fixed-income securities. |
Top Ten Industries as of September 30, 2008
(as a percent of net assets)
| | |
Diversified Financial Services | | 14.3% |
Media | | 9.7% |
Telecommunications | | 9.4% |
Electric | | 8.0% |
Oil & Gas | | 7.9% |
Healthcare - Services | | 6.8% |
Commercial Services | | 3.6% |
Environmental Control | | 3.0% |
Entertainment | | 2.8% |
Chemicals | | 2.6% |
Portfolio holdings are subject to change daily.
5
| | |
| ING INTERMEDIATE BOND FUND | | PORTFOLIO MANAGERS’ REPORT |
Investment Type Allocation
as of September 30, 2008
(as a percent of net assets)
| | | |
U.S. Government Agency Obligations | | 42.0% | |
Collateralized Mortgage Obligations | | 24.8% | |
U.S. Treasury Obligations | | 22.8% | |
Corporate Bonds/Notes | | 22.1% | |
Affiliated Mutual Fund | | 11.4% | |
Asset-Backed Securities | | 2.7% | |
Municipal Bonds | | 1.1% | |
Preferred Stock | | 0.8% | |
Repurchase Agreement | | 0.5% | |
Warrants | | 0.0% | |
Other Assets and Liabilities—Net* | | (28.2 | )% |
| | | |
Net Assets | | 100.0% | |
| | | |
| | * | Includes Securities Lending Collateral |
Portfolio holdings are subject to change daily.
ING Intermediate Bond Fund (the “Fund”) seeks to provide investors with a high level of current income, consistent with the preservation of capital and liquidity. The Fund is managed by James B. Kauffmann, Portfolio Manager of ING Investment Management Co. — the Sub-Adviser.
Performance: For the six-month period ended September 30, 2008, the Fund’s Class A shares, excluding sales charges, provided a total return of (5.95)% compared to the Lehman Brothers® U.S. Aggregate Bond (“LBAB”) Index(1), which returned (1.50)%, for the same period.
Portfolio Specifics: The period witnessed a worldwide and multi-sector collapse of virtually all risk-based asset classes. Disregarding successive and innovative moves by regulators and central banks, markets flew into the hands of perceived safety at an accelerating rate. The House and Senate swiftly passed legislation supporting FNMA and FHLMC explicitly in July. The bankruptcy of Lehman challenged its commercial paper investors, bond holders and derivatives counterparties. The money market fund industry buckled, and several funds either broke the buck or suspended redemptions.
Housing prices continued to drop. The commercial paper markets — a critical source of short-term financing for manufacturing, municipal and financial services — evaporated. The U.S. Congress eventually enacted a $700 billion bailout program but only after adding $150 billion in tax breaks to the bill. Despite this and other innovative responses to the liquidity crisis by central banks, fear continued to grip the lending markets.
In general, the Fund’s duration and yield curve positions detracted from results for the period. Positive real yields abroad compared favorably to negative real yields in the U.S. for the third quarter and resulted in our shorting the U.S. ten-year Treasury and going long ten-year exposures in the UK, Germany and Australia which was positive for the portfolio as foreign rates declined relative to those in the U.S. These positions helped performance by the end of the period.
We actively managed currency exposures during the period, which generally added to performance. While our long yen position was a detractor, shorts in the British pound, Australian and New Zealand dollars were positive.
Developing overweights to investment grade credit and financials hurt performance over the period. The Fund’s exposure to financial companies, such as banks, brokers and insurers, hurt performance relative to the benchmark significantly in the third quarter.
Just as our positions in single name credit default swaps and index credit default swaps helped the Fund endure some of the spread widening early in the period, subsequent spread contraction hurt performance later in the period.
Allocations to non-agency residential mortgage-backed securities (“RMBS”), which are not in the index, were the largest source of underperformance for the portfolio over the last six months. Holdings of sub-prime, Alt-A, non-agency adjustable rate mortgages (“ARMs”) and option ARMs were a significant drag.
Current Strategy and Outlook: We believe that U.S. investment grade credit and securitized assets may be the most undervalued securities in global capital markets. We suspect that many of the battered sectors of the U.S. fixed income market, in our opinion, may rebound before the economy itself bottoms or before other markets feel maximum pain. Nevertheless, recovering from this massive unwinding of leverage is not likely to be instantaneous, and the key is to carefully acquire undervalued bonds and be patient.
We remain overweight securitized assets and RMBS in particular. We do not expect the decline in home prices in the United States to abate soon, yet a number of relative value opportunities may exist in this challenging mortgage market. We are overweight a variety of mortgages and generally view the sector as deeply undervalued.
We are still avoiding the high yield sector, which has not sustained as much pressure as the investment grade credit markets. We will wait for more generalized price weakness or more compelling relative value before entering the emerging markets debt market in a large way.
Portfolio holdings and characteristics are subject to change and may not be representative of current holdings and characteristics. The outlook for this Fund may differ from that presented for other ING Funds. Performance for the different classes of shares will vary based on differences in fees associated with each class.
(1) | | The LBAB Index is a widely recognized, unmanaged index of publicly issued investment grade U.S. Government, mortgage-backed, asset-backed and corporate debt securities. |
Top Ten Industries as of September 30, 2008
(as a percent of net assets)
| | |
Collateralized Mortgage Obligations | | 24.8% |
Federal National Mortgage Association | | 17.5% |
Federal Home Loan Mortgage Corporation | | 13.6% |
U.S. Treasury Notes | | 13.6% |
Government National Mortgage Association | | 10.9% |
U.S. Treasury Bonds | | 8.1% |
Diversified Financial Services | | 7.0% |
Banks | | 5.8% |
Electric | | 1.7% |
Other Asset-Backed Securities | | 1.7% |
Portfolio holdings are subject to change daily.
6
| | |
| PORTFOLIO MANAGERS’ REPORT | | ING NATIONAL TAX-EXEMPT BOND FUND |
ING National Tax-Exempt Bond Fund(1) (the “Fund”) seeks to provide investors with a high level of current income that is exempt from federal income taxes, consistent with the preservation of capital. The Fund is managed by Robert Schonbrunn, Karen Cronk, and Richard Kilbride, Portfolio Managers of ING Investment Management Co. — the Sub-Adviser.
Performance: For the six-month period ended September 30, 2008, the Fund’s Class A shares, excluding sales charges, provided a total return of (2.07)% compared to the Lehman Brothers® Municipal Bond Index(2) and the Lehman Brothers® U.S. Aggregate Bond (“LBAB”) Index(3), which returned (2.59)% and (1.50)%, respectively, for the same period.
Portfolio Specifics: The municipal bond market has been in a volatile downward trend during the last six months as the combination of monoline insurance capital adequacy issues and the unwinding of leveraged positions increased selling pressure. Tax-exempt interest rates have been forced above comparable Treasury issues all along the yield curve, reflecting the municipal bond market’s weakness compared to Treasuries. Credit quality became the focal point of bond performance during this period, and lower quality sectors severely under performed the higher quality sectors.
This was a difficult market environment in which to be liquidating the Fund, with thin markets and a dearth of buyers. Fortunately, we were
able to sell a substantial part of the Fund in late August and early September before conditions in the municipal bond market deteriorated further.
During the first part of the period, the Fund performed relatively well as longer term yields declined while yields on issues maturing in less than 15 years rose. With approximately 46% of the Fund in issues maturing in 10 years and longer, the Fund benefited. Because of the problems at the insurance companies, AAA-rated bonds underperformed AAs and As, which helped the Fund thanks to its heavy weightings in AA- and A-rated issues.
Weaker credits underperformed and the Fund was hurt by its exposure to BBBs and unrated securities. In the third quarter negative pressure built on longer-term issues and weaker credits, which had an adverse effect on the Fund. The program to liquidate holdings in the Fund dominated activity in the latter part of the reporting period.
Portfolio holdings and characteristics are subject to change and may not be representative of current holdings and characteristics. The outlook for this Fund may differ from that presented for other ING Funds. Performance for the different classes of shares will vary based on differences in fees associated with each class.
(1) | | Please note that effective October 23, 2008, the Fund was completely liquidated. |
(2) | | The Lehman Brothers Municipal Bond Index is an unmanaged index of approximately 1,100 investment-grade tax-exempt bonds classified into four sectors: general obligation, revenue, insured and pre-refunded. |
(3) | | The LBAB Index is a widely recognized, unmanaged index of publicly issued investment grade U.S. Government, mortgage-backed, asset-backed and corporate debt securities. |
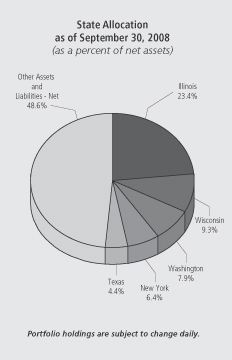
Top Ten Holdings
as of September 30, 2008
(as a percent of net assets)
| | |
Illinois Finance Authority, 5.000%, due 08/15/24 | | 23.4% |
State of Wisconsin, 5.125%, due 11/01/08 | | 9.3% |
City of Seattle, 5.250%, due 12/15/17 | | 7.9% |
New York City Transitional Finance Authority, 5.250%, due 08/15/11 | | 6.4% |
Harris County-Houston Sports Authority,
5.000%, due 11/15/28 | | 4.4% |
Portfolio holdings are subject to change daily.
7
| | |
| ING CLASSIC MONEY MARKET FUND | | PORTFOLIO MANAGERS’ REPORT |
ING Classic Money Market Fund (the “Fund”) seeks to provide investors with a high level of current income, consistent with the preservation of capital and liquidity and the maintenance of a stable $1.00 net asset value per share. The Fund is managed by David S. Yealy, Portfolio Manager of ING Investment Management Co. — the Sub-Adviser.
Portfolio Specifics: The reporting period was one of the most difficult periods on record for money market funds. The seizing up of the credit markets and subsequent loss of confidence in numerous issuers led to unprecedented actions by the Federal Reserve, U.S. Treasury and other major central banks across the globe. The systemic risk and capital market panic that ensued has resulted in a worldwide multi-sector collapse of virtually all risk-based asset prices.
Money market funds were no exception as several funds either “broke the buck” or suspended redemptions. The result was a run on prime money funds as investors sought to redeem their funds and move into lower risk Treasury or government money funds or direct government securities. The flight to quality caused the yield on these short-term government securities to drop precipitously while the market for commercial paper and other short-term bank funding evaporated. Asset-backed commercial paper (“ABCP”), which is viewed by the market and the Federal Reserve Board (the “Fed”) as a safe-haven, was the exception as the Fed agreed to buy back ABCP from money market mutual funds at their cost in order to provide liquidity for the funds to meet the redemptions.
Due to extreme risks in the market we chose to focus on increasing liquidity and reducing risk in the Fund and not on maximizing yield.
Daily liquidity was increased from approximately 9% as of June 30, 2008 to approximately 20% as of September 30, 2008. The increase in daily liquidity was accomplished by investing the proceeds of maturing credit-risk issues into overnight repurchase agreements, instead of the normal practice of buying new securities of those issuers or similar credits out in longer maturities. In addition to the increase in daily liquidity, the Fund maintained an overweight exposure to ABCP at 34% and held a 7% U.S. Government agency exposure. These changes allowed us to reduce credit exposure and risk over the period.
Current Outlook and Strategy: We think the recent actions taken by the Fed, the U.S. Treasury and central banks globally will unfreeze inter-bank lending and ultimately lending to corporations and consumers. We believe the government will continue to play a major role in providing short-term funding via the discount window, the various auction facilities, the ABCP purchase program or the new commercial paper purchase program. We expect LIBOR and rates for money market securities to decline over the near term.
Money market funds in general should slowly resume buying the commercial paper and CDs of the top-tier issuers that they recently stopped funding. We expect that ABCP with maturities of January 31, 2009 or shorter and repurchase agreements will continue to be the primary Fund holdings in the near-term, as the short-term funding markets attempt to return to normalcy. This is likely to be a slow process. Recent developments do not guarantee it, but we believe a return to normalcy has become more likely. We are taking a cautious approach with the Fund. We want to be sure that the recent central bank actions will translate into actual improved market conditions and lending before increasing our exposure to the large, top-tier banks that have received the backing of their central banks and governments. Liquidity and low risk are still our primary objectives, with yield taking either a back seat or waiting for the next train.
Principal Risk Factors: Please see the “Notes to Financial Statements” section for information regarding the Fund’s participation in the U.S. Treasury Department’s Temporary Guarantee Program for money market funds and the Capital Support Agreement that the Fund has entered into.
Although the Fund seeks to preserve the value of your investment at $1.00 per share, it is possible to lose money by investing in the Fund.
Portfolio holdings and characteristics are subject to change and may not be representative of current holdings and characteristics. The outlook for this Fund may differ from that presented for other ING Funds.
The views expressed in this report reflect those of the portfolio managers only through the end of the period as stated on the cover. The portfolio managers’ views are subject to change at any time based on market and other conditions.
Fund holdings are subject to change daily.
This report contains statements that may be “forward-looking” statements. Actual results may differ materially from those projected in the “forward-looking” statements.
8
| | |
| PORTFOLIO MANAGERS’ REPORT | | ING INSTITUTIONAL PRIME MONEY MARKET FUND |
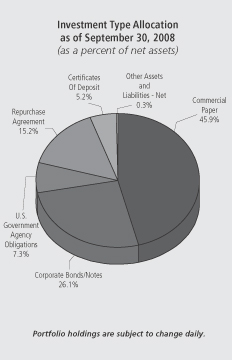
Investment Type Allocation
as of September 30, 2008
(as a percent of net assets)
| | |
Commercial Paper | | 63.0% |
Repurchase Agreement | | 26.1% |
Corporate Bond/Notes | | 9.1% |
Certificates of Deposit | | 4.5% |
U.S. Government Agency Obligations | | 2.0% |
Other Assets and Liabilities — Net | | (4.7)% |
Portfolio holdings are subject to change daily.
ING Institutional Prime Money Market Fund (the “Fund”) seeks to provide investors with a high level of current income, consistent with the preservation of capital and liquidity and the maintenance of a stable $1.00 net asset value per share. The Fund is managed by David S. Yealy, Portfolio Manager of ING Investment Management Co. — the Sub-Adviser.
Portfolio Specifics: The reporting period was one of the most difficult periods on record for money market funds. The seizing up of the credit markets and subsequent loss of confidence in numerous issuers led to unprecedented actions by the Federal Reserve, U.S. Treasury and other major central banks across the globe. The systemic risk and capital market panic that ensued has resulted in a worldwide multi-sector collapse of virtually all risk-based asset prices.
Money market funds were no exception as several funds either “broke the buck” or suspended redemptions. The result was a run on prime money funds as investors sought to redeem their funds and move into lower risk Treasury or government money funds or direct government securities. The flight to quality caused the yield on these short-term government securities to drop precipitously while the market for commercial paper and other short-term bank funding evaporated. Asset-backed commercial paper (ABCP), which is viewed by the market and the Federal Reserve as a safe-haven, was the exception as the Fed agreed to buy back ABCP from money market mutual funds at their cost in order to provide liquidity for the funds to meet the redemptions.
Due to extreme risks in the market we chose to focus on increasing liquidity and reducing risk in the Fund and not on maximizing yield. Daily liquidity was increased from approximately 23% as of June 30, 2008 to over 34% as of September 30, 2008. The increase in daily liquidity was accomplished by investing the proceeds of maturing credit-risk issues into overnight repurchase agreements, instead of the normal practice of buying new securities of those issuers or similar credits out in longer maturities. In addition to the increase in daily liquidity, the Fund maintained an overweight exposure to ABCP at 40% and held a 2% U.S. Govt. agency exposure. These changes allowed us to reduce credit exposure and risk over the period.
Current Outlook and Strategy: We think the recent actions taken by the Fed, the U.S. Treasury and central banks globally will unfreeze inter-bank lending and ultimately lending to corporations and consumers. We believe the government will continue to play a major role in providing short-term funding via the discount window, the various auction facilities, the ABCP purchase program or the new commercial paper purchase program. We expect LIBOR and rates for money market securities to decline over the near term.
Money market funds in general should slowly resume buying the commercial paper and CDs of the top-tier issuers that they recently stopped funding. We expect that ABCP with maturities of January 31, 2009 or shorter and repurchase agreements will continue to be the primary Fund holdings in the near-term, as the short-term funding markets attempt to return to normalcy. This is likely to be a slow process. Recent developments do not guarantee it, but we believe a return to normalcy has become more likely. We are taking a cautious approach with the Fund. We want to be sure that the recent central bank actions will translate into actual improved market conditions and lending before increasing our exposure to the large, top-tier banks that have received the backing of their central banks and governments. Liquidity and low risk are still our primary objectives, with yield taking either a back seat or waiting for the next train.
Principal Risk Factors: Please see the “Notes to Financial Statements” section for information regarding the Fund’s participation in the U.S. Treasury Department’s Temporary Guarantee Program for money market funds and the Capital Support Agreement that the Fund has entered into.
Although the Fund seeks to preserve the value of your investment at $1.00 per share, it is possible to lose money by investing in the Fund.
Portfolio holdings and characteristics are subject to change and may not be representative of current holdings and characteristics. The outlook for this Fund may differ from that presented for other ING Funds.
The views expressed in this report reflect those of the portfolio managers only through the end of the period as stated on the cover. The portfolio managers’ views are subject to change at any time based on market and other conditions.
Fund holdings are subject to change daily.
This report contains statements that may be “forward-looking” statements. Actual results may differ materially from those projected in the “forward-looking” statements.
9
SHAREHOLDER EXPENSE EXAMPLES (UNAUDITED)
As a shareholder of a Fund, you incur two types of costs: (1) transaction costs, including sales charges (loads) on purchase payments, redemption fees, and exchange fees; and (2) ongoing costs, including management fees, distribution and/or service (12b-1) fees, and other Fund expenses. These Examples are intended to help you understand your ongoing costs (in dollars) of investing in a Fund and to compare these costs with the ongoing costs of investing in other mutual funds.
The Examples are based on an investment of $1,000 invested at the beginning of the period and held for the entire period from April 1, 2008 to September 30, 2008. The Funds’ expenses are shown without the imposition of any sales charges or fees. Expenses would have been higher if such charges were included.
Actual Expenses
The first section of the table shown, “Actual Fund Return,” provides information about actual account values and actual expenses. You may use the information in this section, together with the amount you invested, to estimate the expenses that you paid over the period. Simply divide your account value by $1,000 (for example, an $8,600 account value divided by $1,000 = 8.6), then multiply the result by the number in the first section under the heading entitled “Expenses Paid During the Period” to estimate the expenses you paid on your account during this period.
Hypothetical Example for Comparison Purposes
The second section of the table shown, “Hypothetical (5% return before expenses)” provides information about hypothetical account values and hypothetical expenses based on a Fund’s actual expense ratio and an assumed rate of return of 5% per year before expenses, which is not the Fund’s actual return. The hypothetical account values and expenses may not be used to estimate the actual ending account balance or expenses you paid for the period. You may use this information to compare the ongoing costs of investing in each Fund and other funds. To do so, compare this 5% hypothetical example with the 5% hypothetical examples that appear in the shareholder reports of the other funds.
Please note that the expenses shown in the table are meant to highlight your ongoing costs only and do not reflect any transactional costs, such as sales charges (loads), redemption fees, or exchange fees. Therefore, the hypothetical lines of the table are useful in comparing ongoing costs only, and will not help you determine the relative total costs of owning different funds. In addition, if these transactional costs were included, your costs would have been higher.
| | | | | | | | | | | | | | | | |
| | | ING GNMA Income Fund | | Beginning Account Value April 1, 2008 | | Ending Account Value September 30, 2008 | | Annualized Expense Ratio | | | Expenses Paid During the Period Ended September 30, 2008* | | |
| | Actual Fund Return | | | | | | | | | | | | | | |
| | Class A | | $ | 1,000.00 | | $ | 1,004.30 | | 0.97 | % | | $ | 4.87 | | |
| | Class B | | | 1,000.00 | | | 1,001.60 | | 1.72 | | | | 8.63 | | |
| | Class C | | | 1,000.00 | | | 1,001.70 | | 1.72 | | | | 8.63 | | |
| | Class I | | | 1,000.00 | | | 1,005.90 | | 0.66 | | | | 3.32 | | |
| | Class Q | | | 1,000.00 | | | 1,005.80 | | 0.91 | | | | 4.58 | | |
| | Class W | | | 1,000.00 | | | 1,005.70 | | 0.66 | | | | 3.32 | | |
| | Hypothetical (5% return before expenses) | | | | | | | | | | | | | | |
| | Class A | | $ | 1,000.00 | | $ | 1,020.26 | | 0.97 | % | | $ | 4.91 | | |
| | Class B | | | 1,000.00 | | | 1,016.50 | | 1.72 | | | | 8.69 | | |
| | Class C | | | 1,000.00 | | | 1,016.50 | | 1.72 | | | | 8.69 | | |
| | Class I | | | 1,000.00 | | | 1,021.76 | | 0.66 | | | | 3.35 | | |
| | Class Q | | | 1,000.00 | | | 1,020.51 | | 0.91 | | | | 4.61 | | |
| | Class W | | | 1,000.00 | | | 1,021.51 | | 0.66 | | | | 3.35 | | |
| | | | | | | | | | | | | | | | |
| * | | Expenses are equal to each Fund’s respective annualized expense ratios multiplied by the average account value over the period, multiplied by 183/365 to reflect the most recent fiscal half-year. |
10
SHAREHOLDER EXPENSE EXAMPLES (UNAUDITED) (CONTINUED)
| | | | | | | | | | | | | | | | |
| | | ING High Yield Bond Fund | | Beginning Account Value April 1, 2008 | | Ending Account Value September 30, 2008 | | Annualized Expense Ratio | | | Expenses Paid During the Period Ended September 30, 2008* | | |
| | Actual Fund Return | | | | | | | | | | | | | | |
| | Class A | | $ | 1,000.00 | | $ | 927.00 | | 1.10 | % | | $ | 5.31 | | |
| | Class B | | | 1,000.00 | | | 923.40 | | 1.85 | | | | 8.92 | | |
| | Class C | | | 1,000.00 | | | 923.60 | | 1.85 | | | | 8.92 | | |
| | Class I(1) | | | 1,000.00 | | | 932.00 | | 0.85 | | | | 1.39 | | |
| | Hypothetical (5% return before expenses) | | | | | | | | | | | | | | |
| | Class A | | $ | 1,000.00 | | $ | 1,019.55 | | 1.10 | % | | $ | 5.57 | | |
| | Class B | | | 1,000.00 | | | 1,015.79 | | 1.85 | | | | 9.35 | | |
| | Class C | | | 1,000.00 | | | 1,015.79 | | 1.85 | | | | 9.35 | | |
| | Class I | | | 1,000.00 | | | 1,020.81 | | 0.85 | | | | 4.31 | | |
| | ING Intermediate Bond Fund | | | | | | | | | | | | | | |
| | Actual Fund Return | | | | | | | | | | | | | | |
| | Class A | | $ | 1,000.00 | | $ | 940.50 | | 0.69 | % | | $ | 3.36 | | |
| | Class B | | | 1,000.00 | | | 936.60 | | 1.44 | | | | 6.99 | | |
| | Class C | | | 1,000.00 | | | 935.70 | | 1.44 | | | | 6.99 | | |
| | Class I | | | 1,000.00 | | | 941.40 | | 0.36 | | | | 1.75 | | |
| | Class O | | | 1,000.00 | | | 939.60 | | 0.69 | | | | 3.35 | | |
| | Class R | | | 1,000.00 | | | 938.60 | | 0.94 | | | | 4.57 | | |
| | Class W | | | 1,000.00 | | | 944.20 | | 0.44 | | | | 2.14 | | |
| | Hypothetical (5% return before expenses) | | | | | | | | | | | | | | |
| | Class A | | $ | 1,000.00 | | $ | 1,021.61 | | 0.69 | % | | $ | 3.50 | | |
| | Class B | | | 1,000.00 | | | 1,017.85 | | 1.44 | | | | 7.28 | | |
| | Class C | | | 1,000.00 | | | 1,017.85 | | 1.44 | | | | 7.28 | | |
| | Class I | | | 1,000.00 | | | 1,023.26 | | 0.36 | | | | 1.83 | | |
| | Class O | | | 1,000.00 | | | 1,021.61 | | 0.69 | | | | 3.50 | | |
| | Class R | | | 1,000.00 | | | 1,020.36 | | 0.94 | | | | 4.76 | | |
| | Class W | | | 1,000.00 | | | 1,022.86 | | 0.44 | | | | 2.23 | | |
| | ING National Tax-Exempt Bond Fund | | | | | | | | | | | | | | |
| | Actual Fund Return | | | | | | | | | | | | | | |
| | Class A | | $ | 1,000.00 | | $ | 979.30 | | 0.87 | % | | $ | 4.32 | | |
| | Hypothetical (5% return before expenses) | | | | | | | | | | | | | | |
| | Class A | | $ | 1,000.00 | | $ | 1,020.71 | | 0.87 | % | | $ | 4.41 | | |
| | ING Classic Money Market Fund | | | | | | | | | | | | | | |
| | Actual Fund Return | | | | | | | | | | | | | | |
| | Class A | | $ | 1,000.00 | | $ | 1,010.80 | | 0.77 | % | | $ | 3.88 | | |
| | Class B | | | 1,000.00 | | | 1,006.90 | | 1.34 | | | | 6.74 | | |
| | Class C | | | 1,000.00 | | | 1,006.90 | | 1.34 | | | | 6.74 | | |
| | Hypothetical (5% return before expenses) | | | | | | | | | | | | | | |
| | Class A | | $ | 1,000.00 | | $ | 1,021.21 | | 0.77 | % | | $ | 3.90 | | |
| | Class B | | | 1,000.00 | | | 1,018.35 | | 1.34 | | | | 6.78 | | |
| | Class C | | | 1,000.00 | | | 1,018.35 | | 1.34 | | | | 6.78 | | |
| | | | | | | | | | | | | | | | |
| * | | Expenses are equal to each Fund’s respective annualized expense ratios multiplied by the average account value over the period, multiplied by 183/365 to reflect the most recent fiscal half-year. |
(1) | | Commencement of operations for Class I was July 31, 2008. Expenses paid reflect the 62 day period ended September 30, 2008. |
11
SHAREHOLDER EXPENSE EXAMPLES (UNAUDITED) (CONTINUED)
| | | | | | | | | | | | | | | | | |
| | | ING Institutional Prime Money Market Fund | | Beginning Account Value April 1, 2008 | | Ending Account Value September 30, 2008 | | Annualized Expense Ratio | | | Expenses Paid During the Period Ended September 30, 2008* | | |
| | Actual Fund Return | | | | | | | | | | | | | | | |
| | Class I | | $ | 1,000.00 | | $ | 1,013.00 | | $ | 0.15 | % | | $ | 0.76 | | |
| | Class IS | | | 1,000.00 | | | 1,013.50 | | | 0.20 | | | | 1.01 | | |
| | Hypothetical (5% return before expenses) | | | | | | | | | | | | | | | |
| | Class I | | $ | 1,000.00 | | $ | 1,024.32 | | | 0.15 | % | | $ | 0.76 | | |
| | Class IS | | | 1,000.00 | | | 1,024.07 | | | 0.20 | | | | 1.01 | | |
| | | | | | | | | | | | | | | | | |
| * | | Expenses are equal to each Fund’s respective annualized expense ratios multiplied by the average account value over the period, multiplied by 183/365 to reflect the most recent fiscal half-year. |
12
STATEMENTS OF ASSETS AND LIABILITIESASOF SEPTEMBER 30, 2008 (UNAUDITED)
| | | | | | | | | | | | |
| | | ING GNMA Income
Fund | | | ING High Yield Bond Fund | | | ING Intermediate Bond Fund | |
ASSETS: | | | | | | | | | | | | |
Investments in securities at value+* | | $ | 590,037,304 | | | $ | 93,150,189 | | | $ | 1,454,719,809 | |
Short-term investments** | | | — | | | | — | | | | 214,736,704 | |
Short-term investments in affiliates at amortized cost | | | — | | | | 4,000,000 | | | | 142,450,000 | |
Short-term investments at amortized cost | | | — | | | | 513,000 | | | | 6,324,000 | |
Cash | | | 7,208,608 | | | | — | | | | — | |
Cash collateral for futures | | | — | | | | — | | | | 9,162,043 | |
Swap collateral | | | — | | | | 380,000 | | | | 1,150,000 | |
Foreign currencies at value*** | | | — | | | | — | | | | 2,318,519 | |
Receivables: | | | | | | | | | | | | |
Investment securities sold | | | 3,048,823 | | | | 118,000 | | | | 1,223,778 | |
Investment securities sold on a delayed-delivery or when-issued basis | | | — | | | | — | | | | 30,430,290 | |
Fund shares sold | | | 3,097,911 | | | | 208,356 | | | | 4,607,509 | |
Dividends and interest | | | 3,017,510 | | | | 2,841,213 | | | | 10,081,477 | |
Variation margin | | | — | | | | — | | | | 5,704,341 | |
Unrealized appreciation on forward foreign currency contracts | | | — | | | | — | | | | 1,374,128 | |
Upfront payments made on swap agreements | | | — | | | | — | | | | 7,297,163 | |
Unrealized appreciation on swap agreements | | | — | | | | 504,909 | | | | 24,477,179 | |
Prepaid expenses | | | 49,682 | | | | 37,361 | | | | 63,997 | |
Reimbursement due from manager | | | — | | | | 15,139 | | | | 49,755 | |
| | | | | | | | | | | | |
Total assets | | | 606,459,838 | | | | 101,768,167 | | | | 1,916,170,692 | |
| | | | | | | | | | | | |
LIABILITIES: | | | | | | | | | | | | |
Payable for investment securities purchased on a delayed-delivery or
when-issued basis | | | — | | | | — | | | | 422,374,948 | |
Payable for investment securities purchased | | | — | | | | — | | | | 354,061 | |
Payable for fund shares redeemed | | | 3,691,181 | | | | 330,843 | | | | 5,856,431 | |
Payable for futures variation margin | | | — | | | | — | | | | 425,157 | |
Payable upon receipt of securities loaned | | | — | | | | — | | | | 217,650,328 | |
Unrealized depreciation on forward foreign currency contracts | | | — | | | | — | | | | 1,024,268 | |
Upfront payments received on swap agreements | | | — | | | | 362,500 | | | | 5,074,810 | |
Unrealized depreciation on swap agreements | | | — | | | | 992,830 | | | | 9,886,244 | |
Income distribution payable | | | — | | | | 381,326 | | | | 896,240 | |
Payable to affiliates | | | 448,791 | | | | 93,561 | | | | 520,779 | |
Payable to custodian due to bank overdraft | | | — | | | | 463,030 | | | | 1,281,939 | |
Payable for trustee fees | | | 22,931 | | | | 4,067 | | | | 6,866 | |
Other accrued expenses and liabilities | | | 158,838 | | | | 94,072 | | | | 474,151 | |
| | | | | | | | | | | | |
Total liabilities | | | 4,321,741 | | | | 2,722,229 | | | | 665,826,222 | |
| | | | | | | | | | | | |
NET ASSETS | | $ | 602,138,097 | | | $ | 99,045,938 | | | $ | 1,250,344,470 | |
| | | | | | | | | | | | |
NET ASSETS WERE COMPRISED OF: | | | | | | | | | | | | |
Paid-in capital | | $ | 613,893,656 | | | $ | 412,608,621 | | | $ | 1,388,949,112 | |
Undistributed net investment income (distributions in excess of net investment income) | | | 1,574,497 | | | | (562,291 | ) | | | 510,293 | |
Accumulated net realized gain (loss) on investments, foreign currency related transactions, futures, short positions and swaps | | | (15,112,805 | ) | | | (294,624,664 | ) | | | 13,920,369 | |
Net unrealized appreciation or depreciation on investments, foreign currency related transactions, futures and swaps | | | 1,782,749 | | | | (18,375,728 | ) | | | (153,035,304 | ) |
| | | | | | | | | | | | |
NET ASSETS | | $ | 602,138,097 | | | $ | 99,045,938 | | | $ | 1,250,344,470 | |
| | | | | | | | | | | | |
| | | | | | | | | | | | |
+ Including securities loaned at value | | $ | — | | | $ | — | | | $ | 207,667,983 | |
* Cost of investments in securities | | $ | 588,254,555 | | | $ | 111,037,996 | | | $ | 1,621,898,956 | |
** Cost of short-term investments | | $ | — | | | $ | — | | | $ | 217,650,328 | |
*** Cost of foreign currencies | | $ | — | | | $ | — | | | $ | 2,333,619 | |
See Accompanying Notes to Financial Statements
13
STATEMENTS OF ASSETS AND LIABILITIESASOF SEPTEMBER 30, 2008 (UNAUDITED) (CONTINUED)
| | | | | | | | | |
| | | ING GNMA Income Fund | | ING High Yield Bond Fund | | ING
Intermediate Bond Fund |
Class A: | | | | | | | | | |
Net assets | | $ | 502,014,891 | | $ | 71,381,634 | | $ | 652,470,474 |
Shares authorized | | | unlimited | | | unlimited | | | unlimited |
Par value | | $ | 0.001 | | $ | 0.001 | | $ | 0.001 |
Shares outstanding | | | 59,828,400 | | | 10,200,887 | | | 70,102,697 |
Net asset value and redemption price per share | | $ | 8.39 | | $ | 7.00 | | $ | 9.31 |
Maximum offerering price per share (2.50%)(1) | | $ | 8.61 | | $ | 7.18 | | $ | 9.55 |
Class B: | | | | | | | | | |
Net assets | | $ | 40,021,952 | | $ | 18,246,693 | | $ | 31,792,617 |
Shares authorized | | | unlimited | | | unlimited | | | unlimited |
Par value | | $ | 0.001 | | $ | 0.001 | | $ | 0.001 |
Shares outstanding | | | 4,795,919 | | | 2,609,095 | | | 3,422,245 |
Net asset value and redemption price per share(2) | | $ | 8.35 | | $ | 6.99 | | $ | 9.29 |
Maximum offering price per share | | $ | 8.35 | | $ | 6.99 | | $ | 9.29 |
Class C: | | | | | | | | | |
Net assets | | $ | 39,751,269 | | $ | 9,414,863 | | $ | 67,800,614 |
Shares authorized | | | unlimited | | | unlimited | | | unlimited |
Par value | | $ | 0.001 | | $ | 0.001 | | $ | 0.001 |
Shares outstanding | | | 4,757,365 | | | 1,344,915 | | | 7,294,324 |
Net asset value and redemption price per share(2) | | $ | 8.36 | | $ | 7.00 | | $ | 9.29 |
Maximum offering price per share | | $ | 8.36 | | $ | 7.00 | | $ | 9.29 |
Class I: | | | | | | | | | |
Net assets | | $ | 19,245,865 | | $ | 2,748 | | $ | 426,791,949 |
Shares authorized | | | unlimited | | | unlimited | | | unlimited |
Par value | | $ | 0.001 | | $ | 0.001 | | $ | 0.001 |
Shares outstanding | | | 2,291,559 | | | 393 | | | 45,851,559 |
Net asset value and redemption price per share | | $ | 8.40 | | $ | 7.00 | | $ | 9.31 |
Maximum offering price per share | | $ | 8.40 | | $ | 7.00 | | $ | 9.31 |
Class O: | | | | | | | | | |
Net assets | | | n/a | | | n/a | | $ | 48,455,030 |
Shares authorized | | | n/a | | | n/a | | | unlimited |
Par value | | | n/a | | | n/a | | $ | 0.001 |
Shares outstanding | | | n/a | | | n/a | | | 5,204,379 |
Net asset value and redemption price per share | | | n/a | | | n/a | | $ | 9.31 |
Maximum offering price per share | | | n/a | | | n/a | | $ | 9.31 |
Class Q: | | | | | | | | | |
Net assets | | $ | 42,844 | | | n/a | | | n/a |
Shares authorized | | | unlimited | | | n/a | | | n/a |
Par value | | $ | 0.001 | | | n/a | | | n/a |
Shares outstanding | | | 5,091 | | | n/a | | | n/a |
Net asset value and redemption price per share | | $ | 8.42 | | | n/a | | | n/a |
Maximum offering price per share | | $ | 8.42 | | | n/a | | | n/a |
Class R: | | | | | | | | | |
Net assets | | | n/a | | | n/a | | $ | 17,800,005 |
Shares authorized | | | n/a | | | n/a | | | unlimited |
Par value | | | n/a | | | n/a | | $ | 0.001 |
Shares outstanding | | | n/a | | | n/a | | | 1,909,824 |
Net asset value and redemption price per share | | | n/a | | | n/a | | $ | 9.32 |
Maximum offering price per share | | | n/a | | | n/a | | $ | 9.32 |
Class W: | | | | | | | | | |
Net assets | | $ | 1,061,276 | | | n/a | | $ | 5,233,781 |
Shares authorized | | | unlimited | | | n/a | | | unlimited |
Par value | | $ | 0.001 | | | n/a | | $ | 0.001 |
Shares outstanding | | | 126,276 | | | n/a | | | 562,732 |
Net asset value and redemption price per share | | $ | 8.40 | | | n/a | | $ | 9.30 |
Maximum offering price per share | | $ | 8.40 | | | n/a | | $ | 9.30 |
(1) | | Maximum offering price is computed at 100/97.50 of net asset value. On purchases of $100,000 or more, the offering price is reduced. |
(2) | | Redemption price per share may be reduced for any applicable contingent deferred sales charges. |
See Accompanying Notes to Financial Statements
14
STATEMENTS OF ASSETS AND LIABILITIESASOF SEPTEMBER 30, 2008 (UNAUDITED)
| | | | | | | | | | | | |
| | | ING National Tax-
Exempt Bond Fund | | | ING Classic Money Market Fund | | | ING
Institutional Prime
Money Market Fund | |
ASSETS: | | | | | | | | | | | | |
Investments in securities at value* | | $ | 1,660,733 | | | $ | — | | | $ | — | |
Short-term investments at amortized cost | | | — | | | | 1,161,733,997 | | | | 1,226,033,460 | |
Repurchase Agreements | | | — | | | | 209,729,000 | | | | 407,662,000 | |
Cash | | | 1,578,977 | | | | 227,740 | | | | 22,575 | |
Receivables: | | | | | | | | | | | | |
Fund shares sold | | | — | | | | 3,518,999 | | | | 81,948,858 | |
Dividends and interest | | | 21,111 | | | | 3,122,526 | | | | 1,621,880 | |
Prepaid expenses | | | — | | | | 230,911 | | | | 34,033 | |
Reimbursement due from manager | | | 22,522 | | | | 63,000 | | | | — | |
| | | | | | | | | | | | |
Total assets | | | 3,283,343 | | | | 1,378,626,173 | | | | 1,717,322,806 | |
| | | | | | | | | | | | |
LIABILITIES: | | | | | | | | | | | | |
Payable for fund shares redeemed | | | — | | | | 2,373,030 | | | | 153,275,250 | |
Income distribution payable | | | 18,141 | | | | 9,516 | | | | 2,814,783 | |
Payable to affiliates | | | 17,908 | | | | 760,301 | | | | 93,065 | |
Payable for trustee fees | | | 1,618 | | | | 20,717 | | | | 6,950 | |
Other accrued expenses and liabilities | | | 12,949 | | | | 186 | | | | 99,837 | |
| | | | | | | | | | | | |
Total liabilities | | | 50,616 | | | | 3,163,750 | | | | 156,289,885 | |
| | | | | | | | | | | | |
NET ASSETS | | $ | 3,232,727 | | | $ | 1,375,462,423 | | | $ | 1,561,032,921 | |
| | | | | | | | | | | | |
NET ASSETS WERE COMPRISED OF: | | | | | | | | | | | | |
Paid-in capital | | $ | 4,973,854 | | | $ | 1,374,902,556 | | | $ | 1,561,260,498 | |
Undistributed net investment income (distributions in excess of net investment income) | | | (17,972 | ) | | | 591,154 | | | | (21,216 | ) |
Accumulated net realized loss on investments | | | (1,485,851 | ) | | | (31,287 | ) | | | (206,361 | ) |
Net unrealized depreciation on investments | | | (237,304 | ) | | | — | | | | — | |
| | | | | | | | | | | | |
NET ASSETS | | $ | 3,232,727 | | | $ | 1,375,462,423 | | | $ | 1,561,032,921 | |
| | | | | | | | | | | | |
* Cost of investments in securities | | $ | 1,898,037 | | | $ | — | | | $ | — | |
See Accompanying Notes to Financial Statements
15
STATEMENTS OF ASSETS AND LIABILITIESASOF SEPTEMBER 30, 2008 (UNAUDITED) (CONTINUED)
| | | | | | | | | | |
| | | ING
National Tax-
Exempt Bond Fund | | | ING Classic
Money Market Fund | | ING
Institutional Prime Money Market Fund |
Class A: | | | | | | | | | | |
Net assets | | $ | 3,232,727 | | | $ | 1,347,051,307 | | | n/a |
Shares authorized | | | unlimited | | | | unlimited | | | n/a |
Par value | | $ | 0.001 | | | $ | 0.001 | | | n/a |
Shares outstanding | | | 342,000 | | | | 1,346,478,375 | | | n/a |
Net asset value and redemption price per share | | $ | 9.45 | | | $ | 1.00 | | | n/a |
Maximum offerering price per share (2.50%) | | $ | 9.69 | (1) | | $ | 1.00 | | | n/a |
Class B: | | | | | | | | | | |
Net assets | | | n/a | | | $ | 16,855,576 | | | n/a |
Shares authorized | | | n/a | | | | unlimited | | | n/a |
Par value | | | n/a | | | $ | 0.001 | | | n/a |
Shares outstanding | | | n/a | | | | 16,868,442 | | | n/a |
Net asset value and redemption price per share(2) | | | n/a | | | $ | 1.00 | | | n/a |
Maximum offering price per share | | | n/a | | | $ | 1.00 | | | n/a |
Class C: | | | | | | | | | | |
Net assets | | | n/a | | | $ | 11,555,540 | | | n/a |
Shares authorized | | | n/a | | | | unlimited | | | n/a |
Par value | | | n/a | | | $ | 0.001 | | | n/a |
Shares outstanding | | | n/a | | | | 11,556,341 | | | n/a |
Net asset value and redemption price per share(2) | | | n/a | | | $ | 1.00 | | | n/a |
Maximum offering price per share | | | n/a | | | $ | 1.00 | | | n/a |
Class I: | | | | | | | | | | |
Net assets | | | n/a | | | | n/a | | $ | 1,561,031,920 |
Shares authorized | | | n/a | | | | n/a | | | unlimited |
Par value | | | n/a | | | | n/a | | $ | 0.001 |
Shares outstanding | | | n/a | | | | n/a | | | 1,561,288,533 |
Net asset value and redemption price per share | | | n/a | | | | n/a | | $ | 1.00 |
Maximum offering price per share | | | n/a | | | | n/a | | $ | 1.00 |
Class IS: | | | | | | | | | | |
Net assets | | | n/a | | | | n/a | | $ | 1,001 |
Shares authorized | | | n/a | | | | n/a | | | unlimited |
Par value | | | n/a | | | | n/a | | $ | 0.001 |
Shares outstanding | | | n/a | | | | n/a | | | 1,001 |
Net asset value and redemption price per share | | | n/a | | | | n/a | | $ | 1.00 |
Maximum offering price per share | | | n/a | | | | n/a | | $ | 1.00 |
(1) | | Maximum offering price is computed at 100/97.50 of net asset value. On purchases of $100,000 or more, the offering price is reduced. |
(2) | | Redemption price per share may be reduced for any applicable contingent deferred sales charges. |
See Accompanying Notes to Financial Statements
16
STATEMENTS OF OPERATIONSFORTHE SIX MONTHS ENDED SEPTEMBER 30, 2008 (UNAUDITED)
| | | | | | | | | | | | |
| | | ING GNMA
Income
Fund | | | ING High Yield
Bond Fund | | | ING
Intermediate
Bond Fund | |
INVESTMENT INCOME: | | | | | | | | | | | | |
Dividends(1) | | $ | — | | | $ | 23,392 | | | $ | 1,972,480 | |
Interest | | | 16,336,051 | | | | 5,142,696 | | | | 35,079,927 | |
Securities lending income, net | | | — | | | | — | | | | 957,266 | |
| | | | | | | | | | | | |
Total investment income | | | 16,336,051 | | | | 5,166,088 | | | | 38,009,673 | |
| | | | | | | | | | | | |
EXPENSES: | | | | | | | | | | | | |
Investment management fees | | | 1,424,496 | | | | 293,297 | | | | 1,144,326 | |
Distribution and service fees: | | | | | | | | | | | | |
Class A | | | 631,779 | | | | 102,515 | | | | 925,194 | |
Class B | | | 213,716 | | | | 113,656 | | | | 184,379 | |
Class C | | | 181,252 | | | | 51,373 | | | | 387,530 | |
Class O | | | — | | | | — | | | | 66,940 | |
Class Q | | | 53 | | | | — | | | | — | |
Class R | | | — | | | | — | | | | 45,906 | |
Transfer agent fees: | | | | | | | | | | | | |
Class A | | | 182,416 | | | | 63,324 | | | | 473,901 | |
Class B | | | 17,821 | | | | 17,552 | | | | 23,610 | |
Class C | | | 13,111 | | | | 7,933 | | | | 49,547 | |
Class I | | | 1,078 | | | | — | | | | 98,559 | |
Class O | | | — | | | | — | | | | 34,201 | |
Class Q | | | 1 | | | | — | | | | — | |
Class R | | | — | | | | — | | | | 11,149 | |
Class W | | | 234 | | | | — | | | | 1,107 | |
Administrative service fees | | | 303,082 | | | | 57,509 | | | | 673,132 | |
Shareholder reporting expense | | | 86,715 | | | | 54,970 | | | | 174,000 | |
Registration fees | | | 56,210 | | | | 33,656 | | | | 69,831 | |
Professional fees | | | 26,343 | | | | 9,544 | | | | 46,229 | |
Custody and accounting expense | | | 33,124 | | | | 15,934 | | | | 86,685 | |
Trustee fees | | | 13,335 | | | | 985 | | | | 17,754 | |
Miscellaneous expense | | | 10,788 | | | | 7,519 | | | | 20,976 | |
Interest expense | | | — | | | | 3,300 | | | | — | |
| | | | | | | | | | | | |
Total expenses | | | 3,195,554 | | | | 833,067 | | | | 4,534,956 | |
Net waived and reimbursed fees | | | — | | | | (73,984 | ) | | | (123,782 | ) |
| | | | | | | | | | | | |
Net expenses | | | 3,195,554 | | | | 759,083 | | | | 4,411,174 | |
| | | | | | | | | | | | |
Net investment income | | | 13,140,497 | | | | 4,407,005 | | | | 33,598,499 | |
| | | | | | | | | | | | |
REALIZED AND UNREALIZED GAIN (LOSS) ON INVESTMENTS, FOREIGN CURRENCY RELATED TRANSACTIONS, FUTURES, SHORT POSITIONS AND SWAPS: | | | | | | | | | | | | |
Net realized gain (loss) on: | | | | | | | | | | | | |
Investments | | | (1,340,406 | ) | | | (3,334,358 | ) | | | 2,405,460 | |
Foreign currency related transactions | | | — | | | | 103 | | | | 3,067,148 | |
Futures | | | — | | | | — | | | | (13,470,221 | ) |
Short positions | | | — | | | | 1,500 | | | | — | |
Swaps | | | — | | | | 58,153 | | | | (4,206,677 | ) |
| | | | | | | | | | | | |
Net realized loss on investments, foreign currency related transactions, futures, short positions and swaps | | | (1,340,406 | ) | | | (3,274,602 | ) | | | (12,204,290 | ) |
| | | | | | | | | | | | |
Net change in unrealized appreciation or depreciation on: | | | | | | | | | | | | |
Investments | | | (9,758,491 | ) | | | (7,642,645 | ) | | | (105,250,388 | ) |
Foreign currency related transactions | | | — | | | | — | | | | 1,018,353 | |
Futures | | | — | | | | — | | | | 3,562,869 | |
Short positions | | | — | | | | (3,750 | ) | | | — | |
Swaps | | | — | | | | (1,261,640 | ) | | | (1,028,968 | ) |
| | | | | | | | | | | | |
Net change in unrealized appreciation or depreciation on investments, foreign currency related transaction, futures, short positions and swaps | | | (9,758,491 | ) | | | (8,908,035 | ) | | | (101,698,134 | ) |
| | | | | | | | | | | | |
Net realized and unrealized loss on investments, foreign currency related transactions, futures, short positions and swaps | | | (11,098,897 | ) | | | (12,182,637 | ) | | | (113,902,424 | ) |
| | | | | | | | | | | | |
Increase (decrease) in net assets resulting from operations | | $ | 2,041,600 | | | $ | (7,775,632 | ) | | $ | (80,303,925 | ) |
| | | | | | | | | | | | |
| | | | | | | | | | | | |
(1) Affiliated dividend income | | $ | — | | | $ | 18,653 | | | $ | 1,491,687 | |
See Accompanying Notes to Financial Statements
17
STATEMENTS OF OPERATIONSFORTHE SIX MONTHS ENDED SEPTEMBER 30, 2008 (UNAUDITED)
| | | | | | | | | | | |
| | | ING National Tax- Exempt Bond Fund | | | ING Classic
Money Market Fund | | | ING
Institutional Prime Money Market Fund |
INVESTMENT INCOME: | | | | | | | | | | | |
Interest | | $ | 628,653 | | | $ | 20,177,850 | | | $ | 11,259,536 |
| | | | | | | | | | | |
Total investment income | | | 628,653 | | | | 20,177,850 | | | | 11,259,536 |
| | | | | | | | | | | |
EXPENSES: | | | | | | | | | | | |
Investment management fees | | | 44,229 | | | | 1,797,961 | | | | 328,350 |
Distribution and service fees: | | | | | | | | | | | |
Class A | | | 29,534 | | | | 5,278,547 | | | | — |
Class B | | | 13,284 | | | | 88,087 | | | | — |
Class C | | | 16,010 | | | | 65,695 | | | | — |
Transfer agent fees: | | | | | | | | | | | |
Class A | | | 1,755 | | | | 70,388 | | | | — |
Class B | | | 200 | | | | 881 | | | | — |
Class C | | | 237 | | | | 657 | | | | — |
Class I | | | — | | | | — | | | | 22,218 |
Administrative service fees | | | 14,743 | | | | — | | | | — |
Shareholder reporting expense | | | 1,041 | | | | 162,537 | | | | 60,066 |
Registration fees | | | 51,122 | | | | 245,811 | | | | 52,688 |
Professional fees | | | 2,798 | | | | 69,250 | | | | 61,168 |
Custody and accounting expense | | | 1,243 | | | | 66,713 | | | | 41,013 |
Trustee fees | | | 350 | | | | 13,726 | | | | 15,531 |
Miscellaneous expense | | | 1,750 | | | | 13,795 | | | | 35,574 |
Interest expense | | | — | | | | 1,868 | | | | — |
| | | | | | | | | | | |
Total expenses | | | 178,296 | | | | 7,875,916 | | | | 616,608 |
Net waived and reimbursed fees | | | (28,410 | ) | | | (2,251,184 | ) | | | — |
| | | | | | | | | | | |
Net expenses | | | 149,886 | | | | 5,624,732 | | | | 616,608 |
| | | | | | | | | | | |
Net investment income | | | 478,767 | | | | 14,553,118 | | | | 10,642,928 |
| | | | | | | | | | | |
REALIZED AND UNREALIZED GAIN (LOSS) ON INVESTMENTS: | | | | | | | | | | | |
Net realized gain (loss) on investments | | | (1,454,245 | ) | | | 34,711 | | | | 17,521 |
Net change in unrealized appreciation or depreciation on investments | | | 518,403 | | | | — | | | | — |
| | | | | | | | | | | |
Net realized and unrealized gain (loss) on investments | | | (935,842 | ) | | | 34,711 | | | | 17,521 |
| | | | | | | | | | | |
Increase (decrease) in net assets resulting from operations | | $ | (457,075 | ) | | $ | 14,587,829 | | | $ | 10,660,449 |
| | | | | | | | | | | |
See Accompanying Notes to Financial Statements
18
STATEMENTS OF CHANGES IN NET ASSETS (UNAUDITED)
| | | | | | | | | | | | | | | | |
| | | ING GNMA Income Fund | | | ING High Yield Bond Fund | |
| | | Six Months Ended September 30, 2008 | | | Year Ended March 31, 2008 | | | Six Months Ended September 30, 2008 | | | Year Ended March 31, 2008 | |
FROM OPERATIONS: | | | | | | | | | | | | | | | | |
Net investment income | | $ | 13,140,497 | | | $ | 26,323,003 | | | $ | 4,407,005 | | | $ | 10,709,919 | |
Net realized loss on investments, foreign currency related transactions, short positions and swaps | | | (1,340,406 | ) | | | (557,710 | ) | | | (3,274,602 | ) | | | (3,519,737 | ) |
Net change in unrealized appreciation or depreciation on investments, foreign currency related transactions, short positions and swaps | | | (9,758,491 | ) | | | 14,431,867 | | | | (8,908,035 | ) | | | (14,311,005 | ) |
| | | | | | | | | | | | | | | | |
Increase (decrease) in net assets resulting from operations | | | 2,041,600 | | | | 40,197,160 | | | | (7,775,632 | ) | | | (7,120,823 | ) |
| | | | | | | | | | | | | | | | |
FROM DISTRIBUTIONS TO SHAREHOLDERS: | | | | | | | | | | | | | | | | |
Net investment income: | | | | | | | | | | | | | | | | |
Class A | | | (11,073,477 | ) | | | (22,746,437 | ) | | | (3,540,155 | ) | | | (7,399,555 | ) |
Class B | | | (787,998 | ) | | | (1,928,106 | ) | | | (892,898 | ) | | | (2,347,829 | ) |
Class C | | | (658,721 | ) | | | (1,327,518 | ) | | | (405,912 | ) | | | (879,834 | ) |
Class I | | | (501,263 | ) | | | (752,915 | ) | | | (50 | ) | | | — | |
Class Q | | | (942 | ) | | | (2,196 | ) | | | — | | | | — | |
Class W | | | (12,784 | ) | | | (13 | ) | | | — | | | | — | |
| | | | | | | | | | | | | | | | |
Total distributions | | | (13,035,185 | ) | | | (26,757,185 | ) | | | (4,839,015 | ) | | | (10,627,218 | ) |
| | | | | | | | | | | | | | | | |
FROM CAPITAL SHARE TRANSACTIONS: | | | | | | | | | | | | | | | | |
Net proceeds from sale of shares | | | 72,602,964 | | | | 135,282,097 | | | | 6,874,122 | | | | 19,716,245 | |
Reinvestment of distributions | | | 10,848,406 | | | | 22,263,959 | | | | 2,497,225 | | | | 5,417,037 | |
| | | | | | | | | | | | | | | | |
| | | 83,451,370 | | | | 157,546,056 | | | | 9,371,347 | | | | 25,133,282 | |
Cost of shares redeemed | | | (89,461,695 | ) | | | (177,395,457 | ) | | | (16,018,732 | ) | | | (52,319,373 | ) |
| | | | | | | | | | | | | | | | |
Net decrease in net assets resulting from capital share transactions | | | (6,010,325 | ) | | | (19,849,401 | ) | | | (6,647,385 | ) | | | (27,186,091 | ) |
| | | | | | | | | | | | | | | | |
Net decrease in net assets | | | (17,003,910 | ) | | | (6,409,426 | ) | | | (19,262,032 | ) | | | (44,934,132 | ) |
| | | | | | | | | | | | | | | | |
NET ASSETS: | | | | | | | | | | | | | | | | |
Beginning of period | | | 619,142,007 | | | | 625,551,433 | | | | 118,307,970 | | | | 163,242,102 | |
| | | | | | | | | | | | | | | | |
End of period | | $ | 602,138,097 | | | $ | 619,142,007 | | | $ | 99,045,938 | | | $ | 118,307,970 | |
| | | | | | | | | | | | | | | | |
Undistributed net investment income (distributions in excess of net investment income) at end of period | | $ | 1,574,497 | | | $ | 1,469,185 | | | $ | (562,291 | ) | | $ | (130,281 | ) |
| | | | | | | | | | | | | | | | |
See Accompanying Notes to Financial Statements
19
STATEMENTS OF CHANGES IN NET ASSETS (UNAUDITED)
| | | | | | | | | | | | | | | | |
| | | ING Intermediate Bond Fund | | | ING National Tax-Exempt Bond Fund | |
| | | Six Months
Ended
September 30, 2008 | | | Year Ended March 31, 2008 | | | Six Months Ended September 30, 2008 | | | Year Ended March 31, 2008 | |
FROM OPERATIONS: | | | | | | | | | | | | | | | | |
Net investment income | | $ | 33,598,499 | | | $ | 62,064,522 | | | $ | 478,767 | | | $ | 1,038,976 | |
Net realized gain (loss) on investments, foreign currency related transactions, futures, and swaps | | | (12,204,290 | ) | | | 31,278,933 | | | | (1,454,245 | ) | | | (24,790 | ) |
Net change in unrealized appreciation or depreciation on investments, foreign currency related transactions, futures and swaps | | | (101,698,134 | ) | | | (51,475,223 | ) | | | 518,403 | | | | (1,296,013 | ) |
| | | | | | | | | | | | | | | | |
Increase (decrease) in net assets resulting from operations | | | (80,303,925 | ) | | | 41,868,232 | | | | (457,075 | ) | | | (281,827 | ) |
| | | | | | | | | | | | | | | | |
FROM DISTRIBUTIONS TO SHAREHOLDERS: | | | | | | | | | | | | | | | | |
Net investment income: | | | | | | | | | | | | | | | | |
Class A | | | (16,802,815 | ) | | | (33,641,104 | ) | | | (413,590 | ) | | | (884,649 | ) |
Class B | | | (688,677 | ) | | | (1,711,825 | ) | | | (37,532 | ) | | | (82,444 | ) |
Class C | | | (1,454,903 | ) | | | (2,949,270 | ) | | | (44,369 | ) | | | (71,919 | ) |
Class I | | | (10,306,779 | ) | | | (15,026,825 | ) | | | — | | | | — | |
Class O | | | (1,219,358 | ) | | | (2,418,264 | ) | | | — | | | | — | |
Class R | | | (399,124 | ) | | | (483,427 | ) | | | — | | | | — | |
Class W | | | (133,057 | ) | | | (323 | ) | | | — | | | | — | |
| | | | | | | | | | | | | | | | |
Total distributions | | | (31,004,713 | ) | | | (56,231,038 | ) | | | (495,491 | ) | | | (1,039,012 | ) |
| | | | | | | | | | | | | | | | |
FROM CAPITAL SHARE TRANSACTIONS: | | | | | | | | | | | | | | | | |
Net proceeds from sale of shares | | | 292,161,445 | | | | 477,476,865 | | | | 2,614,279 | | | | 5,623,997 | |
Reinvestment of distributions | | | 25,236,891 | | | | 45,349,340 | | | | 71,797 | | | | 128,307 | |
| | | | | | | | | | | | | | | | |
| | | 317,398,336 | | | | 522,826,205 | | | | 2,686,076 | | | | 5,752,304 | |
Cost of shares redeemed | | | (304,169,662 | ) | | | (315,482,815 | ) | | | (27,387,630 | ) | | | (2,673,179 | ) |
| | | | | | | | | | | | | | | | |
Net increase (decrease) in net assets resulting from capital share transactions | | | 13,228,674 | | | | 207,343,390 | | | | (24,701,554 | ) | | | 3,079,125 | |
| | | | | | | | | | | | | | | | |
Net increase (decrease) in net assets | | | (98,079,964 | ) | | | 192,980,584 | | | | (25,654,120 | ) | | | 1,758,286 | |
| | | | | | | | | | | | | | | | |
NET ASSETS: | | | | | | | | | | | | | | | | |
Beginning of period | | | 1,348,424,434 | | | | 1,155,443,850 | | | | 28,886,847 | | | | 27,128,561 | |
| | | | | | | | | | | | | | | | |
End of period | | $ | 1,250,344,470 | | | $ | 1,348,424,434 | | | $ | 3,232,727 | | | $ | 28,886,847 | |
| | | | | | | | | | | | | | | | |
Undistributed net investment income (distributions in excess of net investment income) at end of period | | $ | 510,293 | | | $ | (2,083,493 | ) | | $ | (17,972 | ) | | $ | (1,248 | ) |
| | | | | | | | | | | | | | | | |
See Accompanying Notes to Financial Statements
20
STATEMENTS OF CHANGES IN NET ASSETS (UNAUDITED)
| | | | | | | | | | | | | | | | |
| | | ING Classic Money Market Fund | | | ING Institutional Prime Money Market Fund | |
| | | Six Months Ended September 30, 2008 | | | Year Ended March 31, 2008 | | | Six Months Ended September 30, 2008 | | | Year Ended March 31, 2008 | |
FROM OPERATIONS: | | | | | | | | | | | | | | | | |
Net investment income | | $ | 14,553,118 | | | $ | 48,689,912 | | | $ | 10,642,928 | | | $ | 43,858,903 | |
Net realized gain (loss) on investments | | | 34,711 | | | | 65,348 | | | | 17,521 | | | | (211,929 | ) |
| | | | | | | | | | | | | | | | |
Increase in net assets resulting from operations | | | 14,587,829 | | | | 48,755,260 | | | | 10,660,449 | | | | 43,646,974 | |
| | | | | | | | | | | | | | | | |
FROM DISTRIBUTIONS TO SHAREHOLDERS: | | | | | | | | | | | | | | | | |
Net investment income: | | | | | | | | | | | | | | | | |
Class A | | | (13,746,743 | ) | | | (47,532,303 | ) | | | — | | | | — | |
Class B | | | (122,297 | ) | | | (798,518 | ) | | | — | | | | — | |
Class C | | | (91,339 | ) | | | (359,087 | ) | | | — | | | | — | |
Class I | | | — | | | | — | | | | (10,642,032 | ) | | | (43,858,890 | ) |
Class IS | | | — | | | | — | | | | (13 | ) | | | (13 | ) |
Net realized gains: | | | | | | | | | | | | | | | | |
Class I | | | — | | | | — | | | | — | | | | (66,392 | ) |
| | | | | | | | | | | | | | | | |
Total distributions | | | (13,960,379 | ) | | | (48,689,908 | ) | | | (10,642,045 | ) | | | (43,925,295 | ) |
| | | | | | | | | | | | | | | | |
FROM CAPITAL SHARE TRANSACTIONS: | | | | | | | | | | | | | | | | |
Net proceeds from sale of shares | | | 337,528,510 | | | | 1,266,591,607 | | | | 6,703,461,871 | | | | 12,985,911,059 | |
Reinvestment of distributions | | | 13,826,691 | | | | 48,135,580 | | | | 929,764 | | | | 7,988,771 | |
| | | | | | | | | | | | | | | | |
| | | 351,355,201 | | | | 1,314,727,187 | | | | 6,704,391,635 | | | | 12,993,899,830 | |
Cost of shares redeemed | | | (509,839,486 | ) | | | (730,774,391 | ) | | | (5,943,427,371 | ) | | | (12,917,901,065 | ) |
| | | | | | | | | | | | | | | | |
Net increase (decrease) in net assets resulting from capital share transactions | | | (158,484,285 | ) | | | 583,952,796 | | | | 760,964,264 | | | | 75,998,765 | |
| | | | | | | | | | | | | | | | |
Net increase (decrease) in net assets | | | (157,856,835 | ) | | | 584,018,148 | | | | 760,982,668 | | | | 75,720,444 | |
| | | | | | | | | | | | | | | | |
NET ASSETS: | | | | | | | | | | | | | | | | |
Beginning of period | | | 1,533,319,258 | | | | 949,301,110 | | | | 800,050,253 | | | | 724,329,809 | |
| | | | | | | | | | | | | | | | |
End of period | | $ | 1,375,462,423 | | | $ | 1,533,319,258 | | | $ | 1,561,032,921 | | | $ | 800,050,253 | |
| | | | | | | | | | | | | | | | |
Undistributed net investment income (distributions in excess of net investment income) at end of period | | $ | 591,154 | | | $ | (1,585 | ) | | $ | (21,216 | ) | | $ | (22,099 | ) |
| | | | | | | | | | | | | | | | |
See Accompanying Notes to Financial Statements
21
| | |
| ING GNMA INCOME FUND (UNAUDITED) | | FINANCIAL HIGHLIGHTS |
Selected data for a share of beneficial interest outstanding throughout each period.
| | | | | | | | | | | | | | | | | | |
| | | | | Class A |
| | | | Six Months
Ended
September 30,
2008 | | | Year Ended March 31, |
| | | | | 2008 | | | 2007 | | 2006 | | | 2005 | | | 2004 |
Per Share Operating Performance: | | | | | | | | | | | | | | | | | | |
| Net asset value, beginning of period | | $ | | 8.54 | | | 8.35 | | | 8.30 | | 8.52 | | | 8.91 | | | 9.00 |
| Income (loss) from investment operations: | | | | | | | | | | | | | | | | | | |
| Net investment income | | $ | | 0.19 | | | 0.37 | | | 0.37 | | 0.40 | | | 0.37 | | | 0.32 |
| Net realized and unrealized gain (loss) on investments | | $ | | (0.15 | ) | | 0.20 | | | 0.09 | | (0.19 | ) | | (0.31 | ) | | 0.02 |
| Total from investment operations | | $ | | 0.04 | | | 0.57 | | | 0.46 | | 0.21 | | | 0.06 | | | 0.34 |
| Lest distributions from: | | | | | | | | | | | | | | | | | | |
| Net investment income | | $ | | 0.19 | | | 0.38 | | | 0.41 | | 0.43 | | | 0.45 | | | 0.43 |
| Total distributions | | $ | | 0.19 | | | 0.38 | | | 0.41 | | 0.43 | | | 0.45 | | | 0.43 |
| Net asset value, end of period | | $ | | 8.39 | | | 8.54 | | | 8.35 | | 8.30 | | | 8.52 | | | 8.91 |
Total Return(1) | | % | | 0.43 | | | 7.00 | | | 5.72 | | 2.50 | | | 0.74 | | | 3.88 |
Ratios and Supplemental Data: | | | | | | | | | | | | | | | | | | |
| Net assets, end of period (000’s) | | $ | | 502,015 | | | 515,916 | | | 515,469 | | 504,734 | | | 521,688 | | | 592,066 |
| Ratios to average net assets: | | | | | | | | | | | | | | | | | | |
| Gross expenses prior to expense waiver(3) | | % | | 0.97 | | | 0.96 | | | 0.95 | | 0.99 | | | 0.98 | | | 1.04 |
| Net expenses after expense waiver(2)(3) | | % | | 0.97 | | | 0.96 | | | 0.94 | | 0.98 | | | 0.98 | | | 1.04 |
| Net investment income after expense waiver(2)(3) | | % | | 4.42 | | | 4.45 | | | 4.49 | | 4.70 | | | 4.27 | | | 3.57 |
| Portfolio turnover rate | | % | | 14 | | | 32 | | | 99 | | 39 | | | 40 | | | 128 |
| | | | | | | | | | | | | | | | | | |
| | | | | Class B |
| | | | Six Months
Ended
September 30,
2008 | | | Year Ended March 31, |
| | | | | 2008 | | | 2007 | | 2006 | | | 2005 | | | 2004 |
Per Share Operating Performance: | | | | | | | | | | | | | | | | | | |
| Net asset value, beginning of period | | $ | | 8.49 | | | 8.30 | | | 8.26 | | 8.48 | | | 8.87 | | | 8.96 |
| Income (loss) from investment operations: | | | | | | | | | | | | | | | | | | |
| Net investment income | | $ | | 0.15 | | | 0.31 | | | 0.30 | | 0.33 | | | 0.29 | | | 0.25 |
| Net realized and unrealized gain (loss) on investments | | $ | | (0.14 | ) | | 0.19 | | | 0.09 | | (0.18 | ) | | (0.29 | ) | | 0.02 |
| Total from investment operations | | $ | | 0.01 | | | 0.50 | | | 0.39 | | 0.15 | | | — | | | 0.27 |
| Lest distributions from: | | | | | | | | | | | | | | | | | | |
| Net investment income | | $ | | 0.15 | | | 0.31 | | | 0.35 | | 0.37 | | | 0.39 | | | 0.36 |
| Total distributions | | $ | | 0.15 | | | 0.31 | | | 0.35 | | 0.37 | | | 0.39 | | | 0.36 |
| Net asset value, end of period | | $ | | 8.35 | | | 8.49 | | | 8.30 | | 8.26 | | | 8.48 | | | 8.87 |
Total Return(1) | | % | | 0.16 | | | 6.24 | | | 4.84 | | 1.75 | | | (0.02 | ) | | 3.12 |
Ratios and Supplemental Data: | | | | | | | | | | | | | | | | | | |
| Net assets, end of period (000’s) | | $ | | 40,022 | | | 45,963 | | | 58,568 | | 78,823 | | | 99,130 | | | 130,339 |
| Ratios to average net assets: | | | | | | | | | | | | | | | | | | |
| Gross expenses prior to expense waiver(3) | | % | | 1.72 | | | 1.71 | | | 1.70 | | 1.74 | | | 1.73 | | | 1.79 |
| Net expenses after expense waiver(2)(3) | | % | | 1.72 | | | 1.71 | | | 1.69 | | 1.73 | | | 1.73 | | | 1.79 |
| Net investment income after expense waiver(2)(3) | | % | | 3.66 | | | 3.70 | | | 3.73 | | 3.95 | | | 3.52 | | | 2.84 |
| Portfolio turnover rate | | % | | 14 | | | 32 | | | 99 | | 39 | | | 40 | | | 128 |
(1) | Total return is calculated assuming reinvestment of all dividends and capital gain distributions as net asset value and excluding the deduction of sales charges. Total return for less than one year is not annualized. |
(2) | The Investment Adviser has agreed to limit expenses (excluding interest, taxes, brokerage commissions, extraordinary expenses and acquired fund fees and expenses) subject to possible recoupment by the Investment Adviser within three years of being incurred. |
(3) | Annualized for periods less than one year. |
See Accompanying Notes to Financial Statements
22
| | |
| ING GNMA INCOME FUND (UNAUDITED) (CONTINUED) | | FINANCIAL HIGHLIGHTS |
Selected data for a share of beneficial interest outstanding throughout each period.
| | | | | | | | | | | | | | | | | | |
| | | | | Class C |
| | | | Six Months
Ended
September 30,
2008 | | | Year Ended March 31, |
| | | | | 2008 | | | 2007 | | 2006 | | | 2005 | | | 2004 |
Per Share Operating Performance: | | | | | | | | | | | | | | | | | | |
| Net asset value, beginning of period | | $ | | 8.50 | | | 8.31 | | | 8.27 | | 8.49 | | | 8.88 | | | 8.97 |
| Income (loss) from investment operations: | | | | | | | | | | | | | | | | | | |
| Net investment income | | $ | | 0.15 | | | 0.31 | | | 0.31 | | 0.33 | | | 0.29 | | | 0.25 |
| Net realized and unrealized gain (loss) on investments | | $ | | (0.14 | ) | | 0.20 | | | 0.08 | | (0.18 | ) | | (0.29 | ) | | 0.02 |
| Total from investment operations | | $ | | 0.01 | | | 0.51 | | | 0.39 | | 0.15 | | | — | | | 0.27 |
| Less distributions from: | | | | | | | | | | | | | | | | | | |
| Net investment income | | $ | | 0.15 | | | 0.32 | | | 0.35 | | 0.37 | | | 0.39 | | | 0.36 |
| Total distributions | | $ | | 0.15 | | | 0.32 | | | 0.35 | | 0.37 | | | 0.39 | | | 0.36 |
| Net asset value, end of period | | $ | | 8.36 | | | 8.50 | | | 8.31 | | 8.27 | | | 8.49 | | | 8.88 |
Total Return(1) | | % | | 0.17 | | | 6.23 | | | 4.85 | | 1.74 | | | (0.03 | ) | | 3.11 |
Ratios and Supplemental Data: | | | | | | | | | | | | | | | | | | |
| Net assets, end of period (000’s) | | $ | | 39,751 | | | 36,218 | | | 37,280 | | 34,997 | | | 43,094 | | | 65,762 |
| Ratios to average net assets: | | | | | | | | | | | | | | | | | | |
| Gross expenses prior to expense waiver(3) | | % | | 1.72 | | | 1.71 | | | 1.70 | | 1.74 | | | 1.73 | | | 1.79 |
| Net expenses after expense waiver(2)(3) | | % | | 1.72 | | | 1.71 | | | 1.69 | | 1.73 | | | 1.73 | | | 1.79 |
| Net investment income after expense waiver(2)(3) | | % | | 3.68 | | | 3.70 | | | 3.73 | | 3.95 | | | 3.51 | | | 2.92 |
| Portfolio turnover rate | | % | | 14 | | | 32 | | | 99 | | 39 | | | 40 | | | 128 |
| | | | | | | | | | | | | | | | | | |
| | | | | Class I |
| | | | Six Months
Ended
September 30,
2008 | | | Year Ended March 31, |
| | | | | 2008 | | | 2007 | | 2006 | | | 2005 | | | 2004 |
Per Share Operating Performance: | | | | | | | | | | | | | | | | | | |
| Net asset value, beginning of period | | $ | | 8.55 | | | 8.35 | | | 8.31 | | 8.53 | | | 8.92 | | | 9.01 |
| Income (loss) from investment operations: | | | | | | | | | | | | | | | | | | |
| Net investment income | | $ | | 0.20 | | | 0.40 | | | 0.40 | | 0.45 | | | 0.41 | | | 0.35 |
| Net realized and unrealized gain (loss) on investments | | $ | | (0.15 | ) | | 0.20 | | | 0.08 | | (0.21 | ) | | (0.32 | ) | | 0.01 |
| Total from investment operations | | $ | | 0.05 | | | 0.60 | | | 0.48 | | 0.24 | | | 0.09 | | | 0.36 |
| Less distributions from: | | | | | | | | | | | | | | | | | | |
| Net investment income | | $ | | 0.20 | | | 0.40 | | | 0.44 | | 0.46 | | | 0.48 | | | 0.45 |
| Total distributions | | $ | | 0.20 | | | 0.40 | | | 0.44 | | 0.46 | | | 0.48 | | | 0.45 |
| Net asset value, end of period | | $ | | 8.40 | | | 8.55 | | | 8.35 | | 8.31 | | | 8.53 | | | 8.92 |
Total Return(1) | | % | | 0.59 | | | 7.42 | | | 5.92 | | 2.82 | | | 1.05 | | | 4.21 |
Ratios and Supplemental Data: | | | | | | | | | | | | | | | | | | |
| Net assets, end of period (000’s) | | $ | | 19,246 | | | 21,002 | | | 14,181 | | 18,287 | | | 10,539 | | | 8,760 |
| Ratios to average net assets: | | | | | | | | | | | | | | | | | | |
| Gross expenses prior to expense waiver(3) | | % | | 0.66 | | | 0.67 | | | 0.65 | | 0.67 | | | 0.68 | | | 0.71 |
| Net expenses after expense waiver(2)(3) | | % | | 0.66 | | | 0.67 | | | 0.65 | | 0.67 | | | 0.68 | | | 0.71 |
| Net investment income after expense waiver(2)(3) | | % | | 4.73 | | | 4.74 | | | 4.77 | | 4.96 | | | 4.59 | | | 3.94 |
| Portfolio turnover rate | | % | | 14 | | | 32 | | | 99 | | 39 | | | 40 | | | 128 |
(1) | Total return is calculated assuming reinvestment of all dividends and capital gain distributions at net asset value and excluding the deduction of sales charges. Total return for less than one year is not annualized. |
(2) | The Investment Adviser has agreed to limit expenses (excluding interest, taxes, brokerage commissions, extraordinary expenses and acquired fund fees and expenses) subject to possible recoupment by the Investment Adviser within three years of being incurred. |
(3) | Annualized for periods less than one year. |
See Accompanying Notes to Financial Statements
23
| | |
| ING GNMA INCOME FUND (UNAUDITED) (CONTINUED) | | FINANCIAL HIGHLIGHTS |
Selected data for a share of beneficial interest outstanding throughout each period.
| | | | | | | | | | | | | | | | | |
| | | | | Class Q |
| | | | Six Months
Ended
September 30,
2008 | | | Year Ended March 31, |
| | | | | 2008 | | 2007 | | 2006 | | | 2005 | | | 2004 |
Per Share Operating Performance: | | | | | | | | | | | | | | | | | |
| Net asset value, beginning of period | | $ | | 8.56 | | | 8.37 | | 8.32 | | 8.53 | | | 8.92 | | | 9.01 |
| Income (loss) from investment operations: | | | | | | | | | | | | | | | | | |
| Net investment income | | $ | | 0.19 | | | 0.38 | | 0.36 | | 0.40 | | | 0.39 | | | 0.32 |
| Net realized and unrealized gain (loss) on investments | | $ | | (0.14 | ) | | 0.19 | | 0.11 | | (0.18 | ) | | (0.33 | ) | | 0.02 |
| Total from investment operations | | $ | | 0.05 | | | 0.57 | | 0.47 | | 0.22 | | | 0.06 | | | 0.34 |
| Less distributions from: | | | | | | | | | | | | | | | | | |
| Net investment income | | $ | | 0.19 | | | 0.38 | | 0.42 | | 0.43 | | | 0.45 | | | 0.43 |
| Total distributions | | $ | | 0.19 | | | 0.38 | | 0.42 | | 0.43 | | | 0.45 | | | 0.43 |
| Net asset value, end of period | | $ | | 8.42 | | | 8.56 | | 8.37 | | 8.32 | | | 8.53 | | | 8.92 |
Total Return(2) | | % | | 0.58 | | | 7.06 | | 5.76 | | 2.65 | | | 0.76 | | | 3.94 |
Ratios and Supplemental Data: | | | | | | | | | | | | | | | | | |
| Net assets, end of period (000’s) | | $ | | 43 | | | 43 | | 53 | | 82 | | | 103 | | | 134 |
| Ratios to average net assets: | | | | | | | | | | | | | | | | | |
| Gross expenses prior to expense waiver(4) | | % | | 0.91 | | | 0.92 | | 0.90 | | 0.92 | | | 0.93 | | | 0.96 |
| Net expenses after expense waiver(3)(4) | | % | | 0.91 | | | 0.92 | | 0.90 | | 0.92 | | | 0.93 | | | 0.96 |
| Net investment income after expense waiver(3)(4) | | % | | 4.49 | | | 4.49 | | 4.53 | | 4.77 | | | 4.32 | | | 3.62 |
| Portfolio turnover rate | | % | | 14 | | | 32 | | 99 | | 39 | | | 40 | | | 128 |
| | | | | | | | | | | | | | | | | |
| | | | | | | |
| | | | | Class W |
| | | | | Six Months
Ended
September 30,
2008 | | | December 17,
2007(1) to
March 31, 2008 |
Per Share Operating Performance: | | | | | | | |
| Net asset value, beginning of period | | $ | | 8.55 | | | 8.39 |
| Income (loss) from investment operations: | | | | | | | |
| Net investment income | | $ | | 0.21 | | | 0.11 |
| Net realized and unrealized gain (loss) on investments | | $ | | (0.16 | ) | | 0.15 |
| Total from investment operations | | $ | | 0.05 | | | 0.26 |
| Less distributions from: | | | | | | | |
| Net investment income | | $ | | 0.20 | | | 0.10 |
| Total distributions | | $ | | 0.20 | | | 0.10 |
| Net asset value, end of period | | $ | | 8.40 | | | 8.55 |
Total Return(2) | | % | | 0.57 | | | 3.16 |
Ratios and Supplemental Data: | | | | | | | |
| Net assets, end of period (000’s) | | $ | | 1,061 | | | 1 |
| Ratios to average net assets: | | | | | | | |
| Gross expense prior to expense waiver(4) | | % | | 0.66 | | | 0.64 |
| Net expense after expense waiver(3)(4) | | % | | 0.66 | | | 0.64 |
| Net investment income after expense waiver(3)(4) | | % | | 4.84 | | | 4.86 |
| Portfolio turnover rate | | % | | 14 | | | 32 |
(1) | Commencement of operations. |
(2) | Total return is calculated assuming reinvestment of all dividends and capital gain distributions as net asset value and excluding the deduction of sales charges. Total return for less than one year is not annualized. |
(3) | The Investment Adviser has agreed to limit expenses, (excluding interest, taxes, brokerage commissions, extraordinary expenses and acquired fund fees and expenses) subject to possible recoupment by the Investment Adviser within three years of being incurred. |
(4) | Annualized for periods less than one year. |
See Accompanying Notes to Financial Statements
24
| | |
| ING HIGH YIELD BOND FUND (UNAUDITED) | | FINANCIAL HIGHLIGHTS |
Selected data for a share of beneficial interest outstanding throughout each period.
| | | | | | | | | | | | | | | | | | |
| | | | | Class A |
| | | | | Six Months
Ended
September 30,
2008 | | | Year Ended March 31, |
| | | | | | 2008 | | | 2007 | | 2006 | | | 2005 | | | 2004 |
Per Share Operating Performance: | | | | | | | | | | | | | | | | | | |
| Net asset value, beginning of period | | $ | | 7.89 | | | 8.99 | | | 8.71 | | 8.75 | | | 8.88 | | | 8.29 |
| Income (loss) from investment operations: | | | | | | | | | | | | | | | | | | |
| Net investment income | | $ | | 0.31 | | | 0.67 | | | 0.61 | | 0.55 | | | 0.54 | | | 0.59 |
| Net realized and unrealized gain (loss) on investments | | $ | | (0.86 | ) | | (1.10 | ) | | 0.27 | | (0.04 | ) | | (0.13 | ) | | 0.60 |
| Total from investment operations | | $ | | (0.55 | ) | | (0.43 | ) | | 0.88 | | 0.51 | | | 0.41 | | | 1.19 |
| Less distributions from: | | | | | | | | | | | | | | | | | | |
| Net investment income | | $ | | 0.34 | | | 0.67 | | | 0.60 | | 0.55 | | | 0.54 | | | 0.60 |
| Total distributions | | $ | | 0.34 | | | 0.67 | | | 0.60 | | 0.55 | | | 0.54 | | | 0.60 |
| Net asset value, end of period | | $ | | 7.00 | | | 7.89 | | | 8.99 | | 8.71 | | | 8.75 | | | 8.88 |
Total Return(1) | | % | | (7.30 | ) | | (5.10 | ) | | 10.54 | | 6.01 | | | 4.73 | | | 14.70 |
Ratios and Supplemental Data: | | | | | | | | | | | | | | | | | | |
| Net assets, end of period (000’s) | | $ | | 71,382 | | | 83,327 | | | 104,328 | | 99,178 | | | 110,683 | | | 44,009 |
| Ratios to average net assets: | | | | | | | | | | | | | | | | | | |
| Gross expenses prior to expense waiver/recoupment(3) | | % | | 1.23 | | | 1.16 | | | 1.11 | | 1.31 | | | 1.33 | | | 1.33 |
| Net expenses after expense waiver/recoupment(2)(3) | | % | | 1.10 | † | | 1.11 | † | | 1.10 | | 1.18 | | | 1.22 | | | 1.29 |
| Net investment income after expense waiver/recoupment(2)(3) | | % | | 7.89 | † | | 7.86 | † | | 6.98 | | 6.27 | | | 6.12 | | | 6.81 |
| Portfolio turnover rate | | % | | 34 | | | 66 | | | 122 | | 111 | | | 119 | | | 105 |
| | | | | | | | | | | | | | | | | | |
| | | | | Class B |
| | | | | Six Months
Ended
September 30,
2008 | | | Year Ended March 31, |
| | | | | | 2008 | | | 2007 | | 2006 | | | 2005 | | | 2004 |
Per Share Operating Performance: | | | | | | | | | | | | | | | | | | |
| Net asset value, beginning of period | | $ | | 7.88 | | | 8.98 | | | 8.70 | | 8.74 | | | 8.88 | | | 8.28 |
| Income (loss) from investment operations: | | | | | | | | | | | | | | | | | | |
| Net investment income | | $ | | 0.28 | | | 0.61 | | | 0.53 | | 0.47 | | | 0.48 | | | 0.53 |
| Net realized and unrealized gain (loss) on investments | | $ | | (0.86 | ) | | (1.11 | ) | | 0.29 | | (0.03 | ) | | (0.15 | ) | | 0.60 |
| Total from investment operations | | $ | | (0.58 | ) | | (0.50 | ) | | 0.82 | | 0.44 | | | 0.33 | | | 1.13 |
| Less distributions from: | | | | | | | | | | | | | | | | | | |
| Net investment income | | $ | | 0.31 | | | 0.60 | | | 0.54 | | 0.48 | | | 0.47 | | | 0.53 |
| Total distributions | | $ | | 0.31 | | | 0.60 | | | 0.54 | | 0.48 | | | 0.47 | | | 0.53 |
| Net asset value, end of period | | $ | | 6.99 | | | 7.88 | | | 8.98 | | 8.70 | | | 8.74 | | | 8.88 |
Total Return(1) | | % | | (7.66 | ) | | (5.82 | ) | | 9.72 | | 5.22 | | | 3.83 | | | 14.01 |
Ratios and Supplemental Data: | | | | | | | | | | | | | | | | | | |
| Net assets, end of period (000’s) | | $ | | 18,247 | | | 24,994 | | | 43,427 | | 75,940 | | | 125,603 | | | 18,753 |
| Ratios to average net assets: | | | | | | | | | | | | | | | | | | |
| Gross expenses prior to expense waiver/recoupment(3) | | % | | 1.98 | | | 1.91 | | | 1.86 | | 1.98 | | | 1.98 | | | 1.98 |
| Net expenses after expense waiver/recoupment(2)(3) | | % | | 1.85 | † | | 1.86 | † | | 1.85 | | 1.94 | | | 1.97 | | | 2.04 |
| Net investment income after expense waiver/recoupment(2)(3) | | % | | 7.10 | † | | 7.08 | † | | 6.18 | | 5.50 | | | 5.39 | | | 6.04 |
| Portfolio turnover rate | | % | | 34 | | | 66 | | | 122 | | 111 | | | 119 | | | 105 |
(1) | Total return is calculated assuming reinvestment of all dividends and capital gain distributions at net asset value and excluding the deduction of sales charges. Total return for less than one year is not annualized. |
(2) | The Investment Adviser has agreed to limit expenses, (excluding interest, taxes, brokerage commissions, extraordinary expenses and acquired fund fees and expenses) |
| | subject to possible recoupment by the Investment Adviser within three years of being incurred. |
(3) | Annualized for periods less than one year. |
| † | Impact of waiving the advisory fee for the ING Institutional Prime Money Market Fund holding has less than 0.01% impact on the expense ratio and net investment income ratio. |
See Accompanying Notes to Financial Statements
25
| | |
| ING HIGH YIELD BOND FUND (UNAUDITED) (CONTINUED) | | FINANCIAL HIGHLIGHTS |
Selected data for a share of beneficial interest outstanding throughout each period.
| | | | | | | | | | | | | | | | | | |
| | | | | Class C |
| | | | | Six Months
Ended
September 30,
2008 | | | Year Ended March 31, |
| | | | | | 2008 | | | 2007 | | 2006 | | | 2005 | | | 2004 |
Per Share Operating Performance: | | | | | | | | | | | | | | | | | | |
| Net asset value, beginning of period | | $ | | 7.89 | | | 8.99 | | | 8.71 | | 8.75 | | | 8.88 | | | 8.28 |
| Income (loss) from investment operations: | | | | | | | | | | | | | | | | | | |
| Net investment income | | $ | | 0.28 | | | 0.61 | | | 0.54 | | 0.48 | | | 0.48 | | | 0.53 |
| Net realized and unrealized gain (loss) on investments | | $ | | (0.86 | ) | | (1.11 | ) | | 0.28 | | (0.03 | ) | | (0.13 | ) | | 0.60 |
| Total from investment operations | | $ | | (0.58 | ) | | (0.50 | ) | | 0.82 | | 0.45 | | | 0.35 | | | 1.13 |
| Less distributions from: | | | | | | | | | | | | | | | | | | |
| Net investment income | | $ | | 0.31 | | | 0.60 | | | 0.54 | | 0.49 | | | 0.48 | | | 0.53 |
| Total distributions | | $ | | 0.31 | | | 0.60 | | | 0.54 | | 0.49 | | | 0.48 | | | 0.53 |
| Net asset value, end of period | | $ | | 7.00 | | | 7.89 | | | 8.99 | | 8.71 | | | 8.75 | | | 8.88 |
Total Return(2) | | % | | (7.64 | ) | | (5.81 | ) | | 9.70 | | 5.22 | | | 3.96 | | | 14.03 |
Ratios and Supplemental Data: | | | | | | | | | | | | | | | | | | |
| Net assets, end of period (000’s) | | $ | | 9,415 | | | 9,987 | | | 15,487 | | 17,555 | | | 26,330 | | | 10,780 |
| Ratios to average net assets: | | | | | | | | | | | | | | | | | | |
| Gross expenses prior to expense waiver/recoupment(4) | | % | | 1.98 | | | 1.91 | | | 1.86 | | 1.98 | | | 1.98 | | | 1.98 |
| Net expenses after expense waiver/recoupment(3)(4) | | % | | 1.85 | † | | 1.86 | † | | 1.85 | | 1.94 | | | 1.97 | | | 2.04 |
| Net investment income after expense waiver/recoupment(3)(4) | | % | | 7.14 | † | | 7.09 | † | | 6.21 | | 5.51 | | | 5.37 | | | 6.04 |
| Portfolio turnover rate | | % | | 34 | | | 66 | | | 122 | | 111 | | | 119 | | | 105 |
| | | | | | | | | | | | | | | | | | |
| | | | | |
| | | | | Class I | |
| | | | | July 31,
2008(1) to
September 30,
2008 | |
Per Share Operating Performance: | | | | | |
| Net asset value, beginning of period | | $ | | 7.64 | |
| Income (loss) from investment operations: | | | | | |
| Net investment income | | $ | | 0.11 | |
| Net realized and unrealized loss on investments | | $ | | (0.62 | ) |
| Total from investment operations | | $ | | (0.51 | ) |
| Less distributions from: | | | | | |
| Net investment income | | $ | | 0.13 | |
| Total distributions | | $ | | 0.13 | |
| Net asset value, end of period | | $ | | 7.00 | |
Total Return(2) | | % | | (6.80 | ) |
Ratios and Supplemental Data: | | | | | |
| Net assets, end of period (000’s) | | $ | | 3 | |
| Ratios to average net assets: | | | | | |
| Gross expenses prior to expense waiver(4) | | % | | 0.98 | |
| Net expenses after expense waiver(3)(4) | | % | | 0.85 | † |
| Net investment income after expense waiver(3)(4) | | % | | 8.00 | † |
| Portfolio turnover rate | | % | | 34 | |
(1) | Commencement of operations. |
(2) | Total return is calculated assuming reinvestment of all dividends and capital gain distributions at net asset value and excluding the deduction of sales charges. Total return for less than one year is not annualized. |
(3) | The Investment Adviser has agreed to limit expenses, (excluding interest, taxes, brokerage commissions, |
| | extraordinary expenses and acquired fund fees and expenses) subject to possible recoupment by the Investment Adviser within three years of being incurred. |
(4) | Annualized for periods less than one year. |
| † | Impact of waiving the advisory fee for the ING Institutional Prime Money Market Fund holding has less than 0.01% impact on the expense ratio and net investment income ratio. |
See Accompanying Notes to Financial Statements
26
| | |
| ING INTERMEDIATE BOND FUND (UNAUDITED) | | FINANCIAL HIGHLIGHTS |
Selected data for a share of beneficial interest outstanding throughout each period.
| | | | | | | | | | | | | | | | | | | |
| | | | | Class A |
| | | | | Six Months
Ended
September 30,
2008 | | | Year Ended March 31, |
| | | | | | 2008 | | | 2007 | | | 2006 | | | 2005 | | | 2004 |
Per Share Operating Performance: | | | | | | | | | | | | | | | | | | | |
| Net asset value, beginning of period | | $ | | 10.13 | | | 10.23 | | | 10.13 | | | 10.32 | | | 10.67 | | | 10.51 |
| Income (loss) from investment operations: | | | | | | | | | | | | | | | | | | | |
| Net investment income | | $ | | 0.25 | | | 0.51 | | | 0.50 | | | 0.41 | | | 0.32 | | | 0.31 |
| Net realized and unrealized gain (loss) on investments | | $ | | (0.84 | ) | | (0.15 | ) | | 0.10 | | | (0.14 | ) | | (0.17 | ) | | 0.32 |
| Total from investment operations | | $ | | (0.59 | ) | | 0.36 | | | 0.60 | | | 0.27 | | | 0.15 | | | 0.63 |
| Less distributions from: | | | | | | | | | | | | | | | | | | | |
| Net investment income | | $ | | 0.23 | | | 0.46 | | | 0.50 | | | 0.42 | | | 0.33 | | | 0.33 |
| Net realized gains on investments | | $ | | — | | | — | | | — | | | 0.04 | | | 0.17 | | | 0.14 |
| Total distributions | | $ | | 0.23 | | | 0.46 | | | 0.50 | | | 0.46 | | | 0.50 | | | 0.47 |
| Net asset value, end of period | | $ | | 9.31 | | | 10.13 | | | 10.23 | | | 10.13 | | | 10.32 | | | 10.67 |
Total Return(1) | | % | | (5.95 | ) | | 3.61 | | | 6.03 | | | 2.53 | | | 1.52 | | | 6.16 |
Ratios and Supplemental Data: | | | | | | | | | | | | | | | | | | | |
| Net assets, end of period (000’s) | | $ | | 652,470 | | | 799,369 | | | 698,537 | | | 572,196 | | | 459,850 | | | 268,086 |
| Ratios to average net assets: | | | | | | | | | | | | | | | | | | | |
| Gross expenses prior to expense waiver(3) | | % | | 0.71 | | | 0.73 | | | 0.73 | | | 1.02 | | | 1.14 | | | 1.18 |
| Net expenses after expense waiver(2)(3) | | % | | 0.69 | † | | 0.69 | † | | 0.69 | † | | 0.93 | | | 1.00 | | | 1.10 |
| Net investment income after expense waiver(2)(3) | | % | | 4.95 | † | | 4.98 | † | | 4.89 | † | | 3.92 | | | 3.08 | | | 2.91 |
| Portfolio turnover rate | | % | | 272 | | | 435 | | | 367 | | | 469 | | | 417 | | | 475 |
| | | | | | | | | | | | | | | | | | | |
| | | | | Class B |
| | | | | Six Months
Ended
September 30,
2008 | | | Year Ended March 31, |
| | | | | | 2008 | | | 2007 | | | 2006 | | | 2005 | | | 2004 |
Per Share Operating Performance: | | | | | | | | | | | | | | | | | | | |
| Net asset value, beginning of period | | $ | | 10.11 | | | 10.21 | | | 10.11 | | | 10.30 | | | 10.65 | | | 10.50 |
| Income (loss) from investment operations: | | | | | | | | | | | | | | | | | | | |
| Net investment income | | $ | | 0.21 | | | 0.43 | | | 0.42 | | | 0.32 | | | 0.24 | | | 0.23 |
Net realized and unrealized gain (loss) on investments | | $ | | (0.84 | ) | | (0.14 | ) | | 0.10 | | | (0.13 | ) | | (0.17 | ) | | 0.31 |
| Total from investment operations | | $ | | (0.63 | ) | | 0.29 | | | 0.52 | | | 0.19 | | | 0.07 | | | 0.54 |
| Less distributions from: | | | | | | | | | | | | | | | | | | | |
| Net investment income | | $ | | 0.19 | | | 0.39 | | | 0.42 | | | 0.34 | | | 0.25 | | | 0.25 |
| Net realized gains on investments | | $ | | — | | | — | | | — | | | 0.04 | | | 0.17 | | | 0.14 |
| Total distributions | | $ | | 0.19 | | | 0.39 | | | 0.42 | | | 0.38 | | | 0.42 | | | 0.39 |
| Net asset value, end of period | | $ | | 9.29 | | | 10.11 | | | 10.21 | | | 10.11 | | | 10.30 | | | 10.65 |
Total Return(1) | | % | | (6.34 | ) | | 2.84 | | | 5.23 | | | 1.76 | | | 0.75 | | | 5.28 |
Ratios and Supplemental Data: | | | | | | | | | | | | | | | | | | | |
| Net assets, end of period (000’s) | | $ | | 31,793 | | | 41,078 | | | 50,086 | | | 60,526 | | | 64,779 | | | 67,402 |
| Ratios to average net assets: | | | | | | | | | | | | | | | | | | | |
| Gross expenses prior to expense waiver/recoupment(3) | | % | | 1.46 | | | 1.48 | | | 1.48 | | | 1.70 | | | 1.79 | | | 1.83 |
| Net expenses after expense waiver/recoupment(2)(3) | | % | | 1.44 | † | | 1.44 | † | | 1.44 | † | | 1.69 | | | 1.75 | | | 1.85 |
| Net investment income after expense waiver/recoupment(2)(3) | | % | | 4.20 | † | | 4.26 | † | | 4.13 | † | | 3.14 | | | 2.31 | | | 2.16 |
| Portfolio turnover rate | | % | | 272 | | | 435 | | | 367 | | | 469 | | | 417 | | | 475 |
(1) | Total return is calculated assuming reinvestment of all dividends and capital gain distributions at net asset value and excluding the deduction of sales charges. Total return for less than one year is not annualized. |
(2) | The Investment Adviser has agreed to limit expenses, (excluding interest, taxes, brokerage commissions, extraordinary expenses and |
| | acquired fund fees and expenses) subject to possible recoupment by the Investment Adviser within three years of being incurred. |
(3) | Annualized for periods less than one year. |
| † | Impact of waiving the advisory fee for the ING Institutional Prime Money Market Fund holding has less than 0.01% impact on the expense ratio and net investment income ratio. |
See Accompanying Notes to Financial Statements
27
| | |
| ING INTERMEDIATE BOND FUND (UNAUDITED) (CONTINUED) | | FINANCIAL HIGHLIGHTS |
Selected data for a share of beneficial interest outstanding throughout each period.
| | | | | | | | | | | | | | | | | | | |
| | | | | Class C |
| | | | | Six Months
Ended
September 30,
2008 | | | Year Ended March 31, |
| | | | | | 2008 | | | 2007 | | | 2006 | | | 2005 | | | 2004 |
Per Share Operating Performance: | | | | | | | | | | | | | | | | | | | |
| Net asset value, beginning of period | | $ | | 10.12 | | | 10.22 | | | 10.12 | | | 10.31 | | | 10.65 | | | 10.50 |
| Income (loss) from investment operations: | | | | | | | | | | | | | | | | | | | |
| Net investment income | | $ | | 0.21 | | | 0.43 | | | 0.42 | | | 0.33 | | | 0.24 | | | 0.23 |
Net realized and unrealized gain (loss) on investments | | $ | | (0.85 | ) | | (0.14 | ) | | 0.10 | | | (0.14 | ) | | (0.16 | ) | | 0.31 |
| Total from investment operations | | $ | | (0.64 | ) | | 0.29 | | | 0.52 | | | 0.19 | | | 0.08 | | | 0.54 |
| Less distributions from: | | | | | | | | | | | | | | | | | | | |
| Net investment income | | $ | | 0.19 | | | 0.39 | | | 0.42 | | | 0.34 | | | 0.25 | | | 0.25 |
| Net realized gains on investments | | $ | | — | | | — | | | — | | | 0.04 | | | 0.17 | | | 0.14 |
| Total distributions | | $ | | 0.19 | | | 0.39 | | | 0.42 | | | 0.38 | | | 0.42 | | | 0.39 |
| Net asset value, end of period | | $ | | 9.29 | | | 10.12 | | | 10.22 | | | 10.12 | | | 10.31 | | | 10.65 |
Total Return(1) | | % | | (6.43 | ) | | 2.85 | | | 5.24 | | | 1.77 | | | 0.86 | | | 5.28 |
Ratios and Supplemental Data: | | | | | | | | | | | | | | | | | | | |
| Net assets, end of period (000’s) | | $ | | 67,801 | | | 83,232 | | | 81,556 | | | 73,281 | | | 71,648 | | | 71,228 |
| Ratios to average net assets: | | | | | | | | | | | | | | | | | | | |
| Gross expenses prior to expense waiver/recoupment(3) | | % | | 1.46 | | | 1.48 | | | 1.48 | | | 1.70 | | | 1.79 | | | 1.83 |
| Net expenses after expense waiver/recoupment(2)(3) | | % | | 1.44 | † | | 1.44 | † | | 1.44 | † | | 1.69 | | | 1.75 | | | 1.85 |
| Net investment income after expense waiver/recoupment(2)(3) | | % | | 4.20 | † | | 4.24 | † | | 4.13 | † | | 3.15 | | | 2.31 | | | 2.16 |
| Portfolio turnover rate | | % | | 272 | | | 435 | | | 367 | | | 469 | | | 417 | | | 475 |
| | | | | | | | | | | | | | | | | | | |
| | | | | Class I |
| | | | | Six Months
Ended
September 30,
2008 | | | Year Ended March 31, |
| | | | | | 2008 | | | 2007 | | | 2006 | | | 2005 | | | 2004 |
Per Share Operating Performance: | | | | | | | | | | | | | | | | | | | |
| Net asset value, beginning of period | | $ | | 10.14 | | | 10.23 | | | 10.14 | | | 10.32 | | | 10.67 | | | 10.51 |
| Income (loss) from investment operations: | | | | | | | | | | | | | | | | | | | |
| Net investment income | | $ | | 0.26 | | | 0.54 | | | 0.53 | | | 0.44 | | | 0.36 | * | | 0.35 |
Net realized and unrealized gain (loss) on investments | | $ | | (0.85 | ) | | (0.13 | ) | | 0.09 | | | (0.13 | ) | | (0.17 | ) | | 0.33 |
| Total from investment operations | | $ | | (0.59 | ) | | 0.41 | | | 0.62 | | | 0.31 | | | 0.19 | | | 0.68 |
| Less distributions from: | | | | | | | | | | | | | | | | | | | |
| Net investment income | | $ | | 0.24 | | | 0.50 | | | 0.53 | | | 0.45 | | | 0.37 | | | 0.38 |
| Net realized gains on investments | | $ | | — | | | — | | | — | | | 0.04 | | | 0.17 | | | 0.14 |
| Total distributions | | $ | | 0.24 | | | 0.50 | | | 0.53 | | | 0.49 | | | 0.54 | | | 0.52 |
| Net asset value, end of period | | $ | | 9.31 | | | 10.14 | | | 10.23 | | | 10.14 | | | 10.32 | | | 10.67 |
Total Return(1) | | % | | (5.86 | ) | | 4.05 | | | 6.26 | | | 2.94 | | | 1.85 | | | 6.60 |
Ratios and Supplemental Data: | | | | | | | | | | | | | | | | | | | |
| Net assets, end of period (000’s) | | $ | | 426,792 | | | 351,575 | | | 266,596 | | | 179,582 | | | 43,808 | | | 14,548 |
| Ratios to average net assets: | | | | | | | | | | | | | | | | | | | |
| Gross expenses prior to expense waiver/recoupment(3) | | % | | 0.38 | | | 0.39 | | | 0.40 | | | 0.61 | | | 0.72 | | | 0.68 |
| Net expenses after expense waiver/recoupment(2)(3) | | % | | 0.36 | † | | 0.35 | † | | 0.36 | † | | 0.60 | | | 0.68 | | | 0.71 |
| Net investment income after expense waiver/recoupment(2)(3) | | % | | 5.29 | † | | 5.31 | † | | 5.22 | † | | 4.40 | | | 3.43 | | | 3.30 |
| Portfolio turnover rate | | % | | 272 | | | 435 | | | 367 | | | 469 | | | 417 | | | 475 |
(1) | Total return is calculated assuming reinvestment of all dividends and capital gain distributions as net asset value and excluding the deduction of sales charges. Total return for less than one year is not annualized. |
(2) | The Investment Adviser has agreed to limit expenses, (excluding interest, taxes, brokerage commissions, extraordinary expenses and acquired fund fees and expenses) |
| | subject to possible recoupment by the Investment Adviser within three years of being incurred. |
(3) | Annualized for periods less than one year. |
| † | Impact of waiving the advisory fee for the ING Institutional Prime Money Market Fund holding has less than 0.01% impact on the expense ratio and net investment income ratio. |
| * | Calculated using average number of shares outstanding throughout the period. |
See Accompanying Notes to Financial Statements
28
| | |
| ING INTERMEDIATE BOND FUND (UNAUDITED) (CONTINUED) | | FINANCIAL HIGHLIGHTS |
Selected data for a share of beneficial interest outstanding throughout each period.
| | | | | | | | | | | | | | | | | |
| | | | | Class O | |
| | | | | Six Months
Ended
September 30,
2008 | | | Year Ended March 31, | | | August 13,
2004(1) to
March 31,
2005 | |
| | | | | 2008 | | | 2007 | | | 2006 | | |
Per Share Operating Performance: | | | | | | | | | | | | | | | | | |
| Net asset value, beginning of period | | $ | | 10.14 | | | 10.24 | | | 10.14 | | | 10.32 | | | 10.41 | |
| Income (loss) from investment operations: | | | | | | | | | | | | | | | | | |
| Net investment income | | $ | | 0.25 | | | 0.51 | | | 0.50 | | | 0.40 | | | 0.21 | |
Net realized and unrealized gain (loss) on investments | | $ | | (0.85 | ) | | (0.15 | ) | | 0.09 | | | (0.13 | ) | | (0.04 | ) |
| Total from investment operations | | $ | | (0.60 | ) | | 0.36 | | | 0.59 | | | 0.27 | | | 0.17 | |
| Lest distributions from: | | | | | | | | | | | | | | | | | |
| Net investment income | | $ | | 0.23 | | | 0.46 | | | 0.49 | | | 0.41 | | | 0.22 | |
| Net realized gains on investments | | $ | | — | | | — | | | — | | | 0.04 | | | 0.04 | |
| Total distributions | | $ | | 0.23 | | | 0.46 | | | 0.49 | | | 0.45 | | | 0.26 | |
| Net asset value, end of period | | $ | | 9.31 | | | 10.14 | | | 10.24 | | | 10.14 | | | 10.32 | |
Total Return(2) | | % | | (6.04 | ) | | 3.61 | | | 6.02 | | | 2.58 | | | 1.61 | |
Ratios and Supplemental Data: | | | | | | | | | | | | | | | | | |
| Net assets, end of period (000’s) | | $ | | 48,455 | | | 55,956 | | | 53,096 | | | 43,171 | | | 33,997 | |
| Ratios to average net assets: | | | | | | | | | | | | | | | | | |
| Gross expenses prior to expense waiver(3) | | % | | 0.71 | | | 0.73 | | | 0.73 | | | 0.95 | | | 1.00 | |
| Net expenses after expense waiver(3)(4) | | % | | 0.69 | † | | 0.69 | † | | 0.69 | † | | 0.94 | | | 0.96 | |
| Net investment income after expense waiver(3)(4) | | % | | 4.95 | † | | 4.99 | † | | 4.88 | † | | 3.91 | | | 3.19 | |
| Portfolio turnover rate | | % | | 272 | | | 435 | | | 367 | | | 469 | | | 417 | |
| | | | | | | | | | | | | | | | | | | | |
| | | | | Class R | |
| | | | | Six Months
Ended
September 30,
2008 | | | Year Ended March 31, | | | March 16,
2004(1) to
March 31,
2004 | |
| | | | | 2008 | | | 2007 | | | 2006 | | | 2005 | | |
Per Share Operating Performance: | | | | | | | | | | | | | | | | | | | | |
| Net asset value, beginning of period | | $ | | 10.15 | | | 10.25 | | | 10.15 | | | 10.34 | | | 10.67 | | | 10.71 | |
| Income (loss) from investment operations: | | | | | | | | | | | | | | | | | | | | |
| Net investment income | | $ | | 0.23 | | | 0.48 | | | 0.47 | | | 0.38 | | | 0.33 | | | 0.01 | |
Net realized and unrealized gain (loss) on investments | | $ | | (0.85 | ) | | (0.14 | ) | | 0.10 | | | (0.14 | ) | | (0.16 | ) | | (0.05 | ) |
| Total from investment operations | | $ | | (0.62 | ) | | 0.34 | | | 0.57 | | | 0.24 | | | 0.17 | | | (0.04 | ) |
| Lest distributions from: | | | | | | | | | | | | | | | | | | | | |
| Net investment income | | $ | | 0.21 | | | 0.44 | | | 0.47 | | | 0.39 | | | 0.33 | | | — | |
| Net realized gains on investments | | $ | | — | | | — | | | — | | | 0.04 | | | 0.17 | | | — | |
| Total distributions | | $ | | 0.21 | | | 0.44 | | | 0.47 | | | 0.43 | | | 0.50 | | | — | |
| Net asset value, end of period | | $ | | 9.32 | | | 10.15 | | | 10.25 | | | 10.15 | | | 10.34 | | | 10.67 | |
Total Return(2) | | % | | (6.14 | ) | | 3.36 | | | 5.75 | | | 2.26 | | | 1.64 | | | (0.37 | ) |
Ratios and Supplemental Data: | | | | | | | | | | | | | | | | | | | | |
| Net assets, end of period (000’s) | | $ | | 17,800 | | | 16,773 | | | 5,572 | | | 799 | | | 313 | | | 1 | |
| Ratios to average net assets: | | | | | | | | | | | | | | | | | | | | |
| Gross expenses prior to expense waiver(3) | | % | | 0.96 | | | 0.98 | | | 0.98 | | | 1.17 | | | 1.21 | | | 1.25 | |
| Net expenses after expense waiver(3)(4) | | % | | 0.94 | † | | 0.94 | † | | 0.94 | † | | 1.16 | | | 1.17 | | | 1.25 | |
| Net investment income after expense waiver(3)(4) | | % | | 4.71 | † | | 4.65 | † | | 4.63 | † | | 3.79 | | | 2.96 | | | 3.20 | |
| Portfolio turnover rate | | % | | 272 | | | 435 | | | 367 | | | 469 | | | 417 | | | 475 | |
(1) | Commencement of operations. |
(2) | Total return is calculated assuming reinvestment of all dividends and capital gain distributions at net asset value. Total return for less than one year is not annualized. Total return for less than one year is not annualized. |
(3) | Annualized for periods less than one year. |
(4) | The Investment Adviser has agreed to limit expenses, (excluding interest, taxes, brokerage commissions, |
| | extraordinary expenses and acquired fund fees and expenses) subject to possible recoupment by the Investment Adviser within three years of being incurred. |
| † | Impact of waiving the advisory fee for the ING Institutional Prime Money Market Fund holding has less than 0.01% impact on the expense ratio. |
| * | Calculated using average number of shares outstanding throughout the period. |
See Accompanying Notes to Financial Statements
29
| | |
| ING INTERMEDIATE BOND FUND (UNAUDITED) (CONTINUED) | | FINANCIAL HIGHLIGHTS |
Selected data for a share of beneficial interest outstanding throughout each period.
| | | | | | | | |
| | | | | Class W | |
| | | | | Six Months
Ended
September 30,
2008 | | | December 17,
2007(1) to
March 31,
2008 | |
Per Share Operating Performance: | | | | | | | | |
| Net asset value, beginning of period | | $ | | 10.12 | | | 10.21 | |
| Income (loss) from investment operations: | | | | | | | | |
| Net investment income | | $ | | 0.27 | | | 0.15 | * |
| Net realized and unrealized loss on investments | | $ | | (0.82 | ) | | (0.05 | ) |
| Total from investment operations | | $ | | (0.55 | ) | | 0.10 | |
| Lest distributions from: | | | | | | | | |
| Net investment income | | $ | | 0.27 | | | 0.19 | |
| Total distributions | | $ | | 0.27 | | | 0.19 | |
| Net asset value, end of period | | $ | | 9.30 | | | 10.12 | |
Total Return(2) | | % | | (5.58 | ) | | 0.98 | |
Ratios and Supplemental Data: | | | | | | | | |
| Net assets, end of period (000’s) | | $ | | 5,234 | | | 443 | |
| Ratios to average net assets: | | | | | | | | |
| Gross expenses prior to expense waiver(3) | | % | | 0.46 | | | 0.48 | |
| Net expenses after expense waiver(3)(4) | | % | | 0.44 | † | | 0.44 | |
| Net investment income after expense waiver(3)(4) | | % | | 5.12 | † | | 5.24 | |
| Portfolio turnover rate | | % | | 272 | | | 435 | |
(1) | Commencement of operations. |
(2) | Total return is calculated assuming reinvestment of all dividends and capital gain distributions at net asset value. Total return for less than one year is not annualized. Total return for less than one year is not annualized. |
(3) | Annualized for periods less than one year. |
(4) | The Investment Adviser has agreed to limit expenses, (excluding interest, taxes, brokerage commissions, |
| | extraordinary expenses and acquired fund fees and expenses) subject to possible recoupment by the Investment Adviser within three years of being incurred. |
| † | Impact of waiving the advisory fee for the ING Institutional Prime Money Market Fund holding has less than 0.01% impact on the expense ratio. |
| * | Calculated using average number of shares outstanding throughout the period. |
See Accompanying Notes to Financial Statements
30
| | |
| ING NATIONAL TAX-EXEMPT BOND FUND (UNAUDITED) | | FINANCIAL HIGHLIGHTS |
Selected data for a share of beneficial interest outstanding throughout each period.
| | | | | | | | | | | | | | | | | |
| | | | | Class A |
| | | | | Six Months
Ended
September 30,
2008 | | Year Ended March 31, |
| | | | | | 2008 | | | 2007 | | 2006 | | | 2005 | | | 2004 |
Per Share Operating Performance: | | | | | | | | | | | | | | | | | |
| Net asset value, beginning of period | | $ | | 9.82 | | 10.30 | | | 10.28 | | 10.50 | | | 10.78 | | | 10.87 |
| Income (loss) from investment operations: | | | | | | | | | | | | | | | | | |
| Net investment income | | $ | | 0.17 | | 0.39 | | | 0.40 | | 0.37 | | | 0.34 | | | 0.35 |
| Net realized and unrealized gain (loss) on investments | | $ | | (0.37) | | (0.48 | ) | | 0.09 | | (0.11 | ) | | (0.21 | ) | | 0.12 |
| Total from investment operations | | $ | | (0.20) | | (0.09 | ) | | 0.49 | | 0.26 | | | 0.13 | | | 0.47 |
| Less distributions from: | | | | | | | | | | | | | | | | | |
| Net investment income | | $ | | 0.17 | | 0.39 | | | 0.40 | | 0.37 | | | 0.34 | | | 0.35 |
| Net realized gains on investments | | $ | | — | | — | | | 0.07 | | 0.11 | | | 0.07 | | | 0.21 |
| Total distributions | | $ | | 0.17 | | 0.39 | | | 0.47 | | 0.48 | | | 0.41 | | | 0.56 |
| Net asset value, end of period | | $ | | 9.45 | | 9.82 | | | 10.30 | | 10.28 | | | 10.50 | | | 10.78 |
Total Return(1) | | % | | (2.07) | | (0.87 | ) | | 4.83 | | 2.55 | | | 1.19 | | | 4.41 |
Ratios and Supplemental Data: | | | | | | | | | | | | | | | | | |
| Net assets, end of period (000’s) | | $ | | 3,233 | | 22,963 | | | 22,697 | | 22,864 | | | 23,296 | | | 24,082 |
| Ratios to average net assets: | | | | | | | | | | | | | | | | | |
| Gross expenses prior to expense waiver/recoupment(3) | | % | | 1.06 | | 0.89 | | | 0.95 | | 1.13 | | | 1.13 | | | 1.27 |
| Net expenses after expense waiver/recoupment(2)(3) | | % | | 0.87 | | 0.87 | | | 0.87 | | 1.06 | | | 1.10 | | | 1.15 |
| Net investment income after expense waiver/recoupment(2)(3) | | % | | 3.39 | | 3.89 | | | 3.83 | | 3.55 | | | 3.19 | | | 3.23 |
| Portfolio turnover rate | | % | | 12 | | 7 | | | 47 | | 32 | | | 22 | | | 31 |
(1) | Total return is calculated assuming reinvestment of all dividends and capital gain distributions at net asset value and excluding the deduction of sales charges. Total return for less than one year is not annualized. |
(2) | The Investment Adviser has agreed to limit expenses, (excluding interest, taxes, brokerage commissions, extraordinary expenses and acquired fund fees and expenses) subject to possible recoupment by the Investment Adviser within three years of being incurred. |
(3) | Annualized for periods less than one year. |
See Accompanying Notes to Financial Statements
31
| | |
| ING CLASSIC MONEY MARKET FUND (UNAUDITED) | | FINANCIAL HIGHLIGHTS |
Selected data for a share of beneficial interest outstanding throughout each period.
| | | | | | | | | | | | | | | |
| | | | | Class A | |
| | | | | Six Months
Ended
September 30,
2008 | | Year Ended March 31, | |
| | | | | | 2008 | | 2007 | | 2006 | | 2005 | | 2004 | |
Per Share Operating Performance: | | | | | | | | | | | | | | | |
| Net asset value, beginning of period | | $ | | 1.00 | | 1.00 | | 1.00 | | 1.00 | | 1.00 | | 1.00 | |
| Income from investment operations: | | | | | | | | | | | | | | | |
| Net investment income | | $ | | 0.01 | | 0.04 | | 0.05 | | 0.03 | | 0.01 | | 0.00 | * |
| Total from investment operations | | $ | | 0.01 | | 0.04 | | 0.05 | | 0.03 | | 0.01 | | 0.00 | * |
| Less distributions from: | | | | | | | | | | | | | | | |
| Net investment income | | $ | | 0.01 | | 0.04 | | 0.05 | | 0.03 | | 0.01 | | 0.00 | * |
| Total distributions | | $ | | 0.01 | | 0.04 | | 0.05 | | 0.03 | | 0.01 | | 0.00 | * |
| Net asset value, end of period | | $ | | 1.00 | | 1.00 | | 1.00 | | 1.00 | | 1.00 | | 1.00 | |
Total Return(1) | | % | | 1.08 | | 4.39 | | 4.63 | | 3.07 | | 1.02 | | 0.44 | |
Ratios and Supplemental Data: | | | | | | | | | | | | | | | |
| Net assets, end of period (000’s) | | $ | | 1,347,051 | | 1,498,016 | | 921,623 | | 656,731 | | 550,091 | | 398,997 | |
| Ratios to average net assets: | | | | | | | | | | | | | | | |
| Gross expenses prior to expense waiver(3) | | % | | 1.09 | | 1.11 | | 1.11 | | 1.10 | | 1.08 | | 1.16 | |
| Net expenses after expense waiver(2)(3) | | % | | 0.77 | | 0.77 | | 0.77 | | 0.77 | | 0.77 | | 0.77 | |
| Net investment income after expense waiver(2)(3) | | % | | 2.03 | | 4.22 | | 4.55 | | 3.07 | | 1.06 | | 0.44 | |
| | | | | | | | | | | | | | | |
| | | | | Class B | |
| | | | | Six Months
Ended
September 30,
2008 | | Year Ended March 31, | |
| | | | | | 2008 | | 2007 | | 2006 | | 2005 | | 2004 | |
Per Share Operating Performance: | | | | | | | | | | | | | | | |
| Net asset value, beginning of period | | $ | | 1.00 | | 1.00 | | 1.00 | | 1.00 | | 1.00 | | 1.00 | |
| Income from investment operations: | | | | | | | | | | | | | | | |
| Net investment income | | $ | | 0.01 | | 0.04 | | 0.04 | | 0.02 | | 0.01 | | 0.00 | * |
| Total from investment operations | | $ | | 0.01 | | 0.04 | | 0.04 | | 0.02 | | 0.01 | | 0.00 | * |
| Less distributions from: | | | | | | | | | | | | | | | |
| Net investment income | | $ | | 0.01 | | 0.04 | | 0.04 | | 0.02 | | 0.01 | | 0.00 | * |
| Total distributions | | $ | | 0.01 | | 0.04 | | 0.04 | | 0.02 | | 0.01 | | 0.00 | * |
| Net asset value, end of period | | $ | | 1.00 | | 1.00 | | 1.00 | | 1.00 | | 1.00 | | 1.00 | |
Total Return(1) | | % | | 0.69 | | 3.77 | | 4.00 | | 2.46 | | 0.57 | | 0.15 | |
Ratios and Supplemental Data: | | | | | | | | | | | | | | | |
| Net assets, end of period (000’s) | | $ | | 16,856 | | 19,793 | | 23,333 | | 23,995 | | 26,941 | | 816 | |
| Ratios to average net assets: | | | | | | | | | | | | | | | |
| Gross expenses prior to expense waiver(3) | | % | | 1.34 | | 1.36 | | 1.36 | | 1.34 | | 1.33 | | 1.41 | |
| Net expenses after expense waiver(2)(3) | | % | | 1.34 | | 1.36 | | 1.36 | | 1.34 | | 1.33 | | 1.07 | |
| Net investment income after expense waiver(2)(3) | | % | | 1.47 | | 3.74 | | 3.95 | | 2.43 | | 0.94 | | 0.15 | |
(1) | Total return is calculated assuming reinvestment of all dividends and capital gain distributions at net asset value. Total return for less than one year is not annualized. |
(2) | The Investment Adviser has agreed to limit expenses, (excluding interest, taxes, brokerage commissions, |
| | extraordinary expenses and acquired fund fees and expenses) subject to possible recoupment by the Investment Adviser within three years of being incurred. |
(3) | Annualized for periods less than one year. |
| * | Amount is less than $0.005. |
See Accompanying Notes to Financial Statements
32
| | |
| ING CLASSIC MONEY MARKET FUND (UNAUDITED) (CONTINUED) | | FINANCIAL HIGHLIGHTS |
Selected data for a share of beneficial interest outstanding throughout each period.
| | | | | | | | | | | | | | | |
| | | | | Class C | |
| | | | | Six Months
Ended
September 30,
2008 | | Year Ended March 31, | |
| | | | | | 2008 | | 2007 | | 2006 | | 2005 | | 2004 | |
Per Share Operating Performance: | | | | | | | | | | | | | | | |
| Net asset value, beginning of period | | $ | | 1.00 | | 1.00 | | 1.00 | | 1.00 | | 1.00 | | 1.00 | |
| Income from investment operations: | | | | | | | | | | | | | | | |
| Net investment income | | $ | | 0.01 | | 0.04 | | 0.04 | | 0.02 | | 0.01 | | 0.00 | * |
| Total from investment operations | | $ | | 0.01 | | 0.04 | | 0.04 | | 0.02 | | 0.01 | | 0.00 | * |
| Less distributions from: | | | | | | | | | | | | | | | |
| Net investment income | | $ | | 0.01 | | 0.04 | | 0.04 | | 0.02 | | 0.01 | | 0.00 | * |
| Total distributions | | $ | | 0.01 | | 0.04 | | 0.04 | | 0.02 | | 0.01 | | 0.00 | * |
| Net asset value, end of period | | $ | | 1.00 | | 1.00 | | 1.00 | | 1.00 | | 1.00 | | 1.00 | |
Total Return(1) | | % | | 0.69 | | 3.76 | | 3.99 | | 2.46 | | 0.58 | | 0.14 | |
Ratios and Supplemental Data: | | | | | | | | | | | | | | | |
| Net assets, end of period (000’s) | | $ | | 11,556 | | 15,511 | | 4,345 | | 4,868 | | 3,932 | | 546 | |
| Ratios to average net assets: | | | | | | | | | | | | | | | |
| Gross expenses prior to expense waiver(3) | | % | | 1.34 | | 1.36 | | 1.36 | | 1.34 | | 1.33 | | 1.41 | |
| Net expenses after expense waiver(2)(3) | | % | | 1.34 | | 1.36 | | 1.36 | | 1.34 | | 1.33 | | 1.07 | |
| Net investment income after expense waiver(2)(3) | | % | | 1.47 | | 3.59 | | 3.96 | | 2.47 | | 0.78 | | 0.15 | |
(1) | Total return is calculated assuming reinvestment of all dividends and capital gain distributions at net asset value. Total return for less than one year is not annualized. |
(2) | The Investment Adviser has agreed to limit expenses, (excluding interest, taxes, brokerage commissions, extraordinary expenses and acquired fund fees and expenses) |
| | subject to possible recoupment by the Investment Adviser within three years of being incurred. |
(3) | Annualized for periods less than one year. |
| * | Amount is less than $0.005. |
See Accompanying Notes to Financial Statements
33
| | |
| ING INSTITUTIONAL PRIME MONEY MARKET FUND (UNAUDITED) | | FINANCIAL HIGHLIGHTS |
Selected data for a share of beneficial interest outstanding throughout each period.
| | | | | | | | | | | | | | | | |
| | | | | Class I | | Class IS | |
| | | | | Six Months
Ended
September 30,
2008 | | Year
Ended
March 31, | | July 29,
2005(1) to
March 31,
2006 | | Six Months
Ended
September 30,
2008 | | December 5,
2007(1) to
March 31,
2008 | |
| | | | | | 2008 | | | 2007 | | | |
Per Share Operating Performance: | | | | | | | | | | | | | | | | |
| Net asset value, beginning of period | | $ | | 1.00 | | 1.00 | | | 1.00 | | 1.00 | | 1.00 | | 1.00 | |
| Income from investment operations: | | | | | | | | | | | | | | | | |
| Net investment income | | $ | | 0.01 | | 0.05 | | | 0.05 | | 0.03 | | 0.01 | | 0.01 | |
| Total from investment operations | | $ | | 0.01 | | 0.05 | | | 0.05 | | 0.03 | | 0.01 | | 0.01 | |
| Less distributions from: | | | | | | | | | | | | | | | | |
| Net investment income | | $ | | 0.01 | | 0.05 | | | 0.05 | | 0.03 | | 0.01 | | 0.01 | |
| Net realized gain on investments | | $ | | — | | 0.00 | * | | — | | — | | — | | — | |
| Total distributions | | $ | | 0.01 | | 0.05 | | | 0.05 | | 0.03 | | 0.01 | | 0.01 | |
| Net asset value, end of period | | $ | | 1.00 | | 1.00 | | | 1.00 | | 1.00 | | 1.00 | | 1.00 | |
Total Return(2) | | % | | 1.30 | | 5.00 | | | 5.25 | | 2.70 | | 1.35 | | 1.35 | |
Ratios and Supplemental Data: | | | | | | | | | | | | | | | | |
| Net assets, end of period (000’s) | | $ | | 1,561,032 | | 800,049 | | | 724,330 | | 179,659 | | 1 | | 1 | |
| Ratios to average net assets: | | | | | | | | | | | | | | | | |
| Gross expenses prior to expense waiver/recoupment(3) | | % | | 0.15 | | 0.12 | | | 0.16 | | 0.19 | | 0.20 | | 0.22 | |
| Net expenses after expense waiver/recoupment(3)(4) | | % | | 0.15 | | 0.12 | | | 0.16 | | 0.17 | | 0.20 | | 0.20 | |
| Net investment income after expense waiver/recoupment(3)(4) | | % | | 2.61 | | 4.95 | | | 5.17 | | 4.14 | | 2.39 | | 4.19 | |
(1) | Commencement of operations. |
(2) | Total return is calculated assuming reinvestment of all dividends and capital gain distributions at net asset value. Total return for less than one year is not annualized. |
(3) | Annualized for periods less than one year. |
(4) | The Investment Adviser has agreed to limit expenses, (excluding interest, taxes, brokerage commissions, extraordinary expenses and acquired fund fees and expenses) subject to possible recoupment by the Investment Adviser within three years of being incurred. |
| * | Amount is less than $0.005. |
See Accompanying Notes to Financial Statements
34
NOTES TO FINANCIAL STATEMENTSASOF SEPTEMBER 30, 2008 (UNAUDITED)
NOTE 1 — ORGANIZATION
Organization. ING Funds Trust (“Trust”) is a Delaware statutory trust and is registered as an open-end management investment company under the Investment Company Act of 1940, as amended (“1940 Act”). The Trust was organized on August 6, 1998 and was established under a Trust Instrument dated July 30, 1998. It consists of six separately managed series: ING GNMA Income Fund (“GNMA Income”), ING High Yield Bond Fund (“High Yield Bond”), ING Intermediate Bond Fund (“Intermediate Bond”), ING National Tax-Exempt Bond Fund (“National Tax-Exempt Bond”), ING Classic Money Market Fund (“Classic Money Market”) and ING Institutional Prime Money Market Fund (“Institutional Money Market”) (each, a “Fund” and collectively, the “Funds”).
The investment objective of each Fund is described in each Fund’s prospectus.
Each Fund, except Institutional Money Market, offers at least three of the following classes of shares: Class A, Class B, Class C, Class I, Class O, Class Q, Class R and Class W. Institutional Money Market offers Class I and Class IS shares. The separate classes of shares differ principally in the applicable sales charges (if any), transfer agent fees, distribution fees and shareholder servicing fees. Generally, shareholders of each class also bear certain expenses that pertain to that particular class. All shareholders bear the common expenses of a Fund and earn income and realized gains/losses from the portfolio pro rata based on the average daily net assets of each class, without distinction between share classes. Common expenses of the Funds (including custodial asset-based fees, legal and audit fees, printing and mailing expenses, transfer agency out-of-pocket expenses, and fees and expenses of the independent trustees) are allocated to each Fund in proportion to its relative daily net assets. Expenses directly attributable to a particular fund (including advisory, administration, custodial transaction-based, registration, other professional, distribution and/or service fees, certain taxes, and offering costs) are charged directly to that Fund. Differences in per share dividend rates generally result from the differences in separate class expenses, including distribution, and shareholder servicing fees. Class B shares, along with their pro rata reinvested dividend shares, automatically convert to Class A shares eight years after purchase.
Class B shares of the Funds (except Classic Money Market) are closed to new investment, provided that (1) Class B shares of the Funds may be purchased through the reinvestment of dividends issued by Class B
shares of a Fund; (2) subject to the terms and conditions of relevant exchange privileges and as permitted under their respective prospectuses, Class B shares of the Funds may be acquired through exchange of Class B shares of other funds in the ING mutual funds complex; and (3) certain qualified retirement plans may purchase Class B shares of the Funds, where the Funds have received information reasonably satisfactory indicating that intermediaries maintaining these plans are unable for administrative reasons to effect the closure immediately.
Effective September 26, 2008, Class B and Class C shares of National Tax-Exempt were liquidated.
NOTE 2 — SIGNIFICANT ACCOUNTING POLICIES
The following significant accounting policies are consistently followed by the Funds in the preparation of their financial statements, and such policies are in conformity with U.S. generally accepted accounting principles for investment companies.
| A. | Security Valuation. Investments in equity securities traded on a national securities exchange are valued at the last reported sale price. Securities reported by the National Association of Securities Dealers Automated Quotation System (“NASDAQ”) will be valued at the NASDAQ official closing prices. Securities traded on an exchange or NASDAQ for which there has been no sale and securities traded in the over-the- counter-market are valued at the mean between the last reported bid and ask prices. All investments quoted in foreign currencies will be valued daily in U.S. dollars on the basis of the foreign currency exchange rates prevailing at that time. Debt securities are valued at prices obtained from independent services or from one or more dealers making markets in the securities and may be adjusted based on the Funds’ valuation procedures. U.S. government obligations are valued by using market quotations or independent pricing services that use prices provided by marketmakers or estimates of market values obtained from yield data relating to instruments or securities with similar characteristics. |
Securities and assets for which market quotations are not readily available (which may include certain restricted securities which are subject to limitations as to their sale) are valued at their fair values, as defined by the 1940 Act, as determined in good faith by or under the supervision of the Funds’ Board of Trustees (“Board”), in accordance
35
NOTES TO FINANCIAL STATEMENTSASOF SEPTEMBER 30, 2008 (UNAUDITED) (CONTINUED)
NOTE 2 — SIGNIFICANT ACCOUNTING POLICIES (continued)
with methods that are specifically authorized by the Board. Securities traded on exchanges, including foreign exchanges, which close earlier than the time that a Fund calculates its net asset value (“NAV”) may also be valued at their fair values as determined in good faith by or under the supervision of a Fund’s Board, in accordance with methods that are specifically authorized by the Board. If an event occurs after the time at which the market for foreign securities held by a Fund closes but before the time that a Fund’s NAV is calculated, such event may cause the closing price on the foreign exchange to not represent a readily available reliable market value quotation for such securities at the time the Fund determines its NAV. In such a case, the Fund will use the fair value of such securities as determined under a Fund’s valuation procedures. Events after the close of trading on a foreign market that could require a Fund to fair value some or all of its foreign securities include, among others, securities trading in the U.S. and other markets, corporate announcements, natural and other disasters, and political and other events. Among other elements of analysis in the determination of a security’s fair value, the Board has authorized the use of one or more independent research services to assist with such determinations. An independent research service may use statistical analyses and quantitative models to help determine fair value as of the time a Fund calculates its NAV. There can be no assurance that such models accurately reflect the behavior of the applicable markets or the effect of the behavior of such markets on the fair value of securities, or that such markets will continue to behave in a fashion that is consistent with such models. Unlike the closing price of a security on an exchange, fair value determinations employ elements of judgment. Consequently, the fair value assigned to a security may not represent the actual value that a Fund could obtain if it were to sell the security at the time of the close of the NYSE. Pursuant to procedures adopted by the Board, a Fund is not obligated to use the fair valuations suggested by any research service, and valuation recommendations provided by such research services may be overridden if other events have occurred or if other fair valuations are determined in good faith to be more accurate. Unless an event is such that it causes a Fund to determine that the
closing prices for one or more securities do not represent readily available reliable market value quotations at the time a Fund determines its NAV, events that occur between the time of the close of the foreign market on which they are traded and the close of regular trading on the NYSE will not be reflected in a Fund’s NAV. Investments in securities maturing in 60 days or less from the date of acquisition are valued at amortized cost which approximates market value.
Classic Money Market and Institutional Money Market use the amortized cost method to value their portfolio securities, which approximates market value. The amortized cost method involves valuing a security at its cost and amortizing any discount or premium over the period until maturity regardless of the impact of fluctuating interest rates or the market value of the security.
Effective for fiscal years beginning after November 15, 2007, Financial Accounting Standards Board (“FASB”) Statement of Financial Accounting Standards No. 157, “Fair Value Measurements”, establishes a hierarchy for measuring fair value of assets and liabilities. As required by the standard, each investment asset or liability of the Funds is assigned a level at measurement date based on the significance and source of the inputs to its valuation. Quoted prices in active markets for identical securities are classified as “Level 1”, inputs other than quoted prices for an asset that are observable are classified as “Level 2” and unobservable inputs, including the sub-adviser’s judgment about the assumptions that a market participant would use in pricing an asset or liability are classified as “Level 3”. The inputs used for valuing securities are not necessarily an indication of the risks associated with investing in those securities. A table summarizing the Funds’ investments under these levels of classification is included following the Portfolios of Investments.
| B. | Security Transactions and Revenue Recognition. Securities transactions are accounted for on the trade date. Realized gains and losses are reported on the basis of identified cost of securities sold. Interest income is recorded on an accrual basis. Dividend income is recorded on the ex-dividend date, or for certain foreign securities, when the information becomes available to the Funds. Premium amortization and discount accretion are determined by the effective yield method. |
36
NOTES TO FINANCIAL STATEMENTSASOF SEPTEMBER 30, 2008 (UNAUDITED) (CONTINUED)
NOTE 2 — SIGNIFICANT ACCOUNTING POLICIES (continued)
| C. | Foreign Currency Translation. The books and records of the Funds are maintained in U.S. dollars. Any foreign currency amounts are translated into U.S. dollars on the following basis: |
| | (1) | Market value of investment securities, other assets and liabilities — at the exchange rates prevailing at the end of the day. |
| | (2) | Purchases and sales of investment securities, income and expenses — at the rates of exchange prevailing on the respective dates of such transactions. |
Although the net assets and the market values are presented at the foreign exchange rates at the end of the day, the Funds do not isolate the portion of the results of operations resulting from changes in foreign exchange rates on investments from the fluctuations arising from changes in market prices of securities held. Such fluctuations are included with the net realized and unrealized gains or losses from investments. For securities that are subject to foreign withholding tax upon disposition, liabilities are recorded on the Statements of Assets and Liabilities for the estimated tax withholding based on the securities’ current market values. Upon disposition, realized gains or losses on such securities are recorded net of foreign withholding tax.
Reported net realized foreign exchange gains or losses arise from sales of foreign currencies, currency gains or losses realized between the trade and settlement dates on securities transactions, the difference between the amounts of dividends, interest, and foreign withholding taxes recorded on the Funds’ books, and the U.S. dollar equivalent of the amounts actually received or paid. Net unrealized foreign exchange gains and losses arise from changes in the value of assets and liabilities other than investments in securities at fiscal year end, resulting from changes in the exchange rate. Foreign security and currency transactions may involve certain considerations and risks not typically associated with investing in U.S. companies and U.S. government securities. These risks include, but are not limited to revaluation of currencies and future adverse political and economic developments which could cause securities and their markets to be less liquid and prices more volatile than those of comparable U.S. companies and U.S. government securities.
| D. | Foreign Currency Transactions and Futures Contracts. High Yield Bond, Intermediate Bond and National Tax-Exempt Bond may enter into foreign currency exchange transactions to convert to and from different foreign currencies and to and from the U.S. dollar in connection with the planned purchases or sales of securities. The Funds either enter into these transactions on a spot basis at the spot rate prevailing in the foreign currency exchange market or use forward foreign currency contracts to purchase or sell foreign currencies. When the contract is fulfilled or closed, gains or losses are realized. Until then, the gain or loss is included in unrealized appreciation or depreciation. Risks may arise upon entering into forward contracts from the potential inability of counterparties to meet the terms of their forward contracts and from unanticipated movements in the value of foreign currencies relative to the U.S. dollar. |
High Yield Bond, Intermediate Bond and Institutional Money Market may enter into futures contracts involving foreign currency, interest rates, securities and securities indices. A futures contract obligates the seller of the contract to deliver and the purchaser of the contract to take delivery of the type of foreign currency, financial instrument or security called for in the contract at a specified future time for a specified price. Upon entering into such a contract, a Fund is required to deposit and maintain as collateral such initial margin as required by the exchange on which the contract is traded. Pursuant to the contract, a Fund agrees to receive from or pay to the broker an amount equal to the daily fluctuations in the value of the contract. Such receipts or payments are known as variation margins and are recorded as unrealized gains or losses by the Fund. When the contract is closed, the Fund records a realized gain or loss equal to the difference between the value of the contract at the time it was opened and the value at the time it was closed.
| E. | Distributions to Shareholders. The Funds record distributions to their shareholders on the ex-dividend date. All Funds, with the exception of GNMA Income, declare dividends daily and pay dividends monthly. GNMA Income declares and pays dividends monthly. The characteristics of income and gains to be distributed are determined in accordance with income tax regulations, which may differ from U.S. generally accepted accounting principles for investment companies. |
37
NOTES TO FINANCIAL STATEMENTSASOF SEPTEMBER 30, 2008 (UNAUDITED) (CONTINUED)
NOTE 2 — SIGNIFICANT ACCOUNTING POLICIES (continued)
| F. | Federal Income Taxes. It is the policy of the Funds to comply with Subchapter M of the Internal Revenue Code and related excise tax provisions applicable to regulated investment companies and to distribute substantially all of their net investment income and any net realized capital gains to their shareholders. Therefore, no federal income tax provision is required. Management has considered the sustainability of the Funds’ tax positions taken on federal income tax returns for all open tax years in making this determination. No capital gain distributions shall be made until any capital loss carryforwards have been fully utilized or expired. |
| G. | Use of Estimates. The preparation of financial statements in conformity with U.S. generally accepted accounting principles requires management to make estimates and assumptions that affect the reported amounts of assets and liabilities and disclosure of contingent assets and liabilities at the date of the financial statements and the reported amounts of increases and decreases in net assets from operations during the reporting period. Actual results could differ from those estimates. |
| H. | Repurchase Agreements. Each Fund may invest in repurchase agreements only with government securities dealers recognized by the Board of Governors of the Federal Reserve System. Under such agreements, the seller of the security agrees to repurchase it at a mutually agreed upon time and price. The resale price is in excess of the purchase price and reflects an agreed upon interest rate for the period of time the agreement is outstanding. The period of the repurchase agreements is usually short, from overnight to one week, while the underlying securities generally have longer maturities. Each Fund will receive as collateral securities acceptable to it whose market value is equal to at least 100% of the carrying amount of the repurchase agreements, plus accrued interest, being invested by the Fund. The underlying collateral is valued daily on a mark to market basis to assure that the value, including accrued interest is at least equal to the repurchase price. There would be potential loss to the Fund in the event the Fund is delayed or prevented from exercising its right to dispose of the collateral, and it may incur disposition costs in liquidating the collateral. |
| I. | Securities Lending. Each Fund (except GNMA Income) has the option to temporarily loan up to 30% of its total assets to brokers, dealers or other financial institutions in exchange for a negotiated lender’s fee. The borrower is required to fully collateralize the loans with cash or U.S. government securities. Generally, in the event of counterparty default, a Fund has the right to use collateral to offset losses incurred. There would be potential loss to the Fund in the event the Fund is delayed or prevented from exercising its right to dispose of the collateral. The Fund bears the risk of loss with respect to the investment of collateral. Engaging in securities lending could have a leveraging effect, which may intensify the credit, market and other risks associated with investing in a Fund. |
| J. | Illiquid and Restricted Securities. Classic Money Market and Institutional Money Market may not invest more than 10% of their net assets in illiquid securities and all other Funds may not invest more than 15% of their net assets in illiquid securities. Illiquid securities are not readily marketable. Disposing of illiquid investments may involve time-consuming negotiation and legal expenses, and it may be difficult or impossible for the Funds to sell them promptly at an acceptable price. Restricted securities are those sold under Rule 144A of the Securities Act of 1933 (“1933 Act”) or are securities offered pursuant to Section 4(2) of the 1933 Act, and are subject to legal or contractual restrictions on resale and may not be publicly sold without registration under the 1933 Act. Certain restricted securities may be considered liquid pursuant to procedures adopted by the Board or may be deemed illiquid because they may not be readily marketable. With the exception of Classic Money Market and Institutional Money Market, illiquid and restricted securities are valued using market quotations when readily available. In the absence of market quotations, the securities are valued based upon their fair value determined under procedures approved by the Board. |
| K. | Delayed-Delivery or When-Issued Transactions. The Funds may purchase or sell securities on a when-issued or a delayed-delivery basis. Each Fund (except GNMA Income) may enter into forward commitments. The price of the underlying securities and date when the securities will be delivered and paid for are fixed at the time the transaction is negotiated. The market value of such |
38
NOTES TO FINANCIAL STATEMENTSASOF SEPTEMBER 30, 2008 (UNAUDITED) (CONTINUED)
NOTE 2 — SIGNIFICANT ACCOUNTING POLICIES (continued)
| | is identified in the Funds’ Portfolio of investments. Losses may arise due to changes in the market value of the securities or from the inability of counterparties to meet the terms of the contract. In connection with such purchases, the Funds are required to segregate liquid assets with the Funds’ custodian sufficient to cover the purchase price. |
| L. | Mortgage Dollar Roll Transactions. Each Fund (except National Tax-Exempt Bond) may engage in dollar roll transactions with respect to mortgage-backed securities issued or to be issued by Government National Mortgage Association, Federal National Mortgage Association and Federal Home Loan Mortgage Corp. In a dollar roll transaction, a Fund sells a mortgage-backed security to a financial institution, such as a bank or broker/dealer, and simultaneously agrees to repurchase a substantially similar (i.e., same type, coupon, and maturity) security from the institution on a delayed delivery basis at an agreed upon price. The mortgage-backed securities that are repurchased will bear the same interest rate as those sold, but generally will be collateralized by different pools of mortgages with different prepayment histories. The Funds account for dollar roll transactions as purchases and sales. |
| M. | Options Contracts. High Yield Bond and Intermediate Bond may purchase put and call options and may write (sell) put options and covered call options. High Yield Bond and Intermediate Bond may engage in option transactions as a hedge against adverse movements in the value of portfolio holdings or to increase market exposure. Option contracts are valued daily and unrealized gains or losses are recorded based upon the last sales price on the principal exchange on which the options are traded. The Funds will realize a gain or loss upon the expiration or closing of the option contract. When an option is exercised, the proceeds on sales of the underlying security for a written call option, the purchase cost of the security for a written put option, or the cost of the security for a purchased put or call option is adjusted by the amount of premium received or paid. Realized and unrealized gains or losses on option contracts are reflected in the accompanying financial statements. The risk in writing a call option is that the Funds give up the |
| | opportunity for profit if the market price of the security increases and the option is exercised. The risk in writing a put option is that the Funds may incur a loss if the market price of the security decreases and the option is exercised. The risk in buying an option is that the Funds pay a premium whether or not the option is exercised. Risks may also arise from an illiquid secondary market or from the inability of counterparties to meet the terms of the contract. |
| N. | Swap Contracts. High Yield Bond, Intermediate Bond and National Tax-Exempt Bond may enter into interest rate swaps, currency swaps and other types of swap agreements, including swaps on securities and indices. A swap is an agreement between two parties pursuant to which each party agrees to make one or more payments to the other on regularly scheduled dates over a stated term, based on different interest rates, currency exchange rates, security prices, the prices or rates of other types of financial instruments or assets or the levels of specified indices. During the term of the swap, changes in the value of the swap are recognized by marking-to-market the value of the swap. |
Derivatives are also subject to credit risks related to the counterparty’s ability to perform, and any deterioration in the counterparty’s creditworthiness could adversely affect the instrument.
| O. | Construction Loan Securities. GNMA Income may purchase construction loan securities, which are issued to finance building costs. The funds are disbursed as needed or in accordance with a prearranged plan. The securities provide for the timely payment to the registered holder of interest at the specified rate plus scheduled installments of principal. Upon completion of the construction phase, the construction loan securities are terminated and project loan securities are issued. It is GNMA Income’s policy to record these GNMA certificates on trade date, and to segregate assets to cover its commitments on trade date as well. |
| P. | Indemnifications. In the normal course of business, the Trust may enter into contracts that provide certain indemnifications. The Trust’s maximum exposure under these arrangements is dependent on future claims that may be made against the Funds and, therefore, cannot be estimated; however, based on experience, the risk of loss from such claims is considered remote. |
39
NOTES TO FINANCIAL STATEMENTSASOF SEPTEMBER 30, 2008 (UNAUDITED) (CONTINUED)
NOTE 3 — INVESTMENT TRANSACTIONS
For the six months ended September 30, 2008, the cost of purchases and proceeds from the sales of securities excluding short-term securities, were as follows:
| | | | | | |
| | | Purchases | | Sales |
GNMA Income | | $ | — | | $ | — |
High Yield Bond | | | 36,126,268 | | | 42,810,657 |
Intermediate Bond | | | 229,574,819 | | | 268,090,172 |
National Tax-Exempt Bond | | | 2,779,515 | | | 27,701,168 |
U.S. Government Securities not included above were as follows:
| | | | | | |
| | | Purchases | | Sales |
GNMA Income | | $ | 80,650,231 | | $ | 86,641,151 |
High Yield Bond | | | 1,234,887 | | | 1,312,322 |
Intermediate Bond | | | 3,924,442,043 | | | 3,559,316,158 |
NOTE 4 — INVESTMENT MANAGEMENT AND ADMINISTRATIVE FEES
ING Investments, LLC (“ING Investments” or the ”Investment Adviser”), an Arizona limited liability company, serves as the investment adviser to the Funds. The Investment Adviser serves pursuant to an investment management agreement (“Management Agreement”) between the Investment Adviser and the Trust, on behalf of the Funds.
The Management Agreement compensates the Investment Adviser with a fee, computed daily and payable monthly, based on the average daily net assets of each Fund, at the following annual rates:
For GNMA Income — 0.47% on first $1 billion, 0.40% on next $4 billion and 0.35% on assets thereafter; for High Yield Bond — 0.51% on first $1 billion, 0.45% on next $4 billion and 0.40% on assets thereafter; for Intermediate Bond — 0.17%; for National Tax-Exempt Bond — 0.30%; for Classic Money Market — 0.25%; and for Institutional Money Market — 0.08%.
ING Investment Management Co. (“ING IM”), a Connecticut corporation, serves as the sub-adviser to the Funds. The Investment Adviser has entered into a sub-advisory agreement with ING IM. Subject to such policies as the Board or the Investment Adviser may determine, ING IM manages the Funds’ assets in accordance with the Funds’ investment objectives, policies, and limitations.
ING Funds are permitted to invest end-of-day cash balances into Institutional Money Market. Investment management fees paid by the Funds will be reduced by
an amount equal to the management fees paid indirectly to Institutional Money Market with respect to assets invested by the Funds. For the six months ended September 30, 2008, High Yield Bond and Intermediate Bond waived $586 and $45,372, respectively. These fees are not subject to recoupment.
ING Funds Services, LLC (“IFS”), acts as administrator and provides certain administrative and shareholder services necessary for Fund operations and is responsible for the supervision of other service providers. For its services, IFS is entitled to receive from each Fund, with the exception of Classic Money Market and Institutional Money Market, a fee at an annual rate of 0.10% of its average daily net assets.
ING Funds Distributor, LLC (the “Distributor” or “IFD”) is the principal underwriter of the Funds. The Distributor, IFS, ING Investments and ING IM are indirect, wholly-owned subsidiaries of ING Groep N.V. (“ING Groep”). ING Groep is a global financial institution of Dutch origin offering banking, investments, life insurance and retirement services to over 75 million private, corporate and institutional clients in more than 50 countries. With a diverse workforce of about 125,000 people, ING Groep comprises a broad spectrum of prominent companies that increasingly serve their clients under the ING brand.
NOTE 5 — DISTRIBUTION AND SERVICE FEES
Each share class of the Funds (except Class I and Class W and as otherwise noted below) has adopted a Distribution Plan pursuant to Rule 12b-1 under the 1940 Act and/or a Service Plan (the “Plans”), whereby the Distributor is reimbursed or compensated (depending on the class of shares) by certain of the Funds for expenses incurred in the distribution of each Fund’s shares (“Distribution Fees”). Pursuant to the Plans, the Distributor is entitled to payment each month for expenses incurred in the distribution and promotion of certain of each Fund’s shares, including expenses incurred in printing prospectuses and reports used for sales purposes, expenses incurred in preparing and printing sales literature and other such distribution related expenses, including any distribution or shareholder servicing fees (“Service Fees”) paid to securities dealers who have executed a distribution agreement with the Distributor. Under the Plans, each class of shares of the Fund pays the Distributor a
40
NOTES TO FINANCIAL STATEMENTSASOF SEPTEMBER 30, 2008 (UNAUDITED) (CONTINUED)
NOTE 5 — DISTRIBUTION AND SERVICE FEES (continued)
Distribution and/or Service Fee based on average daily net assets at the following annual rates:
| | | | | | | | | | | | | | | | | | | | | |
| | | Class A | | | Class B | | | Class C | | | Class IS | | | Class O | | | Class Q | | | Class R | |
GNMA Income | | 0.25 | % | | 1.00 | % | | 1.00 | % | | N/A | | | N/A | | | 0.25 | % | | N/A | |
High Yield Bond | | 0.25 | % | | 1.00 | % | | 1.00 | % | | N/A | | | N/A | | | N/A | | | N/A | |
Intermediate Bond | | 0.25 | % | | 1.00 | % | | 1.00 | % | | N/A | | | 0.25 | % | | N/A | | | 0.50 | % |
National Tax-Exempt Bond | | 0.25 | % | | 1.00 | % | | 1.00 | % | | N/A | | | N/A | | | N/A | | | N/A | |
Classic Money Market(1) | | 0.75 | % | | 1.00 | % | | 1.00 | % | | N/A | | | N/A | | | N/A | | | N/A | |
Institutional Money Market | | N/A | | | N/A | | | N/A | | | 0.10 | % | | N/A | | | N/A | | | N/A | |
(1) | The Distributor has contractually agreed to waive a portion of the distribution fee for Class A of Classic Money Market to the extent necessary for expenses not to exceed 0.77%. The fee waiver will continue through at least August 1, 2009. There is no guarantee that this waiver will continue after that date. |
During the six months ended September 30, 2008, the Distributor voluntarily waived $2,251,184 of the Class A Distribution and Service Fees for Classic Money Market. This amount is not subject to recoupment.
The Distributor also receives the proceeds of the initial sales charge paid by shareholders upon the purchase of Class A shares of the Funds, and the contingent deferred sales charge paid by shareholders upon certain redemptions for Class A, Class B, and Class C shares. For the six months ended September 30, 2008, the Distributor retained the following amounts in sales charges:
| | | | | | |
| | | Class A
Shares | | Class C
Shares |
Initial Sales Charges | | | | | | |
GNMA Income | | $ | 10,123 | | | N/A |
High Yield Bond | | | 4,202 | | | N/A |
Intermediate Bond | | | 6,331 | | | N/A |
National Tax-Exempt Bond | | | 416 | | | N/A |
Contingent Deferred Sales Charge | | | | | | |
GNMA Income | | | — | | $ | 4,160 |
High Yield Bond | | | — | | | 714 |
Intermediate Bond | | | 9,300 | | | 7,132 |
National Tax-Exempt Bond | | | — | | | 676 |
Classic Money Market | | | 12,198 | | | 3,148 |
NOTE 6 — OTHER TRANSACTIONS WITH AFFILIATES AND RELATED PARTIES
At September 30, 2008, the Funds had the following amounts recorded in payable to affiliates on the accompanying Statements of Assets and Liabilities (see Notes 4 and 5):
| | | | | | | | | | | | |
Fund | | Accrued Investment Management Fees | | Accrued Administrative Fees | | Accrued Shareholder Service and Distribution Fees | | Total |
GNMA Income | | $ | 232,077 | | $ | 49,378 | | $ | 167,336 | | $ | 448,791 |
High Yield Bond | | | 44,501 | | | 8,771 | | | 40,289 | | | 93,561 |
Intermediate Bond | | | 172,072 | | | 105,148 | | | 243,559 | | | 520,779 |
National Tax-Exempt Bond | | | 6,750 | | | 2,250 | | | 8,908 | | | 17,908 |
Classic Money Market | | | 283,518 | | | — | | | 476,783 | | | 760,301 |
Institutional Money Market | | | 93,065 | | | — | | | — | | | 93,065 |
At September 30, 2008, the following ING Portfolios or indirect, wholly-owned subsidiaries of ING Groep owned more than 5% of the following Funds:
ING Intermediate Bond — Institutional Money Market (8.73%).
ING Life Insurance & Annuity — Intermediate Bond (18.31%) and Tax Exempt Bond (21.12%).
ING National Trust — GNMA Income (7.95%) and Intermediate Bond (16.68%).
ING VP Intermediate Bond — Institutional Money Market (10.58%).
The Trust has adopted a Retirement Policy (“Policy”) covering all independent trustees of the Funds who will have served as an independent trustee for at least five years at the time of retirement. Benefits under this Policy are based on an annual rate as defined in the Policy.
On September 16, 2008, Classic Money Market and Institutional Money Market (each a “Money Market Fund” and collectively, the “Money Market Funds”) obtained a commitment from the Adviser that an affiliate of ING Groep will provide capital support with respect to certain of the Money Market Funds’ portfolio holdings. Each Money Market Fund entered into a Capital Support Agreement (each, an “Agreement” or collectively, the “Agreements”) with ING America Insurance Holdings, Inc., a Delaware corporation (“Capital Support Provider” or “CSP”). Each Agreement establishes certain circumstances (“Contribution Event”) where the CSP is obligated to make a cash contribution (“Capital Contribution”) to each Money Market Fund in an amount sufficient for Classic Money Market to maintain its market-based net asset value per share (“NAV”) at no less than $0.9950 and Institutional Money Market to maintain its NAV at no less than $0.9950 or such greater amount as required by any Nationally Recognized Statistical Rating Organization (as defined in Rule 2a-7 under the 1940 Act) that has issued a rating with respect to Institutional Money Market. The maximum amount that the CSP would be required to contribute under an
41
NOTES TO FINANCIAL STATEMENTSASOF SEPTEMBER 30, 2008 (UNAUDITED) (CONTINUED)
NOTE 6 — OTHER TRANSACTIONS WITH AFFILIATES AND RELATED PARTIES (continued)
Agreement is an amount equal to the outstanding principal balance of certain notes (American General Finance Corp.) (“Notes”) held by each Money Market Fund as a portfolio security on the date of the Contribution Event.
The obligation of the CSP to make Capital Contributions under each Agreement terminates upon the earlier to occur of: (i) the repayment in full, in cash, of all the Notes; (ii) the CSP having made Capital Contributions, in the aggregate, equal to the maximum contribution amount and; (iii) so long as the CSP is not in default with respect to its obligations arising under each Agreement, January 12, 2009 (“Termination Date”).
In addition, a Money Market Fund will sell the Notes: (i) within fifteen (15) calendar days following any change in the CSP’s short-term credit ratings such that the CSP’s short-term obligations no longer qualify as “First Tier Securities” (as defined in Rule 2a-7); or (ii) on the business day immediately prior to the Termination Date, provided that a Money Market Fund shall not be required to complete any such sale if (A) the amount a Money Market Fund expects to receive on such sale date would not result in a loss or the payment of a Capital Contribution, or (B) with respect to an event described above in the first sentence of this paragraph, if the CSP substitutes an obligation or credit support that satisfies the requirement of a First Tier Security within fifteen (15) calendar days from the occurrence of such event and during that 15-day period the CSP’s obligations qualify as “Second Tier Securities” (as defined in Rule 2a-7).
In the event that a Money Market Fund receives a Capital Contribution from the CSP with respect to the Notes and subsequently receives additional payments from, or on behalf of, the Issuer in respect of the Notes, a Money Market Fund shall repay the CSP the lesser of the amount of the Capital Contribution or the amount of such subsequent payments, provided that in no event shall such repayment to the CSP cause a Money Market Fund’s NAV per share to fall below $0.9950.
NOTE 7 — OTHER ACCRUED EXPENSES & LIABILITIES
At September 30, 2008, the following Fund had the below payables included in Other Accrued Expenses and Liabilities on the Statements of Assets and Liabilities that exceeded 5% of total liabilities:
| | | | | |
Fund | | Expense | | Amount |
National Tax-Exempt Bond | | Audit | | $ | 2,979 |
NOTE 8 — EXPENSE LIMITATIONS
Pursuant to a written expense limitation agreement (“Expense Limitation Agreement”) with the Funds, the Investment Adviser has agreed to limit expenses of each Fund, excluding interest, taxes, brokerage commissions and extraordinary expenses (and acquired fund fees and expenses) to the levels listed below:
| | | | | | | | | | | | | | | | | | | | | | | | |
Maximum Operating Expense Limit
(as a percentage of average net assets) | | | | | | | | | | | | | |
| | | Class A | | | Class B | | | Class C | | | Class I | | | Class O | | | Class Q | | | Class R | | | Class W | |
GNMA Income | | 0.97 | % | | 1.72 | % | | 1.72 | % | | 0.67 | % | | N/A | | | 0.92 | % | | N/A | | | 0.72 | % |
High Yield Bond | | 1.10 | % | | 1.85 | % | | 1.85 | % | | 0.85 | % | | N/A | | | N/A | | | N/A | | | N/A | |
Intermediate Bond | | 0.69 | % | | 1.44 | % | | 1.44 | % | | 0.38 | % | | 0.69 | % | | N/A | | | 0.94 | % | | 0.44 | % |
National Tax-Exempt Bond | | 0.87 | % | | N/A | | | N/A | | | N/A | | | N/A | | | N/A | | | N/A | | | N/A | |
Classic Money Market | | 0.77 | % | | 1.41 | % | | 1.41 | % | | N/A | | | N/A | | | N/A | | | N/A | | | N/A | |
The Investment Adviser has agreed to limit expenses, excluding interest, taxes, brokerage commissions, and extraordinary expenses to 0.17% and 0.20% of Institutional Money Market’s Class I and Class IS shares’ average daily net assets, respectively.
The Investment Adviser may at a later date recoup from a Fund for management fees waived and other expenses assumed by the Investment Adviser during the previous 36 months, but only if, after such recoupment, a Fund’s expense ratio does not exceed the percentage described above. Waived and reimbursed fees net of any recoupment by the Investment Adviser of such waived and reimbursed fees are reflected on the accompanying Statements of Operations for each Fund. Amounts payable by the Investment Adviser are reflected on the accompanying Statements of Assets and Liabilities for each Fund.
42
NOTES TO FINANCIAL STATEMENTSASOF SEPTEMBER 30, 2008 (UNAUDITED) (CONTINUED)
NOTE 8 — EXPENSE LIMITATIONS (continued)
As of September 30, 2008, the amounts of waived and reimbursed fees that are subject to possible recoupment by the Investment Adviser, and the related expiration dates are as follows:
| | | | | | | | | | | | |
| | | September 30, |
| | | 2009 | | 2010 | | 2011 | | Total |
GNMA Income | | $ | — | | $ | — | | $ | 22,146 | | $ | 22,146 |
High Yield Bond | | | 65,861 | | | 12,673 | | | 137,110 | | | 215,644 |
Intermediate Bond | | | 77,333 | | | 553,841 | | | 384,288 | | | 1,015,462 |
National Tax-Exempt Bond | | | 11,392 | | | 10,616 | | | 29,464 | | | 51,472 |
Institutional Money Market | | | 22,801 | | | — | | | — | | | 22,801 |
The Expense Limitation Agreement is contractual and shall renew automatically for one-year terms unless ING Investments or the Registrant provides written notice of the termination of the Expense Limitation Agreement within 90 days of the end of the then current term or upon termination of the Management Agreement.
NOTE 9 — LINE OF CREDIT
All of the Funds included in this report with the exception of GNMA Income, in addition to certain other funds managed by the Investment Adviser, have entered into an unsecured committed revolving line of credit agreement (the “Credit Agreement”) with The Bank of New York Mellon Corporation (“BNY”) for an aggregate amount of $125,000,000. The proceeds may be used only to: (1) temporarily finance the purchase and sale of securities; (2) finance the redemption of shares of an investor in the Funds; and (3) enable the Funds to meet other emergency expenses as defined in the Credit Agreement. The Funds to which the line of credit is available pay a commitment fee equal to 0.07% per annum on the daily unused portion of the committed line amount payable quarterly in arrears.
The following Funds utilized the line of credit during the six months ended September 30, 2008:
| | | | | | | | |
Fund | | Days
Utilized | | Approximate Average Daily Balance | | Approximate
Weighted
Average
Interest Rate | |
High Yield Bond | | 36 | | $ | 1,327,778 | | 2.52 | % |
Classic Money Market | | 3 | | | 8,950,000 | | 2.54 | |
NOTE 10 — CAPITAL SHARES
Transactions in capital shares and dollars were as follows:
| | | | | | | | | | | | | | | | | | | | | | | | |
| | | Class A | | | Class B | | | Class C | |
| | | Six Months Ended September 30, 2008 | | | Year Ended March 31, 2008 | | | Six Months Ended September 30, 2008 | | | Year Ended March 31, 2008 | | | Six Months Ended September 30, 2008 | | | Year Ended March 31, 2008 | |
GNMA Income (Number of Shares) | | | | | | | | | | | | | | | | | | | | | | | | |
Shares sold | | | 6,622,115 | | | | 13,295,384 | | | | 278,754 | | | | 437,820 | | | | 1,035,263 | | | | 1,367,117 | |
Reinvestment of distributions | | | 1,120,425 | | | | 2,332,664 | | | | 64,026 | | | | 152,403 | | | | 48,562 | | | | 96,868 | |
Shares redeemed | | | (8,331,122 | ) | | | (16,975,900 | ) | | | (958,849 | ) | | | (2,233,087 | ) | | | (585,220 | ) | | | (1,689,895 | ) |
| | | | | | | | | | | | | | | | | | | | | | | | |
Net increase (decrease) in shares outstanding | | | (588,582 | ) | | | (1,347,852 | ) | | | (616,069 | ) | | | (1,642,864 | ) | | | 498,605 | | | | (225,910 | ) |
| | | | | | | | | | | | | | | | | | | | | | | | |
GNMA Income ($) | | | | | | | | | | | | | | | | | | | | | | | | |
Shares sold | | $ | 55,764,593 | | | $ | 111,307,657 | | | $ | 2,334,068 | | | $ | 3,652,586 | | | $ | 8,712,388 | | | $ | 11,389,473 | |
Reinvestment of distributions | | | 9,402,911 | | | | 19,443,233 | | | | 534,808 | | | | 1,263,888 | | | | 406,083 | | | | 804,733 | |
Shares redeemed | | | (70,006,101 | ) | | | (141,608,970 | ) | | | (7,994,032 | ) | | | (18,492,001 | ) | | | (4,905,151 | ) | | | (14,019,238 | ) |
| | | | | | | | | | | | | | | | | | | | | | | | |
Net increase (decrease) | | $ | (4,838,597 | ) | | $ | (10,858,080 | ) | | $ | (5,125,156 | ) | | $ | (13,575,527 | ) | | $ | 4,213,320 | | | $ | (1,825,032 | ) |
| | | | | | | | | | | | | | | | | | | | | | | | |
43
NOTES TO FINANCIAL STATEMENTSASOF SEPTEMBER 30, 2008 (UNAUDITED) (CONTINUED)
NOTE 10 — CAPITAL SHARES (continued)
| | | | | | | | | | | | | | | | | | | | | | | | |
| | | Class I | | | Class Q | | | Class W | |
| | | Six Months Ended September 30, 2008 | | | Year Ended March 31, 2008 | | | Six Months Ended September 30, 2008 | | | Year Ended March 31, 2008 | | | Six Months Ended September 30, 2008 | | | December 17, 2007(1) to March 31, 2008 | |
GNMA Income (Number of Shares) | | | | | | | | | | | | | | | | | | | | | | | | |
Shares sold | | | 561,557 | | | | 1,058,318 | | | | — | | | | — | | | | 125,025 | | | | 121 | |
Reinvestment of distributions | | | 58,707 | | | | 89,754 | | | | 112 | | | | 258 | | | | 1,249 | | | | — | |
Shares redeemed | | | (785,713 | ) | | | (389,044 | ) | | | — | | | | (1,575 | ) | | | (119 | ) | | | — | |
| | | | | | | | | | | | | | | | | | | | | | | | |
Net increase (decrease) in shares outstanding | | | (165,449 | ) | | | 759,028 | | | | 112 | | | | (1,317 | ) | | | 126,155 | | | | 121 | |
| | | | | | | | | | | | | | | | | | | | | | | | |
GNMA Income ($) | | | | | | | | | | | | | | | | | | | | | | | | |
Shares sold | | $ | 4,736,886 | | | $ | 8,931,369 | | | $ | — | | | $ | — | | | $ | 1,055,029 | | | $ | 1,012 | |
Reinvestment of distributions | | | 493,215 | | | | 749,949 | | | | 942 | | | | 2,156 | | | | 10,447 | | | | — | |
Shares redeemed | | | (6,555,421 | ) | | | (3,262,020 | ) | | | — | | | | (13,228 | ) | | | (990 | ) | | | — | |
| | | | | | | | | | | | | | | | | | | | | | | | |
Net increase (decrease) | | $ | (1,325,320 | ) | | $ | 6,419,298 | | | $ | 942 | | | $ | (11,072 | ) | | $ | 1,064,486 | | | $ | 1,012 | |
| | | | | | | | | | | | | | | | | | | | | | | | |
| | | | | | | | | | | | | | | | | | | | | | | | |
| | | Class A | | | Class B | | | Class C | |
| | | Six Months Ended September 30, 2008 | | | Year Ended March 31, 2008 | | | Six Months Ended September 30, 2008 | | | Year Ended March 31, 2008 | | | Six Months Ended September 30, 2008 | | | Year Ended March 31, 2008 | |
High Yield Bond (Number of Shares) | | | | | | | | | | | | | | | | | | | | | | | | |
Shares sold | | | 655,978 | | | | 1,957,940 | | | | 40,088 | | | | 164,500 | | | | 182,781 | | | | 163,499 | |
Reinvestment of distributions | | | 234,691 | | | | 437,243 | | | | 64,568 | | | | 146,217 | | | | 27,561 | | | | 50,854 | |
Shares redeemed | | | (1,255,169 | ) | | | (3,432,085 | ) | | | (667,213 | ) | | | (1,972,463 | ) | | | (131,556 | ) | | | (670,400 | ) |
| | | | | | | | | | | | | | | | | | | | | | | | |
Net increase (decrease) in shares outstanding | | | (364,500 | ) | | | (1,036,902 | ) | | | (562,557 | ) | | | (1,661,746 | ) | | | 78,786 | | | | (456,047 | ) |
| | | | | | | | | | | | | | | | | | | | | | | | |
High Yield Bond ($) | | | | | | | | | | | | | | | | | | | | | | | | |
Shares sold | | $ | 5,124,259 | | | $ | 16,868,207 | | | $ | 312,196 | | | $ | 1,437,462 | | | $ | 1,434,695 | | | $ | 1,410,576 | |
Reinvestment of distributions | | | 1,787,122 | | | | 3,732,494 | | | | 498,051 | | | | 1,249,800 | | | | 212,024 | | | | 434,743 | |
Shares redeemed | | | (9,773,905 | ) | | | (29,522,311 | ) | | | (5,213,371 | ) | | | (17,052,526 | ) | | | (1,031,456 | ) | | | (5,744,536 | ) |
| | | | | | | | | | | | | | | | | | | | | | | | |
Net increase (decrease) | | $ | (2,862,524 | ) | | $ | (8,921,610 | ) | | $ | (4,403,124 | ) | | $ | (14,365,264 | ) | | $ | 615,263 | | | $ | (3,899,217 | ) |
| | | | | | | | | | | | | | | | | | | | | | | | |
| | | | | | | | | | | | | | | | | | | | | | | | |
| | | Class I | | | | | | | | | | | | | | | | |
| | | July 31, 2008(1) to September 30, 2008 | | | | | | | | | | | | | | | | |
High Yield Bond (Number of Shares) | | | | | | | | | | | | | | | | | | | | | | | | |
Shares sold | | | 389 | | | | | | | | | | | | | | | | | | | | | |
Reinvestment of distributions | | | 4 | | | | | | | | | | | | | | | | | | | | | |
| | | | | | | | | | | | | | | | | | | | | | | | |
Net increase in shares outstanding | | | 393 | | | | | | | | | | | | | | | | | | | | | |
| | | | | | | | | | | | | | | | | | | | | | | | |
High Yield Bond ($) | | | | | | | | | | | | | | | | | | | | | | | | |
Shares sold | | $ | 2,972 | | | | | | | | | | | | | | | | | | | | | |
Reinvestment of distributions | | | 28 | | | | | | | | | | | | | | | | | | | | | |
| | | | | | | | | | | | | | | | | | | | | | | | |
Net increase | | $ | 3,000 | | | | | | | | | | | | | | | | | | | | | |
| | | | | | | | | | | | | | | | | | | | | | | | |
| | | | | | | | | | | | | | | | | | | | | | | | |
(1) | | Commencement of operations. |
44
NOTES TO FINANCIAL STATEMENTSASOF SEPTEMBER 30, 2008 (UNAUDITED) (CONTINUED)
NOTE 10 — CAPITAL SHARES (continued)
| | | | | | | | | | | | | | | | | | | | | | | | |
| | | Class A | | | Class B | | | Class C | |
| | | Six Months Ended September 30, 2008 | | | Year Ended March 31, 2008 | | | Six Months Ended September 30, 2008 | | | Year Ended March 31, 2008 | | | Six Months Ended September 30, 2008 | | | Year Ended March 31, 2008 | |
Intermediate Bond (Number of Shares) | | | | | | | | | | | | | | | | | | | | | |
Shares sold | | | 8,408,131 | | | | 28,480,011 | | | | 125,451 | | | | 667,018 | | | | 891,609 | | | | 2,826,619 | |
Reinvestment of distributions | | | 1,354,010 | | | | 2,585,103 | | | | 48,020 | | | | 111,904 | | | | 86,017 | | | | 162,165 | |
Shares redeemed | | | (18,549,804 | ) | | | (20,443,641 | ) | | | (813,271 | ) | | | (1,621,452 | ) | | | (1,908,989 | ) | | | (2,743,516 | ) |
| | | | | | | | | | | | | | | | | | | | | | | | |
Net increase (decrease) in shares outstanding | | | (8,787,663 | ) | | | 10,621,473 | | | | (639,800 | ) | | | (842,530 | ) | | | (931,363 | ) | | | 245,268 | |
| | | | | | | | | | | | | | | | | | | | | | | | |
Intermediate Bond ($) | | | | | | | | | | | | | | | | | | | | | |
Shares sold | | $ | 82,813,701 | | | $ | 291,815,645 | | | $ | 1,232,070 | | | $ | 6,838,389 | | | $ | 8,803,613 | | | $ | 28,975,277 | |
Reinvestment of distributions | | | 13,218,713 | | | | 26,419,666 | | | | 467,603 | | | | 1,140,978 | | | | 837,659 | | | | 1,655,216 | |
Shares redeemed | | | (182,634,894 | ) | | | (208,958,106 | ) | | | (8,010,060 | ) | | | (16,510,460 | ) | | | (18,731,527 | ) | | | (27,976,194 | ) |
| | | | | | | | | | | | | | | | | | | | | | | | |
Net increase (decrease) | | $ | (86,602,480 | ) | | $ | 109,277,205 | | | $ | (6,310,387 | ) | | $ | (8,531,093 | ) | | $ | (9,090,255 | ) | | $ | 2,654,299 | |
| | | | | | | | | | | | | | | | | | | | | | | | |
| | | | | | | | | | | | | | | | | | | | | | | | |
| | | Class I | | | Class R | | | Class O | |
| | | Six Months Ended September 30, 2008 | | | Year Ended March 31, 2008 | | | Six Months Ended September 30, 2008 | | | Year Ended March 31, 2008 | | | Six Months Ended September 30, 2008 | | | Year Ended March 31, 2008 | |
Intermediate Bond (Number of Shares) | | | | | | | | | | | | | | | | | | | | | |
Shares sold | | | 18,218,069 | | | | 11,692,938 | | | | 556,184 | | | | 1,277,986 | | | | 447,973 | | | | 1,596,051 | |
Reinvestment of distributions | | | 928,808 | | | | 1,312,640 | | | | 38,911 | | | | 43,112 | | | | 117,900 | | | | 222,259 | |
Shares redeemed | | | (7,982,640 | ) | | | (4,367,322 | ) | | | (338,349 | ) | | | (211,711 | ) | | | (881,808 | ) | | | (1,485,374 | ) |
| | | | | | | | | | | | | | | | | | | | | | | | |
Net increase (decrease) in shares outstanding | | | 11,164,237 | | | | 8,638,256 | | | | 256,746 | | | | 1,109,387 | | | | (315,935 | ) | | | 332,936 | |
| | | | | | | | | | | | | | | | | | | | | | | | |
Intermediate Bond ($) | | | | | | | | | | | | | | | | | | | | | |
Shares sold | | $ | 180,210,226 | | | $ | 119,958,808 | | | $ | 5,541,189 | | | $ | 13,062,349 | | | $ | 4,454,859 | | | $ | 16,381,132 | |
Reinvestment of distributions | | | 9,064,794 | | | | 13,418,464 | | | | 379,726 | | | | 442,337 | | | | 1,151,183 | | | | 2,272,058 | |
Shares redeemed | | | (78,755,433 | ) | | | (44,696,824 | ) | | | (3,342,858 | ) | | | (2,171,893 | ) | | | (8,689,153 | ) | | | (15,169,338 | ) |
| | | | | | | | | | | | | | | | | | | | | | | | |
Net increase (decrease) | | $ | 110,519,587 | | | $ | 88,680,448 | | | $ | 2,578,057 | | | $ | 11,332,793 | | | $ | (3,083,111 | ) | | $ | 3,483,852 | |
| | | | | | | | | | | | | | | | | | | | | | | | |
| | | | | | | | | | | | | | | | | | | | | | | | |
| | | Class W | | | | | | | |
| | | Six Months Ended September 30, 2008 | | | December 17, 2007(1) to March 31, 2008 | | | | | | | | | | | | | |
Intermediate Bond (Number of Shares) | | | | | | | | | | | | | | | | | | | | | |
Shares sold | | | 919,379 | | | | 43,677 | | | | | | | | | | | | | | | | | |
Reinvestment of distributions | | | 12,118 | | | | 62 | | | | | | | | | | | | | | | | | |
Shares redeemed | | | (412,504 | ) | | | — | | | | | | | | | | | | | | | | | |
| | | | | | | | | | | | | | | | | | | | | | | | |
Net increase in shares outstanding | | | 518,993 | | | | 43,739 | | | | | | | | | | | | | | | | | |
| | | | | | | | | | | | | | | | | | | | | | | | |
Intermediate Bond ($) | | | | | | | | | | | | | | | | | | | | | |
Shares sold | | $ | 9,105,787 | | | $ | 445,265 | | | | | | | | | | | | | | | | | |
Reinvestment of distributions | | | 117,213 | | | | 621 | | | | | | | | | | | | | | | | | |
Shares redeemed | | | (4,005,737 | ) | | | — | | | | | | | | | | | | | | | | | |
| | | | | | | | | | | | | | | | | | | | | | | | |
Net increase | | $ | 5,217,263 | | | $ | 445,886 | | | | | | | | | | | | | | | | | |
| | | | | | | | | | | | | | | | | | | | | | | | |
| | | | | | | | | | | | | | | | | | | | |
(1) | | Commencement of operations. |
45
NOTES TO FINANCIAL STATEMENTSASOF SEPTEMBER 30, 2008 (UNAUDITED) (CONTINUED)
NOTE 10 — CAPITAL SHARES (continued)
| | | | | | | | | | | | | | | | | | | | | | | | |
| | | Class A | | | Class B* | | | Class C* | |
| | | Six Months Ended September 30, 2008 | | | Year Ended March 31, 2008 | | | Six Months Ended September 30, 2008 | | | Year Ended March 31, 2008 | | | Six Months Ended September 30, 2008 | | | Year Ended March 31, 2008 | |
National Tax-Exempt Bond (Number of
Shares) | | | | | | | | | | | | | | | | | | | | | |
Shares sold | | | 174,569 | | | | 219,687 | | | | 48,270 | | | | 127,657 | | | | 41,634 | | | | 211,875 | |
Reinvestment of distributions | | | 4,196 | | | | 6,772 | | | | 1,942 | | | | 4,234 | | | | 1,179 | | | | 1,785 | |
Shares redeemed | | | (2,175,486 | ) | | | (92,323 | ) | | | (321,333 | ) | | | (110,973 | ) | | | (375,139 | ) | | | (61,775 | ) |
| | | | | | | | | | | | | | | | | | | | | | | | |
Net increase (decrease) in shares outstanding | | | (1,996,721 | ) | | | 134,136 | | | | (271,121 | ) | | | 20,918 | | | | (332,326 | ) | | | 151,885 | |
| | | | | | | | | | | | | | | | | | | | | | | | |
National Tax-Exempt Bond ($) | | | | | | | | | | | | | | | | | | | | | |
Shares sold | | $ | 1,727,638 | | | $ | 2,208,670 | | | $ | 476,805 | | | $ | 1,285,805 | | | $ | 409,836 | | | $ | 2,129,522 | |
Reinvestment of distributions | | | 41,194 | | | | 67,952 | | | | 19,033 | | | | 42,455 | | | | 11,570 | | | | 17,900 | |
Shares redeemed | | | (20,729,313 | ) | | | (933,578 | ) | | | (3,074,254 | ) | | | (1,117,704 | ) | | | (3,584,063 | ) | | | (621,897 | ) |
| | | | | | | | | | | | | | | | | | | | | | | | |
Net increase (decrease) | | $ | (18,960,481 | ) | | $ | 1,343,044 | | | $ | (2,578,416 | ) | | $ | 210,556 | | | $ | (3,162,657 | ) | | $ | 1,525,525 | |
| | | | | | | | | | | | | | | | | | | | | | | | |
| | | | | | | | | | | | | | | | | | | | | | | | |
| | | Class A | | | Class B | | | Class C | |
| | | Six Months Ended September 30, 2008 | | | Year Ended March 31, 2008 | | | Six Months Ended September 30, 2008 | | | Year Ended March 31, 2008 | | | Six Months Ended September 30, 2008 | | | Year Ended March 31, 2008 | |
Classic Money Market (Number of Shares) | | | | | | | | | | | | | | | | | | | | | |
Shares sold | | | 323,161,351 | | | | 1,226,855,371 | | | | 7,623,617 | | | | 15,206,372 | | | | 6,908,469 | | | | 24,529,864 | |
Proceeds from shares issued in merger | | | — | | | | — | | | | — | | | | — | | | | — | | | | — | |
Reinvestment of distributions | | | 13,640,558 | | | | 47,138,864 | | | | 107,485 | | | | 698,221 | | | | 78,648 | | | | 298,495 | |
Shares redeemed | | | (488,380,688 | ) | | | (697,664,762 | ) | | | (10,675,917 | ) | | | (19,445,930 | ) | | | (10,947,808 | ) | | | (13,663,699 | ) |
| | | | | | | | | | | | | | | | | | | | | | | | |
Net increase (decrease) in shares outstanding | | | (151,578,779 | ) | | | 576,329,473 | | | | (2,944,815 | ) | | | (3,541,337 | ) | | | (3,960,691 | ) | | | 11,164,660 | |
| | | | | | | | | | | | | | | | | | | | | | | | |
Classic Money Market ($) | | | | | | | | | | | | | | | | | | | | | |
Shares sold | | $ | 323,071,382 | | | $ | 1,226,855,371 | | | $ | 7,596,986 | | | $ | 15,206,372 | | | $ | 6,860,142 | | | $ | 24,529,864 | |
Reinvestment of distributions | | | 13,640,558 | | | | 47,138,864 | | | | 107,485 | | | | 698,221 | | | | 78,648 | | | | 298,495 | |
Shares redeemed | | | (488,290,719 | ) | | | (697,664,762 | ) | | | (10,649,286 | ) | | | (19,445,930 | ) | | | (10,899,481 | ) | | | (13,663,699 | ) |
| | | | | | | | | | | | | | | | | | | | | | | | |
Net increase (decrease) | | $ | (151,578,779 | ) | | $ | 576,329,473 | | | $ | (2,944,815 | ) | | $ | (3,541,337 | ) | | $ | (3,960,691 | ) | | $ | 11,164,660 | |
| | | | | | | | | | | | | | | | | | | | | | | | |
| | | | | | | | | | | | | | |
| | | Class I | | | Class IS |
| | | Six Months Ended September 30, 2008 | | | Year Ended March 31, 2008 | | | Six Months Ended September 30, 2008 | | Year Ended March 31, 2008 |
Institutional Money Market (Number of Shares) | | | | | | | | | | | | | | |
Shares sold | | | 6,703,461,871 | | | | 12,985,910,058 | | | | — | | | 1,001 |
Reinvestment of distributions | | | 929,764 | | | | 7,988,771 | | | | — | | | — |
Shares redeemed | | | (5,943,427,371 | ) | | | (12,917,901,065 | ) | | | — | | | — |
| | | | | | | | | | | | | | |
Net increase in shares outstanding | | | 760,964,264 | | | | 75,997,764 | | | | — | | | 1,001 |
| | | | | | | | | | | | | | |
Institutional Money Market ($) | | | | | | | | | | | | | | |
Shares sold | | $ | 6,703,461,871 | | | $ | 12,985,910,058 | | | $ | — | | $ | 1,001 |
Reinvestment of distributions | | | 929,764 | | | | 7,988,771 | | | | — | | | — |
Shares redeemed | | | (5,943,427,371 | ) | | | (12,917,901,065 | ) | | | — | | | — |
| | | | | | | | | | | | | | |
Net increase | | $ | 760,964,264 | | | $ | 75,997,764 | | | $ | — | | $ | 1,001 |
| | | | | | | | | | | | | | |
| * | | Class B & C shares of National Tax-Exempt were fully redeemed as of September 26, 2008. |
46
NOTES TO FINANCIAL STATEMENTSASOF SEPTEMBER 30, 2008 (UNAUDITED) (CONTINUED)
NOTE 11 — CREDIT RISK AND DEFAULTED SECURITIES
Although each Fund has a diversified portfolio, High Yield Bond and Intermediate Bond may invest in lower rated and comparable quality unrated high yield securities. Investments in high-yield debt securities generally provide greater income and increased opportunity for capital appreciation than investments in higher quality debt securities, but they also typically entail greater potential price volatility and principal and income risk. High-yield debt securities are not considered investment grade, and are regarded as predominantly speculative with respect to the issuing company’s continuing ability to meet principal and interest payments. The prices of high-yield debt securities have been found to be less sensitive to interest rate changes than higher-rated investments, but more sensitive to adverse economic downturns or individual corporate developments. The risk of loss due to default by the issuer may be significantly greater for the holders of high yielding securities, because such securities are generally unsecured and are often subordinated to other creditors of the issuer. At September 30, 2008, the Funds did not hold any defaulted securities.
During the period, Lehman Brothers Holdings, Inc. (“LBHI”) and certain of its affiliates sought protection under the insolvency laws of their jurisdictions of organization, including the United States, the United Kingdom and Japan. For the period ended September 30, 2008, Intermediate Bond had outstanding securities trades with counterparties affiliated with LBHI. As a result of these events, LBHI’s affiliates were unable to fulfill their commitments and, in certain cases, Intermediate Bond may have terminated its trades and related agreements with the relevant entities and, where appropriate, is in the process of initiating claims for damages. Management has determined that the financial impact to the Fund relating to these events is immaterial.
NOTE 12 — CONCENTRATION OF INVESTMENT RISKS
Corporate Debt Securities (High Yield Bond, Intermediate Bond and Classic Money Market). Corporate debt securities are subject to the risk of the issuer’s inability to meet principal and interest payments on the obligation and may also be subject to price volatility due to such factors as interest rate sensitivity, market perception of the creditworthiness of the issuer and general market liquidity. When interest rates decline, the value of the Fund’s debt securities can be expected to rise, and when interest
rates rise, the value of those securities can be expected to decline. Debt securities with longer maturities tend to be more sensitive to interest rate movements than those with shorter maturities.
Credit Risk (All Funds). A Portfolio could lose money if a bond issuer (debtor) fails to repay interest and principal in a timely manner or if it goes bankrupt. This is especially true during periods of economic uncertainty or economic downturns. High-yield/high-risk bonds are especially subject to credit risk and are considered to be mostly speculative in nature.
Foreign Securities (High Yield Bond, Intermediate Bond, Classic Money Market and Institutional Money Market). There are certain risks in owning foreign securities, including those resulting from: fluctuations in currency exchange rates; devaluation of currencies; political or economic developments and the possible imposition of currency exchange blockages or other foreign governmental laws or restrictions; reduced availability of public information concerning issuers; accounting, auditing and financial reporting standards or other regulatory practices and requirements that are not uniform when compared to those applicable to domestic companies; settlement and clearance procedures in some countries that may not be reliable and can result in delays in settlement; higher transaction and custody expenses than for domestic securities; and limitations on foreign ownership of equity securities. Also, securities of many foreign companies may be less liquid and the prices more volatile than those of domestic companies.
Emerging Markets Investments (High Yield Bond). Because of less developed markets and economies and, in some countries, less mature governments and governmental institutions, the risks of investing in foreign securities can be intensified in the case of investments in issuers domiciled or doing substantial business in emerging market countries. These risks include: high concentration of market capitalization and trading volume in a small number of issuers representing a limited number of industries, as well as a high concentration of investors and financial intermediaries; political and social uncertainties; overdependence on exports, especially with respect to primary commodities, making these economies vulnerable to changes in commodity prices; overburdened infrastructure and obsolete or unseasoned financial systems; environmental problems; less well-developed legal systems; and less reliable custodial services and settlement practices.
47
NOTES TO FINANCIAL STATEMENTSASOF SEPTEMBER 30, 2008 (UNAUDITED) (CONTINUED)
NOTE 12 — CONCENTRATION OF INVESTMENT RISKS (continued)
High-Yield, Lower-Grade Debt Securities Risk (High-Yield Bond and Intermediate Bond). High-yield debt securities (commonly referred to as “junk bonds”) generally present greater credit risk that an issuer cannot make timely payment of interest or principal payments than an issuer of a higher quality debt security, and typically have greater potential price volatility and principal and income risk. Changes in interest rates, the market’s perception of the issuers and the credit worthiness of the issuers may significantly affect the value of these bonds. High-yield bonds are not considered investment grade, and are regarded as predominantly speculative with respect to the issuing company’s continuing ability to meet principal and interest payments. The secondary market in which high-yield securities are traded may be less liquid than the market for higher grade bonds. It may be more difficult to value less liquid high-yield securities, and determination of their value may involve elements of judgment.
Interests in Loans (National Tax-Exempt Bond). Participation interests or assignments are secured variable or floating rate loans, which include participation interests in lease financing. Loans are subject to the credit risk of nonpayment of principal or
interest. Substantial increases in interest rates may cause an increase in loan defaults. Although the loans will generally be fully collateralized at the time of acquisition, the collateral may decline in value, be relatively illiquid, or lose all or substantially all of its value subsequent to the Fund’s investment. Many loans are relatively illiquid, and may be difficult to value.
NOTE 13 — FEDERAL INCOME TAXES
The amount of distributions from net investment income and net realized capital gains are determined in accordance with federal income tax regulations, which may differ from U.S. generally accepted accounting principles for investment companies. These book/tax differences may be either temporary or permanent. Permanent differences are reclassified within the capital accounts based on their federal tax-basis treatment; temporary differences are not reclassified. Key differences include the treatment of short-term capital gains, foreign currency transactions, and wash sale deferrals. Distributions in excess of net investment income and/or net realized capital gains for tax purposes are reported as return of capital.
Dividends paid by the Funds from net investment income and distributions of net realized short-term capital gains are, for federal income tax purposes, taxable as ordinary income to shareholders.
The tax composition of dividends and distributions to shareholders was as follows:
| | | | | | | | | | | | |
| | | Six Months Ended
September 30, 2008 | | Year Ended March 31, 2008 |
| | | Ordinary Income | | Tax-Exempt Income | | Ordinary Income | | Tax-Exempt Income |
GNMA Income | | $ | 13,035,185 | | $ | — | | $ | 26,757,185 | | $ | — |
High Yield Bond | | | 4,839,015 | | | — | | | 10,627,218 | | | — |
Intermediate Bond | | | 31,004,713 | | | — | | | 56,231,038 | | | — |
National Tax-Exempt Bond | | | 23,635 | | | 471,856 | | | 6,799 | | | 1,032,213 |
Classic Money Market | | | 13,960,379 | | | — | | | 48,689,908 | | | — |
Institutional Money Market | | | 10,642,045 | | | — | | | 43,925,295 | | | — |
The tax-basis components of distributable earnings and the expiration dates of the capital loss carryforwards which may be used to offset future realized capital gains for federal income tax purposes as of March 31, 2008 were:
| | | | | | | | | | | | | | | | | | | | | | |
| | | Undistributed Ordinary Income | | Undistributed Tax-Exempt Income | | Unrealized Appreciation/ (Depreciation) | | Post October Currency Losses Deferred | | Post-October Capital Losses Deferred | | | Capital Loss Carryforwards | | | Expiration Dates |
GNMA Income | | $ | 1,469,185 | | $ | — | | $ | 11,541,240 | | $ | — | | $ | (413,532 | ) | | $ | (527,639 | ) | | 2010 |
| | | | | | | | | | | | | | | | | | | (1,081,784 | ) | | 2012 |
| | | | | | | | | | | | | | | | | | | (6,961,357 | ) | | 2013 |
| | | | | | | | | | | | | | | | | | | (3,281,376 | ) | | 2014 |
| | | | | | | | | | | | | | | | | | | (1,506,711 | ) | | 2016 |
| | | | | | | | | | | | | | | | | | | | | | |
| | | | | | | | | | | | | | | | | | $ | (13,358,867 | ) | | |
| | | | | | | | | | | | | | | | | | | | | | |
48
NOTES TO FINANCIAL STATEMENTSASOF SEPTEMBER 30, 2008 (UNAUDITED) (CONTINUED)
NOTE 13 — FEDERAL INCOME TAXES (continued)
| | | | | | | | | | | | | | | | | | | |
| | | Undistributed Ordinary Income | | Undistributed Tax-Exempt Income | | Unrealized Appreciation/ (Depreciation) | | | Post October Currency Losses Deferred | | | Post-October Capital Losses Deferred | | | Capital Loss Carryforwards | | | Expiration Dates |
High Yield Bond | | 1,010,445 | | — | | (10,283,415 | ) | | (2,432 | ) | | (4,000,614 | ) | | | (115,139,658 | ) | | 2009 |
| | | | | | | | | | | | | | | | (79,792,137 | ) | | 2010 |
| | | | | | | | | | | | | | | | (69,190,309 | ) | | 2011 |
| | | | | | | | | | | | | | | | (6,099,584 | ) | | 2012 |
| | | | | | | | | | | | | | | | (126,079 | ) | | 2014 |
| | | | | | | | | | | | | | | | (16,938,959 | ) | | 2015 |
| | | | | | | | | | | | | | | | | | | |
| | | | | | | | | | | | | | | $ | (287,286,726 | ) | | |
| | | | | | | | | | | | | | | | | | | |
Intermediate Bond | | 44,541,382 | | — | | (67,390,094 | ) | | (4,075,631 | ) | | — | | | | — | | | |
National Tax-Exempt Bond | | — | | 77,798 | | (755,707 | ) | | — | | | (4,626 | ) | | | (26,979 | ) | | 2016 |
Classic Money Market | | 51,325 | | — | | — | | | — | | | — | | | | (23,545 | ) | | 2013 |
| | | | | | | | | | | | | | | | (42,453 | ) | | 2014 |
| | | | | | | | | | | | | | | | | | | |
| | | | | | | | | | | | | | | $ | (65,998 | ) | | |
| | | | | | | | | | | | | | | | | | | |
Institutional Money Market | | 1,887,439 | | — | | — | | | — | | | (223,882 | ) | | | — | | | |
The Funds’ major tax jurisdictions are federal and Arizona. The earliest tax year that remains subject to examination by these jurisdictions is 2003.
NOTE 14 — ILLIQUID SECURITIES
Pursuant to guidelines adopted by the Funds’ Board, the following securities have been deemed to be illiquid. Except for GNMA Income, the Funds may invest up to 15% (10% for Classic Money Market and Institutional Money Market) of their net assets in illiquid securities. Fair value for certain securities was determined by ING Funds Valuation Committee appointed by the Funds’ Board and in accordance with the methods specifically authorized by the Board.
| | | | | | | | | | | | | | | | |
Fund | | Security | | Principal Amount/ Shares | | Initial Acquisition Date | | Cost | | Value | | Percent of Net Assets | |
High Yield Bond | | Comforce Corp. | | | 92,950 | | 10/24/04 | | $ | — | | $ | 930 | | 0.0 | % |
| | Dayton Superior Corp. | | | 3,100 | | 10/24/04 | | | — | | | 31 | | 0.0 | % |
| | GT Group Telecom, Inc. | | | 500 | | 03/19/03 | | | — | | | 0 | | 0.0 | % |
| | North Atlantic Trading Co. | | | 17,906 | | 10/24/04 | | | 210,181 | | | 18 | | 0.0 | % |
| | | | | | | | | | | | | | | | |
| | | | | | | | | $ | 210,181 | | $ | 979 | | 0.0 | % |
| | | | | | | | | | | | | | | | |
Intermediate Bond | | Alpine III, 3.357%, due 08/16/14 | | | 527,000 | | 08/04/04 | | $ | 527,156 | | $ | 527,667 | | 0.0 | % |
| | Alpine III, 3.757%, due 08/16/14 | | | 527,000 | | 08/04/04 | | | 527,156 | | | 527,940 | | 0.0 | % |
| | Alpine III, 5.557%, due 08/16/14 | | | 789,000 | | 08/04/04 | | | 794,728 | | | 793,216 | | 0.1 | % |
| | Alpine III, 8.807%, due 08/16/14 | | | 1,348,000 | | 08/16/04 | | | 1,360,295 | | | 1,373,701 | | 0.1 | % |
| | Greater Ohio Ethanol, LLC,
6.301%, due 12/31/13 | | | 1,800,000 | | 11/21/06 | | | 1,791,000 | | | 1,620,000 | | 0.1 | % |
| | Greater Ohio Ethanol, LLC,
12.630%, due 12/31/13 | | | 2,200,000 | | 11/21/06 | | | 2,172,500 | | | 1,100,000 | | 0.1 | % |
| | Greenwich Capital Commercial Funding Corp., 5.444%, due 03/10/39 | | | 1,693,000 | | 07/25/08 | | | 1,568,323 | | | 1,434,941 | | 0.1 | % |
| | Hudson Mezzanine Funding,
3.237%, due 06/12/42 | | | 2,720,000 | | 12/21/06 | | | 2,717,824 | | | 2,720 | | 0.0 | % |
| | Nordea Kredit Realkreditaktieselskab, 6.000%, due 07/01/29 | | DKK | 26 | | 04/16/04 | | | 4 | | | 5 | | 0.0 | % |
| | | | | | | | | | | | | | | | |
| | | | | | | | | $ | 11,458,986 | | $ | 7,380,190 | | 0.5 | % |
| | | | | | | | | | | | | | | | |
National Tax-Exempt Bond | | Harris County-Houston Sports Authority, 5.000%, due 11/15/28 | | | 165,000 | | 08/16/06 | | $ | 167,387 | | $ | 142,568 | | 4.4 | % |
| | Illinois Finance Authority,
5.000%, due 08/15/24 | | | 1,000,000 | | 04/21/06 | | | 969,474 | | | 757,190 | | 23.4 | % |
| | | | | | | | | | | | | | | | |
| | | | | | | | | $ | 1,136,861 | | $ | 899,758 | | 27.8 | % |
| | | | | | | | | | | | | | | | |
49
NOTES TO FINANCIAL STATEMENTSASOF SEPTEMBER 30, 2008 (UNAUDITED) (CONTINUED)
NOTE 14 — ILLIQUID SECURITIES (continued)
| | | | | | | | | | | | | | | |
Fund | | Security | | Principal Amount/ Shares | | Initial Acquisition Date | | Cost | | Value | | Percent of Net Assets | |
Classic Money Market | | American General Finance Corp.,
1.470%, due 10/02/08 | | 25,000,000 | | 09/12/08 | | $ | 24,997,931 | | $ | 24,997,931 | | 1.8 | % |
| | American General Finance Corp.,
4.309%, due 01/09/09 | | 3,000,000 | | 01/16/08 | | | 2,997,234 | | | 2,997,234 | | 0.2 | % |
| | Goldman Sachs Group, Inc.,
3.250%, due 12/23/08 | | 8,600,000 | | 12/07/07 | | | 8,585,937 | | | 8,585,937 | | 0.6 | % |
| | | | | | | | | | | | | | | |
| | | | | | | | $ | 36,581,102 | | $ | 36,581,102 | | 2.6 | % |
| | | | | | | | | | | | | | | |
Institutional Money Market | | American General Finance Corp.,
1.470%, due 10/02/08 | | 46,000,000 | | 09/09/08 | | $ | 45,996,241 | | $ | 45,996,241 | | 2.9 | % |
| | | | | | | | | | | | | | | |
| | | | | | | | $ | 45,996,241 | | $ | 45,996,241 | | 2.9 | % |
| | | | | | | | | | | | | | | |
NOTE 15 — SECURITIES LENDING
Under an agreement with The Bank of New York Mellon Corporation (“BNY”), the Funds can lend their securities to approved brokers, dealers and other financial institutions. Loans are collateralized by cash and U.S. government securities. The collateral is equal to at least 105% of the market value of non-U.S. securities loaned and 102% of the market value of U.S. securities loaned when the transaction is entered into and is adjusted daily for changes in the market values of the securities on loan. The cash collateral received is invested in approved investments as defined in the Securities Lending Agreement with BNY (the “Agreement”). The Funds bear the risk of loss with respect to the investment of collateral. Currently, the cash collateral is invested in the Bank of New York Mellon Corp. Institutional Cash Reserves Fund (“BICR Fund”). BNY serves as investment manager, custodian and operational trustee of the BICR Fund. As of September 30, 2008, the BICR Fund held certain defaulted securities that had market values significantly below amortized cost. The investment in the BICR Fund is included in the Portfolio of Investments under Securities Lending Collateral and the unrealized loss on such investment is included in Net Unrealized Depreciation on the Statement of Assets and Liabilities. Subsequent to September 30, 2008, the Funds agreed, in principle, to the terms of capital support extended by
The Bank of New York Mellon Corporation (“BNYC”), an affiliated company of BNY, for the certain defaulted securities held by the BICR Fund. BNYC will support the value of these securities up to a certain amount and subject, in part, to the Funds’ continued lending of securities. The recorded value of each Fund’s investment in the BICR Fund will include the value of the underlying securities held by the BICR Fund and the estimated value of the support to be provided by BNYC.
Generally, in the event of counterparty default, the Funds have the right to use the collateral to offset losses incurred. The Agreement contains certain guarantees by BNY in the event of counterparty default and/or a borrower’s failure to return a loaned security; however, there would be a potential loss to the Funds in the event the Funds are delayed or prevented from exercising their right to dispose of the collateral. Engaging in securities lending could have a leveraging effect, which may intensify the credit, market and other risks associated with investing in a Fund. At September 30, 2008, the following Fund had securities on loan with the following market values:
| | | | | | |
Fund | | Value of Securities Loaned | | Value of Collateral |
Intermediate Bond | | $ | 207,667,983 | | $ | 214,736,704 |
50
NOTES TO FINANCIAL STATEMENTSASOF SEPTEMBER 30, 2008 (UNAUDITED) (CONTINUED)
NOTE 16 — SUBSEQUENT EVENTS
Subsequent to September 30, 2008, the following Funds declared dividends from net investment income:
| | | | | | | |
| | | Per Share Amount | | Payable Date | | Record Date |
GNMA Income | | | | | | | |
Class A | | $ | 0.0325 | | October 3, 2008 | | September 30, 2008 |
Class B | | $ | 0.0273 | | October 3, 2008 | | September 30, 2008 |
Class C | | $ | 0.0277 | | October 3, 2008 | | September 30, 2008 |
Class I | | $ | 0.0347 | | October 3, 2008 | | September 30, 2008 |
Class Q | | $ | 0.0330 | | October 3, 2008 | | September 30, 2008 |
Class W | | $ | 0.0344 | | October 3, 2008 | | September 30, 2008 |
Class A | | $ | 0.0325 | | November 5, 2008 | | October 31, 2008 |
Class B | | $ | 0.0274 | | November 5, 2008 | | October 31, 2008 |
Class C | | $ | 0.0276 | | November 5, 2008 | | October 31, 2008 |
Class I | | $ | 0.0347 | | November 5, 2008 | | October 31, 2008 |
Class Q | | $ | 0.0330 | | November 5, 2008 | | October 31, 2008 |
Class W | | $ | 0.0341 | | November 5, 2008 | | October 31, 2008 |
High Yield Bond | | | | | | | |
Class A | | $ | 0.0598 | | November 3, 2008 | | Daily |
Class B | | $ | 0.0558 | | November 3, 2008 | | Daily |
Class C | | $ | 0.0560 | | November 3, 2008 | | Daily |
Class I | | $ | 0.0602 | | November 3, 2008 | | Daily |
Intermediate Bond | | | | | | | |
Class A | | $ | 0.0599 | | November 3, 2008 | | Daily |
Class B | | $ | 0.0539 | | November 3, 2008 | | Daily |
Class C | | $ | 0.0540 | | November 3, 2008 | | Daily |
Class I | | $ | 0.0626 | | November 3, 2008 | | Daily |
Class O | | $ | 0.0601 | | November 3, 2008 | | Daily |
Class R | | $ | 0.0582 | | November 3, 2008 | | Daily |
Class W | | $ | 0.0632 | | November 3, 2008 | | Daily |
Classic Money Market | | | | | | | |
Class A | | $ | 0.0017 | | November 3, 2008 | | Daily |
Class B | | $ | 0.0011 | | November 3, 2008 | | Daily |
Class C | | $ | 0.0011 | | November 3, 2008 | | Daily |
Institutional Money Market | | | | | | | |
Class I | | $ | 0.0019 | | November 3, 2008 | | Daily |
Class IS | | $ | 0.0021 | | November 3, 2008 | | Daily |
Class A shares of National Tax-Exempt were liquidated on October 23, 2008.
The U.S. Treasury Department has notified Classic Money Market and Institutional Prime Money Market that they been accepted to participate in the U.S. Treasury Temporary Guarantee Program for Money Market Funds (the “Program”). The Program guarantees shareholders of Classic Money Market and Institutional Prime Money Market the lesser of: (1) the number of shares owned on September 19, 2008 multiplied by $1.00; or (2) the number of shares owned as of the time the Treasury’s obligation under the
Program is triggered multiplied by $1.00. The Treasury’s obligation under the Program is triggered if Classic Money Market’s or Institutional Prime Money Market’s net asset value per share falls below $0.995 and certain conditions are met including the liquidation of Classic Money Market or Institutional Prime Money Market.
Coverage under the Program is limited to persons who were shareholders of Classic Money Market or Institutional Prime Money Market as of the close of business on September 19, 2008. Any increase in the number of shares held in an account after the close of business on September 19, 2008 will not be guaranteed. If the number of shares held in an account fluctuates (even if the number of shares held in an account is reduced to zero), shareholders will be covered for the lesser of the number of shares held as of the close of business on September 19, 2008 or the number of shares held at the time the Treasury’s obligation under the Program is triggered. If a shareholder closes his/her account with Classic Money Market and Institutional Prime Money Market or broker-dealer, any future investment in Classic Money Market and Institutional Prime Money Market will not be guaranteed.
Classic Money Market and Institutional Prime Money Market each paid to participate in the Program for the initial three-month period, which will expire on December 18, 2008. The fee of 139,473 and 198,272 for Classic Money Market and Institutional Prime Money Market, respectively, was either 0.01% or 0.015% of each fund’s net asset value on September 19, 2008 depending on the market based net asset value per share of each fund as of September 19, 2008 (the “Program Participation Payment”). The Board has determined that the Program Participation Payment is an extraordinary expense that will not be subject to any expense limitation agreement currently in effect for the Fund.
On October 2, 2008, American General Finance Corp. commercial paper held by Classic Money Market matured at par of $25,000,000. That commercial paper was one of two positions held by Classic Money Market in American General Finance Corp. Since the commercial paper was paid in full upon maturity, ING America Insurance Holdings, Inc. was not required to make a capital contribution pursuant to the Capital Support Agreement described in Note 6, Other Transactions with Affiliates and Related Parties. Classic Money Market continues to hold American General Finance Corp. $3,000,000 principal corporate note, which is scheduled to mature on January 9, 2009.
51
NOTES TO FINANCIAL STATEMENTSASOF SEPTEMBER 30, 2008 (UNAUDITED) (CONTINUED)
NOTE 16 — SUBSEQUENT EVENTS (continued)
On October 2, 2008, American General Finance Corp. commercial paper held by Institutional Prime Money Market matured at par of $46,000,000. Since the commercial paper was paid in full upon maturity, ING America Insurance Holdings, Inc. was not required to make a capital contribution pursuant to the Capital Support Agreement described in Note 6, Other Transactions with Affiliates and Related Parties.
On October 19, 2008, ING Groep announced that it reached an agreement with the Dutch government to strengthen its capital position, creating a strong buffer to navigate the current market and economic environment. ING will issue non-voting core Tier-1 securities for a total consideration of EUR 10 billion to the Dutch State. The transaction boosts ING Bank’s core Tier-1 ratio, strengthens the insurance balance sheet and reduces ING Group’s Debt/Equity ratio.
NOTE 17 — OTHER ACCOUNTING PRONOUNCEMENTS
On March 19, 2008, the FASB issued Statement of Financial Accounting Standards No. 161 (“SFAS No. 161”), “Disclosure about Derivative Instruments and Hedging Activities.” This new accounting statement requires enhanced disclosures about an entity’s derivative and hedging activities. Entities are required to provide enhanced disclosures about (a) how and why an entity invests in derivatives, (b) how derivatives are accounted for under SFAS No. 133, and (c) how derivatives affect an entity’s financial position, financial performance, and cash flows. SFAS No. 161 also requires enhanced disclosures regarding credit-risk-related contingent features of derivative instruments. SFAS No. 161 is effective for financial statements issued for fiscal years and interim periods beginning after November 15, 2008. As of September 30, 2008, management of the Funds is currently assessing the impact of the expanded financial statement disclosures that will result from adopting SFAS No. 161.
On September 12, 2008, the FASB issued FASB Staff Position (“FSP”) No. FAS 133-1 and FIN 45-4, Disclosures about Credit Derivatives and Certain Guarantees: An Amendment of FASB Statement No. 133 and FASB Interpretation No. 45; and Clarification of the Effective Date of FASB Statement No. 161. The FSP is intended to improve disclosures about credit derivatives by requiring more information about the potential adverse effects of changes in credit risk on the financial position, financial performance, and cash flows of the
sellers of credit derivatives. It amends FASB Statement No. 133, Accounting for Derivative Instruments and Hedging Activities, to require disclosures by sellers of credit derivatives, including credit derivatives embedded in hybrid instruments. The FSP also amends FIN 45, Guarantor’s Accounting and Disclosure Requirements for Guarantees, Including Indirect Guarantees of Indebtedness to Others, to require an additional disclosure about the current status of the payment/performance risk of a guarantee. Management of the Funds is currently assessing the impact of adopting FSP No. FAS 133-1 and FIN 45-4.
NOTE 18 — INFORMATION REGARDING TRADING OF ING’s U.S. MUTUAL FUNDS
As discussed in earlier supplements that were previously filed with the SEC, ING Investments, the adviser to the ING Funds, has reported to the Boards of Directors/Trustees (the “Boards”) of the ING Funds that, like many U.S. financial services companies, ING Investments and certain of its U.S. affiliates have received informal and formal requests for information since September 2003 from various governmental and self-regulatory agencies in connection with investigations related to mutual funds and variable insurance products. ING Investments has advised the Boards that it and its affiliates have cooperated fully with each request.
In addition to responding to regulatory and governmental requests, ING Investments reported that management of U.S. affiliates of ING Groep N.V., including ING Investments (collectively, “ING”), on their own initiative, have conducted, through independent special counsel and a national accounting firm, an extensive internal review of trading in ING insurance, retirement, and mutual fund products. The goal of this review was to identify any instances of inappropriate trading in those products by third parties or by ING investment professionals and other ING personnel. ING’s internal review related to mutual fund trading is now substantially completed. ING has reported that, of the millions of customer relationships that ING maintains, the internal review identified several isolated arrangements allowing third parties to engage in frequent trading of mutual funds within ING’s variable insurance and mutual fund products, and identified other circumstances where frequent trading occurred, despite measures taken by ING intended to combat market timing. ING further reported that each of these arrangements has been terminated and fully disclosed to regulators. The results of the internal review were also reported to the independent members of the Boards.
52
NOTES TO FINANCIAL STATEMENTSASOF SEPTEMBER 30, 2008 (UNAUDITED) (CONTINUED)
NOTE 18 — INFORMATION REGARDING TRADING OF ING’s U.S. MUTUAL FUNDS (continued)
ING Investments has advised the Boards that most of the identified arrangements were initiated prior to ING’s acquisition of the businesses in question in the U.S. ING Investments further reported that the companies in question did not receive special benefits in return for any of these arrangements, which have all been terminated.
Based on the internal review, ING Investments has advised the Boards that the identified arrangements do not represent a systemic problem in any of the companies that were involved.
Despite the extensive internal review conducted through independent special counsel and a national accounting firm, there can be no assurance that the instances of inappropriate trading reported to the Boards are the only instances of such trading respecting the ING Funds.
ING Investments reported to the Boards that ING is committed to conducting its business with the highest standards of ethical conduct with zero tolerance for noncompliance. Accordingly, ING Investments advised the Boards that ING management was disappointed that its voluntary internal review identified these situations. Viewed in the context of the breadth and magnitude of its U.S. business as a whole, ING management does not believe that ING’s acquired companies had systemic ethical or compliance issues in these areas. Nonetheless, ING Investments reported that given ING’s refusal to tolerate any lapses, it has taken the steps noted below, and will continue to seek opportunities to further strengthen the internal controls of its affiliates.
| • | | ING has agreed with the ING Funds to indemnify and hold harmless the ING Funds from all damages resulting from wrongful conduct by ING or its employees or from ING’s internal investigation, any investigations conducted by any governmental or self-regulatory agencies, litigation or other formal |
| | proceedings, including any proceedings by the SEC. ING Investments reported to the Boards that ING management believes that the total amount of any indemnification obligations will not be material to ING or its U.S. business. |
| • | | ING updated its Code of Conduct for employees reinforcing its employees’ obligation to conduct personal trading activity consistent with the law, disclosed limits, and other requirements. |
Other Regulatory Matters
The New York Attorney General and other federal and state regulators are also conducting broad inquiries and investigations involving the insurance industry. These initiatives currently focus on, among other things, compensation and other sales incentives; potential conflicts of interest; potential anti-competitive activity; reinsurance; marketing practices (including suitability); specific product types (including group annuities and indexed annuities); fund selection for investment products and brokerage sales; and disclosure. It is likely that the scope of these industry investigations will further broaden before they conclude. ING has received formal and informal requests in connection with such investigations, and is cooperating fully with each request.
Other federal and state regulators could initiate similar actions in this or other areas of ING’s businesses. These regulatory initiatives may result in new legislation and regulation that could significantly affect the financial services industry, including businesses in which ING is engaged. In light of these and other developments, ING continuously reviews whether modifications to its business practices are appropriate. At this time, in light of the current regulatory factors, ING U.S. is actively engaged in reviewing whether any modifications in our practices are appropriate for the future.
There can be no assurance that these matters, or the adverse publicity associated with them, will not result in increased fund redemptions, reduced sale of fund shares, or other adverse consequences to ING Funds.
53
| | |
| ING GNMA INCOME FUND | | PORTFOLIO OF INVESTMENTS AS OF SEPTEMBER 30, 2008 (UNAUDITED) |
| | | | | | | | |
Principal
Amount | | | | | | Value |
| | | | | | | | |
| | U.S. GOVERNMENT AGENCY OBLIGATIONS: 95.5% |
| | Federal Home Loan Mortgage Corporation: 0.3% |
| $ | 78,711 | | | | 7.000%, due 11/01/14 | | $ | 83,065 |
| | 264,938 | | | | 7.500%, due 12/01/14 | | | 278,771 |
| | 72,936 | | | | 7.500%, due 01/01/30 | | | 79,167 |
| | 12,754 | | | | 8.000%, due 01/01/30 | | | 13,838 |
| | 1,063,093 | | | | 9.000%, due 01/15/31 | | | 1,123,681 |
| | 37,147 | | | | 9.500%, due 07/01/20 | | | 41,589 |
| | | | | | | | |
| | | | | | | | 1,620,111 |
| | | | | | | | |
| | Federal National Mortgage Association##: 0.3% |
| | 48,453 | | | | 6.500%, due 06/01/14 | | | 50,317 |
| | 441,009 | | | | 6.500%, due 02/01/29 | | | 454,011 |
| | 374,897 | | | | 6.600%, due 07/01/27 | | | 394,362 |
| | 160,466 | | | | 6.600%, due 09/01/27 | | | 168,757 |
| | 57,618 | | | | 6.600%, due 11/01/27 | | | 60,595 |
| | 113,347 | | | | 6.600%, due 03/01/28 | | | 119,203 |
| | 131,863 | | | | 6.600%, due 06/01/28 | | | 138,325 |
| | 58,595 | | | | 7.000%, due 03/01/15 | | | 61,819 |
| | 97,086 | | | | 7.500%, due 05/01/28 | | | 105,175 |
| | 39,032 | | | | 8.500%, due 08/01/11 | | | 40,712 |
| | 29,585 | | | | 8.500%, due 08/01/15 | | | 33,417 |
| | 77,275 | | | | 8.500%, due 09/01/15 | | | 87,285 |
| | | | | | | | |
| | | | | | | | 1,713,978 |
| | | | | | | | |
| | Government National Mortgage Association: 94.9% |
| | 703,364 | | | | 4.000%, due 05/20/33 | | | 647,020 |
| | 945,407 | | | | 4.000%, due 08/15/33 | | | 874,983 |
| | 889,339 | | | | 4.000%, due 01/15/34 | | | 821,604 |
| | 748,005 | | | | 4.000%, due 03/15/34 | | | 691,034 |
| | 1,094,939 | | | | 4.000%, due 08/20/35 | | | 1,003,793 |
| | 1,743,140 | | | | 4.500%, due 01/20/34 | | | 1,653,246 |
| | 1,091,661 | | | | 4.500%, due 03/20/34 | | | 1,035,364 |
| | 322,167 | | | | 4.500%, due 05/20/34 | | | 305,553 |
| | 384,757 | | | | 4.500%, due 06/20/34 | | | 364,916 |
| | 1,886,783 | | | | 4.500%, due 10/20/34 | | | 1,794,115 |
| | 819,987 | | | | 4.500%, due 07/20/35 | | | 779,308 |
| | 3,755,410 | | | | 4.500%, due 08/15/35 | | | 3,589,233 |
| | 498,494 | | | | 4.500%, due 09/15/35 | | | 476,435 |
| | 1,288,425 | | | | 4.500%, due 10/20/35 | | | 1,221,307 |
| | 4,117,628 | | | | 4.500%, due 11/15/35 | | | 3,935,423 |
| | 2,909,436 | | | | 4.500%, due 03/20/36 | | | 2,764,347 |
| | 2,941,711 | | | | 4.500%, due 05/20/38 | | | 2,762,565 |
| | 3,494,899 | | | | 4.500%, due 07/20/38 | | | 3,298,270 |
| | 1,872,101 | | | | 4.590%, due 12/15/38 | | | 1,733,403 |
| | 661,034 | | | | 5.000%, due 05/15/18 | | | 672,608 |
| | 1,074,008 | | | | 5.000%, due 04/15/29 | | | 1,061,333 |
| | 1,033,350 | | | | 5.000%, due 04/15/30 | | | 1,019,611 |
| | 1,283,852 | | | | 5.000%, due 10/15/30 | | | 1,266,783 |
| | 619,430 | | | | 5.000%, due 07/15/33 | | | 609,151 |
| | 1,163,048 | | | | 5.000%, due 10/20/33 | | | 1,135,241 |
| | 2,972,438 | | | | 5.000%, due 12/20/33 | | | 2,901,370 |
| | 645,856 | | | | 5.000%, due 02/20/34 | | | 630,252 |
| | 854,306 | | | | 5.000%, due 03/15/34 | | | 839,729 |
| | 2,662,165 | | | | 5.000%, due 04/15/34 | | | 2,614,662 |
| | 524,108 | | | | 5.000%, due 04/20/34 | | | 511,446 |
| | 1,274,226 | | | | 5.000%, due 06/20/34 | | | 1,243,442 |
| | 595,197 | | | | 5.000%, due 07/20/34 | | | 580,817 |
| | 392,670 | | | | 5.000%, due 09/20/34 | | | 383,183 |
| | 1,699,284 | | | | 5.000%, due 12/20/34 | | | 1,658,231 |
| | 752,622 | | | | 5.000%, due 01/15/35 | | | 739,545 |
| | 1,853,709 | | | | 5.000%, due 03/15/35 | | | 1,821,501 |
| | 2,110,514 | | | | 5.000%, due 04/15/35 | | | 2,073,844 |
| | | | | | | | |
Principal
Amount | | | | | | Value |
| | | | | | | | |
| | Government National Mortgage Association: (continued) |
| $ | 663,108 | | | | 5.000%, due 05/15/35 | | $ | 651,587 |
| | 1,339,389 | | | | 5.000%, due 05/20/35 | | | 1,309,342 |
| | 860,620 | | | | 5.000%, due 06/15/35 | | | 845,667 |
| | 22,491,981 | | | | 5.000%, due 11/20/35 | | | 21,987,395 |
| | 4,132,121 | | | | 5.000%, due 04/20/36 | | | 4,038,924 |
| | 3,969,256 | | | | 5.000%, due 05/20/36 | | | 3,879,732 |
| | 1,758,844 | | | | 5.000%, due 05/20/37 | | | 1,714,591 |
| | 3,863,718 | | | | 5.000%, due 12/20/37 | | | 3,766,505 |
| | 4,084,094 | | | | 5.000%, due 01/20/38 | | | 3,925,836 |
| | 1,192,878 | | | | 5.000%, due 02/15/38 | | | 1,171,593 |
| | 4,756,301 | | | | 5.000%, due 03/15/38 | | | 4,671,431 |
| | 1,040,082 | | | | 5.000%, due 05/20/38 | | | 1,015,380 |
| | 6,370,554 | | | | 5.000%, due 06/20/38 | | | 6,201,648 |
| | 233,854 | | | | 5.450%, due 02/15/29 | | | 235,111 |
| | 100,801 | | | | 5.450%, due 10/15/29 | | | 101,343 |
| | 692,883 | | | | 5.500%, due 08/20/24 | | | 703,945 |
| | 28,252 | | | | 5.500%, due 04/20/29 | | | 28,361 |
| | 443,182 | | | | 5.500%, due 10/15/32 | | | 445,209 |
| | 1,444,307 | | | | 5.500%, due 12/15/32 | | | 1,450,912 |
| | 707,438 | | | | 5.500%, due 06/15/33 | | | 710,231 |
| | 677,706 | | | | 5.500%, due 07/15/33 | | | 680,381 |
| | 870,599 | | | | 5.500%, due 11/20/33 | | | 868,952 |
| | 627,251 | | | | 5.500%, due 12/20/33 | | | 626,064 |
| | 2,543,427 | | | | 5.500%, due 01/15/34 | | | 2,550,288 |
| | 471,131 | | | | 5.500%, due 01/20/34 | | | 470,007 |
| | 2,831,056 | | | | 5.500%, due 02/15/34 | | | 2,838,694 |
| | 693,172 | | | | 5.500%, due 03/15/34 | | | 695,584 |
| | 1,022,678 | | | | 5.500%, due 03/20/34 | | | 1,020,237 |
| | 4,621,314 | | | | 5.500%, due 04/15/34 | | | 4,635,867 |
| | 6,922,077 | | | | 5.500%, due 04/20/34 | | | 6,906,243 |
| | 240,105 | | | | 5.500%, due 05/15/34 | | | 240,940 |
| | 1,354,512 | | | | 5.500%, due 06/15/34 | | | 1,359,225 |
| | 1,754,257 | | | | 5.500%, due 06/20/34 | | | 1,751,870 |
| | 1,200,243 | | | | 5.500%, due 07/15/34 | | | 1,204,420 |
| | 1,131,508 | | | | 5.500%, due 07/20/34 | | | 1,130,873 |
| | 7,885,599 | | | | 5.500%, due 08/15/34 | | | 7,913,034 |
| | 861,473 | | | | 5.500%, due 08/20/34 | | | 859,416 |
| | 7,010,736 | | | | 5.500%, due 09/15/34 | | | 7,035,128 |
| | 4,934,570 | | | | 5.500%, due 10/15/34 | | | 4,951,737 |
| | 185,368 | | | | 5.500%, due 12/15/34 | | | 186,013 |
| | 249,481 | | | | 5.500%, due 12/20/34 | | | 248,885 |
| | 4,202,916 | | | | 5.500%, due 01/15/35 | | | 4,215,569 |
| | 421,106 | | | | 5.500%, due 01/20/35 | | | 419,995 |
| | 1,445,247 | | | | 5.500%, due 02/15/35 | | | 1,449,598 |
| | 3,418,725 | | | | 5.500%, due 03/15/35 | | | 3,429,016 |
| | 2,291,370 | | | | 5.500%, due 04/15/35 | | | 2,298,268 |
| | 3,298,559 | | | | 5.500%, due 05/15/35 | | | 3,308,489 |
| | 1,279,877 | | | | 5.500%, due 05/20/35 | | | 1,278,837 |
| | 1,003,175 | | | | 5.500%, due 06/15/35 | | | 1,006,195 |
| | 744,096 | | | | 5.500%, due 06/20/35 | | | 743,491 |
| | 1,327,909 | | | | 5.500%, due 07/15/35 | | | 1,331,907 |
| | 112,823 | | | | 5.500%, due 08/20/35 | | | 112,731 |
| | 1,187,172 | | | | 5.500%, due 09/20/35 | | | 1,186,207 |
| | 785,465 | | | | 5.500%, due 11/15/35 | | | 787,829 |
| | 3,048,184 | | | | 5.500%, due 03/15/36 | | | 3,056,407 |
| | 12,993,557 | | | | 5.500%, due 03/20/36 | | | 12,977,584 |
| | 894,925 | | | | 5.500%, due 04/15/36 | | | 897,340 |
| | 16,949,755 | | | | 5.500%, due 04/20/36 | | | 16,932,154 |
| | 2,259,351 | | | | 5.500%, due 05/15/36 | | | 2,265,447 |
| | 647,218 | | | | 5.500%, due 06/15/36 | | | 648,964 |
| | 22,402,329 | | | | 5.500%, due 06/20/36 | | | 22,379,066 |
| | 2,877,939 | | | | 5.500%, due 07/15/36 | | | 2,885,703 |
See Accompanying Notes to Financial Statements
54
| | |
| ING GNMA INCOME FUND | | PORTFOLIO OF INVESTMENTS AS OF SEPTEMBER 30, 2008 (UNAUDITED) (CONTINUED) |
| | | | | | | | |
Principal
Amount | | | | | | Value |
| | | | | | | | |
| | Government National Mortgage Association: (continued) |
| $ | 613,774 | | | | 5.500%, due 08/15/36 | | $ | 615,430 |
| | 12,758,908 | | | | 5.500%, due 08/20/36 | | | 12,745,659 |
| | 809,287 | | | | 5.500%, due 09/15/36 | | | 811,471 |
| | 3,567,982 | | | | 5.500%, due 10/15/36 | | | 3,577,609 |
| | 3,373,294 | | | | 5.500%, due 11/15/36 | | | 3,382,395 |
| | 2,197,387 | | | | 5.500%, due 12/15/36 | | | 2,203,315 |
| | 5,241,492 | | | | 5.500%, due 01/15/37 | | | 5,255,633 |
| | 8,270,084 | | | | 5.500%, due 07/20/37 | | | 8,254,877 |
| | 828,295 | | | | 5.500%, due 09/20/38 | | | 820,401 |
| | 9,825,288 | | | | 5.630%, due 07/15/45 | | | 9,628,863 |
| | 215,863 | | | | 5.750%, due 11/20/27 | | | 218,692 |
| | 288,130 | | | | 5.750%, due 12/20/27 | | | 291,907 |
| | 103,820 | | | | 5.750%, due 02/20/28 | | | 105,118 |
| | 812,327 | | | | 5.750%, due 03/20/28 | | | 822,488 |
| | 315,098 | | | | 5.750%, due 04/20/28 | | | 319,039 |
| | 178,401 | | | | 5.750%, due 07/20/28 | | | 180,632 |
| | 64,151 | | | | 5.750%, due 01/20/29 | | | 64,910 |
| | 113,200 | | | | 5.750%, due 04/20/29 | | | 114,539 |
| | 543,185 | | | | 5.750%, due 07/20/29 | | | 549,611 |
| | 139,937 | | | | 6.000%, due 10/15/15 | | | 144,661 |
| | 595,843 | | | | 6.000%, due 10/15/25 | | | 608,325 |
| | 1,574,447 | | | | 6.000%, due 04/15/26 | | | 1,606,247 |
| | 1,150,144 | | | | 6.000%, due 10/20/27 | | | 1,173,993 |
| | 595,599 | | | | 6.000%, due 07/15/28 | | | 607,628 |
| | 432,600 | | | | 6.000%, due 08/15/28 | | | 441,337 |
| | 860,617 | | | | 6.000%, due 09/15/28 | | | 877,999 |
| | 357,447 | | | | 6.000%, due 02/15/29 | | | 365,235 |
| | 240,092 | | | | 6.000%, due 04/15/29 | | | 244,791 |
| | 277,885 | | | | 6.000%, due 05/15/29 | | | 283,414 |
| | 117,428 | | | | 6.000%, due 12/15/29 | | | 120,244 |
| | 292,095 | | | | 6.000%, due 02/15/32 | | | 297,538 |
| | 1,689,594 | | | | 6.000%, due 07/15/32 | | | 1,721,080 |
| | 3,876,995 | | | | 6.000%, due 08/15/32 | | | 3,952,158 |
| | 7,752,286 | | | | 6.000%, due 09/15/32 | | | 7,896,753 |
| | 1,259,747 | | | | 6.000%, due 11/15/32 | | | 1,283,223 |
| | 1,037,666 | | | | 6.000%, due 12/15/32 | | | 1,057,003 |
| | 11,417,581 | | | | 6.000%, due 01/15/33 | | | 11,626,785 |
| | 1,119,396 | | | | 6.000%, due 02/15/33 | | | 1,139,906 |
| | 1,696,717 | | | | 6.000%, due 03/15/33 | | | 1,727,806 |
| | 418,275 | | | | 6.000%, due 04/15/33 | | | 425,939 |
| | 1,434,763 | | | | 6.000%, due 05/15/33 | | | 1,461,052 |
| | 3,146,475 | | | | 6.000%, due 09/15/33 | | | 3,204,127 |
| | 4,166,074 | | | | 6.000%, due 10/15/33 | | | 4,242,409 |
| | 1,172,775 | | | | 6.000%, due 12/15/33 | | | 1,194,264 |
| | 795,912 | | | | 6.000%, due 01/15/34 | | | 809,003 |
| | 685,638 | | | | 6.000%, due 01/20/34 | | | 695,088 |
| | 158,682 | | | | 6.000%, due 02/15/34 | | | 161,292 |
| | 1,399,714 | | | | 6.000%, due 02/20/34 | | | 1,419,006 |
| | 3,306,595 | | | | 6.000%, due 03/20/34 | | | 3,352,170 |
| | 424,596 | | | | 6.000%, due 04/20/34 | | | 430,449 |
| | 2,696,916 | | | | 6.000%, due 05/20/34 | | | 2,734,089 |
| | 144,370 | | | | 6.000%, due 06/20/34 | | | 146,360 |
| | 19,570,393 | | | | 6.000%, due 07/20/34 | | | 19,840,136 |
| | 2,166,398 | | | | 6.000%, due 08/20/34 | | | 2,196,258 |
| | 474,431 | | | | 6.000%, due 09/15/34 | | | 482,827 |
| | 833,908 | | | | 6.000%, due 10/15/34 | | | 848,667 |
| | 7,791,318 | | | | 6.000%, due 10/20/34 | | | 7,901,933 |
| | 8,435,715 | | | | 6.000%, due 11/20/34 | | | 8,551,986 |
| | 8,100,208 | | | | 6.000%, due 12/20/34 | | | 8,211,854 |
| | 2,034,714 | | | | 6.000%, due 01/20/35 | | | 2,060,990 |
| | 912,095 | | | | 6.000%, due 02/20/35 | | | 923,874 |
| | 1,462,524 | | | | 6.000%, due 03/20/35 | | | 1,481,411 |
| | | | | | | | |
Principal
Amount | | | | | | Value |
| | | | | | | | |
| | Government National Mortgage Association: (continued) |
| $ | 1,083,499 | | | | 6.000%, due 04/20/35 | | $ | 1,097,491 |
| | 249,199 | | | | 6.000%, due 06/20/35 | | | 252,418 |
| | 833,863 | | | | 6.000%, due 05/15/36 | | | 847,829 |
| | 1,950,891 | | | | 6.000%, due 06/15/36 | | | 1,983,565 |
| | 1,609,473 | | | | 6.000%, due 07/15/36 | | | 1,636,428 |
| | 1,275,284 | | | | 6.000%, due 08/15/36 | | | 1,296,642 |
| | 977,476 | | | | 6.000%, due 09/15/36 | | | 993,847 |
| | 1,719,612 | | | | 6.000%, due 10/15/36 | | | 1,748,412 |
| | 3,178,775 | | | | 6.000%, due 01/20/37 | | | 3,221,586 |
| | 3,723,000 | | | | 6.000%, due 03/15/37 | | | 3,784,236 |
| | 7,948,223 | | | | 6.000%, due 04/20/37 | | | 8,067,025 |
| | 4,263,451 | | | | 6.000%, due 06/15/37 | | | 4,333,575 |
| | 1,261,663 | | | | 6.000%, due 09/20/37 | | | 1,280,521 |
| | 4,832,602 | | | | 6.000%, due 12/20/37 | | | 4,897,686 |
| | 660,288 | | | | 6.000%, due 05/20/38 | | | 664,622 |
| | 5,682,981 | | | | 6.000%, due 08/20/38 | | | 5,712,284 |
| | 10,774,014 | | | | 6.000%, due 09/20/38 | | | 10,934,783 |
| | 91,982 | | | | 6.250%, due 03/15/28 | | | 94,325 |
| | 90,110 | | | | 6.250%, due 04/15/28 | | | 92,405 |
| | 391,788 | | | | 6.250%, due 09/15/29 | | | 401,522 |
| | 200,642 | | | | 6.280%, due 01/20/26 | | | 205,530 |
| | 517,078 | | | | 6.280%, due 05/20/26 | | | 529,674 |
| | 729,804 | | | | 6.490%, due 01/15/28 | | | 766,879 |
| | 246,018 | | | | 6.500%, due 02/15/26 | | | 253,580 |
| | 183,758 | | | | 6.500%, due 03/15/28 | | | 189,406 |
| | 151,933 | | | | 6.500%, due 08/15/28 | | | 156,603 |
| | 1,644,145 | | | | 6.500%, due 11/15/28 | | | 1,694,685 |
| | 270,527 | | | | 6.500%, due 07/20/29 | | | 278,214 |
| | 29,727 | | | | 6.500%, due 05/15/31 | | | 30,603 |
| | 1,024,404 | | | | 6.500%, due 08/20/31 | | | 1,053,092 |
| | 175,875 | | | | 6.500%, due 09/15/31 | | | 181,061 |
| | 1,557,949 | | | | 6.500%, due 01/15/32 | | | 1,602,918 |
| | 610,186 | | | | 6.500%, due 02/15/32 | | | 627,798 |
| | 101,533 | | | | 6.500%, due 04/20/32 | | | 104,340 |
| | 331,397 | | | | 6.500%, due 07/20/32 | | | 340,559 |
| | 304,891 | | | | 6.500%, due 08/15/32 | | | 313,691 |
| | 3,113,271 | | | | 6.500%, due 10/15/33 | | | 3,200,216 |
| | 528,300 | | | | 6.500%, due 10/20/33 | | | 541,878 |
| | 1,789,488 | | | | 6.500%, due 11/15/33 | | | 1,836,591 |
| | 853,375 | | | | 6.500%, due 11/20/33 | | | 875,307 |
| | 344,288 | | | | 6.500%, due 01/20/34 | | | 352,761 |
| | 640,649 | | | | 6.500%, due 02/20/34 | | | 656,416 |
| | 381,515 | | | | 6.500%, due 03/20/34 | | | 390,903 |
| | 336,774 | | | | 6.500%, due 08/20/34 | | | 345,062 |
| | 2,731,841 | | | | 6.500%, due 09/20/34 | | | 2,799,071 |
| | 1,022,478 | | | | 6.500%, due 10/20/34 | | | 1,047,642 |
| | 845,785 | | | | 6.500%, due 11/20/34 | | | 866,599 |
| | 1,005,449 | | | | 6.500%, due 12/20/34 | | | 1,030,192 |
| | 546,560 | | | | 6.500%, due 03/20/35 | | | 559,413 |
| | 452,132 | | | | 6.500%, due 04/20/36 | | | 462,688 |
| | 1,063,653 | | | | 6.500%, due 05/15/36 | | | 1,091,018 |
| | 4,314,162 | | | | 6.500%, due 09/15/36 | | | 4,425,153 |
| | 2,428,417 | | | | 6.500%, due 11/15/36 | | | 2,490,894 |
| | 1,280,472 | | | | 6.500%, due 12/15/36 | | | 1,313,415 |
| | 6,810,363 | | | | 6.500%, due 01/15/37 | | | 6,983,530 |
| | 5,364,206 | | | | 6.500%, due 02/15/37 | | | 5,500,603 |
| | 599,335 | | | | 6.500%, due 02/20/37 | | | 613,758 |
| | 7,061,921 | | | | 6.500%, due 03/15/37 | | | 7,241,485 |
| | 441,246 | | | | 6.500%, due 04/20/37 | | | 451,866 |
| | 7,784,772 | | | | 6.500%, due 10/20/37 | | | 7,979,848 |
| | 5,886,101 | | | | 6.500%, due 05/20/38 | | | 6,034,403 |
| | 5,729,975 | | | | 6.500%, due 06/15/38 | | | 5,875,672 |
See Accompanying Notes to Financial Statements
55
| | |
| ING GNMA INCOME FUND | | PORTFOLIO OF INVESTMENTS AS OF SEPTEMBER 30, 2008 (UNAUDITED) (CONTINUED) |
| | | | | | | | |
Principal
Amount | | | | | | Value |
| | | | | | | | |
| | Government National Mortgage Association: (continued) |
| $ | 4,986,702 | | | | 6.500%, due 06/20/38 | | $ | 5,112,343 |
| | 769,889 | | | | 6.500%, due 07/20/38 | | | 781,076 |
| | 9,164,318 | | | | 6.500%, due 08/20/38 | | | 9,314,313 |
| | 269,978 | | | | 6.600%, due 10/20/26 | | | 280,343 |
| | 349,257 | | | | 6.600%, due 02/20/27 | | | 362,359 |
| | 105,619 | | | | 6.600%, due 05/20/27 | | | 109,582 |
| | 445,007 | | | | 6.600%, due 06/20/27 | | | 461,702 |
| | 386,695 | | | | 6.600%, due 07/20/27 | | | 401,202 |
| | 236,262 | | | | 6.600%, due 09/20/27 | | | 245,126 |
| | 318,830 | | | | 6.600%, due 10/20/27 | | | 330,791 |
| | 121,058 | | | | 6.600%, due 12/20/27 | | | 125,600 |
| | 325,163 | | | | 6.600%, due 02/20/28 | | | 337,008 |
| | 851,896 | | | | 6.600%, due 07/20/28 | | | 882,928 |
| | 11,238 | | | | 6.750%, due 08/15/28 | | | 11,770 |
| | 315,055 | | | | 6.750%, due 10/15/28 | | | 329,961 |
| | 58,446 | | | | 6.750%, due 11/15/28 | | | 61,211 |
| | 66,872 | | | | 7.000%, due 09/15/23 | | | 70,756 |
| | 18,206 | | | | 7.000%, due 12/15/23 | | | 19,263 |
| | 33,986 | | | | 7.000%, due 04/15/26 | | | 35,908 |
| | 167,554 | | | | 7.000%, due 01/15/27 | | | 176,902 |
| | 167,142 | | | | 7.000%, due 11/15/27 | | | 176,467 |
| | 258,198 | | | | 7.000%, due 07/15/28 | | | 272,318 |
| | 20,327 | | | | 7.000%, due 07/15/29 | | | 21,423 |
| | 34,691 | | | | 7.000%, due 10/15/30 | | | 36,532 |
| | 46,710 | | | | 7.000%, due 05/15/31 | | | 49,140 |
| | 539,591 | | | | 7.000%, due 06/15/31 | | | 568,238 |
| | 292,315 | | | | 7.000%, due 09/15/31 | | | 307,523 |
| | 148,373 | | | | 7.000%, due 11/15/31 | | | 155,482 |
| | 165,370 | | | | 7.000%, due 12/15/31 | | | 173,973 |
| | 1,882,517 | | | | 7.000%, due 01/15/32 | | | 1,979,695 |
| | 3,444,156 | | | | 7.000%, due 02/15/32 | | | 3,621,950 |
| | 2,382,258 | | | | 7.000%, due 03/15/32 | | | 2,505,234 |
| | 3,281,290 | | | | 7.000%, due 04/15/32 | | | 3,450,675 |
| | 2,930,358 | | | | 7.000%, due 05/15/32 | | | 3,081,627 |
| | 1,906,414 | | | | 7.000%, due 07/15/32 | | | 2,004,825 |
| | 121,075 | | | | 7.000%, due 06/20/34 | | | 126,202 |
| | 173,800 | | | | 7.000%, due 07/20/34 | | | 181,160 |
| | 1,575,670 | | | | 7.000%, due 09/20/34 | | | 1,642,397 |
| | 375,922 | | | | 7.000%, due 10/20/34 | | | 391,841 |
| | 644,317 | | | | 7.000%, due 08/20/36 | | | 664,862 |
| | 25,093 | | | | 7.250%, due 01/15/29 | | | 26,879 |
| | 71,769 | | | | 7.500%, due 08/20/27 | | | 77,214 |
| | 197,884 | | | | 7.500%, due 12/15/28 | | | 213,740 |
| | 374,228 | | | | 7.500%, due 10/15/30 | | | 403,425 |
| | 48,243 | | | | 7.500%, due 12/15/30 | | | 52,006 |
| | 50,247 | | | | 7.500%, due 01/15/31 | | | 54,142 |
| | 157,568 | | | | 7.500%, due 10/15/31 | | | 169,780 |
| | 87,823 | | | | 7.500%, due 01/15/32 | | | 94,514 |
| | 22,862 | | | | 7.800%, due 05/15/19 | | | 24,888 |
| | 28,809 | | | | 7.800%, due 07/15/19 | | | 31,361 |
| | 5,693 | | | | 8.000%, due 03/20/24 | | | 6,224 |
| | 36,546 | | | | 8.000%, due 11/15/25 | | | 40,119 |
| | 93,090 | | | | 8.000%, due 07/15/26 | | | 102,213 |
| | 137,983 | | | | 8.000%, due 09/15/26 | | | 151,504 |
| | 46,369 | | | | 8.000%, due 09/20/26 | | | 50,728 |
| | 34,134 | | | | 8.000%, due 12/15/26 | | | 37,479 |
| | 21,445 | | | | 8.000%, due 04/15/27 | | | 23,539 |
| | 60,247 | | | | 8.000%, due 06/15/27 | | | 66,129 |
| | 53,968 | | | | 8.000%, due 07/15/27 | | | 59,237 |
| | 26,386 | | | | 8.000%, due 03/15/28 | | | 28,965 |
| | 36,324 | | | | 8.050%, due 07/15/19 | | | 39,630 |
| | 39,350 | | | | 9.000%, due 05/15/16 | | | 43,063 |
| | | | | | | | |
Principal
Amount | | | | | | Value |
| | Government National Mortgage Association: (continued) |
| $ | 25,377 | | | | 9.000%, due 07/15/16 | | $ | 27,771 |
| | 9,103 | | | | 9.500%, due 11/15/21 | | | 10,131 |
| | | | | | | | |
| | | | | | | | 571,400,573 |
| | | | | | | | |
| | Other U.S. Agency Obligations: 0.0% |
| | 13,027 | | C | | Small Business Administration, 8.250%, due 11/01/11 | | | 13,187 |
| | | | | | | | |
| | | | | | | | 13,187 |
| | | | | | | | |
| | | | | Total U.S. Government Agency Obligations
(Cost $572,996,785) | | | 574,747,849 |
| | | | | | | | |
| | U.S. TREASURY OBLIGATIONS: 2.5% | | | |
| | U.S. Treasury Notes: 2.5% | | | |
| | 15,000,000 | | | | 4.875%, due 05/15/09 | | | 15,289,455 |
| | | | | | | | |
| | | | | | | | 15,289,455 |
| | | | | | | | |
| | | | | Total U.S. Treasury Obligations
(Cost $15,257,770) | | | 15,289,455 |
| | | | | | | | |
| | | | | | | | | | |
| | | | Total Investments in Securities
(Cost $588,254,555)* | | 98.0 | % | | $ | 590,037,304 |
| | | | Other Assets and
Liabilities - Net | | 2.0 | | | | 12,100,793 |
| | | | | | | | | | |
| | | | Net Assets | | 100.0 | % | | $ | 602,138,097 |
| | | | | | | | | | |
| ## | On September 7, 2008, the Federal Housing Finance Agency placed the Federal National Mortgage Association and the Federal Home Loan Mortgage Corporation into conservatorship and the U.S. Treasury guaranteed the debt issued by those organizations. |
| C | Bond may be called prior to maturity date. |
| * | Cost for federal income tax purposes is $588,277,041. |
| | | | |
Net unrealized appreciation consists of: | | | | |
Gross Unrealized Appreciation | | $ | 5,178,628 | |
Gross Unrealized Depreciation | | | (3,418,365 | ) |
| | | | |
Net Unrealized Appreciation | | $ | 1,760,263 | |
| | | | |
The following table summarizes the inputs used as of September 30, 2008 in determining the Fund’s investments at fair value for purposes of SFAS 157:
| | | | | | |
| | | Investments in Securities | | Other Financial Instruments* |
Level 1 — Quoted Prices | | $ | — | | $ | — |
Level 2 — Other Significant Observable Inputs | | | 581,569,557 | | | — |
Level 3 — Significant Unobservable Inputs | | | 8,467,747 | | | — |
| | | | | | |
Total | | $ | 590,037,304 | | $ | — |
| | | | | | |
“Fair value” for purposes of SFAS 157 is different from “fair value” as used in the 1940 Act. The former generally implies market value, and can include market quotations as a source of value, and the latter refers to determinations of actual value in absence of available market quotations.
| * | Other financial instruments may include forward foreign currency contracts, futures, swaps, and written options. Forward foreign currency contracts and futures are reported at their unrealized gain/loss at period end. Swaps and written options are reported at their market value at period end. |
See Accompanying Notes to Financial Statements
56
| | |
| ING GNMA INCOME FUND | | PORTFOLIO OF INVESTMENTS AS OF SEPTEMBER 30, 2008 (UNAUDITED) (CONTINUED) |
A roll forward of fair value measurements using significant unobservable inputs (Level 3) for the six months ended September 30, 2008, was as follows:
| | | | | | |
| | | Investments in Securities | | Other Financial Instruments* |
Balance at 03/31/08 | | $ | — | | $ | — |
Net purchases/sales | | | 8,272,550 | | | — |
Total realized and unrealized gain (loss) | | | 194,788 | | | — |
Amortization of premium/discount | | | 409 | | | — |
Transfers in and/or out of
Level 3 | | | — | | | — |
| | | | | | |
Balance at 09/30/08 | | $ | 8,467,747 | | $ | — |
| | | | | | |
| * | Other financial instruments may include forward foreign currency contracts, futures, swaps, and written options. Forward foreign currency contracts and futures are reported at their unrealized gain/loss at period end. Swaps and written options are reported at their market value at period end. |
For the six months ended September 30, 2008, total change in unrealized gain (loss) on Level 3 securities still held at period end included in the change in net assets was $193,961. Total unrealized gain (loss) for all securities (including Level 1 and Level 2) can be found on the accompanying Statement of Operations.
See Accompanying Notes to Financial Statements
57
| | |
| ING HIGH YIELD BOND FUND | | PORTFOLIO OF INVESTMENTS AS OF SEPTEMBER 30, 2008 (UNAUDITED) |
| | | | | | | | |
Principal
Amount | | | | | | Value |
| | | | | | | | |
| | CORPORATE BONDS/NOTES: 93.3% | | | |
| | Advertising: 0.9% | | | |
| $ | 758,000 | | #, C | | R.H. Donnelley, Inc.,
11.750%, due 05/15/15 | | $ | 466,170 |
| | 455,000 | | C | | Visant Corp.,
7.625%, due 10/01/12 | | | 419,738 |
| | | | | | | | |
| | | | | | | | 885,908 |
| | | | | | | | |
| | Aerospace/Defense: 0.8% | | | |
| | 405,000 | | C | | BE Aerospace, Inc.,
8.500%, due 07/01/18 | | | 393,863 |
| | 420,000 | | C | | DRS Technologies, Inc.,
7.625%, due 02/01/18 | | | 441,000 |
| | | | | | | | |
| | | | | | | | 834,863 |
| | | | | | | | |
| | Airlines: 0.7% | | | |
| | 800,000 | | C | | AMR Corp.,
8.608%, due 04/01/11 | | | 660,000 |
| | 578,731 | | C | | Continental Airlines, Inc.,
7.461%, due 04/01/15 | | | 503,496 |
| | | | | | | | |
| | | | | | | | 1,163,496 |
| | | | | | | | |
| | Auto Manufacturers: 0.8% | | | |
| | 1,000,000 | | C | | General Motors Corp.,
7.125%, due 07/15/13 | | | 462,500 |
| | 725,000 | | C | | General Motors Corp.,
8.375%, due 07/15/33 | | | 293,625 |
| | | | | | | | |
| | | | | | | | 756,125 |
| | | | | | | | |
| | Auto Parts & Equipment: 0.3% | | | |
| | 355,000 | | C | | United Components, Inc.,
9.375%, due 06/15/13 | | | 296,425 |
| | | | | | | | |
| | | | | | | | 296,425 |
| | | | | | | | |
| | Banks: 1.5% | | | |
| | 200,000 | | C | | BAC Capital Trust VI,
5.625%, due 03/08/35 | | | 153,180 |
| | 505,000 | | C | | Bank of America Corp.,
8.000%, due 01/30/18 | | | 400,496 |
| | 463,000 | | C | | National City Preferred Capital Trust I,
12.000%, due 12/29/49 | | | 161,682 |
| | 380,000 | | C | | SunTrust Capital VIII,
6.100%, due 12/15/36 | | | 234,768 |
| | 500,000 | | C | | Wells Fargo Capital XV,
9.750%, due 12/29/49 | | | 485,467 |
| | | | | | | | |
| | | | | | | | 1,435,593 |
| | | | | | | | |
| | Beverages: 1.0% | | | |
| | 790,000 | | C | | Constellation Brands, Inc.,
7.250%, due 05/15/17 | | | 730,750 |
| | 255,000 | | C | | Constellation Brands, Inc.,
8.375%, due 12/15/14 | | | 253,725 |
| | | | | | | | |
| | | | | | | | 984,475 |
| | | | | | | | |
| | Building Materials: 1.4% | | | |
| | 825,000 | | C | | Interline Brands, Inc.,
8.125%, due 06/15/14 | | | 820,875 |
| | 620,000 | | #, C | | Nortek, Inc.,
10.000%, due 12/01/13 | | | 548,700 |
| | | | | | | | |
| | | | | | | | 1,369,575 |
| | | | | | | | |
| | Chemicals: 2.3% | | | |
| | 875,000 | | C | | Huntsman International, LLC,
7.875%, due 11/15/14 | | | 756,875 |
| | | | | | | | |
Principal
Amount | | | | | | Value |
| | | | | | | | |
| | Chemicals: (continued) | | | |
| $ | 855,000 | | &, C | | Momentive Performance Materials, Inc.,
10.125%, due 12/01/14 | | $ | 662,625 |
| | 630,000 | | C | | Momentive Performance Materials, Inc.,
11.500%, due 12/01/16 | | | 431,550 |
| | 450,000 | | C | | PolyOne Corp.,
8.875%, due 05/01/12 | | | 429,750 |
| | | | | | | | |
| | | | | | | | 2,280,800 |
| | | | | | | | |
| | Commercial Services: 3.6% | | | |
| | 710,000 | | C | | Alion Science and Technology Corp.,
10.250%, due 02/01/15 | | | 450,850 |
| | 660,000 | | C | | Aramark Services, Inc.,
8.500%, due 02/01/15 | | | 623,700 |
| | 560,000 | | #, C | | Cenveo Corp.,
10.500%, due 08/15/16 | | | 520,800 |
| | 945,000 | | #, C | | Ceridian Corp.,
11.250%, due 11/15/15 | | | 781,988 |
| | 770,000 | | &, #, C | | Ceridian Corp.,
12.250%, due 11/15/15 | | | 629,475 |
| | 575,000 | | C | | Iron Mountain, Inc.,
8.000%, due 06/15/20 | | | 554,875 |
| | | | | | | | |
| | | | | | | | 3,561,688 |
| | | | | | | | |
| | Computers: 0.6% | | | |
| | 649,000 | | C | | Sungard Data Systems, Inc.,
9.125%, due 08/15/13 | | | 587,345 |
| | | | | | | | |
| | | | | | | | 587,345 |
| | | | | | | | |
| | Diversified Financial Services: 14.3% | | | |
| | 705,000 | | # | | Astoria Depositor Corp.,
8.144%, due 05/01/21 | | | 701,475 |
| | 780,000 | | #, C | | Buffalo Thunder Development Authority,
9.375%, due 12/15/14 | | | 331,500 |
| | 840,000 | | C | | Citigroup, Inc.,
8.400%, due 04/29/49 | | | 572,804 |
| | 455,000 | | | | Ford Motor Credit Co.,
5.538%, due 01/13/12 | | | 291,282 |
| | 1,030,000 | | | | Ford Motor Credit Co.,
7.241%, due 04/15/12 | | | 952,362 |
| | 1,600,000 | | | | Ford Motor Credit Co.,
7.250%, due 10/25/11 | | | 1,018,045 |
| | 875,000 | | | | Ford Motor Credit Co.,
7.800%, due 06/01/12 | | | 543,689 |
| | 950,000 | | | | Ford Motor Credit Co.,
9.875%, due 08/10/11 | | | 655,757 |
| | 365,000 | | | | General Motors Acceptance Corp.,
6.750%, due 12/01/14 | | | 140,226 |
| | 3,000,000 | | | | General Motors Acceptance Corp.,
6.875%, due 09/15/11 | | | 1,339,272 |
| | 700,000 | | &, C | | Hawker Beechcraft Acquisition Co. LLC / Hawker Beechcraft Notes Co.,
8.875%, due 04/01/15 | | | 637,000 |
| | 985,000 | | C | | Hawker Beechcraft Acquisition Co. LLC / Hawker Beechcraft Notes Co.,
9.750%, due 04/01/17 | | | 886,500 |
See Accompanying Notes to Financial Statements
58
| | |
| ING HIGH YIELD BOND FUND | | PORTFOLIO OF INVESTMENTS AS OF SEPTEMBER 30, 2008 (UNAUDITED) (CONTINUED) |
| | | | | | | | |
Principal
Amount | | | | | | Value |
| | | | | | | | |
| | Diversified Financial Services: (continued) | | | |
| $ | 670,000 | | C | | Hexion US Finance Corp./Hexion Nova Scotia Finance ULC,
9.750%, due 11/15/14 | | $ | 532,650 |
| | 645,000 | | C | | JP Morgan Chase Capital XVIII, 6.950%, due 08/17/36 | | | 501,413 |
| | 535,000 | | C | | KAR Holdings, Inc.,
8.750%, due 05/01/14 | | | 438,700 |
| | 980,000 | | &, #, C | | Local TV Finance, LLC,
9.250%, due 06/15/15 | | | 641,900 |
| | 1,010,000 | | #, C | | Nuveen Investments, Inc.,
10.500%, due 11/15/15 | | | 782,750 |
| | 1,013,623 | | #, C | | Piper Jaffray Equipment Trust Securities,
6.750%, due 04/01/11 | | | 810,899 |
| | 365,000 | | #, C | | Rainbow National Services, LLC, 8.750%, due 09/01/12 | | | 366,825 |
| | 380,000 | | | | SLM Corp.,
2.940%, due 07/27/09 | | | 334,545 |
| | 500,000 | | #, C | | Snoqualmie Entertainment Authority,
9.125%, due 02/01/15 | | | 363,750 |
| | 950,000 | | C | | Universal City Florida Holding Co. I/II,
7.551%, due 05/01/10 | | | 897,750 |
| | 810,000 | | #, C | | USB Realty Corp.,
6.091%, due 12/22/49 | | | 372,859 |
| | | | | | | | |
| | | | | | | | 14,113,953 |
| | | | | | | | |
| | Electric: 8.0% | | | |
| | 610,000 | | C | | AES Corp.,
8.000%, due 10/15/17 | | | 553,575 |
| | 574,000 | | #, C | | AES Corp.,
8.750%, due 05/15/13 | | | 579,740 |
| | 715,000 | | C | | Edison Mission Energy,
7.000%, due 05/15/17 | | | 647,075 |
| | 1,585,000 | | #, C | | Energy Future Holdings,
10.875%, due 11/01/17 | | | 1,438,388 |
| | 705,363 | | C | | Homer City Funding, LLC,
8.734%, due 10/01/26 | | | 719,470 |
| | 85,875 | | C | | Midwest Generation, LLC,
8.300%, due 07/02/09 | | | 87,004 |
| | 371,486 | | C | | Midwest Generation, LLC,
8.560%, due 01/02/16 | | | 382,631 |
| | 1,085,000 | | C | | Mirant North America, LLC,
7.375%, due 12/31/13 | | | 1,025,325 |
| | 910,000 | | C | | NRG Energy, Inc.,
7.375%, due 02/01/16 | | | 821,275 |
| | 230,000 | | C | | NRG Energy, Inc.,
7.375%, due 01/15/17 | | | 209,875 |
| | 1,560,000 | | #, C | | Texas Competitive Electric Holdings Co., LLC,
10.250%, due 11/01/15 | | | 1,415,700 |
| | | | | | | | |
| | | | | | | | 7,880,058 |
| | | | | | | | |
| | Entertainment: 2.8% | | | |
| | 1,125,000 | | C | | AMC Entertainment, Inc.,
11.000%, due 02/01/16 | | | 1,113,750 |
| | 315,000 | | +, C | | Marquee Holdings, Inc.,
0.000%, (Step Rate 9.505%), due 08/15/14 | | | 233,888 |
| | 435,000 | | #, C | | Mashantucket Western Pequot Tribe,
8.500%, due 11/15/15 | | | 284,925 |
| | | | | | | | |
Principal
Amount | | | | | | Value |
| | | | | | | | |
| | Entertainment: (continued) | | | |
| $ | 485,000 | | C | | Pinnacle Entertainment, Inc.,
8.250%, due 03/15/12 | | $ | 471,056 |
| | 395,000 | | #, C | | Scientific Games Corp.,
7.875%, due 06/15/16 | | | 378,213 |
| | 455,000 | | #, C | | Shingle Springs Tribal Gaming Authority,
9.375%, due 06/15/15 | | | 329,875 |
| | | | | | | | |
| | | | | | | | 2,811,707 |
| | | | | | | | |
| | Environmental Control: 3.0% | | | |
| | 960,000 | | C | | Allied Waste North America, Inc.,
7.250%, due 03/15/15 | | | 924,000 |
| | 1,280,000 | | C | | Waste Services, Inc.,
9.500%, due 04/15/14 | | | 1,260,800 |
| | 865,000 | | C | | WCA Waste Corp.,
9.250%, due 06/15/14 | | | 817,425 |
| | | | | | | | |
| | | | | | | | 3,002,225 |
| | | | | | | | |
| | Food: 1.3% | | | |
| | 590,000 | | C | | Dean Foods Co.,
7.000%, due 06/01/16 | | | 516,250 |
| | 500,000 | | | | Smithfield Foods, Inc.,
7.750%, due 07/01/17 | | | 395,000 |
| | 425,000 | | C | | Stater Brothers Holdings,
8.125%, due 06/15/12 | | | 418,625 |
| | | | | | | | |
| | | | | | | | 1,329,875 |
| | | | | | | | |
| | Forest Products & Paper: 2.2% | | | |
| | 600,000 | | @@ | | Abitibi-Consolidated, Inc.,
7.500%, due 04/01/28 | | | 141,000 |
| | 720,000 | | @@, C | | Abitibi-Consolidated, Inc.,
8.850%, due 08/01/30 | | | 176,400 |
| | 380,000 | | C | | Domtar Corp.,
5.375%, due 12/01/13 | | | 323,000 |
| | 140,000 | | #, C | | Georgia-Pacific Corp.,
7.000%, due 01/15/15 | | | 128,100 |
| | 600,000 | | #, C | | Georgia-Pacific Corp.,
7.125%, due 01/15/17 | | | 538,500 |
| | 500,000 | | C | | NewPage Corp.,
12.000%, due 05/01/13 | | | 440,000 |
| | 145,000 | | C | | Verso Paper Holdings, LLC and Verson Paper, Inc.,
6.551%, due 08/01/14 | | | 120,350 |
| | 380,000 | | C | | Verso Paper Holdings, LLC and Verson Paper, Inc.,
9.125%, due 08/01/14 | | | 328,700 |
| | | | | | | | |
| | | | | | | | 2,196,050 |
| | | | | | | | |
| | Healthcare - Products: 2.4% | | | |
| | 650,000 | | #, C | | Bausch & Lomb, Inc.,
9.875%, due 11/01/15 | | | 619,125 |
| | 500,000 | | C | | Biomet, Inc.,
10.000%, due 10/15/17 | | | 512,500 |
| | 600,000 | | C | | Biomet, Inc.,
11.625%, due 10/15/17 | | | 606,000 |
| | 625,000 | | C | | Boston Scientific Corp.,
6.250%, due 11/15/15 | | | 592,188 |
| | | | | | | | |
| | | | | | | | 2,329,813 |
| | | | | | | | |
| | Healthcare - Services: 6.8% | | | |
| | 690,000 | | C | | Centene Corp.,
7.250%, due 04/01/14 | | | 650,325 |
See Accompanying Notes to Financial Statements
59
| | |
| ING HIGH YIELD BOND FUND | | PORTFOLIO OF INVESTMENTS AS OF SEPTEMBER 30, 2008 (UNAUDITED) (CONTINUED) |
| | | | | | | | |
Principal
Amount | | | | | | Value |
| | | | | | | | |
| | Healthcare - Services: (continued) | | | |
| $ | 895,000 | | C | | DaVita, Inc.,
7.250%, due 03/15/15 | | $ | 854,725 |
| | 1,465,000 | | C | | HCA, Inc.,
9.250%, due 11/15/16 | | | 1,428,375 |
| | 1,180,000 | | &, C | | HCA, Inc.,
9.625%, due 11/15/16 | | | 1,123,950 |
| | 830,000 | | C | | Psychiatric Solutions, Inc.,
7.750%, due 07/15/15 | | | 776,050 |
| | 610,000 | | C | | Select Medical Corp.,
7.625%, due 02/01/15 | | | 497,150 |
| | 325,000 | | C | | Select Medical Corp.,
8.834%, due 09/15/15 | | | 266,500 |
| | 725,000 | | C | | Sun Healthcare Group, Inc.,
9.125%, due 04/15/15 | | | 696,000 |
| | 220,000 | | C | | United Surgical Partners International, Inc.,
8.875%, due 05/01/17 | | | 185,900 |
| | 300,000 | | &, C | | United Surgical Partners International, Inc.,
9.250%, due 05/01/17 | | | 256,500 |
| | | | | | | | |
| | | | | | | | 6,735,475 |
| | | | | | | | |
| | Holding Companies - Diversified: 0.7% | | | |
| | 750,000 | | C | | Atlantic Broadband Finance, LLC,
9.375%, due 01/15/14 | | | 667,500 |
| | | | | | | | |
| | | | | | | | 667,500 |
| | | | | | | | |
| | Home Furnishings: 0.4% | | | |
| | 445,000 | | C | | Norcraft Cos. LP,
9.000%, due 11/01/11 | | | 429,425 |
| | | | | | | | |
| | | | | | | | 429,425 |
| | | | | | | | |
| | Household Products/Wares: 1.4% | | | |
| | 525,000 | | #, C | | American Achievement Corp.,
8.250%, due 04/01/12 | | | 509,250 |
| | 905,000 | | +, C | | Visant Holding Corp.,
0.000% (step rate 10.250%),
due 12/01/13 | | | 823,550 |
| | | | | | | | |
| | | | | | | | 1,332,800 |
| | | | | | | | |
| | Iron/Steel: 0.2% | | | |
| | 260,000 | | &, C | | Metals USA Holdings Corp.,
9.883%, due 07/01/12 | | | 209,300 |
| | | | | | | | |
| | | | | | | | 209,300 |
| | | | | | | | |
| | Leisure Time: 0.5% | | | |
| | 740,000 | | C | | Travelport, LLC,
11.875%, due 09/01/16 | | | 534,650 |
| | | | | | | | |
| | | | | | | | 534,650 |
| | | | | | | | |
| | Lodging: 1.1% | | | |
| | 1,265,000 | | #, C | | Harrah’s Operating Co., Inc.,
10.750%, due 02/01/16 | | | 651,475 |
| | 645,000 | | C | | MGM Mirage,
7.500%, due 06/01/16 | | | 474,075 |
| | | | | | | | |
| | | | | | | | 1,125,550 |
| | | | | | | | |
| | Media: 9.7% | | | |
| | 559,634 | | #, C | | American Media Operations, Inc.,
10.250%, due 05/01/09 | | | 395,941 |
| | 610,000 | | C | | Cablevision Systems Corp.,
8.000%, due 04/15/12 | | | 576,450 |
| | | | | | | | |
Principal
Amount | | | | | | Value |
| | | | | | | | |
| | Media: (continued) | | | |
| $ | 1,185,000 | | C | | Charter Communications Holdings II, LLC,
10.250%, due 09/15/10 | | $ | 1,072,425 |
| | 1,110,000 | | #, C | | Charter Communications Operating, LLC,
8.375%, due 04/30/14 | | | 985,125 |
| | 100,000 | | | | CSC Holdings, Inc.,
7.875%, due 02/15/18 | | | 88,500 |
| | 10,000 | | | | CSC Holdings, Inc.,
8.125%, due 07/15/09 | | | 9,925 |
| | 1,346,000 | | C | | Dex Media West, LLC,
9.875%, due 08/15/13 | | | 837,885 |
| | 385,000 | | #, C | | DirecTV Holdings, LLC/DirecTV Financing Co.,
7.625%, due 05/15/16 | | | 350,350 |
| | 420,000 | | C | | Echostar DBS Corp.,
6.625%, due 10/01/14 | | | 338,100 |
| | 1,010,000 | | C | | Echostar DBS Corp.,
7.125%, due 02/01/16 | | | 815,575 |
| | 810,000 | | C | | Idearc, Inc.,
8.000%, due 11/15/16 | | | 224,775 |
| | 538,222 | | &, #, C | | ION Media Networks, Inc.,
9.041%, due 01/15/13 | | | 291,985 |
| | 690,000 | | | | Liberty Media, LLC,
8.250%, due 02/01/30 | | | 469,048 |
| | 960,000 | | C | | Mediacom Broadband, LLC,
8.500%, due 10/15/15 | | | 796,800 |
| | 479,386 | | C | | Nexstar Finance Holdings, LLC,
11.375%, due 04/01/13 | | | 400,287 |
| | 1,070,000 | | C | | Nexstar Finance, Inc.,
7.000%, due 01/15/14 | | | 807,850 |
| | 545,000 | | @@, C | | Quebecor Media, Inc.,
7.750%, due 03/15/16 | | | 479,600 |
| | 950,000 | | C | | Radio One, Inc.,
6.375%, due 02/15/13 | | | 650,750 |
| | 31,000 | | C | | RH Donnelley Corp.,
8.875%, due 10/15/17 | | | 10,695 |
| | | | | | | | |
| | | | | | | | 9,602,066 |
| | | | | | | | |
| | Miscellaneous Manufacturing: 1.6% | | | |
| | 415,000 | | C | | Harland Clarke Holdings Corp.,
7.554%, due 05/15/15 | | | 271,825 |
| | 540,000 | | C | | Harland Clarke Holdings Corp.,
9.500%, due 05/15/15 | | | 386,100 |
| | 993,321 | | | | Rexnord Corp.,
9.676%, due 03/02/13 | | | 943,655 |
| | | | | | | | |
| | | | | | | | 1,601,580 |
| | | | | | | | |
| | Oil & Gas: 7.9% | | | |
| | 505,000 | | #, C | | Atlas Energy Resources LLC,
10.750%, due 02/01/18 | | | 457,025 |
| | 595,000 | | C | | Berry Petroleum Co.,
8.250%, due 11/01/16 | | | 505,750 |
| | 635,000 | | C | | Chaparral Energy, Inc.,
8.875%, due 02/01/17 | | | 504,825 |
| | 900,000 | | C | | Chesapeake Energy Corp.,
6.625%, due 01/15/16 | | | 812,250 |
| | 405,000 | | C | | Denbury Resources, Inc.,
7.500%, due 12/15/15 | | | 374,625 |
| | 705,000 | | C | | Forest Oil Corp.,
7.250%, due 06/15/19 | | | 606,300 |
See Accompanying Notes to Financial Statements
60
| | |
| ING HIGH YIELD BOND FUND | | PORTFOLIO OF INVESTMENTS AS OF SEPTEMBER 30, 2008 (UNAUDITED) (CONTINUED) |
| | | | | | | | |
Principal
Amount | | | | | | Value |
| | | | | | | | |
| | Oil & Gas: (continued) | | | |
| $ | 565,000 | | @@, #, C | | Griffin Coal Mining Co. Pty Ltd.,
9.500%, due 12/01/16 | | $ | 364,425 |
| | 690,000 | | #, C | | Hilcorp Energy I LP,
7.750%, due 11/01/15 | | | 596,850 |
| | 525,000 | | C | | McMoRan Exploration Co.,
11.875%, due 11/15/14 | | | 501,375 |
| | 470,000 | | C | | Newfield Exploration Co.,
7.125%, due 05/15/18 | | | 411,250 |
| | 575,000 | | @@, C | | OPTI Canada, Inc.,
8.250%, due 12/15/14 | | | 517,500 |
| | 600,000 | | C | | PetroHawk Energy Corp.,
9.125%, due 07/15/13 | | | 567,000 |
| | 600,000 | | C | | Plains Exploration & Production Co.,
7.625%, due 06/01/18 | | | 534,000 |
| | 575,000 | | C | | Quicksilver Resources, Inc.,
8.250%, due 08/01/15 | | | 529,000 |
| | 570,000 | | #, C | | Southwestern Energy Co.,
7.500%, due 02/01/18 | | | 555,750 |
| | | | | | | | |
| | | | | | | | 7,837,925 |
| | | | | | | | |
| | Oil & Gas Services: 0.9% | | | |
| | 460,000 | | @@, C | | Compagnie Generale de Geophysique-Veritas,
7.750%, due 05/15/17 | | | 439,300 |
| | 510,000 | | #, C | | Key Energy Services, Inc.,
8.375%, due 12/01/14 | | | 492,150 |
| | | | | | | | |
| | | | | | | | 931,450 |
| | | | | | | | |
| | Pipelines: 2.3% | | | |
| | 500,000 | | C | | El Paso Corp.,
7.000%, due 06/15/17 | | | 449,182 |
| | 875,000 | | C | | El Paso Corp.,
7.250%, due 06/01/18 | | | 818,125 |
| | 725,000 | | @@, C | | Kinder Morgan Finance Co. ULC,
5.700%, due 01/05/16 | | | 627,125 |
| | 405,000 | | #, C | | Targa Resources Partners L.P.,
8.250%, due 07/01/16 | | | 350,325 |
| | | | | | | | |
| | | | | | | | 2,244,757 |
| | | | | | | | |
| | Retail: 1.6% | | | |
| | 770,000 | | C | | Albertson’s, Inc.,
7.450%, due 08/01/29 | | | 688,710 |
| | 785,000 | | C | | Bon-Ton Stores, Inc.,
10.250%, due 03/15/14 | | | 239,425 |
| | 615,000 | | C | | GSC Holdings Corp.,
8.000%, due 10/01/12 | | | 621,150 |
| | | | | | | | |
| | | | | | | | 1,549,285 |
| | | | | | | | |
| | Telecommunications: 9.4% | | | |
| | 396,000 | | C | | Centennial Cellular Communications Corp.,
8.125%, due 02/01/14 | | | 394,020 |
| | 717,000 | | C | | Centennial Cellular Operating Co.,
10.125%, due 06/15/13 | | | 713,415 |
| | 340,000 | | C | | Centennial Communications Corp.,
10.000%, due 01/01/13 | | | 327,250 |
| | 515,000 | | C | | Cincinnati Bell, Inc.,
8.375%, due 01/15/14 | | | 450,625 |
| | | | | | | | |
Principal
Amount | | | | | | Value |
| | | | | | | | |
| | Telecommunications: (continued) | | | |
| $ | 380,000 | | C | | Citizens Communications Co.,
9.000%, due 08/15/31 | | $ | 292,600 |
| | 1,095,000 | | C | | Cricket Communications, Inc.,
9.375%, due 11/01/14 | | | 1,023,825 |
| | 1,070,000 | | @@, C | | Intelsat Bermuda Ltd.,
11.250%, due 06/15/16 | | | 1,045,925 |
| | 810,000 | | &, C | | iPCS, Inc.,
6.051%, due 05/01/14 | | | 635,850 |
| | 1,070,000 | | C | | MetroPCS Wireless, Inc.,
9.250%, due 11/01/14 | | | 1,005,800 |
| | 725,000 | | C | | Qwest Communications International, Inc.,
7.500%, due 02/15/14 | | | 630,749 |
| | 1,395,000 | | C | | Sprint Capital Corp.,
6.875%, due 11/15/28 | | | 936,703 |
| | 465,000 | | C | | Sprint Capital Corp.,
8.750%, due 03/15/32 | | | 363,463 |
| | 1,025,000 | | C | | Sprint Nextel Corp.,
6.000%, due 12/01/16 | | | 790,435 |
| | 650,000 | | C | | West Corp.,
9.500%, due 10/15/14 | | | 500,500 |
| | 330,000 | | C | | West Corp.,
11.000%, due 10/15/16 | | | 239,250 |
| | | | | | | | |
| | | | | | | | 9,350,410 |
| | | | | | | | |
| | Transportation: 0.4% | | | |
| | 490,000 | | C | | Bristow Group, Inc.,
7.500%, due 09/15/17 | | | 438,550 |
| | | | | | | | |
| | | | | | | | 438,550 |
| | | | | | | | |
| | | | | Total Corporate Bonds/Notes
(Cost $109,784,051) | | | 92,410,697 |
| | | | | | | | |
| | ASSET-BACKED SECURITIES: 0.4% | | | |
| | Home Equity Asset-Backed Securities: 0.4% | | | |
| | 328,495 | | C,S | | Ameriquest Mortgage Securities, Inc.,
4.557%, due 02/25/33 | | | 250,352 |
| | 233,170 | | C | | Morgan Stanley Capital I,
4.407%, due 06/25/33 | | | 166,465 |
| | | | | | | | |
| | | | | Total Asset-Backed Securities
(Cost $469,002) | | | 416,817 |
| | | | | | | | |
| | | |
| Shares | | | | | | Value |
| | COMMON STOCK: 0.3% | | | |
| | Agriculture: 0.0% | | | |
| | 17,906 | | I | | North Atlantic Trading Co. | | $ | 18 |
| | | | | | | | |
| | | | | | | | 18 |
| | | | | | | | |
| | Chemicals: 0.3% | | | |
| | 24,000 | | | | Huntsman Corp. | | | 302,400 |
| | | | | | | | |
| | | | | | | | 302,400 |
| | | | | | | | |
| | Telecommunications: 0.0% | | | |
| | 264 | | @, @@ | | Completel Europe NV | | | 12,287 |
| | | | | | | | |
| | | | | | | | 12,287 |
| | | | | | | | |
| | | | | Total Common Stock
(Cost $776,267) | | | 314,705 |
| | | | | | | | |
See Accompanying Notes to Financial Statements
61
| | |
| ING HIGH YIELD BOND FUND | | PORTFOLIO OF INVESTMENTS AS OF SEPTEMBER 30, 2008 (UNAUDITED) (CONTINUED) |
| | | | | | | |
| | | |
| Shares | | | | | | Value |
| | | | | | | |
| PREFERRED STOCK: 0.0% | | | |
| Media: 0.0% | | | |
| 1 | | &, P | | ION Media Networks, Inc. | | $ | 7,009 |
| | | | | | | |
| | | | Total Preferred Stock
(Cost $8,676 ) | | | 7,009 |
| | | | | | | |
| WARRANTS: 0.0% | | | |
| Building Materials: 0.0% | | | |
| 3,100 | | #, I | | Dayton Superior Corp. | | | 31 |
| | | | | | | |
| | | | | | | 31 |
| | | | | | | |
| Commercial Services: 0.0% | | | |
| 92,950 | | I | | Comforce Corp. | | | 930 |
| | | | | | | |
| | | | | | | 930 |
| | | | | | | |
| Telecommunications: 0.0% | | | |
| 500 | | @@, #, I | | GT Group Telecom, Inc. | | | — |
| | | | | | | |
| | | | | | | — |
| | | | | | | |
| | | | Total Warrants (Cost $—) | | | 961 |
| | | | | | | |
| | | | Total Long-Term Investments
(Cost $111,037,996) | | | 93,150,189 |
| | | | | | | |
| SHORT-TERM INVESTMENTS: 4.6% | | | |
| Affiliated Mutual Fund: 4.1% | | | |
| 4,000,000 | | | | ING Institutional Prime Money Market Fund | | $ | 4,000,000 |
| | | | | | | |
| | | | Total Mutual Fund
(Cost $4,000,000 ) | | | 4,000,000 |
| | | | | | | |
| | | | | | | | | |
| | | |
Principal
Amount | | | | | | | Value |
| | | | | | | | | |
| | Repurchase Agreement: 0.5% | | | | |
| $ | 513,000 | | Goldman Sachs Repurchase Agreement dated 09/30/08, 1.000%, due 10/01/08, $513,014 to be received upon repurchase (Collateralized by $495,000 Federal National Mortgage Association, 4.625%, Market Value plus accrued interest $523,437, due 10/15/14) | | | $ | 513,000 |
| | | | | | | | | |
| | | Total Repurchase Agreement
(Cost $513,000) | | | | 513,000 |
| | | | | | | | | |
| | | Total Short-Term Investments
(Cost $4,513,000) | | | | 4,513,000 |
| | | | | | | | | |
| | | Total Investments in Securities
(Cost $115,550,996)* | | 98.6% | | | | $97,663,189 |
| | | Other Assets and
Liabilities - Net | | 1.4 | | | | 1,382,749 |
| | | | | | | | | |
| | | Net Assets | | 100.0 | % | | $ | 99,045,938 |
| | | | | | | | | |
| @ | Non-income producing security |
| + | Step-up basis bonds. Interest rates shown reflect current and next coupon rates. |
| # | Securities with purchases pursuant to Rule 144A or section 4(2), under the Securities Act of 1933 and may not be resold subject to that rule except to qualified institutional buyers. Unless otherwise noted, these securities have been determined to be liquid under the guidelines established by the Funds’ Board of Directors/Trustees. |
| C | Bond may be called prior to maturity date. |
| P | Preferred Stock may be called prior to convertible date. |
| S | All or a portion of this security is segregated to cover collateral requirements for applicable futures, options, swaps, foreign forward currency contracts and/or when-issued or delayed-delivery securities. |
| * | Cost for federal income tax purposes is $115,623,630. |
| | | | |
Net unrealized depreciation consists of: | | | | |
Gross Unrealized Appreciation | | $ | 31,315 | |
Gross Unrealized Depreciation | | | (17,991,756 | ) |
| | | | |
Net Unrealized Depreciation | | $ | (17,960,441 | ) |
| | | | |
The following table summarizes the inputs used as of September 30, 2008 in determining the Fund’s investments at fair value for purposes of SFAS 157:
| | | | | | | |
| | | Investments in
Securities | | Other Financial
Instruments* | |
Level 1 — Quoted Prices | | $ | 4,314,687 | | $ | — | |
Level 2 — Other Significant Observable Inputs | | | 91,829,119 | | | (850,421 | ) |
Level 3 — Significant Unobservable Inputs | | | 1,519,383 | | | — | |
| | | | | | | |
Total | | $ | 97,663,189 | | $ | (850,421 | ) |
| | | | | | | |
“Fair value” for purposes of SFAS 157 is different from “fair value” as used in the 1940 Act. The former generally implies market value, and can include market quotations as a source of value, and the latter refers to determinations of actual value in absence of available market quotations.
| * | Other financial instruments may include forward foreign currency contracts, futures, swaps, and written options. Forward foreign currency contracts and futures are reported at their unrealized gain/loss at period end. Swaps and written options are reported at their market value at period end. |
See Accompanying Notes to Financial Statements
62
| | |
| ING HIGH YIELD BOND FUND | | PORTFOLIO OF INVESTMENTS AS OF SEPTEMBER 30, 2008 (UNAUDITED) (CONTINUED) |
A roll forward of fair value measurements using significant unobservable inputs (Level 3) for the six months ended September 30, 2008, was as follows:
| | | | | | | |
| | | Investments in
Securities | | | Other Financial
Instruments* |
Balance at 03/31/08 | | $ | 1,726,025 | | | $ | — |
Net purchases/sales | | | (33,299 | ) | | | — |
Total realized and unrealized gain (loss) | | | (173,343 | ) | | | — |
Amortization of premium/discount | | | — | | | | — |
Transfers in and/or out of Level 3 | | | — | | | | — |
| | | | | | | |
Balance at 09/30/08 | | $ | 1,519,383 | | | $ | — |
| | | | | | | |
| * | Other financial instruments may include forward foreign currency contracts, futures, swaps, and written options. Forward foreign currency contracts and futures are reported at their unrealized gain/loss at period end. Swaps and written options are reported at their market value at period end. |
For the six months ended September 30, 2008, total change in unrealized gain (loss) on Level 3 securities still held at period end included in the change in net assets was $174,223. Total unrealized gain (loss) for all securities (including Level 1 and Level 2) can be found on the accompanying Statement of Operations.
ING High Yield Bond Fund Credit Default Swap Agreements Outstanding on September 30, 2008:
| | | | | | | | | | | | | | | | | |
Counterparty | | Reference Entity/ Obligation | | Buy/Sell
Protection(1) | | (Pay)/Receive
Fixed Rate (%) | | | Termination
Date | | | | Notional
Amount | | Unrealized
Appreciation/
(Depreciation) | |
Morgan Stanley Capital Services Inc. | | Beazer Homes USA 6.500%, 11/15/13 | | Sell | | 5.000 | | | 06/20/09 | | USD | | 2,000,000 | | $ | 32,970 | |
Merrill Lynch International | | General Motors 7.125%. 07/15/13 | | Sell | | 5.000 | | | 03/20/09 | | USD | | 2,000,000 | | | (233,405 | ) |
Merrill Lynch International | | GMAC LLC 6.875%, 08/28/12 | | Sell | | 5.000 | | | 06/20/09 | | USD | | 2,000,000 | | | (325,095 | ) |
Goldman Sachs International | | Harrah’s Operating Co. Inc. 5.625%, 06/01/15 | | Sell | | 5.000 | | | 06/20/09 | | USD | | 2,000,000 | | | (122,330 | ) |
Goldman Sachs International | | Idearc Inc. 8.000%, 11/15/16 | | Sell | | 5.000 | | | 06/20/09 | | USD | | 2,000,000 | | | (127,532 | ) |
JPMorgan Chase Bank N.A., New York | | K. Hovnanian Enterprises 6.500%, 01/15/14 | | Sell | | 5.000 | | | 06/20/09 | | USD | | 2,000,000 | | | (42,247 | ) |
Goldman Sachs International | | Newell Rubbermaid Inc. 6.750%, 03/15/12 | | Buy | | (1.200 | ) | | 09/20/13 | | USD | | 2,000,000 | | | (21,455 | ) |
JPMorgan Chase Bank N.A., New York | | Norbord Inc. 7.250%, 07/01/12 | | Buy | | (1.380 | ) | | 06/20/14 | | USD | | 2,000,000 | | | 380,744 | |
Citibank N.A., New York | | Republic of Italy 6.875%, 09/27/23 | | Sell | | 0.495 | | | 09/20/18 | | USD | | 2,000,000 | | | (22,655 | ) |
Citibank N.A., New York | | UniCredit S.p.A. 4.375%, 02/10/14 | | Buy | | (0.775 | ) | | 09/20/18 | | USD | | 2,000,000 | | | 80,515 | |
Credit Suisse International | | Visteon Corp. 7.000%, 03/10/14 | | Sell | | 5.000 | | | 06/20/09 | | USD | | 2,000,000 | | | (98,111 | ) |
Goldman Sachs International | | Whirlpool Corp. 7.750%, 07/15/16 | | Buy | | (0.980 | ) | | 06/20/13 | | USD | | 2,000,000 | | | 10,680 | |
| | | | | | | | | | | | | | | | | |
| | | | | | | | | | | | | | | $ | (487,921 | ) |
| | | | | | | | | | | | | | | | | |
(1) | | If the Fund is a seller of protection and a credit event occurs, as defined under the terms of that particular swap agreement, the Fund must pay to the buyer of the protection an amount up to the notional value of the reference entity/obligation and in certain instances, take delivery of the reference entity/obligation. If the Fund is a buyer of protection and a credit event occurs, as defined under the terms of that particular swap agreement, the Fund may receive from the seller of protection an amount up to the notional value of the reference entity/obligation, which may have little or no value. |
See Accompanying Notes to Financial Statements
63
| | |
| ING INTERMEDIATE BOND FUND | | PORTFOLIO OF INVESTMENTS AS OF SEPTEMBER 30, 2008 (UNAUDITED) |
| | | | | | | | |
Principal
Amount | | | | | | Value |
| | | | | | | | |
| | CORPORATE BONDS/NOTES: 22.1% | | | |
| | Agriculture: 0.2% | | | |
| $ | 898,000 | | | | Philip Morris International, Inc.,
5.650%, due 05/16/18 | | $ | 831,550 |
| | 1,782,000 | | | | Philip Morris International, Inc.,
6.375%, due 05/16/38 | | | 1,572,326 |
| | | | | | | | |
| | | | | | | | 2,403,876 |
| | | | | | | | |
| | Airlines: 0.4% | | | |
| | 5,679,000 | | C, S | | Delta Airlines, Inc.,
7.570%, due 11/18/10 | | | 5,139,495 |
| | | | | | | | |
| | | | | | | | 5,139,495 |
| | | | | | | | |
| | Auto Manufacturers: 0.3% | | | |
| | 2,721,525 | | S | | Ford Motor Co.,
5.490%, due 11/29/13 | | | 1,800,174 |
| | 2,131,000 | | C, S | | General Motors Corp.,
8.250%, due 07/15/23 | | | 847,073 |
| | 3,197,000 | | C, S | | General Motors Corp.,
8.375%, due 07/15/33 | | | 1,294,785 |
| | | | | | | | |
| | | | | | | | 3,942,032 |
| | | | | | | | |
| | Banks: 5.8% | | | |
| | 3,240,000 | | @@, C, S | | Australia & New Zealand Banking Group Ltd.,
3.181%, due 12/31/49 | | | 2,089,800 |
| | 4,915,000 | | C, S | | BAC Capital Trust XIV,
5.630%, due 12/31/49 | | | 2,545,134 |
| | 1,734,000 | | @@, #, C, S | | Banco Mercantil del Norte SA,
6.135%, due 10/13/16 | | | 1,661,786 |
| | 4,637,000 | | C, S | | Bank of America Corp.,
8.000%, due 12/01/49 | | | 3,677,428 |
| | 4,444,000 | | C, S | | Bank of America Corp.,
8.125%, due 12/29/49 | | | 3,596,040 |
| | 1,280,000 | | @@, C, S | | Bank of Ireland,
3.563%, due 12/29/49 | | | 870,400 |
| | 570,000 | | @@, C, S, L | | Bank of Scotland,
3.063%, due 12/31/49 | | | 349,125 |
| | 231,000 | | C, S | | BankAmerica Capital II,
8.000%, due 12/15/26 | | | 198,032 |
| | 1,500,000 | | @@, C, S | | Barclays Bank PLC,
3.250%, due 12/31/49 | | | 967,500 |
| | 730,000 | | @@, C, S | | Barclays Bank PLC,
3.313%, due 08/29/49 | | | 434,743 |
| | 1,304,000 | | @@, #, C, S | | Barclays Bank PLC,
5.926%, due 09/29/49 | | | 908,162 |
| | 3,817,000 | | @@, #, S | | Barclays Bank PLC,
6.050%, due 12/04/17 | | | 3,556,142 |
| | 565,000 | | @@, C, S | | Barclays O/S Inv,
3.189%, due 05/19/08 | | | 364,425 |
| | 2,300,000 | | @@, C, S | | BNP Paribas,
3.998%, due 09/29/49 | | | 1,817,166 |
| | 1,100,000 | | @@, #, C, S | | Danske Bank A/S,
5.914%, due 12/29/49 | | | 964,493 |
| | 690,000 | | @@, C, S | | Den Norske Bank ASA,
3.063%, due 11/29/49 | | | 449,749 |
| | 2,697,000 | | #, C, S | | Dresdner Funding Trust I,
8.151%, due 06/30/31 | | | 2,076,407 |
| | | | | | | | |
Principal
Amount | | | | | | Value |
| | | | | | | | |
| | Banks: (continued) | | | |
| $ | 1,719,000 | | S | | Fifth Third Bancorp.,
8.250%, due 03/01/38 | | $ | 1,306,815 |
| | 2,424,000 | | S | | First Tennessee Bank NA,
2.867%, due 05/18/09 | | | 2,297,082 |
| | 1,331,000 | | @@, #, C, S | | HBOS PLC,
5.375%, due 11/29/49 | | | 824,262 |
| | 3,370,000 | | @@, C, S | | Hongkong & Shanghai Banking Corp., Ltd.,
2.938%, due 07/29/49 | | | 2,257,900 |
| | 3,770,000 | | @@, C, S | | HSBC Bank PLC,
3.288%, due 06/29/49 | | | 2,035,800 |
| | 2,550,000 | | @@, S | | HSBC Bank PLC,
3.437%, due 06/29/49 | | | 1,415,250 |
| | 2,100,000 | | @@, C | | Lloyds TSB Bank PLC,
3.000%, due 11/29/49 | | | 1,186,500 |
| | 2,570,000 | | @@, C | | Lloyds TSB Bank PLC,
3.218%, due 08/29/49 | | | 1,452,050 |
| | 2,630,000 | | @@, C, L | | Lloyds TSB Bank PLC,
3.500%, due 12/31/49 | | | 1,485,950 |
| | 1,116,000 | | @@, #, C | | Lloyds TSB Group PLC,
6.267%, due 11/13/49 | | | 837,061 |
| | 565,000 | | @@, C | | Mizuho Financial Group Cayman Ltd.,
8.375%, due 01/29/49 | | | 485,908 |
| | 7,882,000 | | C | | National City Preferred Capital Trust I,
12.000%, due 12/29/49 | | | 2,752,442 |
| | 340,000 | | @@, C, L | | National Westminster Bank PLC,
3.000%, due 11/29/49 | | | 214,200 |
| | 590,000 | | @@, C | | National Westminster Bank PLC,
3.313%, due 08/29/49 | | | 386,450 |
| | 2,000,000 | | #, C | | PNC Preferred Funding Trust I,
8.700%, due 02/19/49 | | | 1,786,192 |
| | 2,099,000 | | #, C | | Rabobank Capital Funding II,
5.260%, due 12/29/49 | | | 1,945,269 |
| | 1,976,000 | | #, C | | Rabobank Capital Funding Trust,
5.254%, due 12/31/49 | | | 1,705,889 |
| | 1,803,000 | | C | | RBS Capital Trust I,
5.512%, due 12/29/49 | | | 1,458,663 |
| | 4,650,000 | | @@, C, L | | Royal Bank of Scotland Group PLC,
3.375%, due 12/29/49 | | | 2,952,750 |
| | 1,190,000 | | @@, C | | Societe Generale,
3.003%, due 11/29/49 | | | 921,277 |
| | 5,520,000 | | @@, C | | Standard Chartered PLC,
3.063%, due 11/29/49 | | | 2,925,600 |
| | 3,470,000 | | @@, C | | Standard Chartered PLC,
3.188%, due 07/29/49 | | | 1,839,100 |
| | 560,000 | | @@, C | | Standard Chartered PLC,
3.275%, due 01/29/49 | | | 305,200 |
| | 1,060,000 | | @@, C | | Standard Chartered PLC,
3.463%, due 12/29/49 | | | 567,100 |
| | 600,000 | | @@, #, C | | Standard Chartered PLC,
6.409%, due 12/31/49 | | | 463,079 |
| | 500,000 | | @@, #, C | | Standard Chartered PLC,
7.014%, due 07/30/49 | | | 421,690 |
See Accompanying Notes to Financial Statements
64
| | |
| ING INTERMEDIATE BOND FUND | | PORTFOLIO OF INVESTMENTS AS OF SEPTEMBER 30, 2008 (UNAUDITED) (CONTINUED) |
| | | | | | | | |
Principal
Amount | | | | | | Value |
| | | | | | | | |
| | Banks: (continued) | | | |
| $ | 191,000 | | C | | State Street Capital Trust III,
8.250%, due 12/29/49 | | $ | 187,402 |
| | 1,325,000 | | C | | SunTrust Preferred Capital I,
5.853%, due 12/31/49 | | | 729,208 |
| | 400,000 | | @@ | | UBS AG,
5.875%, due 12/20/17 | | | 355,778 |
| | 1,109,000 | | C | | USB Capital IX,
6.189%, due 04/15/11 | | | 543,672 |
| | 1,885,000 | | | | Wachovia Bank NA,
6.600%, due 01/15/38 | | | 1,119,262 |
| | 2,387,000 | | C | | Wachovia Capital Trust III,
5.800%, due 12/31/49 | | | 1,002,991 |
| | 3,523,000 | | C | | Wells Fargo Capital XV,
9.750%, due 12/29/49 | | | 3,420,597 |
| | 1,420,000 | | @@, C | | Westpac Banking Corp.,
4.056%, due 09/30/49 | | | 1,150,466 |
| | 1,269,000 | | @@, #, C | | Westpac Capital Trust IV,
5.256%, due 12/29/49 | | | 982,351 |
| | | | | | | | |
| | | | | | | | 72,247,738 |
| | | | | | | | |
| | Beverages: 0.1% | | | |
| BRL | 3,283,000 | | @@, #, S | | Ambev International Finance Co., Ltd.,
9.500%, due 07/24/17 | | | 1,259,441 |
| | | | | | | | |
| | | | | | | | 1,259,441 |
| | | | | | | | |
| | Chemicals: 0.3% | | | |
| $ | 760,000 | | Z | | Stauffer Chemical,
5.560%, due 04/15/10 | | | 699,274 |
| | 1,570,000 | | Z | | Stauffer Chemical,
12.130%, due 04/15/17 | | | 765,585 |
| | 1,280,000 | | Z | | Stauffer Chemical,
12.720%, due 04/15/18 | | | 573,789 |
| | 2,189,000 | | | | Union Carbide Corp.,
7.750%, due 10/01/96 | | | 1,912,639 |
| | | | | | | | |
| | | | | | | | 3,951,287 |
| | | | | | | | |
| | Computers: 0.3% | | | |
| | 1,851,000 | | C | | Lexmark International, Inc.,
5.900%, due 06/01/13 | | | 1,817,266 |
| | 1,615,000 | | C | | Lexmark International, Inc.,
6.650%, due 06/01/18 | | | 1,558,572 |
| | | | | | | | |
| | | | | | | | 3,375,838 |
| | | | | | | | |
| | Diversified Financial Services: 6.5% | | | |
| | 7,208,000 | | @@, #, C, S | | Aiful Corp.,
4.450%, due 02/16/10 | | | 5,575,244 |
| | 527,000 | | @@, #, C, S, I | | Alpine III,
3.357%, due 08/16/14 | | | 527,667 |
| | 527,000 | | @@, #, S, I | | Alpine III,
3.757%, due 08/16/14 | | | 527,940 |
| | 789,000 | | @@, #, S, I | | Alpine III,
5.557%, due 08/16/14 | | | 793,216 |
| | 1,348,000 | | @@, #, S, I | | Alpine III,
8.807%, due 08/16/14 | | | 1,373,701 |
| | | | | | | | |
Principal
Amount | | | | | | Value |
| | | | | | | | |
| | Diversified Financial Services: (continued) | | | |
| $ | 1,918,000 | | S | | American Express Co.,
7.000%, due 03/19/18 | | $ | 1,695,583 |
| | 1,340,000 | | S | | American Express Co.,
8.150%, due 03/19/38 | | | 1,201,613 |
| | 1,700,000 | | S | | American General Finance Corp.,
6.900%, due 12/15/17 | | | 789,305 |
| | 7,897,000 | | #, S | | Astoria Depositor Corp.,
8.144%, due 05/01/21 | | | 7,857,515 |
| | 1,374,000 | | @@, C, S | | BNP Paribas,
3.438%, due 12/31/49 | | | 1,032,237 |
| | 3,876,000 | | S | | CIT Group, Inc.,
2.939%, due 03/12/10 | | | 2,796,770 |
| | 2,500,000 | | S | | CIT Group, Inc.,
3.054%, due 02/13/12 | | | 1,350,983 |
| | 2,974,000 | | S | | Citigroup, Inc.,
6.125%, due 05/15/18 | | | 2,466,707 |
| | 2,452,000 | | C, S | | Citigroup, Inc.,
8.300%, due 12/21/57 | | | 1,830,906 |
| | 7,201,000 | | C, S | | Citigroup, Inc.,
8.400%, due 04/29/49 | | | 4,910,434 |
| | 2,531,000 | | #, C, S | | Corestates Capital Trust I,
8.000%, due 12/15/26 | | | 1,621,683 |
| | 2,261,000 | | S | | Countrywide Financial Corp.,
5.800%, due 06/07/12 | | | 1,911,510 |
| | 2,130,000 | | @@, S | | Eksportfinans A/S,
5.125%, due 10/26/11 | | | 2,196,473 |
| | 1,310,000 | | @@, C, S | | Financiere CSFB NV,
4.000%, due 03/29/49 | | | 858,050 |
| | 1,512,000 | | S | | Ford Motor Credit Co.,
5.538%, due 01/13/12 | | | 967,952 |
| | 3,279,000 | | S | | Ford Motor Credit Co.,
8.000%, due 12/15/16 | | | 2,075,912 |
| | 2,387,000 | | C, S | | Fund American Cos., Inc.,
5.875%, due 05/15/13 | | | 1,771,925 |
| | 2,892,000 | | S | | General Electric Capital Corp.,
5.875%, due 01/14/38 | | | 2,138,322 |
| | 1,299,000 | | S | | Goldman Sachs Group, Inc.,
5.250%, due 04/01/13 | | | 1,086,126 |
| | 2,957,000 | | S | | Goldman Sachs Group, Inc.,
5.450%, due 11/01/12 | | | 2,508,810 |
| | 2,271,000 | | C, S | | Goldman Sachs Group, Inc.,
5.793%, due 12/31/49 | | | 998,354 |
| | 1,817,000 | | #, C, S | | Harley-Davidson Funding Corp.,
6.800%, due 06/15/18 | | | 1,704,275 |
| | 1,963,000 | | #, C, S | | HVB Funding Trust III,
9.000%, due 10/22/31 | | | 1,738,401 |
| | 4,385,000 | | S | | International Lease Finance Corp.,
6.625%, due 11/15/13 | | | 2,690,675 |
| | 3,662,000 | | C, S | | JPMorgan Chase & Co.,
7.900%, due 04/29/49 | | | 3,091,208 |
| | 9,221,000 | | #, C | | Mangrove Bay Pass-through Trust,
6.102%, due 07/15/33 | | | 4,222,877 |
| | 3,178,000 | | @@, # | | Mantis Reef Ltd.,
4.799%, due 11/03/09 | | | 3,139,705 |
| | 1,025,000 | | | | Morgan Stanley,
6.000%, due 04/28/15 | | | 698,092 |
See Accompanying Notes to Financial Statements
65
| | |
| ING INTERMEDIATE BOND FUND | | PORTFOLIO OF INVESTMENTS AS OF SEPTEMBER 30, 2008 (UNAUDITED) (CONTINUED) |
| | | | | | | | |
Principal
Amount | | | | | | Value |
| | | | | | | | |
| | Diversified Financial Services: (continued) | | | |
| DKK | 26 | | @@, I | | Nordea Kredit Realkreditaktieselskab, 6.000%, due 07/01/29 | | $ | 5 |
| $ | 4,049,551 | | #, C | | Piper Jaffray Equipment Trust Securities,
6.000%, due 09/10/11 | | | 3,239,641 |
| | 2,964,645 | | #, C | | Piper Jaffray Equipment Trust Securities,
6.750%, due 04/01/11 | | | 2,371,716 |
| | 294,043 | | # | | Power Receivable Finance, LLC,
6.290%, due 01/01/12 | | | 304,475 |
| | 3,792,000 | | @@, # | | TNK-BP Finance SA,
7.500%, due 07/18/16 | | | 2,663,880 |
| | 13,479,689 | | #, Z | | Toll Road Investors Partnership II LP, 22.810%, due 02/15/45 | | | 1,431,031 |
| | 1,583,000 | | #, C | | Twin Reefs Pass-through Trust,
3.488%, due 12/10/49 | | | 160,279 |
| | 1,085,000 | | #, C | | Wachovia Capital Trust V,
7.965%, due 06/01/27 | | | 484,897 |
| | | | | | | | |
| | | | | | | | 80,806,095 |
| | | | | | | | |
| | Electric: 1.7% | | | |
| | 5,312,000 | | C, S | | Commonwealth Edison Co.,
6.950%, due 07/15/18 | | | 5,086,240 |
| | 1,571,000 | | C, S | | DTE Energy Co.,
7.050%, due 06/01/11 | | | 1,600,001 |
| | 1,296,000 | | C, S | | FPL Group Capital, Inc.,
6.350%, due 10/01/66 | | | 1,028,246 |
| | 418,000 | | C, S | | FPL Group Capital, Inc.,
6.650%, due 06/15/67 | | | 332,636 |
| | 517,344 | | #, C, S | | Juniper Generation, LLC,
6.790%, due 12/31/14 | | | 547,543 |
| | 1,153,000 | | C | | Nevada Power Co.,
6.750%, due 07/01/37 | | | 1,038,855 |
| | 127,000 | | C | | Nisource Finance Corp.,
6.150%, due 03/01/13 | | | 123,043 |
| | 3,977,000 | | C | | NorthWestern Corp.,
5.875%, due 11/01/14 | | | 3,805,583 |
| | 1,713,000 | | #, C | | Oncor Electric Delivery Co.,
6.800%, due 09/01/18 | | | 1,525,615 |
| | 2,318,000 | | #, C | | Oncor Electric Delivery Co.,
7.500%, due 09/01/38 | | | 1,944,130 |
| | 1,949,000 | | C | | Sierra Pacific Power Co.,
6.250%, due 04/15/12 | | | 1,963,204 |
| | 1,764,000 | | # | | White Pine Hydro Portfolio, LLC,
7.260%, due 07/20/15 | | | 1,702,509 |
| | | | | | | | |
| | | | | | | | 20,697,605 |
| | | | | | | | |
| | Energy - Alternate Sources: 0.4% | | | |
| | 1,800,000 | | S, I | | Greater Ohio Ethanol, LLC,
6.301%, due 12/31/13 | | | 1,620,000 |
| | 2,200,000 | | S, I | | Greater Ohio Ethanol, LLC,
12.630%, due 12/31/13 | | | 1,100,000 |
| | 1,653,000 | | # | | White Pine Hydro, LLC,
6.310%, due 07/10/17 | | | 1,589,406 |
| | 1,195,000 | | # | | White Pine Hydro, LLC,
6.960%, due 07/10/37 | | | 1,156,955 |
| | | | | | | | |
| | | | | | | | 5,466,361 |
| | | | | | | | |
| | | | | | | | |
Principal
Amount | | | | | | Value |
| | | | | | | | |
| | Food: 0.2% | | | |
| $ | 2,513,000 | | S | | Kraft Foods, Inc.,
6.125%, due 02/01/18 | | $ | 2,358,197 |
| | 457,000 | | S | | Kraft Foods, Inc.,
6.875%, due 02/01/38 | | | 421,983 |
| | 197,000 | | S | | Kraft Foods, Inc.,
7.000%, due 08/11/37 | | | 184,860 |
| | | | | | | | |
| | | | | | | | 2,965,040 |
| | | | | | | | |
| | Forest Products & Paper: 0.5% | | | |
| | 1,335,000 | | @@, S | | Abitibi-Consolidated, Inc.,
7.500%, due 04/01/28 | | | 313,725 |
| | 3,899,000 | | @@, C, S | | Abitibi-Consolidated, Inc.,
8.500%, due 08/01/29 | | | 955,255 |
| | 2,406,000 | | @@, C, S | | Abitibi-Consolidated, Inc.,
8.850%, due 08/01/30 | | | 589,470 |
| | 2,841,000 | | C, S | | International Paper Co.,
7.950%, due 06/15/18 | | | 2,796,240 |
| | 2,016,000 | | C, S | | International Paper Co.,
8.700%, due 06/15/38 | | | 2,025,098 |
| | | | | | | | |
| | | | | | | | 6,679,788 |
| | | | | | | | |
| | Gas: 0.4% | | | |
| | 6,691,000 | | C | | Southern Union Co.,
7.200%, due 11/01/66 | | | 4,947,379 |
| | | | | | | | |
| | | | | | | | 4,947,379 |
| | | | | | | | |
| | Healthcare - Services: 0.2% | | | |
| | 2,980,000 | | C | | UnitedHealth Group, Inc.,
6.875%, due 02/15/38 | | | 2,631,173 |
| | | | | | | | |
| | | | | | | | 2,631,173 |
| | | | | | | | |
| | Home Builders: 0.1% | | | |
| | 2,464,000 | | C, S | | Beazer Homes USA, Inc.,
8.125%, due 06/15/16 | | | 1,576,960 |
| | | | | | | | |
| | | | | | | | 1,576,960 |
| | | | | | | | |
| | Insurance: 1.2% | | | |
| | 4,313,000 | | @@, C, S | | Aegon NV,
4.634%, due 12/31/49 | | | 1,983,980 |
| | 3,058,000 | | S | | American International Group, Inc.,
5.850%, due 01/16/18 | | | 1,537,192 |
| | 2,207,000 | | #, C | | Metlife Capital Trust IV,
7.875%, due 12/15/37 | | | 1,515,776 |
| | 817,000 | | #, C | | North Front Pass-through Trust,
5.810%, due 12/15/24 | | | 738,154 |
| | 4,336,000 | | C | | Progressive Corp.,
6.700%, due 06/15/37 | | | 3,538,280 |
| | 1,562,000 | | | | Prudential Financial, Inc.,
6.000%, due 12/01/17 | | | 1,394,727 |
| | 1,699,000 | | | | Prudential Financial, Inc.,
6.625%, due 12/01/37 | | | 1,430,587 |
| | 5,984,000 | | @@, C | | Security Capital Assurance Ltd.,
6.880%, due 06/30/49 | | | 269,322 |
| | 3,238,000 | | @@, #, C | | White Mountains Re Group Ltd.,
7.506%, due 05/29/49 | | | 2,141,791 |
| | 867,000 | | @@, C | | XL Capital, Ltd.,
6.500%, due 12/15/49 | | | 512,246 |
| | | | | | | | |
| | | | | | | | 15,062,055 |
| | | | | | | | |
See Accompanying Notes to Financial Statements
66
| | |
| ING INTERMEDIATE BOND FUND | | PORTFOLIO OF INVESTMENTS AS OF SEPTEMBER 30, 2008 (UNAUDITED) (CONTINUED) |
| | | | | | | | |
Principal
Amount | | | | | | Value |
| | | | | | | | |
| | Media: 0.7% | | | |
| $ | 3,506,000 | | #, C, S | | COX Communications, Inc.,
6.250%, due 06/01/18 | | $ | 3,263,897 |
| | 1,033,000 | | #, C, S | | COX Communications, Inc.,
6.950%, due 06/01/38 | | | 921,649 |
| | 1,598,000 | | C | | News America, Inc.,
6.650%, due 11/15/37 | | | 1,344,139 |
| | 1,180,000 | | @@, C | | Thomson Reuters Corp.,
5.950%, due 07/15/13 | | | 1,179,823 |
| | 725,000 | | @@, C | | Thomson Reuters Corp.,
6.500%, due 07/15/18 | | | 694,591 |
| | 1,370,000 | | C | | Time Warner Cable, Inc.,
7.300%, due 07/01/38 | | | 1,222,109 |
| | | | | | | | |
| | | | | | | | 8,626,208 |
| | | | | | | | |
| | Miscellaneous Manufacturing: 0.2% | | | |
| | 3,321,000 | | S | | General Electric Co.,
5.250%, due 12/06/17 | | | 2,911,076 |
| | | | | | | | |
| | | | | | | | 2,911,076 |
| | | | | | | | |
| | Oil & Gas: 0.2% | | | |
| | 1,295,000 | | @@, #, S | | Empresa Nacional de Petroleo ENAP,
4.875%, due 03/15/14 | | | 1,208,614 |
| | 818,000 | | @@, #, S | | Empresa Nacional de Petroleo ENAP,
6.750%, due 11/15/12 | | | 840,284 |
| | | | | | | | |
| | | | | | | | 2,048,898 |
| | | | | | | | |
| | Pipelines: 0.3% | | | |
| | 906,000 | | C | | Northwest Pipeline Corp.,
7.000%, due 06/15/16 | | | 900,563 |
| | 1,684,000 | | C | | Panhandle Eastern Pipe Line,
6.200%, due 11/01/17 | | | 1,521,043 |
| | 1,262,000 | | C | | Transcontinental Gas Pipe Line Corp.,
6.400%, due 04/15/16 | | | 1,211,092 |
| | | | | | | | |
| | | | | | | | 3,632,698 |
| | | | | | | | |
| | Real Estate: 0.8% | | | |
| | 1,146,000 | | C, S | | iStar Financial, Inc.,
5.150%, due 03/01/12 | | | 573,382 |
| | 348,000 | | C, S | | iStar Financial, Inc.,
5.500%, due 06/15/12 | | | 177,607 |
| | 930,000 | | C, S | | iStar Financial, Inc.,
5.850%, due 03/15/17 | | | 456,319 |
| | 1,788,000 | | C, S | | iStar Financial, Inc.,
8.625%, due 06/01/13 | | | 930,497 |
| | 480,000 | | C | | Liberty Property LP,
6.375%, due 08/15/12 | | | 475,046 |
| | 1,719,000 | | C | | Liberty Property LP,
7.750%, due 04/15/09 | | | 1,717,382 |
| | 423,000 | | C | | Rouse Co.,
7.200%, due 09/15/12 | | | 302,445 |
| | 6,041,000 | | #, C | | Rouse Co. LP/TRC Co.-Issuer, Inc.,
6.750%, due 05/01/13 | | | 4,138,085 |
| | 1,581,000 | | C | | Simon Property Group L.P.,
5.300%, due 05/30/13 | | | 1,478,207 |
| | | | | | | | |
| | | | | | | | 10,248,970 |
| | | | | | | | |
| | Retail: 0.5% | | | |
| | 2,098,268 | | #, C, S | | CVS Lease Pass-through,
6.036%, due 12/10/28 | | | 1,888,561 |
| | | | | | | | |
Principal
Amount | | | | | | Value |
| | | | | | | | |
| | Retail: (continued) | | | |
| $ | 1,766,000 | | C, S | | Darden Restaurants, Inc.,
5.625%, due 10/15/12 | | $ | 1,665,651 |
| | 2,866,000 | | C, S | | Darden Restaurants, Inc.,
6.200%, due 10/15/17 | | | 2,427,892 |
| | | | | | | | |
| | | | | | | | 5,982,104 |
| | | | | | | | |
| | Telecommunications: 0.5% | | | |
| | 4,026,000 | | S | | Bellsouth Telecommunications, Inc.,
7.000%, due 12/01/95 | | | 3,306,433 |
| | 357,000 | | C, S | | Embarq Corp.,
7.995%, due 06/01/36 | | | 255,851 |
| | 3,559,000 | | C | | Sprint Capital Corp.,
6.875%, due 11/15/28 | | | 2,389,769 |
| | | | | | | | |
| | | | | | | | 5,952,053 |
| | | | | | | | |
| | Transportation: 0.3% | | | |
| | 1,958,000 | | C, S | | CSX Corp.,
6.250%, due 04/01/15 | | | 1,867,709 |
| | 2,449,000 | | C, S | | CSX Corp.,
7.450%, due 04/01/38 | | | 2,252,233 |
| | | | | | | | |
| | | | | | | | 4,119,942 |
| | | | | | | | |
| | | | | Total Corporate Bonds/Notes
(Cost $352,484,660) | | | 276,674,112 |
| | | | | | | | |
| | U.S. GOVERNMENT AGENCY OBLIGATIONS: 42.0% |
| | Federal Home Loan Mortgage Corporation##: 13.6% |
| | 279,340 | | C, S | | 2.838%, due 02/15/32 | | | 275,973 |
| | 6,867,870 | | C, S | | 2.838%, due 05/15/33 | | | 6,433,193 |
| | 642,084 | | C, S | | 3.138%, due 04/15/32 | | | 631,745 |
| | 1,161,346 | | C, S | | 4.500%, due 12/15/16 | | | 1,165,765 |
| | 3,488,000 | | C, S | | 4.500%, due 02/15/20 | | | 3,275,721 |
| | 4,405,501 | | C, S | | 5.000%, due 08/15/16 | | | 4,421,101 |
| | 4,151,000 | | C, S | | 5.000%, due 12/15/17 | | | 4,156,868 |
| | 1,346,000 | | C, S | | 5.000%, due 05/15/20 | | | 1,324,683 |
| | 2,255,292 | | C, S | | 5.000%, due 08/15/21 | | | 2,274,025 |
| | 3,588,000 | | C, S | | 5.000%, due 04/15/23 | | | 3,445,775 |
| | 2,600,000 | | C, S | | 5.000%, due 09/15/31 | | | 2,529,347 |
| | 987,000 | | C, S | | 5.000%, due 02/15/32 | | | 963,683 |
| | 4,253,000 | | C, S | | 5.000%, due 03/15/32 | | | 4,134,516 |
| | 4,408,000 | | C, S | | 5.000%, due 04/15/32 | | | 4,354,339 |
| | 3,089,000 | | C, S | | 5.000%, due 08/15/32 | | | 3,042,775 |
| | 3,995,000 | | C, S | | 5.000%, due 12/15/32 | | | 3,933,785 |
| | 2,393,291 | | C, S | | 5.000%, due 02/15/35 | | | 2,368,090 |
| | 531,308 | | S | | 5.015%, due 04/01/35 | | | 528,871 |
| | 9,850,256 | | C, S | | 5.500%, due 08/15/20 | | | 9,553,446 |
| | 1,734,000 | | C, S | | 5.500%, due 12/15/20 | | | 1,731,349 |
| | 6,362,000 | | C, S | | 5.500%, due 11/15/22 | | | 6,324,435 |
| | 4,800,000 | | C, S | | 5.500%, due 07/15/32 | | | 4,770,120 |
| | 3,957,000 | | C, S | | 5.500%, due 09/15/32 | | | 3,932,569 |
| | 1,039,000 | | C, S | | 5.500%, due 10/15/32 | | | 1,037,284 |
| | 925,000 | | C, S | | 5.500%, due 11/15/32 | | | 926,726 |
| | 3,031,000 | | C, S | | 5.500%, due 07/15/33 | | | 3,021,629 |
| | 1,910,000 | | C, S | | 5.500%, due 08/15/33 | | | 1,897,808 |
| | 81,506,000 | | W | | 5.500%, due 10/15/35 | | | 80,990,222 |
| | 33,084 | | S | | 6.000%, due 12/01/28 | | | 33,776 |
| | 42,691 | | S | | 6.000%, due 01/01/29 | | | 43,583 |
| | 6,325,117 | | C, S | | 6.000%, due 01/15/29 | | | 6,469,575 |
| | 47,974 | | S | | 6.500%, due 01/01/24 | | | 49,809 |
| | 74,158 | | S | | 7.000%, due 11/01/31 | | | 77,985 |
| | 24,710 | | S | | 7.000%, due 03/01/32 | | | 25,980 |
| | 6,829 | | S | | 7.500%, due 11/01/28 | | | 7,422 |
| | | | | | | | |
| | | | | | | | 170,153,973 |
| | | | | | | | |
See Accompanying Notes to Financial Statements
67
| | |
| ING INTERMEDIATE BOND FUND | | PORTFOLIO OF INVESTMENTS AS OF SEPTEMBER 30, 2008 (UNAUDITED) (CONTINUED) |
| | | | | | | | |
Principal
Amount | | | | | | Value |
| | | | | | | | |
| | Federal National Mortgage Association##: 17.5% |
| $ | 276,488 | | S | | 3.148%, due 04/18/28 | | $ | 274,001 |
| | 149,278 | | S | | 3.557%, due 08/25/33 | | | 145,505 |
| | 345,692 | | S | | 3.657%, due 10/25/33 | | | 336,867 |
| | 299,181 | | C, S | | 3.757%, due 01/25/32 | | | 299,259 |
| | 2,462,286 | | S | | 5.000%, due 02/25/29 | | | 2,478,981 |
| | 84,231,000 | | W | | 5.000%, due 10/15/33 | | | 82,085,721 |
| | 1,471,000 | | S | | 5.000%, due 10/25/33 | | | 1,435,324 |
| | 3,305,663 | | S | | 5.000%, due 08/01/35 | | | 3,226,762 |
| | 829,977 | | S | | 5.000%, due 10/01/35 | | | 810,167 |
| | 1,037,544 | | S | | 5.027%, due 07/01/35 | | | 1,035,144 |
| | 2,220,266 | | S, ^ | | 5.188%, due 02/17/29 | | | 201,326 |
| | 712,526 | | S | | 5.229%, due 08/01/35 | | | 713,048 |
| | 191,492 | | S | | 5.500%, due 02/01/18 | | | 193,229 |
| | 2,632,000 | | S | | 5.500%, due 05/25/30 | | | 2,597,367 |
| | 91,469,000 | | W | | 5.500%, due 10/15/35 | | | 91,226,058 |
| | 4,378,749 | | S | | 5.500%, due 01/25/36 | | | 4,173,247 |
| | 4,426,630 | | S | | 5.500%, due 12/25/36 | | | 4,204,865 |
| | 4,307,739 | | S | | 5.500%, due 02/25/37 | | | 4,262,996 |
| | 277,401 | | S | | 5.500%, due 06/01/37 | | | 276,913 |
| | 218,184 | | S | | 6.000%, due 08/01/16 | | | 223,368 |
| | 3,212 | | S | | 6.000%, due 12/01/16 | | | 3,288 |
| | 123,872 | | S | | 6.000%, due 03/01/17 | | | 126,815 |
| | 15,063 | | S | | 6.000%, due 07/01/17 | | | 15,416 |
| | 1,091,490 | | S | | 6.000%, due 09/01/17 | | | 1,117,081 |
| | 74,874 | | S | | 6.000%, due 11/01/17 | | | 76,653 |
| | 21,945 | | S | | 6.000%, due 10/01/18 | | | 22,405 |
| | 3,094,892 | | S | | 6.000%, due 07/25/29 | | | 3,157,885 |
| | 1,880,756 | | S | | 6.000%, due 04/25/31 | | | 1,927,219 |
| | 2,631,140 | | S | | 6.000%, due 01/01/38 | | | 2,666,393 |
| | 6,388,521 | | S | | 6.000%, due 08/01/38 | | | 6,478,148 |
| | 40,108 | | S | | 6.500%, due 01/01/23 | | | 41,640 |
| | 18,452 | | S | | 6.500%, due 02/01/28 | | | 19,114 |
| | 31,123 | | S | | 6.500%, due 07/01/29 | | | 32,222 |
| | 1,586 | | S | | 6.500%, due 06/01/31 | | | 1,640 |
| | 274,210 | | S | | 6.500%, due 07/01/31 | | | 284,055 |
| | 9,826 | | S | | 6.500%, due 09/01/31 | | | 10,163 |
| | 176,461 | | S | | 6.500%, due 11/01/31 | | | 182,521 |
| | 92,991 | | S | | 6.500%, due 04/01/32 | | | 96,097 |
| | 49,815 | | S | | 6.500%, due 08/01/32 | | | 51,479 |
| | 21,905 | | S | | 6.500%, due 11/01/32 | | | 22,636 |
| | 94,175 | | S | | 6.500%, due 01/01/33 | | | 97,321 |
| | 76,885 | | S | | 6.500%, due 02/01/33 | | | 79,309 |
| | 415,053 | | S | | 6.500%, due 12/01/33 | | | 428,139 |
| | 48,806 | | S | | 6.500%, due 04/01/37 | | | 50,106 |
| | 127,739 | | S | | 6.500%, due 05/01/37 | | | 131,140 |
| | 54,451 | | S | | 7.000%, due 12/01/27 | | | 57,520 |
| | 39,081 | | S | | 7.000%, due 01/01/30 | | | 41,110 |
| | 232,479 | | S | | 7.000%, due 06/01/31 | | | 244,689 |
| | 23,307 | | S | | 7.000%, due 10/01/31 | | | 24,506 |
| | 13,380 | | S | | 7.000%, due 03/01/32 | | | 14,068 |
| | 8,628 | | S | | 7.500%, due 10/01/30 | | | 9,324 |
| | 25,272 | | S | | 7.500%, due 09/01/31 | | | 27,280 |
| | 69,208 | | S | | 7.500%, due 02/01/32 | | | 74,916 |
| | 268,214 | | C, S | | 7.500%, due 12/25/41 | | | 285,896 |
| | 581,102 | | C, S | | 7.500%, due 01/25/48 | | | 610,350 |
| | | | | | | | |
| | | | | | | | 218,708,692 |
| | | | | | | | |
| | Government National Mortgage Association: 10.9% |
| | 5,239 | | S | | 5.375%, due 04/20/28 | | | 5,308 |
| | 93,622,000 | | W | | 5.500%, due 10/15/38 | | | 93,724,422 |
| | 638,665 | | C, S, ^ | | 5.762%, due 06/16/31 | | | 57,794 |
| | 41,951,000 | | W | | 6.000%, due 10/01/32 | | | 42,573,721 |
| | | | | | | | |
Principal
Amount | | | | | | Value |
| | | | | | | | |
| | Government National Mortgage Association: (continued) |
| $ | 5,638 | | S | | 6.500%, due 02/15/26 | | $ | 5,812 |
| | 4,293 | | S | | 6.500%, due 01/15/29 | | | 4,422 |
| | 11,020 | | S | | 6.500%, due 02/15/29 | | | 11,352 |
| | 1,180 | | S | | 6.500%, due 03/15/31 | | | 1,215 |
| | 17,330 | | S | | 6.500%, due 08/15/31 | | | 17,841 |
| | 59,744 | | S | | 6.500%, due 10/15/31 | | | 61,505 |
| | 14,101 | | S | | 6.500%, due 11/15/31 | | | 14,517 |
| | 30,929 | | S | | 6.500%, due 01/15/32 | | | 31,822 |
| | 11,755 | | S | | 6.500%, due 07/15/32 | | | 12,094 |
| | 59,403 | | S | | 6.500%, due 09/15/32 | | | 61,117 |
| | 40,528 | | S | | 7.000%, due 04/15/26 | | | 42,820 |
| | 7,284 | | S | | 7.000%, due 01/15/28 | | | 7,683 |
| | 39,504 | | S | | 7.000%, due 02/15/28 | | | 41,665 |
| | 19,065 | | S | | 7.000%, due 05/15/32 | | | 20,049 |
| | 44,074 | | S | | 7.500%, due 12/15/22 | | | 47,575 |
| | 20,615 | | S | | 7.500%, due 12/15/23 | | | 22,252 |
| | 5,334 | | S | | 7.500%, due 10/15/26 | | | 5,762 |
| | 8,052 | | S | | 7.500%, due 07/15/29 | | | 8,685 |
| | 127 | | S | | 7.500%, due 11/15/30 | | | 136 |
| | 19,651 | | S | | 7.500%, due 12/15/30 | | | 21,184 |
| | 22,052 | | S | | 7.500%, due 12/15/31 | | | 23,771 |
| | 46,947 | | S | | 7.500%, due 05/15/32 | | | 50,524 |
| | | | | | | | |
| | | | | | | | 136,875,048 |
| | | | | | | | |
| | | | | Total U.S. Government Agency Obligations
(Cost $528,253,929) | | | 525,737,713 |
| | | | | | | | |
| | U.S. TREASURY OBLIGATIONS: 22.8% | | | |
| | U.S. Treasury Bonds: 8.1% | | | |
| | 84,302,000 | | L | | 4.000%, due 08/15/18 | | | 85,527,077 |
| | 15,302,000 | | L | | 4.375%, due 02/15/38 | | | 15,501,645 |
| | | | | | | | |
| | | | | | | | 101,028,722 |
| | | | | | | | |
| | U.S. Treasury Notes: 13.6% | | | |
| | 27,450,000 | | L | | 2.375%, due 08/31/10 | | | 27,668,749 |
| | 121,826,000 | | L | | 3.125%, due 08/31/13 | | | 122,796,831 |
| | 20,000,000 | | | | 3.125%, due 09/30/13 | | | 20,143,760 |
| | | | | | | | |
| | | | | | | | 170,609,340 |
| | | | | | | | |
| | Treasury Inflation Indexed Protected Securitiesip: 1.1% |
| | 14,949,853 | | L | | 1.375%, due 07/15/18 | | | 13,541,924 |
| | | | | | | | |
| | | | | | | | 13,541,924 |
| | | | | | | | |
| | | | | Total U.S. Treasury Obligations
(Cost $287,073,532) | | | 285,179,986 |
| | | | | | | | |
| | ASSET-BACKED SECURITIES: 2.7% | | | |
| | Credit Card Asset-Backed Securities: 0.1% | | | |
| | 1,685,000 | | C, S | | Citibank Credit Card Issuance Trust,
5.650%, due 09/20/19 | | | 1,546,515 |
| | | | | | | | |
| | | | | | | | 1,546,515 |
| | | | | | | | |
| | Home Equity Asset-Backed Securities: 0.9% | | | |
| | 324,038 | | C, S | | Freddie Mac Structured Pass-through Securities,
3.457%, due 05/25/31 | | | 255,332 |
| | 79,930 | | C, S | | Freddie Mac Structured Pass-through Securities,
3.507%, due 01/25/32 | | | 72,538 |
| | 352,000 | | C, S | | GMAC Mortgage Corp. Loan Trust,
6.249%, due 12/25/37 | | | 156,733 |
See Accompanying Notes to Financial Statements
68
| | |
| ING INTERMEDIATE BOND FUND | | PORTFOLIO OF INVESTMENTS AS OF SEPTEMBER 30, 2008 (UNAUDITED) (CONTINUED) |
| | | | | | | | |
Principal
Amount | | | | | | Value |
| | | | | | | | |
| | Home Equity Asset-Backed Securities: (continued) |
| $ | 4,411,837 | | C, S | | GSAA Trust,
5.242%, due 06/25/34 | | $ | 4,345,462 |
| | 1,384,000 | | #, C, S | | Irwin Home Equity,
5.960%, due 08/25/37 | | | 917,526 |
| | 40,848 | | C | | Merrill Lynch Mortgage Investors, Inc.,
3.567%, due 07/25/34 | | | 33,669 |
| | 1,082,006 | | C | | Morgan Stanley Capital I,
4.407%, due 06/25/33 | | | 772,467 |
| | 3,905,000 | | C | | Morgan Stanley Mortgage Loan Trust,
5.858%, due 01/25/47 | | | 2,604,039 |
| | 134,325 | | C | | Renaissance Home Equity Loan Trust,
4.456%, due 05/25/35 | | | 133,049 |
| | 83,275 | | C | | Residential Asset Securities Corp.,
3.807%, due 06/25/32 | | | 61,687 |
| | 1,411,000 | | C | | Residential Funding Mortgage Securities II, Inc.,
5.890%, due 05/25/37 | | | 1,086,580 |
| | 662,576 | | C | | Wells Fargo Home Equity Trust,
3.970%, due 05/25/34 | | | 646,170 |
| | | | | | | | |
| | | | | | | | 11,085,252 |
| | | | | | | | |
| | Other Asset-Backed Securities: 1.7% | | | |
| | 30,018 | | C, S | | Amortizing Residential Collateral Trust,
3.457%, due 05/25/32 | | | 18,879 |
| | 1,210,050 | | C, S | | Bear Stearns Asset-Backed Securities, Inc.,
3.587%, due 06/25/36 | | | 926,819 |
| | 195,000 | | S | | CenterPoint Energy Transition Bond Co., LLC,
4.192%, due 02/01/20 | | | 183,991 |
| | 112,000 | | S | | CenterPoint Energy Transition Bond Co., LLC,
5.234%, due 02/01/23 | | | 100,194 |
| | 205,084 | | C, S | | Chase Funding Mortgage Loan Asset-Backed Certificates,
3.507%, due 07/25/33 | | | 180,303 |
| | 58,789 | | C, S | | Chase Funding Mortgage Loan Asset-Backed Certificates,
4.045%, due 05/25/33 | | | 56,321 |
| | 2,545,989 | | C, S | | Credit-Based Asset Servicing and Securitization, LLC,
4.831%, due 08/25/35 | | | 2,481,596 |
| | 2,394,557 | | C, S | | Credit-Based Asset Servicing and Securitization, LLC,
5.501%, due 12/25/36 | | | 2,181,441 |
| | 1,456,000 | | #, C, S | | Credit-Based Asset Servicing and Securitization, LLC,
5.746%, due 12/25/37 | | | 1,187,550 |
| | 1,188,000 | | #, C, S | | Credit-Based Asset Servicing and Securitization, LLC,
6.020%, due 12/25/37 | | | 762,177 |
| | 1,183,571 | | C, S | | Equity One, Inc.,
5.050%, due 09/25/33 | | | 1,049,035 |
| | 403,836 | | C, S | | Fannie Mae,
3.347%, due 04/25/35 | | | 339,858 |
| | | | | | | | |
Principal
Amount | | | | | | Value |
| | | | | | | | |
| | Other Asset-Backed Securities: (continued) | | | |
| $ | 2,052,934 | | @@, #, C, S | | Franklin CLO Ltd,
3.754%, due 09/20/15 | | $ | 1,974,923 |
| | 5,168,000 | | #, C, S | | Grand Horn Ltd.,
3.388%, due 01/12/22 | | | 4,651,200 |
| | 2,720,000 | | #, C, S, I | | Hudson Mezzanine Funding,
3.237%, due 06/12/42 | | | 2,720 |
| | 980,412 | | C | | Lehman XS Trust,
3.487%, due 08/25/35 | | | 650,407 |
| | 739,815 | | @@, #, C | | Liberty Square CDO Ltd., 3.181%, due 04/15/13 | | | 688,028 |
| | 615,299 | | C | | Merrill Lynch Mortgage Investors, Inc.,
5.609%, due 03/25/37 | | | 574,833 |
| | 147,281 | | C | | Popular Mortgage Pass-through Trust,
4.000%, due 12/25/34 | | | 144,783 |
| | 366,402 | | C | | Residential Asset Mortgage Products, Inc.,
3.477%, due 07/25/35 | | | 350,722 |
| | 5,918 | | C | | Residential Asset Mortgage Products, Inc.,
3.827%, due 06/25/33 | | | 4,801 |
| | 1,209,518 | | C | | Structured Asset Securities Corp.,
4.910%, due 06/25/33 | | | 899,480 |
| | 1,375,000 | | @@, #, C | | TCW Select Loan Fund Ltd., Inc.,
3.490%, due 10/10/13 | | | 1,266,719 |
| | | | | | | | |
| | | | | | | | 20,676,780 |
| | | | | | | | |
| | | | | Total Asset-Backed Securities
(Cost $40,540,748) | | | 33,308,547 |
| | | | | | | | |
| | COLLATERALIZED MORTGAGE OBLIGATIONS: 24.8% |
| | 303,088 | | C, S | | ABN Amro Mortgage Corp.,
3.707%, due 03/25/18 | | | 283,576 |
| | 522,045 | | C, S | | American Home Mortgage Assets,
3.645%, due 02/25/47 | | | 132,916 |
| | 3,863,173 | | C, S | | American Home Mortgage Assets,
3.775%, due 11/25/46 | | | 1,944,814 |
| | 2,206,211 | | C, S | | American Home Mortgage Assets,
3.855%, due 09/25/46 | | | 847,875 |
| | 4,608,880 | | C, S | | American Home Mortgage Investment Trust,
3.497%, due 11/25/45 | | | 2,931,879 |
| | 5,737,134 | | C, S | | American Home Mortgage Investment Trust,
3.587%, due 11/25/45 | | | 2,497,159 |
| | 2,823,841 | | #, S | | Astoria Depositor Corp.,
7.902%, due 05/01/21 | | | 2,866,199 |
| | 4,416,927 | | C, S | | Banc of America Alternative Loan Trust,
6.280%, due 11/25/21 | | | 4,080,103 |
See Accompanying Notes to Financial Statements
69
| | |
| ING INTERMEDIATE BOND FUND | | PORTFOLIO OF INVESTMENTS AS OF SEPTEMBER 30, 2008 (UNAUDITED) (CONTINUED) |
| | | | | | | | |
Principal
Amount | | | | | | Value |
| | | | | | | | |
| | COLLATERALIZED MORTGAGE OBLIGATIONS: (continued) |
| $ | 3,272,866 | | C, S | | Banc of America Alternative Loan Trust,
6.479%, due 04/25/37 | | $ | 2,542,030 |
| | 58,494,785 | | C, S, ^ | | Banc of America Commercial Mortgage, Inc.,
0.465%, due 01/15/49 | | | 970,048 |
| | 319,254 | | C, S | | Banc of America Commercial Mortgage, Inc.,
4.161%, due 12/10/42 | | | 313,447 |
| | 110,000 | | C, S | | Banc of America Commercial Mortgage, Inc.,
4.429%, due 11/10/39 | | | 104,242 |
| | 1,671,000 | | C, S | | Banc of America Commercial Mortgage, Inc.,
4.502%, due 07/10/42 | | | 1,593,292 |
| | 37,346 | | C, S | | Banc of America Commercial Mortgage, Inc.,
4.611%, due 07/10/43 | | | 36,610 |
| | 1,158,000 | | C, S | | Banc of America Commercial Mortgage, Inc.,
4.764%, due 07/10/45 | | | 1,131,057 |
| | 1,365,935 | | C, S | | Banc of America Commercial Mortgage, Inc.,
4.772%, due 07/11/43 | | | 1,338,207 |
| | 104,981 | | C, S | | Banc of America Commercial Mortgage, Inc.,
4.877%, due 11/10/42 | | | 103,263 |
| | 2,300,000 | | C, S | | Banc of America Commercial Mortgage, Inc.,
4.891%, due 07/10/45 | | | 2,182,541 |
| | 1,470,000 | | C, S | | Banc of America Commercial Mortgage, Inc.,
5.463%, due 09/10/47 | | | 965,880 |
| | 290,000 | | C, S | | Banc of America Commercial Mortgage, Inc.,
6.186%, due 06/11/35 | | | 289,846 |
| | 4,188,771 | | C, S | | Banc of America Funding Corp.,
3.398%, due 06/20/47 | | | 2,606,744 |
| | 5,114,907 | | C, S | | Banc of America Funding Corp.,
5.255%, due 09/20/35 | | | 3,317,732 |
| | 8,145,822 | | C, S | | Banc of America Funding Corp.,
5.650%, due 06/20/37 | | | 6,662,835 |
| | 2,296,917 | | C, S | | Banc of America Funding Corp.,
5.750%, due 09/20/34 | | | 2,131,251 |
| | 1,410,556 | | C, S | | Banc of America Funding Corp.,
7.000%, due 10/25/37 | | | 1,125,241 |
| | 2,405,063 | | C, S | | Banc of America Mortgage Securities, Inc.,
5.173%, due 09/25/35 | | | 2,068,235 |
| | 857,354 | | C, S | | Banc of America Mortgage Securities, Inc.,
5.250%, due 11/25/19 | | | 843,196 |
| | 823,755 | | C, S | | Banc of America Mortgage Securities, Inc.,
5.500%, due 11/25/33 | | | 754,178 |
| | 1,403,290 | | C, S | | Banc of America Mortgage Securities, Inc.,
5.500%, due 06/25/35 | | | 1,392,146 |
| | | | | | | | |
Principal
Amount | | | | | | Value |
| | | | | | | | |
| | COLLATERALIZED MORTGAGE OBLIGATIONS: (continued) |
| $ | 798,332 | | C, S | | Bear Stearns Alternative-A Trust,
3.527%, due 07/25/34 | | $ | 619,927 |
| | 696,000 | | C, S | | Bear Stearns Commercial Mortgage Securities,
4.565%, due 07/11/42 | | | 667,502 |
| | 139,676 | | C, S | | Bear Stearns Commercial Mortgage Securities,
5.415%, due 04/12/38 | | | 137,490 |
| | 2,537,000 | | #, C, S | | Bear Stearns Commercial Mortgage Securities,
5.660%, due 09/11/41 | | | 1,705,433 |
| | 1,783,851 | | C, S | | Chase Manhattan Bank-First Union National Bank,
7.439%, due 08/15/31 | | | 1,793,943 |
| | 4,793,130 | | C, S | | Chase Mortgage Finance Corp.,
5.408%, due 12/25/35 | | | 4,055,232 |
| | 2,791,400 | | C, S | | Chase Mortgage Finance Corp.,
5.500%, due 11/25/35 | | | 2,753,224 |
| | 4,153,334 | | C, S | | Chaseflex Trust,
6.500%, due 02/25/37 | | | 3,148,541 |
| | 228,261 | | C, S | | Citicorp Mortgage Securities, Inc.,
3.657%, due 03/25/33 | | | 210,364 |
| | 1,302,465 | | C, S | | Citigroup Mortgage Loan Trust, Inc.,
5.728%, due 08/25/47 | | | 1,046,626 |
| | 3,205,224 | | C, S | | Citigroup Mortgage Loan Trust, Inc.,
5.936%, due 06/25/36 | | | 2,620,194 |
| | 5,231,419 | | C, S | | Citigroup Mortgage Loan Trust, Inc.,
6.000%, due 11/25/35 | | | 4,896,551 |
| | 9,046,431 | | C, S | | Citigroup Mortgage Loan Trust, Inc.,
6.060%, due 08/25/36 | | | 7,529,891 |
| | 1,051,001 | | C, S | | Citigroup Mortgage Securities, Inc.,
5.500%, due 02/25/22 | | | 1,017,426 |
| | 6,667,000 | | C, S | | Citigroup/Deutsche Bank Commercial Mortgage Trust,
5.322%, due 12/11/49 | | | 5,580,186 |
| | 6,667,000 | | C, S | | Citigroup/Deutsche Bank Commercial Mortgage Trust,
5.886%, due 11/15/44 | | | 5,731,861 |
| | 74,960 | | C, S | | Countrywide Alternative Loan Trust,
3.507%, due 02/25/35 | | | 68,993 |
| | 53,301 | | C, S | | Countrywide Alternative Loan Trust,
3.607%, due 02/25/33 | | | 47,454 |
| | 2,598,949 | | C, S | | Countrywide Alternative Loan Trust,
3.735%, due 11/25/46 | | | 997,553 |
| | 515,543 | | C, S | | Countrywide Alternative Loan Trust,
3.757%, due 04/25/33 | | | 480,216 |
See Accompanying Notes to Financial Statements
70
| | |
| ING INTERMEDIATE BOND FUND | | PORTFOLIO OF INVESTMENTS AS OF SEPTEMBER 30, 2008 (UNAUDITED) (CONTINUED) |
| | | | | | | | |
Principal
Amount | | | | | | Value |
| | | | | | | | |
| | COLLATERALIZED MORTGAGE OBLIGATIONS: (continued) |
| $ | 174,546 | | C, S | | Countrywide Alternative Loan Trust,
3.907%, due 09/25/36 | | $ | 173,393 |
| | 6,705,343 | | C, S | | Countrywide Alternative Loan Trust,
5.406%, due 10/25/35 | | | 4,841,624 |
| | 2,667,126 | | C, S | | Countrywide Alternative Loan Trust,
5.500%, due 02/25/25 | | | 2,356,696 |
| | 1,293,970 | | C, S | | Countrywide Home Loan Mortgage Pass-through Trust,
3.527%, due 04/25/35 | | | 552,660 |
| | 434,325 | | C, S | | Countrywide Home Loan Mortgage Pass-through Trust,
3.707%, due 04/25/18 | | | 434,860 |
| | 1,713,411 | | C, S | | Countrywide Home Loan Mortgage Pass-through Trust,
5.250%, due 10/25/35 | | | 1,467,326 |
| | 410,190 | | C, S | | Countrywide Home Loan Mortgage Pass-through Trust,
5.750%, due 07/25/37 | | | 392,017 |
| | 391,723 | | C, S | | Credit Suisse First Boston Mortgage Securities Corp.,
3.727%, due 03/15/35 | | | 370,699 |
| | 387,703 | | C, S | | Credit Suisse First Boston Mortgage Securities Corp.,
3.819%, due 05/15/36 | | | 368,670 |
| | 975,000 | | C, S | | Credit Suisse First Boston Mortgage Securities Corp.,
4.801%, due 03/15/36 | | | 911,676 |
| | 45,000 | | C, S | | Credit Suisse First Boston Mortgage Securities Corp.,
7.899%, due 04/15/62 | | | 46,182 |
| | 7,101,959 | | C, S | | Credit Suisse Mortgage Capital Certificates,
7.000%, due 08/25/36 | | | 5,224,455 |
| | 1,379,599 | | C, S | | DLJ Commercial Mortgage Corp.,
7.300%, due 06/10/32 | | | 1,384,281 |
| | 4,736,723 | | C, S | | First Horizon Alternative Mortgage Securities,
5.500%, due 08/25/35 | | | 3,784,131 |
| | 472,394 | | C, S | | First Horizon Asset Securities, Inc.,
5.396%, due 10/25/35 | | | 426,304 |
| | 1,660,135 | | C, S | | First Horizon Asset Securities, Inc.,
5.500%, due 12/25/35 | | | 1,635,134 |
| | 923,000 | | C, S | | First Horizon Asset Securities, Inc.,
5.750%, due 02/25/36 | | | 872,643 |
| | 53,577,903 | | C, S, ^ | | GE Capital Commercial Mortgage Corp.,
0.673%, due 06/10/48 | | | 661,655 |
| | 698,000 | | C, S | | GE Capital Commercial Mortgage Corp.,
4.371%, due 01/10/38 | | | 680,735 |
| | | | | | | | |
Principal
Amount | | | | | | Value |
| | | | | | | | |
| | COLLATERALIZED MORTGAGE OBLIGATIONS: (continued) |
| $ | 483,000 | | C, S | | GE Capital Commercial Mortgage Corp.,
4.865%, due 07/10/39 | | $ | 464,633 |
| | 265,508 | | C, S | | GE Capital Commercial Mortgage Corp.,
5.560%, due 06/10/38 | | | 263,749 |
| | 1,536,876 | | C, S | | GMAC Mortgage Corp. Loan Trust,
4.582%, due 10/19/33 | | | 1,416,344 |
| | 3,343,943 | | C, S | | GMAC Mortgage Corp. Loan Trust,
5.249%, due 03/18/35 | | | 2,484,210 |
| | 1,800,877 | | C, S | | GMAC Mortgage Corp. Loan Trust,
5.467%, due 11/19/35 | | | 1,550,895 |
| | 78,044 | | C, S | | GMAC Mortgage Corp. Loan Trust,
5.500%, due 09/25/34 | | | 77,330 |
| | 46,176,556 | | #, C, S, ^ | | Greenwich Capital Commercial Funding Corp.,
0.511%, due 03/10/39 | | | 789,739 |
| | 2,544,000 | | C, S | | Greenwich Capital Commercial Funding Corp.,
5.117%, due 04/10/37 | | | 2,493,661 |
| | 1,693,000 | | C, S, I | | Greenwich Capital Commercial Funding Corp.,
5.444%, due 03/10/39 | | | 1,434,941 |
| | 1,393,000 | | C, S | | Greenwich Capital Commercial Funding Corp.,
5.534%, due 03/10/39 | | | 852,274 |
| | 705,000 | | C, S | | Greenwich Capital Commercial Funding Corp.,
5.554%, due 03/10/39 | | | 419,981 |
| | 564,000 | | C, S | | Greenwich Capital Commercial Funding Corp.,
5.613%, due 03/10/39 | | | 275,288 |
| | 2,821,000 | | C, S | | GS Mortgage Securities Corp. II,
5.560%, due 11/10/39 | | | 2,502,312 |
| | 1,949,000 | | C, S | | GS Mortgage Securities Corp. II,
5.815%, due 04/10/38 | | | 1,254,369 |
| | 546,426 | | #, C, S | | GSMPS Mortgage Loan Trust,
3.557%, due 01/25/35 | | | 496,520 |
| | 523,389 | | C, S | | GSR Mortgage Loan Trust,
3.707%, due 06/25/35 | | | 454,898 |
| | 1,286,820 | | C, S | | GSR Mortgage Loan Trust,
5.500%, due 07/25/35 | | | 1,213,585 |
| | 2,663,193 | | C, S | | GSR Mortgage Loan Trust,
6.500%, due 10/25/36 | | | 2,202,910 |
| | 545,285 | | C, S | | Harborview Mortgage Loan Trust,
3.380%, due 01/19/35 | | | 376,747 |
| | 301,525 | | C, S | | Homebanc Mortgage Trust,
4.067%, due 08/25/29 | | | 255,416 |
See Accompanying Notes to Financial Statements
71
| | |
| ING INTERMEDIATE BOND FUND | | PORTFOLIO OF INVESTMENTS AS OF SEPTEMBER 30, 2008 (UNAUDITED) (CONTINUED) |
| | | | | | | | |
Principal
Amount | | | | | | Value |
| | | | | | | | |
| | COLLATERALIZED MORTGAGE OBLIGATIONS: (continued) |
| $ | 235,224 | | C, S | | JPMorgan Alternative Loan Trust,
5.504%, due 01/25/36 | | $ | 194,107 |
| | 158,147,036 | | C, S, ^ | | JPMorgan Chase Commercial Mortgage Securities Corp.,
0.066%, due 01/12/43 | | | 153,229 |
| | 252,435 | | C, S | | JPMorgan Chase Commercial Mortgage Securities Corp.,
4.200%, due 07/12/35 | | | 245,570 |
| | 1,755,000 | | C, S | | JPMorgan Chase Commercial Mortgage Securities Corp.,
4.223%, due 01/15/42 | | | 1,716,296 |
| | 888,905 | | C, S | | JPMorgan Chase Commercial Mortgage Securities Corp.,
4.275%, due 01/12/37 | | | 849,804 |
| | 843,000 | | C, S | | JPMorgan Chase Commercial Mortgage Securities Corp.,
4.865%, due 03/15/46 | | | 797,676 |
| | 433,000 | | C, S | | JPMorgan Chase Commercial Mortgage Securities Corp.,
5.455%, due 05/15/47 | | | 318,594 |
| | 1,306,000 | | C, S | | JPMorgan Chase Commercial Mortgage Securities Corp.,
5.475%, due 04/15/43 | | | 1,153,440 |
| | 866,000 | | C, S | | JPMorgan Chase Commercial Mortgage Securities Corp.,
5.495%, due 05/15/47 | | | 593,589 |
| | 154,563 | | C, S | | JPMorgan Chase Commercial Mortgage Securities Corp.,
6.023%, due 04/15/45 | | | 153,095 |
| | 1,388,000 | | C, S | | JPMorgan Chase Commercial Mortgage Securities Corp.,
6.051%, due 04/15/45 | | | 1,353,551 |
| | 9,889,949 | | C, S | | JPMorgan Mortgage Trust,
5.402%, due 11/25/35 | | | 8,643,476 |
| | 11,936,181 | | C, S, ^ | | LB-UBS Commercial Mortgage Trust,
0.676%, due 02/15/40 | | | 295,744 |
| | 911,000 | | C | | LB-UBS Commercial Mortgage Trust,
3.992%, due 10/15/29 | | | 892,567 |
| | 225,000 | | C, S | | LB-UBS Commercial Mortgage Trust,
4.310%, due 02/15/30 | | | 219,645 |
| | 695,000 | | C | | LB-UBS Commercial Mortgage Trust,
4.510%, due 12/15/29 | | | 658,877 |
| | 1,077,020 | | C, S | | LB-UBS Commercial Mortgage Trust,
4.821%, due 04/15/30 | | | 1,057,847 |
| | 526,000 | | C, S | | LB-UBS Commercial Mortgage Trust,
4.836%, due 02/15/40 | | | 392,247 |
| | 520,000 | | C, S | | LB-UBS Commercial Mortgage Trust,
4.885%, due 09/15/30 | | | 510,645 |
| | 1,010,000 | | C, S | | LB-UBS Commercial Mortgage Trust,
4.998%, due 04/15/30 | | | 961,927 |
| | 1,529,000 | | C | | LB-UBS Commercial Mortgage Trust,
5.103%, due 11/15/30 | | | 1,497,138 |
| | | | | | | | |
Principal
Amount | | | | | | Value |
| | | | | | | | |
| | COLLATERALIZED MORTGAGE OBLIGATIONS: (continued) |
| $ | 2,116,000 | | C, S | | LB-UBS Commercial Mortgage Trust,
5.347%, due 11/15/38 | | $ | 1,842,742 |
| | 2,747,000 | | C, S | | LB-UBS Commercial Mortgage Trust,
5.403%, due 02/15/40 | | | 2,425,430 |
| | 1,845,000 | | C, S | | LB-UBS Commercial Mortgage Trust,
5.456%, due 04/15/40 | | | 1,277,844 |
| | 1,014,000 | | C, S | | LB-UBS Commercial Mortgage Trust,
5.516%, due 11/15/38 | | | 604,730 |
| | 721,000 | | C, S | | LB-UBS Commercial Mortgage Trust,
5.533%, due 02/15/40 | | | 430,730 |
| | 1,442,000 | | C, S | | LB-UBS Commercial Mortgage Trust,
5.563%, due 02/15/40 | | | 816,932 |
| | 2,865,000 | | C, S | | LB-UBS Commercial Mortgage Trust,
6.317%, due 04/15/41 | | | 2,618,476 |
| | 6,629,000 | | C | | LB-UBS Commercial Mortgage Trust,
6.365%, due 12/15/28 | | | 6,646,773 |
| | 4,646,180 | | C, S | | LB-UBS Commercial Mortgage Trust,
7.370%, due 08/15/26 | | | 4,726,605 |
| | 1,579,158 | | C | | Luminent Mortgage Trust,
3.407%, due 10/25/46 | | | 980,937 |
| | 1,618,000 | | C | | MASTR Alternative Loans Trust,
6.250%, due 07/25/36 | | | 1,254,270 |
| | 19,449 | | C | | MASTR Alternative Loans Trust,
6.500%, due 05/25/33 | | | 15,089 |
| | 237,813 | | C | | MASTR Alternative Loans Trust,
8.500%, due 05/25/33 | | | 241,035 |
| | 668,111 | | C | | MASTR Asset Securitization Trust,
5.500%, due 06/25/33 | | | 613,898 |
| | 1,265,889 | | C | | MASTR Reperforming Loan Trust,
3.567%, due 07/25/35 | | | 1,058,018 |
| | 43,959,415 | | C, ^ | | Merrill Lynch Mortgage Trust,
0.215%, due 10/12/41 | | | 720,099 |
| | 37,067,278 | | #, C, ^ | | Merrill Lynch Mortgage Trust,
0.340%, due 11/12/35 | | | 140,429 |
| | 981,000 | | C | | Merrill Lynch Mortgage Trust,
4.892%, due 02/12/42 | | | 938,608 |
| | 8,172,100 | | C, ^ | | Merrill Lynch/Countrywide Commercial Mortgage Trust,
0.730%, due 08/12/48 | | | 248,033 |
| | 625,000 | | C | | Merrill Lynch/Countrywide Commercial Mortgage Trust,
5.479%, due 08/12/48 | | | 369,712 |
| | 696,000 | | C | | Merrill Lynch/Countrywide Commercial Mortgage Trust,
5.509%, due 08/12/48 | | | 390,244 |
See Accompanying Notes to Financial Statements
72
| | |
| ING INTERMEDIATE BOND FUND | | PORTFOLIO OF INVESTMENTS AS OF SEPTEMBER 30, 2008 (UNAUDITED) (CONTINUED) |
| | | | | | | | |
Principal
Amount | | | | | | Value |
| | | | | | | | |
| | COLLATERALIZED MORTGAGE OBLIGATIONS: (continued) |
| $ | 792,446 | | C | | MLCC Mortgage Investors, Inc.,
3.437%, due 04/25/29 | | $ | 727,703 |
| | 503,244 | | C | | MLCC Mortgage Investors, Inc.,
3.527%, due 10/25/28 | | | 490,301 |
| | 276,742 | | C | | MLCC Mortgage Investors, Inc.,
3.527%, due 01/25/29 | | | 255,479 |
| | 3,910,000 | | C | | Morgan Stanley Capital I,
5.007%, due 01/14/42 | | | 3,736,153 |
| | 70,591 | | C | | Morgan Stanley Capital I,
7.020%, due 03/15/32 | | | 70,476 |
| | 406,039 | | C | | Morgan Stanley Dean Witter Capital I,
4.180%, due 03/12/35 | | | 382,182 |
| | 1,621,000 | | C | | New York Mortgage Trust, Inc.,
5.653%, due 05/25/36 | | | 1,302,515 |
| | 1,038,000 | | C | | Nomura Asset Securities Corp.,
6.690%, due 03/15/30 | | | 1,049,898 |
| | 208,971 | | C | | Prime Mortgage Trust,
3.707%, due 02/25/35 | | | 138,805 |
| | 1,930,048 | | C | | Prudential Commercial Mortgage Trust,
3.669%, due 02/11/36 | | | 1,862,824 |
| | 4,938,454 | | C | | RAAC Series,
5.250%, due 09/25/34 | | | 4,650,945 |
| | 1,680,610 | | C | | Residential Accredit Loans, Inc.,
3.447%, due 04/25/46 | | | 689,463 |
| | 6,722,608 | | C | | Residential Accredit Loans, Inc.,
5.500%, due 05/25/34 | | | 4,202,086 |
| | 405,395 | | C | | Residential Funding Mortgage Sec I,
3.607%, due 11/25/17 | | | 401,948 |
| | 369,303 | | C | | Salomon Brothers Mortgage Securities VII,
7.520%, due 12/18/09 | | | 372,821 |
| | 365,060 | | C | | Sequoia Mortgage Trust,
3.458%, due 01/20/35 | | | 319,981 |
| | 506,973 | | C | | Structured Adjustable Rate Mortgage Loan Trust,
3.517%, due 07/25/35 | | | 325,608 |
| | 779,874 | | C | | Structured Asset Mortgage Investments, Inc.,
3.270%, due 04/19/35 | | | 533,390 |
| | 2,769,754 | | C | | Structured Asset Mortgage Investments, Inc.,
5.384%, due 12/27/35 | | | 2,057,232 |
| | 547,887 | | C | | Thornburg Mortgage Securities Trust,
3.557%, due 12/25/33 | | | 528,432 |
| | 1,758,975 | | C | | Thornburg Mortgage Securities Trust,
3.577%, due 09/25/44 | | | 1,689,541 |
| | 200,000 | | C | | Wachovia Bank Commercial Mortgage Trust,
5.285%, due 07/15/42 | | | 196,059 |
| | 581,000 | | #, C | | Wachovia Bank Commercial Mortgage Trust,
5.384% -C213, due 10/15/44 | | | 369,488 |
| | 4,930,000 | | #, C | | Wachovia Bank Commercial Mortgage Trust,
5.384% -C21D, due 10/15/44 | | | 3,476,114 |
| | 702,587 | | C | | WaMu Mortgage Pass-through Certificates,
5.637%, due 12/25/36 | | | 448,762 |
| | | | | | | | |
Principal
Amount | | | | | | Value |
| | | | | | | | |
| | COLLATERALIZED MORTGAGE OBLIGATIONS: (continued) |
| $ | 461,196 | | C | | Washington Mutual Mortgage Pass-through Certificates,
2.920%, due 06/25/44 | | $ | 431,215 |
| | 415,153 | | C | | Washington Mutual Mortgage Pass-through Certificates,
3.517%, due 01/25/45 | | | 277,329 |
| | 432,848 | | C | | Washington Mutual Mortgage Pass-through Certificates,
3.527%, due 08/25/45 | | | 282,601 |
| | 455,067 | | C | | Washington Mutual Mortgage Pass-through Certificates,
3.555%, due 02/25/47 | | | 239,661 |
| | 1,587,705 | | C | | Washington Mutual Mortgage Pass-through Certificates,
3.555%, due 03/25/47 | | | 836,715 |
| | 7,742,979 | | C | | Washington Mutual Mortgage Pass-through Certificates,
3.595%, due 01/25/47 | | | 4,212,700 |
| | 4,350,587 | | C | | Washington Mutual Mortgage Pass-through Certificates -1A,
3.605%, due 06/25/47 | | | 2,515,044 |
| | 2,567,929 | | C | | Washington Mutual Mortgage Pass-through Certificates -1A1B,
3.605%, due 06/25/47 | | | 1,112,196 |
| | 887,590 | | C | | Washington Mutual Mortgage Pass-through Certificates,
3.607%, due 08/25/45 | | | 500,277 |
| | 320,431 | | C | | Washington Mutual Mortgage Pass-through Certificates,
3.615%, due 04/25/47 | | | 139,656 |
| | 464,625 | | C | | Washington Mutual Mortgage Pass-through Certificates,
3.625%, due 04/25/47 | | | 269,652 |
| | 4,389,300 | | C | | Washington Mutual Mortgage Pass-through Certificates -1A,
3.625%, due 05/25/47 | | | 2,546,040 |
| | 2,714,471 | | C | | Washington Mutual Mortgage Pass-through Certificates -1A1B,
3.625%, due 05/25/47 | | | 1,207,293 |
| | 2,845,188 | | C | | Washington Mutual Mortgage Pass-through Certificates -1A,
3.665%, due 07/25/47 | | | 1,641,504 |
| | 4,191,840 | | C | | Washington Mutual Mortgage Pass-through Certificates -1A1B,
3.665%, due 07/25/47 | | | 1,864,160 |
| | 2,129,875 | | C | | Washington Mutual Mortgage Pass-through Certificates,
3.695%, due 11/25/46 | | | 1,154,287 |
| | 617,633 | | C | | Washington Mutual Mortgage Pass-through Certificates,
3.707%, due 01/25/18 | | | 615,147 |
| | 2,028,000 | | C | | Washington Mutual Mortgage Pass-through Certificates,
3.795%, due 06/25/34 | | | 1,979,064 |
| | 2,637,681 | | C | | Washington Mutual Mortgage Pass-through Certificates,
3.815%, due 09/25/46 | | | 1,449,264 |
| | 139,273 | | C | | Washington Mutual Mortgage Pass-through Certificates,
3.825%, due 06/25/46 | | | 75,453 |
See Accompanying Notes to Financial Statements
73
| | |
| ING INTERMEDIATE BOND FUND | | PORTFOLIO OF INVESTMENTS AS OF SEPTEMBER 30, 2008 (UNAUDITED) (CONTINUED) |
| | | | | | | | |
Principal
Amount | | | | | | Value |
| | | | | | | | |
| | COLLATERALIZED MORTGAGE OBLIGATIONS: (continued) |
| $ | 5,758,033 | | C | | Washington Mutual Mortgage Pass-through Certificates,
3.845%, due 06/25/46 | | $ | 3,177,664 |
| | 831,505 | | C | | Washington Mutual Mortgage Pass-through Certificates,
4.059%, due 07/25/46 | | | 458,178 |
| | 723,397 | | C | | Washington Mutual Mortgage Pass-through Certificates,
4.198%, due 10/25/46 | | | 449,225 |
| | 764,224 | | C | | Washington Mutual Mortgage Pass-through Certificates,
4.355%, due 11/25/46 | | | 305,690 |
| | 94,914 | | C | | Washington Mutual Mortgage Pass-through Certificates,
5.000%, due 12/25/18 | | | 92,120 |
| | 3,243,588 | | C | | Washington Mutual Mortgage Pass-through Certificates -2A3,
5.493%, due 01/25/37 | | | 2,661,882 |
| | 453,229 | | C | | Washington Mutual Mortgage Pass-through Certificates -2A4,
5.493%, due 01/25/37 | | | 283,531 |
| | 6,015,479 | | C | | Washington Mutual Mortgage Pass-through Certificates,
5.664%, due 06/25/37 | | | 4,062,537 |
| | 7,924,827 | | C | | Washington Mutual Mortgage Pass-through Certificates,
5.695%, due 06/25/37 | | | 6,470,634 |
| | 442,036 | | C | | Washington Mutual Mortgage Pass-through Certificates,
5.814%, due 06/25/37 | | | 363,306 |
| | 2,989,000 | | C | | Washington Mutual Mortgage Pass-through Certificates,
5.817%, due 10/25/36 | | | 2,361,988 |
| | 5,091,473 | | C | | Washington Mutual Mortgage Pass-through Certificates,
5.867%, due 07/25/37 | | | 3,506,332 |
| | 2,789,574 | | C | | Washington Mutual Mortgage Pass-through Certificates,
5.873%, due 07/25/37 | | | 1,774,852 |
| | 1,546,241 | | C | | Washington Mutual Mortgage Pass-through Certificates,
5.907%, due 07/25/37 | | | 1,147,318 |
| | 1,503,698 | | C | | Washington Mutual Mortgage Pass-through Certificates,
6.000%, due 06/25/34 | | | 1,373,360 |
| | 1,792,092 | | C | | Wells Fargo Alternative Loan Trust,
6.000%, due 06/25/37 | | | 1,099,538 |
| | 912,158 | | C | | Wells Fargo Alternative Loan Trust,
6.250%, due 11/25/37 | | | 812,025 |
| | 3,467,664 | | C | | Wells Fargo Mortgage-Backed Securities Trust,
6.000%, due 12/28/37 | | | 2,955,380 |
| | 3,298,000 | | C | | Wells Fargo Mortgage-Backed Securities Trust,
3.560%, due 06/25/35 | | | 3,251,491 |
| | 2,144,664 | | C | | Wells Fargo Mortgage-Backed Securities Trust,
4.500%, due 08/25/18 | | | 2,040,416 |
| | | | | | | | |
Principal
Amount | | | | | | Value |
| | | | | | | | |
| | COLLATERALIZED MORTGAGE OBLIGATIONS: (continued) |
| $ | 3,691,000 | | C | | Wells Fargo Mortgage-Backed Securities Trust,
4.786%, due 07/25/34 | | $ | 3,290,646 |
| | 1,719,824 | | C | | Wells Fargo Mortgage-Backed Securities Trust,
4.891%, due 08/25/34 | | | 1,513,907 |
| | 4,189,649 | | C | | Wells Fargo Mortgage-Backed Securities Trust,
5.112%, due 03/25/36 | | | 3,476,791 |
| | 5,864,205 | | C | | Wells Fargo Mortgage-Backed Securities Trust,
5.387%, due 08/25/35 | | | 4,934,875 |
| | 3,422,764 | | C | | Wells Fargo Mortgage-Backed Securities Trust,
5.630%, due 12/25/36 | | | 2,880,584 |
| | 3,296,879 | | C | | Wells Fargo Mortgage-Backed Securities Trust,
5.927%, due 11/25/36 | | | 2,728,662 |
| | 2,902,618 | | C | | Wells Fargo Mortgage-Backed Securities Trust,
5.939%, due 10/25/36 | | | 2,411,449 |
| | 4,337,541 | | C | | Wells Fargo Mortgage-Backed Securities Trust,
6.000%, due 06/25/36 | | | 3,868,411 |
| | | | | | | | |
| | | | | Total Collateralized Mortgage Obligations
(Cost $378,957,490) | | | 309,430,046 |
| | | | | | | | |
| | MUNICIPAL BONDS: 1.1% | | | |
| | California: 0.2% | | | |
| | 2,703,000 | | C | | City of San Diego,
7.125%, due 06/01/32 | | | 2,433,700 |
| | | | | | | | |
| | | | | | | | 2,433,700 |
| | | | | | | | |
| | Florida: 0.1% | | | |
| | 1,470,000 | | C, S | | Florida State Board of Education,
4.750%, due 06/01/35 | | | 1,248,280 |
| | | | | | | | |
| | | | | | | | 1,248,280 |
| | | | | | | | |
| | Lousiana: 0.2% | | | |
| | 2,933,000 | | C | | State of Louisiana,
5.000%, due 10/15/17 | | | 3,020,609 |
| | | | | | | | |
| | | | | | | | 3,020,609 |
| | | | | | | | |
| | Michigan: 0.3% | | | |
| | 4,850,000 | | | | Michigan Tobacco Settlement Finance Authority,
7.309%, due 06/01/34 | | | 4,144,713 |
| | | | | | | | |
| | | | | | | | 4,144,713 |
| | | | | | | | |
| | Washington: 0.3% | | | |
| | 3,276,000 | | C | | State of Washington,
5.000%, due 01/01/33 | | | 3,057,818 |
| | | | | | | | |
| | | | | | | | 3,057,818 |
| | | | | | | | |
| | | | | Total Municipal Bonds
(Cost $15,350,979) | | | 13,905,120 |
| | | | | | | | |
See Accompanying Notes to Financial Statements
74
| | |
| ING INTERMEDIATE BOND FUND | | PORTFOLIO OF INVESTMENTS AS OF SEPTEMBER 30, 2008 (UNAUDITED) (CONTINUED) |
| | | | | | | |
| | | |
| Shares | | | | | | Value |
| PREFERRED STOCK: 0.8% | | | |
| Banks: 0.0% | | | | | |
| 105,400 | | @@, P | | Santander Finance | | $ | 845,308 |
| | | | | | | |
| | | | | | | 845,308 |
| | | | | | | |
| Diversified Financial Services: 0.5% | | | |
| 61,000 | | P, S | | JPMorgan Chase Capital XXVI | | | 1,474,980 |
| 133,625 | | P | | Merrill Lynch & Co., Inc. | | | 1,316,206 |
| 3,450 | | #, P | | Zurich RegCaPS Funding Trust | | | 3,068,344 |
| | | | | | | |
| | | | | | | 5,859,530 |
| | | | | | | |
| Insurance: 0.3% | | | | | |
| 148,632 | | @@, P, S | | Aegon NV | | | 1,267,831 |
| 57,053 | | @@, P, S | | Aegon NV - Series 1 | | | 396,518 |
| 135,625 | | P | | Metlife, Inc. | | | 2,104,900 |
| | | | | | | |
| | | | | | | 3,769,249 |
| | | | | | | |
| | | | Total Preferred Stock
(Cost $19,236,116) | | | 10,474,087 |
| | | | | | | |
| WARRANTS: 0.0% | | | | | |
| Telecommunications: 0.0% | | | |
| 20 | | | | American Tower Corp. | | | 10,198 |
| | | | | | | |
| | | | Total Warrants
(Cost $1,502) | | | 10,198 |
| | | | | | | |
| | | | Total Long-Term Investments
(Cost $1,621,898,956) | | | 1,454,719,809 |
| | | | | | | |
| SHORT-TERM INVESTMENTS: 29.1% | | | |
| Affiliated Mutual Fund: 11.4% | | | |
| 142,450,000 | | S | | ING Institutional Prime Money Market Fund | | $ | 142,450,000 |
| | | | | | | |
| | | | Total Mutual Fund
(Cost $142,450,000) | | | 142,450,000 |
| | | | | | | |
| | | | | | | | | | |
Principal
Amount | | | | | | | | Value |
| | Repurchase Agreement: 0.5% | | | | | |
| $ | 6,324,000 | | S | | Goldman Sachs Repurchase Agreement dated 09/30/08, 1.000%, due 10/01/08, $6,324,176 to be received upon repurchase (Collateralized by $6,101,000 Federal National Mortgage Association, 4.625%, Market Value plus accrued interest $6,451,490, due 10/15/14) | | | | $ | 6,324,000 |
| | | | | | | | | | |
| | | | | Total Repurchase Agreement
(Cost $6,324,000) | | | | | 6,324,000 |
| | | | | | | | | | |
| | | | | | | | | | | |
Principal
Amount | | | | | | | | Value | |
| | | | | | | | | | | |
| | Securities Lending Collateralcc: 17.2% | | | | | | |
| $ | 217,650,328 | | | | Bank of New York Mellon Corp. Institutional Cash Reserves | | | | $ | 214,736,704 | |
| | | | | | | | | | | |
| | | | | Total Securities Lending Collateral
(Cost $217,650,328) | | | | | 214,736,704 | |
| | | | | | | | | | | |
| | | | | Total Short-Term Investments
(Cost $366,424,328) | | | | | 363,510,704 | |
| | | | | | | | | | | |
| | | | | Total Investments in Securities
(Cost $1,988,323,284)* | | 145.4% | | | $1,818,230,513 | |
| | | | | Other Assets and Liabilities - Net | | (45.4) | | | (567,886,043 | ) |
| | | | | | | | | | | |
| | | | | Net Assets | | 100.0% | | | $1,250,344,470 | |
| | | | | | | | | | | |
| MASTR | Mortgage Asset Securitization Transaction, Inc. |
| # | Securities with purchases pursuant to Rule 144A or section 4(2), under the Securities Act of 1933 and may not be resold subject to that rule except to qualified institutional buyers. Unless otherwise noted, these securities have been determined to be liquid under the guidelines established by the Funds’ Board of Directors/Trustees. |
| C | Bond may be called prior to maturity date. |
| P | Preferred Stock may be called prior to convertible date. |
| cc | Securities purchased with cash collateral for securities loaned. |
| ip | Treasury inflation indexed protected security whose principal value is adjusted in accordance with changes to the Consumer Price Index. |
| W | Settlement is on a when-issued or delayed-delivery basis with final maturity to be announced in the future. |
| S | All or a portion of this security is segregated to cover collateral requirements for applicable futures, options, swaps, foreign forward currency contracts and/or when-issued or delayed-delivery securities. |
See Accompanying Notes to Financial Statements
75
| | |
| ING INTERMEDIATE BOND FUND | | PORTFOLIO OF INVESTMENTS AS OF SEPTEMBER 30, 2008 (UNAUDITED) (CONTINUED) |
| L | Loaned security, a portion or all of the security is on loan at September 30, 2008. |
| ^ | Interest only securities represent the right to receive the monthly interest payments on an underlying pool of mortgage loans. Principal amount shown represents the notional amount on which current interest is calculated. Payments of principal on the pool reduce the value of the interest only security. |
| Z | Indicates Zero Coupon Bond; rate shown reflects current effective yield. |
| * | Cost for federal income tax purposes is $1,988,559,453. |
| | | | |
Net unrealized depreciation consists of: | |
Gross Unrealized Appreciation | | $ | 1,576,249 | |
Gross Unrealized Depreciation | | | (171,905,189 | ) |
| | | | |
Net Unrealized Depreciation | | $ | (170,328,940 | ) |
| | | | |
The following table summarizes the inputs used as of September 30, 2008 in determining the Fund’s investments at fair value for purposes of SFAS 157:
| | | | | | |
| | | Investments in
Securities | | Other Financial
Instruments* |
Level 1 — Quoted Prices | | $ | 357,196,902 | | $ | 2,131,772 |
Level 2 — Other Significant Observable Inputs | | | 1,421,300,998 | | | 16,961,150 |
Level 3 — Significant Unobservable Inputs | | | 39,732,613 | | | 201,998 |
| | | | | | |
Total | | $ | 1,818,230,513 | | $ | 19,294,920 |
| | | | | | |
“Fair value” for purposes of SFAS 157 is different from “fair value” as used in the 1940 Act. The former generally implies market value,
and can include market quotations as a source of value, and the latter refers to determinations of actual value in absence of available market quotations.
| * | Other financial instruments may include forward foreign currency contracts, futures, swaps, and written options. Forward foreign currency contracts and futures are reported at their unrealized gain/loss at period end. Swaps and written options are reported at their market value at period end. |
A roll forward of fair value measurements using significant unobservable inputs (Level 3) for the six months ended September 30, 2008, was as follows:
| | | | | | | | |
| | | Investments in
Securities | | | Other Financial
Instruments* | |
Balance at 03/31/08 | | $ | 47,395,962 | | | $ | 355,421 | |
Net purchases/sales | | | 7,510,512 | | | | (1,409,185 | ) |
Total realized and unrealized gain (loss) | | | (4,848,805 | ) | | | 1,689,341 | |
Amortization of premium/discount | | | 146,764 | | | | 11,162 | |
Transfers in and/or out of Level 3 | | | (10,471,820 | ) | | | (444,741 | ) |
| | | | | | | | |
Balance at 09/30/08 | | $ | 39,732,613 | | | $ | 201,998 | |
| | | | | | | | |
| * | Other financial instruments may include forward foreign currency contracts, futures, swaps, and written options. Forward foreign currency contracts and futures are reported at their unrealized gain/loss at period end. Swaps and written options are reported at their market value at period end. |
For the six months ended September 30, 2008, total change in unrealized gain (loss) on Level 3 securities still held at period end included in the change in net assets was $(3,499,217). Total unrealized gain (loss) for all securities (including Level 1 and Level 2) can be found on the accompanying Statement of Operations.
At September 30, 2008 the following forward foreign currency contracts were outstanding for the ING Intermediate Bond Fund:
| | | | | | | | | | | | | | | | |
Currency | | | | | | Buy/Sell | | Settlement
Date | | In Exchange
For | | Value | | Unrealized
Appreciation
(Depreciation) | |
| | | | | | | | | | USD | | | | | | |
British Pound Sterling | | GBP | | 14,779,022 | | BUY | | 10/16/08 | | 26,105,000 | | 26,309,217 | | $ | 204,217 | |
British Pound Sterling | | GBP | | 7,476,024 | | BUY | | 10/16/08 | | 13,454,600 | | 13,308,616 | | | (145,984 | ) |
British Pound Sterling | | GBP | | 6,800,870 | | BUY | | 10/16/08 | | 12,231,500 | | 12,106,724 | | | (124,776 | ) |
British Pound Sterling | | GBP | | 14,779,022 | | BUY | | 10/16/08 | | 26,352,475 | | 26,309,217 | | | (43,258 | ) |
Japanese Yen | | JPY | | 2,144,200,654 | | BUY | | 10/10/08 | | 19,586,213 | | 20,194,937 | | | 608,724 | |
Japanese Yen | | JPY | | 1,351,735,081 | | BUY | | 10/31/08 | | 13,044,400 | | 12,775,759 | | | (268,641 | ) |
Japanese Yen | | JPY | | 1,352,320,775 | | BUY | | 10/31/08 | | 13,044,400 | | 12,781,295 | | | (263,105 | ) |
Russian Rubles | | RUB | | 169,455,300 | | BUY | | 10/22/08 | | 6,588,464 | | 6,583,866 | | | (4,598 | ) |
| | | | | | | | | | | | | | | | |
| | | | | | | | | | | | | | $ | (37,421 | ) |
| | | | | | | | | | | | | | | | |
| | | | | | | |
Colombian Pesos | | COP | | 6,821,703,168 | | SELL | | 10/22/08 | | 3,267,600 | | 3,104,346 | | $ | 163,254 | |
Euro | | EUR | | 18,289,778 | | SELL | | 10/16/08 | | 26,105,000 | | 25,792,114 | | | 312,886 | |
British Pound Sterling | | GBP | | 14,276,893 | | SELL | | 10/16/08 | | 25,457,129 | | 25,415,340 | | | 41,789 | |
British Pound Sterling | | GBP | | 14,779,022 | | SELL | | 10/16/08 | | 26,352,475 | | 26,309,217 | | | 43,258 | |
Indonesian Rupiahs | | IDR | | 31,826,424,000 | | SELL | | 10/22/08 | | 3,267,600 | | 3,364,562 | | | (96,962 | ) |
Russian Rubles | | RUB | | 169,455,300 | | SELL | | 10/22/08 | | 6,510,000 | | 6,583,866 | | | (73,866 | ) |
Russian Rubles | | RUB | | 169,455,300 | | SELL | | 10/22/08 | | 6,580,788 | | 6,583,866 | | | (3,078 | ) |
| | | | | | | | | | | | | | | | |
| | | | | | | | | | | | | | $ | 387,281 | |
| | | | | | | | | | | | | | | | |
See Accompanying Notes to Financial Statements
76
| | |
| ING INTERMEDIATE BOND FUND | | PORTFOLIO OF INVESTMENTS AS OF SEPTEMBER 30, 2008 (UNAUDITED) (CONTINUED) |
ING Intermediate Bond Fund Open Futures Contracts on September 30, 2008:
| | | | | | | | |
Contract Description | | Number
of
Contracts | | Expiration
Date | | Unrealized
Appreciation/
(Depreciation) | |
Long Contracts | | | | | | | | |
Australia 90-Day Bank Bill | | 374 | | 09/10/09 | | $ | 353,973 | |
Australia 3-Year Bond | | 812 | | 12/15/08 | | | 590,996 | |
Euro-Bund | | 161 | | 12/08/08 | | | 165,713 | |
Euro-Schatz | | 498 | | 12/08/08 | | | 599,247 | |
Long Gilt | | 235 | | 12/29/08 | | | 37,320 | |
| | | | | | | | |
| | | | | | $ | 1,747,249 | |
| | | | | | | | |
Short Contracts | | | | | | | | |
Australia 10-Year Bond | | 8 | | 12/15/08 | | $ | (8,655 | ) |
U.S. Treasury 2-Year Note | | 263 | | 12/31/08 | | | (358,173 | ) |
U.S. Treasury 5-Year Note | | 308 | | 12/31/08 | | | (143,772 | ) |
U.S. Treasury 10-Year Note | | 1,179 | | 12/19/08 | | | 814,315 | |
U.S. Treasury Long Bond | | 803 | | 12/19/08 | | | 80,808 | |
| | | | | | | | |
| | | | | | $ | 384,523 | |
| | | | | | | | |
ING Intermediate Bond Fund Credit Default Swap Agreements Outstanding on September 30, 2008:
| | | | | | | | | | | | | | | | | |
Counterparty | | Reference Entity/Obligation | | Buy/Sell
Protection(1) | | (Pay)/Receive
Fixed Rate (%) | | | Termination
Date | | | | Notional
Amount | | Unrealized
Appreciation/
(Depreciation) | |
Citibank N.A., New York | | Abitibi-Consolidated Co. of Canada
8.375%, 04/01/15 | | Sell | | 5.000 | | | 06/20/13 | | USD | | 1,115,000 | | $ | (241,598 | ) |
Citibank N.A., New York | | Abitibi-Consolidated Co. of Canada
8.375%, 04/01/15 | | Sell | | 5.000 | | | 06/20/13 | | USD | | 1,115,000 | | | (240,611 | ) |
Goldman Sachs International | | Ace INA Holdings
8.875%, 08/15/29 | | Buy | | (0.650 | ) | | 09/20/13 | | USD | | 9,388,000 | | | 7,764 | |
Barclays Bank PLC | | Agrium Inc.
8.250%, 02/15/11 | | Buy | | (1.055 | ) | | 03/20/13 | | USD | | 3,735,000 | | | (17,589 | ) |
UBS AG | | Australia & New Zealand Banking Group Ltd.
4.450%, 02/05/15 | | Buy | | (0.350 | ) | | 09/20/17 | | USD | | 2,135,000 | | | 155,339 | |
UBS AG | | Australia & New Zealand Banking Group Ltd.
4.450%, 02/05/16 | | Buy | | (0.510 | ) | | 09/20/17 | | USD | | 1,972,000 | | | 222,164 | |
Barclays Bank PLC | | Bank of America Corp. 6.250%, 04/15/12 | | Sell | | 0.900 | | | 03/20/13 | | USD | | 3,495,000 | | | (79,242 | ) |
Citibank N.A., New York | | Bank of America Corp. 6.250%, 04/15/12 | | Buy | | (1.260 | ) | | 09/20/13 | | USD | | 9,344,000 | | | 108,418 | |
Citibank N.A., New York | | Bank of Scotland
5.125%, 12/05/13 | | Buy | | (0.320 | ) | | 09/20/17 | | USD | | 2,744,000 | | | 730,017 | |
Citibank N.A., New York | | Bank of Scotland
5.125%, 12/05/13 | | Buy | | (0.660 | ) | | 09/20/17 | | USD | | 2,781,000 | | | 684,307 | |
Citibank N.A., New York | | Bank of Scotland
5.125%, 12/05/13 | | Buy | | (0.650 | ) | | 09/20/17 | | USD | | 1,294,000 | | | 319,169 | |
Goldman Sachs International | | Bank of Scotland
5.125%, 12/05/13 | | Sell | | 4.350 | | | 09/20/13 | | USD | | 5,833,000 | | | (167,309 | ) |
UBS AG | | Bank of Scotland
5.125%, 12/05/13 | | Buy | | (0.410 | ) | | 09/20/17 | | USD | | 2,135,000 | | | 556,709 | |
See Accompanying Notes to Financial Statements
77
| | |
| ING INTERMEDIATE BOND FUND | | PORTFOLIO OF INVESTMENTS AS OF SEPTEMBER 30, 2008 (UNAUDITED) (CONTINUED) |
| | | | | | | | | | | | | | | | | |
Counterparty | | Reference Entity/Obligation | | Buy/Sell
Protection(1) | | (Pay)/Receive
Fixed Rate (%) | | | Termination
Date | | | | Notional
Amount | | Unrealized
Appreciation/
(Depreciation) | |
Citibank N.A., New York | | Barclays Bank PLC Floating Rate Note, 10/27/15 | | Buy | | (1.250 | ) | | 09/20/13 | | USD | | 6,273,000 | | $ | 315,053 | |
Citibank N.A., New York | | Barclays Bank PLC Floating Rate Note, 10/27/15 | | Buy | | (1.320 | ) | | 09/20/13 | | USD | | 1,862,000 | | | 88,021 | |
Citibank N.A., New York | | BNP Paribas 4.750%, 04/04/11 | | Buy | | (0.490 | ) | | 09/20/13 | | USD | | 5,781,000 | | | 125,825 | |
Citibank N.A., New York | | BNP Paribas 4.750%, 04/04/11 | | Buy | | (0.505 | ) | | 09/20/13 | | USD | | 4,900,000 | | | 103,395 | |
Citibank N.A., New York | | BNP Paribas 5.250%, 12/17/12 | | Buy | | (0.250 | ) | | 09/20/17 | | USD | | 2,744,000 | | | 312,584 | |
Citibank N.A., New York | | BNP Paribas 5.250%, 12/17/12 | | Buy | | (0.520 | ) | | 09/20/17 | | USD | | 574,000 | | | 54,696 | |
Citibank N.A., New York | | BNP Paribas 5.250%, 12/17/12 | | Buy | | (0.520 | ) | | 09/20/17 | | USD | | 1,294,000 | | | 123,305 | |
Citibank N.A., New York | | CDX.EM.9 Index | | Buy | | (2.650 | ) | | 06/20/13 | | USD | | 29,940,000 | | | 927,575 | |
Citibank N.A., New York | | CDX.EM.9 Index | | Buy | | (2.650 | ) | | 06/20/13 | | USD | | 5,116,000 | | | 76,629 | |
Citibank N.A., New York | | CDX.EM.9 Index | | Buy | | (2.650 | ) | | 06/20/13 | | USD | | 5,761,000 | | | 87,030 | |
UBS AG | | CDX.NA.HY.8 Index | | Buy | | (2.750 | ) | | 06/20/12 | | USD | | 5,653,890 | | | 431,733 | |
UBS AG | | CDX.NA.HY.8 Index | | Sell | | 2.750 | | | 06/20/12 | | USD | | 5,549,940 | | | (323,305 | ) |
Barclays Bank PLC | | CDX.NA.HY.10 Index | | Buy | | (5.000 | ) | | 06/20/13 | | USD | | 8,879,000 | | | 556,029 | |
Barclays Bank PLC | | CDX.NA.HY.10 Index | | Buy | | (5.000 | ) | | 06/20/13 | | USD | | 7,063,000 | | | 328,477 | |
Citibank N.A., New York | | CDX.NA.HY.10 Index | | Buy | | (5.000 | ) | | 06/20/13 | | USD | | 9,681,000 | | | 379,610 | |
Morgan Stanley Capital Services Inc. | | CDX.NA.HY.10 Index | | Buy | | (5.000 | ) | | 06/20/13 | | USD | | 7,071,000 | | | 324,665 | |
Barclays Bank PLC | | CDX.NA.IG.10 Index | | Buy | | (1.550 | ) | | 06/20/13 | | USD | | 6,395,000 | | | 67,402 | |
Citibank N.A., New York | | CDX.NA.IG.10 Index | | Buy | | (1.550 | ) | | 06/20/13 | | USD | | 6,271,000 | | | 163,428 | |
Citibank N.A., New York | | CDX.NA.IG.10 Index | | Buy | | (1.550 | ) | | 06/20/13 | | USD | | 18,493,000 | | | (266,651 | ) |
Citibank N.A., New York | | CDX.NA.IG.10 Index | | Sell | | 1.550 | | | 06/20/13 | | USD | | 5,116,000 | | | (68,346 | ) |
Citibank N.A., New York | | CDX.NA.IG.10 Index | | Sell | | 1.550 | | | 06/20/13 | | USD | | 63,768,000 | | | (514,486 | ) |
Goldman Sachs International | | CDX.NA.IG.10 Index | | Sell | | 1.550 | | | 06/20/13 | | USD | | 7,285,000 | | | 16,192 | |
UBS AG | | CDX.NA.IG.10 Index | | Buy | | (1.550 | ) | | 06/20/13 | | USD | | 11,143,000 | | | 273,192 | |
UBS AG | | CDX.NA.IG.10 Index | | Buy | | (1.550 | ) | | 06/20/13 | | USD | | 21,155,000 | | | (432,270 | ) |
Barclays Bank PLC | | CDX.NA.IG.9 Index | | Sell | | 0.600 | | | 12/20/12 | | USD | | 12,448,000 | | | (77,709 | ) |
Citibank N.A., New York | | CDX.NA.IG.10 Index
(7-10% Tranche) | | Sell | | 4.170 | | | 06/20/15 | | USD | | 3,051,000 | | | (191,369 | ) |
Citibank N.A., New York | | CDX.NA.IG.10 Index
(10-15% Tranche) | | Buy | | (1.950 | ) | | 06/20/15 | | USD | | 4,877,000 | | | 72,209 | |
Citibank N.A., New York | | CIT Group Inc.
7.750%, 04/02/12 | | Buy | | (7.450 | ) | | 06/20/13 | | USD | | 909,000 | | | 234,642 | |
Citibank N.A., New York | | CIT Group Inc.
7.750%, 04/02/12 | | Buy | | (5.650 | ) | | 06/20/13 | | USD | | 2,808,000 | | | 832,195 | |
Goldman Sachs International | | CMBX-NA-AAA 5 Index | | Buy | | (0.350 | ) | | 02/15/51 | | USD | | 9,559,000 | | | (250,429 | ) |
Citibank N.A., New York | | CMS Energy Corporation 6.875%, 12/15/15 | | Sell | | 0.820 | | | 03/20/12 | | USD | | 600,000 | | | (20,186 | ) |
Merrill Lynch International | | CMS Energy Corporation 6.875%, 12/15/15 | | Sell | | 0.840 | | | 03/20/12 | | USD | | 3,000,000 | | | (99,044 | ) |
UBS AG | | Countrywide Home Loan 4.000%, 03/22/11 | | Sell | | 9.000 | | | 12/20/12 | | USD | | 248,000 | | | 6,450 | |
Barclays Bank PLC | | Countrywide Home Loan 6.000%, 01/24/18 | | Sell | | 4.150 | | | 12/20/12 | | USD | | 248,000 | | | 48,079 | |
Barclays Bank PLC | | Countrywide Home Loan 6.000%, 01/24/18 | | Buy | | (4.200 | ) | | 06/20/13 | | USD | | 512,000 | | | (15,852 | ) |
Citibank N.A., New York | | Countrywide Home Loan 6.000%, 01/24/18 | | Sell | | 2.580 | | | 09/20/13 | | USD | | 9,344,000 | | | (293,127 | ) |
Citibank N.A., New York | | Darden Restaurants Inc. 6.000%, 08/15/35 | | Buy | | (1.650 | ) | | 06/20/13 | | USD | | 500,000 | | | 5,011 | |
Bear Stearns Credit Products Inc. | | Darden Restaurants Inc. 7.125%, 02/01/16 | | Buy | | (1.640 | ) | | 03/20/18 | | USD | | 2,241,000 | | | 62,846 | |
See Accompanying Notes to Financial Statements
78
| | |
| ING INTERMEDIATE BOND FUND | | PORTFOLIO OF INVESTMENTS AS OF SEPTEMBER 30, 2008 (UNAUDITED) (CONTINUED) |
| | | | | | | | | | | | | | | | | |
Counterparty | | Reference Entity/Obligation | | Buy/Sell
Protection(1) | | (Pay)/Receive
Fixed Rate (%) | | | Termination
Date | | | | Notional
Amount | | Unrealized
Appreciation/
(Depreciation) | |
Citibank N.A., New York | | Darden Restaurants Inc. 7.125%, 02/01/16 | | Buy | | (0.610 | ) | | 12/20/12 | | USD | | 632,000 | | $ | 27,854 | |
Citibank N.A., New York | | Darden Restaurants Inc. 7.125%, 02/01/16 | | Buy | | (1.310 | ) | | 12/20/17 | | USD | | 624,000 | | | 30,961 | |
Citibank N.A., New York | | Deutsche Bank AG
5.500%, 05/18/11 | | Buy | | (0.700 | ) | | 09/20/13 | | USD | | 4,429,000 | | | 167,672 | |
Citibank N.A., New York | | Deutsche Bank AG
5.500%, 05/18/11 | | Buy | | (0.757 | ) | | 09/20/13 | | USD | | 4,288,000 | | | 151,726 | |
Morgan Stanley Capital Services Inc. | | Domtar Corp.
7.875%, 10/15/11 | | Buy | | (2.650 | ) | | 09/20/11 | | USD | | 1,287,500 | | | (6,349 | ) |
UBS AG | | Domtar Corp.
7.875%, 10/15/11 | | Sell | | 2.600 | | | 09/20/11 | | USD | | 1,288,000 | | | 4,604 | |
Citibank N.A., New York | | DTE Energy Co.
7.050%, 06/01/11 | | Buy | | (0.700 | ) | | 06/20/11 | | USD | | 1,692,000 | | | 15,878 | |
Barclays Bank PLC | | GAP Inc. 8.800%, 12/15/08 | | Buy | | (1.200 | ) | | 06/20/13 | | USD | | 1,456,000 | | | (17,119 | ) |
Citibank N.A., New York | | GAP Inc. 8.800%, 12/15/08 | | Buy | | (1.190 | ) | | 06/20/13 | | USD | | 651,000 | | | (7,378 | ) |
Citibank N.A., New York | | GAP Inc. 8.800%, 12/15/08 | | Buy | | (0.850 | ) | | 06/20/13 | | USD | | 645,000 | | | 1,993 | |
Citibank N.A., New York | | General Electric Capital Corp. 6.000%, 06/15/12 | | Sell | | 1.170 | | | 03/20/13 | | USD | | 10,581,000 | | | (1,604,572 | ) |
Barclays Bank PLC | | Goldman Sachs Group Inc. 6.600%, 01/15/12 | | Buy | | (4.000 | ) | | 12/20/12 | | USD | | 2,406,000 | | | 59,022 | |
Barclays Bank PLC | | Goldman Sachs Group Inc. 6.600%, 01/15/12 | | Buy | | (1.100 | ) | | 06/20/13 | | USD | | 4,122,000 | | | 520,239 | |
UBS AG | | HSBC Bank PLC
4.250%, 03/18/16 | | Buy | | (0.400 | ) | | 09/20/17 | | USD | | 2,135,000 | | | 258,803 | |
Citibank N.A., New York | | International Lease Finance Corp. 4.150%, 01/20/15 | | Buy | | (1.670 | ) | | 06/20/13 | | USD | | 5,121,000 | | | 1,144,334 | |
UBS AG | | LCDX.NA.8 Index | | Buy | | (1.200 | ) | | 06/20/12 | | USD | | 10,833,471 | | | 560,301 | |
UBS AG | | LCDX.NA.8 Index | | Buy | | (1.200 | ) | | 06/20/12 | | USD | | 1,824,585 | | | 82,582 | |
Barclays Bank PLC | | LCDX.NA.9 Index
(15-100% Tranche) | | Buy | | (1.613 | ) | | 06/20/12 | | USD | | 4,095,000 | | | 71,020 | |
Citibank N.A., New York | | LCDX.NA.9 Index
(15-100% Tranche) | | Buy | | (1.080 | ) | | 12/20/12 | | USD | | 6,450,000 | | | 250,138 | |
Barclays Bank PLC | | Lloyds TSB Group PLC
5.875%, 07/08/14 | | Buy | | (0.500 | ) | | 12/20/17 | | USD | | 1,113,000 | | | 210,410 | |
Barclays Bank PLC | | Louisiana-Pacific Corp. 8.875%, 08/15/10 | | Buy | | (3.850 | ) | | 03/20/13 | | USD | | 700,000 | | | 57,059 | |
Citibank N.A., New York | | Louisiana-Pacific Corp. 8.875%, 08/15/10 | | Buy | | (2.000 | ) | | 12/20/12 | | USD | | 1,363,000 | | | 188,640 | |
Citibank N.A., New York | | Louisiana-Pacific Corp. 8.875%, 08/15/10 | | Buy | | (2.100 | ) | | 12/20/12 | | USD | | 2,455,000 | | | 331,931 | |
Citibank N.A., New York | | Louisiana-Pacific Corp. 8.875%, 08/15/10 | | Buy | | (3.375 | ) | | 03/20/13 | | USD | | 1,365,000 | | | 132,835 | |
Morgan Stanley Capital Services Inc. | | Louisiana-Pacific Corp. 8.875%, 08/15/10 | | Buy | | (2.230 | ) | | 12/20/12 | | USD | | 2,212,000 | | | 289,889 | |
Morgan Stanley Capital Services Inc. | | Louisiana-Pacific Corp. 8.875%, 08/15/10 | | Buy | | (5.350 | ) | | 09/20/13 | | USD | | 3,931,000 | | | 126,061 | |
UBS AG | | Louisiana-Pacific Corp. 8.875%, 08/15/10 | | Buy | | (2.000 | ) | | 12/20/12 | | USD | | 1,434,000 | | | 198,467 | |
Citibank N.A., New York | | Marks & Spencer PLC
6.375%, 11/07/11 | | Buy | | (1.100 | ) | | 03/20/13 | | USD | | 2,682,000 | | | 173,053 | |
Citibank N.A., New York | | Marks & Spencer PLC
6.375%, 11/07/11 | | Buy | | (1.400 | ) | | 03/20/13 | | USD | | 2,298,000 | | | 121,956 | |
Citibank N.A., New York | | MBIA Inc. 6.625%, 10/01/28 | | Buy | | (5.000 | ) | | 09/20/13 | | USD | | 641,000 | | | (22,454 | ) |
Citibank N.A., New York | | MBIA Inc. 6.625%, 10/01/28 | | Buy | | (5.000 | ) | | 09/20/13 | | USD | | 1,311,000 | | | (28,188 | ) |
See Accompanying Notes to Financial Statements
79
| | |
| ING INTERMEDIATE BOND FUND | | PORTFOLIO OF INVESTMENTS AS OF SEPTEMBER 30, 2008 (UNAUDITED) (CONTINUED) |
| | | | | | | | | | | | | | | | | |
Counterparty | | Reference Entity/Obligation | | Buy/Sell
Protection(1) | | (Pay)/Receive
Fixed Rate (%) | | | Termination
Date | | | | Notional
Amount | | Unrealized
Appreciation/
(Depreciation) | |
Goldman Sachs International | | MBIA Inc. 6.625%, 10/01/28 | | Buy | | (5.000 | ) | | 09/20/13 | | USD | | 2,539,000 | | $ | (76,921 | ) |
JPMorgan Chase Bank, N.A. New York | | MBIA Inc. 6.625%, 10/01/28 | | Buy | | (5.000 | ) | | 09/20/13 | | USD | | 9,443,000 | | | 1,185,384 | |
Citibank N.A., New York | | MBIA Insurance Corp. (no specified obligation) | | Sell | | 5.000 | | | 09/20/13 | | USD | | 641,000 | | | (26,068 | ) |
Citibank N.A., New York | | MBIA Insurance Corp. (no specified obligation) | | Sell | | 5.000 | | | 09/20/13 | | USD | | 1,311,000 | | | (8,755 | ) |
Credit Suisse International | | MBIA Insurance Corp. (no specified obligation) | | Sell | | 5.000 | | | 09/20/13 | | USD | | 2,479,000 | | | (568,550 | ) |
Goldman Sachs International | | MBIA Insurance Corp. (no specified obligation) | | Sell | | 5.000 | | | 09/20/13 | | USD | | 2,538,000 | | | (115,228 | ) |
JPMorgan Chase Bank, N.A. New York | | MBIA Insurance Corp. (no specified obligation) | | Sell | | 5.000 | | | 09/20/13 | | USD | | 3,236,000 | | | (742,165 | ) |
The Royal Bank of Scotland PLC | | MBIA Insurance Corp. (no specified obligation) | | Sell | | 5.000 | | | 09/20/13 | | USD | | 3,724,000 | | | (854,086 | ) |
Barclays Bank PLC | | Merrill Lynch & Co.
5.000%, 01/15/15 | | Buy | | (0.860 | ) | | 09/20/12 | | USD | | 5,173,000 | | | 579,517 | |
Barclays Bank PLC | | Norbord Inc. 7.250%, 07/01/12 | | Buy | | (6.350 | ) | | 06/20/13 | | USD | | 726,000 | | | 1,890 | |
Citibank N.A., New York | | Norbord Inc. 7.250%, 07/01/12 | | Sell | | 2.200 | | | 06/20/12 | | USD | | 606,500 | | | (76,246 | ) |
Citibank N.A., New York | | Norbord Inc. 7.250%, 07/01/12 | | Buy | | (2.450 | ) | | 12/20/17 | | USD | | 3,377,000 | | | 575,611 | |
Morgan Stanley Capital Services Inc. | | Norbord Inc. 7.250%, 07/01/12 | | Buy | | (5.550 | ) | | 09/20/13 | | USD | | 2,136,000 | | | 64,899 | |
UBS AG | | Norbord Inc. 7.250%, 07/01/12 | | Buy | | (1.500 | ) | | 06/20/12 | | USD | | 606,500 | | | 88,495 | |
UBS AG | | Norbord Inc. 7.250%, 07/01/12 | | Buy | | (2.400 | ) | | 12/20/17 | | USD | | 1,342,000 | | | 232,207 | |
Citibank N.A., New York | | Potash Corp. of Saskatchewan
7.750%, 05/31/11 | | Buy | | (0.600 | ) | | 03/20/13 | | USD | | 1,248,000 | | | 2,706 | |
Goldman Sachs International | | Potash Corp. of Saskatchewan
7.750%, 05/31/11 | | Buy | | (0.880 | ) | | 03/20/18 | | USD | | 3,735,000 | | | (39,174 | ) |
Morgan Stanley Capital Services Inc. | | Potash Corp. of Saskatchewan
7.750%, 05/31/11 | | Buy | | (0.610 | ) | | 03/20/13 | | USD | | 2,497,000 | | | 4,395 | |
Citibank N.A., New York | | Republic of Italy
6.875%, 09/27/23 | | Sell | | 0.490 | | | 09/20/18 | | USD | | 994,000 | | | (11,647 | ) |
Citibank N.A., New York | | Republic of Italy
6.875%, 09/27/23 | | Sell | | 0.495 | | | 09/20/18 | | USD | | 4,675,000 | | | (52,955 | ) |
Citibank N.A., New York | | Royal Bank of Scotland PLC
6.000%, 05/10/13 | | Buy | | (0.290 | ) | | 09/20/17 | | USD | | 2,744,000 | | | 734,986 | |
UBS AG | | Royal Bank of Scotland PLC
6.000%, 05/10/13 | | Buy | | (0.400 | ) | | 09/20/17 | | USD | | 2,135,000 | | | 557,847 | |
Citibank N.A., New York | | Royal Bank of Scotland PLC Floating Rate Note, 12/06/20 | | Buy | | (1.095 | ) | | 09/20/13 | | USD | | 8,333,000 | | | 613,381 | |
Citibank N.A., New York | | Santander Intl. Debt SA Floating Rate Note, 08/09/13 | | Buy | | (0.730 | ) | | 09/20/13 | | USD | | 5,658,000 | | | 145,599 | |
Citibank N.A., New York | | Santander Intl. Debt SA Floating Rate Note, 08/09/13 | | Buy | | (0.800 | ) | | 09/20/13 | | USD | | 2,451,000 | | | 55,575 | |
Citibank N.A., New York | | Societe Generale
6.625%, 04/27/15 | | Buy | | (0.510 | ) | | 09/20/17 | | USD | | 574,000 | | | 74,646 | |
Citibank N.A., New York | | Societe Generale
6.625%, 04/27/15 | | Buy | | (0.510 | ) | | 09/20/17 | | USD | | 1,294,000 | | | 168,279 | |
UBS AG | | Societe Generale
6.625%, 04/27/15 | | Buy | | (0.380 | ) | | 09/20/17 | | USD | | 2,135,000 | | | 296,228 | |
Barclays Bank PLC | | Standard Chartered Bank 3.625%, 02/03/17 | | Buy | | (0.750 | ) | | 12/20/17 | | USD | | 1,113,000 | | | 196,770 | |
Citibank N.A., New York | | Standard Chartered Bank 3.625%, 02/03/17 | | Buy | | (0.670 | ) | | 09/20/17 | | USD | | 574,000 | | | 102,693 | |
UBS AG | | Standard Chartered Bank 3.625%, 02/03/17 | | Buy | | (0.420 | ) | | 09/20/17 | | USD | | 2,135,000 | | | 416,120 | |
See Accompanying Notes to Financial Statements
80
| | |
| ING INTERMEDIATE BOND FUND | | PORTFOLIO OF INVESTMENTS AS OF SEPTEMBER 30, 2008 (UNAUDITED) (CONTINUED) |
| | | | | | | | | | | | | | | | | |
Counterparty | | Reference Entity/Obligation | | Buy/Sell
Protection(1) | | (Pay)/Receive
Fixed Rate (%) | | | Termination
Date | | | | Notional
Amount | | Unrealized
Appreciation/
(Depreciation) | |
Goldman Sachs International | | Temple-Inland Inc.
7.875%, 05/01/12 | | Buy | | (1.040 | ) | | 03/20/14 | | USD | | 872,000 | | $ | 75,299 | |
JPMorgan Chase Bank N.A., New York | | Temple-Inland Inc.
7.875%, 05/01/12 | | Buy | | (0.890 | ) | | 03/20/14 | | USD | | 2,646,000 | | | 246,048 | |
JPMorgan Chase Bank N.A., New York | | Temple-Inland Inc.
7.875%, 05/01/12 | | Buy | | (1.020 | ) | | 03/20/14 | | USD | | 2,493,000 | | | 217,482 | |
Morgan Stanley Capital Services Inc. | | Temple-Inland Inc.
7.875%, 05/01/12 | | Buy | | (0.900 | ) | | 03/20/14 | | USD | | 2,318,000 | | | 214,522 | |
Morgan Stanley Capital Services Inc. | | Temple-Inland Inc.
7.875%, 05/01/12 | | Buy | | (1.600 | ) | | 09/20/17 | | USD | | 2,401,000 | | | 190,762 | |
UBS AG | | Temple-Inland Inc.
7.875%, 05/01/12 | | Buy | | (0.900 | ) | | 03/20/14 | | USD | | 2,476,000 | | | 229,145 | |
Citibank N.A., New York | | UniCredit S.p.A.
4.375%, 02/10/14 | | Buy | | (0.590 | ) | | 09/20/18 | | USD | | 994,000 | | | 53,760 | |
Citibank N.A., New York | | UniCredit S.p.A.
4.375%, 02/10/14 | | Buy | | (0.775 | ) | | 09/20/18 | | USD | | 4,667,000 | | | 187,881 | |
Citibank N.A., New York | | VF Corp. 8.500%, 10/01/10 | | Buy | | (0.700 | ) | | 09/20/13 | | USD | | 1,284,000 | | | 1,960 | |
Citibank N.A., New York | | VF Corp. 8.500%, 10/01/10 | | Buy | | (0.800 | ) | | 09/20/13 | | USD | | 644,000 | | | (1,893 | ) |
Citibank N.A., New York | | VF Corp. 8.500%, 10/01/10 | | Buy | | (0.800 | ) | | 09/20/13 | | USD | | 1,063,000 | | | (3,125 | ) |
Citibank N.A., New York | | VF Corp. 8.500%, 10/01/10 | | Buy | | (0.770 | ) | | 09/20/13 | | USD | | 1,249,000 | | | (1,998 | ) |
Morgan Stanley Capital Services Inc. | | VF Corp. 8.500%, 10/01/10 | | Buy | | (0.850 | ) | | 09/20/13 | | USD | | 2,422,000 | | | (12,527 | ) |
Citibank N.A., New York | | Wachovia Corp.
3.625%, 02/17/09 | | Sell | | 1.170 | | | 03/20/13 | | USD | | 4,278,000 | | | (510,322 | ) |
Citibank N.A., New York | | Wachovia Corp.
3.625%, 02/17/09 | | Sell | | 2.950 | | | 03/20/13 | | USD | | 2,508,000 | | | (142,599 | ) |
UBS AG | | Westpac Banking Corp. 5.875%, 04/29/18 | | Buy | | (0.350 | ) | | 09/20/17 | | USD | | 2,135,000 | | | 251,339 | |
UBS AG | | Westpac Banking Corp. 5.875%, 04/29/18 | | Buy | | (0.510 | ) | | 09/20/17 | | USD | | 1,972,000 | | | 210,534 | |
JPMorgan Chase Bank N.A., New York | | Weyerhaeuser Co.
6.750%, 03/15/12 | | Buy | | (0.640 | ) | | 03/20/14 | | USD | | 2,582,000 | | | 150,305 | |
Barclays Bank PLC | | Weyerhaeuser Co.
7.125%, 07/15/23 | | Sell | | 0.780 | | | 09/20/12 | | USD | | 2,478,000 | | | (78,434 | ) |
Citibank N.A., New York | | Whirlpool Corp.
7.750%, 07/15/16 | | Buy | | (1.210 | ) | | 09/20/13 | | USD | | 3,846,000 | | | (12,918 | ) |
Citibank N.A., New York | | Whirlpool Corp.
7.750%, 07/15/16 | | Buy | | (1.250 | ) | | 09/20/13 | | USD | | 388,000 | | | (1,986 | ) |
Citibank N.A., New York | | Whirlpool Corp.
7.750%, 07/15/16 | | Buy | | (1.330 | ) | | 09/20/13 | | USD | | 2,314,000 | | | (19,997 | ) |
Citibank N.A., New York | | Whirlpool Corp.
7.750%, 07/15/16 | | Buy | | (1.400 | ) | | 09/20/13 | | USD | | 1,240,000 | | | (14,537 | ) |
Citibank N.A., New York | | Whirlpool Corp.
7.750%, 07/15/16 | | Buy | | (1.400 | ) | | 09/20/13 | | USD | | 773,000 | | | (9,062 | ) |
Morgan Stanley Capital Services Inc. | | Whirlpool Corp.
7.750%, 07/15/16 | | Buy | | (1.680 | ) | | 09/20/13 | | USD | | 1,369,000 | | | (32,925 | ) |
Citibank N.A., New York | | Williams Partners LP
7.500%, 06/15/11 | | Sell | | 1.030 | | | 03/20/12 | | USD | | 3,020,164 | | | (27,464 | ) |
| | | | | | | | | | | | | | | | | |
| | | | | | | | | | | | | | | $ | 13,677,088 | |
| | | | | | | | | | | | | | | | | |
(1) | | If the Fund is a seller of protection and a credit event occurs, as defined under the terms of that particular swap agreement, the Fund must pay to the buyer of the protection an amount up to the notional value of the reference entity/obligation and in certain instances, take delivery of the reference entity/obligation. If the Fund is a buyer of protection and a credit event occurs, as defined under the terms of that particular swap agreement, the Fund may receive from the seller of protection an amount up to the notional value of the reference entity/obligation, which may have little or no value. |
See Accompanying Notes to Financial Statements
81
| | |
| ING INTERMEDIATE BOND FUND | | PORTFOLIO OF INVESTMENTS AS OF SEPTEMBER 30, 2008 (UNAUDITED) (CONTINUED) |
ING Intermediate Bond Fund Interest Rate Swap Agreements Outstanding on September 30, 2008:
| | | | | | | | | | |
| | | Termination
Date | | | | Notional
Principal
Amount | | Unrealized
Appreciation/
(Depreciation) | |
Receive a fixed rate equal to 4.04221% and pay a floating rate based on 3-month USD-LIBOR Counterparty: Citibank N.A., New York | | 12/13/09 | | USD | | 66,325,000 | | $ | 1,436,043 | |
Receive a fixed rate equal to 3.18600% and pay a floating rate based on 3-month USD-LIBOR Counterparty: Citibank N.A., New York | | 04/22/10 | | USD | | 70,395,000 | | | 307,838 | |
Receive a fixed rate equal to 7.060% and pay a floating rate based on 3-month NZD-BBR-FRA Counterparty: UBS AG, London | | 01/28/11 | | NZD | | 106,622,000 | | | 250,189 | |
Receive a fixed rate equal to 7.015% and pay a floating rate based on 3-month NZD-BBR-FRA Counterparty: UBS AG, London | | 02/04/11 | | NZD | | 52,960,000 | | | 94,725 | |
Receive a floating rate based on 3-month USD-LIBOR and pay a fixed rate equal to 2.87750% Counterparty: Citibank N.A., New York | | 04/14/11 | | USD | | 1,692,000 | | | 18,395 | |
Receive a floating rate based on 3-month USD-LIBOR and pay a fixed rate equal to 3.56500% Counterparty: Citibank N.A., New York | | 04/17/13 | | USD | | 450,000 | | | 2,845 | |
Receive a floating rate based on 3-month NZD-BBR-FRA and pay a fixed rate equal to 7.055% Counterparty: UBS AG, London | | 01/28/16 | | NZD | | 36,251,000 | | | (486,183 | ) |
Receive a floating rate based on 3-month USD-LIBOR and pay a fixed rate equal to 4.80031% Counterparty: Citibank N.A., New York | | 12/13/17 | | USD | | 15,851,000 | | | (771,075 | ) |
Receive a floating rate based on 3-month NZD-BBR-FRA and pay a fixed rate equal to 7.000% Counterparty: UBS AG, London | | 02/04/16 | | NZD | | 17,790,000 | | | (202,221 | ) |
Receive a floating rate based on 3-month USD-LIBOR and pay a fixed rate equal to 4.27000% Counterparty: Citibank N.A., New York | | 01/23/18 | | USD | | 39,593,000 | | | 263,291 | |
| | | | | | | | | | |
| | | | | | | | $ | 913,847 | |
| | | | | | | | | | |
See Accompanying Notes to Financial Statements
82
| | |
| ING NATIONAL TAX-EXEMPT BOND FUND | | PORTFOLIO OF INVESTMENTS AS OF SEPTEMBER 30, 2008 (UNAUDITED) |
| | | | | | | | | | |
| | | | |
Principal
Amount | | | | | | (Unaudited)
Rating(1) | | Value |
| | | | | | | | | | |
| | MUNICIPAL BONDS: 51.4% | | | | | |
| | Illinois: 23.4% | | | | | |
| $ | 1,000,000 | | C, I | | Illinois Finance Authority,
5.000%, due 08/15/24 | | NR/NR | | $ | 757,190 |
| | | | | | | | | | |
| | | | | | | | | | 757,190 |
| | | | | | | | | | |
| | New York: 6.4% | | | | | |
| | 200,000 | | C | | New York City Transitional Finance Authority,
5.250%, due 08/15/11 | | Aa1/AAA | | | 206,762 |
| | | | | | | | | | |
| | | | | | | | | | 206,762 |
| | | | | | | | | | |
| | Texas: 4.4% | | | | | | | |
| | 165,000 | | C, I | | Harris County-Houston Sports Authority,
5.000%, due 11/15/28 | | A2/AA | | | 142,568 |
| | | | | | | | | | |
| | | | | | | | | | 142,568 |
| | | | | | | | | | |
| | Washington: 7.9% | | | | | |
| | 250,000 | | C | | City of Seattle,
5.250%, due 12/15/17 | | Aa1/AAA | | | 253,645 |
| | | | | | | | | | |
| | | | | | | | | | 253,645 |
| | | | | | | | | | |
| | Wisconsin: 9.3% | | | | | |
| | 300,000 | | | | State of Wisconsin,
5.125%, due 11/01/08 | | Aa3/AA | | | 300,568 |
| | | | | | | | | | |
| | | | | | | | | | 300,568 |
| | | | | | | | | | |
| | | | | Total Investments in Securities
(Cost $1,898,037)* | | 51.4% | | | $1,660,733 |
| | | | | Other Assets and Liabilities - Net | | 48.6 | | | 1,571,994 |
| | | | | | | | | | |
| | | | | Net Assets | | 100.0% | | | $3,232,727 |
| | | | | | | | | | |
(1) | Credit ratings are provided by Moody’s Investor’s Service, Inc. and Standard’s and Poor’s Rating Group and are not audited. |
| C | Bond may be called prior to maturity date. |
| * | Cost for federal income tax purposes is the same as for financial statement purposes. |
| | | | |
Net unrealized depreciation consists of: | | | | |
Gross Unrealized Appreciation | | $ | 440 | |
Gross Unrealized Depreciation | | | (237,744 | ) |
| | | | |
Net Unrealized Depreciation | | $ | (237,304 | ) |
| | | | |
The following table summarizes the inputs used as of September 30, 2008 in determining the Fund’s investments at fair value for purposes of SFAS 157:
| | | | | | |
| | | Investments in
Securities | | Other Financial
Instruments* |
Level 1 — Quoted Prices | | $ | — | | $ | — |
Level 2 — Other Significant Observable Inputs | | | 1,660,733 | | | — |
Level 3 — Significant Unobservable Inputs | | | — | | | — |
| | | | | | |
Total | | $ | 1,660,733 | | $ | — |
| | | | | | |
“Fair value” for purposes of SFAS 157 is different from “fair value” as used in the 1940 Act. The former generally implies market value, and can include market quotations as a source of value, and the latter refers to determinations of actual value in absence of available market quotations.
| * | Other financial instruments may include forward foreign currency contracts, futures, swaps, and written options. Forward foreign currency contracts and futures are reported at their unrealized gain/loss at period end. Swaps and written options are reported at their market value at period end. |
See Accompanying Notes to Financial Statements
83
| | |
| ING CLASSIC MONEY MARKET FUND(1) | | PORTFOLIO OF INVESTMENTS AS OF SEPTEMBER 30, 2008 (UNAUDITED) |
| | | | | | | | |
Principal
Amount | | | | | | Value |
| | | | | | | | |
| | CERTIFICATES OF DEPOSIT: 5.2% | | | |
| $ | 6,500,000 | | | | American Express Bank FSB, 2.900%, due 12/11/08 | | $ | 6,500,000 |
| | 22,000,000 | | | | Canadian Imperial Bank of Commerce,
2.820%, due 11/21/08 | | | 22,000,310 |
| | 4,500,000 | | | | Natixis, 2.890%, due 12/11/08 | | | 4,500,000 |
| | 38,000,000 | | | | UBS AG, 2.980%, due 02/23/09 | | | 38,000,000 |
| | | | | | | | |
| | | | | Total Certificates of Deposit
(Cost $71,000,310) | | | 71,000,310 |
| | | | | | | | |
| | COMMERCIAL PAPER: 45.9% | | | |
| | 25,000,000 | | (2), I | | American General Finance Corp., 1.470%, due 10/02/08 | | | 24,997,931 |
| | 8,000,000 | | | | ANZ National International Ltd., 2.750%, due 12/03/08 | | | 7,961,080 |
| | 16,000,000 | | | | ASB Finance Ltd.,
2.680%, due 10/30/08 | | | 15,964,378 |
| | 9,500,000 | | | | ASB Finance Ltd.,
2.980%, due 12/01/08 | | | 9,451,547 |
| | 3,750,000 | | | | Barton Capital, LLC,
1.370%, due 10/01/08 | | | 3,750,000 |
| | 10,750,000 | | | | Barton Capital, LLC,
1.390%, due 10/02/08 | | | 10,749,173 |
| | 5,000,000 | | | | Barton Capital, LLC,
2.630%, due 11/04/08 | | | 4,987,250 |
| | 14,000,000 | | | | Barton Capital, LLC,
2.670%, due 11/05/08 | | | 13,962,511 |
| | 8,351,000 | | | | Barton Capital, LLC,
2.700%, due 11/03/08 | | | 8,329,780 |
| | 11,000,000 | | | | BNP Paribas,
1.250%, due 10/02/08 | | | 10,999,238 |
| | 2,500,000 | | | | Cafco, LLC,
2.320%, due 10/06/08 | | | 2,499,035 |
| | 17,300,000 | | | | Cafco, LLC,
2.570%, due 10/15/08 | | | 17,281,472 |
| | 4,500,000 | | | | Cafco, LLC,
2.660%, due 11/04/08 | | | 4,488,398 |
| | 10,000,000 | | | | Cafco, LLC,
2.700%, due 11/05/08 | | | 9,973,133 |
| | 28,000,000 | | | | Caisse Nationale des Caisses d’Epargne et de Prevoyance, 2.730%, due 11/10/08 | | | 27,913,200 |
| | 21,000,000 | | | | Ciesco L.P.,
2.570%, due 10/15/08 | | | 20,977,491 |
| | 3,000,000 | | # | | Ciesco L.P.,
2.640%, due 10/20/08 | | | 2,995,614 |
| | 7,000,000 | | | | Ciesco L.P.,
2.710%, due 11/03/08 | | | 6,982,162 |
| | 15,000,000 | | | | Ciesco L.P.,
2.720%, due 11/04/08 | | | 14,960,522 |
| | 5,000,000 | | | | Citigroup Funding, Inc.,
2.690%, due 11/12/08 | | | 4,983,958 |
| | 5,500,000 | | # | | Concord Minutemen Capital Co., LLC,
2.820%, due 10/22/08 | | | 5,490,535 |
| | 8,250,000 | | | | Concord Minutemen Capital Co., LLC,
2.890%, due 11/04/08 | | | 8,226,859 |
| | 17,000,000 | | | | Concord Minutemen Capital Co., LLC,
3.000%, due 12/09/08 | | | 16,901,273 |
| | | | | | | | |
Principal
Amount | | | | | | Value |
| | | | | | | | |
| | COMMERCIAL PAPER: (continued) | | | |
| $ | 10,000,000 | | # | | Concord Minutemen Capital Co., LLC,
6.001%, due 10/01/08 | | $ | 10,000,000 |
| | 5,000,000 | | # | | Crown Point Capital Co.,
2.810%, due 10/21/08 | | | 4,991,806 |
| | 6,000,000 | | # | | Crown Point Capital Co.,
2.890%, due 11/04/08 | | | 5,983,170 |
| | 12,250,000 | | # | | Crown Point Capital Co.,
2.950%, due 12/09/08 | | | 12,179,107 |
| | 17,000,000 | | # | | Crown Point Capital Co.,
3.020%, due 10/01/08 | | | 17,000,000 |
| | 7,000,000 | | | | Edison Asset Securitization, LLC, 2.230%, due 10/08/08 | | | 6,996,529 |
| | 18,000,000 | | # | | Jupiter Securities Co., LLC,
2.420%, due 10/09/08 | | | 17,989,120 |
| | 17,000,000 | | | | Jupiter Securities Co., LLC,
2.700%, due 12/04/08 | | | 16,917,493 |
| | 5,000,000 | | | | Jupiter Securities Co., LLC,
5.501%, due 10/01/08 | | | 5,000,000 |
| | 8,000,000 | | | | Louis Dreyfus Corp.,
1.720%, due 10/03/08 | | | 7,998,856 |
| | 9,000,000 | | | | Natexis Banq US Financial Co., 2.810%, due 10/21/08 | | | 8,985,250 |
| | 17,000,000 | | | | Natexis Banq US Financial Co., 2.830%, due 11/24/08 | | | 16,926,815 |
| | 1,850,000 | | # | | Old Line Funding, LLC,
1.330%, due 10/02/08 | | | 1,849,862 |
| | 4,000,000 | | | | Old Line Funding, LLC,
2.580%, due 10/15/08 | | | 3,995,707 |
| | 5,500,000 | | # | | Old Line Funding, LLC,
2.640%, due 10/20/08 | | | 5,491,959 |
| | 2,000,000 | | | | Old Line Funding, LLC,
2.690%, due 11/03/08 | | | 1,994,885 |
| | 15,000,000 | | | | Old Line Funding, LLC,
2.710%, due 11/04/08 | | | 14,960,617 |
| | 4,500,000 | | | | Old Line Funding, LLC,
2.720%, due 11/14/08 | | | 4,484,765 |
| | 9,000,000 | | # | | Old Line Funding, LLC,
2.750%, due 10/01/08 | | | 9,000,000 |
| | 4,000,000 | | # | | Park Avenue,
1.330%, due 10/02/08 | | | 3,999,706 |
| | 15,000,000 | | # | | Park Avenue,
2.420%, due 10/09/08 | | | 14,990,933 |
| | 12,000,000 | | | | Park Avenue,
2.470%, due 10/16/08 | | | 11,986,850 |
| | 2,000,000 | | | | Park Avenue,
2.680%, due 12/01/08 | | | 1,990,816 |
| | 5,000,000 | | | | Park Avenue,
2.680%, due 12/04/08 | | | 4,975,929 |
| | 7,000,000 | | | | Societe Generale,
2.730%, due 11/06/08 | | | 6,980,400 |
| | 5,750,000 | | # | | Thunder Bay Funding, LLC, 2.590%, due 10/15/08 | | | 5,743,806 |
| | 9,000,000 | | | | Thunder Bay Funding, LLC, 2.700%, due 11/05/08 | | | 8,975,675 |
| | 3,656,000 | | # | | Thunder Bay Funding, LLC, 2.730%, due 11/07/08 | | | 3,645,479 |
| | 10,000,000 | | | | Thunder Bay Funding, LLC, 2.740%, due 12/01/08 | | | 9,953,064 |
| | 10,500,000 | | # | | Thunder Bay Funding, LLC, 2.780%, due 10/01/08 | | | 10,500,000 |
See Accompanying Notes to Financial Statements
84
| | |
| ING CLASSIC MONEY MARKET FUND(1) | | PORTFOLIO OF INVESTMENTS AS OF SEPTEMBER 30, 2008 (UNAUDITED) (CONTINUED) |
| | | | | | | | |
Principal
Amount | | | | | | Value |
| | | | | | | | |
| | COMMERCIAL PAPER: (continued) | | | |
| $ | 17,000,000 | | | | Tulip Funding Corp.,
2.670%, due 10/23/08 | | $ | 16,971,113 |
| | 10,750,000 | | | | Tulip Funding Corp.,
2.730%, due 11/12/08 | | | 10,715,009 |
| | 6,000,000 | | | | Tulip Funding Corp.,
2.760%, due 11/20/08 | | | 5,976,667 |
| | 7,000,000 | | # | | Windmill Funding Corp.,
1.390%, due 10/02/08 | | | 6,999,461 |
| | 4,600,000 | | | | Windmill Funding Corp.,
2.530%, due 10/14/08 | | | 4,595,482 |
| | 4,600,000 | | | | Windmill Funding Corp.,
2.610%, due 10/21/08 | | | 4,592,998 |
| | 2,750,000 | | | | Windmill Funding Corp.,
2.660%, due 10/28/08 | | | 2,744,328 |
| | 4,000,000 | | | | Windmill Funding Corp.,
2.700%, due 11/05/08 | | | 3,989,228 |
| | 10,000,000 | | | | Windmill Funding Corp.,
2.710%, due 11/03/08 | | | 9,974,517 |
| | 5,000,000 | | | | Windmill Funding Corp.,
2.740%, due 10/01/08 | | | 5,000,000 |
| | 4,500,000 | | # | | Yorktown Capital, LLC,
1.360%, due 10/02/08 | | | 4,499,661 |
| | 25,000,000 | | | | Yorktown Capital, LLC,
2.660%, due 11/03/08 | | | 24,937,438 |
| | 2,183,000 | | | | Yorktown Capital, LLC,
2.680%, due 11/13/08 | | | 2,175,882 |
| | 16,500,000 | | | | Yorktown Capital, LLC,
2.720%, due 12/01/08 | | | 16,423,115 |
| | | | | | | | |
| | | | | Total Commercial Paper
(Cost $630,910,038) | | | 630,910,038 |
| | | | | | | | |
| | CORPORATE BONDS/NOTES: 26.1% | | | |
| | 11,300,000 | | | | American Express Bank FSB, 2.498%, due 10/16/08 | | | 11,299,022 |
| | 2,500,000 | | | | American Express Bank FSB, 3.899%, due 11/24/08 | | | 2,496,201 |
| | 3,000,000 | | | | American Express Centurion Bank,
4.310%, due 11/07/08 | | | 2,998,362 |
| | 1,275,000 | | | | American Express Credit Corp.,
3.080%, due 12/19/08 | | | 1,273,239 |
| | 3,000,000 | | (2), I | | American General Finance Corp.,
4.309%, due 01/09/09 | | | 2,997,234 |
| | 4,000,000 | | # | | American Honda Finance Corp.,
2.793%, due 11/10/08 | | | 3,999,285 |
| | 2,750,000 | | # | | American Honda Finance Corp.,
2.812%, due 11/07/08 | | | 2,749,643 |
| | 8,750,000 | | # | | American Honda Finance Corp.,
2.874%, due 03/09/09 | | | 8,746,510 |
| | 4,500,000 | | # | | American Honda Finance Corp.,
4.500%, due 05/26/09 | | | 4,537,656 |
| | 18,500,000 | | @@, # | | Australia & New Zealand Banking Group Ltd.,
3.021%, due 09/02/09 | | | 18,500,000 |
| | 5,500,000 | | | | Bank of America NA,
2.497%, due 06/12/09 | | | 5,493,458 |
| | | | | | | | |
Principal
Amount | | | | | | Value |
| | | | | | | | |
| | CORPORATE BONDS/NOTES: (continued) | | | |
| $ | 4,500,000 | | | | Bank of America NA,
2.748%, due 12/18/08 | | $ | 4,498,360 |
| | 12,250,000 | | #, C | | Bank of America NA,
4.350%, due 11/03/09 | | | 12,250,000 |
| | 13,500,000 | | @@, # | | Bank of Scotland PLC,
3.550%, due 12/01/08 | | | 13,510,078 |
| | 11,500,000 | | @@ | | BNP Paribas, 3.014%, due 08/13/09 | | | 11,500,000 |
| | 5,000,000 | | | | Citigroup Funding, Inc.,
2.110%, due 10/03/08 | | | 4,999,899 |
| | 4,800,000 | | | | Citigroup Funding, Inc.,
2.991%, due 03/02/09 | | | 4,794,549 |
| | 1,900,000 | | | | Citigroup, Inc.,
2.836%, due 01/30/09 | | | 1,896,736 |
| | 7,212,000 | | | | Citigroup, Inc.,
3.625%, due 02/09/09 | | | 7,214,174 |
| | 18,500,000 | | @@, # | | Commonwealth Bank of Australia,
2.816%, due 12/18/08 | | | 18,496,834 |
| | 14,000,000 | | | | Credit Suisse First Boston USA, Inc.,
2.944%, due 12/09/08 | | | 13,998,864 |
| | 3,500,000 | | | | Credit Suisse First Boston USA, Inc.,
3.875%, due 01/15/09 | | | 3,505,713 |
| | 3,000,000 | | @@ | | Credit Suisse New York,
3.719%, due 03/27/09 | | | 2,992,699 |
| | 5,000,000 | | @@ | | Deutsche Bank,
3.839%, due 11/26/08 | | | 4,996,078 |
| | 7,000,000 | | @@ | | Deutsche Bank AG,
4.093%, due 01/09/09 | | | 6,994,680 |
| | 3,000,000 | | | | General Electric Capital Corp.,
2.170%, due 01/27/09 | | | 2,993,785 |
| | 1,000,000 | | | | General Electric Capital Corp.,
2.795%, due 10/24/08 | | | 999,852 |
| | 1,000,000 | | | | General Electric Capital Corp.,
2.910%, due 08/31/09 | | | 1,000,182 |
| | 1,000,000 | | | | General Electric Capital Corp.,
4.125%, due 09/01/09 | | | 1,009,787 |
| | 4,000,000 | | | | General Electric Co.,
2.854%, due 12/09/08 | | | 3,999,718 |
| | 8,600,000 | | I | | Goldman Sachs Group, Inc., 3.250%, due 12/23/08 | | | 8,585,937 |
| | 5,500,000 | | | | JPMorgan Chase & Co.,
3.479%, due 06/26/09 | | | 5,492,880 |
| | 5,000,000 | | | | JPMorgan Chase & Co.,
3.500%, due 03/15/09 | | | 5,007,440 |
| | 3,000,000 | | | | Merrill Lynch & Co., Inc.,
4.831%, due 10/27/08 | | | 2,999,601 |
| | 800,000 | | | | Merrill Lynch & Co., Inc.,
6.250%, due 10/15/08 | | | 800,286 |
| | 2,190,000 | | | | Merrill Lynch & Co., Inc.,
6.375%, due 10/15/08 | | | 2,190,878 |
| | 2,125,000 | | @@, # | | Rabobank Nederland NV,
4.208%, due 04/06/09 | | | 2,124,480 |
| | 2,000,000 | | @@, # | | Santander U.S. Debt SA Unipersonal,
2.846%, due 10/21/08 | | | 1,999,995 |
See Accompanying Notes to Financial Statements
85
| | |
| ING CLASSIC MONEY MARKET FUND(1) | | PORTFOLIO OF INVESTMENTS AS OF SEPTEMBER 30, 2008 (UNAUDITED) (CONTINUED) |
| | | | | | | | |
Principal
Amount | | | | | | Value |
| | | | | | | | |
| | CORPORATE BONDS/NOTES: (continued) | | | |
| $ | 15,000,000 | | @@, # | | Societe Generale,
3.285%, due 09/04/09 | | $ | 15,000,000 |
| | 5,210,000 | | | | SunTrust Bank,
4.000%, due 10/15/08 | | | 5,208,136 |
| | 12,000,000 | | | | Toyota Motor Credit Corp., 2.060%, due 10/20/08 | | | 11,996,314 |
| | 10,900,000 | | | | Toyota Motor Credit Corp., 2.410%, due 07/10/09 | | | 10,900,000 |
| | 16,700,000 | | | | Toyota Motor Credit Corp., 2.507%, due 10/06/08 | | | 16,700,137 |
| | 11,000,000 | | | | Toyota Motor Credit Corp., 2.537%, due 01/12/09 | | | 11,001,001 |
| | 6,000,000 | | | | Toyota Motor Credit Corp., 2.739%, due 01/23/09 | | | 6,000,000 |
| | 4,100,000 | | | | US Bancorp.,
5.300%, due 04/28/09 | | | 4,148,857 |
| | 21,000,000 | | | | US Bank NA,
2.912%, due 08/24/09 | | | 21,000,000 |
| | 7,250,000 | | | | Wachovia Bank NA,
2.070%, due 10/03/08 | | | 7,249,744 |
| | 1,500,000 | | | | Wachovia Bank NA,
2.110%, due 02/23/09 | | | 1,496,149 |
| | 4,900,000 | | | | Wachovia Bank NA - Old,
2.998%, due 01/12/09 | | | 4,901,938 |
| | 1,000,000 | | | | Wachovia Corp.,
3.625%, due 02/17/09 | | | 999,391 |
| | 2,000,000 | | | | Wachovia Corp.,
3.759%, due 10/28/08 | | | 1,999,934 |
| | 3,555,000 | | | | Wells Fargo & Co.,
3.125%, due 04/01/09 | | | 3,555,144 |
| | 8,500,000 | | | | Wells Fargo & Co.,
3.552%, due 05/01/09 | | | 8,502,503 |
| | 12,250,000 | | @@, # | | Westpac Banking Corp.,
3.033%, due 07/03/09 | | | 12,250,000 |
| | | | | | | | |
| | | | | Total Corporate Bonds/Notes
(Cost $358,853,343) | | | 358,853,343 |
| | | | | | | | |
| | U.S. GOVERNMENT AGENCY OBLIGATIONS: 7.3% |
| | 54,000,000 | | | | Federal Home Loan Bank,
2.150%, due 03/27/09 | | | 53,981,146 |
| | 23,500,000 | | | | Federal Home Loan Bank,
2.200%, due 04/01/09 | | | 23,489,160 |
| | 23,500,000 | | | | Federal Home Loan Bank,
2.310%, due 04/07/09 | | | 23,500,000 |
| | | | | | | | |
| | | | | Total U.S. Government Agency Obligations
(Cost $100,970,306) | | | 100,970,306 |
| | | | | | | | |
| | | | | | | | | |
Principal
Amount | | | | | | | Value |
| | | | | | | | | |
| | Repurchase Agreement: 15.2% | | | | |
| $ | 99,729,000 | | Deutsche Bank Repurchase Agreement dated 09/30/08, 0.997%, due 10/01/08, $99,731,763 to be received upon repurchase (Collateralized by $87,171,000 various U.S. Government Agency Obligations,
5.300%-6.625%, Market
Value plus accrued interest $101,723,681, due
05/12/20-11/15/30 | | | $ | 99,729,000 |
| | 110,000,000 | | Morgan Stanley Repurchase Agreement dated 09/30/08, 1.500%, due 10/01/08, $110,004,583 to be received upon repurchase (Collateralized by $95,685,000 Federal Home Loan Mortgage Corporation, 5.150%-6.750%, Market Value plus accrued interest $112,201,902, due 05/01/18-09/15/29 | | | | 110,000,000 |
| | | | | | | | | |
| | | Total Repurchase Agreement
(Cost $209,729,000) | | | | 209,729,000 |
| | | | | | | | | |
| | | Total Investments in Securities
(Cost $1,371,462,997)* | | 99.7 | % | | $ | 1,371,462,997 |
| | | Other Assets and Liabilities - Net | | 0.3 | | | | 3,999,426 |
| | | | | | | | | |
| | | Net Assets | | 100.0 | % | | $ | 1,375,462,423 |
| | | | | | | | | |
| (1) | All securities with a maturity date of greater than 13 months have either a variable rate, a demand feature, prerefunded, optional or mandatory put resulting in a maturity of one year or less. Rate shown reflects current rate. |
| (2) | ING America Insurance Holdings, Inc. (“AIH”) has entered into a Capital Support Agreement (“CSA”) with the Fund which provides that AIH will contribute capital to the Fund, up to a specified maximum amount, to maintain a net asset value per share of not less than $0.9950, subject to certain conditions and restrictions. As of September 30, 2008, the Fund held two positions in American General Finance Corp. which are covered by the terms of the CSA. |
| # | Securities with purchases pursuant to Rule144A or section 4(2), under the Securities Act of 1933 and may not be resold subject to that rule except to qualified institutional buyers. Unless otherwise noted, these securities have been determined to be liquid under the guidelines established by the Funds’ Board of Directors/Trustees. |
| C | Bond may be called prior to maturity date. |
| * | Cost for federal income tax purposes is the same as for financial statement purposes. |
See Accompanying Notes to Financial Statements
86
| | |
| ING CLASSIC MONEY MARKET FUND(1) | | PORTFOLIO OF INVESTMENTS AS OF SEPTEMBER 30, 2008 (UNAUDITED) (CONTINUED) |
The following table summarizes the inputs used as of September 30, 2008 in determining the Fund’s investments at fair value for purposes of SFAS 157:
| | | | | | |
| | | Investments in Securities | | Other Financial Instruments* |
Level 1 — Quoted Prices | | $ | — | | $ | — |
Level 2 — Other Significant Observable Inputs | | | 1,371,462,997 | | | — |
Level 3 — Significant Unobservable Inputs | | | — | | | — |
| | | | | | |
Total | | $ | 1,371,462,997 | | $ | — |
| | | | | | |
“Fair value” for purposes of SFAS 157 is different from “fair value” as used in the 1940 Act. The former generally implies market value, and can include market quotations as a source of value, and the latter refers to determinations of actual value in absence of available market quotations.
| * | Other financial instruments may include forward foreign currency contracts, futures, swaps, and written options. Forward foreign currency contracts and futures are reported at their unrealized gain/loss at period end. Swaps and written options are reported at their market value at period end. |
See Accompanying Notes to Financial Statements
87
| | |
ING INSTITUTIONAL PRIME
MONEY MARKET FUND (1) | | PORTFOLIO OF INVESTMENTS AS OF SEPTEMBER 30, 2008 (UNAUDITED) |
| | | | | | | | |
Principal
Amount | | | | | | Value |
| | | | | | | | |
| | CERTIFICATES OF DEPOSIT: 4.5% |
| $ | 32,000,000 | | | | American Express Bank FSB,
2.900%, due 12/11/08 | | $ | 32,000,000 |
| | 8,000,000 | | | | Canadian Imperial Bank of Commerce,
2.820%, due 11/21/08 | | | 8,000,113 |
| | 25,000,000 | | | | Natixis, 2.890%, due 12/11/08 | | | 25,000,000 |
| | 5,000,000 | | | | UBS AG, 2.980%, due 02/23/09 | | | 5,000,000 |
| | | | | | | | |
| | | | | Total Certificates of Deposit
(Cost $70,000,113) | | | 70,000,113 |
| | | | | | | | |
| | COMMERCIAL PAPER: 63.0% |
| | 46,000,000 | | (2), I | | American General Finance Corp.,
1.470%, due 10/02/08 | | | 45,996,241 |
| | 14,386,000 | | | | ANZ National International Ltd.,
1.880%, due 10/02/08 | | | 14,384,501 |
| | 20,000,000 | | | | ANZ National International Ltd.,
2.570%, due 11/05/08 | | | 19,948,667 |
| | 6,000,000 | | | | ANZ National International Ltd.,
2.750%, due 12/03/08 | | | 5,970,810 |
| | 10,000,000 | | | | ASB Finance Ltd.,
2.680%, due 10/30/08 | | | 9,977,767 |
| | 4,500,000 | | | | ASB Finance Ltd.,
2.980%, due 12/01/08 | | | 4,477,049 |
| | 16,386,000 | | | | Bank of America NA,
2.670%, due 12/08/08 | | | 16,302,431 |
| | 34,000,000 | | | | Barton Capital, LLC,
1.390%, due 10/02/08 | | | 33,996,276 |
| | 2,972,000 | | | | Barton Capital, LLC,
2.630%, due 11/04/08 | | | 2,964,421 |
| | 10,000,000 | | | | Barton Capital, LLC,
2.670%, due 10/03/08 | | | 9,997,778 |
| | 7,000,000 | | | | Barton Capital, LLC,
2.670%, due 11/05/08 | | | 6,981,372 |
| | 6,000,000 | | | | Barton Capital, LLC,
2.700%, due 11/03/08 | | | 5,984,783 |
| | 7,966,000 | | | | Barton Capital, LLC,
6.100%, due 10/01/08 | | | 7,966,000 |
| | 3,000,000 | | | | BNP Paribas,
1.250%, due 10/02/08 | | | 2,999,792 |
| | 15,000,000 | | | | Cafco, LLC,
2.570%, due 10/15/08 | | | 14,983,927 |
| | 3,470,000 | | | | Cafco, LLC,
2.660%, due 11/04/08 | | | 3,461,053 |
| | 20,000,000 | | | | Cafco, LLC,
2.670%, due 10/03/08 | | | 19,995,556 |
| | 1,000,000 | | | | Cafco, LLC,
2.700%, due 11/05/08 | | | 997,307 |
| | 13,250,000 | | | | Caisse Nationale des Caisses d’Epargne et de Prevoyance,
2.730%, due 11/10/08 | | | 13,208,925 |
| | 30,000,000 | | | | Ciesco L.P.,
2.050%, due 10/02/08 | | | 29,996,583 |
| | 7,100,000 | | | | Ciesco L.P.,
2.320%, due 10/16/08 | | | 7,092,693 |
| | 4,200,000 | | | | Ciesco L.P.,
2.430%, due 10/27/08 | | | 4,192,356 |
| | 5,000,000 | | | | Ciesco L.P.,
2.520%, due 10/24/08 | | | 4,991,631 |
| | | | | | | | |
Principal
Amount | | | | | | Value |
| | | | | | | | |
| | COMMERCIAL PAPER: (continued) |
| $ | 5,500,000 | | | | Ciesco L.P.,
2.570%, due 10/15/08 | | $ | 5,494,103 |
| | 1,750,000 | | # | | Ciesco L.P.,
2.640%, due 10/20/08 | | | 1,747,442 |
| | 2,000,000 | | | | Ciesco L.P.,
2.710%, due 11/03/08 | | | 1,994,903 |
| | 6,750,000 | | | | Ciesco L.P.,
2.720%, due 11/04/08 | | | 6,732,247 |
| | 25,000,000 | | | | Citigroup Funding, Inc.,
2.690%, due 11/12/08 | | | 24,919,792 |
| | 2,000,000 | | # | | Concord Minutemen Capital Co., LLC,
2.820%, due 10/22/08 | | | 1,996,558 |
| | 6,500,000 | | | | Concord Minutemen Capital Co., LLC,
2.890%, due 11/04/08 | | | 6,481,768 |
| | 6,000,000 | | | | Concord Minutemen Capital Co., LLC,
3.000%, due 12/09/08 | | | 5,965,155 |
| | 50,000,000 | | # | | Concord Minutemen Capital Co., LLC,
6.000%, due 10/01/08 | | | 50,000,000 |
| | 1,200,000 | | | | Crown Point Capital Co.,
1.300%, due 10/02/08 | | | 1,199,913 |
| | 2,500,000 | | # | | Crown Point Capital Co.,
2.810%, due 10/21/08 | | | 2,495,903 |
| | 2,500,000 | | # | | Crown Point Capital Co.,
2.890%, due 11/04/08 | | | 2,492,988 |
| | 9,500,000 | | # | | Crown Point Capital Co.,
2.950%, due 12/09/08 | | | 9,446,324 |
| | 46,000,000 | | # | | Crown Point Capital Co.,
3.020%, due 10/01/08 | | | 46,000,000 |
| | 1,590,000 | | | | Edison Asset Securities, LLC,
2.570%, due 12/03/08 | | | 1,582,766 |
| | 4,600,000 | | # | | Edison Asset Securities, LLC,
6.000%, due 10/01/08 | | | 4,600,000 |
| | 4,000,000 | | | | Edison Asset Securitization, LLC,
2.230%, due 10/08/08 | | | 3,998,017 |
| | 40,000,000 | | | | Jupiter Securities Co., LLC,
1.750%, due 10/02/08 | | | 39,996,111 |
| | 9,000,000 | | # | | Jupiter Securities Co., LLC,
2.420%, due 10/09/08 | | | 8,994,560 |
| | 8,000,000 | | | | Jupiter Securities Co., LLC,
2.700%, due 12/04/08 | | | 7,961,173 |
| | 6,000,000 | | | | Jupiter Securities Co., LLC,
5.500%, due 10/01/08 | | | 6,000,000 |
| | 43,600,000 | | | | Louis Dreyfus Corp.,
1.720%, due 10/03/08 | | | 43,590,025 |
| | 4,200,000 | | | | Louis Dreyfus Corp.,
5.500%, due 10/01/08 | | | 4,200,000 |
| | 5,000,000 | | | | Natexis Banq US Financial Co.,
2.810%, due 10/21/08 | | | 4,991,806 |
| | 1,000,000 | | | | Natexis Banq US Financial Co.,
2.820%, due 12/19/08 | | | 993,768 |
| | 8,000,000 | | | | Natexis Banq US Financial Co.,
2.830%, due 11/24/08 | | | 7,965,560 |
| | 4,000,000 | | | | Old Line Funding, LLC,
2.580%, due 10/15/08 | | | 3,995,707 |
| | 1,500,000 | | # | | Old Line Funding, LLC,
2.640%, due 10/20/08 | | | 1,497,807 |
| | 12,000,000 | | | | Old Line Funding, LLC,
2.670%, due 12/03/08 | | | 11,943,300 |
See Accompanying Notes to Financial Statements
88
| | |
ING INSTITUTIONAL PRIME
MONEY MARKET FUND (1) | | PORTFOLIO OF INVESTMENTS AS OF SEPTEMBER 30, 2008 (UNAUDITED) (CONTINUED) |
| | | | | | | | |
Principal
Amount | | | | | | Value |
| | | | | | | | |
| | COMMERCIAL PAPER: (continued) |
| $ | 3,000,000 | | | | Old Line Funding, LLC,
2.690%, due 11/03/08 | | $ | 2,992,437 |
| | 5,000,000 | | | | Old Line Funding, LLC,
2.710%, due 11/04/08 | | | 4,986,872 |
| | 1,000,000 | | | | Old Line Funding, LLC,
2.720%, due 11/14/08 | | | 996,614 |
| | 12,000,000 | | | | Old Line Funding, LLC,
2.720%, due 12/01/08 | | | 11,944,083 |
| | 10,853,000 | | # | | Old Line Funding, LLC,
2.750%, due 10/01/08 | | | 10,853,000 |
| | 3,000,000 | | # | | Park Avenue,
1.330%, due 10/02/08 | | | 2,999,779 |
| | 7,500,000 | | # | | Park Avenue,
2.420%, due 10/09/08 | | | 7,495,467 |
| | 4,000,000 | | | | Park Avenue,
2.470%, due 10/16/08 | | | 3,995,617 |
| | 2,591,000 | | | | Park Avenue,
2.540%, due 11/06/08 | | | 2,584,263 |
| | 34,829,000 | | | | Park Avenue,
2.680%, due 12/01/08 | | | 34,669,491 |
| | 10,000,000 | | | | Park Avenue,
2.680%, due 12/04/08 | | | 9,951,929 |
| | 3,000,000 | | # | | Park Avenue,
5.500%, due 10/01/08 | | | 3,000,000 |
| | 3,500,000 | | | | Societe Generale,
2.730%, due 11/06/08 | | | 3,490,200 |
| | 3,441,000 | | | | Thunder Bay Funding, LLC,
2.420%, due 10/14/08 | | | 3,437,769 |
| | 2,000,000 | | # | | Thunder Bay Funding, LLC,
2.590%, due 10/15/08 | | | 1,997,846 |
| | 9,000,000 | | | | Thunder Bay Funding, LLC,
2.700%, due 11/05/08 | | | 8,975,831 |
| | 10,000,000 | | | | Thunder Bay Funding, LLC,
2.730%, due 12/08/08 | | | 9,947,867 |
| | 10,000,000 | | | | Thunder Bay Funding, LLC,
2.740%, due 12/01/08 | | | 9,953,064 |
| | 7,250,000 | | # | | Thunder Bay Funding, LLC,
2.780%, due 10/01/08 | | | 7,250,000 |
| | 10,000,000 | | | | Thunder Bay Funding, LLC,
2.890%, due 01/14/09 | | | 9,915,708 |
| | 15,000,000 | | | | Tulip Funding Corp.,
2.100%, due 10/06/08 | | | 14,994,764 |
| | 30,000,000 | | | | Tulip Funding Corp.,
2.210%, due 10/08/08 | | | 29,981,275 |
| | 13,000,000 | | | | Tulip Funding Corp.,
2.670%, due 10/23/08 | | | 12,977,878 |
| | 3,750,000 | | | | Tulip Funding Corp.,
2.730%, due 11/12/08 | | | 3,737,794 |
| | 3,000,000 | | | | Tulip Funding Corp.,
2.760%, due 11/20/08 | | | 2,988,333 |
| | 5,000,000 | | | | Tulip Funding Corp.,
6.500%, due 10/01/08 | | | 5,000,000 |
| | 15,000,000 | | | | UBS Financial, LLC,
2.480%, due 10/27/08 | | | 14,972,158 |
| | 900,000 | | | | UBS Financial, LLC,
2.520%, due 10/31/08 | | | 898,050 |
| | 1,200,000 | | | | UBS Financial, LLC,
2.680%, due 11/10/08 | | | 1,196,347 |
| | 35,000,000 | | | | Westpac Banking Corp.,
2.700%, due 12/04/08 | | | 34,830,133 |
| | 1,000,000 | | # | | Windmill Funding Corp.,
1.390%, due 10/02/08 | | | 999,923 |
| | | | | | | | |
Principal
Amount | | | | | | Value |
| | | | | | | | |
| | COMMERCIAL PAPER: (continued) |
| $ | 23,100,000 | | | | Windmill Funding Corp.,
2.530%, due 10/14/08 | | $ | 23,070,233 |
| | 3,000,000 | | # | | Windmill Funding Corp.,
2.570%, due 10/15/08 | | | 2,996,792 |
| | 3,100,000 | | | | Windmill Funding Corp.,
2.610%, due 10/21/08 | | | 3,095,281 |
| | 1,900,000 | | | | Windmill Funding Corp.,
2.660%, due 10/28/08 | | | 1,896,081 |
| | 1,450,000 | | # | | Windmill Funding Corp.,
2.660%, due 11/21/08 | | | 1,444,454 |
| | 3,000,000 | | | | Windmill Funding Corp.,
2.700%, due 11/05/08 | | | 2,992,067 |
| | 5,500,000 | | | | Windmill Funding Corp.,
2.710%, due 11/03/08 | | | 5,485,984 |
| | 2,000,000 | | | | Windmill Funding Corp.,
2.740%, due 10/01/08 | | | 2,000,000 |
| | 2,500,000 | | # | | Yorktown Capital, LLC,
1.360%, due 10/02/08 | | | 2,499,812 |
| | 616,000 | | | | Yorktown Capital, LLC,
1.790%, due 10/03/08 | | | 615,908 |
| | 1,133,000 | | | | Yorktown Capital, LLC,
2.590%, due 10/22/08 | | | 1,131,207 |
| | 20,997,000 | | | | Yorktown Capital, LLC,
2.610%, due 11/18/08 | | | 20,922,744 |
| | 6,026,000 | | | | Yorktown Capital, LLC,
2.660%, due 11/03/08 | | | 6,010,873 |
| | 6,000,000 | | | | Yorktown Capital, LLC,
2.680%, due 11/13/08 | | | 5,980,435 |
| | 14,000,000 | | | | Yorktown Capital, LLC,
2.710%, due 12/09/08 | | | 13,926,745 |
| | 8,000,000 | | | | Yorktown Capital, LLC,
2.720%, due 12/01/08 | | | 7,962,722 |
| | 1,020,000 | | | | Yorktown Capital, LLC,
2.730%, due 12/12/08 | | | 1,014,390 |
| | | | | | | | |
| | | | | Total Commercial Paper
(Cost $983,205,835) | | | 983,205,835 |
| | | | | | | | |
| | CORPORATE BONDS/NOTES: 9.1% |
| | 5,000,000 | | | | American Express Bank FSB,
2.498%, due 10/16/08 | | | 4,999,594 |
| | 3,000,000 | | # | | American Honda Finance Corp.,
2.874%, due 03/09/09 | | | 2,998,803 |
| | 2,700,000 | | # | | American Honda Finance Corp.,
3.850%, due 11/06/08 | | | 2,702,418 |
| | 2,000,000 | | # | | American Honda Finance Corp.,
4.500%, due 05/26/09 | | | 2,016,736 |
| | 3,000,000 | | | | Bank of America Corp.,
5.875%, due 02/15/09 | | | 3,027,743 |
| | 2,500,000 | | | | Bank of America NA,
2.497%, due 06/12/09 | | | 2,497,026 |
| | 1,000,000 | | | | Bank of America NA,
2.748%, due 12/18/08 | | | 999,636 |
| | 3,000,000 | | #, C | | Bank of America NA,
4.350%, due 11/03/09 | | | 3,000,000 |
| | 5,000,000 | | @@ | | BNP Paribas,
3.014%, due 08/13/09 | | | 5,000,000 |
| | 10,000,000 | | | | Citigroup Funding, Inc.,
2.110%, due 10/03/08 | | | 9,999,779 |
See Accompanying Notes to Financial Statements
89
| | |
ING INSTITUTIONAL PRIME
MONEY MARKET FUND (1) | | PORTFOLIO OF INVESTMENTS AS OF SEPTEMBER 30, 2008 (UNAUDITED) (CONTINUED) |
| | | | | | | | |
Principal
Amount | | | | | | Value |
| | | | | | | | |
| | CORPORATE BONDS/NOTES: (continued) |
| $ | 1,000,000 | | | | Citigroup Funding, Inc.,
2.991%, due 03/02/09 | | $ | 998,864 |
| | 5,000,000 | | @@, # | | Commonwealth Bank of Australia,
2.816%, due 12/18/08 | | | 4,999,144 |
| | 11,500,000 | | | | Credit Suisse First Boston USA, Inc.,
2.944%, due 12/09/08 | | | 11,499,078 |
| | 2,000,000 | | | | Credit Suisse First Boston USA, Inc.,
3.875%, due 01/15/09 | | | 1,999,249 |
| | 4,000,000 | | @@ | | Credit Suisse New York,
3.719%, due 03/27/09 | | | 3,990,265 |
| | 7,500,000 | | @@ | | Deutsche Bank,
3.839%, due 11/26/08 | | | 7,494,117 |
| | 1,000,000 | | | | General Electric Capital Corp.,
2.170%, due 01/27/09 | | | 997,928 |
| | 1,400,000 | | | | General Electric Capital Corp.,
2.859%, due 03/16/09 | | | 1,400,290 |
| | 1,500,000 | | | | General Electric Capital Corp.,
2.910%, due 08/31/09 | | | 1,500,273 |
| | 2,000,000 | | | | General Electric Capital Corp.,
3.600%, due 10/15/08 | | | 2,000,639 |
| | 1,000,000 | | | | General Electric Capital Corp.,
4.625%, due 09/15/09 | | | 1,014,746 |
| | 2,200,000 | | | | General Electric Co.,
2.854%, due 12/09/08 | | | 2,199,832 |
| | 2,500,000 | | | | JPMorgan Chase & Co.,
3.479%, due 06/26/09 | | | 2,496,764 |
| | 2,000,000 | | | | JPMorgan Chase & Co.,
3.500%, due 03/15/09 | | | 2,002,976 |
| | 2,400,000 | | @@, # | | Rabobank Nederland NV,
2.811%, due 01/15/09 | | | 2,399,518 |
| | 4,000,000 | | @@, # | | Santander U.S. Debt SA Unipersonal,
4.750%, due 10/21/08 | | | 3,999,259 |
| | 6,000,000 | | @@, # | | Societe Generale,
3.285%, due 09/04/09 | | | 6,000,000 |
| | 2,100,000 | | | | SunTrust Bank,
4.000%, due 10/15/08 | | | 2,100,928 |
| | 5,000,000 | | | | Toyota Motor Credit Corp.,
2.060%, due 10/20/08 | | | 4,998,464 |
| | 5,700,000 | | | | Toyota Motor Credit Corp.,
2.410%, due 07/10/09 | | | 5,700,000 |
| | 10,000,000 | | | | Toyota Motor Credit Corp.,
2.507%, due 10/06/08 | | | 10,000,082 |
| | 4,000,000 | | | | Toyota Motor Credit Corp.,
2.537%, due 01/12/09 | | | 4,000,364 |
| | 1,000,000 | | | | US Bancorp.,
3.739%, due 04/28/09 | | | 999,081 |
| | 12,500,000 | | | | US Bank NA,
2.912%, due 08/24/09 | | | 12,500,000 |
| | 1,000,000 | | | | Wachovia Bank N.A.,
7.000%, due 10/17/08 | | | 1,000,854 |
| | 1,500,000 | | | | Wachovia Corp.,
3.759%, due 10/28/08 | | | 1,499,951 |
| | 1,100,000 | | | | Wal-Mart Stores, Inc.,
6.875%, due 08/10/09 | | | 1,135,630 |
| | 1,000,000 | | | | Wells Fargo & Co.,
3.552%, due 05/01/09 | | | 1,000,294 |
| | | | | | | | |
Principal
Amount | | | | | | Value |
| | | | | | | | |
| | CORPORATE BONDS/NOTES: (continued) |
| $ | 3,000,000 | | @@, # | | Westpac Banking Corp.,
3.033%, due 07/03/09 | | $ | 3,000,000 |
| | | | | | | | |
| | | | | Total Corporate Bonds/Notes
(Cost $142,170,325) | | | 142,170,325 |
| | | | | | | | |
| | U.S. GOVERNMENT AGENCY OBLIGATIONS: 2.0% |
| | 7,500,000 | | | | Federal Home Loan Bank,
2.200%, due 04/01/09 | | | 7,496,541 |
| | 7,500,000 | | | | Federal Home Loan Bank,
2.310%, due 04/07/09 | | | 7,500,000 |
| | 15,595,000 | | | | Federal Home Loan Bank,
3.000%, due 04/15/09 | | | 15,660,646 |
| | | | | | | | |
| | | | | Total U.S. Government Agency Obligations
(Cost $30,657,187) | | | 30,657,187 |
| | | | | | | | |
| | | | | | | | | |
| Repurchase Agreements: 26.1% | |
| 314,662,000 | | Deutsche Bank Repurchase Agreement dated 09/30/08, 1.523%, due 10/01/08, $314,675,315 to be received upon repurchase (Collateralized by $317,600,000 various U.S. Government Agency Obligations, Discount Note-6.625%, Market Value $320,956,139, due 10/01/08-10/15/20 | | | | 314,662,000 | |
| 93,000,000 | | Morgan Stanley Repurchase Agreement dated 09/30/08,
1.500%, due 10/01/08, $93,003,875 to be received upon repurchase (Collateralized by $90,800,000 Federal Home Loan Mortgage Corporation, 4.125%-6.000%, Market Value plus accrued interest $96,439,010, due 05/21/09-06/15/11 | | | | 93,000,000 | |
| | | | | | | | | |
| | Total Repurchase Agreement
(Cost $407,662,000) | | | | | | 407,662,000 | |
| | | | | | | | | |
| | Total Investments in Securities
(Cost $1,633,695,460)* | | 104.7 | % | | $ | 1,633,695,460 | |
| | Other Assets and Liabilities - Net | | (4.7 | ) | | | (72,662,539 | ) |
| | | | | | | | | |
| | Net Assets | | 100.0 | % | | $ | 1,561,032,921 | |
| | | | | | | | | |
| (1) | All securities with a maturity date of greater than 13 months have either a variable rate, a demand feature, prerefunded, optional or mandatory put resulting in a maturity of one year or less. Rate shown reflects current rate. |
| (2) | ING America Insurance Holdings, Inc. (“AIH”) has entered into a Capital Support Agreement (“CSA”) with the Fund which provides that AIH will contribute capital to the Fund, up to a specified maximum amount, to maintain a net asset value per share of not less than $0.9950, subject to certain conditions and restrictions. As of September 30, 2008, the Fund held |
See Accompanying Notes to Financial Statements
90
| | |
ING INSTITUTIONAL PRIME
MONEY MARKET FUND (1) | | PORTFOLIO OF INVESTMENTS AS OF SEPTEMBER 30, 2008 (UNAUDITED) (CONTINUED) |
| | commercial paper issued by American General Finance Corp. which is covered by the terms of the CSA. |
| # | Securities with purchases pursuant to Rule 144A or section 4(2), under the Securities Act of 1933 and may not be resold subject to that rule except to qualified institutional buyers. Unless otherwise noted, these securities have been determined to be liquid under the guidelines established by the Funds’ Board of Directors/Trustees. |
| C | Bond may be called prior to maturity date. |
| * | Cost for federal income tax purposes is the same as for financial statement purposes. |
The following table summarizes the inputs used as of September 30, 2008 in determining the Fund’s investments at fair value for purposes of SFAS 157:
| | | | | | |
| | | Investments in Securities | | Other Financial Instruments* |
Level 1 — Quoted Prices | | $ | — | | $ | — |
Level 2 — Other Significant Observable Inputs | | | 1,633,695,460 | | | — |
Level 3 — Significant Unobservable Inputs | | | — | | | — |
| | | | | | |
Total | | $ | 1,633,695,460 | | $ | — |
| | | | | | |
“Fair value” for purposes of SFAS 157 is different from “fair value” as used in the 1940 Act. The former generally implies market value, and can include market quotations as a source of value, and the latter refers to determinations of actual value in absence of available market quotations.
| * | Other financial instruments may include forward foreign currency contracts, futures, swaps, and written options. Forward foreign currency contracts and futures are reported at their unrealized gain/loss at period end. Swaps and written options are reported at their market value at period end. |
See Accompanying Notes to Financial Statements
91
ING Funds Distributor, LLC offers the funds listed below. Before investing in a fund, shareholders should carefully review the fund’s prospectus. Investors may obtain a copy of a prospectus of any ING Fund by calling (800) 992-0180 or by going to www.ingfunds.com.
Domestic Equity and Income Funds
ING Balanced Fund
ING Growth and Income Fund
ING Real Estate Fund
Domestic Fund-of-Funds
ING Strategic Allocation Conservative Fund
ING Strategic Allocation Growth Fund
ING Strategic Allocation Moderate Fund
Domestic Equity Growth Funds
ING 130/30 Fundamental Research Fund
ING Corporate Leaders 100 Fund
ING Fundamental Research Fund
ING LargeCap Growth Fund
ING MidCap Opportunities Fund
ING Opportunistic LargeCap Fund
ING Small Company Fund
ING SmallCap Opportunities Fund
ING Tactical Asset Allocation Fund
Domestic Equity Index Funds
ING Index Plus LargeCap Fund
ING Index Plus MidCap Fund
ING Index Plus SmallCap Fund
Domestic Equity Value Funds
ING Financial Services Fund
ING LargeCap Value Fund
ING SmallCap Value Multi-Manager Fund
ING Value Choice Fund
Fixed-lncome Funds
ING GNMA lncome Fund
ING High Yield Bond Fund
ING Intermediate Bond Fund
Global Equity Funds
ING Global Equity Dividend Fund
ING Global Natural Resources Fund
ING Global Real Estate Fund
ING Global Science and Technology Fund
ING Global Value Choice Fund
International Equity Funds
ING Asia-Pacific Real Estate Fund
ING Disciplined International SmallCap Fund
ING Emerging Countries Fund
ING European Real Estate Fund
ING Foreign Fund
ING Greater China Fund
ING Index Plus International Equity Fund
ING International Capital Appreciation Fund
ING International Equity Dividend Fund
ING International Growth Opportunities Fund
ING International Real Estate Fund
ING International SmallCap Multi-Manager Fund
ING International Value Fund
ING International Value Choice Fund
ING Russia Fund
Global and International Fixed-Income Funds
ING Emerging Markets Fixed Income Fund
ING Global Bond Fund
International Funds-of-Funds
ING Diversified International Fund
ING Global Target Payment Fund
Loan Participation Fund
ING Senior lncome Fund
Money Market Funds*
ING Money Market Fund
ING Classic Money Market Fund
| * | An investment in the funds are not insured or guaranteed by the Federal Deposit Insurance Corporation or any other government agency. Although the funds seek to preserve the value of your investment at $1.00 per share, it is possible to lose money by investing in the funds. Please see the “Notes to Financial Statements” section for the funds participation in the U.S. Treasury Department’s Temporary Guarantee Program for money market funds. |
Investment Adviser
ING Investments, LLC
7337 East Doubletree Ranch Road
Scottsdale, Arizona 85258
Administrator
ING Funds Services, LLC
7337 East Doubletree Ranch Road
Scottsdale, Arizona 85258
Distributor
ING Funds Distributor, LLC
7337 East Doubletree Ranch Road
Scottsdale, Arizona 85258
Transfer Agent
DST Systems, Inc.
330 West 9th Street
Kansas City, Missouri 64105
Custodian
The Bank of New York Mellon Corporation
One Wall Street
New York, New York 10286
Legal Counsel
Dechert
1775 I Street, N.W.
Washington, D.C. 20006
For more complete information, or to obtain a prospectus on any ING fund, please call your Investment Professional or ING Funds Distributor, LLC at (800) 992-0180 or log on to www.ingfunds.com. The prospectus should be read carefully before investing. Consider the fund’s investment objectives, risks, charges and expenses carefully before investing. The prospectus contains this information and other information about the fund.
| | | | |
 | | PRSAR-UFIALL | | (0908-112008) |
SIGNATURES
Pursuant to the requirements of the Securities Exchange Act of 1934 and the Investment Company Act of 1940, the registrant has duly caused this report to be signed on its behalf by the undersigned, thereunto duly authorized.
| | |
| (Registrant): ING Funds Trust |
| |
| By | | /s/ Shaun P. Mathews |
| | Shaun P. Mathews |
| | President and Chief Executive Officer |
Date: December 4, 2008
Pursuant to the requirements of the Securities Exchange Act of 1934 and the Investment Company Act of 1940, this report has been signed below by the following persons on behalf of the registrant and in the capacities and on the dates indicated.
| | |
| By | | /s/ Shaun P. Mathews |
| | Shaun P. Mathews |
| | President and Chief Executive Officer |
Date: December 4, 2008
| | |
| By | | /s/ Todd Modic |
| | Todd Modic |
| | Senior Vice President and Chief Financial Officer |
Date: December 4, 2008