| | OMB APPROVAL |
| | OMB Number: | 3235-0570 |
| | Expires: | October 31, 2006 |
| UNITED STATES | Estimated average burden hours per response. . . . . . . . . . . . . . . . .19.3 |
| SECURITIES AND EXCHANGE COMMISSION | |
| Washington, D.C. 20549 | |
| | | | |
FORM N-CSR
CERTIFIED SHAREHOLDER REPORT OF REGISTERED
MANAGEMENT INVESTMENT COMPANIES
Investment Company Act file number | 811-08895 |
|
ING Funds Trust |
(Exact name of registrant as specified in charter) |
|
7337 E. Doubletree Ranch Rd., Scottsdale, AZ | | 85258 |
(Address of principal executive offices) | | (Zip code) |
|
The Corporation Trust Company, 1209 Orange Street, Wilmington, DE 19801 |
(Name and address of agent for service) |
|
Registrant’s telephone number, including area code: | 1-800-992-0180 | |
|
Date of fiscal year end: | March 31 | |
|
Date of reporting period: | April 1, 2005 to September 30, 2005 | |
| | | | | | | | | |
ITEM 1. REPORTS TO STOCKHOLDERS.
The following is a copy of the report transmitted to stockholders pursuant to Rule 30e-1 under the Act (17 CFR 270.30e-1):

Semi-Annual Report
September 30, 2005
Classes A, B, C, M, O and R
Fixed Income Funds
• ING GNMA Income Fund
• ING High Yield Bond Fund
• ING Intermediate Bond Fund
• ING National Tax-Exempt Bond Fund
Money Market Funds
• ING Classic Money Market Fund
• ING Institutional Prime Money Market Fund
 E-Delivery Sign-up – details inside
This report is submitted for general information to shareholders of the ING Funds. It is not authorized for distribution to prospective shareholders unless accompanied or preceded by a prospectus which includes details regarding the funds’ investment objectives, risks, charges, expenses and other information. This information should be read carefully. | 
|
| Go Paperless with E-Delivery! |
|
Sign up now for on-line prospectuses, fund reports, and proxy statements. In less than five minutes, you can help reduce paper mail and lower fund costs. |
Just go to www.ingfunds.com, click on the E-Delivery icon from the home page, follow the directions and complete the quick 5 Steps to Enroll. |
You will be notified by e-mail when these communications become available on the internet. Documents that are not available on the internet will continue to be sent by mail. |
(THIS PAGE INTENTIONALLY LEFT BLANK)

JAMES M. HENNESSY
| Dear Shareholder, |
|
We are in the midst of an exciting time here at ING Funds. We began the year by introducing the ING |
Global Equity Dividend and Premium Opportunity Fund that gave investors an opportunity to invest in |
global companies with a history of attractive dividend yields. |
|
When the Fund’s initial offering period closed, it proved to be one of the five largest unleveraged |
closed-end funds in history. |
|
The success of the Fund offering illustrates what ING Funds is really all about: fresh thinking in |
financial services. The Fund’s offering success also confirmed something else that we have long |
believed; namely, that investors are excited about opportunities beyond our shores. |
|
As globalization grows, investment opportunities grow as well. In 1970, only about one-third of equity market capitalization was located abroad; by 2004, that number had jumped to 50 percent1. It is often said that the world is becoming ever more complicated. This is undoubtedly true in the world of investments where the range of asset classes and investment techniques has never been wider. To take advantage of the opportunities that are now available, it is essential to seek investment partners who have the required breadth and depth of experience — on a global basis. |
|
Our goal at ING Funds is to deliver innovative investment products that help you, the investor, to achieve your financial dreams. We have also long been committed to uncovering opportunities worldwide. |
|
We will continue to bring you opportunities — wherever they occur. With access to more than 700 ING investment management professionals who are located around the world and who, in our consideration, deliver exceptional insight into markets in Europe, the Americas and the Asia-Pacific region, we believe we are in a unique position to help you take advantage of the opportunities that the world has to offer. |
|
On behalf of everyone here at ING Funds, I thank you for your continued support and loyalty. We look forward to serving you in the future. |
|
Sincerely, |
|

|
|
James M. Hennessy
President
ING Funds
October 27, 2005 |
The views expressed in the President’s Letter reflect those of the President as of the date of the letter. Any such views are subject to change at any time based upon market or other conditions and ING Funds disclaims any responsibility to update such views. These views may not be relied on as investment advice and because investment decisions for an ING Fund are based on numerous factors, may not be relied on as an indication of investment intent on behalf of any ING Fund. Reference to specific company securities should not be construed as recommendations or investment advice.
International investing does pose special risks including currency fluctuation, economic and political risks not found in investments that are solely domestic.
1 Morgan Stanley Capital International
1
MARKET PERSPECTIVE: SIX MONTHS ENDED SEPTEMBER 30, 2005
In the six months through September 30, 2005, major markets recovered after first quarter losses. Global equities rose 7.4%, according to the Morgan Stanley Capital International (“MSCI”) World Index(1) (which is calculated in dollars and includes net reinvested dividends). Nearly half of the gain came in July, the best month since 2003. As for currencies, the dollar extended first quarter strength, based on faster U.S. growth and rising short-term interest rates. The euro was further buffeted by the defeat of a proposal for a European constitution, followed by an acrimonious stalemate on a European budget. For the six months, the U.S. currency rose 7.8% against the euro, 7.2% against the pound and 5.9% against the oil price sensitive yen.
Trends in investment grade U.S. fixed income securities had been dominated since the middle of 2004 by the flattening of the U.S. Treasury yield curve as ten-year yields fell even as the Federal Open Market Committee (“FOMC”) raised short-term interest rates seven times to the end of March 2005. In the next five months, apart from approximately five weeks in July 2005 and early August 2005 when the economic data was more upbeat, fears of slowing activity and increasing inflation in the face of repeated record oil prices continued to mount. Inflation would only be controlled by continual “measured” increases in short-term interest rates. The curve-flattening trend was accordingly sustained by three more increases in May, June and August. August ended with second quarter GDP growth being revised downward and a final new record oil price of almost $70 as Hurricane Katrina’s devastation became known. The spread between ten-year and 13-week U.S. Treasury yields had shrunk to 59 basis points, the narrowest since March of 2001. The rebound was swift in early September. However, in Katrina’s aftermath gasoline prices soared: deflationary on demand, inflationary on costs. President Bush lunched with Chairman Greenspan and many hoped that the FOMC might then relent. This caused short-term interest rates to drift down and longer-term rates to rise. But by mid-September, factory prices were reported to have risen by the most in decades. The FOMC duly struck for the 11th time by raising short term interest rates. Katrina was only a near-term setback: the FOMC was still not done. Short rates snapped back, joining longer rates now on the way up. For the half-year the yield on the ten-year U.S. Treasury Note fell by 17 basis points to 4.33%, while the yield on 13-week U.S. Treasury Bills rose 75 basis points to 3.47%. The return on the broader Lehman Brothers Aggregate Bond Index(2) was 2.31%, with not much difference between the Treasury and Corporate components on average. High yield bonds did rather well as investors chased yield. The Lehman Brothers High Yield Bond Index(3) returned 3.71%.
The U.S. equities market in the form of the Standard & Poor’s 500 Index (“S&P 500 Index”)(4), gained 5.0% (including dividends) in the half-year through September. The period started with stocks on the downswing after reaching a 2005 high point on March 7. Economists keenly watched the swirling crosscurrents in the fixed income markets described above. Falling bond yields generally make stocks relatively more attractive. Falling mortgage interest rates have encouraged refinancing on a massive scale and the funds raised have tended not to stay long in the wallets of American consumers, keeping expansion strong. But inexorably rising short-term rates tend to dampen demand and profit margins. Still, stocks benefited from July’s positive reports, especially robust second quarter company earnings figures. On August 3, 2005, the S&P 500 Index reached its highest level in four years, but then fell back. It was not a sell-off, more the drift down of a market that was not particularly cheap or expensive, just one whose best days were probably behind it. Little headway was made in September after Hurricane Katrina followed by Rita. High prices at the pump were already here. An expensive winter for heating fuel appeared to be certain. Evidence of sharply rising factory prices started to be found in local Federal Reserve and purchasing managers’ reports. By month end, with consumer confidence slumping, some commentators could be heard grumbling about stagflation.
Internationally, Japan equities soared 15.0%, based on the MSCI Japan Index(5) calculated in dollars plus net dividends. The market did little until August, but thereafter a new sense of optimism took hold, based on an encouraging improvement in domestic demand. However mostly was due to the chance of a new reformist beginning under Prime Minister Koizumi, who won a landslide election victory in support of his proposal to privatize Japan Post, the savings vehicle of choice among the Japanese public and, improbably, the world’s largest financial institution.
European ex UK markets added 7.4% in the half-year according to the MSCI Europe ex UK Index(6) including net dividends. Such bullish performance belied bearish economic conditions. High unemployment and restrictive employment practices continued to depress
2
MARKET PERSPECTIVE: SIX MONTHS ENDED SEPTEMBER 30, 2005
domestic demand while political deadlock in Germany disappointed reformers. But this served only to depress the euro. Stock markets cheered the weaker currency, while corporate profits held up and merger and acquisition activity revived, allowing stocks to advance in the face of record low bond yields.
The UK market gained 5.7% calculated in dollars, based on the MSCI UK Index(7) including net dividends. The period was dominated by the effect of five interest rate increases to restrain over-stretched consumers and soaring property prices. By the period end, house prices were falling, manufacturing was in decline, retail sales were at multi-year lows and second quarter GDP growth was the slowest since 1993. Nonetheless, company earnings held up and despite terrorist attacks, investors supported an inexpensive market that paid over 3% in dividends as they waited for better times.
(1) The MSCI World Index is an unmanaged index that measures the performance of over 1,400 securities listed on exchanges in the U.S., Europe, Canada, Australia, New Zealand and the Far East.
(2) The Lehman Brothers Aggregate Bond Index is a widely recognized, unmanaged index of publicly issued investment grade U.S. Government, mortgage-backed, asset-backed and corporate debt securities.
(3) The Lehman Brothers High Yield Bond Index is an unmanaged index that measures the performance of fixed-income securities generally representative of corporate bonds rated below investment-grade.
(4) The Standard & Poor’s 500 Index is an unmanaged index that measures the performance of securities of approximately 500 large-capitalization companies whose securities are traded on major U.S. stock markets.
(5) The MSCI Japan Index is a free float-adjusted market capitalization index that is designed to measure developed market equity performance in Japan.
(6) The MSCI Europe ex UK Index is a free float-adjusted market capitalization index that is designed to measure developed market equity performance in Europe, excluding the UK.
(7) The MSCI UK Index is a free float-adjusted market capitalization index that is designed to measure developed market equity performance in the UK.
All indices are unmanaged and investors cannot invest directly in an index.
Past performance does not guarantee future results. The performance quoted represents past performance. Investment return and principal value of an investment will fluctuate, and shares, when redeemed, may be worth more or less than their original cost. The Funds’ performance is subject to change since the period’s end and may be lower or higher than the performance data shown. Please call (800) 992-0180 or log on to www.ingfunds.com to obtain performance data current to the most recent month end.
Market Perspective reflects the views of the Chief Investment Risk Officer only through the end of the period, and is subject to change based on market and other conditions.
3
ING GNMA INCOME FUND | | PORTFOLIO MANAGERS’ REPORT |
Investment Types
as of September 30, 2005
(as a percent of total investments)
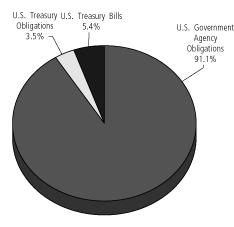
Portfolio holdings are subject to change daily.
The ING GNMA Income Fund (the “Fund”) seeks to generate a high level of current income, consistent with liquidity and safety of principal, through investment primarily in Government National Mortgage Association (“GNMA”) mortgage-backed securities (also known as GNMA Certificates) that are guaranteed as to the timely payment of principal and interest by the U.S. Government. The Fund is managed by Denis P. Jamison, CFA ING Investment Management Co. — the Sub-Adviser.
Performance: For the six months ended September 30, 2005, the Fund’s Class A shares, excluding sales charges, provided a total return of 1.68% compared to 2.12% return for the Lehman Brothers Mortgage-Backed Securities Index (“Lehman MBS Index”)(5).
Portfolio Specifics: The Federal Reserve’s on-going policy of gradually raising short term interest rates has negatively impacted the value of bonds with maturities of five years and less. For example, since March 31, the five-year segment of the U.S. Treasury market has returned just 1.5% compared with a gain of 5.1% for long-term government bonds. Call-protected mortgages on multi-family properties account for about 25% of the Fund’s assets and these securities tend to be valued in line with three- to five-year U.S. Treasury notes rather than single-family mortgages. Accordingly, the softness in this sector of the yield curve hampered the Fund’s return and we do not expect a quick turnaround. The Federal Reserve shows no signs of changing monetary policy near term. Short-term interest rates are expected to continue to rise and the yield curve will flatten. Despite this near term problem, our multi-family loans are the source of the Fund’s relatively high income return because they have an average coupon of 7.3% and a relatively low cost basis. We are not inclined to reduce this holding and are attempting to mitigate the problem by opportunistically increasing and decreasing our holdings of 30-year U.S. Treasury bonds and adding some extra capital gains.
Our single family mortgage investments are defensive. The average coupon for this 66% slice of the portfolio is still 5.72% compared with 5.85% six months ago and 5.36% for the Lehman Mortgage-Backed Securities Index. The higher coupon mortgages tend to be less sensitive to interest rate changes and provide shareholders with a higher income return. Of course, these bonds tend to pay down more quickly and related losses are higher. For the six months ended September 30, prepayment losses amounted to 34 basis points more than that of the benchmark index.
Current Strategy and Outlook: The key factor determining the relative performance of the Fund is the return on three-five year U.S. Treasury securities compared with that of mortgages. In turn, this relates to the changes in the shape of the yield curve and overall market volatility. A flat yield curve and low volatility — the current condition — weigh against strong performance by the Fund. Unfortunately, we view this as the likely investment environment for the remainder of the year. However, we face considerable uncertainty in 2006. Economic expansion is closely tied to the health of the housing market and this sector is facing ever stronger headwinds as interest rates increase. Also, a change in leadership of the Federal Reserve could have an adverse impact on market volatility. We think there will be opportunities to increase the interest rate sensitivity of the Fund through the purchases of both U.S. Treasury bonds and lower coupon mortgages, which could lead to better absolute returns.
4
PORTFOLIO MANAGERS’ REPORT | | ING GNMA INCOME FUND |
| Average Annual Total Returns for the Periods Ended September 30, 2005 | |
| |
| | | | | | | | | Since Inception | | Since Inception | | Since Inception | |
| | | | | | | | | of Class B | | of Class C | | of Class M | |
| | | 1 Year | | 5 Year | | 10 Year | | October 6, 2000 | | October 13, 2000 | | February 23, 2001 | |
| | | | | | | | | | | | | | |
| Including Sales Charge: | | | | | | | | | | | | | | | | | | | |
| Class A(1) | | (2.81 | )% | | 4.72 | % | | 5.73 | % | | — | | | — | | | — | | |
| Class B(2) | | (3.58 | )% | | — | | | — | | | 4.67 | % | | — | | | — | | |
| Class C(3) | | 0.29 | % | | — | | | — | | | — | | | 4.94 | % | | — | | |
| Class M(4) | | (1.78 | )% | | — | | | — | | | — | | | | | | 3.73 | % | |
| | | | | | | | | | | | | | | | | | | | |
| Excluding Sales Charge: | | | | | | | | | | | | | | | | | | | |
| Class A | | 2.03 | % | | 5.74 | % | | 6.25 | % | | — | | | — | | | — | | |
| Class B | | 1.27 | % | | — | | | — | | | 5.00 | % | | — | | | — | | |
| Class C | | 1.26 | % | | — | | | — | | | — | | | 4.94 | % | | — | | |
| Class M | | 1.52 | % | | — | | | — | | | — | | | — | | | 4.47 | % | |
| Lehman Brothers Mortgage-Backed Securities Index(5) | | 3.29 | % | | 6.12 | % | | 6.46 | % | | 6.12 | %(6) | | 6.12 | %(6) | | 5.32 | %(7) | |
| | | | | | | | | | | | | | | | | | | | |
Based on a $10,000 initial investment, the table above illustrates the total return of ING GNMA Income Fund against the index indicated. The index is unmanaged and has no cash in its portfolio, imposes no sales charges and incurs no operating expenses. An investor cannot invest directly in an index. The Fund’s performance is shown both with and without the imposition of sales charges.
The performance table does not reflect the deduction of taxes that a shareholder will pay on Fund distributions or the redemption of Fund shares.
The performance shown may include the effect of fee waivers and/or expense reimbursements by the Investment Manager and/or other service providers, which have the effect of increasing total return. Had all fees and expenses been considered, the total returns would have been lower.
Performance data represents past performance and is no assurance of future results. Investment return and principal value of an investment in the Fund will fluctuate. Shares, when sold, may be worth more or less than their original cost. The Fund’s performance may be lower or higher than the performance data shown. Please log on to www.ingfunds.com or call (800) 992-0180 to get performance through the most recent month end.
This report contains statements that may be “forward-looking” statements. Actual results may differ materially from those projected in the “forward-looking” statements.
The views expressed in this report reflect those of the portfolio manager, only through the end of the period as stated on the cover. The portfolio manager’s views are subject to change at any time based on market and other conditions.
(1) Reflects deduction of the maximum Class A sales charge of 4.75%.
(2) Reflects deduction of the Class B deferred sales charge of 5% and 2%, respectively, for the 1 year and since inception returns.
(3) Reflects deduction of the Class C deferred sales charge of 1% for the 1 year return.
(4) Reflects deduction of the maximum Class M sales charge of 3.25%.
(5) The Lehman Brothers Mortgage-Backed Securities Index is an unmanaged index composed of fixed income security mortgage pools sponsored by GNMA, FNMA and FHLMC, including GNMA Graduated Payment Mortgages.
(6) Since inception performance for index is shown from October 1, 2000.
(7) Since inception performance for index is shown from March 1, 2001.
5
ING HIGH YIELD BOND FUND | | PORTFOLIO MANAGERS’ REPORT |
Investment Types
as of September 30, 2005
(as a percent of total investments)
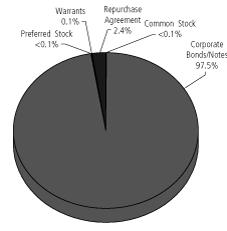
Portfolio holdings are subject to change daily.
The ING High Yield Bond Fund (the “Fund”) seeks to provide investors with a high level of current income and total return by investing at least 80% of its assets in high yield (high risk) bonds, that are unrated or rated below investment grade. The Fund is managed by a team of investment professionals led by Greg Jacobs, CFA and Kurt Kringelis, CFA, CPA, ING Investment Management Co. — the Sub-Adviser.
Performance: For the six months ended September 30, 2005, the Fund’s Class A shares, excluding sales charges, provided a total return of 2.81% compared to 3.71% for the Lehman Brothers High Yield Bond Index(4).
Portfolio Specifics: During the last six months, the portfolio continued to be overweight the middle tier, B-rated part of the universe, and underweight BB-rated securities and CCC-rated securities. During the period, higher quality outperformed lower quality, as BB-rated issues outperformed CCC-rated issues on average by 1.1%. This credit quality positioning had a neutral impact on performance, as the advantage of being underweight with lower quality issuers was offset by the disadvantage of being underweight BB-rated securities.
From a sector standpoint, the Fund benefited from being underweight the two worst performing sectors, automotives and airlines. Both sectors continued to exhibit fundamental declines, with autos experiencing downgrades (Ford and General Motors) and airlines experiencing defaults (Delta and Northwest). As a result, both groups underperformed the benchmark by nearly 5%. The Fund’s overweight positions in consumer-related areas, over the semi-annual period was neutral. All earlier gains were lost as the consumer-related issuers underperformed post Hurricane Katrina, as investors inferred that rising energy costs may finally curtail consumer spending.
Another factor that negatively affected relative performance was related to the benchmark. On June 1, 2005, Ford and General Motors became part of the Lehman Brothers High Yield Index, accounting for approximately 13% of the Index. On August 1, 2005, the Fund changed the official benchmark to the Lehman Brothers High Yield Index 2% Issuer Constrained benchmark. During this period, the Lehman Brothers High Yield Index outperformed the 2% constrained index by 0.34%.
Top Ten Industries
as of September 30, 2005
(as a percent of net assets)
Telecommunications | | 10.9 | % |
Media | | 10.7 | % |
Electric | | 8.9 | % |
Retail | | 5.7 | % |
Oil and Gas | | 5.2 | % |
Diversified Financial Services | | 5.1 | % |
Food | | 4.9 | % |
Lodging | | 4.5 | % |
Chemicals | | 3.7 | % |
Healthcare-Services | | 3.6 | % |
Portfolio holdings are subject to change daily.
Current Strategy and Outlook: We continue to believe that from a fundamental standpoint, the economy remains healthy. However, the impact of Hurricanes Katrina and Rita on energy prices and other related raw materials have yet to be fully understood and could lead to compressed margins for issuers in cyclical sectors and/or higher inflation in the U.S. Either scenario would have a negative impact on the market, although the order of magnitude is a bit uncertain. In the near term, higher energy costs are also likely to squeeze consumers and potentially weigh on their confidence, as they adapt to paying more for goods in general and in particular for fuel for their automobiles and to heat their homes this coming winter. Our current expectations are for GDP growth to moderate before picking up again as the hurricane rebuilding efforts add stimulus to the economy. Despite expectations for slower but relatively healthy near term GDP growth, we believe that consumer confidence will be an important factor in contributing to the sustainability of the economic expansion.
While we expect relatively healthy GDP growth near term, certain cyclical and consumer oriented issuers could be at risk for earnings disappointments. We remain less confident that the trend of improving issuer credit quality will continue and expect to see some moderation in the pace of improvement as the increased focus on shareholder friendly activity and financial transactions keeps the level of event risk in the marketplace elevated. To protect our downside risk, we have reallocated some exposure away from certain cyclical and consumer dependent issuers to other sectors but have made an effort to maintain yield given the possibility that any softness in the economy and market may prove to be temporary.
6
PORTFOLIO MANAGERS’ REPORT | | ING HIGH YIELD BOND FUND |
| Average Annual Total Returns for the Periods Ended September 30, 2005 | |
| | | | | | | |
| | | | | | Since Inception | |
| | 1 Year | | 5 Year | | December 15, 1998 | |
| | | | | | | | | | | |
| Including Sales Charge: | | | | | | | | | | |
| Class A(1) | | (0.80 | )% | | 4.92 | % | | 5.11 | % | |
| Class B(2) | | (1.53 | )% | | 4.90 | % | | 5.09 | % | |
| Class C(3) | | 2.40 | % | | 5.19 | % | | 5.10 | % | |
| | | | | | | | | | | |
| Excluding Sales Charge: | | | | | | | | | | |
| Class A | | 4.15 | % | | 5.95 | % | | 5.86 | % | |
| Class B | | 3.37 | % | | 5.20 | % | | 5.09 | % | |
| Class C | | 3.38 | % | | 5.19 | % | | 5.10 | % | |
| Lehman Brothers High Yield Bond Index(4) | | 6.71 | % | | 7.54 | % | | 5.75 | %(6) | |
| Lehman Brothers High Yield Bond Index — 2% Issuer Constrained(5) | | 6.58 | % | | 7.80 | % | | 5.93 | %(6) | |
| | | | | | | | | | | |
Based on a $10,000 initial investment, the table above illustrates the total return of ING High Yield Bond Fund against the Index indicated. The index is unmanaged and has no cash in its portfolio, imposes no sales charges and incurs no operating expenses. An investor cannot invest directly in an index. The Fund’s performance is shown both with and without the imposition of sales charges.
The performance table does not reflect the deduction of taxes that a shareholder will pay on Fund distributions or the redemption of Fund shares.
The performance shown may include the effect of fee waivers and/or expense reimbursements by the Investment Manager and/or other service providers, which have the effect of increasing total return. Had all fees and expenses been considered, the total returns would have been lower.
Performance data represents past performance and is no assurance of future results. Investment return and principal value of an investment in the Fund will fluctuate. Shares, when sold, may be worth more or less than their original cost. The Fund’s performance may be lower or higher than the performance data shown. Please log on to www.ingfunds.com or call (800) 992-0180 to get performance through the most recent month end.
This report contains statements that may be “forward-looking” statements. Actual results may differ materially from those projected in the “forward-looking” statements.
The views expressed in this report reflect those of the portfolio managers, only through the end of the period as stated on the cover. The portfolio managers’ views are subject to change at any time based on market and other conditions.
Fund holdings are subject to change daily.
(1) Reflects deduction of the maximum Class A sales charge of 4.75%.
(2) Reflects deduction of the Class B deferred sales charge of 5% and 2%, respectively, for the 1 year and 5 year returns.
(3) Reflects deduction of the Class C deferred sales charge of 1% for the 1 year return.
(4) The Lehman Brothers High Yield Bond Index is an unmanaged index that measures the performance of fixed-income securities that are similar, but not identical, to those in the Fund’s portfolio.
(5) This index is the 2% Issuer Cap component of the Lehman Brothers High Yield Bond Index.
(6) Since inception performance for index is shown from December 1, 1998.
7
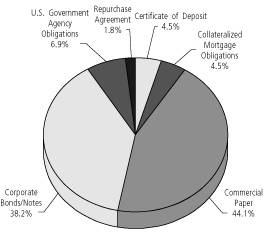
ING INTERMEDIATE BOND FUND | | PORTFOLIO MANAGERS’ REPORT |
Investment Types
as of September 30, 2005
(as a percent of total investments)

Portfolio holdings are subject to change daily.
The ING Intermediate Bond Fund (the “Fund”) seeks to provide investors with a high level of current income, consistent with the preservation of capital and liquidity by investing at least 80% of its assets in investment grade debt securities. The Fund is managed by James B. Kauffmann, ING Investment Management Co. — the Sub-Adviser.
Performance: For the six months ended September 30, 2005, the Fund’s Class A shares, excluding sales charges, provided a total return of 2.37% compared to 2.31% for the Lehman Brothers Aggregate Bond Index(4).
Portfolio Specifics: The Fund matched its benchmark during April largely due to our short duration posture in a rally. We maintained our underweight to credit on a contribution-to-duration and market-weight basis, which was beneficial in a market largely characterized by widening spreads; however, our overweight in commercial mortgage-backed securities was a drag on performance. We maintained a reduced mortgage allocation of 30% versus approximately 35% with a significant emphasis on adjustable rate mortgages and collateralized mortgage obligations over traditional pass-through securities.
The Fund underperformed its benchmark during May due again to our short duration posture in a rally. This duration call was partially offset by overweighting maturities that performed better than others. We initiated positions in auto industry bonds following the rapid price declines early in the month. Furthermore, we continued an underweight to credit. This was also a hindrance as the credit sensitive sectors recouped some of their losses in the final week of the month.
Our short duration posture in June was not beneficial. Term structure exposure was generally flat to the benchmark with a slight bias against the front-end of the yield curve; however, the curve flattened significantly. We continued to add automakers in June, but our positioning may have lagged the market. While we closed the month underweight the sector, the mortgage-backed securities portion of the portfolio was designed to benefit from a curve flattening, which did not occur as we had expected. Credit markets became more risk embracing during July and produced positive excess returns thus rewarding holders — such as ourselves of riskier or less liquid instruments. We actively traded our auto sector during the month with exposures ranging from around 1.00% to 0% to 0.50%, and trust preferred securities (TRUPs) continue to play a significant role in the credit allocation. (TRUPs are trust preferred securities and are a unique form of preferred stock. The Fund has focused on TRUPs that pay floating rate interest. Floating rate securities tend to fare well in environments of increasing short-term interest rates which has been the case this year as the Federal Reserve has raised the Federal Funds rate repeatedly. Generally, TRUPs are subordinate to other debt issued by companies.)
The Fund slightly outperformed the index in August after we quickly withdrew our short duration posture in response to uncertainty about the impact of Hurricane Katrina. Although total returns were positive across the board, the month witnessed negative excess returns in every sector save agencies, asset-backed securities, and commercial mortgage-backed securities. Our modest exposure to high yield was not beneficial this month. The credit-sensitive markets were generally softer following the further downgrades of Ford and GM.
Awareness of inflation risks began to dominate in September. The Fund slightly underperformed the index during the month as we reinstated the short duration posture that we had in place before the storms with an overweight in 30-year maturities. Corporate bonds underperformed by 0.09% with the drag particularly acute in long-dated industrials and utilities. While our underweight in longer-dated corporates helped performance somewhat, exposures to commercial mortgage-backed securities did not.
Top Ten Industries
as of September 30, 2005
(as a percent of net assets)
U.S. Treasury Obligations | | 27.7 | % |
Federal National Mortgage Association | | 23.1 | % |
Whole Loan Collateralized Mortgage Obligations | | 12.8 | % |
Federal Home Loan Mortgage Corporation | | 7.3 | % |
Diversified Financial Sevices | | 5.7 | % |
Asset-Backed Securities | | 5.4 | % |
Commercial Mortgage-Backed Securities | | 5.4 | % |
Banks | | 5.1 | % |
Electric | | 2.6 | % |
Oil and Gas | | 1.6 | % |
Portfolio holdings are subject to change daily.
Current Strategy and Outlook: We have positioned the Fund for the potentiality that sentiment will reverse and higher risk premiums will be required by the market. Indeed, we are keenly aware that preserving capital and receiving adequate compensation for risk are essential elements of successful bond management. Specifically, the ING credit team continues to avoid companies with depressed stock prices and under-utilized assets on the books. Moreover, the contribution to duration of the corporate bond portion of the portfolio is less than the index. Our mortgage team has constructed a portfolio designed to offset an increase in volatility and a change in prepayments. Finally, our portfolio duration is shorter than the index with an overweight in the longest maturity bucket in anticipation of continued tightening by the Federal Reserve.
8
PORTFOLIO MANAGERS’ REPORT | | ING INTERMEDIATE BOND FUND |
| Average Annual Total Returns for the Periods Ended September 30, 2005 | |
| | | | | | | | | | | |
| | | | | | Since Inception | | Since Inception | | Since Inception | |
| | | | | | of Class A, B and C | | of Class O | | of Class R | |
| | 1 Year | | 5 Year | | December 15, 1998 | | August 13, 2004 | | March 16, 2004 | |
| | | | | | | | | | | | | | | | | |
| Including Sales Charge: | | | | | | | | | | | | | | | | |
| Class A(1) | | (1.72 | )% | | 7.22 | % | | 6.14 | % | | — | | | — | | |
| Class B(2) | | (2.56 | )% | | 7.13 | % | | 6.08 | % | | — | | | — | | |
| Class C(3) | | 1.42 | % | | 7.46 | % | | 6.11 | % | | — | | | — | | |
| Class O | | 3.25 | % | | — | | | — | | | 3.59 | % | | — | | |
| Class R | | 3.03 | % | | — | | | — | | | — | | | 2.33 | % | |
| | | | | | | | | | | | | | | | | |
| Excluding Sales Charge: | | | | | | | | | | | | | | | | |
| Class A | | 3.18 | % | | 8.27 | % | | 6.91 | % | | — | | | — | | |
| Class B | | 2.41 | % | | 7.43 | % | | 6.08 | % | | — | | | — | | |
| Class C | | 2.41 | % | | 7.46 | % | | 6.11 | % | | — | | | — | | |
| Class O | | 3.25 | % | | — | | | — | | | 3.59 | % | | — | | |
| Class R | | 3.03 | % | | — | | | — | | | — | | | 2.33 | % | |
| Lehman Brothers Aggregate Bond Index(4) | | 2.80 | % | | 6.62 | % | | 5.78 | %(5) | | 2.83 | %(6) | | 2.31 | %(7) | |
| | | | | | | | | | | | | | | | | |
Based on a $10,000 initial investment, the table above illustrates the total return of ING Intermediate Bond Fund against the Index indicated. The index is unmanaged and has no cash in its portfolio, imposes no sales charges and incurs no operating expenses. An investor cannot invest directly in an index. The Fund’s performance is shown both with and without the imposition of sales charges.
The performance table does not reflect the deduction of taxes that a shareholder will pay on Fund distributions or the redemption of Fund shares.
The performance shown may include the effect of fee waivers and/or expense reimbursements by the Investment Manager and/or other service providers, which have the effect of increasing total return. Had all fees and expenses been considered, the total returns would have been lower.
Performance data represents past performance and is no assurance of future results. Investment return and principal value of an investment in the Fund will fluctuate. Shares, when sold, may be worth more or less than their original cost. The Fund’s performance may be lower or higher than the performance data shown. Please log on to www.ingfunds.com or call (800) 992-0180 to get performance through the most recent month end.
This report contains statements that may be “forward-looking” statements. Actual results may differ materially from those projected in the “forward-looking” statements.
The views expressed in this report reflect those of the portfolio manager, only through the end of the period as stated on the cover. The portfolio manager’s views are subject to change at any time based on market and other conditions.
Fund holdings are subject to change daily.
(1) Reflects deduction of the maximum Class A sales charge of 4.75%.
(2) Reflects deduction of the Class B deferred sales charge of 5% and 2%, respectively, for the 1 year and 5 year returns.
(3) Reflects deduction of the Class C deferred sales charge of 1% for the 1 year return.
(4) The Lehman Brothers Aggregate Bond Index is a widely recognized, unmanaged index of publicly issued investment grade U.S. Government, mortgage-backed, asset-backed and corporate debt securities.
(5) Since inception performance for index is shown from December 1, 1998.
(6) Since inception performance for index is shown from September 1, 2004.
(7) Since inception performance for index is shown from April 1, 2004.
9
ING NATIONAL TAX-EXEMPT BOND FUND | | PORTFOLIO MANAGERS’ REPORT |
Investment Types
as of September 30, 2005
(as a percent of total investments)
Portfolio holdings are subject to change daily.
The ING National-Tax Exempt Bond Fund (the “Fund”) seeks to provide investors with a high level of current income that is exempt from federal income taxes, consistent with preservation of capital. The Fund is managed by Robert Schonbrunn, Managing Director and Portfolio Manager, Karen Cronk, Portfolio Manager, Richard Killbride, Portfolio Manager, ING Investment Management Co. — the Sub-Adviser.
Performance: For the six months ended September 30, 2005, the Fund’s Class A shares, excluding sales charges, returned 2.20% compared to 2.80% for the Lehman Brothers Municipal Bond Index(4) and 2.31% for the Lehman Brothers Aggregate Bond Index(5).
Portfolio Specifics: Over the past six months, interest rates on municipal bonds, as measured by AAA-rated general obligations, maturing in less than four years rose, while rates on bonds maturing in longer than four years actually declined. This condition, known as a flattening of the yield curve, was an important factor affecting performance during this period. Shorter term bond interest rates rose in response to the Federal Reserve’s program of raising the Federal Funds rate, while longer term interest rates declined as inflation remained lower than anticipated. The best performing bonds in the past six months were the longest maturities and the worst were the shortest maturities. We positioned the Fund in a “barbell” structure with overweight positions in the two extreme parts of the yield curve — short and long maturity bonds — to be in a defensive posture while the yield curve flattened. This move was beneficial to the Fund overall, but the shorter term portion of the “barbell” was a drag on performance. In addition, many of the bonds held in the Fund have call options of 10 years or less. The higher coupon bonds that the Fund owns in the portfolio were often priced to the call date instead of to the actual maturity date, which tended to reduce the positive impact of the longer term bonds as interest rates declined.
The Fund is rated AA in quality and currently holds over 45% in AAA-rated bonds which is comparable to the Lehman Municipal Bond Index. An overweight in hospital/medical and BBB-rated bonds during this period added to our returns as lower quality out performed higher quality issues. The Fund is structured with a higher coupon and yield than the benchmark. The Fund began the period with a lower sensitivity to interest rate change known as duration, which hurt performance. In the past six months, the Fund has increased its duration by shifting assets toward longer maturity bonds, which had a positive affect on returns.
Current Strategy and Outlook: Our outlook is for the yield curve to continue to flatten as short-term interest rates rise more than longer-term interest rates. We believe that the Federal Reserve will continue to raise the Federal Funds rate and that the economy will slow but not fall into a recession. It is our opinion that inflation will remain near current levels based upon the impact of globalization, productivity and the low absolute level of interest rates. In this environment the Fund, given its high yield and “barbell” structure, should be well positioned. We continue to look for additional opportunities to increase yield, as this becomes the most important component of investment return when interest rate movement slows.
10
PORTFOLIO MANAGERS’ REPORT | | ING NATIONAL TAX-EXEMPT BOND FUND |
| Average Annual Total Returns for the Periods Ended September 30, 2005 | |
| | | | | | | |
| | | | | | Since Inception | |
| | 1 Year | | 5 Year | | November 8, 1999 | |
| | | | | | | | | | | |
| Including Sales Charge: | | | | | | | | | | |
| Class A(1) | | (2.22 | )% | | 4.41 | % | | 4.59 | % | |
| Class B(2) | | (3.04 | )% | | 4.33 | % | | 4.52 | % | |
| Class C(3) | | 0.92 | % | | 4.65 | % | | 4.68 | % | |
| | | | | | | | | | | |
| Excluding Sales Charge: | | | | | | | | | | |
| Class A | | 2.66 | % | | 5.43 | % | | 5.46 | % | |
| Class B | | 1.90 | % | | 4.66 | % | | 4.66 | % | |
| Class C | | 1.91 | % | | 4.65 | % | | 4.68 | % | |
| Lehman Brothers Municipal Bond Index(4) | | 4.05 | % | | 6.34 | % | | 6.60 | %(6) | |
| Lehman Brothers Aggregate Bond Index(5) | | 2.80 | % | | 6.62 | % | | 6.72 | %(6) | |
| | | | | | | | | | | |
| | | | | | | | | | | | | |
Based on a $10,000 initial investment, the table above illustrates the total return of ING National Tax-Exempt Bond Fund against the Indices indicated. An index is unmanaged and has no cash in its portfolio, imposes no sales charge and incurs no operating expenses. An investor cannot invest directly in an index. The Fund’s performance is shown both with and without the imposition of sales charges.
The performance table does not reflect the deduction of taxes that a shareholder will pay (if any) on Fund distributions or the redemption of Fund shares.
The performance shown may include the effect of fee waivers and/or expense reimbursements by the Investment Manager and/or other service providers, which have the effect of increasing total return. Had all fees and expenses been considered, the total returns would have been lower.
Performance data represents past performance and is no assurance of future results. Investment return and principal value of an investment in the Fund will fluctuate. Shares, when sold, may be worth more or less than their original cost. The Fund’s performance may be lower or higher than the performance data shown. Please log on to www.ingfunds.com or call (800) 992-0180 to get performance through the most recent month end.
This report contains statements that may be “forward-looking” statements. Actual results may differ materially from those projected in the “forward-looking” statements.
The views expressed in this report reflect those of the portfolio managers, only through the end of the period as stated on the cover. The portfolio managers’ views are subject to change at any time based on market and other conditions.
Fund holdings are subject to change daily.
(1) Reflects deduction of the maximum Class A sales charge of 4.75%.
(2) Reflects deduction of the Class B deferred sales charge of 5% and 1%, respectively, for the 1 year and since inception returns.
(3) Reflects deduction of the Class C deferred sales charge of 1% for the 1 year return.
(4) The Lehman Brothers Municipal Bond Index is an unmanaged index of approximately 1,100 investment grade tax-exempt bonds classified into four sectors: general obligation, revenue, insured and pre-refunded.
(5) The Lehman Brothers Aggregate Bond Index is a widely recognized, unmanaged index of publicly issued investment grade U.S. Government, mortgage-backed, asset-backed and corporate debt securities.
(6) Since inception performance for index is shown from November 1, 1999.
11
ING CLASSIC MONEY MARKET FUND | | PORTFOLIO MANAGERS’ REPORT |
Investment Types
as of September 30, 2005
(as a percent of total investments)
Portfolio holdings are subject to change daily.
The ING Classic Money Market Fund (the “Fund”) seeks to provide a high level of current income, consistent with preservation of capital and liquidity and the maintenance of a stable $1.00 net asset value per share. The Fund is managed by David S. Yealy, ING Investment Management Co. — the Sub-Adviser.
Portfolio Specifics: The Federal Open Market Committee (“FOMC”) continued its measured pace of increasing short-term interest rates, raising the Federal Funds rate from 3.25% as of June 30 to 3.75% as of September 30th, despite concerns about the short-term economic growth impact and spike in energy costs related to Hurricane Katrina. The FOMC has raised rates eleven times and a total of 2.75% since the end of June last year. Chairman Greenspan and other FOMC members do not appear to be done raising rates any time soon. In various speeches following Hurricane Katrina and the September 20th FOMC meeting, the FOMC participants focused on the potential for inflation to pick up in 2006 due to higher energy costs and rebuilding efforts following Hurricane Katrina.
Rates for short-term money market securities rose approximately 50 basis points in response to the increases in the Federal Funds rate and in anticipation of more increases in 2005 and 2006. The Fund benefited from the large amount of interest sensitive floating rate securities owned throughout the quarter. In addition to our emphasis on floating rate securities, we continued to focus new purchases on very short maturity securities that typically matured prior to the next FOMC meeting, which also performed well during the rising rate environment. We maintained a short weighted average maturity similar to or shorter than the iMoneyNet First Tier Average.
Current Strategy and Outlook: The short-term market consensus as of the end of September is for the Federal Funds rate to be 4% at year-end. We believe that the FOMC will keep raising the Federal Funds rate at least 25 basis points at each of the meetings in the fourth quarter, taking the rate to 4.25% or higher with additional increases in 2006. We will continue to maintain a high exposure to floating rate notes and make selective purchases in the three-month and under maturity sector where yield levels fully price in 25 basis point increases at each of the Federal Reserve meetings in between. We intend to keep our weighted average maturity relatively short until the markets start to price in a more aggressive Federal Reserve policy than is currently reflected in the market.
12
ING INSTITUTIONAL PRIME MONEY MARKET FUND | | PORTFOLIO MANAGERS’ REPORT |
Investment Types
as of September 30, 2005
(as a percent of total investments)

Portfolio holdings are subject to change daily.
The ING Institutional Money Market Fund (the “Fund”) seeks to provide a high level of current income, consistent with preservation of capital and liquidity and the maintenance of a stable $1.00 net asset value per share. The Fund is managed by David S. Yealy, ING Investment Management Co. — the Sub-Adviser.
Portfolio Specifics: The Federal Open Market Committee (“FOMC”) continued its measured pace of increasing short-term interest rates in order to remove some additional monetary accommodation. The FOMC raised the Federal Funds rate 25 basis points at the two third quarter FOMC Meetings taking the rate from 3.25% at June 30th to 3.75% as of September 30th, despite the concerns about the short-term economic growth impact and spike in energy costs related to Hurricane Katrina. The FOMC has raised rates a total of eleven times and 2.75% since they started increasing the Federal Funds rate at the end of June last year. Chairman Greenspan and the other FOMC members do not appear to be done raising rates any time soon. In various speeches following Hurricane Katrina and the September 20th FOMC meeting, the FOMC participants focused on the potential for inflation to pickup in 2006 due to higher energy costs and the rebuilding efforts
Rates for short-term money market securities increased during the quarter approximately 50 basis points in response to the increases in the Federal Funds rate and in anticipation of more increases in 2005 and 2006. The Fund benefited from starting up in a rising rate environment and from the large amount of interest sensitive floating rate securities purchased during the quarter. In addition to our emphasis on floating rate securities, we focused initial purchases on very short maturity securities that typically matured prior to the next one or two FOMC meetings which also performed well during this rising rate environment. We maintained a short weighted average maturity (WAM) similar to or shorter than the iMoneyNet First Tier Average WAM.
Current Strategy and Outlook: The short-term market consensus as of the end of September is for the Federal Funds rate to be 4% at year-end. We believe that the FOMC will keep raising the Federal Funds rate at least 25 basis points at each of the meetings in the fourth quarter, taking the rate to 4.25% or higher with additional increases in 2006. We will continue to maintain a high exposure to floating rate notes and make selective purchases in the three-month and under maturity sector where yield levels fully price in 25 basis point increases at each of the Federal Reserve meetings in between. We intend to keep our weighted average maturity relatively short until the markets start to price in a more aggressive Federal Reserve policy than is currently reflected in the market.
13
SHAREHOLDER EXPENSE EXAMPLES (Unaudited)
As a shareholder of a Fund, you incur two types of costs: (1) transaction costs, including sales charges (loads) on purchase payments, reinvested dividends, or other distributions; redemption fees; and exchange fees; and (2) ongoing costs, including management fees; distribution [and/or service] (12b–1) fees; and other Fund expenses. These Examples are intended to help you understand your ongoing costs (in dollars) of investing in a Fund and to compare these costs with the ongoing costs of investing in other mutual funds.
The Examples are based on an investment of $1,000 invested at the beginning of the period and held for the entire period from April 1, 2005 to September 30, 2005.
Actual Expenses
The first section of the table shown, “Actual Fund Return,” provides information about actual account values and actual expenses. You may use the information in this section, together with the amount you invested, to estimate the expenses that you paid over the period. Simply divide your account value by $1,000 (for example, an $8,600 account value divided by $1,000 = 8.6), then multiply the result by the number in the first section under the heading entitled “Expenses Paid During Period” to estimate the expenses you paid on your account during this period.
Hypothetical Example for Comparison Purposes
The second section of the table shown, “Hypothetical 5% Return,” provides information about hypothetical account values and hypothetical expenses based on the Fund’s actual expense ratio and an assumed rate of return of 5% per year before expenses, which is not the Fund’s actual return. The hypothetical account values and expenses may not be used to estimate the actual ending account balance or expenses you paid for the period. You may use this information to compare the ongoing costs of investing in the Fund and other funds. To do so, compare this 5% hypothetical example with the 5% hypothetical examples that appear in the shareholder reports of the other funds.
Please note that the expenses shown in the table are meant to highlight your ongoing costs only and do not reflect any transactional costs, such as sales charges (loads), redemption fees, or exchange fees. Therefore, the hypothetical lines of the table are useful in comparing ongoing costs only, and will not help you determine the relative total costs of owning different funds. In addition, if these transactional costs were included, your costs would have been higher.
| | | Beginning | | Ending | | | | Expenses Paid | |
| | | Account | | Account | | Annualized | | During the | |
| | | Value | | Value | | Expense | | Six Months Ended | |
| ING GNMA Income Fund | | April 1, 2005 | | September 30, 2005 | | Ratio | | September 30, 2005* | |
| | | | | | | | | | |
| Actual Fund Return | | | | | | | | | | | | | |
| Class A | | $1,000.00 | | | $1,016.80 | | | 1.01 | % | | $5.11 | | |
| Class B | | 1,000.00 | | | 1,013.10 | | | 1.76 | | | 8.88 | | |
| Class C | | 1,000.00 | | | 1,013.00 | | | 1.76 | | | 8.88 | | |
| Class M | | 1,000.00 | | | 1,014.20 | | | 1.50 | | | 7.57 | | |
| Hypothetical (5% return before expenses) | | | | | | | | | | | | | |
| Class A | | $1,000.00 | | | $1,020.00 | | | 1.01 | % | | $5.11 | | |
| Class B | | 1,000.00 | | | 1,016.24 | | | 1.76 | | | 8.90 | | |
| Class C | | 1,000.00 | | | 1,016.24 | | | 1.76 | | | 8.90 | | |
| Class M | | 1,000.00 | | | 1,017.55 | | | 1.50 | | | 7.59 | | |
| | | | | | | | | | | | | | |
* Expenses are equal to each Fund’s respective annualized expense ratios multiplied by the average account value over the period, multiplied by 183/365 to reflect the most recent fiscal half-year.
14
SHAREHOLDER EXPENSE EXAMPLES (Unaudited) (CONTINUED)
| | Beginning | | Ending | | | | Expenses Paid | |
| | Account | | Account | | Annualized | | During the | |
| | Value | | Value | | Expense | | Six Months Ended | |
| ING High Yield Bond Fund | | April 1, 2005 | | September 30, 2005 | | Ratio | | September 30, 2005* | |
| Actual Fund Return | | | | | | | | | | | | | |
| Class A | | $1,000.00 | | | $1,028.10 | | | 1.21 | % | | $6.15 | | |
| Class B | | 1,000.00 | | | 1,025.40 | | | 1.96 | | | 9.95 | | |
| Class C | | 1,000.00 | | | 1,024.20 | | | 1.96 | | | 9.95 | | |
| Hypothetical (5% return before expenses) | | | | | | | | | | | | | |
| Class A | | $1,000.00 | | | $1,018.50 | | | 1.31 | % | | $6.63 | | |
| Class B | | 1,000.00 | | | 1,015.74 | | | 1.86 | | | 9.40 | | |
| Class C | | 1,000.00 | | | 1,015.24 | | | 1.96 | | | 9.90 | | |
| | | | | | | | | | | | | | |
| ING Intermediate Bond Fund | | | | | | | | | | | | | |
| Actual Fund Return | | | | | | | | | | | | | |
| Class A | | $1,000.00 | | | $1,023.70 | | | 1.00 | % | | $5.07 | | |
| Class B | | 1,000.00 | | | 1,019.90 | | | 1.75 | | | 8.86 | | |
| Class C | | 1,000.00 | | | 1,019.90 | | | 1.75 | | | 8.86 | | |
| Class O | | 1,000.00 | | | 1,024.20 | | | 1.00 | | | 5.07 | | |
| Class R | | 1,000.00 | | | 1,022.20 | | | 1.25 | | | 6.34 | | |
| Hypothetical (5% return before expenses) | | | | | | | | | | | | | |
| Class A | | $1,000.00 | | | $1,020.05 | | | 1.00 | % | | $5.06 | | |
| Class B | | 1,000.00 | | | 1,016.29 | | | 1.75 | | | 8.85 | | |
| Class C | | 1,000.00 | | | 1,016.29 | | | 1.75 | | | 8.85 | | |
| Class O | | 1,000.00 | | | 1,020.05 | | | 1.00 | | | 5.06 | | |
| Class R | | 1,000.00 | | | 1,018.80 | | | 1.25 | | | 6.33 | | |
| | | | | | | | | | | | | | |
| ING National Tax-Exempt Bond Fund | | | | | | | | | | | | | |
| Actual Fund Return | | | | | | | | | | | | | |
| Class A | | $1,000.00 | | | $1,022.00 | | | 1.10 | % | | $5.58 | | |
| Class B | | 1,000.00 | | | 1,017.20 | | | 1.85 | | | 9.36 | | |
| Class C | | 1,000.00 | | | 1,018.10 | | | 1.85 | | | 9.36 | | |
| Hypothetical (5% return before expenses) | | | | | | | | | | | | | |
| Class A | | $1,000.00 | | | $1,019.55 | | | 1.10 | % | | $5.57 | | |
| Class B | | 1,000.00 | | | 1,015.79 | | | 1.85 | | | 9.35 | | |
| Class C | | 1,000.00 | | | 1,015.79 | | | 1.85 | | | 9.35 | | |
| | | | | | | | | | | | | | |
* Expenses are equal to each Fund’s respective annualized expense ratios multiplied by the average account value over the period, multiplied by 183/365 to reflect the most recent fiscal half-year.
15
SHAREHOLDER EXPENSE EXAMPLES (Unaudited) (CONTINUED)
| | Beginning | | Ending | | | | Expenses Paid | |
| | Account | | Account | | Annualized | | During the | |
| | Value | | Value | | Expense | | Six Months Ended | |
| ING Classic Money Market Fund | | April 1, 2005 | | September 30, 2005 | | Ratio | | September 30, 2005* | |
| Actual Fund Return | | | | | | | | | | | | | |
| Class A | | $1,000.00 | | | $1,012.60 | | | 0.77 | % | | $3.88 | | |
| Class B | | 1,000.00 | | | 1,009.70 | | | 1.32 | | | 6.65 | | |
| Class C | | 1,000.00 | | | 1,009.80 | | | 1.32 | | | 6.65 | | |
| Hypothetical (5% return before expenses) | | | | | | | | | | | | | |
| Class A | | $1,000.00 | | | $1,021.21 | | | 0.77 | % | | $3.90 | | |
| Class B | | 1,000.00 | | | 1,018.45 | | | 1.32 | | | 6.68 | | |
| Class C | | 1,000.00 | | | 1,018.45 | | | 1.32 | | | 6.68 | | |
| | | | | | | | | | | | | | |
| ING Institutional Prime Money Market Fund (a) | | | | | | | | | | | | | |
| Actual Fund Return | | $1,000.00 | | | $1,005.90 | | | 0.17 | % | | $0.30 | | |
| Hypothetical (5% return before expenses) | | $1,000.00 | | | $1,024.22 | | | 0.17 | % | | $0.86 | | |
| | | | | | | | | | | | | | |
* Expenses are equal to each Fund’s respective annualized expense ratios multiplied by the average account value over the period, multiplied by 183/365 to reflect the most recent fiscal half-year (except for ING Institutional Prime Money Market Fund’s “Actual Fund Return” information which reflects the 64 day period ended September 30, 2005 due to its inception date of July 28, 2005.
(a) Fund commenced operations July 28, 2005.
16
STATEMENTS OF ASSETS AND LIABILITIES as of September 30, 2005 (UNAUDITED)
| | ING | | ING | | ING | |
| | GNMA Income | | High Yield Bond | | Intermediate Bond | |
| | Fund | | Fund | | Fund | |
ASSETS: | | | | | | | |
Investments in securities at value*+ | | | $ | 611,970,497 | | | $ | 221,959,050 | | | $ | 916,344,134 | |
Short-term investments at amortized cost | | | 34,684,685 | | | — | | | — | |
Repurchase agreement | | | — | | | 5,438,000 | | | 82,978,000 | |
Cash | | | 1,007,825 | | | 290,959 | | | 56,256 | |
Cash collateral for futures | | | — | | | — | | | 261,282 | |
Cash collateral for securities loaned | | | — | | | — | | | 189,517,473 | |
Foreign currencies at value** | | | — | | | — | | | 8,957 | |
Receivables: | | | | | | | | | | |
Investment securities sold | | | — | | | 4,269,544 | | | 12,173,384 | |
Fund shares sold | | | 173,520 | | | 120,961 | | | 1,573,888 | |
Dividends and interest | | | 3,080,644 | | | 4,711,833 | | | 5,626,506 | |
Variation margin receivable | | | — | | | — | | | 19,238 | |
Prepaid expenses | | | 68,738 | | | 26,333 | | | 94,890 | |
Unrealized appreciation on swap agreements | | | — | | | — | | | 149,829 | |
Reimbursement due from manager | | | — | | | 163 | | | — | |
Total assets | | | 650,985,909 | | | 236,816,843 | | | 1,208,803,837 | |
| | | | | | | | | | |
LIABILITIES: | | | | | | | | | | |
Payable for investment securities purchased | | | — | | | 7,504,536 | | | 149,918,457 | |
Payable for fund shares redeemed | | | 442,558 | | | 563,707 | | | 3,737,920 | |
Payable for futures variation margin | | | — | | | — | | | 60,750 | |
Income distribution payable | | | — | | | 574,470 | | | 533,372 | |
Payable upon receipt of securities loaned | | | — | | | — | | | 189,517,473 | |
Payable to affiliates | | | 537,645 | | | 267,507 | | | 665,780 | |
Payable for trustee fees | | | 19,781 | | | 8,066 | | | 7,836 | |
Other accrued expenses and liabilities | | | 361,831 | | | 242,100 | | | 563,405 | |
Total liabilities | | | 1,361,815 | | | 9,160,386 | | | 345,004,993 | |
NET ASSETS | | | $ | 649,624,094 | | | $ | 227,656,457 | | | $ | 863,798,844 | |
| | | | | | | | | | |
NET ASSETS WERE COMPRISED OF: | | | | | | | | | | |
Paid-in capital | | | $ | 662,079,607 | | | $ | 667,806,521 | | | $ | 866,313,807 | |
Undistributed net investment income (accumulated net investment loss) | | | 725,397 | | | (352,648 | ) | | (558,490 | ) |
Accumulated net realized gain (loss) on investments, foreign currency related transactions, futures and swaps | | | (18,951,005 | ) | | (422,612,064 | ) | | 6,398,900 | |
Net unrealized appreciation or depreciation on investments foreign currency related transactions, futures and swaps | | | 5,770,095 | | | (17,185,352 | ) | | (8,355,373 | ) |
NET ASSETS | | | $ | 649,624,094 | | | $ | 227,656,457 | | | $ | 863,798,844 | |
| | | | | | | | | | | | | |
|
+ | | Including securities loaned at value | | | $ | — | | | $ | — | | | $ | 185,179,131 | |
* | | Cost of investments in securities | | | $ | 606,215,034 | | | $ | 239,144,402 | | | $ | 924,611,548 | |
** | | Cost of foreign currencies | | | $ | — | | | $ | — | | | $ | 9,217 | |
| | | | | | | | | | | | | | | | |
See Accompanying Notes to Financial Statements
17
STATEMENTS OF ASSETS AND LIABILITIES as of September 30, 2005 (UNAUDITED) (CONTINUED)
| | ING | | ING | | ING | |
| | GNMA Income | | High Yield Bond | Intermediate Bond | |
| | Fund | | Fund | | Fund | |
Class A: | | | | | | | |
Net assets | | $ | 508,424,239 | | $ | 105,472,999 | | $ | 534,202,800 | |
Shares authorized | | unlimited | | unlimited | | unlimited | |
Par value | | $ | 0.001 | | $ | 0.001 | | $ | 0.001 | |
Shares outstanding | | 60,143,323 | | 12,091,430 | | 51,503,815 | |
Net asset value and redemption price per share | | $ | 8.45 | | $ | 8.72 | | $ | 10.37 | |
Maximum offering price per share (4.75%)(1) | | $ | 8.87 | | $ | 9.15 | | $ | 10.89 | |
| | | | | | | |
Class B: | | | | | | | |
Net assets | | $ | 90,397,461 | | $ | 101,079,537 | | $ | 64,641,606 | |
Shares authorized | | unlimited | | unlimited | | unlimited | |
Par value | | $ | 0.001 | | $ | 0.001 | | $ | 0.001 | |
Shares outstanding | | 10,745,208 | | 11,591,544 | | 6,244,547 | |
Net asset value and redemption price per share(2) | | $ | 8.41 | | $ | 8.72 | | $ | 10.35 | |
Maximum offering price per share | | $ | 8.41 | | $ | 8.72 | | $ | 10.35 | |
| | | | | | | |
Class C: | | | | | | | |
Net assets | | $ | 39,067,482 | | $ | 21,103,921 | | $ | 73,880,602 | |
Shares authorized | | unlimited | | unlimited | | unlimited | |
Par value | | $ | 0.001 | | $ | 0.001 | | $ | 0.001 | |
Shares outstanding | | 4,637,363 | | 2,418,967 | | 7,131,907 | |
Net asset value and redemption price per share(2) | | $ | 8.42 | | $ | 8.72 | | $ | 10.36 | |
Maximum offering price per share | | $ | 8.42 | | $ | 8.72 | | $ | 10.36 | |
| | | | | | | |
Class I: | | | | | | | |
Net assets | | $ | 11,459,484 | | N/A | | $ | 149,921,722 | |
Shares authorized | | unlimited | | N/A | | unlimited | |
Par value | | $ | 0.001 | | N/A | | $ | 0.001 | |
Shares outstanding | | 1,354,237 | | N/A | | 14,450,352 | |
Net asset value and redemption price per share | | $ | 8.46 | | N/A | | $ | 10.37 | |
Maximum offering price per share | | $ | 8.46 | | N/A | | $ | 10.37 | |
| | | | | | | |
Class M: | | | | | | | |
Net assets | | $ | 194,179 | | N/A | | N/A | |
Shares authorized | | unlimited | | N/A | | N/A | |
Par value | | $ | 0.001 | | N/A | | N/A | |
Shares outstanding | | 22,930 | | N/A | | N/A | |
Net asset value and redemption price per share | | $ | 8.47 | | N/A | | N/A | |
Maximum offering price per share (3.25%)(3) | | $ | 8.75 | | N/A | | N/A | |
| | | | | | | |
Class O: | | | | | | | |
Net assets | | N/A | | N/A | | $ | 40,497,262 | |
Shares authorized | | N/A | | N/A | | unlimited | |
Par value | | N/A | | N/A | | $ | 0.001 | |
Shares outstanding | | N/A | | N/A | | 3,902,909 | |
Net asset value and redemption price per share | | N/A | | N/A | | $ | 10.38 | |
Maximum offering price per share | | N/A | | N/A | | $ | 10.38 | |
| | | | | | | |
Class Q: | | | | | | | |
Net assets | | $ | 81,249 | | N/A | | N/A | |
Shares authorized | | unlimited | | N/A | | N/A | |
Par value | | $ | 0.001 | | N/A | | N/A | |
Shares outstanding | | 9,593 | | N/A | | N/A | |
Net asset value and redemption price per share | | $ | 8.47 | | N/A | | N/A | |
Maximum offering price per share | | $ | 8.47 | | N/A | | N/A | |
| | | | | | | |
Class R: | | | | | | | |
Net assets | | N/A | | N/A | | $ | 654,852 | |
Shares authorized | | N/A | | N/A | | unlimited | |
Par value | | N/A | | N/A | | $ | 0.001 | |
Shares outstanding | | N/A | | N/A | | 63,042 | |
Net asset value and redemption price per share | | N/A | | N/A | | $ | 10.39 | |
Maximum offering price per share | | N/A | | N/A | | $ | 10.39 | |
| | | | | | | | | | | | | | | |
(1) Maximum offering price is computed at 100/95.25 of net asset value. On purchases of $50,000 or more, the offering price is reduced.
(2) Redemption price per share may be reduced for any applicable contingent deferred sales charges.
(3) Maximum offering price is computed at 100/96.75 of net asset value. On purchases of $50,000 or more, the offering price is reduced.
See Accompanying Notes to Financial Statements
18
STATEMENTS OF ASSETS AND LIABILITIES as of September 30, 2005 (UNAUDITED)
| | ING | | ING | |
| | National Tax- | | Classic Money | |
| | Exempt Bond | | Market | |
| | Fund | | Fund | |
ASSETS: | | | | | |
Investments in securities at value* | | $ | 27,990,152 | | $ | — | |
Short-term investments at amortized cost | | — | | 573,455,101 | |
Repurchase agreement | | — | | 10,706,000 | |
Cash | | 301,154 | | 56,391 | |
Receivables: | | | | | |
Investment securities sold | | — | | 5,691,934 | |
Fund shares sold | | 10,201 | | 12,332,338 | |
Dividends and interest | | 386,779 | | 1,618,229 | |
Prepaid expenses | | 27,661 | | 185,851 | |
Reimbursement due from manager | | 1,111 | | — | |
Total assets | | 28,717,058 | | 604,045,844 | |
| | | | | |
LIABILITIES: | | | | | |
Payable for fund shares redeemed | | 178 | | 513,225 | |
Income distribution payable | | 80,702 | | 18,614 | |
Payable to affiliates | | 27,222 | | 514,572 | |
Payable for trustee fees | | 994 | | 12,718 | |
Other accrued expenses and liabilities | | 13,454 | | 178,965 | |
Total liabilities | | 122,550 | | 1,238,094 | |
NET ASSETS | | $ | 28,594,508 | | $ | 602,807,750 | |
| | | | | |
NET ASSETS WERE COMPRISED OF: | | | | | |
Paid-in capital | | $ | 27,355,798 | | $ | 603,001,729 | |
Accumulated net investment loss | | (1,160 | ) | (5 | ) |
Accumulated net realized gain (loss) on investments | | 286,747 | | (193,974 | ) |
Net unrealized appreciation or depreciation on investments | | 953,123 | | — | |
NET ASSETS | | $ | 28,594,508 | | $ | 602,807,750 | |
* Cost of investments in securities | | $ | 27,037,029 | | $ | — | |
See Accompanying Notes to Financial Statements
19
STATEMENTS OF ASSETS AND LIABILITIES as of September 30, 2005 (UNAUDITED) (CONTINUED)
| | ING | | ING | |
| | National Tax- | | Classic Money | |
| | Exempt Bond | | Market | |
| | Fund | | Fund | |
Class A: | | | | | |
Net assets | | $ | 23,501,279 | | $ | 566,598,470 | |
Shares authorized | | unlimited | | unlimited | |
Par value | | $ | 0.001 | | $ | 0.001 | |
Shares outstanding | | 2,228,504 | | 566,761,681 | |
Net asset value and redemption price per share | | $ | 10.55 | | $ | 1.00 | |
Maximum offering price per share (4.75%)(1) | | $ | 11.08 | | $ | 1.00 | |
| | | | | |
Class B: | | | | | |
Net assets | | $ | 3,195,466 | | $ | 31,159,293 | |
Shares authorized | | unlimited | | unlimited | |
Par value | | $ | 0.001 | | $ | 0.001 | |
Shares outstanding | | 303,169 | | 31,182,906 | |
Net asset value and redemption price per share(2) | | $ | 10.54 | | $ | 1.00 | |
Maximum offering price per share | | $ | 10.54 | | $ | 1.00 | |
| | | | | |
Class C: | | | | | |
Net assets | | $ | 1,897,763 | | $ | 5,049,987 | |
Shares authorized | | unlimited | | unlimited | |
Par value | | $ | 0.001 | | $ | 0.001 | |
Shares outstanding | | 179,919 | | 5,057,726 | |
Net asset value and redemption price per share(2) | | $ | 10.55 | | $ | 1.00 | |
Maximum offering price per share | | $ | 10.55 | | $ | 1.00 | |
(1) Maximum offering price is computed at 100/95.25 of net asset value. On purchases of $50,000 or more, the offering price is reduced.
(2) Redemption price per share may be reduced for any applicable contingent deferred sales charges.
See Accompanying Notes to Financial Statements
20
STATEMENTS OF ASSETS AND LIABILITIES as of September 30, 2005 (UNAUDITED)
| | ING | |
| | Institutional Prime | |
| | Money Market | |
| | Fund | |
ASSETS: | | | |
Short-term investments at amortized cost | | | $ | 71,289,043 | | |
Repurchase agreement | | | 14,366,000 | | |
Cash | | | 26 | | |
Receivables: | | | | | |
Investment securities sold | | | 3,022,266 | | |
Dividends and interest | | | 461,126 | | |
Prepaid expenses | | | 83,347 | | |
Offering expense | | | 17,260 | | |
Total assets | | | 89,239,068 | | |
| | | | | |
LIABILITIES: | | | | | |
Income distribution payable | | | 159,852 | | |
Payable to affiliates | | | 5,716 | | |
Payable for trustee fees | | | 686 | | |
Other accrued expenses and liabilities | | | 109,805 | | |
Total liabilities | | | 276,059 | | |
NET ASSETS (equivalent to $1.00 per share on 88,961,245 shares outstanding) | | | $ | 88,963,009 | | |
| | | | | |
NET ASSETS WERE COMPRISED OF: | | | | | |
Paid-in capital — shares of beneficial interest at $0.001 par value (unlimited shares authorized) | | | $ | 88,961,245 | | |
Accumulated net realized gain on investments | | | 1,764 | | |
NET ASSETS | | | $ | 88,963,009 | | |
See Accompanying Notes to Financial Statements
21
STATEMENTS OF OPERATIONS for the year ended September 30, 2005 (UNAUDITED)
| | ING | | ING | | ING | |
| | GNMA Income | | High Yield Bond | | Intermediate Bond | |
| | Fund | | Fund | | Fund | |
INVESTMENT INCOME: | | | | | | | |
Dividends, net of foreign taxes withheld* | | $ | — | | $ | 348,245 | | $ | 213,499 | |
Interest | | 19,549,552 | | 8,718,666 | | 16,122,693 | |
Securities lending income | | — | | 42,685 | | 367,412 | |
Total investment income | | 19,549,552 | | 9,109,596 | | 16,703,604 | |
EXPENSES: | | | | | | | |
Investment management fees | | 1,675,044 | | 802,054 | | 1,775,769 | |
Distribution and service fees | | | | | | | |
Class A | | 648,251 | | 195,717 | | 875,505 | |
Class B | | 478,059 | | 559,276 | | 326,995 | |
Class C | | 204,256 | | 116,207 | | 367,476 | |
Class M | | 736 | | — | | — | |
Class Q | | 117 | | — | | — | |
Class O | | — | | — | | 47,983 | |
Class R | | — | | — | | 988 | |
Transfer agent fees | | | | | | | |
Class A | | 191,088 | | 80,974 | | 235,063 | |
Class B | | 35,166 | | 81,095 | | 30,695 | |
Class C | | 15,031 | | 16,855 | | 34,494 | |
Class M | | 68 | | — | | — | |
Class I | | 976 | | — | | 9,166 | |
Class Q | | 9 | | — | | — | |
Class O | | — | | — | | 18,263 | |
Class R | | — | | — | | 185 | |
Administrative service fees | | 333,233 | | 123,467 | | 366,758 | |
Shareholder reporting expense | | 101,110 | | 39,345 | | 103,429 | |
Registration fees | | 43,494 | | 36,991 | | 56,156 | |
Professional fees | | 39,635 | | 16,309 | | 23,800 | |
Custody and accounting fees | | 42,960 | | 17,875 | | 50,835 | |
Trustee fees | | 17,020 | | 3,631 | | 13,160 | |
Insurance expense | | 8,628 | | 4,326 | | 7,324 | |
Miscellaneous expense | | 13,065 | | 9,048 | | 7,660 | |
Total expenses | | 3,847,946 | | 2,103,170 | | 4,351,704 | |
Net waived and reimbursed fees | | — | | (108,336 | ) | (250,133 | ) |
Net expenses | | 3,847,946 | | 1,994,834 | | 4,101,571 | |
Net investment income | | 15,701,606 | | 7,114,762 | | 12,602,033 | |
| | | | | | | |
REALIZED AND UNREALIZED GAIN (LOSS) ON INVESTMENTS, FOREIGN CURRENCY RELATED TRANSACTIONS, FUTURES AND SWAPS: | | | | | | | |
Net realized gain (loss) on: | | | | | | | |
Investments | | 954,637 | | 611,789 | | 3,619,745 | |
Foreign currency related transactions | | — | | 64,787 | | (12,415 | ) |
Futures and swaps | | — | | — | | 1,328,925 | |
Net realized gain on investments, foreign currency related transactions, futures and swaps | | 954,637 | | 676,576 | | 4,936,255 | |
Net change in unrealized appreciation or depreciation on: | | | | | | | |
Investments | | (5,764,626 | ) | (987,549 | ) | (3,043,040 | ) |
Foreign currency related transactions | | — | | (90,038 | ) | (325 | ) |
Futures and swaps | | — | | — | | 419,791 | |
Net change in unrealized depreciation on investments, foreign currency related transactions, futures and swaps | | (5,764,626 | ) | (1,077,587 | ) | (2,623,574 | ) |
Net realized and unrealized gain (loss) on investments, foreign currency related transactions, futures and swaps | | (4,809,989 | ) | (401,011 | ) | 2,312,681 | |
Increase in net assets resulting from operations | | $ | 10,891,617 | | $ | 6,713,751 | | $ | 14,914,714 | |
| | | | | | | | | | | | | | | | | |
*Foreign taxes | | $ | — | | $ | 60,885 | | $ | 650 | |
See Accompanying Notes to Financial Statements
22
STATEMENTS OF OPERATIONS for the year ended September 30, 2005 (UNAUDITED) (CONTINUED)
| | ING
National Tax-
Exempt Bond
Fund | | ING
Classic Money
Market
Fund | | ING
Institutional Prime
Money Market
Fund | |
INVESTMENT INCOME: | | | | | | | | | | | | | |
Interest | | | $ | 646,948 | | | | $ | 9,410,456 | | | | $ | 504,567 | | |
Total investment income | | | 646,948 | | | | 9,410,456 | | | | 504,567 | | |
| | | | | | | | | | | | | |
EXPENSES: | | | | | | | | | | | | | |
Investment management fees | | | 71,740 | | | | 717,984 | | | | 10,969 | | |
Distribution and service fees | | | | | | | | | | | | | |
Class A | | | 41,401 | | | | 2,026,347 | | | | — | | |
Class B | | | 15,900 | | | | 145,880 | | | | — | | |
Class C | | | 9,290 | | | | 24,260 | | | | — | | |
Transfer agent fees | | | | | | | | | | | | | |
Class A | | | 355 | | | | 22,404 | | | | 1,714 | | |
Class B | | | 48 | | | | 1,212 | | | | — | | |
Class C | | | 28 | | | | 201 | | | | — | | |
Administrative service fees | | | 14,348 | | | | — | | | | — | | |
Shareholder reporting expense | | | 3,370 | | | | 65,466 | | | | 2,742 | | |
Registration fees | | | 22,895 | | | | 20,257 | | | | 4,120 | | |
Professional fees | | | 2,722 | | | | 41,707 | | | | 1,372 | | |
Custody and accounting expense | | | 458 | | | | 33,003 | | | | 1,714 | | |
Trustee fees | | | 549 | | | | 8,967 | | | | 686 | | |
Offering expense | | | — | | | | — | | | | 17,260 | | |
Insurance expense | | | 342 | | | | 6,303 | | | | — | | |
Miscellaneous expense | | | 826 | | | | 7,709 | | | | 3 | | |
Total expenses | | | 184,272 | | | | 3,121,700 | | | | 40,580 | | |
Net waived and reimbursed fees | | | (7,488 | ) | | | (816,369 | ) | | | (17,260 | ) | |
Net expenses | | | 176,784 | | | | 2,305,331 | | | | 23,320 | | |
Net investment income | | | 470,164 | | | | 7,105,125 | | | | 481,247 | | |
| | | | | | | | | | | | | |
REALIZED AND UNREALIZED GAIN (LOSS) ON INVESTMENTS: | | | | | | | | | | | | | |
Net realized gain (loss) on: | | | | | | | | | | | | | |
Investments | | | 320,295 | | | | (18,235 | ) | | | 1,764 | | |
Net change in unrealized appreciation or depreciation on: | | | | | | | | | | | | | |
Investments | | | (203,647 | ) | | | — | | | | — | | |
Net realized and unrealized gain on investments | | | 116,648 | | | | (18,235 | ) | | | 1,764 | | |
Increase in net assets resulting from operations | | | $ | 586,812 | | | | $ | 7,086,890 | | | | $ | 483,011 | | |
See Accompanying Notes to Financial Statements
23
STATEMENTS OF CHANGES IN NET ASSETS (UNAUDITED)
| | ING GNMA Income Fund | | ING High Yield Bond Fund | |
| | Six Months
Ended
September 30,
2005 | | Year
Ended
March 31,
2005 | | Six Months
Ended
September 30,
2005 | | Year
Ended
March 31,
2005 | |
FROM OPERATIONS: | | | | | | | | | |
Net investment income | | $ | 15,701,606 | | $ | 29,646,257 | | $ | 7,114,762 | | $ | 9,567,361 | |
Net realized gain (loss) on investments and foreign currency related transactions | | 954,637 | | (3,721,907 | ) | 676,576 | | 7,939,355 | |
Net change in unrealized appreciation or depreciation on investments and foreign currency related transactions | | (5,764,626 | ) | (23,036,826 | ) | (1,077,587 | ) | (13,173,321 | ) |
Net increase in net assets resulting from operations | | 10,891,617 | | 2,887,524 | | 6,713,751 | | 4,333,395 | |
| | | | | | | | | |
FROM DISTRIBUTIONS TO SHAREHOLDERS: | | | | | | | | | |
Net investment income: | | | | | | | | | |
Class A | | (12,922,349 | ) | (28,659,206 | ) | (3,483,458 | ) | (4,775,952 | ) |
Class B | | (2,043,598 | ) | (5,047,902 | ) | (3,060,193 | ) | (3,805,317 | ) |
Class C | | (869,799 | ) | (2,367,634 | ) | (635,898 | ) | (986,091 | ) |
Class M | | (4,390 | ) | (524,100 | ) | — | | — | |
Class I | | (291,738 | ) | (10,826 | ) | — | | — | |
Class Q | | (2,353 | ) | (5,596 | ) | — | | — | |
Total distributions | | (16,134,227 | ) | (36,615,264 | ) | (7,179,549 | ) | (9,567,360 | ) |
| | | | | | | | | |
FROM CAPITAL SHARE TRANSACTIONS: | | | | | | | | | |
Net proceeds from sale of shares | | 50,651,702 | | 123,893,040 | | 18,736,101 | | 33,936,220 | |
Net proceeds from shares issued in merger | | — | | — | | — | | 236,998,843 | |
Dividends reinvested | | 13,436,990 | | 30,021,590 | | 3,320,431 | | 4,092,948 | |
| | 64,088,692 | | 153,914,630 | | 22,056,532 | | 275,028,011 | |
Cost of shares redeemed | | (83,977,781 | ) | (242,803,052 | ) | (56,549,355 | ) | (80,721,751 | ) |
Net increase (decrease) in net assets resulting from capital share transactions | | (19,889,089 | ) | (88,888,422 | ) | (34,492,823 | ) | 194,306,260 | |
Net increase (decrease) in net assets | | (25,131,699 | ) | (122,616,162 | ) | (34,958,621 | ) | 189,072,295 | |
| | | | | | | | | |
NET ASSETS: | | | | | | | | | |
Beginning of period | | 674,755,793 | | 797,371,955 | | 262,615,078 | | 73,542,783 | |
End of period | | $ | 649,624,094 | | $ | 674,755,793 | | $ | 227,656,457 | | $ | 262,615,078 | |
Undistributed net investment income (accumulated net investment loss) at end of period | | $ | 725,397 | | $ | 1,158,018 | | $ | (352,648 | ) | $ | (287,861 | ) |
See Accompanying Notes to Financial Statements
24
STATEMENTS OF CHANGES IN NET ASSETS (UNAUDITED) (CONTINUED)
| | ING Intermediate Bond Fund | | ING National Tax-Exempt Bond Fund | |
| | Six Months
Ended
September 30,
2005 | | Year
Ended
March 31,
2005 | | Six Months
Ended
September 30,
2005 | | Year
Ended
March 31,
2005 | |
| | | | | | | | | |
FROM OPERATIONS: | | | | | | | | | |
Net investment income | | $ | 12,602,033 | | $ | 16,300,103 | | $ | 470,164 | | $ | 861,357 | |
Net realized gain (loss) on investments, foreign currency related transactions, futures and swaps | | 4,936,255 | | 5,855,019 | | 320,295 | | (15,754 | ) |
Net change in unrealized depreciation on investments, foreign currency related transactions, futures and swaps | | (2,623,574 | ) | (13,268,848 | ) | (203,647 | ) | (518,507 | ) |
Net increase in net assets resulting from operations | | 14,914,714 | | 8,886,274 | | 586,812 | | 327,096 | |
| | | | | | | | | |
FROM DISTRIBUTIONS TO SHAREHOLDERS: | | | | | | | | | |
Net investment income: | | | | | | | | | |
Class A | | (9,327,216 | ) | (12,001,725 | ) | (403,182 | ) | (753,523 | ) |
Class B | | (970,906 | ) | (1,597,263 | ) | (42,274 | ) | (68,656 | ) |
Class C | | (1,092,244 | ) | (1,698,192 | ) | (24,708 | ) | (39,179 | ) |
Class I | | (1,133,079 | ) | (1,112,409 | ) | — | | — | |
Class O | | (697,730 | ) | (614,124 | ) | — | | — | |
Class R | | (6,825 | ) | (7,162 | ) | — | | — | |
Net realized gains: | | | | | | | | | |
Class A | | — | | (5,402,910 | ) | — | | (150,444 | ) |
Class B | | — | | (1,055,176 | ) | — | | (18,251 | ) |
Class C | | — | | (1,104,030 | ) | — | | (11,072 | ) |
Class I | | — | | (338,522 | ) | — | | — | |
Class O | | — | | (114,108 | ) | — | | — | |
Class R | | — | | (3,136 | ) | — | | — | |
Total distributions | | (13,228,000 | ) | (25,048,757 | ) | (470,164 | ) | (1,041,125 | ) |
| | | | | | | | | |
FROM CAPITAL SHARE TRANSACTIONS: | | | | | | | | | |
Net proceeds from sale of shares | | 247,131,643 | | 277,518,838 | | 1,036,618 | | 2,535,080 | |
Net proceeds from shares issued in merger | | — | | 137,658,413 | | — | | — | |
Dividends reinvested | | 10,404,750 | | 18,700,295 | | 60,896 | | 137,637 | |
| | 257,536,393 | | 433,877,546 | | 1,097,514 | | 2,672,717 | |
Cost of shares redeemed | | (69,819,791 | ) | (165,583,293 | ) | (762,835 | ) | (1,645,347 | ) |
Net increase in net assets resulting from capital share transactions | | 187,716,602 | | 268,294,253 | | 334,679 | | 1,027,370 | |
Net increase in net assets | | 189,403,316 | | 252,131,770 | | 451,327 | | 313,341 | |
| | | | | | | | | |
NET ASSETS: | | | | | | | | | |
Beginning of period | | 674,395,528 | | 422,263,758 | | 28,143,181 | | 27,829,840 | |
End of period | | $ | 863,798,844 | | $ | 674,395,528 | | $ | 28,594,508 | | $ | 28,143,181 | |
Undistributed net investment income (accumulated net investment loss) at end of period | | $ | (558,490 | ) | $ | 67,477 | | $ | (1,160 | ) | $ | (1,160 | ) |
| | | | | | | | | | | | | | | |
See Accompanying Notes to Financial Statements
25
STATEMENTS OF CHANGES IN NET ASSETS (UNAUDITED) (CONTINUED)
| | ING Classic Money Market Fund | | | ING Institutional Prime
Money Market Fund | | |
| | Six Months
Ended
September 30,
2005 | | Year
Ended
March 31,
2005 | | July 28, 2005(1)
to September 30,
2005 | |
| | | | | | | |
FROM OPERATIONS: | | | | | | | |
Net investment income | | $ | 7,105,125 | | | $ | 4,816,932 | | | $ | 481,247 | | |
Net realized gain (loss) on investments | | (18,235 | ) | | (119,185 | ) | | 1,764 | | |
Net increase in net assets resulting from operations | | 7,086,890 | | | 4,697,747 | | | 483,011 | | |
| | | | | | | | | | |
FROM DISTRIBUTIONS TO SHAREHOLDERS: | | | | | | | | | | |
Net investment income: | | | | | | | | | | |
Class A | | (6,770,363 | ) | | (4,742,850 | ) | | (481,247 | ) | |
Class B | | (286,689 | ) | | (68,615 | ) | | — | | |
Class C | | (48,074 | ) | | (5,471 | ) | | — | | |
Total distributions | | (7,105,126 | ) | | (4,816,936 | ) | | (481,247 | ) | |
| | | | | | | | | | |
FROM CAPITAL SHARE TRANSACTIONS: | | | | | | | | | | |
Net proceeds from sale of shares | | 225,354,400 | | | 406,931,463 | | | 102,300,001 | | |
Net proceeds from shares issued in merger | | — | | | 73,425,807 | | | — | | |
Dividends reinvested | | 6,945,202 | | | 4,652,539 | | | 161,244 | | |
| | 232,299,602 | | | 485,009,809 | | | 102,461,245 | | |
Cost of shares redeemed | | (210,437,281 | ) | | (304,285,630 | ) | | (13,500,000 | ) | |
Net increase in net assets resulting from capital share transactions | | 21,862,321 | | | 180,724,179 | | | 88,961,245 | | |
Net increase in net assets | | 21,844,085 | | | 180,604,990 | | | 88,963,009 | | |
| | | | | | | | | | |
NET ASSETS: | | | | | | | | | | |
Beginning of period | | 580,963,665 | | | 400,358,675 | | | — | | |
End of period | | $ | 602,807,750 | | | $ | 580,963,665 | | | $ | 88,963,009 | | |
Accumulated net investment loss at end of period | | $ | (5 | ) | | $ | (4 | ) | | $ | — | | |
| | | | | | | | | | | | | | | | |
(1) Commencement of operations
See Accompanying Notes to Financial Statements
26
ING GNMA INCOME FUND (UNAUDITED) | | FINANCIAL HIGHLIGHTS |
Selected data for a share of beneficial interest outstanding throughout each period.
| | Class A | |
| | Six Months
Ended
September 30, | | Year Ended March 31, | | Three Months
Ended
March 31, | | Year
Ended
December 31, | |
| | | 2005 | | 2005 | | 2004 | | 2003 | | 2002 | | 2001(1) | | 2000(2) | |
Per Share Operating Performance: | | | | | | | | | | | | | | | | |
Net asset value, beginning of period | $ | | 8.52 | | | 8.91 | | | 9.00 | | | 8.53 | | | 8.63 | | | 8.41 | | | 8.08 | | |
Income (loss) from investment
operations: | | | | | | | | | | | | | | | | | | | | | | | |
Net investment income | $ | | 0.21 | | | 0.37 | | | 0.32 | | | 0.42 | | | 0.46 | | | 0.12 | | | 0.54 | | |
Net realized and unrealized gain (loss)
on investments | $ | | (0.07 | ) | | (0.31 | ) | | 0.02 | | | 0.49 | | | (0.09 | ) | | 0.22 | | | 0.27 | | |
Total from investment operations | $ | | 0.14 | | | 0.06 | | | 0.34 | | | 0.91 | | | 0.37 | | | 0.34 | | | 0.81 | | |
Less distributions from: | | | | | | | | | | | | | | | | | | | | | | | |
Net investment income | $ | | 0.21 | | | 0.45 | | | 0.43 | | | 0.44 | | | 0.47 | | | 0.12 | | | 0.48 | | |
Total distributions | $ | | 0.21 | | | 0.45 | | | 0.43 | | | 0.44 | | | 0.47 | | | 0.12 | | | 0.48 | | |
Net asset value, end of period | $ | | 8.45 | | | 8.52 | | | 8.91 | | | 9.00 | | | 8.53 | | | 8.63 | | | 8.41 | | |
Total Return(3) | % | | 1.68 | | | 0.74 | | | 3.88 | | | 10.82 | | | 4.38 | | | 4.09 | | | 10.36 | | |
| | | | | | | | | | | | | | | | | | | | | | | |
Ratios and Supplemental Data: | | | | | | | | | | | | | | | | | | | | | | | |
Net assets, end of period (000’s) | $ | | 508,424 | | | 521,688 | | | 592,066 | | | 666,433 | | | 535,903 | | | 449,460 | | | 368,615 | | |
Ratios to average net assets: | | | | | | | | | | | | | | | | | | | | | | | |
Expenses(4) | % | | 1.01 | | | 0.98 | | | 1.04 | | | 1.13 | | | 1.22 | | | 1.16 | | | 1.06 | | |
Net investment income(4) | % | | 4.86 | | | 4.27 | | | 3.57 | | | 4.78 | | | 5.32 | | | 5.75 | | | 6.54 | | |
Portfolio turnover rate | % | | 29 | | | 40 | | | 128 | | | 75 | | | 76 | | | 33 | | | 65 | | |
| | Class B | |
| | Six Months
Ended
September 30, | | Year Ended March 31, | | Three Months
Ended
March 31, | | October 6,
2000(5) to
December 31, | |
| | 2005 | | 2005 | | 2004 | | 2003 | | 2002 | | 2001(1) | | 2000 | |
Per Share Operating Performance: | | | | | | | | | | | | | | | | |
Net asset value, beginning of period | $ | | 8.48 | | | 8.87 | | | 8.96 | | | 8.50 | | | 8.61 | | | 8.40 | | | 8.20 | | |
Income (loss) from investment
operations: | | | | | | | | | | | | | | | | | | | | | | | |
Net investment income | $ | | 0.17 | | | 0.29 | | | 0.25 | | | 0.35 | | | 0.39 | | | 0.13 | | | 0.09 | | |
Net realized and unrealized gain (loss)
on investments | $ | | (0.06 | ) | | (0.29 | ) | | 0.02 | | �� | 0.48 | | | (0.09 | ) | | 0.19 | | | 0.18 | | |
Total from investment operations | $ | | 0.11 | | | — | | | 0.27 | | | 0.83 | | | 0.30 | | | 0.32 | | | 0.27 | | |
Less distributions from: | | | | | | | | | | | | | | | | | | | | | | | |
Net investment income | $ | | 0.18 | | | 0.39 | | | 0.36 | | | 0.37 | | | 0.41 | | | 0.11 | | | 0.07 | | |
Total distributions | $ | | 0.18 | | | 0.39 | | | 0.36 | | | 0.37 | | | 0.41 | | | 0.11 | | | 0.07 | | |
Net asset value, end of period | $ | | 8.41 | | | 8.48 | | | 8.87 | | | 8.96 | | | 8.50 | | | 8.61 | | | 8.40 | | |
Total Return(3) | % | | 1.31 | | | (0.02 | ) | | 3.12 | | | 9.95 | | | 3.53 | | | 3.70 | | | 3.32 | | |
| | | | | | | | | | | | | | | | | | | | | | | |
Ratios and Supplemental Data: | | | | | | | | | | | | | | | | | | | | | | | |
Net assets, end of period (000’s) | $ | | 90,397 | | | 99,130 | | | 130,339 | | | 150,549 | | | 79,302 | | | 47,406 | | | 866 | | |
Ratios to average net assets: | | | | | | | | | | | | | | | | | | | | | | | |
Expenses(4) | % | | 1.76 | | | 1.73 | | | 1.79 | | | 1.88 | | | 1.98 | | | 1.90 | | | 1.81 | | |
Net investment income(4) | % | | 4.11 | | | 3.52 | | | 2.84 | | | 3.98 | | | 4.55 | | | 4.88 | | | 5.79 | | |
Portfolio turnover rate | % | | 29 | | | 40 | | | 128 | | | 75 | | | 76 | | | 33 | | | 65 | | |
(1) | The Fund changed its fiscal year end to March 31. |
(2) | Effective July 26, 2000, ING Investments, LLC became the Investment Manager of the Fund. |
(3) | Total return is calculated assuming reinvestment of all dividends and capital gain distributions at net asset value and excluding the deduction of sales charges. Total return for less than one year is not annualized. |
(4) | Annualized for periods less than one year. |
(5) | Commencement of operations. |
See Accompanying Notes to Financial Statements.
27
ING GNMA INCOME FUND (UNAUDITED) (CONTINUED) | | FINANCIAL HIGHLIGHTS |
Selected data for a share of beneficial interest outstanding throughout each period.
| | Class C | |
| | Six Months
Ended
September 30, | | Year Ended March 31, | | Three Months Ended March 31, | | October 13,
2000(2) to December 31, | |
| | 2005 | | 2005 | | 2004 | | 2003 | | 2002 | | 2001(1) | | 2000 | |
Per Share Operating Performance: | | | | | | | | | | | | | | | | |
Net asset value, beginning of period | $ | | 8.49 | | | 8.88 | | | 8.97 | | | 8.51 | | | 8.61 | | | 8.40 | | | 8.24 | | |
Income (loss) from investment operations: | | | | | | | | | | | | | | | | | | | | | | | |
Net investment income | $ | | 0.18 | | | 0.29 | | | 0.25 | | | 0.36 | | | 0.40 | | | 0.11 | | | 0.09 | | |
Net realized and unrealized gain (loss) | | | | | | | | | | | | | | | | | | | | | | | |
on investments | $ | | (0.07 | ) | | (0.29 | ) | | 0.02 | | | 0.47 | | | (0.09 | ) | | 0.21 | | | 0.14 | | |
Total from investment operations | $ | | 0.11 | | | — | | | 0.27 | | | 0.83 | | | 0.31 | | | 0.32 | | | 0.23 | | |
Less distributions from: | | | | | | | | | | | | | | | | | | | | | | | |
Net investment income | $ | | 0.18 | | | 0.39 | | | 0.36 | | | 0.37 | | | 0.41 | | | 0.11 | | | 0.07 | | |
Total distributions | $ | | 0.18 | | | 0.39 | | | 0.36 | | | 0.37 | | | 0.41 | | | 0.11 | | | 0.07 | | |
Net asset value, end of period | $ | | 8.42 | | | 8.49 | | | 8.88 | | | 8.97 | | | 8.51 | | | 8.61 | | | 8.40 | | |
Total Return(3) | % | | 1.30 | | | (0.03 | ) | | 3.11 | | | 9.95 | | | 3.65 | | | 3.69 | | | 2.82 | | |
| | | | | | | | | | | | | | | | | | | | | | | |
Ratios and Supplemental Data: | | | | | | | | | | | | | | | | | | | | | | | |
Net assets, end of period (000’s) | $ | | 39,067 | | | 43,094 | | | 65,762 | | | 87,970 | | | 37,193 | | | 13,744 | | | 1,833 | | |
Ratios to average net assets: | | | | | | | | | | | | | | | | | | | | | | | |
Expenses(4) | % | | 1.76 | | | 1.73 | | | 1.79 | | | 1.88 | | | 1.99 | | | 1.93 | | | 1.81 | | |
Net investment income(4) | % | | 4.11 | | | 3.51 | | | 2.92 | | | 3.97 | | | 4.52 | | | 4.87 | | | 5.79 | | |
Portfolio turnover rate | % | | 29 | | | 40 | | | 128 | | | 75 | | | 76 | | | 33 | | | 65 | | |
| | Class M | |
| | Six Months
Ended
September 30, | | Year Ended March 31, | | February 23,
2001(2) to
March 31, | |
| | 2005 | | 2005 | | 2004 | | 2003 | | 2002 | | 2001 | |
Per Share Operating Performance: | | | | | | | | | | | | | |
Net asset value, beginning of period | $ | | 8.54 | | | 8.92 | | | 9.01 | | | 8.54 | | | 8.63 | | | 8.51 | | |
Income (loss) from investment operations: | | | | | | | | | | | | | | | | | | | | |
Net investment income | $ | | 0.19 | | | 0.33 | * | | 0.31 | | | 0.37 | | | 0.41 | | | 0.04 | | |
Net realized and unrealized gain (loss) | | | | | | | | | | | | | | | | | | | | |
on investments | $ | | (0.07 | ) | | (0.30 | ) | | (0.02 | ) | | 0.49 | | | (0.07 | ) | | 0.08 | | |
Total from investment operations | $ | | 0.12 | | | 0.03 | | | 0.29 | | | 0.86 | | | 0.34 | | | 0.12 | | |
Less distributions from: | | | | | | | | | | | | | | | | | | | | |
Net investment income | $ | | 0.19 | | | 0.41 | | | 0.38 | | | 0.39 | | | 0.43 | | | — | | |
Total distributions | $ | | 0.19 | | | 0.41 | | | 0.38 | | | 0.39 | | | 0.43 | | | — | | |
Net asset value, end of period | $ | | 8.47 | | | 8.54 | | | 8.92 | | | 9.01 | | | 8.54 | | | 8.63 | | |
Total Return(3) | % | | 1.42 | | | 0.33 | | | 3.30 | | | 10.29 | | | 4.03 | | | 1.41 | | |
| | | | | | | | | | | | | | | | | | | | |
Ratios and Supplemental Data: | | | | | | | | | | | | | | | | | | | | |
Net assets, end of period (000’s) | $ | | 194 | | | 201 | | | 312 | | | 1,111 | | | 495 | | | 247 | | |
Ratios to average net assets: | | | | | | | | | | | | | | | | | | | | |
Expenses(4) | % | | 1.51 | | | 1.48 | | | 1.54 | | | 1.62 | | | 1.73 | | | 1.61 | | |
Net investment income(4) | % | | 4.36 | | | 3.76 | | | 3.23 | | | 4.19 | | | 4.81 | | | 4.88 | | |
Portfolio turnover rate | % | | 29 | | | 40 | | | 128 | | | 75 | | | 76 | | | 33 | | |
(1) | The Fund changed its fiscal year end to March 31. |
(2) | Commencement of operations. |
(3) | Total return is calculated assuming reinvestment of all dividends and capital gain distributions at net asset value and excluding the deduction of sales charges. Total return for less than one year is not annualized. |
(4) | Annualized for periods less than one year. |
* | Per share numbers have been calculated using the average number of shares outstanding throughout the period. |
See Accompanying Notes to Financial Statements.
28
ING HIGH YIELD BOND FUND (UNAUDITED) | | FINANCIAL HIGHLIGHTS |
Selected data for a share of beneficial interest outstanding throughout each period.
| | Class A | |
| | Six Months
Ended
September 30, | | Year Ended March 31, | | Five Months
Ended
March 31, | | Year
Ended
October 31, | |
| | 2005 | | 2005 | | 2004 | | 2003 | | 2002 | | 2001(1) | | 2000 | |
Per Share Operating Performance: | | | | | | | | | | | | | | | |
Net asset value, beginning of period | $ | | 8.75 | | | 8.88 | | | 8.29 | | | 8.74 | | | 9.36 | | | 9.24 | | | 9.96 | | |
Income (loss) from investment operations: | | | | | | | | | | | | | | | | | | | | | | | |
Net investment income | $ | | 0.27 | | | 0.54 | | | 0.59 | | | 0.61 | | | 0.78 | | | 0.39 | | | 0.85 | | |
Net realized and unrealized gain (loss)
on investments | $ | | (0.03 | ) | | (0.13 | ) | | 0.60 | | | (0.45 | ) | | (0.62 | ) | | 0.12 | | | (0.65 | ) | |
Total from investment operations | $ | | 0.24 | | | 0.41 | | | 1.19 | | | 0.16 | | | 0.16 | | | 0.51 | | | 0.20 | | |
Less distributions from: | | | | | | | | | | | | | | | | | | | | | | | |
Net investment income | $ | | 0.27 | | | 0.54 | | | 0.60 | | | 0.61 | | | 0.78 | | | 0.39 | | | 0.86 | | |
Net realized gain on investments | $ | | — | | | — | | | — | | | — | | | — | | | — | | | 0.06 | | |
Total distributions | $ | | 0.27 | | | 0.54 | | | 0.60 | | | 0.61 | | | 0.78 | | | 0.39 | | | 0.92 | | |
Net asset value, end of period | $ | | 8.72 | | | 8.75 | | | 8.88 | | | 8.29 | | | 8.74 | | | 9.36 | | | 9.24 | | |
Total Return(2) | % | | 2.81 | | | 4.73 | | | 14.70 | | | 2.24 | | | 1.94 | | | 5.61 | | | 1.89 | | |
| | | | | | | | | | | | | | | | | | | | | | | |
Ratios and Supplemental Data: | | | | | | | | | | | | | | | | | | | | | | | |
Net assets, end of period (000’s) | $ | | 105,473 | | | 110,683 | | | 44,009 | | | 43,375 | | | 38,525 | | | 33,459 | | | 33,220 | | |
Ratios to average net assets: | | | | | | | | | | | | | | | | | | | | | | | |
Net expenses after expense
reimbursement/recoupment(3)(4) | % | | 1.21 | | | 1.22 | | | 1.29 | | | 1.30 | | | 1.30 | | | 1.09 | | | 1.04 | | |
Gross expenses prior to expense
reimbursement/recoupment(3) | % | | 1.35 | | | 1.33 | | | 1.33 | | | 1.43 | | | 1.79 | | | 1.63 | | | 2.16 | | |
Net investment income after expense
reimbursement/recoupment(3)(4) | % | | 6.18 | | | 6.12 | | | 6.81 | | | 7.48 | | | 8.67 | | | 10.24 | | | 8.75 | | |
Portfolio turnover rate | % | | 54 | | | 119 | | | 105 | | | 122 | | | 344 | | | 253 | | | 481 | | |
| | Class B | |
| | Six Months
Ended
September 30, | | Year Ended March 31, | | Five Months
Ended
March 31, | | Year
Ended
October 31, | |
| | 2005 | | 2005 | | 2004 | | 2003 | | 2002 | | 2001(1) | | 2000 | |
Per Share Operating Performance: | | | | | | | | | | | | | | | | |
Net asset value, beginning of period | $ | | 8.74 | | | 8.88 | | | 8.28 | | | 8.74 | | | 9.36 | | | 9.23 | | | 9.96 | | |
Income (loss) from investment operations: | | | | | | | | | | | | | | | | | | | | | | | |
Net investment income | $ | | 0.24 | | | 0.48 | | | 0.53 | | | 0.55 | | | 0.72 | | | 0.36 | | | 0.78 | | |
Net realized and unrealized gain (loss)
on investments | $ | | (0.02 | ) | | (0.15 | ) | | 0.60 | | | (0.46 | ) | | (0.62 | ) | | 0.14 | | | (0.66 | ) | |
Total from investment operations | $ | | 0.22 | | | 0.33 | | | 1.13 | | | 0.09 | | | 0.10 | | | 0.50 | | | 0.12 | | |
Less distributions from: | | | | | | | | | | | | | | | | | | | | | | | |
Net investment income | $ | | 0.24 | | | 0.47 | | | 0.53 | | | 0.55 | | | 0.72 | | | 0.37 | | | 0.79 | | |
Net realized gain on investments | $ | | — | | | — | | | — | | | — | | | — | | | — | | | 0.06 | | |
Total distributions | $ | | 0.24 | | | 0.47 | | | 0.53 | | | 0.55 | | | 0.72 | | | 0.37 | | | 0.85 | | |
Net asset value, end of period | $ | | 8.72 | | | 8.74 | | | 8.88 | | | 8.28 | | | 8.74 | | | 9.36 | | | 9.23 | | |
Total Return(2) | % | | 2.54 | | | 3.83 | | | 14.01 | | | 1.37 | | | 1.29 | | | 5.43 | | | 1.02 | | |
| | | | | | | | | | | | | | | | | | | | | | | |
Ratios and Supplemental Data: | | | | | | | | | | | | | | | | | | | | | | | |
Net assets, end of period (000’s) | $ | | 101,080 | | | 125,603 | | | 18,753 | | | 11,584 | | | 6,673 | | | 5,025 | | | 3,702 | | |
Ratios to average net assets: | | | | | | | | | | | | | | | | | | | | | | | |
Net expenses after expense
reimbursement/recoupment(3)(4) | % | | 1.96 | | | 1.97 | | | 2.04 | | | 2.05 | | | 2.05 | | | 1.84 | | | 1.79 | | |
Gross expenses prior to expense
reimbursement/recoupment(3) | % | | 2.00 | | | 1.98 | | | 1.98 | | | 2.07 | | | 2.44 | | | 2.28 | | | 2.41 | | |
Net investment income after expense
reimbursement/recoupment(3)(4) | % | | 5.42 | | | 5.39 | | | 6.04 | | | 6.73 | | | 7.85 | | | 9.49 | | | 7.99 | | |
Portfolio turnover rate | % | | 54 | | | 119 | | | 105 | | | 122 | | | 344 | | | 253 | | | 481 | | |
(1) | The Fund changed its fiscal year end to March 31. |
(2) | Total return is calculated assuming reinvestment of all dividends and capital gain distributions at net asset value and excluding the deduction of sales charges. Total return for less than one year is not annualized. |
(3) | Annualized for periods less than one year. |
(4) | The Investment Manager has agreed to limit expenses (excluding interest, taxes, brokerage and extraordinary expenses) subject to possible recoupment by ING Investments, LLC within three years. |
See Accompanying Notes to Financial Statements.
29
ING HIGH YIELD BOND FUND (UNAUDITED) (CONTINUED) | | FINANCIAL HIGHLIGHTS |
Selected data for a share of beneficial interest outstanding throughout each period.
| | Class C | |
| | Six Months
Ended
September 30, | | Year Ended March 31, | | Five Months
Ended
March 31, | | Year
Ended
October 31, | |
| | 2005 | | 2005 | | 2004 | | 2003 | | 2002 | | 2001(1) | | 2000 | |
Per Share Operating Performance: | | | | | | | | | | | | | | | | |
Net asset value, beginning of period | $ | | 8.75 | | | 8.88 | | | 8.28 | | | 8.74 | | | 9.36 | | | 9.23 | | | 9.96 | | |
Income (loss) from investment operations: | | | | | | | | | | | | | | | | | | | | | | | |
Net investment income | $ | | 0.24 | | | 0.48 | | | 0.53 | | | 0.56 | | | 0.71 | | | 0.37 | | | 0.78 | | |
Net realized and unrealized gain (loss)
on investments | $ | | (0.03 | ) | | (0.13 | ) | | 0.60 | | | (0.46 | ) | | (0.61 | ) | | 0.12 | | | (0.66 | ) | |
Total from investment operations | $ | | 0.21 | | | 0.35 | | | 1.13 | | | 0.10 | | | 0.10 | | | 0.49 | | | 0.12 | | |
Less distributions from: | | | | | | | | | | | | | | | | | | | | | | | |
Net investment income | $ | | 0.24 | | | 0.48 | | | 0.53 | | | 0.56 | | | 0.72 | | | 0.36 | | | 0.79 | | |
Net realized gain on investments | $ | | — | | | — | | | — | | | — | | | — | | | — | | | 0.06 | | |
Total distributions | $ | | 0.24 | | | 0.48 | | | 0.53 | | | 0.56 | | | 0.72 | | | 0.36 | | | 0.85 | | |
Net asset value, end of period | $ | | 8.72 | | | 8.75 | | | 8.88 | | | 8.28 | | | 8.74 | | | 9.36 | | | 9.23 | | |
Total Return(2) | % | | 2.42 | | | 3.96 | | | 14.03 | | | 1.43 | | | 1.21 | | | 5.39 | | | 1.02 | | |
| | | | | | | | | | | | | | | | | | | | | | | |
Ratios and Supplemental Data: | | | | | | | | | | | | | | | | | | | | | | | |
Net assets, end of period (000’s) | $ | | 21,104 | | | 26,330 | | | 10,780 | | | 5,281 | | | 1,633 | | | 1,314 | | | 1,578 | | |
Ratios to average net assets: | | | | | | | | | | | | | | | | | | | | | | | |
Net expenses after expense
reimbursement/recoupment(3)(4) | % | | 1.96 | | | 1.97 | | | 2.04 | | | 2.04 | | | 2.05 | | | 1.84 | | | 1.79 | | |
Gross expenses prior to expense
reimbursement/recoupment(3) | % | | 2.00 | | | 1.98 | | | 1.98 | | | 2.06 | | | 2.44 | | | 2.29 | | | 2.40 | | |
Net investment income after expense
reimbursement/recoupment(3)(4) | % | | 5.42 | | | 5.37 | | | 6.04 | | | 6.72 | | | 7.92 | | | 9.42 | | | 7.98 | | |
Portfolio turnover rate | % | | 54 | | | 119 | | | 105 | | | 122 | | | 344 | | | 253 | | | 481 | | |
(1) | The Fund changed its fiscal year end to March 31. |
(2) | Total return is calculated assuming reinvestment of all dividends and capital gain distributions at net asset value and excluding the deduction of sales charges. Total return for less than one year is not annualized. |
(3) | Annualized for periods less than one year. |
(4) | The Investment Manager has agreed to limit expenses, (excluding interest, taxes, brokerage and extraordinary expenses) subject to possible recoupment by ING Investments, LLC within three years. |
See Accompanying Notes to Financial Statements.
30
ING INTERMEDIATE BOND FUND (UNAUDITED) | | FINANCIAL HIGHLIGHTS |
Selected data for a share of beneficial interest outstanding throughout each period.
| | Class A | |
| | Six Months
Ended
September 30, | | Year Ended March 31, | | Five Months
Ended
March 31, | | Year
Ended
October 31, | |
| | 2005 | | 2005 | | 2004 | | 2003 | | 2002 | | 2001(1) | | 2000 | |
Per Share Operating Performance: | | | | | | | | | | | | | | | | |
Net asset value, beginning of period | $ | | 10.32 | | | 10.67 | | | 10.51 | | | 9.91 | | | 10.18 | | | 9.52 | | | 9.40 | | |
Income (loss) from investment operations: | | | | | | | | | | | | | | | | | | | | | | | |
Net investment income | $ | | 0.19 | | | 0.32 | | | 0.31 | | | 0.35 | | | 0.51 | | | 0.28 | | | 0.61 | | |
Net realized and unrealized gain (loss) | | | | | | | | | | | | | | | | | | | | | | | |
on investments | $ | | 0.05 | | | (0.17 | ) | | 0.32 | | | 0.77 | | | 0.42 | | | 0.66 | | | 0.12 | | |
Total from investment operations | $ | | 0.24 | | | 0.15 | | | 0.63 | | | 1.12 | | | 0.93 | | | 0.94 | | | 0.73 | | |
Less distributions from: | | | | | | | | | | | | | | | | | | | | | | | |
Net investment income | $ | | 0.19 | | | 0.33 | | | 0.33 | | | 0.37 | | | 0.53 | | | 0.28 | | | 0.61 | | |
Net realized gain on investments | $ | | — | | | 0.17 | | | 0.14 | | | 0.15 | | | 0.67 | | | — | | | — | | |
Total distributions | $ | | 0.19 | | | 0.50 | | | 0.47 | | | 0.52 | | | 1.20 | | | 0.28 | | | 0.61 | | |
Net asset value, end of period | $ | | 10.37 | | | 10.32 | | | 10.67 | | | 10.51 | | | 9.91 | | | 10.18 | | | 9.52 | | |
Total Return(2) | % | | 2.37 | | | 1.52 | | | 6.16 | | | 11.48 | | | 9.27 | | | 10.01 | | | 8.11 | | |
| | | | | | | | | | | | | | | | | | | | | | | |
Ratios and Supplemental Data: | | | | | | | | | | | | | | | | | | | | | | | |
Net assets, end of period (000’s) | $ | | 534,203 | | | 459,850 | | | 268,086 | | | 146,649 | | | 41,503 | | | 33,597 | | | 29,893 | | |
Ratios to average net assets: | | | | | | | | | | | | | | | | | | | | | | | |
Net expenses after expense | | | | | | | | | | | | | | | | | | | | | | | |
reimbursement(3)(4) | % | | 1.00 | | | 1.00 | | | 1.10 | | | 1.14 | | | 1.15 | | | 1.13 | | | 1.00 | | |
Gross expenses prior to expense | | | | | | | | | | | | | | | | | | | | | | | |
reimbursement(3) | % | | 1.10 | | | 1.14 | | | 1.18 | | | 1.24 | | | 1.36 | | | 1.53 | | | 2.08 | | |
Net investment income after expense | | | | | | | | | | | | | | | | | | | | | | | |
reimbursement(3)(4) | % | | 3.55 | | | 3.08 | | | 2.91 | | | 3.21 | | | 4.93 | | | 6.94 | | | 6.48 | | |
Portfolio turnover rate | % | | 304 | | | 417 | | | 475 | | | 639 | | | 1,216 | * | | 838 | | | 733 | | |
| | Class B | |
| | Six Months Ended September 30, | | Year Ended March 31, | | Five Months Ended
March 31, | | Year
Ended
October 31, | |
| | 2005 | | 2005 | | 2004 | | 2003 | | 2002 | | 2001(1) | | 2000 | |
Per Share Operating Performance: | | | | | | | | | | | | | | | | |
Net asset value, beginning of period | $ | | 10.30 | | | 10.65 | | | 10.50 | | | 9.90 | | | 10.18 | | | 9.52 | | | 9.40 | | |
Income (loss) from investment operations: | | | | | | | | | | | | | | | | | | | | | | | |
Net investment income | $ | | 0.15 | | | 0.24 | | | 0.23 | | | 0.28 | | | 0.44 | | | 0.26 | | | 0.53 | | |
Net realized and unrealized gain (loss) | | | | | | | | | | | | | | | | | | | | | | | |
on investments | $ | | 0.06 | | | (0.17 | ) | | 0.31 | | | 0.76 | | | 0.40 | | | 0.66 | | | 0.13 | | |
Total from investment operations | $ | | 0.21 | | | 0.07 | | | 0.54 | | | 1.04 | | | 0.84 | | | 0.92 | | | 0.66 | | |
Less distributions from: | | | | | | | | | | | | | | | | | | | | | | | |
Net investment income | $ | | 0.16 | | | 0.25 | | | 0.25 | | | 0.29 | | | 0.45 | | | 0.26 | | | 0.54 | | |
Net realized gain on investments | $ | | — | | | 0.17 | | | 0.14 | | | 0.15 | | | 0.67 | | | — | | | — | | |
Total distributions | $ | | 0.16 | | | 0.42 | | | 0.39 | | | 0.44 | | | 1.12 | | | 0.26 | | | 0.54 | | |
Net asset value, end of period | $ | | 10.35 | | | 10.30 | | | 10.65 | | | 10.50 | | | 9.90 | | | 10.18 | | | 9.52 | | |
Total Return(2) | % | | 1.99 | | | 0.75 | | | 5.28 | | | 10.64 | | | 8.37 | | | 9.74 | | | 7.30 | | |
| | | | | | | | | | | | | | | | | | | | | | | |
Ratios and Supplemental Data: | | | | | | | | | | | | | | | | | | | | | | | |
Net assets, end of period (000’s) | $ | | 64,642 | | | 64,779 | | | 67,402 | | | 61,544 | | | 11,216 | | | 2,807 | | | 1,523 | | |
Ratios to average net assets: | | | | | | | | | | | | | | | | | | | | | | | |
Net expenses after expense | | | | | | | | | | | | | | | | | | | | | | | |
reimbursement/recoupment(3)(4) | % | | 1.75 | | | 1.75 | | | 1.85 | | | 1.89 | | | 1.90 | | | 1.88 | | | 1.74 | | |
Gross expenses prior to expense | | | | | | | | | | | | | | | | | | | | | | | |
reimbursement/recoupment(3) | % | | 1.75 | | | 1.79 | | | 1.83 | | | 1.89 | | | 2.01 | | | 2.18 | | | 2.33 | | |
Net investment income after expense | | | | | | | | | | | | | | | | | | | | | | | |
reimbursement/recoupment(3)(4) | % | | 2.79 | | | 2.31 | | | 2.16 | | | 2.39 | | | 4.09 | | | 6.20 | | | 5.71 | | |
Portfolio turnover rate | % | | 304 | | | 417 | | | 475 | | | 639 | | | 1,216 | * | | 838 | | | 733 | | |
(1) | The Fund changed its fiscal year end to March 31. |
(2) | Total return is calculated assuming reinvestment of all dividends and capital gain distributions at net asset value and excluding the deduction of sales charges. Total return for less than one year is not annualized. |
(3) | Annualized for periods less than one year. |
(4) | The Investment Manager has agreed to limit expenses, (excluding interest, taxes, brokerage and extraordinary expenses) subject to possible recoupment by ING Investments, LLC within three years. |
* | Portfolio turnover was greater than expected during this period due to active trading undertaken in response to market conditions that existed at that time. |
See Accompanying Notes to Financial Statements.
31
ING INTERMEDIATE BOND FUND (UNAUDITED) (CONTINUED) | | FINANCIAL HIGHLIGHTS |
Selected data for a share of beneficial interest outstanding throughout each period.
| | Class C | |
| | Six Months Ended September 30, | | Year Ended March 31, | | Five Months
Ended
March 31, | | Year
Ended
October 31, | |
| | 2005 | | 2005 | | 2004 | | 2003 | | 2002 | | 2001(1) | | 2000 | |
Per Share Operating Performance: | | | | | | | | | | | | | | | | |
Net asset value, beginning of period | $ | | 10.31 | | | 10.65 | | | 10.50 | | | 9.90 | | | 10.19 | | | 9.52 | | | 9.40 | | |
Income (loss) from investment operations: | | | | | | | | | | | | | | | | | | | | | | | |
Net investment income | $ | | 0.15 | | | 0.24 | | | 0.23 | | | 0.28 | | | 0.44 | | | 0.26 | | | 0.54 | | |
Net realized and unrealized gain (loss) | | | | | | | | | | | | | | | | | | | | | | | |
on investments | $ | | 0.06 | | | (0.16 | ) | | 0.31 | | | 0.76 | | | 0.39 | | | 0.67 | | | 0.12 | | |
Total from investment operations | $ | | 0.21 | | | 0.08 | | | 0.54 | | | 1.04 | | | 0.83 | | | 0.93 | | | 0.66 | | |
Less distributions from: | | | | | | | | | | | | | | | | | | | | | | | |
Net investment income | $ | | 0.16 | | | 0.25 | | | 0.25 | | | 0.29 | | | 0.45 | | | 0.26 | | | 0.54 | | |
Net realized gain on investments | $ | | — | | | 0.17 | | | 0.14 | | | 0.15 | | | 0.67 | | | — | | | — | | |
Total distributions | $ | | 0.16 | | | 0.42 | | | 0.39 | | | 0.44 | | | 1.12 | | | 0.26 | | | 0.54 | | |
Net asset value, end of period | $ | | 10.36 | | | 10.31 | | | 10.65 | | | 10.50 | | | 9.90 | | | 10.19 | | | 9.52 | | |
Total Return(3) | % | | 1.99 | | | 0.86 | | | 5.28 | | | 10.68 | | | 8.24 | | | 9.86 | | | 7.32 | | |
| | | | | | | | | | | | | | | | | | | | | | | |
Ratios and Supplemental Data: | | | | | | | | | | | | | | | | | | | | | | | |
Net assets, end of period (000’s) | $ | | 73,881 | | | 71,648 | | | 71,228 | | | 52,979 | | | 6,382 | | | 4,470 | | | 5,248 | | |
Ratios to average net assets: | | | | | | | | | | | | | | | | | | | | | | | |
Net expenses after expense | | | | | | | | | | | | | | | | | | | | | | | |
reimbursement/recoupment(4)(5) | % | | 1.75 | | | 1.75 | | | 1.85 | | | 1.90 | | | 1.90 | | | 1.85 | | | 1.73 | | |
Gross expenses prior to expense | | | | | | | | | | | | | | | | | | | | | | | |
reimbursement/recoupment(4) | % | | 1.75 | | | 1.79 | | | 1.83 | | | 1.90 | | | 2.01 | | | 2.18 | | | 2.32 | | |
Net investment income after expense | | | | | | | | | | | | | | | | | | | | | | | |
reimbursement/recoupment(4)(5) | % | | 2.80 | | | 2.31 | | | 2.16 | | | 2.36 | | | 4.20 | | | 6.37 | | | 5.74 | | |
Portfolio turnover rate | % | | 304 | | | 417 | | | 475 | | | 639 | | | 1,216 | * | | 838 | | | 733 | | |
| | Class O | | Class R | |
| | Six Months
Ended
September 30,
2005 | | August 13,
2004(2) to
March 31,
2005 | | Six Months
Ended
September 30,
2005 | | Year
Ended
March 31,
2005 | | March 16,
2004(2) to
March 31,
2004 | |
Per Share Operating Performance: | | | | | | | | | | | | |
Net asset value, beginning of period | $ | | 10.32 | | | 10.41 | | | 10.34 | | | 10.67 | | | 10.71 | | |
Income (loss) from investment operations: | | | | | | | | | | | | | | | | | |
Net investment income | $ | | 0.18 | | | 0.21 | | | 0.18 | | | 0.33 | | | 0.01 | | |
Net realized and unrealized loss on investments | $ | | 0.06 | | | (0.04 | ) | | 0.06 | | | (0.16 | ) | | (0.05 | ) | |
Total from investment operations | $ | | 0.24 | | | 0.17 | | | 0.24 | | | 0.17 | | | (0.04 | ) | |
Less distributions from: | | | | | | | | | | | | | | | | | |
Net investment income | $ | | 0.18 | | | 0.22 | | | 0.19 | | | 0.33 | | | — | | |
Net realized gain on investments | $ | | — | | | 0.04 | | | — | | | 0.17 | | | — | | |
Total distributions | $ | | 0.18 | | | 0.26 | | | 0.19 | | | 0.50 | | | — | | |
Net asset value, end of period | $ | | 10.38 | | | 10.32 | | | 10.39 | | | 10.34 | | | 10.67 | | |
Total Return(3) | % | | 2.42 | | | 1.61 | | | 2.22 | | | 1.64 | | | (0.37 | ) | |
| | | | | | | | | | | | | | | | | |
Ratios and Supplemental Data: | | | | | | | | | | | | | | | | | |
Net assets, end of period (000’s) | $ | | 40,497 | | | 33,997 | | | 655 | | | 313 | | | 1 | | |
Ratios to average net assets: | | | | | | | | | | | | | | | | | |
Net expenses after expense reimbursement(4)(5) | % | | 1.00 | | | 0.96 | | | 1.25 | | | 1.17 | | | 1.25 | | |
Gross expenses prior to expense reimbursement(4) | % | | 1.00 | | | 1.00 | | | 1.25 | | | 1.21 | | | 1.25 | | |
Net investment income after expense
reimbursement(4)(5) | % | | 3.55 | | | 3.19 | | | 3.34 | | | 2.96 | | | 3.20 | | |
Portfolio turnover rate | % | | 304 | | | 417 | | | 304 | | | 417 | | | 475 | | |
(1) | The Fund changed its fiscal year end to March 31. |
(2) | Commencement of operations. |
(3) | Total return is calculated assuming reinvestment of all dividends and capital gain distributions at net asset value and excluding the deduction of sales charges. Total return for less than one year is not annualized. |
(4) | Annualized for periods less than one year. |
(5) | The Investment Manager has agreed to limit expenses, (excluding interest, taxes, brokerage and extraordinary expenses) subject to possible recoupment by ING Investments, LLC within three years. |
* | Portfolio turnover was greater than expected during this period due to active trading undertaken in response to market conditions that existed at that time |
See Accompanying Notes to Financial Statements.
32
ING NATIONAL TAX-EXEMPT BOND FUND (UNAUDITED) | FINANCIAL HIGHLIGHTS |
Selected data for a share of beneficial interest outstanding throughout each period.
| | Class A | |
| | Six Months
Ended
September 30, | | Year Ended March 31, | | Five Months
Ended
March 31, | | November 8,
1999(2) to
October 31, | |
| | 2005 | | 2005 | | 2004 | | 2003 | | 2002 | | 2001(1) | | 2000 | |
Per Share Operating Performance: | | | | | | | | | | | | | | | | |
Net asset value, beginning of period | $ | | 10.50 | | | 10.78 | | | 10.87 | | | 10.32 | | | 10.50 | | | 10.11 | | | 10.00 | | |
Income (loss) from investment operations: | | | | | | | | | | | | | | | | | | | | | | | |
Net investment income | $ | | 0.18 | | | 0.34 | | | 0.35 | | | 0.39 | | | 0.41 | | | 0.19 | | | 0.48 | | |
Net realized and unrealized gain (loss) | | | | | | | | | | | | | | | | | | | | | | | |
on investments | $ | | 0.05 | | | (0.21 | ) | | 0.12 | | | 0.67 | | | (0.18 | ) | | 0.39 | | | 0.11 | | |
Total from investment operations | $ | | 0.23 | | | 0.13 | | | 0.47 | | | 1.06 | | | 0.23 | | | 0.58 | | | 0.59 | | |
Less distributions from: | | | | | | | | | | | | | | | | | | | | | | | |
Net investment income | $ | | 0.18 | | | 0.34 | | | 0.35 | | | 0.39 | | | 0.41 | | | 0.19 | | | 0.48 | | |
Net realized gain on investments | $ | | — | | | 0.07 | | | 0.21 | | | 0.12 | | | — | | | — | | | — | | |
Total distributions | $ | | 0.18 | | | 0.41 | | | 0.56 | | | 0.51 | | | 0.41 | | | 0.19 | | | 0.48 | | |
Net asset value, end of period | $ | | 10.55 | | | 10.50 | | | 10.78 | | | 10.87 | | | 10.32 | | | 10.50 | | | 10.11 | | |
Total Return(3) | % | | 2.20 | | | 1.19 | | | 4.41 | | | 10.44 | | | 2.25 | | | 5.79 | | | 6.09 | | |
| | | | | | | | | | | | | | | | | | | | | | | |
Ratios and Supplemental Data: | | | | | | | | | | | | | | | | | | | | | | | |
Net assets, end of period (000’s) | $ | | 23,501 | | | 23,296 | | | 24,082 | | | 23,647 | | | 22,868 | | | 22,074 | | | 21,592 | | |
Ratios to average net assets: | | | | | | | | | | | | | | | | | | | | | | | |
Net expenses after expense | | | | | | | | | | | | | | | | | | | | | | | |
reimbursement/recoupment(4)(5) | % | | 1.10 | | | 1.10 | | | 1.15 | | | 1.15 | | | 1.10 | | | 1.06 | | | 0.95 | | |
Gross expenses prior to expense | | | | | | | | | | | | | | | | | | | | | | | |
reimbursement/recoupment(4) | % | | 1.17 | | | 1.13 | | | 1.27 | | | 1.28 | | | 1.52 | | | 1.50 | | | 2.12 | | |
Net investment income after expense | | | | | | | | | | | | | | | | | | | | | | | |
reimbursement/recoupment(4)(5) | % | | 3.41 | | | 3.19 | | | 3.23 | | | 3.64 | | | 3.97 | | | 4.45 | | | 4.92 | | |
Portfolio turnover rate | % | | 26 | | | 22 | | | 31 | | | 22 | | | 27 | | | 7 | | | 50 | | |
| | Class B | |
| | Six Months
Ended
September 30, | | Year Ended March 31, | | Five Months
Ended
March 31, | | November 8,
1999(2) to
October 31, | |
| | 2005 | | 2005 | | 2004 | | 2003 | | 2002 | | 2001(1) | | 2000 | |
Per Share Operating Performance: | | | | | | | | | | | | | | | | |
Net asset value, beginning of period | $ | | 10.50 | | | 10.77 | | | 10.86 | | | 10.31 | | | 10.48 | | | 10.09 | | | 10.00 | | |
Income (loss) from investment operations: | | | | | | | | | | | | | | | | | | | | | | | |
Net investment income | $ | | 0.14 | | | 0.26 | | | 0.27 | | | 0.31 | | | 0.34 | | | 0.17 | | | 0.38 | | |
Net realized and unrealized gain (loss) | | | | | | | | | | | | | | | | | | | | | | | |
on investments | $ | | 0.04 | | | (0.20 | ) | | 0.12 | | | 0.67 | | | (0.17 | ) | | 0.39 | | | 0.11 | | |
Total from investment operations | $ | | 0.18 | | | 0.06 | | | 0.39 | | | 0.98 | | | 0.17 | | | 0.56 | | | 0.49 | | |
Less distributions from: | | | | | | | | | | | | | | | | | | | | | | | |
Net investment income | $ | | 0.14 | | | 0.26 | | | 0.27 | | | 0.31 | | | 0.34 | | | 0.17 | | | 0.40 | | |
Net realized gain on investments | $ | | — | | | 0.07 | | | 0.21 | | | 0.12 | | | — | | | — | | | — | | |
Total distributions | $ | | 0.14 | | | 0.33 | | | 0.48 | | | 0.43 | | | 0.34 | | | 0.17 | | | 0.40 | | |
Net asset value, end of period | $ | | 10.54 | | | 10.50 | | | 10.77 | | | 10.86 | | | 10.31 | | | 10.48 | | | 10.09 | | |
Total Return(3) | % | | 1.72 | | | 0.54 | | | 3.63 | | | 9.65 | | | 1.59 | | | 5.54 | | | 5.02 | | |
| | | | | | | | | | | | | | | | | | | | | | | |
Ratios and Supplemental Data: | | | | | | | | | | | | | | | | | | | | | | | |
Net assets, end of period (000’s) | $ | | 3,195 | | | 3,041 | | | 2,643 | | | 2,792 | | | 1,265 | | | 588 | | | 311 | | |
Ratios to average net assets: | | | | | | | | | | | | | | | | | | | | | | | |
Net expenses after expense
reimbursement/recoupment(4)(5) | % | | 1.85 | | | 1.85 | | | 1.90 | | | 1.90 | | | 1.84 | | | 1.83 | | | 1.67 | | |
Gross expenses prior to expense
reimbursement/recoupment(4) | % | | 1.82 | | | 1.78 | | | 1.92 | | | 1.94 | | | 2.16 | | | 2.17 | | | 2.32 | | |
Net investment income after expense
reimbursement/recoupment(4)(5) | % | | 2.66 | | | 2.44 | | | 2.48 | | | 2.86 | | | 3.22 | | | 3.69 | | | 3.93 | | |
Portfolio turnover rate | % | | 26 | | | 22 | | | 31 | | | 22 | | | 27 | | | 7 | | | 50 | | |
(1) | The Fund changed its fiscal year end to March 31. |
(2) | Commencement of operations. |
(3) | Total return is calculated assuming reinvestment of all dividends and capital gain distributions at net asset value and excluding the deduction of sales charges. Total return for less than one year is not annualized. |
(4) | Annualized for periods less than one year. |
(5) | The Investment Manager has agreed to limit expenses, (excluding interest, taxes, brokerage and extraordinary expenses) subject to possible recoupment by ING Investments, LLC within three years. |
See Accompanying Notes to Financial Statements.
33
ING NATIONAL TAX-EXEMPT BOND FUND (UNAUDITED) (CONTINUED) | FINANCIAL
HIGHLIGHTS |
Selected data for a share of beneficial interest outstanding throughout each period.
| | Class C | |
| | Six Months
Ended
September 30, | | Year Ended March 31, | | Five Months
Ended
March 31, | | November 8,
1999(2) to
October 31, | |
| | 2005 | | 2005 | | 2004 | | 2003 | | 2002 | | 2001(1) | | 2000 | |
Per Share Operating Performance: | | | | | | | | | | | | | | | | |
Net asset value, beginning of period | $ | | 10.50 | | | 10.78 | | | 10.87 | | | 10.33 | | | 10.49 | | | 10.11 | | | 10.00 | | |
Income (loss) from investment operations: | | | | | | | | | | | | | | | | | | | | | | | |
Net investment income | $ | | 0.14 | | | 0.26 | | | 0.27 | | | 0.31 | | | 0.34 | | | 0.16 | | | 0.39 | | |
Net realized and unrealized gain (loss) | | | | | | | | | | | | | | | | | | | | | | | |
on investments | $ | | 0.05 | | | (0.21 | ) | | 0.12 | | | 0.66 | | | (0.16 | ) | | 0.38 | | | 0.12 | | |
Total from investment operations | $ | | 0.19 | | | 0.05 | | | 0.39 | | | 0.97 | | | 0.18 | | | 0.54 | | | 0.51 | | |
Less distributions from: | | | | | | | | | | | | | | | | | | | | | | | |
Net investment income | $ | | 0.14 | | | 0.26 | | | 0.27 | | | 0.31 | | | 0.34 | | | 0.16 | | | 0.40 | | |
Net realized gains on investments | $ | | — | | | 0.07 | | | 0.21 | | | 0.12 | | | — | | | — | | | — | | |
Total distributions | $ | | 0.14 | | | 0.33 | | | 0.48 | | | 0.43 | | | 0.34 | | | 0.16 | | | 0.40 | | |
Net asset value, end of period | $ | | 10.55 | | | 10.50 | | | 10.78 | | | 10.87 | | | 10.33 | | | 10.49 | | | 10.11 | | |
Total Return(3) | % | | 1.81 | | | 0.49 | | | 3.63 | | | 9.56 | | | 1.69 | | | 5.34 | | | 5.29 | | |
| | | | | | | | | | | | | | | | | | | | | | | |
Ratios and Supplemental Data: | | | | | | | | | | | | | | | | | | | | | | | |
Net assets, end of period (000’s) | $ | | 1,898 | | | 1,806 | | | 1,104 | | | 1,065 | | | 271 | | | 440 | | | 439 | | |
Ratios to average net assets: | | | | | | | | | | | | | | | | | | | | | | | |
Net expenses after expense | | | | | | | | | | | | | | | | | | | | | | | |
reimbursement/recoupment(4)(5) | % | | 1.85 | | | 1.85 | | | 1.90 | | | 1.90 | | | 1.83 | | | 1.81 | | | 1.68 | | |
Gross expenses prior to expense | | | | | | | | | | | | | | | | | | | | | | | |
reimbursement/recoupment(4) | % | | 1.82 | | | 1.78 | | | 1.92 | | | 1.94 | | | 2.18 | | | 2.16 | | | 2.33 | | |
Net investment income after expense | | | | | | | | | | | | | | | | | | | | | | | |
reimbursement/recoupment(4)(5) | % | | 2.66 | | | 2.44 | | | 2.49 | | | 2.84 | | | 3.21 | | | 3.70 | | | 4.00 | | |
Portfolio turnover rate | % | | 26 | | | 22 | | | 31 | | | 22 | | | 27 | | | 7 | | | 50 | | |
(1) | The Fund changed its fiscal year end to March 31. |
(2) | Commencement of operations. |
(3) | Total return is calculated assuming reinvestment of all dividends and capital gain distributions at net asset value and excluding the deduction of sales charges. Total return for less than one year is not annualized. |
(4) | Annualized for periods less than one year. |
(5) | The Investment Manager has agreed to limit expenses, (excluding interest, taxes, brokerage and extraordinary expenses) subject to possible recoupment by ING Investments, LLC within three years. |
See Accompanying Notes to Financial Statements.
34
ING CLASSIC MONEY MARKET FUND (UNAUDITED) | | FINANCIAL HIGHLIGHTS |
Selected data for a share of beneficial interest outstanding throughout each period.
| | | Class A | |
| | | Six Months | | | | | | | | | | Five Months | | Year | |
| | | Ended | | | | | | | | | | Ended | | Ended | |
| | | September 30, | | Year Ended March 31, | | March 31, | | October 31, | |
| | | 2005 | | 2005 | | 2004 | | 2003 | | 2002 | | 2001(1) | | 2000 | |
Per Share Operating Performance: | | | | | | | | | | | | | | | | |
Net asset value, beginning of period | $ | | 1.00 | | | 1.00 | | | 1.00 | | | 1.00 | | | 1.00 | | | 1.00 | | | 1.00 | | |
Income from investment operations: | | | | | | | | | | | | | | | | | | | | | | | |
Net investment income | $ | | 0.01 | | | 0.01 | | | 0.00 | * | | 0.01 | | | 0.03 | | | 0.02 | | | 0.06 | | |
Total from investment operations | $ | | 0.01 | | | 0.01 | | | 0.00 | * | | 0.01 | | | 0.03 | | | 0.02 | | | 0.06 | | |
Less distributions from: | | | | | | | | | | | | | | | | | | | | | | | |
Net investment income | $ | | 0.01 | | | 0.01 | | | 0.00 | * | | 0.01 | | | 0.03 | | | 0.02 | | | 0.06 | | |
Total distributions | $ | | 0.01 | | | 0.01 | | | 0.00 | * | | 0.01 | | | 0.03 | | | 0.02 | | | 0.06 | | |
Net asset value, end of period | $ | | 1.00 | | | 1.00 | | | 1.00 | | | 1.00 | | | 1.00 | | | 1.00 | | | 1.00 | | |
Total Return(2) | % | | 1.26 | | | 1.02 | | | 0.44 | | | 1.06 | | | 2.83 | | | 2.36 | | | 5.70 | | |
| | | | | | | | | | | | | | | | | | | | | | | |
Ratios and Supplemental Data: | | | | | | | | | | | | | | | | | | | | | | | |
Net assets, end of period (000’s) | $ | | 566,598 | | | 550,091 | | | 398,997 | | | 458,964 | | | 549,999 | | | 515,651 | | | 440,651 | | |
Ratios to average net assets: | | | | | | | | | | | | | | | | | | | | | | | |
Net expenses after expense reimbursement(3)(4) | % | | 0.77 | | | 0.77 | | | 0.77 | | | 0.77 | | | 0.77 | | | 0.77 | | | 0.74 | | |
Gross expenses prior to expense reimbursement(3) | % | | 1.07 | | | 1.08 | | | 1.16 | | | 1.27 | | | 1.27 | | | 1.30 | | | 1.42 | | |
Net investment income after expense reimbursement(3)(4) | % | | 2.51 | | | 1.06 | | | 0.44 | | | 1.06 | | | 2.75 | | | 5.61 | | | 5.59 | | |
| | | Class B | |
| | | Six Months | | | | | | | | | | Five Months | | Year | |
| | | Ended | | | | | | | | | | Ended | | Ended | |
| | | September 30, | | Year Ended March 31, | | March 31, | | October 31, | |
| | | 2005 | | 2005 | | 2004 | | 2003 | | 2002 | | 2001(1) | | 2000 | |
Per Share Operating Performance: | | | | | | | | | | | | | | | | | | | | | | | |
Net asset value, beginning of period | $ | | 1.00 | | | 1.00 | | | 1.00 | | | 1.00 | | | 1.00 | | | 1.00 | | | 1.00 | | |
Income from investment operations: | | | | | | | | | | | | | | | | | | | | | | | |
Net investment income | $ | | 0.01 | | | 0.01 | | | 0.00 | * | | 0.00 | * | | 0.02 | | | 0.02 | | | 0.05 | | |
Total from investment operations | $ | | 0.01 | | | 0.01 | | | 0.00 | * | | 0.00 | * | | 0.02 | | | 0.02 | | | 0.05 | | |
Less distributions from: | | | | | | | | | | | | | | | | | | | | | | | |
Net investment income | $ | | 0.01 | | | 0.01 | | | 0.00 | * | | 0.00 | * | | 0.02 | | | 0.02 | | | 0.05 | | |
Total distributions | $ | | 0.01 | | | 0.01 | | | 0.00 | * | | 0.00 | * | | 0.02 | | | 0.02 | | | 0.05 | | |
Net asset value, end of period | $ | | 1.00 | | | 1.00 | | | 1.00 | | | 1.00 | | | 1.00 | | | 1.00 | | | 1.00 | | |
Total Return(2) | % | | 0.97 | | | 0.57 | | | 0.15 | | | 0.43 | | | 2.21 | | | 2.11 | | | 5.03 | | |
| | | | | | | | | | | | | | | | | | | | | | | |
Ratios and Supplemental Data: | | | | | | | | | | | | | | | | | | | | | | | |
Net assets, end of period (000’s) | $ | | 31,159 | | | 26,941 | | | 816 | | | 1,156 | | | 1,987 | | | 2,714 | | | 2,706 | | |
Ratios to average net assets: | | | | | | | | | | | | | | | | | | | | | | | |
Net expenses after expense reimbursement(3)(4) | % | | 1.32 | | | 1.33 | | | 1.07 | | | 1.40 | | | 1.37 | | | 1.41 | | | 1.38 | | |
Gross expenses prior to expense reimbursement(3) | % | | 1.32 | | | 1.33 | | | 1.41 | | | 1.52 | | | 1.53 | | | 1.55 | | | 1.67 | | |
Net investment income after expense reimbursement(3)(4) | % | | 1.97 | | | 0.94 | | | 0.15 | | | 0.46 | | | 2.27 | | | 5.10 | | | 4.93 | | |
(1) | The Fund changed its fiscal year end to March 31. |
(2) | Total return is calculated assuming reinvestment of all dividends and capital gain distributions at net asset value and excluding the deduction of sales charges. Total return for less than one year is not annualized. |
(3) | Annualized for periods less than one year. |
(4) | The Investment Manager has agreed to limit expenses, (excluding interest, taxes, brokerage and extraordinary expenses) subject to possible recoupment by ING Investments, LLC within three years. |
* | Amount is less than $0.01 per share. |
See Accompanying Notes to Financial Statements.
35
ING CLASSIC MONEY MARKET FUND (UNAUDITED) (CONTINUED) | | FINANCIAL
HIGHLIGHTS |
Selected data for a share of beneficial interest outstanding throughout each period.
| | | Class C | |
| | | Six Months | | | | | | | | | | Five Months | | Year | |
| | | Ended | | | | | | | | | | Ended | | Ended | |
| | | September 30, | | Year Ended March 31, | | March 31, | | October 31, | |
| | | 2005 | | 2005 | | 2004 | | 2003 | | 2002 | | 2001(1) | | 2000 | |
Per Share Operating Performance: | | | | | | | | | | | | | | | | | | | | | | | |
Net asset value, beginning of period | $ | | 1.00 | | | 1.00 | | | 1.00 | | | 1.00 | | | 1.00 | | | 1.00 | | | 1.00 | | |
Income from investment operations: | | | | | | | | | | | | | | | | | | | | | | | |
Net investment income | $ | | 0.01 | | | 0.01 | | | 0.00 | * | | 0.00 | * | | 0.02 | | | 0.02 | | | 0.05 | | |
Total from investment operations | $ | | 0.01 | | | 0.01 | | | 0.00 | * | | 0.00 | * | | 0.02 | | | 0.02 | | | 0.05 | | |
Less distributions from: | | | | | | | | | | | | | | | | | | | | | | | |
Net investment income | $ | | 0.01 | | | 0.01 | | | 0.00 | * | | 0.00 | * | | 0.02 | | | 0.02 | | | 0.05 | | |
Total distributions | $ | | 0.01 | | | 0.01 | | | 0.00 | * | | 0.00 | * | | 0.02 | | | 0.02 | | | 0.05 | | |
Net asset value, end of period | $ | | 1.00 | | | 1.00 | | | 1.00 | | | 1.00 | | | 1.00 | | | 1.00 | | | 1.00 | | |
Total Return(2) | % | | 0.98 | | | 0.58 | | | 0.14 | | | 0.42 | | | 2.20 | | | 2.08 | | | 5.03 | | |
| | | | | | | | | | | | | | | | | | | | | | | |
Ratios and Supplemental Data: | | | | | | | | | | | | | | | | | | | | | | | |
Net assets, end of period (000’s) | $ | | 5,050 | | | 3,932 | | | 546 | | | 524 | | | 590 | | | 2,583 | | | 2,035 | | |
Ratios to average net assets: | | | | | | | | | | | | | | | | | | | | | | | |
Net expenses after expense reimbursement(3)(4) | % | | 1.32 | | | 1.33 | | | 1.07 | | | 1.40 | | | 1.38 | | | 1.40 | | | 1.39 | | |
Gross expenses prior to expense reimbursement(3) | % | | 1.32 | | | 1.33 | | | 1.41 | | | 1.52 | | | 1.53 | | | 1.55 | | | 1.67 | | |
Net investment income after expense reimbursement(3)(4) | % | | 1.98 | | | 0.78 | | | 0.15 | | | 0.42 | | | 2.44 | | | 5.00 | | | 5.03 | | |
(1) | The Fund changed its fiscal year end to March 31. |
(2) | Total return is calculated assuming reinvestment of all dividends and capital gain distributions at net asset value and excluding the deduction of sales charges. Total return for less than one year is not annualized. |
(3) | Annualized for periods less than one year. |
(4) | The Investment Manager has agreed to limit expenses, (excluding interest, taxes, brokerage and extraordinary expenses) subject to possible recoupment by ING Investments, LLC within three years. |
* | Amount is less than $0.01 per share. |
See Accompanying Notes to Financial Statements.
36
ING INSTITUTIONAL PRIME MONEY MARKET FUND (UNAUDITED) | | FINANCIAL HIGHLIGHTS |
Selected data for a share of beneficial interest outstanding throughout each period.
| | July 29,
2005(1) to
September 30,
2005 | |
Per Share Operating Performance: | | | |
Net asset value, beginning of period | $ | 1.00 | |
Income from investment operations: | | | |
Net investment income | $ | 0.01 | |
Total from investment operations | $ | 0.01 | |
Less distributions from: | | | |
Net investment income | $ | 0.01 | |
Total distributions | $ | 0.01 | |
Net asset value, end of period | $ | 1.00 | |
Total Return(2) | % | 0.59 | |
| | | |
Ratios and Supplemental Data: | | | |
Net assets, end of period (000’s) | $ | 88,963 | |
Ratios to average net assets: | | | |
Net expenses after expense reimbursement/recoupment(3)(4) | % | 0.17 | |
Gross expenses prior to expense reimbursement/recoupment(3)(4) | % | 0.30 | |
Net investment income after expense reimbursement(3) | % | 3.51 | |
(1) | Commencement of operations. |
(2) | Total return is calculated assuming reinvestment of all dividends and capital gain distributions at net asset value and excluding the deduction of sales charges. Total return for less than one year is not annualized. |
(3) | Annualized for periods less than one year. |
(4) | The Investment Manager has agreed to limit expenses, (excluding interest taxes, brokerage and extraordinary expenses) subject to possible recoupment by ING Investments, LLC within three years. |
See Accompanying Notes to Financial Statements.
37
NOTES TO FINANCIAL STATEMENTS AS OF SEPTEMBER 30, 2005 (UNAUDITED)
NOTE 1 — ORGANIZATION
Organization. ING Funds Trust (“Trust”) is a Delaware business trust registered as an open-end management investment company. The Trust was organized on August 6, 1998 and was established under a Trust Instrument dated June 30, 1998. It consists of six separately managed series: ING GNMA Income Fund (“GNMA Income”), ING High Yield Bond Fund (“High Yield Bond”), ING Intermediate Bond Fund (“Intermediate Bond”), ING National Tax-Exempt Bond Fund (“National Tax-Exempt Bond”), ING Classic Money Market Fund (“Money Market”) and ING Institutional Prime Money Market Fund (“Institutional Money Market”). (Each a “Fund” and collectively, the “Funds”.)
The investment objective of each Fund is described in each Fund’s prospectus.
Each Fund, except Institutional Money Market, offers at least three of the following classes of shares: Class A, Class B, Class C, Class I, Class M, Class O, Class Q and Class R. The separate classes of shares differ principally in the applicable sales charges (if any), transfer agent fees, distribution fees and shareholder servicing fees. Shareholders of each class also bear certain expenses that pertain to that particular class. All shareholders bear the common expenses of the Fund and earn income and realized gains/losses from the portfolio pro rata based on the average daily net assets of each class, without distinction between share classes. Differences in per share dividend rates generally result from the differences in separate class expenses, including distribution, and shareholder servicing fees. Class B shares, along with their pro rata reinvested dividend shares, automatically convert to Class A shares approximately eight years after purchase.
ING Investments, LLC (“ING Investments”), serves as the Investment Manager to the Funds. ING Investments has engaged ING Investment Management Co. (“ING IM”), to serve as the Sub-Adviser to the Funds. ING Funds Distributor, LLC (the “Distributor”) is the principal underwriter of the Funds. The Distributor, ING Investments and INGIM are indirect, wholly-owned subsidiaries of ING Groep N.V. (“ING Groep”). ING Groep is one of the largest financial services organizations in the world, and offers an array of banking, insurance and asset management services to both individuals and institutional investors.
NOTE 2 — SIGNIFICANT ACCOUNTING POLICIES
The following significant accounting policies are consistently followed by the Funds in the preparation of their financial statements, and such policies are in conformity with accounting principles generally accepted in the United States of America for investment companies.
A. Security Valuation. Investments in equity securities traded on a national securities exchange are valued at the last reported sale price. Securities reported by NASDAQ will be valued at the NASDAQ official closing prices. Securities traded on an exchange or NASDAQ for which there has been no sale and securities traded in the over-the-counter-market are valued at the mean between the last reported bid and ask prices. All investments quoted in foreign currencies will be valued daily in U.S. dollars on the basis of the foreign currency exchange rates prevailing at that time. Debt securities are valued at prices obtained from independent services or from one or more dealers making markets in the securities and may be adjusted based on the Funds’ valuation procedures. U.S. Government obligations are valued by using market quotations or independent pricing services that use prices provided by marketmakers or estimates of market values obtained from yield data relating to instruments or securities with similar characteristics.
Securities and assets for which market quotations are not readily available (which may include certain restricted securities which are subject to limitations as to their sale) are valued at their fair values as determined in good faith by or under the supervision of the Funds’ Board of Directors/Trustees (“Board”), in accordance with methods that are specifically authorized by the Board. Securities traded on exchanges, including foreign exchanges, which close earlier than the time that a Fund calculates its net asset value (“NAV”) may also be valued at their fair values as determined in good faith by or under the supervision of a Fund’s Board, in accordance with methods that are specifically authorized by the Board. If an event occurs after the time at which the market for foreign securities held by the Fund closes but before the time that the Fund’s NAV is calculated, such event may cause the closing price on the foreign exchange to not represent a readily available reliable market value quotation for such securities at the time the Fund determines its NAV. In such a case, the Fund will use the fair value of such securities as determined under the Fund’s valuation procedures. Events after the close of trading on a foreign market that could require the Fund to fair value some or all of its foreign securities include, among others, securities trading in the U.S. and other markets, corporate announcements, natural and other disasters, and political and other events. Among other elements
38
NOTES TO FINANCIAL STATEMENTS AS OF SEPTEMBER 30, 2005 (UNAUDITED) (CONTINUED)
NOTE 2 — SIGNIFICANT ACCOUNTING POLICIES (continued)
of analysis in the determination of a security’s fair value, the Board has authorized the use of one or more independent research services to assist with such determinations. An independent research service may use statistical analyses and quantitative models to help determine fair value as of the time a Fund calculates its NAV. There can be no assurance that such models accurately reflect the behavior of the applicable markets or the effect of the behavior of such markets on the fair value of securities, or that such markets will continue to behave in a fashion that is consistent with such models. Unlike the closing price of a security on an exchange, fair value determinations employ elements of judgment. Consequently, the fair value assigned to a security may not represent the actual value that the Fund could obtain if it were to sell the security at the time of the close of the NYSE. Pursuant to procedures adopted by the Board, the Fund is not obligated to use the fair valuations suggested by any research service, and valuation recommendations provided by such research services may be overridden if other events have occurred or if other fair valuations are determined in good faith to be more accurate. Unless an event is such that it causes the Fund to determine that the closing prices for one or more securities do not represent readily available reliable market value quotations at the time the Fund determines its NAV, events that occur between the time of the close of the foreign market on which they are traded and the close of regular trading on the NYSE will not be reflected in the Fund’s NAV. Investments in securities maturing in 60 days or less from the date of acquisition are valued at amortized cost, which, when combined with accrued interest, approximates market value.
The Money Market Funds use the amortized cost method to value their portfolios securities. The amortized cost method involves valuing a security at its cost and amortizing any discount or premium over the period until maturity.
B. Security Transactions and Revenue Recognition. Securities transactions are accounted for on the trade date. Realized gains and losses are reported on the basis of identified cost of securities sold. Interest income is recorded on an accrual basis. Dividend income is recorded on the ex-dividend date, or for certain foreign securities, when the information becomes available to the funds. Premium amortization and discount accretion are determined by the effective yield method.
C. Foreign Currency Translation. The books and records of the Funds are maintained in U.S. dollars. Any foreign currency amounts are translated into U.S. dollars on the following basis:
(1) Market value of investment securities, other assets and liabilities — at the exchange rates prevailing at the end of the day.
(2) Purchases and sales of investment securities, income and expenses — at the rates of exchange prevailing on the respective dates of such transactions.
Although the net assets and the market values are presented at the foreign exchange rates at the end of the day, the Funds do not isolate the portion of the results of operations resulting from changes in foreign exchange rates on investments from the fluctuations arising from changes in market prices of securities held. Such fluctuations are included with the net realized and unrealized gains or losses from investments. For securities that are subject to foreign withholding tax upon disposition, liabilities are recorded on the Statements of Assets and Liabilities for the estimated tax withholding based on the securities’ current market values. Upon disposition, realized gains or losses on such securities are recorded net of foreign withholding tax.
Reported net realized foreign exchange gains or losses arise from sales of foreign currencies, currency gains or losses realized between the trade and settlement dates on securities transactions, the difference between the amounts of dividends, interest, and foreign withholding taxes recorded on the Funds’ books, and the U.S. dollar equivalent of the amounts actually received or paid. Net unrealized foreign exchange gains and losses arise from changes in the value of assets and liabilities other than investments in securities at fiscal year end, resulting from changes in the exchange rate. Foreign security and currency transactions may involve certain considerations and risks not typically associated with investing in U.S. companies and U.S. Government securities. These risks include, but are not limited to revaluation of currencies and future adverse political and economic developments which could cause securities and their markets to be less liquid and prices more volatile than those of comparable U.S. companies and U.S. Government securities.
D. Foreign Currency Transactions and Futures Contracts. High Yield Bond, Intermediate Bond
39
NOTES TO FINANCIAL STATEMENTS AS OF sEPTEMBER 30, 2005 (uNAUDITED) (CONTINUED)
NOTE 2 — SIGNIFICANT ACCOUNTING POLICIES (continued)
and National Tax-Exempt Bond may enter into foreign currency exchange transactions to convert to and from different foreign currencies and to and from the U.S. dollar in connection with the planned purchases or sales of securities. The Funds either enter into these transactions on a spot basis at the spot rate prevailing in the foreign currency exchange market or use forward foreign currency contracts to purchase or sell foreign currencies. When the contract is fulfilled or closed, gains or losses are realized. Until then, the gain or loss is included in unrealized appreciation or depreciation. Risks may arise upon entering into forward contracts from the potential inability of counterparties to meet the terms of their forward contracts and from the potential inability of counterparties to meet the terms of their forward contracts and from unanticipated movements in the value of foreign currencies relative to the U.S. dollar.
High Yield Bond and Intermediate Bond may enter into futures contracts involving foreign currency, interest rates, securities and securities indices. A futures contract obligates the seller of the contract to deliver and the purchaser of the contract to take delivery of the type of foreign currency, financial instrument or security called for in the contract at a specified future time for a specified price. Upon entering into such a contract, a Fund is required to deposit and maintain as collateral such initial margin as required by the exchange on which the contract is traded. Pursuant to the contract, a Fund agrees to receive from or pay to the broker an amount equal to the daily fluctuations in the value of the contract. Such receipts or payments are known as variation margins and are recorded as unrealized gains or losses by the Fund. When the contract is closed, the Fund records a realized gain or loss equal to the difference between the value of the contract at the time it was opened and the value at the time it was closed.
E. Distributions to Shareholders. The Funds record distributions to their shareholders on the ex-dividend date. All Funds, with the exception of GNMA Income, declare dividends daily and pay dividends monthly. GNMA Income declares and pays dividends monthly. The Funds may make distributions on a more frequent basis to comply with the distribution requirements of the Internal Revenue Code. The characteristics of income and gains to be distributed are determined in accordance with income tax regulations, which may differ from accounting principles generally accepted in the United States of America for investment companies.
F. Federal Income Taxes. It is the policy of the Funds to comply with Subchapter M of the Internal Revenue Code and related excise tax provisions applicable to regulated investment companies and to distribute substantially all of their net investment income and any net realized capital gains to their shareholders. Therefore, no federal income tax provision is required. No capital gain distributions shall be made until any capital loss carryforwards have been fully utilized or expired.
G. Use of Estimates. Management of the Funds has made certain estimates and assumptions relating to the reporting of assets, liabilities, income, and expenses to prepare these financial statements in conformity with accounting principles generally accepted in the United States of America for investment companies. Actual results could differ from these estimates.
H. Repurchase Agreements. Each Fund may invest in repurchase agreements only with government securities dealers recognized by the Board of Governors of the Federal Reserve System. Under such agreements, the seller of the security agrees to repurchase it at a mutually agreed upon time and price. The resale price is in excess of the purchase price and reflects an agreed upon interest rate for the period of time the agreement is outstanding. The period of the repurchase agreements is usually short, from overnight to one week, while the underlying securities generally have longer maturities. Each Fund will receive as collateral securities acceptable to it whose market value is equal to at least 100% of the carrying amount of the repurchase agreements, plus accrued interest, being invested by the Fund. The underlying collateral is valued daily on a mark to market basis to assure that the value, including accrued interest is at least equal to the repurchase price. There would be potential loss to the Fund in the event the Fund is delayed or prevented from exercising its right to dispose of the collateral, and it might incur disposition costs in liquidating the collateral.
I. Securities Lending. Each Fund (except GNMA Income) has the option to temporarily loan up to 30% of its total assets to brokers, dealers or other financial institutions in exchange for a negotiated lender’s fee. The borrower is required to fully
40
NOTES TO FINANCIAL STATEMENTS AS OF SEPTEMBER 30, 2005 (UNAUDITED) (CONTINUED)
NOTE 2 — SIGNIFICANT ACCOUNTING POLICIES (continued)
collateralize the loans with cash or U.S. Government securities. Generally, in the event of counterparty default, the Fund has the right to use collateral to offset losses incurred. There would be potential loss to the Fund in the event the Fund is delayed or prevented from exercising its right to dispose of the collateral. The Fund bears the risk of loss with respect to the investment of collateral. Engaging in securities lending could have a leveraging effect, which may intensify the credit, market and other risks associated with investing in a Fund.
J. Illiquid and Restricted Securities. GNMA Income may not invest in illiquid securities. Money Market may not invest more than 10% of its net assets in illiquid securities and all other Funds may not invest more than 15% of their net assets in illiquid securities. Illiquid securities are not readily marketable. Disposing of illiquid investments may involve time-consuming negotiation and legal expenses, and it may be difficult or impossible for the Funds to sell them promptly at an acceptable price. Restricted securities are those sold under Rule 144A of the Securities Act of 1933 (“1933 Act”) or are securities offered pursuant to Section 4(2) of the 1933 Act, and are subject to legal or contractual restrictions on resale and may not be publicly sold without registration under the 1933 Act. Certain restricted securities may be considered liquid pursuant to procedures adopted by the Board or may be deemed illiquid because they may not be readily marketable. Illiquid and restricted securities are valued using market quotations when readily available. In the absence of market quotations, the securities are valued based upon their fair value determined under procedures approved by the Board.
K. Delayed Delivery Transaction. The Funds may purchase or sell securities on a when-issued or forward commitment basis. The price of the underlying securities and date when the securities will be delivered and paid for are fixed at the time the transaction is negotiated. The market value of such is identified in the Funds’ Portfolio of Investments. Losses may arise due to changes in the market value of the securities or from the inability of counterparties to meet the terms of the contract. In connection with such purchases, the Funds are required to hold liquid assets as collateral with the Funds’ custodian sufficient to cover the purchase price.
L. Mortgage Dollar Roll Transactions. Each Fund (except National Tax-Exempt Bond) may engage in dollar roll transactions with respect to mortgage-backed securities issued by Government National Mortgage Association, Federal National Mortgage Association and Federal Home Loan Mortgage Corp. In a dollar roll transaction, a Fund sells a mortgage-backed security to a financial institution, such as a bank or broker/dealer, and simultaneously agrees to repurchase a substantially similar (i.e., same type, coupon, and maturity) security from the institution on a delayed delivery basis at an agreed upon price. The mortgage-backed securities that are repurchased will bear the same interest rate as those sold, but generally will be collateralized by different pools of mortgages with different prepayment histories. The Funds account for dollar roll transactions as purchases and sales.
M. Options Contracts. High Yield Bond and Intermediate Bond may purchase put and call options and may write (sell) put options and covered call options. The Funds may engage in option transactions as a hedge against adverse movements in the value of portfolio holdings or to increase market exposure. Option contracts are valued daily and unrealized gains or losses are recorded based upon the last sales price on the principal exchange on which the options are traded. The Funds will realize a gain or loss upon the expiration or closing of the option contract. When an option is exercised, the proceeds on sales of the underlying security for a written call option, the purchase cost of the security for a written put option, or the cost of the security for a purchased put or call option is adjusted by the amount of premium received or paid. Realized and unrealized gains or losses on option contracts are reflected in the accompanying financial statements. The risk in writing a call option is that the Funds give up the opportunity for profit if the market price of the security increases and the option is exercised. The risk in writing a put option is that the Funds may incur a loss if the market price of the security decreases and the option is exercised. The risk in buying an option is that the Funds pay a premium whether or not the option is exercised. Risks may also arise from an illiquid secondary market or from the inability of counterparties to meet the terms of the contract.
N. Construction Loan Securities. GNMA Income may purchase construction loan securities, which are issued to finance building costs. The funds are disbursed as needed or in accordance with a
41
NOTES TO FINANCIAL STATEMENTS AS OF SEPTEMBER 30, 2005 (UNAUDITED) (CONTINUED)
NOTE 2 — SIGNIFICANT ACCOUNTING POLICIES (continued)
prearranged plan. The securities provide for the timely payment to the registered holder of interest at the specified rate plus scheduled installments of principal. Upon completion of the construction phase, the construction loan securities are terminated and project loan securities are issued. It is the Fund’s policy to record these GNMA certificates on trade date, and to segregate assets to cover its commitments on trade date as well.
NOTE 3 — INVESTMENT TRANSACTIONS
For the six months ended September 30, 2005, the cost of purchases and proceeds from the sales of securities, excluding short-term securities, were as follows:
| | Purchases | | Sales | |
High Yield Bond | | $121,053,187 | | | $152,330,541 | | |
Intermediate Bond | | 208,018,939 | | | 155,715,930 | | |
U.S. Government securities not included above were as follows:
| | Purchases | | Sales | |
GNMA Income | | $ 163,489,377 | | | $ 181,522,778 | | |
Intermediate Bond | | 1,853,145,460 | | | 1,739,667,862 | | |
National Tax-Exempt Bond | | 7,460,846 | | | 7,009,088 | | |
NOTE 4 — INVESTMENT MANAGEMENT AND ADMINISTRATIVE FEES
All Funds in this report have an Investment Management Agreement with ING Investments, LLC (the “Investment Manager”). The Investment Management Agreement compensates the Investment Manager with a fee, computed daily and payable monthly, based on the average daily net assets of each Fund, at the following annual rates:
For GNMA Income — 0.60% of the first $150 million, 0.50% of the next $250 million, 0.45% of the next $400 million and 0.40% in excess of $800 million; for High Yield Bond — 0.65% of the first $250 million, 0.60% of the next $250 million and 0.55% in excess of $500 million; for Intermediate Bond — 0.50% of the first $500 million, 0.45% of the next $500 million, 0.425% of the next $1 billion and 0.40% in excess of $2 billion; for National Tax-Exempt Bond — 0.50% on the first $100 million and 0.40% in excess of $100 million; for Money Market — 0.25%; and for Institutional Money Market — 0.08%.
The Investment Manager has entered into a Sub-Advisory Agreement with ING IM. Subject to such policies as the Board or the Investment Manager may determine, ING IM manages the Funds’ assets in accordance with the Funds’ investment objectives, policies, and limitations.
ING Funds Services, LLC (“IFS”), an indirect, wholly-owned subsidiary of ING Groep, acts as administrator and provides certain administrative and shareholder services necessary for Fund operations and is responsible for the supervision of other service providers. For its services, IFS is entitled to receive from each Fund, with the exception of Money Market and Institutional Money Market, a fee at an annual rate of 0.10% of its average daily net assets.
NOTE 5 — DISTRIBUTION AND SERVICE FEES
Each share class of the Funds (except as noted below) has adopted a Distribution Plan pursuant to Rule 12b-1 under the 1940 Act (the “12b-1 Plans”), whereby the Distributor is reimbursed or compensated (depending on the class of shares) by the Funds for expenses incurred in the distribution of each Fund’s shares (“Distribution Fees”). Pursuant to the 12b-1 Plans, the Distributor is entitled to payment each month for expenses incurred in the distribution and promotion of each Fund’s shares, including expenses incurred in printing prospectuses and reports used for sales purposes, expenses incurred in preparing and printing sales literature and other such distribution related expenses, including any distribution or shareholder servicing fees (“Service Fees”) paid to securities dealers who have executed a distribution agreement with the Distributor. Under the 12b-1 Plans, each class of shares of the Fund pays the Distributor a Distribution and/or Service Fee based on average daily net assets at the following annual rates:
| | Class A | | Class B | | Class C | | Class M | | Class O | | Class Q | | Class R | |
GNMA Income | | 0.25 | % | | 1.00 | % | | 1.00 | % | | 0.75 | % | | N/A | | | 0.25 | % | | N/A | | |
High Yield Bond | | 0.35 | % | | 1.00 | % | | 1.00 | % | | N/A | | | N/A | | | N/A | | | N/A | | |
Intermediate Bond | | 0.35 | % | | 1.00 | % | | 1.00 | % | | N/A | | | 0.25 | % | | N/A | | | 0.50 | % | |
National Tax-Exempt Bond | | 0.35 | % | | 1.00 | % | | 1.00 | % | | N/A | | | N/A | | | N/A | | | N/A | | |
Money Market | | 0.75 | % | | 1.00 | % | | 1.00 | % | | N/A | | | N/A | | | N/A | | | N/A | | |
Institutional Money Market | | N/A | | | N/A | | | N/A | | | N/A | | | N/A | | | N/A | | | N/A | | |
During the six months ended September 30, 2005, the Distributor waived 0.10% of the Class A Distribution Fee for High Yield Bond, Intermediate Bond and National Tax-Exempt Bond.
During the six months ended September 30, 2005, the Distributor voluntarily waived Distribution and Service Fees of 0.30% for Class A of Money Market.
The Distributor also receives the proceeds of initial sales charge paid by shareholders upon the purchase of Class A and Class M shares, and the contingent deferred sales charge paid by shareholders upon
42
NOTES TO FINANCIAL STATEMENTS AS OF SEPTEMBER 30, 2005 (UNAUDITED) (CONTINUED)
NOTE 5 — DISTRIBUTION AND SERVICE FEES (continued)
certain redemptions for Class A, Class B, and Class C shares. For the six months ended September 30, 2005, the Distributor retained the following amounts in sales charges:
| | Class A | | Class B | | Class C | | Class M | |
| | Shares | | Shares | | Shares | | Shares | |
Initial Sales Charges | | | | | | | | | |
GNMA Income | | $12,889 | | | N/A | | | N/A | | | — | | |
High Yield Bond | | 2,360 | | | N/A | | | N/A | | | — | | |
Intermediate Bond | | 15,503 | | | N/A | | | N/A | | | — | | |
National Tax-Exempt | | 399 | | | N/A | | | N/A | | | — | | |
Contingent Deferred Sales Charge | | | | | | | | | | | | | |
GNMA Income | | 15,710 | | | N/A | | | 4,280 | | | N/A | | |
High Yield Bond | | 5,407 | | | N/A | | | 977 | | | N/A | | |
Intermediate Bond | | 3,062 | | | N/A | | | 4,231 | | | N/A | | |
Money Market | | 1,040 | | | N/A | | | 1,898 | | | N/A | | |
NOTE 6 — OTHER TRANSACTIONS WITH AFFILIATES AND RELATED PARTIES
At September 30, 2005, the Funds had the following amounts recorded in payable to affiliates on the accompanying Statements of Assets and Liabilities (see Notes 4 and 5):
| | | | | | Accrued | | | | | |
| | Accrued | | | | Shareholder | | | | | |
| | Investment | | Accrued | | Services and | | Accrued | | | |
| | Management | | Administrative | | Distribution | | Reimbursement | | | |
| | Fees | | Fees | | Fees | | Expense | | Total | |
GNMA Income | | $270,847 | | | $53,795 | | | $213,003 | | | $ — | | | $537,645 | | |
High Yield Bond | | 123,859 | | | 19,055 | | | 124,593 | | | — | | | 267,507 | | |
Intermediate Bond | | 321,331 | | | 66,840 | | | 232,368 | | | 45,241 | | | 665,780 | | |
National Tax-Exempt Bond | | 11,791 | | | 2,358 | | | 13,073 | | | — | | | 27,222 | | |
Money Market | | 154,968 | | | — | | | 359,602 | | | — | | | 514,572 | | |
Institutional Money Market | | 5,716 | | | — | | | — | | | — | | | 5,716 | | |
At September 30, 2005, ING Life Insurance and Annuity Co., an indirect, wholly-owned subsidiary of ING Groep, held 9.84%, 21.02% and 73.57% of the shares outstanding of GNMA Income, Intermediate Bond and National Tax-Exempt Bond, respectively. Also at September 30, 2005, ING National Trust, an indirect, wholly-owned subsidiary of ING Groep, owned 14.63% of Intermediate Bond.
Each Fund has adopted a Retirement Policy covering all independent trustees of the Fund who will have served as an independent trustee for at least five years at the time of retirement. Benefits under this plan are based on an annual rate as defined in the plan agreement.
NOTE 7 — OTHER ACCRUED EXPENSES AND LIABILITIES
At September 30, 2005, Institutional Money Market had $100,000 of accrued offering expense included in Other accrued expenses and liabilities on the Statements of Assets and Liabilities that exceeded 5% of total liabilities.
NOTE 8 — EXPENSE LIMITATIONS
Pursuant to written Expense Limitation Agreements, the Investment Manager has agreed to limit expenses, excluding interest, taxes, brokerage and extraordinary expenses to the following annual expenses to average daily net assets ratios:
| | Class A | | Class B | | Class C | | Class I | | Class M | | Class O | | Class Q | | Class R | |
GNMA Income | | 1.29 | % | 2.04 | % | 2.04 | % | 1.04 | % | 1.79 | % | N/A | | 1.29 | % | N/A | |
High Yield Bond | | 1.20 | % | 1.95 | % | 1.95 | % | N/A | | N/A | | N/A | | N/A | | N/A | |
Intermediate Bond | | 1.00 | % | 1.75 | % | 1.75 | % | 0.75 | % | N/A | | 1.00 | % | N/A | | 1.25 | % |
National Tax-Exempt Bond | | 1.10 | % | 1.85 | % | 1.85 | % | N/A | | N/A | | N/A | | N/A | | N/A | |
Money Market | | 0.77 | % | 1.41 | % | 1.41 | % | N/A | | N/A | | N/A | | N/A | | N/A | |
The Investment Manager has agreed to limit expenses, excluding interest, taxes, brokerage, and extraordinary expenses to 0.17% of Institutional Money Market’s average daily net assets.
The Investment Manager may at a later date recoup from a Fund for management fees waived and other expenses assumed by the Investment Manager during the previous 36 months, but only if, after such recoupment, the Fund’s expense ratio does not exceed the percentage described above. Waived and reimbursed fees net of any recoupment by the Investment Manager of such waived and reimbursed fees are reflected on the accompanying Statements of Operations for each Fund. Amounts payable by the Investment Manager are reflected on the accompanying Statements of Assets and Liabilities for each Fund.
As of September 30, 2005, the amounts of waived and reimbursed fees that are subject to possible recoupment by the Investment Manager, and the related expiration dates are as follows:
| | September 30, | | | |
| | 2006 | | 2007 | | 2008 | | Total | |
High Yield Bond | | — | | — | | $ 52,417 | | $ 52,417 | |
Intermediate Bond | | — | | $31,024 | | 220,012 | | 251,036 | |
National Tax-Exempt Bond | | $ 11,944 | | — | | — | | 11,944 | |
Money Market | | 215,345 | | — | | — | | 215,345 | |
The Expense Limitation Agreements are contractual and shall renew automatically for one-year terms unless ING Investments provides written notice of the termination of the Expense Limitation Agreement within 90 days of the end of the then current term.
43
NOTES TO FINANCIAL STATEMENTS AS OF SEPTEMBER 30, 2005 (UNAUDITED) (CONTINUED)
NOTE 9 — LINE OF CREDIT
All of the Funds included in this report with the exception of GNMA Income, in addition to certain other funds managed by the Investment Manager, have entered into an unsecured committed revolving line of credit agreement (the “Credit Agreement”) with The Bank of New York for an aggregate amount of $125,000,000. The proceeds may be used only to: (1) temporarily finance the purchase and sale of securities; (2) finance the redemption of shares of an investor in the Funds; and (3) enable the Funds to meet other emergency expenses as defined in the Credit Agreement. The Funds to which the line of credit is available pay a commitment fee equal to 0.09% per annum on the daily unused portion of the committed line amount payable quarterly in arrears.
During the six months ended September 30, 2005, High Yield Bond utilized the line of credit for 1 day with an approximate average daily balance of $1,510,000 and an approximate weighted average interest rate of 3.26%.
NOTE 10 — CAPITAL SHARES
Transactions in capital shares and dollars were as follows:
| | Class A Shares | | Class B Shares | | Class C Shares | |
| | Period | | Year | | Period | | Year | | Period | | Year | |
| | Ended | | Ended | | Ended | | Ended | | Ended | | Ended | |
| | September 30, | | March 31, | | September 30, | | March 31, | | September 30, | | March 31, | |
| | 2005 | | 2005 | | 2005 | | 2005 | | 2005 | | 2005 | |
GNMA Income (Number of Shares) | | | | | | | | | | | | | |
Shares sold | | 4,818,092 | | 11,936,769 | | 482,389 | | 1,139,243 | | 479,386 | | 794,628 | |
Dividends reinvested | | 1,329,511 | | 2,880,147 | | 153,320 | | 372,746 | | 59,658 | | 160,143 | |
Shares redeemed | | (7,223,658 | ) | (20,045,296 | ) | (1,578,661 | ) | (4,519,492 | ) | (976,221 | ) | (3,286,313 | ) |
Net decrease in shares outstanding | | (1,076,055 | ) | (5,228,380 | ) | (942,952 | ) | (3,007,503 | ) | (437,177 | ) | (2,331,542 | ) |
| | | | | | | | | | | | | |
GNMA Income ($) | | | | | | | | | | | | | |
Shares sold | | $ | 41,087,595 | | $ | 103,248,084 | | $ | 4,097,824 | | $ | 9,812,626 | | $ | 4,076,494 | | $ | 6,841,947 | |
Dividends reinvested | | 11,331,660 | | 24,892,865 | | 1,301,442 | | 3,211,230 | | 506,973 | | 1,380,904 | |
Shares redeemed | | (61,586,592 | ) | (173,168,149 | ) | (13,396,712 | ) | (38,876,603 | ) | (8,294,429 | ) | (28,306,311 | ) |
Net decrease | | $ | (9,167,337 | ) | $ | (45,027,200 | ) | $ | (7,997,446 | ) | $ | (25,852,747 | ) | $ | (3,710,962 | ) | $ | (20,083,460 | ) |
| | Class I Shares | | Class M Shares | | Class Q Shares | |
| | Period | | Year | | Period | | Year | | Period | | Year | |
| | Ended | | Ended | | Ended | | Ended | | Ended | | Ended | |
| | September 30, | | March 31, | | September 30, | | March 31, | | September 30, | | March 31, | |
| | 2005 | | 2005 | | 2005 | | 2005 | | 2005 | | 2005 | |
GNMA Income (Number of Shares) | | | | | | | | | | | | | |
Shares sold | | 162,710 | | 460,536 | | — | | 12 | | — | | — | |
Dividends reinvested | | 34,211 | | 60,608 | | 347 | | 858 | | 260 | | 583 | |
Shares redeemed | | (78,324 | ) | (267,754 | ) | (925 | ) | (12,295 | ) | (2,752 | ) | (3,468 | ) |
Net increase (decrease) in shares outstanding | | 118,597 | | 253,390 | | (578 | ) | (11,425 | ) | (2,492 | ) | (2,885 | ) |
| | | | | | | | | | | | | |
GNMA Income ($) | | | | | | | | | | | | | |
Shares sold | | $ | 1,389,789 | | $ | 3,990,291 | | $ | — | | $ | 92 | | $ | — | | $ | — | |
Dividends reinvested | | 291,738 | | 524,103 | | 2,959 | | 7,441 | | 2,218 | | 5,047 | |
Shares redeemed | | (668,628 | ) | (2,315,639 | ) | (7,918 | ) | (106,523 | ) | (23,502 | ) | (29,827 | ) |
Net increase (decrease) | | $ | 1,012,899 | | $ | 2,198,755 | | $ | (4,959 | ) | $ | (98,990 | ) | $ | (21,284 | ) | $ | (24,780 | ) |
44
NOTES TO FINANCIAL STATEMENTS AS OF SEPTEMBER 30, 2005 (UNAUDITED) (CONTINUED)
NOTE 10 — CAPITAL SHARES (continued)
| | Class A Shares | | Class B Shares | | Class C Shares | |
| | Period | | Year | | Period | | Year | | Period | | Year | |
| | Ended | | Ended | | Ended | | Ended | | Ended | | Ended | |
| | September 30, | | March 31, | | September 30, | | March 31, | | September 30, | | March 31, | |
| | 2005 | | 2005 | | 2005 | | 2005 | | 2005 | | 2005 | |
High Yield Bond (Number of Shares) | | | | | | | | | | | | | |
Shares sold | | 1,896,581 | | 2,590,514 | | 203,417 | | 770,877 | | 44,358 | | 442,032 | |
Shares issued in merger | | — | | 9,802,063 | | — | | 14,680,633 | | — | | 2,015,478 | |
Dividends reinvested | | 183,260 | | 213,375 | | 162,776 | | 191,276 | | 32,791 | | 53,461 | |
Shares redeemed | | (2,642,989 | ) | (4,907,225 | ) | (3,139,528 | ) | (3,390,430 | ) | (668,042 | ) | (715,334 | ) |
Net increase (decrease) in shares outstanding | | (563,148 | ) | 7,698,727 | | (2,773,335 | ) | 12,252,356 | | (590,893 | ) | 1,795,637 | |
| | | | | | | | | | | | | |
High Yield Bond ($) | | | | | | | | | | | | | |
Shares sold | | $ | 16,561,166 | | $ | 23,138,944 | | $ | 1,784,065 | | $ | 6,867,884 | | $ | 390,870 | | $ | 3,929,392 | |
Shares issued in merger | | — | | 87,682,572 | | — | | 131,283,737 | | — | | 18,032,534 | |
Dividends reinvested | | 1,607,240 | | 1,906,830 | | 1,425,832 | | 1,710,350 | | 287,359 | | 475,768 | |
Shares redeemed | | (23,259,931 | ) | (43,896,845 | ) | (27,472,509 | ) | (30,458,250 | ) | (5,816,915 | ) | (6,366,656 | ) |
Net increase (decrease) | | $ | (5,091,525 | ) | $ | 68,831,501 | | $ | (24,262,612 | ) | $ | 109,403,721 | | $ | (5,138,686 | ) | $ | 16,071,038 | |
| | Class A Shares | | Class B Shares | | Class C Shares | |
| | Period | | Year | | Period | | Year | | Period | | Year | |
| | Ended | | Ended | | Ended | | Ended | | Ended | | Ended | |
| | September 30, | | March 31, | | September 30, | | March 31, | | September 30, | | March 31, | |
| | 2005 | | 2005 | | 2005 | | 2005 | | 2005 | | 2005 | |
Intermediate Bond (Number of Shares) | | | | | | | | | | | | | |
Shares sold | | 9,991,043 | | 20,020,281 | | 636,312 | | 1,242,856 | | 1,008,585 | | 2,376,896 | |
Shares issued in merger | | — | | 7,782,918 | | — | | 281,573 | | — | | 178,918 | |
Dividends reinvested | | 712,960 | | 1,290,740 | | 60,427 | | 162,414 | | 56,669 | | 145,287 | |
Shares redeemed | | (3,743,014 | ) | (9,777,963 | ) | (739,111 | ) | (1,730,794 | ) | (881,953 | ) | (2,438,209 | ) |
Net increase (decrease) in shares outstanding | | 6,960,989 | | 19,315,976 | | (42,372 | ) | (43,951 | ) | 183,301 | | 262,892 | |
| | | | | | | | | | | | | |
Intermediate Bond ($) | | | | | | | | | | | | | |
Shares sold | | $ | 104,358,286 | | $ | 208,496,288 | | $ | 6,634,123 | | $ | 12,918,869 | | $ | 10,522,941 | | $ | 24,752,573 | |
Shares issued in merger | | — | | 81,024,830 | | — | | 2,925,680 | | — | | 1,860,336 | |
Dividends reinvested | | 7,456,956 | | 13,432,920 | | 630,700 | | 1,686,232 | | 591,956 | | 1,509,860 | |
Shares redeemed | | (37,067,179 | ) | (101,648,431 | ) | (7,704,331 | ) | (17,962,624 | ) | (9,191,484 | ) | (25,320,455 | ) |
Net increase (decrease) | | $ | 74,748,063 | | $ | 201,305,607 | | $ | (439,508 | ) | $ | (431,843 | ) | $ | 1,923,413 | | $ | 2,802,314 | |
| | Class I Shares | | Class O Shares | | Class R Shares | |
| | Period | | Year | | Period | | August 13, | | Period | | Year | |
| | Ended | | Ended | | Ended | | 2004(1) to | | Ended | | Ended | |
| | September 30, | | March 31, | | September 30, | | March 31, | | September 30, | | March 31, | |
| | 2005 | | 2005 | | 2005 | | 2005 | | 2005 | | 2005 | |
Intermediate Bond (Number of Shares) | | | | | | | | | | | | | |
Shares sold | | 10,631,022 | | 1,105,426 | | 1,335,605 | | 1,847,824 | | 46,178 | | 51,163 | |
Shares issued at merger | | — | | 2,462,195 | | — | | 2,517,767 | | — | | — | |
Dividends reinvested | | 103,805 | | 134,583 | | 61,142 | | 64,256 | | 130 | | — | |
Shares redeemed | | (527,681 | ) | (822,774 | ) | (786,869 | ) | (1,136,816 | ) | (13,536 | ) | (20,940 | ) |
Net increase in shares outstanding | | 10,207,146 | | 2,879,430 | | 609,878 | | 3,293,031 | | 32,772 | | 30,223 | |
| | | | | | | | | | | | | |
Intermediate Bond ($) | | | | | | | | | | | | | |
Shares sold | | $ | 111,196,051 | | $ | 11,537,314 | | $ | 13,937,872 | | $ | 19,277,116 | | $ | 482,370 | | $ | 536,678 | |
Shares issued at merger | | — | | 25,636,140 | | — | | 26,211,427 | | — | | — | |
Dividends reinvested | | 1,084,245 | | 1,401,462 | | 639,535 | | 669,961 | | 1,358 | | — | |
Shares redeemed | | (5,502,424 | ) | (8,577,165 | ) | (8,190,296 | ) | (11,856,189 | ) | (164,077 | ) | (218,569 | ) |
Net increase | | $ | 106,777,872 | | $ | 29,997,751 | | $ | 6,387,111 | | $ | 34,302,315 | | $ | 319,651 | | $ | 318,109 | |
(1) Commencenment of operations.
45
NOTES TO FINANCIAL STATEMENTS AS OF SEPTEMBER 30, 2005 (UNAUDITED) (CONTINUED)
NOTE 10 — CAPITAL SHARES (continued)
| | Class A Shares | | Class B Shares | | Class C Shares | |
| | Period | | Year | | Period | | Year | | Period | | Year | |
| | Ended | | Ended | | Ended | | Ended | | Ended | | Ended | |
| | September 30, | | March 31, | | September 30, | | March 31, | | September 30, | | March 31, | |
| | 2005 | | 2005 | | 2005 | | 2005 | | 2005 | | 2005 | |
National Tax-Exempt Bond (Number of Shares) | | | | | | | | | | | | | |
Shares sold | | 40,786 | | 41,636 | | 35,907 | | 102,559 | | 20,936 | | 95,788 | |
Dividends reinvested | | 2,678 | | 6,613 | | 2,074 | | 4,182 | | 979 | | 2,212 | |
Shares redeemed | | (33,294 | ) | (64,637 | ) | (24,534 | ) | (62,425 | ) | (13,988 | ) | (28,473 | ) |
Net increase (decrease) in shares outstanding | | 10,170 | | (16,388 | ) | 13,447 | | 44,316 | | 7,927 | | 69,527 | |
| | | | | | | | | | | | | |
National Tax-Exempt Bond ($) | | | | | | | | | | | | | |
Shares sold | | $ | 433,543 | | $ | 441,706 | | $ | 380,329 | | $ | 1,083,239 | | $ | 222,746 | | $ | 1,010,135 | |
Dividends reinvested | | 28,461 | | 69,992 | | 22,028 | | 44,217 | | 10,407 | | 23,428 | |
Shares redeemed | | (354,884 | ) | (684,691 | ) | (260,225 | ) | (659,861 | ) | (147,726 | ) | (300,795 | ) |
Net increase (decrease) | | $ | 107,120 | | $ | (172,993 | ) | $ | 142,132 | | $ | 467,595 | | $ | 85,427 | | $ | 732,768 | |
| | Class A Shares | | Class B Shares | | Class C Shares | |
| | Period | | Year | | Period | | Year | | Period | | Year | |
| | Ended | | Ended | | Ended | | Ended | | Ended | | Ended | |
| | September 30, | | March 31, | | September 30, | | March 31, | | September 30, | | March 31, | |
| | 2005 | | 2005 | | 2005 | | 2005 | | 2005 | | 2005 | |
Money Market (Number of Shares) | | | | | | | | | | | | | |
Shares sold | | 190,027,081 | | 370,502,330 | | 31,122,370 | | 36,332,099 | | 4,204,931 | | 97,034 | |
Shares issued at merger | | — | | 53,558,965 | | — | | 16,217,548 | | — | | 3,649,294 | |
Dividends reinvested | | 6,660,083 | | 4,586,322 | | 248,762 | | 61,152 | | 36,357 | | 5,136 | |
Shares redeemed | | (180,160,533 | ) | (277,466,617 | ) | (27,153,476 | ) | (26,461,630 | ) | (3,123,272 | ) | (357,383 | ) |
Net increase in shares outstanding | | 16,526,631 | | 151,181,000 | | 4,217,656 | | 26,149,169 | | 1,118,016 | | 3,394,081 | |
| | | | | | | | | | | | | |
Money Market ($) | | | | | | | | | | | | | |
Shares sold | | $ | 190,027,084 | | $ | 370,502,330 | | $ | 31,122,385 | | $ | 36,332,099 | | $ | 4,204,931 | | $ | 97,034 | |
Shares issued at merger | | — | | 53,558,965 | | — | | 16,217,548 | | — | | 3,649,294 | |
Dividends reinvested | | 6,660,083 | | 4,586,251 | | 248,762 | | 61,152 | | 36,357 | | 5,136 | |
Shares redeemed | | (180,160,533 | ) | (277,466,617 | ) | (27,153,476 | ) | (26,461,630 | ) | (3,123,272 | ) | (357,383 | ) |
Net increase | | $ | 16,526,634 | | $ | 151,180,929 | | $ | 4,217,671 | | $ | 26,149,169 | | $ | 1,118,016 | | $ | 3,394,081 | |
| | Class A Shares | |
| | July 28, 2005(1) | |
| | to | |
| | September 30, | |
| | 2005 | |
Institutional Prime Money Market | | | |
(Number of Shares) | | | |
Shares sold | | 102,300,001 | |
Dividends reinvested | | 161,244 | |
Shares redeemed | | (13,500,000 | ) |
Net increase (decrease) in shares outstanding | | 88,961,245 | |
| | | |
Institutional Prime Money Market ($) | | | |
Shares sold | | $ | 102,300,001 | |
Dividends reinvested | | 161,244 | |
Shares redeemed | | (13,500,000 | ) |
Net increase | | $ | 88,961,245 | |
(1) Commencement of Operations
46
NOTES TO FINANCIAL STATEMENTS AS OF SEPTEMBER 30, 2005 (UNAUDITED) (CONTINUED)
NOTE 11 — CREDIT RISK AND DEFAULTED SECURITIES
Although each Fund has a diversified portfolio, High Yield Bond Fund invests substantially in lower rated and comparable quality unrated high yield securities. Investments in high yield securities are accompanied by a greater degree of credit risk and such lower rated securities tend to be more sensitive to economic conditions than higher rated securities. The risk of loss due to default by the issuer may be significantly greater for the holders of high yielding securities, because such securities are generally unsecured and are often subordinated to other creditors of the issuer.
High Yield Bond held the following defaulted securities at September 30, 2005.
Security | | Market Value | |
Adelphia Business Solutions | | | $ | 6 | | |
ICG Services, Inc. | | | 4 | | |
International Utility Structures, Inc. | | | 2 | | |
Source Media, Inc. | | | 1 | | |
WinStar Communications, Inc. | | | 625 | | |
| | | $ | 638 | | |
For financial reporting purposes, it is each Fund’s accounting practice to discontinue the accrual of income and to provide an estimate for probable losses due to unpaid interest income on defaulted bonds for the current reporting period.
NOTE 12 — FEDERAL INCOME TAXES
The amount of distributions from net investment income and net realized capital gains are determined in accordance with federal income tax regulations, which may differ from accounting principles generally accepted in the United States of America for investment companies. These book/tax differences may be either temporary or permanent. Permanent differences are reclassified within the capital accounts based on their federal tax-basis treatment; temporary differences are not reclassified. Key differences include the treatment of short-term capital gains, foreign currency transactions, and wash sale deferrals. Distributions in excess of net investment income and/or net realized capital gains for tax purposes are reported as distributions of paid-in capital.
Dividends paid by the Fund from net investment income and distributions of net realized short-term capital gains are, for federal income tax purposes, taxable as ordinary income to shareholders.
The tax composition of dividends and distributions to shareholders was as follows:
| | Six Months Ended September 30, 2005 | | Year Ended March 31, 2005 | |
| | | | | | Tax- | | | |
| | | Ordinary | | | Ordinary | | Exempt | | Long-Term | |
| | | Income | | | Income | | Income | | Capital Gains | |
GNMA Income | | | $ | 16,134,227 | | | $ | 36,615,264 | | $ | — | | $ | — | |
High Yield Bond | | | 7,179,549 | | | 9,567,361 | | — | | — | |
Intermediate Bond | | | 13,228,000 | | | 23,745,777 | | — | | 1,302,980 | |
National Tax-Exempt Bond | | | 470,164 | | | 4,862 | | 857,915 | | 178,348 | |
Money Market | | | 7,105,126 | | | 4,816,936 | | — | | — | |
Institutional Money Market | | | 481,247 | | | — | | — | | — | |
| | | | | | | | | | | | | | | |
The tax-basis components of distributable earnings and the expiration dates of the capital loss carryforwards which may be used to offset future realized capital gains for federal income tax purposes as of March 31, 2005 were:
| | | | | | | | | | Post | | | | | |
| | Undistributed | | Undistributed | | Undistributed | | Unrealized | | October | | Capital | | | |
| | Ordinary | | Tax-Exempt | | Long Term | | Appreciation/ | | Losses | | Loss | | Expiration | |
| | Income | | Income | | Capital Gains | | Depreciation | | Deferred | | Carryforwards | | Dates | |
GNMA Income | | $ | 1,158,018 | | $ | — | | $ | — | | $ | 11,533,310 | | $ | (3,539,500 | ) | $ | (4,473,153 | ) | 2006 | |
| | | | | | | | | | | | (1,688,098 | ) | 2007 | |
| | | | | | | | | | | | (2,870,184 | ) | 2008 | |
| | | | | | | | | | | | (527,639 | ) | 2010 | |
| | | | | | | | | | | | (1,009,937 | ) | 2012 | |
| | | | | | | | | | | | (5,795,720 | ) | 2013 | |
| | | | | | | | | | | | $ | (16,364,731 | ) | | |
| | | | | | | | | | | | | | | | | | | | | |
47
NOTES TO FINANCIAL STATEMENTS AS OF SEPTEMBER 30, 2005 (UNAUDITED) (CONTINUED)
NOTE 12 — FEDERAL INCOME TAXES (continued)
| | | | | | | | | | Post | | | | | |
| | Undistributed | | Undistributed | | Undistributed | | Unrealized | | October | | Capital | | | |
| | Ordinary | | Tax-Exempt | | Long Term | | Appreciation/ | | Losses | | Loss | | Expiration | |
| | Income | | Income | | Capital Gains | | Depreciation | | Deferred | | Carryforwards | | Dates | |
High Yield Bond | | $ | 709,520 | | $ | — | | $ | — | | $ | (16,440,933 | ) | $ | — | | $ | (47,276,599 | ) | 2006 | |
| | | | | | | | | | | | (27,206,911 | ) | 2007 | |
| | | | | | | | | | | | (78,500,574 | ) | 2008 | |
| | | | | | | | | | | | (115,139,658 | ) | 2009 | |
| | | | | | | | | | | | (79,792,137 | ) | 2010 | |
| | | | | | | | | | | | (69,190,309 | ) | 2011 | |
| | | | | | | | | | | | (6,099,584 | ) | 2012 | |
| | | | | | | | | | | | $ | (423,205,772 | ) | | |
Intermediate Bond | | 1,515,969 | | — | | 993,569 | | (6,326,086 | ) | — | | $ | — | | | |
National Tax- | | | | | | | | | | | | | | | |
Exempt Bond | | — | | 69,152 | | — | | 1,156,770 | | (33,547 | ) | $ | — | | | |
Money Market | | 35,366 | | — | | — | | — | | (56,132 | ) | $ | (1,443 | ) | 2010 | |
| | | | | | | | | | | | (36,198 | ) | 2011 | |
| | | | | | | | | | | | (18,913 | ) | 2012 | |
| | | | | | | | | | | | (63,053 | ) | 2013 | |
| | | | | | | | | | | | $ | (119,607 | ) | | |
| | | | | | | | | | | | | | | | | | | | | |
NOTE 13 — REORGANIZATIONS
On August 16, 2004, October 23, 2004 and March 13, 2005, ING Intermediate Bond Fund, ING High Yield Bond Fund and ING Money Market Fund, respectively, as listed below (“Acquiring Fund”), acquired the assets and certain liabilities of the ING Bond Fund, ING High Yield Opportunity Fund, ING Money Market Fund and ING Lexington Money Market Trust, respectively, also listed below (“Acquired Fund”), in a tax-free reorganization in exchange for shares of the Acquiring Fund, pursuant to a plan of reorganization approved by the Acquired Fund’s shareholders. The number and value of shares issued by the Acquiring Funds are presented in Note 9 — Capital Shares. Net assets and unrealized appreciation as of the reorganization dates were as follows:
| | | | | | | | Acquired Fund | | | |
| | | | | | | | Unrealized | | | |
Acquiring | | Acquired | | Total Net Assets of | | Total Net Assets of | | Appreciation/ | | Conversion | |
Fund | | Fund | | Acquired Fund (000) | | Acquiring Fund (000) | | Depreciation (000) | | Ratio | |
| | | | | | | | | | | |
ING Intermediate Bond Fund | | ING Bond Fund | | | $ | 137,658 | | | | $ | 448,460 | | | | $ | 1,584 | | | 1.01 | | |
ING High Yield Bond Fund | | ING High Yield Opportunities Fund | | | 236,999 | | | | 73,458 | | | | (6,510 | ) | | 0.81 | | |
ING Classic Money Market Fund | | ING Money Market Fund | | | 33,880 | | | | 488,618 | | | | — | | | 1.00 | | |
ING Classic Money Market Fund | | ING Lexington Money
Market Trust | | | 39,474 | | | | 488,618 | | | | — | | | 1.00 | | |
The net assets of the ING Intermediate Bond Fund, ING High Yield Bond Fund and ING Classic Money Market Fund after the acquisition were approximately $586,118,000, $310,457,000 and $561,972,000, respectively.
48
NOTES TO FINANCIAL STATEMENTS AS OF SEPTEMBER 30, 2005 (UNAUDITED) (CONTINUED)
NOTE 13 — ILLIQUID SECURITIES
Pursuant to guidelines adopted by the Funds’ Board of Trustees, the following securities have been deemed to be illiquid. The Funds may invest up to 15% (10% for Money Market) of its net assets in illiquid securities. Fair value for certain of securities was determined by ING Funds Valuation Committee appointed by the Funds’ Board.
| | | | Principal | | Initial | | | | | | Percent | |
| | | | Amount/ | | Acquisition | | | | | | of Net | |
Fund | | Security | | Shares | | Date | | Cost | | Value | | Assets | |
High Yield Bond | | Adelphia Business Solutions | | 61,806 | | 7/20/00 | | $ | — | | $ | 6 | | 0.0 | % |
| | Comforce Corp. | | 92,950 | | 12/23/98 | | — | | 930 | | 0.0 | |
| | Dayton Superior Corp. | | 3,100 | | 8/10/00 | | — | | 31 | | 0.0 | |
| | GT Group Telecom, Inc. | | 500 | | 3/19/03 | | — | | — | | 0.0 | |
| | ICG Communications, Inc. | | 6,600 | | 8/3/95 | | — | | 1 | | 0.0 | |
| | ICG Services, Inc., 0.000%, due 02/15/08 | | 3,600,000 | | 3/6/00 | | 3,349,509 | | 4 | | 0.0 | |
| | International Utility Structures, Inc., 0.000%, due 02/01/08 | | 2,456,000 | | 8/1/01 | | 1,154,358 | | 2 | | 0.0 | |
| | International Wireless Communications Holdings, Inc. | | 483,445 | | 8/9/96 | | 8,404,221 | | 31,424 | | 0.0 | |
| | Jordan Telecommunications | | 2,350 | | 1/31/00 | | — | | 56,964 | | 0.0 | |
| | North Atlantic Trading Co. | | 17,906 | | 3/26/04 | | 210,182 | | 18 | | 0.0 | |
| | O’ Sullivan Industries, Inc. | | 373 | | 3/19/03 | | — | | — | | 0.0 | |
| | O’ Sullivan Industries, Inc. | | 1,000 | | 3/19/03 | | — | | — | | 0.0 | |
| | Russell-Stanley Holdings, Inc. | | 100,000 | | 11/28/00 | | 346,704 | | 10 | | 0.0 | |
| | Source Media, Inc., 0.000%, due 11/01/49 | | 623,056 | | 7/25/03 | | — | | 1 | | 0.0 | |
| | WinStar Communications, Inc., 0.000%, due 04/15/10 | | 6,250,000 | | 1/12/01 | | 4,337,809 | | 625 | | 0.0 | |
| | | | | | | | $ | 17,802,783 | | $ | 90,016 | | 0.0 | % |
| | | | | | | | | | | | | |
Intermediate Bond | | Alpine III, 4.330%, due 08/16/14 | | 434,000 | | 8/16/04 | | $ | 434,000 | | $ | 435,201 | | 0.1 | % |
| | Alpine III, 4.740%, due 08/16/14 | | 434,000 | | 8/16/04 | | 434,000 | | 435,046 | | 0.0 | |
| | Alpine III, 6.540%, due 08/16/14 | | 739,000 | | 8/16/04 | | 747,529 | | 742,229 | | 0.1 | |
| | Alpine III, 9.790%, due 08/16/14 | | 1,241,000 | | 8/16/04 | | 1,257,156 | | 1,277,019 | | 0.1 | |
| | Nordea Kredit Realkreditaktieselskab, 6.000%, due 07/01/29 | | 102 | | 7/1/29 | | 17 | | 17 | | 0.0 | |
| | | | | | | | $ | 2,872,702 | | $ | 2,889,512 | | 0.3 | % |
NOTE 14 — SECURITIES LENDING
Under an agreement with The Bank of New York (“BNY”), the Funds (except GNMA Income) can lend their securities to approved brokers, dealers and other financial institutions. Loans are collateralized by cash and U.S. Government securities. The collateral must be in an amount equal to at least 105% of the market value of non-U.S. securities loaned and 102% of the market value of U.S. securities loaned. The cash collateral received is invested in approved investments as defined in the Securities Lending Agreement with BNY (the “Agreement”). The securities purchased with cash collateral received are reflected in the Portfolio of Investments. Generally, in the event of counterparty default, the Funds have the right to use the collateral to offset losses incurred. The Agreement contains certain guarantees by BNY in the event of counterparty default and/or a borrower’s failure to return a loaned security; however, there would be a potential loss to the Funds in the event the Funds are delayed or prevented from exercising their right to dispose of the collateral. The Funds bear the risk of loss with respect to the investment of collateral. Engaging in securities lending could have a leveraging effect, which may intensify the credit, market and other risks associated with investing in a Fund. At September 30, 2005, the following Fund had securities on loan with the following market value:
| | Value of | | | |
| | Securities | | Value of | |
Portfolio | | Loaned | | Collateral | |
Intermediate Bond | | $185,179,131 | | $189,517,473 | |
NOTE 15 — SUBSEQUENT EVENTS
Subsequent to September 30, 2005, the following Funds declared dividends from net investment income,
| | Per Share | | | | | |
| | Amount | | Payable Date | | Record Date | |
| | | | | | | |
GNMA Income | | | | | | | |
Class A | | $ 0.0360 | | October 5, 2005 | | September 30, 2005 | |
Class B | | 0.0307 | | October 5, 2005 | | September 30, 2005 | |
Class C | | 0.0308 | | October 5, 2005 | | September 30, 2005 | |
Class I | | 0.0382 | | October 5, 2005 | | September 30, 2005 | |
Class M | | 0.0326 | | October 5, 2005 | | September 30, 2005 | |
Class Q | | 0.0364 | | October 5, 2005 | | September 30, 2005 | |
Class A | | 0.0360 | | November 3, 2005 | | October 31, 2005 | |
Class B | | 0.0307 | | November 3, 2005 | | October 31, 2005 | |
Class C | | 0.0305 | | November 3, 2005 | | October 31, 2005 | |
Class I | | 0.0383 | | November 3, 2005 | | October 31, 2005 | |
Class M | | 0.0325 | | November 3, 2005 | | October 31, 2005 | |
Class Q | | 0.0365 | | November 3, 2005 | | October 31, 2005 | |
| | | | | | | |
High Yield Bond | | | | | | | |
Class A | | $ 0.0469 | | November 1, 2005 | | Daily | |
Class B | | 0.0414 | | November 1, 2005 | | Daily | |
Class C | | 0.0414 | | November 1, 2005 | | Daily | |
49
NOTES TO FINANCIAL STATEMENTS AS OF SEPTEMBER 30, 2005 (UNAUDITED) (CONTINUED)
NOTE 15 — SUBSEQUENT EVENTS (continued)
| | Per Share | | | | | |
| | Amount | | Payable Date | | Record Date | |
| | | | | | | |
Intermediate Bond | | | | | | | |
Class A | | $0.0358 | | November 1, 2005 | | Daily | |
Class B | | 0.0292 | | November 1, 2005 | | Daily | |
Class C | | 0.0292 | | November 1, 2005 | | Daily | |
Class I | | 0.0381 | | November 1, 2005 | | Daily | |
Class R | | 0.0334 | | November 1, 2005 | | Daily | |
Class O | | 0.0351 | | November 1, 2005 | | Daily | |
| | | | | | | |
National Tax-Exempt Bond | | | | | | | |
Class A | | $0.0316 | | November 1, 2005 | | Daily | |
Class B | | 0.0249 | | November 1, 2005 | | Daily | |
Class C | | 0.0249 | | November 1, 2005 | | Daily | |
| | | | | | | |
Money Market | | | | | | | |
Class A | | $0.0026 | | November 1, 2005 | | Daily | |
Class B | | 0.0021 | | November 1, 2005 | | Daily | |
Class C | | 0.0021 | | November 1, 2005 | | Daily | |
| | | | | | | |
Institutional Money Market | | | | | | | |
| | $0.0032 | | November 1, 2005 | | Daily | |
NOTE 16 — INFORMATION REGARDING TRADING OF ING’s U.S. MUTUAL FUNDS
ING Investments has reported to the Boards of Directors/Trustees (the “Boards”) of the ING Funds that, like many U.S. financial services companies, ING Investments and certain of its U.S. affiliates have received informal and formal requests for information since September 2003 from various governmental and self-regulatory agencies in connection with investigations related to mutual funds and variable insurance products. ING Investments has advised the Boards that it and its affiliates have cooperated fully with each request.
In addition to responding to regulatory and governmental requests, ING Investments reported that management of U.S. affiliates of ING Groep N.V., including ING Investments (collectively, “ING”), on their own initiative, have conducted, through independent special counsel and a national accounting firm, an extensive internal review of trading in ING insurance, retirement, and mutual fund products. The goal of this review was to identify any instances of inappropriate trading in those products by third parties or by ING investment professionals and other ING personnel. ING’s internal review related to mutual fund trading is now substantially completed. ING has reported that, of the millions of customer relationships that ING maintains, the internal review identified several isolated arrangements allowing third parties to engage in frequent trading of mutual funds within ING’s variable insurance and mutual fund products, and identified other circumstances where frequent trading occurred, despite measures taken by ING intended to combat market timing. ING further reported that each of these arrangements has been terminated and fully disclosed to regulators. The results of the internal review were also reported to the independent members of the Board.
ING Investments has advised the Board that most of the identified arrangements were initiated prior to ING’s acquisition of the businesses in question in the U.S. ING Investments further reported that the companies in question did not receive special benefits in return for any of these arrangements, which have all been terminated.
Based on the internal review, ING Investments has advised the Board that the identified arrangements do not represent a systemic problem in any of the companies that were involved.
In September 2005, ING Funds Distributor, LLC (“IFD”), the distributor of certain ING Funds, settled an administrative proceeding with the NASD regarding three arrangements, dating from 1995, 1996 and 1998, under which the administrator to the then-Pilgrim Funds, which subsequently became part of the ING Funds, entered into formal and informal arrangements that permitted frequent trading. Under the terms of the Letter of Acceptance, Waiver and Consent (“AWC”) with the NASD, under which IFD neither admitted nor denied the allegations or findings, IFD consented to the following sanctions: (i) a censure; (ii) a fine of $1.5 million; (iii) restitution of approximately $1.44 million to certain ING Funds for losses attributable to excessive trading described in the AWC; and (iv) agreement to make certification to NASD regarding the review and establishment of certain procedures.
In addition to the arrangements discussed above, ING Investments reported to the Board that, at this time, these instances include the following, in addition to the arrangements subject to the AWC discussed above:
• Aeltus Investment Management, Inc. (a predecessor entity to ING Investment Management Co.) has identified two investment professionals who engaged in extensive frequent trading in certain ING Funds. One was subsequently terminated for cause and incurred substantial financial penalties in connection with this conduct and the second has been disciplined.
• ReliaStar Life Insurance Company (“ReliaStar”) entered into agreements seven years ago permitting the owner of policies issued by the insurer to engage in frequent trading and to submit orders until 4pm Central Time. In 2001 ReliaStar also entered into a selling agreement
50
NOTES TO FINANCIAL STATEMENTS AS OF SEPTEMBER 30, 2005 (UNAUDITED) (CONTINUED)
NOTE 16 — INFORMATION REGARDING TRADING OF ING’s U.S. MUTUAL FUNDS (continued)
with a broker-dealer that engaged in frequent trading. Employees of ING affiliates were terminated and/or disciplined in connection with these matters.
• In 1998, Golden American Life Insurance Company entered into arrangements permitting a broker-dealer to frequently trade up to certain specific limits in a fund available in an ING variable annuity product. No employee responsible for this arrangement remains at the company.
For additional information regarding these matters, you may consult the Form 8-K and Form 8-K/A for each of four life insurance companies, ING USA Annuity and Life Insurance Company, ING Life Insurance and Annuity Company, ING Insurance Company of America, and ReliaStar Life Insurance Company of New York, each filed with the Securities and Exchange Commission (the “SEC”) on October 29, 2004 and September 8, 2004. These Forms 8-K and Forms 8-K/A can be accessed through the SEC’s Web site at http://www.sec.gov. Despite the extensive internal review conducted through independent special counsel and a national accounting firm, there can be no assurance that the instances of inappropriate trading reported to the Board are the only instances of such trading respecting the ING Funds.
ING Investments reported to the Board that ING is committed to conducting its business with the highest standards of ethical conduct with zero tolerance for noncompliance. Accordingly, ING Investments advised the Board that ING management was disappointed that its voluntary internal review identified these situations. Viewed in the context of the breadth and magnitude of its U.S. business as a whole, ING management does not believe that ING’s acquired companies had systemic ethical or compliance issues in these areas. Nonetheless, Investments reported that given ING’s refusal to tolerate any lapses, it has taken the steps noted below, and will continue to seek opportunities to further strengthen the internal controls of its affiliates.
• ING has agreed with the ING Funds to indemnify and hold harmless the ING Funds from all damages resulting from wrongful conduct by ING or its employees or from ING’s internal investigation, any investigations conducted by any governmental or self-regulatory agencies, litigation or other formal proceedings, including any proceedings by the Securities and Exchange Commission. ING Investments reported to the Board that ING management believes that the total amount of any indemnification obligations will not be material to ING or its U.S. business.
• ING updated its Code of Conduct for employees reinforcing its employees’ obligation to conduct personal trading activity consistent with the law, disclosed limits, and other requirements.
• The ING Funds, upon a recommendation from ING, updated their respective Codes of Ethics applicable to investment professionals with ING entities and certain other fund personnel, requiring such personnel to pre-clear any purchases or sales of ING Funds that are not systematic in nature (i.e., dividend reinvestment), and imposing minimum holding periods for shares of ING Funds.
• ING instituted excessive trading policies for all customers in its variable insurance and retirement products and for shareholders of the ING Funds sold to the public through financial intermediaries. ING does not make exceptions to these policies.
• ING reorganized and expanded its U.S. Compliance Department, and created an Enterprise Compliance team to enhance controls and consistency in regulatory compliance.
As has been widely reported in the media, the New York Attorney General’s office (“NYAG”) is conducting broad investigations regarding insurance quoting and brokerage practices. ING U.S. has been subpoenaed in this regard, and is cooperating fully with these NYAG requests for information.
ING U.S. believes that its practices are consistent with our business principles and our commitment to our customers.
At this time, in light of the current regulatory factors, ING U.S. is actively engaged in reviewing whether any modifications in our practices are appropriate for the future.
There can be no assurance that these matters, or the adverse publicity associated with them, will not result in increased fund redemptions, reduced sale of fund shares, or other adverse consequences to ING Funds.
51
| | PORTFOLIO OF INVESTMENTS |
ING GNMA INCOME FUND | | as of September 30, 2005 (Unaudited) |
Principal | | | | | | | |
Amount | | | | | | Value | |
U.S. GOVERNMENT AGENCY OBLIGATIONS: 90.8% | | | | | |
| | | | | | | |
| | Federal Government Loan | | | | | |
| | Mortgage Corporation: 0.2% | | | | | |
$ | 123,938 | | 7.000%, due 11/01/14 | | | | $ | 129,479 | |
742,523 | | 7.500%, due 01/01/30-12/01/14 | | | | 785,025 | |
100,261 | | 8.000%, due 01/01/30 | | | | 107,013 | |
| | | | | | 1,021,517 | |
| | | | | | | |
| | Federal National Mortgage | | | | | |
| | Association: 0.2% | | | | | |
121,769 | | 6.500%, due 06/01/14 | | | | 126,075 | |
156,268 | | 7.000%, due 03/01/15 | | | | 163,408 | |
211,782 | | 7.500%, due 05/01/28 | | | | 224,524 | |
579,429 | | 8.500%, due 08/01/11-09/01/15 | | | | 616,098 | |
| | | | | | 1,130,105 | |
| | | | | | | |
| | Government National | | | | | |
| | Mortgage Association: 90.4% | | | | | |
8,371,680 | | 3.750%, due 05/20/34 | | | | 8,210,853 | |
69,819,957 | | 5.000%, due 04/15/29-09/15/35 | | | | 69,098,887 | |
158,718,393 | | 5.500%, due 04/20/29-05/15/35 | | | | 160,328,891 | |
534,120 | | 5.650%, due 07/15/29 | | | | 539,249 | |
128,795,046 | | 6.000%, due 07/15/28-04/20/35 | | | | 131,839,246 | |
653,183 | | 6.250%, due 04/15/26-04/15/28 | | | | 676,631 | |
130,933 | | 6.340%, due 02/15/29 | | | | 130,378 | |
1,547,529 | | 6.400%, due 10/15/33 | | | | 1,580,237 | |
1,144,315 | | 6.470%, due 09/15/33 | | | | 1,170,043 | |
20,663,513 | | 6.500%, due 02/15/22-12/20/34 | | | | 21,527,136 | |
5,285,024 | | 6.625%, due 01/15/34-01/15/40 | | | | 5,454,662 | |
1,684,154 | | 6.650%, due 10/15/14-06/15/30 | | | | 1,797,058 | |
3,480,743 | | 6.670%, due 01/15/40 | | | | 3,622,433 | |
6,132,080 | | 6.687%, due 07/15/40 | | | | 6,493,184 | |
253,379 | | 6.700%, due 12/15/14 | | | | 257,044 | |
8,372,372 | | 6.750%, due 06/15/13-01/15/41 | | | | 8,826,430 | |
2,816,815 | | 6.810%, due 07/15/39 | | | | 2,974,912 | |
3,997,647 | | 6.820%, due 05/15/27-04/15/34 | | | | 4,193,089 | |
9,706,590 | | 6.840%, due 10/15/36 | | | | 10,580,133 | |
1,783,061 | | 6.870%, due 03/15/39 | | | | 1,890,660 | |
3,233,748 | | 6.875%, due 02/15/40 | | | | 3,426,742 | |
2,134,600 | | 6.900%, due 01/15/32 | | | | 2,336,364 | |
36,601,073 | | 7.000%, due 07/15/22-06/15/34 | | | | 38,555,685 | |
8,862,747 | | 7.010%, due 02/15/37 | | | | 9,633,531 | |
5,503,097 | | 7.100%, due 11/15/39 | | | | 5,918,647 | |
8,858,612 | | 7.125%, due 09/15/39 | | | | 9,356,316 | |
3,299,908 | | 7.150%, due 07/15/36 | | | | 3,571,828 | |
1,610,742 | | 7.250%, due 10/15/27-09/15/31 | | | | 1,736,247 | |
2,917,026 | | 7.300%, due 08/15/36 | | | | 3,141,652 | |
3,479,660 | | 7.500%, due 12/15/19-09/15/32 | | | | 3,656,969 | |
4,934,935 | | 7.600%, due 08/15/31 | | | | 5,350,119 | |
9,349,695 | | 7.625%, due 07/15/38 | | | | 9,876,486 | |
65,136 | | 7.650%, due 12/15/12 | | | | 66,994 | |
383,336 | | 7.700%, due 08/15/13 | | | | 395,136 | |
3,249,882 | | 7.750%, due 06/15/14-12/15/35 | | | | 3,421,411 | |
1,002,206 | | 7.800%, due 05/15/19-01/15/42 | | | | 1,106,744 | |
9,715,069 | | 7.875%, due 09/15/29-04/15/38 | | | | 10,101,101 | |
8,086,219 | | 8.000%, due 12/15/14-01/15/38 | | | | 8,438,351 | |
96,015 | | 8.050%, due 07/15/19-04/15/31 | | | | 103,986 | |
1,133,488 | | 8.100%, due 06/15/12-07/15/12 | | | | 1,156,207 | |
4,942,319 | | 8.125%, due 05/15/38 | | | | 5,164,534 | |
3,720,901 | | 8.150%, due 12/15/11-09/15/15 | | | | 3,803,806 | |
4,473,093 | | 8.200%, due 10/15/11-05/15/13 | | | | 4,546,376 | |
2,020,958 | | 8.250%, due 10/15/24-03/15/41 | | | | 2,135,901 | |
6,770,805 | | 8.500%, due 10/15/31 | | | | 7,084,255 | |
$ | 43,919 | | 8.750%, due 06/15/27 | | | | $ | 45,863 | |
1,981,154 | | 9.000%, due 11/15/27-12/15/34 | | | | 2,083,948 | |
| | | | | | 587,406,355 | |
| | | | | | | |
| | Total U.S. Government | | | | | |
| | Agency Obligations | | | | | |
| | (Cost $583,448,854) | | | | 589,557,977 | |
| | | | | |
U.S. TREASURY OBLIGATIONS: 3.4% | | | | | |
| | | | | |
| | U.S. Treasury Bonds: 3.4% | | | | | |
20,000,000 | | 5.375%, due 02/15/31 | | | | 22,412,520 | |
| | | | | | 22,412,520 | |
| | Total U.S. Treasury Obligations | | | | | |
| | (Cost $22,766,180) | | | | 22,412,520 | |
| | Total Long-Term Investments | | | | | |
| | (Cost $606,215,034) | | | | 611,970,497 | |
| | | | | |
SHORT-TERM INVESTMENTS: 5.3% | | | | | |
| | | | | |
| | U.S. Treasury Bills: 5.3% | | | | | |
35,000,000 | | 3.370%, due 01/05/06 | | | | 34,684,685 | |
| | Total Short-Term Investments | | | | | |
| | (Cost $34,670,053) | | | | 34,684,685 | |
| | Total Investments in | | | | | |
| | Securities (Cost | | | | | |
| | $640,885,087)* | | 99.5 | % | $ | 646,655,182 | |
| | Other Assets and | | | | | |
| | Liabilities-Net | | | 0.5 | | 2,968,912 | |
| | Net Assets | | | 100.0 | % | $ | 649,624,094 | |
| | | | | | | | | | | |
Government National Mortgage Association (“GNMA”) manages a program of Mortgage-backed securities in order to attract funds for secondary mortgages and provide liquidity for existing mortgage securities. GNMA is a quasi-government agency.
Federal Home Loan Mortgage Corporation (“FHLMC”) purchase mortgages from a mortgage originator and holds them as investments in its portfolio, or securitizes them. FHLMC is a private organization.
* Cost for federal income tax purposes is $640,914,663. Net unrealized appreciation consists of:
| | Gross Unrealized Appreciation | | | | $ | 11,668,583 | |
| | Gross Unrealized Depreciation | | | | (5,928,064 | ) |
| | Net Unrealized Appreciation | | | | $ | 5,740,519 | |
See Accompanying Notes to Financial Statements
52
| | PORTFOLIO OF INVESTMENTS |
ING HIGH YIELD BOND FUND | | as of September 30, 2005 (Unaudited) |
Principal | | | | | | | |
Amount | | | | | | Value | |
CORPORATE BONDS/NOTES: 97.4% | | | | | |
| | | | | |
| | Advertising: 0.2% | | | | | |
$ | 555,000 | # | Vertis, Inc., 13.500%, | | | | | |
| | due 12/07/09 | | | | $ | 474,525 | |
| | | | | | 474,525 | |
| | | | | | | |
| | Aerospace/Defense: 1.3% | | | | | |
1,045,000 | | DRS Technologies, Inc., | | | | | |
| | 6.875%, due 11/01/13 | | | | 1,013,650 | |
515,000 | | L-3 Communications Corp., | | | | | |
| | 6.125%, due 07/15/13 | | | | 515,000 | |
435,000 | | L-3 Communications Corp., | | | | | |
| | 7.625%, due 06/15/12 | | | | 458,925 | |
825,000 | | Sequa Corp., 8.875%, | | | | | |
| | due 04/01/08 | | | | 862,125 | |
50,000 | | Sequa Corp., 9.000%, | | | | | |
| | due 08/01/09 | | | | 53,250 | |
| | | | | | 2,902,950 | |
| | | | | | | |
| | Apparel: 1.6% | | | | | |
750,000 | | Levi Strauss & Co., 8.254%, | | | | | |
| | due 04/01/12 | | | | 751,875 | |
1,530,000 | | Phillips-Van Heusen, 8.125%, | | | | | |
| | due 05/01/13 | | | | 1,614,150 | |
1,365,000 | | Russell Corp., 9.250%, | | | | | |
| | due 05/01/10 | | | | 1,385,475 | |
| | | | | | 3,751,500 | |
| | | | | | | |
| | Auto Manufacturers: 0.4% | | | | | |
1,155,000 | | Ford Motor Co., 7.450%, | | | | | |
| | due 07/16/31 | | | | 906,675 | |
| | | | | | 906,675 | |
| | | | | | | |
| | Auto Parts and Equipment: 0.9% | | | | | |
975,000 | | Accuride Corp., 8.500%, | | | | | |
| | due 02/01/15 | | | | 960,375 | |
310,000 | # | Commercial Vehicle Group, Inc., | | | | | |
| | 8.000%, due 07/01/13 | | | | 313,100 | |
30,000 | | Dura Operating Corp., 8.625%, | | | | | |
| | due 04/15/12 | | | | 26,850 | |
695,000 | | Visteon Corp., 8.250%, | | | | | |
| | due 08/01/10 | | | | 663,725 | |
| | | | | | 1,964,050 | |
| | | | | | | |
| | Building Materials: 1.1% | | | | | |
1,905,000 | @@ | Ainsworth Lumber Co., Ltd., | | | | | |
| | 6.750%, due 03/15/14 | | | | 1,733,550 | |
900,000 | | Ply Gem Industries Inc., | | | | | |
| | 9.000%, due 02/15/12 | | | | 760,500 | |
| | | | | | 2,494,050 | |
| | | | | | | |
| | Chemicals: 3.7% | | | | | |
220,000 | | Equistar Funding Corp., | | | | | |
| | 10.625%, due 05/01/11 | | | | 240,900 | |
1,215,000 | | IMC Global, Inc., 10.875%, | | | | | |
| | due 06/01/08 | | | | 1,379,025 | |
2,890,000 | | Lyondell Chemical Co., | | | | | |
| | 9.625%, due 05/01/07 | | | | 3,048,950 | |
1,290,000 | | Nalco Co., 7.750%, | | | | | |
| | due 11/15/11 | | | | 1,325,475 | |
720,000 | | PolyOne Corp., 8.875%, | | | | | |
| | due 05/01/12 | | | | 686,700 | |
$ | 915,000 | # | Rockwood Specialties | | | | | |
| | Group, Inc., 7.500%, | | | | | |
| | due 11/15/14 | | | | $ | 892,125 | |
851,000 | | Rockwood Specialties | | | | | |
| | Group, Inc., 10.625%, | | | | | |
| | due 05/15/11 | | | | 931,845 | |
| | | | | | 8,505,020 | |
| | | | | | | |
| | Commercial Services: 1.6% | | | | | |
900,000 | | Cenveo Corp., 7.875%, | | | | | |
| | due 12/01/13 | | | | 873,000 | |
290,000 | | Cenveo Corp., 9.625%, | | | | | |
| | due 03/15/12 | | | | 312,475 | |
1,650,000 | | Corrections Corp. of America, | | | | | |
| | 7.500%, due 05/01/11 | | | | 1,709,813 | |
430,000 | | United Rentals North America, | | | | | |
| | Inc., 6.500%, due 02/15/12 | | | | 417,100 | |
290,000 | | United Rentals North America, | | | | | |
| | Inc., 7.000%, due 02/15/14 | | | | 270,425 | |
| | | | | | 3,582,813 | |
| | | | | | | |
| | Computers: 0.7% | | | | | |
1,110,000 | # | Sungard Data Systems, Inc., | | | | | |
| | 9.125%, due 08/15/13 | | | | 1,155,787 | |
465,000 | # | Sungard Data Systems, Inc., | | | | | |
| | 10.250%, due 08/15/15 | | | | 473,138 | |
| | | | | | 1,628,925 | |
| | | | | | | |
| | Distribution/Wholesale: 0.4% | | | | | |
870,000 | | Aviall, Inc., 7.625%, | | | | | |
| | due 07/01/11 | | | | 900,450 | |
| | | | | | 900,450 | |
| | | | | | | |
| | Diversified Financial Services: 5.1% | | | | | |
235,000 | | Alamosa Delaware, Inc., | | | | | |
| | 8.500%, due 01/31/12 | | | | 252,038 | |
800,000 | # | Astoria Depositor Corp., | | | | | |
| | 8.144%, due 05/01/21 | | | | 795,420 | |
620,000 | | Ford Motor Credit Co., | | | | | |
| | 4.950%, due 01/15/08 | | | | 590,326 | |
385,000 | | Ford Motor Credit Co., | | | | | |
| | 6.625%, due 06/16/08 | | | | 376,518 | |
500,000 | | General Motors Acceptance | | | | | |
| | Corp., 5.125%, due 05/09/08 | | | | 465,722 | |
620,000 | | General Motors Acceptance | | | | | |
| | Corp., 6.125%, due 02/01/07 | | | | 616,549 | |
465,000 | | General Motors Acceptance | | | | | |
| | Corp., 6.750%, due 12/01/14 | | | | 405,136 | |
1,000,000 | | General Motors Acceptance | | | | | |
| | Corp., 6.875%, due 09/15/11 | | | | 910,686 | |
140,000 | | General Motors Acceptance | | | | | |
| | Corp., 8.000%, due 11/01/31 | | | | 122,549 | |
1,505,000 | | Global Cash Finance Corp., | | | | | |
| | 8.750%, due 03/15/12 | | | | 1,625,400 | |
920,000 | # | Rainbow National Services, | | | | | |
| | LLC, 8.750%, due 09/01/12 | | | | 985,550 | |
930,000 | | Universal City Development | | | | | |
| | Partners, 11.750%, | | | | | |
| | due 04/01/10 | | | | 1,055,550 | |
375,000 | | Universal City Florida Holding | | | | | |
| | Co. I/II, 8.443%, due 05/01/10 | | | | 390,938 | |
1,180,000 | W | Vanguard Health Holding | | | | | |
| | Co. II, LLC, 9.000%, | | | | | |
| | due 10/01/14 | | | | 1,262,600 | |
See Accompanying Notes to Financial Statements
53
| | PORTFOLIO OF INVESTMENTS |
ING HIGH YIELD BOND FUND | | as of September 30, 2005 (Unaudited) (continued) |
Principal | | | | | | | |
Amount | | | | | | Value | |
| | Diversified Financial Services | | | | | |
| | (continued) | | | | | |
$ | 1,825,000 | W | Visant Corp., 7.625%, | | | | | |
| | due 10/01/12 | | | | $ | 1,852,374 | |
| | | | | | 11,707,356 | |
| | | | | | | |
| | Electric: 8.9% | | | | | |
875,000 | # | AES Corp., 8.750%, | | | | | |
| | due 05/15/13 | | | | 962,500 | |
1,475,000 | | AES Corp., 8.875%, | | | | | |
| | due 02/15/11 | | | | 1,607,750 | |
1,065,000 | # | Allegheny Energy Supply, | | | | | |
| | 8.250%, due 04/15/12 | | | | 1,203,450 | |
2,050,000 | | Aquila, Inc., 7.625%, | | | | | |
| | due 11/15/09 | | | | 2,152,500 | |
2,690,000 | | CMS Energy Corp., 7.500%, | | | | | |
| | due 01/15/09 | | | | 2,831,225 | |
1,272,448 | | Homer City Funding, LLC, | | | | | |
| | 8.734%, due 10/01/26 | | | | 1,520,575 | |
860,000 | # | Inergy LP/Inergy Finance | | | | | |
| | Corp., 6.875%, due 12/15/14 | | | | 825,600 | |
3,325,000 | | Midwest Generation, LLC, | | | | | |
| | 8.300%, due 07/02/09 | | | | 3,501,640 | |
1,665,000 | | Nevada Power Co., 5.875%, | | | | | |
| | due 01/15/15 | | | | 1,649,442 | |
1,509,000 | | Nevada Power Co., 10.875%, | | | | | |
| | due 10/15/09 | | | | 1,674,990 | |
665,000 | | TECO Energy, Inc., 7.500%, | | | | | |
| | due 06/15/10 | | | | 718,200 | |
670,000 | # | Texas Genco Financing Corp., | | | | | |
| | 6.875%, due 12/15/14 | | | | 685,075 | |
990,000 | | TXU Corp., 5.550%, due 11/15/14 | | | | 944,784 | |
| | | | | | 20,277,731 | |
| | | | | | | |
| | Electronics: 0.8% | | | | | |
625,000 | @@ | Celestica, Inc., 7.625%, | | | | | |
| | due 07/01/13 | | | | 626,563 | |
1,085,000 | @@ | Flextronics Intl. Ltd., 6.500%, | | | | | |
| | due 05/15/13 | | | | 1,112,125 | |
| | | | | | 1,738,688 | |
| | | | | | | |
| | Entertainment: 3.4% | | | | | |
870,000 | | AMC Entertainment, Inc., | | | | | |
| | 8.625%, due 08/15/12 | | | | 878,700 | |
2,635,000 | W | American Casino & | | | | | |
| | Entertainment Properties, | | | | | |
| | LLC, 7.850%, due 02/01/12 | | | | 2,730,518 | |
630,000 | | Cinemark USA, Inc., 9.000%, | | | | | |
| | due 02/01/13 | | | | 653,625 | |
815,000 | | Loews Cineplex Entertainment | | | | | |
| | Corp., 9.000%, due 08/01/14 | | | | 796,663 | |
1,245,000 | | Pinnacle Entertainment, Inc., | | | | | |
| | 8.250%, due 03/15/12 | | | | 1,251,225 | |
1,495,000 | | Warner Music Group, 7.375%, | | | | | |
| | due 04/15/14 | | | | 1,506,213 | |
| | | | | | 7,816,944 | |
| | | | | | | |
| | Environmental Control: 1.3% | | | | | |
930,000 | # | Allied Waste North America, | | | | | |
| | 7.250%, due 03/15/15 | | | | 920,700 | |
2,030,000 | | Allied Waste North America, | | | | | |
| | 8.500%, due 12/01/08 | | | | 2,126,425 | |
| | | | | | 3,047,125 | |
| | | | | | | |
| | Food: 4.9% | | | | | |
$ | 1,450,000 | | Delhaize America, Inc., | | | | | |
| | 8.125%, due 04/15/11 | | | | $ | 1,578,777 | |
1,485,000 | | Dole Food Co., 8.625%, | | | | | |
| | due 05/01/09 | | | | 1,559,250 | |
1,645,000 | | Land O’ Lakes, Inc., 9.000%, | | | | | |
| | due 12/15/10 | | | | 1,821,838 | |
1,200,000 | | Roundy’s, Inc., 8.875%, | | | | | |
| | due 06/15/12 | | | | 1,332,000 | |
1,295,000 | | Smithfield Foods, Inc., | | | | | |
| | 7.750%, due 05/15/13 | | | | 1,366,225 | |
1,000,000 | | Stater Brothers Holdings, | | | | | |
| | 8.125%, due 06/15/12 | | | | 992,500 | |
1,495,000 | | Swift & Co., 10.125%, | | | | | |
| | due 10/01/09 | | | | 1,616,469 | |
745,000 | | Swift & Co., 12.500%, | | | | | |
| | due 01/01/10 | | | | 815,775 | |
| | | | | | 11,082,834 | |
| | | | | | | |
| | Forest Products and Paper: 2.4% | | | | | |
1,390,000 | | Appleton Papers, Inc., 8.125%, | | | | | |
| | due 06/15/11 | | | | 1,369,150 | |
1,075,000 | | Georgia-Pacific Corp., 7.750%, | | | | | |
| | due 11/15/29 | | | | 1,158,313 | |
1,890,000 | | Georgia-Pacific Corp., 8.875%, | | | | | |
| | due 02/01/10 | | | | 2,116,800 | |
285,000 | | Georgia-Pacific Corp., 9.375%, | | | | | |
| | due 02/01/13 | | | | 319,200 | |
605,000 | @@ | Norske Skog Canada Ltd., | | | | | |
| | 7.375%, due 03/01/14 | | | | 577,775 | |
| | | | | | 5,541,238 | |
| | | | | | | |
| | Gas: 0.3% | | | | | |
615,000 | # | Colorado Interstate Gas Co., | | | | | |
| | 5.950%, due 03/15/15 | | | | 599,586 | |
| | | | | | 599,586 | |
| | | | | | | |
| | Healthcare-Products: 0.8% | | | | | |
735,000 | | Medical Device Manufacturing, | | | | | |
| | Inc., 10.000%, due 07/15/12 | | | | 801,150 | |
1,075,000 | | VWR Intl., Inc., 8.000%, | | | | | |
| | due 04/15/14 | | | | 1,052,156 | |
| | | | | | 1,853,306 | |
| | | | | | | |
| | Healthcare-Services: 3.6% | | | | | |
1,805,000 | | Alliance Imaging, Inc., 7.250%, | | | | | |
| | due 12/15/12 | | | | 1,660,599 | |
805,000 | | Community Health Systems, | | | | | |
| | Inc., 6.500%, due 12/15/12 | | | | 811,038 | |
1,380,000 | | Genesis HealthCare Corp., | | | | | |
| | 8.000%, due 10/15/13 | | | | 1,493,850 | |
1,220,000 | | HCA, Inc., 6.375%, due 01/15/15 | | | | 1,213,108 | |
540,000 | | HCA, Inc., 7.500%, due 11/06/33 | | | | 541,454 | |
1,030,000 | | HCA, Inc., 7.875%, due 02/01/11 | | | | 1,109,134 | |
580,000 | # | Psychiatric Solutions, Inc., | | | | | |
| | 7.750%, due 07/15/15 | | | | 601,750 | |
755,000 | | Tenet Healthcare Corp., | | | | | |
| | 9.875%, due 07/01/14 | | | | 792,750 | |
| | | | | | 8,223,683 | |
| | | | | | | |
| | Holding Companies-Diversified: 1.0% | | | | | |
675,000 | | Atlantic Broadband Finance | | | | | |
| | LLC, 9.375%, due 01/15/14 | | | | 641,250 | |
See Accompanying Notes to Financial Statements
54
| | PORTFOLIO OF INVESTMENTS |
ING HIGH YIELD BOND FUND | | as of September 30, 2005 (Unaudited) (continued) |
Principal | | | | | | | |
Amount | | | | | | Value | |
| | Holding Companies-Diversified | | | | | |
| | (continued) | | | | | |
$ | 1,575,000 | @@,# | Nell AF SARL, 8.375%, | | | | | |
| | due 08/15/15 | | | | $ | 1,547,438 | |
| | | | | | 2,188,688 | |
| | | | | | | |
| | Home Builders: 3.1% | | | | | |
715,000 | | DR Horton, Inc., 6.875%, | | | | | |
| | due 05/01/13 | | | | 752,706 | |
675,000 | | DR Horton, Inc., 7.875%, | | | | | |
| | due 08/15/11 | | | | 740,449 | |
995,000 | | KB Home, 6.375%, | | | | | |
| | due 08/15/11 | | | | 1,002,329 | |
1,150,000 | # | Stanley-Martin Communities | | | | | |
| | LLC, 9.750%, due 08/15/15 | | | | 1,129,875 | |
1,585,000 | | Technical Olympic USA, Inc., | | | | | |
| | 9.000%, due 07/01/10 | | | | 1,648,400 | |
540,000 | | Technical Olympic USA, Inc., | | | | | |
| | 10.375%, due 07/01/12 | | | | 571,050 | |
1,155,000 | | WCI Communities, Inc., | | | | | |
| | 10.625%, due 02/15/11 | | | | 1,232,963 | |
| | | | | | 7,077,772 | |
| | | | | | | |
| | Home Furnishings: 0.5% | | | | | |
990,000 | W | Norcraft Finance Corp., | | | | | |
| | 9.000%, due 11/01/11 | | | | 1,029,600 | |
| | | | | | 1,029,600 | |
| | | | | | | |
| | Household Products/Wares: 1.1% | | | | | |
925,000 | | American Achievement Corp., | | | | | |
| | 8.250%, due 04/01/12 | | | | 938,875 | |
1,200,000 | | Playtex Products, Inc., 8.000%, | | | | | |
| | due 03/01/11 | | | | 1,263,000 | |
535,000 | | Visant Holding Corp., 3.980%, | | | | | |
| | due 12/01/13 | | | | 387,875 | |
| | | | | | 2,589,750 | |
| | | | | | | |
| | Iron/Steel: 0.8% | | | | | |
380,000 | | AK Steel Corp., 7.875%, | | | | | |
| | due 02/15/09 | | | | 370,500 | |
745,000 | | California Steel Industries, | | | | | |
| | Inc., 6.125%, due 03/15/14 | | | | 704,025 | |
690,000 | # | Chaparral Steel Co., 10.000%, | | | | | |
| | due 07/15/13 | | | | 731,400 | |
| | | | | | 1,805,925 | |
| | | | | | | |
| | Leisure Time: 1.1% | | | | | |
1,105,000 | @@,# | NCL Corp., 11.625%, | | | | | |
| | due 07/15/14 | | | | 1,171,300 | |
375,000 | @@ | Royal Caribbean Cruises Ltd., | | | | | |
| | 7.500%, due 10/15/27 | | | | 401,250 | |
765,000 | @@ | Royal Caribbean Cruises Ltd., | | | | | |
| | 8.000%, due 05/15/10 | | | | 831,938 | |
| | | | | | 2,404,488 | |
| | | | | | | |
| | Lodging: 4.5% | | | | | |
1,880,000 | | Aztar Corp., 7.875%, | | | | | |
| | due 06/15/14 | | | | 1,974,000 | |
745,000 | | Mandalay Resort Group, | | | | | |
| | 7.625%, due 07/15/13 | | | | 778,525 | |
1,520,000 | | MGM Mirage, 5.875%, | | | | | |
| | due 02/27/14 | | | | 1,451,600 | |
2,300,000 | | MGM Mirage, 8.500%, | | | | | |
| | due 09/15/10 | | | | 2,512,750 | |
$ | 615,000 | | Starwood Hotels & Resorts | | | | | |
| | Worldwide, Inc., 7.875%, | | | | | |
| | due 05/01/12 | | | | $ | 673,425 | |
1,125,000 | | Station Casinos, Inc., 6.500%, | | | | | |
| | due 02/01/14 | | | | 1,130,625 | |
1,685,000 | W | Wynn Las Vegas Capital Corp., | | | | | |
| | 6.625%, due 12/01/14 | | | | 1,619,706 | |
| | | | | | 10,140,631 | |
| | | | | | | |
| | Machinery-Construction and Mining: 0.5% | | | | | |
1,155,000 | | Terex Corp., 7.375%, | | | | | |
| | due 01/15/14 | | | | 1,172,325 | |
| | | | | | 1,172,325 | |
| | | | | | | |
| | Media: 10.7% | | | | | |
950,000 | | American Media Operation, | | | | | |
| | Inc., 10.250%, due 05/01/09 | | | | 928,625 | |
490,000 | | Block Communications, Inc., | | | | | |
| | 9.250%, due 04/15/09 | | | | 521,850 | |
790,000 | | Cablevision Systems Corp., | | | | | |
| | 8.000%, due 04/15/12 | | | | 770,250 | |
915,000 | @@ | CanWest Media, Inc., 7.625%, | | | | | |
| | due 04/15/13 | | | | 1,000,781 | |
655,183 | @@,W | CanWest Media, Inc., 8.000%, | | | | | |
| | due 09/15/12 | | | | 698,589 | |
440,000 | @@ | CanWest Media, Inc., 10.625%, | | | | | |
| | due 05/15/11 | | | | 480,700 | |
1,240,000 | | CBD Media, Inc., 8.625%, | | | | | |
| | due 06/01/11 | | | | 1,286,500 | |
1,340,000 | # | CCH I LLC, 11.000%, | | | | | |
| | due 10/01/15 | | | | 1,313,199 | |
825,000 | | Charter Communications | | | | | |
| | Holdings II Capital Corp., | | | | | |
| | 10.250%, due 09/15/10 | | | | 849,750 | |
1,655,000 | # | Charter Communications | | | | | |
| | Operating Capital Corp., | | | | | |
| | 8.000%, due 04/30/12 | | | | 1,675,687 | |
1,509,000 | | Dex Media Finance Co., | | | | | |
| | 9.875%, due 08/15/13 | | | | 1,673,103 | |
745,000 | | Dex Media, Inc., 8.000%, | | | | | |
| | due 11/15/13 | | | | 769,213 | |
735,000 | | Echostar DBS Corp., 6.375%, | | | | | |
| | due 10/01/11 | | | | 732,244 | |
760,000 | | Echostar DBS Corp., 6.625%, | | | | | |
| | due 10/01/14 | | | | 756,200 | |
1,150,000 | | Emmis Communications Corp., | | | | | |
| | 9.745%, due 06/15/12 | | | | 1,164,375 | |
790,000 | | Houghton Mifflin Co., 8.250%, | | | | | |
| | due 02/01/11 | | | | 819,625 | |
640,000 | | Houghton Mifflin Co., 9.875%, | | | | | |
| | due 02/01/13 | | | | 681,600 | |
540,000 | + | Insight Communications Co., | | | | | |
| | Inc., .000%, due 02/15/11 | | | | 553,500 | |
1,210,000 | | LIN Television Corp., 6.500%, | | | | | |
| | due 05/15/13 | | | | 1,152,525 | |
790,000 | # | Mediacom Broadband LLC, | | | | | |
| | 8.500%, due 10/15/15 | | | | 766,300 | |
385,000 | + | Nexstar Finance Holdings, Inc., | | | | | |
| | 3.960%, due 04/01/13 | | | | 286,825 | |
585,000 | | Paxson Communications | | | | | |
| | Corp., 10.750%, due 07/15/08 | | | | 577,688 | |
880,000 | | Primedia, Inc., 8.875%, | | | | | |
| | due 05/15/11 | | | | 926,200 | |
See Accompanying Notes to Financial Statements
55
| | PORTFOLIO OF INVESTMENTS |
ING HIGH YIELD BOND FUND | | as of September 30, 2005 (Unaudited) (continued) |
Principal | | | | | | | |
Amount | | | | | | Value | |
| | Media (continued) | | | | | |
$ | 505,000 | @@ | Quebecor Media, Inc., | | | | | |
| | | 11.125%, due 07/15/11 | | | | 554,238 | |
880,000 | @@ | Shaw Communications, Inc., | | | | | |
| | 7.200%, due 12/15/11 | | | | 933,900 | |
623,056 | ##,**,X,l | Source Media, Inc., 0.000%, | | | | | |
| | due 11/01/49 | | | | 1 | |
1,285,000 | @@ | Videotron Ltee, 6.875%, | | | | | |
| | due 01/15/14 | | | | 1,325,155 | |
1,203,000 | | Young Broadcasting, Inc., | | | | | |
| | 10.000%, due 03/01/11 | | | | 1,142,850 | |
| | | | | | 24,341,473 | |
| | | | | | | |
| | Metal Fabricate/Hardware: 0.0% | | | | | |
2,456,000 | @@, I, **, X | International Utility | | | | | |
| | Structures, Inc., .000%, | | | | | |
| | due 02/01/08 | | | | 2 | |
| | | | | | 2 | |
| | | | | | | |
| | Oil and Gas: 5.2% | | | | | |
1,220,000 | | Chesapeake Energy Corp., | | | | | |
| | 6.250%, due 01/15/18 | | | | 1,201,700 | |
1,800,000 | | Chesapeake Energy Corp., | | | | | |
| | 6.375%, due 06/15/15 | | | | 1,818,000 | |
970,000 | | Chesapeake Energy Corp., | | | | | |
| | 7.500%, due 09/15/13 | | | | 1,037,900 | |
1,525,000 | | Energy Partners Ltd., | | | | | |
| | 8.750%, due 08/01/10 | | | | 1,601,250 | |
1,145,000 | | Newfield Exploration Co., | | | | | |
| | 6.625%, due 09/01/14 | | | | 1,196,525 | |
1,445,000 | | Parker Drilling Co., 8.620%, | | | | | |
| | due 09/01/10 | | | | 1,495,575 | |
1,410,000 | | Swift Energy Co., 7.625%, | | | | | |
| | due 07/15/11 | | | | 1,459,350 | |
755,000 | | Swift Energy Co., 9.375%, | | | | | |
| | due 05/01/12 | | | | 819,175 | |
1,065,000 | @@ | Western Oil Sands, Inc., | | | | | |
| | 8.375%, due 05/01/12 | | | | 1,228,744 | |
| | | | | | 11,858,219 | |
| | | | | | | |
| | Oil and Gas Services: 1.2% | | | | | |
1,770,000 | | Hanover Compressor Co., | | | | | |
| | 9.000%, due 06/01/14 | | | | 1,975,763 | |
750,000 | | Hanover Equipment Trust, | | | | | |
| | 8.750%, due 09/01/11 | | | | 800,625 | |
| | | | | | 2,776,388 | |
| | | | | | | |
| | Packaging and Containers: 1.8% | | | | | |
2,390,000 | @@ | Crown European Holdings SA, | | | | | |
| | 10.875%, due 03/01/13 | | | | 2,784,350 | |
645,000 | | Graham Packaging Co., Inc., | | | | | |
| | 8.500%, due 10/15/12 | | | | 645,000 | |
665,000 | | Owens-Brockway, 8.250%, | | | | | |
| | due 05/15/13 | | | | 694,925 | |
| | | | | | 4,124,275 | |
| | | | | | | |
| | Pharmaceuticals: 0.0% | | | | | |
5,000 | # | NBTY, Inc., 7.125%, | | | | | |
| | due 10/01/15 | | | | 4,925 | |
| | | | | | 4,925 | |
| | | | | | | |
| | Pipelines: 3.5% | | | | | |
1,120,000 | | El Paso Corp., 6.950%, | | | | | |
| | due 12/15/07 | | | | 1,141,000 | |
$ | 390,000 | | El Paso Corp., 7.875%, | | | | | |
| | | due 06/15/12 | | | | 405,600 | |
1,425,000 | | El Paso Natural Gas Co., | | | | | |
| | 7.625%, due 08/01/10 | | | | 1,488,803 | |
1,330,000 | | Southern Natural Gas Co., | | | | | |
| | 8.000%, due 03/01/32 | | | | 1,475,146 | |
1,460,000 | | Transcontinental Gas Pipe LN, | | | | | |
| | 7.250%, due 12/01/26 | | | | 1,596,875 | |
1,585,000 | | Transcontinental Gas Pipe LN, | | | | | |
| | 8.875%, due 07/15/12 | | | | 1,856,431 | |
| | | | | | 7,963,855 | |
| | | | | | | |
| | Real Estate Investment Trusts: 2.0% | | | | | |
1,160,000 | | Felcor Lodging LP, 7.780%, | | | | | |
| | due 06/01/11 | | | | 1,215,100 | |
2,070,000 | | Host Marriott LP, 7.125%, | | | | | |
| | due 11/01/13 | | | | 2,124,337 | |
1,070,000 | | Meristar Hospitality Corp., | | | | | |
| | 9.000%, due 01/15/08 | | | | 1,119,488 | |
| | | | | | 4,458,925 | |
| | | | | | | |
| | Retail: 5.7% | | | | | |
1,180,000 | | Denny’s Corp., 10.000%, | | | | | |
| | due 10/01/12 | | | | 1,185,900 | |
830,000 | | Domino’s, Inc., 8.250%, | | | | | |
| | due 07/01/11 | | | | 875,650 | |
515,000 | | General Nutrition Centers, | | | | | |
| | Inc., 8.500%, due 12/01/10 | | | | 441,613 | |
695,000 | | General Nutrition Centers, | | | | | |
| | Inc., 8.625%, due 01/15/11 | | | | 670,675 | |
430,000 | # | GSC Holdings Corp., 7.875%, | | | | | |
| | due 10/01/11 | | | | 432,688 | |
650,000 | # | GSC Holdings Corp., 8.000%, | | | | | |
| | due 10/01/12 | | | | 650,000 | |
1,495,000 | | JC Penney Co., Inc., 9.000%, | | | | | |
| | due 08/01/12 | | | | 1,767,838 | |
2,180,000 | @@ | Jean Coutu Group, Inc., | | | | | |
| | 8.500%, due 08/01/14 | | | | 2,179,999 | |
1,430,000 | # | Neiman-Marcus Group, Inc., | | | | | |
| | 9.000%, due 10/15/15 | | | | 1,440,725 | |
1,440,000 | # | School Specialty, Inc., | | | | | |
| | 10.000%, due 10/01/13 | | | | 1,450,800 | |
725,000 | # | The Restaurant Co., 10.000%, | | | | | |
| | due 10/01/13 | | | | 699,625 | |
1,475,000 | | Toys R US, Inc., 7.375%, | | | | | |
| | due 10/15/18 | | | | 1,187,375 | |
| | | | | | 12,982,888 | |
| | | | | | | |
| | Semiconductors: 0.4% | | | | | |
365,000 | | Freescale Semiconductor, | | | | | |
| | Inc., 6.875%, due 07/15/11 | | | | 385,075 | |
615,000 | @@,# | STATS ChipPAC Ltd., 7.500%, | | | | | |
| | due 07/19/10 | | | | 624,225 | |
| | | | | | 1,009,300 | |
| | | | | | | |
| | Telecommunications: 10.9% | | | | | |
515,000 | | ACC Escrow Corp., 10.000%, | | | | | |
| | due 08/01/11 | | | | 563,925 | |
855,000 | | American Tower Corp., 7.125%, | | | | | |
| | due 10/15/12 | | | | 902,025 | |
1,145,000 | | American Towers, Inc., 7.250%, | | | | | |
| | due 12/01/11 | | | | 1,222,287 | |
725,000 | | Centennial Communications | | | | | |
| | Corp., 10.125%, due 06/15/13 | | | | 819,250 | |
See Accompanying Notes to Financial Statements
56
| | PORTFOLIO OF INVESTMENTS |
ING HIGH YIELD BOND FUND | | as of September 30, 2005 (Unaudited) (continued) |
Principal | | | | | | | |
Amount | | | | | | Value | |
| | Telecommunications (continued) | | | | | |
$ | 340,000 | | Cincinnati Bell, Inc., 7.000%, | | | | | |
| | due 02/15/15 | | | | $ | 329,800 | |
85,000 | | Cincinnati Bell, Inc., 7.250%, | | | | | |
| | due 07/15/13 | | | | 90,738 | |
610,000 | | Citizens Communications Co., | | | | | |
| | 9.250%, due 05/15/11 | | | | 672,525 | |
440,000 | | Dobson Cellular Systems, | | | | | |
| | 9.875%, due 11/01/12 | | | | 484,000 | |
735,000 | # | Dobson Communications Corp., | | | | | |
| | 8.100%, due 10/15/12 | | | | 728,569 | |
840,000 | # | Hawaiian Telcom | | | | | |
| | Communications, Inc., | | | | | |
| | 12.500%, due 05/01/15 | | | | 852,600 | |
3,600,000 | +,I,**,X | ICG Services, Inc., .000%, | | | | | |
| | due 02/15/08 | | | | 4 | |
531,000 | @@ | Inmarsat Finance PLC, 7.625%, | | | | | |
| | due 06/30/12 | | | | 549,585 | |
2,579,000 | | Insight Capital, Inc., 10.500%, | | | | | |
| | due 11/01/10 | | | | 2,720,844 | |
645,000 | @@ | Intelsat Bermuda Ltd., 8.250%, | | | | | |
| | due 01/15/13 | | | | 652,256 | |
2,035,000 | @@ | Intelsat Bermuda Ltd., 8.625%, | | | | | |
| | due 01/15/15 | | | | 2,085,874 | |
130,000 | | IWO Holdings, Inc., 7.349%, | | | | | |
| | due 01/15/12 | | | | 135,850 | |
345,000 | | Lucent Technologies, Inc., | | | | | |
| | 6.450%, due 03/15/29 | | | | 303,600 | |
420,000 | | MCI, Inc., 8.735%, due 05/01/14 | | | | 469,350 | |
2,015,000 | | Qwest Capital Funding, Inc., | | | | | |
| | 6.375%, due 07/15/08 | | | | 1,979,737 | |
520,000 | S | Qwest Capital Funding, Inc., | | | | | |
| | 7.750%, due 08/15/06 | | | | 527,800 | |
255,000 | | Qwest Corp., 6.875%, | | | | | |
| | due 09/15/33 | | | | 222,488 | |
465,000 | # | Qwest Corp., 7.120%, | | | | | |
| | due 06/15/13 | | | | 485,925 | |
325,000 | | Qwest Corp., 7.875%, | | | | | |
| | due 09/01/11 | | | | 340,438 | |
115,000 | | Qwest Corp., 8.875%, | | | | | |
| | due 03/15/12 | | | | 126,213 | |
959,000 | | Qwest Services Corp., | | | | | |
| | 13.500%, due 12/15/10 | | | | 1,102,849 | |
820,000 | @@,W | Rogers Wireless | | | | | |
| | Communications, Inc., | | | | | |
| | 7.250%, due 12/15/12 | | | | 871,250 | |
290,000 | @@,W | Rogers Wireless | | | | | |
| | Communications, Inc., | | | | | |
| | 7.500%, due 03/15/15 | | | | 313,925 | |
340,000 | @@,W | Rogers Wireless | | | | | |
| | Communications, Inc., | | | | | |
| | 8.000%, due 12/15/12 | | | | 360,825 | |
770,000 | | Rural Cellular Corp., 8.250%, | | | | | |
| | due 03/15/12 | | | | 812,350 | |
430,000 | | Rural Cellular Corp., 9.750%, | | | | | |
| | due 01/15/10 | | | | 436,450 | |
885,000 | | Rural Cellular Corp., 9.875%, | | | | | |
| | due 02/01/10 | | | | 933,675 | |
370,000 | W | SBA Communications Corp., | | | | | |
| | 1.480%, due 12/15/11 | | | | 337,625 | |
485,000 | | SBA Communications Corp., | | | | | |
| | 8.500%, due 12/01/12 | | | | 529,863 | |
435,000 | | Triton PCS, Inc., 8.500%, | | | | | |
| | due 06/01/13 | | | | 416,513 | |
$ | 435,000 | | UbiquiTel Operating Co., | | | | | |
| | 9.875%, due 03/01/11 | | | | $ | 485,025 | |
340,000 | | US Unwired, Inc., 10.000%, | | | | | |
| | due 06/15/12 | | | | 392,700 | |
475,000 | | Valor Telecommunications | | | | | |
| | Enterprises LLC, 7.750%, | | | | | |
| | due 02/15/15 | | | | 463,125 | |
6,250,000 | I,X,** | WinStar Communications, Inc., | | | | | |
| | 0.000%, due 04/15/10 | | | | 625 | |
| | | | | | 24,722,483 | |
| | Total Corporate Bonds/Notes | | | | | |
| | (Cost $230,122,311) | | | | 221,651,361 | |
| | | | | | | |
Shares | | | | | | Value | |
COMMON STOCK: 0.0% | | | | | |
| | | | | | | |
| | Diversified Financial Services: 0.0% | | | | | |
17,906 | @,##,X,l | North Atlantic Trading Co. | | | | 18 | |
| | | | | | 18 | |
| | | | | | | |
| | Packaging and Containers: 0.0% | | | | | |
100,000 | @,I,#,X | Russell-Stanley Holdings, Inc. | | | | 10 | |
| | | | | | 10 | |
| | | | | | | |
| | Telecommunications: 0.0% | | | | | |
61,806 | @,I,X | Adelphia Business Solutions | | | | 6 | |
132 | @,@@ | Completel Europe NV | | | | 6,528 | |
483,445 | @,I,X | International Wireless | | | | | |
| | Communications Holdings, Inc. | | | | 31,424 | |
2,350 | @,I,X | Jordan Telecommunications | | | | 56,964 | |
15 | @ | Mpower Holding Corp. | | | | 21 | |
| | | | | | 94,943 | |
| | Total Common Stock | | | | | |
| | (Cost $8,965,003) | | | | 94,971 | |
| | | | | |
PREFERRED STOCK: 0.0% | | | | | |
| | | | | |
| | Media: 0.0% | | | | | |
110 | @,X | Paxson Communications Corp. | | | | 7,494 | |
| | Total Preferred Stock | | | | | |
| | (Cost $9,685) | | | | 7,494 | |
| | | | | |
WARRANTS: 0.1% | | | | | |
| | | | | |
580 | @ | American Tower Corp. | | | | 204,262 | |
92,950 | @,I,X | Comforce Corp. | | | | 930 | |
3,100 | @,#,I | Dayton Superior Corp. | | | | 31 | |
500 | @,@@,#, I, X | GT Group Telecom, Inc. | | | | — | |
6,600 | @,#,I,X | ICG Communications, Inc. | | | | 1 | |
1,000 | @,@@,l,**,X | O Sullivan Industries, Inc. | | | | — | |
| | Total Warrants | | | | | |
| | (Cost $47,403) | | | | 205,224 | |
| | Total Long-Term Investments | | | | | |
| | (Cost $239,144,402) | | | | 221,959,050 | |
See Accompanying Notes to Financial Statements
57
| | PORTFOLIO OF INVESTMENTS |
ING HIGH YIELD BOND FUND | | as of September 30, 2005 (Unaudited) (continued) |
Principal | | | | | | | |
Amount | | | | | | Value | |
SHORT-TERM INVESTMENTS: 2.4% | | | | | |
| | | | | | | |
| | Repurchase Agreement: 2.4% | | | | | |
$ | 5,438,000 | S | Morgan Stanley Repurchase | | | | | |
| | Agreement dated 09/30/05, | | | | | |
| | 3.750%, due 10/03/05, $5,439,699 | | | | | |
| | to be received upon repurchase | | | | | |
| | (Collateralized by $5,525,000 | | | | | |
| | Federal Home Loan Mortgage | | | | | |
| | Corporation, 3.800%, Market | | | | | |
| | Value plus Accrued interest | | | | | |
| | $5,547,579, due 12/27/06) | | | | $ | 5,438,000 | |
| | Total Short-Term Investments | | | | | |
| | (Cost $5,438,000) | | | | 5,438,000 | |
| | Total Investments In | | | | | |
| | Securities (Cost | | | | | |
| | $ 244,582,402)* | | 99.9 | % | $ | 227,397,050 | |
| | Other Assets and | | | | | |
| | Liabilities-Net | | 0.1 | | 259,407 | |
| | Net Assets | | 100.0 | % | $ | 227,656,457 | |
| | | | | | | | | |
Certain foreign securities may have been fair valued in accordance with procedures approved by the Board of Directors/Trustees.
@ Non-income producing security
@@ Foreign issuer
+ Step-up basis bonds. Interest rates shown reflect current coupon rates.
# Securities with purchases pursuant to Rule 144A, under the Securities Act of 1933 and may not be resold subject to that rule except to qualified institutional buyers. These securities have been determined to be liquid under the guidelines established by the Funds’ Board of Directors/Trustees.
I Illiquid securities
## Illiquid and restricted securities
C Bond may be called prior to maturity date.
W When-issued or delayed delivery security.
** Defaulted security
X Fair value determined by ING Funds Valuation Committee appointed by the Funds’ Board of Directors/Trustees.
* Cost for federal income tax purposes is $244,704,054. Net unrealized depreciation consists of:
| | Gross Unrealized Appreciation | | | | $ | 2,971,629 | |
| | Gross Unrealized Depreciation | | | | (20,278,633 | ) |
| | Net Unrealized Depreciation | | | | $ | (17,307,004 | ) |
See Accompanying Notes to Financial Statements
58
| | PORTFOLIO OF INVESTMENTS |
ING INTERMEDIATE BOND FUND | | as of September 30, 2005 (Unaudited) |
Principal | | | | | | | |
Amount | | | | | | Value | |
CORPORATE BONDS/NOTES: 20.9% | | | | | |
| | | | | |
| | Agriculture: 0.1% | | | | | |
$ | 705,000 | #,C,S | R.J. Reynolds Tobacco | | | | | |
| | Holdings, Inc., 6.500%, | | | | | |
| | due 07/15/10 | | | | $ | 706,763 | |
| | | | | | 706,763 | |
| | | | | | | |
| | Auto Manufacturers: 0.3% | | | | | |
1,225,000 | | Ford Motor Co., 6.625%, | | | | | |
| | due 10/01/28 | | | | 891,188 | |
4,764,000 | | General Motors Corp., | | | | | |
| | 4.470%, due 03/15/36 | | | | 1,238,640 | |
434,000 | S | General Motors Corp., | | | | | |
| | 7.400%, due 09/01/25 | | | | 313,565 | |
| | | | | | 2,443,393 | |
| | | | | | | |
| | Banks: 5.1% | | | | | |
2,170,000 | @@,C,L | Australia & New Zealand | | | | | |
| | Banking Group Ltd., | | | | | |
| | 3.556%, due 10/29/49 | | | | 1,847,037 | |
1,104,000 | @@,# | Banco Santander | | | | | |
| | Chile/Pre-merger with | | | | | |
| | Banco Santiago SA, | | | | | |
| | 4.148%, due 12/09/09 | | | | 1,100,376 | |
1,718,000 | @@ | Banco Santander Santiago | | | | | |
| | Chile SA, 7.375%, | | | | | |
| | due 07/18/12 | | | | 1,935,662 | |
1,180,000 | @@,C | Bank of Ireland, 4.170%, | | | | | |
| | due 12/29/49 | | | | 1,012,184 | |
1,270,000 | @@,C | Bank of Nova Scotia, 4.250%, | | | | | |
| | due 08/31/85 | | | | 1,072,495 | |
540,000 | @@,C | Bank of Scotland, 3.750%, | | | | | |
| | due 11/30/49 | | | | 467,100 | |
1,757,000 | C | BankAmerica Capital II, | | | | | |
| | 8.000%, due 12/15/26 | | | | 1,882,986 | |
1,090,000 | @@,C | Barclays Bank PLC, 6.278%, | | | | | |
| | due 12/15/49 | | | | 1,073,933 | |
1,727,000 | @@,#,C | Chuo Mitsui Trust & | | | | | |
| | Banking Co Ltd., | | | | | |
| | 5.506%, due 04/15/49 | | | | 1,665,324 | |
984,000 | @@,#,C | Danske Bank A/S, 5.914%, | | | | | |
| | due 12/29/49 | | | | 1,037,106 | |
1,240,000 | @@,C | Den Norske Bank ASA, | | | | | |
| | 4.186%, due 08/29/49 | | | | 1,044,700 | |
1,631,000 | #,C,S | Dresdner Funding Trust I, | | | | | |
| | 8.151%, due 06/30/31 | | | | 1,997,389 | |
1,117,000 | @@,# | First Citizens St Lucia Ltd., | | | | | |
| | 5.460%, due 02/01/12 | | | | 1,112,178 | |
2,561,000 | @@,#,C | HBOS PLC, 5.375%, | | | | | |
| | due 11/29/49 | | | | 2,582,925 | |
3,110,000 | @@,C | HSBC Bank PLC, 3.787%, due | | | | | |
| | 06/29/49 | | | | 2,666,824 | |
1,700,000 | @@,C | Lloyds TSB Bank PLC, 4.160%, | | | | | |
| | due 08/29/49 | | | | 1,462,826 | |
1,614,000 | #,C | M&T Bank Corp., 3.850%, | | | | | |
| | due 04/01/13 | | | | 1,579,937 | |
1,159,000 | C | Mellon Capital I, 7.720%, | | | | | |
| | due 12/01/26 | | | | 1,238,405 | |
1,190,000 | @@,C | National Australia Bank Ltd., | | | | | |
| | 3.514%, due 10/29/49 | | | | 1,073,585 | |
641,000 | C | NB Capital Trust, 7.830%, | | | | | |
| | due 12/15/26 | | | | 685,936 | |
600,000 | C | NB Capital Trust IV, 8.250%, | | | | | |
| | due 04/15/27 | | | | 648,891 | |
$ | 1,447,000 | | PNC Funding Corp., 4.500%, | | | | | |
| | due 03/10/10 | | | | $ | 1,431,232 | |
2,273,000 | #,C | Rabobank Capital Funding II, | | | | | |
| | 5.260%, due 12/29/49 | | | | 2,283,131 | |
3,660,000 | @@,C | Royal Bank of Scotland | | | | | |
| | Group PLC, 3.813%, | | | | | |
| | due 12/29/49 | | | | 3,147,852 | |
1,210,000 | @@,C | Societe Generale, | | | | | |
| | 3.625%, due 11/29/49 | | | | 1,077,860 | |
2,920,000 | @@,C,L | Standard Chartered PLC, | | | | | |
| | 3.750%, due 11/29/49 | | | | 2,365,200 | |
1,170,000 | @@,C | Standard Chartered PLC, | | | | | |
| | 4.187%, due 07/29/49 | | | | 944,775 | |
1,191,000 | @@,C | Sumitomo Mitsui Banking | | | | | |
| | Corp, 8.150%, due 08/01/49 | | | | 1,257,102 | |
2,036,000 | | Wachovia Corp., 5.500%, | | | | | |
| | due 08/01/35 | | | | 1,993,466 | |
1,200,000 | @@,C | Westpac Banking Corp., | | | | | |
| | 4.333%, due 09/30/49 | | | | 1,023,998 | |
| | | | | | 44,712,415 | |
| | | | | | | |
| | Beverages: 0.3% | | | | | |
1,979,000 | @@,C | Cia Brasileira de Bebidas, | | | | | |
| | 8.750%, due 09/15/13 | | | | 2,359,958 | |
| | | | | | 2,359,958 | |
| | Chemicals: 0.6% | | | | | |
397,000 | @@,# | Sociedad Quimica y Minera | | | | | |
| | de Chile SA, 7.700%, | | | | | |
| | due 09/15/06 | | | | 401,363 | |
490,000 | S | Stauffer Chemical, 5.480%, | | | | | |
| | due 04/15/10 | | | | 391,216 | |
1,080,000 | | Stauffer Chemical, 7.50%, | | | | | |
| | due 04/15/17 | | | | 575,165 | |
3,224,000 | | Union Carbide Corp., 7.750%, | | | | | |
| | due 10/01/96 | | | | 3,406,533 | |
| | | | | | 4,774,277 | |
| | | | | | | |
| | Diversified Financial Services: 5.7% | | | | | |
434,000 | @@,#,I | Alpine III, 4.330%, | | | | | |
| | due 08/16/14 | | | | 435,201 | |
434,000 | @@,#,I | Alpine III, 4.740%, | | | | | |
| | due 08/16/14 | | | | 435,046 | |
739,000 | @@,#,I | Alpine III, 6.540%, | | | | | |
| | due 08/16/14 | | | | 742,229 | |
1,241,000 | @@,#,I | Alpine III, 9.790%, | | | | | |
| | due 08/16/14 | | | | 1,277,019 | |
430,161 | @@,#,C | Arcel Finance Ltd., 5.984%, | | | | | |
| | due 02/01/09 | | | | 437,346 | |
880,000 | @@,# | Arcel Finance Ltd., 6.361%, | | | | | |
| | due 05/01/12 | | | | 870,675 | |
974,673 | @@,#,C | Arcel Finance Ltd., 7.048%, | | | | | |
| | due 09/01/11 | | | | 1,027,747 | |
480,000 | #,C,S | Army Hawaii Family Housing | | | | | |
| | Trust Certificates, 5.524%, | | | | | |
| | due 06/15/50 | | | | 494,378 | |
350,000 | #,C,S | Army Hawaii Family Housing | | | | | |
| | Trust Certificates, 5.624%, | | | | | |
| | due 06/15/50 | | | | 360,908 | |
2,378,761 | # | Astoria Depositor Corp., | | | | | |
| | 7.902%, due 05/01/21 | | | | 2,370,138 | |
3,885,000 | #,S | Astoria Depositor Corp., | | | | | |
| | 8.144%, due 05/01/21 | | | | 3,862,758 | |
See Accompanying Notes to Financial Statements
59
| | PORTFOLIO OF INVESTMENTS |
ING INTERMEDIATE BOND FUND | | as of September 30, 2005 (Unaudited) (continued) |
Principal | | | | | | | |
Amount | | | | | | Value | |
| | Diversified Financial Services (continued) | | | | | |
$ | 254,000 | @@,# | Bosphorus Financial Services | | | | | |
| | Ltd., 5.590%, due 02/15/12 | | | | $ | 246,798 | |
1,944,439 | @@,# | Brazilian Merchant Voucher | | | | | |
| | Receivables Ltd., 5.911%, | | | | | |
| | due 06/15/11 | | | | 1,954,161 | |
2,360,000 | @@,#,C | BTM Curacao Holdings NV, | | | | | |
| | 4.760%, due 07/21/15 | | | | 2,316,552 | |
1,153,000 | C | Citigroup Capital II, 7.750%, | | | | | |
| | due 12/01/36 | | | | 1,223,255 | |
2,340,000 | #,C | Corestates Capital Trust I, | | | | | |
| | 8.000%, due 12/15/26 | | | | 2,502,265 | |
570,000 | @@,C | Financiere CSFB NV, 4.187%, | | | | | |
| | due 03/29/49 | | | | 496,536 | |
1,519,000 | L | Goldman Sachs Group, Inc., | | | | | |
| | 4.070%, due 03/02/10 | | | | 1,521,392 | |
1,711,000 | #,C,S | HVB Funding Trust III, | | | | | |
| | 9.000%, due 10/22/31 | | | | 2,289,145 | |
705,000 | | International Lease Finance | | | | | |
| | Corp, 5.000%, due 04/15/10 | | | | 708,214 | |
1,366,000 | C | JPM Capital Trust I, 7.540%, | | | | | |
| | due 01/15/27 | | | | 1,454,063 | |
1,513,000 | C | JPM Capital Trust II, 7.950%, | | | | | |
| | due 02/01/27 | | | | 1,626,903 | |
2,157,000 | #,C | Mangrove Bay Pass-Through | | | | | |
| | Trust, 6.102%, due 07/15/33 | | | | 2,164,215 | |
1,633,000 | @@,# | Mantis Reef Ltd., 4.799%, | | | | | |
| | due 11/03/09 | | | | 1,609,207 | |
102 | @@,I | Nordea Kredit | | | | | |
| | Realkreditaktieselskab, | | | | | |
| | 6.000%, due 07/01/29 | | | | 17 | |
1,320,000 | @@,C | Paribas, 4.045%, due 12/31/49 | | | | 1,133,359 | |
933,000 | @@,#,C,S | Petroleum Export | | | | | |
| | Ltd/Cayman SPV, 4.623%, | | | | | |
| | due 06/15/10 | | | | 928,688 | |
1,223,000 | @@,#,C,S | Petroleum Export | | | | | |
| | Ltd/Cayman SPV, 5.265%, | | | | | |
| | due 06/15/11 | | | | 1,219,489 | |
3,099,026 | @@,#,C | PF Export Receivables Master | | | | | |
| | Trust, 6.436%, due 06/01/15 | | | | 3,118,132 | |
2,233,000 | #,C | Residential Capital Corp., | | | | | |
| | 6.375%, due 06/30/10 | | | | 2,264,494 | |
800,000,000 | @@ | Takefuji Corp., 1.000%, | | | | | |
| | due 03/01/34 | | | | 3,721,899 | |
9,400,000 | # | Toll Road Investors | | | | | |
| | Partnership II LP, 18.14%, | | | | | |
| | due 02/15/45 | | | | 1,139,618 | |
1,200,000 | #,C | Twin Reefs Pass-Through | | | | | |
| | Trust, 4.728%, due 12/10/49 | | | | 1,197,528 | |
1,313,000 | @@,C,L | UFJ Finance Aruba AEC, | | | | | |
| | 8.750%, due 12/31/49 | | | | 1,439,954 | |
1,085,000 | #,C,S | Wachovia Capital Trust V, | | | | | |
| | 7.965%, due 06/01/27 | | | | 1,173,369 | |
| | | | | | 49,762,698 | |
| | | | | | | |
| | Electric: 2.6% | | | | | |
2,314,466 | C | CE Generation LLC, 7.416%, | | | | | |
| | due 12/15/18 | | | | 2,473,430 | |
2,328,000 | C | Consumers Energy Co., | | | | | |
| | 4.250%, due 04/15/08 | | | | 2,295,981 | |
203,000 | @@,L | Empresa Nacional de | | | | | |
| | Electricidad SA/Chile, | | | | | |
| | 8.500%, due 04/01/09 | | | | 223,552 | |
$ | 1,248,000 | @@ | Empresa Nacional de | | | | | |
| | Electricidad SA/Chile, 8.625%, | | | | | |
| | due 08/01/15 | | | | $ | 1,460,143 | |
1,825,000 | C,S | Entergy Gulf States, Inc., | | | | | |
| | 5.120%, due 08/01/10 | | | | 1,797,776 | |
1,582,000 | C | Enterprise Capital Trust II, | | | | | |
| | 5.240%, due 06/30/28 | | | | 1,569,532 | |
1,578,000 | C,L | FirstEnergy Corp., 6.450%, | | | | | |
| | due 11/15/11 | | | | 1,682,323 | |
2,720,000 | C,L | FirstEnergy Corp., 7.375%, | | | | | |
| | due 11/15/31 | | | | 3,200,244 | |
878,719 | #,C | Juniper Generation, LLC, | | | | | |
| | 6.790%, due 12/31/14 | | | | 861,463 | |
1,345,000 | @@,+ | Korea Electric Power Corp., | | | | | |
| | 0.000%, due 04/01/96 | | | | 807,000 | |
1,263,000 | C | NorthWestern Corp., 5.875%, | | | | | |
| | due 11/01/14 | | | | 1,282,244 | |
1,073,000 | #,C | Pinnacle West Energy Corp., | | | | | |
| | 4.004%, due 04/01/07 | | | | 1,073,000 | |
1,175,000 | C | Potomac Edison Co., 5.000%, | | | | | |
| | due 11/01/06 | | | | 1,177,357 | |
883,000 | # | Power Contract Financing, | | | | | |
| | LLC, 6.256%, due 02/01/10 | | | | 902,372 | |
356,274 | | PPL Montana, LLC, 8.903%, | | | | | |
| | due 07/02/20 | | | | 413,611 | |
466,000 | C | Sierra Pacific Power Co., | | | | | |
| | 6.250%, due 04/15/12 | | | | 476,485 | |
609,456 | # | Tenaska Virginia Partners LP, | | | | | |
| | 6.119%, due 03/30/24 | | | | 632,337 | |
| | | | | | 22,328,850 | |
| | | | | | | |
| | Food: 0.4% | | | | | |
467,000 | C | Delhaize America, Inc., | | | | | |
| | 8.050%, due 04/15/27 | | | | 492,998 | |
692,000 | C,L | Delhaize America, Inc., | | | | | |
| | 8.125%, due 04/15/11 | | | | 753,458 | |
2,451,000 | C | Tyson Foods, Inc., 7.250%, | | | | | |
| | due 10/01/06 | | | | 2,514,584 | |
| | | | | | 3,761,040 | |
| | Gas: 0.2% | | | | | |
1,343,000 | #,C | Williams Gas Pipelines | | | | | |
| | Central, Inc., 7.375%, | | | | | |
| | due 11/15/06 | | | | 1,387,306 | |
| | | | | | 1,387,306 | |
| | Home Builders: 0.0% | | | | | |
54,000 | C | Technical Olympic USA, Inc., | | | | | |
| | 9.000%, due 07/01/10 | | | | 56,160 | |
| | | | | | 56,160 | |
| | Insurance: 0.8% | | | | | |
2,191,000 | | AON Corp., 8.205%, | | | | | |
| | due 01/01/27 | | | | 2,519,280 | |
817,000 | #,C | North Front Pass-Through | | | | | |
| | Trust, 5.810%, due 12/15/24 | | | | 823,109 | |
1,124,000 | | Prudential Financial, Inc., | | | | | |
| | 4.104%, due 11/15/06 | | | | 1,116,534 | |
2,417,000 | #,C | Zurich Capital Trust I, 8.376%, | | | | | |
| | due 06/01/37 | | | | 2,590,016 | |
| | | | | | 7,048,939 | |
See Accompanying Notes to Financial Statements
60
| | PORTFOLIO OF INVESTMENTS |
ING INTERMEDIATE BOND FUND | | as of September 30, 2005 (Unaudited) (continued) |
Principal | | | | | | | |
Amount | | | | | | Value | |
| | Media: 0.2% | | | | | |
$ | 1,210,000 | C | COX Communications, Inc., | | | | | |
| | 6.850%, due 01/15/18 | | | | $ | 1,302,134 | |
| | | | | | 1,302,134 | |
| | | | | | | |
| | Multi-National: 0.1% | | | | | |
1,178,000 | @@,S | Corp Andina de Fomento, | | | | | |
| | 5.125%, due 05/05/15 | | | | 1,161,914 | |
| | | | | | 1,161,914 | |
| | | | | | | |
| | Oil and Gas: 1.6% | | | | | |
1,211,000 | C | Amerada Hess Corp., 6.650%, | | | | | |
| | due 08/15/11 | | | | 1,310,067 | |
1,192,000 | @@,# | Empresa Nacional de Petroleo, | | | | | |
| | 4.875%, due 03/15/14 | | | | 1,144,661 | |
831,000 | @@,# | Empresa Nacional de Petroleo | | | | | |
| | ENAP, 6.750%, due 11/15/12 | | | | 899,105 | |
1,345,000 | @@,+,C | Husky Oil Co., 8.900%, | | | | | |
| | due 08/15/28 | | | | 1,464,492 | |
2,402,000 | @@,# | Pemex Project Funding Master | | | | | |
| | Trust, 5.170%, due 06/15/10 | | | | 2,505,286 | |
1,135,000 | @@,#,C | Pemex Project Funding Master | | | | | |
| | Trust, 5.750%, due 12/15/15 | | | | 1,125,069 | |
3,132,000 | @@,#,C | Ras Laffan Liquefied Natural | | | | | |
| | Gas Co Ltd II, 5.298%, | | | | | |
| | due 09/30/20 | | | | 3,133,764 | |
1,432,000 | @@,#,S | Tengizchevroil Finance Co. | | | | | |
| | SARL, 6.124%, due 11/15/14 | | | | 1,471,380 | |
941,000 | C | Valero Energy Corp., 7.500%, | | | | | |
| | due 04/15/32 | | | | 1,139,412 | |
| | | | | | 14,193,236 | |
| | | | | | | |
| | Pharmaceuticals: 0.1% | | | | | |
251,000 | #,C | AmerisourceBergen Corp, | | | | | |
| | 5.625%, due 09/15/12 | | | | 248,490 | |
502,000 | #,C | AmerisourceBergen Corp, | | | | | |
| | 5.875%, due 09/15/15 | | | | 498,235 | |
| | | | | | 746,725 | |
| | | | | | | |
| | Pipelines: 0.1% | | | | | |
478,000 | C | KN Capital Trust III, 7.630%, | | | | | |
| | due 04/15/28 | | | | 541,784 | |
20,000 | | Transcontinental Gas Pipe LN, | | | | | |
| | 8.875%, due 07/15/12 | | | | 23,425 | |
| | | | | | 565,209 | |
| | | | | | | |
| | Real Estate: 0.1% | | | | | |
1,650,000 | C | EOP Operating LP, 7.750%, | | | | | |
| | due 11/15/07 | | | | 1,747,609 | |
| | | | | | 1,747,609 | |
| | | | | | | |
| | Real Estate Investment Trusts: 0.7% | | | | | |
310,000 | C | Liberty Property LP, 6.375%, | | | | | |
| | due 08/15/12 | | | | 328,777 | |
1,577,000 | C | Liberty Property LP, 7.750%, | | | | | |
| | due 04/15/09 | | | | 1,718,201 | |
1,390,000 | C | Simon Property Group LP, | | | | | |
| | 4.875%, due 03/18/10 | | | | 1,387,618 | |
2,179,000 | C | Simon Property Group LP, | | | | | |
| | 6.375%, due 11/15/07 | | | | 2,244,893 | |
| | | | | | 5,679,489 | |
| | | | | | | |
| | Retail: 0.2% | | | | | |
$ | 1,861,000 | C | May Department Stores Co., | | | | | |
| | 3.950%, due 07/15/071 | | | | $ | 1,835,642 | |
| | | | | | 1,835,642 | |
| | | | | | | |
| | Savings and Loans: 0.2% | | | | | |
1,238,000 | C | Great Western Financial, | | | | | |
| | 8.206%, due 02/01/27 | | | | 1,333,612 | |
| | | | | | 1,333,612 | |
| | | | | | | |
| | Telecommunications: 1.4% | | | | | |
1,152,000 | C | AT&T Corp., 9.750%, | | | | | |
| | due 11/15/31 | | | | 1,464,480 | |
1,047,000 | C | AT&T Wireless Services, Inc., | | | | | |
| | 8.750%, due 03/01/31 | | | | 1,417,505 | |
1,527,000 | C | BellSouth Corp., 4.200%, | | | | | |
| | due 09/15/09 | | | | 1,498,742 | |
1,046,000 | C,L | BellSouth Corp., 6.000%, | | | | | |
| | due 11/15/34 | | | | 1,053,984 | |
1,107,000 | @@,C | British Telecommunications | | | | | |
| | PLC, 8.875%, due 12/15/30 | | | | 1,506,063 | |
975,000 | @@,+,S | Deutsche Telekom | | | | | |
| | International Finance BV, | | | | | |
| | 8.500%, due 06/15/10 | | | | 1,106,477 | |
497,000 | C | New Cingular Wireless | | | | | |
| | Services, Inc., 8.125%, | | | | | |
| | due 05/01/12 | | | | 583,579 | |
1,019,000 | C,L | SBC Communications, Inc., | | | | | |
| | 6.150%, due 09/15/34 | | | | 1,046,360 | |
818,000 | + | Sprint Capital Corp., 4.780%, | | | | | |
| | due 08/17/06 | | | | 819,438 | |
1,183,000 | @@,C,L | Telefonos de Mexico SA de CV, | | | | | |
| | 4.750%, due 01/27/10 | | | | 1,174,786 | |
| | | | | | 11,671,414 | |
| | | | | | | |
| | Transportation: 0.1% | | | | | |
1,208,000 | @@,# | MISC Capital Ltd., 5.000%, | | | | | |
| | due 07/01/09 | | | | 1,214,284 | |
| | | | | | 1,214,284 | |
| | | | | | | |
| | Total Corporate Bonds/notes | | | | | |
| | (Cost $182,279,043) | | | | 180,793,067 | |
| | | | | | | |
U.S. GOVERNMENT AGENCY OBLIGATIONS: 31.3% | | | | | |
| | | | | |
| | Federal Home Loan Bank: 0.8% | | | | | |
7,490,000 | L | 3.250%, due 12/17/07 | | | | 7,313,266 | |
| | | | | | 7,313,266 | |
| | | | | | | |
| | Federal Home Loan Mortgage | | | | | |
| | Corporation: 7.3% | | | | | |
12,885,000 | C | 2.700%, due 03/16/07 | | | | 12,582,307 | |
799,129 | | 3.766%, due 05/25/31 | | | | 799,535 | |
252,662 | | 3.791%, due 01/25/32 | | | | 252,880 | |
3,512,000 | | 3.875%, due 06/15/08 | | | | 3,467,261 | |
617,369 | | 3.921%, due 02/15/32 | | | | 620,100 | |
3,650,000 | | 4.000%, due 08/17/07 | | | | 3,629,560 | |
1,912,228 | C | 4.500%, due 12/15/16 | | | | 1,898,222 | |
779,796 | C | 4.500%, due 06/15/17 | | | | 773,196 | |
3,422,000 | C | 4.500%, due 02/15/20 | | | | 3,261,421 | |
869,000 | C | 5.000%, due 05/15/20 | | | | 864,794 | |
4,270,603 | C | 5.000%, due 08/15/21 | | | | 4,263,602 | |
3,513,000 | C | 5.000%, due 04/15/23 | | | | 3,472,280 | |
715,325 | | 5.038%, due 04/01/35 | | | | 708,801 | |
2,453,313 | | 5.216%, due 06/01/35 | | | | 2,437,389 | |
See Accompanying Notes to Financial Statements
61
| | PORTFOLIO OF INVESTMENTS |
ING INTERMEDIATE BOND FUND | | as of September 30, 2005 (Unaudited) (continued) |
Principal | | | | | | | |
Amount | | | | | | Value | |
| | Federal Home Loan Mortgage | | | | | |
| | Corporation (continued) | | | | | |
$ | 2,000,000 | | 5.500%, due 10/15/18 | | | | $ | 2,029,376 | |
2,323,924 | C | 5.500%, due 11/15/18 | | | | 2,356,353 | |
7,814,000 | | 5.500%, due 10/15/35 | | | | 7,816,438 | |
2,346,000 | | 5.875%, due 03/21/11 | | | | 2,474,263 | |
9,114,005 | C | 6.000%, due 01/15/29 | | | | 9,337,413 | |
11,684 | | 7.500%, due 11/01/28 | | | | 12,416 | |
| | | | | | 63,057,607 | |
| | | | | | | |
| | Federal National Mortgage | | | | | |
| | Association: 23.1% | | | | | |
120,229 | C | 3.841%, due 11/25/32 | | | | 120,239 | |
7,583,000 | | 3.875%, due 07/15/08 | | | | 7,469,172 | |
1,884,457 | C | 3.970%, due 04/25/35 | | | | 1,887,186 | |
601,688 | | 4.091%, due 10/25/33 | | | | 604,674 | |
556,719 | | 4.190%, due 04/18/28 | | | | 560,182 | |
598,651 | C | 4.191%, due 01/25/32 | | | | 598,726 | |
2,213,000 | L | 4.250%, due 09/15/07 | | | | 2,207,872 | |
116,960 | | 4.280%, due 12/25/29 | | | | 117,321 | |
903,936 | | 4.500%, due 09/25/16 | | | | 897,248 | |
2,675,186 | | 4.500%, due 10/25/17 | | | | 2,652,858 | |
68,000 | | 4.500%, due 10/15/18 | | | | 66,598 | |
105,000 | | 4.500%, due 10/15/35 | | | | 100,111 | |
3,250,339 | | 4.643%, due 08/01/35 | | | | 3,231,192 | |
2,187,000 | C | 4.750%, due 12/25/42 | | | | 2,186,711 | |
2,351,771 | | 4.823%, due 08/01/35 | | | | 2,337,219 | |
7,000,000 | | 5.000%, due 10/15/33 | | | | 6,853,434 | |
48,079,000 | | 5.000%, due 11/15/34 | | | | 47,027,272 | |
3,565,000 | | 5.150%, due 09/01/35 | | | | 3,570,348 | |
3,340,000 | | 5.250%, due 08/01/12 | | | | 3,436,202 | |
1,472,795 | | 5.325%, due 07/01/35 | | | | 1,465,492 | |
5,469,980 | | 5.500%, due 10/15/18 | | | | 5,550,323 | |
2,412,804 | | 5.500%, due 11/01/32 | | | | 2,414,849 | |
31,872,000 | | 5.500%, due 10/15/33 | | | | 31,862,056 | |
13,115,351 | | 5.500%, due 11/01/33 | | | | 13,126,013 | |
81,571 | | 6.000%, due 08/01/16 | | | | 83,947 | |
7,098 | | 6.000%, due 12/01/16 | | | | 7,304 | |
251,640 | | 6.000%, due 03/01/17 | | | | 258,970 | |
2,156,513 | | 6.000%, due 09/01/17 | | | | 2,219,299 | |
162,282 | | 6.000%, due 11/01/17 | | | | 167,010 | |
333,000 | | 6.000%, due 10/15/20 | | | | 342,470 | |
4,977,915 | | 6.000%, due 07/25/29 | | | | 5,125,414 | |
2,432,277 | | 6.000%, due 04/25/31 | | | | 2,508,823 | |
1,174,644 | | 6.000%, due 08/01/33 | | | | 1,194,906 | |
24,827,000 | | 6.000%, due 10/15/34 | | | | 25,245,956 | |
59,220 | | 6.500%, due 07/01/29 | | | | 61,166 | |
240,935 | | 6.500%, due 08/01/29 | | | | 248,849 | |
671,650 | | 6.500%, due 04/01/30 | | | | 693,713 | |
2,949 | | 6.500%, due 06/01/31 | | | | 3,042 | |
663,995 | | 6.500%, due 07/01/31 | | | | 686,198 | |
17,336 | | 6.500%, due 09/01/31 | | | | 17,878 | |
10,158,000 | | 6.500%, due 10/01/31 | | | | 10,456,391 | |
308,445 | | 6.500%, due 11/01/31 | | | | 318,074 | |
166,721 | | 6.500%, due 04/01/32 | | | | 171,835 | |
78,980 | | 6.500%, due 07/01/32 | | | | 81,402 | |
218,995 | | 6.500%, due 08/01/32 | | | | 225,713 | |
208,047 | | 6.500%, due 11/01/32 | | | | 214,429 | |
215,881 | | 6.500%, due 01/01/33 | | | | 222,504 | |
176,638 | | 6.500%, due 02/01/33 | | | | 181,862 | |
810,844 | | 6.500%, due 12/01/33 | | | | 834,825 | |
3,015,000 | | 6.625%, due 11/15/10 | | | | 3,300,403 | |
142,658 | | 7.000%, due 01/01/30 | | | | 149,375 | |
7,401 | | 7.000%, due 03/01/30 | | | | 7,752 | |
369,113 | | 7.000%, due 06/01/31 | | | | 387,070 | |
$ | 1,412,360 | | 7.000%, due 08/01/35 | | | | $ | 1,478,741 | |
1,837 | | 7.500%, due 09/01/30 | | | | 1,945 | |
28,640 | | 7.500%, due 10/01/30 | | | | 30,324 | |
9,332 | | 7.500%, due 11/01/30 | | | | 9,880 | |
110,744 | | 7.500%, due 02/01/32 | | | | 117,327 | |
571,055 | C | 7.500%, due 12/25/41 | | | | 602,287 | |
1,137,161 | C | 7.500%, due 01/25/48 | | | | 1,191,362 | |
| | | | | | 199,191,744 | |
| | | | | | | |
| | Government National Mortgage | | | | | |
| | Association: 0.1% | | | | | |
14,933 | | 4.375%, due 04/20/28 | | | | 15,046 | |
1,364 | | 6.500%, due 03/15/31 | | | | 1,420 | |
27,173 | | 6.500%, due 08/15/31 | | | | 28,290 | |
62,605 | | 6.500%, due 10/15/31 | | | | 65,178 | |
32,118 | | 6.500%, due 11/15/31 | | | | 33,437 | |
28,154 | | 6.500%, due 07/15/32 | | | | 29,303 | |
185,868 | | 6.500%, due 09/15/32 | | | | 193,449 | |
76,624 | | 7.000%, due 04/15/26 | | | | 80,829 | |
38,963 | | 7.000%, due 05/15/32 | | | | 40,987 | |
106,345 | | 7.500%, due 12/15/22 | | | | 113,726 | |
6,147 | | 7.500%, due 10/15/26 | | | | 6,545 | |
41,655 | | 7.500%, due 07/15/29 | | | | 44,266 | |
132 | | 7.500%, due 11/15/30 | | | | 140 | |
44,918 | | 7.500%, due 12/15/30 | | | | 47,717 | |
49,534 | | 7.500%, due 12/15/31 | | | | 52,619 | |
87,201 | | 7.500%, due 05/15/32 | | | | 92,617 | |
| | | | | | 845,569 | |
| | | | | | | |
| | Total U.S. Government | | | | | |
| | Agency Obligations | | | | | |
| | (Cost $272,709,316) | | | | 270,408,186 | |
| | | | | | | |
U.S. TREASURY OBLIGATIONS: 27.7% | | | | | |
| | | | | |
| | U.S. Treasury Bonds: 11.6% | | | | | |
71,800,000 | | 4.250%, due 08/15/15 | | | | 71,373,724 | |
19,561,000 | S,L | 5.375%, due 02/15/31 | | | | 21,920,565 | |
3,152,000 | C,S,L | 10.375%, due 11/15/12 | | | | 3,544,771 | |
2,668,000 | C,S,L | 13.250%, due 05/15/14 | | | | 3,473,194 | |
| | | | | | 100,312,254 | |
| | | | | | | |
| | U.S. Treasury Inflation | | | | | |
| | Indexed Bonds: 0.8% | | | | | |
6,720,000 | S | 2.000%, due 01/15/14 | | | | 7,256,648 | |
| | | | | | 7,256,648 | |
| | | | | | | |
| | U.S. Treasury Notes: 14.9% | | | | | |
7,500,000 | S | 1.625%, due 02/28/06 | | | | 7,434,675 | |
38,748,000 | L | 3.875%, due 09/15/10 | | | | 38,212,193 | |
51,440,000 | S,L | 4.000%, due 08/31/07 | | | | 51,281,307 | |
22,176,000 | S,L | 4.125%, due 08/15/08 | | | | 22,150,032 | |
8,695,000 | | 4.125%, due 08/15/10 | | | | 8,658,664 | |
| | | | | | 127,736,871 | |
| | | | | | | |
| | U.S. Treasury STRIP: 0.4% | | | | | |
5,963,000 | | 4.570%, due 05/15/16 | | | | 3,710,041 | |
| | | | | | 3,710,041 | |
| | | | | | | |
| | Total U.S. Treasury | | | | | |
| | Obligations | | | | | |
| | (Cost $241,582,837) | | | | 239,015,814 | |
See Accompanying Notes to Financial Statements
62
| | PORTFOLIO OF INVESTMENTS |
ING INTERMEDIATE BOND FUND | | as of September 30, 2005 (Unaudited) (continued) |
Principal | | | | | | | |
Amount | | | | | | Value | |
ASSET-BACKED SECURITIES: 5.4% | | | | | |
| | Automobile Asset-Backed | | | | | |
| | Securities: 1.3% | | | | | |
$ | 1,554,056 | C | Capital Auto Receivables Asset | | | | | |
| | Trust, 2.750%, | | | | | |
| | due 04/16/07 | | | | $ | 1,544,599 | |
200,000 | C | Capital One Auto Finance | | | | | |
| | Trust, 3.180%, due 09/15/10 | | | | 196,612 | |
2,412,000 | C | Carmax Auto Owner Trust, | | | | | |
| | 4.210%, due 01/15/10 | | | | 2,397,121 | |
204,000 | C | Daimler Chrysler Auto Trust, | | | | | |
| | 3.490%, due 12/08/08 | | | | 201,653 | |
623,000 | C | Honda Auto Receivables | | | | | |
| | Owner Trust, 2.790%, | | | | | |
| | due 03/16/09 | | | | 609,621 | |
917,000 | C | Honda Auto Receivables | | | | | |
| | Owner Trust, 3.820%, | | | | | |
| | due 05/21/10 | | | | 900,013 | |
858,272 | C | Household Automotive Trust, | | | | | |
| | 2.310%, due 04/17/08 | | | | 853,077 | |
1,250,000 | C | Nissan Auto Receivables | | | | | |
| | Owner Trust, 2.050%, | | | | | |
| | due 03/16/09 | | | | 1,218,523 | |
1,370,000 | C | Nissan Auto Receivables | | | | | |
| | Owner Trust, 2.610%, | | | | | |
| | due 07/15/08 | | | | 1,350,932 | |
1,965,000 | C | Nissan Auto Receivables | | | | | |
| | Owner Trust, 4.190%, | | | | | |
| | due 07/15/09 | | | | 1,954,132 | |
200,000 | C | USAA Auto Owner Trust, | | | | | |
| | 2.040%, due 02/16/10 | | | | 196,489 | |
| | | | | | 11,422,772 | |
| | | | | | | |
| | Credit Card Asset-Backed | | | | | |
| | Securities: 1.0% | | | | | |
560,000 | C | Bank One Issuance Trust, | | | | | |
| | 4.540%, due 09/15/10 | | | | 557,099 | |
530,000 | C | Capital One Master Trust, | | | | | |
| | 4.900%, due 03/15/10 | | | | 533,551 | |
800,000 | C | Citibank Credit Card Issuance | | | | | |
| | Trust, 3.100%, due 03/10/10 | | | | 773,913 | |
2,285,000 | C | Citibank Credit Card Issuance | | | | | |
| | Trust, 5.650%, due 06/16/08 | | | | 2,305,202 | |
44,000 | C | Citibank Credit Card Issuance | | | | | |
| | Trust, 6.875%, due 11/16/09 | | | | 46,119 | |
2,429,000 | C | Citibank Credit Card Master | | | | | |
| | Trust I, 5.875%, due 03/10/11 | | | | 2,528,153 | |
193,000 | C | Discover Card Master Trust I, | | | | | |
| | 5.150%, due 10/15/09 | | | | 194,965 | |
1,020,000 | C | Fleet Credit Card Master | | | | | |
| | Trust II, 2.400%, | | | | | |
| | due 07/15/08 | | | | 1,015,319 | |
589,000 | C | MBNA Master Credit Card | | | | | |
| | Trust USA, 5.900%, | | | | | |
| | due 08/15/11 | | | | 614,659 | |
| | | | | | 8,568,980 | |
| | | | | | | |
| | Home Equity Asset-Backed | | | | | |
| | Securities: 1.7% | | | | | |
487,751 | C | Argent Securities, Inc., | | | | | |
| | 3.961%, due 03/25/34 | | | | 488,442 | |
452,979 | C | Asset Backed Funding | | | | | |
| | Certificates, 3.921%, | | | | | |
| | due 11/25/33 | | | | 454,166 | |
$ | 495,308 | C | Bayview Financial Acquisition | | | | | |
| | Trust, 4.337%, | | | | | |
| | due 09/28/43 | | | | $ | 496,660 | |
259,933 | C | Centex Home Equity, 3.921%, | | | | | |
| | due 01/25/34 | | | | 260,215 | |
78,000 | C | Centex Home Equity, 4.140%, | | | | | |
| | due 03/25/28 | | | | 76,961 | |
1,216,566 | C | GMAC Mortgage Corp Loan | | | | | |
| | Trust, 3.871%, due 12/25/20 | | | | 1,217,411 | |
4,851,000 | C | GSAA Trust, 5.242%, | | | | | |
| | due 05/25/35 | | | | 4,851,865 | |
199,827 | C | Merrill Lynch Mortgage | | | | | |
| | Investors, Inc., 4.001%, | | | | | |
| | due 07/25/34 | | | | 200,685 | |
1,270,492 | C | New Century Home Equity | | | | | |
| | Loan Trust, 4.080%, | | | | | |
| | due 04/25/34 | | | | 1,271,474 | |
44,493 | C | New Century Home Equity | | | | | |
| | Loan Trust, 4.086%, | | | | | |
| | due 06/20/31 | | | | 44,525 | |
222,133 | C | New Century Home Equity | | | | | |
| | Loan Trust, 4.390%, | | | | | |
| | due 07/25/30 | | | | 222,315 | |
638,000 | C | Renaissance Home Equity | | | | | |
| | Loan Trust, 4.456%, | | | | | |
| | due 05/25/35 | | | | 630,612 | |
820,000 | C | Renaissance Home Equity | | | | | |
| | Loan Trust, 4.723%, | | | | | |
| | due 10/25/35 | | | | 820,000 | |
254,328 | C | Residential Asset Securities | | | | | |
| | Corp., 3.871%, due 09/25/31 | | | | 254,519 | |
343,650 | C | Residential Asset Securities | | | | | |
| | Corp., 3.941%, due 06/25/32 | | | | 344,493 | |
90,000 | C | Residential Funding Mortgage | | | | | |
| | Securities II, 4.160%, | | | | | |
| | due 11/25/17 | | | | 88,649 | |
1,993,678 | C | Saxon Asset Securities Trust, | | | | | |
| | 3.960%, due 06/25/33 | | | | 1,988,738 | |
984,000 | C | Wells Fargo Home Equity | | | | | |
| | Trust, 3.970%, due 09/25/24 | | | | 966,044 | |
| | | | | | 14,677,774 | |
| | | | | | | |
| | Other Asset-Backed Securities: 1.4% | | | | | |
259,068 | C | Ameriquest Mortgage | | | | | |
| | Securities, Inc., 3.941%, | | | | | |
| | due 02/25/34 | | | | 259,364 | |
93,348 | C | Amortizing Residential | | | | | |
| | Collateral Trust, 4.330%, | | | | | |
| | due 05/25/32 | | | | 93,430 | |
15,919 | C | Chase Funding Mortgage | | | | | |
| | Loan Asset-Backed | | | | | |
| | Certificates, 2.734%, | | | | | |
| | due 09/25/24 | | | | 15,815 | |
15,000 | C | Chase Funding Mortgage | | | | | |
| | Loan Asset-Backed | | | | | |
| | Certificates, 4.045%, | | | | | |
| | due 05/25/33 | | | | 14,827 | |
949,942 | C | Chase Funding Mortgage | | | | | |
| | Loan Asset-Backed | | | | | |
| | Certificates, 4.130%, | | | | | |
| | due 07/25/33 | | | | 952,196 | |
951,000 | C | Countrywide Asset-Backed | | | | | |
| | Certificates, 4.493%, | | | | | |
| | due 12/31/49 | | | | 943,601 | |
See Accompanying Notes to Financial Statements
63
| | PORTFOLIO OF INVESTMENTS |
ING INTERMEDIATE BOND FUND | | as of September 30, 2005 (Unaudited) (continued) |
Principal | | | | | | | |
Amount | | | | | | Value | |
| | Other Asset-Backed Securities (continued) | | | | | |
$ | 3,708,925 | +,C | Lehman XS Trust, 3.921%, | | | | | |
| | due 01/01/49 | | | | $ | 3,708,926 | |
524,000 | C | Popular ABS Mortgage | | | | | |
| | Pass-Through Trust, 3.735%, | | | | | |
| | due 12/25/34 | | | | 516,898 | |
524,000 | C | Popular ABS Mortgage | | | | | |
| | Pass-Through Trust, 4.000%, | | | | | |
| | due 12/25/34 | | | | 514,646 | |
698,000 | C | Popular ABS Mortgage | | | | | |
| | Pass-Through Trust, 4.596%, | | | | | |
| | due 11/25/35 | | | | 694,510 | |
64,532 | C | Residential Asset Mortgage | | | | | |
| | Products, Inc., 2.140%, | | | | | |
| | due 02/25/30 | | | | 64,368 | |
69,530 | C | Residential Asset Mortgage | | | | | |
| | Products, Inc., 3.951%, | | | | | |
| | due 06/25/33 | | | | 69,671 | |
1,000,000 | C | Residential Asset Mortgage | | | | | |
| | Products Inc, 4.100%, | | | | | |
| | due 07/25/35 | | | | 1,001,142 | |
3,300,000 | C | Structured Asset Securities | | | | | |
| | Corp., 6.000%, | | | | | |
| | due 03/25/34 | | | | 3,313,761 | |
| | | | | | 12,163,155 | |
| | Total Asset-backed Securities | | | | | |
| | (Cost $47,262,219) | | | | 46,832,681 | |
| | | | | |
COLLATERALIZED MORTGAGE OBLIGATIONS: 18.5% | | | | | |
| | | | | | | |
| | Commercial Mortgage-Backed | | | | | |
| | Securities: 5.4% | | | | | |
1,609,000 | C | Banc of America Commercial | | | | | |
| | Mortgage, Inc., 4.502%, | | | | | |
| | Due 07/10/42 | | | | 1,576,173 | |
5,336,000 | C | Banc of America Commercial | | | | | |
| | Mortgage, Inc., 4.611%, | | | | | |
| | Due 07/10/43 | | | | 5,289,266 | |
1,114,000 | C | Banc of America Commercial | | | | | |
| | Mortgage, Inc., 4.764%, | | | | | |
| | Due 07/10/45 | | | | 1,108,207 | |
1,524,000 | C | Bear Stearns Commercial | | | | | |
| | Mortgage Securities, 3.880%, | | | | | |
| | Due 08/13/39 | | | | 1,474,271 | |
321,000 | C | Bear Stearns Commercial | | | | | |
| | Mortgage Securities, 4.030%, | | | | | |
| | Due 02/13/46 | | | | 311,619 | |
1,527,000 | C | Bear Stearns Commercial | | | | | |
| | Mortgage Securities, 4.170%, | | | | | |
| | Due 01/12/41 | | | | 1,499,799 | |
672,000 | C,L | Capco America Securitization | | | | | |
| | Corp., 6.260%, due 10/15/30 | | | | 700,156 | |
456,000 | C | Capco America Securitization | | | | | |
| | Corp., 6.460%, due 10/15/30 | | | | 479,695 | |
1,950,000 | C | Chase Manhattan Bank-First | | | | | |
| | Union National Bank, | | | | | |
| | 7.439%, due 08/15/31 | | | | 2,117,822 | |
1,093,000 | C | COMM, 3.600%, due 03/10/39 | | | | 1,054,911 | |
984,750 | C | CS First Boston Mortgage | | | | | |
| | Securities Corp., 3.727%, | | | | | |
| | Due 03/15/35 | | | | 953,322 | |
1,000,000 | C | DLJ Commercial Mortgage | | | | | |
| | Corp., 6.460%, due 03/10/32 | | | | 1,050,391 | |
$ | 688,000 | C | DLJ Commercial Mortgage | | | | | |
| | Corp., 7.300%, | | | | | |
| | due 06/10/32 | | | | $ | 743,998 | |
2,637,535 | C | GE Capital Commercial | | | | | |
| | Mortgage Corp., 3.752%, | | | | | |
| | due 07/10/39 | | | | 2,585,821 | |
698,000 | C | GE Capital Commercial | | | | | |
| | Mortgage Corp., 4.371%, | | | | | |
| | due 01/10/38 | | | | 684,446 | |
483,000 | C | GE Capital Commercial | | | | | |
| | Mortgage Corp., 4.865%, | | | | | |
| | due 07/10/39 | | | | 481,430 | |
1,700,000 | C | JP Morgan Chase Commercial | | | | | |
| | Mortgage Securities Corp., | | | | | |
| | 4.223%, due 01/15/42 | | | | 1,664,964 | |
1,670,947 | C | JP Morgan Chase Commercial | | | | | |
| | Mortgage Securities Corp., | | | | | |
| | 4.275%, due 01/12/37 | | | | 1,639,988 | |
4,263,000 | C | JP Morgan Chase Commercial | | | | | |
| | Mortgage Securities Corp., | | | | | |
| | 5.857%, due 10/12/35 | | | | 4,467,570 | |
2,838,956 | C | JP Morgan Chase Commercial | | | | | |
| | Mortgage Securities Corp., | | | | | |
| | 6.244%, due 04/15/35 | | | | 2,922,422 | |
866,000 | C | LB-UBS Commercial Mortgage | | | | | |
| | Trust, 3.992%, due 10/15/29 | | | | 839,820 | |
225,000 | C | LB-UBS Commercial Mortgage | | | | | |
| | Trust, 4.310%, due 02/15/30 | | | | 220,432 | |
255,000 | C | LB-UBS Commercial Mortgage | | | | | |
| | Trust, 4.510%, due 12/15/29 | | | | 249,996 | |
289,000 | C | LB-UBS Commercial Mortgage | | | | | |
| | Trust, 4.567%, due 06/15/29 | | | | 287,598 | |
2,961,000 | C | LB-UBS Commercial Mortgage | | | | | |
| | Trust, 6.226%, due 03/15/26 | | | | 3,104,048 | |
1,703,000 | C | LB-UBS Commercial Mortgage | | | | | |
| | Trust, 7.370%, due 08/15/26 | | | | 1,873,401 | |
400,000 | C | Morgan Stanley Capital I, | | | | | |
| | 7.020%, due 03/15/32 | | | | 427,471 | |
2,584,880 | C | Mortgage Capital Funding, | | | | | |
| | Inc., 6.663%, due 03/18/30 | | | | 2,678,763 | |
3,777,193 | C | Prudential Commercial | | | | | |
| | Mortgage Trust, 3.669%, | | | | | |
| | due 02/11/36 | | | | 3,648,788 | |
400,000 | C | Salomon Brothers Mortgage | | | | | |
| | Securities VII, 7.520%, | | | | | |
| | due 12/18/09 | | | | 437,103 | |
| | | | | | 46,573,691 | |
| | | | | | | |
| | Whole Loan Collateral PAC: 0.2% | | | | | |
108,868 | C | Countrywide Alternative | | | | | |
| | Loan Trust, 4.230%, | | | | | |
| | due 02/25/33 | | | | 108,989 | |
912,116 | C | MASTR Alternative Loans | | | | | |
| | Trust, 8.500%, due 05/25/33 | | | | 936,749 | |
731,383 | C | Residential Funding Mtg | | | | | |
| | Sec I, 4.041%, | | | | | |
| | due 11/25/17 | | | | 732,932 | |
| | | | | | 1,778,670 | |
| | Whole Loan Collateralized | | | | | |
| | Mortgage Obligations: 12.8% | | | | | |
539,565 | C | ABN Amro Mortgage Corp., | | | | | |
| | 4.141%, due 03/25/18 | | | | 540,129 | |
See Accompanying Notes to Financial Statements
64
| | PORTFOLIO OF INVESTMENTS |
ING INTERMEDIATE BOND FUND | | as of September 30, 2005 (Unaudited) (continued) |
Principal | | | | | | | |
Amount | | | | | | Value | |
| | Whole Loan Collateralized | | | | | |
| | Mortgage Obligations (continued) | | | | | |
$ | 6,509,517 | C | Banc of America Funding | | | | | |
| | Corp., 5.352%, | | | | | |
| | due 12/31/49 | | | | $ | 6,473,064 | |
3,444,422 | C | Banc of America Funding | | | | | |
| | Corp., 5.750%, | | | | | |
| | due 09/20/34 | | | | 3,451,700 | |
1,292,178 | C | Bank of America Mortgage | | | | | |
| | Securities, 5.250%, | | | | | |
| | due 11/25/19 | | | | 1,292,376 | |
2,389,643 | C | Banc of America Mortgage | | | | | |
| | Securities, 5.500%, | | | | | |
| | due 12/01/49 | | | | 2,398,916 | |
1,882,900 | C | Bear Stearns Alt-A Trust, | | | | | |
| | 3.961%, due 07/25/34 | | | | 1,885,686 | |
359,119 | C | Citicorp Mortgage Securities, | | | | | |
| | Inc., 4.091%, due 03/25/33 | | | | 359,578 | |
3,227,032 | C | Citigroup Mortgage Loan | | | | | |
| | Trust, Inc., 3.580%, | | | | | |
| | due 12/25/34 | | | | 3,229,117 | |
1,551,711 | C | Countrywide Alternative | | | | | |
| | Loan Trust, 3.941%, | | | | | |
| | due 02/25/35 | | | | 1,554,807 | |
1,176,018 | C | Countrywide Alternative | | | | | |
| | Loan Trust, 4.191%, | | | | | |
| | due 04/25/33 | | | | 1,178,701 | |
484,340 | C | Countrywide Alternative | | | | | |
| | Loan Trust, 4.330%, | | | | | |
| | due 07/25/35 | | | | 485,756 | |
8,141,382 | C | Countrywide Alternative | | | | | |
| | Loan Trust, 5.415%, | | | | | |
| | due 10/25/35 | | | | 8,128,660 | |
3,916,193 | C | Countrywide Alternative | | | | | |
| | Loan Trust, 5.500%, | | | | | |
| | due 02/25/25 | | | | 3,932,209 | |
741,754 | C | Countrywide Home Loan | | | | | |
| | Mortgage Pass Through | | | | | |
| | Trust,4.330%, due 04/25/18 | | | | 743,734 | |
1,936,595 | C | Countrywide Home Loan | | | | | |
| | Mortgage Pass Through | | | | | |
| | Trust, 5.000%, due 11/25/18 | | | | 1,921,490 | |
4,275,402 | | Fannie Mae, 3.896%, | | | | | |
| | due 02/17/29 | | | | 343,644 | |
595,461 | C | First Horizon Asset Securities, | | | | | |
| | Inc., 5.478%, due 10/25/35 | | | | 596,578 | |
1,360,267 | C | Freddie Mac, 4.418%, | | | | | |
| | due 04/15/32 | | | | 1,370,106 | |
1,277,960 | C | Ginnie Mae, 4.478%, | | | | | |
| | due 06/16/31 | | | | 90,875 | |
4,539,908 | C | GMAC Mortgage Corp. Loan | | | | | |
| | Trust, 5.264%, due 03/18/35 | | | | 4,505,859 | |
967,697 | #,C | GSMPS Mortgage Loan Trust, | | | | | |
| | 3.991%, due 01/25/35 | | | | 971,469 | |
805,735 | C | GSR Mortgage Loan Trust, | | | | | |
| | 4.141%, due 06/25/35 | | | | 808,080 | |
488,538 | C | GSR Mortgage Loan Trust, | | | | | |
| | 4.500%, due 08/25/19 | | | | 483,953 | |
2,266,602 | C | Harborview Mortgage Loan | | | | | |
| | Trust, 4.139%, due 01/19/35 | | | | 2,267,310 | |
1,384,907 | C | Homebanc Mortgage Trust, | | | | | |
| | 4.071%, due 08/25/29 | | | | 1,391,441 | |
$ | 4,676,171 | C | Mastr Adjustable Rate | | | | | |
| | Mortgages Trust, 5.365%, | | | | | |
| | due 06/30/19 | | | | $ | 4,658,635 | |
3,342,211 | C | MASTR Alternative Loans | | | | | |
| | Trust, 5.500%, due 01/25/20 | | | | 3,376,584 | |
496,787 | C | MASTR Alternative Loans | | | | | |
| | Trust, 6.500%, due 05/25/33 | | | | 503,066 | |
2,348,033 | C | MLCC Mortgage Investors, | | | | | |
| | Inc., 3.961%, due 10/25/28 | | | | 2,349,450 | |
3,871,874 | C | MLCC Mortgage Investors, | | | | | |
| | Inc., 4.060%, due 04/25/29 | | | | 3,876,211 | |
1,392,899 | C | MLCC Mortgage Investors, | | | | | |
| | Inc., 4.150%, due 01/25/29 | | | | 1,394,663 | |
1,059,251 | C | QFA Royalties LLC, 7.300%, | | | | | |
| | due 02/20/25 | | | | 1,056,272 | |
4,602,086 | C | Residential Accredit Loans, | | | | | |
| | Inc., 4.041%, due 04/25/35 | | | | 4,604,991 | |
7,732,735 | C | Residential Accredit Loans, | | | | | |
| | Inc., 4.141%, due 08/25/35 | | | | 7,756,211 | |
474,000 | C | Residential Accredit Loans, | | | | | |
| | Inc., 5.750%, due 04/25/35 | | | | 476,221 | |
1,541,793 | C | Sequoia Mortgage Trust, | | | | | |
| | 4.066%, due 01/20/35 | | | | 1,544,381 | |
481,534 | C,L | Sequoia Mortgage Trust, | | | | | |
| | 4.110%, due 11/20/33 | | | | 482,055 | |
1,810,250 | C | Structured Adjustable Rate | | | | | |
| | Mortgage Loan Trust, | | | | | |
| | 4.140%, due 07/25/35 | | | | 1,807,775 | |
4,621,588 | C | Structured Asset Mortgage | | | | | |
| | Investments, Inc., 4.029%, | | | | | |
| | due 04/19/35 | | | | 4,612,200 | |
1,295,850 | C | Thornburg Mortgage | | | | | |
| | Securities Trust, 3.991%, | | | | | |
| | due 12/25/33 | | | | 1,298,840 | |
4,643,450 | C | Thornburg Mortgage | | | | | |
| | Securities Trust, 4.011%, | | | | | |
| | due 09/25/34 | | | | 4,655,608 | |
2,973,692 | C | Washington Mutual, 4.041%, | | | | | |
| | due 08/25/45 | | | | 2,972,763 | |
2,251,715 | C | Washington Mutual, 6.000%, | | | | | |
| | due 06/25/34 | | | | 2,274,232 | |
1,114,995 | C | Washington Mutual MSC | | | | | |
| | Mortgage Pass-Through | | | | | |
| | CTFS, 4.141%, due 01/25/18 | | | | 1,117,865 | |
252,519 | C | Washington Mutual MSC | | | | | |
| | Mortgage Pass-Through | | | | | |
| | CTFS, 4.241%, due 03/25/33 | | | | 252,876 | |
2,062,955 | C | Washington Mutual, Inc., | | | | | |
| | 3.795%, due 06/25/44 | | | | 2,065,548 | |
1,694,146 | C | Washington Mutual, Inc., | | | | | |
| | 3.951%, due 01/25/45 | | | | 1,696,366 | |
3,018,567 | C | Washington Mutual, Inc., | | | | | |
| | 4.080%, due 01/25/45 | | | | 3,020,221 | |
506,942 | C | Wells Fargo Mortgage Backed | | | | | |
| | Securities Trust, 4.141%, | | | | | |
| | due 02/25/34 | | | | 507,257 | |
2,160,000 | C | Wells Fargo Mortgage Backed | | | | | |
| | Securities Trust, 4.500%, | | | | | |
| | due 08/25/18 | | | | 2,083,132 | |
| | | | | | 110,848,661 | |
See Accompanying Notes to Financial Statements
65
| | PORTFOLIO OF INVESTMENTS |
ING INTERMEDIATE BOND FUND | | as of September 30, 2005 (Unaudited) (continued) |
Principal | | | | | | | |
Amount | | | | | | Value | |
| | Whole Loan Collateralized | | | | | |
| | Support CMO: 0.1% | | | | | |
$ | 967,054 | C | Bank of America Mortgage | | | | | |
| | Securities, 5.500%, | | | | | |
| | due 11/25/33 | | | | $ | 963,432 | |
| | | | | | 963,432 | |
| | | | | | | |
| | Total Collateralized | | | | | |
| | Mortgage Obligations | | | | | |
| | (Cost $161,970,420) | | | | 160,164,454 | |
| | | | | | | |
OTHER BONDS: 0.3% | | | | | |
| | | | | | | |
| | Sovereign: 0.3% | | | | | |
1,105,000 | @@,S,L | Mexico Government Intl. | | | | | |
| | Bond, 6.625%, due 03/03/15 | | | | 1,203,345 | |
840,678 | @@ | Uruguay Government Intl. | | | | | |
| | Bond, 10.500%, due 10/20/06 | | | | 1,259,737 | |
| | Total Other Bonds | | | | | |
| | (Cost $2,072,653) | | | | 2,463,082 | |
| | | | | | | |
MUNICIPAL BONDS: 0.3% | | | | | |
| | | | | | | |
| | Municipal: 0.3% | | | | | |
605,000 | | City of New York, NY, 5.000%, | | | | | |
| | due 11/01/08 | | | | 635,704 | |
605,000 | | City of New York, NY, 5.000%, | | | | | |
| | due 11/01/11 | | | | 651,500 | |
605,000 | C | City of New York, NY, 5.000%, | | | | | |
| | due 11/01/15 | | | | 654,943 | |
285,000 | C | City of New York, NY, 5.000%, | | | | | |
| | due 04/01/35 | | | | 294,570 | |
| | Total Municipal Bonds | | | | | |
| | (Cost $2,259,682) | | | | 2,236,717 | |
| | | | | | | | | |
Shares | | | | | | Value | |
| | | | | | | |
PREFERRED STOCK: 1.7% | | | | | |
| | | | | | | |
| | Banks: 0.6% | | | | | |
448 | #,C | DG Funding Trust | | | | 4,796,400 | |
| | | | | | 4,796,400 | |
| | | | | | | |
| | Diversified Financial | | | | | |
| | Services: 0.1% | | | | | |
40,975 | C | National Rural Utilities | | | | | |
| | Cooperative Finance Corp. | | | | 1,000,610 | |
| | | | | | 1,000,610 | |
| | | | | | | |
| | Electric: 0.1% | | | | | |
22,950 | | TECO Energy, Inc. | | | | 581,460 | |
| | | | | | 581,460 | |
| | | | | | | |
| | Insurance: 0.7% | | | | | |
125,557 | @@,C | Aegon NV | | | | 3,200,448 | |
126,650 | C | Metlife, Inc. | | | | 3,210,577 | |
| | | | | | 6,411,025 | |
| | | | | | | |
| | Telecommunications: 0.2% | | | | | |
1,250 | @@,# | Centaur Funding Corp. | | | | 1,633,594 | |
| | | | | | 1,633,594 | |
| | Total Preferred Stock | | | | | |
| | (Cost $14,473,876) | | | | 14,423,089 | |
| | | | | | |
WARRANTS: 0.0% | | | | | | |
20 | @ | American Tower Corp. | | | | $ | 7,044 | |
| | Total Warrants | | | | | |
| | (Cost $1,502) | | | | 7,044 | |
| | Total Long-Term Investments | | | | | |
| | (Cost $924,611,548) | | | | 916,344,134 | |
| | | | | | | | |
Principal | | | | | | | |
Amount | | | | | | Value | |
| | | | | |
SHORT-TERM INVESTMENTS: 31.5% | | | | | |
| | Repurchase Agreement: 9.6% | | | | | |
$ | 82,978,000 | | Goldman Sachs Repurchase | | | | | |
| | Agreement dated 09/30/05, 3.790%, | | | | | |
| | due 10/03/05, $83,004,207 to be | | | | | |
| | received upon repurchase | | | | | |
| | (Collateralized by $151,702,488 | | | | | |
| | various U.S. Agency Obligations, | | | | | |
| | 6.500%-11.250%, Market Value | | | | | |
| | plus accrued interest $85,467,688, | | | | | |
| | due 08/15/06-11/15/26) | | | | 82,978,000 | |
| | Total Repurchase Agreement | | | | | |
| | (Cost $82,978,000) | | | | 82,978,000 | |
| | | | | | | |
| | Securities Lending CollateralCC: 21.9% | | | | | |
189,517,473 | | The Bank of New York Institutional | | | | | |
| | Cash Reserves Fund | | | | 189,517,473 | |
| | Total Securities Lending Collateral | | | | | |
| | (Cost $189,517,473) | | | | 189,517,473 | |
| | Total Short-Term Investments | | | | | |
| | (Cost $272,495,473) | | | | 272,495,473 | |
| | Total Investments In | | | | | |
| | Securities (Cost | | | | | |
| | $1,197,107,021)* | | 137.6 | % | $ | 1,188,839,607 | |
| | Other Assets and | | | | | |
| | Liabilities—Net | | (37.6 | ) | (325,040,763) | |
| | Net Assets | | 100.0 | % | $ | 863,798,844 | |
| | | | | | | | | |
Certain foreign securities may have been fair valued in accordance with procedures approved by the Board of Directors/Trustees.
@ Non-income producing security
@@ Foreign issuer
STRIP Separate Trading of Registered Interest and Principal of Securities
+ Step-up basis bonds. Interest rates shown reflect current coupon rates.
# Securities with purchases pursuant to Rule 144A, under the Securities Act of 1933 and may not be resold subject to that rule except to qualified institutional buyers. These securities have been determined to be liquid under the guidelines established by the Funds’ Board of Directors/Trustees.
C Bond may be called prior to maturity date.
cc Securities purchased with cash collateral for securities loaned.
S Segregated securities for certain derivatives, when-issued or delayed delivery securities and forward currency exchange contracts.
I Illiquid security
L Loaned security, a portion or all of the security is on loan at September 30, 2005.
* Cost for federal income tax purposes is $1,008,412,520. Net unrealized depreciation consists of:
Gross Unrealized Appreciation | | $ | 880,086 | |
Gross Unrealized Depreciation | | (9,970,472 | ) |
Net Unrealized Depreciation | | $ | (9,090,386 | ) |
See Accompanying Notes to Financial Statements
66
| | PORTFOLIO OF INVESTMENTS |
ING INTERMEDIATE BOND FUND | | as of September 30, 2005 (Unaudited) (continued) |
Information concerning open futures at September 30, 2005 is shown below:
Long Contracts | | No. of
Contracts | | Notional
Market Value | | Expiration
Date | | Unrealized
Gain/(Loss) | |
U.S. Long Bond | | 162 | | $ | 18,533,813 | | 12/20/05 | | $ | (237,482 | ) |
| | | | | | | | | |
Short Contracts | | | | | | | | | |
U.S. 2 Year | | | | | | | | | |
Treasury Note | | 90 | | $ | 18,530,156 | | 01/05/06 | | $ | 19,238 | |
Information concerning the Interest Rate Swap Agreements outstanding for the Intermediate Bond Fund at September 30, 2005, is shown below:
| | | | | | Notional | | Unrealized | |
| | Termination | | | | Principal | | Appreciation | |
| | Date | | | | Amount | | (Depreciation) | |
| | | | | | | | | |
Received a fixed rate equal to 1.000% | | | | | | | | | |
and pay a floating rate based on 3-month LIBOR. | | | | | | | | | |
Counterparty: UBS AG | | 03/01/34 | | JPY | | 500,000,000 | | $ | 56,099 | |
| | | | | | | | | |
Received a floating rate equal to 3-month LIBOR + 2.510% | | | | | | | | | |
and pay a floating rate based on 3-month LIBOR + 1.700%. | | | | | | | | | |
Counterparty: UBS AG | | 03/01/34 | | JPY | | 291,945,000 | | 31,275 | |
| | | | | | | | | |
Received a fixed rate equal to 1.000% | | | | | | | | | |
and pay a floating ratebased on 6-month LIBOR. | | | | | | | | | |
Counterparty: UBS AG | | 03/01/34 | | JPY | | 300,000,000 | | 62,455 | |
| | | | | | | | $ | 149,829 | |
See Accompanying Notes to Financial Statements
67
ING NATIONAL | PORTFOLIO OF INVESTMENTS |
TAX-EXEMPT BOND FUND | as of September 30, 2005 (Unaudited) |
Principal | | | | | | | |
Amount | | | | Rating(1) | | Value | |
MUNICIPAL BONDS: 97.9% | | | | | |
| | California: 10.9% | | | | | |
$ | 330,000 | | California State Department
of Veterans Affairs,
4.700%, due 12/01/09 | | AA2/AA+ | | $ | 340,976 | |
1,000,000 | | Pleasant Valley School District-
Ventura County, Reference
Series A, 5.850%,
due 08/01/31 | | AAA/AAA | | 1,218,190 | |
500,000 | | San Marcos Public Facilities
Authority, 5.000%,
due 08/01/21 | | Aaa/AAA | | 526,275 | |
1,000,000 | | State of California, 5.000%,
due 01/01/08 | | AAA/AAA | | 1,042,650 | |
| | | | | | 3,128,091 | |
| | | | | | | |
| | Colorado: 5.6% | | | | | |
500,000 | | Colorado Health Facilities
Authority, 5.350%,
due 08/01/15 | | A3/AAA | | 524,350 | |
1,000,000 | | Interlocken Metropolitan
District Colorado Reference,
Series A, 5.750%,
due 12/15/19 | | NR/AA | | 1,081,420 | |
| | | | | | 1,605,770 | |
| | | | | | | |
| | Connecticut: 1.9% | | | | | |
520,000 | | Connecticut State
Development Authority,
5.000%, due 10/15/23 | | Aaa/AAA | | 550,820 | |
| | | | | | 550,820 | |
| | | | | | | |
| | Florida: 9.2% | | | | | |
250,000 | | City of Tallahassee, 6.375%,
due 12/01/30 | | A3/NR | | 269,298 | |
500,000 | | Florida State Board of
Education, 5.750%,
due 06/01/22 | | Aa1/AA+ | | 551,345 | |
750,000 | | Gulf Breeze, 5.050%,
due 12/01/20 | | AAA/AAA | | 805,238 | |
1,000,000 | | Orlando & Orange County
Expressway Authority,
2.760%, due 07/01/32 | | Aaa/AAA | | 999,999 | |
| | | | | | 2,625,880 | |
| | | | | | | |
| | Illinois: 8.5% | | | | | |
25,000 | | Chicago Illinois Tax Increment
Redevelopment Project,
Series A, 5.000%,
due 11/15/10 | | NR/A | | 26,376 | |
1,250,000 | | De Kalb-Ogle Etc. Counties
Community College District
No 523, FSA Insured, 5.750%,
due 02/01/11 | | Aaa/NR | | 1,367,912 | |
1,000,000 | | State of Illinois, 5.000%,
due 04/01/17 | | Aa3/AA | | 1,046,650 | |
| | | | | | 2,440,938 | |
| | | | | | | |
| | Massachusetts: 4.6% | | | | | |
1,000,000 | | Massachusetts Development
Finance Agency Revenue,
Boston University, Series P,
6.000%, due 05/15/59 | | A3/BBB+ | | 1,198,470 | |
$ | 115,000 | | Massachusetts Health &
Educational Facilities
Authority, 6.500%,
due 07/01/21 | | BAA2/BBB | | $ | 125,833 | |
| | | | | | 1,324,303 | |
| | | | | | | |
| | Nevada: 7.5% | | | | | |
1,000,000 | | County of Clark, 5.000%,
due 06/01/32 | | AAA/AAA | | 1,033,070 | |
1,100,000 | | Washoe County Nevada
Gas & Water Facilities,
6.300%, due 12/01/14 | | Aaa/AAA | | 1,122,396 | |
| | | | | | 2,155,466 | |
| | | | | | | |
| | New Mexico: 5.6% | | | | | |
1,000,000 | | Clovis Public Financing
Authority, 5.000%,
due 08/01/26 | | AAA/NR | | 1,053,560 | |
500,000 | | New Mexico Finance
Authority, 5.000%,
due 04/01/16 | | AAA/AAA | | 538,165 | |
| | | | | | 1,591,725 | |
| | | | | | | |
| | New York: 15.4% | | | | | |
835,000 | | Albany Industrial
Development Agency,
7.750%, due 01/01/10 | | NR/NR | | 921,055 | |
1,000,000 | | City of New York, 5.000%,
due 08/01/24 | | A1/A+ | | 1,045,400 | |
500,000 | | Metropolitan Transportation
Authority, 5.000%,
due 11/15/22 | | Aaa/AAA | | 528,995 | |
1,000,000 | | New York State Dormitory
Authority Revenue,
Series C, 5.500%,
due 07/01/15 | | Aaa/AAA | | 1,101,690 | |
5,000 | | Tobacco Settlement Financing
Authority, 5.000%,
due 06/01/10 | | NR/AA- | | 5,008 | |
775,000 | | Westchester County Industrial
Development Agency,
4.750%, due 07/01/20 | | NR/A | | 783,696 | |
| | | | | | 4,385,844 | |
| | | | | | | |
| | North Carolina: 3.8% | | | | | |
710,000 | | City of Raleigh, 5.000%,
due 02/01/24 | | Aa2/AA+ | | 749,242 | |
295,000 | | New Hanover County,
5.750%, due 11/01/12 | | Aa2/AA | | 331,592 | |
| | | | | | 1,080,834 | |
| | | | | | | |
| | Ohio: 0.2% | | | | | |
55,000 | | Lakota Local School District,
School Improvement,
7.000%, due 12/01/10 | | AAA/AAA | | 64,481 | |
| | | | | | 64,481 | |
| | | | | | | |
| | Oklahoma: 7.9% | | | | | |
1,000,000 | | Oklahoma Industries
Authority, 6.000%,
due 08/15/19 | | NR/AAA | | 1,101,745 | |
See Accompanying Notes to Financial Statements
68
ING NATIONAL | PORTFOLIO OF INVESTMENTS |
TAX-EXEMPT BOND FUND | as of September 30, 2005 (Unaudited) (Continued) |
Principal | | | | | | | |
Amount | | | | Rating(1) | | Value | |
$ | 1,000,000 | | Payne County Oklahoma
Economic Development
Authority, Student Housing
Revenue, Collegiate
Housing Foundation,
Series A, 6.375%,
due 06/01/30 | | Baa3/NR | | $ | 1,145,630 | |
| | | | | | 2,247,375 | |
| | | | | | | |
| | Pennsylvania: 7.4% | | | | | |
1,000,000 | | Lebanon County Health
Facilities Authority,
6.000%, due 11/15/35 | | BAA1/BBB+ | | 1,075,380 | |
1,000,000 | | Philadelphia Pennsylvania
Hospitals & Higher
Education Facilities
Authority Revenue,
Jefferson Health System,
5.000%, due 05/15/18 | | A1/AA+ | | 1,031,620 | |
| | | | | | 2,107,000 | |
| | | | | | | |
| | Rhode Island: 0.5% | | | | | |
35,000 | | Dunns Corner Fire District,
7.950%, due 06/01/06 | | NR/NR | | 36,083 | |
35,000 | | Dunns Corner Fire District,
8.000%, due 06/01/07 | | NR/NR | | 37,588 | |
35,000 | | Dunns Corner Fire District,
8.050%, due 06/01/08 | | NR/NR | | 38,995 | |
35,000 | | Dunns Corner Fire District,
8.100%, due 06/01/09 | | NR/NR | | 40,333 | |
| | | | | | 152,999 | |
| | | | | | | |
| | Tennessee: 0.9% | | | | | |
240,000 | | Knox County Health
Educational & Housing
Facilities Board, 5.750%,
due 04/01/19 | | BAA1/NA | | 250,606 | |
| | | | | | 250,606 | |
| | | | | | | |
| | Texas: 8.0% | | | | | |
1,000,000 | | Harris County Health Facilities
Development Authority
Revenue, Series B, 5.750%,
due 07/01/27 | | Aa3/AAA | | 1,194,600 | |
1,000,000 | | Laredo Independent School
District, 5.500%,
due 08/01/20 | | Aaa/AAA | | 1,083,420 | |
| | | | | | 2,278,020 | |
| | Total Municipal Bonds
(Cost $27,037,029) | | | | 27,990,152 | |
| | | | | | | |
| | Total Investments In Securities (Cost $27,037,029)* | | 97.9 | % | $ | 27,990,152 | |
| | Other Assets and Liabilities-Net | | 2.1 | | 604,356 | |
| | Net Assets | | 100.0 | % | $ | 28,594,508 | |
| | | | | | | | | |
* Cost for federal income tax purposes is the same as for financial statement purposes. Net unrealized appreciation consists of:
Gross Unrealized Appreciation | | $ | 1,046,150 | |
Gross Unrealized Depreciation | | (93,027 | ) |
Net Unrealized Appreciation | | $ | 953,123 | |
(1) Credit ratings are provided by Moody’s Investor’s Service, Inc. and Standards and Poor’s Rating Group (Unaudited)
See Accompanying Notes to Financial Statements
69
ING CLASSIC
MONEY MARKET FUND(1) | PORTFOLIO OF INVESTMENTS
as of September 30, 2005 (Unaudited) |
Principal | | | | | | | |
Amount | | | | | | Value | |
CERTIFICATE OF DEPOSIT: 4.3% | | | | | |
$ | 26,000,000 | | Washington Mutual Bank, | | | | | |
| | 3.854%, due 05/31/06 | | | | $ | 26,100,380 | |
| | Total Certificate of Deposit | | | | | |
| | (Cost $26,100,380) | | | | 26,100,380 | |
| | | | | | | |
COLLATERALIZED MORTGAGE OBLIGATIONS: 4.4% | | | | | |
5,800,000 | @@,# | Cheyne 2004-1A, | | | | | |
| | 3.250%, due 11/10/05 | | | | 5,800,000 | |
5,400,000 | @@,#,I | Newcastle CDO I Ltd., | | | | | |
| | 3.860%, due 09/24/38 | | | | 5,400,000 | |
5,400,000 | @@,#,I | Newcastle CDO III Corp., | | | | | |
| | 3.976%, due 09/26/05 | | | | 5,400,000 | |
5,600,000 | @@,# | Putnam Structured Product | | | | | |
| | CDO, 3.788%, due 10/15/38 | | | | 5,600,000 | |
4,050,000 | @@,# | Whitehawk CDO Funding | | | | | |
| | Ltd., 3.890%, due 09/15/06 | | | | 4,050,000 | |
| | Total Collateralized | | | | | |
| | Mortgage Obligations | | | | | |
| | (Cost $26,250,000) | | | | 26,250,000 | |
| | | | | | | |
COMMERCIAL PAPER: 42.7% | | | | | |
4,075,000 | @@ | Alliance & Leicester PLC, | | | | | |
| | 3.740%, due 12/07/05 | | | | 4,046,408 | |
1,300,000 | @@ | Alliance & Leicester PLC, | | | | | |
| | 3.910%, due 01/26/06 | | | | 1,283,565 | |
1,000,000 | | American Express Bank FSB, | | | | | |
| | 3.789%, due 10/17/05 | | | | 1,000,001 | |
11,600,000 | | American Express Bank FSB, | | | | | |
| | 3.906%, due 03/16/06 | | | | 11,600,000 | |
2,950,000 | | American Express Bank FSB, | | | | | |
| | 3.941%, due 06/13/06 | | | | 2,950,404 | |
5,000,000 | | American Express Credit | | | | | |
| | Corp., 3.820%, | | | | | |
| | due 10/14/05 | | | | 5,000,181 | |
4,100,000 | @@,# | ASB Bank, 3.460%, | | | | | |
| | due 10/18/05 | | | | 4,092,914 | |
13,900,000 | @@,# | ASB Bank, 3.600%, | | | | | |
| | due 11/01/05 | | | | 13,855,713 | |
3,513,000 | | Barton Capital LLC, 3.700%, | | | | | |
| | due 11/01/05 | | | | 3,501,474 | |
14,000,000 | | Bear Sterns Cos., Inc., 2.610%, | | | | | |
| | due 10/03/05 | | | | 13,996,959 | |
10,000,000 | | Concord Minutemen, 3.030%, | | | | | |
| | due 10/05/05 | | | | 9,995,789 | |
6,000,000 | | Concord Minutemen, 3.690%, | | | | | |
| | due 10/25/05 | | | | 5,984,680 | |
7,000,000 | # | Crown Point Capital Co., LLC, | | | | | |
| | 3.630%, due 11/07/05 | | | | 6,973,309 | |
491,000 | # | Crown Point Capital Co., LLC, | | | | | |
| | 3.920%, due 12/15/05 | | | | 486,970 | |
1,400,000 | @@ | Danske, 3.630%, due 10/17/05 | | | | 1,397,604 | |
600,000 | @@ | Danske, 3.740%, due 11/04/05 | | | | 597,824 | |
15,000,000 | | Greenwich Capital Corp., | | | | | |
| | 3.710%, due 10/11/05 | | | | 15,000,000 | |
4,000,000 | | IXIX CP Corp., 3.500%, | | | | | |
| | due 10/21/05 | | | | 3,991,861 | |
12,000,000 | | Master Funding LLC, 3.030%, | | | | | |
| | due 10/05/05 | | | | 11,994,947 | |
7,000,000 | | Master Funding LLC, 3.340%, | | | | | |
| | due 10/12/05 | | | | 6,992,204 | |
9,000,000 | # | Master Funding LLC, 3.700%, | | | | | |
| | due 10/31/05 | | | | 8,971,425 | |
$ | 5,500,000 | | Monument Gardens Funding | | | | | |
| | LLC, 3.230%, due 10/11/05 | | | | $ | 5,494,576 | |
20,500,000 | | Monument Gardens Funding | | | | | |
| | LLC, 3.700%, due 11/18/05 | | | | 20,397,227 | |
3,720,000 | # | Park Avenue Receivables Corp., | | | | | |
| | 3.600%, due 10/18/05 | | | | 3,713,325 | |
3,836,000 | | Rabobank USA Financial Corp., | | | | | |
| | 2.590%, due 10/03/05 | | | | 3,835,173 | |
8,000,000 | @@,# | Saint Germain Holdings, | | | | | |
| | 3.500%, due 10/12/05 | | | | 7,990,687 | |
5,000,000 | @@,# | Saint Germain Holdings, | | | | | |
| | 3.660%, due 10/24/05 | | | | 4,987,829 | |
10,169,000 | @@,# | Saint Germain Holdings, | | | | | |
| | 3.680%, due 10/26/05 | | | | 10,142,037 | |
3,650,000 | @@,# | Saint Germain Holdings, | | | | | |
| | 3.680%, due 10/27/05 | | | | 3,639,956 | |
25,000,000 | # | Three Pillars Funding Corp., | | | | | |
| | 2.590%, due 10/03/05 | | | | 24,994,597 | |
1,250,000 | | Three Pillars Funding Corp., | | | | | |
| | 3.060%, due 10/07/05 | | | | 1,249,256 | |
3,164,000 | # | Thunder Bay Funding, Inc., | | | | | |
| | 3.300%, due 10/07/05 | | | | 3,161,970 | |
20,000,000 | | Tulip Funding Corp., 3.620%, | | | | | |
| | due 10/20/05 | | | | 19,959,889 | |
7,500,000 | | Tulip Funding Corp., 3.690%, | | | | | |
| | due 10/28/05 | | | | 7,478,513 | |
1,700,000 | @@ | UBS Finance, 3.850%, | | | | | |
| | due 11/23/05 | | | | 1,690,239 | |
2,800,000 | @@ | Westpac Capital Corp., | | | | | |
| | 3.570%, due 10/26/05 | | | | 2,792,806 | |
2,300,000 | @@ | Westpactrust, 3.630%, | | | | | |
| | due 10/17/05 | | | | 2,296,064 | |
| | Total Commercial Paper | | | | | |
| | (Cost $257,538,376) | | | | 257,538,376 | |
| | | | | | | |
CORPORATE BONDS/NOTES: 37.1% | | | | | |
2,400,000 | @@ | Alliance & Leicester PLC, | | | | | |
| | 3.813%, due 10/27/05 | | | | 2,400,275 | |
3,419,000 | | American Express Co., 6.875%, | | | | | |
| | due 11/01/05 | | | | 3,427,457 | |
4,600,000 | # | American General Finance | | | | | |
| | Corp., 3.768%, due 10/13/06 | | | | 4,600,000 | |
1,750,000 | | American General Finance | | | | | |
| | Corp., 5.875%, due 07/14/06 | | | | 1,774,899 | |
9,500,000 | # | American Honda Finance, | | | | | |
| | 3.700%, due 09/18/06 | | | | 9,500,000 | |
3,000,000 | # | American Honda Finance, | | | | | |
| | 3.800%, due 10/03/05 | | | | 3,000,024 | |
2,130,000 | | American Intl. Group, Inc., | | | | | |
| | 2.850%, due 12/01/05 | | | | 2,126,307 | |
13,250,000 | | BNP Paribas, 3.742%, | | | | | |
| | due 06/21/06 | | | | 13,246,793 | |
3,990,000 | | Bank One Corp., 3.900%, | | | | | |
| | due 08/11/06 | | | | 3,994,492 | |
— | | Bank One Corp., 6.500%, | | | | | |
| | due 02/01/06 | | | | 692 | |
7,500,000 | | Barclays Bank PLC, 3.754%, | | | | | |
| | due 06/21/06 | | | | 7,498,868 | |
3,000,000 | | Barclays Bank PLC, 3.771%, | | | | | |
| | due 10/31/05 | | | | 2,999,910 | |
5,725,000 | | Bear Stearns Cos, Inc., 3.848%, | | | | | |
| | due 09/28/06 | | | | 5,725,000 | |
5,800,000 | | Bear Stearns Cos, Inc., 3.930%, | | | | | |
| | due 10/05/06 | | | | 5,800,000 | |
See Accompanying Notes to Financial Statements
70
ING CLASSIC
MONEY MARKET FUND(1) | PORTFOLIO OF INVESTMENTS
as of September 30, 2005 (Unaudited) (Continued) |
Principal | | | | | | | |
Amount | | | | | | Value | |
$ | 4,958,000 | | Citigroup, Inc., 6.750%, | | | | | |
| | due 12/01/05 | | | | $ | 4,987,485 | |
2,000,000 | | General Electric Capital Corp., | | | | | |
| | 3.950%, due 05/12/06 | | | | 2,002,230 | |
8,400,000 | | General Electric Capital Corp., | | | | | |
| | 4.040%, due 11/09/06 | | | | 8,401,150 | |
2,940,000 | | Goldman Sachs Group, Inc., | | | | | |
| | 3.900%, due 08/01/06 | | | | 2,941,255 | |
5,300,000 | # | Goldman Sachs Group LP, | | | | | |
| | 3.966%, due 10/13/06 | | | | 5,300,000 | |
10,500,000 | I | Goldman Sachs Group, Inc., | | | | | |
| | 4.001%, due 2/13/06 | | | | 10,500,000 | |
4,800,000 | | HBOS Treasury Services PLC, | | | | | |
| | 3.460%, due 10/18/05 | | | | 4,791,704 | |
4,200,000 | @@,# | HBOS Treasury Services PLC, | | | | | |
| | 3.880%, due 09/01/06 | | | | 4,200,000 | |
10,000,000 | @@ | HBOS Treasury Services PLC, | | | | | |
| | 3.900%, due 01/11/06 | | | | 10,000,243 | |
7,600,000 | @@,# | HBOS Treasury Services PLC, | | | | | |
| | 4.011%, due 10/24/06 | | | | 7,600,000 | |
4,584,000 | | HSBC Finance Corp., 6.500%, | | | | | |
| | due 01/24/06 | | | | 4,619,186 | |
2,300,000 | | Lehman Brothers Holdings, Inc., | | | | | |
| | 6.625%, due 02/05/06 | | | | 2,320,347 | |
11,500,000 | #,I | Money Market Trust Series A, | | | | | |
| | 4.045%, due 8/30/2005 | | | | 11,500,000 | |
8,000,000 | | Morgan Stanley, 3.820%, | | | | | |
| | due 11/1/05 | | | | 7,973,684 | |
8,500,000 | | Morgan Stanley, 3.900%, | | | | | |
| | due 10/03/05 | | | | 8,498,158 | |
10,150,000 | | Morgan Stanley, 4.250%, | | | | | |
| | due 03/27/06 | | | | 10,163,484 | |
6,500,000 | | Societe Generale, 3.771%, | | | | | |
| | due 03/30/06 | | | | 6,498,989 | |
3,500,000 | | Suntrust Bank, 4.090%, | | | | | |
| | due 10/03/05 | | | | 3,500,000 | |
3,750,000 | # | The Bank of New York Co., Inc., | | | | | |
| | 3.870%, due 10/27/06 | | | | 3,750,000 | |
2,410,000 | | UnitedHealth Group, Inc., | | | | | |
| | 7.500%, due 11/15/05 | | | | 2,420,548 | |
10,000,000 | | Verizon Global Funding Corp., | | | | | |
| | 3.980%, due 10/13/06 | | | | 10,000,000 | |
16,448,000 | | Verizon Global Funding Corp., | | | | | |
| | 6.750%, due 12/01/05 | | | | 16,542,760 | |
1,000,000 | | Washington Mutual Bank, | | | | | |
| | 4.000%, due 07/25/06 | | | | 1,002,713 | |
4,500,000 | | Wells Fargo & Co., 3.910%, | | | | | |
| | due 11/02/06 | | | | 4,500,010 | |
3,300,000 | | Westpac Banking Corp., | | | | | |
| | 3.844%, due 10/11/06 | | | | 3,300,000 | |
| | Total Corporate Bonds/Notes | | | | | |
| | (Cost $223,408,663) | | | | 223,408,663 | |
| | | | | | | |
U.S. GOVERNMENT AGENCY OBLIGATIONS: 6.6% | | | | | |
| | Federal Home Loan Bank: 5.4% | | | | | |
11,550,000 | | 2.500%, due 12/15/05 | | | | 11,536,935 | |
15,600,000 | | 3.764%, due 06/14/06 | | | | 15,598,332 | |
5,700,000 | | 3.814%, due 07/21/06 | | | | 5,700,000 | |
| | | | | | 32,835,267 | |
| | Federal National Mortgage | | | | | |
| | Association: 1.2% | | | | | |
$ | 3,500,000 | | 3.749%, due 10/07/05 | | | | $ | 3,500,062 | |
3,800,000 | | 6.000%, due 12/15/05 | | | | 3,822,353 | |
| | | | | | 7,322,415 | |
| | Total U.S. Government | | | | | |
| | Agency Obligations | | | | | |
| | (Cost $40,157,682) | | | | 40,157,682 | |
| | | | | | | |
REPURCHASE AGREEMENT: 1.8% | | | | | |
| | Repurchase Agreement: 1.8% | | | | | |
10,706,000 | | Golodman Sachs Repurchase | | | | | |
| | Agreement dated 09/30/05, 3.790% | | | | | |
| | due 10/03/05, $10,709,381 to be | | | | | |
| | received upon repurchase | | | | | |
| | (Collateralized by $13,518,000 | | | | | |
| | various U.S. Treasury obligations, | | | | | |
| | 3.500%-6.500%, Market Value plus | | | | | |
| | accrued interest $11,027,470, | | | | | |
| | due 11/15/06-11/15/26) | | | | 10,706,000 | |
| | Total Repurchase Agreement | | | | | |
| | (Cost $10,706,000) | | | | 10,706,000 | |
| | Total Investments in | | | | | |
| | Securities (Cost | | | | | |
| | $584,161,101) | | 96.9 | % | $ | 584,161,101 | |
| | Other Assets and | | | | | |
| | Liabilities-Net | | 3.1 | | 18,646,649 | |
| | Net Assets | | 100 | % | $ | 602,807,750 | |
(1) All securities with a maturity date greater than 13 months have either a variable rate, demand feature, prerefunded, optional or mandatory put resulting in an effective maturity of one year or less. Rate shown reflects current rate.
@@ Foreign Issuer
I Illiquid Securities
# Securities with purchases pursuant to Rule 144A, under the Securities Act of 1933 and may not be resold subject to that rule except to qualified institutional buyers. These securities have been determined to be liquid under the guidelines established by the Funds’ Board of Directors/Trustees.
* Cost for federal income tax purposes is the same as for financial statement purposes.
See Accompanying Notes to Financial Statements
71
ING INSTITUTIONAL PRIME
MONEY MARKET FUND(1) | PORTFOLIO OF INVESTMENTS
AS OF SEPTEMBER 30, 2005 (UNAUDITED) |
Principal | | | | | | | |
Amount | | | | | | Value | |
CERTIFICATE OF DEPOSIT: 2.8% | | | | | |
$ | 1,000,000 | | Washington Mutual Bank FA, | | | | | |
| | 3.670%, due 05/31/06 | | | | $ | 1,000,043 | |
1,500,000 | | Wells Fargo Bank, 3.770%, | | | | | |
| | due 07/24/06 | | | | 1,499,708 | |
| | Total Certificate of Deposit | | | | | |
| | (Cost $2,499,751) | | | | 2,499,751 | |
| | | | | | | |
COMMERCIAL PAPER: 37.9% | | | | | |
1,200,000 | | ANZ Delaware, Inc., 3.640%, | | | | | |
| | due 10/18/05 | | | | 1,197,818 | |
2,500,000 | | ANZ National Bank, 3.480%, | | | | | |
| | due 10/21/05 | | | | 2,494,931 | |
1,500,000 | @@,# | ASB Bank Ltd., 3.600%, | | | | | |
| | due 10/18/05 | | | | 1,497,308 | |
1,000,000 | @@,# | ASB Bank Ltd., 3.600%, | | | | | |
| | due 11/01/05 | | | | 996,814 | |
280,000 | @@,# | ASB Bank Ltd., 3.770%, | | | | | |
| | due 11/10/05 | | | | 278,802 | |
1,000,000 | @@ | Alliance & Leicester PLC, | | | | | |
| | 3.910%, due 01/26/06 | | | | 987,358 | |
2,000,000 | @@ | Barclays Bank PLC, 2.400%, | | | | | |
| | due 10/03/05 | | | | 1,999,600 | |
2,500,000 | | Cafco LLC, 2.590%, | | | | | |
| | due 10/03/05 | | | | 2,499,461 | |
300,000 | | CBA Finance, 3.660%, | | | | | |
| | due 10/25/05 | | | | 299,240 | |
600,000 | @@ | Danske, 3.320%, due 10/11/05 | | | | 599,392 | |
2,200,000 | @@ | Danske, 3.620%, due 11/07/05 | | | | 2,191,634 | |
400,000 | @@ | Danske, 3.630%, due 10/17/05 | | | | 399,316 | |
330,000 | @@ | Danske, 3.700%, due 10/24/05 | | | | 329,188 | |
1,600,000 | @@ | Dexia Delaware LLC, 3.830%, | | | | | |
| | due 11/21/05 | | | | 1,591,205 | |
250,000 | | Edison Asset Securities, | | | | | |
| | 3.670%, due 11/14/05 | | | | 248,859 | |
2,500,000 | | Galaxy Funding, Inc., 2.580%, | | | | | |
| | due 10/03/05 | | | | 2,499,463 | |
650,000 | | Galaxy Funding, Inc., 3.610%, | | | | | |
| | due 10/20/05 | | | | 648,700 | |
200,000 | | General Electric Capital Corp., | | | | | |
| | 3.490%, due 10/12/05 | | | | 199,768 | |
2,100,000 | | HBOS Treasury Services PLC, | | | | | |
| | 3.000%, due 10/06/05 | | | | 2,098,951 | |
200,000 | | HBOS Treasury Services PLC, | | | | | |
| | 3.080%, due 10/05/05 | | | | 199,914 | |
700,000 | | HBOS Treasury Services PLC, | | | | | |
| | 3.540%, due 10/25/05 | | | | 698,283 | |
1,000,000 | | Morgan Stanley Group, Inc., | | | | | |
| | 4.250%, due 03/27/06 | | | | 1,001,344 | |
344,000 | | Societe Generale, 3.170%, | | | | | |
| | due 10/06/05 | | | | 343,818 | |
2,300,000 | | UBS Finance, 3.720%, | | | | | |
| | due 11/30/05 | | | | 2,285,587 | |
950,000 | | UBS Finance, 3.850%, | | | | | |
| | due 11/28/05 | | | | 944,046 | |
2,000,000 | | Westpactrust, 2.470%, | | | | | |
| | due 10/03/05 | | | | 1,999,589 | |
1,200,000 | | Westpactrust, 3.430%, | | | | | |
| | due 10/17/05 | | | | 1,198,061 | |
1,500,000 | | Windmill Funding Corp., | | | | | |
| | 2.570%, due 10/03/05 | | | | 1,499,678 | |
$ | 481,000 | | Yorktown Capital LLC, 3.170%, | | | | | |
| | due 10/06/05 | | | | $ | 480,746 | |
| | Total Commercial Paper | | | | | |
| | (Cost $33,708,874) | | | | 33,708,874 | |
| | | | | |
CORPORATE BONDS/NOTES: 39.4% | | | | | |
1,250,000 | # | Allstate Financial Global | | | | | |
| | Funding, 6.150%, | | | | | |
| | due 02/01/06 | | | | 1,258,402 | |
2,500,000 | | American Express Co., 6.875%, | | | | | |
| | due 11/01/05 | | | | 2,506,287 | |
1,000,000 | # | American Honda Finance Corp., | | | | | |
| | 3.700%, due 09/18/06 | | | | 1,000,000 | |
2,000,000 | # | American Honda Finance Corp., | | | | | |
| | 3.800%, due 10/03/05 | | | | 2,000,016 | |
1,000,000 | | American International Group, | | | | | |
| | Inc., 2.850%, due 12/01/05 | | | | 998,266 | |
— | | Bank One Corp., 6.500%, | | | | | |
| | due 02/01/06 | | | | 367 | |
500,000 | | Bear Stearns Cos., Inc., 4.000%, | | | | | |
| | due 09/15/06 | | | | 500,984 | |
3,500,000 | | BNP Paribas, 3.742%, | | | | | |
| | due 06/21/06 | | | | 3,499,153 | |
500,000 | # | Cargill, Inc., 6.250%, | | | | | |
| | due 05/01/06 | | | | 505,759 | |
400,000 | | Citigroup Global Markets | | | | | |
| | Holdings, Inc., 3.884%, | | | | | |
| | due 12/12/05 | | | | 399,985 | |
1,500,000 | # | Goldman Sachs Group LP, | | | | | |
| | 3.868%, due 10/13/06 | | | | 1,501,358 | |
990,000 | | Goldman Sachs Group, Inc., | | | | | |
| | 3.972%, due 08/18/06 | | | | 991,256 | |
1,000,000 | | HSBC Finance Corp., 6.500%, | | | | | |
| | due 01/24/06 | | | | 1,007,676 | |
1,500,000 | | HSBC Finance Corp., 3.974%, | | | | | |
| | due 06/22/06 | | | | 1,500,471 | |
2,000,000 | | Lehman Brothers Holdings, Inc., | | | | | |
| | 4.140%, due 02/13/06 | | | | 2,003,103 | |
1,500,000 | | M&I Marshall & Ilsley Bank, | | | | | |
| | 5.209%, due 12/15/05 | | | | 1,503,602 | |
1,000,000 | | Merrill Lynch & Co., Inc., | | | | | |
| | 3.778%, due 07/25/06 | | | | 1,000,882 | |
1,160,000 | | Merrill Lynch & Co., Inc., | | | | | |
| | 4.020%, due 01/13/06 | | | | 1,161,390 | |
600,000 | | Merrill Lynch & Co., Inc., | | | | | |
| | 4.220%, due 05/22/06 | | | | 601,336 | |
500,000 | | Merrill Lynch & Co., Inc., | | | | | |
| | 4.101%, due 05/26/06 | | | | 500,685 | |
2,000,000 | # | Money Market Trust Series A, | | | | | |
| | 3.843%, due 10/10/06 | | | | 2,001,298 | |
500,000 | | Suntrust Bank, 3.529%, | | | | | |
| | due 10/03/05 | | | | 499,997 | |
3,521,000 | | Verizon Global Funding Corp., | | | | | |
| | 6.750%, due 12/01/05 | | | | 3,536,673 | |
3,015,000 | | Wal-Mart Stores, Inc., 5.875%, | | | | | |
| | due 10/15/05 | | | | 3,017,216 | |
1,580,000 | | Washington Mutual Bank FA, | | | | | |
| | 4.000%, due 07/25/06 | | | | 1,584,256 | |
| | Total Corporate Bonds/Notes | | | | | |
| | (Cost $35,080,418) | | | | 35,080,418 | |
See Accompanying Notes to Financial Statements
72
ING INSTITUTIONAL PRIME
Money Market Fund(1) | PORTFOLIO OF INVESTMENTS
as of September 30, 2005 (Unaudited) (Continued) |
Principal | | | | | | | |
Amount | | | | | | Value | |
REPURCHASE AGREEMENT: 16.2% | | | | | |
$ | 14,366,000 | | Deutsche Bank Repurchase | | | | | |
| | Agreement dated 09/30/05, 3.700%, | | | | | |
| | due 10/03/05, $14,370,430 to be | | | | | |
| | received upon repurchase | | | | | |
| | (Collateralized by $14,518,000 | | | | | |
| | Federal Home Loan Mortgage | | | | | |
| | Corporation, 3.750%, Market Value | | | | | |
| | plus accrued Interest $14,654,143, | | | | | |
| | due 04/15/07) | | | | $ | 14,366,000 | |
| | Total Repurchase Agreement | | | | | |
| | (Cost $14,366,000) | | | | 14,366,000 | |
| | Total Investments In | | | | | |
| | Securities (Cost $85,655,043)* | | 96.3 | % | $ | 85,655,043 | |
| | Other Assets and Liabilities-Net | | 3.7 | | 3,307,966 | |
| | Net Assets | | 100.0 | % | $ | 88,963,009 | |
| | | | | | | | | |
(1) All Securities with a maturity date greater than 13 months have either a variable rate, demand feature, prerefunded, optional or mandatory put resulting in an effective maturity of one year or less. Rate shown reflects current rate.
@@ Foreign issuer
# Securities with purchases pursuant to Rule 144A, under the Securities Act of 1933 and may not be resold subject to that rule except to qualified institutional buyers. These securities have been determined to be liquid under the guidelines established by the Funds’ Board of Directors/Trustees.
* Cost for federal income tax purposes is the same as for financial statement purposes.
See Accompanying Notes to Financial Statements
73
ADVISORY CONTRACT APPROVAL DISCUSSION (UNAUDITED)
Under Section 15(c) of the Investment Company Act of 1940 (the “1940 Act”), after an initial period, the Funds’ existing investment advisory and sub-advisory contracts remain in effect only if the Board of Trustees (the “Board”) of ING Funds Trust, including a majority of the Trustees who have no direct or indirect interest in the advisory and sub-advisory contracts, and who are not “interest persons” of the Funds, as such term is defined under the 1940 Act (the “Independent Trustees”), annually review and renew them.
In this regard, at a meeting held on August 31, 2004 the Board, including a majority of the Independent Trustees, considered whether to renew the investment advisory contracts (the “Advisory Contracts”) between ING Investments, LLC (the “Adviser”) and the Funds and the sub-advisory contracts (“Sub-Advisory Contracts”) with ING Investment Management Co., the sub-adviser to the Funds (the “Sub-Adviser”), for the period September 1, 2004 through August 31, 2005. Subsequently, at its meeting held on July 21, 2005, the Board considered whether to renew the terms of the Advisory and Sub-Advisory Contracts for an “interim” period commencing on September 1, 2005 and ending on November 30, 2005. The interim approval was necessary to align the Funds’ annual renewal periods with those of other Funds in the ING Funds complex.
At the August 31, 2004 meeting, the Board voted to renew the Advisory Contracts and Sub-Advisory Contracts for the Funds for the year ended August 31, 2005. At its July 21, 2005 meeting, the Board voted to renew these Contracts for the interim period ending November 30, 2005. In reaching these decisions, the Board took into account a number of factors its members believed, in light of the legal advice furnished to the Board by Kirkpatrick & Lockhart Nicholson Graham LLP (“K&LNG”), legal counsel to the Independent Trustees, and their own business judgment, to be relevant.
In connection with their deliberations on August 31, 2004 relating to the renewal of each Fund’s current Advisory Contract and Sub-Advisory Contract, the Board, including the Independent Trustees, considered information that had been provided by the Adviser and the Sub-Adviser throughout the year at regular Board Meetings, as well as information furnished in advance of the August 31, 2004 Board meeting, which was held to specifically consider such renewals for purposes of annual renewal. This information included the following items: (1) FACT sheets for each Fund that provide information about the performance and expenses of the Fund and its respective peer group, as well as information about the Fund’s investment portfolio, objective and strategies; (2) the 15(c) Methodology Guide that describes how the FACT sheets were prepared, including how benchmarks and peer groups were selected and how profitability was determined; (3) responses to questions from K&LNG, legal counsel to the Independent Trustees; (4) copies of each form of Advisory and Sub-Advisory Contract; (5) copies of the Form ADV for the Adviser and Sub-Adviser; (6) financial statements for the Adviser and Sub-Adviser; and (7) other information relevant to their evaluations.
In connection with their deliberations on July 21, 2005 relating to each Fund’s current Advisory Contract and Sub-Advisory Contract, the Board, including the Independent Trustees, considered information that had been provided by the Adviser and the Sub-Adviser throughout the year at regular Board and Committee Meetings, beginning in August 2004 in anticipation of the August contract renewal and continuing at periodic meetings thereafter. Such information included, among other things, a detailed analysis of Fund performance, including attribution analysis, provided at all regular Board meetings.
The Board also considered information furnished in advance of the July 21, 2005 Board meeting, which was held to, among other things, specifically consider Advisory and Sub-Advisory Contract renewals for the interim period ending November 30, 2005. This information included the following items: (1) updated performance information through May 31, 2005 with respect to the Funds; (2) responses to questions from K&LNG, legal counsel to the Independent Trustees; (3) copies of each form of Advisory and Sub-Advisory Contract; (4) representations that there were no material changes in the management fees and expense ratios borne by the Funds since the August approval; and (5) other information relevant to their evaluations. In determining that this information was sufficient to support the interim renewal, the Board took into consideration that it would meet again, at an in-person meeting to be held in November 2005, to consider whether to approve the Advisory and Sub-Advisory Contracts for the Funds for a 12-month period beginning on December 1, 2005 and ending November 30, 2006. The interim and subsequent November renewals would place the Funds on a December 1 renewal cycle, and result in all of the mutual funds in the ING mutual funds complex under the purview of the Board being placed on the same annual renewal cycle on a going-forward basis.
74
ADVISORY CONTRACT APPROVAL DISCUSSION (UNAUDITED) (CONTINUED)
The Board was also provided, in August 2004 and July 2005, with narrative summaries addressing key factors the Board customarily considers in evaluating the renewal of Advisory and Sub-Advisory Contracts, including an analysis for each Fund of how performance and fees compare to its selected peer group and/or designated benchmarks.
In arriving at its conclusions with respect to the advisory arrangements with the Adviser, the Board was mindful of the “manager-of-managers” platform of the ING Funds. The Board also noted the resources that the Adviser has committed to the Board and the Board’s International Equity and Fixed Income Investment Review Committee (the “Investment Review Committee”) to assist the Board and Investment Review Committee members with their assessment of the investment performance of the Funds. This includes the appointment of a Chief Investment Risk Officer and his staff, who report directly to the Board, and who have developed attribution analyses and other metrics used by the Investment Review Committee to analyze the key factors underlying investment performance for the Funds. The Board also noted the techniques used by the Adviser to monitor the performance of the Sub-Adviser, and took note of the pro-active approach that the Adviser, working in cooperation with the Investment Review Committee, has taken to advocate or recommend, when it believed appropriate, changes intended to assist performance of the Funds. In considering whether to renew the Sub-Advisory Contracts, the Board took into account any applicable steps that the Sub-Adviser had taken to improve the Funds’ performance, including enhancements to the Sub-Adviser’s fixed-income portfolio management teams and management’s views as to improvements in the Sub-Adviser’s risk strategies for the Funds.
Fund-by-Fund Analysis
The following paragraphs outline certain of the specific factors that the Board considered, and the conclusions reached, at its August 2004 and July 2005 meetings in relation to renewing each Fund’s current Advisory Contract and its Sub-Advisory Contract for the year ending August 31, 2005 and the interim period ending November 30, 2005, respectively.
ING GNMA Income Fund
In its renewal deliberations for ING GNMA Income Fund in August 2004, the Board considered that: (1) the management fee for the Fund is above the median and the average management fees of the funds in its Selected Peer Group, but within one standard deviation of the average; (2) the expense ratio for the Fund is above the median and the average expense ratios of the funds in its Selected Peer Group, but within one standard deviation of the average; and (3) the Fund underperformed its benchmark index for the most recent quarter and one-, three, and five-year periods and its Selected Peer Group median for the most recent quarter and one-year period, but it outperformed its benchmark index for the two-year period and its Selected Peer Group median for the two-, three-, and five-year periods.
In considering whether to approve the Fund’s interim period renewal, the Board further considered that: (1) the Fund underperformed its benchmark index for the periods reviewed by the Board in July 2005; (2) the Fund outperformed its Lipper Category Median for all periods, except for the one-year period ended May 31, 2005; and (3) the Fund outperformed its Morningstar Category Average for the three- and five-year periods ended May 31, 2005, but underperformed during all periods considered. In analyzing this performance data, the Board took into account that the Sub-Adviser had undertaken actions to support and maintain the efforts of the Fund’s portfolio manager who has primary responsibility for managing the Fund.
After its deliberation, the Board reached the following conclusions: (1) the Fund’s management fee rate is reasonable in the context of all factors considered by the Board; (2) the Fund’s expense ratio is reasonable in the context of all factors considered by the Board; (3) although the Fund has underperformed relative to its peers in certain periods, it is reasonable to permit the Sub-Adviser the opportunity to demonstrate the more favorable longer-term performance anticipated by management; and (4) the sub-advisory fee rate payable by the Adviser to the Sub-Adviser is reasonable in the context of all factors considered by the Board. The Board also noted that there would be further opportunity for review of more recent performance and other relevant factors in the course of deliberations for the next annual renewal in November 2005.
Based on these conclusions and other factors, the Board voted to renew the Advisory and Sub-Advisory Contracts for the Fund for year ended August 31, 2005 and the interim period ending November 30, 2005. During this renewal process, different Board members
75
ADVISORY CONTRACT APPROVAL DISCUSSION (UNAUDITED) (CONTINUED)
may have given different weight to different individual factors and related conclusions.
ING High Yield Bond Fund
In its renewal deliberations for ING High Yield Bond Fund in August 2004, the Board considered that: (1) the management fee for the Fund is above the median and the average management fees of the funds in its Selected Peer Group, but within one standard deviation of the average; (2) the expense ratio for the Fund is above the median and the average expense ratios of the funds in its Selected Peer Group, but within one standard deviation of the average; (3) the Fund underperformed its benchmark index for the periods reviewed by the Board; (4) the Sub-Adviser’s focus on higher quality high yield securities adversely affected the Fund’s performance relative to its peers; and (5) the Fund was to merge with ING High Yield Opportunity Fund, which would result in reductions in the Fund’s annualized expense limitation.
In considering whether to approve the Fund’s interim period renewal, the Board further considered that: (1) the Fund underperformed its benchmark index for the periods reviewed by the Board in July 2005; and (2) the Fund underperformed its Lipper Category Median and its Morningstar Category Average for most periods ended May 31, 2005, except that it outperformed both these comparative measures for the year-to-date period, and slightly outperformed the Morningstar Category Average for the five-year period ended May 31, 2005.
In analyzing this performance data, the Board noted that the Fund’s performance vis-à-vis the benchmark index, the Lipper Category Median, and the Morningstar Category Average for more recent periods (one- and three-months and year-to-date ended May 31, 2005) had not been as significant as prior periods, indicating that the Fund’s relative performance was improving. The Board also took into account the Sub-Adviser’s efforts to develop refined processes for capitalizing on opportunities in the full spectrum of the high yield bond universe. Finally, the Board considered that the Fund’s expense limit had been reduced in conjunction with the merger of ING High Yield Opportunity Fund with and into the Fund, which can be expected to contribute to improved performance.
After its deliberation, the Board reached the following conclusions: (1) the Fund’s management fee rate is reasonable in the context of all factors considered by the Board; (2) the Fund’s expense ratio is reasonable in the context of all factors considered by the Board; (3) the portfolio managers had been consistent in their investment approach focusing on higher quality securities and had undertaken steps to refine their investment process, and it is reasonable to permit the Sub-Adviser to continue to manage the Fund in order to demonstrate the more favorable longer-term performance anticipated by management; and (4) the sub-advisory fee rate payable by the Adviser to the Sub-Adviser is reasonable in the context of all factors considered by the Board. The Board also noted that there would be further opportunity for review of more recent performance and other relevant factors in the course of deliberations for the next annual renewal in November 2005.
Based on these conclusions and other factors, the Board voted to renew the Advisory and Sub-Advisory Contracts for the Fund for year ended August 31, 2005 and the interim period ending November 30, 2005. During this renewal process, different Board members may have given different weight to different individual factors and related conclusions.
ING Intermediate Bond Fund
In its renewal deliberations for ING Intermediate Bond Fund in August 2004, the Board considered that: (1) the management fee for the Fund is above the median and the average management fees of the funds in its Selected Peer Group, but within one standard deviation of the average; (2) the expense ratio for the Fund is above the median and the average expense ratios of the funds in its Selected Peer Group, but within one standard deviation of the average; and (3) the Fund outperformed its benchmark index and Selected Peer Group median for all periods reviewed by the Board in August 2004.
In considering whether to approve the Fund’s interim period renewal, the Board further considered that: (1) the Fund outperformed its benchmark for the year-to-date, one-, three- and five-year periods ended May 31, 2005, but underperformed for the one- and three-month periods ended May 31, 2005; and (2) the Fund outperformed its Lipper Category Median and its Morningstar Category Average for all periods considered.
After its deliberation, the Board reached the following conclusions: (1) the Fund’s management fee rate is reasonable in the context of all factors considered by the Board; (2) the Fund’s expense ratio is reasonable in the context of all factors considered
76
ADVISORY CONTRACT APPROVAL DISCUSSION (UNAUDITED) (CONTINUED)
by the Board; (3) the Fund’s performance is reasonable in the context of all factors considered by the Board; and (4) the sub-advisory fee rate payable by the Adviser to the Sub-Adviser is reasonable in the context of all factors considered by the Board. Based on these conclusions and other factors, the Board voted to renew the Advisory and Sub-Advisory Contracts for the Fund for year ended August 31, 2005 and the interim period ending November 30, 2005. During this renewal process, different Board members may have given different weight to different individual factors and related conclusions.
ING National Tax-Exempt Bond Fund
In its renewal deliberations for ING National Tax-Exempt Bond Fund in August 2004, the Board considered that: (1) the management fee for the Fund is above the median and average management fees of the funds in its Selected Peer Group, but within one standard deviation of the average; (2) the expense ratio for the Fund is above the median and average expense ratios of the funds in its Selected Peer Group, but within one standard deviation of the average; and (3) the Fund underperformed the benchmark indices for all periods presented, except the quarter ended June 30, 2004, but the Fund outperformed its Selected Peer Group median for the most recent quarter, two-, and three-year periods.
The Board also considered that, in response to input from the Board, in 2004 management lowered the expense limit for the Fund, thus bringing it slightly above that of its Selected Peer Group average. Additionally, the management fee was modified to include breakpoints, permitting the Fund and its shareholders to benefit from economies of scale as assets grow.
In considering whether to approve the Fund’s interim period renewal, the Board further considered that: (1) the Fund underperformed its benchmark index for the periods reviewed by the Board in July; and (2) the Fund underperformed its Lipper Category Median and its Morningstar Category Average for most periods ended May 31, 2005, except that it outperformed both these comparative measures for the five-year periods, and slightly outperformed the Lipper Category Median for the year-to-date and three year period. In analyzing this performance data, the Board took into account that the Fund’s performance gap vis-à-vis its benchmark lessened for the one- and three-month and year-to-date periods, as compared to the one-, three- and five-year periods, ended May 31, 2005. The Board also considered that the expense cap for the Fund had been lowered in January 2005 and a breakpoint was added to the advisory and sub-advisory fees of the Fund in January 2005 in response to the Board’s directive after the August contract renewal, which can be expected to result in lower fees for the Fund at higher asset levels.
After its deliberation, the Board reached the following conclusions, (1) the Fund’s management fee rate is reasonable in the context of all factors considered by the Board; (2) the Fund’s expense ratio is reasonable in the context of all factors considered by the Board; (3) while the Fund had underperformed relative to its peers in certain periods, it is reasonable to permit the Sub-Adviser to continue to manage the Fund to afford it the opportunity to demonstrate the more favorable longer-term performance anticipated by management; and (4) the sub-advisory fee rate payable by the Adviser to the Sub-Adviser is reasonable in the context of all factors considered by the Board. The Board also noted that there would be further opportunity for review of more recent performance and other relevant factors in the course of deliberations for the next annual renewal in November 2005.
Based on these conclusions and other factors, the Board voted to renew the Advisory and Sub-Advisory Contracts for the Fund for year ended August 31, 2005 and the interim period ending November 30, 2005. During this renewal process, different Board members may have given different weight to different individual factors and related conclusions.
ING Classic Money Market Fund
In its renewal deliberations for ING Classic Money Market Fund, in August 2004 the Board considered that: (1) the management fee for the Fund is below the median and the average management fees of the funds in its comparable universe of funds (“Selected Peer Group”); (2) the expense ratio for the Fund is above the median and the average expense ratios of the funds in its Selected Peer Group, but within one standard deviation of the average; and (3) the Fund has consistently outperformed its Selected Peer Group median and outperformed its benchmark index in all periods reviewed by the Board, except the quarter ended June 30, 2004.
In considering whether to approve the Fund’s interim period renewal, in July 2005 the Board further considered that, based on performance data for the period ended May 31, 2005, the Fund
77
ADVISORY CONTRACT APPROVAL DISCUSSION (UNAUDITED) (CONTINUED)
underperformed its benchmark for all periods considered, but outperformed or met its Lipper Category Median for all such periods. In analyzing this performance data, the Board took into account the addition of a new portfolio manager to the Sub-Adviser’s portfolio management team, and its continuing efforts to maintain portfolio management expertise and credit risk assessment capabilities. The Board also considered that, in February 2005, ING Money Market Fund and ING Lexington Money Market Trust were merged, at the expense of the Adviser, with and into ING Classic Money Market Fund, increasing the size of assets under management, which can be expected to benefit the Fund.
After its deliberation, the Board reached the following conclusions: (1) the Fund’s management fee rate is reasonable in the context of all factors considered by the Board; (2) the Fund’s expense ratio is reasonable in the context of all factors considered by the Board; (3) the Sub-Adviser had committed resources to build and maintain its investment management capabilities, and it is reasonable to permit the Sub-Adviser to continue to manage the Fund to demonstrate the favorable longer-term performance anticipated by management; and (4) the Sub-Advisory fee rate payable by the Adviser to the Sub-Adviser is reasonable in the context of all factors considered by the Board. The Board also noted that there would be further opportunity for review of more recent performance and other relevant factors in the course of deliberations for the next annual renewal in November 2005.
Based on these conclusions and other factors, the Board voted to renew the Advisory and Sub-Advisory Contracts for the Fund for year ended August 31, 2005 and the interim period ending November 30, 2005. During this renewal process, different Board members may have given different weight to different individual factors and related conclusions.
78
ING Funds Distributor, LLC offers the funds listed below. Before investing in a fund, shareholders should carefully review the fund’s prospectus. Investors may obtain a copy of a prospectus of any ING Fund by calling (800) 992-0180.
Domestic Equity and Income Funds
ING Balanced Fund
ING Convertible Fund
ING Equity and Bond Fund
ING Equity Income Fund
ING Real Estate Fund
Domestic Equity Growth Funds
ING Disciplined LargeCap Fund
ING Growth Fund
ING LargeCap Growth Fund
ING MidCap Opportunities Fund
ING SmallCap Opportunities Fund
ING Small Company Fund
Domestic Equity Index Funds
ING Index Plus LargeCap Fund
ING Index Plus MidCap Fund
ING Index Plus SmallCap Fund
Domestic Equity Value Funds
ING Financial Services Fund
ING LargeCap Value Fund
ING MagnaCap Fund
ING MidCap Value Fund
ING MidCap Value Choice Fund
ING SmallCap Value Fund
ING SmallCap Value Choice Fund
ING Value Opportunity Fund
Fixed Income Funds
ING GNMA Income Fund
ING Government Fund
ING High Yield Bond Fund
ING Intermediate Bond Fund
ING National Tax-Exempt Bond Fund
Global Equity Funds
ING Global Equity Dividend Fund
ING Global Real Estate Fund
ING Global Science and Technology Fund
ING Global Value Choice Fund
International Equity Funds
ING Emerging Countries Fund
ING Foreign Fund
ING International Fund
ING International Growth Fund
ING International SmallCap Fund
ING International Value Fund
ING International Value Choice Fund
ING Precious Metals Fund
ING Russia Fund
Loan Participation Fund
ING Senior Income Fund
Money Market Funds*
ING Aeltus Money Market Fund
ING Classic Money Market Fund
ING Institutional Prime Money Market Fund
Strategic Allocation Funds
ING Strategic Allocation Balanced Fund
ING Strategic Allocation Growth Fund
ING Strategic Allocation Income Fund
* An investment in the Fund is not insured or guaranteed by the Federal Deposit Insurance Corporation or any other government agency. Although the Fund seeks to preserve the value of your investment at $1.00 per share, it is possible to lose money by investing in the Fund.
PROXY VOTING INFORMATION
A description of the policies and procedures that the Registrant uses to determine how to vote proxies related to portfolio securities is available (1) without charge, upon request, by calling Shareholder Services toll-free at 800-992-0180; (2) on the Registrant’s website at www.ingfunds.com and (3) on the Securities and Exchange Commission’s (“SEC”) website at www.sec.gov.
Information regarding how the Registrant voted proxies related to portfolio securities during the most recent 12-month period ended June 30 is available without charge on the Registrant’s website at www.ingfunds.com and on the SEC’s website at www.sec.gov.
QUARTERLY PORTFOLIO HOLDINGS
The Registrant files its complete schedule of portfolio holdings with the SEC for the first and third quarters of each fiscal year on Form N-Q. The Registrant’s Forms N-Q are available on the SEC’s website at www.sec.gov. The Registrant’s Forms N-Q may be reviewed and copied at the SEC’s Public Reference Room in Washington, DC, and information on the operation of the Public Reference Room may be obtained by calling 1-800-SEC-0330; and is available upon request from the Registrant by calling Shareholder Services toll-free at 800-992-0180.
Investment Manager
ING Investments, LLC
7337 E. Doubletree Ranch Road
Scottsdale, Arizona 85258
Administrator
ING Funds Services, LLC
7337 E. Doubletree Ranch Road
Scottsdale, Arizona 85258
Distributor
ING Funds Distributor, LLC
7337 E. Doubletree Ranch Road
Scottsdale, Arizona 85258
1-800-334-3444
Transfer Agent
DST Systems, Inc.
330 West 9th Street
Kansas City, Missouri 64105
Custodian
The Bank of New York
100 Colonial Center Parkway, Suite 300
Lake Mary, Florida 32746
Legal Counsel
Dechert
1775 I Street, N.W
Washington, D.C. 20006
For more complete information, or to obtain a prospectus on any ING fund, please call your Investment Professional or ING Funds Distributor, LLC at (800) 992-0180 or log on to www.ingfunds.com. The prospectus should be read carefully before investing. Consider the fund’s investment objectives, risks, charges and expenses carefully before investing. The prospectus contains this information and other information about the fund.

| | PRSAR-UFIABCMOR | | (0905-112705) |
Semi-Annual Report
September 30, 2005
Classes I and Q
Fixed Income Funds
• ING GNMA Income Fund
• ING Intermediate Bond Fund
 E-Delivery Sign-up – details inside
This report is submitted for general information to shareholders of the ING Funds. It is not authorized for distribution to prospective shareholders unless accompanied or preceded by a prospectus which includes details regarding the funds’ investment objectives, risks, charges, expenses and other information. This information should be read carefully. | 
|
TABLE OF CONTENTS
| Go Paperless with E-Delivery! |
|
Sign up now for on-line prospectuses, fund reports, and proxy statements. In less than five minutes, you can help reduce paper mail and lower fund costs. |
|
Just go to www.ingfunds.com, click on the E-Delivery icon from the home page, follow the directions and complete the quick 5 Steps to Enroll. |
|
You will be notified by e-mail when these communications become available on the internet. Documents that are not available on the internet will continue to be sent by mail. |
(THIS PAGE INTENTIONALLY LEFT BLANK)
PRESIDENT’S LETTER

James M. Hennessy
| Dear Shareholder, |
We are in the midst of an exciting time here at ING Funds. We began the year by introducing the ING Global Equity Dividend and Premium Opportunity Fund that gave investors an opportunity to invest in global companies with a history of attractive dividend yields. When the Fund’s initial offering period closed, it proved to be one of the five largest unleveraged closed-end funds in history. The success of the Fund offering illustrates what ING Funds is really all about: fresh thinking in financial services. The Fund’s offering success also confirmed something else that we have long believed; namely, that investors are excited about opportunities beyond our shores. As globalization grows, investment opportunities grow as well. In 1970, only about one-third of equity market capitalization was located abroad; by 2004, that number had jumped to 50 percent1. It is often said that the world is becoming ever more complicated. This is undoubtedly true in the world of investments |
where the range of asset classes and investment techniques has never been wider. To take advantage of the opportunities that are now available, it is essential to seek investment partners who have the required breadth and depth of experience — on a global basis. |
|
Our goal at ING Funds is to deliver innovative investment products that help you, the investor, to achieve your financial dreams. We have also long been committed to uncovering opportunities worldwide. |
|
We will continue to bring you opportunities — wherever they occur. With access to more than 700 ING investment management professionals who are located around the world and who, in our consideration, deliver exceptional insight into markets in Europe, the Americas and the Asia-Pacific region, we believe we are in a unique position to help you take advantage of the opportunities that the world has to offer. |
|
On behalf of everyone here at ING Funds, I thank you for your continued support and loyalty. We look forward to serving you in the future. |
|
Sincerely, |
|

|
|
James M. Hennessy
President
ING Funds
October 27, 2005 |
The views expressed in the President’s Letter reflect those of the President as of the date of the letter. Any such views are subject to change at any time based upon market or other conditions and ING Funds disclaims any responsibility to update such views. These views may not be relied on as investment advice and because investment decisions for an ING Fund are based on numerous factors, may not be relied on as an indication of investment intent on behalf of any ING Fund. Reference to specific company securities should not be construed as recommendations or investment advice.
International investing does pose special risks including currency fluctuation, economic and political risks not found in investments that are solely domestic.
1 Morgan Stanley Capital International
1
MARKET PERSPECTIVE: SIX MONTHS ENDED SEPTEMBER 30, 2005
In the six months through September 30, 2005, major markets recovered after first quarter losses. Global equities rose 7.4%, according to the Morgan Stanley Capital International (“MSCI”) World Index(1) (which is calculated in dollars and includes net reinvested dividends). Nearly half of the gain came in July, the best month since 2003. As for currencies, the dollar extended first quarter strength, based on faster U.S. growth and rising short-term interest rates. The euro was further buffeted by the defeat of a proposal for a European constitution, followed by an acrimonious stalemate on a European budget. For the six months, the U.S. currency rose 7.8% against the euro, 7.2% against the pound and 5.9% against the oil price sensitive yen.
Trends in investment grade U.S. fixed income securities had been dominated since the middle of 2004 by the flattening of the U.S. Treasury yield curve as ten-year yields fell even as the Federal Open Market Committee (“FOMC”) raised short-term interest rates seven times to the end of March 2005. In the next five months, apart from approximately five weeks in July 2005 and early August 2005 when the economic data was more upbeat, fears of slowing activity and increasing inflation in the face of repeated record oil prices continued to mount. Inflation would only be controlled by continual “measured” increases in short-term interest rates. The curve-flattening trend was accordingly sustained by three more increases in May, June and August. August ended with second quarter GDP growth being revised downward and a final new record oil price of almost $70 as Hurricane Katrina’s devastation became known. The spread between ten-year and 13-week U.S. Treasury yields had shrunk to 59 basis points, the narrowest since March of 2001. The rebound was swift in early September. However, in Katrina’s aftermath gasoline prices soared: deflationary on demand, inflationary on costs. President Bush lunched with Chairman Greenspan and many hoped that the FOMC might then relent. This caused short-term interest rates to drift down and longer-term rates to rise. But by mid-September, factory prices were reported to have risen by the most in decades. The FOMC duly struck for the 11th time by raising short term interest rates. Katrina was only a near-term setback: the FOMC was still not done. Short rates snapped back, joining longer rates now on the way up. For the half-year the yield on the ten-year U.S. Treasury Note fell by 17 basis points to 4.33%, while the yield on 13-week U.S. Treasury Bills rose 75 basis points to 3.47%. The return on the broader Lehman Brothers Aggregate Bond Index(2) was 2.31%, with not much difference between the Treasury and Corporate components on average. High yield bonds did rather well as investors chased yield. The Lehman Brothers High Yield Bond Index(3) returned 3.71%.
The U.S. equities market in the form of the Standard & Poor’s 500 Index (“S&P 500 Index”)(4), gained 5.0% (including dividends) in the half-year through September. The period started with stocks on the downswing after reaching a 2005 high point on March 7. Economists keenly watched the swirling crosscurrents in the fixed income markets described above. Falling bond yields generally make stocks relatively more attractive. Falling mortgage interest rates have encouraged refinancing on a massive scale and the funds raised have tended not to stay long in the wallets of American consumers, keeping expansion strong. But inexorably rising short-term rates tend to dampen demand and profit margins. Still, stocks benefited from July’s positive reports, especially robust second quarter company earnings figures. On August 3, 2005, the S&P 500 Index reached its highest level in four years, but then fell back. It was not a sell-off, more the drift down of a market that was not particularly cheap or expensive, just one whose best days were probably behind it. Little headway was made in September after Hurricane Katrina followed by Rita. High prices at the pump were already here. An expensive winter for heating fuel appeared to be certain. Evidence of sharply rising factory prices started to be found in local Federal Reserve and purchasing managers’ reports. By month end, with consumer confidence slumping, some commentators could be heard grumbling about stagflation.
Internationally, Japan equities soared 15.0%, based on the MSCI Japan Index(5) calculated in dollars plus net dividends. The market did little until August, but thereafter a new sense of optimism took hold, based on an encouraging improvement in domestic demand. However mostly was due to the chance of a new reformist beginning under Prime Minister Koizumi, who won a landslide election victory in support of his proposal to privatize Japan Post, the savings vehicle of choice among the Japanese public and, improbably, the world’s largest financial institution.
European ex UK markets added 7.4% in the half-year according to the MSCI Europe ex UK Index(6) including net dividends. Such bullish performance belied bearish economic conditions. High unemployment and restrictive employment practices continued to depress
2
MARKET PERSPECTIVE: SIX MONTHS ENDED SEPTEMBER 30, 2005
domestic demand while political deadlock in Germany disappointed reformers. But this served only to depress the euro. Stock markets cheered the weaker currency, while corporate profits held up and merger and acquisition activity revived, allowing stocks to advance in the face of record low bond yields.
The UK market gained 5.7% calculated in dollars, based on the MSCI UK Index(7) including net dividends. The period was dominated by the effect of five interest rate increases to restrain over-stretched consumers and soaring property prices. By the period end, house prices were falling, manufacturing was in decline, retail sales were at multi-year lows and second quarter GDP growth was the slowest since 1993. Nonetheless, company earnings held up and despite terrorist attacks, investors supported an inexpensive market that paid over 3% in dividends as they waited for better times.
(1) The MSCI World Index is an unmanaged index that measures the performance of over 1,400 securities listed on exchanges in the U.S., Europe, Canada, Australia, New Zealand and the Far East.
(2) The Lehman Brothers Aggregate Bond Index is a widely recognized, unmanaged index of publicly issued investment grade U.S. Government, mortgage-backed, asset-backed and corporate debt securities.
(3) The Lehman Brothers High Yield Bond Index is an unmanaged index that measures the performance of fixed-income securities generally representative of corporate bonds rated below investment-grade.
(4) The Standard & Poor’s 500 Index is an unmanaged index that measures the performance of securities of approximately 500 large-capitalization companies whose securities are traded on major U.S. stock markets.
(5) The MSCI Japan Index is a free float-adjusted market capitalization index that is designed to measure developed market equity performance in Japan.
(6) The MSCI Europe ex UK Index is a free float-adjusted market capitalization index that is designed to measure developed market equity performance in Europe, excluding the UK.
(7) The MSCI UK Index is a free float-adjusted market capitalization index that is designed to measure developed market equity performance in the UK.
All indices are unmanaged and investors cannot invest directly in an index.
Past performance does not guarantee future results. The performance quoted represents past performance. Investment return and principal value of an investment will fluctuate, and shares, when redeemed, may be worth more or less than their original cost. The Funds’ performance is subject to change since the period’s end and may be lower or higher than the performance data shown. Please call (800) 992-0180 or log on to www.ingfunds.com to obtain performance data current to the most recent month end.
Market Perspective reflects the views of the Chief Investment Risk Officer only through the end of the period, and is subject to change based on market and other conditions.
3
ING GNMA INCOME FUND | | PORTFOLIO MANAGERS’ REPORT |
Investment Types
as of September 30, 2005
(as a percent of total investments)
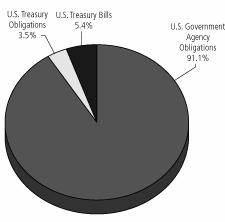
Portfolio holdings are subject to change daily.
The ING GNMA Income Fund (the “Fund”) seeks to generate a high level of current income, consistent with liquidity and safety of principal, through investment primarily in Government National Mortgage Association (“GNMA”) mortgage-backed securities (also known as GNMA Certificates) that are guaranteed as to the timely payment of principal and interest by the U.S. Government. The Fund is managed by Denis P. Jamison, CFA ING Investment Management Co. — the Sub-Adviser.
Performance: For the six months ended September 30, 2005, the Fund’s Class I shares, excluding sales charges, provided a total return of 1.84% compared to 2.12% return for the Lehman Brothers Mortgage-Backed Securities Index (“Lehman MBSIndex”)(5).
Portfolio Specifics: The Federal Reserve’s on-going policy of gradually raising short term interest rates has negatively impacted the value of bonds with maturities of five years and less. For example, since March 31, the five-year segment of the U.S. Treasury market has returned just 1.5% compared with a gain of 5.1% for long-term government bonds. Call-protected mortgages on multi-family properties account for about 25% of the Fund’s assets and these securities tend to be valued in line with three- to five-year U.S. Treasury notes rather than single-family mortgages. Accordingly, the softness in this sector of the yield curve hampered the Fund’s return and we do not expect a quick turnaround. The Federal Reserve shows no signs of changing monetary policy near term. Short-term interest rates are expected to continue to rise and the yield curve will flatten. Despite this near term problem, our multi-family loans are the source of the Fund’s relatively high income return because they have an average coupon of 7.3% and a relatively low cost basis. We are not inclined to reduce this holding and are attempting to mitigate the problem by opportunistically increasing and decreasing our holdings of 30-year U.S. Treasury bonds and adding some extra capital gains.
Our single family mortgage investments are defensive. The average coupon for this 66% slice of the portfolio is still 5.72% compared with 5.85% six months ago and 5.36% for the Lehman Mortgage-Backed Securities Index. The higher coupon mortgages tend to be less sensitive to interest rate changes and provide shareholders with a higher income return. Of course, these bonds tend to pay down more quickly and related losses are higher. For the six months ended September 30, prepayment losses amounted to 34 basis points more than that of the benchmark index.
Current Strategy and Outlook: The key factor determining the relative performance of the Fund is the return on three-five year U.S. Treasury securities compared with that of mortgages. In turn, this relates to the changes in the shape of the yield curve and overall market volatility. A flat yield curve and low volatility — the current condition — weigh against strong performance by the Fund. Unfortunately, we view this as the likely investment environment for the remainder of the year. However, we face considerable uncertainty in 2006. Economic expansion is closely tied to the health of the housing market and this sector is facing ever stronger headwinds as interest rates increase. Also, a change in leadership of the Federal Reserve could have an adverse impact on market volatility. We think there will be opportunities to increase the interest rate sensitivity of the Fund through the purchases of both U.S. Treasury bonds and lower coupon mortgages, which could lead to better absolute returns.
4
PORTFOLIO MANAGERS’ REPORT | | ING GNMA INCOME FUND |
| | |
| Average Annual Total Returns for the Periods Ended September 30, 2005 | |
| | | | | | | | |
| | | | | Since Inception | | Since Inception | |
| | | | | of Class I | | of Class Q | |
| | | 1 Year | | January 7, 2002 | | February 26, 2001 | |
| Class I | | 2.34% | | 4.84 | % | | — | | |
| Class Q | | 2.14% | | — | | | 5.02 | % | |
| Lehman Brothers Mortgage-Backed Securities Index(1) | | 3.29% | | 4.91 | %(2) | | 5.32 | %(3) | |
| | | | | | | | | | |
Based on a $10,000 initial investment, the table above illustrates the total return of ING GNMA Income Fund against the Index indicated. An index is unmanaged and has no cash in its portfolio, imposes no sales charges and incurs no operating expenses. An investor cannot invest directly in an index.
The performance table does not reflect the deduction of taxes that a shareholder will pay on Fund distributions or the redemption of Fund shares.
The performance shown may include the effect of fee waivers and/or expense reimbursements by the Investment Manager and/or other service providers, which have the effect of increasing total return. Had all fees and expenses been considered, the total returns would have been lower.
Performance data represents past performance and is no assurance of future results. Investment return and principal value of an investment in the Fund will fluctuate. Shares, when sold, may be worth more or less than their original cost. The Fund’s performance may be lower or higher than the performance data shown. Please log on to www.ingfunds.com or call (800) 992-0180 to get performance through the most recent month end.
This report contains statements that may be “forward-looking” statements. Actual results may differ materially from those projected in the “forward-looking” statements.
The views expressed in this report reflect those of the portfolio manager, only through the end of the period as stated on the cover. The portfolio manager’s views are subject to change at any time based on market and other conditions.
(1) | The Lehman Brothers Mortgage-Backed Securities Index is an unmanaged index composed of fixed income security mortgage pools sponsored by GNMA, FNMA and FHLMC, including GNMA Graduated Payment Mortgages. |
| |
(2) | Since inception performance for index is shown from January 1, 2002. |
| |
(3) | Since inception performance for index is shown from March 1, 2001. |
5
ING INTERMEDIATE BOND FUND | | PORTFOLIO MANAGERS’ REPORT |
Investment Types
as of September 30, 2005
(as a percent of total investments)

Portfolio holdings are subject to change daily.
The ING Intermediate Bond Fund (the “Fund”) seeks to provide investors with a high level of current income, consistent with the preservation of capital and liquidity by investing at least 80% of its assets in investment grade debt securities. The Fund is managed by James B. Kauffmann, ING Investment Management Co. — the Sub-Adviser.
Performance: For the six months ended September 30, 2005, the Fund’s Class I shares, excluding sales charges, provided a total return of 2.53% compared to 2.31% for the Lehman Brothers Aggregate Bond Index(4).
Portfolio Specifics: The Fund matched its benchmark during April largely due to our short duration posture in a rally. We maintained our underweight to credit on a contribution-to-duration and market-weight basis, which was beneficial in a market largely characterized by widening spreads; however, our overweight in commercial mortgage-backed securities was a drag on performance. We maintained a reduced mortgage allocation of 30% versus approximately 35% with a significant emphasis on adjustable rate mortgages and collateralized mortgage obligations over traditional pass-through securities.
The Fund underperformed its benchmark during May due again to our short duration posture in a rally. This duration call was partially offset by overweighting maturities that performed better than others. We initiated positions in auto industry bonds following the rapid price declines early in the month. Furthermore, we continued an underweight to credit. This was also a hindrance as the credit sensitive sectors recouped some of their losses in the final week of the month.
Our short duration posture in June was not beneficial. Term structure exposure was generally flat to the benchmark with a slight bias against the front-end of the yield curve; however, the curve flattened significantly. We continued to add automakers in June, but our positioning may have lagged the market. While we closed the month underweight the sector, the mortgage-backed securities portion of the portfolio was designed to benefit from a curve flattening, which did not occur as we had expected. Credit markets became more risk embracing during July and produced positive excess returns thus rewarding holders — such as ourselves — of riskier or less liquid instruments. We actively traded our auto sector during the month with exposures ranging from around 1.00% to 0% to 0.50%, and trust preferred securities (TRUPs) continue to play a significant role in the credit allocation. (TRUPs are trust preferred securities and are a unique form of preferred stock. The Fund has focused on TRUPs that pay floating rate interest. Floating rate securities tend to fare well in environments of increasing short-term interest rates which has been the case this year as the Federal Reserve has raised the Federal Funds rate repeatedly. Generally, TRUPs are subordinate to other debt issued by companies.)
The Fund slightly outperformed the index in August after we quickly withdrew our short duration posture in response to uncertainty about the impact of Hurricane Katrina. Although total returns were positive across the board, the month witnessed negative excess returns in every sector save agencies, asset-backed securities, and commercial mortgage-backed securities. Our modest exposure to high yield was not beneficial this month. The credit-sensitive markets were generally softer following the further downgrades of Ford and GM.
Awareness of inflation risks began to dominate in September. The Fund slightly underperformed the index during the month as we reinstated the short duration posture that we had in place before the storms with an overweight in 30-year maturities. Corporate bonds underperformed by 0.09% with the drag particularly acute in long-dated industrials and utilities. While our underweight in longer- dated corporates helped performance somewhat, exposures to commercial mortgage-backed securities did not.
Top Ten Industries
as of September 30, 2005
(as a percent of net assets)
U.S. Treasury Obligations | | 27.7 | % |
Federal National Mortgage Association | | 23.1 | % |
Whole Loan Collateralized Mortgage Obligations | | 12.8 | % |
Federal Home Loan Mortgage Corporation | | 7.3 | % |
Diversified Financial Sevices | | 5.7 | % |
Asset-Backed Securities | | 5.4 | % |
Commercial Mortgage-Backed Securities | | 5.4 | % |
Banks | | 5.1 | % |
Electric | | 2.6 | % |
Oil and Gas | | 1.6 | % |
Portfolio holdings are subject to change daily.
Current Strategy and Outlook: We have positioned the Fund for the potentiality that sentiment will reverse and higher risk premiums will be required by the market. Indeed, we are keenly aware that preserving capital and receiving adequate compensation for risk are essential elements of successful bond management. Specifically, the ING credit team continues to avoid companies with depressed stock prices and under-utilized assets on the books. Moreover, the contribution to duration of the corporate bond portion of the portfolio is less than the index. Our mortgage team has constructed a portfolio designed to offset an increase in volatility and a change in prepayments. Finally, our portfolio duration is shorter than the index with an overweight in the longest maturity bucket in anticipation of continued tightening by the Federal Reserve.
6
PORTFOLIO MANAGERS’ REPORT | | ING INTERMEDIATE BOND FUND |
| | | | | | |
| Average Annual Total Returns for the Periods Ended September 30, 2005 | |
| | | | | | |
| | | | | Since Inception | |
| | | | | of Class I | |
| | | 1 Year | | January 8, 2002 | |
| | | | | | |
| Class I | | 3.50% | | 6.16 | % | |
| Lehman Brothers Aggregate Bond Index(1) | | 2.80% | | 5.43 | %(2) | |
| | | | | | | |
Based on a $1,000,000 initial investment, the table above illustrates the total return of ING Intermediate Bond Fund against the Index indicated. An index is unmanaged and has no cash in its portfolio, imposes no sales charges and incurs no operating expenses. An investor cannot invest directly in an index.
The performance table does not reflect the deduction of taxes that a shareholder will pay on Fund distributions or the redemption of Fund shares.
The performance shown may include the effect of fee waivers and/or expense reimbursements by the Investment Manager and/or other service providers, which have the effect of increasing total return. Had all fees and expenses been considered, the total returns would have been lower.
Performance data represents past performance and is no assurance of future results. Investment return and principal value of an investment in the Fund will fluctuate. Shares, when sold, may be worth more or less than their original cost. The Fund’s performance may be lower or higher than the performance data shown. Please log on to www.ingfunds.com or call (800) 992-0180 to get performance through the most recent month end.
This report contains statements that may be “forward-looking” statements. Actual results may differ materially from those projected in the “forward-looking” statements.
The views expressed in this report reflect those of the portfolio manager, only through the end of the period as stated on the cover. The portfolio manager’s views are subject to change at any time based on market and other conditions.
Fund holdings are subject to change daily.
(1) The Lehman Brothers Aggregate Bond Index is a widely recognized, unmanaged index of publicly issued investment grade U.S. Government, mortgage-backed, asset-backed and corporate debt securities.
(2) Since inception performance for index is shown from January 1, 2002.
7
SHAREHOLDER EXPENSE EXAMPLES (Unaudited)
As a shareholder of a Fund, you incur two types of costs: (1) transaction costs, including sales charges (loads) on purchase payments, reinvested dividends, or other distributions; redemption fees; and exchange fees; and (2) ongoing costs, including management fees; distribution [and/or service] (12b-1) fees; and other Fund expenses. These Examples are intended to help you understand your ongoing costs (in dollars) of investing in a Fund and to compare these costs with the ongoing costs of investing in other mutual funds.
The Examples are based on an investment of $1,000 invested at the beginning of the period and held for the entire period from April 1, 2005 to September 30, 2005.
Actual Expenses
The first section of the table shown, “Actual Fund Return,” provides information about actual account values and actual expenses. You may use the information in this section, together with the amount you invested, to estimate the expenses that you paid over the period. Simply divide your account value by $1,000 (for example, an $8,600 account value divided by $1,000 = 8.6), then multiply the result by the number in the first section under the heading entitled “Expenses Paid During Period” to estimate the expenses you paid on your account during this period.
Hypothetical Example for Comparison Purposes
The second section of the table shown, “Hypothetical 5% Return,” provides information about hypothetical account values and hypothetical expenses based on the Fund’s actual expense ratio and an assumed rate of return of 5% per year before expenses, which is not the Fund’s actual return. The hypothetical account values and expenses may not be used to estimate the actual ending account balance or expenses you paid for the period. You may use this information to compare the ongoing costs of investing in the Fund and other funds. To do so, compare this 5% hypothetical example with the 5% hypothetical examples that appear in the shareholder reports of the other funds.
Please note that the expenses shown in the table are meant to highlight your ongoing costs only and do not reflect any transactional costs, such as sales charges (loads), redemption fees, or exchange fees. Therefore, the hypothetical lines of the table are useful in comparing ongoing costs only, and will not help you determine the relative total costs of owning different funds. In addition, if these transactional costs were included, your costs would have been higher.
| | | | | | | | | | |
| | | Beginning | | Ending | | | | Expenses Paid | |
| | | Account | | Account | | Annualized | | During the | |
| | | Value | | Value | | Expense | | Six Months Ended | |
| ING GNMA Income Fund | | April 1, 2005 | | September 30, 2005 | | Ratio | | September 30, 2005* | |
| | | | | | | | | | |
| Actual Fund Return | | | | | | | | | |
| | | | | | | | | | |
| Class I | | $1,000.00 | | | $1,018.40 | | | 0.70 | % | | $3.54 | | |
| | | | | | | | | | | | | | |
| Class Q | | 1,000.00 | | | 1,018.00 | | | 0.95 | | | 4.81 | | |
| | | | | | | | | | | | | | |
| Hypothetical (5% return before expenses) | | | | | | | | | | | | | |
| | | | | | | | | | | | | | |
| Class I | | $1,000.00 | | | $1,021.56 | | | 0.70 | % | | $3.55 | | |
| | | | | | | | | | | | | | |
| Class Q | | 1,000.00 | | | 1,020.31 | | | 0.95 | | | 4.81 | | |
| | | | | | | | | | | | | | |
| ING Intermediate Bond Fund | | | | | | | | | | | | | |
| | | | | | | | | | | | | | |
| Actual Fund Return | | | | | | | | | | | | | |
| | | | | | | | | | | | | | |
| Class I | | $1,000.00 | | | $1,025.30 | | | 0.69 | % | | $3.50 | | |
| | | | | | | | | | | | | | |
| Hypothetical (5% return before expenses) | | | | | | | | | | | | | |
| | | | | | | | | | | | | | |
| Class I | | $1,000.00 | | | $1,021.61 | | | 0.69 | % | | $3.50 | | |
| | | | | | | | | | |
* Expenses are equal to the Fund’s annualized expense ratios multiplied by the average account value over the period, multiplied by 183/365 to reflect the most recent fiscal half-year.
8
STATEMENTS OF ASSETS AND LIABILITIES as of September 30, 2005 (UNAUDITED)
| | ING | | ING | |
| | GNMA Income
Fund | | Intermediate Bond
Fund | |
ASSETS: | | | | | |
Investments in securities at value*+ | | | $ | 611,970,497 | | | | $ | 916,344,134 | | |
Short-term investments at amortized cost | | | 34,684,685 | | | | — | | |
Repurchase agreement | | | — | | | | 82,978,000 | | |
Cash | | | 1,007,825 | | | | 56,256 | | |
Cash collateral for futures | | | — | | | | 261,282 | | |
Cash collateral for securities loaned | | | — | | | | 189,517,473 | | |
Foreign currencies at value** | | | — | | | | 8,957 | | |
Receivables: | | | | | | | | | |
Investment securities sold | | | — | | | | 12,173,384 | | |
Fund shares sold | | | 173,520 | | | | 1,573,888 | | |
Dividends and interest | | | 3,080,644 | | | | 5,626,506 | | |
Variation margin receivable | | | — | | | | 19,238 | | |
Prepaid expenses | | | 68,738 | | | | 94,890 | | |
Unrealized appreciation on swap agreements | | | — | | | | 149,829 | | |
Total assets | | | 650,985,909 | | | | 1,208,803,837 | | |
| | | | | | | | | |
LIABILITIES: | | | | | | | | | |
Payable for investment securities purchased | | | — | | | | 149,918,457 | | |
Payable for fund shares redeemed | | | 442,558 | | | | 3,737,920 | | |
Payable for futures variation margin | | | — | | | | 60,750 | | |
Income distribution payable | | | — | | | | 533,372 | | |
Payable upon receipt of securities loaned | | | — | | | | 189,517,473 | | |
Payable to affiliates | | | 537,645 | | | | 665,780 | | |
Payable for trustee fees | | | 19,781 | | | | 7,836 | | |
Other accrued expenses and liabilities | | | 361,831 | | | | 563,405 | | |
Total liabilities | | | 1,361,815 | | | | 345,004,993 | | |
NET ASSETS | | | $ | 649,624,094 | | | | $ | 863,798,844 | | |
| | | | | | | | | |
NET ASSETS WERE COMPRISED OF: | | | | | | | | | |
Paid-in capital | | | $ | 662,079,607 | | | | $ | 866,313,807 | | |
Undistributed net investment income (accumulated net investment loss) | | | 725,397 | | | | (558,490 | ) | |
Accumulated net realized gain (loss) on investments, foreign currency related transactions, futures and swaps | | | (18,951,005 | ) | | | 6,398,900 | | |
Net unrealized appreciation or depreciation on investments foreign currency related transactions, futures and swaps | | | 5,770,095 | | | | (8,355,373 | ) | |
NET ASSETS | | | $ | 649,624,094 | | | | $ | 863,798,844 | | |
+ | | Including securities loaned at value | | | $ | — | | | | $ | 185,179,131 | | |
| | Cost of investments in securities | | | $ | 606,215,034 | | | | $ | 924,611,548 | | |
** | | Cost of foreign currencies | | | $ | — | | | | $ | 9,217 | | |
See Accompanying Notes to Financial Statements
9
STATEMENTS OF ASSETS AND LIABILITIES as of September 30, 2005 (UNAUDITED) (CONTINUED)
| | ING | | ING | |
| | GNMA Income
Fund | | Intermediate Bond
Fund | |
Class A: | | | | | |
Net assets | | | $ | 508,424,239 | | | | $ | 534,202,800 | | |
Shares authorized | | | unlimited | | | | unlimited | | |
Par value | | | $ | 0.001 | | | | $ | 0.001 | | |
Shares outstanding | | | 60,143,323 | | | | 51,503,815 | | |
Net asset value and redemption price per share | | | $ | 8.45 | | | | $ | 10.37 | | |
Maximum offering price per share (4.75%)(1) | | | $ | 8.87 | | | | $ | 10.89 | | |
| | | | | | | | | |
Class B: | | | | | | | | | |
Net assets | | | $ | 90,397,461 | | | | $ | 64,641,606 | | |
Shares authorized | | | unlimited | | | | unlimited | | |
Par value | | | $ | 0.001 | | | | $ | 0.001 | | |
Shares outstanding | | | 10,745,208 | | | | 6,244,547 | | |
Net asset value and redemption price per share(2) | | | $ | 8.41 | | | | $ | 10.35 | | |
Maximum offering price per share | | | $ | 8.41 | | | | $ | 10.35 | | |
| | | | | | | | | |
Class C: | | | | | | | | | |
Net assets | | | $ | 39,067,482 | | | | $ | 73,880,602 | | |
Shares authorized | | | unlimited | | | | unlimited | | |
Par value | | | $ | 0.001 | | | | $ | 0.001 | | |
Shares outstanding | | | 4,637,363 | | | | 7,131,907 | | |
Net asset value and redemption price per share(2) | | | $ | 8.42 | | | | $ | 10.36 | | |
Maximum offering price per share | | | $ | 8.42 | | | | $ | 10.36 | | |
| | | | | | | | | |
Class I: | | | | | | | | | |
Net assets | | | $ | 11,459,484 | | | | $ | 149,921,722 | | |
Shares authorized | | | unlimited | | | | unlimited | | |
Par value | | | $ | 0.001 | | | | $ | 0.001 | | |
Shares outstanding | | | 1,354,237 | | | | 14,450,352 | | |
Net asset value and redemption price per share | | | $ | 8.46 | | | | $ | 10.37 | | |
Maximum offering price per share | | | $ | 8.46 | | | | $ | 10.37 | | |
| | | | | | | | | |
Class M: | | | | | | | | | |
Net assets | | | $ | 194,179 | | | | N/A | | |
Shares authorized | | | unlimited | | | | N/A | | |
Par value | | | $ | 0.001 | | | | N/A | | |
Shares outstanding | | | 22,930 | | | | N/A | | |
Net asset value and redemption price per share | | | $ | 8.47 | | | | N/A | | |
Maximum offering price per share (3.25%)(3) | | | $ | 8.75 | | | | N/A | | |
| | | | | | | | | |
Class O: | | | | | | | | | |
Net assets | | | N/A | | | | $ | 40,497,262 | | |
Shares authorized | | | N/A | | | | unlimited | | |
Par value | | | N/A | | | | $ | 0.001 | | |
Shares outstanding | | | N/A | | | | 3,902,909 | | |
Net asset value and redemption price per share | | | N/A | | | | $ | 10.38 | | |
Maximum offering price per share | | | N/A | | | | $ | 10.38 | | |
| | | | | | | | | |
Class Q: | | | | | | | | | |
Net assets | | | $ | 81,249 | | | | N/A | | |
Shares authorized | | | unlimited | | | | N/A | | |
Par value | | | $ | 0.001 | | | | N/A | | |
Shares outstanding | | | 9,593 | | | | N/A | | |
Net asset value and redemption price per share | | | $ | 8.47 | | | | N/A | | |
Maximum offering price per share | | | $ | 8.47 | | | | N/A | | |
| | | | | | | | | |
Class R: | | | | | | | | | |
Net assets | | | N/A | | | | $ | 654,852 | | |
Shares authorized | | | N/A | | | | unlimited | | |
Par value | | | N/A | | | | $ | 0.001 | | |
Shares outstanding | | | N/A | | | | 63,042 | | |
Net asset value and redemption price per share | | | N/A | | | | $ | 10.39 | | |
Maximum offering price per share | | | N/A | | | | $ | 10.39 | | |
(1) | Maximum offering price is computed at 100/95.25 of net asset value. On purchases of $50,000 or more, the offering price is reduced. |
(2) | Redemption price per share may be reduced for any applicable contingent deferred sales charges. |
(3) | Maximum offering price is computed at 100/96.75 of net asset value. On purchases of $50,000 or more, the offering price is reduced. |
See Accompanying Notes to Financial Statements
10
STATEMENTS OF OPERATIONS for the year ended September 30, 2005 (UNAUDITED)
| | ING | | ING | |
| | GNMA Income
Fund | | Intermediate Bond
Fund | |
INVESTMENT INCOME: | | | | | | |
Dividends, net of foreign taxes withheld* | | | $ | — | | | | $ | 213,499 | | |
Interest | | | 19,549,552 | | | | 16,122,693 | | |
Securities lending income | | | — | | | | 367,412 | | |
Total investment income | | | 19,549,552 | | | | 16,703,604 | | |
| | | | | | | | | |
EXPENSES: | | | | | | | | | |
Investment management fees | | | 1,675,044 | | | | 1,775,769 | | |
Distribution and service fees | | | | | | | | | |
Class A | | | 648,251 | | | | 875,505 | | |
Class B | | | 478,059 | | | | 326,995 | | |
Class C | | | 204,256 | | | | 367,476 | | |
Class M | | | 736 | | | | — | | |
Class Q | | | 117 | | | | — | | |
Class O | | | — | | | | 47,983 | | |
Class R | | | — | | | | 988 | | |
Transfer agent fees | | | | | | | | | |
Class A | | | 191,088 | | | | 235,063 | | |
Class B | | | 35,166 | | | | 30,695 | | |
Class C | | | 15,031 | | | | 34,494 | | |
Class M | | | 68 | | | | — | | |
Class I | | | 976 | | | | 9,166 | | |
Class Q | | | 9 | | | | — | | |
Class O | | | — | | | | 18,263 | | |
Class R | | | — | | | | 185 | | |
Administrative service fees | | | 333,233 | | | | 366,758 | | |
Shareholder reporting expense | | | 101,110 | | | | 103,429 | | |
Registration fees | | | 43,494 | | | | 56,156 | | |
Professional fees | | | 39,635 | | | | 23,800 | | |
Custody and accounting fees | | | 42,960 | | | | 50,835 | | |
Trustee fees | | | 17,020 | | | | 13,160 | | |
Insurance expense | | | 8,628 | | | | 7,324 | | |
Miscellaneous expense | | | 13,065 | | | | 7,660 | | |
Total expenses | | | 3,847,946 | | | | 4,351,704 | | |
Net waived and reimbursed fees | | | — | | | | (250,133 | ) | |
Net expenses | | | 3,847,946 | | | | 4,101,571 | | |
Net investment income | | | 15,701,606 | | | | 12,602,033 | | |
| | | | | | | | | |
REALIZED AND UNREALIZED GAIN (LOSS) ON INVESTMENTS, FOREIGN CURRENCY RELATED TRANSACTIONS, FUTURES AND SWAPS: | | | | | | | | | |
Net realized gain (loss) on: | | | | | | | | | |
Investments | | | 954,637 | | | | 3,619,745 | | |
Foreign currency related transactions | | | — | | | | (12,415 | ) | |
Futures and swaps | | | — | | | | 1,328,925 | | |
Net realized gain on investments, foreign currency related transactions,
futures and swaps | | | 954,637 | | | | 4,936,255 | | |
Net change in unrealized appreciation or depreciation on: | | | | | | | | | |
Investments | | | (5,764,626 | ) | | | (3,043,040 | ) | |
Foreign currency related transactions | | | — | | | | (325 | ) | |
Futures and swaps | | | — | | | | 419,791 | | |
Net change in unrealized depreciation on investments, foreign currency related transactions, futures and swaps | | | (5,764,626 | ) | | | (2,623,574 | ) | |
Net realized and unrealized gain (loss) on investments, foreign currency related transactions, futures and swaps | | | (4,809,989 | ) | | | 2,312,681 | | |
Increase in net assets resulting from operations | | | $ | 10,891,617 | | | | $ | 14,914,714 | | |
|
|
*Foreign taxes | | | $ | — | | | | $ | 650 | | |
See Accompanying Notes to Financial Statements
11
STATEMENTS OF CHANGES IN NET ASSETS (UNAUDITED)
| | ING GNMA Income Fund | |
| | Six Months | | Year | |
| | Ended | | Ended | |
| | September 30,
2005 | | March 31,
2005 | |
FROM OPERATIONS: | | | | | |
Net investment income | | $ | 15,701,606 | | $ | 29,646,257 | |
Net realized gain (loss) on investments and foreign currency related transactions | | 954,637 | | (3,721,907 | ) |
Net change in unrealized depreciation on investments and foreign currency
related transactions | | (5,764,626 | ) | (23,036,826 | ) |
Net increase in net assets resulting from operations | | 10,891,617 | | 2,887,524 | |
| | | | | |
FROM DISTRIBUTIONS TO SHAREHOLDERS: | | | | | |
Net investment income: | | | | | |
Class A | | (12,922,349 | ) | (28,659,206 | ) |
Class B | | (2,043,598 | ) | (5,047,902 | ) |
Class C | | (869,799 | ) | (2,367,634 | ) |
Class M | | (4,390 | ) | (524,100 | ) |
Class I | | (291,738 | ) | (10,826 | ) |
Class Q | | (2,353 | ) | (5,596 | ) |
Total distributions | | (16,134,227 | ) | (36,615,264 | ) |
| | | | | |
FROM CAPITAL SHARE TRANSACTIONS: | | | | | |
Net proceeds from sale of shares | | 50,651,702 | | 123,893,040 | |
Dividends reinvested | | 13,436,990 | | 30,021,590 | |
| | 64,088,692 | | 153,914,630 | |
Cost of shares redeemed | | (83,977,781 | ) | (242,803,052 | ) |
Net decrease in net assets resulting from capital share transactions | | (19,889,089 | ) | (88,888,422 | ) |
Net decrease in net assets | | (25,131,699 | ) | (122,616,162 | ) |
| | | | | |
NET ASSETS: | | | | | |
Beginning of period | | 674,755,793 | | 797,371,955 | |
End of period | | $ | 649,624,094 | | $ | 674,755,793 | |
Undistributed net investment income at end of period | | $ | 725,397 | | $ | 1,158,018 | |
See Accompanying Notes to Financial Statements
12
STATEMENTS OF CHANGES IN NET ASSETS (UNAUDITED) (CONTINUED)
| | ING Intermediate Bond Fund | |
| | Six Months | | Year | |
| | Ended | | Ended | |
| | September 30,
2005 | | March 31,
2005 | |
FROM OPERATIONS: | | | | | |
Net investment income | | $ | 12,602,033 | | $ | 16,300,103 | |
Net realized gain on investments, foreign currency
related transactions, futures and swaps | | 4,936,255 | | 5,855,019 | |
Net change in unrealized depreciation on investments,
foreign currency related transactions, futures and swaps | | (2,623,574 | ) | (13,268,848 | ) |
Net increase in net assets resulting from operations | | 14,914,714 | | 8,886,274 | |
| | | | | |
FROM DISTRIBUTIONS TO SHAREHOLDERS: | | | | | |
Net investment income: | | | | | |
Class A | | (9,327,216 | ) | (12,001,725 | ) |
Class B | | (970,906 | ) | (1,597,263 | ) |
Class C | | (1,092,244 | ) | (1,698,192 | ) |
Class I | | (1,133,079 | ) | (1,112,409 | ) |
Class O | | (697,730 | ) | (614,124 | ) |
Class R | | (6,825 | ) | (7,162 | ) |
Net realized gains: | | | | | |
Class A | | — | | (5,402,910 | ) |
Class B | | — | | (1,055,176 | ) |
Class C | | — | | (1,104,030 | ) |
Class I | | — | | (338,522 | ) |
Class O | | — | | (114,108 | ) |
Class R | | — | | (3,136 | ) |
Total distributions | | (13,228,000 | ) | (25,048,757 | ) |
| | | | | |
FROM CAPITAL SHARE TRANSACTIONS: | | | | | |
Net proceeds from sale of shares | | 247,131,643 | | 277,518,838 | |
Net proceeds from shares issued in merger | | — | | 137,658,413 | |
Dividends reinvested | | 10,404,750 | | 18,700,295 | |
| | 257,536,393 | | 433,877,546 | |
Cost of shares redeemed | | (69,819,791 | ) | (165,583,293 | ) |
Net increase in net assets resulting from capital share transactions | | 187,716,602 | | 268,294,253 | |
Net increase in net assets | | 189,403,316 | | 252,131,770 | |
| | | | | |
NET ASSETS: | | | | | |
Beginning of period | | 674,395,528 | | 422,263,758 | |
End of period | | $ | 863,798,844 | | $ | 674,395,528 | |
Undistributed net investment income (accumulated net investment loss) at end of period | | $ | (558,490 | ) | $ | 67,477 | |
See Accompanying Notes to Financial Statements
13
ING GNMA INCOME FUND (UNAUDITED) | | FINANCIAL HIGHLIGHTS |
Selected data for a share of beneficial interest outstanding throughout each period.
| | | | | | Class I | | | | | |
| | Six Months
Ended | | | | | | | | January 7,
2002(1) to | |
| | September 30, | | Year Ended March 31, | | March 31, | |
| | 2005 | | 2005 | | 2004 | | 2003 | | 2002 | |
| | | | | | | | | | | | |
Per Share Operating Performance: | | | | | | | | | | | | |
Net asset value, beginning of period | $ | | 8.53 | | | 8.92 | | | 9.01 | | | 8.54 | | | 8.61 | | |
Income (loss) from investment operations: | | | | | | | | | | | | | | | | | |
Net investment income | $ | | 0.22 | | | 0.41 | | | 0.35 | | | 0.44 | | | 0.10 | | |
Net realized and unrealized gain (loss) on investments | $ | | (0.06 | ) | | (0.32 | ) | | 0.01 | | | 0.50 | | | (0.10 | ) | |
Total from investment operations | $ | | 0.16 | | | 0.09 | | | 0.36 | | | 0.94 | | | 0.00 | | |
Less distributions from: | | | | | | | | | | | | | | | | | |
Net investment income | $ | | 0.23 | | | 0.48 | | | 0.45 | | | 0.47 | | | 0.07 | | |
Total distributions | $ | | 0.23 | | | 0.48 | | | 0.45 | | | 0.47 | | | 0.07 | | |
Net asset value, end of period | $ | | 8.46 | | | 8.53 | | | 8.92 | | | 9.01 | | | 8.54 | | |
Total Return(2) | % | | 1.84 | | | 1.05 | | | 4.21 | | | 11.18 | | | 0.04 | | |
| | | | | | | | | | | | | | | | | |
Ratios and Supplemental Data: | | | | | | | | | | | | | | | | | |
Net assets, end of period (000’s) | $ | | 11,459 | | | 10,539 | | | 8,760 | | | 6,946 | | | 1,615 | | |
Ratios to average net assets: | | | | | | | | | | | | | | | | | |
Expenses(3) | % | | 0.70 | | | 0.68 | | | 0.71 | | | 0.78 | | | 0.88 | | |
Net investment income(3) | % | | 5.16 | | | 4.59 | | | 3.94 | | | 5.00 | | | 5.83 | | |
Portfolio turnover rate | % | | 29 | | | 40 | | | 128 | | | 75 | | | 76 | | |
| | | Class Q | |
| | | Six Months
Ended | | | | | | | | | | February 26,
2001(1) to | |
| | | September 30, | | Year Ended March 31, | | March 31, | |
| | | 2005 | | 2005 | | 2004 | | 2003 | | 2002 | | 2001 | |
| | | | | | | | | | | | | | | | | | | | |
Per Share Operating Performance: | | | | | | | | | | | | | | | | | | | | |
Net asset value, beginning of period | $ | | 8.53 | | | 8.92 | | | 9.01 | | | 8.54 | | | 8.63 | | | 8.51 | | |
Income (loss) from investment operations: | | | | | | | | | | | | | | | | | | | | |
Net investment income | $ | | 0.21 | | | 0.39 | | | 0.32 | | | 0.44 | | | 0.39 | | | 0.04 | | |
Net realized and unrealized gain (loss)
on investments | $ | | (0.06 | ) | | (0.33 | ) | | 0.02 | | | 0.47 | | | (0.01 | ) | | 0.08 | | |
Total from investment operations | $ | | 0.15 | | | 0.06 | | | 0.34 | | | 0.91 | | | 0.38 | | | 0.12 | | |
Less distributions from: | | | | | | | | | | | | | | | | | | | | |
Net investment income | $ | | 0.21 | | | 0.45 | | | 0.43 | | | 0.44 | | | 0.47 | | | — | | |
Total distributions | $ | | 0.21 | | | 0.45 | | | 0.43 | | | 0.44 | | | 0.47 | | | — | | |
Net asset value, end of period | $ | | 8.47 | | | 8.53 | | | 8.92 | | | 9.01 | | | 8.54 | | | 8.63 | | |
Total Return(2) | % | | 1.80 | | | 0.76 | | | 3.94 | | | 10.90 | | | 4.50 | | | 1.41 | | |
| | | | | | | | | | | | | | | | | | | | |
Ratios and Supplemental Data: | | | | | | | | | | | | | | | | | | | | |
Net assets, end of period (000’s) | $ | | 81 | | | 103 | | | 134 | | | 183 | | | 204 | | | 476 | | |
Ratios to average net assets: | | | | | | | | | | | | | | | | | | | | |
Expenses(3) | % | | 0.95 | | | 0.93 | | | 0.96 | | | 1.04 | | | 1.12 | | | 1.14 | | |
Net investment income(3) | % | | 4.93 | | | 4.32 | | | 3.62 | | | 4.89 | | | 5.35 | | | 5.42 | | |
Portfolio turnover rate | % | | 29 | | | 40 | | | 128 | | | 75 | | | 76 | | | 33 | | |
(1) | | Commencement of operations. |
(2) | | Total return is calculated assuming reinvestment of all dividends and capital gain distributions at net asset value. Total return for less than one year is not annualized. |
(3) | | Annualized for periods less than one year. |
See Accompanying Notes to Financial Statements.
14
ING INTERMEDIATE BOND FUND (UNAUDITED) | | FINANCIAL HIGHLIGHTS |
Selected data for a share of beneficial interest outstanding throughout each period.
| | | Class I | |
| | | Six Months
Ended | | | | | | | | January 8,
2002(1) to | |
| | | September 30, | | Year Ended March 31, | | March 31, | |
| | | 2005 | | 2005 | | 2004 | | 2003 | | 2002 | |
| | | | | | | | | | | | | | | | | |
Per Share Operating Performance: | | | | | | | | | | | | | | | | | |
Net asset value, beginning of period | $ | | 10.32 | | | 10.67 | | | 10.51 | | | 9.91 | | | 9.99 | | |
Income (loss) from investment operations: | | | | | | | | | | | | | | | | | |
Net investment income | $ | | 0.21 | | | 0.36 | ** | | 0.35 | | | 0.39 | | | 0.11 | | |
Net realized and unrealized gain (loss) on investments | $ | | 0.05 | | | (0.17 | ) | | 0.33 | | | 0.76 | | | (0.07 | ) | |
Total from investment operations | $ | | 0.26 | | | 0.19 | | | 0.68 | | | 1.15 | | | 0.04 | | |
Less distributions from: | | | | | | | | | | | | | | | | | |
Net investment income | $ | | 0.21 | | | 0.37 | | | 0.38 | | | 0.40 | | | 0.12 | | |
Net realized gain on investments | $ | | — | | | 0.17 | | | 0.14 | | | 0.15 | | | — | | |
Total distributions | $ | | 0.21 | | | 0.54 | | | 0.52 | | | 0.55 | | | 0.12 | | |
Net asset value, end of period | $ | | 10.37 | | | 10.32 | | | 10.67 | | | 10.51 | | | 9.91 | | |
Total Return(2) | % | | 2.53 | | | 1.85 | | | 6.60 | | | 11.88 | | | 0.36 | | |
| | | | | | | | | | | | | | | | | |
Ratios and Supplemental Data: | | | | | | | | | | | | | | | | | |
Net assets, end of period (000’s) | $ | | 150,425 | | | 43,808 | | | 14,548 | | | 15,046 | | | 9,800 | | |
Ratios to average net assets: | | | | | | | | | | | | | | | | | |
Net expenses after expense reimbursement/recoupment(3)(4) | % | | 0.69 | | | 0.68 | | | 0.71 | | | 0.73 | | | 0.82 | | |
Gross expenses prior to expense reimbursement/recoupment(3) | % | | 0.69 | | | 0.72 | | | 0.68 | | | 0.73 | | | 0.90 | | |
Net investment income after expense reimbursement/recoupment(3)(4) | % | | 3.90 | | | 3.43 | | | 3.30 | | | 3.70 | | | 0.05 | | |
Portfolio turnover rate | % | | 304 | | | 417 | | | 475 | | | 639 | | | 1,216 | * | |
(1) | | Commencement of operations. |
(2) | | Total return is calculated assuming reinvestment of all dividends and capital gain distributions at net asset value. Total return for less than one year is not annualized. |
(3) | | Annualized for periods less than one year. |
(4) | | The Investment Manager has agreed to limit expenses, (excluding interest, taxes, brokerage and extraordinary expenses) subject to possible recoupment by ING Investments, LLC within three years. |
* | | Portfolio turnover was greater than expected during this period due to active trading undertaken in response to market conditions that existed at that time. |
** | | Per share data calculated using the average number of shares outstanding throughout the period. |
See Accompanying Notes to Financial Statements.
15
NOTES TO FINANCIAL STATEMENTS AS OF SEPTEMBER 30, 2005 (UNAUDITED)
NOTE 1 — ORGANIZATION
Organization. ING Funds Trust (“Trust”) is a Delaware business trust registered as an open-end management investment company. The Trust was organized on August 6, 1998 and was established under a Trust Instrument dated June 30, 1998. It consists of six separately managed series ING GNMA Income Fund (“GNMA Income”) and ING Intermediate Bond Fund (“Intermediate Bond”) are included in this report. (Each a “Fund” and collectively, the “Funds”.)
The investment objective of each Fund is described in each Fund’s prospectus.
Each Fund offers at least three of the following classes of shares: Class A, Class B, Class C, Class I, Class M, Class O, Class Q and Class R. The separate classes of shares differ principally in the applicable sales charges (if any), transfer agent fees, distribution fees and shareholder servicing fees. Shareholders of each class also bear certain expenses that pertain to that particular class. All shareholders bear the common expenses of the Fund and earn income and realized gains/losses from the portfolio pro rata based on the average daily net assets of each class, without distinction between share classes. Differences in per share dividend rates generally result from the differences in separate class expenses, including distribution, and shareholder servicing fees. Class B shares, along with their pro rata reinvested dividend shares, automatically convert to Class A shares approximately eight years after purchase.
ING Investments, LLC (“ING Investments”), serves as the Investment Manager to the Funds. ING Investments has engaged INGInvestment Management Co. (“ING IM”), to serve as the Sub-Adviser to the Funds. ING Funds Distributor, LLC (the “Distributor”) is the principal underwriter of the Funds. The Distributor, ING Investments and ING IM are indirect, wholly-owned subsidiaries of ING Groep N.V. (“ING Groep”). ING Groep is one of the largest financial services organizations in the world, and offers an array of banking, insurance and asset management services to both individuals and institutional investors.
NOTE 2 — SIGNIFICANT ACCOUNTING POLICIES
The following significant accounting policies are consistently followed by the Funds in the preparation of their financial statements, and such policies are in conformity with accounting principles generally accepted in the United States of America for investment companies.
A. Security Valuation. Investments in equity securities traded on a national securities exchange are valued at the last reported sale price. Securities reported by NASDAQ will be valued at the NASDAQ official closing prices. Securities traded on an exchange or NASDAQ for which there has been no sale and securities traded in the over-the-counter-market are valued at the mean between the last reported bid and ask prices. All investments quoted in foreign currencies will be valued daily in U.S. dollars on the basis of the foreign currency exchange rates prevailing at that time. Debt securities are valued at prices obtained from independent services or from one or more dealers making markets in the securities and may be adjusted based on the Funds’ valuation procedures. U.S. Government obligations are valued by using market quotations or independent pricing services that use prices provided by marketmakers or estimates of market values obtained from yield data relating to instruments or securities with similar characteristics.
Securities and assets for which market quotations are not readily available (which may include certain restricted securities which are subject to limitations as to their sale) are valued at their fair values as determined in good faith by or under the supervision of the Funds’ Board of Directors/Trustees (“Board”), in accordance with methods that are specifically authorized by the Board. Securities traded on exchanges, including foreign exchanges, which close earlier than the time that a Fund calculates its net asset value (“NAV”) may also be valued at their fair values as determined in good faith by or under the supervision of a Fund’s Board, in accordance with methods that are specifically authorized by the Board. If an event occurs after the time at which the market for foreign securities held by the Fund closes but before the time that the Fund’s NAV is calculated, such event may cause the closing price on the foreign exchange to not represent a readily available reliable market value quotation for such securities at the time the Fund determines its NAV. In such a case, the Fund will use the fair value of such securities as determined under the Fund’s valuation procedures. Events after the close of trading on a foreign market that could require the Fund to fair value some or all of its foreign securities include, among others, securities trading in the U.S. and other markets, corporate announcements, natural and other disasters, and political and other events. Among other elements of analysis in the determination of a security’s fair value, the Board has authorized the use of one or more independent research services to assist with such determinations. An independent research service may use statistical analyses and
16
NOTES TO FINANCIAL STATEMENTS AS OF SEPTEMBER 30, 2005 (UNAUDITED) (CONTINUED)
NOTE 2 — SIGNIFICANT ACCOUNTING POLICIES (continued)
quantitative models to help determine fair value as of the time a Fund calculates its NAV. There can be no assurance that such models accurately reflect the behavior of the applicable markets or the effect of the behavior of such markets on the fair value of securities, or that such markets will continue to behave in a fashion that is consistent with such models. Unlike the closing price of a security on an exchange, fair value determinations employ elements of judgment. Consequently, the fair value assigned to a security may not represent the actual value that the Fund could obtain if it were to sell the security at the time of the close of the NYSE. Pursuant to procedures adopted by the Board, the Fund is not obligated to use the fair valuations suggested by any research service, and valuation recommendations provided by such research services may be overridden if other events have occurred or if other fair valuations are determined in good faith to be more accurate. Unless an event is such that it causes the Fund to determine that the closing prices for one or more securities do not represent readily available reliable market value quotations at the time the Fund determines its NAV, events that occur between the time of the close of the foreign market on which they are traded and the close of regular trading on the NYSE will not be reflected in the Fund’s NAV. Investments in securities maturing in 60 days or less from the date of acquisition are valued at amortized cost, which, when combined with accrued interest, approximates market value.
B. Security Transactions and Revenue Recognition. Securities transactions are accounted for on the trade date. Realized gains and losses are reported on the basis of identified cost of securities sold. Interest income is recorded on an accrual basis. Dividend income is recorded on the ex-dividend date, or for certain foreign securities, when the information becomes available to the funds. Premium amortization and discount accretion are determined by the effective yield method.
C. Foreign Currency Translation. The books and records of the Funds are maintained in U.S. dollars. Any foreign currency amounts are translated into U.S. dollars on the following basis:
(1) Market value of investment securities, other assets and liabilities — at the exchange rates prevailing at the end of the day.
(2) Purchases and sales of investment securities, income and expenses — at the rates of exchange prevailing on the respective dates of such transactions.
Although the net assets and the market values are presented at the foreign exchange rates at the end of the day, the Funds do not isolate the portion of the results of operations resulting from changes in foreign exchange rates on investments from the fluctuations arising from changes in market prices of securities held. Such fluctuations are included with the net realized and unrealized gains or losses from investments. For securities that are subject to foreign withholding tax upon disposition, liabilities are recorded on the Statements of Assets and Liabilities for the estimated tax withholding based on the securities’ current market values. Upon disposition, realized gains or losses on such securities are recorded net of foreign withholding tax.
Reported net realized foreign exchange gains or losses arise from sales of foreign currencies, currency gains or losses realized between the trade and settlement dates on securities transactions, the difference between the amounts of dividends, interest, and foreign withholding taxes recorded on the Funds’ books, and the U.S. dollar equivalent of the amounts actually received or paid. Net unrealized foreign exchange gains and losses arise from changes in the value of assets and liabilities other than investments in securities at fiscal year end, resulting from changes in the exchange rate. Foreign security and currency transactions may involve certain considerations and risks not typically associated with investing in U.S. companies and U.S. Government securities. These risks include, but are not limited to revaluation of currencies and future adverse political and economic developments which could cause securities and their markets to be less liquid and prices more volatile than those of comparable U.S. companies and U.S. Government securities.
D. Foreign Currency Transactions and Futures Contracts. Intermediate Bond may enter into foreign currency exchange transactions to convert to and from different foreign currencies and to and from the U.S. dollar in connection with the planned purchases or sales of securities. The Funds either enter into these transactions on a spot basis at the spot rate prevailing in the foreign currency exchange market or use forward foreign currency contracts to purchase or sell foreign currencies. When the contract is fulfilled or closed, gains or
17
NOTES TO FINANCIAL STATEMENTS AS OF SEPTEMBER 30, 2005 (UNAUDITED) (CONTINUED)
NOTE 2 — SIGNIFICANT ACCOUNTING POLICIES (continued)
losses are realized. Until then, the gain or loss is included in unrealized appreciation or depreciation. Risks may arise upon entering into forward contracts from the potential inability of counterparties to meet the terms of their forward contracts and from the potential inability of counterparties to meet the terms of their forward contracts and from unanticipated movements in the value of foreign currencies relative to the U.S. dollar.
Intermediate Bond may enter into futures contracts involving foreign currency, interest rates, securities and securities indices. A futures contract obligates the seller of the contract to deliver and the purchaser of the contract to take delivery of the type of foreign currency, financial instrument or security called for in the contract at a specified future time for a specified price. Upon entering into such a contract, a Fund is required to deposit and maintain as collateral such initial margin as required by the exchange on which the contract is traded. Pursuant to the contract, a Fund agrees to receive from or pay to the broker an amount equal to the daily fluctuations in the value of the contract. Such receipts or payments are known as variation margins and are recorded as unrealized gains or losses by the Fund. When the contract is closed, the Fund records a realized gain or loss equal to the difference between the value of the contract at the time it was opened and the value at the time it was closed.
E. Distributions to Shareholders. The Funds record distributions to their shareholders on the ex-dividend date. Intermediate Bond declares dividends daily and pays dividends monthly. GNMA Income declares and pays dividends monthly. The Funds may make distributions on a more frequent basis to comply with the distribution requirements of the Internal Revenue Code. The characteristics of income and gains to be distributed are determined in accordance with income tax regulations, which may differ from accounting principles generally accepted in the United States of America for investment companies.
F. Federal Income Taxes. It is the policy of the Funds to comply with Subchapter M of the Internal Revenue Code and related excise tax provisions applicable to regulated investment companies and to distribute substantially all of their net investment income and any net realized capital gains to their shareholders. Therefore, no federal income tax provision is required. No capital gain distributions shall be made until any capital loss carryforwards have been fully utilized or expired.
G. Use of Estimates. Management of the Funds has made certain estimates and assumptions relating to the reporting of assets, liabilities, income, and expenses to prepare these financial statements in conformity with accounting principles generally accepted in the United States of America for investment companies. Actual results could differ from these estimates.
H. Repurchase Agreements. Each Fund may invest in repurchase agreements only with government securities dealers recognized by the Board of Governors of the Federal Reserve System. Under such agreements, the seller of the security agrees to repurchase it at a mutually agreed upon time and price. The resale price is in excess of the purchase price and reflects an agreed upon interest rate for the period of time the agreement is outstanding. The period of the repurchase agreements is usually short, from overnight to one week, while the underlying securities generally have longer maturities. Each Fund will receive as collateral securities acceptable to it whose market value is equal to at least 100% of the carrying amount of the repurchase agreements, plus accrued interest, being invested by the Fund. The underlying collateral is valued daily on a mark to market basis to assure that the value, including accrued interest is at least equal to the repurchase price. There would be potential loss to the Fund in the event the Fund is delayed or prevented from exercising its right to dispose of the collateral, and it might incur disposition costs in liquidating the collateral.
I. Securities Lending. Intermediate Bond has the option to temporarily loan up to 30% of its total assets to brokers, dealers or other financial institutions in exchange for a negotiated lender’s fee. The borrower is required to fully collateralize the loans with cash or U.S. Government securities. Generally, in the event of counterparty default, the Fund has the right to use collateral to offset losses incurred. There would be potential loss to the Fund in the event the Fund is delayed or prevented from exercising its right to dispose of the collateral. The Fund bears the risk of loss with respect to the investment of collateral. Engaging in securities lending could have a leveraging effect, which may intensify the credit, market and other risks associated with investing in a Fund.
18
NOTES TO FINANCIAL STATEMENTS AS OF SEPTEMBER 30, 2005 (UNAUDITED) (CONTINUED)
NOTE 2 — SIGNIFICANT ACCOUNTING POLICIES (continued)
J. Illiquid and Restricted Securities. GNMA Income may not invest in illiquid securities. Illiquid securities are not readily marketable. Disposing of illiquid investments may involve time-consuming negotiation and legal expenses, and it may be difficult or impossible for the Funds to sell them promptly at an acceptable price. Restricted securities are those sold under Rule 144A of the Securities Act of 1933 (“1933 Act”) or are securities offered pursuant to Section 4(2) of the 1933 Act, and are subject to legal or contractual restrictions on resale and may not be publicly sold without registration under the 1933 Act. Certain restricted securities may be considered liquid pursuant to procedures adopted by the Board or may be deemed illiquid because they may not be readily marketable. Illiquid and restricted securities are valued using market quotations when readily available. In the absence of market quotations, the securities are valued based upon their fair value determined under procedures approved by the Board.
K. Delayed Delivery Transaction. The Funds may purchase or sell securities on a when-issued or forward commitment basis. The price of the underlying securities and date when the securities will be delivered and paid for are fixed at the time the transaction is negotiated. The market value of such is identified in the Funds’ Portfolio of Investments. Losses may arise due to changes in the market value of the securities or from the inability of counterparties to meet the terms of the contract. In connection with such purchases, the Funds are required to hold liquid assets as collateral with the Funds’ custodian sufficient to cover the purchase price.
L. Mortgage Dollar Roll Transactions. Each Fund may engage in dollar roll transactions with respect to mortgage-backed securities issued by Government National Mortgage Association, Federal National Mortgage Association and Federal Home Loan Mortgage Corp. In a dollar roll transaction, a Fund sells a mortgage-backed security to a financial institution, such as a bank or broker/dealer, and simultaneously agrees to repurchase a substantially similar (i.e., same type, coupon, and maturity) security from the institution on a delayed delivery basis at an agreed upon price. The mortgage-backed securities that are repurchased will bear the same interest rate as those sold, but generally will be collateralized by different pools of mortgages with different prepayment histories. The Funds account for dollar roll transactions as purchases and sales.
M. Options Contracts. Intermediate Bond may purchase put and call options and may write (sell) put options and covered call options. The Funds may engage in option transactions as a hedge against adverse movements in the value of portfolio holdings or to increase market exposure. Option contracts are valued daily and unrealized gains or losses are recorded based upon the last sales price on the principal exchange on which the options are traded. The Funds will realize a gain or loss upon the expiration or closing of the option contract. When an option is exercised, the proceeds on sales of the underlying security for a written call option, the purchase cost of the security for a written put option, or the cost of the security for a purchased put or call option is adjusted by the amount of premium received or paid. Realized and unrealized gains or losses on option contracts are reflected in the accompanying financial statements. The risk in writing a call option is that the Funds give up the opportunity for profit if the market price of the security increases and the option is exercised. The risk in writing a put option is that the Funds may incur a loss if the market price of the security decreases and the option is exercised. The risk in buying an option is that the Funds pay a premium whether or not the option is exercised. Risks may also arise from an illiquid secondary market or from the inability of counterparties to meet the terms of the contract.
N. Construction Loan Securities. GNMA Income may purchase construction loan securities, which are issued to finance building costs. The funds are disbursed as needed or in accordance with a prearranged plan. The securities provide for the timely payment to the registered holder of interest at the specified rate plus scheduled installments of principal. Upon completion of the construction phase, the construction loan securities are terminated and project loan securities are issued. It is the Fund’s policy to record these GNMA certificates on trade date, and to segregate assets to cover its commitments on trade date as well.
NOTE 3 — INVESTMENT TRANSACTIONS
For the six months ended September 30, 2005, the cost of purchases and proceeds from the sales of securities, excluding short-term securities, were as follows:
| | Purchases | | Sales | |
Intermediate Bond | | 208,018,939 | | 155,715,930 | |
19
NOTES TO FINANCIAL STATEMENTS AS OF SEPTEMBER 30, 2005 (UNAUDITED) (CONTINUED)
NOTE 3 — INVESTMENT TRANSACTIONS (continued)
U.S. Government securities not included above were as follows:
| | Purchases | | Sales | |
GNMA Income | | $ | 163,489,377 | | $ | 181,522,778 | |
Intermediate Bond | | 1,853,145,460 | | 1,739,667,862 | |
| | | | | | | |
NOTE 4 — INVESTMENT MANAGEMENT AND ADMINISTRATIVE FEES
All Funds in this report have an Investment Management Agreement with ING Investments, LLC (the “Investment Manager”). The Investment Management Agreement compensates the Investment Manager with a fee, computed daily and payable monthly, based on the average daily net assets of each Fund, at the following annual rates:
For GNMA Income — 0.60% of the first $150 million, 0.50% of the next $250 million, 0.45% of the next $400 million and 0.40% in excess of $800 million; for Intermediate Bond — 0.50% of the first $500 million, 0.45% of the next $500 million, 0.425% of the next $1 billion and 0.40% in excess of $2 billion.
The Investment Manager has entered into a Sub-Advisory Agreement with ING IM. Subject to such policies as the Board or the Investment Manager may determine, ING IM manages the Funds’ assets in accordance with the Funds’ investment objectives, policies, and limitations.
ING Funds Services, LLC (“IFS”), an indirect, wholly-owned subsidiary of ING Groep, acts as administrator and provides certain administrative and shareholder services necessary for Fund operations and is responsible for the supervision of other service providers. For its services, IFS is entitled to receive from each Fund a fee at an annual rate of 0.10% of its average daily net assets.
NOTE 5 — DISTRIBUTION AND SERVICE FEES
Each share class of the Funds (except as noted below) has adopted a Distribution Plan pursuant to Rule 12b-1 under the 1940 Act (the “12b-1 Plans”), whereby the Distributor is reimbursed or compensated (depending on the class of shares) by the Funds for expenses incurred in the distribution of each Fund’s shares (“Distribution Fees”). Pursuant to the 12b-1 Plans, the Distributor is entitled to payment each month for expenses incurred in the distribution and promotion of each Fund’s shares, including expenses incurred in printing prospectuses and reports used for sales purposes, expenses incurred in preparing and printing sales literature and other such distribution related expenses, including any distribution or shareholder servicing fees (“Service Fees”) paid to securities dealers who have executed a distribution agreement with the Distributor. Under the 12b-1 Plans, each class of shares of the Fund pays the Distributor a Distribution and/or Service Fee based on average daily net assets at the following annual rates:
| | Class A | | Class B | | Class C | | Class M | | Class O | | Class Q | | Class R | |
GNMA Income | | 0.25 | % | | 1.00 | % | | 1.00 | % | | 0.75 | % | | N/A | | | 0.25 | % | | N/A | | |
Intermediate | | | | | | | | | | | | | | | | | | | | | | |
Bond | | 0.35 | % | | 1.00 | % | | 1.00 | % | | N/A | | | 0.25 | % | | N/A | | | 0.50 | % | |
During the six months ended September 30, 2005, the Distributor waived 0.10% of the Class A Distribution Fee for Intermediate Bond.
The Distributor also receives the proceeds of initial sales charge paid by shareholders upon the purchase of Class A and Class M shares, and the contingent deferred sales charge paid by shareholders upon certain redemptions for Class A, Class B, and Class C shares. For the six months ended September 30, 2005, the Distributor retained the following amounts in sales charges:
| | Class A
Shares | | Class B
Shares | | Class C
Shares | | Class M
Shares | |
Initial Sales Charges | | | | | | | | | |
GNMA Income | | $12,889 | | | N/A | | N/A | | | — | | |
Intermediate Bond | | 15,503 | | | N/A | | N/A | | | — | | |
Contingent Deferred Sales Charge | | | | | | | | | | | | |
GNMA Income | | 15,710 | | | N/A | | 4,280 | | | N/A | | |
Intermediate Bond | | 3,062 | | | N/A | | 4,231 | | | N/A | | |
NOTE 6 — OTHER TRANSACTIONS WITH AFFILIATES AND RELATED PARTIES
At September 30, 2005, the Funds had the following amounts recorded in payable to affiliates on the accompanying Statements of Assets and Liabilities (see Notes 4 and 5):
| | | | | | Accrued | | | | | |
| | Accrued | | | | Shareholder | | | | | |
| | Investment | | Accrued | | Services and | | Accrued | | | |
| | Management
Fees | | Administrative
Fees | | Distribution
Fees | | Reimbursement
Expense | | Total | |
GNMA Income | | $270,847 | | | $53,795 | | | $213,003 | | | $ — | | | $537,645 | | |
Intermediate | | | | | | | | | | | | | | | | |
Bond | | 321,331 | | | 66,840 | | | 232,368 | | | 45,241 | | | 665,780 | | |
At September 30, 2005, ING Life Insurance and Annuity Co., an indirect, wholly-owned subsidiary of ING Groep, held 9.84% and 21.02% of the shares outstanding of GNMA Income and Intermediate Bond, respectively. Also at September 30, 2005, ING National Trust, an indirect, wholly-owned subsidiary of ING Groep, owned 14.63% of Intermediate Bond.
Each Fund has adopted a Retirement Policy covering all independent trustees of the Fund who will have served as an independent trustee for at least five years at the time of retirement. Benefits under this plan are based on an annual rate as defined in the plan agreement.
20
NOTES TO FINANCIAL STATEMENTS AS OF SEPTEMBER 30, 2005 (UNAUDITED) (CONTINUED)
NOTE 7 — EXPENSE LIMITATIONS
Pursuant to written Expense Limitation Agreements, the Investment Manager has agreed to limit expenses, excluding interest, taxes, brokerage and extraordinary expenses to the following annual expenses to average daily net assets ratios:
| | Class A | | Class B | | Class C | | Class I | | Class M | | Class O | | Class Q | | Class R | |
GNMA | | | | | | | | | | | | | | | | | |
Income | | 1.29 | % | | 2.04 | % | | 2.04 | % | | 1.04 | % | | 1.79 | % | | N/A | | | 1.29 | % | | N/A | | |
Intermediate | | | | | | | | | | | | | | | | | | | | | | | | | |
Bond | | 1.00 | % | | 1.75 | % | | 1.75 | % | | 0.75 | % | | N/A | | | 1.00 | % | | N/A | | | 1.25 | % | |
The Investment Manager may at a later date recoup from a Fund for management fees waived and other expenses assumed by the Investment Manager during the previous 36 months, but only if, after such recoupment, the Fund’s expense ratio does not exceed the percentage described above. Waived and reimbursed fees net of any recoupment by the Investment Manager of such waived and reimbursed fees are reflected on the accompanying Statements of Operations for each Fund. Amounts payable by the Investment Manager are reflected on the accompanying Statements of Assets and Liabilities for each Fund.
As of September 30, 2005, the amounts of waived and reimbursed fees that are subject to possible recoupment by the Investment Manager, and the related expiration dates are as follows:
| | September 30, | | | |
| | 2006 | | 2007 | | 2008 | | Total | |
Intermediate Bond | | — | | $31,024 | | $220,012 | | $251,036 | |
The Expense Limitation Agreements are contractual and shall renew automatically for one-year terms unless ING Investments provides written notice of the termination of the Expense Limitation Agreement within 90 days of the end of the then current term.
NOTE 8 — LINE OF CREDIT
Intermediate Bond, in addition to certain other funds managed by the Investment Manager, have entered into an unsecured committed revolving line of credit agreement (the “Credit Agreement”) with The Bank of New York for an aggregate amount of $125,000,000. The proceeds may be used only to: (1) temporarily finance the purchase and sale of securities; (2) finance the redemption of shares of an investor in the Funds; and (3) enable the Funds to meet other emergency expenses as defined in the Credit Agreement. The Funds to which the line of credit is available pay a commitment fee equal to 0.09% per annum on the daily unused portion of the committed line amount payable quarterly in arrears.
During the six months ended September 30, 2005, Intermediate Bond did not utilize the line of credit.
NOTE 9 — CAPITAL SHARES
Transactions in capital shares and dollars were as follows:
| | Class A Shares | | Class B Shares | | Class C Shares | |
| | Period | | Year | | Period | | Year | | Period | | Year | |
| | Ended | | Ended | | Ended | | Ended | | Ended | | Ended | |
| | September 30,
2005 | | March 31,
2005 | | September 30,
2005 | | March 31,
2005 | | September 30,
2005 | | March 31,
2005 | |
GNMA Income (Number of Shares) | | | | | | | | | | | | | |
Shares sold | | 4,818,092 | | 11,936,769 | | 482,389 | | 1,139,243 | | 479,386 | | 794,628 | |
Dividends reinvested | | 1,329,511 | | 2,880,147 | | 153,320 | | 372,746 | | 59,658 | | 160,143 | |
Shares redeemed | | (7,223,658 | ) | (20,045,296 | ) | (1,578,661 | ) | (4,519,492 | ) | (976,221 | ) | (3,286,313 | ) |
Net decrease in shares outstanding | | (1,076,055 | ) | (5,228,380 | ) | (942,952 | ) | (3,007,503 | ) | (437,177 | ) | (2,331,542 | ) |
| | | | | | | | | | | | | |
GNMA Income ($) | | | | | | | | | | | | | |
Shares sold | | $ | 41,087,595 | | $ | 103,248,084 | | $ | 4,097,824 | | $ | 9,812,626 | | $ | 4,076,494 | | $ | 6,841,947 | |
Dividends reinvested | | 11,331,660 | | 24,892,865 | | 1,301,442 | | 3,211,230 | | 506,973 | | 1,380,904 | |
Shares redeemed | | (61,586,592 | ) | (173,168,149 | ) | (13,396,712 | ) | (38,876,603 | ) | (8,294,429 | ) | (28,306,311 | ) |
Net decrease | | $ | (9,167,337 | ) | $ | (45,027,200 | ) | $ | (7,997,446 | ) | $ | (25,852,747 | ) | $ | (3,710,962 | ) | $ | (20,083,460 | ) |
21
NOTES TO FINANCIAL STATEMENTS AS OF SEPTEMBER 30, 2005 (UNAUDITED) (CONTINUED)
NOTE 9 — CAPITAL SHARES (continued)
| | Class I Shares | | Class M Shares | | Class Q Shares | |
| | Period | | Year | | Period | | Year | | Period | | Year | |
| | Ended | | Ended | | Ended | | Ended | | Ended | | Ended | |
| | September 30,
2005 | | March 31,
2005 | | September 30,
2005 | | March 31,
2005 | | September 30,
2005 | | March 31,
2005 | |
GNMA Income (Number of Shares) | | | | | | | | | | | | | |
Shares sold | | 162,710 | | 460,536 | | — | | 12 | | — | | — | |
Dividends reinvested | | 34,211 | | 60,608 | | 347 | | 858 | | 260 | | 583 | |
Shares redeemed | | (78,324 | ) | (267,754 | ) | (925 | ) | (12,295 | ) | (2,752 | ) | (3,468 | ) |
Net increase (decrease) in shares outstanding | | 118,597 | | 253,390 | | (578 | ) | (11,425 | ) | (2,492 | ) | (2,885 | ) |
| | | | | | | | | | | | | |
GNMA Income ($) | | | | | | | | | | | | | |
Shares sold | | $ | 1,389,789 | | $ | 3,990,291 | | $ | — | | $ | 92 | | $ | — | | $ | — | |
Dividends reinvested | | 291,738 | | 524,103 | | 2,959 | | 7,441 | | 2,218 | | 5,047 | |
Shares redeemed | | (668,628 | ) | (2,315,639 | ) | (7,918 | ) | (106,523 | ) | (23,502 | ) | (29,827 | ) |
Net increase (decrease) | | $ | 1,012,899 | | $ | 2,198,755 | | $ | (4,959 | ) | $ | (98,990 | ) | $ | (21,284 | ) | $ | (24,780 | ) |
| | Class A Shares | | Class B Shares | | Class C Shares | |
| | Period | | Year | | Period | | Year | | Period | | Year | |
| | Ended | | Ended | | Ended | | Ended | | Ended | | Ended | |
| | September 30,
2005 | | March 31,
2005 | | September 30,
2005 | | March 31,
2005 | | September 30,
2005 | | March 31,
2005 | |
Intermediate Bond (Number of Shares) | | | | | | | | | | | | | |
Shares sold | | 9,991,043 | | 20,020,281 | | 636,312 | | 1,242,856 | | 1,008,585 | | 2,376,896 | |
Shares issued in merger | | — | | 7,782,918 | | — | | 281,573 | | — | | 178,918 | |
Dividends reinvested | | 712,960 | | 1,290,740 | | 60,427 | | 162,414 | | 56,669 | | 145,287 | |
Shares redeemed | | (3,743,014 | ) | (9,777,963 | ) | (739,111 | ) | (1,730,794 | ) | (881,953 | ) | (2,438,209 | ) |
Net increase (decrease) in shares outstanding | | 6,960,989 | | 19,315,976 | | (42,372 | ) | (43,951 | ) | 183,301 | | 262,892 | |
| | | | | | | | | | | | | |
Intermediate Bond ($) | | | | | | | | | | | | | |
Shares sold | | $ | 104,358,286 | | $ | 208,496,288 | | $ | 6,634,123 | | $ | 12,918,869 | | $ | 10,522,941 | | $ | 24,752,573 | |
Shares issued in merger | | — | | 81,024,830 | | — | | 2,925,680 | | — | | 1,860,336 | |
Dividends reinvested | | 7,456,956 | | 13,432,920 | | 630,700 | | 1,686,232 | | 591,956 | | 1,509,860 | |
Shares redeemed | | (37,067,179 | ) | (101,648,431 | ) | (7,704,331 | ) | (17,962,624 | ) | (9,191,484 | ) | (25,320,455 | ) |
Net increase (decrease) | | $ | 74,748,063 | | $ | 201,305,607 | | $ | (439,508 | ) | $ | (431,843 | ) | $ | 1,923,413 | | $ | 2,802,314 | |
| | Class I Shares | | Class O Shares | | Class R Shares | |
| | Period | | Year | | Period | | August 13, | | Period | | Year | |
| | Ended | | Ended | | Ended | | 2004(1) to | | Ended | | Ended | |
| | September 30,
2005 | | March 31,
2005 | | September 30,
2005 | | March 31,
2005 | | September 30,
2005 | | March 31,
2005 | |
Intermediate Bond (Number of Shares) | | | | | | | | | | | | | |
Shares sold | | 10,631,022 | | 1,105,426 | | 1,335,605 | | 1,847,824 | | 46,178 | | 51,163 | |
Shares issued at merger | | — | | 2,462,195 | | — | | 2,517,767 | | — | | — | |
Dividends reinvested | | 103,805 | | 134,583 | | 61,142 | | 64,256 | | 130 | | — | |
Shares redeemed | | (527,681 | ) | (822,774 | ) | (786,869 | ) | (1,136,816 | ) | (13,536 | ) | (20,940 | ) |
Net increase in shares outstanding | | 10,207,146 | | 2,879,430 | | 609,878 | | 3,293,031 | | 32,772 | | 30,223 | |
| | | | | | | | | | | | | |
Intermediate Bond ($) | | | | | | | | | | | | | |
Shares sold | | $ | 111,196,051 | | $ | 11,537,314 | | $ | 13,937,872 | | $ | 19,277,116 | | $ | 482,370 | | $ | 536,678 | |
Shares issued at merger | | — | | 25,636,140 | | — | | 26,211,427 | | — | | — | |
Dividends reinvested | | 1,084,245 | | 1,401,462 | | 639,535 | | 669,961 | | 1,358 | | — | |
Shares redeemed | | (5,502,424 | ) | (8,577,165 | ) | (8,190,296 | ) | (11,856,189 | ) | (164,077 | ) | (218,569 | ) |
Net increase | | $ | 106,777,872 | | $ | 29,997,751 | | $ | 6,387,111 | | $ | 34,302,315 | | $ | 319,651 | | $ | 318,109 | |
(1) Commencenment of operations.
NOTE 10 — FEDERAL INCOME TAXES
The amount of distributions from net investment income and net realized capital gains are determined in accordance with federal income tax regulations, which may differ from accounting principles generally accepted in the United States of America for investment companies. These book/tax differences may be either temporary or permanent. Permanent differences are reclassified within the capital accounts based on their federal tax-basis treatment; temporary differences are not reclassified. Key differences include the treatment of short-term capital
22
NOTES TO FINANCIAL STATEMENTS AS OF SEPTEMBER 30, 2005 (UNAUDITED) (CONTINUED)
NOTE 10 — FEDERAL INCOME TAXES (continued)
gains, foreign currency transactions, and wash sale deferrals. Distributions in excess of net investment income and/or net realized capital gains for tax purposes are reported as distributions of paid-in capital.
Dividends paid by the Fund from net investment income and distributions of net realized short-term capital gains are, for federal income tax purposes, taxable as ordinary income to shareholders.
The tax composition of dividends and distributions to shareholders was as follows:
| | Six Months Ended September 30, 2005 | | Year Ended March 31, 2005 | |
| | | | | | | | | | Tax- | | | |
| | | | Ordinary
Income | | | | Ordinary
Income | | Exempt
Income | | Long-Term
Capital Gains | |
GNMA Income | | | | $ 16,134,227 | | | | | $ 36,615,264 | | | $ — | | | $ — | | |
Intermediate Bond | | | | 13,228,000 | | | | | 23,745,777 | | | — | | | 1,302,980 | | |
The tax-basis components of distributable earnings and the expiration dates of the capital loss carryforwards which may be used to offset future realized capital gains for federal income tax purposes as of March 31, 2005 were:
| | | | | | | | | | Post | | | | | |
| | Undistributed | | Undistributed | | Undistributed | | Unrealized | | October | | Capital | | | |
| | Ordinary
Income | | Tax-Exempt
Income | | Long Term
Capital Gains | | Appreciation/
Depreciation | | Losses
Deferred | | Loss
Carryforwards | | Expiration
Dates | |
GNMA Income | | $ | 1,158,018 | | $ | — | | $ | — | | $ | 11,533,310 | | $ | (3,539,500 | ) | $ | (4,473,153 | ) | 2006 | |
| | | | | | | | | | | | (1,688,098 | ) | 2007 | |
| | | | | | | | | | | | (2,870,184 | ) | 2008 | |
| | | | | | | | | | | | (527,639 | ) | 2010 | |
| | | | | | | | | | | | (1,009,937 | ) | 2012 | |
| | | | | | | | | | | | (5,795,720 | ) | 2013 | |
| | | | | | | | | | | | $ | (16,364,731 | ) | | |
Intermediate Bond | | 1,515,969 | | — | | 993,569 | | (6,326,086 | ) | — | | $ | — | | | |
| | | | | | | | | | | | | | | | | | | | | |
NOTE 11 — REORGANIZATIONS
On August 16, 2004, October 23, 2004 and March 13, 2005, ING Intermediate Bond Fund, as listed below (“Acquiring Fund”), acquired the assets and certain liabilities of the ING Bond Fund, also listed below (“Acquired Fund”), in a tax-free reorganization in exchange for shares of the Acquiring Fund, pursuant to a plan of reorganization approved by the Acquired Fund’s shareholders. The number and value of shares issued by the Acquiring Funds are presented in Note 9 — Capital Shares. Net assets and unrealized appreciation as of the reorganization dates were as follows:
| | | | | | | | Acquired Fund | | | |
| | | | | | | | Unrealized | | | |
Acquiring
Fund | | Acquired
Fund | | Total Net Assets of
Acquired Fund (000) | | Total Net Assets of
Acquiring Fund (000) | | Appreciation/
Depreciation (000) | | Conversion
Ratio | |
ING Intermediate | | | | | | | | | | | |
Bond Fund | | ING Bond Fund | | $137,658 | | $448,460 | | $ 1,584 | | 1.01 | |
The net assets of the ING Intermediate Bond Fund after the acquisition were approximately $586,118,000.
NOTE 12 — ILLIQUID SECURITIES
Pursuant to guidelines adopted by the Funds’ Board of Trustees, the following securities have been deemed to be illiquid. The Funds may invest up to 15% (10% for Money Market) of its net assets in illiquid securities. Fair value for certain of securities was determined by ING Funds Valuation Committee appointed by the Funds’ Board.
| | | | Principal | | Initial | | | | | | Percent | |
| | | | Amount/ | | Acquisition | | | | | | of Net | |
Fund | | Security | | Shares | | Date | | Cost | | Value | | Assets | |
Intermediate | | | | | | | | | | | | | |
Bond | | Alpine III, 4.330, due 08/16/14 | | 434,000 | | 8/16/04 | | | $ | 434,000 | | $ | 435,201 | | | 0.1 | % | |
| | Alpine III, 4.740%, due 08/16/14 | | 434,000 | | 8/16/04 | | | 434,000 | | 435,046 | | | 0.0 | | |
| | Alpine III, 6.540%, due 08/16/14 | | 739,000 | | 8/16/04 | | | 747,529 | | 742,229 | | | 0.1 | | |
| | Alpine III, 9.790%, due 08/16/14 | | 1,241,000 | | 8/16/04 | | | 1,257,156 | | 1,277,019 | | | 0.1 | | |
| | Nordea Kredit Realkreditaktieselskab, 6.000%, due 07/01/29 | | 102 | | 7/1/29 | | | 17 | | 17 | | | 0.0 | | |
| | | | | | | | $ | 2,872,702 | | $ | 2,889,512 | | | 0.3 | % | |
23
NOTES TO FINANCIAL STATEMENTS AS OF SEPTEMBER 30, 2005 (UNAUDITED) (CONTINUED)
NOTE 13 — SECURITIES LENDING
Under an agreement with The Bank of New York (“BNY”), Intermediate Bond can lend their securities to approved brokers, dealers and other financial institutions. Loans are collateralized by cash and U.S. Government securities. The collateral must be in an amount equal to at least 105% of the market value of non-U.S. securities loaned and 102% of the market value of U.S. securities loaned. The cash collateral received is invested in approved investments as defined in the Securities Lending Agreement with BNY (the “Agreement”). The securities purchased with cash collateral received are reflected in the Portfolio of Investments. Generally, in the event of counterparty default, the Funds have the right to use the collateral to offset losses incurred. The Agreement contains certain guarantees by BNY in the event of counterparty default and/or a borrower’s failure to return a loaned security; however, there would be a potential loss to the Funds in the event the Funds are delayed or prevented from exercising their right to dispose of the collateral. The Funds bear the risk of loss with respect to the investment of collateral. Engaging in securities lending could have a leveraging effect, which may intensify the credit, market and other risks associated with investing in a Fund. At September 30, 2005, the following Fund had securities on loan with the following market value:
| | Value of | | | |
| | Securities | | Value of | |
Portfolio | | | Loaned | | Collateral | |
Intermediate Bond | | $185,179,131 | | $189,517,473 | |
| | | | | | |
NOTE 14 — SUBSEQUENT EVENTS
Subsequent to September 30, 2005, the following Funds declared dividends from net investment income,
| | Per Share | | | | | |
| | Amount | | Payable Date | | Record Date | |
GNMA Income | | | | | | | |
Class A | | $0.0360 | | | | October 5, 2005 | | | September 30, 2005 | |
Class B | | 0.0307 | | | | October 5, 2005 | | | September 30, 2005 | |
Class C | | 0.0308 | | | | October 5, 2005 | | | September 30, 2005 | |
Class I | | 0.0382 | | | | October 5, 2005 | | | September 30, 2005 | |
Class M | | 0.0326 | | | | October 5, 2005 | | | September 30, 2005 | |
Class Q | | 0.0364 | | | | October 5, 2005 | | | September 30, 2005 | |
Class A | | 0.0360 | | | | November 3, 2005 | | | October 31, 2005 | |
Class B | | 0.0307 | | | | November 3, 2005 | | | October 31, 2005 | |
Class C | | 0.0305 | | | | November 3, 2005 | | | October 31, 2005 | |
Class I | | 0.0383 | | | | November 3, 2005 | | | October 31, 2005 | |
Class M | | 0.0325 | | | | November 3, 2005 | | | October 31, 2005 | |
Class Q | | 0.0365 | | | | November 3, 2005 | | | October 31, 2005 | |
| | | | | | | | | | |
Intermediate Bond | | | | | | | | | | |
Class A | | $0.0358 | | | | November 1, 2005 | | | Daily | |
Class B | | 0.0292 | | | | November 1, 2005 | | | Daily | |
Class C | | 0.0292 | | | | November 1, 2005 | | | Daily | |
Class I | | 0.0381 | | | | November 1, 2005 | | | Daily | |
Class R | | 0.0334 | | | | November 1, 2005 | | | Daily | |
Class O | | 0.0351 | | | | November 1, 2005 | | | Daily | |
NOTE 15 — INFORMATION REGARDING TRADING OF ING’s U.S. MUTUAL FUNDS
ING Investments has reported to the Boards of Directors/Trustees (the “Boards”) of the ING Funds that, like many U.S. financial services companies, ING Investments and certain of its U.S. affiliates have received informal and formal requests for information since September 2003 from various governmental and self-regulatory agencies in connection with investigations related to mutual funds and variable insurance products. ING Investments has advised the Boards that it and its affiliates have cooperated fully with each request.
In addition to responding to regulatory and governmental requests, ING Investments reported that management of U.S. affiliates of ING Groep N.V., including ING Investments (collectively, “ING”), on their own initiative, have conducted, through independent special counsel and a national accounting firm, an extensive internal review of trading in ING insurance, retirement, and mutual fund products. The goal of this review was to identify any instances of inappropriate trading in those products by third parties or by ING investment professionals and other ING personnel. ING’s internal review related to mutual fund trading is now substantially completed. ING has reported that, of the millions of customer relationships that ING maintains, the internal review identified several isolated arrangements allowing third parties to engage in frequent trading of mutual funds within ING’s variable insurance and mutual fund products, and identified other circumstances where frequent trading occurred, despite measures taken by ING intended to combat market timing. ING further reported that each of these arrangements has been terminated and fully disclosed to regulators. The results of the internal review were also reported to the independent members of the Board.
ING Investments has advised the Board that most of the identified arrangements were initiated prior to ING’s acquisition of the businesses in question in the U.S. ING Investments further reported that the companies in question did not receive special benefits in return for any of these arrangements, which have all been terminated.
Based on the internal review, ING Investments has advised the Board that the identified arrangements do not represent a systemic problem in any of the companies that were involved.
In September 2005, ING Funds Distributor, LLC (“IFD”), the distributor of certain ING Funds, settled an
24
NOTES TO FINANCIAL STATEMENTS AS OF SEPTEMBER 30, 2005 (UNAUDITED) (CONTINUED)
NOTE 15 — INFORMATION REGARDING TRADING OF ING’s U.S. MUTUAL FUNDS (continued)
administrative proceeding with the NASD regarding three arrangements, dating from 1995, 1996 and 1998, under which the administrator to the then-Pilgrim Funds, which subsequently became part of the ING Funds, entered into formal and informal arrangements that permitted frequent trading. Under the terms of the Letter of Acceptance, Waiver and Consent (“AWC”) with the NASD, under which IFD neither admitted nor denied the allegations or findings, IFD consented to the following sanctions: (i) a censure; (ii) a fine of $1.5 million; (iii) restitution of approximately $1.44 million to certain ING Funds for losses attributable to excessive trading described in the AWC; and (iv) agreement to make certification to NASD regarding the review and establishment of certain procedures.
In addition to the arrangements discussed above, ING Investments reported to the Board that, at this time, these instances include the following, in addition to the arrangements subject to the AWC discussed above:
• Aeltus Investment Management, Inc. (a predecessor entity to ING Investment Management Co.) has identified two investment professionals who engaged in extensive frequent trading in certain ING Funds. One was subsequently terminated for cause and incurred substantial financial penalties in connection with this conduct and the second has been disciplined.
• ReliaStar Life Insurance Company (“ReliaStar”) entered into agreements seven years ago permitting the owner of policies issued by the insurer to engage in frequent trading and to submit orders until 4pm Central Time. In 2001 ReliaStar also entered into a selling agreement with a broker-dealer that engaged in frequent trading. Employees of ING affiliates were terminated and/or disciplined in connection with these matters.
• In 1998, Golden American Life Insurance Company entered into arrangements permitting a broker-dealer to frequently trade up to certain specific limits in a fund available in an ING variable annuity product. No employee responsible for this arrangement remains at the company.
For additional information regarding these matters, you may consult the Form 8-K and Form 8-K/A for each of four life insurance companies, ING USA Annuity and Life Insurance Company, ING Life Insurance and Annuity Company, ING Insurance Company of America, and ReliaStar Life Insurance Company of New York, each filed with the Securities and Exchange Commission (the “SEC”) on October 29, 2004 and September 8, 2004. These Forms 8-K and Forms 8-K/A can be accessed through the SEC’s Web site at http://www.sec.gov. Despite the extensive internal review conducted through independent special counsel and a national accounting firm, there can be no assurance that the instances of inappropriate trading reported to the Board are the only instances of such trading respecting the ING Funds.
ING Investments reported to the Board that ING is committed to conducting its business with the highest standards of ethical conduct with zero tolerance for noncompliance. Accordingly, ING Investments advised the Board that ING management was disappointed that its voluntary internal review identified these situations. Viewed in the context of the breadth and magnitude of its U.S. business as a whole, ING management does not believe that ING’s acquired companies had systemic ethical or compliance issues in these areas. Nonetheless, Investments reported that given ING’s refusal to tolerate any lapses, it has taken the steps noted below, and will continue to seek opportunities to further strengthen the internal controls of its affiliates.
• ING has agreed with the ING Funds to indemnify and hold harmless the ING Funds from all damages resulting from wrongful conduct by ING or its employees or from ING’s internal investigation, any investigations conducted by any governmental or self-regulatory agencies, litigation or other formal proceedings, including any proceedings by the Securities and Exchange Commission. ING Investments reported to the Board that ING management believes that the total amount of any indemnification obligations will not be material to ING or its U.S. business.
• ING updated its Code of Conduct for employees reinforcing its employees’ obligation to conduct personal trading activity consistent with the law, disclosed limits, and other requirements.
• The ING Funds, upon a recommendation from ING, updated their respective Codes of Ethics applicable to investment professionals with ING entities and certain other fund personnel, requiring such personnel to pre-clear any purchases or sales of ING Funds that are not systematic in nature (i.e., dividend reinvestment), and imposing minimum holding periods for shares of ING Funds.
• ING instituted excessive trading policies for all customers in its variable insurance and retirement products and for shareholders of the ING Funds
25
NOTES TO FINANCIAL STATEMENTS AS OF SEPTEMBER 30, 2005 (UNAUDITED) (CONTINUED)
NOTE 15 — INFORMATION REGARDING TRADING OF ING’s U.S. MUTUAL FUNDS (continued)
sold to the public through financial intermediaries. ING does not make exceptions to these policies.
• ING reorganized and expanded its U.S. Compliance Department, and created an Enterprise Compliance team to enhance controls and consistency in regulatory compliance.
As has been widely reported in the media, the New York Attorney General’s office (“NYAG”) is conducting broad investigations regarding insurance quoting and brokerage practices. ING U.S. has been subpoenaed in this regard, and is cooperating fully with these NYAG requests for information.
ING U.S. believes that its practices are consistent with our business principles and our commitment to our customers.
At this time, in light of the current regulatory factors, ING U.S. is actively engaged in reviewing whether any modifications in our practices are appropriate for the future.
There can be no assurance that these matters, or the adverse publicity associated with them, will not result in increased fund redemptions, reduced sale of fund shares, or other adverse consequences to ING Funds.
26
PORTFOLIO OF INVESTMENTS |
ING GNMA INCOME FUND | AS OF SEPTEMBER 30, 2005 (UNAUDITED) |
Principal | | | | | | | |
Amount | | | | | | Value | |
U.S. GOVERNMENT AGENCY OBLIGATIONS: 90.8% | | | |
| | | | Federal Government Loan Mortgage Corporation: 0.2% | | | |
$ | 123,938 | | | | 7.000%, due 11/01/14 | | $ | 129,479 | |
742,523 | | | | 7.500%, due 01/01/30-12/01/14 | | 785,025 | |
100,261 | | | | 8.000%, due 01/01/30 | | 107,013 | |
| | | | | | 1,021,517 | |
| | | | Federal National Mortgage Association: 0.2% | | | |
121,769 | | | | 6.500%, due 06/01/14 | | 126,075 | |
156,268 | | | | 7.000%, due 03/01/15 | | 163,408 | |
211,782 | | | | 7.500%, due 05/01/28 | | 224,524 | |
579,429 | | | | 8.500%, due 08/01/11-09/01/15 | | 616,098 | |
| | | | | | 1,130,105 | |
| | | | Government National Mortgage Association: 90.4% | | | |
8,371,680 | | | | 3.750%, due 05/20/34 | | 8,210,853 | |
69,819,957 | | | | 5.000%, due 04/15/29-09/15/35 | | 69,098,887 | |
158,718,393 | | | | 5.500%, due 04/20/29-05/15/35 | | 160,328,891 | |
534,120 | | | | 5.650%, due 07/15/29 | | 539,249 | |
128,795,046 | | | | 6.000%, due 07/15/28-04/20/35 | | 131,839,246 | |
653,183 | | | | 6.250%, due 04/15/26-04/15/28 | | 676,631 | |
130,933 | | | | 6.340%, due 02/15/29 | | 130,378 | |
1,547,529 | | | | 6.400%, due 10/15/33 | | 1,580,237 | |
1,144,315 | | | | 6.470%, due 09/15/33 | | 1,170,043 | |
20,663,513 | | | | 6.500%, due 02/15/22-12/20/34 | | 21,527,136 | |
5,285,024 | | | | 6.625%, due 01/15/34-01/15/40 | | 5,454,662 | |
1,684,154 | | | | 6.650%, due 10/15/14-06/15/30 | | 1,797,058 | |
3,480,743 | | | | 6.670%, due 01/15/40 | | 3,622,433 | |
6,132,080 | | | | 6.687%, due 07/15/40 | | 6,493,184 | |
253,379 | | | | 6.700%, due 12/15/14 | | 257,044 | |
8,372,372 | | | | 6.750%, due 06/15/13-01/15/41 | | 8,826,430 | |
2,816,815 | | | | 6.810%, due 07/15/39 | | 2,974,912 | |
3,997,647 | | | | 6.820%, due 05/15/27-04/15/34 | | 4,193,089 | |
9,706,590 | | | | 6.840%, due 10/15/36 | | 10,580,133 | |
1,783,061 | | | | 6.870%, due 03/15/39 | | 1,890,660 | |
3,233,748 | | | | 6.875%, due 02/15/40 | | 3,426,742 | |
2,134,600 | | | | 6.900%, due 01/15/32 | | 2,336,364 | |
36,601,073 | | | | 7.000%, due 07/15/22-06/15/34 | | 38,555,685 | |
8,862,747 | | | | 7.010%, due 02/15/37 | | 9,633,531 | |
5,503,097 | | | | 7.100%, due 11/15/39 | | 5,918,647 | |
8,858,612 | | | | 7.125%, due 09/15/39 | | 9,356,316 | |
3,299,908 | | | | 7.150%, due 07/15/36 | | 3,571,828 | |
1,610,742 | | | | 7.250%, due 10/15/27-09/15/31 | | 1,736,247 | |
2,917,026 | | | | 7.300%, due 08/15/36 | | 3,141,652 | |
3,479,660 | | | | 7.500%, due 12/15/19-09/15/32 | | 3,656,969 | |
4,934,935 | | | | 7.600%, due 08/15/31 | | 5,350,119 | |
9,349,695 | | | | 7.625%, due 07/15/38 | | 9,876,486 | |
65,136 | | | | 7.650%, due 12/15/12 | | 66,994 | |
383,336 | | | | 7.700%, due 08/15/13 | | 395,136 | |
3,249,882 | | | | 7.750%, due 06/15/14-12/15/35 | | 3,421,411 | |
1,002,206 | | | | 7.800%, due 05/15/19-01/15/42 | | 1,106,744 | |
9,715,069 | | | | 7.875%, due 09/15/29-04/15/38 | | 10,101,101 | |
8,086,219 | | | | 8.000%, due 12/15/14-01/15/38 | | 8,438,351 | |
96,015 | | | | 8.050%, due 07/15/19-04/15/31 | | 103,986 | |
1,133,488 | | | | 8.100%, due 06/15/12-07/15/12 | | 1,156,207 | |
4,942,319 | | | | 8.125%, due 05/15/38 | | 5,164,534 | |
3,720,901 | | | | 8.150%, due 12/15/11-09/15/15 | | 3,803,806 | |
4,473,093 | | | | 8.200%, due 10/15/11-05/15/13 | | 4,546,376 | |
2,020,958 | | | | 8.250%, due 10/15/24-03/15/41 | | 2,135,901 | |
6,770,805 | | | | 8.500%, due 10/15/31 | | 7,084,255 | |
$ | 43,919 | | | | 8.750%, due 06/15/27 | | $ | 45,863 | |
1,981,154 | | | | 9.000%, due 11/15/27-12/15/34 | | 2,083,948 | |
| | | | | | 587,406,355 | |
| | | | Total U.S. Government Agency Obligations
(Cost $583,448,854) | | 589,557,977 | |
U.S. TREASURY OBLIGATIONS: 3.4% | | | |
| | | | U.S. Treasury Bonds: 3.4% | | | |
20,000,000 | | | | 5.375%, due 02/15/31 | | 22,412,520 | |
| | | | | | 22,412,520 | |
| | | | Total U.S. Treasury Obligations
(Cost $22,766,180) | | 22,412,520 | |
| | | | Total Long-Term Investments
(Cost $606,215,034) | | 611,970,497 | |
SHORT-TERM INVESTMENTS: 5.3% | | | |
| | U.S. Treasury Bills: 5.3% | | | |
35,000,000 | | 3.370%, due 01/05/06 | | 34,684,685 | |
| | Total Short-Term Investments | | | |
| | (Cost $34,670,053) | | 34,684,685 | |
| | | | | |
| | Total Investments in Securities (Cost $640,885,087)* | | 99.5 | % | $ | 646,655,182 | |
| | Other Assets and Liabilities-Net | | 0.5 | | 2,968,912 | |
| | Net Assets | | 100.0 | % | $ | 649,624,094 | |
| | | | | | | | | | | |
Government National Mortgage Association (“GNMA”) manages a program of Mortgage-backed securities in order to attract funds for secondary mortgages and provide liquidity for existing mortgage securities. GNMA is a quasi-government agency.
Federal Home Loan Mortgage Corporation (“FHLMC”) purchase mortgages from a mortgage originator and holds them as investments in its portfolio, or securitizes them. FHLMC is a private organization.
* Cost for federal income tax purposes is $640,914,663. Net unrealized appreciation consists of:
| | Gross Unrealized Appreciation | | | | $ | 11,668,583 | |
| | Gross Unrealized Depreciation | | | | | (5,928,064 | ) |
| | Net Unrealized Appreciation | | | | $ | 5,740,519 | |
See Accompanying Notes to Financial Statements
27
| PORTFOLIO OF INVESTMENTS |
ING INTERMEDIATE BOND FUND | AS OF SEPTEMBER 30, 2005 (UNAUDITED) |
Principal | | | | | | | |
Amount | | | | | | Value | |
CORPORATE BONDS/NOTES: 20.9% | | | |
| | | | Agriculture: 0.1% | | | |
$ | 705,000 | | #,C,S | | R.J. Reynolds Tobacco Holdings, Inc., 6.500%, due 07/15/10 | | $ | 706,763 | |
| | | | | | 706,763 | |
| | | | Auto Manufacturers: 0.3% | | | |
1,225,000 | | | | Ford Motor Co., 6.625%, due 10/01/28 | | 891,188 | |
4,764,000 | | | | General Motors Corp., . 4.470%, due 03/15/36 | | 1,238,640 | |
434,000 | | S | | General Motors Corp., 7.400%, due 09/01/25 | | 313,565 | |
| | | | | | 2,443,393 | |
| | | | Banks: 5.1% | | | |
2,170,000 | | @@,C,L | | Australia & New Zealand Banking Group Ltd., 3.556%, due 10/29/49 | | 1,847,037 | |
1,104,000 | | @@,# | | Banco Santander Chile/Pre-merger with Banco Santiago SA, 4.148%, due 12/09/09 | | 1,100,376 | |
1,718,000 | | @@ | | Banco Santander Santiago Chile SA, 7.375%, due 07/18/12 | | 1,935,662 | |
1,180,000 | | @@,C | | Bank of Ireland, 4.170%, due 12/29/49 | | 1,012,184 | |
1,270,000 | | @@,C | | Bank of Nova Scotia, 4.250%, due 08/31/85 | | 1,072,495 | |
540,000 | | @@,C | | Bank of Scotland, 3.750%, due 11/30/49 | | 467,100 | |
1,757,000 | | C | | BankAmerica Capital II, 8.000%, due 12/15/26 | | 1,882,986 | |
1,090,000 | | @@,C | | Barclays Bank PLC, 6.278%, due 12/15/49 | | 1,073,933 | |
1,727,000 | | @@,#,C | | Chuo Mitsui Trust & Banking Co Ltd., 5.506%, due 04/15/49 | | 1,665,324 | |
984,000 | | @@,#,C | | Danske Bank A/S, 5.914%, due 12/29/49 | | 1,037,106 | |
1,240,000 | | @@,C | | Den Norske Bank ASA, 4.186%, due 08/29/49 | | 1,044,700 | |
1,631,000 | | #,C,S | | Dresdner Funding Trust I, 8.151%, due 06/30/31 | | 1,997,389 | |
1,117,000 | | @@,# | | First Citizens St Lucia Ltd., 5.460%, due 02/01/12 | | 1,112,178 | |
2,561,000 | | @@,#,C | | HBOS PLC, 5.375%, due 11/29/49 | | 2,582,925 | |
3,110,000 | | @@,C | | HSBC Bank PLC, 3.787%, due 06/29/49 | | 2,666,824 | |
1,700,000 | | @@,C | | Lloyds TSB Bank PLC, 4.160%, due 08/29/49 | | 1,462,826 | |
1,614,000 | | #,C | | M&T Bank Corp., 3.850%, due 04/01/13 | | 1,579,937 | |
1,159,000 | | C | | Mellon Capital I, 7.720%, due 12/01/26 | | 1,238,405 | |
1,190,000 | | @@,C | | National Australia Bank Ltd., 3.514%, due 10/29/49 | | 1,073,585 | |
641,000 | | C | | NB Capital Trust, 7.830%, due 12/15/26 | | 685,936 | |
600,000 | | C | | NB Capital Trust IV, 8.250%, due 04/15/27 | | 648,891 | |
$ | 1,447,000 | | | | PNC Funding Corp., 4.500%, due 03/10/10 | | $ | 1,431,232 | |
2,273,000 | | #,C | | Rabobank Capital Funding II, 5.260%, due 12/29/49 | | 2,283,131 | |
3,660,000 | | @@,C | | Royal Bank of Scotland Group PLC, 3.813%, due 12/29/49 | | 3,147,852 | |
1,210,000 | | @@,C | | Societe Generale, 3.625%, due 11/29/49 | | 1,077,860 | |
2,920,000 | | @@,C,L | | Standard Chartered PLC, 3.750%, due 11/29/49 | | 2,365,200 | |
1,170,000 | | @@,C | | Standard Chartered PLC, 4.187%, due 07/29/49 | | 944,775 | |
1,191,000 | | @@,C | | Sumitomo Mitsui Banking Corp, 8.150%, due 08/01/49 | | 1,257,102 | |
2,036,000 | | | | Wachovia Corp., 5.500%, due 08/01/35 | | 1,993,466 | |
1,200,000 | | @@,C | | Westpac Banking Corp., 4.333%, due 09/30/49 | | 1,023,998 | |
| | | | | | 44,712,415 | |
| | | | Beverages: 0.3% | | | |
1,979,000 | | @@,C | | Cia Brasileira de Bebidas, 8.750%, due 09/15/13 | | 2,359,958 | |
| | | | | | 2,359,958 | |
| | | | Chemicals: 0.6% | | | |
397,000 | | @@,# | | Sociedad Quimica y Minera de Chile SA, 7.700%, due 09/15/06 | | 401,363 | |
490,000 | | S | | Stauffer Chemical, 5.480%, due 04/15/10 | | 391,216 | |
1,080,000 | | | | Stauffer Chemical, 7.50%, due 04/15/17 | | 575,165 | |
3,224,000 | | | | Union Carbide Corp., 7.750%, due 10/01/96 | | 3,406,533 | |
| | | | | | 4,774,277 | |
| | | | Diversified Financial Services: 5.7% | | | |
434,000 | | @@,#,I | | Alpine III, 4.330%, due 08/16/14 | | 435,201 | |
434,000 | | @@,#,I | | Alpine III, 4.740%, due 08/16/14 | | 435,046 | |
739,000 | | @@,#,I | | Alpine III, 6.540%, due 08/16/14 | | 742,229 | |
1,241,000 | | @@,#,I | | Alpine III, 9.790%, due 08/16/14 | | 1,277,019 | |
430,161 | | @@,#,C | | Arcel Finance Ltd., 5.984%, due 02/01/09 | | 437,346 | |
880,000 | | @@,# | | Arcel Finance Ltd., 6.361%, due 05/01/12 | | 870,675 | |
974,673 | | @@,#,C | | Arcel Finance Ltd., 7.048%, due 09/01/11 | | 1,027,747 | |
480,000 | | #,C,S | | Army Hawaii Family Housing Trust Certificates, 5.524%, due 06/15/50 | | 494,378 | |
350,000 | | #,C,S | | Army Hawaii Family Housing Trust Certificates, 5.624%, due 06/15/50 | | 360,908 | |
2,378,761 | | # | | Astoria Depositor Corp., 7.902%, due 05/01/21 | | 2,370,138 | |
3,885,000 | | #,S | | Astoria Depositor Corp., 8.144%, due 05/01/21 | | 3,862,758 | |
See Accompanying Notes to Financial Statements
28
| PORTFOLIO OF INVESTMENTS |
ING INTERMEDIATE BOND FUND | AS OF SEPTEMBER 30, 2005 (UNAUDITED) (CONTINUED) |
Principal | | | | | | | |
Amount | | | | | | Value | |
| | | | Diversified Financial Services (continued) | | | |
$ | 254,000 | | @@,# | | Bosphorus Financial Services Ltd., 5.590%, due 02/15/12 | | $ | 246,798 | |
1,944,439 | | @@,# | | Brazilian Merchant Voucher Receivables Ltd., 5.911%, due 06/15/11 | | 1,954,161 | |
2,360,000 | | @@,#,C | | BTM Curacao Holdings NV, 4.760%, due 07/21/15 | | 2,316,552 | |
1,153,000 | | C | | Citigroup Capital II, 7.750%, due 12/01/36 | | 1,223,255 | |
2,340,000 | | #,C | | Corestates Capital Trust I, 8.000%, due 12/15/26 | | 2,502,265 | |
570,000 | | @@,C | | Financiere CSFB NV, 4.187%, due 03/29/49 | | 496,536 | |
1,519,000 | | L | | Goldman Sachs Group, Inc., 4.070%, due 03/02/10 | | 1,521,392 | |
1,711,000 | | #,C,S | | HVB Funding Trust III, 9.000%, due 10/22/31 | | 2,289,145 | |
705,000 | | | | International Lease Finance Corp, 5.000%, due 04/15/10 | | 708,214 | |
1,366,000 | | C | | JPM Capital Trust I, 7.540%, due 01/15/27 | | 1,454,063 | |
1,513,000 | | C | | JPM Capital Trust II, 7.950%, due 02/01/27 | | 1,626,903 | |
2,157,000 | | #,C | | Mangrove Bay Pass-Through Trust, 6.102%, due 07/15/33 | | 2,164,215 | |
1,633,000 | | @@,# | | Mantis Reef Ltd., 4.799%, due 11/03/09 | | 1,609,207 | |
102 | | @@,I | | Nordea Kredit Realkreditaktieselskab, 6.000%, due 07/01/29 | | 17 | |
1,320,000 | | @@,C | | Paribas, 4.045%, due 12/31/49 | | 1,133,359 | |
933,000 | | @@,#,C,S | | Petroleum Export Ltd/Cayman SPV, 4.623%, due 06/15/10 | | 928,688 | |
1,223,000 | | @@,#,C,S | | Petroleum Export Ltd/Cayman SPV, 5.265%, due 06/15/11 | | 1,219,489 | |
3,099,026 | | @@,#,C | | PF Export Receivables Master Trust, 6.436%, due 06/01/15 | | 3,118,132 | |
2,233,000 | | #,C | | Residential Capital Corp., 6.375%, due 06/30/10 | | 2,264,494 | |
800,000,000 | | @@ | | Takefuji Corp., 1.000%, due 03/01/34 | | 3,721,899 | |
9,400,000 | | # | | Toll Road Investors Partnership II LP, 18.14%, due 02/15/45 | | 1,139,618 | |
1,200,000 | | #,C | | Twin Reefs Pass-Through Trust, 4.728%, due 12/10/49 | | 1,197,528 | |
1,313,000 | | @@,C,L | | UFJ Finance Aruba AEC, 8.750%, due 12/31/49 | | 1,439,954 | |
1,085,000 | | #,C,S | | Wachovia Capital Trust V, 7.965%, due 06/01/27 | | 1,173,369 | |
| | | | | | 49,762,698 | |
| | | | Electric: 2.6% | | | |
2,314,466 | | C | | CE Generation LLC, 7.416%, due 12/15/18 | | 2,473,430 | |
2,328,000 | | C | | Consumers Energy Co., 4.250%, due 04/15/08 | | 2,295,981 | |
203,000 | | @@,L | | Empresa Nacional de Electricidad SA/Chile, 8.500%, due 04/01/09 | | 223,552 | |
$ | 1,248,000 | | @@ | | Empresa Nacional de Electricidad SA/Chile, 8.625%, due 08/01/15 | | $ | 1,460,143 | |
1,825,000 | | C,S | | Entergy Gulf States, Inc., 5.120%, due 08/01/10 | | 1,797,776 | |
1,582,000 | | C | | Enterprise Capital Trust II, 5.240%, due 06/30/28 | | 1,569,532 | |
1,578,000 | | C,L | | FirstEnergy Corp., 6.450%, due 11/15/11 | | 1,682,323 | |
2,720,000 | | C,L | | FirstEnergy Corp., 7.375%, due 11/15/31 | | 3,200,244 | |
878,719 | | #,C | | Juniper Generation, LLC, 6.790%, due 12/31/14 | | 861,463 | |
1,345,000 | | @@,+ | | Korea Electric Power Corp., 0.000%, due 04/01/96 | | 807,000 | |
1,263,000 | | C | | NorthWestern Corp., 5.875%, due 11/01/14 | | 1,282,244 | |
1,073,000 | | #,C | | Pinnacle West Energy Corp., 4.004%, due 04/01/07 | | 1,073,000 | |
1,175,000 | | C | | Potomac Edison Co., 5.000%, due 11/01/06 | | 1,177,357 | |
883,000 | | # | | Power Contract Financing, LLC, 6.256%, due 02/01/10 | | 902,372 | |
356,274 | | | | PPL Montana, LLC, 8.903%, due 07/02/20 | | 413,611 | |
466,000 | | C | | Sierra Pacific Power Co., 6.250%, due 04/15/12 | | 476,485 | |
609,456 | | # | | Tenaska Virginia Partners LP, 6.119%, due 03/30/24 | | 632,337 | |
| | | | | | 22,328,850 | |
| | | | Food: 0.4% | | | |
467,000 | | C | | Delhaize America, Inc., 8.050%, due 04/15/27 | | 492,998 | |
692,000 | | C,L | | Delhaize America, Inc., 8.125%, due 04/15/11 | | 753,458 | |
2,451,000 | | C | | Tyson Foods, Inc., 7.250%, due 10/01/06 | | 2,514,584 | |
| | | | | | 3,761,040 | |
| | | | Gas: 0.2% | | | |
1,343,000 | | #,C | | Williams Gas Pipelines Central, Inc., 7.375%, due 11/15/06 | | 1,387,306 | |
| | | | | | 1,387,306 | |
| | | | Home Builders: 0.0% | | | |
54,000 | | C | | Technical Olympic USA, Inc., 9.000%, due 07/01/10 | | 56,160 | |
| | | | | | 56,160 | |
| | | | Insurance: 0.8% | | | |
2,191,000 | | | | AON Corp., 8.205%, due 01/01/27 | | 2,519,280 | |
817,000 | | #,C | | North Front Pass-Through Trust, 5.810%, due 12/15/24 | | 823,109 | |
1,124,000 | | | | Prudential Financial, Inc., 4.104%, due 11/15/06 | | 1,116,534 | |
2,417,000 | | #,C | | Zurich Capital Trust I, 8.376%, due 06/01/37 | | 2,590,016 | |
| | | | | | 7,048,939 | |
See Accompanying Notes to Financial Statements
29
| PORTFOLIO OF INVESTMENTS |
ING INTERMEDIATE BOND FUND | AS OF SEPTEMBER 30, 2005 (UNAUDITED) (CONTINUED) |
Principal | | | | | | | |
Amount | | | | | | Value | |
| | | | Media: 0.2% | | | |
$ | 1,210,000 | | C | | COX Communications, Inc., 6.850%, due 01/15/18 | | $ | 1,302,134 | |
| | | | | | 1,302,134 | |
| | | | Multi-National: 0.1% | | | |
1,178,000 | | @@,S | | Corp Andina de Fomento, 5.125%, due 05/05/15 | | 1,161,914 | |
| | | | | | 1,161,914 | |
| | | | Oil and Gas: 1.6% | | | |
1,211,000 | | C | | Amerada Hess Corp., 6.650%, due 08/15/11 | | 1,310,067 | |
1,192,000 | | @@,# | | Empresa Nacional de Petroleo, 4.875%, due 03/15/14 | | 1,144,661 | |
831,000 | | @@,# | | Empresa Nacional de Petroleo ENAP, 6.750%, due 11/15/12 | | 899,105 | |
1,345,000 | | @@,+,C | | Husky Oil Co., 8.900%, due 08/15/28 | | 1,464,492 | |
2,402,000 | | @@,# | | Pemex Project Funding Master Trust, 5.170%, due 06/15/10 | | 2,505,286 | |
1,135,000 | | @@,#,C | | Pemex Project Funding Master Trust, 5.750%, due 12/15/15 | | 1,125,069 | |
3,132,000 | | @@,#,C | | Ras Laffan Liquefied Natural Gas Co Ltd II, 5.298%, due 09/30/20 | | 3,133,764 | |
1,432,000 | | @@,#,S | | Tengizchevroil Finance Co. SARL, 6.124%, due 11/15/14 | | 1,471,380 | |
941,000 | | C | | Valero Energy Corp., 7.500%, due 04/15/32 | | 1,139,412 | |
| | | | | | 14,193,236 | |
| | | | Pharmaceuticals: 0.1% | | | |
251,000 | | #,C | | AmerisourceBergen Corp, 5.625%, due 09/15/12 | | 248,490 | |
502,000 | | #,C | | AmerisourceBergen Corp, 5.875%, due 09/15/15 | | 498,235 | |
| | | | | | 746,725 | |
| | | | Pipelines: 0.1% | | | |
478,000 | | C | | KN Capital Trust III, 7.630%, due 04/15/28 | | 541,784 | |
20,000 | | | | Transcontinental Gas Pipe LN, 8.875%, due 07/15/12 | | 23,425 | |
| | | | | | 565,209 | |
| | | | Real Estate: 0.1% | | | |
1,650,000 | | C | | EOP Operating LP, 7.750%, due 11/15/07 | | 1,747,609 | |
| | | | | | 1,747,609 | |
| | | | Real Estate Investment Trusts: 0.7% | | | |
310,000 | | C | | Liberty Property LP, 6.375%, due 08/15/12 | | 328,777 | |
1,577,000 | | C | | Liberty Property LP, 7.750%, due 04/15/09 | | 1,718,201 | |
1,390,000 | | C | | Simon Property Group LP, 4.875%, due 03/18/10 | | 1,387,618 | |
2,179,000 | | C | | Simon Property Group LP, 6.375%, due 11/15/07 | | 2,244,893 | |
| | | | | | 5,679,489 | |
| | | | Retail: 0.2% | | | |
$ | 1,861,000 | | C | | May Department Stores Co., 3.950%, due 07/15/07 | | $ | 1,835,642 | |
| | | | | | 1,835,642 | |
| | | | Savings and Loans: 0.2% | | | |
1,238,000 | | C | | Great Western Financial, 8.206%, due 02/01/27 | | 1,333,612 | |
| | | | | | 1,333,612 | |
| | | | Telecommunications: 1.4% | | | |
1,152,000 | | C | | AT&T Corp., 9.750%, due 11/15/31 | | 1,464,480 | |
1,047,000 | | C | | AT&T Wireless Services, Inc., 8.750%, due 03/01/31 | | 1,417,505 | |
1,527,000 | | C | | BellSouth Corp., 4.200%, due 09/15/09 | | 1,498,742 | |
1,046,000 | | C,L | | BellSouth Corp., 6.000%, due 11/15/34 | | 1,053,984 | |
1,107,000 | | @@,C | | British Telecommunications PLC, 8.875%, due 12/15/30 | | 1,506,063 | |
975,000 | | @@,+,S | | Deutsche Telekom International Finance BV, 8.500%, due 06/15/10 | | 1,106,477 | |
497,000 | | C | | New Cingular Wireless Services, Inc., 8.125%, due 05/01/12 | | 583,579 | |
1,019,000 | | C,L | | SBC Communications, Inc., 6.150%, due 09/15/34 | | 1,046,360 | |
818,000 | | + | | Sprint Capital Corp., 4.780%, due 08/17/06 | | 819,438 | |
1,183,000 | | @@,C,L | | Telefonos de Mexico SA de CV, 4.750%, due 01/27/10 | | 1,174,786 | |
| | | | | | 11,671,414 | |
| | | | Transportation: 0.1% | | | |
1,208,000 | | @@,# | | MISC Capital Ltd., 5.000%, due 07/01/09 | | 1,214,284 | |
| | | | | | 1,214,284 | |
| | | | Total Corporate Bonds/notes
(Cost $182,279,043) | | 180,793,067 | |
U.S. GOVERNMENT AGENCY OBLIGATIONS: 31.3% | | | |
| | | | Federal Home Loan Bank: 0.8% | | | |
7,490,000 | | L | | 3.250%, due 12/17/07 | | 7,313,266 | |
| | | | | | 7,313,266 | |
| | | | Federal Home Loan Mortgage Corporation: 7.3% | | | |
12,885,000 | | C | | 2.700%, due 03/16/07 | | 12,582,307 | |
799,129 | | | | 3.766%, due 05/25/31 | | 799,535 | |
252,662 | | | | 3.791%, due 01/25/32 | | 252,880 | |
3,512,000 | | | | 3.875%, due 06/15/08 | | 3,467,261 | |
617,369 | | | | 3.921%, due 02/15/32 | | 620,100 | |
3,650,000 | | | | 4.000%, due 08/17/07 | | 3,629,560 | |
1,912,228 | | C | | 4.500%, due 12/15/16 | | 1,898,222 | |
779,796 | | C | | 4.500%, due 06/15/17 | | 773,196 | |
3,422,000 | | C | | 4.500%, due 02/15/20 | | 3,261,421 | |
869,000 | | C | | 5.000%, due 05/15/20 | | 864,794 | |
4,270,603 | | C | | 5.000%, due 08/15/21 | | 4,263,602 | |
3,513,000 | | C | | 5.000%, due 04/15/23 | | 3,472,280 | |
715,325 | | | | 5.038%, due 04/01/35 | | 708,801 | |
2,453,313 | | | | 5.216%, due 06/01/35 | | 2,437,389 | |
See Accompanying Notes to Financial Statements
30
| PORTFOLIO OF INVESTMENTS |
ING INTERMEDIATE BOND FUND | AS OF SEPTEMBER 30, 2005 (UNAUDITED) (CONTINUED) |
Principal | | | | | | | |
Amount | | | | | | Value | |
| | | | Federal Home Loan Mortgage Corporation (continued) | | | |
$ | 2,000,000 | | | | 5.500%, due 10/15/18 | | $ | 2,029,376 | |
2,323,924 | | C | | 5.500%, due 11/15/18 | | 2,356,353 | |
7,814,000 | | | | 5.500%, due 10/15/35 | | 7,816,438 | |
2,346,000 | | | | 5.875%, due 03/21/11 | | 2,474,263 | |
9,114,005 | | C | | 6.000%, due 01/15/29 | | 9,337,413 | |
11,684 | | | | 7.500%, due 11/01/28 | | 12,416 | |
| | | | | | 63,057,607 | |
| | | | Federal National Mortgage Association: 23.1% | | | |
120,229 | | C | | 3.841%, due 11/25/32 | | 120,239 | |
7,583,000 | | | | 3.875%, due 07/15/08 | | 7,469,172 | |
1,884,457 | | C | | 3.970%, due 04/25/35 | | 1,887,186 | |
601,688 | | | | 4.091%, due 10/25/33 | | 604,674 | |
556,719 | | | | 4.190%, due 04/18/28 | | 560,182 | |
598,651 | | C | | 4.191%, due 01/25/32 | | 598,726 | |
2,213,000 | | L | | 4.250%, due 09/15/07 | | 2,207,872 | |
116,960 | | | | 4.280%, due 12/25/29 | | 117,321 | |
903,936 | | | | 4.500%, due 09/25/16 | | 897,248 | |
2,675,186 | | | | 4.500%, due 10/25/17 | | 2,652,858 | |
68,000 | | | | 4.500%, due 10/15/18 | | 66,598 | |
105,000 | | | | 4.500%, due 10/15/35 | | 100,111 | |
3,250,339 | | | | 4.643%, due 08/01/35 | | 3,231,192 | |
2,187,000 | | C | | 4.750%, due 12/25/42 | | 2,186,711 | |
2,351,771 | | | | 4.823%, due 08/01/35 | | 2,337,219 | |
7,000,000 | | | | 5.000%, due 10/15/33 | | 6,853,434 | |
48,079,000 | | | | 5.000%, due 11/15/34 | | 47,027,272 | |
3,565,000 | | | | 5.150%, due 09/01/35 | | 3,570,348 | |
3,340,000 | | | | 5.250%, due 08/01/12 | | 3,436,202 | |
1,472,795 | | | | 5.325%, due 07/01/35 | | 1,465,492 | |
5,469,980 | | | | 5.500%, due 10/15/18 | | 5,550,323 | |
2,412,804 | | | | 5.500%, due 11/01/32 | | 2,414,849 | |
31,872,000 | | | | 5.500%, due 10/15/33 | | 31,862,056 | |
13,115,351 | | | | 5.500%, due 11/01/33 | | 13,126,013 | |
81,571 | | | | 6.000%, due 08/01/16 | | 83,947 | |
7,098 | | | | 6.000%, due 12/01/16 | | 7,304 | |
251,640 | | | | 6.000%, due 03/01/17 | | 258,970 | |
2,156,513 | | | | 6.000%, due 09/01/17 | | 2,219,299 | |
162,282 | | | | 6.000%, due 11/01/17 | | 167,010 | |
333,000 | | | | 6.000%, due 10/15/20 | | 342,470 | |
4,977,915 | | | | 6.000%, due 07/25/29 | | 5,125,414 | |
2,432,277 | | | | 6.000%, due 04/25/31 | | 2,508,823 | |
1,174,644 | | | | 6.000%, due 08/01/33 | | 1,194,906 | |
24,827,000 | | | | 6.000%, due 10/15/34 | | 25,245,956 | |
59,220 | | | | 6.500%, due 07/01/29 | | 61,166 | |
240,935 | | | | 6.500%, due 08/01/29 | | 248,849 | |
671,650 | | | | 6.500%, due 04/01/30 | | 693,713 | |
2,949 | | | | 6.500%, due 06/01/31 | | 3,042 | |
663,995 | | | | 6.500%, due 07/01/31 | | 686,198 | |
17,336 | | | | 6.500%, due 09/01/31 | | 17,878 | |
10,158,000 | | | | 6.500%, due 10/01/31 | | 10,456,391 | |
308,445 | | | | 6.500%, due 11/01/31 | | 318,074 | |
166,721 | | | | 6.500%, due 04/01/32 | | 171,835 | |
78,980 | | | | 6.500%, due 07/01/32 | | 81,402 | |
218,995 | | | | 6.500%, due 08/01/32 | | 225,713 | |
208,047 | | | | 6.500%, due 11/01/32 | | 214,429 | |
215,881 | | | | 6.500%, due 01/01/33 | | 222,504 | |
176,638 | | | | 6.500%, due 02/01/33 | | 181,862 | |
810,844 | | | | 6.500%, due 12/01/33 | | 834,825 | |
3,015,000 | | | | 6.625%, due 11/15/10 | | 3,300,403 | |
142,658 | | | | 7.000%, due 01/01/30 | | 149,375 | |
7,401 | | | | 7.000%, due 03/01/30 | | 7,752 | |
369,113 | | | | 7.000%, due 06/01/31 | | 387,070 | |
$ | 1,412,360 | | | | 7.000%, due 08/01/35 | | $ | 1,478,741 | |
1,837 | | | | 7.500%, due 09/01/30 | | 1,945 | |
28,640 | | | | 7.500%, due 10/01/30 | | 30,324 | |
9,332 | | | | 7.500%, due 11/01/30 | | 9,880 | |
110,744 | | | | 7.500%, due 02/01/32 | | 117,327 | |
571,055 | | C | | 7.500%, due 12/25/41 | | 602,287 | |
1,137,161 | | C | | 7.500%, due 01/25/48 | | 1,191,362 | |
| | | | | | 199,191,744 | |
| | | | Government National Mortgage Association: 0.1% | | | |
14,933 | | | | 4.375%, due 04/20/28 | | 15,046 | |
1,364 | | | | 6.500%, due 03/15/31 | | 1,420 | |
27,173 | | | | 6.500%, due 08/15/31 | | 28,290 | |
62,605 | | | | 6.500%, due 10/15/31 | | 65,178 | |
32,118 | | | | 6.500%, due 11/15/31 | | 33,437 | |
28,154 | | | | 6.500%, due 07/15/32 | | 29,303 | |
185,868 | | | | 6.500%, due 09/15/32 | | 193,449 | |
76,624 | | | | 7.000%, due 04/15/26 | | 80,829 | |
38,963 | | | | 7.000%, due 05/15/32 | | 40,987 | |
106,345 | | | | 7.500%, due 12/15/22 | | 113,726 | |
6,147 | | | | 7.500%, due 10/15/26 | | 6,545 | |
41,655 | | | | 7.500%, due 07/15/29 | | 44,266 | |
132 | | | | 7.500%, due 11/15/30 | | 140 | |
44,918 | | | | 7.500%, due 12/15/30 | | 47,717 | |
49,534 | | | | 7.500%, due 12/15/31 | | 52,619 | |
87,201 | | | | 7.500%, due 05/15/32 | | 92,617 | |
| | | | | | 845,569 | |
| | | | Total U.S. Government Agency Obligations
(Cost $272,709,316) | | 270,408,186 | |
U.S. TREASURY OBLIGATIONS: 27.7% | | | |
| | | | U.S. Treasury Bonds: 11.6% | | | |
71,800,000 | | | | 4.250%, due 08/15/15 | | 71,373,724 | |
19,561,000 | | S,L | | 5.375%, due 02/15/31 | | 21,920,565 | |
3,152,000 | | C,S,L | | 10.375%, due 11/15/12 | | 3,544,771 | |
2,668,000 | | C,S,L | | 13.250%, due 05/15/14 | | 3,473,194 | |
| | | | | | 100,312,254 | |
| | | | U.S. Treasury Inflation Indexed Bonds: 0.8% | | | |
6,720,000 | | S | | 2.000%, due 01/15/14 | | 7,256,648 | |
| | | | | | 7,256,648 | |
| | | | U.S. Treasury Notes: 14.9% | | | |
7,500,000 | | S | | 1.625%, due 02/28/06 | | 7,434,675 | |
38,748,000 | | L | | 3.875%, due 09/15/10 | | 38,212,193 | |
51,440,000 | | S,L | | 4.000%, due 08/31/07 | | 51,281,307 | |
22,176,000 | | S,L | | 4.125%, due 08/15/08 | | 22,150,032 | |
8,695,000 | | | | 4.125%, due 08/15/10 | | 8,658,664 | |
| | | | | | 127,736,871 | |
| | | | U.S. Treasury STRIP: 0.4% | | | |
5,963,000 | | | | 4.570%, due 05/15/16 | | 3,710,041 | |
| | | | | | 3,710,041 | |
| | | | Total U.S. Treasury Obligations
(Cost $241,582,837) | | 239,015,814 | |
See Accompanying Notes to Financial Statements
31
| PORTFOLIO OF INVESTMENTS |
ING INTERMEDIATE BOND FUND | AS OF SEPTEMBER 30, 2005 (UNAUDITED) (CONTINUED) |
Principal | | | | | | | |
Amount | | | | | | Value | |
ASSET-BACKED SECURITIES: 5.4% | | | |
| | | | Automobile Asset-Backed Securities: 1.3% | | | |
$ | 1,554,056 | | C | | Capital Auto Receivables Asset Trust, 2.750%, due 04/16/07 | | $ | 1,544,599 | |
200,000 | | C | | Capital One Auto Finance Trust, 3.180%, due 09/15/10 | | 196,612 | |
2,412,000 | | C | | Carmax Auto Owner Trust, 4.210%, due 01/15/10 | | 2,397,121 | |
204,000 | | C | | Daimler Chrysler Auto Trust, 3.490%, due 12/08/08 | | 201,653 | |
623,000 | | C | | Honda Auto Receivables Owner Trust, 2.790%, due 03/16/09 | | 609,621 | |
917,000 | | C | | Honda Auto Receivables Owner Trust, 3.820%, due 05/21/10 | | 900,013 | |
858,272 | | C | | Household Automotive Trust, 2.310%, due 04/17/08 | | 853,077 | |
1,250,000 | | C | | Nissan Auto Receivables Owner Trust, 2.050%, due 03/16/09 | | 1,218,523 | |
1,370,000 | | C | | Nissan Auto Receivables Owner Trust, 2.610%, due 07/15/08 | | 1,350,932 | |
1,965,000 | | C | | Nissan Auto Receivables Owner Trust, 4.190%, due 07/15/09 | | 1,954,132 | |
200,000 | | C | | USAA Auto Owner Trust, 2.040%, due 02/16/10 | | 196,489 | |
| | | | | | 11,422,772 | |
| | | | Credit Card Asset-Backed Securities: 1.0% | | | |
560,000 | | C | | Bank One Issuance Trust, 4.540%, due 09/15/10 | | 557,099 | |
530,000 | | C | | Capital One Master Trust, 4.900%, due 03/15/10 | | 533,551 | |
800,000 | | C | | Citibank Credit Card Issuance Trust, 3.100%, due 03/10/10 | | 773,913 | |
2,285,000 | | C | | Citibank Credit Card Issuance Trust, 5.650%, due 06/16/08 | | 2,305,202 | |
44,000 | | C | | Citibank Credit Card Issuance Trust, 6.875%, due 11/16/09 | | 46,119 | |
2,429,000 | | C | | Citibank Credit Card Master Trust I, 5.875%, due 03/10/11 | | 2,528,153 | |
193,000 | | C | | Discover Card Master Trust I, 5.150%, due 10/15/09 | | 194,965 | |
1,020,000 | | C | | Fleet Credit Card Master Trust II, 2.400%, due 07/15/08 | | 1,015,319 | |
589,000 | | C | | MBNA Master Credit Card Trust USA, 5.900%, due 08/15/11 | | 614,659 | |
| | | | | | 8,568,980 | |
| | | | Home Equity Asset-Backed Securities: 1.7% | | | |
487,751 | | C | | Argent Securities, Inc., 3.961%, due 03/25/34 | | 488,442 | |
452,979 | | C | | Asset Backed Funding Certificates, 3.921%, due 11/25/33 | | 454,166 | |
$ | 495,308 | | C | | Bayview Financial Acquisition Trust, 4.337%, due 09/28/43 | | $ | 496,660 | |
259,933 | | C | | Centex Home Equity, 3.921%, due 01/25/34 | | 260,215 | |
78,000 | | C | | Centex Home Equity, 4.140%, due 03/25/28 | | 76,961 | |
1,216,566 | | C | | GMAC Mortgage Corp Loan Trust, 3.871%, due 12/25/20 | | 1,217,411 | |
4,851,000 | | C | | GSAA Trust, 5.242%, due 05/25/35 | | 4,851,865 | |
199,827 | | C | | Merrill Lynch Mortgage Investors, Inc., 4.001%, due 07/25/34 | | 200,685 | |
1,270,492 | | C | | New Century Home Equity Loan Trust, 4.080%, due 04/25/34 | | 1,271,474 | |
44,493 | | C | | New Century Home Equity Loan Trust, 4.086%, due 06/20/31 | | 44,525 | |
222,133 | | C | | New Century Home Equity Loan Trust, 4.390%, due 07/25/30 | | 222,315 | |
638,000 | | C | | Renaissance Home Equity Loan Trust, 4.456%, due 05/25/35 | | 630,612 | |
820,000 | | C | | Renaissance Home Equity Loan Trust, 4.723%, due 10/25/35 | | 820,000 | |
254,328 | | C | | Residential Asset Securities Corp., 3.871%, due 09/25/31 | | 254,519 | |
343,650 | | C | | Residential Asset Securities Corp., 3.941%, due 06/25/32 | | 344,493 | |
90,000 | | C | | Residential Funding Mortgage Securities II, 4.160%, due 11/25/17 | | 88,649 | |
1,993,678 | | C | | Saxon Asset Securities Trust, 3.960%, due 06/25/33 | | 1,988,738 | |
984,000 | | C | | Wells Fargo Home Equity Trust, 3.970%, due 09/25/24 | | 966,044 | |
| | | | | | 14,677,774 | |
| | | | Other Asset-Backed Securities: 1.4% | | | |
259,068 | | C | | Ameriquest Mortgage Securities, Inc., 3.941%, due 02/25/34 | | 259,364 | |
93,348 | | C | | Amortizing Residential Collateral Trust, 4.330%, due 05/25/32 | | 93,430 | |
15,919 | | C | | Chase Funding Mortgage Loan Asset-Backed Certificates, 2.734%, due 09/25/24 | | 15,815 | |
15,000 | | C | | Chase Funding Mortgage Loan Asset-Backed Certificates, 4.045%, due 05/25/33 | | 14,827 | |
949,942 | | C | | Chase Funding Mortgage Loan Asset-Backed Certificates, 4.130%, due 07/25/33 | | 952,196 | |
951,000 | | C | | Countrywide Asset-Backed Certificates, 4.493%, due 12/31/49 | | 943,601 | |
See Accompanying Notes to Financial Statements
32
| PORTFOLIO OF INVESTMENTS |
ING INTERMEDIATE BOND FUND | AS OF SEPTEMBER 30, 2005 (UNAUDITED) (CONTINUED) |
Principal | | | | | | | |
Amount | | | | | | Value | |
| | | | Other Asset-Backed Securities (continued) | | | |
$ | 3,708,925 | | +,C | | Lehman XS Trust, 3.921%, due 01/01/49 | | $ | 3,708,926 | |
524,000 | | C | | Popular ABS Mortgage Pass-Through Trust, 3.735%, due 12/25/34 | | 516,898 | |
524,000 | | C | | Popular ABS Mortgage Pass-Through Trust, 4.000%, due 12/25/34 | | 514,646 | |
698,000 | | C | | Popular ABS Mortgage Pass-Through Trust, 4.596%, due 11/25/35 | | 694,510 | |
64,532 | | C | | Residential Asset Mortgage Products, Inc., 2.140%, due 02/25/30 | | 64,368 | |
69,530 | | C | | Residential Asset Mortgage Products, Inc., 3.951%, due 06/25/33 | | 69,671 | |
1,000,000 | | C | | Residential Asset Mortgage Products Inc, 4.100%, due 07/25/35 | | 1,001,142 | |
3,300,000 | | C | | Structured Asset Securities Corp., 6.000%, due 03/25/34 | | 3,313,761 | |
| | | | | | 12,163,155 | |
| | | | Total Asset-backed Securities
(Cost $47,262,219) | | 46,832,681 | |
COLLATERALIZED MORTGAGE OBLIGATIONS: 18.5% | | | |
| | | | Commercial Mortgage-Backed Securities: 5.4% | | | |
1,609,000 | | C | | Banc of America Commercial Mortgage, Inc., 4.502%, due 07/10/42 | | 1,576,173 | |
5,336,000 | | C | | Banc of America Commercial Mortgage, Inc., 4.611%, due 07/10/43 | | 5,289,266 | |
1,114,000 | | C | | Banc of America Commercial Mortgage, Inc., 4.764%, due 07/10/45 | | 1,108,207 | |
1,524,000 | | C | | Bear Stearns Commercial Mortgage Securities, 3.880%, due 08/13/39 | | 1,474,271 | |
321,000 | | C | | Bear Stearns Commercial Mortgage Securities, 4.030%, due 02/13/46 | | 311,619 | |
1,527,000 | | C | | Bear Stearns Commercial Mortgage Securities, 4.170%, due 01/12/41 | | 1,499,799 | |
672,000 | | C,L | | Capco America Securitization Corp., 6.260%, due 10/15/30 | | 700,156 | |
456,000 | | C | | Capco America Securitization Corp., 6.460%, due 10/15/30 | | 479,695 | |
1,950,000 | | C | | Chase Manhattan Bank-First Union National Bank, 7.439%, due 08/15/31 | | 2,117,822 | |
1,093,000 | | C | | COMM, 3.600%, due 03/10/39 | | 1,054,911 | |
984,750 | | C | | CS First Boston Mortgage Securities Corp., 3.727%, due 03/15/35 | | 953,322 | |
1,000,000 | | C | | DLJ Commercial Mortgage Corp., 6.460%, due 03/10/32 | | 1,050,391 | |
$ | 688,000 | | C | | DLJ Commercial Mortgage Corp., 7.300%, due 06/10/32 | | $ | 743,998 | |
2,637,535 | | C | | GE Capital Commercial Mortgage Corp., 3.752%, due 07/10/39 | | 2,585,821 | |
698,000 | | C | | GE Capital Commercial Mortgage Corp., 4.371%, due 01/10/38 | | 684,446 | |
483,000 | | C | | GE Capital Commercial Mortgage Corp., 4.865%, due 07/10/39 | | 481,430 | |
1,700,000 | | C | | JP Morgan Chase Commercial Mortgage Securities Corp., 4.223%, due 01/15/42 | | 1,664,964 | |
1,670,947 | | C | | JP Morgan Chase Commercial Mortgage Securities Corp., 4.275%, due 01/12/37 | | 1,639,988 | |
4,263,000 | | C | | JP Morgan Chase Commercial Mortgage Securities Corp., 5.857%, due 10/12/35 | | 4,467,570 | |
2,838,956 | | C | | JP Morgan Chase Commercial Mortgage Securities Corp., 6.244%, due 04/15/35 | | 2,922,422 | |
866,000 | | C | | LB-UBS Commercial Mortgage Trust, 3.992%, due 10/15/29 | | 839,820 | |
225,000 | | C | | LB-UBS Commercial Mortgage Trust, 4.310%, due 02/15/30 | | 220,432 | |
255,000 | | C | | LB-UBS Commercial Mortgage Trust, 4.510%, due 12/15/29 | | 249,996 | |
289,000 | | C | | LB-UBS Commercial Mortgage Trust, 4.567%, due 06/15/29 | | 287,598 | |
2,961,000 | | C | | LB-UBS Commercial Mortgage Trust, 6.226%, due 03/15/26 | | 3,104,048 | |
1,703,000 | | C | | LB-UBS Commercial Mortgage Trust, 7.370%, due 08/15/26 | | 1,873,401 | |
400,000 | | C | | Morgan Stanley Capital I, 7.020%, due 03/15/32 | | 427,471 | |
2,584,880 | | C | | Mortgage Capital Funding, Inc., 6.663%, due 03/18/30 | | 2,678,763 | |
3,777,193 | | C | | Prudential Commercial Mortgage Trust, 3.669%, due 02/11/36 | | 3,648,788 | |
400,000 | | C | | Salomon Brothers Mortgage Securities VII, 7.520%, due 12/18/09 | | 437,103 | |
| | | | | | 46,573,691 | |
| | | | Whole Loan Collateral PAC: 0.2% | | | |
108,868 | | C | | Countrywide Alternative Loan Trust, 4.230%, due 02/25/33 | | 108,989 | |
912,116 | | C | | MASTR Alternative Loans Trust, 8.500%, due 05/25/33 | | 936,749 | |
731,383 | | C | | Residential Funding Mtg Sec I, 4.041%, due 11/25/17 | | 732,932 | |
| | | | | | 1,778,670 | |
| | | | Whole Loan Collateralized Mortgage Obligations: 12.8% | | | |
539,565 | | C | | ABN Amro Mortgage Corp., 4.141%, due 03/25/18 | | 540,129 | |
See Accompanying Notes to Financial Statements
33
| PORTFOLIO OF INVESTMENTS |
ING INTERMEDIATE BOND FUND | AS OF SEPTEMBER 30, 2005 (UNAUDITED) (CONTINUED) |
Principal | | | | | | | |
Amount | | | | | | Value | |
| | | | Whole Loan Collateralized Mortgage Obligations (continued) | | | |
$ | 6,509,517 | | C | | Banc of America Funding Corp., 5.352%, due 12/31/49 | | $ | 6,473,064 | |
3,444,422 | | C | | Banc of America Funding Corp., 5.750%, due 09/20/34 | | 3,451,700 | |
1,292,178 | | C | | Bank of America Mortgage Securities, 5.250%, due 11/25/19 | | 1,292,376 | |
2,389,643 | | C | | Banc of America Mortgage Securities, 5.500%, due 12/01/49 | | 2,398,916 | |
1,882,900 | | C | | Bear Stearns Alt-A Trust, 3.961%, due 07/25/34 | | 1,885,686 | |
359,119 | | C | | Citicorp Mortgage Securities, Inc., 4.091%, due 03/25/33 | | 359,578 | |
3,227,032 | | C | | Citigroup Mortgage Loan Trust, Inc., 3.580%, due 12/25/34 | | 3,229,117 | |
1,551,711 | | C | | Countrywide Alternative Loan Trust, 3.941%, due 02/25/35 | | 1,554,807 | |
1,176,018 | | C | | Countrywide Alternative Loan Trust, 4.191%, due 04/25/33 | | 1,178,701 | |
484,340 | | C | | Countrywide Alternative Loan Trust, 4.330%, due 07/25/35 | | 485,756 | |
8,141,382 | | C | | Countrywide Alternative Loan Trust, 5.415%, due 10/25/35 | | 8,128,660 | |
3,916,193 | | C | | Countrywide Alternative Loan Trust, 5.500%, due 02/25/25 | | 3,932,209 | |
741,754 | | C | | Countrywide Home Loan Mortgage Pass Through Trust,4.330%, due 04/25/18 | | 743,734 | |
1,936,595 | | C | | Countrywide Home Loan Mortgage Pass Through Trust, 5.000%, due 11/25/18 | | 1,921,490 | |
4,275,402 | | | | Fannie Mae, 3.896%, due 02/17/29 | | 343,644 | |
595,461 | | C | | First Horizon Asset Securities, Inc., 5.478%, due 10/25/35 | | 596,578 | |
1,360,267 | | C | | Freddie Mac, 4.418%, due 04/15/32 | | 1,370,106 | |
1,277,960 | | C | | Ginnie Mae, 4.478%, due 06/16/31 | | 90,875 | |
4,539,908 | | C | | GMAC Mortgage Corp. Loan Trust, 5.264%, due 03/18/35 | | 4,505,859 | |
967,697 | | #,C | | GSMPS Mortgage Loan Trust, 3.991%, due 01/25/35 | | 971,469 | |
805,735 | | C | | GSR Mortgage Loan Trust, 4.141%, due 06/25/35 | | 808,080 | |
488,538 | | C | | GSR Mortgage Loan Trust, 4.500%, due 08/25/19 | | 483,953 | |
2,266,602 | | C | | Harborview Mortgage Loan Trust, 4.139%, due 01/19/35 | | 2,267,310 | |
1,384,907 | | C | | Homebanc Mortgage Trust, 4.071%, due 08/25/29 | | 1,391,441 | |
$ | 4,676,171 | | C | | Mastr Adjustable Rate Mortgages Trust, 5.365%, due 06/30/19 | | $ | 4,658,635 | |
3,342,211 | | C | | MASTR Alternative Loans Trust, 5.500%, due 01/25/20 | | 3,376,584 | |
496,787 | | C | | MASTR Alternative Loans Trust, 6.500%, due 05/25/33 | | 503,066 | |
2,348,033 | | C | | MLCC Mortgage Investors, Inc., 3.961%, due 10/25/28 | | 2,349,450 | |
3,871,874 | | C | | MLCC Mortgage Investors, Inc., 4.060%, due 04/25/29 | | 3,876,211 | |
1,392,899 | | C | | MLCC Mortgage Investors, Inc., 4.150%, due 01/25/29 | | 1,394,663 | |
1,059,251 | | C | | QFA Royalties LLC, 7.300%, due 02/20/25 | | 1,056,272 | |
4,602,086 | | C | | Residential Accredit Loans, Inc., 4.041%, due 04/25/35 | | 4,604,991 | |
7,732,735 | | C | | Residential Accredit Loans, Inc., 4.141%, due 08/25/35 | | 7,756,211 | |
474,000 | | C | | Residential Accredit Loans, Inc., 5.750%, due 04/25/35 | | 476,221 | |
1,541,793 | | C | | Sequoia Mortgage Trust, 4.066%, due 01/20/35 | | 1,544,381 | |
481,534 | | C,L | | Sequoia Mortgage Trust, 4.110%, due 11/20/33 | | 482,055 | |
1,810,250 | | C | | Structured Adjustable Rate Mortgage Loan Trust, 4.140%, due 07/25/35 | | 1,807,775 | |
4,621,588 | | C | | Structured Asset Mortgage Investments, Inc., 4.029%, due 04/19/35 | | 4,612,200 | |
1,295,850 | | C | | Thornburg Mortgage Securities Trust, 3.991%, due 12/25/33 | | 1,298,840 | |
4,643,450 | | C | | Thornburg Mortgage Securities Trust, 4.011%, due 09/25/34 | | 4,655,608 | |
2,973,692 | | C | | Washington Mutual, 4.041%, due 08/25/45 | | 2,972,763 | |
2,251,715 | | C | | Washington Mutual, 6.000%, due 06/25/34 | | 2,274,232 | |
1,114,995 | | C | | Washington Mutual MSC Mortgage Pass-Through CTFS, 4.141%, due 01/25/18 | | 1,117,865 | |
252,519 | | C | | Washington Mutual MSC Mortgage Pass-Through CTFS, 4.241%, due 03/25/33 | | 252,876 | |
2,062,955 | | C | | Washington Mutual, Inc., 3.795%, due 06/25/44 | | 2,065,548 | |
1,694,146 | | C | | Washington Mutual, Inc., 3.951%, due 01/25/45 | | 1,696,366 | |
3,018,567 | | C | | Washington Mutual, Inc., 4.080%, due 01/25/45 | | 3,020,221 | |
506,942 | | C | | Wells Fargo Mortgage Backed Securities Trust, 4.141%, due 02/25/34 | | 507,257 | |
2,160,000 | | C | | Wells Fargo Mortgage Backed Securities Trust, 4.500%, due 08/25/18 | | 2,083,132 | |
| | | | | | 110,848,661 | |
See Accompanying Notes to Financial Statements
34
| PORTFOLIO OF INVESTMENTS |
ING INTERMEDIATE BOND FUND | AS OF SEPTEMBER 30, 2005 (UNAUDITED) (CONTINUED) |
Principal | | | | | | | |
Amount | | | | | | Value | |
| | | | Whole Loan Collateralized Support CMO: 0.1% | | | |
$ | 967,054 | | C | | Bank of America Mortgage Securities, 5.500%, due 11/25/33 | | $ | 963,432 | |
| | | | | | 963,432 | |
| | | | Total Collateralized Mortgage Obligations
(Cost $161,970,420) | | 160,164,454 | |
OTHER BONDS: 0.3% | | | |
| | | | Sovereign: 0.3% | | | |
1,105,000 | | @@,S,L | | Mexico Government Intl. Bond, 6.625%, due 03/03/15 | | 1,203,345 | |
840,678 | | @@ | | Uruguay Government Intl. Bond, 10.500%, due 10/20/06 | | 1,259,737 | |
| | | | Total Other Bonds
(Cost $2,072,653) | | 2,463,082 | |
MUNICIPAL BONDS: 0.3% | | | |
| | | | Municipal: 0.3% | | | |
605,000 | | | | City of New York, NY, 5.000%, due 11/01/08 | | 635,704 | |
605,000 | | | | City of New York, NY, 5.000%, due 11/01/11 | | 651,500 | |
605,000 | | C | | City of New York, NY, 5.000%, due 11/01/15 | | 654,943 | |
285,000 | | C | | City of New York, NY, 5.000%, due 04/01/35 | | 294,570 | |
| | | | Total Municipal Bonds
(Cost $2,259,682) | | 2,236,717 | |
| | | | | | | | | |
Shares | | | | | | Value | |
| | | | | | | |
PREFERRED STOCK: 1.7% | | | |
| | | | Banks: 0.6% | | | |
448 | | #,C | | DG Funding Trust | | 4,796,400 | |
| | | | | | 4,796,400 | |
| | | | Diversified Financial Services: 0.1% | | | |
40,975 | | C | | National Rural Utilities Cooperative Finance Corp. | | 1,000,610 | |
| | | | | | 1,000,610 | |
| | | | Electric: 0.1% | | | |
22,950 | | | | TECO Energy, Inc. | | 581,460 | |
| | | | | | 581,460 | |
| | | | Insurance: 0.7% | | | |
125,557 | | @@,C | | Aegon NV | | 3,200,448 | |
126,650 | | C | | Metlife, Inc. | | 3,210,577 | |
| | | | | | 6,411,025 | |
| | | | Telecommunications: 0.2% | | | |
1,250 | | @@,# | | Centaur Funding Corp. | | 1,633,594 | |
| | | | | | 1,633,594 | |
| | | | Total Preferred Stock
(Cost $14,473,876) | | 14,423,089 | |
WARRANTS: 0.0% | | | |
20 | | @ | | American Tower Corp. | | $ | 7,044 | |
| | | | Total Warrants
(Cost $1,502) | | 7,044 | |
| | | | Total Long-Term Investments
(Cost $924,611,548) | | 916,344,134 | |
| | | | | | | | |
Principal | | | | | | | |
Amount | | | | | | Value | |
| | | | | | | |
SHORT-TERM INVESTMENTS: 31.5% | | | | | |
| | Repurchase Agreement: 9.6% | | | | | |
$ | 82,978,000 | | Goldman Sachs Repurchase Agreement dated 09/30/05, 3.790%, due 10/03/05, $83,004,207 to be received upon repurchase (Collateralized by $151,702,488 various U.S. Agency Obligations, 6.500%-11.250%, Market Value plus accrued interest $85,467,688, due 08/15/06-11/15/26) | | | | 82,978,000 | |
| | Total Repurchase Agreement
(Cost $82,978,000) | | | | 82,978,000 | |
| | Securities Lending CollateralCC: 21.9% | | | | | |
189,517,473 | | The Bank of New York Institutional Cash Reserves Fund | | | | 189,517,473 | |
| | Total Securities Lending Collateral
(Cost $189,517,473) | | | | 189,517,473 | |
| | Total Short-Term Investments
(Cost $272,495,473) | | | | 272,495,473 | |
| | Total Investments In Securities (Cost $1,197,107,021)* | | 137.6 | % | $ | 1,188,839,607 | |
| | Other Assets and Liabilities—Net | | (37.6 | ) | (325,040,763 | ) |
| | Net Assets | | 100.0 | % | $ | 863,798,844 | |
| | | | | | | | | |
| | Certain foreign securities may have been fair valued in accordance with procedures approved by the Board of Directors/Trustees. |
@ | | Non-income producing security |
@@ | | Foreign issuer |
STRIP | | Separate Trading of Registered Interest and Principal of Securities |
+ | | Step-up basis bonds. Interest rates shown reflect current coupon rates. |
# | | Securities with purchases pursuant to Rule 144A, under the Securities Act of 1933 and may not be resold subject to that rule except to qualified institutional buyers. These securities have been determined to be liquid under the guidelines established by the Funds’ Board of Directors/Trustees. |
C | | Bond may be called prior to maturity date. |
cc | | Securities purchased with cash collateral for securities loaned. |
S | | Segregated securities for certain derivatives, when-issued or delayed delivery securities and forward currency exchange contracts. |
I | | Illiquid security |
L | | Loaned security, a portion or all of the security is on loan at September 30, 2005. |
* | | Cost for federal income tax purposes is $1,008,412,520. Net unrealized depreciation consists of: |
| | Gross Unrealized Appreciation | | | | $ | 880,086 | |
| | Gross Unrealized Depreciation | | | | | (9,970,472 | ) |
| | Net Unrealized Depreciation | | | | $ | (9,090,386 | ) |
| | | | | | | | | | |
See Accompanying Notes to Financial Statements
35
| PORTFOLIO OF INVESTMENTS |
ING INTERMEDIATE BOND FUND | AS OF SEPTEMBER 30, 2005 (UNAUDITED) (CONTINUED) |
Information concerning open futures at September 30, 2005 is shown below:
| | No. of | | Notional | | Expiration | | Unrealized | |
| | Contracts | | Market Value | | Date | | Gain/(Loss) | |
Long Contracts | | | | | | | | | |
U.S. Long Bond | | 162 | | | $ | 18,533,813 | | | 12/20/05 | | | $ (237,482 | ) | |
| | | | | | | | | | | | | |
Short Contracts | | | | | | | | | | | | | |
U.S. 2 Year | | | | | | | | | | | | | |
Treasury Note | | 90 | | | $ | 18,530,156 | | | 01/05/06 | | | $ 19,238 | | |
Information concerning the Interest Rate Swap Agreements outstanding for the Intermediate Bond Fund at September 30, 2005, is shown below:
| | Termination | | | Notional
Principal | | Unrealized
Appreciation | |
| | Date | | | Amount | | (Depreciation) | |
Received a fixed rate equal to 1.000% and pay a floating rate based on 3-month LIBOR. Counterparty: UBS AG | | 03/01/34 | | JPY | 500,000,000 | | | $ | 56,099 | | |
| | | | | | | | | | |
Received a floating rate equal to 3-month LIBOR + 2.510% and pay a floating rate based on 3-month LIBOR + 1.700%. Counterparty: UBS AG | | 03/01/34 | | JPY | 291,945,000 | | | 31,275 | | |
| | | | | | | | | | |
Received a fixed rate equal to 1.000% and pay a floating ratebased on 6-month LIBOR. Counterparty: UBS AG | | 03/01/34 | | JPY | 300,000,000 | | | 62,455 | | |
| | | | | | | | $ | 149,829 | | |
See Accompanying Notes to Financial Statements
36
ADVISORY CONTRACT APPROVAL DISCUSSION (UNAUDITED)
Under Section 15(c) of the Investment Company Act of 1940 (the “1940 Act”), after an initial period, the Funds’ existing investment advisory and sub-advisory contracts remain in effect only if the Board of Trustees (the “Board”) of ING Funds Trust, including a majority of the Trustees who have no direct or indirect interest in the advisory and sub-advisory contracts, and who are not “interest persons” of the Funds, as such term is defined under the 1940 Act (the “Independent Trustees”), annually review and renew them.
In this regard, at a meeting held on August 31, 2004 the Board, including a majority of the Independent Trustees, considered whether to renew the investment advisory contracts (the “Advisory Contracts”) between ING Investments, LLC (the “Adviser”) and the Funds and the sub-advisory contracts (“Sub-Advisory Contracts”) with ING Investment Management Co., the sub-adviser to the Funds (the “Sub-Adviser”), for the period September 1, 2004 through August 31, 2005. Subsequently, at its meeting held on July 21, 2005, the Board considered whether to renew the terms of the Advisory and Sub-Advisory Contracts for an “interim” period commencing on September 1, 2005 and ending on November 30, 2005. The interim approval was necessary to align the Funds’ annual renewal periods with those of other Funds in the ING Funds complex.
At the August 31, 2004 meeting, the Board voted to renew the Advisory Contracts and Sub-Advisory Contracts for the Funds for the year ended August 31, 2005. At its July 21, 2005 meeting, the Board voted to renew these Contracts for the interim period ending November 30, 2005. In reaching these decisions, the Board took into account a number of factors its members believed, in light of the legal advice furnished to the Board by Kirkpatrick & Lockhart Nicholson Graham LLP (“K&LNG”), legal counsel to the Independent Trustees, and their own business judgment, to be relevant.
In connection with their deliberations on August 31, 2004 relating to the renewal of each Fund’s current Advisory Contract and Sub-Advisory Contract, the Board, including the Independent Trustees, considered information that had been provided by the Adviser and the Sub-Adviser throughout the year at regular Board Meetings, as well as information furnished in advance of the August 31, 2004 Board meeting, which was held to specifically consider such renewals for purposes of annual renewal. This information included the following items: (1) FACT sheets for each Fund that provide information about the performance and expenses of the Fund and its respective peer group, as well as information about the Fund’s investment portfolio, objective and strategies; (2) the 15(c) Methodology Guide that describes how the FACT sheets were prepared, including how benchmarks and peer groups were selected and how profitability was determined; (3) responses to questions from K&LNG, legal counsel to the Independent Trustees; (4) copies of each form of Advisory and Sub-Advisory Contract; (5) copies of the Form ADV for the Adviser and Sub-Adviser; (6) financial statements for the Adviser and Sub-Adviser; and (7) other information relevant to their evaluations.
In connection with their deliberations on July 21, 2005 relating to each Fund’s current Advisory Contract and Sub-Advisory Contract, the Board, including the Independent Trustees, considered information that had been provided by the Adviser and the Sub-Adviser throughout the year at regular Board and Committee Meetings, beginning in August 2004 in anticipation of the August contract renewal and continuing at periodic meetings thereafter. Such information included, among other things, a detailed analysis of Fund performance, including attribution analysis, provided at all regular Board meetings.
The Board also considered information furnished in advance of the July 21, 2005 Board meeting, which was held to, among other things, specifically consider Advisory and Sub-Advisory Contract renewals for the interim period ending November 30, 2005. This information included the following items: (1) updated performance information through May 31, 2005 with respect to the Funds; (2) responses to questions from K&LNG, legal counsel to the Independent Trustees; (3) copies of each form of Advisory and Sub-Advisory Contract; (4) representations that there were no material changes in the management fees and expense ratios borne by the Funds since the August approval; and (5) other information relevant to their evaluations. In determining that this information was sufficient to support the interim renewal, the Board took into consideration that it would meet again, at an in-person meeting to be held in November 2005, to consider whether to approve the Advisory and Sub-Advisory Contracts for the Funds for a 12-month period beginning on December 1, 2005 and ending November 30, 2006. The interim and subsequent November renewals would place the Funds on a December 1 renewal cycle, and result in all of the mutual funds in the ING mutual funds complex
37
ADVISORY CONTRACT APPROVAL DISCUSSION (UNAUDITED) (CONTINUED)
under the purview of the Board being placed on the same annual renewal cycle on a going-forward basis.
The Board was also provided, in August 2004 and July 2005, with narrative summaries addressing key factors the Board customarily considers in evaluating the renewal of Advisory and Sub-Advisory Contracts, including an analysis for each Fund of how performance and fees compare to its selected peer group and/or designated benchmarks.
In arriving at its conclusions with respect to the advisory arrangements with the Adviser, the Board was mindful of the “manager-of-managers” platform of the ING Funds. The Board also noted the resources that the Adviser has committed to the Board and the Board’s International Equity and Fixed Income Investment Review Committee (the “Investment Review Committee”) to assist the Board and Investment Review Committee members with their assessment of the investment performance of the Funds. This includes the appointment of a Chief Investment Risk Officer and his staff, who report directly to the Board, and who have developed attribution analyses and other metrics used by the Investment Review Committee to analyze the key factors underlying investment performance for the Funds. The Board also noted the techniques used by the Adviser to monitor the performance of the Sub-Adviser, and took note of the pro-active approach that the Adviser, working in cooperation with the Investment Review Committee, has taken to advocate or recommend, when it believed appropriate, changes intended to assist performance of the Funds. In considering whether to renew the Sub-Advisory Contracts, the Board took into account any applicable steps that the Sub-Adviser had taken to improve the Funds’ performance, including enhancements to the Sub-Adviser’s fixed-income portfolio management teams and management’s views as to improvements in the Sub-Adviser’s risk strategies for the Funds.
Fund-by-Fund Analysis
The following paragraphs outline certain of the specific factors that the Board considered, and the conclusions reached, at its August 2004 and July 2005 meetings in relation to renewing each Fund’s current Advisory Contract and its Sub-Advisory Contract for the year ending August 31, 2005 and the interim period ending November 30, 2005, respectively.
ING GNMA Income Fund
In its renewal deliberations for ING GNMA Income Fund in August 2004, the Board considered that: (1) the management fee for the Fund is above the median and the average management fees of the funds in its Selected Peer Group, but within one standard deviation of the average; (2) the expense ratio for the Fund is above the median and the average expense ratios of the funds in its Selected Peer Group, but within one standard deviation of the average; and (3) the Fund underperformed its benchmark index for the most recent quarter and one-, three, and five-year periods and its Selected Peer Group median for the most recent quarter and one-year period, but it outperformed its benchmark index for the two-year period and its Selected Peer Group median for the two-, three-, and five-year periods.
In considering whether to approve the Fund’s interim period renewal, the Board further considered that: (1) the Fund underperformed its benchmark index for the periods reviewed by the Board in July 2005; (2) the Fund outperformed its Lipper Category Median for all periods, except for the one-year period ended May 31, 2005; and (3) the Fund outperformed its Morningstar Category Average for the three- and five-year periods ended May 31, 2005, but underperformed during all periods considered. In analyzing this performance data, the Board took into account that the Sub-Adviser had undertaken actions to support and maintain the efforts of the Fund’s portfolio manager who has primary responsibility for managing the Fund.
After its deliberation, the Board reached the following conclusions: (1) the Fund’s management fee rate is reasonable in the context of all factors considered by the Board; (2) the Fund’s expense ratio is reasonable in the context of all factors considered by the Board; (3) although the Fund has underperformed relative to its peers in certain periods, it is reasonable to permit the Sub-Adviser the opportunity to demonstrate the more favorable longer-term performance anticipated by management; and (4) the sub-advisory fee rate payable by the Adviser to the Sub-Adviser is reasonable in the context of all factors considered by the Board. The Board also noted that there would be further opportunity for review of more recent performance and other relevant factors in the course of deliberations for the next annual renewal in November 2005.
38
ADVISORY CONTRACT APPROVAL DISCUSSION (UNAUDITED) (CONTINUED)
Based on these conclusions and other factors, the Board voted to renew the Advisory and Sub-Advisory Contracts for the Fund for year ended August 31, 2005 and the interim period ending November 30, 2005. During this renewal process, different Board members may have given different weight to different individual factors and related conclusions.
ING Intermediate Bond Fund
In its renewal deliberations for ING Intermediate Bond Fund in August 2004, the Board considered that: (1) the management fee for the Fund is above the median and the average management fees of the funds in its Selected Peer Group, but within one standard deviation of the average; (2) the expense ratio for the Fund is above the median and the average expense ratios of the funds in its Selected Peer Group, but within one standard deviation of the average; and (3) the Fund outperformed its benchmark index and Selected Peer Group median for all periods reviewed by the Board in August 2004.
In considering whether to approve the Fund’s interim period renewal, the Board further considered that: (1) the Fund outperformed its benchmark for the year-to-date, one-, three- and five-year periods ended May 31, 2005, but underperformed for the one- and three-month periods ended May 31, 2005; and (2) the Fund outperformed its Lipper Category Median and its Morningstar Category Average for all periods considered.
After its deliberation, the Board reached the following conclusions: (1) the Fund’s management fee rate is reasonable in the context of all factors considered by the Board; (2) the Fund’s expense ratio is reasonable in the context of all factors considered by the Board; (3) the Fund’s performance is reasonable in the context of all factors considered by the Board; and (4) the sub-advisory fee rate payable by the Adviser to the Sub-Adviser is reasonable in the context of all factors considered by the Board. Based on these conclusions and other factors, the Board voted to renew the Advisory and Sub-Advisory Contracts for the Fund for year ended August 31, 2005 and the interim period ending November 30, 2005. During this renewal process, different Board members may have given different weight to different individual factors and related conclusions.
39
(THIS PAGE INTENTIONALLY LEFT BLANK)
(THIS PAGE INTENTIONALLY LEFT BLANK)
(THIS PAGE INTENTIONALLY LEFT BLANK)
ING Funds Distributor, LLC offers the funds listed below. Before investing in a fund, shareholders should carefully review the fund’s prospectus. Investors may obtain a copy of a prospectus of any ING Fund by calling (800) 992-0180.
Domestic Equity and Income Funds
ING Balanced Fund
ING Convertible Fund
ING Equity and Bond Fund
ING Equity Income Fund
ING Real Estate Fund
Domestic Equity Growth Funds
ING Disciplined LargeCap Fund
ING Growth Fund
ING LargeCap Growth Fund
ING MidCap Opportunities Fund
ING SmallCap Opportunities Fund
ING Small Company Fund
Domestic Equity Index Funds
ING Index Plus LargeCap Fund
ING Index Plus MidCap Fund
ING Index Plus SmallCap Fund
Domestic Equity Value Funds
ING Financial Services Fund
ING LargeCap Value Fund
ING MagnaCap Fund
ING MidCap Value Fund
ING MidCap Value Choice Fund
ING SmallCap Value Fund
ING SmallCap Value Choice Fund
ING Value Opportunity Fund
Fixed Income Funds
ING GNMA Income Fund
ING Government Fund
ING High Yield Bond Fund
ING Intermediate Bond Fund
ING National Tax-Exempt Bond Fund
Global Equity Funds
ING Global Equity Dividend Fund
ING Global Real Estate Fund
ING Global Science and Technology Fund
ING Global Value Choice Fund
International Equity Funds
ING Emerging Countries Fund
ING Foreign Fund
ING International Fund
ING International Growth Fund
ING International SmallCap Fund
ING International Value Fund
ING International Value Choice Fund
ING Precious Metals Fund
ING Russia Fund
Loan Participation Fund
ING Senior Income Fund
Money Market Funds*
ING Aeltus Money Market Fund
ING Classic Money Market Fund
ING Institutional Prime Money Market Fund
Strategic Allocation Funds
ING Strategic Allocation Balanced Fund
ING Strategic Allocation Growth Fund
ING Strategic Allocation Income Fund
* An investment in the Fund is not insured or guaranteed by the Federal Deposit Insurance Corporation or any other government agency. Although the Fund seeks to preserve the value of your investment at $1.00 per share, it is possible to lose money by investing in the Fund.
PROXY VOTING INFORMATION
A description of the policies and procedures that the Registrant uses to determine how to vote proxies related to portfolio securities is available (1) without charge, upon request, by calling Shareholder Services toll-free at 800-992-0180; (2) on the Registrant’s website at www.ingfunds.com and (3) on the Securities and Exchange Commission’s (“SEC”) website at www.sec.gov.
Information regarding how the Registrant voted proxies related to portfolio securities during the most recent 12-month period ended June 30 is available without charge on the Registrant’s website at www.ingfunds.com and on the SEC’s website at www.sec.gov.
QUARTERLY PORTFOLIO HOLDINGS
The Registrant files its complete schedule of portfolio holdings with the SEC for the first and third quarters of each fiscal year on Form N-Q. The Registrant’s Forms N-Q are available on the SEC’s website at www.sec.gov. The Registrant’s Forms N-Q may be reviewed and copied at the SEC’s Public Reference Room in Washington, DC, and information on the operation of the Public Reference Room may be obtained by calling 1-800-SEC-0330; and is available upon request from the Registrant by calling Shareholder Services toll-free at 800-992-0180.
Investment Manager
ING Investments, LLC
7337 E. Doubletree Ranch Road
Scottsdale, Arizona 85258
Administrator
ING Funds Services, LLC
7337 E. Doubletree Ranch Road
Scottsdale, Arizona 85258
Distributor
ING Funds Distributor, LLC
7337 E. Doubletree Ranch Road
Scottsdale, Arizona 85258
1-800-334-3444
Transfer Agent
DST Systems, Inc.
330 West 9th Street
Kansas City, Missouri 64105
Custodian
The Bank of New York
100 Colonial Center Parkway, Suite 300
Lake Mary, Florida 32746
Legal Counsel
Dechert
1775 I Street, N.W
Washington, D.C. 20006
For more complete information, or to obtain a prospectus on any ING fund, please call your Investment Professional or ING Funds Distributor, LLC at (800) 992-0180 or log on to www.ingfunds.com. The prospectus should be read carefully before investing. Consider the fund’s investment objectives, risks, charges and expenses carefully before investing. The prospectus contains this information and other information about the fund.

| PRSAR-UFIABCMOR | (0905-112705) |
ITEM 2. CODE OF ETHICS.
Not required for semi-annual filing.
ITEM 3. AUDIT COMMITTEE FINANCIAL EXPERT.
Not required for semi-annual filing.
ITEM 4. PRINCIPAL ACCOUNTANT FEES AND SERVICES.
Not required for semi-annual filing.
ITEM 5. AUDIT COMMITTEE OF LISTED REGISTRANTS.
Not required for semi-annual filing.
ITEM 6. SCHEDULE OF INVESTMENTS.
Schedule is included as part of the report to shareholders filed under Item 1 of
this Form.
ITEM 7. DISCLOSURE OF PROXY VOTING POLICIES AND PROCEDURES FOR CLOSED-END MANAGEMENT INVESTMENT COMPANIES.
Not applicable.
ITEM 8. PORTFOLIO MANAGERS OF CLOSED-END MANAGEMENT INVESTMENT COMPANIES.
Not applicable.
ITEM 9. PURCHASES OF EQUITY SECURITIES BY CLOSED-END MANAGEMENT INVESTMENT COMPANY AND AFFILIATED PURCHASERS.
Not applicable.
ITEM 10. SUBMISSION OF MATTERS TO A VOTE OF SECURITY HOLDERS.
The Board has a Nominating Committee for the purpose of considering and presenting to the Board candidates it proposes for nomination to fill Independent Trustee vacancies on the Board. The Committee currently consists of all Independent Trustees of the Board (6 individuals). The Nominating Committee operates pursuant to a Charter approved by the Board. The primary purpose of the Nominating Committee is to consider and present to the Board the candidates it proposes for nomination to fill vacancies on the Board. In evaluating candidates, the Nominating Committee may consider a variety of factors, but it has not at this time set any specific minimum qualifications that must be met. Specific qualifications of candidates for Board membership will be based on the needs of the Board at the time of nomination.
The Nominating Committee is willing to consider nominations received from shareholders and shall assess shareholder nominees in the same manner as it reviews its own nominees. A shareholder nominee for director should be submitted in writing to the Fund’s Secretary. Any such shareholder nomination should include at a minimum the following information as to each individual proposed for nomination as trustee: such individual’s written consent to be named in the proxy statement as a nominee (if nominated) and to serve as a trustee (if elected), and all information relating to such individual that is required to be disclosed in the solicitation of proxies for election of trustees, or is otherwise required, in each case under applicable federal securities laws, rules and regulations.
The Secretary shall submit all nominations received in a timely manner to the Nominating Committee. To be timely, any such submission must be delivered to the Fund’s Secretary not earlier than the 90th day prior to such meeting and not later than the close of business on the later of the 60th day prior to such meeting or the 10th day following the day on which public announcement of the date of the meeting is first made, by either disclosure in a press release or in a document publicly filed by the Fund with the Securities and Exchange Commission.
ITEM 11. CONTROLS AND PROCEDURES.
(a) Based on our evaluation conducted within 90 days of the filing date, hereof, the design and operation of the registrant’s disclosure controls and procedures are effective to ensure that material information relating to the registrant is made known to the certifying officers by others within the appropriate entities, particularly during the period in which Forms N-CSR are being prepared, and the registrant’s disclosure controls and procedures allow timely preparation and review of the information for the registrant’s Form N-CSR and the officer certifications of such Form N-CSR.
(b) There were no significant changes in the registrant’s internal controls that occurred during the second fiscal quarter of the period covered by this report that has materially affected, or is reasonably likely to materially affect, the registrant’s internal control over financial reporting.
ITEM 12. EXHIBITS.
(a)(1) The Code of Ethics is not required for the semi-annual filing.
(a)(2) A separate certification for each principal executive officer and principal financial officer of the registrant as required by Rule 30a-2 under the Act (17 CFR 270.30a-2) is attached hereto as EX-99.CERT.
(a)(3) Not required for semi-annual filing.
(b) The officer certifications required by Section 906 of the Sarbanes-Oxley Act of 2002 are attached hereto as EX-99.906CERT
SIGNATURES
Pursuant to the requirements of the Securities Exchange Act of 1934 and the Investment Company Act of 1940, the registrant has duly caused this report to be signed on its behalf by the undersigned, thereunto duly authorized.
(Registrant): ING Funds Trust
By | /s/ | James M. Hennessy | |
| | James M. Hennessy |
| | President and Chief Executive Officer |
| |
| |
Date: | December 6, 2005 | |
| | | | |
Pursuant to the requirements of the Securities Exchange Act of 1934 and the Investment Company Act of 1940, this report has been signed below by the following persons on behalf of the registrant and in the capacities and on the dates indicated.
By | /s/ | James M. Hennessy | |
| | James M. Hennessy |
| | President and Chief Executive Officer |
| |
Date: | December 6, 2005 | |
| |
| |
By | /s/ | Todd Modic | |
| | Todd Modic |
| | Senior Vice President and Chief Financial Officer |
| |
| |
Date: | December 6, 2005 | |
| | | | | | |