OMB APPROVAL
OMB Number: 3235-0570
Expires: October 31, 2006
Estimated average burden hours per response: 19.3
UNITED STATES
SECURITIES AND EXCHANGE COMMISSION
Washington, D.C. 20549
FORM N-CSR
CERTIFIED SHAREHOLDER REPORT OF
REGISTERED MANAGEMENT INVESTMENT COMPANIES
Investment Company Act file number: 811-08895
ING Funds Trust
(Exact name of registrant as specified in charter)
7337 E. Doubletree Ranch Rd., Scottsdale, AZ | | 85258 |
(Address of principal executive offices) | | (Zip code) |
The Corporation Trust Company, 1209 Orange Street, Wilmington, DE 19801
(Name and address of agent for service)
Registrant’s telephone number, including area code: 1-800-992-0180
Date of fiscal year end: | March 31 |
| |
Date of reporting period: | September 30, 2006 |
Item 1. Reports to Stockholders.
The following is a copy of the report transmitted to stockholders pursuant to Rule 30e-1 under the Act (17 CFR 270.30e-1):

Funds
Semi-Annual Report
September 30, 2006
Classes A, B, C, I, M, O, Q and R
Fixed Income Funds
n ING GNMA Income Fund
n ING High Yield Bond Fund
n ING Intermediate Bond Fund
n ING National Tax-Exempt Bond Fund
Money Market Funds
n ING Classic Money Market Fund
n ING Institutional Prime Money Market Fund
 E-Delivery Sign-up – details inside
This report is submitted for general information to shareholders of the ING Funds. It is not authorized for distribution to prospective shareholders unless accompanied or preceded by a prospectus which includes details regarding the funds' investment objectives, risks, charges, expenses and other information. This information should be read carefully.

TABLE OF CONTENTS
| President's Letter | | | 1 | | |
|
| Market Perspective | | | 2 | | |
|
| Portfolio Managers' Reports | | | 4 | | |
|
| Shareholder Expense Examples | | | 14 | | |
|
| Statements of Assets and Liabilities | | | 17 | | |
|
| Statements of Operations | | | 21 | | |
|
| Statements of Changes in Net Assets | | | 23 | | |
|
| Financial Highlights | | | 26 | | |
|
| Notes to Financial Statements | | | 39 | | |
|
| Portfolios of Investments | | | 54 | | |
|
 Go Paperless with E-Delivery!
Sign up now for on-line prospectuses, fund reports, and proxy statements. In less than five minutes, you can help reduce paper mail and lower fund costs.
Just go to www.ingfunds.com, click on the E-Delivery icon from the home page, follow the directions and complete the quick 5 Steps to Enroll.
You will be notified by e-mail when these communications become available on the internet. Documents that are not available on the internet will continue to be sent by mail.
(THIS PAGE INTENTIONALLY LEFT BLANK)
PRESIDENT'S LETTER

JAMES M. HENNESSY
Dear Shareholder,
In its recent meetings, the Federal Reserve Board (the "Fed") has stopped a two-year trend of raising interest rates. That string of 17 consecutive rate hikes was interpreted by many analysts as a sign that the Fed was concerned about containing inflation.
The Fed's latest actions put us in a climate that economist refer to as a "plateau." Historically, there have been six similar plateaus since 1982 and during four of those periods the Standard & Poor's 500® Composite Stock Price ("S&P 500®") Index experienced significant growth in the three months following the decrease of Fed interest rates.1
Although past market performance cannot guarantee future market success, I believe the arrival of a "plateau" offers one more reason to be optimistic about the future. So far in 2006, we have seen robust corporate earnings, significant levels of dividend payouts on the part of companies and impressive merger and acquisition announcements.
Whatever the future holds and whatever the economic climate, we at ING Funds continue to work hard to provide you, the investor, with an array of investment choices that enable you to build a smart and diversified portfolio. We also continue to expand and improve our customer service department to ensure that your needs are met promptly and that we indeed continue to make attaining your future goals easier.
On behalf of everyone here at ING Funds, I thank you for your continued support.
Sincerely,

James M. Hennessey
President
ING Funds
October 27, 2006
1 Research provided by ING Investment Management Co. based on S&P 500® Index performance 1987-2006.
The views expressed in the President's Letter reflect those of the President as of the date of the letter. Any such views are subject to change at any time based upon market or other conditions and ING Funds disclaims any responsibility to update such views. These views may not be relied on as investment advice and because investment decisions for an ING Fund are based on numerous factors, may not be relied on as an indication of investment intent on behalf of any ING Fund. Reference to specific company securities should not be construed as recommendations or investment advice.
For more complete information, or to obtain a prospectus on any ING fund, please call your Investment Professional or ING Fund Distributor, LLC at (800) 992-0180 or log on to www.ingfunds.com. The prospectus should be read carefully before investing. Consider the fund's investment objectives, risks, and charges and expenses carefully before investing. The prospectus contains this and other information about the fund. Check with your Investment Professional to determine which funds are available for sale within their firm. Not all funds are available for sale at all firms.
1
MARKET PERSPECTIVE: SIX MONTHS ENDED SEPTEMBER 30, 2006
It did not take long for U.S. fixed income investors to start scratching their heads. At the start of our new fiscal year, the feet of the new Federal Reserve Board (the "Fed") Chairman Dr. Ben Bernanke had seemed already to be firmly under the desk, as in March, the Federal Open Market Committee ("FOMC") had raised rates for the fifteenth time since June 2004. However, the minutes from the March meeting said that the end of the tightening cycle was near, and by the end of April, Dr. Bernanke himself seemed to hint at a pause after May. The statement issued with the sixteenth rate increase on May 10 also suggested somewhat ambivalently, that this was possible. Meanwhile the price of oil and other commodities (and stock markets) had been making new records. The combination of inflationary press ures and a Fed about to go on hold lifted the yield on the ten-year Treasury note/bond through 5% for the first time in nearly four years, to 5.19% on May 12. Importantly, the spread over the three-month Treasury Bill yield was now at its high for the year, as many began to wonder if Dr. Bernanke was just a little bit soft on inflation. Dr. Bernanke's reputation was taking a knock. The respected academic who espoused plain-speaking openness to make policy clear had succeeded in achieving the opposite. He needed to re-establish his inflation fighting credentials by going on the offensive.
About a week later, after another high core Consumer Price Index figure, a Federal Reserve official cast doubt on an FOMC pause. Over the next few weeks he would be joined by every one of his colleagues, each of whom pointedly stressed that inflation was the prime concern. By June 13, the ten-year Treasury yield was back below 5% and the curve inverted over much of its range. Investors feared that with all this tough talk the FOMC would now have to keep raising rates, even as the economy was obviously cooling, evidenced by a shockingly weak employment report on June 2 and a slumping housing market that had driven so much of the consumer spending in recent years. So the seventeenth interest rate increase to 5.25% on June 29 surprised no one, and the month ended with every yield on the Treasury curve lower than the federal funds rate: the market's vote that the FOMC had already gone too far.
The announcement accompanying the increase however, had been couched in relatively mild language. Could the FOMC now, at last, be done?
Not everyone believed it and the doubts intensified when renewed conflict in the Middle East sent the price of a barrel of oil to another all-time peak on July 14. The next FOMC meeting was August 8 and with only a week to go, futures contracts were still signaling a rate increase in the balance. But the flow of data, especially on housing, had pointed almost without exception to cooling demand and gross domestic product ("GDP") growth in the second quarter was in fact reported to have slipped to 2.5%. Finally, a tame employment report on August 4 showed the unemployment rate up and wage growth benign. Most commentators felt that this had now eliminated the chance of another rate increase, even as British Petroleum's closure of the Prudhoe Bay oilfield on August 7 caused the oil price to take another run at a record, failing by just 5 cents per barrel. At the August 8 meeting, the FOMC did indeed leave rates unchanged, citing the 17 prior in creases and "other factors restraining aggregate demand". Those factors became increasingly evident and it was soon the consensus view that the FOMC got it right. Housing data continued to deteriorate, with the first drop in home prices in 11 years, falling sales and record inventories of unsold homes. The FOMC even referred at its September 19 meeting, to the role a vibrant housing market had played in spurring GDP growth, and again took no action. The perception of a weakening economy sent (especially longer) rates onto a downward trajectory and as September drew to a close, the three-month Treasury Bill yield exceeded that of the ten-year Treasury Note by the most since January 2001. For the six months ended September 30, 2006, the ten-year yield fell by 22 basis points ("bps") to 4.63% while the three-month rose by 25 bps to 4.76%. The broader Lehman Brothers Aggregate Bond Index (1) returned 3.73%, the Lehman Brothers High Yield Bond Index (2) 4.40%.
After the best first calendar quarter since 1998 for global equities, reality had set in by mid-May as investors were gripped by fears described above that inflation fighting central bankers would raise interest rates by more than enough to choke off global growth. But from a low point a month later, stock markets found reasons to form a base and recover. In the U.S., it was high and rising corporate profits. The same could be said for Continental Europe, despite a hawkish European Central Bank, p lus improving economic fundamentals. Markets were also supported by broadly based merger and acquisition initiatives. This helped UK stocks as did a recovery in housing prices. All markets cheered the FOMC's pause, while after the failed attempt at a new record on August 7,
2
MARKET PERSPECTIVE: SIX MONTHS ENDED SEPTEMBER 30, 2006
oil prices slid more than 18% by September 30 as seasonal and political pressures eased. Only Japan, burdened by the first increase in interest rates in six years, could not eke out a gain. For the six-month period ended September 30, 2006 the Morgan Stanley Capital International ("MSCI") World® Index (3) in local currencies, including net reinvested dividends, returned 1.8%).
(1) The Lehman Brothers Aggregate Bond Index is a widely recognized, unmanaged index of publicly issued investment grade U.S. Government, mortgage-backed, asset-backed and corporate debt securities.
(2) The Lehman Brothers High Yield Bond Index is an unmanaged index that measures the performance of fixed-income securities generally representative of corporate bonds rated below investment-grade.
(3) The MSCI World® Index is an unmanaged index that measures the performance of over 1,400 securities listed on exchanges in the U.S., Europe, Canada, Australia, New Zealand and the Far East.
All indices are unmanaged and investors cannot invest directly in an index.
Past performance does not guarantee future results. The performance quoted represents past performance. Investment return and principal value of an investment will fluctuate, and shares, when redeemed, may be worth more or less than their original cost. The Funds' performance is subject to change since the period's end and may be lower or higher than the performance data shown. Please call (800) 992-0180 or log on to www.ingfunds.com to obtain performance data current to the most recent month end.
Market Perspective reflects the views of the ING Chief Investment Risk Officer only through the end of the period, and is subject to change based on market and other conditions.
3
ING GNMA INCOME FUND
PORTFOLIO MANAGERS' REPORT
The ING GNMA Income Fund (the "Fund") seeks a high level of current income, consistent with liquidity and safety of principal, through investment primarily in Government National Mortgage Association ("GNMA") mortgage-backed securities (also known as GNMA Certificates) that are guaranteed as to the timely payment of principal and interest by the U.S. government. The Fund is managed by Denis P. Jamison, CFA, Senior Vice President and Senior Portfolio Manager, ING Investment Management Co. — the Sub-Adviser.
Securities issued by the U.S. Treasury are backed by the full faith and credit of the U.S. government. Securities issued by individual agencies and organizations may be backed by the full faith and credit of the U.S. government as to principal or interest but are not direct obligations of the U.S. Treasury. Securities of some agencies and organizations are backed solely by the entity's own resources or by the ability of the entity to borrow from the U.S. Treasury. Government securities also include certain mortgage-related securities that are sponsored by a U.S. government agency or organization and are not direct obligations of the U.S. government.
Performance: For the six months ended September 30, 2006, the Fund's Class A shares, excluding sales charges, provided a total return of 3.09% compared to the Lehman Brothers Mortgage-Backed Securities Index, which returned 3.64% for the same period.
Portfolio Specifics: The bond market went on a rollercoaster ride during the six-month period ended September 30. Worries about higher inflation and the extent to which the U.S. Federal Reserve Board (the "Fed") would tighten monetary supply colored prices during the period. Bond yields rose steadily until mid-June, at which point they moved back to levels seen in the spring as investors perceived an imminent change in Fed monetary policy.
The Fund performed well during this period, although it was unable to keep up with its broad mortgage benchmark because the return on GNMA securities lagged those of Federal National Mortgage Association ("FNMA") and Federal Home Loan Mortgage Corporation ("FHLMC") mortgages. It's worth noting that this same disparity occurred in 2005, but the gap in the relative returns among the mortgage groups closed in the final quarter. Hopefully, this scenario will play out again this year. Despite underperforming its benchmark, the Fund maintained a strong competitive position relative to its peer group.
There was an exceptionally strong bid for call protected multi-family GNMA mortgages during much of the second and third quarters. Dealers were anxious to buy these securities in order to place them into collaterized mortgage obligations. We steadily sold during this period, realizing a gain of about $1.2 million for these securities. In addition, our U.S. Treasury bond trading activity was quite profitable, generating $1 million in capital gains. Our multi-family loan portfolio is now down to about $30 million, versus more than $100 million as of March 31, 2006.
GNMA mortgages were hammered in the second quarter, posting a return of -0.4% compared with slight gains for FNMA and FHLMC securities. GNMAs didn't make up any of this lost ground during the summer. The Fund must hold 80% of its assets in GNMA securities while the Lehman Brothers Mortgage-Backed Securities Index has only a 10% exposure to the sector.
Institutional investors, especially foreign based ones new to the U.S. mortgage market, increasingly are viewing the full, faith and credit guaranteed GNMA mortgages as interchangeable with the agency guaranteed FHLMC and FNMA securities. This has been clearly reflected in a narrowing of the price spread between these securities. For example, on January 20, 2006 GNMA 5.5% mortgages were 15/8% richer than their FNMA cousins. By the end of the third quarter, this spread had narrowed to 26/32%. Unfortunately, for GNMA investors, the spread could get even narrower. The securities have traded as tight as a quarter of a point apart during the last four years.
Current Strategy and Outlook: While rollercoaster rides are very exciting, especially when you're falling, you ultimately end the ride where you began. This sums up our feelings about the current bond market. Over the next few quarters, we believe will likely see plenty of small rallies and reversals but little market direction. We expect investors will get frustrated by the lack of change in Fed monetary policy and become bullish on one-off signs of economic weakness. Directionless markets usually offer lots of opportunities to take short-term trading profits. We intend to maintain a 10%-plus liquidity position in order to have readily available funds to purchase longer-dated U.S. Treasury bonds as oversold conditions develop. With the yield curve inverted, this strategy entails little cost in terms of current income and believe there are profits to be mad e. We also feel that newly minted project loans offer little value compared with single family mortgages. Accordingly, we are not going to rebuild our position as we expect sales of multi-family loans will not be positive going forward.
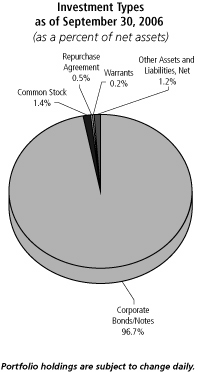
Investment Types
as of September 30, 2006
(as a percent of net assets)
| U.S. Government Agency Obligations | | | 83.0 | % | |
| U.S. Treasury Bills | | | 14.5 | % | |
| U.S. Treasury Obligations | | | 3.2 | % | |
| Other Assets and Liabilities, Net | | | (0.7 | )% | |
| Total | | | 100.0 | % | |
Portfolio holdings are subject to change daily.
4
ING GNMA INCOME FUND
PORTFOLIO MANAGERS' REPORT
| | | Average Annual Total Returns for the Periods Ended September 30, 2006 | |
| | |
1 Year | |
5 Year | |
10 Year | | Since
Inception
of Class B
October 6,
2000 | | Since
Inception
of Class C
October 13,
2000 | | Since
Inception
of Class I
January 7,
2002 | | Since
Inception
of Class M
February 23,
2001 | | Since
Inception
of Class Q
February 26,
2001 | |
| Including Sales Charge: | |
| Class A(1) | | | (1.00 | )% | | | 2.95 | % | | | 5.52 | % | | | — | | | | — | | | | — | | | | — | | | | — | | |
| Class B(2) | | | (1.76 | )% | | | 2.83 | % | | | — | | | | 4.56 | % | | | — | | | | — | | | | — | | | | — | | |
| Class C(3) | | | 2.19 | % | | | 3.18 | % | | | — | | | | — | | | | 4.64 | % | | | — | | | | — | | | | — | | |
| Class I | | | 4.25 | % | | | — | | | | — | | | | — | | | | — | | | | 4.71 | % | | | — | | | | — | | |
| Class M(4) | | | (0.04 | )% | | | 2.74 | % | | | — | | | | — | | | | — | | | | — | | | | 3.65 | % | | | — | | |
| Class Q | | | 3.86 | % | | | 4.00 | % | | | — | | | | — | | | | — | | | | — | | | | — | | | | 4.81 | % | |
| Excluding Sales Charge: | |
| Class A | | | 3.92 | % | | | 3.95 | % | | | 6.04 | % | | | — | | | | — | | | | — | | | | — | | | | — | | |
| Class B | | | 3.18 | % | | | 3.16 | % | | | — | | | | 4.70 | % | | | — | | | | — | | | | — | | | | — | | |
| Class C | | | 3.18 | % | | | 3.18 | % | | | — | | | | — | | | | 4.64 | % | | | — | | | | — | | | | — | | |
| Class I | | | 4.25 | % | | | — | | | | — | | | | — | | | | — | | | | 4.71 | % | | | — | | | | — | | |
| Class M | | | 3.27 | % | | | 3.43 | % | | | — | | | | — | | | | — | | | | — | | | | 4.25 | % | | | — | | |
| Class Q | | | 3.86 | % | | | 4.00 | % | | | — | | | | — | | | | — | | | | — | | | | — | | | | 4.81 | % | |
Lehman Brothers Mortgage-Backed
Securities Index(5) | | | 4.19 | % | | | 4.53 | % | | | 6.29 | % | | | 5.79 | %(6) | | | 5.79 | %(6) | | | 4.76 | %(7) | | | 5.12 | %(8) | | | 5.12 | %(8) | |
Based on a $10,000 initial investment, the table above illustrates the total return of ING GNMA Income Fund against the Index indicated. An index is unmanaged and has no cash in its portfolio, imposes no sales charges and incurs no operating expenses. An investor cannot invest directly in an index. The Fund's performance is shown both with and without the imposition of sales charges.
The performance table does not reflect the deduction of taxes that a shareholder will pay on Fund distributions or the redemption of Fund shares.
The performance shown may include the effect of fee waivers and/or expense reimbursements by the Investment Adviser and/or other service providers, which have the effect of increasing total return. Had all fees and expenses been considered, the total returns would have been lower.
Performance data represents past performance and is no assurance of future results. Investment return and principal value of an investment in the Fund will ßuctuate. Shares, when sold, may be worth more or less than their original cost. The Fund's performance may be lower or higher than the performance data shown. Please log on to www.ingfunds.com or call (800) 992-0180 to get performance through the most recent month end.
This report contains statements that may be "forward-looking" statements. Actual results may differ materially from those projected in the "forward-looking" statements.
The views expressed in this report reßect those of the portfolio manager, only through the end of the period as stated on the cover. The portfolio manager's views are subject to change at any time based on market and other conditions.
Fund holdings are subject to change daily.
(1) Reflects deduction of the maximum Class A sales charge of 4.75%.
(2) Reflects deduction of the Class B deferred sales charge of 5%, 2% and 1% for the 1 year, 5 year and since inception returns, respectively.
(3) Reflects deduction of the Class C deferred sales charge of 1% for the 1 year return.
(4) Reflects deduction of the maximum Class M sales charge of 3.25%.
(5) The Lehman Brothers Mortgage-Backed Securities Index is an unmanaged index composed of fixed income security mortgage pools sponsored by GNMA, FNMA and FHLMC, including GNMA Graduated Payment Mortgages.
(6) Since inception performance for index is shown from October 1, 2000.
(7) Since inception performance for index is shown from January 1, 2002.
(8) Since inception performance for index is shown from March 1, 2001.
5
ING HIGH YIELD BOND FUND
PORTFOLIO MANAGERS' REPORT
The ING High Yield Bond Fund (the "Fund") seeks to provide investors with a high level of current income and total return. The Fund is managed by Greg Jacobs, CFA and Kurt Kringelis, CFA, CPA, ING Investment Management Co. — the Sub-Adviser.
Performance: For the six months ended September 30, 2006, the Fund's Class A shares, excluding sales charges, provided a total return of 3.19% compared to the Lehman Brothers High Yield Bond Index and the Lehman Brothers High Yield Bond Index — 2% Issuer Constrained, which returned 4.33% and 3.69%, respectively, for the same period.
Portfolio Specifics: Over the last six months, activity in the U.S. Treasury market has highlighted the uncertainty in the direction of the U.S. economy. In April, the bond market was attuned to contrasting signs of economic vigor and comments by the Federal Reserve Board (the "Fed") perceived as dovish. Fed Chairman Ben Bernanke's statement that "at some point in the future the Committee may decide to take no action at one or more meetings in the interest of allowing more time to receive information relevant to the outlook" was widely interpreted as a likely pause in interest rates in June. First quarter GDP indicated that the economy grew at a 4.8% real annualized pace — although this strong number must be coupled with the very weak 1.7% 4th quarter result in 2005 for a clearer picture. Data from the domestic manufacturing sector continues to surpris e on the upside, and consumer confidence was unfazed by spiraling energy costs. This combined with increasing inflation metrics, caused concern in the bond market, driving rates up 30-40 basis points across the curve.
By June, the market focus shifted to concerns of a weakening economy. Less than inspiring reports on payrolls, consumer spending, Institute of Supply Management surveys of business activity, and construction outlays pointed to some softness. Despite these anemic reports, wage gains are clearly evident and inflation remains above tolerances. The Federal Open Market Committee (the "FOMC") did, however, raise the overnight rate to 5.25% at their June 29th meeting, but the FOMC introduced some "dovish" language that might be interpreted as more cautious on the economic picture. Weakening economic indicators, combined with the Fed statements, set the table for a Treasury rally in third quarter. During the quarter, the Treasury market erased the second quarter losses, with the 10 year Treasury rallying 50 basis points.
Like the U.S. Treasury market, the high-yield market found a catalyst in the Fed's decision to hold rates where they were and was able to provide investors with positive total returns, as the market took the dovish signals from the Fed as a cue to regain an appetite for risk. For the last six months, the Lehman High Yield 2% Issuer-Constrained Index had a total return of 3.69%. Treasury-relative returns remained positive at 0.22%. Year-to-date, the high-yield market generated a very respectable total return of 6.39% with an excess return of 3.76%. During the period, lower quality issuance outperformed higher quality, as distressed securities outperformed the benchmark by 1.57% and CCC-rated securities on average outperformed the benchmark by 2.45%. During the six months, B-rated and BB-rated issues on average underperformed by 0.20% and 0.75%, respectively.
The Fund continues to be overweight the middle tier B-rated part of the universe and underweight BBs and distressed. This weighting had a neutral impact on the Fund during the period as the benefit of being underweight high-quality issuance was offset by the impact of being underweight the lowest quality part of the universe. The Fund continued to benefit from a strategic overweight in cable, as the sector outperformed the benchmark by 6.40% for the period. The sector showed signs of fundamental improvement during the period. In addition, the Fund shifted from an underweight to an overweight position in automotives. For the period, the industry outperformed the benchmark by 7.23%. The negative impact of being underweight during the first part of the six month period was offset by the benefit of being overweight during the latter half.
Current Outlook and Strategy: The Fed's decision to stop raising rates in August and September fostered a new market consensus for the timing of future rate hikes, with many observers forecasting this pause could last for sometime due to the softness in the residential real estate market and related industries. Indeed, some observers contend that the Fed's next move will be to ease rates sometime in the first quarter of 2007. At present, we disagree with that view. We believe the swift downturn in most residential housing measures clearly has the FOMC concerned, and may well be the primary reason for the Fed's continuing pause. Energy and base metal prices have come off their highs, although this may have more to do with the end of the summer driving season and a decrease in commodity speculation than a barometer of economic activity.
Just like Pluto's reclassification from a planet to asteroid due to its stature, inflation is being perceived as insufficient in size to be of a major concern. Yet, inflation may re-emerge as an issue for policy makers in the future. However, the Fed seems willing to wait for irrefutable evidence, and is more concerned about a slowdown in growth than a rise in core CPI. Nevertheless, the economic climate presents a dilemma to the FOMC, whose next move will be highly dependent on incoming data and its ongoing assessment of the real estate slowdown.
Despite some concerns of a large expected new issue calendar, we believe that accounts have ample cash to put to work for the rest of the year. Fundamentally, we believe the outlook remains relatively favorable for the high yield market as we approach what is likely the mid-point of this credit cycle. As a result, we believe that the market is likely to remain stable through the fourth quarter, despite entering a historically volatile season. We continue to believe that the biggest threat to spreads would come from unwelcome increases in future inflationary data which could present the FED with difficult choices in the event of a continued slowing of the economy with rising inflationary pressures.
Top Ten Industries
as of September 30, 2006
(as a percent of net assets)
| Media | | | 15.5 | % | |
| Telecommunications | | | 11.2 | % | |
| Diversified Financial Services | | | 10.9 | % | |
| Chemicals | | | 7.5 | % | |
| Commercial Services | | | 4.9 | % | |
| Entertainment | | | 4.7 | % | |
| Retail | | | 4.3 | % | |
| Forest Products & Paper | | | 4.2 | % | |
| Electric | | | 3.2 | % | |
| Healthcare - Services | | | 2.7 | % | |
Portfolio holdings are subject to change daily.
6
ING HIGH YIELD BOND FUND
PORTFOLIO MANAGERS' REPORT
| Average Annual Total Returns for the Periods Ended September 30, 2006 | |
| | |
1 Year | |
5 Year | | Since Inception
December 15, 1998 | |
| Including Sales Charge: | |
| Class A(1) | | | 1.41 | % | | | 6.87 | % | | | 5.27 | % | |
| Class B(2) | | | 0.63 | % | | | 6.87 | % | | | 5.15 | % | |
| Class C(3) | | | 4.62 | % | | | 7.19 | % | | | 5.16 | % | |
| Excluding Sales Charge: | |
| Class A | | | 6.41 | % | | | 7.93 | % | | | 5.93 | % | |
| Class B | | | 5.61 | % | | | 7.17 | % | | | 5.15 | % | |
| Class C | | | 5.61 | % | | | 7.19 | % | | | 5.16 | % | |
| Lehman Brothers High Yield Bond Index(4) | | | 8.07 | % | | | 10.51 | % | | | 6.04 | %(6) | |
| Lehman Brothers High Yield Bond Index — 2% Issuer Constrained(5) | | | 7.23 | % | | | 10.54 | % | | | 14.10 | %(6) | |
Based on a $10,000 initial investment, the table above illustrates the total return of ING High Yield Bond Fund against the indices indicated. An index is unmanaged and has no cash in its portfolio, imposes no sales charges and incurs no operating expenses. An investor cannot invest directly in an index. The Fund's performance is shown both with and without the imposition of sales charges.
The performance table does not reflect the deduction of taxes that a shareholder will pay on Fund distributions or the redemption of Fund shares.
The performance shown may include the effect of fee waivers and/or expense reimbursements by the Investment Adviser and/or other service providers, which have the effect of increasing total return. Had all fees and expenses been considered, the total returns would have been lower.
Performance data represents past performance and is no assurance of future results. Investment return and principal value of an investment in the Fund will ßuctuate. Shares, when sold, may be worth more or less than their original cost. The Fund's performance may be lower or higher than the performance data shown. Please log on to www.ingfunds.com or call (800) 992-0180 to get performance through the most recent month end.
This report contains statements that may be "forward-looking" statements. Actual results may differ materially from those projected in the "forward-looking" statements.
The views expressed in this report reflect those of the portfolio managers, only through the end of the period as stated on the cover. The portfolio managers' views are subject to change at any time based on market and other conditions.
Fund holdings are subject to change daily.
(1) Reflects deduction of the maximum Class A sales charge of 4.75%.
(2) Reflects deduction of the Class B deferred sales charge of 5% and 2% for the 1 year and 5 year returns, respectively.
(3) Reflects deduction of the Class C deferred sales charge of 1% for the 1 year return.
(4) The Lehman Brothers High Yield Bond Index is an unmanaged index that measures the performance of fixed-income securities that are similar, but not identical, to those in the Fund's portfolio.
(5) This index is the 2% Issuer Cap component of the Lehman Brothers High Yield Bond Index.
(6) Since inception performance for index is shown from December 1, 1998.
7
ING INTERMEDIATE BOND FUND
PORTFOLIO MANAGERS' REPORT
The ING Intermediate Bond Fund (the "Fund") seeks to provide investors with a high level of current income, consistent with the preservation of capital and liquidity. The Fund is managed by James B. Kauffmann, ING Investment Management Co. — the Sub-Adviser.
Performance: For the six months ended September 30, 2006, the Fund's Class A shares, excluding sales charges, provided a total return of 3.12% compared to 3.73% for the Lehman Brothers Aggregate Bond ("LBAB") Index.
Portfolio Specifics: The LBAB Index posted a total return of 3.73% during the six-month period which was characterized by a marked shift in market sentiment. In the second quarter, the bond market was acutely attuned to contrasting signs of economic vigor and a perceived dovish posture by the U.S. Federal Reserve Board ("Fed"). By the third quarter, the great guessing game focused on the decline in the U.S. residential real estate market and the perceived end of the Fed's tightening cycle. After 17 consecutive rate hikes, the Federal Open Market Committee ("FOMC") decided not to raise the federal funds rate at its August and September meetings, keeping it at 5.25%. Markets quickly forecast the Fed cutting rates as soon as December, despite core inflation remaining above the Fed's comfort zone. During the period, the collapse of Amaranth, an energy trading h edge fund, was also a notable event. Energy prices moved lower during the period, pleasing consumers but not investors with energy exposure. A record level of corporate debt was issued. The yield curve inverted leaving short-term interest rates higher than long-term. The yield on the two-year Treasury declined 0.13% to close at 4.68%; the yield on the five-year Treasury declined 0.23% to close at 4.58%; and the yield on the ten-year Treasury declined 0.22% to close at 4.63%.
Two major themes dominated the Fund's performance during the period. Tactical overweight positions in securitized assets such as mortgage-backed securities — especially adjustable rate mortgages and commercial mortgage-backed securities — helped the Fund, while the Fund's short duration acted as a drag. Duration positioning was the main reason for the Fund's underperformance especially in the latter part of the period.
The portfolio was underweight longer-dated corporate bonds in the face of miniscule yield spreads, or risk compensation; however, tactical allocations to longer maturity credits helped performance. We fared relatively well during the late May and early June market hiccup. A brief sell-off in riskier assets worldwide soon abated, yet the Fund's position in some foreign banks and trusts was not beneficial. During July, by contrast, a small exposure to a large re-insurer had a slight negative impact on the portfolio as Hurricane Ernesto, the only major notable storm in a benign hurricane season compared to 2005, developed and then faded. A minor position in a pipeline company whose previously announced leveraged buyout was re-priced also acted as a slight drag. A long-dated utility and several minerals extractors in South America performed well on a relative basis.
The Fund had a small high yield position, but the high yield bond market outperformed the broader market, indicating that a more sizable commitment was warranted. The same can be said for emerging market debt which performed well during the period.
Current Outlook and Strategy: The Fed's decision to stop raising rates in August and September fostered a new market consensus for the timing of future rate hikes, with many observers forecasting this pause could last for some time due to the softness in the residential real estate market and related industries. Indeed, some observers contend that the Fed's next move will be to ease rates sometime in the first quarter of 2007. At present, we disagree with that view. The swift downturn in most residential housing measures clearly has the FOMC concerned and may well be the primary reason for the Fed's continuing pause. Energy and base metal prices have come off their highs, although this may have more to do with the end of the summer driving season and a decrease in commodity speculation than a barometer of economic activity.
Just like Pluto's reclassification from a planet to an asteroid due to its stature, inflation is being perceived as insufficient in size to be of a major concern. Yet inflation may re-emerge as an issue for policy makers in the future. The Fed seems willing to wait for irrefutable evidence, and is more concerned about a slowdown in growth than a rise in the core consumer price index (CPI). Nevertheless, the economic climate presents a dilemma to the FOMC, whose next move will be highly dependent on incoming data and its ongoing assessment of the real estate slowdown. We believe that the yield curve will become steeper, and anticipate that long-term rates will rise more than short-term rates. While this stance may be a bit early, the position is not hindered by elapsed time or forgone yield. The portfolio is shorter in duration than the index.
We believe that corporate bond investors are not being adequately compensated for risk in the present market. Mergers and acquisition announcements as well as news of firms taking themselves private continue unabated. Such actions by companies are rarely good news for corporate bondholders. Yet credit spreads remain generally tight in the face of some $200 billion of new leveraged buyouts. The credit portfolio remains defensively positioned with a slight underweight. Our mortgage team has constructed a portfolio designed to offset an increase in volatility with a particular focus on ARMs and structured product such as collateralized mortgage obligations. The portfolio's mortgage sector position is now neutral relative to the index.
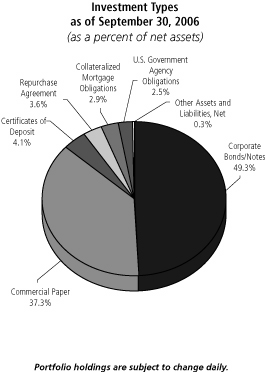
Investment Types
as of September 30, 2006
(as a percent of net assets)
| U.S. Government Agency Obligations | | | 31.4 | % | |
| Collateralized Mortgage Obligations | | | 28.1 | % | |
| Corporate Bonds/Notes | | | 25.3 | % | |
| U.S. Treasury Obligations | | | 11.9 | % | |
| Asset-Backed Securities | | | 6.7 | % | |
| Repurchase Agreement | | | 4.8 | % | |
| Preferred Stock | | | 2.0 | % | |
| Municipal Bonds | | | 0.7 | % | |
| Other Assets and Liabilities, Net* | | | (10.9 | )% | |
| Total | | | 100.0 | % | |
* Includes short-term investment related to securities lending collateral.
Portfolio holdings are subject to change daily.
8
ING INTERMEDIATE BOND FUND
PORTFOLIO MANAGERS' REPORT
| | | Average Annual Total Returns for the Periods Ended September 30, 2006 | |
| | | 1 Year | | 5 Year | | Since
Inception
of Class A, B and C
December 15,
1998 | | Since
Inception
of Class I
January 8,
2002 | | Since
Inception
of Class O
August 13,
2004 | | Since
Inception
of Class R
March 16,
2004 | |
| Including Sales Charge: | |
| Class A(1) | | | (1.65 | )% | | | 4.27 | % | | | 5.77 | % | | | — | | | | — | | | | — | | |
| Class B(2) | | | (2.42 | )% | | | 4.16 | % | | | 5.62 | % | | | — | | | | — | | | | — | | |
| Class C(3) | | | 1.52 | % | | | 4.52 | % | | | 5.64 | % | | | — | | | | — | | | | — | | |
| Class I | | | 3.59 | % | | | — | | | | — | | | | 5.61 | % | | | — | | | | — | | |
| Class O | | | 3.17 | % | | | — | | | | — | | | | — | | | | 3.39 | % | | | — | | |
| Class R | | | 3.02 | % | | | — | | | | — | | | | — | | | | — | | | | 2.60 | % | |
| Excluding Sales Charge: | |
| Class A | | | 3.28 | % | | | 5.29 | % | | | 6.43 | % | | | — | | | | — | | | | — | | |
| Class B | | | 2.49 | % | | | 4.48 | % | | | 5.62 | % | | | — | | | | — | | | | — | | |
| Class C | | | 2.51 | % | | | 4.52 | % | | | 5.64 | % | | | — | | | | — | | | | — | | |
| Class I | | | 3.59 | % | | | — | | | | — | | | | 5.61 | % | | | — | | | | — | | |
| Class O | | | 3.17 | % | | | — | | | | — | | | | — | | | | 3.39 | % | | | — | | |
| Class R | | | 3.02 | % | | | — | | | | — | | | | — | | | | — | | | | 2.60 | % | |
| Lehman Brothers Aggregate Bond Index(4) | | | 3.67 | % | | | 4.81 | % | | | 5.51 | %(5) | | | 5.06 | %(6) | | | 4.01 | %(7) | | | 2.85 | %(8) | |
Based on a $10,000 initial investment, the table above illustrates the total return of ING Intermediate Bond Fund against the Index indicated. An index is unmanaged and has no cash in its portfolio, imposes no sales charges and incurs no operating expenses. An investor cannot invest directly in an index. The Fund's performance is shown both with and without the imposition of sales charges.
The performance table does not reflect the deduction of taxes that a shareholder will pay on Fund distributions or the redemption of Fund shares.
The performance shown may include the effect of fee waivers and/or expense reimbursements by the Investment Adviser and/or other service providers, which have the effect of increasing total return. Had all fees and expenses been considered, the total returns would have been lower.
Performance data represents past performance and is no assurance of future results. Investment return and principal value of an investment in the Fund will ßuctuate. Shares, when sold, may be worth more or less than their original cost. The Fund's performance may be lower or higher than the performance data shown. Please log on to www.ingfunds.com or call (800) 992-0180 to get performance through the most recent month end.
This report contains statements that may be "forward-looking" statements. Actual results may differ materially from those projected in the "forward-looking" statements.
The views expressed in this report reßect those of the portfolio manager, only through the end of the period as stated on the cover. The portfolio manager's views are subject to change at any time based on market and other conditions.
Fund holdings are subject to change daily.
(1) Reflects deduction of the maximum Class A sales charge of 4.75%.
(2) Reflects deduction of the Class B deferred sales charge of 5% and 2% for the 1 year and 5 year returns, respectively.
(3) Reflects deduction of the Class C deferred sales charge of 1% for the 1 year return.
(4) The Lehman Brothers Aggregate Bond Index is a widely recognized, unmanaged index of publicly issued investment grade U.S. government, mortgage-backed, asset-backed and corporate debt securities.
(5) Since inception performance for index is shown from December 1, 1998.
(6) Since inception performance for index is shown from January 1, 2002.
(7) Since inception performance for index is shown from August 1, 2004.
(8) Since inception performance for index is shown from April 1, 2004.
9
ING NATIONAL TAX-EXEMPT BOND FUND
PORTFOLIO MANAGERS' REPORT
The ING National Tax-Exempt Bond Fund (the "Fund") seeks to provide investors with a high level of current income that is exempt from federal income taxes, consistent with the preservation of capital. The Fund is managed by Robert Schonbrunn, Portfolio Manager, Karen Cronk, Managing Director and Portfolio Manager, and Rink Kilbride, ING Investment Management Co. — the Sub-Adviser.
Performance: For the six months ended September 30, 2006, the Fund's Class A shares, excluding sales charges, provided a total return of 3.10% compared to the Lehman Brothers Municipal Bond Index and the Lehman Brothers Aggregate Bond Index, which returned 3.44% and 3.73%, respectively, for the same period.
Portfolio Specifics: The most significant factor that impacted the municipal bond market over the past six months was the change in the direction of interest rates. In the second quarter interest rates moved higher as the Federal Reserve Board ("Fed") continued to raise the federal funds rate. However, after seventeen consecutive rate increases, the Fed paused in August, and interest rates declined in the third quarter. In March, the Fund was positioned defensively and had a relatively low level of sensitivity to interest rate changes. Toward the end of the second quarter, we gradually shifted the portfolio into longer-term issues to increase the Fund's sensitivity to interest rate changes in anticipation of a shift in rates. This strategy had a positive impact on the portfolio by offsetting the negative effect of rising interest rates earlier in the period and also positioned the portfolio to benefit from the rate decline in the third quarter. The relationship of short to long rates, known as the yield curve, flattened as short rates rose faster than longer rates. The portfolio held overweight positions in both short-term and long-term bonds with relatively little in the intermediate maturity sector. This barbell structure performed well as the yield curve flattened. Lower-quality bonds outperformed higher-quality bonds earlier in the year, but became over-valued as interest rates declined. The Fund participated in the lower-quality sector with BBB-rated hospital and tobacco issues during the second quarter. However, we recently shifted the portfolio into higher-quality issues such as municipal housing issues that generate relatively high yields and serve as a replacement for lower-quality bonds. The Fund's yield to maturity of 4.17% was competitively high and positively contributed to the Fund's total return over the period.
Current Strategy and Outlook: We believe there is a high probability that the Fed has completed its two-year program to control the risk of rising inflation. This policy shift has positive longer-term implications for the bond market as interest rates are likely to decline. Weakness in the housing market and the broader impact of lower housing asset values on consumer sentiment and consumer spending will dampen economic activity and should hold inflation at acceptable levels. In the near term, while some analysts are concerned that rising labor costs may extend the period before interest rates decline, we believe the longer-term trend may favor generally lower interest rates. In this environment, we are maintaining a higher sensitivity to interest rate movements using longer-maturity bonds which will enable us to participate in the potential drop in rates a nd also to earn the higher yields available on longer-term bonds. We are gradually shifting assets from the longer and shorter ends of the yield curve and building up the intermediate maturity sector to improve yields. We expect to maintain our focus on higher-quality bonds until yields on the lower-quality sectors widen to more attractive levels.
10
ING NATIONAL TAX-EXEMPT BOND FUND
PORTFOLIO MANAGERS' REPORT
| | | Average Annual Total Returns for the Periods Ended September 30, 2006 | |
| | | 1 Year | | 5 Year | | Since Inception
November 8, 1999 | |
| Including Sales Charge: | |
| Class A(1) | | | (1.50 | )% | | | 3.26 | % | | | 4.42 | % | |
| Class B(2) | | | (2.24 | )% | | | 3.17 | % | | | 4.37 | % | |
| Class C(3) | | | 1.69 | % | | | 3.52 | % | | | 4.39 | % | |
| Excluding Sales Charge: | |
| Class A | | | 3.45 | % | | | 4.28 | % | | | 5.17 | % | |
| Class B | | | 2.68 | % | | | 3.51 | % | | | 4.37 | % | |
| Class C | | | 2.67 | % | | | 3.52 | % | | | 4.39 | % | |
| Lehman Brothers Municipal Bond Index(4) | | | 4.45 | % | | | 5.17 | % | | | 6.29 | %(6) | |
| Lehman Brothers Aggregate Bond Index(5) | | | 3.67 | % | | | 4.81 | % | | | 6.27 | %(6) | |
Based on a $10,000 initial investment, the table above illustrates the total return of ING National Tax-Exempt Bond Fund against the indices indicated. An index is unmanaged and has no cash in its portfolio, imposes no sales charge and incurs no operating expenses. An investor cannot invest directly in an index. The Fund's performance is shown both with and without the imposition of sales charges.
The performance table does not reflect the deduction of taxes that a shareholder will pay (if any) on Fund distributions or the redemption of Fund shares.
The performance shown may include the effect of fee waivers and/or expense reimbursements by the Investment Adviser and/or other service providers, which have the effect of increasing total return. Had all fees and expenses been considered, the total returns would have been lower.
Performance data represents past performance and is no assurance of future results. Investment return and principal value of an investment in the Fund will fluctuate. Shares, when sold, may be worth more or less than their original cost. The Fund's performance may be lower or higher than the performance data shown. Please log on to www.ingfunds.com or call (800) 992-0180 to get performance through the most recent month end.
This report contains statements that may be "forward-looking" statements. Actual results may differ materially from those projected in the "forward-looking" statements.
The views expressed in this report reflect those of the portfolio managers, only through the end of the period as stated on the cover. The portfolio managers' views are subject to change at any time based on market and other conditions.
Fund holdings are subject to change daily.
(1) Reflects deduction of the maximum Class A sales charge of 4.75%.
(2) Reflects deduction of the Class B deferred sales charge of 5% and 2% for the 1 year and 5 year returns, respectively.
(3) Reflects deduction of the Class C deferred sales charge of 1% for the 1 year return.
(4) The Lehman Brothers Municipal Bond Index is an unmanaged index of approximately 1,100 investment grade tax-exempt bonds classified into four sectors: general obligation, revenue, insured and pre-refunded.
(5) The Lehman Brothers Aggregate Bond Index is a widely recognized, unmanaged index of publicly issued investment grade U.S. government, mortgage-backed, asset-backed and corporate debt securities.
(6) Since inception performance for index is shown from November 1, 1999.
11
ING CLASSIC MONEY MARKET FUND
PORTFOLIO MANAGERS' REPORT
ING Classic Money Market Fund (the "Fund") seeks to provide investors with a high level of current return, consistent with the preservation of capital and liquidity, and the maintenance of a stable $1.00 net asset value per share. The Fund is managed by David S. Yealy, Portfolio Manager, ING Investment Management Co. — the Sub-Adviser.
Portfolio Specifics: After seventeen consecutive quarter-point increases in the federal funds rate, the Federal Open Market Committee ("FOMC") voted to keep the rate at 5.25% at its August 8th and September 20th meetings. The FOMC indicated that economic growth could be expected to slow due to a decline in the housing market and higher energy prices. Inflation continues to increase, albeit at a slower pace, and is above the perceived Federal Reserve Board ("Fed") comfort zone remaining a concern to both the Fed and the markets. But, while inflation is a concern, the market has shifted from pricing in a potential Fed increase to pricing in a potential Fed rate cut in late 2006 or early 2007. Short-term money market security yields have declined accordingly.
Our primary investment strategy, which we have had in place since the second half of 2004, did not change significantly during the period. The Fund benefited from interest-rate sensitive floating-rate securities owned throughout the six-month period. In addition to our emphasis on floating-rate securities, we continued to focus on very short maturity securities that typically performed well in a rising rate environment. We made selective purchases in the two-to-three month maturity range only when the market fully priced in future Fed rate increases. For a brief period in June, the market priced in a more aggressive Fed funds rate with the 1-Year London Interbank Offered Rate nearing 5.80%. We took the opportunity to extend the Fund's weighted average maturity ("WAM") from approximately 20 days to 40 days by investing approximately 5% of the Fund in fixed-rate securities with maturities greater than six months. This maturity extension positi oned the Fund to take advantage of the shift in the FOMC's rate posture during the third quarter, and the markets' reaction to such a shift. The fixed-rate securities with maturities longer than six months added a yield premium over shorter securities. We elected to sell a portion of the longer-term fixed-rate securities at a gain during the third quarter as the market priced in future Fed rate cuts. We ended the quarter with a WAM of 31 days.
Current Strategy and Outlook: Statements released by the Fed after each FOMC meeting indicated that the central bank was still concerned with the risks associated with rising inflation. Fed committee members, including Chairman Ben Bernanke, have also continued to express concerns about inflation during recent speeches and public appearances. The market seemed to ignore these concerns, and instead focused on the housing decline and its potential impact on future economic growth. We believe that the market has over reacted. There is still the potential that inflation will become more of a concern and the Fed could be forced to either hold rates where they are for an extended period of time or even raise them. We expect more opportunities in the near-term to extend our weighted average maturity at higher yields than what is currently priced into the market fo r short-term money market securities.
12
ING INSTITUTIONAL PRIME MONEY MARKET FUND
PORTFOLIO MANAGERS' REPORT
The ING Institutional Money Market Fund (the "Fund") seeks to provide investors with a high level of current income, consistent with the preservation of capital and liquidity and the maintenance of a stable $1.00 net asset value per share. The Fund is managed by David S. Yealy, Portfolio Manager, ING Investment Management Co. — the Sub-Adviser.
Portfolio Specifics: After seventeen consecutive quarter-point increases in the federal funds rate, the Federal Open Market Committee ("FOMC") voted to keep the rate at 5.25% at its August 8th and September 20th meetings. The FOMC indicated that economic growth could be expected to slow due to a decline in the housing market and higher energy prices. Inflation continues to increase, albeit at a slower pace, and is above the perceived Federal Reserve Board's ("FED") comfort zone remaining a concern to both the Fed and the markets. But, while inflation is a concern, the market has shifted from pricing in a potential Fed increase to pricing in a potential Fed rate cut in late 2006 or early 2007. Short-term money market security yields have declined accordingly.
Our primary investment strategy, which we have had in place since the second half of 2004, did not change significantly during the period. The Fund benefited from interest-rate sensitive floating-rate securities owned throughout the six-month period. In addition to our emphasis on floating-rate securities, we continued to focus on very short maturity securities that typically performed well in a rising rate environment. We made selective purchases in the two-to-three month maturity range only when the market fully priced in future Fed rate increases. For a brief period in June the market priced in a more aggressive fed funds rate with the 1-Year London Interbank Offered Rate nearing 5.80%. We took the opportunity to extend the Fund's weighted average maturity (WAM) from approximately 20 days to 40 days by investing approximately 10% of the Fund in fixed-rate securities with maturities greater than six months. This maturity extension position ed the Fund to take advantage of the shift in the FOMC's rate posture during the third quarter, and the markets' reaction to such a shift. The fixed-rate securities with maturities longer than six months added a yield premium over shorter securities. We elected to sell a portion of the longer-term fixed-rate securities at a gain during the third quarter as the market priced in future Fed rate cuts. We ended the quarter with a WAM of 31 days.
Current Strategy and Outlook: Statements released by the Fed after each FOMC meeting indicated that the central bank was still concerned with the risks associated with rising inflation. Fed committee members, including Chairman Ben Bernanke, have also continued to express concerns about inflation during recent speeches and public appearances. The market seemed to ignore these concerns, and instead focused on the housing decline and its potential impact on future economic growth. We believe that the market has over reacted. There is still the potential that inflation will become more of a concern and the Fed could be forced to either hold rates where they are for an extended period of time or even raise them. We expect more opportunities in the near-term to extend our weighted average maturity at higher yields than what is currently priced into the market fo r short-term money market securities.
13
SHAREHOLDER EXPENSE EXAMPLES (UNAUDITED)
As a shareholder of a Fund, you incur two types of costs: (1) transaction costs, including sales charges (loads) on purchase payments; redemption fees; and exchange fees; and (2) ongoing costs, including management fees; distribution [and/or service] (12b–1) fees; and other Fund expenses. These Examples are intended to help you understand your ongoing costs (in dollars) of investing in a Fund and to compare these costs with the ongoing costs of investing in other mutual funds.
The Examples are based on an investment of $1,000 invested at the beginning of the period and held for the entire period from April 1, 2006 to September 30, 2006.
Actual Expenses
The first section of the table shown, "Actual Fund Return," provides information about actual account values and actual expenses. You may use the information in this section, together with the amount you invested, to estimate the expenses that you paid over the period. Simply divide your account value by $1,000 (for example, an $8,600 account value divided by $1,000 = 8.6), then multiply the result by the number in the first section under the heading entitled "Expenses Paid During Period" to estimate the expenses you paid on your account during this period.
Hypothetical Example for Comparison Purposes
The second section of the table shown, "Hypothetical 5% Return," provides information about hypothetical account values and hypothetical expenses based on the Fund's actual expense ratio and an assumed rate of return of 5% per year before expenses, which is not the Fund's actual return. The hypothetical account values and expenses may not be used to estimate the actual ending account balance or expenses you paid for the period. You may use this information to compare the ongoing costs of investing in the Fund and other funds. To do so, compare this 5% hypothetical example with the 5% hypothetical examples that appear in the shareholder reports of the other funds.
Please note that the expenses shown in the table are meant to highlight your ongoing costs only and do not reflect any transactional costs, such as sales charges (loads), redemption fees, or exchange fees. Therefore, the hypothetical lines of the table are useful in comparing ongoing costs only, and will not help you determine the relative total costs of owning different funds. In addition, if these transactional costs were included, your costs would have been higher.
| ING GNMA Income Fund | | Beginning
Account
Value
April 1, 2006 | | Ending
Account
Value
September 30, 2006 | | Annualized
Expense
Ratio | | Expenses Paid
During the
Six Months Ended
September 30, 2006* | |
| Actual Fund Return | |
| Class A | | $ | 1,000.00 | | | $ | 1,030.90 | | | | 0.95 | % | | $ | 4.84 | | |
| Class B | | | 1,000.00 | | | | 1,027.30 | | | | 1.70 | | | | 8.64 | | |
| Class C | | | 1,000.00 | | | | 1,027.30 | | | | 1.70 | | | | 8.64 | | |
| Class I | | | 1,000.00 | | | | 1,032.60 | | | | 0.65 | | | | 3.31 | | |
| Class M | | | 1,000.00 | | | | 1,028.10 | | | | 1.46 | | | | 7.42 | | |
| Class Q | | | 1,000.00 | | | | 1,030.00 | | | | 0.91 | | | | 4.63 | | |
| Hypothetical (5% return before expenses) | |
| Class A | | $ | 1,000.00 | | | $ | 1,020.31 | | | | 0.95 | % | | $ | 4.81 | | |
| Class B | | | 1,000.00 | | | | 1,016.55 | | | | 1.70 | | | | 8.59 | | |
| Class C | | | 1,000.00 | | | | 1,016.55 | | �� | | 1.70 | | | | 8.59 | | |
| Class I | | | 1,000.00 | | | | 1,021.81 | | | | 0.65 | | | | 3.29 | | |
| Class M | | | 1,000.00 | | | | 1,017.75 | | | | 1.46 | | | | 7.38 | | |
| Class Q | | | 1,000.00 | | | | 1,020.51 | | | | 0.91 | | | | 4.61 | | |
* Expenses are equal to each Fund's respective annualized expense ratios multiplied by the average account value over the period, multiplied by 183/365 to reflect the most recent fiscal half-year.
14
SHAREHOLDER EXPENSE EXAMPLES (UNAUDITED) (CONTINUED)
| ING High Yield Bond Fund | | Beginning
Account
Value
April 1, 2006 | | Ending
Account
Value
September 30, 2006 | | Annualized
Expense
Ratio | | Expenses Paid
During the
Six Months Ended
September 30, 2006* | |
| Actual Fund Return | |
| Class A | | $ | 1,000.00 | | | $ | 1,031.90 | | | | 1.10 | % | | $ | 5.60 | | |
| Class B | | | 1,000.00 | | | | 1,029.20 | | | | 1.85 | | | | 9.41 | | |
| Class C | | | 1,000.00 | | | | 1,021.20 | | | | 1.85 | | | | 9.41 | | |
| Hypothetical (5% return before expenses) | |
| Class A | | $ | 1,000.00 | | | $ | 1,019.55 | | | | 1.10 | % | | $ | 5.57 | | |
| Class B | | | 1,000.00 | | | | 1,015.79 | | | | 1.85 | | | | 9.35 | | |
| Class C | | | 1,000.00 | | | | 1,015.79 | | | | 1.85 | | | | 9.35 | | |
| ING Intermediate Bond Fund | |
| Actual Fund Return | |
| Class A | | $ | 1,000.00 | | | $ | 1,031.20 | | | | 0.69 | % | | $ | 3.51 | | |
| Class B | | | 1,000.00 | | | | 1,027.20 | | | | 1.44 | | | | 7.32 | | |
| Class C | | | 1,000.00 | | | | 1,027.30 | | | | 1.44 | | | | 7.32 | | |
| Class I | | | 1,000.00 | | | | 1,031.70 | | | | 0.38 | | | | 1.94 | | |
| Class O | | | 1,000.00 | | | | 1,030.10 | | | | 0.69 | | | | 3.51 | | |
| Class R | | | 1,000.00 | | | | 1,029.80 | | | | 0.94 | | | | 4.78 | | |
| Hypothetical (5% return before expenses) | |
| Class A | | $ | 1,000.00 | | | $ | 1,021.61 | | | | 0.69 | % | | $ | 3.50 | | |
| Class B | | | 1,000.00 | | | | 1,017.85 | | | | 1.44 | | | | 7.28 | | |
| Class C | | | 1,000.00 | | | | 1,017.85 | | | | 1.44 | | | | 7.28 | | |
| Class I | | | 1,000.00 | | | | 1,023.16 | | | | 0.38 | | | | 1.93 | | |
| Class O | | | 1,000.00 | | | | 1,021.61 | | | | 0.69 | | | | 3.50 | | |
| Class R | | | 1,000.00 | | | | 1,020.36 | | | | 0.94 | | | | 4.76 | | |
| ING National Tax-Exempt Bond Fund | |
| Actual Fund Return | |
| Class A | | $ | 1,000.00 | | | $ | 1,031.00 | | | | 0.87 | % | | $ | 4.43 | | |
| Class B | | | 1,000.00 | | | | 1,027.20 | | | | 1.62 | | | | 8.23 | | |
| Class C | | | 1,000.00 | | | | 1,027.10 | | | | 1.62 | | | | 8.23 | | |
| Hypothetical (5% return before expenses) | |
| Class A | | $ | 1,000.00 | | | $ | 1,020.71 | | | | 0.87 | % | | $ | 4.41 | | |
| Class B | | | 1,000.00 | | | | 1,016.95 | | | | 1.62 | | | | 8.19 | | |
| Class C | | | 1,000.00 | | | | 1,016.95 | | | | 1.62 | | | | 8.19 | | |
* Expenses are equal to each Fund's respective annualized expense ratios multiplied by the average account value over the period, multiplied by 183/365 to reflect the most recent fiscal half-year.
15
SHAREHOLDER EXPENSE EXAMPLES (UNAUDITED) (CONTINUED)
| ING Classic Money Market Fund | | Beginning
Account
Value
April 1, 2006 | | Ending
Account
Value
September 30, 2006 | | Annualized
Expense
Ratio | | Expenses Paid
During the
Six Months Ended
September 30, 2006* | |
| Actual Fund Return | |
| Class A | | $ | 1,000.00 | | | $ | 1,022.50 | | | | 0.77 | % | | $ | 3.90 | | |
| Class B | | | 1,000.00 | | | | 1,019.40 | | | | 1.36 | | | | 6.88 | | |
| Class C | | | 1,000.00 | | | | 1,019.40 | | | | 1.36 | | | | 6.88 | | |
| Hypothetical (5% return before expenses) | |
| Class A | | $ | 1,000.00 | | | $ | 1,021.21 | | | | 0.77 | % | | $ | 3.90 | | |
| Class B | | | 1,000.00 | | | | 1,018.25 | | | | 1.36 | | | | 6.88 | | |
| Class C | | | 1,000.00 | | | | 1,018.25 | | | | 1.36 | | | | 6.88 | | |
| ING Institutional Prime Money Market Fund | |
| Actual Fund Return | | $ | 1,000.00 | | | $ | 1,025.50 | | | | 0.17 | % | | $ | 0.86 | | |
Hypothetical (5% return before
| |
| expenses) | | $ | 1,000.00 | | | $ | 1,024.22 | | | | 0.17 | % | | $ | 0.86 | | |
* Expenses are equal to each Fund's respective annualized expense ratios multiplied by the average account value over the period, multiplied by 183/365 to reflect the most recent fiscal half-year.
16
STATEMENTS OF ASSETS AND LIABILITIES AS OF SEPTEMBER 30, 2006 (UNAUDITED)
| | | ING
GNMA Income
Fund | | ING
High Yield
Bond
Fund | | ING
Intermediate
Bond
Fund | |
| ASSETS: | |
| Investments in securities at value+* | | $ | 537,990,113 | | | $ | 169,026,890 | | | $ | 1,071,159,567 | | |
| Short-term investments** | | | 90,365,126 | | | | — | | | | — | | |
| Short-term investments at amortized cost | | | — | | | | — | | | | 169,060,933 | | |
| Repurchase agreement | | | — | | | | 796,000 | | | | 48,524,000 | | |
| Cash | | | 550,069 | | | | 198,237 | | | | 1,325,454 | | |
| Cash collateral for futures | | | — | | | | 70,781 | | | | 625,673 | | |
| Foreign currencies at value*** | | | — | | | | — | | | | 9,092,721 | | |
| Receivables: | |
| Investment securities sold | | | 111 | | | | 1,894,900 | | | | 63,257,141 | | |
| Fund shares sold | | | 640,510 | | | | 91,413 | | | | 2,557,392 | | |
| Dividends and interest | | | 2,810,442 | | | | 3,357,974 | | | | 7,425,370 | | |
| Unrealized appreciation on swap agreements | | | — | | | | — | | | | 419,141 | | |
| Prepaid expenses | | | 50,898 | | | | 23,831 | | | | 147,991 | | |
| Reimbursement due from manager | | | — | | | | 1,447 | | | | — | | |
| Total assets | | | 632,407,269 | | | | 175,461,473 | | | | 1,373,595,383 | | |
| LIABILITIES: | |
| Payable for investment securities purchased | | | 7,258,053 | | | | 2,129,911 | | | | 191,003,326 | | |
| Payable for fund shares redeemed | | | 701,324 | | | | 413,673 | | | | 1,482,292 | | |
| Payable for futures variation margin | | | — | | | | 7,969 | | | | 112,832 | | |
| Payable upon receipt of securities loaned | | | — | | | | — | | | | 169,060,933 | | |
| Unrealized depreciation on swap agreements | | | — | | | | — | | | | 255,888 | | |
| Income distribution payable | | | — | | | | 485,280 | | | | 733,316 | | |
| Payable to affiliates | | | 472,179 | | | | 167,442 | | | | 473,223 | | |
| Payable for borrowings against line of credit | | | — | | | | 200,000 | | | | — | | |
| Payable for trustees fees | | | 4,682 | | | | 8,782 | | | | 3,638 | | |
| Other accrued expenses and liabilities | | | 280,981 | | | | 168,117 | | | | 135,633 | | |
| Total liabilities | | | 8,717,219 | | | | 3,581,174 | | | | 363,261,081 | | |
| NET ASSETS | | $ | 623,690,050 | | | $ | 171,880,299 | | | $ | 1,010,334,302 | | |
| NET ASSETS WERE COMPRISED OF: | |
| Paid-in capital | | $ | 642,275,759 | | | $ | 565,803,610 | | | $ | 1,027,706,825 | | |
Undistributed net investment income
(accumulated net investment loss) | | | 835,257 | | | | (193,562 | ) | | | (33,911 | ) | |
Accumulated net realized loss on investments,
foreign currency related transactions, futures, and swaps | | | (15,914,180 | ) | | | (394,668,274 | ) | | | (16,447,885 | ) | |
Net unrealized appreciation or depreciation on investments,
foreign currency related transactions, futures, and swaps | | | (3,506,786 | ) | | | 938,525 | | | | (890,727 | ) | |
| NET ASSETS | | $ | 623,690,050 | | | $ | 171,880,299 | | | $ | 1,010,334,302 | | |
| + Including securities loaned at value | | $ | — | | | $ | — | | | $ | 165,718,213 | | |
| * Cost of investments in securities | | $ | 541,547,691 | | | $ | 168,167,627 | | | $ | 1,071,556,819 | | |
| ** Cost of short-term investments | | $ | 90,314,334 | | | $ | — | | | $ | — | | |
| *** Cost of foreign currencies | | $ | — | | | $ | — | | | $ | 9,417,983 | | |
See Accompanying Notes to Financial Statements
17
STATEMENTS OF ASSETS AND LIABILITIES AS OF SEPTEMBER 30, 2006 (UNAUDITED) (CONTINUED)
| | | ING
GNMA Income
Fund | | ING
High Yield
Bond
Fund | | ING
Intermediate
Bond
Fund | |
| Class A: | |
| Net assets | | $ | 503,588,287 | | | $ | 98,722,649 | | | $ | 636,697,359 | | |
| Shares authorized | | | unlimited | | | | unlimited | | | | unlimited | | |
| Par value | | $ | 0.001 | | | $ | 0.001 | | | $ | 0.001 | | |
| Shares outstanding | | | 60,382,897 | | | | 11,356,859 | | | | 62,474,306 | | |
| Net asset value and redemption price per share | | $ | 8.34 | | | $ | 8.69 | | | $ | 10.19 | | |
| Maximum offering price per share (2.50%)(1) | | $ | 8.55 | | | $ | 8.91 | | | $ | 10.45 | | |
| Class B: | |
| Net assets | | $ | 66,621,459 | | | $ | 56,941,528 | | | $ | 54,484,198 | | |
| Shares authorized | | | unlimited | | | | unlimited | | | | unlimited | | |
| Par value | | $ | 0.001 | | | $ | 0.001 | | | $ | 0.001 | | |
| Shares outstanding | | | 8,029,817 | | | | 6,554,067 | | | | 5,356,607 | | |
| Net asset value and redemption price per share(2) | | $ | 8.30 | | | $ | 8.69 | | | $ | 10.17 | | |
| Maximum offering price per share | | $ | 8.30 | | | $ | 8.69 | | | $ | 10.17 | | |
| Class C: | |
| Net assets | | $ | 35,352,752 | | | $ | 16,216,122 | | | $ | 74,423,132 | | |
| Shares authorized | | | unlimited | | | | unlimited | | | | unlimited | | |
| Par value | | $ | 0.001 | | | $ | 0.001 | | | $ | 0.001 | | |
| Shares outstanding | | | 4,255,031 | | | | 1,865,476 | | | | 7,311,548 | | |
| Net asset value and redemption price per share(2) | | $ | 8.31 | | | $ | 8.69 | | | $ | 10.18 | | |
| Maximum offering price per share | | $ | 8.31 | | | $ | 8.69 | | | $ | 10.18 | | |
| Class I: | |
| Net assets | | $ | 17,909,092 | | | | n/a | | | $ | 194,187,050 | | |
| Shares authorized | | | unlimited | | | | n/a | | | | unlimited | | |
| Par value | | $ | 0.001 | | | | n/a | | | $ | 0.001 | | |
| Shares outstanding | | | 2,145,606 | | | | n/a | | | | 19,048,698 | | |
| Net asset value and redemption price per share | | $ | 8.35 | | | | n/a | | | $ | 10.19 | | |
| Maximum offering price per share | | $ | 8.35 | | | | n/a | | | $ | 10.19 | | |
| Class M: | |
| Net assets | | $ | 134,502 | | | | n/a | | | | n/a | | |
| Shares authorized | | | unlimited | | | | n/a | | | | n/a | | |
| Par value | | $ | 0.001 | | | | n/a | | | | n/a | | |
| Shares outstanding | | | 16,101 | | | | n/a | | | | n/a | | |
| Net asset value and redemption price per share | | $ | 8.35 | | | | n/a | | | | n/a | | |
| Maximum offering price per share (3.25%)(3) | | $ | 8.63 | | | | n/a | | | | n/a | | |
| Class O: | |
| Net assets | | | n/a | | | | n/a | | | $ | 49,651,404 | | |
| Shares authorized | | | n/a | | | | n/a | | | | unlimited | | |
| Par value | | | n/a | | | | n/a | | | $ | 0.001 | | |
| Shares outstanding | | | n/a | | | | n/a | | | | 4,870,233 | | |
| Net asset value and redemption price per share | | | n/a | | | | n/a | | | $ | 10.19 | | |
| Maximum offering price per share | | | n/a | | | | n/a | | | $ | 10.19 | | |
| Class Q: | |
| Net assets | | $ | 83,958 | | | | n/a | | | | n/a | | |
| Shares authorized | | | unlimited | | | | n/a | | | | n/a | | |
| Par value | | $ | 0.001 | | | | n/a | | | | n/a | | |
| Shares outstanding | | | 10,049 | | | | n/a | | | | n/a | | |
| Net asset value and redemption price per share | | $ | 8.35 | | | | n/a | | | | n/a | | |
| Maximum offering price per share | | $ | 8.35 | | | | n/a | | | | n/a | | |
| Class R: | |
| Net assets | | | n/a | | | | n/a | | | $ | 891,159 | | |
| Shares authorized | | | n/a | | | | n/a | | | | unlimited | | |
| Par value | | | n/a | | | | n/a | | | $ | 0.001 | | |
| Shares outstanding | | | n/a | | | | n/a | | | | 87,305 | | |
| Net asset value and redemption price per share | | | n/a | | | | n/a | | | $ | 10.21 | | |
| Maximum offering price per share | | | n/a | | | | n/a | | | $ | 10.21 | | |
(1) Maximum offering price is computed at 100/97.50 of net asset value. On purchases of $100,000 or more, the offering price is reduced.
(2) Redemption price per share may be reduced for any applicable contingent deffered sales charges.
(3) Maximum offering price is computed at 100/96.75 of net asset value. On purchases of $50,000 or more, the offering price is reduced.
See Accompanying Notes to Financial Statements
18
STATEMENTS OF ASSETS AND LIABILITIES AS OF SEPTEMBER 30, 2006 (UNAUDITED) (CONTINUED)
| | | ING
National Tax-
Exempt Bond
Fund | | ING
Classic
Money Market
Fund | | ING
Institutional Prime
Money Market
Fund | |
| ASSETS: | |
| Investments in securities at value* | | $ | 25,380,453 | | | $ | — | | | $ | — | | |
| Short-term investments at amortized cost | | | — | | | | 748,963,164 | | | | 116,563,464 | | |
| Repurchase agreement | | | — | | | | 28,139,000 | | | | 24,393,000 | | |
| Cash | | | 1,223,560 | | | | 139,095 | | | | 6,087 | | |
| Receivables: | |
| Fund shares sold | | | 15,559 | | | | 586,506 | | | | — | | |
| Dividends and interest | | | 343,068 | | | | 2,112,305 | | | | 319,699 | | |
| Prepaid expenses | | | 33,097 | | | | 197,719 | | | | 65,973 | | |
| Reimbursement due from manager | | | 993 | | | | — | | | | — | | |
| Total assets | | | 26,996,730 | | | | 780,137,789 | | | | 141,348,223 | | |
| LIABILITIES: | |
| Payable for fund shares redeemed | | | 178 | | | | 423,450 | | | | — | | |
| Income distribution payable | | | 72,869 | | | | 24,607 | | | | 214,035 | | |
| Payable to affiliates | | | 16,984 | | | | 430,788 | | | | 20,503 | | |
| Payable for trustees fees | | | 1,249 | | | | 5,758 | | | | 787 | | |
| Other accrued expenses and liabilities | | | 17,860 | | | | 101,751 | | | | 44,620 | | |
| Total liabilities | | | 109,140 | | | | 986,354 | | | | 262,412 | | |
| NET ASSETS | | $ | 26,887,590 | | | $ | 779,151,435 | | | $ | 141,085,811 | | |
| NET ASSETS WERE COMPRISED OF: | |
| Paid-in capital | | $ | 26,096,321 | | | $ | 779,308,654 | | | $ | 141,053,137 | | |
Undistributed net investment income
(distributions in excess of net investment income) | | | (1,275 | ) | | | (1,534 | ) | | | 29,357 | | |
| Accumulated net realized gain (loss) on investments | | | 191,232 | | | | (155,685 | ) | | | 3,317 | | |
| Net unrealized appreciation on investments | | | 601,312 | | | | — | | | | — | | |
| NET ASSETS | | $ | 26,887,590 | | | $ | 779,151,435 | | | $ | 141,085,811 | | |
| * Cost of investments in securities | | $ | 24,779,141 | | | $ | — | | | $ | — | | |
See Accompanying Notes to Financial Statements
19
STATEMENTS OF ASSETS AND LIABILITIES AS OF SEPTEMBER 30, 2006 (UNAUDITED) (CONTINUED)
| | | ING
National Tax-
Exempt Bond
Fund | | ING
Classic
Money Market
Fund | | ING
Institutional Prime
Money Market
Fund | |
| Class A: | |
| Net assets | | $ | 22,415,654 | | | $ | 747,942,115 | | | $ | 141,085,811 | | |
| Shares authorized | | | unlimited | | | | unlimited | | | | unlimited | | |
| Par value | | $ | 0.001 | | | $ | 0.001 | | | $ | 0.001 | | |
| Shares outstanding | | | 2,157,251 | | | | 748,070,380 | | | | 141,082,173 | | |
| Net asset value and redemption price per share | | $ | 10.39 | | | $ | 1.00 | | | $ | 1.00 | | |
| Maximum offering price per share (2.50%)(1) | | $ | 10.66 | | | $ | 1.00 | | | $ | 1.00 | | |
| Class B: | |
| Net assets | | $ | 2,843,819 | | | $ | 24,678,978 | | | | n/a | | |
| Shares authorized | | | unlimited | | | | unlimited | | | | n/a | | |
| Par value | | $ | 0.001 | | | $ | 0.001 | | | | n/a | | |
| Shares outstanding | | | 273,881 | | | | 24,701,330 | | | | n/a | | |
| Net asset value and redemption price per share(2) | | $ | 10.38 | | | $ | 1.00 | | | | n/a | | |
| Maximum offering price per share | | $ | 10.38 | | | $ | 1.00 | | | | n/a | | |
| Class C: | |
| Net assets | | $ | 1,628,117 | | | $ | 6,530,342 | | | | n/a | | |
| Shares authorized | | | unlimited | | | | unlimited | | | | n/a | | |
| Par value | | $ | 0.001 | | | $ | 0.001 | | | | n/a | | |
| Shares outstanding | | | 156,665 | | | | 6,537,546 | | | | n/a | | |
| Net asset value and redemption price per share(2) | | $ | 10.39 | | | $ | 1.00 | | | | n/a | | |
| Maximum offering price per share | | $ | 10.39 | | | $ | 1.00 | | | | n/a | | |
(1) Maximum offering price is computed at 100/97.50 of net asset value. On purchases of $100,000 or more, the offering price is reduced for the ING National Tax-Exempt Bond Fund.
(2) Redemption price per share may be reduced for any applicable contingent deffered sales charges.
See Accompanying Notes to Financial Statements
20
STATEMENTS OF OPERATIONS FOR THE SIX MONTHS ENDED SEPTEMBER 30, 2006 (UNAUDITED)
| | | ING
GNMA Income
Fund | | ING
High Yield
Bond
Fund | | ING
Intermediate
Bond
Fund | |
| INVESTMENT INCOME: | |
| Dividends, net of foreign taxes withheld* | | $ | — | | | $ | 59,711 | | | $ | 629,031 | | |
| Interest | | | 17,611,295 | | | | 7,151,654 | | | | 26,242,057 | | |
| Securities lending income | | | — | | | | — | | | | 132,954 | | |
| Total investment income | | | 17,611,295 | | | | 7,211,365 | | | | 27,004,042 | | |
| EXPENSES: | |
| Investment management fees | | | 1,457,724 | | | | 459,987 | | | | 815,900 | | |
| Distribution and service fees: | |
| Class A | | | 621,163 | | | | 123,301 | | | | 750,838 | | |
| Class B | | | 357,799 | | | | 324,504 | | | | 284,752 | | |
| Class C | | | 168,519 | | | | 84,225 | | | | 360,605 | | |
| Class M | | | 535 | | | | — | | | | — | | |
| Class O | | | — | | | | — | | | | 57,832 | | |
| Class Q | | | 103 | | | | — | | | | — | | |
| Class R | | | — | | | | — | | | | 2,102 | | |
| Transfer agent fees: | |
| Class A | | | 188,067 | | | | 82,518 | | | | 313,007 | | |
| Class B | | | 26,981 | | | | 54,311 | | | | 29,724 | | |
| Class C | | | 12,754 | | | | 14,094 | | | | 37,611 | | |
| Class I | | | 891 | | | | — | | | | 41,064 | | |
| Class M | | | 49 | | | | — | | | | — | | |
| Class O | | | — | | | | — | | | | 24,429 | | |
| Class Q | | | 7 | | | | — | | | | — | | |
| Class R | | | — | | | | — | | | | 443 | | |
| Administrative service fees | | | 310,151 | | | | 90,193 | | | | 479,945 | | |
| Shareholder reporting expense | | | 47,040 | | | | 32,905 | | | | 92,404 | | |
| Registration fees | | | 61,392 | | | | 26,119 | | | | 55,462 | | |
| Professional fees | | | 33,965 | | | | 26,573 | | | | 37,837 | | |
| Custody and accounting expense | | | 33,175 | | | | 13,700 | | | | 60,690 | | |
| Trustees fees | | | 9,334 | | | | 2,573 | | | | 10,627 | | |
| Miscellaneous expense | | | 35,331 | | | | 8,732 | | | | 36,368 | | |
| Interest expense | | | — | | | | 2,053 | | | | — | | |
| Total expenses | | | 3,364,980 | | | | 1,345,788 | | | | 3,491,640 | | |
| Net recouped (waived and reimbursed) fees | | | (64,337 | ) | | | (44,274 | ) | | | 17,344 | | |
| Net expenses | | | 3,300,643 | | | | 1,301,514 | | | | 3,508,984 | | |
| Net investment income | | | 14,310,652 | | | | 5,909,851 | | | | 23,495,058 | | |
REALIZED AND UNREALIZED GAIN (LOSS) ON INVESTMENTS,
FOREIGN CURRENCY RELATED TRANSACTIONS, FUTURES, AND SWAPS: | |
| Net realized gain (loss) on: | |
| Investments | | | 496,429 | | | | (5,276,760 | ) | | | (5,602,950 | ) | |
| Foreign currency related transactions | | | — | | | | — | | | | (4,060 | ) | |
| Futures and swaps | | | — | | | | (121,861 | ) | | | (2,452,331 | ) | |
Net realized gain (loss) on investments,
foreign currency related transactions, futures, and swaps | | | 496,429 | | | | (5,398,621 | ) | | | (8,059,341 | ) | |
| Net change in unrealized appreciation or depreciation on: | |
| Investments | | | 3,460,897 | | | | 4,522,123 | | | | 14,047,105 | | |
| Foreign currency related transactions | | | — | | | | — | | | | (325,321 | ) | |
| Futures and swaps | | | — | | | | 222,323 | | | | 596,449 | | |
Net change in unrealized appreciation or depreciation on investments,
foreign currency related transactions, futures, and swaps | | | 3,460,897 | | | | 4,744,446 | | | | 14,318,233 | | |
Net realized and unrealized gain (loss) on investments,
foreign currency related transactions, futures, and swaps | | | 3,957,326 | | | | (654,175 | ) | | | 6,258,892 | | |
| Increase in net assets resulting from operations | | $ | 18,267,978 | | | $ | 5,255,676 | | | $ | 29,753,950 | | |
(1) Dividends at September 30, 2006 include dividends from affiliates of
$44,332 for ING High Yield Bond Fund. | | | | | | | | | | | | | |
| * Foreign taxes withheld | | $ | — | | | $ | — | | | $ | 1,580 | | |
See Accompanying Notes to Financial Statements
21
STATEMENTS OF OPERATIONS FOR THE SIX MONTHS ENDED SEPTEMBER 30, 2006 (UNAUDITED)
| | | ING
National Tax-
Exempt Bond
Fund | | ING
Classic
Money Market
Fund | | ING
Institutional Prime
Money Market
Fund | |
| INVESTMENT INCOME: | |
| Interest | | $ | 659,068 | | | $ | 19,445,276 | | | $ | 4,047,368 | | |
| Total investment income | | | 659,068 | | | | 19,445,276 | | | | 4,047,368 | | |
| EXPENSES: | |
| Investment management fees | | | 40,787 | | | | 930,493 | | | | 62,488 | | |
| Distribution and service fees: | |
| Class A | | | 28,355 | | | | 2,681,343 | | | | — | | |
| Class B | | | 14,360 | | | | 119,548 | | | | — | | |
| Class C | | | 8,174 | | | | 27,298 | | | | — | | |
| Transfer agent fees: | |
| Class A | | | 2,134 | | | | 75,174 | | | | 668 | | |
| Class B | | | 270 | | | | 2,514 | | | | — | | |
| Class C | | | 154 | | | | 574 | | | | — | | |
| Administrative service fees | | | 13,595 | | | | — | | | | — | | |
| Shareholder reporting expense | | | 4,137 | | | | 70,821 | | | | 12,929 | | |
| Registration fees | | | 24,631 | | | | 170,989 | | | | 27,764 | | |
| Professional fees | | | 3,935 | | | | 15,955 | | | | 7,697 | | |
| Custody and accounting expense | | | 512 | | | | 38,100 | | | | 23,607 | | |
| Trustee fees | | | 549 | | | | 9,463 | | | | 2,693 | | |
| Offering expense | | | — | | | | — | | | | 32,604 | | |
| Miscellaneous expense | | | 1,462 | | | | 24,733 | | | | 2,803 | | |
| Interest expense | | | 235 | | | | — | | | | — | | |
| Total expenses | | | 143,290 | | | | 4,167,005 | | | | 173,253 | | |
| Net waived and reimbursed fees | | | (8,087 | ) | | | (1,214,814 | ) | | | (39,584 | ) | |
| Net expenses | | | 135,203 | | | | 2,952,191 | | | | 133,669 | | |
| Net investment income | | | 523,865 | | | | 16,493,085 | | | | 3,913,699 | | |
| REALIZED AND UNREALIZED GAIN (LOSS) ON INVESTMENTS: | |
| Net realized gain on investments | | | 206,513 | | | | 35,485 | | | | 9,711 | | |
| Net change in unrealized appreciation or depreciation on investments | | | 73,465 | | | | — | | | | — | | |
| Net realized and unrealized gain on investments | | | 279,978 | | | | 35,485 | | | | 9,711 | | |
| Increase in net assets resulting from operations | | $ | 803,843 | | | $ | 16,528,570 | | | $ | 3,923,410 | | |
See Accompanying Notes to Financial Statements
22
STATEMENTS OF CHANGES IN NET ASSETS (UNAUDITED)
| | | ING GNMA Income Fund | | ING High Yield Bond Fund | |
| | | Six Months
Ended
September 30,
2006 | | Year
Ended
March 31,
2006 | | Six Months
Ended
September 30,
2006 | | Year
Ended
March 31,
2006 | |
| FROM OPERATIONS: | |
| Net investment income | | $ | 14,310,652 | | | $ | 29,983,281 | | | $ | 5,909,851 | | | $ | 13,310,738 | | |
| Net realized gain on investments and futures | | | 496,429 | | | | 3,622,049 | | | | (5,398,621 | ) | | | (13,191,714 | ) | |
Net change in unrealized appreciation or depreciation on
investments and futures | | | 3,460,897 | | | | (17,878,273 | ) | | | 4,744,446 | | | | 12,301,844 | | |
| Increase in net assets resulting from operations | | | 18,267,978 | | | | 15,727,057 | | | | 5,255,676 | | | | 12,420,868 | | |
| FROM DISTRIBUTIONS TO SHAREHOLDERS: | |
| Net investment income: | |
| Class A | | | (12,681,530 | ) | | | (26,098,410 | ) | | | (3,330,463 | ) | | | (6,737,675 | ) | |
| Class B | | | (1,602,813 | ) | | | (3,959,481 | ) | | | (1,936,993 | ) | | | (5,510,877 | ) | |
| Class C | | | (744,615 | ) | | | (1,693,514 | ) | | | (504,791 | ) | | | (1,171,389 | ) | |
| Class I | | | (482,426 | ) | | | (697,343 | ) | | | — | | | | — | | |
| Class M | | | (3,319 | ) | | | (8,930 | ) | | | — | | | | — | | |
| Class Q | | | (2,119 | ) | | | (4,480 | ) | | | — | | | | — | | |
| Total distributions | | | (15,516,822 | ) | | | (32,462,158 | ) | | | (5,772,247 | ) | | | (13,419,941 | ) | |
| FROM CAPITAL SHARE TRANSACTIONS: | |
| Net proceeds from sale of shares | | | 54,952,978 | | | | 99,407,124 | | | | 19,109,932 | | | | 41,472,047 | | |
| Proceeds issued in merger | | | — | | | | 46,201,389 | | | | — | | | | — | | |
| Dividends reinvested | | | 12,800,942 | | | | 27,137,387 | | | | 2,728,898 | | | | 6,353,721 | | |
| | | | 67,753,920 | | | | 172,745,900 | | | | 21,838,830 | | | | 47,825,768 | | |
| Cost of shares redeemed | | | (83,931,212 | ) | | | (193,650,406 | ) | | | (42,114,933 | ) | | | (116,768,800 | ) | |
Net decrease in net assets resulting from
capital share transactions | | | (16,177,292 | ) | | | (20,904,506 | ) | | | (20,276,103 | ) | | | (68,943,032 | ) | |
| Net decrease in net assets | | | (13,426,136 | ) | | | (37,639,607 | ) | | | (20,792,674 | ) | | | (69,942,105 | ) | |
| NET ASSETS: | |
| Beginning of period | | | 637,116,186 | | | | 674,755,793 | | | | 192,672,973 | | | | 262,615,078 | | |
| End of period | | $ | 623,690,050 | | | $ | 637,116,186 | | | $ | 171,880,299 | | | $ | 192,672,973 | | |
Undistributed net investment income (distributions in
excess of net investment income) at end of period | | $ | 835,257 | | | $ | 2,041,427 | | | $ | (193,562 | ) | | $ | (331,166 | ) | |
See Accompanying Notes to Financial Statements
23
STATEMENTS OF CHANGES IN NET ASSETS (UNAUDITED)
| | | Six Months
Ended
September 30,
2006 | | Year
Ended
March 31,
2006 | | Six Months
Ended
September 30,
2006 | | Year
Ended
March 31,
2006 | |
| FROM OPERATIONS: | |
| Net investment income | | $ | 23,495,058 | | | $ | 31,230,030 | | | $ | 523,865 | | | $ | 968,799 | | |
Net realized gain on investments, foreign currency
related transactions, futures, and swaps | | | (8,059,341 | ) | | | (5,972,981 | ) | | | 206,513 | | | | 323,563 | | |
Net change in unrealized appreciation or depreciation on
investments, foreign currency related transactions,
futures, and swaps | | | 14,318,233 | | | | (9,477,161 | ) | | | 73,465 | | | | (628,923 | ) | |
| Increase in net assets resulting from operations | | | 29,753,950 | | | | 15,779,888 | | | | 803,843 | | | | 663,439 | | |
| FROM DISTRIBUTIONS TO SHAREHOLDERS: | |
| Net investment income: | |
| Class A | | | (14,875,970 | ) | | | (21,129,307 | ) | | | (451,135 | ) | | | (830,785 | ) | |
| Class B | | | (1,194,513 | ) | | | (2,090,084 | ) | | | (46,336 | ) | | | (86,603 | ) | |
| Class C | | | (1,514,165 | ) | | | (2,398,616 | ) | | | (26,394 | ) | | | (51,411 | ) | |
| Class I | | | (4,814,930 | ) | | | (4,945,436 | ) | | | — | | | | — | | |
| Class O | | | (1,146,258 | ) | | | (1,591,398 | ) | | | — | | | | — | | |
| Class R | | | (19,756 | ) | | | (22,537 | ) | | | — | | | | — | | |
| Net realized gains: | |
| Class A | | | — | | | | (1,826,580 | ) | | | — | | | | (252,957 | ) | |
| Class B | | | — | | | | (215,404 | ) | | | — | | | | (32,530 | ) | |
| Class C | | | — | | | | (250,102 | ) | | | — | | | | (19,924 | ) | |
| Class I | | | — | | | | (527,267 | ) | | | — | | | | — | | |
| Class O | | | — | | | | (139,818 | ) | | | — | | | | — | | |
| Class R | | | — | | | | (2,543 | ) | | | — | | | | — | | |
| Total distributions | | | (23,565,592 | ) | | | (35,139,092 | ) | | | (523,865 | ) | | | (1,274,210 | ) | |
| FROM CAPITAL SHARE TRANSACTIONS: | |
| Net proceeds from sale of shares | | | 171,952,101 | | | | 422,545,470 | | | | 1,139,541 | | | | 2,081,336 | | |
| Dividends reinvested | | | 19,345,999 | | | | 28,286,436 | | | | 54,408 | | | | 163,656 | | |
| | | | 191,298,100 | | | | 450,831,906 | | | | 1,193,949 | | | | 2,244,992 | | |
| Cost of shares redeemed | | | (116,707,891 | ) | | | (176,312,495 | ) | | | (2,147,660 | ) | | | (2,216,079 | ) | |
Net increase (decrease) in net assets resulting from
capital share transactions | | | 74,590,209 | | | | 274,519,411 | | | | (953,711 | ) | | | 28,913 | | |
| Net increase (decrease) in net assets | | | 80,778,567 | | | | 255,160,207 | | | | (673,733 | ) | | | (581,858 | ) | |
| NET ASSETS: | |
| Beginning of period | | | 929,555,735 | | | | 674,395,528 | | | | 27,561,323 | | | | 28,413,181 | | |
| End of period | | $ | 1,010,334,302 | | | $ | 929,555,735 | | | $ | 26,887,590 | | | $ | 27,561,323 | | |
Undistributed net investment income (distributions in
excess of net investment income) at end of period | | $ | (33,911 | ) | | $ | 36,623 | | | $ | (1,275 | ) | | $ | (1,275 | ) | |
See Accompanying Notes to Financial Statements
24
STATEMENTS OF CHANGES IN NET ASSETS (UNAUDITED)
| | | ING Classic Money Market Fund | | ING Institutional Prime Money Market Fund | |
| | | Six Months
Ended
September 30,
2006 | | Year
Ended
March 31,
2006 | | Six Months
Ended
September 30,
2006 | | July 28,
2005(1) to
March 31,
2006 | |
| FROM OPERATIONS: | |
| Net investment income | | $ | 16,493,085 | | | $ | 18,629,328 | | | $ | 3,913,699 | | | $ | 4,773,069 | | |
| Net realized gain (loss) on investments | | | 35,485 | | | | (15,431 | ) | | | 9,711 | | | | (6,394 | ) | |
| Increase in net assets resulting from operations | | | 16,528,570 | | | | 18,613,897 | | | | 3,923,410 | | | | 4,766,675 | | |
| FROM DISTRIBUTIONS TO SHAREHOLDERS: | |
| Net investment income: | |
| Class A | | | (15,927,322 | ) | | | (17,827,103 | ) | | | (3,913,378 | ) | | | (4,773,069 | ) | |
| Class B | | | (461,468 | ) | | | (680,890 | ) | | | — | | | | — | | |
| Class C | | | (105,825 | ) | | | (121,335 | ) | | | — | | | | — | | |
| Total distributions | | | (16,494,615 | ) | | | (18,629,328 | ) | | | (3,913,378 | ) | | | (4,773,069 | ) | |
| FROM CAPITAL SHARE TRANSACTIONS: | |
| Net proceeds from sale of shares | | | 262,549,611 | | | | 534,990,330 | | | | 477,244,083 | | | | 462,400,001 | | |
| Dividends reinvested | | | 16,335,597 | | | | 18,332,291 | | | | 2,417,449 | | | | 3,264,932 | | |
| | | | 278,885,208 | | | | 553,322,621 | | | | 479,661,532 | | | | 465,664,933 | | |
| Cost of shares redeemed | | | (185,361,590 | ) | | | (448,676,993 | ) | | | (518,244,292 | ) | | | (286,000,000 | ) | |
Net increase (decrease) in net assets resulting from
capital share transactions | | | 93,523,618 | | | | 104,645,628 | | | | (38,582,760 | ) | | | 179,664,933 | | |
| Net increase (decrease) in net assets | | | 93,557,573 | | | | 104,630,197 | | | | (38,572,728 | ) | | | 179,658,539 | | |
| NET ASSETS: | |
| Beginning of period | | | 685,593,862 | | | | 580,963,665 | | | | 179,658,539 | | | | — | | |
| End of period | | $ | 779,151,435 | | | $ | 685,593,862 | | | $ | 141,085,811 | | | $ | 179,658,539 | | |
Undistributed net investment income
(distributions in excess of net
investment income) at end of period | | $ | (1,534 | ) | | $ | (4 | ) | | $ | 29,357 | | | $ | 29,036 | | |
(1) Commencement of operations
See Accompanying Notes to Financial Statements
25
ING GNMA INCOME FUND (UNAUDITED)
FINANCIAL HIGHLIGHTS
Selected data for a share of beneficial interest outstanding throughout each period.
| | | Class A | |
| | | Six Months
Ended
September 30, | |
Year Ended March 31, | |
| | | 2006 | | 2006 | | 2005 | | 2004 | | 2003 | | 2002 | |
| Per Share Operating Performance: | |
| Net asset value, beginning of period | | $ | 8.30 | | | | 8.52 | | | | 8.91 | | | | 9.00 | | | | 8.53 | | | | 8.63 | | |
| Income (loss) from investment operations: | |
| Net investment income | | $ | 0.19 | | | | 0.40 | | | | 0.37 | | | | 0.32 | | | | 0.42 | | | | 0.46 | | |
| Net realized and unrealized gain (loss) on investments | | $ | 0.06 | | | | (0.19 | ) | | | (0.31 | ) | | | 0.02 | | | | 0.49 | | | | (0.09 | ) | |
| Total from investment operations | | $ | 0.25 | | | | 0.21 | | | | 0.06 | | | | 0.34 | | | | 0.91 | | | | 0.37 | | |
| Less distributions from: | |
| Net investment income | | $ | 0.21 | | | | 0.43 | | | | 0.45 | | | | 0.43 | | | | 0.44 | | | | 0.47 | | |
| Total distributions | | $ | 0.21 | | | | 0.43 | | | | 0.45 | | | | 0.43 | | | | 0.44 | | | | 0.47 | | |
| Net asset value, end of period | | $ | 8.34 | | | | 8.30 | | | | 8.52 | | | | 8.91 | | | | 9.00 | | | | 8.53 | | |
| Total Return(1) | | % | 3.09 | | | | 2.50 | | | | 0.74 | | | | 3.88 | | | | 10.82 | | | | 4.38 | | |
| Ratios and Supplemental Data: | |
| Net assets, end of period (000's) | | $ | 503,588 | | | | 504,734 | | | | 521,688 | | | | 592,066 | | | | 666,433 | | | | 535,903 | | |
| Ratios to average net assets: | |
| Net expenses after expense reimbursement/recoupment(2)(3) | | % | 0.95 | | | | 0.98 | | | | 0.98 | | | | 1.04 | | | | 1.13 | | | | 1.22 | | |
| Gross expenses prior to expense reimbursement/recoupment(3) | | % | 0.97 | | | | 0.99 | | | | 0.98 | | | | 1.04 | | | | 1.13 | | | | 1.22 | | |
| Net investment income after expense reimbursement/recoupment(2)(3) | | % | 4.73 | | | | 4.70 | | | | 4.27 | | | | 3.57 | | | | 4.78 | | | | 5.32 | | |
| Portfolio turnover rate | | % | 54 | | | | 39 | | | | 40 | | | | 128 | | | | 75 | | | | 76 | | |
| | | Class B | |
| | | Six Months
Ended
September 30, | |
Year Ended March 31, | |
| | | 2006 | | 2006 | | 2005 | | 2004 | | 2003 | | 2002 | |
| Per Share Operating Performance: | |
| Net asset value, beginning of period | | $ | 8.26 | | | | 8.48 | | | | 8.87 | | | | 8.96 | | | | 8.50 | | | | 8.61 | | |
| Income (loss) from investment operations: | |
| Net investment income | | $ | 0.16 | | | | 0.33 | | | | 0.29 | | | | 0.25 | | | | 0.35 | | | | 0.39 | | |
| Net realized and unrealized gain (loss) on investments | | $ | 0.06 | | | | (0.18 | ) | | | (0.29 | ) | | | 0.02 | | | | 0.48 | | | | (0.09 | ) | |
| Total from investment operations | | $ | 0.22 | | | | 0.15 | | | | — | | | | 0.27 | | | | 0.83 | | | | 0.30 | | |
| Less distributions from: | |
| Net investment income | | $ | 0.18 | | | | 0.37 | | | | 0.39 | | | | 0.36 | | | | 0.37 | | | | 0.41 | | |
| Total distributions | | $ | 0.18 | | | | 0.37 | | | | 0.39 | | | | 0.36 | | | | 0.37 | | | | 0.41 | | |
| Net asset value, end of period | | $ | 8.30 | | | | 8.26 | | | | 8.48 | | | | 8.87 | | | | 8.96 | | | | 8.50 | | |
| Total Return(1) | | % | 2.73 | | | | 1.75 | | | | (0.02 | ) | | | 3.12 | | | | 9.95 | | | | 3.53 | | |
| Ratios and Supplemental Data: | |
| Net assets, end of period (000's) | | $ | 66,621 | | | | 78,823 | | | | 99,130 | | | | 130,339 | | | | 150,549 | | | | 79,302 | | |
| Ratios to average net assets: | |
| Net expenses after expense reimbursement/recoupment(2)(3) | | % | 1.70 | | | | 1.73 | | | | 1.73 | | | | 1.79 | | | | 1.88 | | | | 1.98 | | |
| Gross expenses prior to expense reimbursement/recoupment(3) | | % | 1.72 | | | | 1.74 | | | | 1.73 | | | | 1.79 | | | | 1.88 | | | | 1.98 | | |
| Net investment income after expense reimbursement/recoupment(2)(3) | | % | 3.98 | | | | 3.95 | | | | 3.52 | | | | 2.84 | | | | 3.98 | | | | 4.55 | | |
| Portfolio turnover rate | | % | 54 | | | | 39 | | | | 40 | | | | 128 | | | | 75 | | | | 76 | | |
(1) Total return is calculated assuming reinvestment of all dividends and capital gain distributions at net asset value and excluding the deduction of sales charges. Total return for less than one year is not annualized.
(2) The Investment Adviser has agreed to limit expenses (excluding interest, taxes, brokerage and extraordinary expenses) subject to possible recoupment by ING Investments, LLC within three years.
(3) Annualized for periods less than one year.
See Accompanying Notes to Financial Statements.
26
ING GNMA INCOME FUND (UNAUDITED) (CONTINUED)
FINANCIAL HIGHLIGHTS
Selected data for a share of beneficial interest outstanding throughout each period.
| | | Class C | |
| | | Six Months
Ended
September 30, | |
Year Ended March 31, | |
| | | 2006 | | 2006 | | 2005 | | 2004 | | 2003 | | 2002 | |
| Per Share Operating Performance: | |
| Net asset value, beginning of period | | $ | 8.27 | | | | 8.49 | | | | 8.88 | | | | 8.97 | | | | 8.51 | | | | 8.61 | | |
| Income (loss) from investment operations: | |
| Net investment income | | $ | 0.16 | | | | 0.33 | | | | 0.29 | | | | 0.25 | | | | 0.36 | | | | 0.40 | | |
| Net realized and unrealized gain (loss) on investments | | $ | 0.06 | | | | (0.18 | ) | | | (0.29 | ) | | | 0.02 | | | | 0.47 | | | | (0.09 | ) | |
| Total from investment operations | | $ | 0.22 | | | | 0.15 | | | | — | | | | 0.27 | | | | 0.83 | | | | 0.31 | | |
| Less distributions from: | |
| Net investment income | | $ | 0.18 | | | | 0.37 | | | | 0.39 | | | | 0.36 | | | | 0.37 | | | | 0.41 | | |
| Total distributions | | $ | 0.18 | | | | 0.37 | | | | 0.39 | | | | 0.36 | | | | 0.37 | | | | 0.41 | | |
| Net asset value, end of period | | $ | 8.31 | | | | 8.27 | | | | 8.49 | | | | 8.88 | | | | 8.97 | | | | 8.51 | | |
| Total Return(2) | | % | 2.73 | | | | 1.74 | | | | (0.03 | ) | | | 3.11 | | | | 9.95 | | | | 3.65 | | |
| Ratios and Supplemental Data: | |
| Net assets, end of period (000's) | | $ | 35,353 | | | | 34,997 | | | | 43,094 | | | | 65,762 | | | | 87,970 | | | | 37,193 | | |
| Ratios to average net assets: | |
| Net expenses after expense reimbursement/recoupment(3)(4) | | % | 1.70 | | | | 1.73 | | | | 1.73 | | | | 1.79 | | | | 1.88 | | | | 1.99 | | |
| Gross expenses prior to expense reimbursement/recoupment(4) | | % | 1.72 | | | | 1.74 | | | | 1.73 | | | | 1.79 | | | | 1.88 | | | | 1.99 | | |
| Net investment income after expense reimbursement/recoupment(3)(4) | | % | 3.98 | | | | 3.95 | | | | 3.51 | | | | 2.92 | | | | 3.97 | | | | 4.52 | | |
| Portfolio turnover rate | | % | 54 | | | | 39 | | | | 40 | | | | 128 | | | | 75 | | | | 76 | | |
| | | Class I | |
| | | Six Months
Ended
September 30, | |
Year Ended March 31, | | January 7,
2002(1) to
March 31, | |
| | | 2006 | | 2006 | | 2005 | | 2004 | | 2003 | | 2002 | |
| Per Share Operating Performance: | |
| Net asset value, beginning of period | | $ | 8.31 | | | | 8.53 | | | | 8.92 | | | | 9.01 | | | | 8.54 | | | | 8.61 | | |
| Income (loss) from investment operations: | |
| Net investment income | | $ | 0.21 | | | | 0.45 | | | | 0.41 | | | | 0.35 | | | | 0.44 | | | | 0.10 | | |
| Net realized and unrealized gain (loss) on investments | | $ | 0.05 | | | | (0.21 | ) | | | (0.32 | ) | | | 0.01 | | | | 0.50 | | | | (0.10 | ) | |
| Total from investment operations | | $ | 0.26 | | | | 0.24 | | | | 0.09 | | | | 0.36 | | | | 0.94 | | | | 0.00 | | |
| Less distributions from: | |
| Net investment income | | $ | 0.22 | | | | 0.46 | | | | 0.48 | | | | 0.45 | | | | 0.47 | | | | 0.07 | | |
| Total distributions | | $ | 0.22 | | | | 0.46 | | | | 0.48 | | | | 0.45 | | | | 0.47 | | | | 0.07 | | |
| Net asset value, end of period | | $ | 8.35 | | | | 8.31 | | | | 8.53 | | | | 8.92 | | | | 9.01 | | | | 8.54 | | |
| Total Return(2) | | % | 3.26 | | | | 2.82 | | | | 1.05 | | | | 4.21 | | | | 11.18 | | | | 0.04 | | |
| Ratios and Supplemental Data: | |
| Net assets, end of period (000's) | | $ | 17,909 | | | | 18,287 | | | | 10,539 | | | | 8,760 | | | | 6,946 | | | | 1,615 | | |
| Ratios to average net assets: | |
| Expenses(4) | | % | 0.65 | | | | 0.67 | | | | 0.68 | | | | 0.71 | | | | 0.78 | | | | 0.88 | | |
| Net investment income(4) | | % | 5.03 | | | | 4.96 | | | | 4.59 | | | | 3.94 | | | | 5.00 | | | | 5.83 | | |
| Portfolio turnover rate | | % | 54 | | | | 39 | | | | 40 | | | | 128 | | | | 75 | | | | 76 | | |
(1) Commencement of operations.
(2) Total return is calculated assuming reinvestment of all dividends and capital gain distributions at net asset value and excluding the deduction of sales charges. Total return for less than one year is not annualized.
(3) The Investment Adviser has agreed to limit expenses (excluding interest, taxes, brokerage and extraordinary expenses) subject to possible recoupment by ING Investments, LLC within three years.
(4) Annualized for periods less than one year.
See Accompanying Notes to Financial Statements.
27
ING GNMA INCOME FUND (UNAUDITED) (CONTINUED)
FINANCIAL HIGHLIGHTS
Selected data for a share of beneficial interest outstanding throughout each period.
| | | Class M | |
| | | Six Months
Ended
September 30, | |
Year Ended March 31, | |
| | | 2006 | | 2006 | | 2005 | | 2004 | | 2003 | | 2002 | |
| Per Share Operating Performance: | |
| Net asset value, beginning of period | | $ | 8.31 | | | | 8.54 | | | | 8.92 | | | | 9.01 | | | | 8.54 | | | | 8.63 | | |
| Income (loss) from investment operations: | |
| Net investment income | | $ | 0.18 | | | | 0.36 | | | | 0.33 | * | | | 0.31 | | | | 0.37 | | | | 0.41 | | |
| Net realized and unrealized gain (loss) on investments | | $ | 0.05 | | | | (0.20 | ) | | | (0.30 | ) | | | (0.02 | ) | | | 0.49 | | | | (0.07 | ) | |
| Total from investment operations | | $ | 0.23 | | | | 0.16 | | | | 0.03 | | | | 0.29 | | | | 0.86 | | | | 0.34 | | |
| Less distributions from: | |
| Net investment income | | $ | 0.19 | | | | 0.39 | | | | 0.41 | | | | 0.38 | | | | 0.39 | | | | 0.43 | | |
| Total distributions | | $ | 0.19 | | | | 0.39 | | | | 0.41 | | | | 0.38 | | | | 0.39 | | | | 0.43 | | |
| Net asset value, end of period | | $ | 8.35 | | | | 8.31 | | | | 8.54 | | | | 8.92 | | | | 9.01 | | | | 8.54 | | |
| Total Return(1) | | % | 2.81 | | | | 1.87 | | | | 0.33 | | | | 3.30 | | | | 10.29 | | | | 4.03 | | |
| Ratios and Supplemental Data: | |
| Net assets, end of period (000's) | | $ | 135 | | | | 194 | | | | 201 | | | | 312 | | | | 1,111 | | | | 495 | | |
| Ratios to average net assets: | |
| Net expenses after expense reimbursement/recoupment(2)(3)(4) | | % | 1.46 | | | | 1.49 | | | | 1.48 | | | | 1.54 | | | | 1.62 | | | | 1.73 | | |
| Gross expenses prior to expense reimbursement/recoupment(3)(4) | | % | 1.46 | | | | 1.74 | | | | 1.48 | | | | 1.54 | | | | 1.62 | | | | 1.73 | | |
| Net investment income after expense reimbursement/recoupment(2)(4) | | % | 4.21 | | | | 4.20 | | | | 3.76 | | | | 3.23 | | | | 4.19 | | | | 4.81 | | |
| Portfolio turnover rate | | % | 54 | | | | 39 | | | | 40 | | | | 128 | | | | 75 | | | | 76 | | |
| | | Class Q | |
| | | Six Months
Ended
September 30, | |
Year Ended March 31, | |
| | | 2006 | | 2006 | | 2005 | | 2004 | | 2003 | | 2002 | |
| Per Share Operating Performance: | |
| Net asset value, beginning of period | | $ | 8.32 | | | | 8.53 | | | | 8.92 | | | | 9.01 | | | | 8.54 | | | | 8.63 | | |
| Income (loss) from investment operations: | |
| Net investment income | | $ | 0.19 | | | | 0.40 | | | | 0.39 | | | | 0.32 | | | | 0.44 | | | | 0.39 | | |
| Net realized and unrealized gain (loss) on investments | | $ | 0.05 | | | | (0.18 | ) | | | (0.33 | ) | | | 0.02 | | | | 0.47 | | | | (0.01 | ) | |
| Total from investment operations | | $ | 0.24 | | | | 0.22 | | | | 0.06 | | | | 0.34 | | | | 0.91 | | | | 0.38 | | |
| Less distributions from: | |
| Net investment income | | $ | 0.21 | | | | 0.43 | | | | 0.45 | | | | 0.43 | | | | 0.44 | | | | 0.47 | | |
| Total distributions | | $ | 0.21 | | | | 0.43 | | | | 0.45 | | | | 0.43 | | | | 0.44 | | | | 0.47 | | |
| Net asset value, end of period | | $ | 8.35 | | | | 8.32 | | | | 8.53 | | | | 8.92 | | | | 9.01 | | | | 8.54 | | |
| Total Return(1) | | % | 3.00 | | | | 2.65 | | | | 0.76 | | | | 3.94 | | | | 10.90 | | | | 4.50 | | |
| Ratios and Supplemental Data: | |
| Net assets, end of period (000's) | | $ | 84 | | | | 82 | | | | 103 | | | | 134 | | | | 183 | | | | 204 | | |
| Ratios to average net assets: | |
| Expenses(4) | | % | 0.91 | | | | 0.92 | | | | 0.93 | | | | 0.96 | | | | 1.04 | | | | 1.12 | | |
| Net investment income(4) | | % | 4.77 | | | | 4.77 | | | | 4.32 | | | | 3.62 | | | | 4.89 | | | | 5.35 | | |
| Portfolio turnover rate | | % | 54 | | | | 39 | | | | 40 | | | | 128 | | | | 75 | | | | 76 | | |
(1) Total return is calculated assuming reinvestment of all dividends and capital gain distributions at net asset value and excluding the deduction of sales charges. Total return for less than one year is not annualized.
(2) The Investment Adviser has agreed to limit expenses (excluding interest, taxes, brokerage and extraordinary expenses) subject to possible recoupment by ING Investments, LLC within three years.
(3) During the year ended March 31, 2006, the Distributor voluntarily waived 0.25% of the Class M Distribution Fee.
(4) Annualized for periods less than one year.
* Per share numbers have been calculated using the average number of shares outstanding throughout the period.
See Accompanying Notes to Financial Statements.
28
ING HIGH YIELD BOND FUND (UNAUDITED)
FINANCIAL HIGHLIGHTS
Selected data for a share of beneficial interest outstanding throughout each period.
| | | Class A | |
| | | Six Months
Ended
September 30, | |
Year Ended March 31, | |
| | | 2006 | | 2006 | | 2005 | | 2004 | | 2003 | | 2002 | |
| Per Share Operating Performance: | |
| Net asset value, beginning of period | | $ | 8.71 | | | | 8.75 | | | | 8.88 | | | | 8.29 | | | | 8.74 | | | | 9.36 | | |
| Income (loss) from investment operations: | |
| Net investment income | | $ | 0.30 | | | | 0.55 | | | | 0.54 | | | | 0.59 | | | | 0.61 | | | | 0.78 | | |
| Net realized and unrealized gain (loss) on investments | | $ | (0.03 | ) | | | (0.04 | ) | | | (0.13 | ) | | | 0.60 | | | | (0.45 | ) | | | (0.62 | ) | |
| Total from investment operations | | $ | 0.27 | | | | 0.51 | | | | 0.41 | | | | 1.19 | | | | 0.16 | | | | 0.16 | | |
| Less distributions from: | |
| Net investment income | | $ | 0.29 | | | | 0.55 | | | | 0.54 | | | | 0.60 | | | | 0.61 | | | | 0.78 | | |
| Total distributions | | $ | 0.29 | | | | 0.55 | | | | 0.54 | | | | 0.60 | | | | 0.61 | | | | 0.78 | | |
| Net asset value, end of period | | $ | 8.69 | | | | 8.71 | | | | 8.75 | | | | 8.88 | | | | 8.29 | | | | 8.74 | | |
| Total Return(1) | | % | 3.19 | | | | 6.01 | | | | 4.73 | | | | 14.70 | | | | 2.24 | | | | 1.94 | | |
| Ratios and Supplemental Data: | |
| Net assets, end of period (000's) | | $ | 98,723 | | | | 99,178 | | | | 110,683 | | | | 44,009 | | | | 43,375 | | | | 38,525 | | |
| Ratios to average net assets: | |
| Net expenses after expense reimbursement/recoupment(2)(3) | | % | 1.10 | | | | 1.18 | | | | 1.22 | | | | 1.29 | | | | 1.30 | | | | 1.30 | | |
| Gross expenses prior to expense reimbursement/recoupment(3) | | % | 1.15 | | | | 1.31 | | | | 1.33 | | | | 1.33 | | | | 1.43 | | | | 1.79 | | |
Net investment income after expense
reimbursement/recoupment(2)(3) | | % | 6.90 | | | | 6.27 | | | | 6.12 | | | | 6.81 | | | | 7.48 | | | | 8.67 | | |
| Portfolio turnover rate | | % | 70 | | | | 111 | | | | 119 | | | | 105 | | | | 122 | | | | 344 | | |
| | | Class B | |
| | | Six Months
Ended
September 30, | | Year Ended March 31, | |
| | | 2006 | | 2006 | | 2005 | | 2004 | | 2003 | | 2002 | |
| Per Share Operating Performance: | |
| Net asset value, beginning of period | | $ | 8.70 | | | | 8.74 | | | | 8.88 | | | | 8.28 | | | | 8.74 | | | | 9.36 | | |
| Income (loss) from investment operations: | |
| Net investment income | | $ | 0.26 | | | | 0.47 | | | | 0.48 | | | | 0.53 | | | | 0.55 | | | | 0.72 | | |
| Net realized and unrealized gain (loss) on investments | | $ | (0.01 | ) | | | (0.03 | ) | | | (0.15 | ) | | | 0.60 | | | | (0.46 | ) | | | (0.62 | ) | |
| Total from investment operations | | $ | 0.25 | | | | 0.44 | | | | 0.33 | | | | 1.13 | | | | 0.09 | | | | 0.10 | | |
| Less distributions from: | |
| Net investment income | | $ | 0.26 | | | | 0.48 | | | | 0.47 | | | | 0.53 | | | | 0.55 | | | | 0.72 | | |
| Total distributions | | $ | 0.26 | | | | 0.48 | | | | 0.47 | | | | 0.53 | | | | 0.55 | | | | 0.72 | | |
| Net asset value, end of period | | $ | 8.69 | | | | 8.70 | | | | 8.74 | | | | 8.88 | | | | 8.28 | | | | 8.74 | | |
| Total Return(1) | | % | 2.92 | | | | 5.22 | | | | 3.83 | | | | 14.01 | | | | 1.37 | | | | 1.29 | | |
| Ratios and Supplemental Data: | |
| Net assets, end of period (000's) | | $ | 56,942 | | | | 75,940 | | | | 125,603 | | | | 18,753 | | | | 11,584 | | | | 6,673 | | |
| Ratios to average net assets: | |
| Net expenses after expense reimbursement/recoupment(2)(3) | | % | 1.85 | | | | 1.94 | | | | 1.97 | | | | 2.04 | | | | 2.05 | | | | 2.05 | | |
| Gross expenses prior to expense reimbursement/recoupment(3) | | % | 1.90 | | | | 1.98 | | | | 1.98 | | | | 1.98 | | | | 2.07 | | | | 2.44 | | |
Net investment income after expense
reimbursement/recoupment(2)(3) | | % | 6.13 | | | | 5.50 | | | | 5.39 | | | | 6.04 | | | | 6.73 | | | | 7.85 | | |
| Portfolio turnover rate | | % | 70 | | | | 111 | | | | 119 | | | | 105 | | | | 122 | | | | 344 | | |
(1) Total return is calculated assuming reinvestment of all dividends and capital gain distributions at net asset value and excluding the deduction of sales charges. Total return for less than one year is not annualized.
(2) The Investment Adviser has agreed to limit expenses (excluding interest, taxes, brokerage and extraordinary expenses) subject to possible recoupment by ING Investments, LLC within three years.
(3) Annualized for periods less than one year.
See Accompanying Notes to Financial Statements.
29
ING HIGH YIELD BOND FUND (UNAUDITED) (CONTINUED)
FINANCIAL HIGHLIGHTS
Selected data for a share of beneficial interest outstanding throughout each period.
| | | Class C | |
| | | Six Months
Ended
September 30, | | Year Ended March 31, | |
| | | 2006 | | 2006 | | 2005 | | 2004 | | 2003 | | 2002 | |
| Per Share Operating Performance: | |
| Net asset value, beginning of period | | $ | 8.71 | | | | 8.75 | | | | 8.88 | | | | 8.28 | | | | 8.74 | | | | 9.36 | | |
| Income (loss) from investment operations: | |
| Net investment income | | $ | 0.26 | | | | 0.48 | | | | 0.48 | | | | 0.53 | | | | 0.56 | | | | 0.71 | | |
| Net realized and unrealized gain (loss) on investments | | $ | (0.02 | ) | | | (0.03 | ) | | | (0.13 | ) | | | 0.60 | | | | (0.46 | ) | | | (0.61 | ) | |
| Total from investment operations | | $ | 0.24 | | | | 0.45 | | | | 0.35 | | | | 1.13 | | | | 0.10 | | | | 0.10 | | |
| Less distributions from: | |
| Net investment income | | $ | 0.26 | | | | 0.49 | | | | 0.48 | | | | 0.53 | | | | 0.56 | | | | 0.72 | | |
| Total distributions | | $ | 0.26 | | | | 0.49 | | | | 0.48 | | | | 0.53 | | | | 0.56 | | | | 0.72 | | |
| Net asset value, end of period | | $ | 8.69 | | | | 8.71 | | | | 8.75 | | | | 8.88 | | | | 8.28 | | | | 8.74 | | |
| Total Return(1) | | % | 2.80 | | | | 5.22 | | | | 3.96 | | | | 14.03 | | | | 1.43 | | | | 1.21 | | |
| Ratios and Supplemental Data: | |
| Net assets, end of period (000's) | | $ | 16,216 | | | | 17,555 | | | | 26,330 | | | | 10,780 | | | | 5,281 | | | | 1,633 | | |
| Ratios to average net assets: | |
| Net expenses after expense reimbursement/recoupment(2)(3) | | % | 1.85 | | | | 1.94 | | | | 1.97 | | | | 2.04 | | | | 2.04 | | | | 2.05 | | |
| Gross expenses prior to expense reimbursement/recoupment(3) | | % | 1.90 | | | | 1.98 | | | | 1.98 | | | | 1.98 | | | | 2.06 | | | | 2.44 | | |
Net investment income after expense
reimbursement/recoupment(2)(3) | | % | 6.15 | | | | 5.51 | | | | 5.37 | | | | 6.04 | | | | 6.72 | | | | 7.92 | | |
| Portfolio turnover rate | | % | 70 | | | | 111 | | | | 119 | | | | 105 | | | | 122 | | | | 344 | | |
(1) Total return is calculated assuming reinvestment of all dividends and capital gain distributions at net asset value and excluding the deduction of sales charges. Total return for less than one year is not annualized.
(2) The Investment Adviser has agreed to limit expenses, (excluding interest, taxes, brokerage and extraordinary expenses) subject to possible recoupment by ING Investments, LLC within three years
(3) Annualized for periods less than one year.
See Accompanying Notes to Financial Statements.
30
ING INTERMEDIATE BOND FUND (UNAUDITED)
FINANCIAL HIGHLIGHTS
Selected data for a share of beneficial interest outstanding throughout each period.
| | | Class A | |
| | | Six Months
Ended
September 30, | | Year Ended March 31, | |
| | | 2006 | | 2006 | | 2005 | | 2004 | | 2003 | | 2002 | |
| Per Share Operating Performance: | |
| Net asset value, beginning of period | | $ | 10.13 | | | | 10.32 | | | | 10.67 | | | | 10.51 | | | | 9.91 | | | | 10.18 | | |
| Income (loss) from investment operations: | |
| Net investment income | | $ | 0.25 | | | | 0.41 | | | | 0.32 | | | | 0.31 | | | | 0.35 | | | | 0.51 | | |
| Net realized and unrealized gain (loss) on investments | | $ | 0.06 | | | | (0.14 | ) | | | (0.17 | ) | | | 0.32 | | | | 0.77 | | | | 0.42 | | |
| Total from investment operations | | $ | 0.31 | | | | 0.27 | | | | 0.15 | | | | 0.63 | | | | 1.12 | | | | 0.93 | | |
| Less distributions from: | |
| Net investment income | | $ | 0.25 | | | | 0.42 | | | | 0.33 | | | | 0.33 | | | | 0.37 | | | | 0.53 | | |
| Net realized gain on investments | | $ | — | | | | 0.04 | | | | 0.17 | | | | 0.14 | | | | 0.15 | | | | 0.67 | | |
| Total distributions | | $ | 0.25 | | | | 0.46 | | | | 0.50 | | | | 0.47 | | | | 0.52 | | | | 1.20 | | |
| Net asset value, end of period | | $ | 10.19 | | | | 10.13 | | | | 10.32 | | | | 10.67 | | | | 10.51 | | | | 9.91 | | |
| Total Return(1) | | % | 3.12 | | | | 2.53 | | | | 1.52 | | | | 6.16 | | | | 11.48 | | | | 9.27 | | |
| Ratios and Supplemental Data: | |
| Net assets, end of period (000's) | | $ | 636,697 | | | | 572,196 | | | | 459,850 | | | | 268,086 | | | | 146,649 | | | | 41,503 | | |
| Ratios to average net assets: | |
| Net expenses after expense reimbursement(2)(3) | | % | 0.69 | | | | 0.93 | | | | 1.00 | | | | 1.10 | | | | 1.14 | | | | 1.15 | | |
| Gross expenses prior to expense reimbursement(3) | | % | 0.69 | | | | 1.02 | | | | 1.14 | | | | 1.18 | | | | 1.24 | | | | 1.36 | | |
| Net investment income after expense reimbursement(2)(3) | | % | 4.94 | | | | 3.92 | | | | 3.08 | | | | 2.91 | | | | 3.21 | | | | 4.93 | | |
| Portfolio turnover rate | | % | 190 | | | | 469 | | | | 417 | | | | 475 | | | | 639 | | | | 1,216 | * | |
| | | Class B | |
| | | Six Months
Ended
September 30, | | Year Ended March 31, | |
| | | 2006 | | 2006 | | 2005 | | 2004 | | 2003 | | 2002 | |
| Per Share Operating Performance: | |
| Net asset value, beginning of period | | $ | 10.11 | | | | 10.30 | | | | 10.65 | | | | 10.50 | | | | 9.90 | | | | 10.18 | | |
| Income (loss) from investment operations: | |
| Net investment income | | $ | 0.21 | | | | 0.32 | | | | 0.24 | | | | 0.23 | | | | 0.28 | | | | 0.44 | | |
| Net realized and unrealized gain (loss) on investments | | $ | 0.06 | | | | (0.13 | ) | | | (0.17 | ) | | | 0.31 | | | | 0.76 | | | | 0.40 | | |
| Total from investment operations | | $ | 0.27 | | | | 0.19 | | | | 0.07 | | | | 0.54 | | | | 1.04 | | | | 0.84 | | |
| Less distributions from: | |
| Net investment income | | $ | 0.21 | | | | 0.34 | | | | 0.25 | | | | 0.25 | | | | 0.29 | | | | 0.45 | | |
| Net realized gain on investments | | $ | — | | | | 0.04 | | | | 0.17 | | | | 0.14 | | | | 0.15 | | | | 0.67 | | |
| Total distributions | | $ | 0.21 | | | | 0.38 | | | | 0.42 | | | | 0.39 | | | | 0.44 | | | | 1.12 | | |
| Net asset value, end of period | | $ | 10.17 | | | | 10.11 | | | | 10.30 | | | | 10.65 | | | | 10.50 | | | | 9.90 | | |
| Total Return(1) | | % | 2.72 | | | | 1.76 | | | | 0.75 | | | | 5.28 | | | | 10.64 | | | | 8.37 | | |
| Ratios and Supplemental Data: | |
| Net assets, end of period (000's) | | $ | 54,484 | | | | 60,526 | | | | 64,779 | | | | 67,402 | | | | 61,544 | | | | 11,216 | | |
| Ratios to average net assets: | |
| Net expenses after expense reimbursement/recoupment(2)(3) | | % | 1.44 | | | | 1.69 | | | | 1.75 | | | | 1.85 | | | | 1.89 | | | | 1.90 | | |
| Gross expenses prior to expense reimbursement/recoupment(3) | | % | 1.44 | | | | 1.70 | | | | 1.79 | | | | 1.83 | | | | 1.89 | | | | 2.01 | | |
| Net investment income after expense | | | | | | | | | | | | | | | | | | | | | | | | | |
| reimbursement/recoupment(2)(3) | | % | 4.18 | | | | 3.14 | | | | 2.31 | | | | 2.16 | | | | 2.39 | | | | 4.09 | | |
| Portfolio turnover rate | | % | 190 | | | | 469 | | | | 417 | | | | 475 | | | | 639 | | | | 1,216 | * | |
(1) Total return is calculated assuming reinvestment of all dividends and capital gain distributions at net asset value and excluding the deduction of sales charges. Total return for less than one year is not annualized.
(2) The Investment Adviser has agreed to limit expenses, (excluding interest, taxes, brokerage and extraordinary expenses) subject to possible recoupment by ING Investments, LLC within three years.
(3) Annualized for periods less than one year.
* Portfolio turnover was greater than expected during this period due to active trading undertaken in response to market conditions that existed at that time.
See Accompanying Notes to Financial Statements.
31
ING INTERMEDIATE BOND FUND (UNAUDITED) (CONTINUED)
FINANCIAL HIGHLIGHTS
Selected data for a share of beneficial interest outstanding throughout each period.
| | | Class C | |
| | | Six Months
Ended
September 30, | | Year Ended March 31, | |
| | | 2006 | | 2006 | | 2005 | | 2004 | | 2003 | | 2002 | |
| Per Share Operating Performance: | |
| Net asset value, beginning of period | | $ | 10.12 | | | | 10.31 | | | | 10.65 | | | | 10.50 | | | | 9.90 | | | | 10.19 | | |
| Income (loss) from investment operations: | |
| Net investment income | | $ | 0.21 | | | | 0.33 | | | | 0.24 | | | | 0.23 | | | | 0.28 | | | | 0.44 | | |
| Net realized and unrealized gain (loss) on investments | | $ | 0.06 | | | | (0.14 | ) | | | (0.16 | ) | | | 0.31 | | | | 0.76 | | | | 0.39 | | |
| Total from investment operations | | $ | 0.27 | | | | 0.19 | | | | 0.08 | | | | 0.54 | | | | 1.04 | | | | 0.83 | | |
| Less distributions from: | |
| Net investment income | | $ | 0.21 | | | | 0.34 | | | | 0.25 | | | | 0.25 | | | | 0.29 | | | | 0.45 | | |
| Net realized gain on investments | | $ | — | | | | 0.04 | | | | 0.17 | | | | 0.14 | | | | 0.15 | | | | 0.67 | | |
| Total distributions | | $ | 0.21 | | | | 0.38 | | | | 0.42 | | | | 0.39 | | | | 0.44 | | | | 1.12 | | |
| Net asset value, end of period | | $ | 10.18 | | | | 10.12 | | | | 10.31 | | | | 10.65 | | | | 10.50 | | | | 9.90 | | |
| Total Return(2) | | % | 2.73 | | | | 1.77 | | | | 0.86 | | | | 5.28 | | | | 10.68 | | | | 8.24 | | |
| Ratios and Supplemental Data: | |
| Net assets, end of period (000's) | | $ | 74,423 | | | | 73,281 | | | | 71,648 | | | | 71,228 | | | | 52,979 | | | | 6,382 | | |
| Ratios to average net assets: | |
| Net expenses after expense reimbursement/recoupment(3)(4) | | % | 1.44 | | | | 1.69 | | | | 1.75 | | | | 1.85 | | | | 1.90 | | | | 1.90 | | |
| Gross expenses prior to expense reimbursement/recoupment(3) | | % | 1.44 | | | | 1.70 | | | | 1.79 | | | | 1.83 | | | | 1.90 | | | | 2.01 | | |
| Net investment income after expense reimbursement/recoupment(3)(4) | | % | 4.19 | | | | 3.15 | | | | 2.31 | | | | 2.16 | | | | 2.36 | | | | 4.20 | | |
| Portfolio turnover rate | | % | 190 | | | | 469 | | | | 417 | | | | 475 | | | | 639 | | | | 1,216 | * | |
| | | Class I | |
| | | Six Months
Ended
September 30, | | Year Ended March 31, | | January 8,
2002(1) to
March 31, | |
| | | 2006 | | 2006 | | 2005 | | 2004 | | 2003 | | 2002 | |
| Per Share Operating Performance: | |
| Net asset value, beginning of period | | $ | 10.14 | | | | 10.32 | | | | 10.67 | | | | 10.51 | | | | 9.91 | | | | 9.99 | | |
| Income (loss) from investment operations: | |
| Net investment income | | $ | 0.27 | | | | 0.44 | | | | 0.36 | ** | | | 0.35 | | | | 0.39 | | | | 0.11 | | |
| Net realized and unrealized gain (loss) on investments | | $ | 0.05 | | | | (0.13 | ) | | | (0.17 | ) | | | 0.33 | | | | 0.76 | | | | (0.07 | ) | |
| Total from investment operations | | $ | 0.32 | | | | 0.31 | | | | 0.19 | | | | 0.68 | | | | 1.15 | | | | 0.04 | | |
| Less distributions from: | |
| Net investment income | | $ | 0.27 | | | | 0.45 | | | | 0.37 | | | | 0.38 | | | | 0.40 | | | | 0.12 | | |
| Net realized gain on investments | | $ | — | | | | 0.04 | | | | 0.17 | | | | 0.14 | | | | 0.15 | | | | — | | |
| Total distributions | | $ | 0.27 | | | | 0.49 | | | | 0.54 | | | | 0.52 | | | | 0.55 | | | | 0.12 | | |
| Net asset value, end of period | | $ | 10.19 | | | | 10.14 | | | | 10.32 | | | | 10.67 | | | | 10.51 | | | | 9.91 | | |
| Total Return(2) | | % | 3.17 | | | | 2.94 | | | | 1.85 | | | | 6.60 | | | | 11.88 | | | | 0.36 | | |
| Ratios and Supplemental Data: | |
| Net assets, end of period (000's) | | $ | 194,187 | | | | 179,582 | | | | 43,808 | | | | 14,548 | | | | 15,046 | | | | 9,800 | | |
| Ratios to average net assets: | |
| Net expenses after expense reimbursement/recoupment(3)(4) | | % | 0.38 | | | | 0.60 | | | | 0.68 | | | | 0.71 | | | | 0.73 | | | | 0.82 | | |
| Gross expenses prior to expense reimbursement/recoupment(3) | | % | 0.38 | | | | 0.61 | | | | 0.72 | | | | 0.68 | | | | 0.73 | | | | 0.90 | | |
Net investment income after expense
reimbursement/recoupment(3)(4) | | % | 5.25 | | | | 4.40 | | | | 3.43 | | | | 3.30 | | | | 3.70 | | | | 0.05 | | |
| Portfolio turnover rate | | % | 190 | | | | 469 | | | | 417 | | | | 475 | | | | 639 | | | | 1,216 | * | |
(1) Commencement of operations.
(2) Total return is calculated assuming reinvestment of all dividends and capital gain distributions at net asset value and excluding the deduction of sales charges. Total return for less than one year is not annualized.
(3) Annualized for periods less than one year.
(4) The Investment Adviser has agreed to limit expenses, (excluding interest, taxes, brokerage and extraordinary expenses) subject to possible recoupment by ING Investments, LLC within three years.
* Portfolio turnover was greater than expected during this period due to active trading undertaken in response to market conditions that existed at that time.
** Per share data calculated using the average number of shares outstanding throughout the period.
See Accompanying Notes to Financial Statements.
32
ING INTERMEDIATE BOND FUND (UNAUDITED) (CONTINUED)
FINANCIAL HIGHLIGHTS
Selected data for a share of beneficial interest outstanding throughout each period.
| | | Class O | | Class R | |
| | | Six Months
Ended
September 30, | | Year
Ended
March 31, | | August 13,
2004(1) to
March 31, | | Six Months
Ended
September 30, | | Year Ended March 31, | | March 16,
2004(1) to
March 31, | |
| | | 2006 | | 2006 | | 2005 | | 2006 | | 2006 | | 2005 | | 2004 | |
| Per Share Operating Performance: | |
| Net asset value, beginning of period | | $ | 10.14 | | | | 10.32 | | | | 10.41 | | | | 10.15 | | | | 10.34 | | | | 10.67 | | | | 10.71 | | |
Income (loss) from investment
operations: | |
| Net investment income | | $ | 0.25 | | | | 0.40 | | | | 0.21 | | | | 0.24 | | | | 0.38 | | | | 0.33 | | | | 0.01 | | |
Net realized and unrealized gain
(loss) on investments | | $ | 0.05 | | | | (0.13 | ) | | | (0.04 | ) | | | 0.06 | | | | (0.14 | ) | | | (0.16 | ) | | | (0.05 | ) | |
| Total from investment operations | | $ | 0.30 | | | | 0.27 | | | | 0.17 | | | | 0.30 | | | | 0.24 | | | | 0.17 | | | | 0.04 | | |
| Less distributions from: | |
| Net investment income | | $ | 0.25 | | | | 0.41 | | | | 0.22 | | | | 0.24 | | | | 0.39 | | | | 0.33 | | | | — | | |
Net realized and unrealized gain
on investments | | $ | — | | | | 0.04 | | | | 0.04 | | | | — | | | | 0.04 | | | | 0.17 | | | | — | | |
| Total distributions | | $ | 0.25 | | | | 0.45 | | | | 0.26 | | | | 0.24 | | | | 0.43 | | | | 0.50 | | | | — | | |
| Net asset value, end of period | | $ | 10.19 | | | | 10.14 | | | | 10.32 | | | | 10.21 | | | | 10.15 | | | | 10.34 | | | | 10.67 | | |
| Total Return(2) | | % | 3.01 | | | | 2.58 | | | | 1.61 | | | | 2.98 | | | | 2.26 | | | | 1.64 | | | | (0.37 | ) | |
| Ratios and Supplemental Data: | |
| Net assets, end of period (000's) | | $ | 49,651 | | | | 43,171 | | | | 33,997 | | | | 891 | | | | 799 | | | | 313 | | | | 1 | | |
| Ratos to average net assets: | |
Net Expenses after expense
reimbursement(3)(4) | | % | 0.69 | | | | 0.94 | | | | 0.96 | | | | 0.94 | | | | 1.16 | | | | 1.17 | | | | 1.25 | | |
Gross Expenses prior to expense
reimbursement(3) | | % | 0.69 | | | | 0.95 | | | | 1.00 | | | | 0.94 | | | | 1.17 | | | | 1.21 | | | | 1.25 | | |
Net investment income after
expense reimbursement(3)(4) | | | %4.94 | | | | 3.91 | | | | 3.19 | | | | 4.69 | | | | 3.79 | | | | 2.96 | | | | 3.20 | | |
| Portfolio turnover rate | | % | 190 | | | | 469 | | | | 417 | | | | 190 | | | | 469 | | | | 417 | | | | 475 | | |
(1) Commencement of operations.
(2) Total return is calculated assuming reinvestment of all dividends and capital gain distributions at net asset value. Total return for less than one year is not annualized. Total return for less than one year is not annualized.
(3) Annualized for periods less than one year.
(4) The Investment Adviser has agreed to limit expenses, (excluding interest, taxes, brokerage and extraordinary expenses) subject to possible recoupment by ING Investments, LLC within three years.
See Accompanying Notes to Financial Statements.
33
ING NATIONAL TAX-EXEMPT BOND FUND (UNAUDITED)
FINANCIAL HIGHLIGHTS
Selected data for a share of beneficial interest outstanding throughout each period.
| | | Class A | |
| | | Six Months
Ended
September 30, | | Year Ended March 31, | |
| | | 2006 | | 2006 | | 2005 | | 2004 | | 2003 | | 2002 | |
| Per Share Operating Performance: | |
| Net asset value, beginning of period | | $ | 10.28 | | | | 10.50 | | | | 10.78 | | | | 10.87 | | | | 10.32 | | | | 10.50 | | |
| Income (loss) from investment operations: | |
| Net investment income | | $ | 0.20 | | | | 0.37 | | | | 0.34 | | | | 0.35 | | | | 0.39 | | | | 0.41 | | |
| Net realized and unrealized gain (loss) on investments | | $ | 0.11 | | | | (0.11 | ) | | | (0.21 | ) | | | 0.12 | | | | 0.67 | | | | (0.18 | ) | |
| Total from investment operations | | $ | 0.31 | | | | 0.26 | | | | 0.13 | | | | 0.47 | | | | 1.06 | | | | 0.23 | | |
| Less distributions from: | |
| Net investment income | | $ | 0.20 | | | | 0.37 | | | | 0.34 | | | | 0.35 | | | | 0.39 | | | | 0.41 | | |
| Net realized gain on investments | | $ | — | | | | 0.11 | | | | 0.07 | | | | 0.21 | | | | 0.12 | | | | — | | |
| Total distributions | | $ | 0.20 | | | | 0.48 | | | | 0.41 | | | | 0.56 | | | | 0.51 | | | | 0.41 | | |
| Net asset value, end of period | | $ | 10.39 | | | | 10.28 | | | | 10.50 | | | | 10.78 | | | | 10.87 | | | | 10.32 | | |
| Total Return(1) | | % | 3.10 | | | | 2.55 | | | | 1.19 | | | | 4.41 | | | | 10.44 | | | | 2.25 | | |
| Ratios and Supplemental Data: | |
| Net assets, end of period (000's) | | $ | 22,416 | | | | 22,864 | | | | 23,296 | | | | 24,082 | | | | 23,647 | | | | 22,868 | | |
| Ratios to average net assets: | |
| Net expenses after expense reimbursement/recoupment(2)(3) | | % | 0.87 | | | | 1.06 | | | | 1.10 | | | | 1.15 | | | | 1.15 | | | | 1.10 | | |
| Gross expenses prior to expense reimbursement/recoupment(3) | | % | 0.93 | | | | 1.13 | | | | 1.13 | | | | 1.27 | | | | 1.28 | | | | 1.52 | | |
Net investment income after expense
reimbursement/recoupment(2)(3) | | % | 3.98 | | | | 3.55 | | | | 3.19 | | | | 3.23 | | | | 3.64 | | | | 3.97 | | |
| Portfolio turnover rate | | % | 29 | | | | 32 | | | | 22 | | | | 31 | | | | 22 | | | | 27 | | |
| | | Class B | |
| | | Six Months
Ended
September 30, | | Year Ended March 31, | |
| | | 2006 | | 2006 | | 2005 | | 2004 | | 2003 | | 2002 | |
| Per Share Operating Performance: | |
| Net asset value, beginning of period | | $ | 10.27 | | | | 10.50 | | | | 10.77 | | | | 10.86 | | | | 10.31 | | | | 10.48 | | |
| Income (loss) from investment operations: | |
| Net investment income | | $ | 0.17 | | | | 0.29 | | | | 0.26 | | | | 0.27 | | | | 0.31 | | | | 0.34 | | |
| Net realized and unrealized gain (loss) on investments | | $ | 0.11 | | | | (0.12 | ) | | | (0.20 | ) | | | 0.12 | | | | 0.67 | | | | (0.17 | ) | |
| Total from investment operations | | $ | 0.28 | | | | 0.17 | | | | 0.06 | | | | 0.39 | | | | 0.98 | | | | 0.17 | | |
| Less distributions from: | |
| Net investment income | | $ | 0.17 | | | | 0.29 | | | | 0.26 | | | | 0.27 | | | | 0.31 | | | | 0.34 | | |
| Net realized gain on investments | | $ | — | | | | 0.11 | | | | 0.07 | | | | 0.21 | | | | 0.12 | | | | — | | |
| Total distributions | | $ | 0.17 | | | | 0.40 | | | | 0.33 | | | | 0.48 | | | | 0.43 | | | | 0.34 | | |
| Net asset value, end of period | | $ | 10.38 | | | | 10.27 | | | | 10.50 | | | | 10.77 | | | | 10.86 | | | | 10.31 | | |
| Total Return(1) | | % | 2.72 | | | | 1.68 | | | | 0.54 | | | | 3.63 | | | | 9.65 | | | | 1.59 | | |
| Ratios and Supplemental Data: | |
| Net assets, end of period (000's) | | $ | 2,844 | | | | 3,032 | | | | 3,041 | | | | 2,643 | | | | 2,792 | | | | 1,265 | | |
| Ratios to average net assets: | |
| Net expenses after expense reimbursement/recoupment(2)(3) | | % | 1.62 | | | | 1.81 | | | | 1.85 | | | | 1.90 | | | | 1.90 | | | | 1.84 | | |
| Gross expenses prior to expense reimbursement/recoupment(3) | | % | 1.68 | | | | 1.78 | | | | 1.78 | | | | 1.92 | | | | 1.94 | | | | 2.16 | | |
Net investment income after expense
reimbursement/recoupment(2)(3) | | % | 3.23 | | | | 2.79 | | | | 2.44 | | | | 2.48 | | | | 2.86 | | | | 3.22 | | |
| Portfolio turnover rate | | % | 29 | | | | 32 | | | | 22 | | | | 31 | | | | 22 | | | | 27 | | |
(1) Total return is calculated assuming reinvestment of all dividends and capital gain distributions at net asset value and excluding the deduction of sales charges. Total return for less than one year is not annualized.
(2) The Investment Adviser has agreed to limit expenses, (excluding interest, taxes, brokerage and extraordinary expenses) subject to possible recoupment by ING Investments, LLC within three years.
(3) Annualized for periods less than one year.
See Accompanying Notes to Financial Statements.
34
ING NATIONAL TAX-EXEMPT BOND FUND (UNAUDITED) (CONTINUED)
FINANCIAL
HIGHLIGHTS
Selected data for a share of beneficial interest outstanding throughout each period.
| | | Class C | |
| | | Six Months
Ended
September 30, | | Year Ended March 31, | |
| | | 2006 | | 2006 | | 2005 | | 2004 | | 2003 | | 2002 | |
| Per Share Operating Performance: | |
| Net asset value, beginning of period | | $ | 10.28 | | | | 10.50 | | | | 10.78 | | | | 10.87 | | | | 10.33 | | | | 10.49 | | |
| Income (loss) from investment operations: | |
| Net investment income | | $ | 0.17 | | | | 0.29 | | | | 0.26 | | | | 0.27 | | | | 0.31 | | | | 0.34 | | |
| Net realized and unrealized gain (loss) on investments | | $ | 0.11 | | | | (0.11 | ) | | | (0.21 | ) | | | 0.12 | | | | 0.66 | | | | (0.16 | ) | |
| Total from investment operations | | $ | 0.28 | | | | 0.18 | | | | 0.05 | | | | 0.39 | | | | 0.97 | | | | 0.18 | | |
| Less distributions from: | |
| Net investment income | | $ | 0.17 | | | | 0.29 | | | | 0.26 | | | | 0.27 | | | | 0.31 | | | | 0.34 | | |
| Net realized gains on investments | | $ | — | | | | 0.11 | | | | 0.07 | | | | 0.21 | | | | 0.12 | | | | — | | |
| Total distributions | | $ | 0.17 | | | | 0.40 | | | | 0.33 | | | | 0.48 | | | | 0.43 | | | | 0.34 | | |
| Net asset value, end of period | | $ | 10.39 | | | | 10.28 | | | | 10.50 | | | | 10.78 | | | | 10.87 | | | | 10.33 | | |
| Total Return(1) | | % | 2.71 | | | | 1.77 | | | | 0.49 | | | | 3.63 | | | | 9.56 | | | | 1.69 | | |
| Ratios and Supplemental Data: | |
| Net assets, end of period (000's) | | $ | 1,628 | | | | 1,665 | | | | 1,806 | | | | 1,104 | | | | 1,065 | | | | 271 | | |
| Ratios to average net assets: | |
| Net expenses after expense reimbursement/recoupment(2)(3) | | % | 1.62 | | | | 1.81 | | | | 1.85 | | | | 1.90 | | | | 1.90 | | | | 1.83 | | |
| Gross expenses prior to expense reimbursement/recoupment(3) | | % | 1.68 | | | | 1.80 | | | | 1.78 | | | | 1.92 | | | | 1.94 | | | | 2.18 | | |
| Net investment income after expense reimbursement/recoupment(2)(3) | | % | 3.23 | | | | 2.80 | | | | 2.44 | | | | 2.49 | | | | 2.84 | | | | 3.21 | | |
| Portfolio turnover rate | | % | 29 | | | | 32 | | | | 22 | | | | 31 | | | | 22 | | | | 27 | | |
(1) Total return is calculated assuming reinvestment of all dividends and capital gain distributions at net asset value and excluding the deduction of sales charges. Total return for less than one year is not annualized.
(2) The Investment Adviser has agreed to limit expenses, (excluding interest, taxes, brokerage and extraordinary expenses) subject to possible recoupment by ING Investments, LLC within three years.
(3) Annualized for periods less than one year.
See Accompanying Notes to Financial Statements.
35
ING CLASSIC MONEY MARKET FUND (UNAUDITED)
FINANCIAL HIGHLIGHTS
Selected data for a share of beneficial interest outstanding throughout each period.
| | | Class A | |
| | | Six Months
Ended
September 30, | | Year Ended March 31, | |
| | | 2006 | | 2006 | | 2005 | | 2004 | | 2003 | | 2002 | |
| Per Share Operating Performance: | |
| Net asset value, beginning of period | | $ | 1.00 | | | | 1.00 | | | | 1.00 | | | | 1.00 | | | | 1.00 | | | | 1.00 | | |
| Income from investment operations: | |
| Net investment income | | $ | 0.02 | | | | 0.03 | | | | 0.01 | | | | 0.00 | * | | | 0.01 | | | | 0.03 | | |
| Total from investment operations | | $ | 0.02 | | | | 0.03 | | | | 0.01 | | | | 0.00 | * | | | 0.01 | | | | 0.03 | | |
| Less distributions from: | |
| Net investment income | | $ | 0.02 | | | | 0.03 | | | | 0.01 | | | | 0.00 | * | | | 0.01 | | | | 0.03 | | |
| Total distributions | | $ | 0.02 | | | | 0.03 | | | | 0.01 | | | | 0.00 | * | | | 0.01 | | | | 0.03 | | |
| Net asset value, end of period | | $ | 1.00 | | | | 1.00 | | | | 1.00 | | | | 1.00 | | | | 1.00 | | | | 1.00 | | |
| Total Return(1) | | % | 2.25 | | | | 3.07 | | | | 1.02 | | | | 0.44 | | | | 1.06 | | | | 2.83 | | |
| Ratios and Supplemental Data: | |
| Net assets, end of period (000's) | | $ | 747,942 | | | | 656,731 | | | | 550,091 | | | | 398,997 | | | | 458,964 | | | | 549,999 | | |
| Ratios to average net assets: | |
| Net expenses after expense reimbursement(2)(3) | | % | 0.77 | | | | 0.77 | | | | 0.77 | | | | 0.77 | | | | 0.77 | | | | 0.77 | | |
| Gross expenses prior to expense reimbursement(3) | | % | 1.11 | | | | 1.10 | | | | 1.08 | | | | 1.16 | | | | 1.27 | | | | 1.27 | | |
| Net investment income after expense reimbursement(2)(3) | | % | 4.46 | | | | 3.07 | | | | 1.06 | | | | 0.44 | | | | 1.06 | | | | 2.75 | | |
| | | Class B | |
| | | Six Months
Ended
September 30, | | Year Ended March 31, | |
| | | 2006 | | 2006 | | 2005 | | 2004 | | 2003 | | 2002 | |
| Per Share Operating Performance: | |
| Net asset value, beginning of period | | $ | 1.00 | | | | 1.00 | | | | 1.00 | | | | 1.00 | | | | 1.00 | | | | 1.00 | | |
| Income from investment operations: | |
| Net investment income | | $ | 0.02 | | | | 0.02 | | | | 0.01 | | | | 0.00 | * | | | 0.00 | * | | | 0.02 | | |
| Total from investment operations | | $ | 0.02 | | | | 0.02 | | | | 0.01 | | | | 0.00 | * | | | 0.00 | * | | | 0.02 | | |
| Less distributions from: | |
| Net investment income | | $ | 0.02 | | | | 0.02 | | | | 0.01 | | | | 0.00 | * | | | 0.00 | * | | | 0.02 | | |
| Total distributions | | $ | 0.02 | | | | 0.02 | | | | 0.01 | | | | 0.00 | * | | | 0.00 | * | | | 0.02 | | |
| Net asset value, end of period | | $ | 1.00 | | | | 1.00 | | | | 1.00 | | | | 1.00 | | | | 1.00 | | | | 1.00 | | |
| Total Return(1) | | % | 1.94 | | | | 2.46 | | | | 0.57 | | | | 0.15 | | | | 0.43 | | | | 2.21 | | |
| Ratios and Supplemental Data: | |
| Net assets, end of period (000's) | | $ | 24,679 | | | | 23,995 | | | | 26,941 | | | | 816 | | | | 1,156 | | | | 1,987 | | |
| Ratios to average net assets: | |
| Net expenses after expense reimbursement(2)(3) | | % | 1.36 | | | | 1.34 | | | | 1.33 | | | | 1.07 | | | | 1.40 | | | | 1.37 | | |
| Gross expenses prior to expense reimbursement(3) | | % | 1.36 | | | | 1.34 | | | | 1.33 | | | | 1.41 | | | | 1.52 | | | | 1.53 | | |
| Net investment income after expense reimbursement(2)(3) | | % | 3.86 | | | | 2.43 | | | | 0.94 | | | | 0.15 | | | | 0.46 | | | | 2.27 | | |
(1) Total return is calculated assuming reinvestment of all dividends and capital gain distributions at net asset value. Total return for less than one year is not annualized.
(2) The Investment Adviser has agreed to limit expenses, (excluding interest, taxes, brokerage and extraordinary expenses) subject to possible recoupment by ING Investments, LLC within three years.
(3) Annualized for periods less than one year.
* Amount is less than $0.01 per share.
See Accompanying Notes to Financial Statements.
36
ING CLASSIC MONEY MARKET FUND (UNAUDITED) (CONTINUED)
FINANCIAL
HIGHLIGHTS
Selected data for a share of beneficial interest outstanding throughout each period.
| | | Class C | |
| | | Six Months
Ended
September 30, | | Year Ended March 31, | |
| | | 2006 | | 2006 | | 2005 | | 2004 | | 2003 | | 2002 | |
| Per Share Operating Performance: | |
| Net asset value, beginning of period | | $ | 1.00 | | | | 1.00 | | | | 1.00 | | | | 1.00 | | | | 1.00 | | | | 1.00 | | |
| Income from investment operations: | |
| Net investment income | | $ | 0.02 | | | | 0.02 | | | | 0.01 | | | | 0.00 | * | | | 0.00 | * | | | 0.02 | | |
| Total from investment operations | | $ | 0.02 | | | | 0.02 | | | | 0.01 | | | | 0.00 | * | | | 0.00 | * | | | 0.02 | | |
| Less distributions from: | |
| Net investment income | | $ | 0.02 | | | | 0.02 | | | | 0.01 | | | | 0.00 | * | | | 0.00 | * | | | 0.02 | | |
| Total distributions | | $ | 0.02 | | | | 0.02 | | | | 0.01 | | | | 0.00 | * | | | 0.00 | * | | | 0.02 | | |
| Net asset value, end of period | | $ | 1.00 | | | | 1.00 | | | | 1.00 | | | | 1.00 | | | | 1.00 | | | | 1.00 | | |
| Total Return(1) | | % | 1.94 | | | | 2.46 | | | | 0.58 | | | | 0.14 | | | | 0.42 | | | | 2.20 | | |
| Ratios and Supplemental Data: | |
| Net assets, end of period (000's) | | $ | 6,530 | | | | 4,868 | | | | 3,932 | | | | 546 | | | | 524 | | | | 590 | | |
| Ratios to average net assets: | |
| Net expenses after expense reimbursement(2)(3) | | % | 1.36 | | | | 1.34 | | | | 1.33 | | | | 1.07 | | | | 1.40 | | | | 1.38 | | |
| Gross expenses prior to expense reimbursement(3) | | % | 1.36 | | | | 1.34 | | | | 1.33 | | | | 1.41 | | | | 1.52 | | | | 1.53 | | |
| Net investment income after expense reimbursement(2)(3) | | % | 3.87 | | | | 2.47 | | | | 0.78 | | | | 0.15 | | | | 0.42 | | | | 2.44 | | |
(1) Total return is calculated assuming reinvestment of all dividends and capital gain distributions at net asset value. Total return for less than one year is not annualized.
(2) The Investment Adviser has agreed to limit expenses, (excluding interest, taxes, brokerage and extraordinary expenses) subject to possible recoupment by ING Investments, LLC within three years.
(3) Annualized for periods less than one year.
* Amount is less than $0.01 per share.
See Accompanying Notes to Financial Statements.
37
ING INSTITUTIONAL PRIME MONEY MARKET FUND (UNAUDITED)
FINANCIAL
HIGHLIGHTS
Selected data for a share of beneficial interest outstanding throughout each period.
| | | Six Months
Ended
September 30,
2006 | | July 28,
2005(1) to
March 31,
2006 | |
| Per Share Operating Performance: | |
| Net asset value, beginning of period | | $ | 1.00 | | | | 1.00 | | |
| Income from investment operations: | |
| Net investment income | | $ | 0.03 | | | | 0.03 | | |
| Total from investment operations | | $ | 0.03 | | | | 0.03 | | |
| Less distributions from: | |
| Net investment income | | $ | 0.03 | | | | 0.03 | | |
| Total distributions | | $ | 0.03 | | | | 0.03 | | |
| Net asset value, end of period | | $ | 1.00 | | | | 1.00 | | |
| Total Return(2) | | % | 2.55 | | | | 2.70 | | |
| Ratios and Supplemental Data: | |
| Net assets, end of period (000's) | | $ | 141,086 | | | | 179,659 | | |
| Ratios to average net assets: | |
| Net expenses after expense reimbursement/recoupment(3)(4) | | % | 0.17 | | | | 0.17 | | |
| Gross expenses prior to expense reimbursement/recoupment(3) | | % | 0.24 | | | | 0.19 | | |
| Net investment income after expense reimbursement(3)(4) | | % | 5.01 | | | | 4.14 | | |
(1) Commencement of operations.
(2) Total return is calculated assuming reinvestment of all dividends and capital gain distributions at net asset value. Total return for less than one year is not annualized.
(3) Annualized for periods less than one year.
(4) The Investment Adviser has agreed to limit expenses, (excluding interest taxes, brokerage and extraordinary expenses) subject to possible recoupment by ING Investments, LLC within three years.
See Accompanying Notes to Financial Statements.
38
NOTES TO FINANCIAL STATEMENTS AS OF SEPTEMBER 30, 2006 (UNAUDITED)
NOTE 1 — ORGANIZATION
Organization. ING Funds Trust ("Trust") is a Delaware statutory trust and is registered as an open-end management investment company under the Investment Company Act of 1940, as amended ("1940 Act"). The Trust was organized on August 6, 1998 and was established under a Trust Instrument dated July 30, 1998. It consists of six separately managed series: ING GNMA Income Fund ("GNMA Income"), ING High Yield Bond Fund ("High Yield Bond"), ING Intermediate Bond Fund ("Intermediate Bond"), ING National Tax-Exempt Bond Fund ("National Tax-Exempt Bond"), ING Classic Money Market Fund ("Classic Money Market") and ING Institutional Prime Money Market Fund ("Institutional Money Market") (Each, a "Fund" and collectively, the "Funds").
The investment objective of each Fund is described in each Fund's prospectus.
Each Fund, except Institutional Money Market, offers at least three of the following classes of shares: Class A, Class B, Class C, Class I, Class M, Class O, Class Q and Class R. The separate classes of shares differ principally in the applicable sales charges (if any), transfer agent fees, distribution fees and shareholder servicing fees. Shareholders of each class also bear certain expenses that pertain to that particular class. All shareholders bear the common expenses of a Fund and earn income and realized gains/losses from the portfolio pro rata based on the average daily net assets of each class, without distinction between share classes. Differences in per share dividend rates generally result from the differences in separate class expenses, including distribution, and shareholder servicing fees. Class B shares, along with their pro rata reinvested dividend shares, automatically convert to Class A shares approximately eight years afte r purchase.
Effective September 29, 2006, Class M shares of GNMA Income are closed to new investment, provided that (1) Class M shares of GNMA Income may be purchased through the reinvestment of dividends issued by GNMA Income; and (2) subject to the terms and conditions of relevant exchange privileges and as permitted under its respective prospectus, Class M shares of GNMA Income may be acquired through exchange of Class M shares of other funds in the ING mutual funds complex.
Effective July 31, 2006, Class B shares of the Funds (except Classic Money Market) are closed to new investment, provided that (1) Class B shares of the Funds may be purchased through the reinvestment of dividends issued by Class B shares of a Fund; and (2) subject to the terms and conditions of relevant exchange privileges and as permitted under their respective prospectuses, Class B shares of the Funds may be acquired through exchange of Class B shares of other funds in the ING mutual funds complex.
Effective July 31, 2006, the maximum Class A sales charge for GNMA Income, High Yield Bond, Intermediate Bond and National Tax-Exempt Bond has been lowered to 2.50%. Return calculations with a starting date prior to July 31, 2006 are based on a 4.75% sales charge, while returns with a starting date on or after July 31, 2006 are based on a 2.50% sales charge.
NOTE 2 — SIGNIFICANT ACCOUNTING POLICIES
The following significant accounting policies are consistently followed by the Funds in the preparation of their financial statements, and such policies are in conformity with U.S. generally accepted accounting principles for investment companies.
A. Security Valuation. Investments in equity securities traded on a national securities exchange are valued at the last reported sale price. Securities reported by NASDAQ will be valued at the NASDAQ official closing prices. Securities traded on an exchange or NASDAQ for which there has been no sale and securities traded in the over-the-counter-market are valued at the mean between the last reported bid and ask prices. All investments quoted in foreign currencies will be valued daily in U.S. dollars on the basis of the foreign currency exchange rates prevailing at that time. Debt securities are valued at prices obtained from independent services or from one or more dealers making markets in the securities and may be adjusted based on the Funds' valuation procedures. U.S. government obligations are valued by using market quotations or independent pricing services that use prices provided by marketmakers or estimates of market values obtained from yield data relating to instruments or securities with similar characteristics.
Securities and assets for which market quotations are not readily available (which may include certain restricted securities which are subject to limitations as to their sale) are valued at their fair values as determined in good faith by or under the supervision of the Funds' Board of Trustees ("Board"), in accordance with methods that are specifically authorized by the Board. Securities traded on exchanges, including foreign exchanges, which close earlier than the time that a Fund calculates its net asset value ("NAV") may also be valued at their fair values as determined in good faith by or under the supervision of a Fund's Board, in accordance with methods that are specifically authorized by the Board. If an event
39
NOTES TO FINANCIAL STATEMENTS AS OF SEPTEMBER 30, 2006 (UNAUDITED) (CONTINUED)
NOTE 2 — SIGNIFICANT ACCOUNTING POLICIES (continued)
occurs after the time at which the market for foreign securities held by the Fund closes but before the time that the Fund's NAV is calculated, such event may cause the closing price on the foreign exchange to not represent a readily available reliable market value quotation for such securities at the time the Fund determines its NAV. In such a case, the Fund will use the fair value of such securities as determined under the Fund's valuation procedures. Events after the close of trading on a foreign market that could require the Fund to fair value some or all of its foreign securities include, among others, securities trading in the U.S. and other markets, corporate announcements, natural and other disasters, and political and other events. Among other elements of analysis in the determination of a security's fair value, the Board has authorized the use of one or more independent research services to assist with such determinations. An indep endent research service may use statistical analyses and quantitative models to help determine fair value as of the time a Fund calculates its NAV. There can be no assurance that such models accurately reflect the behavior of the applicable markets or the effect of the behavior of such markets on the fair value of securities, or that such markets will continue to behave in a fashion that is consistent with such models. Unlike the closing price of a security on an exchange, fair value determinations employ elements of judgment. Consequently, the fair value assigned to a security may not represent the actual value that a Fund could obtain if it were to sell the security at the time of the close of the NYSE. Pursuant to procedures adopted by the Board, a Fund is not obligated to use the fair valuations suggested by any research service, and valuation recommendations provided by such research services may be overridden if other events have occurred or if other fair valuations are determined in good faith to be m ore accurate. Unless an event is such that it causes a Fund to determine that the closing prices for one or more securities do not represent readily available reliable market value quotations at the time a Fund determines its NAV, events that occur between the time of the close of the foreign market on which they are traded and the close of regular trading on the NYSE will not be reflected in a Fund's NAV. Investments in securities maturing in 60 days or less from the date of acquisition are valued at amortized cost, which, when combined with accrued interest, approximates market value.
Classic Money Market and Institutional Money Market use the amortized cost method to value their portfolios securities, which approximates market value. The amortized cost method involves valuing a security at its cost and amortizing any discount or premium over the period until maturity regardless of the impact of fluctuating interest rates or the market value of the security.
B. Security Transactions and Revenue Recognition. Securities transactions are accounted for on the trade date. Realized gains and losses are reported on the basis of identified cost of securities sold. Interest income is recorded on an accrual basis. Dividend income is recorded on the ex-dividend date, or for certain foreign securities, when the information becomes available to the Funds. Premium amortization and discount accretion are determined by the effective yield method.
C. Foreign Currency Translation. The books and records of the Funds are maintained in U.S. dollars. Any foreign currency amounts are translated into U.S. dollars on the following basis:
(1) Market value of investment securities, other assets and liabilities — at the exchange rates prevailing at the end of the day.
(2) Purchases and sales of investment securities, income and expenses — at the rates of exchange prevailing on the respective dates of such transactions.
Although the net assets and the market values are presented at the foreign exchange rates at the end of the day, the Funds do not isolate the portion of the results of operations resulting from changes in foreign exchange rates on investments from the fluctuations arising from changes in market prices of securities held. Such fluctuations are included with the net realized and unrealized gains or losses from investments. For securities that are subject to foreign withholding tax upon disposition, liabilities are recorded on the Statements of Assets and Liabilities for the estimated tax withholding based on the securities' current market values. Upon disposition, realized gains or losses on such securities are recorded net of foreign withholding tax.
Reported net realized foreign exchange gains or losses arise from sales of foreign currencies, currency gains or losses realized between the trade and settlement dates on securities transactions, the difference between the amounts of dividends, interest, and foreign withholding
40
NOTES TO FINANCIAL STATEMENTS AS OF SEPTEMBER 30, 2006 (UNAUDITED) (CONTINUED)
NOTE 2 — SIGNIFICANT ACCOUNTING POLICIES (continued)
taxes recorded on the Funds' books, and the U.S. dollar equivalent of the amounts actually received or paid. Net unrealized foreign exchange gains and losses arise from changes in the value of assets and liabilities other than investments in securities at fiscal year end, resulting from changes in the exchange rate. Foreign security and currency transactions may involve certain considerations and risks not typically associated with investing in U.S. companies and U.S. government securities. These risks include, but are not limited to revaluation of currencies and future adverse political and economic developments which could cause securities and their markets to be less liquid and prices more volatile than those of comparable U.S. companies and U.S. government securities.
D. Foreign Currency Transactions and Futures Contracts. High Yield Bond, Intermediate Bond and National Tax-Exempt Bond may enter into foreign currency exchange transactions to convert to and from different foreign currencies and to and from the U.S. dollar in connection with the planned purchases or sales of securities. The Funds either enter into these transactions on a spot basis at the spot rate prevailing in the foreign currency exchange market or use forward foreign currency contracts to purchase or sell foreign currencies. When the contract is fulfilled or closed, gains or losses are realized. Until then, the gain or loss is included in unrealized appreciation or depreciation. Risks may arise upon entering into forward contracts from the potential inability of counterparties to meet the terms of their forward contracts and from unanticipated movements in the value of foreign currencies relative to the U.S. dollar.
High Yield Bond, Intermediate Bond and Institutional Money Market may enter into futures contracts involving foreign currency, interest rates, securities and securities indices. A futures contract obligates the seller of the contract to deliver and the purchaser of the contract to take delivery of the type of foreign currency, financial instrument or security called for in the contract at a specified future time for a specified price. Upon entering into such a contract, a Fund is required to deposit and maintain as collateral such initial margin as required by the exchange on which the contract is traded. Pursuant to the contract, a Fund agrees to receive from or pay to the broker an amount equal to the daily fluctuations in the value of the contract. Such receipts or payments are known as variation margins and are recorded as unrealized gains or losses by the Fund. When the contract is closed, the Fund records a realized gain or loss equal to the difference between the value of the contract at the time it was opened and the value at the time it was closed.
E. Distributions to Shareholders. The Funds record distributions to their shareholders on the ex-dividend date. All Funds, with the exception of GNMA Income, declare dividends daily and pay dividends monthly. GNMA Income declares and pays dividends monthly. The Funds may make distributions on a more frequent basis to comply with the distribution requirements of the Internal Revenue Code. The characteristics of income and gains to be distributed are determined in accordance with income tax regulations, which may differ from U.S. generally accepted accounting principles for investment companies.
F. Federal Income Taxes. It is the policy of the Funds to comply with Subchapter M of the Internal Revenue Code and related excise tax provisions applicable to regulated investment companies and to distribute substantially all of their net investment income and any net realized capital gains to their shareholders. Therefore, no federal income tax provision is required. No capital gain distributions shall be made until any capital loss carryforwards have been fully utilized or expire.
G. Use of Estimates. Management of the Funds has made certain estimates and assumptions relating to the reporting of assets, liabilities, income, and expenses to prepare these financial statements in conformity with U.S. generally accepted accounting principles for investment companies. Actual results could differ from these estimates.
H. Repurchase Agreements. Each Fund may invest in repurchase agreements only with government securities dealers recognized by the Board of Governors of the Federal Reserve System. Under such agreements, the seller of the security agrees to repurchase it at a mutually agreed upon time and price. The resale price is in excess of the purchase price and reflects an agreed upon interest rate for the period of time the agreement is outstanding. The period of the repurchase agreements is usually short, from overnight to one week, while the underlying securities generally have longer maturities. Each Fund will receive as collateral securities acceptable to it whose market value is equal to at least 100% of the carrying amount of the repurchase agreements, plus accrued interest, being invest ed by the Fund. The underlying collateral is valued daily on a mark to
41
NOTES TO FINANCIAL STATEMENTS AS OF SEPTEMBER 30, 2006 (UNAUDITED) (CONTINUED)
NOTE 2 — SIGNIFICANT ACCOUNTING POLICIES (continued)
market basis to assure that the value, including accrued interest is at least equal to the repurchase price. There would be potential loss to the Fund in the event the Fund is delayed or prevented from exercising its right to dispose of the collateral, and it may incur disposition costs in liquidating the collateral.
I. Securities Lending. Each Fund (except GNMA Income) has the option to temporarily loan up to 30% of its total assets to brokers, dealers or other financial institutions in exchange for a negotiated lender's fee. The borrower is required to fully collateralize the loans with cash or U.S. government securities. Generally, in the event of counterparty default, the Fund has the right to use collateral to offset losses incurred. There would be potential loss to the Fund in the event the Fund is delayed or prevented from exercising its right to dispose of the collateral. The Fund bears the risk of loss with respect to the investment of collateral. Engaging in securities lending could have a leveraging effect, which may intensify the credit, market and other risks associated with investi ng in a Fund.
J. Organization Expenses and Offering Costs. Costs incurred with the organization of the Funds were expensed as incurred. Costs incurred with the offering of shares of the Funds are deferred and amortized over a twelve-month period starting on the first day of the Guarantee Period on a straight-line basis.
K. Illiquid and Restricted Securities. GNMA Income may not invest in illiquid securities. Classic Money Market and Institutional Money Market Funds may not invest more than 10% of their net assets in illiquid securities and all other Funds may not invest more than 15% of their net assets in illiquid securities. Illiquid securities are not readily marketable. Disposing of illiquid investments may involve time-consuming negotiation and legal expenses, and it may be difficult or impossible for the Funds to sell them promptly at an acceptable price. Restricted securities are those sold under Rule 144A of the Securities Act of 1933 ("1933 Act") or are securities offered pursuant to Section 4(2) of the 1933 Act, and are subject to legal or contractual restrictions on resale and may not be publicly sold without registration under the 1933 Act. Certain restricted securities may be considered liquid pursuant to procedures adopted by the Board or may be deemed illiquid because they may not be readily marketable. With the exception to the Classic Money Market and Institutional Money Market Funds, illiquid and restricted securities are valued using market quotations when readily available. In the absence of market quotations, the securities are valued based upon their fair value determined under procedures approved by the Board.
L. Delayed Delivery Transaction. The Funds may purchase or sell securities on a when-issued or a delayed delivery basis. Each Fund (except GNMA Income) may enter into forward commitments. The price of the underlying securities and date when the securities will be delivered and paid for are fixed at the time the transaction is negotiated. The market value of such is identified in the Funds' Portfolio of Investments. Losses may arise due to changes in the market value of the securities or from the inability of counterparties to meet the terms of the contract. In connection with such purchases, the Funds are required to hold liquid assets as collateral with the Funds' custodian sufficient to cover the purchase price.
M. Mortgage Dollar Roll Transactions. Each Fund (except National Tax-Exempt Bond, Classic Money Market and Institutional Money Market) may engage in dollar roll transactions with respect to mortgage-backed securities issued by Government National Mortgage Association, Federal National Mortgage Association and Federal Home Loan Mortgage Corp. In a dollar roll transaction, a Fund sells a mortgage-backed security to a financial institution, such as a bank or broker/dealer, and simultaneously agrees to repurchase a substantially similar (i.e., same type, coupon, and maturity) security from the institution on a delayed delivery basis at an agreed upon price. The mortgage-backed securities that are repurchased will bear the same interest rate as those sold, but generally will be collatera lized by different pools of mortgages with different prepayment histories. The Funds account for dollar roll transactions as purchases and sales.
N. Options Contracts. High Yield Bond and Intermediate Bond may purchase put and call options and may write (sell) put options and covered call options. The Funds may engage in option transactions as a hedge against adverse movements in the value of portfolio holdings or to increase market exposure. Option contracts are valued daily and unrealized gains or losses are recorded based upon the last sales price on the principal exchange on which the options are traded. The Funds will realize a gain or loss upon the expiration or closing of the option contract. When an option is exercised, the proceeds on sales
42
NOTES TO FINANCIAL STATEMENTS AS OF SEPTEMBER 30, 2006 (UNAUDITED) (CONTINUED)
NOTE 2 — SIGNIFICANT ACCOUNTING POLICIES (continued)
of the underlying security for a written call option, the purchase cost of the security for a written put option, or the cost of the security for a purchased put or call option is adjusted by the amount of premium received or paid. Realized and unrealized gains or losses on option contracts are reflected in the accompanying financial statements. The risk in writing a call option is that the Funds give up the opportunity for profit if the market price of the security increases and the option is exercised. The risk in writing a put option is that the Funds may incur a loss if the market price of the security decreases and the option is exercised. The risk in buying an option is that the Funds pay a premium whether or not the option is exercised. Risks may also arise from an illiquid secondary market or from the inability of counterparties to meet the terms of the contract.
O. Construction Loan Securities. GNMA Income may purchase construction loan securities, which are issued to finance building costs. The funds are disbursed as needed or in accordance with a prearranged plan. The securities provide for the timely payment to the registered holder of interest at the specified rate plus scheduled installments of principal. Upon completion of the construction phase, the construction loan securities are terminated and project loan securities are issued. It is the Fund's policy to record these GNMA certificates on trade date, and to segregate assets to cover its commitments on trade date as well.
NOTE 3 — INVESTMENT TRANSACTIONS
For the six months ended September 30, 2006, the cost of purchases and proceeds from the sales of securities, excluding short-term securities, were as follows:
| | | Purchases | | Sales | |
| GNMA Income | | $ | — | | | $ | 5,062 | | |
| High Yield Bond | | | 121,544,882 | | | | 135,043,210 | | |
| Intermediate Bond | | | 421,647,989 | | | | 344,413,475 | | |
| National Tax-Exempt Bond | | | 7,625,756 | | | | 9,331,883 | | |
U.S. Government securities not included above were as follows:
| | | Purchases | | Sales | |
| GNMA Income | | $ | 303,275,440 | | | $ | 316,561,291 | | |
| Intermediate Bond | | | 1,586,736,580 | | | | 1,618,332,204 | | |
NOTE 4 — INVESTMENT MANAGEMENT AND ADMINISTRATIVE FEES
ING Investments, LLC ("ING Investments" or the "Investment Adviser"), an Arizona limited liability company, serves as the investment adviser to the Funds. The Investment Adviser serves pursuant to an investment management agreement ("Management Agreement") between the Investment Adviser and the Trust, on behalf of the Funds.
The Management Agreement compensates the Investment Adviser with a fee, computed daily and payable monthly, based on the average daily net assets of each Fund, at the following annual rates:
For GNMA Income — 0.47% on first $1 billion, 0.40% on next $4 billion and 0.35% on assets thereafter; for High Yield Bond — 0.51% on first $1 billion, 0.45% on next $4 billion and 0.40% on assets thereafter; for Intermediate Bond — 0.17%; for National Tax-Exempt Bond — 0.30%; for Classic Money Market — 0.25%; and for Institutional Money Market — 0.08%.
ING Investment Management Co. ("ING IM"), a Connecticut corporation, serves as the sub-adviser to the Funds. The Investment Adviser has entered into a sub-advisory agreement with ING IM. Subject to such policies as the Board or the Investment Adviser may determine, ING IM manages the Funds' assets in accordance with the Funds' investment objectives, policies, and limitations.
ING Funds Services, LLC ("IFS"), acts as administrator and provides certain administrative and shareholder services necessary for Fund operations and is responsible for the supervision of other service providers. For its services, IFS is entitled to receive from each Fund, with the exception of Classic Money Market and Institutional Money Market, a fee at an annual rate of 0.10% of its average daily net assets.
ING Funds Distributor, LLC ("Distributor") is the principal underwriter of the Funds. The Distributor, IFS, ING Investments and ING IM are indirect, wholly-owned subsidiaries of ING Groep N.V. ("ING Groep"). ING Groep is one of the largest financial service organizations in the world, and offers an array of banking, insurance and asset management services to both individual and institutional investors.
NOTE 5 — DISTRIBUTION AND SERVICE FEES
Each share class of the Funds (except Class I and as otherwise noted below) has adopted a Distribution and/or Service Plan pursuant to Rule 12b-1 under the 1940 Act (the "12b-1 Plans"), whereby the Distributor is reimbursed or compensated (depending on the class of shares) by certain of the Funds for expenses incurred in the distribution of each Fund's shares ("Distribution Fees"). Pursuant to the 12b-1 Plans, the Distributor is entitled to payment each month for expenses incurred in the distribution and promotion of certain of each Fund's shares, including expenses incurred in printing
43
NOTES TO FINANCIAL STATEMENTS AS OF SEPTEMBER 30, 2006 (UNAUDITED) (CONTINUED)
NOTE 5 — DISTRIBUTION AND SERVICE FEES (continued)
prospectuses and reports used for sales purposes, expenses incurred in preparing and printing sales literature and other such distribution related expenses, including any distribution or shareholder servicing fees ("Service Fees") paid to securities dealers who have executed a distribution agreement with the Distributor. Under the 12b-1 Plans, each class of shares of the Fund pays the Distributor a Distribution and/or Service Fee based on average daily net assets at the following annual rates:
| | | Class A | | Class B | | Class C | | Class M | | Class O | | Class Q | | Class R | |
| GNMA Income | | | 0.25 | % | | | 1.00 | % | | | 1.00 | % | | | 0.75 | % | | N/A | | | 0.25 | % | | N/A | |
High Yield
Bond | | | 0.25 | % | | | 1.00 | % | | | 1.00 | % | | N/A | | N/A | | N/A | | N/A | |
Intermediate
Bond | | | 0.25 | % | | | 1.00 | % | | | 1.00 | % | | N/A | | | 0.25 | % | | N/A | | | 0.50 | % | |
National
Tax-Exempt
Bond | | | 0.25 | % | | | 1.00 | % | | | 1.00 | % | | N/A | | N/A | | N/A | | N/A | |
Classic Money
Market(1) | | | 0.75 | % | | | 1.00 | % | | | 1.00 | % | | N/A | | N/A | | N/A | | N/A | |
Institutional
Money
Market | | | N/A | | | | N/A | | | | N/A | | | N/A | | N/A | | N/A | | N/A | |
(1) The Distributor has contractually agreed to waive a portion of the distribution fee for Class A of Classic Money Market to the extent necessary for expenses not to exceed 0.77%. The fee waiver will continue through August 1, 2007.
During the six months ended September 30, 2006, the Distributor waived $54,011, $7,484, and $3,560 of the Class A, Class B, and Class C Distribution Fee, respectively, for GNMA Income.
During the six months ended September 30, 2006, the Distributor voluntarily waived $1,214,814 of the Class A Distribution and Service Fees for Classic Money Market.
The Distributor also receives the proceeds of initial sales charge paid by shareholders upon the purchase of Class A and Class M shares, and the contingent deferred sales charge paid by shareholders upon certain redemptions for Class A, Class B, and Class C shares. For the six months ended September 30, 2006, the Distributor retained the following amounts in sales charges:
| | | Class A
Shares | | Class B
Shares | | Class C
Shares | | Class M
Shares | |
| Initial Sales Charges | | | | | | | | | | | | | | | |
| GNMA Income | | $ | 10,973 | | | N/A | | | N/A | | | | — | | |
| High Yield Bond | | | 2,123 | | | N/A | | | N/A | | | | — | | |
| Intermediate Bond | | | 23,286 | | | N/A | | | N/A | | | | — | | |
| National Tax-Exempt Bond | | | 1,785 | | | N/A | | | N/A | | | | — | | |
| Contingent Deferred Sales Charge | | | | | | | | | | | | | | | |
| GNMA Income | | | 4,772 | | | N/A | | | 2,735 | | | | N/A | | |
| High Yield Bond | | | 1,164 | | | N/A | | | 513 | | | | N/A | | |
| Intermediate Bond | | | 56,204 | | | N/A | | | 4,852 | | | | N/A | | |
| Classic Money Market | | | — | | | N/A | | | 685 | | | | N/A | | |
NOTE 6 — OTHER TRANSACTIONS WITH AFFILIATES AND RELATED PARTIES
At September 30, 2006, the Funds had the following amounts recorded in payable to affiliates on the accompanying Statements of Assets and Liabilities (see Notes 4 and 5):
| | | Accrued
Investment
Management
Fees | | Accrued
Administrative
Fees | | Accrued
Shareholder
Services and
Distribution
Fees | | Accrued
Reimbursement
Expense | | Total | |
| GNMA Income | | $ | 240,036 | | | $ | 51,071 | | | $ | 166,514 | | | $ | 14,558 | | | $ | 472,179 | | |
High Yield
Bond | | | 72,316 | | | | 14,180 | | | | 80,946 | | | | — | | | | 167,442 | | |
Intermediate
Bond | | | 139,860 | | | | 82,271 | | | | 245,836 | | | | 5,256 | | | | 473,223 | | |
National
Tax-Exempt
Bond | | | 6,590 | | | | 2,197 | | | | 8,197 | | | | — | | | | 16,984 | | |
Classic Money
Market | | | 157,846 | | | | — | | | | 272,942 | | | | — | | | | 430,788 | | |
Institutional
Money
Market | | | 10,692 | | | | — | | | | — | | | | 9,811 | | | | 10,692 | | |
At September 30, 2006, the following indirect, wholly-owned subsidiaries of ING Groep owned more than 5% of the following Funds:
ING Clarion
Partners, LLC
| |
-
| |
Institutional Money
Market (10.4%). | |
|
ING Life Insurance and
Annuity Company
| |
-
| |
GNMA Income (15.6%);
Intermediate Bond (19.7%);
and National Tax
Exempt Bond (73.3%). | |
|
ING National Trust
| | -
| | GNMA Income (6.5%);
and Intermediate
Bond (15.6%). | |
|
ING USA Annuity and
Life Insurance Company
| |
-
| |
Institutional Money
Market (7.4%). | |
|
PrimeVest Financial
Services, Inc.
| |
-
| |
Institutional Money
Market (7.1%). | |
|
Security Life of
Denver Insurance
Company
| |
-
| |
Institutional Money
Market (35.5%). | |
|
Each Fund has adopted a Retirement Policy covering all independent trustees of the Fund who will have served as an independent trustee for at least five years at the time of retirement. Benefits under this plan are based on an annual rate as defined in the plan agreement.
44
NOTES TO FINANCIAL STATEMENTS AS OF SEPTEMBER 30, 2006 (UNAUDITED) (CONTINUED)
NOTE 7 — OTHER ACCRUED EXPENSES & LIABILITIES
At September 30, 2006, the funds had the following payables included in Other Accrued Expenses and Liabilities on the Statements of Assets and Liabilities that exceeded 5% of total liabilities:
| | | Accrued
Custody Fees | |
| Institutional Money Market | | $ | 25,136 | | |
| | | Accrued
Prepaid
Offering
Fees | |
| Institutional Money Market | | $ | 17,533 | | |
| | | Postage
Fees | |
| National Tax-Exempt Bond | | $ | 7,110 | | |
NOTE 8 — EXPENSE LIMITATIONS
Pursuant to an written expense limitation agreement ("Expense Limitation Agreement"), the Investment Adviser has agreed to limit expenses, excluding interest, taxes, brokerage and extraordinary expenses to the following annual expenses to average daily net assets ratios:
| | | Class A | | Class B | | Class C | | Class I | | Class M | | Class O | | Class Q | | Class R | |
GNMA(1)
Income | | | 0.97 | % | | | 1.72 | % | | | 1.72 | % | | | 0.67 | % | | | 1.47 | % | | N/A | | | 0.92 | % | | N/A | |
High Yield
Bond | | | 1.10 | % | | | 1.85 | % | | | 1.85 | % | | N/A | | N/A | | N/A | | N/A | | N/A | |
Intermediate
Bond | | | 0.69 | % | | | 1.44 | % | | | 1.44 | % | | | 0.38 | % | | N/A | | | 0.69 | % | | N/A | | | 0.94 | % | |
National
Tax-
Exempt
Bond | | | 0.87 | % | | | 1.62 | % | | | 1.62 | % | | N/A | | N/A | | N/A | | N/A | | N/A | |
Classic
Money
Market | | | 0.77 | % | | | 1.41 | % | | | 1.41 | % | | N/A | | N/A | | N/A | | N/A | | N/A | |
(1) Effective December 5, 2005, the Distributor has waived 0.02% of the distribution fee for GNMA Income Class A, Class B, and Class C. This waiver expires August 1, 2006.
The Investment Adviser has agreed to limit expenses, excluding interest, taxes, brokerage, and extraordinary expenses to 0.17% of Institutional Money Market's average daily net assets.
Prior to January 20, 2006, the expense limits for GNMA Income, High Yield Bond, Intermediate Bond and National Tax-Exempt Bond were as follows:
| | | Class A | | Class B | | Class C | | Class I | | Class M | | Class O | | Class Q | | Class R | |
GNMA
Income | | | 1.29 | % | | | 2.04 | % | | | 2.04 | % | | | 1.04 | % | | | 1.79 | % | | N/A | | | 1.29 | % | | N/A | |
High Yield
Bond | | | 1.20 | % | | | 1.95 | % | | | 1.95 | % | | N/A | | N/A | | N/A | | N/A | | N/A | |
Intermediate
Bond | | | 1.00 | % | | | 1.75 | % | | | 1.75 | % | | | 0.75 | % | | N/A | | | 1.00 | % | | N/A | | | 1.25 | % | |
National
Tax-
Exempt
Bond | | | 1.15 | % | | | 1.90 | % | | | 1.90 | % | | N/A | | N/A | | N/A | | N/A | | N/A | |
The Investment Adviser may at a later date recoup from a Fund for management fees waived and other expenses assumed by the Investment Adviser during the previous 36 months, but only if, after such recoupment, a Fund's expense ratio does not exceed the percentage described above. Waived and reimbursed fees net of any recoupment by the Investment Adviser of such waived and reimbursed fees are reflected on the accompanying Statements of Operations for each Fund. Amounts payable by the Investment Adviser are reflected on the accompanying Statements of Assets and Liabilities for each Fund.
As of September 30, 2006, the amounts of waived and reimbursed fees that are subject to possible recoupment by the Investment Adviser, and the related expiration dates are as follows:
| | | September 30, | | | |
| | | 2007 | | 2008 | | 2009 | | Total | |
| High Yield Bond | | $ | — | | | $ | 52,417 | | | $ | 95,199 | | | $ | 147,616 | | |
| Intermediate Bond | | | 13,680 | | | | 220,012 | | | | 77,333 | | | | 311,025 | | |
National Tax-Exempt
Bond | | | — | | | | 1,111 | | | | 11,392 | | | | 12,503 | | |
| Institutional Money Market | | | — | | | | — | | | | 62,384 | | | | 62,384 | | |
The Expense Limitation Agreement is contractual and shall renew automatically for one-year terms unless ING Investments provides written notice of the termination of the Expense Limitation Agreement within 90 days of the end of the then current term.
NOTE 9 — LINE OF CREDIT
All of the Funds included in this report with the exception of GNMA Income, in addition to certain other funds managed by the Investment Adviser, have entered into an unsecured committed revolving line of credit agreement (the "Credit Agreement") with The Bank of New York for an aggregate amount of $125,000,000. The proceeds may be used only to: (1) temporarily finance the purchase and sale of securities; (2) finance the redemption of shares of an investor in the Funds; and (3) enable the Funds to meet other emergency expenses as defined in the Credit Agreement. The Funds to which the line of credit is available pay a commitment fee equal to 0.09% per annum on the daily unused portion of the committed line amount payable quarterly in arrears.
The following Funds utilized the line of credit during the six months ended September 30, 2006:
| Fund | | Days
Utilized | | Approximate
Average Daily
Balance
For Days
Utilized | | Approximate
Weighted
Average
Interest Rate
For Days
Utilized | |
| High Yield Bond(1) | | | 16 | | | $ | 825,625 | | | | 5.67 | % | |
| National Tax-Exempt Bond | | | 3 | | | | 500,000 | | | | 5.72 | | |
(1) At September 30, 2006, High Yield Bond had an outstanding balance of $200,000.
45
NOTES TO FINANCIAL STATEMENTS AS OF SEPTEMBER 30, 2006 (UNAUDITED) (CONTINUED)
NOTE 10 — CAPITAL SHARES
Transactions in capital shares and dollars were as follows:
| | | Class A | | Class B | | Class C | |
| | | Six Months
Ended
September 30,
2006 | | Year
Ended
March 31,
2006 | | Six Months
Ended
September 30,
2006 | | Year
Ended
March 31,
2006 | | Six Months
Ended
September 30,
2006 | | Year
Ended
March 31,
2006 | |
| GNMA Income (Number of Shares) | |
| Shares sold | | | 5,445,658 | | | | 10,066,265 | | | | 264,497 | | | | 907,252 | | | | 747,310 | | | | 807,886 | | |
| Shares issued from merger | | | — | | | | 3,078,523 | | | | — | | | | 198,454 | | | | — | | | | 90,256 | | |
| Dividends reinvested | | | 1,324,491 | | | | 2,715,779 | | | | 120,864 | | | | 300,193 | | | | 55,644 | | | | 118,917 | | |
| Shares redeemed | | | (7,200,514 | ) | | | (16,266,683 | ) | | | (1,899,673 | ) | | | (3,549,930 | ) | | | (779,482 | ) | | | (1,860,040 | ) | |
| Net increase (decrease) in shares outstanding | | | (430,365 | ) | | | (406,116 | ) | | | (1,514,312 | ) | | | (2,144,031 | ) | | | 23,472 | | | | (842,981 | ) | |
| GNMA Income ($) | |
| Shares sold | | $ | 44,866,770 | | | $ | 79,764,361 | | | $ | 2,165,786 | | | $ | 7,350,196 | | | $ | 6,147,401 | | | $ | 6,683,417 | | |
| Shares issued from merger | | | — | | | | 30,711,195 | | | | — | | | | 1,981,002 | | | | — | | | | 900,531 | | |
| Dividends reinvested | | | 10,871,815 | | | | 22,906,968 | | | | 987,402 | | | | 2,523,048 | | | | 455,283 | | | | 1,000,388 | | |
| Shares redeemed | | | (59,227,405 | ) | | | (137,264,555 | ) | | | (15,551,967 | ) | | | (29,799,295 | ) | | | (6,385,856 | ) | | | (15,663,159 | ) | |
| Net increase (decrease) | | $ | (3,488,820 | ) | | $ | (3,882,031 | ) | | $ | (12,398,779 | ) | | $ | (17,945,049 | ) | | $ | 216,828 | | | $ | (7,078,823 | ) | |
| | | Class I | | Class M | | Class Q | |
| | | Six Months
Ended
September 30,
2006 | | Year
Ended
March 31,
2006 | | Six Months
Ended
September 30,
2006 | | Year
Ended
March 31,
2006 | | Six Months
Ended
September 30,
2006 | | Year
Ended
March 31,
2006 | |
| GNMA Income (Number of Shares) | |
| Shares sold | | | 215,386 | | | | 918,436 | | | | 21 | | | | 11 | | | | — | | | | 6 | | |
| Shares issued from merger | | | — | | | | 1,261,704 | | | | — | | | | — | | | | — | | | | — | | |
| Dividends reinvested | | | 58,631 | | | | 82,697 | | | | 364 | | | | 713 | | | | 241 | | | | 478 | | |
| Shares redeemed | | | (329,709 | ) | | | (1,297,179 | ) | | | (7,580 | ) | | | (936 | ) | | | — | | | | (2,761 | ) | |
| Net increase (decrease) in shares outstanding | | | (55,692 | ) | | | 965,658 | | | | (7,195 | ) | | | (212 | ) | | | 241 | | | | (2,277 | ) | |
| GNMA Income ($) | |
| Shares sold | | $ | 1,772,838 | | | $ | 5,608,472 | | | $ | 183 | | | $ | 468 | | | $ | — | | | $ | 210 | | |
| Shares issued from merger | | | — | | | | 12,608,661 | | | | — | | | | — | | | | — | | �� | | — | | |
| Dividends reinvested | | | 481,467 | | | | 696,912 | | | | 2,991 | | | | 6,027 | | | | 1,984 | | | | 4,044 | | |
| Shares redeemed | | | (2,703,438 | ) | | | (10,891,793 | ) | | | (62,546 | ) | | | (8,021 | ) | | | — | | | | (23,583 | ) | |
| Net increase (decrease) | | $ | (449,133 | ) | | $ | 8,022,252 | | | $ | (59,372 | ) | | $ | (1,526 | ) | | $ | 1,984 | | | $ | (19,329 | ) | |
| | | Class A | | Class B | | Class C | |
| | | Six Months
Ended
September 30,
2006 | | Year
Ended
March 31,
2006 | | Six Months
Ended
September 30,
2006 | | Year
Ended
March 31,
2006 | | Six Months
Ended
September 30,
2006 | | Year
Ended
March 31,
2006 | |
| High Yield Bond (Number of Shares) | |
| Shares sold | | | 1,941,952 | | | | 4,283,666 | | | | 169,019 | | | | 376,934 | | | | 103,617 | | | | 105,440 | | |
| Dividends reinvested | | | 181,551 | | | | 372,895 | | | | 107,230 | | | | 294,963 | | | | 27,334 | | | | 60,504 | | |
| Shares redeemed | | | (2,155,131 | ) | | | (5,922,652 | ) | | | (2,446,948 | ) | | | (6,312,010 | ) | | | (281,163 | ) | | | (1,160,116 | ) | |
| Net decrease in shares outstanding | | | (31,628 | ) | | | (1,266,091 | ) | | | (2,170,699 | ) | | | (5,640,113 | ) | | | (150,212 | ) | | | (994,172 | ) | |
| High Yield Bond ($) | |
| Shares sold | | $ | 16,761,088 | | | $ | 37,259,692 | | | $ | 1,455,606 | | | $ | 3,290,473 | | | $ | 893,238 | | | $ | 921,882 | | |
| Dividends reinvested | | | 1,567,760 | | | | 3,253,464 | | | | 925,146 | | | | 2,572,262 | | | | 235,992 | | | | 527,995 | | |
| Shares redeemed | | | (18,574,707 | ) | | | (51,709,974 | ) | | | (21,119,107 | ) | | | (54,978,481 | ) | | | (2,421,119 | ) | | | (10,080,345 | ) | |
| Net decrease | | $ | (245,859 | ) | | $ | (11,196,818 | ) | | $ | (18,738,355 | ) | | $ | (49,115,746 | ) | | $ | (1,291,889 | ) | | $ | (8,630,468 | ) | |
| | | Class A | | Class B | | Class C | |
| | | Six Months
Ended
September 30,
2006 | | Year
Ended
March 31,
2006 | | Six Months
Ended
September 30,
2006 | | Year
Ended
March 31,
2006 | | Six Months
Ended
September 30,
2006 | | Year
Ended
March 31,
2006 | |
| Intermediate Bond (Number of Shares) | |
| Shares sold | | | 11,962,134 | | | | 20,627,121 | | | | 356,763 | | | | 1,166,619 | | | | 1,170,589 | | | | 1,904,289 | | |
| Dividends reinvested | | | 1,180,940 | | | | 1,775,655 | | | | 78,742 | | | | 147,654 | | | | 80,696 | | | | 139,301 | | |
| Shares redeemed | | | (7,137,389 | ) | | | (10,476,981 | ) | | | (1,063,866 | ) | | | (1,616,224 | ) | | | (1,180,717 | ) | | | (1,751,216 | ) | |
| Net increase (decrease) in shares outstanding | | | 6,005,685 | | | | 11,925,795 | | | | (628,361 | ) | | | (301,951 | ) | | | 70,568 | | | | 292,374 | | |
| Intermediate Bond ($) | |
| Shares sold | | $ | 120,477,964 | | | $ | 213,494,520 | | | $ | 3,583,338 | | | $ | 12,066,655 | | | $ | 11,795,639 | | | $ | 19,701,478 | | |
| Dividends reinvested | | | 11,907,953 | | | | 18,351,362 | | | | 792,203 | | | | 1,523,148 | | | | 812,765 | | | | 1,437,949 | | |
| Shares redeemed | | | (71,913,044 | ) | | | (108,128,079 | ) | | | (10,690,782 | ) | | | (16,685,199 | ) | | | (11,888,882 | ) | | | (18,111,053 | ) | |
| Net increase (decrease) | | $ | 60,472,873 | | | $ | 123,717,803 | | | $ | (6,315,241 | ) | | $ | (3,095,396 | ) | | $ | 719,522 | | | $ | 3,028,374 | | |
46
NOTES TO FINANCIAL STATEMENTS AS OF SEPTEMBER 30, 2006 (UNAUDITED) (CONTINUED)
NOTE 10 — CAPITAL SHARES (continued)
| | | Class I | | Class O | | Class R | |
| | | Six Months
Ended
September 30,
2006 | | Year
Ended
March 31,
2006 | | Six Months
Ended
September 30,
2006 | | Year
Ended
March 31,
2006 | | Six Months
Ended
September 30,
2006 | | Year
Ended
March 31,
2006 | |
| Intermediate Bond (Number of Shares) | |
| Shares sold | | | 2,104,542 | | | | 14,385,293 | | | | 1,452,451 | | | | 2,557,931 | | | | 21,837 | | | | 96,767 | | |
| Dividends reinvested | | | 473,230 | | | | 523,382 | | | | 105,066 | | | | 153,640 | | | | — | | | | — | | |
| Shares redeemed | | | (1,246,307 | ) | | | (1,434,648 | ) | | | (945,977 | ) | | | (1,745,909 | ) | | | (13,266 | ) | | | (48,303 | ) | |
| Net increase in shares outstanding | | | 1,331,465 | | | | 13,474,027 | | | | 611,540 | | | | 965,662 | | | | 8,571 | | | | 48,464 | | |
| Intermediate Bond ($) | |
| Shares sold | | $ | 21,233,648 | | | $ | 149,792,618 | | | $ | 14,640,825 | | | $ | 26,487,057 | | | $ | 220,687 | | | $ | 1,003,142 | | |
| Dividends reinvested | | | 4,773,100 | | | | 5,386,015 | | | | 1,059,978 | | | | 1,587,962 | | | | — | | | | — | | |
| Shares redeemed | | | (12,558,008 | ) | | | (14,825,960 | ) | | | (9,523,651 | ) | | | (18,063,082 | ) | | | (133,524 | ) | | | (499,122 | ) | |
| Net increase | | $ | 13,448,740 | | | $ | 140,352,673 | | | $ | 6,177,152 | | | $ | 10,011,937 | | | $ | 87,163 | | | $ | 504,020 | | |
| | | Class A | | Class B | | Class C | |
| | | Six Months
Ended
September 30,
2006 | | Year
Ended
March 31,
2006 | | Six Months
Ended
September 30,
2006 | | Year
Ended
March 31,
2006 | | Six Months
Ended
September 30,
2006 | | Year
Ended
March 31,
2006 | |
| National Tax-Exempt Bond (Number of Shares) | |
| Shares sold | | | 58,255 | | | | 62,062 | | | | 35,579 | | | | 103,690 | | | | 17,236 | | | | 32,359 | | |
| Dividends reinvested | | | 2,741 | | | | 7,266 | | | | 1,924 | | | | 5,690 | | | | 640 | | | | 2,708 | | |
| Shares redeemed | | | (128,595 | ) | | | (62,812 | ) | | | (58,800 | ) | | | (103,924 | ) | | | (23,227 | ) | | | (45,043 | ) | |
| Net increase (decrease) in shares outstanding | | | (67,599 | ) | | | 6,516 | | | | (21,297 | ) | | | 5,456 | | | | (5,351 | ) | | | (9,976 | ) | |
| National Tax-Exempt Bond ($) | |
| Shares sold | | $ | 596,934 | | | $ | 654,626 | | | $ | 364,882 | | | $ | 1,085,247 | | | $ | 177,725 | | | $ | 341,463 | | |
| Dividends reinvested | | | 28,118 | | | | 75,964 | | | | 19,736 | | | | 59,389 | | | | 6,554 | | | | 28,303 | | |
| Shares redeemed | | | (1,308,266 | ) | | | (660,992 | ) | | | (602,855 | ) | | | (1,084,774 | ) | | | (236,539 | ) | | | (470,313 | ) | |
| Net increase (decrease) | | $ | (683,214 | ) | | $ | 69,598 | | | $ | (218,237 | ) | | $ | 59,862 | | | $ | (52,260 | ) | | $ | (100,547 | ) | |
| | | Class A | | Class B | | Class C | |
| | | Six Months
Ended
September 30,
2006 | | Year
Ended
March 31,
2006 | | Six Months
Ended
September 30,
2006 | | Year
Ended
March 31,
2006 | | Six Months
Ended
September 30,
2006 | | Year
Ended
March 31,
2006 | |
| Classic Money Market (Number of Shares) | |
| Shares sold | | | 253,067,276 | | | | 494,264,073 | | | | 6,389,058 | | | | 34,975,633 | | | | 3,093,277 | | | | 5,750,624 | | |
| Dividends reinvested | | | 15,826,519 | | | | 17,618,283 | | | | 410,090 | | | | 596,983 | | | | 98,988 | | | | 117,025 | | |
| Shares redeemed | | | (177,714,705 | ) | | | (405,226,116 | ) | | | (6,116,582 | ) | | | (38,519,102 | ) | | | (1,530,303 | ) | | | (4,931,775 | ) | |
| Net increase (decrease) in shares outstanding | | | 91,179,090 | | | | 106,656,240 | | | | 682,566 | | | | (2,946,486 | ) | | | 1,661,962 | | | | 935,874 | | |
| Classic Money Market ($) | |
| Shares sold | | $ | 253,067,276 | | | $ | 494,264,073 | | | $ | 6,389,058 | | | $ | 34,975,633 | | | $ | 3,093,277 | | | $ | 5,750,624 | | |
| Dividends reinvested | | | 15,826,519 | | | | 17,618,283 | | | | 410,090 | | | | 596,983 | | | | 99,988 | | | | 117,025 | | |
| Shares redeemed | | | (177,714,705 | ) | | | (405,226,116 | ) | | | (6,116,582 | ) | | | (38,519,102 | ) | | | (1,530,303 | ) | | | (4,931,775 | ) | |
| Net increase (decrease) | | $ | 91,179,090 | | | $ | 106,656,240 | | | $ | 682,566 | | | $ | (2,946,486 | ) | | $ | 1,661,962 | | | $ | 935,874 | | |
| | | Six Months
Ended
September 30,
2006 | | July 28, 2005(1)
to
March 31,
2006 | |
| Institutional Money Market (Number of Shares) | |
| Shares sold | | | 477,244,083 | | | | 462,400,001 | | |
| Dividends reinvested | | | 2,417,449 | | | | 3,264,932 | | |
| Shares redeemed | | | (518,244,292 | ) | | | (286,000,000 | ) | |
| Net increase (decrease) in shares outstanding | | | (38,582,760 | ) | | | 179,664,933 | | |
| Institutional Money Market ($) | |
| Shares sold | | $ | 477,244,083 | | | $ | 462,400,001 | | |
| Dividends reinvested | | | 2,417,449 | | | | 3,264,932 | | |
| Shares redeemed | | | (518,244,292 | ) | | | (286,000,000 | ) | |
| Net increase (decrease) | | $ | (38,582,760 | ) | | $ | 179,664,933 | | |
(1) Commencement of operations
47
NOTES TO FINANCIAL STATEMENTS AS OF SEPTEMBER 30, 2006 (UNAUDITED) (CONTINUED)
NOTE 11 — CREDIT RISK AND DEFAULTED SECURITIES
Although each Fund has a diversified portfolio, High Yield Bond and Intermediate Bond Funds may invest in lower rated and comparable quality unrated high yield securities. Investments in high yield securities are accompanied by a greater degree of credit risk and such lower rated securities tend to be more sensitive to economic conditions than higher rated securities. The risk of loss due to default by the issuer may be significantly greater for the holders of high yielding securities, because such securities are generally unsecured and are often subordinated to other creditors of the issuer. High Yield Bond and Intermediate Bond held the following defaulted securities at September 30, 2006.
| Fund | | Security | | Market
Value | |
| High Yield | | United Air Lines, Inc. | | |
| | |
| Bond | | 6.923%, due 09/01/11 | | $ | 564,247 | | |
| | | | | $ | 564,247 | | |
| Intermediate | | United Air Lines, Inc. | | |
| | |
| Bond | | 6.923%, due 09/01/11 | | $ | 1,908,579 | | |
| | | | | $ | 1,908,579 | | |
For financial reporting purposes, it is each Fund's accounting practice to discontinue the accrual of income and to provide an estimate for probable losses due to unpaid interest income on defaulted bonds for the current reporting period.
NOTE 12 — FEDERAL INCOME TAXES
The amount of distributions from net investment income and net realized capital gains are determined in accordance with federal income tax regulations, which may differ from U.S. generally accepted accounting principles for investment companies. These book/tax differences may be either temporary or permanent. Permanent differences are reclassified within the capital accounts based on their federal tax-basis treatment; temporary differences are not reclassified. Key differences include the treatment of short-term capital gains, foreign currency transactions, and wash sale deferrals. Distributions in excess of net investment income and/or net realized capital gains for tax purposes are reported as distributions of paid-in capital.
Dividends paid by the Funds from net investment income and distributions of net realized short-term capital gains are, for federal income tax purposes, taxable as ordinary income to shareholders.
The tax composition of dividends and distributions to shareholders was as follows:
| | | Six Months Ended
September 30, 2006 | |
Year Ended March 31, 2006 | |
| | | Ordinary
Income | | Ordinary
Income | | Tax-Exempt
Income | | Long-Term
Capital Gains | |
| GNMA Income | | $ | 15,516,822 | | | $ | 32,462,158 | | | $ | — | | | $ | — | | |
| High Yield Bond | | | 5,772,247 | | | | 13,419,941 | | | | — | | | | — | | |
| Intermediate Bond | | | 23,565,592 | | | | 34,140,571 | | | | — | | | | 998,521 | | |
| National Tax-Exempt Bond | | | 523,865 | | | | 32,879 | | | | 936,035 | | | | 305,296 | | |
| Classic Money Market | | | 16,494,615 | | | | 18,629,328 | | | | — | | | | — | | |
| Institutional Money Market | | | 3,913,378 | | | | 4,773,069 | | | | — | | | | — | | |
The tax-basis components of distributable earnings and the expiration dates of the capital loss carryforwards which may be used to offset future realized capital gains for federal income tax purposes as of March 31, 2006 were:
| | | Undistributed
Ordinary
Income | | Undistributed
Tax-Exempt
Income | | Unrealized
Appreciation/
Depreciation | | Post-October
Capital
Losses
Deferred | | Capital
Loss
Carryforwards | | Expiration
Dates | |
| GNMA Income | | $ | 2,041,427 | | | $ | — | | | $ | (6,967,854 | ) | | $ | — | | | $ | (1,688,098 | ) | | | 2007 | | |
| | | | | | | | | | | | (2,870,184 | ) | | | 2008 | | |
| | | | | | | | | | | | (527,639 | ) | | | 2010 | | |
| | | | | | | | | | | | (1,081,784 | ) | | | 2012 | | |
| | | | | | | | | | | | (6,961,357 | ) | | | 2013 | | |
| | | | | | | | | | | | (3,281,376 | ) | | | 2014 | | |
| | | | | | | | | | | $ | (16,410,438 | ) | | | | | |
| High Yield Bond | | | 473,363 | | | | — | | | | (3,869,547 | ) | | | (13,150,775 | ) | | $ | (27,206,911 | ) | | | 2007 | | |
| | | | | | | | | | | | (78,500,574 | ) | | | 2008 | | |
| | | | | | | | | | | | (115,139,658 | ) | | | 2009 | | |
| | | | | | | | | | | | (79,792,137 | ) | | | 2010 | | |
| | | | | | | | | | | | (69,190,309 | ) | | | 2011 | | |
| | | | | | | | | | | | (6,099,584 | ) | | | 2012 | | |
| | | | | | | | | | | | (126,079 | ) | | | 2014 | | |
| | | | | | | | | | | $ | (376,055,252 | ) | | | | | |
48
NOTES TO FINANCIAL STATEMENTS AS OF SEPTEMBER 30, 2006 (UNAUDITED) (CONTINUED)
NOTE 12 — FEDERAL INCOME TAXES (continued)
| | | Undistributed
Ordinary
Income | | Undistributed
Tax-Exempt
Income | | Unrealized
Appreciation/
Depreciation | | Post-October
Capital
Losses
Deferred | | Capital
Loss
Carryforwards | | Expiration
Dates | |
| Intermediate Bond | | | 643,705 | | | | — | | | | (15,770,936 | ) | | | (7,826,568 | ) | | | — | | | | — | | |
National
Tax-Exempt Bond | | | — | | | | 77,796 | | | | 527,847 | | | | (15,280 | ) | | | — | | | | — | | |
Classic Money
Market | | | 17,951 | | | | — | | | | — | | | | (29,110 | ) | | $ | (1,443 | ) | | | 2010 | | |
| | | | | | | | | | | | | | | | | | | | (36,198 | ) | | | 2011 | | |
| | | | | | | | | | | | | | | | | | | | (18,913 | ) | | | 2012 | | |
| | | | | | | | | | | | | | | | | | | | (63,053 | ) | | | 2013 | | |
| | | | | | | | | | | | | | | | | | | | (42,453 | ) | | | 2014 | | |
| | | | | | | | | | | | | | | | | | | $ | (162,060 | ) | | | | | |
Institutional Money
Market | | | 267,799 | | | | — | | | | — | | | | (8,158 | ) | | | — | | | | — | | |
NOTE 13 — REORGANIZATIONS
On December 3, 2005, GNMA Income, as listed below ("Acquiring Fund"), acquired the assets and certain liabilities of ING Government Fund, also listed below ("Acquired Fund"), in a tax-free reorganization in exchange for shares of the Acquiring Fund, pursuant to a plan of reorganization approved by the Acquired Fund's shareholders. The number and value of shares issued by the Acquiring Funds are presented in Note 10 — Capital Shares. Net assets and unrealized appreciation as of the reorganization date was as follows:
Acquiring
Fund | |
Acquired
Fund | |
Total net assets of
Acquired Fund (000) | |
Total net assets of
Acquiring Fund (000) | | Acquired Fund
Unrealized
Appreciation/
Depreciation (000) | |
Conversion
Ratio | |
| GNMA Income | | ING Government
Fund | |
$46,201 | |
$628,965 | |
$(624) | |
1.20 | |
The net assets of GNMA Income after the acquisition were $675,166,000.
NOTE 14 — ILLIQUID SECURITIES
Pursuant to guidelines adopted by the Funds' Board, the following securities have been deemed to be illiquid. Except for GNMA Income, the Funds may invest up to 15% (10% for Classic Money Market and Institutional Money Market) of its net assets in illiquid securities. Fair value for certain of securities was determined by ING Funds Valuation Committee appointed by the Funds' Board.
| Fund | | Security | | Principal
Amount/
Shares | | Initial
Acquisition
Date | | Cost | | Value | | Percent
of Net
Assets | |
High Yield
Bond | | Comforce Corp. | | | 92,950 | | | 10/24/04 | | $ | — | | | $ | 930 | | | | 0.00 | % | |
| | | Dayton Superior Corp. | | | 3,100 | | | 10/24/04 | | | — | | | | 31 | | | | 0.00 | % | |
| | | GT Group Telecom, Inc. | | | 500 | | | 03/19/03 | | | — | | | | — | | | | 0.00 | % | |
| | | Jordan Telecommunications | | | 2,350 | | | 10/24/04 | | | — | | | | 50,807 | | | | 0.03 | % | |
| | | North Atlantic Trading Co. | | | 17,906 | | | 10/24/04 | | | 210,181 | | | | 18 | | | | 0.00 | % | |
| | | | | | | | | | | $ | 210,181 | | | $ | 51,786 | | | | 0.03 | % | |
Intermediate
Bond | | Alpine III, 5.966%, due 08/16/14 | | | 527,000 | | | 08/04/04 | | $ | 527,210 | | | $ | 528,430 | | | | 0.05 | % | |
| | | Alpine III, 6.366%, due 08/16/14 | | | 527,000 | | | 08/04/04 | | | 527,210 | | | | 528,828 | | | | 0.05 | % | |
| | | Alpine III, 8.166%, due 08/16/14 | | | 789,000 | | | 08/04/04 | | | 796,680 | | | | 793,938 | | | | 0.08 | % | |
| | | Alpine III, 11.416%, due 08/16/14 | | | 1,348,000 | | | 08/04/04 | | | 1,364,485 | | | | 1,384,246 | | | | 0.14 | % | |
| | | Cameron Highway Oil Pipeline, 5.860%, due 12/15/17 | | | 4,067,000 | | | 12/05/05 | | | 4,067,000 | | | | 4,016,569 | | | | 0.40 | % | |
| | | Nordea Kredit Realkreditaktieselskab, 6.000%,
due 07/01/29 | | | 44 | | | 04/16/04 | | | 7 | | | | 8 | | | | 0.00 | % | |
| | | | | | | | | | | $ | 7,282,592 | | | $ | 7,252,019 | | | | 0.72 | % | |
Classic Money
Market | | Newcastle CDO Ltd., 5.360%, due 09/24/07 | | | 5,400,000 | | | 10/23/03 | | $ | 5,400,000 | | | $ | 5,400,000 | | | | 0.69 | % | |
| | | Newcastle CDO Ltd., 5.360%, due 10/24/06 | | | 5,400,000 | | | 09/22/05 | | | 5,400,000 | | | | 5,400,000 | | | | 0.69 | % | |
| | | Money Market Trust Series A, 5.405%, due 11/08/07 | | | 11,500,000 | | | 07/30/04 | | | 11,500,000 | | | | 11,500,000 | | | | 1.48 | % | |
| | | Goldman Sachs, 5.370%, due 02/14/07 | | | 8,500,000 | | | 02/13/06 | | | 8,500,000 | | | | 8,500,000 | | | | 1.09 | % | |
| | | Goldman Sachs, 5.370%, due 05/11/07 | | | 10,000,000 | | | 04/11/06 | | | 10,000,000 | | | | 10,000,000 | | | | 1.28 | % | |
| | | | | | | | | | | $ | 40,800,000 | | | $ | 40,800,000 | | | | 5.23 | % | |
49
NOTES TO FINANCIAL STATEMENTS AS OF SEPTEMBER 30, 2006 (UNAUDITED) (CONTINUED)
NOTE 14 — ILLIQUID SECURITIES (continued)
| Fund | | Security | | Principal
Amount/
Shares | | Initial
Acquisition
Date | | Cost | | Value | | Percent
of Net
Assets | |
Institutional
Money
Market | | Money Market Trust Series A-2, 5.395%, due 11/08/07 | | | 2,000,000 | | | 08/31/05 | | $ | 2,000,000 | | | $ | 2,000,000 | | | | 1.42 | % | |
| | | Goldman Sachs, 5.360%, due 05/11/07 | | | 1,000,000 | | | 04/11/06 | | | 1,000,000 | | | | 1,000,000 | | | | 0.71 | % | |
| | | | | | | | | $ | 3,000,000 | | | $ | 3,000,000 | | | | 2.13 | % | |
NOTE 15 — SECURITIES LENDING
Under an agreement with The Bank of New York ("BNY"), the Funds (except GNMA Income) can lend their securities to approved brokers, dealers and other financial institutions. Loans are collateralized by cash and U.S. government securities. The collateral must be in an amount equal to at least 105% of the market value of non-U.S. securities loaned and 102% of the market value of U.S. securities loaned. The cash collateral received is invested in approved investments as defined in the Securities Lending Agreement with BNY (the "Agreement"). The securities purchased with cash collateral received are reflected in the Portfolio of Investments. Generally, in the event of counterparty default, the Funds have the right to use the collateral to offset losses incurred. The Agreement contains certain guarantees by BNY in the event of counterparty default and/or a borrower's failure to return a loaned security; however, there would be a potential loss to the Funds in the event the Funds are delayed or prevented from exercising their right to dispose of the collateral. The Funds bear the risk of loss with respect to the investment of collateral. Engaging in securities lending could have a leveraging effect, which may intensify the credit, market and other risks associated with investing in a Fund. At September 30, 2006, the following Fund had securities on loan with the following market value:
| Fund | | Value of
Securities
Loaned | | Value of
Collateral | |
| Intermediate Bond | | $ | 165,718,213 | | | $ | 169,060,933 | | |
NOTE 16 — SUBSEQUENT EVENTS
Subsequent to September 30, 2006, the following Funds declared dividends from net investment income:
| | | Per Share
Amount | | Payable Date | | Record Date | |
| GNMA Income | |
| Class A | | $ | 0.0350 | | | October 4, 2006 | | September 29, 2006 | |
| Class B | | $ | 0.0298 | | | October 4, 2006 | | September 29, 2006 | |
| Class C | | $ | 0.0300 | | | October 4, 2006 | | September 29, 2006 | |
| Class I | | $ | 0.0372 | | | October 4, 2006 | | September 29, 2006 | |
| Class M | | $ | 0.0317 | | | October 4, 2006 | | September 29, 2006 | |
| Class Q | | $ | 0.0354 | | | October 4, 2006 | | September 29, 2006 | |
| Class A | | $ | 0.0350 | | | November 3, 2006 | | October 31, 2006 | |
| Class B | | $ | 0.0297 | | | November 3, 2006 | | October 31, 2006 | |
| Class C | | $ | 0.0298 | | | November 3, 2006 | | October 31, 2006 | |
| Class I | | $ | 0.0371 | | | November 3, 2006 | | October 31, 2006 | |
| Class M | | $ | 0.0314 | | | November 3, 2006 | | October 31, 2006 | |
| Class Q | | $ | 0.0353 | | | November 3, 2006 | | October 31, 2006 | |
| High Yield Bond | |
| Class A | | $ | 0.0494 | | | November 1, 2006 | | Daily | |
| Class B | | $ | 0.0442 | | | November 1, 2006 | | Daily | |
| Class C | | $ | 0.0423 | | | November 1, 2006 | | Daily | |
| Intermediate Bond | |
| Class A | | $ | 0.0418 | | | November 1, 2006 | | Daily | |
| Class B | | $ | 0.0350 | | | November 1, 2006 | | Daily | |
| Class C | | $ | 0.0352 | | | November 1, 2006 | | Daily | |
| Class I | | $ | 0.0444 | | | November 1, 2006 | | Daily | |
| Class R | | $ | 0.0395 | | | November 1, 2006 | | Daily | |
| Class O | | $ | 0.0416 | | | November 1, 2006 | | Daily | |
| National Tax-Exempt Bond | |
| Class A | | $ | 0.0325 | | | November 1, 2006 | | Daily | |
| Class B | | $ | 0.0257 | | | November 1, 2006 | | Daily | |
| Class C | | $ | 0.0260 | | | November 1, 2006 | | Daily | |
| Classic Money Market | |
| Class A | | $ | 0.0039 | | | November 1, 2006 | | Daily | |
| Class B | | $ | 0.0034 | | | November 1, 2006 | | Daily | |
| Class C | | $ | 0.0034 | | | November 1, 2006 | | Daily | |
Institutional
Money Market | | $ | 0.0044 | | | November 1, 2006 | | Daily | |
50
NOTES TO FINANCIAL STATEMENTS AS OF SEPTEMBER 30, 2006 (UNAUDITED) (CONTINUED)
NOTE 17 — OTHER ACCOUNTING PRONOUNCEMENTS
In June 2006, the Financial Accounting Standards Board ("FASB") issued FASB Interpretation 48 ("FIN 48"), "Accounting for Uncertainty in Income Taxes." This standard defines the threshold for recognizing the benefits of tax-return positions in the financial statements as "more-likely-than-not" to be sustained upon challenge by the taxing authority and requires measurement of a tax position meeting the more-likely-than-not criterion, based on the largest benefit that is more than 50 percent likely to be realized. FIN 48 is effective as of the beginning of the first fiscal year beginning after December 15, 2006, with early application permitted if no interim financial statements have been issued. At adoption, companies must adjust their financial statements to reflect only those tax positions that are more likely-than-not to be sustained as of the adoption date.
On September 15, 2006, the FASB issued Statement of Financial Accounting Standard No. 157 ("SFAS No. 157"), Fair Value Measurements. The new accounting statement defines fair value, establishes a framework for measuring fair value in generally accepted accounting principles (GAAP), and expands disclosures about fair value measurements. SFAS No. 157 defines fair value as the price that would be received upon sale of an asset or paid to transfer a liability in an orderly transaction between market participants at the measurement date (an exit price). SFAS No. 157 also stipulates that, as a market-based measurement, fair value measurement should be determined based on the assumptions that market participants would use in pricing the asset or liability, and establishes a fair value hierarchy that distinguishes between (a) market participant assumptions developed based on market data obtained from sources independent of the reporting entity (obse rvable inputs) and (b) the reporting entity's own assumptions about market participant assumptions developed based on the best information available in the circumstances (unobservable inputs). SFAS No. 157 is effective for financial statements issued for fiscal years beginning after November 15, 2007. As of September, 2006, the Funds are assessing the impact, if any, that will result from adopting FIN 48 and SFAS No. 157.
NOTE 18 — INFORMATION REGARDING TRADING OF ING's U.S. MUTUAL FUNDS
In 2004, ING Investments reported to the Boards of Directors/Trustees (the "Boards") of the ING Funds that, like many U.S. financial services companies, ING Investments and certain of its U.S. affiliates have received informal and formal requests for information since September 2003 from various governmental and self-regulatory agencies in connection with investigations related to mutual funds and variable insurance products. ING Investments has advised the Boards that it and its affiliates have cooperated fully with each request.
In addition to responding to regulatory and governmental requests, ING Investments reported that management of U.S. affiliates of ING Groep, including ING Investments (collectively, "ING"), on their own initiative, have conducted, through independent special counsel and a national accounting firm, an extensive internal review of trading in ING insurance, retirement, and mutual fund products. The goal of this review was to identify any instances of inappropriate trading in those products by third parties or by ING investment professionals and other ING personnel. ING's internal review related to mutual fund trading is now substantially completed. ING has reported that, of the millions of customer relationships that ING maintains, the internal review identified several isolated arrangements allowing third parties to engage in frequent trading of mutual funds within ING's variable insurance and mutual fund products, and identified other circums tances where frequent trading occurred, despite measures taken by ING intended to combat market timing. ING further reported that each of these arrangements has been terminated and fully disclosed to regulators. The results of the internal review were also reported to the independent members of the Boards.
ING Investments has advised the Boards that most of the identified arrangements were initiated prior to ING's acquisition of the businesses in question in the U.S. ING Investments further reported that the companies in question did not receive special benefits in return for any of these arrangements, which have all been terminated.
Based on the internal review, ING Investments has advised the Boards that the identified arrangements do not represent a systemic problem in any of the companies that were involved.
In September 2005, ING Funds Distributor, LLC ("IFD"), the distributor of certain ING Funds, settled an administrative proceeding with the NASD regarding three arrangements, dating from 1995, 1996 and 1998, under which the administrator to the then-Pilgrim Funds, which subsequently became part of the ING Funds, entered into formal and informal arrangements that permitted frequent trading. Under the terms of the Letter of Acceptance, Waiver and Consent ("AWC") with the NASD, under which IFD neither admitted nor
51
NOTES TO FINANCIAL STATEMENTS AS OF SEPTEMBER 30, 2006 (UNAUDITED) (CONTINUED)
NOTE 18 — INFORMATION REGARDING TRADING OF ING's U.S. MUTUAL FUNDS (continued)
denied the allegations or findings, IFD consented to the following sanctions: (i) a censure; (ii) a fine of $1.5 million; (iii) restitution of approximately $1.44 million to certain ING Funds for losses attributable to excessive trading described in the AWC; and (iv) agreement to make certification to NASD regarding the review and establishment of certain procedures.
In addition to the arrangements discussed above, in 2004, ING Investments reported to the Boards that, at this time, these instances include the following, in addition to the arrangements subject to the AWC discussed above:
• Aeltus Investment Management, Inc. (a predecessor entity to ING Investment Management Co.) identified two investment professionals who engaged in extensive frequent trading in certain ING Funds. One was subsequently terminated for cause and incurred substantial financial penalties in connection with this conduct and the second has been disciplined.
• ReliaStar Life Insurance Company ("ReliaStar") entered into agreements seven years ago permitting the owner of policies issued by the insurer to engage in frequent trading and to submit orders until 4pm Central Time. In 2001 ReliaStar also entered into a selling agreement with a broker-dealer that engaged in frequent trading. Employees of ING affiliates were terminated and/or disciplined in connection with these matters.
• In 1998, Golden American Life Insurance Company entered into arrangements permitting a broker-dealer to frequently trade up to certain specific limits in a fund available in an ING variable annuity product. No employee responsible for this arrangement remains at the company.
For additional information regarding these matters, you may consult the Form 8-K and Form 8-K/A for each of four life insurance companies, ING USA Annuity and Life Insurance Company, ING Life Insurance and Annuity Company, ING Insurance Company of America, and ReliaStar Life Insurance Company of New York, each filed with the Securities and Exchange Commission (the "SEC") on October 29, 2004 and September 8, 2004. These Forms 8-K and Forms 8-K/A can be accessed through the SEC's Web site at http://www.sec.gov. Despite the extensive internal review conducted through independent special counsel and a national accounting firm, there can be no assurance that the instances of inappropriate trading reported to the Boards are the only instances of such trading respecting the ING Funds.
ING Investments reported to the Boards that ING is committed to conducting its business with the highest standards of ethical conduct with zero tolerance for noncompliance. Accordingly, ING Investments advised the Board that ING management was disappointed that its voluntary internal review identified these situations. Viewed in the context of the breadth and magnitude of its U.S. business as a whole, ING management does not believe that ING's acquired companies had systemic ethical or compliance issues in these areas. Nonetheless, Investments reported that given ING's refusal to tolerate any lapses, it has taken the steps noted below, and will continue to seek opportunities to further strengthen the internal controls of its affiliates.
• ING has agreed with the ING Funds to indemnify and hold harmless the ING Funds from all damages resulting from wrongful conduct by ING or its employees or from ING's internal investigation, any investigations conducted by any governmental or self-regulatory agencies, litigation or other formal proceedings, including any proceedings by the Securities and Exchange Commission. ING Investments reported to the Board that ING management believes that the total amount of any indemnification obligations will not be material to ING or its U.S. business.
• ING updated its Code of Conduct for employees reinforcing its employees' obligation to conduct personal trading activity consistent with the law, disclosed limits, and other requirements.
• The ING Funds, upon a recommendation from ING, updated their respective Codes of Ethics applicable to investment professionals with ING entities and certain other fund personnel, requiring such personnel to pre-clear any purchases or sales of ING Funds that are not systematic in nature (i.e., dividend reinvestment), and imposing minimum holding periods for shares of ING Funds.
• ING instituted excessive trading policies for all customers in its variable insurance and retirement products and for shareholders of the ING Funds sold to the public through financial intermediaries. ING does not make exceptions to these policies.
• ING reorganized and expanded its U.S. Compliance Department, and created an Enterprise Compliance team to enhance controls and consistency in regulatory compliance.
52
NOTES TO FINANCIAL STATEMENTS AS OF SEPTEMBER 30, 2006 (UNAUDITED) (CONTINUED)
NOTE 18 — INFORMATION REGARDING TRADING OF ING's U.S. MUTUAL FUNDS (continued)
Other Regulatory Matters
The New York Attorney General (the "NYAG") and other federal and state regulators are also conducting broad inquiries and investigations involving the insurance industry. These initiatives currently focus on, among other things, compensation and other sales incentives; potential conflicts of interest; potential anti-competitive activity; reinsurance; marketing practices (including suitability); specific product types (including group annuities and indexed annuities); fund selection for investment products and brokerage sales; and disclosure. It is likely that the scope of these industry investigations will further broaden before they conclude. ING has received formal and informal requests in connection with such investigations, and is cooperating fully with each request. In connection with one such investigation, affiliates of ING Investments were named in a petition for relief and cease and desist order filed by the New Hampshire Bureau of Securities Regulation (the "NH Bureau") concerning their administration of the New Hampshire state employees deferred compensation plan.
On October 10, 2006, an affiliate of ING Investments entered into an assurance of discontinuance with the NYAG (the "NYAG Agreement") regarding the endorsement of its products by the New York State United Teachers Union Member Benefits Trust ("NYSUT") and the sale of their products to NYSUT members. Under the terms of the NYAG Agreement, the affiliate of ING Investments, without admitting or denying the NYAG's findings, will distribute $30 million to NYSUT members, and/or former NYSUT members, who participated in the NYSUT-endorsed products at any point between January 1, 2001 and June 30, 2006. The affiliate also agreed with the NYAG's office to develop a one-page disclosure that will further improve transparency and disclosure regarding retirement product fees (the "One-Page Disclosure"). Pursuant to the terms of the NYAG Agreement, the affiliate has agreed for a five year period to provide its retirement product customers with the One-Pag e Disclosure.
In addition, on the same date, these affiliates of ING Investments entered into a consent agreement with the NH Bureau (the "NH Agreement") to resolve this petition for relief and cease and desist order. Under the terms of the NH Agreement, these affiliates of ING Investments, without admitting or denying the NH Bureau's claims, have agreed to pay $3 million to resolve the matter, and for a five year period to provide their retirement product customers with the One-Page Disclosure described above.
Other federal and state regulators could initiate similar actions in this or other areas of ING's businesses.
These regulatory initiatives may result in new legislation and regulation that could significantly affect the financial services industry, including businesses in which ING is engaged.
In light of these and other developments, ING continuously reviews whether modifications to its business practices are appropriate.
At this time, in light of the current regulatory factors, ING U.S. is actively engaged in reviewing whether any modifications in our practices are appropriate for the future.
There can be no assurance that these matters, or the adverse publicity associated with them, will not result in increased fund redemptions, reduced sale of fund shares, or other adverse consequences to ING Funds.
NOTE 19 — PROXY VOTING INFORMATION
A description of the policies and procedures that the Funds use to determine how to vote proxies related to portfolio securities is available (1) without charge, upon request, by calling Shareholder Services toll-free at 1-800-992-0180; (2) on the Funds' website at www.ingfunds.com and (3) on the SEC's website at www.sec.gov. Information regarding how the Funds voted proxies related to portfolio securities during the most recent 12-month period ended June 30 is available without charge on the Funds' website at www.ingfunds.com and on the SEC's website at www.sec.gov.
NOTE 20 — QUARTERLY PORTFOLIO HOLDINGS
The Funds file their complete schedule of portfolio holdings with the SEC for the first and third quarters of each fiscal year on Form N-Q. The Funds' Forms N-Q are available on the SEC's website at www.sec.gov. The Funds' Forms N-Q may be reviewed and copied at the SEC's Public Reference Room in Washington, DC, and information on the operation of the Public Reference Room may be obtained by calling 1-800-SEC-0330; and is available upon request from the Funds by calling Shareholder Services toll-free at 1-800-992-0180.
53
PORTFOLIO OF INVESTMENTS
ING GNMA INCOME FUND AS OF SEPTEMBER 30, 2006 (UNAUDITED)
Principal
Amount | | | | Value | |
| U.S. GOVERNMENT AGENCY OBLIGATIONS: 83.0% | | | |
| | | Federal Home Loan
Mortgage Corporation: 0.1% | |
| $ | 113,392 | | | 7.000%, due 11/01/14 | | | | $ | 116,428 | | |
| | 449,397 | | | 7.500%, due 12/01/14 | | | | | 466,491 | | |
| | 111,375 | | | 7.500%, due 01/01/30 | | | | | 115,791 | | |
| | 55,015 | | | 8.000%, due 01/01/30 | | | | | 57,912 | | |
| | 42,047 | | | 9.500%, due 07/01/20 | | | | | 45,803 | | |
| | | | 802,425 | | |
| | | Federal National Mortgage
Association: 0.2% | |
| | 89,470 | | | 6.500%, due 06/01/14 | | | | | 91,509 | | |
| | 668,362 | | | 6.500%, due 02/01/29 | | | | | 687,743 | | |
| | 115,479 | | | 7.000%, due 03/01/15 | | | | | 118,963 | | |
| | 125,405 | | | 7.500%, due 05/01/28 | | | | | 130,234 | | |
| | 129,700 | | | 8.500%, due 08/01/11 | | | | | 132,698 | | |
| | 54,573 | | | 8.500%, due 05/01/15 | | | | | 58,205 | | |
| | 36,173 | | | 8.500%, due 08/01/15 | | | | | 38,581 | | |
| | 130,487 | | | 8.500%, due 09/01/15 | | | | | 139,172 | | |
| | | | 1,397,105 | | |
| | | Government National
Mortgage Association: 82.7% | |
| | 7,030,497 | | | 3.750%, due 05/20/34 | | | | | 6,881,867 | | |
| | 842,069 | | | 4.000%, due 05/20/33 | | | | | 756,195 | | |
| | 934,389 | | | 4.000%, due 01/15/34 | | | | | 848,809 | | |
| | 905,356 | | | 4.000%, due 03/15/34 | | | | | 822,435 | | |
| | 1,879,917 | | | 4.500%, due 01/20/34 | | | | | 1,752,638 | | |
| | 513,399 | | | 4.500%, due 05/20/34 | | | | | 478,640 | | |
| | 2,462,114 | | | 4.500%, due 10/20/34 | | | | | 2,301,488 | | |
| | 4,604,712 | | | 4.500%, due 08/15/35 | | | | | 4,351,913 | | |
| | 596,738 | | | 4.500%, due 09/15/35 | | | | | 563,977 | | |
| | 4,386,559 | | | 4.500%, due 11/15/35 | | | | | 4,145,736 | | |
| | 1,129,043 | | | 5.000%, due 04/15/29 | | | | | 1,098,390 | | |
| | 1,277,182 | | | 5.000%, due 04/15/30 | | | | | 1,241,989 | | |
| | 1,343,814 | | | 5.000%, due 10/15/30 | | | | | 1,306,785 | | |
| | 992,177 | | | 5.000%, due 05/15/33 | | | | | 966,157 | | |
| | 1,064,411 | | | 5.000%, due 06/15/33 | | | | | 1,036,498 | | |
| | 2,352,051 | | | 5.000%, due 07/15/33 | | | | | 2,290,369 | | |
| | 1,058,635 | | | 5.000%, due 10/15/33 | | | | | 1,030,873 | | |
| | 6,310,987 | | | 5.000%, due 10/20/33 | | | | | 6,102,262 | | |
| | 1,265,109 | | | 5.000%, due 02/20/34 | | | | | 1,221,891 | | |
| | 976,163 | | | 5.000%, due 03/15/34 | | | | | 949,503 | | |
| | 3,254,861 | | | 5.000%, due 04/15/34 | | | | | 3,162,930 | | |
| | 547,324 | | | 5.000%, due 04/20/34 | | | | | 528,626 | | |
| | 1,316,981 | | | 5.000%, due 06/20/34 | | | | | 1,271,991 | | |
| | 1,040,793 | | | 5.000%, due 07/20/34 | | | | | 1,005,238 | | |
| | 1,950,815 | | | 5.000%, due 12/20/34 | | | | | 1,884,172 | | |
| | 1,735,133 | | | 5.000%, due 03/15/35 | | | | | 1,686,696 | | |
| | 2,938,555 | | | 5.000%, due 04/15/35 | | | | | 2,856,523 | | |
| | 4,097,272 | | | 5.000%, due 05/15/35 | | | | | 3,982,894 | | |
| | 1,725,195 | | | 5.000%, due 05/20/35 | | | | | 1,669,496 | | |
| | 2,056,224 | | | 5.000%, due 06/15/35 | | | | | 1,998,824 | | |
| | 25,304,042 | | | 5.000%, due 03/20/36 | | | | | 24,478,788 | | |
| | 4,960,446 | | | 5.000%, due 04/20/36 | | | | | 4,798,668 | | |
| | 4,643,832 | | | 5.000%, due 05/20/36 | | | | | 4,492,381 | | |
| | 1,045,809 | | | 5.500%, due 08/20/24 | | | | | 1,037,361 | | |
| | 38,721 | | | 5.500%, due 04/20/29 | | | | | 38,398 | | |
| | 540,004 | | | 5.500%, due 10/15/32 | | | | | 537,114 | | |
| | 2,055,277 | | | 5.500%, due 12/15/32 | | | | | 2,044,275 | | |
| | 3,063,239 | | | 5.500%, due 03/15/33 | | | | | 3,046,739 | | |
| | 2,613,894 | | | 5.500%, due 04/15/33 | | | | | 2,599,814 | | |
| | 6,877,753 | | | 5.500%, due 05/15/33 | | | | | 6,840,708 | | |
Principal
Amount | | | | Value | |
| $ | 3,204,475 | | | 5.500%, due 06/15/33 | | | | $ | 3,187,214 | | |
| | 8,841,641 | | | 5.500%, due 07/15/33 | | | | | 8,792,856 | | |
| | 568,392 | | | 5.500%, due 09/15/33 | | | | | 565,330 | | |
| | 863,402 | | | 5.500%, due 10/15/33 | | | | | 858,752 | | |
| | 11,019,588 | | | 5.500%, due 11/15/33 | | | | | 10,957,073 | | |
| | 2,427,064 | | | 5.500%, due 12/15/33 | | | | | 2,413,211 | | |
| | 647,567 | | | 5.500%, due 12/20/33 | | | | | 640,855 | | |
| | 3,782,922 | | | 5.500%, due 01/15/34 | | | | | 3,758,828 | | |
| | 684,870 | | | 5.500%, due 01/20/34 | | | | | 677,663 | | |
| | 3,654,847 | | | 5.500%, due 02/15/34 | | | | | 3,631,570 | | |
| | 1,234,223 | | | 5.500%, due 03/15/34 | | | | | 1,227,384 | | |
| | 1,647,081 | | | 5.500%, due 03/20/34 | | | | | 1,629,749 | | |
| | 12,000,716 | | | 5.500%, due 04/15/34 | | | | | 11,930,018 | | |
| | 1,178,877 | | | 5.500%, due 04/20/34 | | | | | 1,167,502 | | |
| | 407,392 | | | 5.500%, due 05/15/34 | | | | | 405,134 | | |
| | 1,874,164 | | | 5.500%, due 06/15/34 | | | | | 1,863,779 | | |
| | 1,072,130 | | | 5.500%, due 06/20/34 | | | | | 1,060,849 | | |
| | 2,012,710 | | | 5.500%, due 07/15/34 | | | | | 2,001,557 | | |
| | 853,506 | | | 5.500%, due 07/20/34 | | | | | 846,114 | | |
| | 9,947,076 | | | 5.500%, due 08/15/34 | | | | | 9,891,958 | | |
| | 1,087,722 | | | 5.500%, due 08/20/34 | | | | | 1,076,277 | | |
| | 8,869,806 | | | 5.500%, due 09/15/34 | | | | | 8,820,660 | | |
| | 5,759,052 | | | 5.500%, due 10/15/34 | | | | | 5,727,141 | | |
| | 191,192 | | | 5.500%, due 12/15/34 | | | | | 190,133 | | |
| | 257,535 | | | 5.500%, due 12/20/34 | | | | | 254,825 | | |
| | 5,692,442 | | | 5.500%, due 01/15/35 | | | | | 5,656,795 | | |
| | 583,751 | | | 5.500%, due 01/20/35 | | | | | 577,189 | | |
| | 3,371,640 | | | 5.500%, due 02/15/35 | | | | | 3,350,526 | | |
| | 3,933,695 | | | 5.500%, due 03/15/35 | | | | | 3,909,060 | | |
| | 3,038,912 | | | 5.500%, due 04/15/35 | | | | | 3,019,881 | | |
| | 5,550,822 | | | 5.500%, due 05/15/35 | | | | | 5,516,061 | | |
| | 1,033,596 | | | 5.500%, due 06/15/35 | | | | | 1,027,124 | | |
| | 1,095,065 | | | 5.500%, due 03/15/36 | | | | | 1,088,091 | | |
| | 16,052,324 | | | 5.500%, due 03/20/36 | | | | | 15,897,414 | | |
| | 20,715,247 | | | 5.500%, due 04/20/36 | | | | | 20,518,690 | | |
| | 1,398,136 | | | 5.500%, due 05/15/36 | | | | | 1,389,232 | | |
| | 16,880,787 | | | 5.500%, due 06/20/36 | | | | | 16,720,613 | | |
| | 14,971,989 | | | 5.500%, due 08/20/36 | | | | | 14,829,927 | | |
| | 523,560 | | | 5.650%, due 07/15/29 | | | | | 524,322 | | |
| | 339,503 | | | 5.750%, due 11/20/27 | | | | | 340,459 | | |
| | 303,144 | | | 5.750%, due 12/20/27 | | | | | 303,997 | | |
| | 231,327 | | | 5.750%, due 02/20/28 | | | | | 231,993 | | |
| | 861,768 | | | 5.750%, due 03/20/28 | | | | | 864,250 | | |
| | 331,627 | | | 5.750%, due 04/20/28 | | | | | 332,582 | | |
| | 311,860 | | | 5.750%, due 07/20/28 | | | | | 312,758 | | |
| | 209,272 | | | 5.750%, due 01/20/29 | | | | | 209,731 | | |
| | 119,022 | | | 5.750%, due 04/20/29 | | | | | 119,283 | | |
| | 1,032,926 | | | 5.750%, due 07/20/29 | | | | | 1,035,191 | | |
| | 639,364 | | | 6.000%, due 10/15/15 | | | | | 651,409 | | |
| | 845,926 | | | 6.000%, due 10/15/25 | | | | | 858,316 | | |
| | 2,294,887 | | | 6.000%, due 04/15/26 | | | | | 2,329,075 | | |
| | 818,446 | | | 6.000%, due 07/15/28 | | | | | 830,979 | | |
| | 581,285 | | | 6.000%, due 08/15/28 | | | | | 590,186 | | |
| | 1,404,137 | | | 6.000%, due 09/15/28 | | | | | 1,425,639 | | |
| | 513,801 | | | 6.000%, due 02/15/29 | | | | | 521,634 | | |
| | 326,426 | | | 6.000%, due 04/15/29 | | | | | 331,168 | | |
| | 445,225 | | | 6.000%, due 02/15/32 | | | | | 451,528 | | |
| | 2,170,350 | | | 6.000%, due 07/15/32 | | | | | 2,201,070 | | |
| | 5,298,407 | | | 6.000%, due 08/15/32 | | | | | 5,373,392 | | |
| | 10,063,390 | | | 6.000%, due 09/15/32 | | | | | 10,205,834 | | |
| | 1,838,265 | | | 6.000%, due 11/15/32 | | | | | 1,864,285 | | |
| | 1,441,938 | | | 6.000%, due 12/15/32 | | | | | 1,462,349 | | |
| | 15,186,060 | | | 6.000%, due 01/15/33 | | | | | 15,394,538 | | |
| | 1,567,269 | | | 6.000%, due 02/15/33 | | | | | 1,588,785 | | |
See Accompanying Notes to Financial Statements
54
PORTFOLIO OF INVESTMENTS
ING GNMA INCOME FUND AS OF SEPTEMBER 30, 2006 (UNAUDITED) (CONTINUED)
Principal
Amount | | | | Value | |
| | | Government National
Mortgage Association
(continued) | |
| $ | 2,208,165 | | | 6.000%, due 03/15/33 | | | | $ | 2,238,479 | | |
| | 609,890 | | | 6.000%, due 04/15/33 | | | | | 618,263 | | |
| | 2,209,603 | | | 6.000%, due 05/15/33 | | | | | 2,239,937 | | |
| | 4,148,439 | | | 6.000%, due 09/15/33 | | | | | 4,205,389 | | |
| | 5,804,823 | | | 6.000%, due 10/15/33 | | | | | 5,884,513 | | |
| | 1,456,640 | | | 6.000%, due 12/15/33 | | | | | 1,476,637 | | |
| | 1,172,347 | | | 6.000%, due 01/15/34 | | | | | 1,187,089 | | |
| | 1,157,261 | | | 6.000%, due 01/20/34 | | | | | 1,169,002 | | |
| | 324,037 | | | 6.000%, due 02/15/34 | | | | | 328,112 | | |
| | 4,415,331 | | | 6.000%, due 03/20/34 | | | | | 4,460,126 | | |
| | 534,337 | | | 6.000%, due 04/20/34 | | | | | 539,758 | | |
| | 3,421,692 | | | 6.000%, due 05/20/34 | | | | | 3,456,407 | | |
| | 203,772 | | | 6.000%, due 06/20/34 | | | | | 205,840 | | |
| | 1,427,699 | | | 6.000%, due 07/20/34 | | | | | 1,442,183 | | |
| | 3,357,667 | | | 6.000%, due 08/20/34 | | | | | 3,391,732 | | |
| | 487,873 | | | 6.000%, due 09/15/34 | | | | | 494,617 | | |
| | 1,043,954 | | | 6.000%, due 10/15/34 | | | | | 1,058,384 | | |
| | 7,326,440 | | | 6.000%, due 10/20/34 | | | | | 7,400,770 | | |
| | 11,564,255 | | | 6.000%, due 11/20/34 | | | | | 11,681,579 | | |
| | 11,921,196 | | | 6.000%, due 12/20/34 | | | | | 12,042,140 | | |
| | 3,011,084 | | | 6.000%, due 01/20/35 | | | | | 3,037,904 | | |
| | 1,160,312 | | | 6.000%, due 02/20/35 | | | | | 1,170,647 | | |
| | 1,905,306 | | | 6.000%, due 03/20/35 | | | | | 1,922,276 | | |
| | 608,025 | | | 6.000%, due 04/20/35 | | | | | 613,441 | | |
| | 478,028 | | | 6.000%, due 06/20/35 | | | | | 482,285 | | |
| | 996,751 | | | 6.000%, due 05/15/36 | | | | | 1,009,286 | | |
| | 1,998,162 | | | 6.000%, due 06/15/36 | | | | | 2,023,289 | | |
| | 1,857,372 | | | 6.000%, due 07/15/36 | | | | | 1,880,729 | | |
| | 1,305,639 | | | 6.000%, due 08/15/36 | | | | | 1,322,058 | | |
| | 1,000,593 | | | 6.000%, due 09/15/36 | | | | | 1,013,176 | | |
| | 164,271 | | | 6.250%, due 03/15/28 | | | | | 167,448 | | |
| | 181,798 | | | 6.250%, due 04/15/28 | | | | | 185,313 | | |
| | 128,503 | | | 6.340%, due 02/15/29 | | | | | 130,096 | | |
| | 334,043 | | | 6.500%, due 02/15/22 | | | | | 335,137 | | |
| | 331,001 | | | 6.500%, due 02/15/26 | | | | | 340,348 | | |
| | 322,377 | | | 6.500%, due 03/15/28 | | | | | 331,724 | | |
| | 210,543 | | | 6.500%, due 08/15/28 | | | | | 216,648 | | |
| | 2,639,347 | | | 6.500%, due 11/15/28 | | | | | 2,715,883 | | |
| | 410,006 | | | 6.500%, due 07/20/29 | | | | | 420,851 | | |
| | 30,733 | | | 6.500%, due 05/15/31 | | | | | 31,587 | | |
| | 1,594,224 | | | 6.500%, due 08/20/31 | | | | | 1,634,519 | | |
| | 393,209 | | | 6.500%, due 09/15/31 | | | | | 404,131 | | |
| | 2,252,844 | | | 6.500%, due 01/15/32 | | | | | 2,314,457 | | |
| | 1,204,904 | | | 6.500%, due 02/15/32 | | | | | 1,237,857 | | |
| | 104,533 | | | 6.500%, due 04/20/32 | | | | | 107,130 | | |
| | 536,318 | | | 6.500%, due 07/20/32 | | | | | 549,644 | | |
| | 790,406 | | | 6.500%, due 08/15/32 | | | | | 812,023 | | |
| | 2,486,966 | | | 6.500%, due 11/15/33 | | | | | 2,551,981 | | |
| | 1,221,902 | | | 6.500%, due 11/20/33 | | | | | 1,250,791 | | |
| | 689,401 | | | 6.500%, due 01/20/34 | | | | | 705,599 | | |
| | 816,631 | | | 6.500%, due 02/20/34 | | | | | 835,819 | | |
| | 391,856 | | | 6.500%, due 03/20/34 | | | | | 401,063 | | |
| | 459,187 | | | 6.500%, due 08/20/34 | | | | | 469,976 | | |
| | 1,011,785 | | | 6.500%, due 09/20/34 | | | | | 1,035,558 | | |
| | 1,570,589 | | | 6.500%, due 12/20/34 | | | | | 1,607,492 | | |
| | 1,471,423 | | | 6.500%, due 04/20/36 | | | | | 1,504,548 | | |
| | 1,203,587 | | | 6.500%, due 05/15/36 | | | | | 1,234,896 | | |
| | 2,815,435 | | | 6.500%, due 09/15/36 | | | | | 2,888,673 | | |
| | 10,000,000 | | | 6.500%, due 09/20/36 | | | | | 10,235,128 | | |
| | 151,119 | | | 6.650%, due 10/15/14 | | | | | 151,781 | | |
| | 219,462 | | | 6.750%, due 06/15/13 | | | | | 220,659 | | |
| | 9,921 | | | 6.750%, due 04/15/14 | | | | | 9,983 | | |
Principal
Amount | | | | Value | |
| $ | 28,196 | | | 6.750%, due 08/15/28 | | | | $ | 28,907 | | |
| | 447,175 | | | 6.750%, due 10/15/28 | | | | | 458,454 | | |
| | 61,015 | | | 6.750%, due 11/15/28 | | | | | 62,554 | | |
| | 1,577,068 | | | 7.000%, due 07/15/22 | | | | | 1,650,345 | | |
| | 103,961 | | | 7.000%, due 09/15/23 | | | | | 107,366 | | |
| | 27,658 | | | 7.000%, due 12/15/23 | | | | | 28,563 | | |
| | 52,399 | | | 7.000%, due 04/15/26 | | | | | 54,184 | | |
| | 289,227 | | | 7.000%, due 01/15/27 | | | | | 299,172 | | |
| | 196,370 | | | 7.000%, due 11/15/27 | | | | | 203,122 | | |
| | 352,024 | | | 7.000%, due 07/15/28 | | | | | 363,692 | | |
| | 28,768 | | | 7.000%, due 07/15/29 | | | | | 29,729 | | |
| | 55,486 | | | 7.000%, due 10/15/30 | | | | | 57,340 | | |
| | 69,271 | | | 7.000%, due 05/15/31 | | | | | 71,569 | | |
| | 806,454 | | | 7.000%, due 06/15/31 | | | | | 833,396 | | |
| | 370,815 | | | 7.000%, due 09/15/31 | | | | | 383,115 | | |
| | 257,202 | | | 7.000%, due 11/15/31 | | | | | 265,630 | | |
| | 242,108 | | | 7.000%, due 12/15/31 | | | | | 250,139 | | |
| | 2,521,518 | | | 7.000%, due 01/15/32 | | | | | 2,604,800 | | |
| | 4,922,059 | | | 7.000%, due 02/15/32 | | | | | 5,084,625 | | |
| | 3,476,014 | | | 7.000%, due 03/15/32 | | | | | 3,590,820 | | |
| | 4,586,650 | | | 7.000%, due 04/15/32 | | | | | 4,738,137 | | |
| | 4,338,912 | | | 7.000%, due 05/15/32 | | | | | 4,482,218 | | |
| | 2,708,734 | | | 7.000%, due 07/15/32 | | | | | 2,798,199 | | |
| | 902,378 | | | 7.000%, due 06/15/34 | | | | | 931,456 | | |
| | 1,022,646 | | | 7.000%, due 08/20/36 | | | | | 1,051,303 | | |
| | 1,154,453 | | | 7.150%, due 07/15/36 | | | | | 1,216,045 | | |
| | 520,673 | | | 7.250%, due 10/15/27 | | | | | 557,491 | | |
| | 48,051 | | | 7.250%, due 01/15/29 | | | | | 49,702 | | |
| | 505,239 | | | 7.250%, due 06/15/29 | | | | | 520,191 | | |
| | 469,496 | | | 7.250%, due 09/15/31 | | | | | 498,515 | | |
| | 757,286 | | | 7.500%, due 12/15/19 | | | | | 778,058 | | |
| | 106,036 | | | 7.500%, due 08/20/27 | | | | | 109,921 | | |
| | 300,284 | | | 7.500%, due 12/15/28 | | | | | 313,275 | | |
| | 281,902 | | | 7.500%, due 08/15/29 | | | | | 291,327 | | |
| | 446,580 | | | 7.500%, due 10/15/30 | | | | | 464,968 | | |
| | 49,911 | | | 7.500%, due 12/15/30 | | | | | 51,966 | | |
| | 371,027 | | | 7.500%, due 01/15/31 | | | | | 386,187 | | |
| | 166,179 | | | 7.500%, due 01/15/32 | | | | | 172,958 | | |
| | 409,544 | | | 7.500%, due 09/15/32 | | | | | 434,406 | | |
| | 55,101 | | | 7.650%, due 12/15/12 | | | | | 56,163 | | |
| | 299,490 | | | 7.700%, due 08/15/13 | | | | | 305,984 | | |
| | 620,273 | | | 7.750%, due 06/15/14 | | | | | 632,750 | | |
| | 534,149 | | | 7.750%, due 09/15/29 | | | | | 554,944 | | |
| | 923,767 | | | 7.750%, due 03/15/32 | | | | | 923,973 | | |
| | 25,352 | | | 7.800%, due 05/15/19 | | | | | 26,692 | | |
| | 38,649 | | | 7.800%, due 07/15/19 | | | | | 40,692 | | |
| | 925,954 | | | 7.800%, due 01/15/42 | | | | | 994,132 | | |
| | 2,050,492 | | | 7.875%, due 09/15/29 | | | | | 2,094,467 | | |
| | 222,965 | | | 8.000%, due 12/15/14 | | | | | 233,018 | | |
| | 12,782 | | | 8.000%, due 03/20/24 | | | | | 13,471 | | |
| | 48,806 | | | 8.000%, due 11/15/25 | | | | | 51,718 | | |
| | 135,507 | | | 8.000%, due 07/15/26 | | | | | 143,676 | | |
| | 165,412 | | | 8.000%, due 09/15/26 | | | | | 175,384 | | |
| | 70,380 | | | 8.000%, due 09/20/26 | | | | | 74,270 | | |
| | 50,437 | | | 8.000%, due 12/15/26 | | | | | 53,478 | | |
| | 29,170 | | | 8.000%, due 04/15/27 | | | | | 30,924 | | |
| | 66,931 | | | 8.000%, due 06/15/27 | | | | | 70,956 | | |
| | 108,943 | | | 8.000%, due 07/15/27 | | | | | 115,495 | | |
| | 27,500 | | | 8.000%, due 03/15/28 | | | | | 29,166 | | |
| | 324,522 | | | 8.000%, due 05/15/30 | | | | | 332,745 | | |
| | 1,322,994 | | | 8.000%, due 01/15/38 | | | | | 1,332,809 | | |
| | 454,531 | | | 8.000%, due 11/15/38 | | | | | 472,001 | | |
| | 43,637 | | | 8.050%, due 07/15/19 | | | | | 46,305 | | |
| | 18,730 | | | 8.050%, due 07/15/20 | | | | | 19,901 | | |
See Accompanying Notes to Financial Statements
55
PORTFOLIO OF INVESTMENTS
ING GNMA INCOME FUND AS OF SEPTEMBER 30, 2006 (UNAUDITED) (CONTINUED)
Principal
Amount | | | | Value | |
| | | Government National
Mortgage Association
(continued) | |
| $ | 418,742 | | | 8.100%, due 06/15/12 | | | | $ | 423,340 | | |
| | 585,228 | | | 8.100%, due 07/15/12 | | | | | 591,737 | | |
| | 4,913,344 | | | 8.125%, due 05/15/38 | | | | | 5,019,784 | | |
| | 450,570 | | | 8.150%, due 12/15/11 | | | | | 455,434 | | |
| | 951,031 | | | 8.150%, due 04/15/12 | | | | | 962,046 | | |
| | 656,431 | | | 8.150%, due 09/15/12 | | | | | 664,523 | | |
| | 481,089 | | | 8.200%, due 10/15/11 | | | | | 486,377 | | |
| | 687,254 | | | 8.200%, due 06/15/12 | | | | | 696,043 | | |
| | 46,075 | | | 8.200%, due 08/15/12 | | | | | 46,678 | | |
| | 1,519,582 | | | 8.200%, due 09/15/12 | | | | | 1,539,722 | | |
| | 179,813 | | | 8.200%, due 10/15/12 | | | | | 182,224 | | |
| | 711,570 | | | 8.200%, due 05/15/13 | | | | | 721,831 | | |
| | 38,289 | | | 8.250%, due 10/15/24 | | | | | 39,303 | | |
| | 675,722 | | | 8.250%, due 11/15/35 | | | | | 697,091 | | |
| | 457,016 | | | 8.250%, due 12/15/37 | | | | | 466,806 | | |
| | 831,594 | | | 8.250%, due 03/15/41 | | | | | 893,421 | | |
| | 45,808 | | | 9.000%, due 05/15/16 | | | | | 49,058 | | |
| | 57,197 | | | 9.000%, due 07/15/16 | | | | | 61,257 | | |
| | 699,052 | | | 9.000%, due 11/15/27 | | | | | 730,426 | | |
| | 1,263,009 | | | 9.000%, due 12/15/34 | | | | | 1,323,365 | | |
| | 13,025 | | | 9.500%, due 11/15/21 | | | | | 14,210 | | |
| | | | 515,740,265 | | |
| | | Total U.S. Government
Agency Obligations
(Cost $520,855,654) | | | | | 517,939,795 | | |
| U.S. TREASURY OBLIGATIONS: 3.2% | | | |
| | | U.S. Treasury Bonds: 0.6% | |
| | 1,000,000 | | | 9.250%, due 02/15/16 | | | | | 1,346,250 | | |
| | 2,310,000 | | | 14.000%, due 11/15/11 | | | | | 2,335,990 | | |
| | | | 3,682,240 | | |
| | | U.S. Treasury Notes: 2.6% | |
| | 25,000 | | | 2.625%, due 11/15/06 | | | | | 24,935 | | |
| | 3,021,000 | | | 4.000%, due 08/31/07 | | | | | 2,996,337 | | |
| | 300,000 | | | 4.000%, due 02/15/14 | | | | | 288,551 | | |
| | 1,868,000 | | | 4.250%, due 10/31/07 | | | | | 1,855,669 | | |
| | 6,705,000 | | | 4.250%, due 10/15/10 | | | | | 6,623,809 | | |
| | 4,543,000 | | | 4.250%, due 08/15/15 | | | | | 4,420,730 | | |
| | 100,000 | | | 4.375%, due 11/15/08 | | | | | 99,410 | | |
| | | | 16,309,441 | | |
| | | Total U.S. Treasury Obligations
(Cost $20,633,835) | | | | | 19,991,681 | | |
| ASSET-BACKED SECURITIES: 0.0% | | | |
| | | Other Asset-Backed Securities: 0.0% | |
| | 56,276 | | | Small Business Administration
Participation Certificates,
8.250%, due 11/01/11 | |
| | | 58,637 | | |
| | | Total Asset-Backed Securities
(Cost $58,202) | | | | | 58,637 | | |
| | | Total Long-Term Investments
(Cost $541,547,691) | | | | | 537,990,113 | | |
Principal
Amount | | | | Value | |
| SHORT-TERM INVESTMENTS: 14.5% | |
| | | Treasury Bills: 14.5% | |
| $ | 91,500,000 | | | United States Treasury Bill,
4.710%, due 01/04/07 | | | | $ | 90,365,126 | | |
| | | Total Short-Term Investments
(Cost $90,314,334) | | | | | 90,365,126 | | |
| | | Total Investments
in Securities (Cost
$631,862,025)* | |
100.7% | | $ | 628,355,239 | | |
| | | Other Assets and
Liabilities-Net | |
(0.7) | | | (4,665,189 | ) | |
| | Net Assets | | | 100.0 | % | | $ | 623,690,050 | | |
* Cost for federal income tax purposes is $631,862,353
Net unrealized depreciation consists of:
| Gross Unrealized Appreciation | | $ | 3,593,924 | | |
| Gross Unrealized Depreciation | | | (7,101,038 | ) | |
| Net Unrealized Depreciation | | $ | (3,507,114 | ) | |
See Accompanying Notes to Financial Statements
56
PORTFOLIO OF INVESTMENTS
ING HIGH YIELD BOND FUND AS OF SEPTEMBER 30, 2006 (UNAUDITED)
Principal
Amount | | | | | | Value | |
| CORPORATE BONDS/NOTES: 96.7% | | | |
| | | | | Advertising: 1.7% | |
| $ | 1,400,000 | | | C | | R.H. Donnelley Corp., 6.875%,
due 01/15/13 | | | | $ | 1,284,500 | | |
| | 385,000 | | | C | | R.H. Donnelley Corp., 8.875%,
due 01/15/16 | | | | | 387,888 | | |
| | 1,230,000 | | | C | | Vertis, Inc., 9.750%,
due 04/01/09 | | | | | 1,246,913 | | |
| | | | 2,919,301 | | |
| | | | | Aerospace/Defense: 0.6% | |
| | 1,045,000 | | | C | | DRS Technologies, Inc., 6.875%,
due 11/01/13 | | | | | 1,037,163 | | |
| | | | 1,037,163 | | |
| | | | | Airlines: 1.2% | |
| | 800,000 | | | | | AMR Corp., 8.608%,
due 04/01/11 | | | | | 829,500 | | |
| | 642,042 | | | C | | Continental Airlines, Inc., 7.461%,
due 04/01/15 | | | | | 642,444 | | |
| | 515,000 | | | | | United AirLines, Inc., 6.932%,
due 09/01/11 | | | | | 564,247 | | |
| | | | 2,036,191 | | |
| | | | | Apparel: 0.8% | |
| | 750,000 | | | C | | Levi Strauss & Co., 10.122%,
due 04/01/12 | | | | | 776,250 | | |
| | 630,000 | | | C | | Phillips-Van Heusen, 8.125%,
due 05/01/13 | | | | | 659,925 | | |
| | | | 1,436,175 | | |
| | | | | Auto Manufacturers: 1.3% | |
| | 1,160,000 | | | | | Ford Motor Co., 7.450%,
due 07/16/31 | | | | | 901,900 | | |
| | 1,475,000 | | | C | | General Motors Corp., 8.375%,
due 07/15/33 | | | | | 1,283,250 | | |
| | | | 2,185,150 | | |
| | | | | Auto Parts & Equipment: 1.2% | |
| | 260,000 | | | C | | Goodyear Tire & Rubber Co.,
9.000%, due 07/01/15 | | | | | 265,200 | | |
| | 810,000 | | | C | | Tenneco, Inc., 8.625%,
due 11/15/14 | | | | | 803,925 | | |
| | 935,000 | | | C | | Visteon Corp., 8.250%,
due 08/01/10 | | | | | 916,300 | | |
| | | | 1,985,425 | | |
| | | | | Building Materials: 1.6% | |
| | 570,000 | | | @@,C | | Ainsworth Lumber Co., Ltd.,
6.750%, due 03/15/14 | | | | | 401,850 | | |
| | 675,000 | | | C | | Goodman Global Holding Co., Inc.,
7.875%, due 12/15/12 | | | | | 646,313 | | |
| | 205,000 | | | C | | Goodman Global Holdings, Inc.,
8.329%, due 06/15/12 | | | | | 208,331 | | |
| | 625,000 | | | C | | Interline Brands, Inc., 8.125%,
due 06/15/14 | | | | | 635,938 | | |
| | 970,000 | | | C | | Ply Gem Industries, Inc., 9.000%,
due 02/15/12 | | | | | 778,425 | | |
| | | | 2,670,857 | | |
Principal
Amount | | | | | | Value | |
| | | | | Chemicals: 7.5% | |
| $ | 745,000 | | | C | | Equistar Chemicals LP, 10.625%,
due 05/01/11 | | | | $ | 802,738 | | |
| | 3,180,000 | | | @@,#,C | | Ineos Group Holdings PLC,
8.500%, due 02/15/16 | | | | | 3,044,850 | | |
| | 1,675,000 | | | C | | Lyondell Chemical Co., 8.000%,
due 09/15/14 | | | | | 1,704,313 | | |
| | 1,000,000 | | | C | | Lyondell Chemical Co., 8.250%,
due 09/15/16 | | | | | 1,020,000 | | |
| | 1,840,000 | | | @@,C | | Nova Chemicals Corp., 6.500%,
due 01/15/12 | | | | | 1,738,800 | | |
| | 1,775,000 | | | @@,C | | Nova Chemicals Corp., 8.405%,
due 11/15/13 | | | | | 1,819,375 | | |
| | 1,750,000 | | | C | | PolyOne Corp., 8.875%,
due 05/01/12 | | | | | 1,776,250 | | |
| | 851,000 | | | C | | Rockwood Specialties Group, Inc.,
10.625%, due 05/15/11 | | | | | 914,825 | | |
| | | | 12,821,151 | | |
| | | | | Commercial Services: 4.9% | |
| | 1,690,000 | | | #,C | | Ashtead Capital, Inc., 9.000%,
due 08/15/16 | | | | | 1,766,050 | | |
| | 980,000 | | | #,C | | Avis Budget Car Rental, LLC,
7.625%, due 05/15/14 | | | | | 955,500 | | |
| | 465,000 | | | #,C | | Avis Budget Car Rental, LLC,
7.750%, due 05/15/16 | | | | | 451,050 | | |
| | 770,000 | | | C | | Corrections Corp. of America,
7.500%, due 05/01/11 | | | | | 791,175 | | |
| | 780,000 | | | #,C | | H&E Equipment Services, Inc.,
8.375%, due 07/15/16 | | | | | 803,400 | | |
| | 680,000 | | | #,C | | Hertz Corp., 8.875%,
due 01/01/14 | | | | | 715,700 | | |
| | 1,130,000 | | | #,C | | Hertz Corp., 10.500%,
due 01/01/16 | | | | | 1,248,650 | | |
| | 300,000 | | | C | | United Rentals North America,
Inc., 6.500%, due 02/15/12 | | | | | 291,000 | | |
| | 1,560,000 | | | C | | United Rentals North America,
Inc., 7.000%, due 02/15/14 | | | | | 1,474,200 | | |
| | | | 8,496,725 | | |
| | | | | Computers: 0.9% | |
| | 1,545,000 | | | C | | Sungard Data Systems, Inc.,
9.125%, due 08/15/13 | | | | | 1,606,800 | | |
| | | | 1,606,800 | | |
| | | | | Diversified Financial Services: 10.9% | |
| | 1,205,000 | | | # | | Astoria Depositor Corp., 8.144%,
due 05/01/21 | | | | | 1,322,807 | | |
| | 685,000 | | | C | | BCP Crystal US Holdings Corp.,
9.625%, due 06/15/14 | | | | | 746,650 | | |
| | 555,000 | | | +,C | | Crystal US Holdings 3, LLC, 2.550%,
(step rate 10.500%),
due 10/01/14 | | | | | 453,019 | | |
| | 2,200,000 | | | #,S | | Ford Motor Credit Co., 9.750%,
due 09/15/10 | | | | | 2,273,284 | | |
| | 1,030,000 | | | | | Ford Motor Credit Co., 9.824%,
due 04/15/12 | | | | | 1,079,176 | | |
| | 2,295,000 | | | | | Ford Motor Credit Co., 9.875%,
due 08/10/11 | | | | | 2,377,161 | | |
| | 1,330,000 | | | | | General Motors Acceptance Corp.,
5.125%, due 05/09/08 | | | | | 1,303,799 | | |
| | 4,135,000 | | | | | General Motors Acceptance Corp.,
6.875%, due 09/15/11 | | | | | 4,117,344 | | |
See Accompanying Notes to Financial Statements
57
PORTFOLIO OF INVESTMENTS
ING HIGH YIELD BOND FUND AS OF SEPTEMBER 30, 2006 (UNAUDITED) (CONTINUED)
Principal
Amount | | | | | | Value | |
| | | | | Diversified Financial Services (continued) | |
| $ | 1,020,000 | | | | | General Motors Acceptance Corp.,
8.000%, due 11/01/31 | | | | $ | 1,069,441 | | |
| | 1,250,000 | | | #,C,S | | Piper Jaffray Equipment Trust
Securities, 6.750%,
due 04/01/11 | | | | | 1,237,500 | | |
| | 870,000 | | | #,C | | Rainbow National Services, LLC,
8.750%, due 09/01/12 | | | | | 935,250 | | |
| | 950,000 | | | C | | Universal City Florida
Holding Co. I/II, 10.239%,
due 05/01/10 | | | | | 980,875 | | |
| | 855,000 | | | C | | Visant Corp., 7.625%,
due 10/01/12 | | | | | 863,550 | | |
| | | | 18,759,856 | | |
| | | | | Electric: 3.2% | |
| | 495,000 | | | #,C | | AES Corp., 8.750%,
due 05/15/13 | | | | | 533,363 | | |
| | 240,000 | | | C | | CMS Energy Corp., 7.500%,
due 01/15/09 | | | | | 248,400 | | |
| | 1,165,000 | | | C | | CMS Energy Corp., 8.500%,
due 04/15/11 | | | | | 1,264,025 | | |
| | 717,882 | | | C | | Homer City Funding, LLC,
8.734%, due 10/01/26 | | | | | 798,644 | | |
| | 1,809,951 | | | C | | Midwest Generation, LLC,
8.300%, due 07/02/09 | | | | | 1,847,282 | | |
| | 860,000 | | | C | | Mirant North America, LLC,
7.375%, due 12/31/13 | | | | | 865,375 | | |
| | | | 5,557,089 | | |
| | | | | Entertainment: 4.7% | |
| | 820,000 | | | C | | AMC Entertainment, Inc.,
8.625%, due 08/15/12 | | | | | 850,750 | | |
| | 1,325,000 | | | C | | AMC Entertainment, Inc.,
11.000%, due 02/01/16 | | | | | 1,450,875 | | |
| | 1,075,000 | | | C | | American Casino & Entertainment
Properties, LLC, 7.850%,
due 02/01/12 | | | | | 1,096,500 | | |
| | 1,700,000 | | | | | Cedar Fair LP, 7.870%,
due 06/13/12 | | | | | 1,709,911 | | |
| | 885,000 | | | C | | Pinnacle Entertainment, Inc.,
8.250%, due 03/15/12 | | | | | 900,488 | | |
| | 490,000 | | | #,C | | Pokagon Gaming Authority,
10.375%, due 06/15/14 | | | | | 524,913 | | |
| | 195,000 | | | C | | Six Flags Theme Parks, Inc.,
8.875%, due 02/01/10 | | | | | 187,688 | | |
| | 195,000 | | | C | | Six Flags Theme Parks, Inc.,
9.625%, due 06/01/14 | | | | | 174,525 | | |
| | 1,230,000 | | | C | | Warner Music Group - Old,
7.375%, due 04/15/14 | | | | | 1,205,400 | | |
| | | | 8,101,050 | | |
| | | | | Environmental Control: 1.7% | |
| | 680,000 | | | C | | Allied Waste North America, Inc.,
8.500%, due 12/01/08 | | | | | 715,700 | | |
| | 1,230,000 | | | C | | Waste Services, Inc., 9.500%,
due 04/15/14 | | | | | 1,266,900 | | |
| | 865,000 | | | #,C | | WCA Waste Corp., 9.250%,
due 06/15/14 | | | | | 901,763 | | |
| | | | 2,884,363 | | |
Principal
Amount | | | | | | Value | |
| | | | | Food: 1.1% | |
| $ | 770,000 | | | C | | Albertson's, Inc., 7.450%,
due 08/01/29 | | | | $ | 717,070 | | |
| | 980,000 | | | C | | Albertson's, Inc., 7.500%,
due 02/15/11 | | | | | 1,003,335 | | |
| | 175,000 | | | C | | Stater Brothers Holdings,
8.125%, due 06/15/12 | | | | | 176,750 | | |
| | | | 1,897,155 | | |
| | | | | Forest Products & Paper: 4.2% | |
| | 1,958,000 | | | @@,C,S | | Abitibi-Consolidated Finance LP,
7.875%, due 08/01/09 | | | | | 1,948,210 | | |
| | 1,135,000 | | | C | | Appleton Papers, Inc., 8.125%,
due 06/15/11 | | | | | 1,140,675 | | |
| | 715,000 | | | @@,C | | Domtar, Inc., 7.875%,
due 10/15/11 | | | | | 715,000 | | |
| | 740,000 | | | C | | Georgia-Pacific Corp., 7.750%,
due 11/15/29 | | | | | 714,100 | | |
| | 840,000 | | | C | | NewPage Corp., 12.000%,
due 05/01/13 | | | | | 873,600 | | |
| | 530,000 | | | @@,C | | Tembec Industries, Inc., 7.750%,
due 03/15/12 | | | | | 270,300 | | |
| | 685,000 | | | #,C | | Verso Paper Holdings, LLC,
9.125%, due 08/01/14 | | | | | 692,706 | | |
| | 270,000 | | | #,C | | Verso Paper Holdings, LLC,
9.239%, due 08/01/14 | | | | | 274,050 | | |
| | 520,000 | | | #,C | | Verso Paper Holdings, LLC,
11.375%, due 08/01/16 | | | | | 518,700 | | |
| | | | 7,147,341 | | |
| | | | | Healthcare-Products: 1.1% | |
| | 1,805,000 | | | C | | VWR International, Inc., 8.000%,
due 04/15/14 | | | | | 1,829,819 | | |
| | | | 1,829,819 | | |
| | | | | Healthcare-Services: 2.7% | |
| | 990,000 | | | C | | Community Health Systems, Inc.,
6.500%, due 12/15/12 | | | | | 951,638 | | |
| | 1,015,000 | | | C | | DaVita, Inc., 7.250%,
due 03/15/15 | | | | | 1,002,313 | | |
| | 1,280,000 | | | C | | HCA, Inc., 7.875%,
due 02/01/11 | | | | | 1,230,400 | | |
| | 1,080,000 | | | C | | Psychiatric Solutions, Inc.,
7.750%, due 07/15/15 | | | | | 1,058,400 | | |
| | 530,000 | | | C | | Tenet Healthcare Corp.,
6.375%, due 12/01/11 | | | | | 468,388 | | |
| | | | 4,711,139 | | |
| | | | | Holding Companies-Diversified: 0.6% | |
| | 1,100,000 | | | C | | Atlantic Broadband Finance, LLC,
9.375%, due 01/15/14 | | | | | 1,080,750 | | |
| | | | 1,080,750 | | |
| | | | | Home Builders: 1.7% | |
| | 885,000 | | | C | | Standard-Pacific Corp.,
6.500%, due 08/15/10 | | | | | 836,325 | | |
| | 1,150,000 | | | C | | Stanley-Martin Communities, LLC,
9.750%, due 08/15/15 | | | | | 917,125 | | |
| | 995,000 | | | C | | Technical Olympic USA, Inc.,
9.000%, due 07/01/10 | | | | | 951,469 | | |
| | 300,000 | | | C | | Technical Olympic USA, Inc.,
10.375%, due 07/01/12 | | | | | 261,000 | | |
| | | | 2,965,919 | | |
See Accompanying Notes to Financial Statements
58
PORTFOLIO OF INVESTMENTS
ING HIGH YIELD BOND FUND AS OF SEPTEMBER 30, 2006 (UNAUDITED) (CONTINUED)
Principal
Amount | | | | | | Value | |
| | | | | Home Furnishings: 0.5% | |
| $ | 795,000 | | | C | | Norcraft Cos. LP/Norcraft
Finance Corp., 9.000%,
due 11/01/11 | | | | $ | 809,906 | | |
| | | | 809,906 | | |
| | | | | Household Products/Wares: 1.1% | |
| | 925,000 | | | C | | American Achievement Corp.,
8.250%, due 04/01/12 | | | | | 938,875 | | |
| | 1,155,000 | | | +,C | | Visant Holding Corp., 2.620%,
(step rate 10.250%),
due 12/01/13 | | | | | 958,650 | | |
| | | | 1,897,525 | | |
| | | | | Iron/Steel: 0.2% | |
| | 445,000 | | | C | | California Steel Industries, Inc.,
6.125%, due 03/15/14 | | | | | 416,631 | | |
| | | | 416,631 | | |
| | | | | Leisure Time: 0.9% | |
| | 1,005,000 | | | @@,C | | NCL Corp., 10.625%,
due 07/15/14 | | | | | 977,363 | | |
| | 375,000 | | | @@ | | Royal Caribbean Cruises Ltd.,
7.500%, due 10/15/27 | | | | | 368,118 | | |
| | 265,000 | | | @@ | | Royal Caribbean Cruises Ltd.,
8.000%, due 05/15/10 | | | | | 282,153 | | |
| | | | 1,627,634 | | |
| | | | | Lodging: 2.2% | |
| | 490,000 | | | #,C | | French Lick Resorts & Casino
Corp., 10.750%,
due 04/15/14 | | | | | 447,125 | | |
| | 2,100,000 | | | S | | MGM Mirage, 6.284%,
due 04/25/10 | | | | | 2,092,817 | | |
| | 875,000 | | | C | | Station Casinos, Inc., 6.500%,
due 02/01/14 | | | | | 823,594 | | |
| | 480,000 | | | C | | Wynn Las Vegas, LLC, 6.625%,
due 12/01/14 | | | | | 468,000 | | |
| | | | 3,831,536 | | |
| | | | | Machinery-Construction & Mining: 0.1% | |
| | 150,000 | | | C | | Terex Corp., 7.375%,
due 01/15/14 | | | | | 151,500 | | |
| | | | 151,500 | | |
| | | | | Media: 15.5% | |
| | 880,000 | | | C | | American Media Operations, Inc.,
10.250%, due 05/01/09 | | | | | 822,800 | | |
| | 995,000 | | | C | | Cablevision Systems Corp.,
8.000%, due 04/15/12 | | | | | 1,012,413 | | |
| | 1,160,000 | | | C | | CBD Media, Inc., 8.625%,
due 06/01/11 | | | | | 1,148,400 | | |
| | 1,234,959 | | | #,C | | Charter Communications
Holdings, LLC, 10.250%,
due 10/01/13 | | | | | 1,262,746 | | |
| | 1,884,147 | | | #,C | | Charter Communications
Holdings, LLC, 11.000%,
due 10/01/15 | | | | | 1,720,026 | | |
| | 1,430,000 | | | #,C | | Charter Communications
Operating, LLC, 8.000%,
due 04/30/12 | | | | | 1,447,875 | | |
| | 1,375,000 | | | #,C | | Charter Communications
Operating, LLC, 8.375%,
due 04/30/14 | | | | | 1,404,219 | | |
Principal
Amount | | | | | | Value | |
| $ | 1,075,000 | | | #,C | | CMP Susquehanna Corp.,
9.875%, due 05/15/14 | | | | $ | 1,015,875 | | |
| | 570,000 | | | | | CSC Holdings, Inc., 7.625%,
due 04/01/11 | | | | | 587,813 | | |
| | 1,015,000 | | | | | CSC Holdings, Inc., 7.625%,
due 07/15/18 | | | | | 1,044,181 | | |
| | 2,410,000 | | | S | | CSC Holdings, Inc., 8.125%,
due 07/15/09 | | | | | 2,506,400 | | |
| | 1,324,000 | | | C | | Dex Media West, LLC, 9.875%,
due 08/15/13 | | | | | 1,436,540 | | |
| | 495,000 | | | C | | Dex Media, Inc., 8.000%,
due 11/15/13 | | | | | 493,763 | | |
| | 730,000 | | | C | | Echostar DBS Corp., 5.750%,
due 10/01/08 | | | | | 725,438 | | |
| | 1,680,000 | | | +,C | | Houghton Mifflin Co., 1.860%,
(step rate 11.500%),
due 10/15/13 | | | | | 1,474,200 | | |
| | 1,195,000 | | | C | | Houghton Mifflin Co., 8.250%,
due 02/01/11 | | | | | 1,232,038 | | |
| | 985,000 | | | #,C | | Houghton Mifflin Co., 12.031%,
due 05/15/11 | | | | | 1,021,938 | | |
| | 995,000 | | | +,C | | Insight Communications Co., Inc.,
12.250%, due 02/15/11 | | | | | 1,057,188 | | |
| | 1,105,000 | | | #,C | | ION Media Networks, Inc.,
11.624%, due 01/15/13 | | | | | 1,118,813 | | |
| | 625,000 | | | #,C | | Mediacom Broadband, LLC,
8.500%, due 10/15/15 | | | | | 624,219 | | |
| | 930,000 | | | #,C | | Nexstar Finance, Inc., 7.000%,
due 01/15/14 | | | | | 850,950 | | |
| | 750,000 | | | @@,#,C | | Nielsen Finance Co., 10.000%,
due 08/01/14 | | | | | 779,063 | | |
| | 1,540,000 | | | C | | Primedia, Inc., 10.780%,
due 05/15/10 | | | | | 1,582,350 | | |
| | 365,000 | | | C | | Radio One, Inc., 6.375%,
due 02/15/13 | | | | | 333,975 | | |
| | | | 26,703,223 | | |
| | | | | Metal Fabricate/Hardware: 0.5% | |
| | 920,000 | | | C | | Trimas Corp., 9.875%,
due 06/15/12 | | | | | 855,600 | | |
| | | | 855,600 | | |
| | | �� | | Miscellaneous Manufacturing: 0.6% | |
| | 665,000 | | | #,C | | RBS Global, Inc. and Rexnord
Corp., 9.500%, due 08/01/14 | | | | | 678,300 | | |
| | 270,000 | | | #,C | | RBS Global, Inc. and Rexnord
Corp., 11.750%, due 08/01/16 | | | | | 279,450 | | |
| | | | 957,750 | | |
| | | | | Oil & Gas: 2.6% | |
| | 900,000 | | | C | | Chesapeake Energy Corp.,
6.625%, due 01/15/16 | | | | | 873,000 | | |
| | 1,065,000 | | | #,C | | Hilcorp Finance Co., 9.000%,
due 06/01/16 | | | | | 1,104,938 | | |
| | 695,000 | | | C | | Newfield Exploration Co.,
6.625%, due 09/01/14 | | | | | 683,706 | | |
| | 958,000 | | | C | | Parker Drilling Co., 10.150%,
due 09/01/10 | | | | | 983,148 | | |
| | 830,000 | | | C | | Whiting Petroleum Corp., 7.250%,
due 05/01/13 | | | | | 817,550 | | |
| | | | 4,462,342 | | |
See Accompanying Notes to Financial Statements
59
PORTFOLIO OF INVESTMENTS
ING HIGH YIELD BOND FUND AS OF SEPTEMBER 30, 2006 (UNAUDITED) (CONTINUED)
Principal
Amount | | | | | | Value | |
| | | | | Oil & Gas Services: 0.7% | |
| $ | 750,000 | | | C | | Hanover Equipment Trust,
8.750%, due 09/01/11 | | | | $ | 783,750 | | |
| | 365,000 | | | #,C | | RathGibson, Inc., 11.250%,
due 02/15/14 | | | | | 377,775 | | |
| | | | 1,161,525 | | |
| | | | | Packaging & Containers: 0.4% | |
| | 610,000 | | | C | | Graham Packaging Co., Inc.,
8.500%, due 10/15/12 | | | | | 606,950 | | |
| | | | 606,950 | | |
| | | | | Pipelines: 1.5% | |
| | 1,080,000 | | | C | | Southern Natural Gas Co.,
8.000%, due 03/01/32 | | | | | 1,199,479 | | |
| | 1,260,000 | | | C | | Transcontinental Gas Pipe Line
Corp., 7.250%, due 12/01/26 | | | | | 1,289,925 | | |
| | | | 2,489,404 | | |
| | | | | Real Estate Investment Trusts: 0.3% | |
| | 455,000 | | | C | | Felcor Lodging LP, 9.570%,
due 06/01/11 | | | | | 465,238 | | |
| | | | 465,238 | | |
| | | | | Retail: 4.3% | |
| | 1,335,000 | | | C | | Blockbuster, Inc., 9.000%,
due 09/01/12 | | | | | 1,231,538 | | |
| | 855,000 | | | C | | Bon-Ton Stores, Inc., 10.250%,
due 03/15/14 | | | | | 835,763 | | |
| | 705,000 | | | C | | Dominos, Inc., 8.250%,
due 07/01/11 | | | | | 743,775 | | |
| | 270,000 | | | C | | Duane Reade, Inc., 9.890%,
due 12/15/10 | | | | | 274,725 | | |
| | 720,000 | | | C | | General Nutrition Centers, Inc.,
8.500%, due 12/01/10 | | | | | 702,000 | | |
| | 1,205,000 | | | C | | General Nutrition Centers, Inc.,
8.625%, due 01/15/11 | | | | | 1,238,138 | | |
| | 815,000 | | | C | | GSC Holdings Corp., 8.000%,
due 10/01/12 | | | | | 843,525 | | |
| | 1,465,000 | | | C | | Neiman-Marcus Group, Inc.,
9.000%, due 10/15/15 | | | | | 1,563,888 | | |
| | | | 7,433,352 | | |
| | | | | Semiconductors: 0.5% | |
| | 905,000 | | | @@,C | | STATS ChipPAC Ltd., 7.500%,
due 07/19/10 | | | | | 905,000 | | |
| | | | 905,000 | | |
| | | | | Telecommunications: 11.2% | |
| | 330,000 | | | C | | American Tower Corp., 7.125%,
due 10/15/12 | | | | | 339,900 | | |
| | 390,000 | | | C | | Centennial Communications Corp.,
10.000%, due 01/01/13 | | | | | 396,825 | | |
| | 720,000 | | | C | | Centennial Communications Corp.,
10.125%, due 06/15/13 | | | | | 768,600 | | |
| | 1,540,000 | | | C | | Cincinnati Bell, Inc., 8.375%,
due 01/15/14 | | | | | 1,563,100 | | |
| | 830,000 | | | C | | Citizens Communications Co.,
9.000%, due 08/15/31 | | | | | 894,325 | | |
| | 275,000 | | | C | | Citizens Communications Co.,
9.250%, due 05/15/11 | | | | | 304,563 | | |
| | 1,125,000 | | | C | | Dobson Cellular Systems, 9.875%,
due 11/01/12 | | | | | 1,212,188 | | |
Principal
Amount | | | | | | Value | |
| $ | 255,000 | | | C | | Dobson Communications Corp.,
9.624%, due 10/15/12 | | | | $ | 261,375 | | |
| | 2,079,000 | | | C | | Insight Capital, Inc., 10.500%,
due 11/01/10 | | | | | 2,162,160 | | |
| | 1,905,000 | | | @@,#,C | | Intelsat Bermuda Ltd., 11.250%,
due 06/15/16 | | | | | 2,033,588 | | |
| | 2,375,000 | | | @@,C,S | | Intelsat Ltd., 5.250%,
due 11/01/08 | | | | | 2,291,875 | | |
| | 970,000 | | | @@,C | | Intelsat Subsidiary Holding Co.,
Ltd., 8.625%, due 01/15/15 | | | | | 996,675 | | |
| | 260,000 | | | C | | LCI International, Inc., 7.250%,
due 06/15/07 | | | | | 261,950 | | |
| | 860,000 | | | #,C | | PanAmSat Corp., 9.000%,
due 06/15/16 | | | | | 890,100 | | |
| | 3,650,000 | | | C,S | | Qwest Capital Funding, Inc.,
6.375%, due 07/15/08 | | | | | 3,672,813 | | |
| | 445,000 | | | C | | Qwest Capital Funding, Inc.,
7.000%, due 08/03/09 | | | | | 449,450 | | |
| | 465,000 | | | | | Qwest Corp., 8.640%,
due 06/15/13 | | | | | 499,875 | | |
| | 310,000 | | | @@,C | | Rogers Wireless, Inc., 7.250%,
due 12/15/12 | | | | | 325,888 | | |
| | 5,000 | | | C | | Rural Cellular Corp., 9.875%,
due 02/01/10 | | | | | 5,238 | | |
| | | | 19,330,488 | | |
| | | Total Corporate Bonds/Notes
(Cost $165,375,982) | | | | | 166,235,023 | | |
| Shares | | Value | |
| COMMON STOCK: 1.4% | |
| | | | | Agriculture: 0.0% | |
| | 17,906 | | | @,I,X | | North Atlantic Trading Co. | | | | $ | 18 | | |
| | | | 18 | | |
| | | | | Auto Parts & Equipment: 0.6% | |
| | 130,000 | | | @ | | Visteon Corp. | | | | | 1,059,500 | | |
| | | | 1,059,500 | | |
| | | | | Exchange Traded Fund: 0.8% | |
| | 191,500 | | | ** | | ING Prime Rate Trust | | | | | 1,365,395 | | |
| | | | 1,365,395 | | |
| | | | | Telecommunications: 0.0% | |
| | 264 | | | @,@@ | | Completel Europe NV | | | | | 7,236 | | |
| | 2,350 | | | @,I,X | | Jordan Tellecommunications | | | | | 50,807 | | |
| | | | 58,043 | | |
| | | Total Common Stock
(Cost $2,735,566) | | | | | 2,482,956 | | |
| PREFERRED STOCK: 0.0% | | | |
| | | | | Media: 0.0% | |
| | 1 | | | | | ION Media Networks, Inc. | | | | | 8,935 | | |
| | | Total Preferred Stock
(Cost $8,676) | | | | | 8,935 | | |
| WARRANTS: 0.2% | | | |
| | | | | Building Materials: 0.0% | |
| | 3,100 | | | #,I,X | | Dayton Superior Corp. | | | | | 31 | | |
| | | | 31 | | |
See Accompanying Notes to Financial Statements
60
PORTFOLIO OF INVESTMENTS
ING HIGH YIELD BOND FUND AS OF SEPTEMBER 30, 2006 (UNAUDITED) (CONTINUED)
| Shares | | | | | | Value | |
| | | | | Commercial Services: 0.0% | |
| | 92,950 | | | I,X | | Comforce Corp. | | | | $ | 930 | | |
| | | | 930 | | |
| | | | | Telecommunications: 0.2% | |
| | 580 | | | | | American Tower Corp. | | | | | 299,015 | | |
| | 500 | | | @@,#,I,X | | GT Group Telecom, Inc. | | | | | — | | |
| | | | 299,015 | | |
| | | Total Warrants (Cost $47,403) | | | | | 299,976 | | |
| | | Total Long-Term Investments
(Cost $168,167,627) | | | | | 169,026,890 | | |
Principal
Amount | | | | Value | |
| SHORT-TERM INVESTMENTS: 0.5% | |
| | | Repurchase Agreement: 0.5% | |
| $ | 796,000 | | | Goldman Sachs Repurchase | | | |
| |
| | Agreement dated 09/29/06, | | | |
| |
| | 5.320%, due 10/02/06, $796,353 | | | |
| |
| | to be received upon repurchase | | | |
| |
| | (Collateralized by $810,000 | | | |
| |
| | Federal Home Loan Bank, | | | |
| |
| | 3.200%, Market Value plus | | | |
| |
| | accrued interest $815,854, | | | |
| |
| | due 11/29/06) | | $ | 796,000 | | |
| | | Total Short-Term Investments
(Cost $796,000) | |
| | | 796,000 | | |
| | | Total Investments in
Securities (Cost
$168,963,627)* | | | 98.8 | % | | $169,822,890 | |
| | | Other Assets and
Liabilities-Net | | | 1.2 | | | | 2,057,409 | | |
| | | Net Assets | | | 100.0 | % | | $ | 171,880,299 | | |
Certain securities have been fair valued in accordance with procedures approved by the Board of Trustees (Note 2A)
@ Non-income producing security
@@ Foreign Issuer
+ Step-up basis bonds. Interest rates shown reflect current coupon rates.
# Securities with purchases pursuant to Rule 144A, under the Securities Act of 1933 and may not be resold subject to that rule except to qualified institutional buyers. These securities have been determined to be liquid under the guidelines established by the Funds' Board of Directors/Trustees.
C Bond may be called prior to maturity date.
S Segregated securities for certain derivatives, when-issued or delayed delivery securities and forward currency exchange contracts.
I Illiquid security
X Fair value determined by ING Funds Valuation Committee appointed by the Funds' Board of Directors/Trustees.
** Investment in affiliate
* Cost for federal income tax purposes is $169,028,752. Net unrealized appreciation consists of:
| Gross Unrealized Appreciation | | $ | 3,038,274 | | |
| Gross Unrealized Depreciation | | | (2,244,136 | ) | |
| Net Unrealized Appreciation | | $ | 794,138 | | |
Information concerning open futures contracts at September 30, 2006 is shown below:
| Long Contracts | | No. of
Contracts | | Notional
Market Value | | Expiration
Date | | Unrealized
Gain | |
U.S. 10-Year
Treasury Note | | | 85 | | | $ | 9,185,313 | | | | 12/19/2006 | | | $ | 79,262 | | |
See Accompanying Notes to Financial Statements
61
PORTFOLIO OF INVESTMENTS
ING INTERMEDIATE BOND FUND AS OF SEPTEMBER 30, 2006 (UNAUDITED)
Principal
Amount | | | | | | Value | |
| CORPORATE BONDS/NOTES: 25.3% | | | |
| | | | | Airlines: 0.2% | |
| $ | 494,505 | | | | | Continental Airlines, Inc.,
8.312%, due 04/02/11 | | $ | 460,199 | | |
| | 1,742,000 | | | | | United Air Lines, Inc.,
6.932%, due 09/01/11 | | | 1,908,579 | | |
| | | | 2,368,778 | | |
| | | | | Auto Manufacturers: 0.0% | |
| | 115,000 | | | | | General Motors Corp.,
8.375%, due 07/15/33 | | | 100,050 | | |
| | | | 100,050 | | |
| | | | | Banks: 6.7% | |
| | 2,930,000 | | | @@,L | | Australia & New Zealand
Banking Group Ltd.,
5.400%, due 10/29/49 | | | 2,550,940 | | |
| | 754,000 | | | @@,# | | Banco do Brasil, 7.950%,
due 12/31/49 | | | 755,885 | | |
| | 989,048 | | | @@,# | | Banco Itau SA, 5.739%,
due 09/20/08 | | | 986,279 | | |
| | 1,878,000 | | | @@ | | Banco Santander Chile SA,
7.375%, due 07/18/12 | | | 2,057,251 | | |
| | 1,060,000 | | | @@ | | Bank of Ireland, 5.688%,
due 12/29/49 | | | 936,007 | | |
| | 1,180,000 | | | @@ | | Bank of Nova Scotia,
5.625%, due 08/21/85 | | | 1,002,089 | | |
| | 540,000 | | | @@,L | | Bank of Scotland, 5.563%,
due 11/30/49 | | | 471,150 | | |
| | 177,000 | | | | | BankAmerica Capital II,
8.000%, due 12/15/26 | | | 184,604 | | |
| | 710,000 | | | @@,L | | Barclays Bank PLC, 5.750%,
due 12/31/49 | | | 633,525 | | |
| | 843,000 | | | | | Chase Capital I, 7.670%,
due 12/01/26 | | | 877,331 | | |
| | 1,861,000 | | | @@,# | | Chuo Mitsui Trust &
Banking Co., Ltd.,
5.506%, due 04/15/49 | | | 1,787,286 | | |
| | 1,000,000 | | | @@,# | | Danske Bank A/S, 5.914%,
due 12/29/49 | | | 997,204 | | |
| | 1,490,000 | | | @@ | | Den Norske Bank ASA,
5.563%, due 08/29/49 | | | 1,266,500 | | |
| | 230,000 | | | @@ | | Den Norske Creditbank,
5.688%, due 11/29/49 | | | 198,009 | | |
| | 1,638,000 | | | # | | Dresdner Funding Trust I,
8.151%, due 06/30/31 | | | 1,945,417 | | |
| | 858,000 | | | # | | First Chicago NBD
Institutional Capital A,
7.950%, due 12/01/26 | | | 893,216 | | |
| | 3,822,000 | | | @@,# | | HBOS PLC, 5.375%,
due 11/29/49 | | | 3,759,506 | | |
| | 3,010,000 | | | @@ | | HSBC Bank PLC, 5.663%,
due 06/29/49 | | | 2,550,975 | | |
| | 2,390,000 | | | @@,L | | HSBC Bank PLC, 5.875%,
due 06/29/49 | | | 2,055,400 | | |
| | 6,000,000 | | | @@ | | KAUP Bank, 6.600%,
due 12/28/15 | | | 5,647,716 | | |
| | 2,370,000 | | | @@ | | Lloyds TSB Bank PLC,
5.560%, due 08/29/49 | | | 2,055,634 | | |
| | 230,000 | | | @@ | | Lloyds TSB Bank PLC,
5.563%, due 11/29/49 | | | 204,225 | | |
| | 61,000 | | | | | M&I Capital Trust A,
7.650%, due 12/01/26 | | | 63,360 | | |
Principal
Amount | | | | | | Value | |
| $ | 1,684,000 | | | | | Mellon Capital I, 7.720%,
due 12/01/26 | | $ | 1,753,692 | | |
| | 1,420,000 | | | @@ | | Mizuho Financial Group
Cayman Ltd., 8.375%,
due 12/31/49 | | | 1,505,042 | | |
| | 1,090,000 | | | @@ | | National Australia Bank
Ltd., 5.556%,
due 10/29/49 | | | 946,195 | | |
| | 320,000 | | | @@ | | National Westminster
Bank PLC, 5.563%,
due 11/29/49 | | | 274,419 | | |
| | 2,000,000 | | | @@,L | | Paribas, 5.445%,
due 09/29/49 | | | 1,733,718 | | |
| | 1,887,000 | | | # | | Rabobank Capital
Funding II, 5.260%,
due 12/29/49 | | | 1,849,481 | | |
| | 910,000 | | | #,L | | Rabobank Capital Funding
Trust, 5.254%,
due 12/31/49 | | | 880,050 | | |
| | 1,563,000 | | | | | RBS Capital Trust I, 5.512%,
due 09/30/49 | | | 1,521,113 | | |
| | 2,200,000 | | | @@,# | | Resona Bank Ltd., 5.850%,
due 09/29/49 | | | 2,154,680 | | |
| | 4,560,000 | | | @@,L | | Royal Bank of Scotland
Group PLC, 5.750%,
due 12/29/49 | | | 3,955,650 | | |
| | 1,090,000 | | | @@ | | Societe Generale, 5.395%,
due 11/29/49 | | | 941,973 | | |
| | 3,220,000 | | | @@,L | | Standard Chartered PLC,
5.528%, due 07/29/49 | | | 2,664,550 | | |
| | 5,150,000 | | | @@,L | | Standard Chartered PLC,
5.550%, due 11/29/49 | | | 4,313,125 | | |
| | 520,000 | | | @@,L | | Standard Chartered PLC,
5.730%, due 01/29/49 | | | 429,000 | | |
| | 2,000,000 | | | @@ | | Sumitomo Mitsui Banking
Corp., 8.150%,
due 08/01/49 | | | 2,091,662 | | |
| | 1,405,000 | | | | | Wachovia Capital Trust III,
5.800%, due 12/31/49 | | | 1,410,179 | | |
| | 1,250,000 | | | @@ | | Westpac Banking Corp.,
5.525%, due 09/30/49 | | | 1,069,788 | | |
| | 1,108,000 | | | @@,#,L | | Westpac Capital Trust IV,
5.256%, due 12/29/49 | | | 1,037,959 | | |
| | 3,555,000 | | | @@,# | | Woori Bank, 6.125%,
due 05/03/16 | | | 3,633,825 | | |
| | | | 68,045,610 | | |
| | | | | Beverages: 0.5% | |
| | 1,849,000 | | | @@,L | | Cia Brasileira de Bebidas,
8.750%, due 09/15/13 | | | 2,140,218 | | |
| | 2,898,000 | | | @@ | | Diageo Capital PLC,
5.875%, due 09/30/36 | | | 2,845,848 | | |
| | | | 4,986,066 | | |
| | | | | Building Materials: 0.3% | |
| | 3,243,000 | | | | | Masco Corp., 6.125%,
due 10/03/16 | | | 3,226,260 | | |
| | | | 3,226,260 | | |
| | | | | Chemicals: 0.8% | |
| | 1,646,000 | | | | | Lyondell Chemical Co.,
8.000%, due 09/15/14 | | | 1,674,805 | | |
See Accompanying Notes to Financial Statements
62
PORTFOLIO OF INVESTMENTS
ING INTERMEDIATE BOND FUND AS OF SEPTEMBER 30, 2006 (UNAUDITED) (CONTINUED)
Principal
Amount | | | | | | Value | |
| | | | | Chemicals (continued) | |
| $ | 905,000 | | | | | Lyondell Chemical Co.,
8.250%, due 09/15/16 | | $ | 923,100 | | |
| | 720,000 | | | | | Stauffer Chemical, 5.500%,
due 04/15/10 | | | 595,728 | | |
| | 1,230,000 | | | | | Stauffer Chemical, 5.810%,
due 04/15/18 | | | 641,138 | | |
| | 1,510,000 | | | | | Stauffer Chemical, 7.950%,
due 04/15/17 | | | 833,701 | | |
| | 3,647,000 | | | L | | Union Carbide Corp., 7.750%,
due 10/01/96 | | | 3,855,032 | | |
| | | | 8,523,504 | | |
| | | | | Commercial Services: 0.4% | |
| | 3,846,000 | | | | | Tulane University of
Louisiana, 6.205%,
due 11/15/12 | | | 3,865,230 | | |
| | | | 3,865,230 | | |
| | | | | Diversified Financial Services: 6.6% | |
| | 2,801,000 | | | @@,# | | Aiful Corp., 4.450%,
due 02/16/10 | | | 2,686,341 | | |
| | 527,000 | | | @@,#,I | | Alpine III, 5.966%,
due 08/16/14 | | | 528,430 | | |
| | 527,000 | | | @@,#,I | | Alpine III, 6.366%,
due 08/16/14 | | | 528,828 | | |
| | 789,000 | | | @@,#,I | | Alpine III, 8.166%,
due 08/16/14 | | | 793,938 | | |
| | 1,348,000 | | | @@,#,I | | Alpine III, 11.416%,
due 08/16/14 | | | 1,384,246 | | |
| | 3,059,509 | | | # | | Astoria Depositor Corp.,
7.902%, due 05/01/21 | | | 3,205,034 | | |
| | 7,897,000 | | | # | | Astoria Depositor Corp.,
8.144%, due 05/01/21 | | | 8,669,050 | | |
| | 1,651,614 | | | @@,# | | Brazilian Merchant
Voucher Receivables Ltd.,
5.911%, due 06/15/11 | | | 1,618,582 | | |
| | 1,712,000 | | | | | Citigroup Capital II, 7.750%,
due 12/01/36 | | | 1,773,338 | | |
| | 2,340,000 | | | # | | Corestates Capital Trust I,
8.000%, due 12/15/26 | | | 2,438,807 | | |
| | 1,245,000 | | | @@ | | Financiere CSFB NV, 5.500%,
due 03/29/49 | | | 1,061,363 | | |
| | 172,000 | | | | | Ford Motor Credit Co.,
9.875%, due 08/10/11 | | | 178,158 | | |
| | 1,862,000 | | | | | Fund American Cos., Inc.,
5.875%, due 05/15/13 | | | 1,842,933 | | |
| | 1,713,000 | | | # | | HVB Funding Trust III,
9.000%, due 10/22/31 | | | 2,195,367 | | |
| | 1,366,000 | | | L | | JPM Capital Trust I, 7.540%,
due 01/15/27 | | | 1,418,243 | | |
| | 1,509,000 | | | | | JPM Capital Trust II, 7.950%,
due 02/01/27 | | | 1,574,495 | | |
| | 3,486,000 | | | # | | Mangrove Bay Pass-Through
Trust, 6.102%,
due 07/15/33 | | | 3,378,802 | | |
| | 3,178,000 | | | @@,# | | Mantis Reef Ltd., 4.799%,
due 11/03/09 | | | 3,106,387 | | |
| | 1,589,000 | | | @@ | | MUFG Capital Finance 1 Ltd.,
6.346%, due 12/31/49 | | | 1,604,790 | | |
| DKK | 44 | | | @@,I | | Nordea Kredit
Realkreditaktieselskab,
6.000%, due 07/01/29 | | | 8 | | |
Principal
Amount | | | | | | Value | |
| $ | 1,296,000 | | | @@ | | Paribas, 5.563%,
due 12/31/49 | | $ | 1,140,729 | | |
| | 777,500 | | | @@ | | Petroleum Export Ltd.,
4.623%, due 06/15/10 | | | 767,095 | | |
| | 1,161,016 | | | @@,# | | Petroleum Export Ltd.,
5.265%, due 06/15/11 | | | 1,144,528 | | |
| | 2,821,430 | | | @@,# | | PF Export Receivables
Master Trust, 6.436%,
due 06/01/15 | | | 2,851,408 | | |
| | 3,600,000 | | | # | | Piper Jaffray Equipment
Trust Securities, 6.750%,
due 04/01/11 | | | 3,564,000 | | |
| | 986,000 | | | | | Southern Star Central
Corp., 6.750%,
due 03/01/16 | | | 973,675 | | |
| JPY | 1,500,000,000 | | | @@ | | Takefuji Corp., 1.000%,
due 03/01/34 | | | 6,695,873 | | |
| | 3,421,000 | | | @@,# | | TNK-BP Finance SA, 7.500%,
due 07/18/16 | | | 3,580,179 | | |
| | 8,795,153 | | | # | | Toll Road Investors
Partnership II LP,
17.640%, due 02/15/45 | | | 1,117,873 | | |
| | 1,200,000 | | | # | | Twin Reefs Pass-Through
Trust, 6.320%,
due 12/10/49 | | | 1,202,098 | | |
| | 2,098,000 | | | @@,L | | UFJ Finance Aruba AEC,
8.750%, due 12/31/49 | | | 2,216,845 | | |
| | 1,085,000 | | | # | | Wachovia Capital Trust V,
7.965%, due 06/01/27 | | | 1,140,578 | | |
| | | | 66,382,021 | | |
| | | | | Electric: 2.6% | |
| | 3,773,189 | | | | | CE Generation, LLC,
7.416%, due 12/15/18 | | | 3,899,885 | | |
| | 3,938,000 | | | @@,L | | Empresa Nacional
de Electricidad SA,
8.625%, due 08/01/15 | | | 4,569,450 | | |
| | 2,377,000 | | | L | | FirstEnergy Corp., 6.450%,
due 11/15/11 | | | 2,482,318 | | |
| | 773,736 | | | # | | Juniper Generation, LLC,
6.790%, due 12/31/14 | | | 750,811 | | |
| | 1,345,000 | | | @@,+ | | Korea Electric Power Corp.,
0.480%, due 04/01/96 | | | 876,346 | | |
| | 2,475,000 | | | # | | Nevada Power Co.,
5.950%, due 03/15/16 | | | 2,484,974 | | |
| | 1,263,000 | | | | | NorthWestern Corp.,
5.875%, due 11/01/14 | | | 1,248,733 | | |
| | 1,542,000 | | | # | | NorthWestern Corp.,
6.040%, due 09/01/16 | | | 1,560,130 | | |
| | 1,175,000 | | | | | Potomac Edison Co.,
5.000%, due 11/01/06 | | | 1,177,164 | | |
| | 712,513 | | | # | | Power Contract Financing,
LLC, 6.256%, due 02/01/10 | | | 718,404 | | |
| | 336,945 | | | | | PPL Montana, LLC, 8.903%,
due 07/02/20 | | | 376,093 | | |
| | 2,613,000 | | | # | | Sierra Pacific Power Co.,
6.000%, due 05/15/16 | | | 2,632,859 | | |
| | 466,000 | | | | | Sierra Pacific Power Co.,
6.250%, due 04/15/12 | | | 477,260 | | |
| | 2,468,000 | | | | | Southern Co. CAP Trust I,
8.190%, due 02/01/37 | | | 2,583,720 | | |
| | | | 25,838,147 | | |
See Accompanying Notes to Financial Statements
63
PORTFOLIO OF INVESTMENTS
ING INTERMEDIATE BOND FUND AS OF SEPTEMBER 30, 2006 (UNAUDITED) (CONTINUED)
Principal
Amount | | | | | | Value | |
| | | | | Energy-Alternate Sources: 0.2% | |
| $ | 2,287,406 | | | | | Salton Sea Funding Corp.,
7.840%, due 05/30/10 | | $ | 2,355,658 | | |
| | | | 2,355,658 | | |
| | | | | Food: 0.1% | |
| | 467,000 | | | | | Delhaize America, Inc.,
8.050%, due 04/15/27 | | | 498,752 | | |
| | 692,000 | | | | | Delhaize America, Inc.,
8.125%, due 04/15/11 | | | 746,175 | | |
| | | | 1,244,927 | | |
| | | | | Gas: 0.3% | |
| | 2,715,000 | | | # | | Southern Star Central
Gas Pipeline, Inc.,
6.000%, due 06/01/16 | | | 2,742,150 | | |
| | | | 2,742,150 | | |
| | | | | Home Builders: 0.2% | |
| | 1,745,000 | | | | | D.R. Horton, Inc., 5.625%,
due 09/15/14 | | | 1,647,776 | | |
| | | | 1,647,776 | | |
| | | | | Insurance: 0.9% | |
| | 3,521,000 | | | @@ | | Aegon NV, 5.413%,
due 12/31/49 | | | 3,045,665 | | |
| | 2,442,000 | | | L | | AON Corp., 8.205%,
due 01/01/27 | | | 2,806,652 | | |
| | 2,376,000 | | | # | | Liberty Mutual Group, Inc.,
7.500%, due 08/15/36 | | | 2,556,650 | | |
| | 817,000 | | | # | | North Front Pass-Through
Trust, 5.810%,
due 12/15/24 | | | 803,975 | | |
| | | | 9,212,942 | | |
| | | | | Media: 0.3% | |
| | 1,473,000 | | | # | | Charter Communications
Operating LLC, 8.375%,
due 04/30/14 | | | 1,504,301 | | |
| | 1,091,000 | | | | | Houghton Mifflin Co.,
8.250%, due 02/01/11 | | | 1,126,458 | | |
| | | | 2,630,759 | | |
| | | | | Mining: 0.4% | |
| | 3,536,000 | | | | | Southern Copper Corp.,
7.500%, due 07/27/35 | | | 3,718,507 | | |
| | 457,000 | | | @@,L | | Vale Overseas Ltd., 8.250%,
due 01/17/34 | | | 520,980 | | |
| | | | 4,239,487 | | |
| | | | | Multi-National: 0.1% | |
| | 1,174,000 | | | @@,L | | Corp. Andina de Fomento,
5.125%, due 05/05/15 | | | 1,137,658 | | |
| | | | 1,137,658 | | |
| | | | | Oil & Gas: 1.8% | |
| | 1,748,000 | | | | | Anadarko Petroleum Corp.,
5.950%, due 09/15/16 | | | 1,772,184 | | |
| | 1,193,000 | | | @@,#,L | | Empresa Nacional
de Petroleo, 4.875%,
due 03/15/14 | | | 1,128,851 | | |
Principal
Amount | | | | | | Value | |
| $ | 796,000 | | | @@,#,L | | Empresa Nacional
de Petroleo, 6.750%,
due 11/15/12 | | $ | 841,557 | | |
| | 1,898,000 | | | L | | Hess Corp, 7.300%,
due 08/15/31 | | | 2,143,706 | | |
| | 2,087,000 | | | @@,#,L | | Pemex Project Funding
Master Trust, 6.625%,
due 06/15/35 | | | 2,053,086 | | |
| | 2,402,000 | | | @@,# | | Pemex Project Funding
Master Trust, 6.690%,
due 06/15/10 | | | 2,460,849 | | |
| | 2,837,000 | | | S | | Petrobras, 6.125%,
due 10/06/2036 | | | 2,824,432 | | |
| | 2,147,000 | | | @@,# | | Ras Laffan Liquefied
Natural Gas Co., Ltd. II,
5.298%, due 09/30/20 | | | 2,072,969 | | |
| | 3,052,000 | | | @@ | | Transocean, Inc., 5.591%,
due 09/05/08 | | | 3,053,706 | | |
| | | | 18,351,340 | | |
| | | | | Pipelines: 1.1% | |
| | 4,067,000 | | | #,I | | Cameron Highway Oil
Pipeline, 5.860%,
due 12/15/17 | | | 4,016,569 | | |
| | 659,000 | | | | | Dynegy Holdings, Inc.,
7.125%, due 05/15/18 | | | 606,280 | | |
| | 330,000 | | | | | Dynegy Holdings, Inc.,
8.750%, due 02/15/12 | | | 343,613 | | |
| | 906,000 | | | #,L | | Northwest Pipeline Corp.,
7.000%, due 06/15/16 | | | 930,915 | | |
| | 2,843,000 | | | | | ONEOK Partners LP,
6.150%, due 10/01/16 | | | 2,875,109 | | |
| | 1,262,000 | | | # | | Transcontinental Gas
Pipe Line Corp., 6.400%,
due 04/15/16 | | | 1,254,113 | | |
| | 907,000 | | | # | | Williams Partners LP,
7.500%, due 06/15/11 | | | 913,803 | | |
| | | | 10,940,402 | | |
| | | | | Real Estate: 0.2% | |
| | 1,646,000 | | | | | EOP Operating LP, 7.750%,
due 11/15/07 | | | 1,686,515 | | |
| | | | 1,686,515 | | |
| | | | | Real Estate Investment Trusts: 0.3% | |
| | 392,000 | | | | | Liberty Property LP,
6.375%, due 08/15/12 | | | 410,400 | | |
| | 1,583,000 | | | | | Liberty Property LP, 7.750%,
due 04/15/09 | | | 1,665,826 | | |
| | 1,391,000 | | | L | | Simon Property Group LP,
4.875%, due 03/18/10 | | | 1,371,283 | | |
| | | | 3,447,509 | | |
| | | | | Retail: 0.2% | |
| | 1,859,000 | | | | | May Department Stores Co.,
3.950%, due 07/15/07 | | | 1,834,444 | | |
| | | | 1,834,444 | | |
| | | | | Savings & Loans: 0.1% | |
| | 1,238,000 | | | | | Great Western Financial,
8.206%, due 02/01/27 | | | 1,297,641 | | |
| | | | 1,297,641 | | |
See Accompanying Notes to Financial Statements
64
PORTFOLIO OF INVESTMENTS
ING INTERMEDIATE BOND FUND AS OF SEPTEMBER 30, 2006 (UNAUDITED) (CONTINUED)
Principal
Amount | | | | | | Value | |
| | | | | Telecommunications: 0.7% | |
| $ | 3,095,000 | | | @@ | | Rogers Wireless, Inc.,
7.250%, due 12/15/12 | | $ | 3,253,619 | | |
| | 3,415,000 | | | @@ | | Telefonica Emisones SAU,
6.421%, due 06/20/16 | | | 3,519,772 | | |
| | | | 6,773,391 | | |
| | | | | Transportation: 0.3% | |
| | 3,026,000 | | | | | BNSF Funding Trust I,
6.613%, due 12/15/55 | | | 3,049,845 | | |
| | | | 3,049,845 | | |
| | | Total Corporate Bonds/Notes
(Cost $256,747,917) | | | 255,928,110 | | |
| U.S. GOVERNMENT AGENCY OBLIGATIONS: 31.4% | | | |
| | | | | Federal Home Loan Bank: 1.8% | |
| | 4,695,000 | | | | | 5.100%, due 03/06/08 | | | 4,701,085 | | |
| | 4,475,000 | | | | | 5.375%, due 07/18/11 | | | 4,559,134 | | |
| | 2,600,000 | | | L | | 5.375%, due 08/19/11 | | | 2,649,930 | | |
| | 2,055,000 | | | | | 5.550%, due 08/24/07 | | | 2,055,727 | | |
| | 4,693,000 | | | | | 5.625%, due 06/13/16 | | | 4,846,935 | | |
| | | | 18,812,811 | | |
| | | | | Federal Home Loan Mortgage Corporation: 9.6% | |
| | 4,782,000 | | | L | | 4.000%, due 08/17/07 | | | 4,734,998 | | |
| | 1,481,309 | | | | | 4.500%, due 12/15/16 | | | 1,453,496 | | |
| | 3,422,000 | | | | | 4.500%, due 02/15/20 | | | 3,206,131 | | |
| | 9,537,000 | | | | | 4.875%, due 02/17/09 | | | 10,057,306 | | |
| | 4,838,382 | | | | | 5.000%, due 08/15/16 | | | 4,770,070 | | |
| | 869,000 | | | | | 5.000%, due 05/15/20 | | | 846,558 | | |
| | 3,517,952 | | | | | 5.000%, due 08/15/21 | | | 3,485,609 | | |
| | 3,513,000 | | | | | 5.000%, due 04/15/23 | | | 3,383,903 | | |
| | 640,694 | | | | | 5.042%, due 04/01/35 | | | 627,929 | | |
| | 4,912,000 | | | L | | 5.125%, due 04/18/08 | | | 4,922,795 | | |
| | 4,647,000 | | | | | 5.150%, due 01/24/11 | | | 4,635,025 | | |
| | 3,214,000 | | | | | 5.400%, due 10/10/08 | | | 3,214,167 | | |
| | 9,884,000 | | | | | 5.500%, due 04/24/09 | | | 9,887,952 | | |
| | 469,000 | | | W | | 5.500%, due 10/15/18 | | | 468,707 | | |
| | 1,875,334 | | | | | 5.500%, due 11/15/18 | | | 1,882,379 | | |
| | 10,161,466 | | | | | 5.500%, due 08/15/20 | | | 9,676,342 | | |
| | 7,814,000 | | | W | | 5.500%, due 11/15/34 | | | 7,701,674 | | |
| | 1,380,000 | | | | | 5.500%, due 06/01/36 | | | 1,355,850 | | |
| | 439,135 | | | | | 5.670%, due 02/15/32 | | | 441,758 | | |
| | 2,000,000 | | | | | 5.750%, due 05/11/11 | | | 2,003,360 | | |
| | 4,738,000 | | | L | | 5.750%, due 06/27/16 | | | 4,946,718 | | |
| | 3,516,000 | | | L | | 5.875%, due 03/21/11 | | | 4,036,713 | | |
| | 486,483 | | | | | 5.880%, due 01/25/32 | | | 486,994 | | |
| | 7,915,715 | | | | | 6.000%, due 01/15/29 | | | 8,020,285 | | |
| | 9,956 | | | | | 7.500%, due 11/01/28 | | | 10,357 | | |
| | 415,814 | | | | | 7.500%, due 12/25/41 | | | 433,249 | | |
| | | | 96,690,325 | | |
| | | | | Federal National Mortgage
Association: 19.9% | |
| | 3,231,422 | | | ^ | | 2.365%, due 02/17/29 | | | 223,587 | | |
| | 3,829,000 | | | L | | 4.250%, due 09/15/07 | | | 3,798,000 | | |
| | 68,000 | | | W | | 4.500%, due 10/15/18 | | | 65,620 | | |
| | 105,000 | | | W | | 4.500%, due 10/15/35 | | | 98,109 | | |
| | 1,860,364 | | | | | 4.607%, due 08/01/35 | | | 1,812,476 | | |
| | 4,725,000 | | | | | 4.750%, due 08/10/07 | | | 4,708,519 | | |
| | 1,152,967 | | | | | 4.750%, due 12/25/42 | | | 1,144,874 | | |
| | 2,179,931 | | | | | 4.807%, due 08/01/35 | | | 2,136,648 | | |
| | 3,470,790 | | | | | 5.000%, due 02/25/29 | | | 3,429,088 | | |
Principal
Amount | | | | | | Value | |
| $ | 73,287,000 | | | W | | 5.000%, due 10/15/33 | | $ | 70,447,129 | | |
| | 4,848,680 | | | | | 5.000%, due 08/01/35 | | | 4,663,603 | | |
| | 959,742 | | | | | 5.000%, due 10/01/35 | | | 923,108 | | |
| | 1,247,893 | | | | | 5.074%, due 07/01/35 | | | 1,227,960 | | |
| | 3,210,084 | | | | | 5.152%, due 09/01/35 | | | 3,166,594 | | |
| | 9,534,000 | | | | | 5.250%, due 08/01/12 | | | 10,023,912 | | |
| | 5,793,000 | | | L | | 5.250%, due 09/15/16 | | | 5,917,382 | | |
| | 1,074,089 | | | | | 5.252%, due 08/01/35 | | | 1,061,663 | | |
| | 1,576,000 | | | W | | 5.500%, due 10/15/18 | | | 1,575,508 | | |
| | 2,017,266 | | | | | 5.500%, due 11/01/32 | | | 1,994,919 | | |
| | 11,037,617 | | | | | 5.500%, due 11/01/33 | | | 10,911,968 | | |
| | 36,566,000 | | | S,W | | 5.500%, due 10/15/35 | | | 28,726,772 | | |
| | 1,279,512 | | | | | 5.500%, due 06/01/36 | | | 1,260,319 | | |
| | 1,346,288 | | | | | 5.500%, due 07/01/36 | | | 1,326,094 | | |
| | 7,450,000 | | | S | | 5.500%, due 10/01/36 | | | 7,313,805 | | |
| | 425,634 | | | | | 5.720%, due 04/18/28 | | | 429,274 | | |
| | 40,095 | | | | | 5.780%, due 12/25/29 | | | 40,178 | | |
| | 475,457 | | | | | 5.780%, due 10/25/33 | | | 474,269 | | |
| | 61,591 | | | | | 6.000%, due 08/01/16 | | | 62,574 | | |
| | 5,365 | | | | | 6.000%, due 12/01/16 | | | 5,451 | | |
| | 192,729 | | | | | 6.000%, due 03/01/17 | | | 195,805 | | |
| | 1,766,783 | | | | | 6.000%, due 09/01/17 | | | 1,794,850 | | |
| | 123,736 | | | | | 6.000%, due 11/01/17 | | | 125,710 | | |
| | 3,175,000 | | | W | | 6.000%, due 11/15/20 | | | 3,221,634 | | |
| | 4,094,348 | | | | | 6.000%, due 07/25/29 | | | 4,158,304 | | |
| | 2,273,237 | | | | | 6.000%, due 04/25/31 | | | 2,321,446 | | |
| | 816,112 | | | | | 6.000%, due 08/01/33 | | | 819,961 | | |
| | 41,887 | | | | | 6.500%, due 07/01/29 | | | 42,933 | | |
| | 188,689 | | | | | 6.500%, due 08/01/29 | | | 193,397 | | |
| | 551,517 | | | | | 6.500%, due 04/01/30 | | | 565,278 | | |
| | 2,465 | | | | | 6.500%, due 06/01/31 | | | 2,521 | | |
| | 442,905 | | | | | 6.500%, due 07/01/31 | | | 453,919 | | |
| | 10,743 | | | | | 6.500%, due 09/01/31 | | | 10,987 | | |
| | 254,804 | | | | | 6.500%, due 11/01/31 | | | 260,605 | | |
| | 135,291 | | | | | 6.500%, due 04/01/32 | | | 138,319 | | |
| | 67,471 | | | | | 6.500%, due 07/01/32 | | | 68,980 | | |
| | 189,902 | | | | | 6.500%, due 08/01/32 | | | 194,152 | | |
| | 143,370 | | | | | 6.500%, due 11/01/32 | | | 146,579 | | |
| | 213,156 | | | | | 6.500%, due 01/01/33 | | | 217,926 | | |
| | 82,617 | | | | | 6.500%, due 02/01/33 | | | 84,343 | | |
| | 557,445 | | | | | 6.500%, due 12/01/33 | | | 569,090 | | |
| | 3,908,000 | | | W | | 6.500%, due 11/13/36 | | | 3,977,609 | | |
| | 136,591 | | | | | 7.000%, due 01/01/30 | | | 140,447 | | |
| | 5,332 | | | | | 7.000%, due 03/01/30 | | | 5,500 | | |
| | 276,751 | | | | | 7.000%, due 06/01/31 | | | 285,700 | | |
| | 988,304 | | | | | 7.000%, due 08/01/35 | | | 1,015,625 | | |
| | 9,280,000 | | | | | 7.250%, due 01/15/10 | | | 9,939,641 | | |
| | 1,814 | | | | | 7.500%, due 09/01/30 | | | 1,879 | | |
| | 20,079 | | | | | 7.500%, due 10/01/30 | | | 20,796 | | |
| | 97,377 | | | | | 7.500%, due 02/01/32 | | | 101,094 | | |
| | 862,992 | | | | | 7.500%, due 01/25/48 | | | 896,457 | | |
| | | | 200,940,890 | | |
| | | | | Government National Mortgage Association: 0.1% | |
| | 999,982 | | | ^ | | 2.930%, due 06/16/31 | | | 82,808 | | |
| | 10,496 | | | | | 5.375%, due 04/20/28 | | | 10,596 | | |
| | 1,222 | | | | | 6.500%, due 03/15/31 | | | 1,256 | | |
| | 18,224 | | | | | 6.500%, due 08/15/31 | | | 18,730 | | |
| | 45,389 | | | | | 6.500%, due 10/15/31 | | | 46,649 | | |
| | 22,656 | | | | | 6.500%, due 11/15/31 | | | 23,285 | | |
| | 19,050 | | | | | 6.500%, due 07/15/32 | | | 19,571 | | |
| | 131,895 | | | | | 6.500%, due 09/15/32 | | | 135,502 | | |
See Accompanying Notes to Financial Statements
65
PORTFOLIO OF INVESTMENTS
ING INTERMEDIATE BOND FUND AS OF SEPTEMBER 30, 2006 (UNAUDITED) (CONTINUED)
Principal
Amount | | | | | | Value | |
| | | | | Government National Mortgage Association (continued) | |
| $ | 63,020 | | | | | 7.000%, due 04/15/26 | | $ | 65,167 | | |
| | 28,290 | | | | | 7.000%, due 05/15/32 | | | 29,225 | | |
| | 81,999 | | | | | 7.500%, due 12/15/22 | | | 85,362 | | |
| | 5,952 | | | | | 7.500%, due 10/15/26 | | | 6,209 | | |
| | 23,198 | | | | | 7.500%, due 07/15/29 | | | 24,165 | | |
| | 130 | | | | | 7.500%, due 11/15/30 | | | 136 | | |
| | 20,257 | | | | | 7.500%, due 12/15/30 | | | 21,091 | | |
| | 35,805 | | | | | 7.500%, due 12/15/31 | | | 37,277 | | |
| | 59,919 | | | | | 7.500%, due 05/15/32 | | | 62,364 | | |
| | | | 669,393 | | |
| | | Total U.S. Government
Agency Obligations
(Cost $317,143,169) | | | 317,113,419 | | |
| U.S. TREASURY OBLIGATIONS: 11.9% | | | |
| | | | | U.S. Treasury Bonds: 5.9% | |
| | 25,159,000 | | | L | | 4.500%, due 02/15/36 | | | 26,894,004 | | |
| | 15,063,000 | | | L | | 4.875%, due 08/15/16 | | | 12,663,796 | | |
| | 8,658,000 | | | L | | 6.000%, due 02/15/26 | | | 9,908,683 | | |
| | 8,708,000 | | | L | | 6.250%, due 08/15/23 | | | 10,112,853 | | |
| | | | 59,579,336 | | |
| | | | | U.S. Treasury Inflation-Indexed
Bonds: 1.5% | |
| | 4,948,000 | | | L | | 2.000%, due 01/15/16 | | | 4,958,295 | | |
| | 9,570,000 | | | L | | 2.375%, due 04/15/11 | | | 9,825,161 | | |
| | | | 14,783,456 | | |
| | | | | U.S. Treasury Notes: 4.1% | |
| | 21,021,000 | | | L | | 4.625%, due 08/31/11 | | | 20,194,374 | | |
| | 13,870,000 | | | L | | 4.875%, due 08/31/08 | | | 12,970,906 | | |
| | 7,839,000 | | | L | | 4.875%, due 08/15/09 | | | 7,894,735 | | |
| | | | 41,060,015 | | |
| | | | | U.S. Treasury STRIP: 0.4% | |
| | 6,772,000 | | | L | | 4.770%, due 05/15/16 | | | 4,323,360 | | |
| | | | 4,323,360 | | |
| | | Total U.S. Treasury
Obligations
(Cost $118,316,781) | | | 119,746,167 | | |
| ASSET-BACKED SECURITIES: 6.7% | | | |
| | | | | Automobile Asset-Backed Securities: 1.2% | |
| | 373,000 | | | | | AmeriCredit Automobile
Receivables Trust,
4.220%, due 07/06/09 | | | 368,882 | | |
| | 451,000 | | | | | AmeriCredit Automobile
Receivables Trust,
5.610%, due 03/08/10 | | | 452,133 | | |
| | 182,777 | | | | | Capital One Auto Finance
Trust, 3.180%,
due 09/15/10 | | | 180,388 | | |
| | 193,000 | | | | | Capital One Prime Auto
Receivables Trust,
5.010%, due 11/15/11 | | | 193,208 | | |
| | 1,691,000 | | | | | Carmax Auto Owner Trust,
4.210%, due 01/15/10 | | | 1,673,748 | | |
| | 320,000 | | | | | Chase Manhattan Auto
Owner Trust, 5.130%,
due 05/15/11 | | | 320,700 | | |
Principal
Amount | | | | | | Value | |
| $ | 162,879 | | | | | Daimler Chrysler Auto Trust,
3.490%, due 12/08/08 | | $ | 161,785 | | |
| | 251,000 | | | | | Daimler Chrysler Auto Trust,
5.010%, due 01/08/11 | | | 251,095 | | |
| | 467,063 | | | | | Honda Auto Receivables
Owner Trust, 2.790%,
due 03/16/09 | | | 461,270 | | |
| | 917,000 | | | | | Honda Auto Receivables
Owner Trust, 3.820%,
due 05/21/10 | | | 898,449 | | |
| | 661,000 | | | | | Honda Auto Receivables
Owner Trust, 5.300%,
due 07/21/10 | | | 664,408 | | |
| | 641,000 | | | | | Household Automotive Trust,
5.610%, due 06/17/09 | | | 642,907 | | |
| | 828,379 | | | | | Nissan Auto Receivables
Owner Trust, 2.050%,
due 03/16/09 | | | 816,606 | | |
| | 556,259 | | | | | Nissan Auto Receivables
Owner Trust, 2.610%,
due 07/15/08 | | | 550,912 | | |
| | 1,965,000 | | | | | Nissan Auto Receivables
Owner Trust, 4.190%,
due 07/15/09 | | | 1,944,080 | | |
| | 1,667,000 | | | | | Nissan Auto Receivables
Owner Trust, 4.740%,
due 09/15/09 | | | 1,659,255 | | |
| | 316,000 | | | | | Nissan Auto Receivables
Owner Trust, 5.520%,
due 01/15/09 | | | 316,741 | | |
| | 94,582 | | | | | USAA Auto Owner Trust,
2.040%, due 02/16/10 | | | 94,508 | | |
| | | | 11,651,075 | | |
| | | | | Credit Card Asset-Backed Securities: 1.1% | |
| | 560,000 | | | | | Bank One Issuance Trust,
4.540%, due 09/15/10 | | | 554,318 | | |
| | 530,000 | | | | | Capital One Master Trust,
4.900%, due 03/15/10 | | | 529,205 | | |
| | 902,000 | | | | | Capital One Master Trust,
6.310%, due 06/15/11 | | | 918,765 | | |
| | 347,000 | | | | | Capital One Multi-Asset
Execution Trust, 3.650%,
due 07/15/11 | | | 338,295 | | |
| | 863,000 | | | | | Capital One Multi-Asset
Execution Trust, 4.050%,
due 02/15/11 | | | 850,505 | | |
| | 800,000 | | | | | Citibank Credit Card
Issuance Trust, 3.100%,
due 03/10/10 | | | 777,844 | | |
| | 2,583,000 | | | | | Citibank Credit Card
Issuance Trust, 4.850%,
due 02/10/11 | | | 2,572,107 | | |
| | 44,000 | | | | | Citibank Credit Card
Issuance Trust, 6.875%,
due 11/16/09 | | | 44,822 | | |
| | 2,429,000 | | | | | Citibank Credit Card Master
Trust I, 5.875%,
due 03/10/11 | | | 2,477,015 | | |
| | 1,282,000 | | | | | Citibank Credit Card Master
Trust I, 6.050%,
due 01/15/10 | | | 1,298,324 | | |
See Accompanying Notes to Financial Statements
66
PORTFOLIO OF INVESTMENTS
ING INTERMEDIATE BOND FUND AS OF SEPTEMBER 30, 2006 (UNAUDITED) (CONTINUED)
Principal
Amount | | | | | | Value | |
| | | | | Credit Card Asset-Backed
Securities (continued) | |
| $ | 193,000 | | | | | Discover Card Master
Trust I, 5.150%,
due 10/15/09 | | $ | 193,022 | | |
| | 322,000 | | | | | MBNA Credit Card Master
Note Trust, 4.900%,
due 07/15/11 | | | 321,593 | | |
| | 589,000 | | | | | MBNA Master Credit Card
Trust, 5.900%,
due 08/15/11 | | | 601,899 | | |
| | | | 11,477,714 | | |
| | | | | Home Equity Asset-Backed
Securities: 2.5% | |
| | 301,610 | | | | | Bayview Financial
Acquisition Trust,
5.824%, due 09/28/43 | | | 301,879 | | |
| | 78,000 | | | + | | Centex Home Equity,
4.140%, due 03/25/28 | | | 77,240 | | |
| | 538,071 | | | | | Freddie Mac Structured
Pass-Through Securities,
5.580%, due 05/25/31 | | | 538,456 | | |
| | 156,125 | | | | | Freddie Mac Structured
Pass-Through Securities,
5.630%, due 01/25/32 | | | 156,246 | | |
| | 66,582 | | | | | GMAC Mortgage Corp.
Loan Trust, 5.560%,
due 12/25/20 | | | 66,629 | | |
| | 4,851,000 | | | | | GSAA Trust, 5.242%,
due 06/25/34 | | | 4,811,283 | | |
| | 9,517,000 | | | | | GSAA Trust, 5.882%,
due 09/25/36 | | | 9,517,000 | | |
| | 6,608,000 | | | | | GSAA Trust, 6.040%,
due 07/25/36 | | | 6,693,699 | | |
| | 62,349 | | | | | Merrill Lynch Mortgage
Investors, Inc., 5.690%,
due 07/25/34 | | | 62,548 | | |
| | 55,829 | | | | | New Century Home Equity
Loan Trust, 5.890%,
due 07/25/30 | | | 55,883 | | |
| | 62,242 | | | | | Nissan Auto Receivables
Owner Trust, 4.160%,
due 08/25/34 | | | 61,763 | | |
| | 638,000 | | | + | | Renaissance Home Equity
Loan Trust, 4.456%,
due 05/25/35 | | | 631,011 | | |
| | 820,000 | | | + | | Renaissance Home Equity
Loan Trust, 4.723%,
due 11/25/35 | | | 812,693 | | |
| | 698,000 | | | + | | Renaissance Home Equity
Loan Trust, 5.608%,
due 05/25/36 | | | 698,642 | | |
| | 195,079 | | | | | Residential Asset
Securities Corp.,
5.930%, due 06/25/32 | | | 195,283 | | |
| | 984,000 | | | | | Wells Fargo Home Equity
Trust, 3.970%,
due 05/25/34 | | | 963,908 | | |
| | | | 25,644,163 | | |
Principal
Amount | | | | | | Value | |
| | | | | Other Asset-Backed Securities: 1.9% | |
| $ | 49,596 | | | | | Amortizing Residential
Collateral Trust, 5.830%,
due 05/25/32 | | $ | 49,673 | | |
| | 288,000 | | | | | Caterpillar Financial Asset
Trust, 5.590%,
due 02/25/09 | | | 288,225 | | |
| | 13,911 | | | | | Chase Funding Mortgage
Loan, 4.045%,
due 05/25/33 | | | 13,714 | | |
| | 327,156 | | | | | Chase Funding Mortgage
Loan, 5.630%,
due 07/25/33 | | | 328,196 | | |
| | 951,000 | | | | | Countrywide Asset-Backed
Certificates, 4.493%,
due 02/25/36 | | | 941,037 | | |
| | 1,331,000 | | | + | | Credit-Based Asset Servicing
and Securitization,
5.501%, due 12/25/36 | | | 1,330,487 | | |
| | 1,355,000 | | | | | Equity One ABS, Inc.,
5.050%, due 09/25/33 | | | 1,336,505 | | |
| | 1,022,231 | | | | | Fannie Mae Grantor Trust,
5.470%, due 04/25/35 | | | 1,024,097 | | |
| | 74,555 | | | | | Fannie Mae Grantor Trust,
5.530%, due 11/25/32 | | | 74,602 | | |
| | 2,185,334 | | | | | Lehman XS Trust, 5.610%,
due 08/25/35 | | | 2,192,691 | | |
| | 3,064,434 | | | | | Long Beach Mortgage
Loan Trust, 5.660%,
due 01/25/36 | | | 3,074,642 | | |
| | 3,846,000 | | | | | Merrill Lynch Mortgage
Investors, Inc., 5.530%,
due 01/25/37 | | | 3,849,951 | | |
| | 989,000 | | | + | | Merrill Lynch Mortgage
Investors, Inc., 5.609%,
due 03/25/37 | | | 989,648 | | |
| | 275,604 | | | | | Popular ABS Mortgage
Pass-Through Trust,
3.735%, due 12/25/34 | | | 274,299 | | |
| | 524,000 | | | | | Popular ABS Mortgage
Pass-Through Trust,
4.000%, due 12/25/34 | | | 517,116 | | |
| | 698,000 | | | | | Popular ABS Mortgage
Pass-Through Trust,
4.596%, due 11/25/35 | | | 691,030 | | |
| | 1,000,000 | | | | | Residential Asset Mortgage
Products, Inc., 5.600%,
due 07/25/35 | | | 1,002,334 | | |
| | 33,205 | | | | | Residential Asset Mortgage
Products, Inc., 5.640%,
due 06/25/33 | | | 33,256 | | |
| | 1,194,254 | | | + | | Structured Asset Securities
Corp., 6.000%,
due 03/25/34 | | | 1,192,146 | | |
| | | | 19,203,649 | | |
| | | Total Asset-Backed
Securities (Cost
$68,147,029) | | | 67,976,601 | | |
See Accompanying Notes to Financial Statements
67
PORTFOLIO OF INVESTMENTS
ING INTERMEDIATE BOND FUND AS OF SEPTEMBER 30, 2006 (UNAUDITED) (CONTINUED)
Principal
Amount | | | | | | Value | |
| COLLATERALIZED MORTGAGE OBLIGATIONS: 28.1% | | | |
| $ | 436,387 | | | | | ABN Amro Mortgage Corp.,
5.830%, due 03/25/18 | | $ | 436,199 | | |
| | 2,991,419 | | | | | American Home Mortgage
Assets, 5.432%,
due 09/25/46 | | | 2,987,680 | | |
| | 8,373,415 | | | | | American Home Mortgage
Investment Trust,
5.620%, due 11/25/45 | | | 8,415,158 | | |
| | 4,186,708 | | | | | American Home Mortgage
Investment Trust,
5.770%, due 11/25/45 | | | 4,220,475 | | |
| | 110,000 | | | | | Banc of America Commercial
Mortgage, Inc., 4.429%,
due 11/10/39 | | | 106,254 | | |
| | 1,609,000 | | | | | Banc of America Commercial
Mortgage, Inc., 4.502%,
due 07/10/42 | | | 1,562,432 | | |
| | 6,262,000 | | | | | Banc of America Commercial
Mortgage, Inc., 4.611%,
due 07/10/43 | | | 6,166,445 | | |
| | 1,114,000 | | | | | Banc of America Commercial
Mortgage, Inc., 4.764%,
due 07/10/45 | | | 1,101,223 | | |
| | 2,130,000 | | | | | Banc of America Commercial
Mortgage, Inc., 4.772%,
due 07/11/43 | | | 2,111,392 | | |
| | 2,210,000 | | | | | Banc of America Commercial
Mortgage, Inc., 4.891%,
due 07/10/45 | | | 2,167,248 | | |
| | 198,994 | | | | | Banc of America Commercial
Mortgage, Inc., 5.363%,
due 07/10/46 | | | 200,692 | | |
| | 59,235 | | | | | Banc of America Commercial
Mortgage, Inc., 5.685%,
due 07/10/44 | | | 59,957 | | |
| | 270,000 | | | | | Banc of America Commercial
Mortgage, Inc., 6.186%,
due 06/11/35 | | | 281,932 | | |
| | 5,962,580 | | | | | Banc of America Funding
Corp., 5.284%,
due 09/20/35 | | | 5,865,455 | | |
| | 2,867,647 | | | | | Banc of America Funding
Corp., 5.750%,
due 09/20/34 | | | 2,858,346 | | |
| | 2,534,344 | | | S | | Banc of America Funding
Corp., 5.860%,
due 05/20/36 | | | 2,544,227 | | |
| | 1,074,277 | | | | | Banc of America Mortgage
Securities, 5.250%,
due 11/25/19 | | | 1,067,866 | | |
| | 823,412 | | | | | Banc of America Mortgage
Securities, 5.500%,
due 11/25/33 | | | 811,384 | | |
| | 2,061,105 | | | | | Banc of America Mortgage
Securities, 5.500%,
due 06/25/35 | | | 2,052,167 | | |
| | 977,701 | | | | | Bank of America
Alternative Loan Trust,
6.500%, due 04/25/36 | | | 991,523 | | |
| | 6,919,244 | | | | | Bank of America
Alternative Loan Trust,
6.500%, due 05/25/36 | | | 6,996,269 | | |
Principal
Amount | | | | | | Value | |
| $ | 1,289,923 | | | | | Bear Stearns Alt-A Trust,
5.650%, due 07/25/34 | | $ | 1,291,454 | | |
| | 1,524,000 | | | | | Bear Stearns Commercial
Mortgage Securities,
3.880%, due 08/13/39 | | | 1,479,826 | | |
| | 391,000 | | | | | Bear Stearns Commercial
Mortgage Securities,
4.030%, due 02/13/46 | | | 378,616 | | |
| | 1,527,000 | | | | | Bear Stearns Commercial
Mortgage Securities,
4.170%, due 01/12/41 | | | 1,495,393 | | |
| | 696,000 | | | | | Bear Stearns Commercial
Mortgage Securities,
4.565%, due 07/11/42 | | | 677,714 | | |
| | 110,000 | | | | | Bear Stearns Commercial
Mortgage Securities,
5.294%, due 09/11/41 | | | 110,447 | | |
| | 672,000 | | | | | Capco America
Securitization Corp.,
6.260%, due 10/15/30 | | | 683,418 | | |
| | 456,000 | | | | | Capco America
Securitization Corp.,
6.460%, due 10/15/30 | | | 467,439 | | |
| | 1,950,000 | | | | | Chase Manhattan
Bank-First Union
National Bank, 7.439%,
due 08/15/31 | | | 2,056,504 | | |
| | 5,834,224 | | | | | Chase Mortgage Finance
Corp., 5.416%,
due 12/25/35 | | | 5,764,972 | | |
| | 290,626 | | | | | Citicorp Mortgage
Securities, Inc., 5.780%,
due 03/25/33 | | | 292,215 | | |
| | 390,000 | | | | | Citigroup Commercial
Mortgage Trust, 4.639%,
due 05/15/43 | | | 383,421 | | |
| | 429,488 | | | | | Citigroup Commercial
Mortgage Trust, 5.720%,
due 03/15/49 | | | 437,108 | | |
| | 957,233 | | | | | Citigroup Mortgage Loan
Trust, Inc., 5.450%,
due 02/25/35 | | | 958,031 | | |
| | 3,842,566 | | | S | | Citigroup Mortgage Loan
Trust, Inc., 5.952%,
due 06/25/36 | | | 3,856,987 | | |
| | 7,017,239 | | | | | Citigroup Mortgage Loan
Trust, Inc., 6.000%,
due 11/25/35 | | | 7,027,056 | | |
| | 1,093,000 | | | | | Commercial Mortgage
Pass - Through
Certificates, 3.600%,
due 03/10/39 | | | 1,058,189 | | |
| | 3,266,000 | | | | | Countrywide Alternative
Loan Trust, 4.826%,
due 09/29/46 | | | 3,266,000 | | |
| | 7,753,359 | | | | | Countrywide Alternative
Loan Trust, 5.408%,
due 10/25/35 | | | 7,658,923 | | |
| | 3,200,265 | | | | | Countrywide Alternative
Loan Trust, 5.500%,
due 02/25/25 | | | 3,197,055 | | |
See Accompanying Notes to Financial Statements
68
PORTFOLIO OF INVESTMENTS
ING INTERMEDIATE BOND FUND AS OF SEPTEMBER 30, 2006 (UNAUDITED) (CONTINUED)
Principal
Amount | | | | | | Value | |
| COLLATERALIZED MORTGAGE OBLIGATIONS (continued) | | | |
| $ | 392,999 | | | | | Countrywide Alternative
Loan Trust, 5.500%,
due 07/25/35 | | $ | 394,852 | | |
| | 640,081 | | | | | Countrywide Alternative
Loan Trust, 5.630%,
due 02/25/35 | | | 640,688 | | |
| | 80,592 | | | | | Countrywide Alternative
Loan Trust, 5.730%,
due 02/25/33 | | | 80,789 | | |
| | 814,123 | | | | | Countrywide Alternative
Loan Trust, 5.880%,
due 04/25/33 | | | 819,080 | | |
| | 1,756,626 | | | | | Countrywide Alternative
Loan Trust, 6.000%,
due 05/25/36 | | | 1,767,451 | | |
| | 8,478,223 | | | | | Countrywide Alternative
Loan Trust, 6.037%,
due 09/25/36 | | | 8,501,559 | | |
| | 4,186,474 | | | | | Countrywide Home Loan
Mortgage Pass-Through
Trust, 5.733%,
due 02/25/35 | | | 4,217,035 | | |
| | 634,616 | | | | | Countrywide Home Loan
Mortgage Pass-Through
Trust, 5.830%,
due 04/25/18 | | | 638,141 | | |
| | 915,605 | | | | | Credit Suisse First Boston
Mortgage Securities
Corp., 3.727%,
due 03/15/35 | | | 885,587 | | |
| | 430,430 | | | | | Credit Suisse First Boston
Mortgage Securities
Corp., 3.819%,
due 05/15/36 | | | 412,275 | | |
| | 451,000 | | | | | Credit Suisse First Boston
Mortgage Securities
Corp., 4.321%,
due 01/15/37 | | | 436,054 | | |
| | 975,000 | | | | | Credit Suisse First Boston
Mortgage Securities
Corp., 4.801%,
due 03/15/36 | | | 950,402 | | |
| | 646,000 | | | | | Credit Suisse First Boston
Mortgage Securities
Corp., 5.183%,
due 11/15/36 | | | 645,663 | | |
| | 411,218 | | | | | Credit Suisse Mortgage
Capital Certificates,
4.991%, due 06/15/38 | | | 409,788 | | |
| | 9,430,570 | | | | | Credit Suisse Mortgage
Capital Certificates,
7.000%, due 08/25/36 | | | 9,585,088 | | |
| | 688,000 | | | | | DLJ Commercial Mortgage
Corp., 7.300%,
due 06/10/32 | | | 720,281 | | |
| | 6,640,846 | | | | | First Horizon Alternative
Mortgage Securities,
5.500%, due 08/25/35 | | | 6,562,405 | | |
| | 545,809 | | | | | First Horizon Asset
Securities, Inc., 5.392%,
due 10/25/35 | | | 542,137 | | |
| | 937,090 | | | | | Freddie Mac, 5.970%,
due 04/15/32 | | | 949,364 | | |
Principal
Amount | | | | | | Value | |
| $ | 1,749,581 | | | | | GE Capital Commercial
Mortgage Corp.,
3.752%, due 07/10/39 | | $ | 1,713,862 | | |
| | 698,000 | | | | | GE Capital Commercial
Mortgage Corp.,
4.371%, due 01/10/38 | | | 681,113 | | |
| | 483,000 | | | | | GE Capital Commercial
Mortgage Corp., 4.865%,
due 07/10/39 | | | 476,185 | | |
| | 468,333 | | | | | GE Capital Commercial
Mortgage Corp., 5.560%,
due 06/10/38 | | | 472,149 | | |
| | 1,726,592 | | | | | GMAC Mortgage Corp.
Loan Trust, 4.602%,
due 10/19/33 | | | 1,677,135 | | |
| | 4,093,341 | | | | | GMAC Mortgage Corp.
Loan Trust, 5.264%,
due 03/18/35 | | | 4,026,664 | | |
| | 595,000 | | | | | Greenwich Capital
Commercial Funding
Corp., 5.117%,
due 04/10/37 | | | 594,376 | | |
| | 500,000 | | | | | Greenwich Capital
Commercial Funding
Corp., 5.912%,
due 07/10/38 | | | 515,926 | | |
| | 736,941 | | | # | | GSMPS Mortgage Loan
Trust, 5.680%,
due 01/25/35 | | | 740,336 | | |
| | 684,728 | | | | | GSR Mortgage Loan Trust,
5.825%, due 06/25/35 | | | 683,398 | | |
| | 1,310,083 | | | | | Harborview Mortgage
Loan Trust, 5.680%,
due 01/19/35 | | | 1,316,246 | | |
| | 659,365 | | | | | Homebanc Mortgage Trust,
5.760%, due 08/25/29 | | | 660,753 | | |
| | 361,481 | | | | | JP Morgan Alternative
Loan Trust, 5.516%,
due 01/25/36 | | | 360,217 | | |
| | 469,614 | | | | | JP Morgan Chase Commercial
Mortgage Securities Corp.,
4.200%, due 07/12/35 | | | 458,358 | | |
| | 1,700,000 | | | | | JP Morgan Chase Commercial
Mortgage Securities Corp.,
4.223%, due 01/15/42 | | | 1,656,405 | | |
| | 1,558,898 | | | | | JP Morgan Chase Commercial
Mortgage Securities Corp.,
4.275%, due 01/12/37 | | | 1,526,049 | | |
| | 370,000 | | | | | JP Morgan Chase Commercial
Mortgage Securities Corp.,
5.289%, due 05/15/45 | | | 371,273 | | |
| | 100,000 | | | | | JP Morgan Chase Commercial
Mortgage Securities Corp.,
5.338%, due 05/12/45 | | | 100,601 | | |
| | 213,259 | | | | | JP Morgan Chase Commercial
Mortgage Securities Corp.,
5.833%, due 04/15/45 | | | 216,782 | | |
| | 4,263,000 | | | | | JP Morgan Chase Commercial
Mortgage Securities Corp.,
5.857%, due 10/12/35 | | | 4,379,230 | | |
| | 440,000 | | | | | JP Morgan Chase Commercial
Mortgage Securities Corp.,
5.861%, due 04/15/45 | | | 453,580 | | |
See Accompanying Notes to Financial Statements
69
PORTFOLIO OF INVESTMENTS
ING INTERMEDIATE BOND FUND AS OF SEPTEMBER 30, 2006 (UNAUDITED) (CONTINUED)
Principal
Amount | | | | | | Value | |
| COLLATERALIZED MORTGAGE OBLIGATIONS (continued) | | | |
| $ | 6,139,347 | | | S | | JP Morgan Mortgage Trust,
5.409%, due 11/25/35 | | $ | 6,066,473 | | |
| | 866,000 | | | | | LB-UBS Commercial
Mortgage Trust,
3.992%, due 10/15/29 | | | 839,998 | | |
| | 225,000 | | | | | LB-UBS Commercial
Mortgage Trust,
4.310%, due 02/15/30 | | | 219,492 | | |
| | 255,000 | | | | | LB-UBS Commercial
Mortgage Trust,
4.510%, due 12/15/29 | | | 247,368 | | |
| | 289,000 | | | | | LB-UBS Commercial
Mortgage Trust,
4.567%, due 06/15/29 | | | 285,362 | | |
| | 520,000 | | | | | LB-UBS Commercial
Mortgage Trust,
4.885%, due 09/15/30 | | | 516,401 | | |
| | 1,010,000 | | | | | LB-UBS Commercial
Mortgage Trust,
4.998%, due 04/15/30 | | | 999,882 | | |
| | 413,325 | | | | | LB-UBS Commercial
Mortgage Trust,
5.741%, due 06/15/32 | | | 420,884 | | |
| | 2,961,000 | | | | | LB-UBS Commercial
Mortgage Trust,
6.226%, due 03/15/26 | | | 3,031,934 | | |
| | 1,703,000 | | | | | LB-UBS Commercial
Mortgage Trust,
7.370%, due 08/15/26 | | | 1,817,870 | | |
| | 2,820,607 | | | | | MASTR Alternative Loans
Trust, 5.500%,
due 01/25/20 | | | 2,828,331 | | |
| | 145,776 | | | | | MASTR Alternative Loans
Trust, 6.500%,
due 05/25/33 | | | 146,143 | | |
| | 577,742 | | | | | MASTR Alternative Loans
Trust, 8.500%,
due 05/25/33 | | | 585,602 | | |
| | 2,244,044 | | | | | MASTR Seasoned Securities
Trust, 5.730%,
due 10/25/32 | | | 2,247,949 | | |
| | 981,000 | | | | | Merrill Lynch Mortgage
Trust, 4.892%,
due 02/12/42 | | | 966,908 | | |
| | 320,000 | | | S | | Merrill Lynch/Countrywide
Commercial Mortgage
Trust, 4.711%,
due 07/12/46 | | | 316,798 | | |
| | 425,000 | | | | | Merrill Lynch/Countrywide
Commercial Mortgage
Trust, 5.439%,
due 02/12/39 | | | 429,066 | | |
| | 1,946,335 | | | | | MLCC Mortgage
Investors, Inc., 5.560%,
due 04/25/29 | | | 1,948,718 | | |
| | 1,292,511 | | | | | MLCC Mortgage
Investors, Inc., 5.650%,
due 10/25/28 | | | 1,292,738 | | |
| | 644,319 | | | | | MLCC Mortgage
Investors, Inc., 5.650%,
due 01/25/29 | | | 645,063 | | |
| | 1,320,000 | | | | | Morgan Stanley Capital I,
4.827%, due 06/12/47 | | | 1,297,210 | | |
Principal
Amount | | | | | | Value | |
| $ | 3,660,000 | | | | | Morgan Stanley Capital I,
5.007%, due 01/14/42 | | $ | 3,624,712 | | |
| | 307,704 | | | | | Morgan Stanley Capital I,
5.490%, due 07/12/44 | | | 311,239 | | |
| | 160,000 | | | | | Morgan Stanley Capital I,
5.741%, due 08/12/41 | | | 164,187 | | |
| | 340,137 | | | | | Morgan Stanley Capital I,
7.020%, due 03/15/32 | | | 350,867 | | |
| | 246,885 | | | | | Morgan Stanley
Dean Witter Capital I,
4.180%, due 03/12/35 | | | 238,719 | | |
| | 1,770,309 | | | | | Mortgage Capital
Funding, Inc., 6.663%,
due 03/18/30 | | | 1,792,595 | | |
| | 1,038,000 | | | | | Nomura Asset Securities
Corp., 6.690%,
due 03/15/30 | | | 1,105,841 | | |
| | 3,558,608 | | | | | Prudential Commercial
Mortgage Trust, 3.669%,
due 02/11/36 | | | 3,422,828 | | |
| | 6,023,937 | | | | | Residential Accredit
Loans, Inc., 5.500%,
due 05/25/34 | | | 5,781,719 | | |
| | 3,465,506 | | | | | Residential Accredit
Loans, Inc., 5.730%,
due 04/25/35 | | | 3,482,684 | | |
| | 6,103,564 | | | | | Residential Accredit
Loans, Inc., 5.820%,
due 08/25/35 | | | 6,134,315 | | |
| | 619,155 | | | | | Residential Funding Mtg
Sec I, 5.730%,
due 11/25/17 | | | 621,147 | | |
| | 400,000 | | | | | Salomon Brothers
Mortgage Securities VII,
7.520%, due 12/18/09 | | | 424,683 | | |
| | 765,583 | | | | | Sequoia Mortgage Trust,
5.600%, due 01/20/35 | | | 767,493 | | |
| | 222,245 | | | | | Sequoia Mortgage Trust,
5.640%, due 11/20/33 | | | 222,422 | | |
| | 1,170,615 | | | | | Structured Adjustable Rate
Mortgage Loan Trust,
5.640%, due 07/25/35 | | | 1,175,690 | | |
| | 1,807,381 | | | | | Structured Asset Mortgage
Investments, Inc.,
5.570%, due 04/19/35 | | | 1,811,655 | | |
| | 6,561,916 | | | | | Structured Asset Mortgage
Investments, Inc.,
6.766%, due 12/27/35 | | | 6,668,719 | | |
| | 932,614 | | | | | Thornburg Mortgage
Securities Trust,
5.680%, due 12/25/33 | | | 934,142 | | |
| | 3,394,273 | | | | | Thornburg Mortgage
Securities Trust,
5.700%, due 09/25/34 | | | 3,412,028 | | |
| | 190,000 | | | | | Wachovia Bank Commercial
Mortgage Trust, 5.224%,
due 07/15/42 | | | 190,347 | | |
| | 407,916 | | | | | Wachovia Bank Commercial
Mortgage Trust, 5.726%,
due 06/15/45 | | | 413,400 | | |
| | 420,000 | | | | | Wachovia Bank Commercial
Mortgage Trust, 5.935%,
due 06/15/45 | | | 432,576 | | |
See Accompanying Notes to Financial Statements
70
PORTFOLIO OF INVESTMENTS
ING INTERMEDIATE BOND FUND AS OF SEPTEMBER 30, 2006 (UNAUDITED) (CONTINUED)
Principal
Amount | | | | | | Value | |
| COLLATERALIZED MORTGAGE OBLIGATIONS (continued) | | | |
| $ | 5,829,117 | | | | | Wamu Alternative
Mortgage Pass-Through
Certificates, 5.553%,
due 07/25/46 | | $ | 5,820,922 | | |
| | 8,064,885 | | | | | Wamu Alternative
Mortgage Pass-Through
Certificates, 5.750%,
due 02/25/36 | | | 8,117,889 | | |
| | 1,890,000 | | | + | | Wamu Alternative
Mortgage Pass-Through
Certificates, 5.764%,
due 10/25/36 | | | 1,890,000 | | |
| | 2,045,000 | | | + | | Wamu Alternative
Mortgage Pass-Through
Certificates, 6.081%,
due 09/25/36 | | | 2,049,608 | | |
| | 887,644 | | | S | | Washington Mutual MSC
Mortgage Pass-Through
Certificates, 5.830%,
due 01/25/18 | | | 890,601 | | |
| | 3,000,000 | | | | | Washington Mutual, Inc.,
5.443%, due 10/25/46 | | | 3,000,000 | | |
| | 1,027,140 | | | | | Washington Mutual, Inc.,
5.580%, due 01/25/45 | | | 1,029,364 | | |
| | 968,834 | | | | | Washington Mutual, Inc.,
5.640%, due 01/25/45 | | | 975,362 | | |
| | 1,000,000 | | | | | Washington Mutual, Inc.,
5.667%, due 10/25/46 | | | 1,003,447 | | |
| | 2,012,565 | | | | | Washington Mutual, Inc.,
5.730%, due 08/25/45 | | | 2,021,611 | | |
| | 1,215,666 | | | | | Washington Mutual, Inc.,
5.795%, due 06/25/44 | | | 1,220,706 | | |
| | 1,919,367 | | | | | Washington Mutual, Inc.,
6.000%, due 06/25/34 | | | 1,915,170 | | |
| | 2,160,000 | | | | | Wells Fargo
Mortgage-Backed
Securities Trust, 4.500%,
due 08/25/18 | | | 2,066,607 | | |
| | 6,654,248 | | | | | Wells Fargo
Mortgage-Backed
Securities Trust, 5.388%,
due 08/25/35 | | | 6,566,001 | | |
| | 2,809,131 | | | S | | Wells Fargo
Mortgage-Backed
Securities Trust, 5.500%,
due 12/25/35 | | | 2,732,760 | | |
| | 4,749,036 | | | S | | Wells Fargo
Mortgage-Backed
Securities Trust, 5.500%,
due 01/25/36 | | | 4,628,829 | | |
| | 5,520,316 | | | | | Wells Fargo
Mortgage-Backed
Securities Trust, 6.000%,
due 06/25/36 | | | 5,503,065 | | |
| | 4,237,000 | | | | | Wells Fargo
Mortgage-Backed
Securities Trust, 6.000%,
due 10/25/36 | | | 4,234,352 | | |
| | | | 284,084,861 | | |
| | | Total Collateralized
Mortgage Obligations
(Cost $285,009,802) | | | 284,084,861 | | |
Principal
Amount | | | | | | Value | |
| MUNICIPAL BONDS: 0.7% | | | |
| | | | | California: 0.2% | |
| $ | 1,925,000 | | | | | City of San Diego, 7.125%,
due 06/01/32 | | $ | 1,994,897 | | |
| | | | 1,994,897 | | |
| | | | | Michigan: 0.5% | |
| | 4,625,000 | | | | | Michigan Tobacco
Settlement Finance
Authority, 7.309%,
due 06/01/34 | | | 4,644,471 | | |
| | | | 4,644,471 | | |
| | | Total Municipal Bonds
(Cost $6,553,358) | | | 6,639,368 | | |
| Shares | | | | | | Value | |
| PREFERRED STOCK: 2.0% | | | |
| | | | | Banks: 0.5% | |
| | 448 | | | | | DG Funding Trust | | $ | 4,709,600 | | |
| | | | 4,709,600 | | |
| | | | | Diversified Financial Services: 0.5% | |
| | 142,000 | | | P | | Merrill Lynch & Co., Inc. | | | 3,676,380 | | |
| | 41,975 | | | P | | National Rural Utilities
Cooperative Finance Corp. | | | 972,141 | | |
| | | | 4,648,521 | | |
| | | | | Insurance: 0.8% | |
| | 125,557 | | | @@ | | Aegon NV | | | 3,175,337 | | |
| | 48,306 | | | @@ | | Aegon NV - Series 1 | | | 1,220,693 | | |
| | 126,650 | | | P | | Metlife, Inc. | | | 3,281,502 | | |
| | | | 7,677,532 | | |
| | | | | Real Estate Investment Trusts: 0.2% | |
| | 103,025 | | | P | | Duke Realty Corp. | | | 2,625,077 | | |
| | | | 2,625,077 | | |
| | | Total Preferred Stock
(Cost $19,637,197) | | | 19,660,730 | | |
| WARRANTS: 0.0% | | | |
| | | | | Telecommunications: 0.0% | |
| | 20 | | | | | American Tower Corp. | | | 10,311 | | |
| | | | 10,311 | | |
| | | Total Warrants
(Cost $1,502) | | | 10,311 | | |
| | | Total Long-Term
Investments (Cost
$1,071,556,819) | | | 1,071,159,567 | | |
See Accompanying Notes to Financial Statements
71
PORTFOLIO OF INVESTMENTS
ING INTERMEDIATE BOND FUND AS OF SEPTEMBER 30, 2006 (UNAUDITED) (CONTINUED)
Principal
Amount | | | | Value | |
| SHORT-TERM INVESTMENTS: 21.5% | |
| | | Repurchase Agreement: 4.8% | |
| $ | 48,524,000 | | | Goldman Sachs Repurchase | | | | |
| | |
| | | Agreement dated, 09/29/06, | | | | |
| | |
| | | 5.320%, due 10/02/06 $48,545,512 | | | | |
| | |
| | | to be received upon repurchase | | | | |
| | |
| | | (Collateralized by $48,486,000 | | | | |
| | |
| | | U.S. Treasury Department, 4.6250%, | | | | |
| | |
| | | Market Value plus accrued | | | | |
| | |
| | | interest $49,494,927, | | | | |
| | |
| | | due 03/31/09) | | $ | | | 48,524,000 | | |
| | | Total Repurchase Agreement
(Cost $48,524,000) | | | | | 48,524,000 | | |
| | | Securities Lending CollateralCC: 16.7% | |
| 169,060,933 | | The Bank of New York Institutional | | | | |
| | |
| | | Cash Reserves Fund | | | | | 169,060,933 | | |
| | | Total Securities Lending Collateral
(Cost $169,060,933) | | | | | 169,060,933 | | |
| | | Total Short-Term Investments
(Cost $217,584,933) | | | | | 217,584,933 | | |
| | Total Investments in
Securities (Cost
$1,289,141,752)* | | |
127.6% | | | $ | 1,288,744,500 | | |
| | Other Assets and
Liabilities-Net | | |
(27.6) | | | | (278,410,198 | ) | |
| | | Net Assets | | | 100.0 | % | | $ | 1,010,334,302 | | |
@@ Foreign Issuer
STRIP Separate Trading of Registered Interest and Principal of Securities
+ Step-up basis bonds. Interest rates shown reflect current coupon rates.
# Securities with purchases pursuant to Rule 144A, under the Securities Act of 1933 and may not be resold subject to that rule except to qualified institutional buyers. These securities have been determined to be liquid under the guidelines established by the Funds' Board of Directors/Trustees.
P Preferred Stock may be called prior to convertible date.
cc Securities purchased with cash collateral for securities loaned.
W When-issued or delayed delivery security.
S Segregated securities for certain derivatives, when-issued or delayed delivery securities and forward currency exchange contracts.
I Illiquid security
L Loaned security, a portion or all of the security is on loan at September 30, 2006.
^ Interest only security.
MASTR Mortgage Asset Securitization Transaction, Inc.
DKK Danish Krone
JPY Japanese Yen
* Cost for federal income tax purposes is $1,290,274,106. Net unrealized depreciation consists of:
| Gross Unrealized Appreciation | | $ | 7,121,684 | | |
| Gross Unrealized Depreciation | | | (8,651,290 | ) | |
| Net Unrealized Depreciation | | $ | (1,529,606 | ) | |
Information concerning open futures contracts at September 30, 2006 is shown below:
| Long Contracts | | No. of
Contracts | | Notional
Market Value | | Expiration
Date | | Unrealized
Gain (Loss) | |
U.S. 5-Year
Treasury Note | | | 261 | | | $ | 27,539,579 | | | 12/29/2006 | | $ | 149,587 | | |
U.S. 2-Year
Treasury Note | | | 789 | | | | 161,350,500 | | | 12/29/2006 | | | 279,602 | | |
U.S. 10-Year
Treasury Note | | | 635 | | | | 68,619,688 | | | 12/19/2006 | | | 592,138 | | |
| | | | | | | $ | 257,509,767 | | | | | $ | 1,021,327 | | |
| Short Contracts | | | | | | | | | |
| U.S. Long Bond | | | 822 | | | $ | (92,397,938 | ) | | 12/19/2006 | | $ | (1,352,704 | ) | |
| | | | | | | $ | (92,397,938 | ) | | | | $ | (1,352,704 | ) | |
ING Intermediate Bond Interest Rate Swap Agreements Outstanding on September 30, 2006:
| | | Termination
Date | | Notional
Principal
Amount | | Unrealized
Appreciation/
(Depreciation) | |
Receive a floating rate based
on 6-month USD-LIBOR plus
2.255% (notional value
$6,934,305) and pay a
fixed rate equal to 1.000%
(notional value ¥1,500,000,000).
Upon termination of the
contract, receive $6, 934,305
and pay ¥1,500,000,000. | | | 3/1/34 | | | SEE DESCRIPTION | | $ | 326,621 | | |
| | | | | $ | 326,621 | | |
See Accompanying Notes to Financial Statements
72
PORTFOLIO OF INVESTMENTS
ING INTERMEDIATE BOND FUND AS OF SEPTEMBER 30, 2006 (UNAUDITED) (CONTINUED)
ING Intermediate Bond Credit Default Swap Agreements Outstanding on September 30, 2006:
| Counterparty | | Reference
Entity/Obligation | | Buy/Sell
Protection | | (Pay)/Receive
Fixed Rate | | Termination
Date | | Notional
Amount | | Unrealized
Appreciation/
(Depreciation) | |
| UBS AG | | Russian Federation
5% Step due 3/31/2030 | | Sell | | | 0.31 | % | | 8/20/07 | | USD | $10,271,000 | | | $ | 7,909 | | |
| UBS AG | | Russian Federation
5% Step due 3/31/2030 | | Buy | | | (0.55 | )% | | 8/20/11 | | USD | 5,136,000 | | | | (4,171 | ) | |
Morgan Stanley Capital
Services Inc. | | Domtar Inc.
7.875% due 10/15/2011 | | Buy | | | (2.65)% | | | 9/20/11 | | | USD1,287,500 | | | | 980 | | |
| UBS AG | | Domtar Inc.
7.875% due 10/15/2011 | | Sell | | | 2.60 | % | | 9/20/11 | | USD | 1,288,000 | | | | (5,240 | ) | |
Morgan Stanley Capital
Services Inc. | | Donnelley (R.R.) & Sons Company
4.95% due 4/1/2014 | | Buy | | | (1.40)% | | | 9/20/11 | | | USD1,327,500 | | | | (17,528) | | |
| Citibank N.A., New York | | Glitnir Banki HF
3.284% floating rate due 1/27/2010 | | Buy | | | (0.60 | )% | | 9/20/11 | | USD | 2,655,000 | | | | (20,032 | ) | |
| UBS AG | | Glitnir Banki HF
3.284% floating rate due 1/27/2010 | | Buy | | | (0.61 | )% | | 9/20/11 | | USD | 2,655,000 | | | | (21,195 | ) | |
Morgan Stanley Capital
Services Inc. | | H.J. Heinz Co.
6% due 3/15/2008 | | Buy | | | (0.35)% | | | 9/20/11 | | | USD7,965,000 | | | | 5,016 | | |
Morgan Stanley Capital
Services Inc. | | H.J. Heinz Co.
6% due 3/15/2008 | | Buy | | | (0.41)% | | | 9/20/11 | | | USD9,292,500 | | | | (18,803) | | |
| Barclays Bank PLC | | Kinder Morgan Inc.
6.5% due 9/1/2012 | | Sell | | | 1.70 | % | | 9/20/11 | | USD | 515,000 | | | | 6,166 | | |
Merrill Lynch
International | | Kinder Morgan Inc.
6.5% due 9/1/2012 | | Buy | | | (1.90)% | | | 9/20/11 | | | USD1,288,000 | | | | (19,707) | | |
| UBS AG | | Kinder Morgan Inc.
6.5% due 9/1/2012 | | Buy | | | (1.90 | )% | | 9/20/11 | | USD | 1,288,000 | | | | (26,024 | ) | |
| UBS AG | | Rogers Wireless Inc.
6.375% due 3/1/2014 | | Sell | | | 1.30 | % | | 9/20/11 | | USD | 2,568,000 | | | | 33,322 | | |
| Citibank N.A., New York | | Dow Jones CDX.NA.IG.6 Index
(7 - 10% Tranche) | | Sell | | | 1.0025% | | | 6/20/16 | | | USD7,646,400 | | | | (30,397) | | |
| Citibank N.A., New York | | Dow Jones CDX.NA.IG.6 Index
(3 - 7% Tranche) | | Buy | | | (4.66)% | | | 6/20/16 | | | USD2,575,350 | | | | 27,263 | | |
| Citibank N.A., New York | | Countrywide Home Loan
4% due 3/22/2011 | | Buy | | | (0.57 | )% | | 9/20/16 | | USD | 3,832,000 | | | | 11,864 | | |
| UBS AG | | XL Capital LTD 5.25% due 9/15/2014 | | Buy | | | (0.61 | )% | | 9/20/16 | | USD | 2,655,000 | | | | (30,930 | ) | |
| UBS AG | | XL Capital LTD 5.25% due 9/15/2014 | | Buy | | | (0.61 | )% | | 9/20/16 | | USD | 5,310,000 | | | | (61,861 | ) | |
| | | | | | | $ | (163,368 | ) | |
See Accompanying Notes to Financial Statements
73
PORTFOLIO OF INVESTMENTS
ING NATIONAL TAX-EXEMPT BOND FUND AS OF SEPTEMBER 30, 2006 (UNAUDITED)
Principal
Amount | | | | Rating(1) | | Value | |
| MUNICIPAL BONDS: 94.4% | | | |
| | | California: 14.3% | |
| $ | 1,000,000 | | | California Housing Finance
Agency, 4.600%,
due 08/01/21 | |
Aa2/AA- | | $ | 1,010,620 | | |
| | 1,000,000 | | | Clovis Public Financing
Authority, 5.000%,
due 08/01/26 | |
Aaa/NR | | | 1,061,920 | | |
| | 1,000,000 | | | Pleasant Valley School
District, 5.850%,
due 08/01/31 | |
Aaa/AAA | | | 1,230,888 | | |
| | 500,000 | | | San Marcos California
Public Facility Authority
Tax Allocation Reserve,
5.000%, due 08/01/21 | |
Aaa/AAA | | | 528,865 | | |
| | | | 3,832,293 | | |
| | | Colorado: 4.0% | |
| | 1,000,000 | | | Interlocken Metropolitan
District, 5.750%,
due 12/15/19 | |
NR/AAA | | | 1,062,070 | | |
| | | | 1,062,070 | | |
| | | Connecticut: 2.1% | |
| | 520,000 | | | Connecticut State
Development Authority
SPL Obligation, 5.000%,
due 10/15/23 | |
Aaa/AAA | | | 553,800 | | |
| | | | 553,800 | | |
| | | Florida: 8.3% | |
| | 750,000 | | | City of Gulf Breeze, 5.050%,
due 12/01/20 | |
Aaa/AAA | | | 800,513 | | |
| | 250,000 | | | City of Tallahassee, 6.375%,
due 12/01/30 | |
Baa2/NR | | | 268,663 | | |
| | 100,000 | | | County of Orange, 5.250%,
due 10/01/23 | |
Aaa/AAA | | | 108,304 | | |
| | 500,000 | | | Florida State Board of
Education, 5.750%,
due 06/01/22 | |
Aa1/AAA | | | 538,415 | | |
| | 500,000 | | | Tampa Housing Authority,
4.650%, due 07/01/22 | |
NR/AAA | | | 509,995 | | |
| | | | 2,225,890 | | |
| | | Illinois: 7.6% | |
| | 1,000,000 | | | De Kalb-Ogle Etc Counties
Community College
District No. 523, 5.750%,
due 02/01/11 | |
Aaa/NR | | | 1,067,020 | | |
| | 1,000,000 | | | Illinois Finance Authority,
5.000%, due 08/15/24 | |
NR/NR | | |
981,860 | | |
| | | | 2,048,880 | | |
| | | Nevada: 8.0% | |
| | 1,000,000 | | | County of Clark, 5.000%,
due 06/01/32 | |
Aaa/AAA | | | 1,040,010 | | |
| | 1,100,000 | | | Washoe County, 6.300%,
due 12/01/14 | |
Aaa/AAA | | | 1,118,986 | | |
| | | | 2,158,996 | | |
Principal
Amount | | | | Rating(1) | | Value | |
| | | New Hampshire: 2.8% | |
| $ | 740,000 | | | New Hampshire Housing
Finance Authority, 4.850%,
due 07/01/26 | |
Aaa/NR | | $ | 753,150 | | |
| | | | 753,150 | | |
| | | New Mexico: 2.0% | |
| | 500,000 | | | New Mexico Finance
Authority, 5.000%,
due 04/01/16 | |
Aaa/AAA | | | 537,845 | | |
| | | | 537,845 | | |
| | | New York: 17.8% | |
| | 690,000 | | | Albany Industrial
Development Agency,
7.750%, due 01/01/10 | |
NR/NR | | | 742,419 | | |
| | 1,000,000 | | | City of New York, 5.000%,
due 08/01/24 | |
A1/AA- | | | 1,056,620 | | |
| | 1,000,000 | | | New York State Dormitory
Authority, 5.500%,
due 07/01/15 | |
Aaa/AAA | | | 1,077,370 | | |
| | 1,000,000 | | | Port Authority of New York &
New Jersey, 6.250%,
due 12/01/11 | |
Aaa/AAA | | | 1,115,140 | | |
| | 775,000 | | | Westchester County Industrial
Development Agency,
4.750%, due 07/01/20 | |
NR/A | | | 794,205 | | |
| | | | 4,785,754 | | |
| | | North Carolina: 4.0% | |
| | 295,000 | | | New Hanover County,
5.750%, due 11/01/12 | |
Aa2/AA | | | 322,338 | | |
| | 710,000 | | | Raleigh North Carolina
Certificates, 5.000%,
due 02/01/24 | |
Aa2/AA+ | | | 748,297 | | |
| | | | 1,070,635 | | |
| | | North Dakota: 1.0% | |
| | 250,000 | | | Oliver County, 5.300%,
due 01/01/27 | |
Aaa/AAA | | | 262,033 | | |
| | | | 262,033 | | |
| | | Ohio: 0.2% | |
| | 55,000 | | | Lakota Local School District,
7.000%, due 12/01/10 | |
Aaa/AAA | | | 62,242 | | |
| | | | 62,242 | | |
| | | Oklahoma: 8.1% | |
| | 1,000,000 | | | Oklahoma Industries
Authority, 6.000%,
due 08/15/19 | |
NR/AAA | | | 1,069,331 | | |
| | 1,000,000 | | | Payne County Economic
Development Authority,
6.375%, due 06/01/30 | |
Baa3/NR | | | 1,116,470 | | |
| | | | 2,185,801 | | |
| | | Pennsylvania: 4.0% | |
| | 1,000,000 | | | Lebanon County Health
Facilities Authority, 6.000%,
due 11/15/35 | |
Baa2/BBB | | | 1,081,860 | | |
| | | | 1,081,860 | | |
See Accompanying Notes to Financial Statements
74
PORTFOLIO OF INVESTMENTS
ING NATIONAL TAX-EXEMPT BOND FUND AS OF SEPTEMBER 30, 2006 (UNAUDITED) (CONTINUED)
Principal
Amount | | | | Rating(1) | | Value | |
| | | Rhode Island: 0.4% | |
| $ | 35,000 | | | Dunns Corner Fire District,
8.000%, due 06/01/07 | |
NR/NR | | |
$35,970 | | |
| | 35,000 | | | Dunns Corner Fire District,
8.050%, due 06/01/08 | |
NR/NR | | | 37,384 | | |
| | 35,000 | | | Dunns Corner Fire District,
8.100%, due 06/01/09 | |
NR/NR | | | 38,736 | | |
| | | | 112,090 | | |
| | | Tennessee: 0.9% | |
| | 240,000 | | | Knox County Health
Educational & Housing
Facilities Board, 5.750%,
due 04/01/19 | |
Baa1/NR | | | 250,310 | | |
| | | | 250,310 | | |
| | | Texas: 7.8% | |
| | 500,000 | | | Alamo Community College
District, 5.000%,
due 02/15/24 | |
Aaa/AAA | | | 531,715 | | |
| | 200,000 | | | Cleburne 4B Economic
Development Corp.,
5.625%, due 02/15/27 | |
Aaa/NR | | | 214,084 | | |
| | 165,000 | | | Harris County-Houston Sports
Authority, 5.000%,
due 11/15/28 | |
Aa3/AAA | | | 168,191 | | |
| | 1,000,000 | | | Harris County Health Facilities
Development Corp, 5.750%,
due 07/01/27 | |
Aaa/AAA | | | 1,195,070 | | |
| | | | 2,109,060 | | |
| | | Virginia: 1.1% | |
| | 290,000 | | | Virginia Housing
Development Authority,
4.500%, due 04/01/24 | |
Aaa/AAA | | | 287,744 | | |
| | | | 287,744 | | |
| | | | | Total Municipal Bonds
(Cost $24,779,141) | | | | | 25,380,453 | | |
| | | | | Total Investments in
Securities (Cost
$24,779,141)* | |
94.4% | | |
$25,380,453 | | |
| | | | | Other Assets and
Liabilities-Net | |
5.6 | | | 1,507,137 | | |
| | | | | Net Assets | | | 100.0 | % | | $ | 26,887,590 | | |
SPL Special Purpose Loan
(1) Credit ratings are provided by Moody's Investor's Service, Inc. and Standards and Poor's Rating Group
* Cost for federal income tax purposes is the same as for financial statement purposes.
Net unrealized appreciation consists of:
| Gross Unrealized Appreciation | | $ | 659,383 | | |
| Gross Unrealized Depreciation | | | (58,071 | ) | |
| Net Unrealized Appreciation | | $ | 601,312 | | |
See Accompanying Notes to Financial Statements
75
PORTFOLIO OF INVESTMENTS
ING CLASSIC MONEY MARKET FUND(1) AS OF SEPTEMBER 30, 2006 (UNAUDITED)
Principal
Amount | | | | | | | | Value | |
| CERTIFICATES OF DEPOSIT: 4.1% | | | |
| $ | 5,000,000 | | | | | Credit Suisse, 5.506%,
due 02/02/07 | | | | $ | 4,988,035 | | |
| | 26,800,000 | | | | | Mizuho Corporate Bank,
5.350%, due 10/13/06 | | | | | 26,800,012 | | |
| | | Total Certificates of Deposit
(Cost $31,788,047) | | | | | 31,788,047 | | |
| COLLATERALIZED MORTGAGE OBLIGATIONS: 2.9% | | | |
| | 6,000,000 | | | #, C | | Cheyne High Grade ABS
CDO Ltd., 5.466%,
due 11/10/06 | | | | | 6,000,000 | | |
| | 5,400,000 | | | #, C, I | | Newcastle CDO Ltd., 5.360%,
due 10/24/06 | | | | | 5,400,000 | | |
| | 5,400,000 | | | #, C, I | | Newcastle CDO Ltd., 5.360%,
due 09/24/07 | | | | | 5,400,000 | | |
| | 5,600,000 | | | #, C | | Putnam Structured
Product CDO, 5.350%,
due 11/15/06 | | | | | 5,600,000 | | |
| | | Total Collateralized
Mortgage Obligations
(Cost $22,400,000) | | | | | 22,400,000 | | |
| COMMERCIAL PAPER: 37.3% | | | |
| | 2,000,000 | | | | | ANZ National Bank, 5.170%,
due 04/04/07 | | | | | 1,946,864 | | |
| | 8,000,000 | | | | | ASB Bank Ltd., 5.270%,
due 10/18/06 | | | | | 7,980,091 | | |
| | 34,000,000 | | | | | BHP Billiton Finance USA Ltd.
5.280%, due 10/05/06 | | | | | 33,942,933 | | |
| | 4,841,000 | | | | | Barton Capital Corp., 5.320%,
due 10/05/06 | | | | | 4,838,138 | | |
| | 15,000,000 | | | | | Cargill, Inc., 5.280%,
due 10/05/06 | | | | | 14,978,000 | | |
| | 5,000,000 | | | | | Cargill Asia Pacific, 5.300%,
due 10/03/06 | | | | | 4,998,528 | | |
| | 30,900,000 | | | | | Citigroup Funding, Inc.,
5.300%, due 10/06/06 | | | | | 30,877,254 | | |
| | 33,500,000 | | | | | Concord Minutemen
Capital Co., LLC, 5.290%,
due 10/18/06 | | | | | 33,416,315 | | |
| | 27,930,000 | | | | | Crown Point Capital Co.,
5.290%, due 10/16/06 | | | | | 27,868,438 | | |
| | 16,000,000 | | | | | Duke Funding High
Grade I Ltd., 5.300%,
due 10/13/06 | | | | | 15,962,943 | | |
| | 15,864,000 | | | | | Galaxy Funding, Inc., 5.450%
due 10/02/06 | | | | | 15,861,598 | | |
| | 8,500,000 | | | | | Jupiter Securitization Corp,
5.280%, due 10/27/06 | | | | | 8,467,587 | | |
| | 10,750,000 | | | | | Louis Dreyfus Corp., 5.280%,
due 10/20/06 | | | | | 10,708,702 | | |
| | 35,824,000 | | | | | Monument Gardens Funding,
5.280%, due 10/23/06 | | | | | 35,708,322 | | |
| | 4,000,000 | | | | | St. Germain Holdings Ltd.,
5.275%, due 10/10/06 | | | | | 3,994,725 | | |
| | 10,947,000 | | | | | Thunder Bay Funding, LLC,
5.290%, due 10/17/06 | | | | | 10,919,956 | | |
| | 13,000,000 | | | | | Tulip Funding Corp., 5.280%,
due 10/30/06 | | | | | 12,944,705 | | |
| | 10,000,000 | | | | | Variable Funding Capital,
5.280%, due 10/18/06 | | | | | 9,975,067 | | |
Principal
Amount | | | | | | | | Value | |
| $ | 5,316,000 | | | | | Yorktown Capital, LLC,
5.280%, due 10/20/06 | | | | $ | 5,301,186 | | |
| | | Total Commercial Paper
(Cost $290,691,352) | | | | | 290,691,352 | | |
| CORPORATE BONDS/NOTES: 49.3% | | | |
| | 15,000,000 | | | # | | Allstate Life Global
Funding II, 5.350%,
due 11/09/06 | | | | | 15,000,835 | | |
| | 5,300,000 | | | # | | Allstate Life Global
Funding II, 5.442%,
due 04/02/07 | | | | | 5,302,109 | | |
| | 11,600,000 | | | | | American Express Bank,
5.286%, due 01/26/07 | | | | | 11,600,000 | | |
| | 12,500,000 | | | | | American Express Bank FSB,
5.333%, due 12/01/06 | | | | | 12,500,804 | | |
| | 9,500,000 | | | #, C | | American General
Finance Corp., 5.360%,
due 10/15/07 | | | | | 9,499,922 | | |
| | 1,000,000 | | | | | American General
Finance Corp., 5.565%,
due 11/15/06 | | | | | 1,000,164 | | |
| | 15,000,000 | | | | | Bank of America NA, 5.310%,
due 11/21/06 | | | | | 14,999,883 | | |
| | 10,000,000 | | | | | Bank of America NA, 5.315%,
due 04/18/07 | | | | | 9,999,541 | | |
| | 3,750,000 | | | # | | Bank of New York, 5.386%,
due 10/26/07 | | | | | 3,750,000 | | |
| | 5,725,000 | | | | | Bear Stearns Cos., Inc.,
5.364%, due 10/26/07 | | | | | 5,725,000 | | |
| | 10,500,000 | | | | | Bear Stearns Cos., Inc.,
5.370%, due 08/01/07 | | | | | 10,503,228 | | |
| | 5,800,000 | | | | | Bear Stearns Cos., Inc.,
5.401%, due 11/05/07 | | | | | 5,800,000 | | |
| | 4,000,000 | | | | | Bear Stearns Cos., Inc.,
5.483%, due 03/01/07 | | | | | 4,003,050 | | |
| | 4,427,000 | | | | | Bear Stearns Cos., Inc.,
5.615%, due 07/27/07 | | | | | 4,430,991 | | |
| | 12,000,000 | | | | | BNP Paribas, 5.140%,
due 01/26/07 | | | | | 12,000,000 | | |
| | 3,000,000 | | | # | | Concord Minutemen
Capital Co., LLC, 5.300%,
due 10/17/07 | | | | | 2,999,970 | | |
| | 4,000,000 | | | | | Credit Suisse, 5.358%,
due 03/27/07 | | | | | 3,999,866 | | |
| | 15,000,000 | | | | | Credit Suisse, 5.470%,
due 01/12/07 | | | | | 14,997,643 | | |
| | 21,000,000 | | | | | Duke Funding High
Grade I Ltd., 5.300%,
due 12/06/06 | | | | | 21,000,000 | | |
| | 8,400,000 | | | | | General Electric Capital
Corp., 5.445%,
due 07/09/07 | | | | | 8,400,000 | | |
| | 11,890,000 | | | | | General Electric Capital
Corp., 5.447%,
due 06/22/07 | | | | | 11,897,488 | | |
| | 8,500,000 | | | I | | Goldman Sachs Group, Inc.,
5.370%, due 02/14/07 | | | | | 8,500,000 | | |
| | 10,000,000 | | | I | | Goldman Sachs Group, Inc.,
5.370%, due 05/11/07 | | | | | 10,000,000 | | |
| | 5,300,000 | | | # | | Goldman Sachs Group, Inc.,
5.380%, due 11/15/07 | | | | | 5,300,000 | | |
| | 4,200,000 | | | @@, # | | HBOS Treasury Services PLC,
5.373%, due 11/01/07 | | | | | 4,200,000 | | |
See Accompanying Notes to Financial Statements
76
PORTFOLIO OF INVESTMENTS
ING CLASSIC MONEY MARKET FUND(1) AS OF SEPTEMBER 30, 2006 (UNAUDITED) (CONTINUED)
Principal
Amount | | | | | | | | Value | |
| $ | 16,085,000 | | | @@, # | | HBOS Treasury Services PLC,
5.459%, due 10/24/07 | | | | $ | 16,092,100 | | |
| | 2,889,000 | | | | | HSBC Finance Corp., 5.473%,
due 01/30/07 | | | | | 2,891,444 | | |
| | 7,000,000 | | | | | Lehman Brothers
Holdings, Inc., 5.395%,
due 07/19/07 | | | | | 7,005,315 | | |
| | 20,500,000 | | | | | Merrill Lynch & Co., Inc.,
5.296%, due 07/27/07 | | | | | 20,500,000 | | |
| | 11,500,000 | | | #, I | | Money Market Trust Series A,
5.405%, due 10/10/07 | | | | | 11,500,000 | | |
| | 5,000,000 | | | | | Morgan Stanley, 5.342%,
due 11/02/07 | | | | | 5,002,877 | | |
| | 12,000,000 | | | | | Morgan Stanley, 5.396%,
due 10/26/07 | | | | | 12,005,338 | | |
| | 5,000,000 | | | | | Morgan Stanley, 5.530%,
due 02/15/07 | | | | | 5,003,078 | | |
| | 8,400,000 | | | | | Morgan Stanley, 5.640%,
due 01/12/07 | | | | | 8,402,746 | | |
| | 30,000,000 | | | | | PNC Bank NA, 5.294%,
due 01/29/07 | | | | | 29,999,722 | | |
| | 4,000,000 | | | @@, C | | Royal Bank of Scotland
Group PLC, 5.496%,
due 04/27/07 | | | | | 3,966,512 | | |
| | 10,000,000 | | | | | Toyota Motor Credit Corp.,
5.130%, due 04/26/07 | | | | | 10,000,000 | | |
| | 10,000,000 | | | # | | Verizon Global Funding
Corp., 5.500%,
due 01/12/07 | | | | | 10,000,000 | | |
| | 2,500,000 | | | | | Wachovia Corp., 5.540%,
due 02/06/07 | | | | | 2,500,572 | | |
| | 14,000,000 | | | | | Washington Mutual Bank,
5.440%, due 02/28/07 | | | | | 14,003,567 | | |
| | 4,500,000 | | | | | Wells Fargo & Co., 5.373%,
due 11/02/07 | | | | | 4,500,000 | | |
| | 3,300,000 | | | | | Westpac Banking Corp.,
5.430%, due 10/11/07 | | | | | 3,300,000 | | |
| | | Total Corporate Bonds/Notes
(Cost $384,083,765) | | | | | 384,083,765 | | |
| U.S. GOVERNMENT AGENCY OBLIGATIONS: 2.5% | | | |
| | 20,000,000 | | | | | Federal Home Loan Bank,
5.555%, due 08/15/07 | | | | | 20,000,000 | | |
| | | Total U.S. Government
Agency Obligations
(Cost $20,000,000) | | | | | 20,000,000 | | |
Principal
Amount | | Value | |
| REPURCHASE AGREEMENT: 3.6% | |
| $ | 28,139,000 | | | Goldman Sachs Repurchase | |
| |
| | | Agreement dated 09/29/06, 5.320%, | |
| |
| | | due 10/02/06, $28,151,475 to be | |
| |
| | | received upon repurchase | |
| |
| | | (Collateralized by $28,117,000 | |
| |
| | | U.S. Treasury Note, 4.625% Market | |
| |
| | | Value plus accrued interest | |
| |
| | | $28,702,076, due 03/31/08) | | $ | 28,139,000 | | |
| | Total Repurchase Agreement
(Cost $28,139,000) | | | | 28,139,000 | |
| | Total Investments in
Securities (Cost
$777,102,164)* | | | 99.7 | % | | $777,102,164 | |
| | Other Assets and
Liabilities-Net | | | 0.3 | | | 2,049,271 | |
| | | Net Assets | | | 100.0 | % | | $ | 779,151,435 | | |
(1) All securities with a maturity date of greater than 13 months have either a variable rate, a demand feature, prerefunded, optional or mandatory put resulting in an effective maturity of one year or less. Rate shown reflects current rate.
ABS Asset-Backed Securities
CDO Collateralized Debt Obligations
@@ Foreign Issuer
# Securities with purchases pursuant to Rule 144A, under the Securities Act of 1933 and may not be resold subject to that rule except to qualified institutional buyers. These securities have been determined to be liquid under the guidelines established by the Funds' Board of Directors/Trustees.
C Bond may be called prior to maturity date.
I Illiquid security
* Cost for federal income tax purposes is the same as for financial statement purposes.
See Accompanying Notes to Financial Statements
77
ING INSTITUTIONAL PRIME PORTFOLIO OF INVESTMENTS
MONEY MARKET FUND(1) AS OF SEPTEMBER 30, 2006 (UNAUDITED)
Principal
Amount | | | | | | | | Value | |
| CERTIFICATES OF DEPOSIT: 0.5% | | | |
| $ | 750,000 | | | | | Deutsche Bank,
5.030%, 02/14/07 | | | | $ | 748,938 | | |
| | | Total Certificates of Deposit
(Cost $748,938) | | | | | 748,938 | | |
| COLLATERALIZED MORTGAGE OBLIGATIONS: 0.7% | | | |
| | 1,000,000 | | | #, C | | Cheyne High Grade ABS
CDO Ltd., 5.466%,
due 11/10/06 | | | | | 1,000,000 | | |
| | | Total Collateralized
Mortgage Obligations
(Cost $1,000,000) | | | | | 1,000,000 | | |
| COMMERCIAL PAPER: 52.6% | | | |
| | 2,750,000 | | | | | ANZ National Bank,
5.260%, 04/04/07 | | | | | 2,677,220 | | |
| | 1,027,000 | | | | | Barton Capital Corp.,
2.700%, 10/02/06 | | | | | 1,026,846 | | |
| | 1,018,000 | | | | | Barton Capital Corp.,
5.060%, 10/20/06 | | | | | 1,015,147 | | |
| | 5,000,000 | | | | | BHP Billiton Finance USA Ltd.,
5.100%, due 10/26/06 | | | | | 4,981,667 | | |
| | 700,000 | | | | | CAFCO, LLC, 5.010%,
10/19/06 | | | | | 698,156 | | |
| | 2,000,000 | | | | | Cargill Asia Pacific, 3.530%,
due 10/03/06 | | | | | 1,999,411 | | |
| | 4,000,000 | | | | | Cargill, Inc., 4.230%,
due 10/05/06 | | | | | 3,997,653 | | |
| | 5,000,000 | | | | | Citigroup Funding, Inc.,
4.420%, due 10/06/06 | | | | | 4,996,319 | | |
| | 3,775,000 | | | | | Concord Minutemen
Capital Co., 5.000%,
due 10/18/06 | | | | | 3,765,579 | | |
| | 3,000,000 | | | | | Concord Minutemen
Capital Co., 5.010%,
due 10/18/06 | | | | | 2,992,506 | | |
| | 4,000,000 | | | | | Crown Point Capital Co.,
5.040%, due 10/20/06 | | | | | 3,988,832 | | |
| | 2,700,000 | | | | | Dexia Delaware, LLC,
4.980%, 10/16/06 | | | | | 2,694,038 | | |
| | 2,900,000 | | | | | HBOS Treasury Services PLC,
5.100%, due 10/24/06 | | | | | 2,890,180 | | |
| | 600,000 | | | | | IXIS, 5.090%, 10/25/06 | | | | | 597,888 | | |
| | 250,000 | | | | | IXIS, 5.100%, 01/04/07 | | | | | 246,649 | | |
| | 800,000 | | | | | IXIS, 5.190%, 11/08/06 | | | | | 795,524 | | |
| | 517,000 | | | | | Jupiter Securitization Corp.,
4.900%, due 10/13/06 | | | | | 516,087 | | |
| | 1,479,000 | | | | | Jupiter Securitization Corp.,
4.980%, due 10/16/06 | | | | | 1,475,734 | | |
| | 566,000 | | | | | Jupiter Securitization Corp.,
5.200%, due 10/10/06 | | | | | 562,667 | | |
| | 298,000 | | | | | Jupiter Securitization Corp.,
5.230%, due 10/20/06 | | | | | 295,806 | | |
| | 3,000,000 | | | | | Louis Dreyfus Corp., 5.030%,
due 10/20/06 | | | | | 2,991,648 | | |
| | 1,000,000 | | | | | Louis Dreyfus Corp., 5.140%,
due 10/31/06 | | | | | 995,592 | | |
| | 1,052,000 | | | | | Park Avenue Receivables,
4.900%, 10/13/06 | | | | | 1,050,141 | | |
| | 511,000 | | | | | Park Avenue Receivables,
4.980%, 10/17/06 | | | | | 509,801 | | |
| | 2,000,000 | | | | | Park Avenue Receivables,
5.030%, 10/20/06 | | | | | 1,994,427 | | |
Principal
Amount | | | | | | | | Value | |
| $ | 1,000,000 | | | | | St. Germain Holdings Ltd.,
4.750%, due 10/10/06 | | | | $ | 998,681 | | |
| | 2,500,000 | | | | | St. Germain Holdings Ltd.,
5.030%, due 10/19/06 | | | | | 2,493,381 | | |
| | 1,260,000 | | | | | Societe Generale, Inc.,
5.080%, 10/19/06 | | | | | 1,256,630 | | |
| | 4,000,000 | | | | | Thunder Bay Funding, LLC,
5.030%, due 10/20/06 | | | | | 3,988,853 | | |
| | 786,000 | | | | | Tulip Funding Corp., 4.980%,
due 10/24/06 | | | | | 783,399 | | |
| | 508,000 | | | | | Tulip Funding Corp., 5.010%,
due 10/27/06 | | | | | 506,100 | | |
| | 4,000,000 | | | | | Tulip Funding Corp., 5.130%,
due 10/30/06 | | | | | 3,982,987 | | |
| | 942,000 | | | | | UBS Finance, Inc.,
4.830% 10/11/06 | | | | | 940,613 | | |
| | 764,000 | | | @@ | | UBS Finance, Inc.,
5.150%, 10/19/06 | | | | | 761,956 | | |
| | 600,000 | | | | | Westpac Banking Corp.,
5.190%, due 11/10/06 | | | | | 596,477 | | |
| | 2,000,000 | | | | | Westpac Banking Corp.,
5.260%, due 11/17/06 | | | | | 1,986,083 | | |
| | 726,000 | | | | | Windmill Funding,
4.840%, 10/12/06 | | | | | 724,927 | | |
| | 1,400,000 | | | | | Windmill Funding,
4.960%, 10/16/06 | | | | | 1,396,920 | | |
| | 2,000,000 | | | | | Windmill Funding,
5.120%, 10/30/06 | | | | | 1,991,501 | | |
| | 2,000,000 | | | | | Yorktown Capital, LLC,
5.030%, 10/20/06 | | | | | 1,994,427 | | |
| | | Total Commercial Paper
(Cost $74,158,453) | | | | | 74,158,453 | | |
| CORPORATE BONDS/NOTES: 28.1% | | | |
| | 2,000,000 | | | | | American Express
Centurion Bank, 5.410%,
due 07/19/07 | | | | | 2,001,768 | | |
| | 1,000,000 | | | #, C | | American General
Finance Corp., 5.350%,
due 11/15/07 | | | | | 999,984 | | |
| | 2,000,000 | | | | | American General
Finance Corp., 5.470%,
due 04/05/07 | | | | | 2,000,859 | | |
| | 1,500,000 | | | # | | American Honda
Finance Corp., 5.540%,
due 12/12/06 | | | | | 1,500,376 | | |
| | 500,000 | | | | | Bear Stearns Cos., Inc.,
5.364%, due 10/26/07 | | | | | 500,000 | | |
| | 1,200,000 | | | | | Bear Stearns Cos., Inc.,
5.534%, due 01/16/07 | | | | | 1,200,507 | | |
| | 690,000 | | | | | Bear Stearns Cos., Inc.,
5.700%, due 01/15/07 | | | | | 690,522 | | |
| | 2,000,000 | | | | | BNP Paribas, 5.322%,
due 01/26/07 | | | | | 2,000,000 | | |
| | 2,000,000 | | | | | Credit Suisse USA, Inc.,
5.905%, due 02/15/07 | | | | | 2,003,678 | | |
| | 1,900,000 | | | | | Dexia Credit Local NY,
5.261%, due 11/06/06 | | | | | 1,899,868 | | |
| | 1,000,000 | | | I | | Goldman Sachs Group LP,
5.360%, due 05/11/07 | | | | | 1,000,000 | | |
| | 1,500,000 | | | # | | Goldman Sachs Group LP,
5.420%, due 09/14/07 | | | | | 1,500,000 | | |
| | 1,500,000 | | | @@, # | | HBOS Treasury Services PLC,
5.459%, due 10/24/07 | | | | | 1,501,255 | | |
See Accompanying Notes to Financial Statements
78
ING INSTITUTIONAL PRIME PORTFOLIO OF INVESTMENTS
MONEY MARKET FUND(1) AS OF SEPTEMBER 30, 2006 (UNAUDITED) (CONTINUED)
Principal
Amount | | | | | | | | Value | |
| $ | 3,000,000 | | | | | Merrill Lynch & Co., Inc.,
5.296%, due 07/27/07 | | | | $ | 3,000,000 | | |
| | 800,000 | | | | | Merrill Lynch & Co., Inc.,
5.495%, due 07/09/07 | | | | | 800,592 | | |
| | 2,000,000 | | | | | Merrill Lynch & Co., Inc.,
5.515%, due 03/19/07 | | | | | 2,001,327 | | |
| | 2,000,000 | | | #, I | | Money Market Trust
Series A-2, 5.395%,
due 11/08/07 | | | | | 2,000,000 | | |
| | 1,200,000 | | | | | Morgan Stanley, 5.342%,
due 11/02/07 | | | | | 1,200,691 | | |
| | 1,205,000 | | | | | Morgan Stanley, 5.500%,
due 11/09/06 | | | | | 1,205,043 | | |
| | 4,000,000 | | | @@, C | | Royal Bank of Scotland
Group PLC, 3.950%,
due 04/27/07 | | | | | 3,966,512 | | |
| | 800,000 | | | | | Sciete Generale NA, Inc.,
5.380%, 10/12/06 | | | | | 798,704 | | |
| | 5,000,000 | | | | | Toyota Motor Credit Corp.,
5.312%, due 04/26/07 | | | | | 5,000,000 | | |
| | 885,000 | | | C | | UnitedHealth Group, Inc.,
5.200%, due 01/17/07 | | | | | 884,387 | | |
| | | Total Corporate Bonds/Notes
(Cost $39,656,073) | | | | | 39,656,073 | | |
| U.S. GOVERNMENT AGENCY OBLIGATIONS: 0.7% | | | |
| | 1,000,000 | | | | | Federal Home Loan Bank,
5.575%, due 08/17/07 | | | | | 1,000,000 | | |
| | | Total U.S. Government
Agency Obligations
(Cost $1,000,000) | | | | | 1,000,000 | | |
| REPURCHASE AGREEMENT: 17.3% | | | |
| 24,393,000 | | Deutsche Bank Repurchase
Agreement date 09/29/06, 5.250%,
due 10/02/06 $24,403,672 to be
received upon repurchase
(Collateralized by $24,585,000
various U.S. Government Agency
obligations, 3.625%-5.375%,
Market value plus accrued
interest $24,884,104 due
07/05/07-11/14/08). | |
| | |
24,393,000 | | |
| | Total Repurchase Agreement
(Cost $24,393,000) | |
| | |
24,393,000 | | |
| | Total Investments in
Securities (Cost
$140,956,464)* | | | 99.9 | % | | $ | 140,956,464 | | |
| | Other Assets and
Liabilities-Net | | | 0.1 | | | | 129,347 | | |
| | | Net Assets | | | 100.0 | % | | $ | 141,085,811 | | |
(1) All securities with a maturity date of greater than 13 months have either a variable rate, a demand feature, prerefunded, optional or mandatory put resulting in an effective maturity of one year or less. Rate shown reflects current rate.
ABS Asset-Backed Securities
CDO Collateralized Debt Obligations
@@ Foreign Issuer
# Securities with purchases pursuant to Rule 144A, under the Securities Act of 1933 and may not be resold subject to that rule except to qualified institutional buyers. These securities have been determined to be liquid under the guidelines established by the Funds' Board of Directors/Trustees.
C Bond may be called prior to maturity date.
I Illiquid security
* Cost for federal income tax purposes is the same as for financial statement purposes.
See Accompanying Notes to Financial Statements
79
(THIS PAGE INTENTIONALLY LEFT BLANK)
(THIS PAGE INTENTIONALLY LEFT BLANK)
(THIS PAGE INTENTIONALLY LEFT BLANK)
ING Funds Distributor, LLC offers the funds listed below. Before investing in a fund, shareholders should carefully review the fund's prospectus. Investors may obtain a copy of a prospectus of any ING Fund by calling (800) 992-0180 or by going to www.ingfunds.com.
Domestic Equity and Income Funds
ING Balanced Fund
ING Growth and Income Fund
ING Real Estate Fund
Domestic Equity Growth Funds
ING 130/30 Fundamental Research Fund
ING Disciplined LargeCap Fund
ING Fundamental Research Fund
ING Growth Fund
ING LargeCap Growth Fund
ING MidCap Opportunities Fund
ING Opportunistic LargeCap Fund
ING SmallCap Opportunities Fund
ING Small Company Fund
Domestic Equity Index Funds
ING Index Plus LargeCap Fund
ING Index Plus MidCap Fund
ING Index Plus SmallCap Fund
Domestic Equity Value Funds
ING Financial Services Fund
ING LargeCap Value Fund
ING MagnaCap Fund
ING MidCap Value Fund
ING MidCap Value Choice Fund
ING SmallCap Value Fund
ING SmallCap Value Choice Fund
Fixed Income Funds
ING GNMA Income Fund
ING High Yield Bond Fund
ING Intermediate Bond Fund
ING National Tax-Exempt Bond Fund
Global Equity Funds
ING Global Equity Dividend Fund
ING Global Real Estate Fund
ING Global Science and Technology Fund
ING Global Value Choice Fund
International Equity Funds
ING Emerging Countries Fund
ING Foreign Fund
ING Greater China Fund
ING Index Plus International Equity Fund
ING International Fund
ING International Capital Appreciation Fund
ING International Growth Fund
ING International Real Estate
ING International SmallCap Fund
ING International Value Fund
ING International Value Choice Fund
ING Global Natural Resources Fund
ING Russia Fund
International Fixed Income Funds
ING Emerging Markets Fixed Income Fund
ING Global Bond Fund
International Fund-of-Funds
ING Diversified International Fund
Loan Participation Fund
ING Senior Income Fund
Money Market Funds*
ING Aeltus Money Market Fund
ING Classic Money Market Fund
Strategic Allocation Funds
ING Strategic Allocation Conservative Fund
ING Strategic Allocation Growth Fund
ING Strategic Allocation Moderate Fund
* An investment in the Funds are not insured or guaranteed by the Federal Deposit Insurance Corporation or any other government agency. Although the Funds seek to preserve the value of your investment at $1.00 per share, it is possible to lose money by investing in the Funds.
| Investment Adviser | | Transfer Agent | |
| ING Investments, LLC | | DST Systems, Inc. | |
|
| 7337 East Doubletree Ranch Road | | 330 West 9th Street | |
|
| Scottsdale, Arizona 85258 | | Kansas City, Missouri 64105 | |
|
| Administrator | | Custodian | |
| ING Funds Services, LLC | | The Bank of New York | |
|
| 7337 East Doubletree Ranch Road | | One Wall Street | |
|
| Scottsdale, Arizona 85258 | | New York, New York 10286 | |
|
| Distributor | | Legal Counsel | |
| ING Funds Distributor, LLC | | Dechert | |
|
| 7337 East Doubletree Ranch Road | | 1775 I Street, N.W | |
|
| Scottsdale, Arizona 85258 | | Washington, D.C. 20006 | |
|
| 1-800-334-3444 | | | |
|
| For more complete information, or to obtain a prospectus on any ING fund, please call your Investment Professional or ING Funds Distributor, LLC at (800) 992-0180 or log on to www.ingfunds.com. The prospectus should be read carefully before investing. Consider the fund's investment objectives, risks, charges and expenses carefully before investing. The prospectus contains this information and other information about the fund. | |

PRSAR-UFIALL (0906-112206)
ITEM 2. CODE OF ETHICS.
Not required for semi-annual filing.
ITEM 3. AUDIT COMMITTEE FINANCIAL EXPERT.
Not required for semi-annual filing.
ITEM 4. PRINCIPAL ACCOUNTANT FEES AND SERVICES.
Not required for semi-annual filing.
ITEM 5. AUDIT COMMITTEE OF LISTED REGISTRANTS.
Not required for semi-annual filing.
ITEM 6. SCHEDULE OF INVESTMENTS.
Schedule is included as part of the report to shareholders filed under Item 1 of
this Form.
ITEM 7. DISCLOSURE OF PROXY VOTING POLICIES AND PROCEDURES FOR CLOSED-END MANAGEMENT INVESTMENT COMPANIES.
Not applicable.
ITEM 8. PORTFOLIO MANAGERS OF CLOSED-END MANAGEMENT INVESTMENT COMPANIES.
Not applicable.
ITEM 9. PURCHASES OF EQUITY SECURITIES BY CLOSED-END MANAGEMENT INVESTMENT COMPANY AND AFFILIATED PURCHASERS.
Not applicable.
ITEM 10. SUBMISSION OF MATTERS TO A VOTE OF SECURITY HOLDERS.
The Board has a Nominating Committee for the purpose of considering and presenting to the Board candidates it proposes for nomination to fill Independent Trustee vacancies on the Board. The Committee currently consists of all Independent Trustees of the Board (6 individuals). The Nominating Committee operates pursuant to a Charter approved by the Board. The primary purpose of the Nominating Committee is to consider and present to the Board the candidates it proposes for nomination to fill vacancies on the Board. In evaluating candidates, the Nominating Committee may consider a variety of factors, but it has not at this time set any specific minimum qualifications that must be met. Specific qualifications of candidates for Board membership will be based on the needs of the Board at the time of nomination.
The Nominating Committee is willing to consider nominations received from shareholders and shall assess shareholder nominees in the same manner as it reviews its own nominees. A shareholder nominee for director should be submitted in writing to the Fund’s Secretary. Any such shareholder nomination should include at a minimum the following information as to each individual proposed for nomination as trustee: such individual’s written consent to be named in the proxy statement as a nominee (if nominated) and to serve as a trustee (if elected), and all information relating to such individual that is required to be disclosed in the solicitation of proxies for election of trustees, or is otherwise required, in each case under applicable federal securities laws, rules and regulations.
The Secretary shall submit all nominations received in a timely manner to the Nominating Committee. To be timely, any such submission must be delivered to the Fund’s Secretary not earlier than the 90th day prior to such meeting and not later than the close of business on the later of the 60th day prior to such meeting or the 10th day following the day on which public announcement of the date of the meeting is first made, by either disclosure in a press release or in a document publicly filed by the Fund with the Securities and Exchange Commission.
ITEM 11. CONTROLS AND PROCEDURES.
(a) Based on our evaluation conducted within 90 days of the filing date, hereof, the design and operation of the registrant’s disclosure controls and procedures are effective to ensure that material information relating to the registrant is made known to the certifying officers by others within the appropriate entities, particularly during the period in which Forms N-CSR are being prepared, and the registrant’s disclosure controls and procedures allow timely preparation and review of the information for the registrant’s Form N-CSR and the officer certifications of such Form N-CSR.
(b) There were no significant changes in the registrant’s internal controls that occurred during the second fiscal quarter of the period covered by this report that has materially affected, or is reasonably likely to materially affect, the registrant’s internal control over financial reporting.
ITEM 12. EXHIBITS.
(a)(1) The Code of Ethics is not required for the semi-annual filing.
(a)(2) A separate certification for each principal executive officer and principal financial officer of the registrant as required by Rule 30a-2 under the Act (17 CFR 270.30a-2) is attached hereto as EX-99.CERT.
(a)(3) Not required for semi-annual filing.
(b) The officer certifications required by Section 906 of the Sarbanes-Oxley Act of 2002 are attached hereto as EX-99.906CERT
SIGNATURES
Pursuant to the requirements of the Securities Exchange Act of 1934 and the Investment Company Act of 1940, the registrant has duly caused this report to be signed on its behalf by the undersigned, thereunto duly authorized.
(Registrant): ING Funds Trust
By | /s/ Shaun P. Mathews |
| Shaun P. Mathews |
| President and Chief Executive Officer |
Date: November 29, 2006
Pursuant to the requirements of the Securities Exchange Act of 1934 and the Investment Company Act of 1940, this report has been signed below by the following persons on behalf of the registrant and in the capacities and on the dates indicated.
By | /s/ Shaun P. Mathews |
| Shaun P. Mathews |
| President and Chief Executive Officer |
Date: November 29, 2006
By | /s/ Todd Modic |
| Todd Modic |
| Senior Vice President and Chief Financial Officer |
Date: November 29, 2006
5