| | |
OMB APPROVAL |
OMB Number: | | 3235-0570 |
Expires: | | August 31, 2011 |
Estimated average burden |
hours per response: | | 18.9 |
UNITED STATES
SECURITIES AND EXCHANGE COMMISSION
Washington, D.C. 20549
FORM N-CSR
CERTIFIED SHAREHOLDER REPORT OF REGISTERED
MANAGEMENT INVESTMENT COMPANIES
Investment Company Act file number: 811-08895
ING Funds Trust
(Exact name of registrant as specified in charter)
| | |
| 7337 E. Doubletree Ranch Rd., Scottsdale, AZ | | 85258 |
| (Address of principal executive offices) | | (Zip code) |
The Corporation Trust Company, 1209 Orange Street, Wilmington, DE 19801
(Name and address of agent for service)
Registrant’s telephone number, including area code: 1-800-992-0180
Date of fiscal year end: March 31
Date of reporting period: April l, 2009 to September 30, 2009

Semi-Annual Report
September 30, 2009
Classes A, B, C, I, IS, O, Q, R and W
Fixed-Income Funds
| n | ING High Yield Bond Fund |
| n | ING Intermediate Bond Fund |
Money Market Funds
| n | ING Classic Money Market Fund |
| n | ING Institutional Prime Money Market Fund |
| | |
 | | E-Delivery Sign-up – details inside |
This report is submitted for general information to shareholders of the ING Funds. It is not authorized for distribution to prospective shareholders unless accompanied or preceded by a prospectus which includes details regarding the funds’ investment objectives, risks, charges, expenses and other information. This information should be read carefully.
MUTUAL FUNDS | 
|
TABLE OF CONTENTS
| | | | |
| | | |
 | | Go Paperless with E-Delivery! | | |
Sign up now for on-line prospectuses, fund reports, and proxy statements. In less than five minutes, you can help reduce paper mail and lower fund costs. Just go to www.ingfunds.com, click on the E-Delivery icon from the home page, follow the directions and complete the quick 5 Steps to Enroll. You will be notified by e-mail when these communications become available on the internet. Documents that are not available on the internet will continue to be sent by mail. |
PROXY VOTING INFORMATION
A description of the policies and procedures that the Funds use to determine how to vote proxies related to portfolio securities is available: (1) without charge, upon request, by calling Shareholder Services toll-free at (800) 992-0180; (2) on the Funds’ website at www.ingfunds.com; and (3) on the U.S. Securities and Exchange Commission’s (“SEC”) website at www.sec.gov. Information regarding how the Funds voted proxies related to portfolio securities during the most recent 12-month period ended June 30 is available without charge on the Funds’ website at www.ingfunds.com and on the SEC’s website at www.sec.gov.
QUARTERLY PORTFOLIO HOLDINGS
The Funds file their complete schedule of portfolio holdings with the SEC for the first and third quarters of each fiscal year on Form N-Q. The Funds’ Forms N-Q are available on the website at www.sec.gov. The Funds’ Forms N-Q may be reviewed and copied at the SEC’s Public Reference Room in Washington, DC, and information on the operation of the Public Reference Room may be obtained by calling (800) SEC-0330; and is available upon request from the Funds by calling Shareholder Services toll-free at (800) 992-0180.
Please note that your investment in money market funds: is not a bank deposit, is not insured or guaranteed by the Federal Deposit Insurance Corporation (“FDIC”), the Federal Reserve Board or any other government agency, and is affected by market fluctuations. There is no guarantee that the ING Classic Money Market Fund or the ING Institutional Prime Money Market Fund will achieve its investment objective.
PRESIDENT’S LETTER

Dear Shareholder,
As we move through Autumn, we find ourselves crossing a divide that does not feel like much of a change, yet portends hope for the future. Federal Reserve Chairman Benjamin S. Bernanke recently said that it was “very likely” the recession has ended, though he noted it could take many months for the unemployment rate to drop meaningfully. It may take some time before we notice the recovery in our daily lives.
Yet the equity markets seem to be taking economic events in stride, and have come back impressively since spring. For the 12 months ended September 30, 2009, the Dow Jones Industrial Average and the Standard & Poor’s 500® Composite Stock Price Index have nearly erased their losses; the NASDAQ Composite Index has moved into positive territory for the same period.
At ING Funds, we expect economic growth will accelerate next year and continue in 2011, but with elevated unemployment for the next few years.
How might this affect your investment plans? Despite recent gains in household wealth, many people still face net declines in their portfolios overall and may have pushed their investment goals further into the future. If that is the case for you, it may be prudent to reexamine your portfolio and see if you need to make any adjustments for a longer horizon.
For others, the need to preserve capital or increase income may have become paramount. If these are concerns for you, it may be advisable to review your current investments to determine whether they meet your expected needs.
Only you and your investment advisor can determine the answers to these questions. We urge you to discuss these matters thoroughly with your advisor before making any changes to your investment goals or your portfolio.
Thank you for your continued confidence in ING Funds. We look forward to serving your investment needs in the future.
Sincerely,

Shaun Mathews
President and Chief Executive Officer
ING Funds
November 6, 2009
The views expressed in the President’s Letter reflect those of the President as of the date of the letter. Any such views are subject to change at any time based upon market or other conditions and the ING Funds disclaim any responsibility to update such views. These views may not be relied on as investment advice and because investment decisions for an ING Fund are based on numerous factors, may not be relied on as an indication of investment intent on behalf of any ING Fund. Reference to specific company securities should not be construed as recommendations or investment advice.
For more complete information, or to obtain a prospectus for any ING Fund, please call your investment professional or ING Funds Distributor, LLC at (800) 992-0180 or log on to www.ingfunds.com. The prospectus should be read carefully before investing. Consider the fund’s investment objectives, risks, and charges and expenses carefully before investing. The prospectus contains this information and other information about the fund. Check with your investment professional to determine which funds are available for sale within their firm. Not all funds are available for sale at all firms.
1
MARKET PERSPECTIVE: SIX MONTHS ENDED SEPTEMBER 30, 2009
From its earliest days in mid-March, the resurgence of risky asset classes like equities and corporate bonds encountered skeptics. It was based they said, not on good economic news but news that was merely less awful. That banks were making money again relied on extraordinarily low interest rates to depositors and “special” items. The government’s willingness to incur $1.75 trillion in additional debt to bail out banks, insurers, auto companies and people who bought housing beyond their means, while the Federal Reserve printed money to buy the debt and keep interest rates down, would have its day of inflationary reckoning.
But the believers would have none of it. Conditions don’t go from bad to good in one step, they said. The news has to get less bad first. The richest harvest must start with a few green shoots in an empty field. In no time, every commentator seemed to be talking about “green shoots”.
However described, the news on which markets advanced was on balance improving, albeit weakly and erratically.
In housing, the Standard & Poor’s (“S&P”)/Case-Shiller National U.S. Home Price Index(1) of house prices in 20 cities sank a record 19% year-over-year in January. But from there the declines moderated to 13.3% in the most recent report. Sales of existing homes rose for four months, before slipping in September. Still, the proportion of distressed sales was down to less than one third, from nearly half earlier in the year. New home sales, helped by an $8,000 government grant to first-time home buyers, had three straight months of gain through September.
After a fall in first quarter gross domestic product (“GDP”) of 5.5% annualized, the contraction for the second quarter was just 0.7% annualized, and after four straight falls there were high hopes that GDP in the third quarter would rebound. By September, closely watched purchasing managers’ indices were flirting with levels suggesting expansion.
A “Cash-for-Clunkers” program under which the government offered to subsidize the trade-in of old vehicles for newer, more efficient models was vigorously taken up. Retail sales and industrial production were boosted. Auto companies re-opened production lines.
A flimsier green shoot emerged in the employment reports. The September report showed payroll cuts at little more than one third of the January level. But the unemployment rate stood at a 26-year high of 9.7%.
The average work week languished near the lowest since records began in 1964. Wage growth remained insipid. Increasingly commentators asked what kind of real recovery could take place under these conditions and as the various government support programs expired.
In fixed income markets, three-month dollar London Interbank Offered Rate (“LIBOR”), the basis of trillions of dollars of financial agreements, fell below 1% for the first time ever and stayed there. Various measures of spread against LIBOR, indicating willingness to lend, fell to levels well below those seen before the financial crisis emerged.
Bonds at first sight had a solid six months. The Barclays Capital U.S. Aggregate Bond Index(2) of investment grade bonds returned 5.59%. But within this figure there were cross-currents. Improved risk appetite propelled the Barclays Capital Corporate Investment-Grade Bond Index(3) to a 19.41% gain amid surging new issuance. High yield bonds, represented by the Barclays Capital High Yield Bond — 2% Issuer Constrained Composite Index(4), did even better, gaining an equity-like 40.24%. At first, the Barclays Capital U.S. Treasury Index(5) lost about 3%, as greater risk appetite was reinforced by concerns about massive government borrowing. The excess yield on 10-year Treasuries over 2-year issues briefly reached a record 275 basis points (“bp”). But ultimately, the fragile economy became uppermost in investors’ minds. They began to feel that inflation would not be an immediate problem and with the Federal Reserve buying Treasuries, seekers of safety could move up the yield curve to get some return rather than receive practically nothing at the very short end. The Barclays Capital U.S. Treasury Index ended the six-month period with just a 0.98% loss. The annual yield on the 90-day Treasury Bills started the fiscal year at 20bp and ended it at 12bp.
In currencies, the dollar relinquished first quarter benefits from its safe haven status, falling 9.5% against the euro, 10.7% against the pound and 7.5% against the yen.
U.S. equities, represented by the S&P 500® Composite Stock Price (“S&P 500®”) Index(6) including dividends, returned 34.0% in the six months through September, led by the Financials component which rose 70.4%. Profits for S&P 500® companies suffered their eighth straight quarter of decline in the second quarter and by the half way point in our fiscal year the price to earnings ratio of the S&P 500® Index,
2
MARKET PERSPECTIVE: SIX MONTHS ENDED SEPTEMBER 30, 2009
based on operating earnings in the trailing four quarters, had not been so high since the first half of 2002.
In international markets, referring to MSCI indices in local currencies with net reinvested dividends, the MSCI Japan® Index(7) rose 18.8% for the six months through September, but weakened at the end. A rise in gross domestic product (“GDP”) of 2.3% annualized was due to net exports and government stimulus. Domestic demand was still in the doldrums and deflation had again taken hold. The MSCI Europe ex UK® Index(8) surged 41.0%. After a drop in GDP of 2.5% in the first quarter second quarter GDP barely fell and actually rose in France and Germany. Confidence measures, from investor to business to consumer, continued to advance. The MSCI UK® Index(9) jumped 34.4%. GDP fell for the fifth consecutive quarter and stood 5.5% below the level one year earlier. Yet house prices were by all accounts edging back up again. Purchasing managers’ indices were in or near expansion territory. And in September consumer confidence rose by the most since 1995.
(1) The S&P/Case-Shiller National U.S. Home Price Index tracks the value of single-family housing within the United States. The index is a composite of single family home price indices for the nine U.S. Census divisions and is calculated quarterly.
(2) The Barclays Capital U.S. Aggregate Bond Index is an unmanaged index of publicly issued investment grade U.S. Government, mortgage-backed, asset-backed and corporate debt securities.
(3) The Barclays Capital Corporate Investment-Grade Bond Index is an unmanaged index that measures the performance USD-denominated, investment-grade, fixed-rate, taxable securities sold by industrial, utility and financial issuers.
(4) The Barclays Capital High Yield Bond — 2% Issuer Constrained Composite Index is an unmanaged index that measures the performance of fixed-income securities.
(5) The Barclays Capital U.S. Treasury Index is an unmanaged index that includes public obligations of the U.S. Treasury. Treasury bills, certain special issues, such as state and local government series bonds (SLGs), as well as U.S. Treasury TIPS and STRIPS, are excluded.
(6) The S&P 500® Index is an unmanaged index that measures the performance of securities of approximately 500 large-capitalization companies whose securities are traded on major U.S. stock markets.
(7) The MSCI Japan® Index is a free float-adjusted market capitalization index that is designed to measure developed market equity performance in Japan.
(8) The MSCI Europe ex UK® Index is a free float-adjusted market capitalization index that is designed to measure developed market equity performance in Europe, excluding the UK.
(9) The MSCI UK® Index is a free float-adjusted market capitalization index that is designed to measure developed market equity performance in the UK.
Parentheses denote a negative number when applicable.
All indices are unmanaged and investors cannot invest directly in an index. Past performance does not guarantee future results. The performance quoted represents past performance. Investment return and principal value of an investment will fluctuate, and shares, when redeemed, may be worth more or less than their original cost. The Funds’ performance is subject to change since the period’s end and may be lower or higher than the performance data shown. Please call (800) 992-0180 or log on to www.ingfunds.com to obtain performance data current to the most recent month end.
Market Perspective reflects the views of ING’s Chief Investment Risk Officer only through the end of the period, and is subject to change based on market and other conditions.
3
| | |
| ING GNMA INCOME FUND | | PORTFOLIO MANAGERS’ REPORT |
ING GNMA Income Fund (the “Fund”) seeks to generate a high level of current income, consistent with liquidity and safety of principal, through investment primarily in Government National Mortgage Association (“GNMA”) mortgage-backed securities (also known as GNMA Certificates) that are guaranteed as to the timely payment of principal and interest by the U.S. government. The Fund is managed by Peter Guan, Jeff Dutra and Justin McWhorter, Portfolio Managers* of ING Investment Management Co. — the Sub-Adviser.
Securities issued by the U.S. Treasury are backed by the full faith and credit of the federal government. Securities issued by individual agencies and organizations may be backed by the full faith and credit of the federal government as to principal or interest but are not direct obligations of the U.S. Treasury. Securities of some agencies and organizations are backed solely by the entity’s own resources or by the ability of the entity to borrow from the U.S. Treasury. Government securities also include certain mortgage-related securities that are sponsored by a U.S. government agency or organization and are not direct obligations of the U.S. government.
Performance: For the six-month period ended September 30, 2009, the Fund’s Class A shares, excluding sales charges, provided a total return of 2.57% compared to the Barclays Capital U.S. Mortgage-Backed Securities (“MBS”) Index(1) which returned 3.03%, for the same period.
Portfolio Specifics: Economic pessimism waned as positive surprises dominated economic releases. Emerging economies appear to be outpacing the developed world. Responding to the revival of many economies, investors left the “safe haven” of U.S. Treasury debt and embraced riskier assets. Domestic inflation remained muted. Despite the sell-off in Treasuries, the widely watched Barclays Capital U.S. Aggregate Bond Index reported another strong period with a 5.59% total return. GNMAs posted 2.07% of excess return.(2)
The Federal Reserve (the “Fed”) and the U.S. Treasury Department, combined, have now purchased more than $1 trillion of residential mortgage-backed securities (“RMBS”) and nearly $300 billion of U.S. Treasuries as they engage in quantitative easing. Moreover, the Fed will continue by buying another $300+ billion of RMBS by April of 2010. The big surprise so far this year is the lack of new supply into the market. Origination was expected to increase substantially with the implementation of streamlined refinancing and loan modification programs offered by the government sponsored enterprises (“GSEs”): the Federal Home Loan Mortgage Corporation (“FHLMC”), the Federal National Mortgage Association (“FNMA”) and the Government National Mortgage Association (“GNMA”).
The Fund continued to focus on RMBS with reduced prepayment risk. Security selection became a priority as most areas of the agency RMBS market were priced at fairly rich levels. The Fund’s duration profile was slightly lower and its exposure to higher coupon mortgages was moderately higher than the benchmark.
The Fund’s strategy of investing in higher income specified pools did well with prepayments remaining subdued and prices rising as a result. Specified pools have unique characteristics that we prefer versus the generic, or “TBA” market. While we don’t expect much additional price action from here, the strategy is still attractive compared to current production pools, or freshly minted mortgages, and TBAs. The Fund’s build-up of cash and short-term Treasuries in late August and early September led to a small give-back in performance as interest rates continued to rally and yield spreads narrowed further.
Prepayments remain lower than expected, providing a boost to the premium-coupon mortgages that the Fund owns. As prepayments remain low the carry, or yield, advantage provided by the higher coupon mortgages increases and the amortization of the premium paid decreases. The Fund has maintained an overweight to premium-coupon mortgages throughout 2009. An announcement by the Federal Housing Authority in late September instituting more-rigorous underwriting standards for GNMA borrowers reinforces the barriers to refinancing, which should ultimately benefit premium mortgages. The slight underperformance of the Fund was close to the expense ratio and associated management fees.
Current Strategy & Outlook: The Fed announcement of an official “end-game” to their RMBS purchasing program may provide an impetus for the spreads in sector to widen vs. Treasuries; however, their current purchases will likely continue to be greater than the net supply. We believe this will keep yield spreads tight in the near term. Moreover, while the infusion of liquidity will ultimately lead to higher rates, the Fed will be forced for the near-term to keep rates at historical lows.
Consequently, the Fund will continue to be managed to benefit from slower prepayments combined with the risk of higher interest rates in the future. The predominant focus continues to be on specified GNMA pools and collateralized mortgage obligations (“CMOs”) that we believe provide a superior level of current income while minimizing the risk to prepayments. Special attention is focused on pools with lower loan balances, those with loans in slow prepaying regions, and those that are sufficiently seasoned as to reduce the prepayment sensitivity to interest rate movements. Also, we will continue to seek GNMA CMOs that provide structural prepayment and extension protection in our view.
We believe the downside to the huge government support in the agency mortgage market is that relative value remains sparse and reinvestment of cash flows is at much tighter spreads than one year ago. Therefore, we remain cautious and defensive with regards to reinvesting.
Portfolio holdings and characteristics are subject to change and may not be representative of current holdings and characteristics. The outlook for this Fund may differ from that presented for other ING Funds. Performance for the different classes of shares will vary based on differences in fees associated with each class. An index has no cash in its portfolio, imposes no sales charges and incurs no operating expenses. An investor cannot invest directly in an index.
The views expressed in this report reflect those of the portfolio managers, only through the end of the period as stated on the cover. The portfolio managers’ views are subject to change at any time based on market and other conditions.
Fund holdings are subject to change daily.
This report contains statements that may be “forward-looking” statements. Actual results may differ materially from those projected in the “forward-looking” statements.
| * | | Effective May 19, 2009, Peter Guan, Jeff Dutra and Justin McWhorter joined Denis Jamison as portfolio managers to the Fund. Effective September 30, 2009, Mr. Jamison no longer manages the Fund. |
| (1) | | The Barclays Capital U.S. MBS Index is an unmanaged index composed of fixed-income security mortgage pools sponsored by GNMA, FNMA and FHLMC, including GNMA Graduated Payment Mortgages. |
| (2) | | For fixed income asset classes, excess return is defined as the return of an asset class over a U.S. Treasury security of comparable duration. |
4
| | |
| PORTFOLIO MANAGERS’ REPORT | | ING HIGH YIELD BOND FUND |
ING High Yield Bond Fund (the “Fund”) seeks to provide investors with a high level of current income and total return. The Fund is managed by Randall Parrish, CFA and Dan Doyle, Portfolio Managers of ING Investment Management Co. — the Sub-Adviser.
Performance: For the six month period ended September 30, 2009, the Fund’s Class A shares, excluding sales charges, provided a total return of 33.19% compared to the Barclays Capital High Yield Bond — 2% Issuer Constrained Composite Index(1) and the Barclays Capital® Corporate High Yield Index(2), which returned 40.17% and 40.57%, respectively, for the same period.
Portfolio Specifics: For the six-month period ended September 30, 2009, the Fund underperformed its benchmark, the Barclays Capital 2% Issuer Constrained High Yield Index.
Economic pessimism waned as positive surprises dominated economic releases. Emerging economies appear to be outpacing the developed world. Responding to the revival of many economies, investors left the “safe haven” of U.S. Treasury debt and embraced riskier assets. Domestic inflation remained muted.
Risk-based fixed income assets posted strong results as positive excess returns(3) broke many records. Investment grade corporate bonds, in general, posted 20.10% of excess return, but financials led the pack with 25.82% of return above comparable duration Treasuries. Generally, lower rated corporate bonds outperformed higher credit quality issuers, as did bonds with longer maturities. High yield, in particular, has been buoyed by about $25.5 billion of inflows into mutual funds so far in 2009, a strong new issues market and a significant decline in default expectations.
During the period the Barclays Capital High Yield Bond — 2% Issuer Constrained Composite Index produced 40.17% of total returns bringing year-to-date returns to 49.52%. Returns for the six months continued to favor lower rated issues: CCC-rated bonds returned 70.28% and distressed debt topped 100.00%, while BB- rated bonds notched 27.73% Generally, lower-rated, lower priced bonds outperformed the rest of the high yield universe.
The Fund underperformed the Barclays Capital High Yield Bond — 2% Issuer Constrained Composite Index during the period because of its underweights in distressed debt securities specifically, and lower rated issues generally. As the period progressed, however, we added lower-rated bonds, which provided a partial offset. The Fund’s underweights in cyclicals, including technology, consumer cyclicals and chemicals, also hurt results as these areas performed well. Our absence from subordinated bank insurance debt also hurt
performance. Moreover, cash kept on hand for transactions, redemptions or the inflow of subscriptions was a drag during a period of historically high returns for high yield.
Positives from security selection included new purchases of lower priced, lower-rated names such as ServiceMaster, Blockbuster and ArvinMeritor, which we added during the period. Additionally, existing higher risk positions, such as Momentive, Bon-Ton Stores and R.H. Donnelly recovered significantly. The underperformers in the period were primarily higher quality, shorter dated positions that had insufficient upside to keep pace with the strong market — names including Constellation Brands, Inc., DaVita, Inc., EchoStar Communications Corp., Cablevision Systems Corp. and Centennial Communications Corp.
Current Strategy & Outlook: Signs of economic recovery have given investors increased confidence that the worst is past in terms of defaults and wide spreads for the high yield market. We believe that the reopening of both the credit and equity markets may keep the default rate below levels projected just a few months ago, and cash flows into the asset class are likely to continue to support prices despite robust new issuance. Accordingly, we are constructive on the asset class over the near term, though we note that many of the recent vintage leveraged buyouts still have balance sheets that are unsustainable over the longer term. On an historical return/risk basis, the higher quality end of the market is cheap relative to lower quality, but lower quality will likely continue to outperform as long as investors are convinced that economic recovery is on track.
Although the high yield market has posted a record return year-to-date, we believe the returns will remain attractive relative to other investment alternatives going forward. We continue to selectively add cyclical exposure to the portfolio. In recent months, we have added secured or senior
unsecured bonds where we believe there is value through the more senior levels of the capital structure, and we expect to see additional attractive opportunities in the new issue market. We have funded these purchases by selling more defensive positions that have little upside in our view.
Portfolio holdings and characteristics are subject to change and may not be representative of current holdings and characteristics. The outlook for this Fund may differ from that presented for other ING Funds. Performance for the different classes of shares will vary based on differences in fees associated with each class. An index has no cash in its portfolio, imposes no sales charges and incurs no operating expenses. An investor cannot invest directly in an index.
The views expressed in this report reflect those of the portfolio managers, only through the end of the period as stated on the cover. The portfolio managers’ views are subject to change at any time based on market and other conditions.
Fund holdings are subject to change daily.
This report contains statements that may be “forward-looking” statements. Actual results may differ materially from those projected in the “forward-looking” statements.
| (1) | | The Barclays Capital High Yield Bond — 2% Issuer Constrained Composite Index is an unmanaged index that measures the performance of fixed-income securities. |
| (2) | | The Barclays Capital Corporate High Yield Index is an unmanaged index that measures the performance of fixed-income securities generally representative of corporate bonds rated below investment grade. |
| (3) | | For fixed income asset classes, excess return is defined as the return of an asset class over a U.S. Treasury security of comparable duration. |
Top Ten Holdings*
as of September 30, 2009
(as a percent of net assets)
| | |
General Motors Acceptance Corp.,
6.875%, due 09/15/11 | | 2.4% |
Charter Communications Operating, LLC,
10.375%, due 04/30/14 | | 1.4% |
Chesapeake Energy Corp., 6.625%, due 01/15/16 | | 1.1% |
Ford Motor Credit Co., LLC, 8.700%, due 10/01/14 | | 1.1% |
Nielsen Finance LLC/Nielsen Finance Co.,
0.000%, due 08/01/16 | | 1.1% |
ServiceMaster Co, 10.750%, due 07/15/15 | | 1.0% |
Toys R Us Property Co. I LLC, 10.750%, due 07/15/17 | | 1.0% |
NewPage Corp., 11.375%, due 12/31/14 | | 1.0% |
MetroPCS Wireless, Inc., 9.250%, due 11/01/14 | | 1.0% |
Psychiatric Solutions, Inc., 7.750%, due 07/15/15 | | 1.0% |
| | * | Excludes short-term investments related to ING Institutional Prime Money Market Fund — Class I. |
Portfolio holdings are subject to change daily.
5
| | |
| ING INTERMEDIATE BOND FUND | | PORTFOLIO MANAGERS’ REPORT |
Investment Type Allocation
as of September 30, 2009
(as a percent of net assets)
| | |
Corporate Bonds/Notes | | 39.7% |
U.S. Government Agency Obligations | | 32.8% |
U.S. Treasury Obligations | | 16.4% |
Collateralized Mortgage Obligations | | 13.1% |
Asset-Backed Securities | | 3.6% |
Foreign Government Bonds | | 2.8% |
Preferred Stock | | 0.3% |
Other Assets and Liabilities — Net* | | (8.7)% |
| | |
Net Assets | | 100.0% |
| | |
| | * | Includes short-term investments related to ING Institutional Prime Money Market Fund — Class I and securities lending collateral. |
Portfolio holdings are subject to change daily.
ING Intermediate Bond Fund (the “Fund”) seeks to provide investors with a high level of current income, consistent with the preservation of capital and liquidity. The Fund is managed by Christine Hurtsellers, Michael Hyman, Peter Guan and Chris Diaz, Portfolio Managers of ING Investment Management Co. — the Sub-Adviser.
Performance: For the six-month period ended September 30, 2009, the Fund’s Class A shares, excluding sales charges, provided a total return of 13.04% compared to the Barclays Capital U.S. Aggregate Bond Index(1), which returned 5.59%, for the same period.
Economic pessimism waned as positive surprises dominated economic releases. Emerging economies appear to be outpacing the developed world. In response, investors left the “safe haven” of U.S. Treasury debt and embraced riskier assets. Domestic inflation remained muted. Despite the sell-off in Treasuries. the Barclays Capital U.S. Aggregate Bond Index returned 5.59% for the period.
Risk-based fixed income assets posted strong, positive excess returns(2) that broke many records. Corporate bonds, in general, posted 20.10% of excess return, but financials led the pack with 25.82% of return above comparable duration Treasuries. Generally, lower rated corporate bonds outperformed higher credit quality issuers, as did bonds with longer maturities. Commercial mortgage-backed securities (“CMBS”) earned 27.00% of excess returns as asset-backed securities (“ABS”) posted 14.22% of excess return. Within ABS, home equity loans outperformed with 36.37%.
High yield bonds continued their strong performance with an excess return of 41.93%, while emerging market debt (“EMD”) came in with 26.22%. High yield has been buoyed by about $25.5 billion of inflows into mutual funds so far in 2009, a strong new-issues market and a significant decline in default expectations.
Portfolio Specifics: The Fund outperformed the benchmark due to significant sector overweights to credit and non-agency residential mortgage-backed securities (“RMBS”), while it dragged from the initial underweight in longer dated CMBS at the beginning of the period. The allocations to non-agency RMBS had a powerful positive impact on both sector allocation and security selection.
Within corporate bonds, our combined overweights to financials and overweights to lower rated bonds also proved beneficial especially in the context of security selection. Eventually, we moved allocations from money center banks, in part, to smaller banks, Real Estate Investment Trusts and insurance companies in a timely fashion as the market began to search out value in these issuers. In general we reduced exposures to “big pharma” — after some early wins — and technology before they stalled slightly in September.
We have underweighted agency debentures and agency RMBS to “fund” our overweights in the riskier sectors; indeed, this call has been intrinsically correct as we were very happy to underweight two modestly winning sectors in order to increase the overweight to an even stronger sector. The Fund benefited modestly from tactical adjustments to our yield curve posture during the period. Foreign security exposures proved beneficial as the dollar fell across most major currencies.
Current Strategy & Outlook: Although concerns about inflation may resurface, we believe that it will not be a problem for the near term. Housing prices have slowed their rate of descent and consumer confidence is turning up. Although our macro outlook is for a modest and drawn-out recovery, we are mindful of the increasing number of upside surprises in the United States and abroad. The brighter news on residential real estate prices remains key to the pace and direction of the economic recovery.
The portfolio maintains a significant overweight to investment grade credit and non-agency RMBS. Additionally, we are overweight CMBS and ABS. We are slightly underweight agency RMBS and may trim further. We will tactically trade duration with a bias to staying neutral in an environment with little interest rate volatility.
Our credit team believes that financials may be the new cyclicals and should be overweighted as the economy confirms a recovery phase. We are positive on issues that benefit from commodities including dollar-denominated issues of foreign entities. Nevertheless, we are tactically concerned about a temporary widening in credit spreads as 2009 closes and will take steps to mitigate that risk synthetically.
We are also maintaining our active risk to Brazil (currency and debt) with emphasis on the high yields available in short-dated bonds. Allocations to the currencies of India and Indonesia follow our positive theme for emerging economies.
Portfolio holdings and characteristics are subject to change and may not be representative of current holdings and characteristics. The outlook for this Fund may differ from that presented for other ING Funds. Performance for the different classes of shares will vary based on differences in fees associated with each class. An index has no cash in its portfolio, imposes no sales charges and incurs no operating expenses. An investor cannot invest directly in an index.
The views expressed in this report reflect those of the portfolio managers, only through the end of the period as stated on the cover. The portfolio managers’ views are subject to change at any time based on market and other conditions.
Fund holdings are subject to change daily.
This report contains statements that may be “forward-looking” statements. Actual results may differ materially from those projected in the “forward-looking” statements.
| (1) | | The Barclays Capital U.S. Aggregate Bond Index is a widely recognized, unmanaged index of publicly issued investment grade U.S. Government, mortgage-backed, asset-backed and corporate debt securities. |
| (2) | | For fixed income asset classes, excess return is defined as the return of an asset class over a U.S. Treasury security of comparable duration. |
Top Ten Holdings*
as of September 30, 2009
(as a percent of net assets)
| | |
U.S. Treasury Note, 3.625%, due 08/15/19 | | 5.7% |
U.S. Treasury Note, 4.250%, due 05/15/39 | | 5.2% |
Federal National Mortgage Association,
6.000%, due 10/14/39 | | 4.3% |
Federal National Mortgage Association,
5.500%, due 10/15/35 | | 4.0% |
U.S. Treasury Note, 1.750%, due 08/15/12 | | 2.0% |
Federal National Mortgage Association,
6.500%, due 10/01/31 | | 1.4% |
Federal Home Loan Mortgage Corporation,
5.000%, due 11/15/34 | | 1.3% |
U.S. Treasury Note, 2.375%, due 08/31/14 | | 1.3% |
Federal Home Loan Mortgage Corporation,
5.500%, due 08/15/20 | | 1.2% |
Brazil Notas do Tesouro Nacional Series F,
10.000%, due 01/01/17 | | 1.2% |
| | * | Excludes short-term investments related to ING Institutional Prime Money Market Fund — Class I. |
Portfolio holdings are subject to change daily.
6
| | |
| PORTFOLIO MANAGERS’ REPORT | | ING CLASSIC MONEY MARKET FUND |
Investment Type Allocation
as of September 30, 2009
(as a percent of net assets)
| | |
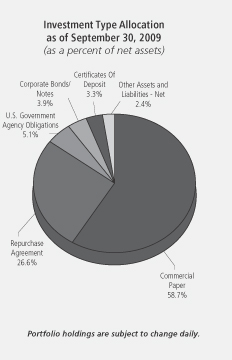
Commercial Paper | | 62.1% |
U.S. Government Agency Obligations | | 17.9% |
Repurchase Agreement | | 12.5% |
Corporate Bonds/Notes | | 4.3% |
Certificates of Deposit | | 3.8% |
Other Assets and Liabilities — Net | | (0.6)% |
| | |
Net Assets | | 100.0% |
| | |
Portfolio holdings are subject to change daily.
ING Classic Money Market Fund (the “Fund”) seeks to provide investors with a high level of current income, consistent with the preservation of capital and liquidity and the maintenance of a stable $1.00 net asset value per share. The Fund is managed by David S. Yealy, Portfolio Manager of ING Investment Management Co. — the Sub-Adviser.
Portfolio Specifics: The six-months ended September 30, 2009 were a period of historically low yields and returns for money market mutual funds and short-term money market securities, with numerous funds having to waive fees in order to provide a zero or slight positive return.
The Federal Open Market Committee (“FOMC”) maintained the targeted federal funds rate in a range of 0.00-0.25% and continued
the quantitative easing program in place. Economic releases during the quarter were much more upbeat and positive compared to the previous few quarters. However, rising foreclosures and unemployment remain significant headwinds to any recovery in housing and consumer spending.
Money market yields declined over the period as the various programs put into place by the Federal Reserve (the “Fed”), U.S. Department of the Treasury (“U.S. Treasury”) and other central banks across the globe helped to stabilize the markets and the global economies. The improved market conditions for short-term investors were reflected in the large drop in London Interbank Offered Rate (“LIBOR”). The three-month U.S. LIBOR declined from 1.19% at the end of March to 0.29% at the end of September.
Our focus during this period has not been on maximizing yield and returns but rather on preservation of capital, reducing risk and increasing liquidity due to extreme risks in the market. The Fund did take on interest rate risk, maintaining a longer than average weighted average maturity (“WAM”) for most of the period by buying longer term U.S. Treasury and agency securities.
Current Strategy & Outlook: It is our opinion that the economy is finding a bottom and is poised to turn positive entering the final quarter of 2009. We are not expecting a sharp recovery but see it as more of a long and slow recovery, as unemployment and housing continue to be a drag on consumer spending and confidence. We expect the FOMC will be forced to keep the federal funds rate in the 0.00-0.25% range for the foreseeable future, until economic and market conditions improve significantly. In our view, an increase in short-term rates will depend on how soon and how quickly the Fed can remove its quantitative easing.
As we become more comfortable that the economic recovery is taking hold and the risks of a relapse of the credit crisis are diminished, we are no longer relying primarily on U.S. Treasuries and agencies for the Fund’s longer-term exposures. We have started to modestly increase exposure to selective top-tier corporate and bank issuers and to extend maturities in those issuers further out the yield curve. We plan to maintain an extended WAM with the view that the Fed will not be in a position to raise short-term rates until mid-2010 at the earliest.
Principal Risk Factors: Although the Fund seeks to preserve the value of your investment at $1.00 per share, it is possible to lose money by investing in the Fund.
Please see Note 16 in the “Notes to Financial Statements” section for information regarding the Fund’s participation during the reporting period in the U.S. Treasury Department’s Temporary Money Market Guarantee Program, which expired on September 19, 2009.
Portfolio holdings and characteristics are subject to change and may not be representative of current holdings and characteristics. The outlook for this Fund may differ from that presented for other ING Funds.
The views expressed in this report reflect those of the portfolio managers only through the end of the period as stated on the cover. The portfolio managers’ views are subject to change at any time based on market and other conditions.
This report contains statements that may be “forward-looking” statements. Actual results may differ materially from those projected in the “forward-looking” statements.
7
| | |
| ING INSTITUTIONAL PRIME MONEY MARKET FUND | | PORTFOLIO MANAGERS’ REPORT |
ING Institutional Prime Money Market Fund (the “Fund”) seeks to provide investors with a high level of current income, consistent with the preservation of capital and liquidity and the maintenance of a stable $1.00 net asset value per share. The Fund is managed by David S. Yealy, Portfolio Manager of ING Investment Management Co. — the Sub-Adviser.
Portfolio Specifics: The six-months ended September 30, 2009 were a period of historically low yields and returns for money market mutual funds and short-term money market securities, with numerous funds having to waive fees in order to provide a zero or slight positive return.
The Federal Open Market Committee (“FOMC”) maintained the targeted federal funds rate in a range of 0.00-0.25% and continued the quantitative easing program in place. Economic releases during the quarter were much more upbeat and positive compared to the previous few quarters. However, rising foreclosures and unemployment remain significant headwinds to any recovery in housing and consumer spending.
Money market yields declined over the period as the various programs put into place by the Federal Reserve (the “Fed”), U.S. Department of the Treasury (“U.S. Treasury”) and other central banks across the globe helped to stabilize the markets and the global economies. The improved market conditions for short-term investors are reflected in the large drop in the London Interbank Offered Rate (“LIBOR”). The three-month U.S. LIBOR declined from 1.19% at the end of March to 0.29% at the end of September.
Our focus during this period has not been on maximizing yield and returns but rather on preservation of capital, reducing risk and increasing liquidity due to extreme risks in the market. The Fund did take on interest rate risk, maintaining a longer than average weighted average maturity (“WAM”) for most of the period by buying longer term U.S. Treasury and agency securities.
Current Strategy & Outlook: It is our opinion that the economy is finding a bottom and is poised to turn positive entering the final quarter of 2009. We are not expecting a sharp recovery but see it as more of a long and slow recovery, as unemployment and housing continue to be a drag on consumer spending and confidence. We expect the FOMC will be forced to keep the federal funds rate in the 0.00-0.25% range for the foreseeable future, until economic and market conditions improve significantly. In our view, an increase in short-term rates will depend on how soon and how quickly the Fed can remove its quantitative easing.
As we become more comfortable that the economic recovery is taking hold and the risks of a relapse of the credit crisis are diminished, we are no longer relying primarily on U.S. Treasuries and agencies for the Fund’s longer-term exposures. We have started to modestly increase exposure to selective top-tier corporate and bank issuers and to extend maturities in those issuers further out the yield curve. We plan to maintain an extended WAM with the view that the Fed will not be in a position to raise short-term rates until mid-2010 at the earliest.
Principal Risk Factors: Although the Fund seeks to preserve the value of your investment at $1.00 per share, it is possible to lose money by investing in the Fund.
Please see Note 16 in the “Notes to Financial Statements” section for information regarding the Fund’s participation during the reporting period in the U.S. Treasury Department’s Temporary Money Market Guarantee Program, which expired on September 19, 2009.
Portfolio holdings and characteristics are subject to change and may not be representative of current holdings and characteristics. The outlook for this Fund may differ from that presented for other ING Funds.
The views expressed in this report reflect those of the portfolio managers only through the end of the period as stated on the cover. The portfolio managers’ views are subject to change at any time based on market and other conditions.
This report contains statements that may be “forward-looking” statements. Actual results may differ materially from those projected in the “forward-looking” statements.
8
SHAREHOLDER EXPENSE EXAMPLES (UNAUDITED)
As a shareholder of a Fund, you incur two types of costs: (1) transaction costs, including sales charges (loads) on purchase payments, redemption fees, and exchange fees, and (2) ongoing costs, including management fees, distribution and/or service (12b-1) fees, and other Fund expenses. These Examples are intended to help you understand your ongoing costs (in dollars) of investing in a Fund and to compare these costs with the ongoing costs of investing in other mutual funds.
The Examples are based on an investment of $1,000 invested at the beginning of the period and held for the entire period from April 1, 2009 to September 30, 2009. The Funds’ expenses are shown without the imposition of any sales charges or fees. Expenses would have been higher if such charges were included.
Actual Expenses
The first section of the table shown below, “Actual Fund Return,” provides information about actual account values and actual expenses. You may use the information in this section, together with the amount you invested, to estimate the expenses that you paid over the period. Simply divide your account value by $1,000 (for example, an $8,600 account value divided by $1,000 = 8.6), then multiply the result by the number in the first section under the heading entitled “Expenses Paid During the Period” to estimate the expenses you paid on your account during this period.
Hypothetical Example for Comparison Purposes
The second section of the table shown below, “Hypothetical (5% return before expenses)” provides information about hypothetical account values and hypothetical expenses based on a Fund’s actual expense ratio and an assumed rate of return of 5% per year before expenses, which is not the Fund’s actual return. The hypothetical account values and expenses may not be used to estimate the actual ending account balance or expenses you paid for the period. You may use this information to compare the ongoing costs of investing in each Fund and other funds. To do so, compare this 5% hypothetical example with the 5% hypothetical examples that appear in the shareholder reports of the other funds.
Please note that the expenses shown in the table are meant to highlight your ongoing costs only and do not reflect any transactional costs, such as sales charges (loads), redemption fees, or exchange fees. Therefore, the hypothetical lines of the table are useful in comparing ongoing costs only, and will not help you determine the relative total costs of owning different funds. In addition, if these transactional costs were included, your costs would have been higher.
| | | | | | | | | | | | | | | | | | | | | | | | |
| | | Actual Fund Return | | Hypothetical (5% return before expenses) |
| | | Beginning
Account
Value
April 1, 2009 | | Ending
Account Value
September 30, 2009 | | Annualized Expense Ratio | | | Expenses Paid
During the
Period Ended
September 30, 2009* | | Beginning
Account
Value
April 1, 2009 | | Ending
Account Value
September 30, 2009 | | Annualized Expense Ratio | | | Expenses Paid
During the
Period Ended
September 30, 2009* |
ING GNMA Income Fund | | | | | | | | | | | | | | | | |
Class A | | $ | 1,000.00 | | $ | 1,025.70 | | 0.94 | % | | $ | 4.77 | | $ | 1,000.00 | | $ | 1,020.36 | | 0.94 | % | | $ | 4.76 |
Class B | | | 1,000.00 | | | 1,023.10 | | 1.69 | | | | 8.57 | | | 1,000.00 | | | 1,016.60 | | 1.69 | | | | 8.54 |
Class C | | | 1,000.00 | | | 1,022.10 | | 1.69 | | | | 8.57 | | | 1,000.00 | | | 1,016.60 | | 1.69 | | | | 8.54 |
Class I | | | 1,000.00 | | | 1,027.20 | | 0.63 | | | | 3.20 | | | 1,000.00 | | | 1,021.91 | | 0.63 | | | | 3.19 |
Class Q | | | 1,000.00 | | | 1,027.10 | | 0.88 | | | | 4.47 | | | 1,000.00 | | | 1,020.66 | | 0.88 | | | | 4.46 |
Class W | | | 1,000.00 | | | 1,027.20 | | 0.63 | | | | 3.20 | | | 1,000.00 | | | 1,021.91 | | 0.63 | | | | 3.19 |
ING High Yield Bond Fund | | | | | | | | | | | | | | | | |
Class A | | $ | 1,000.00 | | $ | 1,331.90 | | 1.10 | % | | $ | 6.43 | | $ | 1,000.00 | | $ | 1,019.55 | | 1.10 | % | | $ | 5.57 |
Class B | | | 1,000.00 | | | 1,325.00 | | 1.85 | | | | 10.78 | | | 1,000.00 | | | 1,015.79 | | 1.85 | | | | 9.35 |
Class C | | | 1,000.00 | | | 1,327.10 | | 1.85 | | | | 10.79 | | | 1,000.00 | | | 1,015.79 | | 1.85 | | | | 9.35 |
Class I | | | 1,000.00 | | | 1,335.50 | | 0.77 | | | | 4.51 | | | 1,000.00 | | | 1,021.21 | | 0.77 | | | | 3.90 |
| * | | Expenses are equal to each Fund’s respective annualized expense ratios multiplied by the average account value over the period, multiplied by 183/365 to reflect the most recent fiscal half-year. |
9
SHAREHOLDER EXPENSE EXAMPLES (UNAUDITED) (CONTINUED)
| | | | | | | | | | | | | | | | | | | | | | | | |
| | | Actual Fund Return | | Hypothetical (5% return before expenses) |
| | | Beginning
Account
Value
April 1, 2009 | | Ending
Account Value
September 30, 2009 | | Annualized Expense Ratio | | | Expenses Paid
During the
Period Ended
September 30, 2009* | | Beginning
Account
Value
April 1, 2009 | | Ending
Account Value
September 30, 2009 | | Annualized Expense Ratio | | | Expenses Paid
During the
Period Ended
September 30, 2009* |
ING Intermediate Bond Fund | | | | | | | | | | | | | | | | |
Class A | | $ | 1,000.00 | | $ | 1,130.40 | | 0.68 | % | | $ | 3.63 | | $ | 1,000.00 | | $ | 1,021.66 | | 0.68 | % | | $ | 3.45 |
Class B | | | 1,000.00 | | | 1,126.30 | | 1.43 | | | | 7.62 | | | 1,000.00 | | | 1,017.90 | | 1.43 | | | | 7.23 |
Class C | | | 1,000.00 | | | 1,126.30 | | 1.43 | | | | 7.62 | | | 1,000.00 | | | 1,017.90 | | 1.43 | | | | 7.23 |
Class I | | | 1,000.00 | | | 1,132.20 | | 0.36 | | | | 1.92 | | | 1,000.00 | | | 1,023.26 | | 0.36 | | | | 1.83 |
Class O | | | 1,000.00 | | | 1,130.20 | | 0.68 | | | | 3.63 | | | 1,000.00 | | | 1,021.66 | | 0.68 | | | | 3.45 |
Class R | | | 1,000.00 | | | 1,130.00 | | 0.93 | | | | 4.97 | | | 1,000.00 | | | 1,020.41 | | 0.93 | | | | 4.71 |
Class W | | | 1,000.00 | | | 1,132.10 | | 0.36 | | | | 1.92 | | | 1,000.00 | | | 1,023.26 | | 0.36 | | | | 1.83 |
ING Classic Money Market Fund | | | | | | | | | | | | | | | | |
Class A | | $ | 1,000.00 | | $ | 1,001.50 | | 0.59 | %•• | | $ | 2.95 | | $ | 1,000.00 | | $ | 1,022.11 | | 0.59 | %•• | | $ | 2.96 |
Class B | | | 1,000.00 | | | 1,001.50 | | 0.59 | •• | | | 2.95 | | | 1,000.00 | | | 1,022.11 | | 0.59 | •• | | | 2.96 |
Class C | | | 1,000.00 | | | 1,001.50 | | 0.59 | •• | | | 2.95 | | | 1,000.00 | | | 1,022.11 | | 0.59 | •• | | | 2.96 |
ING Institutional Prime Money Market Fund | | | | | | | | | | | | | | | | |
Class I | | $ | 1,000.00 | | $ | 1,002.60 | | 0.22 | % | | $ | 1.10 | | $ | 1,000.00 | | $ | 1,023.97 | | 0.22 | % | | $ | 1.12 |
Class IS | | | 1,000.00 | | | 1,003.90 | | 0.25 | | | | 1.26 | | | 1,000.00 | | | 1,023.82 | | 0.25 | | | | 1.27 |
| * | | Expenses are equal to each Fund’s respective annualized expense ratios multiplied by the average account value over the period, multiplied by 183/365 to reflect the most recent fiscal half-year. |
| •• | | Expense ratios reflect waivers of 0.18%, 0.81% and 0.81% of distribution and shareholder servicing fees for Classes A, B and C, respectively, in order to maintain a yield of not less than zero. |
10
STATEMENTS OF ASSETS AND LIABILITIESASOF SEPTEMBER 30, 2009 (UNAUDITED)
| | | | | | | | | | | | |
| | | ING GNMA Income Fund | | | ING High Yield Bond Fund | | | ING Intermediate Bond Fund | |
ASSETS: | | | | | | | | | | | | |
Investments in securities at value+* | | $ | 773,741,474 | | | $ | 98,649,046 | | | $ | 985,308,141 | |
Short-term investments** | | | — | | | | — | | | | 4,989,886 | |
Short-term investments in affiliates*** | | | — | | | | 2,002,000 | | | | 12,331,000 | |
Cash | | | 20,927,867 | | | | 606 | | | | 5,250 | |
Cash collateral for futures | | | — | | | | — | | | | 12,383,065 | |
Foreign currencies at value**** | | | — | | | | — | | | | 119,351 | |
Receivables: | | | | | | | | | | | | |
Investment securities sold | | | 248 | | | | 243,298 | | | | 54,150,421 | |
Investments securities sold on a delayed-delivery or when-issued basis | | | — | | | | — | | | | 50,589,917 | |
Fund shares sold | | | 2,527,171 | | | | 360,536 | | | | 970,060 | |
Dividends and interest | | | 3,278,926 | | | | 2,394,129 | | | | 9,282,479 | |
Variation margin | | | — | | | | — | | | | 170,250 | |
Receivable for collateral held at broker (Note 2) | | | — | | | | — | | | | 330,000 | |
Unrealized appreciation on forward foreign currency contracts | | | — | | | | — | | | | 31,832 | |
Upfront payments made on swap agreements | | | — | | | | — | | | | 2,617,753 | |
Unrealized appreciation on swap agreements | | | — | | | | — | | | | 1,246,668 | |
Prepaid expenses | | | 57,572 | | | | 41,067 | | | | 51,234 | |
Reimbursement due from manager | | | — | | | | 19,938 | | | | — | |
| | | | | | | | | | | | |
Total assets | | | 800,533,258 | | | | 103,710,620 | | | | 1,134,577,307 | |
| | | | | | | | | | | | |
LIABILITIES: | | | | | | | | | | | | |
Payable for investment securities purchased | | | 4,592,360 | | | | 1,993,116 | | | | 28,296,281 | |
Payable for investment securities purchased on a delayed-delivery or when-issued basis | | | — | | | | — | | | | 183,932,506 | |
Payable for variation margin | | | — | | | | — | | | | 80,647 | |
Payable for fund shares redeemed | | | 1,168,792 | | | | 212,994 | | | | 4,183,008 | |
Payable upon receipt of securities loaned | | | — | | | | — | | | | 5,655,857 | |
Payable for terminated investment contracts (Note 11) | | | — | | | | 461,580 | | | | 1,368,703 | |
Upfront payments received on swap agreements | | | — | | | | — | | | | 1,369,759 | |
Unrealized depreciation on swap agreements | | | — | | | | — | | | | 1,993,743 | |
Income distribution payable | | | — | | | | 283,134 | | | | 679,013 | |
Payable to affiliates | | | 599,438 | | | | 83,801 | | | | 362,792 | |
Payable for trustee fees | | | 14,039 | | | | 6,562 | | | | 14,515 | |
Other accrued expenses and liabilities | | | 214,757 | | | | 114,206 | | | | 470,903 | |
| | | | | | | | | | | | |
Total liabilities | | | 6,589,386 | | | | 3,155,393 | | | | 228,407,727 | |
| | | | | | | | | | | | |
NET ASSETS | | $ | 793,943,872 | | | $ | 100,555,227 | | | $ | 906,169,580 | |
| | | | | | | | | | | | |
NET ASSETS WERE COMPRISED OF: | | | | | | | | | | | | |
Paid-in capital | | $ | 776,453,172 | | | $ | 297,741,775 | | | $ | 1,079,989,191 | |
Undistributed net investment income (distributions in excess of net investment income) | | | 1,482,889 | | | | (212,027 | ) | | | 33,659,010 | |
Accumulated net realized loss on investments, foreign currency related transactions, futures, swaps, and written options | | | (12,841,285 | ) | | | (198,647,004 | ) | | | (218,498,305 | ) |
Net unrealized appreciation on investments, foreign currency related transactions, futures, and swaps | | | 28,849,096 | | | | 1,672,483 | | | | 11,019,684 | |
| | | | | | | | | | | | |
NET ASSETS | | $ | 793,943,872 | | | $ | 100,555,227 | | | $ | 906,169,580 | |
| | | | | | | | | | | | |
| | | | | | | | | | | | |
+ Including securities loaned at value | | $ | — | | | $ | — | | | $ | 5,542,113 | |
* Cost of investments in securities | | $ | 744,892,378 | | | $ | 96,976,563 | | | $ | 971,381,898 | |
** Cost of short-term investments | | $ | — | | | $ | — | | | $ | 5,655,857 | |
*** Cost of short-term investments in affiliates | | $ | — | | | $ | 2,002,000 | | | $ | 12,331,000 | |
****Cost of foreign currencies | | $ | — | | | $ | — | | | $ | 124,821 | |
See Accompanying Notes to Financial Statements
11
STATEMENTS OF ASSETS AND LIABILITIESASOF SEPTEMBER 30, 2009 (UNAUDITED) (CONTINUED)
| | | | | | | | | |
| | | ING GNMA Income Fund | | ING High Yield Bond Fund | | ING Intermediate Bond Fund |
Class A: | | | | | | | | | |
Net assets | | $ | 614,081,767 | | $ | 76,966,910 | | $ | 418,820,944 |
Shares authorized | | | unlimited | | | unlimited | | | unlimited |
Par value | | $ | 0.001 | | $ | 0.001 | | $ | 0.001 |
Shares outstanding | | | 70,141,827 | | | 10,994,657 | | | 45,653,718 |
Net asset value and redemption price per share | | $ | 8.75 | | $ | 7.00 | | $ | 9.17 |
Maximum offering price per share (2.50%)(1) | | $ | 8.97 | | $ | 7.18 | | $ | 9.41 |
Class B: | | | | | | | | | |
Net assets | | $ | 32,325,058 | | $ | 13,167,332 | | $ | 22,759,189 |
Shares authorized | | | unlimited | | | unlimited | | | unlimited |
Par value | | $ | 0.001 | | $ | 0.001 | | $ | 0.001 |
Shares outstanding | | | 3,713,320 | | | 1,882,821 | | | 2,485,713 |
Net asset value and redemption price per share(2) | | $ | 8.71 | | $ | 6.99 | | $ | 9.16 |
Maximum offering price per share | | $ | 8.71 | | $ | 6.99 | | $ | 9.16 |
Class C: | | | | | | | | | |
Net assets | | $ | 98,085,697 | | $ | 10,418,240 | | $ | 49,638,372 |
Shares authorized | | | unlimited | | | unlimited | | | unlimited |
Par value | | $ | 0.001 | | $ | 0.001 | | $ | 0.001 |
Shares outstanding | | | 11,257,207 | | | 1,488,644 | | | 5,418,294 |
Net asset value and redemption price per share(2) | | $ | 8.71 | | $ | 7.00 | | $ | 9.16 |
Maximum offering price per share | | $ | 8.71 | | $ | 7.00 | | $ | 9.16 |
Class I: | | | | | | | | | |
Net assets | | $ | 42,443,997 | | $ | 2,745 | | $ | 354,674,455 |
Shares authorized | | | unlimited | | | unlimited | | | unlimited |
Par value | | $ | 0.001 | | $ | 0.001 | | $ | 0.001 |
Shares outstanding | | | 4,842,583 | | | 393 | | | 38,660,697 |
Net asset value and redemption price per share | | $ | 8.76 | | $ | 6.99 | | $ | 9.17 |
Maximum offering price per share | | $ | 8.76 | | $ | 6.99 | | $ | 9.17 |
Class O: | | | | | | | | | |
Net assets | | | n/a | | | n/a | | $ | 42,155,601 |
Shares authorized | | | n/a | | | n/a | | | unlimited |
Par value | | | n/a | | | n/a | | $ | 0.001 |
Shares outstanding | | | n/a | | | n/a | | | 4,593,640 |
Net asset value and redemption price per share | | | n/a | | | n/a | | $ | 9.18 |
Maximum offering price per share | | | n/a | | | n/a | | $ | 9.18 |
Class Q: | | | | | | | | | |
Net assets | | $ | 74,798 | | | n/a | | | n/a |
Shares authorized | | | unlimited | | | n/a | | | n/a |
Par value | | $ | 0.001 | | | n/a | | | n/a |
Shares outstanding | | | 8,521 | | | n/a | | | n/a |
Net asset value and redemption price per share | | $ | 8.78 | | | n/a | | | n/a |
Maximum offering price per share | | $ | 8.78 | | | n/a | | | n/a |
Class R: | | | | | | | | | |
Net assets | | | n/a | | | n/a | | $ | 15,971,929 |
Shares authorized | | | n/a | | | n/a | | | unlimited |
Par value | | | n/a | | | n/a | | $ | 0.001 |
Shares outstanding | | | n/a | | | n/a | | | 1,738,758 |
Net asset value and redemption price per share | | | n/a | | | n/a | | $ | 9.19 |
Maximum offering price per share | | | n/a | | | n/a | | $ | 9.19 |
Class W: | | | | | | | | | |
Net assets | | $ | 6,932,555 | | | n/a | | $ | 2,149,090 |
Shares authorized | | | unlimited | | | n/a | | | unlimited |
Par value | | $ | 0.001 | | | n/a | | $ | 0.001 |
Shares outstanding | | | 790,378 | | | n/a | | | 234,480 |
Net asset value and redemption price per share | | $ | 8.77 | | | n/a | | $ | 9.17 |
Maximum offering price per share | | $ | 8.77 | | | n/a | | $ | 9.17 |
| (1) | | Maximum offering price is computed at 100/97.50 of net asset value. On purchases of $100,000 or more, the offering price is reduced. |
| (2) | | Redemption price per share may be reduced for any applicable contingent deferred sales charges. |
See Accompanying Notes to Financial Statements
12
STATEMENTS OF ASSETS AND LIABILITIESASOF SEPTEMBER 30, 2009 (UNAUDITED)
| | | | | | | | |
| | | ING Classic Money Market Fund | | | ING Institutional Prime
Money Market Fund | |
ASSETS: | | | | | | | | |
Short-term investments at amortized cost | | $ | 884,777,157 | | | $ | 1,124,911,589 | |
Repurchase agreements | | | 125,893,000 | | | | 422,431,000 | |
Cash | | | 9,999,965 | | | | 182 | |
Receivables: | | | | | | | | |
Fund shares sold | | | 1,372,479 | | | | 86,387,122 | |
Dividends and interest | | | 484,715 | | | | 472,102 | |
Prepaid expenses | | | 149,135 | | | | 44,397 | |
| | | | | | | | |
Total assets | | | 1,022,676,451 | | | | 1,634,246,392 | |
| | | | | | | | |
LIABILITIES: | | | | | | | | |
Payable for investment securities purchased | | | 16,999,306 | | | | 10,249,715 | |
Payable for fund shares redeemed | | | 94,041 | | | | 37,850,567 | |
Income distribution payable | | | — | | | | 215,918 | |
Payable to affiliates | | | 243,607 | | | | 99,606 | |
Payable for trustee fees | | | 24,038 | | | | 6,787 | |
Other accrued expenses and liabilities | | | 265,234 | | | | 246,743 | |
| | | | | | | | |
Total liabilities | | | 17,626,226 | | | | 48,669,336 | |
| | | | | | | | |
NET ASSETS | | $ | 1,005,050,225 | | | $ | 1,585,577,056 | |
| | | | | | | | |
NET ASSETS WERE COMPRISED OF: | | | | | | | | |
Paid-in capital | | $ | 1,005,010,399 | | | $ | 1,585,386,023 | |
Distributions in excess of net investment income | | | (3,182 | ) | | | (21,216 | ) |
Accumulated net realized gain on investments | | | 43,008 | | | | 212,249 | |
| | | | | | | | |
NET ASSETS | | $ | 1,005,050,225 | | | $ | 1,585,577,056 | |
| | | | | | | | |
See Accompanying Notes to Financial Statements
13
STATEMENTS OF ASSETS AND LIABILITIESASOF SEPTEMBER 30, 2009 (UNAUDITED) (CONTINUED)
| | | | | | |
| | | ING Classic Money Market Fund | | ING Institutional Prime Money Market Fund |
Class A: | | | | | | |
Net assets | | $ | 985,128,460 | | | n/a |
Shares authorized | | | unlimited | | | n/a |
Par value | | $ | 0.001 | | | n/a |
Shares outstanding | | | 985,067,853 | | | n/a |
Net asset value and redemption price per share | | $ | 1.00 | | | n/a |
Maximum offering price per share | | $ | 1.00 | | | |
Class B: | | | | | | |
Net assets | | $ | 11,702,201 | | | n/a |
Shares authorized | | | unlimited | | | n/a |
Par value | | $ | 0.001 | | | n/a |
Shares outstanding | | | 11,720,681 | | | n/a |
Net asset value and redemption price per share(1) | | $ | 1.00 | | | n/a |
Maximum offering price per share | | $ | 1.00 | | | n/a |
Class C: | | | | | | |
Net assets | | $ | 8,219,564 | | | n/a |
Shares authorized | | | unlimited | | | n/a |
Par value | | $ | 0.001 | | | n/a |
Shares outstanding | | | 8,222,514 | | | n/a |
Net asset value and redemption price per share(1) | | $ | 1.00 | | | n/a |
Maximum offering price per share | | $ | 1.00 | | | n/a |
Class I: | | | | | | |
Net assets | | | n/a | | $ | 1,585,576,056 |
Shares authorized | | | n/a | | | unlimited |
Par value | | | n/a | | $ | 0.001 |
Shares outstanding | | | n/a | | | 1,585,414,058 |
Net asset value and redemption price per share | | | n/a | | $ | 1.00 |
Maximum offering price per share | | | n/a | | $ | 1.00 |
Class IS: | | | | | | |
Net assets | | | n/a | | $ | 1,000 |
Shares authorized | | | n/a | | | unlimited |
Par value | | | n/a | | $ | 0.001 |
Shares outstanding | | | n/a | | | 1,000 |
Net asset value and redemption price per share | | | n/a | | $ | 1.00 |
Maximum offering price per share | | | n/a | | $ | 1.00 |
| (1) | | Redemption price per share may be reduced for any applicable contingent deferred sales charges. |
See Accompanying Notes to Financial Statements
14
STATEMENTS OF OPERATIONSFORTHE SIX MONTHS ENDED SEPTEMBER 30, 2009 (UNAUDITED)
| | | | | | | | | | | |
| | | ING GNMA Income Fund | | ING High Yield Bond Fund | | | ING Intermediate Bond Fund | |
INVESTMENT INCOME: | | | | | | | | | | | |
Dividends(1) | | $ | — | | $ | 3,263 | | | $ | 85,123 | |
Interest | | | 18,823,263 | | | 5,015,263 | | | | 24,423,115 | |
Securities lending income, net | | | — | | | — | | | | 192,108 | |
| | | | | | | | | | | |
Total investment income | | | 18,823,263 | | | 5,018,526 | | | | 24,700,346 | |
| | | | | | | | | | | |
EXPENSES: | | | | | | | | | | | |
Investment management fees | | | 1,838,465 | | | 238,307 | | | | 788,872 | |
Distribution and service fees: | | | | | | | | | | | |
Class A | | | 765,964 | | | 89,067 | | | | 547,227 | |
Class B | | | 177,373 | | | 65,355 | | | | 115,644 | |
Class C | | | 431,313 | | | 45,632 | | | | 257,941 | |
Class O | | | — | | | — | | | | 50,307 | |
Class Q | | | 86 | | | — | | | | — | |
Class R | | | — | | | — | | | | 40,750 | |
Transfer agent fees: | | | | | | | | | | | |
Class A | | | 203,081 | | | 56,386 | | | | 274,729 | |
Class B | | | 11,763 | | | 10,334 | | | | 14,449 | |
Class C | | | 28,565 | | | 7,243 | | | | 32,337 | |
Class I | | | 2,509 | | | — | | | | 95,711 | |
Class O | | | — | | | — | | | | 24,988 | |
Class Q | | | 3 | | | — | | | | 5 | |
Class R | | | — | | | — | | | | 10,122 | |
Class W | | | 408 | | | — | | | | 600 | |
Administrative service fees | | | 391,159 | | | 46,727 | | | | 464,041 | |
Shareholder reporting expense | | | 47,785 | | | 26,927 | | | | 97,545 | |
Registration fees | | | 57,568 | | | 49,791 | | | | 58,647 | |
Professional fees | | | 28,030 | | | 22,029 | | | | 40,459 | |
Custody and accounting expense | | | 42,505 | | | 15,018 | | | | 77,850 | |
Trustee fees | | | 9,236 | | | 2,535 | | | | 17,175 | |
Miscellaneous expense | | | 11,646 | | | 6,973 | | | | 25,528 | |
Interest expense | | | — | | | 168 | | | | 1,431 | |
| | | | | | | | | | | |
Total expenses | | | 4,047,459 | | | 682,492 | | | | 3,036,358 | |
Net waived and reimbursed fees | | | — | | | (84,726 | ) | | | (146,206 | ) |
| | | | | | | | | | | |
Net expenses | | | 4,047,459 | | | 597,766 | | | | 2,890,152 | |
| | | | | | | | | | | |
Net investment income | | | 14,775,804 | | | 4,420,760 | | | | 21,810,194 | |
| | | | | | | | | | | |
REALIZED AND UNREALIZED GAIN (LOSS) ON INVESTMENTS, FOREIGN CURRENCY RELATED TRANSACTIONS, FUTURES, SWAPS, AND WRITTEN OPTIONS | | | | | | | | | | | |
Net realized gain (loss) on: | | | | | | | | | | | |
Investments | | | 1,933,698 | | | (4,191,102 | ) | | | (45,361,087 | ) |
Foreign currency related transactions | | | — | | | — | | | | 1,242,025 | |
Futures | | | — | | | — | | | | 3,052,084 | |
Swaps | | | — | | | (68,304 | ) | | | 80,208 | |
Written Options | | | — | | | — | | | | (44,800 | ) |
| | | | | | | | | | | |
Net realized gain (loss) on investments, foreign currency related transactions, futures, swaps, and written options | | | 1,933,698 | | | (4,259,406 | ) | | | (41,031,570 | ) |
| | | | | | | | | | | |
Net change in unrealized appreciation or depreciation on: | | | | | | | | | | | |
Investments | | | 2,861,574 | | | 25,659,959 | | | | 130,817,752 | |
Foreign currency related transactions | | | — | | | — | | | | 1,264,968 | |
Futures | | | — | | | — | | | | 488,367 | |
Swaps | | | — | | | 287,074 | | | | 237,125 | |
| | | | | | | | | | | |
Net change in unrealized appreciation on investments, foreign currency related transactions, futures, and swaps | | | 2,861,574 | | | 25,947,033 | | | | 132,808,212 | |
| | | | | | | | | | | |
Net realized and unrealized gain on investments, foreign currency related transactions, futures, swaps, and written options | | | 4,795,272 | | | 21,687,627 | | | | 91,776,642 | |
| | | | | | | | | | | |
Increase in net assets resulting from operations | | $ | 19,571,076 | | $ | 26,108,387 | | | $ | 113,586,836 | |
| | | | | | | | | | | |
| | | | | | | | | | | |
(1) Dividends from affiliates | | $ | — | | $ | 3,203 | | | $ | 53,107 | |
See Accompanying Notes to Financial Statements
15
STATEMENTS OF OPERATIONSFORTHE SIX MONTHS ENDED SEPTEMBER 30, 2009 (UNAUDITED)
| | | | | | | |
| | | ING Classic Money Market Fund | | | ING Institutional Prime Money Market Fund |
INVESTMENT INCOME: | | | | | | | |
Interest | | $ | 3,441,726 | | | $ | 2,898,361 |
| | | | | | | |
Total investment income | | | 3,441,726 | | | | 2,898,361 |
| | | | | | | |
EXPENSES: | | | | | | | |
Investment management fees | | | 1,458,776 | | | | 522,239 |
Distribution and service fees: | | | | | | | |
Class A | | | 4,290,412 | | | | — |
Class B | | | 69,375 | | | | — |
Class C | | | 45,200 | | | | — |
Transfer agent fees: | | | | | | | |
Class A | | | 64,019 | | | | |
Class B | | | 753 | | | | — |
Class C | | | 495 | | | | — |
Class I | | | — | | | | 201,231 |
Shareholder reporting expense | | | 156,762 | | | | 40,973 |
Registration fees | | | 230,838 | | | | 32,588 |
Professional fees | | | 67,891 | | | | 97,094 |
Custody and accounting expense | | | 75,994 | | | | 94,666 |
Trustee fees | | | 24,450 | | | | 21,555 |
Guarantee fees (Note 16) | | | 253,789 | | | | 363,496 |
Miscellaneous expense | | | 33,604 | | | | 48,573 |
| | | | | | | |
Total expenses | | | 6,772,358 | | | | 1,422,417 |
Net waived and reimbursed fees | | | (3,327,706 | ) | | | — |
| | | | | | | |
Net expenses | | | 3,444,652 | | | | 1,422,417 |
| | | | | | | |
Net investment income (loss) | | | (2,926 | ) | | | 1,475,944 |
| | | | | | | |
REALIZED AND UNREALIZED GAIN (LOSS) ON INVESTMENTS | | | | | | | |
Net realized gain on investments | | | 295,224 | | | | 188,562 |
| | | | | | | |
Increase in net assets resulting from operations | | $ | 292,298 | | | $ | 1,664,506 |
| | | | | | | |
See Accompanying Notes to Financial Statements
16
STATEMENTS OF CHANGES IN NET ASSETS (UNAUDITED)
| | | | | | | | | | | | | | | | |
| | | ING GNMA Income Fund | | | ING High Yield Bond Fund | |
| | | Six Months Ended September 30, 2009 | | | Year Ended March 31, 2009 | | | Six Months Ended September 30, 2009 | | | Year Ended March 31, 2009 | |
FROM OPERATIONS: | | | | | | | | | | | | | | | | |
Net investment income | | $ | 14,775,804 | | | $ | 26,880,070 | | | $ | 4,420,760 | | | $ | 8,791,288 | |
Net realized gain (loss) on investments and swaps | | | 1,933,698 | | | | 395,796 | | | | (4,259,406 | ) | | | (19,275,591 | ) |
Net change in unrealized appreciation or depreciation on investments and swaps | | | 2,861,574 | | | | 14,446,282 | | | | 25,947,033 | | | | (14,806,857 | ) |
| | | | | | | | | | | | | | | | |
Increase (decrease) in net assets resulting from operations | | | 19,571,076 | | | | 41,722,148 | | | | 26,108,387 | | | | (25,291,160 | ) |
| | | | | | | | | | | | | | | | |
FROM DISTRIBUTIONS TO SHAREHOLDERS: | | | | | | | | | | | | | | | | |
Net investment income: | | | | | | | | | | | | | | | | |
Class A | | | (12,641,780 | ) | | | (22,932,802 | ) | | | (3,565,027 | ) | | | (5,651,666 | ) |
Class B | | | (613,211 | ) | | | (1,526,184 | ) | | | (605,596 | ) | | | (1,292,734 | ) |
Class C | | | (1,446,463 | ) | | | (1,624,129 | ) | | | (420,644 | ) | | | (647,080 | ) |
Class I | | | (900,585 | ) | | | (1,151,718 | ) | | | (133 | ) | | | (12,515 | ) |
Class Q | | | (1,387 | ) | | | (1,935 | ) | | | — | | | | — | |
Class W | | | (145,020 | ) | | | (55,336 | ) | | | — | | | | — | |
Return of capital: | | | | | | | | | | | | | | | | |
Class A | | | — | | | | — | | | | — | | | | (1,363,089 | ) |
Class B | | | — | | | | — | | | | — | | | | (346,757 | ) |
Class C | | | — | | | | — | | | | — | | | | (174,874 | ) |
Class I | | | — | | | | — | | | | — | | | | (2,081 | ) |
| | | | | | | | | | | | | | | | |
Total distributions | | | (15,748,446 | ) | | | (27,292,104 | ) | | | (4,591,400 | ) | | | (9,490,796 | ) |
| | | | | | | | | | | | | | | | |
FROM CAPITAL SHARE TRANSACTIONS: | | | | | | | | | | | | | | | | |
Net proceeds from sale of shares | | | 144,073,015 | | | | 295,311,177 | | | | 15,859,346 | | | | 34,528,518 | |
Reinvestment of distributions | | | 13,036,302 | | | | 22,747,989 | | | | 2,589,745 | | | | 4,988,124 | |
| | | | | | | | | | | | | | | | |
| | | 157,109,317 | | | | 318,059,166 | | | | 18,449,091 | | | | 39,516,642 | |
Cost of shares redeemed | | | (128,905,334 | ) | | | (189,713,958 | ) | | | (18,110,315 | ) | | | (44,343,192 | ) |
| | | | | | | | | | | | | | | | |
Net increase (decrease) in net assets resulting from capital share transactions | | | 28,203,983 | | | | 128,345,208 | | | | 338,776 | | | | (4,826,550 | ) |
| | | | | | | | | | | | | | | | |
Net increase (decrease) in net assets | | | 32,026,613 | | | | 142,775,252 | | | | 21,855,763 | | | | (39,608,506 | ) |
| | | | | | | | | | | | | | | | |
NET ASSETS: | | | | | | | | | | | | | | | | |
Beginning of period | | | 761,917,259 | | | | 619,142,007 | | | | 78,699,464 | | | | 118,307,970 | |
| | | | | | | | | | | | | | | | |
End of period | | $ | 793,943,872 | | | $ | 761,917,259 | | | $ | 100,555,227 | | | $ | 78,699,464 | |
| | | | | | | | | | | | | | | | |
Undistributed net investment income (distributions in excess of net investment income) at end of period | | $ | 1,482,889 | | | $ | 2,455,531 | | | $ | (212,027 | ) | | $ | (41,387 | ) |
| | | | | | | | | | | | | | | | |
See Accompanying Notes to Financial Statements
17
STATEMENTS OF CHANGES IN NET ASSETS (UNAUDITED)
| | | | | | | | | | | | | | | | |
| | | ING Intermediate Bond Fund | | | ING Classic Money Market Fund | |
| | | Six Months Ended September 30, 2009 | | | Year Ended March 31, 2009 | | | Six Months Ended September 30, 2009 | | | Year Ended March 31, 2009 | |
FROM OPERATIONS: | | | | | | | | | | | | | | | | |
Net investment income (loss) | | $ | 21,810,194 | | | $ | 59,477,948 | | | $ | (2,926 | ) | | $ | 20,023,863 | |
Net realized gain (loss) on investments, foreign currency related transactions, futures, swaps, and written options | | | (41,031,570 | ) | | | (139,525,797 | ) | | | 295,224 | | | | 1,949,010 | |
Net change in unrealized appreciation or depreciation on investments, foreign currency related transactions, futures, and swaps | | | 132,808,212 | | | | (70,451,358 | ) | | | — | | | | — | |
| | | | | | | | | | | | | | | | |
Increase (decrease) in net assets resulting from operations | | | 113,586,836 | | | | (150,499,207 | ) | | | 292,298 | | | | 21,972,873 | |
| | | | | | | | | | | | | | | | |
FROM DISTRIBUTIONS TO SHAREHOLDERS: | | | | | | | | | | | | | | | | |
Net investment income: | | | | | | | | | | | | | | | | |
Class A | | | (10,593,030 | ) | | | (31,202,947 | ) | | | — | | | | (19,850,192 | ) |
Class B | | | (474,894 | ) | | | (1,292,434 | ) | | | — | | | | (160,872 | ) |
Class C | | | (1,057,156 | ) | | | (2,767,063 | ) | | | — | | | | (119,890 | ) |
Class I | | | (9,236,517 | ) | | | (20,895,106 | ) | | | — | | | | — | |
Class O | | | (982,129 | ) | | | (2,322,681 | ) | | | — | | | | — | |
Class R | | | (371,354 | ) | | | (852,329 | ) | | | — | | | | — | |
Class W | | | (58,463 | ) | | | (296,146 | ) | | | — | | | | — | |
Net realized gains: | | | | | | | | | | | | | | | | |
Class A | | | — | | | | (13,734,278 | ) | | | (1,986,984 | ) | | | — | |
Class B | | | — | | | | (680,458 | ) | | | (23,948 | ) | | | — | |
Class C | | | — | | | | (1,469,140 | ) | | | (15,876 | ) | | | — | |
Class I | | | — | | | | (9,646,219 | ) | | | — | | | | — | |
Class O | | | — | | | | (1,051,523 | ) | | | — | | | | — | |
Class R | | | — | | | | (462,042 | ) | | | — | | | | — | |
Class W | | | — | | | | (165,327 | ) | | | — | | | | — | |
| | | | | | | | | | | | | | | | |
Total distributions | | | (22,773,543 | ) | | | (86,837,693 | ) | | | (2,026,808 | ) | | | (20,130,954 | ) |
| | | | | | | | | | | | | | | | |
FROM CAPITAL SHARE TRANSACTIONS: | | | | | | | | | | | | | | | | |
Net proceeds from sale of shares | | | 70,818,347 | | | | 417,193,674 | | | | 75,428,897 | | | | 651,983,951 | |
Reinvestment of distributions | | | 18,230,692 | | | | 67,885,769 | | | | 2,020,532 | | | | 19,963,168 | |
| | | | | | | | | | | | | | | | |
| | | 89,049,039 | | | | 485,079,443 | | | | 77,449,429 | | | | 671,947,119 | |
Cost of shares redeemed | | | (243,801,920 | ) | | | (626,057,809 | ) | | | (421,265,465 | ) | | | (856,507,525 | ) |
| | | | | | | | | | | | | | | | |
Net decrease in net assets resulting from capital share transactions | | | (154,752,881 | ) | | | (140,978,366 | ) | | | (343,816,036 | ) | | | (184,560,406 | ) |
| | | | | | | | | | | | | | | | |
Net decrease in net assets | | | (63,939,588 | ) | | | (378,315,266 | ) | | | (345,550,546 | ) | | | (182,718,487 | ) |
| | | | | | | | | | | | | | | | |
NET ASSETS: | | | | | | | | | | | | | | | | |
Beginning of period | | | 970,109,168 | | | | 1,348,424,434 | | | | 1,350,600,771 | | | | 1,533,319,258 | |
| | | | | | | | | | | | | | | | |
End of period | | $ | 906,169,580 | | | $ | 970,109,168 | | | $ | 1,005,050,225 | | | $ | 1,350,600,771 | |
| | | | | | | | | | | | | | | | |
Undistributed net investment income (distributions in excess of net investment income) at end of period | | $ | 33,659,010 | | | $ | 34,622,359 | | | $ | (3,182 | ) | | $ | (308 | ) |
| | | | | | | | | | | | | | | | |
See Accompanying Notes to Financial Statements
18
STATEMENTS OF CHANGES IN NET ASSETS (UNAUDITED)
| | | | | | | | |
| | | ING Institutional Prime Money Market Fund | |
| | | Six Months Ended September 30, 2009 | | | Year Ended March 31, 2009 | |
FROM OPERATIONS: | | | | | | | | |
Net investment income | | $ | 1,475,944 | | | $ | 19,341,678 | |
Net realized gain on investments | | | 188,562 | | | | 2,061,974 | |
| | | | | | | | |
Increase in net assets resulting from operations | | | 1,664,506 | | | | 21,403,652 | |
| | | | | | | | |
FROM DISTRIBUTIONS TO SHAREHOLDERS: | | | | | | | | |
Net investment income: | | | | | | | | |
Class I | | | (1,475,941 | ) | | | (19,340,775 | ) |
Class IS | | | (2 | ) | | | (21 | ) |
Net realized gains: | | | | | | | | |
Class I | | | (1,814,403 | ) | | | — | |
Class IS | | | (2 | ) | | | — | |
| | | | | | | | |
Total distributions | | | (3,290,348 | ) | | | (19,340,796 | ) |
| | | | | | | | |
FROM CAPITAL SHARE TRANSACTIONS: | | | | | | | | |
Net proceeds from sale of shares | | | 7,583,694,052 | | | | 15,924,743,767 | |
Reinvestment of distributions | | | 85,957 | | | | 1,265,544 | |
| | | | | | | | |
| | | 7,583,780,009 | | | | 15,926,009,311 | |
Cost of shares redeemed | | | (7,202,481,471 | ) | | | (15,522,218,060 | ) |
| | | | | | | | |
Net increase in net assets resulting from capital share transactions | | | 381,298,538 | | | | 403,791,251 | |
| | | | | | | | |
Net increase in net assets | | | 379,672,696 | | | | 405,854,107 | |
| | | | | | | | |
NET ASSETS: | | | | | | | | |
Beginning of period | | | 1,205,904,360 | | | | 800,050,253 | |
| | | | | | | | |
End of period | | $ | 1,585,577,056 | | | $ | 1,205,904,360 | |
| | | | | | | | |
Distributions in excess of net investment income at end of period | | $ | (21,216 | ) | | $ | (21,217 | ) |
| | | | | | | | |
See Accompanying Notes to Financial Statements
19
FINANCIAL HIGHLIGHTS (UNAUDITED)
Selected data for a share of beneficial interest outstanding throughout each year or period.
| | | | | | | | | | | | | | | | | | | | | | | | | | | | | | | | | | | | | | | |
| | | | | Income (loss)
from
investment
operations | | | | | Less distributions | | | | | | | | | Ratios to average net assets | | | Supplemental
data | |
| | | | | | | | | | | | | | | | | | | | | | | | | | | | | | | | | | | | | | | |
| | | Net asset value, beginning of year or period | | Net investment income (loss) | | Net realized and unrealized gain (loss) on investments | | | Total from investment operations | | From net investment income | | From net realized gains | | From return of capital | | Total distributions | | Net asset value, end of year or period | | Total Return(1) | | | Expenses before reductions/additions(2)(3) | | | Expenses net of fee waivers and/or recoupments, if any(2)(3) | | | Expenses net of all reductions/additions(2)(3) | | | Net investment income (loss)(2)(3) | | | Net assets, end of year or period | | Portfolio turnover rate | |
| | | | | | | | | | | | | | | | | | | | | | | | | | | | | | | | | | | | | | | |
Year or period ended | | ($) | | ($) | | ($) | | | ($) | | ($) | | ($) | | ($) | | ($) | | ($) | | (%) | | | (%) | | | (%) | | | (%) | | | (%) | | | ($000’s) | | (%) | |
ING GNMA Income Fund | | | | | | | | | | | | | | | | | | | | | | | | | | | | | | | | | | | | | | | |
Class A | | | | | | | | | | | | | | | | | | | | | | | | | | | | | | | | | | | | | | | |
09-30-09 | | 8.71 | | 0.17 | | 0.05 | | | 0.22 | | 0.18 | | — | | — | | 0.18 | | 8.75 | | 2.57 | | | 0.94 | | | 0.94 | | | 0.94 | | | 3.88 | | | 614,082 | | 37 | |
03-31-09 | | 8.54 | | 0.37 | | 0.18 | | | 0.55 | | 0.38 | | — | | — | | 0.38 | | 8.71 | | 6.62 | | | 0.96 | | | 0.96 | | | 0.96 | | | 4.33 | | | 606,856 | | 39 | |
03-31-08 | | 8.35 | | 0.37 | | 0.20 | | | 0.57 | | 0.38 | | — | | — | | 0.38 | | 8.54 | | 7.00 | | | 0.96 | | | 0.96 | | | 0.96 | | | 4.45 | | | 515,916 | | 32 | |
03-31-07 | | 8.30 | | 0.37 | | 0.09 | | | 0.46 | | 0.41 | | — | | — | | 0.41 | | 8.35 | | 5.72 | | | 0.95 | | | 0.94 | | | 0.94 | | | 4.49 | | | 515,469 | | 99 | |
03-31-06 | | 8.52 | | 0.40 | | (0.19 | ) | | 0.21 | | 0.43 | | — | | — | | 0.43 | | 8.30 | | 2.50 | | | 0.99 | | | 0.98 | | | 0.98 | | | 4.70 | | | 504,734 | | 39 | |
03-31-05 | | 8.91 | | 0.37 | | (0.31 | ) | | 0.06 | | 0.45 | | — | | — | | 0.45 | | 8.52 | | 0.74 | | | 0.98 | | | 0.98 | | | 0.98 | | | 4.27 | | | 521,688 | | 40 | |
Class B | | | | | | | | | | | | | | | | | | | | | | | | | | | | | | | | | | | | | | | |
09-30-09 | | 8.66 | | 0.14 | | 0.06 | | | 0.20 | | 0.15 | | — | | — | | 0.15 | | 8.71 | | 2.31 | | | 1.69 | | | 1.69 | | | 1.69 | | | 3.13 | | | 32,325 | | 37 | |
03-31-09 | | 8.49 | | 0.30 | | 0.18 | | | 0.48 | | 0.31 | | — | | — | | 0.31 | | 8.66 | | 5.86 | | | 1.71 | | | 1.71 | | | 1.71 | | | 3.57 | | | 38,718 | | 39 | |
03-31-08 | | 8.30 | | 0.31 | | 0.19 | | | 0.50 | | 0.31 | | — | | — | | 0.31 | | 8.49 | | 6.24 | | | 1.71 | | | 1.71 | | | 1.71 | | | 3.70 | | | 45,963 | | 32 | |
03-31-07 | | 8.26 | | 0.30 | | 0.09 | | | 0.39 | | 0.35 | | — | | — | | 0.35 | | 8.30 | | 4.84 | | | 1.70 | | | 1.69 | | | 1.69 | | | 3.73 | | | 58,568 | | 99 | |
03-31-06 | | 8.48 | | 0.33 | | (0.18 | ) | | 0.15 | | 0.37 | | — | | — | | 0.37 | | 8.26 | | 1.75 | | | 1.74 | | | 1.73 | | | 1.73 | | | 3.95 | | | 78,823 | | 39 | |
03-31-05 | | 8.87 | | 0.29 | | (0.29 | ) | | — | | 0.39 | | — | | — | | 0.39 | | 8.48 | | (0.02 | ) | | 1.73 | | | 1.73 | | | 1.73 | | | 3.52 | | | 99,130 | | 40 | |
Class C | | | | | | | | | | | | | | | | | | | | | | | | | | | | | | | | | | | | | | | |
09-30-09 | | 8.67 | | 0.13 | | 0.06 | | | 0.19 | | 0.15 | | — | | — | | 0.15 | | 8.71 | | 2.21 | | | 1.69 | | | 1.69 | | | 1.69 | | | 3.12 | | | 98,086 | | 37 | |
03-31-09 | | 8.50 | | 0.30 | | 0.18 | | | 0.48 | | 0.31 | | — | | — | | 0.31 | | 8.67 | | 5.88 | | | 1.71 | | | 1.71 | | | 1.71 | | | 3.59 | | | 73,209 | | 39 | |
03-31-08 | | 8.31 | | 0.31 | | 0.20 | | | 0.51 | | 0.32 | | — | | — | | 0.32 | | 8.50 | | 6.23 | | | 1.71 | | | 1.71 | | | 1.71 | | | 3.70 | | | 36,218 | | 32 | |
03-31-07 | | 8.27 | | 0.31 | | 0.08 | | | 0.39 | | 0.35 | | — | | — | | 0.35 | | 8.31 | | 4.85 | | | 1.70 | | | 1.69 | | | 1.69 | | | 3.73 | | | 37,280 | | 99 | |
03-31-06 | | 8.49 | | 0.33 | | (0.18 | ) | | 0.15 | | 0.37 | | — | | — | | 0.37 | | 8.27 | | 1.74 | | | 1.74 | | | 1.73 | | | 1.73 | | | 3.95 | | | 34,997 | | 39 | |
03-31-05 | | 8.88 | | 0.29 | | (0.29 | ) | | — | | 0.39 | | — | | — | | 0.39 | | 8.49 | | (0.03 | ) | | 1.73 | | | 1.73 | | | 1.73 | | | 3.51 | | | 43,094 | | 40 | |
Class I | | | | | | | | | | | | | | | | | | | | | | | | | | | | | | | | | | | | | | | |
09-30-09 | | 8.72 | | 0.18 | | 0.05 | | | 0.23 | | 0.19 | | — | | — | | 0.19 | | 8.76 | | 2.72 | | | 0.63 | | | 0.63 | | | 0.63 | | | 4.18 | | | 42,444 | | 37 | |
03-31-09 | | 8.55 | | 0.39 | | 0.18 | | | 0.57 | | 0.40 | | — | | — | | 0.40 | | 8.72 | | 6.95 | | | 0.65 | | | 0.65 | | | 0.65 | | | 4.64 | | | 38,908 | | 39 | |
03-31-08 | | 8.35 | | 0.40 | | 0.20 | | | 0.60 | | 0.40 | | — | | — | | 0.40 | | 8.55 | | 7.42 | | | 0.67 | | | 0.67 | | | 0.67 | | | 4.74 | | | 21,002 | | 32 | |
03-31-07 | | 8.31 | | 0.40 | | 0.08 | | | 0.48 | | 0.44 | | — | | — | | 0.44 | | 8.35 | | 5.92 | | | 0.65 | | | 0.65 | | | 0.65 | | | 4.77 | | | 14,181 | | 99 | |
03-31-06 | | 8.53 | | 0.45 | | (0.21 | ) | | 0.24 | | 0.46 | | — | | — | | 0.46 | | 8.31 | | 2.82 | | | 0.67 | | | 0.67 | | | 0.67 | | | 4.96 | | | 18,287 | | 39 | |
03-31-05 | | 8.92 | | 0.41 | | (0.32 | ) | | 0.09 | | 0.48 | | — | | — | | 0.48 | | 8.53 | | 1.05 | | | 0.68 | | | 0.68 | | | 0.68 | | | 4.59 | | | 10,539 | | 40 | |
Class Q | | | | | | | | | | | | | | | | | | | | | | | | | | | | | | | | | | | | | | | |
09-30-09 | | 8.73 | | 0.17 | | 0.06 | | | 0.23 | | 0.18 | | — | | — | | 0.18 | | 8.78 | | 2.71 | | | 0.88 | | | 0.88 | | | 0.88 | | | 3.93 | | | 75 | | 37 | |
03-31-09 | | 8.56 | | 0.37 | | 0.18 | | | 0.55 | | 0.38 | | — | | — | | 0.38 | | 8.73 | | 6.67 | | | 0.90 | | | 0.90 | | | 0.90 | | | 4.39 | | | 45 | | 39 | |
03-31-08 | | 8.37 | | 0.38 | | 0.19 | | | 0.57 | | 0.38 | | — | | — | | 0.38 | | 8.56 | | 7.06 | | | 0.92 | | | 0.92 | | | 0.92 | | | 4.49 | | | 43 | | 32 | |
03-31-07 | | 8.32 | | 0.36 | | 0.11 | | | 0.47 | | 0.42 | | — | | — | | 0.42 | | 8.37 | | 5.76 | | | 0.90 | | | 0.90 | | | 0.90 | | | 4.53 | | | 53 | | 99 | |
03-31-06 | | 8.53 | | 0.40 | | (0.18 | ) | | 0.22 | | 0.43 | | — | | — | | 0.43 | | 8.32 | | 2.65 | | | 0.92 | | | 0.92 | | | 0.92 | | | 4.77 | | | 82 | | 39 | |
03-31-05 | | 8.92 | | 0.39 | | (0.33 | ) | | 0.06 | | 0.45 | | — | | — | | 0.45 | | 8.53 | | 0.76 | | | 0.93 | | | 0.93 | | | 0.93 | | | 4.32 | | | 103 | | 40 | |
See Accompanying Notes to Financial Statements
20
FINANCIAL HIGHLIGHTS (UNAUDITED) (CONTINUED)
Selected data for a share of beneficial interest outstanding throughout each year or period.
| | | | | | | | | | | | | | | | | | | | | | | | | | | | | | | | | | | | | | | |
| | | | | Income (loss)
from
investment
operations | | | | | | Less distributions | | | | | | | | | Ratios to average net assets | | | Supplemental
data |
| | | | | | | | | | | | | | | | | | | | | | | | | | | | | | | | | | | | | | | |
| | | Net asset value, beginning of year or period | | Net investment income (loss) | | | Net realized and unrealized gain (loss) on investments | | | Total from investment operations | | | From net investment income | | From net realized gains | | From return of capital
| | Total distributions | | Net asset value, end of year or period | | Total Return(1) | | | Expenses before reductions/ additions(2)(3) | | Expenses net of fee waivers and/or recoupments, if any(2)(3) | | | Expenses net of all reductions/ additions(2)(3) | | | Net investment income (loss)(2)(3) | | | Net assets, end of year or period | | Portfolio turnover rate |
| | | | | | | | | | | | | | | | | | | | | | | | | | | | | | | | | | | | | | | |
Year or period ended | | ($) | | ($) | | | ($) | | | ($) | | | ($) | | ($) | | ($) | | ($) | | ($) | | (%) | | | (%) | | (%) | | | (%) | | | (%) | | | ($000’s) | | (%) |
ING GNMA Income Fund (Continued) | | | | | | | | | | | | | | | | | | | | | | | | | | | | | | | | | | | | | | | |
Class W | | | | | | | | | | | | | | | | | | | | | | | | | | | | | | | | | | | | | | | |
09-30-09 | | 8.73 | | 0.18 | | | 0.05 | | | 0.23 | | | 0.19 | | — | | — | | 0.19 | | 8.77 | | 2.72 | | | 0.63 | | 0.63 | | | 0.63 | | | 4.33 | | | 6,933 | | 37 |
03-31-09 | | 8.55 | | 0.39 | | | 0.19 | | | 0.58 | | | 0.40 | | — | | — | | 0.40 | | 8.73 | | 7.03 | | | 0.65 | | 0.65 | | | 0.65 | | | 4.70 | | | 4,180 | | 39 |
12-17-07(4) - 03-31-08 | | 8.39 | | 0.11 | | | 0.15 | | | 0.26 | | | 0.10 | | — | | — | | 0.10 | | 8.55 | | 3.16 | | | 0.64 | | 0.64 | | | 0.64 | | | 4.86 | | | 1 | | 32 |
ING High Yield Bond Fund | | | | | | | | | | | | | | | | | | | | | | | | | | | | | | | | | | | | | | | |
Class A | | | | | | | | | | | | | | | | | | | | | | | | | | | | | | | | | | | | | | | |
09-30-09 | | 5.52 | | 0.31 | | | 1.49 | | | 1.80 | | | 0.32 | | — | | — | | 0.32 | | 7.00 | | 33.19 | | | 1.28 | | 1.10 | † | | 1.10 | † | | 9.64 | † | | 76,967 | | 51 |
03-31-09 | | 7.89 | | 0.62 | | | (2.32 | ) | | (1.70 | ) | | 0.54 | | — | | 0.13 | | 0.67 | | 5.52 | | (22.36 | )(a) | | 1.25 | | 1.10 | † | | 1.10 | † | | 9.30 | † | | 59,307 | | 75 |
03-31-08 | | 8.99 | | 0.67 | | | (1.10 | ) | | (0.43 | ) | | 0.67 | | — | | — | | 0.67 | | 7.89 | | (5.10 | ) | | 1.16 | | 1.11 | † | | 1.11 | † | | 7.86 | † | | 83,327 | | 66 |
03-31-07 | | 8.71 | | 0.61 | | | 0.27 | | | 0.88 | | | 0.60 | | — | | — | | 0.60 | | 8.99 | | 10.54 | | | 1.11 | | 1.10 | | | 1.10 | | | 6.98 | | | 104,328 | | 122 |
03-31-06 | | 8.75 | | 0.55 | | | (0.04 | ) | | 0.51 | | | 0.55 | | — | | — | | 0.55 | | 8.71 | | 6.01 | | | 1.31 | | 1.18 | | | 1.18 | | | 6.27 | | | 99,178 | | 111 |
03-31-05 | | 8.88 | | 0.54 | | | (0.13 | ) | | 0.41 | | | 0.54 | | — | | — | | 0.54 | | 8.75 | | 4.73 | | | 1.33 | | 1.22 | | | 1.22 | | | 6.12 | | | 110,683 | | 119 |
Class B | | | | | | | | | | | | | | | | | | | | | | | | | | | | | | | | | | | | | | | |
09-30-09 | | 5.52 | | 0.28 | | | 1.49 | | | 1.77 | | | 0.30 | | — | | — | | 0.30 | | 6.99 | | 32.50 | | | 2.03 | | 1.85 | † | | 1.85 | † | | 8.91 | † | | 13,167 | | 51 |
03-31-09 | | 7.88 | | 0.58 | | | (2.32 | ) | | (1.74 | ) | | 0.49 | | — | | 0.13 | | 0.62 | | 5.52 | | (22.86 | )(a) | | 2.00 | | 1.85 | † | | 1.85 | † | | 8.38 | † | | 12,289 | | 75 |
03-31-08 | | 8.98 | | 0.61 | | | (1.11 | ) | | (0.50 | ) | | 0.60 | | — | | — | | 0.60 | | 7.88 | | (5.82 | ) | | 1.91 | | 1.86 | † | | 1.86 | † | | 7.08 | † | | 24,994 | | 66 |
03-31-07 | | 8.70 | | 0.53 | | | 0.29 | | | 0.82 | | | 0.54 | | — | | — | | 0.54 | | 8.98 | | 9.72 | | | 1.86 | | 1.85 | | | 1.85 | | | 6.18 | | | 43,427 | | 122 |
03-31-06 | | 8.74 | | 0.47 | | | (0.03 | ) | | 0.44 | | | 0.48 | | — | | — | | 0.48 | | 8.70 | | 5.22 | | | 1.98 | | 1.94 | | | 1.94 | | | 5.50 | | | 75,940 | | 111 |
03-31-05 | | 8.88 | | 0.48 | | | (0.15 | ) | | 0.33 | | | 0.47 | | — | | — | | 0.47 | | 8.74 | | 3.83 | | | 1.98 | | 1.97 | | | 1.97 | | | 5.39 | | | 125,603 | | 119 |
Class C | | | | | | | | | | | | | | | | | | | | | | | | | | | | | | | | | | | | | | | |
09-30-09 | | 5.52 | | 0.29 | | | 1.49 | | | 1.78 | | | 0.30 | | — | | — | | 0.30 | | 7.00 | | 32.71 | | | 2.03 | | 1.85 | † | | 1.85 | † | | 8.85 | † | | 10,418 | | 51 |
03-31-09 | | 7.89 | | 0.58 | | | (2.33 | ) | | (1.75 | ) | | 0.49 | | — | | 0.13 | | 0.62 | | 5.52 | | (22.95 | )(a) | | 2.00 | | 1.85 | † | | 1.85 | † | | 8.57 | † | | 7,101 | | 75 |
03-31-08 | | 8.99 | | 0.61 | | | (1.11 | ) | | (0.50 | ) | | 0.60 | | — | | — | | 0.60 | | 7.89 | | (5.81 | ) | | 1.91 | | 1.86 | † | | 1.86 | † | | 7.09 | † | | 9,987 | | 66 |
03-31-07 | | 8.71 | | 0.54 | | | 0.28 | | | 0.82 | | | 0.54 | | — | | — | | 0.54 | | 8.99 | | 9.70 | | | 1.86 | | 1.85 | | | 1.85 | | | 6.21 | | | 15,487 | | 122 |
03-31-06 | | 8.75 | | 0.48 | | | (0.03 | ) | | 0.45 | | | 0.49 | | — | | — | | 0.49 | | 8.71 | | 5.22 | | | 1.98 | | 1.94 | | | 1.94 | | | 5.51 | | | 17,555 | | 111 |
03-31-05 | | 8.88 | | 0.48 | | | (0.13 | ) | | 0.35 | | | 0.48 | | — | | — | | 0.48 | | 8.75 | | 3.96 | | | 1.98 | | 1.97 | | | 1.97 | | | 5.37 | | | 26,330 | | 119 |
Class I | | | | | | | | | | | | | | | | | | | | | | | | | | | | | | | | | | | | | | | |
09-30-09 | | 5.51 | | 0.32 | | | 1.50 | | | 1.82 | | | 0.34 | | — | | — | | 0.34 | | 6.99 | | 33.55 | | | 0.95 | | 0.77 | † | | 0.77 | † | | 9.99 | † | | 3 | | 51 |
07-31-08(4) - 03-31-09 | | 7.64 | | 0.37 | Ÿ | | (1.92 | ) | | (1.55 | ) | | 0.49 | | — | | 0.09 | | 0.58 | | 5.51 | | (20.35 | )(a) | | 0.95 | | 0.80 | † | | 0.80 | † | | 9.61 | † | | 2 | | 75 |
| | | | | | | | | | | | | | | | |
ING Intermediate Bond Fund | | | | | | | | | | | | | | | | | | | | | | | | | | | | | | | | | | | | | | | |
Class A | | | | | | | | | | | | | | | | | | | | | | | | | | | | | | | | | | | | | | | |
09-30-09 | | 8.31 | | 0.28 | | | 0.79 | | | 1.07 | | | 0.21 | | — | | — | | 0.21 | | 9.17 | | 13.04 | | | 0.71 | | 0.68 | † | | 0.68 | † | | 4.64 | † | | 418,821 | | 328 |
03-31-09 | | 10.13 | | 0.45 | | | (1.60 | ) | | (1.15 | ) | | 0.45 | | 0.22 | | — | | 0.67 | | 8.31 | | (11.65 | ) | | 0.72 | | 0.70 | † | | 0.70 | † | | 4.84 | † | | 471,185 | | 674 |
03-31-08 | | 10.23 | | 0.51 | | | (0.15 | ) | | 0.36 | | | 0.46 | | — | | — | | 0.46 | | 10.13 | | 3.61 | | | 0.73 | | 0.69 | † | | 0.69 | † | | 4.98 | † | | 799,369 | | 435 |
03-31-07 | | 10.13 | | 0.50 | | | 0.10 | | | 0.60 | | | 0.50 | | — | | — | | 0.50 | | 10.23 | | 6.03 | | | 0.73 | | 0.69 | † | | 0.69 | † | | 4.89 | † | | 698,537 | | 367 |
03-31-06 | | 10.32 | | 0.41 | | | (0.14 | ) | | 0.27 | | | 0.42 | | 0.04 | | — | | 0.46 | | 10.13 | | 2.53 | | | 1.02 | | 0.93 | | | 0.93 | | | 3.92 | | | 572,196 | | 469 |
03-31-05 | | 10.67 | | 0.32 | | | (0.17 | ) | | 0.15 | | | 0.33 | | 0.17 | | — | | 0.50 | | 10.32 | | 1.52 | | | 1.14 | | 1.00 | | | 1.00 | | | 3.08 | | | 459,850 | | 417 |
See Accompanying Notes to Financial Statements
21
FINANCIAL HIGHLIGHTS (UNAUDITED) (CONTINUED)
Selected data for a share of beneficial interest outstanding throughout each year or period.
| | | | | | | | | | | | | | | | | | | | | | | | | | | | | | | | | | | | | | | |
| | | | | Income (loss)
from
investment
operations | | | | | | Less distributions | | | | | | | | | Ratios to average net assets | | | Supplemental
data |
| | | | | | | | | | | | | | | | | | | | | | | | | | | | | | | | | | | | | | | |
| | | Net asset value, beginning of year or period | | Net investment income (loss) | | | Net realized and unrealized gain (loss) on investments | | | Total from investment operations | | | From net investment income | | From net realized gains | | From return of capital
| | Total distributions | | Net asset value, end of year or period | | Total Return(1) | | | Expenses before reductions/ additions(2)(3) | | Expenses net of fee waivers and/or recoupments, if any(2)(3) | | | Expenses net of all reductions/ additions(2)(3) | | | Net investment income (loss)(2)(3) | | | Net assets, end of year or period | | Portfolio turnover rate |
| | | | | | | | | | | | | | | | | | | | | | | | | | | | | | | | | | | | | | | |
Year or period ended | | ($) | | ($) | | | ($) | | | ($) | | | ($) | | ($) | | ($) | | ($) | | ($) | | (%) | | | (%) | | (%) | | | (%) | | | (%) | | | ($000’s) | | (%) |
ING Intermediate Bond Fund (Continued) | | | | | | | | | | | | | | | | | | | | | | | | | | | | | | | | | | | | | | | |
Class B | | | | | | | | | | | | | | | | | | | | | | | | | | | | | | | | | | | | | | | |
09-30-09 | | 8.30 | | 0.21 | | | 0.83 | | | 1.04 | | | 0.18 | | — | | — | | 0.18 | | 9.16 | | 12.63 | | | 1.46 | | 1.43 | † | | 1.43 | † | | 3.89 | † | | 22,759 | | 328 |
03-31-09 | | 10.11 | | 0.38 | | | (1.59 | ) | | (1.21 | ) | | 0.38 | | 0.22 | | — | | 0.60 | | 8.30 | | (12.26 | ) | | 1.47 | | 1.45 | † | | 1.45 | † | | 4.08 | † | | 23,721 | | 674 |
03-31-08 | | 10.21 | | 0.43 | | | (0.14 | ) | | 0.29 | | | 0.39 | | — | | — | | 0.39 | | 10.11 | | 2.84 | | | 1.48 | | 1.44 | † | | 1.44 | † | | 4.26 | † | | 41,078 | | 435 |
03-31-07 | | 10.11 | | 0.42 | | | 0.10 | | | 0.52 | | | 0.42 | | — | | — | | 0.42 | | 10.21 | | 5.23 | | | 1.48 | | 1.44 | † | | 1.44 | † | | 4.13 | † | | 50,086 | | 367 |
03-31-06 | | 10.30 | | 0.32 | | | (0.13 | ) | | 0.19 | | | 0.34 | | 0.04 | | — | | 0.38 | | 10.11 | | 1.76 | | | 1.70 | | 1.69 | | | 1.69 | | | 3.14 | | | 60,526 | | 469 |
03-31-05 | | 10.65 | | 0.24 | | | (0.17 | ) | | 0.07 | | | 0.25 | | 0.17 | | — | | 0.42 | | 10.30 | | 0.75 | | | 1.79 | | 1.75 | | | 1.75 | | | 2.31 | | | 64,779 | | 417 |
Class C | | | | | | | | | | | | | | | | | | | | | | | | | | | | | | | | | | | | | | | |
09-30-09 | | 8.30 | | 0.23 | | | 0.81 | | | 1.04 | | | 0.18 | | — | | — | | 0.18 | | 9.16 | | 12.63 | | | 1.46 | | 1.43 | † | | 1.43 | † | | 3.89 | † | | 49,638 | | 328 |
03-31-09 | | 10.12 | | 0.38 | | | (1.60 | ) | | (1.22 | ) | | 0.38 | | 0.22 | | — | | 0.60 | | 8.30 | | (12.35 | ) | | 1.47 | | 1.45 | † | | 1.45 | † | | 4.08 | † | | 53,534 | | 674 |
03-31-08 | | 10.22 | | 0.43 | | | (0.14 | ) | | 0.29 | | | 0.39 | | — | | — | | 0.39 | | 10.12 | | 2.85 | | | 1.48 | | 1.44 | † | | 1.44 | † | | 4.24 | † | | 83,232 | | 435 |
03-31-07 | | 10.12 | | 0.42 | | | 0.10 | | | 0.52 | | | 0.42 | | — | | — | | 0.42 | | 10.22 | | 5.24 | | | 1.48 | | 1.44 | † | | 1.44 | † | | 4.13 | † | | 81,556 | | 367 |
03-31-06 | | 10.31 | | 0.33 | | | (0.14 | ) | | 0.19 | | | 0.34 | | 0.04 | | — | | 0.38 | | 10.12 | | 1.77 | | | 1.70 | | 1.69 | | | 1.69 | | | 3.15 | | | 73,281 | | 469 |
03-31-05 | | 10.65 | | 0.24 | | | (0.16 | ) | | 0.08 | | | 0.25 | | 0.17 | | — | | 0.42 | | 10.31 | | 0.86 | | | 1.79 | | 1.75 | | | 1.75 | | | 2.31 | | | 71,648 | | 417 |
Class I | | | | | | | | | | | | | | | | | | | | | | | | | | | | | | | | | | | | | | | |
09-30-09 | | 8.31 | | 0.25 | | | 0.84 | | | 1.09 | | | 0.23 | | — | | — | | 0.23 | | 9.17 | | 13.22 | | | 0.39 | | 0.36 | † | | 0.36 | † | | 4.96 | † | | 354,674 | | 328 |
03-31-09 | | 10.14 | | 0.48 | | | (1.61 | ) | | (1.13 | ) | | 0.48 | | 0.22 | | — | | 0.70 | | 8.31 | | (11.42 | ) | | 0.39 | | 0.37 | † | | 0.37 | † | | 5.17 | † | | 362,162 | | 674 |
03-31-08 | | 10.23 | | 0.54 | | | (0.13 | ) | | 0.41 | | | 0.50 | | — | | — | | 0.50 | | 10.14 | | 4.05 | | | 0.39 | | 0.35 | † | | 0.38 | † | | 5.31 | † | | 351,575 | | 435 |
03-31-07 | | 10.14 | | 0.53 | | | 0.09 | | | 0.62 | | | 0.53 | | — | | — | | 0.53 | | 10.23 | | 6.26 | | | 0.40 | | 0.36 | † | | 0.36 | † | | 5.22 | † | | 266,596 | | 367 |
03-31-06 | | 10.32 | | 0.44 | | | (0.13 | ) | | 0.31 | | | 0.45 | | 0.04 | | — | | 0.49 | | 10.14 | | 2.94 | | | 0.61 | | 0.60 | | | 0.60 | | | 4.40 | | | 179,582 | | 469 |
03-31-05 | | 10.67 | | 0.36 | Ÿ | | (0.17 | ) | | 0.19 | | | 0.37 | | 0.17 | | — | | 0.54 | | 10.32 | | 1.85 | | | 0.72 | | 0.68 | | | 0.68 | | | 3.43 | | | 43,808 | | 417 |
Class O | | | | | | | | | | | | | | | | | | | | | | | | | | | | | | | | | | | | | | | |
09-30-09 | | 8.32 | | 0.21 | | | 0.86 | | | 1.07 | | | 0.21 | | — | | — | | 0.21 | | 9.18 | | 13.02 | | | 0.71 | | 0.68 | † | | 0.68 | † | | 4.65 | † | | 42,156 | | 328 |
03-31-09 | | 10.14 | | 0.45 | | | (1.60 | ) | | (1.15 | ) | | 0.45 | | 0.22 | | — | | 0.67 | | 8.32 | | (11.62 | ) | | 0.72 | | 0.70 | † | | 0.70 | † | | 4.84 | † | | 39,188 | | 674 |
03-31-08 | | 10.24 | | 0.51 | | | (0.15 | ) | | 0.36 | | | 0.46 | | — | | — | | 0.46 | | 10.14 | | 3.61 | | | 0.73 | | 0.69 | † | | 0.69 | † | | 4.99 | † | | 55,956 | | 435 |
03-31-07 | | 10.14 | | 0.50 | | | 0.09 | | | 0.59 | | | 0.49 | | — | | — | | 0.49 | | 10.24 | | 6.02 | | | 0.73 | | 0.69 | † | | 0.69 | † | | 4.88 | † | | 53,096 | | 367 |
03-31-06 | | 10.32 | | 0.40 | | | (0.13 | ) | | 0.27 | | | 0.41 | | 0.04 | | — | | 0.45 | | 10.14 | | 2.58 | | | 0.95 | | 0.94 | | | 0.94 | | | 3.91 | | | 43,171 | | 469 |
08-13-04(4) - 03-31-05 | | 10.41 | | 0.21 | | | (0.04 | ) | | 0.17 | | | 0.22 | | 0.04 | | — | | 0.26 | | 10.32 | | 1.61 | | | 1.00 | | 0.96 | | | 0.96 | | | 3.19 | | | 33,997 | | 417 |
Class R | | | | | | | | | | | | | | | | | | | | | | | | | | | | | | | | | | | | | | | |
09-30-09 | | 8.32 | | 0.27 | | | 0.80 | | | 1.07 | | | 0.20 | | — | | — | | 0.20 | | 9.19 | | 13.00 | | | 0.96 | | 0.93 | † | | 0.93 | † | | 4.39 | † | | 15,972 | | 328 |
03-31-09 | | 10.15 | | 0.43 | | | (1.61 | ) | | (1.18 | ) | | 0.43 | | 0.22 | | — | | 0.65 | | 8.32 | | (11.93 | ) | | 0.97 | | 0.95 | † | | 0.95 | † | | 4.59 | † | | 18,240 | | 674 |
03-31-08 | | 10.25 | | 0.48 | | | (0.14 | ) | | 0.34 | | | 0.44 | | — | | — | | 0.44 | | 10.15 | | 3.36 | | | 0.98 | | 0.94 | † | | 0.94 | † | | 4.65 | † | | 16,773 | | 435 |
03-31-07 | | 10.15 | | 0.47 | | | 0.10 | | | 0.57 | | | 0.47 | | — | | — | | 0.47 | | 10.25 | | 5.75 | | | 0.98 | | 0.94 | † | | 0.94 | † | | 4.63 | † | | 5,572 | | 367 |
03-31-06 | | 10.34 | | 0.38 | | | (0.14 | ) | | 0.24 | | | 0.39 | | 0.04 | | — | | 0.43 | | 10.15 | | 2.26 | | | 1.17 | | 1.16 | | | 1.16 | | | 3.79 | | | 799 | | 469 |
03-31-05 | | 10.67 | | 0.33 | | | (0.16 | ) | | 0.17 | | | 0.33 | | 0.17 | | — | | 0.50 | | 10.34 | | 1.64 | | | 1.21 | | 1.17 | | | 1.17 | | | 2.96 | | | 313 | | 417 |
03-16-04(4) - 03-31-04 | | 10.71 | | 0.01 | | | (0.05 | ) | | (0.04 | ) | | — | | — | | — | | — | | 10.67 | | (0.37 | ) | | 1.25 | | 1.25 | | | 1.25 | | | 3.20 | | | 1 | | 475 |
See Accompanying Notes to Financial Statements
22
FINANCIAL HIGHLIGHTS (UNAUDITED) (CONTINUED)
Selected data for a share of beneficial interest outstanding throughout each year or period.
| | | | | | | | | | | | | | | | | | | | | | | | | | | | | | | | | | | | | | | | | | |
| | | | | Income (loss)
from
investment
operations | | | | | | Less distributions | | | | | | | Ratios to average net assets | | | Supplemental
data |
| | | | | | | | | | | | | | | | | | | | | | | | | | | | | | | | | | | | | | | | | | |
| | | Net asset value, beginning of year or period | | Net investment income (loss) | | | Net realized and unrealized gain (loss) on investments | | | Total from investment operations | | | From net investment income | | | From net realized gains | | | From return of capital
| | Total distributions | | | Net asset value, end of year or period | | Total Return(1) | | | Expenses before reductions/ additions(2)(3) | | Expenses net of fee waivers and/or recoupments, if any(2)(3) | | | Expenses net of all reductions/ additions(2)(3) | | | Net investment income (loss)(2)(3) | | | Net assets, end of year or period | | Portfolio turnover rate |
| | | | | | | | | | | | | | | | | | | | | | | | | | | | | | | | | | | | | | | | | | |
Year or period ended | | ($) | | ($) | | | ($) | | | ($) | | | ($) | | | ($) | | | ($) | | ($) | | | ($) | | (%) | | | (%) | | (%) | | | (%) | | | (%) | | | ($000’s) | | (%) |
ING Intermediate Bond Fund (Continued) | | | | | | | | | | | | | | | | | | | | | | | | | | | | | | | | | | | | | | | | | | |
Class W | | | | | | | | | | | | | | | | | | | | | | | | | | | | | | | | | | | | | | | | | | |
09-30-09 | | 8.31 | | 0.23 | | | 0.86 | | | 1.09 | | | 0.23 | | | — | | | — | | 0.23 | | | 9.17 | | 13.21 | | | 0.39 | | 0.36 | † | | 0.36 | † | | 4.98 | † | | 2,149 | | 328 |
03-31-09 | | 10.12 | | 0.45 | | | (1.53 | ) | | (1.08 | ) | | 0.51 | | | 0.22 | | | — | | 0.73 | | | 8.31 | | (11.03 | ) | | 0.39 | | 0.37 | † | | 0.37 | † | | 5.09 | † | | 2,079 | | 674 |
12-17-07(4) - 03-31-08 | | 10.21 | | 0.15 | Ÿ | | (0.05 | ) | | 0.10 | | | 0.19 | | | — | | | — | | 0.19 | | | 10.12 | | 0.98 | | | 0.48 | | 0.44 | † | | 0.44 | † | | 5.24 | † | | 443 | | 435 |
ING Classic Money Market Fund | | | | | | | | | | | | | | | | | | | | | | | | | | | | | | | | | | | | | | | | | | |
Class A | | | | | | | | | | | | | | | | | | | | | | | | | | | | | | | | | | | | | | | | | | |
09-30-09 | | 1.00 | | (0.00 | )* | | — | | | 0.00 | * | | 0.00 | * | | 0.00 | * | | — | | 0.00 | * | | 1.00 | | 0.15 | | | 1.15 | | 0.59 | •• | | 0.59 | | | 0.00 | | | 985,128 | | — |
03-31-09 | | 1.00 | | 0.01 | | | — | | | 0.01 | | | 0.01 | | | — | | | — | | 0.01 | | | 1.00 | | 1.43 | | | 1.13 | | 0.79 | | | 0.79 | | | 1.42 | | | 1,323,512 | | — |
03-31-08 | | 1.00 | | 0.04 | | | — | | | 0.04 | | | 0.04 | | | — | | | — | | 0.04 | | | 1.00 | | 4.39 | | | 1.11 | | 0.77 | | | 0.77 | | | 4.22 | | | 1,498,016 | | — |
03-31-07 | | 1.00 | | 0.05 | | | — | | | 0.05 | | | 0.05 | | | — | | | — | | 0.05 | | | 1.00 | | 4.63 | | | 1.11 | | 0.77 | | | 0.77 | | | 4.55 | | | 921,623 | | — |
03-31-06 | | 1.00 | | 0.03 | | | — | | | 0.03 | | | 0.03 | | | — | | | — | | 0.03 | | | 1.00 | | 3.07 | | | 1.10 | | 0.77 | | | 0.77 | | | 3.07 | | | 656,731 | | — |
03-31-05 | | 1.00 | | 0.01 | | | — | | | 0.01 | | | 0.01 | | | — | | | — | | 0.01 | | | 1.00 | | 1.02 | | | 1.08 | | 0.77 | | | 0.77 | | | 1.06 | | | 550,091 | | — |
Class B | | | | | | | | | | | | | | | | | | | | | | | | | | | | | | | | | | | | | | | | | | |
09-30-09 | | 1.00 | | (0.00 | )* | | — | | | 0.00 | * | | — | | | 0.00 | * | | — | | 0.00 | * | | 1.00 | | 0.15 | | | 1.40 | | 0.59 | •• | | 0.59 | | | 0.00 | | | 11,702 | | — |
03-31-09 | | 1.00 | | 0.01 | | | — | | | 0.01 | | | 0.01 | | | — | | | — | | 0.01 | | | 1.00 | | 0.92 | | | 1.38 | | 1.29 | | | 1.29 | | | 0.94 | | | 16,160 | | — |
03-31-08 | | 1.00 | | 0.04 | | | — | | | 0.04 | | | 0.04 | | | — | | | — | | 0.04 | | | 1.00 | | 3.77 | | | 1.36 | | 1.36 | | | 1.36 | | | 3.74 | | | 19,793 | | — |
03-31-07 | | 1.00 | | 0.04 | | | — | | | 0.04 | | | 0.04 | | | — | | | — | | 0.04 | | | 1.00 | | 4.00 | | | 1.36 | | 1.36 | | | 1.36 | | | 3.95 | | | 23,333 | | — |
03-31-06 | | 1.00 | | 0.02 | | | — | | | 0.02 | | | 0.02 | | | — | | | — | | 0.02 | | | 1.00 | | 2.46 | | | 1.34 | | 1.34 | | | 1.34 | | | 2.43 | | | 23,995 | | — |
03-31-05 | | 1.00 | | 0.01 | | | — | | | 0.01 | | | 0.01 | | | — | | | — | | 0.01 | | | 1.00 | | 0.57 | | | 1.33 | | 1.33 | | | 1.33 | | | 0.94 | | | 26,941 | | — |
Class C | | | | | | | | | | | | | | | | | | | | | | | | | | | | | | | | | | | | | | | | | | |
09-30-09 | | 1.00 | | (0.00 | )* | | — | | | 0.00 | * | | — | | | 0.00 | * | | — | | 0.00 | * | | 1.00 | | 0.15 | | | 1.40 | | 0.59 | •• | | 0.59 | | | 0.00 | | | 8,220 | | — |
03-31-09 | | 1.00 | | 0.01 | | | — | | | 0.01 | | | 0.01 | | | — | | | — | | 0.01 | | | 1.00 | | 0.92 | | | 1.38 | | 1.29 | | | 1.29 | | | 0.95 | | | 10,929 | | — |
03-31-08 | | 1.00 | | 0.04 | | | — | | | 0.04 | | | 0.04 | | | — | | | — | | 0.04 | | | 1.00 | | 3.76 | | | 1.36 | | 1.36 | | | 1.36 | | | 3.59 | | | 15,511 | | — |
03-31-07 | | 1.00 | | 0.04 | | | — | | | 0.04 | | | 0.04 | | | — | | | — | | 0.04 | | | 1.00 | | 3.99 | | | 1.36 | | 1.36 | | | 1.36 | | | 3.96 | | | 4,345 | | — |
03-31-06 | | 1.00 | | 0.02 | | | — | | | 0.02 | | | 0.02 | | | — | | | — | | 0.02 | | | 1.00 | | 2.46 | | | 1.34 | | 1.34 | | | 1.34 | | | 2.47 | | | 4,868 | | — |
03-31-05 | | 1.00 | | 0.01 | | | — | | | 0.01 | | | 0.01 | | | — | | | — | | 0.01 | | | 1.00 | | 0.58 | | | 1.33 | | 1.33 | | | 1.33 | | | 0.78 | | | 3,932 | | — |
ING Institutional Prime Money Market Fund | | | | | | | | | | | | | | | | | | | | | | | | | | | | | | | | | | | | | | | | | | |
Class I | | | | | | | | | | | | | | | | | | | | | | | | | | | | | | | | | | | | | | | | | | |
09-30-09 | | 1.00 | | 0.00 | * | | — | | | 0.00 | * | | 0.00 | * | | 0.00 | * | | — | | 0.00 | * | | 1.00 | | 0.26 | | | 0.22 | | 0.22 | | | 0.22 | | | 0.23 | | | 1,585,576 | | — |
03-31-09 | | 1.00 | | 0.02 | | | — | | | 0.02 | | | 0.02 | | | — | | | — | | 0.02 | | | 1.00 | | 1.89 | | | 0.20 | | 0.20 | | | 0.20 | | | 1.74 | | | 1,205,903 | | — |
03-31-08 | | 1.00 | | 0.05 | | | — | | | 0.05 | | | 0.05 | | | 0.00 | * | | — | | 0.05 | | | 1.00 | | 5.00 | | | 0.12 | | 0.12 | | | 0.12 | | | 4.95 | | | 800,049 | | — |
03-31-07 | | 1.00 | | 0.05 | | | — | | | 0.05 | | | 0.05 | | | — | | | — | | 0.05 | | | 1.00 | | 5.25 | | | 0.16 | | 0.16 | | | 0.16 | | | 5.17 | | | 724,330 | | — |
07-29-05(4) - 03-31-06 | | 1.00 | | 0.03 | | | — | | | 0.03 | | | 0.03 | | | — | | | — | | 0.03 | | | 1.00 | | 2.70 | | | 0.19 | | 0.17 | | | 0.17 | | | 4.14 | | | 179,659 | | — |
Class IS | | | | | | | | | | | | | | | | | | | | | | | | | | | | | | | | | | | | | | | | | | |
09-30-09 | | 1.00 | | 0.00 | * | | — | | | 0.00 | * | | 0.00 | * | | 0.00 | * | | — | | 0.00 | * | | 1.00 | | 0.39 | | | 0.25 | | 0.25 | | | 0.25 | | | 0.20 | | | 1 | | — |
03-31-09 | | 1.00 | | 0.02 | | | — | | | 0.02 | | | 0.02 | | | — | | | — | | 0.02 | | | 1.00 | | 2.05 | | | 0.23 | | 0.23 | | | 0.23 | | | 1.77 | | | 1 | | — |
12-05-07(4) - 03-31-08 | | 1.00 | | 0.01 | | | — | | | 0.01 | | | 0.01 | | | — | | | — | | 0.01 | | | 1.00 | | 1.35 | | | 0.22 | | 0.20 | | | 0.20 | | | 4.19 | | | 1 | | — |
See Accompanying Notes to Financial Statements
23
FINANCIAL HIGHLIGHTS (UNAUDITED) (CONTINUED)
| (1) | | Total return is calculated assuming reinvestment of all dividends, capital gain distributions and return of capital distributions, if any, at net asset value and excluding the deduction of sales charges. Total return for periods less than one year is not annualized. |
| (2) | | Annualized for periods less than one year. |
| (3) | | Expense ratios reflect operating expenses of a Fund. Expenses before reductions do not reflect amounts reimbursed by the Investment Adviser and/or Distributor or reductions from brokerage service arrangements or other expense offset arrangements and do not represent the amount paid by a Fund during periods when reimbursements or reductions occur. Expenses net of fee waivers reflect expenses after reimbursement by the Investment Adviser and/or Distributor but prior to reductions from brokerage commission recapture arrangements or other expense offset arrangements. Expenses net of all reductions represent the net expenses paid by a Fund. Net investment income (loss) is net of all such additions or reductions. |
| (4) | | Commencement of operations. |
| † | | Impact of waiving the advisory fee for the ING Institutional Prime Money Market Fund holding has less than 0.005% impact on the expense ratio and net investment income or loss ratio. |
| * | | Amount is less than $0.005 or more than ($0.005). |
| Ÿ | | Calculated using average number of shares outstanding throughout the period. |
| •• | | Expense ratios reflect waivers of 0.18%, 0.81% and 0.81% of distribution and shareholder servicing fees for Classes A, B and C, respectively, in order to maintain a yield of not less than zero. |
See Accompanying Notes to Financial Statements
24
NOTES TO FINANCIAL STATEMENTSASOF SEPTEMBER 30, 2009 (UNAUDITED)
NOTE 1 — ORGANIZATION
Organization. ING Funds Trust (“Trust”) is a Delaware statutory trust and is registered as an open-end management investment company under the Investment Company Act of 1940, as amended (“1940 Act” or the “Act”). The Trust was organized on August 6, 1998 and was established under a Trust Instrument dated July 30, 1998. It consists of five separately managed series: ING GNMA Income Fund (“GNMA Income”), ING High Yield Bond Fund (“High Yield Bond”), ING Intermediate Bond Fund (“Intermediate Bond”), ING Classic Money Market Fund (“Classic Money Market”) and ING Institutional Prime Money Market Fund (“Institutional Money Market”) (each, a “Fund” and collectively, the “Funds”).
The investment objective of each Fund is described in each Fund’s prospectus.
Each Fund, except Institutional Money Market, offers at least three of the following classes of shares: Class A, Class B, Class C, Class I, Class O, Class Q, Class R and Class W. Institutional Money Market offers Class I and Class IS shares. The separate classes of shares differ principally in the applicable sales charges (if any), transfer agent fees, distribution fees and shareholder servicing fees. Generally, shareholders of each class also bear certain expenses that pertain to that particular class. All shareholders bear the common expenses of a Fund and earn income and realized gains/losses from the portfolio pro rata based on the average daily net assets of each class, without distinction between share classes. Common expenses of the Funds (including custodial asset-based fees, legal and audit fees, printing and mailing expenses, transfer agency out-of-pocket expenses, and fees and expenses of the independent trustees) are allocated to each Fund in proportion to its average net assets. Expenses directly attributable to a particular fund (including advisory, administration, custodial transaction-based, registration, other professional, distribution and/or service fees, certain taxes, and offering costs) are charged directly to that Fund. Differences in per share dividend rates generally result from the differences in separate class expenses, including distribution, and shareholder servicing fees. Class B shares, along with their pro rata reinvested dividend shares, automatically convert to Class A shares eight years after purchase.
Class B shares of the Funds (except Classic Money Market) are closed to new investment, provided that (1) Class B shares of the Funds may be purchased through the reinvestment of dividends issued by Class B shares of a Fund; (2) subject to the terms and conditions
of relevant exchange privileges and as permitted under their respective prospectuses, Class B shares of the Funds may be acquired through exchange of Class B shares of other funds in the ING mutual funds complex; and (3) certain qualified retirement plans may purchase Class B shares of the Funds, where the Funds have received information reasonably satisfactory indicating that intermediaries maintaining these plans are unable for administrative reasons to effect the closure immediately.
NOTE 2 — SIGNIFICANT ACCOUNTING POLICIES
The following significant accounting policies are consistently followed by the Funds in the preparation of their financial statements, and such policies are in conformity with U.S. generally accepted accounting principles for investment companies.
| A. | Security Valuation. Investments in equity securities traded on a national securities exchange are valued at the last reported sale price. Securities reported by the National Association of Securities Dealers Automated Quotation System (“NASDAQ”) will be valued at the NASDAQ official closing prices. Securities traded on an exchange or NASDAQ for which there has been no sale and securities traded in the over-the- counter-market are valued at the mean between the last reported bid and ask prices. All investments quoted in foreign currencies will be valued daily in U.S. dollars on the basis of the foreign currency exchange rates prevailing at that time. Debt securities acquired with more than 60 days to maturity are fair valued using matrix pricing methods determined by an independent pricing service which takes into consideration such factors as yields, maturities, liquidity, ratings and traded prices in similar or identical securities. Securities for which valuations are not readily available from an independent pricing service may be valued by brokers which use prices provided by market makers or estimates of fair market value obtained from yield data relating to investments or securities with similar characteristics. Investments in open-end mutual funds are valued at the net asset value (“NAV”). |
Securities and assets for which market quotations are not readily available (which may include certain restricted securities which are subject to limitations as to their sale) are valued at their fair values, as defined by the 1940 Act, as determined in good faith by or under the supervision of the
25
NOTES TO FINANCIAL STATEMENTSASOF SEPTEMBER 30, 2009 (UNAUDITED) (CONTINUED)
NOTE 2 — SIGNIFICANT ACCOUNTING POLICIES (continued)
Funds’ Board of Trustees (“Board”), in accordance with methods that are specifically authorized by the Board. Securities traded on exchanges, including foreign exchanges, which close earlier than the time that a Fund calculates its NAV may also be valued at their fair values as defined by the 1940 Act and as determined in good faith by or under the supervision of the Funds’ Board, in accordance with methods that are specifically authorized by the Board. If an event occurs after the time at which the market for foreign securities held by a Fund closes but before the time that a Fund’s NAV is calculated, such event may cause the closing price on the foreign exchange to not represent a readily available reliable market value quotation for such securities at the time a Fund determines its NAV. In such a case, a Fund will use the fair value of such securities as determined under a Fund’s valuation procedures. Events after the close of trading on a foreign market that could require a Fund to fair value some or all of its foreign securities include, among others, securities trading in the U.S. and other markets, corporate announcements, natural and other disasters, and political and other events. Among other elements of analysis in the determination of a security’s fair value, the Board has authorized the use of one or more independent research services to assist with such determinations. An independent research service may use statistical analyses and quantitative models to help determine fair value as of the time a Fund calculates its NAV. There can be no assurance that such models accurately reflect the behavior of the applicable markets or the effect of the behavior of such markets on the fair value of securities, or that such markets will continue to behave in a fashion that is consistent with such models. Unlike the closing price of a security on an exchange, fair value determinations employ elements of judgment. Consequently, the fair value assigned to a security may not represent the actual value that a Fund could obtain if it were to sell the security at the time of the close of the NYSE. Pursuant to procedures adopted by the Board, a Fund is not obligated to use the fair valuations suggested by any research service, and valuation recommendations provided by such research services may be overridden if other events have occurred or if other fair valuations are determined in good faith to be more accurate. Unless an event
is such that it causes a Fund to determine that the closing prices for one or more securities do not represent readily available reliable market value quotations at the time a Fund determines its NAV, events that occur between the time of the close of the foreign market on which they are traded and the close of regular trading on the NYSE will not be reflected in a Fund’s NAV. Investments in securities maturing in 60 days or less from the date of acquisition are valued at amortized cost which approximates market value.
Classic Money Market and Institutional Money Market use the amortized cost method to value their portfolio securities, which generally approximates market value. The amortized cost method involves valuing a security at its cost and amortizing any discount or premium over the period until maturity regardless of the impact of fluctuating interest rates or the market value of the security.
Fair Value is defined as the price that the Fund would receive to sell an asset or pay to transfer a liability in an orderly transaction between market participants at the measurement date. Each investment asset or liability of the Funds is assigned a level at measurement date based on the significance and source of the inputs to its valuation. Quoted prices in active markets for identical securities are classified as “Level 1”, inputs other than quoted prices for an asset or liability that are observable are classified as “Level 2” and unobservable inputs, including the sub-adviser’s judgment about the assumptions that a market participant would use in pricing an asset or liability are classified as “Level 3”. The inputs used for valuing securities are not necessarily an indication of the risks associated with investing in those securities. Securities valued at amortized cost are generally considered to be Level 2 securities under applicable accounting rules. A table summarizing the Funds’ investments under these levels of classification is included following the Portfolios of Investments.
For the six months ended September 30, 2009, there have been no significant changes to the fair valuation methodologies.
On April 9, 2009, the Financial Accounting Standards Board (“FASB”) issued FASB Accounting Standards Codification (“ASC”) 820, Determining Fair Value When the Volume and Level of Activity
26
NOTES TO FINANCIAL STATEMENTSASOF SEPTEMBER 30, 2009 (UNAUDITED) (CONTINUED)
NOTE 2 — SIGNIFICANT ACCOUNTING POLICIES (continued)
for the Asset or Liability Have Significantly Decreased and Identifying Transactions That Are Not Orderly. ASC 820 requires enhanced disclosures about the inputs and valuation technique(s) used to measure fair value and a discussion of changes in valuation techniques and related inputs, if any, during the period. In addition, the three-level hierarchy disclosure and the level three roll-forward disclosure are to be expanded for each major category of equity and debt securities. There was no change to the financial position of the Funds and the results of their operations due to the adoption of ASC 820 and all disclosures have been made for the current period as part of the Notes to Financial Statements and Portfolio of Investments.
On March 19, 2008, the FASB issued ASC 815, “Disclosure about Derivative Instruments and Hedging Activities.” This new accounting statement requires enhanced disclosures about an entity’s derivative and hedging activities. Entities are required to provide enhanced disclosures about (a) how and why an entity invests in derivatives, (b) how derivatives are accounted for under ASC 815, and (c) how derivatives affect an entity’s financial position, financial performance, and cash flows. ASC 815 also requires enhanced disclosures regarding credit-risk-related contingent features of derivative instruments. All changes to disclosures have been made in accordance with ASC 815 and have been incorporated for the current period as part of the Notes to Financial Statements and Portfolio of Investments.
Effective for fiscal years and interim periods ending after November 15, 2008, the FASB issued FASB ASC 815 and FASB ASC 460, “Disclosures about Credit Derivatives and Certain Guarantees: An Amendment of FASB ASC 815 and FASB ASC 460; and Clarification of the Effective Date of FASB ASC 815.” The amendments to FASB ASC 815 require enhanced disclosure regarding credit derivatives sold, including (1) the nature and terms of the credit derivative, reasons for entering into the credit derivative, the events or circumstances that would require the seller to perform under the credit derivative, and the current status of the payment/performance risk of the credit derivative, (2) the maximum potential amount of future payments (undiscounted) the seller could be
required to make under the credit derivative, (3) the fair value of the credit derivative, and (4) the nature of any recourse provisions and assets held either as collateral or by third parties. The amendments to FASB ASC 460 require additional disclosures about the current status of the payment/performance risk of a guarantee. All changes to accounting policies have been made in accordance with the ASC and incorporated for the current period as part of the Notes to Financial Statements and Portfolio of Investments.
| B. | Security Transactions and Revenue Recognition. Securities transactions are accounted for on the trade date. Realized gains and losses are reported on the basis of identified cost of securities sold. Interest income is recorded on an accrual basis. Dividend income is recorded on the ex-dividend date, or for certain foreign securities, when the information becomes available to the Funds. Premium amortization and discount accretion are determined by the effective yield method. |
| C. | Foreign Currency Translation. The books and records of the Funds are maintained in U.S. dollars. Any foreign currency amounts are translated into U.S. dollars on the following basis: |
| | (1) | Market value of investment securities, other assets and liabilities — at the exchange rates prevailing at the end of the day. |
| | (2) | Purchases and sales of investment securities, income and expenses — at the rates of exchange prevailing on the respective dates of such transactions. |
Although the net assets and the market values are presented at the foreign exchange rates at the end of the day, the Funds do not isolate the portion of the results of operations resulting from changes in foreign exchange rates on investments from the fluctuations arising from changes in market prices of securities held. Such fluctuations are included with the net realized and unrealized gains or losses from investments. For securities that are subject to foreign withholding tax upon disposition, liabilities are recorded on the Statements of Assets and Liabilities for the estimated tax withholding based on the securities’ current market values. Upon disposition, realized gains or losses on such securities are recorded net of foreign withholding tax.
Reported net realized foreign exchange gains or losses arise from sales of foreign currencies,
27
NOTES TO FINANCIAL STATEMENTSASOF SEPTEMBER 30, 2009 (UNAUDITED) (CONTINUED)
NOTE 2 — SIGNIFICANT ACCOUNTING POLICIES (continued)
currency gains or losses realized between the trade and settlement dates on securities transactions, the difference between the amounts of dividends, interest, and foreign withholding taxes recorded on the Funds’ books, and the U.S. dollar equivalent of the amounts actually received or paid. Net unrealized foreign exchange gains and losses arise from changes in the value of assets and liabilities other than investments in securities at fiscal year end, resulting from changes in the exchange rate. Foreign security and currency transactions may involve certain considerations and risks not typically associated with investing in U.S. companies and U.S. government securities. These risks include, but are not limited to revaluation of currencies and future adverse political and economic developments which could cause securities and their markets to be less liquid and prices more volatile than those of comparable U.S. companies and U.S. government securities.
| D. | Risk Exposures and the use of Derivative Instruments. The Funds investment objectives permit them to enter into various types of derivatives contracts, including, but not limited to, forward foreign currency exchange contracts, futures, purchased options, written options, and swaps. In doing so, the Funds will employ strategies in differing combinations to permit it to increase or decrease the level of risk, or change the level or types of exposure to market risk factors. This may allow the Funds to pursue their objectives more quickly, and efficiently than if it were to make direct purchases or sales of securities capable of affecting a similar response to market factors. |
Market Risk Factors. In pursuit of its investment objectives, the Funds may seek to use derivatives to increase or decrease their exposure to the following market risk factors:
Credit Risk. Credit risk relates to the ability of the issuer to meet interest and principal payments, or both, as they come due. In general, lower-grade, higher-yield bonds are subject to credit risk to a greater extent than lower-yield, higher-quality bonds.
Equity Risk. Equity risk relates to the change in value of equity securities as they relate to increases or decreases in the general market.
Foreign Exchange Rate Risk. Foreign exchange rate risk relates to the change in U.S. dollar value of a security held that is denominated in a foreign currency. The U.S. dollar value of a foreign currency denominated security will decrease as the dollar appreciates against the currency, while the U.S. dollar value will increase as the dollar depreciates against the currency.
Interest Rate Risk. Interest rate risk refers to the fluctuations in value of fixed-income securities resulting from the inverse relationship between price and yield. For example, an increase in general interest rates will tend to reduce the market value of already issued fixed-income investments, and a decline in general interest rates will tend to increase their value. In addition, debt securities with longer maturities, which tend to have higher yields, are subject to potentially greater fluctuations in value from changes in interest rates than obligations with shorter maturities.
Risks of Investing in Derivatives. The Funds use of derivatives can result in losses due to unanticipated changes in the market risk factors and the overall market. In instances where the Funds are using derivatives to decrease, or hedge, exposures to market risk factors for securities held by the Fund, there are also risks that those derivatives may not perform as expected resulting in losses for the combined or hedged positions.
The use of these strategies involves certain special risks, including a possible imperfect correlation, or even no correlation, between price movements of derivative instruments and price movements of related investments. While some strategies involving derivative instruments can reduce the risk of loss, they can also reduce the opportunity for gain or even result in losses by offsetting favorable price movements in related investments or otherwise, due to the possible inability of the Funds to purchase or sell a portfolio security at a time that otherwise would be favorable or the possible need to sell a portfolio security at a disadvantageous time because the Funds are required to maintain asset coverage or offsetting positions in connection with transactions in derivative instruments. Additional associated risks from investing in derivatives also exist and potentially could have significant effects on the valuation of the derivative and the Funds. Associated risks are not the risks that the Funds are attempting to increase or decrease exposure to,
28
NOTES TO FINANCIAL STATEMENTSASOF SEPTEMBER 30, 2009 (UNAUDITED) (CONTINUED)
NOTE 2 — SIGNIFICANT ACCOUNTING POLICIES (continued)
per its investment objectives, but are the additional risks from investing in derivatives. Examples of these associated risks are liquidity risk, which is the risk that the Funds will not be able to sell the derivative in the open market in a timely manner, and counterparty credit risk, which is the risk that the counterparty will not fulfill its obligation to the Funds. Associated risks can be different for each type of derivative and are discussed by each derivative type in the following notes.
Counterparty Credit Risk. Certain derivative positions are subject to counterparty credit risk, which is the risk that the counterparty will not fulfill its obligation to the Funds. The Funds derivative counterparties are financial institutions who are subject to market conditions that may weaken their financial position. The Funds intend to enter into financial transactions with counterparties that they believe to be creditworthy at the time of the transaction. To reduce this risk the Funds have entered into master netting arrangements, established within the Funds International Swap and Derivatives Association, Inc. (“ISDA”) Master Agreements. These agreements are with select counterparties that govern transactions, over-the-counter derivative and forward foreign exchange contracts, entered into by the Funds and those counterparties. The ISDA Master Agreements maintain provisions for general obligations, representations, agreements, collateral, and events of default or termination. Events of termination include conditions that may entitle counterparties to elect to terminate early and cause settlement of all outstanding transactions under the applicable ISDA Master Agreement.
A Fund may also enter into collateral agreements with certain counterparties to further mitigate counterparty risk on swaps, over the counter (“OTC”) derivatives and forward foreign currency contracts. Subject to established minimum levels, collateral is generally determined based on the net aggregate unrealized gain or loss on contracts with a certain counterparty. Collateral pledged to or from a Fund is held in a segregated account by a third-party agent and can be in the form of cash or debt securities issued by the U.S. government or related agencies. At September 30, 2009, Intermediate Bond has pledged $330,000 in collateral.
| E. | Foreign Currency Transactions and Futures Contracts. High Yield Bond and Intermediate Bond may enter into foreign currency exchange transactions to convert to and from different foreign currencies and to and from the U.S. dollar in connection with the planned purchases or sales of securities. The Funds either enter into these transactions on a spot basis at the spot rate prevailing in the foreign currency exchange market or use forward foreign currency contracts to purchase or sell foreign currencies. When the contract is fulfilled or closed, gains or losses are realized. Until then, the gain or loss is included in unrealized appreciation or depreciation. Risks may arise upon entering into forward contracts from the potential inability of counterparties to meet the terms of their forward contracts and from unanticipated movements in the value of foreign currencies relative to the U.S. dollar. |
For the six months ended September 30, 2009, Intermediate Bond has entered into forward foreign currency contracts with the obligation to buy and sell specified foreign currencies in the future at a currently negotiated forward rate in order to increase or decrease exposure to foreign exchange rate risk. The Fund uses forward foreign currency contracts to enhance potential gain, hedge against anticipated currency exchange rates, and to maintain diversity and liquidity of the portfolio.
Please refer to the table following the Portfolio of Investments that discloses the fair value of forward foreign currency contracts outstanding at period end and the amounts of realized and changes in unrealized gains and losses on forward foreign currency contracts during the six months ended September 30, 2009 which serves as an indicator of the volume of derivative activity for the Fund.
High Yield Bond and Intermediate Bond may enter into futures contracts involving foreign currency, interest rates, securities and securities indices. A futures contract obligates the seller of the contract to deliver and the purchaser of the contract to take delivery of the type of foreign currency, financial instrument or security called for in the contract at a specified future time for a specified price. Upon entering into such a contract, a Fund is required to deposit and maintain as collateral such initial margin as required by the exchange on which the contract is traded. Pursuant to the contract, a Fund agrees to receive from or pay to the broker an
29
NOTES TO FINANCIAL STATEMENTSASOF SEPTEMBER 30, 2009 (UNAUDITED) (CONTINUED)
NOTE 2 — SIGNIFICANT ACCOUNTING POLICIES (continued)
amount equal to the daily fluctuations in the value of the contract. Such receipts or payments are known as variation margins and are recorded as unrealized gains or losses by the Fund. When the contract is closed, the Fund records a realized gain or loss equal to the difference between the value of the contract at the time it was opened and the value at the time it was closed.
Futures contracts are exposed to the market risk factor of the underlying financial instrument. During the six months ended September 30, 2009, Intermediate Bond has both purchased and sold futures contracts on various bonds and notes to increase or decrease exposure to interest rate risk. Additional associated risks of entering into futures contracts include the possibility that there may be an illiquid market where the Fund is unable to liquidate the contract or enter into an offsetting position and, if used for hedging purposes, the risk that the price of the contract will correlate imperfectly with the prices of the Fund’s securities.
Please refer to the table following the Portfolio of Investments that discloses the fair value of futures contracts outstanding at period end and the amounts of realized and changes in unrealized gains and losses on futures during the six months ended September 30, 2009 which serves as an indicator of the volume of derivative activity for the Fund.
| F. | Distributions to Shareholders. The Funds record distributions to their shareholders on the ex-dividend date. All Funds, with the exception of GNMA Income, declare dividends daily and pay dividends monthly. GNMA Income declares and pays dividends monthly. The characteristics of income and gains to be distributed are determined in accordance with income tax regulations, which may differ from U.S. generally accepted accounting principles for investment companies. |
| G. | Federal Income Taxes. It is the policy of the Funds to comply with Subchapter M of the Internal Revenue Code and related excise tax provisions applicable to regulated investment companies and to distribute substantially all of their net investment income and any net realized capital gains to their shareholders. Therefore, no federal income tax provision is required. Management has considered the sustainability of the Funds’ tax |
| | positions taken on federal income tax returns for all open tax years in making this determination. No capital gain distributions shall be made until any capital loss carryforwards have been fully utilized or expired. |
| H. | Use of Estimates. The preparation of financial statements in conformity with U.S. generally accepted accounting principles requires management to make estimates and assumptions that affect the reported amounts of assets and liabilities and disclosure of contingent assets and liabilities at the date of the financial statements and the reported amounts of increases and decreases in net assets from operations during the reporting period. Actual results could differ from those estimates. |
| I. | Repurchase Agreements. Each Fund may invest in repurchase agreements only with government securities dealers recognized by the Board of Governors of the Federal Reserve System. Under such agreements, the seller of the security agrees to repurchase it at a mutually agreed upon time and price. The resale price is in excess of the purchase price and reflects an agreed upon interest rate for the period of time the agreement is outstanding. The period of the repurchase agreements is generally short, from possibly overnight to one week, (although it may extend over a number of months) while the underlying securities generally have longer maturities. Each Fund will receive as collateral securities acceptable to it whose market value is equal to at least 100% of the carrying amount of the repurchase agreements, plus accrued interest, being invested by a Fund. The underlying collateral is valued daily on a mark to market basis to assure that the value, including accrued interest is at least equal to the repurchase price. There would be potential loss to a Fund in the event a Fund is delayed or prevented from exercising its right to dispose of the collateral, and it may incur disposition costs in liquidating the collateral. |
| J. | Securities Lending. Each Fund has the option to temporarily loan up to 33 1/3% of its total assets to brokers, dealers or other financial institutions in exchange for a negotiated lender’s fee. The borrower is required to fully collateralize the loans with cash or U.S. government securities. Generally, in the event of counterparty default, a Fund has the right to use collateral to offset losses incurred. There would be potential loss to a Fund in the event the Fund is delayed or prevented from |
30
NOTES TO FINANCIAL STATEMENTSASOF SEPTEMBER 30, 2009 (UNAUDITED) (CONTINUED)
NOTE 2 — SIGNIFICANT ACCOUNTING POLICIES (continued)
| | exercising its right to dispose of the collateral. A Fund bears the risk of loss with respect to the investment of collateral. Engaging in securities lending could have a leveraging effect, which may intensify the credit, market and other risks associated with investing in a Fund. |
| K. | Illiquid and Restricted Securities. Classic Money Market and Institutional Money Market may not invest more than 10% of their net assets in illiquid securities and all other Funds may not invest more than 15% of their net assets in illiquid securities. Illiquid securities are not readily marketable. Disposing of illiquid investments may involve time- consuming negotiation and legal expenses, and it may be difficult or impossible for the Funds to sell them promptly at an acceptable price. Restricted securities are those sold under Rule 144A of the Securities Act of 1933 (“1933 Act”) or are securities offered pursuant to Section 4(2) of the 1933 Act, and are subject to legal or contractual restrictions on resale and may not be publicly sold without registration under the 1933 Act. Certain restricted securities may be considered liquid pursuant to procedures adopted by the Board or may be deemed illiquid because they may not be readily marketable. With the exception of Classic Money Market and Institutional Money Market, illiquid and restricted securities are valued using market quotations when readily available. In the absence of market quotations, the securities are valued based upon their fair value determined under procedures approved by the Board. |
| L. | Delayed-Delivery or When-Issued Transactions. The Funds may purchase or sell securities on a when-issued or a delayed-delivery basis. Each Fund (except GNMA Income) may enter into forward commitments. The price of the underlying securities and date when the securities will be delivered and paid for are fixed at the time the transaction is negotiated. The market value of such is identified in the Funds’ Portfolio of investments. Losses may arise due to changes in the market value of the securities or from the inability of counterparties to meet the terms of the contract. In connection with such purchases, the Funds are required to segregate liquid assets with the Funds’ custodian sufficient to cover the purchase price. |
| M. | Mortgage Dollar Roll Transactions. Each Fund may engage in dollar roll transactions with respect to mortgage-backed securities issued or to be issued by Government National Mortgage Association, Federal National Mortgage Association and Federal Home Loan Mortgage Corp. In a dollar roll transaction, a Fund sells a mortgage-backed security to a financial institution, such as a bank or broker/dealer, and simultaneously agrees to repurchase a substantially similar (i.e., same type, coupon, and maturity) security from the institution on a delayed delivery basis at an agreed upon price. The mortgage-backed securities that are repurchased will bear the same interest rate as those sold, but generally will be collateralized by different pools of mortgages with different prepayment histories. The Funds account for dollar roll transactions as purchases and sales. |
| N. | Options Contracts. The Funds (except GNMA Income) may write call and put options on futures, swaps (“swaptions”), securities, commodity or currencies it owns or in which it may invest. Writing put options tends to increase the Funds exposure to the underlying instrument. Writing call options tends to decrease the Funds exposure to the underlying instrument. When a Fund writes a call or put option, an amount equal to the premium received is recorded as a liability and subsequently marked to market to reflect the current value of the option written. These liabilities are reflected as written options outstanding on the Statements of Assets and Liabilities. Certain options may be written with premiums to be determined on a future date. Premiums received from writing options which expire are treated as realized gains. Premiums received from writing options which are exercised or closed are added to the proceeds or offset against amounts paid on the underlying futures, swap, security or currency transaction to determine the realized gain or loss. Each Fund as a writer of an option has no control over whether the underlying instrument may be sold (call) or purchased (put) and as a result bears the market risk of an unfavorable change in the price of the instrument underlying the written option. There is the risk the Funds may not be able to enter into a closing transaction because of an illiquid market. |
The Funds may also purchase put and call options. Purchasing call options tends to increase the Funds exposure to the underlying instrument. Purchasing
31
NOTES TO FINANCIAL STATEMENTSASOF SEPTEMBER 30, 2009 (UNAUDITED) (CONTINUED)
NOTE 2 — SIGNIFICANT ACCOUNTING POLICIES (continued)
put options tends to decrease the Funds exposure to the underlying instrument. The Funds pay a premium which is included on the Statements of Assets and Liabilities as an investment and subsequently marked to market to reflect the current value of the option. Premiums paid for purchasing options which expire are treated as realized losses. Certain options may be purchased with premiums to be determined on a future date. The premiums for these options are based upon implied volatility parameters at specified terms. The risk associated with purchasing put and call options is limited to the premium paid. Premiums paid for purchasing options which are exercised or closed are added to the amounts paid or offset against the proceeds on the underlying investment transaction to determine the realized gain or loss.
During the six months ended September 30, 2009, Intermediate Bond has written swaptions on credit default swaps in an attempt to decrease exposure to credit risk. Please refer to the table following the Portfolio of Investments that discloses the amounts of realized and changes in unrealized gains and losses on written call options during the six months ended September 30, 2009 which serves as an indicator of the volume of derivative activity for the Fund. There were no open written swaptions at September 30, 2009.
| O. | Swap Agreements. High Yield Bond and Intermediate Bond may enter into swap agreements. A swap is an agreement between two parties pursuant to which each party agrees to make one or more payments to the other at specified future intervals based on the return of an asset (such as a stock, bond or currency) or non-asset reference (such as an interest rate or index). The swap agreement will specify the “notional” amount of the asset or non-asset reference to which the contract relates. Subsequent changes in market value, if any, are calculated based upon changes in the performance of the asset or non-asset reference multiplied by the notional value of the contract. A Fund may enter into credit default, interest rate, total return and currency swaps to manage its exposure to credit, currency and interest rate risk. All outstanding swap agreements are reported following each Fund’s Portfolio of Investments. |
Swaps are marked to market daily using quotations primarily from third party pricing services, counterparties or brokers. The value of the swap contract is recorded on each Fund’s Statements of Assets or Liabilities. During the term of the swap, changes in the value of the swap, if any, are recorded as unrealized gains or losses on the Statements of Operations. Upfront payments paid or received by a Fund when entering into the agreements are reported on the Statements of Assets and Liabilities and as a component of the changes in unrealized gains or losses on the Statements of Operations. These upfront payments represent the amounts paid or received when initially entering into the swap agreement to compensate for differences between the stated terms of the swap agreement and the prevailing market conditions. The upfront payments are included as a component in the realized gains or losses on each Fund’s Statement of Operations upon termination or maturity of the swap. A Fund also records net periodic payments paid or received on the swap contract as a realized gain or loss on the Statements of Operations.
Entering into swap agreements involves the risk that the maximum potential loss of an investment exceeds the current value of the investment as reported on each Fund’s Statements of Assets and Liabilities. Other risks involve the possibility that the counterparty to the agreements may default on its obligation to perform, that there will be no liquid market for these investments and that unfavorable changes in the market will have a negative impact on the value of the index or securities underlying the respective swap agreement.
Credit Default Swap Contracts. A credit default swap is a bilateral agreement between counterparties in which the buyer of the protection agrees to make a stream of periodic payments to the seller of protection in exchange for the right to receive a specified return in the event of a default or other credit event for a referenced entity, obligation or index. As a seller of protection on credit default swaps, a Fund will generally receive from the buyer a fixed payment stream based on the notional amount of the swap contract. This fixed payment stream will continue until the swap contract expires or a defined credit event occurs.
A Fund is subject to credit risk in the normal course of pursuing its investment objectives. As a seller of protection in a credit default swap, a Fund may
32
NOTES TO FINANCIAL STATEMENTSASOF SEPTEMBER 30, 2009 (UNAUDITED) (CONTINUED)
NOTE 2 — SIGNIFICANT ACCOUNTING POLICIES (continued)
execute these contracts to manage its exposure to the market or certain sectors of the market. A Fund may also enter into credit default swaps to speculate on changes in an issuer’s credit quality, to take advantage of perceived spread advantages, or to offset an existing short equivalent (i.e. buying protection on an equivalent reference entity).
High Yield Bond and Intermediate Bond may sell credit default swaps which expose these Funds to the risk of loss from credit risk- related events specified in the contract. Although contract specific, credit events are generally defined as bankruptcy, failure to pay, restructuring, obligation acceleration, obligation default or repudiation/moratorium. If a Fund is a seller of protection, and a credit event occurs, as defined under the terms of that particular swap agreement, a Fund will generally either (i) pay to the buyer an amount equal to the notional amount of the swap and take delivery of the referenced obligation, other deliverable obligations, or underlying securities comprising a referenced index or (ii) pay a net settlement amount in the form of cash or securities equal to the notional amount of the swap less the recovery value of the referenced obligation or underlying securities comprising a referenced index. If a Fund is a buyer of protection and a credit event occurs, as defined under the terms of that particular swap agreement, a Fund will either (i) receive from the seller of protection an amount equal to the notional amount of the swap and deliver the referenced obligation, other deliverable obligations or underlying securities comprising the referenced index or (ii) receive a net settlement amount in the form of cash or securities equal to the notional amount of the swap less the recovery value of the referenced obligation or underlying securities comprising the referenced index. Recovery values are assumed by market makers considering either industry standard recovery rates or entity specific factors and considerations until a credit event occurs. If a credit event has occurred, the recovery value is determined by a facilitated auction whereby a minimum number of allowable broker bids, together with a specified valuation method, are used to calculate the settlement value.
Implied credit spreads, represented in absolute terms, utilized in determining the market value of
credit default swap agreements on corporate issues or sovereign issues are disclosed in each Fund’s Portfolio of Investment and serve as an indicator of the current status of the payment/performance risk and represent the likelihood or risk of default for the credit derivative. The implied credit spread of a particular referenced entity reflects the cost of buying/selling protection and may include upfront payments required to be made to enter into the agreement. For credit default swaps on asset-backed securities or credit indices, the quoted market prices and resulting market values serve as the indicator of the current status of the payment/performance risk. Wider credit spreads and increasing market values, in absolute terms when compared to the notional amount of the swap, represent a deterioration of the referenced entity’s credit soundness and a greater likelihood or risk of default or other credit event occurring as defined under the terms of the agreement.
The maximum amount of future payments (undiscounted) that a Fund as seller of protection could be required to make under a credit default swap agreement would be an amount equal to the notional amount of the agreement. Notional amounts of all credit default swap agreements outstanding as of September 30, 2009, for which a Fund is seller of protection, are disclosed in each Fund’s Portfolio of Investments. These potential amounts would be partially offset by any recovery values of the respective referenced obligations, upfront payments received upon entering into the agreements, or net amounts received from the settlement of buy protection credit default swap agreements entered into by a Fund for the same referenced entity or entities.
For the six months ended September 30, 2009, High Yield Bond and Intermediate Bond have purchased credit protection through credit default swaps to decrease exposure to the credit risk of individual securities and to hedge against anticipated potential credit events.
For the six months ended September 30, 2009, Intermediate Bond has sold credit protection through credit default swaps to gain exposure to the credit risk of individual securities that are either unavailable or considered to be less attractive in the bond market and to hedge against anticipated potential credit events.
Please refer to the table following the Portfolio of Investments that discloses the fair value of credit
33
NOTES TO FINANCIAL STATEMENTSASOF SEPTEMBER 30, 2009 (UNAUDITED) (CONTINUED)
NOTE 2 — SIGNIFICANT ACCOUNTING POLICIES (continued)
default swaps outstanding at period end and the amounts of realized and changes in unrealized gains and losses on futures during the six months ended September 30, 2009 which serves as an indicator of the volume of derivative activity for the Fund. High Yield Bond had no open swap contracts outstanding at period end.
| P. | Construction Loan Securities. GNMA Income may purchase construction loan securities, which are issued to finance building costs. The funds are disbursed as needed or in accordance with a prearranged plan. The securities provide for the timely payment to the registered holder of interest at the specified rate plus scheduled installments of principal. Upon completion of the construction phase, the construction loan securities are terminated and project loan securities are issued. It is GNMA Income’s policy to record these GNMA certificates on trade date, and to segregate assets to cover its commitments on trade date as well. |
| Q. | Indemnifications. In the normal course of business, the Trust may enter into contracts that provide certain indemnifications. The Trust’s maximum exposure under these arrangements is dependent on future claims that may be made against the Funds and, therefore, cannot be estimated; however, based on experience, the risk of loss from such claims is considered remote. |
NOTE 3 — INVESTMENT TRANSACTIONS
For the six months ended September 30, 2009, the cost of purchases and proceeds from the sales of securities excluding short-term and U.S. government securities, were as follows:
| | | | | | |
| | | Purchases | | Sales |
High Yield Bond | | $ | 46,021,978 | | $ | 45,377,325 |
Intermediate Bond | | | 420,485,813 | | | 405,887,722 |
U.S. government securities not included above were as follows:
| | | | | | |
| | | Purchases | | Sales |
GNMA Income | | $ | 294,769,092 | | $ | 297,155,488 |
Intermediate Bond | | | 3,093,046,731 | | | 3,400,665,628 |
NOTE 4 — INVESTMENT MANAGEMENT AND ADMINISTRATIVE FEES
ING Investments, LLC (“ING Investments” or the ”Investment Adviser”), an Arizona limited liability
company, serves as the investment adviser to the Funds. The Investment Adviser serves pursuant to an investment management agreement (“Management Agreement”) between the Investment Adviser and the Trust, on behalf of the Funds.
The Management Agreement compensates the Investment Adviser with a fee, computed daily and payable monthly, based on the average daily net assets of each Fund, at the following annual rates:
For GNMA Income — 0.47% on first $1 billion, 0.40% on next $4 billion and 0.35% on assets thereafter; for High Yield Bond — 0.51% on first $1 billion, 0.45% on next $4 billion and 0.40% on assets thereafter; for Intermediate Bond — 0.17%; for Classic Money Market — 0.25%; and for Institutional Money Market — 0.08%.
ING Investment Management Co. (“ING IM”), a Connecticut corporation, serves as the sub-adviser to the Funds. The Investment Adviser has entered into a sub-advisory agreement with ING IM. Subject to such policies as the Board or the Investment Adviser may determine, ING IM manages the Funds’ assets in accordance with the Funds’ investment objectives, policies, and limitations.
ING Funds are permitted to invest end-of-day cash balances into Institutional Money Market. Investment management fees paid by the Funds will be reduced by an amount equal to the management fees paid indirectly to Institutional Money Market with respect to assets invested by the Funds. For the six months ended September 30, 2009, High Yield Bond and Intermediate Bond waived $1,098 and $17,935, respectively. These fees are not subject to recoupment.
ING Funds Services, LLC (“IFS”), acts as administrator and provides certain administrative and shareholder services necessary for Fund operations and is responsible for the supervision of other service providers. For its services, IFS is entitled to receive from each Fund, with the exception of Classic Money Market and Institutional Money Market, a fee at an annual rate of 0.10% of its average daily net assets.
ING Funds Distributor, LLC (the “Distributor” or “IFD”) is the principal underwriter of the Funds. The Distributor, IFS, ING Investments and ING IM are indirect, wholly-owned subsidiaries of ING Groep N.V. (“ING Groep”). ING Groep is a global financial institution of Dutch origin offering banking, investments, life insurance and retirement services.
34
NOTES TO FINANCIAL STATEMENTSASOF SEPTEMBER 30, 2009 (UNAUDITED) (CONTINUED)
NOTE 4 — INVESTMENT MANAGEMENT AND ADMINISTRATIVE FEES (continued)
On October 19, 2008, ING Groep announced that it reached an agreement with the Dutch government to strengthen its capital position. ING Groep issued non-voting core Tier-1 securities for a total consideration of EUR 10 billion to the Dutch State. The transaction boosted ING Bank’s core Tier-1 ratio, strengthened the insurance balance sheet and reduced ING Groep’s Debt/Equity ratio.”
On October 26, 2009, ING Groep announced that it will move towards a complete separation of its banking and insurance operations. A formal restructuring plan (“Restructuring Plan”) was submitted to the European Commission (“EC”), which approved it on November 18, 2009. It is expected that the Restructuring Plan will be achieved over the next four years by a divestment of all insurance operations (including ING Investment Management) as well as a divestment of ING Direct US by the end of 2013. ING Groep will explore all options, including initial public offerings, sales or combinations thereof. ING Groep has also announced its intention to repurchase EUR 5 billion of Core Tier 1 securities in the fourth quarter of 2009, financed by a EUR 7.5 billion underwritten rights issue.
NOTE 5 — DISTRIBUTION AND SERVICE FEES
Each share class of the Funds (except Class I and Class W and as otherwise noted below) has adopted a Distribution Plan pursuant to Rule 12b-1 under the 1940 Act and/or a Service Plan (the “Plans”), whereby the Distributor is reimbursed or compensated (depending on the class of shares) by certain of the Funds for expenses incurred in the distribution of each Fund’s shares (“Distribution Fees”). Pursuant to the Plans, the Distributor is entitled to payment each month for expenses incurred in the distribution and promotion of certain of each Fund’s shares, including expenses incurred in printing prospectuses and reports used for sales purposes, expenses incurred in preparing and printing sales literature and other such distribution related expenses, including any distribution or shareholder servicing fees (“Service Fees”) paid to securities dealers who have executed a distribution agreement with the Distributor. Under the Plans, each class of shares of the Fund pays the Distributor a Distribution and/or Service Fee based on average daily net assets at the following annual rates:
| | | | | | | | | | | | | | | | | | | | | |
| | | Class A | | | Class B | | | Class C | | | Class IS | | | Class O | | | Class Q | | | Class R | |
GNMA Income | | 0.25 | % | | 1.00 | % | | 1.00 | % | | N/A | | | N/A | | | 0.25 | % | | N/A | |
High Yield Bond | | 0.25 | % | | 1.00 | % | | 1.00 | % | | N/A | | | N/A | | | N/A | | | N/A | |
Intermediate Bond | | 0.25 | % | | 1.00 | % | | 1.00 | % | | N/A | | | 0.25 | % | | N/A | | | 0.50 | % |
Classic Money Market(1) | | 0.75 | % | | 1.00 | % | | 1.00 | % | | N/A | | | N/A | | | N/A | | | N/A | |
Institutional Money Market | �� | N/A | | | N/A | | | N/A | | | 0.10 | % | | N/A | | | N/A | | | N/A | |
| (1) | The Distributor has contractually agreed to waive a portion of the distribution fee for Class A of Classic Money Market to the extent necessary for expenses not to exceed 0.77%. The fee waiver will continue through at least August 1, 2010. There is no guarantee that this waiver will continue after that date. |
IFD and ING Investments have contractually agreed to waive a portion of their distribution and/or shareholder servicing fees and management fees, as applicable, and to reimburse certain expenses to the extent necessary to assist Classic Money Market in maintaining a yield of not less than zero. This arrangement will continue through at least August 1, 2010. There is no guarantee that this waiver will continue after that date. Fees waived or expenses reimbursed are subject to possible recoupment by IFD or ING Investments, as applicable, within three years subject to certain restrictions. For the six months ended September 30, 2009, IFD waived $1,313,160 of distribution and servicing fees to maintain a yield of not less than zero. Please note that these waivers or reimbursements are in addition to existing contractual expense limitations, if any. As of September 30, 2009, the amounts of waived distribution and servicing fees that are subject to possible recoupment by IFD and the Investment Adviser, and the related expiration dates are as follows:
| | | | | | | | | | | | |
| | | September 30, | | |
| | | 2010 | | 2011 | | 2012 | | Total |
Classic Money Market | | $ | — | | $ | — | | $ | 244,086 | | $ | 244,086 |
The Distributor also receives the proceeds of the initial sales charge paid by shareholders upon the purchase of Class A shares of the Funds, and the contingent deferred sales charge paid by shareholders upon certain redemptions for Class A, Class B, and Class C shares. For the six months ended September 30, 2009, the Distributor retained the following amounts in sales charges:
| | | | | | |
| | | Class A
Shares | | Class C
Shares |
Initial Sales Charges | | | | | | |
GNMA Income | | $ | 60,358 | | | N/A |
High Yield Bond | | | 5,649 | | | N/A |
Intermediate Bond | | | 3,454 | | | N/A |
Contingent Deferred Sales Charge | | | | | | |
GNMA Income | | $ | 9,915 | | $ | 7,861 |
High Yield Bond | | | — | | | 2,100 |
Intermediate Bond | | | 49,022 | | | 967 |
Classic Money Market | | | — | | | 1,311 |
35
NOTES TO FINANCIAL STATEMENTSASOF SEPTEMBER 30, 2009 (UNAUDITED) (CONTINUED)
NOTE 6 — OTHER TRANSACTIONS WITH AFFILIATES AND RELATED PARTIES
At September 30, 2009, the Funds had the following amounts recorded in payable to affiliates on the accompanying Statements of Assets and Liabilities (see Notes 4 and 5):
| | | | | | | | | | | | |
Fund | | Accrued Investment Management Fees | | Accrued Administrative Fees | | Accrued Shareholder Service and Distribution Fees | | Total |
GNMA Income | | $ | 304,343 | | $ | 64,753 | | $ | 230,342 | | $ | 599,438 |
High Yield Bond | | | 41,155 | | | 8,108 | | | 34,538 | | | 83,801 |
Intermediate Bond | | | 126,428 | | | 74,917 | | | 161,447 | | | 362,792 |
Classic Money Market | | | 211,485 | | | — | | | 32,122 | | | 243,607 |
Institutional Money Market | | | 99,606 | | | — | | | — | | | 99,606 |
At September 30, 2009, the following ING Portfolios or indirect, wholly-owned subsidiaries of ING Groep owned more than 5% of the following Funds:
ING Life Insurance & Annuity — GNMA Income (23.57%) and Intermediate Bond (21.29%).
ING National Trust — GNMA Income (8.13%) and Intermediate Bond (19.65%).
ING Russell Large Cap Index — Institutional Money Market (5.68%).
Control is defined by the 1940 Act as the beneficial ownership, either directly or through one or more controlled companies, of more than 25% of the voting securities of a company. The 1940 Act defines affiliates as companies that are under common control. Therefore, because the Funds have a common owner that owns over 25% of the outstanding securities of the Funds, they may be deemed to be affiliates of each other. Investment activities of these shareholders could have a material impact on the Funds.
The Trust has adopted a retirement policy under which any Trustee, who as of May 9, 2007, had served for at least five (5) years as a Trustee of one or more ING Funds and who is not an “interested person” of such ING Funds (as such item is defined in the Investment Company Act of 1940, as amended) shall be entitled to a retirement payment (“Retirement Benefit”) if such Trustee: (a) retires in accordance with the retirement policy; (b) dies; or (c) becomes disabled. The Retirement Benefit shall be made promptly to, as applicable, the Trustee or the Trustee’s estate, after such retirement, death or disability in an amount equal to two times the annual compensation payable to such Trustee, as in effect at the time of his or her retirement, death or disability. The annual compensation determination shall be based upon the annual Board membership retainer fee (but not any separate annual retainer fees
for chairpersons of committees and of the Board). This amount shall be paid by the Trust or ING Funds on whose Board the Trustee was serving at the time of his or her retirement. The retiring Trustee may elect to receive payment of his or her benefit in a lump sum or in three substantially equal payments. For the purpose of this policy, disability shall be the inability to perform the duties of a member of the Board because of the physical or mental impairment that has lasted or that can be expected to last for a continuous period of not less than 12 months, as reasonably determined by a majority of the Board.
NOTE 7 — EXPENSE LIMITATIONS
Pursuant to a written expense limitation agreement (“Expense Limitation Agreement”) with the Funds, the Investment Adviser has agreed to limit expenses of each Fund, excluding interest, taxes, brokerage commissions and extraordinary expenses (and acquired fund fees and expenses) to the levels listed below:
| | | | | | | | | | | | | | | | | | | | | | | | |
Maximum Operating Expense Limit
(as a percentage of average net assets) | | | | | | | | | | | | | |
| | | Class A | | | Class B | | | Class C | | | Class I | | | Class O | | | Class Q | | | Class R | | | Class W | |
GNMA Income | | 0.97 | % | | 1.72 | % | | 1.72 | % | | 0.67 | % | | N/A | | | 0.92 | % | | N/A | | | 0.72 | % |
High Yield Bond | | 1.10 | % | | 1.85 | % | | 1.85 | % | | 0.85 | % | | N/A | | | N/A | | | N/A | | | N/A | |
Intermediate Bond(1) | | 0.75 | % | | 1.50 | % | | 1.50 | % | | 0.50 | % | | 0.75 | % | | N/A | | | 1.00 | % | | 0.50 | % |
Classic Money Market | | 0.77 | % | | 1.41 | % | | 1.41 | % | | N/A | | | N/A | | | N/A | | | N/A | | | N/A | |
| (1) | Prior to August 1, 2009, the expense limits were 0.69%, 1.44%, 1.44%, 0.38%, 0.69%, 0.94% and 0.44% for Classes A, B, C, I, O, R and W shares, respectively. |
The Investment Adviser has agreed to limit expenses, excluding interest, taxes, brokerage commissions, and extraordinary expenses to 0.17% and 0.20% of Institutional Money Market’s Class I and Class IS shares’ average daily net assets, respectively.
The Investment Adviser may at a later date recoup from a Fund for management fees waived and other expenses assumed by the Investment Adviser during the previous 36 months, but only if, after such recoupment, a Fund’s expense ratio does not exceed the percentage described above. Waived and reimbursed fees net of any recoupment by the Investment Adviser of such waived and reimbursed fees are reflected on the accompanying Statements of Operations for each Fund. Amounts payable by the Investment Adviser are reflected on the accompanying Statements of Assets and Liabilities for each Fund.
As of September 30, 2009, the amounts of waived and reimbursed fees that are subject to possible
36
NOTES TO FINANCIAL STATEMENTSASOF SEPTEMBER 30, 2009 (UNAUDITED) (CONTINUED)
NOTE 7 — EXPENSE LIMITATIONS (continued)
recoupment by the Investment Adviser, and the related expiration dates are as follows:
| | | | | | | | | | | | |
| | | September 30, | | |
| | | 2010 | | 2011 | | 2012 | | Total |
High Yield Bond | | $ | 12,673 | | $ | 137,109 | | $ | 154,898 | | $ | 304,680 |
The Expense Limitation Agreement is contractual and shall renew automatically for one-year terms unless ING Investments or the Registrant provides written notice of the termination of the Expense Limitation Agreement within 90 days of the end of the then current term or upon termination of the Management Agreement.
NOTE 8 — LINE OF CREDIT
Each of the Funds included in this report with the exception of GNMA Income, in addition to certain other funds managed by the Investment Adviser, have entered into an unsecured committed revolving line of credit agreement (the “Credit Agreement”) with The Bank of New York Mellon (“BNY”) for an aggregate amount of $125,000,000. The proceeds may be used only to: (1) temporarily finance the purchase and sale
of securities; or (2) finance the redemption of shares of an investor in the Funds. The Funds to which the line of credit is available pay a commitment fee equal to 0.15% per annum on the daily unused portion of the committed line amount payable quarterly in arrears.
The following Funds utilized the line of credit during the six months ended September 30, 2009:
| | | | | | | | |
Fund | | Days
Utilized | | Approximate Average Daily Balance | | Approximate Weighted Average Interest Rate | |
High Yield Bond | | 8 | | $ | 530,000 | | 1.45 | % |
Intermediate Bond | | 14 | | | 3,057,857 | | 1.22 | |
NOTE 9 — WRITTEN OPTIONS
Transactions in written options for Intermediate Bond for the six months ended September 30, 2009 were as follows:
| | | | | | | |
| | | Number of
Contracts | | | Premium | |
Balance at 03/31/09 | | 0 | | | $ | — | |
Options Written | | 224,000,000 | | | | 604,800 | |
Options Expired | | (224,000,000 | ) | | | (604,800 | ) |
| | | | | | | |
Balance at 09/30/09 | | 0 | | | $ | — | |
| | | | | | | |
NOTE 10 — CAPITAL SHARES
Transactions in capital shares and dollars were as follows:
| | | | | | | | | | | | | | | | | | | | | | |
| | | Shares
sold | | Reinvestment
of
distributions | | Shares
redeemed | | | Net increase
(decrease) in
shares
outstanding | | | | | Shares
sold | | Reinvestment
of
distributions | | Shares
redeemed | | | Net increase
(decrease) | |
Year or period ended | | # | | # | | # | | | # | | | | | ($) | | ($) | | ($) | | | ($) | |
GNMA Income | | | | | | | | | | | | | |
Class A | | | | | | | | | | | | | | | | | | | | | | |
09-30-09 | | 10,513,004 | | 1,241,821 | | (11,271,070 | ) | | 483,755 | | | | | 91,249,680 | | 10,745,400 | | (97,678,621 | ) | | 4,316,459 | |
03-31-09 | | 24,540,147 | | 2,318,672 | | (17,617,729 | ) | | 9,241,090 | | | | | 208,874,722 | | 19,556,282 | | (149,072,103 | ) | | 79,358,901 | |
Class B | | | | | | | | | | | | | | | | | | | | | | |
09-30-09 | | 66,979 | | 51,645 | | (874,750 | ) | | (756,126 | ) | | | | 578,366 | | 444,734 | | (7,542,672 | ) | | (6,519,572 | ) |
03-31-09 | | 698,344 | | 126,419 | | (1,767,305 | ) | | (942,542 | ) | | | | 5,875,386 | | 1,060,402 | | (14,809,716 | ) | | (7,873,928 | ) |
Class C | | | | | | | | | | | | | | | | | | | | | | |
09-30-09 | | 4,400,841 | | 95,716 | | (1,681,077 | ) | | 2,815,480 | | | | | 38,027,152 | | 824,996 | | (14,503,066 | ) | | 24,349,082 | |
03-31-09 | | 5,923,049 | | 113,194 | | (1,853,276 | ) | | 4,182,967 | | | | | 50,307,172 | | 951,996 | | (15,713,864 | ) | | 35,545,304 | |
Class I | | | | | | | | | | | | | | | | | | | | | | |
09-30-09 | | 1,022,337 | | 103,043 | | (744,180 | ) | | 381,200 | | | | | 8,875,821 | | 892,511 | | (6,449,954 | ) | | 3,318,378 | |
03-31-09 | | 3,052,829 | | 134,249 | | (1,182,703 | ) | | 2,004,375 | | | | | 26,002,333 | | 1,135,414 | | (9,924,183 | ) | | 17,213,564 | |
Class Q | | | | | | | | | | | | | | | | | | | | | | |
09-30-09 | | 3,612 | | 109 | | (407 | ) | | 3,314 | | | | | 31,531 | | 946 | | (3,537 | ) | | 28,940 | |
03-31-09 | | — | | 228 | | — | | | 228 | | | | | — | | 1,934 | | — | | | 1,934 | |
Class W | | | | | | | | | | | | | | | | | | | | | | |
09-30-09 | | 610,623 | | 14,741 | | (313,991 | ) | | 311,373 | | | | | 5,310,465 | | 127,715 | | (2,727,484 | ) | | 2,710,696 | |
03-31-09 | | 496,469 | | 4,947 | | (22,532 | ) | | 478,884 | | | | | 4,251,564 | | 41,961 | | (194,092 | ) | | 4,099,433 | |
37
NOTES TO FINANCIAL STATEMENTSASOF SEPTEMBER 30, 2009 (UNAUDITED) (CONTINUED)
NOTE 10 — CAPITAL SHARES (continued)
| | | | | | | | | | | | | | | | | | | | | | |
| | | Shares
sold | | Reinvestment
of
distributions | | Shares
redeemed | | | Net increase
(decrease) in
shares
outstanding | | | | | Shares
sold | | Reinvestment
of
distributions | | Shares
redeemed | | | Net increase
(decrease) | |
Year or period ended | | # | | # | | # | | | # | | | | | ($) | | ($) | | ($) | | | ($) | |
High Yield Bond | | | | | | | | | | | | | |
Class A | | | | | | | | | | | | | | | | | | | | | | |
09-30-09 | | 1,982,314 | | 304,324 | | (2,031,599 | ) | | 255,039 | | | | | 12,316,974 | | 1,980,390 | | (13,043,132 | ) | | 1,254,232 | |
03-31-09 | | 4,828,513 | | 566,516 | | (5,220,798 | ) | | 174,231 | | | | | 28,824,466 | | 3,638,861 | | (31,164,101 | ) | | 1,299,226 | |
Class B | | | | | | | | | | | | | | | | | | | | | | |
09-30-09 | | 80,847 | | 55,105 | | (480,259 | ) | | (344,307 | ) | | | | 510,572 | | 357,850 | | (3,051,746 | ) | | (2,183,324 | ) |
03-31-09 | | 149,683 | | 137,581 | | (1,231,788 | ) | | (944,524 | ) | | | | 922,538 | | 901,293 | | (8,416,365 | ) | | (6,592,534 | ) |
Class C | | | | | | | | | | | | | | | | | | | | | | |
09-30-09 | | 470,570 | | 38,528 | | (306,394 | ) | | 202,704 | | | | | 3,031,800 | | 251,505 | | (2,015,437 | ) | | 1,267,868 | |
03-31-09 | | 560,134 | | 68,826 | | (609,149 | ) | | 19,811 | | | | | 3,598,162 | | 440,112 | | (3,601,411 | ) | | 436,863 | |
Class I | | | | | | | | | | | | | | | | | | | | | | |
09-30-09 | | — | | — | | — | | | — | | | | | — | | — | | — | | | — | |
07-31-08(1) - 03-31-09 | | 203,842 | | 1,368 | | (204,817 | ) | | 393 | | | | | 1,183,352 | | 7,858 | | (1,161,315 | ) | | 29,895 | |
Intermediate Bond | | | | | | | | | | | | | |
Class A | | | | | | | | | | | | | | | | | | | | | | |
09-30-09 | | 3,262,933 | | 997,803 | | (15,282,641 | ) | | (11,021,905 | ) | | | | 28,541,376 | | 8,801,211 | | (132,357,531 | ) | | (95,014,944 | ) |
03-31-09 | | 15,146,115 | | 3,961,253 | | (41,322,105 | ) | | (22,214,737 | ) | | | | 141,875,251 | | 35,618,498 | | (380,896,966 | ) | | (203,403,217 | ) |
Class B | | | | | | | | | | | | | | | | | | | | | | |
09-30-09 | | 53,417 | | 38,256 | | (464,833 | ) | | (373,160 | ) | | | | 468,311 | | 337,424 | | (4,032,608 | ) | | (3,226,873 | ) |
03-31-09 | | 266,381 | | 155,855 | | (1,625,408 | ) | | (1,203,172 | ) | | | | 2,456,380 | | 1,391,842 | | (15,080,030 | ) | | (11,231,808 | ) |
Class C | | | | | | | | | | | | | | | | | | | | | | |
09-30-09 | | 279,509 | | 74,212 | | (1,383,493 | ) | | (1,029,772 | ) | | | | 2,441,483 | | 654,894 | | (12,029,602 | ) | | (8,933,225 | ) |
03-31-09 | | 1,601,530 | | 286,562 | | (3,665,713 | ) | | (1,777,621 | ) | | | | 14,931,464 | | 2,557,931 | | (34,030,972 | ) | | (16,541,577 | ) |
Class I | | | | | | | | | | | | | | | | | | | | | | |
09-30-09 | | 3,958,771 | | 898,082 | | (9,757,991 | ) | | (4,901,138 | ) | | | | 34,474,953 | | 7,928,341 | | (84,970,791 | ) | | (42,567,497 | ) |
03-31-09 | | 23,450,514 | | 2,791,452 | | (17,367,453 | ) | | 8,874,513 | | | | | 225,576,561 | | 25,061,205 | | (160,967,306 | ) | | 89,670,460 | |
Class O | | | | | | | | | | | | | | | | | | | | | | |
09-30-09 | | 265,180 | | 12,294 | | (396,141 | ) | | (118,667 | ) | | | | 2,310,810 | | 108,581 | | (3,418,855 | ) | | (999,464 | ) |
03-31-09 | | 944,652 | | 172,137 | | (1,924,796 | ) | | (808,007 | ) | | | | 8,762,295 | | 1,621,392 | | (17,822,830 | ) | | (7,439,143 | ) |
Class R | | | | | | | | | | | | | | | | | | | | | | |
09-30-09 | | 251,885 | | 41,001 | | (745,332 | ) | | (452,446 | ) | | | | 2,202,360 | | 362,545 | | (6,426,272 | ) | | (3,861,367 | ) |
03-31-09 | | 1,078,910 | | 141,607 | | (682,391 | ) | | 538,126 | | | | | 10,164,328 | | 1,262,369 | | (6,297,544 | ) | | 5,129,153 | |
Class W | | | | | | | | | | | | | | | | | | | | | | |
09-30-09 | | 44,272 | | 4,271 | | (64,321 | ) | | (15,778 | ) | | | | 379,054 | | 37,696 | | (566,261 | ) | | (149,511 | ) |
03-31-09 | | 1,415,327 | | 41,872 | | (1,250,680 | ) | | 206,519 | | | | | 13,427,395 | | 372,532 | | (10,962,161 | ) | | 2,837,766 | |
38
NOTES TO FINANCIAL STATEMENTSASOF SEPTEMBER 30, 2009 (UNAUDITED) (CONTINUED)
NOTE 10 — CAPITAL SHARES (continued)
| | | | | | | | | | | | | | | | | | | | | | |
| | | Shares
sold | | Reinvestment
of
distributions | | Shares
redeemed | | | Net increase
(decrease) in
shares
outstanding | | | | | Shares
sold | | Reinvestment
of
distributions | | Shares
redeemed | | | Net increase
(decrease) | |
Year or period ended | | # | | # | | # | | | # | | | | | ($) | | ($) | | ($) | | | ($) | |
Classic Money Market | | | | | | | | | | | | | |
Class A | | | | | | | | | | | | | | | | | | | | | | |
09-30-09 | | 71,714,059 | | 1,982,738 | | (410,379,718 | ) | | (336,682,921 | ) | | | | 71,714,057 | | 1,982,693 | | (410,379,718 | ) | | (336,682,968 | ) |
03-31-09 | | 623,180,311 | | 19,717,074 | | (819,203,765 | ) | | (176,306,380 | ) | | | | 623,180,311 | | 19,717,074 | | (819,203,765 | ) | | (176,306,380 | ) |
Class B | | | | | | | | | | | | | | | | | | | | | | |
09-30-09 | | 757,370 | | 22,672 | | (5,216,893 | ) | | (4,436,851 | ) | | | | 757,370 | | 22,672 | | (5,216,893 | ) | | (4,436,851 | ) |
03-31-09 | | 15,722,793 | | 142,190 | | (19,520,708 | ) | | (3,655,725 | ) | | | | 15,722,793 | | 142,190 | | (19,520,708 | ) | | (3,655,725 | ) |
Class C | | | | | | | | | | | | | | | | | | | | | | |
09-30-09 | | 2,957,470 | | 15,167 | | (5,668,854 | ) | | (2,696,217 | ) | | | | 2,957,470 | | 15,167 | | (5,668,854 | ) | | (2,696,217 | ) |
03-31-09 | | 13,080,847 | | 103,904 | | (17,783,052 | ) | | (4,598,301 | ) | | | | 13,080,847 | | 103,904 | | (17,783,052 | ) | | (4,598,301 | ) |
Institutional Money Market | | | | | | | | | | | | | |
Class I | | | | | | | | | | | | | | | | | | | | | | |
09-30-09 | | 7,583,694,051 | | 85,957 | | (7,202,481,470 | ) | | 381,298,538 | | | | | 7,583,694,052 | | 85,957 | | (7,202,481,470 | ) | | 381,298,539 | |
03-31-09 | | 15,924,743,767 | | 1,265,544 | | (15,522,218,060 | ) | | 403,791,251 | | | | | 15,924,743,767 | | 1,265,544 | | (15,522,218,060 | ) | | 403,791,251 | |
Class IS | | | | | | | | | | | | | | | | | | | | | | |
09-30-09 | | — | | — | | (1 | ) | | (1 | ) | | | | — | | — | | (1 | ) | | (1 | ) |
03-31-09 | | — | | — | | — | | | — | | | | | — | | — | | — | | | — | |
| (1) | | Commencement of operations. |
NOTE 11 — CREDIT RISK AND DEFAULTED SECURITIES
Although each Fund has a diversified portfolio, High Yield Bond and Intermediate Bond may invest in lower rated and comparable quality unrated high yield securities. Investments in high-yield debt securities generally provide greater income and increased opportunity for capital appreciation than investments in higher quality debt securities, but they also typically entail greater potential price volatility and principal and income risk. High-yield debt securities are not considered investment grade, and are regarded as predominantly speculative with respect to the issuing company’s continuing ability to meet principal and interest payments. The prices of high-yield debt securities have been found to be less sensitive to interest rate changes than higher-rated investments, but more sensitive to adverse economic downturns or individual corporate developments. The risk of loss due to default by the issuer may be significantly greater for the holders of high yielding securities, because such securities are generally unsecured and are often subordinated to other creditors of the issuer. High Yield Bond and Intermediate Bond held the following defaulted securities at September 30, 2009:
| | | | | |
Fund | | Security | | Market Value |
High Yield Bond | | Buffalo Thunder Development Authority,
9.375%, due 12/15/14 | | $ | 142,350 |
| | Charter Communications Operating, LLC,
10.375%, due 04/30/14 | | | 1,363,250 |
Intermediate Bond | | Twin Reefs Pass-through Trust, 0.000%, due 12/10/49 | | | 5,145 |
During the period, Lehman Brothers Holdings, Inc. (“LBHI”) and certain of its affiliates sought protection under the insolvency laws of their jurisdictions of organization, including the United States, the United Kingdom and Japan. For the period ended September 30, 2009, High Yield Bond and Intermediate Bond had outstanding securities trades with counterparties affiliated with LBHI. As a result of these events, LBHI’s affiliates were unable to fulfill their commitments and, in certain cases, High Yield Bond and Intermediate Bond may have terminated their trades and related agreements with the relevant entities and, where appropriate, is in the process of initiating claims for damages. Management has determined that the financial impact to the Funds relating to these events is immaterial.
39
NOTES TO FINANCIAL STATEMENTSASOF SEPTEMBER 30, 2009 (UNAUDITED) (CONTINUED)
NOTE 12 — CONCENTRATION OF INVESTMENT RISKS
Corporate Debt Securities (High Yield Bond, Intermediate Bond and Classic Money Market). Corporate debt securities are subject to the risk of the issuer’s inability to meet principal and interest payments on the obligation and may also be subject to price volatility due to such factors as interest rate sensitivity, market perception of the creditworthiness of the issuer and general market liquidity. When interest rates decline, the value of a Fund’s debt securities can be expected to rise, and when interest rates rise, the value of those securities can be expected to decline. Debt securities with longer maturities tend to be more sensitive to interest rate movements than those with shorter maturities.
Credit Risk (All Funds). A Fund could lose money if a bond issuer (debtor) fails to repay interest and principal in a timely manner or if it goes bankrupt. This is especially true during periods of economic uncertainty or economic downturns. High-yield/high-risk bonds are especially subject to credit risk and are considered to be mostly speculative in nature.
Foreign Securities (High Yield Bond, Intermediate Bond, Classic Money Market and Institutional Money Market). There are certain risks in owning foreign securities, including those resulting from: fluctuations in currency exchange rates; devaluation of currencies; political or economic developments and the possible imposition of currency exchange blockages or other foreign governmental laws or restrictions; reduced availability of public information concerning issuers; accounting, auditing and financial reporting standards or other regulatory practices and requirements that are not uniform when compared to those applicable to domestic companies; settlement and clearance procedures in some countries that may not be reliable and can result in delays in settlement; higher transaction and custody expenses than for domestic securities; and limitations on foreign ownership of equity securities. Also, securities of many foreign companies may be less liquid and the prices more volatile than those of domestic companies.
Emerging Markets Investments (High Yield Bond). Because of less developed markets and economies and, in some countries, less mature governments and governmental institutions, the risks of investing in foreign securities can be intensified in the case of investments in issuers domiciled or doing substantial business in emerging market countries. These risks include: high concentration of market capitalization
and trading volume in a small number of issuers representing a limited number of industries, as well as a high concentration of investors and financial intermediaries; political and social uncertainties; overdependence on exports, especially with respect to primary commodities, making these economies vulnerable to changes in commodity prices; overburdened infrastructure and obsolete or unseasoned financial systems; environmental problems; less well-developed legal systems; and less reliable custodial services and settlement practices.
High-Yield, Lower-Grade Debt Securities Risk (High-Yield Bond and Intermediate Bond). High-yield debt securities (commonly referred to as “junk bonds”) generally present greater credit risk that an issuer cannot make timely payment of interest or principal payments than an issuer of a higher quality debt security, and typically have greater potential price volatility and principal and income risk. Changes in interest rates, the market’s perception of the issuers and the credit worthiness of the issuers may significantly affect the value of these bonds. High-yield bonds are not considered investment grade, and are regarded as predominantly speculative with respect to the issuing company’s continuing ability to meet principal and interest payments. The secondary market in which high-yield securities are traded may be less liquid than the market for higher grade bonds. It may be more difficult to value less liquid high-yield securities, and determination of their value may involve elements of judgment.
NOTE 13 — FEDERAL INCOME TAXES
The amount of distributions from net investment income and net realized capital gains are determined in accordance with federal income tax regulations, which may differ from U.S. generally accepted accounting principles for investment companies. These book/tax differences may be either temporary or permanent. Permanent differences are reclassified within the capital accounts based on their federal tax-basis treatment; temporary differences are not reclassified. Key differences include the treatment of short-term capital gains, foreign currency transactions, and wash sale deferrals. Distributions in excess of net investment income and/or net realized capital gains for tax purposes are reported as return of capital.
Dividends paid by the Funds from net investment income and distributions of net realized short-term capital gains are, for federal income tax purposes, taxable as ordinary income to shareholders.
40
NOTES TO FINANCIAL STATEMENTSASOF SEPTEMBER 30, 2009 (UNAUDITED) (CONTINUED)
NOTE 13 — FEDERAL INCOME TAXES (continued)
The tax composition of dividends and distributions to shareholders was as follows:
| | | | | | | | | |
| | | Six Months Ended September 30, 2009 | | Year Ended March 31, 2009 |
| | | Ordinary Income | | Ordinary Income | | Return of Capital |
GNMA Income | | $ | 15,748,446 | | $ | 27,292,104 | | $ | — |
High Yield Bond | | | 4,591,400 | | | 7,603,995 | | | 1,886,801 |
Intermediate Bond | | | 22,773,543 | | | 86,837,693 | | | — |
Classic Money Market | | | 2,026,808 | | | 20,130,954 | | | — |
Institutional Money Market | | | 3,290,348 | | | 19,340,796 | | | — |
The tax-basis components of distributable earnings and the expiration dates of the capital loss carryforwards which may be used to offset future realized capital gains for federal income tax purposes as of March 31, 2009 were:
| | | | | | | | | | | | | | | | | |
| | | Undistributed Ordinary Income | | Unrealized Appreciation/ (Depreciation) | | | Post-October Capital Losses Deferred | | | Capital Loss Carryforwards | | | Expiration Dates |
GNMA Income | | $ | 2,455,531 | | $ | 25,965,036 | | | $ | — | | | $ | (527,639 | ) | | 2010 |
| | | | | | | | | | | | | | (1,081,784 | ) | | 2012 |
| | | | | | | | | | | | | | (6,961,357 | ) | | 2013 |
| | | | | | | | | | | | | | (3,281,376 | ) | | 2014 |
| | | | | | | | | | | | | | (1,506,711 | ) | | 2016 |
| | | | | | | | | | | | | | (1,393,630 | ) | | 2017 |
| | | | | | | | | | | | | | | | | |
| | | | | | | | | | | | | $ | (14,752,497 | ) | | |
| | | | | | | | | | | | | | | | | |
| | | | | | | | | | | | | | | | | |
High Yield Bond | | | — | | | (24,131,755 | ) | | | (13,089,984 | ) | | | (79,792,137 | ) | | 2010 |
| | | | | | | | | | | | | | (69,190,309 | ) | | 2011 |
| | | | | | | | | | | | | | (6,099,584 | ) | | 2012 |
| | | | | | | | | | | | | | (126,079 | ) | | 2014 |
| | | | | | | | | | | | | | (16,938,959 | ) | | 2015 |
| | | | | | | | | | | | | | (9,006,267 | ) | | 2017 |
| | | | | | | | | | | | | | | | | |
| | | | | | | | | | | | | $ | (181,153,335 | ) | | |
| | | | | | | | | | | | | | | | | |
Intermediate Bond | | | 32,972,538 | | | (118,345,476 | ) | | | (161,080,561 | ) | | | (17,571,919 | ) | | 2017 |
Classic Money Market | | | 1,774,644 | | | — | | | | — | | | | — | | | — |
Institutional Money Market | | | 2,133,067 | | | — | | | | — | | | | — | | | — |
The Funds’ major tax jurisdictions are federal and Arizona. The earliest tax year that remains subject to examination by these jurisdictions is 2004.
As of September 30, 2009, no provisions for income tax would be required in the Funds’ financial statements as a result of tax positions taken on federal income tax returns for open tax years. The Funds’ federal and state income and federal excise tax returns for tax years for which the applicable statutes of limitations have not expired are subject to examination by the Internal Revenue Service and state department of revenue.
41
NOTES TO FINANCIAL STATEMENTSASOF SEPTEMBER 30, 2009 (UNAUDITED) (CONTINUED)
NOTE 14 — ILLIQUID SECURITIES
Pursuant to guidelines adopted by the Funds’ Board, the following securities have been deemed to be illiquid. Except for GNMA Income, the Funds may invest up to 15% (10% for Classic Money Market and Institutional Money Market) of their net assets in illiquid securities. Fair value for certain securities was determined by ING Funds Valuation Committee appointed by the Funds’ Board and in accordance with the methods specifically authorized by the Board.
| | | | | | | | | | | | | | | |
Fund | | Security | | Principal Amount/ Shares | | Initial Acquisition Date | | Cost | | Value | | Percent of Net Assets | |
High Yield Bond | | American Media Stock Certificates | | 5,810 | | 02/03/09 | | $ | 128,699 | | $ | 6 | | 0.0 | % |
| | Comforce Corp. | | 92,950 | | 10/24/04 | | | — | | | 930 | | 0.0 | % |
| | GT Group Telecom, Inc | | 500 | | 03/19/03 | | | — | | | — | | 0.0 | % |
| | ION Media Networks, Inc. | | 1 | | 09/27/06 | | | 8,676 | | | — | | 0.0 | % |
| | North Atlantic Trading Co. | | 17,906 | | 10/24/04 | | | 210,181 | | | 18 | | 0.0 | % |
| | | | | | | | | | | | | | | |
| | | | | | | | $ | 347,556 | | $ | 954 | | 0.0 | % |
| | | | | | | | | | | | | | | |
Intermediate Bond | | Hudson Mezzanine Funding, 0.994%, due 06/12/42 | | 2,720,000 | | 12/21/06 | | | 2,717,824 | | | 3 | | 0.0 | % |
| | Nordea Kredit Realkreditaktieselskab,
6.000%, due 07/01/29 | | 26 | | 04/16/04 | | | 4 | | | 5 | | 0.0 | % |
| | PEA Lima, LLC, 0.000%, due 03/20/14 | | 277,964 | | 03/20/09 | | | 29,684 | | | 28 | | 0.0 | % |
| | | | | | | | | | | | | | | |
| | | | | | | | $ | 2,747,512 | | $ | 36 | | 0.0 | % |
| | | | | | | | | | | | | | | |
NOTE 15 — SECURITIES LENDING
Under an agreement with The Bank of New York Mellon (“BNY”), the Funds can lend their securities to approved brokers, dealers and other financial institutions. Loans are collateralized by cash and U.S. government securities. The collateral is equal to at least 105% of the market value of non-U.S. securities loaned and 102% of the market value of U.S. securities loaned. The market value of the loaned securities is determined at the close of business of the Funds at their last sale price or official closing price on the principal exchange or system on which they are traded and any additional collateral is delivered to the Funds on the next business day. The cash collateral received is invested in approved investments as defined in the Securities Lending Agreement with BNY (the “Agreement”). The Funds bear the risk of loss with respect to the investment of collateral. Currently, the cash collateral is invested in the Bank of New York Mellon Corp. Institutional Cash Reserves Fund (“BICR Fund”). BNY serves as investment manager, custodian and operational trustee of the BICR Fund. As of September 30, 2009, the BICR Fund held certain defaulted securities issued by Lehman Brothers Holdings, Inc. (the “Lehman Securities”) in a separate sleeve designated as Series B. The Lehman Securities have market values significantly below amortized cost. On May 22, 2009, the Funds agreed to the terms of a capital support agreement (the “Capital Support Agreement”) extended by The Bank of New York Mellon Corporation (“BNYC”), an affiliated company of BNY, for the Lehman Securities held by the BICR Fund, Series B. Under the terms of the Capital Support
Agreement, BNYC will support the value of the Lehman Securities up to 80% of the par value (the remaining 20% of the par value represents an unrealized loss to the Funds) and subject, in part, to the Funds’ continued participation in the BNY securities lending program through September 15, 2011. At September 15, 2011, if the Funds have complied with the requirements under Capital Support Agreement to continue to participate in the BNY securities lending program and if such securities have not otherwise been sold, the Funds will have the right to sell the defaulted securities to BNYC at a price equal to 80% of par value. The recorded value of each Fund’s investment in the BICR Fund includes the value of the underlying securities held by the BICR Fund and the estimated value of the support to be provided by BNYC. The investment in the BICR Fund is included in the Portfolio of Investments under Securities Lending Collateral and the unrealized loss on such investment is included in Net Unrealized Depreciation on the Statements of Assets and Liabilities.
Generally, in the event of counterparty default, the Funds have the right to use the collateral to offset losses incurred. The Agreement contains certain guarantees by BNY in the event of counterparty default and/or a borrower’s failure to return a loaned security; however, there would be a potential loss to the Funds in the event the Funds are delayed or prevented from exercising their right to dispose of the collateral. Engaging in securities lending could have a leveraging effect, which may intensify the credit, market and other risks associated with
42
NOTES TO FINANCIAL STATEMENTSASOF SEPTEMBER 30, 2009 (UNAUDITED) (CONTINUED)
NOTE 15 — SECURITIES LENDING (continued)
investing in a Fund. At September 30, 2009, the following Fund had securities on loan with the following market values:
| | | | | | |
| | | Value of Securities Loaned | | Cash Collateral Received* |
Intermediate Bond | | $ | 5,542,113 | | $ | 5,655,857 |
| * | Cash collateral received was invested in the BICR Fund, the fair value of which is presented in the respective Fund’s Portfolio of Investments. |
NOTE 16 — U.S. TREASURY TEMPORARY GUARANTEE PROGRAM
Throughout the period covered by this report, Classic Money Market and Institutional Money Market have been participating in the U.S. Treasury Temporary Guarantee Program for Money Market Funds (the “Program”). The Program guaranteed shareholders of Classic Money Market and Institutional Money Market as of September 19, 2008 that in the event of a liquidation of Classic Money Market or Institutional Money Market, the respective shareholders would receive the lesser of: (1) the number of shares owned on September 19, 2008 multiplied by $1.00; or (2) the number of shares owned as of the time the U.S. Treasury Department’s obligation under the Program was triggered multiplied by $1.00. The U.S. Treasury Department’s obligation under the Program would have been triggered if Classic Money Market’s or Institutional Money Market’s net asset value per share fell below $0.995 and certain conditions were met including the liquidation of Classic Money Market or Institutional Money Market.
Coverage under the Program was limited to persons who were shareholders of Classic Money Market or Institutional Money Market as of the close of business on September 19, 2008. Any increase in the number of shares held in an account after the close of business on September 19, 2008 would not have been guaranteed. If the number of shares held in an account fluctuates (even if the number of shares held in an account was reduced to zero), shareholders would have been covered for the lesser of the number of shares held as of the close of business on September 19, 2008 or the number of shares held at the time the U.S. Treasury Department’s obligation under the Program was triggered. If a shareholder closed his/her account with Classic Money Market and Institutional Money Market or broker-dealer, any future investment in Classic Money Market and Institutional Money Market was not guaranteed.
Classic Money Market and Institutional Money Market each paid to participate in the Program for the initial
three-month period, which expired on December 18, 2008. The fee of $139,473 and $198,272 for Classic Money Market and Institutional Money Market, respectively, was 0.01% of each fund’s NAV on September 19, 2008 depending on the market based net asset value per share of each fund as of September 19, 2008 (the “Program Participation Payment”). On November 24, 2008, the U.S. Treasury Department announced that it would extend the Program from December 19, 2008 through April 30, 2009. The Board approved the continued participation of Classic Money Market and Institutional Money Market in the Program, and Classic Money Market and Institutional Money Market paid fees of $209,068 and $297,408, respectively, to extend their participation to April 30, 2009 based on 0.015% of each fund’s net asset value on September 19, 2008. On March 31, 2009, the U.S. Treasury Department announced that it would extend the Program through September 18, 2009, and the Board approved Classic Money Market’s and Institutional Money Market’s continued participation in the Program for the fees of $209,068 and $297,408, respectively, based on 0.015% of each fund’s net asset value on September 19, 2008. The Program was not extended beyond September 18, 2009. The Board determined that the Program Participation Payment, and the payments for participating in the extensions of the Program, are extraordinary expenses that will not be subject to any expense limitation agreement currently in effect for Classic Money Market and Institutional Money Market.
NOTE 17 — SUBSEQUENT EVENTS
Subsequent to September 30, 2009, the following Funds declared dividends and distributions of:
| | | | | | | | | |
| | | Type | | Per Share Amount | | Payable Date | | Record Date |
GNMA Income | | | | | | | | | |
Class A | | NII | | $ | 0.0300 | | October 2, 2009 | | September 30, 2009 |
Class B | | NII | | $ | 0.0246 | | October 2, 2009 | | September 30, 2009 |
Class C | | NII | | $ | 0.0248 | | October 2, 2009 | | September 30, 2009 |
Class I | | NII | | $ | 0.0322 | | October 2, 2009 | | September 30, 2009 |
Class Q | | NII | | $ | 0.0304 | | October 2, 2009 | | September 30, 2009 |
Class W | | NII | | $ | 0.0322 | | October 2, 2009 | | September 30, 2009 |
Class A | | NII | | $ | 0.0300 | | November 3, 2009 | | October 30, 2009 |
Class B | | NII | | $ | 0.0244 | | November 3, 2009 | | October 30, 2009 |
Class C | | NII | | $ | 0.0245 | | November 3, 2009 | | October 30, 2009 |
Class I | | NII | | $ | 0.0323 | | November 3, 2009 | | October 30, 2009 |
Class Q | | NII | | $ | 0.0304 | | November 3, 2009 | | October 30, 2009 |
Class W | | NII | | $ | 0.0323 | | November 3, 2009 | | October 30, 2009 |
Class A | | NII | | $ | 0.0200 | | November 19, 2009 | | November 17, 2009 |
Class B | | NII | | $ | 0.0157 | | November 19, 2009 | | November 17, 2009 |
Class C | | NII | | $ | 0.0158 | | November 19, 2009 | | November 17, 2009 |
Class I | | NII | | $ | 0.0217 | | November 19, 2009 | | November 17, 2009 |
Class Q | | NII | | $ | 0.0203 | | November 19, 2009 | | November 17, 2009 |
Class W | | NII | | $ | 0.0215 | | November 19, 2009 | | November 17, 2009 |
43
NOTES TO FINANCIAL STATEMENTSASOF SEPTEMBER 30, 2009 (UNAUDITED) (CONTINUED)
NOTE 17 — SUBSEQUENT EVENTS (continued)
| | | | | | | | | |
| | | Type | | Per Share Amount | | Payable Date | | Record Date |
High Yield Bond | | | | | | | |
Class A | | NII | | $ | 0.0539 | | November 2, 2009 | | Daily |
Class B | | NII | | $ | 0.0494 | | November 2, 2009 | | Daily |
Class C | | NII | | $ | 0.0498 | | November 2, 2009 | | Daily |
Class I | | NII | | $ | 0.0558 | | November 2, 2009 | | Daily |
Intermediate Bond | | | | | | | |
Class A | | NII | | $ | 0.0474 | | November 2, 2009 | | Daily |
Class B | | NII | | $ | 0.0416 | | November 2, 2009 | | Daily |
Class C | | NII | | $ | 0.0417 | | November 2, 2009 | | Daily |
Class I | | NII | | $ | 0.0498 | | November 2, 2009 | | Daily |
Class O | | NII | | $ | 0.0475 | | November 2, 2009 | | Daily |
Class R | | NII | | $ | 0.0456 | | November 2, 2009 | | Daily |
Class W | | NII | | $ | 0.0494 | | November 2, 2009 | | Daily |
Institutional Money Market | | | | | | | |
Class I | | NII | | $ | 0.0001 | | November 2, 2009 | | Daily |
Class IS | | NII | | $ | 0.0000 | | November 2, 2009 | | Daily |
Class I | | STCG | | $ | 0.0001 | | November 19, 2009 | | November 17, 2009 |
Class IS | | STCG | | $ | 0.0001 | | November 19, 2009 | | November 17, 2009 |
NII - Net investment income
STCG - Short-term capital gains
Effective January 4, 2010, Class B shares of the Funds, are closed to new investment, provided that: (1) Class B shares of the Funds may be purchased through the reinvestment of dividends issued by Class B Shares of the Fund; and (2) subject to the terms and conditions of relevant exchange privileges and as permitted under their respective prospectuses, Class B shares of the Fund may be acquired through exchange of Class B shares of other funds in the ING Mutual Funds Complex.
The Fund has evaluated events occurring after the balance sheet date (subsequent events) through November 25, 2009, the date the financial statements were issued, to determine whether any subsequent events necessitated adjustment to or disclosure in the financial statements. Other than the above, no such subsequent events were identified.
44
| | |
| ING GNMA INCOME FUND | | PORTFOLIO OF INVESTMENTS ASOF SEPTEMBER 30, 2009 (UNAUDITED) |
| | | | | | | | |
Principal Amount | | | | | | Value |
| | | | | | | | |
| U.S. GOVERNMENT AGENCY OBLIGATIONS: 91.1% |
| Federal Home Loan Mortgage Corporation##: 0.1% |
| $ | 67,724 | | | | 7.000%, due 11/01/14 | | $ | 72,693 |
| | 249,768 | | | | 7.500%, due 12/01/14-01/01/30 | | | 272,607 |
| | 12,537 | | | | 8.000%, due 01/01/30 | | | 14,252 |
| | 34,299 | | | | 9.500%, due 07/01/20 | | | 38,344 |
| | | | | | | | |
| | | | | | | | 397,896 |
| | | | | | | | |
| Federal National Mortgage Association##: 0.2% |
| | 410,251 | | | | 6.500%, due 06/01/14-02/01/29 | | | 443,250 |
| | 786,107 | | | | 6.600%, due 07/01/27-06/01/28 | | | 864,761 |
| | 40,687 | | | | 7.000%, due 03/01/15 | | | 43,300 |
| | 93,214 | | | | 7.500%, due 05/01/28 | | | 104,415 |
| | 84,297 | | | | 8.500%, due 08/01/11-09/01/15 | | | 94,193 |
| | | | | | | | |
| | | | | | | | 1,549,919 |
| | | | | | | | |
| Government National Mortgage Association: 90.8% |
| | 14,690,125 | | | | 4.000%, due 05/20/33-07/20/39 | | | 14,475,893 |
| | 21,741,161 | | | | 4.500%, due 03/20/34-06/20/39 | | | 22,036,174 |
| | 126,752,489 | | | | 5.000%, due 05/15/18-08/15/39 | | | 131,644,131 |
| | 561,167 | | | | 5.100%, due 04/20/32 | | | 585,995 |
| | 2,268,461 | | | | 5.250%, due 11/20/36-01/20/38 | | | 2,373,256 |
| | 324,443 | | | | 5.450%, due 02/15/29-10/15/29 | | | 343,093 |
| | 7,770,542 | | S | | 5.500%, due 04/20/34 | | | 8,200,555 |
| | 205,044,428 | | | | 5.500%, due 08/20/24-03/15/39 | | | 215,959,580 |
| | 315,656 | | | | 5.550%, due 06/15/27 | | | 333,437 |
| | 3,377,756 | | | | 5.600%, due 03/20/37-02/20/38 | | | 3,553,526 |
| | 559,851 | | | | 5.625%, due 04/15/39 | | | 589,513 |
| | 9,747,907 | | | | 5.630%, due 07/15/45 | | | 10,232,033 |
| | 488,096 | | | | 5.680%, due 05/15/47 | | | 521,010 |
| | 491,986 | | | | 5.690%, due 11/15/42 | | | 522,400 |
| | 2,237,015 | | | | 5.750%, due 11/20/27-03/20/28 | | | 2,379,557 |
| | 5,608,649 | | | | 5.950%, due 02/15/44 | | | 6,065,867 |
| | 1,925,883 | | | | 5.970%, due 11/15/31 | | | 2,087,368 |
| | 173,206,505 | | | | 6.000%, due 10/15/15-08/15/39 | | | 184,105,711 |
| | 482,190 | | | | 6.125%, due 02/15/39-04/15/39 | | | 510,778 |
| | 4,080,641 | | | | 6.200%, due 08/20/28-10/20/29 | | | 4,382,652 |
| | 902,158 | | | | 6.250%, due 09/15/27-09/15/29 | | | 968,454 |
| | 658,801 | | | | 6.280%, due 01/20/26-05/20/26 | | | 709,091 |
| | 532,310 | | | | 6.490%, due 01/15/28 | | | 577,715 |
| | 43,829,168 | | | | 6.500%, due 08/15/28-02/15/37 | | | 46,682,347 |
| | 3,141,142 | | | | 6.600%, due 10/20/26-07/20/28 | | | 3,396,376 |
| | 364,852 | | | | 6.750%, due 08/15/28-10/15/28 | | | 399,487 |
| | 37,442,554 | | | | 7.000%, due 09/15/23-12/15/38 | | | 40,617,793 |
| | 6,383,397 | | | | 7.200%, due 03/15/39 | | | 7,039,503 |
| | 24,300 | | | | 7.250%, due 01/15/29 | | | 27,033 |
| | 4,060,413 | | | | 7.350%, due 03/15/43 | | | 4,486,577 |
| | 3,093,431 | | | | 7.500%, due 08/20/27-01/15/31 | | | 3,378,842 |
| | 21,454 | | | | 7.800%, due 05/15/19 | | | 23,772 |
| | 465,314 | | | | 8.000%, due 03/20/24-07/15/26 | | | 528,046 |
| | 32,165 | | | | 8.050%, due 07/15/19 | | | 35,531 |
| | 1,105,469 | | | | 9.000%, due 05/15/16-01/15/31 | | | 1,217,821 |
| | 7,713 | | | | 9.500%, due 11/15/21 | | | 8,657 |
| | | | | | | | |
| | | | | | | | 720,999,574 |
| | | | | | | | |
| Other U.S. Agency Obligations: 0.0% |
| | 9,083 | | | | Small Business Administration, 8.250%, due 11/01/11 | | | 9,309 |
| | | | | | | | |
| | | | | | | | 9,309 |
| | | | | | | | |
| | | | | Total U.S. Government Agency Obligations
(Cost $694,377,015) | | | 722,956,698 |
| | | | | | | | |
| | | | | | | | | |
Principal Amount | | | | | | | Value |
| | | | | | | | | |
| U.S. TREASURY OBLIGATIONS: 6.4% |
| U.S. Treasury Notes: 6.4% |
| $ | 50,620,000 | | 0.875%, due 03/31/11-05/31/11 | | | $ | 50,784,776 |
| | | | | | | | | |
| | | Total U.S. Treasury Obligations
(Cost $50,515,363) | | | | | | 50,784,776 |
| | | | | | | | | |
| | | Total Investments in Securities
(Cost $744,892,378)* | | 97.5 | % | | $ | 773,741,474 |
| | | Other Assets and
Liabilities - Net | | 2.5 | | | | 20,202,398 |
| | | | | | | | | |
| | | Net Assets | | 100.0 | % | | $ | 793,943,872 |
| | | | | | | | | |
| ## | On September 7, 2008, the Federal Housing Finance Agency placed the Federal National Mortgage Association and the Federal Home Loan Mortgage Corporation into conservatorship and the U.S. Treasury guaranteed the debt issued by those organizations. |
| S | All or a portion of this security is segregated to cover collateral requirements for applicable futures, options, swaps, foreign forward currency contracts and/or when-issued or delayed-delivery securities. |
| * | Cost for federal income tax purposes is $744,910,965. |
| | | | |
Net unrealized appreciation consists of: | | | | |
Gross Unrealized Appreciation | | $ | 28,879,131 | |
Gross Unrealized Depreciation | | | (48,622 | ) |
| | | | |
Net Unrealized Appreciation | | $ | 28,830,509 | |
| | | | |
See Accompanying Notes to Financial Statements
45
| | |
| ING GNMA INCOME FUND | | PORTFOLIO OF INVESTMENTS AS OF SEPTEMBER 30, 2009 (UNAUDITED) (CONTINUED) |
Fair Value Measurements*
The following is a summary of the fair valuations according to the inputs used as of September 30, 2009 in valuing the Fund’s assets and liabilities:
| | | | | | | | | | | | |
| | | Quoted Prices in Active Markets for Identical Investments (Level 1) | | Significant Other Observable Inputs (Level 2) | | Significant Unobservable Inputs (Level 3) | | Fair Value at 09/30/2009 |
Asset Table | | | | | | | | | | | | |
Investments, at value | | | | | | | | | | | | |
U.S. Government Agency Obligations | | $ | — | | $ | 722,956,698 | | $ | — | | $ | 722,956,698 |
U.S. Treasury Obligations | | | — | | | 50,784,776 | | | — | | | 50,784,776 |
| | | | | | | | | | | | |
Total Investments, at value | | $ | — | | $ | 773,741,474 | | $ | — | | $ | 773,741,474 |
| | | | | | | | | | | | |
“Fair value” for purposes of ASC 820 is different from “fair value” as used in the 1940 Act. The former generally implies market value, and can include market quotations as a source of value, and the latter refers to determinations of value in absence of available market quotations.
| * | See Note 2, “Significant Accounting Policies” in the Notes to Financial Statements for additional information. |
See Accompanying Notes to Financial Statements
46
| | |
| ING HIGH YIELD BOND FUND | | PORTFOLIO OF INVESTMENTS ASOF SEPTEMBER 30, 2009 (UNAUDITED) |
| | | | | | | | |
Principal
Amount | | | | | | Value |
| | | | | | | | |
| CORPORATE BONDS/NOTES: 97.8% | | | |
| Advertising: 2.2% | | | |
| $ | 820,000 | | # | | Interpublic Group of Cos., Inc.,
10.000%, due 07/15/17 | | $ | 889,700 |
| | 310,000 | | | | Lamar Media Corp.,
9.750%, due 04/01/14 | | | 337,125 |
| | 905,000 | | | | Visant Holding Corp.,
10.250%, due 12/01/13 | | | 941,200 |
| | | | | | | | |
| | | | | | | | 2,168,025 |
| | | | | | | | |
| Auto Parts & Equipment: 2.1% | | | |
| | 265,000 | | | | Affinia Group, Inc.,
9.000%, due 11/30/14 | | | 253,075 |
| | 320,000 | | # | | Affinia Group, Inc.,
10.750%, due 08/15/16 | | | 345,600 |
| | 940,000 | | | | ArvinMeritor, Inc.,
8.125%, due 09/15/15 | | | 822,500 |
| | 410,000 | | | | Goodyear Tire & Rubber Co.,
10.500%, due 05/15/16 | | | 446,900 |
| | 355,000 | | | | United Components, Inc.,
9.375%, due 06/15/13 | | | 286,663 |
| | | | | | | | |
| | | | | | | | 2,154,738 |
| | | | | | | | |
| Banks: 2.6% | | | |
| | 224,000 | | # | | General Motors Acceptance Corp.,
6.750%, due 12/01/14 | | | 192,640 |
| | 2,564,000 | | # | | General Motors Acceptance Corp.,
6.875%, due 09/15/11 | | | 2,448,621 |
| | | | | | | | |
| | | | | | | | 2,641,261 |
| | | | | | | | |
| Beverages: 0.8% | | | |
| | 360,000 | | | | Constellation Brands, Inc.,
7.250%, due 05/15/17 | | | 360,000 |
| | 405,000 | | | | Constellation Brands, Inc.,
8.375%, due 12/15/14 | | | 424,238 |
| | | | | | | | |
| | | | | | | | 784,238 |
| | | | | | | | |
| Building Materials: 0.8% | | | |
| | 760,000 | | | | Nortek, Inc.,
10.000%, due 12/01/13 | | | 779,000 |
| | 70,000 | | # | | USG Corp.,
9.750%, due 08/01/14 | | | 73,500 |
| | | | | | | | |
| | | | | | | | 852,500 |
| | | | | | | | |
| Chemicals: 1.6% | | | |
| | 670,000 | | | | Hexion US Finance Corp./Hexion Nova Scotia Finance ULC,
9.750%, due 11/15/14 | | | 579,550 |
| | 46,211 | | & | | Momentive Performance Materials, Inc.,
10.125%, due 12/01/14 | | | 33,734 |
| | 551,000 | | # | | Momentive Performance Materials, Inc.,
12.500%, due 06/15/14 | | | 573,040 |
| | 450,000 | | | | PolyOne Corp.,
8.875%, due 05/01/12 | | | 456,750 |
| | | | | | | | |
| | | | | | | | 1,643,074 |
| | | | | | | | |
| | | | | | | | |
Principal
Amount | | | | | | Value |
| | | | | | | | |
| Coal: 0.5% | | | |
| $ | 120,000 | | # | | Arch Coal, Inc.,
8.750%, due 08/01/16 | | $ | 124,200 |
| | 540,000 | | @@, # | | Griffin Coal Mining Co. Pty Ltd.,
9.500%, due 12/01/16 | | | 380,700 |
| | | | | | | | |
| | | | | | | | 504,900 |
| | | | | | | | |
| Commercial Services: 6.5% | | | |
| | 600,000 | | | | Aramark Services, Inc.,
8.500%, due 02/01/15 | | | 608,250 |
| | 230,000 | | | | Avis Budget Car Rental LLC/Avis Budget Finance, Inc.,
7.750%, due 05/15/16 | | | 201,250 |
| | 560,000 | | # | | Cenveo Corp.,
10.500%, due 08/15/16 | | | 529,200 |
| | 810,000 | | | | Ceridian Corp.,
11.250%, due 11/15/15 | | | 730,013 |
| | 290,000 | | & | | Ceridian Corp.,
12.250%, due 11/15/15 | | | 247,950 |
| | 974,000 | | | | Hertz Corp.,
8.875%, due 01/01/14 | | | 988,610 |
| | 320,000 | | | | Iron Mountain, Inc.,
8.000%, due 06/15/20 | | | 323,200 |
| | 535,000 | | | | KAR Holdings, Inc.,
8.750%, due 05/01/14 | | | 532,325 |
| | 470,000 | | # | | RSC Equipment Rental, Inc.,
10.000%, due 07/15/17 | | | 507,600 |
| | 220,000 | | | | Service Corp. International,
6.750%, due 04/01/15 | | | 216,700 |
| | 210,000 | | | | Service Corp. International,
7.000%, due 06/15/17 | | | 205,800 |
| | 1,100,000 | | &, # | | ServiceMaster Co,
10.750%, due 07/15/15 | | | 1,053,250 |
| | 380,000 | | | | United Rentals North America, Inc.,
7.750%, due 11/15/13 | | | 342,000 |
| | | | | | | | |
| | | | | | | | 6,486,148 |
| | | | | | | | |
| Computers: 1.8% | | | |
| | 370,000 | | @@, # | | Seagate Technology International,
10.000%, due 05/01/14 | | | 406,075 |
| | 390,000 | | @@ | | Seagate Technology, Inc.,
6.800%, due 10/01/16 | | | 359,775 |
| | 649,000 | | | | Sungard Data Systems, Inc.,
9.125%, due 08/15/13 | | | 658,735 |
| | 396,000 | | | | SunGard Data Systems, Inc.,
10.250%, due 08/15/15 | | | 405,900 |
| | | | | | | | |
| | | | | | | | 1,830,485 |
| | | | | | | | |
| Diversified Financial Services: 7.3% | | | |
| | 415,000 | | | | American General Finance Corp.,
4.000%, due 03/15/11 | | | 357,309 |
| | 255,000 | | | | American General Finance Corp.,
5.200%, due 12/15/11 | | | 205,712 |
| | 365,000 | | | | American General Finance Corp.,
5.625%, due 08/17/11 | | | 307,135 |
See Accompanying Notes to Financial Statements
47
| | |
| ING HIGH YIELD BOND FUND | | PORTFOLIO OF INVESTMENTS ASOF SEPTEMBER 30, 2009 (UNAUDITED) (CONTINUED) |
| | | | | | | | |
Principal
Amount | | | | | | Value |
| | | | | | | | |
| Diversified Financial Services: (continued) | | | |
| $ | 725,000 | | | | American General Finance Corp.,
5.850%, due 06/01/13 | | $ | 549,289 |
| | 345,000 | | | | American General Finance Corp.,
6.900%, due 12/15/17 | | | 241,626 |
| | 780,000 | | #, ± | | Buffalo Thunder Development Authority,
9.375%, due 12/15/14 | | | 142,350 |
| | 350,000 | | | | CIT Group, Inc.,
0.420%, due 03/12/10 | | | 252,438 |
| | 360,000 | | | | CIT Group, Inc.,
0.782%, due 07/28/11 | | | 252,440 |
| | 440,000 | | | | CIT Group, Inc.,
4.125%, due 11/03/09 | | | 354,981 |
| | 385,000 | | | | CIT Group, Inc.,
5.800%, due 07/28/11 | | | 261,947 |
| | 455,000 | | | | Ford Motor Credit Co., LLC,
3.034%, due 01/13/12 | | | 410,069 |
| | 585,000 | | | | Ford Motor Credit Co., LLC,
7.250%, due 10/25/11 | | | 568,422 |
| | 510,000 | | | | Ford Motor Credit Co., LLC,
7.500%, due 08/01/12 | | | 489,989 |
| | 625,000 | | | | Ford Motor Credit Co., LLC,
7.800%, due 06/01/12 | | | 604,385 |
| | 1,140,000 | | | | Ford Motor Credit Co., LLC,
8.700%, due 10/01/14 | | | 1,117,794 |
| | 200,000 | | | | Ford Motor Credit Co., LLC,
9.875%, due 08/10/11 | | | 202,924 |
| | 325,000 | | | | Universal City Development Partners,
11.750%, due 04/01/10 | | | 328,250 |
| | 700,000 | | | | Universal City Florida Holding Co. I/II,
5.233%, due 05/01/10 | | | 687,750 |
| | | | | | | | |
| | | | | | | | 7,334,810 |
| | | | | | | | |
| Electric: 4.3% | | | |
| | 360,000 | | | | AES Corp.,
8.000%, due 10/15/17 | | | 364,050 |
| | 574,000 | | # | | AES Corp.,
8.750%, due 05/15/13 | | | 587,633 |
| | 180,000 | | # | | AES Corp.,
9.750%, due 04/15/16 | | | 197,100 |
| | 590,000 | | | | Edison Mission Energy,
7.000%, due 05/15/17 | | | 495,600 |
| | 940,000 | | | | Energy Future Holdings,
10.875%, due 11/01/17 | | | 714,400 |
| | 699,596 | | | | Homer City Funding, LLC,
8.734%, due 10/01/26 | | | 661,118 |
| | 371,486 | | | | Midwest Generation, LLC,
8.560%, due 01/02/16 | | | 377,058 |
| | 910,000 | | | | NRG Energy, Inc.,
7.375%, due 02/01/16 | | | 882,700 |
| | | | | | | | |
| | | | | | | | 4,279,659 |
| | | | | | | | |
| Entertainment: 3.3% | | | |
| | 935,000 | | | | AMC Entertainment, Inc.,
11.000%, due 02/01/16 | | | 1,000,450 |
| | 315,000 | | | | Marquee Holdings, Inc.,
9.505%, due 08/15/14 | | | 262,238 |
| | 435,000 | | # | | Mashantucket Western Pequot Tribe,
8.500%, due 11/15/15 | | | 159,863 |
| | 265,000 | | # | | Penn National Gaming, Inc.,
8.750%, due 08/15/19 | | | 266,988 |
| | | | | | | | |
Principal
Amount | | | | | | Value |
| | | | | | | | |
| Entertainment: (continued) | | | |
| $ | 313,000 | | | | Pinnacle Entertainment, Inc.,
8.250%, due 03/15/12 | | $ | 314,565 |
| | 165,000 | | # | | Pinnacle Entertainment, Inc.,
8.625%, due 08/01/17 | | | 166,650 |
| | 395,000 | | # | | Scientific Games Corp.,
7.875%, due 06/15/16 | | | 392,038 |
| | 500,000 | | # | | Snoqualmie Entertainment Authority,
9.125%, due 02/01/15 | | | 267,500 |
| | 265,000 | | # | | Warner Music Group,
9.500%, due 06/15/16 | | | 280,900 |
| | 190,000 | | + | | WMG Holdings Corp.,
0.000% (step rate 9.500%), due 12/15/14 | | | 183,825 |
| | | | | | | | |
| | | | | | | | 3,295,017 |
| | | | | | | | |
| Environmental Control: 1.6% | | | |
| | 780,000 | | | | Waste Services, Inc.,
9.500%, due 04/15/14 | | | 780,000 |
| | 865,000 | | | | WCA Waste Corp.,
9.250%, due 06/15/14 | | | 832,563 |
| | | | | | | | |
| | | | | | | | 1,612,563 |
| | | | | | | | |
| Food: 3.0% | | | |
| | 180,000 | | # | | Dole Food Co., Inc.,
8.000%, due 10/01/16 | | | 181,575 |
| | 375,000 | | | | Ingles Markets, Inc.,
8.875%, due 05/15/17 | | | 386,250 |
| | 760,000 | | # | | JBS USA LLC,
11.625%, due 05/01/14 | | | 820,800 |
| | 275,000 | | | | Smithfield Foods, Inc.,
7.750%, due 05/15/13 | | | 246,125 |
| | 315,000 | | | | Smithfield Foods, Inc.,
7.750%, due 07/01/17 | | | 260,663 |
| | 565,000 | | # | | Smithfield Foods, Inc.,
10.000%, due 07/15/14 | | | 596,075 |
| | 485,000 | | | | Stater Brothers Holdings,
8.125%, due 06/15/12 | | | 489,850 |
| | | | | | | | |
| | | | | | | | 2,981,338 |
| | | | | | | | |
| Forest Products & Paper: 2.9% | | | |
| | 41,000 | | | | Domtar Corp.,
7.875%, due 10/15/11 | | | 42,589 |
| | 620,000 | | | | Domtar Corp.,
10.750%, due 06/01/17 | | | 697,500 |
| | 1,055,000 | | # | | NewPage Corp.,
11.375%, due 12/31/14 | | | 1,041,813 |
| | 115,000 | | | | NewPage Corp.,
12.000%, due 05/01/13 | | | 54,338 |
| | 380,000 | | | | Verso Paper Holdings, LLC and Verson Paper, Inc.,
9.125%, due 08/01/14 | | | 283,100 |
| | 765,000 | | # | | Verso Paper Holdings, LLC and Verson Paper, Inc.,
11.500%, due 07/01/14 | | | 787,950 |
| | | | | | | | |
| | | | | | | | 2,907,290 |
| | | | | | | | |
| Healthcare - Products: 1.3% | | | |
| | 525,000 | | & | | Biomet, Inc.,
10.375%, due 10/15/17 | | | 560,438 |
| | 673,000 | | | | Biomet, Inc.,
11.625%, due 10/15/17 | | | 736,935 |
| | | | | | | | |
| | | | | | | | 1,297,373 |
| | | | | | | | |
See Accompanying Notes to Financial Statements
48
| | |
| ING HIGH YIELD BOND FUND | | PORTFOLIO OF INVESTMENTS ASOF SEPTEMBER 30, 2009 (UNAUDITED) (CONTINUED) |
| | | | | | | | |
Principal
Amount | | | | | | Value |
| | | | | | | | |
| Healthcare - Services: 6.7% | | | |
| $ | 295,000 | | # | | Apria Healthcare Group, Inc.,
12.375%, due 11/01/14 | | $ | 316,388 |
| | 480,000 | | | | Centene Corp.,
7.250%, due 04/01/14 | | | 470,400 |
| | 920,000 | | | | HCA, Inc.,
9.250%, due 11/15/16 | | | 953,350 |
| | 978,000 | | & | | HCA, Inc.,
9.625%, due 11/15/16 | | | 1,019,565 |
| | 1,065,000 | | # | | Psychiatric Solutions, Inc.,
7.750%, due 07/15/15 | | | 1,027,175 |
| | 325,000 | | | | Select Medical Corp.,
6.428%, due 09/15/15 | | | 287,625 |
| | 705,000 | | | | Select Medical Corp.,
7.625%, due 02/01/15 | | | 663,581 |
| | 220,000 | | | | United Surgical Partners International, Inc.,
8.875%, due 05/01/17 | | | 217,250 |
| | 300,000 | | & | | United Surgical Partners International, Inc.,
9.250%, due 05/01/17 | | | 286,500 |
| | 225,000 | | # | | US Oncology, Inc.,
9.125%, due 08/15/17 | | | 237,938 |
| | 775,000 | | | | US Oncology, Inc.,
10.750%, due 08/15/14 | | | 813,750 |
| | 420,000 | | | | Vanguard Health Holding Co. II, LLC,
9.000%, due 10/01/14 | | | 430,500 |
| | | | | | | | |
| | | | | | | | 6,724,022 |
| | | | | | | | |
| Holding Companies - Diversified: 0.7% | | | |
| | 750,000 | | | | Atlantic Broadband Finance, LLC,
9.375%, due 01/15/14 | | | 731,250 |
| | | | | | | | |
| | | | | | | | 731,250 |
| | | | | | | | |
| Home Builders: 1.0% | | | |
| | 730,000 | | | | K Hovnanian Enterprises, Inc.,
11.500%, due 05/01/13 | | | 773,800 |
| | 123,000 | | | | KB Home,
6.375%, due 08/15/11 | | | 124,845 |
| | 83,000 | | | | Toll Corp.,
8.250%, due 12/01/11 | | | 85,075 |
| | | | | | | | |
| | | | | | | | 983,720 |
| | | | | | | | |
| Home Furnishings: 0.8% | | | |
| | 445,000 | | | | Norcraft Cos. LP,
9.000%, due 11/01/11 | | | 447,225 |
| | 320,000 | | # | | Sealy Mattress Co.,
10.875%, due 04/15/16 | | | 354,400 |
| | | | | | | | |
| | | | | | | | 801,625 |
| | | | | | | | |
| Hotels: 0.7% | | | |
| | 730,000 | | # | | Felcor Lodging L.P.,
10.000%, due 10/01/14 | | | 709,925 |
| | | | | | | | |
| | | | | | | | 709,925 |
| | | | | | | | |
| Household Products/Wares: 1.1% | | | |
| | 540,000 | | # | | ACCO Brands Corp.,
10.625%, due 03/15/15 | | | 567,000 |
| | 525,000 | | # | | American Achievement Corp.,
8.250%, due 04/01/12 | | | 525,000 |
| | | | | | | | |
| | | | | | | | 1,092,000 |
| | | | | | | | |
| | | | | | | | |
Principal
Amount | | | | | | Value |
| | | | | | | | |
| Iron/Steel: 0.2% | | | |
| $ | 78,299 | | & | | Metals USA Holdings Corp.,
7.540%, due 07/01/12 | | $ | 207,333 |
| | | | | | | | |
| | | | | | | | 207,333 |
| | | | | | | | |
| Leisure Time: 1.2% | | | |
| | 480,000 | | # | | Brunswick Corp.,
11.250%, due 11/01/16 | | | 525,600 |
| | 740,000 | | | | Travelport, LLC,
11.875%, due 09/01/16 | | | 680,800 |
| | | | | | | | |
| | | | | | | | 1,206,400 |
| | | | | | | | |
| Lodging: 3.2% | | | |
| | 625,000 | | # | | Ameristar Casinos, Inc.,
9.250%, due 06/01/14 | | | 651,563 |
| | 225,000 | | # | | Harrah’s Operating Co., Inc.,
11.250%, due 06/01/17 | | | 228,375 |
| | 935,000 | | # | | Harrahs Operating Escrow LLC/Harrahs Escrow Corp.,
11.250%, due 06/01/17 | | | 965,388 |
| | 840,000 | | | | MGM Mirage,
8.500%, due 09/15/10 | | | 837,900 |
| | 380,000 | | # | | MGM Mirage, Inc.,
10.375%, due 05/15/14 | | | 407,550 |
| | 135,000 | | # | | MGM Mirage, Inc.,
11.125%, due 11/15/17 | | | 148,163 |
| | | | | | | | |
| | | | | | | | 3,238,939 |
| | | | | | | | |
| Machinery - Diversified: 0.2% | | | |
| | 185,000 | | # | | Case New Holland, Inc.,
7.750%, due 09/01/13 | | | 185,000 |
| | | | | | | | |
| | | | | | | | 185,000 |
| | | | | | | | |
| Media: 6.1% | | | |
| | 30,358 | | &, # | | American Media Operations, Inc.,
9.000%, due 05/01/13 | | | 19,126 |
| | 6,942 | | &, # | | American Media Operations, Inc.,
14.000%, due 11/01/13 | | | 4,373 |
| | 1,330,000 | | #, ± | | Charter Communications Operating, LLC,
10.375%, due 04/30/14 | | | 1,363,250 |
| | 630,000 | | # | | CSC Holdings, Inc.,
8.500%, due 04/15/14 | | | 664,650 |
| | 420,000 | | | | Echostar DBS Corp.,
6.625%, due 10/01/14 | | | 409,500 |
| | 975,000 | | | | Mediacom Broadband, LLC,
8.500%, due 10/15/15 | | | 989,625 |
| | 479,386 | | | | Nexstar Finance Holdings, LLC,
11.375%, due 04/01/13 | | | 203,739 |
| | 1,063,984 | | &, # | | Nexstar Finance, Inc.,
7.000%, due 01/15/14 | | | 537,312 |
| | 1,365,000 | | + | | Nielsen Finance LLC/Nielsen Finance Co.,
0.000% (step rate 12.500%), due 08/01/16 | | | 1,081,763 |
| | 235,000 | | | | Nielsen Finance LLC/Nielsen Finance Co.,
10.000%, due 08/01/14 | | | 237,350 |
| | 315,000 | | | | Nielsen Finance LLC/Nielsen Finance Co.,
11.500%, due 05/01/16 | | | 332,325 |
| | 950,000 | | | | Radio One, Inc.,
6.375%, due 02/15/13 | | | 334,875 |
| | | | | | | | |
| | | | | | | | 6,177,888 |
| | | | | | | | |
See Accompanying Notes to Financial Statements
49
| | |
| ING HIGH YIELD BOND FUND | | PORTFOLIO OF INVESTMENTS ASOF SEPTEMBER 30, 2009 (UNAUDITED) (CONTINUED) |
| | | | | | | | |
Principal
Amount | | | | | | Value |
| | | | | | | | |
| Metal Fabricate/Hardware: 0.6% | | | |
| $ | 645,000 | | | | Mueller Water Products,
7.375%, due 06/01/17 | | $ | 565,181 |
| | | | | | | | |
| | | | | | | | 565,181 |
| | | | | | | | |
| Miscellaneous Manufacturing: 1.0% | | | |
| | 510,000 | | @@, # | | Bombardier, Inc.,
8.000%, due 11/15/14 | | | 525,300 |
| | 540,000 | | | | Harland Clarke Holdings Corp.,
9.500%, due 05/15/15 | | | 486,000 |
| | | | | | | | |
| | | | | | | | 1,011,300 |
| | | | | | | | |
| Oil & Gas: 6.0% | | | |
| | 595,000 | | | | Berry Petroleum Co.,
8.250%, due 11/01/16 | | | 574,175 |
| | 475,000 | | | | Berry Petroleum Co.,
10.250%, due 06/01/14 | | | 509,438 |
| | 635,000 | | | | Chaparral Energy, Inc.,
8.875%, due 02/01/17 | | | 514,350 |
| | 1,200,000 | | | | Chesapeake Energy Corp.,
6.625%, due 01/15/16 | | | 1,139,982 |
| | 155,000 | | | | Chesapeake Energy Corp.,
6.875%, due 01/15/16 | | | 147,638 |
| | 135,000 | | | | Concho Resources, Inc.,
8.625%, due 10/01/17 | | | 139,050 |
| | 85,000 | | # | | Continental Resources, Inc.,
8.250%, due 10/01/19 | | | 87,763 |
| | 340,000 | | | | Encore Acquisition Co.,
7.250%, due 12/01/17 | | | 317,900 |
| | 80,000 | | | | Encore Acquisition Co.,
9.500%, due 05/01/16 | | | 84,800 |
| | 380,000 | | @@, # | | Gibson Energy ULC / GEP Midstream Finance Corp.,
11.750%, due 05/27/14 | | | 399,000 |
| | 405,000 | | | | McMoRan Exploration Co.,
11.875%, due 11/15/14 | | | 407,025 |
| | 575,000 | | @@ | | OPTI Canada, Inc.,
8.250%, due 12/15/14 | | | 448,500 |
| | 350,000 | | | | PetroHawk Energy Corp.,
9.125%, due 07/15/13 | | | 361,375 |
| | 730,000 | | | | Plains Exploration & Production Co.,
7.625%, due 06/01/18 | | | 719,050 |
| | 245,000 | | | | Swift Energy Co.,
7.125%, due 06/01/17 | | | 214,375 |
| | | | | | | | |
| | | | | | | | 6,064,421 |
| | | | | | | | |
| Packaging & Containers: 1.3% | | | |
| | 610,000 | | # | | Graphic Packaging International Corp.,
9.500%, due 06/15/17 | | | 651,175 |
| | 290,000 | | # | | Plastipak Holdings, Inc.,
10.625%, due 08/15/19 | | | 308,850 |
| | 300,000 | | # | | Solo Cup Co.,
10.500%, due 11/01/13 | | | 319,500 |
| | | | | | | | |
| | | | | | | | 1,279,525 |
| | | | | | | | |
| Pharmaceuticals: 0.4% | | | |
| | 195,000 | | | | Omnicare, Inc.,
6.125%, due 06/01/13 | | | 188,663 |
| | 105,000 | | | | Omnicare, Inc.,
6.750%, due 12/15/13 | | | 102,113 |
| | | | | | | | |
Principal
Amount | | | | | | Value |
| | | | | | | | |
| Pharmaceuticals: (continued) | | | |
| $ | 105,000 | | | | Omnicare, Inc.,
6.875%, due 12/15/15 | | $ | 101,325 |
| | | | | | | | |
| | | | | | | | 392,101 |
| | | | | | | | |
| Pipelines: 1.3% | | | |
| | 500,000 | | | | El Paso Corp.,
7.000%, due 06/15/17 | | | 492,500 |
| | 875,000 | | | | El Paso Corp.,
7.250%, due 06/01/18 | | | 865,015 |
| | | | | | | | |
| | | | | | | | 1,357,515 |
| | | | | | | | |
| Retail: 8.1% | | | |
| | 770,000 | | | | Albertson’s, Inc.,
7.450%, due 08/01/29 | | | 666,050 |
| | 290,000 | | | | Blockbuster, Inc.,
9.000%, due 09/01/12 | | | 187,050 |
| | 910,000 | | # | | Blockbuster, Inc.,
11.750%, due 10/01/14 | | | 871,325 |
| | 785,000 | | | | Bon-Ton Stores, Inc.,
10.250%, due 03/15/14 | | | 576,975 |
| | 250,000 | | | | GSC Holdings Corp.,
8.000%, due 10/01/12 | | | 259,375 |
| | 590,000 | | # | | Limited Brands,
8.500%, due 06/15/19 | | | 618,239 |
| | 435,000 | | | | Macys Retail Holdings, Inc.,
5.750%, due 07/15/14 | | | 410,879 |
| | 560,000 | | | | Macys Retail Holdings, Inc.,
5.900%, due 12/01/16 | | | 515,868 |
| | 530,000 | | | | Michaels Stores, Inc.,
11.375%, due 11/01/16 | | | 498,200 |
| | 660,000 | | & | | Neiman-Marcus Group, Inc.,
9.000%, due 10/15/15 | | | 567,600 |
| | 130,000 | | | | Rite Aid Corp.,
6.875%, due 08/15/13 | | | 107,250 |
| | 780,000 | | # | | Rite Aid Corp.,
6.875%, due 12/15/28 | | | 432,900 |
| | 500,000 | | | | Rite Aid Corp.,
7.500%, due 03/01/17 | | | 442,500 |
| | 345,000 | | # | | Rite Aid Corp.,
9.750%, due 06/12/16 | | | 374,325 |
| | 90,000 | | | | Rite Aid Corp.,
10.375%, due 07/15/16 | | | 89,325 |
| | 440,000 | | | | Sally Holdings, LLC,
9.250%, due 11/15/14 | | | 457,600 |
| | 965,000 | | # | | Toys R Us Property Co. I LLC,
10.750%, due 07/15/17 | | | 1,042,200 |
| | | | | | | | |
| | | | | | | | 8,117,661 |
| | | | | | | | |
| Software: 0.4% | | | |
| | 440,000 | | | | First Data Corporation,
9.875%, due 09/24/15 | | | 408,650 |
| | | | | | | | |
| | | | | | | | 408,650 |
| | | | | | | | |
| Telecommunications: 14.2% | | | |
| | 396,000 | | | | Centennial Cellular Communications Corp.,
8.125%, due 02/01/14 | | | 403,920 |
| | 467,000 | | | | Centennial Cellular Operating Co.,
10.125%, due 06/15/13 | | | 483,345 |
| | 340,000 | | | | Centennial Communications Corp.,
10.000%, due 01/01/13 | | | 355,725 |
| | 390,000 | | | | Cincinnati Bell, Inc.,
7.000%, due 02/15/15 | | | 380,250 |
See Accompanying Notes to Financial Statements
50
| | |
| ING HIGH YIELD BOND FUND | | PORTFOLIO OF INVESTMENTS ASOF SEPTEMBER 30, 2009 (UNAUDITED) (CONTINUED) |
| | | | | | | | |
Principal
Amount | | | | | | Value |
| | | | | | | | |
| Telecommunications: (continued) | | | |
| $ | 440,000 | | | | Cincinnati Bell, Inc.,
8.375%, due 01/15/14 | | $ | 444,400 |
| | 410,000 | | # | | Cricket Communications, Inc.,
7.750%, due 05/15/16 | | | 418,200 |
| | 895,000 | | | | Cricket Communications, Inc.,
9.375%, due 11/01/14 | | | 912,900 |
| | 380,000 | | | | Frontier Communications Co.,
9.000%, due 08/15/31 | | | 374,300 |
| | 360,000 | | | | Frontier Communications Corp.,
8.250%, due 05/01/14 | | | 372,600 |
| | 450,000 | | # | | GeoEye, Inc.,
9.625%, due 10/01/15 | | | 457,875 |
| | 385,000 | | | | Hughes Network Systems LLC/HNS Finance Corp.,
9.500%, due 04/15/14 | | | 388,850 |
| | 250,000 | | | | Intelsat Corp.,
9.250%, due 06/15/16 | | | 258,750 |
| | 210,000 | | @@, + | | Intelsat Intermediate Holding Co. Ltd.,
0.000% (step rate 9.500%), due 02/01/15 | | | 210,525 |
| | 395,000 | | @@ | | Intelsat Jackson Holdings Ltd.,
9.500%, due 06/15/16 | | | 416,725 |
| | 800,000 | | @@ | | Intelsat Jackson Holdings Ltd.,
11.250%, due 06/15/16 | | | 860,000 |
| | 650,000 | | @@ | | Intelsat Subsidiary Holding Co. Ltd,
8.875%, due 01/15/15 | | | 664,625 |
| | 503,633 | | & | | iPCS, Inc.,
3.733%, due 05/01/14 | | | 387,797 |
| | 1,010,000 | | | | MetroPCS Wireless, Inc.,
9.250%, due 11/01/14 | | | 1,037,775 |
| | 855,000 | | | | Nextel Communications, Inc.,
5.950%, due 03/15/14 | | | 760,950 |
| | 805,000 | | | | Nextel Communications, Inc.,
7.375%, due 08/01/15 | | | 726,513 |
| | 835,000 | | | | Qwest Capital Funding, Inc.,
7.250%, due 02/15/11 | | | 839,175 |
| | 770,000 | | | | Qwest Communications International, Inc.,
7.500%, due 02/15/14 | | | 764,225 |
| | 670,000 | | | | Sprint Capital Corp.,
6.875%, due 11/15/28 | | | 562,800 |
| | 520,000 | | | | Sprint Capital Corp.,
8.750%, due 03/15/32 | | | 494,000 |
| | 650,000 | | | | West Corp.,
9.500%, due 10/15/14 | | | 640,250 |
| | 330,000 | | | | West Corp.,
11.000%, due 10/15/16 | | | 329,175 |
| | 370,000 | | | | Windstream Corp.,
7.000%, due 03/15/19 | | | 347,800 |
| | | | | | | | |
| | | | | | | | 14,293,450 |
| | | | | | | | |
| | | | | Total Corporate Bonds/Notes
(Cost $96,216,687) | | | 98,321,325 |
| | | | | | | | |
| ASSET-BACKED SECURITIES: 0.3% | | | |
| Home Equity Asset-Backed Securities: 0.3% | | | |
| | 287,544 | | | | Ameriquest Mortgage Securities, Inc.,
1.596%, due 02/25/33 | | | 193,975 |
| | | | | | | | |
Principal
Amount | | | | | | Value |
| | | | | | | | |
| Home Equity Asset-Backed Securities: (continued) |
| $ | 201,560 | | | | Morgan Stanley Capital, Inc.,
1.446%, due 06/25/33 | | $ | 120,986 |
| | | | | | | | |
| | | | | Total Asset-Backed Securities
(Cost $412,320) | | | 314,961 |
| | | | | | | | |
| | | |
| Shares | | | | | | Value |
| COMMON STOCK: 0.0% | | | |
| Agriculture: 0.0% | | | |
| | 17,906 | | @, I, X | | North Atlantic Trading Co. | | | 18 |
| | | | | | | | |
| | | | | | | | 18 |
| | | | | | | | |
| Media: 0.0% | | | |
| | 5,810 | | @, I, X | | American Media Stock Certificates | | | 6 |
| | | | | | | | |
| | | | | | | | 6 |
| | | | | | | | |
| Telecommunications: 0.0% | | | |
| | 264 | | @, @@ | | Completel Europe NV | | | 11,806 |
| | | | | | | | |
| | | | | | | | 11,806 |
| | | | | | | | |
| | | | | Total Common Stock
(Cost $338,880) | | | 11,830 |
| | | | | | | | |
| PREFERRED STOCK: 0.0% | | | |
| Media: 0.0% | | | |
| | 1 | | @, I, X | | ION Media Networks, Inc. | | | — |
| | | | | | | | |
| | | | | Total Preferred Stock
(Cost $8,676) | | | — |
| | | | | | | | |
| WARRANTS: 0.0% | | | |
| Commercial Services: 0.0% | | | |
| | 92,950 | | I, X | | Comforce Corp. | | | 930 |
| | | | | | | | |
| | | | | | | | 930 |
| | | | | | | | |
| Telecommunications: 0.0% | | | |
| | 500 | | @@, #, I, X | | GT Group Telecom, Inc. | | | — |
| | | | | | | | |
| | | | | | | | — |
| | | | | | | | |
| | | | | Total Warrants
(Cost $—) | | | 930 |
| | | | | | | | |
| | | | | Total Long-Term Investments
(Cost $96,976,563) | | | 98,649,046 |
| | | | | | | | |
| SHORT-TERM INVESTMENTS: 2.0% | | | |
| Affiliated Mutual Fund: 2.0% | | | |
| | 2,002,000 | | S | | ING Institutional Prime Money Market Fund - Class I | | $ | 2,002,000 |
| | | | | | | | |
| | | | | | | | | |
| | Total Short-Term Investments
(Cost $2,002,000) | | | | 2,002,000 | |
| | | | | | | | | |
| | | | | | | | | |
| | Total Investments in Securities
(Cost $98,978,563)* | | 100.1 | % | | $ | 100,651,046 | |
| | Other Assets and Liabilities - Net | | (0.1 | ) | | | (95,819 | ) |
| | | | | | | | | |
| | Net Assets | | 100.0 | % | | $ | 100,555,227 | |
| | | | | | | | | |
See Accompanying Notes to Financial Statements
51
| | |
| ING HIGH YIELD BOND FUND | | PORTFOLIO OF INVESTMENTS ASOF SEPTEMBER 30, 2009 (UNAUDITED) (CONTINUED) |
| @ | Non-income producing security |
| + | Step-up basis bonds. Interest rates shown reflect current and next coupon rates. |
| # | Securities with purchases pursuant to Rule 144A or section 4(2), under the Securities Act of 1933 and may not be resold subject to that rule except to qualified institutional buyers. Unless otherwise noted, these securities have been determined to be liquid under the guidelines established by the Funds’ Board of Directors/Trustees. These securities amount to $29,358,189 or 29.20% of the Fund’s net assets at September 30, 2009. |
| S | All or a portion of this security is segregated to cover collateral requirements for applicable futures, options, swaps, |
| | foreign forward currency contracts and/or when-issued or delayed-delivery securities. |
| X | Fair value determined by ING Funds Valuation Committee appointed by the Funds’ Board of Directors/Trustees. These securities amount to $954 or 0.001% of the Fund’s net assets at September 30, 2009. |
| * | Cost for federal income tax purposes is $99,117,962. |
| | | | |
Net unrealized appreciation consists of: | | | | |
Gross Unrealized Appreciation | | $ | 6,609,764 | |
Gross Unrealized Depreciation | | | (5,076,680 | ) |
| | | | |
Net Unrealized Appreciation | | $ | 1,533,084 | |
| | | | |
Fair Value Measurements*
The following is a summary of the fair valuations according to the inputs used as of September 30, 2009 in valuing the Fund’s assets and liabilities:
| | | | | | | | | | | | |
| | | Quoted Prices in Active Markets for Identical Investments (Level 1) | | Significant Other Observable Inputs (Level 2) | | Significant Unobservable Inputs (Level 3) | | Fair Value at 09/30/2009 |
Asset Table | | | | | | | | | | | | |
Investments, at value | | | | | | | | | | | | |
Common Stock | | | | | | | | | | | | |
Agriculture | | $ | — | | $ | — | | $ | 18 | | $ | 18 |
Media | | | — | | | — | | | 6 | | | 6 |
Telecommunications | | | 11,806 | | | — | | | — | | | 11,806 |
| | | | | | | | | | | | |
Total Common Stock | | | 11,806 | | | — | | | 24 | | | 11,830 |
| | | | | | | | | | | | |
Warrants | | | — | | | — | | | 930 | | | 930 |
Corporate Bonds/Notes | | | — | | | 98,321,325 | | | — | | | 98,321,325 |
Asset-Backed Securities | | | — | | | 314,961 | | | — | | | 314,961 |
Short-Term Investments | | | 2,002,000 | | | — | | | — | | | 2,002,000 |
| | | | | | | | | | | | |
Total Investments, at value | | $ | 2,013,806 | | $ | 98,636,286 | | $ | 954 | | $ | 100,651,046 |
| | | | | | | | | | | | |
The following is a reconciliation of the fair valuations using significant unobservable inputs (Level 3) for the Fund’s assets and liabilities during the period ended September 30, 2009:
| | | | | | | | | | | | | | | | | | | | | | | | | | | | | | | | | | |
| | | Beginning Balance at 03/31/2009 | | Purchases | | Issuances | | Settlements | | Sales | | Accrued Discounts/ (Premiums) | | Total Realized Gain/(Loss) | | Total Unrealized Appreciation/ (Depreciation) | | | Transfers Into Level 3 | | Transfers Out of Level 3 | | Ending Balance at 09/30/2009 |
Asset Table | | | | | | | | | | | | | | | | | | | | | | | | | | | | | | | | | | |
Investments, at value | | | | | | | | | | | | | | | | | | | | | | | | | | | | | | | | | | |
Common Stock | | $ | 24 | | $ | — | | $ | — | | $ | — | | $ | — | | $ | — | | $ | — | | $ | — | | | $ | — | | $ | — | | $ | 24 |
Preferred Stock | | | 7,009 | | | — | | | — | | | — | | | — | | | — | | | — | | | (7,009 | ) | | | — | | | — | | | — |
Warrants | | | 961 | | | — | | | — | | | — | | | — | | | — | | | — | | | (31 | ) | | | — | | | — | | | 930 |
| | | | | | | | | | | | | | | | | | | | | | | | | | | | | | | | | | |
Total Investments, at value | | $ | 7,994 | | $ | — | | $ | — | | $ | — | | $ | — | | $ | — | | $ | — | | $ | (7,040 | ) | | $ | — | | $ | — | | $ | 954 |
| | | | | | | | | | | | | | | | | | | | | | | | | | | | | | | | | | |
As of September 30, 2009, total change in unrealized gain (loss) on Level 3 securities still held at period end and included in the change in net assets was $(7,040).
“Fair value” for purposes of ASC 820 is different from “fair value” as used in the 1940 Act. The former generally implies market value, and can include market quotations as a source of value, and the latter refers to determinations of value in absence of available market quotations.
| + | See Note 2, “Significant Accounting Policies” in the Notes to Financial Statements for additional information. |
See Accompanying Notes to Financial Statements
52
| | |
| ING HIGH YIELD BOND FUND | | PORTFOLIO OF INVESTMENTS ASOF SEPTEMBER 30, 2009 (UNAUDITED) (CONTINUED) |
Transfers into Level 3 represents either the beginning balance (for transfer in), or the ending value (for transfers out) of any security or derivative instrument where a change in the pricing level occurred from the beginning to the end of the period.
| ** | For further breakdown of Common Stock by Industry type, please refer to the Portfolio of Investments. |
The effect of derivative instruments on the Fund’s Statement of Operations for the six months ended September 30, 2009 was as follows:
| | | | |
| | | Amount of Realized Gain or (Loss) on Derivatives Recognized in Income | |
Derivatives not accounted for as hedging instruments under ASC 815 | | Swaps | |
Credit contracts | | $ | (68,304 | ) |
| | | | |
Total | | $ | (68,304 | ) |
| | | | |
| |
| | | Change in Unrealized Appreciation or (Depreciation) on Derivatives Recognized in Income | |
Derivatives not accounted for as hedging instruments under ASC 815 | | Swaps | |
Credit contracts | | $ | 287,074 | |
| | | | |
Total | | $ | 287,074 | |
| | | | |
See Accompanying Notes to Financial Statements
53
| | |
| ING INTERMEDIATE BOND FUND | | PORTFOLIO OF INVESTMENTS ASOF SEPTEMBER 30, 2009 (UNAUDITED) |
| | | | | | | | |
Principal
Amount | | | | | | Value |
| | | | | | | | |
| CORPORATE BONDS/NOTES: 39.7% | | | |
| Advertising: 0.1% | | | |
| $ | 1,040,000 | | # | | Interpublic Group of Cos., Inc.,
10.000%, due 07/15/17 | | $ | 1,128,400 |
| | | | | | | | |
| | | | | | | | 1,128,400 |
| | | | | | | | |
| Agriculture: 0.4% | | | |
| | 2,996,000 | | | | Altria Group, Inc.,
9.700%, due 11/10/18 | | | 3,727,135 |
| | 234,000 | | | | Philip Morris International, Inc.,
5.650%, due 05/16/18 | | | 249,500 |
| | | | | | | | |
| | | | | | | | 3,976,635 |
| | | | | | | | |
| Apartments: 0.1% | | | |
| | 784,000 | | | | AvalonBay Communities, Inc.,
5.700%, due 03/15/17 | | | 801,919 |
| | | | | | | | |
| | | | | | | | 801,919 |
| | | | | | | | |
| Banks: 7.6% | | | |
| | 1,924,000 | | | | American Express Bank FSB,
5.500%, due 04/16/13 | | | 2,032,240 |
| | 500,000 | | | | Bank of America Corp.,
5.420%, due 03/15/17 | | | 478,447 |
| | 1,970,000 | | | | Bank of America Corp.,
8.000%, due 12/29/49 | | | 1,754,068 |
| | 1,280,000 | | @@ | | Bank of Ireland,
0.563%, due 12/29/49 | | | 448,000 |
| | 300,000 | | @@ | | Barclays Bank PLC,
0.875%, due 08/29/49 | | | 162,000 |
| | 5,574,000 | | @@, # | | Barclays Bank PLC,
6.050%, due 12/04/17 | | | 5,618,438 |
| | 2,070,000 | | @@, # | | Barclays Bank PLC,
7.375%, due 06/29/49 | | | 1,842,300 |
| | 719,000 | | | | Capital One Financial Corp.,
7.375%, due 05/23/14 | | | 803,209 |
| | 3,670,000 | | | | Citigroup, Inc.,
5.000%, due 09/15/14 | | | 3,496,068 |
| | 3,126,000 | | | | Citigroup, Inc.,
6.125%, due 05/15/18 | | | 3,083,071 |
| | 965,000 | | | | Citigroup, Inc.,
6.375%, due 08/12/14 | | | 998,739 |
| | 957,000 | | | | Citigroup, Inc.,
8.500%, due 05/22/19 | | | 1,082,114 |
| | 2,214,000 | | @@ | | Credit Suisse/New York NY,
5.300%, due 08/13/19 | | | 2,274,462 |
| | 1,155,000 | | # | | Dresdner Funding Trust I,
8.151%, due 06/30/31 | | | 814,668 |
| | 4,239,000 | | | | Fifth Third Bancorp.,
8.250%, due 03/01/38 | | | 3,961,104 |
| | 3,599,000 | | | | First Tennessee Bank NA,
5.650%, due 04/01/16 | | | 2,961,761 |
| | 1,299,000 | | L | | Goldman Sachs Group, Inc.,
5.250%, due 04/01/13 | | | 1,381,499 |
| | 1,211,000 | | | | Goldman Sachs Group, Inc.,
5.450%, due 11/01/12 | | | 1,297,871 |
| | 2,158,000 | | | | Goldman Sachs Group, Inc.,
5.500%, due 11/15/14 | | | 2,286,487 |
| | 1,759,000 | | | | Goldman Sachs Group, Inc.,
6.000%, due 05/01/14 | | | 1,914,897 |
| | | | | | | | |
Principal
Amount | | | | | | Value |
| | | | | | | | |
| Banks: (continued) | | | |
| $ | 937,000 | | | | Goldman Sachs Group, Inc.,
6.250%, due 09/01/17 | | $ | 992,513 |
| | 2,400,000 | | @@ | | HSBC Bank PLC,
1.288%, due 06/29/49 | | | 1,392,000 |
| | 2,356,000 | | @@, # | | HSBC Capital Funding L.P./Jersey Channel Islands,
9.547%, due 12/29/49 | | | 2,403,120 |
| | 1,073,000 | | | | JPMorgan Chase & Co.,
4.650%, due 06/01/14 | | | 1,120,292 |
| | 2,062,000 | | | | JPMorgan Chase Bank NA,
5.875%, due 06/13/16 | | | 2,162,861 |
| | 1,082,000 | | | | Morgan Stanley,
4.750%, due 04/01/14 | | | 1,075,088 |
| | 4,216,000 | | | | Morgan Stanley,
7.300%, due 05/13/19 | | | 4,646,879 |
| | 4,371,000 | | | | National City Preferred Capital Trust I,
12.000%, due 12/29/49 | | | 4,944,353 |
| | 4,129,000 | | @@, # | | Rabobank,
11.000%, due 12/29/49 | | | 5,072,146 |
| | 1,055,000 | | | | Wachovia Bank NA,
6.000%, due 11/15/17 | | | 1,108,691 |
| | 3,632,000 | | | | Wachovia Bank NA,
6.600%, due 01/15/38 | | | 4,000,190 |
| | 411,000 | | | | Wachovia Corp.,
5.250%, due 08/01/14 | | | 417,838 |
| | 1,175,000 | | | | Wells Fargo Capital XIII,
7.700%, due 12/29/49 | | | 1,039,875 |
| | | | | | | | |
| | | | | | | | 69,067,289 |
| | | | | | | | |
| Beverages: 0.9% | | | |
| | 2,768,000 | | # | | Anheuser-Busch InBev Worldwide, Inc.,
5.375%, due 11/15/14 | | | 2,956,733 |
| | 2,896,000 | | # | | Anheuser-Busch InBev Worldwide, Inc.,
7.750%, due 01/15/19 | | | 3,432,582 |
| | 1,088,000 | | | | Dr Pepper Snapple Group, Inc.,
6.820%, due 05/01/18 | | | 1,238,866 |
| | 598,000 | | | | Dr Pepper Snapple Group, Inc.,
7.450%, due 05/01/38 | | | 747,197 |
| | | | | | | | |
| | | | | | | | 8,375,378 |
| | | | | | | | |
| Building Materials: 0.1% | | | |
| | 1,157,000 | | @@, # | | Voto-Votorantim Overseas Trading Operations NV,
6.625%, due 09/25/19 | | | 1,158,446 |
| | | | | | | | |
| | | | | | | | 1,158,446 |
| | | | | | | | |
| Chemicals: 0.5% | | | |
| | 1,202,000 | | # | | Chevron Phillips Chemical Co. LLC,
7.000%, due 06/15/14 | | | 1,330,710 |
| | 1,109,000 | | # | | Chevron Phillips Chemical Co. LLC,
8.250%, due 06/15/19 | | | 1,341,686 |
| | 2,010,000 | | | | Dow Chemical Co.,
7.600%, due 05/15/14 | | | 2,225,739 |
| | | | | | | | |
| | | | | | | | 4,898,135 |
| | | | | | | | |
See Accompanying Notes to Financial Statements
54
| | |
| ING INTERMEDIATE BOND FUND | | PORTFOLIO OF INVESTMENTS ASOF SEPTEMBER 30, 2009 (UNAUDITED) (CONTINUED) |
| | | | | | | | |
Principal
Amount | | | | | | Value |
| | | | | | | | |
| Coal: 0.1% | | | |
| $ | 1,155,000 | | # | | Arch Coal, Inc.,
8.750%, due 08/01/16 | | $ | 1,195,425 |
| | | | | | | | |
| | | | | | | | 1,195,425 |
| | | | | | | | |
| Commercial Services: 0.5% | | | |
| | 2,140,000 | | | | RR Donnelley & Sons Co.,
8.600%, due 08/15/16 | | | 2,256,983 |
| | 2,020,000 | | &, # | | ServiceMaster Co,
10.750%, due 07/15/15 | | | 1,934,150 |
| | | | | | | | |
| | | | | | | | 4,191,133 |
| | | | | | | | |
| Computers: 0.2% | | | |
| | 1,935,000 | | @@ | | Seagate Technology, Inc.,
6.800%, due 10/01/16 | | | 1,785,038 |
| | | | | | | | |
| | | | | | | | 1,785,038 |
| | | | | | | | |
| Diversified Financial Services: 4.0% | | | |
| | 3,911,000 | | @@, # | | Aiful Corp.,
4.450%, due 02/16/10 | | | 2,600,975 |
| | 945,000 | | | | American Express Credit Corp.,
5.125%, due 08/25/14 | | | 978,577 |
| | 1,796,000 | | | | American Express Credit Corp.,
7.300%, due 08/20/13 | | | 1,993,443 |
| | 1,290,000 | | | | Capital One Bank USA NA,
6.500%, due 06/13/13 | | | 1,376,438 |
| | 2,458,000 | | | | Capital One Bank USA NA,
8.800%, due 07/15/19 | | | 2,846,160 |
| | 1,724,000 | | | | Capital One Capital V,
10.250%, due 08/15/39 | | | 1,909,825 |
| | 1,277,000 | | # | | Corestates Capital Trust I,
8.000%, due 12/15/26 | | | 1,173,981 |
| | 2,604,000 | | @@ | | Credit Suisse/Guernsey,
5.860%, due 12/31/49 | | | 1,992,060 |
| | 2,193,000 | | | | FIA Card Services NA,
6.625%, due 06/15/12 | | | 2,352,688 |
| | 2,324,000 | | | | Fund American Cos., Inc.,
5.875%, due 05/15/13 | | | 2,222,072 |
| | 2,892,000 | | | | General Electric Capital Corp.,
5.875%, due 01/14/38 | | | 2,660,903 |
| | 1,425,000 | | | | General Electric Capital Corp.,
6.000%, due 08/07/19 | | | 1,448,247 |
| | 964,000 | | @@, # | | Iberdrola Finance Ireland, Ltd.,
3.800%, due 09/11/14 | | | 978,511 |
| | 1,314,000 | | @@, # | | Iberdrola Finance Ireland, Ltd.,
5.000%, due 09/11/19 | | | 1,325,838 |
| | 4,385,000 | | | | International Lease Finance Corp.,
6.625%, due 11/15/13 | | | 3,479,883 |
| | 3,178,000 | | @@, # | | Mantis Reef Ltd.,
4.799%, due 11/03/09 | | | 3,170,344 |
| | 2,274,000 | | | | Merrill Lynch & Co., Inc.,
6.050%, due 08/15/12 | | | 2,426,788 |
| | 824,000 | | | | National Rural Utilities Cooperative Finance Corp.,
10.375%, due 11/01/18 | | | 1,091,520 |
| | DKK 26 | | @@, I | | Nordea Kredit Realkreditaktieselskab,
6.000%, due 07/01/29 | | | 5 |
| | | | | | | | |
Principal
Amount | | | | | | Value |
| | | | | | | | |
| Diversified Financial Services: (continued) | | | |
| $ | 216,549 | | # | | Power Receivable Finance, LLC,
6.290%, due 01/01/12 | | $ | 221,188 |
| | 1,583,000 | | #, ± | | Twin Reefs Pass-through Trust,
due 12/10/49 | | | 5,145 |
| | | | | | | | |
| | | | | | | | 36,254,591 |
| | | | | | | | |
| Electric: 4.9% | | | |
| | 2,025,000 | | @@, # | | Abu Dhabi National Energy Co.,
4.750%, due 09/15/14 | | | 2,031,139 |
| | 975,000 | | | | AES Corp.,
8.000%, due 10/15/17 | | | 985,969 |
| | 1,467,000 | | # | | Allegheny Energy Supply Co. LLC,
5.750%, due 10/15/19 | | | 1,468,740 |
| | 688,000 | | # | | Allegheny Energy Supply Co. LLC,
6.750%, due 10/15/39 | | | 696,850 |
| | 1,191,000 | | | | Ameren Corp.,
8.875%, due 05/15/14 | | | 1,340,018 |
| | 249,000 | | | | Commonwealth Edison Co.,
6.150%, due 03/15/12 | | | 270,355 |
| | 5,312,000 | | | | Commonwealth Edison Co.,
6.950%, due 07/15/18 | | | 6,026,432 |
| | 1,571,000 | | | | DTE Energy Co.,
7.050%, due 06/01/11 | | | 1,672,009 |
| | 112,000 | | | | DTE Energy Co.,
7.625%, due 05/15/14 | | | 123,748 |
| | 1,825,000 | | | | Duke Energy Corp.,
3.950%, due 09/15/14 | | | 1,854,078 |
| | 923,000 | | | | Duke Energy Corp.,
6.300%, due 02/01/14 | | | 1,022,067 |
| | 1,282,000 | | | | Entergy Texas, Inc.,
7.125%, due 02/01/19 | | | 1,438,703 |
| | 898,000 | | | | Exelon Generation Co. LLC,
6.250%, due 10/01/39 | | | 919,686 |
| | 696,000 | | # | | FirstEnergy Solutions Corp.,
4.800%, due 02/15/15 | | | 715,995 |
| | 896,000 | | # | | FirstEnergy Solutions Corp.,
6.050%, due 08/15/21 | | | 927,855 |
| | 1,180,000 | | | | Indiana Michigan Power,
7.000%, due 03/15/19 | | | 1,362,237 |
| | 812,000 | | | | Jersey Central Power and Light,
7.350%, due 02/01/19 | | | 960,441 |
| | 374,818 | | # | | Juniper Generation, LLC,
6.790%, due 12/31/14 | | | 344,068 |
| | 2,391,000 | | | | Metropolitan Edison,
7.700%, due 01/15/19 | | | 2,829,371 |
| | 709,000 | | | | Nevada Power Co.,
7.125%, due 03/15/19 | | | 807,876 |
| | 3,977,000 | | | | NorthWestern Corp.,
5.875%, due 11/01/14 | | | 4,195,644 |
| | 1,713,000 | | | | Oncor Electric Delivery Co.,
6.800%, due 09/01/18 | | | 1,974,375 |
| | 2,318,000 | | | | Oncor Electric Delivery Co.,
7.500%, due 09/01/38 | | | 2,995,646 |
| | 1,218,000 | | | | Progress Energy, Inc.,
6.050%, due 03/15/14 | | | 1,337,162 |
See Accompanying Notes to Financial Statements
55
| | |
| ING INTERMEDIATE BOND FUND | | PORTFOLIO OF INVESTMENTS ASOF SEPTEMBER 30, 2009 (UNAUDITED) (CONTINUED) |
| | | | | | | | |
Principal
Amount | | | | | | Value |
| | | | | | | | |
| Electric: (continued) | | | |
| $ | 957,000 | | | | Progress Energy, Inc.,
7.050%, due 03/15/19 | | $ | 1,116,247 |
| | 1,949,000 | | | | Sierra Pacific Power Co.,
6.250%, due 04/15/12 | | | 2,081,947 |
| | 2,425,000 | | | | Southwestern Electric Power,
5.550%, due 01/15/17 | | | 2,492,822 |
| | | | | | | | |
| | | | | | | | 43,991,480 |
| | | | | | | | |
| Electronics: 0.2% | | | |
| | 1,365,000 | | | | Jabil Circuit, Inc.,
7.750%, due 07/15/16 | | | 1,392,300 |
| | | | | | | | |
| | | | | | | | 1,392,300 |
| | | | | | | | |
| Energy - Alternate Sources: 0.0% | | | |
| | 1,800,000 | | | | Greater Ohio Ethanol, LLC,
6.301%, due 12/31/13 | | | 180 |
| | 2,200,000 | | | | Greater Ohio Ethanol, LLC,
12.630%, due 12/31/13 | | | 220 |
| | 277,964 | | I | | PEA Lima, LLC,
due 03/20/14 | | | 28 |
| | | | | | | | |
| | | | | | | | 428 |
| | | | | | | | |
| Entertainment: 0.6% | | | |
| | 1,170,000 | | | | AMC Entertainment, Inc.,
8.750%, due 06/01/19 | | | 1,213,875 |
| | 1,945,000 | | # | | Pinnacle Entertainment, Inc.,
8.625%, due 08/01/17 | | | 1,964,450 |
| | 1,405,000 | | # | | Warner Music Group,
9.500%, due 06/15/16 | | | 1,489,300 |
| | 485,000 | | + | | WMG Holdings Corp.,
0.000% (step rate 9.500%), due 12/15/14 | | | 469,238 |
| | | | | | | | |
| | | | | | | | 5,136,863 |
| | | | | | | | |
| Food: 0.8% | | | |
| | 2,918,000 | | | | Kraft Foods, Inc.,
6.125%, due 08/23/18 | | | 3,100,416 |
| | 732,000 | | | | Kraft Foods, Inc.,
6.500%, due 08/11/17 | | | 793,065 |
| | 1,054,000 | | | | Safeway, Inc.,
6.250%, due 03/15/14 | | | 1,165,528 |
| | 2,150,000 | | # | | Smithfield Foods, Inc.,
10.000%, due 07/15/14 | | | 2,268,250 |
| | | | | | | | |
| | | | | | | | 7,327,259 |
| | | | | | | | |
| Forest Products & Paper: 0.1% | | | |
| | 1,054,000 | | | | Domtar Corp.,
10.750%, due 06/01/17 | | | 1,185,750 |
| | | | | | | | |
| | | | | | | | 1,185,750 |
| | | | | | | | |
| Gas: 0.3% | | | |
| | 2,775,000 | | | | Sempra Energy,
6.500%, due 06/01/16 | | | 3,071,786 |
| | | | | | | | |
| | | | | | | | 3,071,786 |
| | | | | | | | |
| Healthcare - Products: 0.2% | | | |
| | 1,950,000 | | & | | Biomet, Inc.,
10.375%, due 10/15/17 | | | 2,081,625 |
| | | | | | | | |
| | | | | | | | 2,081,625 |
| | | | | | | | |
| | | | | | | | |
Principal
Amount | | | | | | Value |
| | | | | | | | |
| Healthcare - Services: 0.5% | | | |
| $ | 1,080,000 | | | | HCA, Inc.,
9.250%, due 11/15/16 | | $ | 1,119,150 |
| | 1,950,000 | | & | | HCA, Inc.,
9.625%, due 11/15/16 | | | 2,032,875 |
| | 1,054,000 | | # | | US Oncology, Inc.,
9.125%, due 08/15/17 | | | 1,114,605 |
| | | | | | | | |
| | | | | | | | 4,266,630 |
| | | | | | | | |
| Holding Companies - Diversified: 0.2% | | | |
| | 1,998,000 | | @@, # | | Hutchison Whampoa International Ltd.,
4.625%, due 09/11/15 | | | 1,988,214 |
| | | | | | | | |
| | | | | | | | 1,988,214 |
| | | | | | | | |
| Home Builders: 0.1% | | | |
| | 863,000 | | | | Toll Brothers Finance Corp.,
6.750%, due 11/01/19 | | | 861,909 |
| | | | | | | | |
| | | | | | | | 861,909 |
| | | | | | | | |
| Hotels: 0.1% | | | |
| | 480,000 | | # | | Felcor Lodging L.P.,
10.000%, due 10/01/14 | | | 466,800 |
| | | | | | | | |
| | | | | | | | 466,800 |
| | | | | | | | |
| Household Products/Wares: 0.0% | | | |
| | 229,000 | | # | | ACCO Brands Corp.,
10.625%, due 03/15/15 | | | 240,450 |
| | | | | | | | |
| | | | | | | | 240,450 |
| | | | | | | | |
| Insurance: 2.4% | | | |
| | 4,313,000 | | @@ | | Aegon NV,
3.598%, due 12/31/49 | | | 2,020,641 |
| | 3,058,000 | | | | American International Group, Inc.,
5.850%, due 01/16/18 | | | 2,217,350 |
| | 1,739,000 | | | | Hartford Financial Services Group, Inc.,
5.250%, due 10/15/11 | | | 1,740,567 |
| | 1,326,000 | | | | Hartford Financial Services Group, Inc.,
6.000%, due 01/15/19 | | | 1,259,681 |
| | 1,432,000 | | | | Lincoln National Corp.,
8.750%, due 07/01/19 | | | 1,659,006 |
| | 2,748,000 | | | | Metlife, Inc.,
7.717%, due 02/15/19 | | | 3,240,722 |
| | 2,020,000 | | # | | Pacific Life Insurance Co.,
9.250%, due 06/15/39 | | | 2,322,671 |
| | 1,118,000 | | | | Principal Financial Group, Inc.,
7.875%, due 05/15/14 | | | 1,236,669 |
| | 756,000 | | | | Prudential Financial, Inc.,
4.750%, due 09/17/15 | | | 751,658 |
| | 886,000 | | | | Prudential Financial, Inc.,
5.700%, due 12/14/36 | | | 796,529 |
| | 1,562,000 | | | | Prudential Financial, Inc.,
6.000%, due 12/01/17 | | | 1,585,628 |
| | 1,404,000 | | | | Prudential Financial, Inc.,
6.625%, due 12/01/37 | | | 1,438,328 |
| | 795,000 | | | | Prudential Financial, Inc.,
7.375%, due 06/15/19 | | | 888,793 |
| | 787,000 | | | | UnumProvident Corp.,
7.125%, due 09/30/16 | | | 797,368 |
| | | | | | | | |
| | | | | | | | 21,955,611 |
| | | | | | | | |
See Accompanying Notes to Financial Statements
56
| | |
| ING INTERMEDIATE BOND FUND | | PORTFOLIO OF INVESTMENTS ASOF SEPTEMBER 30, 2009 (UNAUDITED) (CONTINUED) |
| | | | | | | | |
Principal
Amount | | | | | | Value |
| | | | | | | | |
| Investment Companies: 0.1% | | | |
| $ | 881,000 | | @@, # | | Xstrata Finance Canada Ltd,
5.500%, due 11/16/11 | | $ | 916,658 |
| | | | | | | | |
| | | | | | | | 916,658 |
| | | | | | | | |
| Iron/Steel: 0.6% | | | |
| | 2,481,000 | | @@ | | ArcelorMittal,
9.850%, due 06/01/19 | | | 2,939,305 |
| | 2,694,000 | | @@, # | | CSN Islands XI Corp.,
6.875%, due 09/21/19 | | | 2,724,308 |
| | | | | | | | |
| | | | | | | | 5,663,613 |
| | | | | | | | |
| Lodging: 0.3% | | | |
| | 2,375,000 | | # | | Hyatt Hotels Corp.,
6.875%, due 08/15/19 | | | 2,441,438 |
| | | | | | | | |
| | | | | | | | 2,441,438 |
| | | | | | | | |
| Machinery - Diversified: 0.1% | | | |
| | 1,250,000 | | # | | Case New Holland, Inc.,
7.750%, due 09/01/13 | | | 1,250,000 |
| | | | | | | | |
| | | | | | | | 1,250,000 |
| | | | | | | | |
| Media: 4.2% | | | |
| | 1,920,000 | | # | | Cablevision Systems Corp.,
8.625%, due 09/15/17 | | | 1,992,000 |
| | 824,000 | | | | Comcast Corp.,
5.300%, due 01/15/14 | | | 882,577 |
| | 1,215,000 | | | | Comcast Corp.,
5.700%, due 05/15/18 | | | 1,279,582 |
| | 769,000 | | | | Comcast Corp.,
5.900%, due 03/15/16 | | | 827,557 |
| | 97,000 | | | | Comcast Corp.,
6.300%, due 11/15/17 | | | 106,442 |
| | 1,254,000 | | | | Comcast Corp.,
6.500%, due 01/15/17 | | | 1,378,363 |
| | 1,652,000 | | # | | COX Communications, Inc.,
6.250%, due 06/01/18 | | | 1,755,557 |
| | 1,416,000 | | # | | COX Communications, Inc.,
6.950%, due 06/01/38 | | | 1,532,264 |
| | 451,000 | | # | | Cox Communications, Inc.,
8.375%, due 03/01/39 | | | 558,076 |
| | 1,255,000 | | # | | Cox Enterprises, Inc.,
7.375%, due 07/15/27 | | | 1,361,934 |
| | 998,000 | | # | | DirecTV Holdings, LLC,
5.875%, due 10/01/19 | | | 996,753 |
| | 647,000 | | | | Discovery Communications, LLC,
5.625%, due 08/15/19 | | | 665,201 |
| | 1,080,000 | | | | Echostar DBS Corp.,
7.125%, due 02/01/16 | | | 1,077,300 |
| | 1,955,000 | | # | | Mediacom LLC / Mediacom Capital Corp.,
9.125%, due 08/15/19 | | | 2,018,538 |
| | 218,000 | | # | | News America, Inc.,
5.650%, due 08/15/20 | | | 221,439 |
| | 1,971,000 | | | | News America, Inc.,
6.150%, due 03/01/37 | | | 1,934,814 |
| | 1,598,000 | | | | News America, Inc.,
6.650%, due 11/15/37 | | | 1,670,027 |
| | 3,204,000 | | | | News America, Inc.,
6.900%, due 03/01/19 | | | 3,581,566 |
| | 1,842,000 | | | | Time Warner Cable, Inc.,
6.750%, due 07/01/18 | | | 2,038,370 |
| | | | | | | | |
Principal
Amount | | | | | | Value |
| | | | | | | | |
| Media: (continued) | | | |
| $ | 3,475,000 | | | | Time Warner Cable, Inc.,
8.750%, due 02/14/19 | | $ | 4,288,136 |
| | 648,000 | | | | Time Warner Entertainment Co. LP,
8.375%, due 07/15/33 | | | 781,032 |
| | 1,921,000 | | | | Time Warner, Inc.,
5.500%, due 11/15/11 | | | 2,043,435 |
| | 2,656,000 | | | | Time Warner, Inc.,
7.700%, due 05/01/32 | | | 3,011,888 |
| | 1,101,000 | | | | Viacom, Inc.,
4.250%, due 09/15/15 | | | 1,099,544 |
| | 568,000 | | | | Viacom, Inc.,
5.625%, due 09/15/19 | | | 578,414 |
| | | | | | | | |
| | | | | | | | 37,680,809 |
| | | | | | | | |
| Mining: 0.6% | | | |
| | 1,183,000 | | | | Newmont Mining Corp.,
5.125%, due 10/01/19 | | | 1,184,769 |
| | 780,000 | | | | Newmont Mining Corp.,
6.250%, due 10/01/39 | | | 777,314 |
| | 1,114,000 | | @@ | | Rio Tinto Finance USA Ltd.,
8.950%, due 05/01/14 | | | 1,315,988 |
| | 1,705,000 | | @@ | | Vale Overseas Ltd.,
5.625%, due 09/15/19 | | | 1,742,815 |
| | | | | | | | |
| | | | | | | | 5,020,886 |
| | | | | | | | |
| Miscellaneous Manufacturing: 0.9% | | | |
| | 520,000 | | @@, # | | Bombardier, Inc.,
8.000%, due 11/15/14 | | | 535,600 |
| | 3,321,000 | | | | General Electric Co.,
5.250%, due 12/06/17 | | | 3,413,812 |
| | 3,230,000 | | @@ | | Tyco International Finance,
8.500%, due 01/15/19 | | | 3,943,775 |
| | | | | | | | |
| | | | | | | | 7,893,187 |
| | | | | | | | |
| Oil & Gas: 1.0% | | | |
| | 1,081,000 | | | | Chesapeake Energy Corp.,
7.250%, due 12/15/18 | | | 1,026,950 |
| | 1,171,000 | | | | Hess Corp.,
8.125%, due 02/15/19 | | | 1,409,173 |
| | 1,413,000 | | | | Marathon Oil Corp.,
6.500%, due 02/15/14 | | | 1,557,454 |
| | 1,005,000 | | | | Marathon Oil Corp.,
7.500%, due 02/15/19 | | | 1,161,196 |
| | 1,263,000 | | @@, #, S | | Petroleum Co. of Trinidad & Tobago Ltd.,
9.750%, due 08/14/19 | | | 1,436,663 |
| | 1,920,000 | | | | Plains Exploration & Production Co.,
8.625%, due 10/15/19 | | | 1,953,600 |
| | 967,000 | | @@ | | Shell International Finance BV,
4.300%, due 09/22/19 | | | 973,696 |
| | | | | | | | |
| | | | | | | | 9,518,732 |
| | | | | | | | |
See Accompanying Notes to Financial Statements
57
| | |
| ING INTERMEDIATE BOND FUND | | PORTFOLIO OF INVESTMENTS ASOF SEPTEMBER 30, 2009 (UNAUDITED) (CONTINUED) |
| | | | | | | | |
Principal
Amount | | | | | | Value |
| | | | | | | | |
| Oil & Gas Services: 0.2% | | | |
| $ | 1,217,000 | | @@ | | Weatherford International, Ltd.,
9.625%, due 03/01/19 | | $ | 1,525,972 |
| | | | | | | | |
| | | | | | | | 1,525,972 |
| | | | | | | | |
| Packaging & Containers: 0.1% | | | |
| | 631,000 | | # | | Solo Cup Co.,
10.500%, due 11/01/13 | | | 672,015 |
| | | | | | | | |
| | | | | | | | 672,015 |
| | | | | | | | |
| Pharmaceuticals: 0.2% | | | |
| | 1,022,000 | | | | Express Scripts, Inc.,
6.250%, due 06/15/14 | | | 1,124,272 |
| | 255,000 | | | | Express Scripts, Inc.,
7.250%, due 06/15/19 | | | 300,023 |
| | | | | | | | |
| | | | | | | | 1,424,295 |
| | | | | | | | |
| Pipelines: 1.4% | | | |
| | 2,023,000 | | | | Enbridge Energy Partners,
9.875%, due 03/01/19 | | | 2,516,438 |
| | 1,744,000 | | | | Energy Transfer Partners,
9.700%, due 03/15/19 | | | 2,162,225 |
| | 906,000 | | | | Northwest Pipeline Corp.,
7.000%, due 06/15/16 | | | 1,032,112 |
| | 1,150,000 | | | | Plains All American Pipeline L.P.,
4.250%, due 09/01/12 | | | 1,183,023 |
| | 2,217,000 | | | | Plains All American Pipeline LP,
5.750%, due 01/15/20 | | | 2,238,456 |
| | 776,000 | | @@ | | Trans-Canada Pipelines,
7.125%, due 01/15/19 | | | 917,140 |
| | 861,000 | | @@ | | Trans-Canada Pipelines,
7.625%, due 01/15/39 | | | 1,102,368 |
| | 1,262,000 | | | | Transcontinental Gas Pipe Line Corp.,
6.400%, due 04/15/16 | | | 1,399,168 |
| | 249,000 | | | | Williams Cos., Inc.,
8.750%, due 01/15/20 | | | 286,762 |
| | | | | | | | |
| | | | | | | | 12,837,692 |
| | | | | | | | |
| Regional Malls: 0.2% | | | |
| | 1,769,000 | | | | Simon Property Group, Inc.,
6.750%, due 05/15/14 | | | 1,899,101 |
| | | | | | | | |
| | | | | | | | 1,899,101 |
| | | | | | | | |
| Retail: 0.9% | | | |
| | 2,397,000 | | | | CVS Caremark Corp.,
6.125%, due 09/15/39 | | | 2,446,704 |
| | 1,026,000 | | | | CVS Caremark Corp.,
6.600%, due 03/15/19 | | | 1,158,647 |
| | 1,345,000 | | # | | Limited Brands,
8.500%, due 06/15/19 | | | 1,409,374 |
| | 805,000 | | # | | QVC, Inc.,
7.500%, due 10/01/19 | | | 810,031 |
| | 1,950,000 | | # | | Toys R Us Property Co. I LLC,
10.750%, due 07/15/17 | | | 2,106,000 |
| | 568,000 | | | | Yum! Brands, Inc.,
5.300%, due 09/15/19 | | | 571,653 |
| | | | | | | | |
| | | | | | | | 8,502,409 |
| | | | | | | | |
| | | | | | | | |
Principal
Amount | | | | | | Value |
| | | | | | | | |
| Telecommunications: 3.4% | | | |
| $ | 1,903,000 | | | | AT&T, Inc.,
6.550%, due 02/15/39 | | $ | 2,081,808 |
| | 2,512,000 | | | | AT&T, Inc.,
6.700%, due 11/15/13 | | | 2,848,575 |
| | 725,000 | | @@ | | British Telecommunications PLC,
5.150%, due 01/15/13 | | | 755,877 |
| | 1,792,000 | | @@ | | British Telecommunications PLC,
5.950%, due 01/15/18 | | | 1,818,221 |
| | 1,612,000 | | | | CenturyTel, Inc.,
7.600%, due 09/15/39 | | | 1,611,131 |
| | 970,000 | | | | Cricket Communications, Inc.,
9.375%, due 11/01/14 | | | 989,400 |
| | 1,043,000 | | | | Cricket Communications, Inc.,
10.000%, due 07/15/15 | | | 1,076,898 |
| | 1,466,000 | | | | Embarq Corp.,
6.738%, due 06/01/13 | | | 1,591,025 |
| | 1,040,000 | | | | Embarq Corp.,
7.995%, due 06/01/36 | | | 1,089,674 |
| | 730,000 | | | | Frontier Communications Corp.,
8.125%, due 10/01/18 | | | 738,213 |
| | 1,949,000 | | @@, # | | Intelsat Subsidiary Holding Co. Ltd.,
8.875%, due 01/15/15 | | | 1,983,108 |
| | 975,000 | | L | | MetroPCS Wireless, Inc.,
9.250%, due 11/01/14 | | | 1,001,813 |
| | 980,000 | | | | Nextel Communications, Inc.,
5.950%, due 03/15/14 | | | 872,200 |
| | 1,054,000 | | | | Qwest Communications International, Inc.,
7.500%, due 02/15/14 | | | 1,046,095 |
| | 1,080,000 | | | | Sprint Nextel Corp.,
6.000%, due 12/01/16 | | | 969,300 |
| | 1,251,000 | | @@ | | Telefonica Emisones SAU,
5.855%, due 02/04/13 | | | 1,363,551 |
| | 660,000 | | @@ | | Telefonica Emisones SAU,
5.877%, due 07/15/19 | | | 718,447 |
| | 350,000 | | | | Verizon Communications, Inc.,
7.350%, due 04/01/39 | | | 416,403 |
| | 2,142,000 | | | | Verizon Communications, Inc.,
8.950%, due 03/01/39 | | | 2,943,763 |
| | 4,221,000 | | # | | Verizon Wireless Capital LLC,
5.550%, due 02/01/14 | | | 4,565,953 |
| | | | | | | | |
| | | | | | | | 30,481,455 |
| | | | | | | | |
| Transportation: 0.6% | | | |
| | 1,958,000 | | | | CSX Corp.,
6.250%, due 04/01/15 | | | 2,167,578 |
| | 2,693,000 | | | | CSX Corp.,
7.450%, due 04/01/38 | | | 3,333,018 |
| | | | | | | | |
| | | | | | | | 5,500,596 |
| | | | | | | | |
| | | | | Total Corporate Bonds/Notes
(Cost $339,393,350) | | | 360,028,352 |
| | | | | | | | |
See Accompanying Notes to Financial Statements
58
| | |
| ING INTERMEDIATE BOND FUND | | PORTFOLIO OF INVESTMENTS ASOF SEPTEMBER 30, 2009 (UNAUDITED) (CONTINUED) |
| | | | | | | | |
Principal
Amount | | | | | | Value |
| | | | | | | | |
| U.S. GOVERNMENT AGENCY OBLIGATIONS: 32.8% |
| Federal Home Loan Mortgage Corporation##: 11.4% |
| $ | 239,727 | | S | | 0.593%, due 02/15/32 | | $ | 235,662 |
| | 548,388 | | S | | 1.206%, due 04/15/32 | | | 539,987 |
| | 1,748,996 | | S | | 3.343%, due 03/15/38 | | | 1,610,027 |
| | 4,363,681 | | S, ^ | | 4.936%, due 03/15/33 | | | 4,526,976 |
| | 461,856 | | S | | 4.966%, due 04/01/35 | | | 484,813 |
| | 11,763,000 | | W | | 5.000%, due 11/15/34 | | | 12,110,373 |
| | 4,880,223 | | S, ^ | | 5.000%, due 05/15/17-01/15/29 | | | 294,095 |
| | 25,431,728 | | S | | 5.000%, due 08/15/16-02/15/35 | | | 26,701,038 |
| | 32,463,262 | | S | | 5.500%, due 08/15/20-02/15/34 | | | 34,042,466 |
| | 5,376,000 | | W | | 6.000%, due 11/01/33 | | | 5,657,401 |
| | 1,443,148 | | S, ^ | | 6.000%, due 04/15/33 | | | 174,976 |
| | 8,961,639 | | S | | 6.000%, due 12/01/28-10/15/32 | | | 9,695,106 |
| | 18,489,252 | | S, ^ | | 6.157%, due 10/15/37 | | | 1,996,701 |
| | 4,000,000 | | W | | 6.500%, due 11/15/34 | | | 4,250,624 |
| | 39,917 | | S | | 6.500%, due 01/01/24 | | | 43,039 |
| | 5,426,543 | | S, ^ | | 6.507%, due 05/15/35 | | | 704,269 |
| | 94,577 | | S | | 7.000%, due 11/01/31-03/01/32 | | | 103,961 |
| | 6,556 | | S | | 7.500%, due 11/01/28 | | | 7,411 |
| | | | | | | | |
| | | | | | | | 103,178,925 |
| | | | | | | | |
| Federal National Mortgage Association##: 16.1% |
| | 324,339 | | S | | 0.386%, due 04/25/35 | | | 298,706 |
| | 119,920 | | S | | 0.596%, due 08/25/33 | | | 117,322 |
| | 243,417 | | S | | 0.644%, due 04/18/28 | | | 239,923 |
| | 285,551 | | S | | 0.764%, due 10/25/33 | | | 280,169 |
| | 250,161 | | S | | 0.796%, due 01/25/32 | | | 247,059 |
| | 2,789,955 | | S, ^ | | 4.000%, due 11/01/18 | | | 255,099 |
| | 2,039,000 | | W | | 4.500%, due 10/15/18 | | | 2,111,639 |
| | 13,147,662 | | S | | 5.000%, due 02/25/29-07/01/36 | | | 13,676,644 |
| | 989,939 | | S | | 5.013%, due 07/01/35 | | | 1,042,079 |
| | 601,442 | | S | | 5.253%, due 08/01/35 | | | 632,941 |
| | 34,542,000 | | W | | 5.500%, due 10/15/35 | | | 36,134,179 |
| | 9,031,296 | | S | | 5.500%, due 02/01/18-01/01/39 | | | 9,494,471 |
| | 37,263,000 | | W | | 6.000%, due 10/14/39 | | | 39,318,278 |
| | 2,152,595 | | S, ^ | | 6.000%, due 08/25/33 | | | 361,310 |
| | 13,500,264 | | S | | 6.000%, due 08/01/16-08/01/38 | | | 14,410,765 |
| | 8,124,837 | | S, ^ | | 6.204%, due 04/25/37 | | | 868,431 |
| | 4,596,427 | | S, ^ | | 6.344%, due 06/25/36 | | | 496,943 |
| | 2,489,191 | | S, ^ | | 6.354%, due 08/25/25 | | | 137,276 |
| | 3,843,370 | | S, ^ | | 6.454%, due 08/25/26 | | | 507,604 |
| | 9,092,668 | | S, ^ | | 6.494%, due 01/25/37 | | | 1,058,317 |
| | 12,193,000 | | W | | 6.500%, due 10/01/31 | | | 13,033,171 |
| | 1,271,517 | | S | | 6.500%, due 01/01/23-05/01/37 | | | 1,370,192 |
| | 27,990,736 | | S, ^ | | 6.504%, due 10/25/35 | | | 4,002,952 |
| | 315,434 | | S | | 7.000%, due 12/01/27-03/01/32 | | | 348,738 |
| | 1,860,628 | | S, ^ | | 7.443%, due 02/17/29 | | | 258,943 |
| | 870,271 | | S | | 7.500%, due 10/01/30-01/25/48 | | | 962,650 |
| | 187,776 | | S | | 27.615%, due 02/25/34 | | | 235,789 |
| | 2,931,001 | | S | | 28.215%, due 03/25/35 | | | 3,898,565 |
| | | | | | | | |
| | | | | | | | 145,800,155 |
| | | | | | | | |
| | | | | | | | |
Principal
Amount | | | | | | Value |
| | | | | | | | |
| Government National Mortgage Association: 5.3% |
| $ | 4,394 | | S | | 4.375%, due 04/20/28 | | $ | 4,495 |
| | 6,747,000 | | W | | 4.500%, due 11/15/35 | | | 6,825,009 |
| | 1,984,891 | | S | | 4.500%, due 04/15/39 | | | 2,019,006 |
| | 1,480,000 | | W | | 5.000%, due 03/15/38 | | | 1,526,019 |
| | 38,786,918 | | S, ^ | | 5.000%, due 04/20/38-06/16/39 | | | 5,461,542 |
| | 7,569,000 | | W | | 5.500%, due 11/01/32 | | | 7,915,516 |
| | 4,079,735 | | S | | 5.500%, due 09/15/38 | | | 4,289,458 |
| | 3,640,881 | | | | 5.500%, due 03/20/39 | | | 3,832,000 |
| | 33,123,859 | | S, ^ | | 5.954%, due 06/20/38-04/20/39 | | | 3,106,337 |
| | 5,598,000 | | W | | 6.000%, due 10/01/32 | | | 5,910,268 |
| | 1,241,744 | | S | | 6.000%, due 10/15/38 | | | 1,313,726 |
| | 17,829,264 | | S, ^ | | 6.054%, due 05/20/39 | | | 1,596,823 |
| | 15,528,103 | | S, ^ | | 6.154%, due 04/20/38 | | | 1,629,589 |
| | 3,344,527 | | S, ^ | | 6.259%, due 05/16/38 | | | 379,607 |
| | 19,880,059 | | S, ^ | | 6.304%, due 01/20/38 | | | 1,659,394 |
| | 186,212 | | S | | 6.500%, due 02/15/26-09/15/32 | | | 200,821 |
| | 93,011 | | S | | 7.000%, due 04/15/26-05/15/32 | | | 102,463 |
| | 134,974 | | S | | 7.500%, due 12/15/22-05/15/32 | | | 151,022 |
| | 521,131 | | S, ^ | | 8.009%, due 06/16/31 | | | 77,595 |
| | | | | | | | |
| | | | | | | | 48,000,690 |
| | | | | | | | |
| | | | | Total U.S. Government Agency Obligations
(Cost $286,792,876) | | | 296,979,770 |
| | | | | | | | |
| U.S. TREASURY OBLIGATIONS: 16.4% | | | |
| U.S. Treasury Notes: 16.4% | | | |
| | 9,125,000 | | S | | 1.000%, due 08/31/11 | | | 9,143,898 |
| | 3,165,000 | | | | 1.000%, due 09/30/11 | | | 3,168,463 |
| | 5,390,000 | | | | 1.375%, due 09/15/12 | | | 5,382,422 |
| | 18,155,000 | | | | 1.750%, due 08/15/12 | | | 18,347,915 |
| | 11,699,000 | | S | | 2.375%, due 08/31/14 | | | 11,746,533 |
| | 2,594,000 | | | | 2.375%, due 09/30/14 | | | 2,601,504 |
| | 50,574,000 | | L | | 3.625%, due 08/15/19 | | | 51,925,287 |
| | 45,135,000 | | S | | 4.250%, due 05/15/39 | | | 46,707,684 |
| | | | | | | | |
| | | | | Total U.S. Treasury Obligations
(Cost $147,182,426) | | | 149,023,706 |
| | | | | | | | |
| ASSET-BACKED SECURITIES: 3.6% | | | |
| Automobile Asset-Backed Securities: 2.2% | | | |
| | 2,317,000 | | #, S | | Bank of America Auto Trust,
2.130%, due 09/15/13 | | | 2,322,170 |
| | 1,737,000 | | #, S | | Bank of America Auto Trust,
2.670%, due 07/15/13 | | | 1,755,801 |
| | 1,372,000 | | S | | Harley-Davidson Motorcycle Trust,
2.620%, due 03/15/14 | | | 1,395,013 |
| | 3,661,000 | | S | | Harley-Davidson Motorcycle Trust,
3.190%, due 11/15/13 | | | 3,739,542 |
| | 1,507,000 | | S | | Harley-Davidson Motorcycle Trust,
5.520%, due 11/15/13 | | | 1,591,664 |
| | 1,029,000 | | S | | Honda Auto Receivables Owner Trust,
2.310%, due 05/15/13 | | | 1,045,249 |
See Accompanying Notes to Financial Statements
59
| | |
| ING INTERMEDIATE BOND FUND | | PORTFOLIO OF INVESTMENTS ASOF SEPTEMBER 30, 2009 (UNAUDITED) (CONTINUED) |
| | | | | | | | |
Principal
Amount | | | | | | Value |
| | | | | | | | |
| Automobile Asset-Backed Securities: (continued) |
| $ | 1,607,000 | | S | | Honda Auto Receivables Owner Trust,
4.880%, due 09/18/14 | | $ | 1,692,185 |
| | 887,000 | | S | | Hyundai Auto Receivables Trust,
2.030%, due 08/15/13 | | | 888,257 |
| | 1,188,000 | | @@ | | Mercedes-Benz Auto Receivables Trust,
1.670%, due 01/15/14 | | | 1,187,970 |
| | 866,000 | | @@ | | Mercedes-Benz Auto Receivables Trust,
2.430%, due 03/15/16 | | | 865,825 |
| | 1,178,000 | | S | | Nissan Auto Receivables Owner Trust,
2.940%, due 07/15/11 | | | 1,193,040 |
| | 605,250 | | S | | Nissan Auto Receivables Owner Trust,
4.280%, due 06/16/14 | | | 630,832 |
| | 484,000 | | S | | Nissan Auto Receivables Owner Trust,
4.460%, due 04/16/12 | | | 500,441 |
| | 1,465,000 | | S | | USAA Auto Owner Trust,
5.070%, due 06/15/13 | | | 1,541,526 |
| | | | | | | | |
| | | | | | | | 20,349,515 |
| | | | | | | | |
| Home Equity Asset-Backed Securities: 0.5% | | | |
| | 290,059 | | S | | Freddie Mac Structured Pass-through Securities,
0.496%, due 05/25/31 | | | 202,558 |
| | 67,547 | | S | | Freddie Mac Structured Pass-through Securities,
0.546%, due 01/25/32 | | | 59,548 |
| | 2,648,856 | | S | | GSAA Trust,
5.242%, due 06/25/34 | | | 2,460,362 |
| | 1,384,000 | | #,
S | | Irwin Home Equity,
5.960%, due 08/25/37 | | | 446,203 |
| | 40,848 | | S | | Merrill Lynch Mortgage Investors Trust,
0.606%, due 07/25/34 | | | 28,618 |
| | 935,320 | | S | | Morgan Stanley Capital, Inc.,
1.446%, due 06/25/33 | | | 561,425 |
| | 72,722 | | S | | Renaissance Home Equity Loan Trust,
4.456%, due 05/25/35 | | | 71,052 |
| | 75,704 | | S | | Residential Asset Securities Corp.,
0.846%, due 06/25/32 | | | 26,289 |
| | 588,116 | | S | | Residential Funding Mortgage Securities II, Inc.,
5.890%, due 06/25/37 | | | 534,640 |
| | 224,588 | | | | Wells Fargo Home Equity Trust,
3.970%, due 05/25/34 | | | 219,779 |
| | | | | | | | |
| | | | | | | | 4,610,474 |
| | | | | | | | |
| Other Asset-Backed Securities: 0.9% | | | |
| | 27,400 | | S | | Amortizing Residential Collateral Trust,
0.496%, due 05/25/32 | | | 16,440 |
| | 1,026,446 | | S | | Bear Stearns Asset-Backed Securities, Inc.,
0.626%, due 06/25/36 | | | 581,037 |
| | | | | | | | |
Principal
Amount | | | | | | Value |
| | | | | | | | |
| Other Asset-Backed Securities: (continued) |
| $ | 173,541 | | S | | CenterPoint Energy Transition Bond Co., LLC,
4.192%, due 02/01/20 | | $ | 182,633 |
| | 149,538 | | S | | Chase Funding Mortgage Loan Asset-Backed Certificates,
0.846%, due 07/25/33 | | | 124,754 |
| | 21,604 | | S | | Chase Funding Mortgage Loan Asset-Backed Certificates,
4.045%, due 05/25/33 | | | 21,233 |
| | 1,982,753 | | S | | Credit-Based Asset Servicing and Securitization, LLC,
4.831%, due 08/25/35 | | | 1,853,183 |
| | 1,382,660 | | S | | Credit-Based Asset Servicing and Securitization, LLC,
5.501%, due 12/25/36 | | | 1,068,045 |
| | 1,456,000 | | #, S | | Credit-Based Asset Servicing and Securitization, LLC,
5.746%, due 12/25/37 | | | 1,113,722 |
| | 1,188,000 | | #, S | | Credit-Based Asset Servicing and Securitization, LLC,
6.020%, due 12/25/37 | | | 665,235 |
| | 892,753 | | S | | Equity One, Inc.,
5.050%, due 09/25/33 | | | 761,480 |
| | 2,720,000 | | #, S, I | | Hudson Mezzanine Funding,
0.994%, due 06/12/42 | | | 3 |
| | 753,943 | | S | | Lehman XS Trust,
0.526%, due 08/25/35 | | | 412,267 |
| | 53,523 | | S | | Popular Mortgage Pass-through Trust,
4.000%, due 12/25/34 | | | 52,802 |
| | 233,850 | | S | | Residential Asset Mortgage Products, Inc.,
0.516%, due 07/25/35 | | | 201,238 |
| | 4,913 | | S | | Residential Asset Mortgage Products, Inc.,
0.866%, due 06/25/33 | | | 2,743 |
| | 910,640 | | S | | Structured Asset Securities Corp.,
4.910%, due 06/25/33 | | | 669,904 |
| | | | | | | | |
| | | | | | | | 7,726,719 |
| | | | | | | | |
| | | | | Total Asset-Backed Securities
(Cost $38,954,029) | | | 32,686,708 |
| | | | | | | | |
| COLLATERALIZED MORTGAGE OBLIGATIONS: 13.1% |
| | 206,968 | | S | | ABN Amro Mortgage Corp.,
0.746%, due 03/25/18 | | | 185,346 |
| | 481,092 | | S | | American Home Mortgage Assets,
1.691%, due 02/25/47 | | | 80,836 |
| | 2,069,033 | | S | | American Home Mortgage Assets,
1.901%, due 09/25/46 | | | 409,765 |
| | 4,138,693 | | S | | American Home Mortgage Investment Trust,
0.536%, due 11/25/45 | | | 2,179,609 |
| | 5,151,845 | | S | | American Home Mortgage Investment Trust,
0.626%, due 11/25/45 | | | 1,549,663 |
See Accompanying Notes to Financial Statements
60
| | |
| ING INTERMEDIATE BOND FUND | | PORTFOLIO OF INVESTMENTS ASOF SEPTEMBER 30, 2009 (UNAUDITED) (CONTINUED) |
| | | | | | | | |
Principal
Amount | | | | | | Value |
| | | | | | | | |
| COLLATERALIZED MORTGAGE OBLIGATIONS: (continued) |
| $ | 1,614,430 | | S | | Banc of America Commercial Mortgage, Inc.,
4.161%, due 12/10/42 | | $ | 1,615,226 |
| | 767,836 | | S | | Banc of America Commercial Mortgage, Inc.,
4.772%, due 07/11/43 | | | 786,971 |
| | 1,000,000 | | S | | Banc of America Commercial Mortgage, Inc.,
6.186%, due 06/11/35 | | | 1,052,762 |
| | 4,664,661 | | #, S | | Banc of America Funding Corp.,
5.250%, due 08/26/35 | | | 4,314,812 |
| | 4,741,226 | | S | | Banc of America Funding Corp.,
5.258%, due 09/20/35 | | | 3,286,480 |
| | 2,170,864 | | S | | Banc of America Mortgage Securities, Inc.,
5.145%, due 09/25/35 | | | 1,943,128 |
| | 696,850 | | S | | Bear Stearns Alternative-A Trust,
0.566%, due 07/25/34 | | | 452,957 |
| | 696,000 | | S | | Bear Stearns Commercial Mortgage Securities,
4.565%, due 07/11/42 | | | 696,346 |
| | 97,032 | | S | | Bear Stearns Commercial Mortgage Securities,
5.415%, due 04/12/38 | | | 98,242 |
| | 6,151,608 | | S | | Chase Mortgage Finance Corp.,
5.405%, due 12/25/35 | | | 5,257,348 |
| | 1,997,245 | | S | | Chase Mortgage Finance Corp.,
5.500%, due 11/25/35 | | | 1,851,823 |
| | 121,217 | | S | | Citicorp Mortgage Securities, Inc.,
0.696%, due 03/25/33 | | | 114,945 |
| | 712,000 | | S | | Citigroup Commercial Mortgage Trust,
5.888%, due 12/10/49 | | | 621,670 |
| | 4,458,996 | | #, S | | Citigroup Mortgage Loan Trust, Inc.,
18.984%, due 10/25/35 | | | 4,213,751 |
| | 4,420,000 | | S | | Commercial Mortgage Pass-through Certificates,
6.010%, due 12/10/49 | | | 3,994,149 |
| | 32,343 | | S | | Countrywide Alternative Loan Trust,
0.646%, due 02/25/33 | | | 30,296 |
| | 357,212 | | S | | Countrywide Alternative Loan Trust,
0.796%, due 04/25/33 | | | 295,355 |
| | 1,195,388 | | S | | Countrywide Home Loan Mortgage Pass-through Trust,
0.566%, due 04/25/35 | | | 213,915 |
| | 306,338 | | S | | Countrywide Home Loan Mortgage Pass-through Trust,
0.746%, due 04/25/18 | | | 246,912 |
| | | | | | | | |
Principal
Amount | | | | | | Value |
| | | | | | | | |
| COLLATERALIZED MORTGAGE OBLIGATIONS: (continued) |
| $ | 1,660,193 | | S | | Countrywide Home Loan Mortgage Pass-through Trust,
5.250%, due 10/25/35 | | $ | 1,184,137 |
| | 334,013 | | S | | Credit Suisse First Boston Mortgage Securities Corp.,
3.727%, due 03/15/35 | | | 337,373 |
| | 2,000,000 | | S | | Fannie Mae,
5.000%, due 05/25/32 | | | 2,084,503 |
| | 923,000 | | S | | First Horizon Asset Securities, Inc.,
5.750%, due 02/25/36 | | | 828,260 |
| | 1,151,456 | | S | | First Horizon Mortgage Pass-through Trust,
5.500%, due 12/25/35 | | | 1,038,291 |
| | 408,067 | | S | | GE Capital Commercial Mortgage Corp.,
4.371%, due 01/10/38 | | | 412,880 |
| | 178,267 | | S | | GE Capital Commercial Mortgage Corp.,
5.560%, due 06/10/38 | | | 183,292 |
| | 930,000 | | S | | GE Capital Commercial Mortgage Corp.,
6.531%, due 05/15/33 | | | 969,540 |
| | 4,564,321 | | S | | GMAC Mortgage Corp. Loan Trust,
4.980%, due 06/25/34 | | | 4,041,981 |
| | 2,692,415 | | S | | GMAC Mortgage Corp. Loan Trust,
5.254%, due 03/18/35 | | | 2,558,035 |
| | 1,618,070 | | S | | GMAC Mortgage Corp. Loan Trust,
5.463%, due 11/19/35 | | | 1,382,217 |
| | 39,157 | | S | | GMAC Mortgage Corp. Loan Trust,
5.500%, due 09/25/34 | | | 38,933 |
| | 4,285,000 | | S | | Greenwich Capital Commercial Funding Corp.,
5.444%, due 03/10/39 | | | 3,807,771 |
| | 4,630,000 | | S | | Greenwich Capital Commercial Funding Corp.,
5.736%, due 12/10/49 | | | 4,180,558 |
| | 1,500,000 | | S | | GSMS RR1JPA5.3739 9/17/39,
5.374%, due 09/17/39 | | | 1,408,650 |
| | 325,699 | | S | | GSR Mortgage Loan Trust,
0.746%, due 06/25/35 | | | 242,130 |
| | 1,179,014 | | S | | GSR Mortgage Loan Trust,
5.500%, due 07/25/35 | | | 1,058,621 |
| | 504,803 | | S | | Harborview Mortgage Loan Trust,
0.596%, due 01/19/35 | | | 278,596 |
| | 274,382 | | S | | Homebanc Mortgage Trust,
1.106%, due 08/25/29 | | | 164,604 |
| | 205,012 | | S | | JPMorgan Alternative Loan Trust,
5.508%, due 01/25/36 | | | 139,167 |
| | 124,584,459 | | S, ^ | | JPMorgan Chase Commercial Mortgage Securities Corp.,
0.274%, due 02/15/51 | | | 881,585 |
| | 140,543 | | S | | JPMorgan Chase Commercial Mortgage Securities Corp.,
4.200%, due 07/12/35 | | | 142,894 |
See Accompanying Notes to Financial Statements
61
| | |
| ING INTERMEDIATE BOND FUND | | PORTFOLIO OF INVESTMENTS ASOF SEPTEMBER 30, 2009 (UNAUDITED) (CONTINUED) |
| | | | | | | | |
Principal
Amount | | | | | | Value |
| | | | | | | | |
| COLLATERALIZED MORTGAGE OBLIGATIONS: (continued) |
| $ | 746,172 | | S | | JPMorgan Chase Commercial Mortgage Securities Corp.,
4.275%, due 01/12/37 | | $ | 760,274 |
| | 5,110,000 | | S | | JPMorgan Chase Commercial Mortgage Securities Corp.,
5.336%, due 05/15/47 | | | 4,391,356 |
| | 92,854 | | S | | JPMorgan Chase Commercial Mortgage Securities Corp.,
6.023%, due 04/15/45 | | | 94,238 |
| | 544,782 | | S | | JPMorgan Commercial Mortgage Finance Corp.,
7.371%, due 08/15/32 | | | 548,444 |
| | 3,797,602 | | S | | JPMorgan Mortgage Trust,
5.294%, due 07/25/35 | | | 3,529,676 |
| | 190,509 | | S | | LB-UBS Commercial Mortgage Trust,
4.310%, due 02/15/30 | | | 190,934 |
| | 640,000 | | S | | LB-UBS Commercial Mortgage Trust,
5.156%, due 02/15/31 | | | 603,554 |
| | 1,000,000 | | S | | LB-UBS Commercial Mortgage Trust,
5.372%, due 09/15/39 | | | 912,931 |
| | 2,747,000 | | S | | LB-UBS Commercial Mortgage Trust,
5.403%, due 02/15/40 | | | 2,632,823 |
| | 2,300,000 | | S | | LB-UBS Commercial Mortgage Trust,
6.080%, due 06/15/38 | | | 2,182,980 |
| | 3,000,000 | | S | | LB-UBS Commercial Mortgage Trust,
6.365%, due 12/15/28 | | | 3,147,534 |
| | 2,002,928 | | S | | LB-UBS Commercial Mortgage Trust,
7.370%, due 08/15/26 | | | 2,047,135 |
| | 1,382,657 | | S | | Luminent Mortgage Trust,
0.446%, due 10/25/46 | | | 635,931 |
| | 19,124 | | S | | MASTR Alternative Loans Trust,
6.500%, due 05/25/33 | | | 16,631 |
| | 175,927 | | S | | MASTR Alternative Loans Trust,
8.500%, due 05/25/33 | | | 166,262 |
| | 460,690 | | S | | MASTR Asset Securitization Trust,
5.500%, due 06/25/33 | | | 454,553 |
| | 1,132,935 | | #, S | | MASTR Reperforming Loan Trust,
0.606%, due 07/25/35 | | | 953,370 |
| | 706,292 | | S | | MLCC Mortgage Investors, Inc.,
0.476%, due 04/25/29 | | | 616,130 |
| | 452,289 | | S | | MLCC Mortgage Investors, Inc.,
0.566%, due 10/25/28 | | | 358,826 |
| | 239,952 | | S | | MLCC Mortgage Investors, Inc.,
0.566%, due 01/25/29 | | | 203,452 |
| | 362,625 | | S | | Morgan Stanley Dean Witter Capital I,
4.180%, due 03/12/35 | | | 368,392 |
| | | | | | | | |
Principal
Amount | | | | | | Value |
| | | | | | | | |
| COLLATERALIZED MORTGAGE OBLIGATIONS: (continued) |
| $ | 678,380 | | S | | Morgan Stanley Dean Witter Capital I,
7.200%, due 10/15/33 | | $ | 698,268 |
| | 1,621,000 | | S | | New York Mortgage Trust, Inc.,
5.651%, due 05/25/36 | | | 1,214,217 |
| | 1,016,543 | | S | | Nomura Asset Securities Corp.,
6.690%, due 03/15/30 | | | 1,085,599 |
| | 169,519 | | S | | Prime Mortgage Trust,
0.746%, due 02/25/35 | | | 97,748 |
| | 1,658,010 | | S | | Prudential Commercial Mortgage Trust,
3.669%, due 02/11/36 | | | 1,671,029 |
| | 268,064 | | S | | Residential Funding Mortgage Sec I,
0.646%, due 11/25/17 | | | 189,705 |
| | 101,760 | | S | | Salomon Brothers Mortgage Securities VII,
7.520%, due 02/18/32 | | | 102,009 |
| | 342,928 | | S | | Sequoia Mortgage Trust,
0.516%, due 01/20/35 | | | 242,980 |
| | 452,138 | | S | | Structured Adjustable Rate Mortgage Loan Trust,
0.556%, due 07/25/35 | | | 239,155 |
| | 693,347 | | S | | Structured Asset Mortgage Investments, Inc.,
0.486%, due 04/19/35 | | | 376,318 |
| | 2,642,034 | | S | | Structured Asset Mortgage Investments, Inc.,
3.198%, due 12/27/35 | | | 1,365,675 |
| | 433,374 | | S | | Thornburg Mortgage Securities Trust,
0.596%, due 12/25/33 | | | 347,290 |
| | 1,623,000 | | S | | Wachovia Bank Commercial Mortgage Trust,
5.308%, due 11/15/48 | | | 1,465,103 |
| | 880,960 | | | | Wachovia Bank Commercial Mortgage Trust,
5.506%, due 03/15/45 | | | 899,574 |
| | 1,280,000 | | S | | Wachovia Bank Commercial Mortgage Trust,
5.558%, due 03/15/45 | | | 1,238,803 |
| | 369,956 | | | | Washington Mutual Mortgage Pass-through Certificates,
0.556%, due 01/25/45 | | | 233,488 |
| | 397,680 | | | | Washington Mutual Mortgage Pass-through Certificates,
0.566%, due 08/25/45 | | | 251,178 |
| | 815,474 | | S | | Washington Mutual Mortgage Pass-through Certificates,
0.646%, due 08/25/45 | | | 333,848 |
| | 413,945 | | | | Washington Mutual Mortgage Pass-through Certificates,
0.670%, due 06/25/44 | | | 266,331 |
| | 418,659 | | S | | Washington Mutual Mortgage Pass-through Certificates,
0.746%, due 01/25/18 | | | 301,839 |
| | 1,485,101 | | | | Washington Mutual Mortgage Pass-through Certificates,
1.601%, due 03/25/47 | | | 770,936 |
| | 2,717,229 | | | | Washington Mutual Mortgage Pass-through Certificates,
1.711%, due 07/25/47 | | | 1,455,827 |
See Accompanying Notes to Financial Statements
62
| | |
| ING INTERMEDIATE BOND FUND | | PORTFOLIO OF INVESTMENTS ASOF SEPTEMBER 30, 2009 (UNAUDITED) (CONTINUED) |
| | | | | | | |
Principal
Amount | | | | | | Value |
| | | | | | | |
COLLATERALIZED MORTGAGE OBLIGATIONS: (continued) |
| $ 1,958,838 | | | | Washington Mutual Mortgage Pass-through Certificates,
1.741%, due 11/25/46 | | $ | 922,655 |
| 4,917,189 | | | | Washington Mutual Mortgage Pass-through Certificates,
1.891%, due 06/25/46 | | | 2,415,371 |
| 5,200,908 | | S | | Washington Mutual Mortgage Pass-through Certificates,
5.232%, due 01/25/36 | | | 4,457,236 |
| 1,370,767 | | | | Washington Mutual Mortgage Pass-through Certificates,
6.000%, due 06/25/34 | | | 1,243,307 |
| 5,058,400 | | S | | Wells Fargo Mortgage-Backed Securities Trust,
4.418%, due 10/25/35 | | | 4,388,613 |
| 1,826,000 | | | | Wells Fargo Mortgage-Backed Securities Trust,
4.769%, due 07/25/34 | | | 1,743,919 |
| 1,324,620 | | | | Wells Fargo Mortgage-Backed Securities Trust,
4.868%, due 08/25/34 | | | 1,281,876 |
| | | | | | | |
| | | | Total Collateralized Mortgage Obligations
(Cost $132,992,084) | | | 118,971,648 |
| | | | | | | |
OTHER BONDS: 2.8% | | | |
Foreign Government Bonds: 2.8% | | | |
| BRL 9,568,000 | | S | | Brazil Notas do Tesouro Nacional,
6.000%, due 08/15/12 | | | 9,952,605 |
| BRL 21,117,000 | | | | Brazil Notas do Tesouro Nacional Series F,
10.000%, due 01/01/17 | | | 10,754,758 |
| $ 4,515,000 | | | | Indonesia Government International Bond, due 01/25/12 | | | 4,515,000 |
| | | | | | | |
| | | | Total Other Bonds
(Cost $22,789,633) | | | 25,222,363 |
| | | | | | | |
| | | |
| Shares | | | | | | Value |
PREFERRED STOCK: 0.3% | | | |
Diversified Financial Services: 0.3% | | | |
| 3,450 | | #, P | | Zurich RegCaPS Funding Trust | | $ | 2,395,594 |
| | | | | | | |
| | | | Total Preferred Stock
(Cost $3,277,500) | | | 2,395,594 |
| | | | | | | |
| | | | Total Long-Term Investments
(Cost $971,381,898) | | | 985,308,141 |
| | | | | | | |
SHORT-TERM INVESTMENTS: 1.9% | | | |
Affiliated Mutual Fund: 1.4% | | | |
| 12,331,000 | | S | | ING Institutional Prime Money Market Fund - Class I | | | 12,331,000 |
| | | | | | | |
| | | | Total Mutual Fund
(Cost $12,331,000) | | | 12,331,000 |
| | | | | | | |
| | | | | | | | | | |
Principal
Amount | | | | | | | Value | |
| | | | | | | | | | |
| Securities Lending Collateralcc: 0.5% | | | | | |
| $ | 2,326,001 | | Bank of New York Mellon Corp. Institutional Cash Reserves, Series A (1) | | | $ | 2,326,001 | |
| | 3,329,856 | | Bank of New York Mellon Corp. Institutional Cash Reserves, Series B (1)(2) | | | | 2,663,885 | |
| | | | | | | | | | |
| | | Total Securities Lending Collateral
(Cost $5,655,857) | | | | 4,989,886 | |
| | | | | | | | | | |
| | | Total Short-Term Investments
(Cost $17,986,857) | | | | 17,320,886 | |
| | | | | | | | | | |
| | | Total Investments in Securities
(Cost $989,368,755)* | | 110.6 | % | | $ | 1,002,629,027 | |
| | | Other Assets and Liabilities - Net | | (10.6 | ) | | | (96,459,447 | ) |
| | | | | | | | | | |
| | | Net Assets | | 100.0 | % | | $ | 906,169,580 | |
| | | | | | | | | | |
| MASTR | Mortgage Asset Securitization Transaction, Inc. |
| + | Step-up basis bonds. Interest rates shown reflect current and next coupon rates. |
| # | Securities with purchases pursuant to Rule 144A or section 4(2), under the Securities Act of 1933 and may not be resold subject to that rule except to qualified institutional buyers. Unless otherwise noted, these securities have been determined to be liquid under the guidelines established by the Funds’ Board of Directors/Trustees. These securities amount to $107,212,543 or 11.83% of the Fund’s net assets at September 30, 2009. |
| P | Preferred Stock may be called prior to convertible date. |
| cc | Securities purchased with cash collateral for securities loaned. |
| 1 | Collateral received from brokers for securites lending was invested in these short-term investments. |
| 2 | On September 12, 2008, BNY established a separate sleeve of the Institutional Cash Reserves Fund (Series B) to hold certain Lehman Brothers defaulted debt obligations. The Fund’s position in Series B is being marked to market daily. Please see the accompanying Notes to Financial Statements for additional details on securities lending. |
| ## | On September 7, 2008, the Federal Housing Finance Agency placed the Federal National Mortgage Association and the Federal Home Loan Mortgage Corporation into conservatorship and the U.S. Treasury guaranteed the debt issued by those organizations. |
| W | Settlement is on a when-issued or delayed-delivery basis. |
| S | All or a portion of this security is segregated to cover collateral requirements for applicable futures, options, swaps, foreign forward currency contracts and/or when-issued or delayed-delivery securities. |
| L | Loaned security, a portion or all of the security is on loan at September 30, 2009. |
See Accompanying Notes to Financial Statements
63
| | |
| ING INTERMEDIATE BOND FUND | | PORTFOLIO OF INVESTMENTS ASOF SEPTEMBER 30, 2009 (UNAUDITED) (CONTINUED) |
| ^ | Interest only securities represent the right to receive the monthly interest payments on an underlying pool of mortgage loans. Principal amount shown represents the notional amount on which current interest is calculated. Payments of principal on the pool reduce the value of the interest only security. |
| * | Cost for federal income tax purposes is $989,847,081. |
| | | | |
Net unrealized appreciation consists of: | |
Gross Unrealized Appreciation | | $ | 50,596,524 | |
Gross Unrealized Depreciation | | | (37,814,578 | ) |
| | | | |
Net Unrealized Appreciation | | $ | 12,781,946 | |
| | | | |
Fair Value Measurements*
The following is a summary of the fair valuations according to the inputs used as of September 30, 2009 in valuing the Fund’s assets and liabilities:
| | | | | | | | | | | | | | | |
| | | Quoted Prices in Active Markets for Identical Investments (Level 1) | | | Significant Other Observable Inputs (Level 2) | | | Significant Unobservable Inputs (Level 3) | | Fair Value at 09/30/2009 | |
Asset Table | | | | | | | | | | | | | | | |
Investments, at value | | | | | | | | | | | | | | | |
Preferred Stock | | $ | — | | | $ | 2,395,594 | | | $ | — | | $ | 2,395,594 | |
Corporate Bonds/Notes | | | — | | | | 359,579,924 | | | | 448,428 | | | 360,028,352 | |
U.S. Government Agency Obligations | | | — | | | | 296,979,770 | | | | — | | | 296,979,770 | |
U.S. Treasury Obligations | | | — | | | | 149,023,706 | | | | — | | | 149,023,706 | |
Asset-Backed Securities | | | — | | | | 32,670,265 | | | | 16,443 | | | 32,686,708 | |
Collateralized Mortgage Obligations | | | — | | | | 109,034,435 | | | | 9,937,213 | | | 118,971,648 | |
Other Bonds | | | — | | | | 14,467,605 | | | | 10,754,758 | | | 25,222,363 | |
Short-Term Investments | | | 14,657,001 | | | | 2,663,885 | | | | — | | | 17,320,886 | |
| | | | | | | | | | | | | | | |
Total Investments, at value | | $ | 14,657,001 | | | $ | 966,815,184 | | | $ | 21,156,842 | | $ | 1,002,629,027 | |
| | | | | | | | | | | | | | | |
Other Financial Instruments++: | | | | | | | | | | | | | | | |
Forward foreign currency contracts | | | — | | | | 31,832 | | | | — | | | 31,832 | |
Futures | | | 127,535 | | | | — | | | | — | | | 127,535 | |
Swaps | | | — | | | | 3,864,421 | | | | — | | | 3,864,421 | |
| | | | | | | | | | | | | | | |
Total Assets | | $ | 14,784,536 | | | $ | 970,711,437 | | | $ | 21,156,842 | | $ | 1,006,652,815 | |
| | | | | | | | | | | | | | | |
Liabilities Table | | | | | | | | | | | | | | | |
Other Financial Instruments++: | | | | | | | | | | | | | | | |
Futures | | | (1,647,041 | ) | | | — | | | | — | | | (1,647,041 | ) |
Swaps | | | — | | | | (3,363,502 | ) | | | — | | | (3,363,502 | ) |
| | | | | | | | | | | | | | | |
Total Liabilities | | $ | (1,647,041 | ) | | $ | (3,363,502 | ) | | $ | — | | $ | (5,010,543 | ) |
| | | | | | | | | | | | | | | |
See Accompanying Notes to Financial Statements
64
| | |
| ING INTERMEDIATE BOND FUND | | PORTFOLIO OF INVESTMENTS ASOF SEPTEMBER 30, 2009 (UNAUDITED) (CONTINUED) |
The following is a reconciliation of the fair valuations using significant unobservable inputs (Level 3) for the Fund’s assets and liabilities during the period ended September 30, 2009:
| | | | | | | | | | | | | | | | | | | | | | | | | | | | | | | | | | | | | | |
| | | Beginning Balance at 03/31/2009 | | Purchases | | Issuances | | Settlements | | Sales | | | Accrued Discounts/ (Premiums) | | | Total Realized Gain/(Loss) | | | Total Unrealized Appreciation/ (Depreciation) | | | Transfers Into Level 3 | | Transfers Out of Level 3 | | | Ending Balance at 09/30/2009 |
Asset Table | | | | | | | | | | | | | | | | | | | | | | | | | | | | | | | | | | | | | | |
Investments, at value | | | | | | | | | | | | | | | | | | | | | | | | | | | | | | | | | | | | | | |
Corporate Bonds/Notes | | $ | 751,552 | | $ | — | | $ | — | | $ | — | | $ | (303,698 | ) | | $ | (127,961 | ) | | $ | (338,397 | ) | | $ | 466,932 | | | $ | — | | $ | — | | | $ | 448,428 |
Asset-Backed Securities | | | 1,360 | | | — | | | — | | | — | | | — | | | | — | | | | — | | | | (1,357 | ) | | | 16,440 | | | — | | | | 16,443 |
Collateralized Mortgage Obligations | | | 224,602 | | | 9,899,039 | | | — | | | — | | | (780,950 | ) | | | 3,236 | | | | (149,876 | ) | | | 822,302 | | | | — | | | (81,140 | ) | | | 9,937,213 |
Other Bonds | | | 3,692,800 | | | 22,419,727 | | | — | | | — | | | (16,433,292 | ) | | | (276,373 | ) | | | 1,661,240 | | | | 2,097,877 | | | | — | | | (2,407,221 | ) | | | 10,754,758 |
| | | | | | | | | | | | | | | | | | | | | | | | | | | | | | | | | | | | | | |
Total Investments, at value | | $ | 4,670,314 | | $ | 32,318,766 | | $ | — | | $ | — | | $ | (17,517,940 | ) | | $ | (401,098 | ) | | $ | 1,172,967 | | | $ | 3,385,754 | | | $ | 16,440 | | $ | (2,488,361 | ) | | $ | 21,156,842 |
| | | | | | | | | | | | | | | | | | | | | | | | | | | | | | | | | | | | | | |
As of September 30, 2009, total change in unrealized gain (loss) on Level 3 securities still held at period end and included in the change in net assets was $1,670,988.
“Fair value” for purposes of ASC 820 is different from “fair value” as used in the 1940 Act. The former generally implies market value, and can include market quotations as a source of value, and the latter refers to determinations of value in absence of available market quotations.
| + | See Note 2, “Significant Accounting Policies” in the Notes to Financial Statements for additional information. |
Transfers into Level 3 represents either the beginning balance (for transfer in), or the ending value (for transfers out) of any security or derivative instrument where a change in the pricing level occurred from the beginning to the end of the period.
At September 30, 2009 the following forward foreign currency contracts were outstanding for the ING Intermediate Bond Fund:
| | | | | | | | | | | |
Currency | | Buy/Sell | | Settlement
Date | | In Exchange
For USD | | Value | | Unrealized
Appreciation
(Depreciation) |
Indonesian Rupiah IDR 22,215,690,200 | | BUY | | 10/15/09 | | 2,285,800 | | 2,291,882 | | $ | 6,082 |
Indian Rupee INR 221,877,202 | | BUY | | 10/15/09 | | 4,581,400 | | 4,607,150 | | | 25,750 |
| | | | | | | | | | | |
| | | | | | | | | | $ | 31,832 |
| | | | | | | | | | | |
ING Intermediate Bond Fund Open Futures Contracts on September 30, 2009:
| | | | | | | | |
Contract Description | | Number of Contracts | | Expiration Date | | Unrealized Appreciation/ (Depreciation) | |
Long Contracts | | | | | | | | |
U.S. Treasury 5-Year Note | | 92 | | 12/31/09 | | $ | 126,989 | |
U.S. Treasury 10-Year Note | | 19 | | 12/21/09 | | | 546 | |
| | | | | | | | |
| | | | | | $ | 127,535 | |
| | | | | | | | |
Short Contracts | | | | | | | | |
U.S. Treasury 2-Year Note | | 397 | | 12/31/09 | | $ | (124,481 | ) |
U.S. Treasury 30-Year Bond | | 624 | | 12/21/09 | | | (1,522,560 | ) |
| | | | | | | | |
| | | | | | $ | (1,647,041 | ) |
| | | | | | | | |
See Accompanying Notes to Financial Statements
65
| | |
| ING INTERMEDIATE BOND FUND | | PORTFOLIO OF INVESTMENTS ASOF SEPTEMBER 30, 2009 (UNAUDITED) (CONTINUED) |
ING Intermediate Bond Fund Credit Default Swap Agreements Outstanding on September 30, 2009:
Credit Default Swaps on Corporate and Sovereign Issues — Buy Protection(1)
| | | | | | | | | | | | | | | | | | | | | | | | | | |
Counterparty | | Reference Entity/
Obligation | | Buy/Sell Protection | | (Pay)/Receive Fixed Rate (%) | | | Termination Date | | | | | | Notional Amount(2) | | Market Value(3) | | | Upfront Premium Paid/ (Received) | | Unrealized Appreciation/ (Depreciation) | |
Morgan Stanley Capital Services Inc. | | Domtar Inc.
7.875%, 10/15/11 | | Buy | | (2.650 | ) | | 09/20/11 | | | | USD | | 1,287,500 | | $ | (6,250 | ) | | $ | — | | $ | (6,250 | ) |
Citibank N.A., New York | | MBIA Inc.
6.625%, 10/01/28 | | Buy | | (5.000 | ) | | 09/20/13 | | | | USD | | 640,000 | | | 184,292 | | | | 171,852 | | | 12,440 | |
Citibank N.A., New York | | MBIA Inc.
6.625%, 10/01/28 | | Buy | | (5.000 | ) | | 09/20/13 | | | | USD | | 1,311,000 | | | 377,509 | | | | 337,858 | | | 39,651 | |
JPMorgan Chase Bank, N.A. New York | | MBIA Inc.
6.625%, 10/01/28 | | Buy | | (5.000 | ) | | 09/20/13 | | | | USD | | 5,079,000 | | | 1,462,525 | | | | 712,315 | | | 750,210 | |
| | | | | | | | | | | | | | | | | | | | | | | | | | |
| | | | | | | | | | | | | | | | | $ | 2,018,076 | | | $ | 1,222,025 | | $ | 796,051 | |
| | | | | | | | | | | | | | | | | | | | | | | | | | |
Credit Default Swaps on Credit Indices — Sell Protection(4)
| | | | | | | | | | | | | | | | | | | | | | | |
Counterparty | | Reference Entity/Obligation | | Buy/Sell Protection | | (Pay)/Receive Fixed Rate (%) | | Termination Date | | | | | | Notional Amount(2) | | Market Value(3) | | Upfront Premium Paid/(Received) | | Unrealized Appreciation/ (Depreciation) |
Barclays Bank PLC | | CDX.EM.11 Index | | Sell | | 5.000 | | 06/20/14 | | | | USD | | 9,311,000 | | $ | 925,640 | | $ | 703,541 | | $ | 222,099 |
Barclays Bank PLC | | CDX.EM.11 Index | | Sell | | 5.000 | | 06/20/14 | | | | USD | | 9,148,000 | | | 909,436 | | | 692,187 | | | 217,249 |
| | | | | | | | | | | | | | | | | | | | | | | |
| | | | | | | | | | | | | | | | $ | 1,835,076 | | $ | 1,395,728 | | $ | 439,348 |
| | | | | | | | | | | | | | | | | | | | | | | |
Credit Default Swaps on Corporate and Sovereign Issues—Sell Protection
| | | | | | | | | | | | | | | | | | | | | | | | | | |
Counterparty | | Reference Entity/Obligation | | Buy/Sell Protection | | (Pay)/Receive Fixed Rate (%) | | Termination Date | | Implied Credit Spread At
09/30/09 (%)(5) | | | | Notional Amount(2) | | Market Value(3) | | | Upfront Premium Paid/(Received) | | | Unrealized Appreciation/ (Depreciation) | |
UBS AG | | Domtar Inc.
7.875%, 10/15/11 | | Sell | | 2.600 | | 09/20/11 | | 2.40 | | USD | | 1,288,000 | | $ | 5,019 | | | $ | — | | | $ | 5,019 | |
Citibank N.A., New York | | MBIA Global Funding LLC, FRN, 10/06/10 | | Sell | | 5.000 | | 09/20/13 | | 36.27 | | USD | | 641,000 | | | (373,416 | ) | | | (191,514 | ) | | | (181,902 | ) |
Citibank N.A., New York | | MBIA Global Funding LLC, FRN, 10/06/10 | | Sell | | 5.000 | | 09/20/13 | | 36.27 | | USD | | 1,311,000 | | | (763,727 | ) | | | (427,292 | ) | | | (336,435 | ) |
Goldman Sachs International | | MBIA Global Funding LLC, FRN, 10/06/10 | | Sell | | 5.000 | | 09/20/13 | | 36.27 | | USD | | 1,271,000 | | | (740,425 | ) | | | (374,935 | ) | | | (365,490 | ) |
JPMorgan Chase Bank, N.A. New York | | MBIA Global Funding LLC, FRN, 10/06/10 | | Sell | | 5.000 | | 09/20/13 | | 36.27 | | USD | | 2,540,000 | | | (1,479,684 | ) | | | (376,018 | ) | | | (1,103,666 | ) |
| | | | | | | | | | | | | | | | | | | | | | | | | | |
| | | | | | | | | | | | | | | | $ | (3,352,233 | ) | | $ | (1,369,759 | ) | | $ | (1,982,474 | ) |
| | | | | | | | | | | | | | | | | | | | | | | | | | |
| (1) | If a Fund is a buyer of protection and a credit event occurs, as defined under the terms of that paticular swap agreement, a Fund will either 1.) receive from the seller of protection an amount equal to the notional amount of the swap and deliver the referenced obligation, other deliverable obligations or underlying securities comprising the referenced index or 2.) receive a net settlement amount in the form of cash or securities equal to the notional amount of the swap less the recovery value of the referenced obligation or underlying securities comprising the referenced index. |
See Accompanying Notes to Financial Statements
66
| | |
| ING INTERMEDIATE BOND FUND | | PORTFOLIO OF INVESTMENTS ASOF SEPTEMBER 30, 2009 (UNAUDITED) (CONTINUED) |
| (2) | The maximum amount of future payments (undiscounted) that a Fund as seller of protection could be required to make or receive as a buyer of credit protection under a credit default swap agreement would be an amount equal to the notional amount of the agreement. |
| (3) | The market values for credit default swap agreements serve as an indicator of the current status of the payment/performance risk and represent the likelihood or risk of default for the credit derivative. Increasing market values, in absolute terms, when compared to the notional amount of the agreement, represent a deterioration of the referenced obligation’s credit soundness and a greater likelihood or risk of default or other credit event occurring. |
| (4) | If the Fund is a seller of protection, and a credit event occurs, as defined under the terms of that particular swap agreement, the Fund will generally either 1.) Pay to the buyer an amount equal to the notional amount of the swap and take delivery of the referenced obligation, other deliverable obligations, or underlying securities comprising a referenced index or 2.) Pay a net settlement amount in the form of cash or securities equal to the notional amount of the swap less the recovery value of the referenced obligation or underlying securities comprising a referenced index. |
| (5) | Implied credit spreads, represented in absolute terms, utilized in determining the market value of credit default swap agreements on corporate issues or sovereign issues are disclosed in the table above and serve as an indicator of the current status of the payment/performance risk and represent the likelihood or risk of default for the credit derivative. The implied credit spread of a particular referenced entity reflects the cost of buying/selling protection and may include upfront payments required to be made to enter into the agreement. For credit default swaps on asset-backed securities or credit indices, the quoted market prices and resulting market values serve as the indicator of the current status of the payment/performance risk. Wider credit spreads and increasing market values, in absolute terms when compared to the notional amount of the swap, represent a deterioration of the referenced entity’s credit soundness and a greater likelihood or risk of default or other credit event occurring as defined under the terms of the agreement. |
A summary of derivative instruments by primary risk exposure is outlined in the following tables.
The fair value of derivative instruments as of September 30, 2009 was as follows:
| | | | | |
Derivatives not accounted for as hedging instruments under ASC 815 | | Location on Statement of Assets and Liabilities | | Fair Value |
Asset Derivatives | | | | | |
Interest rate contracts | | Variation margin receivable* | | $ | 170,250 |
Foreign exchange contracts | | Unrealized appreciation on forward foreign currency contracts | | | 31,832 |
Credit contracts | | Unrealized appreciation on swap agreements, net of upfront payments made | | | 3,864,421 |
| | | | | |
Total Asset Derivatives | | | | $ | 4,066,503 |
| | | | | |
| | |
Liability Derivatives | | | | | |
Interest rate contracts | | Payable for futures variation margin* | | $ | 80,647 |
Credit contracts | | Unrealized depreciation on swap agreements, net of upfront payments received | | | 3,363,502 |
| | | | | |
Total Liability Derivatives | | | | $ | 3,444,149 |
| | | | | |
| * | The Fair Values of Derivative Instruments may include cumulative appreciation/depreciation of futures contracts as reported in the table following the Portfolio of Investments. Only current day’s variation margin is reported within the Statement of Assets and Liabilities. |
See Accompanying Notes to Financial Statements
67
| | |
| ING INTERMEDIATE BOND FUND | | PORTFOLIO OF INVESTMENTS ASOF SEPTEMBER 30, 2009 (UNAUDITED) (CONTINUED) |
The effect of derivative instruments on the Fund’s Statement of Operations for the six months ended September 30, 2009 was as follows:
| | | | | | | | | | | | | | | | | | |
| | | Amount of Realized Gain or (Loss) on Derivatives Recognized in Income | |
Derivatives not accounted for as hedging instruments under ASC 815 | | Forward Foreign Currency Contracts | | | Futures | | Swaps | | Written
options | | | Total | |
Credit contracts | | $ | — | | | $ | — | | $ | 80,208 | | $ | (44,800 | ) | | $ | 35,408 | |
Foreign exchange contracts | | | (291,677 | ) | | | — | | | — | | | — | | | | (291,677 | ) |
Interest rate contracts | | | — | | | | 3,052,084 | | | — | | | — | | | | 3,052,084 | |
| | | | | | | | | | | | | | | | | | |
Total | | $ | (291,677 | ) | | $ | 3,052,084 | | $ | 80,208 | | $ | (44,800 | ) | | $ | 2,795,815 | |
| | | | | | | | | | | | | | | | | | |
| |
| | | Change in Unrealized Appreciation or (Depreciation) on Derivatives Recognized in Income | |
Derivatives not accounted for as hedging instruments under ASC 815 | | Forward Foreign
Currency Contracts | | | Futures | | Swaps | | Written
options | | | Total | |
Credit contracts | | $ | — | | | $ | — | | $ | 237,125 | | $ | — | | | $ | 237,125 | |
Foreign exchange contracts | | | 1,304,940 | | | | — | | | — | | | — | | | | 1,304,940 | |
Interest rate contracts | | | — | | | | 488,367 | | | — | | | — | | | | 488,367 | |
| | | | | | | | | | | | | | | | | | |
Total | | $ | 1,304,940 | | | $ | 488,367 | | $ | 237,125 | | $ | — | | | $ | 2,030,432 | |
| | | | | | | | | | | | | | | | | | |
See Accompanying Notes to Financial Statements
68
| | |
| ING CLASSIC MONEY MARKET FUND(1) | | PORTFOLIO OF INVESTMENTS ASOF SEPTEMBER 30, 2009 (UNAUDITED) |
| | | | | | | | |
Principal Amount | | | | | | Value |
| | | | | | | | |
| CERTIFICATES OF DEPOSIT: 3.8% |
| $ | 15,000,000 | | | | BNP Paribas,
0.210%, due 10/28/09 | | $ | 15,000,000 |
| | 10,750,000 | | @@ | | Credit Suisse New York,
0.885%, due 08/12/10 | | | 10,750,000 |
| | 12,000,000 | | | | Rabobank USA Financial Corp.,
0.400%, due 10/05/09 | | | 12,000,320 |
| | | | | | | | |
| | | | | Total Certificates of Deposit
(Cost $37,750,320) | | | 37,750,320 |
| | | | | | | | |
| COMMERCIAL PAPER: 62.1% |
| | 8,500,000 | | | | ANZ National Bank Ltd.,
0.390%, due 03/22/10 | | | 8,484,162 |
| | 4,000,000 | | | | ANZ National Bank Ltd.,
0.400%, due 03/04/10 | | | 3,993,156 |
| | 4,000,000 | | | | ANZ National Bank Ltd.,
0.700%, due 09/17/10 | | | 3,972,700 |
| | 7,500,000 | | | | ASB Finance Ltd.,
0.450%, due 01/22/10 | | | 7,489,406 |
| | 8,000,000 | | | | ASB Finance Ltd.,
0.500%, due 02/26/10 | | | 7,983,556 |
| | 3,014,000 | | | | Barton Capital, LLC,
0.160%, due 10/05/09 | | | 3,013,933 |
| | 5,000,000 | | | | Barton Capital, LLC,
0.170%, due 10/02/09 | | | 4,999,953 |
| | 12,750,000 | | | | Barton Capital, LLC,
0.170%, due 10/20/09 | | | 12,748,789 |
| | 6,197,000 | | | | Barton Capital, LLC,
0.230%, due 10/14/09 | | | 6,196,441 |
| | 3,500,000 | | | | Barton Capital, LLC,
0.280%, due 01/14/10 | | | 3,497,142 |
| | 6,500,000 | | | | Barton Capital, LLC,
0.290%, due 01/06/10 | | | 6,494,921 |
| | 5,000,000 | | | | Cafco, LLC,
0.290%, due 01/15/10 | | | 4,995,731 |
| | 18,500,000 | | | | Cafco, LLC,
0.300%, due 11/24/09 | | | 18,491,398 |
| | 6,000,000 | | | | Cafco, LLC,
0.360%, due 01/07/10 | | | 5,994,120 |
| | 9,500,000 | | | | Cafco, LLC,
0.360%, due 01/12/10 | | | 9,490,215 |
| | 22,500,000 | | | | Ciesco, LLC,
0.300%, due 11/17/09 | | | 22,490,887 |
| | 16,000,000 | | | | Ciesco, LLC,
0.360%, due 01/13/10 | | | 15,983,360 |
| | 17,000,000 | | | | Concord Minutemen Capital Co., LLC,
0.550%, due 12/11/09 | | | 16,981,224 |
| | 20,500,000 | | | | Concord Minutemen Capital Co., LLC,
1.000%, due 02/18/10 | | | 20,420,278 |
| | 15,500,000 | | | | Crown Point Capital Co.,
0.550%, due 12/11/09 | | | 15,482,881 |
| | 3,000,000 | | | | Crown Point Capital Co.,
0.960%, due 03/19/10 | | | 2,986,480 |
| | 18,500,000 | | | | Crown Point Capital Co.,
1.000%, due 02/17/10 | | | 18,428,569 |
| | 6,000,000 | | | | Danske Corp.,
0.210%, due 10/15/09 | | | 5,999,487 |
| | 9,000,000 | | | | Danske Corp.,
0.540%, due 12/18/09 | | | 8,989,275 |
| | | | | | | | |
Principal Amount | | | | | | Value |
| | | | | | | | |
| COMMERCIAL PAPER: (continued) |
| $ | 15,000,000 | | | | Dexia,
0.130%, due 10/01/09 | | $ | 15,000,000 |
| | 15,000,000 | | | | Dexia,
0.210%, due 10/05/09 | | | 14,999,567 |
| | 5,276,000 | | | | Edison Asset Securities, LLC,
0.270%, due 11/25/09 | | | 5,273,824 |
| | 8,000,000 | | | | Edison Asset Securities, LLC,
0.360%, due 03/09/10 | | | 7,987,280 |
| | 12,000,000 | | | | Edison Asset Securities, LLC,
0.530%, due 10/30/09 | | | 11,994,716 |
| | 9,500,000 | | | | Edison Asset Securities, LLC,
0.650%, due 10/20/09 | | | 9,496,591 |
| | 5,000,000 | | | | Edison Asset Securities, LLC,
0.670%, due 10/21/09 | | | 4,998,056 |
| | 5,250,000 | | | | Jupiter Securities Co., LLC,
0.170%, due 10/26/09 | | | 5,249,343 |
| | 6,750,000 | | | | Jupiter Securities Co., LLC,
0.180%, due 10/13/09 | | | 6,749,549 |
| | 15,000,000 | | | | Jupiter Securities Co., LLC,
0.180%, due 10/22/09 | | | 14,998,336 |
| | 10,300,000 | | | | Jupiter Securities Co., LLC,
0.190%, due 10/15/09 | | | 10,299,198 |
| | 11,500,000 | | | | Natexis Banques Populaires US Finance Co, LLC,
0.050%, due 10/02/09 | | | 11,499,967 |
| | 8,000,000 | | | | Natexis Banques Populaires US Finance Co, LLC,
0.470%, due 12/15/09 | | | 7,992,000 |
| | 8,000,000 | | | | Natexis Banques Populaires US Finance Co, LLC,
0.900%, due 05/21/10 | | | 7,953,600 |
| | 14,500,000 | | | | Old Line Funding, LLC,
0.340%, due 10/15/09 | | | 14,497,968 |
| | 14,500,000 | | | | Old Line Funding, LLC,
0.350%, due 02/25/10 | | | 14,479,277 |
| | 7,750,000 | | | | Old Line Funding, LLC,
0.500%, due 02/18/10 | | | 7,734,931 |
| | 1,500,000 | | | | Old Line Funding, LLC,
0.650%, due 01/20/10 | | | 1,496,994 |
| | 7,000,000 | | | | Park Avenue Receivables,
0.150%, due 10/05/09 | | | 6,999,852 |
| | 21,500,000 | | | | Park Avenue Receivables,
0.170%, due 10/09/09 | | | 21,499,092 |
| | 9,000,000 | | | | Park Avenue Receivables,
0.180%, due 10/20/09 | | | 8,999,098 |
| | 14,000,000 | | | | Societe Generale,
0.030%, due 10/01/09 | | | 14,000,000 |
| | 8,000,000 | | | | Societe Generale,
0.150%, due 10/06/09 | | | 7,999,806 |
| | 7,000,000 | | | | Societe Generale,
0.570%, due 05/21/10 | | | 6,974,287 |
| | 5,239,000 | | | | Thunder Bay Funding, LLC,
0.320%, due 10/15/09 | | | 5,238,307 |
| | 3,000,000 | | | | Thunder Bay Funding, LLC,
0.320%, due 02/02/10 | | | 2,996,693 |
| | 6,500,000 | | | | Thunder Bay Funding, LLC,
0.350%, due 02/12/10 | | | 6,491,532 |
| | 9,500,000 | | | | Thunder Bay Funding, LLC,
0.380%, due 10/19/09 | | | 9,498,100 |
| | 5,500,000 | | | | Thunder Bay Funding, LLC,
0.480%, due 10/08/09 | | | 5,499,412 |
See Accompanying Notes to Financial Statements
69
| | |
| ING CLASSIC MONEY MARKET FUND(1) | | PORTFOLIO OF INVESTMENTS AS OF SEPTEMBER 30, 2009 (UNAUDITED) (CONTINUED) |
| | | | | | | | |
Principal Amount | | | | | | Value |
| | | | | | | | |
| COMMERCIAL PAPER: (continued) |
| $ | 8,000,000 | | | | Thunder Bay Funding, LLC,
0.650%, due 01/20/10 | | $ | 7,983,967 |
| | 7,000,000 | | | | Tulip Funding Corp.,
0.140%, due 10/07/09 | | | 6,999,806 |
| | 10,000,000 | | | | Tulip Funding Corp.,
0.180%, due 10/09/09 | | | 9,999,556 |
| | 9,000,000 | | | | Tulip Funding Corp.,
0.180%, due 10/13/09 | | | 8,999,400 |
| | 11,500,000 | | | | Tulip Funding Corp.,
0.220%, due 10/19/09 | | | 11,498,677 |
| | 14,000,000 | | | | UBS AG,
0.030%, due 10/07/09 | | | 13,999,907 |
| | 21,000,000 | | | | Variable Funding Capital,
0.910%, due 10/15/09 | | | 20,992,078 |
| | 3,500,000 | | | | Yorktown Capital, LLC,
0.260%, due 12/18/09 | | | 3,498,028 |
| | 12,000,000 | | | | Yorktown Capital, LLC,
0.300%, due 12/16/09 | | | 11,992,400 |
| | 14,187,000 | | | | Yorktown Capital, LLC,
0.440%, due 10/09/09 | | | 14,185,424 |
| | 9,500,000 | | | | Yorktown Capital, LLC,
0.470%, due 10/16/09 | | | 9,498,021 |
| | | | | | | | |
| | | | | Total Commercial Paper
(Cost $624,152,704) | | | 624,152,704 |
| | | | | | | | |
| CORPORATE BONDS/NOTES: 4.3% |
| | 500,000 | | # | | American Honda Finance Corp.,
0.872%, due 02/05/10 | | | 500,654 |
| | 4,250,000 | | | | Credit Suisse First Boston USA, Inc.,
0.640%, due 08/15/10 | | | 4,253,872 |
| | 1,342,000 | | | | Credit Suisse First Boston USA, Inc.,
4.875%, due 08/15/10 | | | 1,385,606 |
| | 1,500,000 | | | | Fannie Mae,
0.400%, due 07/13/10 | | | 1,501,075 |
| | 1,500,000 | | | | Freddie Mac,
0.405%, due 07/14/10 | | | 1,501,014 |
| | 12,000,000 | | | | General Electric Capital Corp.,
0.709%, due 06/09/10 | | | 12,056,037 |
| | 3,000,000 | | @@, # | | Rabobank,
0.440%, due 09/16/10 | | | 3,000,000 |
| | 2,426,000 | | @@ | | Royal Bank of Canada,
0.334%, due 06/08/10 | | | 2,427,481 |
| | 2,000,000 | | | | Toyota Motor Credit Corp.,
1.334%, due 12/03/09 | | | 2,003,687 |
| | 14,000,000 | | @@, C | | Westpac Banking Corp.,
0.479%, due 08/27/10 | | | 14,000,000 |
| | | | | | | | |
| | | | | Total Corporate Bonds/Notes
(Cost $42,629,426) | | | 42,629,426 |
| | | | | | | | |
| U.S. GOVERNMENT AGENCY OBLIGATIONS: 17.9% |
| | 26,000,000 | | Z | | Federal National Mortgage Association,
0.620%, due 12/01/09 | | | 25,972,126 |
| | 3,000,000 | | | | Federal National Mortgage Association,
2.375%, due 05/20/10 | | | 3,035,775 |
| | | | | | | | |
Principal Amount | | | | | | Value |
| | | | | | | | |
| U.S. GOVERNMENT AGENCY OBLIGATIONS: (continued) |
| $ | 15,000,000 | | | | Federal National Mortgage Association, 4.625%, due 12/15/09 | | $ | 15,101,086 |
| | 1,250,000 | | | | Federal National Mortgage Association, 7.125%, due 06/15/10 | | | 1,309,045 |
| | 92,000,000 | | Z | | Federal Home Loan Bank, 0.690%, due 12/14/09 | | | 91,867,622 |
| | 15,000,000 | | Z | | Federal Home Loan Bank, 0.780%, due 11/18/09 | | | 14,984,000 |
| | 5,000,000 | | Z | | Federal Home Loan Bank, 0.840%, due 12/22/09 | | | 4,990,319 |
| | 4,000,000 | | Z | | Federal Home Loan Mortgage Corporation, 0.850%, due 01/05/10 | | | 3,990,827 |
| | 2,500,000 | | | | Federal Home Loan Mortgage Corporation, 3.250%, due 07/16/10 | | | 2,552,670 |
| | 16,000,000 | | | | Federal Home Loan Mortgage Corporation, 4.125%, due 07/12/10 | | | 16,441,237 |
| | | | | | | | |
| | | | | Total U.S. Government Agency Obligations
(Cost $180,244,707) | | | 180,244,707 |
| | | | | | | | |
| | | | | | | | | |
REPURCHASE AGREEMENTS: 12.5% | |
| 125,893,000 | | Goldman Sachs Repurchase Agreement dated 09/30/09, 0.040%, due 10/01/09, $125,893,140 to be received upon repurchase (Collateralized by $266,302,425 U.S. Treasury, Discount Note-11.750%, Market Value $129,669,813, due 11/15/09-02/15/36) | | | | 125,893,000 | |
| | | | | | | | | |
| | Total Repurchase Agreement
(Cost $125,893,000) | | | | 125,893,000 | |
| | | | | | | | | |
| | Total Investments in Securities
(Cost $1,010,670,157)* | | 100.6 | % | | $ | 1,010,670,157 | |
| | Other Assets and Liabilities - Net | | (0.6 | ) | | | (5,619,932 | ) |
| | | | | | | | | |
| | Net Assets | | 100.0 | % | | $ | 1,005,050,225 | |
| | | | | | | | | |
| (1) | All securities with a maturity date of greater than 13 months have either a variable rate, a demand feature, prerefunded, optional or mandatory put resulting in a maturity of one year or less. Rate shown reflects current rate. |
| # | Securities with purchases pursuant to Rule 144A or section 4(2), under the Securities Act of 1933 and may not be resold subject to that rule except to qualified institutional buyers. Unless otherwise noted, these securities have been determined to be liquid under the guidelines established by the Funds’ Board of Directors/Trustees. These securities amount to $3,500,654 or 0.35% of the Fund’s net assets at September 30, 2009. |
| C | Bond may be called prior to maturity date. |
| Z | Indicates Zero Coupon Bond; rate shown reflects current effective yield. |
| * | Cost for federal income tax purposes is the same as for financial statement purposes. |
See Accompanying Notes to Financial Statements
70
| | |
| ING CLASSIC MONEY MARKET FUND(1) | | PORTFOLIO OF INVESTMENTS AS OF SEPTEMBER 30, 2009 (UNAUDITED) (CONTINUED) |
Fair Value Measurements*
The following is a summary of the fair valuations according to the inputs used as of September 30, 2009 in valuing the Fund’s assets and liabilities:
| | | | | | | | | | | | |
| | | Quoted Prices in Active Markets for Identical Investments (Level 1) | | Significant Other Observable Inputs (Level 2) | | Significant Unobservable Inputs (Level 3) | | Fair Value at 09/30/2009 |
Asset Table | | | | | | | | | | | | |
Investments, at value | | | | | | | | | | | | |
Certificates of Deposit | | $ | — | | $ | 37,750,320 | | $ | — | | $ | 37,750,320 |
Commercial Paper | | | — | | | 624,152,704 | | | — | | | 624,152,704 |
Corporate Bonds | | | — | | | 42,629,426 | | | — | | | 42,629,426 |
U.S. Government Agency Obligations | | | — | | | 180,244,707 | | | — | | | 180,244,707 |
Repurchase Agreements | | | — | | | 125,893,000 | | | — | | | 125,893,000 |
| | | | | | | | | | | | |
Total Investments, at value | | $ | — | | $ | 1,010,670,157 | | $ | — | | $ | 1,010,670,157 |
| | | | | | | | | | | | |
“Fair value” for purposes of ASC 820 is different from “fair value” as used in the 1940 Act. The former generally implies market value, and can include market quotations as a source of value, and the latter refers to determinations of value in absence of available market quotations.
| + | See Note 2, “Significant Accounting Policies” in the Notes to Financial Statements for additional information. |
Money market securities are valued using the amortized cost method, in accordance with rules under the 1940 Act. Generally, amortized cost approximates the market value of a security, but since the value is not obtained from a quoted price in an active market, such securities are reflected as Level 2.
See Accompanying Notes to Financial Statements
71
| | |
ING INSTITUTIONAL PRIME MONEY
MARKET FUND(1) | | PORTFOLIO OF INVESTMENTS ASOF SEPTEMBER 30, 2009 (UNAUDITED) |
| | | | | | | | |
Principal Amount | | | | | | Value |
| | | | | | | | |
| CERTIFICATES OF DEPOSIT: 3.3% |
| $ | 21,500,000 | | | | BNP Paribas,
0.210%, due 10/28/09 | | $ | 21,500,000 |
| | 400,000 | | | | BNP Paribas,
0.480%, due 12/07/09 | | | 400,096 |
| | 10,500,000 | | @@ | | Credit Suisse New York,
0.885%, due 08/12/10 | | | 10,500,000 |
| | 550,000 | | | | Rabobank USA Financial Corp.,
0.270%, due 01/19/10 | | | 550,000 |
| | 19,000,000 | | | | Rabobank USA Financial Corp.,
0.400%, due 10/05/09 | | | 19,000,506 |
| | | | | | | | |
| | | | | Total Certificates of Deposit
(Cost $51,950,602) | | | 51,950,602 |
| | | | | | | | |
| COMMERCIAL PAPER: 58.7% |
| | 410,000 | | | | American Honda Finance,
0.300%, due 12/02/09 | | | 409,788 |
| | 397,000 | | | | American Honda Finance,
0.300%, due 12/16/09 | | | 396,749 |
| | 7,000,000 | | | | ANZ National Bank Ltd.,
0.390%, due 03/22/10 | | | 6,986,957 |
| | 3,000,000 | | | | ANZ National Bank Ltd.,
0.400%, due 03/04/10 | | | 2,994,867 |
| | 3,500,000 | | | | ANZ National Bank Ltd.,
0.700%, due 09/17/10 | | | 3,476,112 |
| | 13,000,000 | | | | ASB Finance Ltd.,
0.450%, due 01/22/10 | | | 12,981,638 |
| | 7,000,000 | | | | ASB Finance Ltd.,
0.500%, due 02/26/10 | | | 6,985,611 |
| | 12,500,000 | | | | Barton Capital, LLC,
0.170%, due 10/02/09 | | | 12,499,908 |
| | 7,000,000 | | | | Barton Capital, LLC,
0.170%, due 10/07/09 | | | 6,999,767 |
| | 14,250,000 | | | | Barton Capital, LLC,
0.170%, due 10/20/09 | | | 14,248,646 |
| | 2,198,000 | | | | Barton Capital, LLC,
0.180%, due 10/09/09 | | | 2,197,902 |
| | 5,000,000 | | | | Barton Capital, LLC,
0.230%, due 10/14/09 | | | 4,999,549 |
| | 2,000,000 | | | | Barton Capital, LLC,
0.280%, due 01/14/10 | | | 1,998,367 |
| | 7,000,000 | | | | Barton Capital, LLC,
0.290%, due 01/06/10 | | | 6,994,530 |
| | 6,000,000 | | | | Barton Capital, LLC,
0.310%, due 10/15/09 | | | 5,999,230 |
| | 600,000 | | | | BNP Paribas,
0.050%, due 10/01/09 | | | 600,000 |
| | 11,000,000 | | | | Cafco, LLC,
0.290%, due 01/15/10 | | | 10,990,607 |
| | 24,000,000 | | | | Cafco, LLC,
0.300%, due 11/24/09 | | | 23,988,840 |
| | 11,000,000 | | | | Cafco, LLC,
0.360%, due 01/07/10 | | | 10,989,220 |
| | 3,000,000 | | | | Cafco, LLC,
0.360%, due 01/12/10 | | | 2,996,910 |
| | 7,500,000 | | | | Caisse Nationale des Caisses d’Epargne et de Prevoyance,
0.220%, due 10/02/09 | | | 7,499,908 |
| | | | | | | | |
Principal Amount | | | | | | Value |
| | | | | | | | |
| COMMERCIAL PAPER: (continued) |
| $ | 1,400,000 | | | | Caisse Nationale des Caisses d’Epargne et de Prevoyance,
0.260%, due 10/16/09 | | $ | 1,399,837 |
| | 11,500,000 | | | | CBA Finance, Inc.,
0.080%, due 10/06/09 | | | 11,499,840 |
| | 1,250,000 | | | | Ciesco, LLC,
0.100%, due 10/02/09 | | | 1,249,993 |
| | 1,000,000 | | | | Ciesco, LLC,
0.280%, due 10/19/09 | | | 999,850 |
| | 33,750,000 | | | | Ciesco, LLC,
0.300%, due 11/17/09 | | | 33,736,455 |
| | 15,000,000 | | | | Ciesco, LLC,
0.360%, due 01/13/10 | | | 14,984,400 |
| | 18,000,000 | | | | Concord Minutemen Capital Co., LLC,
0.550%, due 12/11/09 | | | 17,980,120 |
| | 33,000,000 | | | | Concord Minutemen Capital Co., LLC,
1.000%, due 02/18/10 | | | 32,871,667 |
| | 23,750,000 | | | | Crown Point Capital Co.,
0.550%, due 12/11/09 | | | 23,723,769 |
| | 3,750,000 | | | | Crown Point Capital Co.,
0.960%, due 03/19/10 | | | 3,733,100 |
| | 26,000,000 | | | | Crown Point Capital Co.,
1.000%, due 02/17/10 | | | 25,899,611 |
| | 8,000,000 | | | | Danske Corp.,
0.540%, due 12/18/09 | | | 7,990,467 |
| | 24,000,000 | | | | Dexia,
0.130%, due 10/01/09 | | | 24,000,000 |
| | 22,500,000 | | | | Dexia,
0.210%, due 10/05/09 | | | 22,499,350 |
| | 7,500,000 | | | | Edison Asset Securities, LLC,
0.270%, due 11/25/09 | | | 7,496,906 |
| | 8,000,000 | | | | Edison Asset Securities, LLC,
0.360%, due 03/09/10 | | | 7,987,280 |
| | 10,000,000 | | | | Edison Asset Securities, LLC,
0.530%, due 10/30/09 | | | 9,995,569 |
| | 7,500,000 | | | | Edison Asset Securities, LLC,
0.650%, due 10/20/09 | | | 7,497,308 |
| | 5,998,000 | | | | Edison Asset Securities, LLC,
0.670%, due 10/21/09 | | | 5,995,667 |
| | 8,500,000 | | | | Jupiter Securities Co., LLC,
0.170%, due 10/26/09 | | | 8,498,938 |
| | 23,000,000 | | | | Jupiter Securities Co., LLC,
0.180%, due 10/13/09 | | | 22,998,467 |
| | 25,300,000 | | | | Jupiter Securities Co., LLC,
0.180%, due 10/22/09 | | | 25,297,185 |
| | 24,500,000 | | | | Natexis Banques Populaires US Finance Co, LLC,
0.050%, due 10/02/09 | | | 24,499,932 |
| | 12,000,000 | | | | Natexis Banques Populaires US Finance Co, LLC,
0.470%, due 12/15/09 | | | 11,988,000 |
| | 12,000,000 | | | | Natexis Banques Populaires US Finance Co, LLC,
0.900%, due 05/21/10 | | | 11,930,400 |
| | 19,000,000 | | | | Old Line Funding, LLC,
0.340%, due 10/15/09 | | | 18,997,297 |
| | 18,750,000 | | | | Old Line Funding, LLC,
0.350%, due 02/25/10 | | | 18,723,203 |
| | 12,000,000 | | | | Old Line Funding, LLC,
0.500%, due 02/18/10 | | | 11,976,667 |
See Accompanying Notes to Financial Statements
72
| | |
ING INSTITUTIONAL PRIME MONEY
MARKET FUND(1) | | PORTFOLIO OF INVESTMENTS AS OF SEPTEMBER 30, 2009 (UNAUDITED) (CONTINUED) |
| | | | | | | | |
Principal Amount | | | | | | Value |
| | | | | | | | |
| COMMERCIAL PAPER: (continued) |
| $ | 1,250,000 | | | | Old Line Funding, LLC,
0.650%, due 01/20/10 | | $ | 1,247,495 |
| | 4,000,000 | | | | Park Avenue Receivables,
0.150%, due 10/05/09 | | | 3,999,916 |
| | 38,000,000 | | | | Park Avenue Receivables,
0.170%, due 10/09/09 | | | 37,998,396 |
| | 14,000,000 | | | | Park Avenue Receivables,
0.180%, due 10/20/09 | | | 13,998,596 |
| | 27,000,000 | | | | Societe Generale,
0.030%, due 10/01/09 | | | 27,000,000 |
| | 1,000,000 | | | | Societe Generale,
0.050%, due 10/02/09 | | | 999,997 |
| | 8,000,000 | | | | Societe Generale,
0.150%, due 10/06/09 | | | 7,999,806 |
| | 15,000,000 | | | | Societe Generale,
0.570%, due 05/21/10 | | | 14,944,900 |
| | 523,000 | | | | Thunder Bay Funding, LLC,
0.170%, due 10/06/09 | | | 522,985 |
| | 2,500,000 | | | | Thunder Bay Funding, LLC,
0.220%, due 10/05/09 | | | 2,499,925 |
| | 3,000,000 | | | | Thunder Bay Funding, LLC,
0.320%, due 10/15/09 | | | 2,999,778 |
| | 16,750,000 | | | | Thunder Bay Funding, LLC,
0.320%, due 02/02/10 | | | 16,731,538 |
| | 11,000,000 | | | | Thunder Bay Funding, LLC,
0.350%, due 02/12/10 | | | 10,985,669 |
| | 7,000,000 | | | | Thunder Bay Funding, LLC,
0.380%, due 10/19/09 | | | 6,998,600 |
| | 5,000,000 | | | | Thunder Bay Funding, LLC,
0.480%, due 10/08/09 | | | 4,999,465 |
| | 8,000,000 | | | | Thunder Bay Funding, LLC,
0.650%, due 01/20/10 | | | 7,983,967 |
| | 10,250,000 | | | | Tulip Funding Corp.,
0.140%, due 10/07/09 | | | 10,249,715 |
| | 20,000,000 | | | | Tulip Funding Corp.,
0.180%, due 10/09/09 | | | 19,999,111 |
| | 10,000,000 | | | | Tulip Funding Corp.,
0.200%, due 10/28/09 | | | 9,998,425 |
| | 16,000,000 | | | | Tulip Funding Corp.,
0.220%, due 10/19/09 | | | 15,998,160 |
| | 31,000,000 | | | | UBS AG,
0.030%, due 10/07/09 | | | 30,999,793 |
| | 45,000,000 | | | | US Bank NA,
0.030%, due 10/01/09 | | | 45,000,000 |
| | 755,000 | | | | Variable Funding Capital,
0.150%, due 10/01/09 | | | 755,000 |
| | 850,000 | | | | Variable Funding Capital,
0.150%, due 10/05/09 | | | 849,982 |
| | 21,000,000 | | | | Variable Funding Capital,
0.910%, due 10/15/09 | | | 20,992,078 |
| | 1,346,000 | | | | Westpac Banking Corp.,
0.170%, due 10/07/09 | | | 1,345,955 |
| | 14,500,000 | | | | Yorktown Capital, LLC,
0.260%, due 12/18/09 | | | 14,491,832 |
| | 24,000,000 | | | | Yorktown Capital, LLC,
0.300%, due 12/16/09 | | | 23,984,800 |
| | 6,000,000 | | | | Yorktown Capital, LLC,
0.440%, due 10/09/09 | | | 5,999,333 |
| | 4,093,000 | | | | Yorktown Capital, LLC,
0.470%, due 10/16/09 | | | 4,092,147 |
| | | | | | | | |
| | | | | Total Commercial Paper
(Cost $930,353,748) | | | 930,353,748 |
| | | | | | | | |
| | | | | | | | |
Principal Amount | | | | | | Value |
| | | | | | | | |
| CORPORATE BONDS/NOTES: 3.9% |
| $ | 1,000,000 | | # | | American Honda Finance Corp.,
0.872%, due 02/05/10 | | $ | 1,001,307 |
| | 3,000,000 | | | | Credit Suisse First Boston USA, Inc.,
0.326%, due 11/20/09 | | | 2,999,295 |
| | 4,000,000 | | | | Credit Suisse First Boston USA, Inc.,
0.640%, due 08/15/10 | | | 4,004,852 |
| | 1,230,000 | | | | Credit Suisse First Boston USA, Inc.,
0.749%, due 01/15/10 | | | 1,229,820 |
| | 1,500,000 | | | | Credit Suisse First Boston USA, Inc.,
4.875%, due 08/15/10 | | | 1,548,740 |
| | 2,500,000 | | | | Danske Corp.,
0.100%, due 10/02/09 | | | 2,499,986 |
| | 700,000 | | | | Danske Corp.,
0.110%, due 10/01/09 | | | 700,000 |
| | 700,000 | | | | Danske Corp.,
0.190%, due 10/19/09 | | | 699,930 |
| | 8,000,000 | | | | Danske Corp.,
0.210%, due 10/15/09 | | | 7,999,316 |
| | 3,000,000 | | @@, # | | Danske Corp.,
0.274%, due 10/08/09 | | | 2,999,707 |
| | 758,000 | | @@ | | Deutsche Bank AG/New York NY,
1.004%, due 01/25/10 | | | 757,567 |
| | 12,000,000 | | | | General Electric Capital Corp.,
0.709%, due 06/09/10 | | | 12,056,037 |
| | 3,500,000 | | @@, # | | Rabobank,
0.440%, due 09/16/10 | | | 3,500,000 |
| | 1,000,000 | | @@ | | Royal Bank of Canada,
0.334%, due 06/08/10 | | | 1,000,611 |
| | 5,000,000 | | | | Toyota Motor Credit Corp.,
1.334%, due 12/03/09 | | | 5,009,218 |
| | 13,000,000 | | @@, C | | Westpac Banking Corp.,
0.479%, due 08/27/10 | | | 13,000,000 |
| | | | | | | | |
| | | | | Total Corporate Bonds/Notes
(Cost $61,006,386) | | | 61,006,386 |
| | | | | | | | |
| U.S. GOVERNMENT AGENCY OBLIGATIONS: 5.1% |
| | 2,000,000 | | | | Federal National Mortgage Association,
0.400%, due 07/13/10 | | | 2,001,433 |
| | 19,500,000 | | Z | | Federal National Mortgage Association,
0.620%, due 12/01/09 | | | 19,479,413 |
| | 3,000,000 | | | | Federal National Mortgage Association,
2.375%, due 05/20/10 | | | 3,035,775 |
| | 1,707,000 | | | | Federal National Mortgage Association,
4.250%, due 08/15/10 | | | 1,763,070 |
| | 8,000,000 | | | | Federal National Mortgage Association,
4.625%, due 12/15/09 | | | 8,053,913 |
| | 2,000,000 | | | | Federal National Mortgage Association,
7.125%, due 06/15/10 | | | 2,094,472 |
See Accompanying Notes to Financial Statements
73
| | |
ING INSTITUTIONAL PRIME MONEY
MARKET FUND(1) | | PORTFOLIO OF INVESTMENTS AS OF SEPTEMBER 30, 2009 (UNAUDITED) (CONTINUED) |
| | | | | | | | |
Principal Amount | | | | | | Value |
| | | | | | | | |
| U.S. GOVERNMENT AGENCY OBLIGATIONS: (continued) |
| $ | 3,750,000 | | Z | | Federal Home Loan Bank,
0.690%, due 12/14/09 | | $ | 3,744,604 |
| | 12,000,000 | | Z | | Federal Home Loan Bank,
0.780%, due 11/18/09 | | | 11,987,200 |
| | 1,750,000 | | | | Federal Home Loan Mortgage Corporation,
0.410%, due 07/12/10 | | | 1,751,225 |
| | 2,500,000 | | Z | | Federal Home Loan Mortgage Corporation,
0.850%, due 01/05/10 | | | 2,494,267 |
| | 3,000,000 | | | | Federal Home Loan Mortgage Corporation,
3.250%, due 07/16/10 | | | 3,063,205 |
| | 18,000,000 | | | | Federal Home Loan Mortgage Corporation,
4.125%, due 07/12/10 | | | 18,496,587 |
| | 3,500,000 | | C | | Federal Home Loan Mortgage Corporation,
4.830%, due 08/23/10 | | | 3,635,689 |
| | | | | | | | |
| | | | | Total U.S. Government Agency Obligations
(Cost $81,600,853) | | | 81,600,853 |
| | | | | | | | |
| | | | | | | | |
REPURCHASE AGREEMENTS: 26.6% |
| 25,431,000 | | Deutsche Bank Repurchase Agreement dated 09/30/09, 0.060%, due 10/01/09, $25,431,042 to be received upon repurchase (Collateralized by $25,940,000 Federal National Mortgage Association, Discount Note, Market Value $25,940,000, due 10/01/09) | | | | 25,431,000 |
| 214,000,000 | | Goldman Sachs Repurchase Agreement dated 09/30/09, 0.040%, due 10/01/09, $214,000,238 to be received upon repurchase (Collateralized by $403,372,594 U.S. Treasury, Discount Note-4.250%, Market Value $220,420,000, due 08/15/17-05/15/39) | | | | 214,000,000 |
| 183,000,000 | | Morgan Stanley Repurchase Agreement dated 09/30/09, 0.030%, due 10/01/09, $183,000,153 to be received upon repurchase (Collateralized by $184,470,000 Federal Home Loan Mortgage Corporation, 1.625%, Market Value plus accrued interest $188,185,303, due 04/2 | | | | 183,000,000 |
| | | | | | | | |
| | Total Repurchase Agreement
(Cost $422,431,000) | | | | 422,431,000 |
| | | | | | | | |
| | Total Investments in Securities (Cost $1,547,342,589)* | | 97.6 | % | | $ | 1,547,342,589 |
| | Other Assets and Liabilities - Net | | 2.4 | | | | 38,234,467 |
| | | | | | | | |
| | Net Assets | | 100.0 | % | | $ | 1,585,577,056 |
| | | | | | | | |
| (1) | All securities with a maturity date of greater than 13 months have either a variable rate, a demand feature, prerefunded, optional or mandatory put resulting in a maturity of one year or less. Rate shown reflects current rate. |
| # | Securities with purchases pursuant to Rule144A or section 4(2), under the Securities Act of 1933 and may not be resold subject to that rule except to qualified institutional buyers. Unless otherwise noted, these securities have been determined to be liquid under the guidelines established by the Funds’ Board of Directors/Trustees. These securities amount to $7,501,014 or 0.47% of the Fund’s net assets at September 30, 2009. |
| C | Bond may be called prior to maturity date. |
| Z | Indicates Zero Coupon Bond; rate shown reflects current effective yield. |
| * | Cost for federal income tax purposes is the same as for financial statement purposes. |
See Accompanying Notes to Financial Statements
74
| | |
ING INSTITUTIONAL PRIME MONEY
MARKET FUND(1) | | PORTFOLIO OF INVESTMENTS AS OF SEPTEMBER 30, 2009 (UNAUDITED) (CONTINUED) |
Fair Value Measurements*
The following is a summary of the fair valuations according to the inputs used as of September 30, 2009 in valuing the Fund’s assets and liabilities:
| | | | | | | | | | | | |
| | | Quoted Prices in Active Markets for Identical Investments (Level 1) | | Significant Other Observable Inputs (Level 2) | | Significant Unobservable Inputs (Level 3) | | Fair Value at 09/30/2009 |
Asset Table | | | | | | | | | | | | |
Investments, at value | | | | | | | | | | | | |
Certificates of Deposit | | $ | — | | $ | 51,950,602 | | $ | — | | $ | 51,950,602 |
Commercial Paper | | | — | | | 930,353,748 | | | — | | | 930,353,748 |
Corporate Bonds | | | — | | | 61,006,386 | | | — | | | 61,006,386 |
U.S. Government Agency Obligations | | | — | | | 81,600,853 | | | — | | | 81,600,853 |
Repurchase Agreements | | | — | | | 422,431,000 | | | — | | | 422,431,000 |
| | | | | | | | | | | | |
Total Investments, at value | | $ | — | | $ | 1,547,342,589 | | $ | — | | $ | 1,547,342,589 |
| | | | | | | | | | | | |
“Fair value” for purposes of ASC 820 is different from “fair value” as used in the 1940 Act. The former generally implies market value, and can include market quotations as a source of value, and the latter refers to determinations of value in absence of available market quotations.
| + | See Note 2, “Significant Accounting Policies” in the Notes to Financial Statements for additional information. |
Money market securities are valued using the amortized cost method, in accordance with rules under the 1940 Act. Generally, amortized cost approximates the market value of a security, but since the value is not obtained from a quoted price in an active market, such securities are reflected as Level 2.
See Accompanying Notes to Financial Statements
75
ING Funds Distributor, LLC offers the funds listed below. Before investing in a fund, shareholders should carefully review the fund’s prospectus. Investors may obtain a copy of a prospectus of any ING Fund by calling (800) 992-0180 or by going to www.ingfunds.com.
Domestic Equity and Income Funds
ING Balanced Fund
ING Growth and Income Fund
ING Real Estate Fund
Domestic Fund-of-Funds
ING Strategic Allocation Conservative Fund
ING Strategic Allocation Growth Fund
ING Strategic Allocation Moderate Fund
Domestic Equity Growth Funds
ING Corporate Leaders 100 Fund
ING Equity Dividend Fund
ING Growth Opportunities Fund
ING MidCap Opportunities Fund
ING Opportunistic LargeCap Fund
ING Small Company Fund
ING SmallCap Opportunities Fund
ING Tactical Asset Allocation Fund
Domestic Equity Index Funds
ING Index Plus LargeCap Fund
ING Index Plus MidCap Fund
ING Index Plus SmallCap Fund
Domestic Equity Value Funds
ING SmallCap Value Multi-Manager Fund
ING Value Choice Fund
Fixed-lncome Funds
ING GNMA lncome Fund
ING High Yield Bond Fund
ING Intermediate Bond Fund
Global Equity Funds
ING Global Equity Dividend Fund
ING Global Natural Resources Fund
ING Global Real Estate Fund
ING Global Value Choice Fund
International Equity Funds
ING Asia-Pacific Real Estate Fund
ING Emerging Countries Fund
ING European Real Estate Fund
ING Foreign Fund
ING Greater China Fund
ING Index Plus International Equity Fund
ING International Capital Appreciation Fund
ING International Real Estate Fund
ING International SmallCap Multi-Manager Fund
ING International Value Fund
ING International Value Choice Fund
ING Russia Fund
Global and International Fixed-Income Funds
ING Global Bond Fund
International Funds-of-Funds
ING Diversified International Fund
ING Global Target Payment Fund
Loan Participation Fund
ING Senior lncome Fund
Money Market Funds*
ING Classic Money Market Fund
ING Money Market Fund
| * | An investment in the funds are not insured or guaranteed by the Federal Deposit Insurance Corporation or any other government agency. Although the funds seek to preserve the value of your investment at $1.00 per share, it is possible to lose money by investing in the funds. Please see the “Notes to Financial Statements” section for the funds’ participation during the reporting period in the U.S. Treasury Department’s Temporary Guarantee Program for money market funds, which terminated on September 19, 2009. |
Investment Adviser
ING Investments, LLC
7337 East Doubletree Ranch Road
Scottsdale, Arizona 85258
Administrator
ING Funds Services, LLC
7337 East Doubletree Ranch Road
Scottsdale, Arizona 85258
Distributor
ING Funds Distributor, LLC
7337 East Doubletree Ranch Road
Scottsdale, Arizona 85258
Transfer Agent
PNC Global Investment Servicing (U.S.) Inc.
301 Bellevue Parkway
Wilmington, Delaware 19809
Custodian
The Bank of New York Mellon
One Wall Street
New York, New York 10286
Legal Counsel
Dechert
1775 I Street, N.W.
Washington, D.C. 20006
For more complete information, or to obtain a prospectus on any ING fund, please call your Investment Professional or ING Funds Distributor, LLC at (800) 992-0180 or log on to www.ingfunds.com. The prospectus should be read carefully before investing. Consider the fund’s investment objectives, risks, charges and expenses carefully before investing. The prospectus contains this information and other information about the fund.
| | | | |
 | | PRSAR-UFIALL | | (0909-112809) |
Not required for semi-annual filing.
| Item 3. | Audit Committee Financial Expert. |
Not required for semi-annual filing.
| Item 4. | Principal Accountant Fees and Services. |
Not required for semi-annual filing.
| Item 5. | Audit Committee Of Listed Registrants. |
Not required for semi-annual filing.
| Item 6. | Schedule of Investments. |
Schedule is included as part of the report to shareholders filed under Item 1 of this Form.
| Item 7. | Disclosure of Proxy Voting Policies and Procedures for Closed-end Management Investment Companies. |
Not applicable.
| Item 8. | Portfolio Managers of Closed-end Management Investment Companies. |
Not applicable.
| Item 9. | Purchases of Equity Securities by Closed-end Management Investment Company and Affiliated Purchasers. |
Not applicable.
| Item 10. | Submission of Matters to a Vote of Security Holders. |
The Board has a Nominating Committee for the purpose of considering and presenting to the Board candidates it proposes for nomination to fill Independent Trustee vacancies on the Board. The Committee currently consists of all Independent Trustees of the Board. (6 individuals). The Nominating Committee operates pursuant to a Charter approved by the Board. The primary purpose of the Nominating Committee is to consider and present to the Board the candidates it proposes for nomination to fill vacancies on the Board. In evaluating candidates, the Nominating Committee may consider a variety of factors, but it has not at this time set any specific minium qualifications that must be met. Specific qualifications of candidates for Board membership will be based on the needs of the Board at the time of nomination.
The Nominating Committee is willing to consider nominations received from shareholders and shall assess shareholder nominees in the same manner as it reviews its own nominees. A shareholder nominee for director should be submitted in writing to the Fund’s Secretary. Any such shareholder nomination should include at a minimum the following information as to each individual proposed for nomination as trustee: such individual’s written consent to be named in the proxy statement as a nominee (if nominated) and to serve as a trustee (if elected), and all information relating to such individual that is required to be disclosed in the solicitation of proxies for election of trustees, or is otherwise required, in each case under applicable federal securities laws, rules and regulations.
The secretary shall submit all nominations received in a timely manner to the Nominating Committee. To be timely, any such submission must be delivered to the Fund’s Secretary not earlier than the 90th day prior to such meeting and not later than the close of business on the later of the 60th day prior to such meeting or the 10th day following the day on which public announcement of the date of the meeting is first made, by either disclosure in a press release or in a document publicly filed by the Fund with the Securities and Exchange Commission.
| Item 11. | Controls and Procedures. |
| (a) | Based on our evaluation conducted within 90 days of the filing date, hereof, the design and operation of the registrant’s disclosure controls and procedures are effective to ensure that material information relating to the registrant is made known to the certifying officers by others within the appropriate entities, particularly during the period in which Forms N-CSR are being prepared, and the registrant’s disclosure controls and procedures allow timely preparation and review of the information for the registrant’s Form N-CSR and the officer certifications of such Form N-CSR. |
| (b) | There were no significant changes in the registrant’s internal controls that occurred during the second fiscal quarter of the period covered by this report that has materially affected, or is reasonably likely to materially affect, the registrant’s internal control over financial reporting. |
| | |
| (a)(1) | | The Code of Ethics is not required for the semi-annual filing. |
| |
| (a)(2) | | A separate certification for each principal executive officer and principal financial officer of the registrant as required by Rule 30a-2 under the Act (17 CFR 270.30a-2) is attached hereto as EX-99.CERT. |
| |
| (a)(3) | | Not required for semi-annual filing. |
| |
| (b) | | The officer certifications required by Section 906 of the Sarbanes-Oxley Act of 2002 are attached hereto as
EX-99.906CERT. |
SIGNATURES
Pursuant to the requirements of the Securities Exchange Act of 1934 and the Investment Company Act of 1940, the registrant has duly caused this report to be signed on its behalf by the undersigned, thereunto duly authorized.
| | |
| (Registrant): ING Funds Trust |
| |
| By | | /s/ Shaun P. Mathews |
| | Shaun P. Mathews |
| | President and Chief Executive Officer |
Date: December 4, 2009
Pursuant to the requirements of the Securities Exchange Act of 1934 and the Investment Company Act of 1940, this report has been signed below by the following persons on behalf of the registrant and in the capacities and on the dates indicated.
| | |
| By | | /s/ Shaun P. Mathews |
| | Shaun P. Mathews |
| | President and Chief Executive Officer |
Date: December 4, 2009
| | |
| By | | /s/ Todd Modic |
| | Todd Modic |
| | Senior Vice President and Chief Financial Officer |
Date: December 4, 2009