OMB APPROVAL
OMB Number: 3235-0570
Expires: October 31, 2006
Estimated average burden hours per response: 19.3
UNITED STATES
SECURITIES AND EXCHANGE COMMISSION
Washington, D.C. 20549
FORM N-CSR
CERTIFIED SHAREHOLDER REPORT OF
REGISTERED MANAGEMENT INVESTMENT COMPANIES
Investment Company Act file number: 811-08895
ING Funds Trust
(Exact name of registrant as specified in charter)
7337 E. Doubletree Ranch Rd., Scottsdale, AZ | | 85258 |
(Address of principal executive offices) | | (Zip code) |
The Corporation Trust Company, 1209 Orange Street, Wilmington, DE 19801
(Name and address of agent for service)
Registrant’s telephone number, including area code: 1-800-992-0180
Date of fiscal year end: | March 31 |
| |
Date of reporting period: | March 31, 2006 |
Item 1. Reports to Stockholders.
The following is a copy of the report transmitted to stockholders pursuant to Rule 30e-1 under the Act (17 CFR 270.30e-1):

Annual Report
March 31, 2006
Classes A, B, C, I, M, O, Q and R
Fixed Income Funds |
§ | ING GNMA Income Fund |
§ | ING High Yield Bond Fund |
§ | ING Intermediate Bond Fund |
§ | ING National Tax-Exempt Bond Fund |
|
Money Market Funds |
§ | ING Classic Money Market Fund |
§ | ING Institutional Prime Money Market Fund |
 E-Delivery Sign-up – details inside
This report is submitted for general information to shareholders of the ING Funds. It is not authorized for distribution to prospective shareholders unless accompanied or preceded by a prospectus which includes details regarding the funds’ investment objectives, risks, charges, expenses and other information. This information should be read carefully. | |

|

| Go Paperless with E-Delivery! |
|
Sign up now for on-line prospectuses, fund reports, and proxy statements. In less than five minutes, you can help reduce paper mail and lower fund costs. |
|
Just go to www.ingfunds.com, click on the E-Delivery icon from the home page, follow the directions and complete the quick 5 Steps to Enroll. |
|
You will be notified by e-mail when these communications become available on the internet. Documents that are not available on the internet will continue to be sent by mail. |
(THIS PAGE INTENTIONALLY LEFT BLANK)

| Dear Shareholder, |
|
As you may recall in my last letter, I described the enthusiasm that we were experiencing here at ING Funds as we worked to bring more of the world’s investment opportunities to you, the investor. |
|
I am happy to report that that enthusiasm is continuing to thrive. With the New Year, we have launched a series of new international mutual funds, each created to bring more of the world’s opportunities to you. |
|
Meanwhile, we have also heard you loud and clear. Our research tells us that many investors report that they find investing an intimidating and overly-complex endeavor. That is why ING is committed to helping investors across the country cut through the confusion and clutter. “Your future. Made easier.SM” are more than words, they represent our promise to you. |
| |
Those two objectives — bringing you more of the world’s opportunities and doing it in a way that is easier for you — are behind the development of the ING Diversified International Fund. The new Fund is among those that we launched in January but it is unique in that it is a fund-of-funds. It is also, we believe, simply an easier way to invest internationally. |
| |
The ING Diversified International Fund brings together six distinct, international mutual funds, each managed by well-known asset managers who specialize in key international sub-asset classes. What’s more, the Fund is periodically reviewed by a seasoned team of ING asset allocation experts who re-adjust the Fund’s allocation based on prevailing market conditions. |
|
Best of all: we’ve made it easy. With just one investment, investors can now acquire a broadly diversified, actively managed international equity portfolio. |
|
The ING Diversified International Fund marks one more way that we at ING Funds are continuing to offer you the global expertise, product innovation and world-class service that you have come to expect from us. |
|
On behalf of everyone at ING Funds, I thank you for your continued support and loyalty. We look forward to serving you in the future. |
|
Sincerely, |
|

James M. Hennessy
President
ING Funds
April 10, 2006
The views expressed in the President’s Letter reflect those of the President as of the date of the letter. Any such views are subject to change at any time based upon market or other conditions and ING Funds disclaims any responsibility to update such views. These views may not be relied on as investment advice and because investment decisions for an ING Fund are based on numerous factors, may not be relied on as an indication of investment intent on behalf of any ING Fund. Reference to specific company securities should not be construed as recommendations or investment advice.
International investing does pose special risks including currency fluctuation, economic and political risks not found in investments that are solely domestic.
For more complete information, or to obtain a prospectus on any ING fund, please call your Investment Professional or ING Fund Distributor, LLC at (800) 992-0180 or log on to www.ingfunds.com. The prospectus should be read carefully investing. Consider the fund’s investment objectives, risks, and charges and expenses carefully before investing. The prospectus contains this information and other information about the fund. Check with your Investment Professional to determine which funds are available for sale within their firm. Not all funds are available for sale at all firms.
1
MARKET PERSPECTIVE: YEAR ENDED MARCH 31, 2006
As we discussed in our semi-annual report, the main issue for U.S. fixed-income investors for over a year had been the unexpected flattening of the U.S. treasury yield curve, i.e. the shrinking difference between short-term and long-term interest rates. Between June 2004 and September 30, 2005 the Federal Open Market Committee (“FOMC”) had raised the federal funds rate by 25 basis points eleven times, pulling other short-term rates up as well. However, the yield on the ten-year U.S. Treasury Note had actually fallen by 29 basis points over the same period. This was due to an apparently growing perception in the market that inflation was a problem solved, due to a vigilant Federal Reserve Board, cheap goods and labor abroad and consistent productivity growth at home. In addition foreign investors’ hunger for U.S. investments kept U.S. Treasury yields down at the long end. There were times during the last three months of 2005 that the trend seemed about to break: for example when already high energy prices, now affected by Hurricanes Katrina and Rita, looked to be filtering through to the general price level. Yet, ultimately, the forces of curve flattening prevailed. By year-end the FOMC had raised rates twice more, oil prices and the inflation scare had subsided and foreigners were still buying record amounts of U.S. securities.
With the new year came the retirement of Alan Greenspan after 18 years as Chairman of the Federal Reserve Board. Chairing his final FOMC meeting on the last day of January 2006, he fired his parting shot at inflation with the fourteenth rate increase, before riding off to the lecture circuit. Many of Mr. Greenspan’s legions of admirers consider him the greatest central banker of all time, for his presumed role in creating generally stable and prosperous conditions in the U.S. But one should note the view is by no means unanimous. Without doubt, Greenspan’s actions greatly moderated the economic damage from the various crises he had to confront: the stock market crash of 1987, the Asian meltdown, Russian default and Long Term Capital failure of 1997/8, the bursting of the stock market bubble in 2000 and the economic aftermath of 9/11. The low inflation and productivity driven growth that we have come to expect is the product not of monetary policy but globalization and the relentless infusion of technology and the Internet in flexible American workplaces. Greenspan’s critics argue moreover, that his failure to cool the “irrational exuberance” in stock prices increased the need for monetary loosening later. A new bubble was inflated, this time in housing prices, which made consumers feel richer and promoted a spending spree that on the Chairman Greenspan’s last day saw a U.S. current account deficit in excess of 6% of gross domestic product (“GDP”) and negative savings rates in eight months out of the last nine. Nonetheless, incoming Chairman Dr. Ben Bernanke quickly confirmed that he would maintain the focus of his predecessor.
The other fixed-income “event” of early 2006 was the sale in February of 30-year Treasury Bonds for the first time since 2001. The sale went well: so much so that its yield immediately fell below that of the 10-year U.S. Treasury Note. In fact, by March 2006 month-end, the yield curve had slightly inverted along much of its range, and the spread of the ten-year U.S. Treasury yield over the 13-week Bill yield stood at 0.04%, the lowest since January 18, 2001. This largely disappeared in March 2006 as fourth quarter core inflation was reported at an uncomfortable 2.4% and Mr Bernanke’s FOMC raised the federal funds rate for the fifteenth time. This action sent the yield on the ten-year U.S. Treasury Note to the highest since before the FOMC started tightening. For the six-month period ended March 31, 2006, the yield rose by 52 basis points to 4.9%, while the yield on the three-month U.S. Treasury Bill, a closer relative of the federal funds rate, increased by 105 basis points to 4.5%. The broader Lehman Brothers Aggregate Bond Index(1) fell by 6 basis points (returning 2.3% for the year ended March 31, 2006), but the Lehman Brothers High Yield Bond Index(2) returned 3.6% (returning 7.4% for the year ended March 31, 2006).
In other markets, global equities registered solid gains in the second six months ended March 31, 2006, especially overseas. U.S. stocks in the form of the Standard and Poor’s 500® Composite Stock Price Index(3) (“S&P 500® Index”), gained 6.4% (11.7% for the year ended March 31, 2006), supported by continuing double-digit profits growth, but tempered by rising interest rates, high energy prices and by occasional weak housing data that threatened to undermine the foundations of consumer demand. Outside the U.S. (based on Morgan Stanley Capital International (“MSCI”) indices including net dividends and calculated in dollars), the MSCI Japan® Index(4) soared 19.4% (37.3% for the year ended March 31, 2006) on a practically uninterrupted flow of bullish news about rising wages, the end of deflation and GDP growth better than 5%, led at last by domestic demand. The MSCI Europe ex UK® Index(5) climbed 15.5% (24.0% for the
2
MARKET PERSPECTIVE: YEAR ENDED MARCH 31, 2006
year ended March 31, 2006) and the MSCI UK® Index(6) added 8.5% (14.7% for the year ended March 31, 2006), mostly in the later months, with much of the buying interest, in the face of generally gloomy economic reports, inspired by the busiest quarter for merger and acquisition activity since 2000. As for currencies, the dollar’s unexpectedly powerful run of the first three quarters extended to the end of 2005 before stalling in 2006. The strength had been attributed to relatively high U.S. interest rates, the re-cycling of oil exporters’ burgeoning wealth into dollar denominated securities, foreign investors in Japanese stocks hedging their currency risk and the tax-related “repatriation” into dollars of U.S. corporations’ foreign currency balances. Each of these dynamics was losing steam by the end of 2005. For the six-month period ended March 31, 2006, the U.S. dollar fell 0.8% against the euro, but gained 3.8% against the yen, and 1.7% against the pound (gaining 7.0% against the euro, 9.9% against the yen, and 8.8% against the pound for the year ended March 31, 2006).
(1) The Lehman Brothers Aggregate Bond Index is a widely recognized, unmanaged index of publicly issued investment grade U.S. government, mortgage-backed, asset-backed and corporate debt securities.
(2) The Lehman Brothers High Yield Bond Index is an unmanaged index that measures the performance of fixed-income securities generally representative of corporate bonds rated below investment-grade.
(3) The Standard & Poor’s 500® Composite Stock Price Index is an unmanaged index that measures the performance of securities of approximately 500 large-capitalization companies whose securities are traded on major U.S. stock markets.
(4) The MSCI Japan® Index is a free float-adjusted market capitalization index that is designed to measure developed market equity performance in Japan.
(5) The MSCI Europe ex UK® Index is a free float-adjusted market capitalization index that is designed to measure developed market equity performance in Europe, excluding the UK.
(6) The MSCI UK® Index is a free float-adjusted market capitalization index that is designed to measure developed market equity performance in the UK.
All indices are unmanaged and investors cannot invest directly in an index.
Past performance does not guarantee future results. The performance quoted represents past performance. Investment return and principal value of an investment will fluctuate, and shares, when redeemed, may be worth more or less than their original cost. The Funds’ performance is subject to change since the period’s end and may be lower or higher than the performance data shown. Please call (800) 992-0180 or log on to www.ingfunds.com to obtain performance data current to the most recent month end.
Market Perspective reflects the views of the Chief Investment Risk Officer only through the end of the period, and is subject to change based on market and other conditions.
3
ING GNMA INCOME FUND | PORTFOLIO MANAGERS’ REPORT |
The ING GNMA Income Fund (the “Fund”) seeks to generate a high level of current income, consistent with liquidity and safety of principal, through investment primarily in Government National Mortgage Association (“GNMA”) mortgage-backed securities (also known as GNMA Certificates) that are guaranteed as to the timely payment of principal and interest by the U.S. Government. The Fund is managed by Denis P. Jamison, CFA, Senior Vice President and Senior Portfolio Manager, ING Investment Management Co. — the Sub-Adviser.
Securities issued by the U.S. Treasury are backed by the full faith and credit of the federal government. Securities issued by individual agencies and organizations may be backed by the full faith and credit of the federal government as to principal or interest but are not direct obligations of the U.S. Treasury. Securities of some agencies and organizations are backed solely by the entity’s own resources or by the ability of the entity to borrow from the U.S. Treasury. Government securities also include certain mortgage-related securities that are sponsored by a U.S. Government agency or organization and are not direct obligations of the U.S. Government.
Performance: For the year ended March 31, 2006, the Fund’s Class A shares, excluding sales charges, provided a total return of 2.50% compared to 2.67% for the Lehman Brothers Mortgage-Backed Securities Index.
Portfolio Specifics: The Federal Reserve (“Fed”) maintained its policy of gradually raising short-term interest rates over the last year and as a result, the shape of the yield curve changed dramatically. The spread between two-year and 10-year U.S. Treasury notes narrowed from 70 basis points to only four basis points by the end of the period. In fact, for a short period, the yield curve became inverted — a situation where shorter term securities yield more than their longer term cohorts. The bearish flattener produced generally lackluster performance results for U.S. Treasury bonds during the period. Our project loan securities are call-protected, unlike single-family mortgages that can prepay at any time. Therefore, these multi-family holdings are valued more in line with a blend of three- to five-year U.S. Treasury notes, the segment of the market most negatively impacted by the Fed’s consistent interest rate increases. However, late in the period we sold about $30 million worth of our lower coupon project loan securities, realizing sizeable gains. This helped to blunt the losses elsewhere in the portfolio. Single-family mortgage securities performed better than five-year U.S. Treasury notes. For example, as of March 31, the Lehman Mortgage-Backed Securities Index returned 2.67% for the prior 12 months compared with 0.45% for the five-year segment of the yield curve. We have maintained a defensive bias in our single-family mortgage investments. The weighted average coupon for this 67% portion of our portfolio is 5.68% compared with 5.34% for the Lehman Mortgage-Backed Securities Index. Higher coupon securities are less sensitive to changes in interest rates and provide shareholders with better income return. However, they will tend to pay off faster than lower coupon securities. We try to lessen this risk by carefully selecting single-family pools that have characteristics associated with more stable refinancing activity, including loan balance and geographic orientation. The portfolio is now defensively positioned with U.S. Treasury bills accounting for over 13% of total net assets.
Current Strategy and Outlook: Under the new leadership of Dr. Bernanke, the Fed is giving no hints of abandoning its policy of steadily increasing short-term interest rates. The economy is expanding at a healthy pace and the labor market continues to tighten. Recent reports suggest that while inflation appears to be under control, the figures are running near the top of the Fed’s comfort zone. Technically, yields have plowed through various support levels as if they didn’t even exist. Volatility is near all time lows but threatens to increase in the coming months. Accordingly, we remain very cautious on the prospects for the bond market going forward. We intend to maintain the defensive positioning that we have brought the Fund to over the past several months. Of course, our position will change if economic data and market activity point to a change in market sentiment.
4
PORTFOLIO MANAGERS’ REPORT | ING GNMA INCOME FUND |

| | | | | | | | | | | | | | | | | | | | | | | | | |
| Average Annual Total Returns for the Periods Ended March 31, 2006 | |
| | | 1 Year | | 5 Year | | 10 Year | | Since
Inception
of Class B
October 6,
2000 | | Since
Inception
of Class C
October 13,
2000 | | Since
Inception
of Class I
January 7,
2002 | | Since
Inception
of Class M
February 23,
2001 | | Since
Inception
of Class Q
February 26,
2001 | |
| | | | | | | | | | | | | | | | | |
| Including Sales Charge: | | | | | | | | | | | | | | | | |
| Class A(1) | | (2.31 | )% | | 3.40 | % | | 5.47 | % | | — | | | — | | — | | | — | | | — | | |
| Class B(2) | | (3.12 | )% | | 3.28 | % | | — | | | 4.47 | % | | — | | — | | | — | | | — | | |
| Class C(3) | | 0.76 | % | | 3.63 | % | | — | | | — | | | 4.56 | % | — | | | — | | | — | | |
| Class I | | 2.82 | % | | — | | | — | | | — | | | — | | 4.49 | % | | — | | | — | | |
| Class M(4) | | (1.48 | )% | | 3.22 | % | | — | | | — | | | — | | — | | | 3.46 | % | | — | | |
| Class Q | | 2.65 | % | | 4.49 | % | | — | | | — | | | — | | — | | | — | | | 4.69 | % | |
| Excluding Sales Charge: | | | | | | | | | | | | | | | | | | | | | | | | |
| Class A | | 2.50 | % | | 4.41 | % | | 5.98 | % | | — | | | — | | — | | | — | | | — | | |
| Class B | | 1.75 | % | | 3.61 | % | | — | | | 4.62 | % | | — | | — | | | — | | | — | | |
| Class C | | 1.74 | % | | 3.63 | % | | — | | | — | | | 4.56 | % | — | | | — | | | — | | |
| Class I | | 2.82 | % | | — | | | — | | | — | | | — | | 4.49 | % | | — | | | — | | |
| Class M | | 1.87 | % | | 3.91 | % | | — | | | — | | | — | | — | | | 4.11 | % | | — | | |
| Class Q | | 2.65 | % | | 4.49 | % | | — | | | — | | | — | | — | | | — | | | 4.69 | % | |
| Lehman Brothers Mortgage-Backed Securities Index(5) | | 2.67 | % | | 4.86 | % | | 6.21 | % | | 5.65 | %(6) | | 5.65 | %(6) | 4.45 | %(7) | | 4.90 | %(8) | | 4.90 | %(8) | |
| | | | | | | | | | | | | | | | | | | | | | | | | |
| | | | | | | | | | | | | | | | | | | | | | | | | | | | | |
Based on a $10,000 initial investment, the graph and table above illustrate the total return of ING GNMA Income Fund against the index indicated. The index is unmanaged and has no cash in its portfolio, imposes no sales charges and incurs no operating expenses. An investor cannot invest directly in an index. The Fund’s performance is shown both with and without the imposition of sales charges.
The performance graph and table do not reflect the deduction of taxes that a shareholder will pay on Fund distributions or the redemption of Fund shares.
The performance shown may include the effect of fee waivers and/or expense reimbursements by the Investment Manager and/or other service providers, which have the effect of increasing total return. Had all fees and expenses been considered, the total returns would have been lower.
Performance data represents past performance and is no assurance of future results. Investment return and principal value of an investment in the Fund will fuctuate. Shares, when sold, may be worth more or less than their original cost. The Fund’s performance may be lower or higher than the performance data shown. Please log on to www.ingfunds.com or call (800) 992-0180 to get performance through the most recent month end.
This report contains statements that may be “forward-looking” statements. Actual results may differ materially from those projected in the “forward-looking” statements.
The views expressed in this report respect those of the portfolio manager, only through the end of the period as stated on the cover. The portfolio manager’s views are subject to change at any time based on market and other conditions.
(1) Reflects deduction of the maximum Class A sales charge of 4.75%.
(2) Reflects deduction of the Class B deferred sales charge of 5%, 2% and 1% for the 1 year, 5 year and since inception returns, respectively.
(3) Reflects deduction of the Class C deferred sales charge of 1% for the 1 year return.
(4) Reflects deduction of the maximum Class M sales charge of 3.25%.
(5) The Lehman Brothers Mortgage-Backed Securities Index is an unmanaged index composed of fixed income security mortgage pools sponsored by GNMA, FNMA and FHLMC, including GNMA Graduated Payment Mortgages.
(6) Since inception performance for index is shown from October 1, 2000.
(7) Since inception performance for index is shown from January 1, 2002.
(8) Since inception performance for index is shown from March 1, 2001.
5
ING HIGH YIELD BOND FUND | PORTFOLIO MANAGERS’ REPORT |
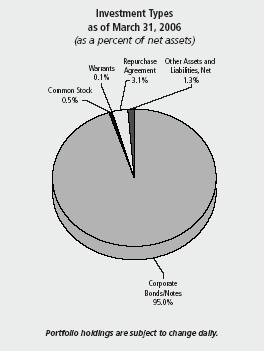
The ING High Yield Bond Fund (the “Fund”) seeks to provide investors with a high level of current income and total return by investing at least 80% of its assets in high yield (high risk) bonds. The Fund is managed by Greg Jacobs, CFA and Kurt Kringelis, CFA, CPA, ING Investment Management Co. — the Sub-Adviser.
Performance: For the year ended March 31, 2006, the Fund’s Class A shares, excluding sales charges, provided a total return of 6.01% compared to 7.43% for the Lehman Brothers High Yield Bond Index and 7.15% for the Lehman Brothers High Yield Bond 2% Issuer Constrained Composite Index.
Portfolio Specifics: As is consistent with our long-term strategy, the Fund was positioned conservatively relative to the benchmark, maintaining an underweight position to the riskiest, highest yielding fixed-income securities. This had a negative impact on relative performance during the year, as the lowest-rated, Ca-distressed high yield securities outperformed the broad market by 8.8%. However, this was partially offset by favorable positioning in a few key sectors, including an underweight in autos. With the turbulence caused by rating agency downgrades and continued fundamental deterioration, the sector experienced significant volatility and was the worst performing sector in the universe, underperforming the benchmark by 6.4%. Our overweight position in Wireless Communications also positively impacted performance, as continued improving fundamentals in the sector led to relative performance that exceeded the benchmark by 4.4%.
From a security standpoint, the Fund benefited from avoiding the most significant credit defaults during the year, including Dana, Delphi, Delta, Northwest Air and Calpine. The Fund experienced no losses due to credit default during the year.
Current Strategy and Outlook: We continue to be cautious regarding the prospects of the high yield market. The underlying fundamentals continue to be strong, including strengthening balance sheets, operating improvement and low default rates. However, with spreads at historically tight levels, the potential for enhanced returns through bond price appreciation has significantly decreased, leaving investors with little upside beyond current coupon returns.
As a result, we maintain underweight the highest yielding, riskiest part of the high yield universe. With spreads compressed across the risk spectrum, we do not believe investors are being adequately compensated for taking on the additional credit risk that comes with investing in the lower quality part of the universe. In addition, the recent environment has exhibited flat yield and credit spread curves. Given our view that spreads are not likely to tighten materially, we are taking advantage of the flat curves to shorten our exposure to many issuers without sacrificing much current yield. We continue to focus on investing in companies that are showing positive operating momentum and have taken advantage of the environment to extend maturities and bolster liquidity positions.
Top Ten Industries*
as of March 31, 2006
(as a percent of net assets)
Telecommunications | | 13.8 | % |
Media | | 11.0 | % |
Electric | | 8.7 | % |
Lodging | | 6.0 | % |
Diversified Financial Services | | 4.8 | % |
Food | | 4.1 | % |
Chemicals | | 3.6 | % |
Pipelines | | 3.3 | % |
Commercial Services | | 3.2 | % |
Healthcare-Services | | 3.0 | % |
| | | |
* Excludes short-term investments related to repurchase agreement. |
Portfolio holdings are subject to change daily.
6
PORTFOLIO MANAGERS’ REPORT | ING HIGH YIELD BOND FUND |

| | |
| Average Annual Total Returns for the Periods Ended March 31, 2006 | |
| | | 1 Year | | 5 Year | | Since Inception
December 15, 1998 | |
| | | | | | | | |
| Including Sales Charge: | | | | | | | |
| Class A(1) | | 0.94 | % | | 4.79 | % | | 5.19 | % | |
| Class B(2) | | 0.24 | % | | 4.74 | % | | 5.11 | % | |
| Class C(3) | | 4.23 | % | | 5.04 | % | | 5.13 | % | |
| Excluding Sales Charge: | | | | | | | | | | |
| Class A | | 6.01 | % | | 5.82 | % | | 5.90 | % | |
| Class B | | 5.22 | % | | 5.04 | % | | 5.11 | % | |
| Class C | | 5.22 | % | | 5.04 | % | | 5.13 | % | |
| Lehman Brothers High Yield Bond Index(4) | | 7.43 | % | | 8.13 | % | | 5.85 | %(6) | |
| Lehman Brothers High Yield Bond Index — 2% Issuer Constrained(5) | | 7.15 | % | | 8.32 | % | | 6.05 | %(6) | |
| | | | | | | | | | | |
Based on a $10,000 initial investment, the graph and table above illustrate the total return of ING High Yield Bond Fund against the Index indicated. The index is unmanaged and has no cash in its portfolio, imposes no sales charges and incurs no operating expenses. An investor cannot invest directly in an index. The Fund’s performance is shown both with and without the imposition of sales charges.
The performance graph and table do not reflect the deduction of taxes that a shareholder will pay on Fund distributions or the redemption of Fund shares.
The performance shown may include the effect of fee waivers and/or expense reimbursements by the Investment Manager and/or other service providers, which have the effect of increasing total return. Had all fees and expenses been considered, the total returns would have been lower.
Performance data represents past performance and is no assurance of future results. Investment return and principal value of an investment in the Fund will ßuctuate. Shares, when sold, may be worth more or less than their original cost. The Fund’s performance may be lower or higher than the performance data shown. Please log on to www.ingfunds.com or call (800) 992-0180 to get performance through the most recent month end.
This report contains statements that may be “forward-looking” statements. Actual results may differ materially from those projected in the “forward-looking” statements.
The views expressed in this report reflect those of the portfolio managers, only through the end of the period as stated on the cover. The portfolio managers’ views are subject to change at any time based on market and other conditions.
Fund holdings are subject to change daily.
(1) Reflects deduction of the maximum Class A sales charge of 4.75%.
(2) Reflects deduction of the Class B deferred sales charge of 5% and 2% for the 1 year and 5 year returns, respectively.
(3) Reflects deduction of the Class C deferred sales charge of 1% for the 1 year return.
(4) The Lehman Brothers High Yield Bond Index is an unmanaged index that measures the performance of fixed-income securities that are similar, but not identical, to those in the Fund’s portfolio.
(5) This index is the 2% Issuer Cap component of the Lehman Brothers High Yield Bond Index.
(6) Since inception performance for index is shown from December 1, 1998.
7
ING INTERMEDIATE BOND FUND | PORTFOLIO MANAGERS’ REPORT |
Investment Types
as of March 31, 2006
(as a percent of net assets)
U.S. Government Agency Obligations | | 32.0 | % |
Corporate Bonds/Notes | | 28.2 | % |
Collateralized Mortgage Obligations | | 26.1 | % |
U.S. Treasury Obligations | | 15.9 | % |
Asset-Backed Security | | 5.7 | % |
Repurchase Agreement | | 3.1 | % |
Preferred Stock | | 2.1 | % |
Other Bonds | | 0.2 | % |
Municipal Bonds | | 0.0 | % |
Warrants | | 0.0 | % |
Other Assets And Liabilities, Net* | | (13.3 | )% |
Total | | 100.0 | % |
| | | |
* Includes securities lending collateral. |
| | | | |
Portfolio holdings are subject to change daily.
The ING Intermediate Bond Fund (the “Fund”) seeks to provide investors with a high level of current income, consistent with the preservation of capital and liquidity. The Fund is managed by James B. Kauffmann, ING Investment Management Co. — the Sub-Adviser.
Performance: For the year ended March 31, 2006, the Fund’s Class A shares, excluding sales charges, provided a total return of 2.53% compared to 2.26% for the Lehman Brothers Aggregate Bond Index.
Portfolio Specifics: While it is often difficult to summarize an entire year of performance in a few brief words, several major themes are evident. Generally, the Fund had a shorter duration — or less sensitivity to rising interest rates — than the index, which contributed to better relative returns than the benchmark. Moreover, the Fund was underweight in shorter maturity securities, which experienced the largest increase in yields. Careful security selection in both the corporate bond and mortgage-backed securities (MBS) sectors was also beneficial. The swoon in the credit quality of the automotive industry left the Fund largely unscathed as we had little or no exposure prior to the downgrades of Ford and General Motors in May. However, we did actively manage opportunistic exposure to the autos in the following months, which resulted in outperformance versus the benchmark. A number of floating rate securities — especially in the finance industry — also helped. The mortgage team focused on issues that were likely to outperform in a rising rate environment. Our exposures to the emerging market debt and high yield sectors were very slight for most of the year. Emerging market debt performed strongly, and with perfect hindsight, a larger allocation to the sector would have been desirable. Relative weakness in the high yield markets favored our underweight to that group.
Current Outlook and Strategy: We believe that inflation and economic growth will trend higher than consensus, but we remain vigilant for the next change in the yield curve. Although the curve showed its first early signs of steepening — that is, long rates increasing more than short rates — we are not yet ready to adjust the portfolio. We remain concerned that a global expansion may be underway in an environment of tightening employment and high commodities prices. We would not be surprised if the Federal Reserve continues to raise rates in an attempt to control inflation.
We believe investors are not being adequately compensated for risk in the present market. Formerly, bondholder-friendly executives have yielded to shareholder-friendly initiatives as evidenced by the increasing number of leveraged buyouts and recapitalizations in the credit markets; moreover, the increase in private equity funds is not a good omen. Share repurchases and dividend payouts are on the rise yet credit spreads remain tight and volatility low. Our credit stance remains defensive. Our mortgage team has constructed a portfolio designed to offset an increase in volatility and a change in prepayments. Finally, portfolio duration is shorter than the index.
8
PORTFOLIO MANAGERS’ REPORT | ING INTERMEDIATE BOND FUND |

| | | | | | | | | | | | | | | | | | | | |
| Average Annual Total Returns for the Periods Ended March 31, 2006 | |
| | | 1 Year | | 5 Year | | Since
Inception
of Class A, B and C
December 15,
1998 | | Since
Inception
of Class I
January 8,
2002 | | Since
Inception
of Class O
August 13,
2004 | | Since
Inception
of Class R
March 16,
2004 | |
| Including Sales Charge: | | | | | | | | | | | | | |
| Class A(1) | | (2.30 | )% | | 5.08 | % | | 5.73 | % | | — | | | — | | | — | | |
| Class B(2) | | (3.15 | )% | | 4.96 | % | | 5.62 | % | | — | | | — | | | — | | |
| Class C(3) | | 0.79 | % | | 5.29 | % | | 5.65 | % | | — | | | — | | | — | | |
| Class I | | 2.94 | % | | — | | | — | | | 5.51 | % | | — | | | — | | |
| Class O | | 2.58 | % | | — | | | — | | | — | | | 2.57 | % | | — | | |
| Class R | | 2.26 | % | | — | | | — | | | — | | | — | | | 1.77 | % | |
| Excluding Sales Charge: | | | | | | | | | | | | | | | | | | | |
| Class A | | 2.53 | % | | 6.11 | % | | 6.44 | % | | — | | | — | | | — | | |
| Class B | | 1.76 | % | | 5.29 | % | | 5.62 | % | | — | | | — | | | — | | |
| Class C | | 1.77 | % | | 5.29 | % | | 5.65 | % | | — | | | — | | | — | | |
| Class I | | 2.94 | % | | — | | | — | | | 5.51 | % | | — | | | — | | |
| Class O | | 2.58 | % | | — | | | — | | | — | | | 2.57 | % | | — | | |
| Class R | | 2.26 | % | | — | | | — | | | — | | | — | | | 1.77 | % | |
| Lehman Brothers Aggregate Bond Index(4) | | 2.26 | % | | 5.11 | % | | 5.37 | %(5) | | 4.77 | %(6) | | 2.96 | %(7) | | 1.70 | %(8) | |
| | | | | | | | | | | | | | | | | | | | |
| | | | | | | | | | | | | | | | | | | | | |
Based on a $10,000 initial investment, the graph and table above illustrate the total return of ING Intermediate Bond Fund against the Index indicated. The index is unmanaged and has no cash in its portfolio, imposes no sales charges and incurs no operating expenses. An investor cannot invest directly in an index. The Fund’s performance is shown both with and without the imposition of sales charges.
The performance graph and table do not reflect the deduction of taxes that a shareholder will pay on Fund distributions or the redemption of Fund shares.
The performance shown may include the effect of fee waivers and/or expense reimbursements by the Investment Manager and/or other service providers, which have the effect of increasing total return. Had all fees and expenses been considered, the total returns would have been lower.
Performance data represents past performance and is no assurance of future results. Investment return and principal value of an investment in the Fund will ßuctuate. Shares, when sold, may be worth more or less than their original cost. The Fund’s performance may be lower or higher than the performance data shown. Please log on to www.ingfunds.com or call (800) 992-0180 to get performance through the most recent month end.
This report contains statements that may be “forward-looking” statements. Actual results may differ materially from those projected in the “forward-looking” statements.
The views expressed in this report reßect those of the portfolio manager, only through the end of the period as stated on the cover. The portfolio manager’s views are subject to change at any time based on market and other conditions.
Fund holdings are subject to change daily.
(1) Reflects deduction of the maximum Class A sales charge of 4.75%.
(2) Reflects deduction of the Class B deferred sales charge of 5% and 2% for the 1 year and 5 year returns, respectively.
(3) Reflects deduction of the Class C deferred sales charge of 1% for the 1 year return.
(4) The Lehman Brothers Aggregate Bond Index is a widely recognized, unmanaged index of publicly issued investment grade U.S. government, mortgage-backed, asset-backed and corporate debt securities.
(5) Since inception performance for index is shown from December 1, 1998.
(6) Since inception performance for index is shown from January 1, 2002.
(7) Since inception performance for index is shown from August 1, 2004.
(8) Since inception performance for index is shown from April 7, 2004.
9
ING NATIONAL TAX-EXEMPT BOND FUND | PORTFOLIO MANAGERS’ REPORT |
The ING National-Tax Exempt Bond Fund (the “Fund”) seeks to provide investors with a high level of current income that is exempt from federal income taxes, consistent with preservation of capital. The Fund is managed by Robert Schonbrunn, Portfolio Manager, Karen Cronk, Managing Director and Portfolio Manager, and Rick Kilbride, ING Investment Management Co. — the Sub-Adviser.
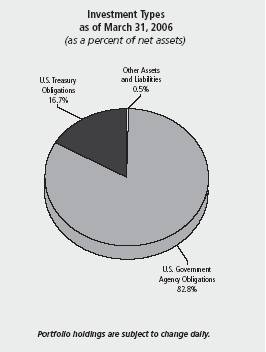
Performance: For the year ended March 31, 2006, the Fund’s Class A shares, excluding sales charges, provided a total return of 2.55% compared to 3.81% for the Lehman Brothers Municipal Bond Index and 2.26% for the Lehman Brothers Aggregate Bond Index.
Portfolio Specifics: Over the past fiscal year the major change that impacted the Municipal bond market was the flattening of the yield curve, which caused shorter term bonds to rise in yield while yields of longer term issues actually declined. The result of this flattening was that the yield differential between one and thirty year Municipal bonds was reduced from over 2% in March of 2005 to less than 1% a year later. The yields of bonds with maturities of ten years and under rose while the yields of bonds with longer maturities declined. The Fund implemented investment strategies in an attempt to protect assets from the negative effects expected from a flattening yield curve and rising interest rates. We shifted to a barbell yield curve strategy that overweighted short and long maturities while underweighting intermediate maturities in order to create a defense against the flattening yield curve. We reduced the portfolio’s overall sensitivity to interest rate change to protect against rising interest rates. These strategies had mixed success last fiscal year. The longer maturity issues held in the barbell strategy performed well, but the shorter term issues underperformed. The strategy to adjust the portfolio sensitivity to interest rate change was not timed correctly in the early part of the fiscal year, but was effective more recently. The total yield on the portfolio of 4.17% remains competitively high which improved the Fund’s total return. During the year we shifted assets to higher yielding, lower quality issues including hospital and tobacco bonds which added to overall performance as quality spreads tightened. The Fund’s overall quality remains high with an AA rating.
Current Strategy and Outlook: We believe the Federal Reserve’s (“Fed”) extended program of raising the Fed Funds Rate is nearing an end. Since June 2004 when the Fed Funds Rate was 1%, the Fed has raised the rate 1/4% at each of its last fifteen meetings in an attempt to slow economic growth and reduce potential future inflation. U.S. economic growth led by consumer spending has been stronger than anticipated, but higher interest rate levels are beginning to impact the housing market and are likely to slow consumer spending and the economy. When the Fed signals that it is changing its restrictive policy, interest rates usually decline causing bond prices to rise. The Fund is currently positioned defensively with a low sensitivity to interest rate change and a barbell yield curve position. As we get closer to the turning point in Fed policy, we expect to shift assets into bonds with longer maturities in order to more fully participate in the positive effects of declining bond yields.
10
PORTFOLIO MANAGERS’ REPORT | ING NATIONAL TAX-EXEMPT BOND FUND |
| | |
| Average Annual Total Returns for the Periods Ended March 31, 2006 | |
| | | 1 Year | | 5 Year | | Since Inception
November 8, 1999 | |
| | | | | | | | |
| Including Sales Charge: | | | | | | | |
| Class A(1) | | (2.29 | )% | | 3.11 | % | | 4.28 | % | |
| Class B(2) | | (3.21 | )% | | 3.02 | % | | 4.28 | % | |
| Class C(3) | | 0.79 | % | | 3.37 | % | | 4.30 | % | |
| Excluding Sales Charge: | | | | | | | | | | |
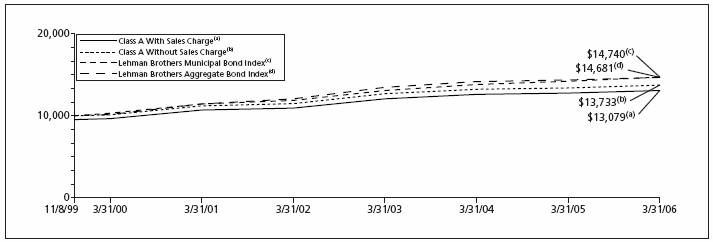
| Class A | | 2.55 | % | | 4.11 | % | | 5.08 | % | |
| Class B | | 1.68 | % | | 3.36 | % | | 4.28 | % | |
| Class C | | 1.77 | % | | 3.37 | % | | 4.30 | % | |
| Lehman Brothers Municipal Bond Index(4) | | 3.81 | % | | 5.18 | % | | 6.23 | %(6) | |
| Lehman Brothers Aggregate Bond Index(5) | | 2.26 | % | | 5.11 | % | | 6.17 | %(6) | |
| | | | | | | | | | | |
Based on a $10,000 initial investment, the graph and table above illustrate the total return of ING National Tax-Exempt Bond Fund against the Indices indicated. An index is unmanaged and has no cash in its portfolio, imposes no sales charge and incurs no operating expenses. An investor cannot invest directly in an index. The Fund’s performance is shown both with and without the imposition of sales charges.
The performance graph and table do not reflect the deduction of taxes that a shareholder will pay (if any) on Fund distributions or the redemption of Fund shares.
The performance shown may include the effect of fee waivers and/or expense reimbursements by the Investment Manager and/or other service providers, which have the effect of increasing total return. Had all fees and expenses been considered, the total returns would have been lower.
Performance data represents past performance and is no assurance of future results. Investment return and principal value of an investment in the Fund will fluctuate. Shares, when sold, may be worth more or less than their original cost. The Fund’s performance may be lower or higher than the performance data shown. Please log on to www.ingfunds.com or call (800) 992-0180 to get performance through the most recent month end.
This report contains statements that may be “forward-looking” statements. Actual results may differ materially from those projected in the “forward-looking” statements.
The views expressed in this report reflect those of the portfolio managers, only through the end of the period as stated on the cover. The portfolio managers’ views are subject to change at any time based on market and other conditions.
Fund holdings are subject to change daily.
(1) Reflects deduction of the maximum Class A sales charge of 4.75%.
(2) Reflects deduction of the Class B deferred sales charge of 5% and 2% for the 1 year and 5 year returns, respectively.
(3) Reflects deduction of the Class C deferred sales charge of 1% for the 1 year return.
(4) The Lehman Brothers Municipal Bond Index is an unmanaged index of approximately 1,100 investment grade tax-exempt bonds classified into four sectors: general obligation, revenue, insured and pre-refunded.
(5) The Lehman Brothers Aggregate Bond Index is a widely recognized, unmanaged index of publicly issued investment grade U.S. government, mortgage-backed, asset-backed and corporate debt securities.
(6) Since inception performance for index is shown from November 1, 1999.
11
ING CLASSIC MONEY MARKET FUND | PORTFOLIO MANAGERS’ REPORT |
ING Classic Money Market Fund (the “Fund”) seeks to provide investors with a high level of current income, consistent with the preservation of capital and liquidity and the maintenance of a stable $1.00 net asset value per share. The Fund is managed by David S. Yealy, Portfolio Manager, ING Investment Management Co. — the Sub-Adviser.
Portfolio Specifics: Economic growth remained strong during the year ended March 31, 2006 while core inflation remained elevated and the unemployment rate continued its decline. Against this economic backdrop, the Federal Reserve Board’s (“Fed”) Federal Open Market Committee (“FOMC”) continued its measured pace of increasing short-term interest rates. During the most recent 12-month period, the FOMC raised the Federal Funds Rate from 2.75% as of March 31, 2005 to 4.75% as of March 31, 2006 in 0.25% increments at each of the FOMC meetings during the period. The FOMC has now raised rates at 15 consecutive meetings for a total of 3.75% since they started raising rates in June 2004. Yields for short-term money market securities and for money market funds increased in direct response to the FOMC rate moves.
The Fund’s strategy of maintaining a high concentration of interest sensitive floating rate securities and focusing new purchases on very short-term maturities that typically matured prior to or just after the next Fed meeting added to the relative performance of the Fund. Within the floating rate security sector, we overweighted floaters that reset either weekly or monthly as opposed to quarterly, thereby capturing the rate increases sooner. The Fund had purchased a limited amount of longer-term maturity securities in mid-2004, which originally added to performance in 2004 but were a small drag on performance early in the period as the FOMC increased rates higher than what was priced in at the time of purchase. Those securities matured in April and May 2005 and the proceeds were reinvested in better performing floating rate securities and very short-term securities.
Current Strategy and Outlook: The short-term market consensus as of the end of March 2006 is for the Federal Funds Rate to be increased by the FOMC to at least 5%. We anticipate that the FOMC may keep raising the Federal Funds Rate to 5.25% or higher in response to wage inflation pressures due to a tightening labor market with the unemployment rate currently at 4.7%. Our strategy continues to be one of focusing new purchases until the next FOMC meeting, maintaining a high exposure to floating rate notes, and making selective purchases in the three-month and under maturity sector where yield levels fully price in 0.25% increases at each of the FOMC meetings in between. We plan on keeping our weighted average maturity relatively short until the markets start to price in a more aggressive FOMC than what is currently priced into the market or the FOMC reaches the end of its tightening phase.
Principal Risk Factor(s): An investment in the Fund is not insured or guaranteed by the Federal Deposit Insurance Corporation or any other government agency.
Although the Fund seeks to preserve the value of your investment at $1.00 per share, it is possible to lose money by investing in the Fund.
The views expressed in this report reflect those of the portfolio manager only through the end of the period as stated on the cover. The portfolio manager’s views are subject to change at any time based on market and other conditions.
Fund holdings are subject to change daily.
This report contains statements that may be “forward-looking” statements. Actual results may differ materially from those projected in the “forward-looking” statements.
12
ING INSTITUTIONAL PRIME MONEY MARKET FUND | PORTFOLIO MANAGERS’ REPORT |

The ING Institutional Money Market Fund (the “Fund”) seeks to provide investors with a high level of current income, consistent with the preservation of capital and liquidity and the maintenance of a stable $1.00 net asset value per share. The Fund is managed by David S. Yealy, Portfolio Manager, ING Investment Management Co. — the Sub-Adviser.
Portfolio Specifics: Economic growth remained strong during the period while core inflation stayed in the high end of the perceived Federal Reserve Board’s (“Fed”) Federal Open Market Committee (“FOMC”) comfort range and the unemployment rate continued its decline. Against this economic backdrop, the FOMC continued its measured pace of increasing short-term interest rates. During the most recent 12-month period, the FOMC raised the Federal Funds Rate from 2.75% as of March 31, 2005 to 4.75% as of March 31, 2006 in 0.25% increments at each of the FOMC meetings during the period. The FOMC has now raised rates at 15 consecutive meetings and a total of 3.75% since they started raising rates in June 2004. Yields for short-term money market securities and for money market funds increased in direct response to the FOMC rate moves.
The Fund’s strategy of focusing new purchases on very short-term maturities that typically matured prior to or just after the next Fed meeting and maintaining an exposure in interest sensitive floating rate securities added to the relative performance of the Fund. Within the floating rate security sector, we overweighted floaters that reset either weekly or monthly as opposed to quarterly, thereby capturing the rate increases sooner. The Fund maintained an excess amount of very short-term liquidity since the Fund was a new start-up and had limited shareholder history in order to judge the appropriate amount of liquidity needed to meet potential daily withdrawals. The excess liquidity was a small drag on the yield and return of the Fund but was necessary to protect the Fund in the start-up phase as it grows and builds shareholder diversification and stability.
Current Strategy and Outlook: The short-term market consensus as of the end of March 2006 is for the Federal Funds Rate to be increased by the FOMC to at least 5%. We anticipate that the FOMC may keep raising the Federal Funds Rate to 5.25% or higher in response to wage inflation pressures due to a tightening labor market with the unemployment rate currently at 4.7%. Our strategy continues to be one of focusing new purchases to the next FOMC meeting, maintaining a high exposure to floating rate notes, and making selective purchases in the three-month and under maturity sector where yield levels fully price in 0.25% increases at each of the FOMC meetings in between. We plan on keeping our weighted average maturity relatively short until the markets start to price in a more aggressive FOMC policy than what is currently priced into the market or the FOMC reaches the end of its tightening phase.
Principal Risk Factor(s): An investment in the Fund is not insured or guaranteed by the Federal Deposit Insurance Corporation or any other government agency.
Although the Fund seeks to preserve the value of your investment at $1.00 per share, it is possible to lose money by investing in the Fund.
The views expressed in this report reflect those of the portfolio manager only through the end of the period as stated on the cover. The portfolio manager’s views are subject to change at any time based on market and other conditions.
Fund holdings are subject to change daily.
This report contains statements that may be “forward-looking” statements. Actual results may differ materially from those projected in the “forward-looking” statements.
13
SHAREHOLDER EXPENSE EXAMPLES (UNAUDITED)
As a shareholder of a Fund, you incur two types of costs: (1) transaction costs, including sales charges (loads) on purchase payments; redemption fees; and exchange fees; and (2) ongoing costs, including management fees; distribution [and/or service] (12b–1) fees; and other Fund expenses. These Examples are intended to help you understand your ongoing costs (in dollars) of investing in a Fund and to compare these costs with the ongoing costs of investing in other mutual funds.
The Examples are based on an investment of $1,000 invested at the beginning of the period and held for the entire period from October 1, 2005 to March 31, 2006.
Actual Expenses
The first section of the table shown, “Actual Fund Return,” provides information about actual account values and actual expenses. You may use the information in this section, together with the amount you invested, to estimate the expenses that you paid over the period. Simply divide your account value by $1,000 (for example, an $8,600 account value divided by $1,000 = 8.6), then multiply the result by the number in the first section under the heading entitled “Expenses Paid During Period” to estimate the expenses you paid on your account during this period.
Hypothetical Example for Comparison Purposes
The second section of the table shown, “Hypothetical 5% Return,” provides information about hypothetical account values and hypothetical expenses based on the Fund’s actual expense ratio and an assumed rate of return of 5% per year before expenses, which is not the Fund’s actual return. The hypothetical account values and expenses may not be used to estimate the actual ending account balance or expenses you paid for the period. You may use this information to compare the ongoing costs of investing in the Fund and other funds. To do so, compare this 5% hypothetical example with the 5% hypothetical examples that appear in the shareholder reports of the other funds.
Please note that the expenses shown in the table are meant to highlight your ongoing costs only and do not reflect any transactional costs, such as sales charges (loads), redemption fees, or exchange fees. Therefore, the hypothetical lines of the table are useful in comparing ongoing costs only, and will not help you determine the relative total costs of owning different funds. In addition, if these transactional costs were included, your costs would have been higher.
| | | | | | | | | | |
| | | Beginning
Account
Value
October 1, 2005 | | Ending
Account
Value
March 31, 2006 | | Annualized
Expense
Ratio | | Expenses Paid
During the
Six Months Ended
March 31, 2006* | |
| ING GNMA Income Fund | | | | | | | | | | | | | |
| Actual Fund Return | | | | | | | | | | | | | |
| Class A | | $1,000.00 | | | $1,008.10 | | | 0.96 | % | | $4.81 | | |
| Class B | | 1,000.00 | | | 1,004.30 | | | 1.71 | | | 8.54 | | |
| Class C | | 1,000.00 | | | 1,004.30 | | | 1.71 | | | 8.54 | | |
| Class I | | 1,000.00 | | | 1,009.60 | | | 0.66 | | | 3.31 | | |
| Class M | | 1,000.00 | | | 1,004.40 | | | 1.47 | | | 7.35 | | |
| Class Q | | 1,000.00 | | | 1,008.40 | | | 0.90 | | | 4.51 | | |
| Hypothetical (5% return before expenses) | | | | | | | | | | | | | |
| Class A | | $1,000.00 | | | $1,020.14 | | | 0.96 | % | | $4.84 | | |
| Class B | | 1,000.00 | | | 1,016.40 | | | 1.71 | | | 8.60 | | |
| Class C | | 1,000.00 | | | 1,016.40 | | | 1.71 | | | 8.60 | | |
| Class I | | 1,000.00 | | | 1,021.64 | | | 0.66 | | | 3.33 | | |
| Class M | | 1,000.00 | | | 1,017.60 | | | 1.47 | | | 7.39 | | |
| Class Q | | 1,000.00 | | | 1,020.44 | | | 0.90 | | | 4.53 | | |
| | | | | | | | | | | | | | |
* Expenses are equal to each Fund’s respective annualized expense ratios multiplied by the average account value over the period, multiplied by 182/365 to reflect the most recent fiscal half-year.
14
SHAREHOLDER EXPENSE EXAMPLES (UNAUDITED) (CONTINUED)
| | | | | | | | | | |
| ING High Yield Bond Fund | | Beginning
Account
Value
October 1, 2005 | | Ending
Account
Value
March 31, 2006 | | Annualized
Expense
Ratio | | Expenses Paid
During the
Six Months Ended
March 31, 2006* | |
| Actual Fund Return | | | | | | | | | | | | | |
| Class A | | $1,000.00 | | | $1,031.20 | | | 1.16 | % | | $5.87 | | |
| Class B | | 1,000.00 | | | 1,027.40 | | | 1.91 | | | 9.65 | | |
| Class C | | 1,000.00 | | | 1,027.30 | | | 1.91 | | | 9.65 | | |
| Hypothetical (5% return before expenses) | | | | | | | | | | | | | |
| Class A | | $1,000.00 | | | $1,019.15 | | | 1.16 | % | | $5.84 | | |
| Class B | | 1,000.00 | | | 1,015.41 | | | 1.91 | | | 9.60 | | |
| Class C | | 1,000.00 | | | 1,015.41 | | | 1.91 | | | 9.60 | | |
| | | | | | | | | | | | | | |
| ING Intermediate Bond Fund | | | | | | | | | | | | | |
| Actual Fund Return | | | | | | | | | | | | | |
| Class A | | $1,000.00 | | | $1,001.60 | | | 0.87 | % | | $4.34 | | |
| Class B | | 1,000.00 | | | 997.70 | | | 1.62 | | | 8.07 | | |
| Class C | | 1,000.00 | | | 997.80 | | | 1.62 | | | 8.07 | | |
| Class I | | 1,000.00 | | | 1,004.10 | | | 0.56 | | | 2.80 | | |
| Class O | | 1,000.00 | | | 1,001.50 | | | 0.88 | | | 4.39 | | |
| Class R | | 1,000.00 | | | 1,000.40 | | | 1.11 | | | 5.54 | | |
| Hypothetical (5% return before expenses) | | | | | | | | | | | | | |
| Class A | | $1,000.00 | | | $1,020.59 | | | 0.87 | % | | $4.38 | | |
| Class B | | 1,000.00 | | | 1,016.85 | | | 1.62 | | | 8.15 | | |
| Class C | | 1,000.00 | | | 1,016.85 | | | 1.62 | | | 8.15 | | |
| Class I | | 1,000.00 | | | 1,022.14 | | | 0.56 | | | 2.82 | | |
| Class O | | 1,000.00 | | | 1,020.54 | | | 0.88 | | | 4.43 | | |
| Class R | | 1,000.00 | | | 1,019.40 | | | 1.11 | | | 5.59 | | |
| | | | | | | | | | | | | | |
| ING National Tax-Exempt Bond Fund | | | | | | | | | | | | | |
| Actual Fund Return | | | | | | | | | | | | | |
| Class A | | $1,000.00 | | | $1,003.40 | | | 1.01 | % | | $5.04 | | |
| Class B | | 1,000.00 | | | 999.60 | | | 1.76 | | | 8.77 | | |
| Class C | | 1,000.00 | | | 999.60 | | | 1.76 | | | 8.77 | | |
| Hypothetical (5% return before expenses) | | | | | | | | | | | | | |
| Class A | | $1,000.00 | | | $1,019.90 | | | 1.01 | % | | $5.09 | | |
| Class B | | 1,000.00 | | | 1,016.16 | | | 1.76 | | | 8.85 | | |
| Class C | | 1,000.00 | | | 1,016.16 | | | 1.76 | | | 8.85 | | |
| | | | | | | | | | | | | | |
* Expenses are equal to each Fund’s respective annualized expense ratios multiplied by the average account value over the period, multiplied by 182/365 to reflect the most recent fiscal half-year.
15
SHAREHOLDER EXPENSE EXAMPLES (UNAUDITED) (CONTINUED)
| | | | | | | | | | |
| | | Beginning
Account
Value
October 1, 2005 | | Ending
Account
Value
March 31, 2006 | | Annualized
Expense
Ratio | | Expenses Paid
During the
Six Months Ended
March 31, 2006* | |
| ING Classic Money Market Fund | | | | | | | | | | | | | |
| Actual Fund Return | | | | | | | | | | | | | |
| Class A | | $1,000.00 | | | $1,017.80 | | | 0.77 | % | | $3.87 | | |
| Class B | | 1,000.00 | | | 1,014.70 | | | 1.34 | | | 6.73 | | |
| Class C | | 1,000.00 | | | 1,014.70 | | | 1.34 | | | 6.73 | | |
| Hypothetical (5% return before expenses) | | | | | | | | | | | | | |
| Class A | | $1,000.00 | | | $1,021.09 | | | 0.77 | % | | $3.88 | | |
| Class B | | 1,000.00 | | | 1,018.25 | | | 1.34 | | | 6.74 | | |
| Class C | | 1,000.00 | | | 1,018.25 | | | 1.34 | | | 6.74 | | |
| | | | | | | | | | | | | | |
| ING Institutional Prime Money Market Fund | | | | | | | | | | | | | |
| Actual Fund Return | | $1,000.00 | | | $1,021.00 | | | 0.17 | % | | $0.86 | | |
| Hypothetical (5% return before expenses) | | $1,000.00 | | | $1,024.08 | | | 0.17 | % | | $0.86 | | |
| | | | | | | | | | | | | | |
| Effective January 20, 2006, the contractual obligations for ING GNMA Income Fund, ING High Yield Bond Fund, ING Intermediate Bond Fund and National Tax-Exempt Bond Fund have changed. If these changes had been in place during the entire six-month period, actual and hypothetical ending account balances annualized expense ratio and expenses paid would have been as follows: | |
| | | | | | | | | | | | | | |
| | | Beginning
Account
Value
October 1, 2005 | | Ending
Account
Value
March 31, 2006 | | Annualized
Expense
Ratio
(adjusted for
contractual
changes) | | Expenses Paid
During the
Six Months Ended
March 31, 2006** | |
| ING GNMA Income Fund | | | | | | | | | | | | | |
| Actual Fund Return | | | | | | | | | | | | | |
| Class A | | $1,000.00 | | | $1,008.10 | | | 0.88 | % | | $4.41 | | |
| Class B | | 1,000.00 | | | 1,004.30 | | | 1.63 | | | 8.15 | | |
| Class C | | 1,000.00 | | | 1,004.30 | | | 1.63 | | | 8.15 | | |
| Class I | | 1,000.00 | | | 1,009.60 | | | 0.59 | | | 2.96 | | |
| Class M | | 1,000.00 | | | 1,004.40 | | | 1.40 | | | 7.00 | | |
| Class Q | | 1,000.00 | | | 1,008.40 | | | 0.83 | | | 4.16 | | |
| Hypothetical (5% return before expenses) | | | | | | | | | | | | | |
| Class A | | $1,000.00 | | | $1,020.54 | | | 0.88 | % | | $4.43 | | |
| Class B | | 1,000.00 | | | 1,016.80 | | | 1.63 | | | 8.20 | | |
| Class C | | 1,000.00 | | | 1,016.80 | | | 1.63 | | | 8.20 | | |
| Class I | | 1,000.00 | | | 1,021.99 | | | 0.59 | | | 2.97 | | |
| Class M | | 1,000.00 | | | 1,017.95 | | | 1.40 | | | 7.04 | | |
| Class Q | | 1,000.00 | | | 1,020.79 | | | 0.83 | | | 4.18 | | |
| | | | | | | | | | | | | | |
* Expenses are equal to each Fund’s respective annualized expense ratios multiplied by the average account value over the period, multiplied by 182/365 to reflect the most recent fiscal half-year.
** Expenses are equal to each Fund’s respective annualized expense ratios, adjusted for contractual changes, multiplied by the average account value over the period, multiplied by 182/365 to reflect the most recent fiscal half-year.
16
SHAREHOLDER EXPENSE EXAMPLES (UNAUDITED) (CONTINUED)
| | | | | | | | | | |
| | | Beginning
Account
Value
October 1, 2005 | | Ending
Account
Value
March 31, 2006 | | Annualized
Expense
Ratio
(adjusted for
contractual
changes) | | Expenses Paid
During the
Six Months Ended
March 31, 2006** | |
| ING High Yield Bond Fund | | | | | | | | | | | | | |
| Actual Fund Return | | | | | | | | | | | | | |
| Class A | | $1,000.00 | | | $1,031.20 | | | 0.55 | % | | $2.79 | | |
| Class B | | 1,000.00 | | | 1,027.40 | | | 0.93 | | | 4.70 | | |
| Class C | | 1,000.00 | | | 1,027.30 | | | 0.93 | | | 4.70 | | |
| Hypothetical (5% return before expenses) | | | | | | | | | | | | | |
| Class A | | $1,000.00 | | | $1,022.19 | | | 0.55 | % | | $2.77 | | |
| Class B | | 1,000.00 | | | 1,020.29 | | | 0.93 | | | 4.68 | | |
| Class C | | 1,000.00 | | | 1,020.29 | | | 0.93 | | | 4.68 | | |
| | | | | | | | | | | | | | |
| ING Intermediate Bond Fund | | | | | | | | | | | | | |
| Actual Fund Return | | | | | | | | | | | | | |
| Class A | | $1,000.00 | | | $1,001.60 | | | 0.69 | % | | $3.44 | | |
| Class B | | 1,000.00 | | | 997.70 | | | 1.44 | | | 7.17 | | |
| Class C | | 1,000.00 | | | 997.80 | | | 1.44 | | | 7.17 | | |
| Class I | | 1,000.00 | | | 1,004.10 | | | 0.38 | | | 1.90 | | |
| Class O | | 1,000.00 | | | 1,001.50 | | | 0.69 | | | 3.44 | | |
| Class R | | 1,000.00 | | | 1,000.40 | | | 0.94 | | | 4.69 | | |
| Hypothetical (5% return before expenses) | | | | | | | | | | | | | |
| Class A | | $1,000.00 | | | $1,021.49 | | | 0.69 | % | | $3.48 | | |
| Class B | | 1,000.00 | | | 1,017.75 | | | 1.44 | | | 7.24 | | |
| Class C | | 1,000.00 | | | 1,017.75 | | | 1.44 | | | 7.24 | | |
| Class I | | 1,000.00 | | | 1,023.04 | | | 0.38 | | | 1.92 | | |
| Class O | | 1,000.00 | | | 1,021.49 | | | 0.69 | | | 3.48 | | |
| Class R | | 1,000.00 | | | 1,020.24 | | | 0.94 | | | 4.73 | | |
| | | | | | | | | | | | | | |
| ING National Tax-Exempt Bond Fund | | | | | | | | | | | | | |
| Actual Fund Return | | | | | | | | | | | | | |
| Class A | | $1,000.00 | | | $1,003.40 | | | 0.87 | % | | $4.35 | | |
| Class B | | 1,000.00 | | | 999.60 | | | 1.62 | | | 8.08 | | |
| Class C | | 1,000.00 | | | 999.60 | | | 1.62 | | | 8.08 | | |
| Hypothetical (5% return before expenses) | | | | | | | | | | | | | |
| Class A | | $1,000.00 | | | $1,020.59 | | | 0.87 | % | | $4.38 | | |
| Class B | | 1,000.00 | | | 1,016.85 | | | 1.62 | | | 8.15 | | |
| Class C | | 1,000.00 | | | 1,016.85 | | | 1.62 | | | 8.15 | | |
| | | | | | | | | | | | | | |
** Expenses are equal to each Fund’s respective annualized expense ratios, adjusted for contractual changes, multiplied by the average account value over the period, multiplied by 182/365 to reflect the most recent fiscal half-year.
17
REPORT OF INDEPENDENT REGISTERED PUBLIC ACCOUNTING FIRM
The Board of Trustees and Shareholders
of ING Funds Trust:
We have audited the accompanying statements of assets and liabilities of ING GNMA Income Fund, ING High Yield Bond Fund, ING Intermediate Bond Fund, ING National Tax-Exempt Bond Fund, ING Classic Money Market Fund and ING Institutional Prime Money Market Fund, each a series of ING Funds Trust (collectively the “Funds”), including the portfolios of investments, as of March 31, 2006, and the related statements of operations for the year then ended, the statements of changes in net assets for each of the years in the two-year period then ended, and the financial highlights for each of the years in the three-year period then ended, except for the ING Institutional Prime Money Market Fund, for which the statements of operations and changes in net assets and financial highlights are for the period from July 28, 2005 (commencement of operations) to March 31, 2006. These financial statements and financial highlights are the responsibility of management. Our responsibility is to express an opinion on these financial statements and financial highlights based on our audits. For all periods prior to April 1, 2003, the financial highlight were audited by other independent registered public accounting firms whose reports dated May 23, 2003 expressed an unqualified opinion on those financial highlights.
We conducted our audits in accordance with the standards of the Public Company Accounting Oversight Board (United States). Those standards require that we plan and perform the audits to obtain reasonable assurance about whether the financial statements and financial highlights are free of material misstatement. An audit includes examining, on a test basis, evidence supporting the amounts and disclosures in the financial statements. Our procedures included confirmation of securities owned as of March 31, 2006 by correspondence with the custodian and brokers, or by other appropriate auditing procedures. An audit also includes assessing the accounting principles used and significant estimates made by management, as well as evaluating the overall financial statement presentation. We believe that our audits provide a reasonable basis for our opinion.
In our opinion, the financial statements and financial highlights referred to above and indicated as having been audited by us present fairly, in all material respects, the financial position of ING GNMA Income Fund, ING High Yield Bond Fund, ING Intermediate Bond Fund, ING National Tax-Exempt Bond Fund, ING Classic Money Market Fund and Institutional Prime Money Market Fund as of March 31, 2006, the results of their operations, the changes in their net assets, and the financial highlights for the periods specified in the first paragraph above, in conformity with U.S. generally accepted accounting principles.

Boston, Massachusetts
May 22, 2006
18
STATEMENTS OF ASSETS AND LIABILITIES AS OF MARCH 31, 2006
| | ING
GNMA Income
Fund | | ING
High Yield
Bond
Fund | | ING
Intermediate
Bond
Fund | |
ASSETS: | | | | | | | |
Investments in securities at value+* | | $ | 633,888,667 | | $ | 184,214,944 | | $ | 1,024,602,270 | |
Short-term investments at amortized cost | | — | | — | | 183,250,298 | |
Repurchase agreement | | — | | 6,034,000 | | 28,577,000 | |
Cash | | 743,136 | | 1,651,603 | | 113,097 | |
Cash collateral for futures | | — | | — | | 289,858 | |
Foreign currencies at value** | | — | | — | | 8,607 | |
Receivables: | | | | | | | |
Investment securities sold | | 175 | | 1,166,674 | | 83,609,647 | |
Fund shares sold | | 978,822 | | 88,465 | | 3,311,027 | |
Dividends and interest | | 2,974,988 | | 3,847,053 | | 6,356,840 | |
Variation margin receivable | | — | | — | | 31,757 | |
Unrealized appreciation on swap agreements | | — | | — | | 116,280 | |
Upfront payments made on swap agreements | | — | | 70,916 | | 29,948 | |
Prepaid expenses | | 46,429 | | 23,347 | | 121,766 | |
Reimbursement due from manager | | — | | 2,161 | | 77,333 | |
Total assets | | 638,632,217 | | 197,099,163 | | 1,330,495,728 | |
| | | | | | | |
LIABILITIES: | | | | | | | |
Payable for investment securities purchased | | — | | 2,341,581 | | 209,081,007 | |
Payable for fund shares redeemed | | 720,833 | | 704,596 | | 7,020,014 | |
Payable for futures variation margin | | — | | — | | 21,769 | |
Payable upon receipt of securities loaned | | — | | — | | 183,250,298 | |
Unrealized depreciation on swap agreements | | — | | 143,060 | | 176,294 | |
Upfront payments received on swap agreements | | — | | 314,551 | | 1,365 | |
Income distribution payable | | — | | 554,230 | | 607,080 | |
Payable to affiliates | | 483,977 | | 202,638 | | 457,960 | |
Payable for trustee fees | | 13,881 | | 12,211 | | 7,505 | |
Other accrued expenses and liabilities | | 297,340 | | 153,323 | | 316,701 | |
Total liabilities | | 1,516,031 | | 4,426,190 | | 400,939,993 | |
NET ASSETS | | $ | 637,116,186 | | $ | 192,672,973 | | $ | 929,555,735 | |
| | | | | | | |
NET ASSETS WERE COMPRISED OF: | | | | | | | |
Paid-in capital | | $ | 658,453,051 | | $ | 586,079,713 | | $ | 953,116,616 | |
Accumulated net investment income (loss) | | 2,041,427 | | (331,166 | ) | 36,623 | |
Accumulated net realized loss on investments | | (16,410,609 | ) | (389,269,653 | ) | (8,388,544 | ) |
Net unrealized depreciation on investments | | (6,967,683 | ) | (3,805,921 | ) | (15,208,960 | ) |
NET ASSETS | | $ | 637,116,186 | | $ | 192,672,973 | | $ | 929,555,735 | |
+ Including securities loaned at value | | $ | — | | $ | — | | $ | 176,613,282 | |
* Cost of investments in securities | | $ | 640,856,350 | | $ | 187,877,804 | | $ | 1,039,046,627 | |
** Cost of foreign currencies | | $ | — | | $ | — | | $ | 8,672 | |
See Accompanying Notes to Financial Statements
19
STATEMENTS OF ASSETS AND LIABILITIES AS OF MARCH 31, 2005 (CONTINUED)
| | ING
GNMA Income
Fund | | ING
High Yield
Bond
Fund | | ING
Intermediate
Bond
Fund | |
Class A: | | | | | | | |
Net assets | | $ | 504,733,913 | | $ | 99,178,417 | | $ | 572,196,403 | |
Shares authorized | | unlimited | | unlimited | | unlimited | |
Par value | | $ | 0.001 | | $ | 0.001 | | $ | 0.001 | |
Shares outstanding | | 60,813,262 | | 11,388,487 | | 56,468,621 | |
Net asset value and redemption price per share | | $ | 8.30 | | $ | 8.71 | | $ | 10.13 | |
Maximum offering price per share (4.75%)(1) | | $ | 8.71 | | $ | 9.14 | | $ | 10.64 | |
| | | | | | | |
Class B: | | | | | | | |
Net assets | | $ | 78,823,449 | | $ | 75,939,868 | | $ | 60,525,951 | |
Shares authorized | | unlimited | | unlimited | | unlimited | |
Par value | | $ | 0.001 | | $ | 0.001 | | $ | 0.001 | |
Shares outstanding | | 9,544,129 | | 8,724,766 | | 5,984,968 | |
Net asset value and redemption price per share(2) | | $ | 8.26 | | $ | 8.70 | | $ | 10.11 | |
Maximum offering price per share | | $ | 8.26 | | $ | 8.70 | | $ | 10.11 | |
| | | | | | | |
Class C: | | | | | | | |
Net assets | | $ | 34,997,020 | | $ | 17,554,688 | | $ | 73,281,201 | |
Shares authorized | | unlimited | | unlimited | | unlimited | |
Par value | | $ | 0.001 | | $ | 0.001 | | $ | 0.001 | |
Shares outstanding | | 4,231,559 | | 2,015,688 | | 7,240,980 | |
Net asset value and redemption price per share(2) | | $ | 8.27 | | $ | 8.71 | | $ | 10.12 | |
Maximum offering price per share | | $ | 8.27 | | $ | 8.71 | | $ | 10.12 | |
| | | | | | | |
Class I: | | | | | | | |
Net assets | | $ | 18,286,575 | | n/a | | $ | 179,582,309 | |
Shares authorized | | unlimited | | n/a | | unlimited | |
Par value | | $ | 0.001 | | n/a | | $ | 0.001 | |
Shares outstanding | | 2,201,298 | | n/a | | 17,717,233 | |
Net asset value and redemption price per share | | $ | 8.31 | | n/a | | $ | 10.14 | |
Maximum offering price per share | | $ | 8.31 | | n/a | | $ | 10.14 | |
| | | | | | | |
Class M: | | | | | | | |
Net assets | | $ | 193,671 | | n/a | | n/a | |
Shares authorized | | unlimited | | n/a | | n/a | |
Par value | | $ | 0.001 | | n/a | | n/a | |
Shares outstanding | | 23,296 | | n/a | | n/a | |
Net asset value and redemption price per share | | $ | 8.31 | | n/a | | n/a | |
Maximum offering price per share (3.25%)(3) | | $ | 8.59 | | n/a | | n/a | |
| | | | | | | |
Class O: | | | | | | | |
Net assets | | n/a | | n/a | | $ | 43,170,796 | |
Shares authorized | | n/a | | n/a | | unlimited | |
Par value | | n/a | | n/a | | $ | 0.001 | |
Shares outstanding | | n/a | | n/a | | 4,258,693 | |
Net asset value and redemption price per share | | n/a | | n/a | | $ | 10.14 | |
Maximum offering price per share | | n/a | | n/a | | $ | 10.14 | |
| | | | | | | |
Class Q: | | | | | | | |
Net assets | | $ | 81,558 | | n/a | | n/a | |
Shares authorized | | unlimited | | n/a | | n/a | |
Par value | | $ | 0.001 | | n/a | | n/a | |
Shares outstanding | | 9,808 | | n/a | | n/a | |
Net asset value and redemption price per share | | $ | 8.32 | | n/a | | n/a | |
Maximum offering price per share | | $ | 8.32 | | n/a | | n/a | |
| | | | | | | |
Class R: | | | | | | | |
Net assets | | n/a | | n/a | | $ | 799,075 | |
Shares authorized | | n/a | | n/a | | unlimited | |
Par value | | n/a | | n/a | | $ | 0.001 | |
Shares outstanding | | n/a | | n/a | | 78,734 | |
Net asset value and redemption price per share | | n/a | | n/a | | $ | 10.15 | |
Maximum offering price per share | | n/a | | n/a | | $ | 10.15 | |
(1) Maximum offering price is computed at 100/95.25 of net asset value. On purchases of $50,000 or more, the offering price is reduced.
(2) Redemption price per share may be reduced for any applicable contingent deferred sales charges.
(3) Maximum offering price is computed at 100/96.75 of net asset value. On purchases of $50,000 or more, the offering price is reduced.
See Accompanying Notes to Financial Statements
20
STATEMENTS OF ASSETS AND LIABILITIES AS OF MARCH 31, 2006
| | ING
National Tax-
Exempt Bond
Fund | | ING
Classic
Money Market
Fund | |
ASSETS: | | | | | |
Investments in securities at value* | | $ | 26,839,204 | | $ | — | |
Short-term investments at amortized cost | | — | | 637,124,647 | |
Repurchase agreement | | — | | 45,855,000 | |
Cash | | 680,494 | | 273,025 | |
Receivables: | | | | | |
Investment securities sold | | — | | 8,002,344 | |
Fund shares sold | | 51,442 | | 781,493 | |
Dividends and interest | | 370,402 | | 2,412,273 | |
Prepaid expenses | | 14,176 | | 162,993 | |
Reimbursement due from manager | | 4,306 | | — | |
Total assets | | 27,960,024 | | 694,611,775 | |
| | | | | |
LIABILITIES: | | | | | |
Payable for investment securities purchased | | 284,925 | | 8,001,576 | |
Payable for fund shares redeemed | | — | | 425,378 | |
Income distribution payable | | 79,071 | | 17,955 | |
Payable to affiliates | | 18,235 | | 403,669 | |
Payable for trustee fees | | 1,135 | | 8,006 | |
Other accrued expenses and liabilities | | 15,335 | | 161,329 | |
Total liabilities | | 398,701 | | 9,017,913 | |
NET ASSETS | | $ | 27,561,323 | | $ | 685,593,862 | |
| | | | | |
NET ASSETS WERE COMPRISED OF: | | | | | |
Paid-in capital | | $ | 27,050,032 | | $ | 685,785,036 | |
Accumulated net investment loss | | (1,275 | ) | (4 | ) |
Accumulated net realized loss on investments | | (15,281 | ) | (191,170 | ) |
Net unrealized appreciation on investments | | 527,847 | | — | |
NET ASSETS | | $ | 27,561,323 | | $ | 685,593,862 | |
* Cost of investments in securities | | $ | 26,311,357 | | $ | — | |
| | | | | |
Class A: | | | | | |
Net assets | | $ | 22,864,236 | | $ | 656,730,810 | |
Shares authorized | | unlimited | | unlimited | |
Par value | | $ | 0.001 | | $ | 0.001 | |
Shares outstanding | | 2,224,850 | | 656,891,290 | |
Net asset value and redemption price per share | | $ | 10.28 | | $ | 1.00 | |
Maximum offering price per share (4.75%)(1) | | $ | 10.79 | | $ | 1.00 | |
| | | | | |
Class B: | | | | | |
Net assets | | $ | 3,031,741 | | $ | 23,995,185 | |
Shares authorized | | unlimited | | unlimited | |
Par value | | $ | 0.001 | | $ | 0.001 | |
Shares outstanding | | 295,178 | | 24,018,764 | |
Net asset value and redemption price per share(2) | | $ | 10.27 | | $ | 1.00 | |
Maximum offering price per share | | $ | 10.27 | | $ | 1.00 | |
| | | | | |
Class C: | | | | | |
Net assets | | $ | 1,665,346 | | $ | 4,867,867 | |
Shares authorized | | unlimited | | unlimited | |
Par value | | $ | 0.001 | | $ | 0.001 | |
Shares outstanding | | 162,016 | | 4,875,584 | |
Net asset value and redemption price per share(2) | | $ | 10.28 | | $ | 1.00 | |
Maximum offering price per share | | $ | 10.28 | | $ | 1.00 | |
(1) Maximum offering price is computed at 100/95.25 of net asset value. On purchases of $50,000 or more, the offering price is reduced.
(2) Redemption price per share may be reduced for any applicable contingent deferred sales charges.
See Accompanying Notes to Financial Statements
21
STATEMENT OF ASSETS AND LIABILITIES AS OF MARCH 31, 2006
| | ING
Institutional Prime
Money Market
Fund | |
ASSETS: | | |
Short-term investments at amortized cost | | $ | 170,275,353 | |
Repurchase agreement | | 13,736,000 | |
Cash | | 17,658 | |
Receivables: | | | |
Investment securities sold | | 6,001,758 | |
Dividends and interest | | 603,364 | |
Prepaid expenses | | 51,734 | |
Total assets | | 190,685,867 | |
| | | |
LIABILITIES: | | | |
Payable for investment securities purchased | | 9,699,589 | |
Payable for fund shares redeemed | | 1,000,000 | |
Income distribution payable | | 236,999 | |
Payable to affiliates | | 54,635 | |
Payable for trustee fees | | 1,309 | |
Other accrued expenses and liabilities | | 34,796 | |
Total liabilities | | 11,027,328 | |
NET ASSETS | | $ | 179,658,539 | |
| | | |
NET ASSETS WERE COMPRISED OF: | | | |
Paid-in capital | | $ | 179,635,897 | |
Undistributed net investment income | | 29,036 | |
Accumulated net realized loss on investments | | (6,394 | ) |
Net unrealized appreciation on investments | | — | |
NET ASSETS | | $ | 179,658,539 | |
| | | |
Net assets | | $ | 179,658,539 | |
Shares authorized | | unlimited | |
Par value | | $ | 0.001 | |
Shares outstanding | | 179,664,933 | |
Net asset value and redemption price per share | | $ | 1.00 | |
| | | | | |
See Accompanying Notes to Financial Statements
22
STATEMENTS OF OPERATIONS FOR THE YEAR ENDED MARCH 31, 2006
| | ING
GNMA Income
Fund | | ING
High Yield Bond
Fund | | ING
Intermediate Bond
Fund | |
INVESTMENT INCOME: | | | | |
Dividends, net of foreign taxes withheld* | | $ | — | | $ | 454,252 | | $ | 752,090 | |
Interest | | 37,357,999 | | 16,423,325 | | 37,787,523 | |
Securities lending income | | 15,890 | | 28,240 | | 908,565 | |
Total investment income | | 37,373,889 | | 16,905,817 | | 39,448,178 | |
| | | | | | | |
EXPENSES: | | | | | | | |
Investment management fees | | 3,268,309 | | 1,421,515 | | 3,346,443 | |
Distribution and service fees: | | | | | | | |
Class A | | 1,287,080 | | 353,829 | | 1,719,443 | |
Class B | | 902,189 | | 992,995 | | 640,662 | |
Class C | | 387,877 | | 210,885 | | 732,917 | |
Class M | | 1,949 | | — | | — | |
Class Q | | 219 | | — | | — | |
Class O | | — | | — | | 99,652 | |
Class R | | — | | — | | 2,906 | |
Transfer agent fees: | | | | | | | |
Class A | | 383,936 | | 162,094 | | 534,531 | |
Class B | | 66,772 | | 150,997 | | 65,269 | |
Class C | | 28,739 | | 32,161 | | 74,674 | |
Class M | | 127 | | — | | — | |
Class I | | 2,010 | | — | | 56,939 | |
Class Q | | 14 | | — | | — | |
Class O | | — | | — | | 42,179 | |
Class R | | — | | — | | 582 | |
Administrative service fees | | 658,016 | | 227,045 | | 810,021 | |
Shareholder reporting expense | | 141,391 | | 68,475 | | 242,981 | |
Registration fees | | 106,084 | | 62,070 | | 108,280 | |
Professional fees | | 56,945 | | 31,415 | | 74,730 | |
Custody and accounting expense | | 83,910 | | 38,805 | | 99,065 | |
Trustee fees | | 20,580 | | 10,911 | | 24,990 | |
Insurance expense | | 18,631 | | 8,881 | | 16,875 | |
Miscellaneous expense | | 17,278 | | 13,524 | | 15,569 | |
Total expenses | | 7,432,056 | | 3,785,602 | | 8,708,708 | |
Net waived and reimbursed fees | | (41,448 | ) | (190,523 | ) | (490,560 | ) |
Net expenses | | 7,390,608 | | 3,595,079 | | 8,218,148 | |
Net investment income | | 29,983,281 | | 13,310,738 | | 31,230,030 | |
| | | | | | | |
REALIZED AND UNREALIZED GAIN (LOSS) ON INVESTMENTS, FOREIGN CURRENCY RELATED TRANSACTIONS, FUTURES AND SWAPS: | | | | | | | |
Net realized gain (loss) on: | | | | | | | |
Investments | | 3,622,049 | | (13,256,721 | ) | (7,071,875 | ) |
Foreign currency and foreign currency related transactions | | — | | 65,007 | | 3,370 | |
Futures and swaps | | — | | — | | 1,095,524 | |
Net realized gain (loss) on investments, foreign currency related transactions, futures and swaps | | 3,622,049 | | (13,191,714 | ) | (5,972,981 | ) |
Net change in unrealized appreciation or depreciation on: | | | | | | | |
Investments | | (17,878,273 | ) | 12,534,942 | | (9,219,983 | ) |
Foreign currency and foreign currency related transactions | | — | | (90,038 | ) | (65 | ) |
Futures and swaps | | — | | (143,060 | ) | (257,113 | ) |
Net change in unrealized appreciation or depreciation on investments, foreign currency related transactions, futures and swaps | | (17,878,273 | ) | 12,301,844 | | (9,477,161 | ) |
Net realized and unrealized loss on investments, foreign currency related transactions, futures and swaps | | (14,256,224 | ) | (889,870 | ) | (15,450,142 | ) |
Increase in net assets resulting from operations | | $ | 15,727,057 | | $ | 12,420,868 | | $ | 15,779,888 | |
| | | | | | | | | | |
*Foreign taxes | | $ | — | | $ | — | | $ | 1,244 | |
See Accompanying Notes to Financial Statements
23
| | ING
National Tax
Exempt Bond
Fund | | ING
Classic
Money Market
Fund | | ING
Institutional Prime
Money Market
Fund | |
| | Year Ended
March 31,
2006 | | Year Ended
March 31,
2006 | | July 28, 2005(1) to March 31,
2006 | |
INVESTMENT INCOME: | | | | |
Interest | | $ | 1,305,214 | | $ | 23,540,923 | | $ | 4,969,116 | |
Total investment income | | 1,305,214 | | 23,540,923 | | 4,969,116 | |
| | | | | | | |
EXPENSES: | | | | | | | |
Investment management fees | | 130,897 | | 1,533,086 | | 92,438 | |
Distribution and service fees: | | | | | | | |
Class A | | 77,436 | | 4,352,009 | | — | |
Class B | | 30,989 | | 280,553 | | — | |
Class C | | 18,381 | | 49,112 | | — | |
Transfer agent fees: | | | | | | | |
Class A | | 1,949 | | 87,529 | | 1,095 | |
Class B | | 259 | | 4,041 | | — | |
Class C | | 153 | | 723 | | — | |
Administrative service fees | | 28,347 | | — | | — | |
Shareholder reporting expense | | 7,148 | | 137,899 | | 15,273 | |
Registration fees | | 44,824 | | 186,113 | | 7,244 | |
Professional fees | | 8,628 | | 55,637 | | 5,892 | |
Custody and accounting expense | | 912 | | 70,403 | | 24,215 | |
Trustee fees | | 1,095 | | 21,885 | | 3,404 | |
Organization expense | | — | | — | | 67,397 | |
Insurance expense | | 747 | | 14,028 | | 371 | |
Miscellaneous expense | | 2,522 | | 13,565 | | 1,519 | |
Total expenses | | 354,287 | | 6,806,583 | | 218,848 | |
Net waived and reimbursed fees | | (17,872 | ) | (1,894,988 | ) | (22,801 | ) |
Net expenses | | 336,415 | | 4,911,595 | | 196,047 | |
Net investment income | | 968,799 | | 18,629,328 | | 4,773,069 | |
| | | | | | | |
REALIZED AND UNREALIZED GAIN (LOSS) ON INVESTMENTS: | | | | | | | |
Net realized gain (loss) on investments | | 323,563 | | (15,431 | ) | (6,394 | ) |
Net change in unrealized appreciation or depreciation on investments | | (628,923 | ) | — | | — | |
Net realized and unrealized gain (loss) on investments | | (305,360 | ) | (15,431 | ) | (6,394 | ) |
Increase in net assets resulting from operations | | $ | 663,439 | | $ | 18,613,897 | | $ | 4,766,675 | |
| | | | | | | | | | | | | | |
(1) Commencement of operations
See Accompanying Notes to Financial Statements
24
STATEMENTS OF CHANGES IN NET ASSETS
| | ING GNMA Income Fund | | ING High Yield Bond Fund | |
| | Year
Ended
March 31,
2006 | | Year
Ended
March 31,
2005 | | Year
Ended
March 31,
2006 | | Year
Ended
March 31,
2005 | |
FROM OPERATIONS: | | | | | | | | | |
Net investment income | | $ | 29,983,281 | | $ | 29,646,257 | | $ | 13,310,738 | | $ | 9,567,361 | |
Net realized gain (loss) on investments and foreign currency related transactions | | 3,622,049 | | (3,721,907 | ) | (13,191,714 | ) | 7,939,355 | |
Net change in unrealized appreciation or depreciation on investments and foreign currency related transactions | | (17,878,273 | ) | (23,036,826 | ) | 12,301,844 | | (13,173,321 | ) |
Net increase in net assets resulting from operations | | 15,727,057 | | 2,887,524 | | 12,420,868 | | 4,333,395 | |
| | | | | | | | | |
FROM DISTRIBUTIONS TO SHAREHOLDERS: | | | | | | | | | |
Net investment income: | | | | | | | | | |
Class A | | (26,098,410 | ) | (28,659,206 | ) | (6,737,675 | ) | (4,775,952 | ) |
Class B | | (3,959,481 | ) | (5,047,902 | ) | (5,510,877 | ) | (3,805,317 | ) |
Class C | | (1,693,514 | ) | (2,367,634 | ) | (1,171,389 | ) | (986,091 | ) |
Class M | | (8,930 | ) | (10,826 | ) | — | | — | |
Class I | | (697,343 | ) | (524,100 | ) | — | | — | |
Class Q | | (4,480 | ) | (5,596 | ) | — | | — | |
Total distributions | | (32,462,158 | ) | (36,615,264 | ) | (13,419,941 | ) | (9,567,360 | ) |
| | | | | | | | | |
FROM CAPITAL SHARE TRANSACTIONS: | | | | | | | | | |
Net proceeds from sale of shares | | 99,407,124 | | 123,893,040 | | 41,472,047 | | 33,936,220 | |
Net proceeds from shares issued in merger | | 46,201,389 | | — | | — | | 236,998,843 | |
Dividends reinvested | | 27,137,387 | | 30,021,590 | | 6,353,721 | | 4,092,948 | |
| | 172,745,900 | | 153,914,630 | | 47,825,768 | | 275,028,011 | |
Cost of shares redeemed | | (193,650,406 | ) | (242,803,052 | ) | (116,768,800 | ) | (80,721,751 | ) |
Net increase (decrease) in net assets resulting from capital share transactions | | (20,904,506 | ) | (88,888,422 | ) | (68,943,032 | ) | 194,306,260 | |
Net increase (decrease) in net assets | | (37,639,607 | ) | (122,616,162 | ) | (69,942,105 | ) | 189,072,295 | |
| | | | | | | | | |
NET ASSETS: | | | | | | | | | |
Beginning of year | | 674,755,793 | | 797,371,955 | | 262,615,078 | | 73,542,783 | |
End of year | | $ | 637,116,186 | | $ | 674,755,793 | | $ | 192,672,973 | | $ | 262,615,078 | |
Undistributed net investment income (accumulated net investment loss) at end of year | | $ | 2,041,427 | | $ | 1,158,018 | | $ | (331,166 | ) | $ | (287,861 | ) |
See Accompanying Notes to Financial Statements
25
STATEMENTS OF CHANGES IN NET ASSETS
| | ING Intermediate Bond Fund | | ING National Tax-Exempt Bond Fund | |
| | Year
Ended
March 31,
2006 | | Year
Ended
March 31,
2005 | | Year
Ended
March 31,
2006 | | Year
Ended
March 31,
2005 | |
FROM OPERATIONS: | | | | | | | | |
Net investment income | | $ | 31,230,030 | | $ | 16,300,103 | | $ | 968,799 | | $ | 861,357 | |
Net realized gain (loss) on investments, foreign currency and foreign currency related transactions, futures, and swaps | | (5,972,981 | ) | 5,855,019 | | 323,563 | | (15,754 | ) |
Net change in unrealized appreciation or depreciation on investments, foreign currency and foreign currency related transactions, futures, and swaps | | (9,477,161 | ) | (13,268,848 | ) | (628,923 | ) | (518,507 | ) |
Net increase in net assets resulting from operations | | 15,779,888 | | 8,886,274 | | 663,439 | | 327,096 | |
| | | | | | | | | |
FROM DISTRIBUTIONS TO SHAREHOLDERS: | | | | | | | | | |
Net investment income: | | | | | | | | | |
Class A | | (21,129,307 | ) | (12,001,725 | ) | (830,785 | ) | (753,523 | ) |
Class B | | (2,090,084 | ) | (1,597,263 | ) | (86,603 | ) | (68,656 | ) |
Class C | | (2,398,616 | ) | (1,698,192 | ) | (51,411 | ) | (39,179 | ) |
Class I | | (4,945,436 | ) | (1,112,409 | ) | — | | — | |
Class O | | (1,591,398 | ) | (614,124 | ) | — | | — | |
Class R | | (22,537 | ) | (7,162 | ) | — | | — | |
Net realized gains: | | | | | | | | | |
Class A | | (1,826,580 | ) | (5,402,910 | ) | (252,957 | ) | (150,444 | ) |
Class B | | (215,404 | ) | (1,055,176 | ) | (32,530 | ) | (18,251 | ) |
Class C | | (250,102 | ) | (1,104,030 | ) | (19,924 | ) | (11,072 | ) |
Class I | | (527,267 | ) | (338,522 | ) | — | | — | |
Class O | | (139,818 | ) | (114,108 | ) | — | | — | |
Class R | | (2,543 | ) | (3,136 | ) | — | | — | |
Total distributions | | (35,139,092 | ) | (25,048,757 | ) | (1,274,210 | ) | (1,041,125 | ) |
| | | | | | | | | |
FROM CAPITAL SHARE TRANSACTIONS: | | | | | | | | | |
Net proceeds from sale of shares | | 422,545,470 | | 277,518,838 | | 2,081,336 | | 2,535,080 | |
Net proceeds from shares issued in merger | | — | | 137,658,413 | | — | | — | |
Dividends reinvested | | 28,286,436 | | 18,700,295 | | 163,656 | | 137,637 | |
| | 450,831,906 | | 433,877,546 | | 2,244,992 | | 2,672,717 | |
Cost of shares redeemed | | (176,312,495 | ) | (165,583,293 | ) | (2,216,079 | ) | (1,645,347 | ) |
Net increase in net assets resulting from capital share transactions | | 274,519,411 | | 268,294,253 | | 28,913 | | 1,027,370 | |
Net increase (decrease) in net assets | | 255,160,207 | | 252,131,770 | | (581,858 | ) | 313,341 | |
| | | | | | | | | |
NET ASSETS: | | | | | | | | | |
Beginning of year | | 674,395,528 | | 422,263,758 | | 28,143,181 | | 27,829,840 | |
End of year | | $ | 929,555,735 | | $ | 674,395,528 | | $ | 27,561,323 | | $ | 28,143,181 | |
Undistributed net investment income (accumulated net investment loss) at end of year | | $ | 36,623 | | $ | 67,477 | | $ | (1,275 | ) | $ | (1,160 | ) |
| | | | | | | | | | | | | | |
See Accompanying Notes to Financial Statements
26
STATEMENTS OF CHANGES IN NET ASSETS
| | ING Classic Money Market Fund | | ING Institutional Prime
Money Market Fund | |
| | Year Ended
March 31,
2006 | | Year Ended
March 31,
2005 | | July 28, 2005(1) to
March 31,
2006 | |
FROM OPERATIONS: | | | | |
Net investment income | | $ | 18,629,328 | | $ | 4,816,932 | | $ | 4,773,069 | |
Net realized loss on investments | | (15,431 | ) | (119,185 | ) | (6,394 | ) |
Net increase in net assets resulting from operations | | 18,613,897 | | 4,697,747 | | 4,766,675 | |
| | | | | | | |
FROM DISTRIBUTIONS TO SHAREHOLDERS: | | | | | | | |
Net investment income: | | | | | | | |
Class A | | (17,827,103 | ) | (4,742,850 | ) | (4,773,069 | ) |
Class B | | (680,890 | ) | (68,615 | ) | — | |
Class C | | (121,335 | ) | (5,471 | ) | — | |
Total distributions | | (18,629,328 | ) | (4,816,936 | ) | (4,773,069 | ) |
| | | | | | | |
FROM CAPITAL SHARE TRANSACTIONS: | | | | | | | |
Net proceeds from sale of shares | | 534,990,330 | | 406,931,463 | | 462,400,001 | |
Net Proceeds from shares issued in merger | | — | | 73,425,807 | | — | |
Dividends reinvested | | 18,332,291 | | 4,652,539 | | 3,264,932 | |
| | 553,322,621 | | 485,009,809 | | 465,664,933 | |
Cost of shares redeemed | | (448,676,993 | ) | (304,285,630 | ) | (286,000,000 | ) |
Net increase in net assets resulting from capital share transactions | | 104,645,628 | | 180,724,179 | | 179,664,933 | |
Net increase in net assets | | 104,630,197 | | 180,604,990 | | 179,658,539 | |
| | | | | | | |
NET ASSETS: | | | | | | | |
Beginning of period | | 580,963,665 | | 400,358,675 | | — | |
End of period | | $ | 685,593,862 | | $ | 580,963,665 | | $ | 179,658,539 | |
Undistributed net investment income (accumulated net investment loss) at end of period | | $ | (4 | ) | $ | (4 | ) | $ | 29,036 | |
| | | | | | | | | | | |
(1) Commencement of Operations
See Accompanying Notes to Financial Statements
27
Selected data for a share of beneficial interest outstanding throughout each period.
| | Class A | |
| | Year Ended March 31, | |
| | 2006 | | 2005 | | 2004 | | 2003 | | 2002 | |
Per Share Operating Performance: | | | | | | | | | | | |
Net asset value, beginning of year | $ | 8.52 | | | 8.91 | | | 9.00 | | | 8.53 | | | 8.63 | | |
Income (loss) from investment operations: | | | | | | | | | | | | | | | | |
Net investment income | $ | 0.40 | | | 0.37 | | | 0.32 | | | 0.42 | | | 0.46 | | |
Net realized and unrealized gain (loss) on investments | $ | (0.19) | | | (0.31 | ) | | 0.02 | | | 0.49 | | | (0.09 | ) | |
Total from investment operations | $ | 0.21 | | | 0.06 | | | 0.34 | | | 0.91 | | | 0.37 | | |
Less distributions from: | | | | | | | | | | | | | | | | |
Net investment income | $ | 0.43 | | | 0.45 | | | 0.43 | | | 0.44 | | | 0.47 | | |
Total distributions | $ | 0.43 | | | 0.45 | | | 0.43 | | | 0.44 | | | 0.47 | | |
Net asset value, end of year | $ | 8.30 | | | 8.52 | | | 8.91 | | | 9.00 | | | 8.53 | | |
Total Return(1) | % | 2.50 | | | 0.74 | | | 3.88 | | | 10.82 | | | 4.38 | | |
| | | | | | | | | | | | | | | | |
Ratios and Supplemental Data: | | | | | | | | | | | | | | | | |
Net assets, end of year (000’s) | $ | 504,734 | | | 521,688 | | | 592,066 | | | 666,433 | | | 535,903 | | |
Ratios to average net assets: | | | | | | | | | | | | | | | | |
Net expenses after expense reimbursement/recoupment(2) | % | 0.98 | | | 0.98 | | | 1.04 | | | 1.13 | | | 1.22 | | |
Gross expenses prior to expense reimbursement/recoupment(2) | % | 0.99 | | | 0.98 | | | 1.04 | | | 1.13 | | | 1.22 | | |
Net investment income | % | 4.70 | | | 4.27 | | | 3.57 | | | 4.78 | | | 5.32 | | |
Portfolio turnover rate | % | 39 | | | 40 | | | 128 | | | 75 | | | 76 | | |
| | Class B | |
| | Year Ended March 31, | |
| | 2006 | | 2005 | | 2004 | | 2003 | | 2002 | |
Per Share Operating Performance: | | | | | | | | | | | | | | | | |
Net asset value, beginning of year | $ | 8.48 | | | 8.87 | | | 8.96 | | | 8.50 | | | 8.61 | | |
Income (loss) from investment operations: | | | | | | | | | | | | | | | | |
Net investment income | $ | 0.33 | | | 0.29 | | | 0.25 | | | 0.35 | | | 0.39 | | |
Net realized and unrealized gain (loss) on investments | $ | (0.18 | ) | | (0.29 | ) | | 0.02 | | | 0.48 | | | (0.09 | ) | |
Total from investment operations | $ | 0.15 | | | — | | | 0.27 | | | 0.83 | | | 0.30 | | |
Less distributions from: | | | | | | | | | | | | | | | | |
Net investment income | $ | 0.37 | | | 0.39 | | | 0.36 | | | 0.37 | | | 0.41 | | |
Total distributions | $ | 0.37 | | | 0.39 | | | 0.36 | | | 0.37 | | | 0.41 | | |
Net asset value, end of year | $ | 8.26 | | | 8.48 | | | 8.87 | | | 8.96 | | | 8.50 | | |
Total Return(1) | % | 1.75 | | | (0.02 | ) | | 3.12 | | | 9.95 | | | 3.53 | | |
| | | | | | | | | | | | | | | | |
Ratios and Supplemental Data: | | | | | | | | | | | | | | | | |
Net assets, end of year (000’s) | $ | 78,823 | | | 99,130 | | | 130,339 | | | 150,549 | | | 79,302 | | |
Ratios to average net assets: | | | | | | | | | | | | | | | | |
Net expenses after expense reimbursement/recoupment(2) | % | 1.73 | | | 1.73 | | | 1.79 | | | 1.88 | | | 1.98 | | |
Gross expenses prior to expense reimbursement/recoupment(2) | % | 1.74 | | | 1.73 | | | 1.79 | | | 1.88 | | | 1.98 | | |
Net investment income | % | 3.95 | | | 3.52 | | | 2.84 | | | 3.98 | | | 4.55 | | |
Portfolio turnover rate | % | 39 | | | 40 | | | 128 | | | 75 | | | 76 | | |
(1) Total return is calculated assuming reinvestment of all dividends and capital gain distributions at net asset value and excluding the deduction of sales charges.
(2) The Investment Manager has agreed to limit expenses (excluding interest, taxes, brokerage and extraordinary expenses) subject to possible recoupment by ING Investments, LLC within three years.
See Accompanying Notes to Financial Statements.
28
Ing Gnma INCOME FUND (CONTINUED) | | FINANCIAL HIGHLIGHTS |
Selected data for a share of beneficial interest outstanding throughout each period.
| | Class C | |
| | Year Ended March 31, | |
| | 2006 | | 2005 | | 2004 | | 2003 | | 2002 | |
Per Share Operating Performance: | | | | | | | | | | | |
Net asset value, beginning of year | $ | 8.49 | | | 8.88 | | | 8.97 | | | 8.51 | | | 8.61 | | |
Income (loss) from investment operations: | | | | | | | | | | | | | | | | |
Net investment income | $ | 0.33 | | | 0.29 | | | 0.25 | | | 0.36 | | | 0.40 | | |
Net realized and unrealized gain (loss) on investments | $ | (0.18 | ) | | (0.29 | ) | | 0.02 | | | 0.47 | | | (0.09 | ) | |
Total from investment operations | $ | 0.15 | | | — | | | 0.27 | | | 0.83 | | | 0.31 | | |
Less distributions from: | | | | | | | | | | | | | | | | |
Net investment income | $ | 0.37 | | | 0.39 | | | 0.36 | | | 0.37 | | | 0.41 | | |
Total distributions | $ | 0.37 | | | 0.39 | | | 0.36 | | | 0.37 | | | 0.41 | | |
Net asset value, end of year | $ | 8.27 | | | 8.49 | | | 8.88 | | | 8.97 | | | 8.51 | | |
Total Return(2) | % | 1.74 | | | (0.03 | ) | | 3.11 | | | 9.95 | | | 3.65 | | |
| | | | | | | | | | | | | | | | |
Ratios and Supplemental Data: | | | | | | | | | | | | | | | | |
Net assets, end of year (000’s) | $ | 34,997 | | | 43,094 | | | 65,762 | | | 87,970 | | | 37,193 | | |
Ratios to average net assets: | | | | | | | | | | | | | | | | |
Net expenses after expense reimbursement/recoupment(3) | % | 1.73 | | | 1.73 | | | 1.79 | | | 1.88 | | | 1.99 | | |
Gross expenses prior to expense reimbursement/recoupment(3) | % | 1.74 | | | 1.73 | | | 1.79 | | | 1.88 | | | 1.99 | | |
Net investment income | % | 3.95 | | | 3.51 | | | 2.92 | | | 3.97 | | | 4.52 | | |
Portfolio turnover rate | % | 39 | | | 40 | | | 128 | | | 75 | | | 76 | | |
| | Class I | |
| | Year Ended March 31, | | January 7,
2002(1) to
March 31, | |
| | 2006 | | 2005 | | 2004 | | 2003 | | 2002 | |
Per Share Operating Performance: | | | | | | | | | | | | | | | | |
Net asset value, beginning of period | $ | 8.53 | | | 8.92 | | | 9.01 | | | 8.54 | | | 8.61 | | |
Income (loss) from investment operations: | | | | | | | | | | | | | | | | |
Net investment income | $ | 0.45 | | | 0.41 | | | 0.35 | | | 0.44 | | | 0.10 | | |
Net realized and unrealized gain (loss) on investments | $ | (0.21 | ) | | (0.32 | ) | | 0.01 | | | 0.50 | | | (0.10 | ) | |
Total from investment operations | $ | 0.24 | | | 0.09 | | | 0.36 | | | 0.94 | | | 0.00 | | |
Less distributions from: | | | | | | | | | | | | | | | | |
Net investment income | $ | 0.46 | | | 0.48 | | | 0.45 | | | 0.47 | | | 0.07 | | |
Total distributions | $ | 0.46 | | | 0.48 | | | 0.45 | | | 0.47 | | | 0.07 | | |
Net asset value, end of period | $ | 8.31 | | | 8.53 | | | 8.92 | | | 9.01 | | | 8.54 | | |
Total Return(2) | % | 2.82 | | | 1.05 | | | 4.21 | | | 11.18 | | | 0.04 | | |
| | | | | | | | | | | | | | | | |
Ratios and Supplemental Data: | | | | | | | | | | | | | | | | |
Net assets, end of period (000’s) | $ | 18,287 | | | 10,539 | | | 8,760 | | | 6,946 | | | 1,615 | | |
Ratios to average net assets: | | | | | | | | | | | | | | | | |
Expenses(4) | % | 0.67 | | | 0.68 | | | 0.71 | | | 0.78 | | | 0.88 | | |
Net investment income(4) | % | 4.96 | | | 4.59 | | | 3.94 | | | 5.00 | | | 5.83 | | |
Portfolio turnover rate | % | 39 | | | 40 | | | 128 | | | 75 | | | 76 | | |
(1) Commencement of operations.
(2) Total return is calculated assuming reinvestment of all dividends and capital gain distributions at net asset value and excluding the deduction of sales charges.
(3) The Investment Manager has agreed to limit expenses (excluding interest, taxes, brokerage and extraordinary expenses) subject to possible recoupment by ING Investments, LLC within three years.
(4) Annualized for periods less than one year.
See Accompanying Notes to Financial Statements.
29
Ing Gnma INCOME FUND (CONTINUED) | | FINANCIAL HIGHLIGHTS |
Selected data for a share of beneficial interest outstanding throughout each period.
| | Class M | |
| | Year Ended March 31, | |
| | 2006 | | 2005 | | 2004 | | 2003 | | 2002 | |
Per Share Operating Performance: | | | | | | | | | | | |
Net asset value, beginning of year | $ | | 8.54 | | | 8.92 | | | 9.01 | | | 8.54 | | | 8.63 | | |
Income (loss) from investment operations: | | | | | | | | | | | | | | | | |
Net investment income | $ | | 0.36 | | | 0.33 | * | | 0.31 | | | 0.37 | | | 0.41 | | |
Net realized and unrealized gain (loss) on investments | $ | | (0.20 | ) | | (0.30 | ) | | (0.02 | ) | | 0.49 | | | (0.07 | ) | |
Total from investment operations | $ | | 0.16 | | | 0.03 | | | 0.29 | | | 0.86 | | | 0.34 | | |
Less distributions from: | | | | | | | | | | | | | | | | |
Net investment income | $ | | 0.39 | | | 0.41 | | | 0.38 | | | 0.39 | | | 0.43 | | |
Total distributions | $ | | 0.39 | | | 0.41 | | | 0.38 | | | 0.39 | | | 0.43 | | |
Net asset value, end of year | $ | | 8.31 | | | 8.54 | | | 8.92 | | | 9.01 | | | 8.54 | | |
Total Return(1) | % | 1.87 | | | 0.33 | | | 3.30 | | | 10.29 | | | 4.03 | | |
| | | | | | | | | | | | | | | | |
Ratios and Supplemental Data: | | | | | | | | | | | | | | | | |
Net assets, end of year (000’s) | $ | | 194 | | | 201 | | | 312 | | | 1,111 | | | 495 | | |
Ratios to average net assets: | | | | | | | | | | | | | | | | |
Net expenses after expense reimbursement/recoupment(2)(3) | % | 1.49 | | | 1.48 | | | 1.54 | | | 1.62 | | | 1.73 | | |
Gross expenses prior to expense reimbursement/recoupment(2)(3) | % | 1.74 | | | 1.48 | | | 1.54 | | | 1.62 | | | 1.73 | | |
Net investment income | % | 4.20 | | | 3.76 | | | 3.23 | | | 4.19 | | | 4.81 | | |
Portfolio turnover rate | % | 39 | | | 40 | | | 128 | | | 75 | | | 76 | | |
| | Class Q | |
| | Year Ended March 31, | |
| | 2006 | | 2005 | | 2004 | | 2003 | | 2002 | |
Per Share Operating Performance: | | | | | | | | | | | |
Net asset value, beginning of year | $ | | 8.53 | | | 8.92 | | | 9.01 | | | 8.54 | | | 8.63 | | |
Income (loss) from investment operations: | | | | | | | | | | | | | | | | |
Net investment income | $ | | 0.40 | | | 0.39 | | | 0.32 | | | 0.44 | | | 0.39 | | |
Net realized and unrealized gain (loss) on investments | $ | | (0.18 | ) | | (0.33 | ) | | 0.02 | | | 0.47 | | | (0.01 | ) | |
Total from investment operations | $ | | 0.22 | | | 0.06 | | | 0.34 | | | 0.91 | | | 0.38 | | |
Less distributions from: | | | | | | | | | | | | | | | | |
Net investment income | $ | | 0.43 | | | 0.45 | | | 0.43 | | | 0.44 | | | 0.47 | | |
Total distributions | $ | | 0.43 | | | 0.45 | | | 0.43 | | | 0.44 | | | 0.47 | | |
Net asset value, end of year | $ | | 8.32 | | | 8.53 | | | 8.92 | | | 9.01 | | | 8.54 | | |
Total Return(1) | % | 2.65 | | | 0.76 | | | 3.94 | | | 10.90 | | | 4.50 | | |
| | | | | | | | | | | | | | | | |
Ratios and Supplemental Data: | | | | | | | | | | | | | | | | |
Net assets, end of year (000’s) | $ | | 82 | | | 103 | | | 134 | | | 183 | | | 204 | | |
Ratios to average net assets: | | | | | | | | | | | | | | | | |
Expenses | % | 0.92 | | | 0.93 | | | 0.96 | | | 1.04 | | | 1.12 | | |
Net investment income | % | 4.77 | | | 4.32 | | | 3.62 | | | 4.89 | | | 5.35 | | |
Portfolio turnover rate | % | 39 | | | 40 | | | 128 | | | 75 | | | 76 | | |
(1) Total return is calculated assuming reinvestment of all dividends and capital gain distributions at net asset value and excluding the deduction of sales charges.
(2) The Investment Manager has agreed to limit expenses (excluding interest, taxes, brokerage and extraordinary expenses) subject to possible recoupment by ING Investments, LLC within three years.
(3) During the year ended March 31, 2006, the Distributor voluntarily waived 0.25% of the Class M Distribution Fee.
* Per share numbers have been calculated using the average number of shares outstanding throughout the period.
See Accompanying Notes to Financial Statements.
30
Ing HIGH YIELD BOND FUND | | FINANCIAL HIGHLIGHTS |
Selected data for a share of beneficial interest outstanding throughout each period.
| | Class A | |
| | Year Ended March 31, | |
| | 2006 | | 2005 | | 2004 | | 2003 | | 2002 | |
Per Share Operating Performance: | | | | | | | | | | | |
Net asset value, beginning of year | $ | 8.75 | | | 8.88 | | | 8.29 | | | 8.74 | | | 9.36 | | |
Income (loss) from investment operations: | | | | | | | | | | | | | | | | |
Net investment income | $ | 0.55 | | | 0.54 | | | 0.59 | | | 0.61 | | | 0.78 | | |
Net realized and unrealized gain (loss) on investments | $ | (0.04 | ) | | (0.13 | ) | | 0.60 | | | (0.45 | ) | | (0.62 | ) | |
Total from investment operations | $ | 0.51 | | | 0.41 | | | 1.19 | | | 0.16 | | | 0.16 | | |
Less distributions from: | | | | | | | | | | | | | | | | |
Net investment income | $ | 0.55 | | | 0.54 | | | 0.60 | | | 0.61 | | | 0.78 | | |
Total distributions | $ | 0.55 | | | 0.54 | | | 0.60 | | | 0.61 | | | 0.78 | | |
Net asset value, end of year | $ | 8.71 | | | 8.75 | | | 8.88 | | | 8.29 | | | 8.74 | | |
Total Return(1) | % | 6.01 | | | 4.73 | | | 14.70 | | | 2.24 | | | 1.94 | | |
| | | | | | | | | | | | | | | | |
Ratios and Supplemental Data: | | | | | | | | | | | | | | | | |
Net assets, end of year (000’s) | $ | 99,178 | | | 110,683 | | | 44,009 | | | 43,375 | | | 38,525 | | |
Ratios to average net assets: | | | | | | | | | | | | | | | | |
Net expenses after expense reimbursement/recoupment(2) | % | 1.18 | | | 1.22 | | | 1.29 | | | 1.30 | | | 1.30 | | |
Gross expenses prior to expense reimbursement/recoupment | % | 1.31 | | | 1.33 | | | 1.33 | | | 1.43 | | | 1.79 | | |
Net investment income after expense reimbursement/recoupment(2) | % | 6.27 | | | 6.12 | | | 6.81 | | | 7.48 | | | 8.67 | | |
Portfolio turnover rate | % | 111 | | | 119 | | | 105 | | | 122 | | | 344 | | |
| | Class B | |
| | Year Ended March 31, | |
| | 2006 | | | 2005 | | | 2004 | | | 2003 | | | 2002 | | |
Per Share Operating Performance: | | | | | | | | | | | | | | | | |
Net asset value, beginning of year | $ | 8.74 | | | 8.88 | | | 8.28 | | | 8.74 | | | 9.36 | | |
Income (loss) from investment operations: | | | | | | | | | | | | | | | | |
Net investment income | $ | 0.47 | | | 0.48 | | | 0.53 | | | 0.55 | | | 0.72 | | |
Net realized and unrealized gain (loss) on investments | $ | (0.03 | ) | | (0.15 | ) | | 0.60 | | | (0.46 | ) | | (0.62 | ) | |
Total from investment operations | $ | 0.44 | | | 0.33 | | | 1.13 | | | 0.09 | | | 0.10 | | |
Less distributions from: | | | | | | | | | | | | | | | | |
Net investment income | $ | 0.48 | | | 0.47 | | | 0.53 | | | 0.55 | | | 0.72 | | |
Total distributions | $ | 0.48 | | | 0.47 | | | 0.53 | | | 0.55 | | | 0.72 | | |
Net asset value, end of year | $ | 8.70 | | | 8.74 | | | 8.88 | | | 8.28 | | | 8.74 | | |
Total Return(1) | % | 5.22 | | | 3.83 | | | 14.01 | | | 1.37 | | | 1.29 | | |
| | | | | | | | | | | | | | | | |
Ratios and Supplemental Data: | | | | | | | | | | | | | | | | |
Net assets, end of year (000’s) | $ | 75,940 | | | 125,603 | | | 18,753 | | | 11,584 | | | 6,673 | | |
Ratios to average net assets: | | | | | | | | | | | | | | | | |
Net expenses after expense reimbursement/recoupment(2) | % | 1.94 | | | 1.97 | | | 2.04 | | | 2.05 | | | 2.05 | | |
Gross expenses prior to expense reimbursement/recoupment | % | 1.98 | | | 1.98 | | | 1.98 | | | 2.07 | | | 2.44 | | |
Net investment income after expense reimbursement/recoupment(2) | % | 5.50 | | | 5.39 | | | 6.04 | | | 6.73 | | | 7.85 | | |
Portfolio turnover rate | % | 111 | | | 119 | | | 105 | | | 122 | | | 344 | | |
(1) Total return is calculated assuming reinvestment of all dividends and capital gain distributions at net asset value and excluding the deduction of sales charges.
(2) The Investment Manager has agreed to limit expenses (excluding interest, taxes, brokerage and extraordinary expenses) subject to possible recoupment by ING Investments, LLC within three years.
See Accompanying Notes to Financial Statements.
31
Ing HIGH YIELD BOND FUND (CONTINUED) | | FINANCIAL HIGHLIGHTS |
Selected data for a share of beneficial interest outstanding throughout each period.
| | Class C | |
| | Year Ended March 31, | |
| | 2006 | | 2005 | | 2004 | | 2003 | | 2002 | |
Per Share Operating Performance: | | | | | | | | | | | |
Net asset value, beginning of year | $ | 8.75 | | | 8.88 | | | 8.28 | | | 8.74 | | | 9.36 | | |
Income (loss) from investment operations: | | | | | | | | | | | | | | | | |
Net investment income | $ | 0.48 | | | 0.48 | | | 0.53 | | | 0.56 | | | 0.71 | | |
Net realized and unrealized gain (loss) on investments | $ | (0.03 | ) | | (0.13 | ) | | 0.60 | | | (0.46 | ) | | (0.61 | ) | |
Total from investment operations | $ | 0.45 | | | 0.35 | | | 1.13 | | | 0.10 | | | 0.10 | | |
Less distributions from: | | | | | | | | | | | | | | | | |
Net investment income | $ | 0.49 | | | 0.48 | | | 0.53 | | | 0.56 | | | 0.72 | | |
Total distributions | $ | 0.49 | | | 0.48 | | | 0.53 | | | 0.56 | | | 0.72 | | |
Net asset value, end of year | $ | 8.71 | | | 8.75 | | | 8.88 | | | 8.28 | | | 8.74 | | |
Total Return(1) | % | 5.22 | | | 3.96 | | | 14.03 | | | 1.43 | | | 1.21 | | |
| | | | | | | | | | | | | | | | |
Ratios and Supplemental Data: | | | | | | | | | | | | | | | | |
Net assets, end of year (000’s) | $ | 17,555 | | | 26,330 | | | 10,780 | | | 5,281 | | | 1,633 | | |
Ratios to average net assets: | | | | | | | | | | | | | | | | |
Net expenses after expense reimbursement/recoupment(2) | % | 1.94 | | | 1.97 | | | 2.04 | | | 2.04 | | | 2.05 | | |
Gross expenses prior to expense reimbursement/recoupment | % | 1.98 | | | 1.98 | | | 1.98 | | | 2.06 | | | 2.44 | | |
Net investment income after expense reimbursement/recoupment(2) | % | 5.51 | | | 5.37 | | | 6.04 | | | 6.72 | | | 7.92 | | |
Portfolio turnover rate | % | 111 | | | 119 | | | 105 | | | 122 | | | 344 | | |
(1) Total return is calculated assuming reinvestment of all dividends and capital gain distributions at net asset value and excluding the deduction of sales charges.
(2) The Investment Manager has agreed to limit expenses, (excluding interest, taxes, brokerage and extraordinary expenses) subject to possible recoupment by ING Investments, LLC within three years
See Accompanying Notes to Financial Statements.
32
Ing INTERMEDIATE BOND FUND | | FINANCIAL HIGHLIGHTS |
Selected data for a share of beneficial interest outstanding throughout each period.
| | Class A | |
| | Year Ended March 31, | |
| | 2006 | | 2005 | | 2004 | | 2003 | | 2002 | |
Per Share Operating Performance: | | | | | | | | | | | |
Net asset value, beginning of year | $ | 10.32 | | | 10.67 | | | 10.51 | | | 9.91 | | | 10.18 | | |
Income (loss) from investment operations: | | | | | | | | | | | | | | | | |
Net investment income | $ | 0.41 | | | 0.32 | | | 0.31 | | | 0.35 | | | 0.51 | | |
Net realized and unrealized gain (loss) on investments | $ | (0.14 | ) | | (0.17 | ) | | 0.32 | | | 0.77 | | | 0.42 | | |
Total from investment operations | $ | 0.27 | | | 0.15 | | | 0.63 | | | 1.12 | | | 0.93 | | |
Less distributions from: | | | | | | | | | | | | | | | | |
Net investment income | $ | 0.42 | | | 0.33 | | | 0.33 | | | 0.37 | | | 0.53 | | |
Net realized gain on investments | $ | 0.04 | | | 0.17 | | | 0.14 | | | 0.15 | | | 0.67 | | |
Total distributions | $ | 0.46 | | | 0.50 | | | 0.47 | | | 0.52 | | | 1.20 | | |
Net asset value, end of year | $ | 10.13 | | | 10.32 | | | 10.67 | | | 10.51 | | | 9.91 | | |
Total Return(1) | % | 2.53 | | | 1.52 | | | 6.16 | | | 11.48 | | | 9.27 | | |
| | | | | | | | | | | | | | | | |
Ratios and Supplemental Data: | | | | | | | | | | | | | | | | |
Net assets, end of year (000’s) | $ | 572,196 | | | 459,850 | | | 268,086 | | | 146,649 | | | 41,503 | | |
Ratios to average net assets: | | | | | | | | | | | | | | | | |
Net expenses after expense reimbursement(2) | % | 0.93 | | | 1.00 | | | 1.10 | | | 1.14 | | | 1.15 | | |
Gross expenses prior to expense reimbursement | % | 1.02 | | | 1.14 | | | 1.18 | | | 1.24 | | | 1.36 | | |
Net investment income after expense reimbursement(2) | % | 3.92 | | | 3.08 | | | 2.91 | | | 3.21 | | | 4.93 | | |
Portfolio turnover rate | % | 469 | | | 417 | | | 475 | | | 639 | | | 1,216 | * | |
| | Class B | |
| | Year Ended March 31, | |
| | 2006 | | | 2005 | | | 2004 | | | 2003 | | | 2002 | | |
Per Share Operating Performance: | | | | | | | | | | | | | | | | |
Net asset value, beginning of year | $ | 0.30 | | | 10.65 | | | 10.50 | | | 9.90 | | | 10.18 | | |
Income (loss) from investment operations: | | | | | | | | | | | | | | | | |
Net investment income | $ | 0.32 | | | 0.24 | | | 0.23 | | | 0.28 | | | 0.44 | | |
Net realized and unrealized gain (loss) on investments | $ | (0.13 | ) | | (0.17 | ) | | 0.31 | | | 0.76 | | | 0.40 | | |
Total from investment operations | $ | 0.19 | | | 0.07 | | | 0.54 | | | 1.04 | | | 0.84 | | |
Less distributions from: | | | | | | | | | | | | | | | | |
Net investment income | $ | 0.34 | | | 0.25 | | | 0.25 | | | 0.29 | | | 0.45 | | |
Net realized gain on investments | $ | 0.04 | | | 0.17 | | | 0.14 | | | 0.15 | | | 0.67 | | |
Total distributions | $ | 0.38 | | | 0.42 | | | 0.39 | | | 0.44 | | | 1.12 | | |
Net asset value, end of year | $ | 10.11 | | | 10.30 | | | 10.65 | | | 10.50 | | | 9.90 | | |
Total Return(1) | % | 1.76 | | | 0.75 | | | 5.28 | | | 10.64 | | | 8.37 | | |
| | | | | | | | | | | | | | | | |
Ratios and Supplemental Data: | | | | | | | | | | | | | | | | |
Net assets, end of year (000’s) | $ | 60,526 | | | 64,779 | | | 67,402 | | | 61,544 | | | 11,216 | | |
Ratios to average net assets: | | | | | | | | | | | | | | | | |
Net expenses after expense reimbursement/recoupment(2) | % | 1.69 | | | 1.75 | | | 1.85 | | | 1.89 | | | 1.90 | | |
Gross expenses prior to expense reimbursement/recoupment | % | 1.70 | | | 1.79 | | | 1.83 | | | 1.89 | | | 2.01 | | |
Net investment income after expense reimbursement/recoupment(2) | % | 3.14 | | | 2.31 | | | 2.16 | | | 2.39 | | | 4.09 | | |
Portfolio turnover rate | % | 469 | | | 417 | | | 475 | | | 639 | | | 1,216 | * | |
(1) Total return is calculated assuming reinvestment of all dividends and capital gain distributions at net asset value and excluding the deduction of sales charges.
(2) The Investment Manager has agreed to limit expenses, (excluding interest, taxes, brokerage and extraordinary expenses) subject to possible recoupment by ING Investments, LLC within three years.
* Portfolio turnover was greater than expected during this period due to active trading undertaken in response to market conditions that existed at that time.
See Accompanying Notes to Financial Statements.
33
Ing INTERMEDIATE BOND FUND (CONTINUED) | | FINANCIAL HIGHLIGHTS |
Selected data for a share of beneficial interest outstanding throughout each period.
| | Class C | |
| | Year Ended March 31, | |
| | 2006 | | 2005 | | 2004 | | 2003 | | 2002 | |
Per Share Operating Performance: | | | | | | | | | | | |
Net asset value, beginning of year | $ | 10.31 | | | 10.65 | | | 10.50 | | | 9.90 | | | 10.19 | | |
Income (loss) from investment operations: | | | | | | | | | | | | | | | | |
Net investment income | $ | 0.33 | | | 0.24 | | | 0.23 | | | 0.28 | | | 0.44 | | |
Net realized and unrealized gain (loss) on investments | $ | (0.14 | ) | | (0.16 | ) | | 0.31 | | | 0.76 | | | 0.39 | | |
Total from investment operations | $ | 0.19 | | | 0.08 | | | 0.54 | | | 1.04 | | | 0.83 | | |
Less distributions from: | | | | | | | | | | | | | | | | |
Net investment income | $ | 0.34 | | | 0.25 | | | 0.25 | | | 0.29 | | | 0.45 | | |
Net realized gain on investments | $ | 0.04 | | | 0.17 | | | 0.14 | | | 0.15 | | | 0.67 | | |
Total distributions | $ | 0.38 | | | 0.42 | | | 0.39 | | | 0.44 | | | 1.12 | | |
Net asset value, end of year | $ | 10.12 | | | 10.31 | | | 10.65 | | | 10.50 | | | 9.90 | | |
Total Return(2) | % | 1.77 | | | 0.86 | | | 5.28 | | | 10.68 | | | 8.24 | | |
| | | | | | | | | | | | | | | | |
Ratios and Supplemental Data: | | | | | | | | | | | | | | | | |
Net assets, end of year (000’s) | $ | 73,281 | | | 71,648 | | | 71,228 | | | 52,979 | | | 6,382 | | |
Ratios to average net assets: | | | | | | | | | | | | | | | | |
Net expenses after expense reimbursement/recoupment(4) | % | 1.69 | | | 1.75 | | | 1.85 | | | 1.90 | | | 1.90 | | |
Gross expenses prior to expense reimbursement/recoupment | % | 1.70 | | | 1.79 | | | 1.83 | | | 1.90 | | | 2.01 | | |
Net investment income after expense reimbursement/recoupment(4) | % | 3.15 | | | 2.31 | | | 2.16 | | | 2.36 | | | 4.20 | | |
Portfolio turnover rate | % | 469 | | | 417 | | | 475 | | | 639 | | | 1,216 | * | |
| | Class I | |
| | | | | | | | | | | | | | January 8, | | |
| | | | | | | | | | | | | | 2002(1) to | | |
| | Year Ended March 31, | | | March 31, | | |
| | 2006 | | | 2005 | | | 2004 | | | 2003 | | | 2002 | | |
Per Share Operating Performance: | | | | | | | | | | | | | | | | |
Net asset value, beginning of period | $ | 10.32 | | | 10.67 | | | 10.51 | | | 9.91 | | | 9.99 | | |
Income (loss) from investment operations: | | | | | | | | | | | | | | | | |
Net investment income | $ | 0.44 | | | 0.36 | ** | | 0.35 | | | 0.39 | | | 0.11 | | |
Net realized and unrealized gain (loss) on investments | $ | (0.13 | ) | | (0.17 | ) | | 0.33 | | | 0.76 | | | (0.07 | ) | |
Total from investment operations | $ | 0.31 | | | 0.19 | | | 0.68 | | | 1.15 | | | 0.04 | | |
Less distributions from: | | | | | | | | | | | | | | | | |
Net investment income | $ | 0.45 | | | 0.37 | | | 0.38 | | | 0.40 | | | 0.12 | | |
Net realized gain on investments | $ | 0.04 | | | 0.17 | | | 0.14 | | | 0.15 | | | — | | |
Total distributions | $ | 0.49 | | | 0.54 | | | 0.52 | | | 0.55 | | | 0.12 | | |
Net asset value, end of period | $ | 10.14 | | | 10.32 | | | 10.67 | | | 10.51 | | | 9.91 | | |
Total Return(2) | % | 2.94 | | | 1.85 | | | 6.60 | | | 11.88 | | | 0.36 | | |
| | | | | | | | | | | | | | | | |
Ratios and Supplemental Data: | | | | | | | | | | | | | | | | |
Net assets, end of period (000’s) | $ | 179,582 | | | 43,808 | | | 14,548 | | | 15,046 | | | 9,800 | | |
Ratios to average net assets: | | | | | | | | | | | | | | | | |
Net expenses after expense reimbursement/
recoupment(3)(4) | % | 0.60 | | | 0.68 | | | 0.71 | | | 0.73 | | | 0.82 | | |
Gross expenses prior to expense reimbursement/recoupment(3) | % | 0.61 | | | 0.72 | | | 0.68 | | | 0.73 | | | 0.90 | | |
Net investment income after expense reimbursement/recoupment(3)(4) | % | 4.40 | | | 3.43 | | | 3.30 | | | 3.70 | | | 0.05 | | |
Portfolio turnover rate | % | 469 | | | 417 | | | 475 | | | 639 | | | 1,216 | * | |
(1) Commencement of operations.
(2) Total return is calculated assuming reinvestment of all dividends and capital gain distributions at net asset value and excluding the deduction of sales charges. Total return for less than one year is not annualized.
(3) Annualized for periods less than one year.
(4) The Investment Manager has agreed to limit expenses, (excluding interest, taxes, brokerage and extraordinary expenses) subject to possible recoupment by ING Investments, LLC within three years.
* Portfolio turnover was greater than expected during this period due to active trading undertaken in response to market conditions that existed at that time.
** Per share data calculated using the average number of shares outstanding throughout the period.
See Accompanying Notes to Financial Statements.
34
Ing INTERMEDIATE BOND FUND (CONTINUED) | | FINANCIAL HIGHLIGHTS |
Selected data for a share of beneficial interest outstanding throughout each period.
| | Class O | | Class R | |
| | Year | | August 13, | | | | | | March 16, | |
| | Ended | | 2004(1) to | | | | | | 2004(1) to | |
| | March 31, | | March 31, | | Year Ended March 31, | | March 31, | |
| | 2006 | | 2005 | | 2006 | | 2005 | | 2004 | |
Per Share Operating Performance: | | | | | | | | | | | |
Net asset value, beginning of year | $ | 10.32 | | | 10.41 | | | 10.34 | | | 10.67 | | | 10.71 | | |
Income (loss) from investment operations: | | | | | | | | | | | | | | | | |
Net investment income | $ | 0.40 | | | 0.21 | | | 0.38 | | | 0.33 | | | 0.01 | | |
Net realized and unrealized loss on investments | $ | (0.13 | ) | | (0.04 | ) | | (0.14 | ) | | (0.16 | ) | | (0.05 | ) | |
Total from investment operations | $ | 0.27 | | | 0.17 | | | 0.24 | | | 0.17 | | | (0.04 | ) | |
Less distributions from: | | | | | | | | | | | | | | | | |
Net investment income | $ | 0.41 | | | 0.22 | | | 0.39 | | | 0.33 | | | — | | |
Net realized gain on investments | $ | 0.04 | | | 0.04 | | | 0.04 | | | 0.17 | | | — | | |
Total distributions | $ | 0.45 | | | 0.26 | | | 0.43 | | | 0.50 | | | — | | |
Net asset value, end of period | $ | 10.14 | | | 10.32 | | | 10.15 | | | 10.34 | | | 10.67 | | |
Total Return(2) | % | 2.58 | | | 1.61 | | | 2.26 | | | 1.64 | | | (0.37 | ) | |
| | | | | | | | | | | | | | | | |
Ratios and Supplemental Data: | | | | | | | | | | | | | | | | |
Net assets, end of period (000’s) | $ | 43,171 | | | 33,997 | | | 799 | | | 313 | | | 1 | | |
Ratios to average net assets: | | | | | | | | | | | | | | | | |
Net expenses after expense reimbursement(3)(4) | % | 0.94 | | | 0.96 | | | 1.16 | | | 1.17 | | | 1.25 | | |
Gross expenses prior to expense reimbursement(3) | % | 0.95 | | | 1.00 | | | 1.17 | | | 1.21 | | | 1.25 | | |
Net investment income after expense reimbursement(3)(4) | % | 3.91 | | | 3.19 | | | 3.79 | | | 2.96 | | | 3.20 | | |
Portfolio turnover rate | % | 469 | | | 417 | | | 469 | | | 417 | | | 475 | | |
(1) Commencement of operations.
(2) Total return is calculated assuming reinvestment of all dividends and capital gain distributions at net asset value. Total return for less than one year is not annualized.
(3) Annualized for periods less than one year.
(4) The Investment Manager has agreed to limit expenses, (excluding interest, taxes, brokerage and extraordinary expenses) subject to possible recoupment by ING Investments, LLC within three years.
See Accompanying Notes to Financial Statements.
35
ing NATIONAL TAX-EXEMPT BOND FUND | | FINANCIAL HIGHLIGHTS |
Selected data for a share of beneficial interest outstanding throughout each period.
| | Class A | |
| | Year Ended March 31, | |
| | 2006 | | 2005 | | 2004 | | 2003 | | 2002 | |
Per Share Operating Performance: | | | | | | | | | | | |
Net asset value, beginning of year | $ | 10.50 | | | 10.78 | | | 10.87 | | | 10.32 | | | 10.50 | | |
Income (loss) from investment operations: | | | | | | | | | | | | | | | | |
Net investment income | $ | 0.37 | | | 0.34 | | | 0.35 | | | 0.39 | | | 0.41 | | |
Net realized and unrealized gain (loss) on investments | $ | (0.11 | ) | | (0.21 | ) | | 0.12 | | | 0.67 | | | (0.18 | ) | |
Total from investment operations | $ | 0.26 | | | 0.13 | | | 0.47 | | | 1.06 | | | 0.23 | | |
Less distributions from: | | | | | | | | | | | | | | | | |
Net investment income | $ | 0.37 | | | 0.34 | | | 0.35 | | | 0.39 | | | 0.41 | | |
Net realized gain on investments | $ | 0.11 | | | 0.07 | | | 0.21 | | | 0.12 | | | — | | |
Total distributions | $ | 0.48 | | | 0.41 | | | 0.56 | | | 0.51 | | | 0.41 | | |
Net asset value, end of year | $ | 10.28 | | | 10.50 | | | 10.78 | | | 10.87 | | | 10.32 | | |
Total Return(1) | % | 2.55 | | | 1.19 | | | 4.41 | | | 10.44 | | | 2.25 | | |
| | | | | | | | | | | | | | | | |
Ratios and Supplemental Data: | | | | | | | | | | | | | | | | |
Net assets, end of year (000’s) | $ | 22,864 | | | 23,296 | | | 24,082 | | | 23,647 | | | 22,868 | | |
Ratios to average net assets: | | | | | | | | | | | | | | | | |
Net expenses after expense reimbursement/recoupment(2) | % | 1.06 | | | 1.10 | | | 1.15 | | | 1.15 | | | 1.10 | | |
Gross expenses prior to expense reimbursement/recoupment | % | 1.13 | | | 1.13 | | | 1.27 | | | 1.28 | | | 1.52 | | |
Net investment income after expense reimbursement/recoupment(2) | % | 3.55 | | | 3.19 | | | 3.23 | | | 3.64 | | | 3.97 | | |
Portfolio turnover rate | % | 32 | | | 22 | | | 31 | | | 22 | | | 27 | | |
| | Class B | |
| | Year Ended March 31, | |
| | 2006 | | 2005 | | 2004 | | 2003 | | 2002 | |
Per Share Operating Performance: | | | | | | | | | | | | | | | | |
Net asset value, beginning of year | $ | 10.50 | | | 10.77 | | | 10.86 | | | 10.31 | | | 10.48 | | |
Income (loss) from investment operations: | | | | | | | | | | | | | | | | |
Net investment income | $ | 0.29 | | | 0.26 | | | 0.27 | | | 0.31 | | | 0.34 | | |
Net realized and unrealized gain (loss) on investments | $ | (0.12 | ) | | (0.20 | ) | | 0.12 | | | 0.67 | | | (0.17 | ) | |
Total from investment operations | $ | 0.17 | | | 0.06 | | | 0.39 | | | 0.98 | | | 0.17 | | |
Less distributions from: | | | | | | | | | | | | | | | | |
Net investment income | $ | 0.29 | | | 0.26 | | | 0.27 | | | 0.31 | | | 0.34 | | |
Net realized gain on investments | $ | 0.11 | | | 0.07 | | | 0.21 | | | 0.12 | | | — | | |
Total distributions | $ | 0.40 | | | 0.33 | | | 0.48 | | | 0.43 | | | 0.34 | | |
Net asset value, end of year | $ | 10.27 | | | 10.50 | | | 10.77 | | | 10.86 | | | 10.31 | | |
Total Return(1) | % | 1.68 | | | 0.54 | | | 3.63 | | | 9.65 | | | 1.59 | | |
| | | | | | | | | | | | | | | | |
Ratios and Supplemental Data: | | | | | | | | | | | | | | | | |
Net assets, end of year (000’s) | $ | 3,032 | | | 3,041 | | | 2,643 | | | 2,792 | | | 1,265 | | |
Ratios to average net assets: | | | | | | | | | | | | | | | | |
Net expenses after expense reimbursement/recoupment(2) | % | 1.81 | | | 1.85 | | | 1.90 | | | 1.90 | | | 1.84 | | |
Gross expenses prior to expense reimbursement/recoupment | % | 1.78 | | | 1.78 | | | 1.92 | | | 1.94 | | | 2.16 | | |
Net investment income after expense reimbursement/recoupment(2) | % | 2.79 | | | 2.44 | | | 2.48 | | | 2.86 | | | 3.22 | | |
Portfolio turnover rate | % | 32 | | | 22 | | | 31 | | | 22 | | | 27 | | |
(1) Total return is calculated assuming reinvestment of all dividends and capital gain distributions at net asset value and excluding the deduction of sales charges.
(2) The Investment Manager has agreed to limit expenses, (excluding interest, taxes, brokerage and extraordinary expenses) subject to possible recoupment by ING Investments, LLC within three years.
See Accompanying Notes to Financial Statements.
36
ing NATIONAL TAX-EXEMPT BOND FUND (CONTINUED) | | FINANCIAL HIGHLIGHTS |
Selected data for a share of beneficial interest outstanding throughout each period.
| | Class C | |
| | Year Ended March 31, | |
| | 2006 | | 2005 | | 2004 | | 2003 | | 2002 | |
Per Share Operating Performance: | | | | | | | | | | | |
Net asset value, beginning of year | $ | 10.50 | | | 10.78 | | | 10.87 | | | 10.33 | | | 10.49 | | |
Income (loss) from investment operations: | | | | | | | | | | | | | | | | |
Net investment income | $ | 0.29 | | | 0.26 | | | 0.27 | | | 0.31 | | | 0.34 | | |
Net realized and unrealized gain (loss) on investments | $ | (0.11 | ) | | (0.21 | ) | | 0.12 | | | 0.66 | | | (0.16 | ) | |
Total from investment operations | $ | 0.18 | | | 0.05 | | | 0.39 | | | 0.97 | | | 0.18 | | |
Less distributions from: | | | | | | | | | | | | | | | | |
Net investment income | $ | 0.29 | | | 0.26 | | | 0.27 | | | 0.31 | | | 0.34 | | |
Net realized gains on investments | $ | 0.11 | | | 0.07 | | | 0.21 | | | 0.12 | | | — | | |
Total distributions | $ | 0.40 | | | 0.33 | | | 0.48 | | | 0.43 | | | 0.34 | | |
Net asset value, end of year | $ | 10.28 | | | 10.50 | | | 10.78 | | | 10.87 | | | 10.33 | | |
Total Return(1) | % | 1.77 | | | 0.49 | | | 3.63 | | | 9.56 | | | 1.69 | | |
| | | | | | | | | | | | | | | | |
Ratios and Supplemental Data: | | | | | | | | | | | | | | | | |
Net assets, end of year (000’s) | $ | 1,665 | | | 1,806 | | | 1,104 | | | 1,065 | | | 271 | | |
Ratios to average net assets: | | | | | | | | | | | | | | | | |
Net expenses after expense reimbursement/recoupment(2) | % | 1.81 | | | 1.85 | | | 1.90 | | | 1.90 | | | 1.83 | | |
Gross expenses prior to expense reimbursement/recoupment | % | 1.80 | | | 1.78 | | | 1.92 | | | 1.94 | | | 2.18 | | |
Net investment income after expense reimbursement/recoupment(2) | % | 2.80 | | | 2.44 | | | 2.49 | | | 2.84 | | | 3.21 | | |
Portfolio turnover rate | % | 32 | | | 22 | | | 31 | | | 22 | | | 27 | | |
(1) Total return is calculated assuming reinvestment of all dividends and capital gain distributions at net asset value and excluding the deduction of sales charges.
(2) The Investment Manager has agreed to limit expenses, (excluding interest, taxes, brokerage and extraordinary expenses) subject to possible recoupment by ING Investments, LLC within three years.
See Accompanying Notes to Financial Statements.
37
ING CLASSIC MONEY MARKET FUND | | FINANCIAL HIGHLIGHTS |
Selected data for a share of beneficial interest outstanding throughout each period.
| | Class A | |
| | Year Ended March 31, | |
| | 2006 | | 2005 | | 2004 | | 2003 | | 2002 | |
Per Share Operating Performance: | | | | | | | | | | | |
Net asset value, beginning of year | $ | 1.00 | | | 1.00 | | | 1.00 | | | 1.00 | | | 1.00 | | |
Income from investment operations: | | | | | | | | | | | | | | | | |
Net investment income | $ | 0.03 | | | 0.01 | | | 0.00 | * | | 0.01 | | | 0.03 | | |
Total from investment operations | $ | 0.03 | | | 0.01 | | | 0.00 | * | | 0.01 | | | 0.03 | | |
Less distributions from: | | | | | | | | | | | | | | | | |
Net investment income | $ | 0.03 | | | 0.01 | | | 0.00 | * | | 0.01 | | | 0.03 | | |
Total distributions | $ | 0.03 | | | 0.01 | | | 0.00 | * | | 0.01 | | | 0.03 | | |
Net asset value, end of year | $ | 1.00 | | | 1.00 | | | 1.00 | | | 1.00 | | | 1.00 | | |
Total Return(1) | % | 3.07 | | | 1.02 | | | 0.44 | | | 1.06 | | | 2.83 | | |
| | | | | | | | | | | | | | | | |
Ratios and Supplemental Data: | | | | | | | | | | | | | | | | |
Net assets, end of year (000’s) | $ | 656,731 | | | 550,091 | | | 398,997 | | | 458,964 | | | 549,999 | | |
Ratios to average net assets: | | | | | | | | | | | | | | | | |
Net expenses after expense reimbursement(2) | % | 0.77 | | | 0.77 | | | 0.77 | | | 0.77 | | | 0.77 | | |
Gross expenses prior to expense reimbursement | % | 1.10 | | | 1.08 | | | 1.16 | | | 1.27 | | | 1.27 | | |
Net investment income after expense reimbursement(2) | % | 3.07 | | | 1.06 | | | 0.44 | | | 1.06 | | | 2.75 | | |
| | Class B | |
| | Year Ended March 31, | |
| | 2006 | | 2005 | | 2004 | | 2003 | | 2002 | |
Per Share Operating Performance: | | | | | | | | | | | | | | | | |
Net asset value, beginning of year | $ | 1.00 | | | 1.00 | | | 1.00 | | | 1.00 | | | 1.00 | | |
Income from investment operations: | | | | | | | | | | | | | | | | |
Net investment income | $ | 0.02 | | | 0.01 | | | 0.00 | * | | 0.00 | * | | 0.02 | | |
Total from investment operations | $ | 0.02 | | | 0.01 | | | 0.00 | * | | 0.00 | * | | 0.02 | | |
Less distributions from: | | | | | | | | | | | | | | | | |
Net investment income | $ | 0.02 | | | 0.01 | | | 0.00 | * | | 0.00 | * | | 0.02 | | |
Total distributions | $ | 0.02 | | | 0.01 | | | 0.00 | * | | 0.00 | * | | 0.02 | | |
Net asset value, end of year | $ | 1.00 | | | 1.00 | | | 1.00 | | | 1.00 | | | 1.00 | | |
Total Return(1) | % | 2.46 | | | 0.57 | | | 0.15 | | | 0.43 | | | 2.21 | | |
| | | | | | | | | | | | | | | | |
Ratios and Supplemental Data: | | | | | | | | | | | | | | | | |
Net assets, end of year (000’s) | $ | 23,995 | | | 26,941 | | | 816 | | | 1,156 | | | 1,987 | | |
Ratios to average net assets: | | | | | | | | | | | | | | | | |
Net expenses after expense reimbursement(2) | % | 1.34 | | | 1.33 | | | 1.07 | | | 1.40 | | | 1.37 | | |
Gross expenses prior to expense reimbursement | % | 1.34 | | | 1.33 | | | 1.41 | | | 1.52 | | | 1.53 | | |
Net investment income after expense reimbursement(2) | % | 2.43 | | | 0.94 | | | 0.15 | | | 0.46 | | | 2.27 | | |
(1) Total return is calculated assuming reinvestment of all dividends and capital gain distributions at net asset value and excluding the deduction of sales charges.
(2) The Investment Manager has agreed to limit expenses, (excluding interest, taxes, brokerage and extraordinary expenses) subject to possible recoupment by ING Investments, LLC within three years.
* Amount is less than $0.01 per share.
See Accompanying Notes to Financial Statements.
38
Ing CLASSIC MONEY MARKET FUND (CONTINUED) | | FINANCIAL HIGHLIGHTS |
Selected data for a share of beneficial interest outstanding throughout each period.
| | Class C | |
| | Year Ended March 31, | |
| | 2006 | | 2005 | | 2004 | | 2003 | | 2002 | |
Per Share Operating Performance: | | | | | | | | | | | |
Net asset value, beginning of year | $ | 1.00 | | | 1.00 | | | 1.00 | | | 1.00 | | | 1.00 | | |
Income from investment operations: | | | | | | | | | | | | | | | | |
Net investment income | $ | 0.02 | | | 0.01 | | | 0.00 | * | | 0.00 | * | | 0.02 | | |
Total from investment operations | $ | 0.02 | | | 0.01 | | | 0.00 | * | | 0.00 | * | | 0.02 | | |
Less distributions from: | | | | | | | | | | | | | | | | |
Net investment income | $ | 0.02 | | | 0.01 | | | 0.00 | * | | 0.00 | * | | 0.02 | | |
Total distributions | $ | 0.02 | | | 0.01 | | | 0.00 | * | | 0.00 | * | | 0.02 | | |
Net asset value, end of year | $ | 1.00 | | | 1.00 | | | 1.00 | | | 1.00 | | | 1.00 | | |
Total Return(1) | % | 2.46 | | | 0.58 | | | 0.14 | | | 0.42 | | | 2.20 | | |
| | | | | | | | | | | | | | | | |
Ratios and Supplemental Data: | | | | | | | | | | | | | | | | |
Net assets, end of year (000’s) | $ | 4,868 | | | 3,932 | | | 546 | | | 524 | | | 590 | | |
Ratios to average net assets: | | | | | | | | | | | | | | | | |
Net expenses after expense reimbursement(2) | % | 1.34 | | | 1.33 | | | 1.07 | | | 1.40 | | | 1.38 | | |
Gross expenses prior to expense reimbursement | % | 1.34 | | | 1.33 | | | 1.41 | | | 1.52 | | | 1.53 | | |
Net investment income after expense reimbursement(2) | % | 2.47 | | | 0.78 | | | 0.15 | | | 0.42 | | | 2.44 | | |
(1) Total return is calculated assuming reinvestment of all dividends and capital gain distributions at net asset value and excluding the deduction of sales charges.
(2) The Investment Manager has agreed to limit expenses, (excluding interest, taxes, brokerage and extraordinary expenses) subject to possible recoupment by ING Investments, LLC within three years.
* Amount is less than $0.01 per share.
See Accompanying Notes to Financial Statements.
39
Ing INSTITUTIONAL PRIME MONEY MARKET FUND | | FINANCIAL HIGHLIGHTS |
Selected data for a share of beneficial interest outstanding throughout each period.
| | July 28,
2005(1) to
March 31,
2006 | |
Per Share Operating Performance: | | | |
Net asset value, beginning of period | $ | 1.00 | |
Income from investment operations: | | | |
Net investment income | $ | 0.03 | |
Total from investment operations | $ | 0.03 | |
Less distributions from: | | | |
Net investment income | $ | 0.03 | |
Total distributions | $ | 0.03 | |
Net asset value, end of period | $ | 1.00 | |
Total Return(2) | % | 2.70 | |
| | | |
Ratios and Supplemental Data: | | | |
Net assets, end of period (000’s) | $ | 179,659 | |
Ratios to average net assets: | | | |
Net expenses after expense reimbursement/recoupment(3)(4) | % | 0.17 | |
Gross expenses prior to expense reimbursement/recoupment(3) | % | 0.19 | |
Net investment income after expense reimbursement(3)(4) | % | 4.14 | |
(1) Commencement of operations.
(2) Total return is calculated assuming reinvestment of all dividends and capital gain distributions at net asset value and excluding the deduction of sales charges. Total return for less than one year is not annualized.
(3) Annualized for periods less than one year.
(4) The Investment Manager has agreed to limit expenses, (excluding interest taxes, brokerage and extraordinary expenses) subject to possible recoupment by ING Investments, LLC within three years.
See Accompanying Notes to Financial Statements.
40
NOTES TO FINANCIAL STATEMENTS AS OF MARCH 31, 2006
NOTE 1 — ORGANIZATION
Organization. ING Funds Trust (“Trust”) is a Delaware business trust registered as an open-end management investment company. The Trust was organized on August 6, 1998 and was established under a Trust Instrument dated July 30, 1998. It consists of six separately managed series: ING GNMA Income Fund (“GNMA Income”), ING High Yield Bond Fund (“High Yield Bond”), ING Intermediate Bond Fund (“Intermediate Bond”), ING National Tax-Exempt Bond Fund (“National Tax-Exempt Bond”), ING Classic Money Market Fund (“Classic Money Market”) and ING Institutional Prime Money Market Fund (“Institutional Money Market”) (Each, a “Fund” and collectively, the “Funds”).
The investment objective of each Fund is described in each Fund’s prospectus.
Each Fund, except Institutional Money Market, offers at least three of the following classes of shares: Class A, Class B, Class C, Class I, Class M, Class O, Class Q and Class R. The separate classes of shares differ principally in the applicable sales charges (if any), transfer agent fees, distribution fees and shareholder servicing fees. Shareholders of each class also bear certain expenses that pertain to that particular class. All shareholders bear the common expenses of the Fund and earn income and realized gains/losses from the portfolio pro rata based on the average daily net assets of each class, without distinction between share classes. Differences in per share dividend rates generally result from the differences in separate class expenses, including distribution, and shareholder servicing fees. Class B shares, along with their pro rata reinvested dividend shares, automatically convert to Class A shares approximately eight years after purchase.
ING Investments, LLC (“ING Investments”), serves as the Investment Manager to the Funds. ING Investments has engaged ING Investment Management Co. (“ING IM”), to serve as the Sub-Adviser to the Funds. ING Funds Distributor, LLC (the “Distributor”) is the principal underwriter of the Funds. The Distributor, ING Investments and ING IM are indirect, wholly-owned subsidiaries of ING Groep N.V. (“ING Groep”). ING Groep is one of the largest financial services organizations in the world, and offers an array of banking, insurance and asset management services to both individuals and institutional investors.
NOTE 2 — SIGNIFICANT ACCOUNTING POLICIES
The following significant accounting policies are consistently followed by the Funds in the preparation of their financial statements, and such policies are in conformity with U.S. generally accepted accounting principles for investment companies.
A. Security Valuation. Investments in equity securities traded on a national securities exchange are valued at the last reported sale price. Securities reported by NASDAQ will be valued at the NASDAQ official closing prices. Securities traded on an exchange or NASDAQ for which there has been no sale and securities traded in the over-the-counter-market are valued at the mean between the last reported bid and ask prices. All investments quoted in foreign currencies will be valued daily in U.S. dollars on the basis of the foreign currency exchange rates prevailing at that time. Debt securities are valued at prices obtained from independent services or from one or more dealers making markets in the securities and may be adjusted based on the Funds’ valuation procedures. U.S. government obligations are valued by using market quotations or independent pricing services that use prices provided by marketmakers or estimates of market values obtained from yield data relating to instruments or securities with similar characteristics.
Securities and assets for which market quotations are not readily available (which may include certain restricted securities which are subject to limitations as to their sale) are valued at their fair values as determined in good faith by or under the supervision of the Funds’ Board of Trustees (“Board”), in accordance with methods that are specifically authorized by the Board. Securities traded on exchanges, including foreign exchanges, which close earlier than the time that a Fund calculates its net asset value (“NAV”) may also be valued at their fair values as determined in good faith by or under the supervision of a Fund’s Board, in accordance with methods that are specifically authorized by the Board. If an event occurs after the time at which the market for foreign securities held by the Fund closes but before the time that the Fund’s NAV is calculated, such event may cause the closing price on the foreign exchange to not represent a readily available reliable market value quotation for such securities at the time the Fund determines its NAV. In such a case, the Fund will use the fair value of such securities as determined under the Fund’s valuation procedures. Events after the close of trading on a foreign market that could require the Fund to fair value some or all of its foreign securities include, among others, securities trading in the U.S. and other markets, corporate announcements, natural and other disasters, and political and other events. Among other elements
41
NOTES TO FINANCIAL STATEMENTS AS OF MARCH 31, 2006 (CONTINUED)
NOTE 2 — SIGNIFICANT ACCOUNTING POLICIES (continued)
of analysis in the determination of a security’s fair value, the Board has authorized the use of one or more independent research services to assist with such determinations. An independent research service may use statistical analyses and quantitative models to help determine fair value as of the time a Fund calculates its NAV. There can be no assurance that such models accurately reflect the behavior of the applicable markets or the effect of the behavior of such markets on the fair value of securities, or that such markets will continue to behave in a fashion that is consistent with such models. Unlike the closing price of a security on an exchange, fair value determinations employ elements of judgment. Consequently, the fair value assigned to a security may not represent the actual value that the Fund could obtain if it were to sell the security at the time of the close of the NYSE. Pursuant to procedures adopted by the Board, the Fund is not obligated to use the fair valuations suggested by any research service, and valuation recommendations provided by such research services may be overridden if other events have occurred or if other fair valuations are determined in good faith to be more accurate. Unless an event is such that it causes the Fund to determine that the closing prices for one or more securities do not represent readily available reliable market value quotations at the time the Fund determines its NAV, events that occur between the time of the close of the foreign market on which they are traded and the close of regular trading on the NYSE will not be reflected in the Fund’s NAV. Investments in securities maturing in 60 days or less from the date of acquisition are valued at amortized cost, which, when combined with accrued interest, approximates market value.
Classic Money Market and Institutional Money Market use the amortized cost method to value their portfolios securities. The amortized cost method involves valuing a security at its cost and amortizing any discount or premium over the period until maturity.
B. Security Transactions and Revenue Recognition. Securities transactions are accounted for on the trade date. Realized gains and losses are reported on the basis of identified cost of securities sold. Interest income is recorded on an accrual basis. Dividend income is recorded on the ex-dividend date, or for certain foreign securities, when the information becomes available to the Funds.
Premium amortization and discount accretion are determined by the effective yield method.
C. Foreign Currency Translation. The books and records of the Funds are maintained in U.S. dollars. Any foreign currency amounts are translated into U.S. dollars on the following basis:
(1) Market value of investment securities, other assets and liabilities — at the exchange rates prevailing at the end of the day.
(2) Purchases and sales of investment securities, income and expenses — at the rates of exchange prevailing on the respective dates of such transactions.
Although the net assets and the market values are presented at the foreign exchange rates at the end of the day, the Funds do not isolate the portion of the results of operations resulting from changes in foreign exchange rates on investments from the fluctuations arising from changes in market prices of securities held. Such fluctuations are included with the net realized and unrealized gains or losses from investments. For securities that are subject to foreign withholding tax upon disposition, liabilities are recorded on the Statements of Assets and Liabilities for the estimated tax withholding based on the securities’ current market values. Upon disposition, realized gains or losses on such securities are recorded net of foreign withholding tax.
Reported net realized foreign exchange gains or losses arise from sales of foreign currencies, currency gains or losses realized between the trade and settlement dates on securities transactions, the difference between the amounts of dividends, interest, and foreign withholding taxes recorded on the Funds’ books, and the U.S. dollar equivalent of the amounts actually received or paid. Net unrealized foreign exchange gains and losses arise from changes in the value of assets and liabilities other than investments in securities at fiscal year end, resulting from changes in the exchange rate. Foreign security and currency transactions may involve certain considerations and risks not typically associated with investing in U.S. companies and U.S. Government securities. These risks include, but are not limited to revaluation of currencies and future adverse political and economic developments which could cause securities and their markets to be less liquid and prices more volatile than those of comparable U.S. companies and U.S. Government securities.
42
NOTES TO FINANCIAL STATEMENTS AS OF MARCH 31, 2006 (CONTINUED)
NOTE 2 — SIGNIFICANT ACCOUNTING POLICIES (continued)
D. Foreign Currency Transactions and Futures Contracts. High Yield Bond, Intermediate Bond and National Tax-Exempt Bond may enter into foreign currency exchange transactions to convert to and from different foreign currencies and to and from the U.S. dollar in connection with the planned purchases or sales of securities. The Funds either enter into these transactions on a spot basis at the spot rate prevailing in the foreign currency exchange market or use forward foreign currency contracts to purchase or sell foreign currencies. When the contract is fulfilled or closed, gains or losses are realized. Until then, the gain or loss is included in unrealized appreciation or depreciation. Risks may arise upon entering into forward contracts from the potential inability of counterparties to meet the terms of their forward contracts and from the potential inability of counterparties to meet the terms of their forward contracts and from unanticipated movements in the value of foreign currencies relative to the U.S. dollar.
High Yield Bond and Intermediate Bond may enter into futures contracts involving foreign currency, interest rates, securities and securities indices. A futures contract obligates the seller of the contract to deliver and the purchaser of the contract to take delivery of the type of foreign currency, financial instrument or security called for in the contract at a specified future time for a specified price. Upon entering into such a contract, a Fund is required to deposit and maintain as collateral such initial margin as required by the exchange on which the contract is traded. Pursuant to the contract, a Fund agrees to receive from or pay to the broker an amount equal to the daily fluctuations in the value of the contract. Such receipts or payments are known as variation margins and are recorded as unrealized gains or losses by the Fund. When the contract is closed, the Fund records a realized gain or loss equal to the difference between the value of the contract at the time it was opened and the value at the time it was closed.
E. Distributions to Shareholders. The Funds record distributions to their shareholders on the ex-dividend date. All Funds, with the exception of GNMA Income, declare dividends daily and pay dividends monthly. GNMA Income declares and pays dividends monthly. The Funds may make distributions on a more frequent basis to comply with the distribution requirements of the Internal
Revenue Code. The characteristics of income and gains to be distributed are determined in accordance with income tax regulations, which may differ from U.S. generally accepted accounting principles for investment companies.
F. Federal Income Taxes. It is the policy of the Funds to comply with Subchapter M of the Internal Revenue Code and related excise tax provisions applicable to regulated investment companies and to distribute substantially all of their net investment income and any net realized capital gains to their shareholders. Therefore, no federal income tax provision is required. No capital gain distributions shall be made until any capital loss carryforwards have been fully utilized or expired.
G. Use of Estimates. Management of the Funds has made certain estimates and assumptions relating to the reporting of assets, liabilities, income, and expenses to prepare these financial statements in conformity with U.S. generally accepted accounting principles for investment companies. Actual results could differ from these estimates.
H. Repurchase Agreements. Each Fund may invest in repurchase agreements only with government securities dealers recognized by the Board of Governors of the Federal Reserve System. Under such agreements, the seller of the security agrees to repurchase it at a mutually agreed upon time and price. The resale price is in excess of the purchase price and reflects an agreed upon interest rate for the period of time the agreement is outstanding. The period of the repurchase agreements is usually short, from overnight to one week, while the underlying securities generally have longer maturities. Each Fund will receive as collateral securities acceptable to it whose market value is equal to at least 100% of the carrying amount of the repurchase agreements, plus accrued interest, being invested by the Fund. The underlying collateral is valued daily on a mark to market basis to assure that the value, including accrued interest is at least equal to the repurchase price. There would be potential loss to the Fund in the event the Fund is delayed or prevented from exercising its right to dispose of the collateral, and it might incur disposition costs in liquidating the collateral.
I. Securities Lending. Each Fund (except GNMA Income) has the option to temporarily loan up to 331/1% of its total assets to brokers, dealers or other financial institutions in exchange for a negotiated lender’s fee. The borrower is required to fully
43
NOTES TO FINANCIAL STATEMENTS AS OF MARCH 31, 2006 (CONTINUED)
NOTE 2 — SIGNIFICANT ACCOUNTING POLICIES (continued)
collateralize the loans with cash or U.S. Government securities. Generally, in the event of counterparty default, the Fund has the right to use collateral to offset losses incurred. There would be potential loss to the Fund in the event the Fund is delayed or prevented from exercising its right to dispose of the collateral. The Fund bears the risk of loss with respect to the investment of collateral. Engaging in securities lending could have a leveraging effect, which may intensify the credit, market and other risks associated with investing in a Fund.
J. Organization Expenses and Offering Costs. Costs incurred with the offering of common shares were recorded as a reduction of capital paid in excess of par applicable to common shares. Organization expenses are expensed as incurred.
K. Illiquid and Restricted Securities. GNMA Income may not invest in illiquid securities. Classic Money Market and Institutional Money Market Funds may not invest more than 10% of their net assets in illiquid securities and all other Funds may not invest more than 15% of their net assets in illiquid securities. Illiquid securities are not readily marketable. Disposing of illiquid investments may involve time-consuming negotiation and legal expenses, and it may be difficult or impossible for the Funds to sell them promptly at an acceptable price. Restricted securities are those sold under Rule 144A of the Securities Act of 1933 (“1933 Act”) or are securities offered pursuant to Section 4(2) of the 1933 Act, and are subject to legal or contractual restrictions on resale and may not be publicly sold without registration under the 1933 Act. Certain restricted securities may be considered liquid pursuant to procedures adopted by the Board or may be deemed illiquid because they may not be readily marketable. Illiquid and restricted securities are valued using market quotations when readily available. In the absence of market quotations, the securities are valued based upon their fair value determined under procedures approved by the Board.
L. Delayed Delivery Transaction. The Funds (except for Classic Money Market and Institutional Money Market) may purchase or sell securities on a when-issued or forward commitment basis. The price of the underlying securities and date when the securities will be delivered and paid for are fixed at the time the transaction is negotiated. The market value of such is identified in the Funds’ Portfolio of Investments. Losses may arise due to changes in the market value of the securities or from the inability of counterparties to meet the terms of the contract. In connection with such purchases, the Funds are required to hold liquid assets as collateral with the Funds’ custodian sufficient to cover the purchase price.
M. Mortgage Dollar Roll Transactions. Each Fund (except National Tax-Exempt Bond, Classic Money Market and Institutional Money Market) may engage in dollar roll transactions with respect to mortgage-backed securities issued by Government National Mortgage Association, Federal National Mortgage Association and Federal Home Loan Mortgage Corp. In a dollar roll transaction, a Fund sells a mortgage-backed security to a financial institution, such as a bank or broker/dealer, and simultaneously agrees to repurchase a substantially similar (i.e., same type, coupon, and maturity) security from the institution on a delayed delivery basis at an agreed upon price. The mortgage-backed securities that are repurchased will bear the same interest rate as those sold, but generally will be collateralized by different pools of mortgages with different prepayment histories. The Funds account for dollar roll transactions as purchases and sales.
N. Options Contracts. High Yield Bond and Intermediate Bond may purchase put and call options and may write (sell) put options and covered call options. The Funds may engage in option transactions as a hedge against adverse movements in the value of portfolio holdings or to increase market exposure. Option contracts are valued daily and unrealized gains or losses are recorded based upon the last sales price on the principal exchange on which the options are traded. The Funds will realize a gain or loss upon the expiration or closing of the option contract. When an option is exercised, the proceeds on sales of the underlying security for a written call option, the purchase cost of the security for a written put option, or the cost of the security for a purchased put or call option is adjusted by the amount of premium received or paid. Realized and unrealized gains or losses on option contracts are reflected in the accompanying financial statements. The risk in writing a call option is that the Funds give up the opportunity for profit if the market price of the security increases and the option is exercised. The risk in writing a put option is that the Funds may incur a loss if the market price of the security decreases and the option is exercised. The risk in buying an option is that the Funds pay a premium whether or not the option is exercised. Risks may also arise from an illiquid secondary market or from the inability of counterparties to meet the terms of the contract.
44
NOTES TO FINANCIAL STATEMENTS AS OF MARCH 31, 2006 (CONTINUED)
NOTE 2 — SIGNIFICANT ACCOUNTING POLICIES (continued)
O. Construction Loan Securities. GNMA Income may purchase construction loan securities, which are issued to finance building costs. The funds are disbursed as needed or in accordance with a prearranged plan. The securities provide for the timely payment to the registered holder of interest at the specified rate plus scheduled installments of principal. Upon completion of the construction phase, the construction loan securities are terminated and project loan securities are issued. It is the Fund’s policy to record these GNMA certificates on trade date, and to segregate assets to cover its commitments on trade date as well.
NOTE 3 — INVESTMENT TRANSACTIONS
For the year ended March 31, 2006, the cost of purchases and proceeds from the sales of securities, excluding short-term securities, were as follows:
| | Purchases | | Sales | |
GNMA Income | | $ 43,994,741 | | $ 4,873,745 | |
High Yield Bond | | 242,314,754 | | 310,755,524 | |
Intermediate Bond | | 641,566,908 | | 412,039,862 | |
National Tax-Exempt Bond | | 8,804,161 | | 9,039,439 | |
U.S. Government securities not included above were as follows:
| | Purchases | | Sales | |
GNMA Income | | $ 211,617,581 | | $ 322,092,719 | |
Intermediate Bond | | 3,753,895,043 | | 3,693,459,564 | |
NOTE 4 — INVESTMENT MANAGEMENT AND ADMINISTRATIVE FEES
All Funds in this report have an Investment Management Agreement with ING Investments, LLC (the “Investment Manager”). The Investment Management Agreement compensates the Investment Manager with a fee, computed daily and payable monthly, based on the average daily net assets of each Fund, at the following annual rates:
For GNMA Income — 0.47% on first $1 billion, 0.40% on next $4 billion and 0.35% on assets thereafter; for High Yield Bond — 0.51% on first $1 billion, 0.45% on next $4 billion and 0.40% on assets thereafter; for Intermediate Bond — 0.17%; for National Tax-Exempt Bond — 0.30%; for Classic Money Market — 0.25%; and for Institutional Money Market — 0.08%.
Prior to January 20, 2006, the investment management fees were as follows — GNMA Income — 0.60% of the first $150 million, 0.50% of the next $250 million, 0.45% of the next $400 million and 0.40% in excess of $800 million; for High Yield Bond — 0.65% of the first $250 million, 0.60% of the next $250 million and 0.55% in excess of $500 million; for Intermediate Bond — 0.50% of the first $500 million, 0.45% of the next $500 million, 0.425% of the next $1 billion and 0.40% in excess of $2 billion; for National Tax-Exempt Bond — 0.50% on the first $100 million and 0.40% in excess of $100 million; for Classic Money Market — 0.25%; and for Institutional Money Market — 0.08%.
The Investment Manager has entered into a Sub-Advisory Agreement with ING IM. Subject to such policies as the Board or the Investment Manager may determine, ING IM manages the Funds’ assets in accordance with the Funds’ investment objectives, policies, and limitations.
ING Funds Services, LLC (“IFS”), an indirect, wholly-owned subsidiary of ING Groep, acts as administrator and provides certain administrative and shareholder services necessary for Fund operations and is responsible for the supervision of other service providers. For its services, IFS is entitled to receive from each Fund, with the exception of Money Market and Institutional Money Market, a fee at an annual rate of 0.10% of its average daily net assets.
NOTE 5 — DISTRIBUTION AND SERVICE FEES
Each share class of the Funds (except Class I and as otherwise noted below) has adopted a Distribution and/or Service Plan pursuant to Rule 12b-1 under the 1940 Act (the “12b-1 Plans”), whereby the Distributor is reimbursed or compensated (depending on the class of shares) by certain of the Funds for expenses incurred in the distribution of each Fund’s shares (“Distribution Fees”). Pursuant to the 12b-1 Plans, the Distributor is entitled to payment each month for expenses incurred in the distribution and promotion of certain of each Fund’s shares, including expenses incurred in printing prospectuses and reports used for sales purposes, expenses incurred in preparing and printing sales literature and other such distribution related expenses, including any distribution or shareholder servicing fees (“Service Fees”) paid to securities dealers who have executed a distribution agreement with the Distributor. Under the 12b-1 Plans, each class of shares of the Fund pays the Distributor a Distribution and/or Service Fee based on average daily net assets at the following annual rates:
| | Class A | | Class B | | Class C | | Class M | | Class O | | Class Q | | Class R | |
GNMA Income | | 0.25 | % | | 1.00 | % | | 1.00 | % | | 1.00 | % | | N/A | | | 0.25 | % | | N/A | | |
High Yield Bond | | 0.25 | % | | 1.00 | % | | 1.00 | % | | N/A | | | N/A | | | N/A | | | N/A | | |
Intermediate Bond | | 0.25 | % | | 1.00 | % | | 1.00 | % | | N/A | | | 0.25 | % | | N/A | | | 0.50 | % | |
National Tax-Exempt Bond | | 0.25 | % | | 1.00 | % | | 1.00 | % | | N/A | | | N/A | | | N/A | | | N/A | | |
Classic Money Market | | 0.75 | % | | 1.00 | % | | 1.00 | % | | N/A | | | N/A | | | N/A | | | N/A | | |
Institutional Money Market | | N/A | | | N/A | | | N/A | | | N/A | | | N/A | | | N/A | | | N/A | | |
45
NOTES TO FINANCIAL STATEMENTS AS OF MARCH 31, 2006 (CONTINUED)
NOTE 5 — DISTRIBUTION AND SERVICE FEES (continued)
Prior to January 20, 2006, the distribution and service fees for High Yield Bond, Intermediate Bond and National Tax-Exempt Bond were as follows:
| | Class A | | Class B | | Class C | | Class M | | Class O | | Class Q | | Class R | |
High Yield Bond | | 0.35 | % | | 1.00 | % | | 1.00 | % | | N/A | | | N/A | | | N/A | | | N/A | | |
Intermediate Bond | | 0.35 | % | | 1.00 | % | | 1.00 | % | | N/A | | | 0.25 | % | | N/A | | | 0.50 | % | |
National Tax-Exempt Bond | | 0.35 | % | | 1.00 | % | | 1.00 | % | | N/A | | | N/A | | | N/A | | | N/A | | |
During the year ended March 31, 2006, the Distributor waived $33,270, $5,354, and $2,337 of the Class A, Class B, and Class C Distribution Fee for GNMA Income and $487 of the Class M Distribution Fee.
During the year ended March 31, 2006, the Distributor voluntarily waived 0.25% of the Class M Distribution Fee for GNMA Income.
From April 1, 2005 to January 19, 2006, the Distributor waived 0.10% of the Class A Distribution Fee for High Yield Bond, Intermediate Bond and National Tax-Exempt Bond.
During the year ended March 31, 2006, the Distributor voluntarily waived Distribution and Service Fees of 0.33% for Class A of Classic Money Market.
The Distributor also receives the proceeds of initial sales charge paid by shareholders upon the purchase of Class A and Class M shares, and the contingent deferred sales charge paid by shareholders upon certain redemptions for Class A, Class B, and Class C shares. For the year ended March 31, 2006, the Distributor retained the following amounts in sales charges:
| | Class A
Shares | | Class B
Shares | | Class C
Shares | | Class M
Shares | |
Initial Sales Charges | | | | | | | | | | | | | |
GNMA Income | | $24,293 | | | N/A | | | N/A | | | — | | |
High Yield Bond | | 4,678 | | | N/A | | | N/A | | | — | | |
Intermediate Bond | | 35,887 | | | N/A | | | N/A | | | — | | |
National Tax-Exempt | | 1,109 | | | N/A | | | N/A | | | — | | |
Contingent Deferred Sales Charge | | | | | | | | | | | | | |
GNMA Income | | 15,856 | | | N/A | | | $7,571 | | | N/A | | |
High Yield Bond | | 5,407 | | | N/A | | | 1,615 | | | N/A | | |
Intermediate Bond | | 16,007 | | | N/A | | | 7,148 | | | N/A | | |
Classic Money Market | | 1,040 | | | N/A | | | 4,353 | | | N/A | | |
NOTE 6 — OTHER TRANSACTIONS WITH AFFILIATES AND RELATED PARTIES
At March 31, 2006, the Funds had the following amounts recorded in payable to affiliates on the accompanying Statements of Assets and Liabilities (see Notes 4 and 5):
| | Accrued
Investment
Management
Fees | | Accrued
Administrative
Fees | | Accrued
Shareholder
Services and
Distribution
Fees | | Accrued
Reimbursement/
Recoupment
Expense | | Total | |
GNMA Income | | $256,779 | | | $54,633 | | | $165,640 | | | $ 6,925 | | | $483,977 | | |
High Yield Bond | | 84,380 | | | 16,545 | | | 101,713 | | | — | | | 202,638 | | |
Intermediate Bond | | 134,050 | | | 78,853 | | | 245,057 | | | — | | | 457,960 | | |
National Tax-Exempt Bond | | 7,056 | | | 2,352 | | | 8,827 | | | — | | | 18,235 | | |
Classic Money Market | | 147,569 | | | — | | | 256,100 | | | — | | | 403,669 | | |
Institutional Money Market | | 13,365 | | | — | | | — | | | 41,270 | | | 54,635 | | |
At March 31, 2006, the following indirect, wholly-owned subsidiaries of ING Groep owned more than 5% of the following Funds:
ING Life Insurance and Annuity Company | - | GNMA Income (14.6%); |
| | Intermediate Bond (20.0%); |
| | and National Tax-Exempt Bond (74.4%). |
| | |
ING National Trust | - | GNMA Income (5.9%); |
| | and Intermediate Bond (16.0%). |
| | |
ING USA Annuity and Life Insurance Company | - | Institutional Money Market (5.7%). |
Each Fund has adopted a Retirement Policy covering all independent trustees of the Fund who will have served as an independent trustee for at least five years at the time of retirement. Benefits under this plan are based on an annual rate as defined in the plan agreement.
NOTE 7 — Expense Limitations
Pursuant to written Expense Limitation Agreements, the Investment Manager has agreed to limit expenses, excluding interest, taxes, brokerage and extraordinary expenses to the following annual expenses to average daily net assets ratios:
| | Class A | | Class B | | Class C | | Class I | | Class M | | Class O | | Class Q | | Class R | |
GNMA(1) Income | | 0.95 | % | | 1.70 | % | | 1.70 | % | | 0.67 | % | | 1.47 | % | | N/A | | | 0.92 | % | | N/A | | |
High Yield Bond | | 1.10 | % | | 1.85 | % | | 1.85 | % | | N/A | | | N/A | | | N/A | | | N/A | | | N/A | | |
Intermediate Bond | | 0.69 | % | | 1.44 | % | | 1.44 | % | | 0.38 | % | | N/A | | | 0.69 | % | | N/A | | | 0.94 | % | |
National Tax-Exempt Bond | | 0.87 | % | | 1.62 | % | | 1.62 | % | | N/A | | | N/A | | | N/A | | | N/A | | | N/A | | |
Classic Money Market | | 0.77 | % | | 1.41 | % | | 1.41 | % | | N/A | | | N/A | | | N/A | | | N/A | | | N/A | | |
(1) Effective December 5, 2005, ING Investments has waived 0.02% of the distribution fee for GNMA Income Class A, Class B, and Class C. This waiver expires August 1, 2006.
46
NOTES TO FINANCIAL STATEMENTS AS OF MARCH 31, 2006 (CONTINUED)
NOTE 7 — EXPENSE LIMITATIONS (continued)
The Investment Manager has agreed to limit expenses, excluding interest, taxes, brokerage, and extraordinary expenses to 0.17% of Institutional Money Market’s average daily net assets.
Prior to January 20, 2006, the expense limits for GNMA Income, High Yield Bond, Intermediate Bond and National Tax-Exempt Bond were as follows:
| | Class A | | Class B | | Class C | | Class I | | Class M | | Class O | | Class Q | | Class R | |
GNMA Income | | 1.29 | % | | 2.04 | % | | 2.04 | % | | 1.04 | % | | 1.79 | % | | N/A | | | 1.29 | % | | N/A | | |
High Yield Bond | | 1.20 | % | | 1.95 | % | | 1.95 | % | | N/A | | | N/A | | | N/A | | | N/A | | | N/A | | |
Intermediate Bond | | 1.00 | % | | 1.75 | % | | 1.75 | % | | 0.75 | % | | N/A | | | 1.00 | % | | N/A | | | 1.25 | % | |
National Tax-Exempt Bond | | 1.15 | % | | 1.90 | % | | 1.90 | % | | N/A | | | N/A | | | N/A | | | N/A | | | N/A | | |
The Investment Manager may at a later date recoup from a Fund for management fees waived and other expenses assumed by the Investment Manager during the previous 36 months, but only if, after such recoupment, the Fund’s expense ratio does not exceed the percentage described above. Waived and reimbursed fees net of any recoupment by the Investment Manager of such waived and reimbursed fees are reflected on the accompanying Statements of Operations for each Fund. Amounts payable by the Investment Manager are reflected on the accompanying Statements of Assets and Liabilities for each Fund.
As of March 31, 2006, the amounts of waived and reimbursed fees that are subject to possible recoupment by the Investment Manager, and the related expiration dates are as follows:
| | March 31, | | | |
| | 2007 | | 2008 | | 2009 | | Total | |
High Yield Bond | | $ — | | $ — | | $113,342 | | $113,342 | |
Intermediate Bond | | — | | 251,036 | | 77,333 | | 328,369 | |
National Tax-Exempt Bond | | 3,844 | | — | | 4,415 | | 8,259 | |
Institutional Money Market | | — | | — | | 22,801 | | 22,801 | |
The Expense Limitation Agreement is contractual and shall renew automatically for one-year terms unless ING Investments provides written notice of the termination of the Expense Limitation Agreement within 90 days of the end of the then current term.
NOTE 8 — LINE OF CREDIT
All of the Funds included in this report with the exception of GNMA Income, in addition to certain other funds managed by the Investment Manager, have entered into an unsecured committed revolving line of credit agreement (the “Credit Agreement”) with The Bank of New York for an aggregate amount of $125,000,000. The proceeds may be used only to: (1) temporarily finance the purchase and sale of securities; (2) finance the redemption of shares of an investor in the Funds; and (3) enable the Funds to meet other emergency expenses as defined in the Credit Agreement. The Funds to which the line of credit is available pay a commitment fee equal to 0.09% per annum on the daily unused portion of the committed line amount payable quarterly in arrears.
The following Funds utilized the line of credit during the year ended March 31, 2006:
Fund | | Days
Utilized | | Approximate
Average Daily
Balance
For Days
Utilized | | Approximate
Weighted
Average
Interest Rate
For Days
Utilized | |
High Yield Bond | | 21 | | | $1,199,048 | | | 4.70 | % | |
Intermediate Bond | | 2 | | | 1,410,000 | | | 5.01 | % | |
NOTE 9 — CAPITAL SHARES
Transactions in capital shares and dollars were as follows:
| | Class A | | Class B | | Class C | |
| | Year
Ended
March 31,
2006 | | Year
Ended
March 31,
2005 | | Year
Ended
March 31,
2006 | | Year
Ended
March 31,
2005 | | Year
Ended
March 31,
2006 | | Year
Ended
March 31,
2005 | |
GNMA Income (Number of Shares) | | | | | | | | | | | | | |
Shares sold | | 10,066,265 | | 11,936,769 | | 907,252 | | 1,139,243 | | 807,886 | | 794,628 | |
Shares issued in merger | | 3,078,523 | | — | | 198,454 | | — | | 90,256 | | — | |
Dividends reinvested | | 2,715,779 | | 2,880,147 | | 300,193 | | 372,746 | | 118,917 | | 160,143 | |
Shares redeemed | | (16,266,683 | ) | (20,045,296 | ) | (3,549,930 | ) | (4,519,492 | ) | (1,860,040 | ) | (3,286,313 | ) |
Net decrease in shares outstanding | | (406,116 | ) | (5,228,380 | ) | (2,144,031 | ) | (3,007,503 | ) | (842,981 | ) | (2,331,542 | ) |
| | | | | | | | | | | | | |
GNMA Income ($) | | | | | | | | | | | | | |
Shares sold | | $ | 79,764,361 | | $ | 103,248,084 | | $ | 7,350,196 | | $ | 9,812,626 | | $ | 6,683,417 | | $ | 6,841,947 | |
Shares issued in merger | | 30,711,195 | | — | | 1,981,002 | | — | | 900,531 | | — | |
Dividends reinvested | | 22,906,968 | | 24,892,865 | | 2,523,048 | | 3,211,230 | | 1,000,388 | | 1,380,904 | |
Shares redeemed | | (137,264,555 | ) | (173,168,149 | ) | (29,799,295 | ) | (38,876,603 | ) | (15,663,159 | ) | (28,306,311 | ) |
Net decrease | | $ | (3,882,031 | ) | $ | (45,027,200 | ) | $ | (17,945,049 | ) | $ | (25,852,747 | ) | $ | (7,078,823 | ) | $ | (20,083,460 | ) |
47
NOTES TO FINANCIAL STATEMENTS AS OF MARCH 31, 2006 (CONTINUED)
NOTE 9 — CAPITAL SHARES (continued)
| | Class I | | Class M | | Class Q | |
| | Year
Ended
March 31,
2006 | | Year
Ended
March 31,
2005 | | Year
Ended
March 31,
2006 | | Year
Ended
March 31,
2005 | | Year
Ended
March 31,
2006 | | Year
Ended
March 31,
2005 | |
GNMA Income (Number of Shares) | | | | | | | | | | | | | |
Shares sold | | 918,436 | | 460,536 | | 11 | | 12 | | 6 | | — | |
Shares issued in merger | | 1,261,704 | | — | | — | | — | | — | | — | |
Dividends reinvested | | 82,697 | | 60,608 | | 713 | | 858 | | 478 | | 583 | |
Shares redeemed | | (1,297,179 | ) | (267,754 | ) | (936 | ) | (12,295 | ) | (2,761 | ) | (3,468 | ) |
Net increase (decrease) in shares outstanding | | 965,658 | | 253,390 | | (212 | ) | (11,425 | ) | (2,277 | ) | (2,885 | ) |
GNMA Income ($) | | | | | | | | | | | | | |
Shares sold | | $ | 5,608,472 | | $ | 3,990,291 | | $ | 468 | | $ | 92 | | $ | 210 | | $ | — | |
Shares issued in merger | | 12,608,661 | | — | | — | | — | | — | | — | |
Dividends reinvested | | 696,912 | | 524,103 | | 6,027 | | 7,441 | | 4,044 | | 5,047 | |
Shares redeemed | | (10,891,793 | ) | (2,315,639 | ) | (8,021 | ) | (106,523 | ) | (23,583 | ) | (29,827 | ) |
Net increase (decrease) | | $ | 8,022,252 | | $ | 2,198,755 | | $ | (1,526 | ) | $ | (98,990 | ) | $ | (19,329 | ) | $ | (24,780 | ) |
| | Class A | | Class B | | Class C | |
| | Year
Ended
March 31,
2006 | | Year
Ended
March 31,
2005 | | Year
Ended
March 31,
2006 | | Year
Ended
March 31,
2005 | | Year
Ended
March 31,
2006 | | Year
Ended
March 31,
2005 | |
High Yield Bond (Number of Shares) | | | | | | | | | | | | | |
Shares sold | | 4,283,666 | | 2,590,514 | | 376,934 | | 770,877 | | 105,440 | | 442,032 | |
Shares issued in merger | | — | | 9,802,063 | | — | | 14,680,633 | | — | | 2,015,478 | |
Dividends reinvested | | 372,895 | | 213,375 | | 294,963 | | 191,276 | | 60,504 | | 53,461 | |
Shares redeemed | | (5,922,652 | ) | (4,907,225 | ) | (6,312,010 | ) | (3,390,430 | ) | (1,160,116 | ) | (715,334 | ) |
Net increase (decrease) in shares outstanding | | (1,266,091 | ) | 7,698,727 | | (5,640,113 | ) | 12,252,356 | | (994,172 | ) | 1,795,637 | |
High Yield Bond ($) | | | | | | | | | | | | | |
Shares sold | | $ | 37,259,692 | | $ | 23,138,944 | | $ | 3,290,473 | | $ | 6,867,884 | | $ | 921,882 | | $ | 3,929,392 | |
Shares issued in merger | | — | | 87,682,572 | | — | | 131,283,737 | | — | | 18,032,534 | |
Dividends reinvested | | 3,253,464 | | 1,906,830 | | 2,572,262 | | 1,710,350 | | 527,995 | | 475,768 | |
Shares redeemed | | (51,709,974 | ) | (43,896,845 | ) | (54,978,481 | ) | (30,458,250 | ) | (10,080,345 | ) | (6,366,656 | ) |
Net increase (decrease) | | $ | (11,196,818 | ) | $ | 68,831,501 | | $ | (49,115,746 | ) | $ | 109,403,721 | | $ | (8,630,468 | ) | $ | 16,071,038 | |
| | Class A | | Class B | | Class C | |
| | Year
Ended
March 31,
2006 | | Year
Ended
March 31,
2005 | | Year
Ended
March 31,
2006 | | Year
Ended
March 31,
2005 | | Year
Ended
March 31,
2006 | | Year
Ended
March 31,
2005 | |
Intermediate Bond (Number of Shares) | | | | | | | | | | | | | |
Shares sold | | 20,627,121 | | 20,020,281 | | 1,166,619 | | 1,242,856 | | 1,904,289 | | 2,376,896 | |
Shares issued in merger | | — | | 7,782,918 | | — | | 281,573 | | — | | 178,918 | |
Dividends reinvested | | 1,775,655 | | 1,290,740 | | 147,654 | | 162,414 | | 139,301 | | 145,287 | |
Shares redeemed | | (10,476,981 | ) | (9,777,963 | ) | (1,616,224 | ) | (1,730,794 | ) | (1,751,216 | ) | (2,438,209 | ) |
Net increase (decrease) in shares outstanding | | 11,925,795 | | 19,315,976 | | (301,951 | ) | (43,951 | ) | 292,374 | | 262,892 | |
Intermediate Bond ($) | | | | | | | | | | | | | |
Shares sold | | $ | 213,494,520 | | $ | 208,496,288 | | $ | 12,066,655 | | $ | 12,918,869 | | $ | 19,701,478 | | $ | 24,752,573 | |
Shares issued in merger | | — | | 81,024,830 | | — | | 2,925,680 | | — | | 1,860,336 | |
Dividends reinvested | | 18,351,362 | | 13,432,920 | | 1,523,148 | | 1,686,232 | | 1,437,949 | | 1,509,860 | |
Shares redeemed | | (108,128,079 | ) | (101,648,431 | ) | (16,685,199 | ) | (17,962,624 | ) | (18,111,053 | ) | (25,320,455 | ) |
Net increase (decrease) | | $ | 123,717,803 | | $ | 201,305,607 | | $ | (3,095,396 | ) | $ | (431,843 | ) | $ | 3,028,374 | | $ | 2,802,314 | |
| | Class I | | Class O | | Class R | |
| | Year
Ended
March 31,
2006 | | Year
Ended
March 31,
2005 | | Year
Ended
March 31,
2006 | | August 13,
2004(1) to
March 31,
2005 | | Year
Ended
March 31,
2006 | | Year
Ended
March 31,
2005 | |
Intermediate Bond (Number of Shares) | | | | | | | | | | | | | |
Shares sold | | 14,385,293 | | 1,105,426 | | 2,557,931 | | 1,847,824 | | 96,767 | | 51,163 | |
Shares issued in merger | | — | | 2,462,195 | | — | | 2,517,767 | | — | | — | |
Dividends reinvested | | 523,382 | | 134,583 | | 153,640 | | 64,256 | | — | | — | |
Shares redeemed | | (1,434,648 | ) | (822,774 | ) | (1,745,909 | ) | (1,136,816 | ) | (48,303 | ) | (20,940 | ) |
Net increase in shares outstanding | | 13,474,027 | | 2,879,430 | | 965,662 | | 3,293,031 | | 48,464 | | 30,223 | |
Intermediate Bond ($) | | | | | | | | | | | | | |
Shares sold | | $ | 149,792,618 | | $ | 11,537,314 | | $ | 26,487,057 | | $ | 19,277,116 | | $ | 1,003,142 | | $ | 536,678 | |
Shares issued in merger | | — | | 25,636,140 | | — | | 26,211,427 | | — | | — | |
Dividends reinvested | | 5,386,015 | | 1,401,462 | | 1,587,962 | | 669,961 | | — | | — | |
Shares redeemed | | (14,825,960 | ) | (8,577,165 | ) | (18,063,082 | ) | (11,856,189 | ) | (499,122 | ) | (218,569 | ) |
Net increase | | $ | 140,352,673 | | $ | 29,997,751 | | $ | 10,011,937 | | $ | 34,302,315 | | $ | 504,020 | | $ | 318,109 | |
48
NOTES TO FINANCIAL STATEMENTS AS OF MARCH 31, 2006 (CONTINUED)
NOTE 9 — CAPITAL SHARES (continued)
| | Class A | | Class B | | Class C | |
| | Year
Ended
March 31,
2006 | | Year
Ended
March 31,
2005 | | Year
Ended
March 31,
2006 | | Year
Ended
March 31,
2005 | | Year
Ended
March 31,
2006 | | Year
Ended
March 31,
2005 | |
National Tax-Exempt Bond (Number of Shares) | | | | | | | | | | | | | |
Shares sold | | 62,062 | | 41,636 | | 103,690 | | 102,559 | | 32,359 | | 95,788 | |
Dividends reinvested | | 7,266 | | 6,613 | | 5,690 | | 4,182 | | 2,708 | | 2,212 | |
Shares redeemed | | (62,812 | ) | (64,637 | ) | (103,924 | ) | (62,425 | ) | (45,043 | ) | (28,473 | ) |
Net increase (decrease) in shares outstanding | | 6,516 | | (16,388 | ) | 5,456 | | 44,316 | | (9,976 | ) | 69,527 | |
| | | | | | | | | | | | | |
National Tax-Exempt Bond ($) | | | | | | | | | | | | | |
Shares sold | | $ | 654,626 | | $ | 441,706 | | $ | 1,085,247 | | $ | 1,083,239 | | $ | 341,463 | | $ | 1,010,135 | |
Dividends reinvested | | 75,964 | | 69,992 | | 59,389 | | 44,217 | | 28,303 | | 23,428 | |
Shares redeemed | | (660,992 | ) | (684,691 | ) | (1,084,774 | ) | (659,861 | ) | (470,313 | ) | (300,795 | ) |
Net increase (decrease) | | $ | 69,598 | | $ | (172,993 | ) | $ | 59,862 | | $ | 467,595 | | $ | (100,547 | ) | $ | 732,768 | |
(1) Commencenment of Operations.
| | Class A | | Class B | | Class C | |
| | Year
Ended
March 31,
2006 | | Year
Ended
March 31,
2005 | | Year
Ended
March 31,
2006 | | Year
Ended
March 31,
2005 | | Year
Ended
March 31,
2006 | | Year
Ended
March 31,
2005 | |
Classic Money Market (Number of Shares) | | | | | | | | | | | | | |
Shares sold | | 494,264,073 | | 370,502,330 | | 34,975,633 | | 36,332,099 | | 5,750,624 | | 97,034 | |
Shares issued in merger | | — | | 53,558,965 | | — | | 16,217,548 | | — | | 3,649,294 | |
Dividends reinvested | | 17,618,283 | | 4,586,322 | | 596,983 | | 61,152 | | 117,025 | | 5,136 | |
Shares redeemed | | (405,226,116 | ) | (277,466,617 | ) | (38,519,102 | ) | (26,461,630 | ) | (4,931,775 | ) | (357,383 | ) |
Net increase (decrease) in shares outstanding | | 106,656,240 | | 151,181,000 | | (2,946,486 | ) | 26,149,169 | | 935,874 | | 3,394,081 | |
Classic Money Market ($) | | | | | | | | | | | | | |
Shares sold | | $ | 494,264,073 | | $ | 370,502,330 | | $ | 34,975,633 | | $ | 36,332,099 | | $ | 5,750,624 | | $ | 97,034 | |
Shares issued in merger | | — | | 53,558,965 | | — | | 16,217,548 | | — | | 3,649,294 | |
Dividends reinvested | | 17,618,283 | | 4,586,251 | | 596,983 | | 61,152 | | 117,025 | | 5,136 | |
Shares redeemed | | (405,226,116 | ) | (277,466,617 | ) | (38,519,102 | ) | (26,461,630 | ) | (4,931,775 | ) | (357,383 | ) |
Net increase (decrease) | | $ | 106,656,240 | | $ | 151,180,929 | | $ | (2,946,486 | ) | $ | 26,149,169 | | $ | 935,874 | | $ | 3,394,081 | |
| | | | | | | | | | | | | |
| | July 28, 2005(1)
to
March 31,
2006 | | | | | | | | | | | |
Institutional Money Market (Number of Shares) | | | | | | | | | | | | | |
Shares sold | | 462,400,001 | | | | | | | | | | | |
Dividends reinvested | | 3,264,932 | | | | | | | | | | | |
Shares redeemed | | (286,000,000 | ) | | | | | | | | | | |
Net increase in shares outstanding | | 179,664,933 | | | | | | | | | | | |
Institutional Money Market ($) | | | | | | | | | | | | | |
Shares sold | | $ | 462,400,001 | | | | | | | | | | | |
Dividends reinvested | | 3,264,932 | | | | | | | | | | | |
Shares redeemed | | (286,000,000 | ) | | | | | | | | | | |
Net increase | | $ | 179,664,933 | | | | | | | | | | | |
(1) Commencement of Operations
49
NOTES TO FINANCIAL STATEMENTS AS OF MARCH 31, 2006 (CONTINUED)
NOTE 10 — CREDIT RISK AND DEFAULTED SECURITIES
Although each Fund has a diversified portfolio, High Yield Bond and Intermediate Bond Funds may invest in lower rated and comparable quality unrated high yield securities. Investments in high yield securities are accompanied by a greater degree of credit risk and such lower rated securities tend to be more sensitive to economic conditions than higher rated securities. The risk of loss due to default by the issuer may be significantly greater for the holders of high yielding securities, because such securities are generally unsecured and are often subordinated to other creditors of the issuer. High Yield Bond and Intermediate Bond held the following defaulted securities at March 31, 2006.
Fund | | Security | | Market
Value | |
High Yield Bond | | ICG Services, Inc., | | $ | 4 | |
| | 10.000%, due 02/15/08 | | | |
| | International Utility Structures, Inc.,
13.000%, due 02/01/08 | | 2 | |
| | | | $ | 6 | |
Intermediate Bond | | United Airlines, Inc., | | | | |
| | 6.602%, due 09/01/2013 | | $ | 503,239 | |
| | | | $ | 503,239 | |
For financial reporting purposes, it is each Fund’s accounting practice to discontinue the accrual of income and to provide an estimate for probable losses due to unpaid interest income on defaulted bonds for the current reporting period.
NOTE 11 — FEDERAL INCOME TAXES
The amount of distributions from net investment income and net realized capital gains are determined in accordance with federal income tax regulations, which may differ from U.S. generally accepted accounting principles for investment companies. These book/tax differences may be either temporary or permanent. Permanent differences are reclassified within the capital accounts based on their federal tax-basis treatment; temporary differences are not reclassified. Key differences include the treatment of short-term capital gains, foreign currency transactions, and wash sale deferrals. Distributions in excess of net investment income and/or net realized capital gains for tax purposes are reported as distributions of paid-in capital.
The following permanent tax differences have been reclassified as of March 31, 2006:
| | Paid-In
Capital | | Undistributed
Net Investment
Income On
Investments | | Accumulated
Net Realized
Gains/
(Losses) | |
GNMA Income | | $ | (4,472,754 | ) | | $3,362,286 | | | $ | 1,110,468 | |
High Yield Bond | | (47,276,599 | ) | 65,898 | | | 47,210,701 | |
Intermediate Bond | | — | | 916,494 | | | (916,494 | ) |
National Tax-Exempt Bond | | — | | (115 | ) | | 115 | |
Institutional Money Market | | (29,036 | ) | 29,036 | | | — | |
| | | | | | | | | | | |
Dividends paid by the Funds from net investment income and distributions of net realized short-term capital gains are, for federal income tax purposes, taxable as ordinary income to shareholders.
The tax composition of dividends and distributions to shareholders was as follows:
| | Year Ended March 31, 2006 | | Year Ended March 31, 2005 | |
| | Ordinary
Income | | Tax-
Exempt
Income | | Long-Term
Capital Gains | | Ordinary
Income | | Tax-
Exempt
Income | | Long-Term
Capital Gains | |
GNMA Income | | $32,462,158 | | $ — | | $ — | | $36,615,264 | | $ — | | $ | — | |
High Yield Bond | | 13,419,941 | | — | | — | | 9,567,361 | | — | | — | |
Intermediate Bond | | 34,140,571 | | — | | 998,520 | | 23,745,777 | | — | | 1,302,980 | |
National Tax-Exempt Bond | | 32,879 | | 936,035 | | 305,296 | | 4,862 | | 857,915 | | 178,348 | |
Classic Money Market | | 18,629,328 | | — | | — | | 4,816,936 | | — | | — | |
Institutional Money Market | | 4,773,069 | | — | | — | | — | | — | | — | |
| | | | | | | | | | | | | | | | | | | | |
The tax-basis components of distributable earnings and the expiration dates of the capital loss carryforwards which may be used to offset future realized capital gains for federal income tax purposes as of March 31, 2006 were:
| | Undistributed
Ordinary
Income | | Undistributed
Tax-Exempt
Income | | Unrealized
Appreciation/
Depreciation | | Post-October
Capital
Losses
Deferred | | Capital
Loss
Carryforwards | | Expiration
Dates | |
GNMA Income | | $2,041,427 | | $— | | $(6,967,854) | | $— | | $ | (1,688,098 | ) | 2007 | |
| | | | | | | | | | (2,870,184 | ) | 2008 | |
| | | | | | | | | | (527,639 | ) | 2010 | |
| | | | | | | | | | (1,081,784 | ) | 2012 | |
| | | | | | | | | | (6,961,357 | ) | 2013 | |
| | | | | | | | | | (3,281,376 | ) | 2014 | |
| | | | | | | | | | $ | (16,410,438 | ) | | |
50
NOTES TO FINANCIAL STATEMENTS AS OF MARCH 31, 2006 (CONTINUED)
NOTE 11 — FEDERAL INCOME TAXES (continued)
| | Undistributed
Ordinary
Income | | Undistributed
Tax-Exempt
Income | | Unrealized
Appreciation/
Depreciation | | Post-October
Capital
Losses
Deferred | | Capital
Loss
Carryforwards | | Expiration
Dates | |
High Yield Bond | | 473,363 | | — | | (3,869,547 | ) | (13,150,775 | ) | $ | (27,206,911 | ) | 2007 | |
| | | | | | | | | | (78,500,574 | ) | 2008 | |
| | | | | | | | | | (115,139,658 | ) | 2009 | |
| | | | | | | | | | (79,792,137 | ) | 2010 | |
| | | | | | | | | | (69,190,309 | ) | 2011 | |
| | | | | | | | | | (6,099,584 | ) | 2012 | |
| | | | | | | | | | (126,079 | ) | 2014 | |
| | | | | | | | | | $ | (376,055,252 | ) | | |
Intermediate Bond | | 643,705 | | — | | (15,770,936 | ) | (7,826,568 | ) | — | | — | |
National Tax-Exempt Bond | | — | | 77,796 | | 527,847 | | (15,280 | ) | — | | — | |
Classic Money Market | | 17,951 | | — | | — | | (29,110 | ) | $ | (1,443 | ) | 2010 | |
| | | | | | | | | | (36,198 | ) | 2011 | |
| | | | | | | | | | (18,913 | ) | 2012 | |
| | | | | | | | | | (63,053 | ) | 2013 | |
| | | | | | | | | | (42,453 | ) | 2014 | |
| | | | | | | | | | $ | (162,060 | ) | | |
Institutional Money Market | | 267,799 | | — | | — | | (8,158 | ) | — | | — | |
NOTE 12 — REORGANIZATIONS
On December 3, 2005, ING GNMA Income Fund, as listed below (“Acquiring Fund”), acquired the assets and certain liabilities of ING Government Fund, also listed below (“Acquired Fund”), in a tax-free reorganization in exchange for shares of the Acquiring Fund, pursuant to a plan of reorganization approved by the Acquired Fund’s shareholders. The number and value of shares issued by the Acquiring Funds are presented in Note 9 — Capital Shares. Net assets and unrealized appreciation as of the reorganization date was as follows:
Acquiring
Fund | | Acquired
Fund | | Total net assets of
Acquired Fund (000) | | Total net assets of
Acquiring Fund (000) | | Acquired Fund
Unrealized
Appreciation/
Depreciation (000) | | Conversion
Ratio | |
ING GNMA Income Fund | | ING Government Fund | | $46,201 | | $628,965 | | $(624) | | 1.20 | |
The net assets of ING GNMA Income Fund after the acquisition were $675,166,000.
On August 16, 2004, October 23, 2004 and March 12, 2005, ING Intermediate Bond Fund, ING High Yield Bond Fund and ING Classic Money Market Fund, respectively, as listed below (“Acquiring Fund”), acquired the assets and certain liabilities of the ING Bond Fund, ING High Yield Opportunity Fund, ING Money Market Fund, and ING Lexington Money Market Trust, respectively, also listed below (“Acquired Fund”), in a tax-free reorganization in exchange for shares of the Acquiring Fund, pursuant to a plan of reorganization approved by the Acquired Fund’s shareholders. The number and value of shares issued by the Acquiring Funds are presented in Note 9 — Capital Shares. Net assets and unrealized appreciation as of the reorganization dates were as follows:
Acquiring
Fund | | Acquired
Fund | | Total net assets of
Acquired Fund (000) | | Total net assets of
Acquiring Fund (000) | | Acquired Fund
Unrealized
Appreciation/
Depreciation (000) | | Conversion
Ratio | |
ING Intermediate Bond Fund | | ING Bond Fund | | $137,658 | | $448,460 | | $ 1,594 | | 1.01 | |
ING High Yield Bond Fund | | ING High Yield Opportunity Fund | | 236,999 | | 73,458 | | (6,510 | ) | 0.81 | |
ING Classic Money Market Fund | | ING Money Market Fund | | 33,880 | | 488,618 | | — | | 1.00 | |
ING Classic Money Market Trust | | ING Lexington Money Market Fund | | 39,474 | | 488,618 | | — | | 1.00 | |
| | | | | | | | | | | | | | |
The net assets of the ING Intermediate Bond Fund, ING High Yield Bond Fund, and ING Classic Money Market Fund, after the acquisition were approximately $586,118,000, $310,457,000, and $561,972,000, respectively.
51
NOTES TO FINANCIAL STATEMENTS AS OF MARCH 31, 2006 (CONTINUED)
NOTE 13 — ILLIQUID SECURITIES
Pursuant to guidelines adopted by the Funds’ Board of Trustees, the following securities have been deemed to be illiquid. Except for GNMA Income, the Funds may invest up to 15% (10% for Classic Money Market and Institutional Money Market) of its net assets in illiquid securities. Fair value for certain of securities was determined by ING Funds Valuation Committee appointed by the Funds’ Board.
Fund | | Security | | Principal
Amount/
Shares | | Initial
Acquisition
Date | | Cost | | Value | | Percent
of Net
Assets | |
High Yield
Bond | | Comforce Corp. | | 92,950 | | 12/23/98 | | $ | — | | $ | 930 | | 0.00 | % |
| | Dayton Superior Corp. | | 3,100 | | 8/10/00 | | — | | 31 | | 0.00 | % |
| | GT Group Telecom, Inc. | | 500 | | 3/19/03 | | — | | — | | 0.00 | % |
| | ICG Services, Inc., 10.000%, due 02/15/08 | | 3,600,000 | | 3/6/00 | | 3,400,459 | | 4 | | 0.00 | % |
| | International Utility Structures, Inc., 13.000%, due 02/01/08 | | 2,456,000 | | 8/1/01 | | 1,154,358 | | 2 | | 0.00 | % |
| | Jordan Telecommunications | | 2,350 | | 1/31/00 | | — | | 52,687 | | 0.03 | % |
| | North Atlantic Trading Co. | | 17,906 | | 3/26/04 | | 210,181 | | 18 | | 0.00 | % |
| | O Sullivan Industries, Inc. | | 373 | | 3/19/03 | | — | | — | | 0.00 | % |
| | O Sullivan Industries, Inc. | | 1,000 | | 3/19/03 | | — | | — | | 0.00 | % |
| | | | | | | | $ | 4,764,998 | | $ | 53,672 | | 0.03 | % |
Intermediate
Bond | | Alpine III, 5.290%, due 08/16/14 | | 527,000 | | 8/16/04 | | $ | 527,223 | | $ | 528,306 | | 0.06 | % |
| | Alpine III, 5.700%, due 08/16/14 | | 527,000 | | 8/16/04 | | 527,223 | | 528,499 | | 0.06 | % |
| | Alpine III, 7.500%, due 08/16/14 | | 789,000 | | 8/16/04 | | 797,168 | | 793,145 | | 0.09 | % |
| | Alpine III, 10.750%, due 08/16/14 | | 1,348,000 | | 8/16/04 | | 1,365,534 | | 1,385,344 | | 0.15 | % |
| | Cameron Highway Oil Pipeline, 5.860%, due 09/15/12 | | 4,067,000 | | 12/5/05 | | 4,067,000 | | 3,940,923 | | 0.42 | % |
| | | | | | | | $ | 7,284,148 | | $ | 7,176,217 | | 0.78 | % |
Classic Money
Market | | Newcastle CDO I Ltd., 4.839%, due 09/25/06 | | 5,400,000 | | 10/23/03 | | $ | 5,400,000 | | $ | 5,400,000 | | 0.79 | % |
| | Newcastle CDO III Corp., 4.839%, due 10/24/06 | | 5,400,000 | | 9/22/05 | | 5,400,000 | | 5,400,000 | | 0.79 | % |
| | Money Market Trust, 4.976%, due 05/11/07 | | 11,500,000 | | 7/30/04 | | 11,500,000 | | 11,500,000 | | 1.68 | % |
| | Goldman Sachs 4.941%, due 02/14/07 | | 8,500,000 | | 2/13/06 | | 8,500,000 | | 8,500,000 | | 1.24 | % |
| | | | | | | | $ | 30,800,000 | | $ | 30,800,000 | | 4.50 | % |
Institutional
Money
Market | | Money Market Trust GECC Series A-2, 4.976%, due 05/11/07 | | 2,000,000 | | 8/31/05 | | $ | 2,000,607 | | $ | 2,000,607 | | 1.11 | % |
| | | | | | | | $ | 2,000,607 | | $ | 2,000,607 | | 1.11 | % |
| | | | | | | | | | | | | | | | | |
NOTE 14 — SECURITIES LENDING
Under an agreement with The Bank of New York (“BNY”), the Funds (except GNMA Income) can lend their securities to approved brokers, dealers and other financial institutions. Loans are collateralized by cash and U.S. Government securities. The collateral must be in an amount equal to at least 105% of the market value of non-U.S. securities loaned and 102% of the market value of U.S. securities loaned. The cash collateral received is invested in approved investments as defined in the Securities Lending Agreement with BNY (the “Agreement”). The securities purchased with cash collateral received are reflected in the Portfolio of Investments. Generally, in the event of counterparty default, the Funds have the right to use the collateral to offset losses incurred. The Agreement contains certain guarantees by BNY in the event of counterparty default and/or a borrower’s failure to return a loaned security; however, there would be a potential loss to the Funds in the event the Funds are delayed or prevented from exercising their right to dispose of the collateral. The Funds bear the risk of loss with respect to the investment of collateral. Engaging in securities lending could have a leveraging effect, which may intensify the credit, market and other risks associated with investing in a Fund. At March 31, 2006, the following Fund had securities on loan with the following market value:
Portfolio | | Value of
Securities
Loaned | | Value of
Collateral | |
Intermediate Bond | | $176,613,282 | | $183,250,298 | |
52
NOTES TO FINANCIAL STATEMENTS AS OF MARCH 31, 2006 (CONTINUED)
NOTE 15 — SUBSEQUENT EVENTS
Subsequent to March 31, 2006, the following Funds declared dividends from net investment income:
| | Per Share
Amount | | Payable Date | | Record Date | |
GNMA Income | | | | | | | |
Class A | | $ 0.0360 | | April 5, 2006 | | March 31, 2006 | |
Class B | | $ 0.0308 | | April 5, 2006 | | March 31, 2006 | |
Class C | | $ 0.0308 | | April 5, 2006 | | March 31, 2006 | |
Class I | | $ 0.0382 | | April 5, 2006 | | March 31, 2006 | |
Class M | | $ 0.0323 | | April 5, 2006 | | March 31, 2006 | |
Class Q | | $ 0.0365 | | April 5, 2006 | | March 31, 2006 | |
Class A | | $ 0.0350 | | May 3, 2006 | | April 28, 2006 | |
Class B | | $ 0.0300 | | May 3, 2006 | | April 28, 2006 | |
Class C | | $ 0.0300 | | May 3, 2006 | | April 28, 2006 | |
Class I | | $ 0.0372 | | May 3, 2006 | | April 28, 2006 | |
Class M | | $ 0.0304 | | May 3, 2006 | | April 28, 2006 | |
Class Q | | $ 0.0354 | | May 3, 2006 | | April 28, 2006 | |
| | | | | | | |
High Yield Bond | | | | | | | |
Class A | | $ 0.0464 | | May 1, 2006 | | Daily | |
Class B | | $ 0.0410 | | May 1, 2006 | | Daily | |
Class C | | $ 0.0410 | | May 1, 2006 | | Daily | |
| | | | | | | |
Intermediate Bond | | | | | | | |
Class A | | $ 0.0400 | | May 1, 2006 | | Daily | |
Class B | | $ 0.0336 | | May 1, 2006 | | Daily | |
Class C | | $ 0.0336 | | May 1, 2006 | | Daily | |
Class I | | $ 0.0424 | | May 1, 2006 | | Daily | |
Class R | | $ 0.0379 | | May 1, 2006 | | Daily | |
Class O | | $ 0.0400 | | May 1, 2006 | | Daily | |
| | | | | | | |
National Tax-Exempt Bond | | | | | | | |
Class A | | $ 0.0332 | | May 1, 2006 | | Daily | |
Class B | | $ 0.0269 | | May 1, 2006 | | Daily | |
Class C | | $ 0.0269 | | May 1, 2006 | | Daily | |
| | | | | | | |
Classic Money Market | | | | | | | |
Class A | | $ 0.0034 | | May 1, 2006 | | Daily | |
Class B | | $ 0.0029 | | May 1, 2006 | | Daily | |
Class C | | $ 0.0029 | | May 1, 2006 | | Daily | |
| | | | | | | |
Institutional Money Market | | $ 0.0038 | | May 1, 2006 | | Daily | |
NOTE 16 — INFORMATION REGARDING TRADING OF ING’s U.S. MUTUAL FUNDS
In 2004, ING Investments reported to the Boards of Directors/Trustees (the “Boards”) of the ING Funds that, like many U.S. financial services companies, ING Investments and certain of its U.S. affiliates have received informal and formal requests for information since September 2003 from various governmental and self-regulatory agencies in connection with investigations related to mutual funds and variable insurance products. ING Investments has advised the Boards that it and its affiliates have cooperated fully with each request.
In addition to responding to regulatory and governmental requests, ING Investments reported that management of U.S. affiliates of ING Groep N.V., including ING Investments (collectively, “ING”), on their own initiative, have conducted, through independent special counsel and a national accounting firm, an extensive internal review of trading in ING insurance, retirement, and mutual fund products. The goal of this review was to identify any instances of inappropriate trading in those products by third parties or by ING investment professionals and other ING personnel. ING’s internal review related to mutual fund trading is now substantially completed. ING has reported that, of the millions of customer relationships that ING maintains, the internal review identified several isolated arrangements allowing third parties to engage in frequent trading of mutual funds within ING’s variable insurance and mutual fund products, and identified other circumstances where frequent trading occurred, despite measures taken by ING intended to combat market timing. ING further reported that each of these arrangements has been terminated and fully disclosed to regulators. The results of the internal review were also reported to the independent members of the Board.
ING Investments has advised the Board that most of the identified arrangements were initiated prior to ING’s acquisition of the businesses in question in the U.S. ING Investments further reported that the companies in question did not receive special benefits in return for any of these arrangements, which have all been terminated.
Based on the internal review, ING Investments has advised the Board that the identified arrangements do not represent a systemic problem in any of the companies that were involved.
In September 2005, ING Funds Distributor, LLC (“IFD”), the distributor of certain ING Funds, settled an administrative proceeding with the NASD regarding three arrangements, dating from 1995, 1996 and 1998, under which the administrator to the then-Pilgrim Funds, which subsequently became part of the ING Funds, entered into formal and informal arrangements that permitted frequent trading. Under the terms of the Letter of Acceptance, Waiver and Consent (“AWC”) with the NASD, under which IFD neither admitted nor denied the allegations or findings, IFD consented to the following sanctions: (i) a censure; (ii) a fine of $1.5 million; (iii) restitution of approximately $1.44 million to certain ING Funds for losses attributable to excessive trading described in the AWC; and (iv) agreement to make certification to NASD regarding the review and establishment of certain procedures.
In addition to the arrangements discussed above, in 2004, ING Investments reported to the Board that, at this time, these instances include the following, in
53
NOTES TO FINANCIAL STATEMENTS AS OF MARCH 31, 2006 (CONTINUED)
NOTE 16 — INFORMATION REGARDING TRADING OF ING’s U.S. MUTUAL FUNDS (continued)
addition to the arrangements subject to the AWC discussed above:
• Aeltus Investment Management, Inc. (a predecessor entity to ING Investment Management Co.) has identified two investment professionals who engaged in extensive frequent trading in certain ING Funds. One was subsequently terminated for cause and incurred substantial financial penalties in connection with this conduct and the second has been disciplined.
• ReliaStar Life Insurance Company (“ReliaStar”) entered into agreements seven years ago permitting the owner of policies issued by the insurer to engage in frequent trading and to submit orders until 4pm Central Time. In 2001 ReliaStar also entered into a selling agreement with a broker-dealer that engaged in frequent trading. Employees of ING affiliates were terminated and/or disciplined in connection with these matters.
• In 1998, Golden American Life Insurance Company entered into arrangements permitting a broker-dealer to frequently trade up to certain specific limits in a fund available in an ING variable annuity product. No employee responsible for this arrangement remains at the company.
For additional information regarding these matters, you may consult the Form 8-K and Form 8-K/A for each of four life insurance companies, ING USA Annuity and Life Insurance Company, ING Life Insurance and Annuity Company, ING Insurance Company of America, and ReliaStar Life Insurance Company of New York, each filed with the Securities and Exchange Commission (the “SEC”) on October 29, 2004 and September 8, 2004. These Forms 8-K and Forms 8-K/A can be accessed through the SEC’s Web site at http://www.sec.gov. Despite the extensive internal review conducted through independent special counsel and a national accounting firm, there can be no assurance that the instances of inappropriate trading reported to the Board are the only instances of such trading respecting the ING Funds.
ING Investments reported to the Board that ING is committed to conducting its business with the highest standards of ethical conduct with zero tolerance for noncompliance. Accordingly, ING Investments advised the Board that ING management was disappointed that its voluntary internal review identified these situations. Viewed in the context of the breadth and magnitude of its U.S. business as a whole, ING management does not believe that ING’s acquired companies had systemic ethical or compliance issues in these areas. Nonetheless, Investments reported that given ING’s refusal to tolerate any lapses, it has taken the steps noted below, and will continue to seek opportunities to further strengthen the internal controls of its affiliates.
• ING has agreed with the ING Funds to indemnify and hold harmless the ING Funds from all damages resulting from wrongful conduct by ING or its employees or from ING’s internal investigation, any investigations conducted by any governmental or self-regulatory agencies, litigation or other formal proceedings, including any proceedings by the Securities and Exchange Commission. ING Investments reported to the Board that ING management believes that the total amount of any indemnification obligations will not be material to ING or its U.S. business.
• ING updated its Code of Conduct for employees reinforcing its employees’ obligation to conduct personal trading activity consistent with the law, disclosed limits, and other requirements.
• The ING Funds, upon a recommendation from ING, updated their respective Codes of Ethics applicable to investment professionals with ING entities and certain other fund personnel, requiring such personnel to pre-clear any purchases or sales of ING Funds that are not systematic in nature (i.e., dividend reinvestment), and imposing minimum holding periods for shares of ING Funds.
• ING instituted excessive trading policies for all customers in its variable insurance and retirement products and for shareholders of the ING Funds sold to the public through financial intermediaries. ING does not make exceptions to these policies.
• ING reorganized and expanded its U.S. Compliance Department, and created an Enterprise Compliance team to enhance controls and consistency in regulatory compliance.
As has been widely reported in the media, the New York Attorney General’s office (“NYAG”) is conducting broad investigations regarding insurance quoting and brokerage practices. ING U.S. has been subpoenaed in this regard, and is cooperating fully with these NYAG requests for information.
ING U.S. believes that its practices are consistent with our business principles and our commitment to our customers.
54
NOTES TO FINANCIAL STATEMENTS AS OF MARCH 31, 2006 (CONTINUED)
NOTE 16 — INFORMATION REGARDING TRADING OF ING’s U.S. MUTUAL FUNDS (continued)
At this time, in light of the current regulatory factors, ING U.S. is actively engaged in reviewing whether any modifications in our practices are appropriate for the future.
There can be no assurance that these matters, or the adverse publicity associated with them, will not result in increased fund redemptions, reduced sale of fund shares, or other adverse consequences to ING Funds.
NOTE 17 — PROXY VOTING INFORMATION
A description of the policies and procedures that the Fund uses to determine how to vote proxies related to portfolio securities is available (1) without charge, upon request, by calling Shareholder Services toll-free at 1-800-992-0180; (2) on the Fund’s website at www.ingfunds.com and (3) on the SEC’s website at www.sec.gov. Information regarding how the Fund voted proxies related to portfolio securities during the most recent 12-month period ended June 30 is available without charge on the Fund’s website at www.ingfunds.com and on the SEC’s website at www.sec.gov.
NOTE 18 — QUARTERLY PORTFOLIO HOLDINGS
The Fund files its complete schedule of portfolio holdings with the Commission for the first and third quarters of each fiscal year on Form N-Q. The Fund’s Forms N-Q are available on the SEC’s website at www.sec.gov. The Fund’s Forms N-Q may be reviewed and copied at the Commissions Public Reference Room in Washington, DC, and information on the operation of the Public Reference Room may be obtained by calling 1-800-SEC-0330; and is available upon request from the Fund by calling Shareholder Services toll-free at 1-800-992-0180.
55
| | PORTFOLIO OF INVESTMENTS |
ING GNMA INCOME FUND | | AS OF MARCH 31, 2006 |
Principal
Amount | | | | | | Value | |
CORPORATE BONDS/NOTES: 0.0% | | | |
| | | |
| | | | Agency Collateral CMO: 0.0% | | | |
$ | 61,338 | | | | Small Business Administration CMO, 8.250%, due 11/01/11 | | $ | 63,954 | |
| | | | Total Corporate Bonds/Notes (Cost $63,604) | | 63,954 | |
| | | | | | | |
U.S. GOVERNMENT AGENCY OBLIGATION: 82.8% | | | |
| | | | | | | |
| | | | Federal Government Loan Mortgage Corporation: 0.1% | | | |
118,514 | | | | 7.000%, due 11/01/14 | | 121,945 | |
508,064 | | | | 7.500%, due 12/01/14 | | 529,641 | |
129,593 | | | | 7.500%, due 01/01/30 | | 135,607 | |
55,732 | | | | 8.000%, due 01/01/30 | | 59,399 | |
| | | | | | 846,592 | |
| | | | Federal Home Loan Mortgage Corporation: 0.0% | | | |
43,055 | | | | 9.500%, due 07/01/20 | | 47,216 | |
| | | | | | 47,216 | |
| | | | Federal National Mortgage Association: 0.3% | | | |
103,856 | | | | 6.500%, due 06/01/14 | | 106,338 | |
754,123 | | | | 6.500%, due 02/01/29 | | 782,989 | |
133,876 | | | | 7.000%, due 03/01/15 | | 137,750 | |
127,342 | | | | 7.500%, due 05/01/28 | | 133,244 | |
168,043 | | | | 8.500%, due 08/01/11 | | 173,215 | |
70,511 | | | | 8.500%, due 05/01/15 | | 74,455 | |
37,668 | | | | 8.500%, due 08/01/15 | | 39,775 | |
167,062 | | | | 8.500%, due 09/01/15 | | 176,408 | |
| | | | | | 1,624,174 | |
| | | | Government National Mortgage Association: 82.4% | | | |
7,858,080 | | | | 3.750%, due 05/20/34 | | 7,655,488 | |
874,038 | | | | 4.000%, due 05/20/33 | | 783,216 | |
944,691 | | | | 4.000%, due 01/15/34 | | 854,826 | |
914,928 | | | | 4.000%, due 03/15/34 | | 827,894 | |
1,896,034 | | | | 4.500%, due 01/20/34 | | 1,763,441 | |
2,530,765 | | | | 4.500%, due 10/20/34 | | 2,360,188 | |
4,819,660 | | | | 4.500%, due 08/15/35 | | 4,536,888 | |
624,598 | | | | 4.500%, due 09/15/35 | | 587,953 | |
4,429,407 | | | | 4.500%, due 11/15/35 | | 4,169,532 | |
1,141,847 | | | | 5.000%, due 04/15/29 | | 1,109,458 | |
1,347,243 | | | | 5.000%, due 04/15/30 | | 1,308,410 | |
1,357,810 | | | | 5.000%, due 10/15/30 | | 1,318,673 | |
1,071,611 | | | | 5.000%, due 05/15/33 | | 1,039,871 | |
8,319,316 | | | | 5.000%, due 06/15/33 | | 8,072,913 | |
2,621,390 | | | | 5.000%, due 07/15/33 | | 2,543,749 | |
1,067,528 | | | | 5.000%, due 10/15/33 | | 1,035,909 | |
1,869,110 | | | | 5.000%, due 10/20/33 | | 1,802,085 | |
4,656,959 | | | | 5.000%, due 12/20/33 | | 4,489,965 | |
1,479,898 | | | | 5.000%, due 02/20/34 | | 1,426,292 | |
1,092,847 | | | | 5.000%, due 03/15/34 | | 1,060,078 | |
3,321,670 | | | | 5.000%, due 04/15/34 | | 3,219,114 | |
552,349 | | | | 5.000%, due 04/20/34 | | 532,341 | |
1,538,160 | | | | 5.000%, due 06/20/34 | | 1,482,443 | |
1,298,934 | | | | 5.000%, due 07/20/34 | | 1,251,883 | |
2,074,766 | | | | 5.000%, due 12/20/34 | | 1,999,612 | |
1,804,840 | | | | 5.000%, due 03/15/35 | | 1,749,435 | |
3,045,984 | | | | 5.000%, due 04/15/35 | | 2,952,479 | |
4,186,966 | | | | 5.000%, due 05/15/35 | | 4,058,434 | |
2,128,022 | | | | 5.000%, due 06/15/35 | | 2,062,697 | |
| 11,164,901 | | | | 5.000%, due 07/15/35 | | | 10,822,160 | |
2,683,340 | | | | 5.000%, due 09/15/35 | | 2,600,966 | |
44,642 | | | | 5.500%, due 04/20/29 | | 44,130 | |
598,427 | | | | 5.500%, due 10/15/32 | | 593,220 | |
2,190,457 | | | | 5.500%, due 12/15/32 | | 2,171,397 | |
1,688,821 | | | | 5.500%, due 03/15/33 | | 1,673,944 | |
723,420 | | | | 5.500%, due 03/15/33 | | 717,048 | |
778,767 | | | | 5.500%, due 03/15/33 | | 771,906 | |
2,282,341 | | | | 5.500%, due 03/15/33 | | 2,262,236 | |
1,019,840 | | | | 5.500%, due 04/15/33 | | 1,010,856 | |
886,140 | | | | 5.500%, due 04/15/33 | | 878,334 | |
841,325 | | | | 5.500%, due 04/15/33 | | 833,913 | |
2,303,297 | | | | 5.500%, due 05/15/33 | | 2,283,008 | |
725,768 | | | | 5.500%, due 05/15/33 | | 719,375 | |
506,867 | | | | 5.500%, due 05/15/33 | | 502,402 | |
1,026,138 | | | | 5.500%, due 05/15/33 | | 1,017,098 | |
2,858,713 | | | | 5.500%, due 05/15/33 | | 2,833,530 | |
641,130 | | | | 5.500%, due 06/15/33 | | 635,483 | |
834,383 | | | | 5.500%, due 06/15/33 | | 827,033 | |
1,122,919 | | | | 5.500%, due 06/15/33 | | 1,113,027 | |
6,094,498 | | | | 5.500%, due 06/15/33 | | 6,040,811 | |
847,938 | | | | 5.500%, due 06/15/33 | | 840,468 | |
6,695,521 | | | | 5.500%, due 07/15/33 | | 6,636,539 | |
797,611 | | | | 5.500%, due 07/15/33 | | 790,585 | |
713,693 | | | | 5.500%, due 07/15/33 | | 707,406 | |
1,406,047 | | | | 5.500%, due 07/15/33 | | 1,392,954 | |
4,826,882 | | | | 5.500%, due 07/15/33 | | 4,784,362 | |
597,401 | | | | 5.500%, due 09/15/33 | | 592,138 | |
871,352 | | | | 5.500%, due 10/15/33 | | 863,676 | |
977,358 | | | | 5.500%, due 11/15/33 | | 968,257 | |
8,897,001 | | | | 5.500%, due 11/15/33 | | 8,818,626 | |
2,628,629 | | | | 5.500%, due 11/15/33 | | 2,604,151 | |
827,798 | | | | 5.500%, due 12/15/33 | | 820,089 | |
850,721 | | | | 5.500%, due 12/15/33 | | 843,227 | |
831,453 | | | | 5.500%, due 12/15/33 | | 824,128 | |
652,267 | | | | 5.500%, due 12/20/33 | | 643,269 | |
3,001,515 | | | | 5.500%, due 01/15/34 | | 2,973,565 | |
1,314,000 | | | | 5.500%, due 01/15/34 | | 1,301,764 | |
8,745,880 | | | | 5.500%, due 01/15/34 | | 8,668,818 | |
320,637 | | | | 5.500%, due 01/20/34 | | 316,214 | |
977,884 | | | | 5.500%, due 02/15/34 | | 968,778 | |
2,939,351 | | | | 5.500%, due 02/15/34 | | 2,911,980 | |
1,312,503 | | | | 5.500%, due 03/15/34 | | 1,300,938 | |
1,658,540 | | | | 5.500%, due 03/20/34 | | 1,635,660 | |
920,894 | | | | 5.500%, due 04/15/34 | | 912,780 | |
2,867,647 | | | | 5.500%, due 04/15/34 | | 2,842,379 | |
2,951,315 | | | | 5.500%, due 04/15/34 | | 2,925,310 | |
2,654,356 | | | | 5.500%, due 04/15/34 | | 2,629,639 | |
2,926,259 | | | | 5.500%, due 04/15/34 | | 2,899,010 | |
792,222 | | | | 5.500%, due 04/15/34 | | 785,242 | |
558,535 | | | | 5.500%, due 04/20/34 | | 551,871 | |
438,860 | | | | 5.500%, due 05/15/34 | | 434,993 | |
914,320 | | | | 5.500%, due 06/15/34 | | 906,264 | |
1,267,185 | | | | 5.500%, due 06/15/34 | | 1,256,019 | |
1,080,967 | | | | 5.500%, due 06/20/34 | | 1,066,056 | |
1,068,309 | | | | 5.500%, due 07/15/34 | | 1,058,896 | |
1,027,528 | | | | 5.500%, due 07/15/34 | | 1,018,475 | |
859,316 | | | | 5.500%, due 07/20/34 | | 849,063 | |
1,982,977 | | | | 5.500%, due 08/15/34 | | 1,965,505 | |
6,629,400 | | | | 5.500%, due 08/15/34 | | 6,570,987 | |
1,094,860 | | | | 5.500%, due 08/15/34 | | 1,085,213 | |
1,204,077 | | | | 5.500%, due 08/15/34 | | 1,193,468 | |
684,964 | | | | 5.500%, due 08/20/34 | | 675,515 | |
553,321 | | | | 5.500%, due 08/20/34 | | 545,688 | |
See Accompanying Notes to Financial Statements
56
| | PORTFOLIO OF INVESTMENTS |
ING GNMA INCOME FUND | | AS OF MARCH 31, 2006 (CONTINUED) |
Principal
Amount | | | | | | Value | |
| | | | Government National Mortgage Association (continued) | | | |
$ | 1,646,580 | | | | 5.500%, due 09/15/34 | | $ | 1,632,072 | |
1,014,884 | | | | 5.500%, due 09/15/34 | | 1,005,941 | |
1,015,783 | | | | 5.500%, due 09/15/34 | | 1,006,833 | |
3,967,901 | | | | 5.500%, due 09/15/34 | | 3,932,939 | |
1,033,337 | | | | 5.500%, due 09/15/34 | | 1,024,232 | |
889,502 | | | | 5.500%, due 09/15/34 | | 881,664 | |
418,948 | | | | 5.500%, due 10/15/34 | | 415,257 | |
1,063,559 | | | | 5.500%, due 10/15/34 | | 1,054,188 | |
2,753,001 | | | | 5.500%, due 10/15/34 | | 2,728,744 | |
1,655,822 | | | | 5.500%, due 10/15/34 | | 1,641,232 | |
259,414 | | | | 5.500%, due 12/15/34 | | 257,128 | |
1,464,027 | | | | 5.500%, due 01/15/35 | | 1,450,715 | |
1,519,040 | | | | 5.500%, due 01/15/35 | | 1,505,228 | |
1,338,247 | | | | 5.500%, due 01/15/35 | | 1,326,079 | |
1,799,279 | | | | 5.500%, due 01/15/35 | | 1,782,918 | |
1,807,771 | | | | 5.500%, due 02/15/35 | | 1,791,333 | |
1,820,989 | | | | 5.500%, due 02/15/35 | | 1,804,431 | |
1,976,062 | | | | 5.500%, due 03/15/35 | | 1,958,094 | |
1,058,072 | | | | 5.500%, due 03/15/35 | | 1,048,451 | |
927,031 | | | | 5.500%, due 03/15/35 | | 918,602 | |
1,072,643 | | | | 5.500%, due 04/15/35 | | 1,062,890 | |
993,186 | | | | 5.500%, due 04/15/35 | | 984,155 | |
993,609 | | | | 5.500%, due 04/15/35 | | 984,574 | |
1,956,531 | | | | 5.500%, due 05/15/35 | | 1,938,741 | |
964,069 | | | | 5.500%, due 05/15/35 | | 955,303 | |
998,390 | | | | 5.500%, due 05/15/35 | | 989,312 | |
1,884,895 | | | | 5.500%, due 05/15/35 | | 1,867,755 | |
1,040,298 | | | | 5.500%, due 06/15/35 | | 1,030,839 | |
528,917 | | | | 5.650%, due 07/15/29 | | 524,395 | |
551,605 | | | | 5.750%, due 11/20/27 | | 552,080 | |
306,632 | | | | 5.750%, due 12/20/27 | | 306,896 | |
233,891 | | | | 5.750%, due 02/20/28 | | 234,026 | |
265,769 | | | | 5.750%, due 03/20/28 | | 265,922 | |
717,515 | | | | 5.750%, due 03/20/28 | | 717,928 | |
335,392 | | | | 5.750%, due 04/20/28 | | 335,586 | |
318,179 | | | | 5.750%, due 07/20/28 | | 318,363 | |
211,412 | | | | 5.750%, due 01/20/29 | | 211,442 | |
120,366 | | | | 5.750%, due 04/20/29 | | 120,383 | |
1,142,695 | | | | 5.750%, due 07/20/29 | | 1,142,854 | |
956,766 | | | | 6.000%, due 10/15/15 | | 974,767 | |
945,736 | | | | 6.000%, due 10/15/25 | | 958,938 | |
764,677 | | | | 6.000%, due 07/15/28 | | 775,237 | |
159,047 | | | | 6.000%, due 07/15/28 | | 161,244 | |
712,396 | | | | 6.000%, due 08/15/28 | | 722,233 | |
623,576 | | | | 6.000%, due 09/15/28 | | 632,187 | |
920,028 | | | | 6.000%, due 09/15/28 | | 932,733 | |
566,290 | | | | 6.000%, due 02/15/29 | | 574,091 | |
465,570 | | | | 6.000%, due 04/15/29 | | 471,820 | |
533,783 | | | | 6.000%, due 02/15/32 | | 540,670 | |
2,191,396 | | | | 6.000%, due 07/15/32 | | 2,219,671 | |
839,203 | | | | 6.000%, due 08/15/32 | | 850,031 | |
2,376,399 | | | | 6.000%, due 08/15/32 | | 2,407,252 | |
2,670,723 | | | | 6.000%, due 08/15/32 | | 2,705,182 | |
543,671 | | | | 6.000%, due 09/15/32 | | 550,686 | |
2,363,949 | | | | 6.000%, due 09/15/32 | | 2,394,450 | |
8,013,979 | | | | 6.000%, due 09/15/32 | | 8,117,380 | |
19,603 | | | | 6.000%, due 11/15/32 | | 19,856 | |
1,951,501 | | | | 6.000%, due 11/15/32 | | 1,976,680 | |
1,609,087 | | | | 6.000%, due 12/15/32 | | 1,629,848 | |
4,397,542 | | | | 6.000%, due 01/15/33 | | 4,453,596 | |
1,089,661 | | | | 6.000%, due 01/15/33 | | 1,103,550 | |
5,490,144 | | | | 6.000%, due 01/15/33 | | 5,560,125 | |
| 5,417,413 | | | | 6.000%, due 01/15/33 | | | 5,486,467 | |
146,691 | | | | 6.000%, due 01/15/33 | | 148,561 | |
417,162 | | | | 6.000%, due 02/15/33 | | 422,479 | |
788,077 | | | | 6.000%, due 02/15/33 | | 798,123 | |
782,081 | | | | 6.000%, due 02/15/33 | | 792,050 | |
1,376,023 | | | | 6.000%, due 03/15/33 | | 1,393,563 | |
6,043,341 | | | | 6.000%, due 03/15/33 | | 6,120,375 | |
956,049 | | | | 6.000%, due 03/15/33 | | 968,236 | |
6,517,168 | | | | 6.000%, due 04/15/33 | | 6,600,241 | |
615,822 | | | | 6.000%, due 04/15/33 | | 623,672 | |
1,526,166 | | | | 6.000%, due 05/15/33 | | 1,545,620 | |
1,254,019 | | | | 6.000%, due 05/15/33 | | 1,270,004 | |
4,591,385 | | | | 6.000%, due 06/15/33 | | 4,649,910 | |
776,104 | | | | 6.000%, due 09/15/33 | | 785,997 | |
367,069 | | | | 6.000%, due 09/15/33 | | 371,748 | |
632,202 | | | | 6.000%, due 09/15/33 | | 640,260 | |
2,977,760 | | | | 6.000%, due 09/15/33 | | 3,015,717 | |
754,671 | | | | 6.000%, due 10/15/33 | | 764,291 | |
2,891,339 | | | | 6.000%, due 10/15/33 | | 2,928,194 | |
553,725 | | | | 6.000%, due 10/15/33 | | 560,783 | |
1,234,788 | | | | 6.000%, due 10/15/33 | | 1,250,528 | |
749,954 | | | | 6.000%, due 10/15/33 | | 759,514 | |
1,609,583 | | | | 6.000%, due 12/15/33 | | 1,630,100 | |
1,181,120 | | | | 6.000%, due 01/15/34 | | 1,195,441 | |
1,295,050 | | | | 6.000%, due 01/20/34 | | 1,304,880 | |
327,549 | | | | 6.000%, due 02/15/34 | | 331,520 | |
1,666,620 | | | | 6.000%, due 03/20/34 | | 1,679,270 | |
541,178 | | | | 6.000%, due 03/20/34 | | 545,285 | |
288,478 | | | | 6.000%, due 03/20/34 | | 290,668 | |
2,329,187 | | | | 6.000%, due 03/20/34 | | 2,346,866 | |
537,932 | | | | 6.000%, due 04/20/34 | | 542,015 | |
861,843 | | | | 6.000%, due 05/20/34 | | 868,385 | |
2,998,004 | | | | 6.000%, due 05/20/34 | | 3,020,761 | |
236,660 | | | | 6.000%, due 06/20/34 | | 238,457 | |
1,437,164 | | | | 6.000%, due 07/20/34 | | 1,448,073 | |
3,554,677 | | | | 6.000%, due 08/20/34 | | 3,581,659 | |
491,149 | | | | 6.000%, due 09/15/34 | | 497,143 | |
1,114,726 | | | | 6.000%, due 10/15/34 | | 1,128,331 | |
840,894 | | | | 6.000%, due 10/20/34 | | 847,277 | |
2,474,629 | | | | 6.000%, due 10/20/34 | | 2,493,412 | |
1,878,333 | | | | 6.000%, due 11/20/34 | | 1,892,591 | |
998,688 | | | | 6.000%, due 11/20/34 | | 1,006,269 | |
9,701,386 | | | | 6.000%, due 11/20/34 | | 9,775,025 | |
8,247,846 | | | | 6.000%, due 12/20/34 | | 8,310,452 | |
956,626 | | | | 6.000%, due 12/20/34 | | 963,887 | |
2,428,861 | | | | 6.000%, due 12/20/34 | | 2,447,297 | |
1,791,499 | | | | 6.000%, due 12/20/34 | | 1,805,098 | |
1,175,133 | | | | 6.000%, due 01/20/35 | | 1,183,950 | |
532,148 | | | | 6.000%, due 01/20/35 | | 536,141 | |
593,135 | | | | 6.000%, due 01/20/35 | | 597,585 | |
730,782 | | | | 6.000%, due 01/20/35 | | 736,265 | |
1,167,550 | | | | 6.000%, due 02/20/35 | | 1,176,309 | |
1,569,788 | | | | 6.000%, due 03/20/35 | | 1,581,566 | |
486,040 | | | | 6.000%, due 03/20/35 | | 489,686 | |
797,523 | | | | 6.000%, due 04/20/35 | | 803,506 | |
632,896 | | | | 6.000%, due 06/20/35 | | 637,644 | |
229,373 | | | | 6.250%, due 03/15/28 | | 235,961 | |
205,415 | | | | 6.250%, due 04/15/28 | | 211,315 | |
129,738 | | | | 6.340%, due 02/15/29 | | 130,145 | |
339,926 | | | | 6.500%, due 02/15/22 | | 340,781 | |
356,229 | | | | 6.500%, due 02/15/26 | | 369,189 | |
36,619 | | | | 6.500%, due 03/15/28 | | 38,020 | |
6,543 | | | | 6.500%, due 03/15/28 | | 6,793 | |
46,196 | | | | 6.500%, due 03/15/28 | | 47,964 | |
See Accompanying Notes to Financial Statements
57
| | PORTFOLIO OF INVESTMENTS |
ING GNMA INCOME FUND | | AS OF MARCH 31, 2006 (CONTINUED) |
Principal
Amount | | | | | | Value | |
| | | | Government National Mortgage Association (continued) | | | |
$ | 171,914 | | | | 6.500%, due 03/15/28 | | $ | 178,494 | |
16,866 | | | | 6.500%, due 03/15/28 | | 17,512 | |
53,833 | | | | 6.500%, due 03/15/28 | | 55,894 | |
259,827 | | | | 6.500%, due 08/15/28 | | 269,773 | |
3,089,502 | | | | 6.500%, due 11/15/28 | | 3,207,765 | |
465,215 | | | | 6.500%, due 07/20/29 | | 478,269 | |
30,962 | | | | 6.500%, due 05/15/31 | | 32,120 | |
1,819,934 | | | | 6.500%, due 08/20/31 | | 1,868,649 | |
461,692 | | | | 6.500%, due 09/15/31 | | 478,953 | |
2,504,802 | | | | 6.500%, due 01/15/32 | | 2,598,165 | |
1,530,019 | | | | 6.500%, due 02/15/32 | | 1,587,049 | |
105,216 | | | | 6.500%, due 04/20/32 | | 108,021 | |
462,078 | | | | 6.500%, due 07/20/32 | | 474,394 | |
938,239 | | | | 6.500%, due 08/15/32 | | 973,211 | |
438,249 | | | | 6.500%, due 12/20/34 | | 449,351 | |
157,982 | | | | 6.650%, due 10/15/14 | | 158,027 | |
6,110,776 | | | | 6.687%, due 07/15/40 | | 6,163,409 | |
232,179 | | | | 6.750%, due 06/15/13 | | 232,686 | |
22,016 | | | | 6.750%, due 04/15/14 | | 22,070 | |
36,357 | | | | 6.750%, due 08/15/28 | | 37,645 | |
193,741 | | | | 6.750%, due 10/15/28 | | 200,603 | |
304,973 | | | | 6.750%, due 10/15/28 | | 315,774 | |
61,591 | | | | 6.750%, due 11/15/28 | | 63,773 | |
1,776,667 | | | | 6.870%, due 03/15/39 | | 1,832,393 | |
2,120,607 | | | | 6.900%, due 01/15/32 | | 2,242,875 | |
1,602,597 | | | | 7.000%, due 07/15/22 | | 1,668,630 | |
131,971 | | | | 7.000%, due 09/15/23 | | 137,556 | |
30,808 | | | | 7.000%, due 12/15/23 | | 32,112 | |
57,216 | | | | 7.000%, due 04/15/26 | | 59,728 | |
294,075 | | | | 7.000%, due 01/15/27 | | 307,109 | |
198,331 | | | | 7.000%, due 11/15/27 | | 207,121 | |
100,022 | | | | 7.000%, due 07/15/28 | | 104,332 | |
310,418 | | | | 7.000%, due 07/15/28 | | 323,794 | |
40,287 | | | | 7.000%, due 07/15/29 | | 42,035 | |
56,215 | | | | 7.000%, due 10/15/30 | | 58,658 | |
69,808 | | | | 7.000%, due 05/15/31 | | 72,828 | |
913,487 | | | | 7.000%, due 06/15/31 | | 953,192 | |
373,425 | | | | 7.000%, due 09/15/31 | | 389,578 | |
259,420 | | | | 7.000%, due 11/15/31 | | 270,543 | |
290,575 | | | | 7.000%, due 12/15/31 | | 303,144 | |
697,133 | | | | 7.000%, due 01/15/32 | | 727,204 | |
304,294 | | | | 7.000%, due 01/15/32 | | 317,420 | |
670,334 | | | | 7.000%, due 01/15/32 | | 699,249 | |
1,136,673 | | | | 7.000%, due 01/15/32 | | 1,185,705 | |
444,949 | | | | 7.000%, due 02/15/32 | | 464,142 | |
978,313 | | | | 7.000%, due 02/15/32 | | 1,020,514 | |
1,727,225 | | | | 7.000%, due 02/15/32 | | 1,801,731 | |
774,919 | | | | 7.000%, due 02/15/32 | | 808,346 | |
904,313 | | | | 7.000%, due 02/15/32 | | 943,322 | |
503,930 | | | | 7.000%, due 02/15/32 | | 525,668 | |
397,949 | | | | 7.000%, due 03/15/32 | | 415,115 | |
892,337 | | | | 7.000%, due 03/15/32 | | 930,829 | |
772,546 | | | | 7.000%, due 03/15/32 | | 805,870 | |
283,097 | | | | 7.000%, due 03/15/32 | | 295,309 | |
322,720 | | | | 7.000%, due 03/15/32 | | 336,640 | |
1,444,794 | | | | 7.000%, due 03/15/32 | | 1,507,116 | |
628,649 | | | | 7.000%, due 04/15/32 | | 655,767 | |
932,483 | | | | 7.000%, due 04/15/32 | | 972,707 | |
1,856,244 | | | | 7.000%, due 04/15/32 | | 1,936,315 | |
954,456 | | | | 7.000%, due 04/15/32 | | 995,628 | |
752,599 | | | | 7.000%, due 04/15/32 | | 785,063 | |
1,450,394 | | | | 7.000%, due 05/15/32 | | 1,512,958 | |
| 3,372,926 | | | | 7.000%, due 05/15/32 | | | 3,518,420 | |
3,018,343 | | | | 7.000%, due 07/15/32 | | 3,148,542 | |
907,358 | | | | 7.000%, due 06/15/34 | | 939,085 | |
8,825,281 | | | | 7.010%, due 02/15/37 | | 9,367,115 | |
5,485,386 | | | | 7.100%, due 11/15/39 | | 5,758,960 | |
8,828,942 | | | | 7.125%, due 09/15/39 | | 9,133,697 | |
1,159,658 | | | | 7.150%, due 07/15/36 | | 1,223,393 | |
2,126,039 | | | | 7.150%, due 07/15/36 | | 2,242,888 | |
525,489 | | | | 7.250%, due 10/15/27 | | 562,326 | |
48,462 | | | | 7.250%, due 01/15/29 | | 50,537 | |
509,200 | | | | 7.250%, due 06/15/29 | | 524,588 | |
472,512 | | | | 7.250%, due 09/15/31 | | 502,405 | |
2,904,927 | | | | 7.300%, due 08/15/36 | | 3,037,390 | |
773,518 | | | | 7.500%, due 12/15/19 | | 790,109 | |
121,291 | | | | 7.500%, due 08/20/27 | | 126,508 | |
341,796 | | | | 7.500%, due 12/15/28 | | 359,450 | |
283,937 | | | | 7.500%, due 08/15/29 | | 293,293 | |
500,407 | | | | 7.500%, due 10/15/30 | | 525,176 | |
97,545 | | | | 7.500%, due 12/15/30 | | 102,373 | |
52,378 | | | | 7.500%, due 01/15/31 | | 54,956 | |
139,259 | | | | 7.500%, due 01/15/31 | | 146,112 | |
253,013 | | | | 7.500%, due 10/15/31 | | 265,465 | |
167,698 | | | | 7.500%, due 01/15/32 | | 175,942 | |
411,749 | | | | 7.500%, due 09/15/32 | | 434,524 | |
4,905,093 | | | | 7.600%, due 08/15/31 | | 5,166,405 | |
9,318,918 | | | | 7.625%, due 07/15/38 | | 9,605,732 | |
60,219 | | | | 7.650%, due 12/15/12 | | 61,277 | |
342,249 | | | | 7.700%, due 08/15/13 | | 348,969 | |
283,703 | | | | 7.750%, due 06/15/14 | | 289,539 | |
365,066 | | | | 7.750%, due 06/15/14 | | 372,575 | |
538,043 | | | | 7.750%, due 09/15/29 | | 560,130 | |
605,857 | | | | 7.750%, due 10/15/29 | | 631,280 | |
929,636 | | | | 7.750%, due 03/15/32 | | 939,470 | |
25,913 | | | | 7.800%, due 05/15/19 | | 27,454 | |
41,287 | | | | 7.800%, due 07/15/19 | | 43,743 | |
929,221 | | | | 7.800%, due 01/15/42 | | 993,596 | |
2,065,450 | | | | 7.875%, due 09/15/29 | | 2,099,722 | |
4,356,296 | | | | 7.875%, due 11/15/34 | | 4,459,623 | |
1,187,511 | | | | 7.875%, due 03/15/38 | | 1,206,998 | |
2,056,251 | | | | 7.875%, due 04/15/38 | | 2,085,349 | |
232,107 | | | | 8.000%, due 12/15/14 | | 241,676 | |
21,292 | | | | 8.000%, due 03/20/24 | | 22,696 | |
49,436 | | | | 8.000%, due 11/15/25 | | 52,983 | |
41,646 | | | | 8.000%, due 07/15/26 | | 44,664 | |
110,962 | | | | 8.000%, due 07/15/26 | | 119,004 | |
193,806 | | | | 8.000%, due 09/15/26 | | 207,852 | |
78,587 | | | | 8.000%, due 09/20/26 | | 83,889 | |
69,535 | | | | 8.000%, due 12/15/26 | | 74,574 | |
29,648 | | | | 8.000%, due 04/15/27 | | 31,719 | |
88,999 | | | | 8.000%, due 06/15/27 | | 95,216 | |
110,350 | | | | 8.000%, due 07/15/27 | | 118,060 | |
27,748 | | | | 8.000%, due 03/15/28 | | 29,702 | |
1,058,023 | | | | 8.000%, due 01/15/30 | | 1,075,554 | |
326,617 | | | | 8.000%, due 05/15/30 | | 333,325 | |
924,342 | | | | 8.000%, due 10/15/30 | | 943,449 | |
2,429,473 | | | | 8.000%, due 03/15/35 | | 2,509,812 | |
1,327,381 | | | | 8.000%, due 01/15/38 | | 1,344,657 | |
455,854 | | | | 8.000%, due 11/15/38 | | 472,176 | |
45,274 | | | | 8.050%, due 07/15/19 | | 48,260 | |
19,548 | | | | 8.050%, due 07/15/20 | | 20,866 | |
28,247 | | | | 8.050%, due 04/15/21 | | 30,189 | |
446,895 | | | | 8.100%, due 06/15/12 | | 451,030 | |
623,205 | | | | 8.100%, due 07/15/12 | | 629,032 | |
4,928,140 | | | | 8.125%, due 05/15/38 | | 5,039,081 | |
See Accompanying Notes to Financial Statements
58
| | PORTFOLIO OF INVESTMENTS |
ING GNMA INCOME FUND | | AS OF MARCH 31, 2006 (CONTINUED) |
Principal
Amount | | | | | | Value | |
| | | | Government National Mortgage Association (continued) | | | |
$ | 495,786 | | | | 8.150%, due 12/15/11 | | $ | 500,533 | |
956,753 | | | | 8.150%, due 04/15/12 | | 966,322 | |
60,935 | | | | 8.150%, due 04/15/12 | | 61,544 | |
707,654 | | | | 8.150%, due 09/15/12 | | 715,092 | |
1,205,871 | | | | 8.150%, due 09/15/15 | | 1,222,688 | |
549,797 | | | | 8.200%, due 10/15/11 | | 555,431 | |
747,243 | | | | 8.200%, due 06/15/12 | | 755,586 | |
49,555 | | | | 8.200%, due 08/15/12 | | 50,119 | |
1,617,246 | | | | 8.200%, due 09/15/12 | | 1,635,824 | |
207,965 | | | | 8.200%, due 10/15/12 | | 210,376 | |
768,610 | | | | 8.200%, due 05/15/13 | | 778,054 | |
38,727 | | | | 8.250%, due 10/15/24 | | 39,594 | |
678,310 | | | | 8.250%, due 11/15/35 | | 696,683 | |
458,354 | | | | 8.250%, due 12/15/37 | | 469,055 | |
836,594 | | | | 8.250%, due 03/15/41 | | 896,867 | |
47,222 | | | | 9.000%, due 05/15/16 | | 50,751 | |
59,324 | | | | 9.000%, due 07/15/16 | | 63,758 | |
704,271 | | | | 9.000%, due 11/15/27 | | 732,932 | |
1,267,557 | | | | 9.000%, due 12/15/34 | | 1,322,251 | |
14,280 | | | | 9.500%, due 11/15/21 | | 15,694 | |
| | | | | | 524,991,765 | |
| | | | Total U.S. Government Agency Obligations
(Cost $533,688,012) | | 527,509,747 | |
| | | | | | | |
U.S. TREASURY OBLIGATIONS: 3.1% | | | |
| | | | | | | |
| | | | U.S. Treasury Bonds: 3.1% | | | |
3,021,000 | | | | 4.000%, due 08/31/07 | | 2,986,660 | |
300,000 | | | | 4.000%, due 02/15/14 | | 282,961 | |
1,868,000 | | | | 4.250%, due 10/31/07 | | 1,851,509 | |
6,705,000 | | | | 4.250%, due 10/15/10 | | 6,550,477 | |
4,543,000 | | | | 4.250%, due 08/15/15 | | 4,329,161 | |
100,000 | | | | 4.375%, due 11/15/08 | | 98,891 | |
1,000,000 | | | | 9.250%, due 02/15/16 | | 1,335,938 | |
2,310,000 | | | | 14.000%, due 11/15/11 | | 2,439,397 | |
| | | | Total U.S. Treasury Obligations
(Cost $20,662,780) | | 19,874,994 | |
| | | | Total Long-Term Investments
(Cost $554,414,396) | | $ | 547,448,695 | |
SHORT-TERM INVESTMENT: 13.6% | | | |
| | | | | | | |
U.S. TREASURY OBLIGATIONS: 13.6% | | | |
| | | | U.S. Treasury Bills: 13.6% | | | |
$ | 25,000 | | | | 2.625%, due 11/15/06 | | $ | 24,666 | |
41,000,000 | | | | 4.290%, due 05/04/06 | | 40,834,679 | |
13,000,000 | | | | 4.300%, due 06/08/06 | | 12,893,790 | |
15,000,000 | | | | 4.320%, due 06/15/06 | | 14,864,370 | |
4,000,000 | | | | 4.350%, due 04/06/06 | | 3,997,103 | |
14,000,000 | | | | 4.370%, due 07/13/06 | | 13,825,364 | |
| | | | Total U.S. Treasury Obligations
(Cost $86,441,954) | | 86,439,972 | |
| | | | Total Investments in Securities
(Cost $640,856,350)* | 99.5 | % | $ | 633,888,667 | |
| | | | Other Assets and Liabilities-Net | 0.5 | | 3,227,519 | |
| | | | Net Assets | 100.0 | % | $ | 637,116,186 | |
| Government National Mortgage Association (“GNMA”) manages a program of Mortgage-backed securities in order to attract funds for secondary mortgages and provide liquidity for existing mortgage securities. GNMA is a quasi-government agency. |
| Federal National Mortgage Association (“FNMA”) purchases both government-backed and conventional mortgages from lenders and securitizes them. FNMA is a congressionally chartered, shareholder-owned company. |
| Federal Home Loan Mortgage Corporation (“FHLMC”) purchase mortgages from a mortgage originator and holds them as investments in its portfolio, or securitizes them. FHLMC is a private organization. |
| CMO Collateralized Mortgage Obligations |
* | Cost for federal income tax purposes is $640,856,521. |
| Net unrealized depreciation consists of: |
| | | | Gross Unrealized Appreciation | | $ | 4,096,142 | |
| | | | Gross Unrealized Depreciation | | (11,063,996 | ) |
| | | | Net Unrealized Depreciation | | $ | (6,967,854 | ) |
| | | | | | | | | |
See Accompanying Notes to Financial Statements
59
| | PORTFOLIO OF INVESTMENTS |
ING HIGH YIELD BOND FUND | | AS OF MARCH 31, 2006 |
Principal
Amount | | | | | | Value | |
CORPORATE BONDS/NOTES: 95.0% | | | |
| | | | Advertising: 1.4% | | | |
$ | 900,000 | | # | | RH Donnelley Corp., 6.875%, due 01/15/13 | | $ | 846,000 | |
500,000 | | # | | RH Donnelley Corp., 6.875%, due 01/15/13 | | 470,000 | |
1,125,000 | | # | | RH Donnelley Corp., 8.875%, due 01/15/16 | | 1,175,625 | |
195,000 | | | | Vertis, Inc., 9.750%, due 04/01/09 | | 200,850 | |
| | | | | | 2,692,475 | |
| | | | Aerospace/Defense: 1.4% | | | |
540,000 | | | | DRS Technologies, Inc., 6.625%, due 02/01/16 | | 540,000 | |
1,145,000 | | | | DRS Technologies, Inc., 6.875%, due 11/01/13 | | 1,150,725 | |
270,000 | | | | DRS Technologies, Inc., 7.625%, due 02/01/18 | | 279,450 | |
670,000 | | | | L-3 Communications Corp., 7.625%, due 06/15/12 | | 695,125 | |
50,000 | | | | Sequa Corp., 9.000%, due 08/01/09 | | 53,750 | |
| | | | | | 2,719,050 | |
| | | | Apparel: 1.8% | | | |
750,000 | | | | Levi Strauss & Co., 9.740%, due 04/01/12 | | 780,000 | |
1,380,000 | | | | Phillips-Van Heusen, 8.125%, due 05/01/13 | | 1,469,700 | |
1,215,000 | | | | Russell Corp., 9.250%, due 05/01/10 | | 1,266,638 | |
| | | | | | 3,516,338 | |
| | | | Auto Manufacturers: 0.9% | | | |
2,220,000 | | | | General Motors Corp., 8.375%, due 07/15/33 | | 1,637,250 | |
| | | | | | 1,637,250 | |
| | | | Auto Parts & Equipment: 1.3% | | | |
1,410,000 | | | | Accuride Corp., 8.500%, due 02/01/15 | | 1,404,713 | |
340,000 | | | | ArvinMeritor, Inc., 8.125%, due 09/15/15 | | 320,025 | |
810,000 | | | | Tenneco, Inc., 8.625%, due 11/15/14 | | 814,050 | |
| | | | | | 2,538,788 | |
| | | | Building Materials: 2.0% | | | |
1,905,000 | | @@ | | Ainsworth Lumber Co. Ltd., 6.750%, due 03/15/14 | | 1,662,113 | |
280,000 | | | | Goodman Global Holding Co., Inc., 7.491%, due 06/15/12 | | 286,300 | |
565,000 | | | | Goodman Global Holding Co., Inc., 7.875%, due 12/15/12 | | 560,763 | |
1,495,000 | | | | Ply Gem Industries, Inc., 9.000%, due 02/15/12 | | 1,397,825 | |
| | | | | | 3,907,001 | |
| | | | Chemicals: 3.6% | | | |
745,000 | | | | Equistar Chemicals LP, 10.625%, due 05/01/11 | | 810,188 | |
2,290,000 | | S | | Lyondell Chemical Co., 9.625%, due 05/01/07 | | 2,375,875 | |
| 1,480,000 | | @@ | | Nova Chemicals Corp., 6.500%, due 01/15/12 | | | 1,383,800 | |
1,450,000 | | @@ | | Nova Chemicals Corp., 7.561%, due 11/15/13 | | 1,464,500 | |
851,000 | | | | Rockwood Specialties Group, Inc., 10.625%, due 05/15/11 | | 938,228 | |
| | | | | | 6,972,591 | |
| | | | Commercial Services: 3.2% | | | |
435,000 | | | | American Color Graphics, Inc., 10.000%, due 06/15/10 | | 311,569 | |
820,000 | | | | Cenveo Corp., 7.875%, due 12/01/13 | | 805,650 | |
1,250,000 | | | | Corrections Corp. of America, 7.500%, due 05/01/11 | | 1,293,750 | |
1,300,000 | | # | | Hertz Corp., 8.875%, due 01/01/14 | | 1,355,250 | |
290,000 | | | | Mail-Well I, Corp., 9.625%, due 03/15/12 | | 313,563 | |
930,000 | | | | United Rentals North America, Inc., 6.500%, due 02/15/12 | | 916,050 | |
1,265,000 | | | | United Rentals North America, Inc., 7.000%, due 02/15/14 | | 1,223,888 | |
| | | | | | 6,219,720 | |
| | | | Computers: 0.3% | | | |
600,000 | | # | | Solar Capital Corp., 9.125%, due 08/15/13 | | 637,500 | |
| | | | | | 637,500 | |
| | | | Diversified Financial Services: 4.8% | | | |
1,205,000 | | # | | Astoria Depositor Corp., 8.144%, due 05/01/21 | | 1,266,003 | |
1,555,000 | | | | General Motors Acceptance Corp., 5.125%, due 05/09/08 | | 1,464,149 | |
620,000 | | S | | General Motors Acceptance Corp., 6.125%, due 02/01/07 | | 610,549 | |
2,400,000 | | S | | General Motors Acceptance Corp., 6.875%, due 09/15/11 | | 2,239,457 | |
640,000 | | | | Jostens IH Corp., 7.625%, due 10/01/12 | | 635,200 | |
870,000 | | # | | Rainbow National Services LLC, 8.750%, due 09/01/12 | | 930,900 | |
930,000 | | | | Universal City Development Partners, 11.750%, due 04/01/10 | | 1,029,975 | |
1,050,000 | | | | Vanguard Health Holding Co. II LLC, 9.000%, due 10/01/14 | | 1,079,700 | |
| | | | | | 9,255,933 | |
| | | | Electric: 8.7% | | | |
495,000 | | # | | AES Corp., 8.750%, due 05/15/13 | | 537,075 | |
815,000 | | | | AES Corp., 8.875%, due 02/15/11 | | 882,238 | |
2,415,000 | | S | | Aquila, Inc., 7.625%, due 11/15/09 | | 2,484,431 | |
1,240,000 | | | | CMS Energy Corp., 7.500%, due 01/15/09 | | 1,281,850 | |
1,266,304 | | | | Homer City Funding LLC, 8.734%, due 10/01/26 | | 1,437,255 | |
2,075,000 | | | | Midwest Generation LLC, 8.300%, due 07/02/09 | | 2,145,365 | |
See Accompanying Notes to Financial Statements
60
| | PORTFOLIO OF INVESTMENTS |
ING HIGH YIELD BOND FUND | | AS OF MARCH 31, 2006 (CONTINUED) |
Principal
Amount | | | | | | Value | |
| | | | Electric (continued) | | | |
$ | 2,710,000 | | #,S | | Mirant North America LLC, 7.375%, due 12/31/13 | | $ | 2,777,750 | |
1,359,000 | | | | Nevada Power Co., 10.875%, due 10/15/09 | | 1,472,296 | |
1,180,000 | | | | NRG Energy, Inc., 7.250%, due 02/01/14 | | 1,202,125 | |
750,000 | | | | TECO Energy, Inc., 6.750%, due 05/01/15 | | 774,375 | |
815,000 | | | | TECO Energy, Inc., 7.500%, due 06/15/10 | | 861,863 | |
990,000 | | | | TXU Corp., 5.550%, due 11/15/14 | | 930,992 | |
| | | | | | 16,787,615 | |
| | | | Electronics: 0.6% | | | |
625,000 | | @@ | | Celestica, Inc., 7.625%, due 07/01/13 | | 629,688 | |
280,000 | | @@ | | Celestica, Inc., 7.875%, due 07/01/11 | | 287,000 | |
280,000 | | | | Sanmina-SCI Corp., 8.125%, due 03/01/16 | | 284,200 | |
| | | | | | 1,200,888 | |
| | | | Entertainment: 2.7% | | | |
1,325,000 | | | | American Casino and Entertainment, 7.850%, due 02/01/12 | | 1,364,750 | |
820,000 | | | | Marquee, Inc., 8.625%, due 08/15/12 | | 861,000 | |
1,050,000 | | | | Pinnacle Entertainment, Inc., 8.250%, due 03/15/12 | | 1,105,125 | |
1,850,000 | | | | Warner Music Group, 7.375%, due 04/15/14 | | 1,840,750 | |
| | | | | | 5,171,625 | |
| | | | Environmental Control: 1.4% | | | |
2,180,000 | | S | | Allied Waste North America, Inc., 8.500%, due 12/01/08 | | 2,302,625 | |
375,000 | | | | Waste Services, Inc., 9.500%, due 04/15/14 | | 387,969 | |
| | | | | | 2,690,594 | |
| | | | Food: 4.1% | | | |
1,650,000 | | | | Albertson’s, Inc., 7.450%, due 08/01/29 | | 1,460,776 | |
1,450,000 | | | | Delhaize America, Inc., 8.125%, due 04/15/11 | | 1,572,582 | |
1,285,000 | | | | Dole Food Co., Inc., 8.625%, due 05/01/09 | | 1,297,850 | |
1,645,000 | | | | Land O’ Lakes, Inc., 9.000%, due 12/15/10 | | 1,760,150 | |
740,000 | | | | Smithfield Foods, Inc., 7.750%, due 05/15/13 | | 765,900 | |
1,030,000 | | | | Stater Brothers Holdings, 8.125%, due 06/15/12 | | 1,033,863 | |
| | | | | | 7,891,121 | |
| | | | Forest Products & Paper: 1.9% | | | |
878,000 | | @@ | | Abitibi-Consolidated Finance LP, 7.875%, due 08/01/09 | | 875,805 | |
1,135,000 | | | | Appleton Papers, Inc., 8.125%, due 06/15/11 | | 1,146,350 | |
400,000 | | @@ | | Domtar, Inc., 7.125%, due 08/15/15 | | 356,000 | |
| 535,000 | | @@ | | Domtar, Inc., 7.875%, due 10/15/11 | | | 509,588 | |
740,000 | | | | Georgia-Pacific Corp., 7.750%, due 11/15/29 | | 728,900 | |
| | | | | | 3,616,643 | |
| | | | Gas: 0.3% | | | |
615,000 | | | | Colorado Interstate Gas Co., 5.950%, due 03/15/15 | | 593,284 | |
| | | | | | 593,284 | |
| | | | Healthcare-Products: 0.9% | | | |
1,805,000 | | | | VWR International, Inc., 8.000%, due 04/15/14 | | 1,809,513 | |
| | | | | | 1,809,513 | |
| | | | Healthcare-Services: 3.0% | | | |
990,000 | | | | Community Health Systems, Inc., 6.500%, due 12/15/12 | | 964,013 | |
1,015,000 | | | | DaVita, Inc., 7.250%, due 03/15/15 | | 1,025,150 | |
720,000 | | | | HCA, Inc., 6.375%, due 01/15/15 | | 704,358 | |
1,030,000 | | | | HCA, Inc., 7.875%, due 02/01/11 | | 1,089,099 | |
1,080,000 | | | | Psychiatric Solutions, Inc., 7.750%, due 07/15/15 | | 1,104,300 | |
530,000 | | | | Tenet Healthcare Corp., 6.375%, due 12/01/11 | | 480,975 | |
330,000 | | | | Tenet Healthcare Corp., 9.875%, due 07/01/14 | | 335,775 | |
| | | | | | 5,703,670 | |
| | | | Holding Companies-Diversified: 0.3% | | | |
675,000 | | | | Atlantic Broadband Finance LLC, 9.375%, due 01/15/14 | | 642,938 | |
| | | | | | 642,938 | |
| | | | Home Builders: 1.8% | | | |
950,000 | | | | Standard-Pacific Corp., 6.500%, due 08/15/10 | | 912,000 | |
215,000 | | | | Standard-Pacific Corp., 6.875%, due 05/15/11 | | 206,400 | |
1,150,000 | | # | | Stanley-Martin Communities, 9.750%, due 08/15/15 | | 1,058,000 | |
245,000 | | | | Technical Olympic USA, Inc., 10.375%, due 07/01/12 | | 248,675 | |
995,000 | | | | Technical Olympic USA, Inc., 9.000%, due 07/01/10 | | 1,024,850 | |
| | | | | | 3,449,925 | |
| | | | Home Furnishings: 0.6% | | | |
1,100,000 | | | | Norcraft Finance Corp., 9.000%, due 11/01/11 | | 1,149,500 | |
| | | | | | 1,149,500 | |
| | | | Household Products/Wares: 1.8% | | | |
925,000 | | | | American Achievement Corp., 8.250%, due 04/01/12 | | 948,125 | |
1,585,000 | | | | Playtex Products, Inc., 8.000%, due 03/01/11 | | 1,684,063 | |
1,155,000 | | + | | Visant Holding Corp., 3.440%, due 12/01/13 | | 889,350 | |
| | | | | | 3,521,538 | |
See Accompanying Notes to Financial Statements
61
| | PORTFOLIO OF INVESTMENTS |
ING HIGH YIELD BOND FUND | | AS OF MARCH 31, 2006 (CONTINUED) |
Principal
Amount | | | | | | Value | |
| | | | Iron/Steel: 0.4% | | | |
$ | 745,000 | | | | California Steel Industries, Inc., 6.125%, due 03/15/14 | | $ | 715,200 | |
| | | | | | 715,200 | |
| | | | Leisure Time: 1.2% | | | |
1,005,000 | | @@ | | NCL Corp., 10.625%, due 07/15/14 | | 1,045,200 | |
375,000 | | @@ | | Royal Caribbean Cruises Ltd., 7.500%, due 10/15/27 | | 394,048 | |
765,000 | | @@ | | Royal Caribbean Cruises Ltd., 8.000%, due 05/15/10 | | 821,873 | |
| | | | | | 2,261,121 | |
| | | | Lodging: 5.5% | | | |
1,580,000 | | | | Aztar Corp., 7.875%, due 06/15/14 | | 1,718,250 | |
1,320,000 | | | | Boyd Gaming Corp., 7.125%, due 02/01/16 | | 1,344,750 | |
670,000 | | # | | French Lick Resorts & Casino LLC., 10.750%, due 04/15/14 | | 673,350 | |
745,000 | | | | Mandalay Resort Group, 7.625%, due 07/15/13 | | 772,938 | |
1,400,000 | | | | MGM Mirage, 0.000%, due 04/25/10 | | 1,403,976 | |
1,370,000 | | | | MGM Mirage, 5.875%, due 02/27/14 | | 1,298,075 | |
1,675,000 | | | | Station Casinos, Inc., 6.500%, due 02/01/14 | | 1,664,531 | |
640,000 | | # | | Station Casinos, Inc., 6.625%, due 03/15/18 | | 628,800 | |
1,065,000 | | | | Wynn Las Vegas Capital Corp., 6.625%, due 12/01/14 | | 1,039,706 | |
| | | | | | 10,544,376 | |
| | | | Machinery-Construction & Mining: 0.4% | | | |
820,000 | | | | Terex Corp., 7.375%, due 01/15/14 | | 844,600 | |
| | | | | | 844,600 | |
| | | | Media: 11.0% | | | |
780,000 | | @@ | | CanWest Media, Inc., 8.000%, due 09/15/12 | | 803,400 | |
1,160,000 | | | | CBD Media, Inc., 8.625%, due 06/01/11 | | 1,181,750 | |
1,145,000 | | | | Charter Communications Holdings Capital Corp., 8.625%, due 04/01/09 | | 772,875 | |
1,890,000 | | # | | Charter Communications Holdings Capital Corp., 8.000%, due 04/30/12 | | 1,890,000 | |
675,000 | | # | | Charter Communications Holdings Capital Corp., 8.375%, due 04/30/14 | | 676,688 | |
570,000 | | | | CSC Holdings, Inc., 7.625%, due 04/01/11 | | 575,700 | |
1,015,000 | | | | CSC Holdings, Inc., 7.625%, due 07/15/18 | | 1,008,656 | |
2,060,000 | | S | | CSC Holdings, Inc., 8.125%, due 07/15/09 | | 2,139,825 | |
1,324,000 | | | | Dex Media, Inc., 9.875%, due 08/15/13 | | 1,471,295 | |
495,000 | | | | Dex Media, Inc., 8.000%, due 11/15/13 | | 512,325 | |
| 2,300,000 | | S | | Echostar DBS Corp., 5.750%, due 10/01/08 | | | 2,288,500 | |
990,000 | | # | | Echostar DBS Corp., 7.125%, due 02/01/16 | | 978,863 | |
835,000 | | + | | Houghton Mifflin Co., 2.050%, due 10/15/13 | | 716,013 | |
335,000 | | | | Houghton Mifflin Co., 8.250%, due 02/01/11 | | 348,400 | |
995,000 | | + | | Insight Communications Co., Inc., 12.250%, due 02/15/11 | | 1,059,675 | |
1,110,000 | | # | | Nexstar Finance, Inc., 7.000%, due 01/15/14 | | 1,054,500 | |
700,000 | | | | Primedia, Inc., 10.124%, due 05/15/10 | | 714,000 | |
400,000 | | | | Primedia, Inc., 8.000%, due 05/15/13 | | 368,000 | |
880,000 | | @@ | | Shaw Communications, Inc., 7.200%, due 12/15/11 | | 913,000 | |
1,100,000 | | | | Sinclair Broadcast Group, Inc., 8.000%, due 03/15/12 | | 1,127,500 | |
510,000 | | @@ | | Videotron Ltee, 6.875%, due 01/15/14 | | 515,100 | |
| | | | | | 21,116,065 | |
| | | | Metal Fabricate/Hardware: 0.0% | | | |
2,456,000 | | @@,I,X | | International Utility Structures, Inc., 13.000%, due 02/01/08 | | 2 | |
| | | | | | 2 | |
| | | | Oil & Gas: 2.7% | | | |
1,220,000 | | | | Chesapeake Energy Corp., 6.250%, due 01/15/18 | | 1,198,650 | |
500,000 | | | | Chesapeake Energy Corp., 6.375%, due 06/15/15 | | 494,375 | |
625,000 | | | | Energy Partners Ltd., 8.750%, due 08/01/10 | | 642,188 | |
1,145,000 | | | | Newfield Exploration Co., 6.625%, due 09/01/14 | | 1,153,588 | |
1,445,000 | | | | Parker Drilling Co., 9.570%, due 09/01/10 | | 1,495,575 | |
265,000 | | | | Swift Energy Co., 7.625%, due 07/15/11 | | 268,975 | |
| | | | | | 5,253,351 | |
| | | | Oil & Gas Services: 1.2% | | | |
365,000 | | | | Hanover Compressor Co., 9.000%, due 06/01/14 | | 394,200 | |
750,000 | | | | Hanover Equipment Trust, 8.750%, due 09/01/11 | | 788,438 | |
1,030,000 | | # | | RathGibson, Inc., 11.250%, due 02/15/14 | | 1,081,500 | |
| | | | | | 2,264,138 | |
| | | | Packaging & Containers: 1.6% | | | |
275,000 | | + | | Consolidated Container Co. LLC, 2.444%, due 06/15/09 | | 254,375 | |
400,000 | | | | Consolidated Container Co. LLC, 10.125%, due 07/15/09 | | 352,000 | |
1,125,000 | | | | Graham Packaging Co., Inc., 8.500%, due 10/15/12 | | 1,141,875 | |
865,000 | | | | Graphic Packaging Co., Inc., 8.500%, due 08/15/11 | | 860,675 | |
See Accompanying Notes to Financial Statements
62
| | PORTFOLIO OF INVESTMENTS |
ING HIGH YIELD BOND FUND | | AS OF MARCH 31, 2006 (CONTINUED) |
Principal
Amount | | | | | | Value | |
| | | | Packaging & Containers (continued) | | | |
$ | 450,000 | | | | Smurfit-Stone Container Corp., 8.250%, due 10/01/12 | | $ | 443,813 | |
| | | | | | 3,052,738 | |
| | | | Pipelines: 3.3% | | | |
970,000 | | | | El Paso Corp., 6.950%, due 12/15/07 | | 982,125 | |
390,000 | | | | El Paso Corp., 7.875%, due 06/15/12 | | 408,038 | |
530,000 | | | | El Paso Corp., 7.625%, due 08/01/10 | | 555,175 | |
1,080,000 | | | | Southern Natural Gas Co., 8.000%, due 03/01/32 | | 1,189,876 | |
940,000 | | # | | Targa Resources, Inc., 8.500%, due 11/01/13 | | 982,300 | |
1,260,000 | | | | Transcontinental Gas Pipe Line Corp., 7.250%, due 12/01/26 | | 1,321,425 | |
785,000 | | | | Transcontinental Gas Pipe Line Corp., 8.875%, due 07/15/12 | | 898,825 | |
| | | | | | 6,337,764 | |
| | | | Real Estate Investment Trust: 1.8% | | | |
1,385,000 | | | | Felcor Lodging LP, 8.830%, due 06/01/11 | | 1,442,131 | |
1,370,000 | | | | Meristar Hospitality Corp., 9.000%, due 01/15/08 | | 1,459,050 | |
425,000 | | | | MeriStar Hospitality Corp., 9.125%, due 01/15/11 | | 494,063 | |
| | | | | | 3,395,244 | |
| | | | Retail: 2.6% | | | |
1,005,000 | | # | | Bon-Ton Stores, Inc., 10.250%, due 03/15/14 | | 971,835 | |
705,000 | | | | Dominos, Inc., 8.250%, due 07/01/11 | | 726,150 | |
515,000 | | | | General Nutrition Centers, Inc., 8.500%, due 12/01/10 | | 490,538 | |
1,205,000 | | | | General Nutrition Centers, Inc., 8.625%, due 01/15/11 | | 1,226,088 | |
800,000 | | # | | GSC Holdings Corp., 8.000%, due 10/01/12 | | 798,000 | |
700,000 | | # | | Neiman-Marcus Group, Inc., 9.000%, due 10/15/15 | | 743,750 | |
| | | | | | 4,956,361 | |
| | | | Semiconductors: 0.5% | | | |
905,000 | | @@ | | STATS ChipPAC Ltd., 7.500%, due 07/19/10 | | 924,231 | |
| | | | | | 924,231 | |
| | | | Software: 0.3% | | | |
615,000 | | # | | Serena Software, Inc., 10.375%, due 03/15/16 | | 647,288 | |
| | | | | | 647,288 | |
| | | | Telecommunications: 13.7% | | | |
515,000 | | | | American Tower Corp., 10.000%, due 08/01/11 | | 561,350 | |
535,000 | | | | American Tower Corp., 7.125%, due 10/15/12 | | 559,075 | |
| 720,000 | | | | American Tower Corp., 7.250%, due 12/01/11 | | | 754,200 | |
1,295,000 | | | | Centennial Communications Corp.,10.125%, due 06/15/13 | | 1,421,263 | |
1,280,000 | | | | Centennial Communications Corp.,10.000%, due 01/01/13 | | 1,336,000 | |
475,000 | | | | Cincinnati Bell, Inc., 8.375%, due 01/15/14 | | 485,094 | |
1,210,000 | | | | Citizens Communications Co., 9.000%, due 08/15/31 | | 1,299,238 | |
1,540,000 | | | | Citizens Communications Co., 9.250%, due 05/15/11 | | 1,697,850 | |
1,650,000 | | | | Dobson Communications Corp., 9.875%, due 11/01/12 | | 1,810,875 | |
735,000 | | | | Dobson Communications Corp., 9.295%, due 10/15/12 | | 733,163 | |
705,000 | | # | | Hawaiian Telcom Communications, Inc., 12.500%, due 05/01/15 | | 701,475 | |
3,600,000 | | I,X | | ICG Services, Inc., 10.000%, due 02/15/08 | | 4 | |
2,579,000 | | S | | Insight Capital, Inc., 10.500%, due 11/01/10 | | 2,727,275 | |
1,690,000 | | @@ | | Intelsat Ltd., 5.250%, due 11/01/08 | | 1,605,500 | |
555,000 | | @@ | | Intelsat Ltd., 6.500%, due 11/01/13 | | 417,638 | |
1,500,000 | | @@ | | Intelsat Ltd., 8.625%, due 01/15/15 | | 1,556,250 | |
3,175,000 | | S | | Qwest Capital Funding, Inc., 6.375%, due 07/15/08 | | 3,175,000 | |
445,000 | | | | Qwest Capital Funding, Inc., 7.000%, due 08/03/09 | | 453,900 | |
585,000 | | | | Qwest Corp., 6.875%, due 09/15/33 | | 564,525 | |
465,000 | | | | Qwest Corp., 8.160%, due 06/15/13 | | 513,825 | |
435,000 | | | | Rural Cellular Corp., 8.250%, due 03/15/12 | | 454,575 | |
430,000 | | | | Rural Cellular Corp., 9.750%, due 01/15/10 | | 438,600 | |
700,000 | | | | Rural Cellular Corp., 9.875%, due 02/01/10 | | 750,750 | |
308,000 | | | | SBA Communications Corp., 8.500%, due 12/01/12 | | 343,420 | |
313,000 | | + | | SBA Communications Corp., 9.750%, due 12/15/11 | | 300,480 | |
715,000 | | | | Ubiquitel, Inc., 9.875%, due 03/01/11 | | 784,713 | |
340,000 | | | | U.S. Unwired, Inc., 10.000%, due 06/15/12 | | 382,925 | |
475,000 | | | | Valor Telecommunications Enterprises LLC, 7.750%, due 02/15/15 | | 499,938 | |
| | | | | | 26,328,901 | |
| | | | Total Corporate Bonds/Notes
(Cost $186,730,802) | | 182,966,880 | |
See Accompanying Notes to Financial Statements
63
| | PORTFOLIO OF INVESTMENTS |
ING HIGH YIELD BOND FUND | | AS OF MARCH 31, 2006 (CONTINUED) |
Shares | | | | | | Value | |
COMMON STOCK: 0.5% | | | |
| | | | Agriculture: 0.0% | | | |
17,906 | | @,I,X | | North Atlantic Trading Co. | | $ | 18 | |
| | | | | | 18 | |
| | | | Lodging: 0.5% | | | |
16,800 | | | | Hilton Hotels Corp. | | 427,727 | |
7,400 | | | | Starwood Hotels & Resorts Worldwide, Inc. | | 501,202 | |
| | | | | | 928,929 | |
| | | | Telecommunications: 0.0% | | | |
132 | | @,@@ | | Completel Europe NV | | 8,717 | |
2,350 | | @,I,X | | Jordan Tellecommunications | | 52,687 | |
15 | | @ | | Mpower Holding Corp. | | 22 | |
| | | | | | 61,426 | |
| | | | Total Common Stock
(Cost $1,090,913) | | 990,373 | |
PREFERRED STOCK: 0.0% | | | |
| | | | Home Furnishings: 0.0% | | | |
373 | | @,I | | O’ Sullivan Industries, Inc. | | — | |
| | | | | | — | |
| | | | Media: 0.0% | | | |
100 | | @ | | Paxson Communications Corp. | | 8,728 | |
| | | | | | 8,728 | |
| | | | Total Preferred Stock
(Cost $8,686) | | 8,728 | |
WARRANTS: 0.1% | | | |
| | | | Building Materials: 0.0% | | | |
3,100 | | @,#,I,X | | Dayton Superior Corp. | | 31 | |
| | | | | | 31 | |
| | | | Commercial Services: 0.0% | | | |
92,950 | | @,I,X | | Comforce Corp. | | 930 | |
| | | | | | 930 | |
| | | | Home Furnishings: 0.0% | | | |
1,000 | | @,I,X | | O’ Sullivan Industries, Inc. | | — | |
| | | | | | — | |
| | | | Telecommunications: 0.1% | | | |
580 | | | | American Tower Corp., | | 248,002 | |
500 | | @@,#,I,X | | GT Group Telecom, Inc. | | — | |
| | | | | | 248,002 | |
| | | | Total Warrants
(Cost $47,403) | | 248,963 | |
| | | | Total Long-Term Investments:
(Cost $187,877,804) | | 184,214,944 | |
| | | | | | | | |
Principal
Amount | | | | | | Value | |
SHORT-TERM INVESTMENT: 3.1% | | | |
| | | |
| | | | Repurchase Agreement: 3.1% | | | |
$ | 6,034,000 | | | | Deutsche Bank Repurchase Agreement dated, 03/31/06, 4.750%, due 04/03/06, $6,036,388 to be received upon repurchase (Collateralized by $6,149,000 Federal National Mortgage Association, 0.000%, Market Value $6,154,744, due 09/22/06) | | $ | 6,034,000 | |
| | | | Total Short-Term Investments:
(Cost $6,034,000) | | 6,034,000 | |
| | | | Total Investments in Securities
(Cost $193,911,804)* | 98.7 | % | $ | 190,248,944 | |
| | | | Other Assets and Liabilities-Net | 1.3 | | 2,424,029 | |
| | | | Net Assets | 100.0 | % | $ | 192,672,973 | |
| | | | | | | | | | |
Certain foreign securities have been fair valued in accordance with procedures approved by the Board of Trustees (Note 2A).
@ | Non-income producing security |
@@ | Foreign Issuer |
+ | Step-up basis bonds. Interest rates shown reflect current coupon rates. |
# | Securities with purchases pursuant to Rule 144A, under the Securities Act of 1933 and may not be resold subject to that rule except to qualified institutional buyers. These securities have been determined to be liquid under the guidelines established by the Funds’ Board of Directors/Trustees. |
S | Segregated securities for certain derivatives, when-issued or delayed delivery securities and forward currency exchange contracts. |
I | Illiquid security |
X | Fair value determined by ING Funds Valuation Committee appointed by the Funds’ Board of Directors/Trustees. |
* | Cost for federal income tax purposes is $193,975,431. |
| Net unrealized depreciation consists of: |
| | | | Gross Unrealized Appreciation | | $ | 2,511,051 | |
| | | | Gross Unrealized Depreciation | | (6,237,538 | ) |
| | | | Net Unrealized Depreciation | | $ | (3,726,487 | ) |
| Information concerning open futures contracts at March 31, 2006 is shown below: |
| |
Information concerning the Credit Default Swap Agreements outstanding for the ING High Yield Bond Fund at March 31, 2006, is shown below: |
| | | | | | | | | |
| | Termination
Date | | Notional
Principal | | Unrealized
Appreciation
(Depreciation) | |
Dow Jones CDX.NA.HY.5 Index Receive $2,739,000 upon event of default and pay 3.95% Counterparty: Goldman Sachs International | | 12/20/10 | | $ | 3,234,000 | | $ | (47,451 | ) |
Dow Jones CDX.NA.HY.5 Index Receive $6,600,000 upon event of default and pay 3.95% Counterparty: Goldman Sachs International | | 12/20/10 | | 6,468,000 | | (95,609 | ) |
| | | | | | $ | (143,060 | ) |
| | | | | | | | | |
See Accompanying Notes to Financial Statements
64
| | PORTFOLIO OF INVESTMENTS |
ING INTERMEDIATE BOND FUND | | AS OF MARCH 31, 2006 |
Principal
Amount | | | | | | Value | |
CORPORATE BONDS/NOTES: 28.2% | | | |
| | | | Airlines: 0.1% | | | |
$ | 631,853 | | | | Continental Airlines, Inc., 8.312%, due 04/02/11 | | $ | 607,527 | |
508,060 | | L | | United Airlines, Inc., 6.602%, due 09/01/13 | | 503,239 | |
| | | | | | 1,110,766 | |
| | | | Banks: 7.2% | | | |
2,925,000 | | | | American Express Centurion Bank, 4.866%, due 07/19/07 | | 2,929,648 | |
2,930,000 | | @@,L | | Australia & New Zealand Banking Group Ltd., 4.588%, due 10/29/49 | | 2,537,497 | |
1,320,000 | | @@,# | | Banco do Brasil Cayman, 7.950%, due 12/31/49 | | 1,313,400 | |
1,309,034 | | @@,# | | Banco Itau SA/Cayman Islands, 5.356%, due 09/20/08 | | 1,302,882 | |
1,663,000 | | @@,# | | Banco Santander Chile SA, 5.220%, due 12/09/09 | | 1,665,408 | |
1,878,000 | | @@,L | | Banco Santander Chile SA, 7.375%, due 07/18/12 | | 2,034,599 | |
1,060,000 | | @@ | | Bank of Ireland, 5.180%, due 12/29/49 | | 929,057 | |
1,180,000 | | @@ | | Bank of Nova Scotia, 5.125%, due 08/21/85 | | 994,301 | |
540,000 | | @@ | | Bank of Scotland, 4.813%, due 11/30/49 | | 467,100 | |
177,000 | | | | BankAmerica Capital II, 8.000%, due 12/15/26 | | 186,586 | |
710,000 | | @@ | | Barclays Bank PLC, 4.938%, due 12/31/49 | | 629,926 | |
1,090,000 | | @@,L | | Barclays Bank PLC, 6.278%, due 12/15/49 | | 1,046,149 | |
2,000,000 | | @@ | | BNP Paribas, 5.185%, due 09/29/49 | | 1,725,154 | |
843,000 | | | | Chase Capital I, 7.670%, due 12/01/26 | | 884,405 | |
1,727,000 | | @@,#,L | | Chuo Mitsui Trust & Banking Co., Ltd., 5.506%, due 04/15/49 | | 1,641,912 | |
987,000 | | @@,# | | Danske Bank A/S, 5.914%, due 12/29/49 | | 992,624 | |
1,720,000 | | @@ | | Den Norske Bank ASA, 5.125%, due 08/29/49 | | 1,449,100 | |
1,638,000 | | # | | Dresdner Funding Trust I, 8.151%, due 06/30/31 | | 1,916,398 | |
858,000 | | # | | First Chicago NBD Institutional Capital A, 7.950%, due 12/01/26 | | 901,049 | |
1,117,000 | | @@ | | First Citizens St Lucia Ltd., 5.460%, due 02/01/12 | | 1,088,959 | |
3,817,000 | | @@,# | | HBOS PLC, 5.375%, due 11/29/49 | | 3,692,031 | |
3,010,000 | | @@ | | HSBC Bank PLC, 4.788%, due 06/29/49 | | 2,528,400 | |
2,390,000 | | @@,L | | HSBC Bank PLC, 5.000%, due 06/29/49 | | 2,067,350 | |
6,000,000 | | @@ | | KAUP BANK, 6.600%, due 12/28/15 | | 5,727,990 | |
| 220,000 | | @@ | | Lloyds TSB Bank PLC, 5.000%, due 11/29/49 | | | 193,984 | |
2,340,000 | | @@ | | Lloyds TSB Bank PLC, 5.080%, due 08/29/49 | | 2,017,040 | |
1,465,000 | | | | Mellon Capital I, 7.720%, due 12/01/26 | | 1,539,728 | |
1,110,000 | | @@,L | | Mizuho Financial Group Cayman Ltd., 8.375%, due 12/31/49 | | 1,182,789 | |
1,090,000 | | @@ | | National Australia Bank Ltd., 4.525%, due 10/29/49 | | 941,244 | |
320,000 | | @@ | | National Westminster Bank Plc, 5.000%, due 11/29/49 | | 271,279 | |
910,000 | | # | | Rabobank Capital Funding Trust, 5.254%, due 12/31/49 | | 861,760 | |
12,000 | | @@,#,L | | Resona Bank Ltd., 5.850%, due 09/29/49 | | 11,666 | |
4,560,000 | | @@ | | Royal Bank of Scotland Group PLC, 4.875%, due 12/29/49 | | 3,930,072 | |
1,090,000 | | @@ | | Societe Generale, 4.656%, due 11/29/49 | | 943,895 | |
5,150,000 | | @@,L | | Standard Chartered PLC, 4.875%, due 11/29/49 | | 4,261,625 | |
520,000 | | @@ | | Standard Chartered PLC, 4.900%, due 01/29/49 | | 429,000 | |
3,210,000 | | @@ | | Standard Chartered PLC, 5.188%, due 07/29/49 | | 2,664,300 | |
1,785,000 | | @@ | | Sumitomo Mitsui Banking Corp., 8.150%, due 08/01/49 | | 1,853,546 | |
4,120,000 | | | | Wachovia Capital Trust III, 5.800%, due 12/31/49 | | 4,052,098 | |
1,250,000 | | @@ | | Westpac Banking Corp., 5.275%, due 09/30/49 | | 1,064,091 | |
1,000 | | @@,# | | Westpac Capital Trust IV, 5.256%, due 12/29/49 | | 949 | |
| | | | | | 66,870,991 | |
| | | | Beverages: 0.3% | | | |
1,849,000 | | @@ | | Cia Brasileira de Bebidas, 8.750%, due 09/15/13 | | 2,135,595 | |
1,080,000 | | @@ | | Diageo Capital PLC, 4.691%, due 04/20/07 | | 1,081,149 | |
| | | | | | 3,216,744 | |
| | | | Chemicals: 0.8% | | | |
1,360,000 | | | | Dow Chemical, 8.625%, due 04/01/2006 | | 1,360,112 | |
390,000 | | @@,# | | Sociedad Quimica y Minera de Chile SA, 7.700%, due 09/15/06 | | 393,193 | |
720,000 | | | | Stauffer Chemical, 0.000%, due 04/15/10 | | 574,956 | |
1,510,000 | | | | Stauffer Chemical, 0.000%, due 04/15/17 | | 789,035 | |
1,230,000 | | | | Stauffer Chemical, 0.000%, due 04/15/18 | | 602,885 | |
3,645,000 | | | | Union Carbide Corp., 7.750%, due 10/01/96 | | 3,773,515 | |
| | | | | | 7,493,696 | |
See Accompanying Notes to Financial Statements
65
| | PORTFOLIO OF INVESTMENTS |
ING INTERMEDIATE BOND FUND | | AS OF MARCH 31, 2006 (CONTINUED) |
Principal
Amount | | | | | | Value | |
| | | | Commercial Services: 0.4% | | | |
$ | 3,568,000 | | | | Tulane University of Louisiana, 5.549%, due 11/15/12 | | $ | 3,585,840 | |
| | | | | | 3,585,840 | |
| | | | Diversified Financial Services: 9.6% | | | |
527,000 | | @@,#,I | | Alpine III, 5.290%, due 08/16/14 | | 528,306 | |
527,000 | | @@,#,I | | Alpine III, 5.700%, due 08/16/14 | | 528,499 | |
789,000 | | @@,#,I | | Alpine III, 7.500%, due 08/16/14 | | 793,145 | |
1,348,000 | | @@,#,I | | Alpine III, 10.750%, due 08/16/14 | | 1,385,344 | |
467,000 | | # | | Army Hawaii Family Housing Trust Certificates, 5.524%, due 06/15/50 | | 450,216 | |
344,000 | | # | | Army Hawaii Family Housing Trust Certificates, 5.624%, due 06/15/50 | | 332,259 | |
3,210,721 | | # | | Astoria Depositor Corp., 7.902%, due 05/01/21 | | 3,241,464 | |
4,655,000 | | # | | Astoria Depositor Corp., 8.144%, due 05/01/21 | | 4,890,659 | |
1,800,174 | | @@,# | | Brazilian Merchant Voucher Receivables Ltd., 5.911%, due 06/15/11 | | 1,800,174 | |
2,360,000 | | @@,# | | BTM Curacao Holdings NV, 4.760%, due 07/21/15 | | 2,279,743 | |
1,714,000 | | | | Citigroup Capital II, 7.750%, due 12/01/36 | | 1,792,515 | |
2,340,000 | | # | | Corestates Capital Trust I, 8.000%, due 12/15/26 | | 2,461,076 | |
2,930,000 | | | | Countrywide Financial Corp., 5.100%, due 12/19/07 | | 2,932,558 | |
2,930,000 | | | | Countrywide Financial Corp., 5.188%, due 04/11/07 | | 2,933,408 | |
3,678,000 | | # | | Farmer Mac Guaranteed Notes Trust 2006-1, 4.875%, due 01/14/11 | | 3,609,295 | |
1,245,000 | | @@ | | Financiere CSFB NV, 5.125%, due 03/29/49 | | 1,033,350 | |
1,652,000 | | | | Fund American Cos, Inc., 5.875%, due 05/15/13 | | 1,625,447 | |
7,482,000 | | | | General Motors Acceptance Corp., 6.875%, due 08/28/12 | | 6,910,891 | |
2,550,000 | | | | General Motors Acceptance Corp., 7.000%, due 02/01/12 | | 2,377,100 | |
1,709,000 | | # | | HVB Funding Trust III, 9.000%, due 10/22/31 | | 2,200,042 | |
2,297,000 | | #,L | | ILFC E-Capital Trust II, 6.250%, due 12/21/65 | | 2,205,295 | |
704,000 | | | | International Lease Finance Corp., 5.000%, due 04/15/10 | | 691,150 | |
1,366,000 | | | | JPM Capital Trust I, 7.540%, due 01/15/27 | | 1,432,149 | |
1,509,000 | | | | JPM Capital Trust II, 7.950%, due 02/01/27 | | 1,593,776 | |
| 3,486,000 | | # | | Mangrove Bay Pass-Through Trust, 6.102%, due 07/15/33 | | | 3,377,969 | |
1,921,000 | | @@,# | | Mantis Reef Ltd., 4.799%, due 11/03/09 | | 1,857,119 | |
1,690,000 | | | | Morgan Stanley, 6.100%, due 04/15/06 | | 1,690,539 | |
57 | | @@ | | Nordea Kredit Realkreditaktieselskab, 6.000%, due 07/01/29 | | 10 | |
1,296,000 | | @@ | | BNP Paribas, 5.063%, due 12/31/49 | | 1,131,860 | |
881,167 | | @@ | | Petroleum Export Ltd., 4.623%, due 06/15/10 | | 865,432 | |
1,228,804 | | @@,# | | Petroleum Export Ltd/Cayman SPV, 5.265%, due 06/15/11 | | 1,201,984 | |
2,982,651 | | @@,# | | PF Export Receivables Master Trust, 6.436%, due 06/01/15 | | 2,924,862 | |
5,266,000 | | # | | Piper Jaffray Equipment Trust Securities, 7.000%, due 09/10/13 | | 5,173,845 | |
2,481,000 | | | | Residential Capital Corp., 6.375%, due 06/30/10 | | 2,501,704 | |
1,837,000 | | L | | Residential Capital Corp., 6.875%, due 06/30/15 | | 1,918,372 | |
1,962,000 | | | | Southern Star Central Corp., 8.500%, due 08/01/10 | | 2,116,508 | |
1,500,000,000 | | @@ | | Takefuji Corp., 1.000%, due 03/01/34 | | 6,674,537 | |
8,795,153 | | # | | Toll Road Investment, 0.000%, due 02/15/45 | | 1,046,526 | |
1,200,000 | | # | | Twin Reefs Pass-Through Trust, 5.849%, due 12/10/49 | | 1,201,188 | |
1,865,000 | | @@,L | | UFJ Finance Aruba AEC, 8.750%, due 12/31/49 | | 2,002,178 | |
1,085,000 | | # | | Wachovia Capital Trust V, 7.965%, due 06/01/27 | | 1,151,183 | |
2,633,000 | | @@,# | | ZFS Finance USA Trust I, 6.450%, due 12/15/65 | | 2,538,186 | |
| | | | | | 89,401,863 | |
| | | | Electric: 3.0% | | | |
2,261,880 | | | | CE Generation LLC, 7.416%, due 12/15/18 | | 2,359,236 | |
850,000 | | | | DTE Energy Co., 6.450%, due 06/01/06 | | 851,436 | |
3,938,000 | | @@,L | | Empresa Nacional de Electricidad SA, 8.625%, due 08/01/15 | | 4,500,216 | |
1,825,000 | | | | Entergy Gulf States, Inc., 5.120%, due 08/01/10 | | 1,753,179 | |
1,578,000 | | L | | FirstEnergy Corp., 6.450%, due 11/15/11 | | 1,634,724 | |
2,720,000 | | L | | FirstEnergy Corp., 7.375%, due 11/15/31 | | 3,030,480 | |
830,438 | | # | | Juniper Generation, 6.790%, due 12/31/14 | | 799,422 | |
1,345,000 | | @@,+ | | Korea Electric Power Corp., 0.000%, due 04/01/96 | | 731,344 | |
See Accompanying Notes to Financial Statements
66
| | PORTFOLIO OF INVESTMENTS |
ING INTERMEDIATE BOND FUND | | AS OF MARCH 31, 2006 (CONTINUED) |
Principal
Amount | | | | | | Value | |
| | | | Electric (continued) | | | |
$ | 1,313,000 | | # | | Mirant North America LLC,7.375%, due 12/31/13 | | $ | 1,345,825 | |
1,327,000 | | # | | Nevada Power Co., 5.950%, due 03/15/16 | | 1,312,889 | |
1,263,000 | | | | NorthWestern Corp., 5.875%, due 11/01/14 | | 1,250,327 | |
1,175,000 | | | | Potomac Edison Co., 5.000%, due 11/01/06 | | 1,175,113 | |
857,000 | | # | | Power Contract Financing LLC, 6.256%, due 02/01/10 | | 862,103 | |
356,274 | | | | PPL Montana LLC, 8.903%, due 07/02/20 | | 398,555 | |
2,632,000 | | # | | Sierra Pacific Power Co., 6.000%, due 05/15/16 | | 2,609,333 | |
466,000 | | | | Sierra Pacific Power Co., 6.250%, due 04/15/12 | | 471,963 | |
2,468,000 | | | | Southern Co. CAP Trust I, 8.190%, due 02/01/37 | | 2,609,619 | |
| | | | | | 27,695,764 | |
| | | | Food: 0.1% | | | |
467,000 | | | | Delhaize America, Inc., 8.050%, due 04/15/27 | | 483,641 | |
692,000 | | L | | Delhaize America, Inc., 8.125%, due 04/15/11 | | 750,501 | |
| | | | | | 1,234,142 | |
| | | | Forest Products & Paper: 0.1% | | | |
1,041,000 | | | | Georgia-Pacific Corp., 7.250%, due 06/01/28 | | 988,950 | |
| | | | | | 988,950 | |
| | | | Healthcare-Services: 0.2% | | | |
1,426,000 | | | | WellPoint, Inc., 5.250%, due 01/15/16 | | 1,377,740 | |
| | | | | | 1,377,740 | |
| | | | Household Products/Wares: 0.0% | | | |
25,000 | | L | | Spectrum Brands, Inc., 7.375%, due 02/01/15 | | 21,875 | |
| | | | | | 21,875 | |
| | | | Insurance: 1.1% | | | |
3,511,000 | | @@ | | Aegon NV, 5.585%, due 12/31/49 | | 3,102,846 | |
2,191,000 | | L | | AON Capital Trust, 8.205%, due 01/01/27 | | 2,514,942 | |
817,000 | | # | | North Front Pass-Through, 5.810%, due 12/15/24 | | 795,372 | |
3,101,000 | | # | | Zurich Capital Trust I, 8.376%, due 06/01/37 | | 3,318,228 | |
| | | | | | 9,731,388 | |
| | | | Media: 0.5% | | | |
1,116,000 | | L | | Comcast Corp., 5.650%, due 06/15/35 | | 975,875 | |
2,902,000 | | #,L | | News America, Inc., 6.400%, due 12/15/35 | | 2,783,659 | |
1,260,000 | | | | Time Warner, Inc., 6.125%, due 04/15/06 | | 1,260,431 | |
| | | | | | 5,019,965 | |
| | | | Multi-National: 0.1% | | | |
| 1,173,000 | | @@ | | Corp. Andina de Fomento CAF, 5.125%, due 05/05/15 | | | 1,117,482 | |
| | | | | | 1,117,482 | |
| | | | Oil & Gas: 1.2% | | | |
1,192,000 | | @@,# | | Empresa Nacional de Petroleo ENAP, 4.875%, due 03/15/14 | | 1,113,770 | |
796,000 | | @@,# | | Empresa Nacional de Petroleo ENAP, 6.750%, due 11/15/12 | | 835,370 | |
1,346,000 | | @@ | | Husky Oil Co., 8.900%, due 08/15/28 | | 1,429,490 | |
2,402,000 | | @@,# | | Pemex Project Funding Master Trust, 6.210%, due 06/15/10 | | 2,471,658 | |
1,220,000 | | L | | Pemex Project Funding Master Trust, 6.625%, due 06/15/35 | | 1,180,045 | |
867,000 | | @@,# | | Pemex Project Funding Master Trust, 6.625%, due 06/15/35 | | 838,606 | |
2,076,000 | | @@,# | | Ras Laffan Liquefied Natural Gas Co. Ltd. II, 5.298%, due 09/30/20 | | 1,964,295 | |
1,432,000 | | @@,# | | Tengizchevroil, 6.124%, due 11/15/14 | | 1,432,000 | |
| | | | | | 11,265,234 | |
| | | | Pharmaceuticals: 0.3% | | | |
1,863,000 | | | | AmerisourceBergen Corp., 5.625%, due 09/15/12 | | 1,841,577 | |
502,000 | | # | | AmerisourceBergen Corp., 5.875%, due 09/15/15 | | 496,257 | |
| | | | | | 2,337,834 | |
| | | | Pipelines: 0.6% | | | |
4,067,000 | | #,I | | Cameron Highway Oil Pipeline, 5.860%, due 12/15/17 | | 3,940,923 | |
1,705,000 | | | | Kinder Morgan Finance Co. ULC, 5.350%, due 01/05/11 | | 1,679,546 | |
| | | | | | 5,620,469 | |
| | | | Real Estate: 0.2% | | | |
1,648,000 | | | | EOP Operating LP, 7.750%, due 11/15/07 | | 1,704,217 | |
| | | | | | 1,704,217 | |
| | | | Real Estate Investment Trust: 0.6% | | | |
310,000 | | | | Liberty Property LP, 6.375%, due 08/15/12 | | 319,460 | |
1,578,000 | | | | Liberty Property LP, 7.750%, due 04/15/09 | | 1,670,198 | |
1,390,000 | | | | Simon Property Group LP, 4.875%, due 03/18/10 | | 1,356,587 | |
2,179,000 | | | | Simon Property Group LP, 6.375%, due 11/15/07 | | 2,211,386 | |
| | | | | | 5,557,631 | |
See Accompanying Notes to Financial Statements
67
| | PORTFOLIO OF INVESTMENTS |
ING INTERMEDIATE BOND FUND | | AS OF MARCH 31, 2006 (CONTINUED) |
Principal
Amount | | | | | | Value | |
| | | | Retail: 0.3% | | | |
$ | 1,306,000 | | | | JC Penney Corp., Inc., 7.625%, due 03/01/97 | | $ | 1,324,998 | |
1,859,000 | | | | May Department Stores Co., 3.950%, due 07/15/07 | | 1,820,714 | |
| | | | | | 3,145,712 | |
| | | | Savings & Loans: 0.1% | | | |
1,238,000 | | | | Great Western Financial, 8.206%, due 02/01/27 | | 1,310,078 | |
| | | | | | 1,310,078 | |
| | | | Telecommunications: 0.9% | | | |
1,152,000 | | L | | AT&T Corp., 9.750%, due 11/15/31 | | 1,379,687 | |
1,526,000 | | | | BellSouth Corp., 4.200%, due 09/15/09 | | 1,465,351 | |
2,340,000 | | | | SBC Communications, Inc., 5.750%, due 05/02/06 | | 2,341,072 | |
3,037,000 | | | | Verizon Global Funding Corp., 5.850%, due 09/15/35 | | 2,732,999 | |
| | | | | | 7,919,109 | |
| | | | Transportation: 0.5% | | | |
3,026,000 | | | | BNSF Funding Trust I, 6.613%, due 12/15/55 | | 2,976,789 | |
1,217,000 | | @@,# | | MISC Capital Ltd., 5.000%, due 07/01/09 | | 1,200,978 | |
| | | | | | 4,177,767 | |
| | | | Total Corporate Bonds/Notes
(Cost $266,438,836) | | 261,905,257 | |
| | | | | | | |
U.S. GOVERNMENT AGENCY OBLIGATIONS: 32.0% | | | |
| | | |
| | | | Federal Home Loan Bank: 1.5% | | | |
9,375,000 | | | | 4.750%, due 08/17/07 | | 9,332,559 | |
4,520,000 | | | | 4.850%, due 02/06/08 | | 4,503,471 | |
| | | | | | 13,836,030 | |
| | | | Federal Home Loan Mortgage Corporation: 9.1% | | | |
4,332,000 | | | | 3.875%, due 06/15/08 | | 4,227,673 | |
4,320,000 | | | | 4.000%, due 08/17/07 | | 4,258,012 | |
8,742,000 | | L | | 4.375%, due 11/16/07 | | 8,647,106 | |
1,670,961 | | | | 4.500%, due 12/15/16 | | 1,634,984 | |
3,422,000 | | | | 4.500%, due 02/15/20 | | 3,151,160 | |
9,100,000 | | L | | 4.875%, due 02/17/09 | | 9,056,993 | |
5,025,038 | | S | | 5.000%, due 08/15/16 | | 4,915,025 | |
869,000 | | | | 5.000%, due 05/15/20 | | 831,572 | |
3,884,900 | | S | | 5.000%, due 08/15/21 | | 3,835,541 | |
3,513,000 | | | | 5.000%, due 04/15/23 | | 3,331,679 | |
704,247 | | | | 5.040%, due 04/01/35 | | 690,533 | |
522,450 | | | | 5.099%, due 02/15/32 | | 525,369 | |
4,647,000 | | | | 5.150%, due 01/24/11 | | 4,615,642 | |
2,315,697 | | | | 5.221%, due 06/01/35 | | 2,267,101 | |
2,084,985 | | | | 5.500%, due 11/15/18 | | 2,084,866 | |
2,000,000 | | W | | 5.500%, due 04/15/19 | | 1,986,876 | |
9,886,454 | | S | | 5.500%, due 08/15/20 | | 9,406,015 | |
7,814,000 | | W | | 5.500%, due 04/01/33 | | 7,630,855 | |
3,295,000 | | L | | 5.875%, due 03/21/11 | | 3,374,627 | |
2,277,000 | | S | | 6.000%, due 01/15/29 | | 2,286,464 | |
2,630,474 | | | | 6.000%, due 01/15/29 | | 2,642,635 | |
3,565,753 | | | | 6.000%, due 01/15/29 | | 3,596,404 | |
10,567 | | | | 7.500%, due 11/01/28 | | 11,068 | |
| | | | | | 85,008,200 | |
| | | | Federal National Mortgage Association: 21.3% | | | |
| 9,250,000 | | | | 3.875%, due 07/15/08 | | | 9,021,035 | |
2,587,000 | | L | | 4.250%, due 09/15/07 | | 2,557,019 | |
68,000 | | W | | 4.500%, due 04/01/18 | | 65,025 | |
105,000 | | W | | 4.500%, due 04/15/35 | | 96,863 | |
1,985,732 | | | | 4.640%, due 08/01/35 | | 1,931,719 | |
4,612,000 | | | | 4.750%, due 08/10/07 | | 4,591,223 | |
2,004,520 | | | | 4.750%, due 12/25/42 | | 1,989,812 | |
2,283,135 | | | | 4.811%, due 08/01/35 | | 2,228,149 | |
1,394,376 | | S | | 4.958%, due 04/25/35 | | 1,395,987 | |
92,630 | | | | 5.018%, due 11/25/32 | | 92,655 | |
103,000 | | W | | 5.000%, due 04/15/21 | | 100,425 | |
3,839,425 | | S | | 5.000%, due 02/25/29 | | 3,767,691 | |
5,461,817 | | S | | 5.000%, due 08/01/35 | | 5,202,716 | |
984,973 | | | | 5.000%, due 10/01/35 | | 938,247 | |
61,793,000 | | W | | 5.000%, due 04/15/36 | | 58,838,553 | |
1,330,971 | | | | 5.086%, due 07/01/35 | | 1,308,928 | |
3,415,095 | | | | 5.148%, due 09/01/35 | | 3,366,619 | |
471,956 | | | | 5.176%, due 04/18/28 | | 475,199 | |
9,248,000 | | | | 5.250%, due 08/01/12 | | 9,166,433 | |
73,536 | | | | 5.268%, due 12/25/29 | | 73,734 | |
526,676 | | | | 5.268%, due 10/25/33 | | 529,337 | |
1,181,190 | | | | 5.293%, due 08/01/35 | | 1,159,517 | |
527,219 | | | | 5.368%, due 01/25/32 | | 527,156 | |
6,450,000 | | W | | 5.500%, due 04/15/19 | | 6,411,700 | |
2,185,436 | | | | 5.500%, due 11/01/32 | | 2,139,102 | |
6,127,869 | | | | 5.500%, due 11/01/33 | | 5,997,951 | |
5,772,988 | | S | | 5.500%, due 11/01/33 | | 5,648,185 | |
33,373,000 | | W | | 5.500%, due 04/15/36 | | 32,580,391 | |
71,361 | | | | 6.000%, due 08/01/16 | | 72,382 | |
6,001 | | | | 6.000%, due 12/01/16 | | 6,087 | |
218,732 | | | | 6.000%, due 03/01/17 | | 221,861 | |
1,922,406 | | | | 6.000%, due 09/01/17 | | 1,949,746 | |
141,863 | | | | 6.000%, due 11/01/17 | | 143,892 | |
333,000 | | W | | 6.000%, due 04/01/18 | | 337,475 | |
1,328,414 | | | | 6.000%, due 07/25/29 | | 1,337,881 | |
3,126,224 | | | | 6.000%, due 07/25/29 | | 3,147,786 | |
2,495,674 | | | | 6.000%, due 04/25/31 | | 2,527,105 | |
990,148 | | | | 6.000%, due 08/01/33 | | 990,457 | |
12,721,000 | | W | | 6.000%, due 04/01/34 | | 12,721,000 | |
58,454 | | | | 6.500%, due 07/01/29 | | 59,946 | |
210,557 | | | | 6.500%, due 08/01/29 | | 215,929 | |
607,287 | | | | 6.500%, due 04/01/30 | | 622,782 | |
1,652,000 | | W | | 6.500%, due 04/01/31 | | 1,685,555 | |
2,515 | | | | 6.500%, due 06/01/31 | | 2,574 | |
544,184 | | | | 6.500%, due 07/01/31 | | 558,113 | |
2,307 | | | | 6.500%, due 09/01/31 | | 2,361 | |
12,171 | | | | 6.500%, due 09/01/31 | | 12,456 | |
272,851 | | | | 6.500%, due 11/01/31 | | 279,242 | |
146,286 | | | | 6.500%, due 04/01/32 | | 149,610 | |
70,648 | | | | 6.500%, due 07/01/32 | | 72,254 | |
14,958 | | | | 6.500%, due 08/01/32 | | 15,297 | |
62,735 | | | | 6.500%, due 08/01/32 | | 64,161 | |
116,588 | | | | 6.500%, due 08/01/32 | | 119,237 | |
144,358 | | | | 6.500%, due 11/01/32 | | 147,638 | |
214,543 | | | | 6.500%, due 01/01/33 | | 219,417 | |
135,279 | | | | 6.500%, due 02/01/33 | | 138,200 | |
653,524 | | | | 6.500%, due 12/01/33 | | 667,636 | |
3,886,000 | | | | 6.625%, due 11/15/10 | | 4,121,223 | |
24,340 | | | | 7.000%, due 01/01/30 | | 25,111 | |
113,508 | | | | 7.000%, due 01/01/30 | | 116,937 | |
6,125 | | | | 7.000%, due 03/01/30 | | 6,319 | |
302,757 | | | | 7.000%, due 06/01/31 | | 312,461 | |
See Accompanying Notes to Financial Statements
68
| | PORTFOLIO OF INVESTMENTS |
ING INTERMEDIATE BOND FUND | | AS OF MARCH 31, 2006 (CONTINUED) |
Principal
Amount | | | | | | Value | |
| | | | Federal National Mortgage Association (continued) | | | |
$ | 1,164,874 | | | | 7.000%, due 08/01/35 | | $ | 1,200,040 | |
1,826 | | | | 7.500%, due 09/01/30 | | 1,909 | |
13,381 | | | | 7.500%, due 10/01/30 | | 13,991 | |
10,110 | | | | 7.500%, due 10/01/30 | | 10,570 | |
103,121 | | | | 7.500%, due 02/01/32 | | 107,892 | |
477,994 | | | | 7.500%, due 12/25/41 | | 495,372 | |
992,967 | | | | 7.500%, due 01/25/48 | | 1,022,611 | |
| | | | | | 198,123,887 | |
| | | | Government National Mortgage Association: 0.1% | | | |
12,653 | | | | 4.375%, due 04/20/28 | | 12,687 | |
1,232 | | | | 6.500%, due 03/15/31 | | 1,278 | |
18,394 | | | | 6.500%, due 08/15/31 | | 19,082 | |
52,102 | | | | 6.500%, due 10/15/31 | | 54,049 | |
25,451 | | | | 6.500%, due 11/15/31 | | 26,403 | |
22,063 | | | | 6.500%, due 07/15/32 | | 22,886 | |
160,516 | | | | 6.500%, due 09/15/32 | | 166,499 | |
75,582 | | | | 7.000%, due 04/15/26 | | 78,901 | |
33,613 | | | | 7.000%, due 05/15/32 | | 35,063 | |
97,015 | | | | 7.500%, due 12/15/22 | | 102,079 | |
6,053 | | | | 7.500%, due 10/15/26 | | 6,368 | |
25,421 | | | | 7.500%, due 07/15/29 | | 26,690 | |
131 | | | | 7.500%, due 11/15/30 | | 138 | |
20,398 | | | | 7.500%, due 12/15/30 | | 21,408 | |
40,606 | | | | 7.500%, due 12/15/31 | | 42,613 | |
33,064 | | | | 7.500%, due 05/15/32 | | 34,690 | |
39,367 | | | | 7.500%, due 05/15/32 | | 41,302 | |
| | | | | | 692,136 | |
| | | | Total U.S. Government Agency Obligations
(Cost $302,130,407) | | 297,660,253 | |
| | | | | | | |
U.S. TREASURY OBLIGATIONS: 15.9% | | | |
| | | |
| | | | U.S. Treasury Bond: 2.9% | | | |
7,272,000 | | S | | 0.000%, due 05/15/16 | | 4,412,395 | |
5,212,000 | | L | | 5.375%, due 02/15/31 | | 5,488,074 | |
7,583,000 | | L | | 6.000%, due 02/15/26 | | 8,463,341 | |
7,500,000 | | L | | 6.250%, due 08/15/23 | | 8,508,405 | |
| | | | | | 26,872,215 | |
| | | | U.S. Treasury Note: 12.9% | | | |
11,129,000 | | L | | 4.500%, due 02/15/09 | | 11,035,973 | |
75,721,000 | | L | | 4.500%, due 02/28/11 | | 75,525,782 | |
26,553,000 | | L | | 4.500%, due 02/15/16 | | 25,833,175 | |
7,892,000 | | L | | 4.625%, due 02/29/08 | | 7,863,638 | |
| | | | | | 120,258,568 | |
| | | | U.S. Treasury STRIP: 0.1% | | | |
3,659,688 | | | | 2.933%, due 02/17/29 | | 265,302 | |
1,112,456 | | | | 3.499%, due 06/16/31 | | 88,583 | |
| | | | | | 353,885 | |
| | | | | | | |
| | | | Total U.S. Treasury Obligations | | | |
| | | | (Cost $148,891,910) | | 147,484,668 | |
| | | | | | | |
ASSET-BACKED SECURITY: 5.7% | | | |
| | | |
| | | | Automobile Asset Backed Securities: 1.2% | | | |
| 654,419 | | | | Capital Auto Receivables Asset Trust, 2.750%, due 04/16/07 | | | 651,483 | |
200,000 | | | | Capital One Auto Finance Trust, 3.180%, due 09/15/10 | | 196,506 | |
193,000 | | | | Capital One Prime Auto Receivables Trust, 5.010%, due 11/15/11 | | 191,914 | |
1,691,000 | | | | Carmax Auto Owner Trust, 4.210%, due 01/15/10 | | 1,666,059 | |
204,000 | | | | Daimler Chrysler Auto Trust, 3.490%, due 12/08/08 | | 201,557 | |
623,000 | | | | Honda Auto Receivables Owner Trust, 2.790%, due 03/16/09 | | 610,644 | |
917,000 | | | | Honda Auto Receivables Owner Trust, 3.820%, due 05/21/10 | | 890,812 | |
315,158 | | | | Household Automotive Trust, 2.310%, due 04/17/08 | | 313,970 | |
1,250,000 | | | | Nissan Auto Receivables Owner Trust, 2.050%, due 03/16/09 | | 1,223,001 | |
1,023,124 | | | | Nissan Auto Receivables Owner Trust, 2.610%, due 07/15/08 | | 1,010,399 | |
90,000 | | | | Nissan Auto Receivables Owner Trust, 4.160%, due 08/25/34 | | 88,487 | |
1,965,000 | | | | Nissan Auto Receivables Owner Trust, 4.190%, due 07/15/09 | | 1,936,698 | |
1,560,000 | | | | Nissan Auto Receivables Owner Trust, 4.740%, due 09/15/09 | | 1,548,882 | |
174,653 | | | | USAA Auto Owner Trust, 2.040%, due 02/16/10 | | 172,946 | |
| | | | | | 10,703,358 | |
| | | | Credit Card Asset Backed Securities: 1.1% | | | |
560,000 | | | | Bank One Issuance Trust, 4.540%, due 09/15/10 | | 551,586 | |
530,000 | | | | Capital One Master Trust, 4.900%, due 03/15/10 | | 528,391 | |
800,000 | | | | Citibank Credit Card Issuance Trust, 3.100%, due 03/10/10 | | 769,604 | |
2,583,000 | | | | Citibank Credit Card Issuance Trust, 4.850%, due 02/10/11 | | 2,557,568 | |
2,285,000 | | | | Citibank Credit Card Issuance Trust, 5.650%, due 06/16/08 | | 2,289,324 | |
44,000 | | | | Citibank Credit Card Issuance Trust, 6.875%, due 11/16/09 | | 45,144 | |
See Accompanying Notes to Financial Statements
69
| | PORTFOLIO OF INVESTMENTS |
ING INTERMEDIATE BOND FUND | | AS OF MARCH 31, 2006 (CONTINUED) |
Principal
Amount | | | | | | Value | |
| | | | Credit Card Asset Backed Securities (continued) | | | |
$ | 2,429,000 | | | | Citibank Credit Card Master Trust I, 5.875%, due 03/10/11 | | $ | 2,474,428 | |
193,000 | | | | Discover Card Master Trust I, 5.150%, due 10/15/09 | | 192,931 | |
322,000 | | | | MBNA Credit Card Master Note Trust, 4.900%, due 07/15/11 | | 319,979 | |
589,000 | | | | MBNA Master Credit Card Trust USA, 5.900%, due 08/15/11 | | 601,498 | |
| | | | | | 10,330,453 | |
| | | | Home Equity Asset Backed Securities: 1.3% | | | |
402,108 | | | | Bayview Financial Acquisition Trust, 5.321%, due 09/28/43 | | 402,653 | |
78,000 | | + | | Centex Home Equity, 4.140%, due 03/25/28 | | 76,802 | |
197,885 | | | | Freddie Mac, 4.968%, due 01/25/32 | | 198,023 | |
650,582 | | | | Freddie Mac, 5.068%, due 05/25/31 | | 650,891 | |
516,639 | | | | GMAC Mortgage Corp. Loan Trust, 5.048%, due 12/25/20 | | 517,075 | |
4,851,000 | | S | | GSAA Trust, 5.242%, due 06/25/34 | | 4,750,761 | |
103,005 | | | | Merrill Lynch Mortgage Investors, Inc., 5.178%, due 07/25/34 | | 103,257 | |
371,799 | | | | New Century Home Equity Loan Trust, 5.068%, due 08/25/34 | | 372,111 | |
134,291 | | | | New Century Home Equity Loan Trust, 5.378%, due 07/25/30 | | 134,385 | |
1,465,320 | | | | QFA Royalties LLC, 7.300%, due 02/20/25 | | 1,470,815 | |
638,000 | | + | | Renaissance Home Equity Loan Trust, 4.456%, due 05/25/35 | | 626,402 | |
820,000 | | + | | Renaissance Home Equity Loan Trust, 4.723%, due 11/25/35 | | 808,889 | |
698,000 | | + | | Renaissance Home Equity Loan Trust, 5.608%, due 05/25/36 | | 697,983 | |
255,578 | | | | Residential Asset Securities Corp., 5.118%, due 06/25/32 | | 255,947 | |
187,683 | | | | Residential Asset Securities Corp., 5.278%, due 09/25/31 | | 187,802 | |
984,000 | | | | Wells Fargo Home Equity Trust, 3.970%, due 09/25/24 | | 961,361 | |
| | | | | | 12,215,157 | |
| | | | Other Asset Backed Securities: 2.1% | | | |
| 74,161 | | | | Amortizing Residential Collateral Trust, 5.318%, due 05/25/32 | | | 74,258 | |
5,456 | | | | Chase Funding Mortgage Loan, 2.734%, due 09/25/24 | | 5,430 | |
15,000 | | | | Chase Funding Mortgage Loan, 4.045%, due 05/25/33 | | 14,759 | |
596,108 | | | | Chase Funding Mortgage Loan, 5.118%, due 07/25/33 | | 597,618 | |
951,000 | | | | Countrywide Asset-Backed Certificates, 4.493%, due 02/25/36 | | 935,788 | |
1,331,000 | | + | | Credit-Based Asset Servicing and Securitization, 5.501%, due 12/25/36 | | 1,336,156 | |
2,861,774 | | | | Lehman XS Trust, 5.098%, due 08/25/35 | | 2,871,391 | |
3,818,936 | | S | | Long Beach Mortgage Loan Trust, 5.148%, due 01/25/36 | | 3,831,371 | |
3,846,000 | | S | | Merrill Lynch Mortgage Investors, Inc., 5.018%, due 01/25/37 | | 3,846,000 | |
989,000 | | + | | Merrill Lynch Mortgage Investors, Inc., 5.609%, due 03/25/37 | | 989,000 | |
524,000 | | | | Popular ABS Mortgage Pass-Through Trust, 3.735%, due 12/25/34 | | 518,316 | |
524,000 | | | | Popular ABS Mortgage Pass-Through Trust, 4.000%, due 12/25/34 | | 513,964 | |
698,000 | | | | Popular ABS Mortgage Pass-Through Trust, 4.596%, due 11/25/35 | | 687,781 | |
1,000,000 | | | | Residential Asset Mortgage Products, Inc., 5.088%, due 07/25/35 | | 1,002,052 | |
54,126 | | | | Residential Asset Mortgage Products, Inc., 5.128%, due 06/25/33 | | 54,222 | |
2,160,409 | | + | | Structured Asset Securities Corp., 6.000%, due 03/25/34 | | 2,157,981 | |
| | | | | | 19,436,087 | |
| | | | Total Asset-Backed Securities
(Cost $53,296,311) | | 52,685,055 | |
| | | | | | | |
COLLATERALIZED MORTGAGE OBLIGATIONS: 26.1% | | | |
| | | |
| | | | Commercial Mortgage Backed Securities: 6.5% | | | |
1,609,000 | | | | Banc of America Commercial Mortgage, Inc., 4.502%, due 07/10/42 | | 1,540,419 | |
6,262,000 | | S | | Banc of America Commercial Mortgage, Inc., 4.611%, due 07/10/43 | | 6,095,742 | |
See Accompanying Notes to Financial Statements
70
| | PORTFOLIO OF INVESTMENTS |
ING INTERMEDIATE BOND FUND | | AS OF MARCH 31, 2006 (CONTINUED) |
Principal
Amount | | | | | | Value | |
| | | | Commercial Mortgage Backed Securities (continued) | | | |
$ | 1,114,000 | | | | Banc of America Commercial Mortgage, Inc., 4.764%, due 07/10/45 | | $ | 1,086,384 | |
2,130,000 | | | | Banc of America Commercial Mortgage, Inc., 4.772%, due 07/11/43 | | 2,096,555 | |
2,210,000 | | | | Banc of America Commercial Mortgage, Inc., 4.891%, due 07/10/45 | | 2,137,723 | |
1,524,000 | | | | Bear Stearns Commercial Mortgage Securities, 3.880%, due 08/13/39 | | 1,456,242 | |
321,000 | | | | Bear Stearns Commercial Mortgage Securities, 4.030%, due 02/13/46 | | 305,930 | |
1,527,000 | | | | Bear Stearns Commercial Mortgage Securities, 4.170%, due 01/12/41 | | 1,481,120 | |
696,000 | | | | Bear Stearns Commercial Mortgage Securities, 4.565%, due 07/11/42 | | 667,716 | |
672,000 | | | | Capco America Securitization Corp., 6.260%, due 10/15/30 | | 685,490 | |
456,000 | | | | Capco America Securitization Corp., 6.460%, due 10/15/30 | | 469,428 | |
1,950,000 | | | | Chase Manhattan Bank-First Union National Bank, 7.439%, due 08/15/31 | | 2,064,381 | |
1,093,000 | | | | Commercial Mortgage Pass Through Certificates, 3.600%, due 03/10/39 | | 1,046,400 | |
959,058 | | | | CS First Boston Mortgage Securities Corp., 3.727%, due 03/15/35 | | 917,064 | |
451,000 | | | | CS First Boston Mortgage Securities Corp., 4.321%, due 01/15/37 | | 429,566 | |
975,000 | | | | CS First Boston Mortgage Securities Corp., 4.801%, due 03/15/36 | | 935,049 | |
646,000 | | | | CS First Boston Mortgage Securities Corp., 5.183%, due 11/15/36 | | 636,227 | |
1,000,000 | | | | DLJ Commercial Mortgage Corp., 6.460%, due 03/10/32 | | 1,028,674 | |
688,000 | | | | DLJ Commercial Mortgage Corp., 7.300%, due 06/10/32 | | 724,792 | |
2,397,335 | | | | GE Capital Commercial Mortgage Corp., 3.752%, due 07/10/39 | | 2,330,348 | |
698,000 | | | | GE Capital Commercial Mortgage Corp., 4.371%, due 01/10/38 | | 671,991 | |
483,000 | | | | GE Capital Commercial Mortgage Corp., 4.865%, due 07/10/39 | | 469,566 | |
| 488,450 | | | | JP Morgan Chase Commercial Mortgage Securities Corp., 4.200%, due 07/12/35 | | | 472,266 | |
1,700,000 | | | | JP Morgan Chase Commercial Mortgage Securities Corp., 4.223%, due 01/15/42 | | 1,638,026 | |
1,613,994 | | | | JP Morgan Chase Commercial Mortgage Securities Corp., 4.275%, due 01/12/37 | | 1,561,254 | |
4,263,000 | | S | | JP Morgan Chase Commercial Mortgage Securities Corp., 5.857%, due 10/12/35 | | 4,336,633 | |
2,706,088 | | | | JP Morgan Chase Commercial Mortgage Securities Corp., 6.244%, due 04/15/35 | | 2,741,645 | |
866,000 | | | | LB-UBS Commercial Mortgage Trust, 3.992%, due 10/15/29 | | 830,497 | |
225,000 | | | | LB-UBS Commercial Mortgage Trust, 4.310%, due 02/15/30 | | 217,090 | |
255,000 | | | | LB-UBS Commercial Mortgage Trust, 4.510%, due 12/15/29 | | 243,982 | |
289,000 | | | | LB-UBS Commercial Mortgage Trust, 4.567%, due 06/15/29 | | 283,416 | |
1,010,000 | | | | LB-UBS Commercial Mortgage Trust, 4.998%, due 04/15/30 | | 987,042 | |
2,961,000 | | | | LB-UBS Commercial Mortgage Trust, 6.226%, due 03/15/26 | | 3,035,204 | |
1,703,000 | | | | LB-UBS Commercial Mortgage Trust, 7.370%, due 08/15/26 | | 1,822,816 | |
981,000 | | | | Merrill Lynch Mortgage Trust, 4.892%, due 02/12/42 | | 952,020 | |
1,320,000 | | | | Morgan Stanley Capital I, 4.827%, due 06/12/47 | | 1,277,355 | |
3,470,000 | | | | Morgan Stanley Capital I, 5.007%, due 01/14/42 | | 3,392,971 | |
400,000 | | | | Morgan Stanley Capital I, 7.020%, due 03/15/32 | | 415,998 | |
2,196,165 | | | | Mortgage Capital Funding, Inc., 6.663%, due 03/18/30 | | 2,229,101 | |
1,038,000 | | | | Nomura Asset Securities Corp., 6.690%, due 03/15/30 | | 1,104,026 | |
3,666,377 | | S | | Prudential Commercial Mortgage Trust, 3.669%, due 02/11/36 | | 3,492,398 | |
400,000 | | | | Salomon Brothers Mortgage Securities VII, 7.520%, due 12/18/09 | | 426,065 | |
| | | | | | 60,736,612 | |
See Accompanying Notes to Financial Statements
71
| | PORTFOLIO OF INVESTMENTS |
ING INTERMEDIATE BOND FUND | | AS OF MARCH 31, 2006 (CONTINUED) |
Principal
Amount | | | | | | Value | |
| | | | Whole Loan Collateral PAC: 0.1% | | | |
$ | 92,335 | | | | Countrywide Alternative Loan Trust, 5.218%, due 02/25/33 | | $ | 92,509 | |
757,949 | | | | MASTR Alternative Loans Trust, 8.500%, due 05/25/33 | | 771,103 | |
672,761 | | | | Residential Funding Mtg Sec I, 5.218%, due 11/25/17 | | 674,261 | |
| | | | | | 1,537,873 | |
| | | | Whole Loan Collateralized Mortage Obligations: 19.4% | | | |
488,126 | | | | ABN Amro Mortgage Corp., 5.318%, due 03/25/18 | | 487,866 | |
9,429,971 | | S | | American Home Mortgage Investment Trust, 5.108%, due 11/25/45 | | 9,451,337 | |
4,714,986 | | | | American Home Mortgage Investment Trust, 5.258%, due 11/25/45 | | 4,740,350 | |
6,337,823 | | | | Banc of America Funding Corp., 5.279%, due 09/20/35 | | 6,148,322 | |
3,134,489 | | | | Banc of America Funding Corp., 5.750%, due 09/20/34 | | 3,066,668 | |
1,118,957 | | | | Banc of America Mortgage Securities, 5.250%, due 11/25/19 | | 1,096,917 | |
2,262,186 | | | | Banc of America Mortgage Securities, 5.500%, due 06/25/35 | | 2,211,809 | |
1,062,000 | | | | Banc of America Mortgage, 6.500%, due 03/25/36 | | 1,077,080 | |
1,558,248 | | | | Bear Stearns Alt-A Trust, 5.138%, due 07/25/34 | | 1,560,983 | |
11,469,081 | | S | | Bear Stearns Asset Backed Securities, Inc., 5.148%, due 11/25/35 | | 11,474,626 | |
318,374 | | | | Citicorp Mortgage Securities, Inc., 5.268%, due 03/25/33 | | 319,979 | |
1,982,474 | | | | Citigroup Mortgage Loan Trust, Inc., 4.938%, due 02/25/35 | | 1,984,226 | |
7,695,090 | | S | | Citigroup Mortgage Loan Trust, Inc., 6.000%, due 10/25/35 | | 7,664,728 | |
994,398 | | | | Countrywide Alternative Loan Trust, 5.118%, due 02/25/35 | | 995,428 | |
443,815 | | | | Countrywide Alternative Loan Trust, 5.318%, due 07/25/35 | | 447,093 | |
920,419 | | | | Countrywide Alternative Loan Trust, 5.368%, due 04/25/33 | | 923,564 | |
7,968,473 | | S | | Countrywide Alternative Loan Trust, 5.414%, due 10/25/35 | | 7,824,110 | |
| 3,507,450 | | S | | Countrywide Alternative Loan Trust, 5.500%, due 02/25/25 | | | 3,457,104 | |
1,880,000 | | | | Countrywide Alternative Loan Trust, 6.000%, due 03/01/49 | | 1,890,857 | |
5,105,521 | | S | | Countrywide Home Loan Mortgage Pass-Through Trust, 5.004%, due 02/25/35 | | 5,134,623 | |
682,950 | | | | Countrywide Home Loan Mortgage Pass-Through Trust, 5.318%, due 04/25/18 | | 687,980 | |
7,165,637 | | S | | First Horizon Alternative Mortgage Securities, 5.500%, due 08/25/35 | | 7,025,198 | |
588,444 | | S | | First Horizon Asset Securities, Inc., 5.400%, due 10/25/35 | | 580,830 | |
1,075,191 | | | | Freddie Mac, 5.399%, due 04/15/32 | | 1,090,282 | |
1,833,724 | | | | GMAC Mortgage Corp. Loan Trust, 4.598%, due 10/19/33 | | 1,773,706 | |
4,299,243 | | S | | GMAC Mortgage Corp. Loan Trust, 5.264%, due 03/18/35 | | 4,249,533 | |
844,252 | | # | | GSMPS Mortgage Loan Trust, 5.168%, due 01/25/35 | | 848,021 | |
738,183 | | S | | GSR Mortgage Loan Trust, 5.318%, due 06/25/35 | | 738,253 | |
1,741,174 | | | | Harborview Mortgage Loan Trust, 5.126%, due 01/19/35 | | 1,745,397 | |
963,655 | | | | Homebanc Mortgage Trust, 5.248%, due 08/25/29 | | 966,086 | |
389,378 | | | | JP Morgan Alternative Loan Trust, 5.521%, due 01/25/36 | | 387,140 | |
4,460,497 | | | | MASTR Adjustable Rate Mortgages Trust, 5.365%, due 06/25/35 | | 4,330,888 | |
3,078,545 | | | | MASTR Alternative Loans Trust, 5.500%, due 01/25/20 | | 3,031,006 | |
233,586 | | | | MASTR Alternative Loans Trust, 6.500%, due 05/25/33 | | 233,677 | |
2,561,238 | | | | MASTR Seasoned Securities Trust, 5.218%, due 10/25/32 | | 2,566,622 | |
2,771,810 | | | | MLCC Mortgage Investors, Inc., 5.048%, due 04/25/29 | | 2,774,708 | |
925,960 | | | | MLCC Mortgage Investors, Inc., 5.138%, due 01/25/29 | | 926,958 | |
1,724,660 | | | | MLCC Mortgage Investors, Inc., 5.138%, due 10/25/28 | | 1,725,480 | |
See Accompanying Notes to Financial Statements
72
| | PORTFOLIO OF INVESTMENTS |
ING INTERMEDIATE BOND FUND | | AS OF MARCH 31, 2006 (CONTINUED) |
Principal
Amount | | | | | | Value | |
| | | | Whole Loan Collateralized Mortage Obligations (continued) | | | |
$ | 3,981,967 | | | | Residential Accredit Loans, Inc., 5.218%, due 04/25/35 | | $ | 3,999,932 | |
6,919,611 | | | | Residential Accredit Loans, Inc., 5.318%, due 08/25/35 | | 6,973,451 | |
1,047,183 | | | | Sequoia Mortgage Trust, 5.046%, due 01/20/35 | | 1,048,698 | |
320,291 | | | | Sequoia Mortgage Trust, 5.086%, due 11/20/33 | | 320,552 | |
1,562,645 | | | | Structured Adjustable Rate Mortgage Loan Trust, 5.128%, due 07/25/35 | | 1,569,369 | |
2,759,071 | | | | Structured Asset Mortgage Investments, Inc., 5.016%, due 04/19/35 | | 2,762,872 | |
8,567,365 | | S | | Structured Asset Mortgage Investments, Inc., 5.781%, due 12/27/35 | | 8,717,294 | |
3,301,051 | | | | Suntrust Alternative Loan Trust, 6.500%, due 12/25/35 | | 3,323,193 | |
1,108,425 | | | | Thornburg Mortgage Securities Trust, 5.168%, due 12/25/33 | | 1,113,750 | |
3,927,821 | | S | | Thornburg Mortgage Securities Trust, 5.188%, due 09/25/34 | | 3,947,426 | |
8,629,879 | | S | | Washington Mutual Alternative Mortgage Pass-Through Certs, 5.750%, due 02/25/36 | | 8,573,139 | |
3,950,202 | | | | Washington Mutual Alternative Mortgage Pass-Through Certs, 6.500%, due 03/25/36 | | 3,974,367 | |
998,366 | | | | Washington Mutual MSC Mortgage Pass-Through CTFS, 5.318%, due 01/25/18 | | 1,001,477 | |
89,931 | | | | Washington Mutual MSC Mortgage Pass-Through CTFS, 5.418%, due 03/25/33 | | 90,043 | |
1,643,890 | | | | Washington Mutual, Inc., 5.045%, due 06/25/44 | | 1,647,344 | |
1,891,897 | | | | Washington Mutual, Inc., 5.068%, due 01/25/45 | | 1,894,628 | |
1,248,554 | | | | Washington Mutual, Inc., 5.128%, due 01/25/45 | | 1,254,478 | |
2,765,499 | | | | Washington Mutual, Inc., 5.218%, due 08/25/45 | | 2,780,836 | |
6,547,921 | | | | Washington Mutual, Inc., 5.627%, due 01/25/36 | | 6,474,001 | |
2,130,967 | | | | Washington Mutual, Inc., 6.000%, due 06/25/34 | | 2,116,317 | |
2,160,000 | | | | Wells Fargo Mortgage Backed Securities Trust, 4.500%, due 08/25/18 | | 2,032,060 | |
6,896,320 | | | | Wells Fargo Mortgage Backed Securities Trust, 5.388%, due 08/25/35 | | 6,788,362 | |
| | | | | | 180,043,024 | |
| | | | Whole Loan Collateral Support CMO: 0.1% | | | |
| 868,819 | | | | Banc of America Mortgage Securities, 5.500%, due 11/25/33 | | | 846,645 | |
| | | | | | 846,645 | |
| | | | Total Collateralized Mortgage Obligations
(Cost $246,695,589) | | 243,164,154 | |
| | | | | | | |
OTHER BONDS: 0.2% | | | |
| | | | Sovereign: 0.2% | | | |
1,224,000 | | @@,L | | Mexico Government International Bond, 6.750%, due 09/27/34 | | 1,266,840 | |
366,101 | | @@ | | Republica Orient Uruguay, 10.500%, due 10/20/06 | | 543,666 | |
| | | | Total Other Bonds (Cost $1,688,562) | | 1,810,506 | |
| | | | | | | |
MUNICIPAL BONDS: 0.0% | | | |
| | | | Municipal: 0.0% | | | |
285,000 | | | | City of New York NY, 5.000%, due 04/01/35 | | 292,259 | |
| | | | Total Municipal Bond
(Cost $291,614) | | 292,259 | |
Shares | | | | | | Value | |
| | | |
PREFERRED STOCK: 2.1% | | | |
| | | | Banks: 0.5% | | | |
448 | | | | DG Funding Trust | | 4,753,000 | |
| | | | | | 4,753,000 | |
| | | | Diversified Financial Services: 0.5% | | | |
142,000 | | | | Merrill Lynch & Co., Inc. | | 3,615,320 | |
41,975 | | | | National Rural Utilities Cooperative Finance Corp. | | 988,092 | |
| | | | | | 4,603,412 | |
| | | | Insurance: 0.8% | | | |
47,306 | | @@ | | Aegon NV | | 1,211,034 | |
125,557 | | @@ | | Aegon NV | | 3,126,369 | |
126,650 | | | | Metlife, Inc. | | 3,239,707 | |
| | | | | | 7,577,110 | |
| | | | Real Estate Investment Trust: 0.3% | | | |
103,025 | | | | Duke Realty Corp. | | 2,658,044 | |
| | | | | | 2,658,044 | |
| | | | Total Preferred Stock
(Cost $19,611,897) | | 19,591,566 | |
| | | | | | | |
WARRANTS: 0.0% | | | |
| | | | Telecommunications: 0.0% | | | |
20 | | @ | | American Tower Corp. | | 8,552 | |
| | | | Total Warrants
(Cost $1,501) | | 8,552 | |
| | | | Total Long-Term Investments:
(Cost $1,039,046,627) | | $ | 1,024,602,270 | |
| | | | | | | | |
See Accompanying Notes to Financial Statements
73
| | PORTFOLIO OF INVESTMENTS |
ING INTERMEDIATE BOND FUND | | AS OF MARCH 31, 2006 (CONTINUED) |
Principal
Amount | | | | | | Value | |
SHORT-TERM INVESTMENT: 22.8% | | | | | |
| | | | | |
| | Repurchase Agreement: 3.1% | | | | | |
$ | 28,577,000 | | Goldman Sachs, Repurchase Agreement dated, 03/31/06, 4.790%, due 04/03/06 $28,588,407 to be received upon repurchase (Collateralized by $24,461,000 Treasury Inflation Note, 3.375%,Market Value plus accrued interest $29,149,379, due 01/15/12) | | | | $ | 28,577,000 | |
| | Total Repurchase Agreements:
(Cost $28,577,000) | | | | 28,577,000 | |
| | Securities Lending CollateralCC: 19.7% | | | | | |
183,250,296 | | The Bank of New York Institutional Cash Reserves Fund | | | | 183,250,298 | |
| | Total Securities Lending Collateral
(Cost $183,250,298) | | | | 183,250,298 | |
| | Total Short-Term Investments:
(Cost $211,827,298) | | | | 211,827,298 | |
| | Total Investments in Securities
(Cost $1,250,873,925)* | | 133.0 | % | $ | 1,236,429,568 | |
| | Other Assets and Liabilities-Net | | (33.0 | ) | (306,873,833 | ) |
| | Net Assets | | 100.0 | % | $ | 929,555,735 | |
| | | | | | | | | |
@@ | Foreign Issuer |
STRIP | Separate Trading of Registered Interest and Principal of Securities |
+ | Variable rate basis bonds. Interest rates shown reflect current coupon rates. |
# | Securities with purchases pursuant to Rule 144A, under the Securities Act of 1933 and may not be resold subject to that rule except to qualified institutional buyers. These securities have been determined to be liquid under the guidelines established by the Funds’ Board of Directors/Trustees. |
CC | Securities purchased with cash collateral for securities loaned. |
W | When-issued or delayed delivery security. |
S | Segregated securities for certain derivatives, when-issued or delayed delivery securities and forward currency exchange contracts. |
I | Illiquid security |
L | Loaned security, a portion or all of the security is on loan at March 31, 2006. |
MASTR | Mortgage Asset Securitization Transaction, Inc. |
* | Cost for federal income tax purposes is $1,252,140,461. |
| | Net unrealized depreciation consists of: | | | | | |
| | Gross Unrealized Appreciation | | | | $ | 709,900 | |
| | Gross Unrealized Depreciation | | | | (16,420,793 | ) |
| | Net Unrealized Depreciation | | | | $ | (15,710,893 | ) |
Information concerning open future contracts at March 31, 2006 is shown below:
Long Contracts | | No. of
Contracts | | Notional
Market Value | | Expiration
Date | | Unrealized
Gain (Loss) | |
U.S. 10 Year Note Future | | 170 | | $ | 18,086,407 | | 06/21/06 | | $ | (223,974 | ) |
U.S. Long Bond Future | | 160 | | 17,465,000 | | 06/21/06 | | (599,550 | ) |
90Day Euro Future | | 739 | | 175,022,913 | | 09/18/06 | | (256,352 | ) |
| | | | | | | | $ | (1,079,876 | ) |
Short Contracts | | | | | | | | | |
U.S. 2 Year Note | | 110 | | $ | (22,424,532 | ) | 06/30/06 | | $ | 37,262 | |
U.S. 5 Year Note | | 14 | | (1,462,125 | ) | 06/30/06 | | 8,243 | |
90Day Euro Future | | 739 | | (175,133,763 | ) | 03/19/07 | | 329,812 | |
| | | | | | | | $ | 375,317 | |
Information concerning the Interest Rate Swap Agreements outstanding for the ING Intermediate Bond Fund at March 31, 2006, is shown below:
| | Termination
Date | | Unrealized
Appreciation
(Depreciation) | |
Receive a floating rate equal to 6-month USD-LIBOR plus 2.255% on $6,934,305 and pay a floating rate equal to 1.0% on ¥1,500,000,000 upon termination of the contract, receive $6,934,305 and pay ¥1,500,000,000. Counterparty: UBS AG | | 03/01/34 | | $ | 99,556 | |
| | | | $ | 99,556 | |
Information concerning the Credit Default Swap Agreements outstanding for the ING Intermediate Bond Fund at March 31, 2006, is shown below:
| | Termination
Date | | Notional
Principal | | Unrealized
Appreciation
(Depreciation) | |
Dow Jones CDX.EM.5 Index Receive $2,739,000 upon event of default and pay 1.35% Counterparty: Morgan Stanley Capital Services, Inc. | | 06/20/11 | | $ | 2,739,000 | | $ | (22,571 | ) |
Dow Jones CDX.EM.5 Index Receive $41,080,000 upon event of default and pay 0.40% Counterparty: UBS AG | | 06/20/11 | | 41,080,000 | | 16,724 | |
General Motors Acceptance Corporation Receive $1,354,500 upon event of default and pay 4.00% Counterparty: UBS AG | | 03/20/11 | | 1,354,500 | | (22,275 | ) |
General Motors Acceptance Corporation Receive $1,354,500 upon event of default and pay 4.10% Counterparty: UBS AG | | 03/20/11 | | 1,354,500 | | (27,743 | ) |
General Motors Acceptance Corporation Receive $1,360,000 upon event of default and pay 4.75% Counterparty: UBS AG | | 03/20/11 | | 1,360,000 | | (67,846 | ) |
General Motors Acceptance Corporation Receive $4,132,000 upon event of default and pay 3.90% Counterparty: UBS AG | | 06/20/11 | | 4,132,000 | | — | |
General Motors Acceptance Corporation Receive $1,390,000 upon event of default and pay 3.65% Counterparty: UBS AG | | 06/20/11 | | 1,390,000 | | — | |
Georgia Pacific Receive $531,000 upon event of default and pay 3.55% Counterparty: Citigroup | | 12/20/10 | | 531,000 | | (35,859 | ) |
| | | | | | $ | (159,570 | ) |
| | | | | | | | | |
See Accompanying Notes to Financial Statements
74
| | PORTFOLIO OF INVESTMENTS |
ING NATIONAL TAX-EXEMPT BOND FUND | | AS OF MARCH 31, 2006 |
Principal
Amount | | | | Rating(1) | | Value | |
MUNICIPAL BOND: 97.4% | | | | | |
| | | | | |
| | California: 8.1% | | | | | |
$ | 1,000,000 | | Pleasant Valley School District-Ventura County CA, 5.850%, due 08/01/31 | | Aaa/AAA | | $ | 1,185,470 | |
500,000 | | San Marcos California Public Facility Authority Tax Allocation Reserve, 5.000%, due 08/01/21 | | Aaa/AAA | | 520,670 | |
500,000 | | State of California, 5.000%, due 01/01/08 | | Aa3/AA- | | 512,040 | |
| | | | | | 2,218,180 | |
| | Colorado: 5.7% | | | | | |
500,000 | | Colorado Health Facilities Authority, 5.350%, due 08/01/15 | | A3/AAA | | 512,265 | |
1,000,000 | | Interlocken Metropolitan District, 5.750%, due 12/15/19 | | NR/AA | | 1,067,040 | |
| | | | | | 1,579,305 | |
| | Connecticut: 2.0% | | | | | |
520,000 | | Connecticut State Development Authority SPL Obligation, 5.000%, due 10/15/23 | | Aaa/AAA | | 545,210 | |
| | | | | | 545,210 | |
| | Florida: 9.4% | | | | | |
250,000 | | City of Tallahassee, 6.375%, due 12/01/30 | | Baa2/NR | | 266,645 | |
500,000 | | Florida State Board of Education, 5.750%, due 06/01/22 | | Aa1/AAA | | 540,525 | |
750,000 | | Gulf Breeze FL, 5.050%, due 12/01/20 | | Aaa/AAA | | 791,648 | |
1,000,000 | | Orlando & Orange County Expressway Authority, 3.070%, due 07/01/32 | | Aaa/AAA | | 1,000,000 | |
| | | | | | 2,598,818 | |
| | Illinois: 8.7% | | | | | |
25,000 | | City of Chicago, IL, 5.000%, due 11/15/10 | | NR/A | | 25,898 | |
1,250,000 | | De Kalb-Ogle Etc Counties Community College, 5.750%, due 02/01/11 | | Aaa/NR | | 1,336,625 | |
1,000,000 | | State of Illinois, 5.000%, due 04/01/17 | | Aa3/AA | | 1,030,220 | |
| | | | | | 2,392,743 | |
| | Massachusetts: 0.5% | | | | | |
115,000 | | Massachusetts Health & Educational Facilities Authority, 6.500%, due 07/01/21 | | Baa2/BBB | | 125,948 | |
| | | | | | 125,948 | |
| | Nevada: 7.8% | | | | | |
1,000,000 | | County of Clark, 5.000%, due 06/01/32 | | Aaa/AAA | | 1,026,430 | |
1,100,000 | | Washoe County, 6.300%, due 12/01/14 | | Aaa/AAA | | 1,130,349 | |
| | | | | | 2,156,779 | |
| | New Mexico: 5.7% | | | | | |
| 1,000,000 | | Clovis Public Financing Authority, 5.000%, due 08/01/26 | | Aaa/NR | | | 1,040,410 | |
500,000 | | New Mexico Finance Authority, 5.000%, due 04/01/16 | | Aaa/AAA | | 528,680 | |
| | | | | | 1,569,090 | |
| | New York: 15.5% | | | | | |
780,000 | | Albany Industrial Development Agency, 7.750%, due 01/01/10 | | NR/NR | | 851,596 | |
1,000,000 | | City of New York, NY, 5.000%, due 08/01/24 | | A1/A+ | | 1,039,640 | |
500,000 | | Metropolitan Transportation Authority, 5.000%, due 11/15/22 | | Aaa/AAA | | 521,835 | |
1,000,000 | | New York State Dormitory Authority, 5.500%, due 07/01/15 | | Aaa/AAA | | 1,078,320 | |
5,000 | | Tobacco Settlement Financing Authority, 5.000%, due 06/01/10 | | A1/AA- | | 5,006 | |
775,000 | | Westchester County Industrial Development Agency, 4.750%, due 07/01/20 | | NR/A | | 776,387 | |
| | | | | | 4,272,784 | |
| | North Carolina: 3.9% | | | | | |
295,000 | | New Hanover County North Carolina, 5.750%, due 11/01/12 | | Aa2/AA | | 322,960 | |
710,000 | | Raleigh, North Carolina CTFS, 5.000%, due 02/01/24 | | Aa2/AA+ | | 736,646 | |
| | | | | | 1,059,606 | |
| | Ohio: 0.2% | | | | | |
55,000 | | Lakota Local School District, 7.000%, due 12/01/10 | | Aaa/AAA | | 62,652 | |
| | | | | | 62,652 | |
| | Oklahoma: 8.0% | | | | | |
1,000,000 | | Oklahoma Industries Authority, 6.000%, due 08/15/19 | | NR/AAA | | 1,075,648 | |
1,000,000 | | Payne County Economic Development Authority, 6.375%, due 06/01/30 | | Baa3/NR | | 1,117,810 | |
| | | | | | 2,193,458 | |
| | Pennsylvania: 7.6% | | | | | |
1,000,000 | | Lebanon County Health Facilities Authority, 6.000%, due 11/15/35 | | Baa2/BBB | | 1,066,770 | |
1,000,000 | | Philadelphia Hospitals & Higher Education Facilities Authority, 5.000%, due 05/15/18 | | Aa3/AA- | | 1,024,560 | |
| | | | | | 2,091,330 | |
| | Rhode Island: 0.5% | | | | | |
35,000 | | Dunns Corner Fire District/RI, 7.950%, due 06/01/06 | | NR/NR | | 35,241 | |
35,000 | | Dunns Corner Fire District/RI, 8.000%, due 06/01/07 | | NR/NR | | 36,683 | |
See Accompanying Notes to Financial Statements
75
| | PORTFOLIO OF INVESTMENTS |
ING NATIONAL TAX-EXEMPT BOND FUND | | AS OF MARCH 31, 2006 (CONTINUED) |
Principal
Amount | | | | Rating(1) | | Value | |
| | Rhode Island (continued) | | | | | |
$ | 35,000 | | Dunns Corner Fire District/RI, 8.050%, due 06/01/08 | | NR/NR | | $ | 38,018 | |
35,000 | | Dunns Corner Fire District/RI, 8.100%, due 06/01/09 | | NR/NR | | 39,269 | |
| | | | | | 149,211 | |
| | Tennessee: 0.9% | | | | | |
240,000 | | Knox County Tenn Health Educational & Housing, 5.750%, due 04/01/19 | | Baa1/NR | | 250,123 | |
| | | | | | 250,123 | |
| | Texas: 8.1% | | | | | |
1,000,000 | | Harris County Health Facilities Development Authority/TX, 5.750%, due 07/01/27 | | Aa3/AAA | | 1,174,050 | |
1,000,000 | | Laredo Independent School District/TX, 5.500%, due 08/01/20 | | Aaa/AAA | | 1,057,030 | |
| | | | | | 2,231,080 | |
| | Virginia: 1.0% | | | | | |
290,000 | | Virginia Housing Development Authority, 4.500%, due 04/01/24 | | Aaa/AAA | | 284,217 | |
| | | | | | 284,217 | |
| | Wisconsin: 3.8% | | | | | |
1,000,000 | | Badger TOB Asset Securitization Corp., 6.000%, due 06/01/17 | | Baa3/BBB | | 1,058,670 | |
| | | | | | 1,058,670 | |
| | Total Municipal Bonds
(Cost $26,311,357) | | | | 26,839,204 | |
| | Total Investments In Securities
(Cost $26,311,357)* | | 97.4 | % | $ | 26,839,204 | |
| | Other Assets and Liabilities-Net | | 2.6 | | 722,119 | |
| | Net Assets | | 100.0 | % | $ | 27,561,323 | |
| | | | | | | | | |
SPL | Special purpose loan |
TOB | Tobacco bonds |
* | Cost for federal income tax purposes is the same as for financial statement purposes. |
| Net unrealized appreciation consists of: |
| | | Gross Unrealized Appreciation | | | | $ | 752,099 | |
| | | Gross Unrealized Depreciation | | | | (224,252 | ) |
| | | Net Unrealized Appreciation | | | | $ | 527,847 | |
(1) Credit ratings are provided by Moody’s Investor’s Service, Inc. and Standards and Poor’s Rating Group (unaudited)
See Accompanying Notes to Financial Statements
76
| | PORTFOLIO OF INVESTMENTS |
ING CLASSIC MONEY MARKET FUND(1) | | AS OF MARCH 31, 2006 |
Principal
Amount | | | | | | Value | |
CERTIFICATE OF DEPOSIT: 3.8% | | | |
| | | | Federal Home Loan Mortgage Corporation: 0.2% | | | |
$ | 26,100,000 | | | | Washington Mutual Bank, 4.819%, due 05/31/06 | | $ | 26,100,094 | |
| | | | Total Certificate of Deposit
(Cost $26,100,094) | | 26,100,094 | |
| | | | | | | |
COLLATERALIZED MORTGAGE OBLIGATIONS: 3.9% | | | |
6,000,000 | | @@,# | | Cheyne High Grade ABS CDO Ltd., 4.740%, due 11/10/06 | | 6,000,000 | |
5,400,000 | | @@,#,I | | Newcastle CDO I Ltd., 4.839%, due 09/25/06 | | 5,400,000 | |
5,400,000 | | #,I | | Newcastle CDO III Corp., 4.839%, due 10/24/06 | | 5,400,000 | |
5,600,000 | | @@,# | | Putnam Structured Product CDO, 4.921%, due 05/15/06 | | 5,600,000 | |
4,050,000 | | @@,# | | Whitehawk CDO Funding Ltd., 4.930%, due 09/15/06 | | 4,050,000 | |
| | | | Total Collateralized
Mortgage Obligations
(Cost $26,450,000) | | 26,450,000 | |
| | | | | | | |
COMMERCIAL PAPER: 30.6% | | | |
1,050,000 | | @@ | | ANZ Delaware, Inc., 4.680%, due 04/17/06 | | 1,047,816 | |
14,000,000 | | | | Bank of America Corp., 4.800%, due 04/12/06 | | 13,979,467 | |
15,000,000 | | | | Barton Capital Corp., 4.800%, due 04/03/06 | | 14,996,000 | |
3,500,000 | | | | BNP Paribas Finance, Inc., 4.550%, due 04/04/06 | | 3,498,673 | |
5,950,000 | | | | Caisse, 4.550%, due 04/04/06 | | 5,947,744 | |
4,800,000 | | | | Caisse, 4.550%, due 04/13/06 | | 4,792,656 | |
32,586,000 | | | | Crown Point Capital Co., 4.730%, due 04/13/06 | | 32,534,623 | |
11,500,000 | | | | Duke Funding High Grade, 4.755%, due 04/19/06 | | 11,472,659 | |
6,500,000 | | | | Duke Funding, 4.755%, due 04/26/06 | | 6,478,243 | |
9,000,000 | | | | Goldman Sachs Group, Inc., 4.850%, due 04/06/06 | | 8,993,938 | |
8,500,000 | | I | | Goldman Sachs Group, Inc., 4.941%, due 02/14/07 | | 8,500,000 | |
1,000,000 | | | | HBOS Treasury Services PLC, 4.650%, due 04/03/06 | | 999,742 | |
13,000,000 | | | | Monument Gardens Funding LLC, 4.735%, due 04/20/06 | | 12,967,101 | |
9,000,000 | | | | Monument Gardens Funding LLC, 4.735%, due 04/21/06 | | 8,976,700 | |
10,000,000 | | | | Monument Gardens Funding LLC, 4.735%, due 05/24/06 | | 9,930,290 | |
9,420,000 | | | | Old Line Funding LLC, 4.640%, due 04/04/06 | | 9,416,358 | |
8,000,000 | | | | Park Ave. Receivables Corp., 4.620%, due 04/04/06 | | 7,996,920 | |
7,250,000 | | | | Preferred Receivable Funding Corp., 4.880%, due 04/04/06 | | 7,247,052 | |
5,756,000 | | | | Societe Generale NA, Inc., 4.870%, due 04/03/06 | | 5,754,443 | |
17,000,000 | | | | St. Germain Holdings Ltd., 4.610%, due 04/03/06 | | 16,995,646 | |
4,000,000 | | | | St. Germain Holdings Ltd., 4.610%, due 04/13/06 | | 3,993,733 | |
5,000,000 | | | | Swiss Re Financial Products, 4.830%, due 06/12/06 | | 4,951,700 | |
3,000,000 | | | | Tulip Funding Corp., 4.825%, due 06/01/06 | | 2,975,473 | |
| 4,740,000 | | | | Westpac Trust Securities Ltd., 4.620%, due 04/21/06 | | | 4,727,833 | |
935,000 | | | | Windmill Funding, 4.680%, due 04/11/06 | | 933,784 | |
| | | | Total Commercial Paper
(Cost $210,108,594) | | 210,108,594 | |
| | | | | | | |
CORPORATE BONDS/NOTES: 51.5% | | | |
15,000,000 | | # | | Allstate Life Global Funding II, 4.879%, due 11/09/06 | | 15,004,754 | |
11,600,000 | | | | American Express Bank FSB/Salt Lake City, UT, 4.778%, due 01/26/07 | | 11,600,000 | |
12,500,000 | | | | American Express Bank FSB/Salt Lake City, UT, 4.836%, due 12/01/06 | | 12,503,216 | |
2,950,000 | | | | American Express Bank FSB/Salt Lake City, UT, 4.880%, due 06/13/06 | | 2,950,116 | |
1,750,000 | | | | American General Finance Corp., 4.004%, due 07/14/06 | | 1,759,054 | |
1,000,000 | | | | American General Finance Corp., 4.909%, due 11/15/06 | | 1,000,830 | |
9,500,000 | | # | | American General Finance Corp., 4.931%, due 04/13/07 | | 9,499,895 | |
3,020,000 | | @@,# | | American Honda Finance Corp., 4.443%, due 04/03/06 | | 3,019,732 | |
9,500,000 | | @@,# | | American Honda Finance Corp., 4.899%, due 04/13/07 | | 9,500,000 | |
1,000,000 | | @@,# | | American Honda Finance Corp., 4.919%, due 08/15/06 | | 1,000,557 | |
3,750,000 | | # | | Bank of New York, 4.858%, due 04/27/07 | | 3,750,000 | |
3,990,000 | | | | Bank One Corp., 4.860%, due 08/11/06 | | 3,991,888 | |
7,500,000 | | | | Barclays Bank PLC/New York, 4.723%, due 06/21/06 | | 7,499,651 | |
1,010,000 | | | | Bear Stearns Cos, Inc., 4.811%, due 05/01/06 | | 1,011,301 | |
5,725,000 | | | | Bear Stearns Cos, Inc., 4.861%, due 04/27/07 | | 5,725,000 | |
5,800,000 | | | | Bear Stearns Cos, Inc., 4.880%, due 04/05/07 | | 5,800,000 | |
4,000,000 | | | | Bear Stearns Cos, Inc., 4.986%, due 03/01/07 | | 4,006,746 | |
13,250,000 | | | | BNP Paribas/New York, 4.710%, due 06/21/06 | | 13,249,012 | |
12,000,000 | | | | BNP Paribas SA, 4.969%, due 01/26/07 | | 12,000,000 | |
18,402,000 | | # | | Cargill, Inc., 4.536%, due 05/01/06 | | 18,426,282 | |
5,000,000 | | | | Caterpillar Financial Services Ltd., 5.143%, due 07/10/06 | | 5,001,412 | |
7,789,000 | | | | Citigroup, Inc., 4.643%, due 05/10/06 | | 7,797,459 | |
20,900,000 | | # | | Concord Minutemen Capital Co. LLC, 5.102%, due 04/11/07 | | 20,900,000 | |
2,605,000 | | | | Credit Suisse First Boston USA, Inc., 5.210%, due 06/19/06 | | 2,606,392 | |
See Accompanying Notes to Financial Statements
77
| | PORTFOLIO OF INVESTMENTS |
ING CLASSIC MONEY MARKET FUND(1) | | AS OF MARCH 31, 2006 |
Principal
Amount | | | | | | Value | |
CORPORATE NOTES (continued) | | | |
$ | 5,500,000 | | | | Credit Suisse/New York, NY, 4.620%, due 04/24/07 | | $ | 5,500,440 | |
1,000,000 | | | | Credit Suisse/New York, NY, 4.836%, due 08/01/06 | | 1,000,059 | |
2,000,000 | | | | General Electric Capital Corp., 4.910%, due 05/12/06 | | 2,000,410 | |
8,400,000 | | | | General Electric Capital Corp., 4.949%, due 04/09/07 | | 8,400,316 | |
10,400,000 | | | | General Electric Capital Corp., 5.060%, due 09/18/06 | | 10,406,695 | |
2,300,000 | | | | Goldman Sachs Group, Inc., 4.810%, due 10/27/06 | | 2,302,317 | |
6,390,000 | | | | Goldman Sachs Group, Inc., 4.866%, due 08/01/06 | | 6,391,180 | |
5,300,000 | | # | | Goldman Sachs Group, Inc., 4.951%, due 05/15/07 | | 5,300,000 | |
15,000,000 | | | | Greenwich Capital Holdings, Inc., 4.812%, due 05/11/06 | | 15,000,000 | |
4,200,000 | | @@,# | | HBOS Treasury Services PLC, 4.876%, due 05/01/07 | | 4,200,000 | |
7,600,000 | | @@,# | | HBOS Treasury Services PLC, 5.000%, due 04/24/07 | | 7,600,000 | |
5,000,000 | | | | Merrill Lynch & Co., 5.160%, due 06/19/06 | | 5,002,049 | |
11,500,000 | | #,I | | Money Market Trust, 4.976%, due 04/09/07 | | 11,500,000 | |
11,224,000 | | | | Morgan Stanley, 4.705%, due 04/15/06 | | 11,229,644 | |
12,000,000 | | | | Morgan Stanley, 4.888%, due 04/27/07 | | 12,010,857 | |
8,400,000 | | | | Morgan Stanley, 5.185%, due 01/12/07 | | 8,407,626 | |
30,000,000 | | | | PNC Bank NA, 4.792%, due 01/29/07 | | 29,999,297 | |
10,000,000 | | # | | Verizon Global Funding Corp., 5.020%, due 01/12/07 | | 10,000,000 | |
2,500,000 | | | | Wachovia Corp., 4.770%, due 02/06/07 | | 2,501,390 | |
1,000,000 | | | | Washington Mutual Bank, 4.973%, due 07/25/06 | | 1,001,050 | |
6,000,000 | | | | Washington Mutual Financial Corp., 4.677%, due 05/15/06 | | 6,011,000 | |
4,500,000 | | | | Wells Fargo & Co., 4.876%, due 05/02/07 | | 4,500,000 | |
3,300,000 | | | | Westpac Banking Corp./NY, 4.930%, due 04/11/07 | | 3,300,000 | |
| | | | Total Corporate Notes
(Cost $353,167,627) | | 353,167,627 | |
| | | | | | | |
U.S. GOVERNMENT AGENCY OBLIGATIONS: 3.1% | | | |
| | | | Federal Home Loan Bank: 3.1% | | | |
15,600,000 | | | | 4.769%, due 06/14/06 | | 15,598,332 | |
5,700,000 | | | | 4.819%, due 07/21/06 | | 5,700,000 | |
| | | | | | 21,298,332 | |
| | | | Total U.S. Government
Agency Obligations
(Cost $21,298,332) | | 21,298,332 | |
| | | | | | | |
REPURCHASE AGREEMENT: 6.7% | | | |
$ | 45,855,000 | | | | Morgan Stanley Repurchase Agreement dated 03/31/06, 4.800%, due 04/03/06, $45,873,342 to be received upon repurchase (Collateralized by $48,525,000 various U.S. Government Agency and Treasury obligations, 2.750% - 6.000%, market value plus accrued interest $46,789,826, due 06/30/06 - 09/29/25) | | $ | 45,855,000 | |
| | | | Total Repurchase Agreement
(Cost $45,855,000) | | 45,855,000 | |
| | | | Total Investments in Securities
(Cost $682,979,647)* | 99.6 | % | $ | 682,979,647 | |
| | | | Other Assets and Liabilities-Net | 0.4 | | 2,614,215 | |
| | | | Net Assets | 100.0 | % | $ | 685,593,862 | |
(1) | | All securities with a maturity date of greater than 13 months have either a variable rate, a demand feature, prerefunded, optional or mandatory put resulting in an effective maturity of one year or less. Rate shown reflects current rate. |
@@ | | Foreign Issuer |
# | | Securities with purchases pursuant to Rule 144A, under the Securities Act of 1933 and may not be resold subject to that rule except to qualified institutional buyers. These securities have been determined to be liquid under the guidelines established by the Funds’ Board of Directors/Trustees. |
I | | Illiquid security |
* | | Cost for federal income tax purposes is the same as for financial statement purposes. |
See Accompanying Notes to Financial Statements
78
ING INSTITUTIONAL PRIME | | PORTFOLIO OF INVESTMENTS |
MONEY MARKET FUND(1) | | AS OF MARCH 31, 2006 |
Principal
Amount | | | | | | Value | |
CERTIFICATES OF DEPOSIT: 1.4% | | | |
$ | 1,000,000 | | | | Washington Mutual Bank, 4.819%, due 05/31/06 | | $ | 1,000,011 | |
1,500,000 | | | | Wells Fargo Bank NA, 4.749%, due 07/24/06 | | 1,499,887 | |
| | | | Total Certificates of Deposit
(Cost $2,499,898) | | 2,499,898 | |
| | | | | | | |
COLLATERALIZED MORTGAGE OBLIGATIONS: 0.6% | | | |
1,000,000 | | @@,# | | Cheyne High Grade ABS CDO Ltd., 4.740%, due 11/10/06 | | 1,000,000 | |
| | | | Total Collateralized
Mortgage Obligations
(Cost $1,000,000) | | 1,000,000 | |
| | | |
COMMERICAL PAPER: 56.5% | | | |
3,450,000 | | | | ASK Bank Ltd., 4.610%, 04/04/06 | | 3,448,669 | |
2,000,000 | | | | ASK Bank Ltd., 4.610%, 04/11/06 | | 1,997,439 | |
1,108,000 | | | | ASK Bank Ltd., 4.610%, 05/22/06 | | 1,100,528 | |
6,000,000 | | | | Bank of America, 4.800%, due 04/12/06 | | 5,991,200 | |
579,000 | | | | CAFCO LLC, 4.800%, due 04/24/06 | | 577,224 | |
2,000,000 | | | | Caisse, 4.570%, due 04/04/06 | | 1,999,223 | |
4,000,000 | | | | Caisse, 4.570%, due 04/13/06 | | 3,993,880 | |
1,000,000 | | | | Concord Minutemen Capital Co. LLC, 4.490%, due 04/07/06 | | 999,252 | |
3,000,000 | | | | Crown Point Capital Co., 4.820%, due 04/13/06 | | 2,995,180 | |
500,000 | | | | Danske Corp., 4.700%, due 04/06/06 | | 499,674 | |
5,000,000 | | | | Danske Corp., 4.740%, due 04/07/06 | | 4,996,050 | |
852,000 | | | | Danske Corp., 4.740%, due 06/02/06 | | 844,854 | |
2,000,000 | | | | Dexia Delaware LLC, 4.560%, due 04/04/06 | | 1,999,242 | |
2,500,000 | | | | Dexia Delaware LLC, 4.560%, due 04/06/06 | | 2,498,412 | |
288,000 | | | | Edison Asset Securitization Corp., 4.605%, due 04/03/06 | | 287,926 | |
1,580,000 | | | | Edison Asset Securitization Corp., 4.605%, due 04/12/06 | | 1,577,777 | |
2,500,000 | | | | Galaxy Funding Inc., 4.790%, due 04/04/06 | | 2,498,992 | |
5,000,000 | | | | Galaxy Funding Inc., 4.790%, due 05/08/06 | | 4,975,385 | |
3,500,000 | | | | General Electric Capital Corp., 4.860%, due 04/03/06 | | 3,499,055 | |
4,000,000 | | | | Goldman Sachs Group, Inc., 4.850%, due 04/06/06 | | 3,997,306 | |
3,700,000 | | | | HBOS Treasury Services PLC, 4.550%, due 04/04/06 | | 3,698,556 | |
900,000 | | | | HBOS Treasury Services PLC, 4.550%, due 05/08/06 | | 895,699 | |
1,200,000 | | | | HBOS Treasury Services PLC, 4.550%, due 05/09/06 | | 1,193,926 | |
| 700,000 | | | | HBOS Treasury Services PLC, 4.550%, due 05/15/06 | | | 695,936 | |
600,000 | | | | IXIS, 4.600%, due 04/04/06 | | 599,770 | |
7,000,000 | | | | Lloyd’s TSB Bank PLC, 4.850%, due 04/04/06 | | 6,999,057 | |
3,000,000 | | | | Monument Gardens Funding LLC, 4.735%, due 05/24/06 | | 2,979,087 | |
704,000 | | | | Old Line Funding LLC, 4.680%, due 04/07/06 | | 703,451 | |
7,055,000 | | | | Rabobank USA Finance, 4.830%, due 04/03/06 | | 7,053,107 | |
7,000,000 | | | | Societe Generale NA, Inc., 4.870%, due 04/03/06 | | 6,998,106 | |
990,000 | | | | St. Germain Holdings Ltd., 4.820%, due 04/27/06 | | 986,554 | |
839,000 | | | | Swiss Re Financial Products, 4.610%, due 04/24/06 | | 836,529 | |
4,200,000 | | | | Swiss Re Financial Products, 4.610%, due 06/12/06 | | 4,159,428 | |
2,200,000 | | | | Svenska Handelsbank Series S., 4.570%, due 04/05/06 | | 2,198,857 | |
1,045,000 | | | | Thunder Bay Funding, Inc., 4.850%, due 04/03/06 | | 1,044,718 | |
500,000 | | | | UBS Finance, Inc., 4.600%, due 04/03/06 | | 499,867 | |
1,675,000 | | | | UBS Finance, Inc., 4.600%, due 04/10/06 | | 1,673,036 | |
500,000 | | | | UBS Finance, Inc., 4.600%, due 04/11/06 | | 499,361 | |
675,000 | | | | UBS Finance, Inc., 4.600%, due 05/22/06 | | 670,443 | |
2,436,000 | | | | Westpac Trust Securities Ltd., 4.615%, due 04/10/06 | | 2,433,189 | |
337,000 | | | | Windmill Funding, 4.620%, due 04/03/06 | | 336,914 | |
608,000 | | | | Windmill Funding, 4.620%, due 04/06/06 | | 607,607 | |
2,500,000 | | | | Windmill Funding, 4.620%, due 04/17/06 | | 2,494,717 | |
548,000 | | | | Yorktown Capital LLC, 4.670%, due 04/06/06 | | 547,645 | |
| | | | Total Commerical Paper
(Cost $101,582,828) | | 101,582,828 | |
| | | | | | | |
CORPORATE BONDS/NOTES: 34.9% | | | |
1,600,000 | | | | Allstate Life Global Funding Trusts, 4.945%, due 09/22/06 | | 1,599,589 | |
2,000,000 | | | | American General Finance Corp., 5.100%, due 04/05/07 | | 2,001,704 | |
845,000 | | | | American General Finance Corp., 4.550%, due 05/22/06 | | 846,580 | |
1,000,000 | | | | American General Finance Corp., 4.931%, due 05/15/07 | | 999,978 | |
1,000,000 | | @@,# | | American Honda Finance Corp., 4.899%, due 09/18/06 | | 1,000,000 | |
1,000,000 | | @@,# | | American Honda Finance Corp., 4.919%, due 08/15/06 | | 1,000,557 | |
See Accompanying Notes to Financial Statements
79
ING INSTITUTIONAL PRIME | | PORTFOLIO OF INVESTMENTS |
MONEY MARKET FUND(1) | | AS OF MARCH 31, 2006 (CONTINUED) |
Principal
Amount | | | | | | Value | |
CORPORATE BONDS/NOTES (continued) | | | |
$ | 950,000 | | | | The Bank of New York, 4.719%, due 05/22/06 | | $ | 949,914 | |
1,000,000 | | @@,# | | Bank of Scotland, 4.650%, due 05/01/06 | | 997,962 | |
3,500,000 | | | | BNP Paribas/New York, 4.710%, due 06/21/06 | | 3,499,739 | |
2,000,000 | | | | BNP Paribas SA, 4.969%, due 01/26/07 | | 2,000,000 | |
500,000 | | | | Bear Stearns Cos, Inc., 4.861%, due 04/27/07 | | 500,000 | |
1,200,000 | | | | Bear Stearns Cos, Inc., 5.228%, due 01/16/07 | | 1,201,373 | |
1,500,000 | | | | Bear Stearns Cos, Inc., 5.131%, due 09/15/06 | | 1,501,586 | |
3,500,000 | | | | Cargill, Inc., 4.209%, due 05/01/06 | | 3,504,553 | |
5,350,000 | | | | Caterpillar Financial Services Corp., 5.950%, due 05/01/06 | | 5,355,497 | |
1,140,000 | | | | Citigroup, Inc., 4.920%, due 09/01/06 | | 1,140,498 | |
1,900,000 | | | | Dexia Credit Local NY, 4.770%, due 11/06/06 | | 1,899,199 | |
1,300,000 | | | | General Electric Capital Corp., 4.910%, due 05/12/06 | | 1,300,220 | |
3,000,000 | | | | General Electric Capital Corp., 5.060%, due 09/18/06 | | 3,001,834 | |
1,500,000 | | # | | Goldman Sachs Group LP, 5.001%, due 04/13/07 | | 1,500,650 | |
990,000 | | | | Goldman Sachs Group, Inc., 4.940%, due 08/18/06 | | 990,544 | |
3,000,000 | | | | HSBC Finance Corp., 4.850%, due 02/28/07 | | 3,001,294 | |
1,000,000 | | | | Merrill Lynch & Co., Inc., 4.750%, due 07/25/06 | | 1,000,342 | |
500,000 | | | | Merrill Lynch & Co., Inc., 5.060%, due 05/26/06 | | 500,159 | |
600,000 | | | | Merrill Lynch & Co., Inc., 5.170%, due 05/22/06 | | 600,292 | |
2,000,000 | | #,I | | Money Market Trust GECC Series A-2, 4.976%, due 04/09/07 | | 2,000,607 | |
1,205,000 | | | | Morgan Stanley, 4.780%, due 11/09/06 | | 1,205,244 | |
1,685,000 | | | | Morgan Stanley, 5.043%, due 03/01/07 | | 1,712,267 | |
1,250,000 | | | | State Street Bank & Trust Co., 4.820%, due 12/11/06 | | 1,249,472 | |
500,000 | | | | Svenska Handelsbanken/NY, 4.716%, due 09/20/06 | | 499,829 | |
7,550,000 | | | | Toyota Motor Credit Corp., 4.708%, due 04/13/06 | | 7,547,410 | |
700,000 | | @@ | | Toyota Motor Credit Corp., 4.841%, due 09/18/06 | | 699,931 | |
1,400,000 | | | | US Bank NA, 4.660%, due 07/28/06 | | 1,399,914 | |
1,500,000 | | | | Washington Mutual Financial Corp., 4.677%, due 05/15/06 | | 1,502,750 | |
| 1,580,000 | | | | Washington Mutual Financial Corp., 4.973%, due 07/25/06 | | | 1,581,648 | |
1,400,000 | | | | Wells Fargo & Co., 4.769%, due 05/21/06 | | 1,402,060 | |
| | | | Total Corporate Bonds/Notes (Cost $62,695,196) | | 62,695,196 | |
| | | | | | | |
U.S. GOVERNMENT AGENCY OBLIGATIONS: 1.4% | | | |
2,500,000 | | | | Federal Home Loan Bank, 2.625%, due 04/20/06 | | 2,497,396 | |
| | | | Total U.S. Government Agency Obligations (Cost $2,497,396) | | 2,497,396 | |
| | | | | | | |
REPURCHASE AGREEMENT: 7.6% | | | |
$ | 13,736,000 | | | | Deutsche Bank Repurchase Agreement dated 03/31/06, 4.750%, due 04/03/06, $13,741,437 to be received upon repurchase (Collateralized by $13,761,000 various U.S. Government Agency obligations, 4.125%-5.750%, Market value plus accrued interest 14,011,064 due 04/15/09-02/15/08) | | $ | 13,736,000 | |
| | | | Total Repurchase Agreement:
(Cost $13,736,000) | | 13,736,000 | |
| | | | Total Investments in Securities
(Cost $184,011,353)* | | 102.4 | % | $ | 184,011,353 | |
| | | | Other Assets andLiabilities-Net | | (2.4 | ) | (4,352,814 | ) |
| | | | Net Assets | | 100.0 | % | $ | 179,658,539 | |
(1) | | All securities with a maturity date of greater than 13 months have either a variable rate, a demand feature, prerefunded, optional or mandatory put resulting in an effective maturity of one year or less. Rate shown reflects current rate. |
@@ | | Foreign Issuer |
# | | Securities with purchases pursuant to Rule 144A, under the Securities Act of 1933 and may not be resold subject to that rule except to qualified institutional buyers. These securities have been determined to be liquid under the guidelines established by the Funds’ Board of Directors/Trustees. |
I | | Illiquid security |
ABS | | Asset backed security. |
CDO | | Collateralized debt obligation. |
* | | Cost for federal income tax purposes is the same as for financial statement purposes. |
See Accompanying Notes to Financial Statements
80
TAX INFORMATION (UNAUDITED)
Dividends paid during the year ended March 31, 2006 were as follows:
Fund Name | | Type | | Per Share Amount | |
ING GNMA Income Fund | | | | | |
Class A | | NII | | | $0.4300 | |
Class B | | NII | | | $0.3668 | |
Class C | | NII | | | $0.3664 | |
Class I | | NII | | | $0.4561 | |
Class M | | NII | | | $0.3881 | |
Class Q | | NII | | | $0.4323 | |
| | | | | | |
ING High Yield Bond Fund | | | | | | |
Class A | | NII | | | $0.5509 | |
Class B | | NII | | | $0.4850 | |
Class C | | NII | | | $0.4851 | |
| | | | | | |
ING Intermediate Bond Fund | | | | | | |
Class A | | NII | | | $0.4167 | |
Class B | | NII | | | $0.3374 | |
Class C | | NII | | | $0.3385 | |
Class I | | NII | | | $0.4477 | |
Class O | | NII | | | $0.4112 | |
Class R | | NII | | | $0.3887 | |
All Classes | | STCG | | | $0.0232 | |
All Classes | | LTCG | | | $0.0118 | |
| | | | | | |
ING National Tax-Exempt Bond Fund | | | | | | |
Class A | | NII | | | $0.0126 | |
Class B | | NII | | | $0.0099 | |
Class C | | NII | | | $0.0099 | |
Class A | | TEI | | | $0.3603 | |
Class B | | TEI | | | $0.2835 | |
Class C | | TEI | | | $0.2826 | |
All Classes | | LTCG | | | $0.1130 | |
| | | | | | |
ING Classic Money Market Fund | | | | | | |
Class A | | NII | | | $0.0302 | |
Class B | | NII | | | $0.0243 | |
Class C | | NII | | | $0.0244 | |
| | | | | | |
ING Institutional Prime Money Market Fund | | NII | | | $0.0269 | |
NII — Net investment income
TEI — Tax-exempt income
STCG — Short-term capital gain
LTCG — Long-term capital gain
Total long-term capital gains distributions designated by the Funds are as follows:
ING Intermediate Bond Fund | | $998,520 | |
ING National Tax-Exempt Bond Fund | | $305,296 | |
Pursuant to Internal Revenue Code Section 871(k), the Funds designate the following percentages of ordinary distributions as interest-related dividends:
ING GNMA Income Fund | | 92.12 | % |
ING High Yield Bond Fund | | 94.79 | % |
ING Intermediate Bond Fund | | 91.75 | % |
ING National Tax-Exempt Bond Fund | | 100.00 | % |
ING Classic Money Market Fund | | 99.81 | % |
ING Institutional Prime Money Market Fund | | 100.00 | % |
Above figures may differ from those cited elsewhere in this report due to differences in the calculation of income and gains under U.S. generally accepted accounting principles (book) purposes and Internal Revenue Service (tax) purposes.
Shareholders are strongly advised to consult their own tax advisers with respect to the tax consequences of their investments in the Funds. In January, shareholders, excluding corporate shareholders, receive an IRS 1099-DIV regarding the federal tax status of the dividends and distributions they received in the calendar year.
81
ADVISORY CONTRACT APPROVAL DISCUSSION (UNAUDITED)
Section 15(c) of the Investment Company Act of 1940 (the “1940 Act”) provides that, after an initial period, the Funds’ existing investment advisory and sub-advisory contracts remain in effect only if the Trustees of ING Funds Trust (the “Trust”), including a majority of the Trustees who have no direct or indirect interest in the advisory and sub-advisory contracts, and who are not “interested persons” of the Funds, as such term is defined under the 1940 Act (the “Independent Trustees”), annually review and renew them. In this regard, at a meeting held on November 10, 2005 the Board, including a majority of the Independent Trustees, considered whether to renew the Advisory Contracts (the “Advisory Contracts”) between ING Investments, LLC (the “Adviser”) and the Funds and the Sub-Advisory Contracts (“Sub-Advisory Contracts”) with ING Investment Management Co., the sub-adviser to the Funds (“ING IM” or the “Sub-Adviser”).
The Independent Trustees also held separate meetings on October 11 and November 8, 2005 to consider renewals of the Advisory Contracts and Sub-Advisory Contracts. Thus, references herein to factors considered and determinations made by the Independent Trustees include, as applicable, factors considered and determinations made on those earlier dates.
At the November 10, 2005 meeting, the Board voted to renew the Advisory and Sub-Advisory Contracts for the Funds. In reaching these decisions, the Board took into account information furnished throughout the year at regular Board meetings, as well as information prepared specifically in connection with the annual review process. The Board’s determination took into account a number of factors that its members believed, in light of the legal advice furnished to them by Kirkpatrick & Lockhart Nicholson Graham LLP (“K&LNG”), their independent legal counsel, and their own business judgment, to be relevant. Further, while the Advisory Contracts and Sub-Advisory Contracts for all the Funds were considered at the same Board meeting, the Trustees considered each Fund’s advisory and sub-advisory relationships separately.
Provided below is an overview of the Board’s contract approval process in general, as well as a discussion of certain of the specific factors the Board considered at the November 10, 2005 meeting. While the Board gave its attention to the information furnished, at its request, that was most relevant to its consideration, discussed below are a number of the primary factors relevant to the Board’s consideration as to whether to renew the Advisory and Sub-Advisory Contracts for the year ending November 30, 2006. Each Trustee may have accorded different weight to the various factors in reaching his or her conclusions with respect to the Funds’ advisory and sub-advisory arrangements.
Overview of the Contract Approval Process
In 2003, the Board determined to undertake steps to further enhance the process under which the Board determines whether to renew existing Advisory and Sub-Advisory Contracts and to approve new advisory arrangements. Among the measures the Board implemented was to: retain the services of an independent consultant with experience in the mutual fund industry to assist the Independent Trustees of the Board in working with the personnel employed by the Funds’ Adviser or its affiliates who administer the Funds (“Management”) to identify the types of information presented to the Trustees to inform their deliberations with respect to advisory and sub-advisory relationships; establish the format in which the information requested by the Board is provided to the Board; and determine the process for reviewing such information in connection with the Advisory and Sub-Advisory Contract renewal process. The end result was the implementation of the current process relied upon by the Board to review and analyze information in connection with the annual renewal of the Funds’ Advisory and Sub-Advisory Contracts, as well as its review and approval of new advisory relationships.
Since this process was implemented, the Board has continuously reviewed and refined the process. In addition, the Board established a Contracts Committee and two Investment Review Committees, including the International Equity and Fixed Income Funds Investment Review Committee (the “IE&FI IRC”). The type and format of the information provided to the Board or its counsel to inform its annual review and renewal process has been codified in the Funds’ 15(c) Methodology Guide (the “Methodology Guide”). The Methodology Guide was developed under the direction of the Board, and sets out a written blueprint under which the Board requests certain information necessary to facilitate a thorough and informed review in connection with the annual Advisory and Sub-Advisory Contract renewal process. Management provides Fund-specific information to the Board based on the Methodology Guide through “Fund Analysis and Comparison Tables” or “FACT” sheets prior to the Board’s review
82
ADVISORY CONTRACT APPROVAL DISCUSSION (UNAUDITED) (CONTINUED)
of Advisory and Sub-Advisory Contracts. Certain of this information for a representative sample of Funds in the ING Funds complex was verified, at the Board’s request, by an independent firm to test its accuracy.
On its own and as part of a regular on-going process, the Board’s Contracts Committee recommends or considers recommendations from Management for refinements and other changes to the Methodology Guide and other aspects of the review process, and the IE&FI IRC reviews benchmarks used to assess the performance of each Fund. The IE&FI IRC also meets regularly with the Adviser and ING IM. The IE&FI IRC may apply a heightened level of scrutiny in cases where performance has lagged a benchmark and/or peer group.
The Board employed its process for reviewing contracts when considering the renewals of the Advisory and Sub-Advisory Contracts that would be effective through November 30, 2006. A number of the Board’s primary considerations and conclusions resulting from this process are discussed below.
Nature, Extent and Quality of Service
In determining whether to approve the Advisory Contracts and Sub-Advisory Contracts for the Funds for the year ending November 30, 2006, the Board received and evaluated such information as it deemed necessary regarding the nature, extent and quality of services provided to the Funds by the Adviser and Sub-Adviser. This included information about the Adviser and ING IM to the Funds provided throughout the year at regular Board meetings, as well as information furnished for the November 10, 2005 Board meeting, which was held to specifically consider renewal for the period ending November 30, 2006. In addition, the Board’s Independent Trustees also held meetings on October 11th and November 8th, prior to the November 10, 2005 meeting of the full Board, to consider the annual renewal of the Advisory and Sub-Advisory Contracts.
The materials requested by and provided to the Board or to K&LNG prior to the November 2005 Board meeting included the following items: (1) FACT sheets for each Fund that provide information about the performance and expenses of the Fund and other, similarly managed funds in a selected peer group (“Selected Peer Group”), as well as information about the Fund’s investment Fund, objectives and strategies; (2) the Methodology Guide, which describes how the FACT sheets were prepared, including the manner in which benchmarks and Selected Peer Groups were selected and how profitability was determined; (3) responses to a detailed series of questions from K&LNG, legal counsel to the Independent Trustees; (4) copies of each form of Advisory Contract and Sub-Advisory Contract; (5) copies of the Forms ADV for the Adviser and ING IM; (6) financial statements for the Adviser and ING IM; (7) drafts of narrative summaries addressing key factors the Board customarily considers in evaluating the renewals of Advisory Contracts and Sub-Advisory Contracts, including a written analysis for each Fund of how performance and fees compare to its Selected Peer Group and/or designated benchmarks; and (8) other information relevant to the Board’s evaluations.
For each Fund, except ING Institutional Prime Money Market Fund, the Fund’s Class A shares were used for purposes of certain comparisons to the funds in the Selected Peer Group. Class A shares were selected, as general matter, so that the Portfolio class with the longest performance history was compared to the analogous class of shares for each fund in the Selected Peer Group. ING Institutional Prime Money Market Fund has only one class of shares, and the performance of this class was compared to the funds in its Selected Peer Group. The mutual funds chosen for inclusion in a Fund’s Selected Peer group were selected based upon criteria designed to mirror the Fund class being compared to the Selected Peer Group.
In arriving at its conclusions with respect to the advisory arrangements with the Adviser, the Board was mindful of the “manager-of-managers” platform of the ING Funds. The Board also noted the resources that the Adviser has committed to the Board and its Investment Review Committees, including the IE&FI IRC to assist the Board and Committee members with their assessment of the investment performance of the Funds. This includes the appointment of a Chief Investment Risk Officer and his staff, who report directly to the Board, and who have developed attribution analyses and other metrics used by the Investment Review Committees to analyze the key factors underlying investment performance for the Funds.
The Board also noted the techniques used by the Adviser to monitor the performance of ING IM, and took note of the pro-active approach that the Adviser, working in cooperation with the IE&FI IRC, has taken to advocate or recommend, when it believed appropriate, changes intended to assist performance of the Funds.
83
ADVISORY CONTRACT APPROVAL DISCUSSION (UNAUDITED) (CONTINUED)
In considering the Funds’ Advisory Contracts, the Board also considered the extent of benefits provided to the Funds’ shareholders, beyond advisory services, from being part of the ING family of Funds. This includes, in most cases, the right to exchange or transfer investments between the same class of shares of such Funds, without a sales charge, or among Funds available in a product platform, and the wide variety in the types of Funds available for exchange or transfer.
The Board also took into account the Adviser’s extensive efforts in recent years to reduce the expenses of the Funds through re-negotiated arrangements with the Funds’ service providers. In addition, the Board considered the extensive efforts of the Adviser and expense it incurred in recent years to help make the Fund complex more efficient by reducing the number of Funds through reorganizations of similar Funds.
Further, the Board received periodic reports showing that the investment policies and restrictions for each Fund were consistently complied with and other periodic reports covering matters such as compliance by Adviser and Sub-Adviser personnel with codes of ethics. The Board evaluated the Adviser’s and ING IM’s regulatory compliance systems and procedures reasonably designed to assure compliance with the federal securities laws, including those related to late trading and market timing, best execution, fair value pricing, proxy voting procedures, and trade allocation, among others. The Board considered the implementation by the Adviser and ING IM of enhanced compliance policies and procedures in response to SEC rule changes and other regulatory initiatives. The Board also took into account the reports of the Chief Compliance Officer and his recommendations. In this regard, the Board also considered the policies and procedures developed by the Chief Compliance Officer in consultation with the Board’s Compliance Committee that guide the Chief Compliance Officer’s compliance oversight function.
The Board reviewed the level of staffing, quality and experience of each Fund’s portfolio management team. The Board took into account the respective resources and reputations of the Adviser and ING IM, and evaluated the ability of the Adviser and ING IM to attract and retain qualified investment advisory personnel. For larger Funds, the Board also considered the adequacy of the resources committed to the Funds by the Adviser and ING IM, and whether those resources are commensurate with the needs of larger Funds and are appropriate to attempt to sustain expected levels of performance, compliance, and other needs.
Based on their deliberations and the materials presented to them, the Board concluded that the advisory and related services provided by the Adviser and INGIM are appropriate in light of the Funds’ operations, the competitive landscape of the investment company business, and investor needs, and that the nature and quality of the overall services provided by the Adviser and Sub-Adviser were appropriate.
Fund Performance
In assessing advisory and sub-advisory relationships, the Board placed emphasis on the investment performance of each Fund, taking into account the importance of such performance to the Fund’s shareholders. While the Board considered the performance reports and discussions with portfolio managers at Board and Committee meetings during the year, particular attention in assessing performance was given to the Fund FACT sheets furnished in advance of the November meeting of the Independent Trustees. The FACT sheet prepared for each Fund included its investment performance compared to the Morningstar category median, Lipper category median, Selected Peer Group and Fund’s primary benchmark. The Board’s findings specific to each Fund’s performance are discussed under “Fund-by-Fund Analysis,” below.
Economies of Scale
In considering the reasonableness of advisory fees, the Board also considered whether economies of scale will be realized by the Adviser as a Fund grows larger and the extent to which this is reflected in the level of management fee rates charged. In this regard, the Board noted any breakpoints in advisory fee schedules that resulted in a lower advisory fee because a Fund achieved sufficient asset levels to receive a breakpoint discount. In the case of sub-advisory fees, the Board considered that breakpoints would inure to the benefit of the Adviser, except to the extent that these savings are passed through in the form of breakpoints on advisory fees that resulted in savings to the Funds. For Funds that did not have breakpoint discounts on advisory fees, but did benefit from waivers to or reimbursements of advisory or other fees, the Board also considered the extent to which economies of scale could effectively be realized through such waivers, reimbursements, or expense reductions.
84
ADVISORY CONTRACT APPROVAL DISCUSSION (UNAUDITED) (CONTINUED)
Information about Services to Other Clients
The Board requested, and in many instances received and, if so, considered, information about the nature of services and fee rates offered by the Adviser and ING IM to other clients, including other registered investment companies and institutional accounts. When rates offered to other clients differed materially from those charged to the Funds, the Board considered the underlying rationale provided by the Adviser and ING IM for these differences.
Fee Rates and Profitability
The Board reviewed and considered each contractual investment advisory fee rate, combined with the administrative fee rate, payable by each Fund to the Adviser. The Board also considered the contractual sub-advisory fee rates payable by the Adviser to ING IM for sub-advisory services. In addition, the Board reviewed and took into account fee waivers and expense limitations applicable to the fees payable by the Funds.
The Board considered the fee structures of the Funds as they relate to the services provided under the Contracts, and the potential fall-out benefits to the Adviser and ING IM, and their respective affiliates, from their association with the Funds. For each Fund, the Board determined that the fees payable to the Adviser and ING IM are reasonable for the services that each performs, which were considered in light of the nature and quality of the services that each has performed and is expected to perform through the year ending November 30, 2006.
For each Fund, the Board considered information on revenues, costs and profits realized by the Adviser, which was prepared by Management in accordance with the allocation methodology (including assumptions) specified in the Methodology Guide. In analyzing the profitability of the Adviser in connection with its services to a Fund, the Board took into account the sub-advisory fee rate payable by the Adviser to ING IM. The Board also considered information that it requested and was provided by Management with respect to the profitability of service providers affiliated with the Adviser, as well as information provided by ING IM with respect to its profitability.
The Board determined that it had requested and received sufficient information to gain a reasonable understanding regarding the Adviser’s and ING IM’s profitability. The Board also recognized that profitability analysis is not an exact science and there is no uniform methodology for determining profitability for this purpose. In this context, the Board realized that Management’s calculations regarding its costs incurred in establishing the infrastructure necessary for the Funds’ operations may not be fully reflected in the expenses allocated to each Fund in determining profitability, and that the information presented may not portray all of the costs borne by Management nor capture Management’s entrepreneurial risk associated with offering and managing a mutual fund complex in today’s regulatory environment.
In their examination of advisory fees, the Independent Trustees have, from time to time, requested the Adviser, and the Adviser has agreed, to implement remedial actions for certain Funds. These remedial actions have included, among others: reductions in expense caps or management fee rates and the merger of certain Funds with and into comparable Funds. The Independent Trustees requested these adjustments largely on the basis of: (a) a Fund’s performance, as compared to its Selected Peer Group; (b) the performance of a Fund, as compared to its benchmark index; or (c) a Fund’s expenses in relation to its Selected Peer Group.
Based on the information on revenues, costs, and profitability considered by the Board, after considering the factors described in this section, as well as any remedial actions requested by the Independent Trustees and agreed to by the Adviser, the Board concluded that the profits, if any, realized by the Adviser and ING IM were not excessive.
Fund-by-Fund Analysis
The following paragraphs outline certain of the specific factors that the Board considered, and the conclusions reached, at its November 2005 meeting in relation to renewing each Fund’s current Advisory Contract and its Sub-Advisory Contract for the year ending November 30, 2006. These specific factors are in addition to those considerations discussed above. In each case, the Fund’s performance was compared to its Morningstar category median and its primary benchmark, a broad-based securities market index that appears in the Fund’s prospectus. Each Fund’s management fee and expense ratio were compared to the fees and expense ratios of the funds in its Selected Peer Group.
85
ADVISORY CONTRACT APPROVAL DISCUSSION (UNAUDITED) (CONTINUED)
ING GNMA Income Fund
In considering whether to approve the renewal of the Advisory and Sub-Advisory Contracts for ING GNMA Income Fund, the Board considered that, based on performance data for the periods ended June 30, 2005: (1) the Fund underperformed its Morningstar category median for the most recent calendar quarter and one-year period, but outperformed for the three- and five-year periods; (2) the Fund matched its Morningstar category median year-to-date; (3) the Fund underperformed its primary benchmark index for all periods presented; and (4) the Fund is ranked in the fourth quintile for the one-year period, and in the second quintile for the three- and five-year periods. In analyzing this performance data, the Board also took into consideration: (1) Management’s analysis regarding the Sub-Adviser’s rationale for the Fund’s underperformance over the prior twelve months; and (2) Management’s confidence in the Sub-Adviser’s capabilities in the asset class it manages, especially in light of its ability to deliver reasonable long-term performance.
In considering the fees payable under the Advisory and Sub-Advisory Contracts for the Fund, the Board took into account the factors described above and also considered: (1) the fairness of the compensation under an Advisory Contract with level fees that does not include breakpoints; (2) the pricing structure (including the expense ratio to be borne by shareholders) of the Fund, as compared to its Selected Peer Group, including that: (a) the management fee for the Fund is above the median and the average management fees of the funds in its Selected Peer Group; and (b) the expense ratio for the Fund is below the median and the average expense ratios of the funds in its Selected Peer Group.
After its deliberation, the Board reached the following conclusions: (1) the Fund’s management fee rate is reasonable in the context of all factors considered by the Board; (2) the Fund’s expense ratio is reasonable in the context of all factors considered by the Board; (3) the Fund’s performance is reasonable in the context of all factors considered by the Board; and (4) the sub-advisory fee rate payable by the Adviser to the Sub-Adviser is reasonable in the context of all factors considered by the Board. Based on these conclusions and other factors, the Board voted to renew the Advisory and Sub-Advisory Contracts for the Fund for the year ending November 30, 2006. During this renewal process, different Board members may have given different weight to different individual factors and related conclusions.
ING High Yield Bond Fund
In considering whether to approve the renewal of the Advisory and Sub-Advisory Contracts for ING High Yield Bond Fund, the Board considered that, based on performance data for the periods ended June 30, 2005: (1) the Fund underperformed its Morningstar category median for the year-to-date, one- and three-year periods, but outperformed the Morningstar category median for the most recent calendar quarter and performed on par with its Morningstar category median for the five-year period; (2) the Fund underperformed its primary benchmark index for all periods presented; and (3) the Fund is ranked in the fifth (or lowest) quintile for the three-year period, in the fourth quintile for the one-year period, in the third quintile for the year-to-date, and in the second quintile for the most recent calendar quarter. In analyzing this performance data, the Board took into consideration Management’s analysis regarding the Sub-Adviser’s rationale for underperformance, including its underweight in the distressed part of the high yield universe, which had a significant negative impact on relative performance. The Board also noted Management’s representations that relative performance had more recently improved.
In considering the fees payable under the Advisory and Sub-Advisory Contracts for the Fund, the Board took into account the factors described above and also considered: (1) the fairness of the compensation under an Advisory Contract with a breakpoint fee schedule where the asset level necessary to achieve a breakpoint discount had not been reached by the Fund; (2) the pricing structure (including the expense ratio to be borne by shareholders) of the Fund, as compared to its Selected Peer Group, including that: (a) the management fee (inclusive of the advisory fee and a 0.10% administration fee) for the Fund is above the median and the average management fees of the funds in its Selected Peer Group, and (b) the expense ratio for the Fund is equal to the median and above the average expense ratio of the funds in its Selected Peer Group. In analyzing this fee data, the Board considered that, in response to the Board’s direction, Management lowered the Fund’s expense limit in October 2004 and the Fund’s total expense ratio includes additional expenses incurred in connection with a prior merger.
86
ADVISORY CONTRACT APPROVAL DISCUSSION (UNAUDITED) (CONTINUED)
After its deliberation, the Board reached the following conclusions: (1) the Fund’s management fee rate is reasonable in the context of all factors considered by the Board; (2) the Fund’s expense ratio is reasonable in the context of all factors considered by the Board; (3) the Fund’s performance is reasonable in the context of all factors considered by the Board; and (4) the sub-advisory fee rate payable by the Adviser to the Sub-Adviser is reasonable in the context of all factors considered by the Board. Based on these conclusions and other factors, the Board voted to renew the Advisory and Sub-Advisory Contracts for the Fund for the year ending November 30, 2006. During this renewal process, different Board members may have given different weight to different individual factors and related conclusions.
ING Intermediate Bond Fund
In considering whether to approve the renewal of the Advisory and Sub-Advisory Contracts for ING Intermediate Bond Fund, the Board considered that, based on performance data for the periods ended June 30, 2005: (1) the Fund outperformed its Morningstar category median for all periods presented; (2) the Fund outperformed its primary benchmark index for the one-, three- and five-year periods but underperformed for the most recent calendar quarter and year-to-date periods; and (3) the Fund is ranked in the second quintile for the most recent calendar quarter, one- and three-year periods and in the first (highest) quintile for the year-to-date and five-year periods.
In considering the fees payable under the Advisory and Sub-Advisory Contracts for the Fund, the Board took into account the factors described above and also considered: (1) economies of scale benefits to the Fund and its shareholders from breakpoint discounts applicable to the Fund’s advisory fees, which result in lower fees at higher asset levels; (2) the pricing structure (including the expense ratio to be borne by shareholders) of the Fund, as compared to its Selected Peer Group, including that: (a) the management fee (inclusive of the advisory fee and a 0.10% administration fee) for the Fund is above the median and equal to the average management fees of the funds in its Selected Peer Group; and (b) the expense ratio for the Fund is equal to the median and below the average expense ratios of the funds in its Selected Peer Group.
After its deliberation, the Board reached the following conclusions: (1) the Fund’s management fee rate is reasonable in the context of all factors considered by the Board; (2) the Fund’s expense ratio is reasonable in the context of all factors considered by the Board; (3) the Fund’s performance is reasonable in the context of all factors considered by the Board; and (4) the sub-advisory fee rate payable by the Adviser to the Sub-Adviser is reasonable in the context of all factors considered by the Board. Based on these conclusions and other factors, the Board voted to renew the Advisory and Sub-Advisory Contracts for the Fund for the year ending November 30, 2006. During this renewal process, different Board members may have given different weight to different individual factors and related conclusions.
ING National Tax-Exempt Bond Fund
In considering whether to approve the renewal of the Advisory and Sub-Advisory Contracts for ING National Tax-Exempt Bond Fund, the Board considered that, based on performance data for the periods ended June 30, 2005: (1) the Fund underperformed its Morningstar category median for the one- and three-year periods, but outperformed for the most recent calendar quarter, year-to-date, and five-year periods; (2) the Fund underperformed its primary benchmark index for all periods presented; and (3) the Fund was ranked in the fourth quintile for the one-year period and in the third quintile for the most recent calendar quarter, three- and five-year periods.
In analyzing this performance data, the Board took into account: (1) Management’s analysis regarding the Sub-Adviser’s rationale for underperformance in certain periods, including the effect of duration/maturity on the performance of municipal bonds; and (2) while the Fund has underperformed for the one-year period, its overall performance for the three- and five-year periods and short-term performance has been reasonable.
In considering the fees payable under the Advisory and Sub-Advisory Contracts for ING National Tax-Exempt Bond Fund, the Board took into account the factors described above and also considered: (1) the fairness of the compensation under an Advisory Contract with a breakpoint fee schedule where the asset level necessary to achieve a breakpoint discount had not been reached by the Fund; and (2) the pricing structure (including the expense ratio to be borne by shareholders) of ING National Tax-Exempt Bond Fund, as compared to its Selected
87
ADVISORY CONTRACT APPROVAL DISCUSSION (UNAUDITED) (CONTINUED)
Peer Group, including that: (a) the management fee (inclusive of the advisory fee and a 0.10% administration fee) for the Fund is above the median and the average management fees of the funds in its Selected Peer Group; and (b) the expense ratio for the Fund is above the median and the average expense ratios of the funds in its Selected Peer Group.
After its deliberation, the Board reached the following conclusions: (1) the Fund’s management fee rate is reasonable in the context of all factors considered by the Board; (2) the Fund’s expense ratio is reasonable in the context of all factors considered by the Board; (3) the Fund’s performance is reasonable in the context of all factors considered by the Board, and Management will continue to closely monitor the Fund; and (4) the sub-advisory fee rate payable by the Adviser to the Sub-Adviser is reasonable in the context of all factors considered by the Board. Based on these conclusions and other factors, the Board voted to renew the Advisory and Sub-Advisory Contracts for the Fund for the year ending November 30, 2006. During this renewal process, different Board members may have given different weight to different individual factors and related conclusions.
ING Classic Money Market Fund
In considering whether to approve the renewal of the Advisory and Sub-Advisory Contracts for ING Classic Money Market Fund, the Board considered that, based on performance data for the periods ended June 30, 2005, the Fund outperformed its primary benchmark index for all periods presented.
In considering the fees payable under the Advisory and Sub-Advisory Contracts for ING Classic Money Market Fund, the Board took into account the factors described above and also considered: (1) the fairness of the compensation under an Advisory Contract with level fees that does not include breakpoints; and (2) the pricing structure (including the expense ratio to be borne by shareholders) of ING Classic Money Market Fund, as compared to its Selected Peer Group, including that: (a) the management fee for the Fund is below the median and the average management fees of the funds in its Selected Peer Group; and (b) the expense ratio for the Fund is below the median and the average expense ratios of the funds in its Selected Peer Group.
After its deliberation, the Board reached the following conclusions: (1) the Fund’s management fee rate is reasonable in the context of all factors considered by the Board; (2) the Fund’s expense ratio is reasonable in the context of all factors considered by the Board; (3) the Fund’s performance is reasonable in the context of all factors considered by the Board; and (4) the sub-advisory fee rate payable by the Adviser to the Sub-Adviser is reasonable in the context of all factors considered by the Board. Based on these conclusions and other factors, the Board voted to renew the Advisory and Sub-Advisory Contracts for the Fund for the year ending November 30, 2006. During this renewal process, different Board members may have given different weight to different individual factors and related conclusions.
BOARD CONSIDERATION AND APPROVAL OF NEW INVESTMENT ADVISORY AND SUB-ADVISORY CONTRACTS FOR ING INSTITUTIONAL PRIME MONEY MARKET FUND
Section 15 of the 1940 mandates that, when a Fund enters into a new advisory or sub-advisory arrangement, the Trustees, including a majority of the Independent Trustees, must approve the new Advisory and Sub-Advisory Contracts with respect to the Fund. At its May 12, 2005 meeting the Board approved the launch of ING Institutional Prime Money Market Fund, a new series of the Trust that is managed by the Adviser and sub-advised by ING IM.
The Board’s consideration of the new advisory and sub-advisory arrangements related to the launch of ING Institutional Prime Money Market Fund (“Institutional Money Market Fund”) is discussed below. In considering the Advisory and Sub-Advisory Contracts for the Fund, the Board members considered a number of factors they believed, in light of the legal advice furnished to them by K&LNG, their independent legal counsel, and their own business judgment, to be relevant. Based on these considerations, the Board determined to approve the Advisory and Sub-Advisory Contracts for the Fund.
The information provided to the Board to inform its deliberations regarding Institutional Money Market Fund included the following: (1) a memorandum presenting Management’s rationale for requesting the launch of the new Fund that discusses the performance of ING IM in managing similar money market funds, with such performance being compared against an appropriate peer group, as determined based upon a methodology
88
ADVISORY CONTRACT APPROVAL DISCUSSION (UNAUDITED) (CONTINUED)
approved by the Board; (2) responses to questions posed by independent legal counsel on behalf of the Independent Trustees; (3) copies of the form of Advisory and Sub-Advisory Contracts Agreements for Institutional Money Market Fund; and (4) other information relevant to the Board’s evaluation. In addition, the Board considered the information provided periodically throughout the year in presentations to the Board by the Adviser and ING IM in the context of Fund oversight in general and money market fund investment in particular.
In considering the approval of the advisory arrangements for Institutional Money Market Fund, the Board considered several factors including, but not limited to, the following: (1) the nature and quality of the services to be provided by the Adviser to Institutional Money Market Fund under the proposed Advisory Contract; (2) the Adviser’s experience as a manager-of-managers overseeing ING IM in managing money market Funds in the ING Funds complex; (3) the nature and quality of the services to be provided by ING IM under the proposed Sub-Advisory Contract; (4) ING IM’s substantial experience in managing similar money market products; (5) ING IM’s relationships with an institutional investor base for which the Fund would normally be a part of a larger relationship, and which is expected to invest in Institutional Money Market Fund, leading to higher initial and subsequent asset levels; (6) the Adviser’s strength and reputation within the industry, particularly its reputation as a manager-of-managers of similar money market Funds; (7) the fairness of the compensation under a proposed Advisory Contract with a level fee that does not include breakpoints, in light of the services to be provided to Institutional Money Market Fund; (8) the highly competitive pricing structure of the new Fund, as compared to other similarly-managed money market Funds, and the projected profitability to the Adviser when sub-advisory fees payable by the Adviser to ING IM are taken into account; (9) the personnel, operations, financial condition, and investment management capabilities, methodologies and resources of the Adviser and ING IM, including ING IM’s management team’s expertise in the management of money market funds; (10) the expenses to be borne by shareholders, which are below those of other ING money market funds; (11) the Adviser’ and ING IM’s compliance capabilities, as demonstrated by, among other things, their respective policies and procedures designed to prevent violations of the Federal securities laws, which had previously been approved by the Board in connection with their oversight of other Funds in the ING Funds complex; (12) the information that had been provided by the Adviser at regular Board meetings, and in anticipation of the May meeting, with respect to the Adviser’ capabilities as a manager-of-managers; (13) “fall-out benefits” to the Adviser and its affiliates and benefits to the shareholders from Institutional Money Market Fund’s relationship with ING; and (14) that while there would not be economies of scale benefits from breakpoints, the advisory fee and expense structure was nonetheless highly competitive.
In its discussions regarding the Advisory Contract, the Board, including a majority of the Independent Trustees, did not identify any single factor as all-important or controlling. The Board determined, among other things, that: (1) the management fee payable to the Adviser by Institutional Money Market Fund is significantly below those of its selected peer group; and (2) the expense ratio for Institutional Money Market Fund is significantly below those of its selected peer group. The Board considered that the attractive expense ratio and low advisory fees payable by Institutional Money Market Fund would make it competitive in the niche market in which this Fund would be offered.
In reviewing the Sub-Advisory Contract with ING IM, the Board considered the following factors: (1) the Adviser’s view of the reputation of ING IM as a manager to money market funds; (2) ING IM’s experience and skill in managing money market funds, including other Funds in the ING Funds line-up; (3) the information that had been provided by ING IM at regular Board meetings, and in anticipation of the May meeting, with respect to its sub-advisory services in general and its management of money market products in particular; (4) the nature and quality of the services provided by ING IM; (5) ING IM’s experience in managing other money market funds; (6) the fairness of the compensation under the Sub-Advisory Contract in light of the services to be provided and the projected profitability of the Adviser, as Institutional Money Market Fund’s adviser, and ING IM, as its sub-adviser; (7) prior performance of other money market Funds sub-advised by ING IM compared to the relevant index; (8) ING IM’s operations and compliance program, including its policies and procedures intended to assure compliance with the Federal securities laws, which had previously been approved by the Board as part of its oversight of the Funds in the ING Funds complex; (9) ING IM’s financial condition; (10) the costs for the services to be provided by ING IM and the representation that these costs will be paid by the Adviser and not directly by Institutional Money Market Fund; (11) the appropriateness of the selection of ING IM in light of the Fund’s
89
ADVISORY CONTRACT APPROVAL DISCUSSION (UNAUDITED) (CONTINUED)
investment objective and prospective institutional investor base; and (12) ING IM’s Code of Ethics, which has previously been approved for other series of IFT, and related procedures for complying with that Code.
During the course of its deliberations, the Board reached the following conclusions: (1) ING IM is qualified to manage Institutional Money Market Fund’s assets in accordance with its investment objective and policies; (2) the investment strategy to be pursued by ING IM is appropriate for seeking the Fund’ s investment objective and is consistent with the interests of the institutional investors that would choose to invest in the new Fund; (3) based upon the Board’s experience with ING IM in managing other money market Funds in the ING Funds line-up, ING IM is likely to execute the new Fund’s investment strategy consistently over time; (4) the Adviser and ING IM each has sufficient financial resources available to it to fulfill its commitments to Institutional Money Market Fund under the proposed advisory and sub-advisory agreements; (5) the Adviser and ING IM each maintains appropriate compliance programs, with this conclusion based upon the Board’s previous and ongoing review of the compliance programs of these two ING entities; (6) the compensation to be paid to the Adviser and ING IM is reasonable, particularly in view of the highly competitive expense ratio of and management fee payable by the new Fund; and (7) ING IM would be able to utilize its relationships with institutional investors to develop a solid base of institutional investors for the new Fund.
Based upon its review, the Board determined that the Advisory Contract and the Sub-Advisory Contract are in the best interests of Institutional Money Market Fund and its shareholders and that the fees payable under each advisory arrangement are reasonable. After further discussion, upon motion duly made and seconded, the Board, including a majority of the Independent Trustees, considered and unanimously approved the Advisory and Sub-Advisory Contracts for Institutional Money Market Fund.
90
TRUSTEE AND OFFICER INFORMATION (UNAUDITED)
The business and affairs of the Trust are managed under the direction of the Trust’s Board of Trustees. A Trustee who is not an interested person of the Trust, as defined in the 1940 Act, is an independent Trustee (“Independent Trustee”). The Trustees and Officers of the Trust are listed below. The Statement of Additional Information includes additional information about Trustees of the Registrant and is available, without charge, upon request at 1-800-992-0180.
Name, Address | | Position(s)
held with | | Term of
Office and
Length of
Time | | Principal
Occupation(s)
during the | | Number of
Portfolios in
Fund Complex
Overseen | | Other
Directorships
held by |
and Age | | Trust | | | Served(1) | | | Past Five Years | | by Trustee | | Trustee |
Independent Trustees: | | | | | | | | | | |
| | | | | | | | | | |
John V. Boyer
7337 E. Doubletree Ranch Rd.
Scottsdale, Arizona 85258
Age: 52 | | Trustee | | January 2005 -Present | | President and Chief Executive Officer, Franklin and Eleanor Roosevelt Institute (March 2006 - Present). Formerly, Executive Director, The Mark Twain House & Museum(2) (September 1989 - November 2005). | | 174 | | None |
| | | | | | | | | | |
Patricia W. Chadwick
7337 E. Doubletree Ranch Rd.
Scottsdale, Arizona 85258
Age: 57 | | Trustee | | January 2006 - Present | | Consultant and President of self-owned company, Ravengate Partners LLC (January 2000 - Present). | | 174 | | None |
| | | | | | | | | | |
J. Michael Earley
7337 E. Doubletree Ranch Rd.
Scottsdale, Arizona 85258
Age: 60 | | Trustee | | February 2002 - Present | | President and Chief Executive Officer, Bankers Trust Company, N.A. (June 1992 - Present). | | 174 | | None |
| | | | | | | | | | |
R. Barbara Gitenstein
7337 E. Doubletree Ranch Rd.
Scottsdale, Arizona 85258
Age: 58 | | Trustee | | February 2002 - Present | | President, College of New Jersey (January 1999 - Present). | | 174 | | None |
| | | | | | | | | | |
Patrick W. Kenny
7337 E. Doubletree Ranch Rd.
Scottsdale, Arizona 85258
Age: 63 | | Trustee | | January 2005 - Present | | President and Chief Executive Officer, International Insurance Society (June 2001 - Present). Formerly, Executive Vice President, Frontier Insurance Group, Inc. (September 1998 - March 2001). | | 174 | | Assured Guaranty Ltd. (November 2003 - Present). |
| | | | | | | | | | |
Walter H. May
7337 E. Doubletree Ranch Rd.
Scottsdale, Arizona 85258
Age: 69 | | Trustee | | March 2001 - Present | | Retired. | | 174 | | BestPrep (September 1991 - Present). |
| | | | | | | | | | |
Jock Patton
7337 E. Doubletree Ranch Rd.
Scottsdale, Arizona 85258
Age: 60 | | Chairman and Trustee | | February 2001 - Present | | Private Investor (June 1997 - Present). Formerly Director and Chief Executive Officer, Rainbow Multimedia Group, Inc. (January 1999 - December 2001). | | 174 | | JDA Software Group, Inc. (January 1999 - Present); and Swift Transportation Co. (March 2004 - Present). |
| | | | | | | | | | |
Sheryl K. Pressler
7337 E. Doubletree Ranch Rd.
Scottsdale, Arizona 85258
Age: 55 | | Trustee | | January 2006 - Present | | Consultant (May 2001 - Present). Formerly, Chief Executive Officer, Lend Lease Real Estate Investments, Inc. (March 2000 - April 2001). | | 174 | | Stillwater Mining Company (May 2002 - Present); California HealthCare Foundation (June 1999 - Present); and Romanian-American Enterprise Fund (February 2004 - Present). |
| | | | | | | | | | | | |
91
TRUSTEE AND OFFICER INFORMATION (UNAUDITED) (CONTINUED)
Name, Address | | Position(s)
held with | | Term of
Office and
Length of
Time | | Principal
Occupation(s)
during the | | Number of
Portfolios in
Fund Complex
Overseen | | Other
Directorships
held by |
and Age | | Trust | | | Served(1) | | | Past Five Years | | by Trustee | | Trustee |
David W.C. Putnam
7337 E. Doubletree Ranch Rd.
Scottsdale, Arizona 85258
Age: 66 | | Trustee | | March 2001 Present | | President and Director, F.L. Putnam Securities Company, Inc. (June 1978 - Present). | | 174 | | Progressive Capital Accumulation Trust (August 1998 - Present); Principled Equity Market Trust (November 1996 - Present), Mercy Endowment Foundation (September 1995 - Present); Asian American Bank and Trust Company (June 1992 - Present); and Notre Dame Health Care Center (July 1991 - Present). |
| | | | | | | | | | |
Roger B. Vincent
7337 E. Doubletree Ranch Rd.
Scottsdale, Arizona 85258
Age: 60 | | Trustee | | February 2002 - Present | | President, Springwell Corporation (March 1989 - Present). | | 174 | | AmeriGas Propane, Inc. (January 1998 - Present); and UGI Corporation (February 2006 - Present). |
| | | | | | | | | | |
Richard A. Wedemeyer
7337 E. Doubletree Ranch Rd.
Scottsdale, Arizona 85258
Age: 70 | | Trustee | | March 2001 - Present | | Retired. Formerly, Vice President - Finance and Administration, The Channel Corporation (June 1996 - April 2002); and Trustee, First Choice Funds (February 1997 - April 2001). | | 174 | | Touchstone Consulting Group (June 1997 - Present); and Jim Henson Legacy (April 1994 - Present). |
| | | | | | | | | | |
Trustees who are “Interested
Persons”: | | | | | | | | | | |
| | | | | | | | | | |
Thomas J. McInerney(3)
7337 E. Doubletree Ranch Rd.
Scottsdale, Arizona 85258
Age: 49 | | Trustee | | March 2001 - Present | | Chief Executive Officer, ING U.S. Financial Services (January 2005 Present); General Manager and Chief Executive Officer, ING U.S. Financial Services (December 2003 - December 2004); Chief Executive Officer, ING U.S. Financial Services (September 2001 - December 2003); and General Manager and Chief Executive Officer, ING U.S. Worksite Financial Services (December 2000 - September 2001). | | 214 | | Equitable Life Insurance Co., Golden American Life Insurance Co., Life Insurance Company of Georgia, Midwestern United Life Insurance Co., ReliaStar Life Insurance Co., Security Life of Denver, Security Connecticut Life Insurance Co., Southland Life Insurance Co., USG Annuity and Life Company, and United Life and Annuity Insurance Co. Inc.; Ameribest Life Insurance Co.; First Columbine Life Insurance Co.; and Metro Atlanta Chamber of Commerce (January 2003 - Present). |
| | | | | | | | | | | | | |
92
TRUSTEE AND OFFICER INFORMATION (UNAUDITED) (CONTINUED)
Name, Address | | Position(s)
held with | | Term of
Office and
Length of
Time | | Principal
Occupation(s)
during the | | Number of
Portfolios in
Fund Complex
Overseen | | Other
Directorships
held by |
and Age | | Trust | | | Served(1) | | | Past Five Years | | by Trustee | | Trustee |
John G. Turner(4)
7337 E. Doubletree Ranch Rd.
Scottsdale, Arizona 85258
Age: 66 | | Trustee | | March 2001 - Present | | Retired. Formerly, Vice Chairman of ING Americas (September 2000 - January 2002); Director of ReliaStar Life Insurance Company of New York (April 1975 - December 2001); and Chairman and Trustee of the Northstar affiliated investment companies (May 1993 - December 2001). | | 214 | | Hormel Foods Corporation (March 2000 - Present); ShopKo Stores, Inc. (August 1999 - Present); and Conseco, Inc. (September 2003 - Present). |
| | | | | | | | | | | | | | |
(1) Trustees serve until their successors are duly elected and qualified, subject to the Board’s retirement policy.
(2) Shaun Mathews, President, ING USFS Mutual Funds and Investment Products, has held a seat on the Board of Directors of The Mark Twain House & Museum since September 19, 2002. ING Groep N.V. makes non-material, charitable contributions to The Mark Twain House & Museum.
(3) Mr. McInerney is an “interested person,” as defined under the 1940 Act, because of his affiliation with ING Groep N.V., the parent corporation of the Investment Manager, ING Investments, LLC and the Distributor, ING Funds Distributor, LLC.
(4) Mr. Turner is an “interested person,” as defined under the 1940 Act, because of his affiliation with ING Groep N.V., the parent corporation of the Investment Manager, ING Investments, LLC and the Distributor, ING Funds Distributor, LLC.
93
TRUSTEE AND OFFICER INFORMATION (UNAUDITED) (CONTINUED)
Name, Address | | Position(s) | | Term of Office and | | Principal Occupation(s) during the |
and Age | | Held with the Trust | | | Length of Time Served(1) | | | Past Five Years |
Officers: | | | | | | |
| | | | | | |
James M. Hennessy
7337 E. Doubletree Ranch Rd.
Scottsdale, AZ 85258
Age: 56 | | President and Chief Executive Officer | | February 2001 - Present | | President and Chief Executive Officer, ING Investments, LLC (December 2000 - Present). Formerly, Chief Operating Officer, ING Investments, LLC (December 2000 - March 2006). |
| | | | | | |
Michael J. Roland
7337 E. Doubletree Ranch Rd.
Scottsdale, AZ 85258
Age: 47 | | Executive Vice President | | February 2002 - Present | | Executive Vice President, ING Investments, LLC (December 2001 - Present). Formerly, Chief Compliance Officer, ING Investments, LLC, ING Life Insurance and Annuity Company and Directed Services, Inc. (October 2004 - December 2005); Chief Financial Officer and Treasurer, ING Investments, LLC (December 2001 - March 2005); and Senior Vice President, ING Investments, LLC (June 1998 - December 2001). |
| | | | | | |
Stanley D. Vyner
7337 E. Doubletree Ranch Rd.
Scottsdale, AZ 85258
Age: 55 | | Executive Vice President | | October 2000 - Present | | Executive Vice President, ING Investments, LLC (July 2000 - Present); and Chief Investment Risk Officer (January 2003 - Present). Formerly, Chief Investment Officer of the International Portfolios, ING Investments, LLC (August 2000 - January 2003). |
| | | | | | |
Joseph M. O’Donnell
7337 E. Doubletree Ranch Rd.
Scottsdale, AZ 85258
Age: 51 | | Executive Vice President
Chief Compliance Officer | | March 2006 - Present
November 2004 - Present | | Chief Compliance Officer and Executive Vice President (March 2006 - Present) of the ING Funds (November 2004 - Present) and ING Investments, LLC, ING Life Insurance and Annuity Company and Directed Services, Inc. (March 2006 - Present). Formerly, Vice President, Chief Legal Counsel, Chief Compliance Officer and Secretary of Atlas Securities, Inc., Atlas Advisers, Inc. and Atlas Funds (October 2001 - October 2004); and Chief Operating Officer and General Counsel of Matthews International Capital Management LLC and Vice President and Secretary of Matthews International Funds (August 1999 - May 2001). |
| | | | | | |
Robert S. Naka
7337 E. Doubletree Ranch Rd.
Scottsdale, AZ 85258
Age: 42 | | Executive Vice President and Chief Operating Officer
Assistant Secretary | | March 2006 - Present
October 2000 - Present | | Executive Vice President and Chief Operating Officer, ING Funds Services, LLC and ING Investments, LLC (March 2006 - Present); and Assistant Secretary, ING Funds Services, LLC (October 2001 - Present). Formerly, Senior Vice President (August 1999 - March 2006). |
| | | | | | |
Todd Modic
7337 E. Doubletree Ranch Rd.
Scottsdale, Arizona 85258
Age: 38 | | Senior Vice President, Chief/Principal Financial Officer and Assistant Secretary | | March 2005 - Present | | Senior Vice President, ING Funds Services, LLC (April 2005 - Present). Formerly, Vice President, ING Funds Services, LLC (September 2002 - March 2005); and Director, Financial Reporting, ING Investments, LLC (March 2001 - September 2002). |
| | | | | | |
Kimberly A. Anderson
7337 E. Doubletree Ranch Rd.
Scottsdale, AZ 85258
Age: 41 | | Senior Vice President | | November 2003 - Present | | Senior Vice President and Assistant Secretary, ING Investments, LLC (October 2003 - Present). Formerly, Vice President and Assistant Secretary, ING Investments, LLC (January 2001 - October 2003). |
| | | | | | |
Robyn L. Ichilov
7337 E. Doubletree Ranch Rd.
Scottsdale, AZ 85258
Age: 38 | | Vice President and Treasurer | | October 2000 - Present
March 2001 - Present | | Vice President and Treasurer, ING Funds Services, LLC (October 2001 - Present) and ING Investments, LLC (August 1997 - Present). |
| | | | | | | | |
94
TRUSTEE AND OFFICER INFORMATION (UNAUDITED) (CONTINUED)
Name, Address | | Position(s) | | Term of Office and | | Principal Occupation(s) during the |
and Age | | Held with the Trust | | | Length of Time Served(1) | | | Past Five Years |
Lauren D. Bensinger
7337 E. Doubletree Ranch Rd.
Scottsdale, Arizona 85258
Age: 52 | | Vice President | | February 2003 - Present | | Vice President and Chief Compliance Officer, ING Funds Distributor, LLC (July 1995 - Present); and Vice President (February 1996 - Present) and Director of Compliance (October 2004 - Present), ING Investments, LLC. Formerly, Chief Compliance Officer, ING Investments, LLC (October 2001 - October 2004). |
| | | | | | |
Maria M. Anderson
7337 E. Doubletree Ranch Rd.
Scottsdale, AZ 85258
Age: 47 | | Vice President | | September 2004 - Present | | Vice President, ING Funds Services, LLC (September 2004 - Present). Formerly, Assistant Vice President, ING Funds Services, LLC (October 2001 - September 2004); and Manager Fund Accounting and Fund Compliance, ING Investments, LLC (September 1999 - October 2001). |
| | | | | | |
Mary A. Gaston
7337 E. Doubletree Ranch Rd.
Scottsdale, AZ 85258
Age: 40 | | Vice President | | March 2005 - Present | | Vice President, ING Funds Services, LLC (April 2005 - Present). Formerly, Assistant Vice President, Financial Reporting, ING Funds Services, LLC (April 2004 - April 2005); Manager, Financial Reporting, ING Funds Services, LLC (August 2002 - April 2004); and Controller Z Seven Fund, Inc. and Ziskin Asset Management, Inc. (January 2000 - March 2002). |
| | | | | | |
Kimberly K. Palmer
7337 E. Doubletree Ranch Rd.
Scottsdale, AZ 85258
Age: 48 | | Vice President | | March 2006 - Present | | Vice President, ING Funds Services, LLC (March 2006 - Present). Formerly, Assistant Vice President, ING Funds Services, LLC (August 2004 - March 2006). Formerly, Manager, Registration Statements, ING Funds Services, LLC (May 2003 - August 2004); Associate Partner, AMVESCAP PLC (October 2000 - May 2003); and Director of Federal Filings and Blue Sky Filings, INVESCO Funds Group, Inc. (March 1994 - May 2003). |
| | | | | | |
Susan P. Kinens
7337 E. Doubletree Ranch Rd.
Scottsdale, AZ 85258
Age: 29 | | Assistant Vice President | | February 2003 - Present | | Assistant Vice President, ING Funds Services, LLC (December 2002 - Present); and has held various other positions with ING Funds Services, LLC for more than the last five years. |
| | | | | | |
Huey P. Falgout, Jr.
7337 E. Doubletree Ranch Rd.
Scottsdale, AZ 85258
Age: 42 | | Secretary | | August 2003 - Present | | Chief Counsel, ING Americas, U.S. Legal Services (September 2003 - Present). Formerly, Counsel, ING Americas, U.S. Legal Services (November 2002 - September 2003); and Associate General Counsel of AIG American General (January 1999 - November 2002). |
| | | | | | |
Theresa K. Kelety
7337 E. Doubletree Ranch Rd.
Scottsdale, AZ 85258
Age: 43 | | Assistant Secretary | | August 2003 - Present | | Counsel, ING Americas, U.S. Legal Services (April 2003 - Present). Formerly, Senior Associate with Shearman & Sterling (February 2000 - April 2003). |
| | | | | | |
Robin R. Nesbitt
7337 E. Doubletree Ranch Rd.
Scottsdale, AZ 85258
Age: 32 | | Assistant Secretary | | September 2004 - Present | | Counsel, ING Americas, U.S. Legal Services (April 2006 - Present). Formerly, Supervisor, Board Operations, ING Funds Services, LLC (August 2003 - April 2006); Senior Legal Analyst, ING Funds Services, LLC (August 2002 - August 2003); and Associate, PricewaterhouseCoopers (January 2001 - August 2001). |
| | | | | | | | | |
(1) The Officers hold office until the next annual meeting of the Trustees and until their successors have been elected and qualified.
95
(THIS PAGE INTENTIONALLY LEFT BLANK)
(THIS PAGE INTENTIONALLY LEFT BLANK)
ING Funds Distributor, LLC offers the funds listed below. Before investing in a fund, shareholders should carefully review the fund’s prospectus. Investors may obtain a copy of a prospectus of any ING Fund by calling (800) 992-0180 or by going to www.ingfunds.com.
Domestic Equity and Income Funds
ING Balanced Fund
ING Convertible Fund
ING Equity Income Fund
ING Real Estate Fund
Domestic Equity Growth Funds
ING 130/30 Fundamental Research Fund
ING Disciplined LargeCap Fund
ING Fundamental Research Fund
ING Growth Fund
ING LargeCap Growth Fund
ING MidCap Opportunities Fund
ING Opportunistic LargeCap Fund
ING SmallCap Opportunities Fund
ING Small Company Fund
Domestic Equity Index Funds
ING Index Plus LargeCap Fund
ING Index Plus MidCap Fund
ING Index Plus SmallCap Fund
Domestic Equity Value Funds
ING Financial Services Fund
ING LargeCap Value Fund
ING MagnaCap Fund
ING MidCap Value Fund
ING MidCap Value Choice Fund
ING SmallCap Value Fund
ING SmallCap Value Choice Fund
Fixed Income Funds
ING GNMA Income Fund
ING High Yield Bond Fund
ING Intermediate Bond Fund
ING National Tax-Exempt Bond Fund
Global Equity Funds
ING Global Equity Dividend Fund
ING Global Real Estate Fund
ING Global Science and Technology Fund
ING Global Value Choice Fund
International Equity Funds
ING Emerging Countries Fund
ING Foreign Fund
ING Greater China Fund
ING Index Plus International Equity Fund
ING International Fund
ING International Capital Appreciation Fund
ING International Growth Fund
ING International Real Estate
ING International SmallCap Fund
ING International Value Fund
ING International Value Choice Fund
ING Precious Metals Fund
ING Russia Fund
International Fixed Income Fund
ING Emerging Markets Fixed Income Fund
International Fund-of-Funds
ING Diversified International Fund
Loan Participation Fund
ING Senior Income Fund
Money Market Funds*
ING Aeltus Money Market Fund
ING Classic Money Market Fund
Strategic Allocation Funds
ING Strategic Allocation Conservative Fund
ING Strategic Allocation Growth Fund
ING Strategic Allocation Moderate Fund
* An investment in the Fund is not insured or guaranteed by the Federal Deposit Insurance Corporation or any other government agency. Although the Fund seeks to preserve the value of your investment at $1.00 per share, it is possible to lose money by investing in the Fund.
PROXY VOTING INFORMATION
A description of the policies and procedures that the Registrant uses to determine how to vote proxies related to portfolio securities is available (1) without charge, upon request, by calling Shareholder Services toll-free at 800-992-0180; (2) on the Registrant’s website at www.ingfunds.com and (3) on the Securities and Exchange Commission’s (“SEC”) website at www.sec.gov.
Information regarding how the Registrant voted proxies related to portfolio securities during the most recent 12-month period ended June 30 is available without charge on the Registrant’s website at www.ingfunds.com and on the SEC’s website at www.sec.gov.
QUARTERLY PORTFOLIO HOLDINGS
The Registrant files its complete schedule of portfolio holdings with the SEC for the first and third quarters of each fiscal year on Form N-Q. The Registrant’s Forms N-Q are available on the SEC’s website at www.sec.gov. The Registrant’s Forms N-Q may be reviewed and copied at the SEC’s Public Reference Room in Washington, DC, and information on the operation of the Public Reference Room may be obtained by calling 1-800-SEC-0330; and is available upon request from the Registrant by calling Shareholder Services toll-free at 800-992-0180.
Investment Manager | | |
ING Investments, LLC | | |
7337 East Doubletree Ranch Road | | |
Scottsdale, Arizona 85258 | | |
| | |
Administrator | | |
ING Funds Services, LLC | | |
7337 East Doubletree Ranch Road | | |
Scottsdale, Arizona 85258 | | |
| | |
Distributor | | |
ING Funds Distributor, LLC | | |
7337 East Doubletree Ranch Road | | |
Scottsdale, Arizona 85258 | | |
1-800-334-3444 | | |
| | |
Transfer Agent | | |
DST Systems, Inc. | | |
330 West 9th Street | | |
Kansas City, Missouri 64105 | | |
| | |
Custodian | | |
The Bank of New York | | |
100 Colonial Center Parkway, Suite 300 | | |
Lake Mary, Florida 32746 | | |
| | |
Legal Counsel | | |
Dechert | | |
1775 I Street, N.W | | |
Washington, D.C. 20006 | | |
| | |
Independent Registered Public Accounting Firm | | |
KPMG LLP | | |
99 High Street | | |
Boston, Massachusetts 02110 | | |
For more complete information, or to obtain a prospectus on any ING fund, please call your Investment Professional or ING Funds Distributor, LLC at (800) 992-0180 or log on to www.ingfunds.com. The prospectus should be read carefully before investing. Consider the fund’s investment objectives, risks, charges and expenses carefully before investing. The prospectus contains this information and other information about the fund.

| | PRAR-UFIABCIMOQR | (0306-052706) |
Item 2. Code of Ethics.
As of the end of the period covered by this report, Registrant had adopted a code of ethics, as defined in Item 2 of Form N-CSR, that applies to the Registrant’s principal executive officer and principal financial officer. There were no amendments to the Code during the period covered by the report. The Registrant did not grant any waivers, including implicit waivers, from any provisions of the Code during the period covered by this report. The code of ethics is filed herewith pursuant to Item 10(a)(1), Exhibit 99.CODE ETH.
Item 3. Audit Committee Financial Expert.
The Board of Trustees has determined that David Putnam is an audit committee financial expert, as defined in Item 3 of Form N-CSR. Mr. Putnam is “independent” for purposes of Item 3 of Form N-CSR.
Item 4. Principal Accountant Fees and Services.
(a) | | Audit Fees: The aggregate fees billed for each of the last two fiscal years for professional services rendered by KPMG LLP (“KPMG”), the principal accountant for the audit of the registrant’s annual financial statements, for services that are normally provided by the accountant in connection with statutory and regulatory filings or engagements for those fiscal years were $83,750 for year ended March 31, 2006 and $68,000 for year ended March 31, 2005. |
| | |
(b) | | Audit-Related Fees: The aggregate fees billed in the last fiscal year for assurance and related services by KPMG that are reasonably related to the performance of the audit of the registrant’s financial statements and are not reported under paragraph (a) of this Item were $9,500 for the year ended March 31, 2006. |
| | |
| | There were no other fees for the year ended March 31, 2005. |
| | |
(c) | | Tax Fees: The aggregate fees billed in each of the last two fiscal years for professional services rendered by KPMG for tax compliance, tax advice, and tax planning were $18,030 in the year ended March 31, 2006 and $17,230 in the year ended March 31, 2005. Such services included review of excise distribution calculations (if applicable), preparation of the Funds’ federal, state and excise tax returns, tax services related to mergers and routine consulting. |
| | |
(d) | | All Other Fees: The aggregate fees billed in each of the last two fiscal years for products and services provided by KPMG, other than the services reported in paragraphs (a) through (c) of this Item were $4,185 for the year ended March 31, 2005. There were no other fees for the year ended March 31, 2006. |
| | |
(e) (1) | | Audit Committee Pre-Approval Policies and Procedures |
2
FORM OF
AUDIT AND NON-AUDIT SERVICES
PRE-APPROVAL POLICY
I. Statement of Principles
Under the Sarbanes-Oxley Act of 2002 (the “Act”), the Audit Committee of the Board of Directors or Trustees (the “Committee”) of the ING Funds (each a “Fund,” collectively, the “Funds”) set out on Exhibit A to this Audit and Non-Audit Services Pre-Approval Policy (“Policy”) is responsible for the oversight of the work of the Funds’ independent auditors. As part of its responsibilities, the Committee must pre-approve the audit and non-audit services performed by the auditors in order to assure that the provision of these services does not impair the auditors’ independence from the Funds. The Committee has adopted, and the Board has ratified, this Policy, which sets out the procedures and conditions under which the services of the independent auditors may be pre-approved.
Under Securities and Exchange Commission (“SEC”) rules promulgated in accordance with the Act, the Funds may establish two different approaches to pre-approving audit and non-audit services. The Committee may approve services without consideration of specific case-by-case services (“general pre-approval”) or it may pre-approve specific services (“specific pre-approval”). The Committee believes that the combination of these approaches contemplated in this Policy results in an effective and efficient method for pre-approving audit and non-audit services to be performed by the Funds’ independent auditors. Under this Policy, services that are not of a type that may receive general pre-approval require specific pre-approval by the Committee. Any proposed services that exceed pre-approved cost levels or budgeted amounts will also require the Committee’s specific pre-approval.
For both types of approval, the Committee considers whether the subject services are consistent with the SEC’s rules on auditor independence and that such services are compatible with maintaining the auditors independence. The Committee also considers whether a particular audit firm is in the best position to provide effective and efficient services to the Funds. Reasons that the auditors are in the best position include the auditors’ familiarity with the Funds’ business, personnel, culture, accounting systems, risk profile, and other factors, and whether the services will enhance the Funds’ ability to manage and control risk or improve audit quality. Such factors will be considered as a whole, with no one factor being determinative.
The appendices attached to this Policy describe the audit, audit-related, tax-related, and other services that have the Committee’s general pre-approval. For any service that has been approved through general pre-approval, the general pre-approval will remain in place for a period 12 months from the date of pre-approval, unless the Committee determines that a different period is appropriate. The Committee will annually review and pre-approve the services that may be provided by the independent auditors without specific pre-approval. The Committee will revise the list of services subject to general pre-approval as appropriate. This Policy does not serve as a delegation to Fund management of the Committee’s duty to pre-approve services performed by the Funds’ independent auditors.
II. Audit Services
The annual audit services engagement terms and fees are subject to the Committee’s specific pre-approval. Audit services are those services that are normally provided by auditors in connection with statutory and regulatory filings or engagements or those that generally only independent auditors can reasonably provide. They include the Funds’ annual financial statement audit and procedures that the independent auditors must perform in order to form an opinion on the Funds’ financial statements (e.g., information systems and procedural reviews and testing). The Committee will monitor the audit services engagement and approve any changes in terms, conditions or fees deemed by the Committee to be necessary or appropriate.
The Committee may grant general pre-approval to other audit services, such as statutory audits and services associated with SEC registration statements, periodic reports and other documents filed with the SEC or issued in connection with securities offerings.
The Committee has pre-approved the audit services listed on Appendix A. The Committee must specifically approve all audit services not listed on Appendix A.
III. Audit-related Services
Audit-related services are assurance and related services that are reasonably related to the performance of the audit or the review of the Funds’ financial statements or are traditionally performed by the independent auditors. The Committee believes that the provision of audit-related services will not impair the independent auditors’ independence, and therefore may grant pre-approval to audit-related services. Audit-related services include accounting consultations related to accounting, financial reporting or disclosure matters not classified as “audit services;” assistance with understanding and implementing new accounting and financial reporting guidance from rulemaking authorities; agreed-upon or expanded audit procedures relating to accounting and/or billing records required to respond to or comply with financial, accounting or regulatory reporting matters; and assistance with internal control reporting requirements under Form N-SAR or Form N-CSR.
The Committee has pre-approved the audit-related services listed on Appendix B. The Committee must specifically approve all audit-related services not listed on Appendix B.
IV. Tax Services
The Committee believes the independent auditors can provide tax services to the Funds, including tax compliance, tax planning, and tax advice, without compromising the auditors’ independence. Therefore, the Committee may grant general pre-approval with respect to tax services historically provided by the Funds’ independent auditors that do not, in the Committee’s view, impair auditor independence and that are consistent with the SEC’s rules on auditor independence.
The Committee will not grant pre-approval if the independent auditors initially recommends a transaction the sole business purpose of which is tax avoidance and the tax treatment of which may not be supported in the Internal Revenue Code and related regulations. The Committee may consult outside counsel to determine that tax planning and reporting positions are consistent with this Policy.
The Committee has pre-approved the tax-related services listed on Appendix C. The Committee must specifically approve all tax-related services not listed on Appendix C.
V. Other Services
The Committee believes it may grant approval of non-audit services that are permissible services for independent auditors to a Fund. The Committee has determined to grant general pre-approval to other services that it believes are routine and recurring, do not impair auditor independence, and are consistent with SEC rules on auditor independence.
The Committee has pre-approved the non-audit services listed on Appendix D. The Committee must specifically approve all non-audit services not listed on Appendix D.
A list of the SEC’s prohibited non-audit services is attached to this Policy as Appendix E. The SEC’s rules and relevant guidance should be consulted to determine the precise definitions of these impermissible services and the applicability of exceptions to certain of the SEC’s prohibitions.
VI. Pre-approval of Fee levels and Budgeted Amounts
The Committee will annually establish pre-approval fee levels or budgeted amounts for audit, audit-related, tax and non-audit services to be provided to the Funds by the independent auditors. Any proposed services exceeding these levels or amounts require the Committee’s specific pre-approval. The Committee considers fees for audit and non-audit services when deciding whether to pre-approve services. The Committee may determine, for a pre-approval period of 12 months, the appropriate ratio between the total amount of fees for the Fund’s audit, audit-related, and tax services (including fees for services provided to Fund affiliates that are subject to pre-approval), and the total amount of fees for certain permissible non-audit services for the Fund classified as other services (including any such services provided to Fund affiliates that are subject to pre-approval).
VII. Procedures
Requests or applications for services to be provided by the independent auditors will be submitted to management. If management determines that the services do not fall within those services generally pre-approved by the Committee and set out in the appendices to these procedures, management will submit the services to the Committee or its delagee. Any such submission will include a detailed description of the services to be rendered. Notwithstanding this paragraph, the Committee will, on a quarterly basis, receive from the independent auditors a list of services provided for the previous calendar quarter on a cumulative basis by the auditors during the Pre-Approval Period.
VIII. Delegation
The Committee may delegate pre-approval authority to one or more of the Committee’s members. Any member or members to whom such pre-approval authority is delegated must report any pre-approval decisions, including any pre-approved services, to the Committee at its next scheduled meeting. The Committee will identify any member to whom pre-approval authority is delegated in writing. The member will retain such authority for a period of 12 months from the date of pre-approval unless the Committee determines that a different period is appropriate. The period of delegated authority may be terminated by the Committee or at the option of the member.
IX. Additional Requirements
The Committee will take any measures the Committee deems necessary or appropriate to oversee the work of the independent auditors and to assure the auditors’ independence from the Funds. This may include reviewing a formal written statement from the independent auditors delineating all relationships between the auditors and the Funds, consistent with Independence Standards Board No. 1, and discussing with the auditors their methods and procedures for ensuring independence.
Amended: November 9, 2005
Appendix A
Pre-Approved Audit Services for the Pre-Approval Period January 1, 2006 through December 31, 2006
Service |
| The Fund(s) | Fee Range |
Statutory audits or financial audits (including tax services associated with audit services) | √ | As presented to Audit Committee[1] |
Services associated with SEC registration statements, periodic reports and other documents filed with the SEC or other documents issued in connection with securities offerings (e.g., consents), and assistance in responding to SEC comment letters. | √ | Not to exceed $9,300 per filing |
Consultations by Fund management with respect to accounting or disclosure treatment of transactions or events and/or the actual or potential effect of final or proposed rules, standards or interpretations by the SEC, Financial Accounting Standards Board, or other regulatory or standard setting bodies. | √ | Not to exceed $8,000 during the Pre-Approval Period |
Seed capital audit and related review and issuance of consent on the N-2 registration statement | √ | Not to exceed $12,000 per audit |
Appendix B
Pre-Approved Audit-Related Services for the Pre-Approval Period January 1, 2006 through December 31, 2006
Service |
| The Fund(s) | Fund Affiliates | Fee Range |
Services related to Fund mergers (Excludes tax services — See Appendix C for tax services associated with Fund mergers) | √ | √ | Not to exceed $10,000 per merger |
Consultations by Fund management with respect to accounting or disclosure treatment of transactions or events and/or the actual or potential effect of final or proposed rules, standards or interpretations by the SEC, Financial Accounting Standards Board, or other regulatory or standard setting bodies. [Note: Under SEC rules some consultations may be “audit” services and others may be “audit-related” services.] | √ | | Not to exceed $5,000 per occurrence during the Pre-Approval Period |
Review of the Funds’ semi-annual financial statements | √ | | Not to exceed $2,100 per set of financial statements per fund |
Reports to regulatory or government agencies related to the annual engagement | √ | | Up to $5,000 per occurrence during the Pre-Approval Period |
Regulatory compliance assistance | √ | √ | Not to exceed $5,000 per quarter |
Training courses | √ | √ | Not to exceed $2,000 per course |
For Prime Rate Trust, agreed upon procedures for quarterly reports to rating agencies | √ | | Not to exceed $9,000 per quarter |
For Prime Rate Trust and Senior Income Fund, agreed upon procedures for the Revolving Credit and Security Agreement with Citigroup | √ | | Not to exceed $20,000 per fund per year |
Appendix C
Pre-Approved Tax Services for the Pre-Approval Period January 1, 2006 through December 31, 2006
Service |
| The Fund(s) | Fund Affiliates | Fee Range |
Preparation of federal and state income tax returns and federal excise tax returns for the Funds including assistance and review with excise tax distributions | √ | | As presented to Audit Committee[2] |
Review of IRC Sections 851(b) and 817(h) diversification testing on a real-time basis | √ | | As presented to Audit Committee2 |
Assistance and advice regarding year-end reporting for 1099’s | √ | | As presented to Audit Committee2 |
Tax assistance and advice regarding statutory, regulatory or administrative developments | √ | √ | Not to exceed $5,000 for the Funds or for the Funds’ investment adviser during the Pre-Approval Period |
| | | |
Appendix C, continued
Service |
| The Fund(s) | Fund Affiliates | Fee Range |
Tax training courses | √ | √ | Not to exceed $2,000 per course during the Pre-Approval Period |
Tax services associated with Fund mergers | √ | √ | Not to exceed $4,000 per fund per merger during the Pre-Approval Period |
| | | |
| | | |
Loan Staff Services | | √ | Not to exceed $15,000 during the Pre-Approval Period |
Other tax-related assistance and consultation, including, without limitation, assistance in evaluating derivative financial instruments and international tax issues, qualification and distribution issues, and similar routine tax consultations. | √ | | Not to exceed $120,000 during the Pre-Approval Period |
Appendix D
Pre-Approved Other Services for the Pre-Approval Period January 1, 2006 through December 31, 2006
Service |
| The Fund(s) | Fund Affiliates | Fee Range |
Agreed-upon procedures for Class B share 12b-1 programs | | √ | Not to exceed $50,000 during the Pre-Approval Period |
Security counts performed pursuant to Rule 17f-2 of the 1940 Act (i.e., counts for Funds holding securities with affiliated sub-custodians) | √ | | Not to exceed $5,000 per Fund during the Pre-Approval Period |
Agreed upon procedures for 15 (c) FACT Books | √ | | Not to exceed $35,000 during the Pre-Approval Period |
Appendix E
Prohibited Non-Audit Services
Dated: January 1, 2006
Bookkeeping or other services related to the accounting records or financial statements of the Funds
Financial information systems design and implementation
Appraisal or valuation services, fairness opinions, or contribution-in-kind reports
Actuarial services
Internal audit outsourcing services
Management functions
Human resources
Broker-dealer, investment adviser, or investment banking services
Legal services
Expert services unrelated to the audit
Any other service that the Public Company Accounting Oversight Board determines, by regulation, is impermissible
EXHIBIT A
ING EQUITY TRUST
ING FUNDS TRUST
ING GLOBAL ADVANTAGE AND PREMIUM OPPORTUNITY FUND
ING GLOBAL EQUITY DIVIDEND AND PREMIUM OPPORTUNITY FUND
ING INVESTMENT FUNDS, INC.
ING INVESTORS TRUST
ING MAYFLOWER TRUST
ING MUTUAL FUNDS
ING PARTNERS, INC.
ING PRIME RATE TRUST
ING SENIOR INCOME FUND
ING VARIABLE INSURANCE TRUST
ING VARIABLE PRODUCTS TRUST
ING VP EMERGING MARKETS FUND, INC.
ING VP NATURAL RESOURCES TRUST
USLICO SERIES FUND
[1] For new Funds launched during the Pre-Approval Period, the fee ranges pre-approved will be the same as those for existing Funds, pro-rated in accordance with inception dates as provided in the auditors’ Proposal or any Engagement Letter covering the period at issue. Fees in the Engagement Letter will be controlling.
[2] For new Funds launched during the Pre-Approval Period, the fee ranges pre-approved will be the same as those for existing Funds, pro-rated in accordance with inception dates as provided in the auditors’ Proposal or any Engagement Letter covering the period at issue. Fees in the Engagement Letter will be controlling.
(e) (2) | | Percentage of services referred to in (4)(b)-(4)(d) that were approved by the audit committee |
| | |
| | 100% of the services were approved by the audit committee. |
| | |
(f) | | Percentage of hours expended attributable to work performed by other than full time employees of KPMG if greater than 50% |
| | |
| | Not applicable |
| | |
(g) | | Non-Audit Fees: The non-audit fees billed by the registrant's accountant for services rendered to the registrant, and rendered to the registrant's investment adviser, and any entity controlling, controlled by, or under common control with the adviser that provides ongoing services to the registrant for each of the last two fiscal years of the registrant were $359,654 for year ended March 31, 2006 and $384,560 for fiscal year ended March 31, 2005. |
| | |
(h) | | Principal Accountants Independence: the Registrant's Audit committee has considered whether the provision of non-audit services that were rendered to the registrant's invesment adviser and any entity controlling, controlled by, or under common control with the invesment adviser that provides ongoing services to the registrant that were not pre-approved pursuant to Rule 2.01(c)(7)(ii) of Regulation S-X is compatible with maintaining KPMG's independence. |
SIGNATURES
Pursuant to the requirements of the Securities Exchange Act of 1934 and the Investment Company Act of 1940, the registrant has duly caused this report to be signed on its behalf by the undersigned, thereunto duly authorized.
(Registrant): ING Funds Trust
By | /s/ James M. Hennessy |
| James M. Hennessy |
| President and Chief Executive Officer |
Date: June 8, 2006
Pursuant to the requirements of the Securities Exchange Act of 1934 and the Investment Company Act of 1940, this report has been signed below by the following persons on behalf of the registrant and in the capacities and on the dates indicated.
By | /s/ James M. Hennessy |
| James M. Hennessy |
| President and Chief Executive Officer |
Date: June 8, 2006
By | /s/ Todd Modic |
| Todd Modic |
| Senior Vice President and Chief Financial Officer |
Date: June 8, 2006
5