Table of Contents
OMB APPROVAL
OMB Number: 3235-0570
Expires: August 31, 2010
Estimated average burden hours per response: 18.9
UNITED STATES
SECURITIES AND EXCHANGE COMMISSION
Washington, D.C. 20549
FORM N-CSR
CERTIFIED SHAREHOLDER REPORT OF
REGISTERED MANAGEMENT INVESTMENT COMPANIES
Investment Company Act file number: 811-08895
ING Funds Trust
(Exact name of registrant as specified in charter)
| 7337 E. Doubletree Ranch Rd., Scottsdale, AZ | 85258 | |
| (Address of principal executive offices) | (Zip code) |
The Corporation Trust Company, 1209 Orange Street, Wilmington, DE 19801
(Name and address of agent for service)
Registrant’s telephone number, including area code: 1-800-992-0180
Date of fiscal year end: | March 31 | |
Date of reporting period: | March 31, 2008 | |
Table of Contents
Item 1. Reports to Stockholders.
The following is a copy of the report transmitted to stockholders pursuant to Rule 30e-1 under the Act (17 CFR 270.30e-1):
Table of Contents

Annual Report
March 31, 2008
Classes A, B, C, I, IS, O, Q, R and W
Fixed-Income Funds
| n | ING GNMA Income Fund |
| n | ING High Yield Bond Fund |
| n | ING Intermediate Bond Fund |
| n | ING National Tax-Exempt Bond Fund |
Money Market Funds
| n | ING Classic Money Market Fund |
| n | ING Institutional Prime Money Market Fund |
 | E-Delivery Sign-up – details inside |
This report is submitted for general information to shareholders of the ING Funds. It is not authorized for distribution to prospective shareholders unless accompanied or preceded by a prospectus which includes details regarding the funds’ investment objectives, risks, charges, expenses and other information. This information should be read carefully.
F U N D S |
|

Table of Contents
| 1 | ||
| 2 | ||
| 4 | ||
| 14 | ||
| 17 | ||
| 18 | ||
| 22 | ||
| 24 | ||
| 27 | ||
| 40 | ||
| 57 | ||
| 95 | ||
| 98 | ||
| 100 | ||
| 104 | ||
| | Go Paperless with E-Delivery! | | ||
Sign up now for on-line prospectuses, fund reports, and proxy statements. In less than five minutes, you can help reduce paper mail and lower fund costs.
Just go to www.ingfunds.com, click on the E-Delivery icon from the home page, follow the directions and complete the quick 5 Steps to Enroll.
You will be notified by e-mail when these communications become available on the internet. Documents that are not available on the internet will continue to be sent by mail.
| ||||
PROXY VOTING INFORMATION
A description of the policies and procedures that the Funds use to determine how to vote proxies related to portfolio securities is available: (1) without charge, upon request, by calling Shareholder Services toll-free at (800) 992-0180; (2) on the Funds’ website at www.ingfunds.com; and (3) on the U.S. Securities and Exchange Commission’s (“SEC”) website at www.sec.gov. Information regarding how the Funds voted proxies related to portfolio securities during the most recent 12-month period ended June 30 is available without charge on the Funds’ website at www.ingfunds.com and on the SEC’s website at www.sec.gov.
QUARTERLY PORTFOLIO HOLDINGS
The Funds file their complete schedule of portfolio holdings with the SEC for the first and third quarters of each fiscal year on Form N-Q. The Funds’ Forms N-Q are available on the website at www.sec.gov. The Funds’ Forms N-Q may be reviewed and copied at the SEC’s Public Reference Room in Washington, DC, and information on the operation of the Public Reference Room may be obtained by calling (800) SEC-0330; and is available upon request from the Funds by calling Shareholder Services toll-free at (800) 992-0180.
Table of Contents

Dear Shareholder,
Recent months have been a challenging time for investors. We have seen a variety of industries — including banking, retailing, real estate, manufacturing and others — announce disappointing earnings, which, further contributed to overall economic uncertainty and market volatility.
As a result, the confidence of the average investor has been tested. But we should not lose sight of the positives that have emerged: the Federal Reserve responded quickly and diligently to contain the credit crisis. Lawmakers enacted stimulus packages that some economists believe may help strengthen the economy in the second half of the year. And regulators have introduced reforms to improve the mortgage industry.
But, as often happens in these situations, anxiety can cloud sound investment principles. Market corrections are a natural part of the investment cycle, and attempts to “time” buy-and-sell decisions often hinder achieving long-term investment goals. Based on Bloomberg research, if you were fully invested in domestic equities between
December 1997 and December 2007, a $10,000 investment would have grown to more than $17,000. However, had you missed the “best” 10 days of that ten-year period, your $10,000 would have grown to less than $12,000. Missing the best 20 days of that ten-year cycle would have been even costlier — resulting in your original $10,000 investment being worth less than $8,000.(1) No one knows when those “best” days will occur, but history tells us that — when investing — staying focused on the long term may be the prudent strategy.
ING encourages you to take this opportunity to meet with your financial professionals to ensure your portfolio reflects your goals and risk tolerance. In doing this, many investors discover that building a well-diversified investment portfolio — one made up of allocations to a wide range of asset classes — may be the best way to withstand market volatility.
At ING Funds we strive to offer our clients quality investments. I thank you for your continued support and confidence and we look forward to serving you in the future.
Sincerely,

/s/ Shaun P. Mathews
Shaun Mathews,
CEO
ING Funds
April 25, 2008
The views expressed in the President’s Letter reflect those of the President as of the date of the letter. Any such views are subject to change at any time based upon market or other conditions and ING Funds disclaims any responsibility to update such views. These views may not be relied on as investment advice and because investment decisions for an ING Fund are based on numerous factors, may not be relied on as an indication of investment intent on behalf of any ING Fund. Reference to specific company securities should not be construed as recommendations or investment advice.
For more complete information, or to obtain a prospectus for any ING Fund, please call your Investment Professional or ING Funds Distributor, LLC at (800) 992-0180 or log on to www.ingfunds.com. The prospectus should be read carefully before investing. Consider the fund’s investment objectives, risks, and charges and expenses carefully before investing. The prospectus contains this information and other information about the fund. Check with your Investment Professional to determine which funds are available for sale within their firm. Not all funds are available for sale at all firms.
(1) | Bloomberg calculation based on performance of the Standard & Poor’s 500® Composite Stock Price Index (“S&P 500® Index”) between December 31, 1997 and December 31, 2007. |
1
Table of Contents
MARKET PERSPECTIVE: YEAR ENDED MARCH 31, 2008
In our semi-annual report we described how a deteriorating housing market had undermined the sub-prime mortgage loan sector, which was in increasing distress after years of lax lending standards in a low interest rate environment. The problem had been exacerbated by the business of repackaging and securitizing the loans, which were then sold on in their billions worldwide to financial institutions, funded by commercial paper, over the cost of which an effortless profit could apparently be made.
But as in banking anywhere, confidence is all. When it became obvious that these securities, many of them boasting A or higher credit ratings, were ultimately backed by mortgages with questionable repayment prospects, confidence evaporated. The asset backed commercial paper market seized up and then contracted sharply. Banks stopped lending to each other.
The Federal Reserve Board’s (the “Fed”) first response to the problem: four reductions in the discount rate amounting to 1.50%, and three in the federal funds rate amounting to 1.00%, had little effect. Using the discount window had a stigma attached to it while the liquidity problem was not an overnight one. Credit conditions only eased somewhat after the Fed announced in December that in coordination with other central banks it would add targeted liquidity through the use of a “term auction facility” where 28-day loans would be auctioned, collateralized by broader forms of assets.
But the credit crisis had its roots in the real economy and on this front 2008 brought little respite. In housing the percentage of mortgages with late payments rose to multi-year record levels. Home prices and sales continued to fall. Payrolls fell for the first time in over four years and the March report showed a decline in private sector jobs of over 100,000. Gross domestic product (“GDP”) growth was reported at a wafer-thin 0.6% annualized. One measure of consumer confidence plumbed a sixteen-year low.
So despite core inflation stubbornly above 2%, there was no doubt about the required direction of policy. Congress agreed in February to spend $117 billion in tax rebates as part of a $168 billion plan to stimulate the economy. Capital requirements for the Federal National Mortgage Association (“Fannie Mae”) and the Federal Home Loan Mortgage Corporation (“Freddie Mac”) were loosened in an effort to encourage them to expand their $1.5 trillion mortgage portfolios. In three tranches in January and March the Federal Open Market Committee (“FOMC”) reduced the discount and Federal Funds rates by 2.25% and 2.00% respectively.
Back in the financial sector, write-downs of asset backed securities continued in their billions. In March the Fed agreed to lend overnight to primary dealers at the discount rate and to accept mortgage backed securities as collateral. This was after Bear Stearns, an investment bank near the eye of the storm since the credit crisis blew in, was forced, in a deal brokered by the Fed, to sell itself cheaply after rumors of liquidity problems caused its financing to dry up all together.
As our fiscal year ended, with the oil price firmly entrenched above $100 per barrel, mutually reinforcing financial dislocation and economic weakness were driving investors from risky assets faster than ever.
Given the above turmoil the pattern of returns to fixed income investors was not surprising and mostly reflected the flight to safety. Continuing a pronounced steepening of the U.S. Treasury yield curve, U.S. Treasury Bill yields plunged 255 basis points (2.55%) in the second half of our fiscal year (345 basis points (3.45%) for the entire fiscal year) to 1.27%, while 10-year U.S. Treasury Note yields fell by less, 104 basis points (1.04%) in the second half of our fiscal year (120 basis points (1.20%) for the entire fiscal year), as inflationary concerns persisted. The Lehman Brothers® Aggregate Bond Index(1) (“LBAB Index”) of investment grade bonds returned 5.23% in the second half of our fiscal year (7.67% for the entire fiscal year), but the Lehman Brothers® High Yield Bond – 2% Issuer Constrained Composite Index(2) fell 4.01% (3.47% for the entire fiscal year). In general, both for the second six months and for the whole fiscal year, government bonds significantly outperformed investment grade corporates.
In currencies the dollar was initially strong against the yen, but after the events of August, “carry trades” were unwound and by March the dollar was trading at 12-year lows. The euro cruised through the $1.50 level as the European Central Bank defiantly held interest rates firm despite the crisis. Only the pound was relatively flat as the United Kingdom’s economy ultimately faced challenges roughly similar to the United States. In the second six months of our fiscal year the dollar fell 9.7% and 13.6% against the euro and yen respectively (15.6% and 15.8% for the whole year, respectively), but rose 2.6% against the pound in the second six months, (fell 1.6% for the year).
Despite reaching a new high on October 9, U.S. equities, represented by the Standard & Poor’s 500® Composite Stock Price (“S&P 500®”) Index(3) including dividends, returned -12.5% in the six months through March 2008, and -5.1% for the year. In addition to the conditions and events described above
2
Table of Contents
MARKET PERSPECTIVE: YEAR ENDED MARCH 31, 2008
investors faced dividend cuts on some high-profile financials and two quarters of declining profits.
Internationally, based on local currency Morgan Stanley Capital International (“MSCI”) indices with net reinvested dividends the MSCI Japan® Index(4) sank 28.1% during the fiscal year as the one source of vibrant growth, exports, faced the twin threats of a slowing world economy and a sharply higher yen. The MSCI Europe ex UK® Index(5) dropped 13.8% as the euro soared and the European Central Bank showed no inclination to reduce interest rates with headline inflation at a multi-year high. In the UK, the MSCI UK Index®(6) fell 7.1% for the year. The Bank of England cut rates only twice, by 1/4%, again restrained by inflation worries. The UK did less badly than the rest of Europe, because of its rather more resilient sector breakdown and high-flying materials companies.
(1) The LBAB Index is a widely recognized, unmanaged index of publicly issued investment grade U.S. Government, mortgage-backed, asset-backed and corporate debt securities.
(2) The Lehman Brothers® High Yield Bond – 2% Issuer Constrained Composite Index is an unmanaged index that measures the performance of fixed-income securities.
(3) The S&P 500® Index is an unmanaged index that measures the performance of securities of approximately 500 of the largest companies in the United States.
(4) The MSCI Japan® Index is a free float-adjusted market capitalization index that is designed to measure developed market equity performance in Japan.
(5) The MSCI Europe ex UK® Index is a free float rising adjusted market capitalization index that is designed to measure developed market equity performance in Europe, excluding the UK.
(6) The MSCI UK® Index is a free float-adjusted market capitalization index that is designed to measure developed market equity performance in the UK.
All indices are unmanaged and investors cannot invest directly in an index.
Past performance does not guarantee future results. The performance quoted represents past performance. Investment return and principal value of an investment will fluctuate, and shares, when redeemed, may be worth more or less than their original cost. The Funds’ performance is subject to change since the period’s end and may be lower or higher than the performance data shown. Please call (800) 992-0180 or logo on to www.ingfunds.com to obtain performance data current to the most recent month end.
Market Perspective reflects the views of ING’s Chief Investment Risk Officer only through the end of the period, and is subject to change based on market and other conditions.
3
Table of Contents
| ING GNMA INCOME FUND | PORTFOLIO MANAGERS’ REPORT |
ING GNMA Income Fund (the “Fund”) seeks to generate a high level of current income, consistent with liquidity and safety of principal, through investment primarily in Government National Mortgage Association (“GNMA”) mortgage-backed securities (also known as GNMA Certificates) that are guaranteed as to the timely payment of principal and interest by the U.S. government. The Fund is managed by Denis P. Jamison, CFA, Senior Vice President and Senior Portfolio Manager of ING Investment Management Co. — the Sub-Adviser.
Securities issued by the U.S. Treasury are backed by the full faith and credit of the federal government. Securities issued by individual agencies and organizations may be backed by the full faith and credit of the federal government as to principal or interest but are not direct obligations of the U.S. Treasury. Securities of some agencies and organizations are backed solely by the entity’s own resources or by the ability of the entity to borrow from the U.S. Treasury. Government securities also include certain mortgage-related securities that are sponsored by a U.S. government agency or organization and are not direct obligations of the U.S. government.
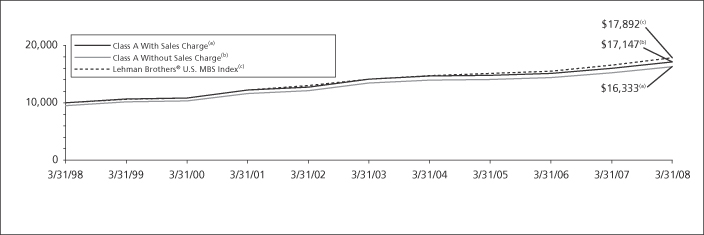
Performance: For the year ended March 31, 2008, the Fund’s Class A shares, excluding sales charges, provided a total return of 7.00% compared to the Lehman Brothers® U.S. Mortgage-Backed Securities (“MBS”) Index(1), which returned 7.82% for the same period.
Portfolio Specifics: The spread between the yield of mortgage securities and those of U.S. Treasury bonds widened steadily during the fiscal year ended March 31. While part of this can be explained by the turmoil in the mortgage market, the prime cause, at least for those securities with government backing like GNMAs, was the steady increase in overall market volatility. Wider price
fluctuations increase the call risk implicit in mortgage securities. So, while ten-year U.S. Treasury yields fell from about 4.7% to less than 3.5% during that period, the current coupon GNMA mortgage saw its yield decline from about 5.6% to just 5.1%.
GNMA mortgages benefited from a flight to quality bid during the second half of 2007. So, for the twelve months ended March 31st, 2008, this segment out performed the Lehman Brothers MBS Index benchmark by eighteen basis points. GNMA securities account for only 10% of the Lehman MBS benchmark; mortgages backed by the Federal National Mortgage Association (“FNMA”) and the Federal Home Loan Mortgage Corporation (“FHLMC”) constitute the remainder. Accordingly, GNMA performance can often vary from that of the broader benchmark index. Aggressive liquidity injections by the Federal Reserve — specifically, their willingness to accept agency-guaranteed mortgage collateral for U.S. Treasury swaps — reduced the attractiveness of GNMA mortgages. In the month of March, for example, the sub-sector lagged the benchmark by thirty basis points. Clearly, that remains a risk going forward.
Our lack of exposure to the U.S. Treasury market during the March quarter limited the Fund’s returns. In response to trading losses during 2007 and high volatility, we eliminated our U.S. Treasury bond holdings and reinvested the cash in mortgages. The continuing weakness in the economy and a flight from riskier assets helped U.S. Treasury securities to return over 4% during the quarter compared to only about 2% for mortgages.
There were no individual positions that significantly enhanced our return during the period. Trading losses on long-term U.S. Treasury bonds reduced the Fund’s total return by about 0.25% during the first half of the fiscal year. We decided to curtail this activity during the most recent two quarters because (1) of our lack of success earlier in the year, (2) the market no longer exhibits a clear trend, and (3) the heightened level of volatility has greatly increased the risk of active trading.
Current Strategy and Outlook: To ward off a collapse of financial stability and economic growth, the Federal Reserve has cut overnight borrowing costs by three percentage points since September, created new lending facilities, opened the borrowing window to both securities dealers as well as banks and expanded the types of collateral acceptable for loans. We believe interest rates will remain low for an extended period.
In our opinion, the yield curve should exhibit a steep upward slope and bond price volatility should abate. We believe this is a combination which should lead to better mortgage performance. Accordingly, we plan to remain fully invested in GNMA securities and will use our cash flow to invest in lower coupon securities with better return potential than the mortgage index in a declining yield environment.
Portfolio holdings and characteristics are subject to change and may not be representative of current holdings and characteristics. The outlook for this Fund may differ from that presented for other ING Funds. Performance for the different classes of shares will vary based on differences in fees associated with each class.
(1) | The Lehman Brothers® U.S. MBS Index is an unmanaged index composed of fixed-income security mortgage pools sponsored by GNMA, FNMA and FHLMC, including GNMA Graduated Payment Mortgages. |
4
Table of Contents
| PORTFOLIO MANAGERS’ REPORT | ING GNMA INCOME FUND |
Average Annual Total Returns for the Periods Ended March 31, 2008 |
| |||||||||||||||||||||||||||
1 Year | 5 Year | 10 Year | Since | Since | Since | Since | Since | |||||||||||||||||||||
Including Sales Charge: | ||||||||||||||||||||||||||||
Class A(1) | 4.38 | % | 2.93 | % | 5.02 | % | — | — | — | — | — | |||||||||||||||||
Class B(2) | 1.24 | % | 2.82 | % | — | 4.88 | % | — | — | — | — | |||||||||||||||||
Class C(3) | 5.23 | % | 3.15 | % | — | — | 4.83 | % | — | — | — | |||||||||||||||||
Class I | 7.42 | % | 4.25 | % | — | — | — | 5.12 | % | — | — | |||||||||||||||||
Class Q | 7.06 | % | 4.00 | % | — | — | — | — | 5.18 | % | ||||||||||||||||||
Class W | — | — | — | — | — | — | — | 3.16 | % | |||||||||||||||||||
Excluding Sales Charge: | ||||||||||||||||||||||||||||
Class A | 7.00 | % | 3.94 | % | 5.53 | % | — | — | — | — | — | |||||||||||||||||
Class B | 6.24 | % | 3.16 | % | — | 4.88 | % | — | — | — | — | |||||||||||||||||
Class C | 6.23 | % | 3.15 | % | — | — | 4.83 | % | — | — | — | |||||||||||||||||
Class I | 7.42 | % | 4.25 | % | — | — | — | 5.12 | % | — | — | |||||||||||||||||
Class Q | 7.06 | % | 4.00 | % | — | — | — | — | 5.18 | % | ||||||||||||||||||
Class W | — | — | — | — | — | — | — | 3.16 | % | |||||||||||||||||||
Lehman Brothers ® U.S. MBS Index(4) | 7.82 | % | 4.80 | % | 5.99 | % | 6.11 | %(5) | 6.11 | %(5) | 5.38 | %(6) | 5.61 | %(7) | 2.43 | %(8) | ||||||||||||
Based on a $10,000 initial investment, the graph and table above illustrate the total return of ING GNMA Income Fund against the index indicated. An index is unmanaged and has no cash in its portfolio, imposes no sales charges and incurs no operating expenses. An investor cannot invest directly in an index. The Fund’s performance is shown both with and without the imposition of sales charges.
The performance graph and table do not reflect the deduction of taxes that a shareholder will pay on Fund distributions or the redemption of Fund shares.
The performance shown may include the effect of fee waivers and/or expense reimbursements by the Investment Adviser and/or other service providers, which have the effect of increasing total return. Had all fees and expenses been considered, the total returns would have been lower.
Performance data represents past performance and is no assurance of future results. Investment return and principal value of an investment in the Fund will fluctuate. Shares, when sold, may be worth more or less than their original cost. The Fund’s performance may be lower or higher than the performance data shown. Please log on to www.ingfunds.com or call (800) 992-0180 to get performance through the most recent month end.
This report contains statements that may be “forward-looking” statements. Actual results may differ materially from those projected in the “forward-looking” statements.
The views expressed in this report reflect those of the portfolio managers, only through the end of the period as stated on the cover. The portfolio managers’ views are subject to change at any time based on market and other conditions.
Fund holdings are subject to change daily.
(1) | Reflects deduction of the maximum Class A sales charge of 4.75%. Effective July 31, 2006, the maximum Class A sales charge was lowered to 2.50%. |
(2) | Reflects deduction of the Class B deferred sales charge of 5% and 2% for the 1 year and 5 year returns, respectively. |
(3) | Reflects deduction of the Class C deferred sales charge of 1% for the 1 year return. |
(4) | The Lehman Brothers® U.S. MBS Index is an unmanaged index composed of fixed-income security mortgage pools sponsored by GNMA, FNMA and FHLMC, including GNMA Graduated Payment Mortgages. |
(5) | Since inception performance for index is shown from October 1, 2000. |
(6) | Since inception performance for index is shown from January 1, 2002. |
(7) | Since inception performance for index is shown from March 1, 2001. |
(8) | Since inception performance for index is shown from January 1, 2008. |
5
Table of Contents
| ING HIGH YIELD BOND FUND | PORTFOLIO MANAGERS’ REPORT |
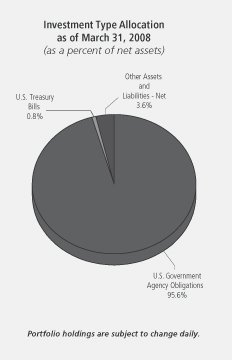
Investment Type Allocation as of March 31, 2008
(as a percent of net assets)
Corporate Bonds/Notes | 95.1% | |
Other Assets and Liabilities — Net* | 4.9% | |
Net Assets | 100.0% | |
| * | Includes short-term investments related to ING Institutional Prime Money Market Fund and repurchase agreement. |
Portfolio holdings are subject to change daily.
ING High Yield Bond Fund (the “Fund”) seeks to provide investors with a high level of current income and total return. The Fund is managed by Randall Parrish, CFA and Portfolio Manager of ING Investment Management Co. — the Sub-Adviser.
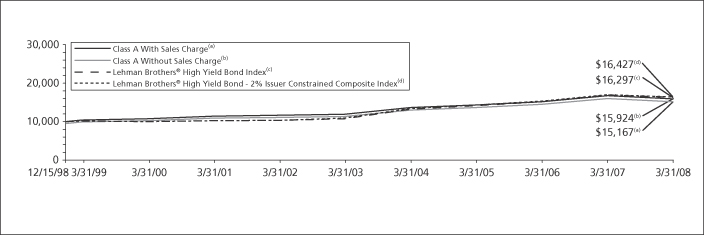
Performance: For the year ended March 31, 2008, the Fund’s Class A shares, excluding sales charges, provided a total return of (5.10)% compared to the Lehman Brothers® High Yield Bond Index(1) and the Lehman Brothers® High Yield Bond — 2% Issuer Constrained Composite Index(2), which returned (3.74)% and (3.47)%, respectively, for the same period.
Portfolio Specifics: The reporting period marked the return of volatility to the high yield market after more than three years of generally steady gains. The market shrugged off the initial signs of subprime distress as the yield on the benchmark reached an all-time tight spread against Treasuries in May 2007. Growth remained solid despite weakness in the housing market, and inflation was declining and investors continued to reach for yield by taking more risk.
By period-end, the Standard & Poor’s 500® (“S&P 500®”) was 19% off its October 2007 high, the Federal Reserve Board (the “Fed”) had cut rates at the most aggressive pace in history and Bear Stearns was being acquired by JP Morgan with the assistance of the U.S. Government. The spread of the high yield index had widened to nearly four times its May 2007 low and liquidity in the market was virtually non-existent. The deteriorating economic environment led to indiscriminate selling of financial assets, as investors who had bought with borrowed money were forced to de-lever their positions to meet margin calls and redemptions. The market finally rebounded somewhat in the last two weeks of March, as the Fed’s aggressive actions began to restore liquidity to the financial system.
At the beginning of the period the market rewarded a more aggressive posture, and then harshly punished it a few months later. An underweight of BB-rated bonds hurt performance when those bonds outperformed B and CCC bonds in which the Fund was overweight. Also detracting from results were the Fund’s holdings in floating-rate notes, which significantly underperformed their fixed rate counterparts when the Fed increased the pace of its rate cutting.
Successes generally came in small increments from positive events across a broad range of industries, most notably in the chemicals and wireless sectors. The Fund’s underweights of homebuilders and financials were significant contributors to results as those sectors underperformed. The Fund also benefited by avoiding some of the worst performing bonds.
The Fund experienced its first default in several years: the frozen credit markets prevented commercial printer Quebecor World Cap Corp. from refinancing its maturing debt, forcing the company to seek bankruptcy protection. Performance also was hurt by holdings in two yellow pages publishers, Idearc, Inc. and RH Donnelley Corp., after they reduced their earnings outlooks for 2008. The Fund still owns both, as we believe the businesses are sound and able to generate free cash flow to reduce debt.
Current Strategy and Outlook: Last quarter, we noted that the odds of a recession in the United States had increased, but that we felt high yield spreads appropriately reflected that risk. By no means did we foresee the events that followed. With credit conditions significantly tighter, we believe we have entered an economic downturn — perhaps of some duration — and expect an increase in defaults.
We still believe the high yield market offers value, though, in our opinion, it is unlikely to sustain a meaningful rally until the impact of the downturn and the coming increase in defaults is clearer. Though we are comfortable with the majority of Fund holdings, we continue to selectively reduce exposure to highly leveraged companies and sectors most at risk to economic weakness.
The market has generally sold off with little distinction between lower and higher default risk. We believe this indiscriminate selling presents attractive investment opportunities, which we intend to take advantage of in coming months.
Portfolio holdings and characteristics are subject to change and may not be representative of current holdings and characteristics. The outlook for this Fund may differ from that presented for other ING Funds. Performance for the different classes of shares will vary based on differences in fees associated with each class.
(1) | The Lehman Brothers® High Yield Bond Index is an unmanaged index that measures the performance of fixed-income securities generally representative of corporate bonds rated below investment grade. |
(2) | The Lehman Brothers® High Yield Bond — 2% Issuer Constrained Composite Index is an unmanaged index that measures the performance of fixed-income securities. |
Top Ten Industries as of March 31, 2008
(as a percent of net assets)
Diversified Financial Services | 13.8% | |
Media | 9.7% | |
Telecommunications | 8.6% | |
Electric | 6.5% | |
Healthcare — Services | 6.0% | |
Oil & Gas | 5.8% | |
Forest Products & Paper | 4.6% | |
Retail | 4.3% | |
Commercial Services | 3.3% | |
Chemicals | 2.7% |
Portfolio holdings are subject to change daily.
6
Table of Contents
| PORTFOLIO MANAGERS’ REPORT | ING HIGH YIELD BOND FUND |
Average Annual Total Returns for the Periods Ended March 31, 2008 | |||||||||||||
1 Year | 5 Year | Since Inception | |||||||||||
Including Sales Charge: | |||||||||||||
Class A(1) | (7.46) | % | 4.94 | % | 4.59 | % | |||||||
Class B(2) | (10.20) | % | 4.86 | % | 4.35 | % | |||||||
Class C(3) | (6.69) | % | 5.20 | % | 4.37 | % | |||||||
Excluding Sales Charge: | |||||||||||||
Class A | (5.10) | % | 5.96 | % | 5.14 | % | |||||||
Class B | (5.82) | % | 5.17 | % | 4.35 | % | |||||||
Class C | (5.81) | % | 5.20 | % | 4.37 | % | |||||||
Lehman Brothers High Yield Bond Index(4) | (3.74) | % | 8.62 | % | 5.37 | %(6) | |||||||
Lehman Brothers High Yield Bond — 2% Issuer Constrained Composite Index(5) | (3.47) | % | 8.50 | % | 5.46 | %(6) | |||||||
Based on a $10,000 initial investment, the graph and table above illustrate the total return of ING High Yield Bond Fund against the indices indicated. An index is unmanaged and has no cash in its portfolio, imposes no sales charges and incurs no operating expenses. An investor cannot invest directly in an index. The Fund’s performance is shown both with and without the imposition of sales charges.
The performance graph and table do not reflect the deduction of taxes that a shareholder will pay on Fund distributions or the redemption of Fund shares.
The performance shown may include the effect of fee waivers and/or expense reimbursements by the Investment Adviser and/or other service providers, which have the effect of increasing total return. Had all fees and expenses been considered, the total returns would have been lower.
Performance data represents past performance and is no assurance of future results. Investment return and principal value of an investment in the Fund will fluctuate. Shares, when sold, may be worth more or less than their original cost. The Fund’s performance may be lower or higher than the performance data shown. Please log on to www.ingfunds.com or call (800) 992-0180 to get performance through the most recent month end.
This report contains statements that may be “forward-looking” statements. Actual results may differ materially from those projected in the “forward-looking” statements.
The views expressed in this report reflect those of the portfolio managers, only through the end of the period as stated on the cover. The portfolio managers’ views are subject to change at any time based on market and other conditions.
Fund holdings are subject to change daily.
(1) | Reflects deduction of the maximum Class A sales charge of 4.75%. Effective July 31, 2006, the maximum Class A sales charge was lowered to 2.50%. |
(2) | Reflects deduction of the Class B deferred sales charge of 5% and 2% for the 1 year and 5 year returns, respectively. |
(3) | Reflects deduction of the Class C deferred sales charge of 1% for the 1 year return. |
(4) | The Lehman Brothers® High Yield Bond Index is an unmanaged index that measures the performance of fixed-income securities generally representative of corporate bonds rated below investment grade. |
(5) | The Lehman Brothers® High Yield Bond — 2% Issuer Constrained Composite Index is an unmanaged index that measures the performance of fixed-income securities. The Composite Index more closely tracks the types of securities in which the Fund invests than the Lehman Brothers® High Yield Bond Index. |
(6) | Since inception performance for indices is shown from December 1, 1998. |
7
Table of Contents
| ING INTERMEDIATE BOND FUND | PORTFOLIO MANAGERS’ REPORT |
ING Intermediate Bond Fund (the “Fund”) seeks to provide investors with a high level of current income, consistent with the preservation of capital and liquidity. The Fund is managed by James B. Kauffmann, Portfolio Manager of ING Investment Management Co. — the Sub-Adviser.
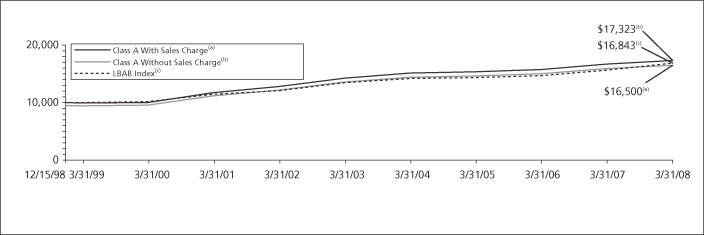
Performance: For the year ended March 31, 2008, the Fund’s Class A shares, excluding sales charges, provided a total return of 3.61% compared to Lehman Brothers® Aggregate Bond Index(1) (“LBAB Index”), which returned 7.67% for the same period.
Portfolio Specifics: Most of the fiscal year ending March 31, 2008 witnessed unprecedented stress in the fixed-income markets as risk aversion remained high, liquidity low, and many major financial institutions faced dire circumstances. The credit crisis was initially centered on lax lending practices in the sub- and non-prime mortgage markets, but the problems quickly spread to levered buyers of other sectors.
The shuttering of a few banks, brokers, mortgage originators, and quite a few hedge funds forced a flood of unwanted securities into ever weakening markets. Supposedly AAA-rated securities were hit the hardest. Central banks around the world stepped in with new and innovative techniques to bolster the flagging financial intermediaries and illiquid markets.
The Fund’s exposure to off-index residential mortgage backed securities (“RMBS”) was the chief source of underperformance, as that sector was hit by multiple waves of large liquidations. Failures of hedge funds and mortgage companies, and near-death experiences at a few banks flooded the bond market with paper. By August liquidity was nearly non-existent for all but U.S. Treasuries; thus pruning holdings was difficult. We did sell some RMBS in the brief liquidity respite of September/October 2007.
Investment Type Allocation
as of March 31, 2008
(as a percent of net assets)
Corporate Bonds/Notes | 26.8 | % | |
Collateralized Mortgage Obligations | 25.6 | % | |
U.S. Government Agency Obligations | 24.1 | % | |
Mutual Fund | 16.2 | % | |
U.S. Treasury Obligations | 8.1 | % | |
Other Bonds | 2.3 | % | |
Asset-Backed Securities | 2.0 | % | |
Preferred Stock | 1.1 | % | |
Municipal Bonds | 1.0 | % | |
Repurchase Agreement | 0.5 | % | |
Other Assets and Liabilities — Net* | (7.7 | )% | |
Net Assets | 100.0 | % | |
| * | Includes Securities Lending Collateral |
Portfolio holdings are subject to change daily.
Forced liquidations during the month of March put extreme pressure on asset valuations. Collateralized mortgage obligations, hybrid adjustable rate mortgages (“ARMs”), non-agency floaters, Alt-A, option ARMs and other securitized assets were hurt the most by the lack of liquidity and the extinction of available financing alternatives in the repurchase market. Such holdings in the Fund hurt performance, as did sub-prime and not-prime holdings.
Corporate exposures, while generally less than an index weight on a contribution to duration basis, were also stressed; holdings in financials and floating rate instruments were particularly vulnerable. Duration and yield curve posture (term structure) were actively managed throughout the year and were in aggregate beneficial; the interest rates strategies team anticipated Federal Open Market Committee (“FOMC”) easings well in advance of market consensus in most cases.
Because investors showed little differentiation between the characteristics of individual securities, security selection did not add value. The use of credit default swaps helped to mitigate losses in some instances while providing unique relative value opportunities once traditional “cash” markets seized up in July.
Current Outlook and Strategy: Thirteen months after the sub-prime mortgage crisis began, we believe the highly levered “shadow banking system” is routed. Credit destruction from collapsing collateral prices has led to capital destruction on lenders’ balance sheets, which has led to credit contraction. This credit contraction may have already resulted in a recession.
Remedies for the current crisis abound. Certainly the opening of the Federal Reserve Board (the “Fed”) discount window and other bold moves to provide short-term financing for banks and brokers, address the symptoms. While it is always good to reduce the fever of a patient, eventually the actual disease must be treated. In this case, we believe fresh capital must be raised by numerous financial institutions and some firms will simply fail. De-leveraging must also complete its painful purge while markets must move from discounting the improbable worst case to a more measured estimate of losses both in individual securities and at the level of entities that hold those securities.
Doom and gloom notwithstanding, portfolio managers must be forward looking, and timing is everything. We believe many securities are “priced for disaster, priced for liquidation” and offer significant discounts to their intrinsic values. The credit team is focusing on new issues which come at
steep discounts to the secondary market and may have identified municipal bonds that it believes offer relative value following the auction rate preferred debacle.
The Fund’s duration posture is 0.25 years short with a bias for a steepening yield curve. We continue to hold some special situation high-yield bonds despite our negative outlook for the sector. We will wait for more generalized price weakness or more compelling relative value before entering emerging market debt in a large way. The decoupling of global economies may be more conjecture than reality and setbacks may be forthcoming.
Portfolio holdings and characteristics are subject to change and may not be representative of current holdings and characteristics. The outlook for this Fund may differ from that presented for other ING Funds. Performance for the different classes of shares will vary based on differences in fees associated with each class.
(1) | The LBAB Index is a widely recognized, unmanaged index of publicly issued investment grade U.S. Government, mortgage-backed, asset-backed and corporate debt securities. |
Top Ten Industries
as of March 31, 2008
(as a percent of net assets)
Collateralized Mortgage Obligations | 25.6% | |
Federal National Mortgage Association | 12.5% | |
Federal Home Loan Mortgage Corporation | 11.6% | |
Diversified Financial Services | 7.6% | |
Banks | 7.3% | |
U.S. Treasury Notes | 5.9% | |
Other Bonds | 2.3% | |
Insurance | 1.7% | |
U.S. Treasury Bonds | 1.7% | |
Retail | 1.5% |
Portfolio holdings are subject to change daily.
8
Table of Contents
| PORTFOLIO MANAGERS’ REPORT | ING INTERMEDIATE BOND FUND |
Average Annual Total Returns for the Periods Ended March 31, 2008 |
| ||||||||||||||||||||||||
1 Year | 5 Year | Since Inception | Since | Since | Since | Since | |||||||||||||||||||
Including Sales Charge: | |||||||||||||||||||||||||
Class A(1) | 1.04 | % | 2.95 | % | 5.53 | % | — | — | — | — | |||||||||||||||
Class B(2) | (2.11) | % | 2.81 | % | 5.28 | % | — | — | — | — | |||||||||||||||
Class C(3) | 1.86 | % | 3.18 | % | 5.30 | % | — | — | — | — | |||||||||||||||
Class I | 4.05 | % | 4.32 | % | — | 5.40 | % | — | — | — | |||||||||||||||
Class O | 3.61 | % | — | — | — | 3.79 | % | — | — | ||||||||||||||||
Class R | 3.36 | % | — | — | — | — | 3.13 | % | — | ||||||||||||||||
Class W | — | — | — | — | — | — | 0.98 | % | |||||||||||||||||
Excluding Sales Charge: | |||||||||||||||||||||||||
Class A | 3.61 | % | 3.95 | % | 6.09 | % | — | — | — | — | |||||||||||||||
Class B | 2.84 | % | 3.15 | % | 5.28 | % | — | — | — | — | |||||||||||||||
Class C | 2.85 | % | 3.18 | % | 5.30 | % | — | — | — | — | |||||||||||||||
Class I | 4.05 | % | 4.32 | % | — | 5.40 | % | — | — | — | |||||||||||||||
Class O | 3.61 | % | — | — | — | 3.79 | % | — | — | ||||||||||||||||
Class R | 3.36 | % | — | — | — | — | 3.13 | % | |||||||||||||||||
Class W | — | — | — | — | — | — | 0.98 | % | |||||||||||||||||
LBAB Index(4) | 7.67 | % | 4.58 | % | 5.74 | %(5) | 5.52 | %(6) | 5.21 | %(7) | 4.38 | %(8) | 2.17 | %(9) | |||||||||||
Based on a $10,000 initial investment, the graph and table above illustrate the total return of ING Intermediate Bond Fund against the index indicated. An index is unmanaged and has no cash in its portfolio, imposes no sales charges and incurs no operating expenses. An investor cannot invest directly in an index. The Fund’s performance is shown both with and without the imposition of sales charges.
The performance graph and table do not reflect the deduction of taxes that a shareholder will pay on Fund distributions or the redemption of Fund shares.
The performance shown may include the effect of fee waivers and/or expense reimbursements by the Investment Adviser and/or other service providers, which have the effect of increasing total return. Had all fees and expenses been considered, the total returns would have been lower.
Performance data represents past performance and is no assurance of future results. Investment return and principal value of an investment in the Fund will fluctuate. Shares, when sold, may be worth more or less than their original cost. The Fund’s performance may be lower or higher than the performance data shown. Please log on to www.ingfunds.com or call (800) 992-0180 to get performance through the most recent month end.
This report contains statements that may be “forward-looking” statements. Actual results may differ materially from those projected in the “forward-looking” statements.
The views expressed in this report reflect those of the portfolio managers, only through the end of the period as stated on the cover. The portfolio managers’ views are subject to change at any time based on market and other conditions.
Fund holdings are subject to change daily.
(1) | Reflects deduction of the maximum Class A sales charge of 4.75%. Effective July 31, 2006, the maximum Class A sales charge was lowered to 2.50%. |
(2) | Reflects deduction of the Class B deferred sales charge of 5% and 2% for the 1 year and 5 year returns, respectively. |
(3) | Reflects deduction of the Class C deferred sales charge of 1% for the 1 year return. |
(4) | The LBAB Index is a widely recognized, unmanaged index of publicly issued investment grade U.S. Government, mortgage-backed, asset-backed and corporate debt securities. |
(5) | Since inception performance for index is shown from December 1, 1998. |
(6) | Since inception performance for index is shown from January 1, 2002. |
(7) | Since inception performance for index is shown from August 1, 2004. |
(8) | Since inception performance for index is shown from April 1, 2004. |
(9) | Since inception performance for index is shown from January 1, 2008. |
9
Table of Contents
| ING NATIONAL TAX-EXEMPT BOND FUND | PORTFOLIO MANAGERS’ REPORT |
ING National Tax-Exempt Bond Fund (the “Fund”) seeks to provide investors with a high level of current income that is exempt from federal income taxes, consistent with the preservation of capital. The Fund is managed by Robert Schonbrunn, Karen Cronk, and Rick Kilbride, Portfolio Managers of ING Investment Management Co. — the Sub-Adviser.
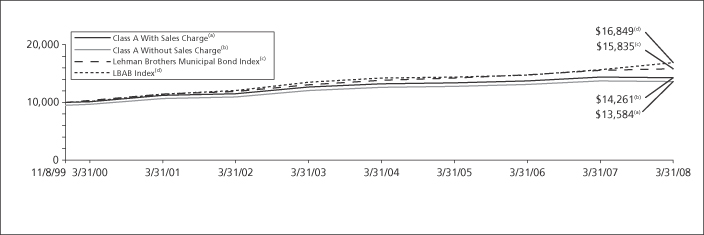
Performance: For the year ended March 31, 2008, the Fund’s Class A shares, excluding sales charges, provided a total return of (0.87)% compared to the Lehman Brothers Municipal Bond Index(1) and the Lehman Brothers® Aggregate Bond Index(2) (“LBAB Index”), which returned 1.90% and 7.67%, respectively, for the same period.
Portfolio Specifics: During the reporting period the municipal bond market reversed its direction from previous years, when longer-term and lower-quality bonds were the strongest performers. As the financial crisis developed in the summer of 2007, led by the sub-prime mortgage debacle, longer-term and lower-quality municipal bonds underperformed shorter-term and higher-quality issues. In anticipation of a weaker economy and lower interest rates, the Fund was positioned with longer-term bonds to better participate in the rising prices associated with this outlook. While taxable interest rates did decline, longer-term, tax-exempt interest rates actually rose during the period.
Over the past few years some nontraditional investors, including investment banks, hedge funds and foreign investors, bought long-term municipal bonds as part of a leveraged arbitrage to create short-term, variable-rate instruments. When their funding became more expensive and less available, these arbitrageurs began unwinding their positions, selling significant amounts of longer-maturity municipal bonds into a weak market. The Fund’s exposure to this sector increased when interest rates rose above the call prices of certain callable bonds, which were then priced to maturity instead of being priced to their call dates. This extended the Fund’s duration and average maturity and detracted from results.
The monoline insurers, which insure about half of all municipal bond issues, have experienced pressure on their capital bases because of their exposure to financial derivatives.
Although the insurance backing some of the Fund’s bonds is less secure, municipal bonds remain an extremely high quality asset class with a strong record of interest payments and a low rate of defaults. We do not believe the weakening of the monoline insurer’s capitalizations will have a lasting negative effect on the municipal bond market.
The unrest that has dominated the financial markets since last summer has focused on risk, which has caused higher quality municipal bonds to sell at lower yields (higher prices) than lower quality bonds. The Fund has maintained an AA rating overall, but has exposure to BBB and
unrated bonds. The Fund ended the fiscal year with a coupon of 5.24% and a yield to maturity of 4.38% both of which were comparatively attractive rates.
Current Strategy and Outlook: We believe the municipal bond market is undervalued at this time and offers higher yields than comparable taxable issues all along the yield curve. As arbitrageurs continue to unwind their positions and the insurance problem works itself out, we believe municipal bond issues will face heavy supply in the primary and secondary markets in the near term. We believe the re-establishment of a more normal relationship between municipal bond issues and taxable bonds will cause municipal bond issues to outperform, and makes them an attractive asset class at this time.
Portfolio holdings and characteristics are subject to change and may not be representative of current holdings and characteristics. The outlook for this Fund may differ from that presented for other ING Funds. Performance for the different classes of shares will vary based on differences in fees associated with each class.
(1) | The Lehman Brothers Municipal Bond Index is an unmanaged index of approximately 1,100 investment-grade tax-exempt bonds classified into four sectors: general obligation, revenue, insured and pre-refunded. |
(2) | The LBAB Index is a widely recognized, unmanaged index of publicly issued investment grade U.S. Government, mortgage-backed, asset-backed and corporate debt securities. |
Top Ten Holdings
as of March 31, 2008
(as a percent of net assets)
Payne County Economic Development Authority, | 3.8% | |
Harris County Health Facilities Development Corp., | 3.8% | |
Port Authority of New York & New Jersey, | 3.8% | |
New York State Dormitory Authority, | 3.7% | |
Oklahoma Industries Authority, | 3.7% | |
De Kalb-Ogle Etc Counties Community College District No. 523, 5.750%, due 02/01/11 | 3.6% | |
Interlocken Metropolitan District, | 3.6% | |
City of New York, | 3.6% | |
Pleasant Valley School District, | 3.6% | |
City of New York, | 3.5% |
Portfolio holdings are subject to change daily.
10
Table of Contents
| PORTFOLIO MANAGERS’ REPORT | ING NATIONAL TAX-EXEMPT BOND FUND |
Average Annual Total Returns for the Periods Ended March 31, 2008 |
| ||||||||||||
1 Year | 5 Year | Since Inception | |||||||||||
Including Sales Charge: | |||||||||||||
Class A(1) | (3.31 | )% | 1.41 | % | 3.72 | % | |||||||
Class B(2) | (6.39 | )% | 1.29 | % | 3.53 | % | |||||||
Class C(3) | (2.57 | )% | 1.64 | % | 3.55 | % | |||||||
Excluding Sales Charge: | |||||||||||||
Class A | (0.87 | )% | 2.40 | % | 4.32 | % | |||||||
Class B | (1.63 | )% | 1.63 | % | 3.53 | % | |||||||
Class C | (1.62 | )% | 1.64 | % | 3.55 | % | |||||||
Lehman Brothers Municipal Bond Index(4) | 1.90 | % | 3.92 | % | 5.61 | %(6) | |||||||
LBAB Index(5) | 7.67 | % | 4.58 | % | 6.39 | %(6) | |||||||
Based on a $10,000 initial investment, the graph and table above illustrate the total return of ING National Tax-Exempt Bond Fund against the indices indicated. An index is unmanaged and has no cash in its portfolio, imposes no sales charge and incurs no operating expenses. An investor cannot invest directly in an index. The Fund’s performance is shown both with and without the imposition of sales charges.
The performance graph and table do not reflect the deduction of taxes that a shareholder will pay (if any) on Fund distributions or the redemption of Fund shares.
The performance shown may include the effect of fee waivers and/or expense reimbursements by the Investment Adviser and/or other service providers, which have the effect of increasing total return. Had all fees and expenses been considered, the total returns would have been lower.
Performance data represents past performance and is no assurance of future results. Investment return and principal value of an investment in the Fund will fluctuate. Shares, when sold, may be worth more or less than their original cost. The Fund’s performance may be lower or higher than the performance data shown. Please log on to www.ingfunds.com or call (800) 992-0180 to get performance through the most recent month end.
This report contains statements that may be “forward-looking” statements. Actual results may differ materially from those projected in the “forward-looking” statements.
The views expressed in this report reflect those of the portfolio managers, only through the end of the period as stated on the cover. The portfolio managers’ views are subject to change at any time based on market and other conditions.
Fund holdings are subject to change daily.
(1) | Reflects deduction of the maximum Class A sales charge of 4.75%. Effective July 31, 2006, the maximum Class A sales charge was lowered to 2.50%. |
(2) | Reflects deduction of the Class B deferred sales charge of 5% and 2% for the 1 year and 5 year returns, respectively. |
(3) | Reflects deduction of the Class C deferred sales charge of 1% for the 1 year return. |
(4) | The Lehman Brothers Municipal Bond Index is an unmanaged index of approximately 1,100 investment grade tax-exempt bonds classified into four sectors: general obligation, revenue, insured and pre-refunded. |
(5) | The LBAB Index is a widely recognized, unmanaged index of publicly issued investment grade U.S. Government, mortgage-backed, asset-backed and corporate debt securities. |
(6) | Since inception performance for indices is shown from November 1, 1999. |
11
Table of Contents
| ING CLASSIC MONEY MARKET FUND | PORTFOLIO MANAGERS’ REPORT |
ING Classic Money Market Fund (the “Fund”) seeks to provide investors with a high level of current income, consistent with the preservation of capital and liquidity and the maintenance of a stable $1.00 net asset value per share. The Fund is managed by David S. Yealy, Portfolio Manager of ING Investment Management Co. — the Sub-Adviser.
Portfolio Specifics: The Fund’s fiscal year ending March 31, 2008 was a difficult and challenging one for money market funds. The period started off uneventfully, with few changes in rates for short-term money market securities, or in economic expectations. Events and markets changed dramatically in early August, driven by the sub-prime mortgage melt-down and its impact on hedge funds, commercial debt obligations (“CDOs”) and asset-backed commercial paper (“ABCP”) issued by structured investment vehicles (“SIVs”). Commercial paper rates and the London Interbank Offered Rate (“LIBOR”) skyrocketed in a flight to quality.
The Federal Reserve Board (the “Fed”) and other major central banks around the globe were forced to take unprecedented actions to keep the financial system from collapsing. Markets remained in disarray for the remainder of the fiscal year ending in March. There were brief periods of improved market conditions followed by more concerns about sub-prime, liquidity, and inter-bank lending risks amid a slowing economic back-drop. The Fed has aggressively lowered the federal funds rate a total of 3.00% so far, with the current rate at 2.25% and the potential for more rate cuts.
The Fund was able to outperform its peers for the fiscal year. The Fund maintained an over-weight position in floating-rate securities, the majority of which had rates tied to LIBOR. These floating-rate securities allowed the Fund to capture higher yields relative to other money market securities as LIBOR rates spiked due to the market dislocations and liquidity concerns.
We avoided issuers that had large exposure to sub-prime and CDO assets. Initially, the market did not differentiate between well-structured ABCP issuers and higher risk issuers such as SIVs. As a result, we were able to purchase high quality assets at fire-sale prices.
As the Federal Open Market Committee (“FOMC”) lowered interest rates, we periodically extended the weighted-average-maturity (“WAM”) of the Fund to lock in high current yields for longer periods. The Fund ended the fiscal year with a WAM of 61 days, compared to the previous year-end of 31 days. The longer WAM benefited the Fund relative to most of its peers.
Current Strategy and Outlook: We do not expect to see an improvement in the conditions for money market securities in the near-term, as liquidity issues, credit concerns and recession risks dominate the markets. Additional actions by the U.S. Treasury, further U.S. rate cuts and actions by other central banks will be necessary to address these risks. Our current strategy is to continue to take advantage of the high LIBOR rates by buying floating rate securities of highly rated issuers and maintaining a longer-than normal WAM by buying longer-term fixed rate securities.
We look to increase exposure to the highest quality issuers by buying U.S. Treasury securities, U.S. government agency securities and highly rated corporate money market securities as we expect credit risks to increase in light of the current market conditions and deteriorating economic outlook.
Principal Risk Factor(s): An investment in the Fund is not guaranteed by the Federal Deposit Insurance Corporation or any other government agency.
Although the Fund seeks to preserve the value of your investment at $1.00 per share, it is possible to lose money by investing in the Fund.
Portfolio holdings and characteristics are subject to change and may not be representative of current holdings and characteristics. The outlook for this Fund may differ from that presented for other ING Funds.
The views expressed in this report reflect those of the portfolio managers only through the end of the period as stated on the cover. The portfolio managers’ views are subject to change at any time based on market and other conditions.
Fund holdings are subject to change daily.
This report contains statements that may be “forward-looking” statements. Actual results may differ materially from those projected in the “forward-looking” statements.
12
Table of Contents
| PORTFOLIO MANAGERS’ REPORT | ING INSTITUTIONAL PRIME MONEY MARKET FUND |
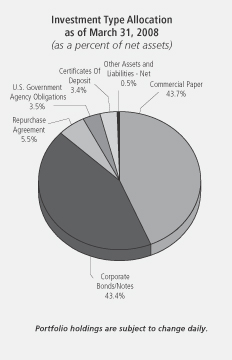
Investment Type Allocation
as of March 31, 2008
(as a percent of net assets)
Corporate Bonds/Notes | 47.7% | |
Commercial Paper | 41.8% | |
Repurchase Agreement | 10.0% | |
Certificates of Deposit | 0.6% | |
U.S. Government Agency Obligations | 0.1% | |
Other Assets and Liabilities — Net | (0.2)% | |
Net Assets | 100.0% | |
Portfolio holdings are subject to change daily.
ING Institutional Prime Money Market Fund (the “Fund”) seeks to provide investors with a high level of current income, consistent with the preservation of capital and liquidity and the maintenance of a stable $1.00 net asset value per share. The Fund is managed by David S. Yealy, Portfolio Manager of ING Investment Management Co. — the Sub-Adviser.
Portfolio Specifics: The Fund’s fiscal year ending March 31, 2008 was a difficult and challenging one for money market funds. The period started off uneventfully, with few changes in rates for short-term money market securities, or in economic expectations. Events and markets changed dramatically in early August, driven by the sub-prime mortgage melt-down and its impact on hedge funds, commercial debt obligations (“CDOs”) and asset-backed commercial paper (“ABCP”) issued by structured investment vehicles (“SIVs”). Commercial paper rates and the London Interbank Offered Rate (“LIBOR”) skyrocketed in a flight to quality.
The Federal Reserve Board (the “Fed”) and other major central banks around the globe were forced to take unprecedented actions to keep the financial system from collapsing. Markets remained in disarray for the remainder of the fiscal year ending in March. There were brief periods of improved market conditions followed by more concerns about sub-prime, liquidity, and inter-bank lending risks amid a slowing economic back-drop. The Fed has aggressively lowered the federal funds rate a total of 3.00% so far, with the current rate at 2.25% and the potential for more rate cuts.
The Fund was able to outperform its peers for the fiscal year. The Fund maintained an over-weight position in floating-rate securities, the majority of which had rates tied to LIBOR. These floating-rate securities allowed the Fund to capture higher yields relative to other money market securities as LIBOR rates spiked due to the market dislocations and liquidity concerns.
We avoided issuers that had large exposure to sub-prime and CDO assets. Initially, the market did not differentiate between well-structured ABCP issuers and higher risk issuers such as SIVs. As a result, we were able to purchase high quality assets at fire-sale prices.
As the Federal Open Market Committee (“FOMC”) lowered interest rates, we periodically extended the weighted-average-maturity (“WAM”) of the Fund to lock in high current yields for longer periods. The Fund ended the fiscal year with a WAM of 40 days, compared to the previous year-end of 28 days. The longer WAM benefited the Fund relative to most of its peers.
Current Strategy and Outlook: We do not expect to see an improvement in the conditions for money market securities in the near-term, as liquidity issues, credit concerns and recession risks dominate the markets. Additional actions by the U.S. Treasury, further U.S. rate cuts and actions by other central banks will be necessary to address these risks. Our current strategy is to continue to take advantage of the high LIBOR rates by buying floating rate securities of highly rated issuers and maintaining a longer-than normal WAM by buying longer-term fixed rate securities.
We look to increase exposure to the highest quality issuers by buying U.S. Treasury securities, U.S. government agency securities and highly rated corporate money market securities as we expect credit risks to increase in light of the current market conditions and deteriorating economic outlook.
Principal Risk Factor(s): An investment in the Fund is not guaranteed by the Federal Deposit Insurance Corporation or any other government agency.
Although the Fund seeks to preserve the value of your investment at $1.00 per share, it is possible to lose money by investing in the Fund.
Portfolio holdings and characteristics are subject to change and may not be representative of current holdings and characteristics. The outlook for this Fund may differ from that presented for other ING Funds.
The views expressed in this report reflect those of the portfolio managers only through the end of the period as stated on the cover. The portfolio managers’ views are subject to change at any time based on market and other conditions.
Fund holdings are subject to change daily.
This report contains statements that may be “forward-looking” statements. Actual results may differ materially from those projected in the “forward-looking” statements.
13
Table of Contents
SHAREHOLDER EXPENSE EXAMPLES (UNAUDITED)
As a shareholder of a Fund, you incur two types of costs: (1) transaction costs, including sales charges (loads) on purchase payments, redemption fees, and exchange fees; and (2) ongoing costs, including management fees, distribution and/or service (12b-1) fees, and other Fund expenses. These Examples are intended to help you understand your ongoing costs (in dollars) of investing in a Fund and to compare these costs with the ongoing costs of investing in other mutual funds.
The Examples are based on an investment of $1,000 invested at the beginning of the period and held for the entire period from October 1, 2007 to March 31, 2008. The Funds’ expenses are shown without the imposition of any sales charges or fees. Expenses would have been higher if such charges were included.
Actual Expenses
The first section of the table shown, “Actual Fund Return,” provides information about actual account values and actual expenses. You may use the information in this section, together with the amount you invested, to estimate the expenses that you paid over the period. Simply divide your account value by $1,000 (for example, an $8,600 account value divided by $1,000 = 8.6), then multiply the result by the number in the first section under the heading entitled “Expenses Paid During the Period” to estimate the expenses you paid on your account during this period.
Hypothetical Example for Comparison Purposes
The second section of the table shown, “Hypothetical (5% return before expenses)” provides information about hypothetical account values and hypothetical expenses based on the Fund’s actual expense ratio and an assumed rate of return of 5% per year before expenses, which is not the Fund’s actual return. The hypothetical account values and expenses may not be used to estimate the actual ending account balance or expenses you paid for the period. You may use this information to compare the ongoing costs of investing in each Fund and other funds. To do so, compare this 5% hypothetical example with the 5% hypothetical examples that appear in the shareholder reports of the other funds.
Please note that the expenses shown in the table are meant to highlight your ongoing costs only and do not reflect any transactional costs, such as sales charges (loads), redemption fees, or exchange fees. Therefore, the hypothetical lines of the table are useful in comparing ongoing costs only, and will not help you determine the relative total costs of owning different funds. In addition, if these transactional costs were included, your costs would have been higher.
ING GNMA Income Fund | Beginning | Ending | Annualized | Expenses Paid | ||||||||||||
Actual Fund Return | ||||||||||||||||
Class A | $ | 1,000.00 | $ | 1,053.00 | 0.96 | % | $ | 4.93 | ||||||||
Class B | 1,000.00 | 1,048.10 | 1.71 | 8.76 | ||||||||||||
Class C | 1,000.00 | 1,048.00 | 1.71 | 8.76 | ||||||||||||
Class I | 1,000.00 | 1,054.40 | 0.67 | 3.44 | ||||||||||||
Class Q | 1,000.00 | 1,053.00 | 0.92 | 4.72 | ||||||||||||
Class W(1) | 1,000.00 | 1,031.60 | 0.64 | 1.88 | ||||||||||||
Hypothetical (5% return before expenses) | ||||||||||||||||
Class A | $ | 1,000.00 | $ | 1,020.20 | 0.96 | % | $ | 4.85 | ||||||||
Class B | 1,000.00 | 1,016.45 | 1.71 | 8.62 | ||||||||||||
Class C | 1,000.00 | 1,016.45 | 1.71 | 8.62 | ||||||||||||
Class I | 1,000.00 | 1,021.65 | 0.67 | 3.39 | ||||||||||||
Class Q | 1,000.00 | 1,020.40 | 0.92 | 4.65 | ||||||||||||
Class W(1) | 1,000.00 | 1,021.80 | 0.64 | 3.23 | ||||||||||||
| * | Expenses are equal to each Fund’s respective annualized expense ratios multiplied by the average account value over the period, multiplied by 183/366 to reflect the most recent fiscal half-year. |
(1) | Commencement of operations for Class W was December 17, 2007. Expenses paid reflect the 106 day period ended March 31, 2008. |
14
Table of Contents
SHAREHOLDER EXPENSE EXAMPLES (UNAUDITED) (CONTINUED)
ING High Yield Bond Fund | Beginning | Ending | Annualized | Expenses Paid | ||||||||||||
Actual Fund Return | ||||||||||||||||
Class A | $ | 1,000.00 | $ | 940.70 | 1.11 | % | $ | 5.39 | ||||||||
Class B | 1,000.00 | 937.10 | 1.86 | 9.01 | ||||||||||||
Class C | 1,000.00 | 937.10 | 1.86 | 9.01 | ||||||||||||
Hypothetical (5% return before expenses) | ||||||||||||||||
Class A | $ | 1,000.00 | $ | 1,019.45 | 1.11 | % | $ | 5.60 | ||||||||
Class B | 1,000.00 | 1,015.70 | 1.86 | 9.37 | ||||||||||||
Class C | 1,000.00 | 1,015.70 | 1.86 | 9.37 | ||||||||||||
ING Intermediate Bond Fund | ||||||||||||||||
Actual Fund Return | ||||||||||||||||
Class A | $ | 1,000.00 | $ | 1,016.40 | 0.69 | % | $ | 3.48 | ||||||||
Class B | 1,000.00 | 1,012.70 | 1.44 | 7.25 | ||||||||||||
Class C | 1,000.00 | 1,012.70 | 1.44 | 7.25 | ||||||||||||
Class I | 1,000.00 | 1,019.00 | 0.35 | 1.77 | ||||||||||||
Class O | 1,000.00 | 1,016.40 | 0.69 | 3.48 | ||||||||||||
Class R | 1,000.00 | 1,015.20 | 0.94 | 4.74 | ||||||||||||
Class W(1) | 1,000.00 | 1,009.80 | 0.44 | 1.28 | ||||||||||||
Hypothetical (5% return before expenses) | ||||||||||||||||
Class A | $ | 1,000.00 | $ | 1,021.55 | 0.69 | % | $ | 3.49 | ||||||||
Class B | 1,000.00 | 1,017.80 | 1.44 | 7.26 | ||||||||||||
Class C | 1,000.00 | 1,017.80 | 1.44 | 7.26 | ||||||||||||
Class I | 1,000.00 | 1,023.25 | 0.35 | 1.77 | ||||||||||||
Class O | 1,000.00 | 1,021.55 | 0.69 | 3.49 | ||||||||||||
Class R | 1,000.00 | 1,020.30 | 0.94 | 4.75 | ||||||||||||
Class W(1) | 1,000.00 | 1,022.80 | 0.44 | 2.23 | ||||||||||||
ING National Tax-Exempt Bond Fund | ||||||||||||||||
Actual Fund Return | ||||||||||||||||
Class A | $ | 1,000.00 | $ | 993.50 | 0.87 | % | $ | 4.34 | ||||||||
Class B | 1,000.00 | 989.70 | 1.62 | 8.06 | ||||||||||||
Class C | 1,000.00 | 989.70 | 1.62 | 8.06 | ||||||||||||
Hypothetical (5% return before expenses) | ||||||||||||||||
Class A | $ | 1,000.00 | $ | 1,020.65 | 0.87 | % | $ | 4.39 | ||||||||
Class B | 1,000.00 | 1,016.90 | 1.62 | 8.17 | ||||||||||||
Class C | 1,000.00 | 1,016.90 | 1.62 | 8.17 | ||||||||||||
| * | Expenses are equal to each Fund’s respective annualized expense ratios multiplied by the average account value over the period, multiplied by 183/366 to reflect the most recent fiscal half-year. |
(1) | Commencement of operations for Class W was December 17, 2007. Expenses paid reflect the 106 day period ended March 31, 2008. |
15
Table of Contents
SHAREHOLDER EXPENSE EXAMPLES (UNAUDITED) (CONTINUED)
ING Classic Money Market Fund | Beginning | Ending | Annualized | Expenses Paid | ||||||||||||
Actual Fund Return | ||||||||||||||||
Class A | $ | 1,000.00 | $ | 1,019.90 | 0.77 | % | $ | 3.89 | ||||||||
Class B | 1,000.00 | 1,016.90 | 1.36 | 6.86 | ||||||||||||
Class C | 1,000.00 | 1,016.90 | 1.36 | 6.86 | ||||||||||||
Hypothetical (5% return before expenses) | ||||||||||||||||
Class A | $ | 1,000.00 | $ | 1,021.15 | 0.77 | % | $ | 3.89 | ||||||||
Class B | 1,000.00 | 1,018.20 | 1.36 | 6.86 | ||||||||||||
Class C | 1,000.00 | 1,018.20 | 1.36 | 6.86 | ||||||||||||
ING Institutional Prime Money Market Fund | ||||||||||||||||
Actual Fund Return | ||||||||||||||||
Class I | $ | 1,000.00 | $ | 1,022.50 | 0.12 | % | $ | 0.61 | ||||||||
Class IS(1) | 1,000.00 | 1,013.50 | 0.20 | 0.65 | ||||||||||||
Hypothetical (5% return before expenses) | ||||||||||||||||
Class I | $ | 1,000.00 | $ | 1,024.40 | 0.12 | % | $ | 0.61 | ||||||||
Class IS(1) | 1,000.00 | 1,024.00 | 0.20 | 1.01 | ||||||||||||
| * | Expenses are equal to each Fund’s respective annualized expense ratios multiplied by the average account value over the period, multiplied by 183/366 to reflect the most recent fiscal half-year. |
(1) | Commencement of operations for Class IS was December 5, 2007. Expenses paid reflect the 118 day period ended March 31, 2008. |
16
Table of Contents
REPORT OF INDEPENDENT REGISTERED PUBLIC ACCOUNTING FIRM
The Shareholders and Board of Trustees
ING Funds Trust
We have audited the accompanying statements of assets and liabilities, including the portfolios of investments, of ING GNMA Income Fund, ING High Yield Bond Fund, ING Intermediate Bond Fund, ING National Tax-Exempt Bond Fund, ING Classic Money Market Fund, and ING Institutional Prime Money Market Fund, each a series of ING Funds Trust, as of March 31, 2008, and the related statements of operations for the year then ended, the statements of changes in net assets for each of the years in the two-year period then ended, and the financial highlights for each of the years or periods in the five-year period then ended. These financial statements and financial highlights are the responsibility of management. Our responsibility is to express an opinion on these financial statements and financial highlights based on our audits.
We conducted our audits in accordance with the standards of the Public Company Accounting Oversight Board (United States). Those standards require that we plan and perform the audits to obtain reasonable assurance about whether the financial statements and financial highlights are free of material misstatement. An audit includes examining, on a test basis, evidence supporting the amounts and disclosures in the financial statements. Our procedures included confirmation of securities owned as of March 31, 2008, by correspondence with the custodian and brokers, or by other appropriate auditing procedures where replies from brokers were not received. An audit also includes assessing the accounting principles used and significant estimates made by management, as well as evaluating the overall financial statement presentation. We believe that our audits provide a reasonable basis for our opinion.
In our opinion, the financial statements and financial highlights referred to above present fairly, in all material respects, the financial position of the aforementioned funds as of March 31, 2008, and the results of their operations, the changes in their net assets, and the financial highlights for the periods specified in the first paragraph above, in conformity with U.S. generally accepted accounting principles.
Boston, Massachusetts
May 29, 2008
17
Table of Contents
STATEMENTS OF ASSETS AND LIABILITIESASOF MARCH 31, 2008
ING | ING | ING | ||||||||||
ASSETS: | ||||||||||||
Investments in securities at value+* | $ | 591,884,102 | $ | 112,517,795 | $ | 1,226,586,547 | ||||||
Short-term investments in affiliates at amortized cost | — | 2,050,000 | 218,600,000 | |||||||||
Short-term investments at amortized cost | 4,997,822 | 620,000 | 118,763,000 | |||||||||
Cash | 19,991,151 | 183,338 | 6,308,536 | |||||||||
Cash collateral for futures | — | — | 5,980,563 | |||||||||
Foreign currencies at value** | — | 241 | 203,133 | |||||||||
Receivables: | ||||||||||||
Investment securities sold | 214 | 5,045,561 | 41,303,008 | |||||||||
Fund shares sold | 976,897 | 84,968 | 2,428,158 | |||||||||
Dividends and interest | 2,872,529 | 2,984,798 | 9,949,591 | |||||||||
Variation margin | — | — | 911,017 | |||||||||
Unrealized appreciation on forward foreign currency contracts | — | — | 278,009 | |||||||||
Upfront payments made on swap agreements | — | 1,046,648 | 4,173,850 | |||||||||
Unrealized appreciation on swap agreements | — | 1,190,027 | 26,241,625 | |||||||||
Prepaid expenses | 50,086 | 31,894 | 69,024 | |||||||||
Reimbursement due from manager | — | 27,235 | 126,640 | |||||||||
Total assets | 620,772,801 | 125,782,505 | 1,661,922,701 | |||||||||
LIABILITIES: | ||||||||||||
Payable for investment securities purchased | — | 4,597,926 | 181,751,693 | |||||||||
Payable for fund shares redeemed | 956,673 | 168,507 | 1,413,715 | |||||||||
Payable for futures variation margin | — | — | 741,197 | |||||||||
Payable upon receipt of securities loaned | — | — | 112,034,000 | |||||||||
Securities sold short^ | — | 543,750 | — | |||||||||
Unrealized depreciation on forward foreign currency contracts | — | — | 964,772 | |||||||||
Upfront payments received on swap agreements | — | 1,159,134 | 4,538,670 | |||||||||
Unrealized depreciation on swap agreements | — | 416,308 | 10,621,722 | |||||||||
Income distribution payable | — | 385,295 | 371,659 | |||||||||
Payable to affiliates | 470,963 | 108,278 | 595,117 | |||||||||
Payable for trustee fees | 28,403 | 4,950 | 10,060 | |||||||||
Other accrued expenses and liabilities | 174,755 | 90,387 | 455,662 | |||||||||
Total liabilities | 1,630,794 | 7,474,535 | 313,498,267 | |||||||||
NET ASSETS | $ | 619,142,007 | $ | 118,307,970 | $ | 1,348,424,434 | ||||||
NET ASSETS WERE COMPRISED OF: | ||||||||||||
Paid-in capital | $ | 619,903,981 | $ | 419,256,006 | $ | 1,375,720,438 | ||||||
Undistributed net investment income (distribution in excess of net investment income) | 1,469,185 | (130,281 | ) | (2,083,493 | ) | |||||||
Accumulated net realized gain (loss) on investments, foreign currency related transactions, futures, swaps and written options | (13,772,399 | ) | (291,350,062 | ) | 26,124,659 | |||||||
Net unrealized appreciation or depreciation on investments, foreign currency related transactions, futures, and swaps | 11,541,240 | (9,467,693 | ) | (51,337,170 | ) | |||||||
NET ASSETS | $ | 619,142,007 | $ | 118,307,970 | $ | 1,348,424,434 | ||||||
| ||||||||||||
+ Including securities loaned at value | $ | — | $ | — | $ | 109,601,579 | ||||||
* Cost of investments in securities | $ | 580,342,862 | $ | 122,762,957 | $ | 1,291,428,930 | ||||||
** Cost of foreign currencies | $ | — | $ | 241 | $ | 203,462 | ||||||
^ Proceeds from short sales | $ | — | $ | 547,500 | $ | — | ||||||
See Accompanying Notes to Financial Statements
18
Table of Contents
STATEMENTS OF ASSETS AND LIABILITIESASOF MARCH 31, 2008 (CONTINUED)
ING | ING | ING | |||||||
Class A: | |||||||||
Net assets | $ | 515,915,587 | $ | 83,327,082 | $ | 799,368,643 | |||
Shares authorized | unlimited | unlimited | unlimited | ||||||
Par value | $ | 0.001 | $ | 0.001 | $ | 0.001 | |||
Shares outstanding | 60,416,982 | 10,565,387 | 78,890,360 | ||||||
Net asset value and redemption price per share | $ | 8.54 | $ | 7.89 | $ | 10.13 | |||
Maximum offering price per share (2.50%)(1) | $ | 8.76 | $ | 8.09 | $ | 10.39 | |||
Class B: | |||||||||
Net assets | $ | 45,962,898 | $ | 24,993,754 | $ | 41,077,969 | |||
Shares authorized | unlimited | unlimited | unlimited | ||||||
Par value | $ | 0.001 | $ | 0.001 | $ | 0.001 | |||
Shares outstanding | 5,411,988 | 3,171,652 | 4,062,045 | ||||||
Net asset value and redemption price per share(2) | $ | 8.49 | $ | 7.88 | $ | 10.11 | |||
Maximum offering price per share | $ | 8.49 | $ | 7.88 | $ | 10.11 | |||
Class C: | |||||||||
Net assets | $ | 36,217,636 | $ | 9,987,134 | $ | 83,231,848 | |||
Shares authorized | unlimited | unlimited | unlimited | ||||||
Par value | $ | 0.001 | $ | 0.001 | $ | 0.001 | |||
Shares outstanding | 4,258,760 | 1,266,129 | 8,225,687 | ||||||
Net asset value and redemption price per share(2) | $ | 8.50 | $ | 7.89 | $ | 10.12 | |||
Maximum offering price per share | $ | 8.50 | $ | 7.89 | $ | 10.12 | |||
Class I: | |||||||||
Net assets | $ | 21,002,246 | n/a | $ | 351,575,164 | ||||
Shares authorized | unlimited | n/a | unlimited | ||||||
Par value | $ | 0.001 | n/a | $ | 0.001 | ||||
Shares outstanding | 2,457,008 | n/a | 34,687,322 | ||||||
Net asset value and redemption price per share | $ | 8.55 | n/a | $ | 10.14 | ||||
Maximum offering price per share | $ | 8.55 | n/a | $ | 10.14 | ||||
Class O: | |||||||||
Net assets | n/a | n/a | $ | 55,955,611 | |||||
Shares authorized | n/a | n/a | unlimited | ||||||
Par value | n/a | n/a | $ | 0.001 | |||||
Shares outstanding | n/a | n/a | 5,520,314 | ||||||
Net asset value and redemption price per share | n/a | n/a | $ | 10.14 | |||||
Maximum offering price per share | n/a | n/a | $ | 10.14 | |||||
Class Q: | |||||||||
Net assets | $ | 42,609 | n/a | n/a | |||||
Shares authorized | unlimited | n/a | n/a | ||||||
Par value | $ | 0.001 | n/a | n/a | |||||
Shares outstanding | 4,979 | n/a | n/a | ||||||
Net asset value and redemption price per share | $ | 8.56 | n/a | n/a | |||||
Maximum offering price per share | $ | 8.56 | n/a | n/a | |||||
Class R: | |||||||||
Net assets | n/a | n/a | $ | 16,772,547 | |||||
Shares authorized | n/a | n/a | unlimited | ||||||
Par value | n/a | n/a | $ | 0.001 | |||||
Shares outstanding | n/a | n/a | 1,653,078 | ||||||
Net asset value and redemption price per share | n/a | n/a | $ | 10.15 | |||||
Maximum offering price per share | n/a | n/a | $ | 10.15 | |||||
Class W: | |||||||||
Net assets | $ | 1,031 | n/a | $ | 442,652 | ||||
Shares authorized | unlimited | n/a | unlimited | ||||||
Par value | $ | 0.001 | n/a | $ | 0.001 | ||||
Shares outstanding | 121 | n/a | 43,739 | ||||||
Net asset value and redemption price per share | $ | 8.55 | n/a | $ | 10.12 | ||||
Maximum offering price per share | $ | 8.55 | n/a | $ | 10.12 | ||||
(1) | Maximum offering price is computed at 100/97.50 of net asset value. On purchases of $100,000 or more, the offering price is reduced. |
(2) | Redemption price per share may be reduced for any applicable contingent deferred sales charges. |
See Accompanying Notes to Financial Statements
19
Table of Contents
STATEMENTS OF ASSETS AND LIABILITIESASOF MARCH 31, 2008
ING | ING | ING | ||||||||||
ASSETS: | ||||||||||||
Investments in securities at value* | $ | 27,249,782 | $ | — | $ | — | ||||||
Short-term investments at amortized cost | — | 1,525,589,771 | 721,766,552 | |||||||||
Repurchase agreement | — | — | 80,264,000 | |||||||||
Cash | 1,379,602 | 39,092 | — | |||||||||
Receivables: | ||||||||||||
Fund shares sold | 3,817 | 5,655,437 | 35,296,000 | |||||||||
Dividends and interest | 378,883 | 3,364,099 | 1,960,388 | |||||||||
Prepaid expenses | 29,184 | 256,431 | 60,159 | |||||||||
Reimbursement due from manager | 819 | — | — | |||||||||
Total assets | 29,042,087 | 1,534,904,830 | 839,347,099 | |||||||||
LIABILITIES: | ||||||||||||
Payable for fund shares redeemed | 35,056 | 467,596 | 37,274,000 | |||||||||
Income distribution payable | 79,046 | 52,910 | 1,909,538 | |||||||||
Payable to affiliates | 19,454 | 903,525 | 52,217 | |||||||||
Payable to custodian due to bank overdraft | — | — | 17,612 | |||||||||
Payable for trustee fees | 1,719 | 26,679 | 2,807 | |||||||||
Other accrued expenses and liabilities | 19,965 | 134,862 | 40,672 | |||||||||
Total liabilities | 155,240 | 1,585,572 | 39,296,846 | |||||||||
NET ASSETS | $ | 28,886,847 | $ | 1,533,319,258 | $ | 800,050,253 | ||||||
NET ASSETS WERE COMPRISED OF: | ||||||||||||
Paid-in capital | $ | 29,675,408 | $ | 1,533,386,841 | $ | 800,296,234 | ||||||
Undistributed net investment income (distribution in excess of net investment income) | (1,248 | ) | (1,585 | ) | (22,099 | ) | ||||||
Accumulated net realized loss on investments | (31,606 | ) | (65,998 | ) | (223,882 | ) | ||||||
Net unrealized depreciation on investments | (755,707 | ) | — | — | ||||||||
NET ASSETS | $ | 28,886,847 | $ | 1,533,319,258 | $ | 800,050,253 | ||||||
| ||||||||||||
* Cost of investments in securities | $ | 28,005,489 | $ | — | $ | — | ||||||
See Accompanying Notes to Financial Statements
20
Table of Contents
STATEMENTS OF ASSETS AND LIABILITIESASOF MARCH 31, 2008 (CONTINUED)
ING | ING | ING | ||||||||
Class A: | ||||||||||
Net assets | $ | 22,963,388 | $ | 1,498,016,042 | n/a | |||||
Shares authorized | unlimited | unlimited | n/a | |||||||
Par value | $ | 0.001 | $ | 0.001 | n/a | |||||
Shares outstanding | 2,338,721 | 1,498,057,154 | n/a | |||||||
Net asset value and redemption price per share | $ | 9.82 | $ | 1.00 | n/a | |||||
Maximum offering price per share (2.50%) | $ | 10.07 | (1) | $ | 1.00 | n/a | ||||
Class B: | ||||||||||
Net assets | $ | 2,660,119 | $ | 19,792,582 | n/a | |||||
Shares authorized | unlimited | unlimited | n/a | |||||||
Par value | $ | 0.001 | $ | 0.001 | n/a | |||||
Shares outstanding | 271,121 | 19,813,257 | n/a | |||||||
Net asset value and redemption price per share(2) | $ | 9.81 | $ | 1.00 | n/a | |||||
Maximum offering price per share | $ | 9.81 | $ | 1.00 | n/a | |||||
Class C: | ||||||||||
Net assets | $ | 3,263,340 | $ | 15,510,634 | n/a | |||||
Shares authorized | unlimited | unlimited | n/a | |||||||
Par value | $ | 0.001 | $ | 0.001 | n/a | |||||
Shares outstanding | 332,326 | 15,517,032 | n/a | |||||||
Net asset value and redemption price per share(2) | $ | 9.82 | $ | 1.00 | n/a | |||||
Maximum offering price per share | $ | 9.82 | $ | 1.00 | n/a | |||||
Class I: | ||||||||||
Net assets | n/a | n/a | $ | 800,049,252 | ||||||
Shares authorized | n/a | n/a | unlimited | |||||||
Par value | n/a | n/a | $ | 0.001 | ||||||
Shares outstanding | n/a | n/a | 800,324,269 | |||||||
Net asset value and redemption price per share | n/a | n/a | $ | 1.00 | ||||||
Maximum offering price per share | n/a | n/a | $ | 1.00 | ||||||
Class IS: | ||||||||||
Net assets | n/a | n/a | $ | 1,001 | ||||||
Shares authorized | n/a | n/a | unlimited | |||||||
Par value | n/a | n/a | $ | 0.001 | ||||||
Shares outstanding | n/a | n/a | 1,001 | |||||||
Net asset value and redemption price per share | n/a | n/a | $ | 1.00 | ||||||
Maximum offering price per share | n/a | n/a | $ | 1.00 | ||||||
(1) | Maximum offering price is computed at 100/97.50 of net asset value. On purchases of $100,000 or more, the offering price is reduced. |
(2) | Redemption price per share may be reduced for any applicable contingent deferred sales charges. |
See Accompanying Notes to Financial Statements
21
Table of Contents
STATEMENTS OF OPERATIONSFORTHE YEAR ENDED MARCH 31, 2008
ING | ING | ING | ||||||||||
INVESTMENT INCOME: | ||||||||||||
Dividends, net of foreign taxes withheld*(1) | $ | — | $ | 83,263 | $ | 3,589,615 | ||||||
Interest | 32,733,790 | 12,528,362 | 65,043,458 | |||||||||
Securities lending income | — | — | 1,927,737 | |||||||||
Total investment income | 32,733,790 | 12,611,625 | 70,560,810 | |||||||||
EXPENSES: | ||||||||||||
Investment management fees | 2,844,094 | 718,161 | 2,114,660 | |||||||||
Distribution and service fees: | ||||||||||||
Class A | 1,259,174 | 237,182 | 1,862,824 | |||||||||
Class B | 504,987 | 334,296 | 446,839 | |||||||||
Class C | 350,576 | 125,136 | 778,641 | |||||||||
Class O | — | — | 133,466 | |||||||||
Class Q | 120 | — | — | |||||||||
Class R | — | — | 58,495 | |||||||||
Transfer agent fees: | ||||||||||||
Class A | 335,506 | 141,519 | 958,046 | |||||||||
Class B | 33,681 | 49,725 | 57,391 | |||||||||
Class C | 23,353 | 18,617 | 100,094 | |||||||||
Class I | 3,752 | — | 127,508 | |||||||||
Class O | — | — | 68,608 | |||||||||
Class Q | 12 | — | — | |||||||||
Class R | — | — | 15,610 | |||||||||
Administrative service fees | 605,119 | 140,814 | 1,243,903 | |||||||||
Shareholder reporting expense | 189,020 | 68,088 | 423,494 | |||||||||
Registration fees | 90,552 | 58,568 | 118,421 | |||||||||
Professional fees | 58,415 | 18,528 | 111,641 | |||||||||
Custody and accounting expense | 63,550 | 44,150 | 282,930 | |||||||||
Trustee fees | 23,930 | 1,830 | 37,508 | |||||||||
Miscellaneous expense | 24,946 | 11,514 | 49,288 | |||||||||
Interest expense | — | 10,353 | 1,828 | |||||||||
Total expenses | 6,410,787 | 1,978,481 | 8,991,195 | |||||||||
Net waived and reimbursed fees | — | (76,775 | ) | (494,907 | ) | |||||||
Net expenses | 6,410,787 | 1,901,706 | 8,496,288 | |||||||||
Net investment income | 26,323,003 | 10,709,919 | 62,064,522 | |||||||||
REALIZED AND UNREALIZED GAIN (LOSS) ON INVESTMENTS, FOREIGN CURRENCY RELATED TRANSACTIONS, FUTURES, SWAPS, AND WRITTEN OPTIONS: | ||||||||||||
Net realized gain (loss) on: | ||||||||||||
Investments | (557,710 | ) | (3,278,430 | ) | 23,363,909 | |||||||
Foreign currency related transactions | — | (2,432 | ) | (4,178,064 | ) | |||||||
Futures, swaps and written options | — | (238,875 | ) | 12,093,088 | ||||||||
Net realized gain (loss) on investments, foreign currency related transactions, futures, swaps and written options | (557,710 | ) | (3,519,737 | ) | 31,278,933 | |||||||
Net change in unrealized appreciation or depreciation on: | ||||||||||||
Investments | 14,431,867 | (15,017,236 | ) | (64,652,769 | ) | |||||||
Foreign currency related transactions | — | — | (647,946 | ) | ||||||||
Futures and swaps | — | 706,231 | 13,825,492 | |||||||||
Net change in unrealized appreciation or depreciation on investments, foreign currency related transactions, futures, and swaps | 14,431,867 | (14,311,005 | ) | (51,475,223 | ) | |||||||
Net realized and unrealized gain (loss) on investments, foreign currency related transactions, futures, swaps and written options | 13,874,157 | (17,830,742 | ) | (20,196,290 | ) | |||||||
Increase (decrease) in net assets resulting from operations | $ | 40,197,160 | $ | (7,120,823 | ) | $ | 41,868,232 | |||||
| ||||||||||||
* Foreign taxes withheld | $ | — | $ | — | $ | 17,679 | ||||||
(1) Affiliated dividend income | $ | — | $ | 79,629 | $ | 2,650,057 | ||||||
See Accompanying Notes to Financial Statements
22
Table of Contents
STATEMENTS OF OPERATIONSFORTHE YEAR ENDED MARCH 31, 2008
ING | ING | ING | ||||||||||
INVESTMENT INCOME: | ||||||||||||
Interest | $ | 1,316,489 | $ | 57,810,271 | $ | 44,935,054 | ||||||
Total investment income | 1,316,489 | 57,810,271 | 44,935,054 | |||||||||
EXPENSES: | ||||||||||||
Investment management fees | 83,013 | 2,899,544 | 709,624 | |||||||||
Distribution and service fees: | ||||||||||||
Class A | 56,889 | 8,463,387 | — | |||||||||
Class B | 26,279 | 213,441 | — | |||||||||
Class C | 22,875 | 100,233 | — | |||||||||
Transfer agent fees: | ||||||||||||
Class A | 4,097 | 198,631 | — | |||||||||
Class B | 473 | 3,941 | — | |||||||||
Class C | 412 | 1,702 | — | |||||||||
Class I | — | — | 2,464 | |||||||||
Administrative service fees | 27,671 | — | — | |||||||||
Shareholder reporting expense | 4,897 | 195,513 | 24,178 | |||||||||
Registration fees | 48,124 | 560,722 | 78,974 | |||||||||
Professional fees | 3,954 | 76,516 | 59,945 | |||||||||
Custody and accounting expense | 1,429 | 102,740 | 127,290 | |||||||||
Trustee fees | 1,056 | 46,014 | 21,426 | |||||||||
Miscellaneous expense | 1,581 | 50,226 | 52,250 | |||||||||
Total expenses | 282,750 | 12,912,610 | 1,076,151 | |||||||||
Net waived and reimbursed fees | (5,237 | ) | (3,792,251 | ) | — | |||||||
Net expenses | 277,513 | 9,120,359 | 1,076,151 | |||||||||
Net investment income | 1,038,976 | 48,689,912 | 43,858,903 | |||||||||
REALIZED AND UNREALIZED GAIN (LOSS) ON INVESTMENTS: | ||||||||||||
Net realized gain (loss) on investments | (24,790 | ) | 65,348 | (211,929 | ) | |||||||
Net change in unrealized appreciation or depreciation on investments | (1,296,013 | ) | — | — | ||||||||
Net realized and unrealized gain (loss) on investments | (1,320,803 | ) | 65,348 | (211,929 | ) | |||||||
Increase (decrease) in net assets resulting from operations | $ | (281,827 | ) | $ | 48,755,260 | $ | 43,646,974 | |||||
See Accompanying Notes to Financial Statements
23
Table of Contents
STATEMENTS OF CHANGES IN NET ASSETS
ING GNMA Income Fund | ING High Yield Bond Fund | |||||||||||||||
Year Ended | Year Ended | Year Ended | Year Ended | |||||||||||||
FROM OPERATIONS: | ||||||||||||||||
Net investment income | $ | 26,323,003 | $ | 27,084,773 | $ | 10,709,919 | $ | 11,582,825 | ||||||||
Net realized gain (loss) on investment, foreign currency related transactions, futures and swaps | (557,710 | ) | 2,060,584 | (3,519,737 | ) | (3,558,821 | ) | |||||||||
Net change in unrealized appreciation or depreciation on investments, foreign currency related transactions, futures and swaps | 14,431,867 | 4,077,056 | (14,311,005 | ) | 8,649,233 | |||||||||||
Increase (decrease) in net assets resulting from operations | 40,197,160 | 33,222,413 | (7,120,823 | ) | 16,673,237 | |||||||||||
FROM DISTRIBUTIONS TO SHAREHOLDERS: | ||||||||||||||||
Net investment income: | ||||||||||||||||
Class A | (22,746,437 | ) | (24,757,907 | ) | (7,399,555 | ) | (6,941,636 | ) | ||||||||
Class B | (1,928,106 | ) | (2,891,035 | ) | (2,347,829 | ) | (3,496,316 | ) | ||||||||
Class C | (1,327,518 | ) | (1,498,660 | ) | (879,834 | ) | (993,583 | ) | ||||||||
Class I | (752,915 | ) | (915,994 | ) | — | — | ||||||||||
Class M(1) | — | (5,358 | ) | — | — | |||||||||||
Class Q | (2,196 | ) | (3,646 | ) | — | — | ||||||||||
Class W | (13 | ) | — | — | — | |||||||||||
Total distributions | (26,757,185 | ) | (30,072,600 | ) | (10,627,218 | ) | (11,431,535 | ) | ||||||||
FROM CAPITAL SHARE TRANSACTIONS: | ||||||||||||||||
Net proceeds from sale of shares | 135,282,097 | 122,343,215 | 19,716,245 | 35,632,305 | ||||||||||||
Reinvestment of distributions | 22,263,959 | 24,814,234 | 5,417,037 | 5,505,836 | ||||||||||||
| 157,546,056 | 147,157,449 | 25,133,282 | 41,138,141 | |||||||||||||
Cost of shares redeemed | (177,395,457 | ) | (161,872,015 | ) | (52,319,373 | ) | (75,810,714 | ) | ||||||||
Net decrease in net assets resulting from capital share transactions | (19,849,401 | ) | (14,714,566 | ) | (27,186,091 | ) | (34,672,573 | ) | ||||||||
Net decrease in net assets | (6,409,426 | ) | (11,564,753 | ) | (44,934,132 | ) | (29,430,871 | ) | ||||||||
NET ASSETS: | ||||||||||||||||
Beginning of year | 625,551,433 | 637,116,186 | 163,242,102 | 192,672,973 | ||||||||||||
End of year | $ | 619,142,007 | $ | 625,551,433 | $ | 118,307,970 | $ | 163,242,102 | ||||||||
Undistributed net investment income (distribution in excess of net investment income) at end of year | $ | 1,469,185 | $ | 540,901 | $ | (130,281 | ) | $ | (78,894 | ) | ||||||
(1) | Effective January 2, 2007, Class M shareholders of ING GNMA Income Fund were converted to Class A shares of the Fund. |
See Accompanying Notes to Financial Statements
24
Table of Contents
STATEMENTS OF CHANGES IN NET ASSETS
ING Intermediate Bond Fund | ING National Tax-Exempt | |||||||||||||||
Year Ended | Year Ended | Year Ended | Year Ended | |||||||||||||
FROM OPERATIONS: | ||||||||||||||||
Net investment income | $ | 62,064,522 | $ | 49,892,208 | $ | 1,038,976 | $ | 1,009,715 | ||||||||
Net realized gain (loss) on investments, foreign currency related transactions, futures, swaps and written options | 31,278,933 | (4,772,417 | ) | (24,790 | ) | 199,698 | ||||||||||
Net change in unrealized appreciation or depreciation on investments, foreign currency related transactions, futures, and swaps | (51,475,223 | ) | 15,347,013 | (1,296,013 | ) | 12,459 | ||||||||||
Increase (decrease) in net assets resulting from operations | 41,868,232 | 60,466,804 | (281,827 | ) | 1,221,872 | |||||||||||
FROM DISTRIBUTIONS TO SHAREHOLDERS: | ||||||||||||||||
Net investment income: | ||||||||||||||||
Class A | (33,641,104 | ) | (31,032,270 | ) | (884,649 | ) | (869,673 | ) | ||||||||
Class B | (1,711,825 | ) | (2,250,414 | ) | (82,444 | ) | (85,769 | ) | ||||||||
Class C | (2,949,270 | ) | (3,109,875 | ) | (71,919 | ) | (54,285 | ) | ||||||||
Class I | (15,026,825 | ) | (10,979,278 | ) | — | — | ||||||||||
Class O | (2,418,264 | ) | (2,394,701 | ) | — | — | ||||||||||
Class R | (483,427 | ) | (72,583 | ) | — | — | ||||||||||
Class W | (323 | ) | — | |||||||||||||
Net realized gains: | ||||||||||||||||
Class A | — | — | — | (157,342 | ) | |||||||||||
Class B | — | — | — | (19,212 | ) | |||||||||||
Class C | — | — | — | (14,604 | ) | |||||||||||
Total distributions | (56,231,038 | ) | (49,839,121 | ) | (1,039,012 | ) | (1,200,885 | ) | ||||||||
FROM CAPITAL SHARE TRANSACTIONS: | ||||||||||||||||
Net proceeds from sale of shares | 477,476,865 | 432,382,913 | 5,623,997 | 3,218,925 | ||||||||||||
Reinvestment of distributions | 45,349,340 | 40,670,307 | 128,307 | 139,725 | ||||||||||||
| 522,826,205 | 473,053,220 | 5,752,304 | 3,358,650 | |||||||||||||
Cost of shares redeemed | (315,482,815 | ) | (257,792,788 | ) | (2,673,179 | ) | (3,812,399 | ) | ||||||||
Net increase (decrease) in net assets resulting from capital share transactions | 207,343,390 | 215,260,432 | 3,079,125 | (453,749 | ) | |||||||||||
Net increase (decrease) in net assets | 192,980,584 | 225,888,115 | 1,758,286 | (432,762 | ) | |||||||||||
NET ASSETS: | ||||||||||||||||
Beginning of year | 1,155,443,850 | 929,555,735 | 27,128,561 | 27,561,323 | ||||||||||||
End of year | $ | 1,348,424,434 | $ | 1,155,443,850 | $ | 28,886,847 | $ | 27,128,561 | ||||||||
Distribution in excess of net investment income at end of year | $ | (2,083,493 | ) | $ | (858,326 | ) | $ | (1,248 | ) | $ | (1,212 | ) | ||||
See Accompanying Notes to Financial Statements
25
Table of Contents
STATEMENTS OF CHANGES IN NET ASSETS
ING Classic Money Market Fund | ING Institutional Prime Money | |||||||||||||||
Year Ended | Year Ended | Year Ended | Year Ended | |||||||||||||
FROM OPERATIONS: | ||||||||||||||||
Net investment income | $ | 48,689,912 | $ | 36,320,532 | $ | 43,858,903 | $ | 16,054,720 | ||||||||
Net realized gain (loss) on investments | 65,348 | 59,824 | (211,929 | ) | 9,378 | |||||||||||
Increase in net assets resulting from operations | 48,755,260 | 36,380,356 | 43,646,974 | 16,064,098 | ||||||||||||
FROM DISTRIBUTIONS TO SHAREHOLDERS: | ||||||||||||||||
Net investment income: | ||||||||||||||||
Class A | (47,532,303 | ) | (35,149,030 | ) | — | — | ||||||||||
Class B | (798,518 | ) | (952,278 | ) | — | — | ||||||||||
Class C | (359,087 | ) | (220,809 | ) | — | — | ||||||||||
Class I | — | — | (43,858,890 | ) | (16,054,400 | ) | ||||||||||
Class IS | — | — | (13 | ) | — | |||||||||||
Net realized gains: | ||||||||||||||||
Class I | — | — | (66,392 | ) | — | |||||||||||
Total distributions | (48,689,908 | ) | (36,322,117 | ) | (43,925,295 | ) | (16,054,400 | ) | ||||||||
FROM CAPITAL SHARE TRANSACTIONS: | ||||||||||||||||
Net proceeds from sale of shares | 1,266,591,607 | 623,159,627 | 12,985,911,059 | 2,451,588,496 | ||||||||||||
Reinvestment of distributions | 48,135,580 | 35,961,113 | 7,988,771 | 5,275,844 | ||||||||||||
| 1,314,727,187 | 659,120,740 | 12,993,899,830 | 2,456,864,340 | |||||||||||||
Cost of shares redeemed | (730,774,391 | ) | (395,471,731 | ) | (12,917,901,065 | ) | (1,912,202,768 | ) | ||||||||
Net increase in net assets resulting from capital share transactions | 583,952,796 | 263,649,009 | 75,998,765 | 544,661,572 | ||||||||||||
Net increase in net assets | 584,018,148 | 263,707,248 | 75,720,444 | 544,671,270 | ||||||||||||
NET ASSETS: | ||||||||||||||||
Beginning of year | 949,301,110 | 685,593,862 | 724,329,809 | 179,658,539 | ||||||||||||
End of year | $ | 1,533,319,258 | $ | 949,301,110 | $ | 800,050,253 | $ | 724,329,809 | ||||||||
Undistributed net investment income (distribution in excess of net investment income) at end of year | $ | (1,585 | ) | $ | (1,589 | ) | $ | (22,099 | ) | $ | 31,120 | |||||
See Accompanying Notes to Financial Statements
26
Table of Contents
| ING GNMA INCOME FUND | FINANCIAL HIGHLIGHTS |
Selected data for a share of beneficial interest outstanding throughout each year.
| Class A | |||||||||||||||
| Year Ended March 31, | |||||||||||||||
| 2008 | 2007 | 2006 | 2005 | 2004 | |||||||||||
Per Share Operating Performance: | |||||||||||||||
| Net asset value, beginning of year | $ | 8.35 | 8.30 | 8.52 | 8.91 | 9.00 | |||||||||
| Income (loss) from investment operations: | |||||||||||||||
| Net investment income | $ | 0.37 | 0.37 | 0.40 | 0.37 | 0.32 | |||||||||
| Net realized and unrealized gain (loss) on investments | $ | 0.20 | 0.09 | (0.19 | ) | (0.31 | ) | 0.02 | |||||||
| Total from investment operations | $ | 0.57 | 0.46 | 0.21 | 0.06 | 0.34 | |||||||||
| Lest distributions from: | |||||||||||||||
| Net investment income | $ | 0.38 | 0.41 | 0.43 | 0.45 | 0.43 | |||||||||
| Total distributions | $ | 0.38 | 0.41 | 0.43 | 0.45 | 0.43 | |||||||||
| Net asset value, end of year | $ | 8.54 | 8.35 | 8.30 | 8.52 | 8.91 | |||||||||
Total Return(1) | % | 7.00 | 5.72 | 2.50 | 0.74 | 3.88 | |||||||||
Ratios and Supplemental Data: | |||||||||||||||
| Net assets, end of year (000’s) | $ | 515,916 | 515,469 | 504,734 | 521,688 | 592,066 | |||||||||
| Ratios to average net assets: | |||||||||||||||
| Gross expenses prior to expense waiver | % | 0.96 | 0.95 | 0.99 | 0.98 | 1.04 | |||||||||
| Net expenses after expense waiver(2) | % | 0.96 | 0.94 | 0.98 | 0.98 | 1.04 | |||||||||
| Net investment income after expense waiver(2) | % | 4.45 | 4.49 | 4.70 | 4.27 | 3.57 | |||||||||
| Portfolio turnover rate | % | 32 | 99 | 39 | 40 | 128 | |||||||||
| Class B | |||||||||||||||
| Year Ended March 31, | |||||||||||||||
| 2008 | 2007 | 2006 | 2005 | 2004 | |||||||||||
Per Share Operating Performance: | |||||||||||||||
| Net asset value, beginning of year | $ | 8.30 | 8.26 | 8.48 | 8.87 | 8.96 | |||||||||
| Income (loss) from investment operations: | |||||||||||||||
| Net investment income | $ | 0.31 | 0.30 | 0.33 | 0.29 | 0.25 | |||||||||
| Net realized and unrealized gain (loss) on investments | $ | 0.19 | 0.09 | (0.18 | ) | (0.29 | ) | 0.02 | |||||||
| Total from investment operations | $ | 0.50 | 0.39 | 0.15 | — | 0.27 | |||||||||
| Lest distributions from: | |||||||||||||||
| Net investment income | $ | 0.31 | 0.35 | 0.37 | 0.39 | 0.36 | |||||||||
| Total distributions | $ | 0.31 | 0.35 | 0.37 | 0.39 | 0.36 | |||||||||
| Net asset value, end of year | $ | 8.49 | 8.30 | 8.26 | 8.48 | 8.87 | |||||||||
Total Return(1) | % | 6.24 | 4.84 | 1.75 | (0.02 | ) | 3.12 | ||||||||
Ratios and Supplemental Data: | |||||||||||||||
| Net assets, end of year (000’s) | $ | 45,963 | 58,568 | 78,823 | 99,130 | 130,339 | |||||||||
| Ratios to average net assets: | |||||||||||||||
| Gross expenses prior to expense waiver | % | 1.71 | 1.70 | 1.74 | 1.73 | 1.79 | |||||||||
| Net expenses after expense waiver(2) | % | 1.71 | 1.69 | 1.73 | 1.73 | 1.79 | |||||||||
| Net investment income after expense waiver(2) | % | 3.70 | 3.73 | 3.95 | 3.52 | 2.84 | |||||||||
| Portfolio turnover rate | % | 32 | 99 | 39 | 40 | 128 | |||||||||
(1) | Total return is calculated assuming reinvestment of all dividends and capital gain distributions as net asset value and excluding the deduction of sales charges. |
(2) | The Investment Adviser has agreed to limit expenses (excluding interest, taxes, brokerage and extraordinary expenses) subject to possible recoupment by the Investment Adviser within three years of being incurred. |
See Accompanying Notes to Financial Statements
27
Table of Contents
| ING GNMA INCOME FUND (CONTINUED) | FINANCIAL HIGHLIGHTS |
Selected data for a share of beneficial interest outstanding throughout each year.
| Class C | |||||||||||||||
| Year Ended March 31, | |||||||||||||||
| 2008 | 2007 | 2006 | 2005 | 2004 | |||||||||||
Per Share Operating Performance: | |||||||||||||||
| Net asset value, beginning of year | $ | 8.31 | 8.27 | 8.49 | 8.88 | 8.97 | |||||||||
| Income (loss) from investment operations: | |||||||||||||||
| Net investment income | $ | 0.31 | 0.31 | 0.33 | 0.29 | 0.25 | |||||||||
| Net realized and unrealized gain (loss) on investments | $ | 0.20 | 0.08 | (0.18 | ) | (0.29 | ) | 0.02 | |||||||
| Total from investment operations | $ | 0.51 | 0.39 | 0.15 | — | 0.27 | |||||||||
| Less distributions from: | |||||||||||||||
| Net investment income | $ | 0.32 | 0.35 | 0.37 | 0.39 | 0.36 | |||||||||
| Total distributions | $ | 0.32 | 0.35 | 0.37 | 0.39 | 0.36 | |||||||||
| Net asset value, end of year | $ | 8.50 | 8.31 | 8.27 | 8.49 | 8.88 | |||||||||
Total Return(1) | % | 6.23 | 4.85 | 1.74 | (0.03 | ) | 3.11 | ||||||||
Ratios and Supplemental Data: | |||||||||||||||
| Net assets, end of year (000’s) | $ | 36,218 | 37,280 | 34,997 | 43,094 | 65,762 | |||||||||
| Ratios to average net assets: | |||||||||||||||
| Gross expenses prior to expense waiver | % | 1.71 | 1.70 | 1.74 | 1.73 | 1.79 | |||||||||
| Net expenses after expense waiver(2) | % | 1.71 | 1.69 | 1.73 | 1.73 | 1.79 | |||||||||
| Net investment income after expense waiver(2) | % | 3.70 | 3.73 | 3.95 | 3.51 | 2.92 | |||||||||
| Portfolio turnover rate | % | 32 | 99 | 39 | 40 | 128 | |||||||||
| Class I | |||||||||||||||
| Year Ended March 31, | |||||||||||||||
| 2008 | 2007 | 2006 | 2005 | 2004 | |||||||||||
Per Share Operating Performance: | |||||||||||||||
| Net asset value, beginning of year | $ | 8.35 | 8.31 | 8.53 | 8.92 | 9.01 | |||||||||
| Income (loss) from investment operations: | |||||||||||||||
| Net investment income | $ | 0.40 | 0.40 | 0.45 | 0.41 | 0.35 | |||||||||
| Net realized and unrealized gain (loss) on investments | $ | 0.20 | 0.08 | (0.21 | ) | (0.32 | ) | 0.01 | |||||||
| Total from investment operations | $ | 0.60 | 0.48 | 0.24 | 0.09 | 0.36 | |||||||||
| Less distributions from: | |||||||||||||||
| Net investment income | $ | 0.40 | 0.44 | 0.46 | 0.48 | 0.45 | |||||||||
| Total distributions | $ | 0.40 | 0.44 | 0.46 | 0.48 | 0.45 | |||||||||
| Net asset value, end of year | $ | 8.55 | 8.35 | 8.31 | 8.53 | 8.92 | |||||||||
Total Return(1) | % | 7.42 | 5.92 | 2.82 | 1.05 | 4.21 | |||||||||
Ratios and Supplemental Data: | |||||||||||||||
| Net assets, end of year (000’s) | $ | 21,002 | 14,181 | 18,287 | 10,539 | 8,760 | |||||||||
| Ratios to average net assets: | |||||||||||||||
| Expenses(2) | % | 0.67 | 0.65 | 0.67 | 0.68 | 0.71 | |||||||||
| Net investment income(2) | % | 4.74 | 4.77 | 4.96 | 4.59 | 3.94 | |||||||||
| Portfolio turnover rate | % | 32 | 99 | 39 | 40 | 128 | |||||||||
(1) | Total return is calculated assuming reinvestment of all dividends and capital gain distributions at net asset value and excluding the deduction of sales charges. |
(2) | The Investment Adviser has agreed to limit expenses (excluding interest, taxes, brokerage and extraordinary expenses) subject to possible recoupment by the Investment Adviser within three years of being incurred. |
See Accompanying Notes to Financial Statements
28
Table of Contents
| ING GNMA INCOME FUND (CONTINUED) | FINANCIAL HIGHLIGHTS |
Selected data for a share of beneficial interest outstanding throughout each period.
| Class Q | Class W | |||||||||||||||
| Year Ended March 31, | December 17, 2007(1) to March 31, 2008 | |||||||||||||||
| 2008 | 2007 | 2006 | 2005 | 2004 | ||||||||||||
Per Share Operating Performance: | ||||||||||||||||
| Net asset value, beginning of period | $ | 8.37 | 8.32 | 8.53 | 8.92 | 9.01 | 8.39 | |||||||||
| Income (loss) from investment operations: | ||||||||||||||||
| Net investment income | $ | 0.38 | 0.36 | 0.40 | 0.39 | 0.32 | 0.11 | |||||||||
| Net realized and unrealized gain (loss) on investments | $ | 0.19 | 0.11 | (0.18 | ) | (0.33 | ) | 0.02 | 0.15 | |||||||
| Total from investment operations | $ | 0.57 | 0.47 | 0.22 | 0.06 | 0.34 | 0.26 | |||||||||
| Less distributions from: | ||||||||||||||||
| Net investment income | $ | 0.38 | 0.42 | 0.43 | 0.45 | 0.43 | 0.10 | |||||||||
| Total distributions | $ | 0.38 | 0.42 | 0.43 | 0.45 | 0.43 | 0.10 | |||||||||
| Net asset value, end of period | $ | 8.56 | 8.37 | 8.32 | 8.53 | 8.92 | 8.55 | |||||||||
Total Return(2) | % | 7.06 | 5.76 | 2.65 | 0.76 | 3.94 | 3.16 | |||||||||
Ratios and Supplemental Data: | ||||||||||||||||
| Net assets, end of period (000’s) | $ | 43 | 53 | 82 | 103 | 134 | 1 | |||||||||
| Ratios to average net assets: | ||||||||||||||||
| Expenses(3)(4) | % | 0.92 | 0.90 | 0.92 | 0.93 | 0.96 | 0.64 | |||||||||
| Net investment income(3)(4) | % | 4.49 | 4.53 | 4.77 | 4.32 | 3.62 | 4.86 | |||||||||
| Portfolio turnover rate | % | 32 | 99 | 39 | 40 | 128 | 32 | |||||||||
(1) | Commencement of operations. |
(2) | Total return is calculated assuming reinvestment of all dividends and capital gain distributions as net asset value and excluding the deduction of sales charges. Total return for less than one year is not annualized. |
(3) | The Investment Adviser has agreed to limit expenses (excluding interest, taxes, brokerage and extraordinary expenses) subject to possible recoupment by the Investment Adviser within three years of being incurred. |
(4) | Annualized for periods less than one year. |
See Accompanying Notes to Financial Statements
29
Table of Contents
| ING HIGH YIELD BOND FUND | FINANCIAL HIGHLIGHTS |
Selected data for a share of beneficial interest outstanding throughout each year.
| Class A | |||||||||||||||
| Year Ended March 31, | |||||||||||||||
| 2008 | 2007 | 2006 | 2005 | 2004 | |||||||||||
Per Share Operating Performance: | |||||||||||||||
| Net asset value, beginning of year | $ | 8.99 | 8.71 | 8.75 | 8.88 | 8.29 | |||||||||
| Income (loss) from investment operations: | �� | ||||||||||||||
| Net investment income | $ | 0.67 | 0.61 | 0.55 | 0.54 | 0.59 | |||||||||
| Net realized and unrealized gain (loss) on investments, futures and swaps | $ | (1.10 | ) | 0.27 | (0.04 | ) | (0.13 | ) | 0.60 | ||||||
| Total from investment operations | $ | (0.43 | ) | 0.88 | 0.51 | 0.41 | 1.19 | ||||||||
| Less distributions from: | |||||||||||||||
| Net investment income | $ | 0.67 | 0.60 | 0.55 | 0.54 | 0.60 | |||||||||
| Total distributions | $ | 0.67 | 0.60 | 0.55 | 0.54 | 0.60 | |||||||||
| Net asset value, end of year | $ | 7.89 | 8.99 | 8.71 | 8.75 | 8.88 | |||||||||
Total Return(1) | % | (5.10 | ) | 10.54 | 6.01 | 4.73 | 14.70 | ||||||||
Ratios and Supplemental Data: | |||||||||||||||
| Net assets, end of year (000’s) | $ | 83,327 | 104,328 | 99,178 | 110,683 | 44,009 | |||||||||
| Ratios to average net assets: | |||||||||||||||
| Gross expenses prior to expense waiver/recoupment | % | 1.16 | 1.11 | 1.31 | 1.33 | 1.33 | |||||||||
| Net expenses after expense waiver/recoupment(2) | % | 1.11 | † | 1.10 | 1.18 | 1.22 | 1.29 | ||||||||
| Net investment income after expense waiver/recoupment(2) | % | 7.86 | † | 6.98 | 6.27 | 6.12 | 6.81 | ||||||||
| Portfolio turnover rate | % | 66 | 122 | 111 | 119 | 105 | |||||||||
| Class B | |||||||||||||||
| Year Ended March 31, | |||||||||||||||
| 2008 | 2007 | 2006 | 2005 | 2004 | |||||||||||
Per Share Operating Performance: | |||||||||||||||
| Net asset value, beginning of year | $ | 8.98 | 8.70 | 8.74 | 8.88 | 8.28 | |||||||||
| Income (loss) from investment operations: | |||||||||||||||
| Net investment income | $ | 0.61 | 0.53 | 0.47 | 0.48 | 0.53 | |||||||||
| Net realized and unrealized gain (loss) on investments, futures and swaps | $ | (1.11 | ) | 0.29 | (0.03 | ) | (0.15 | ) | 0.60 | ||||||
| Total from investment operations | $ | (0.50 | ) | 0.82 | 0.44 | 0.33 | 1.13 | ||||||||
| Less distributions from: | |||||||||||||||
| Net investment income | $ | 0.60 | 0.54 | 0.48 | 0.47 | 0.53 | |||||||||
| Total distributions | $ | 0.60 | 0.54 | 0.48 | 0.47 | 0.53 | |||||||||
| Net asset value, end of year | $ | 7.88 | 8.98 | 8.70 | 8.74 | 8.88 | |||||||||
Total Return(1) | % | (5.82 | ) | 9.72 | 5.22 | 3.83 | 14.01 | ||||||||
Ratios and Supplemental Data: | |||||||||||||||
| Net assets, end of year (000’s) | $ | 24,994 | 43,427 | 75,940 | 125,603 | 18,753 | |||||||||
| Ratios to average net assets: | |||||||||||||||
| Gross expenses prior to expense waiver/recoupment | % | 1.91 | 1.86 | 1.98 | 1.98 | 1.98 | |||||||||
| Net expenses after expense waiver/recoupment(2) | % | 1.86 | † | 1.85 | 1.94 | 1.97 | 2.04 | ||||||||
| Net investment income after expense waiver/recoupment(2) | % | 7.08 | † | 6.18 | 5.50 | 5.39 | 6.04 | ||||||||
| Portfolio turnover rate | % | 66 | 122 | 111 | 119 | 105 | |||||||||
(1) | Total return is calculated assuming reinvestment of all dividends and capital gain distributions at net asset value and excluding the deduction of sales charges. |
(2) | The Investment Adviser has agreed to limit expenses (excluding interest, taxes, brokerage and extraordinary expenses) subject to |
possible recoupment by the Investment Adviser within three years of being incurred. |
| † | Impact of waiving the advisory fee for the ING Institutional Prime Money Market Fund holding has less than 0.01% impact on the expense ratio and net investment income ratio. |
See Accompanying Notes to Financial Statements
30
Table of Contents
| ING HIGH YIELD BOND FUND (CONTINUED) | FINANCIAL HIGHLIGHTS |
Selected data for a share of beneficial interest outstanding throughout each year.
| Class C | |||||||||||||||
| Year Ended March 31, | |||||||||||||||
| 2008 | 2007 | 2006 | 2005 | 2004 | |||||||||||
Per Share Operating Performance: | |||||||||||||||
| Net asset value, beginning of year | $ | 8.99 | 8.71 | 8.75 | 8.88 | 8.28 | |||||||||
| Income (loss) from investment operations: | |||||||||||||||
| Net investment income | $ | 0.61 | 0.54 | 0.48 | 0.48 | 0.53 | |||||||||
| Net realized and unrealized gain (loss) on investments, futures and swaps | $ | (1.11 | ) | 0.28 | (0.03 | ) | (0.13 | ) | 0.60 | ||||||
| Total from investment operations | $ | (0.50 | ) | 0.82 | 0.45 | 0.35 | 1.13 | ||||||||
| Less distributions from: | |||||||||||||||
| Net investment income | $ | 0.60 | 0.54 | 0.49 | 0.48 | 0.53 | |||||||||
| Total distributions | $ | 0.60 | 0.54 | 0.49 | 0.48 | 0.53 | |||||||||
| Net asset value, end of year | $ | 7.89 | 8.99 | 8.71 | 8.75 | 8.88 | |||||||||
Total Return(1) | % | (5.81 | ) | 9.70 | 5.22 | 3.96 | 14.03 | ||||||||
Ratios and Supplemental Data: | |||||||||||||||
| Net assets, end of year (000’s) | $ | 9,987 | 15,487 | 17,555 | 26,330 | 10,780 | |||||||||
| Ratios to average net assets: | |||||||||||||||
| Gross expenses prior to expense waiver/recoupment | % | 1.91 | 1.86 | 1.98 | 1.98 | 1.98 | |||||||||
| Net expenses after expense waiver/recoupment(2) | % | 1.86 | † | 1.85 | 1.94 | 1.97 | 2.04 | ||||||||
| Net investment income after expense waiver/recoupment(2) | % | 7.09 | † | 6.21 | 5.51 | 5.37 | 6.04 | ||||||||
| Portfolio turnover rate | % | 66 | 122 | 111 | 119 | 105 | |||||||||
(1) | Total return is calculated assuming reinvestment of all dividends and capital gain distributions at net asset value and excluding the deduction of sales charges. |
(2) | The Investment Adviser has agreed to limit expenses (excluding interest, taxes, brokerage and extraordinary expenses) subject to possible recoupment by the Investment Adviser within three years of being incurred. |
| † | Impact of waiving the advisory fee for the ING Institutional Prime Money Market Fund holding has less than 0.01% impact on the expense ratio and net investment income ratio. |
See Accompanying Notes to Financial Statements
31
Table of Contents
| ING INTERMEDIATE BOND FUND | FINANCIAL HIGHLIGHTS |
Selected data for a share of beneficial interest outstanding throughout each year.
| Class A | ||||||||||||||||
| Year Ended March 31, | ||||||||||||||||
| 2008 | 2007 | 2006 | 2005 | 2004 | ||||||||||||
Per Share Operating Performance: | ||||||||||||||||
| Net asset value, beginning of year | $ | 10.23 | 10.13 | 10.32 | 10.67 | 10.51 | ||||||||||
| Income (loss) from investment operations: | ||||||||||||||||
| Net investment income | $ | 0.51 | 0.50 | 0.41 | 0.32 | 0.31 | ||||||||||
Net realized and unrealized gain (loss) on investments, foreign currency related transactions, futures, swaps and written options | $ | (0.15 | ) | 0.10 | (0.14 | ) | (0.17 | ) | 0.32 | |||||||
| Total from investment operations | $ | 0.36 | 0.60 | 0.27 | 0.15 | 0.63 | ||||||||||
| Less distributions from: | ||||||||||||||||
| Net investment income | $ | 0.46 | 0.50 | 0.42 | 0.33 | 0.33 | ||||||||||
| Net realized gains on investments | $ | — | — | 0.04 | 0.17 | 0.14 | ||||||||||
| Total distributions | $ | 0.46 | 0.50 | 0.46 | 0.50 | 0.47 | ||||||||||
| Net asset value, end of year | $ | 10.13 | 10.23 | 10.13 | 10.32 | 10.67 | ||||||||||
Total Return(1) | % | 3.61 | 6.03 | 2.53 | 1.52 | 6.16 | ||||||||||
Ratios and Supplemental Data: | ||||||||||||||||
| Net assets, end of year (000’s) | $ | 799,369 | 698,537 | 572,196 | 459,850 | 268,086 | ||||||||||
| Ratios to average net assets: | ||||||||||||||||
| Gross expenses prior to expense waiver | % | 0.73 | 0.73 | 1.02 | 1.14 | 1.18 | ||||||||||
| Net expenses after expense waiver(2) | % | 0.69 | † | 0.69 | † | 0.93 | 1.00 | 1.10 | ||||||||
| Net investment income after expense waiver(2) | % | 4.98 | † | 4.89 | † | 3.92 | 3.08 | 2.91 | ||||||||
| Portfolio turnover rate | % | 435 | 367 | 469 | 417 | 475 | ||||||||||
| Class B | ||||||||||||||||
| Year Ended March 31, | ||||||||||||||||
| 2008 | 2007 | 2006 | 2005 | 2004 | ||||||||||||
Per Share Operating Performance: | ||||||||||||||||
| Net asset value, beginning of year | $ | 10.21 | 10.11 | 10.30 | 10.65 | 10.50 | ||||||||||
| Income (loss) from investment operations: | ||||||||||||||||
| Net investment income | $ | 0.43 | 0.42 | 0.32 | 0.24 | 0.23 | ||||||||||
Net realized and unrealized gain (loss) on investments, foreign currency related transactions, futures, swaps and written options | $ | (0.14 | ) | 0.10 | (0.13 | ) | (0.17 | ) | 0.31 | |||||||
| Total from investment operations | $ | 0.29 | 0.52 | 0.19 | 0.07 | 0.54 | ||||||||||
| Less distributions from: | ||||||||||||||||
| Net investment income | $ | 0.39 | 0.42 | 0.34 | 0.25 | 0.25 | ||||||||||
| Net realized gains on investments | $ | — | — | 0.04 | 0.17 | 0.14 | ||||||||||
| Total distributions | $ | 0.39 | 0.42 | 0.38 | 0.42 | 0.39 | ||||||||||
| Net asset value, end of year | $ | 10.11 | 10.21 | 10.11 | 10.30 | 10.65 | ||||||||||
Total Return(1) | % | 2.84 | 5.23 | 1.76 | 0.75 | 5.28 | ||||||||||
Ratios and Supplemental Data: | ||||||||||||||||
| Net assets, end of year (000’s) | $ | 41,078 | 50,086 | 60,526 | 64,779 | 67,402 | ||||||||||
| Ratios to average net assets: | ||||||||||||||||
| Gross expenses prior to expense waiver/recoupment | % | 1.48 | 1.48 | 1.70 | 1.79 | 1.83 | ||||||||||
| Net expenses after expense waiver/recoupment(2) | % | 1.44 | † | 1.44 | † | 1.69 | 1.75 | 1.85 | ||||||||
| Net investment income after expense waiver/recoupment(2) | % | 4.26 | † | 4.13 | † | 3.14 | 2.31 | 2.16 | ||||||||
| Portfolio turnover rate | % | 435 | 367 | 469 | 417 | 475 | ||||||||||
(1) | Total return is calculated assuming reinvestment of all dividends and capital gain distributions at net asset value and excluding the deduction of sales charges. |
(2) | The Investment Adviser has agreed to limit expenses, (excluding interest, taxes, brokerage and extraordinary expenses) subject to |
possible recoupment by the Investment Adviser within three years of being incurred. |
| † | Impact of waiving the advisory fee for the ING Institutional Prime Money Market Fund holding has less than 0.01% impact on the expense ratio and net investment income ratio. |
See Accompanying Notes to Financial Statements
32
Table of Contents
| ING INTERMEDIATE BOND FUND (CONTINUED) | FINANCIAL HIGHLIGHTS |
Selected data for a share of beneficial interest outstanding throughout each year.
| Class C | ||||||||||||||||
| Year Ended March 31, | ||||||||||||||||
| 2008 | 2007 | 2006 | 2005 | 2004 | ||||||||||||
Per Share Operating Performance: | ||||||||||||||||
| Net asset value, beginning of year | $ | 10.22 | 10.12 | 10.31 | 10.65 | 10.50 | ||||||||||
| Income (loss) from investment operations: | ||||||||||||||||
| Net investment income | $ | 0.43 | 0.42 | 0.33 | 0.24 | 0.23 | ||||||||||
Net realized and unrealized gain (loss) on investments, foreign currency related transactions, futures, swaps and written options | $ | (0.14 | ) | 0.10 | (0.14 | ) | (0.16 | ) | 0.31 | |||||||
| Total from investment operations | $ | 0.29 | 0.52 | 0.19 | 0.08 | 0.54 | ||||||||||
| Less distributions from: | ||||||||||||||||
| Net investment income | $ | 0.39 | 0.42 | 0.34 | 0.25 | 0.25 | ||||||||||
| Net realized gains on investments | $ | — | — | 0.04 | 0.17 | 0.14 | ||||||||||
| Total distributions | $ | 0.39 | 0.42 | 0.38 | 0.42 | 0.39 | ||||||||||
| Net asset value, end of year | $ | 10.12 | 10.22 | 10.12 | 10.31 | 10.65 | ||||||||||
Total Return(1) | % | 2.85 | 5.24 | 1.77 | 0.86 | 5.28 | ||||||||||
Ratios and Supplemental Data: | ||||||||||||||||
| Net assets, end of year (000’s) | $ | 83,232 | 81,556 | 73,281 | 71,648 | 71,228 | ||||||||||
| Ratios to average net assets: | ||||||||||||||||
| Gross expenses prior to expense waiver/recoupment | % | 1.48 | 1.48 | 1.70 | 1.79 | 1.83 | ||||||||||
| Net expenses after expense waiver/recoupment(2) | % | 1.44 | † | 1.44 | † | 1.69 | 1.75 | 1.85 | ||||||||
| Net investment income after expense waiver/recoupment(2) | % | 4.24 | † | 4.13 | † | 3.15 | 2.31 | 2.16 | ||||||||
| Portfolio turnover rate | % | 435 | 367 | 469 | 417 | 475 | ||||||||||
| Class I | ||||||||||||||||
| Year Ended March 31, | ||||||||||||||||
| 2008 | 2007 | 2006 | 2005 | 2004 | ||||||||||||
Per Share Operating Performance: | ||||||||||||||||
| Net asset value, beginning of year | $ | 10.23 | 10.14 | 10.32 | 10.67 | 10.51 | ||||||||||
| Income (loss) from investment operations: | ||||||||||||||||
| Net investment income | $ | 0.54 | 0.53 | 0.44 | 0.36 | * | 0.35 | |||||||||
Net realized and unrealized gain (loss) on investments, foreign currency related transactions, futures, swaps and written options | $ | (0.13 | ) | 0.09 | (0.13 | ) | (0.17 | ) | 0.33 | |||||||
| Total from investment operations | $ | 0.41 | 0.62 | 0.31 | 0.19 | 0.68 | ||||||||||
| Less distributions from: | ||||||||||||||||
| Net investment income | $ | 0.50 | 0.53 | 0.45 | 0.37 | 0.38 | ||||||||||
| Net realized gains on investments | $ | — | — | 0.04 | 0.17 | 0.14 | ||||||||||
| Total distributions | $ | 0.50 | 0.53 | 0.49 | 0.54 | 0.52 | ||||||||||
| Net asset value, end of year | $ | 10.14 | 10.23 | 10.14 | 10.32 | 10.67 | ||||||||||
Total Return(1) | % | 4.05 | 6.26 | 2.94 | 1.85 | 6.60 | ||||||||||
Ratios and Supplemental Data: | ||||||||||||||||
| Net assets, end of year (000’s) | $ | 351,575 | 266,596 | 179,582 | 43,808 | 14,548 | ||||||||||
| Ratios to average net assets: | ||||||||||||||||
| Gross expenses prior to expense waiver/recoupment | % | 0.39 | 0.40 | 0.61 | 0.72 | 0.68 | ||||||||||
| Net expenses after expense waiver/recoupment(2) | % | 0.35 | † | 0.36 | † | 0.60 | 0.68 | 0.71 | ||||||||
| Net investment income after expense waiver/recoupment(2) | % | 5.31 | † | 5.22 | † | 4.40 | 3.43 | 3.30 | ||||||||
| Portfolio turnover rate | % | 435 | 367 | 469 | 417 | 475 | ||||||||||
(1) | Total return is calculated assuming reinvestment of all dividends and capital gain distributions as net asset value and excluding the deduction of sales charges. |
(2) | The Investment Adviser has agreed to limit expenses, (excluding interest, taxes, brokerage and extraordinary expenses) subject to possible recoupment by the Investment Adviser within three years of being incurred. |
| † | Impact of waiving the advisory fee for the ING Institutional Prime Money Market Fund holding has less than 0.01% impact on the expense ratio and net investment income ratio. |
| * | Calculated using average number of shares outstanding throughout the period. |
See Accompanying Notes to Financial Statements
33
Table of Contents
| ING INTERMEDIATE BOND FUND (CONTINUED) | FINANCIAL HIGHLIGHTS |
Selected data for a share of beneficial interest outstanding throughout each period.
| Class O | ||||||||||||||
| Year Ended March 31, | August 13, 2004(1) to March 31, 2005 | |||||||||||||
| 2008 | 2007 | 2006 | ||||||||||||
Per Share Operating Performance: | ||||||||||||||
| Net asset value, beginning of period | $ | 10.24 | 10.14 | 10.32 | 10.41 | |||||||||
| Income (loss) from investment operations: | ||||||||||||||
| Net investment income | $ | 0.51 | 0.50 | 0.40 | 0.21 | |||||||||
Net realized and unrealized gain (loss) on investments, foreign currency related transactions, futures, swaps and written options | $ | (0.15 | ) | 0.09 | (0.13 | ) | (0.04 | ) | ||||||
| Total from investment operations | $ | 0.36 | 0.59 | 0.27 | 0.17 | |||||||||
| Lest distributions from: | ||||||||||||||
| Net investment income | $ | 0.46 | 0.49 | 0.41 | 0.22 | |||||||||
| Net realized gains on investments | $ | — | — | 0.04 | 0.04 | |||||||||
| Total distributions | $ | 0.46 | 0.49 | 0.45 | 0.26 | |||||||||
| Net asset value, end of period | $ | 10.14 | 10.24 | 10.14 | 10.32 | |||||||||
Total Return(2) | % | 3.61 | 6.02 | 2.58 | 1.61 | |||||||||
Ratios and Supplemental Data: | ||||||||||||||
| Net assets, end of period (000’s) | $ | 55,956 | 53,096 | 43,171 | 33,997 | |||||||||
| Ratios to average net assets: | ||||||||||||||
| Gross expenses prior to expense waiver(3) | % | 0.73 | 0.73 | 0.95 | 1.00 | |||||||||
| Net expenses after expense waiver(3)(4) | % | 0.69 | † | 0.69 | † | 0.94 | 0.96 | |||||||
| Net investment income after expense waiver(3)(4) | % | 4.99 | † | 4.88 | † | 3.91 | 3.19 | |||||||
| Portfolio turnover rate | % | 435 | 367 | 469 | 417 | |||||||||
| Class R | Class W | |||||||||||||||||||
| Year Ended March 31, | March 16, 2004(1) to March 31, 2004 | December 17, 2007(1) to March 31, 2008 | ||||||||||||||||||
| 2008 | 2007 | 2006 | 2005 | |||||||||||||||||
Per Share Operating Performance: | ||||||||||||||||||||
| Net asset value, beginning of period | $ | 10.25 | 10.15 | 10.34 | 10.67 | 10.71 | 10.21 | |||||||||||||
| Income (loss) from investment operations: | ||||||||||||||||||||
| Net investment income | $ | 0.48 | 0.47 | 0.38 | 0.33 | 0.01 | 0.15 | * | ||||||||||||
Net realized and unrealized gain (loss) on investments, foreign currency related transactions, futures, swaps and written options | $ | (0.14 | ) | 0.10 | (0.14 | ) | (0.16 | ) | (0.05 | ) | (0.05 | ) | ||||||||
| Total from investment operations | $ | 0.34 | 0.57 | 0.24 | 0.17 | (0.04 | ) | 0.10 | ||||||||||||
| Lest distributions from: | ||||||||||||||||||||
| Net investment income | $ | 0.44 | 0.47 | 0.39 | 0.33 | — | 0.19 | |||||||||||||
| Net realized gains on investments | $ | — | — | 0.04 | 0.17 | — | — | |||||||||||||
| Total distributions | $ | 0.44 | 0.47 | 0.43 | 0.50 | — | 0.19 | |||||||||||||
| Net asset value, end of period | $ | 10.15 | 10.25 | 10.15 | 10.34 | 10.67 | 10.12 | |||||||||||||
Total Return(2) | % | 3.36 | 5.75 | 2.26 | 1.64 | (0.37 | ) | 0.98 | ||||||||||||
Ratios and Supplemental Data: | ||||||||||||||||||||
| Net assets, end of period (000’s) | $ | 16,773 | 5,572 | 799 | 313 | 1 | 443 | |||||||||||||
| Ratios to average net assets: | ||||||||||||||||||||
| Gross expenses prior to expense waiver(3) | % | 0.98 | 0.98 | 1.17 | 1.21 | 1.25 | 0.48 | |||||||||||||
| Net expenses after expense waiver(3)(4) | % | 0.94 | † | 0.94 | † | 1.16 | 1.17 | 1.25 | 0.44 | |||||||||||
| Net investment income after expense waiver(3)(4) | % | 4.65 | † | 4.63 | † | 3.79 | 2.96 | 3.20 | 5.24 | |||||||||||
| Portfolio turnover rate | % | 435 | 367 | 469 | 417 | 475 | 435 | |||||||||||||
(1) | Commencement of operations. |
(2) | Total return is calculated assuming reinvestment of all dividends and capital gain distributions at net asset value. Total return for less than one year is not annualized. Total return for less than one year is not annualized. |
(3) | Annualized for periods less than one year. |
(4) | The Investment Adviser has agreed to limit expenses, (excluding interest, taxes, brokerage and extraordinary expenses) subject to |
possible recoupment by the Investment Adviser within three years of being incurred. |
| † | Impact of waiving the advisory fee for the ING Institutional Prime Money Market Fund holding has less than 0.01% impact on the expense ratio. |
| * | Calculated using average number of shares outstanding throughout the period. |
See Accompanying Notes to Financial Statements
34
Table of Contents
| ING NATIONAL TAX-EXEMPT BOND FUND | FINANCIAL HIGHLIGHTS |
Selected data for a share of beneficial interest outstanding throughout each year.
| Class A | |||||||||||||||
| Year Ended March 31, | |||||||||||||||
| 2008 | 2007 | 2006 | 2005 | 2004 | |||||||||||
Per Share Operating Performance: | |||||||||||||||
| Net asset value, beginning of year | $ | 10.30 | 10.28 | 10.50 | 10.78 | 10.87 | |||||||||
| Income (loss) from investment operations: | |||||||||||||||
| Net investment income | $ | 0.39 | 0.40 | 0.37 | 0.34 | 0.35 | |||||||||
| Net realized and unrealized gain (loss) on investments | $ | (0.48 | ) | 0.09 | (0.11 | ) | (0.21 | ) | 0.12 | ||||||
| Total from investment operations | $ | (0.09 | ) | 0.49 | 0.26 | 0.13 | 0.47 | ||||||||
| Less distributions from: | |||||||||||||||
| Net investment income | $ | 0.39 | 0.40 | 0.37 | 0.34 | 0.35 | |||||||||
| Net realized gains on investments | $ | — | 0.07 | 0.11 | 0.07 | 0.21 | |||||||||
| Total distributions | $ | 0.39 | 0.47 | 0.48 | 0.41 | 0.56 | |||||||||
| Net asset value, end of year | $ | 9.82 | 10.30 | 10.28 | 10.50 | 10.78 | |||||||||
Total Return(1) | % | (0.87 | ) | 4.83 | 2.55 | 1.19 | 4.41 | ||||||||
Ratios and Supplemental Data: | |||||||||||||||
| Net assets, end of year (000’s) | $ | 22,963 | 22,697 | 22,864 | 23,296 | 24,082 | |||||||||
| Ratios to average net assets: | |||||||||||||||
| Gross expenses prior to expense waiver | % | 0.89 | 0.95 | 1.13 | 1.13 | 1.27 | |||||||||
| Net expenses after expense waiver(2) | % | 0.87 | 0.87 | 1.06 | 1.10 | 1.15 | |||||||||
| Net investment income after expense waiver(2) | % | 3.89 | 3.83 | 3.55 | 3.19 | 3.23 | |||||||||
| Portfolio turnover rate | % | 7 | 47 | 32 | 22 | 31 | |||||||||
| Class B | |||||||||||||||
| Year Ended March 31, | |||||||||||||||
| 2008 | 2007 | 2006 | 2005 | 2004 | |||||||||||
Per Share Operating Performance: | |||||||||||||||
| Net asset value, beginning of year | $ | 10.29 | 10.27 | 10.50 | 10.77 | 10.86 | |||||||||
| Income (loss) from investment operations: | |||||||||||||||
| Net investment income | $ | 0.32 | 0.32 | 0.29 | 0.26 | 0.27 | |||||||||
| Net realized and unrealized gain (loss) on investments | $ | (0.48 | ) | 0.09 | (0.12 | ) | (0.20 | ) | 0.12 | ||||||
| Total from investment operations | $ | (0.16 | ) | 0.41 | 0.17 | 0.06 | 0.39 | ||||||||
| Less distributions from: | |||||||||||||||
| Net investment income | $ | 0.32 | 0.32 | 0.29 | 0.26 | 0.27 | |||||||||
| Net realized gains on investments | $ | — | 0.07 | 0.11 | 0.07 | 0.21 | |||||||||
| Total distributions | $ | 0.32 | 0.39 | 0.40 | 0.33 | 0.48 | |||||||||
| Net asset value, end of year | $ | 9.81 | 10.29 | 10.27 | 10.50 | 10.77 | |||||||||
Total Return(1) | % | (1.63 | ) | 4.05 | 1.68 | 0.54 | 3.63 | ||||||||
Ratios and Supplemental Data: | |||||||||||||||
| Net assets, end of year (000’s) | $ | 2,660 | 2,574 | 3,032 | 3,041 | 2,643 | |||||||||
| Ratios to average net assets: | |||||||||||||||
| Gross expenses prior to expense waiver/recoupment | % | 1.64 | 1.70 | 1.78 | 1.78 | 1.92 | |||||||||
| Net expenses after expense waiver/recoupment(2) | % | 1.62 | 1.62 | 1.81 | 1.85 | 1.90 | |||||||||
| Net investment income after expense waiver/recoupment(2) | % | 3.14 | 3.09 | 2.79 | 2.44 | 2.48 | |||||||||
| Portfolio turnover rate | % | 7 | 47 | 32 | 22 | 31 | |||||||||
(1) | Total return is calculated assuming reinvestment of all dividends and capital gain distributions at net asset value and excluding the deduction of sales charges. |
(2) | The Investment Adviser has agreed to limit expenses, (excluding interest, taxes, brokerage and extraordinary expenses) subject to possible recoupment by the Investment Adviser within three years of being incurred. |
See Accompanying Notes to Financial Statements
35
Table of Contents
| ING NATIONAL TAX-EXEMPT BOND FUND (CONTINUED) | FINANCIAL HIGHLIGHTS |
Selected data for a share of beneficial interest outstanding throughout each year.
| Class C | |||||||||||||||
| Year Ended March 31, | |||||||||||||||
| 2008 | 2007 | 2006 | 2005 | 2004 | |||||||||||
Per Share Operating Performance: | |||||||||||||||
| Net asset value, beginning of year | $ | 10.30 | 10.28 | 10.50 | 10.78 | 10.87 | |||||||||
| Income (loss) from investment operations: | |||||||||||||||
| Net investment income | $ | 0.32 | 0.32 | 0.29 | 0.26 | 0.27 | |||||||||
| Net realized and unrealized gain (loss) on investments | $ | (0.48 | ) | 0.09 | (0.11 | ) | (0.21 | ) | 0.12 | ||||||
| Total from investment operations | $ | (0.16 | ) | 0.41 | 0.18 | 0.05 | 0.39 | ||||||||
| Less distributions from: | |||||||||||||||
| Net investment income | $ | 0.32 | 0.32 | 0.29 | 0.26 | 0.27 | |||||||||
| Net realized gains on investments | $ | — | 0.07 | 0.11 | 0.07 | 0.21 | |||||||||
| Total distributions | $ | 0.32 | 0.39 | 0.40 | 0.33 | 0.48 | |||||||||
| Net asset value, end of year | $ | 9.82 | 10.30 | 10.28 | 10.50 | 10.78 | |||||||||
Total Return(1) | % | (1.62 | ) | 4.04 | 1.77 | 0.49 | 3.63 | ||||||||
Ratios and Supplemental Data: | |||||||||||||||
| Net assets, end of year (000’s) | $ | 3,263 | 1,858 | 1,665 | 1,806 | 1,104 | |||||||||
| Ratios to average net assets: | |||||||||||||||
| Gross expenses prior to expense waiver/recoupment | % | 1.64 | 1.70 | 1.80 | 1.78 | 1.92 | |||||||||
| Net expenses after expense waiver/recoupment(2) | % | 1.62 | 1.62 | 1.81 | 1.85 | 1.90 | |||||||||
| Net investment income after expense waiver/recoupment(2) | % | 3.14 | 3.07 | 2.80 | 2.44 | 2.49 | |||||||||
| Portfolio turnover rate | % | 7 | 47 | 32 | 22 | 31 | |||||||||
(1) | Total return is calculated assuming reinvestment of all dividends and capital gain distributions at net asset value and excluding the deduction of sales charges. |
(2) | The Investment Adviser has agreed to limit expenses, (excluding interest, taxes, brokerage and extraordinary expenses) subject to possible recoupment by the Investment Adviser within three years of being incurred. |
See Accompanying Notes to Financial Statements
36
Table of Contents
| ING CLASSIC MONEY MARKET FUND | FINANCIAL HIGHLIGHTS |
Selected data for a share of beneficial interest outstanding throughout each year.
| Class A | |||||||||||||
| Year Ended March 31, | |||||||||||||
| 2008 | 2007 | 2006 | 2005 | 2004 | |||||||||
Per Share Operating Performance: | |||||||||||||
| Net asset value, beginning of year | $ | 1.00 | 1.00 | 1.00 | 1.00 | 1.00 | |||||||
| Income from investment operations: | |||||||||||||
| Net investment income | $ | 0.04 | 0.05 | 0.03 | 0.01 | 0.00 | * | ||||||
| Total from investment operations | $ | 0.04 | 0.05 | 0.03 | 0.01 | 0.00 | * | ||||||
| Less distributions from: | |||||||||||||
| Net investment income | $ | 0.04 | 0.05 | 0.03 | 0.01 | 0.00 | * | ||||||
| Total distributions | $ | 0.04 | 0.05 | 0.03 | 0.01 | 0.00 | * | ||||||
| Net asset value, end of year | $ | 1.00 | 1.00 | 1.00 | 1.00 | 1.00 | |||||||
Total Return(1) | % | 4.39 | 4.63 | 3.07 | 1.02 | 0.44 | |||||||
Ratios and Supplemental Data: | |||||||||||||
| Net assets, end of year (000’s) | $ | 1,498,016 | 921,623 | 656,731 | 550,091 | 398,997 | |||||||
| Ratios to average net assets: | |||||||||||||
| Gross expenses prior to expense waiver | % | 1.11 | 1.11 | 1.10 | 1.08 | 1.16 | |||||||
| Net expenses after expense waiver(2) | % | 0.77 | 0.77 | 0.77 | 0.77 | 0.77 | |||||||
| Net investment income after expense waiver(2) | % | 4.22 | 4.55 | 3.07 | 1.06 | 0.44 | |||||||
| Class B | |||||||||||||
| Year Ended March 31, | |||||||||||||
| 2008 | 2007 | 2006 | 2005 | 2004 | |||||||||
Per Share Operating Performance: | |||||||||||||
| Net asset value, beginning of year | $ | 1.00 | 1.00 | 1.00 | 1.00 | 1.00 | |||||||
| Income from investment operations: | |||||||||||||
| Net investment income | $ | 0.04 | 0.04 | 0.02 | 0.01 | 0.00 | * | ||||||
| Total from investment operations | $ | 0.04 | 0.04 | 0.02 | 0.01 | 0.00 | * | ||||||
| Less distributions from: | |||||||||||||
| Net investment income | $ | 0.04 | 0.04 | 0.02 | 0.01 | 0.00 | * | ||||||
| Total distributions | $ | 0.04 | 0.04 | 0.02 | 0.01 | 0.00 | * | ||||||
| Net asset value, end of year | $ | 1.00 | 1.00 | 1.00 | 1.00 | 1.00 | |||||||
Total Return(1) | % | 3.77 | 4.00 | 2.46 | 0.57 | 0.15 | |||||||
Ratios and Supplemental Data: | |||||||||||||
| Net assets, end of year (000’s) | $ | 19,793 | 23,333 | 23,995 | 26,941 | 816 | |||||||
| Ratios to average net assets: | |||||||||||||
| Gross expenses prior to expense waiver | % | 1.36 | 1.36 | 1.34 | 1.33 | 1.41 | |||||||
| Net expenses after expense waiver(2) | % | 1.36 | 1.36 | 1.34 | 1.33 | 1.07 | |||||||
| Net investment income after expense waiver(2) | % | 3.74 | 3.95 | 2.43 | 0.94 | 0.15 | |||||||
(1) | Total return is calculated assuming reinvestment of all dividends and capital gain distributions at net asset value. |
(2) | The Investment Adviser has agreed to limit expenses, (excluding interest, taxes, brokerage and extraordinary expenses) subject |
to possible recoupment by the Investment Adviser within three years of being incurred. |
| * | Amount is less than $0.005. |
See Accompanying Notes to Financial Statements
37
Table of Contents
| ING CLASSIC MONEY MARKET FUND (CONTINUED) | FINANCIAL HIGHLIGHTS |
Selected data for a share of beneficial interest outstanding throughout each year.
| Class C | |||||||||||||
| Year Ended March 31, | |||||||||||||
| 2008 | 2007 | 2006 | 2005 | 2004 | |||||||||
Per Share Operating Performance: | |||||||||||||
| Net asset value, beginning of year | $ | 1.00 | 1.00 | 1.00 | 1.00 | 1.00 | |||||||
| Income from investment operations: | |||||||||||||
| Net investment income | $ | 0.04 | 0.04 | 0.02 | 0.01 | 0.00 | * | ||||||
| Total from investment operations | $ | 0.04 | 0.04 | 0.02 | 0.01 | 0.00 | * | ||||||
| Less distributions from: | |||||||||||||
| Net investment income | $ | 0.04 | 0.04 | 0.02 | 0.01 | 0.00 | * | ||||||
| Total distributions | $ | 0.04 | 0.04 | 0.02 | 0.01 | 0.00 | * | ||||||
| Net asset value, end of year | $ | 1.00 | 1.00 | 1.00 | 1.00 | 1.00 | |||||||
Total Return(1) | % | 3.76 | 3.99 | 2.46 | 0.58 | 0.14 | |||||||
Ratios and Supplemental Data: | |||||||||||||
| Net assets, end of year (000’s) | $ | 15,511 | 4,345 | 4,868 | 3,932 | 546 | |||||||
| Ratios to average net assets: | |||||||||||||
| Gross expenses prior to expense waiver | % | 1.36 | 1.36 | 1.34 | 1.33 | 1.41 | |||||||
| Net expenses after expense waiver(2) | % | 1.36 | 1.36 | 1.34 | 1.33 | 1.07 | |||||||
| Net investment income after expense waiver(2) | % | 3.59 | 3.96 | 2.47 | 0.78 | 0.15 | |||||||
(1) | Total return is calculated assuming reinvestment of all dividends and capital gain distributions at net asset value. |
(2) | The Investment Adviser has agreed to limit expenses, (excluding interest, taxes, brokerage and extraordinary expenses) subject |
to possible recoupment by the Investment Adviser within three years of being incurred. |
| * | Amount is less than $0.005. |
See Accompanying Notes to Financial Statements
38
Table of Contents
| ING INSTITUTIONAL PRIME MONEY MARKET FUND | FINANCIAL HIGHLIGHTS |
Selected data for a share of beneficial interest outstanding throughout each period.
| Class I | Class IS | |||||||||||
| Year Ended March 31, | July 29, 2005(1) to March 31, | December 5, 2007(1) to March 31, 2008 | ||||||||||
| 2008 | 2007 | 2006 | ||||||||||
Per Share Operating Performance: | ||||||||||||
| Net asset value, beginning of period | $ | 1.00 | 1.00 | 1.00 | 1.00 | |||||||
| Income from investment operations: | ||||||||||||
| Net investment income | $ | 0.05 | 0.05 | 0.03 | 0.01 | |||||||
| Total from investment operations | $ | 0.05 | 0.05 | 0.03 | 0.01 | |||||||
| Less distributions from: | ||||||||||||
| Net investment income | $ | 0.05 | 0.05 | 0.03 | 0.01 | |||||||
| Net realized gain on investments | $ | 0.00 | * | — | — | — | ||||||
| Total distributions | $ | 0.05 | * | 0.05 | 0.03 | 0.01 | ||||||
| Net asset value, end of period | $ | 1.00 | 1.00 | 1.00 | 1.00 | |||||||
Total Return(2) | % | 5.00 | 5.25 | 2.70 | 1.35 | |||||||
Ratios and Supplemental Data: | ||||||||||||
| Net assets, end of period (000’s) | $ | 800,049 | 724,330 | 179,659 | 1 | |||||||
| Ratios to average net assets: | ||||||||||||
| Gross expenses prior to expense waiver/recoupment(3) | % | 0.12 | 0.16 | 0.19 | 0.22 | |||||||
| Net expenses after expense waiver/recoupment(3)(4) | % | 0.12 | 0.16 | 0.17 | 0.20 | |||||||
| Net investment income after expense waiver/recoupment(3)(4) | % | 4.95 | 5.17 | 4.14 | 4.19 | |||||||
(1) | Commencement of operations. |
(2) | Total return is calculated assuming reinvestment of all dividends and capital gain distributions at net asset value. Total return for less than one year is not annualized. |
(3) | Annualized for periods less than one year. |
(4) | The Investment Adviser has agreed to limit expenses, (excluding interest taxes, brokerage and extraordinary expenses) subject to possible recoupment by the Investment Adviser within three years of being incurred. |
* Amount is less than $0.005.
See Accompanying Notes to Financial Statements
39
Table of Contents
NOTES TO FINANCIAL STATEMENTSASOF MARCH 31, 2008
NOTE 1 — ORGANIZATION
Organization. ING Funds Trust (“Trust”) is a Delaware statutory trust and is registered as an open-end management investment company under the Investment Company Act of 1940, as amended (“1940 Act”). The Trust was organized on August 6, 1998 and was established under a Trust Instrument dated July 30, 1998. It consists of six separately managed series: ING GNMA Income Fund (“GNMA Income”), ING High Yield Bond Fund (“High Yield Bond”), ING Intermediate Bond Fund (“Intermediate Bond”), ING National Tax-Exempt Bond Fund (“National Tax-Exempt Bond”), ING Classic Money Market Fund (“Classic Money Market”) and ING Institutional Prime Money Market Fund (“Institutional Money Market”) (each, a “Fund” and collectively, the “Funds”).
The investment objective of each Fund is described in each Fund’s prospectus.
Each Fund, except Institutional Money Market, offers at least three of the following classes of shares: Class A, Class B, Class C, Class I, Class O, Class Q, Class R and W. Institutional Money Market offers Class I and Class IS shares. The separate classes of shares differ principally in the applicable sales charges (if any), transfer agent fees, distribution fees and shareholder servicing fees. Generally, shareholders of each class also bear certain expenses that pertain to that particular class. All shareholders bear the common expenses of a Fund and earn income and realized gains/losses from the portfolio pro rata based on the average daily net assets of each class, without distinction between share classes. Common expenses of the Funds (including custodial asset-based fees, legal and audit fees, printing and mailing expenses, transfer agency out-of-pocket expenses, and fees and expenses of the independent trustees) are allocated to each Fund in proportion to its relative daily net assets. Expenses directly attributable to a particular fund (including advisory, administration, custodial transaction-based, registration, other professional, distribution and/or service fees, certain taxes, and offering costs) are charged directly to that Fund. Differences in per share dividend rates generally result from the differences in separate class expenses, including distribution, and shareholder servicing fees. Class B shares, along with their pro rata reinvested dividend shares, automatically convert to Class A shares approximately eight years after purchase.
Class B shares of the Funds (except Classic Money Market) are closed to new investment, provided that (1) Class B shares of the Funds may be purchased through the reinvestment of dividends issued by Class B
shares of a Fund; (2) subject to the terms and conditions of relevant exchange privileges and as permitted under their respective prospectuses, Class B shares of the Funds may be acquired through exchange of Class B shares of other funds in the ING mutual funds complex; and (3) certain qualified retirement plans may purchase Class B shares of the Funds, where the Funds have received information reasonably satisfactory indicating that intermediaries maintaining these plans are unable for administrative reasons to effect the closure immediately.
Effective January 2, 2007, Class M shareholders of GNMA Income were converted to Class A shares of GNMA Income. In addition, GNMA Income does not impose any front-end sales charge (load) on purchases of Class A shares of the Fund by its former Class M shareholders.
NOTE 2 — SIGNIFICANT ACCOUNTING POLICIES
The following significant accounting policies are consistently followed by the Funds in the preparation of their financial statements, and such policies are in conformity with U.S. generally accepted accounting principles for investment companies.
| A. | Security Valuation. Investments in equity securities traded on a national securities exchange are valued at the last reported sale price. Securities reported by the National Association of Securities Dealers Automated Quotation System (“NASDAQ”) will be valued at the NASDAQ official closing prices. Securities traded on an exchange or NASDAQ for which there has been no sale and securities traded in the over-the- counter-market are valued at the mean between the last reported bid and ask prices. All investments quoted in foreign currencies will be valued daily in U.S. dollars on the basis of the foreign currency exchange rates prevailing at that time. Debt securities are valued at prices obtained from independent services or from one or more dealers making markets in the securities and may be adjusted based on the Funds’ valuation procedures. U.S. government obligations are valued by using market quotations or independent pricing services that use prices provided by marketmakers or estimates of market values obtained from yield data relating to instruments or securities with similar characteristics. |
Securities and assets for which market quotations are not readily available (which may include certain restricted securities which are subject to
40
Table of Contents
NOTES TO FINANCIAL STATEMENTSASOF MARCH 31, 2008 (CONTINUED)
NOTE 2 — SIGNIFICANT ACCOUNTING POLICIES (continued)
limitations as to their sale) are valued at their fair values as determined in good faith by or under the supervision of the Funds’ Board of Trustees (“Board”), in accordance with methods that are specifically authorized by the Board. Securities traded on exchanges, including foreign exchanges, which close earlier than the time that a Fund calculates its net asset value (“NAV”) may also be valued at their fair values as determined in good faith by or under the supervision of a Fund’s Board, in accordance with methods that are specifically authorized by the Board. If an event occurs after the time at which the market for foreign securities held by a Fund closes but before the time that a Fund’s NAV is calculated, such event may cause the closing price on the foreign exchange to not represent a readily available reliable market value quotation for such securities at the time the Fund determines its NAV. In such a case, the Fund will use the fair value of such securities as determined under a Fund’s valuation procedures. Events after the close of trading on a foreign market that could require a Fund to fair value some or all of its foreign securities include, among others, securities trading in the U.S. and other markets, corporate announcements, natural and other disasters, and political and other events. Among other elements of analysis in the determination of a security’s fair value, the Board has authorized the use of one or more independent research services to assist with such determinations. An independent research service may use statistical analyses and quantitative models to help determine fair value as of the time a Fund calculates its NAV. There can be no assurance that such models accurately reflect the behavior of the applicable markets or the effect of the behavior of such markets on the fair value of securities, or that such markets will continue to behave in a fashion that is consistent with such models. Unlike the closing price of a security on an exchange, fair value determinations employ elements of judgment. Consequently, the fair value assigned to a security may not represent the actual value that a Fund could obtain if it were to sell the security at the time of the close of the NYSE. Pursuant to procedures adopted by the Board, a Fund is not obligated to use the fair valuations suggested by any research service, and valuation recommendations provided by such research services may be overridden if other events have
occurred or if other fair valuations are determined in good faith to be more accurate. Unless an event is such that it causes a Fund to determine that the closing prices for one or more securities do not represent readily available reliable market value quotations at the time a Fund determines its NAV, events that occur between the time of the close of the foreign market on which they are traded and the close of regular trading on the NYSE will not be reflected in a Fund’s NAV. Investments in securities maturing in 60 days or less from the date of acquisition are valued at amortized cost which approximates market value.
Classic Money Market and Institutional Money Market use the amortized cost method to value their portfolio securities, which approximates market value. The amortized cost method involves valuing a security at its cost and amortizing any discount or premium over the period until maturity regardless of the impact of fluctuating interest rates or the market value of the security.
| B. | Security Transactions and Revenue Recognition. Securities transactions are accounted for on the trade date. Realized gains and losses are reported on the basis of identified cost of securities sold. Interest income is recorded on an accrual basis. Dividend income is recorded on the ex-dividend date, or for certain foreign securities, when the information becomes available to the Funds. Premium amortization and discount accretion are determined by the effective yield method. |
| C. | Foreign Currency Translation. The books and records of the Funds are maintained in U.S. dollars. Any foreign currency amounts are translated into U.S. dollars on the following basis: |
| (1) | Market value of investment securities, other assets and liabilities — at the exchange rates prevailing at the end of the day. |
| (2) | Purchases and sales of investment securities, income and expenses — at the rates of exchange prevailing on the respective dates of such transactions. |
Although the net assets and the market values are presented at the foreign exchange rates at the end of the day, the Funds do not isolate the portion of the results of operations resulting from changes in foreign exchange rates on investments from the fluctuations arising from changes in market prices of securities held. Such fluctuations are included
41
Table of Contents
NOTES TO FINANCIAL STATEMENTSASOF MARCH 31, 2008 (CONTINUED)
NOTE 2 — SIGNIFICANT ACCOUNTING POLICIES (continued)
with the net realized and unrealized gains or losses from investments. For securities that are subject to foreign withholding tax upon disposition, liabilities are recorded on the Statements of Assets and Liabilities for the estimated tax withholding based on the securities’ current market values. Upon disposition, realized gains or losses on such securities are recorded net of foreign withholding tax.
Reported net realized foreign exchange gains or losses arise from sales of foreign currencies, currency gains or losses realized between the trade and settlement dates on securities transactions, the difference between the amounts of dividends, interest, and foreign withholding taxes recorded on the Funds’ books, and the U.S. dollar equivalent of the amounts actually received or paid. Net unrealized foreign exchange gains and losses arise from changes in the value of assets and liabilities other than investments in securities at fiscal year end, resulting from changes in the exchange rate. Foreign security and currency transactions may involve certain considerations and risks not typically associated with investing in U.S. companies and U.S. government securities. These risks include, but are not limited to revaluation of currencies and future adverse political and economic developments which could cause securities and their markets to be less liquid and prices more volatile than those of comparable U.S. companies and U.S. government securities.
| D. | Foreign Currency Transactions and Futures Contracts. High Yield Bond, Intermediate Bond and National Tax-Exempt Bond may enter into foreign currency exchange transactions to convert to and from different foreign currencies and to and from the U.S. dollar in connection with the planned purchases or sales of securities. The Funds either enter into these transactions on a spot basis at the spot rate prevailing in the foreign currency exchange market or use forward foreign currency contracts to purchase or sell foreign currencies. When the contract is fulfilled or closed, gains or losses are realized. Until then, the gain or loss is included in unrealized appreciation or depreciation. Risks may arise upon entering into forward contracts from the potential inability of counterparties to meet the terms of their forward contracts and from unanticipated movements in the value of foreign currencies relative to the U.S. dollar. |
High Yield Bond, Intermediate Bond and Institutional Money Market may enter into futures contracts involving foreign currency, interest rates, securities and securities indices. A futures contract obligates the seller of the contract to deliver and the purchaser of the contract to take delivery of the type of foreign currency, financial instrument or security called for in the contract at a specified future time for a specified price. Upon entering into such a contract, a Fund is required to deposit and maintain as collateral such initial margin as required by the exchange on which the contract is traded. Pursuant to the contract, a Fund agrees to receive from or pay to the broker an amount equal to the daily fluctuations in the value of the contract. Such receipts or payments are known as variation margins and are recorded as unrealized gains or losses by the Fund. When the contract is closed, the Fund records a realized gain or loss equal to the difference between the value of the contract at the time it was opened and the value at the time it was closed.
| E. | Distributions to Shareholders. The Funds record distributions to their shareholders on the ex-dividend date. All Funds, with the exception of GNMA Income, declare dividends daily and pay dividends monthly. GNMA Income declares and pays dividends monthly. The characteristics of income and gains to be distributed are determined in accordance with income tax regulations, which may differ from U.S. generally accepted accounting principles for investment companies. |
| F. | Federal Income Taxes. It is the policy of the Funds to comply with Subchapter M of the Internal Revenue Code and related excise tax provisions applicable to regulated investment companies and to distribute substantially all of their net investment income and any net realized capital gains to their shareholders. Therefore, no federal income tax provision is required. No capital gain distributions shall be made until any capital loss carryforwards have been fully utilized or expired. |
| G. | Use of Estimates. The preparation of financial statements in conformity with U.S. generally accepted accounting principles requires management to make estimates and assumptions that affect the reported amounts of assets and liabilities and disclosure of contingent assets and liabilities at the date of the financial statements and the reported amounts of increases and decreases in net assets from operations during the |
42
Table of Contents
NOTES TO FINANCIAL STATEMENTSASOF MARCH 31, 2008 (CONTINUED)
NOTE 2 — SIGNIFICANT ACCOUNTING POLICIES (continued)
reporting period. Actual results could differ from those estimates. |
| H. | Repurchase Agreements. Each Fund may invest in repurchase agreements only with government securities dealers recognized by the Board of Governors of the Federal Reserve System. Under such agreements, the seller of the security agrees to repurchase it at a mutually agreed upon time and price. The resale price is in excess of the purchase price and reflects an agreed upon interest rate for the period of time the agreement is outstanding. The period of the repurchase agreements is usually short, from overnight to one week, while the underlying securities generally have longer maturities. Each Fund will receive as collateral securities acceptable to it whose market value is equal to at least 100% of the carrying amount of the repurchase agreements, plus accrued interest, being invested by the Fund. The underlying collateral is valued daily on a mark to market basis to assure that the value, including accrued interest is at least equal to the repurchase price. There would be potential loss to the Fund in the event the Fund is delayed or prevented from exercising its right to dispose of the collateral, and it may incur disposition costs in liquidating the collateral. |
| I. | Securities Lending. Each Fund (except GNMA Income) has the option to temporarily loan up to 30% of its total assets to brokers, dealers or other financial institutions in exchange for a negotiated lender’s fee. The borrower is required to fully collateralize the loans with cash or U.S. government securities. Generally, in the event of counterparty default, a Fund has the right to use collateral to offset losses incurred. There would be potential loss to the Fund in the event the Fund is delayed or prevented from exercising its right to dispose of the collateral. The Fund bears the risk of loss with respect to the investment of collateral. Engaging in securities lending could have a leveraging effect, which may intensify the credit, market and other risks associated with investing in a Fund. |
| J. | Illiquid and Restricted Securities. Classic Money Market and Institutional Money Market Funds may not invest more than 10% of their net assets in |
illiquid securities and all other Funds may not invest more than 15% of their net assets in illiquid securities. Illiquid securities are not readily marketable. Disposing of illiquid investments may involve time-consuming negotiation and legal expenses, and it may be difficult or impossible for the Funds to sell them promptly at an acceptable price. Restricted securities are those sold under Rule 144A of the Securities Act of 1933 (“1933 Act”) or are securities offered pursuant to Section 4(2) of the 1933 Act, and are subject to legal or contractual restrictions on resale and may not be publicly sold without registration under the 1933 Act. Certain restricted securities may be considered liquid pursuant to procedures adopted by the Board or may be deemed illiquid because they may not be readily marketable. With the exception to the Classic Money Market and Institutional Money Market Funds, illiquid and restricted securities are valued using market quotations when readily available. In the absence of market quotations, the securities are valued based upon their fair value determined under procedures approved by the Board. |
| K. | Delayed-Delivery or When-Issued Transactions. The Funds may purchase or sell securities on a when-issued or a delayed-delivery basis. Each Fund (except GNMA Income) may enter into forward commitments. The price of the underlying securities and date when the securities will be delivered and paid for are fixed at the time the transaction is negotiated. The market value of such is identified in the Funds’ Portfolio of investments. Losses may arise due to changes in the market value of the securities or from the inability of counterparties to meet the terms of the contract. In connection with such purchases, the Funds are required to segregate liquid assets with the Funds’ custodian sufficient to cover the purchase price. |
| L. | Mortgage Dollar Roll Transactions. Each Fund (except National Tax-Exempt Bond) may engage in dollar roll transactions with respect to mortgage-backed securities issued or to be issued by Government National Mortgage Association, Federal National Mortgage Association and Federal Home Loan Mortgage Corp. In a dollar roll transaction, a Fund sells a mortgage-backed security to a financial institution, such as a bank or broker/dealer, and simultaneously agrees to repurchase a substantially similar (i.e., same type, |
43
Table of Contents
NOTES TO FINANCIAL STATEMENTSASOF MARCH 31, 2008 (CONTINUED)
NOTE 2 — SIGNIFICANT ACCOUNTING POLICIES (continued)
coupon, and maturity) security from the institution on a delayed delivery basis at an agreed upon price. The mortgage-backed securities that are repurchased will bear the same interest rate as those sold, but generally will be collateralized by different pools of mortgages with different prepayment histories. The Funds account for dollar roll transactions as purchases and sales. |
| M. | Options Contracts. High Yield Bond and Intermediate Bond may purchase put and call options and may write (sell) put options and covered call options. High Yield Bond and Intermediate Bond may engage in option transactions as a hedge against adverse movements in the value of portfolio holdings or to increase market exposure. Option contracts are valued daily and unrealized gains or losses are recorded based upon the last sales price on the principal exchange on which the options are traded. High Yield Bond and Intermediate Bond will realize a gain or loss upon the expiration or closing of the option contract. When an option is exercised, the proceeds on sales of the underlying security for a written call option, the purchase cost of the security for a written put option, or the cost of the security for a purchased put or call option is adjusted by the amount of premium received or paid. Realized and unrealized gains or losses on option contracts are reflected in the accompanying financial statements. The risk in writing a call option is that High Yield Bond and Intermediate Bond give up the opportunity for profit if the market price of the security increases and the option is exercised. The risk in writing a put option is that High Yield Bond and Intermediate Bond may incur a loss if the market price of the security decreases and the option is exercised. The risk in buying an option is that High Yield Bond and Intermediate Bond pay a premium whether or not the option is exercised. Risks may also arise from an illiquid secondary market or from the inability of counterparties to meet the terms of the contract. |
| N. | Swap Contracts. High Yield Bond, Intermediate Bond and National Tax-Exempt Bond may enter into interest rate swaps, currency swaps and other types of swap agreements, including swaps on securities and indices. A swap is an agreement between two parties pursuant to which each party agrees to make one or more payments to the other on regularly scheduled dates over a stated term, based on different interest rates, currency exchange rates, security prices, the prices or rates of other types of financial instruments or assets or the levels of specified indices. During the term of the swap, |
changes in the value of the swap are recognized by marking-to-market the value of the swap. |
Derivatives are also subject to credit risks related to the counterparty’s ability to perform, and any deterioration in the counterparty’s creditworthiness could adversely affect the instrument.
| O. | Construction Loan Securities. GNMA Income may purchase construction loan securities, which are issued to finance building costs. The funds are disbursed as needed or in accordance with a prearranged plan. The securities provide for the timely payment to the registered holder of interest at the specified rate plus scheduled installments of principal. Upon completion of the construction phase, the construction loan securities are terminated and project loan securities are issued. It is GNMA Income’s policy to record these GNMA certificates on trade date, and to segregate assets to cover its commitments on trade date as well. |
| P. | Indemnifications. In the normal course of business, the Trust may enter into contracts that provide certain indemnifications. The Trust’s maximum exposure under these arrangements is dependent on future claims that may be made against the Funds and, therefore, cannot be estimated; however, based on experience, the risk of loss from such claims is considered remote. |
NOTE 3 — INVESTMENT TRANSACTIONS
For the year ended March 31, 2008, the cost of purchases and proceeds from the sales of securities excluding short-term securities, were as follows:
Purchases | Sales | |||||
GNMA Income | $ | 9,715,090 | $ | 926,973 | ||
High Yield Bond | 87,181,927 | 119,266,633 | ||||
Intermediate Bond | 493,866,776 | 403,191,471 | ||||
National Tax-Exempt Bond | 3,745,306 | 1,782,190 | ||||
U.S. Government Securities not included above were as follows:
Purchases | Sales | |||||
GNMA Income | $ | 216,781,600 | $ | 185,025,312 | ||
High Yield Bond | 3,199,793 | 3,295,477 | ||||
Intermediate Bond | 5,093,056,123 | 5,117,437,823 | ||||
NOTE 4 — TRANSACTIONS IN WRITTEN OPTIONS
Written option activity for Intermediate Bond for the year ended March 31, 2008 was as follows:
Number of | Premium | ||||||
Balance at 03/31/07 | — | $ | — | ||||
Options Written | 1,604 | 316,790 | |||||
Options Terminated in Closing Purchase Transactions | (1,604 | ) | (316,790 | ) | |||
Balance at 03/31/08 | — | $ | — | ||||
44
Table of Contents
NOTES TO FINANCIAL STATEMENTSASOF MARCH 31, 2008 (CONTINUED)
NOTE 5 — INVESTMENT MANAGEMENT AND ADMINISTRATIVE FEES
ING Investments, LLC (“ING Investments” or the ”Investment Adviser”), an Arizona limited liability company, serves as the investment adviser to the Funds. The Investment Adviser serves pursuant to an investment management agreement (“Management Agreement”) between the Investment Adviser and the Trust, on behalf of the Funds.
The Management Agreement compensates the Investment Adviser with a fee, computed daily and payable monthly, based on the average daily net assets of each Fund, at the following annual rates:
For GNMA Income — 0.47% on first $1 billion, 0.40% on next $4 billion and 0.35% on assets thereafter; for High Yield Bond — 0.51% on first $1 billion, 0.45% on next $4 billion and 0.40% on assets thereafter; for Intermediate Bond — 0.17%; for National Tax-Exempt Bond — 0.30%; for Classic Money Market — 0.25%; and for Institutional Money Market — 0.08%.
ING Investment Management Co. (“ING IM”), a Connecticut corporation, serves as the sub-adviser to the Funds. The Investment Adviser has entered into a sub-advisory agreement with ING IM. Subject to such policies as the Board or the Investment Adviser may determine, ING IM manages the Funds’ assets in accordance with the Funds’ investment objectives, policies, and limitations.
Certain ING Funds sub-advised by ING IM are permitted to invest end-of-day cash balances into Institutional Money Market. Investment management fees paid by the Funds will be reduced by an amount equal to the management fees paid indirectly to Institutional Money Market with respect to assets invested by the Funds. For the year ended March 31, 2008, High Yield Bond and Intermediate Bond waived $390 and $45,875, respectively. These fees are not subject to recoupment.
ING Funds Services, LLC (“IFS”), acts as administrator and provides certain administrative and shareholder services necessary for Fund operations and is responsible for the supervision of other service providers. For its services, IFS is entitled to receive from each Fund, with the exception of Classic Money Market and Institutional Money Market, a fee at an annual rate of 0.10% of its average daily net assets.
ING Funds Distributor, LLC (the “Distributor” or “IFD”) is the principal underwriter of the Funds. The Distributor, IFS, ING Investments and ING IM are indirect, wholly-owned subsidiaries of ING Groep N.V. (“ING Groep”). ING Groep is one of the largest financial service organizations in the world, and offers an array of banking, insurance and asset management services to both individual and institutional investors.
NOTE 6 — DISTRIBUTION AND SERVICE FEES
Each share class of the Funds (except Class I and Class W and as otherwise noted below) has adopted a Distribution Plan pursuant to Rule 12b-1 under the 1940 Act and/or a Service Plan (the “Plans”), whereby the Distributor is reimbursed or compensated (depending on the class of shares) by certain of the Funds for expenses incurred in the distribution of each Fund’s shares (“Distribution Fees”). Pursuant to the Plans, the Distributor is entitled to payment each month for expenses incurred in the distribution and promotion of certain of each Fund’s shares, including expenses incurred in printing prospectuses and reports used for sales purposes, expenses incurred in preparing and printing sales literature and other such distribution related expenses, including any distribution or shareholder servicing fees (“Service Fees”) paid to securities dealers who have executed a distribution agreement with the Distributor. Under the Plans, each class of shares of the Fund pays the Distributor a Distribution and/or Service Fee based on average daily net assets at the following annual rates:
Class A | Class B | Class C | Class IS | Class O | Class Q | Class R | |||||||||||||||
GNMA Income | 0.25 | % | 1.00 | % | 1.00 | % | N/A | N/A | 0.25 | % | N/A | ||||||||||
High Yield Bond | 0.25 | % | 1.00 | % | 1.00 | % | N/A | N/A | N/A | N/A | |||||||||||
Intermediate Bond | 0.25 | % | 1.00 | % | 1.00 | % | N/A | 0.25 | % | N/A | 0.50 | % | |||||||||
National Tax-Exempt Bond | 0.25 | % | 1.00 | % | 1.00 | % | N/A | N/A | N/A | N/A | |||||||||||
Classic Money Market(1) | 0.75 | % | 1.00 | % | 1.00 | % | N/A | N/A | N/A | N/A | |||||||||||
Institutional Money Market | N/A | N/A | N/A | 0.10 | % | N/A | N/A | N/A |
| (1) | The Distributor has contractually agreed to waive a portion of the distribution fee for Class A of Classic Money Market to the extent necessary for expenses not to exceed 0.77%. The fee waiver will continue through at least August 1, 2008. There is no guarantee that this waiver will continue after that date. |
During the year ended March 31, 2008, the Distributor voluntarily waived $3,792,251 of the Class A Distribution and Service Fees for Classic Money Market. This amount is not subject to recoupment.
The Distributor also receives the proceeds of the initial sales charge paid by shareholders upon the purchase of Class A shares of the Funds, and the contingent deferred sales charge paid by shareholders upon certain redemptions for Class A, Class B, and Class C shares. For the year ended March 31, 2008, the Distributor retained the following amounts in sales charges:
| Class A Shares | Class C Shares | |||||
Initial Sales Charges | ||||||
GNMA Income | $ | 18,105 | N/A | |||
High Yield Bond | 6,386 | N/A | ||||
Intermediate Bond | 31,702 | N/A | ||||
National Tax-Exempt Bond | 1,405 | N/A | ||||
Contingent Deferred Sales Charge | ||||||
GNMA Income | 8,293 | $ | 8,748 | |||
High Yield Bond | 9,712 | 505 | ||||
Intermediate Bond | 20,021 | 7,432 | ||||
National Tax-Exempt Bond | — | 492 | ||||
Classic Money Market | 92 | 10,678 | ||||
45
Table of Contents
NOTES TO FINANCIAL STATEMENTSASOF MARCH 31, 2008 (CONTINUED)
NOTE 7 — OTHER TRANSACTIONS WITH AFFILIATES AND RELATED PARTIES
At March 31, 2008, the Funds had the following amounts recorded in payable to affiliates on the accompanying Statements of Assets and Liabilities (see Notes 4 and 5):
Fund | Accrued | Accrued | Accrued | Total | ||||||||
GNMA Income | $ | 242,660 | $ | 51,629 | $ | 176,674 | $ | 470,963 | ||||
High Yield Bond | 50,980 | 10,007 | 47,291 | 108,278 | ||||||||
Intermediate Bond | 184,480 | 114,740 | 295,897 | 595,117 | ||||||||
National Tax-Exempt Bond | 7,291 | 2,430 | 9,733 | 19,454 | ||||||||
Classic Money Market | 325,038 | — | 578,487 | 903,525 | ||||||||
Institutional Money Market | 52,217 | — | — | 52,217 | ||||||||
At March 31, 2008, the following ING Portfolios or indirect, wholly-owned subsidiaries of ING Groep owned more than 5% of the following Funds:
ING Intermediate Bond — Institutional Money Market (27.25%).
ING Life Insurance & Annuity — GNMA Income (19.98%); Intermediate Bond (20.40%); and National Tax Exempt Bond (64.47%).
ING National Trust — GNMA Income (7.31%) and Intermediate Bond (18.65%).
ING VP Intermediate Bond — Institutional Money Market (5.93%).
Security Life of Denver Insurance — Institutional Money Market (6.23%).
The Trust has adopted a Retirement Policy (“Policy”) covering all independent trustees of the Funds who will have served as an independent trustee for at least five years at the time of retirement. Benefits under this Policy are based on an annual rate as defined in the Policy.
NOTE 8 — EXPENSE LIMITATIONS
Pursuant to a written expense limitation agreement (“Expense Limitation Agreement”) with the Funds, the Investment Adviser has agreed to limit expenses of each Fund, excluding interest, taxes, brokerage and extraordinary expenses (and acquired fund fees and expenses) to the levels listed below:
| Maximum Operating Expense Limit (as a percentage of average net assets) | ||||||||||||||||||||||||
Class A | Class B | Class C | Class I | Class O | Class Q | Class R | Class W | |||||||||||||||||
GNMA Income | 0.97 | % | 1.72 | % | 1.72 | % | 0.67 | % | N/A | 0.92 | % | N/A | 0.72 | % | ||||||||||
High Yield Bond | 1.10 | % | 1.85 | % | 1.85 | % | N/A | N/A | N/A | N/A | N/A | |||||||||||||
Intermediate Bond | 0.69 | % | 1.44 | % | 1.44 | % | 0.38 | % | 0.69 | % | N/A | 0.94 | % | 0.44 | % | |||||||||
National Tax-Exempt Bond | 0.87 | % | 1.62 | % | 1.62 | % | N/A | N/A | N/A | N/A | N/A | |||||||||||||
Classic Money Market | 0.77 | % | 1.41 | % | 1.41 | % | N/A | N/A | N/A | N/A | N/A | |||||||||||||
The Investment Adviser has agreed to limit expenses, excluding interest, taxes, brokerage, and extraordinary expenses to 0.17% and 0.20% of Institutional Money Market’s Class I and Class IS shares’ average daily net assets.
The Investment Adviser may at a later date recoup from a Fund for management fees waived and other expenses assumed by the Investment Adviser during the previous 36 months, but only if, after such recoupment, a Fund’s expense ratio does not exceed the percentage described above. Waived and reimbursed fees net of any recoupment by the Investment Adviser of such waived and reimbursed fees are reflected on the accompanying Statements of Operations for each Fund. Amounts payable by the Investment Adviser are reflected on the accompanying Statements of Assets and Liabilities for each Fund.
As of March 31, 2008, the amounts of waived and reimbursed fees that are subject to possible recoupment by the Investment Adviser, and the related expiration dates are as follows:
| March 31, | ||||||||||||
2009 | 2010 | 2011 | Total | |||||||||
High Yield Bond | $ | 113,342 | $ | 4,936 | $ | 76,385 | $ | 194,663 | ||||
Intermediate Bond | 77,333 | 410,687 | 449,032 | 937,052 | ||||||||
National Tax-Exempt Bond | 4,415 | 14,521 | 5,237 | 24,173 | ||||||||
Institutional Money Market | 22,801 | — | — | 22,801 | ||||||||
The Expense Limitation Agreement is contractual and shall renew automatically for one-year terms unless ING Investments or the Registrant provides written notice of the termination of the Expense Limitation Agreement within 90 days of the end of the then current term or upon termination of the Management Agreement.
46
Table of Contents
NOTES TO FINANCIAL STATEMENTSASOF MARCH 31, 2008 (CONTINUED)
NOTE 9 — LINE OF CREDIT
All of the Funds included in this report with the exception of GNMA Income, in addition to certain other funds managed by the Investment Adviser, have entered into an unsecured committed revolving line of credit agreement (the “Credit Agreement”) with The Bank of New York Mellon Corporation (“BNY”) for an aggregate amount of $125,000,000. The proceeds may be used only to: (1) temporarily finance the purchase and sale of securities; (2) finance the redemption of shares of an investor in the Funds; and (3) enable the Funds to meet other emergency expenses as defined in
the Credit Agreement. The Funds to which the line of credit is available pay a commitment fee equal to 0.09% per annum on the daily unused portion of the committed line amount payable quarterly in arrears.
The following Funds utilized the line of credit during the year ended March 31, 2008:
Fund | Days | Approximate | Approximate | |||||
High Yield Bond | 71 | $ | 1,143,380 | 4.67 | % | |||
Intermediate Bond | 14 | 1,128,571 | 4.24 | |||||
NOTE 10 — CAPITAL SHARES
Transactions in capital shares and dollars were as follows:
| Class A | Class B | Class C | ||||||||||||||||||||||
Year | Year | Year | Year | Year | Year | |||||||||||||||||||
GNMA Income (Number of Shares) | ||||||||||||||||||||||||
Shares sold | 13,295,384 | 12,317,038 | 437,820 | 418,493 | 1,367,117 | 1,638,013 | ||||||||||||||||||
Shares issued in exchange | — | 16,260 | — | — | — | — | ||||||||||||||||||
Dividends reinvested | 2,332,664 | 2,562,078 | 152,403 | 219,336 | 96,868 | 110,704 | ||||||||||||||||||
Shares redeemed | (16,975,900 | ) | (13,943,804 | ) | (2,233,087 | ) | (3,127,106 | ) | (1,689,895 | ) | (1,495,606 | ) | ||||||||||||
Net increase (decrease) in shares outstanding | (1,347,852 | ) | 951,572 | (1,642,864 | ) | (2,489,277 | ) | (225,910 | ) | 253,111 | ||||||||||||||
GNMA Income ($) | ||||||||||||||||||||||||
Shares sold | $ | 111,307,657 | $ | 102,165,092 | $ | 3,652,586 | $ | 3,440,663 | $ | 11,389,473 | $ | 13,544,694 | ||||||||||||
Proceeds from shares issued in exchange | — | 135,446 | — | — | — | — | ||||||||||||||||||
Dividends reinvested | 19,443,233 | 21,176,600 | 1,263,888 | 1,803,444 | 804,733 | 912,233 | ||||||||||||||||||
Shares redeemed | (141,608,970 | ) | (115,414,682 | ) | (18,492,001 | ) | (25,729,304 | ) | (14,019,238 | ) | (12,329,180 | ) | ||||||||||||
Net increase (decrease) | $ | (10,858,080 | ) | $ | 8,062,456 | $ | (13,575,527 | ) | $ | (20,485,197 | ) | $ | (1,825,032 | ) | $ | 2,127,747 | ||||||||
| Class I | Class M(1) | |||||||||||||||||||||||
Year | Year | Year | Year | |||||||||||||||||||||
GNMA Income (Number of Shares) | ||||||||||||||||||||||||
Shares sold | 1,058,318 | 388,666 | — | 21 | ||||||||||||||||||||
Shares issued in exchange | — | — | — | (16,260 | ) | |||||||||||||||||||
Dividends reinvested | 89,754 | 110,547 | — | 539 | ||||||||||||||||||||
Shares redeemed | (389,044 | ) | (1,002,531 | ) | — | (7,596 | ) | |||||||||||||||||
Net increase (decrease) in shares outstanding | 759,028 | (503,318 | ) | — | (23,296 | ) | ||||||||||||||||||
GNMA Income ($) | ||||||||||||||||||||||||
Shares sold | $ | 8,931,369 | $ | 3,217,751 | $ | — | $ | 183 | ||||||||||||||||
Proceeds from shares issued in exchange | — | — | — | (135,446 | ) | |||||||||||||||||||
Dividends reinvested | 749,949 | 914,120 | — | 4,454 | ||||||||||||||||||||
Shares redeemed | (3,262,020 | ) | (8,303,394 | ) | — | (87,845 | ) | |||||||||||||||||
Net increase (decrease) | $ | 6,419,298 | $ | (4,171,523 | ) | $ | — | $ | (218,654 | ) | ||||||||||||||
(1) | Effective January 2, 2007, Class M shareholders of GNMA Income were converted to Class A shares of the Fund. |
47
Table of Contents
NOTES TO FINANCIAL STATEMENTSASOF MARCH 31, 2008 (CONTINUED)
NOTE 10 — CAPITAL SHARES (continued)
| Class Q | Class W | |||||||||||||||||||||||
Year | Year | December 17, | ||||||||||||||||||||||
GNMA Income (Number of Shares) | ||||||||||||||||||||||||
Shares sold | — | — | 121 | |||||||||||||||||||||
Dividends reinvested | 258 | 409 | — | |||||||||||||||||||||
Shares redeemed | (1,575 | ) | (3,921 | ) | — | |||||||||||||||||||
Net increase (decrease) in shares outstanding | (1,317 | ) | (3,512 | ) | 121 | |||||||||||||||||||
GNMA Income ($) | ||||||||||||||||||||||||
Shares sold | $ | — | $ | — | $ | 1,012 | ||||||||||||||||||
Dividends reinvested | 2,156 | 3,383 | — | |||||||||||||||||||||
Shares redeemed | (13,228 | ) | (32,778 | ) | — | |||||||||||||||||||
Net increase (decrease) | $ | (11,072 | ) | $ | (29,395 | ) | $ | 1,012 | ||||||||||||||||
| Class A | Class B | Class C | ||||||||||||||||||||||
Year | Year | Year | Year | Year | Year | |||||||||||||||||||
High Yield Bond (Number of Shares) | ||||||||||||||||||||||||
Shares sold | 1,957,940 | 3,615,770 | 164,500 | 266,421 | 163,499 | 191,105 | ||||||||||||||||||
Dividends reinvested | 437,243 | 378,969 | 146,217 | 195,187 | 50,854 | 53,837 | ||||||||||||||||||
Shares redeemed | (3,432,085 | ) | (3,780,937 | ) | (1,972,463 | ) | (4,352,976 | ) | (670,400 | ) | (538,454 | ) | ||||||||||||
Net increase (decrease) in shares outstanding | (1,036,902 | ) | 213,802 | (1,661,746 | ) | (3,891,368 | ) | (456,047 | ) | (293,512 | ) | |||||||||||||
High Yield Bond ($) | ||||||||||||||||||||||||
Shares sold | $ | 16,868,207 | $ | 31,635,027 | $ | 1,437,462 | $ | 2,319,953 | $ | 1,410,576 | $ | 1,677,325 | ||||||||||||
Dividends reinvested | 3,732,494 | 3,326,451 | 1,249,800 | 1,707,325 | 434,743 | 472,060 | ||||||||||||||||||
Shares redeemed | (29,522,311 | ) | (33,073,507 | ) | (17,052,526 | ) | (38,030,482 | ) | (5,744,536 | ) | (4,706,725 | ) | ||||||||||||
Net increase (decrease) | $ | (8,921,610 | ) | $ | 1,887,971 | $ | (14,365,264 | ) | $ | (34,003,204 | ) | $ | (3,899,217 | ) | $ | (2,557,340 | ) | |||||||
| Class A | Class B | Class C | ||||||||||||||||||||||
Year | Year | Year | Year | Year | Year | |||||||||||||||||||
Intermediate Bond (Number of Shares) | ||||||||||||||||||||||||
Shares sold | 28,480,011 | 25,965,894 | 667,018 | 656,261 | 2,826,619 | 2,984,740 | ||||||||||||||||||
Dividends reinvested | 2,585,103 | 2,435,262 | 111,904 | 147,555 | 162,165 | 168,367 | ||||||||||||||||||
Shares redeemed | (20,443,641 | ) | (16,600,890 | ) | (1,621,452 | ) | (1,884,209 | ) | (2,743,516 | ) | (2,413,668 | ) | ||||||||||||
Net increase (decrease) in shares outstanding | 10,621,473 | 11,800,266 | (842,530 | ) | (1,080,393 | ) | 245,268 | 739,439 | ||||||||||||||||
Intermediate Bond ($) | ||||||||||||||||||||||||
Shares sold | $ | 291,815,645 | $ | 263,447,770 | $ | 6,838,389 | $ | 6,636,660 | $ | 28,975,277 | $ | 30,296,219 | ||||||||||||
Dividends reinvested | 26,419,666 | 24,727,335 | 1,140,978 | 1,494,084 | 1,655,216 | 1,707,577 | ||||||||||||||||||
Shares redeemed | (208,958,106 | ) | (168,607,669 | ) | (16,510,460 | ) | (19,047,257 | ) | (27,976,194 | ) | (24,468,594 | ) | ||||||||||||
Net increase (decrease) | $ | 109,277,205 | $ | 119,567,436 | $ | (8,531,093 | ) | $ | (10,916,513 | ) | $ | 2,654,299 | $ | 7,535,202 | ||||||||||
(1) | Commencement of operations. |
48
Table of Contents
NOTES TO FINANCIAL STATEMENTSASOF MARCH 31, 2008 (CONTINUED)
NOTE 10 — CAPITAL SHARES (continued)
| Class I | Class O | Class R | ||||||||||||||||||||||
Year | Year | Year | Year | Year | Year | |||||||||||||||||||
Intermediate Bond (Number of Shares) | ||||||||||||||||||||||||
Shares sold | 11,692,938 | 10,117,583 | 1,596,051 | 2,350,555 | 1,277,986 | 505,198 | ||||||||||||||||||
Dividends reinvested | 1,312,640 | 1,030,404 | 222,259 | 220,506 | 43,112 | 3,191 | ||||||||||||||||||
Shares redeemed | (4,367,322 | ) | (2,816,154 | ) | (1,485,374 | ) | (1,642,376 | ) | (211,711 | ) | (43,432 | ) | ||||||||||||
Net increase in shares outstanding | 8,638,256 | 8,331,833 | 332,936 | 928,685 | 1,109,387 | 464,957 | ||||||||||||||||||
Intermediate Bond ($) | ||||||||||||||||||||||||
Shares sold | $ | 119,958,808 | $ | 103,002,028 | $ | 16,381,132 | $ | 23,813,433 | $ | 13,062,349 | $ | 5,186,803 | ||||||||||||
Dividends reinvested | 13,418,464 | 10,468,517 | 2,272,058 | 2,240,145 | 442,337 | 32,649 | ||||||||||||||||||
Shares redeemed | (44,696,824 | ) | (28,589,953 | ) | (15,169,338 | ) | (16,637,324 | ) | (2,171,893 | ) | (441,991 | ) | ||||||||||||
Net increase | $ | 88,680,448 | $ | 84,880,592 | $ | 3,483,852 | $ | 9,416,254 | $ | 11,332,793 | $ | 4,777,461 | ||||||||||||
| Class W | ||||||||||||||||||||||||
December 17, | ||||||||||||||||||||||||
Intermediate Bond (Number of Shares) | ||||||||||||||||||||||||
Shares sold | 43,677 | |||||||||||||||||||||||
Dividends reinvested | 62 | |||||||||||||||||||||||
Net increase in shares outstanding | 43,739 | |||||||||||||||||||||||
Intermediate Bond ($) | ||||||||||||||||||||||||
Shares sold | $ | 445,265 | ||||||||||||||||||||||
Dividends reinvested | 621 | |||||||||||||||||||||||
Net increase | $ | 445,886 | ||||||||||||||||||||||
| Class A | Class B | Class C | ||||||||||||||||||||||
Year | Year | Year | Year | Year | Year | |||||||||||||||||||
National Tax-Exempt Bond (Number of Shares) | ||||||||||||||||||||||||
Shares sold | 219,687 | 144,957 | 127,657 | 76,125 | 211,875 | 90,281 | ||||||||||||||||||
Dividends reinvested | 6,772 | 7,130 | 4,234 | 4,451 | 1,785 | 1,965 | ||||||||||||||||||
Shares redeemed | (92,323 | ) | (172,352 | ) | (110,973 | ) | (125,551 | ) | (61,775 | ) | (73,821 | ) | ||||||||||||
Net increase (decrease) in shares outstanding | 134,136 | (20,265 | ) | 20,918 | (44,975 | ) | 151,885 | 18,425 | ||||||||||||||||
National Tax-Exempt Bond ($) | ||||||||||||||||||||||||
Shares sold | $ | 2,208,670 | $ | 1,495,877 | $ | 1,285,805 | $ | 785,282 | $ | 2,129,522 | $ | 937,766 | ||||||||||||
Dividends reinvested | 67,952 | 73,567 | 42,455 | 45,884 | 17,900 | 20,274 | ||||||||||||||||||
Shares redeemed | (933,578 | ) | (1,760,695 | ) | (1,117,704 | ) | (1,293,075 | ) | (621,897 | ) | (758,629 | ) | ||||||||||||
Net increase (decrease) | $ | 1,343,044 | $ | (191,251 | ) | $ | 210,556 | $ | (461,909 | ) | $ | 1,525,525 | $ | 199,411 | ||||||||||
(1) | Commencement of operations. |
49
Table of Contents
NOTES TO FINANCIAL STATEMENTSASOF MARCH 31, 2008 (CONTINUED)
NOTE 10 — CAPITAL SHARES (continued)
| Class A | Class B | Class C | ||||||||||||||||||||||
Year | Year | Year | Year | Year | Year | |||||||||||||||||||
Classic Money Market (Number of Shares) | ||||||||||||||||||||||||
Shares sold | 1,226,855,371 | 606,768,162 | 15,206,372 | 11,233,378 | 24,529,864 | 5,158,087 | ||||||||||||||||||
Dividends reinvested | 47,138,864 | 34,927,509 | 698,221 | 842,041 | 298,495 | 191,563 | ||||||||||||||||||
Shares redeemed | (697,664,762 | ) | (376,859,280 | ) | (19,445,930 | ) | (12,739,589 | ) | (13,663,699 | ) | (5,872,862 | ) | ||||||||||||
Net increase (decrease) in shares outstanding | 576,329,473 | 264,836,391 | (3,541,337 | ) | (664,170 | ) | 11,164,660 | (523,212 | ) | |||||||||||||||
Classic Money Market ($) | ||||||||||||||||||||||||
Shares sold | $ | 1,226,855,371 | $ | 606,768,162 | $ | 15,206,372 | $ | 11,233,378 | $ | 24,529,864 | $ | 5,158,087 | ||||||||||||
Dividends reinvested | 47,138,864 | 34,927,509 | 698,221 | 842,041 | 298,495 | 191,563 | ||||||||||||||||||
Shares redeemed | (697,664,762 | ) | (376,859,280 | ) | (19,445,930 | ) | (12,739,589 | ) | (13,663,699 | ) | (5,872,862 | ) | ||||||||||||
Net increase (decrease) | $ | 576,329,473 | $ | 264,836,391 | $ | (3,541,337 | ) | $ | (664,170 | ) | $ | 11,164,660 | $ | (523,212 | ) | |||||||||
| Class I | Class IS | |||||||||||||||||||||||
Year | Year | December 5, | ||||||||||||||||||||||
Institutional Money Market (Number of Shares) | ||||||||||||||||||||||||
Shares sold | 12,985,910,058 | 2,451,588,496 | 1,001 | |||||||||||||||||||||
Dividends reinvested | 7,988,771 | 5,275,844 | — | |||||||||||||||||||||
Shares redeemed | (12,917,901,065 | ) | (1,912,202,768 | ) | — | |||||||||||||||||||
Net increase in shares outstanding | 75,997,764 | 544,661,572 | 1,001 | |||||||||||||||||||||
Institutional Money Market ($) | ||||||||||||||||||||||||
Shares sold | $ | 12,985,910,058 | $ | 2,451,588,496 | $ | 1,001 | ||||||||||||||||||
Dividends reinvested | 7,988,771 | 5,275,844 | — | |||||||||||||||||||||
Shares redeemed | (12,917,901,065 | ) | (1,912,202,768 | ) | — | |||||||||||||||||||
Net increase | $ | 75,997,764 | $ | 544,661,572 | $ | 1,001 | ||||||||||||||||||
(1) | Commencement of operations. |
NOTE 11 — CREDIT RISK AND DEFAULTED SECURITIES
Although each Fund has a diversified portfolio, High Yield Bond and Intermediate Bond may invest in lower rated and comparable quality unrated high yield securities. Investments in high-yield debt securities generally provide greater income and increased opportunity for capital appreciation than investments in higher quality debt securities, but they also typically entail greater potential price volatility and principal and income risk. High-yield debt securities are not considered investment grade, and are regarded as predominantly speculative with respect to the issuing company’s continuing ability to meet principal and interest payments. The prices of high-yield debt securities have been found to be less sensitive to interest rate changes than higher-rated investments, but more sensitive to adverse economic downturns or individual corporate developments. The risk of loss due to default by the issuer may be significantly greater for the holders of high yielding securities, because such securities are generally unsecured and are often subordinated to other creditors of the issuer. At March 31, 2008, the Funds did not hold any defaulted securities.
NOTE 12 — CONCENTRATION OF INVESTMENT RISKS
Corporate Debt Securities (High Yield Bond, Intermediate Bond and Classic Money Market). Corporate debt securities are subject to the risk of the issuer’s inability to meet principal and interest payments on the obligation and may also be subject to price volatility due to such factors as interest rate sensitivity, market perception of the creditworthiness of the issuer and general market liquidity. When interest rates decline, the value of the Fund’s debt securities can be expected to rise, and when interest rates rise, the value of those securities can be expected to decline. Debt securities with longer maturities tend to be more sensitive to interest rate movements than those with shorter maturities.
Credit Risk (GNMA Income, High Yield Bond, Intermediate Bond and National Tax-Exempt Bond). A Portfolio could lose money if a bond issuer (debtor) fails to repay interest and principal in a timely manner or if it goes bankrupt. This is especially true during periods of economic uncertainty or economic downturns. High-yield/high-risk
50
Table of Contents
NOTES TO FINANCIAL STATEMENTSASOF MARCH 31, 2008 (CONTINUED)
NOTE 12 — CONCENTRATION OF INVESTMENT RISKS
(continued)
bonds are especially subject to credit risk and are considered to be mostly speculative in nature.
Foreign Securities (High Yield Bond, Intermediate Bond, Classic Money Market and Institutional Money Market). There are certain risks in owning foreign securities, including those resulting from: fluctuations in currency exchange rates; devaluation of currencies; political or economic developments and the possible imposition of currency exchange blockages or other foreign governmental laws or restrictions; reduced availability of public information concerning issuers; accounting, auditing and financial reporting standards or other regulatory practices and requirements that are not uniform when compared to those applicable to domestic companies; settlement and clearance procedures in some countries that may not be reliable and can result in delays in settlement; higher transaction and custody expenses than for domestic securities; and limitations on foreign ownership of equity securities. Also, securities of many foreign companies may be less liquid and the prices more volatile than those of domestic companies.
Emerging Markets Investments (High Yield Bond). Because of less developed markets and economies and, in some countries, less mature governments and governmental institutions, the risks of investing in foreign securities can be intensified in the case of investments in issuers domiciled or doing substantial business in emerging market countries. These risks include: high concentration of market capitalization and trading volume in a small number of issuers representing a limited number of industries, as well as a high concentration of investors and financial intermediaries; political and social uncertainties; overdependence on exports, especially with respect to primary commodities, making these economies vulnerable to changes in commodity prices; overburdened infrastructure and obsolete or unseasoned financial systems; environmental problems; less well-developed legal systems; and less reliable custodial services and settlement practices.
High-Yield, Lower-Grade Debt Securities Risk (High-Yield Bond and Intermediate Bond). High-yield debt
securities (commonly referred to as “junk bonds”) generally present greater credit risk that an issuer cannot make timely payment of interest or principal payments than an issuer of a higher quality debt security, and typically have greater potential price volatility and principal and income risk. Changes in interest rates, the market’s perception of the issuers and the credit worthiness of the issuers may significantly affect the value of these bonds. High-yield bonds are not considered investment grade, and are regarded as predominantly speculative with respect to the issuing company’s continuing ability to meet principal and interest payments. The secondary market in which high-yield securities are traded may be less liquid than the market for higher grade bonds. It may be more difficult to value less liquid high-yield securities, and determination of their value may involve elements of judgment.
Interests in Loans (National Tax-Exempt Bond). Participation interests or assignments are secured variable or floating rate loans, which include participation interests in lease financing. Loans are subject to the credit risk of nonpayment of principal or interest. Substantial increases in interest rates may cause an increase in loan defaults. Although the loans will generally be fully collateralized at the time of acquisition, the collateral may decline in value, be relatively illiquid, or lose all or substantially all of its value subsequent to the Fund’s investment. Many loans are relatively illiquid, and may be difficult to value.
NOTE 13 — FEDERAL INCOME TAXES
The amount of distributions from net investment income and net realized capital gains are determined in accordance with federal income tax regulations, which may differ from U.S. generally accepted accounting principles for investment companies. These book/tax differences may be either temporary or permanent. Permanent differences are reclassified within the capital accounts based on their federal tax-basis treatment; temporary differences are not reclassified. Key differences include the treatment of short-term capital gains, foreign currency transactions, and wash sale deferrals. Distributions in excess of net investment income and/or net realized capital gains for tax purposes are reported as return of capital.
51
Table of Contents
NOTES TO FINANCIAL STATEMENTSASOF MARCH 31, 2008 (CONTINUED)
NOTE 13 — FEDERAL INCOME TAXES (continued)
The following permanent tax differences have been reclassified as of March 31, 2008:
Paid-in | Undistributed | Accumulated | |||||||||
GNMA Income | $ | (2,870,184 | ) | $ | 1,362,466 | $ | 1,507,718 | ||||
High Yield Bond | (77,758,132 | ) | (134,088 | ) | 77,892,220 | ||||||
Intermediate Bond | — | (7,058,651 | ) | 7,058,651 | |||||||
Institutional Money Market | — | (53,219 | ) | 53,219 | |||||||
Dividends paid by the Funds from net investment income and distributions of net realized short-term capital gains are, for federal income tax purposes, taxable as ordinary income to shareholders.
The tax composition of dividends and distributions to shareholders was as follows:
| Year Ended March 31, 2008 | Year Ended March 31, 2007 | ||||||||||||||
Ordinary | Tax-Exempt | Ordinary | Tax-Exempt | Long-Term | |||||||||||
GNMA Income | $ | 26,757,185 | $ | — | $ | 30,072,600 | $ | — | $ | — | |||||
High Yield Bond | 10,627,218 | — | 11,431,535 | — | — | ||||||||||
Intermediate Bond | 56,231,038 | — | 49,839,121 | — | — | ||||||||||
National Tax-Exempt Bond | 6,799 | 1,032,213 | 79,219 | 978,363 | 143,303 | ||||||||||
Classic Money Market | 48,689,908 | — | 36,322,117 | — | — | ||||||||||
Institutional Money Market | 43,925,295 | — | 16,054,400 | — | — | ||||||||||
The tax-basis components of distributable earnings and the expiration dates of the capital loss carryforwards which may be used to offset future realized capital gains for federal income tax purposes as of March 31, 2008 were:
Undistributed | Undistributed | Unrealized | Post October | Post-October | Capital Loss | Expiration | ||||||||||||||||||
GNMA Income | $ | 1,469,185 | $ | — | $ | 11,541,240 | $ | — | $ | (413,532 | ) | $ | (527,639 | ) | 2010 | |||||||||
| (1,081,784 | ) | 2012 | ||||||||||||||||||||||
| (6,961,357 | ) | 2013 | ||||||||||||||||||||||
| (3,281,376 | ) | 2014 | ||||||||||||||||||||||
| (1,506,711 | ) | 2016 | ||||||||||||||||||||||
| $ | (13,358,867 | ) | ||||||||||||||||||||||
High Yield Bond | 1,010,445 | — | (10,283,415 | ) | (2,432 | ) | (4,000,614 | ) | (115,139,658 | ) | 2009 | |||||||||||||
| (79,792,137 | ) | 2010 | ||||||||||||||||||||||
| (69,190,309 | ) | 2011 | ||||||||||||||||||||||
| (6,099,584 | ) | 2012 | ||||||||||||||||||||||
| (126,079 | ) | 2014 | ||||||||||||||||||||||
| (16,938,959 | ) | 2015 | ||||||||||||||||||||||
| $ | (287,286,726 | ) | ||||||||||||||||||||||
Intermediate Bond | 44,541,382 | — | (67,390,094 | ) | (4,075,631 | ) | — | — | ||||||||||||||||
National Tax-Exempt Bond | — | 77,798 | (755,707 | ) | — | (4,626 | ) | (26,979 | ) | 2016 | ||||||||||||||
Classic Money Market | 51,325 | — | — | — | — | (23,545 | ) | 2013 | ||||||||||||||||
| (42,453 | ) | 2014 | ||||||||||||||||||||||
| $ | (65,998 | ) | ||||||||||||||||||||||
Institutional Money Market | 1,887,439 | — | — | — | (223,882 | ) | — | |||||||||||||||||
The Funds’ major tax jurisdictions are federal and Arizona. The earliest tax year that remains subject
to examination by these jurisdictions is 2003.
52
Table of Contents
NOTES TO FINANCIAL STATEMENTSASOF MARCH 31, 2008 (CONTINUED)
NOTE 14 — ILLIQUID SECURITIES
Pursuant to guidelines adopted by the Funds’ Board, the following securities have been deemed to be illiquid. Except for GNMA Income, the Funds may invest up to 15% (10% for Classic Money Market and Institutional Money Market) of their net assets in illiquid securities. Fair value for certain securities was determined by ING Funds Valuation Committee appointed by the Funds’ Board and in accordance with the methods specifically authorized by the Board.
Fund | Security | Principal | Initial | Cost | Value | Percent of | |||||||||
High Yield Bond | Comforce Corp. | 92,950 | 10/24/04 | $ | — | $ | 930 | 0.0 | % | ||||||
Dayton Superior Corp. | 3,100 | 10/24/04 | — | 31 | 0.0 | % | |||||||||
GT Group Telecom, Inc. | 500 | 03/19/03 | — | — | 0.0 | % | |||||||||
North Atlantic Trading Co. | 17,906 | 10/24/04 | 210,181 | 18 | 0.0 | % | |||||||||
| $ | 210,181 | $ | 979 | 0.0 | % | ||||||||||
Intermediate Bond | Alpine III, 3.620%, due 08/16/14 | 527,000 | 08/04/04 | $ | 527,170 | $ | 528,865 | 0.0 | % | ||||||
Alpine III, 4.020%, due 08/16/14 | 527,000 | 08/04/04 | 527,170 | 529,123 | 0.0 | % | |||||||||
Alpine III, 5.820%, due 08/16/14 | 789,000 | 08/04/04 | 795,216 | 795,299 | 0.1 | % | |||||||||
Alpine III, 9.070%, due 08/16/14 | 1,348,000 | 08/17/04 | 1,361,344 | 1,380,398 | 0.1 | % | |||||||||
Nordea Kredit Realkreditaktieselskab, | DKK 29 | 04/16/04 | 5 | 6 | 0.0 | % | |||||||||
| $ | 3,210,905 | $ | 3,233,691 | 0.2 | % | ||||||||||
Classic Money Market | Bear Stearns Cos, Inc., 2.758%, due 08/28/08 | 5,725,000 | 09/18/07 | $ | 5,725,000 | $ | 5,725,000 | 0.4 | % | ||||||
Bear Stearns Cos, Inc., 2.841%, due 08/05/08 | 5,800,000 | 09/12/07 | 5,800,000 | 5,800,000 | 0.4 | % | |||||||||
Bear Stearns Cos, Inc., 3.456%, due 04/29/08 | 6,260,000 | 04/13/07 | 6,260,794 | 6,260,794 | 0.4 | % | |||||||||
Bear Stearns Cos, Inc., 5.323%, due 07/02/08 | 7,400,000 | 07/09/07 | 7,347,127 | 7,347,127 | 0.5 | % | |||||||||
Goldman Sachs Group, Inc., 3.030%, due 04/11/08 | 15,000,000 | 04/12/07 | 15,000,000 | 15,000,000 | 1.0 | % | |||||||||
| $ | 40,132,921 | $ | 40,132,921 | 2.7 | % | ||||||||||
Institutional Money Market | Bear Stearns Cos, Inc., 2.758%, due 08/28/08 | 500,000 | 09/18/07 | $ | 500,000 | $ | 500,000 | 0.1 | % | ||||||
Bear Stearns Cos, Inc., 3.456%, due 04/29/08 | 2,515,000 | 04/13/07 | 2,515,273 | 2,515,273 | 0.3 | % | |||||||||
Bear Stearns Cos, Inc., 4.554%, due 07/02/08 | 1,763,000 | 06/01/07 | 1,751,739 | 1,751,739 | 0.2 | % | |||||||||
Goldman Sachs Group, Inc., 3.030%, due 04/11/08 | 10,000,000 | 04/12/07 | 10,000,000 | 10,000,000 | 1.2 | % | |||||||||
| $ | 14,767,012 | $ | 14,767,012 | 1.8 | % | ||||||||||
NOTE 15 — SECURITIES LENDING
Under an agreement with Bank of New York Mellon Corporation (“BNY”), the Funds (except GNMA Income) can lend their securities to approved brokers, dealers and other financial institutions. Loans are collateralized by cash and U.S. government securities. The collateral must be in an amount equal to at least 105% of the market value of non-U.S. securities loaned and 102% of the market value of U.S. securities loaned. The cash collateral received is invested in approved investments as defined in the Securities Lending Agreement with BNY (the “Agreement”). The securities purchased with cash collateral received are reflected in the Portfolio of Investments. Generally, in the event of counterparty default, the Funds have the right to use the collateral to offset losses incurred. The Agreement contains
certain guarantees by BNY in the event of counterparty default and/or a borrower’s failure to return a loaned security; however, there would be a potential loss to the Funds in the event the Funds are delayed or prevented from exercising their right to dispose of the collateral. The Funds bear the risk of loss with respect to the investment of collateral. Engaging in securities lending could have a leveraging effect, which may intensify the credit, market and other risks associated with investing in a Fund. At March 31, 2008, the following Fund had securities on loan and related collateral with the following values:
Fund | Value of | Value of | ||||
Intermediate Bond | $ | 109,601,579 | $ | 112,034,000 | ||
53
Table of Contents
NOTES TO FINANCIAL STATEMENTSASOF MARCH 31, 2008 (CONTINUED)
NOTE 16 — SUBSEQUENT EVENTS
Subsequent to March 31, 2008, the following Funds declared dividends from net investment income:
Per Share | Payable Date | Record Date | |||||
GNMA Income | |||||||
Class A | $ | 0.0325 | April 3, 2008 | March 31, 2008 | |||
Class B | $ | 0.0271 | April 3, 2008 | March 31, 2008 | |||
Class C | $ | 0.0272 | April 3, 2008 | March 31, 2008 | |||
Class I | $ | 0.0347 | April 3, 2008 | March 31, 2008 | |||
Class Q | $ | 0.0327 | April 3, 2008 | March 31, 2008 | |||
Class W | $ | 0.0350 | April 3, 2008 | March 31, 2008 | |||
Class A | $ | 0.0300 | May 5, 2008 | April 30, 2008 | |||
Class B | $ | 0.0243 | May 5, 2008 | April 30, 2008 | |||
Class C | $ | 0.0249 | May 5, 2008 | April 30, 2008 | |||
Class I | $ | 0.0321 | May 5, 2008 | April 30, 2008 | |||
Class Q | $ | 0.0304 | May 5, 2008 | April 30, 2008 | |||
Class W | $ | 0.0322 | May 5, 2008 | April 30, 2008 | |||
High Yield Bond | |||||||
Class A | $ | 0.0515 | May 1, 2008 | Daily | |||
Class B | $ | 0.0464 | May 1, 2008 | Daily | |||
Class C | $ | 0.0467 | May 1, 2008 | Daily | |||
Intermediate Bond | |||||||
Class A | $ | 0.0227 | May 1, 2008 | Daily | |||
Class B | $ | 0.0147 | May 1, 2008 | Daily | |||
Class C | $ | 0.0148 | May 1, 2008 | Daily | |||
Class I | $ | 0.0268 | May 1, 2008 | Daily | |||
Class O | $ | 0.0227 | May 1, 2008 | Daily | |||
Class R | $ | 0.0210 | May 1, 2008 | Daily | |||
Class W | $ | 0.0277 | May 1, 2008 | Daily | |||
National Tax-Exempt Bond | |||||||
Class A | $ | 0.0313 | May 1, 2008 | Daily | |||
Class B | $ | 0.0249 | May 1, 2008 | Daily | |||
Class C | $ | 0.0250 | May 1, 2008 | Daily | |||
Classic Money Market | |||||||
Class A | $ | 0.0018 | May 1, 2008 | Daily | |||
Class B | $ | 0.0013 | May 1, 2008 | Daily | |||
Class C | $ | 0.0013 | May 1, 2008 | Daily | |||
Institutional Money Market | |||||||
Class I | $ | 0.0023 | May 1, 2008 | Daily | |||
Class IS | $ | 0.0024 | May 1, 2008 | Daily | |||
NOTE 17 — OTHER ACCOUNTING PRONOUNCEMENTS
In June 2006, the Financial Accounting Standards Board (“FASB”) issued FASB Interpretation No. 48 (“FIN 48”), “Accounting for Uncertainty in Income Taxes.” This standard defines the threshold for recognizing the benefits of tax-return positions in the financial statements as “more-likely-than-not” to be sustained upon challenge by the taxing authority and requires measurement of a tax position meeting the more-likely-than-not criterion, based on the largest benefit that is more than 50 percent likely to be realized. FIN 48 was effective for fiscal years beginning after
December 15, 2006, with early application permitted if no interim financial statements have been issued. Acknowledging the unique issues that FIN 48 presents for investment companies that calculate NAVs, the SEC indicated that they would not object if a fund implemented FIN 48 in its NAV calculation as late as its last NAV calculation in the first required financial statement reporting period for its fiscal year beginning after December 15, 2006. At adoption, companies must adjust their financial statements to reflect only those tax positions that are more likely-than-not to be sustained as of the adoption date. Management of the Funds has analyzed the tax positions of the Funds. Upon adoption of FIN 48, we identified no uncertain tax positions that have not met the more likely-than-not standard.
On September 15, 2006, the FASB issued Statement of Financial Accounting Standards No. 157 (“SFAS No. 157”), “Fair Value Measurements.” The new accounting statement defines fair value, establishes a framework for measuring fair value in generally accepted accounting principles (“GAAP”), and expands disclosures about fair value measurements. SFAS No. 157 defines fair value as the price that would be received to sell an asset or paid to transfer a liability in an orderly transaction between market participants at the measurement date (an exit price). SFAS No. 157 also stipulates that, as a market-based measurement, fair value should be determined based on the assumptions that market participants would use in pricing the asset or liability, and establishes a fair value hierarchy that distinguishes between (a) market participant assumptions developed based on market data obtained from sources independent of the reporting entity (observable inputs) and (b) the reporting entity’s own assumptions about market participant assumptions developed based on the best information available in the circumstances (unobservable inputs). SFAS No. 157 is effective for financial statements issued for fiscal years beginning after November 15, 2007. As of March 31, 2008, management of the Funds is currently assessing the potential impact, in addition to expanded financial statement disclosure, that may result from adopting SFAS No. 157.
On March 19, 2008, the FASB issued Statement of Financial Accounting Standards No. 161 (“SFAS No. 161”), “Disclosure about Derivative Instruments and Hedging Activities.” This new accounting statement requires enhanced disclosures about an entity’s derivative and hedging activities. Entities are required to provide enhanced disclosures about (a) how and why
54
Table of Contents
NOTES TO FINANCIAL STATEMENTSASOF MARCH 31, 2008 (CONTINUED)
NOTE 17 — OTHER ACCOUNTING PRONOUNCEMENTS (continued)
an entity invests in derivatives, (b) how derivatives are accounted for under Statement 133, and (c) how derivatives affect an entity’s financial position, financial performance, and cash flows. SFAS No. 161 also requires enhanced disclosures regarding credit-risk-related contingent features of derivative instruments. SFAS No. 161 is effective for financial statements issued for fiscal years and interim periods beginning after November 15, 2008. As of March 31, 2008, management of the Funds is currently assessing the impact of the expanded financial statement disclosures that will result from adopting SFAS No. 161.
NOTE 18 — INFORMATION REGARDING TRADING OF ING’s U.S. MUTUAL FUNDS
As discussed in earlier supplements that were previously filed with the SEC, ING Investments, the adviser to the ING Funds, has reported to the Boards of Directors/Trustees (the “Boards”) of the ING Funds that, like many U.S. financial services companies, ING Investments and certain of its U.S. affiliates have received informal and formal requests for information since September 2003 from various governmental and self-regulatory agencies in connection with investigations related to mutual funds and variable insurance products. ING Investments has advised the Boards that it and its affiliates have cooperated fully with each request.
In addition to responding to regulatory and governmental requests, ING Investments reported that management of U.S. affiliates of ING Groep N.V., including ING Investments (collectively, “ING”), on their own initiative, have conducted, through independent special counsel and a national accounting firm, an extensive internal review of trading in ING insurance, retirement, and mutual fund products. The goal of this review was to identify any instances of inappropriate trading in those products by third parties or by ING investment professionals and other ING personnel. ING’s internal review related to mutual fund trading is now substantially completed. ING has reported that, of the millions of customer relationships that ING maintains, the internal review identified several isolated arrangements allowing third parties to engage in frequent trading of mutual funds within ING’s variable insurance and mutual fund products, and identified other circumstances where frequent trading occurred, despite measures taken by ING intended to combat market timing. ING further reported that each of these arrangements has been terminated and fully
disclosed to regulators. The results of the internal review were also reported to the independent members of the Boards.
ING Investments has advised the Boards that most of the identified arrangements were initiated prior to ING’s acquisition of the businesses in question in the U.S. ING Investments further reported that the companies in question did not receive special benefits in return for any of these arrangements, which have all been terminated.
Based on the internal review, ING Investments has advised the Boards that the identified arrangements do not represent a systemic problem in any of the companies that were involved.
Despite the extensive internal review conducted through independent special counsel and a national accounting firm, there can be no assurance that the instances of inappropriate trading reported to the Boards are the only instances of such trading respecting the ING Funds.
ING Investments reported to the Boards that ING is committed to conducting its business with the highest standards of ethical conduct with zero tolerance for noncompliance. Accordingly, ING Investments advised the Boards that ING management was disappointed that its voluntary internal review identified these situations. Viewed in the context of the breadth and magnitude of its U.S. business as a whole, ING management does not believe that ING’s acquired companies had systemic ethical or compliance issues in these areas. Nonetheless, ING Investments reported that given ING’s refusal to tolerate any lapses, it has taken the steps noted below, and will continue to seek opportunities to further strengthen the internal controls of its affiliates.
| • | ING has agreed with the ING Funds to indemnify and hold harmless the ING Funds from all damages resulting from wrongful conduct by ING or its employees or from ING’s internal investigation, any investigations conducted by any governmental or self-regulatory agencies, litigation or other formal proceedings, including any proceedings by the SEC. ING Investments reported to the Boards that ING management believes that the total amount of any indemnification obligations will not be material to ING or its U.S. business. |
| • | ING updated its Code of Conduct for employees reinforcing its employees’ obligation to conduct personal trading activity consistent with the law, disclosed limits, and other requirements. |
55
Table of Contents
NOTES TO FINANCIAL STATEMENTSASOF MARCH 31, 2008 (CONTINUED)
NOTE 18 — INFORMATION REGARDING TRADING OF ING’s U.S. MUTUAL FUNDS (continued)
Other Regulatory Matters
The New York Attorney General and other federal and state regulators are also conducting broad inquiries and investigations involving the insurance industry. These initiatives currently focus on, among other things, compensation and other sales incentives; potential conflicts of interest; potential anti-competitive activity; reinsurance; marketing practices (including suitability); specific product types (including group annuities and indexed annuities); fund selection for investment products and brokerage sales; and disclosure. It is likely that the scope of these industry investigations will further broaden before they conclude. ING has received formal and informal requests in connection with such investigations, and is cooperating fully with each request.
Other federal and state regulators could initiate similar actions in this or other areas of ING’s businesses. These regulatory initiatives may result in new legislation and regulation that could significantly affect the financial services industry, including businesses in which ING is engaged. In light of these and other developments, ING continuously reviews whether modifications to its business practices are appropriate. At this time, in light of the current regulatory factors, ING U.S. is actively engaged in reviewing whether any modifications in our practices are appropriate for the future.
There can be no assurance that these matters, or the adverse publicity associated with them, will not result in increased fund redemptions, reduced sale of fund shares, or other adverse consequences to ING Funds.
56
Table of Contents
| ING GNMA INCOME FUND | ASOF MARCH 31, 2008 |
| Principal Amount | Value | |||||||
| U.S. GOVERNMENT AGENCY OBLIGATIONS: 95.6% | ||||||||
| Federal Home Loan Mortgage Corporation: 0.1% | ||||||||
| $ | 83,891 | 7.000%, due 11/01/14 | $ | 88,140 | ||||
| 303,096 | 7.500%, due 12/01/14 | 317,888 | ||||||
| 79,632 | 7.500%, due 01/01/30 | 86,329 | ||||||
| 52,199 | 8.000%, due 01/01/30 | 56,685 | ||||||
| 38,380 | 9.500%, due 07/01/20 | 42,925 | ||||||
| 591,967 | ||||||||
| Federal National Mortgage Association: 0.3% | ||||||||
| 57,207 | 6.500%, due 06/01/14 | 60,071 | ||||||
| 492,533 | 6.500%, due 02/01/29 | 515,362 | ||||||
| 383,285 | 6.600%, due 07/01/27 | 406,424 | ||||||
| 164,793 | 6.600%, due 09/01/27 | 174,746 | ||||||
| 58,339 | 6.600%, due 11/01/27 | 61,863 | ||||||
| 116,797 | 6.600%, due 03/01/28 | 123,851 | ||||||
| 134,900 | 6.600%, due 06/01/28 | 143,049 | ||||||
| 70,857 | 7.000%, due 03/01/15 | 74,475 | ||||||
| 108,085 | 7.500%, due 05/01/28 | 116,978 | ||||||
| 57,895 | 8.500%, due 08/01/11 | 61,498 | ||||||
| 31,323 | 8.500%, due 08/01/15 | 35,891 | ||||||
| 99,118 | 8.500%, due 09/01/15 | 113,572 | ||||||
| 1,887,780 | ||||||||
| Government National Mortgage Association: 95.2% | ||||||||
| 735,626 | 4.000%, due 05/20/33 | 687,824 | ||||||
| 901,239 | 4.000%, due 01/15/34 | 846,270 | ||||||
| 757,438 | 4.000%, due 03/15/34 | 711,240 | ||||||
| 1,106,587 | 4.000%, due 08/20/35 | 1,031,312 | ||||||
| 1,958,558 | 4.500%, due 01/20/34 | 1,888,630 | ||||||
| 1,215,914 | 4.500%, due 03/20/34 | 1,172,501 | ||||||
| 325,716 | 4.500%, due 05/20/34 | 314,087 | ||||||
| 388,638 | 4.500%, due 06/20/34 | 374,762 | ||||||
| 2,003,504 | 4.500%, due 10/20/34 | 1,937,173 | ||||||
| 3,910,830 | 4.500%, due 08/15/35 | 3,802,070 | ||||||
| 521,783 | 4.500%, due 09/15/35 | 507,273 | ||||||
| 1,470,111 | 4.500%, due 10/20/35 | 1,417,103 | ||||||
| 4,210,947 | 4.500%, due 11/15/35 | 4,093,840 | ||||||
| 2,984,827 | 4.500%, due 03/20/36 | 2,883,990 | ||||||
| 4,899,670 | 4.750%, due 05/20/34 | 4,911,631 | ||||||
| 736,713 | 5.000%, due 05/15/18 | 749,271 | ||||||
| 1,088,352 | 5.000%, due 04/15/29 | 1,101,597 | ||||||
| 1,126,350 | 5.000%, due 04/15/30 | 1,138,388 | ||||||
| 1,299,481 | 5.000%, due 10/15/30 | 1,313,369 | ||||||
| 804,134 | 5.000%, due 05/15/33 | 805,772 | ||||||
| 911,649 | 5.000%, due 06/15/33 | 913,506 | ||||||
| 2,003,360 | 5.000%, due 07/15/33 | 2,007,441 | ||||||
| 838,696 | 5.000%, due 10/15/33 | 840,404 | ||||||
| 1,174,240 | 5.000%, due 10/20/33 | 1,168,774 | ||||||
| 3,001,606 | 5.000%, due 12/20/33 | 2,987,633 | ||||||
| 1,038,658 | 5.000%, due 02/20/34 | 1,033,527 | ||||||
| 879,858 | 5.000%, due 03/15/34 | 881,400 | ||||||
| 2,775,991 | 5.000%, due 04/15/34 | 2,780,113 | ||||||
| 530,140 | 5.000%, due 04/20/34 | 527,521 | ||||||
| 1,285,342 | 5.000%, due 06/20/34 | 1,278,992 | ||||||
| 600,465 | 5.000%, due 07/20/34 | 597,498 | ||||||
| 396,419 | 5.000%, due 09/20/34 | 394,460 | ||||||
| 1,714,890 | 5.000%, due 12/20/34 | 1,706,417 | ||||||
| 819,474 | 5.000%, due 01/15/35 | 820,719 | ||||||
| 1,897,993 | 5.000%, due 03/15/35 | 1,900,876 | ||||||
| 2,452,987 | 5.000%, due 04/15/35 | 2,456,713 | ||||||
| 670,379 | 5.000%, due 05/15/35 | 671,397 | ||||||
| 1,428,588 | 5.000%, due 05/20/35 | 1,424,751 | ||||||
| Principal Amount | Value | |||||||
| $ | 867,613 | 5.000%, due 06/15/35 | $ | 868,931 | ||||
| 23,892,422 | 5.000%, due 11/20/35 | 23,828,248 | ||||||
| 4,399,743 | 5.000%, due 04/20/36 | 4,387,348 | ||||||
| 4,165,940 | 5.000%, due 05/20/36 | 4,154,204 | ||||||
| 1,771,298 | 5.000%, due 05/20/37 | 1,761,994 | ||||||
| 3,893,092 | 5.000%, due 12/20/37 | 3,872,644 | ||||||
| 4,112,175 | 5.000%, due 01/20/38 | 4,032,662 | ||||||
| 237,004 | 5.450%, due 02/15/29 | 242,040 | ||||||
| 102,085 | 5.450%, due 10/15/29 | 104,254 | ||||||
| 787,528 | 5.500%, due 08/20/24 | 813,131 | ||||||
| 32,677 | 5.500%, due 04/20/29 | 33,367 | ||||||
| 497,515 | 5.500%, due 10/15/32 | 508,810 | ||||||
| 1,504,850 | 5.500%, due 12/15/32 | 1,539,015 | ||||||
| 2,271,031 | 5.500%, due 03/15/33 | 2,321,949 | ||||||
| 2,184,864 | 5.500%, due 04/15/33 | 2,233,851 | ||||||
| 5,357,227 | 5.500%, due 05/15/33 | 5,477,342 | ||||||
| 2,626,394 | 5.500%, due 06/15/33 | 2,685,282 | ||||||
| 6,984,656 | 5.500%, due 07/15/33 | 7,140,138 | ||||||
| 433,980 | 5.500%, due 09/15/33 | 443,710 | ||||||
| 617,237 | 5.500%, due 10/15/33 | 631,077 | ||||||
| 9,331,520 | 5.500%, due 11/15/33 | 9,538,048 | ||||||
| 878,128 | 5.500%, due 11/20/33 | 894,390 | ||||||
| 2,032,243 | 5.500%, due 12/15/33 | 2,077,092 | ||||||
| 632,576 | 5.500%, due 12/20/33 | 644,292 | ||||||
| 2,693,319 | 5.500%, due 01/15/34 | 2,750,894 | ||||||
| 546,837 | 5.500%, due 01/20/34 | 556,733 | ||||||
| 3,028,550 | 5.500%, due 02/15/34 | 3,093,292 | ||||||
| 768,358 | 5.500%, due 03/15/34 | 785,262 | ||||||
| 1,031,008 | 5.500%, due 03/20/34 | 1,049,668 | ||||||
| 5,316,715 | 5.500%, due 04/15/34 | 5,432,335 | ||||||
| 7,363,877 | 5.500%, due 04/20/34 | 7,497,870 | ||||||
| 268,574 | 5.500%, due 05/15/34 | 274,483 | ||||||
| 1,541,259 | 5.500%, due 06/15/34 | 1,575,167 | ||||||
| 1,768,350 | 5.500%, due 06/20/34 | 1,802,214 | ||||||
| 1,447,487 | 5.500%, due 07/15/34 | 1,479,331 | ||||||
| 1,142,494 | 5.500%, due 07/20/34 | 1,165,308 | ||||||
| 8,426,488 | 5.500%, due 08/15/34 | 8,611,868 | ||||||
| 868,458 | 5.500%, due 08/20/34 | 884,175 | ||||||
| 7,408,501 | 5.500%, due 09/15/34 | 7,571,486 | ||||||
| 5,048,550 | 5.500%, due 10/15/34 | 5,159,618 | ||||||
| 186,898 | 5.500%, due 12/15/34 | 191,010 | ||||||
| 251,695 | 5.500%, due 12/20/34 | 256,251 | ||||||
| 4,593,219 | 5.500%, due 01/15/35 | 4,693,984 | ||||||
| 424,239 | 5.500%, due 01/20/35 | 431,889 | ||||||
| 1,510,754 | 5.500%, due 02/15/35 | 1,543,897 | ||||||
| 3,446,560 | 5.500%, due 03/15/35 | 3,522,171 | ||||||
| 2,308,875 | 5.500%, due 04/15/35 | 2,359,527 | ||||||
| 3,435,210 | 5.500%, due 05/15/35 | 3,510,571 | ||||||
| 1,289,889 | 5.500%, due 05/20/35 | 1,315,568 | ||||||
| 1,011,242 | 5.500%, due 06/15/35 | 1,033,426 | ||||||
| 847,553 | 5.500%, due 06/20/35 | 864,425 | ||||||
| 1,439,100 | 5.500%, due 07/15/35 | 1,470,671 | ||||||
| 1,272,132 | 5.500%, due 09/20/35 | 1,297,457 | ||||||
| 832,484 | 5.500%, due 11/15/35 | 850,747 | ||||||
| 3,071,462 | 5.500%, due 03/15/36 | 3,137,657 | ||||||
| 13,875,435 | 5.500%, due 03/20/36 | 14,143,834 | ||||||
| 901,771 | 5.500%, due 04/15/36 | 921,205 | ||||||
| 18,070,727 | 5.500%, due 04/20/36 | 18,423,609 | ||||||
| 2,275,703 | 5.500%, due 05/15/36 | 2,324,748 | ||||||
| 652,018 | 5.500%, due 06/15/36 | 666,071 | ||||||
| 23,855,284 | 5.500%, due 06/20/36 | 24,321,124 | ||||||
| 2,898,217 | 5.500%, due 07/15/36 | 2,960,679 | ||||||
| 617,979 | 5.500%, due 08/15/36 | 631,297 | ||||||
See Accompanying Notes to Financial Statements
57
Table of Contents
| ING GNMA INCOME FUND | PORTFOLIO OF INVESTMENTS ASOF MARCH 31, 2008 (CONTINUED) |
| Principal Amount | Value | |||||||
| Government National Mortgage Association (continued) | ||||||||
| $ | 13,436,436 | 5.500%, due 08/20/36 | $ | 13,698,820 | ||||
| 815,263 | 5.500%, due 09/15/36 | 832,834 | ||||||
| 3,642,976 | 5.500%, due 10/15/36 | 3,721,488 | ||||||
| 3,400,492 | 5.500%, due 11/15/36 | 3,473,778 | ||||||
| 2,212,702 | 5.500%, due 12/15/36 | 2,260,389 | ||||||
| 5,278,202 | 5.500%, due 01/15/37 | 5,391,056 | ||||||
| 8,487,800 | 5.500%, due 07/20/37 | 8,645,276 | ||||||
| 9,862,309 | 5.630%, due 07/15/45 | 9,841,303 | ||||||
| 218,773 | 5.750%, due 11/20/27 | 225,176 | ||||||
| 292,147 | 5.750%, due 12/20/27 | 300,698 | ||||||
| 105,197 | 5.750%, due 02/20/28 | 108,248 | ||||||
| 825,025 | 5.750%, due 03/20/28 | 848,957 | ||||||
| 319,422 | 5.750%, due 04/20/28 | 328,687 | ||||||
| 183,961 | 5.750%, due 07/20/28 | 189,297 | ||||||
| 64,925 | 5.750%, due 01/20/29 | 66,797 | ||||||
| 114,723 | 5.750%, due 04/20/29 | 118,030 | ||||||
| 550,235 | 5.750%, due 07/20/29 | 566,095 | ||||||
| 147,796 | 6.000%, due 10/15/15 | 152,802 | ||||||
| 606,595 | 6.000%, due 10/15/25 | 629,974 | ||||||
| 1,767,886 | 6.000%, due 04/15/26 | 1,834,484 | ||||||
| 1,166,169 | 6.000%, due 10/20/27 | 1,209,210 | ||||||
| 643,857 | 6.000%, due 07/15/28 | 668,121 | ||||||
| 483,993 | 6.000%, due 08/15/28 | 502,232 | ||||||
| 913,753 | 6.000%, due 09/15/28 | 948,188 | ||||||
| 389,349 | 6.000%, due 02/15/29 | 404,020 | ||||||
| 316,227 | 6.000%, due 04/15/29 | 328,123 | ||||||
| 281,038 | 6.000%, due 05/15/29 | 291,233 | ||||||
| 146,803 | 6.000%, due 12/15/29 | 152,319 | ||||||
| 303,996 | 6.000%, due 02/15/32 | 315,053 | ||||||
| 1,711,602 | 6.000%, due 07/15/32 | 1,773,856 | ||||||
| 4,091,325 | 6.000%, due 08/15/32 | 4,242,024 | ||||||
| 8,324,925 | 6.000%, due 09/15/32 | 8,627,715 | ||||||
| 1,343,715 | 6.000%, due 11/15/32 | 1,392,588 | ||||||
| 1,087,366 | 6.000%, due 12/15/32 | 1,126,915 | ||||||
| 12,235,691 | 6.000%, due 01/15/33 | 12,674,353 | ||||||
| 1,221,542 | 6.000%, due 02/15/33 | 1,265,335 | ||||||
| 1,851,265 | 6.000%, due 03/15/33 | 1,917,634 | ||||||
| 422,597 | 6.000%, due 04/15/33 | 437,748 | ||||||
| 1,528,950 | 6.000%, due 05/15/33 | 1,583,765 | ||||||
| 3,300,288 | 6.000%, due 09/15/33 | 3,418,605 | ||||||
| 4,334,894 | 6.000%, due 10/15/33 | 4,490,304 | ||||||
| 1,182,633 | 6.000%, due 12/15/33 | 1,225,032 | ||||||
| 830,150 | 6.000%, due 01/15/34 | 858,103 | ||||||
| 771,098 | 6.000%, due 01/20/34 | 796,138 | ||||||
| 159,896 | 6.000%, due 02/15/34 | 165,280 | ||||||
| 1,528,065 | 6.000%, due 02/20/34 | 1,577,686 | ||||||
| 3,399,719 | 6.000%, due 03/20/34 | 3,510,120 | ||||||
| 523,018 | 6.000%, due 04/20/34 | 540,002 | ||||||
| 2,718,102 | 6.000%, due 05/20/34 | 2,806,368 | ||||||
| 161,340 | 6.000%, due 06/20/34 | 166,579 | ||||||
| 22,002,906 | 6.000%, due 07/20/34 | 22,717,410 | ||||||
| 2,567,479 | 6.000%, due 08/20/34 | 2,650,853 | ||||||
| 477,916 | 6.000%, due 09/15/34 | 494,678 | ||||||
| 898,345 | 6.000%, due 10/15/34 | 929,853 | ||||||
| 8,463,424 | 6.000%, due 10/20/34 | 8,741,798 | ||||||
| 9,241,438 | 6.000%, due 11/20/34 | 9,541,537 | ||||||
| 9,079,345 | 6.000%, due 12/20/34 | 9,374,180 | ||||||
| 2,240,150 | 6.000%, due 01/20/35 | 2,310,744 | ||||||
| 918,744 | 6.000%, due 02/20/35 | 947,697 | ||||||
| 1,473,731 | 6.000%, due 03/20/35 | 1,520,173 | ||||||
| 1,091,037 | 6.000%, due 04/20/35 | 1,125,419 | ||||||
| 250,984 | 6.000%, due 06/20/35 | 258,893 | ||||||
| Principal Amount | Value | |||||||
| $ | 978,776 | 6.000%, due 05/15/36 | $ | 1,011,787 | ||||
| 1,963,289 | 6.000%, due 06/15/36 | 2,029,504 | ||||||
| 1,823,921 | 6.000%, due 07/15/36 | 1,885,435 | ||||||
| 1,283,246 | 6.000%, due 08/15/36 | 1,326,525 | ||||||
| 983,539 | 6.000%, due 09/15/36 | 1,016,711 | ||||||
| 1,730,235 | 6.000%, due 10/15/36 | 1,788,590 | ||||||
| 3,198,346 | 6.000%, due 01/20/37 | 3,297,778 | ||||||
| 4,416,346 | 6.000%, due 03/15/37 | 4,565,054 | ||||||
| 8,894,996 | 6.000%, due 04/20/37 | 9,184,906 | ||||||
| 4,579,048 | 6.000%, due 06/15/37 | 4,733,300 | ||||||
| 1,271,499 | 6.000%, due 09/20/37 | 1,312,940 | ||||||
| 135,008 | 6.250%, due 03/15/28 | 140,199 | ||||||
| 142,465 | 6.250%, due 04/15/28 | 147,943 | ||||||
| 396,199 | 6.250%, due 09/15/29 | 411,268 | ||||||
| 203,816 | 6.280%, due 01/20/26 | 212,297 | ||||||
| 542,915 | 6.280%, due 05/20/26 | 565,504 | ||||||
| 740,686 | 6.490%, due 01/15/28 | 777,987 | ||||||
| 296,770 | 6.500%, due 02/15/26 | 310,910 | ||||||
| 234,411 | 6.500%, due 03/15/28 | 245,239 | ||||||
| 165,569 | 6.500%, due 08/15/28 | 173,217 | ||||||
| 1,700,195 | 6.500%, due 11/15/28 | 1,778,732 | ||||||
| 299,962 | 6.500%, due 07/20/29 | 313,958 | ||||||
| 29,991 | 6.500%, due 05/15/31 | 31,348 | ||||||
| 1,141,416 | 6.500%, due 08/20/31 | 1,193,954 | ||||||
| 284,316 | 6.500%, due 09/15/31 | 297,186 | ||||||
| 1,770,531 | 6.500%, due 01/15/32 | 1,848,221 | ||||||
| 733,887 | 6.500%, due 02/15/32 | 766,090 | ||||||
| 102,325 | 6.500%, due 04/20/32 | 106,893 | ||||||
| 334,381 | 6.500%, due 07/20/32 | 349,309 | ||||||
| 380,703 | 6.500%, due 08/15/32 | 397,408 | ||||||
| 634,792 | 6.500%, due 10/20/33 | 662,057 | ||||||
| 1,802,577 | 6.500%, due 11/15/33 | 1,878,910 | ||||||
| 959,898 | 6.500%, due 11/20/33 | 1,001,126 | ||||||
| 521,018 | 6.500%, due 01/20/34 | 543,177 | ||||||
| 645,378 | 6.500%, due 02/20/34 | 672,826 | ||||||
| 384,238 | 6.500%, due 03/20/34 | 400,580 | ||||||
| 339,179 | 6.500%, due 08/20/34 | 353,605 | ||||||
| 2,817,100 | 6.500%, due 09/20/34 | 2,936,914 | ||||||
| 1,205,804 | 6.500%, due 10/20/34 | 1,257,088 | ||||||
| 1,373,745 | 6.500%, due 11/20/34 | 1,432,172 | ||||||
| 1,183,507 | 6.500%, due 12/20/34 | 1,233,843 | ||||||
| 550,866 | 6.500%, due 03/20/35 | 573,722 | ||||||
| 1,445,657 | 6.500%, due 04/20/36 | 1,504,284 | ||||||
| 1,184,314 | 6.500%, due 05/15/36 | 1,232,616 | ||||||
| 4,915,823 | 6.500%, due 09/15/36 | 5,116,315 | ||||||
| 2,936,865 | 6.500%, due 11/15/36 | 3,056,645 | ||||||
| 1,685,176 | 6.500%, due 12/15/36 | 1,753,906 | ||||||
| 14,222,894 | 6.500%, due 01/15/37 | 14,803,037 | ||||||
| 6,417,105 | 6.500%, due 02/15/37 | 6,678,854 | ||||||
| 1,123,970 | 6.500%, due 02/20/37 | 1,169,553 | ||||||
| 8,219,213 | 6.500%, due 03/15/37 | 8,554,469 | ||||||
| 808,429 | 6.500%, due 04/20/37 | 841,215 | ||||||
| 9,062,855 | 6.500%, due 10/20/37 | 9,439,551 | ||||||
| 275,959 | 6.600%, due 10/20/26 | 292,228 | ||||||
| 355,225 | 6.600%, due 02/20/27 | 375,984 | ||||||
| 108,693 | 6.600%, due 05/20/27 | 115,045 | ||||||
| 453,444 | 6.600%, due 06/20/27 | 479,942 | ||||||
| 393,758 | 6.600%, due 07/20/27 | 416,768 | ||||||
| 242,198 | 6.600%, due 09/20/27 | 256,351 | ||||||
| 325,236 | 6.600%, due 10/20/27 | 344,242 | ||||||
| 123,838 | 6.600%, due 12/20/27 | 131,075 | ||||||
| 330,551 | 6.600%, due 02/20/28 | 349,612 | ||||||
| 868,450 | 6.600%, due 07/20/28 | 918,530 | ||||||
See Accompanying Notes to Financial Statements
58
Table of Contents
| ING GNMA INCOME FUND | PORTFOLIO OF INVESTMENTS ASOF MARCH 31, 2008 (CONTINUED) |
| Principal Amount | Value | |||||||
| Government National Mortgage Association (continued) | ||||||||
| $ | 16,013 | 6.750%, due 08/15/28 | $ | 17,024 | ||||
| 320,597 | 6.750%, due 10/15/28 | 340,827 | ||||||
| 59,109 | 6.750%, due 11/15/28 | 62,839 | ||||||
| 77,353 | 7.000%, due 09/15/23 | 82,889 | ||||||
| 20,363 | 7.000%, due 12/15/23 | 21,820 | ||||||
| 34,892 | 7.000%, due 04/15/26 | 37,382 | ||||||
| 189,969 | 7.000%, due 01/15/27 | 203,447 | ||||||
| 169,161 | 7.000%, due 11/15/27 | 181,162 | ||||||
| 277,404 | 7.000%, due 07/15/28 | 296,855 | ||||||
| 20,649 | 7.000%, due 07/15/29 | 22,089 | ||||||
| 53,121 | 7.000%, due 10/15/30 | 56,796 | ||||||
| 47,172 | 7.000%, due 05/15/31 | 50,399 | ||||||
| 581,958 | 7.000%, due 06/15/31 | 622,222 | ||||||
| 361,929 | 7.000%, due 09/15/31 | 386,696 | ||||||
| 149,636 | 7.000%, due 11/15/31 | 157,629 | ||||||
| 166,848 | 7.000%, due 12/15/31 | 178,265 | ||||||
| 1,992,103 | 7.000%, due 01/15/32 | 2,128,188 | ||||||
| 3,634,427 | 7.000%, due 02/15/32 | 3,882,703 | ||||||
| 2,461,294 | 7.000%, due 03/15/32 | 2,629,432 | ||||||
| 3,468,043 | 7.000%, due 04/15/32 | 3,704,952 | ||||||
| 3,021,663 | 7.000%, due 05/15/32 | 3,228,079 | ||||||
| 1,975,198 | 7.000%, due 07/15/32 | 2,110,128 | ||||||
| 246,073 | 7.000%, due 06/20/34 | 262,090 | ||||||
| 174,991 | 7.000%, due 07/20/34 | 186,381 | ||||||
| 1,992,225 | 7.000%, due 09/20/34 | 2,121,897 | ||||||
| 522,529 | 7.000%, due 10/20/34 | 556,539 | ||||||
| 752,993 | 7.000%, due 08/20/36 | 791,707 | ||||||
| 25,340 | 7.250%, due 01/15/29 | 27,154 | ||||||
| 79,496 | 7.500%, due 08/20/27 | 85,477 | ||||||
| 220,267 | 7.500%, due 12/15/28 | 237,751 | ||||||
| 377,619 | 7.500%, due 10/15/30 | 406,987 | ||||||
| 48,717 | 7.500%, due 12/15/30 | 52,506 | ||||||
| 56,908 | 7.500%, due 01/15/31 | 61,307 | ||||||
| 159,194 | 7.500%, due 10/15/31 | 171,501 | ||||||
| 88,846 | 7.500%, due 01/15/32 | 95,606 | ||||||
| 23,524 | 7.800%, due 05/15/19 | 25,567 | ||||||
| 31,424 | 7.800%, due 07/15/19 | 34,153 | ||||||
| 5,949 | 8.000%, due 03/20/24 | 6,498 | ||||||
| 37,113 | 8.000%, due 11/15/25 | 40,704 | ||||||
| 109,118 | 8.000%, due 07/15/26 | 119,722 | ||||||
| 141,502 | 8.000%, due 09/15/26 | 155,252 | ||||||
| 50,547 | 8.000%, due 09/20/26 | 55,257 | ||||||
| Principal Amount | Value | |||||||
| $ | 39,279 | 8.000%, due 12/15/26 | $ | 43,096 | ||||
| 24,430 | 8.000%, due 04/15/27 | 26,799 | ||||||
| 62,073 | 8.000%, due 06/15/27 | 68,091 | ||||||
| 54,944 | 8.000%, due 07/15/27 | 60,270 | ||||||
| 26,680 | 8.000%, due 03/15/28 | 29,274 | ||||||
| 38,273 | 8.050%, due 07/15/19 | 41,727 | ||||||
| 41,139 | 9.000%, due 05/15/16 | 44,962 | ||||||
| 26,922 | 9.000%, due 07/15/16 | 29,424 | ||||||
| 10,048 | 9.500%, due 11/15/21 | 11,215 | ||||||
| 589,384,831 | ||||||||
| Other U.S. Agency Obligations: 0.0% | ||||||||
| 19,204 | C | Small Business Administration, 8.250%, due 11/01/11 | 19,524 | |||||
| 19,524 | ||||||||
Total U.S. Government Agency Obligations | 591,884,102 | |||||||
| SHORT-TERM INVESTMENTS: 0.8% | ||||||||||
| U.S. Treasury Bills: 0.8% | ||||||||||
| 5,000,000 | Z | 0.300%, due 05/22/08 | 4,997,822 | |||||||
Total Short-Term Investments | 4,997,822 | |||||||||
Total Investments in Securities | 96.4 | % | $ | 596,881,924 | ||||||
Other Assets and Liabilities - Net | 3.6 | 22,260,083 | ||||||||
Net Assets | 100.0 | % | $ | 619,142,007 | ||||||
| C | Bond may be called prior to maturity date. |
| Z | Indicates Zero Coupon Bond; rate shown reflects current effective yield. |
| * | Cost for federal income tax purposes is the same as for financial statement purposes. |
Net unrealized appreciation consists of: | ||||
Gross Unrealized Appreciation | $ | 12,385,977 | ||
Gross Unrealized Depreciation | (844,737 | ) | ||
Net Unrealized Appreciation | $ | 11,541,240 | ||
See Accompanying Notes to Financial Statements
59
Table of Contents
| ING HIGH YIELD BOND FUND | PORTFOLIO OF INVESTMENTS ASOF MARCH 31, 2008 |
| Principal Amount | Value | |||||||
| CORPORATE BONDS/NOTES: 95.1% | ||||||||
| Advertising: 0.4% | ||||||||
| $ | 455,000 | C | Visant Corp., | $ | 444,763 | |||
| 444,763 | ||||||||
| Airlines: 1.6% | ||||||||
| 800,000 | C | AMR Corp., 8.608%, due 04/01/11 | 768,000 | |||||
| 604,260 | C | Continental Airlines, Inc., | 561,962 | |||||
| 515,000 | United Airlines, Inc., | 597,400 | ||||||
| 1,927,362 | ||||||||
| Auto Manufacturers: 1.9% | ||||||||
| 1,678,750 | Ford Motor Co., | 1,379,985 | ||||||
| 800,000 | C | General Motors Corp., | 618,000 | |||||
| 340,000 | C | General Motors Corp., | 241,400 | |||||
| 2,239,385 | ||||||||
| Auto Parts & Equipment: 0.3% | ||||||||
| 355,000 | C | United Components, Inc., | 327,044 | |||||
| 327,044 | ||||||||
| Banks: 2.4% | ||||||||
| 440,000 | C | BAC Capital Trust VI, | 370,514 | |||||
| 315,000 | C | Bank of America Corp., | 315,910 | |||||
| 463,000 | C | National City Preferred Capital | 463,000 | |||||
| 695,000 | C | SunTrust Capital VIII, | 551,920 | |||||
| 600,000 | C | Wachovia Corp., | 591,320 | |||||
| 610,000 | C | Wells Fargo Capital X, | 551,384 | |||||
| 2,844,048 | ||||||||
| Beverages: 0.9% | ||||||||
| 790,000 | C | Constellation Brands, Inc., | 770,250 | |||||
| 255,000 | C | Constellation Brands, Inc., | 263,925 | |||||
| 1,034,175 | ||||||||
| Building Materials: 0.7% | ||||||||
| 825,000 | C | Interline Brands, Inc., | 792,000 | |||||
| 792,000 | ||||||||
| Chemicals: 2.7% | ||||||||
| 610,000 | C | Huntsman International, LLC, | 649,650 | |||||
| 760,000 | C | Momentive Performance Materials, Inc., | 685,900 | |||||
| 700,000 | &, C | Momentive Performance Materials, Inc., | 612,500 | |||||
| Principal Amount | Value | |||||||
| $ | 720,000 | @@, C | Nova Chemicals Corp., | $ | 606,600 | |||
| 650,000 | C | PolyOne Corp., | 659,750 | |||||
| 3,214,400 | ||||||||
| Commercial Services: 3.3% | ||||||||
| 710,000 | C | Alion Science and Technology Corp., | 404,700 | |||||
| 440,000 | C | Aramark Services, Inc., | 390,500 | |||||
| 660,000 | C | Aramark Services, Inc., | 664,950 | |||||
| 1,140,000 | #, C | Ashtead Capital, Inc., | 929,100 | |||||
| 580,000 | C | Hertz Corp., | 552,450 | |||||
| 680,000 | C | Hertz Corp., | 640,050 | |||||
| 680,000 | C | Neff Corp., | 326,400 | |||||
| 3,908,150 | ||||||||
| Computers: 1.5% | ||||||||
| 530,000 | #, C | Ceridian Corp., | 454,475 | |||||
| 530,000 | &, #, C | Ceridian Corp., | 443,875 | |||||
| 845,000 | C | Sungard Data Systems, Inc., | 857,675 | |||||
| 1,756,025 | ||||||||
| Diversified Financial Services: 13.8% | ||||||||
| 705,000 | # | Astoria Depositor Corp., | 729,675 | |||||
| 700,000 | #, C | Biomet, Inc., | 736,750 | |||||
| 600,000 | #, C | Biomet, Inc., | 603,000 | |||||
| 780,000 | #, C | Buffalo Thunder Development Authority, | 588,900 | |||||
| 455,000 | Ford Motor Credit Co., | 336,856 | ||||||
| 1,030,000 | Ford Motor Credit Co., | 968,078 | ||||||
| 265,000 | Ford Motor Credit Co., | 218,774 | ||||||
| 1,795,000 | Ford Motor Credit Co., | 1,601,770 | ||||||
| 365,000 | General Motors Acceptance Corp., | 258,626 | ||||||
| 1,480,000 | General Motors Acceptance Corp., | 1,133,547 | ||||||
| 700,000 | &, C | Hawker Beechcraft Acquisition Co. LLC/Hawker Beechcraft Notes Co., | 719,250 | |||||
See Accompanying Notes to Financial Statements
60
Table of Contents
| ING HIGH YIELD BOND FUND | PORTFOLIO OF INVESTMENTS ASOF MARCH 31, 2008 (CONTINUED) |
| Principal Amount | Value | |||||||
| Diversified Financial Services (continued) | ||||||||
| $ | 985,000 | C, W | Hawker Beechcraft Acquisition Co. LLC/Hawker Beechcraft Notes Co., | $ | 985,000 | |||
| 670,000 | C | Hexion US Finance Corp./Hexion Nova Scotia Finance ULC, | 721,925 | |||||
| 645,000 | C | JP Morgan Chase Capital XVIII, | 595,842 | |||||
| 535,000 | C | KAR Holdings, Inc., | 478,825 | |||||
| 980,000 | &, #, C | Local TV Finance, LLC, | 790,125 | |||||
| 1,010,000 | #, C | Nuveen Investments, Inc., | 871,125 | |||||
| 1,046,922 | #, C | Piper Jaffray Equipment Trust Securities, | 989,342 | |||||
| 670,000 | &, C | PNA Intermediate Holding Corp., | 524,275 | |||||
| 365,000 | #, C | Rainbow National Services, LLC, | 375,038 | |||||
| 720,000 | C | Residential Capital Corp., | 365,400 | |||||
| 405,000 | C | Residential Capital Corp., | 198,450 | |||||
| 380,000 | C | Residential Capital, LLC, | 188,100 | |||||
| 500,000 | #, C | Snoqualmie Entertainment Authority, | 430,000 | |||||
| 950,000 | C | Universal City Florida Holding Co. I/II, | 926,250 | |||||
| 16,334,923 | ||||||||
| Electric: 6.5% | ||||||||
| 610,000 | C | AES Corp., | 620,675 | |||||
| 309,000 | #, C | AES Corp., | 322,905 | |||||
| 715,000 | C | Edison Mission Energy, | 715,000 | |||||
| 1,180,000 | #, C | Energy Future Holdings, | 1,197,700 | |||||
| 708,100 | C | Homer City Funding, LLC, | 757,667 | |||||
| 590,000 | @@, #, C | Intergen NV, | 619,500 | |||||
| 126,261 | C | Midwest Generation, LLC, | 128,786 | |||||
| 371,486 | C | Midwest Generation, LLC, | 403,062 | |||||
| 1,085,000 | C | Mirant North America, LLC, | 1,101,275 | |||||
| 350,000 | C | Reliant Energy, Inc., | 349,125 | |||||
| 395,000 | C | Reliant Energy, Inc., | 395,000 | |||||
| Principal Amount | Value | |||||||
| $ | 1,085,000 | #, C | Texas Competitive Electric Holdings Co., LLC, | $ | 1,086,356 | |||
| 7,697,051 | ||||||||
| Entertainment: 2.6% | ||||||||
| 1,125,000 | C | AMC Entertainment, Inc., | 1,058,906 | |||||
| 315,000 | +, C | Marquee Holdings, Inc., | 237,038 | |||||
| 435,000 | #, C | Mashantucket Western Pequot Tribe, | 384,975 | |||||
| 485,000 | C | Pinnacle Entertainment, Inc., | 459,538 | |||||
| 455,000 | #, C | Shingle Springs Tribal Gaming Authority, | 404,950 | |||||
| 670,000 | C | Warner Music Group-Old, 7.375%, due 04/15/14 | 519,250 | |||||
| 3,064,657 | ||||||||
| Environmental Control: 2.6% | ||||||||
| 1,000,000 | C | Allied Waste North America, Inc., | 1,003,750 | |||||
| 1,280,000 | C | Waste Services, Inc., | 1,232,000 | |||||
| 865,000 | C | WCA Waste Corp., | 867,163 | |||||
| 3,102,913 | ||||||||
| Food: 0.8% | ||||||||
| 590,000 | C | Dean Foods Co., | 519,200 | |||||
| 425,000 | C | Stater Brothers Holdings, | 428,188 | |||||
| 947,388 | ||||||||
| Forest Products & Paper: 4.6% | ||||||||
| 600,000 | @@ | Abitibi-Consolidated, Inc., | 262,500 | |||||
| 720,000 | @@, C | Abitibi-Consolidated, Inc., | 327,600 | |||||
| 855,000 | @@, C | Catalyst Paper Corp., | 716,063 | |||||
| 785,000 | C | Domtar Corp., | 690,800 | |||||
| 215,000 | C | Domtar Corp., | 203,713 | |||||
| 420,000 | C | Exopack Holding Corp., | 386,400 | |||||
| 140,000 | #, C | Georgia-Pacific Corp., | 131,950 | |||||
| 740,000 | C | Georgia-Pacific Corp., | 625,300 | |||||
| 1,015,000 | C | NewPage Corp., | 1,022,613 | |||||
| 270,000 | C | Verso Paper Holdings, LLC and Verson Paper, Inc., | 229,500 | |||||
| 685,000 | C | Verso Paper Holdings, LLC and Verson Paper, Inc., | 664,450 | |||||
See Accompanying Notes to Financial Statements
61
Table of Contents
| ING HIGH YIELD BOND FUND | PORTFOLIO OF INVESTMENTS ASOF MARCH 31, 2008 (CONTINUED) |
| Principal Amount | Value | |||||||
| Forest Products & Paper (continued) | ||||||||
| $ | 250,000 | C | Verso Paper Holdings, LLC and Verson Paper, Inc., | $ | 230,625 | |||
| 5,491,514 | ||||||||
| Healthcare - Products: 1.1% | ||||||||
| 650,000 | #, C | Bausch & Lomb, Inc., | 663,000 | |||||
| 625,000 | C | Boston Scientific Corp., | 585,938 | |||||
| 1,248,938 | ||||||||
| Healthcare - Services: 6.0% | ||||||||
| 690,000 | C | Centene Corp., | 645,150 | |||||
| 665,000 | C | DaVita, Inc., | 651,700 | |||||
| 1,465,000 | C | HCA, Inc., | 1,523,600 | |||||
| 1,380,000 | &, C | HCA, Inc., | 1,435,200 | |||||
| 830,000 | C | Psychiatric Solutions, Inc., | 830,000 | |||||
| 840,000 | C | Sun Healthcare Group, Inc., | 814,800 | |||||
| 625,000 | C | United Surgical Partners | 590,625 | |||||
| 645,000 | &, C | United Surgical Partners International, Inc., | 599,850 | |||||
| 7,090,925 | ||||||||
| Holding Companies - Diversified: 0.6% | ||||||||
| 750,000 | C | Atlantic Broadband Finance, LLC, | 663,750 | |||||
| 663,750 | ||||||||
| Home Builders: 0.2% | ||||||||
| 446,000 | C | Stanley-Martin Communities, LLC, | 216,310 | |||||
| 216,310 | ||||||||
| Home Furnishings: 0.4% | ||||||||
| 445,000 | C | Norcraft Cos. LP, | 450,563 | |||||
| 450,563 | ||||||||
| Household Products/Wares: 1.5% | ||||||||
| 525,000 | C | American Achievement Corp., | 471,188 | |||||
| 560,000 | C | Jarden Corp., | 492,800 | |||||
| 905,000 | +, C | Visant Holding Corp., | 850,700 | |||||
| 1,814,688 | ||||||||
| Investment Companies: 1.0% | ||||||||
| 1,185,000 | @@, C | Intelsat Bermuda Ltd., | 1,207,219 | |||||
| 1,207,219 | ||||||||
| Principal Amount | Value | |||||||
| Iron/Steel: 0.2% | ||||||||
| $ | 260,000 | &, C | Metals USA Holdings Corp., | $ | 195,000 | |||
| 195,000 | ||||||||
| Leisure Time: 0.5% | ||||||||
| 740,000 | C | Travelport, LLC, | 632,700 | |||||
| 632,700 | ||||||||
| Lodging: 2.0% | ||||||||
| 600,000 | Green Valley Ranch Gaming, | 477,750 | ||||||
| 665,000 | #, C | Harrah’s Operating Co., | 563,588 | |||||
| 1,015,000 | C | MGM Mirage, | 918,575 | |||||
| 575,000 | #, C | Seminole Hard Rock Entertainment, Inc., | 458,563 | |||||
| 2,418,476 | ||||||||
| Media: 9.7% | ||||||||
| 540,000 | C | American Media Operations, Inc., | 364,500 | |||||
| 19,634 | #, C | American Media Operations, Inc., | 13,253 | |||||
| 180,000 | C | Charter Communications Holdings II, LLC, | 155,250 | |||||
| 1,110,000 | #, C | Charter Communications Operating, LLC, | 1,004,550 | |||||
| 600,000 | #, C | Charter Communications, Inc., | 594,000 | |||||
| 295,000 | CSC Holdings, Inc., | 293,156 | ||||||
| 10,000 | CSC Holdings, Inc., | 10,125 | ||||||
| 1,074,000 | C | Dex Media West, LLC, | 937,065 | |||||
| 135,000 | C | Dex Media, Inc., | 99,225 | |||||
| 870,000 | C | Echostar DBS Corp., | 815,625 | |||||
| 1,480,000 | C | Idearc, Inc., | 965,700 | |||||
| 525,000 | #, C | ION Media Networks, Inc., | 395,063 | |||||
| 690,000 | Liberty Media, LLC, | 582,508 | ||||||
| 960,000 | C | Mediacom Broadband, LLC, | 811,200 | |||||
| 750,000 | +, C | Nexstar Finance Holdings, LLC, | 732,188 | |||||
| 1,070,000 | C | Nexstar Finance, Inc., | 926,888 | |||||
| 750,000 | C | Nielsen Finance LLC/Nielsen Finance Co., | 750,000 | |||||
See Accompanying Notes to Financial Statements
62
Table of Contents
| ING HIGH YIELD BOND FUND | PORTFOLIO OF INVESTMENTS ASOF MARCH 31, 2008 (CONTINUED) |
| Principal Amount | Value | |||||||
| Media (continued) | ||||||||
| $ | 545,000 | @@, C | Quebecor Media, Inc., | $ | 500,038 | |||
| 1,290,000 | #, C | R.H. Donnelley Corp., | 812,700 | |||||
| 950,000 | C | Radio One, Inc., | 688,750 | |||||
| 11,451,784 | ||||||||
| Mining: 1.4% | ||||||||
| 954,000 | C | Freeport-McMoRan Copper & Gold, Inc., | 1,014,818 | |||||
| 805,000 | &, #, C | Noranda Aluminium Acquisition Corp., | 635,950 | |||||
| 1,650,768 | ||||||||
| Miscellaneous Manufacturing: 1.7% | ||||||||
| 540,000 | C | Harland Clarke Holdings Corp., | 399,600 | |||||
| 246,000 | C | Indalex Holding Corp., | 201,720 | |||||
| 555,000 | C | RBS Global, Inc. and Rexnord Corp., | 521,700 | |||||
| 945,555 | Rexnord Corp., | 862,819 | ||||||
| 1,985,839 | ||||||||
| Oil & Gas: 5.8% | ||||||||
| 360,000 | #, C | Atlas Energy Resources LLC, | 366,300 | |||||
| 290,000 | C | Chaparral Energy, Inc., | 253,025 | |||||
| 900,000 | C | Chesapeake Energy Corp., | 886,500 | |||||
| 405,000 | C | Denbury Resources, Inc., | 416,138 | |||||
| 705,000 | C | Forest Oil Corp., | 720,863 | |||||
| 565,000 | @@, #, C | Griffin Coal Mining Co. Pty Ltd., | 409,625 | |||||
| 690,000 | #, C | Hilcorp Energy I LP, | 650,325 | |||||
| 525,000 | C | McMoRan Exploration Co., | 532,875 | |||||
| 670,000 | @@, C | OPTI Canada, Inc., | 666,650 | |||||
| 600,000 | C | PetroHawk Energy Corp., | 619,500 | |||||
| 145,000 | C | Sabine Pass LNG LP, | 140,650 | |||||
| 650,000 | C | Sabine Pass LNG LP, | 630,500 | |||||
| 570,000 | #, C | Southwestern Energy Co., | 592,800 | |||||
| 6,885,751 | ||||||||
| Principal Amount | Value | |||||||
| Oil & Gas Services: 0.8% | ||||||||
| $ | 460,000 | @@, C | Compagnie Generale de Geophysique-Veritas, | $ | 469,200 | |||
| 510,000 | #, C | Key Energy Services, Inc., | 511,275 | |||||
| 980,475 | ||||||||
| Pipelines: 1.6% | ||||||||
| 1,235,000 | C | El Paso Corp., | 1,276,384 | |||||
| 710,000 | @@, C | Kinder Morgan Finance Co. ULC, | 676,275 | |||||
| 1,952,659 | ||||||||
| Retail: 4.3% | ||||||||
| 770,000 | C | Albertson’s, Inc., | 712,871 | |||||
| 785,000 | C | Bon-Ton Stores, Inc., | 527,913 | |||||
| 1,130,000 | &, C, W | General Nutrition Centers, Inc., | 949,200 | |||||
| 615,000 | C | GSC Holdings Corp., | 653,438 | |||||
| 730,000 | C | NPC International, Inc., | 664,300 | |||||
| 885,000 | #, C | Rite Aid Corp., | 860,663 | |||||
| 775,000 | C | Rite Aid Corp., | 701,375 | |||||
| 5,069,760 | ||||||||
| Software: 0.5% | ||||||||
| 810,000 | #, C | Open Solutions, Inc., | 631,800 | |||||
| 631,800 | ||||||||
| Telecommunications: 8.6% | ||||||||
| 396,000 | C | Centennial Cellular Communications Corp., | 376,200 | |||||
| 717,000 | C | Centennial Cellular Operating Co., | 711,623 | |||||
| 340,000 | C | Centennial Communications Corp., | 317,900 | |||||
| 515,000 | C | Cincinnati Bell, Inc., | 485,387 | |||||
| 380,000 | C | Citizens Communications Co., | 334,400 | |||||
| 885,000 | #, C | Cricket Communications, Inc., | 842,963 | |||||
| 610,000 | C | Intelsat Corp., | 617,625 | |||||
| 970,000 | @@, C | Intelsat Subsidiary Holding Co., Ltd., | 982,125 | |||||
| 810,000 | &, C | iPCS, Inc., | 627,750 | |||||
| 790,000 | C | MetroPCS Wireless, Inc., | 730,750 | |||||
See Accompanying Notes to Financial Statements
63
Table of Contents
| ING HIGH YIELD BOND FUND | PORTFOLIO OF INVESTMENTS ASOF MARCH 31, 2008 (CONTINUED) |
| Principal Amount | Value | |||||||
| Telecommunications (continued) | ||||||||
| $ | 925,000 | C | Qwest Communications International, Inc., | $ | 874,125 | |||
| 1,455,000 | C | Rural Cellular Corp., | 1,462,275 | |||||
| 950,000 | C | SunCom Wireless Holdings, Inc., | 993,938 | |||||
| 300,000 | C | West Corp., | 270,000 | |||||
| 570,000 | C | Windstream Corp., | 498,750 | |||||
| 10,125,811 | ||||||||
| Transportation: 0.6% | ||||||||
| 690,000 | C | Bristow Group, Inc., | 696,900 | |||||
| 696,900 | ||||||||
Total Corporate Bonds/Notes | 112,495,914 | |||||||
| Shares | Value | |||||||
| COMMON STOCK: 0.0% | ||||||||
| Agriculture: 0.0% | ||||||||
| 17,906 | I | North Atlantic Trading Co. | 18 | |||||
| 18 | ||||||||
| Telecommunications: 0.0% | ||||||||
| 264 | @, @@ | Completel Europe NV | 13,893 | |||||
| 13,893 | ||||||||
Total Common Stock | 13,911 | |||||||
| PREFERRED STOCK: 0.0% | ||||||||
| Media: 0.0% | ||||||||
| 1 | &, P | ION Media Networks, Inc. | 7,009 | |||||
Total Preferred Stock | 7,009 | |||||||
| WARRANTS: 0.0% | ||||||||
| Building Materials: 0.0% | ||||||||
| 3,100 | #, I | Dayton Superior Corp. | 31 | |||||
| 31 | ||||||||
| Commercial Services: 0.0% | ||||||||
| 92,950 | I | Comforce Corp. | 930 | |||||
| 930 | ||||||||
| Telecommunications: 0.0% | ||||||||
| 500 | @@, #, I | GT Group Telecom, Inc. | — | |||||
| — | ||||||||
Total Warrants | 961 | |||||||
Total Long-Term Investments | 112,517,795 | |||||||
| SHORT-TERM INVESTMENTS: 2.3% | ||||||||
| Mutual Fund: 1.8% | ||||||||
| 2,050,000 | **, S | ING Institutional Prime Money Market Fund | 2,050,000 | |||||
Total Mutual Fund | 2,050,000 | |||||||
| Principal Amount | Value | ||||||||
| Repurchase Agreement: 0.5% | |||||||||
| $ | 620,000 | Goldman Sachs Repurchase Agreement dated 03/31/08, | $ | 620,000 | |||||
Total Repurchase Agreement | 620,000 | ||||||||
Total Short-Term Investments | 2,670,000 | ||||||||
Total Investments in Securities | 97.4 | % | $ | 115,187,795 | |||||
Other Assets and Liabilities - Net | 2.6 | 3,120,175 | |||||||
Net Assets | 100.0 | % | $ | 118,307,970 | |||||
| @ | Non-income producing security |
| @@ | Foreign Issuer |
| & | Payment-in-kind |
| + | Step-up basis bonds. Interest rates shown reflect current and next coupon rates. |
| # | Securities with purchases pursuant to Rule 144A or section 4(2), under the Securities Act of 1933 and may not be resold subject to that rule except to qualified institutional buyers. Unless otherwise footnoted, these securities have been determined to be liquid under the guidelines established by the Funds’ Board of Directors/Trustees. |
| C | Bond may be called prior to maturity date. |
| P | Preferred Stock may be called prior to convertible date. |
| W | When-issued or delayed delivery security |
| S | All or a portion of this security is segregated for certain derivatives, when-issued or delayed delivery securities and forward currency exchange contracts. |
| I | Illiquid security |
| ** | Investment in affiliate |
| * | Cost for federal income tax purposes is $125,495,679. |
Net unrealized depreciation consists of: | ||||
Gross Unrealized Appreciation | $ | 672,774 | ||
Gross Unrealized Depreciation | (10,980,658 | ) | ||
Net Unrealized Depreciation | $ | (10,307,884 | ) | |
See Accompanying Notes to Financial Statements
64
Table of Contents
| ING HIGH YIELD BOND FUND | PORTFOLIO OF INVESTMENTS ASOF MARCH 31, 2008 (CONTINUED) |
Information concerning the Credit Default Swap Agreements outstanding for the ING High Yield Bond Fund at March 31, 2008 is shown below:
Counterparty | Reference Entity/ Obligation | Buy/Sell | (Pay)/Receive | Termination Date | Notional Amount | Unrealized | |||||||||||
Lehman Brothers Special Financing Inc. | CDX.NA.HY.9 Index | Buy | (3.750 | )% | 12/20/12 | USD | 3,000,000 | $ | (39,632 | ) | |||||||
Merrill Lynch International | Centex Corp. | Sell | 5.600 | % | 03/20/13 | USD | 3,000,000 | 89,485 | |||||||||
Citibank N.A., New York | CMBX-NA-AAA 4 Index | Sell | 0.350 | % | 02/17/51 | USD | 3,000,000 | 210,056 | |||||||||
Merrill Lynch International | D.R. Horton Inc. 5.375%, 06/15/12 | Buy | (4.600 | )% | 03/20/13 | USD | 3,000,000 | (65,473 | ) | ||||||||
Merrill Lynch International | Ford Motor Co. 6.500%, 08/01/18 | Buy | (5.000 | )% | 03/20/13 | USD | 3,000,000 | (30,753 | ) | ||||||||
Merrill Lynch International | Ford Motor Credit Co. LLC 7.250%, 10/25/11 | Sell | 5.000 | % | 03/20/13 | USD | 3,000,000 | 104,230 | |||||||||
Merrill Lynch International | General Motors 7.125%. 07/15/13 | Sell | 5.000 | % | 03/20/09 | USD | 2,000,000 | (18,669 | ) | ||||||||
Goldman Sachs International | Idearc Inc. | Sell | 5.000 | % | 06/20/09 | USD | 2,000,000 | (82,552 | ) | ||||||||
JPMorgan Chase Bank N.A., New York | Norbord Inc. | Buy | (1.380 | )% | 06/20/14 | USD | 2,000,000 | 412,633 | |||||||||
Lehman Brothers Special Financing Inc. | Radian Group Inc. 5.375%, 06/15/15 | Sell | 3.900 | % | 09/20/14 | USD | 900,000 | (179,229 | ) | ||||||||
UBS AG | Radian Group Inc. 5.375%, 06/15/15 | Buy | (0.850 | )% | 09/20/14 | USD | 900,000 | 273,566 | |||||||||
Goldman Sachs International | Temple-Inland Inc. 7.875%, 05/01/12 | Buy | (1.040 | )% | 03/20/14 | USD | 900,000 | 79,338 | |||||||||
| $ | 753,000 | ||||||||||||||||
Information concerning the Interest Rate Swap Agreements outstanding for the ING High Yield Bond Fund at March 31, 2008 is shown below:
Termination Date | Notional | Unrealized | |||||||
Receive a fixed rate equal to 4.920% and pay a floating rate based on | |||||||||
Counterparty: Citibank N.A., New York | 09/25/10 | GBP | 6,000,000 | $ | 20,719 | ||||
| $ | 20,719 | ||||||||
The following short position was held by the ING High Yield Bond Fund at March 31, 2008:
Shares | Description | Market | ||
| (600,000) | Jefferson Smurfit Corp., 8.250% due 10/01/12 | $(543,750) | ||
Total Short Positions (Proceeds $547,500) | $(543,750) | |||
See Accompanying Notes to Financial Statements
65
Table of Contents
| ING INTERMEDIATE BOND FUND | PORTFOLIO OF INVESTMENTS ASOF MARCH 31, 2008 |
| Principal Amount | Value | |||||
| CORPORATE BONDS/NOTES: 26.8% | ||||||
| Aerospace/Defense: 0.2% | ||||||
| $ 2,100,000 | C | United Technologies Corp., | $ 2,158,468 | |||
| 2,158,468 | ||||||
| Airlines: 0.6% | ||||||
| 5,679,000 | C | Delta Airlines, Inc., | 5,661,282 | |||
| 1,742,000 | United Air Lines, Inc., | 2,020,720 | ||||
| 7,682,002 | ||||||
| Auto Manufacturers: 0.2% | ||||||
| 2,735,375 | Ford Motor Co., | 2,248,563 | ||||
| 2,248,563 | ||||||
| Banks: 7.2% | ||||||
| 3,050,000 | @@, C | Australia & New Zealand Banking Group Ltd., | 2,301,780 | |||
| 4,915,000 | C, L | BAC Capital Trust XIV, | 3,596,772 | |||
| 174,538 | @@, # | Banco Itau SA, | 171,047 | |||
| 2,344,000 | @@, #, C | Banco Mercantil del Norte SA, | 2,310,493 | |||
| 3,030,000 | Bank of America Corp., | 3,141,377 | ||||
| 2,581,000 | C | Bank of America Corp., | 2,588,459 | |||
| 1,190,000 | @@, C | Bank of Ireland, | 737,800 | |||
| 540,000 | @@, C, L | Bank of Scotland, | 363,402 | |||
| 177,000 | C | BankAmerica Capital II, | 182,559 | |||
| 1,450,000 | @@, C | Barclays Bank PLC, | 935,250 | |||
| 1,304,000 | @@, #, C | Barclays Bank PLC, | 1,120,119 | |||
| 3,786,000 | @@, # | Barclays Bank PLC, | 3,699,414 | |||
| 565,000 | @@, C | Barclays O/S Inv, | 341,825 | |||
| 2,170,000 | @@, C, L | BNP Paribas, | 1,603,810 | |||
| 4,070,000 | @@, #, C | Chuo Mitsui Trust & Banking Co., Ltd., | 3,404,913 | |||
| 1,100,000 | @@, #, C | Danske Bank A/S, | 1,016,997 | |||
| 670,000 | @@, C | Den Norske Bank ASA, | 492,450 | |||
| 2,584,000 | #, C | Dresdner Funding Trust I, | 2,289,894 | |||
| 1,779,000 | Fifth Third Bancorp., | 1,817,837 | ||||
| Principal Amount | Value | |||||
| $ 1,228,000 | @@, #, C | HBOS PLC, | $ 1,055,088 | |||
| 3,370,000 | @@, C | Hongkong & Shanghai Banking Corp., Ltd., | 2,224,200 | |||
| 3,460,000 | @@, C | HSBC Bank PLC, | 2,145,200 | |||
| 2,390,000 | @@, C | HSBC Bank PLC, | 1,541,550 | |||
| 2,370,000 | @@, C, L | Lloyds TSB Bank PLC, | 1,552,350 | |||
| 2,080,000 | @@, C, L | Lloyds TSB Bank PLC, | 1,362,400 | |||
| 2,630,000 | @@, C, L | Lloyds TSB Bank PLC, | 1,670,050 | |||
| 1,116,000 | @@, #, C | Lloyds TSB Group PLC, | 857,270 | |||
| 2,575,000 | @@, C | Mizuho Financial Group Cayman Ltd., | 2,566,116 | |||
| 7,882,000 | C | National City Preferred Capital Trust I, | 7,882,000 | |||
| 590,000 | @@, C | National Westminster Bank PLC, | 404,167 | |||
| 320,000 | @@, C, L | National Westminster Bank PLC, | 202,800 | |||
| 2,000,000 | #, C | PNC Preferred Funding Trust I, | 2,010,000 | |||
| 1,975,000 | #, C | Rabobank Capital Funding II, | 1,697,513 | |||
| 1,926,000 | #, C | Rabobank Capital Funding Trust, | 1,602,309 | |||
| 1,767,000 | C | RBS Capital Trust I, | 1,453,317 | |||
| 3,156,000 | @@, #, C | Resona Bank Ltd., | 2,626,660 | |||
| 4,330,000 | @@, C, L | Royal Bank of Scotland Group PLC, | 2,792,850 | |||
| 1,090,000 | @@, C | Societe Generale, | 795,515 | |||
| 3,220,000 | @@, C | Standard Chartered PLC, | 1,899,800 | |||
| 520,000 | @@, C, L | Standard Chartered PLC, | 314,600 | |||
| 1,060,000 | @@, C, L | Standard Chartered PLC, | 641,300 | |||
| 5,150,000 | @@, C, L | Standard Chartered PLC, | 3,038,500 | |||
| 600,000 | @@, #, C | Standard Chartered PLC, | 493,721 |
See Accompanying Notes to Financial Statements
66
Table of Contents
| ING INTERMEDIATE BOND FUND | PORTFOLIO OF INVESTMENTS ASOF MARCH 31, 2008 (CONTINUED) |
| Principal Amount | Value | |||||
| Banks (continued) | ||||||
| $ 500,000 | @@, #, C | Standard Chartered PLC, | $ 436,524 | |||
| 1,606,000 | C | State Street Capital Trust III, | 1,618,703 | |||
| 2,777,000 | @@, C | Sumitomo Mitsui Banking Corp., | 2,815,878 | |||
| 2,360,000 | SunTrust Bank, | 2,417,775 | ||||
| 1,137,000 | C | SunTrust Preferred Capital I, | 843,313 | |||
| 1,167,000 | C | USB Capital IX, | 867,051 | |||
| 1,626,000 | Wachovia Bank NA, | 1,511,203 | ||||
| 2,402,000 | C | Wachovia Capital Trust III, | 1,712,487 | |||
| 3,101,000 | Wells Fargo & Co., | 3,088,441 | ||||
| 4,093,000 | Wells Fargo & Co., | 4,194,355 | ||||
| 1,340,000 | @@, C | Westpac Banking Corp., | 1,025,347 | |||
| 1,108,000 | @@, #, C | Westpac Capital Trust IV, | 984,068 | |||
| 96,460,619 | ||||||
| Beverages: 0.3% | ||||||
| BRL 3,283,000 | @@, # | Ambev International Finance Co., Ltd., | 1,613,716 | |||
| $ 1,135,000 | C | Anheuser-Busch Cos., Inc., | 1,175,174 | |||
| 1,615,000 | L | PepsiCo, Inc., | 1,673,382 | |||
| 4,462,272 | ||||||
| Chemicals: 0.5% | ||||||
| 1,798,000 | C | PPG Industries, Inc., | 1,953,628 | |||
| 720,000 | Z | Stauffer Chemical, | 675,151 | |||
| 1,510,000 | Z | Stauffer Chemical, | 937,076 | |||
| 1,230,000 | Z | Stauffer Chemical, | 720,509 | |||
| 3,081,000 | Union Carbide Corp., | 2,830,327 | ||||
| 7,116,691 | ||||||
| Commercial Services: 0.3% | ||||||
| 3,735,000 | C | Block Financial, LLC, | 4,014,837 | |||
| 4,014,837 | ||||||
| Principal Amount | Value | |||||
| Diversified Financial Services: 7.1% | ||||||
| $ 6,842,000 | @@, #, C | Aiful Corp., | $ 6,427,197 | |||
| 527,000 | @@, #, C, I | Alpine III, | 528,865 | |||
| 527,000 | @@, #, I | Alpine III, | 529,123 | |||
| 789,000 | @@, #, I | Alpine III, | 795,299 | |||
| 1,348,000 | @@, #, I | Alpine III, | 1,380,398 | |||
| 1,984,000 | American Express Co., | 2,086,585 | ||||
| 1,403,000 | American Express Co., | 1,559,456 | ||||
| 1,700,000 | American General Finance Corp., | 1,664,254 | ||||
| 7,897,000 | # | Astoria Depositor Corp., | 8,173,395 | |||
| 1,969,000 | Caterpillar Financial Services Corp., | 2,015,852 | ||||
| 1,616,000 | Caterpillar Financial Services Corp., | 1,647,135 | ||||
| 672,000 | CIT Group, Inc., | 474,706 | ||||
| 2,013,000 | CIT Group, Inc., | 1,616,578 | ||||
| 2,500,000 | CIT Group, Inc., | 1,827,678 | ||||
| 2,409,000 | Citigroup, Inc., | 2,409,776 | ||||
| 3,072,000 | C | Citigroup, Inc., | 3,035,308 | |||
| 2,340,000 | #, C | Corestates Capital Trust I, | 2,442,251 | |||
| 2,261,000 | Countrywide Financial Corp., | 2,050,279 | ||||
| 2,130,000 | @@ | Eksportfinans A/S, | 2,273,464 | |||
1,245,000 | @@, C | Financiere CSFB NV, | 922,066 | |||
| 1,512,000 | Ford Motor Credit Co., | 1,119,399 | ||||
| 3,019,000 | Ford Motor Credit Co., | 2,837,504 | ||||
| 3,513,000 | Ford Motor Credit Co., | 2,753,950 | ||||
| 2,252,000 | C | Fund American Cos., Inc., | 2,350,075 | |||
| 2,746,000 | General Electric Capital Corp., | 2,655,852 | ||||
| 2,271,000 | C | Goldman Sachs Group, Inc., | 1,513,985 | |||
| 1,818,000 | #, C | HVB Funding Trust III, | 1,892,642 | |||
See Accompanying Notes to Financial Statements
67
Table of Contents
| ING INTERMEDIATE BOND FUND | PORTFOLIO OF INVESTMENTS ASOF MARCH 31, 2008 (CONTINUED) |
| Principal Amount | Value | |||||
| Diversified Financial Services (continued) | ||||||
| $ 2,954,000 | John Deere Capital Corp., | $ 3,063,121 | ||||
| 3,679,000 | JPMorgan Chase & Co., | 3,843,639 | ||||
| 2,661,000 | C | Lehman Brothers Holdings Capital Trust VIII, | 1,577,747 | |||
| 3,618,000 | #, C | Mangrove Bay Pass-through Trust, | 2,671,307 | |||
| 3,178,000 | @@, # | Mantis Reef Ltd., | 3,281,593 | |||
| 1,989,000 | @@, C | MUFG Capital Finance 1 Ltd., | 1,623,298 | |||
| DKK 29 | @@, I | Nordea Kredit Realkreditaktieselskab, | 6 | |||
| $ 1,296,000 | @@, C | BNP Paribas, | 1,003,006 | |||
| 466,500 | @@, #, C | Petroleum Export Ltd., | 464,790 | |||
| 2,337,769 | @@, #, C | PF Export Receivables Master Trust, | 2,431,280 | |||
| 4,069,386 | #, C | Piper Jaffray Equipment Trust Securities, | 3,743,835 | |||
| 3,062,039 | #, C | Piper Jaffray Equipment Trust Securities, | 2,893,627 | |||
| 331,155 | # | Power Receivable Finance, LLC, | 346,813 | |||
| 3,792,000 | @@, # | TNK-BP Finance SA, | 3,531,300 | |||
| 12,750,092 | #, Z | Toll Road Investors Partnership II LP, | 1,918,965 | |||
| 1,200,000 | #, C | Twin Reefs Pass-through Trust, | 121,500 | |||
| 2,695,000 | @@, C | UFJ Finance Aruba AEC, | 2,704,131 | |||
| 1,085,000 | #, C | Wachovia Capital Trust V, | 1,096,218 | |||
| 95,299,248 | ||||||
| Electric: 1.4% | ||||||
| 5,316,000 | C | Commonwealth Edison Co., | 5,475,480 | |||
| 657,000 | @@, L | Empresa Nacional de Electricidad SA, | 773,089 | |||
| 593,435 | #, C | Juniper Generation, LLC, | 635,884 | |||
| 2,475,000 | C | Nevada Power Co., | 2,444,340 | |||
| Principal Amount | Value | |||||
| $ 1,375,000 | C, L | Nevada Power Co., | $ 1,325,473 | |||
| 3,845,000 | C | NorthWestern Corp., | 3,880,224 | |||
| 1,949,000 | C | Sierra Pacific Power Co., | 1,999,083 | |||
| 1,764,000 | # | White Pine Hydro Portfolio, LLC, | 1,811,346 | |||
| 18,344,919 | ||||||
| Energy - Alternate Sources: 0.5% | ||||||
| 1,800,000 | Greater Ohio Ethanol, LLC, | 1,678,500 | ||||
| 2,200,000 | Greater Ohio Ethanol, LLC, | 1,941,500 | ||||
| 1,195,000 | # | White Pine Hydro Portfolio, LLC, | 1,030,348 | |||
| 1,653,000 | # | White Pine Hydro, LLC, | 1,623,866 | |||
| 6,274,214 | ||||||
| Food: 0.3% | ||||||
| 2,374,000 | Kraft Foods, Inc., | 2,376,837 | ||||
| 1,475,000 | Kraft Foods, Inc., | 1,456,086 | ||||
| 3,832,923 | ||||||
| Forest Products & Paper: 0.2% | ||||||
| 1,335,000 | @@ | Abitibi-Consolidated, Inc., | 584,063 | |||
| 3,236,000 | @@, C | Abitibi-Consolidated, Inc., | 1,488,560 | |||
| 2,406,000 | @@, C | Abitibi-Consolidated, Inc., | 1,094,730 | |||
| 3,167,353 | ||||||
| Gas: 0.6% | ||||||
| 2,984,000 | @@, #, C | Nakilat, Inc., | 2,719,970 | |||
| 296,000 | #, C | Nakilat, Inc., | 264,823 | |||
| 6,691,000 | C, L | Southern Union Co., | 5,653,890 | |||
| 8,638,683 | ||||||
| Healthcare - Products: 0.2% | ||||||
| 2,128,000 | C | Baxter International, Inc., | 2,184,656 | |||
| 2,184,656 | ||||||
| Healthcare - Services: 0.2% | ||||||
| 2,485,000 | C | UnitedHealth Group, Inc., | 2,381,604 | |||
| 2,381,604 | ||||||
| Home Builders: 0.1% | ||||||
| 2,464,000 | C | Beazer Homes USA, Inc., | 1,829,520 | |||
| 1,829,520 | ||||||
See Accompanying Notes to Financial Statements
68
Table of Contents
| ING INTERMEDIATE BOND FUND | PORTFOLIO OF INVESTMENTS ASOF MARCH 31, 2008 (CONTINUED) |
| Principal Amount | Value | |||||
| Insurance: 1.2% | ||||||
| $ 4,124,000 | @@, C | Aegon NV, | $ 2,474,400 | |||
| 3,058,000 | American International Group, Inc., | 3,006,457 | ||||
| 119,000 | #, C | MBIA Insurance Corp., | 116,745 | |||
| 2,207,000 | #, C | Metlife Capital Trust IV, | 2,012,232 | |||
| 817,000 | #, C | North Front Pass-through Trust, | 807,791 | |||
| 4,384,000 | C | Progressive Corp., | 3,910,918 | |||
| 1,508,000 | Prudential Financial, Inc., | 1,522,692 | ||||
| 1,635,000 | Prudential Financial, Inc., | 1,620,141 | ||||
| 5,984,000 | @@, C | Security Capital Assurance Ltd., | 299,260 | |||
| 867,000 | @@, C | XL Capital, Ltd., | 650,873 | |||
| 16,421,509 | ||||||
| Media: 0.2% | ||||||
| 1,355,000 | C | Dex Media West, LLC, | 1,182,238 | |||
| 1,516,000 | #, C | News America, Inc., | 1,533,827 | |||
| 2,716,065 | ||||||
| Miscellaneous Manufacturing: 0.5% | ||||||
| 3,293,000 | General Electric Co., | 3,294,637 | ||||
| 3,795,000 | C | Honeywell International, Inc., | 3,896,361 | |||
| 7,190,998 | ||||||
| Multi-National: 0.1% | ||||||
| 1,929,000 | @@ | Corp. Andina de Fomento CAF, 5.125%, due 05/05/15 | 1,855,713 | |||
| 1,855,713 | ||||||
| Oil & Gas: 0.7% | ||||||
| 1,193,000 | @@, # | Empresa Nacional de Petroleo ENAP, | 1,164,115 | |||
| 796,000 | @@, # | Empresa Nacional de Petroleo ENAP, | 861,146 | |||
| 2,402,000 | @@, # | Pemex Project Funding Master Trust, | 2,394,794 | |||
| 2,822,000 | @@, C | Transocean, Inc., | 2,908,201 | |||
| 2,446,000 | @@, C | Transocean, Inc., | 2,506,808 | |||
| 9,835,064 | ||||||
| Principal Amount | Value | |||||
| Pipelines: 0.6% | ||||||
| $ 1,964,000 | #, C | NGPL PipeCo, LLC, | $ 2,035,191 | |||
| 1,657,000 | #, C | NGPL PipeCo, LLC, | 1,707,668 | |||
| 906,000 | C | Northwest Pipeline Corp., | 967,155 | |||
| 1,590,000 | C | Panhandle Eastern Pipe Line, | 1,561,266 | |||
| 913,000 | @@, C | Trans - Canada Pipelines, | 883,245 | |||
| 1,262,000 | C | Transcontinental Gas Pipe Line Corp., | 1,301,438 | |||
| 8,455,963 | ||||||
| Real Estate: 0.7% | ||||||
| 1,146,000 | C | iStar Financial, Inc., | 848,743 | |||
| 348,000 | C | iStar Financial, Inc., | 257,746 | |||
| 930,000 | C | iStar Financial, Inc., | 642,709 | |||
| 444,000 | C | Liberty Property LP, | 444,124 | |||
| 1,583,000 | C | Liberty Property LP, | 1,622,637 | |||
| 423,000 | C | Rouse Co., | 388,182 | |||
| 6,041,000 | #, C | Rouse Co. LP/TRC Co. - Issuer, Inc., | 5,236,170 | |||
| 9,440,311 | ||||||
| Retail: 1.5% | ||||||
| 1,266,000 | C | Darden Restaurants, Inc., | 1,259,980 | |||
| 2,866,000 | C | Darden Restaurants, Inc., | 2,794,622 | |||
| 1,928,000 | @@, #, C | Marks & Spencer PLC, | 1,871,737 | |||
| 3,886,000 | C | McDonald’s Corp., | 3,941,006 | |||
| 947,000 | C | McDonald’s Corp., | 996,173 | |||
| 2,889,000 | C | McDonald’s Corp., | 2,965,781 | |||
| 1,063,000 | C | Nordstrom, Inc., | 1,060,051 | |||
| 806,000 | C | Nordstrom, Inc., | 800,265 | |||
| 4,114,000 | C | Target Corp., | 3,990,592 | |||
| 301,000 | Wal-Mart Stores, Inc., | 317,116 | ||||
| 19,997,323 | ||||||
| Savings & Loans: 0.1% | ||||||
| 100,000 | #, C | Washington Mutual IV, | 76,608 | |||
See Accompanying Notes to Financial Statements
69
Table of Contents
| ING INTERMEDIATE BOND FUND | PORTFOLIO OF INVESTMENTS ASOF MARCH 31, 2008 (CONTINUED) |
| Principal Amount | Value | |||||
| Savings & Loans (continued) | ||||||
| $ 1,200,000 | #, C | Washington Mutual Preferred Funding Delaware, | $ 633,631 | |||
| 710,239 | ||||||
| Telecommunications: 0.9% | ||||||
| 1,591,000 | C | AT&T, Inc., | 1,560,728 | |||
| 3,804,000 | Bellsouth Telecommunications, Inc., | 3,745,818 | ||||
| 214,000 | C | Embarq Corp., | 195,950 | |||
| 1,937,000 | @@, C | Rogers Wireless, Inc., | 2,076,079 | |||
| 3,723,000 | C | Sprint Capital Corp., | 2,780,173 | |||
| 2,200,000 | C | Verizon Communications, Inc., | 2,146,742 | |||
| 276,000 | C | Verizon Communications, Inc., | 269,584 | |||
| 12,775,074 | ||||||
| Transportation: 0.3% | ||||||
| 1,272,000 | C | CSX Corp., | 1,291,697 | |||
| 2,272,000 | C | CSX Corp., | 2,339,931 | |||
| 3,631,628 | ||||||
| Water: 0.1% | ||||||
| 1,303,000 | #, C | American Water Capital Corp., | 1,358,448 | |||
| 624,000 | #, C | American Water Capital Corp., | 627,060 | |||
| 1,985,508 | ||||||
Total Corporate Bonds/Notes | 361,111,967 | |||||
| U.S. GOVERNMENT AGENCY OBLIGATIONS: 24.1% | ||||||
| Federal Home Loan Mortgage Corporation: 11.6% | ||||||
| 309,065 | C, S | 3.168%, due 02/15/32 | 303,012 | |||
| 7,825,023 | C, S | 3.168%, due 05/15/33 | 7,795,122 | |||
| 688,250 | C, S | 3.468%, due 04/15/32 | 677,523 | |||
| 3,409,000 | L | 3.500%, due 05/29/13 | 3,435,624 | |||
| 1,079,981 | C, S | 4.500%, due 12/15/16 | 1,095,829 | |||
| 3,488,000 | C, S | 4.500%, due 02/15/20 | 3,435,890 | |||
| 4,376,000 | C | 5.000%, due 12/11/12 | 4,399,665 | |||
| 4,316,180 | C, S | 5.000%, due 08/15/16 | 4,424,684 | |||
| 4,151,000 | C, S | 5.000%, due 12/15/17 | 4,301,975 | |||
| 905,000 | C, S | 5.000%, due 05/15/20 | 917,486 | |||
| 2,569,962 | C, S | 5.000%, due 08/15/21 | 2,631,104 | |||
| 3,588,000 | C, S | 5.000%, due 04/15/23 | 3,573,051 | |||
| 2,507,000 | C, S | 5.000%, due 09/15/31 | 2,489,987 | |||
| 951,000 | C, S | 5.000%, due 02/15/32 | 945,333 | |||
| 5,707,000 | C, S | 5.000%, due 03/15/32 | 5,661,049 | |||
| 4,276,000 | C, S | 5.000%, due 04/15/32 | 4,315,166 | |||
| Principal Amount | Value | |||||
| $ 3,089,000 | C, S | 5.000%, due 08/15/32 | $ 3,065,980 | |||
| 4,508,000 | C, S | 5.000%, due 12/15/32 | 4,463,814 | |||
| 3,171,365 | C, S | 5.000%, due 02/15/35 | 3,207,969 | |||
| 546,453 | S | 5.001%, due 04/01/35 | 542,937 | |||
| 6,406,000 | C | 5.250%, due 03/15/12 | 6,482,020 | |||
| 11,033,259 | C, S | 5.500%, due 08/15/20 | 11,131,246 | |||
| 1,673,000 | C, S | 5.500%, due 12/15/20 | 1,728,181 | |||
| 6,362,000 | C, S | 5.500%, due 11/15/22 | 6,610,899 | |||
| 3,957,000 | C, S | 5.500%, due 09/15/32 | 4,045,685 | |||
| 1,003,000 | C, S | 5.500%, due 10/15/32 | 1,035,039 | |||
| 893,000 | C, S | 5.500%, due 11/15/32 | 917,896 | |||
| 14,992,000 | W | 5.500%, due 04/01/33 | 15,139,581 | |||
| 2,888,000 | C, S | 5.500%, due 07/15/33 | 2,944,285 | |||
| 1,144,650 | S | 5.500%, due 06/01/36 | 1,143,003 | |||
| 6,571,444 | C, S | 6.000%, due 01/15/29 | 6,810,677 | |||
| 23,401,000 | W | 6.000%, due 04/01/34 | 23,997,000 | |||
| 12,578,000 | W | 6.500%, due 04/15/34 | 13,047,713 | |||
| 7,621 | S | 7.500%, due 11/01/28 | 8,270 | |||
| 156,724,695 | ||||||
| Federal National Mortgage Association: 12.5% | ||||||
| 163,127 | S | 2.949%, due 08/25/33 | 157,174 | |||
| 371,541 | S | 3.049%, due 10/25/33 | 369,345 | |||
| 332,628 | C, S | 3.149%, due 01/25/32 | 332,519 | |||
| 304,314 | S | 3.175%, due 04/18/28 | 299,593 | |||
| 4,949,000 | L | 3.250%, due 04/09/13 | 4,948,624 | |||
| 2,444,444 | S, ^ | 4.868%, due 02/17/29 | 289,622 | |||
| 2,959,000 | W | 5.000%, due 04/15/21 | 2,987,202 | |||
| 2,682,849 | S | 5.000%, due 02/25/29 | 2,719,486 | |||
| 1,471,000 | S | 5.000%, due 10/25/33 | 1,435,790 | |||
| 3,398,259 | S | 5.000%, due 08/01/35 | 3,368,920 | |||
| 867,515 | S | 5.000%, due 10/01/35 | 860,026 | |||
| 2,618,404 | S | 5.000%, due 03/01/37 | 2,554,065 | |||
| 17,847,000 | 5.000%, due 04/01/37 | 17,829,042 | ||||
| 13,676,566 | S | 5.000%, due 08/01/37 | 13,340,506 | |||
| 1,081,754 | S | 5.037%, due 07/01/35 | 1,079,916 | |||
| 742,275 | S | 5.224%, due 08/01/35 | 744,215 | |||
| 1,769,000 | S | 5.500%, due 05/25/30 | 1,801,684 | |||
| 4,484,480 | S | 5.500%, due 01/25/36 | 4,460,573 | |||
| 4,506,285 | S | 5.500%, due 12/25/36 | 4,505,787 | |||
| 4,434,551 | S | 5.500%, due 02/25/37 | 4,536,431 | |||
| 292,305 | S | 5.500%, due 06/01/37 | 295,393 | |||
| 5,219,000 | 5.500%, due 04/01/38 | 5,204,322 | ||||
| 40,217,000 | W | 5.500%, due 04/01/38 | 40,600,308 | |||
| 42,038 | S | 6.000%, due 08/01/16 | 43,398 | |||
| 3,694 | S | 6.000%, due 12/01/16 | 3,813 | |||
| 141,373 | S | 6.000%, due 03/01/17 | 145,945 | |||
| 1,226,781 | S | 6.000%, due 09/01/17 | 1,266,396 | |||
| 86,048 | S | 6.000%, due 11/01/17 | 88,832 | |||
| 3,323,502 | S | 6.000%, due 07/25/29 | 3,446,165 | |||
| 1,816,722 | S | 6.000%, due 04/25/31 | 1,893,536 | |||
| 39,497,000 | 6.000%, due 04/01/34 | 40,465,901 | ||||
| 2,718,867 | S | 6.000%, due 01/01/38 | 2,788,007 | |||
| 39,784 | S | 6.500%, due 07/01/29 | 41,596 | |||
| 1,840 | S | 6.500%, due 06/01/31 | 1,920 | |||
| 316,214 | S | 6.500%, due 07/01/31 | 330,967 | |||
| 9,972 | S | 6.500%, due 09/01/31 | 10,407 | |||
| 186,882 | S | 6.500%, due 11/01/31 | 195,042 | |||
| 98,939 | S | 6.500%, due 04/01/32 | 103,156 | |||
| 52,565 | S | 6.500%, due 08/01/32 | 54,805 | |||
| 22,083 | S | 6.500%, due 11/01/32 | 23,024 | |||
| 94,898 | S | 6.500%, due 01/01/33 | 98,942 | |||
| 78,380 | S | 6.500%, due 02/01/33 | 81,604 | |||
See Accompanying Notes to Financial Statements
70
Table of Contents
| ING INTERMEDIATE BOND FUND | PORTFOLIO OF INVESTMENTS ASOF MARCH 31, 2008 (CONTINUED) |
| Principal Amount | Value | |||||
| Federal National Mortgage Association (continued) | ||||||
| $ 417,451 | S | 6.500%, due 12/01/33 | $ 434,619 | |||
| 86,182 | S | 7.000%, due 01/01/30 | 90,555 | |||
| 237,965 | S | 7.000%, due 06/01/31 | 253,444 | |||
| 8,743 | S | 7.500%, due 10/01/30 | 9,441 | |||
| 78,849 | S | 7.500%, due 02/01/32 | 85,280 | |||
| 291,678 | C, S | 7.500%, due 12/25/41 | 317,885 | |||
| 635,155 | C, S | 7.500%, due 01/25/48 | 667,071 | |||
| 167,662,294 | ||||||
| Government National Mortgage Association: 0.0% | ||||||
| 713,630 | C, S, ^ | 5.433%, due 06/16/31 | 76,208 | |||
| 6,207 | S | 6.375%, due 04/20/28 | 6,344 | |||
| 1,191 | 6.500%, due 03/15/31 | 1,245 | ||||
| 17,579 | S | 6.500%, due 08/15/31 | 18,375 | |||
| 33,633 | S | 6.500%, due 10/15/31 | 35,155 | |||
| 15,719 | S | 6.500%, due 11/15/31 | 16,430 | |||
| 13,582 | S | 6.500%, due 07/15/32 | 14,178 | |||
| 59,920 | S | 6.500%, due 09/15/32 | 62,549 | |||
| 45,950 | S | 7.000%, due 04/15/26 | 49,230 | |||
| 20,505 | S | 7.000%, due 05/15/32 | 21,905 | |||
| 48,267 | S | 7.500%, due 12/15/22 | 52,029 | |||
| 5,530 | S | 7.500%, due 10/15/26 | 5,970 | |||
| 9,184 | S | 7.500%, due 07/15/29 | 9,903 | |||
| 128 | 7.500%, due 11/15/30 | 137 | ||||
| 19,811 | S | 7.500%, due 12/15/30 | 21,352 | |||
| 24,468 | S | 7.500%, due 12/15/31 | 26,369 | |||
| 48,423 | S | 7.500%, due 05/15/32 | 52,107 | |||
| 469,486 | ||||||
Total U.S. Government Agency Obligations | 324,856,475 | |||||
| U.S. TREASURY OBLIGATIONS: 8.1% | ||||||
| U.S. Treasury Bonds: 1.7% | ||||||
| 11,002,000 | L | 3.500%, due 02/15/18 | 11,069,046 | |||
| 10,299,000 | L | 5.000%, due 05/15/37 | 11,524,427 | |||
| 22,593,473 | ||||||
| U.S. Treasury Notes: 5.9% | ||||||
| 643,000 | 1.750%, due 03/31/10 | 644,407 | ||||
| 30,711,000 | L | 2.000%, due 02/28/10 | 30,934,146 | |||
| 35,525,000 | L | 2.500%, due 03/31/13 | 35,588,838 | |||
| 12,000,000 | L | 4.500%, due 05/15/10 | 12,736,884 | |||
| 79,904,275 | ||||||
| Treasury Inflation Indexed Protected Securities: 0.5% | ||||||
| 6,790,954 | 1.750%, due 01/15/28 | 6,734,189 | ||||
| 6,734,189 | ||||||
Total U.S. Treasury Obligations | 109,231,937 | |||||
| ASSET-BACKED SECURITIES: 2.0% | ||||||
| Automobile Asset-Backed Securities: 0.0% | ||||||
| 25,545 | C, S | AmeriCredit Automobile Receivables Trust, | 25,546 | |||
| 25,546 | ||||||
| Principal Amount | Value | |||||
| Credit Card Asset-Backed Securities: 0.1% | ||||||
| $ 1,685,000 | C, S | Citibank Credit Card Issuance Trust, | $ 1,665,781 | |||
| 1,665,781 | ||||||
| Home Equity Asset-Backed Securities: 0.9% | ||||||
| 355,221 | C, S | Freddie Mac Structured Pass-through Securities, | 295,278 | |||
| 88,987 | C, S | Freddie Mac Structured Pass-through Securities, | 83,749 | |||
| 4,851,000 | C, S | GSAA Trust, | 4,795,797 | |||
| 1,384,000 | #, C, S | Irwin Home Equity, | 1,101,145 | |||
| 40,848 | C, S | Merrill Lynch Mortgage Investors, Inc., | 35,099 | |||
| 3,905,000 | C, S | Morgan Stanley Mortgage Loan Trust, | 3,310,107 | |||
| 134,325 | C, S | Renaissance Home Equity Loan Trust, | 134,160 | |||
| 63,213 | C, S | Renaissance Home Equity Loan Trust, | 63,009 | |||
| 95,286 | C, S | Residential Asset Securities Corp., | 88,796 | |||
| 1,411,000 | C, S | Residential Funding Mortgage Securities II, Inc., | 1,233,438 | |||
| 645,520 | C, S | Wells Fargo Home Equity Trust, | 621,762 | |||
| 11,762,340 | ||||||
| Other Asset-Backed Securities: 1.0% | ||||||
| 30,018 | C, S | Amortizing Residential Collateral Trust, | 24,366 | |||
| 261,844 | C, S | Chase Funding Mortgage Loan Asset-Backed Certificates, | 253,573 | |||
| 5,962 | C, S | Chase Funding Mortgage Loan Asset-Backed Certificates, | 5,890 | |||
| 2,871,000 | C, S | Credit-Based Asset Servicing and Securitization, LLC, | 2,826,218 | |||
| 2,831,000 | C, S | Credit-Based Asset Servicing and Securitization, LLC, | 2,735,921 | |||
| 1,456,000 | #, C, S | Credit-Based Asset Servicing and Securitization, LLC, | 1,260,577 | |||
See Accompanying Notes to Financial Statements
71
Table of Contents
| ING INTERMEDIATE BOND FUND | PORTFOLIO OF INVESTMENTS ASOF MARCH 31, 2008 (CONTINUED) |
| Principal Amount | Value | |||||
| Other Asset-Backed Securities (continued) | ||||||
| $ 1,188,000 | #, C, S | Credit-Based Asset Servicing and Securitization, LLC, | $ 887,473 | |||
| 1,292,090 | C, S | Equity One, Inc., | 1,225,127 | |||
| 403,836 | C, S | Fannie Mae, | 393,195 | |||
| 2,720,000 | #, C, S | Hudson Mezzanine Funding, | 20,400 | |||
| 1,185,234 | C, S | Lehman XS Trust, | 839,709 | |||
| 814,319 | C, S | Merrill Lynch Mortgage Investors, Inc., | 784,432 | |||
| 147,281 | C, S | Popular Mortgage Pass-through Trust, | 144,168 | |||
| 466,229 | C, S | Residential Asset Mortgage Products, Inc., | 440,340 | |||
| 7,470 | C, S | Residential Asset Mortgage Products, Inc., | 7,303 | |||
| 1,338,459 | C, S | Structured Asset Securities Corp., | 1,367,501 | |||
| 102,777 | C, S | Structured Asset Securities Corp., | 102,602 | |||
| 13,318,795 | ||||||
Total Asset-Backed Securities | 26,772,462 | |||||
| COLLATERALIZED MORTGAGE OBLIGATIONS: 25.6% | ||||||
| 332,195 | C, S | ABN Amro Mortgage Corp., | 332,598 | |||
| 3,872,505 | C, S | American Home Mortgage Assets, | 3,087,376 | |||
| 2,294,787 | C, S | American Home Mortgage Assets, | 1,264,684 | |||
| 4,865,674 | C, S | American Home Mortgage Investment Trust, | 3,827,299 | |||
| 2,989,165 | # | Astoria Depositor Corp., | 3,019,057 | |||
| 4,646,283 | C, S | Banc of America Alternative Loan Trust, | 4,407,130 | |||
| 3,350,754 | C, S | Banc of America Alternative Loan Trust, | 3,267,738 | |||
| 58,549,698 | C, S, ^ | Banc of America Commercial Mortgage, Inc., | 1,069,521 | |||
| Principal Amount | Value | |||||
| $ 323,000 | C, S | Banc of America Commercial Mortgage, Inc., | $ 318,735 | |||
| 110,000 | C, S | Banc of America Commercial Mortgage, Inc., | 106,202 | |||
| 1,609,000 | C, S | Banc of America Commercial Mortgage, Inc., | 1,560,489 | |||
| 1,114,000 | C, S | Banc of America Commercial Mortgage, Inc., | 1,101,034 | |||
| 1,713,111 | C, S | Banc of America Commercial Mortgage, Inc., | 1,702,410 | |||
| 2,210,000 | C, S | Banc of America Commercial Mortgage, Inc., | 2,150,913 | |||
| 1,470,000 | C, S | Banc of America Commercial Mortgage, Inc., | 1,057,155 | |||
| 270,000 | C, S | Banc of America Commercial Mortgage, Inc., | 275,321 | |||
| 4,489,084 | C, S | Banc of America Funding Corp., | 3,178,752 | |||
| 5,244,323 | C, S | Banc of America Funding Corp., | 4,913,923 | |||
| 8,072,478 | C, S | Banc of America Funding Corp., | 7,423,712 | |||
| 2,391,818 | C, S | Banc of America Funding Corp., | 2,233,329 | |||
| 2,156,487 | C, S | Banc of America Funding Corp., | 1,955,341 | |||
| 1,445,250 | C, S | Banc of America Funding Corp., | 1,339,623 | |||
| 2,457,340 | C, S | Banc of America Mortgage Securities, Inc., | 2,203,617 | |||
| 871,557 | C, S | Banc of America Mortgage Securities, Inc., | 844,218 | |||
| 761,391 | C, S | Banc of America Mortgage Securities, Inc., | 702,423 | |||
| 1,552,107 | C, S | Banc of America Mortgage Securities, Inc., | 1,532,047 | |||
| 884,370 | C, S | Bear Stearns Alternative-A Trust, | 771,174 | |||
| 381,081 | C, S | Bear Stearns Commercial Mortgage Securities, | 375,955 |
See Accompanying Notes to Financial Statements
72
Table of Contents
| ING INTERMEDIATE BOND FUND | PORTFOLIO OF INVESTMENTS ASOF MARCH 31, 2008 (CONTINUED) |
| Principal Amount | Value | |||||
| COLLATERALIZED MORTGAGE OBLIGATIONS (continued) | ||||||
| $ 696,000 | C, S | Bear Stearns Commercial Mortgage Securities, | $ 676,675 | |||
| 2,537,000 | S | Bear Stearns Commercial Mortgage Securities, | 1,864,954 | |||
| 472,417 | C, S | Capco America Securitization Corp., | 473,387 | |||
| 456,000 | C, S | Capco America Securitization Corp., | 458,139 | |||
| 1,809,630 | C, S | Chase Manhattan Bank-First Union National Bank, | 1,852,608 | |||
| 5,038,038 | C, S | Chase Mortgage Finance Corp., | 5,083,342 | |||
| 3,013,444 | C, S | Chase Mortgage Finance Corp., | 2,964,001 | |||
| 4,266,588 | C, S | Chaseflex Trust, | 4,047,352 | |||
| 251,250 | C, S | Citicorp Mortgage Securities, Inc., | 229,161 | |||
| 1,686,965 | C, S | Citigroup Mortgage Loan Trust, Inc., | 1,646,425 | |||
| 1,373,118 | C, S | Citigroup Mortgage Loan Trust, Inc., | 1,343,697 | |||
| 3,362,961 | C, S | Citigroup Mortgage Loan Trust, Inc., | 3,047,654 | |||
| 5,570,204 | C, S | Citigroup Mortgage Loan Trust, Inc., | 5,339,549 | |||
| 9,916,174 | C, S | Citigroup Mortgage Loan Trust, Inc., | 9,009,729 | |||
| 1,047,010 | C, S | Citigroup Mortgage Securities, Inc., | 1,036,181 | |||
| 1,093,000 | C, S | Commercial Mortgage Pass-through Certificates, | 1,080,854 | |||
| 152,696 | C, S | Countrywide Alternative Loan Trust, | 141,149 | |||
| 58,144 | C, S | Countrywide Alternative Loan Trust, | 51,218 | |||
| 570,711 | C, S | Countrywide Alternative Loan Trust, | 528,227 | |||
| 1,257,177 | C, S | Countrywide Alternative Loan Trust, | 1,257,019 | |||
| 2,656,267 | C, S | Countrywide Alternative Loan Trust, | 1,660,167 | |||
| Principal Amount | Value | |||||
| $ 6,502,559 | C, S | Countrywide Alternative Loan Trust, | $ 5,343,475 | |||
| 2,572,483 | C, S | Countrywide Alternative Loan Trust, | 2,358,568 | |||
| 476,209 | C, S | Countrywide Home Loan Mortgage Pass-through Trust, | 476,438 | |||
| 1,738,993 | C, S | Countrywide Home Loan Mortgage Pass-through Trust, | 1,513,677 | |||
| 430,675 | C, S | Countrywide Home Loan Mortgage Pass-through Trust, | 424,894 | |||
| 460,992 | C, S | Credit Suisse First Boston Mortgage Securities Corp., | 440,979 | |||
| 387,265 | C, S | Credit Suisse First Boston Mortgage Securities Corp., | 373,022 | |||
| 975,000 | C, S | Credit Suisse First Boston Mortgage Securities Corp., | 954,119 | |||
| 7,428,803 | C, S | Credit Suisse Mortgage Capital Certificates, | 6,710,517 | |||
| 646,803 | C, S | DLJ Commercial Mortgage Corp., | 659,191 | |||
| 5,038,333 | C, S | First Horizon Alternative Mortgage Securities, | 4,490,717 | |||
| 484,684 | C, S | First Horizon Asset Securities, Inc., | 455,079 | |||
| 1,776,212 | C, S | First Horizon Asset Securities, Inc., | 1,747,858 | |||
| 923,000 | C, S | First Horizon Asset Securities, Inc., | 887,063 | |||
| 55,614,267 | C, S, ^ | GE Capital Commercial Mortgage Corp., | 795,729 | |||
| 889,024 | C, S | GE Capital Commercial Mortgage Corp., | 881,024 | |||
| 698,000 | C, S | GE Capital Commercial Mortgage Corp., | 686,820 | |||
| 483,000 | C, S | GE Capital Commercial Mortgage Corp., | 473,740 | |||
| 308,622 | C, S | GE Capital Commercial Mortgage Corp., | 310,546 |
See Accompanying Notes to Financial Statements
73
Table of Contents
| ING INTERMEDIATE BOND FUND | PORTFOLIO OF INVESTMENTS ASOF MARCH 31, 2008 (CONTINUED) |
| Principal Amount | Value | |||||
| COLLATERALIZED MORTGAGE OBLIGATIONS (continued) | ||||||
| $ 1,449,386 | C, S | GMAC Mortgage Corp. Loan Trust, | $ 1,323,238 | |||
| 3,505,387 | C, S | GMAC Mortgage Corp. Loan Trust, | 3,370,136 | |||
| 1,838,322 | C, S | GMAC Mortgage Corp. Loan Trust, | 1,662,079 | |||
| 46,194,190 | #, C, S, ^ | Greenwich Capital Commercial Funding Corp., | 874,031 | |||
| 2,451,000 | C, S | Greenwich Capital Commercial Funding Corp., | 2,438,102 | |||
| 1,393,000 | C, S | Greenwich Capital Commercial Funding Corp., | 977,345 | |||
| 705,000 | C, S | Greenwich Capital Commercial Funding Corp., | 480,354 | |||
| 564,000 | C, S | Greenwich Capital Commercial Funding Corp., | 348,427 | |||
| 1,949,000 | C, S | GS Mortgage Securities Corp. II, | 1,352,601 | |||
| 544,726 | #, C, S | GSMPS Mortgage Loan Trust, | 408,367 | |||
| 558,565 | C, S | GSR Mortgage Loan Trust, | 542,921 | |||
| 1,338,545 | C, S | GSR Mortgage Loan Trust, | 1,262,734 | |||
| 2,920,046 | C, S | GSR Mortgage Loan Trust, | 2,956,873 | |||
| 608,642 | C, S | Harborview Mortgage Loan Trust, | 533,067 | |||
| 340,600 | C, S | Homebanc Mortgage Trust, | 322,604 | |||
| 247,166 | C, S | JPMorgan Alternative Loan Trust, | 212,909 | |||
| Principal Amount | Value | |||||
| $ 163,886,701 | C, S, ^ | JPMorgan Chase Commercial Mortgage Securities Corp., | $ 189,437 | |||
| 272,535 | C, S | JPMorgan Chase Commercial Mortgage Securities Corp., | 267,743 | |||
| 1,700,000 | C, S | JPMorgan Chase Commercial Mortgage Securities Corp., | 1,673,929 | |||
| 1,037,970 | C, S | JPMorgan Chase Commercial Mortgage Securities Corp., | 1,012,277 | |||
| 843,000 | C, S | JPMorgan Chase Commercial Mortgage Securities Corp., | 819,358 | |||
| 433,000 | C, S | JPMorgan Chase Commercial Mortgage Securities Corp., | 340,342 | |||
| 866,000 | C, S | JPMorgan Chase Commercial Mortgage Securities Corp., | 642,361 | |||
| 164,035 | C, S | JPMorgan Chase Commercial Mortgage Securities Corp., | 165,137 | |||
| 4,263,000 | C, S | JPMorgan Chase Commercial Mortgage Securities Corp., | 4,339,352 | |||
| 1,226,000 | C, S | JPMorgan Chase Commercial Mortgage Securities Corp., | 1,230,342 | |||
| 10,318,488 | C, S | JPMorgan Mortgage Trust, | 9,306,881 | |||
| 11,952,175 | C, S, ^ | LB-UBS Commercial Mortgage Trust, | 330,647 | |||
| 866,000 | C, S | LB-UBS Commercial Mortgage Trust, | 852,269 | |||
| 2,230,000 | C, S | LB-UBS Commercial Mortgage Trust, | 2,200,310 | |||
| 225,000 | C, S | LB-UBS Commercial Mortgage Trust, | 221,550 | |||
| 695,000 | C, S | LB-UBS Commercial Mortgage Trust, | 672,055 | |||
| 1,209,000 | C, S | LB-UBS Commercial Mortgage Trust, | 1,203,078 |
See Accompanying Notes to Financial Statements
74
Table of Contents
| ING INTERMEDIATE BOND FUND | PORTFOLIO OF INVESTMENTS ASOF MARCH 31, 2008 (CONTINUED) |
| Principal Amount | Value | |||||
| COLLATERALIZED MORTGAGE OBLIGATIONS (continued) | ||||||
| $ 943,643 | C, S | LB-UBS Commercial Mortgage Trust, | $ 937,594 | |||
| 516,000 | C, S | LB-UBS Commercial Mortgage Trust, | 405,221 | |||
| 520,000 | C, S | LB-UBS Commercial Mortgage Trust, | 516,761 | |||
| 1,010,000 | C, S | LB-UBS Commercial Mortgage Trust, | 987,187 | |||
| 1,469,000 | C, S | LB-UBS Commercial Mortgage Trust, | 1,460,438 | |||
| 1,845,000 | C, S | LB-UBS Commercial Mortgage Trust, | 1,385,632 | |||
| 2,747,000 | C, S | LB-UBS Commercial Mortgage Trust, | 2,712,322 | |||
| 1,014,000 | C, S | LB-UBS Commercial Mortgage Trust, | 653,464 | |||
| 721,000 | C, S | LB-UBS Commercial Mortgage Trust, | 492,291 | |||
| 1,442,000 | C, S | LB-UBS Commercial Mortgage Trust, | 957,400 | |||
| 6,432,000 | C, S | LB-UBS Commercial Mortgage Trust, | 6,595,971 | |||
| 4,697,326 | C, S | LB-UBS Commercial Mortgage Trust, | 4,878,243 | |||
| 1,618,000 | C, S | MASTR Alternative Loans Trust, | 1,467,886 | |||
| 47,976 | C, S | MASTR Alternative Loans Trust, | 48,386 | |||
| 280,480 | C, S | MASTR Alternative Loans Trust, | 282,655 | |||
| 37,067,278 | #, C, S, ^ | Merrill Lynch Mortgage Trust, | 182,475 | |||
| 44,266,081 | S, ^ | Merrill Lynch Mortgage Trust, | 747,853 | |||
| 981,000 | C, S | Merrill Lynch Mortgage Trust, | 959,169 | |||
| 8,197,063 | C, S, ^ | Merrill Lynch/Countrywide Commercial Mortgage Trust, | 263,409 | |||
| 625,000 | C, S | Merrill Lynch/Countrywide Commercial Mortgage Trust, | 422,946 | |||
| Principal Amount | Value | |||||
| $ 696,000 | C, S | Merrill Lynch/Countrywide Commercial Mortgage Trust, | $ 457,877 | |||
| 907,248 | C, S | MLCC Mortgage Investors, Inc., | 831,300 | |||
| 587,927 | C, S | MLCC Mortgage Investors, Inc., | 572,255 | |||
| 296,602 | C, S | MLCC Mortgage Investors, Inc., | 281,112 | |||
| 3,660,000 | C, S | Morgan Stanley Capital I, | 3,583,604 | |||
| 117,724 | C, S | Morgan Stanley Capital I, | 118,683 | |||
| 210,296 | C, S | Morgan Stanley Dean Witter Capital I, | 201,850 | |||
| 1,621,000 | C, S | New York Mortgage Trust, Inc., | 1,531,607 | |||
| 1,038,000 | C, S | Nomura Asset Securities Corp., | 1,075,897 | |||
| 2,106,232 | C, S | Prudential Commercial Mortgage Trust, | 2,046,665 | |||
| 5,047,209 | C, S | RAAC Series, | 4,802,034 | |||
| 6,540,676 | C, S | Residential Accredit Loans, Inc., | 4,450,918 | |||
| 461,304 | C, S | Residential Funding Mortgage Sec I, | 461,662 | |||
| 393,590 | C, S | Salomon Brothers Mortgage Securities VII, | 404,590 | |||
| 405,132 | C, S | Sequoia Mortgage Trust, | 372,964 | |||
| 550,026 | C, S | Structured Adjustable Rate Mortgage Loan Trust, | 425,795 | |||
| 881,119 | C, S | Structured Asset Mortgage Investments, Inc., | 824,723 | |||
| 2,898,323 | C, S | Structured Asset Mortgage Investments, Inc., | 2,399,503 | |||
| 610,425 | C, S | Thornburg Mortgage Securities Trust, | 606,288 | |||
| 1,912,387 | C, S | Thornburg Mortgage Securities Trust, | 1,835,379 | |||
| 581,000 | #, C, S | Wachovia Bank Commercial Mortgage Trust, | 406,373 |
See Accompanying Notes to Financial Statements
75
Table of Contents
| ING INTERMEDIATE BOND FUND | PORTFOLIO OF INVESTMENTS ASOF MARCH 31, 2008 (CONTINUED) |
| Principal Amount | Value | |||||
| COLLATERALIZED MORTGAGE OBLIGATIONS (continued) | ||||||
| $ 4,930,000 | C, S | Wachovia Bank Commercial Mortgage Trust, | $ 3,653,453 | |||
| 190,000 | C, S | Wachovia Bank Commercial Mortgage Trust, | 189,435 | |||
| 762,529 | C, S | WaMu Mortgage Pass-Through Certificates, | 672,222 | |||
| 448,642 | C, S | Washington Mutual Mortgage Pass-through Certificates, | 358,033 | |||
| 466,552 | C, S | Washington Mutual Mortgage Pass-through Certificates, | 362,732 | |||
| 956,704 | C, S | Washington Mutual Mortgage Pass-through Certificates, | 771,704 | |||
| 695,297 | C, S | Washington Mutual Mortgage Pass-through Certificates, | 691,887 | |||
| 511,939 | C, S | Washington Mutual Mortgage Pass-through Certificates, | 487,657 | |||
| 2,028,000 | C, S | Washington Mutual Mortgage Pass-through Certificates, | 1,996,582 | |||
| 416,508 | C, S | Washington Mutual Mortgage Pass-through Certificates, | 286,466 | |||
| 1,665,329 | C, S | Washington Mutual Mortgage Pass-through Certificates, | 1,083,708 | |||
| 338,576 | C, S | Washington Mutual Mortgage Pass-through Certificates, | 230,109 | |||
| 490,935 | C, S | Washington Mutual Mortgage Pass-through Certificates, | 328,055 | |||
| 6,434,701 | C, S | Washington Mutual Mortgage Pass-through Certificates OA4 1A, | 4,290,507 | |||
| 2,859,867 | C, S | Washington Mutual Mortgage Pass-through Certificates OA4 1A1B, | 1,554,867 | |||
| 1,636,229 | C, S | Washington Mutual Mortgage Pass-through Certificates, | 887,320 | |||
| 1,516,238 | C, S | Washington Mutual Mortgage Pass-through Certificates, | 1,005,720 | |||
| Principal Amount | Value | |||||
| $ 2,721,659 | C, S | Washington Mutual Mortgage Pass-through Certificates, | $ 1,855,705 | |||
| 143,045 | C, S | Washington Mutual Mortgage Pass-through Certificates, | 92,979 | |||
| 906,301 | C, S | Washington Mutual Mortgage Pass-through Certificates, | 635,596 | |||
| 770,931 | C, S | Washington Mutual Mortgage Pass-through Certificates, | 651,437 | |||
| 3,515,390 | C, S | Washington Mutual Mortgage Pass-through Certificates AR-18 2A3, | 3,224,454 | |||
| 496,247 | C, S | Washington Mutual Mortgage Pass-through Certificates AR18 2A4, | 440,407 | |||
| 6,468,293 | C, S | Washington Mutual Mortgage Pass-through Certificates, | 6,119,742 | |||
| 8,098,377 | C, S | Washington Mutual Mortgage Pass-through Certificates, | 7,363,652 | |||
| 5,875,794 | C, S | Washington Mutual Mortgage Pass-through Certificates, | 5,716,138 | |||
| 2,806,000 | C, S | Washington Mutual Mortgage Pass-through Certificates, | 2,607,102 | |||
| 5,364,472 | C, S | Washington Mutual Mortgage Pass-through Certificates, | 5,068,877 | |||
| 5,117,321 | C, S | Washington Mutual Mortgage Pass-through Certificates, | 4,705,219 | |||
| 3,949,874 | C, S | Washington Mutual Mortgage Pass-through Certificates, | 3,651,420 | |||
| 1,591,222 | C, S | Washington Mutual Mortgage Pass-through Certificates, | 1,556,909 | |||
| 2,804,118 | C, S | Washington Mutual Mortgage Pass-through Certificates, | 2,740,944 | |||
| 1,844,030 | C, S | Wells Fargo Alternative Loan Trust, | 1,633,230 | |||
| 942,938 | C, S | Wells Fargo Alternative Loan Trust, | 838,368 | |||
| 3,766,291 | C, S | Wells Fargo Mortgage-Backed Securities Trust, | 3,607,331 |
See Accompanying Notes to Financial Statements
76
Table of Contents
| ING INTERMEDIATE BOND FUND | PORTFOLIO OF INVESTMENTS ASOF MARCH 31, 2008 (CONTINUED) |
| Principal Amount | Value | |||||
| COLLATERALIZED MORTGAGE OBLIGATIONS (continued) | ||||||
| $ 3,223,000 | C, S | Wells Fargo Mortgage-Backed Securities Trust, | $ 3,131,564 | |||
| 2,160,000 | C, S | Wells Fargo Mortgage-Backed Securities Trust, | 2,161,834 | |||
| 1,799,000 | C, S | Wells Fargo Mortgage-Backed Securities Trust A5, | 1,684,104 | |||
| 1,826,000 | C, S | Wells Fargo Mortgage-Backed Securities Trust A6, | 1,658,546 | |||
| 1,818,816 | C, S | Wells Fargo Mortgage-Backed Securities Trust, | 1,658,914 | |||
| 4,391,914 | C, S | Wells Fargo Mortgage-Backed Securities Trust, | 3,910,668 | |||
| 5,788,550 | C, S | Wells Fargo Mortgage-Backed Securities Trust, | 5,160,834 | |||
| 2,586,442 | C, S | Wells Fargo Mortgage-Backed Securities Trust, | 2,524,771 | |||
| 4,335,055 | C, S | Wells Fargo Mortgage-Backed Securities Trust, | 4,285,745 | |||
| 8,520,285 | C, S | Wells Fargo Mortgage-Backed Securities Trust, | 7,667,189 | |||
| 3,552,182 | C, S | Wells Fargo Mortgage-Backed Securities Trust, | 3,212,835 | |||
| 3,130,419 | C, S | Wells Fargo Mortgage-Backed Securities Trust, | 3,187,538 | |||
| 4,683,707 | C, S | Wells Fargo Mortgage-Backed Securities Trust, | 4,602,074 | |||
Total Collateralized Mortgage Obligations | 344,584,541 | |||||
| MUNICIPAL BONDS: 1.0% | ||||||
| California: 0.2% | ||||||
| 2,654,000 | C | City of San Diego, | 2,599,965 | |||
| 2,599,965 | ||||||
| Lousiana: 0.2% | ||||||
| 2,933,000 | C | State of Louisiana, | 3,160,278 | |||
| 3,160,278 | ||||||
| Michigan: 0.3% | ||||||
| 4,620,000 | Michigan Tobacco Settlement Finance Authority, | 4,444,902 | ||||
| 4,444,902 | ||||||
| Washington: 0.3% | ||||||
| 3,276,000 | C | State of Washington, | $ 3,271,119 | |||
| 3,271,119 | ||||||
Total Municipal Bonds | 13,476,264 | |||||
| Principal Amount | Value | |||||
| OTHER BONDS: 2.3% | ||||||
| Foreign Government Bonds: 2.3% | ||||||
| JPY 3,085,503,300 | Japan Government CPI Linked, | 30,924,834 | ||||
Total Other Bonds | 30,924,834 | |||||
| Shares | Value | |||||
| PREFERRED STOCK: 1.1% | ||||||
| Banks: 0.1% | ||||||
| 105,400 | @@, P | Santander Finance | $ 1,823,420 | |||
| 1,823,420 | ||||||
| Diversified Financial Services: 0.5% | ||||||
| 76,000 | P | Deutsche Bank Capital Trust II | 1,655,280 | |||
| 125,050 | P | Merrill Lynch & Co., Inc. | 1,765,706 | |||
| 3,450 | #, P | Zurich RegCaPS Funding Trust | 3,161,063 | |||
| 6,582,049 | ||||||
| Insurance: 0.5% | ||||||
| 140,557 | @@, P | Aegon NV | 2,853,307 | |||
| 54,306 | @@, P | Aegon NV - Series 1 | 982,939 | |||
| 126,650 | P | Metlife, Inc. | 2,905,351 | |||
| 6,741,597 | ||||||
| Sovereign: 0.0% | ||||||
| 26,900 | P | Federal National Mortgage Association, Series P | 469,943 | |||
| 469,943 | ||||||
Total Preferred Stock | 15,617,009 | |||||
| WARRANTS: 0.0% | ||||||
| Telecommunications: 0.0% | ||||||
| 20 | American Tower Corp. | 11,058 | ||||
Total Warrants | 11,058 | |||||
Total Long-Term Investments | 1,239,476,324 | |||||
| SHORT-TERM INVESTMENTS: 25.0% | ||||||
| Mutual Fund: 16.2% | ||||||
| 218,600,000 | **, S | ING Institutional Prime Money Market Fund | 218,600,000 | |||
Total Mutual Fund | 218,600,000 | |||||
| Principal Amount | Value | ||||||
| Repurchase Agreement: 0.5% | |||||||
| $ | 6,729,000 | Goldman Sachs Repurchase Agreement dated 03/31/08, 2.250%, due 04/01/08, $6,729,421 to be received upon repurchase (Collateralized by $6,774,000 Federal Home Loan Mortgage Corporation, 5.000%, Market Value plus accrued interest $6,864,320, due 09/16/08) | 6,729,000 | ||||
Total Repurchase Agreement | 6,729,000 | ||||||
See Accompanying Notes to Financial Statements
77
Table of Contents
| ING INTERMEDIATE BOND FUND | PORTFOLIO OF INVESTMENTS ASOF MARCH 31, 2008 (CONTINUED) |
| Principal Amount | Value | |||||||
| Securities Lending Collateralcc: 8.3% | ||||||||
| $ 112,034,000 | Bank of New York Mellon Corp. Institutional Cash Reserves | $ 112,034,000 | ||||||
Total Securities Lending Collateral | 112,034,000 | |||||||
Total Short-Term Investments | 337,363,000 | |||||||
Total Investments in Securities | 116.0 | % | $1,563,949,547 | |||||
Other Assets and Liabilities - Net | (16.0 | ) | (215,525,113 | ) | ||||
Net Assets | 100.0 | % | $1,348,424,434 | |||||
| @@ | Foreign Issuer |
| MASTR | Mortgage Asset Securitization Transaction, Inc. |
| # | Securities with purchases pursuant to Rule 144A or section 4(2), under the Securities Act of 1933 and may not be resold subject to that rule except to qualified institutional buyers. Unless otherwise footnoted, these securities have been determined to be liquid under the guidelines established by the Funds’ Board of Directors/Trustees. |
| C | Bond may be called prior to maturity date. |
| P | Preferred Stock may be called prior to convertible date. |
| cc | Securities purchased with cash collateral for securities loaned. |
| W | When-issued or delayed delivery security |
| S | All or a portion of this security is segregated for certain derivatives, when-issued or delayed delivery securities and forward currency exchange contracts. |
| I | Illiquid security |
| L | Loaned security, a portion or all of the security is on loan at March 31, 2008. |
| ** | Investment in affiliate |
| ^ | Interest Only (IO) Security |
| Z | Indicates Zero Coupon Bond; rate shown reflects current effective yield. |
| BRL | Brazilian Real |
| DKK | Danish Krone |
| JPY | Japanese Yen |
| * | Cost for federal income tax purposes is $1,628,998,097 |
Net unrealized depreciation consists of: | ||||
Gross Unrealized Appreciation | $ | 12,822,533 | ||
Gross Unrealized Depreciation | (77,871,083 | ) | ||
Net Unrealized Depreciation | $ | (65,048,550 | ) | |
Information concerning open future contracts for ING Intermediate Bond Fund at March 31, 2008 is shown below:
Contract Description | Number | Notional | Expiration | Unrealized | |||||||
Long Contracts | |||||||||||
90-Day Eurodollar | 1,398 | 341,950,800 | 12/15/08 | $ | (395,231 | ) | |||||
90-Day Sterling | 541 | 127,715,383 | 12/17/08 | 79,074 | |||||||
90-Day Sterling | 541 | 128,024,069 | 03/18/09 | (1,930 | ) | ||||||
Canada 10-Year Bond | 212 | 24,739,013 | 06/19/08 | 916,719 | |||||||
Euro-Schatz | 1,818 | 299,948,043 | 06/06/08 | (2,082,575 | ) | ||||||
Long Gilt | 113 | 24,960,605 | 06/26/08 | 599,941 | |||||||
| $ | (884,002 | ) | |||||||||
Short Contracts | |||||||||||
90-Day Eurodollar | 1,398 | (339,521,775 | ) | 12/14/09 | $ | 489,013 | |||||
90-Day Sterling | 541 | (127,983,805 | ) | 12/16/09 | (430,525 | ) | |||||
90-Day Sterling | 541 | (127,889,858 | ) | 03/17/10 | (297,826 | ) | |||||
Euro-Bund | 99 | (18,127,311 | ) | 06/06/08 | 159,719 | ||||||
Japan 10-Year Bond (TSE) | 22 | (31,013,644 | ) | 06/11/08 | (335,134 | ) | |||||
Japanese Government Bonds 10-Year Mini | 64 | (9,018,299 | ) | 06/10/08 | (76,808 | ) | |||||
U.S. Treasury 10-Year Note | 70 | (8,326,719 | ) | 06/19/08 | (50,488 | ) | |||||
U.S. Treasury Long Bond | 49 | (5,821,047 | ) | 06/19/08 | (5,046 | ) | |||||
| $ | (547,095 | ) | |||||||||
See Accompanying Notes to Financial Statements
78
Table of Contents
| ING INTERMEDIATE BOND FUND | PORTFOLIO OF INVESTMENTS ASOF MARCH 31, 2008 (CONTINUED) |
ING Intermediate Bond Fund Credit Default Swap Agreements Outstanding on March 31, 2008:
Counterparty | Reference Entity/Obligation | Buy/Sell Protection | (Pay)/Receive Fixed Rate | Termination Date | Notional Amount | Unrealized (Depreciation) | |||||||||||
Lehman Brothers Special Financing Inc. | Agrium Inc. 8.250%, 02/15/11 | Buy | (0.670 | )% | 03/20/13 | USD | 3,735,000 | $ | (502 | ) | |||||||
Barclays Bank PLC, London | Alcoa Inc. 5.375%, 01/15/13 | Buy | (0.390 | )% | 09/20/12 | USD | 2,396,000 | 67,948 | |||||||||
Citibank N.A., New York | Alcoa Inc. 5.375%, 01/15/13 | Buy | (1.000 | )% | 03/20/13 | USD | 878,000 | 5,360 | |||||||||
Citibank N.A., New York | Alcoa Inc. 5.375%, 01/15/13 | Buy | (0.570 | )% | 12/20/17 | USD | 5,910,000 | 287,673 | |||||||||
JPMorgan Chase Bank N.A., New York | Alcoa Inc. 5.375%, 01/15/13 | Buy | (0.430 | )% | 09/20/12 | USD | 1,296,000 | 34,620 | |||||||||
Lehman Brothers Special Financing Inc. | Alcoa Inc. 5.375%, 01/15/13 | Buy | (0.400 | )% | 09/20/12 | USD | 2,592,000 | 72,440 | |||||||||
Lehman Brothers Special Financing Inc. | AMBAC Financial Group Inc. | Buy | (5.000 | )% | 03/20/13 | USD | 502,000 | 1,251 | |||||||||
UBS AG | Australia & New Zealand Banking Group Ltd. | Buy | (0.350 | )% | 09/20/17 | USD | 2,135,000 | 110,172 | |||||||||
UBS AG | Australia and New Zealand Banking Group | Buy | (0.510 | )% | 09/20/17 | USD | 1,972,000 | 170,520 | |||||||||
Barclays Bank PLC, London | Bank of America Corp. | Sell | 0.900 | % | 03/20/13 | USD | 3,495,000 | (6,952 | ) | ||||||||
Citibank N.A., New York | Bank of Scotland | Buy | (0.320 | )% | 09/20/17 | USD | 2,744,000 | 534,428 | |||||||||
Citibank N.A., New York | Bank of Scotland | Buy | (0.660 | )% | 09/20/17 | USD | 2,781,000 | 476,161 | |||||||||
Citibank N.A., New York | Bank of Scotland | Buy | (0.650 | )% | 09/20/17 | USD | 1,294,000 | 222,454 | |||||||||
UBS AG | Bank of Scotland | Buy | (0.410 | )% | 09/20/17 | USD | 2,135,000 | 402,513 | |||||||||
Lehman Brothers Special Financing Inc. | Belo Corp. | Buy | (3.450 | )% | 03/20/13 | USD | 1,522,000 | (29,849 | ) | ||||||||
Merrill Lynch International | Belo Corp. | Buy | (2.050 | )% | 12/20/17 | USD | 2,374,000 | 109,850 | |||||||||
Citibank N.A., New York | Belo Corp. | Buy | (0.930 | )% | 09/20/12 | USD | 1,436,000 | 113,825 | |||||||||
Citibank N.A., New York | Belo Corp. | Buy | (1.400 | )% | 09/20/14 | USD | 1,438,000 | 111,982 | |||||||||
JPMorgan Chase Bank N.A., New York | Block Financial Corp. | Buy | (3.250 | )% | 03/20/13 | USD | 3,735,000 | (170,182 | ) | ||||||||
Citibank N.A., New York | BNP Paribas | Buy | (0.250 | )% | 09/20/17 | USD | 2,744,000 | 252,234 | |||||||||
Citibank N.A., New York | BNP Paribas | Buy | (0.520 | )% | 09/20/17 | USD | 574,000 | 41,070 | |||||||||
Citibank N.A., New York | BNP Paribas | Buy | (0.520 | )% | 09/20/17 | USD | 1,294,000 | 92,587 | |||||||||
Citibank N.A., New York | CDX.EM.7 Index | Buy | (1.250 | )% | 06/20/12 | USD | 7,399,000 | 84,699 | |||||||||
Citibank N.A., New York | CDX.EM.7 Index | Buy | (1.250 | )% | 06/20/12 | USD | 1,868,000 | 59,372 | |||||||||
UBS AG | CDX.EM.7 Index | Buy | (1.250 | )% | 06/20/12 | USD | 5,989,000 | 76,822 | |||||||||
UBS AG | CDX.EM.7 Index | Buy | (1.250 | )% | 06/20/12 | USD | 4,559,000 | 129,870 | |||||||||
UBS AG | CDX.EM.7 Index | Buy | (1.250 | )% | 06/20/12 | USD | 4,692,000 | 149,006 | |||||||||
Citibank N.A., New York | CDX.EM.8 Index | Buy | (1.750 | )% | 12/20/12 | USD | 2,634,000 | 16,240 | |||||||||
Lehman Brothers Special Financing Inc. | CDX.EM.8 Index | Buy | (1.750 | )% | 12/20/12 | USD | 5,879,000 | 76,319 | |||||||||
UBS AG | CDX.EM.8 Index | Buy | (1.750 | )% | 12/20/12 | USD | 4,354,000 | 93,386 | |||||||||
UBS AG | CDX.EM.8 Index | Buy | (1.750 | )% | 12/20/12 | USD | 4,144,000 | 53,796 | |||||||||
UBS AG | CDX.NA.HY.8 Index | Sell | 2.750 | % | 06/20/12 | USD | 5,549,940 | (200,586 | ) | ||||||||
UBS AG | CDX.NA.HY.8 Index | Buy | (2.750 | )% | 06/20/12 | USD | 5,653,890 | 320,511 | |||||||||
See Accompanying Notes to Financial Statements
79
Table of Contents
| ING INTERMEDIATE BOND FUND | PORTFOLIO OF INVESTMENTS ASOF MARCH 31, 2008 (CONTINUED) |
Counterparty | Reference Entity/Obligation | Buy/Sell Protection | (Pay)/Receive Fixed Rate | Termination Date | Notional Amount | Unrealized (Depreciation) | |||||||||||
Lehman Brothers Special Financing Inc. | CDX.NA.HY.8 Index | Buy | (4.750 | )% | 06/20/12 | USD | 7,594,000 | $ | 1,205,054 | ||||||||
Citibank N.A., New York | CDX.NA.HY.9 Index | Buy | (3.750 | )% | 12/20/12 | USD | 9,586,170 | 942,941 | |||||||||
UBS AG | CDX.NA.HY.9 Index | Buy | (3.750 | )% | 12/20/12 | USD | 8,301,150 | 641,733 | |||||||||
Lehman Brothers Special Financing Inc. | CDX.NA.HY.9 Index | Sell | 7.050 | % | 12/20/12 | USD | 3,797,000 | (676,291 | ) | ||||||||
Lehman Brothers Special Financing Inc. | CDX.NA.HY.9 Index | Sell | 2.600 | % | 12/20/12 | USD | 8,717,000 | (801,406 | ) | ||||||||
Lehman Brothers Special Financing Inc. | CDX.NA.HY.9 Index | Sell | 1.950 | % | 12/20/12 | USD | 4,666,000 | (563,028 | ) | ||||||||
Lehman Brothers Special Financing Inc. | CDX.NA.IG.9 Index | Sell | 0.600 | % | 12/20/12 | USD | 12,448,000 | (293,850 | ) | ||||||||
Lehman Brothers Special Financing Inc. | CDX.NA.IG.9 Index | Buy | (0.600 | )% | 12/20/12 | USD | 18,761,000 | (127,521 | ) | ||||||||
Citibank N.A., New York | CDX.NA.IG.9 Index | Sell | 0.740 | % | 12/20/12 | USD | 4,389,000 | (70,154 | ) | ||||||||
Citibank N.A., New York | CDX.NA.IG.9 Index | Sell | 0.780 | % | 12/20/12 | USD | 5,644,000 | (100,012 | ) | ||||||||
Lehman Brothers Special Financing Inc. | CDX.NA.IG.9 Index | Sell | 0.455 | % | 12/20/12 | USD | 22,877,000 | 86,143 | |||||||||
UBS AG | CDX.NA.IG.HVOL.9 Index | Sell | 1.400 | % | 12/20/12 | USD | 10,906,000 | (435,946 | ) | ||||||||
Lehman Brothers Special Financing Inc. | Centex Corp. | Sell | 5.300 | % | 03/20/13 | USD | 1,269,000 | 23,657 | |||||||||
JPMorgan Chase Bank N.A., New York | Citizens Communications Co. | Buy | (3.800 | )% | 03/20/13 | USD | 5,067,000 | 162,233 | |||||||||
Morgan Stanley Capital Services Inc. | Citizens Communications Co. | Buy | (4.150 | )% | 03/20/13 | USD | 1,268,000 | 22,844 | |||||||||
Citibank N.A., New York | Clear Channel Communications | Buy | (6.700 | )% | 03/20/13 | USD | 1,120,000 | 48,493 | |||||||||
Citibank N.A., New York | Clear Channel Communications | Buy | (6.850 | )% | 03/20/13 | USD | 820,000 | 31,112 | |||||||||
Citibank N.A., New York | Clear Channel Communications | Buy | (6.900 | )% | 03/20/13 | USD | 1,258,000 | 45,485 | |||||||||
Citibank N.A., New York | Clear Channel Communications | Buy | (6.900 | )% | 03/20/13 | USD | 1,396,000 | 50,475 | |||||||||
Citibank N.A., New York | Clear Channel Communications | Buy | (6.800 | )% | 03/20/13 | USD | 704,000 | 27,968 | |||||||||
Citibank N.A., New York | Clear Channel Communications | Buy | (7.050 | )% | 06/20/13 | USD | 1,019,000 | 33,492 | |||||||||
Lehman Brothers Special Financing Inc. | Clear Channel Communications | Buy | (8.080 | )% | 03/20/13 | USD | 2,539,000 | (15,172 | ) | ||||||||
Lehman Brothers Special Financing Inc. | Clear Channel Communications | Buy | (8.450 | )% | 03/20/13 | USD | 254,000 | (4,873 | ) | ||||||||
Morgan Stanley Capital Services Inc. | Clear Channel Communications | Buy | (6.850 | )% | 06/20/13 | USD | 513,000 | 20,631 | |||||||||
UBS AG | Clear Channel Communications | Buy | (6.900 | )% | 03/20/13 | USD | 859,000 | 31,059 | |||||||||
See Accompanying Notes to Financial Statements
80
Table of Contents
| ING INTERMEDIATE BOND FUND | PORTFOLIO OF INVESTMENTS ASOF MARCH 31, 2008 (CONTINUED) |
Counterparty | Reference Entity/Obligation | Buy/Sell Protection | (Pay)/Receive Fixed Rate | Termination Date | Notional Amount | Unrealized (Depreciation) | |||||||||||
Citibank N.A., New York | CMBX-NA-AAA 4 Index | Sell | 0.350 | % | 02/17/51 | USD | 2,139,000 | $ | (45,929 | ) | |||||||
Citibank N.A., New York | CMBX-NA-AAA 4 Index | Sell | 0.350 | % | 02/17/51 | USD | 5,142,000 | 233,328 | |||||||||
Citibank N.A., New York | CMBX-NA-AAA 4 Index | Sell | 0.350 | % | 02/17/51 | USD | 1,912,000 | (19,268 | ) | ||||||||
Citibank N.A., New York | CMBX-NA-AAA 4 Index | Sell | 0.350 | % | 02/17/51 | USD | 2,508,000 | 175,050 | |||||||||
Citibank N.A., New York | CMS Energy Corporation | Sell | 0.820 | % | 03/20/12 | USD | 600,000 | (15,856 | ) | ||||||||
Merrill Lynch International | CMS Energy Corporation | Sell | 0.840 | % | 03/20/12 | USD | 3,000,000 | (77,085 | ) | ||||||||
Lehman Brothers Special Financing Inc. | Countrywide Home Loan | Sell | 8.700 | % | 12/20/12 | USD | 248,000 | 50,629 | |||||||||
UBS AG | Countrywide Home Loan | Sell | 9.000 | % | 12/20/12 | USD | 248,000 | 53,414 | |||||||||
Credit Suisse International | D.R. Horton Inc. | Buy | (4.250 | )% | 03/20/13 | USD | 1,269,000 | (10,849 | ) | ||||||||
Bear Stearns Credit Products Inc. | Darden Restaurants Inc. | Buy | (1.640 | )% | 03/20/18 | USD | 2,241,000 | 18,569 | |||||||||
Citibank N.A., New York | Darden Restaurants Inc. | Buy | (0.610 | )% | 12/20/12 | USD | 632,000 | 29,586 | |||||||||
Citibank N.A., New York | Darden Restaurants Inc. | Buy | (1.310 | )% | 12/20/17 | USD | 624,000 | 20,146 | |||||||||
Morgan Stanley Capital Services Inc. | Domtar Corp. | Buy | (2.650 | )% | 09/20/11 | USD | 1,287,500 | 44,172 | |||||||||
UBS AG | Domtar Corp. | Sell | 2.600 | % | 09/20/11 | USD | 1,288,000 | (46,171 | ) | ||||||||
Citibank N.A., New York | Federal Home Loan Mortgage Corp. | Buy | (0.560 | )% | 03/20/13 | USD | 3,052,000 | (8,955 | ) | ||||||||
Lehman Brothers Special Financing Inc. | Federal Home Loan Mortgage Corp. | Buy | (0.960 | )% | 03/20/13 | USD | 1,251,000 | (26,721 | ) | ||||||||
Lehman Brothers Special Financing Inc. | Federal Home Loan Mortgage Corp. | Buy | (2.100 | )% | 03/20/13 | USD | 1,251,000 | (44,068 | ) | ||||||||
Lehman Brothers Special Financing Inc. | Federal National Mortgage Association | Buy | (1.470 | )% | 03/20/13 | USD | 2,336,000 | (13,615 | ) | ||||||||
Lehman Brothers Special Financing Inc. | Federal National Mortgage Association | Buy | (2.070 | )% | 03/20/13 | USD | 1,251,000 | (90,740 | ) | ||||||||
Citibank N.A., New York | Federal National Mortgage Association | Buy | (0.820 | )% | 03/20/13 | USD | 5,470,000 | (81,821 | ) | ||||||||
Citibank N.A., New York | Federal National Mortgage Association | Buy | (0.560 | )% | 03/20/13 | USD | 3,050,000 | (9,105 | ) | ||||||||
Citibank N.A., New York | Federal National Mortgage Association | Buy | (0.840 | )% | 03/20/18 | USD | 5,470,000 | (81,821 | ) | ||||||||
Lehman Brothers Special Financing Inc. | Federal National Mortgage Association | Buy | (0.830 | )% | 03/20/13 | USD | 2,448,000 | (37,745 | ) | ||||||||
Lehman Brothers Special Financing Inc. | Federal National Mortgage Association | Buy | (0.930 | )% | 03/20/13 | USD | 1,251,000 | (25,053 | ) | ||||||||
See Accompanying Notes to Financial Statements
81
Table of Contents
| ING INTERMEDIATE BOND FUND | PORTFOLIO OF INVESTMENTS ASOF MARCH 31, 2008 (CONTINUED) |
Counterparty | Reference Entity/Obligation | Buy/Sell Protection | (pay)/Receive Fixed Rate | Termination Date | Notional Amount | Unrealized (Depreciation) | |||||||||||
Barclays Bank PLC, London | Federative Republic of Brazil | Sell | 0.240 | % | 06/20/08 | USD | 9,213,000 | $ | (5,004 | ) | |||||||
Citibank N.A., New York | Federative Republic of Brazil | Sell | 0.240 | % | 07/20/08 | USD | 5,827,000 | (4,325 | ) | ||||||||
Citibank N.A., New York | Federative Republic of Brazil | Buy | (0.740 | )% | 07/20/12 | USD | 1,457,000 | 48,259 | |||||||||
Lehman Brothers Special Financing Inc. | Federative Republic of Brazil | Buy | (0.800 | )% | 07/20/12 | USD | 2,594,000 | 79,766 | |||||||||
Lehman Brothers Special Financing Inc. | Federative Republic of Brazil | Buy | (1.420 | )% | 03/20/13 | USD | 5,879,000 | 87,758 | |||||||||
UBS AG | Federative Republic of Brazil | Buy | (0.780 | )% | 07/20/12 | USD | 5,987,500 | 188,850 | |||||||||
UBS AG | Federative Republic of Brazil | Buy | (0.860 | )% | 08/20/12 | USD | 1,676,000 | 50,092 | |||||||||
UBS AG | Federative Republic of Brazil | Buy | (1.150 | )% | 08/20/12 | USD | 4,104,000 | 74,805 | |||||||||
UBS AG | Federative Republic of Brazil | Sell | 1.400 | % | 01/20/13 | USD | 1,524,000 | (20,947 | ) | ||||||||
UBS AG | Federative Republic of Brazil | Buy | (1.420 | )% | 03/20/13 | USD | 4,144,000 | 61,859 | |||||||||
Citibank N.A., New York | First Data Corp. | Buy | (5.350 | )% | 12/20/12 | USD | 2,892,000 | 306,711 | |||||||||
Citibank N.A., New York | First Data Corp. | Buy | (5.900 | )% | 12/20/17 | USD | 1,635,000 | 204,212 | |||||||||
Citibank N.A., New York | Ford Motor Co. | Sell | 6.100 | % | 12/20/12 | USD | 1,235,000 | (214,804 | ) | ||||||||
Barclays Bank PLC, London | Gannett Co. 6.375%, 04/01/12 | Buy | (0.780 | )% | 09/20/14 | USD | 2,280,000 | 194,607 | |||||||||
Citibank N.A., New York | Gannett Co. 6.375%, 04/01/12 | Buy | (0.690 | )% | 06/20/14 | USD | 3,637,000 | 321,401 | |||||||||
Citibank N.A., New York | Gannett Co. 6.375%, 04/01/12 | Buy | (0.860 | )% | 09/20/14 | USD | 1,098,000 | 89,092 | |||||||||
Citibank N.A., New York | General Electric Capital Corp. | Sell | 1.170 | % | 03/20/13 | USD | 10,581,000 | (70,807 | ) | ||||||||
Barclays Bank PLC, London | Georgia-Pacific Corp. | Sell | 3.000 | % | 09/20/12 | USD | 1,200,000 | (95,852 | ) | ||||||||
Citibank N.A., New York | Goldman Sachs Group Inc. | Buy | (0.960 | )% | 12/20/12 | USD | 3,472,000 | 80,547 | |||||||||
Lehman Brothers Special Financing Inc. | Goldman Sachs Group Inc. | Buy | (1.030 | )% | 12/20/12 | USD | 2,406,000 | 48,729 | |||||||||
Morgan Stanley Capital Services Inc. | Goldman Sachs Group Inc. | Buy | (1.030 | )% | 12/20/12 | USD | 2,212,000 | 44,800 | |||||||||
UBS AG | Harrah’s Operating Co. Inc. | Buy | (7.450 | )% | 03/20/13 | USD | 1,089,000 | 127,970 | |||||||||
Lehman Brothers Special Financing Inc. | Hilton Hotels Corp. | Buy | (7.250 | )% | 03/20/13 | USD | 935,000 | 78,620 | |||||||||
Lehman Brothers Special Financing Inc. | Hilton Hotels Corp. | Buy | (7.650 | )% | 03/20/13 | USD | 2,260,000 | 160,304 | |||||||||
UBS AG | HSBC Bank PLC | Buy | (0.400 | )% | 09/20/17 | USD | 2,135,000 | 234,272 | |||||||||
UBS AG | LCDX.NA.8 Index | Buy | (1.200 | )% | 06/20/12 | USD | 11,061,544 | 354,604 | |||||||||
UBS AG | LCDX.NA.8 Index | Buy | (1.200 | )% | 06/20/12 | USD | 1,862,997 | 46,068 | |||||||||
Citibank N.A., New York | Lehman Brothers Hldgs. | Buy | (1.100 | )% | 12/20/12 | USD | 1,069,000 | 80,683 | |||||||||
Citibank N.A., New York | Lehman Brothers Hldgs. | Buy | (1.100 | )% | 12/20/12 | USD | 1,039,000 | 78,419 | |||||||||
See Accompanying Notes to Financial Statements
82
Table of Contents
| ING INTERMEDIATE BOND FUND | PORTFOLIO OF INVESTMENTS ASOF MARCH 31, 2008 (CONTINUED) |
Counterparty | Reference Entity/Obligation | Buy/Sell Protection | (Pay)/Receive Fixed Rate | Termination Date | Notional Amount | Unrealized (Depreciation) | |||||||||||
Lehman Brothers Special Financing Inc. | Liberty Mutual Insurance | Buy | (1.150 | )% | 03/20/13 | USD | 2,560,000 | $ | (35,687 | ) | |||||||
Barclays Bank PLC, London | Lloyds TSB Group PLC | Buy | (0.500 | )% | 12/20/17 | USD | 1,113,000 | 89,481 | |||||||||
Barclays Bank PLC, London | Louisiana-Pacific Corp. | Buy | (3.850 | )% | 03/20/13 | USD | 700,000 | 46,775 | |||||||||
Citibank N.A., New York | Louisiana-Pacific Corp. | Buy | (2.000 | )% | 12/20/12 | USD | 1,363,000 | 179,187 | |||||||||
Citibank N.A., New York | Louisiana-Pacific Corp. | Buy | (2.100 | )% | 12/20/12 | USD | 2,455,000 | 313,875 | |||||||||
Citibank N.A., New York | Louisiana-Pacific Corp. | Buy | (3.010 | )% | 03/20/13 | USD | 271,000 | 26,640 | |||||||||
Citibank N.A., New York | Louisiana-Pacific Corp. | Buy | (3.375 | )% | 03/20/13 | USD | 1,979,000 | 167,469 | |||||||||
Morgan Stanley Capital Services Inc. | Louisiana-Pacific Corp. | Buy | (2.230 | )% | 12/20/12 | USD | 2,212,000 | 272,417 | |||||||||
UBS AG | Louisiana-Pacific Corp. | Buy | (2.000 | )% | 12/20/12 | USD | 1,434,000 | 188,521 | |||||||||
Lehman Brothers Special Financing Inc. | Macquarie Bank Ltd. | Buy | (1.200 | )% | 12/20/12 | USD | 8,446,000 | 852,545 | |||||||||
Lehman Brothers Special Financing Inc. | Macquarie Bank Ltd. | Sell | 1.300 | % | 12/20/17 | USD | 5,030,000 | (826,324 | ) | ||||||||
Citibank N.A., New York | Marks & Spencer PLC | Buy | (1.100 | )% | 03/20/13 | USD | 3,146,000 | 133,832 | |||||||||
Citibank N.A., New York | Marks & Spencer PLC | Buy | (1.400 | )% | 03/20/13 | USD | 2,298,000 | 67,580 | |||||||||
JPMorgan Chase Bank N.A., New York | MBIA Inc. 6.625%, 10/01/28 | Sell | 0.000 | % | 09/20/08 | USD | 6,254,000 | 458,971 | |||||||||
Barclays Bank PLC, London | Merrill Lynch & Co. | Buy | (0.860 | )% | 09/20/12 | USD | 5,173,000 | 372,098 | |||||||||
Barclays Bank PLC, London | Morgan Stanley | Buy | (1.040 | )% | 12/20/12 | USD | 2,220,000 | 100,119 | |||||||||
Citibank N.A., New York | Morgan Stanley | Buy | (1.080 | )% | 12/20/12 | USD | 3,472,000 | 150,853 | |||||||||
Citibank N.A., New York | Norbord Inc. 7.250%, 07/01/12 | Sell | 2.200 | % | 06/20/12 | USD | 606,500 | (89,164 | ) | ||||||||
Citibank N.A., New York | Norbord Inc. 7.250%, 07/01/12 | Buy | (5.250 | )% | 03/20/13 | USD | 1,380,000 | 70,267 | |||||||||
Citibank N.A., New York | Norbord Inc. 7.250%, 07/01/12 | Buy | (2.450 | )% | 12/20/17 | USD | 3,377,000 | 590,075 | |||||||||
Credit Suisse International | Norbord Inc. 7.250%, 07/01/12 | Buy | (1.450 | )% | 06/20/14 | USD | 3,860,000 | 785,130 | |||||||||
UBS AG | Norbord Inc. 7.250%, 07/01/12 | Buy | (1.500 | )% | 06/20/12 | USD | 606,500 | 102,758 | |||||||||
UBS AG | Norbord Inc. 7.250%, 07/01/12 | Buy | (2.400 | )% | 12/20/17 | USD | 1,342,000 | 238,117 | |||||||||
Citibank N.A., New York | Potash Corp. Of Saskatchewan | Buy | (0.600 | )% | 03/20/13 | USD | 1,248,000 | 3,722 | |||||||||
Lehman Brothers Special Financing Inc. | Potash Corp. Of Saskatchewan | Buy | (0.670 | )% | 03/20/18 | USD | 3,735,000 | 29,693 | |||||||||
Morgan Stanley Capital Services Inc. | Potash Corp. Of Saskatchewan | Buy | (0.610 | )% | 03/20/13 | USD | 2,497,000 | 6,304 | |||||||||
Lehman Brothers Special Financing Inc. | Radian Group Inc. | Sell | 3.900 | % | 09/20/14 | USD | 5,588,000 | (1,112,811 | ) | ||||||||
UBS AG | Radian Group Inc. | Buy | (0.850 | )% | 09/20/14 | USD | 5,588,000 | 1,698,537 | |||||||||
Citibank N.A., New York | Royal Bank of Scotland PLC | Buy | (0.290 | )% | 09/20/17 | USD | 2,744,000 | 396,194 | |||||||||
UBS AG | Royal Bank of Scotland PLC | Buy | (0.400 | )% | 09/20/17 | USD | 2,135,000 | 291,265 | |||||||||
See Accompanying Notes to Financial Statements
83
Table of Contents
| ING INTERMEDIATE BOND FUND | PORTFOLIO OF INVESTMENTS ASOF MARCH 31, 2008 (CONTINUED) |
Counterparty | Reference Entity/Obligation | Buy/Sell Protection | (Pay)/Receive Fixed Rate | Termination Date | Notional Amount | Unrealized (Depreciation) | |||||||||||
Citibank N.A., New York | Societe Generale | Buy | (0.510 | )% | 09/20/17 | USD | 574,000 | $ | 60,763 | ||||||||
Citibank N.A., New York | Societe Generale | Buy | (0.510 | )% | 09/20/17 | USD | 1,294,000 | 136,980 | |||||||||
UBS AG | Societe Generale | Buy | (0.380 | )% | 09/20/17 | USD | 2,135,000 | 246,448 | |||||||||
JPMorgan Chase Bank N.A., New York | Sprint Nextel Corp. | Sell | 3.820 | % | 03/20/13 | USD | 2,534,000 | (201,004 | ) | ||||||||
Morgan Stanley Capital Services Inc. | Sprint Nextel Corp. | Sell | 3.800 | % | 03/20/13 | USD | 5,077,000 | (406,477 | ) | ||||||||
Barclays Bank PLC, London | Standard Chartered Bank | Buy | (0.750 | )% | 12/20/17 | USD | 1,113,000 | 107,241 | |||||||||
Citibank N.A., New York | Standard Chartered Bank | Buy | (0.670 | )% | 09/20/17 | USD | 574,000 | 57,644 | |||||||||
UBS AG | Standard Chartered Bank | Buy | (0.420 | )% | 09/20/17 | USD | 2,135,000 | 253,568 | |||||||||
Goldman Sachs International | Temple-Inland Inc. | Buy | (1.040 | )% | 03/20/14 | USD | 872,000 | 76,870 | |||||||||
JPMorgan Chase Bank N.A., New York | Temple-Inland Inc. | Buy | (0.890 | )% | 03/20/14 | USD | 2,646,000 | 252,601 | |||||||||
JPMorgan Chase Bank N.A., New York | Temple-Inland Inc. | Buy | (1.020 | )% | 03/20/14 | USD | 2,493,000 | 222,198 | |||||||||
Morgan Stanley Capital Services Inc. | Temple-Inland Inc. | Buy | (0.900 | )% | 03/20/14 | USD | 2,318,000 | 220,158 | |||||||||
Morgan Stanley Capital Services Inc. | Temple-Inland Inc. | Buy | (1.600 | )% | 09/20/17 | USD | 2,401,000 | 194,277 | |||||||||
UBS AG | Temple-Inland Inc. | Buy | (0.900 | )% | 03/20/14 | USD | 2,476,000 | 235,165 | |||||||||
UBS AG | Toll Bros Finance Corp. | Buy | (1.000 | )% | 06/20/12 | USD | 5,671,000 | 441,680 | |||||||||
Citibank N.A., New York | United Mexican States | Sell | 0.160 | % | 07/20/08 | USD | 8,830,000 | (494 | ) | ||||||||
Citibank N.A., New York | United Mexican States | Buy | (0.355 | )% | 07/20/12 | USD | 1,104,000 | 36,184 | |||||||||
UBS AG | United Mexican States | Buy | (0.620 | )% | 08/20/12 | USD | 4,332,000 | 100,713 | |||||||||
Citibank N.A., New York | Univision Communications Inc. | Sell | 5.000 | % | 03/20/13 | USD | 1,120,000 | (162,994 | ) | ||||||||
Citibank N.A., New York | Univision Communications Inc. | Sell | 5.000 | % | 03/20/13 | USD | 859,000 | (117,624 | ) | ||||||||
Citibank N.A., New York | Univision Communications Inc. | Sell | 5.000 | % | 03/20/13 | USD | 820,000 | (114,272 | ) | ||||||||
Citibank N.A., New York | Univision Communications Inc. | Sell | 5.000 | % | 03/20/13 | USD | 1,265,000 | (169,855 | ) | ||||||||
Citibank N.A., New York | Univision Communications Inc. | Sell | 5.000 | % | 03/20/13 | USD | 1,400,000 | (188,145 | ) | ||||||||
Citibank N.A., New York | Univision Communications Inc. | Sell | 5.000 | % | 03/20/13 | USD | 710,000 | (88,439 | ) | ||||||||
Citibank N.A., New York | Verizon Communications Inc. | Buy | (1.150 | )% | 03/20/13 | USD | 637,000 | (2,268 | ) | ||||||||
Citibank N.A., New York | Wachovia Corp. | Sell | 1.170 | % | 03/20/13 | USD | 4,278,000 | (198,964 | ) | ||||||||
Citibank N.A., New York | Wachovia Corp. | Sell | 2.950 | % | 03/20/13 | USD | 2,508,000 | 128,203 | |||||||||
See Accompanying Notes to Financial Statements
84
Table of Contents
| ING INTERMEDIATE BOND FUND | PORTFOLIO OF INVESTMENTS ASOF MARCH 31, 2008 (CONTINUED) |
Counterparty | Reference Entity/Obligation | Buy/Sell Protection | (Pay)/Receive Fixed Rate | Termination Date | Notional Amount | Unrealized (Depreciation) | |||||||||||
UBS AG | Westpac Banking Corp. | Buy | (0.350 | )% | 09/20/17 | USD | 2,135,000 | $ | 205,146 | ||||||||
UBS AG | Westpac Banking Corp. | Buy | (0.510 | )% | 09/20/17 | USD | 1,972,000 | 166,580 | |||||||||
JPMorgan Chase Bank N.A., New York | Weyerhaeuser Co. | Buy | (0.640 | )% | 03/20/14 | USD | 2,582,000 | 157,030 | |||||||||
Barclays Bank PLC, London | Weyerhaeuser Co. | Sell | 0.780 | % | 09/20/12 | USD | 2,478,000 | (98,529 | ) | ||||||||
Citibank N.A., New York | Williams Partners LP | Sell | 1.030 | % | 03/20/12 | USD | 3,020,164 | (15,248 | ) | ||||||||
Deutsche Bank | XL Capital Assurance Inc. | Buy | (5.000 | )% | 03/20/13 | USD | 750,000 | 61,247 | |||||||||
Lehman Brothers Special Financing Inc. | XL Capital Assurance Inc. | Buy | (5.000 | )% | 03/20/13 | USD | 502,000 | 38,745 | |||||||||
Merrill Lynch International | XL Capital Assurance Inc. | Buy | (5.000 | )% | 03/20/13 | USD | 750,000 | 61,247 | |||||||||
UBS AG | XL Capital Assurance Inc. | Buy | (6.400 | )% | 12/20/12 | USD | 739,000 | 139,775 | |||||||||
UBS AG | XL Capital Assurance Inc. | Buy | (5.000 | )% | 03/20/13 | USD | 2,622,000 | (32,073 | ) | ||||||||
UBS AG | XL Capital Ltd. | Buy | (0.610 | )% | 09/20/16 | USD | 2,655,000 | 394,479 | |||||||||
UBS AG | XL Capital Ltd. | Buy | (0.610 | )% | 09/20/16 | USD | 5,310,000 | 788,957 | |||||||||
| $ | 15,220,838 | ||||||||||||||||
See Accompanying Notes to Financial Statements
85
Table of Contents
| ING INTERMEDIATE BOND FUND | PORTFOLIO OF INVESTMENTS ASOF MARCH 31, 2008 (CONTINUED) |
Information concerning the Interest rate Swap Agreements outstanding for ING Intermediate Bond Fund at March 31, 2008 is shown below.
| Termination Date | Notional Principal Amount | Unrealized | ||||||||||||
Receive a fixed rate equal to 4.04221% and pay a floating rate based on 3-month USD-LIBOR Counterparty: Citibank N.A., New York | 12/13/09 | USD | 66,325,000 | $ | 2,526,181 | |||||||||
Receive a fixed rate equal to 4.67000% and pay a floating rate based on 6-month GBP-LIBOR Counterparty: Citibank N.A., New York | 08/05/10 | GBP | 17,973,000 | (106,718 | ) | |||||||||
Receive a fixed rate equal to 4.92000% and pay a floating rate based on 6-month GBP-LIBOR Counterparty: Citibank N.A., New York | 08/23/10 | GBP | 17,973,000 | 61,062 | ||||||||||
Receive a floating rate based on 3-month USD-LIBOR and pay a fixed rate equal to 4.80031% Counterparty: Citibank N.A., New York | 12/13/17 | USD | 15,851,000 | (1,196,953 | ) | |||||||||
Receive a floating rate based on 3-month USD-LIBOR and pay a fixed rate equal to 4.27000% Counterparty: Citibank N.A., New York | 01/23/18 | USD | 39,593,000 | (757,572 | ) | |||||||||
Receive a floating rate based on 6-month GBP-LIBOR and pay a fixed rate equal to 4.87000% Counterparty: Citibank N.A., New York | 08/06/18 | GBP | 4,348,000 | 30,307 | ||||||||||
Receive a floating rate based on 6-month GBP-LIBOR and pay a fixed rate equal to 5.15000% Counterparty: Citibank N.A., New York | 08/22/18 | GBP | 4,348,000 | (157,242 | ) | |||||||||
| $ | 399,065 | |||||||||||||
At March 31, 2008 the following forward foreign currency contracts were outstanding for the ING Intermediate Bond Fund:
Currency | Buy/Sell | Settlement Date | In Exchange For USD | Value | Unrealized | |||||||||||
Australia Dollars | Sell | 4/30/08 | 13,759,433 | 13,650,808 | $ | 108,625 | ||||||||||
Brazil Real | Sell | 4/30/08 | 4,346,857 | 4,309,915 | 36,942 | |||||||||||
EURO | Sell | 4/30/08 | 35,007,742 | 35,420,939 | (413,197 | ) | ||||||||||
Japanese Yen | Sell | 4/16/08 | 17,236,464 | 17,788,039 | (551,575 | ) | ||||||||||
Japanese Yen | Sell | 4/30/08 | 13,487,336 | 13,354,894 | 132,442 | |||||||||||
| $ | (686,763 | ) | ||||||||||||||
86
Table of Contents
| ING NATIONAL TAX-EXEMPT BOND FUND | PORTFOLIO OF INVESTMENTS ASOF MARCH 31, 2008 |
| Principal Amount | (Unaudited) Rating(1) | Value | |||||||
| MUNICIPAL BONDS: 94.3% | |||||||||
| Arizona: 3.4% | |||||||||
| $1,000,000 | C | Salt River Project Agricultural Improvement & Power District, 4.750%, due 01/01/35 | Aa1/AA | $ | 971,890 | ||||
| 971,890 | |||||||||
| California: 13.0% | |||||||||
| 350,000 | C | California Statewide Communities Development Authority, | Aaa/AAA | 381,052 | |||||
| 1,000,000 | C | Clovis Public Financing Authority, | Aaa/NR | 992,820 | |||||
| 1,000,000 | C | Golden State Tobacco Securitization Corp., 5.000%, due 06/01/33 | Baa3/BBB | 837,980 | |||||
| 1,000,000 | Pleasant Valley School District, | Aaa/AAA | 1,028,950 | ||||||
| 500,000 | C | San Marcos Califonia Public Facility Authority Tax Allocation Reserve, 5.000%, due 08/01/21 | A3/A- | 507,845 | |||||
| 3,748,647 | |||||||||
| Colorado: 3.6% | |||||||||
| 1,000,000 | C | Interlocken Metropolitan District, | NR/AA | 1,050,630 | |||||
| 1,050,630 | |||||||||
| Connecticut: 5.9% | |||||||||
| 185,000 | City of New Britain, 6.000%, due 03/01/12 | Aaa/AAA | 198,194 | ||||||
| 520,000 | C | Connecticut State Development Authority, 5.000%, due 10/15/23 | Aaa/AAA | 533,983 | |||||
| 890,000 | C | Connecticut State Health & Educational Facility Authority, 5.375%, due 07/01/25 | NR/AAA | 892,982 | |||||
| 60,000 | State of Connecticut, 7.125%, due 06/01/10 | Aaa/AA | 63,949 | ||||||
| 1,689,108 | |||||||||
| Florida: 7.5% | |||||||||
| 750,000 | C | City of Gulf Breeze, 5.050%, due 12/01/20 | Baa3/NR | 797,258 | |||||
| 250,000 | C | City of Tallahassee, 6.375%, due 12/01/30 | Baa2/NR | 252,130 | |||||
| 100,000 | C | County of Orange, 5.250%, due 10/01/23 | Aaa/AAA | 108,914 | |||||
| 500,000 | C | Florida State Board of Education, 5.750%, due 06/01/22 | Aa1/AAA | 525,745 | |||||
| Principal Amount | (Unaudited) Rating(1) | Value | |||||||
| $ 500,000 | C | Tampa Housing Authority, | NR/AAA | $ | 493,305 | ||||
| 2,177,352 | |||||||||
| Illinois: 6.9% | |||||||||
| 1,000,000 | C | De Kalb-Ogle Etc Counties Community College District No. 523, | Aaa/NR | 1,053,000 | |||||
| 1,000,000 | C | Illinois Finance Authority, 5.000%, due 08/15/24 | 832,880 | ||||||
| 100,000 | State of Illinois, 6.250%, due 12/15/20 | Aaa/AAA | 115,379 | ||||||
| 2,001,259 | |||||||||
| Kentucky: 0.5% | |||||||||
| 300,000 | Z | Kentucky Economic Development Finance Authority, 5.440%, due 10/01/21 | Aaa/AAA | 146,700 | |||||
| 146,700 | |||||||||
| Lousiana: 3.2% | |||||||||
| 1,000,000 | C | Louisiana Public Facilities Authority, 4.650%, due 12/15/32 | Aaa/AAA | 931,810 | |||||
| 931,810 | |||||||||
| Massachusetts: 0.7% | |||||||||
| 200,000 | Massachusetts Housing Finance Agency, 4.600%, due 12/01/14 | Aa2/AA | 203,620 | ||||||
| 203,620 | |||||||||
| New Hampshire: 2.4% | |||||||||
| 740,000 | C | New Hampshire Housing Finance Authority, 4.850%, due 07/01/26 | Aaa/NR | 692,744 | |||||
| 692,744 | |||||||||
| New Jersey: 3.2% | |||||||||
| 1,000,000 | C | New Jersey St Housing & Mortgage Finance Agency, | Aa2/AA | 932,930 | |||||
| 932,930 | |||||||||
| New York: 19.4% | |||||||||
| 430,000 | Albany Industrial Development Agency, | NR/NR | 451,371 | ||||||
| 1,000,000 | C | City of New York, 5.000%, due 08/01/24 | Aa3/AA | 1,013,410 | |||||
| 1,000,000 | C | City of New York, 5.000%, due 12/01/18 | Aa3/AA | 1,047,340 | |||||
| 250,000 | C | Hudson Yards Infrastructure Corp., 5.000%, due 02/15/47 | A3/A | 241,393 | |||||
| 1,000,000 | C | New York State Dormitory Authority, | Aaa/AAA | 1,071,750 | |||||
See Accompanying Notes to Financial Statements
87
Table of Contents
| ING NATIONAL TAX-EXEMPT BOND FUND | PORTFOLIO OF INVESTMENTS ASOF MARCH 31, 2008 (CONTINUED) |
| Principal Amount | (Unaudited) Rating(1) | Value | |||||||
| New York (continued) | |||||||||
| $1,000,000 | Port Authority of New York & New Jersey, 6.250%, due 12/01/11 | Aaa/AAA | $ | 1,083,380 | |||||
| 775,000 | C | Westchester County Industrial Development Agency, | NR/NR | 702,065 | |||||
| 5,610,709 | |||||||||
| North Carolina: 3.6% | |||||||||
| 295,000 | C | New Hanover County, 5.750%, due 11/01/12 | Aa1/AA | 322,385 | |||||
| 710,000 | C | Raleigh North Carolina Certificates, | Aa2/AA+ | 720,210 | |||||
| 1,042,595 | |||||||||
| North Dakota: 0.9% | |||||||||
| 250,000 | C | Oliver County, | Aaa/AAA | 252,013 | |||||
| 252,013 | |||||||||
| Ohio: 0.2% | |||||||||
| 55,000 | Lakota Local School District, | Aaa/AAA | 61,475 | ||||||
| 61,475 | |||||||||
| Oklahoma: 7.9% | |||||||||
| 1,000,000 | C | Oklahoma Industries Authority, | Aaa/AAA | 1,065,800 | |||||
| 100,000 | C | Oklahoma Student Loan Authority, | Aaa/AAA | 98,638 | |||||
| 1,000,000 | C | Payne County Economic Development Authority, | Baa3/NR | 1,112,130 | |||||
| 2,276,568 | |||||||||
| Pennsylvania: 3.9% | |||||||||
| 130,000 | C | Allegheny County Hospital Development Authority, | Aaa/AAA | 133,288 | |||||
| 1,000,000 | C | Lebanon County Health Facilities Authority, 6.000%, due 11/15/35 | Baa2/BBB | 982,710 | |||||
| 1,115,998 | |||||||||
| Principal Amount | (Unaudited) Rating(1) | Value | ||||||||
| Rhode Island: 0.3% | ||||||||||
| $ 35,000 | Dunns Corner Fire District, | NR/NR | $ | 35,333 | ||||||
| 35,000 | Dunns Corner Fire District, | NR/NR | 37,254 | |||||||
| 72,587 | ||||||||||
| Texas: 6.9% | ||||||||||
| 500,000 | C | Alamo Community College District, | Aaa/AAA | 512,725 | ||||||
| 200,000 | C | Cleburne 4B Economic Development Corp., 5.625%, due 02/15/27 | A3/NR | 216,922 | ||||||
| 1,000,000 | C | Harris County Health Facilities Development Corp., | Aa3/AAA | 1,110,376 | ||||||
| 165,000 | C | Harris County-Houston Sports Authority, | Aaa/AAA | 163,941 | ||||||
| 2,003,964 | ||||||||||
| Virginia: 0.9% | ||||||||||
| 290,000 | C | Virginia Housing Development Authority, | Aaa/AAA | 267,183 | ||||||
| 267,183 | ||||||||||
Total Investments | 94.3 | % | $ | 27,249,782 | ||||||
Other Assets and | 5.7 | 1,637,065 | ||||||||
Net Assets | 100.0 | % | $ | 28,886,847 | ||||||
| (1) | Credit ratings are provided by Moody’s Investor’s Service, Inc. and Standard’s and Poor’s Rating Group and are not audited. |
| C | Bond may be called prior to maturity date. |
| Z | Indicates Zero Coupon Bond; rate shown reflects current effective yield. |
| * | Cost for federal income tax purposes is the same as for financial statement purposes. |
Net unrealized depreciation consists of: | ||||
Gross Unrealized Appreciation | $ | 385,111 | ||
Gross Unrealized Depreciation | (1,140,818 | ) | ||
Net Unrealized Depreciation | $ | (755,707 | ) | |
See Accompanying Notes to Financial Statements
88
Table of Contents
| ING CLASSIC MONEY MARKET FUND(1) | PORTFOLIO OF INVESTMENTS ASOF MARCH 31, 2008 |
| Principal Amount | Value | |||||||
| CERTIFICATES OF DEPOSIT: 3.4% | ||||||||
| $ | 11,700,000 | Canadian Imperial Bank of Commerce, | $ | 11,698,515 | ||||
| 1,500,000 | Societe Generale, | 1,502,576 | ||||||
| 38,000,000 | UBS AG, | 38,000,000 | ||||||
Total Certificates of Deposit | 51,201,091 | |||||||
| COMMERCIAL PAPER: 43.7% | ||||||||
| 21,000,000 | ANZ National International Ltd., | 20,910,458 | ||||||
| 24,000,000 | ASB Finance Ltd., | 23,791,050 | ||||||
| 50,000,000 | Barton Capital, LLC, | 49,995,763 | ||||||
| 25,000,000 | Cafco, LLC, | 25,000,000 | ||||||
| 15,000,000 | Commercial Paper Direct, 3.040%, due 04/03/08 | 14,997,467 | ||||||
| 53,000,000 | Concord Minutemen Capital Co., LLC, | 52,919,175 | ||||||
| 62,000,000 | Crown Point Capital Co., 5.100%, due 04/16/08 | 61,932,656 | ||||||
| 29,000,000 | Edison Asset Securitization, LLC, | 28,824,780 | ||||||
| 41,000,000 | General Electric Capital Corp., | 40,702,704 | ||||||
| 57,556,000 | # | Old Line Funding, LLC, | 57,447,084 | |||||
| 51,987,000 | Park Avenue, | 51,807,616 | ||||||
| 1,000,000 | Royal Bank of Scotland, | 993,067 | ||||||
| 56,922,000 | Thunder Bay Funding, LLC, 3.140%, due 04/10/08 | 56,822,454 | ||||||
| 43,000,000 | # | Tulip Funding Corp., | 42,896,220 | |||||
| 40,500,000 | Variable Funding Capital, 3.110%, due 04/25/08 | 40,345,048 | ||||||
| 50,000,000 | Windmill Funding Corp., 4.500%, due 04/10/08 | 49,959,581 | ||||||
| 51,250,000 | Yorktown Capital, LLC, | 51,020,463 | ||||||
Total Commercial Paper | 670,365,586 | |||||||
| CORPORATE BONDS/NOTES: 43.4% | ||||||||
| 6,000,000 | @@, # | ABN AMRO Bank N.V., | 6,002,652 | |||||
| 3,000,000 | # | Allstate Financial Global Funding, | 2,980,863 | |||||
| 4,000,000 | Allstate Life Global Funding Trusts, | 4,000,152 | ||||||
| Principal Amount | Value | |||||||
| $ | 3,000,000 | American Express Bank FSB, | $ | 2,999,614 | ||||
| 11,300,000 | American Express Bank FSB, | 11,287,100 | ||||||
| 2,500,000 | American Express Bank FSB, | 2,483,329 | ||||||
| 3,000,000 | American Express Centurion Bank, | 2,990,266 | ||||||
| 6,000,000 | American Express Credit Corp., | 6,000,040 | ||||||
| 1,275,000 | American Express Credit Corp., | 1,269,161 | ||||||
| 3,250,000 | American Express Credit Corp., | 3,240,604 | ||||||
| 23,500,000 | # | American General Finance Corp., | 23,501,844 | |||||
| 2,700,000 | American General Finance Corp., | 2,693,194 | ||||||
| 3,000,000 | American General Finance Corp., | 2,992,174 | ||||||
| 4,000,000 | # | American Honda Finance Corp., | 3,996,018 | |||||
| 2,750,000 | # | American Honda Finance Corp., | 2,747,878 | |||||
| 700,000 | # | American International Group, Inc., | 700,032 | |||||
| 2,950,000 | C | American International Group, Inc., | 2,940,818 | |||||
| 6,750,000 | @@, # | ANZ National International Ltd., | 6,752,873 | |||||
| 1,800,000 | @@, # | ANZ National International Ltd., | 1,797,792 | |||||
| 18,500,000 | @@, #, C | Australia & New Zealand Banking Group Ltd., | 18,500,000 | |||||
| 4,600,000 | @@, # | Banco Santander Totta SA, | 4,600,078 | |||||
| 12,250,000 | Bank of America NA, | 12,250,000 | ||||||
| 3,750,000 | # | Bank of New York Mellon Corp., | 3,750,000 | |||||
| 4,200,000 | @@, # | Bank of Scotland PLC, | 4,200,000 | |||||
| 13,500,000 | @@, # | Bank of Scotland PLC, | 13,540,311 | |||||
See Accompanying Notes to Financial Statements
89
Table of Contents
| ING CLASSIC MONEY MARKET FUND(1) | PORTFOLIO OF INVESTMENTS ASOF MARCH 31, 2008 (CONTINUED) |
| Principal Amount | Value | |||||||
| CORPORATE BONDS/NOTES (continued) | ||||||||
| $ | 2,055,000 | @@, # | Bank of Scotland PLC, | $ | 2,043,965 | |||
| 3,500,000 | Bank One Corp., | 3,506,832 | ||||||
| 1,475,000 | Bank One Corp., | 1,465,106 | ||||||
| 5,725,000 | I | Bear Stearns Cos., Inc., | 5,725,000 | |||||
| 5,800,000 | I | Bear Stearns Cos., Inc., | 5,800,000 | |||||
| 6,260,000 | I | Bear Stearns Cos., Inc., | 6,260,794 | |||||
| 7,400,000 | I | Bear Stearns Cos., Inc., | 7,347,127 | |||||
| 11,500,000 | @@ | BNP Paribas, | 11,500,000 | |||||
| 16,750,000 | @@ | BNP Paribas Finance, Inc., | 16,761,343 | |||||
| 4,000,000 | Canadian Imperial Bank of Commerce, | 4,000,309 | ||||||
| 3,000,000 | Citigroup Funding, Inc., | 2,996,377 | ||||||
| 4,800,000 | Citigroup Funding, Inc., | 4,787,987 | ||||||
| 8,000,000 | Citigroup, Inc., | 7,999,845 | ||||||
| 1,900,000 | Citigroup, Inc., | 1,891,800 | ||||||
| 7,212,000 | Citigroup, Inc., | 7,217,211 | ||||||
| 18,500,000 | @@, # | Commonwealth Bank of Australia, | 18,489,406 | |||||
| 14,000,000 | Credit Suisse First Boston USA, Inc., | 13,995,851 | ||||||
| 5,690,000 | Credit Suisse First Boston USA, Inc., | 5,690,253 | ||||||
| 3,500,000 | Credit Suisse First Boston USA, Inc., | 3,515,575 | ||||||
| 8,600,000 | @@, # | Danske Bank A/S, | 8,599,744 | |||||
| 22,000,000 | Deutsche Bank AG, | 22,001,209 | ||||||
| 7,000,000 | @@ | Deutsche Bank AG, | 6,984,944 | |||||
| 3,000,000 | General Electric Capital Corp., | 2,984,146 | ||||||
| 1,000,000 | General Electric Capital Corp., | 998,676 | ||||||
| 15,000,000 | I | Goldman Sachs Group LP, | 15,000,000 | |||||
| 8,600,000 | Goldman Sachs Group, Inc., 2.639%, due 12/23/08 | 8,554,930 | ||||||
| 9,300,000 | # | Goldman Sachs Group, Inc., 2.888%, due 09/12/08 | 9,300,796 | |||||
| 9,000,000 | Goldman Sachs Group, Inc., 3.406%, due 07/29/08 | 8,986,339 | ||||||
| Principal Amount | Value | |||||||
| $ | 16,085,000 | @@, # | HBOS Treasury Services PLC, | $ | 16,085,000 | |||
| 3,250,000 | HSBC Finance Corp., | 3,248,726 | ||||||
| 21,250,000 | HSBC Finance Corp., | 21,299,717 | ||||||
| 5,000,000 | JPMorgan Chase & Co., | 5,015,691 | ||||||
| 1,800,000 | Lehman Brothers Holdings, Inc., 4.733%, due 04/02/08 | 1,799,997 | ||||||
| 4,286,000 | Lehman Brothers Holdings, Inc., 5.448%, due 08/07/08 | 4,257,300 | ||||||
| 3,400,000 | MBNA Corp., | 3,401,391 | ||||||
| 5,000,000 | Merrill Lynch & Co., Inc., | 4,985,635 | ||||||
| 26,500,000 | Merrill Lynch & Co., Inc., | 26,489,563 | ||||||
| 3,000,000 | Merrill Lynch & Co., Inc., | 2,996,794 | ||||||
| 800,000 | Merrill Lynch & Co., Inc., | 804,019 | ||||||
| 2,190,000 | Merrill Lynch & Co., Inc., | 2,202,362 | ||||||
| 7,145,000 | Merrill Lynch & Co., Inc., | 7,138,556 | ||||||
| 1,400,000 | Merrill Lynch & Co., Inc., | 1,390,804 | ||||||
| 12,000,000 | Morgan Stanley, | 12,000,000 | ||||||
| 5,000,000 | Morgan Stanley, | 5,001,752 | ||||||
| 5,000,000 | Morgan Stanley, | 5,000,000 | ||||||
| 6,000,000 | Morgan Stanley, | 6,000,190 | ||||||
| 7,500,000 | Royal Bank of Canada, | 7,499,997 | ||||||
| 9,000,000 | @@, # | Royal Bank of Scotland Group PLC, | 9,000,859 | |||||
| 3,000,000 | Royal Bank of Scotland Group PLC, | 2,999,961 | ||||||
| 8,000,000 | @@, # | Santander U.S. Debt SA Unipersonal, | 7,994,100 | |||||
| 2,000,000 | @@, # | Santander U.S. Debt SA Unipersonal, | 1,999,948 | |||||
| 10,000,000 | SunTrust Bank, | 9,999,441 | ||||||
| 2,000,000 | SunTrust Bank, | 2,003,719 | ||||||
| 5,210,000 | SunTrust Bank, | 5,184,087 | ||||||
| 12,000,000 | Toyota Motor Credit Corp., 2.310%, due 10/20/08 | 11,960,811 | ||||||
| 26,000,000 | Toyota Motor Credit Corp., 2.340%, due 06/16/08 | 25,998,792 | ||||||
| 7,250,000 | Wachovia Bank NA, | 7,226,306 | ||||||
See Accompanying Notes to Financial Statements
90
Table of Contents
| ING CLASSIC MONEY MARKET FUND(1) | PORTFOLIO OF INVESTMENTS ASOF MARCH 31, 2008 (CONTINUED) |
| Principal Amount | Value | |||||||
| CORPORATE BONDS/NOTES (continued) | ||||||||
| $ | 1,500,000 | Wachovia Bank NA, | $ | 1,491,288 | ||||
| 20,000,000 | Wachovia Bank NA, | 20,007,142 | ||||||
| 4,900,000 | Wachovia Bank NA, | 4,905,381 | ||||||
| 2,000,000 | Wachovia Corp., | 1,999,488 | ||||||
| 1,000,000 | Wachovia Corp., | 998,595 | ||||||
| 1,250,000 | Wachovia Corp., | 1,248,417 | ||||||
| 18,000,000 | Washington Mutual Bank, 3.981%, due 04/18/08 | 17,998,395 | ||||||
| 9,000,000 | # | Wells Fargo & Co., | 9,001,889 | |||||
| 1,000,000 | Wells Fargo & Co., | 1,003,718 | ||||||
| 8,000,000 | # | Westpac Banking Corp., | 8,001,252 | |||||
| 3,300,000 | Westpac Banking Corp., | 3,300,000 | ||||||
| 12,250,000 | @@, # | Westpac Banking Corp., | 12,250,000 | |||||
Total Corporate Bonds/Notes | 665,813,441 | |||||||
| U.S. GOVERNMENT AGENCY OBLIGATIONS: 3.5% | ||||||||
| 54,000,000 | Federal Home Loan Bank, | 53,961,653 | ||||||
Total U.S. Government Agency Obligations | 53,961,653 | |||||||
| Principal Amount | Value | ||||||||
| REPURCHASE AGREEMENT: 5.5% | |||||||||
| $ | 84,248,000 | Deutsche Bank Repurchase Agreement dated 03/31/08, | $ | 84,248,000 | |||||
Total Repurchase Agreement | 84,248,000 | ||||||||
Total Investments in Securities | 99.5 | % | $ | 1,525,589,771 | |||||
Other Assets and Liabilities - Net | 0.5 | 7,729,487 | |||||||
Net Assets | 100.0 | % | $ | 1,533,319,258 | |||||
| (1) | All securities with a maturity date of greater than 13 months have either a variable rate, a demand feature, prerefunded, optional or mandatory put resulting in a maturity of one year or less. Rate shown reflects current rate. |
| @@ | Foreign Issuer |
| # | Securities with purchases pursuant to Rule 144A or section 4(2), under the Securities Act of 1933 and may not be resold subject to that rule except to qualified institutional buyers. Unless otherwise footnoted, these securities have been determined to be liquid under the guidelines established by the Funds’ Board of Directors/Trustees. |
| C | Bond may be called prior to maturity date. |
| I | Illiquid security. |
| * | Cost for federal income tax purposes is the same as for financial statement purposes. |
See Accompanying Notes to Financial Statements
91
Table of Contents
| ING INSTITUTIONAL PRIME MONEY MARKET FUND(1) | PORTFOLIO OF INVESTMENTS ASOF MARCH 31, 2008 |
| Principal Amount | Value | |||||||
| CERTIFICATES OF DEPOSIT: 0.6% | ||||||||
| $ | 5,000,000 | UBS AG, | $ | 5,000,000 | ||||
Total Certificates of Deposit | 5,000,000 | |||||||
| COMMERCIAL PAPER: 41.8% | ||||||||
| 5,000,000 | ANZ National International Ltd., 3.070%, due 05/21/08 | 4,978,681 | ||||||
| 7,300,000 | ASB Finance Ltd., | 7,252,891 | ||||||
| 33,418,000 | Barton Capital, LLC, | 33,415,360 | ||||||
| 20,000,000 | Cafco, LLC, | 20,000,000 | ||||||
| 24,800,000 | Concord Minutemen Capital Co., LLC, | 24,770,208 | ||||||
| 36,026,000 | Crown Point Capital Co., 5.100%, due 04/16/08 | 36,002,500 | ||||||
| 13,400,000 | Edison Asset Securitization, LLC, 2.650%, due 08/04/08 | 13,327,390 | ||||||
| 15,000,000 | General Electric Capital Corp., 2.510%, due 07/14/08 | 14,891,233 | ||||||
| 15,314,000 | Jupiter Securities Co., LLC, 3.050%, due 04/04/08 | 15,312,557 | ||||||
| 27,998,000 | # | Old Line Funding, LLC, 3.200%, due 04/11/08 | 27,963,609 | |||||
| 34,360,000 | Park Avenue, | 34,322,916 | ||||||
| 1,000,000 | Royal Bank of Scotland, 3.900%, due 06/04/08 | 993,067 | ||||||
| 27,076,000 | Thunder Bay Funding, LLC, 3.140%, due 04/10/08 | 27,034,607 | ||||||
| 23,923,000 | # | Tulip Funding Corp., | 23,880,910 | |||||
| 13,500,000 | Variable Funding Capital, 3.110%, due 04/25/08 | 13,446,257 | ||||||
| 3,800,000 | Westpac Banking Corp., 3.200%, due 04/03/08 | 3,799,258 | ||||||
| 15,000,000 | Windmill Funding Corp., 3.150%, due 04/10/08 | 14,988,463 | ||||||
| 18,219,000 | Yorktown Capital, LLC, 5.305%, due 04/01/08 | 18,141,315 | ||||||
Total Commercial Paper | 334,521,222 | |||||||
| CORPORATE BONDS/NOTES: 47.7% | ||||||||
| 5,000,000 | @@, # | ABN AMRO Bank N.V., 4.001%, due 04/18/08 | 5,002,210 | |||||
| 4,500,000 | Allstate Life Global Funding Trusts, | 4,500,258 | ||||||
| 5,000,000 | American Express Bank FSB, 2.828%, due 10/16/08 | 4,994,658 | ||||||
| 5,000,000 | American Express Credit Corp., | 5,000,034 | ||||||
| 2,000,000 | American Express Credit Corp., | 1,994,180 | ||||||
| Principal Amount | Value | |||||||
| $ | 21,000,000 | # | American General Finance Corp., | $ | 21,002,662 | |||
| 8,025,000 | C | American International Group, Inc., | 8,000,647 | |||||
| 3,000,000 | @@, # | ANZ National International Ltd., 4.447%, due 04/14/08 | 3,001,277 | |||||
| 2,000,000 | @@, # | ANZ National International Ltd., 5.302%, due 05/16/08 | 1,997,547 | |||||
| 3,500,000 | @@, # | Banco Santander Totta SA, 2.828%, due 08/15/08 | 3,500,059 | |||||
| 3,000,000 | Bank of America NA, | 3,000,000 | ||||||
| 3,750,000 | Bank One Corp., | 3,757,320 | ||||||
| 3,600,000 | Banque Nationale de Paris, 2.640%, due 07/03/08 | 3,599,267 | ||||||
| 500,000 | I | Bear Stearns Cos., Inc., | 500,000 | |||||
| 2,515,000 | I | Bear Stearns Cos., Inc., | 2,515,273 | |||||
| 1,763,000 | I | Bear Stearns Cos., Inc., | 1,751,739 | |||||
| 5,000,000 | @@ | BNP Paribas, | 5,000,000 | |||||
| 7,500,000 | @@ | BNP Paribas Finance, Inc., 2.770%, due 06/16/08 | 7,505,079 | |||||
| 10,000,000 | Canadian Imperial Bank of Commerce, | 10,000,773 | ||||||
| 5,000,000 | Citigroup Funding, Inc., 2.360%, due 10/03/08 | 4,993,928 | ||||||
| 1,000,000 | Citigroup Funding, Inc., 3.256%, due 03/02/09 | 997,497 | ||||||
| 1,900,000 | Citigroup, Inc., | 1,900,044 | ||||||
| 5,000,000 | @@, # | Commonwealth Bank of Australia, | 4,997,137 | |||||
| 11,500,000 | Credit Suisse First Boston USA, Inc., | 11,496,634 | ||||||
| 1,100,000 | Credit Suisse First Boston USA, Inc., | 1,100,148 | ||||||
| 2,000,000 | Credit Suisse First Boston USA, Inc., | 1,998,001 | ||||||
| 10,000,000 | @@, # | Danske Bank A/S, | 9,999,707 | |||||
| 22,000,000 | Deutsche Bank AG, | 22,001,209 | ||||||
| 15,595,000 | Federal Home Loan Bank, 3.000%, due 04/15/09 | 15,721,938 | ||||||
| 1,000,000 | General Electric Capital Corp., | 994,715 | ||||||
| 2,000,000 | General Electric Capital Corp., | 2,008,993 | ||||||
| 1,400,000 | General Electric Capital Corp., | 1,400,610 | ||||||
| 10,000,000 | I | Goldman Sachs Group LP, 3.030%, due 04/11/08 | 10,000,000 | |||||
See Accompanying Notes to Financial Statements
92
Table of Contents
| ING INSTITUTIONAL PRIME MONEY MARKET FUND(1) | PORTFOLIO OF INVESTMENTS AS OF MARCH 31, 2008 (CONTINUED) |
| Principal Amount | Value | |||||||
| $ | 6,000,000 | # | Goldman Sachs Group, Inc., 2.888%, due 09/12/08 | $ | 6,001,194 | |||
| 3,000,000 | Goldman Sachs Group, Inc., 3.406%, due 07/29/08 | 2,994,032 | ||||||
| 1,500,000 | @@, # | HBOS Treasury Services PLC, 2.669%, due 06/24/08 | 1,500,000 | |||||
| 5,470,000 | HSBC Finance Corp., | 5,469,980 | ||||||
| 3,000,000 | HSBC Finance Corp., | 2,998,824 | ||||||
| 13,000,000 | HSBC Finance Corp., | 13,028,292 | ||||||
| 2,000,000 | JPMorgan Chase & Co., 3.162%, due 03/15/09 | 2,006,277 | ||||||
| 2,000,000 | JPMorgan Chase & Co., 5.309%, due 05/01/08 | 1,997,263 | ||||||
| 2,000,000 | Lehman Brothers Holdings, Inc., 2.734%, due 05/29/08 | 2,000,139 | ||||||
| 5,000,000 | Lehman Brothers Holdings, Inc., 3.115%, due 05/29/08 | 5,000,305 | ||||||
| 1,700,000 | Lehman Brothers Holdings, Inc., 4.733%, due 04/02/08 | 1,699,997 | ||||||
| 4,850,000 | Lehman Brothers Holdings, Inc., 3.500%, due 08/07/08 | 4,817,477 | ||||||
| 4,066,000 | MBNA Corp., | 4,067,595 | ||||||
| 20,500,000 | Merrill Lynch & Co., Inc., 3.058%, due 08/22/08 | 20,497,913 | ||||||
| 4,500,000 | Merrill Lynch & Co., Inc., 3.700%, due 04/21/08 | 4,495,993 | ||||||
| 13,000,000 | Morgan Stanley, | 13,004,031 | ||||||
| 6,200,000 | Morgan Stanley, | 6,201,377 | ||||||
| 5,000,000 | Morgan Stanley, | 5,000,161 | ||||||
| 4,500,000 | Morgan Stanley, | 4,502,151 | ||||||
| 4,500,000 | Royal Bank of Canada, 2.305%, due 04/02/08 | 4,499,998 | ||||||
| 3,100,000 | Royal Bank of Scotland, 2.640%, due 07/03/08 | 3,099,373 | ||||||
| 9,000,000 | @@, # | Royal Bank of Scotland Group PLC, | 9,000,857 | |||||
| 2,300,000 | @@, # | Royal Bank of Scotland Group PLC, | 2,300,018 | |||||
| 4,000,000 | @@, # | Santander U.S. Debt SA Unipersonal, | 3,997,050 | |||||
| 4,000,000 | @@, # | Santander U.S. Debt SA Unipersonal, | 3,992,569 | |||||
| 6,000,000 | SunTrust Bank, | 5,999,665 | ||||||
| 2,000,000 | SunTrust Bank, | 2,000,006 | ||||||
| 7,325,000 | SunTrust Bank, | 7,338,222 | ||||||
| 5,000,000 | Toyota Motor Credit Corp., 2.310%, due 10/20/08 | 4,983,671 | ||||||
| 15,000,000 | Toyota Motor Credit Corp., 2.340%, due 06/16/08 | 14,998,254 | ||||||
| Principal Amount | Value | |||||||
| $ | 5,000,000 | Wachovia Bank NA, | $ | 5,001,748 | ||||
| 1,000,000 | Wachovia Bank NA, | 1,010,617 | ||||||
| 2,000,000 | Wachovia Bank NA, | 1,985,940 | ||||||
| 1,500,000 | Wachovia Corp., | 1,499,616 | ||||||
| 9,000,000 | # | Wells Fargo & Co., | 9,001,889 | |||||
| 500,000 | Wells Fargo & Co., | 500,009 | ||||||
| 3,500,000 | # | Westpac Banking Corp., 2.871%, due 07/11/08 | 3,500,548 | |||||
| 3,000,000 | @@, # | Westpac Banking Corp., 3.278%, due 03/27/09 | 3,000,000 | |||||
Total Corporate Bonds/Notes | 381,226,595 | |||||||
| U.S. GOVERNMENT AGENCY OBLIGATIONS: 0.1% | ||||||
| 1,000,000 | C | Fannie Mae, 4.100%, due 04/20/09 | 1,018,735 | |||
Total U.S. Government Agency Obligations ( Cost $1,018,735) | 1,018,735 | |||||
| REPURCHASE AGREEMENT: 10.0% | |||||||||
| 80,264,000 | Deutsche Bank Repurchase Agreement dated 03/31/08, 2.250%, due 04/01/08, $80,269,017 to be received upon repurchase (Collateralized by $125,016,000 various U.S. Government Agency Obligations, 0.000%-4.250%, Market Value plus accrued interest $81,869,311, due 03/04/10-01/15/28) |
| 80,264,000 | ||||||
Total Repurchase Agreement |
| 80,264,000 | |||||||
Total Investments in Securities | 100.2 | % | $ | 802,030,552 | |||||
Other Assets and | (0.2 | ) | (1,980,299 | ) | |||||
Net Assets | 100.0 | % | $ | 800,050,253 | |||||
See Accompanying Notes to Financial Statements
93
Table of Contents
| ING INSTITUTIONAL PRIME MONEY MARKET FUND(1) | PORTFOLIO OF INVESTMENTS AS OF MARCH 31, 2008 (CONTINUED) |
| (1) | All securities with a maturity date of greater than 13 months have either a variable rate, a demand feature, prerefunded, optional or mandatory put resulting in a maturity of one year or less. Rate shown reflects current rate. |
| @@ | Foreign Issuer |
| # | Securities with purchases pursuant to Rule144A or section 4(2), under the Securities Act of 1933 and may not be resold subject to that rule except to qualified institutional buyers. Unless otherwise footnoted, these securities have been determined to be liquid under the guidelines established by the Funds’ Board of Directors/Trustees. |
| C | Bond may be called prior to maturity date. |
| I | Illiquid security. |
| * | Cost for federal income tax purposes is the same as for financial statement purposes. |
See Accompanying Notes to Financial Statements
94
Table of Contents
SHAREHOLDER MEETING INFORMATION (UNAUDITED)
A special meeting of shareholders of ING Funds Trust was held October 25, 2007, at the offices of ING Funds, 7337 East Doubletree Ranch Road, Scottsdale, AZ 85258.
A brief description of each matter voted upon as well as the results are outlined below:
Matters:
| 1 | To approve the election of eleven nominees to the Board of Trustees of the Funds. |
| 2 | To approve a “Manager-of-Managers” arrangement for certain Funds to permit the Funds’ investment adviser, subject to prior approval by the Board, to enter into and materially amend agreements with unaffiliated sub-advisers without obtaining the approval of the Funds’ shareholders. |
| 3 | To approve the conversion of certain Funds’ investment objectives from fundamental to non-fundamental. |
| 4 | To approve modifications to ING GNMA Income Fund’s fundamental investment restriction governing borrowing. |
| 5 | To approve modifications to ING GNMA Income Fund’s fundamental investment restriction regarding lending. |
Results:
Proposal* | Shares voted for | Shares voted | Shares | Broker non- | Total Shares | |||||||
| Colleen D. Baldwin | 1 | 882,192,757 | 4,473,471 | — | — | 886,666,228 | ||||||
| John V. Boyer | 1 | 882,249,232 | 4,416,996 | — | — | 886,666,228 | ||||||
| Patricia W. Chadwick | 1 | 882,194,975 | 4,471,253 | — | — | 886,666,228 | ||||||
| Robert W. Crispin | 1 | 882,259,733 | 4,406,495 | — | — | 886,666,228 | ||||||
| Peter S. Drotch | 1 | 882,284,187 | 4,382,041 | — | — | 886,666,228 | ||||||
| J. Michael Earley | 1 | 882,259,257 | 4,406,971 | — | — | 886,666,228 | ||||||
| Patrick W. Kenny | 1 | 882,481,019 | 4,185,209 | — | — | 886,666,228 | ||||||
| Shaun P. Mathews | 1 | 882,550,843 | 4,115,385 | — | — | 886,666,228 | ||||||
| Sheryl K. Pressler | 1 | 882,188,705 | 4,477,523 | — | — | 886,666,228 | ||||||
| David W.C. Putnam | 1 | 882,241,694 | 4,424,534 | — | — | 886,666,228 | ||||||
| Roger B. Vincent | 1 | 882,497,945 | 4,168,283 | — | — | 886,666,228 | ||||||
| ING Classic Money Market Fund | 2 | 39,961,116 | 3,468,003 | 2,491,718 | 15,574,027 | 61,494,864 | ||||||
| ING GNMA Income Fund | 2 | 29,151,567 | 3,025,675 | 1,089,428 | 8,740,672 | 42,007,342 | ||||||
| ING GNMA Income Fund | 3 | 27,727,384 | 3,507,362 | 2,031,924 | 8,740,672 | 42,007,342 | ||||||
| ING GNMA Income Fund | 4 | 29,115,225 | 2,259,665 | 1,891,780 | 8,740,672 | 42,007,342 | ||||||
| ING GNMA Income Fund | 5 | 28,971,974 | 2,280,573 | 2,014,123 | 8,740,672 | 42,007,342 | ||||||
| ING High Yield Bond Fund | 2 | 6,619,251 | 640,305 | 338,796 | 3,775,618 | 11,373,970 | ||||||
| ING Intermediate Bond Fund | 2 | 30,852,268 | 4,597,000 | 790,133 | 16,032,709 | 52,272,110 | ||||||
| ING National Tax-Exempt Bond Fund* | 2 | 2,197,433 | 13,340 | 17,361 | 201,066 | 2,429,200 |
| *The | Shareholder Meeting for all proposals was adjourned to November 21, 2007. |
95
Table of Contents
SHAREHOLDER MEETING INFORMATION (UNAUDITED) (CONTINUED)
A special meeting of shareholders of ING Funds Trust was held November 21, 2007, at the offices of ING Funds, 7337 East Doubletree Ranch Road, Scottsdale, AZ 85258.
A brief description of each matter voted upon as well as the results are outlined below:
Matters:
| 1 | To approve the election of eleven nominees to the Boards of Directors/Trustees of the Funds. |
| 2 | To approve a “Manager-of-Managers” arrangement for certain Funds to permit the Funds’ investment adviser, subject to prior approval by the Board, to enter into and materially amend agreements with unaffiliated sub-advisers without obtaining the approval of the Funds’ shareholders. |
| 3 | To approve the conversion of certain Funds’ investment objectives from fundamental to non-fundamental. |
Results:
Proposal | Shares voted for | Shares voted | Shares | Broker non- | Total Shares | |||||||
| Colleen D. Baldwin | 1 | 985,745,915 | 8,169,155 | — | — | 993,915,070 | ||||||
| John V. Boyer | 1 | 985,806,386 | 8,108,684 | — | — | 993,915,070 | ||||||
| Patricia W. Chadwick | 1 | 985,769,021 | 8,146,049 | — | — | 993,915,070 | ||||||
| Robert W. Crispin | 1 | 985,806,575 | 8,108,495 | — | — | 993,915,070 | ||||||
| Peter S. Drotch | 1 | 985,786,099 | 8,128,971 | — | — | 993,915,070 | ||||||
| J. Michael Earley | 1 | 985,814,783 | 8,100,287 | — | — | 993,915,070 | ||||||
| Patrick W. Kenny | 1 | 986,038,172 | 7,876,898 | — | — | 993,915,070 | ||||||
| Shaun P. Mathews | 1 | 986,105,018 | 7,810,052 | — | — | 993,915,070 | ||||||
| Sheryl K. Pressler | 1 | 985,752,027 | 8,163,043 | — | — | 993,915,070 | ||||||
| David W.C. Putnam | 1 | 985,797,220 | 8,117,850 | — | — | 993,915,070 | ||||||
| Roger B. Vincent | 1 | 986,047,724 | 7,867,346 | — | — | 993,915,070 | ||||||
| ING Classic Money Market Fund* | 2 | 141,214,125 | 6,017,847 | 4,007,715 | 5,708,610 | 156,948,297 | ||||||
| ING High Yield Bond Fund** | 2 | 7,415,444 | 681,169 | 369,144 | 3,127,135 | 11,592,892 | ||||||
| ING Intermediate Bond Fund*** | 2 | 39,303,742 | 4,946,484 | 1,052,804 | 14,534,713 | 59,837,744 | ||||||
| ING National Tax-Exempt Bond Fund | 2 | 2,214,025 | 14,142 | 17,361 | 187,468 | 2,432,996 | ||||||
| ING GNMA Income Fund | 2 | 33,631,839 | 3,085,955 | 1,247,736 | 8,113,797 | 46,079,327 | ||||||
| ING GNMA Income Fund | 3 | 32,128,906 | 3,638,770 | 2,197,854 | 8,113,797 | 46,079,327 |
| *The | Shareholder Meeting for ING Classic Money Market Fund was adjourned to December 17, 2007. |
| **The | Shareholder Meeting for ING High Yield Bond Fund was adjourned to December 17, 2007. |
| ***The | Shareholder Meeting for ING Intermediate Bond Fund was adjourned to December 17, 2007. |
96
Table of Contents
SHAREHOLDER MEETING INFORMATION (UNAUDITED) (CONTINUED)
A special meeting of shareholders of ING Funds Trust was held December 17, 2007, at the offices of ING Funds, 7337 East Doubletree Ranch Road, Scottsdale, AZ 85258.
A brief description of each matter voted upon as well as the results are outlined below:
Matter:
| 1 | To approve a “Manager-of-Managers” arrangement for certain Funds to permit the Funds’ investment adviser, subject to prior approval by the Board, to enter into and materially amend agreements with unaffiliated sub-advisers without obtaining the approval of the Funds’ shareholders. |
Results:
Proposal | Shares voted for | Shares voted | Shares | Broker non- | Total Shares | |||||||
| ING Classic Money Market Fund | 1 | 445,724,201 | 32,130,357 | 17,583,563 | 13,664,772 | 509,102,893 | ||||||
| ING High Yield Bond Fund | 1 | 8,444,248 | 741,454 | 438,074 | 2,555,906 | 12,179,682 | ||||||
| ING Intermediate Bond Fund | 1 | 44,775,416 | 5,258,214 | 1,549,932 | 13,281,555 | 64,865,117 |
97
Table of Contents
Dividends paid during the year ended March 31, 2008 were as follows:
Fund Name | Type | Per Share Amount | |||
ING GNMA Income Fund | |||||
Class A | NII | $ | 0.3775 | ||
Class B | NII | $ | 0.3147 | ||
Class C | NII | $ | 0.3151 | ||
Class I | NII | $ | 0.4002 | ||
Class Q | NII | $ | 0.3830 | ||
Class W * | NII | $ | 0.1041 | ||
ING High Yield Bond Fund | |||||
Class A | NII | $ | 0.6688 | ||
Class B | NII | $ | 0.6040 | ||
Class C | NII | $ | 0.6036 | ||
ING Intermediate Bond Fund | |||||
Class A | NII | $ | 0.4640 | ||
Class B | NII | $ | 0.3865 | ||
Class C | NII | $ | 0.3875 | ||
Class I | NII | $ | 0.4976 | ||
Class O | NII | $ | 0.4638 | ||
Class R | NII | $ | 0.4395 | ||
Class W * | NII | $ | 0.1924 | ||
ING National Tax-Exempt Bond Fund | |||||
Class A | NII | $ | 0.0026 | ||
Class B | NII | $ | 0.0021 | ||
Class C | NII | $ | 0.0021 | ||
Class A | TEI | $ | 0.3891 | ||
Class B | TEI | $ | 0.3130 | ||
Class C | TEI | $ | 0.3140 | ||
ING Classic Money Market Fund | |||||
Class A | NII | $ | 0.0431 | ||
Class B | NII | $ | 0.0371 | ||
Class C | NII | $ | 0.0370 | ||
ING Institutional Prime Money Market Fund | |||||
Class I | NII | $ | 0.0488 | ||
Class IS ** | NII | $ | 0.0134 | ||
NII - Net investment income
TEI - Tax-exempt income
* Commenced operations December 17, 2007.
** Commenced operations December 5, 2007.
Of the ordinary distributions made during the year ended March 31, 2008, the following percentage qualifies for the dividends received deduction (DRD) available to corporate shareholders:
ING Intermediate Bond Fund | 0.51% |
For the year ended March 31, 2008, the following percentage of net investment income dividends paid by the Funds is designated as qualifying dividend income (QDI) subject to reduced income tax rates for individuals:
ING Intermediate Bond Fund | 0.86% |
98
Table of Contents
TAX INFORMATION (UNAUDITED) (CONTINUED)
Pursuant to Internal Revenue Code Section 871(k)(1), the Funds designate the following percentages of net investment income distributions as interest-related dividends:
ING GNMA Income Fund | 98.50% | |
ING High Yield Bond Fund | 96.33% | |
ING Intermediate Bond Fund | 84.42% | |
ING National Tax-Exempt Bond Fund | 100.00% | |
ING Classic Money Market Fund | 100.00% | |
ING Institutional Money Market Fund | 100.00% |
Pursuant to Internal Revenue Code Section 871(k)(2), the Funds designate the following percentage of net investment income distributions as short-term capital gain dividends:
ING Institutional Money Market Fund | 100.00% |
Above figures may differ from those cited elsewhere in this report due to differences in the calculation of income and gains under U.S. generally accepted accounting principles (book) purposes and Internal Revenue Service (tax) purposes.
Shareholders are strongly advised to consult their own tax advisers with respect to the tax consequences of their investments in the Funds. In January, shareholders, excluding corporate shareholders, receive an IRS 1099-DIV regarding the federal tax status of the dividends and distributions they received in the calendar year.
99
Table of Contents
TRUSTEE AND OFFICER INFORMATION (UNAUDITED)
The business and affairs of the Trust are managed under the direction of the Board. A Trustee who is not an interested person of the Trust, as defined in the 1940 Act, is an independent trustee (“Independent Trustee”). The Trustees and Officers of the Trust are listed below. The Statement of Additional Information includes additional information about trustees of the Fund and is available, without charge, upon request at (800) 992-0180.
Name, Address and Age | Position(s) | Term of Office | Principal Occupation(s) during the Past Five Years | Number of | Other Directorships | |||||
Independent Trustees: | ||||||||||
Colleen D. Baldwin 7337 E. Doubletree Ranch Rd. Scottsdale, Arizona 85258 Age: 47 | Trustee | November 2007 - Present | Consultant (January 2005 - Present). Formerly, Chief Operating Officer, Ivy Asset Management Group (April 2002 - October 2004). | 184 | None | |||||
John V. Boyer 7337 E. Doubletree Ranch Rd. Scottsdale, Arizona 85258 Age: 54 | Trustee | January 2005 - Present | President, Bechtler Arts Foundation (March 2008 - Present), Consultant (July 2007 - Present). Formerly, President and Chief Executive Officer, Franklin and Eleanor Roosevelt Institute (March 2006 - July 2007), and Executive Director, The Mark Twain House & Museum(3) (September 1989 - November 2005). | 184 | None | |||||
Patricia W. Chadwick Scottsdale, Arizona 85258 Age: 59 | Trustee | January 2006 - Present | Consultant and President of self-owned company, Ravengate Partners LLC (January 2000 - Present). | 184 | Wisconsin Energy (June 2006 - Present). | |||||
Peter S. Drotch 7337 E. Doubletree Ranch Rd. Scottsdale, Arizona 85258 Age: 66 | Trustee | November 2007 - Present | Retired partner. PricewaterhouseCoopers. | 184 | First Marblehead Corporation,(October 2003 - Present); BlackRock Funds/State Street Research Funds, Trustee (February 2004 - January 2007); Tufts Health Plan, Director (June 2006 - Present); and University of Connecticut, Trustee (November 2004 - Present) | |||||
J. Michael Earley 7337 E. Doubletree Ranch Rd. Scottsdale, Arizona 85258 Age: 62 | Trustee | February 2002 - Present | President, Chief Executive Officer and Director, Bankers Trust Company, N.A., Des Moines (June 1992 - Present). | 184 | Midamerica Financial Corporation (December 2002 - Present). | |||||
Patrick W. Kenny 7337 E. Doubletree Ranch Rd. Scottsdale, Arizona 85258 Age: 65 | Trustee | January 2005 - Present | President and Chief Executive Officer, International Insurance Society (June 2001 - Present). | 184 | Assured Guaranty Ltd. (April 2004 - Present); and Odyssey Reinsurance Holdings (November 2006 - Present). | |||||
Sheryl K. Pressler 7337 E. Doubletree Ranch Rd. Scottsdale, Arizona 85258 Age: 57 | Trustee | January 2006 - Present | Consultant (May 2001 - Present). | 184 | Stillwater Mining Company (May 2002 - Present); California HealthCare Foundation (June 1999 - Present); Romanian-American Enterprise Fund (February 2004 - Present) and Global Alternative Asset Management, Inc. (October 2007 - Present). | |||||
Roger B. Vincent 7337 E. Doubletree Ranch Rd. Scottsdale, Arizona 85258 Age: 62 | Chairman/Trustee | February 2002 - Present | President, Springwell Corporation (March 1989 - Present). | 184 | UGI Corporation (February 2006 - Present); and UGI Utilities, Inc. (February 2006 - Present). | |||||
100
Table of Contents
TRUSTEE AND OFFICER INFORMATION (UNAUDITED) (CONTINUED)
Name, Address and Age | Position(s) | Term of Office | Principal Occupation(s) during the Past Five Years | Number of | Other Directorships | |||||
Directors who are “Interested Persons”: | ||||||||||
Robert W. Crispin(4) 7337 E. Doubletree Ranch Rd. Scottsdale, Arizona 85258 Age: 61 | Trustee | November 2007 - Present | Retired Chairman and Chief Investment Officer, ING Investment Management Co. (June 2001 - December 2007). | 184 | ING Life Insurance and Annuity Company (May 2006- Present); ING USA Annuity and Life Insurance Company (May 2006 - Present); Midwestern United Life Insurance Company (May 2006 - Present); ReliaStar Life Insurance Company (May 2006 - Present); Security Life of Denver Insurance Company (May 2006 - Present); Belair Insurance Company Inc. (August 2005 - Present); The Nordic Insurance Company of Canada (February 2005 - Present); Trafalgar Insurance Company of Canada (February 2005 - Present); ING Novex Insurance Company of Canada (February 2005 - Present); Allianz Insurance Company of Canada (February 2005 - Present); ING Canada Inc. (December 2004 - Present); ING Bank, fsb (June 2001 - Present); ING Investment Management, Inc (June 2001 - December 2007); ING Insurance Company of Canada (June 2001 - Present); Sul America S.A. (June 2001 - Present); and ING Foundation (March 2004 - Present) | |||||
Shaun P. Mathews(4) 7337 E. Doubletree Ranch Rd. Scottsdale, Arizona 85258 Age: 52 | Trustee | November 2007 - Present | President and Chief Executive Officer, ING Investments, LLC (December 2006 - Present), and Head of ING USFS Mutual Funds and Investment Products (November 2004 - November 2006). Formerly, CMO, ING USFS (April 2002 - October 2004), and Head of Rollover/Payout (October 2001 - December 2003). | 184 | Mark Twain House & Museum(3) (September 2002 - Present); Connecticut Forum (May 2002 - Present); Capital Community College Foundation (February 2002 - Present); ING Services Holding Company, Inc. (May 2000 - Present); Southland Life Insurance Company (June 2002 - Present); and ING Capital Corporation, LLC, ING Funds Distributor, LLC(5), ING Funds Services, LLC(6), ING Investments, LLC(7) and ING Pilgrim Funding, Inc. (March 2006 - Present). | |||||
(1) | The Board is divided into three classes, with the term of one class expiring at each annual meeting of the Fund. At each annual meeting, one class of Trustees is elected to a three-year term and serves until their successors are duly elected and qualified. The tenure of each Trustee is subject to the Board’s retirement policy, which states that each Independent Trustee shall retire from service as a Trustee at the conclusion of the first regularly scheduled meeting of the Board that is held after (a) the Trustee reaches the age of 70, if that Trustee qualifies for a retirement benefit as discussed in the board’s retirement policy; or (b) the Trustee reaches the age of 72 or has served as a Trustee for 15 years, if that Trustee does not qualify for the retirement benefit. A unanimous vote of the Board may extend the retirement date of a Trustee for up to one year. An extension may be permitted if the retirement would trigger a requirement to hold a meeting of shareholders of the Fund under applicable law, whether for purposes of appointing a successor to the Trustee or if otherwise necessary under applicable law, in which case the extension would apply until such time as the shareholder meeting can be held or is no longer needed. |
(2) | For the purposes of this table, “Fund Complex” means the following investment companies: ING Asia Pacific High Dividend Equity Income Fund, ING Equity Trust; ING Funds Trust; ING Global Equity Dividend and Premium Opportunity Fund; ING Global Advantage and Premium Opportunity Fund; ING International High Dividend Equity Income Fund; ING Investment Funds, Inc.; ING Investors Trust; ING Mayflower Trust; ING Mutual Funds; ING Prime Rate Trust; ING Risk Managed Natural Resources Fund; ING Senior Income Fund; ING Variable Insurance Trust; ING Variable Products Trust; and ING Partners, Inc. |
(3) | Shaun Mathews, President, ING USFS Mutual Funds and Investment Products, has held a seat on the Board of Directors of The Mark Twain House & Museum since September 19, 2002. ING Groep N.V. makes non-material, charitable contributions to The Mark Twain House & Museum. |
(4) | Messrs. Mathews and Crispin are deemed to be “interested persons” of the Fund as defined in the 1940 Act because of their relationship with ING Groep, the parent corporation of the Adviser, ING Investments, LLC and the Distributor, ING Funds Distributor, LLC. |
(5) | ING Funds Distributor, LLC is the sucessor in interest to ING Funds Distributor, Inc., which was previously known as ING Pilgrim Securities, Inc., and before that was known as Pilgrim Securities, Inc., and before that was known as Pilgrim America Securities, Inc. |
(6) | ING Investments, LLC was previously named ING Pilgrim Investments, LLC. ING Pilgrim Investments, LLC is the sucessor in interest to ING Pilgrim Investments, Inc., which was previously known as Pilgrim Investments, Inc. and before that was known as Pilgrim America Investments, Inc. |
(7) | ING Funds Services, LLC was previously named ING Pilgrim Group, LLC. ING Pilgrim Group, LLC is the sucessor in interest to ING Pilgrim Group, Inc., which was previously known as Pilgrim Group, Inc. and before that was known as Pilgrim America Group, Inc. |
101
Table of Contents
TRUSTEE AND OFFICER INFORMATION (UNAUDITED) (CONTINUED)
Name, Address and Age | Position(s) Held | Term of Office | Principal Occupation(s) during the Past Five Years | |||
Officers: | ||||||
Shaun P. Mathews(5) 7337 East Doubletree Ranch Rd. Scottsdale, Arizona 85258 Age: 52 | President and Chief Executive Officer | April 2006 - Present | President and Chief Executive Officer, ING Investments, LLC(2) and ING Funds Services, LLC(3) (December 2006 - Present); and Head of ING USFS Mutual Funds and Investment Products (October 2004 - November 2006). Formerly, CMO, ING USFS (April 2002 - October 2004); and Head of Rollover/Payout (October 2001 - December 2003). | |||
Michael J. Roland 7337 East Doubletree Ranch Rd. Scottsdale, Arizona 85258 Age: 49 | Executive Vice President | February 2002 - Present | Head of Mutual Fund Platform (February 2007 - Present); and Executive Vice President, ING Investments, LLC(2) and ING Funds Services, LLC(3) (December 2001 - Present). Formerly, Head of Product Management (January 2005 - January 2007); Chief Compliance Officer, ING Investments, LLC(2) and Directed Services, LLC(6) (October 2004 - December 2005); and Chief Financial Officer and Treasurer, ING Investments, LLC(2) (December 2001 - March 2005). | |||
Stanley D. Vyner 230 Park Avenue New York, New York 10169 Age: 57 | Executive Vice President | October 2000 - Present | Executive Vice President, ING Investments, LLC(2) (July 2000 - Present); and Chief Investment Risk Officer, ING Investments, LLC(2) (January 2003 - Present). Formerly, Chief Investment Officer of International Investments (August 2000 - January 2003). | |||
Joseph M. O’Donnell 7337 East Doubletree Ranch Rd. Scottsdale, Arizona 85258 Age: 53 | Executive Vice President and Chief Compliance Officer | March 2006 - Present November 2004 - Present | Chief Compliance Officer of the ING Funds (November 2004 - Present), ING Investments, LLC(2) and Directed Services, LLC(6) (March 2006 - Present); and Executive Vice President of the ING Funds (March 2006 - Present). Formerly, Chief Compliance Officer of ING Life Insurance and Annuity Company (March 2006 - December 2006); Vice President, Chief Legal Counsel, Chief Compliance Officer and Secretary of Atlas Securities, Inc., Atlas Advisers, Inc. and Atlas Funds (October 2001 - October 2004). | |||
Todd Modic 7337 East Doubletree Ranch Rd. Scottsdale, Arizona 85258 Age: 40 | Senior Vice President, Chief/Principal Financial Officer and Assistant Secretary | March 2005 - Present | Senior Vice President, ING Funds Services, LLC(3) (April 2005 - Present). Formerly, Vice President, ING Funds Services, LLC(3) (September 2002 - March 2005). | |||
Kimberly A. Anderson 7337 East Doubletree Ranch Rd. Scottsdale, Arizona 85258 Age: 43 | Senior Vice President | November 2003 - Present | Senior Vice President, ING Investments, LLC(2) (October 2003 - Present). Formerly, Vice President and Assistant Secretary, ING Investments, LLC(2) (January 2001 - October 2003). | |||
Robert Terris 7337 East Doubletree Ranch Rd. Scottsdale, Arizona 85258 Age: 37 | Senior Vice President | May 2006 - Present | Senior Vice President, Head of Division Operations, ING Funds (May 2006 - Present); and Vice President, Head of Division Operations, ING Funds Services, LLC(3) (March 2006 - Present). Formerly, Vice President of Administration, ING Funds Services, LLC(3) (October 2001 - March 2006). | |||
Robyn L. Ichilov 7337 East Doubletree Ranch Rd. Scottsdale, Arizona 85258 Age: 40 | Vice President and Treasurer | October 2000 - Present March 2001 - Present | Vice President and Treasurer, ING Funds Services, LLC(3) (October 2001 - Present) and ING Investments, LLC(2) (August 1997 - Present). | |||
Lauren D. Bensinger 7337 East Doubletree Ranch Rd. Scottsdale, Arizona 85258 Age: 54 | Vice President | February 2003 - Present | Vice President and Chief Compliance Officer, ING Funds Distributor, LLC(4) (July 1995 - Present); and Vice President, ING Investments, LLC(2) (February 1996 - Present); and Director of Compliance, ING Investments, LLC(2) (October 2004 - Present). Formerly, Chief Compliance Officer, ING Investments, LLC(2) (October 2001 - October 2004). | |||
William Evans 10 State House Square Hartford, Connecticut 06103 Age: 35 | Vice President | September 2007 - Present | Vice President, Head of Mutual Fund Advisory Group (April 2007 - Present), Vice President, U.S. Mutual Funds and Investment Products ( May 2005 - April 2007), Senior Fund Analyst, U.S. Mutual Funds and Investment Products (May 2002 - May 2005) | |||
Maria M. Anderson 7337 East Doubletree Ranch Rd. Scottsdale, Arizona 85258 Age: 49 | Vice President | September 2004 - Present | Vice President, ING Funds Services, LLC(3) (September 2004 - Present). Formerly, Assistant Vice President, ING Funds Services, LLC(3) (October 2001 - September 2004). | |||
102
Table of Contents
TRUSTEE AND OFFICER INFORMATION (UNAUDITED) (CONTINUED)
Name, Address and Age | Position(s) Held | Term of Office | Principal Occupation(s) during the Past Five Years | |||
Denise Lewis 7337 East Doubletree Ranch Rd. Scottsdale, Arizona 85258 Age: 44 | Vice President | January 2007 - Present | Vice President, ING Funds Services, LLC(3) (December 2006 - Present). Formerly, Senior Vice President, UMB Investment Services Group, LLC (November 2003 - December 2006); and Vice President, Wells Fargo Funds Management, LLC (December 2000 - August 2003). | |||
Kimberly K. Palmer 7337 East Doubletree Ranch Rd. Scottsdale, Arizona 85258 Age: 50 | Vice President | March 2006 - Present | Vice President, ING Funds Services, LLC(3) (March 2006 - Present). Formerly, Assistant Vice President, ING Funds Services, LLC(3) (August 2004 - March 2006); Manager, Registration Statements, ING Funds Services, LLC(3) (May 2003 - August 2004); Associate Partner, AMVESCAP PLC (October 2000 - May 2003); and Director of Federal Filings and Blue Sky Filings, INVESCO Funds Group, Inc. (March 1994 - May 2003). | |||
Susan P. Kinens 7337 East Doubletree Ranch Rd. Scottsdale, Arizona 85258 Age: 31 | Assistant Vice President | February 2003 - Present | Assistant Vice President, ING Funds Services, LLC(3) (December 2002 - Present); and has held various other positions with ING Funds Services, LLC(3) for more than the last five years. | |||
Huey P. Falgout, Jr. 7337 East Doubletree Ranch Rd. Scottsdale, Arizona 85258 Age: 44 | Secretary | August 2003 - Present | Chief Counsel, ING Americas, U.S. Legal Services (September 2003 - Present). Formerly, Counsel, ING Americas, U.S. Legal Services (November 2002 - September 2003). | |||
Theresa K. Kelety 7337 East Doubletree Ranch Rd. Scottsdale, Arizona 85258 Age: 44 | Assistant Secretary | August 2003 - Present | Senior Counsel, ING Americas, U.S. Legal Services (April 2003 - Present). Formerly, Senior Associate with Shearman & Sterling (February 2000 - April 2003). | |||
(1) | The officers hold office until the next annual meeting of the Trustees and until their successors shall have been elected and qualified. |
(2) | ING Investments, LLC was previously named ING Pilgrim Investments, LLC. ING Pilgrim Investments, LLC is the sucessor in interest to ING Pilgrim Investments, Inc., which was previously known as Pilgrim Investments, Inc. and before that was known as Pilgrim America Investments, Inc. |
(3) | ING Funds Services, LLC was previously named ING Pilgrim Group, LLC. ING Pilgrim Group, LLC is the sucessor in interest to ING Pilgrim Group, Inc., which was previously known as Pilgrim Group, Inc. and before that was known as Pilgrim America Group, Inc. |
(4) | ING Funds Distributor, LLC is the sucessor in interest to ING Funds Distributor, Inc., which was previously known as ING Pilgrim Securities, Inc., and before that was known as Pilgrim Securities, Inc., and before that was known as Pilgrim America Securities, Inc. |
(5) | Mr. Mathews commenced services as CEO and President of the ING Funds on November 11, 2006. |
(6) | Directed Services, LLC is the sucessor in interest to Directed Services, Inc. |
103
Table of Contents
ADVISORY CONTRACT APPROVAL DISCUSSION (UNAUDITED)
BOARD CONSIDERATION AND RE-APPROVAL OF INVESTMENT ADVISORY AND SUB-ADVISORY CONTRACTS
Section 15(c) of the Investment Company Act of 1940, as amended (the “1940 Act”) provides that, after an initial period, the Funds’ existing investment advisory and sub-advisory contracts will remain in effect only if the Board of Trustees (the “Board”) of ING Funds Trust, including a majority of Board members who have no direct or indirect interest in the advisory and sub-advisory contracts, and who are not “interested persons” of the Funds, as such term is defined under the 1940 Act (the “Independent Trustees”), annually review and approve them. Thus, at a meeting held on November 30, 2007, the Board, including a majority of the Independent Trustees, considered whether to renew the investment advisory contracts (the “Advisory Contracts”) between ING Investments, LLC (the “Adviser”) and the Funds and the sub-advisory contracts (“Sub-Advisory Contracts”) with ING Investment Management Co., the sub-adviser to each Fund (“ING IM” or the “Sub-Adviser”).
The Independent Trustees also held separate meetings on October 10 and November 28, 2007 to consider the renewal of the Advisory Contracts and Sub-Advisory Contracts. As a result, subsequent references herein to factors considered and determinations made by the Independent Trustees include, as applicable, factors considered and determinations made on those earlier dates by the Independent Trustees.
At its November 30, 2007 meeting, the Board voted to renew the Advisory and Sub-Advisory Contracts for the Funds. In reaching these decisions, the Board took into account information furnished to it throughout the year at regular meetings of the Board and the Board’s committees, as well as information prepared specifically in connection with the annual renewal process. Determinations by the Independent Trustees also took into account various factors that they believed, in light of the legal advice furnished to them by Kirkpatrick & Lockhart Preston Gates Ellis LLP (“K&L Gates”), their independent legal counsel, and their own business judgment, to be relevant. Further, while the Advisory Contracts and Sub-Advisory Contracts for all the Funds were considered at the same Board meeting, the Trustees considered each Fund’s advisory and sub-advisory relationships separately.
Provided below is an overview of the Board’s contract approval process in general, as well as a discussion of certain specific factors that the Board considered at its renewal meeting. While the Board gave its attention to the information furnished, at its request, that was most relevant to its considerations, discussed below are a number of the primary factors relevant to the Board’s consideration as to whether to renew the Advisory and Sub-Advisory Contracts for the one-year period ending November 30, 2008. Each Board member may have accorded different weight to the various factors in reaching his or her conclusions with respect to each Fund’s advisory and sub-advisory arrangements.
Overview of the Contract Renewal and Approval Process
Several years ago, the Independent Trustees instituted a revised process by which they seek and consider relevant information when they decide whether to approve new or existing advisory and sub-advisory arrangements for the investment companies in the ING Funds complex under their jurisdiction, including the Funds’ existing Advisory and Sub-Advisory Contracts. Among other actions, the Independent Trustees: retained the services of independent consultants with experience in the mutual fund industry to assist the Independent Trustees in working with the personnel employed by the Adviser or its affiliates who administer the Funds (“Management”) to identify the types of information presented to the Board to inform its deliberations with respect to advisory and sub-advisory relationships and to help evaluate that information; established a specific format in which certain requested information is provided to the Board; and determined the process for reviewing such information in connection with Advisory and Sub-Advisory Contract renewals and approvals. The end result was an enhanced process which is currently employed by the Independent Trustees to review and analyze information in connection with their annual renewal of the ING Funds’ advisory and sub-advisory contracts, as well as their review and approval of new advisory relationships.
Since the current renewal and approval process was first implemented, the Board’s membership has changed substantially through periodic retirements of some Trustees and the appointment and election of new Trustees. In addition, throughout this period the Independent Trustees have reviewed and refined the renewal and approval process at least annually. The Board also established a Contracts Committee and two Investment Review Committees, including the International/Balanced/Fixed Income Funds Investment Review Committee (the “I/B/F IRC”). Among
104
Table of Contents
ADVISORY CONTRACT APPROVAL DISCUSSION (UNAUDITED) (CONTINUED)
other matters, the Contracts Committee provides oversight with respect to the contracts renewal process, and each Fund is assigned to the I/B/F IRC, which provides oversight regarding, among other matters, investment performance.
The type and format of the information provided to the Board or to legal counsel for the Independent Trustees in connection with the contract approval and renewal process has been codified in the Funds’ 15(c) Methodology Guide. This Guide was developed under the direction of the Independent Trustees and sets out a blueprint pursuant to which the Independent Trustees request certain information that they deem important to facilitate an informed review in connection with initial and annual approvals of advisory and sub-advisory contracts.
Management provides certain of the information requested by the 15(c) Methodology Guide in Fund Analysis and Comparison Tables (“FACT sheets”) prior to the Independent Trustees’ review of advisory and sub-advisory arrangements (including the Funds’ Advisory and Sub-Advisory Contracts). The Independent Trustees previously retained an independent firm to verify and test the accuracy of certain FACT sheet data for a representative sample of funds in the ING Funds complex. In 2007, the Contracts Committee employed the services of an independent consultant to assist in its review and analysis of, among other matters, the 15(c) Methodology Guide, the content and format of the FACT sheets, and proposed selected peer groups of investment companies (“SPGs”) to be used by the Funds for certain comparison purposes during the renewal process.
As part of an ongoing process, the Contracts Committee recommends or considers recommendations from Management for refinements to the 15(c) Methodology Guide and other aspects of the review process, and the Board’s Investment Review Committees (including the I/B/F IRC) review benchmarks used to assess the performance of the funds in the ING Funds complex. The Investment Review Committees may apply a heightened level of scrutiny in cases where performance has lagged an ING Fund’s relevant benchmark and/or SPG.
The Board employed its process for reviewing contracts when considering the renewals of the Funds’ Advisory and Sub-Advisory Contracts that would be effective through November 30, 2008. Set forth below is a discussion of many of the Board’s primary considerations and conclusions resulting from this process.
Nature, Extent and Quality of Service
In determining whether to approve the Advisory and Sub-Advisory Contracts for the Funds for the year ending November 30, 2008, the Independent Trustees received and evaluated such information as they deemed necessary regarding the nature, extent and quality of services provided to the Funds by the Adviser and Sub-Adviser. This included information regarding the Adviser and Sub-Adviser provided throughout the year at regular meetings of the Board and its committees, as well as information furnished in connection with the contract renewal meetings.
The materials requested by and provided to the Board and/or to K&L Gates prior to the November 30, 2007 Board meeting included, among other information, the following items for each Fund: (1) FACT sheets that provided information regarding the performance and expenses of the Fund and other similarly managed funds in its SPG, as well as information regarding the Fund’s investment portfolio, objective and strategies; (2) the 15(c) Methodology Guide, which describes how the FACT sheets were prepared, including the manner in which the Fund’s benchmark and SPG were selected and how profitability was determined; (3) responses from the Adviser and the Sub-Adviser to a series of questions posed by K&L Gates on behalf of the Trustees; (4) copies of the forms of Advisory Contract and Sub-Advisory Contract; (5) copies of the Forms ADV for the Adviser and Sub-Adviser; (6) financial statements for the Adviser and Sub-Adviser; (7) a draft of a narrative summary addressing key factors the Board customarily considers in evaluating the renewals of the ING Funds’ (including the Funds’) advisory contracts and sub-advisory contracts, including a written analysis for the Fund of how performance, fees and expenses compare to its SPG and/or designated benchmark; (8) independent analyses of Fund performance by the Trust’s Chief Investment Risk Officer; (9) information regarding net asset flows into and out of the Fund; and (10) other information relevant to the Board’s evaluations.
For each Fund, except for ING Institutional Prime Money Market Fund, Class A shares were used for purposes of certain comparisons to the funds in its SPG. ING Institutional Prime Money Market Fund used Class I shares for purposes of certain comparisons to the funds in its SPG. These classes were selected so that the Fund’s share class with the longest performance history was compared to the analogous class of shares for each fund in its SPG. ING Institutional Prime Money Market Fund has only one class of shares available and these were used for purposes of comparison. The mutual funds included in the Fund’s SPG were selected based upon criteria designed to mirror the Fund share class being compared to the SPG.
105
Table of Contents
ADVISORY CONTRACT APPROVAL DISCUSSION (UNAUDITED) (CONTINUED)
In arriving at its conclusions with respect to the Advisory Contracts, the Board was mindful of the “manager-of-managers” platform of the ING Funds that has been developed by Management. The Board also considered the techniques that the Adviser has developed, at the Board’s direction, to screen and perform due diligence on the Sub-Adviser that are recommended to the Board to manage the investment portfolios of the funds in the ING Funds complex. The Board noted the resources that the Adviser has committed to the Board and the I/B/F IRC to assist the Board and to the I/B/F IRC with their assessment of the investment performance of the Funds on an ongoing basis throughout the year. This includes the appointment of a Chief Investment Risk Officer and his staff, who report directly to the Board and who have developed attribution analyses and other metrics used by the Board’s Investment Review Committees to analyze the key factors underlying investment performance for the funds in the ING Funds complex.
The Board also noted the techniques used by the Adviser to monitor the performance of the Sub-Adviser and the proactive approach that the Adviser, working in cooperation with the I/B/F IRC, has taken to advocate or recommend, when it believed appropriate, changes designed to assist in improving the Funds’ performance. Such changes could include, for example, changes in personnel who are responsible for managing a Fund’s portfolio. In considering the Funds’ Advisory Contracts, the Board also considered the extent of benefits provided to the Funds’ shareholders, beyond advisory services, from being part of the ING family of Funds. This includes, in most cases, the right to exchange or transfer investments, without a sales charge, between the same class of shares of such Funds or among ING Funds available on a product platform, and the wide range of ING Funds available for exchange or transfer. The Board also took into account the Adviser’s efforts in recent years to reduce the expenses of the ING Funds through renegotiated arrangements with the ING Funds’ service providers.
Further, the Board received periodic reports showing that the investment policies and restrictions for each Fund were consistently complied with and other periodic reports covering matters such as compliance by Adviser and Sub-Adviser personnel with codes of ethics. The Board considered reports from the Trust’s Chief Compliance Officer (“CCO”) evaluating whether the regulatory compliance systems and procedures of the Adviser and Sub-Adviser are reasonably designed to assure compliance with the federal securities laws, including those related to, among others, late trading and market timing, best execution, fair value pricing, proxy voting and trade allocation practices. The Board also took into account the CCO’s annual and periodic reports and recommendations with respect to service provider compliance programs. In this regard, the Board also considered the policies and procedures developed by the CCO in consultation with the Board’s Compliance Committee that guide the CCO’s compliance oversight function.
The Board reviewed the level of staffing, quality and experience of each Fund’s portfolio management team. The Board took into account the respective resources and reputations of the Adviser and the Sub-Adviser, and evaluated the ability of the Adviser and the Sub-Adviser to attract and retain qualified investment advisory personnel. The Board also considered the adequacy of the resources committed to the Funds (and other relevant funds in the ING Funds complex) by the Adviser and the Sub-Adviser, and whether those resources are commensurate with the needs of the Funds and are sufficient to sustain appropriate levels of performance and compliance needs.
Based on their deliberations and the materials presented to them, the Board concluded that the advisory and related services provided by the Adviser and Sub-Adviser are appropriate in light of the Funds’ operations, the competitive landscape of the investment company business, and investor needs, and that the nature and quality of the overall services provided by the Adviser and Sub-Adviser were appropriate.
Fund Performance
In assessing advisory and sub-advisory relationships, the Board placed emphasis on the net investment returns of each Fund. While the Board considered the performance reports and discussions with portfolio managers at Board and committee meetings during the year, particular attention in assessing performance was given to the FACT sheets furnished in connection with the renewal process. The FACT sheet prepared for each Fund included its investment performance compared to the Fund’s Morningstar category median, Lipper category median, SPG and primary benchmark. The Board’s findings specific to each Fund’s performance are discussed under “Fund-by-Fund Analysis,” below.
106
Table of Contents
ADVISORY CONTRACT APPROVAL DISCUSSION (UNAUDITED) (CONTINUED)
Economies of Scale
When evaluating the reasonableness of advisory fee rates, the Board also considered whether economies of scale will be realized by the Adviser as a Fund grows larger and the extent to which any such economies are reflected in contractual fee rates. In the case of sub-advisory fees, the Board considered that breakpoints would inure to the benefit of the Adviser, except to the extent that there are corresponding advisory fee breakpoints or waivers. For a Fund that did not have advisory fee breakpoints, but did benefit from waivers or reimbursements of advisory or other fees, the Board also considered the extent to which economies of scale could be realized through waivers, reimbursements or expense reductions.
In evaluating economies of scale, the Independent Trustees also considered prior periodic management reports and industry information on this topic, and the Independent Trustees who were Board members at that time also considered a November 2006 evaluation and analysis presented to them by an independent consultant regarding fee breakpoint arrangements and economies of scale.
Information Regarding Services to Other Clients
The Board requested and considered information regarding the nature of services and fee rates offered by the Adviser and the Sub-Adviser to other clients, including other registered investment companies and institutional accounts. When fee rates offered to other clients differed materially from those charged to the Funds, the Board considered any underlying rationale provided by the Adviser or Sub-Adviser for these differences. The Board also noted that the fee rates charged to the Funds and similar institutional clients may differ materially due to the different services and additional regulatory overlay associated with registered investment companies, such as the Funds.
Fee Rates and Profitability
The Board reviewed and considered each contractual investment advisory fee rate, combined with the administrative fee rate, payable by each Fund to the Adviser. The Board also considered the contractual sub-advisory fee rate payable by the Adviser to the Sub-Adviser for sub-advisory services for each Fund. In addition, the Board considered fee waivers and expense limitations applicable to the fees payable by the Funds.
The Board considered the fee structure of each Fund as it relates to the services provided under the contracts and the potential fall-out benefits to the Adviser and Sub-Adviser and their respective affiliates from their association with the Funds. For each Fund, the Board determined that the fees payable to the Adviser and the Sub-Adviser are reasonable for the services that each performs, which were considered in light of the nature and quality of the services that each has performed and is expected to perform.
For each Fund, the Board considered information on revenues, costs and profits realized by the Adviser, which was prepared by Management in accordance with the allocation methodology (including related assumptions) specified in the 15(c) Methodology Guide. In analyzing the profitability of the Adviser in connection with its services to a Fund, the Board took into account the sub-advisory fee rate payable by the Adviser to Sub-Adviser. The Board also considered information that it requested and was provided by Management with respect to the profitability of service providers affiliated with the Adviser, as well as information provided by the Sub-Adviser with respect to its profitability.
The Board determined that it had requested and received sufficient information to gain a reasonable understanding regarding the Adviser’s and Sub-Adviser’s profitability. The Board also recognized that profitability analysis is not an exact science and there is no uniform methodology for determining profitability for this purpose. In this context, the Board realized that Management’s calculations regarding its costs incurred in establishing the infrastructure necessary for the Funds’ operations may not be fully reflected in the expenses allocated to each Fund in determining profitability, and that the information presented may not portray all of the costs borne by Management or capture Management’s entrepreneurial risk associated with offering and managing a mutual fund complex in the current regulatory and market environment.
Based on the information on revenues, costs, and profitability considered by the Board, and after considering the factors described in this section, the Board concluded that the profits, if any, realized by the Adviser and Sub-Adviser
107
Table of Contents
ADVISORY CONTRACT APPROVAL DISCUSSION (UNAUDITED) (CONTINUED)
were not excessive. In making its determinations, the Board based its conclusions on the reasonableness of the advisory and sub-advisory fees of the Adviser and Sub-Adviser primarily on the factors described for each Fund below.
Fund-by-Fund Analysis
The following paragraphs outline certain of the specific factors that the Board considered, and the conclusions reached, at its November 30, 2007 meeting in relation to renewing each Fund’s current Advisory and Sub-Advisory Contracts for the year ending November 30, 2008. These specific factors are in addition to those considerations discussed above. In each case, the Fund’s performance was compared to its Morningstar category median, except for ING Classic Money Market Fund and ING Institutional Prime Money Market Fund which was compared to its Lipper category median, and its primary benchmark, a broad-based securities market index that appears in the Fund’s prospectus. With respect to Morningstar quintile rankings, the first quintile represents the highest (best) performance and the fifth quintile represents the lowest performance. Each Fund’s management fee and expense ratio were compared to the fees and expense ratios of the funds in its SPG.
ING Classic Money Market Fund
In considering whether to approve the renewal of the Advisory and Sub-Advisory Contracts for ING Classic Money Market Fund, the Board considered that, based on performance data for the periods ended June 30, 2007: (1) the Fund outperformed its Lipper category median for all periods presented; (2) the Fund outperformed its primary benchmark for all periods presented; and (3) although the Fund is not ranked by Morningstar, under ratings available by Lipper, the Fund ranked in the third quintile of its Lipper category for all periods presented.
In considering the fees payable under the Advisory and Sub-Advisory Contracts for ING Classic Money Market Fund, the Board took into account the factors described above and also considered: (1) the fairness of the compensation under an Advisory Contract with level fees that does not include breakpoints; and (2) the pricing structure (including the expense ratio to be borne by shareholders) of the Fund as compared to its SPG, including that: (a) the management fee for the Fund is below the median and the average management fees of the funds in its SPG; and (b) the expense ratio for the Fund is below the median and the average expense ratios of the funds in its SPG.
After its deliberation, the Board reached the following conclusions: (1) the Fund’s management fee rate is reasonable in the context of all factors considered by the Board; (2) the Fund’s expense ratio is reasonable in the context of all factors considered by the Board; (3) the Fund’s performance is reasonable in the context of all factors considered by the Board; and (4) the sub-advisory fee rate payable by the Adviser to the Sub-Adviser is reasonable in the context of all factors considered by the Board. Based on these conclusions and other factors, the Board voted to renew the Advisory and Sub-Advisory Contracts for the Fund for the year ending November 30, 2008. During this renewal process, different Board members may have given different weight to different individual factors and related conclusions.
ING GNMA Income Fund
In considering whether to approve the renewal of the Advisory and Sub-Advisory Contracts for ING GNMA Income Fund, the Board considered that, based on performance data for the periods ended June 30, 2007: (1) the Fund outperformed its Morningstar category median for the three-year, five-year, and ten-year periods, but underperformed for the most recent calendar quarter, year-to-date, and one-year periods; (2) the Fund underperformed its primary benchmark for all periods presented; and (3) the Fund is ranked in the second quintile of its Morningstar category for the five-year period, the third quintile for the one-year and three-year periods, and the fifth (lowest) quintile for the most recent calendar quarter and year-to-date periods.
In considering the fees payable under the Advisory and Sub-Advisory Contracts for the Fund, the Board took into account the factors described above and also considered: (1) the fairness of the compensation under an Advisory Contract with a breakpoint fee schedule where the asset level necessary to achieve a breakpoint discount had not been reached by the Fund; and (2) the pricing structure (including the expense ratio to be borne by shareholders) of the Fund, as compared to its SPG, including that: (a) the management fee (inclusive of 0.10% administration fee) for the Fund is equal to the median and above the average management fees of the funds in its SPG; and (b) the expense ratio for the Fund is equal to the median and below the average expense ratios of the funds in its SPG.
108
Table of Contents
ADVISORY CONTRACT APPROVAL DISCUSSION (UNAUDITED) (CONTINUED)
After its deliberation, the Board reached the following conclusions: (1) the Fund’s management fee is reasonable in the context of all factors considered by the Board; (2) the Fund’s expense ratio is reasonable in the context of all factors considered by the Board; (3) the Fund’s performance is reasonable in the context of all factors considered by the Board; and (4) the sub-advisory fee rate payable by the Adviser to the Sub-Adviser is reasonable in the context of all factors considered by the Board. Based on these conclusions and other factors, the Board voted to renew the Advisory and Sub-Advisory Contracts for the Fund for the year ending November 30, 2008. During this renewal process, different Board members may have given different weight to different individual factors and related conclusions.
ING High Yield Bond Fund
In considering whether to approve the renewal of the Advisory and Sub-Advisory Contracts for ING High Yield Bond Fund, the Board considered that, based on performance data for the periods ended June 30, 2007: (1) the Fund outperformed its Morningstar category median for all periods presented, with the exception of the three-year and five-year periods, during which it underperformed; (2) the Fund underperformed its primary benchmark for all periods presented, with the exception of the most recent calendar quarter and year-to-date periods, during which it outperformed; and (3) the Fund is ranked in the second quintile of its Morningstar category for the year-to-date and one-year periods, the third quintile for the most recent calendar quarter, the fourth quintile for the three-year period, and the fifth (lowest) quintile for the five-year period.
In analyzing this performance data, the Board took into account that in March 2007 the portfolio manager to the Fund was changed to address the Board’s concerns about the Portfolio’s performance.
In considering the fees payable under the Advisory and Sub-Advisory Contracts for ING High Yield Bond Fund, the Board took into account the factors described above and also considered: (1) the fairness of the compensation under an Advisory Contract with a breakpoint fee schedule where the asset level necessary to achieve a breakpoint discount had not been reached by the Fund; and (2) the pricing structure (including the expense ratio to be borne by shareholders) of ING High Yield Bond Fund, as compared to its SPG, including that: (a) the management fee (inclusive of 0.10% administration fee) for the Fund is below the median and the average management fees of the funds in its SPG; and (b) the expense ratio for the Fund is below the median and the average expense ratios of the funds in its SPG.
After its deliberation, the Board reached the following conclusions: (1) the Fund’s management fee rate is reasonable in the context of all factors considered by the Board; (2) the Fund’s expense ratio is reasonable in the context of all factors considered by the Board; (3) there was a change in the Fund’s portfolio managers in March 2007 and it is reasonable to allow the Sub-Adviser to continue to manage the Portfolio to assess whether performance improves as a result of the change that has been implemented; and (4) the sub-advisory fee rate payable by the Adviser to the Sub-Adviser is reasonable in the context of all factors considered by the Board. Based on these conclusions and other factors, the Board voted to renew the Advisory and Sub-Advisory Contracts for the Fund for the year ending November 30, 2008. During this renewal process, different Board members may have given different weight to different individual factors and related conclusions.
ING Institutional Prime Money Market Fund
In considering whether to approve the renewal of the Advisory and Sub-Advisory Contracts for ING Institutional Prime Money Market Fund, the Board considered that, based on performance data for the periods ended June 30, 2007: (1) the Fund outperformed its Lipper category median for all periods presented; (2) the Fund outperformed its primary benchmark for all periods presented; and (3) the Fund is ranked in the first (highest) quintile of its Lipper category for the all periods presented.
In considering the fees payable under the Advisory and Sub-Advisory Contracts for ING Institutional Prime Money Market Fund, the Board took into account the factors described above and also considered: (1) the fairness of the compensation under an Advisory Contract with level fees that does not include breakpoints; and (2) the pricing structure (including the expense ratio to be borne by shareholders) of the Fund as compared to its SPG, including that: (a) the management fee for the Fund is below the median and the average management fees of the funds in its SPG; and (b) the expense ratio for the Fund is below the median and the average expense ratios of the funds in its SPG.
109
Table of Contents
ADVISORY CONTRACT APPROVAL DISCUSSION (UNAUDITED) (CONTINUED)
After its deliberation, the Board reached the following conclusions: (1) the Fund’s management fee rate is reasonable in the context of all factors considered by the Board; (2) the Fund’s expense ratio is reasonable in the context of all factors considered by the Board; (3) the Fund’s performance is reasonable in the context of all factors considered by the Board; and (4) the sub-advisory fee rate payable by the Adviser to the Sub-Adviser is reasonable in the context of all factors considered by the Board. Based on these conclusions and other factors, the Board voted to renew the Advisory and Sub-Advisory Contracts for the Fund for the year ending November 30, 2008. During this renewal process, different Board members may have given different weight to different individual factors and related conclusions.
ING Intermediate Bond Fund
In considering whether to approve the renewal of the Advisory and Sub-Advisory Contracts for ING Intermediate Bond Fund, the Board considered that, based on performance data for the periods ended June 30, 2007: (1) the Fund outperformed its Morningstar category median for all periods presented; (2) the Fund underperformed its primary benchmark for the most recent calendar quarter, one-year, and three-year periods, but outperformed for the year-to-date and five-year periods; and (3) the Fund is ranked in the second quintile of its Morningstar category for the most recent calendar quarter, year-to-date, three-year, and five-year periods, and the third quintile for the one-year period.
In considering the fees payable under the Advisory and Sub-Advisory Contracts for ING Intermediate Bond Fund, the Board took into account the factors described above and also considered: (1) the fairness of the compensation under an Advisory Contract with level fees that does not include breakpoints; and (2) the pricing structure (including the expense ratio to be borne by shareholders) of the Fund as compared to its SPG, including that: (a) the management fee (inclusive of the advisory fee and 0.10% administration fee) for the Fund is below the median and the average management fees of the funds in its SPG; and (b) the expense ratio for the Fund is below the median and the average expense ratios of the funds in its SPG.
After its deliberation, the Board reached the following conclusions: (1) the Fund’s management fee rate is reasonable in the context of all factors considered by the Board; (2) the Fund’s expense ratio is reasonable in the context of all factors considered by the Board; (3) the Fund’s performance is reasonable in the context of all factors considered by the Board; and (4) the sub-advisory fee rate payable by the Adviser to the Sub-Adviser is reasonable in the context of all factors considered by the Board. Based on these conclusions and other factors, the Board voted to renew the Advisory and Sub-Advisory Contracts for the Fund for the year ending November 30, 2008. During this renewal process, different Board members may have given different weight to different individual factors and related conclusions.
ING National Tax-Exempt Bond Fund
In considering whether to approve the renewal of the Advisory and Sub-Advisory Contracts for ING National Tax-Exempt Bond Fund, the Board considered that, based on performance data for the periods ended June 30, 2007: (1) the Fund outperformed its Morningstar category median for all periods presented, with the exception of the most recent calendar quarter and year-to-date periods, during which it underperformed; (2) the Fund underperformed its primary benchmark for all periods presented; and (3) the Fund is ranked in the first (highest) quintile of its Morningstar category median for the one-year period, the second quintile for the three- and five- year periods, the fourth quintile for the year-to-date period, and the fifth (lowest) quintile for the most recent calendar quarter.
In analyzing this performance data, the Board took into account Management’s representations that, while nearer-term performance had been less favorable, the performance for the one-, three- and five-year periods has been reasonable.
In considering the fees payable under the Advisory and Sub-Advisory Contracts for the Fund, the Board took into account the factors described above and also considered: (1) the fairness of the compensation under an Advisory Contract with level fees that does not include breakpoints; and (2) the pricing structure (including the expense ratio to be borne by shareholders) of the Fund, as compared to its SPG, including that: (a) the management fee (inclusive
110
Table of Contents
ADVISORY CONTRACT APPROVAL DISCUSSION (UNAUDITED) (CONTINUED)
of the advisory fee and a 0.10% administration fee) for the Fund is below the median and the average management fees of the funds in its SPG; and (b) the expense ratio for the Fund is below the median and the average expense ratios of the funds in its SPG.
After its deliberation, the Board reached the following conclusions: (1) the Fund’s management fee rate is reasonable in the context of all factors considered by the Board; (2) the Fund’s expense ratio is reasonable in the context of all factors considered by the Board; (3) the Fund’s performance is reasonable in the context of all factors considered by the Board; and (4) the sub-advisory fee rate payable by the Adviser to the Sub-Adviser is reasonable in the context of all factors considered by the Board. Based on these conclusions and other factors, the Board voted to renew the Advisory and Sub-Advisory Contracts for the Fund for the year ending November 30, 2008. During this renewal process, different Board members may have given different weight to different individual factors and related conclusions.
111
Table of Contents
ING Funds Distributor, LLC offers the funds listed below. Before investing in a fund, shareholders should carefully review the fund’s prospectus. Investors may obtain a copy of a prospectus of any ING Fund by calling (800) 992-0180 or by going to www.ingfunds.com.
Domestic Equity and Income Funds ING Balanced Fund ING Growth and Income Fund ING Real Estate Fund
Domestic Equity Growth Funds ING 130/30 Fundamental Research Fund ING Disciplined LargeCap Fund ING Fundamental Research Fund ING Growth Fund ING LargeCap Growth Fund ING MidCap Opportunities Fund ING Opportunistic LargeCap Fund ING Small Company Fund ING SmallCap Opportunities Fund
Domestic Equity Index Funds ING Index Plus LargeCap Fund ING Index Plus MidCap Fund ING Index Plus SmallCap Fund
Domestic Equity Value Funds ING Financial Services Fund ING LargeCap Value Fund ING SmallCap Value Multi-Manager Fund ING Value Choice Fund
Domestic Fund-of-Funds ING Strategic Allocation Conservative Fund ING Strategic Allocation Growth Fund ING Strategic Allocation Moderate Fund
Fixed-lncome Funds ING GNMA lncome Fund ING High Yield Bond Fund ING Intermediate Bond Fund ING National Tax-Exempt Bond Fund |
Global Equity Funds ING Global Equity Dividend Fund ING Global Natural Resources Fund ING Global Real Estate Fund ING Global Science and Technology Fund ING Global Value Choice Fund
International Equity Funds ING Disciplined International SmallCap Fund ING Emerging Countries Fund ING Foreign Fund ING Greater China Fund ING Index Plus International Equity Fund ING International Capital Appreciation Fund ING International Equity Fund ING International Equity Dividend Fund ING International Growth Opportunities Fund ING International Real Estate ING International SmallCap Multi-Manager Fund ING International Value Fund ING International Value Choice Fund ING International Value Opportunities Fund ING Russia Fund
Global and International Fixed-Income Funds ING Emerging Markets Fixed Income Fund ING Global Bond Fund
International Fund-of-Funds ING Diversified International Fund
Loan Participation Fund ING Senior lncome Fund
Money Market Funds* ING Money Market Fund ING Classic Money Market Fund |
| * | An investment in the funds are not insured or guaranteed by the Federal Deposit Insurance Corporation or any other government agency. Although the funds seek to preserve the value of your investment at $1.00 per share, it is possible to lose money by investing in the funds. |
Table of Contents
Investment Adviser
ING Investments, LLC
7337 East Doubletree Ranch Road
Scottsdale, Arizona 85258
Administrator
ING Funds Services, LLC
7337 East Doubletree Ranch Road
Scottsdale, Arizona 85258
Distributor
ING Funds Distributor, LLC
7337 East Doubletree Ranch Road
Scottsdale, Arizona 85258
Transfer Agent
DST Systems, Inc.
330 West 9th Street
Kansas City, Missouri 64105
Independent Registered Public Accounting Firm
KPMG LLP
99 High Street
Boston, Massachusetts 02110
Custodian
The Bank of New York Mellon Corporation
One Wall Street
New York, New York 10286
Legal Counsel
Dechert
1775 I Street, N.W.
Washington, D.C. 20006
For more complete information, or to obtain a prospectus on any ING fund, please call your Investment Professional or ING Funds Distributor, LLC at (800) 992-0180 or log on to www.ingfunds.com. The prospectus should be read carefully before investing. Consider the fund’s investment objectives, risks, charges and expenses carefully before investing. The prospectus contains this information and other information about the fund.
 | PRAR-UFIALL | (0308-052308) |
Table of Contents
Item 2. Code of Ethics.
As of the end of the period covered by this report, Registrant had adopted a code of ethics, as defined in Item 2 of Form N-CSR, that applies to the Registrant’s principal executive officer and principal financial officer. There were no amendments to the Code during the period covered by the report. The Registrant did not grant any waivers, including implicit waivers, from any provisions of the Code during the period covered by this report. The code of ethics is filed herewith pursuant to Item 10(a)(1), Exhibit 99.CODE ETH.
Item 3. Audit Committee Financial Expert.
The Board of Trustees has determined that Patrick W. Kenny is an audit committee financial expert, as defined in Item 3 of Form N-CSR. Mr. Kenny is “independent” for purposes of Item 3 of Form N-CSR.
Item 4. Principal Accountant Fees and Services.
| (a) | Audit Fees: The aggregate fees billed for each of the last two fiscal years for professional services rendered by KPMG LLP (“KPMG”), the principal accountant for the audit of the registrant’s annual financial statements, for services that are normally provided by the accountant in connection with statutory and regulatory filings or engagements for those fiscal years were $106,000 for year ended March 31, 2008 and $104,000 for year ended March 31, 2007. |
| (b) | Audit-Related Fees: The aggregate fees billed in the last fiscal year for assurance and related services by KPMG that are reasonably related to the performance of the audit of the registrant’s financial statements and are not reported under paragraph (a) of this Item were $12,450 for the year ended March 31, 2008 and $88,288 for year ended March 31, 2007. |
| (c) | Tax Fees: The aggregate fees billed in each of the last two fiscal years for professional services rendered by KPMG for tax compliance, tax advice, and tax planning were $47,111 in the year ended March 31, 2008 and $12,060 in the year ended March 31, 2007. Such services included review of excise distribution calculations (if applicable), preparation of the Funds’ federal, state and excise tax returns, tax services related to mergers and routine consulting. |
| (d) | All Other Fees: The aggregate fees billed in each of the last two fiscal years for products and services provided by KPMG, other than the services reported in paragraphs (a) through (c) of this Item. |
| None. |
| (e) (1) | Audit Committee Pre-Approval Policies and Procedures |
Table of Contents
AUDIT AND NON-AUDIT SERVICES
PRE-APPROVAL POLICY
I. Statement of Principles
Under the Sarbanes-Oxley Act of 2002 (the “Act”), the Audit Committee of the Board of Directors or Trustees (the “Committee”) of the ING Funds (each a “Fund,” collectively, the “Funds”) set out on Exhibit A to this Audit and Non-Audit Services Pre-Approval Policy (“Policy”) is responsible for the oversight of the work of the Funds’ independent auditors. As part of its responsibilities, the Committee must pre-approve the audit and non-audit services performed by the auditors in order to assure that the provision of these services does not impair the auditors’ independence from the Funds. The Committee has adopted, and the Board has ratified, this Policy, which sets out the procedures and conditions under which the services of the independent auditors may be pre-approved.
Under Securities and Exchange Commission (“SEC”) rules promulgated in accordance with the Act, the Funds may establish two different approaches to pre-approving audit and non-audit services. The Committee may approve services without consideration of specific case-by-case services (“general pre-approval”) or it may pre-approve specific services (“specific pre-approval”). The Committee believes that the combination of these approaches contemplated in this Policy results in an effective and efficient method for pre-approving audit and non-audit services to be performed by the Funds’ independent auditors. Under this Policy, services that are not of a type that may receive general pre-approval require specific pre-approval by the Committee. Any proposed services that exceed pre-approved cost levels or budgeted amounts will also require the Committee’s specific pre-approval.
For both types of approval, the Committee considers whether the subject services are consistent with the SEC’s rules on auditor independence and that such services are compatible with maintaining the auditors independence. The Committee also considers whether a particular audit firm is in the best position to provide effective and efficient services to the Funds. Reasons that the auditors are in the best position include the auditors’ familiarity with the Funds’ business, personnel, culture, accounting systems, risk profile, and other factors, and whether the services will enhance the Funds’ ability to manage and control risk or improve audit quality. Such factors will be considered as a whole, with no one factor being determinative.
The appendices attached to this Policy describe the audit, audit-related, tax-related, and other services that have the Committee’s general pre-approval. For any service that has been approved through general pre-approval, the general pre-approval will remain in place for a period 12 months from the date of pre-approval, unless the Committee determines that a different period is appropriate. The Committee will annually review and pre-approve the services that may be provided by the independent auditors without specific pre-approval. The Committee will revise the list of services subject to general pre-approval as appropriate. This Policy does not serve as a delegation to Fund management of the Committee’s duty to pre-approve services performed by the Funds’ independent auditors.
Table of Contents
II. Audit Services
The annual audit services engagement terms and fees are subject to the Committee’s specific pre-approval. Audit services are those services that are normally provided by auditors in connection with statutory and regulatory filings or engagements or those that generally only independent auditors can reasonably provide. They include the Funds’ annual financial statement audit and procedures that the independent auditors must perform in order to form an opinion on the Funds’ financial statements (e.g., information systems and procedural reviews and testing). The Committee will monitor the audit services engagement and approve any changes in terms, conditions or fees deemed by the Committee to be necessary or appropriate.
The Committee may grant general pre-approval to other audit services, such as statutory audits and services associated with SEC registration statements, periodic reports and other documents filed with the SEC or issued in connection with securities offerings.
The Committee has pre-approved the audit services listed on Appendix A. The Committee must specifically approve all audit services not listed on Appendix A.
III. Audit-related Services
Audit-related services are assurance and related services that are reasonably related to the performance of the audit or the review of the Funds’ financial statements or are traditionally performed by the independent auditors. The Committee believes that the provision of audit-related services will not impair the independent auditors’ independence, and therefore may grant pre-approval to audit-related services. Audit-related services include accounting consultations related to accounting, financial reporting or disclosure matters not classified as “audit services;” assistance with understanding and implementing new accounting and financial reporting guidance from rulemaking authorities; agreed-upon or expanded audit procedures relating to accounting and/or billing records required to respond to or comply with financial, accounting or regulatory reporting matters; and assistance with internal control reporting requirements under Form N-SAR or Form N-CSR.
The Committee has pre-approved the audit-related services listed on Appendix B. The Committee must specifically approve all audit-related services not listed on Appendix B.
IV. Tax Services
The Committee believes the independent auditors can provide tax services to the Funds, including tax compliance, tax planning, and tax advice, without compromising the auditors’ independence. Therefore, the Committee may grant general pre-approval with respect to tax services historically provided by the Funds’ independent auditors that do not, in the Committee’s view, impair auditor independence and that are consistent with the SEC’s rules on auditor independence.
The Committee will not grant pre-approval if the independent auditors initially recommends a transaction the sole business purpose of which is tax avoidance and the tax treatment of which may not be supported in the Internal Revenue Code and related regulations. The Committee may consult outside counsel to determine that tax planning and reporting positions are consistent with this Policy.
Table of Contents
The Committee has pre-approved the tax-related services listed on Appendix C. The Committee must specifically approve all tax-related services not listed on Appendix C.
V. Other Services
The Committee believes it may grant approval of non-audit services that are permissible services for independent auditors to a Fund. The Committee has determined to grant general pre-approval to other services that it believes are routine and recurring, do not impair auditor independence, and are consistent with SEC rules on auditor independence.
The Committee has pre-approved the non-audit services listed on Appendix D. The Committee must specifically approve all non-audit services not listed on Appendix D.
A list of the SEC’s prohibited non-audit services is attached to this Policy as Appendix E. The SEC’s rules and relevant guidance should be consulted to determine the precise definitions of these impermissible services and the applicability of exceptions to certain of the SEC’s prohibitions.
VI. Pre-approval of Fee levels and Budgeted Amounts
The Committee will annually establish pre-approval fee levels or budgeted amounts for audit, audit-related, tax and non-audit services to be provided to the Funds by the independent auditors. Any proposed services exceeding these levels or amounts require the Committee’s specific pre-approval. The Committee considers fees for audit and non-audit services when deciding whether to pre-approve services. The Committee may determine, for a pre-approval period of 12 months, the appropriate ratio between the total amount of fees for the Fund’s audit, audit-related, and tax services (including fees for services provided to Fund affiliates that are subject to pre-approval), and the total amount of fees for certain permissible non-audit services for the Fund classified as other services (including any such services provided to Fund affiliates that are subject to pre-approval).
VII. Procedures
Requests or applications for services to be provided by the independent auditors will be submitted to management. If management determines that the services do not fall within those services generally pre-approved by the Committee and set out in the appendices to these procedures, management will submit the services to the Committee or its delagee. Any such submission will include a detailed description of the services to be rendered. Notwithstanding this paragraph, the Committee will, on a quarterly basis, receive from the independent auditors a list of services provided for the previous calendar quarter on a cumulative basis by the auditors during the Pre-Approval Period.
Table of Contents
VIII. Delegation
The Committee may delegate pre-approval authority to one or more of the Committee’s members. Any member or members to whom such pre-approval authority is delegated must report any pre-approval decisions, including any pre-approved services, to the Committee at its next scheduled meeting. The Committee will identify any member to whom pre-approval authority is delegated in writing. The member will retain such authority for a period of 12 months from the date of pre-approval unless the Committee determines that a different period is appropriate. The period of delegated authority may be terminated by the Committee or at the option of the member.
IX. Additional Requirements
The Committee will take any measures the Committee deems necessary or appropriate to oversee the work of the independent auditors and to assure the auditors’ independence from the Funds. This may include reviewing a formal written statement from the independent auditors delineating all relationships between the auditors and the Funds, consistent with Independence Standards Board No. 1, and discussing with the auditors their methods and procedures for ensuring independence.
Last Approved: November 29, 2007
Table of Contents
Appendix A
Pre-Approved Audit Services for the Pre-Approval Period January 1, 2008 through December 31, 2008
| Service | ||||
| The Fund(s) | Fee Range | |||
Statutory audits or financial audits (including tax services associated with audit services) | ü | As presented to Audit Committee1 | ||
| Services associated with SEC registration statements, periodic reports and other documents filed with the SEC or other documents issued in connection with securities offerings (e.g., consents), and assistance in responding to SEC comment letters. | ü | Not to exceed $9,750 per filing | ||
| Consultations by Fund management with respect to accounting or disclosure treatment of transactions or events and/or the actual or potential effect of final or proposed rules, standards or interpretations by the SEC, Financial Accounting Standards Board, or other regulatory or standard setting bodies. | ü | Not to exceed $8,000 during the Pre- Approval Period | ||
| Seed capital audit and related review and issuance of consent on the N-2 registration statement | ü | Not to exceed $12,600 per audit | ||
1 | For new Funds launched during the Pre-Approval Period, the fee ranges pre-approved will be the same as those for existing Funds, pro-rated in accordance with inception dates as provided in the auditors’ Proposal or any Engagement Letter covering the period at issue. Fees in the Engagement Letter will be controlling. |
Table of Contents
Appendix B
Pre-Approved Audit-Related Services for the Pre-Approval Period January 1, 2008 through December 31, 2008
| Service | ||||||
| The Fund(s) | Fund Affiliates | Fee Range | ||||
| Services related to Fund mergers (Excludes tax services — See Appendix C for tax services associated with Fund mergers) | ü | ü | Not to exceed $10,000 per merger | |||
| Consultations by Fund management with respect to accounting or disclosure treatment of transactions or events and/or the actual or potential effect of final or proposed rules, standards or interpretations by the SEC, Financial Accounting Standards Board, or other regulatory or standard setting bodies. [Note: Under SEC rules some consultations may be “audit” services and others may be “audit-related” services.] | ü | Not to exceed $5,000 per occurrence during the Pre-Approval Period | ||||
| Review of the Funds’ semi-annual financial statements | ü | Not to exceed $2,200 per set of financial statements per fund | ||||
| Reports to regulatory or government agencies related to the annual engagement | ü | Up to $5,000 per occurrence during the Pre-Approval Period | ||||
| Regulatory compliance assistance | ü | ü | Not to exceed $5,000 per quarter | |||
| Training courses | ü | Not to exceed $2,000 per course | ||||
| For Prime Rate Trust, agreed upon procedures for quarterly reports to rating agencies | ü | Not to exceed $9,450 per quarter | ||||
| For Prime Rate Trust and Senior Income Fund, agreed upon procedures for the Revolving Credit and Security Agreement with Citigroup | ü | Not to exceed $21,000 per fund per year | ||||
Table of Contents
Appendix C
Pre-Approved Tax Services for the Pre-Approval Period January 1, 2008 through December 31, 2008
| Service | ||||||
| The Fund(s) | Fund Affiliates | Fee Range | ||||
| Preparation of federal and state income tax returns and federal excise tax returns for the Funds including assistance and review with excise tax distributions | ü | As presented to Audit Committee2 | ||||
| Review of IRC Sections 851(b) and 817(h) diversification testing on a real-time basis | ü | As presented to Audit Committee2 | ||||
| Assistance and advice regarding year-end reporting for 1099’s | ü | As presented to Audit Committee2 | ||||
| Tax assistance and advice regarding statutory, regulatory or administrative developments | ü | ü | Not to exceed $5,000 for the Funds or for the Funds’ investment adviser during the Pre- Approval Period | |||
2 | For new Funds launched during the Pre-Approval Period, the fee ranges pre-approved will be the same as those for existing Funds, pro-rated in accordance with inception dates as provided in the auditors’ Proposal or any Engagement Letter covering the period at issue. Fees in the Engagement Letter will be controlling. |
Table of Contents
Appendix C, continued
| Service | ||||||
| The Fund(s) | Fund Affiliates | Fee Range | ||||
| Tax training courses | ü | Not to exceed $2,000 per course during the Pre-Approval Period | ||||
| Tax services associated with Fund mergers | ü | ü | Not to exceed $4,000 per fund per merger during the Pre-Approval Period | |||
| Other tax-related assistance and consultation, including, without limitation, assistance in evaluating derivative financial instruments and international tax issues, qualification and distribution issues, and similar routine tax consultations. | ü | Not to exceed $120,000 during the Pre-Approval Period | ||||
Table of Contents
Appendix D
Pre-Approved Other Services for the Pre-Approval Period January 1, 2008 through December 31, 2008
| Service | ||||||
| The Fund(s) | Fund Affiliates | Fee Range | ||||
| Agreed-upon procedures for Class B share 12b-1 programs | ü | Not to exceed $50,000 during the Pre-Approval Period | ||||
Security counts performed pursuant to Rule 17f-2 of the 1940 Act (i.e., counts for Funds holding securities with affiliated sub-custodians)
Cost to be borne 50% by the Funds and 50% by ING Investments, LLC. | ü | ü | Not to exceed $5,000 per Fund during Approval Period | |||
| Agreed upon procedures for 15 (c) FACT Books | ü | Not to exceed $35,000 Approval Period | ||||
Table of Contents
Appendix E
Prohibited Non-Audit Services
Dated: January 1, 2008
| • | Bookkeeping or other services related to the accounting records or financial statements of the Funds |
| • | Financial information systems design and implementation |
| • | Appraisal or valuation services, fairness opinions, or contribution-in-kind reports |
| • | Actuarial services |
| • | Internal audit outsourcing services |
| • | Management functions |
| • | Human resources |
| • | Broker-dealer, investment adviser, or investment banking services |
| • | Legal services |
| • | Expert services unrelated to the audit |
| • | Any other service that the Public Company Accounting Oversight Board determines, by regulation, is impermissible |
Table of Contents
EXHIBIT A
ING EQUITY TRUST
ING FUNDS TRUST
ING ASIA PACIFIC HIGH DIVIDEND EQUITY INCOME FUND
ING GLOBAL ADVANTAGE AND PREMIUM OPPORTUNITY FUND
ING GLOBAL EQUITY DIVIDEND AND PREMIUM OPPORTUNITY FUND
ING INTERNATIONAL HIGH DIVIDEND EQUITY INCOME FUND
ING RISK MANAGED NATURAL RESOURCES FUND
ING INVESTMENT FUNDS, INC.
ING INVESTORS TRUST
ING MAYFLOWER TRUST
ING MUTUAL FUNDS
ING PARTNERS, INC.
ING PRIME RATE TRUST
ING SENIOR INCOME FUND
ING SEPARATE PORTFOLIOS TRUST
ING VARIABLE INSURANCE TRUST
ING VARIABLE PRODUCTS TRUST
Table of Contents
| (e)(2) | Percentage of services referred to in (4)(b)-(4)(d) that were approved by the audit committee | |
| 100% of the services were approved by the audit committee. | ||
| (f) | Percentage of hours expended attributable to work performed by other than full time employees of KPMG if greater than 50% | |
| Not applicable | ||
| (g) | Non-Audit Fees: The non-audit fees billed by the registrant’s accountant for services rendered to the registrant, and rendered to the registrant’s investment adviser, and any entity controlling, controlled by, or under common control with the adviser that provides ongoing services to the registrant for each of the last two fiscal years of the registrant were $1,235,180 for year ended March 31, 2008 and $963,560 for fiscal year ended March 31, 2007. | |
| (h) | Principal Accountants Independence: the Registrant’s Audit committee has considered whether the provision of non-audit services that were rendered to the registrant’s investment adviser and any entity controlling, controlled by, or under common control with the investment adviser that provides ongoing services to the registrant that were not pre-approved pursuant to Rule 2.01(c)(7)(ii) of Regulation S-X is compatible with maintaining KPMG’s independence. | |
Item 5. Audit Committee of Listed Registrants.
Not applicable.
Item 6. Schedule of Investments
Schedule is included as part of the report to shareholders filed under Item 1 of this Form.
Item 7. Disclosure of Proxy Voting Policies and Procedures for Closed-End Management Investment companies.
Not applicable.
Item 8. Purchases of Equity Securities by Closed-End Management Investment Company and Affiliated Purchasers
Not applicable.
Item 9. Submission of Matters to a Vote of Security Holders.
Nominating Committee. The Nominating Committee operates pursuant to a Charter approved by the Board. The primary purpose of the Nominating Committee is to consider, evaluate and make recommendations to the Board with respect to the nomination and selection of Independent Trustees. In evaluating candidates, the Nominating Committee may consider a variety of factors, but specific qualifications of candidates for Board membership will be based on the needs of the Board at the time of nomination.
The Nominating Committee is willing to consider nominations received from shareholders and shall assess shareholder nominees in the same manner as it reviews nominees it identifies. A shareholder nominee for director should be submitted in writing to the Fund’s Secretary. Any such shareholder nomination should include sufficient background information concerning the candidate and should be received in a timely manner. At a minimum, the following information as to each individual proposed for nomination as director should be included: the individual’s written consent to be named in the proxy statement as a nominee (if nominated) and to serve as a director (if elected), and all information relating to such individual that is required to be disclosed in a solicitation of proxies for election of directors, or is otherwise required, in each case under applicable federal securities laws, rules and regulations.
The Secretary shall submit all nominations received in a timely manner to the Nominating Committee. To be timely, any such submission must be delivered to the Fund’s Secretary not earlier than the 90th day prior to such meeting and not later than the close of business on the later of the 60th day prior to such meeting or the 10th day following the day on which public announcement of the date of the meeting is first made, by either disclosure in a press release or in a document publicly filed by the Fund with the SEC.
In evaluating a candidate for the position of Independent Trustee, including any candidate recommended by shareholders of the Fund, the Nominating Committee shall consider the following: (i) the candidate’s knowledge in matters relating to the mutual fund industry; (ii) any experience possessed by the candidate as a director or senior officer of other public companies; (iii) the candidate’s educational background, reputation for high ethical standards and professional integrity; (iv) any specific financial, technical or other expertise possessed by the candidate, and the extent to which such expertise would complement the Board’s existing mix of skills, core competencies and qualifications; (v) the candidate’s perceived ability to contribute to the ongoing functions of the Board, including the candidate’s ability and commitment to attend meetings regularly and work collaboratively with other members of the Board; (vi) the candidate’s ability to qualify as an Independent Trustee for purposes of the 1940 Act; and (vii) such other factors as the Committee determines to be relevant in light of the existing composition of the Board and any anticipated vacancies. Prior to making a final recommendation to the Board, the Committee shall conduct personal interviews with those candidates it concludes are the most qualified candidates.
Item 10. Controls and Procedures.
| (a) | Based on our evaluation conducted within 90 days of the filing date, hereof, the design and operation of the registrant’s disclosure controls and procedures are effective to ensure that material information relating to the registrant is made known to the certifying officers by others within the appropriate entities, particularly during the period in which Forms N-CSR are being prepared, and the registrant’s disclosure controls and procedures allow timely preparation and review of the information for the registrant’s Form N-CSR and the officer certifications of such Form N-CSR. |
| (b) | There were no significant changes in the registrant’s internal controls that occurred during the second fiscal quarter of the period covered by this report that has materially affected, or is reasonably likely to materially affect, the registrant’s internal control over financial reporting. |
Item 11. Exhibits.
| (a)(1) | Code of Ethics pursuant to Item 2 of Form N-CSR is filed and attached hereto as EX-99.CODE ETH. | |
| (a)(2) | A separate certification for each principal executive officer and principal financial officer of the registrant as required by Rule 30a-2 under the Act (17 CFR 270.30a-2) is attached hereto as EX-99.CERT. | |
| (b) | The officer certifications required by Section 906 of the Sarbanes-Oxley Act of 2002 are attached hereto as EX-99.906CERT | |
| (3) | Not applicable. | |
Table of Contents
SIGNATURES
Pursuant to the requirements of the Securities Exchange Act of 1934 and the Investment Company Act of 1940, the registrant has duly caused this report to be signed on its behalf by the undersigned, thereunto duly authorized.
| (Registrant): ING Funds Trust | ||
| By | /s/ Shaun P. Mathews | |
| Shaun P. Mathews | ||
| President and Chief Executive Officer | ||
| Date: June 6, 2008 | ||
Pursuant to the requirements of the Securities Exchange Act of 1934 and the Investment Company Act of 1940, this report has been signed below by the following persons on behalf of the registrant and in the capacities and on the dates indicated.
| By | /s/ Shaun P. Mathews | |
| Shaun P. Mathews | ||
| President and Chief Executive Officer | ||
| Date: June 6, 2008 | ||
| By | /s/ Todd Modic | |
| Todd Modic | ||
| Senior Vice President and Chief Financial Officer | ||
| Date: June 6, 2008 | ||