OMB APPROVAL
OMB Number: 3235-0570
Expires: August 31, 2011
Estimated average burden hours per response: 18.9
UNITED STATES
SECURITIES AND EXCHANGE COMMISSION
Washington, D.C. 20549
FORM N-CSR
CERTIFIED SHAREHOLDER REPORT OF
REGISTERED MANAGEMENT INVESTMENT COMPANIES
Investment Company Act file number: 811-08895
ING Funds Trust
(Exact name of registrant as specified in charter)
| | |
| 7337 E. Doubletree Ranch Rd., Scottsdale, AZ | | 85258 |
| (Address of principal executive offices) | | (Zip code) |
The Corporation Trust Company, 1209 Orange Street, Wilmington, DE 19801
(Name and address of agent for service)
Registrant’s telephone number, including area code: 1-800-992-0180
| | |
Date of fiscal year end: | | March 31 |
| |
Date of reporting period: | | March 31, 2010 |
Item 1. Reports to Stockholders.
The following is a copy of the report transmitted to stockholders pursuant to Rule 30e-1 under the Act (17 CFR 270.30e-1):

Annual Report
March 31, 2010
Classes A, B, C, I, IS, O, R and W
Fixed-Income Funds
| n | ING High Yield Bond Fund |
| n | ING Intermediate Bond Fund |
Money Market Funds
| n | ING Classic Money Market Fund |
| n | ING Institutional Prime Money Market Fund |
| | |
 | | E-Delivery Sign-up – details inside |
This report is submitted for general information to shareholders of the ING Funds. It is not authorized for distribution to prospective shareholders unless accompanied or preceded by a prospectus which includes details regarding the funds’ investment objectives, risks, charges, expenses and other information. This information should be read carefully.
MUTUAL FUNDS | 
|
TABLE OF CONTENTS
| | | | |
| | | |
 | | Go Paperless with E-Delivery! | | |
Sign up now for on-line prospectuses, fund reports, and proxy statements. In less than five minutes, you can help reduce paper mail and lower fund costs. Just go to www.ingfunds.com, click on the E-Delivery icon from the home page, follow the directions and complete the quick 5 Steps to Enroll. You will be notified by e-mail when these communications become available on the internet. Documents that are not available on the internet will continue to be sent by mail. |
PROXY VOTING INFORMATION
A description of the policies and procedures that the Funds use to determine how to vote proxies related to portfolio securities is available: (1) without charge, upon request, by calling Shareholder Services toll-free at (800) 992-0180; (2) on the Funds’ website at www.ingfunds.com; and (3) on the U.S. Securities and Exchange Commission’s (“SEC”) website at www.sec.gov. Information regarding how the Funds voted proxies related to portfolio securities during the most recent 12-month period ended June 30 is available without charge on the Funds’ website at www.ingfunds.com and on the SEC’s website at www.sec.gov.
QUARTERLY PORTFOLIO HOLDINGS
The Funds file their complete schedule of portfolio holdings with the SEC for the first and third quarters of each fiscal year on Form N-Q. The Funds’ Forms N-Q are available on the website at www.sec.gov. The Funds’ Forms N-Q may be reviewed and copied at the SEC’s Public Reference Room in Washington, DC, and information on the operation of the Public Reference Room may be obtained by calling (800) SEC-0330; and is available upon request from the Funds by calling Shareholder Services toll-free at (800) 992-0180.
Please note that your investment in money market funds: is not a bank deposit, is not insured or guaranteed by the Federal Deposit Insurance Corporation (“FDIC”), the Federal Reserve Board or any other government agency, and is affected by market fluctuations. There is no guarantee that the ING Classic Money Market Fund or the ING Institutional Prime Money Market Fund will achieve its investment objective.
PRESIDENT’S LETTER

Dear Shareholder,
Observers were waiting anxiously, and mostly pessimistically, for the March 5 unemployment report. Its arrival, however, brought some encouraging news: the U.S. Department of Labor reported that job losses continued to decline in February, a hopeful sign that employment might turn positive soon, after 26 months of contraction or no gain.
The global recovery from the largest economic decline since the Great Depression continues, if somewhat fitfully at times. The U.S. economy seems to be expanding at a moderate pace, though the factors that have driven the recovery so far may be nearing the end of their effectiveness. Congress recently passed an extension of unemployment benefits, which should help sustain recovery until job growth can take up the slack.
Economies outside the United States also remain on an upward if somewhat uneven track. At this point, it looks as if the emerging world will lead the recovery while developed nations lag — Asia has been particularly strong out of the recession, while Europe continues to grapple with a variety of issues including runaway sovereign debt (Greece being one very visible example of this concern). As a result, the performance of regional securities markets may increasingly diverge, implying that global asset allocation could reaffirm its value as a portfolio diversification tool.
We have long recommended a broadly diversified asset mix as most likely to serve your financial needs. Should you choose to add to your portfolio’s global diversification, please discuss prospective actions thoroughly with your investment advisor before you make any adjustments.
Thank you for your continued confidence in ING Funds. We look forward to serving your investment needs in the future.
Sincerely,

Shaun Mathews
President and Chief Executive Officer
ING Funds
April 23, 2010
The views expressed in the President’s Letter reflect those of the President as of the date of the letter. Any such views are subject to change at any time based upon market or other conditions and the ING Funds disclaim any responsibility to update such views. These views may not be relied on as investment advice and because investment decisions for an ING Fund are based on numerous factors, may not be relied on as an indication of investment intent on behalf of any ING Fund. Reference to specific company securities should not be construed as recommendations or investment advice.
For more complete information, or to obtain a prospectus for any ING Fund, please call your investment professional or ING Funds Distributor, LLC at (800) 992-0180 or log on to www.ingfunds.com. The prospectus should be read carefully before investing. Consider the fund’s investment objectives, risks, and charges and expenses carefully before investing. The prospectus contains this information and other information about the fund. Check with your investment professional to determine which funds are available for sale within their firm. Not all funds are available for sale at all firms.
1
MARKET PERSPECTIVE: YEAR ENDED MARCH 31, 2010
In our semi-annual report, we described the resurgence of risky asset classes like equities and corporate bonds after their markets reached a bottom in early March 2009. Further gains were made in the second half of the fiscal year, but were smaller and more erratic.
The financial crisis that led to recession forced governments to intervene massively to recapitalize companies considered systemically important, or at least make practically unlimited amounts of liquidity available to them at low cost. These were mainly banks and other financial institutions, but in the U.S. also included major auto makers. Interest rates have been reduced to record low levels to encourage these institutions to lend and generally to support demand. Bank lending has continued to stagnate, however (except in China, where banks tend to follow government directions).
“Cash-for-Clunkers” programs were successfully introduced in a number of countries, under which governments subsidized the trade-in of old vehicles for newer models. In the U.S., the government offered tax credits to home buyers and extended jobless benefits. In Europe, to reduce the number of workers being laid off, corporations were subsidized to keep them on part-time. The U.K. reduced its Value Added Tax.
Government budget deficits have soared to modern-day records: in the U.S. alone, $1.42 trillion for the fiscal year ending September 2009. To keep interest rates down, the Federal Reserve and the Bank of England have been buying Treasury bonds in a strategy known as quantitative easing.
What will happen when large-scale government intervention ends is probably the greatest concern for investors. But China’s rate of gross domestic product (“GDP”) growth is now back above 10% and some key areas of the domestic economy are looking better.
House prices have started to rise again. The Standard & Poor’s (“S&P”)/Case-Shiller National U.S. Home Price Index(1) of house prices in 20 cities was reported in March to have risen for the eighth consecutive month and was only down 0.7% from a year earlier. Sales of existing homes reached the highest levels since February 2007 but then fell in the three months through February 2010, perhaps distorted by tax credit effects.
Improvement on the employment front has been clear, but so far too slow to sustain a vigorous recovery and jobs were still being lost as our fiscal year ended. The unemployment rate was reported at 9.7% in February, having peaked at 10.1% in October. Wage growth
remains weak and the participation rate (percentage of the population in the labor force) fell to 64.6% in December, the lowest level since August 1985, before edging up in January and February.
At least the economy has started to expand again after four quarterly declines. In the third quarter of 2009, GDP in the U.S. rose by 2.2% at an annual rate and 5.6% in the fourth quarter. Most of the latter figure was due to inventory rebuilding, but it was accompanied by a 30.6% increase in corporate profits over the fourth quarter of 2008, the biggest rise since 1984.
In fixed income markets, the three-month dollar London Interbank Offered Rate (“LIBOR”), the basis of trillions of dollars of financial agreements, fell below 1% for the first time in May 2009 and stayed there.
In bond markets, the riskier issues performed the best, especially in the first half of the fiscal year. The Barclays Capital U.S. Aggregate Bond Index(2) of investment grade bonds returned 7.69% for the fiscal year. But within this figure, improved risk appetite propelled the Barclays Capital Corporate Investment Grade Bond Index(3) to a 23.80% gain for the fiscal year. At the other extreme, the Barclays Capital Long Term U.S. Treasury Index(4) lost 7.26% for the fiscal year as investors fretted about the huge volume of new issuance and future inflation. The Treasury yield curve, measured by the excess yield on 10-year Treasuries over 2-year issues, reached a new all-time high 2.94% on February 18. High yield bonds, represented by the Barclays Capital High Yield Bond — 2% Issuer Constrained Composite Index(5), were the star performers, gaining an equity-like 55.63% for the fiscal year. The annual yield on the 90-day Treasury Bill started the fiscal year at 20 basis points (“bps”), moved in a range between 21 bps and 0 bps and ended at 15 bps.
In currencies, the U.S. dollar, on a trade weighted basis, touched a 15-month low in late November but rebounded somewhat later. Depressing the euro recently has been uncertainty about Greece’s ability to repay vast sovereign debts falling due in 2010. For the fiscal year, the U.S. dollar lost 1.8% to the euro, 5.7% against the pound, and 4.7% against the yen.
U.S. equities, represented by the S&P 500® Composite Stock Price (“S&P 500®”) Index(6) including dividends soared 49.77% in the fiscal year, about three quarters of it in the first half, led by the financials sector, which recorded an 83% gain. Profits for S&P 500® companies suffered their ninth straight quarter of annual decline
2
MARKET PERSPECTIVE: YEAR ENDED MARCH 31, 2010
in the third quarter of 2009 before showing strong improvement in the fourth.
In international markets, based on local currencies including dividends, the MSCI® Japan Index(7) rose 30.4% over the fiscal year. Bolstered by government stimulus and trade, GDP resumed growth in the fourth quarter, despite weak domestic demand and falling wages. The MSCI Europe ex UK® Index(8) gained 48.7% for the fiscal year. As in the U.S., the region’s economy returned to growth in the third quarter of 2009, by 0.4% over the previous quarter, but only rose by 0.1% in the fourth. The MSCI UK® Index(9) returned 50.7% for the fiscal year. The U.K. had to wait until the fourth quarter for a rise in GDP, by 0.4%. Consumers continued to pay down debt at record rates and the household savings rate rose to 8.4%, the highest in eleven years.
(1) The S&P/Case-Shiller National U.S. Home Price Index tracks the value of single-family housing within the United States. The index is a composite of single family home price indices for the nine U.S. Census divisions and is calculated quarterly.
(2) The Barclays Capital U.S. Aggregate Bond Index is an unmanaged index of publicly issued investment grade U.S. Government, mortgage-backed, asset-backed and corporate debt securities.
(3) The Barclays Capital Corporate Investment Grade Bond Index is the corporate component of the Barclays Capital U.S. Credit Index. The U.S. Credit Index includes publicly-issued U.S. corporate and specified foreign debentures and secured notes that meet the specified maturity, liquidity, and quality requirements. The index includes both corporate and non-corporate sectors. The corporate sectors are industrial, utility and finance, which includes both U.S. and non-U.S. corporations.
(4) The Barclays Capital Long Term U.S. Treasury Index is an unmanaged index that includes public obligations of the U.S. Treasury that have a remaining maturity of 10 or more years. Treasury bills, certain special issues, such
as state and local government series bonds (SLGs), as well as U.S. Treasury TIPS and STRIPS, are excluded.
(5) The Barclays Capital High Yield Bond — 2% Issuer Constrained Composite Index is an unmanaged index that includes all fixed income securities having a maximum quality rating of Ba1, a minimum amount outstanding of $150 million, and at least one year to maturity.
(6) The S&P 500® Index is an unmanaged index that measures the performance of securities of approximately 500 large-capitalization companies whose securities are traded on major U.S. stock markets.
(7) The MSCI Japan® Index is a free float-adjusted market capitalization index that is designed to measure developed market equity performance in Japan.
(8) The MSCI Europe ex UK® Index is a free float-adjusted market capitalization index that is designed to measure developed market equity performance in Europe, excluding the UK.
(9) The MSCI UK® Index is a free float-adjusted market capitalization index that is designed to measure developed market equity performance in the UK.
Parentheses denote a negative number.
All indices are unmanaged and investors cannot invest directly in an index. Past performance does not guarantee future results. The performance quoted represents past performance. Investment return and principal value of an investment will fluctuate, and shares, when redeemed, may be worth more or less than their original cost. The Funds’ performance is subject to change since the period’s end and may be lower or higher than the performance data shown. Please call (800) 992-0180 or log on to www.ingfunds.com to obtain performance data current to the most recent month end.
Market Perspective reflects the views of ING’s Chief Investment Risk Officer only through the end of the period, and is subject to change based on market and other conditions.
3
| | |
| ING GNMA INCOME FUND | | PORTFOLIO MANAGERS’ REPORT |
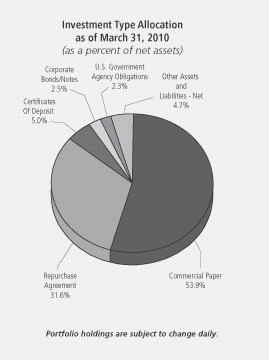
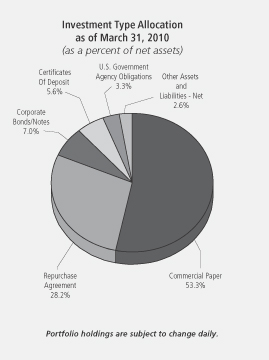
Investment Type Allocation
as of March 31, 2010
(as a percent of net assets)
| | | |
Government National Mortgage Association | | 99.6% | |
Federal National Mortgage Association | | 2.5% | |
Federal Home Loan Mortgage Corporation | | 1.9% | |
Other U.S. Agency Obligations | | 0.0% | * |
Other Assets and Liabilities — Net | | (4.0)% | |
| | | |
Net Assets | | 100.0% | |
| | | |
| | * | Amount is less than 0.05% but more than 0.00% |
Portfolio holdings are subject to change daily.
ING GNMA Income Fund (the “Fund”) seeks to generate a high level of current income, consistent with liquidity and safety of principal, through investment primarily in Government National Mortgage Association (“GNMA”) mortgage-backed securities (also known as GNMA Certificates) that are guaranteed as to the timely payment of principal and interest by the U.S. government. The Fund is managed by Peter Guan, Jeff Dutra and Justin McWhorter, Portfolio Managers* of ING Investment Management Co. — the Sub-Adviser.
Securities issued by the U.S. Treasury are backed by the full faith and credit of the federal government. Securities issued by individual agencies and organizations may be backed by the full faith and credit of the federal government as to principal or interest but are not direct obligations of the U.S. Treasury. Securities of some agencies and organizations are backed solely by the entity’s own resources or by the ability of the entity to borrow from the U.S. Treasury. Government securities also include certain mortgage-related securities that are sponsored by a U.S. government agency or organization and are not direct obligations of the U.S. government.
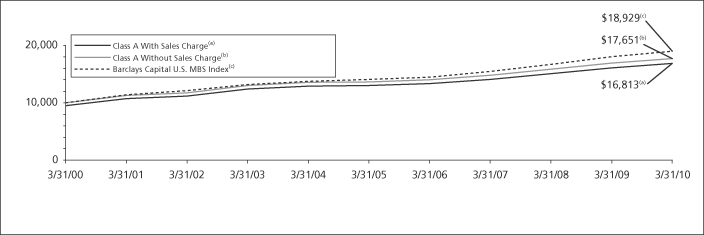
Performance: For the year ended March 31, 2010, the Fund’s Class A shares, excluding sales charges, provided a total return of 4.68% compared to the Barclays Capital U.S. Mortgage-Backed Securities (“MBS”) Index(1) which returned 5.21%, for the same period.
Portfolio Specifics: For the better part of 2009 and into 2010, bond markets focused on the signs of healing. Both in the U.S. and abroad, there were consistent signs that the worst of the economic recession was behind us. Equities came roaring back after hitting lows in early March 2009, and although agency and Government National Mortgage Association (“GNMA”) residential mortgage-backed securities (“RMBS”) markets had already recovered substantially from the widest spreads in history by spring of 2009, they continued to benefit from a dominating $1.5 billion mortgage-backed securities (“MBS”) purchase program by the Federal Reserve (the “Fed”) and U.S. Treasury.
Owning mortgages in 2009 appeared to be a no-lose strategy as they continually outperformed duration equivalent Treasuries 11 out of 12 months of the year. Slow voluntary prepayments, limited net new supply and continuous demand by the government resulted in the biggest “change of ownership” ever. At the purchase program’s conclusion, the government owned nearly 25% of all agency and GNMA RMBS, and approximately 66% if you take just 30-year, fixed-rate agency RMBS. Therefore, it was no surprise when many investors fled mortgages toward the end of the year in preparation for the widely advertised end of the buying on March 31, 2010. But mortgages did not widen as expected; instead, they have remained steadfast versus U.S. Treasury equivalents, as investors have been flush with cash and underweight exposure, and new supply of agency RMBS has remained light.
The Fund outperformed its benchmark before the deduction of fees and expenses, but lagged the benchmark on a net-asset-value basis (after deducting fees and expenses). A causal factor of the Fund’s underperformance was its allocation to GNMA securities and adjustable rate mortgages. Further detracting from results was selection among Federal Home Loan Mortgage Corporation (“FHLMC”) securities, and among Federal National Mortgage Association (“FNMA”) securities. In contrast, the Fund benefited from security selection within GNMA and Treasury securities; its duration (interest-rate) exposure also contributed to results. The Fund also benefited from its exposures to higher coupon mortgages. Although GNMAs underperformed conventional agency MBS due to the Federal Reserve purchases of FNMA and FHLMC bonds, the Fund offset some of that relative detraction by focusing on specific pools with prepayment protected and GNMA collateralized mortgage obligations (“CMOs”) with good structure.
Current Strategy & Outlook: We continue to look for a gradual economic recovery to take hold in 2010. We believe business investment and inventory rebuilding are helping provide some recent lift to economic growth. In our opinion, gradual recovery in consumer spending and a recovery in household net worth will be important drivers for further economic gains as consumer spending historically constitutes close to two-thirds of economic growth in the United States. Despite good gains in consumer spending and an improvement of the jobs market in March, the headwinds for the consumer are sizeable with a 9.7% unemployment rate and a housing market that may still have yet to find the elusive bottom.
Therefore, we expect modest pressure on U.S. Treasury rates due to the higher debt issuance needs of the U.S. government and the market’s expectation of eventually higher interest rate targeting by the Fed, although we see Fed tightening more likely taking place late 2010 or early 2011 at this point.
The Fed concluded its MBS purchase program on March 31, as promised, leaving the agency MBS market without its largest buyer over the past year. Depressed supply is currently offsetting decreased demand, resulting in slightly higher mortgage rates, a housing market that has shown little improvement and continued restrictive lending practices. These counterweights should keep mortgage securities range-bound in the near term.
With this outlook in mind, we continue to manage the Fund seeking to benefit from spread widening combined with the risk of higher interest rates in the future. The predominant focus remains on specified GNMA pools and CMOs that provide more price protection as the economy mends and rates continue to rise.
| * | | Effective May 19, 2009, Peter Guan, Jeff Dutra and Justin McWhorter joined Denis Jamison as portfolio managers to the Fund. Effective September 30, 2009, Mr. Jamison no longer manages the Fund. |
| (1) | | The Barclays Capital U.S. MBS Index is an unmanaged index composed of fixed-income security mortgage pools sponsored by GNMA, FNMA and FHLMC, including GNMA Graduated Payment Mortgages. |
Portfolio holdings and characteristics are subject to change and may not be representative of current holdings and characteristics. The outlook for this Fund may differ from that presented for other ING Funds. Performance for the different classes of shares will vary based on differences in fees associated with each class. An index has no cash in its portfolio, imposes no sales charges and incurs no operating expenses. An investor cannot invest directly in an index.
The views expressed in this report reflect those of the portfolio managers, only through the end of the period as stated on the cover. The portfolio managers’ views are subject to change at any time based on market and other conditions.
Fund holdings are subject to change daily.
This report contains statements that may be “forward-looking” statements. Actual results may differ materially from those projected in the “forward-looking” statements.
4
| | |
| ING GNMA INCOME FUND | | PORTFOLIO MANAGERS’ REPORT |
| | | | | | | | | | | | | | | | | | | | | | | | | |
| | | |
| | | Average Annual Total Returns for the Periods Ended March 31, 2010 | | | |
| | | | | 1 Year | | | 5 Year | | | 10 Year | | | Since Inception of Class B October 6, 2000 | | | Since Inception of Class C October 13, 2000 | | | Since Inception of Class I January 7, 2002 | | | Since Inception of Class W December 17, 2007 | | | |
| | | Including Sales Charge: | | | | | | | | | | | | | | | | | | | | | | | |
| | | Class A(1) | | 2.10 | % | | 4.28 | % | | 5.34 | % | | — | | | — | | | — | | | — | | | |
| | | Class B(2) | | (1.11 | )% | | 4.16 | % | | — | | | 4.88 | % | | — | | | — | | | — | | | |
| | | Class C(3) | | 2.92 | % | | 4.51 | % | | — | | | — | | | 4.85 | % | | — | | | — | | | |
| | | Class I | | 5.00 | % | | 5.60 | % | | — | | | — | | | — | | | 5.32 | % | | — | | | |
| | | Class W | | 4.97 | % | | — | | | — | | | — | | | — | | | — | | | 6.67 | % | | |
| | | Excluding Sales Charge: | | | | | | | | | | | | | | | | | | | | | | | |
| | | Class A | | 4.68 | % | | 5.29 | % | | 5.84 | % | | — | | | — | | | — | | | — | | | |
| | | Class B | | 3.89 | % | | 4.50 | % | | — | | | 4.88 | % | | — | | | — | | | — | | | |
| | | Class C | | 3.92 | % | | 4.51 | % | | — | | | — | | | 4.85 | % | | — | | | — | | | |
| | | Class I | | 5.00 | % | | 5.60 | % | | — | | | — | | | — | | | 5.32 | % | | — | | | |
| | | Class W | | 4.97 | % | | — | | | — | | | — | | | — | | | — | | | 6.67 | % | | |
| | | Barclays Capital U.S. MBS Index(4) | | 5.21 | % | | 6.13 | % | | 6.47 | % | | 6.22 | %(5) | | 6.22 | %(5) | | 5.68 | %(6) | | 7.02 | %(7) | | |
Based on a $10,000 initial investment, the graph and table above illustrate the total return of ING GNMA Income Fund against the index indicated. An index is unmanaged and has no cash in its portfolio, imposes no sales charges and incurs no operating expenses. An investor cannot invest directly in an index. The Fund’s performance is shown both with and without the imposition of sales charges.
The performance graph and table do not reflect the deduction of taxes that a shareholder will pay on Fund distributions or the redemption of Fund shares.
The performance shown may include the effect of fee waivers and/or expense reimbursements by the Investment Adviser and/or other service providers, which have the effect of increasing total return. Had all fees and expenses been considered, the total returns would have been lower.
Performance data represents past performance and is no assurance of future results. Investment return and principal value of an investment in the Fund will fluctuate. Shares, when sold, may be worth more or less than their original cost. The Fund’s performance may be lower or higher than the performance data shown. Please log on to www.ingfunds.com or call (800) 992-0180 to get performance through the most recent month end.
This report contains statements that may be “forward-looking” statements. Actual results may differ materially from those projected in the “forward-looking” statements.
The views expressed in this report reflect those of the portfolio managers, only through the end of the period as stated on the cover. The portfolio managers’ views are subject to change at any time based on market and other conditions.
Fund holdings are subject to change daily.
| (1) | | Reflects deduction of the maximum Class A sales charge of 4.75%. Effective July 31, 2006, the maximum Class A sales charge was lowered to 2.50%. |
| (2) | | Reflects deduction of the Class B deferred sales charge of 5% and 2% for the 1 year and 5 year returns, respectively. |
| (3) | | Reflects deduction of the Class C deferred sales charge of 1% for the 1 year return. |
| (4) | | The Barclays Capital U.S. MBS Index is an unmanaged index composed of fixed-income security mortgage pools sponsored by GNMA, FNMA and FHLMC, including GNMA Graduated Payment Mortgages. |
| (5) | | Since inception performance for index is shown from October 1, 2000. |
| (6) | | Since inception performance for index is shown from January 1, 2002. |
| (7) | | Since inception performance for index is shown from January 1, 2008. |
5
| | |
| PORTFOLIO MANAGERS’ REPORT | | ING HIGH YIELD BOND FUND |
ING High Yield Bond Fund (the “Fund”) seeks to provide investors with a high level of current income and total return. The Fund is managed by Randall Parrish, CFA, and Matt Toms, Portfolio Managers of ING Investment Management Co. — the Sub-Adviser.*
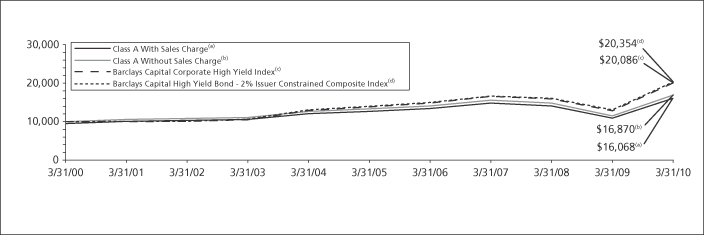
Performance: For the year ended March 31, 2010, the Fund’s Class A shares, excluding sales charges, provided a total return of 46.88% compared to the Barclays Capital Corporate High Yield Index(1) and the Barclays Capital High Yield bond — 2% Issuer Constrained Composite Index(2), which returned 56.18% and 55.64%, respectively, for the same period.
Portfolio Specifics: For the better part of 2009 and into 2010, bond markets focused on the signs of economies stabilizing, or in cases such as China, accelerating, as the tsunami of policy-induced liquidity propelled risk-based bonds ahead of sovereign debt. The so-called “olive belt,” with particular focus on the financial difficulties in Greece, emerged as a point of concern, as did debt troubles in Dubai. Although this “Greek tragedy” appears to have been partially resolved, the specter of sovereign indebtedness may resurface like Banquo’s ghost. U.S. Treasuries rose substantively over the year — the yield on the ten-year note increased 1.16%.
As the economy pulled back from the brink during the period, high yield bonds made strong gains, most notably among the lower quality (bonds rated CCC and below) and distressed bonds. High yield financials, a sector that investors have historically ignored, produced high double-digit returns thanks to gains by downgraded subordinated bonds of the “too-big-to-fail” banks.
The Fund began the year with a somewhat defensive posture given the considerable risks in the overall economic and financial environment. Our overweight position in defensive sectors such as healthcare, supermarkets, and cable weighed on relative performance in the first half of the year as the market rallied furiously off the bottom on signs of recovery and increasing government support. In response to these developments, we moved in mid-2009 to position the portfolio for recovery, adding more cyclical names and bonds trading at lower dollar prices. Additions included auto parts suppliers American Axle and Manufacturing Inc. and Arvin Meritor, as well as retailers Michaels Stores Inc. and Neiman Marcus Group Inc., all of which contributed to performance. Bonds that significantly detracted from results included GMAC, Nexstar Broadcasting, Harrah’s, Centene Corp., Pinnacle Entertainment and Blockbuster.
Current Strategy & Outlook: We continue to look for a gradual economic recovery to take hold in 2010. Business investment and inventory rebuilding are helping provide some recent lift to economic growth. Gradual recovery in consumer spending and a recovery in household net worth will be important drivers for further economic gains as consumer spending historically constitutes close to two-thirds of economic growth in the United States. Despite good gains in consumer spending and an improvement of the jobs market in March, the headwinds for the consumer are sizeable with a 9.7% unemployment rate and a housing market that may still have yet to find the elusive bottom.
We believe the prospects for high yield returns are attractive relative to other asset classes. Issuers have been focusing on profitability, cash flow and debt reduction, which in aggregate has improved the ratings of their securities. Earnings continue to surpass expectations and both the credit and equity markets remain open, allowing issuers to refinance debt and reduce leverage. As a result, we expect the default rate to fall below its long-term average (5%) by mid-2010. This should support a further narrowing of credit spreads. Potential threats to this scenario include renewed economic weakness, further sovereign debt concerns and less accommodative monetary and fiscal policies.
Because we expect gradual improvement in economic conditions and credit quality, we continue to maintain a slightly cyclical bias and an overweight to lower quality bonds, but we have begun to gradually reduce the Fund’s risk profile. We have used the recent robust new issue calendar to add some higher quality exposure, which we have funded by selectively paring portfolio positions that in our view offer less potential going forward.
| * | | Effective March 22, 2010, Matt Toms replaced Dan Boyle as a portfolio manager to the Fund. |
| (1) | | The Barclays Capital Corporate High Yield Index is an unmanaged index that measures the performance of fixed-income securities generally representative of corporate bonds rated below investment grade. |
| (2) | | The Barclays Capital High Yield Bond — 2% Issuer Constrained Composite Index is an unmanaged index that measures the performance of fixed-income securities. |
Portfolio holdings and characteristics are subject to change and may not be representative of current holdings and characteristics. The outlook for this Fund may differ from that presented for other ING Funds. Performance for the different classes of shares will vary based on differences in fees associated with each class. An index has no cash in its portfolio, imposes no sales charges and incurs no operating expenses. An investor cannot invest directly in an index.
The views expressed in this report reflect those of the portfolio managers, only through the end of the period as stated on the cover. The portfolio managers’ views are subject to change at any time based on market and other conditions.
Fund holdings are subject to change daily.
This report contains statements that may be “forward-looking” statements. Actual results may differ materially from those projected in the “forward-looking” statements.
Top Ten Holdings*
as of March 31, 2010
(as a percent of net assets)
| | |
Ford Motor Credit Co., LLC, 8.700%, due 10/01/14 | | 1.1% |
CIT Group, Inc., 7.000%, due 05/01/15 | | 1.1% |
K Hovnanian Enterprises, Inc.,
10.625%, due 10/15/16 | | 1.0% |
Harrah’s Operating Co., Inc., 11.250%, due 06/01/17 | | 1.0% |
HCA, Inc., 9.625%, due 11/15/16 | | 1.0% |
General Motors Acceptance Corp.,
8.000%, due 03/15/20 | | 1.0% |
AMC Entertainment, Inc., 11.000%, due 02/01/16 | | 0.9% |
HCA, Inc., 9.250%, due 11/15/16 | | 0.9% |
CIT Group, Inc., 7.000%, due 05/01/17 | | 0.9% |
Visant Holding Corp., 10.250%, due 12/01/13 | | 0.9% |
| | * | Excludes short-term investments related to ING Institutional Prime Money Market Fund — Class I. |
Portfolio holdings are subject to change daily.
6
| | |
| PORTFOLIO MANAGERS’ REPORT | | ING HIGH YIELD BOND FUND |
| | | | | | | | | | | | | | | | |
| | | |
| | | Average Annual Total Returns for the Periods Ended March 31, 2010 | | | |
| | | | | 1 Year | | | 5 Year | | | 10 Year | | | Since Inception of Class I July 31, 2008 | | | |
| | | Including Sales Charge: | | | | | | | | | | | | | | |
| | | Class A(1) | | 43.25 | % | | 3.84 | % | | 4.86 | % | | — | | | |
| | | Class B(2) | | 40.58 | % | | 3.78 | % | | 4.59 | % | | — | | | |
| | | Class C(3) | | 44.82 | % | | 4.08 | % | | 4.60 | % | | — | | | |
| | | Class I | | 47.55 | % | | — | | | — | | | 10.18 | % | | |
| | | Excluding Sales Charge: | | | | | | | | | | | | | | |
| | | Class A | | 46.88 | % | | 4.86 | % | | 5.37 | % | | — | | | |
| | | Class B | | 45.58 | % | | 4.07 | % | | 4.59 | % | | — | | | |
| | | Class C | | 45.82 | % | | 4.08 | % | | 4.60 | % | | — | | | |
| | | Class I | | 47.55 | % | | — | | | — | | | 10.18 | % | | |
| | | Barclays Capital Corporate High Yield Index(4) | | 56.18 | % | | 7.78 | % | | 7.45 | % | | 14.61 | %(6) | | |
| | | Barclays Capital High Yield Bond — 2% Issuer Constrained Composite Index(5) | | 55.64 | % | | 7.78 | % | | 7.59 | % | | 14.82 | %(6) | | |
Based on a $10,000 initial investment, the graph and table above illustrate the total return of ING High Yield Bond Fund against the indices indicated. An index is unmanaged and has no cash in its portfolio, imposes no sales charges and incurs no operating expenses. An investor cannot invest directly in an index. The Fund’s performance is shown both with and without the imposition of sales charges.
The performance graph and table do not reflect the deduction of taxes that a shareholder will pay on Fund distributions or the redemption of Fund shares.
The performance shown may include the effect of fee waivers and/or expense reimbursements by the Investment Adviser and/or other service providers, which have the effect of increasing total return. Had all fees and expenses been considered, the total returns would have been lower.
Performance data represents past performance and is no assurance of future results. Investment return and principal value of an investment in the Fund will fluctuate. Shares, when sold, may be worth more or less than their original cost. The Fund’s performance may be lower or higher than the performance data shown. Please log on to www.ingfunds.com or call (800) 992-0180 to get performance through the most recent month end.
This report contains statements that may be “forward-looking” statements. Actual results may differ materially from those projected in the “forward-looking” statements.
The views expressed in this report reflect those of the portfolio managers, only through the end of the period as stated on the cover. The portfolio managers’ views are subject to change at any time based on market and other conditions.
Fund holdings are subject to change daily.
| (1) | | Reflects deduction of the maximum Class A sales charge of 4.75%. Effective July 31, 2006, the maximum Class A sales charge was lowered to 2.50%. |
| (2) | | Reflects deduction of the Class B deferred sales charge of 5% and 2% for the 1 year and 5 year returns, respectively. |
| (3) | | Reflects deduction of the Class C deferred sales charge of 1% for the 1 year return. |
| (4) | | The Barclays Capital Corporate High Yield Index is an unmanaged index that measures the performance of fixed-income securities generally representative of corporate bonds rated below investment grade. |
| (5) | | The Barclays Capital High Yield Bond — 2% Issuer Constrained Composite Index is an unmanaged index that measures the performance of fixed-income securities. |
| (6) | | Since inception performance for the indices is shown from August 1, 2008. |
7
| | |
| ING INTERMEDIATE BOND FUND | | PORTFOLIO MANAGERS’ REPORT |
Investment Type Allocation
as of March 31, 2010
(as a percent of net assets)
| | |
Corporate Bonds/Notes | | 38.4% |
U.S. Government Agency Obligations | | 22.6% |
Collateralized Mortgage Obligations | | 15.1% |
U.S. Treasury Obligations | | 15.1% |
Asset-Backed Securities | | 6.3% |
Other Bonds | | 3.2% |
Preferred Stock | | 0.3% |
Municipal Bonds | | 0.1% |
Other Assets and Liabilities — Net* | | (1.1)% |
| | |
Net Assets | | 100.0% |
| | |
| | * | Includes short-term investments related to ING Institutional Prime Money Market Fund — Class I and securities lending collateral. |
Portfolio holdings are subject to change daily.
ING Intermediate Bond Fund (the “Fund”) seeks to provide investors with a high level of current income, consistent with the preservation of capital and liquidity. The Fund is managed by Christine Hurtsellers, Michael Hyman, Peter Guan and Chris Diaz, Portfolio Managers of ING Investment Management Co. — the Sub-Adviser.
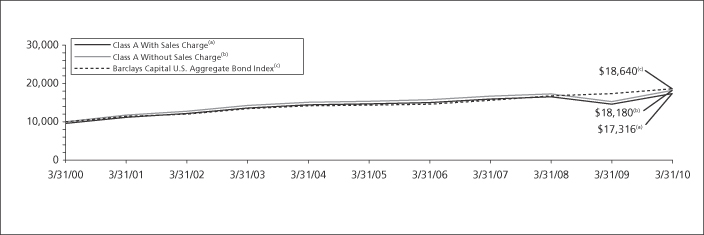
Performance: For the year ended March 31, 2010, the Fund’s Class A shares, excluding sales charges, provided a total return of 18.95% compared to the Barclays Capital U.S. Aggregate Bond Index(1), which returned 7.69%, for the same period.
Portfolio Specifics: For the better part of 2009 and into 2010, bond markets focused on the signs of economies stabilizing, or in cases such as China, accelerating, as the tsunami of policy-induced liquidity propelled risk-based bonds ahead of sovereign debt. The so-called “olive belt,” with particular focus on the financial difficulties in Greece, emerged as a point of concern, as did debt troubles in Dubai. Although this “Greek tragedy” appears to have been partially resolved, the specter of sovereign indebtedness may resurface like Banquo’s ghost. U.S. Treasuries rose substantively over the year — the yield on the ten-year note increased 1.16%. Given the brightening economic picture in most major economies, eyes are turning to the potential for central bank’s raising short-term rates. Australia and a number of Scandinavian central banks have already taken steps to raise domestic rates.
The widely watched Barclays Capital U.S. Aggregate Bond Index rose 7.69% over the period, despite the fact that Treasury yields rose significantly. Risk-based assets of all
ilk responded to the signs of global economic recovery and the restoration of financial confidence. Excess returns(2) for risky fixed income assets produced returns often expected only from equities. U.S. corporates and commercial mortgage-backed securities (“CMBS”) posted strong gains. U.S. high yield also performed well, as did emerging market debt (“EMD”). Residential mortgage-backed securities (“RMBS”) generated more modest returns.
The Fund benefited from overweights to spread product (corporates, non-agency RMBS and CMBS in particular). Our exposure to corporates included both bonds rated as investment grade and high yield bonds. The strong returns of these sectors boosted relative returns from an asset allocation perspective. An overweight to financials was also a boon for performance during the year.
Current Strategy & Outlook: We continue to look for a gradual economic recovery to take hold in 2010. Business investment and inventory rebuilding are helping provide some recent lift to economic growth. Gradual recovery in consumer spending and a recovery in household net worth will be important drivers for further economic gains as consumer spending historically constitutes close to two-thirds of economic growth in the United States. Despite good gains in consumer spending and an improvement of the jobs market in March, the headwinds for the consumer are sizeable with a 9.7% unemployment rate and a housing market that may still have yet to find the elusive bottom.
Therefore, we expect modest pressure on U.S. Treasury rates due to the higher debt issuance needs of the U.S. government and the market’s expectation of eventually higher interest rate targeting by the Federal Reserve Board (the “Fed”), although we see Fed tightening more likely taking place late 2010 or early 2011 at this point.
The newly arisen debt woes of the U.K., Greece and other southern European countries have placed considerable headwinds on economic recovery across Europe and pose some further downside risk to the ongoing global economic recovery.
As credit markets have continued to rally back from the crisis, we continue to see value in a number of sectors such as investment grade corporate bonds, high quality commercial mortgage-backed securities, asset-backed securities and non-agency mortgage securities. Corporate balance sheets remain strong with high levels of corporate cash and liquid investments, while earnings continue to surpass expectations. We particularly favor large financial institutions given their structural importance to the economy. We continue to underweight agency mortgage bonds as spreads have tightened dramatically and the Fed has completed its $1.25 trillion mortgage buying program at the end of March. In interest rates, we will tactically trade duration with a bias to staying short as the debate about the timing of Fed tightening increases.
In non-investment grade sectors, our emerging market debt model target remains at zero based on current EMD sovereign yields and spreads being near all-time lows. Longer term, we remain watchful for valuation opportunities in the emerging market sector due to the many ongoing structural achievements from these economies. We maintain a 10% overweight target to the high yield sector, where fundamentals remain positive and spreads are still attractive versus other sectors.
| (1) | | The Barclays Capital U.S. Aggregate Bond Index is a widely recognized, unmanaged index of publicly issued investment grade U.S. Government, mortgage-backed, asset-backed and corporate debt securities. |
| (2) | | For fixed income asset classes, excess return is defined as the return of an asset class over a U.S. Treasury security of comparable duration. |
Portfolio holdings and characteristics are subject to change and may not be representative of current holdings and characteristics. The outlook for this Fund may differ from that presented for other ING Funds. Performance for the different classes of shares will vary based on differences in fees associated with each class. An index has no cash in its portfolio, imposes no sales charges and incurs no operating expenses. An investor cannot invest directly in an index.
The views expressed in this report reflect those of the portfolio managers, only through the end of the period as stated on the cover. The portfolio managers’ views are subject to change at any time based on market and other conditions.
Fund holdings are subject to change daily.
This report contains statements that may be “forward-looking” statements. Actual results may differ materially from those projected in the “forward-looking” statements.
Top Ten Holdings*
as of March 31, 2010
(as a percent of net assets)
| | |
U.S. Treasury Note, 4.375%, due 11/15/39 | | 6.3% |
U.S. Treasury Note, 0.875%, due 02/29/12 | | 4.3% |
Brazil Notas do Tesouro Nacional Series F,
10.000%, due 01/01/12 | | 2.6% |
U.S. Treasury Note, 1.375%, due 03/15/13 | | 1.7% |
U.S. Treasury Note, 2.375%, due 02/28/15 | | 1.5% |
Federal Home Loan Mortgage Corporation,
5.500%, due 08/15/20 | | 1.4% |
U.S. Treasury Note, 3.625%, due 02/15/20 | | 1.2% |
Federal Home Loan Mortgage Corporation,
3.250%, due 04/23/15 | | 1.1% |
Federal Home Loan Mortgage Corporation,
3.000%, due 04/07/15 | | 1.0% |
Federal Home Loan Mortgage Corporation,
3.125%, due 03/16/15 | | 1.0% |
| | * | Excludes short-term investments related to ING Institutional Prime Money Market Fund — Class I and securities lending collateral. |
Portfolio holdings are subject to change daily.
8
| | |
| ING INTERMEDIATE BOND FUND | | PORTFOLIO MANAGERS’ REPORT |
| | | | | | | | | | | | | | | | | | | | | | | | | |
| | | |
| | | Average Annual Total Returns for the Periods Ended March 31, 2010 | | | |
| | | | | 1 Year | | | 5 Year | | | 10 Year | | | Since
Inception
of Class I
January 8,
2002 | | | Since
Inception
of Class O
August 13,
2004 | | | Since
Inception
of Class R
March 16,
2004 | | | Since
Inception
of Class W
December 17,
2007 | | | |
| | | Including Sales Charge: | | | | | | | | | | | | | | | | | | | | | | | |
| | | Class A(1) | | 16.02 | % | | 2.44 | % | | 5.65 | % | | — | | | — | | | — | | | — | | | |
| | | Class B(2) | | 12.96 | % | | 2.32 | % | | 5.35 | % | | — | | | — | | | — | | | — | | | |
| | | Class C(3) | | 17.08 | % | | 2.66 | % | | 5.37 | % | | — | | | — | | | — | | | — | | | |
| | | Class I | | 19.33 | % | | 3.77 | % | | — | | | 4.76 | % | | — | | | — | | | — | | | |
| | | Class O | | 18.94 | % | | 3.44 | % | | — | | | — | | | 3.34 | % | | — | | | — | | | |
| | | Class R | | 18.64 | % | | 3.15 | % | | — | | | — | | | — | | | 2.83 | % | | — | | | |
| | | Class W | | 19.15 | % | | — | | | — | | | — | | | — | | | — | | | 3.02 | % | | |
| | | Excluding Sales Charge: | | | | | | | | | | | | | | | | | | | | | | | |
| | | Class A | | 18.95 | % | | 3.43 | % | | 6.16 | % | | — | | | — | | | — | | | — | | | |
| | | Class B | | 17.96 | % | | 2.65 | % | | 5.35 | % | | — | | | — | | | — | | | — | | | |
| | | Class C | | 18.08 | % | | 2.66 | % | | 5.37 | % | | — | | | — | | | — | | | — | | | |
| | | Class I | | 19.33 | % | | 3.77 | % | | — | | | 4.76 | % | | — | | | — | | | — | | | |
| | | Class O | | 18.94 | % | | 3.44 | % | | — | | | — | | | 3.34 | % | | — | | | — | | | |
| | | Class R | | 18.64 | % | | 3.15 | % | | — | | | — | | | — | | | 2.83 | % | | | | | |
| | | Class W | | 19.15 | % | | — | | | — | | | — | | | — | | | — | | | 3.02 | % | | |
| | | Barclays Capital U.S. Aggregate Bond Index(4) | | 7.69 | % | | 5.44 | % | | 6.29 | % | | 5.48 | %(5) | | 5.27 | %(6) | | 4.71 | %(7) | | 5.78 | %(8) | | |
Based on a $10,000 initial investment, the graph and table above illustrate the total return of ING Intermediate Bond Fund against the index indicated. An index is unmanaged and has no cash in its portfolio, imposes no sales charges and incurs no operating expenses. An investor cannot invest directly in an index. The Fund’s performance is shown both with and without the imposition of sales charges.
The performance graph and table do not reflect the deduction of taxes that a shareholder will pay on Fund distributions or the redemption of Fund shares.
The performance shown may include the effect of fee waivers and/or expense reimbursements by the Investment Adviser and/or other service providers, which have the effect of increasing total return. Had all fees and expenses been considered, the total returns would have been lower.
Performance data represents past performance and is no assurance of future results. Investment return and principal value of an investment in the Fund will fluctuate. Shares, when sold, may be worth more or less than their original cost. The Fund’s performance may be lower or higher than the performance data shown. Please log on to www.ingfunds.com or call (800) 992-0180 to get performance through the most recent month end.
This report contains statements that may be “forward-looking” statements. Actual results may differ materially from those projected in the “forward-looking” statements.
The views expressed in this report reflect those of the portfolio managers, only through the end of the period as stated on the cover. The portfolio managers’ views are subject to change at any time based on market and other conditions.
Fund holdings are subject to change daily.
| (1) | | Reflects deduction of the maximum Class A sales charge of 4.75%. Effective July 31, 2006, the maximum Class A sales charge was lowered to 2.50%. |
| (2) | | Reflects deduction of the Class B deferred sales charge of 5% and 2% for the 1 year and 5 year returns, respectively. |
| (3) | | Reflects deduction of the Class C deferred sales charge of 1% for the 1 year return. |
| (4) | | The Barclays Capital U.S. Aggregate Bond Index is an unmanaged index of publicly issued investment grade U.S. Government, mortgage-backed, asset-backed and corporate debt securities. |
| (5) | | Since inception performance for index is shown from January 1, 2002. |
| (6) | | Since inception performance for index is shown from August 1, 2004. |
| (7) | | Since inception performance for index is shown from April 1, 2004. |
| (8) | | Since inception performance for index is shown from January 1, 2008. |
9
| | |
| PORTFOLIO MANAGERS’ REPORT | | ING CLASSIC MONEY MARKET FUND |
ING Classic Money Market Fund (the “Fund”) seeks to provide investors with a high level of current income, consistent with the preservation of capital and liquidity and the maintenance of a stable $1.00 net asset value per share. The Fund is managed by David S. Yealy, Portfolio Manager of ING Investment Management Co. — the Sub-Adviser.
Portfolio Specifics: For money market investors, the year ended March 31, 2010 was characterized by low interest rates, a struggling global economy and continued government support in the first half of the period, followed by stabilization and modest recovery in the latter half. Throughout the period, the U.S. Federal Reserve kept the federal funds rate within the 0.00-0.25% range.
Short-term money market rates changed little during the period. Late in the period, the Securities and Exchange Commission (“SEC”) announced new rules under SEC Rule 2a-7 for money market funds. The Fund is implementing these rules, which are intended to reduce the risks for money funds but will also reduce potential yields going forward.
The Fund’s focus for the period was not on maximizing yield or return, but on preserving capital, limiting credit risk and keeping an excess liquidity cushion due to elevated risks. Certain fees of the Fund were waived to provide a positive return after fees and expenses, due to the historically low yields offered for short-term money market securities. The Fund did take on interest rate risk throughout the year, maintaining a weighted average maturity (“WAM”) at the longer end of its maturity range by purchasing longer term Treasury and agency securities.
After the new SEC rules for money market mutual funds were announced — which included reducing the maximum allowable WAM from 90 days to 60 days — and after the Fund received notification of a large redemption expected to take place at the end of April, we reduced the Fund’s WAM. The Fund ended the period with a 19-day WAM as we repositioned it to meet the new rules and the large redemption.
During the first half of the year, we avoided additional credit risk — but gave up some incremental yield — by avoiding higher yielding debt of more marginal issues and structured securities not covered by the government programs. We started adding longer credit exposure marginally during the third quarter of 2009 as the economy and markets stabilized.
Current Strategy & Outlook: It is our opinion that the economy is positioned for a slow recovery in 2010 due to expected high continuing unemployment and the significant slack in the domestic economy. We believe the lack of a sustained and significant housing recovery will remain a drag. We believe the Federal Open Market Committee (“FOMC”) will be forced to keep the federal funds rate in the 0.00–0.25% range for most if not all of 2010. An increase in short-term rates will depend on the strength and speed of the economic recovery and future inflation expectations.
Our current strategy for the Fund continues to focus on maintaining an extended WAM posture with a view that the markets have built in an expectation for a strong economic rebound and the FOMC raising short-term rates much earlier in 2010 than we currently expect.
Preservation of capital and liquidity remain our top objectives. We plan on maintaining above normal excess daily liquidity and short-term liquidity as well as reduced credit exposure until we see how the short-term markets react to the terminations of those programs and the unwind of quantitative easing.
Principal Risk Factors: Although the Fund seeks to preserve the value of your investment at $1.00 per share, it is possible to lose money by investing in the Fund.
Please see Note 16 in the “Notes to Financial Statements” section for information regarding the Fund’s participation during the reporting period in the U.S. Treasury Department’s Temporary Money Market Guarantee Program, which expired on September 18, 2009.
Portfolio holdings and characteristics are subject to change and may not be representative of current holdings and characteristics. The outlook for this Fund may differ from that presented for other ING Funds.
The views expressed in this report reflect those of the portfolio managers only through the end of the period as stated on the cover. The portfolio managers’ views are subject to change at any time based on market and other conditions.
This report contains statements that may be “forward-looking” statements. Actual results may differ materially from those projected in the “forward-looking” statements.
10
| | |
| ING INSTITUTIONAL PRIME MONEY MARKET FUND | | PORTFOLIO MANAGERS’ REPORT |
Portfolio holdings are subject to change daily.
ING Institutional Prime Money Market Fund (the “Fund”) seeks to provide investors with a high level of current income, consistent with the preservation of capital and liquidity and the maintenance of a stable $1.00 net asset value per share. The Fund is managed by David S. Yealy, Portfolio Manager of ING Investment Management Co. — the Sub-Adviser.
Portfolio Specifics: For money market investors, the year ended March 31, 2010 was characterized by low interest rates, a struggling global economy and continued government support in the first half of the period, followed by stabilization and modest recovery in the latter half. Throughout the period, the U.S. Federal Reserve kept the federal funds rate within the 0.00–0.25% range.
Short-term money market rates changed little during the period. Late in the period, the Securities and Exchange Commission (“SEC”) announced new rules under SEC Rule 2a-7 for money market funds. The Fund is implementing these rules, which are intended to reduce the risks for money funds but will also reduce potential yields going forward.
The Fund’s focus for the period was not on maximizing yield or return, but on preserving capital, limiting credit risk and keeping an excess liquidity cushion due to elevated risks. The Fund did take on interest rate risk throughout the year, maintaining a weighted average maturity (“WAM”) at the longer end of its maturity range by purchasing longer term Treasury and agency securities. The Fund ended the period with a 45-day WAM.
During the first half of the year, we avoided additional credit risk — but gave up some incremental yield — by avoiding higher yielding debt of more marginal issues and structured securities not covered by the government programs. We started adding longer credit exposure marginally during the third quarter of 2009 as the economy and markets stabilized.
Current Strategy & Outlook: It is our opinion that the economy is positioned for a slow recovery in 2010 due to expected high continuing unemployment and the significant slack in the domestic economy. We believe the lack of a sustained and significant housing recovery will remain a drag. We believe the Federal Open Market Committee (“FOMC”) will be forced to keep the federal funds rate in the 0.00–0.25% range for most if not all of 2010. An increase in short-term rates will depend on the strength and speed of the economic recovery and future inflation expectations.
Our current strategy for the Fund continues to focus on maintaining an extended WAM posture with a view that the markets have built in an expectation for a strong economic rebound and the FOMC raising short-term rates much earlier in 2010 than we currently expect.
Preservation of capital and liquidity remain our top objectives. We plan on maintaining above normal excess daily liquidity and short-term liquidity as well as reduced credit exposure until we see how the short-term markets react to the terminations of those programs and the unwind of quantitative easing.
Principal Risk Factors: Although the Fund seeks to preserve the value of your investment at $1.00 per share, it is possible to lose money by investing in the Fund.
Please see Note 16 in the “Notes to Financial Statements” section for information regarding the Fund’s participation during the reporting period in the U.S. Treasury Department’s Temporary Money Market Guarantee Program, which expired on September 18, 2009.
Portfolio holdings and characteristics are subject to change and may not be representative of current holdings and characteristics. The outlook for this Fund may differ from that presented for other ING Funds.
The views expressed in this report reflect those of the portfolio managers only through the end of the period as stated on the cover. The portfolio managers’ views are subject to change at any time based on market and other conditions.
This report contains statements that may be “forward-looking” statements. Actual results may differ materially from those projected in the “forward-looking” statements.
11
SHAREHOLDER EXPENSE EXAMPLES (UNAUDITED)
As a shareholder of a Fund, you incur two types of costs: (1) transaction costs, including sales charges (loads) on purchase payments, redemption fees, and exchange fees, and (2) ongoing costs, including management fees, distribution and/or service (12b-1) fees, and other Fund expenses. These Examples are intended to help you understand your ongoing costs (in dollars) of investing in a Fund and to compare these costs with the ongoing costs of investing in other mutual funds.
The Examples are based on an investment of $1,000 invested at the beginning of the period and held for the entire period from October 1, 2009 to March 31, 2010. The Funds’ expenses are shown without the imposition of any sales charges or fees. Expenses would have been higher if such charges were included.
Actual Expenses
The first section of the table shown below, “Actual Fund Return,” provides information about actual account values and actual expenses. You may use the information in this section, together with the amount you invested, to estimate the expenses that you paid over the period. Simply divide your account value by $1,000 (for example, an $8,600 account value divided by $1,000 = 8.6), then multiply the result by the number in the first section under the heading entitled “Expenses Paid During the Period” to estimate the expenses you paid on your account during this period.
Hypothetical Example for Comparison Purposes
The second section of the table shown below, “Hypothetical (5% return before expenses)” provides information about hypothetical account values and hypothetical expenses based on a Fund’s actual expense ratio and an assumed rate of return of 5% per year before expenses, which is not the Fund’s actual return. The hypothetical account values and expenses may not be used to estimate the actual ending account balance or expenses you paid for the period. You may use this information to compare the ongoing costs of investing in each Fund and other funds. To do so, compare this 5% hypothetical example with the 5% hypothetical examples that appear in the shareholder reports of the other funds.
Please note that the expenses shown in the table are meant to highlight your ongoing costs only and do not reflect any transactional costs, such as sales charges (loads), redemption fees, or exchange fees. Therefore, the hypothetical lines of the table are useful in comparing ongoing costs only, and will not help you determine the relative total costs of owning different funds. In addition, if these transactional costs were included, your costs would have been higher.
| | | | | | | | | | | | | | | | | | | | | | | | |
| | | Actual Fund Return | | Hypothetical (5% return before expenses) |
| | | Beginning
Account
Value
October 1, 2009 | | Ending
Account Value
March 31, 2010 | | Annualized Expense Ratio | | | Expenses Paid
During the
Period Ended
March 31, 2010* | | Beginning
Account
Value
October 1, 2009 | | Ending
Account Value
March 31, 2010 | | Annualized Expense Ratio | | | Expenses Paid
During the
Period Ended
March 31, 2010* |
ING GNMA Income Fund | | | | | | | | | | | | | | | | |
Class A | | $ | 1,000.00 | | $ | 1,020.60 | | 0.94 | % | | $ | 4.74 | | $ | 1,000.00 | | $ | 1,020.24 | | 0.94 | % | | $ | 4.73 |
Class B | | | 1,000.00 | | | 1,015.50 | | 1.69 | | | | 8.49 | | | 1,000.00 | | | 1,016.50 | | 1.69 | | | | 8.50 |
Class C | | | 1,000.00 | | | 1,016.80 | | 1.69 | | | | 8.50 | | | 1,000.00 | | | 1,016.50 | | 1.69 | | | | 8.50 |
Class I | | | 1,000.00 | | | 1,022.20 | | 0.64 | | | | 3.23 | | | 1,000.00 | | | 1,021.74 | | 0.64 | | | | 3.23 |
Class W | | | 1,000.00 | | | 1,022.00 | | 0.66 | | | | 3.33 | | | 1,000.00 | | | 1,021.64 | | 0.66 | | | | 3.33 |
ING High Yield Bond Fund | | | | | | | | | | | | | | | | |
Class A | | $ | 1,000.00 | | $ | 1,102.80 | | 1.10 | % | | $ | 5.77 | | $ | 1,000.00 | | $ | 1,019.45 | | 1.10 | % | | $ | 5.54 |
Class B | | | 1,000.00 | | | 1,098.70 | | 1.85 | | | | 9.68 | | | 1,000.00 | | | 1,015.71 | | 1.85 | | | | 9.30 |
Class C | | | 1,000.00 | | | 1,098.80 | | 1.85 | | | | 9.68 | | | 1,000.00 | | | 1,015.71 | | 1.85 | | | | 9.30 |
Class I | | | 1,000.00 | | | 1,104.80 | | 0.78 | | | | 4.09 | | | 1,000.00 | | | 1,021.04 | | 0.78 | | | | 3.93 |
| * | | Expenses are equal to each Fund’s respective annualized expense ratios multiplied by the average account value over the period, multiplied by 182/365 to reflect the most recent fiscal half-year. |
12
SHAREHOLDER EXPENSE EXAMPLES (UNAUDITED) (CONTINUED)
| | | | | | | | | | | | | | | | | | | | | | | | |
| | | Actual Fund Return | | Hypothetical (5% return before expenses) |
| | | Beginning
Account
Value
October 1, 2009 | | Ending
Account Value
March 31, 2010 | | Annualized Expense Ratio | | | Expenses Paid
During the
Period Ended
March 31, 2010* | | Beginning
Account
Value
October 1, 2009 | | Ending
Account Value
March 31, 2010 | | Annualized Expense Ratio | | | Expenses Paid
During the
Period Ended
March 31, 2010* |
ING Intermediate Bond Fund | | | | | | | | | | | | | | | | |
Class A | | $ | 1,000.00 | | $ | 1,052.40 | | 0.69 | % | | $ | 3.53 | | $ | 1,000.00 | | $ | 1,021.49 | | 0.69 | % | | $ | 3.48 |
Class B | | | 1,000.00 | | | 1,047.30 | | 1.44 | | | | 7.35 | | | 1,000.00 | | | 1,017.75 | | 1.44 | | | | 7.24 |
Class C | | | 1,000.00 | | | 1,048.40 | | 1.44 | | | | 7.35 | | | 1,000.00 | | | 1,017.75 | | 1.44 | | | | 7.24 |
Class I | | | 1,000.00 | | | 1,054.00 | | 0.37 | | | | 1.89 | | | 1,000.00 | | | 1,023.09 | | 0.37 | | | | 1.87 |
Class O | | | 1,000.00 | | | 1,052.30 | | 0.69 | | | | 3.53 | | | 1,000.00 | | | 1,021.49 | | 0.69 | | | | 3.48 |
Class R | | | 1,000.00 | | | 1,049.90 | | 0.94 | | | | 4.80 | | | 1,000.00 | | | 1,020.24 | | 0.94 | | | | 4.73 |
Class W | | | 1,000.00 | | | 1,052.40 | | 0.40 | | | | 2.05 | | | 1,000.00 | | | 1,022.94 | | 0.40 | | | | 2.02 |
ING Classic Money Market Fund | | | | | | | | | | | | | | | | |
Class A | | $ | 1,000.00 | | $ | 1,000.00 | | 0.47 | %•• | | $ | 2.34 | | $ | 1,000.00 | | $ | 1,022.59 | | 0.47 | %•• | | $ | 2.37 |
Class B | | | 1,000.00 | | | 1,000.00 | | 0.47 | •• | | | 2.34 | | | 1,000.00 | | | 1,022.59 | | 0.47 | •• | | | 2.37 |
Class C | | | 1,000.00 | | | 1,000.00 | | 0.47 | •• | | | 2.34 | | | 1,000.00 | | | 1,022.59 | | 0.47 | •• | | | 2.37 |
ING Institutional Prime Money Market Fund | | | | | | | | | | | | | | | | |
Class I | | $ | 1,000.00 | | $ | 1,000.80 | | 0.18 | % | | $ | 0.90 | | $ | 1,000.00 | | $ | 1,024.03 | | 0.18 | % | | $ | 0.91 |
Class IS | | | 1,000.00 | | | 1,001.60 | | 0.21 | | | | 1.05 | | | 1,000.00 | | | 1,023.88 | | 0.21 | | | | 1.06 |
| * | | Expenses are equal to each Fund’s respective annualized expense ratios multiplied by the average account value over the period, multiplied by 182/365 to reflect the most recent fiscal half-year. |
| •• | | Expense ratios reflect waivers of 0.30%, 0.91% and 0.91% of distribution and shareholder servicing fees for Classes A, B and C, respectively, in order to maintain a yield of not less than zero. |
13
REPORT OF INDEPENDENT REGISTERED PUBLIC ACCOUNTING FIRM
The Shareholders and Board of Trustees
ING Funds Trust
We have audited the accompanying statements of assets and liabilities, including the portfolios of investments, of the ING GNMA Income Fund, ING High Yield Bond Fund, ING Intermediate Bond Fund, ING Classic Money Market Fund, and ING Institutional Prime Money Market Fund, each a series of ING Funds Trust, as of March 31, 2010, and the related statements of operations for the year then ended, the statements of changes in net assets for each of the years in the two-year period then ended, and the financial highlights for each of the years or periods in the five-year period then ended. These financial statements and financial highlights are the responsibility of management. Our responsibility is to express an opinion on these financial statements and financial highlights based on our audits.
We conducted our audits in accordance with the standards of the Public Company Accounting Oversight Board (United States). Those standards require that we plan and perform the audit to obtain reasonable assurance about whether the financial statements and financial highlights are free of material misstatement. An audit includes examining, on a test basis, evidence supporting the amounts and disclosures in the financial statements. Our procedures included confirmation of securities owned as of March 31, 2010, by correspondence with the custodian and brokers or by other appropriate auditing procedures where replies from brokers were not received. An audit also includes assessing the accounting principles used and significant estimates made by management, as well as evaluating the overall financial statement presentation. We believe that our audits provide a reasonable basis for our opinion.
In our opinion, the financial statements and financial highlights referred to above present fairly, in all material respects, the financial position of the aforementioned funds as of March 31, 2010, and the results of their operations, the changes in their net assets, and the financial highlights for the periods specified in the first paragraph above, in conformity with U.S. generally accepted accounting principles.

Boston, Massachusetts
May 25, 2010
14
STATEMENTS OF ASSETS AND LIABILITIESASOF MARCH 31, 2010
| | | | | | | | | | | | |
| | | ING GNMA Income Fund | | | ING High Yield Bond Fund | | | ING Intermediate Bond Fund | |
ASSETS: | | | | | | | | | | | | |
Investments in securities at value+* | | $ | 811,249,484 | | | $ | 104,597,463 | | | $ | 799,353,000 | |
Short-term investments** | | | — | | | | — | | | | 69,351,129 | |
Short-term investments in affiliates*** | | | — | | | | 3,334,000 | | | | 42,956,000 | |
Cash | | | 12,610,155 | | | | 9,543 | | | | 92,810 | |
Cash collateral for futures | | | — | | | | — | | | | 2,880,011 | |
Foreign currencies at value**** | | | — | | | | — | | | | 41,206 | |
Foreign cash collateral for futures***** | | | — | | | | — | | | | 174,345 | |
Receivables: | | | | | | | | | | | | |
Investment securities sold | | | 17,370,743 | | | | 395,575 | | | | 7,579,766 | |
Investment securities sold on a delayed-delivery or when-issued basis | | | — | | | | — | | | | 31,169,267 | |
Fund shares sold | | | 1,638,701 | | | | 151,442 | | | | 2,091,248 | |
Dividends and interest | | | 3,791,964 | | | | 1,903,057 | | | | 7,934,011 | |
Receivable for derivatives collateral (Note 2) | | | — | | | | — | | | | 330,000 | |
Unrealized appreciation on forward foreign currency contracts | | | — | | | | — | | | | 106,751 | |
Upfront payments made on swap agreements | | | — | | | | — | | | | 1,068,640 | |
Unrealized appreciation on swap agreements | | | — | | | | — | | | | 501,321 | |
Prepaid expenses | | | 53,739 | | | | 40,862 | | | | 62,939 | |
Reimbursement due from manager | | | — | | | | 140 | | | | — | |
| | | | | | | | | | | | |
Total assets | | | 846,714,786 | | | | 110,432,082 | | | | 965,692,444 | |
| | | | | | | | | | | | |
LIABILITIES: | | | | | | | | | | | | |
Payable for investment securities purchased | | | 60,399,708 | | | | 1,798,177 | | | | 21,488,802 | |
Payable for investment securities purchased on a delayed-delivery or when-issued basis | | | — | | | | — | | | | 71,323,935 | |
Payable for fund shares redeemed | | | 5,792,191 | | | | 397,352 | | | | 5,767,799 | |
Payable upon receipt of securities loaned | | | — | | | | — | | | | 70,017,100 | |
Payable for terminated investment contracts (Note 11) | | | — | | | | — | | | | 1,630,542 | |
Unrealized depreciation on forward foreign currency contracts | | | — | | | | — | | | | 176,353 | |
Upfront payments received on swap agreements | | | — | | | | — | | | | 1,197,830 | |
Unrealized depreciation on swap agreements | | | — | | | | — | | | | 1,784,720 | |
Income distribution payable | | | — | | | | 271,370 | | | | 511,119 | |
Payable to affiliates | | | 619,932 | | | | 96,291 | | | | 325,695 | |
Payable for trustee fees | | | 8,857 | | | | 7,773 | | | | 12,578 | |
Other accrued expenses and liabilities | | | 190,535 | | | | 108,547 | | | | 390,686 | |
| | | | | | | | | | | | |
Total liabilities | | | 67,011,223 | | | | 2,679,510 | | | | 174,627,159 | |
| | | | | | | | | | | | |
NET ASSETS | | $ | 779,703,563 | | | $ | 107,752,572 | | | $ | 791,065,285 | |
| | | | | | | | | | | | |
NET ASSETS WERE COMPRISED OF: | | | | | | | | | | | | |
Paid-in capital | | $ | 762,589,110 | | | $ | 219,392,217 | | | $ | 959,472,598 | |
Undistributed (distribution in excess of) net investment income | | | 3,564,888 | | | | (305,010 | ) | | | 21,509,983 | |
Accumulated net realized loss on investments, foreign currency related transactions, futures, swaps and written options | | | (12,150,312 | ) | | | (117,567,900 | ) | | | (211,294,848 | ) |
Net unrealized appreciation on investments, foreign currency related transactions, futures, and swaps | | | 25,699,877 | | | | 6,233,265 | | | | 21,377,552 | |
| | | | | | | | | | | | |
NET ASSETS | | $ | 779,703,563 | | | $ | 107,752,572 | | | $ | 791,065,285 | |
| | | | | | | | | | | | |
| | | | | | | | | | | | |
+ Including securities loaned at value | | $ | — | | | $ | — | | | $ | 68,560,552 | |
* Cost of investments in securities | | $ | 785,549,607 | | | $ | 98,364,198 | | | $ | 775,746,573 | |
** Cost of short-term investments | | $ | — | | | $ | — | | | $ | 70,017,100 | |
*** Cost of short-term investments in affiliates | | $ | — | | | $ | 3,334,000 | | | $ | 42,956,000 | |
****Cost of foreign currencies | | $ | — | | | $ | — | | | $ | 49,951 | |
*****Costof foreign cash collateral for futures | | $ | — | | | $ | — | | | $ | 173,686 | |
See Accompanying Notes to Financial Statements
15
STATEMENTS OF ASSETS AND LIABILITIESASOF MARCH 31, 2010 (CONTINUED)
| | | | | | | | | |
| | | ING GNMA Income Fund | | ING High Yield Bond Fund | | ING Intermediate Bond Fund |
Class A: | | | | | | | | | |
Net assets | | $ | 589,813,050 | | $ | 83,033,545 | | $ | 348,871,041 |
Shares authorized | | | unlimited | | | unlimited | | | unlimited |
Par value | | $ | 0.001 | | $ | 0.001 | | $ | 0.001 |
Shares outstanding | | | 67,393,752 | | | 11,253,462 | | | 37,786,660 |
Net asset value and redemption price per share | | $ | 8.75 | | $ | 7.38 | | $ | 9.23 |
Maximum offering price per share (2.50%)(1) | | $ | 8.97 | | $ | 7.57 | | $ | 9.47 |
Class B: | | | | | | | | | |
Net assets | | $ | 25,704,055 | | $ | 12,098,851 | | $ | 18,604,969 |
Shares authorized | | | unlimited | | | unlimited | | | unlimited |
Par value | | $ | 0.001 | | $ | 0.001 | | $ | 0.001 |
Shares outstanding | | | 2,953,542 | | | 1,641,283 | | | 2,019,179 |
Net asset value and redemption price per share(2) | | $ | 8.70 | | $ | 7.37 | | $ | 9.21 |
Maximum offering price per share | | $ | 8.70 | | $ | 7.37 | | $ | 9.21 |
Class C: | | | | | | | | | |
Net assets | | $ | 103,102,530 | | $ | 11,038,019 | | $ | 45,015,587 |
Shares authorized | | | unlimited | | | unlimited | | | unlimited |
Par value | | $ | 0.001 | | $ | 0.001 | | $ | 0.001 |
Shares outstanding | | | 11,836,833 | | | 1,496,337 | | | 4,882,349 |
Net asset value and redemption price per share(2) | | $ | 8.71 | | $ | 7.38 | | $ | 9.22 |
Maximum offering price per share | | $ | 8.71 | | $ | 7.38 | | $ | 9.22 |
Class I: | | | | | | | | | |
Net assets | | $ | 52,880,219 | | $ | 1,582,157 | | $ | 316,209,400 |
Shares authorized | | | unlimited | | | unlimited | | | unlimited |
Par value | | $ | 0.001 | | $ | 0.001 | | $ | 0.001 |
Shares outstanding | | | 6,035,445 | | | 214,563 | | | 34,246,643 |
Net asset value and redemption price per share | | $ | 8.76 | | $ | 7.37 | | $ | 9.23 |
Maximum offering price per share | | $ | 8.76 | | $ | 7.37 | | $ | 9.23 |
Class O: | | | | | | | | | |
Net assets | | | n/a | | | n/a | | $ | 41,860,018 |
Shares authorized | | | n/a | | | n/a | | | unlimited |
Par value | | | n/a | | | n/a | | $ | 0.001 |
Shares outstanding | | | n/a | | | n/a | | | 4,532,226 |
Net asset value and redemption price per share | | | n/a | | | n/a | | $ | 9.24 |
Maximum offering price per share | | | n/a | | | n/a | | $ | 9.24 |
Class R: | | | | | | | | | |
Net assets | | | n/a | | | n/a | | $ | 18,417,419 |
Shares authorized | | | n/a | | | n/a | | | unlimited |
Par value | | | n/a | | | n/a | | $ | 0.001 |
Shares outstanding | | | n/a | | | n/a | | | 1,992,271 |
Net asset value and redemption price per share | | | n/a | | | n/a | | $ | 9.24 |
Maximum offering price per share | | | n/a | | | n/a | | $ | 9.24 |
Class W: | | | | | | | | | |
Net assets | | $ | 8,203,709 | | | n/a | | $ | 2,086,851 |
Shares authorized | | | unlimited | | | n/a | | | unlimited |
Par value | | $ | 0.001 | | | n/a | | $ | 0.001 |
Shares outstanding | | | 935,582 | | | n/a | | | 226,223 |
Net asset value and redemption price per share | | $ | 8.77 | | | n/a | | $ | 9.22 |
Maximum offering price per share | | $ | 8.77 | | | n/a | | $ | 9.22 |
| (1) | | Maximum offering price is computed at 100/97.50 of net asset value. On purchases of $100,000 or more, the offering price is reduced. |
| (2) | | Redemption price per share may be reduced for any applicable contingent deferred sales charges. |
See Accompanying Notes to Financial Statements
16
STATEMENTS OF ASSETS AND LIABILITIESASOF MARCH 31, 2010
| | | | | | | |
| | | ING Classic Money Market Fund | | ING Institutional Prime Money Market Fund | |
ASSETS: | | | | | | | |
Short-term investments at amortized cost | | $ | 531,982,625 | | $ | 1,012,156,169 | |
Repurchase agreements | | | 263,299,000 | | | 411,916,000 | |
Cash | | | 3,750,498 | | | 45,126,260 | |
Receivables: | | | | | | | |
Investment securities sold | | | 39,265,284 | | | — | |
Fund shares sold | | | 87,041 | | | 5,258 | |
Interest | | | 529,861 | | | 840,022 | |
Prepaid expenses | | | 133,910 | | | 35,190 | |
| | | | | | | |
Total assets | | | 839,048,219 | | | 1,470,078,899 | |
| | | | | | | |
LIABILITIES: | | | | | | | |
Payable for investment securities purchased | | | 3,749,888 | | | 7,125,287 | |
Payable for fund shares redeemed | | | 163,418 | | | 8,786 | |
Income distribution payable | | | — | | | 143,721 | |
Payable to affiliates | | | 96,365 | | | 87,767 | |
Payable for trustee fees | | | 26,536 | | | 9,945 | |
Other accrued expenses and liabilities | | | 235,342 | | | 279,137 | |
| | | | | | | |
Total liabilities | | | 4,271,549 | | | 7,654,643 | |
| | | | | | | |
NET ASSETS | | $ | 834,776,670 | | $ | 1,462,424,256 | |
| | | | | | | |
NET ASSETS WERE COMPRISED OF: | | | | | | | |
Paid-in capital | | $ | 834,653,233 | | $ | 1,462,380,657 | |
Distribution in excess of net investment income | | | — | | | (21,215 | ) |
Accumulated net realized gain on investments | | | 123,437 | | | 64,814 | |
| | | | | | | |
NET ASSETS | | $ | 834,776,670 | | $ | 1,462,424,256 | |
| | | | | | | |
See Accompanying Notes to Financial Statements
17
STATEMENTS OF ASSETS AND LIABILITIESASOF MARCH 31, 2010 (CONTINUED)
| | | | | | |
| | | ING Classic Money Market Fund | | ING Institutional Prime Money Market Fund |
Class A: | | | | | | |
Net assets | | $ | 819,755,151 | | | n/a |
Shares authorized | | | unlimited | | | n/a |
Par value | | $ | 0.001 | | | n/a |
Shares outstanding | | | 819,634,602 | | | n/a |
Net asset value and redemption price per share | | $ | 1.00 | | | n/a |
Maximum offering price per share | | $ | 1.00 | | | n/a |
Class B: | | | | | | |
Net assets | | $ | 8,034,302 | | | n/a |
Shares authorized | | | unlimited | | | n/a |
Par value | | $ | 0.001 | | | n/a |
Shares outstanding | | | 8,033,072 | | | n/a |
Net asset value and redemption price per share(1) | | $ | 1.00 | | | n/a |
Maximum offering price per share | | $ | 1.00 | | | n/a |
Class C: | | | | | | |
Net assets | | $ | 6,987,217 | | | n/a |
Shares authorized | | | unlimited | | | n/a |
Par value | | $ | 0.001 | | | n/a |
Shares outstanding | | | 6,986,161 | | | n/a |
Net asset value and redemption price per share(1) | | $ | 1.00 | | | n/a |
Maximum offering price per share | | $ | 1.00 | | | n/a |
Class I: | | | | | | |
Net assets | | | n/a | | $ | 1,462,423,256 |
Shares authorized | | | n/a | | | unlimited |
Par value | | | n/a | | $ | 0.001 |
Shares outstanding | | | n/a | | | 1,462,408,693 |
Net asset value and redemption price per share | | | n/a | | $ | 1.00 |
Maximum offering price per share | | | n/a | | $ | 1.00 |
Class IS: | | | | | | |
Net assets | | | n/a | | $ | 1,000 |
Shares authorized | | | n/a | | | unlimited |
Par value | | | n/a | | $ | 0.001 |
Shares outstanding | | | n/a | | | 1,000 |
Net asset value and redemption price per share | | | n/a | | $ | 1.00 |
Maximum offering price per share | | | n/a | | $ | 1.00 |
| (1) | | Redemption price per share may be reduced for any applicable contingent deferred sales charges. |
See Accompanying Notes to Financial Statements
18
STATEMENTS OF OPERATIONSFORTHE YEAR ENDED MARCH 31, 2010
| | | | | | | | | | | | |
| | | ING GNMA Income Fund | | | ING High Yield Bond Fund | | | ING Intermediate Bond Fund | |
INVESTMENT INCOME: | | | | | | | | | | | | |
Dividends(1) | | $ | — | | | $ | 4,348 | | | $ | 115,153 | |
Interest | | | 37,780,633 | | | | 10,143,713 | | | | 49,822,030 | |
Securities lending income, net | | | — | | | | — | | | | 207,381 | |
| | | | | | | | | | | | |
Total investment income | | | 37,780,633 | | | | 10,148,061 | | | | 50,144,564 | |
| | | | | | | | | | | | |
EXPENSES: | | | | | | | | | | | | |
Investment management fees | | | 3,718,382 | | | | 503,836 | | | | 1,485,579 | |
Distribution and service fees: | | | | | | | | | | | | |
Class A | | | 1,531,582 | | | | 189,544 | | | | 1,018,617 | |
Class B | | | 320,172 | | | | 128,619 | | | | 218,124 | |
Class C | | | 943,353 | | | | 98,023 | | | | 494,330 | |
Class O | | | — | | | | — | | | | 102,562 | |
Class Q(2) | | | 113 | | | | — | | | | — | |
Class R | | | — | | | | — | | | | 82,924 | |
Transfer agent fees: | | | | | | | | | | | | |
Class A | | | 408,863 | | | | 138,721 | | | | 490,822 | |
Class B | | | 21,367 | | | | 23,443 | | | | 26,188 | |
Class C | | | 62,954 | | | | 17,946 | | | | 59,451 | |
Class I | | | 5,411 | | | | 354 | | | | 179,893 | |
Class O | | | — | | | | — | | | | 48,996 | |
Class Q(2) | | | 4 | | | | — | | | | — | |
Class R | | | — | | | | — | | | | 19,816 | |
Class W | | | 3,018 | | | | — | | | | 1,814 | |
Administrative service fees | | | 791,138 | | | | 98,791 | | | | 873,868 | |
Shareholder reporting expense | | | 108,865 | | | | 24,793 | | | | 143,945 | |
Registration fees | | | 118,660 | | | | 95,377 | | | | 111,491 | |
Professional fees | | | 61,826 | | | | 29,612 | | | | 64,132 | |
Custody and accounting expense | | | 94,505 | | | | 24,644 | | | | 158,315 | |
Trustee fees | | | 20,260 | | | | 5,265 | | | | 28,585 | |
Miscellaneous expense | | | 27,153 | | | | 14,090 | | | | 49,512 | |
Interest expense | | | — | | | | 195 | | | | 1,892 | |
| | | | | | | | | | | | |
Total expenses | | | 8,237,626 | | | | 1,393,253 | | | | 5,660,856 | |
Net waived and reimbursed fees | | | — | | | | (137,751 | ) | | | (152,981 | ) |
| | | | | | | | | | | | |
Net expenses | | | 8,237,626 | | | | 1,255,502 | | | | 5,507,875 | |
| | | | | | | | | | | | |
Net investment income | | | 29,543,007 | | | | 8,892,559 | | | | 44,636,689 | |
| | | | | | | | | | | | |
REALIZED AND UNREALIZED GAIN (LOSS) ON INVESTMENTS, FOREIGN CURRENCY RELATED TRANSACTIONS, FUTURES, SWAPS AND WRITTEN OPTIONS | | | | | | | | | | | | |
Net realized gain (loss) on: | | | | | | | | | | | | |
Investments | | | 5,839,917 | | | | (3,125,264 | ) | | | (40,511,668 | ) |
Foreign currency related transactions | | | — | | | | — | | | | 3,225,078 | |
Futures | | | — | | | | — | | | | 3,258,541 | |
Swaps | | | — | | | | (68,304 | ) | | | 468,460 | |
Written options | | | — | | | | — | | | | 1,410,100 | |
| | | | | | | | | | | | |
Net realized gain (loss) on investments, foreign currency related transactions, futures, swaps, and written options | | | 5,839,917 | | | | (3,193,568 | ) | | | (32,149,489 | ) |
| | | | | | | | | | | | |
Net change in unrealized appreciation or depreciation on: | | | | | | | | | | | | |
Investments | | | (287,645 | ) | | | 30,220,741 | | | | 140,497,936 | |
Foreign currency related transactions | | | — | | | | — | | | | 1,160,629 | |
Futures | | | — | | | | — | | | | 1,806,714 | |
Swaps | | | — | | | | 287,074 | | | | (299,199 | ) |
| | | | | | | | | | | | |
Net change in unrealized appreciation or depreciation on investments, foreign currency related transactions, futures, and swaps | | | (287,645 | ) | | | 30,507,815 | | | | 143,166,080 | |
| | | | | | | | | | | | |
Net realized and unrealized gain on investments, foreign currency related transactions, futures, swaps, and written options | | | 5,552,272 | | | | 27,314,247 | | | | 111,016,591 | |
| | | | | | | | | | | | |
Increase in net assets resulting from operations | | $ | 35,095,279 | | | $ | 36,206,806 | | | $ | 155,653,280 | |
| | | | | | | | | | | | |
| | | | | | | | | | | | |
(1) Dividends from affiliates | | $ | — | | | $ | 4,287 | | | $ | 63,899 | |
| (2) | | Effective November 20, 2009, Class Q shareholders of ING GNMA Income Fund converted into Class W shares of the Fund. |
See Accompanying Notes to Financial Statements
19
STATEMENTS OF OPERATIONSFORTHE YEAR ENDED MARCH 31, 2010
| | | | | | | |
| | | ING Classic Money Market Fund | | | ING Institutional Prime Money Market Fund |
INVESTMENT INCOME: | | | | | | | |
Interest | | $ | 4,965,081 | | | $ | 4,990,496 |
| | | | | | | |
Total investment income | | | 4,965,081 | | | | 4,990,496 |
| | | | | | | |
EXPENSES: | | | | | | | |
Investment management fees | | | 2,616,809 | | | | 1,138,833 |
Distribution and service fees: | | | | | | | |
Class A | | | 7,700,707 | | | | — |
Class B | | | 117,822 | | | | — |
Class C | | | 81,826 | | | | — |
Transfer agent fees: | | | | | | | |
Class A | | | 123,659 | | | | — |
Class B | | | 1,248 | | | | — |
Class C | | | 976 | | | | — |
Class I | | | — | | | | 401,451 |
Shareholder reporting expense | | | 303,004 | | | | 65,414 |
Registration fees | | | 391,604 | | | | 64,331 |
Professional fees | | | 87,794 | | | | 142,799 |
Custody and accounting expense | | | 136,511 | | | | 172,595 |
Trustee fees | | | 46,607 | | | | 47,348 |
Guarantee fees (Note 16) | | | 253,789 | | | | 363,498 |
Miscellaneous expense | | | 66,192 | | | | 95,781 |
| | | | | | | |
Total expenses | | | 11,928,548 | | | | 2,492,050 |
Net waived and reimbursed fees | | | (6,960,641 | ) | | | — |
| | | | | | | |
Net expenses | | | 4,967,907 | | | | 2,492,050 |
| | | | | | | |
Net investment income (loss) | | | (2,826 | ) | | | 2,498,446 |
| | | | | | | |
REALIZED GAIN ON INVESTMENTS | | | | | | | |
Net realized gain on investments | | | 425,919 | | | | 236,529 |
| | | | | | | |
Increase in net assets resulting from operations | | $ | 423,093 | | | $ | 2,734,975 |
| | | | | | | |
See Accompanying Notes to Financial Statements
20
STATEMENTS OF CHANGES IN NET ASSETS
| | | | | | | | | | | | | | | | |
| | | ING GNMA Income Fund | | | ING High Yield Bond Fund | |
| | | Year Ended March 31, 2010 | | | Year Ended March 31, 2009 | | | Year Ended March 31, 2010 | | | Year Ended March 31, 2009 | |
FROM OPERATIONS: | | | | | | | | | | | | | | | | |
Net investment income | | $ | 29,543,007 | | | $ | 26,880,070 | | | $ | 8,892,559 | | | $ | 8,791,288 | |
Net realized gain (loss) on investments, foreign currency related transactions, swaps and payment by affiliates | | | 5,839,917 | | | | 395,796 | | | | (3,193,568 | ) | | | (19,275,591 | ) |
Net change in unrealized appreciation or depreciation on investments, swaps, and short positions | | | (287,645 | ) | | | 14,446,282 | | | | 30,507,815 | | | | (14,806,857 | ) |
| | | | | | | | | | | | | | | | |
Increase (decrease) in net assets resulting from operations | | | 35,095,279 | | | | 41,722,148 | | | | 36,206,806 | | | | (25,291,160 | ) |
| | | | | | | | | | | | | | | | |
FROM DISTRIBUTIONS TO SHAREHOLDERS: | | | | | | | | | | | | | | | | |
Net investment income: | | | | | | | | | | | | | | | | |
Class A | | | (25,155,664 | ) | | | (22,932,802 | ) | | | (6,986,125 | ) | | | (5,651,666 | ) |
Class B | | | (1,099,922 | ) | | | (1,526,184 | ) | | | (1,093,360 | ) | | | (1,292,734 | ) |
Class C | | | (3,140,989 | ) | | | (1,624,129 | ) | | | (827,545 | ) | | | (647,080 | ) |
Class I | | | (1,916,719 | ) | | | (1,151,718 | ) | | | (28,023 | ) | | | (12,515 | ) |
Class Q(1) | | | (2,079 | ) | | | (1,935 | ) | | | — | | | | — | |
Class W | | | (333,523 | ) | | | (55,336 | ) | | | — | | | | — | |
Return of capital: | | | | | | | | | | | | | | | | |
Class A | | | — | | | | — | | | | (229,275 | ) | | | (1,363,089 | ) |
Class B | | | — | | | | — | | | | (38,943 | ) | | | (346,757 | ) |
Class C | | | — | | | | — | | | | (29,726 | ) | | | (174,874 | ) |
Class I | | | — | | | | — | | | | (1,015 | ) | | | (2,081 | ) |
Class Q(1) | | | — | | | | — | | | | — | | | | — | |
Class W | | | — | | | | — | | | | — | | | | — | |
| | | | | | | | | | | | | | | | |
Total distributions | | | (31,648,896 | ) | | | (27,292,104 | ) | | | (9,234,012 | ) | | | (9,490,796 | ) |
| | | | | | | | | | | | | | | | |
FROM CAPITAL SHARE TRANSACTIONS: | | | | | | | | | | | | | | | | |
Net proceeds from sale of shares | | | 275,408,526 | | | | 295,311,177 | | | | 29,719,990 | | | | 34,528,518 | |
Reinvestment of distributions | | | 26,412,537 | | | | 22,747,989 | | | | 5,568,334 | | | | 4,988,124 | |
| | | | | | | | | | | | | | | | |
| | | 301,821,063 | | | | 318,059,166 | | | | 35,288,324 | | | | 39,516,642 | |
Cost of shares redeemed | | | (287,481,142 | ) | | | (189,713,958 | ) | | | (33,208,010 | ) | | | (44,343,192 | ) |
| | | | | | | | | | | | | | | | |
Net increase (decrease) in net assets resulting from capital share transactions | | | 14,339,921 | | | | 128,345,208 | | | | 2,080,314 | | | | (4,826,550 | ) |
| | | | | | | | | | | | | | | | |
Net increase (decrease) in net assets | | | 17,786,304 | | | | 142,775,252 | | | | 29,053,108 | | | | (39,608,506 | ) |
| | | | | | | | | | | | | | | | |
NET ASSETS: | | | | | | | | | | | | | | | | |
Beginning of year | | | 761,917,259 | | | | 619,142,007 | | | | 78,699,464 | | | | 118,307,970 | |
| | | | | | | | | | | | | | | | |
End of year | | $ | 779,703,563 | | | $ | 761,917,259 | | | $ | 107,752,572 | | | $ | 78,699,464 | |
| | | | | | | | | | | | | | | | |
Undistributed net investment income (distributions in excess of net investment income) at end of year | | $ | 3,564,888 | | | $ | 2,455,531 | | | $ | (305,010 | ) | | $ | (41,387 | ) |
| | | | | | | | | | | | | | | | |
| (1) | | Effective November 20, 2009, Class Q shareholders of ING GNMA Income Fund converted into Class W shares of the Fund. |
See Accompanying Notes to Financial Statements
21
STATEMENTS OF CHANGES IN NET ASSETS
| | | | | | | | | | | | | | | | |
| | | ING Intermediate Bond Fund | | | ING Classic Money Market Fund | |
| | | Year Ended March 31, 2010 | | | Year Ended March 31, 2009 | | | Year Ended March 31, 2010 | | | Year Ended March 31, 2009 | |
FROM OPERATIONS: | | | | | | | | | | | | | | | | |
Net investment income (loss) | | $ | 44,636,689 | | | $ | 59,477,948 | | | $ | (2,826 | ) | | $ | 20,023,863 | |
Net realized gain (loss) on investments, foreign currency related transactions, futures, swaps, and written options | | | (32,149,489 | ) | | | (139,525,797 | ) | | | 425,919 | | | | 1,949,010 | |
Net change in unrealized appreciation and depreciation on investments, foreign currency related transactions, futures, and swaps | | | 143,166,080 | | | | (70,451,358 | ) | | | — | | | | — | |
| | | | | | | | | | | | | | | | |
Increase (decrease) in net assets resulting from operations | | | 155,653,280 | | | | (150,499,207 | ) | | | 423,093 | | | | 21,972,873 | |
| | | | | | | | | | | | | | | | |
FROM DISTRIBUTIONS TO SHAREHOLDERS: | | | | | | | | | | | | | | | | |
Net investment income: | | | | | | | | | | | | | | | | |
Class A | | | (27,470,003 | ) | | | (31,202,947 | ) | | | — | | | | (19,850,192 | ) |
Class B | | | (1,318,758 | ) | | | (1,292,434 | ) | | | — | | | | (160,872 | ) |
Class C | | | (2,996,473 | ) | | | (2,767,063 | ) | | | — | | | | (119,890 | ) |
Class I | | | (23,534,860 | ) | | | (20,895,106 | ) | | | — | | | | — | |
Class O | | | (2,840,820 | ) | | | (2,322,681 | ) | | | — | | | | — | |
Class R | | | (1,102,439 | ) | | | (852,329 | ) | | | — | | | | — | |
Class W | | | (164,336 | ) | | | (296,146 | ) | | | — | | | | — | |
Net realized gains: | | | | | | | | | | | | | | | | |
Class A | | | — | | | | (13,734,278 | ) | | | (2,033,287 | ) | | | — | |
Class B | | | — | | | | (680,458 | ) | | | (24,447 | ) | | | — | |
Class C | | | — | | | | (1,469,140 | ) | | | (16,258 | ) | | | — | |
Class I | | | — | | | | (9,646,219 | ) | | | — | | | | — | |
Class O | | | — | | | | (1,051,523 | ) | | | — | | | | — | |
Class R | | | — | | | | (462,042 | ) | | | — | | | | — | |
Class W | | | — | | | | (165,327 | ) | | | — | | | | — | |
| | | | | | | | | | | | | | | | |
Total distributions | | | (59,427,689 | ) | | | (86,837,693 | ) | | | (2,073,992 | ) | | | (20,130,954 | ) |
| | | | | | | | | | | | | | | | |
FROM CAPITAL SHARE TRANSACTIONS: | | | | | | | | | | | | | | | | |
Net proceeds from sale of shares | | | 145,033,805 | | | | 417,193,674 | | | | 217,000,287 | | | | 651,983,951 | |
Reinvestment of distributions | | | 47,744,888 | | | | 67,885,769 | | | | 2,025,529 | | | | 19,963,168 | |
| | | | | | | | | | | | | | | | |
| | | 192,778,693 | | | | 485,079,443 | | | | 219,025,816 | | | | 671,947,119 | |
Cost of shares redeemed | | | (468,048,167 | ) | | | (626,057,809 | ) | | | (733,199,018 | ) | | | (856,507,525 | ) |
| | | | | | | | | | | | | | | | |
Net decrease in net assets resulting from capital share transactions | | | (275,269,474 | ) | | | (140,978,366 | ) | | | (514,173,202 | ) | | | (184,560,406 | ) |
| | | | | | | | | | | | | | | | |
Net decrease in net assets | | | (179,043,883 | ) | | | (378,315,266 | ) | | | (515,824,101 | ) | | | (182,718,487 | ) |
| | | | | | | | | | | | | | | | |
NET ASSETS: | | | | | | | | | | | | | | | | |
Beginning of year | | | 970,109,168 | | | | 1,348,424,434 | | | | 1,350,600,771 | | | | 1,533,319,258 | |
| | | | | | | | | | | | | | | | |
End of year | | $ | 791,065,285 | | | $ | 970,109,168 | | | $ | 834,776,670 | | | $ | 1,350,600,771 | |
| | | | | | | | | | | | | | | | |
Undistributed net investment income (distributions in excess of net investment income) at end of year | | $ | 21,509,983 | | | $ | 34,622,359 | | | $ | — | | | $ | (308 | ) |
| | | | | | | | | | | | | | | | |
See Accompanying Notes to Financial Statements
22
STATEMENTS OF CHANGES IN NET ASSETS
| | | | | | | | |
| | | ING Institutional Prime Money Market Fund | |
| | | Year Ended March 31, 2010 | | | Year Ended March 31, 2009 | |
FROM OPERATIONS: | | | | | | | | |
Net investment income | | $ | 2,498,446 | | | $ | 19,341,678 | |
Net realized gain on investments | | | 236,529 | | | | 2,061,974 | |
| | | | | | | | |
Increase in net assets resulting from operations | | | 2,734,975 | | | | 21,403,652 | |
| | | | | | | | |
FROM DISTRIBUTIONS TO SHAREHOLDERS: | | | | | | | | |
Net investment income: | | | | | | | | |
Class I | | | (2,498,440 | ) | | | (19,340,775 | ) |
Class IS | | | (4 | ) | | | (21 | ) |
Net realized gains: | | | | | | | | |
Class I | | | (2,009,805 | ) | | | — | |
Class IS | | | (2 | ) | | | — | |
| | | | | | | | |
Total distributions | | | (4,508,251 | ) | | | (19,340,796 | ) |
| | | | | | | | |
FROM CAPITAL SHARE TRANSACTIONS: | | | | | | | | |
Net proceeds from sale of shares | | | 14,422,386,767 | | | | 15,924,743,767 | |
Reinvestment of distributions | | | 119,162 | | | | 1,265,544 | |
| | | | | | | | |
| | | 14,422,505,929 | | | | 15,926,009,311 | |
Cost of shares redeemed | | | (14,164,212,757 | ) | | | (15,522,218,060 | ) |
| | | | | | | | |
Net increase in net assets resulting from capital share transactions | | | 258,293,172 | | | | 403,791,251 | |
| | | | | | | | |
Net increase in net assets | | | 256,519,896 | | | | 405,854,107 | |
| | | | | | | | |
NET ASSETS: | | | | | | | | |
Beginning of year | | | 1,205,904,360 | | | | 800,050,253 | |
| | | | | | | | |
End of year | | $ | 1,462,424,256 | | | $ | 1,205,904,360 | |
| | | | | | | | |
Distributions in excess of net investment income at end of year | | $ | (21,215 | ) | | $ | (21,217 | ) |
| | | | | | | | |
See Accompanying Notes to Financial Statements
23
FINANCIAL HIGHLIGHTS
Selected data for a share of beneficial interest outstanding throughout each year or period.
| | | | | | | | | | | | | | | | | | | | | | | | | | | | | | | | | | | | | | | | | |
| | | | | Income (loss)
from
investment
operations | | | | | | Less distributions | | | | | | | | | Ratios to average net assets | | | Supplemental
data | |
| | | | | | | | | | | | | | | | | | | | | | | | | | | | | | | | | | | | | | | | | |
| | | Net asset value, beginning of year or period | | Net investment income (loss) | | | Net realized and unrealized gain (loss) on investments | | | Total from investment operations | | | From net investment income | | From net realized gains | | From return of capital | | Total distributions | | Net asset value, end of year or period | | Total Return(1) | | | Expenses before reductions/additions(2)(3) | | | Expenses net of fee waivers and/or recoupments, if any(2)(3) | | | Expenses net of all reductions/additions(2)(3) | | | Net investment income (loss)(2)(3) | | | Net assets, end of year or period | | Portfolio turnover rate | |
| | | | | | | | | | | | | | | | | | | | | | | | | | | | | | | | | | | | | | | | | |
Year or period ended | | ($) | | ($) | | | ($) | | | ($) | | | ($) | | ($) | | ($) | | ($) | | ($) | | (%) | | | (%) | | | (%) | | | (%) | | | (%) | | | ($000’s) | | (%) | |
ING GNMA Income Fund | | | | | | | | | | | | | | | | | | | | | | | | | | | | | | | | | | | | | | | | | |
Class A | | | | | | | | | | | | | | | | | | | | | | | | | | | | | | | | | | | | | | | | | |
03-31-10 | | 8.71 | | 0.33 | • | | 0.07 | | | 0.40 | | | 0.36 | | — | | — | | 0.36 | | 8.75 | | 4.68 | | | 0.94 | | | 0.94 | | | 0.94 | | | 3.83 | | | 589,813 | | 114 | |
03-31-09 | | 8.54 | | 0.37 | | | 0.18 | | | 0.55 | | | 0.38 | | — | | — | | 0.38 | | 8.71 | | 6.62 | | | 0.96 | | | 0.96 | | | 0.96 | | | 4.33 | | | 606,856 | | 39 | |
03-31-08 | | 8.35 | | 0.37 | | | 0.20 | | | 0.57 | | | 0.38 | | — | | — | | 0.38 | | 8.54 | | 7.00 | | | 0.96 | | | 0.96 | | | 0.96 | | | 4.45 | | | 515,916 | | 32 | |
03-31-07 | | 8.30 | | 0.37 | | | 0.09 | | | 0.46 | | | 0.41 | | — | | — | | 0.41 | | 8.35 | | 5.72 | | | 0.95 | | | 0.94 | | | 0.94 | | | 4.49 | | | 515,469 | | 99 | |
03-31-06 | | 8.52 | | 0.40 | | | (0.19 | ) | | 0.21 | | | 0.43 | | — | | — | | 0.43 | | 8.30 | | 2.50 | | | 0.99 | | | 0.98 | | | 0.98 | | | 4.70 | | | 504,734 | | 39 | |
Class B | | | | | | | | | | | | | | | | | | | | | | | | | | | | | | | | | | | | | | | | | |
03-31-10 | | 8.66 | | 0.27 | • | | 0.06 | | | 0.33 | | | 0.29 | | — | | — | | 0.29 | | 8.70 | | 3.89 | | | 1.69 | | | 1.69 | | | 1.69 | | | 3.08 | | | 25,704 | | 114 | |
03-31-09 | | 8.49 | | 0.30 | | | 0.18 | | | 0.48 | | | 0.31 | | — | | — | | 0.31 | | 8.66 | | 5.86 | | | 1.71 | | | 1.71 | | | 1.71 | | | 3.57 | | | 38,718 | | 39 | |
03-31-08 | | 8.30 | | 0.31 | | | 0.19 | | | 0.50 | | | 0.31 | | — | | — | | 0.31 | | 8.49 | | 6.24 | | | 1.71 | | | 1.71 | | | 1.71 | | | 3.70 | | | 45,963 | | 32 | |
03-31-07 | | 8.26 | | 0.30 | | | 0.09 | | | 0.39 | | | 0.35 | | — | | — | | 0.35 | | 8.30 | | 4.84 | | | 1.70 | | | 1.69 | | | 1.69 | | | 3.73 | | | 58,568 | | 99 | |
03-31-06 | | 8.48 | | 0.33 | | | (0.18 | ) | | 0.15 | | | 0.37 | | — | | — | | 0.37 | | 8.26 | | 1.75 | | | 1.74 | | | 1.73 | | | 1.73 | | | 3.95 | | | 78,823 | | 39 | |
Class C | | | | | | | | | | | | | | | | | | | | | | | | | | | | | | | | | | | | | | | | | |
03-31-10 | | 8.67 | | 0.27 | • | | 0.06 | | | 0.33 | | | 0.29 | | — | | — | | 0.29 | | 8.71 | | 3.92 | | | 1.69 | | | 1.69 | | | 1.69 | | | 3.09 | | | 103,103 | | 114 | |
03-31-09 | | 8.50 | | 0.30 | | | 0.18 | | | 0.48 | | | 0.31 | | — | | — | | 0.31 | | 8.67 | | 5.88 | | | 1.71 | | | 1.71 | | | 1.71 | | | 3.59 | | | 73,209 | | 39 | |
03-31-08 | | 8.31 | | 0.31 | | | 0.20 | | | 0.51 | | | 0.32 | | — | | — | | 0.32 | | 8.50 | | 6.23 | | | 1.71 | | | 1.71 | | | 1.71 | | | 3.70 | | | 36,218 | | 32 | |
03-31-07 | | 8.27 | | 0.31 | | | 0.08 | | | 0.39 | | | 0.35 | | — | | — | | 0.35 | | 8.31 | | 4.85 | | | 1.70 | | | 1.69 | | | 1.69 | | | 3.73 | | | 37,280 | | 99 | |
03-31-06 | | 8.49 | | 0.33 | | | (0.18 | ) | | 0.15 | | | 0.37 | | — | | — | | 0.37 | | 8.27 | | 1.74 | | | 1.74 | | | 1.73 | | | 1.73 | | | 3.95 | | | 34,997 | | 39 | |
Class I | | | | | | | | | | | | | | | | | | | | | | | | | | | | | | | | | | | | | | | | | |
03-31-10 | | 8.72 | | 0.36 | • | | 0.07 | | | 0.43 | | | 0.39 | | — | | — | | 0.39 | | 8.76 | | 5.00 | | | 0.64 | | | 0.64 | | | 0.64 | | | 4.15 | | | 52,880 | | 114 | |
03-31-09 | | 8.55 | | 0.39 | | | 0.18 | | | 0.57 | | | 0.40 | | — | | — | | 0.40 | | 8.72 | | 6.95 | | | 0.65 | | | 0.65 | | | 0.65 | | | 4.64 | | | 38,908 | | 39 | |
03-31-08 | | 8.35 | | 0.40 | | | 0.20 | | | 0.60 | | | 0.40 | | — | | — | | 0.40 | | 8.55 | | 7.42 | | | 0.67 | | | 0.67 | | | 0.67 | | | 4.74 | | | 21,002 | | 32 | |
03-31-07 | | 8.31 | | 0.40 | | | 0.08 | | | 0.48 | | | 0.44 | | — | | — | | 0.44 | | 8.35 | | 5.92 | | | 0.65 | | | 0.65 | | | 0.65 | | | 4.77 | | | 14,181 | | 99 | |
03-31-06 | | 8.53 | | 0.45 | | | (0.21 | ) | | 0.24 | | | 0.46 | | — | | — | | 0.46 | | 8.31 | | 2.82 | | | 0.67 | | | 0.67 | | | 0.67 | | | 4.96 | | | 18,287 | | 39 | |
Class W | | | | | | | | | | | | | | | | | | | | | | | | | | | | | | | | | | | | | | | | | |
03-31-10 | | 8.73 | | 0.36 | • | | 0.06 | | | 0.42 | | | 0.38 | | — | | — | | 0.38 | | 8.77 | | 4.97 | | | 0.66 | | | 0.66 | | | 0.66 | | | 4.15 | | | 8,204 | | 114 | |
03-31-09 | | 8.55 | | 0.39 | | | 0.19 | | | 0.58 | | | 0.40 | | — | | — | | 0.40 | | 8.73 | | 7.03 | | | 0.65 | | | 0.65 | | | 0.65 | | | 4.70 | | | 4,180 | | 39 | |
12-17-07(4) - 03-31-08 | | 8.39 | | 0.11 | | | 0.15 | | | 0.26 | | | 0.10 | | — | | — | | 0.10 | | 8.55 | | 3.16 | | | 0.64 | | | 0.64 | | | 0.64 | | | 4.86 | | | 1 | | 32 | |
| | | | | | | | | | | | | | | | |
ING High Yield Bond Fund | | | | | | | | | | | | | | | | | | | | | | | | | | | | | | | | | | | | | | | | | |
Class A | | | | | | | | | | | | | | | | | | | | | | | | | | | | | | | | | | | | | | | | | |
03-31-10 | | 5.52 | | 0.62 | | | 1.89 | | | 2.51 | | | 0.63 | | — | | 0.02 | | 0.65 | | 7.38 | | 46.88 | | | 1.24 | | | 1.10 | † | | 1.10 | † | | 9.17 | † | | 83,034 | | 103 | |
03-31-09 | | 7.89 | | 0.62 | | | (2.32 | ) | | (1.70 | ) | | 0.54 | | — | | 0.13 | | 0.67 | | 5.52 | | (22.36 | ) | | 1.25 | | | 1.10 | † | | 1.10 | † | | 9.30 | † | | 59,307 | | 75 | |
03-31-08 | | 8.99 | | 0.67 | | | (1.10 | ) | | (0.43 | ) | | 0.67 | | — | | — | | 0.67 | | 7.89 | | (5.10 | ) | | 1.16 | | | 1.11 | † | | 1.11 | † | | 7.86 | † | | 83,327 | | 66 | |
03-31-07 | | 8.71 | | 0.61 | | | 0.27 | | | 0.88 | | | 0.60 | | — | | — | | 0.60 | | 8.99 | | 10.54 | | | 1.11 | | | 1.10 | | | 1.10 | | | 6.98 | | | 104,328 | | 122 | |
03-31-06 | | 8.75 | | 0.55 | | | (0.04 | ) | | 0.51 | | | 0.55 | | — | | — | | 0.55 | | 8.71 | | 6.01 | | | 1.31 | | | 1.18 | | | 1.18 | | | 6.27 | | | 99,178 | | 111 | |
See Accompanying Notes to Financial Statements
24
FINANCIAL HIGHLIGHTS (CONTINUED)
Selected data for a share of beneficial interest outstanding throughout each year or period.
| | | | | | | | | | | | | | | | | | | | | | | | | | | | | | | | | | | | | | | |
| | | | | Income (loss)
from
investment
operations | | | | | | Less distributions | | | | | | | | | Ratios to average net assets | | | Supplemental
data |
| | | | | | | | | | | | | | | | | | | | | | | | | | | | | | | | | | | | | | | |
| | | Net asset value, beginning of year or period | | Net investment income (loss) | | | Net realized and unrealized gain (loss) on investments | | | Total from investment operations | | | From net investment income | | From net realized gains | | From return of capital
| | Total distributions | | Net asset value, end of year or period | | Total Return(1) | | | Expenses before reductions/ additions(2)(3) | | Expenses net of fee waivers and/or recoupments, if any(2)(3) | | | Expenses net of all reductions/ additions(2)(3) | | | Net investment income (loss)(2)(3) | | | Net assets, end of year or period | | Portfolio turnover rate |
| | | | | | | | | | | | | | | | | | | | | | | | | | | | | | | | | | | | | | | |
Year or period ended | | ($) | | ($) | | | ($) | | | ($) | | | ($) | | ($) | | ($) | | ($) | | ($) | | (%) | | | (%) | | (%) | | | (%) | | | (%) | | | ($000’s) | | (%) |
ING High Yield Bond Fund (Continued) | | | | | | | | | | | | | | | | | | | | | | | | | | | | | | | | | | | | | | | |
Class B | | | | | | | | | | | | | | | | | | | | | | | | | | | | | | | | | | | | | | | |
03-31-10 | | 5.52 | | 0.57 | | | 1.87 | | | 2.44 | | | 0.57 | | — | | 0.02 | | 0.59 | | 7.37 | | 45.58 | | | 1.99 | | 1.85 | † | | 1.85 | † | | 8.46 | † | | 12,099 | | 103 |
03-31-09 | | 7.88 | | 0.58 | | | (2.32 | ) | | (1.74 | ) | | 0.49 | | — | | 0.13 | | 0.62 | | 5.52 | | (22.86 | ) | | 2.00 | | 1.85 | † | | 1.85 | † | | 8.38 | † | | 12,289 | | 75 |
03-31-08 | | 8.98 | | 0.61 | | | (1.11 | ) | | (0.50 | ) | | 0.60 | | — | | — | | 0.60 | | 7.88 | | (5.82 | ) | | 1.91 | | 1.86 | † | | 1.86 | † | | 7.08 | † | | 24,994 | | 66 |
03-31-07 | | 8.70 | | 0.53 | | | 0.29 | | | 0.82 | | | 0.54 | | — | | — | | 0.54 | | 8.98 | | 9.72 | | | 1.86 | | 1.85 | | | 1.85 | | | 6.18 | | | 43,427 | | 122 |
03-31-06 | | 8.74 | | 0.47 | | | (0.03 | ) | | 0.44 | | | 0.48 | | — | | — | | 0.48 | | 8.70 | | 5.22 | | | 1.98 | | 1.94 | | | 1.94 | | | 5.50 | | | 75,940 | | 111 |
Class C | | | | | | | | | | | | | | | | | | | | | | | | | | | | | | | | | | | | | | | |
03-31-10 | | 5.52 | | 0.57 | | | 1.89 | | | 2.46 | | | 0.58 | | — | | 0.02 | | 0.60 | | 7.38 | | 45.82 | | | 1.99 | | 1.85 | † | | 1.85 | † | | 8.40 | † | | 11,038 | | 103 |
03-31-09 | | 7.89 | | 0.58 | | | (2.33 | ) | | (1.75 | ) | | 0.49 | | — | | 0.13 | | 0.62 | | 5.52 | | (22.95 | ) | | 2.00 | | 1.85 | † | | 1.85 | † | | 8.57 | † | | 7,101 | | 75 |
03-31-08 | | 8.99 | | 0.61 | | | (1.11 | ) | | (0.50 | ) | | 0.60 | | — | | — | | 0.60 | | 7.89 | | (5.81 | ) | | 1.91 | | 1.86 | † | | 1.86 | † | | 7.09 | † | | 9,987 | | 66 |
03-31-07 | | 8.71 | | 0.54 | | | 0.28 | | | 0.82 | | | 0.54 | | — | | — | | 0.54 | | 8.99 | | 9.70 | | | 1.86 | | 1.85 | | | 1.85 | | | 6.21 | | | 15,487 | | 122 |
03-31-06 | | 8.75 | | 0.48 | | | (0.03 | ) | | 0.45 | | | 0.49 | | — | | — | | 0.49 | | 8.71 | | 5.22 | | | 1.98 | | 1.94 | | | 1.94 | | | 5.51 | | | 17,555 | | 111 |
Class I | | | | | | | | | | | | | | | | | | | | | | | | | | | | | | | | | | | | | | | |
03-31-10 | | 5.51 | | 0.64 | • | | 1.90 | | | 2.54 | | | 0.66 | | — | | 0.02 | | 0.68 | | 7.37 | | 47.55 | | | 0.92 | | 0.78 | † | | 0.78 | † | | 8.99 | † | | 1,582 | | 103 |
07-31-08(4) - 03-31-09 | | 7.64 | | 0.37 | • | | (1.92 | ) | | (1.55 | ) | | 0.49 | | — | | 0.09 | | 0.58 | | 5.51 | | (20.35 | ) | | 0.95 | | 0.80 | † | | 0.80 | † | | 9.61 | † | | 2 | | 75 |
| | | | | | | | | | | | | | | | |
ING Intermediate Bond Fund | | | | | | | | | | | | | | | | | | | | | | | | | | | | | | | | | | | | | | | |
Class A | | | | | | | | | | | | | | | | | | | | | | | | | | | | | | | | | | | | | | | |
03-31-10 | | 8.31 | | 0.45 | • | | 1.09 | | | 1.54 | | | 0.62 | | — | | — | | 0.62 | | 9.23 | | 18.95 | | | 0.71 | | 0.69 | † | | 0.69 | † | | 5.04 | † | | 348,871 | | 540 |
03-31-09 | | 10.13 | | 0.45 | | | (1.60 | ) | | (1.15 | ) | | 0.45 | | 0.22 | | — | | 0.67 | | 8.31 | | (11.65 | ) | | 0.72 | | 0.70 | † | | 0.70 | † | | 4.84 | † | | 471,185 | | 674 |
03-31-08 | | 10.23 | | 0.51 | | | (0.15 | ) | | 0.36 | | | 0.46 | | — | | — | | 0.46 | | 10.13 | | 3.61 | | | 0.73 | | 0.69 | † | | 0.69 | † | | 4.98 | † | | 799,369 | | 435 |
03-31-07 | | 10.13 | | 0.50 | | | 0.10 | | | 0.60 | | | 0.50 | | — | | — | | 0.50 | | 10.23 | | 6.03 | | | 0.73 | | 0.69 | † | | 0.69 | † | | 4.89 | † | | 698,537 | | 367 |
03-31-06 | | 10.32 | | 0.41 | | | (0.14 | ) | | 0.27 | | | 0.42 | | 0.04 | | — | | 0.46 | | 10.13 | | 2.53 | | | 1.02 | | 0.93 | | | 0.93 | | | 3.92 | | | 572,196 | | 469 |
Class B | | | | | | | | | | | | | | | | | | | | | | | | | | | | | | | | | | | | | | | |
03-31-10 | | 8.30 | | 0.38 | • | | 1.08 | | | 1.46 | | | 0.55 | | — | | — | | 0.55 | | 9.21 | | 17.96 | | | 1.46 | | 1.44 | † | | 1.44 | † | | 4.31 | † | | 18,605 | | 540 |
03-31-09 | | 10.11 | | 0.38 | | | (1.59 | ) | | (1.21 | ) | | 0.38 | | 0.22 | | — | | 0.60 | | 8.30 | | (12.26 | ) | | 1.47 | | 1.45 | † | | 1.45 | † | | 4.08 | † | | 23,721 | | 674 |
03-31-08 | | 10.21 | | 0.43 | | | (0.14 | ) | | 0.29 | | | 0.39 | | — | | — | | 0.39 | | 10.11 | | 2.84 | | | 1.48 | | 1.44 | † | | 1.44 | † | | 4.26 | † | | 41,078 | | 435 |
03-31-07 | | 10.11 | | 0.42 | | | 0.10 | | | 0.52 | | | 0.42 | | — | | — | | 0.42 | | 10.21 | | 5.23 | | | 1.48 | | 1.44 | † | | 1.44 | † | | 4.13 | † | | 50,086 | | 367 |
03-31-06 | | 10.30 | | 0.32 | | | (0.13 | ) | | 0.19 | | | 0.34 | | 0.04 | | — | | 0.38 | | 10.11 | | 1.76 | | | 1.70 | | 1.69 | | | 1.69 | | | 3.14 | | | 60,526 | | 469 |
Class C | | | | | | | | | | | | | | | | | | | | | | | | | | | | | | | | | | | | | | | |
03-31-10 | | 8.30 | | 0.38 | • | | 1.09 | | | 1.47 | | | 0.55 | | — | | — | | 0.55 | | 9.22 | | 18.08 | | | 1.46 | | 1.44 | † | | 1.44 | † | | 4.31 | † | | 45,016 | | 540 |
03-31-09 | | 10.12 | | 0.38 | | | (1.60 | ) | | (1.22 | ) | | 0.38 | | 0.22 | | — | | 0.60 | | 8.30 | | (12.35 | ) | | 1.47 | | 1.45 | † | | 1.45 | † | | 4.08 | † | | 53,534 | | 674 |
03-31-08 | | 10.22 | | 0.43 | | | (0.14 | ) | | 0.29 | | | 0.39 | | — | | — | | 0.39 | | 10.12 | | 2.85 | | | 1.48 | | 1.44 | † | | 1.44 | † | | 4.24 | † | | 83,232 | | 435 |
03-31-07 | | 10.12 | | 0.42 | | | 0.10 | | | 0.52 | | | 0.42 | | — | | — | | 0.42 | | 10.22 | | 5.24 | | | 1.48 | | 1.44 | † | | 1.44 | † | | 4.13 | † | | 81,556 | | 367 |
03-31-06 | | 10.31 | | 0.33 | | | (0.14 | ) | | 0.19 | | | 0.34 | | 0.04 | | — | | 0.38 | | 10.12 | | 1.77 | | | 1.70 | | 1.69 | | | 1.69 | | | 3.15 | | | 73,281 | | 469 |
See Accompanying Notes to Financial Statements
25
FINANCIAL HIGHLIGHTS (CONTINUED)
Selected data for a share of beneficial interest outstanding throughout each year or period.
| | | | | | | | | | | | | | | | | | | | | | | | | | | | | | | | | | | | | | | | | |
| | | | | Income (loss)
from
investment
operations | | | | | | Less distributions | | | | | | | | | | Ratios to average net assets | | | Supplemental
data |
| | | | | | | | | | | | | | | | | | | | | | | | | | | | | | | | | | | | | | | | | |
| | | Net asset value, beginning of year or period | | Net investment income (loss) | | | Net realized and unrealized gain (loss) on investments | | | Total from investment operations | | | From net investment income | | From net realized gains | | | From return of capital
| | Total distributions | | | Net asset value, end of year or period | | Total Return(1) | | | Expenses before reductions/ additions(2)(3) | | Expenses net of fee waivers and/or recoupments, if any(2)(3) | | | Expenses net of all reductions/ additions(2)(3) | | | Net investment income (loss)(2)(3) | | | Net assets, end of year or period | | Portfolio turnover rate |
| | | | | | | | | | | | | | | | | | | | | | | | | | | | | | | | | | | | | | | | | |
Year or period ended | | ($) | | ($) | | | ($) | | | ($) | | | ($) | | ($) | | | ($) | | ($) | | | ($) | | (%) | | | (%) | | (%) | | | (%) | | | (%) | | | ($000’s) | | (%) |
ING Intermediate Bond Fund (Continued) | | | | | | | | | | | | | | | | | | | | | | | | | | | | | | | | | | | | | | | | | |
Class I | | | | | | | | | | | | | | | | | | | | | | | | | | | | | | | | | | | | | | | | | |
03-31-10 | | 8.31 | | 0.48 | • | | 1.09 | | | 1.57 | | | 0.65 | | — | | | — | | 0.65 | | | 9.23 | | 19.33 | | | 0.39 | | 0.37 | † | | 0.37 | † | | 5.37 | † | | 316,209 | | 540 |
03-31-09 | | 10.14 | | 0.48 | | | (1.61 | ) | | (1.13 | ) | | 0.48 | | 0.22 | | | — | | 0.70 | | | 8.31 | | (11.42 | ) | | 0.39 | | 0.37 | † | | 0.37 | † | | 5.17 | † | | 362,162 | | 674 |
03-31-08 | | 10.23 | | 0.54 | | | (0.13 | ) | | 0.41 | | | 0.50 | | — | | | — | | 0.50 | | | 10.14 | | 4.05 | | | 0.39 | | 0.35 | † | | 0.38 | † | | 5.31 | † | | 351,575 | | 435 |
03-31-07 | | 10.14 | | 0.53 | | | 0.09 | | | 0.62 | | | 0.53 | | — | | | — | | 0.53 | | | 10.23 | | 6.26 | | | 0.40 | | 0.36 | † | | 0.36 | † | | 5.22 | † | | 266,596 | | 367 |
03-31-06 | | 10.32 | | 0.44 | | | (0.13 | ) | | 0.31 | | | 0.45 | | 0.04 | | | — | | 0.49 | | | 10.14 | | 2.94 | | | 0.61 | | 0.60 | | | 0.60 | | | 4.40 | | | 179,582 | | 469 |
Class O | | | | | | | | | | | | | | | | | | | | | | | | | | | | | | | | | | | | | | | | | |
03-31-10 | | 8.32 | | 0.46 | • | | 1.08 | | | 1.54 | | | 0.62 | | — | | | — | | 0.62 | | | 9.24 | | 18.94 | | | 0.71 | | 0.69 | † | | 0.69 | † | | 5.09 | † | | 41,860 | | 540 |
03-31-09 | | 10.14 | | 0.45 | | | (1.60 | ) | | (1.15 | ) | | 0.45 | | 0.22 | | | — | | 0.67 | | | 8.32 | | (11.62 | ) | | 0.72 | | 0.70 | † | | 0.70 | † | | 4.84 | † | | 39,188 | | 674 |
03-31-08 | | 10.24 | | 0.51 | | | (0.15 | ) | | 0.36 | | | 0.46 | | — | | | — | | 0.46 | | | 10.14 | | 3.61 | | | 0.73 | | 0.69 | † | | 0.69 | † | | 4.99 | † | | 55,956 | | 435 |
03-31-07 | | 10.14 | | 0.50 | | | 0.09 | | | 0.59 | | | 0.49 | | — | | | — | | 0.49 | | | 10.24 | | 6.02 | | | 0.73 | | 0.69 | † | | 0.69 | † | | 4.88 | † | | 53,096 | | 367 |
03-31-06 | | 10.32 | | 0.40 | | | (0.13 | ) | | 0.27 | | | 0.41 | | 0.04 | | | — | | 0.45 | | | 10.14 | | 2.58 | | | 0.95 | | 0.94 | | | 0.94 | | | 3.91 | | | 43,171 | | 469 |
Class R | | | | | | | | | | | | | | | | | | | | | | | | | | | | | | | | | | | | | | | | | |
03-31-10 | | 8.32 | | 0.43 | • | | 1.09 | | | 1.52 | | | 0.60 | | — | | | — | | 0.60 | | | 9.24 | | 18.64 | | | 0.96 | | 0.94 | † | | 0.94 | † | | 4.83 | † | | 18,417 | | 540 |
03-31-09 | | 10.15 | | 0.43 | | | (1.61 | ) | | (1.18 | ) | | 0.43 | | 0.22 | | | — | | 0.65 | | | 8.32 | | (11.93 | ) | | 0.97 | | 0.95 | † | | 0.95 | † | | 4.59 | † | | 18,240 | | 674 |
03-31-08 | | 10.25 | | 0.48 | | | (0.14 | ) | | 0.34 | | | 0.44 | | — | | | — | | 0.44 | | | 10.15 | | 3.36 | | | 0.98 | | 0.94 | † | | 0.94 | † | | 4.65 | † | | 16,773 | | 435 |
03-31-07 | | 10.15 | | 0.47 | | | 0.10 | | | 0.57 | | | 0.47 | | — | | | — | | 0.47 | | | 10.25 | | 5.75 | | | 0.98 | | 0.94 | † | | 0.94 | † | | 4.63 | † | | 5,572 | | 367 |
03-31-06 | | 10.34 | | 0.38 | | | (0.14 | ) | | 0.24 | | | 0.39 | | 0.04 | | | — | | 0.43 | | | 10.15 | | 2.26 | | | 1.17 | | 1.16 | | | 1.16 | | | 3.79 | | | 799 | | 469 |
Class W | | | | | | | | | | | | | | | | | | | | | | | | | | | | | | | | | | | | | | | | | |
03-31-10 | | 8.31 | | 0.48 | • | | 1.08 | | | 1.56 | | | 0.65 | | — | | | — | | 0.65 | | | 9.22 | | 19.15 | | | 0.42 | | 0.40 | † | | 0.40 | † | | 5.42 | † | | 2,087 | | 540 |
03-31-09 | | 10.12 | | 0.45 | | | (1.53 | ) | | (1.08 | ) | | 0.51 | | 0.22 | | | — | | 0.73 | | | 8.31 | | (11.03 | ) | | 0.39 | | 0.37 | † | | 0.37 | † | | 5.09 | † | | 2,079 | | 674 |
12-17-07(4) - 03-31-08 | | 10.21 | | 0.15 | Ÿ | | (0.05 | ) | | 0.10 | | | 0.19 | | — | | | — | | 0.19 | | | 10.12 | | 0.98 | | | 0.48 | | 0.44 | † | | 0.44 | † | | 5.24 | † | | 443 | | 435 |
| | | | | | | | | | | | | | | | |
ING Classic Money Market Fund | | | | | | | | | | | | | | | | | | | | | | | | | | | | | | | | | | | | | | | | | |
Class A | | | | | | | | | | | | | | | | | | | | | | | | | | | | | | | | | | | | | | | | | |
03-31-10 | | 1.00 | | (0.00 | )* | | — | | | 0.00 | * | | — | | 0.00 | * | | — | | 0.00 | * | | 1.00 | | 0.15 | | | 1.13 | | 0.47 | •• | | 0.47 | | | (0.00 | )* | | 819,755 | | — |
03-31-09 | | 1.00 | | 0.01 | | | — | | | 0.01 | | | 0.01 | | — | | | — | | 0.01 | | | 1.00 | | 1.43 | | | 1.13 | | 0.79 | | | 0.79 | | | 1.42 | | | 1,323,512 | | — |
03-31-08 | | 1.00 | | 0.04 | | | — | | | 0.04 | | | 0.04 | | — | | | — | | 0.04 | | | 1.00 | | 4.39 | | | 1.11 | | 0.77 | | | 0.77 | | | 4.22 | | | 1,498,016 | | — |
03-31-07 | | 1.00 | | 0.05 | | | — | | | 0.05 | | | 0.05 | | — | | | — | | 0.05 | | | 1.00 | | 4.63 | | | 1.11 | | 0.77 | | | 0.77 | | | 4.55 | | | 921,623 | | — |
03-31-06 | | 1.00 | | 0.03 | | | — | | | 0.03 | | | 0.03 | | — | | | — | | 0.03 | | | 1.00 | | 3.07 | | | 1.10 | | 0.77 | | | 0.77 | | | 3.07 | | | 656,731 | | — |
Class B | | | | | | | | | | | | | | | | | | | | | | | | | | | | | | | | | | | | | | | | | |
03-31-10 | | 1.00 | | 0.00 | * | | — | | | 0.00 | * | | — | | 0.00 | * | | — | | 0.00 | * | | 1.00 | | 0.15 | | | 1.38 | | 0.47 | •• | | 0.47 | | | 0.00 | * | | 8,034 | | — |
03-31-09 | | 1.00 | | 0.01 | | | — | | | 0.01 | | | 0.01 | | — | | | — | | 0.01 | | | 1.00 | | 0.92 | | | 1.38 | | 1.29 | | | 1.29 | | | 0.94 | | | 16,160 | | — |
03-31-08 | | 1.00 | | 0.04 | | | — | | | 0.04 | | | 0.04 | | — | | | — | | 0.04 | | | 1.00 | | 3.77 | | | 1.36 | | 1.36 | | | 1.36 | | | 3.74 | | | 19,793 | | — |
03-31-07 | | 1.00 | | 0.04 | | | — | | | 0.04 | | | 0.04 | | — | | | — | | 0.04 | | | 1.00 | | 4.00 | | | 1.36 | | 1.36 | | | 1.36 | | | 3.95 | | | 23,333 | | — |
03-31-06 | | 1.00 | | 0.02 | | | — | | | 0.02 | | | 0.02 | | — | | | — | | 0.02 | | | 1.00 | | 2.46 | | | 1.34 | | 1.34 | | | 1.34 | | | 2.43 | | | 23,995 | | — |
See Accompanying Notes to Financial Statements
26
FINANCIAL HIGHLIGHTS (CONTINUED)
Selected data for a share of beneficial interest outstanding throughout each year or period.
| | | | | | | | | | | | | | | | | | | | | | | | | | | | | | | | | | | | | | | |
| | | | | Income (loss)
from
investment
operations | | | | | Less distributions | | | | | | Ratios to average net assets | | | Supplemental
data |
| | | | | | | | | | | | | | | | | | | | | | | | | | | | | | | | | | | | | | | |
| | | Net asset value, beginning of year or period | | Net investment income (loss) | | | Net realized and unrealized gain (loss) on investments | | Total from investment operations | | | From net investment income | | | From net realized gains | | | From return of capital
| | Total distributions | | | Net asset value, end of year or period | | Total Return(1) | | Expenses before reductions/ additions(2)(3) | | Expenses net of fee waivers and/or recoupments, if any(2)(3) | | | Expenses net of all reductions/ additions(2)(3) | | Net investment income (loss)(2)(3) | | | Net assets, end of year or period | | Portfolio turnover rate |
| | | | | | | | | | | | | | | | | | | | | | | | | | | | | | | | | | | | | | | |
Year or period ended | | ($) | | ($) | | | ($) | | ($) | | | ($) | | | ($) | | | ($) | | ($) | | | ($) | | (%) | | (%) | | (%) | | | (%) | | (%) | | | ($000’s) | | (%) |
ING Classic Money Market Fund (Continued) | | | | | | | | | | | | | | | | | | | | | | | | | | | | | | | | | | | | | | | |
Class C | | | | | | | | | | | | | | | | | | | | | | | | | | | | | | | | | | | | | | | |
03-31-10 | | 1.00 | | (0.00 | )* | | — | | 0.00 | * | | — | | | 0.00 | * | | — | | 0.00 | * | | 1.00 | | 0.15 | | 1.38 | | 0.47 | •• | | 0.47 | | (0.00 | )* | | 6,987 | | — |
03-31-09 | | 1.00 | | 0.01 | | | — | | 0.01 | | | 0.01 | | | — | | | — | | 0.01 | | | 1.00 | | 0.92 | | 1.38 | | 1.29 | | | 1.29 | | 0.95 | | | 10,929 | | — |
03-31-08 | | 1.00 | | 0.04 | | | — | | 0.04 | | | 0.04 | | | — | | | — | | 0.04 | | | 1.00 | | 3.76 | | 1.36 | | 1.36 | | | 1.36 | | 3.59 | | | 15,511 | | — |
03-31-07 | | 1.00 | | 0.04 | | | — | | 0.04 | | | 0.04 | | | — | | | — | | 0.04 | | | 1.00 | | 3.99 | | 1.36 | | 1.36 | | | 1.36 | | 3.96 | | | 4,345 | | — |
03-31-06 | | 1.00 | | 0.02 | | | — | | 0.02 | | | 0.02 | | | — | | | — | | 0.02 | | | 1.00 | | 2.46 | | 1.34 | | 1.34 | | | 1.34 | | 2.47 | | | 4,868 | | — |
| | | | | | | | | | | | | | | | |
ING Institutional Prime Money Market Fund | | | | | | | | | | | | | | | | | | | | | | | | | | | | | | | | | | | | | | | |
Class I | | | | | | | | | | | | | | | | | | | | | | | | | | | | | | | | | | | | | | | |
03-31-10 | | 1.00 | | 0.00 | * | | — | | 0.00 | * | | 0.00 | * | | 0.00 | * | | — | | 0.00 | * | | 1.00 | | 0.35 | | 0.18 | | 0.18 | | | 0.18 | | 0.18 | | | 1,462,423 | | — |
03-31-09 | | 1.00 | | 0.02 | | | — | | 0.02 | | | 0.02 | | | — | | | — | | 0.02 | | | 1.00 | | 1.89 | | 0.20 | | 0.20 | | | 0.20 | | 1.74 | | | 1,205,903 | | — |
03-31-08 | | 1.00 | | 0.05 | | | — | | 0.05 | | | 0.05 | | | 0.00 | * | | — | | 0.05 | | | 1.00 | | 5.00 | | 0.12 | | 0.12 | | | 0.12 | | 4.95 | | | 800,049 | | — |
03-31-07 | | 1.00 | | 0.05 | | | — | | 0.05 | | | 0.05 | | | — | | | — | | 0.05 | | | 1.00 | | 5.25 | | 0.16 | | 0.16 | | | 0.16 | | 5.17 | | | 724,330 | | — |
07-29-05(4) - 03-31-06 | | 1.00 | | 0.03 | | | — | | 0.03 | | | 0.03 | | | — | | | — | | 0.03 | | | 1.00 | | 2.70 | | 0.19 | | 0.17 | | | 0.17 | | 4.14 | | | 179,659 | | — |
Class IS | | | | | | | | | | | | | | | | | | | | | | | | | | | | | | | | | | | | | | | |
03-31-10 | | 1.00 | | 0.00 | * | | — | | 0.00 | * | | 0.00 | * | | 0.00 | * | | — | | 0.00 | * | | 1.00 | | 0.56 | | 0.21 | | 0.21 | | | 0.21 | | 0.15 | | | 1 | | — |
03-31-09 | | 1.00 | | 0.02 | | | — | | 0.02 | | | 0.02 | | | — | | | — | | 0.02 | | | 1.00 | | 2.05 | | 0.23 | | 0.23 | | | 0.23 | | 1.77 | | | 1 | | — |
12-05-07(4) - 03-31-08 | | 1.00 | | 0.01 | | | — | | 0.01 | | | 0.01 | | | — | | | — | | 0.01 | | | 1.00 | | 1.35 | | 0.22 | | 0.20 | | | 0.20 | | 4.19 | | | 1 | | — |
| (1) | | Total return is calculated assuming reinvestment of all dividends, capital gain distributions and return of capital distributions, if any, at net asset value and excluding the deduction of sales charges. Total return for periods less than one year is not annualized. |
| (2) | | Annualized for periods less than one year. |
| (3) | | Expense ratios reflect operating expenses of a Fund. Expenses before reductions do not reflect amounts reimbursed by the Investment Adviser and/or Distributor or reductions from brokerage service arrangements or other expense offset arrangements and do not represent the amount paid by a Fund during periods when reimbursements or reductions occur. Expenses net of fee waivers reflect expenses after reimbursement by the Investment Adviser and/or Distributor but prior to reductions from brokerage commission recapture arrangements or other expense offset arrangements. Expenses net of all reductions represent the net expenses paid by a Fund. Net investment income (loss) is net of all such additions or reductions. |
| (4) | | Commencement of operations. |
| † | | Impact of waiving the advisory fee for the ING Institutional Prime Money Market Fund holding has less than 0.005% impact on the expense ratio and net investment income or loss ratio. |
| * | | Amount is less than $0.005 or more than ($0.005). |
| Ÿ | | Calculated using average number of shares outstanding throughout the period. |
| •• | | Expense ratios reflect waivers of 0.30%, 0.91% and 0.91% of distribution and shareholder servicing fees for Classes A, B and C, respectively, in order to maintain a yield of not less than zero (NOTE 5). |
See Accompanying Notes to Financial Statements
27
NOTES TO FINANCIAL STATEMENTSASOF MARCH 31, 2010
NOTE 1 — ORGANIZATION
Organization. ING Funds Trust (“Trust”) is a Delaware statutory trust and is registered as an open-end management investment company under the Investment Company Act of 1940, as amended (“1940 Act” or the “Act”). The Trust was organized on August 6, 1998 and was established under a Trust Instrument dated July 30, 1998. It consists of five separately managed series: ING GNMA Income Fund (“GNMA Income”), ING High Yield Bond Fund (“High Yield Bond”), ING Intermediate Bond Fund (“Intermediate Bond”), ING Classic Money Market Fund (“Classic Money Market”) and ING Institutional Prime Money Market Fund (“Institutional Money Market”) (each, a “Fund” and collectively, the “Funds”).
The investment objective of each Fund is described in each Fund’s prospectus.
Each Fund, except Institutional Money Market, offers at least three of the following classes of shares: Class A, Class B, Class C, Class I, Class O, Class R and Class W. Institutional Money Market offers Class I and Class IS shares. The separate classes of shares differ principally in the applicable sales charges (if any), transfer agent fees, distribution fees and shareholder servicing fees. Generally, shareholders of each class also bear certain expenses that pertain to that particular class. All shareholders bear the common expenses of a Fund and earn income and realized gains/losses from the portfolio pro rata based on the average daily net assets of each class, without distinction between share classes. Common expenses of the Funds (including custodial asset-based fees, legal and audit fees, printing and mailing expenses, transfer agency out-of-pocket expenses, and fees and expenses of the independent trustees) are allocated to each Fund in proportion to its average net assets. Expenses directly attributable to a particular fund (including advisory, administration, custodial transaction-based, registration, other professional, distribution and/or service fees, certain taxes, and offering costs) are charged directly to that Fund. Differences in per share dividend rates generally result from the differences in separate class expenses, including distribution, and shareholder servicing fees. Class B shares, along with their pro rata reinvested dividend shares, automatically convert to Class A shares eight years after purchase.
Class B shares of the Funds are closed to new investment, provided that (1) Class B shares of the Funds may be purchased through the reinvestment of dividends issued by Class B shares of a Fund; and (2) subject to the terms and conditions of relevant
exchange privileges and as permitted under their respective prospectuses, Class B shares of the Funds may be acquired through exchange of Class B shares of other funds in the ING mutual funds complex.
NOTE 2 — SIGNIFICANT ACCOUNTING POLICIES
The following significant accounting policies are consistently followed by the Funds in the preparation of their financial statements, and such policies are in conformity with U.S. generally accepted accounting principles for investment companies.
| A. | Security Valuation. Investments in equity securities traded on a national securities exchange are valued at the last reported sale price. Securities reported by the National Association of Securities Dealers Automated Quotation System (“NASDAQ”) will be valued at the NASDAQ official closing prices. Securities traded on an exchange or NASDAQ for which there has been no sale and securities traded in the over-the- counter-market are valued at the mean between the last reported bid and ask prices. All investments quoted in foreign currencies will be valued daily in U.S. dollars on the basis of the foreign currency exchange rates prevailing at that time. Debt securities acquired with more than 60 days to maturity are valued using matrix pricing methods determined by an independent pricing service which takes into consideration such factors as yields, maturities, liquidity, ratings and traded prices in similar or identical securities. Securities for which valuations are not readily available from an independent pricing service may be valued by brokers which use prices provided by market makers or estimates of fair market value obtained from yield data relating to investments or securities with similar characteristics. Investments in open-end mutual funds are valued at the net asset value (“NAV”). Investments in securities maturing 60 days or less from date of acquisition are valued at amortized cost which approximates market value. |
Securities and assets for which market quotations are not readily available (which may include certain restricted securities which are subject to limitations as to their sale) are valued at their fair values, as defined by the 1940 Act, as determined in good faith by or under the supervision of the Funds’ Board of Trustees (“Board”), in accordance with methods that are specifically authorized by the Board. Securities traded on exchanges, including foreign exchanges, which close earlier
28
NOTES TO FINANCIAL STATEMENTSASOF MARCH 31, 2010 (CONTINUED)
NOTE 2 — SIGNIFICANT ACCOUNTING POLICIES (continued)
than the time that a Fund calculates its NAV may also be valued at their fair values as defined by the 1940 Act and as determined in good faith by or under the supervision of the Funds’ Board, in accordance with methods that are specifically authorized by the Board. If an event occurs after the time at which the market for foreign securities held by a Fund closes but before the time that a Fund’s NAV is calculated, such event may cause the closing price on the foreign exchange to not represent a readily available reliable market value quotation for such securities at the time a Fund determines its NAV. In such a case, a Fund will use the fair value of such securities as determined under a Fund’s valuation procedures. Events after the close of trading on a foreign market that could require a Fund to fair value some or all of its foreign securities include, among others, securities trading in the U.S. and other markets, corporate announcements, natural and other disasters, and political and other events. Among other elements of analysis in the determination of a security’s fair value, the Board has authorized the use of one or more independent research services to assist with such determinations. An independent research service may use statistical analyses and quantitative models to help determine fair value as of the time a Fund calculates its NAV. There can be no assurance that such models accurately reflect the behavior of the applicable markets or the effect of the behavior of such markets on the fair value of securities, or that such markets will continue to behave in a fashion that is consistent with such models. Unlike the closing price of a security on an exchange, fair value determinations employ elements of judgment. Consequently, the fair value assigned to a security may not represent the actual value that a Fund could obtain if it were to sell the security at the time of the close of the NYSE. Pursuant to procedures adopted by the Board, a Fund is not obligated to use the fair valuations suggested by any research service, and valuation recommendations provided by such research services may be overridden if other events have occurred or if other fair valuations are determined in good faith to be more accurate. Unless an event is such that it causes a Fund to determine that the closing prices for one or more securities do not represent readily available reliable market value quotations at the time a Fund determines its NAV,
events that occur between the time of the close of the foreign market on which they are traded and the close of regular trading on the NYSE will not be reflected in a Fund’s NAV.
Classic Money Market and Institutional Money Market use the amortized cost method to value their portfolio securities, which generally approximates market value. The amortized cost method involves valuing a security at its cost and amortizing any discount or premium over the period until maturity regardless of the impact of fluctuating interest rates or the market value of the security.
Fair Value is defined as the price that the Fund would receive to sell an asset or pay to transfer a liability in an orderly transaction between market participants at the measurement date. Each investment asset or liability of the Funds is assigned a level at measurement date based on the significance and source of the inputs to its valuation. Quoted prices in active markets for identical securities are classified as “Level 1”, inputs other than quoted prices for an asset or liability that are observable are classified as “Level 2” and unobservable inputs, including the sub-adviser’s judgment about the assumptions that a market participant would use in pricing an asset or liability are classified as “Level 3”. The inputs used for valuing securities are not necessarily an indication of the risks associated with investing in those securities. Short-term securities of sufficient credit quality which are valued at amortized cost, which approximates fair value, are generally considered to be Level 2 securities under applicable accounting rules. A table summarizing the Funds’ investments under these levels of classification is included following the Portfolios of Investments.
For the year ended March 31, 2010, there have been no significant changes to the fair valuation methodologies.
| B. | Security Transactions and Revenue Recognition. Securities transactions are accounted for on the trade date. Realized gains and losses are reported on the basis of identified cost of securities sold. Interest income is recorded on an accrual basis. Dividend income is recorded on the ex-dividend date, or for certain foreign securities, when the information becomes available to the Funds. Premium amortization and discount accretion are determined by the effective yield method. |
29
NOTES TO FINANCIAL STATEMENTSASOF MARCH 31, 2010 (CONTINUED)
NOTE 2 — SIGNIFICANT ACCOUNTING POLICIES (continued)
| C. | Foreign Currency Translation. The books and records of the Funds are maintained in U.S. dollars. Any foreign currency amounts are translated into U.S. dollars on the following basis: |
| | (1) | Market value of investment securities, other assets and liabilities — at the exchange rates prevailing at the end of the day. |
| | (2) | Purchases and sales of investment securities, income and expenses — at the rates of exchange prevailing on the respective dates of such transactions. |
Although the net assets and the market values are presented at the foreign exchange rates at the end of the day, the Funds do not isolate the portion of the results of operations resulting from changes in foreign exchange rates on investments from the fluctuations arising from changes in market prices of securities held. Such fluctuations are included with the net realized and unrealized gains or losses from investments. For securities that are subject to foreign withholding tax upon disposition, liabilities are recorded on the Statements of Assets and Liabilities for the estimated tax withholding based on the securities’ current market values. Upon disposition, realized gains or losses on such securities are recorded net of foreign withholding tax.
Reported net realized foreign exchange gains or losses arise from sales of foreign currencies, currency gains or losses realized between the trade and settlement dates on securities transactions, the difference between the amounts of dividends, interest, and foreign withholding taxes recorded on the Funds’ books, and the U.S. dollar equivalent of the amounts actually received or paid. Net unrealized foreign exchange gains and losses arise from changes in the value of assets and liabilities other than investments in securities at fiscal year end, resulting from changes in the exchange rate. Foreign security and currency transactions may involve certain considerations and risks not typically associated with investing in U.S. companies and U.S. government securities. These risks include, but are not limited to revaluation of currencies and future adverse political and economic developments which could cause securities and their markets to be less liquid and prices more volatile than those of comparable U.S. companies and U.S. government securities.
| D. | Risk Exposures and the use of Derivative Instruments. The Funds’ investment objectives permit them to enter into various types of derivatives contracts, including, but not limited to, forward foreign currency exchange contracts, futures, purchased options, written options, and swaps. In doing so, the Funds will employ strategies in differing combinations to permit them to increase or decrease the level of risk, or change the level or types of exposure to market risk factors. This may allow the Funds to pursue their objectives more quickly, and efficiently than if it were to make direct purchases or sales of securities capable of affecting a similar response to market factors. |
Market Risk Factors. In pursuit of its investment objectives, the Funds may seek to use derivatives to increase or decrease their exposure to the following market risk factors:
Credit Risk. Credit risk relates to the ability of the issuer to meet interest and principal payments, or both, as they come due. In general, lower-grade, higher-yield bonds are subject to credit risk to a greater extent than lower-yield, higher-quality bonds.
Equity Risk. Equity risk relates to the change in value of equity securities as they relate to increases or decreases in the general market.
Foreign Exchange Rate Risk. Foreign exchange rate risk relates to the change in U.S. dollar value of a security held that is denominated in a foreign currency. The U.S. dollar value of a foreign currency denominated security will decrease as the dollar appreciates against the currency, while the U.S. dollar value will increase as the dollar depreciates against the currency.
Interest Rate Risk. Interest rate risk refers to the fluctuations in value of fixed-income securities resulting from the inverse relationship between price and yield. For example, an increase in general interest rates will tend to reduce the market value of already issued fixed-income investments, and a decline in general interest rates will tend to increase their value. In addition, debt securities with longer maturities, which tend to have higher yields, are subject to potentially greater fluctuations in value from changes in interest rates than obligations with shorter maturities.
Risks of Investing in Derivatives. The Funds’ use of derivatives can result in losses due to unanticipated changes in the market risk factors and the overall
30
NOTES TO FINANCIAL STATEMENTSASOF MARCH 31, 2010 (CONTINUED)
NOTE 2 — SIGNIFICANT ACCOUNTING POLICIES (continued)
market. In instances where the Funds are using derivatives to decrease, or hedge, exposures to market risk factors for securities held by a Fund, there are also risks that those derivatives may not perform as expected resulting in losses for the combined or hedged positions.
The use of these strategies involves certain special risks, including a possible imperfect correlation, or even no correlation, between price movements of derivative instruments and price movements of related investments. While some strategies involving derivative instruments can reduce the risk of loss, they can also reduce the opportunity for gain or even result in losses by offsetting favorable price movements in related investments or otherwise, due to the possible inability of the Funds to purchase or sell a portfolio security at a time that otherwise would be favorable or the possible need to sell a portfolio security at a disadvantageous time because the Funds are required to maintain asset coverage or offsetting positions in connection with transactions in derivative instruments. Additional associated risks from investing in derivatives also exist and potentially could have significant effects on the valuation of the derivatives and the Funds. Associated risks are not the risks that the Funds are attempting to increase or decrease exposure to, per its investment objectives, but are the additional risks from investing in derivatives. Examples of these associated risks are liquidity risk, which is the risk that the Funds will not be able to sell the derivative in the open market in a timely manner, and counterparty credit risk, which is the risk that the counterparty will not fulfill its obligation to the Funds. Associated risks can be different for each type of derivative and are discussed by each derivative type in the following notes.
Counterparty Credit Risk and Credit Related Contingent Features. Certain derivative positions are subject to counterparty credit risk, which is the risk that the counterparty will not fulfill its obligation to the Funds. The Funds derivative counterparties are financial institutions who are subject to market conditions that may weaken their financial position. The Funds intends to enter into financial transactions with counterparties that they believe to be creditworthy at the time of the transaction. To reduce this risk, the Funds generally
enter into master netting arrangements, established within the Funds International Swap and Derivatives Association, Inc. (“ISDA”) Master Agreements (“Master Agreements”). These agreements are with select counterparties and they govern transactions, including certain over-the-counter (“OTC”) derivative and forward foreign currency contracts, entered into by the Funds and the counterparty. The Master Agreements maintain provisions for general obligations, representations, agreements, collateral, and events of default or termination. The occurrence of a specified event of termination may give a counterparty the right to terminate all of its contracts and affect settlement of all outstanding transactions under the applicable Master Agreement.
The Funds may also enter into collateral agreements with certain counterparties to further mitigate OTC derivative and forward foreign currency contracts. Subject to established minimum levels, collateral is generally determined based on the net aggregate unrealized gain or loss on contracts with a certain counterparty. Collateral pledged to or from the Funds is held in a segregated account by a third-party agent and can be in the form of cash or debt securities issued by the U.S. government or related agencies.
As of March 31, 2010, the maximum amount of loss that Intermediate Bond would incur if the counterparties to its derivative transactions failed to perform would be $1,542,329, which represents the gross payments to be received by the Fund on open credit default swaps were they to be unwound as of March 31, 2010.
The Funds have credit related contingent features that if triggered would allow its derivatives counterparties to close out and demand payment or additional collateral to cover their exposure from the Funds. Credit related contingent features are established between the Funds and their derivatives counterparties to reduce the risk that the Funds will not fulfill their payment obligations to their counterparties. These triggering features include, but are not limited to, a percentage decrease in the Funds net assets and or a percentage decrease in the Funds NAV, which could cause the Funds to accelerate payment of any net liability owed to the counterparty. The contingent features are established within the Funds Master Agreements.
31
NOTES TO FINANCIAL STATEMENTSASOF MARCH 31, 2010 (CONTINUED)
NOTE 2 — SIGNIFICANT ACCOUNTING POLICIES (continued)
As of March 31, 2010, Intermediate Bond had a net liability position of $2,954,918 on credit default swaps with credit related contingent features. If a contingent feature would have been triggered as of March 31, 2010, Intermediate Bond could have been required to pay this amount in cash to its counterparties. As of March 31, 2010 Intermediate Bond had posted $330,000 to its counterparties in cash collateral for its derivatives transactions.
| E. | Foreign Currency Transactions and Futures Contracts. High Yield Bond and Intermediate Bond may enter into foreign currency exchange transactions to convert to and from different foreign currencies and to and from the U.S. dollar in connection with the planned purchases or sales of securities. The Funds either enter into these transactions on a spot basis at the spot rate prevailing in the foreign currency exchange market or use forward foreign currency contracts to purchase or sell foreign currencies. When the contract is fulfilled or closed, gains or losses are realized. Until then, the gain or loss is included in unrealized appreciation or depreciation. Risks may arise upon entering into forward contracts from the potential inability of counterparties to meet the terms of their forward contracts and from unanticipated movements in the value of foreign currencies relative to the U.S. dollar. |
For the year ended March 31, 2010, Intermediate Bond has entered into forward foreign currency contracts with the obligation to buy and sell specified foreign currencies in the future at a currently negotiated forward rate in order to increase or decrease exposure to foreign exchange rate risk. The Fund uses forward foreign currency contracts to enhance potential gain, hedge against anticipated currency exchange rates, and to maintain diversity and liquidity of the portfolio.
During the year ended March 31, 2010, Intermediate Bond had average contract amounts on forward foreign currency contracts to buy and sell of $17,029,044 and $21,824,097, respectively.
High Yield Bond and Intermediate Bond may enter into futures contracts involving foreign currency, interest rates, securities and securities indices. A futures contract obligates the seller of the contract to deliver and the purchaser of the contract to take delivery of the type of foreign currency, financial
instrument or security called for in the contract at a specified future time for a specified price. Upon entering into such a contract, a Fund is required to deposit and maintain as collateral such initial margin as required by the exchange on which the contract is traded. Pursuant to the contract, a Fund agrees to receive from or pay to the broker an amount equal to the daily fluctuations in the value of the contract. Such receipts or payments are known as variation margins and are recorded as unrealized gains or losses by the Fund. When the contract is closed, the Fund records a realized gain or loss equal to the difference between the value of the contract at the time it was opened and the value at the time it was closed.
Futures contracts are exposed to the market risk factor of the underlying financial instrument. During the year ended March 31, 2010, Intermediate Bond has both purchased and sold futures contracts on various bonds and notes to increase or decrease exposure to interest rate risk. Additional associated risks of entering into futures contracts include the possibility that there may be an illiquid market where the Fund is unable to liquidate the contract or enter into an offsetting position and, if used for hedging purposes, the risk that the price of the contract will correlate imperfectly with the prices of the Fund’s securities.
During the year ended March 31, 2010, Intermediate Bond had an average market value of $60,380,976 and $136,420,924 on futures contracts purchased and sold, respectively.
| F. | Distributions to Shareholders. The Funds record distributions to their shareholders on the ex-dividend date. All Funds, with the exception of GNMA Income, declare dividends daily and pay dividends monthly. GNMA Income declares and pays dividends monthly. The characteristics of income and gains to be distributed are determined in accordance with income tax regulations, which may differ from U.S. generally accepted accounting principles for investment companies. |
| G. | Federal Income Taxes. It is the policy of the Funds to comply with the requirements of subchapter M of the Internal Revenue Code that are applicable to regulated investment companies and to distribute substantially all of their net investment income and any net realized capital gains to their shareholders. Therefore, a federal income tax or excise tax provision is not required. Management |
32
NOTES TO FINANCIAL STATEMENTSASOF MARCH 31, 2010 (CONTINUED)
NOTE 2 — SIGNIFICANT ACCOUNTING POLICIES (continued)
| | has considered the sustainability of the Funds’ tax positions taken on federal income tax returns for all open tax years in making this determination. No capital gain distributions shall be made until the capital loss carryforwards have been fully utilized or expire. |
| H. | Use of Estimates. The preparation of financial statements in conformity with U.S. generally accepted accounting principles requires management to make estimates and assumptions that affect the reported amounts of assets and liabilities and disclosure of contingent assets and liabilities at the date of the financial statements and the reported amounts of increases and decreases in net assets from operations during the reporting period. Actual results could differ from those estimates. |
| I. | Repurchase Agreements. Each Fund may invest in repurchase agreements only with government securities dealers recognized by the Board of Governors of the Federal Reserve System. Under such agreements, the seller of the security agrees to repurchase it at a mutually agreed upon time and price. The resale price is in excess of the purchase price and reflects an agreed upon interest rate for the period of time the agreement is outstanding. The period of the repurchase agreements is generally short, from possibly overnight to one week, (although it may extend over a number of months) while the underlying securities generally have longer maturities. Each Fund will receive as collateral securities acceptable to it whose market value is equal to at least 100% of the carrying amount of the repurchase agreements, plus accrued interest, being invested by a Fund. The underlying collateral is valued daily on a mark to market basis to assure that the value, including accrued interest is at least equal to the repurchase price. There would be potential loss to a Fund in the event a Fund is delayed or prevented from exercising its right to dispose of the collateral, and it may incur disposition costs in liquidating the collateral. |
| J. | Securities Lending. Each Fund has the option to temporarily loan up to 33 1/3% of its total assets to brokers, dealers or other financial institutions in exchange for a negotiated lender’s fee. The borrower is required to fully collateralize the loans with cash or U.S. government securities. Generally, |
| | in the event of counterparty default, a Fund has the right to use collateral to offset losses incurred. There would be potential loss to a Fund in the event the Fund is delayed or prevented from exercising its right to dispose of the collateral. A Fund bears the risk of loss with respect to the investment of collateral. Engaging in securities lending could have a leveraging effect, which may intensify the credit, market and other risks associated with investing in a Fund. |
| K. | Illiquid and Restricted Securities. Classic Money Market and Institutional Money Market may not invest more than 10% of their net assets in illiquid securities and all other Funds may not invest more than 15% of their net assets in illiquid securities. Illiquid securities are not readily marketable. Disposing of illiquid investments may involve time- consuming negotiation and legal expenses, and it may be difficult or impossible for the Funds to sell them promptly at an acceptable price. Restricted securities are those sold under Rule 144A of the Securities Act of 1933 (“1933 Act”) or are securities offered pursuant to Section 4(2) of the 1933 Act, and are subject to legal or contractual restrictions on resale and may not be publicly sold without registration under the 1933 Act. Certain restricted securities may be considered liquid pursuant to procedures adopted by the Board or may be deemed illiquid because they may not be readily marketable. With the exception of Classic Money Market and Institutional Money Market, illiquid and restricted securities are valued using market quotations when readily available. In the absence of market quotations, the securities are valued based upon their fair value determined under procedures approved by the Board. |
| L. | Delayed-Delivery or When-Issued Transactions. The Funds may purchase or sell securities on a when-issued or a delayed-delivery basis. Each Fund (except GNMA Income) may enter into forward commitments. The price of the underlying securities and date when the securities will be delivered and paid for are fixed at the time the transaction is negotiated. The market value of such is identified in the Funds’ Portfolio of investments. Losses may arise due to changes in the market value of the securities or from the inability of counterparties to meet the terms of the contract. In connection with such purchases, the Funds are required to segregate liquid assets with the Funds’ custodian sufficient to cover the purchase price. |
33
NOTES TO FINANCIAL STATEMENTSASOF MARCH 31, 2010 (CONTINUED)
NOTE 2 — SIGNIFICANT ACCOUNTING POLICIES (continued)
| M. | Mortgage Dollar Roll Transactions. Each Fund may engage in dollar roll transactions with respect to mortgage-backed securities issued or to be issued by Government National Mortgage Association, Federal National Mortgage Association and Federal Home Loan Mortgage Corp. In a dollar roll transaction, a Fund sells a mortgage-backed security to a financial institution, such as a bank or broker/dealer, and simultaneously agrees to repurchase a substantially similar (i.e., same type, coupon, and maturity) security from the institution on a delayed delivery basis at an agreed upon price. The mortgage-backed securities that are repurchased will bear the same interest rate as those sold, but generally will be collateralized by different pools of mortgages with different prepayment histories. The Funds account for dollar roll transactions as purchases and sales. |
| N. | Options Contracts. The Funds (except GNMA Income, Classic Money Market and Institutional Money Market) may write call and put options on futures, swaps (“swaptions”), securities, commodity or currencies it owns or in which it may invest. Writing put options tends to increase the Funds exposure to the underlying instrument. Writing call options tends to decrease the Funds exposure to the underlying instrument. When a Fund writes a call or put option, an amount equal to the premium received is recorded as a liability and subsequently marked to market to reflect the current value of the option written. These liabilities are reflected as written options outstanding on the Statements of Assets and Liabilities. Certain options may be written with premiums to be determined on a future date. Premiums received from writing options which expire are treated as realized gains. Premiums received from writing options which are exercised or closed are added to the proceeds or offset against amounts paid on the underlying futures, swap, security or currency transaction to determine the realized gain or loss. Each Fund as a writer of an option has no control over whether the underlying instrument may be sold (call) or purchased (put) and as a result bears the market risk of an unfavorable change in the price of the instrument underlying the written option. There is the risk the Funds may not be able to enter into a closing transaction because of an illiquid market. |
The Funds may also purchase put and call options. Purchasing call options tends to increase the Funds exposure to the underlying instrument. Purchasing put options tends to decrease the Funds’ exposure to the underlying instrument. The Funds pay a premium which is included on the Statements of Assets and Liabilities as an investment and subsequently marked to market to reflect the current value of the option. Premiums paid for purchasing options which expire are treated as realized losses. Certain options may be purchased with premiums to be determined on a future date. The premiums for these options are based upon implied volatility parameters at specified terms. The risk associated with purchasing put and call options is limited to the premium paid. Premiums paid for purchasing options which are exercised or closed are added to the amounts paid or offset against the proceeds on the underlying investment transaction to determine the realized gain or loss.
During the year ended March 31, 2010 Intermediate Bond has purchased and written swaptions on credit default swaps in an attempt to increase or decrease exposure to credit risk. Please refer to Note 9 for the volume of both purchased and written swaption activity during the year ended March 31, 2010. There were no open swaptions at March 31, 2010.
| O. | Swap Agreements. High Yield Bond and Intermediate Bond may enter into swap agreements. A swap is an agreement between two parties pursuant to which each party agrees to make one or more payments to the other at specified future intervals based on the return of an asset (such as a stock, bond or currency) or non-asset reference (such as an interest rate or index). The swap agreement will specify the “notional” amount of the asset or non-asset reference to which the contract relates. Subsequent changes in market value, if any, are calculated based upon changes in the performance of the asset or non-asset reference multiplied by the notional value of the contract. A Fund may enter into credit default, interest rate, total return and currency swaps to manage its exposure to credit, currency and interest rate risk. All outstanding swap agreements are reported following each Fund’s Portfolio of Investments. |
Swaps are marked to market daily using quotations primarily from third party pricing services,
34
NOTES TO FINANCIAL STATEMENTSASOF MARCH 31, 2010 (CONTINUED)
NOTE 2 — SIGNIFICANT ACCOUNTING POLICIES (continued)
counterparties or brokers. The value of the swap contract is recorded on each Fund’s Statements of Assets or Liabilities. During the term of the swap, changes in the value of the swap, if any, are recorded as unrealized gains or losses on the Statements of Operations. Upfront payments paid or received by a Fund when entering into the agreements are reported on the Statements of Assets and Liabilities and as a component of the changes in unrealized gains or losses on the Statements of Operations. These upfront payments represent the amounts paid or received when initially entering into the swap agreement to compensate for differences between the stated terms of the swap agreement and the prevailing market conditions. The upfront payments are included as a component in the realized gains or losses on each Fund’s Statement of Operations upon termination or maturity of the swap. A Fund also records net periodic payments paid or received on the swap contract as a realized gain or loss on the Statements of Operations.
Entering into swap agreements involves the risk that the maximum potential loss of an investment exceeds the current value of the investment as reported on each Fund’s Statements of Assets and Liabilities. Other risks involve the possibility that the counterparty to the agreements may default on its obligation to perform, that there will be no liquid market for these investments and that unfavorable changes in the market will have a negative impact on the value of the index or securities underlying the respective swap agreement.
Credit Default Swap Contracts. A credit default swap is a bilateral agreement between counterparties in which the buyer of the protection agrees to make a stream of periodic payments to the seller of protection in exchange for the right to receive a specified return in the event of a default or other credit event for a referenced entity, obligation or index. As a seller of protection on credit default swaps, a Fund will generally receive from the buyer a fixed payment stream based on the notional amount of the swap contract. This fixed payment stream will continue until the swap contract expires or a defined credit event occurs.
A Fund is subject to credit risk in the normal course of pursuing its investment objectives. As a seller of
protection in a credit default swap, a Fund may execute these contracts to manage its exposure to the market or certain sectors of the market. A Fund may also enter into credit default swaps to speculate on changes in an issuer’s credit quality, to take advantage of perceived spread advantages, or to offset an existing short equivalent (i.e. buying protection on an equivalent reference entity).
High Yield Bond and Intermediate Bond may sell credit default swaps which expose these Funds to the risk of loss from credit risk- related events specified in the contract. Although contract specific, credit events are generally defined as bankruptcy, failure to pay, restructuring, obligation acceleration, obligation default or repudiation/moratorium. If a Fund is a seller of protection, and a credit event occurs, as defined under the terms of that particular swap agreement, a Fund will generally either (i) pay to the buyer an amount equal to the notional amount of the swap and take delivery of the referenced obligation, other deliverable obligations, or underlying securities comprising a referenced index or (ii) pay a net settlement amount in the form of cash or securities equal to the notional amount of the swap less the recovery value of the referenced obligation or underlying securities comprising a referenced index. If a Fund is a buyer of protection and a credit event occurs, as defined under the terms of that particular swap agreement, a Fund will either (i) receive from the seller of protection an amount equal to the notional amount of the swap and deliver the referenced obligation, other deliverable obligations or underlying securities comprising the referenced index or (ii) receive a net settlement amount in the form of cash or securities equal to the notional amount of the swap less the recovery value of the referenced obligation or underlying securities comprising the referenced index. Recovery values are assumed by market makers considering either industry standard recovery rates or entity specific factors and considerations until a credit event occurs. If a credit event has occurred, the recovery value is determined by a facilitated auction whereby a minimum number of allowable broker bids, together with a specified valuation method, are used to calculate the settlement value.
Implied credit spreads, represented in absolute terms, utilized in determining the market value of credit default swap agreements on corporate issues
35
NOTES TO FINANCIAL STATEMENTSASOF MARCH 31, 2010 (CONTINUED)
NOTE 2 — SIGNIFICANT ACCOUNTING POLICIES (continued)
or sovereign issues are disclosed in each Fund’s Portfolio of Investments and serve as an indicator of the current status of the payment/performance risk and represent the likelihood or risk of default for the credit derivative. The implied credit spread of a particular referenced entity reflects the cost of buying/selling protection and may include upfront payments required to be made to enter into the agreement. For credit default swaps on asset-backed securities or credit indices, the quoted market prices and resulting market values serve as the indicator of the current status of the payment/performance risk. Wider credit spreads and increasing market values, in absolute terms when compared to the notional amount of the swap, represent a deterioration of the referenced entity’s credit soundness and a greater likelihood or risk of default or other credit event occurring as defined under the terms of the agreement.
The maximum amount of future payments (undiscounted) that a Fund as seller of protection could be required to make under a credit default swap agreement would be an amount equal to the notional amount of the agreement. Notional amounts of all credit default swap agreements outstanding as of March 31, 2010, for which a Fund is seller of protection, are disclosed in each Fund’s Portfolio of Investments. These potential amounts would be partially offset by any recovery values of the respective referenced obligations, upfront payments received upon entering into the agreements, or net amounts received from the settlement of buy protection credit default swap agreements entered into by a Fund for the same referenced entity or entities.
For the year ended March 31, 2010, High Yield Bond and Intermediate Bond have purchased credit protection through credit default swaps to decrease exposure to the credit risk of individual securities and to hedge against anticipated potential credit events.
For the year ended March 31, 2010, High Yield Bond and Intermediate Bond have sold credit protection through credit default swaps to gain exposure to the credit risk of individual securities that are either unavailable or considered to be less attractive in the bond market and to hedge against anticipated potential credit events.
For the year ended March 31, 2010, Intermediate Bond had average notional amounts of $12,252,700 and $14,458,672 on credit default swaps to buy protection and credit default swaps to sell protection, respectively.
For the year ended March 31, 2010, High Yield Bond had average notional amounts of $2,400,00 and $1,600,000 on credit default swaps to buy protection and credit default swaps to sell protection, respectively. High Yield Bond had no open swap contracts outstanding at year end.
| P. | Construction Loan Securities. GNMA Income may purchase construction loan securities, which are issued to finance building costs. The funds are disbursed as needed or in accordance with a prearranged plan. The securities provide for the timely payment to the registered holder of interest at the specified rate plus scheduled installments of principal. Upon completion of the construction phase, the construction loan securities are terminated and project loan securities are issued. It is GNMA Income’s policy to record these GNMA certificates on trade date, and to segregate assets to cover its commitments on trade date as well. |
| Q. | Indemnifications. In the normal course of business, the Trust may enter into contracts that provide certain indemnifications. The Trust’s maximum exposure under these arrangements is dependent on future claims that may be made against the Funds and, therefore, cannot be estimated; however, based on experience, management believes the risk of loss from such claims is considered remote. |
NOTE 3 — INVESTMENT TRANSACTIONS
For the year ended March 31, 2010, the cost of purchases and proceeds from the sales of securities excluding short-term and U.S. government securities, were as follows:
| | | | | | |
| | | Purchases | | Sales |
High Yield Bond | | $ | 99,535,584 | | $ | 98,144,299 |
Intermediate Bond | | | 732,464,043 | | | 801,140,733 |
U.S. government securities not included above were as follows:
| | | | | | |
| | | Purchases | | Sales |
GNMA Income | | $ | 945,188,619 | | $ | 908,235,366 |
Intermediate Bond | | | 4,499,006,027 | | | 4,924,465,182 |
36
NOTES TO FINANCIAL STATEMENTSASOF MARCH 31, 2010 (CONTINUED)
NOTE 4 — INVESTMENT MANAGEMENT AND ADMINISTRATIVE FEES
ING Investments, LLC (“ING Investments” or the ”Investment Adviser”), an Arizona limited liability company, serves as the investment adviser to the Funds. The Investment Adviser serves pursuant to an investment management agreement (“Management Agreement”) between the Investment Adviser and the Trust, on behalf of the Funds.
The Management Agreement compensates the Investment Adviser with a fee, computed daily and payable monthly, based on the average daily net assets of each Fund, at the following annual rates:
For GNMA Income — 0.47% on first $1 billion, 0.40% on next $4 billion and 0.35% on assets thereafter; for High Yield Bond — 0.51% on first $500 million, 0.45% on next $4.5 billion and 0.40% on assets thereafter; for Intermediate Bond — 0.17%; for Classic Money Market — 0.25%; and for Institutional Money Market — 0.08%.
Prior to January 1, 2010, for High Yield Bond, the Management Agreement compensated the Investment Adviser with a fee, computed daily and payable monthly, based on the average daily net assets of the Fund, at the following annual rates: 0.51% on first $1 billion, 0.45% on next $4 billion and 0.40% on assets thereafter.
ING Investment Management Co. (“ING IM”), a Connecticut corporation, serves as the sub-adviser to the Funds. The Investment Adviser has entered into a sub-advisory agreement with ING IM. Subject to such policies as the Board or the Investment Adviser may determine, ING IM manages the Funds’ assets in accordance with the Funds’ investment objectives, policies, and limitations.
ING Funds are permitted to invest end-of-day cash balances into Institutional Money Market. Investment management fees paid by the Funds will be reduced by an amount equal to the management fees paid indirectly to Institutional Money Market with respect to assets invested by the Funds. For the year ended March 31, 2010, High Yield Bond and Intermediate Bond waived $1,704 and $24,710, respectively. These fees are not subject to recoupment.
ING Funds Services, LLC (“IFS”), acts as administrator and provides certain administrative and shareholder services necessary for Fund operations and is responsible for the supervision of other service providers. For its services, IFS is entitled to receive from
each Fund, with the exception of Classic Money Market and Institutional Money Market, a fee at an annual rate of 0.10% of its average daily net assets.
ING Funds Distributor, LLC (the “Distributor” or “IFD”) is the principal underwriter of the Funds. The Distributor, IFS, ING Investments and ING IM are indirect, wholly-owned subsidiaries of ING Groep N.V. (“ING Groep”). ING Groep is a global financial institution of Dutch origin offering banking, investments, life insurance and retirement services.
On October 19, 2008, ING Groep announced that it reached an agreement with the Dutch government to strengthen its capital position. ING Groep issued non-voting core Tier-1 securities for a total consideration of EUR 10 billion to the Dutch State. The transaction boosted ING Bank’s core Tier-1 ratio, strengthened the insurance balance sheet and reduced ING Groep’s Debt/Equity ratio.
On October 26, 2009, ING Groep announced that it will move towards a complete separation of its banking and insurance operations. A formal restructuring plan (“Restructuring Plan”) was submitted to the European Commission (“EC”), which approved it on November 18, 2009. It is expected that the Restructuring Plan will be achieved over the next four years by a divestment of all insurance operations (including ING Investment Management) as well as a divestment of ING Direct US by the end of 2013. ING Groep will explore all options, including initial public offerings, sales or combinations thereof.
On December 21, 2009, ING Groep announced that it has completed its planned repurchase of EUR 5 billion of Core Tier 1 securities issued in November 2008 to the Dutch state and its EUR 7.5 billion rights issue.
NOTE 5 — DISTRIBUTION AND SERVICE FEES
Each share class of the Funds (except Class I and Class W and as otherwise noted below) has adopted a Distribution Plan pursuant to Rule 12b-1 under the 1940 Act and/or a Service Plan (the “Plans”), whereby the Distributor is reimbursed or compensated (depending on the class of shares) by certain of the Funds for expenses incurred in the distribution of each Fund’s shares (“Distribution Fees”). Pursuant to the Plans, the Distributor is entitled to payment each month for expenses incurred in the distribution and promotion of certain of each Fund’s shares, including expenses incurred in printing prospectuses and reports used for sales purposes, expenses incurred in preparing and printing sales literature and other such distribution
37
NOTES TO FINANCIAL STATEMENTSASOF MARCH 31, 2010 (CONTINUED)
NOTE 5 — DISTRIBUTION AND SERVICE FEES
(continued)
related expenses, including any distribution or shareholder servicing fees (“Service Fees”) paid to securities dealers who have executed a distribution agreement with the Distributor. Under the Plans, each class of shares of the Fund pays the Distributor a Distribution and/or Service Fee based on average daily net assets at the following annual rates:
| | | | | | | | | | | | | | | | | | |
| | | Class A | | | Class B | | | Class C | | | Class IS | | | Class O | | | Class R | |
GNMA Income | | 0.25 | % | | 1.00 | % | | 1.00 | % | | N/A | | | N/A | | | N/A | |
High Yield Bond | | 0.25 | % | | 1.00 | % | | 1.00 | % | | N/A | | | N/A | | | N/A | |
Intermediate Bond | | 0.25 | % | | 1.00 | % | | 1.00 | % | | N/A | | | 0.25 | % | | 0.50 | % |
Classic Money Market | | 0.75 | % | | 1.00 | % | | 1.00 | % | | N/A | | | N/A | | | N/A | |
Institutional Money Market | | N/A | | | N/A | | | N/A | | | 0.10 | % | | N/A | | | N/A | |
The Distributor has contractually agreed to waive a portion of the distribution fee for Class A of Classic Money Market to the extent necessary for expenses not to exceed 0.77%. The fee waiver will continue through at least August 1, 2010. There is no guarantee that this waiver will continue after that date. For the year ended March 31, 2010, The Distributor waived $3,558,160 of Class A distribution fees.
ING Investments and IFD have contractually agreed to waive a portion of their management fees, distribution and/or shareholder servicing fees, as applicable, and to reimburse certain expenses to the extent necessary to assist the Fund in maintaining a yield of not less than zero. This arrangement will continue through at least August 1, 2010. There is no guarantee that this waiver will continue after that date. Fees waived or expenses reimbursed are subject to possible recoupment by ING Investments or IFD, as applicable, within three years subject to certain restrictions. For the year ended March 31, 2010, ING Investments and IFD waived $3,402,481 of class specific management, distribution and shareholder servicing fees to maintain a yield of not less than zero. The class specific waivers were comprised of the following amounts per class:
| | | | | | | | | |
| | | Management Fee | | Distribution Fee | | Shareholder Servicing Fee |
Class A | | $ | 214,273 | | $ | 1,516,231 | | $ | 1,491,292 |
Class B | | | 2,177 | | | 87,612 | | | 16,318 |
Class C | | | 1,741 | | | 60,903 | | | 11,934 |
Please note that these waivers or reimbursements are in addition to existing contractual limitations, if any. As of March 31, 2010, amounts of waived management, distribution and shareholder servicing fees that are subject to possible recoupment by ING Investments and IFD, and the related expiration dates are as follows:
| | | | | | | | | | | | |
| | | March 31, | | |
| | | 2011 | | 2012 | | 2013 | | Total |
Class A | | $ | — | | $ | 68 | | $ | 523,437 | | $ | 523,505 |
Class B | | | — | | | 16,205 | | | 90,543 | | | 106,748 |
Class C | | | — | | | 11,366 | | | 63,110 | | | 74,476 |
The Distributor also receives the proceeds of the initial sales charge paid by shareholders upon the purchase of Class A shares of the Funds, and the contingent deferred sales charge paid by shareholders upon certain redemptions for Class A, Class B, and Class C shares. For the year ended March 31, 2010, the Distributor retained the following amounts in sales charges:
| | | | | | |
| | | Class A
Shares | | Class C
Shares |
Initial Sales Charges | | | | | | |
GNMA Income | | $ | 104,662 | | | N/A |
High Yield Bond | | | 11,972 | | | N/A |
Intermediate Bond | | | 9,293 | | | N/A |
Contingent Deferred Sales Charge | | | | | | |
GNMA Income | | $ | 9,986 | | $ | 24,152 |
High Yield Bond | | | — | | | 3,042 |
Intermediate Bond | | | 146,013 | | | 2,963 |
Classic Money Market | | | — | | | 1,463 |
NOTE 6 — OTHER TRANSACTIONS WITH AFFILIATES AND RELATED PARTIES
At March 31, 2010, the Funds had the following amounts recorded in payable to affiliates on the accompanying Statements of Assets and Liabilities (see Notes 4 and 5):
| | | | | | | | | | | | |
Fund | | Accrued Investment Management Fees | | Accrued Administrative Fees | | Accrued Shareholder Service and Distribution Fees | | Total |
GNMA Income | | $ | 315,065 | | $ | 67,035 | | $ | 237,832 | | $ | 619,932 |
High Yield Bond | | | 50,114 | | | 9,096 | | | 37,081 | | | 96,291 |
Intermediate Bond | | | 112,135 | | | 67,379 | | | 146,181 | | | 325,695 |
Classic Money Market | | | 96,365 | | | — | | | — | | | 96,365 |
Institutional Money Market | | | 87,767 | | | — | | | — | | | 87,767 |
At March 31, 2010, the following ING Portfolios or indirect, wholly-owned subsidiaries of ING Groep owned more than 5% of the following Funds:
ING Life Insurance & Annuity — GNMA Income (21.68%) and Intermediate Bond (23.07%).
ING National Trust — GNMA Income (9.41%) and Intermediate Bond (14.20%).
38
NOTES TO FINANCIAL STATEMENTSASOF MARCH 31, 2010 (CONTINUED)
NOTE 6 — OTHER TRANSACTIONS WITH AFFILIATES AND RELATED PARTIES (continued)
ING Stock Index Portfolio — Institutional Money Market (14.20%).
Control is defined by the 1940 Act as the beneficial ownership, either directly or through one or more controlled companies, of more than 25% of the voting securities of a company. The 1940 Act defines affiliates as companies that are under common control. Therefore, because the Funds have a common owner that owns over 25% of the outstanding securities of the Funds, they may be deemed to be affiliates of each other. Investment activities of these shareholders could have a material impact on the Funds.
The Funds have adopted a Retirement Policy (“Policy”) covering independent trustees of the Fund who were trustees on or before May 9, 2007, and who will have served as an independent trustee for at least five years as of the date of their retirement (as that term is defined in the Policy). Benefits under the Policy are based on an annual rate as defined in the Policy.
The Funds have adopted a Deferred Compensation Plan (the “Plan”), which allows eligible non-affiliated trustees as described in the Plan to defer the receipt of all or a portion of the trustees fees payable. Amounts deferred are treated as though invested in various “notional” funds advised by ING Investments until distribution in accordance with the Plan.
NOTE 7 — EXPENSE LIMITATIONS
Pursuant to a written expense limitation agreement (“Expense Limitation Agreement”) with the Funds, the Investment Adviser has agreed to limit expenses of each Fund, excluding interest, taxes, brokerage commissions and extraordinary expenses (and acquired fund fees and expenses) to the levels listed below:
| | | | | | | | | | | | | | | | | | | | | |
Maximum Operating Expense Limit
(as a percentage of average net assets) | | | | | | | | | | |
| | | Class A | | | Class B | | | Class C | | | Class I | | | Class O | | | Class R | | | Class W | |
GNMA Income | | 0.97 | % | | 1.72 | % | | 1.72 | % | | 0.67 | % | | N/A | | | N/A | | | 0.72 | % |
High Yield Bond | | 1.10 | % | | 1.85 | % | | 1.85 | % | | 0.85 | % | | N/A | | | N/A | | | N/A | |
Intermediate Bond(1) | | 0.75 | % | | 1.50 | % | | 1.50 | % | | 0.50 | % | | 0.75 | % | | 1.00 | % | | 0.50 | % |
Classic Money Market | | 0.77 | % | | 1.41 | % | | 1.41 | % | | N/A | | | N/A | | | N/A | | | N/A | |
| (1) | Prior to August 1, 2009, the expense limits were 0.69%, 1.44%, 1.44%, 0.38%, 0.69%, 0.94% and 0.44% for Classes A, B, C, I, O, R and W shares, respectively. |
The Investment Adviser has agreed to limit expenses, excluding interest, taxes, brokerage commissions, and extraordinary expenses to 0.17% and 0.20% of Institutional Money Market’s Class I and Class IS shares’ average daily net assets, respectively.
The Investment Adviser may at a later date recoup from a Fund for management fees waived and other expenses assumed by the Investment Adviser during the previous 36 months, but only if, after such recoupment, a Fund’s expense ratio does not exceed the percentage described above. Waived and reimbursed fees net of any recoupment by the Investment Adviser of such waived and reimbursed fees are reflected on the accompanying Statements of Operations for each Fund. Amounts payable by the Investment Adviser are reflected on the accompanying Statements of Assets and Liabilities for each Fund.
As of March 31, 2010, the amounts of waived and reimbursed fees that are subject to possible recoupment by the Investment Adviser, and the related expiration dates are as follows:
| | | | | | | | | | | | |
| | | March 31, | | |
| | | 2011 | | 2012 | | 2013 | | Total |
High Yield Bond | | $ | 76,385 | | $ | 144,667 | | $ | 136,047 | | $ | 357,099 |
Intermediate Bond | | | 449,032 | | | 151,192 | | | 128,272 | | | 728,496 |
The Expense Limitation Agreement is contractual and shall renew automatically for one-year terms unless ING Investments or the Registrant provides written notice of the termination of the Expense Limitation Agreement within 90 days of the end of the then current term or upon termination of the Management Agreement.
NOTE 8 — LINE OF CREDIT
Each of the Funds included in this report with the exception of GNMA Income, in addition to certain other funds managed by the Investment Adviser, have entered into an unsecured committed revolving line of credit agreement (the “Credit Agreement”) with The Bank of New York Mellon (“BNY”) for an aggregate amount of $125,000,000. The proceeds may be used only to: (1) temporarily finance the purchase and sale of securities; or (2) finance the redemption of shares of an investor in the Funds. The Funds to which the line of credit is available pay a commitment fee equal to 0.15% per annum on the daily unused portion of the committed line amount payable quarterly in arrears.
The following Funds utilized the line of credit during the year ended March 31, 2010:
| | | | | | | | |
Fund | | Days
Utilized | | Approximate Average Daily Balance | | Approximate Weighted Average Interest Rate | |
High Yield Bond | | 9 | | $ | 550,000 | | 1.44 | % |
Intermediate Bond | | 26 | | | 2,107,692 | | 1.26 | |
39
NOTES TO FINANCIAL STATEMENTSASOF MARCH 31, 2010 (CONTINUED)
NOTE 9 — PURCHASED AND WRITTEN SWAPTIONS
Transactions in purchased and written swaptions for Intermediate Bond for the year ended March 31, 2010 were as follows:
Transactions in Purchased Swaptions
| | | | | | | | |
| | | USD
Notional | | | Cost | |
Balance at 03/31/09 | | $ | — | | | $ | — | |
Options Purchased | | | 481,000,000 | | | | 2,314,500 | |
Options Terminated in Closing Sell Transactions | | | (224,000,000 | ) | | | (649,600 | ) |
Options Expired | | | (257,000,000 | ) | | | (1,664,900 | ) |
Options Exercised | | | — | | | | — | |
| | | | | | | | |
Balance at 03/31/10 | | $ | — | | | $ | — | |
| | | | | | | | |
Transactions in Written Swaptions
| | | | | | | | |
| | | USD
Notional | | | Premium | |
Balance at 03/31/09 | | $ | — | | | $ | — | |
Options Written | | | 586,000,000 | | | | 1,410,100 | |
Options Terminated in Closing Purchase Transactions | | | — | | | | — | |
Options Expired | | | (586,000,000 | ) | | | (1,410,100 | ) |
Options Exercised | | | — | | | | — | |
| | | | | | | | |
Balance at 03/31/10 | | $ | — | | | $ | — | |
| | | | | | | | |
NOTE 10 — CAPITAL SHARES
Transactions in capital shares and dollars were as follows:
| | | | | | | | | | | | | | | | | | | | | | | | | | | | | | | | |
| | | Shares
sold | | Proceeds
from
shares
converted | | Reinvestment
of
distributions | | Shares
redeemed | | | Shares
converted | | | Net increase
(decrease) in
shares
outstanding | | | | | Shares
sold | | Proceeds
from
shares
converted | | Reinvestment
of
distributions | | Shares
redeemed | | | Shares
converted | | | Net increase
(decrease) | |
Year or period ended | | # | | # | | # | | # | | | # | | | # | | | | | ($) | | ($) | | ($) | | ($) | | | ($) | | | ($) | |
GNMA Income | | | | | | | | | | | | | | | | | | | | | | | | | | | | | | | | |
Class A | | | | | | | | | | | | | | | | | | | | | | | | | | | | | | | | |
03-31-10 | | 19,576,866 | | — | | 2,478,996 | | (24,320,182 | ) | | — | | | (2,264,320 | ) | | | | 170,536,214 | | — | | 21,550,033 | | (211,744,101 | ) | | — | | | (19,657,854 | ) |
03-31-09 | | 24,540,147 | | — | | 2,318,672 | | (17,617,729 | ) | | — | | | 9,241,090 | | | | | 208,874,722 | | — | | 19,556,282 | | (149,072,103 | ) | | — | | | 79,358,901 | |
Class B | | | | | | | | | | | | | | | | | | | | | | | | | | | | | | | | |
03-31-10 | | 124,001 | | — | | 94,320 | | (1,734,225 | ) | | — | | | (1,515,904 | ) | | | | 1,074,963 | | — | | 815,731 | | (15,015,734 | ) | | — | | | (13,125,040 | ) |
03-31-09 | | 698,344 | | — | | 126,419 | | (1,767,305 | ) | | — | | | (942,542 | ) | | | | 5,875,386 | | — | | 1,060,402 | | (14,809,716 | ) | | — | | | (7,873,928 | ) |
Class C | | | | | | | | | | | | | | | | | | | | | | | | | | | | | | | | |
03-31-10 | | 6,917,222 | | — | | 219,900 | | (3,742,016 | ) | | — | | | 3,395,106 | | | | | 59,949,807 | | — | | 1,904,907 | | (32,451,078 | ) | | — | | | 29,403,636 | |
03-31-09 | | 5,923,049 | | — | | 113,194 | | (1,853,276 | ) | | — | | | 4,182,967 | | | | | 50,307,172 | | — | | 951,996 | | (15,713,864 | ) | | — | | | 35,545,304 | |
Class I | | | | | | | | | | | | | | | | | | | | | | | | | | | | | | | | |
03-31-10 | | 3,829,573 | | — | | 212,517 | | (2,468,028 | ) | | — | | | 1,574,062 | | | | | 33,449,988 | | — | | 1,849,714 | | (21,534,212 | ) | | — | | | 13,765,490 | |
03-31-09 | | 3,052,829 | | — | | 134,249 | | (1,182,703 | ) | | — | | | 2,004,375 | | | | | 26,002,333 | | — | | 1,135,414 | | (9,924,183 | ) | | — | | | 17,213,564 | |
Class Q(2) | | | | | | | | | | | | | | | | | | | | | | | | | | | | | | | | |
03-31-10 | | 3,612 | | — | | 155 | | (407 | ) | | (8,567 | ) | | (5,207 | ) | | | | 31,531 | | — | | 1,345 | | (3,537 | ) | | (75,518 | ) | | (46,179 | ) |
03-31-09 | | — | | — | | 228 | | — | | | — | | | 228 | | | | | — | | — | | 1,934 | | — | | | — | | | 1,934 | |
Class W | | | | | | | | | | | | | | | | | | | | | | | | | | | | | | | | |
03-31-10 | | 1,185,827 | | 8,574 | | 33,379 | | (771,203 | ) | | — | | | 456,577 | | | | | 10,366,023 | | 75,518 | | 290,807 | | (6,732,480 | ) | | — | | | 3,999,868 | |
03-31-09 | | 496,469 | | — | | 4,947 | | (22,532 | ) | | — | | | 478,884 | | | | | 4,251,564 | | — | | 41,961 | | (194,092 | ) | | — | | | 4,099,433 | |
High Yield Bond | | | | | | | | | | | | | | | | | | | | | | | | | | | | | | | | |
Class A | | | | | | | | | | | | | | | | | | | | | | | | | | | | | | | | |
03-31-10 | | 3,488,979 | | — | | 622,857 | | (3,597,992 | ) | | — | | | 513,844 | | | | | 23,171,133 | | — | | 4,283,036 | | (24,366,521 | ) | | — | | | 3,087,648 | |
03-31-09 | | 4,828,513 | | — | | 566,516 | | (5,220,798 | ) | | — | | | 174,231 | | | | | 28,824,466 | | — | | 3,638,861 | | (31,164,101 | ) | | — | | | 1,299,226 | |
Class B | | | | | | | | | | | | | | | | | | | | | | | | | | | | | | | | |
03-31-10 | | 133,732 | | — | | 104,520 | | (824,097 | ) | | — | | | (585,845 | ) | | | | 891,376 | | — | | 714,386 | | (5,528,456 | ) | | — | | | (3,922,694 | ) |
03-31-09 | | 149,683 | | — | | 137,581 | | (1,231,788 | ) | | — | | | (944,524 | ) | | | | 922,538 | | — | | 901,293 | | (8,416,365 | ) | | — | | | (6,592,534 | ) |
Class C | | | | | | | | | | | | | | | | | | | | | | | | | | | | | | | | |
03-31-10 | | 614,472 | | — | | 79,902 | | (483,977 | ) | | — | | | 210,397 | | | | | 4,069,056 | | — | | 550,305 | | (3,288,533 | ) | | — | | | 1,330,828 | |
03-31-09 | | 560,134 | | — | | 68,826 | | (609,149 | ) | | — | | | 19,811 | | | | | 3,598,162 | | — | | 440,112 | | (3,601,411 | ) | | — | | | 436,863 | |
Class I | | | | | | | | | | | | | | | | | | | | | | | | | | | | | | | | |
03-31-10 | | 214,679 | | — | | 2,830 | | (3,339 | ) | | — | | | 214,170 | | | | | 1,588,425 | | — | | 20,607 | | (24,500 | ) | | — | | | 1,584,532 | |
07-31-08(1)-03-31-09 | | 203,842 | | — | | 1,368 | | (204,817 | ) | | — | | | 393 | | | | | 1,183,352 | | — | | 7,858 | | (1,161,315 | ) | | — | | | 29,895 | |
40
NOTES TO FINANCIAL STATEMENTSASOF MARCH 31, 2010 (CONTINUED)
NOTE 10 — CAPITAL SHARES (continued)
| | | | | | | | | | | | | | | | | | | | | | | | | | | | | | |
| | | Shares
sold | | Proceeds
from
shares
converted | | Reinvestment
of
distributions | | Shares
redeemed | | | Shares
converted | | Net increase
(decrease) in
shares
outstanding | | | | | Shares
sold | | Proceeds
from
shares
converted | | Reinvestment
of
distributions | | Shares
redeemed | | | Shares
converted | | Net increase
(decrease) | |
Year or
period
ended | | # | | # | | # | | # | | | # | | # | | | | | ($) | | ($) | | ($) | | ($) | | | ($) | | ($) | |
Intermediate Bond | | | | | | | | | | | | | | | | | | | | | | | | | | | | |
Class A | | | | | | | | | | | | | | | | | | | | | | | | | | | | | | |
03-31-10 | | 6,958,052 | | — | | 2,568,754 | | (28,415,769 | ) | | — | | (18,888,963 | ) | | | | 62,494,813 | | — | | 23,169,031 | | (253,003,731 | ) | | — | | (167,339,887 | ) |
03-31-09 | | 15,146,115 | | — | | 3,961,253 | | (41,322,105 | ) | | — | | (22,214,737 | ) | | | | 141,875,251 | | — | | 35,618,498 | | (380,896,966 | ) | | — | | (203,403,217 | ) |
Class B | | | | | | | | | | | | | | | | | | | | | | | | | | | | | | |
03-31-10 | | 113,544 | | — | | 107,747 | | (1,060,985 | ) | | — | | (839,694 | ) | | | | 1,019,849 | | — | | 971,311 | | (9,503,906 | ) | | — | | (7,512,746 | ) |
03-31-09 | | 266,381 | | — | | 155,855 | | (1,625,408 | ) | | — | | (1,203,172 | ) | | | | 2,456,380 | | — | | 1,391,842 | | (15,080,030 | ) | | — | | (11,231,808 | ) |
Class C | | | | | | | | | | | | | | | | | | | | | | | | | | | | | | |
03-31-10 | | 669,093 | | — | | 213,733 | | (2,448,543 | ) | | — | | (1,565,717 | ) | | | | 6,018,663 | | — | | 1,928,786 | | (21,811,456 | ) | | — | | (13,864,007 | ) |
03-31-09 | | 1,601,530 | | — | | 286,562 | | (3,665,713 | ) | | — | | (1,777,621 | ) | | | | 14,931,464 | | — | | 2,557,931 | | (34,030,972 | ) | | — | | (16,541,577 | ) |
Class I | | | | | | | | | | | | | | | | | | | | | | | | | | | | | | |
03-31-10 | | 7,079,914 | | — | | 2,236,388 | | (18,631,494 | ) | | — | | (9,315,192 | ) | | | | 63,139,964 | | — | | 20,172,137 | | (166,536,338 | ) | | — | | (83,224,237 | ) |
03-31-09 | | 23,450,514 | | — | | 2,791,452 | | (17,367,453 | ) | | — | | 8,874,513 | | | | | 225,576,561 | | — | | 25,061,205 | | (160,967,306 | ) | | — | | 89,670,460 | |
Class O | | | | | | | | | | | | | | | | | | | | | | | | | | | | | | |
03-31-10 | | 561,868 | | — | | 34,185 | | (776,134 | ) | | — | | (180,081 | ) | | | | 5,032,515 | | — | | 308,868 | | (6,916,315 | ) | | — | | (1,574,932 | ) |
03-31-09 | | 944,652 | | — | | 172,137 | | (1,924,796 | ) | | — | | (808,007 | ) | | | | 8,762,295 | | — | | 1,621,392 | | (17,822,830 | ) | | — | | (7,439,143 | ) |
Class R | | | | | | | | | | | | | | | | | | | | | | | | | | | | | | |
03-31-10 | | 710,000 | | — | | 119,448 | | (1,028,381 | ) | | — | | (198,933 | ) | | | | 6,423,330 | | — | | 1,080,762 | | (9,032,616 | ) | | — | | (1,528,524 | ) |
03-31-09 | | 1,078,910 | | — | | 141,607 | | (682,391 | ) | | — | | 538,126 | | | | | 10,164,328 | | — | | 1,262,369 | | (6,297,544 | ) | | — | | 5,129,153 | |
Class W | | | | | | | | | | | | | | | | | | | | | | | | | | | | | | |
03-31-10 | | 101,459 | | — | | 12,622 | | (138,116 | ) | | — | | (24,035 | ) | | | | 904,671 | | — | | 113,993 | | (1,243,805 | ) | | — | | (225,141 | ) |
03-31-09 | | 1,415,327 | | — | | 41,872 | | (1,250,680 | ) | | — | | 206,519 | | | | | 13,427,395 | | — | | 372,532 | | (10,962,161 | ) | | — | | 2,837,766 | |
Classic Money Market | | | | | | | | | | | | | | | | | | | | | | | | | | | | |
Class A | | | | | | | | | | | | | | | | | | | | | | | | | | | | | | |
03-31-10 | | 210,222,530 | | — | | 1,986,848 | | (714,325,550 | ) | | — | | (502,116,172 | ) | | | | 210,222,530 | | — | | 1,986,848 | | (714,325,550 | ) | | — | | (502,116,172 | ) |
03-31-09 | | 623,180,311 | | — | | 19,717,074 | | (819,203,765 | ) | | — | | (176,306,380 | ) | | | | 623,180,311 | | — | | 19,717,074 | | (819,203,765 | ) | | — | | (176,306,380 | ) |
Class B | | | | | | | | | | | | | | | | | | | | | | | | | | | | | | |
03-31-10 | | 1,237,850 | | — | | 23,154 | | (9,385,464 | ) | | — | | (8,124,460 | ) | | | | 1,237,850 | | — | | 23,154 | | (9,385,464 | ) | | — | | (8,124,460 | ) |
03-31-09 | | 15,722,793 | | — | | 142,190 | | (19,520,708 | ) | | — | | (3,655,725 | ) | | | | 15,722,793 | | — | | 142,190 | | (19,520,708 | ) | | — | | (3,655,725 | ) |
Class C | | | | | | | | | | | | | | | | | | | | | | | | | | | | | | |
03-31-10 | | 5,539,907 | | — | | 15,527 | | (9,488,004 | ) | | — | | (3,932,570 | ) | | | | 5,539,907 | | — | | 15,527 | | (9,488,004 | ) | | — | | (3,932,570 | ) |
03-31-09 | | 13,080,847 | | — | | 103,904 | | (17,783,052 | ) | | — | | (4,598,301 | ) | | | | 13,080,847 | | — | | 103,904 | | (17,783,052 | ) | | — | | (4,598,301 | ) |
Institutional Money Market | | | | | | | | | | | | | | | | | | | | | | | | |
Class I | | | | | | | | | | | | | | | | | | | | | | | | | | | | | | |
03-31-10 | | 14,422,386,767 | | — | | 119,162 | | (14,164,212,756 | ) | | — | | 258,293,173 | | | | | 14,422,386,767 | | — | | 119,162 | | (14,164,212,756 | ) | | — | | 258,293,173 | |
03-31-09 | | 15,924,743,767 | | — | | 1,265,544 | | (15,522,218,060 | ) | | — | | 403,791,251 | | | | | 15,924,743,767 | | — | | 1,265,544 | | (15,522,218,060 | ) | | — | | 403,791,251 | |
Class IS | | | | | | | | | | | | | | | | | | | | | | | | | | | | | | |
03-31-10 | | — | | — | | — | | (1 | ) | | — | | (1 | ) | | | | — | | — | | — | | (1 | ) | | — | | (1 | ) |
03-31-09 | | — | | — | | — | | — | | | — | | — | | | | | — | | — | | — | | — | | | — | | — | |
| (1) | | Commencement of operations. |
| (2) | | Effective November 20, 2009, Class Q shareholders of GNMA Income converted into Class W shares of the Fund. |
41
NOTES TO FINANCIAL STATEMENTSASOF MARCH 31, 2010 (CONTINUED)
NOTE 11 — CREDIT RISK AND DEFAULTED SECURITIES
Although each Fund has a diversified portfolio, High Yield Bond and Intermediate Bond may invest in lower rated and comparable quality unrated high yield securities. Investments in high-yield debt securities generally provide greater income and increased opportunity for capital appreciation than investments in higher quality debt securities, but they also typically entail greater potential price volatility and principal and income risk. High-yield debt securities are not considered investment grade, and are regarded as predominantly speculative with respect to the issuing company’s continuing ability to meet principal and interest payments. The prices of high-yield debt securities have been found to be less sensitive to interest rate changes than higher-rated investments, but more sensitive to adverse economic downturns or individual corporate developments. The risk of loss due to default by the issuer may be significantly greater for the holders of high yielding securities, because such securities are generally unsecured and are often subordinated to other creditors of the issuer. Intermediate Bond held the following defaulted securities at March 31, 2010:
| | | | | |
Fund | | Security | | Market Value |
Intermediate Bond | | Greater Ohio Ethanol, LLC, 6.301%, due 12/31/13 | | $ | — |
| | Greater Ohio Ethanol, LLC, 12.630%, due 12/31/13 | | | — |
| | PEA Lima, LLC, 0.000%, due 03/20/14 | | | — |
| | Twin Reefs Pass-through Trust, 1.386%, due 12/10/49 | | | — |
During 2008, Lehman Brothers Holdings, Inc. (“LBHI”) and certain of its affiliates sought protection under the insolvency laws of their jurisdictions of organization, including the United States, the United Kingdom and Japan. For the year ended March 31, 2010, High Yield Bond and Intermediate Bond had outstanding securities trades with counterparties affiliated with LBHI. As a result of these events, LBHI’s affiliates were unable to fulfill their commitments and, in certain cases, High Yield Bond and Intermediate Bond may have terminated their trades and related agreements with the relevant entities and, where appropriate, is in the process of initiating claims for damages. Management has determined that the financial impact to the Funds relating to these events is immaterial.
NOTE 12 — CONCENTRATION OF INVESTMENT RISKS
All mutual funds involve risk — some more than others — and there is always the chance that you could lose money or not earn as much as you hope. Each Fund’s risk profile is largely a factor of the principal securities in which it invests and investment techniques that it uses. For more information regarding the types of securities and investment techniques that may be used by each Fund and its corresponding risks, see each Fund’s most recent Prospectus and/or the Statement of Additional Information.
Corporate Debt Securities (High Yield Bond, Intermediate Bond and Classic Money Market). Corporate debt securities are subject to the risk of the issuer’s inability to meet principal and interest payments on the obligation and may also be subject to price volatility due to such factors as interest rate sensitivity, market perception of the creditworthiness of the issuer and general market liquidity. When interest rates decline, the value of a Fund’s debt securities can be expected to rise, and when interest rates rise, the value of those securities can be expected to decline. Debt securities with longer maturities tend to be more sensitive to interest rate movements than those with shorter maturities.
Credit Risk (All Funds). A Fund could lose money if a bond issuer (debtor) fails to repay interest and principal in a timely manner or if it goes bankrupt. This is especially true during periods of economic uncertainty or economic downturns. High-yield/high-risk bonds are especially subject to credit risk and are considered to be mostly speculative in nature.
Foreign Securities (High Yield Bond, Intermediate Bond, Classic Money Market and Institutional Money Market). There are certain risks in owning foreign securities, including those resulting from: fluctuations in currency exchange rates; devaluation of currencies; political or economic developments and the possible imposition of currency exchange blockages or other foreign governmental laws or restrictions; reduced availability of public information concerning issuers; accounting, auditing and financial reporting standards or other regulatory practices and requirements that are not uniform when compared to those applicable to domestic companies; settlement and clearance procedures in some countries that may not be reliable
42
NOTES TO FINANCIAL STATEMENTSASOF MARCH 31, 2010 (CONTINUED)
NOTE 12 — CONCENTRATION OF INVESTMENT RISKS (continued)
and can result in delays in settlement; higher transaction and custody expenses than for domestic securities; and limitations on foreign ownership of equity securities. Also, securities of many foreign companies may be less liquid and the prices more volatile than those of domestic companies.
Emerging Markets Investments (High Yield Bond). Because of less developed markets and economies and, in some countries, less mature governments and governmental institutions, the risks of investing in foreign securities can be intensified in the case of investments in issuers domiciled or doing substantial business in emerging market countries. These risks include: high concentration of market capitalization and trading volume in a small number of issuers representing a limited number of industries, as well as a high concentration of investors and financial intermediaries; political and social uncertainties; overdependence on exports, especially with respect to primary commodities, making these economies vulnerable to changes in commodity prices; overburdened infrastructure and obsolete or unseasoned financial systems; environmental problems; less well-developed legal systems; and less reliable custodial services and settlement practices.
High-Yield, Lower-Grade Debt Securities Risk (High-Yield Bond and Intermediate Bond). High-yield debt securities (commonly referred to as “junk bonds”) generally present greater credit risk that an issuer cannot make timely payment of interest or principal
payments than an issuer of a higher quality debt security, and typically have greater potential price volatility and principal and income risk. Changes in interest rates, the market’s perception of the issuers and the credit worthiness of the issuers may significantly affect the value of these bonds. High-yield bonds are not considered investment grade, and are regarded as predominantly speculative with respect to the issuing company’s continuing ability to meet principal and interest payments. The secondary market in which high-yield securities are traded may be less liquid than the market for higher grade bonds. It may be more difficult to value less liquid high-yield securities, and determination of their value may involve elements of judgment.
NOTE 13 — FEDERAL INCOME TAXES
The amount of distributions from net investment income and net realized capital gains are determined in accordance with federal income tax regulations, which may differ from U.S. generally accepted accounting principles for investment companies. These book/tax differences may be either temporary or permanent. Permanent differences are reclassified within the capital accounts based on their federal tax-basis treatment; temporary differences are not reclassified. Key differences include the treatment of short-term capital gains, foreign currency transactions, wash sale deferrals and the expiration of capital loss carryforwards. Distributions in excess of net investment income and/or net realized capital gains for tax purposes are reported as return of capital.
The following permanent tax differences have been reclassified as of March 31, 2010:
| | | | | | | | | | | | |
| | | Paid-in Capital | | | Undistributed Net Investment Income | | | Accumulated Net Realized Gains/ (Losses) | |
GNMA Income | | $ | — | | | $ | 3,215,246 | | | $ | (3,215,246 | ) |
High Yield Bond | | | (79,792,137 | ) | | | (221,129 | ) | | | 80,013,266 | |
Intermediate Bond | | | — | | | | 1,678,624 | | | | (1,678,624 | ) |
Classic Money Market | | | — | | | | 3,134 | | | | (3,134 | ) |
Dividends paid by the Funds from net investment income and distributions of net realized short-term capital gains are, for federal income tax purposes, taxable as ordinary income to shareholders.
The tax composition of dividends and distributions to shareholders was as follows:
| | | | | | | | | | | | |
| | | Year Ended March 31, 2010 | | Year Ended March 31, 2009 |
| | | Ordinary Income | | Return of Capital | | Ordinary Income | | Return of Capital |
GNMA Income | | $ | 31,648,896 | | $ | — | | $ | 27,292,104 | | $ | — |
High Yield Bond | | | 8,935,053 | | | 298,959 | | | 7,603,995 | | | 1,886,801 |
Intermediate Bond | | | 59,427,689 | | | — | | | 86,837,693 | | | — |
Classic Money Market | | | 2,073,992 | | | — | | | 20,130,954 | | | — |
Institutional Money Market | | | 4,508,251 | | | — | | | 19,340,796 | | | — |
43
NOTES TO FINANCIAL STATEMENTSASOF MARCH 31, 2010 (CONTINUED)
NOTE 13 — FEDERAL INCOME TAXES (continued)
The tax-basis components of distributable earnings and the expiration dates of the capital loss carryforwards which may be used to offset future realized capital gains for federal income tax purposes as of March 31, 2010 were:
| | | | | | | | | | | | | | | | |
| | | Undistributed Ordinary Income | | Unrealized Appreciation/ (Depreciation) | | Post-October Capital Losses Deferred | | | Capital Loss Carryforwards | | | Expiration Dates |
GNMA Income | | $ | 3,564,888 | | $ | 25,691,061 | | $ | — | | | $ | (5,959,779 | ) | | 2013 |
| | | | | | | | | | | | | (3,281,376 | ) | | 2014 |
| | | | | | | | | | | | | (1,506,711 | ) | | 2016 |
| | | | | | | | | | | | | (1,393,630 | ) | | 2017 |
| | | | | | | | | | | | | | | | |
| | | | | | | | | | | | $ | (12,141,496 | ) | | |
| | | | | | | | | | | | | | | | |
High Yield Bond | | | — | | | 6,068,985 | | | (1,062,257 | ) | | | (69,190,309 | ) | | 2011 |
| | | | | | | | | | | | | (6,099,584 | ) | | 2012 |
| | | | | | | | | | | | | (126,079 | ) | | 2014 |
| | | | | | | | | | | | | (16,938,959 | ) | | 2015 |
| | | | | | | | | | | | | (9,006,267 | ) | | 2017 |
| | | | | | | | | | | | | (14,980,165 | ) | | 2018 |
| | | | | | | | | | | | | | | | |
| | | | | | | | | | | | $ | (116,341,363 | ) | | |
| | | | | | | | | | | | | | | | |
Intermediate Bond | | | 20,630,968 | | | 22,516,305 | | | (17,282 | ) | | | (17,571,919 | ) | | 2017 |
| | | | | | | | | | | | | (193,454,083 | ) | | 2018 |
| | | | | | | | | | | | | | | | |
| | | | | | | | | | | | $ | (211,026,002 | ) | | |
| | | | | | | | | | | | | | | | |
Classic Money Market | | | 123,437 | | | — | | | — | | | | — | | | — |
Institutional Money Market | | | 187,320 | | | — | | | — | | | | — | | | — |
The Funds’ major tax jurisdictions are federal and Arizona. The earliest tax year that remains subject to examination by these jurisdictions is 2005.
As of March 31, 2010, no provision for income tax is required in the Funds’ financial statements as a result of tax positions taken on federal and state income tax returns for open tax years. The Funds’ federal and state income and federal excise tax returns for tax years for which the applicable statutes of limitations have not expired are subject to examination by the Internal Revenue Service and state department of revenue.
NOTE 14 — ILLIQUID SECURITIES
Pursuant to guidelines adopted by the Funds’ Board, the following securities have been deemed to be illiquid. Except for GNMA Income, the Funds may invest up to 15% (10% for Classic Money Market and Institutional Money Market) of their net assets in illiquid securities. Fair value for certain securities was determined by ING Funds Valuation Committee appointed by the Funds’ Board and in accordance with the methods specifically authorized by the Board.
| | | | | | | | | | | | | | | |
Fund | | Security | | Principal Amount/ Shares | | Initial Acquisition Date | | Cost | | Value | | Percent of Net Assets | |
High Yield Bond | | American Media Stock Certificates | | 5,810 | | 02/03/2009 | | $ | 128,699 | | $ | 6 | | 0.0 | % |
| | GT Group Telecom, Inc. | | 500 | | 03/19/2003 | | | — | | | — | | 0.0 | % |
| | | | | | | | | | | | | | | |
| | | | | | | | $ | 128,699 | | $ | 6 | | 0.0 | % |
| | | | | | | | | | | | | | | |
Intermediate Bond | | Bank of New York Mellon Corp. Institutional Cash Reserves, Series B | | 3,329,856 | | 09/12/08 | | | 3,329,856 | | | 2,663,885 | | 0.3 | % |
| | Greater Ohio Ethanol, LLC,
6.301%, due 12/31/13 | | 1,800,000 | | 11/21/06 | | | 1,791,000 | | | — | | 0.0 | % |
| | Greater Ohio Ethanol, LLC,
12.630%, due 12/31/13 | | 2,200,000 | | 11/21/06 | | | 2,172,500 | | | — | | 0.0 | % |
| | Hudson Mezzanine Funding,
1.004%, due 06/12/42 | | 2,720,000 | | 12/21/06 | | | 2,717,824 | | | — | | 0.0 | % |
| | PEA Lima, LLC, due 03/20/14 | | 277,964 | | 03/20/09 | | | 35,012 | | | — | | 0.0 | % |
| | Twin Reefs Pass-through Trust,
1.386%, due 12/10/49 | | 1,583,000 | | 12/07/04 | | | 1,244,595 | | | — | | 0.0 | % |
| | | | | | | | | | | | | | | |
| | | | | | | | $ | 11,290,787 | | $ | 2,663,885 | | 0.3 | % |
| | | | | | | | | | | | | | | |
44
NOTES TO FINANCIAL STATEMENTSASOF MARCH 31, 2010 (CONTINUED)
NOTE 15 — SECURITIES LENDING
Under an agreement with The Bank of New York Mellon (“BNY”), the Funds may lend their securities to approved brokers, dealers and other financial institutions. Loans are collateralized by cash and U.S. government securities. The collateral is equal to at least 105% of the market value of non-U.S. securities loaned and 102% of the market value of U.S. securities loaned. The market value of the loaned securities is determined at the close of business of the Funds at their last sale price or official closing price on the principal exchange or system on which they are traded and any additional collateral is delivered to the Funds on the next business day. The cash collateral received is invested in approved investments as defined in the Securities Lending Agreement with BNY (the “Agreement”). The Funds bear the risk of loss with respect to the investment of collateral. Currently, the cash collateral is invested in the Bank of New York Mellon Corp. Institutional Cash Reserves Fund (“BICR Fund”). BNY serves as investment manager, custodian and operational trustee of the BICR Fund. As of March 31, 2010, the BICR Fund held certain defaulted securities issued by Lehman Brothers Holdings, Inc. (the “Lehman Securities”) in a separate sleeve designated as Series B. The Lehman Securities have market values significantly below amortized cost. On May 22, 2009, the Funds agreed to the terms of a capital support agreement (the “Capital Support Agreement”) extended by The Bank of New York Mellon Corporation (“BNYC”), an affiliated company of BNY, for the Lehman Securities held by the BICR Fund, Series B. Under the terms of the Capital Support Agreement, BNYC will support the value of the Lehman Securities up to 80% of the par value (the remaining 20% of the par value represents an unrealized loss to the Funds) and subject, in part, to the Funds’ continued participation in the BNY securities lending program through September 15, 2011. At September 15, 2011, if the Funds have complied with the requirements under the Capital Support Agreement to continue to participate in the BNY securities lending program and if such securities have not otherwise been sold, the Funds will have the right to sell the defaulted securities to BNYC at a price equal to 80% of par value. The recorded value of each Fund’s investment in the BICR Fund includes the value of the underlying securities held by the BICR Fund and the estimated value of the support to be provided by BNYC. The investment in the BICR Fund is included in the Portfolio of Investments under Securities Lending Collateral and the unrealized
loss on such investment is included in Net Unrealized Depreciation on the Statements of Assets and Liabilities.
Generally, in the event of counterparty default, the Funds have the right to use the collateral to offset losses incurred. The Agreement contains certain guarantees by BNY in the event of counterparty default and/or a borrower’s failure to return a loaned security; however, there would be a potential loss to the Funds in the event the Funds are delayed or prevented from exercising their right to dispose of the collateral. Engaging in securities lending could have a leveraging effect, which may intensify the credit, market and other risks associated with investing in a Fund. At March 31, 2010, the following Fund had securities on loan with the following market values:
| | | | | | |
| | | Value of Securities Loaned | | Cash Collateral Received* |
Intermediate Bond | | $ | 68,560,552 | | $ | 70,017,100 |
| * | Cash collateral received was invested in the BICR Fund, the fair value of which is presented in the respective Fund’s Portfolio of Investments. |
NOTE 16 — U.S. TREASURY TEMPORARY GUARANTEE PROGRAM
Until September 18, 2009, Classic Money Market and Institutional Money Market participated in the U.S. Treasury Temporary Guarantee Program for Money Market Funds (the “Program”). The Program guaranteed shareholders of Classic Money Market and Institutional Money Market as of September 19, 2008 that, in the event of a liquidation of Classic Money Market or Institutional Money Market, the respective shareholders would receive the lesser of: (1) the number of shares owned on September 19, 2008 multiplied by $1.00; or (2) the number of shares owned as of the time the U.S. Treasury Department’s obligation under the Program was triggered multiplied by $1.00. The U.S. Treasury Department’s obligation under the Program would have been triggered if Classic Money Market’s or Institutional Money Market’s net asset value per share fell below $0.995 and certain conditions were met including the liquidation of Classic Money Market or Institutional Money Market.
Coverage under the Program was limited to persons who were shareholders of Classic Money Market or Institutional Money Market as of the close of business on September 19, 2008. Any increase in the number of shares held in an account after the close of business on
45
NOTES TO FINANCIAL STATEMENTSASOF MARCH 31, 2010 (CONTINUED)
NOTE 16 — U.S. TREASURY TEMPORARY GUARANTEE PROGRAM (continued)
September 19, 2008 would not have been guaranteed. If the number of shares held in an account fluctuates (even if the number of shares held in an account was reduced to zero), shareholders would have been covered for the lesser of the number of shares held as of the close of business on September 19, 2008 or the number of shares held at the time the U.S. Treasury Department’s obligation under the Program was triggered. If a shareholder closed his/her account with Classic Money Market and Institutional Money Market or broker-dealer, any future investment in Classic Money Market and Institutional Money Market was not guaranteed.
Classic Money Market and Institutional Money Market each paid to participate in the Program for the initial three-month period, which expired on December 18, 2008. The fee of $139,473 and $198,272 for Classic Money Market and Institutional Money Market, respectively, was 0.01% of each fund’s NAV on September 19, 2008 depending on the market based net asset value per share of each fund as of September 19, 2008 (the “Program Participation Payment”). On November 24, 2008, the U.S. Treasury Department announced that it would extend the Program from December 19, 2008 through April 30, 2009. The Board approved the continued participation of Classic Money Market and Institutional Money Market in the Program, and Classic Money Market and Institutional Money Market paid fees of $209,068 and $297,408, respectively, to extend their participation until April 30, 2009 based on 0.015% of each fund’s net asset value on September 19, 2008. On March 31, 2009, the U.S. Treasury Department announced that it would extend the Program through September 18, 2009, and the Board approved Classic Money Market’s and Institutional Money Market’s continued participation in the Program for the fees of $209,068 and $297,408, respectively, based on 0.015% of each fund’s net asset value on September 19, 2008. The Program was not extended beyond September 18, 2009. The Board determined that the Program Participation Payment, and the payments for participating in the extensions of the Program, are extraordinary expenses that will not be subject to any expense limitation agreement currently in effect for Classic Money Market and Institutional Money Market.
NOTE 17 — SUBSEQUENT EVENTS
Subsequent to March 31, 2010, the following Funds declared dividends and distributions of:
| | | | | | | | | |
| | | Type | | Per Share Amount | | Payable Date | | Record Date |
GNMA Income | | | | | | | | | |
Class A | | NII | | $ | 0.0291 | | April 5, 2010 | | March 31, 2010 |
Class B | | NII | | $ | 0.0235 | | April 5, 2010 | | March 31, 2010 |
Class C | | NII | | $ | 0.0236 | | April 5, 2010 | | March 31, 2010 |
Class I | | NII | | $ | 0.0314 | | April 5, 2010 | | March 31, 2010 |
Class W | | NII | | $ | 0.0310 | | April 5, 2010 | | March 31, 2010 |
Class A | | NII | | $ | 0.0291 | | May 4, 2010 | | April 30, 2010 |
Class B | | NII | | $ | 0.0236 | | May 4, 2010 | | April 30, 2010 |
Class C | | NII | | $ | 0.0237 | | May 4, 2010 | | April 30, 2010 |
Class I | | NII | | $ | 0.0313 | | May 4, 2010 | | April 30, 2010 |
Class W | | NII | | $ | 0.0309 | | May 4, 2010 | | April 30, 2010 |
| | | | |
High Yield Bond | | | | | | | | | |
Class A | | NII | | $ | 0.0487 | | May 3, 2010 | | Daily |
Class B | | NII | | $ | 0.0440 | | May 3, 2010 | | Daily |
Class C | | NII | | $ | 0.0440 | | May 3, 2010 | | Daily |
Class I | | NII | | $ | 0.0511 | | May 3, 2010 | | Daily |
| | | | |
Intermediate Bond | | | | | | | | | |
Class A | | NII | | $ | 0.0340 | | May 3, 2010 | | Daily |
Class B | | NII | | $ | 0.0282 | | May 3, 2010 | | Daily |
Class C | | NII | | $ | 0.0282 | | May 3, 2010 | | Daily |
Class I | | NII | | $ | 0.0365 | | May 3, 2010 | | Daily |
Class O | | NII | | $ | 0.0341 | | May 3, 2010 | | Daily |
Class R | | NII | | $ | 0.0322 | | May 3, 2010 | | Daily |
Class W | | NII | | $ | 0.0360 | | May 3, 2010 | | Daily |
Classic Money Market | | | | | | | | | |
All Classes | | STCG | | $ | 0.0002 | | April 22, 2010 | | April 20, 2010 |
| | | | |
Institutional Money Market | | | | | | | | | |
Class I | | NII | | $ | 0.0001 | | May 3, 2010 | | Daily |
Class IS | | NII | | $ | 0.0003 | | May 3, 2010 | | Daily |
NII - Net investment income
STCG - Short-term capital gain
On April 26, 2010, Classic Money Market had a redemption of approximately $503 million, which was 60% of the total net assets of the Fund as of March 31, 2010.
46
NOTES TO FINANCIAL STATEMENTSASOF MARCH 31, 2010 (CONTINUED)
NOTE 17 — SUBSEQUENT EVENTS (continued)
On January 27, 2010, the SEC approved amendments to Rule 2A-7 designed to strengthen the regulatory requirements governing money market funds and better protect investors. They are intended to increase the resilience of money market funds to economic stresses and reduce the risks of runs on the funds by tightening maturity and credit-quality standards and imposing new liquidity requirements. Classic Money Market and Institutional Money Market have adopted
the new amendments effective May 5, 2010; however, required compliance dates for certain amendments are staggered throughout 2010-2011.
The Funds have evaluated events occurring after the Statements of Assets and Liabilities date (subsequent events) to determine whether any subsequent events necessitated adjustment to or disclosure in the financial statements. Other than the above, no such subsequent events were identified.
47
| | |
| ING GNMA INCOME FUND | | PORTFOLIO OF INVESTMENTS ASOF MARCH 31, 2010 |
| | | | | | | | |
Principal
Amount | | | | | | Value |
| | | | | | | | |
| U.S. GOVERNMENT AGENCY OBLIGATIONS: 104.0% |
| Federal Home Loan Mortgage Corporation##: 1.9% |
| $ | 29,035,946 | | S, ^ | | 0.500%, due 07/15/36 | | $ | 316,370 |
| | 4,054,780 | | S, ^ | | 5.500%, due 09/15/35 | | | 595,200 |
| | 7,382,184 | | | | 5.500%, due 02/01/40 | | | 7,804,463 |
| | 5,031,516 | | | | 6.000%, due 05/15/36 | | | 5,457,152 |
| | 61,917 | | | | 7.000%, due 11/01/14 | | | 67,095 |
| | 211,565 | | | | 7.500%, due 12/01/14-01/01/30 | | | 232,288 |
| | 1,565,607 | | S, ^ | | 7.750%, due 10/25/23 | | | 205,564 |
| | 12,422 | | | | 8.000%, due 01/01/30 | | | 14,337 |
| | 32,764 | | | | 9.500%, due 07/01/20 | | | 38,258 |
| | | | | | | | |
| | | | | | | | 14,730,727 |
| | | | | | | | |
| Federal National Mortgage Association##: 2.5% |
| | 5,774,939 | | | | 5.500%, due 02/01/40 | | | 6,093,548 |
| | 7,987,552 | | | | 6.000%, due 02/25/36 | | | 8,582,266 |
| | 377,765 | | | | 6.500%, due 06/01/14-02/01/29 | | | 415,847 |
| | 761,535 | | | | 6.600%, due 07/01/27-06/01/28 | | | 850,177 |
| | 33,801 | | | | 7.000%, due 03/01/15 | | | 36,231 |
| | 68,087 | | | | 7.500%, due 05/01/28 | | | 77,061 |
| | 2,940,147 | | | | 8.000%, due 12/25/45 | | | 3,312,856 |
| | 69,067 | | | | 8.500%, due 08/01/11-09/01/15 | | | 77,809 |
| | | | | | | | |
| | | | | | | | 19,445,795 |
| | | | | | | | |
| Government National Mortgage Association: 99.6% |
| | 90,800,217 | | S, ^ | | 0.890%, due 01/16/50 | | | 4,911,366 |
| | 99,259,127 | | S, ^ | | 0.988%, due 11/16/46 | | | 4,459,067 |
| | 6,075,606 | | S | | 4.000%, due 07/20/39 | | | 5,916,255 |
| | 3,841,118 | | | | 4.000%, due 05/20/33-08/20/35 | | | 3,774,411 |
| | 21,114,664 | | | | 4.500%, due 01/20/34-02/20/40 | | | 21,309,280 |
| | 72,760,001 | | S, ^ | | 5.000%, due 05/20/35-04/20/37 | | | 11,393,260 |
| | 21,324,123 | | S | | 5.000%, due 01/15/40-03/15/40 | | | 22,217,393 |
| | 188,990,618 | | | | 5.000%, due 05/15/18-03/15/40 | | | 196,450,572 |
| | 554,535 | | | | 5.100%, due 04/20/32 | | | 585,111 |
| | 2,090,209 | | | | 5.250%, due 11/20/36-03/20/38 | | | 2,202,324 |
| | 188,637 | | | | 5.450%, due 02/15/29-10/15/29 | | | 201,164 |
| | 1,600,000 | | W | | 5.500%, due 05/15/33 | | | 1,687,000 |
| | 5,973,138 | | S, ^ | | 5.500%, due 11/20/33 | | | 509,110 |
| | 216,286,762 | | | | 5.500%, due 08/20/24-02/15/40 | | | 229,659,836 |
| | 310,488 | | | | 5.550%, due 06/15/27 | | | 326,477 |
| | 2,748,511 | | | | 5.600%, due 12/20/36-02/20/38 | | | 2,926,331 |
| | 556,339 | | | | 5.625%, due 04/15/39 | | | 590,962 |
| | 9,707,481 | | | | 5.630%, due 07/15/45 | | | 10,092,122 |
| | 486,327 | | | | 5.680%, due 05/15/47 | | | 510,879 |
| | 489,641 | | | | 5.690%, due 11/15/42 | | | 514,054 |
| | 8,523,043 | | | | 5.750%, due 11/20/27-07/20/38 | | | 9,211,368 |
| | 5,584,851 | | | | 5.950%, due 02/15/44 | | | 5,903,543 |
| | 1,905,356 | | | | 5.970%, due 11/15/31 | | | 2,040,003 |
| | 17,047,341 | | | | 5.980%, due 01/20/30-07/20/34 | | | 18,505,883 |
| | 3,003,574 | | S, ^ | | 6.000%, due 01/20/34 | | | 479,874 |
| | 1,906,468 | | S | | 6.000%, due 07/15/38 | | | 2,039,756 |
| | 123,490,298 | | | | 6.000%, due 01/20/24-08/15/39 | | | 132,860,368 |
| | 412,278 | | | | 6.125%, due 02/15/39-04/15/39 | | | 441,943 |
| | 3,775,886 | | | | 6.200%, due 08/20/28-02/20/30 | | | 4,146,649 |
| | 746,942 | | | | 6.250%, due 09/15/27-09/15/29 | | | 815,155 |
| | 19,879,304 | | S, ^ | | 6.260%, due 09/20/38 | | | 2,666,576 |
| | 643,320 | | | | 6.280%, due 01/20/26-05/20/26 | | | 700,767 |
| | 464,966 | | | | 6.490%, due 01/15/28 | | | 511,760 |
| | 19,347,189 | | | | 6.500%, due 03/15/28-07/20/38 | | | 21,011,519 |
| | 2,900,783 | | | | 6.600%, due 10/20/26-07/20/28 | | | 3,230,016 |
| | 4,311 | | S | | 6.750%, due 08/15/28 | | | 4,817 |
| | 1,133,216 | | | | 6.750%, due 10/15/28-04/20/37 | | | 1,243,426 |
| | 31,146,094 | | | | 7.000%, due 09/15/23-12/15/38 | | | 34,476,425 |
| | | | | | | | |
Principal
Amount | | | | | | Value |
| | | | | | | | |
| Government National Mortgage Association: (continued) |
| $ | 6,352,996 | | | | 7.200%, due 03/15/39 | | $ | 6,864,329 |
| | 23,813 | | | | 7.250%, due 01/15/29 | | | 26,748 |
| | 5,937,977 | | S, ^ | | 7.270%, due 05/16/31 | | | 914,143 |
| | 4,046,962 | | | | 7.350%, due 03/15/43 | | | 4,373,022 |
| | 2,337,026 | | | | 7.500%, due 08/20/27-10/15/38 | | | 2,584,924 |
| | 20,705 | | | | 7.800%, due 05/15/19 | | | 23,391 |
| | 4,826 | | S | | 8.000%, due 03/20/24 | | | 5,541 |
| | 431,269 | | | | 8.000%, due 11/15/25-03/15/28 | | | 495,973 |
| | 29,950 | | | | 8.050%, due 07/15/19 | | | 33,693 |
| | 1,093,529 | | | | 9.000%, due 05/15/16-01/15/31 | | | 1,208,573 |
| | 7,145 | | | | 9.500%, due 11/15/21 | | | 8,212 |
| | | | | | | | |
| | | | | | | | 777,065,371 |
| | | | | | | | |
| | | | | | | | | | |
| Other U.S. Agency Obligations: 0.0% | | | | | |
| $ | 7,410 | | Small Business Administration, 8.250%, due 11/01/11 | | | | | | 7,591 | |
| | | | | | | | | | |
| | | | | | | | | 7,591 | |
| | | | | | | | | | |
| | | Total Investments in
Securities
(Cost $785,549,607)* | | 104.0 | % | | $ | 811,249,484 | |
| | | Other Assets and
Liabilities - Net | | (4.0 | ) | | | (31,545,921 | ) |
| | | | | | | | | | |
| | | Net Assets | | 100.0 | % | | $ | 779,703,563 | |
| | | | | | | | | | |
| ## | On September 7, 2008, the Federal Housing Finance Agency placed the Federal National Mortgage Association and the Federal Home Loan Mortgage Corporation into conservatorship and the U.S. Treasury guaranteed the debt issued by those organizations. |
| W | Settlement is on a when-issued or delayed-delivery basis. |
| S | All or a portion of this security has been identified by the Fund to cover future collateral requirements for applicable futures, options, swaps, foreign currency contracts and/or when-issued or delayed-delivery securities. |
| ^ | Interest only securities represent the right to receive the monthly interest payments on an underlying pool of mortgage loans. Principal amount shown represents the notional amount on which current interest is calculated. Payments of principal on the pool reduce the value of the interest only security. |
| * | Cost for federal income tax purposes is $785,558,423. |
| | | | |
Net unrealized appreciation consists of: | | | | |
Gross Unrealized Appreciation | | $ | 26,654,030 | |
Gross Unrealized Depreciation | | | (962,969 | ) |
| | | | |
Net Unrealized Appreciation | | $ | 25,691,061 | |
| | | | |
See Accompanying Notes to Financial Statements
48
| | |
| ING GNMA INCOME FUND | | PORTFOLIO OF INVESTMENTS ASOF MARCH 31, 2010 (CONTINUED) |
Fair Value Measurements^
The following is a summary of the fair valuations according to the inputs used as of March 31, 2010 in valuing the Fund’s assets and liabilities:
| | | | | | | | | | | | |
| | | Quoted Prices in Active Markets for Identical Investments (Level 1) | | Significant Other Observable Inputs (Level 2) | | Significant Unobservable Inputs (Level 3) | | Fair Value at 3/31/2010 |
Asset Table | | | | | | | | | | | | |
Investments, at value | | | | | | | | | | | | |
U.S. Government Agency Obligations | | $ | — | | $ | 811,249,484 | | $ | — | | $ | 811,249,484 |
| | | | | | | | | | | | |
Total Investments, at value | | $ | — | | $ | 811,249,484 | | $ | — | | $ | 811,249,484 |
| | | | | | | | | | | | |
The following is a reconciliation of the fair valuations using significant unobservable inputs (Level 3) for the Fund’s assets and liabilities during the period ended February 28, 2010:
| | | | | | | | | | | | | | | | | | | | | | | | | | | | | | |
| | | Beginning Balance 3/31/2009 | | Purchases | | Sales | | | Accrued Discounts/ (Premiums) | | Total Realized Gain/ (Loss) | | Total Unrealized Appreciation/ (Depreciation) | | | Transfers Into Level 3 | | Transfers Out of Level 3 | | | Ending Balance 3/31/2010 |
Asset Table | | | | | | | | | | | | | | | | | | | | | | | | | | | | | | |
Investments, at value | | | | | | | | | | | | | | | | | | | | | | | | | | | | | | |
U.S. Government Agency Obligations | | $ | 17,922,530 | | $ | — | | $ | (5,306,591 | ) | | $ | 185 | | $ | 145,011 | | $ | (185 | ) | | $ | — | | $ | (12,760,950 | ) | | $ | — |
| | | | | | | | | | | | | | | | | | | | | | | | | | | | | | |
Total Investments, at value | | $ | 17,922,530 | | $ | — | | $ | (5,306,591 | ) | | $ | 185 | | $ | 145,011 | | $ | (185 | ) | | $ | — | | $ | (12,760,950 | ) | | $ | — |
| | | | | | | | | | | | | | | | | | | | | | | | | | | | | | |
| ^ | See Note 2, “Significant Accounting Policies” in the Notes to Financial Statements for additional information. |
Transfers in or out of Level 3 represents either the beginning value (for transfers in), or the ending value (for transfers out) of any security or derivative instrument where a change in the pricing level occurred from the beginning to the end of the period.
See Accompanying Notes to Financial Statements
49
| | |
| ING HIGH YIELD BOND FUND | | PORTFOLIO OF INVESTMENTS ASOF MARCH 31, 2010 |
| | | | | | | | |
Principal
Amount | | | | | | Value |
| | | | | | | | |
| CORPORATE BONDS/NOTES: 96.7% | | | |
| Advertising: 1.5% | | | |
| $ | 405,000 | | | | Interpublic Group of Cos., Inc., 10.000%, due 07/15/17 | | $ | 460,181 |
| | 200,000 | | # | | Sitel, LLC/Sitel Finance Corp., 11.500%, due 04/01/18 | | | 202,500 |
| | 905,000 | | | | Visant Holding Corp.,
10.250%, due 12/01/13 | | | 936,675 |
| | | | | | | | |
| | | | | | | | 1,599,356 |
| | | | | | | | |
| Aerospace/Defense: 0.1% | | | |
| | 100,000 | | | | Triumph Group, Inc.,
8.000%, due 11/15/17 | | | 100,500 |
| | | | | | | | |
| | | | | | | | 100,500 |
| | | | | | | | |
| Apparel: 0.3% | | | |
| | 270,000 | | | | Hanesbrands, Inc.,
8.000%, due 12/15/16 | | | 280,800 |
| | | | | | | | |
| | | | | | | | 280,800 |
| | | | | | | | |
| Auto Manufacturers: 0.2% | | | |
| | 100,000 | | # | | Oshkosh Corp.,
8.250%, due 03/01/17 | | | 103,750 |
| | 140,000 | | # | | Oshkosh Corp.,
8.500%, due 03/01/20 | | | 145,600 |
| | | | | | | | |
| | | | | | | | 249,350 |
| | | | | | | | |
| Auto Parts & Equipment: 2.4% | | | |
| | 265,000 | | | | Affinia Group, Inc.,
9.000%, due 11/30/14 | | | 265,000 |
| | 255,000 | | # | | Affinia Group, Inc.,
10.750%, due 08/15/16 | | | 279,225 |
| | 475,000 | | | | American Axle & Manufacturing Holdings, Inc.,
7.875%, due 03/01/17 | | | 445,313 |
| | 225,000 | | # | | American Axle & Manufacturing Holdings, Inc.,
9.250%, due 01/15/17 | | | 241,313 |
| | 260,000 | | | | ArvinMeritor, Inc.,
8.125%, due 09/15/15 | | | 252,200 |
| | 305,000 | | | | ArvinMeritor, Inc.,
10.625%, due 03/15/18 | | | 317,200 |
| | 410,000 | | | | Goodyear Tire & Rubber Co., 10.500%, due 05/15/16 | | | 444,850 |
| | 355,000 | | | | United Components, Inc.,
9.375%, due 06/15/13 | | | 358,550 |
| | | | | | | | |
| | | | | | | | 2,603,651 |
| | | | | | | | |
| Banks: 4.5% | | | | | |
| | 595,000 | | | | CIT Group, Inc.,
7.000%, due 05/01/14 | | | 563,763 |
| | 1,280,000 | | | | CIT Group, Inc.,
7.000%, due 05/01/15 | | | 1,196,781 |
| | 210,000 | | | | CIT Group, Inc.,
7.000%, due 05/01/16 | | | 194,250 |
| | 1,015,000 | | | | CIT Group, Inc.,
7.000%, due 05/01/17 | | | 938,875 |
| | 224,000 | | | | General Motors Acceptance Corp., 6.750%, due 12/01/14 | | | 225,120 |
| | 734,000 | | | | General Motors Acceptance Corp., 6.875%, due 09/15/11 | | | 745,922 |
| | 1,005,000 | | # | | General Motors Acceptance Corp., 8.000%, due 03/15/20 | | | 1,032,638 |
| | | | | | | | |
| | | | | | | | 4,897,349 |
| | | | | | | | |
| | | | | | | | |
Principal
Amount | | | | | | Value |
| | | | | | | | |
| Beverages: 0.8% | | | |
| $ | 360,000 | | | | Constellation Brands, Inc.,
7.250%, due 05/15/17 | | $ | 370,800 |
| | 435,000 | | # | | Cott Beverages, Inc.,
8.375%, due 11/15/17 | | | 450,225 |
| | | | | | | | |
| | | | | | | | 821,025 |
| | | | | | | | |
| Building Materials: 1.8% | | | |
| | 75,000 | | # | | Building Materials Corp. of America,
7.500%, due 03/15/20 | | | 75,188 |
| | 1,290,000 | | #, Z | | Goodman Global Group, Inc.,
11.860%, due 12/15/14 | | | 761,100 |
| | 610,377 | | | | Nortek, Inc.,
11.000%, due 12/01/13 | | | 657,681 |
| | 400,000 | | | | Ply Gem Industries, Inc.,
11.750%, due 06/15/13 | | | 424,000 |
| | | | | | | | |
| | | | | | | | 1,917,969 |
| | | | | | | | |
| Chemicals: 3.3% | | | |
| | 280,000 | | # | | Hexion Finance Escrow, LLC/Hexion Escrow Corp.,
8.875%, due 02/01/18 | | | 277,200 |
| | 750,000 | | | | Hexion US Finance Corp./Hexion Nova Scotia Finance ULC,
9.750%, due 11/15/14 | | | 768,750 |
| | 48,723 | | & | | Momentive Performance Materials, Inc.,
10.125%, due 12/01/14 | | | 47,261 |
| | 551,000 | | # | | Momentive Performance Materials, Inc.,
12.500%, due 06/15/14 | | | 625,385 |
| | 490,000 | | # | | Nova Chemicals Corp.,
8.375%, due 11/01/16 | | | 505,925 |
| | 310,000 | | # | | Nova Chemicals Corp.,
8.625%, due 11/01/19 | | | 320,850 |
| | 450,000 | | | | PolyOne Corp.,
8.875%, due 05/01/12 | | | 478,125 |
| | 350,000 | | | | Solutia, Inc.,
8.750%, due 11/01/17 | | | 371,000 |
| | 95,000 | | | | Terra Capital, Inc.,
7.750%, due 11/01/19 | | | 115,188 |
| | | | | | | | |
| | | | | | | | 3,509,684 |
| | | | | | | | |
| Coal: 0.7% | | | | | |
| | 200,000 | | # | | Consol Energy, Inc.,
8.000%, due 04/01/17 | | | 206,500 |
| | 200,000 | | # | | Consol Energy, Inc.,
8.250%, due 04/01/20 | | | 206,500 |
| | 140,000 | | | | International Coal Group, Inc.,
9.125%, due 04/01/18 | | | 142,800 |
| | 215,000 | | # | | Murray Energy Corp.,
10.250%, due 10/15/15 | | | 221,450 |
| | | | | | | | |
| | | | | | | | 777,250 |
| | | | | | | | |
| Commercial Services: 6.3% | | | |
| | 230,000 | | | | Avis Budget Car Rental LLC/Avis Budget Finance, Inc.,
7.750%, due 05/15/16 | | | 226,550 |
| | 195,000 | | # | | Avis Budget Car Rental LLC/Avis Budget Finance, Inc.,
9.625%, due 03/15/18 | | | 204,750 |
| | 440,000 | | # | | Cenveo Corp.,
8.875%, due 02/01/18 | | | 447,150 |
See Accompanying Notes to Financial Statements
50
| | |
| ING HIGH YIELD BOND FUND | | PORTFOLIO OF INVESTMENTS ASOF MARCH 31, 2010 (CONTINUED) |
| | | | | | | | |
Principal
Amount | | | | | | Value |
| | | | | | | | |
| Commercial Services: (continued) | | | |
| $ | 560,000 | | # | | Cenveo Corp.,
10.500%, due 08/15/16 | | $ | 573,300 |
| | 425,000 | | | | Ceridian Corp.,
11.250%, due 11/15/15 | | | 409,063 |
| | 308,850 | | &, S | | Ceridian Corp.,
12.250%, due 11/15/15 | | | 298,040 |
| | 824,000 | | | | Hertz Corp.,
8.875%, due 01/01/14 | | | 850,780 |
| | 320,000 | | | | Iron Mountain, Inc.,
8.000%, due 06/15/20 | | | 329,600 |
| | 535,000 | | | | KAR Holdings, Inc.,
8.750%, due 05/01/14 | | | 548,375 |
| | 470,000 | | # | | RSC Equipment Rental, Inc., 10.000%, due 07/15/17 | | | 500,550 |
| | 220,000 | | | | Service Corp. International,
6.750%, due 04/01/15 | | | 220,000 |
| | 330,000 | | | | ServiceMaster Co,
7.450%, due 08/15/27 | | | 253,275 |
| | 795,000 | | &, # | | ServiceMaster Co,
10.750%, due 07/15/15 | | | 838,725 |
| | 335,000 | | # | | Trico Shipping AS,
11.875%, due 11/01/14 | | | 321,600 |
| | 260,000 | | | | United Rentals North America, Inc.,
7.750%, due 11/15/13 | | | 249,600 |
| | 515,000 | | | | United Rentals North America, Inc.,
9.250%, due 12/15/19 | | | 527,875 |
| | | | | | | | |
| | | | | | | | 6,799,233 |
| | | | | | | | |
| Computers: 1.4% | | | |
| | 75,000 | | # | | Brocade Communications Systems, Inc.,
6.875%, due 01/15/20 | | | 76,875 |
| | 390,000 | | | | Seagate Technology, Inc.,
6.800%, due 10/01/16 | | | 392,925 |
| | 649,000 | | | | SunGard Data Systems, Inc.,
9.125%, due 08/15/13 | | | 668,470 |
| | 396,000 | | | | SunGard Data Systems, Inc.,
10.250%, due 08/15/15 | | | 418,275 |
| | | | | | | | |
| | | | | | | | 1,556,545 |
| | | | | | | | |
| Distribution/Wholesale: 0.7% | | | |
| | 750,000 | | # | | McJunkin Red Man Corp.,
9.500%, due 12/15/16 | | | 769,688 |
| | | | | | | | |
| | | | | | | | 769,688 |
| | | | | | | | |
| Diversified Financial Services: 5.9% | | | |
| | 360,000 | | | | American General Finance Corp.,
5.400%, due 12/01/15 | | | 310,727 |
| | 450,000 | | | | American General Finance Corp.,
5.850%, due 06/01/13 | | | 421,638 |
| | 345,000 | | | | American General Finance Corp.,
6.900%, due 12/15/17 | | | 302,620 |
| | 625,000 | | | | Ford Motor Credit Co., LLC,
7.800%, due 06/01/12 | | | 648,548 |
| | 240,000 | | | | Ford Motor Credit Co., LLC,
8.125%, due 01/15/20 | | | 252,179 |
| | 1,140,000 | | | | Ford Motor Credit Co., LLC,
8.700%, due 10/01/14 | | | 1,237,264 |
| | | | | | | | |
Principal
Amount | | | | | | Value |
| | | | | | | | |
| Diversified Financial Services: (continued) | | | |
| $ | 320,000 | | | | International Lease Finance Corp.,
5.400%, due 02/15/12 | | $ | 315,012 |
| | 325,000 | | | | International Lease Finance Corp.,
5.625%, due 09/20/13 | | | 306,799 |
| | 325,000 | | | | International Lease Finance Corp.,
5.650%, due 06/01/14 | | | 301,484 |
| | 325,000 | | | | International Lease Finance Corp.,
6.375%, due 03/25/13 | | | 317,819 |
| | 263,000 | | # | | International Lease Finance Corp.,
8.625%, due 09/15/15 | | | 269,511 |
| | 235,000 | | # | | LBI Escrow Corp.,
8.000%, due 11/01/17 | | | 244,106 |
| | 200,000 | | # | | New Communications Holdings, Inc.,
8.250%, due 04/15/17 | | | 204,500 |
| | 200,000 | | # | | New Communications Holdings, Inc.,
8.500%, due 04/15/20 | | | 202,500 |
| | 745,000 | | # | | Universal City Development Partners Ltd.,
8.875%, due 11/15/15 | | | 754,313 |
| | 305,000 | | # | | Universal City Development Partners Ltd.,
10.875%, due 11/15/16 | | | 320,250 |
| | | | | | | | |
| | | | | | | | 6,409,270 |
| | | | | | | | |
| Electric: 3.6% | | | |
| | 360,000 | | | | AES Corp.,
8.000%, due 10/15/17 | | | 367,200 |
| | 182,000 | | # | | AES Corp.,
8.750%, due 05/15/13 | | | 185,640 |
| | 530,000 | | | | Energy Future Holdings,
5.550%, due 11/15/14 | | | 389,550 |
| | 685,000 | | # | | Energy Future Holdings,
10.000%, due 01/15/20 | | | 717,538 |
| | 645,000 | | | | Energy Future Holdings,
10.875%, due 11/01/17 | | | 482,138 |
| | 696,566 | | | | Homer City Funding, LLC,
8.734%, due 10/01/26 | | | 672,186 |
| | 338,911 | | | | Midwest Generation, LLC,
8.560%, due 01/02/16 | | | 346,977 |
| | 760,000 | | | | NRG Energy, Inc.,
7.375%, due 02/01/16 | | | 756,200 |
| | | | | | | | |
| | | | | | | | 3,917,429 |
| | | | | | | | |
| Electrical Components & Equipment: 0.3% | | | |
| | 280,000 | | # | | Coleman Cable, Inc.,
9.000%, due 02/15/18 | | | 284,200 |
| | | | | | | | |
| | | | | | | | 284,200 |
| | | | | | | | |
| Electronics: 0.4% | | | |
| | 405,000 | | | | Jabil Circuit, Inc.,
7.750%, due 07/15/16 | | | 428,288 |
| | | | | | | | |
| | | | | | | | 428,288 |
| | | | | | | | |
| Entertainment: 1.6% | | | |
| | 935,000 | | | | AMC Entertainment, Inc.,
11.000%, due 02/01/16 | | | 1,008,630 |
| | 315,000 | | | | Marquee Holdings, Inc.,
12.000%, due 08/15/14 | | | 265,388 |
| | 313,000 | | | | Pinnacle Entertainment, Inc.,
8.250%, due 03/15/12 | | | 312,218 |
See Accompanying Notes to Financial Statements
51
| | |
| ING HIGH YIELD BOND FUND | | PORTFOLIO OF INVESTMENTS ASOF MARCH 31, 2010 (CONTINUED) |
| | | | | | | | |
Principal
Amount | | | | | | Value |
| | | | | | | | |
| Entertainment: (continued) | | | |
| $ | 190,000 | | | | WMG Holdings Corp.,
9.500%, due 12/15/14 | | $ | 192,375 |
| | | | | | | | |
| | | | | | | | 1,778,611 |
| | | | | | | | |
| Environmental Control: 1.6% | | | |
| | 780,000 | | | | Waste Services, Inc.,
9.500%, due 04/15/14 | | | 807,300 |
| | 865,000 | | | | WCA Waste Corp.,
9.250%, due 06/15/14 | | | 875,813 |
| | | | | | | | |
| | | | | | | | 1,683,113 |
| | | | | | | | |
| Food: 1.9% | | | |
| | 650,000 | | # | | JBS USA LLC,
11.625%, due 05/01/14 | | | 744,250 |
| | 485,000 | | | | Stater Brothers Holdings,
8.125%, due 06/15/12 | | | 489,850 |
| | 675,000 | | # | | Tops Markets, LLC,
10.125%, due 10/15/15 | | | 705,375 |
| | 140,000 | | | | TreeHouse Foods, Inc.,
7.750%, due 03/01/18 | | | 145,600 |
| | | | | | | | |
| | | | | | | | 2,085,075 |
| | | | | | | | |
| Forest Products & Paper: 2.1% | | | |
| | 115,000 | | # | | Boise Paper Holdings LLC / Boise Co-Issuer Co.,
8.000%, due 04/01/20 | | | 115,575 |
| | 480,000 | | # | | Boise Paper Holdings, LLC / Boise Finance Co.,
9.000%, due 11/01/17 | | | 506,400 |
| | 41,000 | | | | Domtar Corp.,
7.875%, due 10/15/11 | | | 43,973 |
| | 790,000 | | | | NewPage Corp.,
11.375%, due 12/31/14 | | | 790,000 |
| | 260,000 | | | | Verso Paper Holdings, LLC and Verson Paper, Inc.,
9.125%, due 08/01/14 | | | 253,500 |
| | 475,000 | | # | | Verso Paper Holdings, LLC and Verson Paper, Inc.,
11.500%, due 07/01/14 | | | 515,375 |
| | | | | | | | |
| | | | | | | | 2,224,823 |
| | | | | | | | |
| Healthcare - Products: 1.5% | | | |
| | 525,000 | | & | | Biomet, Inc.,
10.375%, due 10/15/17 | | | 580,125 |
| | 673,000 | | | | Biomet, Inc.,
11.625%, due 10/15/17 | | | 757,125 |
| | 80,000 | | # | | DJO Finance, LLC/DJO Finance Corp.,
10.875%, due 11/15/14 | | | 87,300 |
| | 200,000 | | | | Reable Therapeutics Finance,
10.875%, due 11/15/14 | | | 217,750 |
| | | | | | | | |
| | | | | | | | 1,642,300 |
| | | | | | | | |
| Healthcare - Services: 7.3% | | | |
| | 295,000 | | # | | Apria Healthcare Group, Inc.,
12.375%, due 11/01/14 | | | 324,500 |
| | 480,000 | | | | Centene Corp.,
7.250%, due 04/01/14 | | | 478,200 |
| | 275,000 | | # | | HCA, Inc.,
7.250%, due 09/15/20 | | | 279,469 |
| | 920,000 | | | | HCA, Inc.,
9.250%, due 11/15/16 | | | 980,375 |
| | | | | | | | |
Principal
Amount | | | | | | Value |
| | | | | | | | |
| Healthcare - Services: (continued) | | | |
| $ | 978,000 | | & | | HCA, Inc.,
9.625%, due 11/15/16 | | $ | 1,050,128 |
| | 440,000 | | | | Healthsouth Corp.,
8.125%, due 02/15/20 | | | 440,000 |
| | 1,065,000 | | # | | Psychiatric Solutions, Inc.,
7.750%, due 07/15/15 | | | 1,090,294 |
| | 200,000 | | | | Radnet, Inc.,
10.375%, due 04/01/18 | | | 197,360 |
| | 325,000 | | | | Select Medical Corp.,
6.143%, due 09/15/15 | | | 292,500 |
| | 540,000 | | | | Select Medical Corp.,
7.625%, due 02/01/15 | | | 517,050 |
| | 220,000 | | | | United Surgical Partners International, Inc.,
8.875%, due 05/01/17 | | | 229,350 |
| | 300,000 | | & | | United Surgical Partners International, Inc.,
9.250%, due 05/01/17 | | | 312,000 |
| | 225,000 | | | | US Oncology, Inc.,
9.125%, due 08/15/17 | | | 236,250 |
| | 775,000 | | | | US Oncology, Inc.,
10.750%, due 08/15/14 | | | 809,875 |
| | 620,000 | | # | | Vanguard Health Holding Co. II, LLC/Vanguard Holding Co. II, Inc.,
8.000%, due 02/01/18 | | | 606,050 |
| | | | | | | | |
| | | | | | | | 7,843,401 |
| | | | | | | | |
| Holding Companies - Diversified: 0.7% |
| | 750,000 | | | | Atlantic Broadband Finance, LLC,
9.375%, due 01/15/14 | | | 753,750 |
| | | | | | | | |
| | | | | | | | 753,750 |
| | | | | | | | |
| Home Builders: 1.1% |
| | 995,000 | | | | K Hovnanian Enterprises, Inc.,
10.625%, due 10/15/16 | | | 1,064,650 |
| | 123,000 | | | | KB Home,
6.375%, due 08/15/11 | | | 126,383 |
| | | | | | | | |
| | | | | | | | 1,191,033 |
| | | | | | | | |
| Household Products/Wares: 0.8% |
| | 400,000 | | | | Central Garden & Pet Co.,
8.250%, due 03/01/18 | | | 407,500 |
| | 160,000 | | | | Jarden Corp.,
7.500%, due 01/15/20 | | | 162,400 |
| | 295,000 | | # | | Prestige Brands, Inc.,
8.250%, due 04/01/18 | | | 303,850 |
| | | | | | | | |
| | | | | | | | 873,750 |
| | | | | | | | |
| Iron/Steel: 0.3% |
| | 8,745 | | &, S | | Metals USA Holdings Corp.,
6.751%, due 07/01/12 | | | 7,696 |
| | 295,000 | | # | | Steel Dynamics, Inc.,
7.625%, due 03/15/20 | | | 303,850 |
| | | | | | | | |
| | | | | | | | 311,546 |
| | | | | | | | |
| Leisure Time: 0.8% |
| | 740,000 | | | | Travelport, LLC,
11.875%, due 09/01/16 | | | 814,925 |
| | | | | | | | |
| | | | | | | | 814,925 |
| | | | | | | | |
See Accompanying Notes to Financial Statements
52
| | |
| ING HIGH YIELD BOND FUND | | PORTFOLIO OF INVESTMENTS ASOF MARCH 31, 2010 (CONTINUED) |
| | | | | | | | |
Principal
Amount | | | | | | Value |
| | | | | | | | |
| Lodging: 3.0% |
| $ | 625,000 | | | | Ameristar Casinos, Inc.,
9.250%, due 06/01/14 | | $ | 657,813 |
| | 645,000 | | | | Harrah’s Operating Co., Inc.,
10.000%, due 12/15/18 | | | 536,963 |
| | 980,000 | | | | Harrah’s Operating Co., Inc.,
11.250%, due 06/01/17 | | | 1,060,850 |
| | 525,000 | | | | MGM Mirage, Inc.,
7.625%, due 01/15/17 | | | 439,688 |
| | 75,000 | | # | | MGM Mirage, Inc.,
9.000%, due 03/15/20 | | | 77,625 |
| | 380,000 | | # | | MGM Mirage, Inc.,
10.375%, due 05/15/14 | | | 420,850 |
| | | | | | | | |
| | | | | | | | 3,193,789 |
| | | | | | | | |
| Machinery - Diversified: 0.2% |
| | 185,000 | | # | | Case New Holland, Inc.,
7.750%, due 09/01/13 | | | 192,863 |
| | | | | | | | |
| | | | | | | | 192,863 |
| | | | | | | | |
| Media: 7.8% |
| | 31,724 | | &, # | | American Media Operations, Inc.,
9.000%, due 05/01/13 | | | 20,779 |
| | 7,427 | | &, # | | American Media Operations, Inc.,
14.000%, due 11/01/13 | | | 4,865 |
| | 845,000 | | # | | Charter Communications Operating, LLC,
8.375%, due 04/30/14 | | | 872,463 |
| | 485,000 | | | | Clear Channel Communications, Inc.,
10.750%, due 08/01/16 | | | 381,938 |
| | 525,000 | | # | | Clear Channel Worldwide Holdings, Inc.,
9.250%, due 12/15/17 | | | 550,625 |
| | 500,000 | | # | | CSC Holdings, Inc.,
8.500%, due 04/15/14 | | | 535,000 |
| | 490,000 | | | | DISH DBS Corp.,
7.875%, due 09/01/19 | | | 512,050 |
| | 400,000 | | # | | McClatchy Co.,
11.500%, due 02/15/17 | | | 410,500 |
| | 795,000 | | # | | Media General, Inc.,
11.750%, due 02/15/17 | | | 790,031 |
| | 510,000 | | | | Mediacom Broadband, LLC,
8.500%, due 10/15/15 | | | 524,025 |
| | 801,983 | | &, # | | Nexstar Broadcasting, Inc.,
7.000%, due 01/15/14 | | | 653,616 |
| | 264,000 | | | | Nexstar Finance, Inc.,
7.000%, due 01/15/14 | | | 215,160 |
| | 935,000 | | + | | Nielsen Finance LLC/Nielsen Finance Co.,
0.000% (step rate 12.500%), due 08/01/16 | | | 892,925 |
| | 235,000 | | | | Nielsen Finance LLC/Nielsen Finance Co.,
10.000%, due 08/01/14 | | | 247,338 |
| | 300,000 | | | | Salem Communications Corp.,
9.625%, due 12/15/16 | | | 315,000 |
| | 220,000 | | | | Sinclair Broadcast Group, Inc.,
8.000%, due 03/15/12 | | | 218,900 |
| | 765,000 | | # | | Sinclair Television Group, Inc.,
9.250%, due 11/01/17 | | | 808,988 |
| | | | | | | | |
Principal
Amount | | | | | | Value |
| | | | | | | | |
| Media: (continued) |
| $ | 400,000 | | # | | Sirius XM Radio, Inc.,
8.750%, due 04/01/15 | | $ | 400,500 |
| | | | | | | | |
| | | | | | | | 8,354,703 |
| | | | | | | | |
| Metal Fabricate/Hardware: 0.7% |
| | 645,000 | | | | Mueller Water Products,
7.375%, due 06/01/17 | | | 585,338 |
| | 195,000 | | # | | Severstal Columbus, LLC,
10.250%, due 02/15/18 | | | 202,800 |
| | | | | | | | |
| | | | | | | | 788,138 |
| | | | | | | | |
| Miscellaneous Manufacturing: 1.6% |
| | 400,000 | | # | | Amsted Industries, Inc.,
8.125%, due 03/15/18 | | | 402,000 |
| | 310,000 | | # | | Bombardier, Inc.,
7.500%, due 03/15/18 | | | 324,725 |
| | 310,000 | | # | | Bombardier, Inc.,
7.750%, due 03/15/20 | | | 325,500 |
| | 540,000 | | | | Harland Clarke Holdings Corp.,
9.500%, due 05/15/15 | | | 508,950 |
| | 130,000 | | # | | Koppers, Inc.,
7.875%, due 12/01/19 | | | 134,550 |
| | | | | | | | |
| | | | | | | | 1,695,725 |
| | | | | | | | |
| Oil & Gas: 7.7% |
| | 475,000 | | | | Berry Petroleum Co.,
10.250%, due 06/01/14 | | | 526,063 |
| | 735,000 | | | | Chaparral Energy, Inc.,
8.875%, due 02/01/17 | | | 676,200 |
| | 950,000 | | | | Chesapeake Energy Corp.,
6.625%, due 01/15/16 | | | 935,750 |
| | 155,000 | | | | Chesapeake Energy Corp.,
6.875%, due 01/15/16 | | | 153,838 |
| | 75,000 | | # | | Continental Resources, Inc.,
7.375%, due 10/01/20 | | | 75,563 |
| | 380,000 | | # | | Gibson Energy ULC / GEP Midstream Finance Corp., 11.750%, due 05/27/14 | | | 418,950 |
| | 775,000 | | # | | Hilcorp Energy I LP,
8.000%, due 02/15/20 | | | 755,625 |
| | 160,000 | | # | | Linn Energy, LLC/Linn Energy Finance Corp.,
8.625%, due 04/15/20 | | | 160,600 |
| | 640,000 | | | | McMoRan Exploration Co.,
11.875%, due 11/15/14 | | | 691,200 |
| | 325,000 | | # | | NFR Energy, LLC/NFR Energy Finance Corp.,
9.750%, due 02/15/17 | | | 325,813 |
| | 575,000 | | | | OPTI Canada, Inc.,
8.250%, due 12/15/14 | | | 543,375 |
| | 210,000 | | # | | OPTI Canada, Inc.,
9.000%, due 12/15/12 | | | 217,350 |
| | 195,000 | | # | | Parker Drilling Co.,
9.125%, due 04/01/18 | | | 200,606 |
| | 535,000 | | | | Pioneer Natural Resources Co.,
7.500%, due 01/15/20 | | | 553,135 |
| | 730,000 | | | | Plains Exploration & Production Co.,
7.625%, due 06/01/18 | | | 740,950 |
| | 200,000 | | # | | SandRidge Energy, Inc.,
8.000%, due 06/01/18 | | | 191,000 |
| | 285,000 | | | | Stone Energy Corp.,
8.625%, due 02/01/17 | | | 282,150 |
See Accompanying Notes to Financial Statements
53
| | |
| ING HIGH YIELD BOND FUND | | PORTFOLIO OF INVESTMENTS ASOF MARCH 31, 2010 (CONTINUED) |
| | | | | | | | |
Principal
Amount | | | | | | Value |
| | | | | | | | |
| Oil & Gas: (continued) |
| $ | 245,000 | | | | Swift Energy Co.,
7.125%, due 06/01/17 | | $ | 233,975 |
| | 600,000 | | | | Swift Energy Co.,
8.875%, due 01/15/20 | | | 627,000 |
| | | | | | | | |
| | | | | | | | 8,309,143 |
| | | | | | | | |
| Oil & Gas Services: 0.2% |
| | 230,000 | | # | | Expro Finance Luxembourg SCA,
8.500%, due 12/15/16 | | | 233,450 |
| | | | | | | | |
| | | | | | | | 233,450 |
| | | | | | | | |
| Packaging & Containers: 1.9% |
| | 325,000 | | | | Berry Plastics Corp.,
8.250%, due 11/15/15 | | | 328,656 |
| | 670,000 | | | | Berry Plastics Corp.,
8.875%, due 09/15/14 | | | 657,438 |
| | 360,000 | | | | Graphic Packaging International Corp.,
9.500%, due 06/15/17 | | | 386,100 |
| | 290,000 | | # | | Plastipak Holdings, Inc.,
10.625%, due 08/15/19 | | | 324,075 |
| | 300,000 | | | | Solo Cup Co. / Solo Cup Operating Corp.,
10.500%, due 11/01/13 | | | 318,000 |
| | | | | | | | |
| | | | | | | | 2,014,269 |
| | | | | | | | |
| Pipelines: 0.6% | | | |
| | 625,000 | | | | El Paso Corp.,
7.250%, due 06/01/18 | | | 648,067 |
| | | | | | | | |
| | | | | | | | 648,067 |
| | | | | | | | |
| Real Estate: 0.7% | | | |
| | 760,000 | | | | Felcor Lodging L.P.,
10.000%, due 10/01/14 | | | 786,600 |
| | | | | | | | |
| | | | | | | | 786,600 |
| | | | | | | | |
| Retail: 6.6% | | | |
| | 520,000 | | | | Albertson’s, Inc.,
7.450%, due 08/01/29 | | | 442,000 |
| | 681,000 | | # | | Blockbuster, Inc.,
11.750%, due 10/01/14 | | | 505,643 |
| | 535,000 | | | | Bon-Ton Stores, Inc.,
10.250%, due 03/15/14 | | | 524,300 |
| | 210,000 | | | | JC Penney Corp., Inc.,
5.750%, due 02/15/18 | | | 211,313 |
| | 505,000 | | | | JC Penney Corp., Inc.,
6.375%, due 10/15/36 | | | 472,806 |
| | 590,000 | | | | Limited Brands, Inc.,
8.500%, due 06/15/19 | | | 660,800 |
| | 560,000 | | | | Macys Retail Holdings, Inc.,
5.900%, due 12/01/16 | | | 561,400 |
| | 430,000 | | | | Macys Retail Holdings, Inc.,
6.375%, due 03/15/37 | | | 397,750 |
| | 105,000 | | | | Macys Retail Holdings, Inc.,
6.650%, due 07/15/24 | | | 99,750 |
| | 530,000 | | | | Michaels Stores, Inc.,
11.375%, due 11/01/16 | | | 575,050 |
| | 426,087 | | & | | Neiman-Marcus Group, Inc.,
9.000%, due 10/15/15 | | | 436,739 |
| | 130,000 | | | | Rite Aid Corp.,
6.875%, due 08/15/13 | | | 113,588 |
| | 540,000 | | # | | Rite Aid Corp.,
6.875%, due 12/15/28 | | | 310,500 |
| | | | | | | | |
Principal
Amount | | | | | | Value |
| | | | | | | | |
| Retail: (continued) | | | |
| $ | 345,000 | | | | Rite Aid Corp.,
9.750%, due 06/12/16 | | $ | 372,600 |
| | 300,000 | | # | | Sonic Automotive, Inc.,
9.000%, due 03/15/18 | | | 309,000 |
| | 630,000 | | # | | Toys R Us Property Co. I LLC,
10.750%, due 07/15/17 | | | 705,600 |
| | 430,000 | | # | | Toys R Us Property Co., LLC,
8.500%, due 12/01/17 | | | 448,275 |
| | | | | | | | |
| | | | | | | | 7,147,114 |
| | | | | | | | |
| Semiconductors: 0.2% | | | |
| | 225,000 | | | | Sensata Technologies BV,
8.000%, due 05/01/14 | | | 233,438 |
| | | | | | | | |
| | | | | | | | 233,438 |
| | | | | | | | |
| Software: 1.2% | | | |
| | 560,000 | | | | First Data Corp.,
9.875%, due 09/24/15 | | | 485,800 |
| | 285,000 | | & | | First Data Corp.,
10.550%, due 09/24/15 | | | 242,250 |
| | 570,000 | | | | First Data Corp.,
11.250%, due 03/31/16 | | | 458,850 |
| | 95,000 | | # | | JDA Software Group, Inc.,
8.000%, due 12/15/14 | | | 99,275 |
| | | | | | | | |
| | | | | | | | 1,286,175 |
| | | | | | | | |
| Telecommunications: 10.3% | | | |
| | 390,000 | | | | Cincinnati Bell, Inc.,
7.000%, due 02/15/15 | | | 381,225 |
| | 440,000 | | | | Cincinnati Bell, Inc.,
8.375%, due 01/15/14 | | | 454,850 |
| | 590,000 | | | | Cincinnati Bell, Inc.,
8.750%, due 03/15/18 | | | 598,113 |
| | 270,000 | | # | | Clearwire Communications, LLC/Clearwire Finance, Inc.,
12.000%, due 12/01/15 | | | 276,750 |
| | 410,000 | | | | Cricket Communications, Inc.,
7.750%, due 05/15/16 | | | 427,425 |
| | 435,000 | | | | Cricket Communications, Inc.,
9.375%, due 11/01/14 | | | 444,788 |
| | 380,000 | | | | Frontier Communications Co.,
9.000%, due 08/15/31 | | | 372,400 |
| | 385,000 | | | | Hughes Network Systems LLC/HNS Finance Corp.,
9.500%, due 04/15/14 | | | 393,663 |
| | 210,000 | | + | | Intelsat Intermediate Holding Co. Ltd.,
9.500%, due 02/01/15 | | | 218,400 |
| | 45,000 | | # | | Intelsat Jackson Holdings Ltd.,
8.500%, due 11/01/19 | | | 47,475 |
| | 800,000 | | | | Intelsat Jackson Holdings Ltd.,
11.250%, due 06/15/16 | | | 870,000 |
| | 105,000 | | | | Intelsat Ltd.,
7.625%, due 04/15/12 | | | 107,625 |
| | 345,000 | | + | | Intelsat Luxembourg SA,
11.250%, due 02/04/17 | | | 366,563 |
| | 584,375 | | & | | Intelsat Luxembourg SA,
11.500%, due 02/04/17 | | | 601,906 |
| | 665,000 | | | | Intelsat SA,
6.500%, due 11/01/13 | | | 653,363 |
| | 18,024 | | & | | iPCS, Inc.,
4.249%, due 05/01/14 | | | 16,041 |
See Accompanying Notes to Financial Statements
54
| | |
| ING HIGH YIELD BOND FUND | | PORTFOLIO OF INVESTMENTS ASOF MARCH 31, 2010 (CONTINUED) |
| | | | | | | | |
Principal
Amount | | | | | | Value |
| | | | | | | | |
| Telecommunications: (continued) | | | |
| $ | 495,000 | | | | MetroPCS Wireless, Inc.,
9.250%, due 11/01/14 | | $ | 508,613 |
| | 860,000 | | | | Nextel Communications, Inc.,
5.950%, due 03/15/14 | | | 806,250 |
| | 805,000 | | | | Nextel Communications, Inc.,
7.375%, due 08/01/15 | | | 768,775 |
| | 385,000 | | | | Qwest Communications International, Inc.,
7.500%, due 02/15/14 | | | 393,663 |
| | 670,000 | | | | Sprint Capital Corp.,
6.875%, due 11/15/28 | | | 542,700 |
| | 420,000 | | | | Sprint Capital Corp.,
8.750%, due 03/15/32 | | | 391,650 |
| | 725,000 | | | | West Corp.,
9.500%, due 10/15/14 | | | 748,563 |
| | 330,000 | | | | West Corp.,
11.000%, due 10/15/16 | | | 351,450 |
| | 370,000 | | | | Windstream Corp.,
7.000%, due 03/15/19 | | | 346,875 |
| | | | | | | | |
| | | | | | | | 11,089,126 |
| | | | | | | | |
| Transportation: 0.1% | | | |
| | 115,000 | | # | | Martin Midstream Partners & Finance,
8.875%, due 04/01/18 | | | 116,725 |
| | | | | | | | |
| | | | | | | | 116,725 |
| | | | | | | | |
| | | | | Total Corporate Bonds/Notes
(Cost $97,821,933) | | | 104,213,239 |
| | | | | | | | |
| ASSET-BACKED SECURITIES: 0.3% | | | |
| Home Equity Asset-Backed Securities: 0.3% | | | |
| | 267,766 | | | | Ameriquest Mortgage Securities, Inc.,
1.596%, due 02/25/33 | | | 200,427 |
| | 189,529 | | | | Morgan Stanley Capital, Inc.,
1.446%, due 06/25/33 | | | 144,093 |
| | | | | | | | |
| | | | | Total Asset-Backed Securities
(Cost $386,966) | | | 344,520 |
| | | | | | | | |
| | | |
| Shares | | | | | | Value |
| COMMON STOCK: 0.1% | | | |
| Building Materials: 0.1% | | | |
| | 760 | | @ | | Nortek, Inc. | | $ | 30,780 |
| | | | | | | | |
| | | | | | | | 30,780 |
| | | | | | | | |
| Media: 0.0% | | | |
| | 5,810 | | @, I, X | | American Media Stock Certificates | | | 6 |
| | | | | | | | |
| | | | | | | | 6 |
| | | | | | | | |
| Telecommunications: 0.0% | | | |
| | 264 | | @ | | Completel Europe NV | | | 8,918 |
| | | | | | | | |
| | | | | | | | 8,918 |
| | | | | | | | |
| | | | | Total Common Stock
(Cost $ 155,299) | | | 39,704 |
| | | | | | | | | |
Shares | | | | | | | | Value |
| | | | | | | | | |
WARRANTS: 0.0% | | | | | |
Telecommunications: 0.0% | | | | | |
| 500 | | #, I, X | | GT Group Telecom, Inc. | | | | $ | — |
| | | | Total Warrants
(Cost $-) | | | | | — |
| | | | | | | | | |
| | | | Total Long-Term Investments
(Cost $98,364,198) | | | | | 104,597,463 |
| | | | | | | | | |
| | | | | | | | | |
SHORT-TERM INVESTMENTS: 3.1% | | | | | | | |
Affiliated Mutual Fund: 3.1% | | | | | | | |
| 3,334,000 | | ING Institutional Prime Money Market Fund - Class I | | | | | | 3,334,000 | |
| | Total Short-Term Investments
(Cost $3,334,000) | | | | | | 3,334,000 | |
| | Total Investments in Securities
(Cost $101,698,198)* | | 100.2 | % | | $ | 107,931,463 | |
| | Other Assets and
Liabilities - Net | | (0.2 | ) | | | (178,891 | ) |
| | | | | | | | | |
| | Net Assets | | 100.0 | % | | $ | 107,752,572 | |
| | | | | | | | | |
| @ | Non-income producing security |
| + | Step basis bonds. Interest rates shown reflect current and next coupon rates. |
| # | Securities with purchases pursuant to Rule 144A or section 4(2), under the Securities Act of 1933 and may not be resold subject to that rule except to qualified institutional buyers. Unless otherwise noted, these securities have been determined to be liquid under the guidelines established by the Funds’ Board of Directors/Trustees. |
| S | All or a portion of this security has been identified by the Fund to cover future collateral requirements for applicable futures, options, swaps, foreign currency contracts and/or when-issued or delayed-delivery securities. |
| X | Fair value determined by ING Funds Valuation Committee appointed by the Funds’ Board of Directors/Trustees. |
| Z | Indicates Zero Coupon Bond; rate shown reflects current effective yield. |
| * | Cost for federal income tax purposes is $101,862,478. |
| | | | |
Net unrealized appreciation consists of: | | | | |
Gross Unrealized Appreciation | | $ | 7,227,819 | |
Gross Unrealized Depreciation | | | (1,158,834 | ) |
| | | | |
Net Unrealized Appreciation | | $ | 6,068,985 | |
| | | | |
See Accompanying Notes to Financial Statements
55
| | |
| ING HIGH YIELD BOND FUND | | PORTFOLIO OF INVESTMENTS ASOF MARCH 31, 2010 (CONTINUED) |
Fair Value Measurements^
The following is a summary of the fair valuations according to the inputs used as of March 31, 2010 in valuing the Fund’s assets and liabilities:
| | | | | | | | | | | | |
| | | Quoted Prices
in Active Markets for
Identical Investments
(Level 1) | | Significant Other
Observable
Inputs
(Level 2) | | Significant
Unobservable
Inputs
(Level 3) | | Fair Value
at
03/31/2010 |
Asset Table | | | | | | | | | | | | |
Investments, at value | | | | | | | | | | | | |
Common Stock | | | | | | | | | | | | |
Building Materials | | $ | — | | $ | 30,780 | | $ | — | | $ | 30,780 |
Media | | | — | | | — | | | 6 | | | 6 |
Telecommunications | | | 8,918 | | | — | | | — | | | 8,918 |
| | | | | | | | | | | | |
Total Common Stock | | | 8,918 | | | 30,780 | | | 6 | | | 39,704 |
| | | | | | | | | | | | |
Corporate Bonds/Notes | | | — | | | 104,213,239 | | | — | | | 104,213,239 |
Asset-Backed Securities | | | — | | | 344,520 | | | — | | | 344,520 |
Short-Term Investments | | | 3,334,000 | | | — | | | — | | | 3,334,000 |
| | | | | | | | | | | | |
Total Investments, at value | | $ | 3,342,918 | | $ | 104,588,539 | | $ | 6 | | $ | 107,931,463 |
| | | | | | | | | | | | |
The following is a reconciliation of the fair valuations using significant unobservable inputs (Level 3) for the Fund’s assets and liabilities during the period ended March 31, 2010:
| | | | | | | | | | | | | | | | | | | | | | | | | | | | | |
| | | Beginning
Balance
3/31/2009 | | Purchases | | Sales | | Accrued
Discounts/
(Premiums) | | Total Realized
Gain/(Loss) | | | Total Unrealized
Appreciation/
(Depreciation) | | | Transfers
Into
Level 3 | | Transfers
Out of
Level 3 | | Ending
Balance
03/31/2010 |
Asset Table | | | | | | | | | | | | | | | | | | | | | | | | | | | | | |
Investments, at value | | | | | | | | | | | | | | | | | | | | | | | | | | | | | |
Common Stock | | $ | 24 | | $ | — | | $ | — | | $ | — | | $ | (210,181 | ) | | $ | 210,163 | | | $ | — | | $ | — | | $ | 6 |
Preferred Stock | | | 7,008 | | | — | | | — | | | — | | | (8,676 | ) | | | 1,668 | | | | — | | | — | | | — |
Warrants | | | 961 | | | — | | | — | | | — | | | — | | | | (961 | ) | | | — | | | — | | | — |
| | | | | | | | | | | | | | | | | | | | | | | | | | | | | |
Total Investments, at value | | $ | 7,993 | | $ | — | | $ | — | | $ | — | | $ | (218,857 | ) | | $ | 210,870 | | | $ | — | | $ | — | | $ | 6 |
| | | | | | | | | | | | | | | | | | | | | | | | | | | | | |
As of March 31, 2010, total change in unrealized gain (loss) on Level 3 securities still held at year end and included in the change in net assets was $0.
| ^ | See Note 2, “Significant Accounting Policies” in the Notes to Financial Statements for additional information. |
Transfers in or out of Level 3 represents either the beginning value (for transfers in), or the ending value (for transfers out) of any security or derivative instrument where a change in the pricing level occurred from the beginning to the end of the period.
The effect of derivative instruments on the Fund’s Statement of Operations for the year ended March 31, 2010 was as follows:
| | | | |
| | | Amount of Realized Gain or (Loss) on Derivatives Recognized in Income | |
Derivatives not accounted for as hedging
instruments under FASB ASC 815 | | Swaps | |
Credit contracts | | $ | (68,304 | ) |
| | | | |
Total | | $ | (68,304 | ) |
| | | | |
| |
| | | Change in Unrealized Appreciation or (Depreciation) on Derivatives Recognized in Income | |
Derivatives not accounted for as hedging
instruments under FASB ASC 815 | | Swaps | |
Credit contracts | | $ | 287,074 | |
| | | | |
Total | | $ | 287,074 | |
| | | | |
See Accompanying Notes to Financial Statements
56
| | |
| ING INTERMEDIATE BOND FUND | | PORTFOLIO OF INVESTMENTS ASOF MARCH 31, 2010 |
| | | | | | | | |
Principal
Amount | | | | | | Value |
| | | | | | | | |
| CORPORATE BONDS/NOTES: 38.4% | | | |
| Advertising: 0.1% | | | |
| $ | 1,040,000 | | S | | Interpublic Group of Cos., Inc.,
10.000%, due 07/15/17 | | $ | 1,181,700 |
| | | | | | | | |
| | | | | | | | 1,181,700 |
| | | | | | | | |
| Agriculture: 0.4% | | | |
| | 2,496,000 | | S | | Altria Group, Inc.,
9.700%, due 11/10/18 | | | 3,073,846 |
| | | | | | | | |
| | | | | | | | 3,073,846 |
| | | | | | | | |
| Apparel: 0.2% | | | |
| | 1,415,000 | | | | Hanesbrands, Inc.,
8.000%, due 12/15/16 | | | 1,471,600 |
| | | | | | | | |
| | | | | | | | 1,471,600 |
| | | | | | | | |
| Banks: 6.9% | | | |
| | 500,000 | | S | | Bank of America Corp.,
5.420%, due 03/15/17 | | | 494,829 |
| | 1,970,000 | | S | | Bank of America Corp.,
8.000%, due 12/29/49 | | | 2,012,948 |
| | 1,280,000 | | | | Bank of Ireland,
0.886%, due 12/29/49 | | | 512,000 |
| | 4,074,000 | | # | | Barclays Bank PLC,
6.050%, due 12/04/17 | | | 4,207,798 |
| | 2,504,000 | | # | | Barclays Bank PLC,
7.375%, due 06/29/49 | | | 2,453,920 |
| | 2,411,000 | | S | | Citigroup, Inc.,
5.000%, due 09/15/14 | | | 2,409,975 |
| | 1,876,000 | | S | | Citigroup, Inc.,
6.010%, due 01/15/15 | | | 1,972,907 |
| | 1,468,000 | | S | | Citigroup, Inc.,
8.500%, due 05/22/19 | | | 1,716,237 |
| | 2,013,000 | | S | | Discover Bank/Greenwood DE, 8.700%, due 11/18/19 | | | 2,208,430 |
| | 1,155,000 | | # | | Dresdner Funding Trust I,
8.151%, due 06/30/31 | | | 918,426 |
| | 3,739,000 | | | | Fifth Third Bancorp.,
8.250%, due 03/01/38 | | | 3,939,777 |
| | 3,599,000 | | | | First Tennessee Bank NA,
5.650%, due 04/01/16 | | | 3,470,537 |
| | 872,000 | | S | | Goldman Sachs Group, Inc., 5.375%, due 03/15/20 | | | 865,580 |
| | 2,116,000 | | S | | Goldman Sachs Group, Inc., 6.250%, due 09/01/17 | | | 2,278,951 |
| | 1,062,000 | | | | JPMorgan Chase Bank NA, 5.875%, due 06/13/16 | | | 1,144,004 |
| | 2,488,000 | | # | | Lloyds TSB Bank PLC,
5.800%, due 01/13/20 | | | 2,431,970 |
| | 1,500,000 | | S | | Morgan Stanley,
4.100%, due 01/26/15 | | | 1,493,547 |
| | 1,082,000 | | S | | Morgan Stanley,
4.750%, due 04/01/14 | | | 1,105,802 |
| | 3,137,000 | | S | | Morgan Stanley,
7.300%, due 05/13/19 | | | 3,471,633 |
| | 4,371,000 | | S | | National City Preferred Capital Trust I,
12.000%, due 12/29/49 | | | 5,091,218 |
| | 3,129,000 | | # | | Rabobank,
11.000%, due 12/29/49 | | | 4,038,384 |
| | 1,008,000 | | S | | USB Capital XIII Trust,
6.625%, due 12/15/39 | | | 1,023,685 |
| | 2,207,000 | | S | | Wachovia Bank NA,
6.600%, due 01/15/38 | | | 2,278,039 |
| | | | | | | | |
Principal
Amount | | | | | | Value |
| | | | | | | | |
| Banks: (continued) | | | |
| $ | 411,000 | | | | Wachovia Corp.,
5.250%, due 08/01/14 | | $ | 432,125 |
| | 2,322,000 | | S | | Wells Fargo Capital XIII,
7.700%, due 12/29/49 | | | 2,409,075 |
| | | | | | | | |
| | | | | | | | 54,381,797 |
| | | | | | | | |
| Beverages: 0.3% | | | |
| | 1,268,000 | | # | | Anheuser-Busch InBev Worldwide, Inc.,
5.375%, due 11/15/14 | | | 1,374,786 |
| | 777,000 | | # | | Anheuser-Busch InBev Worldwide, Inc.,
7.750%, due 01/15/19 | | | 925,670 |
| | | | | | | | |
| | | | | | | | 2,300,456 |
| | | | | | | | |
| Chemicals: 0.8% | | | |
| | 702,000 | | # | | Chevron Phillips Chemical Co. LLC,
7.000%, due 06/15/14 | | | 791,571 |
| | 1,109,000 | | # | | Chevron Phillips Chemical Co. LLC,
8.250%, due 06/15/19 | | | 1,326,157 |
| | 1,510,000 | | S | | Dow Chemical Co.,
7.600%, due 05/15/14 | | | 1,725,346 |
| | 1,730,000 | | # | | Nova Chemicals Corp.,
8.375%, due 11/01/16 | | | 1,786,225 |
| | 350,000 | | # | | Nova Chemicals Corp.,
8.625%, due 11/01/19 | | | 362,250 |
| | | | | | | | |
| | | | | | | | 5,991,549 |
| | | | | | | | |
| Coal: 0.3% | | | |
| | 1,575,000 | | # | | Arch Coal, Inc.,
8.750%, due 08/01/16 | | | 1,673,438 |
| | 300,000 | | # | | Consol Energy, Inc.,
8.000%, due 04/01/17 | | | 309,750 |
| | 300,000 | | # | | Consol Energy, Inc.,
8.250%, due 04/01/20 | | | 309,750 |
| | | | | | | | |
| | | | | | | | 2,292,938 |
| | | | | | | | |
| Commercial Services: 0.6% | | | |
| | 2,140,000 | | S | | RR Donnelley & Sons Co.,
8.600%, due 08/15/16 | | | 2,377,880 |
| | 535,000 | | S | | Service Corp. International, 7.000%, due 06/15/17 | | | 526,975 |
| | 2,020,000 | | &, # | | ServiceMaster Co,
10.750%, due 07/15/15 | | | 2,131,100 |
| | | | | | | | |
| | | | | | | | 5,035,955 |
| | | | | | | | |
| Computers: 0.5% | | | |
| | 150,000 | | # | | Brocade Communications Systems, Inc.,
6.625%, due 01/15/18 | | | 153,375 |
| | 1,730,000 | | # | | Brocade Communications Systems, Inc.,
6.875%, due 01/15/20 | | | 1,773,250 |
| | 1,935,000 | | S | | Seagate Technology, Inc.,
6.800%, due 10/01/16 | | | 1,949,513 |
| | | | | | | | |
| | | | | | | | 3,876,138 |
| | | | | | | | |
| Diversified Financial Services: 3.6% | | | |
| | 1,296,000 | | S | | American Express Credit Corp.,
7.300%, due 08/20/13 | | | 1,455,746 |
See Accompanying Notes to Financial Statements
57
| | |
| ING INTERMEDIATE BOND FUND | | PORTFOLIO OF INVESTMENTS ASOF MARCH 31, 2010 (CONTINUED) |
| | | | | | | | |
Principal
Amount | | | | | | Value |
| | | | | | | | |
| Diversified Financial Services: (continued) | | | |
| $ | 965,000 | | # | | Cantor Fitzgerald L.P.,
7.875%, due 10/15/19 | | $ | 968,675 |
| | 1,290,000 | | | | Capital One Bank USA NA, 6.500%, due 06/13/13 | | | 1,411,189 |
| | 1,458,000 | | S | | Capital One Bank USA NA, 8.800%, due 07/15/19 | | | 1,764,556 |
| | 1,724,000 | | S | | Capital One Capital V,
10.250%, due 08/15/39 | | | 2,047,752 |
| | 1,277,000 | | # | | Corestates Capital Trust I,
8.000%, due 12/15/26 | | | 1,294,182 |
| | 2,604,000 | | S | | Credit Suisse/Guernsey,
5.860%, due 12/31/49 | | | 2,454,270 |
| | 1,945,000 | | S | | Ford Motor Credit Co., LLC, 8.125%, due 01/15/20 | | | 2,043,699 |
| | 2,324,000 | | S | | Fund American Cos., Inc.,
5.875%, due 05/15/13 | | | 2,393,590 |
| | 765,000 | | S | | General Electric Capital Corp.,
5.500%, due 01/08/20 | | | 781,969 |
| | 1,742,000 | | S | | General Electric Capital Corp.,
5.875%, due 01/14/38 | | | 1,661,711 |
| | 1,425,000 | | S | | General Electric Capital Corp.,
6.000%, due 08/07/19 | | | 1,508,452 |
| | 2,262,000 | | S | | International Lease Finance Corp.,
6.625%, due 11/15/13 | | | 2,203,269 |
| | 421,000 | | # | | International Lease Finance Corp.,
8.625%, due 09/15/15 | | | 431,423 |
| | 811,000 | | # | | International Lease Finance Corp.,
8.750%, due 03/15/17 | | | 831,707 |
| | 410,000 | | # | | LBI Escrow Corp.,
8.000%, due 11/01/17 | | | 425,888 |
| | 1,359,000 | | S | | Merrill Lynch & Co., Inc.,
6.050%, due 05/16/16 | | | 1,387,463 |
| | 777,000 | | S | | Merrill Lynch & Co., Inc.,
6.875%, due 04/25/18 | | | 838,650 |
| | 500,000 | | # | | New Communications Holdings, Inc.,
7.875%, due 04/15/15 | | | 516,250 |
| | DKK 22 | | S | | Nordea Kredit Realkreditaktieselskab,
6.000%, due 07/01/29 | | | 4 |
| $ | 175,780 | | # | | Power Receivable Finance, LLC,
6.290%, due 01/01/12 | | | 180,458 |
| | 2,295,000 | | S | | SLM Corp.,
8.000%, due 03/25/20 | | | 2,238,538 |
| | 1,583,000 | | ±, I, X | | Twin Reefs Pass-through Trust,
1.386%, due 12/10/49 | | | — |
| | | | | | | | |
| | | | | | | | 28,839,441 |
| | | | | | | | |
| Electric: 4.1% | | | |
| | 1,700,000 | | S | | AES Corp.,
8.000%, due 10/15/17 | | | 1,734,000 |
| | 1,467,000 | | # | | Allegheny Energy Supply Co. LLC,
5.750%, due 10/15/19 | | | 1,450,270 |
| | | | | | | | |
Principal
Amount | | | | | | Value |
| | | | | | | | |
| Electric: (continued) | | | |
| $ | 1,191,000 | | S | | Ameren Corp.,
8.875%, due 05/15/14 | | $ | 1,375,438 |
| | 309,000 | | L | | Ameren Energy Generating Co.,
6.300%, due 04/01/20 | | | 311,088 |
| | 1,043,000 | | S | | CMS Energy Corp.,
6.250%, due 02/01/20 | | | 1,035,850 |
| | 249,000 | | | | Commonwealth Edison Co.,
6.150%, due 03/15/12 | | | 269,828 |
| | 5,312,000 | | S | | Commonwealth Edison Co.,
6.950%, due 07/15/18 | | | 5,870,721 |
| | 112,000 | | S | | DTE Energy Co.,
7.625%, due 05/15/14 | | | 127,530 |
| | 782,000 | | S | | Entergy Texas, Inc.,
7.125%, due 02/01/19 | | | 878,419 |
| | 696,000 | | S | | FirstEnergy Solutions Corp.,
4.800%, due 02/15/15 | | | 713,069 |
| | 964,000 | | # | | Iberdrola Finance Ireland Ltd.,
3.800%, due 09/11/14 | | | 970,436 |
| | 1,754,000 | | # | | Iberdrola Finance Ireland Ltd.,
5.000%, due 09/11/19 | | | 1,727,018 |
| | 1,180,000 | | | | Indiana Michigan Power,
7.000%, due 03/15/19 | | | 1,334,086 |
| | 812,000 | | | | Jersey Central Power and Light,
7.350%, due 02/01/19 | | | 941,766 |
| | 308,382 | | # | | Juniper Generation, LLC,
6.790%, due 12/31/14 | | | 286,577 |
| | 2,391,000 | | | | Metropolitan Edison,
7.700%, due 01/15/19 | | | 2,787,784 |
| | 709,000 | | | | Nevada Power Co.,
7.125%, due 03/15/19 | | | 799,741 |
| | 645,000 | | S | | Nisource Finance Corp.,
6.125%, due 03/01/22 | | | 674,377 |
| | 3,977,000 | | S | | NorthWestern Corp.,
5.875%, due 11/01/14 | | | 4,078,542 |
| | 1,318,000 | | | | Oncor Electric Delivery Co.,
7.500%, due 09/01/38 | | | 1,547,038 |
| | 1,949,000 | | | | Sierra Pacific Power Co.,
6.250%, due 04/15/12 | | | 2,082,489 |
| | 1,169,000 | | S | | Southwestern Electric Power,
5.550%, due 01/15/17 | | | 1,221,993 |
| | | | | | | | |
| | | | | | | | 32,218,060 |
| | | | | | | | |
| Electronics: 0.2% | | | |
| | 1,365,000 | | | | Jabil Circuit, Inc.,
7.750%, due 07/15/16 | | | 1,443,488 |
| | | | | | | | |
| | | | | | | | 1,443,488 |
| | | | | | | | |
| Energy - Alternate Sources: 0.0% | | | |
| | 1,800,000 | | ±, I, X | | Greater Ohio Ethanol, LLC,
6.301%, due 12/31/13 | | | — |
| | 2,200,000 | | ±, I, X | | Greater Ohio Ethanol, LLC,
12.630%, due 12/31/13 | | | — |
| | 277,964 | | ±, I, X | | PEA Lima, LLC, due 03/20/14 | | | — |
| | | | | | | | |
| | | | | | | | — |
| | | | | | | | |
| Entertainment: 0.6% | | | |
| | 2,065,000 | | S | | AMC Entertainment, Inc.,
8.750%, due 06/01/19 | | | 2,178,575 |
See Accompanying Notes to Financial Statements
58
| | |
| ING INTERMEDIATE BOND FUND | | PORTFOLIO OF INVESTMENTS ASOF MARCH 31, 2010 (CONTINUED) |
| | | | | | | | |
Principal
Amount | | | | | | Value |
| | | | | | | | |
| Entertainment: (continued) | | | |
| $ | 2,040,000 | | # | | Pinnacle Entertainment, Inc.,
8.625%, due 08/01/17 | | $ | 2,004,300 |
| | 485,000 | | L | | WMG Holdings Corp.,
9.500%, due 12/15/14 | | | 491,063 |
| | | | | | | | |
| | | | | | | | 4,673,938 |
| | | | | | | | |
| Food: 1.4% | | | |
| | 525,000 | | # | | Dole Food Co., Inc.,
8.000%, due 10/01/16 | | | 540,750 |
| | 702,000 | | S | | Kraft Foods, Inc.,
5.375%, due 02/10/20 | | | 714,837 |
| | 2,918,000 | | | | Kraft Foods, Inc.,
6.125%, due 08/23/18 | | | 3,185,172 |
| | 732,000 | | S | | Kraft Foods, Inc.,
6.500%, due 08/11/17 | | | 821,165 |
| | 863,000 | | | | Kraft Foods, Inc.,
6.500%, due 02/09/40 | | | 897,309 |
| | 2,150,000 | | # | | Smithfield Foods, Inc.,
10.000%, due 07/15/14 | | | 2,408,000 |
| | 315,000 | | S | | TreeHouse Foods, Inc.,
7.750%, due 03/01/18 | | | 327,600 |
| | 1,840,000 | | S | | Tyson Foods, Inc.,
7.850%, due 04/01/16 | | | 1,987,200 |
| | | | | | | | |
| | | | | | | | 10,882,033 |
| | | | | | | | |
| Forest Products & Paper: 0.2% | | | |
| | 1,054,000 | | S | | Domtar Corp.,
10.750%, due 06/01/17 | | | 1,285,880 |
| | | | | | | | |
| | | | | | | | 1,285,880 |
| | | | | | | | |
| Gas: 0.3% | | | |
| | 2,275,000 | | | | Sempra Energy,
6.500%, due 06/01/16 | | | 2,544,856 |
| | | | | | | | |
| | | | | | | | 2,544,856 |
| | | | | | | | |
| Healthcare - Products: 0.5% | | | |
| | 1,950,000 | | &, S | | Biomet, Inc.,
10.375%, due 10/15/17 | | | 2,154,750 |
| | 963,000 | | S | | Boston Scientific Corp.,
4.500%, due 01/15/15 | | | 923,885 |
| | 848,000 | | S | | Boston Scientific Corp.,
6.000%, due 01/15/20 | | | 802,546 |
| | | | | | | | |
| | | | | | | | 3,881,181 |
| | | | | | | | |
| Healthcare - Services: 0.5% | | | |
| | 1,080,000 | | S | | HCA, Inc.,
9.250%, due 11/15/16 | | | 1,150,875 |
| | 1,950,000 | | & | | HCA, Inc.,
9.625%, due 11/15/16 | | | 2,093,813 |
| | 1,054,000 | | | | US Oncology, Inc.,
9.125%, due 08/15/17 | | | 1,106,700 |
| | | | | | | | |
| | | | | | | | 4,351,388 |
| | | | | | | | |
| Holding Companies - Diversified: 0.2% | | | |
| | 805,000 | | # | | Reynolds Group DL Escrow, Inc./Reynolds Group Escrow LLC,
7.750%, due 10/15/16 | | | 831,163 |
| | 1,176,000 | | # | | Voto-Votorantim Ltd.,
6.750%, due 04/05/21 | | | 1,167,180 |
| | | | | | | | |
| | | | | | | | 1,998,343 |
| | | | | | | | |
| | | | | | | | |
Principal
Amount | | | | | | Value |
| | | | | | | | |
| Home Builders: 0.1% | | | |
| $ | 863,000 | | S | | Toll Brothers Finance Corp.,
6.750%, due 11/01/19 | | $ | 873,517 |
| | | | | | | | |
| | | | | | | | 873,517 |
| | | | | | | | |
| Insurance: 3.6% | | | |
| | 4,313,000 | | | | Aegon NV,
3.923%, due 12/31/49 | | | 2,841,836 |
| | 3,058,000 | | S | | American International Group, Inc.,
5.850%, due 01/16/18 | | | 2,845,717 |
| | 2,733,000 | | S | | Genworth Financial, Inc.,
6.515%, due 05/22/18 | | | 2,696,520 |
| | 1,239,000 | | S | | Hartford Financial Services Group, Inc.,
5.250%, due 10/15/11 | | | 1,293,478 |
| | 710,000 | | S | | Hartford Financial Services Group, Inc.,
5.500%, due 03/30/20 | | | 700,611 |
| | 1,326,000 | | S | | Hartford Financial Services Group, Inc.,
6.000%, due 01/15/19 | | | 1,360,207 |
| | 1,432,000 | | | | Lincoln National Corp.,
8.750%, due 07/01/19 | | | 1,753,912 |
| | 1,729,000 | | # | | Pacific Life Insurance Co.,
9.250%, due 06/15/39 | | | 2,148,686 |
| | 1,126,000 | | # | | Pacific LifeCorp,
6.000%, due 02/10/20 | | | 1,101,071 |
| | 1,118,000 | | S | | Principal Financial Group, Inc.,
7.875%, due 05/15/14 | | | 1,266,248 |
| | 3,121,000 | | | | Protective Life Corp.,
8.450%, due 10/15/39 | | | 3,282,315 |
| | 756,000 | | S | | Prudential Financial, Inc.,
4.750%, due 09/17/15 | | | 779,056 |
| | 886,000 | | S | | Prudential Financial, Inc.,
5.700%, due 12/14/36 | | | 842,293 |
| | 1,562,000 | | S | | Prudential Financial, Inc.,
6.000%, due 12/01/17 | | | 1,655,670 |
| | 394,000 | | | | Prudential Financial, Inc.,
6.625%, due 12/01/37 | | | 414,627 |
| | 795,000 | | S | | Prudential Financial, Inc.,
7.375%, due 06/15/19 | | | 913,255 |
| | 2,207,000 | | # | | Teachers Insurance & Annuity Association of America,
6.850%, due 12/16/39 | | | 2,401,949 |
| | | | | | | | |
| | | | | | | | 28,297,451 |
| | | | | | | | |
| Investment Companies: 0.1% |
| | 881,000 | | # | | Xstrata Finance Canada Ltd,
5.500%, due 11/16/11 | | | 924,614 |
| | | | | | | | |
| | | | | | | | 924,614 |
| | | | | | | | |
| Iron/Steel: 0.7% |
| | 943,000 | | | | ArcelorMittal,
7.000%, due 10/15/39 | | | 971,505 |
| | 2,481,000 | | S | | ArcelorMittal,
9.850%, due 06/01/19 | | | 3,158,400 |
| | 1,240,000 | | S | | Steel Dynamics, Inc.,
7.750%, due 04/15/16 | | | 1,302,000 |
| | | | | | | | |
| | | | | | | | 5,431,905 |
| | | | | | | | |
| Lodging: 0.6% |
| | 2,975,000 | | # | | Hyatt Hotels Corp.,
6.875%, due 08/15/19 | | | 3,050,931 |
See Accompanying Notes to Financial Statements
59
| | |
| ING INTERMEDIATE BOND FUND | | PORTFOLIO OF INVESTMENTS ASOF MARCH 31, 2010 (CONTINUED) |
| | | | | | | | |
Principal
Amount | | | | | | Value |
| | | | | | | | |
| Lodging: (continued) |
| $ | 1,405,000 | | # | | Wynn Las Vegas LLC / Wynn Las Vegas Capital Corp.,
7.875%, due 11/01/17 | | $ | 1,436,613 |
| | | | | | | | |
| | | | | | | | 4,487,544 |
| | | | | | | | |
| Machinery - Diversified: 0.2% |
| | 1,250,000 | | # | | Case New Holland, Inc.,
7.750%, due 09/01/13 | | | 1,303,125 |
| | | | | | | | |
| | | | | | | | 1,303,125 |
| | | | | | | | |
| Media: 3.8% |
| | 1,920,000 | | # | | Cablevision Systems Corp.,
8.625%, due 09/15/17 | | | 2,040,000 |
| | 2,495,000 | | # | | Clear Channel Worldwide Holdings, Inc.,
9.250%, due 12/15/17 | | | 2,609,625 |
| | 1,215,000 | | S | | Comcast Corp.,
5.700%, due 05/15/18 | | | 1,290,348 |
| | 769,000 | | S | | Comcast Corp.,
5.900%, due 03/15/16 | | | 841,105 |
| | 97,000 | | S | | Comcast Corp.,
6.300%, due 11/15/17 | | | 107,034 |
| | 517,000 | | S | | Comcast Corp.,
6.400%, due 03/01/40 | | | 527,257 |
| | 1,254,000 | | S | | Comcast Corp.,
6.500%, due 01/15/17 | | | 1,396,016 |
| | 652,000 | | # | | COX Communications, Inc.,
6.250%, due 06/01/18 | | | 694,517 |
| | 616,000 | | # | | COX Communications, Inc.,
6.950%, due 06/01/38 | | | 668,830 |
| | 1,255,000 | | # | | Cox Enterprises, Inc.,
7.375%, due 07/15/27 | | | 1,334,764 |
| | 1,966,000 | | # | | DirecTV Holdings, LLC,
5.200%, due 03/15/20 | | | 1,939,253 |
| | 647,000 | | | | Discovery Communications, LLC,
5.625%, due 08/15/19 | | | 676,638 |
| | 1,080,000 | | S | | DISH DBS Corp.,
7.125%, due 02/01/16 | | | 1,105,650 |
| | 1,955,000 | | # | | Mediacom LLC / Mediacom Capital Corp.,
9.125%, due 08/15/19 | | | 2,025,869 |
| | 1,509,000 | | S | | News America, Inc.,
6.150%, due 03/01/37 | | | 1,492,261 |
| | 1,598,000 | | | | News America, Inc.,
6.650%, due 11/15/37 | | | 1,686,066 |
| | 851,000 | | | | News America, Inc.,
6.900%, due 03/01/19 | | | 968,770 |
| | 227,000 | | S | | Time Warner Cable, Inc.,
3.500%, due 02/01/15 | | | 227,442 |
| | 2,659,000 | | S | | Time Warner Cable, Inc.,
8.750%, due 02/14/19 | | | 3,302,970 |
| | 648,000 | | | | Time Warner Entertainment Co. LP,
8.375%, due 07/15/33 | | | 782,657 |
| | 591,000 | | S | | Time Warner, Inc.,
6.200%, due 03/15/40 | | | 585,412 |
| | 2,547,000 | | S | | Time Warner, Inc.,
7.700%, due 05/01/32 | | | 2,948,012 |
| | 1,101,000 | | S | | Viacom, Inc.,
4.250%, due 09/15/15 | | | 1,117,818 |
| | | | | | | | |
| | | | | | | | 30,368,314 |
| | | | | | | | |
| | | | | | | | |
Principal
Amount | | | | | | Value |
| | | | | | | | |
| Mining: 0.5% |
| $ | 1,114,000 | | S | | Rio Tinto Finance USA Ltd.,
8.950%, due 05/01/14 | | $ | 1,343,548 |
| | 1,950,000 | | S | | Teck Resources Ltd.,
10.250%, due 05/15/16 | | | 2,330,250 |
| | | | | | | | |
| | | | | | | | 3,673,798 |
| | | | | | | | |
| Miscellaneous Manufacturing: 0.5% |
| | 900,000 | | # | | Bombardier, Inc.,
7.500%, due 03/15/18 | | | 942,750 |
| | 900,000 | | # | | Bombardier, Inc.,
7.750%, due 03/15/20 | | | 945,000 |
| | 2,321,000 | | S | | General Electric Co.,
5.250%, due 12/06/17 | | | 2,438,217 |
| | | | | | | | |
| | | | | | | | 4,325,967 |
| | | | | | | | |
| Office/Business Equipment: 0.1% |
| | 657,000 | | S | | Xerox Corp.,
4.250%, due 02/15/15 | | | 663,148 |
| | 307,000 | | S | | Xerox Corp.,
5.625%, due 12/15/19 | | | 316,149 |
| | | | | | | | |
| | | | | | | | 979,297 |
| | | | | | | | |
| Oil & Gas: 0.7% |
| | 2,045,000 | | S | | Newfield Exploration Co.,
6.875%, due 02/01/20 | | | 2,070,563 |
| | 1,350,000 | | | | Pioneer Natural Resources Co.,
7.500%, due 01/15/20 | | | 1,395,761 |
| | 1,920,000 | | S | | Plains Exploration & Production Co.,
8.625%, due 10/15/19 | | | 2,044,800 |
| | | | | | | | |
| | | | | | | | 5,511,124 |
| | | | | | | | |
| Oil & Gas Services: 0.0% |
| | 221,000 | | S | | Weatherford International Ltd.,
9.625%, due 03/01/19 | | | 280,089 |
| | | | | | | | |
| | | | | | | | 280,089 |
| | | | | | | | |
| Packaging & Containers: 0.1% |
| | 631,000 | | S | | Solo Cup Co. / Solo Cup Operating Corp.,
10.500%, due 11/01/13 | | | 668,860 |
| | | | | | | | |
| | | | | | | | 668,860 |
| | | | | | | | |
| Pipelines: 1.4% |
| | 1,523,000 | | S | | Enbridge Energy Partners,
9.875%, due 03/01/19 | | | 1,982,181 |
| | 1,244,000 | | | | Energy Transfer Partners,
9.700%, due 03/15/19 | | | 1,577,097 |
| | 906,000 | | | | Northwest Pipeline Corp.,
7.000%, due 06/15/16 | | | 1,046,445 |
| | 1,717,000 | | | | Plains All American Pipeline LP,
5.750%, due 01/15/20 | | | 1,763,987 |
| | 1,375,000 | | # | | Rockies Express Pipeline LLC,
5.625%, due 04/15/20 | | | 1,356,270 |
| | 861,000 | | S | | Trans-Canada Pipelines,
7.625%, due 01/15/39 | | | 1,052,614 |
| | 1,262,000 | | S | | Transcontinental Gas Pipe Line Corp.,
6.400%, due 04/15/16 | | | 1,420,209 |
| | 587,000 | | # | | Williams Partners L.P.,
5.250%, due 03/15/20 | | | 589,326 |
| | | | | | | | |
| | | | | | | | 10,788,129 |
| | | | | | | | |
See Accompanying Notes to Financial Statements
60
| | |
| ING INTERMEDIATE BOND FUND | | PORTFOLIO OF INVESTMENTS ASOF MARCH 31, 2010 (CONTINUED) |
| | | | | | | | |
Principal
Amount | | | | | | Value |
| | | | | | | | |
| Real Estate: 0.6% |
| $ | 784,000 | | | | AvalonBay Communities, Inc.,
5.700%, due 03/15/17 | | $ | 827,584 |
| | 808,000 | | S | | ProLogis,
6.875%, due 03/15/20 | | | 799,508 |
| | 920,000 | | | | ProLogis,
7.375%, due 10/30/19 | | | 946,014 |
| | 2,142,000 | | S | | Simon Property Group, Inc.,
6.750%, due 05/15/14 | | | 2,345,601 |
| | | | | | | | |
| | | | | | | | 4,918,707 |
| | | | | | | | |
| Retail: 1.0% | | | |
| | 1,858,000 | | S | | CVS Caremark Corp.,
6.125%, due 09/15/39 | | | 1,852,883 |
| | 1,026,000 | | | | CVS Caremark Corp.,
6.600%, due 03/15/19 | | | 1,149,052 |
| | 1,885,000 | | | | Limited Brands, Inc.,
8.500%, due 06/15/19 | | | 2,111,200 |
| | 805,000 | | # | | QVC, Inc.,
7.500%, due 10/01/19 | | | 825,125 |
| | 2,025,000 | | # | | Toys R Us Property Co. I LLC,
10.750%, due 07/15/17 | | | 2,268,000 |
| | | | | | | | |
| | | | | | | | 8,206,260 |
| | | | | | | | |
| Telecommunications: 2.7% | | | |
| | 1,979,000 | | S | | AT&T, Inc.,
6.550%, due 02/15/39 | | | 2,087,323 |
| | 1,612,000 | | S | | CenturyTel, Inc.,
7.600%, due 09/15/39 | | | 1,558,343 |
| | 1,043,000 | | L | | Cricket Communications, Inc.,
10.000%, due 07/15/15 | | | 1,089,935 |
| | 1,980,000 | | S | | Crown Castle International Corp.,
7.125%, due 11/01/19 | | | 2,014,650 |
| | 1,040,000 | | S | | Embarq Corp.,
7.995%, due 06/01/36 | | | 1,057,406 |
| | 730,000 | | S | | Frontier Communications Corp.,
8.125%, due 10/01/18 | | | 733,650 |
| | 1,949,000 | | # | | Intelsat Subsidiary Holding Co. Ltd.,
8.875%, due 01/15/15 | | | 2,012,343 |
| | 975,000 | | L | | MetroPCS Wireless, Inc.,
9.250%, due 11/01/14 | | | 1,001,813 |
| | 980,000 | | S | | Nextel Communications, Inc.,
5.950%, due 03/15/14 | | | 918,750 |
| | 1,015,000 | | # | | Qwest Communications International, Inc.,
7.125%, due 04/01/18 | | | 1,053,063 |
| | 1,054,000 | | S | | Qwest Communications International, Inc.,
7.500%, due 02/15/14 | | | 1,077,715 |
| | 1,080,000 | | S | | Sprint Nextel Corp.,
6.000%, due 12/01/16 | | | 980,100 |
| | 1,251,000 | | S | | Telefonica Emisones SAU,
5.855%, due 02/04/13 | | | 1,361,131 |
| | 660,000 | | S | | Telefonica Emisones SAU,
5.877%, due 07/15/19 | | | 708,155 |
| | 1,550,000 | | | | Verizon Communications, Inc.,
8.950%, due 03/01/39 | | | 2,108,484 |
| | 1,270,000 | | # | | Virgin Media Secured Finance PLC,
6.500%, due 01/15/18 | | | 1,279,525 |
| | | | | | | | |
| | | | | | | | 21,042,386 |
| | | | | | | | |
| | | | | Total Corporate Bonds/Notes
(Cost $285,115,906) | | | 303,805,674 |
| | | | | | | | |
| | | | | | | | |
Principal
Amount | | | | | | Value |
| | | | | | | | |
| U.S. GOVERNMENT AGENCY OBLIGATIONS: 22.6% |
| Federal Home Loan Mortgage Corporation##: 11.4% |
| $ | 210,824 | | | | 0.580%, due 02/15/32 | | $ | 211,070 |
| | 8,230,000 | | | | 3.000%, due 04/07/15 | | | 8,221,186 |
| | 7,986,000 | | S | | 3.125%, due 03/16/15 | | | 8,008,201 |
| | 8,940,000 | | | | 3.250%, due 04/23/15 | | | 8,942,968 |
| | 1,621,379 | | | | 3.330%, due 03/15/38 | | | 1,622,312 |
| | 3,781,520 | | | | 4.883%, due 03/15/33 | | | 3,702,105 |
| | 361,377 | | | | 4.935%, due 04/01/35 | | | 379,646 |
| | 4,407,000 | | S | | 5.000%, due 03/15/32 | | | 4,672,903 |
| | 4,008,304 | | ^ | | 5.000%, due 05/15/17-01/15/29 | | | 219,361 |
| | 12,077,962 | | | | 5.000%, due 12/15/17-02/15/35 | | | 12,785,153 |
| | 564,000 | | W | | 5.500%, due 05/01/37 | | | 593,698 |
| | 7,927,000 | | S | | 5.500%, due 07/15/32-12/15/32 | | | 8,402,326 |
| | 20,119,079 | | | | 5.500%, due 08/15/20-02/15/34 | | | 21,359,424 |
| | 3,988,000 | | S | | 6.000%, due 10/15/32 | | | 4,316,162 |
| | 1,274,912 | | ^ | | 6.000%, due 04/15/33 | | | 176,811 |
| | 4,051,971 | | | | 6.000%, due 12/01/28-07/15/32 | | | 4,386,781 |
| | 15,937,214 | | S, ^ | | 6.170%, due 10/15/37 | | | 1,846,465 |
| | 36,391 | | | | 6.500%, due 01/01/24 | | | 39,979 |
| | 4,881,686 | | ^ | | 6.520%, due 05/15/35 | | | 562,783 |
| | 73,252 | | | | 7.000%, due 11/01/31-03/01/32 | | | 82,180 |
| | 6,100 | | | | 7.500%, due 11/01/28 | | | 6,961 |
| | | | | | | | |
| | | | | | | | 90,538,475 |
| | | | | | | | |
| Federal National Mortgage Association##: 8.7% |
| | 228,216 | | | | 0.636%, due 04/18/28 | | | 229,296 |
| | 259,712 | | | | 0.696%, due 10/25/33 | | | 260,499 |
| | 226,226 | | | | 0.796%, due 01/25/32 | | | 226,083 |
| | 2,483,827 | | ^ | | 4.000%, due 11/01/18 | | | 238,130 |
| | 4,558,000 | | W | | 4.500%, due 05/01/24-06/01/37 | | | 4,616,282 |
| | 2,509,852 | | S | | 5.000%, due 01/01/36 | | | 2,596,723 |
| | 10,353,503 | | | | 5.000%, due 02/25/29-07/01/36 | | | 10,783,404 |
| | 920,825 | | | | 5.011%, due 07/01/35 | | | 975,773 |
| | 5,721,000 | | W | | 5.500%, due 05/01/37 | | | 6,008,841 |
| | 2,860,000 | | S | | 5.500%, due 05/25/30 | | | 3,064,196 |
| | 5,575,414 | | | | 5.500%, due 02/01/18-01/01/39 | | | 5,892,864 |
| | 3,548,000 | | W | | 6.000%, due 06/01/37 | | | 3,775,849 |
| | 50,021 | | S | | 6.000%, due 11/01/17 | | | 54,170 |
| | 1,956,120 | | ^ | | 6.000%, due 08/25/33 | | | 356,996 |
| | 14,567,146 | | | | 6.000%, due 08/01/16-12/25/49 | | | 15,666,663 |
| | 7,523,504 | | S, ^ | | 6.204%, due 04/25/37 | | | 733,746 |
| | 4,203,578 | | ^ | | 6.344%, due 06/25/36 | | | 464,890 |
| | 1,760,342 | | ^ | | 6.354%, due 08/25/25 | | | 74,130 |
| | 3,480,323 | | ^ | | 6.454%, due 08/25/26 | | | 433,559 |
| | 8,449,893 | | ^ | | 6.494%, due 01/25/37 | | | 1,027,586 |
| | 5,040,000 | | W | | 6.500%, due 05/01/37 | | | 5,447,141 |
| | 994,375 | | | | 6.500%, due 02/01/28-12/01/33 | | | 1,095,642 |
| | 25,864,966 | | S, ^ | | 6.504%, due 10/25/35 | | | 3,103,574 |
| | 289,100 | | | | 7.000%, due 12/01/27-03/01/32 | | | 324,613 |
| | 1,728,972 | | ^ | | 7.455%, due 02/17/29 | | | 286,292 |
| | 830,948 | | | | 7.500%, due 10/01/30-01/25/48 | | | 947,157 |
| | 172,014 | | | | 27.616%, due 02/25/34 | | | 225,275 |
| | | | | | | | |
| | | | | | | | 68,909,374 |
| | | | | | | | |
| Government National Mortgage Association: 2.5% |
| | 3,967 | | | | 4.375%, due 04/20/28 | | | 4,096 |
| | 1,941,208 | | | | 4.500%, due 04/15/39 | | | 1,968,790 |
| | 36,201,414 | | ^ | | 5.000%, due 04/20/38-06/16/39 | | | 4,043,161 |
| | 2,526,000 | | | | 5.000%, due 05/15/34 | | | 2,609,674 |
| | 3,202,601 | | | | 5.500%, due 09/15/38 | | | 3,394,143 |
| | 27,842,612 | | ^ | | 5.960%, due 06/20/38-04/20/39 | | | 2,581,103 |
| | 15,255,965 | | ^ | | 6.060%, due 05/20/39 | | | 1,651,431 |
| | 12,971,203 | | ^ | | 6.160%, due 04/20/38 | | | 1,249,586 |
See Accompanying Notes to Financial Statements
61
| | |
| ING INTERMEDIATE BOND FUND | | PORTFOLIO OF INVESTMENTS ASOF MARCH 31, 2010 (CONTINUED) |
| | | | | | | | |
Principal
Amount | | | | | | Value |
| | | | | | | | |
| Government National Mortgage Association: (continued) |
| $ | 3,112,430 | | ^ | | 6.270%, due 05/16/38 | | $ | 363,096 |
| | 14,159,039 | | ^ | | 6.310%, due 01/20/38 | | | 1,200,494 |
| | 167,251 | | | | 6.500%, due 02/15/26-09/15/32 | | | 183,490 |
| | 90,919 | | | | 7.000%, due 04/15/26-05/15/32 | | | 102,098 |
| | 128,148 | | | | 7.500%, due 12/15/22-05/15/32 | | | 144,851 |
| | 469,977 | | ^ | | 8.020%, due 06/16/31 | | | 55,337 |
| | | | | | | | |
| | | | | | | | 19,551,350 |
| | | | | | | | |
| | | | | Total U.S. Government Agency Obligations
(Cost $170,815,181) | | | 178,999,199 |
| | | | | | | | |
| U.S. TREASURY OBLIGATIONS: 15.1% | | | |
| U.S. Treasury Notes: 15.1% | | | |
| | 33,991,000 | | L | | 0.875%, due 02/29/12 | | | 33,931,278 |
| | 882,000 | | S | | 1.375%, due 02/15/13 | | | 878,142 |
| | 13,462,000 | | L | | 1.375%, due 03/15/13 | | | 13,387,326 |
| | 12,187,000 | | L | | 2.375%, due 02/28/15 | | | 12,107,090 |
| | 9,366,500 | | L | | 3.625%, due 02/15/20 | | | 9,209,911 |
| | 52,864,000 | | L | | 4.375%, due 11/15/39 | | | 50,006,066 |
| | | | | | | | |
| | | | | Total U.S. Treasury Obligations
(Cost $120,145,063) | | | 119,519,813 |
| | | | | | | | |
| ASSET-BACKED SECURITIES: 6.3% | | | |
| Automobile Asset-Backed Securities: 3.3% | | | |
| | 1,376,000 | | # | | Bank of America Auto Trust,
1.390%, due 03/15/14 | | | 1,378,181 |
| | 1,305,000 | | # | | Bank of America Auto Trust,
1.670%, due 12/15/13 | | | 1,315,223 |
| | 2,317,000 | | # | | Bank of America Auto Trust,
3.030%, due 10/15/16 | | | 2,385,734 |
| | 1,401,000 | | # | | Bank of America Auto Trust,
3.520%, due 06/15/16 | | | 1,459,466 |
| | 2,008,000 | | | | CarMax Auto Owner Trust,
1.740%, due 04/15/14 | | | 2,018,402 |
| | 621,000 | | | | CarMax Auto Owner Trust,
2.400%, due 04/15/15 | | | 621,403 |
| | 1,353,000 | | | | CarMax Auto Owner Trust,
2.820%, due 12/15/14 | | | 1,359,609 |
| | 1,699,000 | | | | CarMax Auto Owner Trust,
5.810%, due 12/16/13 | | | 1,821,642 |
| | 1,372,000 | | | | Harley-Davidson Motorcycle Trust,
2.620%, due 03/15/14 | | | 1,400,807 |
| | 2,292,000 | | | | Harley-Davidson Motorcycle Trust,
3.190%, due 11/15/13 | | | 2,353,899 |
| | 1,507,000 | | | | Harley-Davidson Motorcycle Trust,
5.520%, due 11/15/13 | | | 1,579,676 |
| | 183,000 | | | | Honda Auto Receivables Owner
Trust,
1.250%, due 10/21/13 | | | 182,946 |
| | 312,000 | | | | Honda Auto Receivables Owner Trust,
1.980%, due 05/23/16 | | | 312,754 |
| | 1,029,000 | | | | Honda Auto Receivables Owner Trust,
2.310%, due 05/15/13 | | | 1,048,482 |
| | 1,607,000 | | | | Honda Auto Receivables Owner Trust,
4.880%, due 09/18/14 | | | 1,698,362 |
| | | | | | | | |
Principal
Amount | | | | | | Value |
| | | | | | | | |
| Automobile Asset-Backed Securities: (continued) |
| $ | 887,000 | | | | Hyundai Auto Receivables Trust,
2.030%, due 08/15/13 | | $ | 900,259 |
| | 1,188,000 | | | | Mercedes-Benz Auto Receivables Trust,
1.670%, due 01/15/14 | | | 1,199,834 |
| | 866,000 | | | | Mercedes-Benz Auto Receivables Trust,
2.430%, due 03/15/16 | | | 874,625 |
| | 605,250 | | | | Nissan Auto Receivables Owner Trust,
4.280%, due 06/16/14 | | | 629,436 |
| | 1,371,000 | | | | Volkswagen Auto Loan Enhanced Trust,
1.310%, due 01/20/14 | | | 1,374,117 |
| | | | | | | | |
| | | | | | | | 25,914,857 |
| | | | | | | | |
| Credit Card Asset-Backed Securities: 1.3% | | | |
| | 200,000 | | | | Chase Issuance Trust,
5.120%, due 10/15/14 | | | 216,667 |
| | 3,650,000 | | | | Chase Issuance Trust,
5.160%, due 04/16/18 | | | 3,991,288 |
| | 3,382,000 | | | | Citibank Credit Card Issuance Trust,
5.300%, due 03/15/18 | | | 3,720,231 |
| | 1,762,000 | | | | Discover Card Master Trust,
5.650%, due 03/16/20 | | | 1,933,606 |
| | | | | | | | |
| | | | | | | | 9,861,792 |
| | | | | | | | |
| Home Equity Asset-Backed Securities: 0.6% | | | |
| | 4,434,229 | | | | Ameriquest Mortgage Securities, Inc.,
1.521%, due 08/25/33 | | | 3,804,153 |
| | 277,177 | | | | Freddie Mac Structured Pass-through Securities,
0.496%, due 05/25/31 | | | 251,113 |
| | 62,239 | | | | Freddie Mac Structured Pass-through Securities,
0.546%, due 01/25/32 | | | 60,835 |
| | 40,848 | | | | Merrill Lynch Mortgage Investors Trust,
0.606%, due 07/25/34 | | | 29,753 |
| | 879,491 | | | | Morgan Stanley Capital, Inc.,
1.446%, due 06/25/33 | | | 668,652 |
| | 29,496 | | | | Renaissance Home Equity Loan Trust,
4.456%, due 05/25/35 | | | 29,231 |
| | 68,904 | | | | Residential Asset Securities Corp.,
0.846%, due 06/25/32 | | | 31,534 |
| | 14,621 | | | | Wells Fargo Home Equity Trust,
3.970%, due 05/25/34 | | | 14,598 |
| | | | | | | | |
| | | | | | | | 4,889,869 |
| | | | | | | | |
| Other Asset-Backed Securities: 1.1% | | | |
| | 26,394 | | | | Amortizing Residential Collateral Trust,
0.496%, due 05/25/32 | | | 13,857 |
| | 947,948 | | | | Bear Stearns Asset-Backed Securities, Inc.,
0.626%, due 06/25/36 | | | 602,601 |
| | 1,400,000 | | # | | Carlyle High Yield Partners,
0.620%, due 08/11/16 | | | 1,328,250 |
See Accompanying Notes to Financial Statements
62
| | |
| ING INTERMEDIATE BOND FUND | | PORTFOLIO OF INVESTMENTS ASOF MARCH 31, 2010 (CONTINUED) |
| | | | | | | | |
Principal
Amount | | | | | | Value |
| | | | | | | | |
| Other Asset-Backed Securities: (continued) | | | |
| $ | 162,884 | | | | CenterPoint Energy Transition Bond Co., LLC,
4.192%, due 02/01/20 | | $ | 173,703 |
| | 124,792 | | | | Chase Funding Mortgage Loan Asset-Backed Certificates,
0.846%, due 07/25/33 | | | 111,134 |
| | 8,963 | | | | Chase Funding Mortgage Loan Asset-Backed Certificates,
4.045%, due 05/25/33 | | | 8,867 |
| | 1,775,547 | | | | Credit-Based Asset Servicing and Securitization, LLC,
4.831%, due 08/25/35 | | | 1,737,197 |
| | 1,144,576 | | | | Credit-Based Asset Servicing and Securitization, LLC,
5.501%, due 12/25/36 | | | 833,608 |
| | 1,456,000 | | # | | Credit-Based Asset Servicing and Securitization, LLC,
5.746%, due 12/25/37 | | | 1,404,148 |
| | 1,188,000 | | # | | Credit-Based Asset Servicing and Securitization, LLC,
6.020%, due 12/25/37 | | | 886,861 |
| | 793,946 | | | | Equity One, Inc.,
5.050%, due 09/25/33 | | | 697,255 |
| | 2,720,000 | | I, X | | Hudson Mezzanine Funding,
1.004%, due 06/12/42 | | | — |
| | 683,260 | | | | Lehman XS Trust,
0.526%, due 08/25/35 | | | 474,391 |
| | 171,897 | | | | Residential Asset Mortgage Products, Inc.,
0.516%, due 07/25/35 | | | 153,275 |
| | 4,703 | | | | Residential Asset Mortgage Products, Inc.,
0.866%, due 06/25/33 | | | 2,928 |
| | 849,719 | | | | Structured Asset Securities Corp.,
4.910%, due 06/25/33 | | | 629,616 |
| | | | | | | | |
| | | | | | | | 9,057,691 |
| | | | | | | | |
| | | | | Total Asset-Backed Securities
(Cost $53,689,457) | | | 49,724,209 |
| | | | | | | | |
| COLLATERALIZED MORTGAGE OBLIGATIONS: 15.1% |
| | 178,573 | | | | ABN Amro Mortgage Corp.,
0.729%, due 03/25/18 | | | 171,456 |
| | 448,396 | | | | American Home Mortgage Assets,
1.253%, due 02/25/47 | | | 36,855 |
| | 1,940,076 | | | | American Home Mortgage Assets,
1.463%, due 09/25/46 | | | 428,543 |
| | 4,661,217 | | | | American Home Mortgage Investment Trust,
0.626%, due 11/25/45 | | | 1,335,408 |
| | 937,514 | | | | Banc of America Commercial Mortgage, Inc.,
4.161%, due 12/10/42 | | | 945,555 |
| | 1,780,000 | | | | Banc of America Commercial Mortgage, Inc.,
4.783%, due 07/10/43 | | | 1,819,141 |
| | 2,260,000 | | | | Banc of America Commercial Mortgage, Inc.,
5.179%, due 09/10/47 | | | 2,355,386 |
| | | | | | | | |
Principal
Amount | | | | | | Value |
| | | | | | | | |
| COLLATERALIZED MORTGAGE OBLIGATIONS: (continued) |
| $ | 1,660,000 | | | | Banc of America Commercial Mortgage, Inc.,
5.414%, due 06/10/39 | | $ | 1,743,134 |
| | 4,272,392 | | # | | Banc of America Funding Corp.,
5.250%, due 08/26/35 | | | 4,272,392 |
| | 647,788 | | | | Bear Stearns Alternative-A Trust,
0.566%, due 07/25/34 | | | 454,935 |
| | 73,930 | | | | Bear Stearns Commercial Mortgage Securities,
5.415%, due 04/12/38 | | | 74,404 |
| | 5,556,504 | | S | | Chase Mortgage Finance Corp.,
5.406%, due 12/25/35 | | | 4,823,023 |
| | 1,673,479 | | | | Chase Mortgage Finance Corp.,
5.500%, due 11/25/35 | | | 1,582,095 |
| | 100,191 | | | | Citicorp Mortgage Securities, Inc.,
0.696%, due 03/25/33 | | | 95,383 |
| | 3,367,000 | | | | Citigroup Commercial Mortgage Trust,
5.699%, due 12/10/49 | | | 3,359,117 |
| | 4,213,401 | | # | | Citigroup Mortgage Loan Trust, Inc.,
18.985%, due 10/25/35 | | | 4,065,932 |
| | 1,910,000 | | | | Commercial Mortgage Asset Trust,
6.975%, due 01/17/32 | | | 2,065,970 |
| | 77,407,845 | | ^ | | Commercial Mortgage Pass-through Certificates,
0.076%, due 12/10/49 | | | 608,248 |
| | 3,810,000 | | # | | Commercial Mortgage Pass-through Certificates,
0.730%, due 07/16/34 | | | 3,625,274 |
| | 930,000 | | | | Commercial Mortgage Pass-through Certificates,
4.715%, due 03/10/39 | | | 950,400 |
| | 3,820,000 | | | | Commercial Mortgage Pass-through Certificates,
5.816%, due 12/10/49 | | | 3,826,428 |
| | 25,447 | | | | Countrywide Alternative Loan Trust,
0.646%, due 02/25/33 | | | 24,058 |
| | 316,580 | | | | Countrywide Alternative Loan Trust,
0.796%, due 04/25/33 | | | 264,893 |
| | 1,152,219 | | | | Countrywide Home Loan Mortgage Pass-through Trust,
0.566%, due 04/25/35 | | | 233,547 |
| | 245,032 | | | | Credit Suisse First Boston Mortgage Securities Corp.,
3.727%, due 03/15/35 | | | 250,238 |
| | 300,000 | | | | Credit Suisse First Boston Mortgage Securities Corp.,
6.133%, due 04/15/37 | | | 318,718 |
| | 1,350,000 | | # | | Credit Suisse Mortgage Capital Certificates,
5.342%, due 12/15/43 | | | 1,285,677 |
| | 923,000 | | | | First Horizon Asset Securities, Inc.,
5.750%, due 02/25/36 | | | 855,256 |
| | 2,496,063 | | | | GMAC Mortgage Corp. Loan Trust,
5.260%, due 03/18/35 | | | 2,114,910 |
See Accompanying Notes to Financial Statements
63
| | |
| ING INTERMEDIATE BOND FUND | | PORTFOLIO OF INVESTMENTS ASOF MARCH 31, 2010 (CONTINUED) |
| | | | | | | | |
Principal
Amount | | | | | | Value |
| | | | | | | | |
| COLLATERALIZED MORTGAGE OBLIGATIONS: (continued) |
| $ | 1,514,202 | | | | GMAC Mortgage Corp. Loan Trust,
5.399%, due 11/19/35 | | $ | 1,325,636 |
| | 28,160 | | | | GMAC Mortgage Corp. Loan Trust,
5.500%, due 09/25/34 | | | 27,984 |
| | 3,525,000 | | | | Greenwich Capital Commercial Funding Corp.,
5.444%, due 03/10/39 | | | 3,434,432 |
| | 2,790,000 | | | | Greenwich Capital Commercial Funding Corp.,
5.700%, due 12/10/49 | | | 2,914,569 |
| | 3,480,000 | | | | Greenwich Capital Commercial Funding Corp.,
5.736%, due 12/10/49 | | | 3,389,535 |
| | 1,130,000 | | | | Greenwich Capital Commercial Funding Corp.,
5.886%, due 07/10/38 | | | 1,213,923 |
| | 3,990,000 | | | | Greenwich Capital Commercial Funding Corp.,
5.886%, due 07/10/38 | | | 4,074,157 |
| | 1,660,000 | | | | GS Mortgage Securities
Corp. II,
5.560%, due 11/10/39 | | | 1,646,254 |
| | 1,963,981 | | | | GSAA Trust,
5.242%, due 05/25/35 | | | 1,849,735 |
| | 1,500,000 | | # | | GSMS RR1JPA5.3739 9/17/39,
5.374%, due 05/17/45 | | | 1,561,650 |
| | 267,806 | | | | GSR Mortgage Loan Trust,
0.746%, due 06/25/35 | | | 204,799 |
| | 1,122,851 | | | | GSR Mortgage Loan Trust,
5.500%, due 07/25/35 | | | 1,009,518 |
| | 266,266 | | | | Homebanc Mortgage Trust,
1.106%, due 08/25/29 | | | 166,345 |
| | 245,915,625 | | S, ^ | | JPMorgan Chase Commercial Mortgage Securities Corp.,
0.156%, due 02/15/51 | | | 1,687,006 |
| | 610,108 | | | | JPMorgan Chase Commercial Mortgage Securities Corp.,
4.275%, due 01/12/37 | | | 628,300 |
| | 3,460,000 | | | | JPMorgan Chase Commercial Mortgage Securities Corp.,
5.180%, due 12/15/44 | | | 3,586,394 |
| | 2,660,000 | | S | | JPMorgan Chase Commercial Mortgage Securities Corp.,
5.336%, due 05/15/47 | | | 2,598,385 |
| | 3,180,000 | | | | JPMorgan Chase Commercial Mortgage Securities Corp.,
5.399%, due 05/15/45 | | | 3,181,223 |
| | 41,363 | | | | JPMorgan Chase Commercial Mortgage Securities Corp.,
5.832%, due 04/15/45 | | | 41,703 |
| | 52,245 | | | | JPMorgan Commercial Mortgage Finance Corp.,
7.371%, due 08/15/32 | | | 52,447 |
| | 3,249,582 | | | | JPMorgan Mortgage Trust,
5.290%, due 07/25/35 | | | 3,037,623 |
| | 41,577 | | | | LB-UBS Commercial Mortgage Trust,
4.310%, due 02/15/30 | | | 41,593 |
| | 2,730,000 | | | | LB-UBS Commercial Mortgage Trust,
5.197%, due 11/15/30 | | | 2,801,507 |
| | | | | | | | |
Principal
Amount | | | | | | Value |
| | | | | | | | |
| COLLATERALIZED MORTGAGE OBLIGATIONS: (continued) |
| $ | 2,130,000 | | | | LB-UBS Commercial Mortgage Trust,
5.223%, due 06/15/29 | | $ | 2,191,332 |
| | 1,235,000 | | | | LB-UBS Commercial Mortgage Trust,
5.372%, due 09/15/39 | | | 1,258,265 |
| | 2,940,000 | | | | LB-UBS Commercial Mortgage Trust,
5.424%, due 02/15/40 | | | 2,853,288 |
| | 3,230,000 | | | | LB-UBS Commercial Mortgage Trust,
5.883%, due 06/15/38 | | | 3,398,452 |
| | 4,502,501 | | # | | LVII Resecuritization Trust,
5.728%, due 11/27/37 | | | 4,561,596 |
| | 17,858 | | | | MASTR Alternative Loans Trust,
6.500%, due 05/25/33 | | | 15,794 |
| | 136,920 | | | | MASTR Alternative Loans Trust,
8.500%, due 05/25/33 | | | 131,399 |
| | 61,186,792 | | #, ^ | | Merrill Lynch Mortgage Trust,
0.365%, due 08/12/43 | | | 1,189,459 |
| | 2,610,000 | | S | | Merrill Lynch Mortgage Trust,
4.747%, due 06/12/43 | | | 2,650,698 |
| | 435,622 | | | | MLCC Mortgage Investors, Inc.,
0.566%, due 10/25/28 | | | 386,747 |
| | 229,285 | | | | MLCC Mortgage Investors, Inc.,
0.566%, due 01/25/29 | | | 191,292 |
| | 310,000 | | | | Morgan Stanley Capital I,
5.731%, due 07/12/44 | | | 320,421 |
| | 327,441 | | | | Sequoia Mortgage Trust,
0.510%, due 01/20/35 | | | 273,191 |
| | 154,904 | | | | Structured Adjustable Rate Mortgage Loan Trust,
5.500%, due 11/25/34 | | | 142,207 |
| | 662,689 | | | | Structured Asset Mortgage Investments, Inc.,
0.477%, due 04/19/35 | | | 336,208 |
| | 1,860,000 | | | | Wachovia Bank Commercial Mortgage Trust,
5.308%, due 11/15/48 | | | 1,849,690 |
| | 787,841 | | | | Wachovia Bank Commercial Mortgage Trust,
5.506%, due 03/15/45 | | | 798,661 |
| | 1,975,000 | | | | Wachovia Bank Commercial Mortgage Trust,
5.558%, due 03/15/45 | | | 2,080,335 |
| | 4,244,386 | | | | WaMu Mortgage Pass-Through Certificates,
5.229%, due 01/25/36 | | | 3,839,775 |
| | 348,710 | | | | Washington Mutual Mortgage Pass-through Certificates,
0.746%, due 01/25/18 | | | 285,463 |
| | 1,337,212 | | | | Washington Mutual Mortgage Pass-through Certificates,
6.000%, due 06/25/34 | | | 1,309,049 |
| | 5,555,609 | | S | | Wells Fargo Mortgage-Backed Securities Trust,
3.000%, due 10/25/35 | | | 4,856,469 |
| | | | | | | | |
| | | | | Total Collateralized Mortgage Obligations
(Cost $119,286,131) | | | 119,380,885 |
| | | | | | | | |
See Accompanying Notes to Financial Statements
64
| | |
| ING INTERMEDIATE BOND FUND | | PORTFOLIO OF INVESTMENTS ASOF MARCH 31, 2010 (CONTINUED) |
| | | | | | | | |
Principal
Amount | | | | | | Value |
| | | | | | | | |
| MUNICIPAL BONDS: 0.0% |
| California: 0.0% |
| $ | 308,000 | | S | | State of California,
7.625%, due 03/01/40 | | $ | 320,988 |
| | | | | | | | |
| | | | | Total Municipal Bonds
(Cost $313,240) | | | 320,988 |
| | | | | | | | |
| OTHER BONDS: 3.2% |
| Foreign Government Bonds: 3.2% |
| | BRL 36,185,000 | | S | | Brazil Notas do Tesouro Nacional Series F,
10.000%, due 01/01/12 | | | 20,317,501 |
| $ | 4,515,000 | | S, ^^ | | Deutsche Bank AG, London-Republic of Indonesia Government International Bond Credit Linked Notes, 13.150%, due 01/25/12 | | | 4,614,962 |
| | | | | | | | |
| | | | | Total Other Bonds
(Cost $23,749,720) | | | 24,932,463 |
| | | | | | | | |
| | | |
| Shares | | | | | | Value |
| PREFERRED STOCK: 0.3% | | | |
| Diversified Financial Services: 0.3% | | | |
| | 71,275 | | P | | Citigroup Capital XII,
8.500%, due 03/30/40 | | | 1,829,629 |
| | 34,000 | | P | | JPMorgan Chase Capital XXIX,
6.700%, due 04/02/40 | | | 840,140 |
| | | | | | | | |
| | | | | Total Preferred Stock
(Cost $2,631,875) | | | 2,669,769 |
| | | | | | | | |
| | | | | Total Long-Term Investments
(Cost $775,746,573) | | | 799,353,000 |
| | | | | | | | |
| SHORT-TERM INVESTMENTS: 14.2% | | | |
| Affiliated Mutual Fund: 5.4% | | | |
| | 42,956,000 | | | | ING Institutional Prime Money Market Fund - Class I | | | 42,956,000 |
| | | | | | | | |
| | | | | Total Mutual Fund
(Cost $42,956,000) | | | 42,956,000 |
| | | | | | | | |
| Securities Lending Collateralcc: 8.8% | | | |
| | 66,687,244 | | | | Bank of New York Mellon Corp. Institutional Cash Reserves, Series A(1) | | | 66,687,244 |
| | 3,329,856 | | I | | Bank of New York Mellon Corp. Institutional Cash Reserves, Series B(1)(2) | | | 2,663,885 |
| | | | | | | | |
| | | | | Total Securities Lending Collateral
(Cost $70,017,100) | | | 69,351,129 |
| | | | | | | | |
| | | | | Total Short-Term Investments
(Cost $112,973,100) | | | 112,307,129 |
| | | | | | | | |
| | | | | | | | | | | |
| | | | Total Investments in Securities
(Cost $888,719,673)* | | 115.2 | % | | $ | 911,660,129 | |
| | | | Other Assets and
Liabilities - Net | | (15.2 | ) | | | (120,594,844 | ) |
| | | | | | | | | | | |
| | | | Net Assets | | 100.0 | % | | $ | 791,065,285 | |
| | | | | | | | | | | |
| @ | Non-income producing security |
| MASTR | Mortgage Asset Securitization Transaction, Inc. |
| # | Securities with purchases pursuant to Rule 144A or section 4(2), under the Securities Act of 1933 and may not be resold subject to that rule except to qualified institutional buyers. Unless otherwise noted, these securities have been determined to be liquid under the guidelines established by the Funds’ Board of Directors/Trustees. |
| P | Preferred Stock may be called prior to convertible date. |
| cc | Securities purchased with cash collateral for securities loaned. |
| (1) | Collateral received from brokers for securities lending was invested in these short-term investments. |
| (2) | On September 12, 2008, BNY established a separate sleeve of the Institutional Cash Reserves Fund (Series B) to hold certain Lehman Brothers defaulted debt obligations. The Fund’s position in Series B is being fair valued daily. Please see the accompanying Notes to Financial Statements for additional details on securities lending. |
| ## | On September 7, 2008, the Federal Housing Finance Agency placed the Federal National Mortgage Association and the Federal Home Loan Mortgage Corporation into conservatorship and the U.S. Treasury guaranteed the debt issued by those organizations. |
| W | Settlement is on a when-issued or delayed-delivery basis. |
| S | All or a portion of this security has been identified by the Fund to cover future collateral requirements for applicable futures, options, swaps, foreign currency contracts and/or when-issued or delayed-delivery securities. |
| L | Loaned security, a portion or all of the security is on loan at March 31, 2010. |
| X | Fair value determined by ING Funds Valuation Committee appointed by the Funds’ Board of Directors/Trustees. |
| ^ | Interest only securities represent the right to receive the monthly interest payments on an underlying pool of mortgage loans. Principal amount shown represents the notional amount on which current interest is calculated. Payments of principal on the pool reduce the value of the interest only security. |
| * | Cost for federal income tax purposes is $892,683,933. |
| | | | |
Net unrealized appreciation consists of: | | | | |
Gross Unrealized Appreciation | | $ | 41,457,986 | |
Gross Unrealized Depreciation | | | (19,151,934 | ) |
| | | | |
Net Unrealized Appreciation | | $ | 22,306,052 | |
| | | | |
See Accompanying Notes to Financial Statements
65
| | |
| ING INTERMEDIATE BOND FUND | | PORTFOLIO OF INVESTMENTS ASOF MARCH 31, 2010 (CONTINUED) |
Fair Value Measurements^
The following is a summary of the fair valuations according to the inputs used as of March 31, 2010 in valuing the Fund’s assets and liabilities:
| | | | | | | | | | | | | | | |
| | | Quoted Prices in Active Markets for Identical Investments (Level 1) | | | Significant Other Observable Inputs (Level 2) | | | Significant Unobservable Inputs (Level 3) | | Fair Value at 03/31/2010 | |
Asset Table | | | | | | | | | | | | | | | |
Investments, at value | | | | | | | | | | | | | | | |
Preferred Stock | | $ | — | | | $ | 2,669,769 | | | $ | — | | $ | 2,669,769 | |
Corporate Bonds/Notes | | | — | | | | 303,293,674 | | | | 512,000 | | | 303,805,674 | |
U.S. Government Agency Obligations | | | — | | | | 178,999,199 | | | | — | | | 178,999,199 | |
U.S. Treasury Obligations | | | — | | | | 119,519,813 | | | | — | | | 119,519,813 | |
Asset-Backed Securities | | | — | | | | 49,710,352 | | | | 13,857 | | | 49,724,209 | |
Collateralized Mortgage Obligations | | | — | | | | 103,633,638 | | | | 15,747,247 | | | 119,380,885 | |
Municipal Bonds | | | — | | | | 320,988 | | | | — | | | 320,988 | |
Other Bonds | | | — | | | | 20,317,501 | | | | 4,614,962 | | | 24,932,463 | |
Short-Term Investments | | | 109,643,244 | | | | — | | | | 2,663,885 | | | 112,307,129 | |
| | | | | | | | | | | | | | | |
Total Investments, at value | | $ | 109,643,244 | | | $ | 778,464,934 | | | $ | 23,551,951 | | $ | 911,660,129 | |
| | | | | | | | | | | | | | | |
Other Financial Instruments+: | | | | | | | | | | | | | | | |
Forward foreign currency contracts | | | — | | | | 106,751 | | | | — | | | 106,751 | |
Futures | | | 275,875 | | | | — | | | | — | | | 275,875 | |
Swaps, at value | | | — | | | | 1,542,329 | | | | — | | | 1,542,329 | |
| | | | | | | | | | | | | | | |
Total Assets | | $ | 109,919,119 | | | $ | 780,114,014 | | | $ | 23,551,951 | | $ | 913,585,084 | |
| | | | | | | | | | | | | | | |
Liabilities Table | | | | | | | | | | | | | | | |
Other Financial Instruments+: | | | | | | | | | | | | | | | |
Forward foreign currency contracts | | $ | — | | | $ | (176,353 | ) | | $ | — | | $ | (176,353 | ) |
Futures | | | (477,034 | ) | | | — | | | | — | | | (477,034 | ) |
Swaps, at value | | | — | | | | (2,954,918 | ) | | | — | | | (2,954,918 | ) |
| | | | | | | | | | | | | | | |
Total Liabilities | | $ | (477,034 | ) | | $ | (3,131,271 | ) | | $ | — | | $ | (3,608,305 | ) |
| | | | | | | | | | | | | | | |
The following is a reconciliation of the fair valuations using significant unobservable inputs (Level 3) for the Fund’s assets and liabilities during the period ended March 31, 2010:
| | | | | | | | | | | | | | | | | | | | | | | | | | | | | | | | |
| | | Beginning Balance 3/31/2009 | | Purchases | | Sales | | | Accrued Discounts/ (Premiums) | | | Total Realized Gain/(Loss) | | | Total Unrealized Appreciation/ (Depreciation) | | | Transfers Into Level 3 | | Transfers Out of Level 3 | | | Ending Balance 03/31/2010 |
Asset Table | | | | | | | | | | | | | | | | | | | | | | | | | | | | | | | | |
Investments, at value | | | | | | | | | | | | | | | | | | | | | | | | | | | | | | | | |
Corporate Bonds/Notes | | $ | 4,124,352 | | $ | — | | $ | (1,314,632 | ) | | $ | (450,940 | ) | | $ | (780,811 | ) | | $ | 829,251 | | | $ | 512,000 | | $ | (2,407,220 | ) | | $ | 512,000 |
Asset-Backed Securities | | | 1,360 | | | — | | | — | | | | — | | | | — | | | | (1,360 | ) | | | 13,857 | | | — | | | | 13,857 |
Collateralized Mortgage Obligations | | | 224,602 | | | 16,300,091 | | | (2,067,499 | ) | | | 19,404 | | | | (79,989 | ) | | | 1,431,778 | | | | — | | | (81,140 | ) | | | 15,747,247 |
Other Bonds | | | — | | | 4,515,000 | | | — | | | | — | | | | — | | | | 99,962 | | | | — | | | — | | | | 4,614,962 |
Short-Term Investments | | | — | | | — | | | — | | | | — | | | | — | | | | - | | | | 2,663,885 | | | — | | | | 2,663,885 |
| | | | | | | | | | | | | | | | | | | | | | | | | | | | | | | | |
Total Investments, at value | | $ | 4,350,314 | | $ | 20,815,091 | | $ | (3,382,131 | ) | | $ | (431,536 | ) | | $ | (860,800 | ) | | $ | 2,359,631 | | | $ | 3,189,742 | | $ | (2,488,360 | ) | | $ | 23,551,951 |
| | | | | | | | | | | | | | | | | | | | | | | | | | | | | | | | |
As of March 31, 2010, total change in unrealized gain (loss) on Level 3 securities still held at year end and included in the change in net assets was $1,406,875.
| ^ | See Note 2, “Significant Accounting Policies” in the Notes to Financial Statements for additional information. |
| + | Other Financial Instruments are derivatives not reflected in the Portfolio of Investments and may include open forward foreign currency contracts, futures, swaps, and written options. Forward foreign currency contracts and futures are reported at their unrealized gain/loss at measurement date which represents the amount due to/from the Fund. Swaps and written options are reported at their market value at measurement date. |
See Accompanying Notes to Financial Statements
66
| | |
| ING INTERMEDIATE BOND FUND | | PORTFOLIO OF INVESTMENTS ASOF MARCH 31, 2010 (CONTINUED) |
Transfers in or out of Level 3 represents either the beginning value (for transfers in), or the ending value (for transfers out) of any security or derivative instrument where a change in the pricing level occurred from the beginning to the end of the period.
At March 31, 2010 the following forward foreign currency contracts were outstanding for the ING Intermediate Bond Fund:
| | | | | | | | | | | | | | | | |
Currency | | | | Buy/Sell | | Settlement Date | | In Exchange For | | Value | | Unrealized
Appreciation
(Depreciation) | |
Indian Rupee INR | | 221,877,202 | | BUY | | 4/9/10 | | $ | 4,841,837 | | $ | 4,938,307 | | $ | 96,470 | |
| | | | | | | | | | | | | | | | |
| | | | | | | | | | | | | | $ | 96,470 | |
| | | | | | | | | | | | | | | | |
Brazilian Real BRL | | 29,161,412 | | SELL | | 4/9/10 | | $ | 16,250,439 | | $ | 16,367,638 | | $ | (117,199 | ) |
Brazilian Real BRL | | 6,999,248 | | SELL | | 4/9/10 | | | 3,938,800 | | | 3,928,519 | | | 10,281 | |
Indonesian Rupiah IDR | | 43,126,857,857 | | SELL | | 4/9/10 | | | 4,672,466 | | | 4,731,620 | | | (59,154 | ) |
| | | | | | | | | | | | | | | | |
| | | | | | | | | | | | | | $ | (166,072 | ) |
| | | | | | | | | | | | | | | | |
ING Intermediate Bond Fund Open Futures Contracts on March 31, 2010:
| | | | | | | | | | | |
Contract Description | | Number
of
Contracts | | Expiration Date | | Market Value | | Unrealized
Appreciation/
(Depreciation) | |
Long Contracts | | | | | | | | | | | |
Euro-Bund | | 156 | | 06/08/10 | | $ | 25,990,167 | | $ | 147,417 | |
Euro-Schatz | | 641 | | 06/08/10 | | | 94,131,021 | | | 111,504 | |
U.S. Treasury 5-Year Note | | 458 | | 06/30/10 | | | 52,598,437 | | | (48,340 | ) |
| | | | | | | | | | | |
| | | | | | $ | 172,719,625 | | $ | 210,581 | |
| | | | | | | | | | | |
Short Contracts | | | | | | | | | | | |
Euro-Bobl 5-Year | | 222 | | 06/08/10 | | $ | 35,105,973 | | $ | (77,240 | ) |
U.S. Treasury 2-Year Note | | 296 | | 06/30/10 | | | 64,218,124 | | | (19,239 | ) |
U.S. Treasury 10-Year Note | | 156 | | 06/21/10 | | | 18,135,000 | | | 16,954 | |
U.S. Treasury Long Bond | | 436 | | 06/21/10 | | | 50,630,500 | | | (332,215 | ) |
| | | | | | | | | | | |
| | | | | | $ | 168,089,597 | | $ | (411,740 | ) |
| | | | | | | | | | | |
ING Intermediate Bond Fund Credit Default Swap Agreements Outstanding on March 31, 2010:
Credit Default Swaps on Corporate and Sovereign Issues — Buy Protection(1)
| | | | | | | | | | | | | | | | | | | | | | | | |
Counterparty | | Reference Entity/Obligation | | Buy/Sell Protection | | (Pay)/Receive Fixed Rate (%) | | | Termination Date | | | | Notional Amount(4) | | Market Value(5) | | | Upfront Premium Paid /(Received) | | Unrealized Appreciation/ (Depreciation) | |
Morgan Stanley Capital Services Inc. | | Domtar Inc. 7.875%, 10/15/11 | | Buy | | (2.650 | ) | | 09/20/11 | | USD | | 1,287,500 | | $ | (36,732 | ) | | $ | — | | $ | (36,732 | ) |
Citibank N.A., New York | | MBIA Inc. 6.625%, 10/01/28 | | Buy | | (5.000 | ) | | 09/20/13 | | USD | | 640,000 | | | 137,152 | | | | 150,281 | | | (13,129 | ) |
Citibank N.A., New York | | MBIA Inc. 6.625%, 10/01/28 | | Buy | | (5.000 | ) | | 09/20/13 | | USD | | 1,311,000 | | | 280,948 | | | | 295,451 | | | (14,503 | ) |
JPMorgan Chase Bank, N.A. New York | | MBIA Inc. 6.625%, 10/01/28 | | Buy | | (5.000 | ) | | 09/20/13 | | USD | | 5,079,000 | | | 1,088,434 | | | | 622,908 | | | 465,526 | |
| | | | | | | | | | | | | | | | | | | | | | | | |
| | | | | | | | | | | | | | | $ | 1,469,802 | | | $ | 1,068,640 | | $ | 401,162 | |
| | | | | | | | | | | | | | | | | | | | | | | | |
See Accompanying Notes to Financial Statements
67
| | |
| ING INTERMEDIATE BOND FUND | | PORTFOLIO OF INVESTMENTS ASOF MARCH 31, 2010 (CONTINUED) |
Credit Default Swaps on Corporate and Sovereign Issues — Sell Protection(2)
| | | | | | | | | | | | | | | | | | | | | | | | | | |
Counterparty | | Reference Entity /Obligation | | Buy/Sell Protection | | (Pay)/Receive Fixed Rate (%) | | Termination Date | | Implied Credit Spread at 03/31/10 (%)(3) | | | | Notional Amount(4) | | Market Value(5) | | | Upfront Premium Paid /(Received) | | | Unrealized Appreciation/ (Depreciation) | |
UBS AG | | Domtar Inc. 7.875%, 10/15/11 | | Sell | | 2.600 | | 09/20/11 | | 0.72 | | USD | | 1,288,000 | | $ | 35,795 | | | $ | — | | | $ | 35,795 | |
Citibank N.A., New York | | MBIA Global Funding LLC, FRN, 10/06/10 | | Sell | | 5.000 | | 09/20/13 | | 34.32 | | USD | | 1,311,000 | | | (663,846 | ) | | | (373,659 | ) | | | (290,187 | ) |
Citibank N.A., New York | | MBIA Global Funding LLC, FRN, 10/06/10 | | Sell | | 5.000 | | 09/20/13 | | 34.32 | | USD | | 641,000 | | | (324,580 | ) | | | (167,476 | ) | | | (157,104 | ) |
Goldman Sachs International | | MBIA Global Funding LLC, FRN, 10/06/10 | | Sell | | 5.000 | | 09/20/13 | | 34.32 | | USD | | 1,271,000 | | | (643,591 | ) | | | (327,874 | ) | | | (315,717 | ) |
JPMorgan Chase Bank, N.A. New York | | MBIA Global Funding LLC, FRN, 10/06/10 | | Sell | | 5.000 | | 09/20/13 | | 34.32 | | USD | | 2,540,000 | | | (1,286,169 | ) | | | (328,821 | ) | | | (957,348 | ) |
| | | | | | | | | | | | | | | | | | | | | | | | | | |
| | | | | | | | | | | | | | | | $ | (2,882,391 | ) | | $ | (1,197,830 | ) | | $ | (1,684,561 | ) |
| | | | | | | | | | | | | | | | | | | | | | | | | | |
| (1) | If a Fund is a buyer of protection and a credit event occurs, as defined under the terms of that particular swap agreement, a Fund will either 1.) receive from the seller of protection an amount equal to the notional amount of the swap and deliver the referenced obligation, other deliverable obligations or underlying securities comprising the referenced index or 2.) receive a net settlement amount in the form of cash or securities equal to the notional amount of the swap less the recovery value of the referenced obligation or underlying securities comprising the referenced index. |
| (2) | If the Fund is a seller of protection, and a credit event occurs, as defined under the terms of that particular swap agreement, the Fund will generally either 1.) Pay to the buyer an amount equal to the notional amount of the swap and take delivery of the referenced obligation, other deliverable obligations, or underlying securities comprising a referenced index or 2.) Pay a net settlement amount in the form of cash or securities equal to the notional amount of the swap less the recovery value of the referenced obligation or underlying securities comprising a referenced index. |
| (3) | Implied credit spreads, represented in absolute terms, utilized in determining the market value of credit default swap agreements on corporate issues or sovereign issues are disclosed in each Fund’s Portfolio of Investments and serve as an indicator of the current status of the payment/performance risk and represent the likelihood or risk of default for the credit derivative. The implied credit spread of a particular referenced entity reflects the cost of buying/selling protection and may include upfront payments required to be made to enter into the agreement. For credit default swaps on asset-backed securities or credit indices, the quoted market prices and resulting market values serve as the indicator of the current status of the payment/performance risk. Wider credit spreads and increasing market values, in absolute terms when compared to the notional amount of the swap, represent a deterioration of the referenced entity’s credit soundness and a greater likelihood or risk of default or other credit event occurring as defined under the terms of the agreement. |
| (4) | The maximum amount of future payments (undiscounted) that a Fund as seller of protection could be required to make or receive as a buyer of credit protection under a credit default swap agreement would be an amount equal to the notional amount of the agreement. |
| (5) | The market values for credit default swap agreements serve as an indicator of the current status of the payment/performance risk and represent the likelihood or risk of default for the credit derivative. Increasing market values, in absolute terms, when compared to the notional amount of the agreement, represent a deterioration of the referenced obligation’s credit soundness and a greater likelihood or risk of default or other credit event occurring. |
See Accompanying Notes to Financial Statements
68
| | |
| ING INTERMEDIATE BOND FUND | | PORTFOLIO OF INVESTMENTS ASOF MARCH 31, 2010 (CONTINUED) |
A summary of derivative instruments by primary risk exposure is outlined in the following tables.
The fair value of derivative instruments as of March 31, 2010 was as follows:
| | | | | |
Derivatives not accounted for as hedging
instruments under FASB ASC 815 | | Location on Statement of Assets and Liabilities | | Fair Value |
Asset Derivatives | | | | | |
Interest rate contracts | | Net Assets- Unrealized appreciation* | | $ | 275,875 |
Foreign exchange contracts | | Unrealized appreciation on forward foreign currency contracts | | | 106,751 |
Credit contracts | | Unrealized appreciation on swap agreements, net of upfront payments | | | 1,542,329 |
| | | | | |
Total Asset Derivatives | | | | $ | 1,924,955 |
| | | | | |
| | |
Liability Derivatives | | | | | |
Interest rate contracts | | Net Assets- Unrealized depreciation* | | $ | 477,034 |
Foreign exchange contracts | | Unrealized depreciation on forward foreign currency contracts | | | 176,353 |
Credit contracts | | Unrealized depreciation on swap agreements, net of upfront payments | | | 2,954,918 |
| | | | | |
Total Liability Derivatives | | | | $ | 3,608,305 |
| | | | | |
| * | Includes cumulative appreciation/depreciation of futures contracts as reported in the table following the Portfolio of Investments. |
The effect of derivative instruments on the Fund’s Statement of Operations for the year ended March 31, 2010 was as follows:
| | | | | | | | | | | | | | | | | | | | | |
| | | Amount of Realized Gain or (Loss) on Derivatives Recognized in Income | |
Derivatives not accounted for as hedging
instruments under FASB ASC 815 | | Investments* | | | Forward Foreign Currency Contracts | | Futures | | Swaps | | | Written options | | Total | |
Foreign exchange contracts | | $ | — | | | $ | 678,672 | | $ | — | | $ | — | | | $ | — | | $ | 678,672 | |
Interest rate contracts | | | — | | | | — | | | 3,258,541 | | | — | | | | — | | | 3,258,541 | |
Credit contracts | | | (2,314,500 | ) | | | — | | | — | | | 468,460 | | | | 1,410,100 | | | (435,940 | ) |
| | | | | | | | | | | | | | | | | | | | | |
Total | | $ | (2,314,500 | ) | | $ | 678,672 | | $ | 3,258,541 | | $ | 468,460 | | | $ | 1,410,100 | | $ | 3,501,273 | |
| | | | | | | | | | | | | | | | | | | | | |
| |
| | | Change in Unrealized Appreciation or (Depreciation) on
Derivatives Recognized in Income | |
Derivatives not accounted for as hedging
instruments under FASB ASC 815 | | Investments* | | | Forward Foreign Currency Contracts | | Futures | | Swaps | | | Written options | | Total | |
Foreign exchange contracts | | $ | — | | | $ | 1,203,506 | | $ | — | | $ | — | | | $ | — | | $ | 1,203,506 | |
Interest rate contracts | | | — | | | | — | | | 1,806,714 | | | — | | | | — | | | 1,806,714 | |
Credit contracts | | | — | | | | — | | | — | | | (299,199 | ) | | | — | | | (299,199 | ) |
| | | | | | | | | | | | | | | | | | | | | |
Total | | $ | — | | | $ | 1,203,506 | | $ | 1,806,714 | | $ | (299,199 | ) | | $ | — | | $ | 2,711,021 | |
| | | | | | | | | | | | | | | | | | | | | |
| * | Amounts recognized for purchased options are included in net realized gain (loss) on investments and net change in unrealized appreciation or depreciation on investments. |
See Accompanying Notes to Financial Statements
69
| | |
| ING CLASSIC MONEY MARKET FUND(1) | | PORTFOLIO OF INVESTMENTS ASOF MARCH 31, 2010 |
| | | | | | | | |
Principal
Amount | | | | | | Value |
| | | | | | | | |
| CERTIFICATES OF DEPOSIT: 5.0% |
| $ | 19,000,000 | | | | BNP Paribas,
0.600%, due 04/20/10 | | $ | 19,003,952 |
| | 8,000,000 | | | | Natixis,
0.280%, due 04/05/10 | | | 8,000,000 |
| | 15,000,000 | | | | Societe Generale,
1.250%, due 04/19/10 | | | 15,007,856 |
| | | | | | | | |
| | | | | Total Certificates of Deposit
(Cost $42,011,808) | | | 42,011,808 |
| | | | | | | | |
| COMMERCIAL PAPER: 53.9% |
| | 15,000,000 | | | | Barclays PLC,
0.130%, due 04/01/10 | | | 15,000,000 |
| | 3,250,000 | | # | | Barton Capital, LLC,
0.180%, due 04/20/10 | | | 3,249,691 |
| | 4,750,000 | | # | | Barton Capital, LLC,
0.180%, due 04/09/10 | | | 4,749,810 |
| | 7,023,000 | | # | | Barton Capital, LLC,
0.180%, due 04/22/10 | | | 7,022,263 |
| | 12,250,000 | | # | | Barton Capital, LLC,
0.190%, due 04/06/10 | | | 12,249,677 |
| | 4,129,000 | | # | | Barton Capital, LLC,
0.200%, due 04/01/10 | | | 4,129,000 |
| | 500,000 | | | | BNP Paribas,
0.300%, due 04/08/10 | | | 499,971 |
| | 9,000,000 | | # | | Cafco, LLC,
0.180%, due 04/29/10 | | | 8,998,740 |
| | 250,000 | | # | | Cafco, LLC,
0.250%, due 04/14/10 | | | 249,977 |
| | 1,250,000 | | # | | Ciesco L.P.,
0.190%, due 04/20/10 | | | 1,249,875 |
| | 18,750,000 | | # | | Ciesco L.P.,
0.200%, due 04/06/10 | | | 18,749,529 |
| | 10,250,000 | | # | | Ciesco L.P.,
0.230%, due 04/23/10 | | | 10,248,559 |
| | 3,000,000 | | # | | Concord Minutemen Capital Co., LLC,
0.320%, due 04/19/10 | | | 2,999,520 |
| | 8,750,000 | | # | | Concord Minutemen Capital Co., LLC,
0.330%, due 04/22/10 | | | 8,748,316 |
| | 12,500,000 | | # | | Concord Minutemen Capital Co., LLC,
0.400%, due 04/28/10 | | | 12,496,250 |
| | 2,250,000 | | # | | Concord Minutemen Capital Co., LLC,
0.551%, due 07/12/10 | | | 2,246,494 |
| | 3,000,000 | | # | | Concord Minutemen Capital Co., LLC,
0.900%, due 05/03/10 | | | 2,997,600 |
| | 3,750,000 | | # | | Crown Point Capital Co.,
0.320%, due 04/19/10 | | | 3,749,400 |
| | 9,000,000 | | # | | Crown Point Capital Co.,
0.350%, due 04/21/10 | | | 8,998,250 |
| | 17,500,000 | | # | | Crown Point Capital Co.,
0.400%, due 04/22/10 | | | 17,496,274 |
| | 16,000,000 | | # | | Danske Corp.,
0.205%, due 04/21/10 | | | 15,998,178 |
| | 15,500,000 | | | | Dexia Del, LLC,
0.230%, due 04/21/10 | | | 15,498,020 |
| | 26,000,000 | | # | | Edison Asset Securities, LLC,
0.320%, due 04/21/10 | | | 25,996,619 |
| | 30,250,000 | | # | | Jupiter,
0.190%, due 04/19/10 | | | 30,247,058 |
| | 900,000 | | # | | Jupiter,
0.200%, due 04/20/10 | | | 899,905 |
| | 8,000,000 | | | | Natixis,
0.200%, due 04/22/10 | | | 7,999,067 |
| | 5,500,000 | | # | | Old Line Funding, LLC,
0.170%, due 04/05/10 | | | 5,499,896 |
| | | | | | | | |
Principal
Amount | | | | | | Value |
| | | | | | | | |
| COMMERCIAL PAPER: (continued) |
| $ | 19,250,000 | | # | | Old Line Funding, LLC,
0.180%, due 04/20/10 | | $ | 19,248,080 |
| | 5,500,000 | | # | | Old Line Funding, LLC,
0.200%, due 04/22/10 | | | 5,499,358 |
| | 7,250,000 | | # | | Park Avenue Receivables Corp.,
0.160%, due 04/06/10 | | | 7,249,839 |
| | 7,000,000 | | # | | Park Avenue Receivables Corp.,
0.170%, due 04/07/10 | | | 6,999,802 |
| | 11,500,000 | | # | | Park Avenue Receivables Corp.,
0.190%, due 04/16/10 | | | 11,499,090 |
| | 4,500,000 | | # | | Park Avenue Receivables Corp.,
0.190%, due 04/21/10 | | | 4,499,531 |
| | 11,000,000 | | # | | Thunder Bay Funding, LLC,
0.180%, due 04/20/10 | | | 10,998,955 |
| | 20,500,000 | | # | | Thunder Bay Funding, LLC,
0.180%, due 04/14/10 | | | 20,498,668 |
| | 4,003,000 | | # | | Tulip Funding Corp.,
0.190%, due 04/09/10 | | | 4,002,831 |
| | 23,000,000 | | # | | Tulip Funding Corp.,
0.190%, due 04/13/10 | | | 22,998,543 |
| | 6,000,000 | | # | | Tulip Funding Corp.,
0.200%, due 04/15/10 | | | 5,999,526 |
| | 4,250,000 | | # | | Variable Funding Capital Corp.,
0.180%, due 04/20/10 | | | 4,249,596 |
| | 10,750,000 | | # | | Variable Funding Capital Corp.,
0.180%, due 04/14/10 | | | 10,749,301 |
| | 20,000,000 | | # | | Variable Funding Capital Corp.,
0.190%, due 04/22/10 | | | 19,997,783 |
| | 16,750,000 | | # | | Windmill Funding Corp.,
0.180%, due 04/23/10 | | | 16,748,158 |
| | 15,000,000 | | # | | Windmill Funding Corp.,
0.210%, due 04/21/10 | | | 14,998,250 |
| | 7,500,000 | | # | | Yorkstown Capital, LLC,
0.170%, due 04/05/10 | | | 7,499,858 |
| | 3,000,000 | | # | | Yorkstown Capital, LLC,
0.200%, due 04/12/10 | | | 2,999,817 |
| | 5,250,000 | | # | | Yorkstown Capital, LLC,
0.210%, due 04/23/10 | | | 5,249,326 |
| | | | | | | | |
| | | | | Total Commercial Paper
(Cost $450,254,251) | | | 450,254,251 |
| | | | | | | | |
| CORPORATE BONDS/NOTES: 2.5% |
| | 13,000,000 | | #, C | | Commonwealth Bank of Australia,
0.640%, due 01/05/11 | | | 13,000,000 |
| | 4,250,000 | | | | Credit Suisse USA, Inc.,
0.450%, due 08/15/10 | | | 4,251,656 |
| | 1,342,000 | | | | Credit Suisse USA, Inc.,
4.875%, due 08/15/10 | | | 1,360,649 |
| | 2,426,000 | | | | Royal Bank of Canada,
0.272%, due 06/08/10 | | | 2,426,403 |
| | | | | | | | |
| | | | | Total Corporate Bonds/Notes (Cost $21,038,708) | | | 21,038,708 |
| | | | | | | | |
| U.S. GOVERNMENT AGENCY OBLIGATIONS: 2.3% |
| | 2,500,000 | | | | Freddie Mac,
3.250%, due 07/16/10 | | | 2,519,386 |
| | 16,000,000 | | | | Freddie Mac,
4.125%, due 07/12/10 | | | 16,158,472 |
| | | | | | | | |
| | | | | Total U.S. Government Agency Obligations
(Cost $18,677,858) | | | 18,677,858 |
| | | | | | | | |
See Accompanying Notes to Financial Statements
70
| | |
| ING CLASSIC MONEY MARKET FUND(1) | | PORTFOLIO OF INVESTMENTS ASOF MARCH 31, 2010 (CONTINUED) |
| | | | | | | | | |
Principal
Amount | | | | | | | Value |
| | | | | | | | | |
| REPURCHASE AGREEMENTS: 31.6% |
| $ | 213,299,000 | | Goldman Sachs Repurchase Agreement dated 03/31/10, 0.005%, due 04/01/10, $213,299,030 to be received upon repurchase (Collateralized by $212,415,000 various U.S. Government Agency Obligations, 1.625%-6.875%, Market Value plus accrued interest $217,565,103, due 09/15/10-03/20/13) | | | | | $ | 213,299,000 |
| | 50,000,000 | | Morgan Stanley Repurchase Agreement dated 03/31/10, 0.010%, due 04/01/10, $50,000,014 to be received upon repurchase (Collateralized by $50,950,000 various U.S. Government Agency Obligations, Discount Note-1.550%, Market Value $51,009,641, due 05/17/10 - 05/24/12) | | | | | | 50,000,000 |
| | | | | | | | | |
| | | Total Repurchase Agreement
(Cost $263,299,000) | | | | | | 263,299,000 |
| | | | | | | | | |
| | | Total Investments in Securities
(Cost $795,281,625)* | | 95.3 | % | | $ | 795,281,625 |
| | | Other Assets and Liabilities - Net | | 4.7 | | | | 39,495,045 |
| | | | | | | | | |
| | | Net Assets | | 100.0 | % | | $ | 834,776,670 |
| | | | | | | | | |
| (1) | All securities with a maturity date of greater than 13 months have either a variable rate, a demand feature, prerefunded, optional or mandatory put resulting in a maturity of one year or less. Rate shown reflects current rate. |
| # | Securities with purchases pursuant to Rule 144A or section 4(2), under the Securities Act of 1933 and may not be resold subject to that rule except to qualified institutional buyers. Unless otherwise noted, these securities have been determined to be liquid under the guidelines established by the Funds’ Board of Directors/Trustees. |
| C | Bond may be called prior to maturity date. |
| * | Cost for federal income tax purposes is the same as for financial statement purposes. |
Fair Value Measurements^
The following is a summary of the fair valuations according to the inputs used as of March 31, 2010 in valuing the Fund’s assets and liabilities:
| | | | | | | | | | | | |
| | | Quoted Prices in Active Markets for Identical Investments (Level 1) | | Significant Other Observable Inputs (Level 2) | | Significant Unobservable Inputs (Level 3) | | Fair Value at 03/31/2010 |
Asset Table | | | | | | | | | | | | |
Investments, at value | | | | | | | | | | | | |
Certificates of Deposit | | $ | — | | $ | 42,011,808 | | $ | — | | $ | 42,011,808 |
Commercial Paper | | | — | | | 450,254,251 | | | — | | | 450,254,251 |
Corporate Bonds/Notes | | | — | | | 21,038,708 | | | — | | | 21,038,708 |
U.S. Government Agency Obligations | | | — | | | 18,677,858 | | | — | | | 18,677,858 |
Repurchase Agreements | | | — | | | 263,299,000 | | | — | | | 263,299,000 |
| | | | | | | | | | | | |
Total Investments, at value | | $ | — | | $ | 795,281,625 | | $ | — | | $ | 795,281,625 |
| | | | | | | | | | | | |
| ^ | See Note 2, “Significant Accounting Policies” in the Notes to Financial Statements for additional information. |
See Accompanying Notes to Financial Statements
71
| | |
ING INSTITUTIONAL PRIME MONEY
MARKET FUND(1) | | PORTFOLIO OF INVESTMENTS ASOF MARCH 31, 2010 |
| | | | | | | | |
Principal
Amount | | | | | | Value |
| | | | | | | | |
| CERTIFICATES OF DEPOSIT: 5.6% |
| $ | 5,480,000 | | | | BNP Paribas,
0.200%, due 05/19/10 | | $ | 5,480,000 |
| | 1,000,000 | | | | BNP Paribas,
0.230%, due 05/26/10 | | | 1,000,015 |
| | 16,000,000 | | | | BNP Paribas,
0.270%, due 08/02/10 | | | 16,000,000 |
| | 10,000,000 | | | | Natixis,
0.280%, due 04/05/10 | | | 10,000,000 |
| | 14,250,000 | | | | Rabobank,
0.270%, due 06/02/10 | | | 14,250,000 |
| | 2,750,000 | | | | Rabobank,
0.280%, due 08/30/10 | | | 2,749,768 |
| | 7,750,000 | | | | Societe Generale,
0.250%, due 06/15/10 | | | 7,750,000 |
| | 575,000 | | | | Svenska Handelsbanken AB,
0.205%, due 05/26/10 | | | 574,978 |
| | 4,250,000 | | | | Svenska Handelsbanken AB,
0.290%, due 09/01/10 | | | 4,250,000 |
| | 5,000,000 | | | | Toronoto Dominion Bank,
0.330%, due 05/17/10 | | | 5,000,191 |
| | 6,750,000 | | | | Toronoto Dominion Bank,
0.330%, due 05/19/10 | | | 6,750,898 |
| | 8,000,000 | | | | Toronto-Dominion Bank,
0.260%, due 06/30/10 | | | 8,000,199 |
| | | | | | | | |
| | | | | Total Certificates of Deposit
(Cost $81,806,049) | | | 81,806,049 |
| | | | | | | | |
| COMMERCIAL PAPER: 53.3% |
| | 8,500,000 | | | | American Honda Finance Corp.,
0.280%, due 08/31/10 | | | 8,489,951 |
| | 3,500,000 | | # | | ANZ National Bank Ltd.,
0.700%, due 09/17/10 | | | 3,488,499 |
| | 4,000,000 | | # | | ASB Finance Ltd.,
0.205%, due 05/20/10 | | | 3,998,884 |
| | 17,500,000 | | # | | ASB Finance Ltd.,
0.340%, due 05/06/10 | | | 17,494,215 |
| | 7,250,000 | | # | | Barton Capital, LLC,
0.180%, due 04/09/10 | | | 7,249,710 |
| | 5,500,000 | | # | | Barton Capital, LLC,
0.180%, due 05/05/10 | | | 5,499,065 |
| | 13,787,000 | | # | | Barton Capital, LLC,
0.180%, due 04/22/10 | | | 13,785,552 |
| | 8,000,000 | | # | | Barton Capital, LLC,
0.180%, due 05/18/10 | | | 7,998,120 |
| | 3,000,000 | | # | | Barton Capital, LLC,
0.190%, due 04/06/10 | | | 2,999,921 |
| | 5,000,000 | | # | | Barton Capital, LLC,
0.190%, due 05/25/10 | | | 4,998,575 |
| | 21,000,000 | | # | | Cafco, LLC,
0.180%, due 04/29/10 | | | 20,997,044 |
| | 15,600,000 | | # | | Cafco, LLC,
0.290%, due 07/12/10 | | | 15,587,327 |
| | 1,010,000 | | # | | Cafco, LLC,
0.295%, due 07/07/10 | | | 1,009,197 |
| | 9,000,000 | | # | | Cafco, LLC,
0.320%, due 06/14/10 | | | 8,994,080 |
| | 6,000,000 | | | | CBA Del Finance, Inc.,
0.300%, due 06/10/10 | | | 5,997,278 |
| | 3,250,000 | | # | | Ciesco L.P.,
0.190%, due 04/20/10 | | | 3,249,674 |
| | 1,500,000 | | # | | Ciesco L.P.,
0.210%, due 05/10/10 | | | 1,499,659 |
| | | | | | | | |
Principal
Amount | | | | | | Value |
| | | | | | | | |
| COMMERCIAL PAPER: (continued) |
| $ | 4,000,000 | | # | | Ciesco L.P.,
0.220%, due 05/12/10 | | $ | 3,998,998 |
| | 5,000,000 | | # | | Ciesco L.P.,
0.230%, due 04/23/10 | | | 4,999,297 |
| | 8,000,000 | | # | | Ciesco L.P.,
0.250%, due 04/05/10 | | | 7,999,778 |
| | 8,250,000 | | # | | Ciesco L.P.,
0.300%, due 07/07/10 | | | 8,243,331 |
| | 5,000,000 | | # | | Ciesco L.P.,
0.310%, due 07/14/10 | | | 4,995,522 |
| | 2,000,000 | | # | | Ciesco LLC,
0.300%, due 06/07/10 | | | 1,998,883 |
| | 3,360,000 | | | | Commonwealth Bank of Australia,
0.230%, due 05/24/10 | | | 3,358,862 |
| | 4,000,000 | | | | Commonwealth Bank of Australia,
0.245%, due 06/21/10 | | | 3,997,795 |
| | 18,500,000 | | # | | Concord Minutemen Capital Co., LLC,
0.400%, due 04/28/10 | | | 18,494,450 |
| | 3,000,000 | | # | | Concord Minutemen Capital Co., LLC,
0.551%, due 07/12/10 | | | 2,995,325 |
| | 7,000,000 | | # | | Concord Minutemen Capital Co., LLC,
0.592%, due 09/02/10 | | | 6,982,333 |
| | 5,000,000 | | # | | Concord Minutemen Capital Co., LLC,
0.800%, due 06/23/10 | | | 4,990,778 |
| | 8,750,000 | | # | | Concord Minutemen Capital Co., LLC,
0.900%, due 05/03/10 | | | 8,743,000 |
| | 6,750,000 | | # | | Crown Point Capital Co.,
0.400%, due 05/18/10 | | | 6,746,475 |
| | 12,500,000 | | # | | Crown Point Capital Co.,
0.400%, due 04/22/10 | | | 12,497,083 |
| | 3,500,000 | | # | | Crown Point Capital Co.,
0.551%, due 07/12/10 | | | 3,494,546 |
| | 8,000,000 | | # | | Crown Point Capital Co.,
0.592%, due 09/02/10 | | | 7,979,809 |
| | 5,000,000 | | # | | Crown Point Capital Co.,
0.800%, due 06/24/10 | | | 4,990,667 |
| | 8,250,000 | | # | | Crown Point Capital Co.,
0.900%, due 05/03/10 | | | 8,243,400 |
| | 14,000,000 | | # | | Danske Corp.,
0.250%, due 06/18/10 | | | 13,992,417 |
| | 8,500,000 | | # | | Danske Corp.,
0.250%, due 06/25/10 | | | 8,494,983 |
| | 23,750,000 | | | | Deutsche Bank AG/London,
0.270%, due 07/26/10 | | | 23,729,335 |
| | 31,000,000 | | | | Dexia Del, LLC,
0.310%, due 05/26/10 | | | 30,985,165 |
| | 5,716,000 | | # | | Edison Asset Securities, LLC,
0.200%, due 05/20/10 | | | 5,714,427 |
| | 10,750,000 | | # | | Edison Asset Securities, LLC,
0.200%, due 05/26/10 | | | 10,746,715 |
| | 14,250,000 | | # | | Edison Asset Securities, LLC,
0.210%, due 06/09/10 | | | 14,244,264 |
| | 5,250,000 | | # | | Edison Asset Securities, LLC,
0.290%, due 06/01/10 | | | 5,247,420 |
See Accompanying Notes to Financial Statements
72
| | |
ING INSTITUTIONAL PRIME MONEY
MARKET FUND(1) | | PORTFOLIO OF INVESTMENTS ASOF MARCH 31, 2010 (CONTINUED) |
| | | | | | | | |
Principal
Amount | | | | | | Value |
| | | | | | | | |
| COMMERCIAL PAPER: (continued) |
| $ | 10,500,000 | | # | | Edison Asset Securities, LLC,
0.320%, due 04/21/10 | | $ | 10,498,133 |
| | 15,200,000 | | # | | Jupiter,
0.175%, due 05/10/10 | | | 15,196,807 |
| | 5,700,000 | | # | | Jupiter,
0.195%, due 05/19/10 | | | 5,698,518 |
| | 7,000,000 | | # | | Jupiter,
0.200%, due 05/03/10 | | | 6,998,756 |
| | 15,000,000 | | # | | Jupiter,
0.210%, due 05/20/10 | | | 14,995,713 |
| | 12,000,000 | | | | Natixis,
0.900%, due 05/21/10 | | | 11,985,000 |
| | 9,000,000 | | # | | Old Line Funding, LLC,
0.170%, due 04/05/10 | | | 8,999,830 |
| | 5,547,000 | | # | | Old Line Funding, LLC,
0.180%, due 04/20/10 | | | 5,546,473 |
| | 2,531,000 | | # | | Old Line Funding, LLC,
0.180%, due 04/13/10 | | | 2,530,848 |
| | 11,150,000 | | # | | Old Line Funding, LLC,
0.210%, due 06/18/10 | | | 11,144,927 |
| | 2,604,000 | | # | | Old Line Funding, LLC,
0.220%, due 05/17/10 | | | 2,603,268 |
| | 4,250,000 | | # | | Old Line Funding, LLC,
0.250%, due 06/21/10 | | | 4,247,609 |
| | 12,000,000 | | # | | Old Line Funding, LLC,
0.260%, due 07/20/10 | | | 11,990,467 |
| | 7,250,000 | | # | | Park Avenue Receivables Corp.,
0.160%, due 04/06/10 | | | 7,249,839 |
| | 21,000,000 | | # | | Park Avenue Receivables Corp.,
0.170%, due 04/07/10 | | | 20,999,405 |
| | 2,000,000 | | # | | Park Avenue Receivables Corp.,
0.170%, due 05/06/10 | | | 1,999,669 |
| | 5,000,000 | | # | | Park Avenue Receivables Corp.,
0.180%, due 05/07/10 | | | 4,999,100 |
| | 2,000,000 | | # | | Park Avenue Receivables Corp.,
0.190%, due 04/21/10 | | | 1,999,800 |
| | 6,750,000 | | # | | Park Avenue Receivables Corp.,
0.215%, due 05/10/10 | | | 6,748,428 |
| | 9,500,000 | | | | Royal Bank of Canada,
0.200%, due 06/15/10 | | | 9,496,042 |
| | 15,000,000 | | | | Societe Generale,
0.570%, due 05/21/10 | | | 14,988,125 |
| | 20,521,000 | | # | | Thunder Bay Funding, LLC,
0.180%, due 04/20/10 | | | 20,519,051 |
| | 6,245,000 | | # | | Thunder Bay Funding, LLC,
0.180%, due 05/11/10 | | | 6,243,751 |
| | 12,250,000 | | # | | Thunder Bay Funding, LLC,
0.190%, due 05/10/10 | | | 12,247,479 |
| | 5,000,000 | | # | | Tulip Funding Corp.,
0.190%, due 04/09/10 | | | 4,999,789 |
| | 8,000,000 | | # | | Tulip Funding Corp.,
0.190%, due 04/13/10 | | | 7,999,493 |
| | 29,000,000 | | # | | Tulip Funding Corp.,
0.200%, due 04/15/10 | | | 28,997,744 |
| | 5,305,000 | | # | | Tulip Funding Corp.,
0.210%, due 04/20/10 | | | 5,304,412 |
| | 7,500,000 | | # | | Variable Funding Capital Corp.,
0.180%, due 04/20/10 | | | 7,499,288 |
| | 20,000,000 | | # | | Variable Funding Capital Corp.,
0.180%, due 04/14/10 | | | 19,998,700 |
| | 15,750,000 | | # | | Variable Funding Capital Corp., 0.180%, due 05/11/10 | | | 15,746,850 |
| | | | | | | | |
Principal
Amount | | | | | | Value |
| | | | | | | | |
| COMMERCIAL PAPER: (continued) |
| $ | 500,000 | | | | Westpac Banking Corp.,
0.250%, due 06/11/10 | | $ | 499,753 |
| | 19,750,000 | | # | | Windmill Funding Corp.,
0.180%, due 04/23/10 | | | 19,747,828 |
| | 23,600,000 | | # | | Windmill Funding Corp.,
0.190%, due 04/26/10 | | | 23,596,744 |
| | 15,150,000 | | # | | Yorkstown Capital, LLC,
0.170%, due 04/05/10 | | | 15,149,714 |
| | 250,000 | | # | | Yorkstown Capital, LLC,
0.200%, due 04/12/10 | | | 249,985 |
| | 8,500,000 | | # | | Yorkstown Capital, LLC,
0.200%, due 05/03/10 | | | 8,498,489 |
| | 17,000,000 | | # | | Yorkstown Capital, LLC,
0.210%, due 04/23/10 | | | 16,997,818 |
| | 12,500,000 | | # | | Yorkstown Capital, LLC,
0.240%, due 07/09/10 | | | 12,491,750 |
| | | | | | | | |
| | | | | Total Commercial Paper
(Cost $779,947,204) | | | 779,947,204 |
| | | | | | | | |
| CORPORATE BONDS/NOTES: 7.0% | | | |
| | 4,750,000 | | | | Australia & New Zealand Banking Group Ltd.,
4.875%, due 11/08/10 | | | 4,875,229 |
| | 5,000,000 | | #, C | | Commonwealth Bank of Australia,
0.640%, due 01/05/11 | | | 5,000,000 |
| | 3,810,000 | | | | Credit Suisse USA, Inc.,
0.442%, due 03/02/11 | | | 3,814,145 |
| | 4,000,000 | | | | Credit Suisse USA, Inc.,
0.450%, due 08/15/10 | | | 4,002,075 |
| | 4,489,000 | | | | Credit Suisse USA, Inc.,
4.875%, due 08/15/10 | | | 4,558,771 |
| | 6,800,000 | | | | Deutsche Bank AG/London,
5.000%, due 10/12/10 | | | 6,965,766 |
| | 12,000,000 | | | | General Electric Capital Corp.,
0.654%, due 06/09/10 | | | 12,015,404 |
| | 10,000,000 | | | | Kreditanstalt fuer Wiederaufbau,
1.875%, due 03/15/11 | | | 10,125,026 |
| | 9,000,000 | | | | Kreditanstalt fuer Wiederaufbau,
3.250%, due 02/15/11 | | | 9,221,448 |
| | 3,500,000 | | # | | Rabobank,
0.250%, due 03/16/11 | | | 3,500,000 |
| | 3,700,000 | | # | | Rabobank,
0.651%, due 05/19/10 | | | 3,702,165 |
| | 2,394,000 | | | | Royal Bank of Canada,
0.272%, due 06/08/10 | | | 2,394,320 |
| | 19,000,000 | | #, C | | Svenska Handelsbanken AB,
0.280%, due 02/09/11 | | | 19,000,000 |
| | 13,000,000 | | C | | Westpac Banking Corp.,
0.249%, due 04/28/11 | | | 13,000,000 |
| | | | | | | | |
| | | | | Total Corporate Bonds/Notes
(Cost $102,174,349) | | | 102,174,349 |
| | | | | | | | |
| U.S. GOVERNMENT AGENCY OBLIGATIONS: 3.3% |
| | 1,750,000 | | | | Federal Home Loan Mortgage Corporation,
0.151%, due 07/12/10 | | | 1,750,440 |
| | 4,000,000 | | | | Federal Home Loan Mortgage Corporation,
1.550%, due 12/15/10 | | | 4,033,670 |
See Accompanying Notes to Financial Statements
73
| | |
ING INSTITUTIONAL PRIME MONEY
MARKET FUND(1) | | PORTFOLIO OF INVESTMENTS ASOF MARCH 31, 2010 (CONTINUED) |
| | | | | | | | |
Principal
Amount | | | | | | Value |
| | | | | | | | |
| U.S. GOVERNMENT AGENCY OBLIGATIONS: (continued) |
| $ | 1,203,000 | | | | Federal Home Loan Mortgage Corporation,
2.875%, due 11/23/10 | | $ | 1,221,469 |
| | 5,025,000 | | | | Federal Home Loan Mortgage Corporation,
3.125%, due 10/25/10 | | | 5,101,375 |
| | 3,000,000 | | | | Federal Home Loan Mortgage Corporation,
3.250%, due 07/16/10 | | | 3,023,263 |
| | 18,000,000 | | | | Federal Home Loan Mortgage Corporation,
4.125%, due 07/12/10 | | | 18,178,352 |
| | 3,500,000 | | | | Federal Home Loan Mortgage Corporation,
4.830%, due 08/23/10 | | | 3,559,936 |
| | 2,000,000 | | | | Federal National Mortgage Association,
0.141%, due 07/13/10 | | | 2,000,518 |
| | 3,000,000 | | | | Federal National Mortgage Association,
2.375%, due 05/20/10 | | | 3,007,589 |
| | 1,707,000 | | | | Federal National Mortgage Association,
4.250%, due 08/15/10 | | | 1,730,980 |
| | 1,000,000 | | | | Federal National Mortgage Association,
4.750%, due 12/15/10 | | | 1,031,036 |
| | 1,505,000 | | | | Federal National Mortgage Association,
6.625%, due 11/15/10 | | | 1,562,369 |
| | 2,000,000 | | | | Federal National Mortgage Association,
7.125%, due 06/15/10 | | | 2,027,570 |
| | | | | | | | |
| | | | | Total U.S. Government Agency Obligations
(Cost $48,228,567) | | | 48,228,567 |
| | | | | | | | |
| | | | | | |
REPURCHASE AGREEMENTS: 28.2% | | |
| 159,668,000 | | Deutsche Bank Repurchase Agreement dated 03/31/10, 0.020%, due 04/01/10, $159,668,089 to be received upon repurchase (Collateralized by $162,834,000 various U.S. Government Agency Obligations, Discount Note - 4.750%, Market Value $162,862,169, due 04/01/10 - 01/18/11) | | | | 159,668,000 |
| | | | | | | | | |
Principal
Amount | | | | | | | Value |
| | | | | | | | | |
| REPURCHASE AGREEMENTS: (continued) | | | | |
| $ | 252,248,000 | | Goldman Sachs Repurchase Agreement dated 03/31/10, 0.005%, due 04/01/10, $252,248,035 to be received upon repurchase (Collateralized by $242,223,000 various U.S. Government Agency Obligations, 1.625% - 4.875%, Market Value plus accrued interest $257,294,735, due 01/21/11 - 01/22/19) | | | | | $ | 252,248,000 |
| | | | | | | | | |
| | | Total Repurchase Agreement
(Cost $411,916,000) | | | | 411,916,000 |
| | | | | | | | | |
| | | Total Investments in Securities
(Cost $1,424,072,169)* | | 97.4 | % | | $ | 1,424,072,169 |
| | | Other Assets and Liabilities - Net | | 2.6 | | | | 38,352,087 |
| | | | | | | | | |
| | | Net Assets | | 100.0 | % | | $ | 1,462,424,256 |
| | | | | | | | | |
| (1) | All securities with a maturity date of greater than 13 months have either a variable rate, a demand feature, prerefunded, optional or mandatory put resulting in a maturity of one year or less. Rate shown reflects current rate. |
| # | Securities with purchases pursuant to Rule 144A or section 4(2), under the Securities Act of 1933 and may not be resold subject to that rule except to qualified institutional buyers. Unless otherwise noted, these securities have been determined to be liquid under the guidelines established by the Funds’ Board of Directors/Trustees. |
| C | Bond may be called prior to maturity date. |
| * | Cost for federal income tax purposes is the same as for financial statement purposes. |
Fair Value Measurements^
The following is a summary of the fair valuations according to the inputs used as of March 31, 2010 in valuing the Fund’s assets and liabilities:
| | | | | | | | | | | | |
| | | Quoted Prices in Active Markets for Identical Investments (Level 1) | | Significant Other Observable Inputs (Level 2) | | Significant Unobservable Inputs (Level 3) | | Fair Value at 03/31/2010 |
Asset Table | | | | | | | | | | | | |
Investments, at value | | | | | | | | | | | | |
Certificates of Deposit | | $ | — | | $ | 81,806,049 | | $ | — | | $ | 81,806,049 |
Commercial Paper | | | — | | | 779,947,204 | | | — | | | 779,947,204 |
Corporate Bonds/Notes | | | — | | | 102,174,349 | | | — | | | 102,174,349 |
U.S. Government Agency Obligations | | | — | | | 48,228,567 | | | — | | | 48,228,567 |
Repurchase Agreements | | | — | | | 411,916,000 | | | — | | | 411,916,000 |
| | | | | | | | | | | | |
Total Investments, at value | | $ | — | | $ | 1,424,072,169 | | $ | — | | $ | 1,424,072,169 |
| | | | | | | | | | | | |
| ^ | See Note 2, “Significant Accounting Policies” in the Notes to Financial Statements for additional information. |
See Accompanying Notes to Financial Statements
74
TAX INFORMATION (UNAUDITED)
Dividends and distributions paid during the year ended March 31, 2010 were as follows:
| | | | | |
Fund Name | | Type | | Per Share Amount |
| | |
ING GNMA Income Fund | | | | | |
Class A | | NII | | $ | 0.3582 |
Class B | | NII | | $ | 0.2911 |
Class C | | NII | | $ | 0.2934 |
Class I | | NII | | $ | 0.3851 |
Class Q(1) | | NII | | $ | 0.2636 |
Class W | | NII | | $ | 0.3836 |
| | |
ING High Yield Bond Fund | | | | | |
Class A | | NII | | $ | 0.6258 |
Class B | | NII | | $ | 0.5728 |
Class C | | NII | | $ | 0.5753 |
Class I | | NII | | $ | 0.6564 |
All Classes | | ROC | | $ | 0.0206 |
| | |
ING Intermediate Bond Fund | | | | | |
Class A | | NII | | $ | 0.6228 |
Class B | | NII | | $ | 0.5543 |
Class C | | NII | | $ | 0.5544 |
Class I | | NII | | $ | 0.6511 |
Class O | | NII | | $ | 0.6227 |
Class R | | NII | | $ | 0.6004 |
Class W | | NII | | $ | 0.6466 |
| | |
ING Classic Money Market Fund | | | | | |
All Classes | | STCG | | $ | 0.0015 |
| | |
ING Institutional Prime Money Market Fund | | | | | |
Class I | | NII | | $ | 0.0018 |
Class IS | | NII | | $ | 0.0039 |
All Classes | | STCG | | $ | 0.0016 |
NII - Net investment income
ROC - Return of capital
STCG - Short-term capital gain
| (1) | Effective November 20, 2009, Class Q shares converted into Class W. |
Of the ordinary distributions made during the year ended March 31, 2010, the following percentage qualifies for the dividends received deduction (DRD) available to corporate shareholders:
| | | |
| |
ING Intermediate Bond Fund | | 0.25 | % |
For the year ended March 31, 2010, the following percentage of net investment income dividends paid by the Funds is designated as qualifying dividend income (QDI) subject to reduced income tax rates for individuals:
| | | |
| |
ING Intermediate Bond Fund | | 0.51 | % |
75
TAX INFORMATION (UNAUDITED) (CONTINUED)
Pursuant to Internal Revenue Code Section 871(k)(1), the Funds designate the following percentages of net investment income distributions as interest-related dividends:
| | | |
| |
ING GNMA Income Fund | | 96.73 | % |
| |
ING High Yield Bond Fund | | 98.88 | % |
| |
ING Intermediate Bond Fund | | 83.30 | % |
| |
ING Institutional Prime Money Market Fund | | 100.00 | % |
The following Funds designate 100% of their short-term capital gain distribution as short-term capital gain dividends as defined in Internal Revenue Code Section 871(k)(2):
| | |
| |
ING Classic Money Market Fund | | |
| |
ING Institutional Prime Money Market Fund | | |
Above figures may differ from those cited elsewhere in this report due to differences in the calculation of income and gains under U.S. generally accepted accounting principles (book) purposes and Internal Revenue Service (tax) purposes.
Shareholders are strongly advised to consult their own tax advisers with respect to the tax consequences of their investments in the Funds. In January, shareholders, excluding corporate shareholders, receive an IRS 1099-DIV regarding the federal tax status of the dividends and distributions they received in the calendar year.
76
TRUSTEE AND OFFICER INFORMATION (UNAUDITED)
The business and affairs of the Trust are managed under the direction of the Board. A Trustee who is not an interested person of the Trust, as defined in the 1940 Act, is an independent trustee (“Independent Trustee”). The Trustees and Officers of the Trust are listed below. The Statement of Additional Information includes additional information about trustees of the trust, and is available, without charge, upon request at (800) 992-0180.
| | | | | | | | | | |
Name, Address and Age | | Position(s)
held with
Trust | | Term of Office
and Length of
Time Served(1) | | Principal Occupation(s) – during the Past Five Years | | Number of
Funds
in Fund
Complex
Overseen
by Trustee(2) | | Other Directorships/ Trusteeships
held by Trustee |
Independent Trustees: | | | | | | | | | | |
| | | | | |
Colleen D. Baldwin 7337 E. Doubletree Ranch Rd. Scottsdale, Arizona 85258 Age: 49 | | Trustee | | November 2007 – Present | | Consultant, Glantuam Partners, LLC (January 2009 – Present); President, National Charity League/Canaan Parish Board (April 2005 – March 2009) and Consultant (January 2005 – Present). | | 137 | | None. |
| | | | | |
John V. Boyer(4) 7337 E. Doubletree Ranch Rd. Scottsdale, Arizona 85258 Age: 56 | | Trustee | | January 2005 – Present | | President and Chief Executive Officer, Bechtler Arts Foundation (January 2008 – Present). Formerly, Consultant (July 2007 – February 2008); President and Chief Executive Officer, Franklin and Eleanor Roosevelt Institute (March 2006 – July 2007); and Executive Director, The Mark Twain House & Museum (September 1989 – March 2006). | | 137 | | None. |
| | | | | |
Patricia W. Chadwick 7337 E. Doubletree Ranch Rd. Scottsdale, Arizona 85258 Age: 61 | | Trustee | | January 2006 – Present | | Consultant and President, Ravengate Partners LLC (January 2000 – Present). | | 137 | | The Royce Fund (2009 – Present) and Wisconsin Energy Corporation (June 2006 – Present). |
| | | | | |
Peter S. Drotch 7337 E. Doubletree Ranch Rd. Scottsdale, Arizona 85258 Age: 68 | | Trustee | | November 2007 – Present | | Retired partner, PricewaterhouseCoopers, LLP. | | 137 | | First Marblehead Corporation (September 2003 – Present). |
| | | | | |
J. Michael Earley 7337 E. Doubletree Ranch Rd. Scottsdale, Arizona 85258 Age: 64 | | Trustee | | February 2002 –Present | | Retired. Formerly, President and Chief Executive Officer, Bankers Trust Company, N.A., Des Moines (June 1992 – December 2008). | | 137 | | None. |
| | | | | |
Patrick W. Kenny 7337 E. Doubletree Ranch Rd. Scottsdale, Arizona 85258 Age: 67 | | Trustee | | January 2005 – Present | | Retired. Formerly, President and Chief Executive Officer, International Insurance Society (June 2001 –June 2009). | | 137 | | Assured Guaranty Ltd. (April 2004 – Present). |
| | | | | |
Sheryl K. Pressler 7337 E. Doubletree Ranch Rd. Scottsdale, Arizona 85258 Age: 59 | | Trustee | | January 2006 – Present | | Consultant (May 2001 – Present). | | 137 | | Stillwater Mining Company (May 2002 – Present). |
| | | | | |
Roger B. Vincent 7337 E. Doubletree Ranch Rd. Scottsdale, Arizona 85258 Age: 64 | | Chairman/ Trustee | | February 2002 – Present | | President, Springwell Corporation (March 1989 – Present). | | 137 | | UGI Corporation (February 2006 – Present) and UGI Utilities, Inc. (February 2006 – Present). |
77
TRUSTEE AND OFFICER INFORMATION (UNAUDITED) (CONTINUED)
| | | | | | | | | | |
Name, Address and Age | | Position(s)
held with
Trust | | Term of Office
and Length of
Time Served(1) | | Principal Occupation(s) – during the Past Five Years | | Number of
Funds
in Fund
Complex
Overseen
by Trustee(2) | | Other Directorships/ Trusteeships
held by Trustee |
Trustees who are “Interested Persons:” | | | | | | | | |
| | | | | |
Robert W. Crispin(5) 7337 E. Doubletree Ranch Rd. Scottsdale, Arizona 85258 Age: 63 | | Trustee | | November 2007 – Present | | Retired. Chairman and Chief Executive Officer, ING Investment Management Co. (July 2001 – December 2007). | | 137 | | Intact Financial Corporation (December 2004 – Present). |
| | | | | |
Shaun P. Mathews (3)(5) 7337 E. Doubletree Ranch Rd. Scottsdale, Arizona 85258 Age: 54 | | Trustee | | November 2007 – Present | | President and Chief Executive Officer, ING Investments, LLC(6) (November 2006 – Present). Formerly, Head of ING Mutual Funds and Investment Products (November 2004 – November 2006). | | 179 | | ING Retirement Holdings, Inc. (September 1998 – Present); ING Services Holding Company, Inc. (May 2000 – Present); ING Financial Advisers, LLC(8) (April 2002 – Present); Southland Life Insurance Company (June 2002 – Present); and ING Capital Corporation, LLC and ING Funds Distributor, LLC(7) (December 2005 – Present); ING Funds Services, LLC, ING Investments, LLC and ING Pilgrim Funding, Inc. (March 2006 – Present); and Directed Services, LLC (December 2006 – Present). |
| (1) | The Board is divided into three classes, with the term of one class expiring at each annual meeting of the Fund. At each annual meeting, one class of Trustees is elected to a three-year term and serves until their successors are duly elected and qualified. The tenure of each Trustee is subject to the Board’s retirement policy, which states that each duly elected or appointed Trustee who is not an “interested person” of the Fund, as defined in the Investment Company Act of 1940, as amended (“1940 Act”) (“Independent Trustees”), shall retire from service as a Trustee at the conclusion of the first regularly scheduled meeting of the Board that is held after the Trustee reaches the age of 72. A unanimous vote of the Board may extend the retirement date of a Trustee for up to one year. An extension may be permitted if the retirement would trigger a requirement to hold a meeting of shareholders of the Fund under applicable law, whether for purposes of appointing a successor to the Trustee or if otherwise necessary under applicable law, in which case the extension would apply until such time as the shareholder meeting can be held or is no longer needed. |
| (2) | For the purposes of this table (except for Mr. Mathews), ”Fund Complex” means the following investment companies: ING Asia Pacific High Dividend Equity Income Fund, ING Equity Trust; ING Funds Trust; ING Global Equity Dividend and Premium Opportunity Fund; ING Global Advantage and Premium Opportunity Fund; ING Infrastructure, Industrials, and Materials Fund; ING International High Dividend Equity Income Fund; ING Investors Trust; ING Mayflower Trust; ING Mutual Funds; ING Partners, Inc.; ING Prime Rate Trust; ING Risk Managed Natural Resources Fund; ING Senior Income Fund; ING Separate Portfolios Trust; ING Variable Insurance Trust; and ING Variable Products Trust. |
| (3) | For Mr. Mathews, the Fund Complex also includes the following investment companies: ING Series Fund, Inc.; ING Strategic Allocation Portfolios, Inc.; ING Variable Funds; ING Variable Portfolios, Inc.; ING Balanced Portfolio, Inc.; ING Intermediate Bond Portfolio; and ING Money Market Portfolio. |
| (4) | Mr. Boyer held a seat on the Board of Directors of The Mark Twain House & Museum from September 1989 to November 2005. ING Groep N.V. makes non-material, charitable contributions to The Mark Twain House & Museum. |
| (5) | Messrs. Mathews and Crispin are deemed to be “interested persons” of the Fund as defined in the 1940 Act because of their relationship with ING Groep, N.V., the parent corporation of the Manager, ING Investment Manager. |
| (6) | ING Investments, LLC was previously named ING Pilgrim Investments, LLC. ING Pilgrim Investments, LLC is the successor in interest to ING Pilgrim Investments, Inc., which was previously known as Pilgrim Investments, Inc. and before that was known as Pilgrim America Investments, Inc. |
| (7) | ING Funds Distributor, LLC is the successor in interest to ING Funds Distributor, Inc., which was previously known as ING Pilgrim Securities, Inc., and before that was known as Pilgrim Securities, Inc., and before that was known as Pilgrim America Securities, Inc. |
| (8) | ING Funds Services, LLC was previously named ING Pilgrim Group, LLC. ING Pilgrim Group, LLC is the successor in interest to ING Pilgrim Group, Inc., which was previously known as Pilgrim Group, Inc. and before that was known as Pilgrim America Group, Inc. |
78
TRUSTEE AND OFFICER INFORMATION (UNAUDITED) (CONTINUED)
| | | | | | |
Name, Address and Age | | Position(s) Held with the Trust | | Term of Office and Length of Time Served(1) | | Principal Occupation(s) during the Past Five Years |
Officers: | | | | | | |
Shaun P. Mathews(5) 7337 East Doubletree Ranch Rd. Scottsdale, Arizona 85258 Age: 54 | | President and Chief Executive Officer | | November 2006 – Present | | President and Chief Executive Officer, ING Investments, LLC (November 2006 – Present). Formerly, Head of ING Mutual Funds and Investment Products (November 2004 – November 2006). |
| | | |
Michael J. Roland 7337 East Doubletree Ranch Rd. Scottsdale, Arizona 85258 Age: 51 | | Executive Vice President | | February 2002 – Present | | Executive Vice President and Chief Operating Officer, ING Investments, LLC(2) and ING Funds Services, LLC(3) (January 2007 – Present). Formerly, Executive Vice President, Head of Product Management (January 2005 – January 2007); Chief Compliance Officer, ING Investments, LLC(2) and Directed Services LLC(6) (October 2004 – December 2005). |
| | | |
Stanley D. Vyner 230 Park Avenue New York, New York 10169 Age: 59 | | Executive Vice President and Chief Investment Risk Officer | | October 2000 – Present September 2009 – Present | | Executive Vice President, ING Investments, LLC(2) (July 2000 – Present) and Chief Investment Risk Officer, ING Investments, LLC(2) (January 2003 – Present). |
| | | |
Joseph M. O’Donnell 7337 East Doubletree Ranch Rd. Scottsdale, Arizona 85258 Age: 55 | | Executive Vice President and Chief Compliance Officer | | March 2006 – Present November 2004 – Present | | Chief Compliance Officer of the ING Funds (November 2004 – Present); Executive Vice President of the ING Funds (March 2006 – Present); Chief Compliance Officer of ING Investments, LLC(2) (March 2006 – July 2008 and October 2009 – Present); and Investment Advisor Chief Compliance Officer, Directed Services LLC(6) (March 2006 – July 2008 and October 2009 – Present). Formerly, Investment Advisor Chief Compliance Officer, ING Life Insurance and Annuity Company (March 2006 – December 2006). |
| | | |
Todd Modic 7337 East Doubletree Ranch Rd. Scottsdale, Arizona 85258 Age: 42 | | Senior Vice President, Chief/Principal Financial Officer and Assistant Secretary | | March 2005 – Present | | Senior Vice President, ING Funds Services, LLC(3) (March 2005 – Present). |
| | | |
Kimberly A. Anderson 7337 East Doubletree Ranch Rd. Scottsdale, Arizona 85258 Age: 45 | | Senior Vice President | | November 2003 – Present | | Senior Vice President, ING Investments, LLC(2) (June 1995 – Present). |
| | | |
Robert Terris 7337 East Doubletree Ranch Rd. Scottsdale, Arizona 85258 Age: 39 | | Senior Vice President | | May 2006 – Present | | Senior Vice President, Head of Division Operations, ING Funds Services, LLC(3) (May 2006 – Present). Formerly, Vice President of Administration, ING Funds Services, LLC(3) (October 2001 – May 2006). |
| | | |
Robyn L. Ichilov 7337 East Doubletree Ranch Rd. Scottsdale, Arizona 85258 Age: 42 | | Vice President and Treasurer | | October 2000 – Present March 2001 – Present | | Vice President and Treasurer, ING Funds Services, LLC(3) (November 1995 – Present) and ING Investments, LLC(2) (August 1997 – Present). |
| | | |
Lauren D. Bensinger 7337 East Doubletree Ranch Rd. Scottsdale, Arizona 85258 Age: 56 | | Vice President | | February 2003 – Present | | Vice President and Chief Compliance Officer, ING Funds Distributor, LLC(4) (August 1995 – Present); Vice President, ING Investments, LLC(2) and ING Funds Services, LLC (3)(February 1996 – Present); and Director of Compliance, ING Investments, LLC(2) (October 2004 – Present). |
| | | |
William Evans 10 State House Square Hartford, Ct 06103 Age: 37 | | Vice President | | September 2007 – Present | | Vice President, Head of Manage Research and Selection Group (April 2007 – Present). Formerly, Vice President, U.S. Mutual Funds and Investment Products (May 2005 – April 2007) and Senior Fund Analyst, U.S. Mutual Funds and Investment Products (May 2002 – May 2005). |
79
TRUSTEE AND OFFICER INFORMATION (UNAUDITED) (CONTINUED)
| | | | | | |
Name, Address and Age | | Position(s) Held with the Trust | | Term of Office and Length of Time Served(1) | | Principal Occupation(s) during the Past Five Years |
Maria M. Anderson 7337 East Doubletree Ranch Rd. Scottsdale, Arizona 85258 Age: 51 | | Vice President | | September 2004 – Present | | Vice President, ING Funds Services, LLC(3) (September 2004 – Present). |
| | | |
Denise Lewis 7337 East Doubletree Ranch Rd. Scottsdale, Arizona 85258 Age: 46 | | Vice President | | January 2007 – Present | | Vice President, ING Funds Services, LLC (December 2006 – Present). Formerly, Senior Vice President, UMB Investment Services Group, LLC (November 2003 – December 2006). |
| | | |
Kimberly K. Springer 7337 East Doubletree Ranch Rd. Scottsdale, Arizona 85258 Age: 52 | | Vice President | | March 2006 – Present | | Vice President, ING Funds Services, LLC(3) (March 2006 – Present) and Managing Paralegal Registration Statements (June 2003 – Present). Formerly, Assistant Vice President, ING Funds Services, LLC(3) (August 2004 – March 2006). |
Craig Wheeler 7337 East Doubletree Ranch Rd. Scottsdale, Arizona 85258 Age: 40 | | Assistant Vice President | | May 2008 – Present | | Assistant Vice President – Director of Tax, ING Funds Services (March 2008 – Present). Formerly, Tax Manager, ING Funds Services (March 2005 – March 2008). |
| | | |
Huey P. Falgout, Jr. 7337 East Doubletree Ranch Rd. Scottsdale, Arizona 85258 Age: 46 | | Secretary | | August 2003 – Present | | Chief Counsel, ING Americas, U.S. Legal Services (September 2003 – Present). |
| | | |
Theresa K. Kelety 7337 East Doubletree Ranch Rd. Scottsdale, Arizona 85258 Age: 47 | | Assistant Secretary | | August 2003 – Present | | Senior Counsel, ING Americas, U.S. Legal Services (April 2008 – Present). Formerly, Counsel, ING Americas, U.S. Legal Services (April 2003 – April 2008). |
| | | |
Kathleen Nichols 7337 East Doubletree Ranch Rd. Scottsdale, Arizona 85258 Age: 34 | | Assistant Secretary | | May 2008 – Present | | Counsel, ING Americas, U.S. Legal Services (February 2008 – Present). Formerly, Associate, Ropes & Gray LLP (September 2005 – February 2008) |
| (1) | The officers hold office until the next annual meeting of the Trustees and until their successors shall have been elected and qualified. |
| (2) | ING Investments, LLC was previously named ING Pilgrim Investments, LLC. ING Pilgrim Investments, LLC is the successor in interest to ING Pilgrim Investments, Inc., which was previously known as Pilgrim Investments, Inc. and before that was known as Pilgrim America Investments, Inc. |
| (3) | ING Funds Services, LLC was previously named ING Pilgrim Group, LLC. ING Pilgrim Group, LLC is the successor in interest to ING Pilgrim Group, Inc., which was previously known as Pilgrim Group, Inc. and before that was known as Pilgrim America Group, Inc. |
| (4) | ING Funds Distributor, LLC is the successor in interest to ING Funds Distributor, Inc., which was previously known as ING Pilgrim Securities, Inc., and before that was known as Pilgrim Securities, Inc., and before that was known as Pilgrim America Securities, Inc. |
| (5) | Mr. Mathews commenced services as CEO and President of the ING Funds on November 11, 2006. |
| (6) | Directed Services LLC is the successor in interest to Directed Services, Inc. |
80
ADVISORY CONTRACT APPROVAL DISCUSSION (UNAUDITED)
BOARD CONSIDERATION AND RE-APPROVAL OF INVESTMENT ADVISORY AND SUB-ADVISORY CONTRACTS
Section 15(c) of the Investment Company Act of 1940, as amended (the “1940 Act”) provides that, after an initial period, the Funds’ existing investment advisory and sub-advisory contracts will remain in effect only if the Board of Trustees (the “Board”) of ING Funds Trust (the “Trust”), including a majority of Board members who have no direct or indirect interest in the advisory and sub-advisory contracts, and who are not “interested persons” of the Funds, as such term is defined under the 1940 Act (the “Independent Trustees”), annually review and approve them. Thus, at a meeting held on November 12, 2009, the Board, including a majority of the Independent Trustees, considered whether to renew the investment advisory contracts (the “Advisory Contracts”) between ING Investments, LLC (the “Adviser”) and the sub-advisory contracts (“Sub-Advisory Contracts”) with ING Investment Management Co., the sub-adviser to each Fund (the “Sub-Adviser”).
The Independent Trustees also held separate meetings on October 13 and November 10, 2009 to consider the renewal of the Advisory Contracts and Sub-Advisory Contracts. As a result, subsequent references herein to factors considered and determinations made by the Independent Trustees include, as applicable, factors considered and determinations made on those earlier dates by the Independent Trustees.
At its November 12, 2009 meeting, the Board voted to renew the Advisory and Sub-Advisory Contracts for the Funds. In reaching these decisions, the Board took into account information furnished to it throughout the year at regular meetings of the Board and the Board’s committees, as well as information prepared specifically in connection with the annual renewal process. Determinations by the Independent Trustees also took into account various factors that they believed, in light of the legal advice furnished to them by K&L Gates LLP (“K&L Gates”), their independent legal counsel, and their own business judgment, to be relevant. Further, while the Advisory Contracts and Sub-Advisory Contracts for all the ING Funds were considered at the same Board meeting, the Trustees considered each Fund’s advisory and sub-advisory relationships separately.
Provided below is an overview of the Board’s contract approval process in general, as well as a discussion of certain specific factors that the Board considered at its
renewal meeting. While the Board gave its attention to the information furnished, at its request, that was most relevant to its considerations, discussed below are a number of the primary factors relevant to the Board’s consideration as to whether to renew the Advisory and Sub-Advisory Contracts for the one-year period ending November 30, 2010. Each Board member may have accorded different weight to the various factors in reaching his or her conclusions with respect to each Fund’s advisory and sub-advisory arrangements.
Overview of the Contract Renewal and Approval Process
Several years ago, the Independent Trustees instituted a revised process by which they seek and consider relevant information when they decide whether to approve new or existing advisory and sub-advisory arrangements for the investment companies in the ING Funds complex under their jurisdiction, including the Funds’ existing Advisory and Sub-Advisory Contracts. Among other actions, the Independent Trustees: retained the services of independent consultants with experience in the mutual fund industry to assist the Independent Trustees in working with the personnel employed by the Adviser or its affiliates who administer the Funds (“Management”) to identify the types of information presented to the Board to inform its deliberations with respect to advisory and sub-advisory relationships and to help evaluate that information; established a specific format in which certain requested information is provided to the Board; and determined the process for reviewing such information in connection with Advisory and Sub-Advisory Contract renewals and approvals. The end result was an enhanced process which is currently employed by the Independent Trustees to review and analyze information in connection with their annual renewal of the ING Funds’ advisory and sub-advisory contracts, as well as their review and approval of new advisory relationships.
Since the current renewal and approval process was first implemented, the Board’s membership has changed substantially through periodic retirements of some Trustees and the appointment and election of new Trustees. In addition, throughout this period the Independent Trustees have reviewed and refined the renewal and approval process at least annually. The Board also established a Contracts Committee and two Investment Review Committees (“IRCs”). Among other matters, the Contracts Committee provides oversight with respect to the contracts renewal process, and each
81
ADVISORY CONTRACT APPROVAL DISCUSSION (UNAUDITED) (CONTINUED)
Fund is assigned to an IRC, which provides oversight regarding, among other matters, investment performance.
The type and format of the information provided to the Board or to legal counsel for the Independent Trustees in connection with the contract approval and renewal process has been codified in the ING Funds’ 15(c) Methodology Guide. This Guide was developed under the direction of the Independent Trustees and sets out a blueprint pursuant to which the Independent Trustees request certain information that they deem important to facilitate an informed review in connection with initial and annual approvals of advisory and sub-advisory contracts.
Management provides certain of the information requested by the 15(c) Methodology Guide in Fund Analysis and Comparison Tables (“FACT sheets”) prior to the Independent Trustees’ review of advisory and sub-advisory arrangements (including the Funds’ Advisory and Sub-Advisory Contracts). The Independent Trustees previously retained an independent firm to verify and test the accuracy of certain FACT sheet data for a representative sample of funds in the ING Funds complex. In addition, in 2007, 2008 and 2009 the Contracts Committee employed the services of an independent consultant to assist in its review and analysis of, among other matters, the 15(c) Methodology Guide, the content and format of the FACT sheets, and proposed Selected Peer Groups of investment companies (“SPGs”) to be used by the Funds for certain comparison purposes during the renewal process.
As part of an ongoing process, the Contracts Committee recommends or considers recommendations from Management for refinements to the 15(c) Methodology Guide and other aspects of the review process, and the IRC reviews benchmarks used to assess the performance of the funds in the ING Funds complex. The IRCs may apply a heightened level of scrutiny in cases where performance has lagged an ING Fund’s relevant benchmark and/or SPG.
The Board employed its process for reviewing contracts when considering the renewals of the Funds’ Advisory and Sub-Advisory Contracts that would be effective through November 30, 2010. Set forth below is a discussion of many of the Board’s primary considerations and conclusions resulting from this process.
Nature, Extent and Quality of Service
In determining whether to approve the Advisory and Sub-Advisory Contracts for the Funds for the year ending November 30, 2010, the Independent Trustees received and evaluated such information as they deemed necessary regarding the nature, extent and quality of services provided to the Funds by the Adviser and Sub-Advisers. This included information regarding the Adviser and Sub-Advisers provided throughout the year at regular meetings of the Board and its committees, as well as information furnished in connection with the contract renewal meetings.
The materials requested by and provided to the Board and/or to K&L Gates prior to the November 12, 2009 Board meeting included, among other information, the following items for each Fund: (1) FACT sheets that provided information regarding the performance and expenses of the Fund and other similarly managed funds in its SPG, as well as information regarding the Fund’s investment portfolio, objective and strategies; (2) reports providing risk and attribution analyses of the Fund; (3) the 15(c) Methodology Guide, which describes how the FACT sheets were prepared, including the manner in which each Fund’s benchmark and SPG were selected and how profitability was determined; (4) responses from the Adviser and relevant Sub-Adviser or Sub-Advisers to a series of questions posed by K&L Gates on behalf of the Trustees; (5) copies of the forms of Advisory and Sub-Advisory Contracts; (6) copies of the Forms ADV for the Adviser and Sub-Advisers; (7) financial statements for the Adviser and Sub-Adviser; (8) a draft of a narrative summary addressing key factors the Board customarily considers in evaluating the renewals of the ING Funds’ (including the Funds’) advisory contracts and sub-advisory contracts, including a written analysis for each Fund of how performance, fees and expenses compare to its SPG and/or designated benchmark; (9) independent analyses of Fund performance by the Trust’s Chief Investment Risk Officer; (10) information regarding net asset flows into and out of the Fund; and (11) other information relevant to the Board’s evaluations.
For each Fund, except for ING Institutional Prime Money Market Fund, Class A shares were used for purposes of certain comparisons to the funds in its SPG. Class A shares generally were selected so that the Fund’s share class with the longest performance history was compared to the analogous class of shares for each fund in its SPG. The ING Institutional Prime Money Market Fund has only one class of shares available,
82
ADVISORY CONTRACT APPROVAL DISCUSSION (UNAUDITED) (CONTINUED)
Class I, and these were used for purposes of comparison. The mutual funds included in the Funds’ SPGs were selected based upon criteria designed to mirror the Fund share class being compared to the SPG.
In arriving at its conclusions with respect to the Advisory Contracts, the Board was mindful of the “manager-of-managers” platform of the ING Funds that has been developed by Management. The Board also considered the techniques that the Adviser has developed, at the Board’s direction, to screen and perform due diligence on the Sub-Advisers that are recommended to the Board to manage the investment portfolios of the funds in the ING Funds complex. The Board noted the resources that the Adviser has committed to the Board and the IRCs to assist the Board and the IRCs with their assessment of the investment performance of the funds in the ING Funds Complex (including the Funds) on an ongoing basis throughout the year. This includes the appointment of a Chief Investment Risk Officer and his staff, who report directly to the Board and who have developed attribution analyses and other metrics used by the IRCs to analyze the key factors underlying investment performance for the funds in the ING Funds complex.
The Board also noted the techniques used by the Adviser to monitor the performance of the Sub-Advisers and the proactive approach that the Adviser, working in cooperation with the IRCs, has taken to advocate or recommend, when it believed appropriate, changes designed to assist in improving the Funds’ performance.
In considering the Funds’ Advisory Contracts, the Board also considered the extent of benefits provided to the Funds’ shareholders, beyond advisory services, from being part of the ING family of funds. This includes, in most cases, the right to exchange or transfer investments, without a sales charge, between the same class of shares of such funds or among ING Funds available on a product platform, and the wide range of ING Funds available for exchange or transfer. The Board also took into account the Adviser’s efforts in recent years to reduce the expenses of the ING Funds through renegotiated arrangements with the ING Funds’ service providers. In addition, the Board considered the efforts of the Adviser and the expenses that it incurred in recent years to help make the ING Funds complex more efficient by combinations of similar funds.
Further, the Board received periodic reports showing that the investment policies and restrictions for each
Fund were consistently complied with and other periodic reports covering matters such as compliance by Adviser and Sub-Adviser personnel with codes of ethics. The Board considered reports from the Trust’s Chief Compliance Officer (“CCO”) evaluating whether the regulatory compliance systems and procedures of the Adviser and each Sub-Adviser are reasonably designed to assure compliance with the federal securities laws, including those related to, among others, late trading and market timing, best execution, fair value pricing, proxy voting and trade allocation practices. The Board also took into account the CCO’s annual and periodic reports and recommendations with respect to service provider compliance programs. In this regard, the Board also considered the policies and procedures developed by the CCO in consultation with the Board’s Compliance Committee that guide the CCO’s compliance oversight function.
The Board reviewed the level of staffing, quality and experience of each Fund’s portfolio management team. The Board took into account the respective resources and reputations of the Adviser and Sub-Advisers, and evaluated the ability of the Adviser and the Sub-Advisers to attract and retain qualified investment advisory personnel. The Board also considered the adequacy of the resources committed to the Funds (and other relevant funds in the ING Funds complex) by the Adviser and Sub-Advisers, and whether those resources are commensurate with the needs of the Funds and are sufficient to sustain appropriate levels of performance and compliance needs. In this regard, the Board considered the financial stability of the Adviser and the Sub-Advisers.
Based on their deliberations and the materials presented to them, the Board concluded that the advisory and related services provided by the Adviser and each Sub-Adviser are appropriate in light of the Funds’ operations, the competitive landscape of the investment company business, and investor needs, and that the nature and quality of the overall services provided by the Adviser and the Sub-Advisers were appropriate.
Fund Performance
In assessing advisory and sub-advisory relationships, the Board placed emphasis on the net investment returns of each Fund. While the Board considered the performance reports and discussions with portfolio managers at Board and committee meetings during the year, particular attention in assessing performance was given to the FACT sheets furnished in connection with
83
ADVISORY CONTRACT APPROVAL DISCUSSION (UNAUDITED) (CONTINUED)
the renewal process. The FACT sheet prepared for each Fund included its investment performance compared to the Fund’s Morningstar category median and/or Lipper category median, SPG and primary benchmark. The FACT sheet performance data was as of June 30, 2009. In addition, the Board also considered at its November 12, 2009 meeting certain additional data regarding performance and Fund asset levels as of September 30, 2009. The Board’s findings specific to each Fund’s performance are discussed under “Fund-by-Fund Analysis” below.
Economies of Scale
When evaluating the reasonableness of advisory fee rates, the Board also considered whether economies of scale will be realized by the Adviser and Sub-Adviser as a Fund grows larger and the extent to which any such economies are reflected in contractual fee rates. In this regard, the Board noted any breakpoints in advisory fee schedules that will result in a lower advisory fee rate when a Fund achieves sufficient asset levels to receive a breakpoint discount. In the case of sub-advisory fees, the Board considered that breakpoints would inure to the benefit of the Adviser, except to the extent that there are corresponding advisory fee breakpoints or waivers. For a Fund that did not have advisory fee breakpoints, but did benefit from waivers or reimbursements of advisory or other fees, the Board also considered the extent to which economies of scale could be realized through waivers, reimbursements or expense reductions.
In evaluating economies of scale, the Independent Trustees also considered prior periodic management reports and industry information on this topic, and the Independent Trustees who were Board members at that time also considered a November 2006 evaluation and analysis presented to them by an independent consultant regarding fee breakpoint arrangements and economies of scale.
The Board also considered that many of the Funds have experienced material declines in assets due to general market declines precipitated by the credit crises and other generally adverse market developments. As a result of these asset declines, the Board considered that there were fewer opportunities to realize economies of scale.
Information Regarding Services to Other Clients
The Board requested and considered information regarding the nature of services and fee rates offered
by the Adviser and Sub-Advisers to other clients, including other registered investment companies and institutional accounts. When fee rates offered to other clients differed materially from those charged to the Funds, the Board considered any underlying rationale provided by the Adviser or a Sub-Adviser for these differences.
For unaffiliated Sub-Advisers, the Board did not view this information as being a key factor in its deliberations because of the arms-length nature of negotiations between the Adviser and unaffiliated Sub-Advisers with respect to sub-advisory fee rates. The Board also noted that the fee rates charged to the Funds and other institutional clients of the Adviser or a Sub-Adviser (including other investment companies) may differ materially due to, among other reasons: differences in services; different regulatory requirements associated with registered investment companies, such as the Funds, as compared to non-registered investment company clients; market differences in fee rates that existed when a Fund first was organized; differences in the original sponsors of Funds that now are managed by the Adviser; investment capacity constraints that existed when certain contracts were first agreed upon or that might exist at present; and different pricing structures that are necessary to be competitive in different marketing channels.
Fee Rates and Profitability
The Board reviewed and considered each contractual investment advisory fee rate, combined with the administrative fee rate, payable by each Fund to the Adviser. The Board also considered the contractual sub-advisory fee rate payable by the Adviser to each Sub-Adviser for sub-advisory services for each Fund. In addition, the Board considered fee waivers and expense limitations applicable to the fees payable by the Funds.
The Board considered: (1) the fee structure of each Fund as it relates to the services provided under the contracts; and (2) the potential fall-out benefits to the Adviser and the Sub-Advisers and their respective affiliates from their association with the Funds. For each Fund, the Board determined that the fees payable to the Adviser and the Sub-Advisers are reasonable for the services that each performs, which were considered in light of the nature and quality of the services that each has performed and is expected to perform.
For each Fund, the Board considered information on revenues, costs and profits realized by the Adviser,
84
ADVISORY CONTRACT APPROVAL DISCUSSION (UNAUDITED) (CONTINUED)
which was prepared by Management in accordance with the allocation methodology (including related assumptions) specified in the 15(c) Methodology Guide. In analyzing the profitability of the Adviser in connection with its services to a Fund, the Board took into account the sub-advisory fee rate payable by the Adviser to each Sub-Adviser. The Board also considered information that it requested and was provided by Management with respect to the profitability of service providers affiliated with the Adviser, as well as information provided by certain Sub-Advisers with respect to their profitability. In the case of non-affiliated Sub-Advisers, the Board gave less weight to profitability considerations, or did not view this data as imperative to its deliberations, given the arm’s-length nature of the relationship between the Adviser and these Sub-Advisers with respect to the negotiation of sub-advisory fee rates. Further, the Board considered that the decline in asset levels of many Funds caused by recent adverse economic conditions was likely to cause a similar decline in any profits realized by the Adviser and Sub-Advisers.
The Board recognized that analysis of the Adviser’s and affiliated Sub-Adviser’s profitability is not an exact science and there is no uniform methodology for determining profitability for this purpose. In this context, the Board realized that Management’s calculations regarding its costs incurred in establishing the infrastructure necessary for the Funds’ operations may not be fully reflected in the expenses allocated to each Fund in determining profitability, and that the information presented may not portray all of the costs borne by Management or capture Management’s entrepreneurial risk associated with offering and managing a mutual fund complex in the current regulatory and market environment. In addition, the Board recognized that the use of different methodologies for purposes of calculating profit data can give rise to dramatically different profit and loss results.
At the request of the Board, the Adviser has from time to time agreed to implement remedial actions for certain Funds. These remedial actions have included, among others: reductions in fee rates; changes in Sub-Advisers or portfolio managers; and strategy modifications.
In making its determinations, the Board based its conclusions on the reasonableness of the advisory and sub-advisory fees of the Adviser and affiliated Sub-Adviser primarily on the factors described for each Fund below.
Fund-by-Fund Analysis
The following paragraphs outline certain of the specific factors that the Board considered, and the conclusions reached, at its November 12, 2009 meeting in relation to renewing each Fund’s current Advisory and Sub-Advisory Contracts for the year ending November 30, 2010. These specific factors are in addition to those considerations discussed above. In each case, the Fund’s performance was compared to its Morningstar category median and its primary benchmark, a broad-based securities market index that appears in the Fund’s prospectus. With respect to Morningstar quintile rankings, the first quintile represents the highest (best) performance and the fifth quintile represents the lowest performance. Each Fund’s management fee and expense ratio were compared to the fees and expense ratios of the funds in its SPG.
ING Classic Money Market Fund
In considering whether to approve the renewal of the Advisory and Sub-Advisory Contracts for ING Classic Money Market Fund, the Board considered that, based on performance data for the periods ended June 30, 2009: (1) the Fund outperformed its Lipper category median for all periods presented; (2) the Fund outperformed its primary benchmark for all periods presented, with the exception of the year-to-date period, during which it underperformed; and (3) the Fund is ranked in the first (highest) quintile of its Lipper category for the most recent calendar quarter, the second quintile for the year-to-date, one-year, three-year and five-year periods, and third quintile for the ten-year period.
In considering the fees payable under the Advisory and Sub-Advisory Contracts for the Fund, the Board took into account the factors described above and also considered: (1) the fairness of the compensation under an Advisory Contract with level fees that does not include breakpoints; and (2) the pricing structure (including the expense ratio to be borne by shareholders) of the Fund, as compared to its SPG, including that: (a) the management fee for the Fund is below the median and the average management fees of the funds in its SPG; and (b) the expense ratio for the Fund is below the median and the average expense ratios of the funds in its SPG.
After its deliberation, the Board reached the following conclusions: (1) the Fund’s management fee rate is reasonable in the context of all factors considered by the Board; (2) the Fund’s expense ratio is reasonable in
85
ADVISORY CONTRACT APPROVAL DISCUSSION (UNAUDITED) (CONTINUED)
the context of all factors considered by the Board; (3) the Fund’s performance is reasonable in the context of all factors considered by the Board; and (4) the sub-advisory fee rate payable by the Adviser to the Sub-Adviser is reasonable in the context of all factors considered by the Board. Based on these conclusions and other factors, the Board voted to renew the Advisory and Sub-Advisory Contracts for the Fund for the year ending November 30, 2010. During this renewal process, different Board members may have given different weight to different individual factors and related conclusions.
ING GNMA Income Fund
In considering whether to approve the renewal of the Advisory and Sub-Advisory Contracts for ING GNMA Income Fund, the Board considered that, based on performance data for the periods ended June 30, 2009: (1) the Fund outperformed its Morningstar category median for all periods presented; (2) the Fund underperformed its primary benchmark for all periods presented; and (3) the Fund is ranked in the first (highest) quintile of its Morningstar category for the one-year period, and in the second quintile for the most recent calendar quarter, year-to-date, three-year, five-year, and ten-year periods.
In considering the fees payable under the Advisory and Sub-Advisory Contracts for ING GNMA Income Fund, the Board took into account the factors described above and also considered: (1) the fairness of the compensation under an Advisory Contract with a breakpoint fee schedule where the asset level necessary to achieve a breakpoint discount had not been reached by the Fund; and (2) the pricing structure (including the expense ratio to be borne by shareholders) of the Fund, as compared to its SPG, including that: (a) the management fee (inclusive of a 0.10% administration fee) for the Fund is above the median and the average management fees of the funds in its SPG; and (b) the expense ratio for the Fund is above the median and the average expense ratios of the funds in its SPG.
After its deliberation, the Board reached the following conclusions: (1) the Fund’s management fee rate is reasonable in the context of all factors considered by the Board; (2) the Fund’s expense ratio is reasonable in the context of all factors considered by the Board; (3) the Fund’s performance is reasonable in the context of all factors considered by the Board; and (4) the sub-advisory fee rate payable by the Adviser to the Sub-Adviser is reasonable in the context of all factors considered by the Board. Based on these conclusions
and other factors, the Board voted to renew the Advisory and Sub-Advisory Contracts for the Fund for the year ending November 30, 2010. During this renewal process, different Board members may have given different weight to different individual factors and related conclusions.
ING High Yield Bond Fund
In considering whether to approve the renewal of the Advisory and Sub-Advisory Contracts for ING High Yield Bond Fund, the Board considered that, based on performance data for the periods ended June 30, 2009: (1) the Fund underperformed its Morningstar category median for all periods presented, with the exception of the most recent calendar quarter, during which it outperformed; (2) the Fund underperformed its primary benchmark for all periods presented; and (3) the Fund is ranked in the third quintile of its Morningstar category for the most recent calendar quarter and ten-year periods, the fourth quintile for the year-to-date, one-year, and three-year periods, and the fifth (lowest) quintile for the five-year period.
In analyzing this performance data, the Board took into account: (1) in January 2009, the Portfolio’s portfolio management team was modified; (2) Management would continue to monitor, and the Board or its IRC would periodically review, the Fund’s performance; and (3) Management’s expectation that the Fund’s longer-term performance will improve.
In considering the fees payable under the Advisory and Sub-Advisory Contracts for the Fund, the Board took into account the factors described above and also considered: (1) the fairness of the compensation under an Advisory Contract with a breakpoint fee schedule where the asset level necessary to achieve a breakpoint discount had not been reached by the Fund; (2) the pricing structure (including the expense ratio to be borne by shareholders) of the Fund, as compared to its SPG, including that: (a) the management fee (inclusive of a 0.10% administration fee) for the Fund is below the median and the average management fees of the funds in its SPG; and (b) the expense ratio for the Fund is below the median and the average expense ratios of the funds in its SPG.
After its deliberation, the Board reached the following conclusions: (1) the Fund’s management fee rate is reasonable in the context of all factors considered by the Board; (2) the Fund’s expense ratio is reasonable in the context of all factors considered by the Board; (3) taking into account that the Fund’s portfolio
86
ADVISORY CONTRACT APPROVAL DISCUSSION (UNAUDITED) (CONTINUED)
management team was changed in January 2009 and that Management would continue to monitor, and the Board or its IRC would periodically review, the Fund’s performance, the Board will permit the Fund to establish a longer performance record for purposes of evaluating performance; and (4) the sub-advisory fee rate payable by the Adviser to the Sub-Adviser is reasonable in the context of all factors considered by the Board. Based on these conclusions and other factors, the Board voted to renew the Advisory and Sub-Advisory Contracts for the Fund for the year ending November 30, 2010. During this renewal process, different Board members may have given different weight to different individual factors and related conclusions.
ING Institutional Prime Money Market Fund
In considering whether to approve the renewal of the Advisory and Sub-Advisory Contracts for ING Institutional Prime Money Market Fund, the Board considered that, based on performance data for the periods ended June 30, 2009: (1) the Fund outperformed its Lipper category median for all periods presented; (2) the Fund outperformed its primary benchmark for all periods presented, with the exception of the year-to-date period, during which it underperformed; and (3) the Fund is ranked in the first (highest) quintile of its Lipper category for the most recent calendar quarter and three-year periods, and the second quintile for the year-to-date and one-year periods.
In considering the fees payable under the Advisory and Sub-Advisory Contracts for the Fund, the Board took into account the factors described above and also considered: (1) the fairness of the compensation under an Advisory Contract with level fees that does not include breakpoints; and (2) the pricing structure (including the expense ratio to be borne by shareholders) of the Fund, as compared to its SPG, including that: (a) the management fee for the Fund is below the median and the average management fees of the funds in its SPG; and (b) the expense ratio for the Fund is below the median and the average expense ratios of the funds in its SPG.
After its deliberation, the Board reached the following conclusions: (1) the Fund’s management fee rate is reasonable in the context of all factors considered by the Board; (2) the Fund’s expense ratio is reasonable in the context of all factors considered by the Board; (3) the Fund’s performance is reasonable in the context of all factors considered by the Board; and (4) the
sub-advisory fee rate payable by the Adviser to the Sub-Adviser is reasonable in the context of all factors considered by the Board. Based on these conclusions and other factors, the Board voted to renew the Advisory and Sub-Advisory Contracts for the Fund for the year ending November 30, 2010. During this renewal process, different Board members may have given different weight to different individual factors and related conclusions.
ING Intermediate Bond Fund
In considering whether to approve the renewal of the Advisory and Sub-Advisory Contracts for ING Intermediate Bond Fund, the Board considered that, based on performance data for the periods ended June 30, 2009: (1) the Fund underperformed its Morningstar category median for all periods presented, with the exception of the ten-year period, during which it outperformed; (2) the Fund underperformed its primary benchmark for all periods presented, with the exception of the most recent calendar quarter and year-to-date periods, during which it outperformed; and (3) the Fund is ranked in the third quintile for the most recent calendar quarter, and the fifth (lowest) quintile for the year-to-date, one-year, three-year, and five-year periods.
In analyzing this performance data, the Board took into account: (1) in January 2009, the Fund’s portfolio management team was changed to address the Board’s concerns regarding investment performance; (2) that Management would continue to monitor, and the Board or its IRC would periodically review, the Fund’s performance; and (3) Management’s expectation that the Fund’s longer-term performance will improve.
In considering the fees payable under the Advisory and Sub-Advisory Contracts for ING Intermediate Bond Fund, the Board took into account the factors described above and also considered: (1) the fairness of the compensation under an Advisory Contract with level fees that does not include breakpoints; (2) the pricing structure (including the expense ratio to be borne by shareholders) of the Fund, as compared to its SPG, including that: (a) the management fee (inclusive of a 0.10% administration fee) for the Fund is below the median and the average management fees of the funds in its SPG; and (b) the expense ratio for the Fund is below the median and the average expense ratios of the funds in its SPG.
In analyzing this fee data, the Board took into account that the Fund has been operating at a loss to the Adviser.
87
ADVISORY CONTRACT APPROVAL DISCUSSION (UNAUDITED) (CONTINUED)
After its deliberation, the Board reached the following conclusions: (1) the Fund’s management fee is reasonable in the context of all factors considered by the Board; (2) the Fund’s expense ratio is reasonable in the context of all factors considered by the Board; (3) taking into account that the Fund’s portfolio management team was changed in January 2009 and that Management would continue to monitor, and the Board or its IRC would periodically review, the Fund’s performance, the Board will permit the Fund to establish a longer performance record for purposes of
evaluating performance; (4) the sub-advisory fee rate payable by the Adviser to the Sub-Adviser is reasonable in the context of all factors considered by the Board. Based on these conclusions and other factors, the Board voted to renew the Advisory and Sub-Advisory Contracts for the Fund for the year ending November 30, 2010. During this renewal process, different Board members may have given different weight to different individual factors and related conclusions.
88
ING Funds Distributor, LLC offers the funds listed below. Before investing in a fund, shareholders should carefully review the fund’s prospectus. Investors may obtain a copy of a prospectus of any ING Fund by calling (800) 992-0180 or by going to www.ingfunds.com.
Domestic Equity and Income Funds
ING Balanced Fund
ING Core Equity Research Fund
ING Real Estate Fund
Domestic Funds-of-Funds
ING Strategic Allocation Conservative Fund
ING Strategic Allocation Growth Fund
ING Strategic Allocation Moderate Fund
Domestic Equity Growth Funds
ING Corporate Leaders 100 Fund
ING Equity Dividend Fund
ING Growth Opportunities Fund
ING MidCap Opportunities Fund
ING Opportunistic LargeCap Fund
ING Small Company Fund
ING SmallCap Opportunities Fund
ING Tactical Asset Allocation Fund
Domestic Equity Index Funds
ING Index Plus LargeCap Fund
ING Index Plus MidCap Fund
ING Index Plus SmallCap Fund
Domestic Equity Value Fund
ING Value Choice Fund
Fixed-lncome Funds
ING GNMA lncome Fund
ING High Yield Bond Fund
ING Intermediate Bond Fund
Global Equity Funds
ING Global Equity Dividend Fund
ING Global Natural Resources Fund
ING Global Real Estate Fund
ING Global Value Choice Fund
International Equity Funds
ING Asia-Pacific Real Estate Fund
ING Emerging Countries Fund
ING European Real Estate Fund
ING Foreign Fund
ING Greater China Fund
ING Index Plus International Equity Fund
ING International Capital Appreciation Fund
ING International Real Estate Fund
ING International SmallCap Multi-Manager Fund
ING International Value Fund
ING International Value Choice Fund
ING Russia Fund
Global Fixed-Income Fund
ING Global Bond Fund
International Funds-of-Funds
ING Diversified International Fund
ING Global Target Payment Fund
Loan Participation Fund
ING Senior lncome Fund
Money Market Funds*
ING Classic Money Market Fund
ING Money Market Fund
| * | An investment in the funds are not insured or guaranteed by the Federal Deposit Insurance Corporation or any other government agency. Although the funds seek to preserve the value of your investment at $1.00 per share, it is possible to lose money by investing in the funds. Please see the “Notes to Financial Statements” section for the funds’ participation during the reporting period in the U.S. Treasury Department’s Temporary Guarantee Program for money market funds, which terminated on September 19, 2009. |
Investment Adviser
ING Investments, LLC
7337 East Doubletree Ranch Road
Scottsdale, Arizona 85258
Administrator
ING Funds Services, LLC
7337 East Doubletree Ranch Road
Scottsdale, Arizona 85258
Distributor
ING Funds Distributor, LLC
7337 East Doubletree Ranch Road
Scottsdale, Arizona 85258
Transfer Agent
PNC Global Investment Servicing (U.S.) Inc.
301 Bellevue Parkway
Wilmington, Delaware 19809
Independent Registered Public Accounting Firm
KPMG LLP
Two Financial Center
60 South Street
Boston, Massachusetts 02111
Custodian
The Bank of New York Mellon
One Wall Street
New York, New York 10286
Legal Counsel
Dechert
1775 I Street, N.W.
Washington, D.C. 20006
For more complete information, or to obtain a prospectus on any ING fund, please call your Investment Professional or ING Funds Distributor, LLC at (800) 992-0180 or log on to www.ingfunds.com. The prospectus should be read carefully before investing. Consider the fund’s investment objectives, risks, charges and expenses carefully before investing. The prospectus contains this information and other information about the fund.
| | | | |
 | | PRAR-UFIALL | | (0310-052810) |
Item 2. Code of Ethics.
As of the end of the period covered by this report, Registrant had adopted a code of ethics, as defined in Item 2 of Form N-CSR, that applies to the Registrant’s principal executive officer and principal financial officer. There were no amendments to the Code during the period covered by the report. The Registrant did not grant any waivers, including implicit waivers, from any provisions of the Code during the period covered by this report. The code of ethics is filed herewith pursuant to Item 10(a)(1), Exhibit 99.CODE ETH.
Item 3. Audit Committee Financial Expert.
The Board of Trustees has determined that J. Michael Early and Peter S. Drotch are an audit committee financial experts, as defined in Item 3 of Form N-CSR. Mr. Early and Mr. Drotch are “independent” for purposes of Item 3 of Form N-CSR.
Item 4. Principal Accountant Fees and Services.
| (a) | Audit Fees: The aggregate fees billed for each of the last two fiscal years for professional services rendered by KPMG LLP (“KPMG”), the principal accountant for the audit of the registrant’s annual financial statements, for services that are normally provided by the accountant in connection with statutory and regulatory filings or engagements for those fiscal years were $88,000 for year ended March 31, 2010 and $88,000 for year ended March 31, 2009. |
| (b) | Audit-Related Fees: The aggregate fees billed in the last fiscal year for assurance and related services by KPMG that are reasonably related to the performance of the audit of the registrant’s financial statements and are not reported under paragraph (a) of this Item were $10,750 for the year ended March 31, 2010 and $10,750 for year ended March 31, 2009. |
| (c) | Tax Fees: The aggregate fees billed in each of the last two fiscal years for professional services rendered by KPMG for tax compliance, tax advice, and tax planning were $39,025 in the year ended March 31, 2010 and $12,008 in the year ended March 31, 2009. Such services included review of excise distribution calculations (if applicable), preparation of the Funds’ federal, state and excise tax returns, tax services related to mergers and routine consulting. |
| (d) | All Other Fees: The aggregate fees billed in each of the last two fiscal years for products and services provided by KPMG, other than the services reported in paragraphs (a) through (c) of this Item. |
| (e) (1) | Audit Committee Pre-Approval Policies and Procedures |
AUDIT AND NON-AUDIT SERVICES
PRE-APPROVAL POLICY
| I. | Statement of Principles |
Under the Sarbanes-Oxley Act of 2002 (the “Act”), the Audit Committee of the Board of Directors or Trustees (the “Committee”) of the ING Funds (each a “Fund,” collectively, the “Funds”) set out on Exhibit A to this Audit and Non-Audit Services Pre-Approval Policy (“Policy”) is responsible for the oversight of the work of the Funds’ independent auditors. As part of its responsibilities, the Committee must pre-approve the audit and non-audit services performed by the auditors in order to assure that the provision of these services does not impair the auditors’ independence from the Funds. The Committee has adopted, and the Board has ratified, this Policy, which sets out the procedures and conditions under which the services of the independent auditors may be pre-approved.
Under Securities and Exchange Commission (“SEC”) rules promulgated in accordance with the Act, the Funds may establish two different approaches to pre-approving audit and non-audit services. The Committee may approve services without consideration of specific case-by-case services (“general pre-approval”) or it may pre-approve specific services (“specific pre-approval”). The Committee believes that the combination of these approaches contemplated in this Policy results in an effective and efficient method for pre-approving audit and non-audit services to be performed by the Funds’ independent auditors. Under this Policy, services that are not of a type that may receive general pre-approval require specific pre-approval by the Committee. Any proposed services that exceed pre-approved cost levels or budgeted amounts will also require the Committee’s specific pre-approval.
For both types of approval, the Committee considers whether the subject services are consistent with the SEC’s rules on auditor independence and that such services are compatible with maintaining the auditors independence. The Committee also considers whether a particular audit firm is in the best position to provide effective and efficient services to the Funds. Reasons that the auditors are in the best position include the auditors’ familiarity with the Funds’ business, personnel, culture, accounting systems, risk profile, and other factors, and whether the services will enhance the Funds’ ability to manage and control risk or improve audit quality. Such factors will be considered as a whole, with no one factor being determinative.
The appendices attached to this Policy describe the audit, audit-related, tax-related, and other services that have the Committee’s general pre-approval. For any service that has been approved through general pre-approval, the general pre-approval will remain in place for a period 12 months from the date of pre-approval, unless the Committee determines that a different period is appropriate. The Committee will annually review and pre-approve the services that may be provided by the independent auditors without specific pre-approval. The Committee will revise the list of services subject to general pre-approval as appropriate. This Policy does not serve as a delegation to Fund management of the Committee’s duty to pre-approve services performed by the Funds’ independent auditors.
The annual audit services engagement terms and fees are subject to the Committee’s specific pre-approval. Audit services are those services that are normally provided by auditors in connection with statutory and regulatory filings or engagements or those that generally only independent auditors can reasonably provide. They include the Funds’ annual financial statement audit and procedures that the independent auditors must perform in order to form an opinion on the Funds’ financial statements (e.g., information systems and procedural reviews and testing). The Committee will monitor the audit services engagement and approve any changes in terms, conditions or fees deemed by the Committee to be necessary or appropriate.
The Committee may grant general pre-approval to other audit services, such as statutory audits and services associated with SEC registration statements, periodic reports and other documents filed with the SEC or issued in connection with securities offerings.
The Committee has pre-approved the audit services listed on Appendix A. The Committee must specifically approve all audit services not listed on Appendix A.
| III. | Audit-related Services |
Audit-related services are assurance and related services that are reasonably related to the performance of the audit or the review of the Funds’ financial statements or are traditionally performed by the independent auditors. The Committee believes that the provision of audit-related services will not impair the independent auditors’ independence, and therefore may grant pre-approval to audit-related services. Audit-related services include accounting consultations related to accounting, financial reporting or disclosure matters not classified as “audit services;” assistance with understanding and implementing new accounting and financial reporting guidance from rulemaking authorities; agreed-upon or expanded audit procedures relating to accounting and/or billing records required to respond to or comply with financial, accounting or regulatory reporting matters; and assistance with internal control reporting requirements under Form N-SAR or Form N-CSR.
The Committee has pre-approved the audit-related services listed on Appendix B. The Committee must specifically approve all audit-related services not listed on Appendix B.
The Committee believes the independent auditors can provide tax services to the Funds, including tax compliance, tax planning, and tax advice, without compromising the auditors’ independence. Therefore, the Committee may grant general pre-approval with respect to tax services historically provided by the Funds’ independent auditors that do not, in the Committee’s view, impair auditor independence and that are consistent with the SEC’s rules on auditor independence.
The Committee will not grant pre-approval if the independent auditors initially recommends a transaction the sole business purpose of which is tax avoidance and the tax treatment of which may not be supported in the Internal Revenue Code and related regulations. The Committee may consult outside counsel to determine that tax planning and reporting positions are consistent with this Policy.
3
The Committee has pre-approved the tax-related services listed on Appendix C. The Committee must specifically approve all tax-related services not listed on Appendix C.
The Committee believes it may grant approval of non-audit services that are permissible services for independent auditors to a Fund. The Committee has determined to grant general pre-approval to other services that it believes are routine and recurring, do not impair auditor independence, and are consistent with SEC rules on auditor independence.
The Committee has pre-approved the non-audit services listed on Appendix D. The Committee must specifically approve all non-audit services not listed on Appendix D.
A list of the SEC’s prohibited non-audit services is attached to this Policy as Appendix E. The SEC’s rules and relevant guidance should be consulted to determine the precise definitions of these impermissible services and the applicability of exceptions to certain of the SEC’s prohibitions.
| VI. | Pre-approval of Fee levels and Budgeted Amounts |
The Committee will annually establish pre-approval fee levels or budgeted amounts for audit, audit-related, tax and non-audit services to be provided to the Funds by the independent auditors. Any proposed services exceeding these levels or amounts require the Committee’s specific pre-approval. The Committee considers fees for audit and non-audit services when deciding whether to pre-approve services. The Committee may determine, for a pre-approval period of 12 months, the appropriate ratio between the total amount of fees for the Fund’s audit, audit-related, and tax services (including fees for services provided to Fund affiliates that are subject to pre-approval), and the total amount of fees for certain permissible non-audit services for the Fund classified as other services (including any such services provided to Fund affiliates that are subject to pre-approval).
Requests or applications for services to be provided by the independent auditors will be submitted to management. If management determines that the services do not fall within those services generally pre-approved by the Committee and set out in the appendices to these procedures, management will submit the services to the Committee or its delagee. Any such submission will include a detailed description of the services to be rendered. Notwithstanding this paragraph, the Committee will, on a quarterly basis, receive from the independent auditors a list of services provided for the previous calendar quarter on a cumulative basis by the auditors during the Pre-Approval Period.
4
The Committee may delegate pre-approval authority to one or more of the Committee’s members. Any member or members to whom such pre-approval authority is delegated must report any pre-approval decisions, including any pre-approved services, to the Committee at its next scheduled meeting. The Committee will identify any member to whom pre-approval authority is delegated in writing. The member will retain such authority for a period of 12 months from the date of pre-approval unless the Committee determines that a different period is appropriate. The period of delegated authority may be terminated by the Committee or at the option of the member.
| IX. | Additional Requirements |
The Committee will take any measures the Committee deems necessary or appropriate to oversee the work of the independent auditors and to assure the auditors’ independence from the Funds. This may include reviewing a formal written statement from the independent auditors delineating all relationships between the auditors and the Funds, consistent with Independence Standards Board No. 1, and discussing with the auditors their methods and procedures for ensuring independence.
Effective April 23, 2008, the KPMG LLP (“KPMG”) audit team for the ING Funds accepted the global responsibility for monitoring the auditor independence for KPMG relative to the ING Funds. Using a proprietary system called Sentinel, the audit team is able to identify and manage potential conflicts of interest across the member firms of the KPMG International Network and prevent the provision of prohibited services to the ING entities that would impair KPMG independence with the respect to the ING Funds. In addition to receiving pre-approval from the ING Funds Audit Committee for services provided to the ING Funds and for services for ING entities in the Investment Company Complex, the audit team has developed a process for periodic notification via email to the ING Funds’ Audit Committee Chairpersons regarding requests to provide services to ING Groep NV and its affiliates from KPMG offices worldwide. Additionally, KPMG provides a quarterly summary of the fees for services that have commenced for ING Groep NV and Affiliates at each Audit Committee Meeting.
5
Last Approved: November 11, 2009
6
Appendix A
Pre-Approved Audit Services for the Pre-Approval Period January 1, 2010 through December 31, 2010
Service
| | | | |
| | | The Fund(s) | | Fee Range |
| Statutory audits or financial audits (including tax services associated with audit services) | | ü | | As presented
to Audit
Committee1 |
| | |
| Services associated with SEC registration statements, periodic reports and other documents filed with the SEC or other documents issued in connection with securities offerings (e.g., consents), and assistance in responding to SEC comment letters. | | ü | | Not to exceed
$9,750 perfiling |
| | |
| Consultations by Fund management with respect to accounting or disclosure treatment of transactions or events and/or the actual or potential effect of final or proposed rules, standards or interpretations by the SEC, Financial Accounting Standards Board, or other regulatory or standard setting bodies. | | ü | | Not to exceed
$8,000 during
the Pre-Approval
Period |
| | |
| Seed capital audit and related review and issuance of consent on the N-2 registration statement | | ü | | Not to exceed
$12,600 per
audit |
| 1 | For new Funds launched during the Pre-Approval Period, the fee ranges pre-approved will be the same as those for existing Funds, pro-rated in accordance with inception dates as provided in the auditors’ Proposal or any Engagement Letter covering the period at issue. Fees in the Engagement Letter will be controlling. |
7
Appendix B
Pre-Approved Audit-Related Services for the Pre-Approval Period January 1, 2010 through December 31, 2010
Service
| | | | | | |
| | | The Fund(s) | | Fund Affiliates | | Fee Range |
| Services related to Fund mergers (Excludes tax services - See Appendix C for tax services associated with Fund mergers) | | ü | | ü | | Not to exceed
$10,000 per
merger |
| | | |
| Consultations by Fund management with respect to accounting or disclosure treatment of transactions or events and/or the actual or potential effect of final or proposed rules, standards or interpretations by the SEC, Financial Accounting Standards Board, or other regulatory or standard setting bodies. [Note: Under SEC rules some consultations may be “audit” services and others may be “audit-related” services.] | | ü | | | | Not to exceed
$5,000 per
occurrence during
the Pre-Approval
Period |
| | | |
| Review of the Funds’ semi-annual financial statements | | ü | | | | Not to exceed
$2,200 per set of
financial
statements per
fund |
| | | |
| Reports to regulatory or government agencies related to the annual engagement | | ü | | | | Up to $5,000 per
occurrence during
the Pre-Approval
Period |
| | | |
| Regulatory compliance assistance | | ü | | ü | | Not to exceed
$5,000 per quarter |
| | | |
| Training courses | | | | ü | | Not to exceed
$2,000 per course |
| | | |
| For Prime Rate Trust, agreed upon procedures for quarterly reports to rating agencies | | ü | | | | Not to exceed
$9,450 per quarter |
| | | |
| For Prime Rate Trust and Senior Income Fund, agreed upon procedures for the Revolving Credit and Security Agreement with Citigroup | | ü | | | | Not to exceed
$21,000 per fund
per year |
8
Appendix C
Pre-Approved Tax Services for the Pre-Approval Period January 1, 2010 through December 31, 2010
Service
| | | | | | |
| | | The Fund(s) | | Fund Affiliates | | Fee Range |
| Preparation of federal and state income tax returns and federal excise tax returns for the Funds including assistance and review with excise tax distributions | | ü | | | | As presented to
Audit
Committee2 |
| | | |
| Review of IRC Sections 851(b) and 817(h) diversification testing on a real-time basis | | ü | | | | As presented to
Audit
Committee2 |
| | | |
| Assistance and advice regarding year-end reporting for 1099’s | | ü | | | | As presented to
Audit
Committee2 |
| | | |
| Tax assistance and advice regarding statutory, regulatory or administrative developments | | ü | | ü | | Not to exceed
$5,000 for the
Funds or for the
Funds’
investment
adviser during
the Pre-Approval
Period |
| 2 | For new Funds launched during the Pre-Approval Period, the fee ranges pre-approved will be the same as those for existing Funds, pro-rated in accordance with inception dates as provided in the auditors’ Proposal or any Engagement Letter covering the period at issue. Fees in the Engagement Letter will be controlling. |
9
Appendix C, continued
Service
| | | | | | |
| | | The Fund(s) | | Fund Affiliates | | Fee Range |
| Tax training courses | | | | ü | | Not to exceed
$2,000 per
course during
the Pre-Approval
Period |
| | | |
| Tax services associated with Fund mergers | | ü | | ü | | Not to exceed
$4,000 per fund
per merger
during
the Pre-Approval
Period |
| | | |
| Other tax-related assistance and consultation, including, without limitation, assistance in evaluating derivative financial instruments and international tax issues, qualification and distribution issues, and similar routine tax consultations. | | ü | | | | Not to exceed
$120,000 during
the Pre-Approval
Period |
10
Appendix D
Pre-Approved Other Services for the Pre-Approval Period January 1, 2010 through December 31, 2010
Service
| | | | | | |
| | | The Fund(s) | | Fund Affiliates | | Fee Range |
| Agreed-upon procedures for Class B share 12b-1 programs | | | | ü | | Not to exceed
$60,000during
the Pre-Approval
Period |
| | | |
Security counts performed pursuant to Rule 17f-2 of the 1940 Act (i.e., counts for Funds holding securities with affiliated sub-custodians) Cost to be borne 50% by the Funds and 50% by ING Investments, LLC. | | ü | | ü | | Not to exceed
$5,000 per
Fund during
the Pre-Approval
Period |
| | | |
| Agreed upon procedures for 15 (c) FACT Books | | ü | | | | Not to exceed
$35,000during the Pre-Approval
Period |
11
Appendix E
Prohibited Non-Audit Services
Dated: January 1, 2010
| | • | | Bookkeeping or other services related to the accounting records or financial statements of the Funds |
| | • | | Financial information systems design and implementation |
| | • | | Appraisal or valuation services, fairness opinions, or contribution-in-kind reports |
| | • | | Internal audit outsourcing services |
| | • | | Broker-dealer, investment adviser, or investment banking services |
| | • | | Expert services unrelated to the audit |
| | • | | Any other service that the Public Company Accounting Oversight Board determines, by regulation, is impermissible |
12
EXHIBIT A
ING EQUITY TRUST
ING FUNDS TRUST
ING ASIA PACIFIC HIGH DIVIDEND EQUITY INCOME FUND
ING GLOBAL ADVANTAGE AND PREMIUM OPPORTUNITY FUND
ING GLOBAL EQUITY DIVIDEND AND PREMIUM OPPORTUNITY FUND
ING INTERNATIONAL HIGH DIVIDEND EQUITY INCOME FUND
ING RISK MANAGED NATURAL RESOURCES FUNDING INVESTORS TRUST
ING INFRASTRUCTURE, INDUSTRIALS AND MATERIALS FUND
ING MAYFLOWER TRUST
ING MUTUAL FUNDS
ING PARTNERS, INC.
ING PRIME RATE TRUST
ING SENIOR INCOME FUND
ING SEPARATE PORTFOLIOS TRUST
ING VARIABLE INSURANCE TRUST
ING VARIABLE PRODUCTS TRUST
13
| | |
| |
| (e)(2) | | Percentage of services referred to in (4)(b)-(4)(d) that were approved by the audit committee |
| |
| | 100% of the services were approved by the audit committee. |
| |
| (f) | | Percentage of hours expended attributable to work performed by other than full time employees of KPMG if greater than 50% |
| |
| | Not applicable |
| |
| (g) | | Non-Audit Fees: The non-audit fees billed by the registrant’s accountant for services rendered to the registrant, and rendered to the registrant’s investment adviser, and any entity controlling, controlled by, or under common control with the adviser that provides ongoing services to the registrant for each of the last two fiscal years of the registrant were $1,613,771 for year ended March 31, 2010 and $2,040,485 for fiscal year ended March 31, 2009. |
| |
| (h) | | Principal Accountants Independence: the Registrant’s Audit committee has considered whether the provision of non-audit services that were rendered to the registrant’s investment adviser and any entity controlling, controlled by, or under common control with the investment adviser that provides ongoing services to the registrant that were not pre-approved pursuant to Rule 2.01(c)(7)(ii) of Regulation S-X is compatible with maintaining KPMG’s independence. |
14
SIGNATURES
Pursuant to the requirements of the Securities Exchange Act of 1934 and the Investment Company Act of 1940, the registrant has duly caused this report to be signed on its behalf by the undersigned, thereunto duly authorized.
| | |
| (Registrant): ING Funds Trust |
| |
| By | | /s/ Shaun P. Mathews |
| | Shaun P. Mathews |
| | President and Chief Executive Officer |
|
| Date: June 3, 2010 |
Pursuant to the requirements of the Securities Exchange Act of 1934 and the Investment Company Act of 1940, this report has been signed below by the following persons on behalf of the registrant and in the capacities and on the dates indicated.
| | |
| By | | /s/ Shaun P. Mathews |
| | Shaun P. Mathews |
| | President and Chief Executive Officer |
|
| Date: June 3, 2010 |
| | |
| By | | /s/ Todd Modic |
| | Todd Modic |
| | Senior Vice President and Chief Financial Officer |
|
| Date: June 3, 2010 |