In the theatre of the global financial markets, local crises and disasters have come and gone like poor players, strutting and fretting their moment on the stage, to be heard no more. Yet alongside these short-lived tragedies, bigger, more serious shows dominate the marquees, continuing their runs long after the others have closed.
About a year ago in our second quarter 2011 market review, we noted the similarity of then-current concerns to those of 2010: “In many ways, the second quarter of 2011 bore a strong resemblance to its 2010 counterpart, with the U.S. mired in an economic soft patch, the euro zone in a Greece-centered crisis and China trying to engineer a soft landing for its economy.” Variations on these dramas still command our attention today.
Despite these worries, markets have delivered, with risk assets of all types and domiciles posting gains. After its best first quarter since 1998, the S&P 500® Index has clawed its way back to 2008 levels, while the Nasdaq hasn’t seen its current surroundings since the early 2000s. The markets slackened a bit in early April before regaining momentum as strong first quarter earnings began to flow. As of this writing, about 200 companies in the S&P 500® Index have reported earnings; around 80% have beaten analysts’ forecasts, according to financial data provider FactSet, a rate superior to the trailing four-quarter average.
After slumping in the second and third quarters of 2011, the global economy has rebounded thanks to a more expansionary corporate sector and a positive feedback loop of confidence, financial conditions, growth and monetary policy easing. Does this mean the big global risks — the sovereign debt crisis in Europe, the meandering U.S. economy and a slowing China — are fading?
Maybe not, but it does mean that investors should not stand on the sidelines hoping to time an ideal reentry point. Opportunity turns up unpredictably. We therefore advocate staying invested in a globally diversified portfolio with a wide range of asset classes and risk/return characteristics. Don’t be intimidated by market theatrics: stick with your investment program and resist the urge to market time. As always, discuss any proposed changes to your goals or portfolio with your investment advisor before you take any action.
Thank you for your confidence in ING Funds. It is our privilege to serve your investment needs, and we look forward to continuing to do so in the future.
MARKET PERSPECTIVE: YEAR ENDED MARCH 31, 2012
By the half way point in our fiscal year, global equities in the form of the MSCI World IndexSM, measured in local currencies including net reinvested dividends, were down more than 15%. But better news from the U.S. drove a rebound in October, which held to year-end and gathered new strength in 2012. For the whole tumultuous fiscal year, the MSCI World IndexSM squeezed out a gain of 1.45%. (The MSCI World IndexSM returned 0.56% for the year ended March 31, 2012, measured in U.S. dollars.)
In our semi-annual report we described how the domestic economy seemed to be on the brink of another recession and according to most commentators it was all about jobs. Healthy employment conditions, it was said, boost wages, consumer confidence, spending, house prices, and ultimately investment and Gross Domestic Product (“GDP”) itself. While the cause and effect relationships are arguably more complex, the fact remained that recent reports had shown no jobs created at all in August, the unemployment rate at 9.1%, GDP meandering up at a rate of 1.3% (quarter-over-quarter, annualized), wages & salaries and retail sales flat and home prices falling.
Markets were greatly relieved, therefore, when more positive data started to emerge in October, with the employment report showing 103,000 new jobs in September. Improvement continued into 2012 and in March, as the Bureau of Labor Statistics announced 243,000 jobs were created in February, with a three-month average of 245,000, and the unemployment rate down to 8.3%.
Investors’ relief at a healthier labor market was reinforced by the March results of the Federal Reserve’s stress tests on banks, which indicated that 15 out of 19 large banks could maintain adequate capital levels even in a pessimistic recession scenario. Reported fourth quarter 2011 GDP growth was much improved at 3.0%, and as the fiscal year ended, purchasing managers’ indices were clearly in expansion territory.
Not part of the brighter picture was the housing market, with uneven sales and falling prices, as represented by the S&P/Case-Shiller 20-City Composite Home Price Index, which ended the period at less than two-thirds of its July 2006 high level.
The euro zone’s sovereign debt crisis continued to move markets. The European Central Bank (“ECB”) started to buy Italian and Spanish bonds to restrain soaring yields in August and it was reluctantly accepted that Greece would need a second huge bailout to avoid default on bonds maturing in March.
As a step towards fiscal union, which would reduce the need for future bailouts, euro zone leaders reached agreement in December on a fiscal-discipline treaty. In addition, new ECB President Draghi announced that the ECB would lend unlimited funds to banks for three years at an interest rate of 1% in Longer Term Refinancing Operations (“LTRO”). On December 21, the ECB loaned €489 billion to 523 banks. At the end of February, 800 banks borrowed a further €530 billion.
The perceived effect of LTRO was to reduce greatly the risk of banks and the banking system failing in the short term for lack of liquidity. Sentiment and risk appetite quickly improved. Stock markets surged in the first three months of 2012 and the ten-year government bond yields of Italy, Portugal and Ireland fell 150-200 basis points. (Ominously, Spain’s did not.)
In reality, LTRO buys time for banks, but does nothing to address the solvency of sovereigns or the uncompetitive markets and practices of the euro zone’s periphery.
In U.S. fixed income markets, the Barclays Capital U.S. Aggregate Bond Index of investment grade bonds rose 7.71% in the fiscal year. Both the corporate investment grade bond and Treasury sub-indices outperformed; investment grade corporates were seen as good value while Treasuries were supported during periods of risk-aversion in the first half of the fiscal year. Agency mortgage backed securities underperformed, on fears that measures to help the mortgage market would lead to a high volume of early repayments. The Barclays Capital High Yield Bond — 2% Issuer Constrained Composite Index returned 6.43% in the fiscal year.
U.S. equities, represented by the S&P 500® Index including dividends, rose by 8.54%, thanks to a 26% advance after September, as the perceived risk of recession eased. Technology led the way with a return of over 20%, followed by the consumer sectors, both of which returned over 17%. The laggard was energy, losing nearly 7%. It is also noteworthy that March was the first month-end since the index’s all-time record on October 9, 2007, at which the total return was positive: a wafer-thin 3 basis points per annum.
In currencies, the euro zone’s problems finally took their toll on the euro, which dropped sharply after October, before recovering. The dollar appreciated 5.99% over the fiscal year. The trading range was narrower against the pound, the dollar finally gaining 0.81%. But the dollar lost 0.45% against the yen, despite suspicions of heavy Bank of Japan intervention after Japan’s first trade deficit in 30 years.
In international markets, the MSCI Japan® Index fell 0.45% in the fiscal year, moderated by a 19% rebound in 2012. The economy contracted in four quarters out of the last five. But in mid-February, the Bank of Japan adopted an official inflation target and increased asset purchases, raising hopes that asset reflation may be under way at last. The MSCI Europe ex UK® Index lost 7.20%, relieved at better U.S. data and LTRO but depressed by falling fourth quarter GDP and unemployment perched at 10.7%, a euro-era high. The MSCI UK® Index added 1.60%. GDP fell 0.2% in the fourth quarter from the third, in the face of weak euro zone demand and fiscal austerity at home. But surprisingly, good purchasing managers’ indices suggested that a return to technical recession might yet be avoided.
Parentheses denote a negative number.
Past performance does not guarantee future results. The performance quoted represents past performance.
Investment return and principal value of an investment will fluctuate, and shares, when redeemed, may be worth more or less than their original cost. Each Fund’s performance is subject to change since the period’s end and may be lower or higher than the performance data shown. Please call (800) 992-0180 or log on to www.inginvestment.com to obtain performance data current to the most recent month end.
Market Perspective reflects the views of ING’s Chief Investment Risk Officer only through the end of the period, and is subject to change based on market and other conditions.
2
BENCHMARK DESCRIPTIONS
| Index | | | | Description |
|---|
MSCI World IndexSM | | | | An unmanaged index that measures the performance of over 1,400 securities listed on exchanges in the U.S., Europe, Canada, Australia, New Zealand and the Far East. |
| S&P/Case-Shiller 20-City Composite Home Price Index | | | | A composite index of the home price index for the top 20 Metropolitan Statistical Areas in the United States. The index is published monthly by Standard & Poor’s. |
| Barclays Capital U.S. Aggregate Bond Index | | | | An unmanaged index of publicly issued investment grade U.S. Government, mortgage-backed, asset-backed and corporate debt securities. |
| Barclays Capital U.S. MBS Index | | | | An unmanaged index composed of fixed-income security mortgage pools sponsored by GNMA, FNMA and FHLMC, including GNMA Graduated Payment Mortgages. |
| Barclays Capital High Yield Bond — 2% Issuer Constrained Composite Index | | | | An unmanaged index that includes all fixed income securities having a maximum quality rating of Ba1, a minimum amount outstanding of $150 million, and at least one year to maturity. |
| S&P 500® Index | | | | An unmanaged index that measures the performance of securities of approximately 500 large-capitalization companies whose securities are traded on major U.S. stock markets. |
| MSCI Japan® Index | | | | A free float-adjusted market capitalization index that is designed to measure developed market equity performance in Japan. |
| MSCI Europe ex UK® Index | | | | A free float-adjusted market capitalization index that is designed to measure developed market equity performance in Europe, excluding the UK. |
| MSCI UK® Index | | | | A free float-adjusted market capitalization index that is designed to measure developed market equity performance in the UK. |
3
| ING GNMA INCOME FUND | PORTFOLIO MANAGERS’ REPORT |
| | Investment Type Allocation
as of March 31, 2012
(as a percentage of net assets)
|
| | | | | | | | |
| | U.S. Government Agency Obligations | | | | | 101.8% | |
| | Liabilities in Excess of Other Assets | | | | | (1.8)% | |
| | Net Assets | | | | | 100.0% | |
| | | | | | | | |
| | |
| | Portfolio holdings are subject to change daily.
|
| | |
ING GNMA Income Fund (the “Fund”) seeks a high level of current income, consistent with liquidity and safety of principal, through investment primarily in Government National Mortgage Association (“GNMA”) mortgage-backed securities (also known as GNMA Certificates) that are guaranteed as to the timely payment of principal and interest by the U.S. government. The Fund is managed by Peter Guan, Jeff Dutra and Justin McWhorter, Portfolio Managers of ING Investment Management Co. LLC — the Sub-Adviser.
Securities issued by the U.S. Treasury are backed by the full faith and credit of the federal government. Securities issued by individual agencies and organizations may be backed by the full faith and credit of the federal government as to principal or interest but are not direct obligations of the U.S. Treasury. Securities of some agencies and organizations are backed solely by the entity’s own resources or by the ability of the entity to borrow from the U.S. Treasury. Government securities also include certain mortgage-related securities that are sponsored by a U.S. government agency or organization and are not direct obligations of the U.S. government.
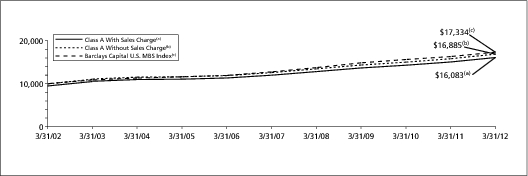
Performance: For the one year ended March 31, 2012, the Fund’s Class A shares, excluding sales charges, provided a total return of 6.87% compared to the Barclays Capital U.S. Mortgage-Backed Securities (“MBS”) Index which returned 6.21%, for the same period.
Portfolio Specifics: The past 12 months was another period of substantial government involvement. Quantitative easing by the Federal Reserve, Operation Twist (a program whereby the Federal Reserve plans to purchase $400 billion of longer-term Treasury securities and sell an equal amount of short-term Treasury securities by June 2012), enhanced refinance programs for mortgage borrowers and on we go. What were the results? The housing market declined an additional 3-4%, underemployment dropped less than 1% (from 15.7% to 14.9%) and negative real wage growth.
Both domestic and international economic developments pushed U.S. interest rates to 40+ year lows in the fall of 2011. Credit-related investments suffered while high quality, government-backed securities outperformed. In that context, U.S. Treasuries, followed by GNMA mortgages and other agency-backed MBS provided superior relative performance.
MBS prepayment speeds accelerated in the fall of 2011, as borrowers took advantage of historic low mortgage rates. However, some borrowers seeking to refinance continued to encounter impediments as multiple years of home price declines placed many homeowners underwater on their existing loans. Tighter underwriting standards also contributed to subdued prepayment speeds for everyone except the highest quality borrowers. The government attempted to correct this dynamic when they expanded refinance programs to assist underwater and otherwise constrained homeowners. As we entered 2012, rates remained depressed and the revamped assistance programs were materializing. In this environment, it is critical for mortgage investors to effectively manage prepayment risk.
The Fund was well positioned for an environment characterized by tight spreads and low rates, and took advantage of the excess yield offered by premium securities. Despite historic low interest rates, higher coupon mortgages performed well due to relatively benign prepayments for most of the year. Additionally, GNMA mortgages benefited from broad-based investor demand seeking explicit government credit guarantees. Finally, the Fund’s focus on securities with prepayment protection and high current income performed better than “generic” positions found in the benchmark.
Current Strategy & Outlook: The U.S. economy appears to be heading in the right direction, but headwinds persist. Asian growth is slowing rapidly, Europe is in a recession and domestic underemployment and fiscal tightening impede further growth. These forces will weigh on Treasury rates and, in our opinion, may lead to a continued range-bound interest rate environment. In this scenario, agency MBS, specifically GNMA bonds, should provide attractive returns relative to other high quality investments.
With this in mind, we continue to manage the Fund seeking to benefit from high current income investments. The predominant focus remains on specified GNMA pools and collateralized mortgage obligations (“CMOs”) that we believe provide more attractive current income while minimizing prepayment risks. We are paying special attention to pools with lower loan balances, those with loans possessing what we believe are more attractive credit characteristics and those that are sufficiently seasoned to reduce their prepayment sensitivity to interest rate movements. In addition, we will continue to seek GNMA CMOs that provide structural prepayment and extension protection.
Portfolio holdings and characteristics are subject to change and may not be representative of current holdings and characteristics. The outlook for this Fund may differ from that presented for other ING Funds. Performance for the different classes of shares will vary based on differences in fees associated with each class. An index has no cash in its portfolio, imposes no sales charges and incurs no operating expenses. An investor cannot invest directly in an index. The views expressed in this report reflect those of the portfolio managers, only through the end of the period as stated on the cover. The portfolio managers’ views are subject to change at any time based on market and other conditions. Fund holdings are subject to change daily. This report contains statements that may be “forward-looking” statements. Actual results may differ materially from those projected in the “forward-looking” statements.
4
PORTFOLIO MANAGERS’ REPORT | | ING GNMA INCOME FUND
|
Average Annual Total Returns for the Periods Ended March 31, 2012
|
|
|---|
| | | | 1 Year
| | 5 Year
| | 10 Year
| | Since Inception
of Class W
December 17, 2007
|
|---|
Including Sales Charge: | | | | | | | | | | | | | | | | | | |
Class A(1) | | | | | 4.16 | % | | | 5.55 | % | | | 4.86 | % | | | — | |
Class B(2) | | | | | 1.08 | % | | | 4.97 | % | | | 4.58 | % | | | — | |
Class C(3) | | | | | 5.12 | % | | | 5.30 | % | | | 4.58 | % | | | — | |
| Class I | | | | | 7.16 | % | | | 6.41 | % | | | 5.69 | % | | | — | |
| Class W | | | | | 7.12 | % | | | — | | | | — | | | | 6.50 | % |
Excluding Sales Charge: | | | | | | | | | | | | | | | | | | |
| Class A | | | | | 6.87 | % | | | 6.08 | % | | | 5.37 | % | | | — | |
| Class B | | | | | 6.08 | % | | | 5.30 | % | | | 4.58 | % | | | — | |
| Class C | | | | | 6.12 | % | | | 5.30 | % | | | 4.58 | % | | | — | |
| Class I | | | | | 7.16 | % | | | 6.41 | % | | | 5.69 | % | | | — | |
| Class W | | | | | 7.12 | % | | | — | | | | — | | | | 6.50 | % |
| Barclays Capital U.S. MBS Index | | | | | 6.21 | % | | | 6.33 | % | | | 5.65 | % | | | 6.20 | %(4) |
Based on a $10,000 initial investment, the graph and table above illustrate the total return of ING GNMA Income Fund against the index indicated. An index is unmanaged and has no cash in its portfolio, imposes no sales charges and incurs no operating expenses. An investor cannot invest directly in an index. The Fund’s performance is shown both with and without the imposition of sales charges.
The performance graph and table do not reflect the deduction of taxes that a shareholder will pay on Fund distributions or the redemption of Fund shares.
The performance shown may include the effect of fee waivers and/ or expense reimbursements by the Investment Adviser and/or other service providers, which have the effect of increasing total return. Had all fees and expenses been considered, the total returns would have been lower.
Performance data represents past performance and is no assurance of future results. Investment return and principal value of an investment in the Fund will fluctuate. Shares, when sold, may be worth more or less than their original cost. The Fund’s performance may be lower or higher than the performance data shown. Please log on to www.inginvestment.com or call (800) 992-0180 to get performance through the most recent month end.
This report contains statements that may be “forward-looking” statements. Actual results may differ materially from those projected in the “forward-looking” statements.
The views expressed in this report reflect those of the portfolio managers, only through the end of the period as stated on the cover. The portfolio managers’ views are subject to change at any time based on market and other conditions.
Fund holdings are subject to change daily.
(1) | | Reflects deduction of the maximum Class A sales charge of 4.75%. Effective July 31, 2006, the maximum Class A sales charge was lowered to 2.50%. |
(2) | | Reflects deduction of the Class B deferred sales charge of 5% and 2% for the 1 year and 5 year returns, respectively. |
(3) | | Reflects deduction of the Class C deferred sales charge of 1% for the 1 year return. |
(4) | | Since inception performance for index is shown from January 1, 2008. |
5
ING HIGH YIELD BOND FUND | | PORTFOLIO MANAGERS’ REPORT
|
Sector Diversification
as of March 31, 2012
(as a percentage of net assets)
|
| | | | | | | |
| Consumer Discretionary | | | | | 28.2 | % |
| Energy | | | | | 16.4 | % |
| Health Care | | | | | 9.6 | % |
| Financials | | | | | 8.1 | % |
| Materials | | | | | 7.2 | % |
| Industrials | | | | | 6.9 | % |
| Telecommunication Services | | | | | 6.5 | % |
| Information Technology | | | | | 4.8 | % |
| Consumer Staples | | | | | 4.7 | % |
| Utilities | | | | | 2.1 | % |
| Other Asset-Backed Securities | | | | | 0.7 | % |
| Assets in Excess of Other Liabilities* | | | | | 4.8 | % |
| Net Assets | | | | | 100.0 | % |
| |
| | | | | | | |
* Includes short-term investments.
|
Portfolio holdings are subject to change daily.
|
ING High Yield Bond Fund (the “Fund”) seeks to provide investors with a high level of current income and total return. The Fund is managed by Randall Parrish, CFA, and Matthew Toms, Portfolio Managers of ING Investment Management Co. LLC — the Sub-Adviser.
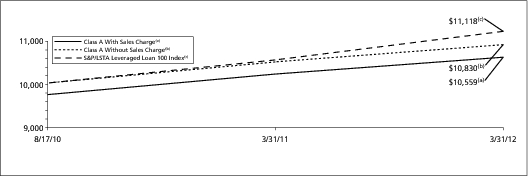
Performance: For the one year ended March 31, 2012, the Fund’s Class A shares, excluding sales charges, provided a total return of 6.72%, compared to the Barclays Capital High Yield Bond — 2% Issuer Constrained Composite Index (“Index”), which returned 6.43%, for the same period.
Portfolio Specifics: The road was a rocky one during the reporting period, as the high yield market endured a sell-off through late summer and fall, only to then rally strongly from December 2011 through March 2012. Concerns over European sovereign debt and the durability of the U.S. economic recovery were met with aggressive central bank action on both sides of the Atlantic. In addition, Greece’s debt restructuring failed to derail the global financial system. As investors gained comfort with the central bank backstop and the sustainability of the U.S. economic recovery, they were drawn to riskier assets, including equities and high yield bonds. Through the market volatility, underlying credit quality remained strong — whether measured by earnings growth, declining leverage, near-record corporate liquidity or a virtual absence of defaults. Assets continued to flow into the high yield market and issuance remained at record levels. This, in turn, allowed companies to refinance upcoming debt maturities and lock in low rates, thus reinforcing the virtuous cycle of low defaults and credit quality improvement.
Higher quality bonds outperformed lower quality, with BB-rated bonds returning 7.8% versus 4.3% for CCC-rated bonds. The best performing sectors were generally more defensive (including pharmaceuticals, cable and packaging), whereas the laggards were generally those with fundamentally challenged businesses (paper, independent electric utilities and transportation services).
Even though the high yield market met our return expectations for the past 12 months, the make-up was somewhat different than we anticipated. We expected slightly higher Treasury yields and lower credit spreads. In reality, we saw just the opposite, as the U.S. economic recovery remained bumpy and the European sovereign debt crisis lingered. The Fund’s credit quality positioning (underweight BB, overweight CCC) negatively impacted performance. However, this was more than offset by security selection and by successfully avoiding most of the market’s pitfalls during the period. The largest positive sector contribution was from energy, which benefited from our long-held view favoring oil over natural gas. In addition to the general outperformance of our oil-focused holdings, we benefited from the acquisition of holdings Petrohawk Energy Corp. and Brigham Exploration Company. The Fund also benefited from underweights of the paper, electric utilities and wireless telecommunication sectors, each of which faced fundamental challenges. Other company-specific outperformers included Insight Communications Company, Inc. and chemical manufacturer Solutia, Inc., both of which were acquired by investment grade companies. The only significant negative sector impact was in metals and mining, where our holdings in coal producers (including James River and Patriot Coal Corp.) were negatively impacted by the warm winter in the United States and by the threat of slowing steel production in China. Elsewhere, American Rock Salt Company suffered from a lack of winter snow in the northeastern U.S.
Top Ten Holdings
as of March 31, 2012*
(as a percentage of net assets)
|
| | | | | | | |
| Monitronics International, Inc., 9.125%, 04/01/20 | | | | | 0.8 | % |
| Physio-Control International, Inc., 9.875%, 01/15/19 | | | | | 0.7 | % |
| Ally Financial, Inc., 8.000%, 03/15/20 | | | | | 0.7 | % |
| Caesars Operating Escrow LLC / Caesars Escrow Corp., 8.500%, 02/15/20 | | | | | 0.7 | % |
| Taylor Morrison Communities, Inc. / Monarch Communities, Inc., 7.750%, 04/15/20 | | | | | 0.7 | % |
| Codere Finance Luxembourg SA, 9.250%, 02/15/19 | | | | | 0.7 | % |
| JM Huber Corp., 9.875%, 11/01/19 | | | | | 0.7 | % |
| GSC Partners CDO Fund Ltd, 2.495%, 12/16/15 | | | | | 0.7 | % |
| Intelsat Luxembourg S.A., 11.250%, 02/04/17 | | | | | 0.7 | % |
| AMC Entertainment, Inc., 9.750%, 12/01/20 | | | | | 0.6 | % |
| |
| | | | | | | |
* Excludes short-term investments.
|
Portfolio holdings are subject to change daily.
|
Current Strategy & Outlook: Our longer term positive view on the high yield market has not changed: We continue to expect a sustained — if modest — U.S. economic recovery and a below-average default rate for several more quarters. Under this scenario, we believe investors are being attractively compensated for the default risk taken, even after the strong returns of the last two quarters. Even if returns come in somewhat below the current market yield of more than 7%, we believe this is sufficiently attractive versus a 2% 10-year Treasury and a near-zero money market rate to continue to attract assets to high yield bonds. We are likely to see continued volatility in the near term due to periodic concerns about emerging market growth, the resurgence of European sovereign debt fears and the U.S. election and budget battle. We believe default activity will remain below historical levels for some time. In addition, we feel that defaults will be largely confined to a known list of candidates with weak business models or over-leveraged capital structures put in place in the peak of the leveraged buyout boom in 2006-2007. In keeping with our view of economic recovery and continuing strong credit fundamentals, we maintain a slight cyclical bias and an overweight to single-B profile credits (underweight BBs and the lowest quality CCC and below). We continue to maintain an overweight to the energy sector, particularly oil-focused exploration and production companies, as well as an overweight to chemicals (mainly specialty producers) and healthcare. Conversely, we are underweight sectors where operating fundamentals are under pressure, including utilities and wireless telecommunications. We have reduced our position in coal companies given the continuing demand and pricing headwinds, but will likely look for an opportunity to add at lower prices as we still believe in the long-term investment thesis.
Portfolio holdings and characteristics are subject to change and may not be representative of current holdings and characteristics. The outlook for this Fund may differ from that presented for other ING Funds. Performance for the different classes of shares will vary based on differences in fees associated with each class. An index has no cash in its portfolio, imposes no sales charges and incurs no operating expenses. An investor cannot invest directly in an index. The views expressed in this report reflect those of the portfolio managers, only through the end of the period as stated on the cover. The portfolio managers’ views are subject to change at any time based on market and other conditions. Fund holdings are subject to change daily. This report contains statements that may be “forward-looking” statements. Actual results may differ materially from those projected in the “forward-looking” statements.
6
PORTFOLIO MANAGERS’ REPORT | | ING HIGH YIELD BOND FUND
|
Average Annual Total Returns for the Periods Ended March 31, 2012
|
|
|---|
| | | | 1 Year
| | 5 Year
| | 10 Year
| | Since Inception
of Class I
July 31, 2008
| | Since Inception
of Class W
July 29, 2011
|
|---|
Including Sales Charge: |
Class A(1) | | | | | 4.05 | % | | | 5.16 | % | | | 6.09 | % | | | — | | | | — | |
Class B(2) | | | | | 0.90 | % | | | 4.59 | % | | | 5.80 | % | | | — | | | | — | |
Class C(3) | | | | | 5.05 | % | | | 4.90 | % | | | 5.83 | % | | | — | | | | — | |
| Class I | | | | | 7.30 | % | | | — | | | | — | | | | 10.63 | % | | | — | |
| Class W | | | | | — | | | | — | | | | — | | | | — | | | | 5.77 | % |
Excluding Sales Charge: |
| Class A | | | | | 6.72 | % | | | 5.69 | % | | | 6.62 | % | | | — | | | | — | |
| Class B | | | | | 5.89 | % | | | 4.88 | % | | | 5.80 | % | | | — | | | | — | |
| Class C | | | | | 6.05 | % | | | 4.90 | % | | | 5.83 | % | | | — | | | | — | |
| Class I | | | | | 7.30 | % | | | — | | | | — | | | | 10.63 | % | | | — | |
| Class W | | | | | — | | | | — | | | | — | | | | — | | | | 5.77 | % |
| Barclays Capital High Yield Bond — 2% Issuer Constrained Composite Index | | | | | 6.43 | % | | | 8.27 | % | | | 9.34 | % | | | 12.32 | %(4) | | | 4.12 | %(5) |
| Barclays Capital Corporate High Yield Index | | | | | 6.45 | % | | | 8.10 | % | | | 9.24 | % | | | 12.24 | %(4) | | | 4.14 | %(5) |
| |
Based on a $10,000 initial investment, the graph and table above illustrate the total return of ING High Yield Bond Fund against the indices indicated. An index is unmanaged and has no cash in its portfolio, imposes no sales charges and incurs no operating expenses. An investor cannot invest directly in an index. The Fund’s performance is shown both with and without the imposition of sales charges.
The performance graph and table do not reflect the deduction of taxes that a shareholder will pay on Fund distributions or the redemption of Fund shares.
The performance shown may include the effect of fee waivers and/ or expense reimbursements by the Investment Adviser and/or other service providers, which have the effect of increasing total return. Had all fees and expenses been considered, the total returns would have been lower.
Performance data represents past performance and is no assurance of future results. Investment return and principal value of an investment in the Fund will fluctuate. Shares, when sold, may be worth more or less than their original cost. The Fund’s performance may be lower or higher than the performance data shown. Please log on to www.inginvestment.com or call (800) 992-0180 to get performance through the most recent month end.
This report contains statements that may be “forward-looking” statements. Actual results may differ materially from those projected in the “forward-looking” statements.
The views expressed in this report reflect those of the portfolio managers, only through the end of the period as stated on the cover. The portfolio managers’ views are subject to change at any time based on market and other conditions.
Fund holdings are subject to change daily.
(1) | | Reflects deduction of the maximum Class A sales charge of 4.75%. Effective July 31, 2006, the maximum Class A sales charge was lowered to 2.50%. |
(2) | | Reflects deduction of the Class B deferred sales charge of 5% and 2% for the 1 year and 5 year returns, respectively. |
(3) | | Reflects deduction of the Class C deferred sales charge of 1% for the 1 year return. |
(4) | | Since inception performance for the indices is shown from August 1, 2008. |
(5) | | Since inception performance for the indices is shown from August 1, 2011. |
7
ING INTERMEDIATE BOND FUND | | PORTFOLIO MANAGERS’ REPORT
|
Investment Type Allocation
as of March 31, 2012
(as a percentage of net assets)
|
| | | | | | | |
| Corporate Bonds/Notes | | | | | 33.2 | % |
| U.S. Government Agency Obligations | | | | | 30.9 | % |
Collateralized Mortgage Obligations
| | | | | 11.2 | % |
| U.S. Treasury Obligations | | | | | 10.6 | % |
| Foreign Government Bonds | | | | | 7.2 | % |
| Asset-Backed Securities | | | | | 4.2 | % |
| Preferred Stock | | | | | 0.3 | % |
| Purchased Options | | | | | 0.1 | % |
| Assets in Excess of Other Liabilities* | | | | | 2.3 | % |
| Net Assets | | | | | 100.0 | % |
| | | | | | | |
*Includes short-term investments.
|
Portfolio holdings are subject to change daily.
|
| | | | | | | |
ING Intermediate Bond Fund (the “Fund”) seeks to maximize total return through income and capital appreciation. The Fund is managed by Christine Hurtsellers, Matthew Toms and Michael Mata, Portfolio Managers of ING Investment Management Co. LLC — the Sub-Adviser.
Performance: For the one year ended March 31, 2012, the Fund’s Class A shares, excluding sales charges, provided a total return of 8.61% compared to the Barclays Capital U.S. Aggregate Bond Index, which returned 7.71%, for the same period.
Portfolio Specifics: At the start of this period European sovereign debt concerns and slowing U.S. macroeconomic data stole the headlines. Investors shed risk assets and favored U.S. Treasury and government related securities as U.S. interest rates fell. As we moved into the summer and volatility picked up, risk assets underperformed and interest rates fell significantly. Tactically positioning the Fund’s duration slightly longer than that of the benchmark helped relative performance. As the calendar year came to a close, the economy showed more signs of life and growth with an improving jobs picture and hopes that housing might be starting to turn around in some areas of the country. This gave a stronger bid for spread assets such as commercial mortgage-backed securities (“CMBS”), non-agency residential mortgage-backed securities (“RMBS”) and high yield corporate bonds.
Risk assets rallied in blockbuster fashion throughout the first quarter of 2012 as markets began to price out the near-term potential of a systemic unwinding of Europe. Equity markets posted double-digit returns during the quarter. Spread sectors such as high yield followed suit. Investment grade credit, CMBS and asset-backed securities also gained.
For the full reporting period, our tactical duration management helped relative performance versus the benchmark. At times the Fund had small allocations to non-U.S. dollar investments, which helped relative performance. Our bias to holding overweights in high-quality spread assets such as agency and non-agency RMBS, CMBS and investment grade credit — and funding these overweights with underweights to U.S. Treasury and agency bonds — benefited relative performance. Our allocation to off-benchmark sectors such high yield and emerging market debt also helped relative performance. Lastly our security selection within agency RMBS, and CMBS also benefited the Fund. In contrast, security selection among U.S. Treasuries detracted from relative performance.
The Fund used the following derivative instruments throughout the period: currency forwards and options, which when combined with cash securities led to underperformance from currency management; U.S. Treasury futures and swaps for duration and yield curve management, which when combined with cash securities had a positive impact relative to the benchmark; and credit default swaps and options on credit default swaps for managing credit risks and sector exposures, which when combined with our cash bond allocations was a significant contributor to relative outperformance. Top Ten Holdings
as of March 31, 2012*
(as a percentage of net assets)
|
| | | | | | | |
| Ginnie Mae, 3.500%, 10/15/41 | | | | | 3.3 | % |
| Fannie Mae, 4.000%, 02/25/39 | | | | | 2.9 | % |
| United States Treasury Note, 0.250%, 03/31/14 | | | | | 2.8 | % |
| United States Treasury Note, 2.000%, 02/15/22 | | | | | 2.5 | % |
| Fannie Mae, 3.500%, 12/25/40 | | | | | 2.3 | % |
| Brazil Notas do Tesouro Nacional Series F, 10.000%, 01/01/21 | | | �� | | 2.2 | % |
| South Africa Government Bond, 7.250%, 01/15/20 | | | | | 1.9 | % |
| United States Treasury Note, 1.500%, 03/31/19 | | | | | 1.6 | % |
| Freddie Mac, 5.500%, 02/15/36 | | | | | 1.5 | % |
| United States Treasury Note, 3.125%, 11/15/41 | | | | | 1.4 | % |
| | | | | | | |
*Excludes short-term investments.
|
| |
Portfolio holdings are subject to change daily. |
| |
Current Strategy & Outlook: We think it is best to frame the market’s recent rally and some of the sell-off in U.S. Treasuries as the market pricing out the near-term potential of a systemic unwinding in Europe. Investors are enjoying the relief rally, but should not be fooled into thinking this is all fundamentally driven. After all, the business cycle is driven by economic momentum, which is measured by growth in many forms, like productivity, corporate earnings and the extension of credit. We believe economic momentum, on balance, has been improving and corporate fundamentals have been improving. But markets like easy money and there is a high correlation to central bank balance sheet growth and risk market performance. Case in point, the S&P 500® Index and German DAX have both posted double-digit returns year-to-date on the basis of multiple expansion, not earnings growth.
Our fundamental case is for sustained global growth given the current resilience of the U.S. economy as supported by stronger employment numbers and signs of improvement, albeit regionally, in the housing market. With the U.S. Federal Reserve explicitly on hold through 2014, we do not see the impetus for short-term rates to rise significantly without a change in central bank rhetoric. Europe is in recession and China is slowing, though we do believe emerging markets will continue to be the speedometer for global growth. In our opinion, the current speed is strong enough to maintain risk appetite, but not enough to justify another leg tighter. Tactically, where we have the capacity to do so, our bias would be to reduce positions by selling into this rally. We believe we likely have the ingredients to generate a general sideways move with the possibility of increased volatility. This is not a call to sell and run to the hills. Rather, it is an acknowledgment that we are more likely to trade sideways in a choppy pattern than to see a continued rally.
Portfolio holdings and characteristics are subject to change and may not be representative of current holdings and characteristics. The outlook for this Fund may differ from that presented for other ING Funds. Performance for the different classes of shares will vary based on differences in fees associated with each class. An index has no cash in its portfolio, imposes no sales charges and incurs no operating expenses. An investor cannot invest directly in an index.
The views expressed in this report reflect those of the portfolio managers, only through the end of the period as stated on the cover. The portfolio managers’ views are subject to change at any time based on market and other conditions.
Fund holdings are subject to change daily. This report contains statements that may be “forward-looking” statements. Actual results may differ materially from those projected in the “forward-looking” statements.
8
PORTFOLIO MANAGERS’ REPORT | | ING INTERMEDIATE BOND FUND
|
Average Annual Total Returns for the Periods Ended March 31, 2012
|
|
|---|
| | | | 1 Year
| | 5 Year
| | 10 Year
| | Since Inception
of Class O
August 13, 2004
| | Since Inception
of Class R
March 16, 2004
| | Since Inception
of Class W
December 17, 2007
|
|---|
Including Sales Charge: |
Class A(1) | | | | | 5.94 | % | | | 4.49 | % | | | 4.74 | % | | | — | | | | — | | | | — | |
Class B(2) | | | | | 2.77 | % | | | 3.89 | % | | | 4.44 | % | | | — | | | | — | | | | — | |
Class C(3) | | | | | 6.78 | % | | | 4.22 | % | | | 4.46 | % | | | — | | | | — | | | | — | |
| Class I | | | | | 8.90 | % | | | 5.35 | % | | | 5.59 | % | | | — | | | | — | | | | — | |
| Class O | | | | | 8.49 | % | | | 4.99 | % | | | — | | | | 4.60 | % | | | — | | | | — | |
| Class R | | | | | 8.33 | % | | | 4.73 | % | | | — | | | | — | | | | 4.10 | % | | | — | |
| Class W | | | | | 10.09 | % | | | — | | | | — | | | | — | | | | — | | | | 5.85 | % |
Excluding Sales Charge: |
| Class A | | | | | 8.61 | % | | | 5.01 | % | | | 5.25 | % | | | — | | | | — | | | | — | |
| Class B | | | | | 7.77 | % | | | 4.22 | % | | | 4.44 | % | | | — | | | | — | | | | — | |
| Class C | | | | | 7.78 | % | | | 4.22 | % | | | 4.46 | % | | | — | | | | — | | | | — | |
| Class I | | | | | 8.90 | % | | | 5.35 | % | | | 5.59 | % | | | — | | | | — | | | | — | |
| Class O | | | | | 8.49 | % | | | 4.99 | % | | | — | | | | 4.60 | % | | | — | | | | — | |
| Class R | | | | | 8.33 | % | | | 4.73 | % | | | — | | | | — | | | | 4.10 | % | | | — | |
| Class W | | | | | 10.09 | % | | | — | | | | — | | | | — | | | | — | | | | 5.85 | % |
| Barclays Capital U.S. Aggregate Bond Index | | | | | 7.71 | % | | | 6.25 | % | | | 5.80 | % | | | 5.57 | %(4) | | | 5.13 | %(5) | | | 6.07 | %(6) |
Based on a $10,000 initial investment, the graph and table above illustrate the total return of ING Intermediate Bond Fund against the index indicated. An index is unmanaged and has no cash in its portfolio, imposes no sales charges and incurs no operating expenses. An investor cannot invest directly in an index. The Fund’s performance is shown both with and without the imposition of sales charges.
The performance graph and table do not reflect the deduction of taxes that a shareholder will pay on Fund distributions or the redemption of Fund shares.
The performance shown may include the effect of fee waivers and/or expense reimbursements by the Investment Adviser and/or other service providers, which have the effect of increasing total return. Had all fees and expenses been considered, the total returns would have been lower.
Performance data represents past performance and is no assurance of future results. Investment return and principal value of an investment in the Fund will fluctuate. Shares, when sold, may be worth more or less than their original cost. The Fund’s performance may be lower or higher than the performance data shown. Please log on to www.inginvestment.com or call (800) 992-0180 to get performance through the most recent month end.
This report contains statements that may be “forward-looking” statements. Actual results may differ materially from those projected in the “forward-looking” statements.
The views expressed in this report reflect those of the portfolio managers, only through the end of the period as stated on the cover. The portfolio managers’ views are subject to change at any time based on market and other conditions.
Fund holdings are subject to change daily.
(1) | | Reflects deduction of the maximum Class A sales charge of 4.75%. Effective July 31, 2006, the maximum Class A sales charge was lowered to 2.50%. |
(2) | | Reflects deduction of the Class B deferred sales charge of 5% and 2% for the 1 year and 5 year returns, respectively. |
(3) | | Reflects deduction of the Class C deferred sales charge of 1% for the 1 year return. |
(4) | | Since inception performance for index is shown from August 1, 2004. |
(5) | | Since inception performance for index is shown from April 1, 2004. |
(6) | | Since inception performance for index is shown from January 1, 2008. |
9
SHAREHOLDER EXPENSE EXAMPLES (UNAUDITED)
As a shareholder of a Fund, you incur two types of costs: (1) transaction costs, including sales charges (loads) on purchase payments, redemption fees, and exchange fees, and (2) ongoing costs, including management fees, distribution and/or service (12b-1) fees, and other Fund expenses. These Examples are intended to help you understand your ongoing costs (in dollars) of investing in a Fund and to compare these costs with the ongoing costs of investing in other mutual funds.
The Examples are based on an investment of $1,000 invested at the beginning of the period and held for the entire period from October 1, 2011 to March 31, 2012. The Funds’ expenses are shown without the imposition of any sales charges or fees. Expenses would have been higher if such charges were included.
Actual Expenses
The left section of the table shown below, “Actual Fund Return,” provides information about actual account values and actual expenses. You may use the information in this section, together with the amount you invested, to estimate the expenses that you paid over the period. Simply divide your account value by $1,000 (for example, an $8,600 account value divided by $1,000 = 8.6), then multiply the result by the number in the first section under the heading entitled “Expenses Paid During the Period” to estimate the expenses you paid on your account during this period.
Hypothetical Example for Comparison Purposes
The right section of the table shown below, “Hypothetical (5% return before expenses)” provides information about hypothetical account values and hypothetical expenses based on a Fund’s actual expense ratio and an assumed rate of return of 5% per year before expenses, which is not the Fund’s actual return. The hypothetical account values and expenses may not be used to estimate the actual ending account balance or expenses you paid for the period. You may use this information to compare the ongoing costs of investing in each Fund and other funds. To do so, compare this 5% hypothetical example with the 5% hypothetical examples that appear in the shareholder reports of the other funds.
Please note that the expenses shown in the table are meant to highlight your ongoing costs only and do not reflect any transactional costs, such as sales charges (loads), redemption fees, or exchange fees. Therefore, the hypothetical lines of the table are useful in comparing ongoing costs only, and will not help you determine the relative total costs of owning different funds. In addition, if these transactional costs were included, your costs would have been higher.
| | | | Actual Fund Return
| | Hypothetical (5% return before expenses)
| |
|---|
| | | | Beginning
Account
Value
October 1,
2011
| | Ending
Account
Value
March 31,
2012
| | Annualized
Expense
Ratio
| | Expenses Paid
During the
Period Ended
March 31,
2012
| | Beginning
Account
Value
October 1,
2011
| | Ending
Account
Value
March 31,
2012
| | Annualized
Expense
Ratio
| | Expenses Paid
During the
Period Ended
March 31,
2012*
|
|---|
ING GNMA Income Fund
|
| Class A | | | | $ | 1,000.00 | | | $ | 1,022.70 | | | | 0.93 | % | | $ | 4.70 | | | $ | 1,000.00 | | | $ | 1,020.34 | | | | 0.93 | % | | $ | 4.70 | |
| Class B | | | | | 1,000.00 | | | | 1,018.90 | | | | 1.68 | | | | 8.48 | | | | 1,000.00 | | | | 1,016.61 | | | | 1.68 | | | | 8.47 | |
| Class C | | | | | 1,000.00 | | | | 1,017.90 | | | | 1.68 | | | | 8.48 | | | | 1,000.00 | | | | 1,016.59 | | | | 1.68 | | | | 8.47 | |
| Class I | | | | | 1,000.00 | | | | 1,024.00 | | | | 0.65 | | | | 3.29 | | | | 1,000.00 | | | | 1,021.73 | | | | 0.65 | | | | 3.29 | |
| Class W | | | | | 1,000.00 | | | | 1,023.90 | | | | 0.68 | | | | 3.44 | | | | 1,000.00 | | | | 1,021.58 | | | | 0.68 | | | | 3.44 | |
ING High Yield Bond Fund | | | | | | | | | | | | | | | | | | | | | | | | | | | | | | | | | | |
| Class A | | | | | 1,000.00 | | | | 1,122.70 | | | | 1.10 | | | | 5.84 | | | | 1,000.00 | | | | 1,019.50 | | | | 1.10 | | | | 5.55 | |
| Class B | | | | | 1,000.00 | | | | 1,118.40 | | | | 1.85 | | | | 9.80 | | | | 1,000.00 | | | | 1,015.75 | | | | 1.85 | | | | 9.32 | |
| Class C | | | | | 1,000.00 | | | | 1,118.40 | | | | 1.85 | | | | 9.80 | | | | 1,000.00 | | | | 1,015.76 | | | | 1.85 | | | | 9.32 | |
| Class I | | | | | 1,000.00 | | | | 1,125.00 | | | | 0.67 | | | | 3.56 | | | | 1,000.00 | | | | 1,021.65 | | | | 0.67 | | | | 3.39 | |
| Class W | | | | | 1,000.00 | | | | 1,057.70 | | | | 0.85 | | | | 4.37 | | | | 1,000.00 | | | | 1,020.77 | | | | 0.85 | | | | 4.29 | |
| * | | Expenses are equal to each Fund’s respective annualized expense ratios multiplied by the average account value over the period, multiplied by 183/366 to reflect the most recent fiscal half-year. |
10
SHAREHOLDER EXPENSE EXAMPLES (UNAUDITED) (CONTINUED)
| | | | Actual Fund Return
| | Hypothetical (5% return before expenses)
| |
|---|
| | | | Beginning
Account
Value
October 1,
2011
| | Ending
Account
Value
March 31,
2012
| | Annualized
Expense
Ratio
| | Expenses Paid
During the
Period Ended
March 31,
2012
| | Beginning
Account
Value
October 1,
2011
| | Ending
Account
Value
March 31,
2012
| | Annualized
Expense
Ratio
| | Expenses Paid
During the
Period Ended
March 31,
2012*
|
|---|
ING Intermediate Bond Fund | | | | | | | | | | | | | | | | | | | | | | | | | | | | | | | | | | |
| Class A | | | | $ | 1,000.00 | | | $ | 1,039.30 | | | | 0.68 | % | | $ | 3.47 | | | $ | 1,000.00 | | | $ | 1,021.62 | | | | 0.68 | % | | $ | 3.44 | |
| Class B | | | | | 1,000.00 | | | | 1,035.50 | | | | 1.43 | | | | 7.28 | | | | 1,000.00 | | | | 1,017.87 | | | | 1.43 | | | | 7.21 | |
| Class C | | | | | 1,000.00 | | | | 1,035.50 | | | | 1.43 | | | | 7.28 | | | | 1,000.00 | | | | 1,017.86 | | | | 1.43 | | | | 7.21 | |
| Class I | | | | | 1,000.00 | | | | 1,040.80 | | | | 0.40 | | | | 2.04 | | | | 1,000.00 | | | | 1,023.00 | | | | 0.40 | | | | 2.02 | |
| Class O | | | | | 1,000.00 | | | | 1,039.30 | | | | 0.68 | | | | 3.47 | | | | 1,000.00 | | | | 1,021.61 | | | | 0.68 | | | | 3.44 | |
| Class R | | | | | 1,000.00 | | | | 1,038.00 | | | | 0.93 | | | | 4.74 | | | | 1,000.00 | | | | 1,020.37 | | | | 0.93 | | | | 4.70 | |
| Class W | | | | | 1,000.00 | | | | 1,040.80 | | | | 0.43 | | | | 2.19 | | | | 1,000.00 | | | | 1,022.83 | | | | 0.43 | | | | 2.17 | |
| * | | Expenses are equal to each Fund’s respective annualized expense ratios multiplied by the average account value over the period, multiplied by 183/366 to reflect the most recent fiscal half-year. |
11
REPORT OF INDEPENDENT REGISTERED PUBLIC ACCOUNTING FIRM
The Shareholders and Board of Trustees
ING Funds Trust
We have audited the accompanying statements of assets and liabilities, including the summary portfolios of investments, of ING GNMA Income Fund, ING High Yield Bond Fund, and ING Intermediate Bond Fund, each a series of ING Funds Trust, as of March 31, 2012, and the related statements of operations for the year then ended, the statements of changes in net assets for each of the years in the two-year period then ended, and the financial highlights for each of the years in the five-year period then ended. These financial statements and financial highlights are the responsibility of management. Our responsibility is to express an opinion on these financial statements and financial highlights based on our audits.
We conducted our audits in accordance with the standards of the Public Company Accounting Oversight Board (United States). Those standards require that we plan and perform the audits to obtain reasonable assurance about whether the financial statements and financial highlights are free of material misstatement. An audit includes examining, on a test basis, evidence supporting the amounts and disclosures in the financial statements. Our procedures included confirmation of securities owned as of March 31, 2012, by correspondence with the custodian and brokers, or by other appropriate auditing procedures when replies from brokers were not received. An audit also includes assessing the accounting principles used and significant estimates made by management, as well as evaluating the overall financial statement presentation. We believe that our audits provide a reasonable basis for our opinion.
In our opinion, the financial statements and financial highlights referred to above present fairly, in all material respects, the financial position of the aforementioned funds as of March 31, 2012, and the results of their operations, the changes in their net assets, and the financial highlights for the periods specified in the first paragraph above, in conformity with U.S. generally accepted accounting principles.
Boston, Massachusetts
May 30, 2012
12
STATEMENTS OF ASSETS AND LIABILITIES AS OF MARCH 31, 2012
| | | | ING
GNMA
Income
Fund
| | ING
High Yield
Bond
Fund
| | ING
Intermediate
Bond
Fund
|
|---|
ASSETS: | | | | | | | | | | | | | | |
| Investments in securities at value+* | | | | $ | 998,139,986 | | | $ | 132,904,095 | | | $ | 807,518,940 | |
| Short-term investments at value*** | | | | | — | | | | 5,063,000 | | | | 124,043,045 | |
| Cash | | | | | 86,328,495 | | | | 297,840 | | | | 55,812 | |
| Cash collateral for futures | | | | | 1,735,674 | | | | — | | | | 2,169,716 | |
| Receivable for derivatives collateral (Note 2) | | | | | — | | | | — | | | | 5,095,000 | |
| Foreign currencies at value***** | | | | | �� | | | | 12,633 | | | | 3,338,993 | |
| Receivables: | | | | | | | | | | | | | | |
| Investments securities sold | | | | | — | | | | 16,909,000 | | | | 68,872,928 | |
| Investment securities sold on a delayed-delivery or when-issued basis | | | | | 165,562,164 | | | | — | | | | 80,310,883 | |
| Fund shares sold | | | | | 4,714,494 | | | | 511,607 | | | | 9,375,519 | |
| Dividends | | | | | — | | | | 561 | | | | 24,837 | |
| Interest | | | | | 4,145,468 | | | | 2,940,491 | | | | 5,139,469 | |
| Unrealized appreciation on forward foreign currency contracts | | | | | — | | | | — | | | | 545,087 | |
| Upfront payments paid on OTC swap agreements | | | | | — | | | | — | | | | 452,571 | |
| Unrealized appreciation on OTC swap agreements | | | | | — | | | | — | | | | 264,608 | |
| Prepaid expenses | | | | | 40,290 | | | | 32,795 | | | | 56,368 | |
| Reimbursement due from manager | | | | | — | | | | 4,828 | | | | — | |
| Total assets | | | | | 1,260,666,571 | | | | 158,676,850 | | | | 1,107,263,776 | |
| |
LIABILITIES: | | | | | | | | | | | | | | |
| Income distribution payable | | | | | — | | | | 175,637 | | | | 229,066 | |
| Payable for investment securities purchased | | | | | 1,421,127 | | | | 5,982,984 | | | | 75,284,249 | |
| Payable for investment securities purchased on a delayed-delivery or when-issued basis | | | | | 274,390,359 | | | | — | | | | 160,674,644 | |
| Payable for fund shares redeemed | | | | | 3,414,921 | | | | 12,700,308 | | | | 4,542,169 | |
| Payable upon receipt of securities loaned | | | | | — | | | | — | | | | 33,451,480 | |
| Unrealized depreciation on forward foreign currency contracts | | | | | — | | | | — | | | | 2,228,747 | |
| Upfront payments received on OTC swap agreements | | | | | — | | | | — | | | | 507,283 | |
| Unrealized depreciation on OTC swap agreements | | | | | — | | | | — | | | | 2,938,581 | |
| Payable to affiliates | | | | | 725,269 | | | | 114,913 | | | | 296,851 | |
| Payable for trustee fees | | | | | 4,277 | | | | 680 | | | | 3,948 | |
| Other accrued expenses and liabilities | | | | | 213,963 | | | | 82,195 | | | | 142,757 | |
| Written options, at fair value^ | | | | | — | | | | — | | | | 25,000 | |
| Total liabilities | | | | | 280,169,916 | | | | 19,056,717 | | | | 280,324,775 | |
NET ASSETS | | | | $ | 980,496,655 | | | $ | 139,620,133 | | | $ | 826,939,001 | |
NET ASSETS WERE COMPRISED OF: | | | | | | | | | | | | | | |
| Paid-in capital | | | | $ | 934,227,989 | | | $ | 176,020,896 | | | $ | 941,992,329 | |
| Undistributed (distributions in excess of) net investment income | | | | | (10,084 | ) | | | (79,880 | ) | | | 20,559,366 | |
| Accumulated net realized gain (loss) | | | | | 308,330 | | | | (41,057,807 | ) | | | (149,027,815 | ) |
| Net unrealized appreciation | | | | | 45,970,420 | | | | 4,736,924 | | | | 13,415,121 | |
NET ASSETS | | | | $ | 980,496,655 | | | $ | 139,620,133 | | | $ | 826,939,001 | |
| | | | | | | | | | | | | | |
| + Including securities loaned at value | | | | $ | — | | | $ | — | | | $ | 32,707,588 | |
| * Cost of investments in securities | | | | $ | 954,000,073 | | | $ | 128,166,897 | | | $ | 789,776,005 | |
| *** Cost of short-term investments | | | | $ | — | | | $ | 5,063,000 | | | $ | 124,043,045 | |
| ***** Cost of foreign currencies | | | | $ | — | | | $ | 12,907 | | | $ | 3,342,432 | |
| ^ Premiums received on written options | | | | $ | — | | | $ | — | | | $ | 151,078 | |
See Accompanying Notes to Financial Statements
13
STATEMENTS OF ASSETS AND LIABILITIES AS OF MARCH 31, 2012 (CONTINUED)
| | | | ING
GNMA
Income
Fund
| | ING
High Yield
Bond
Fund
| | ING
Intermediate
Bond
Fund
|
|---|
Class A | | | | | | | | | | | | | | |
| Net assets | | | | $ | 681,899,658 | | | $ | 98,122,755 | | | $ | 293,277,238 | |
| Shares authorized | | | | | unlimited | | | | unlimited | | | | unlimited | |
| Par value | | | | $ | 0.001 | | | $ | 0.001 | | | $ | 0.001 | |
| Shares outstanding | | | | | 75,046,138 | | | | 12,574,055 | | | | 29,627,589 | |
| Net asset value and redemption price per share | | | | $ | 9.09 | | | $ | 7.80 | | | $ | 9.90 | |
Maximum offering price per share (2.50%)(1) | | | | $ | 9.32 | | | $ | 8.00 | | | $ | 10.15 | |
| |
Class B | | | | | | | | | | | | | | |
| Net assets | | | | $ | 3,676,278 | | | $ | 2,369,838 | | | $ | 4,143,957 | |
| Shares authorized | | | | | unlimited | | | | unlimited | | | | unlimited | |
| Par value | | | | $ | 0.001 | | | $ | 0.001 | | | $ | 0.001 | |
| Shares outstanding | | | | | 406,884 | | | | 304,043 | | | | 419,345 | |
| Net asset value and redemption price per share† | | | | $ | 9.04 | | | $ | 7.79 | | | $ | 9.88 | |
| |
Class C | | | | | | | | | | | | | | |
| Net assets | | | | $ | 138,542,534 | | | $ | 12,727,485 | | | $ | 35,255,590 | |
| Shares authorized | | | | | unlimited | | | | unlimited | | | | unlimited | |
| Par value | | | | $ | 0.001 | | | $ | 0.001 | | | $ | 0.001 | |
| Shares outstanding | | | | | 15,326,593 | | | | 1,631,297 | | | | 3,566,432 | |
| Net asset value and redemption price per share† | | | | $ | 9.04 | | | $ | 7.80 | | | $ | 9.89 | |
| |
Class I | | | | | | | | | | | | | | |
| Net assets | | | | $ | 144,678,168 | | | $ | 24,848,515 | | | $ | 331,423,246 | |
| Shares authorized | | | | | unlimited | | | | unlimited | | | | unlimited | |
| Par value | | | | $ | 0.001 | | | $ | 0.001 | | | $ | 0.001 | |
| Shares outstanding | | | | | 15,901,743 | | | | 3,187,508 | | | | 33,485,477 | |
| Net asset value and redemption price per share | | | | $ | 9.10 | | | $ | 7.80 | | | $ | 9.90 | |
| |
Class O | | | | | | | | | | | | | | |
| Net assets | | | | $ | n/a | | | $ | n/a | | | $ | 42,500,012 | |
| Shares authorized | | | | | n/a | | | | n/a | | | | unlimited | |
| Par value | | | | $ | n/a | | | $ | n/a | | | $ | 0.001 | |
| Shares outstanding | | | | | n/a | | | | n/a | | | | 4,291,810 | |
| Net asset value and redemption price per share | | | | $ | n/a | | | $ | n/a | | | $ | 9.90 | |
| |
Class R | | | | | | | | | | | | | | |
| Net assets | | | | $ | n/a | | | $ | n/a | | | $ | 12,322,602 | |
| Shares authorized | | | | | n/a | | | | n/a | | | | unlimited | |
| Par value | | | | $ | n/a | | | $ | n/a | | | $ | 0.001 | |
| Shares outstanding | | | | | n/a | | | | n/a | | | | 1,243,092 | |
| Net asset value and redemption price per share | | | | $ | n/a | | | $ | n/a | | | $ | 9.91 | |
| |
Class W | | | | | | | | | | | | | | |
| Net assets | | | | $ | 11,700,017 | | | $ | 1,551,540 | | | $ | 108,016,356 | |
| Shares authorized | | | | | unlimited | | | | unlimited | | | | unlimited | |
| Par value | | | | $ | 0.001 | | | $ | 0.001 | | | $ | 0.001 | |
| Shares outstanding | | | | | 1,284,891 | | | | 198,722 | | | | 10,923,583 | |
| Net asset value and redemption price per share | | | | $ | 9.11 | | | $ | 7.81 | | | $ | 9.89 | |
| | | | | | | | | | | | | | |
(1)Maximum offering price is computed at 100/97.50 of net asset value. On purchases of $100,000 or more, the offering price is reduced. |
| †Redemption price per share may be reduced for any applicable contingent deferred sales charges. |
See Accompanying Notes to Financial Statements
14
STATEMENTS OF OPERATIONS FOR THE YEAR ENDED MARCH 31, 2012
| | | | ING
GNMA
Income
Fund
| | ING
High Yield
Bond
Fund
| | ING
Intermediate
Bond
Fund
|
|---|
INVESTMENT INCOME: | | | | | | | | | | | | | | |
| Dividends | | | | $ | — | | | $ | 8,671 | | | $ | 171,581 | |
| Interest, net of foreign taxes withheld* | | | | | 29,978,428 | | | | 10,606,269 | | | | 36,477,109 | |
| Securities lending income, net | | | | | — | | | | — | | | | 128,007 | |
| Total investment income | | | | | 29,978,428 | | | | 10,614,940 | | | | 36,776,697 | |
| |
EXPENSES: | | | | | | | | | | | | | | |
| Investment management fees | | | | | 4,020,454 | | | | 693,086 | | | | 1,342,413 | |
| Distribution and service fees: | | | | | | | | | | | | | | |
| Class A | | | | | 1,575,118 | | | | 214,690 | | | | 765,784 | |
| Class B | | | | | 62,485 | | | | 33,732 | | | | 59,172 | |
| Class C | | | | | 1,143,870 | | | | 116,428 | | | | 335,200 | |
| Class O | | | | | — | | | | — | | | | 104,802 | |
| Class R | | | | | — | | | | — | | | | 69,154 | |
| Transfer agent fees: | | | | | | | | | | | | | | |
| Class A | | | | | 385,551 | | | | 153,595 | | | | 286,245 | |
| Class B | | | | | 3,742 | | | | 6,037 | | | | 5,406 | |
| Class C | | | | | 70,215 | | | | 20,825 | | | | 31,456 | |
| Class I | | | | | 30,513 | | | | 1,217 | | | | 217,721 | |
| Class O | | | | | — | | | | — | | | | 39,305 | |
| Class R | | | | | — | | | | — | | | | 12,862 | |
| Class W | | | | | 4,544 | | | | 312 | | | | 63,746 | |
| Administrative service fees | | | | | 855,405 | | | | 135,897 | | | | 789,645 | |
| Shareholder reporting expense | | | | | 57,072 | | | | 23,058 | | | | 25,610 | |
| Registration fees | | | | | 91,085 | | | | 76,392 | | | | 126,694 | |
| Professional fees | | | | | 103,244 | | | | 10,758 | | | | 86,696 | |
| Custody and accounting expense | | | | | 114,500 | | | | 25,254 | | | | 194,870 | |
| Trustee fees | | | | | 25,663 | | | | 3,398 | | | | 23,690 | |
| Miscellaneous expense | | | | | 43,897 | | | | 3,545 | | | | 42,286 | |
| Interest expense | | | | | — | | | | 241 | | | | 2,033 | |
| Total expenses | | | | | 8,587,358 | | | | 1,518,465 | | | | 4,624,790 | |
| Net waived and reimbursed fees | | | | | — | | | | (60,446 | ) | | | — | |
| Net expenses | | | | | 8,587,358 | | | | 1,458,019 | | | | 4,624,790 | |
| Net investment income | | | | | 21,391,070 | | | | 9,156,921 | | | | 32,151,907 | |
| |
REALIZED AND UNREALIZED GAIN (LOSS): | | | | | | | | | | | | | | |
| Net realized gain (loss) on: | | | | | | | | | | | | | | |
| Investments | | | | | 19,044,955 | | | | 4,950,966 | | | | 46,837,931 | |
| Foreign currency related transactions | | | | | — | | | | — | | | | 3,731,336 | |
| Futures | | | | | (2,674,504 | ) | | | — | | | | (4,835,273 | ) |
| Swaps | | | | | — | | | | 633,112 | | | | (1,785,691 | ) |
| Written options | | | | | — | | | | — | | | | 302,145 | |
| Net realized gain | | | | | 16,370,451 | | | | 5,584,078 | | | | 44,250,448 | |
| Net change in unrealized appreciation (depreciation) on: | | | | | | | | | | | | | | |
| Investments | | | | | 14,736,248 | | | | (3,641,803 | ) | | | (9,407,229 | ) |
| Foreign currency related transactions | | | | | — | | | | (791 | ) | | | (876,476 | ) |
| Futures | | | | | 1,830,507 | | | | — | | | | (176,588 | ) |
| Swaps | | | | | — | | | | — | | | | (1,733,074 | ) |
| Written options | | | | | — | | | | — | | | | 172,616 | |
| Net change in unrealized appreciation (depreciation) | | | | | 16,566,755 | | | | (3,642,594 | ) | | | (12,020,751 | ) |
| Net realized and unrealized gain | | | | | 32,937,206 | | | | 1,941,484 | | | | 32,229,697 | |
Increase in net assets resulting from operations | | | | $ | 54,328,276 | | | $ | 11,098,405 | | | $ | 64,381,604 | |
| | | | | | | | | | | | | | |
| *Foreign taxes withheld | | | | $ | — | | | $ | — | | | $ | 1,530 | |
See Accompanying Notes to Financial Statements
15
STATEMENTS OF CHANGES IN NET ASSETS
| | | | ING GNMA Income Fund
| | ING High Yield Bond Fund
| |
|---|
| | | | Year Ended
March 31,
2012
| | Year Ended
March 31,
2011
| | Year Ended
March 31,
2012
| | Year Ended
March 31,
2011
|
|---|
FROM OPERATIONS: | | | | | | | | | | | | | | | | | | |
| Net investment income | | | | $ | 21,391,070 | | | $ | 28,634,271 | | | $ | 9,156,921 | | | $ | 8,507,329 | |
| Net realized gain | | | | | 16,370,451 | | | | 6,946,705 | | | | 5,584,078 | | | | 4,791,701 | |
| Net change in unrealized appreciation (depreciation) | | | | | 16,566,755 | | | | 3,703,788 | | | | (3,642,594 | ) | | | 2,146,253 | |
| Increase in net assets resulting from operations | | | | | 54,328,276 | | | | 39,284,764 | | | | 11,098,405 | | | | 15,445,283 | |
| |
FROM DISTRIBUTIONS TO SHAREHOLDERS: | | | | | | | | | | | | | | | | | | |
| Net investment income: | | | | | | | | | | | | | | | | | | |
| Class A | | | | | (23,332,536 | ) | | | (24,627,310 | ) | | | (5,806,199 | ) | | | (6,170,719 | ) |
| Class B | | | | | (205,679 | ) | | | (637,962 | ) | | | (202,844 | ) | | | (641,089 | ) |
| Class C | | | | | (3,388,606 | ) | | | (3,671,286 | ) | | | (701,323 | ) | | | (746,145 | ) |
| Class I | | | | | (3,755,417 | ) | | | (3,133,728 | ) | | | (2,484,636 | ) | | | (798,345 | ) |
| Class W | | | | | (282,449 | ) | | | (346,694 | ) | | | (12,261 | ) | | | — | |
| Net realized gains: | | | | | | | | | | | | | | | | | | |
| Class A | | | | | (759,067 | ) | | | — | | | | — | | | | — | |
| Class B | | | | | (4,732 | ) | | | — | | | | — | | | | — | |
| Class C | | | | | (152,779 | ) | | | — | | | | — | | | | — | |
| Class I | | | | | (148,809 | ) | | | — | | | | — | | | | — | |
| Class W | | | | | (11,773 | ) | | | — | | | | — | | | | — | |
| Return of capital: | | | | | | | | | | | | | | | | | | |
| Class A | | | | | — | | | | — | | | | — | | | | (181,532 | ) |
| Class B | | | | | — | | | | — | | | | — | | | | (14,496 | ) |
| Class C | | | | | — | | | | — | | | | — | | | | (25,403 | ) |
| Class I | | | | | — | | | | — | | | | — | | | | (45,501 | ) |
| Total distributions | | | | | (32,041,847 | ) | | | (32,416,980 | ) | | | (9,207,263 | ) | | | (8,623,230 | ) |
| |
FROM CAPITAL SHARE TRANSACTIONS: | | | | | | | | | | | | | | | | | | |
| Net proceeds from sale of shares | | | | | 394,973,148 | | | | 252,757,052 | | | | 94,098,655 | | | | 61,128,322 | |
| Reinvestment of distributions | | | | | 27,796,341 | | | | 27,473,342 | | | | 7,479,518 | | | | 6,221,442 | |
| | | | | | 422,769,489 | | | | 280,230,394 | | | | 101,578,173 | | | | 67,349,764 | |
| Cost of shares redeemed | | | | | (249,313,865 | ) | | | (282,047,139 | ) | | | (90,258,244 | ) | | | (55,515,327 | ) |
| Net increase (decrease) in net assets resulting from capital share transactions | | | | | 173,455,624 | | | | (1,816,745 | ) | | | 11,319,929 | | | | 11,834,437 | |
| Net increase in net assets | | | | | 195,742,053 | | | | 5,051,039 | | | | 13,211,071 | | | | 18,656,490 | |
| |
NET ASSETS: | | | | | | | | | | | | | | | | | | |
| Beginning of year or period | | | | | 784,754,602 | | | | 779,703,563 | | | | 126,409,062 | | | | 107,752,572 | |
| End of year or period | | | | $ | 980,496,655 | | | $ | 784,754,602 | | | $ | 139,620,133 | | | $ | 126,409,062 | |
| Undistributed (distributions in excess of) net investment income at end of year or period | | | | $ | (10,084 | ) | | $ | 3,173,437 | | | $ | (79,880 | ) | | $ | (148,927 | ) |
See Accompanying Notes to Financial Statements
16
STATEMENTS OF CHANGES IN NET ASSETS
| | | | ING Intermediate Bond Fund
| |
|---|
| | | | Year Ended
March 31,
2012
| | Year Ended
March 31,
2011
|
|---|
FROM OPERATIONS: | | | | | | | | | | |
| Net investment income | | | | $ | 32,151,907 | | | $ | 39,498,147 | |
| Net realized gain | | | | | 44,250,448 | | | | 17,244,376 | |
| Net change in unrealized appreciation (depreciation) | | | | | (12,020,751 | ) | | | 4,058,320 | |
| Increase in net assets resulting from operations | | | | | 64,381,604 | | | | 60,800,843 | |
| |
FROM DISTRIBUTIONS TO SHAREHOLDERS: | | | | | | | | | | |
| Net investment income: | | | | | | | | | | |
| Class A | | | | | (13,736,906 | ) | | | (15,674,008 | ) |
| Class B | | | | | (223,678 | ) | | | (566,077 | ) |
| Class C | | | | | (1,233,602 | ) | | | (1,594,653 | ) |
| Class I | | | | | (15,356,199 | ) | | | (15,443,401 | ) |
| Class O | | | | | (1,866,285 | ) | | | (1,909,958 | ) |
| Class R | | | | | (591,428 | ) | | | (664,621 | ) |
| Class W | | | | | (2,854,338 | ) | | | (113,308 | ) |
| Total distributions | | | | | (35,862,436 | ) | | | (35,966,026 | ) |
| |
FROM CAPITAL SHARE TRANSACTIONS: | | | | | | | | | | |
| Net proceeds from sale of shares | | | | | 288,283,900 | | | | 183,546,425 | |
| Reinvestment of distributions | | | | | 30,494,755 | | | | 29,932,608 | |
| | | | | | 318,778,655 | | | | 213,479,033 | |
| Cost of shares redeemed | | | | | (269,875,971 | ) | | | (279,861,986 | ) |
| Net increase (decrease) in net assets resulting from capital share transactions | | | | | 48,902,684 | | | | (66,382,953 | ) |
| Net increase (decrease) in net assets | | | | | 77,421,852 | | | | (41,548,136 | ) |
| |
NET ASSETS: | | | | | | | | | | |
| Beginning of year or period | | | | | 749,517,149 | | | | 791,065,285 | |
| End of year or period | | | | $ | 826,939,001 | | | $ | 749,517,149 | |
| Undistributed net investment income at end of year or period | | | | $ | 20,559,366 | | | $ | 20,849,573 | |
See Accompanying Notes to Financial Statements
17
FINANCIAL HIGHLIGHTS
Selected data for a share of beneficial interest outstanding throughout each year or period.
| | | | | | Income (loss)
from investment
operations
| | | | Less Distributions
| | | | | | | | | | Ratios to average
net assets
| | Supplemental
Data
| |
|---|
| | | | | | | | | | | | | | | | | | | | | | | | | | | | | | | | | | | | |
|---|
| | | | Net
asset
value,
beginning
of year
or period
|
| Net
investment
income
(loss)
|
| Net
realized
and
unrealized
gain
(loss)
|
| Total
from
investment
operations
|
| From
net
investment
income
|
| From
net
realized
gains
|
| From
return
of
capital
|
| Total
distributions
|
| Payment
by
affiliate
|
| Net
asset
value,
end of
year or
period
|
| Total
Return
|
| Expenses
before
reductions/
additions
|
| Expenses
net
of fee
waivers
and/or
recoupments
if any
|
| Expense
net
of all
reductions/
additions
|
| Net
investment
income
(loss)
|
| Net
assets,
end of
year or
period
|
| Portfolio
turnover
rate
|
|---|
Year or period ended
|
|
|
| ($)
|
| ($)
|
| ($)
|
| ($)
|
| ($)
|
| ($)
|
| ($)
|
| ($)
|
| ($)
|
| ($)
|
| (%)(1)
|
| (%)(2)(3)
|
| (%)(2)(3)
|
| (%)(2)(3)
|
| (%)(2)(3)
|
| ($000’s)
|
| (%)
|
|---|
ING GNMA Income Fund | | | | | | | | | | | | | | | | | | | | | | | | | | | | | | | | | | | | | | | | | | | | | | | | | | | | | | | | | | | | | | | | | | | | | | |
Class A | | | | | | | | | | | | | | | | | | | | | | | | | | | | | | | | | | | | | | | | | | | | | | | | | | | | | | | | | | | | | | | | | | | | | | |
| 03-31-12 | | | | | 8.84 | | | | 0.23 | • | | | 0.37 | | | | 0.60 | | | | 0.34 | | | | 0.01 | | | | — | | | | 0.35 | | | | — | | | | 9.09 | | | | 6.87 | | | | 0.93 | | | | 0.93 | | | | 0.93 | | | | 2.58 | | | | 681,900 | | | | 335 | |
| 03-31-11 | | | | | 8.75 | | | | 0.32 | | | | 0.13 | | | | 0.45 | | | | 0.36 | | | | — | | | | — | | | | 0.36 | | | | — | | | | 8.84 | | | | 5.26 | | | | 0.93 | | | | 0.93 | | | | 0.93 | | | | 3.63 | | | | 593,080 | | | | 193 | |
| 03-31-10 | | | | | 8.71 | | | | 0.33 | • | | | 0.07 | | | | 0.40 | | | | 0.36 | | | | — | | | | — | | | | 0.36 | | | | — | | | | 8.75 | | | | 4.68 | | | | 0.94 | | | | 0.94 | | | | 0.94 | | | | 3.83 | | | | 589,813 | | | | 114 | |
| 03-31-09 | | | | | 8.54 | | | | 0.37 | | | | 0.18 | | | | 0.55 | | | | 0.38 | | | | — | | | | — | | | | 0.38 | | | | — | | | | 8.71 | | | | 6.62 | | | | 0.96 | | | | 0.96 | | | | 0.96 | | | | 4.33 | | | | 606,856 | | | | 39 | |
| 03-31-08 | | | | | 8.35 | | | | 0.37 | | | | 0.20 | | | | 0.57 | | | | 0.38 | | | | — | | | | — | | | | 0.38 | | | | — | | | | 8.54 | | | | 7.00 | | | | 0.96 | | | | 0.96 | | | | 0.96 | | | | 4.45 | | | | 515,916 | | | | 32 | |
Class B | | | | | | | | | | | | | | | | | | | | | | | | | | | | | | | | | | | | | | | | | | | | | | | | | | | | | | | | | | | | | | | | | | | | | | |
| 03-31-12 | | | | | 8.79 | | | | 0.17 | • | | | 0.36 | | | | 0.53 | | | | 0.27 | | | | 0.01 | | | | — | | | | 0.28 | | | | — | | | | 9.04 | | | | 6.08 | | | | 1.68 | | | | 1.68 | | | | 1.68 | | | | 1.87 | | | | 3,676 | | | | 335 | |
| 03-31-11 | | | | | 8.70 | | | | 0.26 | • | | | 0.13 | | | | 0.39 | | | | 0.30 | | | | — | | | | — | | | | 0.30 | | | | — | | | | 8.79 | | | | 4.48 | | | | 1.68 | | | | 1.68 | | | | 1.68 | | | | 2.90 | | | | 11,262 | | | | 193 | |
| 03-31-10 | | | | | 8.66 | | | | 0.27 | • | | | 0.06 | | | | 0.33 | | | | 0.29 | | | | — | | | | — | | | | 0.29 | | | | — | | | | 8.70 | | | | 3.89 | | | | 1.69 | | | | 1.69 | | | | 1.69 | | | | 3.08 | | | | 25,704 | | | | 114 | |
| 03-31-09 | | | | | 8.49 | | | | 0.30 | | | | 0.18 | | | | 0.48 | | | | 0.31 | | | | — | | | | — | | | | 0.31 | | | | — | | | | 8.66 | | | | 5.86 | | | | 1.71 | | | | 1.71 | | | | 1.71 | | | | 3.57 | | | | 38,718 | | | | 39 | |
| 03-31-08 | | | | | 8.30 | | | | 0.31 | | | | 0.19 | | | | 0.50 | | | | 0.31 | | | | — | | | | — | | | | 0.31 | | | | — | | | | 8.49 | | | | 6.24 | | | | 1.71 | | | | 1.71 | | | | 1.71 | | | | 3.70 | | | | 45,963 | | | | 32 | |
Class C | | | | | | | | | | | | | | | | | | | | | | | | | | | | | | | | | | | | | | | | | | | | | | | | | | | | | | | | | | | | | | | | | | | | | | |
| 03-31-12 | | | | | 8.79 | | | | 0.16 | • | | | 0.37 | | | | 0.53 | | | | 0.27 | | | | 0.01 | | | | — | | | | 0.28 | | | | — | | | | 9.04 | | | | 6.12 | | | | 1.68 | | | | 1.68 | | | | 1.68 | | | | 1.82 | | | | 138,543 | | | | 335 | |
| 03-31-11 | | | | | 8.71 | | | | 0.25 | | | | 0.13 | | | | 0.38 | | | | 0.30 | | | | — | | | | — | | | | 0.30 | | | | — | | | | 8.79 | | | | 4.38 | | | | 1.68 | | | | 1.68 | | | | 1.68 | | | | 2.88 | | | | 104,196 | | | | 193 | |
| 03-31-10 | | | | | 8.67 | | | | 0.27 | • | | | 0.06 | | | | 0.33 | | | | 0.29 | | | | — | | | | — | | | | 0.29 | | | | — | | | | 8.71 | | | | 3.92 | | | | 1.69 | | | | 1.69 | | | | 1.69 | | | | 3.09 | | | | 103,103 | | | | 114 | |
| 03-31-09 | | | | | 8.50 | | | | 0.30 | | | | 0.18 | | | | 0.48 | | | | 0.31 | | | | — | | | | — | | | | 0.31 | | | | — | | | | 8.67 | | | | 5.88 | | | | 1.71 | | | | 1.71 | | | | 1.71 | | | | 3.59 | | | | 73,209 | | | | 39 | |
| 03-31-08 | | | | | 8.31 | | | | 0.31 | | | | 0.20 | | | | 0.51 | | | | 0.32 | | | | — | | | | — | | | | 0.32 | | | | — | | | | 8.50 | | | | 6.23 | | | | 1.71 | | | | 1.71 | | | | 1.71 | | | | 3.70 | | | | 36,218 | | | | 32 | |
Class I | | | | | | | | | | | | | | | | | | | | | | | | | | | | | | | | | | | | | | | | | | | | | | | | | | | | | | | | | | | | | | | | | | | | | | |
| 03-31-12 | | | | | 8.85 | | | | 0.26 | • | | | 0.36 | | | | 0.62 | | | | 0.36 | | | | 0.01 | | | | — | | | | 0.37 | | | | — | | | | 9.10 | | | | 7.16 | | | | 0.65 | | | | 0.65 | | | | 0.65 | | | | 2.83 | | | | 144,678 | | | | 335 | |
| 03-31-11 | | | | | 8.76 | | | | 0.34 | | | | 0.14 | | | | 0.48 | | | | 0.39 | | | | — | | | | — | | | | 0.39 | | | | — | | | | 8.85 | | | | 5.57 | | | | 0.63 | | | | 0.63 | | | | 0.63 | | | | 3.92 | | | | 68,996 | | | | 193 | |
| 03-31-10 | | | | | 8.72 | | | | 0.36 | • | | | 0.07 | | | | 0.43 | | | | 0.39 | | | | — | | | | — | | | | 0.39 | | | | — | | | | 8.76 | | | | 5.00 | | | | 0.64 | | | | 0.64 | | | �� | 0.64 | | | | 4.15 | | | | 52,880 | | | | 114 | |
| 03-31-09 | | | | | 8.55 | | | | 0.39 | | | | 0.18 | | | | 0.57 | | | | 0.40 | | | | — | | | | — | | | | 0.40 | | | | — | | | | 8.72 | | | | 6.95 | | | | 0.65 | | | | 0.65 | | | | 0.65 | | | | 4.64 | | | | 38,908 | | | | 39 | |
| 03-31-08 | | | | | 8.35 | | | | 0.40 | | | | 0.20 | | | | 0.60 | | | | 0.40 | | | | — | | | | — | | | | 0.40 | | | | — | | | | 8.55 | | | | 7.42 | | | | 0.67 | | | | 0.67 | | | | 0.67 | | | | 4.74 | | | | 21,002 | | | | 32 | |
Class W | | | | | | | | | | | | | | | | | | | | | | | | | | | | | | | | | | | | | | | | | | | | | | | | | | | | | | | | | | | | | | | | | | | | | | |
| 03-31-12 | | | | | 8.86 | | | | 0.26 | • | | | 0.36 | | | | 0.62 | | | | 0.36 | | | | 0.01 | | | | — | | | | 0.37 | | | | — | | | | 9.11 | | | | 7.12 | | | | 0.68 | | | | 0.68 | | | | 0.68 | | | | 2.83 | | | | 11,700 | | | | 335 | |
| 03-31-11 | | | | | 8.77 | | | | 0.35 | | | | 0.13 | | | | 0.48 | | | | 0.39 | | | | — | | | | — | | | | 0.39 | | | | — | | | | 8.86 | | | | 5.51 | | | | 0.68 | | | | 0.68 | | | | 0.68 | | | | 3.88 | | | | 7,221 | | | | 193 | |
| 03-31-10 | | | | | 8.73 | | | | 0.36 | • | | | 0.06 | | | | 0.42 | | | | 0.38 | | | | — | | | | — | | | | 0.38 | | | | — | | | | 8.77 | | | | 4.97 | | | | 0.66 | | | | 0.66 | | | | 0.66 | | | | 4.15 | | | | 8,204 | | | | 114 | |
| 03-31-09 | | | | | 8.55 | | | | 0.39 | | | | 0.19 | | | | 0.58 | | | | 0.40 | | | | — | | | | — | | | | 0.40 | | | | — | | | | 8.73 | | | | 7.03 | | | | 0.65 | | | | 0.65 | | | | 0.65 | | | | 4.70 | | | | 4,180 | | | | 39 | |
12-17-07(4)–03-31-08 | | | | | 8.39 | | | | 0.11 | | | | 0.15 | | | | 0.26 | | | | 0.10 | | | | — | | | | — | | | | 0.10 | | | | — | | | | 8.55 | | | | 3.16 | | | | 0.64 | | | | 0.64 | | | | 0.64 | | | | 4.86 | | | | 1 | | | | 32 | |
ING High Yield Bond Fund | | | | | | | | | | | | | | | | | | | | | | | | | | | | | | | | | | | | | | | | | | | | | | | | | | | | | | | | | | | | | | | | | | | | | | |
Class A | | | | | | | | | | | | | | | | | | | | | | | | | | | | | | | | | | | | | | | | | | | | | | | | | | | | | | | | | | | | | | | | | | | | | | |
| 03-31-12 | | | | | 7.82 | | | | 0.52 | | | | (0.02 | ) | | | 0.50 | | | | 0.52 | | | | — | | | | — | | | | 0.52 | | | | — | | | | 7.80 | | | | 6.72 | | | | 1.14 | | | | 1.10 | | | | 1.10 | | | | 6.73 | | | | 98,123 | | | | 100 | |
| 03-31-11 | | | | | 7.38 | | | | 0.56 | | | | 0.45 | | | | 1.01 | | | | 0.55 | | | | — | | | | 0.02 | | | | 0.57 | | | | — | | | | 7.82 | | | | 14.22 | | | | 1.13 | | | | 1.10 | † | | | 1.10 | † | | | 7.43 | † | | | 86,017 | | | | 87 | |
| 03-31-10 | | | | | 5.52 | | | | 0.62 | | | | 1.89 | | | | 2.51 | | | | 0.63 | | | | — | | | | 0.02 | | | | 0.65 | | | | — | | | | 7.38 | | | | 46.88 | | | | 1.24 | | | | 1.10 | † | | | 1.10 | † | | | 9.17 | † | | | 83,034 | | | | 103 | |
| 03-31-09 | | | | | 7.89 | | | | 0.62 | | | | (2.32 | ) | | | (1.70 | ) | | | 0.54 | | | | — | | | | 0.13 | | | | 0.67 | | | | — | | | | 5.52 | | | | (22.36 | ) | | | 1.25 | | | | 1.10 | † | | | 1.10 | † | | | 9.30 | † | | | 59,307 | | | | 75 | |
| 03-31-08 | | | | | 8.99 | | | | 0.67 | | | | (1.10 | ) | | | (0.43 | ) | | | 0.67 | | | | — | | | | — | | | | 0.67 | | | | — | | | | 7.89 | | | | (5.10 | ) | | | 1.16 | | | | 1.11 | † | | | 1.11 | † | | | 7.86 | † | | | 83,327 | | | | 66 | |
Class B | | | | | | | | | | | | | | | | | | | | | | | | | | | | | | | | | | | | | | | | | | | | | | | | | | | | | | | | | | | | | | | | | | | | | | |
| 03-31-12 | | | | | 7.81 | | | | 0.46 | | | | (0.02 | ) | | | 0.44 | | | | 0.46 | | | | — | | | | — | | | | 0.46 | | | | — | | | | 7.79 | | | | 5.89 | | | | 1.89 | | | | 1.85 | | | | 1.85 | | | | 6.00 | | | | 2,370 | | | | 100 | |
| 03-31-11 | | | | | 7.37 | | | | 0.51 | • | | | 0.44 | | | | 0.95 | | | | 0.49 | | | | — | | | | 0.02 | | | | 0.51 | | | | — | | | | 7.81 | | | | 13.35 | | | | 1.88 | | | | 1.85 | † | | | 1.85 | † | | | 6.74 | † | | | 6,864 | | | | 87 | |
| 03-31-10 | | | | | 5.52 | | | | 0.57 | | | | 1.87 | | | | 2.44 | | | | 0.57 | | | | — | | | | 0.02 | | | | 0.59 | | | | — | | | | 7.37 | | | | 45.58 | | | | 1.99 | | | | 1.85 | † | | | 1.85 | † | | | 8.46 | † | | | 12,099 | | | | 103 | |
| 03-31-09 | | | | | 7.88 | | | | 0.58 | | | | (2.32 | ) | | | (1.74 | ) | | | 0.49 | | | | — | | | | 0.13 | | | | 0.62 | | | | — | | | | 5.52 | | | | (22.86 | ) | | | 2.00 | | | | 1.85 | † | | | 1.85 | † | | | 8.38 | † | | | 12 | | | | 75 | |
| 03-31-08 | | | | | 8.98 | | | | 0.61 | | | | (1.11 | ) | | | (0.50 | ) | | | 0.60 | | | | — | | | | — | | | | 0.60 | | | | — | | | | 7.88 | | | | (5.82 | ) | | | 1.91 | | | | 1.86 | † | | | 1.86 | † | | | 7.08 | † | | | 24,994 | | | | 66 | |
Class C | | | | | | | | | | | | | | | | | | | | | | | | | | | | | | | | | | | | | | | | | | | | | | | | | | | | | | | | | | | | | | | | | | | | | | |
| 03-31-12 | | | | | 7.81 | | | | 0.46 | | | | (0.01 | ) | | | 0.45 | | | | 0.46 | | | | — | | | | — | | | | 0.46 | | | | — | | | | 7.80 | | | | 6.05 | | | | 1.89 | | | | 1.85 | | | | 1.85 | | | | 6.00 | | | | 12,727 | | | | 100 | |
| 03-31-11 | | | | | 7.38 | | | | 0.50 | | | | 0.44 | | | | 0.94 | | | | 0.49 | | | | — | | | | 0.02 | | | | 0.51 | | | | — | | | | 7.81 | | | | 13.22 | | | | 1.88 | | | | 1.85 | † | | | 1.85 | † | | | 6.66 | † | | | 11,938 | | | | 87 | |
| 03-31-10 | | | | | 5.52 | | | | 0.57 | | | | 1.89 | | | | 2.46 | | | | 0.58 | | | | — | | | | 0.02 | | | | 0.60 | | | | — | | | | 7.38 | | | | 45.82 | | | | 1.99 | | | | 1.85 | † | | | 1.85 | † | | | 8.40 | † | | | 11,038 | | | | 103 | |
| 03-31-09 | | | | | 7.89 | | | | 0.58 | | | | (2.33 | ) | | | (1.75 | ) | | | 0.49 | | | | — | | | | 0.13 | | | | 0.62 | | | | — | | | | 5.52 | | | | (22.95 | ) | | | 2.00 | | | | 1.85 | † | | | 1.85 | † | | | 8.57 | † | | | 7,101 | | | | 75 | |
| 03-31-08 | | | | | 8.99 | | | | 0.61 | | | | (1.11 | ) | | | (0.50 | ) | | | 0.60 | | | | — | | | | — | | | | 0.60 | | | | — | | | | 7.89 | | | | (5.81 | ) | | | 1.91 | | | | 1.86 | † | | | 1.86 | † | | | 7.09 | † | | | 9,987 | | | | 66 | |
See Accompanying Notes to Financial Statements
18
FINANCIAL HIGHLIGHTS (CONTINUED)
Selected data for a share of beneficial interest outstanding throughout each year or period.
| | | | | | Income (loss)
from investment
operations
| | | | Less Distributions
| | | | | | | | | | Ratios to average
net assets
| | Supplemental
Data
| |
|---|
| | | | | | | | | | | | | | | | | | | | | | | | | | | | | | | | | | | | |
|---|
| | | | Net
asset
value,
beginning
of year
or period
|
| Net
investment
income
(loss)
|
| Net
realized
and
unrealized
gain
(loss)
|
| Total
from
investment
operations
|
| From
net
investment
income
|
| From
net
realized
gains
|
| From
return
of
capital
|
| Total
distributions
|
| Payment
by
affiliate
|
| Net
asset
value,
end of
year or
period
|
| Total
Return
|
| Expenses
before
reductions/
additions
|
| Expenses
net
of fee
waivers
and/or
recoupments
if any
|
| Expense
net
of all
reductions/
additions
|
| Net
investment
income
(loss)
|
| Net
assets,
end of
year or
period
|
| Portfolio
turnover
rate
|
|---|
Year or period ended
|
|
|
| ($)
|
| ($)
|
| ($)
|
| ($)
|
| ($)
|
| ($)
|
| ($)
|
| ($)
|
| ($)
|
| ($)
|
| (%)(1)
|
| (%)(2)(3)
|
| (%)(2)(3)
|
| (%)(2)(3)
|
| (%)(2)(3)
|
| ($000’s)
|
| (%)
|
|---|
ING High Yield Bond Fund (continued) | | | | | | | | | | | | | | | | | | | | | | | | | | | | | | | | | | | | | | | | | | | | | | | | | | | | | | | | | | | | | | | | | | | | | | |
Class I | | | | | | | | | | | | | | | | | | | | | | | | | | | | | | | | | | | | | | | | | | | | | | | | | | | | | | | | | | | | | | | | | | | | | | |
| 03-31-12 | | | | | 7.81 | | | | 0.55 | | | | (0.01 | ) | | | 0.54 | | | | 0.55 | | | | — | | | | — | | | | 0.55 | | | | — | | | | 7.80 | | | | 7.30 | | | | 0.71 | | | | 0.67 | | | | 0.67 | | | | 7.09 | | | | 24,849 | | | | 100 | |
| 03-31-11 | | | | | 7.37 | | | | 0.57 | • | | | 0.48 | | | | 1.05 | | | | 0.59 | | | | — | | | | 0.02 | | | | 0.61 | | | | — | | | | 7.81 | | | | 14.86 | | | | 0.76 | | | | 0.73 | † | | | 0.73 | † | | | 7.53 | † | | | 21,590 | | | | 87 | |
| 03-31-10 | | | | | 5.51 | | | | 0.64 | • | | | 1.90 | | | | 2.54 | | | | 0.66 | | | | — | | | | 0.02 | | | | 0.68 | | | | — | | | | 7.37 | | | | 47.55 | | | | 0.92 | | | | 0.78 | † | | | 0.78 | † | | | 8.99 | † | | | 1,582 | | | | 103 | |
07-31-08(4)–03-31-09 | | | | | 7.64 | | | | 0.37 | • | | | (1.92 | ) | | | (1.55 | ) | | | 0.49 | | | | — | | | | 0.09 | | | | 0.58 | | | | — | | | | 5.51 | | | | (20.35 | ) | | | 0.95 | | | | 0.80 | † | | | 0.80 | † | | | 9.61 | † | | | 2 | | | | 75 | |
Class W | | | | | | | | | | | | | | | | | | | | | | | | | | | | | | | | | | | | | | | | | | | | | | | | | | | | | | | | | | | | | | | | | | | | | | |
07-29-11(4)–03-31-12 | | | | | 7.82 | | | | 0.36 | • | | | 0.07 | | | | 0.43 | | | | 0.44 | | | | — | | | | — | | | | 0.44 | | | | — | | | | 7.81 | | | | 5.77 | | | | 0.89 | | | | 0.85 | | | | 0.85 | | | | 6.93 | | | | 1,552 | | | | 100 | |
ING Intermediate Bond Fund | | | | | | | | | | | | | | | | | | | | | | | | | | | | | | | | | | | | | | | | | | | | | | | | | | | | | | | | | | | | | | | | | | | | | | |
Class A | | | | | | | | | | | | | | | | | | | | | | | | | | | | | | | �� | | | | | | | | | | | | | | | | | | | | | | | | | | | | | | | | | | | | | | | |
| 03-31-12 | | | | | 9.53 | | | | 0.38 | | | | 0.42 | | | | 0.80 | | | | 0.43 | | | | — | | | | — | | | | 0.43 | | | | — | | | | 9.90 | | | | 8.61 | | | | 0.68 | | | | 0.68 | | | | 0.68 | | | | 3.99 | | | | 293,277 | | | | 500 | |
| 03-31-11 | | | | | 9.23 | | | | 0.47 | • | | | 0.26 | | | | 0.73 | | | | 0.43 | | | | — | | | | — | | | | 0.43 | | | | — | | | | 9.53 | | | | 8.00 | | | | 0.68 | | | | 0.68 | | | | 0.68 | | | | 4.97 | | | | 316,000 | | | | 384 | |
| 03-31-10 | | | | | 8.31 | | | | 0.45 | • | | | 1.09 | | | | 1.54 | | | | 0.62 | | | | — | | | | — | | | | 0.62 | | | | — | | | | 9.23 | | | | 18.95 | | | | 0.71 | | | | 0.69 | † | | | 0.69 | † | | | 5.04 | † | | | 348,871 | | | | 540 | |
| 03-31-09 | | | | | 10.13 | | | | 0.45 | | | | (1.60 | ) | | | (1.15 | ) | | | 0.45 | | | | 0.22 | | | | — | | | | 0.67 | | | | — | | | | 8.31 | | | | (11.65 | ) | | | 0.72 | | | | 0.70 | † | | | 0.70 | † | | | 4.84 | † | | | 471,185 | | | | 674 | |
| 03-31-08 | | | | | 10.23 | | | | 0.51 | | | | (0.15 | ) | | | 0.36 | | | | 0.46 | | | | — | | | | — | | | | 0.46 | | | | — | | | | 10.13 | | | | 3.61 | | | | 0.73 | | | | 0.69 | † | | | 0.69 | † | | | 4.98 | † | | | 799,369 | | | | 435 | |
Class B | | | | | | | | | | | | | | | | | | | | | | | | | | | | | | | | | | | | | | | | | | | | | | | | | | | | | | | | | | | | | | | | | | | | | | |
| 03-31-12 | | | | | 9.51 | | | | 0.32 | • | | | 0.41 | | | | 0.73 | | | | 0.36 | | | | — | | | | — | | | | 0.36 | | | | — | | | | 9.88 | | | | 7.77 | | | | 1.43 | | | | 1.43 | | | | 1.43 | | | | 3.30 | | | | 4,144 | | | | 500 | |
| 03-31-11 | | | | | 9.21 | | | | 0.40 | • | | | 0.26 | | | | 0.66 | | | | 0.36 | | | | — | | | | — | | | | 0.36 | | | | — | | | | 9.51 | | | | 7.21 | | | | 1.43 | | | | 1.43 | | | | 1.43 | | | | 4.24 | | | | 9,379 | | | | 384 | |
| 03-31-10 | | | | | 8.30 | | | | 0.38 | • | | | 1.08 | | | | 1.46 | | | | 0.55 | | | | — | | | | — | | | | 0.55 | | | | — | | | | 9.21 | | | | 17.96 | | | | 1.46 | | | | 1.44 | † | | | 1.44 | † | | | 4.31 | † | | | 18,605 | | | | 540 | |
| 03-31-09 | | | | | 10.11 | | | | 0.38 | | | | (1.59 | ) | | | (1.21 | ) | | | 0.38 | | | | 0.22 | | | | — | | | | 0.60 | | | | — | | | | 8.30 | | | | (12.26 | ) | | | 1.47 | | | | 1.45 | † | | | 1.45 | † | | | 4.08 | † | | | 23,721 | | | | 674 | |
| 03-31-08 | | | | | 10.21 | | | | 0.43 | | | | (0.14 | ) | | | 0.29 | | | | 0.39 | | | | — | | | | — | | | | 0.39 | | | | — | | | | 10.11 | | | | 2.84 | | | | 1.48 | | | | 1.44 | † | | | 1.44 | † | | | 4.26 | † | | | 41,078 | | | | 435 | |
Class C | | | | | | | | | | | | | | | | | | | | | | | | | | | | | | | | | | | | | | | | | | | | | | | | | | | | | | | | | | | | | | | | | | | | | | |
| 03-31-12 | | | | | 9.52 | | | | 0.32 | | | | 0.41 | | | | 0.73 | | | | 0.36 | | | | — | | | | — | | | | 0.36 | | | | — | | | | 9.89 | | | | 7.78 | | | | 1.43 | | | | 1.43 | | | | 1.43 | | | | 3.22 | | | | 35,256 | | | | 500 | |
| 03-31-11 | | | | | 9.22 | | | | 0.40 | • | | | 0.26 | | | | 0.66 | | | | 0.36 | | | | — | | | | — | | | | 0.36 | | | | — | | | | 9.52 | | | | 7.21 | | | | 1.43 | | | | 1.43 | | | | 1.43 | | | | 4.22 | | | | 33,994 | | | | 384 | |
| 03-31-10 | | | | | 8.30 | | | | 0.38 | • | | | 1.09 | | | | 1.47 | | | | 0.55 | | | | — | | | | — | | | | 0.55 | | | | — | | | | 9.22 | | | | 18.08 | | | | 1.46 | | | | 1.44 | † | | | 1.44 | † | | | 4.31 | † | | | 45,016 | | | | 540 | |
| 03-31-09 | | | | | 10.12 | | | | 0.38 | | | | (1.60 | ) | | | (1.22 | ) | | | 0.38 | | | | 0.22 | | | | — | | | | 0.60 | | | | — | | | | 8.30 | | | | (12.35 | ) | | | 1.47 | | | | 1.45 | † | | | 1.45 | † | | | 4.08 | † | | | 53,534 | | | | 674 | |
| 03-31-08 | | | | | 10.22 | | | | 0.43 | | | | (0.14 | ) | | | 0.29 | | | | 0.39 | | | | — | | | | — | | | | 0.39 | | | | — | | | | 10.12 | | | | 2.85 | | | | 1.48 | | | | 1.44 | † | | | 1.44 | † | | | 4.24 | † | | | 83,232 | | | | 435 | |
Class I | | | | | | | | | | | | | | | | | | | | | | | | | | | | | | | | | | | | | | | | | | | | | | | | | | | | | | | | | | | | | | | | | | | | | | |
| 03-31-12 | | | | | 9.53 | | | | 0.41 | | | | 0.42 | | | | 0.83 | | | | 0.46 | | | | — | | | | — | | | | 0.46 | | | | — | | | | 9.90 | | | | 8.90 | | | | 0.40 | | | | 0.40 | | | | 0.40 | | | | 4.26 | | | | 331,423 | | | | 500 | |
| 03-31-11 | | | | | 9.23 | | | | 0.50 | | | | 0.26 | | | | 0.76 | | | | 0.46 | | | | — | | | | — | | | | 0.46 | | | | — | | | | 9.53 | | | | 8.35 | | | | 0.38 | | | | 0.38 | | | | 0.38 | | | | 5.25 | | | | 332,193 | | | | 384 | |
| 03-31-10 | | | | | 8.31 | | | | 0.48 | • | | | 1.09 | | | | 1.57 | | | | 0.65 | | | | — | | | | — | | | | 0.65 | | | | — | | | | 9.23 | | | | 19.33 | | | | 0.39 | | | | 0.37 | † | | | 0.37 | † | | | 5.37 | † | | | 316,209 | | | | 540 | |
| 03-31-09 | | | | | 10.14 | | | | 0.48 | | | | (1.61 | ) | | | (1.13 | ) | | | 0.48 | | | | 0.22 | | | | — | | | | 0.70 | | | | — | | | | 8.31 | | | | (11.42 | ) | | | 0.39 | | | | 0.37 | † | | | 0.37 | † | | | 5.17 | † | | | 362,162 | | | | 674 | |
| 03-31-08 | | | | | 10.23 | | | | 0.54 | | | | (0.13 | ) | | | 0.41 | | | | 0.50 | | | | — | | | | — | | | | 0.50 | | | | — | | | | 10.14 | | | | 4.05 | | | | 0.39 | | | | 0.35 | † | | | 0.38 | † | | | 5.31 | † | | | 351,575 | | | | 435 | |
Class O | | | | | | | | | | | | | | | | | | | | | | | | | | | | | | | | | | | | | | | | | | | | | | | | | | | | | | | | | | | | | | | | | | | | | | |
| 03-31-12 | | | | | 9.54 | | | | 0.39 | | | | 0.40 | | | | 0.79 | | | | 0.43 | | | | — | | | | — | | | | 0.43 | | | | — | | | | 9.90 | | | | 8.49 | | | | 0.68 | | | | 0.68 | | | | 0.68 | | | | 3.98 | | | | 42,500 | | | | 500 | |
| 03-31-11 | | | | | 9.24 | | | | 0.47 | • | | | 0.26 | | | | 0.73 | | | | 0.43 | | | | — | | | | — | | | | 0.43 | | | | — | | | | 9.54 | | | | 8.00 | | | | 0.68 | | | | 0.68 | | | | 0.68 | | | | 4.96 | | | | 41,335 | | | | 384 | |
| 03-31-10 | | | | | 8.32 | | | | 0.46 | • | | | 1.08 | | | | 1.54 | | | | 0.62 | | | | — | | | | — | | | | 0.62 | | | | — | | | | 9.24 | | | | 18.94 | | | | 0.71 | | | | 0.69 | † | | | 0.69 | † | | | 5.09 | † | | | 41,860 | | | | 540 | |
| 03-31-09 | | | | | 10.14 | | | | 0.45 | | | | (1.60 | ) | | | (1.15 | ) | | | 0.45 | | | | 0.22 | | | | — | | | | 0.67 | | | | — | | | | 8.32 | | | | (11.62 | ) | | | 0.72 | | | | 0.70 | † | | | 0.70 | † | | | 4.84 | † | | | 39,188 | | | | 674 | |
| 03-31-08 | | | | | 10.24 | | | | 0.51 | | | | (0.15 | ) | | | 0.36 | | | | 0.46 | | | | — | | | | — | | | | 0.46 | | | | — | | | | 10.14 | | | | 3.61 | | | | 0.73 | | | | 0.69 | † | | | 0.69 | † | | | 4.99 | † | | | 55,956 | | | | 435 | |
Class R | | | | | | | | | | | | | | | | | | | | | | | | | | | | | | | | | | | | | | | | | | | | | | | | | | | | | | | | | | | | | | | | | | | | | | |
| 03-31-12 | | | | | 9.54 | | | | 0.35 | | | | 0.43 | | | | 0.78 | | | | 0.41 | | | | — | | | | — | | | | 0.41 | | | | — | | | | 9.91 | | | | 8.33 | | | | 0.93 | | | | 0.93 | | | | 0.93 | | | | 3.73 | | | | 12,323 | | | | 500 | |
| 03-31-11 | | | | | 9.24 | | | | 0.45 | • | | | 0.25 | | | | 0.70 | | | | 0.40 | | | | — | | | | — | | | | 0.40 | | | | — | | | | 9.54 | | | | 7.72 | | | | 0.93 | | | | 0.93 | | | | 0.93 | | | | 4.72 | | | | 14,339 | | | | 384 | |
| 03-31-10 | | | | | 8.32 | | | | 0.43 | • | | | 1.09 | | | | 1.52 | | | | 0.60 | | | | — | | | | — | | | | 0.60 | | | | — | | | | 9.24 | | | | 18.64 | | | | 0.96 | | | | 0.94 | † | | | 0.94 | † | | | 4.83 | † | | | 18,417 | | | | 540 | |
| 03-31-09 | | | | | 10.15 | | | | 0.43 | | | | (1.61 | ) | | | (1.18 | ) | | | 0.43 | | | | 0.22 | | | | — | | | | 0.65 | | | | — | | | | 8.32 | | | | (11.93 | ) | | | 0.97 | | | | 0.95 | † | | | 0.95 | † | | | 4.59 | † | | | 18,240 | | | | 674 | |
| 03-31-08 | | | | | 10.25 | | | | 0.48 | | | | (0.14 | ) | | | 0.34 | | | | 0.44 | | | | — | | | | — | | | | 0.44 | | | | — | | | | 10.15 | | | | 3.36 | | | | 0.98 | | | | 0.94 | † | | | 0.94 | † | | | 4.65 | † | | | 16,773 | | | | 435 | |
Class W | | | | | | | | | | | | | | | | | | | | | | | | | | | | | | | | | | | | | | | | | | | | | | | | | | | | | | | | | | | | | | | | | | | | | | |
| 03-31-12 | | | | | 9.52 | | | | 0.40 | • | | | 0.53 | | | | 0.93 | | | | 0.56 | | | | — | | | | — | | | | 0.56 | | | | — | | | | 9.89 | | | | 10.09 | | | | 0.43 | | | | 0.43 | | | | 0.43 | | | | 4.17 | | | | 108,016 | | | | 500 | |
| 03-31-11 | | | | | 9.22 | | | | 0.48 | | | | 0.27 | | | | 0.75 | | | | 0.45 | | | | — | | | | — | | | | 0.45 | | | | — | | | | 9.52 | | | | 8.29 | | | | 0.43 | | | | 0.43 | | | | 0.43 | | | | 5.21 | | | | 2,276 | | | | 384 | |
| 03-31-10 | | | | | 8.31 | | | | 0.48 | • | | | 1.08 | | | | 1.56 | | | | 0.65 | | | | — | | | | — | | | | 0.65 | | | | — | | | | 9.22 | | | | 19.15 | | | | 0.42 | | | | 0.40 | † | | | 0.40 | † | | | 5.42 | † | | | 2,087 | | | | 540 | |
| 03-31-09 | | | | | 10.12 | | | | 0.45 | | | | (1.53 | ) | | | (1.08 | ) | | | 0.51 | | | | 0.22 | | | | — | | | | 0.73 | | | | — | | | | 8.31 | | | | (11.03 | ) | | | 0.39 | | | | 0.37 | † | | | 0.37 | † | | | 5.09 | † | | | 2,079 | | | | 674 | |
12-17-07(4)–03-31-08 | | | | | 10.21 | | | | 0.15 | | | | (0.05 | ) | | | 0.10 | | | | 0.19 | | | | — | | | | — | | | | 0.19 | | | | — | | | | 10.12 | | | | 0.98 | | | | 0.48 | | | | 0.44 | † | | | 0.44 | † | | | 5.24 | † | | | 443 | | | | 435 | |
See Accompanying Notes to Financial Statements
19
FINANCIAL HIGHLIGHTS (CONTINUED)
(1) | | Total return is calculated assuming reinvestment of all dividends, capital gain distributions and return of capital distributions, if any, at net asset value and excluding the deduction of sales charges. Total return for periods less than one year is not annualized. |
(2) | | Annualized for periods less than one year. |
(3) | | Expense ratios reflect operating expenses of a Fund. Expenses before reductions/additions do not reflect amounts reimbursed by the Investment Adviser and/or Distributor or reductions from brokerage service arrangements or other expense offset arrangements and do not represent the amount paid by a Fund during periods when reimbursements or reductions occur. Expenses net of fee waivers reflect expenses after reimbursement by an Investment Adviser and/or Distributor but prior to reductions from brokerage service arrangements or other expense offset arrangements. Expenses net of all reductions/additions represent the net expenses paid by a Fund. Net investment income (loss) is net of all such additions or reductions. |
(4) | | Commencement of operations. |
• | | Calculated using average number of shares outstanding throughout the period. |
† | | Impact of waiving the advisory fee for the ING Institutional Prime Money Market Fund holding has less than 0.005% impact on the expense ratio and net investment income or loss ratio. |
See Accompanying Notes to Financial Statements
20
NOTES TO FINANCIAL STATEMENTS AS OF MARCH 31, 2012
NOTE 1 — ORGANIZATION
Organization. ING Funds Trust (“Trust”) is a Delaware statutory trust and is registered as an open-end management investment company under the Investment Company Act of 1940, as amended (“1940 Act” or the “Act”). The Trust was organized on August 6, 1998 and was established under a Trust Instrument dated July 30, 1998. It consists of four separately managed series. This report is for: ING GNMA Income Fund (“GNMA Income”), ING High Yield Bond Fund (“High Yield Bond”) and ING Intermediate Bond Fund (“Intermediate Bond”) (each, a “Fund” and collectively, the “Funds”).
The investment objective of each Fund is described in each Fund’s prospectus.
Each Fund offers at least four of the following classes of shares: Class A, Class B, Class C, Class I, Class O, Class R and Class W. The separate classes of shares differ principally in the applicable sales charges (if any), transfer agent fees, distribution fees and shareholder servicing fees. Generally, shareholders of each class also bear certain expenses that pertain to that particular class. All shareholders bear the common expenses of a Fund and earn income and realized gains/losses from the portfolio pro rata based on the average daily net assets of each class, without discrimination between share classes. Expenses that are specific to a fund or a class are charged directly to that fund or class. Other operating expenses shared by several funds are generally allocated among those funds based on average net assets. Dividends are determined separately for each class based on income and expenses allocated to each class. Realized gain distributions are allocated to each class pro rata based on the shares outstanding of each class on the date of the distribution. Differences in per share dividend rates generally result from the differences in separate class expenses, including distribution, and shareholder servicing fees. Class B shares, along with their pro rata reinvested dividend shares, automatically convert to Class A shares eight years after purchase.
Class B shares of the Funds are closed to new investment, provided that (1) Class B shares of the Funds may be purchased through the reinvestment of dividends issued by Class B shares of a Fund; and (2) subject to the terms and conditions of relevant exchange privileges and as permitted under their respective prospectuses, Class B shares of the Funds may be acquired through exchange of Class B shares of other funds in the ING mutual funds complex.
NOTE 2 — SIGNIFICANT ACCOUNTING POLICIES
The following significant accounting policies are consistently followed by the Funds in the preparation of their financial statements, and such policies are in conformity with U.S. generally accepted accounting principles (“GAAP”) for investment companies.
A. Security Valuation. All investments in securities are recorded at their estimated fair value, as described below. Investments in equity securities traded on a national securities exchange are valued at the last reported sale price. Securities reported by the National Association of Securities Dealers Automated Quotation System (“NASDAQ”) will be valued at the NASDAQ official closing prices. Securities traded on an exchange or NASDAQ for which there has been no sale and securities traded in the over-the- counter-market are valued at the mean between the last reported bid and ask prices. All investments quoted in foreign currencies will be valued daily in U.S. dollars on the basis of the foreign currency exchange rates prevailing at that time. Debt securities with more than 60 days to maturity are valued using matrix pricing methods determined by an independent pricing service which takes into consideration such factors as yields, maturities, liquidity, ratings and traded prices in similar or identical securities. Securities for which valuations are not readily available from an independent pricing service may be valued by brokers which use prices provided by market makers or estimates of fair market value obtained from yield data relating to investments or securities with similar characteristics. Investments in open-end mutual funds are valued at the net asset value (“NAV”). Investments in securities of sufficient credit quality maturing in 60 days or less are valued at amortized cost which approximates fair value.
Securities and assets for which market quotations are not readily available (which may include certain restricted securities which are subject to limitations as to their sale) are valued at their fair values, as defined by the 1940 Act, as determined in good faith by or under the supervision of the Funds’ Board of Trustees (“Board”), in accordance with methods that are specifically authorized by the Board. Securities traded on exchanges, including foreign exchanges, which close earlier than the time that a Fund calculates its NAV may also be valued at their fair values as defined by the 1940 Act and as determined in good faith by or under the supervision of the Funds’ Board, in accordance with methods that are specifically authorized by the Board. If an event occurs after the time at which the market for foreign securities held by a Fund closes but before the time that a Fund’s NAV is
21
NOTES TO FINANCIAL STATEMENTS AS OF MARCH 31, 2012 (CONTINUED)
NOTE 2 — SIGNIFICANT ACCOUNTING POLICIES (continued)
calculated, such event may cause the closing price on the foreign exchange to not represent a readily available reliable market value quotation for such securities at the time a Fund determines its NAV. In such a case, a Fund will use the fair value of such securities as determined under a Fund’s valuation procedures. Events after the close of trading on a foreign market that could require a Fund to fair value some or all of its foreign securities include, among others, securities trading in the U.S. and other markets, corporate announcements, natural and other disasters, and political and other events. Among other elements of analysis in the determination of a security’s fair value, the Board has authorized the use of one or more independent research services to assist with such determinations. An independent research service may use statistical analyses and quantitative models to help determine fair value as of the time a Fund calculates its NAV. There can be no assurance that such models accurately reflect the behavior of the applicable markets or the effect of the behavior of such markets on the fair value of securities, or that such markets will continue to behave in a fashion that is consistent with such models. Unlike the closing price of a security on an exchange, fair value determinations employ elements of judgment. Consequently, the fair value assigned to a security may not represent the actual value that a Fund could obtain if it were to sell the security at the time of the close of the New York Stock Exchange (“NYSE”). Pursuant to procedures adopted by the Board, a Fund is not obligated to use the fair valuations suggested by any research service, and valuation recommendations provided by such research services may be overridden if other events have occurred or if other fair valuations are determined in good faith to be more accurate. Unless an event is such that it causes a Fund to determine that the closing prices for one or more securities do not represent readily available reliable fair value quotations at the time a Fund determines its NAV, events that occur between the time of the close of the foreign market on which they are traded and the close of regular trading on the NYSE will not be reflected in a Fund’s NAV.
Fair Value is defined as the price that the Fund would receive to sell an asset or pay to transfer a liability in an orderly transaction between market participants at the measurement date. Each investment asset or liability of the Funds is assigned a level at measurement date based on the significance and source of the inputs to its valuation. Quoted prices in active markets for identical securities are classified as “Level 1,” inputs other than quoted prices for an asset or liability that are observable are classified as “Level 2” and unobservable inputs, including the sub-adviser’s judgment about the assumptions that a market participant would use in pricing an asset or liability are classified as “Level 3”. The inputs used for valuing securities are not necessarily an indication of the risks associated with investing in those securities. Short-term securities of sufficient credit quality which are valued at amortized cost, which approximates fair value, are generally considered to be Level 2 securities under applicable accounting rules. A table summarizing the Funds’ investments under these levels of classification is included following the Summary Portfolios of Investments.
For the year ended March 31, 2012, there have been no significant changes to the fair valuation methodologies.
B. Security Transactions and Revenue Recognition. Securities transactions are accounted for on the trade date. Realized gains and losses are reported on the basis of identified cost of securities sold. Interest income is recorded on an accrual basis. Dividend income is recorded on the ex-dividend date, or for certain foreign securities, when the information becomes available to the Funds. Premium amortization and discount accretion are determined by the effective yield method.
C. Foreign Currency Translation. The books and records of the Funds are maintained in U.S. dollars. Any foreign currency amounts are translated into U.S. dollars on the following basis:
| (1) | | Market value of investment securities, other assets and liabilities — at the exchange rates prevailing at the end of the day. |
| (2) | | Purchases and sales of investment securities, income and expenses — at the rates of exchange prevailing on the respective dates of such transactions. |
Although the net assets and the market values are presented at the foreign exchange rates at the end of the day, the Funds do not isolate the portion of the results of operations resulting from changes in foreign exchange rates on investments from the fluctuations arising from changes in market prices of securities held. Such fluctuations are included with the net realized and unrealized gains or losses from investments. For securities that are subject to foreign withholding tax upon disposition, liabilities are recorded on the Statements of Assets and Liabilities for the estimated tax withholding based on the securities’ current market values. Upon disposition, realized gains or losses on
22
NOTES TO FINANCIAL STATEMENTS AS OF MARCH 31, 2012 (CONTINUED)
NOTE 2 — SIGNIFICANT ACCOUNTING POLICIES (continued)
such securities are recorded net of foreign withholding tax.
Reported net realized foreign exchange gains or losses arise from sales of foreign currencies, currency gains or losses realized between the trade and settlement dates on securities transactions, the difference between the amounts of dividends, interest, and foreign withholding taxes recorded on the Funds’ books, and the U.S. dollar equivalent of the amounts actually received or paid. Net unrealized foreign exchange gains and losses arise from changes in the value of assets and liabilities other than investments in securities at fiscal year end, resulting from changes in the exchange rate. Foreign security and currency transactions may involve certain considerations and risks not typically associated with investing in U.S. companies and U.S. government securities. These risks include, but are not limited to revaluation of currencies and future adverse political and economic developments which could cause securities and their markets to be less liquid and prices more volatile than those of comparable U.S. companies and U.S. government securities.
D. Risk Exposures and the use of Derivative Instruments. The Funds’ investment objectives permit them to enter into various types of derivatives contracts, including, but not limited to, forward foreign currency exchange contracts, futures, purchased options, written options, and swaps. In doing so, the Funds will employ strategies in differing combinations to permit them to increase or decrease the level of risk, or change the level or types of exposure to market risk factors. This may allow the Funds to pursue their objectives more quickly, and efficiently than if they were to make direct purchases or sales of securities capable of affecting a similar response to market factors.
Market Risk Factors. In pursuit of their investment objectives, the Funds may seek to use derivatives to increase or decrease their exposure to the following market risk factors:
Credit Risk. Credit risk relates to the ability of the issuer to meet interest and principal payments, or both, as they come due. In general, lower-grade, higher-yield bonds are subject to credit risk to a greater extent than lower-yield, higher-quality bonds.
Equity Risk. Equity risk relates to the change in value of equity securities as they relate to increases or decreases in the general market.
Foreign Exchange Rate Risk. Foreign exchange rate risk relates to the change in U.S. dollar value of a security held that is denominated in a foreign currency. The U.S. dollar value of a foreign currency denominated security will decrease as the dollar appreciates against the currency, while the U.S. dollar value will increase as the dollar depreciates against the currency.
Interest Rate Risk. Interest rate risk refers to the fluctuations in value of fixed-income securities resulting from the inverse relationship between price and yield. For example, an increase in general interest rates will tend to reduce the market value of already issued fixed-income investments, and a decline in general interest rates will tend to increase their value. In addition, debt securities with longer durations, which tend to have higher yields, are subject to potentially greater fluctuations in value from changes in interest rates than obligations with shorter durations.
Risks of Investing in Derivatives. The Funds’ use of derivatives can result in losses due to unanticipated changes in the market risk factors and the overall market. In instances where the Funds are using derivatives to decrease, or hedge, exposures to market risk factors for securities held by a Fund, there are also risks that those derivatives may not perform as expected resulting in losses for the combined or hedged positions.
The use of these strategies involves certain special risks, including a possible imperfect correlation, or even no correlation, between price movements of derivative instruments and price movements of related investments. While some strategies involving derivative instruments can reduce the risk of loss, they can also reduce the opportunity for gain or even result in losses by offsetting favorable price movements in related investments or otherwise, due to the possible inability of the Funds to purchase or sell a portfolio security at a time that otherwise would be favorable or the possible need to sell a portfolio security at a disadvantageous time because the Funds are required to maintain asset coverage or offsetting positions in connection with transactions in derivative instruments. Additional associated risks from investing in derivatives also exist and potentially could have significant effects on the valuation of the derivatives and the Funds. Associated risks are not the risks that the Funds are attempting to increase or decrease exposure to, per its investment objectives, but are the additional risks from investing in derivatives. Examples of these associated risks are liquidity risk, which is the risk that the Funds will not be able to sell the derivative in the open market
23
NOTES TO FINANCIAL STATEMENTS AS OF MARCH 31, 2012 (CONTINUED)
NOTE 2 — SIGNIFICANT ACCOUNTING POLICIES (continued)
in a timely manner, and counterparty credit risk, which is the risk that the counterparty will not fulfill its obligation to the Funds. Associated risks can be different for each type of derivative and are discussed by each derivative type in the following notes.
Counterparty Credit Risk and Credit Related Contingent Features. Certain derivative positions are subject to counterparty credit risk, which is the risk that the counterparty will not fulfill its obligation to the Funds. The Funds derivative counterparties are financial institutions who are subject to market conditions that may weaken their financial position. The Funds intend to enter into financial transactions with counterparties that they believe to be creditworthy at the time of the transaction. To reduce this risk, the Funds generally enter into master netting arrangements, established within the Funds International Swap and Derivatives Association, Inc. (“ISDA”) Master Agreements (“Master Agreements”). These agreements are with select counterparties and they govern transactions, including certain over-the-counter (“OTC”) derivative and forward foreign currency contracts, entered into by the Funds and the counterparty. The Master Agreements maintain provisions for general obligations, representations, agreements, collateral, and events of default or termination. The occurrence of a specified event of termination may give a counterparty the right to terminate all of its contracts and affect settlement of all outstanding transactions under the applicable Master Agreement.
The Funds may also enter into collateral agreements with certain counterparties to further mitigate credit risk associated with OTC derivative and forward foreign currency contracts. Subject to established minimum levels, collateral is generally determined based on the net aggregate unrealized gain or loss on contracts with a certain counterparty. Collateral pledged to or from the Funds is held in a segregated account by a third-party agent and can be in the form of cash or debt securities issued by the U.S. government or related agencies.
As of March 31, 2012, the maximum amount of loss that Intermediate Bond would incur if the counterparties to its derivative transactions failed to perform would be $1,919,627, which represents the gross payments to be received by the Fund on open forward foreign currency contracts, purchased options and swaps were they to be unwound as of March 31, 2012. At March 31, 2012, certain counterparties posted U.S. Treasury Bonds with a par value of $861,000 as collateral for open OTC derivatives.
The Funds’ master agreements with derivative counterparties have credit related contingent features that if triggered would allow its derivatives counterparties to close out and demand payment or additional collateral to cover their exposure from the Funds. Credit related contingent features are established between the Funds and their derivatives counterparties to reduce the risk that the Funds will not fulfill their payment obligations to their counterparties. These triggering features include, but are not limited to, a percentage decrease in the Funds net assets and or a percentage decrease in the Funds NAV, which could cause the Funds to accelerate payment of any net liability owed to the counterparty. The contingent features are established within the Funds Master Agreements.
As of March 31, 2012, Intermediate Bond had a net liability position of $5,699,611 on open forward foreign currency contracts, written options and swaps with credit related contingent features. If a contingent feature would have been triggered as of March 31, 2012, Intermediate Bond could have been required to pay this amount in cash to its counterparties. As of March 31, 2012 Intermediate Bond had posted $5,095,000 to its counterparties in cash collateral for its open derivatives transactions.
E. Foreign Currency Transactions and Futures Contracts. High Yield Bond and Intermediate Bond may enter into foreign currency exchange transactions to convert to and from different foreign currencies and to and from the U.S. dollar in connection with the planned purchases or sales of securities. The Funds either enter into these transactions on a spot basis at the spot rate prevailing in the foreign currency exchange market or use forward foreign currency contracts to purchase or sell foreign currencies. When the contract is fulfilled or closed, gains or losses are realized. Until then, the gain or loss is included in unrealized appreciation or depreciation. Risks may arise upon entering into forward contracts from the potential inability of counterparties to meet the terms of their forward contracts and from unanticipated movements in the value of foreign currencies relative to the U.S. dollar.
For the year ended March 31, 2012, Intermediate Bond has entered into forward foreign currency contracts with the obligation to buy and sell specified foreign currencies in the future at a currently negotiated forward rate in order to increase or decrease exposure to foreign exchange rate risk. The Fund uses forward foreign currency contracts primarily to protect its
24
NOTES TO FINANCIAL STATEMENTS AS OF MARCH 31, 2012 (CONTINUED)
NOTE 2 — SIGNIFICANT ACCOUNTING POLICIES (continued)
non-U.S. dollar-denominated holdings from adverse currency movements.
During the year ended March 31, 2012, Intermediate Bond had average contract amounts on forward foreign currency contracts to buy and sell of $10,654,488 and $62,492,917, respectively.
High Yield Bond and Intermediate Bond may enter into futures contracts involving foreign currency, interest rates, securities and securities indices. A futures contract obligates the seller of the contract to deliver and the purchaser of the contract to take delivery of the type of foreign currency, financial instrument or security called for in the contract at a specified future time for a specified price. Upon entering into such a contract, a Fund is required to deposit and maintain as collateral such initial margin as required by the exchange on which the contract is traded. Pursuant to the contract, a Fund agrees to receive from or pay to the broker an amount equal to the daily fluctuations in the value of the contract. Such receipts or payments are known as variation margins and are recorded as unrealized gains or losses by the Fund. When the contract is closed, the Fund records a realized gain or loss equal to the difference between the value of the contract at the time it was opened and the value at the time it was closed.
Futures contracts are exposed to the market risk factor of the underlying financial instrument. During the year ended March 31, 2012, Intermediate Bond has both purchased and sold futures contracts on various bonds and notes to gain exposure to different parts of the yield curve while maintaining overall duration. GNMA also purchased futures contracts on various notes to gain additional exposure to the yield curve while maintaining overall duration. Additional associated risks of entering into futures contracts include the possibility that there may be an illiquid market where a Fund is unable to liquidate the contract or enter into an offsetting position and, if used for hedging purposes, the risk that the price of the contract will correlate imperfectly with the prices of the Fund’s securities. With futures, there is minimal counterparty credit risk to a Fund since futures are exchange traded and the exchange’s clearinghouse, as counterparty to all exchange traded futures, guarantees the futures against default.
During the year ended March 31, 2012, Intermediate Bond had an average notional value of $235,090,143 and $251,869,868 on futures contracts purchased and sold, respectively. GNMA had an average notional value of $50,326,992 on futures contracts purchased during the period ended March 31, 2012.
F. Distributions to Shareholders. The Funds record distributions to their shareholders on the ex-dividend date. All Funds, with the exception of GNMA Income, declare dividends daily and pay dividends monthly. GNMA Income declares and pays dividends monthly. The characteristics of income and gains to be distributed are determined in accordance with income tax regulations, which may differ from U.S. generally accepted accounting principles for investment companies.
G. Federal Income Taxes. It is the policy of the Funds to comply with the requirements of subchapter M of the Internal Revenue Code that are applicable to regulated investment companies and to distribute substantially all of their net investment income and any net realized capital gains to their shareholders. Therefore, a federal income tax or excise tax provision is not required. Management has considered the sustainability of the Funds’ tax positions taken on federal income tax returns for all open tax years in making this determination. No capital gain distributions shall be made until the capital loss carryforwards have been fully utilized or expire.
H. Use of Estimates. The preparation of financial statements in conformity with U.S. generally accepted accounting principles requires management to make estimates and assumptions that affect the reported amounts of assets and liabilities and disclosure of contingent assets and liabilities at the date of the financial statements and the reported amounts of increases and decreases in net assets from operations during the reporting period. Actual results could differ from those estimates.
I. Repurchase Agreements. Each Fund may invest in repurchase agreements only with government securities dealers recognized by the Board of Governors of the Federal Reserve System. Under such agreements, the seller of the security agrees to repurchase it at a mutually agreed upon time and price. The resale price is in excess of the purchase price and reflects an agreed upon interest rate for the period of time the agreement is outstanding. The period of the repurchase agreements is generally short, from possibly overnight to one week, (although it may extend over a number of months) while the underlying securities generally have longer maturities. Each Fund will receive as collateral securities acceptable to it whose market value is equal to at least 100% of the carrying amount of the repurchase agreements, plus accrued interest, being invested by a Fund. The underlying collateral is
25
NOTES TO FINANCIAL STATEMENTS AS OF MARCH 31, 2012 (CONTINUED)
NOTE 2 — SIGNIFICANT ACCOUNTING POLICIES (continued)
valued daily on a mark to market basis to assure that the value, including accrued interest is at least equal to the repurchase price. There would be potential loss to a Fund in the event a Fund is delayed or prevented from exercising its right to dispose of the collateral, and it may incur disposition costs in liquidating the collateral.
J. Securities Lending. Each Fund has the option to temporarily loan up to 33-1/3% of its total assets to brokers, dealers or other financial institutions in exchange for a negotiated lender’s fee. The borrower is required to fully collateralize the loans with cash or U.S. government securities. Generally, in the event of counterparty default, a Fund has the right to use collateral to offset losses incurred. There would be potential loss to a Fund in the event the Fund is delayed or prevented from exercising its right to dispose of the collateral. Each Fund bears the risk of loss with respect to the investment of collateral with the following exception: Effective October 1, 2011, BNY provides the Fund indemnification from loss with respect to the investment of collateral provided that the cash collateral is invested solely in overnight repurchase agreements. Engaging in securities lending could have a leveraging effect, which may intensify the credit, market and other risks associated with investing in a Fund.
K. Restricted Securities. Each Fund may invest in restricted securities which include those sold under Rule 144A of the Securities Act of 1933 (“1933 Act”) or securities offered pursuant to Section 4(2) of the 1933 Act, and/or are subject to legal or contractual restrictions on resale and may not be publicly sold without registration under the 1933 Act. Restricted securities are fair valued using market quotations when readily available. In the absence of market quotations, the securities are valued based upon their fair value determined in good faith under procedures approved by the Board.
L. Delayed-Delivery or When-Issued Transactions. The Funds may purchase or sell securities on a when-issued or a delayed-delivery basis. Each Fund may enter into forward commitments. The price of the underlying securities and date when the securities will be delivered and paid for are fixed at the time the transaction is negotiated. The market value of such is identified in the Funds’ Summary Portfolio of investments. Losses may arise due to changes in the market value of the securities or from the inability of counterparties to meet the terms of the contract. In connection with such purchases, the Funds are required to segregate liquid assets with the Funds’ custodian sufficient to cover the purchase price.
M. Mortgage Dollar Roll Transactions. Each Fund may engage in dollar roll transactions with respect to mortgage-backed securities issued or to be issued by Government National Mortgage Association, Federal National Mortgage Association and Federal Home Loan Mortgage Corp. In a dollar roll transaction, a Fund sells a mortgage-backed security to a financial institution, such as a bank or broker/dealer, and simultaneously agrees to repurchase a substantially similar (i.e., same type, coupon, and maturity) security from the institution on a delayed delivery basis at an agreed upon price. The mortgage-backed securities that are repurchased will bear the same interest rate as those sold, but generally will be collateralized by different pools of mortgages with different prepayment histories. The Funds account for dollar roll transactions as purchases and sales.
N. Options Contracts. The Funds may write call and put options on futures, swaptions, securities, commodity or currencies they own or in which they may invest. Writing put options tends to increase the Funds exposure to the underlying instrument. Writing call options tends to decrease the Funds exposure to the underlying instrument. When a Fund writes a call or put option, an amount equal to the premium received is recorded as a liability and subsequently marked to market to reflect the current value of the option written. These liabilities are reflected as written options outstanding on the Statements of Assets and Liabilities. Certain options may be written with premiums to be determined on a future date. Premiums received from writing options which expire are treated as realized gains. Premiums received from writing options which are exercised or closed are added to the proceeds or offset against amounts paid on the underlying futures, swap, security or currency transaction to determine the realized gain or loss. Each Fund as a writer of an option has no control over whether the underlying instrument may be sold (call) or purchased (put) and as a result bears the market risk of an unfavorable change in the price of the instrument underlying the written option. There is the risk the Funds may not be able to enter into a closing transaction because of an illiquid market.
The Funds may also purchase put and call options. Purchasing call options tends to increase the Funds exposure to the underlying instrument. Purchasing put options tends to decrease the Funds’ exposure to the underlying instrument. The Funds pay a premium which is included on the Statements of Assets and
26
NOTES TO FINANCIAL STATEMENTS AS OF MARCH 31, 2012 (CONTINUED)
NOTE 2 — SIGNIFICANT ACCOUNTING POLICIES (continued)
Liabilities as an investment and subsequently marked to market to reflect the current value of the option. Premiums paid for purchasing options which expire are treated as realized losses. Certain options may be purchased with premiums to be determined on a future date. The premiums for these options are based upon implied volatility parameters at specified terms. The risk associated with purchasing put and call options is limited to the premium paid. Premiums paid for purchasing options which are exercised or closed are added to the amounts paid or offset against the proceeds on the underlying investment transaction to determine the realized gain or loss.
During the year ended March 31, 2012, Intermediate Bond has purchased and written foreign currency options in order to hedge the value of its non-U.S. dollar-denominated holdings from adverse currency movements and to generate income. Please refer to the Summary Portfolio of Investments for open purchased foreign currency options and the table following for open written foreign currency options.
During the year ended March 31, 2012, Intermediate Bond has purchased and written swaptions on credit default swap indices (“CDX”) as part of managing the Fund’s credit risk and sector exposure and as a means of generating additional income. Please refer to the Summary Portfolio of Investments for open purchased CDX swaptions. There were no open written CDX swaptions at March 31, 2012.
During the year ended March 31, 2012, Intermediate Bond has purchased and written options on exchange-traded futures contracts on various bonds and notes as part of its duration strategy and to generate income. There were no open options on exchange-traded futures at March 31, 2012.
Please refer to Note 9 for the volume of both purchased and written options and swaption activity during the year ended March 31, 2012.
O. Swap Agreements. High Yield Bond and Intermediate Bond may enter into swap agreements. A swap is an agreement between two parties pursuant to which each party agrees to make one or more payments to the other at specified future intervals based on the return of an asset (such as a stock, bond or currency) or non-asset reference (such as an interest rate or index). The swap agreement will specify the “notional” amount of the asset or non-asset reference to which the contract relates. Subsequent changes in fair value, if any, are calculated based upon changes in the performance of the asset or non-asset reference multiplied by the notional value of the contract. A Fund may enter into credit default, interest rate, total return and currency swaps to manage its exposure to credit, currency and interest rate risk. All outstanding swap agreements are reported following each Fund’s Summary Portfolio of Investments.
Swaps are marked to market daily using quotations primarily from third party pricing services, counterparties or brokers. The fair value of the swap contract is recorded on each Fund’s Statement of Assets or Liabilities. During the term of the swap, changes in the fair value of the swap, if any, are recorded as unrealized gains or losses on the Statement of Operations. Upfront payments paid or received by a Fund when entering into the agreements are reported on the Statement of Assets and Liabilities and as a component of the changes in unrealized gains or losses on the Statement of Operations. These upfront payments represent the amounts paid or received when initially entering into the swap agreement to compensate for differences between the stated terms of the swap agreement and the prevailing market conditions. The upfront payments are included as a component in the realized gains or losses on each Fund’s Statement of Operations upon termination or maturity of the swap. A Fund also records net periodic payments paid or received on the swap contract as a realized gain or loss on the Statement of Operations.
Entering into swap agreements involves the risk that the maximum potential loss of an investment exceeds the current value of the investment as reported on each Fund’s Statement of Assets and Liabilities. Other risks involve the possibility that the counterparty to the agreements may default on its obligation to perform, that there will be no liquid market for these investments and that unfavorable changes in the market will have a negative impact on the value of the index or securities underlying the respective swap agreement.
Credit Default Swap Contracts. A credit default swap is a bilateral agreement between counterparties in which the buyer of the protection agrees to make a stream of periodic payments to the seller of protection in exchange for the right to receive a specified return in the event of a default or other credit event for a referenced entity, obligation or index. As a seller of protection on credit default swaps, a Fund will generally receive from the buyer a fixed payment stream based on the notional amount of the swap contract. This fixed payment stream will continue until the swap contract expires or a defined credit event occurs.
27
NOTES TO FINANCIAL STATEMENTS AS OF MARCH 31, 2012 (CONTINUED)
NOTE 2 — SIGNIFICANT ACCOUNTING POLICIES (continued)
A Fund is subject to credit risk in the normal course of pursuing its investment objectives. As a seller of protection in a credit default swap, a Fund may execute these contracts to manage its exposure to the market or certain sectors of the market. A Fund may also enter into credit default swaps to speculate on changes in an issuer’s credit quality, to take advantage of perceived spread advantages, or to offset an existing short equivalent (i.e. buying protection on an equivalent reference entity).
High Yield Bond and Intermediate Bond may sell credit default swaps which expose these Funds to the risk of loss from credit risk- related events specified in the contract. Although contract specific, credit events are generally defined as bankruptcy, failure to pay, restructuring, obligation acceleration, obligation default or repudiation/moratorium. If a Fund is a seller of protection, and a credit event occurs, as defined under the terms of that particular swap agreement, a Fund will generally either (i) pay to the buyer an amount equal to the notional amount of the swap and take delivery of the referenced obligation, other deliverable obligations, or underlying securities comprising a referenced index or (ii) pay a net settlement amount in the form of cash or securities equal to the notional amount of the swap less the recovery value of the referenced obligation or underlying securities comprising a referenced index. If a Fund is a buyer of protection and a credit event occurs, as defined under the terms of that particular swap agreement, a Fund will either (i) receive from the seller of protection an amount equal to the notional amount of the swap and deliver the referenced obligation, other deliverable obligations or underlying securities comprising the referenced index or (ii) receive a net settlement amount in the form of cash or securities equal to the notional amount of the swap less the recovery value of the referenced obligation or underlying securities comprising the referenced index. Recovery values are assumed by market makers considering either industry standard recovery rates or entity specific factors and considerations until a credit event occurs. If a credit event has occurred, the recovery value is determined by a facilitated auction whereby a minimum number of allowable broker bids, together with a specified valuation method, are used to calculate the settlement value.
Implied credit spreads, represented in absolute terms, utilized in determining the fair value of credit default swap agreements on corporate issues or sovereign issues are disclosed in each Fund’s Summary Portfolio of Investments and serve as an indicator of the current status of the payment/performance risk and represent the likelihood or risk of default for the credit derivative. The implied credit spread of a particular referenced entity reflects the cost of buying/selling protection and may include upfront payments required to be made to enter into the agreement. For credit default swaps on asset-backed securities or credit indices, the quoted market prices and resulting fair values serve as the indicator of the current status of the payment/performance risk. Wider credit spreads and increasing fair values, in absolute terms when compared to the notional amount of the swap, represent a deterioration of the referenced entity’s credit soundness and a greater likelihood or risk of default or other credit event occurring as defined under the terms of the agreement.
The maximum amount of future payments (undiscounted) that a Fund as seller of protection could be required to make under a credit default swap agreement would be an amount equal to the notional amount of the agreement. Notional amounts of all credit default swap agreements outstanding as of March 31, 2012, for which a Fund is seller of protection, are disclosed in each Fund’s Summary Portfolio of Investments. These potential amounts would be partially offset by any recovery values of the respective referenced obligations, upfront payments received upon entering into the agreements, or net amounts received from the settlement of buy protection credit default swap agreements entered into by a Fund for the same referenced entity or entities.
For the year ended March 31, 2012, Intermediate Bond has purchased credit protection through credit default swaps to decrease exposure to the credit risk of individual securities to hedge against anticipated potential credit events. Please refer to the table following the Summary Portfolio of Investments for open credit default swaps.
For the year ended March 31, 2012, Intermediate Bond has sold credit protection through credit default swaps to gain exposure to the credit risk of individual securities or CDX indices that are either unavailable or considered to be less attractive in the bond market. Please refer to the table following the Summary Portfolio of Investments for open credit default swaps.
For the year ended March 31, 2012, Intermediate Bond had average notional amounts of $7,030,000 and $13,713,000 on credit default swaps to buy protection and credit default swaps to sell protection, respectively.
28
NOTES TO FINANCIAL STATEMENTS AS OF MARCH 31, 2012 (CONTINUED)
NOTE 2 — SIGNIFICANT ACCOUNTING POLICIES (continued)
For the year ended March 31, 2012, High Yield Bond has sold credit protection through credit default swaps with an average notional amount of $1,862,000 to gain exposure to the credit risk of individual securities that are either unavailable or considered to be less attractive in the bond market. There were no open credit default swaps at March 31, 2012.
Interest Rate Swap Contracts. An interest rate swap involves the agreement between counterparties to exchange periodic payments based on interest rates. One payment will be based on a floating rate of a specified interest rate while the other will be a fixed rate. Risks involve the future fluctuations of interest rates in which a Portfolio may make payments that are greater than what a Portfolio received from the counterparty. Other risks include credit, liquidity and market risk. For the year ended March 31, 2012, Intermediate Bond had entered into interest rate swaps in which it pays a floating interest rate and receives a fixed interest rate (“Long interest rate swap”) in order to increase exposure to interest rate risk. Average notional amounts on long interest rate swaps was $64,231,332. For the year ended March 31, 2012, Intermediate Bond had entered into interest rate swaps in which it pays a fixed interest rate and receives a floating interest rate (“Short interest rate swap”) in order to decrease exposure to interest rate risk. Average notional amounts on short interest rate swaps was $78,506,444. Intermediate Bond entered into interest rate swaps to adjust interest rate and yield curve exposures and to substitute for physical fixed-income securities. Please refer to the table following the Summary Portfolio of Investments for open interest rate swaps at March 31, 2012.
P. Construction Loan Securities. GNMA Income may purchase construction loan securities, which are issued to finance building costs. The funds are disbursed as needed or in accordance with a prearranged plan. The securities provide for the timely payment to the registered holder of interest at the specified rate plus scheduled installments of principal. Upon completion of the construction phase, the construction loan securities are terminated and project loan securities are issued. It is GNMA Income’s policy to record these GNMA certificates on trade date, and to segregate assets to cover its commitments on trade date as well.
Q. Indemnifications. In the normal course of business, the Trust may enter into contracts that provide certain indemnifications. The Trust’s maximum exposure under these arrangements is dependent on future claims that may be made against the Funds and, therefore, cannot be estimated; however, based on experience, management considers risk of loss from such claims remote.
NOTE 3 — INVESTMENT TRANSACTIONS
For the year ended March 31, 2012, the cost of purchases and proceeds from the sales of securities excluding short-term and U.S. government securities, were as follows:
| | | | Purchases
| | Sales
|
|---|
| High Yield Bond | | | | $ | 139,709,289 | | | $ | 127,287,184 | |
| Intermediate Bond | | | | | 781,022,990 | | | | 861,319,050 | |
U.S. government securities not included above were as follows:
| | | | Purchases
| | Sales
|
|---|
| GNMA Income | | | | $ | 3,202,366,615 | | | $ | 3,041,580,417 | |
| Intermediate Bond | | | | | 3,446,665,989 | | | | 3,383,093,968 | |
NOTE 4 — INVESTMENT MANAGEMENT AND ADMINISTRATIVE FEES
ING Investments, LLC (“ING Investments” or the “Investment Adviser”), an Arizona limited liability company, serves as the investment adviser to the Funds. The Investment Adviser serves pursuant to an investment management agreement (“Management Agreement”) between the Investment Adviser and the Trust, on behalf of the Funds.
The Management Agreement compensates the Investment Adviser with a fee, computed daily and payable monthly, based on the average daily net assets of each Fund, at the following annual rates:
For GNMA Income — 0.47% on first $1 billion, 0.40% on next $4 billion and 0.35% on assets thereafter; for High Yield Bond — 0.51% on first $500 million, 0.45% on next $4.5 billion and 0.40% on assets thereafter; and for Intermediate Bond — 0.17% on all assets.
ING Investment Management Co. LLC (“ING IM”), a Delaware limited liability company, serves as the sub-adviser to the Funds. The Investment Adviser has entered into a sub-advisory agreement with ING IM. Subject to such policies as the Board or the Investment Adviser may determine, ING IM manages the Funds’ assets in accordance with the Funds’ investment objectives, policies, and limitations.
ING Funds Services, LLC (“IFS”), acts as administrator and provides certain administrative and shareholder services necessary for Fund operations and is responsible for the supervision of other service providers. For its services, IFS is entitled to receive from
29
NOTES TO FINANCIAL STATEMENTS AS OF MARCH 31, 2012 (CONTINUED)
NOTE 4 — INVESTMENT MANAGEMENT AND ADMINISTRATIVE FEES (continued)
each Fund a fee at an annual rate of 0.10% of its average daily net assets.
ING Investments Distributor, LLC (the “Distributor” or “IID”) is the principal underwriter of the Funds. The Distributor, IFS, ING Investments and ING IM are indirect, wholly-owned subsidiaries of ING Groep N.V. (“ING Groep”). ING Groep is a global financial institution of Dutch origin offering banking, investments, life insurance and retirement services.
ING Groep has adopted a formal restructuring plan that was approved by the European Commission in November 2009 under which the ING life insurance businesses, including the retirement services and investment management businesses, which include the Adviser and its immediate affiliates, would be separated from ING Groep by the end of 2013. To achieve this goal, in a series of announcements beginning November 2010, ING Groep announced that it plans to pursue transactions to restructure certain businesses, including an initial public offering for its U.S. based insurance, retirement services, and investment management operations; and other transactions, which could include an initial public offering or other type of transaction, for its European based insurance and investment management operations and Asian based insurance and investment management operations. There can be no assurance that all or part of the restructuring plan will be carried out.
The restructuring plan and the uncertainty about its implementation, whether implemented through the planned public offerings or through other means, in whole or in part, may be disruptive to the businesses of ING entities, including the ING entities that service the Funds, and may cause, among other things, interruption or reduction of business and services, diversion of management’s attention from day-to-day operations, and loss of key employees or customers. A failure to complete the offerings or other means of implementation on favorable terms could have a material adverse impact on the operations of the businesses subject to the restructuring plan. The restructuring plan may result in the Investment Adviser’s loss of access to services and resources of ING Groep, which could adversely affect its businesses and profitability. In addition, the divestment of ING businesses, including the Investment Adviser, may potentially be deemed a “change of control” of each entity. A change of control would result in the termination of the Funds’ advisory and sub-advisory agreements, which would trigger the necessity for new agreements that would require approval of the board, and may trigger the need for shareholder approval. Currently, the Investment Adviser does not anticipate that the restructuring will have a material adverse impact on the Funds or their operations and administration.
NOTE 5 — DISTRIBUTION AND SERVICE FEES
Each share class of the Funds (except Class I and Class W and as otherwise noted below) has adopted a Distribution Plan pursuant to Rule 12b-1 under the 1940 Act and/or a Service Plan (the “Plans”), whereby the Distributor is reimbursed or compensated (depending on the class of shares) by certain of the Funds for expenses incurred in the distribution of each Fund’s shares (“Distribution Fees”). Pursuant to the Plans, the Distributor is entitled to payment each month for expenses incurred in the distribution and promotion of certain of each Fund’s shares, including expenses incurred in printing prospectuses and reports used for sales purposes, expenses incurred in preparing and printing sales literature and other such distribution related expenses, including any distribution or shareholder servicing fees (“Service Fees”) paid to securities dealers who have executed a distribution agreement with the Distributor. Under the Plans, each class of shares of each Fund pays the Distributor a Distribution and/or Service Fee based on average daily net assets at the following annual rates:
| | | | Class A
| | Class B
| | Class C
| | Class O
| | Class R
|
|---|
| GNMA Income | | | | | 0.25 | % | | | 1.00 | % | | | 1.00 | % | | | N/A | | | | N/A | |
| High Yield Bond | | | | | 0.25 | % | | | 1.00 | % | | | 1.00 | % | | | N/A | | | | N/A | |
| Intermediate Bond | | | | | 0.25 | % | | | 1.00 | % | | | 1.00 | % | | | 0.25 | % | | | 0.50 | % |
The Distributor may also retain the proceeds of the initial sales charge paid by shareholders upon the purchase of Class A shares of the Funds, and the contingent deferred sales charge paid by shareholders upon certain redemptions for Class A, Class B, and Class C shares. For the year ended March 31, 2012, the Distributor retained the following amounts in sales charges:
Initial Sales Charges:
| | | | Class A
| | Class C
|
|---|
| GNMA Income | | | | $ | 58,265 | | | $ | — | |
| High Yield Bond | | | | | 10,127 | | | | — | |
| Intermediate Bond | | | | | 10,674 | | | | — | |
Contingent Deferred Sales Charges:
| | | | | | |
|---|
| GNMA Income | | | | $ | 21 | | | $ | 5,105 | |
| High Yield Bond | | | | | — | | | | 109 | |
| Intermediate Bond | | | | | 1,132 | | | | 32 | |
30
NOTES TO FINANCIAL STATEMENTS AS OF MARCH 31, 2012 (CONTINUED)
NOTE 6 — OTHER TRANSACTIONS WITH AFFILIATES AND RELATED PARTIES
At March 31, 2012, the Funds had the following amounts recorded as payable to affiliates on the accompanying Statements of Assets and Liabilities (see Notes 4 and 5):
Fund
| | | | Accrued
Investment
Management
Fees
| | Accrued
Administrative
Fees
| | Accrued
Shareholder
Service and
Distribution
Fees
| | Total
|
|---|
| GNMA Income | | | | $ | 382,893 | | | $ | 81,465 | | | $ | 260,911 | | | $ | 725,269 | |
| High Yield Bond | | | | | 68,125 | | | | 13,357 | | | | 33,431 | | | | 114,913 | |
| Intermediate Bond | | | | | 117,345 | | | | 69,025 | | | | 110,481 | | | | 296,851 | |
At March 31, 2012, the following ING Funds or indirect, wholly-owned subsidiaries of ING Groep owned more than 5% of the following Funds:
ING Fund or Subsidiary
| | | | Fund
| | Percentage
|
|---|
| ING Capital Allocation Fund | | | | High Yield Bond | | | 9.87 | % |
| | | | | Intermediate Bond | | | 5.45 | % |
| ING Life Insurance & Annuity Company | | | | GNMA Income | | | 17.42 | % |
| | | | | Intermediate Bond | | | 17.48 | % |
| ING National Trust | | | | GNMA Income | | | 17.65 | % |
| | | | | Intermediate Bond | | | 9.36 | % |
Control is defined by the 1940 Act as the beneficial ownership, either directly or through one or more controlled companies, of more than 25% of the voting securities of a company. The 1940 Act defines affiliates as companies that are under common control. Therefore, because the Funds have a common owner that owns over 25% of the outstanding securities of the Funds, they may be deemed to be affiliates of each other. Investment activities of these shareholders could have a material impact on the Funds.
The Funds have adopted a Deferred Compensation Plan (the “Plan”), which allows eligible non-affiliated trustees as described in the Plan to defer the receipt of all or a portion of the trustees fees payable. Amounts deferred are treated as though invested in various “notional” funds advised by ING Investments until distribution in accordance with the Plan.
NOTE 7 — EXPENSE LIMITATIONS
Pursuant to a written expense limitation agreement (“Expense Limitation Agreement”) with the Funds, the Investment Adviser has agreed to limit expenses of each Fund, excluding interest, taxes, brokerage commissions and extraordinary expenses (and acquired fund fees and expenses) to the levels listed below:
Fund
| | | | Class A
| | Class B
| | Class C
| | Class I
| | Class O
| | Class R
| | Class W
|
|---|
| GNMA Income | | | | | 0.97 | % | | | 1.72 | % | | | 1.72 | % | | | 0.67 | % | | | N/A | | | | N/A | | | | 0.72 | % |
| High Yield Bond | | | | | 1.10 | % | | | 1.85 | % | | | 1.85 | % | | | 0.85 | % | | | N/A | | | | N/A | | | | 0.85 | % |
| Intermediate Bond | | | | | 0.75 | % | | | 1.50 | % | | | 1.50 | % | | | 0.50 | % | | | 0.75 | % | | | 1.00 | % | | | 0.50 | % |
The Investment Adviser may at a later date recoup from a Fund for management fees waived and other expenses assumed by the Investment Adviser during the previous 36 months, but only if, after such recoupment, a Fund’s expense ratio does not exceed the percentage described above. Waived and reimbursed fees net of any recoupment by the Investment Adviser of such waived and reimbursed fees are reflected on the accompanying Statements of Operations for each Fund. Amounts payable by the Investment Adviser are reflected on the accompanying Statements of Assets and Liabilities for each Fund.
As of March 31, 2012 the amounts of waived and reimbursed fees that are subject to possible recoupment by the Investment Adviser, and the related expiration dates are as follows:
| | | | March 31,
| | | |
|---|
| | | | 2013
| | 2014
| | 2015
| | Total
|
|---|
| High Yield Bond | | | | $ | 136,047 | | | $ | 37,645 | | | $ | 60,446 | | | $ | 234,138 | |
| Intermediate Bond | | | | | 128,272 | | | | — | | | | — | | | | 128,272 | |
The Expense Limitation Agreement is contractual and shall renew automatically for one-year terms unless ING Investments or the Trust provides written notice of the termination of the Expense Limitation Agreement within 90 days of the end of the then current term or upon termination of the Management Agreement.
NOTE 8 — LINE OF CREDIT
Each of the Funds included in this report with the exception of GNMA Income, in addition to certain other funds managed by the Investment Adviser, have entered into an unsecured committed revolving line of credit agreement (the “Credit Agreement”) with The Bank of New York Mellon (“BNY”) for an aggregate amount of $125,000,000. The proceeds may be used only to: (1) temporarily finance the purchase and sale of securities; or (2) finance the redemption of shares of an investor in the funds. Effective May 27, 2011, the funds to which the line of credit is available pay a commitment fee equal to 0.08% per annum on the daily unused portion of the committed line amount payable quarterly in arrears. Prior to May 27, 2011, the funds to which the line of credit is available paid a commitment fee equal to 0.15% per annum on the
31
NOTES TO FINANCIAL STATEMENTS AS OF MARCH 31, 2012 (CONTINUED)
NOTE 8 — LINE OF CREDIT (continued)
daily unused portion of the committed line amount payable quarterly in arrears.
Generally, borrowings under the Credit Agreement accrue interest at the federal funds rate plus a specified margin. Repayments generally must be made within 60 days after the date of a revolving credit advance.
The following Funds utilized the line of credit during the year ended March 31, 2012:
Portfolio
| | | | Days
Utilized
| | Approximate
Average Daily
Balance For
Days Utilized
| | Approximate
Weighted
Average
Interest Rate For
Days Utilized
|
|---|
| High Yield Bond | | | | | 7 | | | $ | 1,025,714 | | | | 1.23 | % |
| Intermediate Bond | | | | | 37 | | | | 1,570,946 | | | | 1.28 | |
NOTE 9 — PURCHASED AND WRITTEN OPTIONS
Transactions in purchased options on exchange-traded futures contracts for Intermediate Bond during the year ended March 31, 2012 were as follows:
| | | | Number of
Contracts
| | Cost
|
|---|
| Balance at 03/31/11 | | | | | 242 | | | $ | 342,935 | |
| Options Purchased | | | | | 482 | | | | 227,143 | |
| Options Terminated in Closing Sell Transactions | | | | | (724 | ) | | | (570,078 | ) |
| Options Exercised | | | | | — | | | | — | |
| Options Expired | | | | | — | | | | — | |
| Balance at 03/31/12 | | | | | — | | | $ | — | |
Transactions in purchased options on foreign currencies for Intermediate Bond during the year ended March 31, 2012 were as follows:
| | | | Notional
Amount
| | Cost
|
|---|
| Balance at 03/31/11 | | | | | — | | | $ | — | |
| Options Purchased | | | | | 200,600,000 | | | | 2,397,550 | |
| Options Terminated in Closing Sell Transactions | | | | | (164,400,000 | ) | | | (2,151,525 | ) |
| Options Exercised | | | | | — | | | | — | |
| Options Expired | | | | | (16,600,000 | ) | | | (89,225 | ) |
| Balance at 03/31/12 | | | | | 19,600,000 | | | $ | 156,800 | |
Transactions in purchased credit default swaptions for Intermediate Bond during the year ended March 31, 2012 were as follows:
| | | | Notional
Amount
| | Cost
|
|---|
| Balance at 03/31/11 | | | | | — | | | $ | — | |
| Options Purchased | | | | | 94,177,000 | | | | 943,148 | |
| Options Terminated in Closing Sell Transactions | | | | | (53,997,000 | ) | | | (188,989 | ) |
| Options Exercised | | | | | — | | | | — | |
| Options Expired | | | | | — | | | | — | |
| Balance at 03/31/12 | | | | | 40,180,000 | | | $ | 754,159 | |
Transactions in written options on exchange-traded futures contracts for Intermediate Bond during the year ended March 31, 2012 were as follows:
| | | | Number of
Contracts
| | Premiums
Received
|
|---|
| Balance at 03/31/11 | | | | | 242 | | | $ | 138,744 | |
| Options Written | | | | | 482 | | | | 51,514 | |
| Options Terminated in Closing Purchase Transactions | | | | | (724 | ) | | | (190,258 | ) |
| Options Exercised | | | | | — | | | | — | |
| Options Expired | | | | | — | | | | — | |
| Balance at 03/31/12 | | | | | — | | | $ | — | |
Transactions in written options on foreign currencies for Intermediate Bond during the year ended March 31, 2012 were as follows:
| | | | Notional
Amount
| | Premiums
Received
|
|---|
| Balance at 03/31/11 | | | | | — | | | $ | — | |
| Options Written | | | | | 219,800,000 | | | | 2,201,505 | |
| Options Terminated in Closing Purchase Transactions | | | | | (145,000,000 | ) | | | (1,642,524 | ) |
| Options Exercised | | | | | — | | | | — | |
| Options Expired | | | | | (55,200,000 | ) | | | (407,903 | ) |
| Balance at 03/31/12 | | | | | 19,600,000 | | | $ | 151,078 | |
Transactions in written credit default swaptions for Intermediate Bond during the year ended March 31, 2012 were as follows:
| | | | Notional
Amount
| | Premiums
Received
|
|---|
| Balance at 03/31/11 | | | | | — | | | $ | — | |
| Options Written | | | | | 53,997,000 | | | | 188,990 | |
| Options Terminated in Closing Purchase Transactions | | | | | — | | | | — | |
| Options Exercised | | | | | — | | | | — | |
| Options Expired | | | | | (53,997,000 | ) | | | (188,990 | ) |
| Balance at 03/31/12 | | | | | — | | | $ | — | |
32
NOTES TO FINANCIAL STATEMENTS AS OF MARCH 31, 2012 (CONTINUED)
NOTE 10 — CAPITAL SHARES
| | | | Shares sold
| | Shares
issued in
merger
| | Reinvestment
of
distributions
| | Shares
redeemed
| | Net increase
(decrease)
in shares
outstanding
| | Shares sold
| | Proceeds
from shares
issued in
merger
| | Reinvestment
of
distributions
| | Shares
redeemed
| | Net increase
(decrease)
|
|---|
Year or period ended
| | | | #
| | #
| | #
| | #
| | #
| | ($)
| | ($)
| | ($)
| | ($)
| | ($)
|
|---|
GNMA Income |
Class A |
| 3/31/2012 | | | | | 24,514,742 | | | | — | | | | 2,375,996 | | | | (18,954,717 ) | | | | 7,936,021 | | | | 221,856,424 | | | | — | | | | 21,423,816 | | | | (171,310,378 ) | | | | 71,969,862 | |
| 3/31/2011 | | | | | 18,504,611 | | | | — | | | | 2,445,141 | | | | (21,233,387 ) | | | | (283,635 ) | | | | 164,417,869 | | | | — | | | | 21,639,688 | | | | (188,250,654 ) | | | | (2,193,097 ) | |
Class B |
| 3/31/2012 | | | | | 37,213 | | | | — | | | | 18,726 | | | | (930,578 ) | | | | (874,639 ) | | | | 335,404 | | | | — | | | | 167,427 | | | | (8,308,133 ) | | | | (7,805,302 ) | |
| 3/31/2011 | | | | | 36,609 | | | | — | | | | 55,994 | | | | (1,764,623 ) | | | | (1,672,020 ) | | | | 323,505 | | | | — | | | | 493,030 | | | | (15,559,560 ) | | | | (14,743,025 ) | |
Class C |
| 3/31/2012 | | | | | 5,764,855 | | | | — | | | | 293,474 | | | | (2,580,225 | ) | | | 3,478,104 | | | | 51,973,193 | | | | — | | | | 2,635,071 | | | | (23,168,192 | ) | | | 31,440,072 | |
| 3/31/2011 | | | | | 4,030,435 | | | | — | | | | 283,015 | | | | (4,301,794 | ) | | | 11,656 | | | | 35,705,363 | | | | — | | | | 2,494,291 | | | | (37,914,742 | ) | | | 284,912 | |
Class I |
| 3/31/2012 | | | | | 12,189,352 | | | | — | | | | 364,066 | | | | (4,449,136 | ) | | | 8,104,282 | | | | 110,555,426 | | | | — | | | | 3,289,782 | | | | (40,299,123 | ) | | | 73,546,085 | |
| 3/31/2011 | | | | | 5,309,047 | | | | — | | | | 286,168 | | | | (3,833,200 | ) | | | 1,762,015 | | | | 47,286,190 | | | | — | | | | 2,536,951 | | | | (33,952,716 | ) | | | 15,870,425 | |
Class W |
| 3/31/2012 | | | | | 1,128,864 | | | | — | | | | 31,026 | | | | (690,349 ) | | | | 469,541 | | | | 10,252,700 | | | | — | | | | 280,245 | | | | (6,228,039 ) | | | | 4,304,906 | |
| 3/31/2011 | | | | | 563,741 | | | | — | | | | 34,877 | | | | (718,850 ) | | | | (120,232 ) | | | | 5,024,125 | | | | — | | | | 309,382 | | | | (6,369,467 ) | | | | (1,035,960 | ) |
| |
High Yield Bond |
Class A |
| 3/31/2012 | | | | | 5,429,446 | | | | — | | | | 569,801 | | | | (4,429,121 | ) | | | 1,570,126 | | | | 41,242,516 | | | | — | | | | 4,362,523 | | | | (33,773,850 | ) | | | 11,831,189 | |
| 3/31/2011 | | | | | 4,221,124 | | | | — | | | | 582,319 | | | | (5,052,976 | ) | | | (249,533 ) | | | | 31,528,957 | | | | — | | | | 4,400,242 | | | | (37,776,855 | ) | | | (1,847,656 | ) |
Class B |
| 3/31/2012 | | | | | 30,242 | | | | — | | | | 20,536 | | | | (625,689 ) | | | | (574,911 ) | | | | 230,699 | | | | — | | | | 157,258 | | | | (4,827,850 ) | | | | (4,439,893 | ) |
| 3/31/2011 | | | | | 79,800 | | | | — | | | | 62,984 | | | | (905,113 ) | | | | (762,329 ) | | | | 595,373 | | | | — | | | | 472,981 | | | | (6,815,808 ) | | | | (5,747,454 | ) |
Class C |
| 3/31/2012 | | | | | 407,936 | | | | — | | | | 64,710 | | | | (368,990 ) | | | | 103,656 | | | | 3,142,134 | | | | — | | | | 494,993 | | | | (2,823,460 ) | | | | 813,667 | |
| 3/31/2011 | | | | | 397,852 | | | | — | | | | 71,615 | | | | (438,163 ) | | | | 31,304 | | | | 3,011,775 | | | | — | | | | 540,373 | | | | (3,314,772 ) | | | | 237,376 | |
Class I |
| 3/31/2012 | | | | | 6,417,691 | | | | — | | | | 320,569 | | | | (6,314,003 | ) | | | 424,257 | | | | 47,915,561 | | | | — | | | | 2,452,620 | | | | (48,795,651 | ) | | | 1,572,530 | |
| 3/31/2011 | | | | | 3,422,861 | | | | — | | | | 105,301 | | | | (979,473 ) | | | | 2,548,689 | | | | 25,992,217 | | | | — | | | | 807,846 | | | | (7,607,892 ) | | | | 19,192,171 | |
Class W |
7/29/2011(1)–3/31/2012 | | | | | 202,028 | | | | — | | | | 1,552 | | | | (4,858 ) | | | | 198,722 | | | | 1,567,745 | | | | — | | | | 12,123 | | | | (37,433 ) | | | | 1,542,435 | |
| |
Intermediate Bond |
Class A |
| 3/31/2012 | | | | | 6,561,524 | | | | — | | | | 1,296,044 | | | | (11,379,209 | ) | | | (3,521,641 | ) | | | 63,697,285 | | | | — | | | | 12,600,909 | | | | (110,525,656 | ) | | | (34,227,462 | ) |
| 3/31/2011 | | | | | 7,129,198 | | | | — | | | | 1,488,918 | | | | (13,255,546 | ) | | | (4,637,430 | ) | | | 67,433,425 | | | | — | | | | 14,090,479 | | | | (125,623,492 | ) | | | (44,099,588 | ) |
Class B |
| 3/31/2012 | | | | | 54,776 | | | | — | | | | 17,362 | | | | (638,746 ) | | | | (566,608 ) | | | | 531,835 | | | | — | | | | 168,218 | | | | (6,191,473 ) | | | | (5,491,420 | ) |
| 3/31/2011 | | | | | 94,373 | | | | — | | | | 46,546 | | | | (1,174,144 | ) | | | (1,033,225 | ) | | | 892,369 | | | | — | | | | 438,794 | | | | (11,114,683 | ) | | | (9,783,520 | ) |
Class C |
| 3/31/2012 | | | | | 853,505 | | | | — | | | | 88,646 | | | | (947,245 ) | | | | (5,094 ) | | | | 8,317,392 | | | | — | | | | 860,583 | | | | (9,202,857 ) | | | | (24,882 ) | |
| 3/31/2011 | | | | | 446,057 | | | | — | | | | 115,401 | | | | (1,872,281 | ) | | | (1,310,823 | ) | | | 4,198,381 | | | | — | | | | 1,089,771 | | | | (17,694,919 | ) | | | (12,406,767 | ) |
Class I |
| 3/31/2012 | | | | | 9,644,301 | | | | — | | | | 1,364,634 | | | | (12,378,499 | ) | | | (1,369,564 | ) | | | 94,381,732 | | | | — | | | | 13,271,296 | | | | (120,165,741 | ) | | | (12,512,713 | ) |
| 3/31/2011 | | | | | 10,667,680 | | | | — | | | | 1,410,739 | | | | (11,470,021 | ) | | | 608,398 | | | | 101,428,879 | | | | — | | | | 13,357,971 | | | | (108,520,351 | ) | | | 6,266,499 | |
Class O |
| 3/31/2012 | | | | | 476,284 | | | | — | | | | 17,313 | | | | (536,344 ) | | | | (42,747 ) | | | | 4,640,739 | | | | — | | | | 168,443 | | | | (5,228,316 ) | | | | (419,134 ) | |
| 3/31/2011 | | | | | 510,135 | | | | — | | | | 19,848 | | | | (727,653 ) | | | | (197,670 ) | | | | 4,836,398 | | | | — | | | | 187,918 | | | | (6,903,950 ) | | | | (1,879,634 | ) |
Class R |
| 3/31/2012 | | | | | 608,390 | | | | — | | | | 60,759 | | | | (928,354 ) | | | | (259,205 ) | | | | 5,915,026 | | | | — | | | | 591,378 | | | | (9,011,314 ) | | | | (2,504,910 | ) |
| 3/31/2011 | | | | | 391,554 | | | | — | | | | 69,698 | | | | (951,226 ) | | | | (489,974 ) | | | | 3,722,992 | | | | — | | | | 660,288 | | | | (8,985,020 ) | | | | (4,601,740 | ) |
Class W |
| 3/31/2012 | | | | | 11,373,799 | | | | — | | | | 290,877 | | | | (980,106 ) | | | | 10,684,570 | | | | 110,799,889 | | | | — | | | | 2,833,928 | | | | (9,550,614 ) | | | | 104,083,203 | |
| 3/31/2011 | | | | | 108,973 | | | | — | | | | 11,343 | | | | (107,526 ) | | | | 12,790 | | | | 1,033,981 | | | | — | | | | 107,387 | | | | (1,019,571 ) | | | | 121,797 | |
(1) | | Commencement of operations. |
NOTE 11 — CREDIT RISK AND DEFAULTED SECURITIES
Although each Fund has a diversified portfolio, High Yield Bond and Intermediate Bond may invest in lower rated and comparable quality unrated high yield securities. Investments in high-yield debt securities generally provide greater income and increased opportunity for capital appreciation than investments in higher quality debt securities, but they also typically entail greater potential price volatility and principal and income risk. High-yield debt securities are not considered investment grade, and are regarded as predominantly speculative with respect to the issuing company’s continuing ability to meet principal and
33
NOTES TO FINANCIAL STATEMENTS AS OF MARCH 31, 2012 (CONTINUED)
NOTE 11 — CREDIT RISK AND DEFAULTED SECURITIES (continued)
interest payments. The prices of high-yield debt securities have been found to be less sensitive to interest rate changes than higher-rated investments, but more sensitive to adverse economic downturns or individual corporate developments. The risk of loss due to default by the issuer may be significantly greater for the holders of high yielding securities, because such securities are generally unsecured and are often subordinated to other creditors of the issuer.
Intermediate Bond held the following defaulted securities at March 31, 2012:
Fund
| | | | Security
| | Fair Value
|
|---|
| Intermediate Bond | | | | Greater Ohio Ethanol, LLC, 6.301%, due 12/31/13 | | $ | — | |
| | | | | Greater Ohio Ethanol, LLC, 12.630%, due 12/31/13 | | | — | |
| | | | | Twin Reefs Pass-through Trust, 1.390%, due 12/10/49 | | | — | |
NOTE 12 — CONCENTRATION OF INVESTMENT RISKS
All mutual funds involve risk — some more than others — and there is always the chance that you could lose money or not earn as much as you hope. Each Fund’s risk profile is largely a factor of the principal securities in which it invests and investment techniques that it uses. For more information regarding the types of securities and investment techniques that may be used by each Fund and its corresponding risks, see each Fund’s most recent Prospectus and/or the Statement of Additional Information.
Credit Risk (All Funds). A Fund could lose money if a bond issuer (debtor) fails to repay interest and principal in a timely manner or if it goes bankrupt. This is especially true during periods of economic uncertainty or economic downturns. High-yield/high-risk bonds are especially subject to credit risk and are considered to be mostly speculative in nature.
Foreign Securities (High Yield Bond and Intermediate Bond). There are certain risks in owning foreign securities, including those resulting from: fluctuations in currency exchange rates; devaluation of currencies; political or economic developments and the possible imposition of currency exchange blockages or other foreign governmental laws or restrictions; reduced availability of public information concerning issuers; accounting, auditing and financial reporting standards or other regulatory practices and requirements that are not uniform when compared to those applicable to domestic companies; settlement and clearance procedures in some countries that may not be reliable and can result in delays in settlement; higher transaction and custody expenses than for domestic securities; and limitations on foreign ownership of equity securities. Also, securities of many foreign companies may be less liquid and the prices more volatile than those of domestic companies.
Emerging Markets Investments (High Yield Bond). Because of less developed markets and economies and, in some countries, less mature governments and governmental institutions, the risks of investing in foreign securities can be intensified in the case of investments in issuers domiciled or doing substantial business in emerging market countries. These risks include: high concentration of market capitalization and trading volume in a small number of issuers representing a limited number of industries, as well as a high concentration of investors and financial intermediaries; political and social uncertainties; overdependence on exports, especially with respect to primary commodities, making these economies vulnerable to changes in commodity prices; overburdened infrastructure and obsolete or unseasoned financial systems; environmental problems; less well-developed legal systems; and less reliable custodial services and settlement practices.
NOTE 13 — FEDERAL INCOME TAXES
The amount of distributions from net investment income and net realized capital gains are determined in accordance with federal income tax regulations, which may differ from U.S. generally accepted accounting principles for investment companies. These book/tax differences may be either temporary or permanent. Permanent differences are reclassified within the capital accounts based on their federal tax-basis treatment; temporary differences are not reclassified. Key differences include the treatment of short-term capital gains, foreign currency transactions, wash sale deferrals and the expiration of capital loss carryforwards. Distributions in excess of net investment income and/or net realized capital gains for tax purposes are reported as return of capital.
The following permanent tax differences have been reclassified as of March 31, 2012:
| | | | Paid-in
Capital
| | Undistributed
Net Investment Income
| | Accumulated
Net Realized
Gains/(Losses)
|
|---|
| GNMA Income | | | | $ | — | | | $ | 6,390,096 | | | $ | (6,390,096 | ) |
| High Yield Bond | | | | | (515,331 | ) | | | 119,389 | | | | 395,942 | |
| Intermediate Bond | | | | | — | | | | 3,420,322 | | | | (3,420,322 | ) |
34
NOTES TO FINANCIAL STATEMENTS AS OF MARCH 31, 2012 (CONTINUED)
NOTE 13 — FEDERAL INCOME TAXES (continued)
Dividends paid by the Funds from net investment income and distributions of net realized short-term capital gains are, for federal income tax purposes, taxable as ordinary income to shareholders.
The tax composition of dividends and distributions to shareholders was as follows:
| | | | Year Ended March 31, 2012
| | Year Ended March 31, 2011
| |
|---|
| | | | Ordinary
Income
| | Long-Term
Capital Gain
| | Ordinary
Income
| | Return of
Capital
|
|---|
| GNMA Income | | | | $ | 30,964,687 | | | $ | 1,077,160 | | | $ | 32,416,980 | | | $ | — | |
| High Yield Bond | | | | | 9,207,263 | | | | — | | | | 8,356,298 | | | | 266,932 | |
| Intermediate Bond | | | | | 35,862,436 | | | | — | | | | 35,966,026 | | | | — | |
The tax-basis components of distributable earnings and the expiration dates of the capital loss carryforwards which may be used to offset future realized capital gains for federal income tax purposes as of March 31, 2012 were:
| | | | Undistributed
Ordinary
Income
| | Undistributed
Long-Term
Capital Gains
| | Unrealized
Appreciation/
(Depreciation)
| | Short-term
Capital Loss
Carryforwards
| | Expiration
|
|---|
| GNMA Income | | | | $ | 2,736,628 | | | $ | 2,141,445 | | | $ | 41,400,677 | | | $ | — | | | | — | |
| High Yield Bond | | | | | 97,691 | | | | — | | | | 4,730,587 | | | | (126,079 | ) | | | 2014 | |
| | | | | | | | | | | | | | | | | | (16,938,959 | ) | | | 2015 | |
| | | | | | | | | | | | | | | | | | (9,006,267 | ) | | | 2017 | |
| | | | | | | | | | | | | | | | | | (14,980,165 | ) | | | 2018 | |
| | | | | | | | | | | | | | | | | $ | (41,051,470 | ) | | | | |
| Intermediate Bond | | | | | 18,766,276 | | | | — | | | | 14,714,859 | | | | (148,289,915 | ) | | | 2018 | |
The Funds’ major tax jurisdictions are federal and Arizona. The earliest tax year that remains subject to examination by these jurisdictions is 2007.
As of March 31, 2012, no provision for income tax is required in the Funds’ financial statements as a result of tax positions taken on federal and state income tax returns for open tax years. The Funds’ federal and state income and federal excise tax returns for tax years for which the applicable statutes of limitations have not expired are subject to examination by the Internal Revenue Service and state department of revenue.
The Regulated Investment Company Modernization Act of 2010 (the “Act”) was enacted on December 22, 2010. The Act made changes to several tax rules impacting the Funds. In general, the provisions of the Act were effective for the Funds’ tax year ended March 31, 2012. Although the Act provides several benefits, including the unlimited carryforward of future capital losses, there may be a greater likelihood that all or a portion of the Funds’ pre-enactment capital loss carryforwards may expire without being utilized due to the fact that post-enactment capital losses are required to be utilized before pre-enactment capital loss carryforwards.
NOTE 14 — SECURITIES LENDING
Under an agreement with The Bank of New York Mellon (“BNY”), the Funds can lend their securities to approved brokers, dealers and other financial institutions. Loans are collateralized by cash and U.S. government securities. The collateral is equal to at least 105% of the market value of non-U.S. securities loaned and 102% of the market value of U.S. securities loaned. The market value of the loaned securities is determined at the close of business of the Funds at their last sale price or official closing price on the principal exchange or system on which they are traded and any additional collateral is delivered to the Funds on the next business day. The cash collateral received is invested in approved investments as defined in the Securities Lending Agreement with BNY (the “Agreement”). The Funds bear the risk of loss with respect to the investment of collateral with the following exception: Effective October 1, 2011, BNY provides the Funds’ indemnification from loss with respect to the investment of collateral provided that the cash collateral is invested solely in overnight repurchase agreements.
Currently, the cash collateral is invested in overnight repurchase agreements that are collateralized at 102% with securities issued or fully guaranteed by the United States Treasury; United States government or any agency, instrumentality or authority of the United States government. The securities purchased with cash collateral received are reflected in the Summary Portfolio of Investments under Securities Lending Collateral.
Prior to October 1, 2011, the cash collateral was invested in the BNY Mellon Overnight Government
35
NOTES TO FINANCIAL STATEMENTS AS OF MARCH 31, 2012 (CONTINUED)
NOTE 14 — SECURITIES LENDING (continued)
Fund (formerly, The BNY Institutional Cash Reserves Fund — Series A) and the BNY Institutional Cash Reserves Fund — Series B (“BICR — Series B”), each a series within the BNY Institutional Cash Reserves Trust (collectively, the “BICR Fund”). BNY serves as investment manager, custodian and operational trustee of the BICR Fund. From the beginning of the period covered by this report through October 16, 2011, BICR-Series B held certain defaulted securities issued by Lehman Brothers Holdings, Inc. (the “Lehman Securities”). The Lehman securities had market values significantly below amortized cost. On May 22, 2009, the Funds agreed to the terms of a capital support agreement (the “Capital Support Agreement”) extended by The Bank of New York Mellon Corporation (“BNYC”), an affiliated company of BNY, for the Lehman securities held by BICR- Series B. Under the terms of the Capital Support Agreement, BNYC agreed to support the value of the Lehman Securities up to 80% of the par value (the remaining 20% of the par value represents a realized loss to the Funds) and subject, in part, to the Funds’ continued participation in the BNY securities lending program through September 15, 2011. As of September 15, 2011, the Funds had complied with the requirements under the Capital Support Agreement and therefore the Funds could exercise their right to sell the Lehman Securities to BNYC at a price equal to 80% of par value. The sale of the Lehman Securities was completed on October 17, 2011.
Generally, in the event of counterparty default, the Funds have the right to use the collateral to offset losses incurred. The Agreement contains certain guarantees by BNY in the event of counterparty default and/or a borrower’s failure to return a loaned security; however, there would be a potential loss to the Funds in the event the Funds are delayed or prevented from exercising its right to dispose of the collateral. Engaging in securities lending could have a leveraging effect, which may intensify the credit, market and other risks associated with investing in a Fund. At March 31, 2012, the following Fund had securities on loan with the following market values:
Portfolio
| | | | Value of
Securities
Loaned
| | Cash Collateral
Received
|
|---|
| Intermediate Bond | | | | $ | 32,707,588 | | | $ | 33,451,480 | |
NOTE 15 — OTHER ACCOUNTING PRONOUNCEMENTS
In May 2011, the Financial Accounting Standards Board (“FASB”) issued Accounting Standards Update (“ASU”) No. 2011-04 “Amendments to Achieve Common Fair Value Measurement and Disclosure Requirements”. ASU No. 2011-04 amends FASB ASC Topic 820, Fair Value Measurements and Disclosures, to establish common requirements for measuring fair value and for disclosing information about fair value measurements in accordance with GAAP and the International Financial Reporting Standards (“IFRSs”). The ASU is effective prospectively for interim and annual periods beginning after December 15, 2011. As of March 31, 2012, management of the Funds is currently assessing the potential impact to financial statement disclosure that may result from adopting this ASU.
NOTE 16 — SUBSEQUENT EVENTS
Dividends. Subsequent to March 31, 2012, the following Funds paid net investment income dividends of:
| | | | Per Share Amount
| | Payable Date
| | Record Date
|
|---|
GNMA Income | | | | | | | | | | | | | | |
| Class A | | | | $ | 0.0285 | | | April 3, 2012 | | March 30, 2012 |
| Class B | | | | $ | 0.0225 | | | April 3, 2012 | | March 30, 2012 |
| Class C | | | | $ | 0.0229 | | | April 3, 2012 | | March 30, 2012 |
| Class I | | | | $ | 0.0305 | | | April 3, 2012 | | March 30, 2012 |
| Class W | | | | $ | 0.0304 | | | April 3, 2012 | | March 30, 2012 |
| Class A | | | | $ | 0.0275 | | | May 2, 2012 | | April 30, 2012 |
| Class B | | | | $ | 0.0225 | | | May 2, 2012 | | April 30, 2012 |
| Class C | | | | $ | 0.0226 | | | May 2, 2012 | | April 30, 2012 |
| Class I | | | | $ | 0.0293 | | | May 2, 2012 | | April 30, 2012 |
| Class W | | | | $ | 0.0292 | | | May 2, 2012 | | April 30, 2012 |
High Yield Bond | | | | | | | | | | | | | | |
| Class A | | | | $ | 0.0434 | | | May 1, 2012 | | Daily |
| Class B | | | | $ | 0.0385 | | | May 1, 2012 | | Daily |
| Class C | | | | $ | 0.0387 | | | May 1, 2012 | | Daily |
| Class I | | | | $ | 0.0464 | | | May 1, 2012 | | Daily |
| Class W | | | | $ | 0.0475 | | | May 1, 2012 | | Daily |
36
NOTES TO FINANCIAL STATEMENTS AS OF MARCH 31, 2012 (CONTINUED)
NOTE 16 — SUBSEQUENT EVENTS (continued)
| | | | Per Share Amount
| | Payable Date
| | Record Date
|
|---|
Intermediate Bond | | | | | | | | | | | | | | |
| Class A | | | | $ | 0.0150 | | | May 1, 2012 | | Daily |
| Class B | | | | $ | 0.0083 | | | May 1, 2012 | | Daily |
| Class C | | | | $ | 0.0085 | | | May 1, 2012 | | Daily |
| Class I | | | | $ | 0.0178 | | | May 1, 2012 | | Daily |
| Class O | | | | $ | 0.0150 | | | May 1, 2012 | | Daily |
| Class R | | | | $ | 0.0129 | | | May 1, 2012 | | Daily |
| Class W | | | | $ | 0.0179 | | | May 1, 2012 | | Daily |
The Funds have evaluated events occurring after the Statements of Assets and Liabilities date (subsequent events) to determine whether any subsequent events necessitated adjustment to or disclosure in the financial statements. Other than the above, no such subsequent events were identified.
37
| ING GNMA INCOME FUND | SUMMARY PORTFOLIO OF INVESTMENTS
AS OF MARCH 31, 2012 |
Principal
Amount†
|
|
|
|
|
|
|
| Value
|
| Percentage
of Net
Assets
|
|---|
| |
U.S. GOVERNMENT AGENCY OBLIGATIONS: 101.8%
|
| Collateralized Mortgage Obligations: 0.1% |
| 1,056,408 | | | | | | 5.500%, due 01/16/33 | | $ | 1,253,038 | | | | 0.1 | |
| |
| Federal Home Loan Mortgage Corporation: 5.1%## |
| 9,565,717 | | | | | | 6.000%, due 04/15/36 | | | 11,190,024 | | | | 1.1 | |
| 10,704,620 | | | | | | 6.000%, due 05/15/36 | | | 12,529,925 | | | | 1.3 | |
| 6,389,489 | | | | | | 27.633%, due 04/15/32 | | | 9,191,027 | | | | 0.9 | |
| 39,558,491 | | | | ˆ | | 0.500%–21.090%, due 11/01/14–07/01/38 | | | 17,467,839 | | | | 1.8 | |
| | | | | | | | | | 50,378,815 | | | | 5.1 | |
| |
| Federal National Mortgage Association: 11.8%## |
| 16,000,000 | | | | W | | 4.000%, due 12/15/39 | | | 17,127,500 | | | | 1.7 | |
| 17,172,513 | | | | | | 4.500%, due 09/01/41 | | | 18,329,321 | | | | 1.9 | |
| 32,327,681 | | | | | | 4.500%, due 09/01/41 | | | 34,505,402 | | | | 3.5 | |
| 15,899,989 | | | | | | 4.624%, due 11/25/33 | | | 15,898,049 | | | | 1.6 | |
| 5,174,938 | | | | | | 6.000%, due 06/25/29 | | | 5,825,098 | | | | 0.6 | |
| 4,984,858 | | | | | | 6.500%, due 07/25/34 | | | 5,592,261 | | | | 0.6 | |
| 15,915,983 | | | | | | 5.300%–8.500%, due 06/01/14–12/25/45 | | | 18,357,732 | | | | 1.9 | |
| | | | | | | | | | 115,635,363 | | | | 11.8 | |
| |
| Government National Mortgage Association: 84.8% |
| 22,785,208 | | | | | | 0.632%, due 07/20/41 | | | 22,798,055 | | | | 2.3 | |
| 88,609,000 | | | | ˆ | | 0.879%, due 01/16/50 | | | 4,360,980 | | | | 0.4 | |
| 24,323,083 | | | | | | 0.892%, due 06/20/40 | | | 24,380,751 | | | | 2.5 | |
| 98,690,151 | | | | ˆ | | 1.091%, due 01/16/51 | | | 5,122,019 | | | | 0.5 | |
| 20,605,720 | | | | | | 1.282%, due 03/20/39 | | | 20,938,517 | | | | 2.1 | |
| 87,900,000 | | | | W | | 3.500%, due 10/15/41 | | | 91,347,324 | | | | 9.3 | |
| 15,536,919 | | | | | | 4.000%, due 07/20/41 | | | 16,647,268 | | | | 1.7 | |
| 19,955,614 | | | | | | 4.000%, due 02/20/42 | | | 21,450,073 | | | | 2.2 | |
| 4,042,450 | | | | | | 4.500%, due 10/15/39 | | | 4,430,782 | | | | 0.5 | |
| 3,947,146 | | | | | | 4.500%, due 11/15/39 | | | 4,326,323 | | | | 0.4 | |
| 20,165,597 | | | | | | 4.500%, due 09/20/41 | | | 22,011,400 | | | | 2.2 | |
| 13,078,168 | | | | | | 4.660%, due 09/20/61 | | | 14,881,930 | | | | 1.5 | |
| 4,260,533 | | | | | | 4.861%, due 06/20/61 | | | 4,786,169 | | | | 0.5 | |
| 6,636,826 | | | | | | 5.000%, due 04/20/30 | | | 7,223,904 | | | | 0.7 | |
| 4,777,824 | | | | | | 5.000%, due 10/20/34 | | | 5,456,873 | | | | 0.6 | |
| 6,056,536 | | | | | | 5.000%, due 01/20/39 | | | 6,524,147 | | | | 0.7 | |
| 16,152,734 | | | | | | 5.000%, due 05/16/39 | | | 18,385,098 | | | | 1.9 | |
| 4,384,935 | | | | | | 5.000%, due 11/15/39 | | | 4,877,644 | | | | 0.5 | |
| 4,525,021 | | | | | | 5.000%, due 12/20/39 | | | 5,033,470 | | | | 0.5 | |
| 12,948,986 | | | | | | 5.000%, due 05/15/40 | | | 14,395,891 | | | | 1.5 | |
| 35,406,094 | | | | | | 5.000%, due 05/20/40 | | | 40,188,689 | | | | 4.1 | |
| 6,943,859 | | | | | | 5.000%, due 07/20/41 | | | 7,666,594 | | | | 0.8 | |
| 8,100,000 | | | | | | 5.250%, due 01/20/38 | | | 9,347,723 | | | | 1.0 | |
| 7,720,199 | | | | | | 5.368%, due 02/20/38 | | | 8,736,968 | | | | 0.9 | |
| 13,844,385 | | | | | | 5.473%, due 01/20/60 | | | 15,804,563 | | | | 1.6 | |
| |
U.S. GOVERNMENT AGENCY OBLIGATIONS: (continued)
|
| Government National Mortgage Association: (continued) |
| 3,929,178 | | | | | | 5.500%, due 11/15/33 | | $ | 4,434,525 | | | | 0.5 | |
| 4,064,005 | | | | | | 5.500%, due 03/16/34 | | | 4,819,437 | | | | 0.5 | |
| 9,192,879 | | | | | | 5.500%, due 12/16/35 | | | 10,887,478 | | | | 1.1 | |
| 7,934,000 | | | | | | 5.500%, due 04/20/36 | | | 8,696,568 | | | | 0.9 | |
| 7,197,000 | | | | | | 5.500%, due 09/20/36 | | | 7,962,539 | | | | 0.8 | |
| 3,822,765 | | | | | | 5.500%, due 10/20/37 | | | 4,405,491 | | | | 0.4 | |
| 5,319,012 | | | | | | 5.500%, due 11/20/37 | | | 6,087,843 | | | | 0.6 | |
| 10,800,000 | | | | | | 5.750%, due 07/20/38 | | | 12,147,123 | | | | 1.2 | |
| 5,481,946 | | | | | | 5.950%, due 02/15/44 | | | 5,980,277 | | | | 0.6 | |
| 6,514,276 | | | | | | 6.000%, due 07/20/34 | | | 7,376,586 | | | | 0.8 | |
| 7,589,000 | | | | | | 6.000%, due 07/20/37 | | | 9,016,162 | | | | 0.9 | |
| 41,590,059 | | | | ˆ | | 6.108%, due 04/16/39 | | | 4,781,900 | | | | 0.5 | |
| 6,214,705 | | | | | | 6.417%, due 04/20/37 | | | 7,137,828 | | | | 0.7 | |
| 4,184,048 | | | | | | 6.500%, due 01/20/39 | | | 4,789,301 | | | | 0.5 | |
| 5,574,578 | | | | | | 7.000%, due 10/20/38 | | | 6,449,484 | | | | 0.7 | |
| 6,219,444 | | | | | | 7.200%, due 03/15/39 | | | 6,722,016 | | | | 0.7 | |
| 607,713,082 | | | | ˆ | | 0.250%–31.539%, due 05/15/16–10/16/52 | | | 318,055,057 | | | | 32.5 | |
| | | | | | | | | | 830,872,770 | | | | 84.8 | |
| |
| | | | | | | Total U.S. Government Agency Obligations | | | | | | | | |
| | | | | | | (Cost $954,000,073) | | | 998,139,986 | | | | 101.8 | |
| | | | | | | Liabilities in Excess of Other Assets | | | (17,643,331 | ) | | | (1.8 | ) |
| | | | | | | Net Assets | | $ | 980,496,655 | | | | 100.0 | |
“Other Securities” represents issues not identified as the top 50 holdings in terms of market value and issues or issuers not exceeding 1% of net assets individually or in aggregate respectively as of March 31, 2012.
The following footnotes apply to either the individual securities noted or one or more of the securities aggregated and listed as a single line item.
| † | | Unless otherwise indicated, principal amount is shown in USD. |
| ## | | On September 7, 2008, the Federal Housing Finance Agency placed the Federal National Mortgage Association and the Federal Home Loan Mortgage Corporation into conservatorship and the U.S. Treasury guaranteed the debt issued by those organizations. |
| W | | Settlement is on a when-issued or delayed-delivery basis. |
| ˆ | | Interest only securities represent the right to receive the monthly interest payments on an underlying pool of mortgage loans. Principal amount shown represents the notional amount on which current interest is calculated. Payments of principal on the pool reduce the value of the interest only security. |
| Cost for federal income tax purposes is $956,739,309. |
| Net unrealized appreciation consists of: | | | | | | |
| Gross Unrealized Appreciation | | | | $ | 46,062,749 | |
| Gross Unrealized Depreciation | | | | | (4,662,072 | ) |
| Net Unrealized Appreciation | | | | $ | 41,400,677 | |
See Accompanying Notes to Financial Statements
38
| ING GNMA INCOME FUND | SUMMARY PORTFOLIO OF INVESTMENTS
AS OF MARCH 31, 2012 (CONTINUED) |
Fair Value Measurementsˆ
The following is a summary of the fair valuations according to the inputs used as of March 31, 2012 in valuing the assets and liabilities:
| | | | Quoted Prices
in Active Markets
for Identical
Investments
(Level 1)
| | Significant
Other
Observable
Inputs
(Level 2)
| | Significant
Unobservable
Inputs
(Level 3)
| | Fair Value
at
3/31/2012
|
|---|
Asset Table | | | | | | | | | | | | | | | | | | |
Investments, at value | | | | | | | | | | | | | | | | | | |
| U.S. Government Agency Obligations | | | | $ | — | | | $ | 998,139,986 | | | $ | — | | | $ | 998,139,986 | |
| Total Investments, at value | | | | $ | — | | | $ | 998,139,986 | | | $ | — | | | $ | 998,139,986 | |
| |
Other Financial Instruments+ | | | | | | | | | | | | | | | | | | |
| Futures | | | | | 1,830,507 | | | | — | | | | — | | | | 1,830,507 | |
| Total Assets | | | | $ | 1,830,507 | | | $ | 998,139,986 | | | $ | — | | | $ | 999,970,493 | |
| | | | | | | | | | | | | | | | | | | |
| ˆ | | See Note 2, “Significant Accounting Policies” in the Notes to Financial Statements for additional information. |
| + | | Other Financial Instruments are derivatives not reflected in the Portfolio of Investments and may include open forward foreign currency contracts, equity forwards, futures, swaps, and written options. Forward foreign currency contracts, equity forwards and futures are valued at the unrealized gain (loss) on the instrument. Swaps and written options are valued at the fair value of the instrument. |
There were no significant transfers between Level 1 and 2 during the year ended March 31, 2012.
| | | | Beginning
Balance on
3/31/2011
| | Purchases
| | Sales
| | Accrued
Discounts/
(Premiums)
| | Total
Realized
Gain (Loss)
| | Total Unrealized
Appreciation
(Depreciation)
| | Transfers
into
Level 3
| | Transfers
Out of
Level 3
| | Ending
Balance on
3/31/2012
|
|---|
Asset Table | | | | | | | | | | | | | | | | | | | | | | | | | | | | | | | | | | | | | | |
Investments, at value | | | | | | | | | | | | | | | | | | | | | | | | | | | | | | | | | | | | | | |
| U.S. Government Agency Obligations | | | | $ | 5,450,000 | | | $ | — | | | $ | — | | | $ | — | | | $ | — | | | $ | — | | | $ | — | | | $ | (5,450,000 | ) | | $ | — | |
| Preferred Stock | | | | | — | | | | — | | | | — | | | | — | | | | — | | | | — | | | | — | | | | — | | | | — | |
| Warrants | | | | | — | | | | — | | | | — | | | | — | | | | — | | | | — | | | | — | | | | — | | | | — | |
| Total Investments, at value | | | | $ | 5,450,000 | | | $ | — | | | $ | — | | | $ | — | | | $ | — | | | $ | — | | | $ | — | | | $ | (5,450,000 | ) | | $ | — | |
As of March 31, 2012, total change in unrealized gain (loss) on Level 3 securities still held at year end and included in the change in net assets was $—.
ING GNMA Income Fund Open Futures Contracts on March 31, 2012:
Contract Description
| | | | Number
of Contracts
| | Expiration
Date
| | Notional
Value
| | Unrealized
Appreciation/
(Depreciation)
|
|---|
Short Contracts | | | | | | | | | | | | | | | | | | |
| U.S. Treasury 10-Year Note | | | | | 791 | | | | 06/20/12 | | | $ | 102,422,145 | | | $ | 1,493,503 | |
| U.S. Treasury Long Bond | | | | | 89 | | | | 06/20/12 | | | | 12,259,750 | | | | 337,004 | |
| | | | | | | | | | | | | $ | 114,681,895 | | | $ | 1,830,507 | |
A summary of derivative instruments by primary risk exposure is outlined in the following tables.
The fair value of derivative instruments as of March 31, 2012 was as follows:
Derivatives not accounted for as
hedging instruments
| | | | Location on Statement
of Assets and Liabilities
| | Fair Value
|
|---|
Asset Derivatives | | | | | | | | |
| Interest rate contracts | | | | Net Assets — Unrealized appreciation* | | $ | 1,830,507 | |
Total Asset Derivatives | | | | | | $ | 1,830,507 | |
| * | | Includes cumulative appreciation/depreciation of futures contracts as reported in the table following the Summary Portfolio of Investments. |
See Accompanying Notes to Financial Statements
39
| ING GNMA INCOME FUND | SUMMARY PORTFOLIO OF INVESTMENTS
AS OF MARCH 31, 2012 (CONTINUED) |
The effect of derivative instruments on the Fund’s Statement of Operations for the year ended March 31, 2012 was as follows:
| | | | Amount of Realized Gain or (Loss)
on Derivatives Recognized in Income
|
|---|
Derivatives not accounted for as hedging instruments
| | | | Futures
|
|---|
| Interest rate contracts | | | | $ | (2,674,504 | ) |
Total | | | | $ | (2,674,504 | ) |
| | | | Change in Unrealized Appreciation
or (Depreciation) on Derivatives
Recognized in Income
|
|---|
Derivatives not accounted for as hedging instruments
| | | | Futures
|
|---|
| Interest rate contracts | | | | $ | 1,830,507 | |
Total | | | | $ | 1,830,507 | |
See Accompanying Notes to Financial Statements
40
| ING HIGH YIELD BOND FUND | SUMMARY PORTFOLIO OF INVESTMENTS
AS OF MARCH 31, 2012 |
Principal
Amount†
|
|
|
|
|
|
|
| Value
|
| Percentage
of Net
Assets
|
|---|
| |
CORPORATE BONDS/NOTES: 94.5%
|
| Consumer Discretionary: 28.2% |
| 223,000 | | | | # | | Affinia Group, Inc., 10.750%, 08/15/16 | | $ | 244,743 | | | | 0.2 | |
| 400,000 | | | | # | | Alliance Data Systems Corp., 6.375%, 04/01/20 | | | 409,000 | | | | 0.3 | |
| 950,000 | | | | | | AMC Entertainment, Inc., 9.750%, 12/01/20 | | | 900,125 | | | | 0.6 | |
| 34,781 | | | | # | | American Media, Inc., 13.500%, 06/15/18 | | | 26,434 | | | | 0.0 | |
| 665,000 | | | | # | | Block Communications, Inc., 7.250%, 02/01/20 | | | 680,794 | | | | 0.5 | |
| 500,000 | | | | # | | Bresnan Broadband Holdings LLC, 8.000%, 12/15/18 | | | 517,500 | | | | 0.4 | |
| 720,000 | | | | | | Cablevision Systems Corp., 7.750%, 04/15/18 | | | 756,000 | | | | 0.5 | |
| 1,000,000 | | | | # | | Caesars Operating Escrow LLC/Caesars Escrow Corp., 8.500%, 02/15/20 | | | 1,020,000 | | | | 0.7 | |
| 400,000 | | | | | | CCO Holdings LLC/ CCO Holdings Capital Corp., 6.500%, 04/30/21 | | | 416,000 | | | | 0.3 | |
| 205,000 | | | | # | | Cenveo Corp., 11.500%, 05/15/17 | | | 189,625 | | | | 0.1 | |
| 765,000 | | | | # | | Cequel Communications Holdings I, LLC and Cequel Capital Corp., 8.625%, 11/15/17 | | | 825,244 | | | | 0.6 | |
| 730,000 | | | | #, Z | | Checkout Holding Corp., 10.490%, 11/15/15 | | | 306,600 | | | | 0.2 | |
| 100,000 | | | | # | | Chester Downs & Marina LLC, 9.250%, 02/01/20 | | | 105,875 | | | | 0.1 | |
| 950,000 | | | | | | Chrysler Group LLC/CG Co-Issuer, Inc., 8.000%–8.250%, 06/15/19–06/15/21 | | | 962,000 | | | | 0.7 | |
| 480,000 | | | | # | | Clear Channel Worldwide Holdings, Inc., 7.625%, 03/15/20 | | | 472,800 | | | | 0.3 | |
| 105,000 | | | | # | | Clear Channel Worldwide Holdings, Inc., 7.625%, 03/15/20 | | | 101,850 | | | | 0.1 | |
| 1,000,000 | | | | # | | Codere Finance Luxembourg SA, 9.250%, 02/15/19 | | | 997,500 | | | | 0.7 | |
| 710,000 | | | | # | | Commercial Vehicle Group, Inc., 7.875%, 04/15/19 | | | 720,650 | | | | 0.5 | |
| 635,000 | | | | # | | Cumulus Media, Inc., 7.750%, 05/01/19 | | | 603,250 | | | | 0.4 | |
| 778,000 | | | | | | Emergency Medical Services Corp., 8.125%, 06/01/19 | | | 803,285 | | | | 0.6 | |
| 645,000 | | | | | | Gray Television, Inc., 10.500%, 06/29/15 | | | 674,025 | | | | 0.5 | |
| |
CORPORATE BONDS/NOTES: (continued)
|
| Consumer Discretionary: (continued) |
| 825,000 | | | | # | | Harron Communications L.P./Harron Finance Corp., 9.125%, 04/01/20 | | $ | 855,938 | | | | 0.6 | |
| 500,000 | | | | # | | Jaguar Holding Co. II/ Jaguar Merger Sub, Inc., 9.500%, 12/01/19 | | | 545,000 | | | | 0.4 | |
| 750,000 | | | | | | KB Home, 6.250%, 06/15/15 | | | 738,750 | | | | 0.6 | |
| 1,015,000 | | | | | | KB Home, 5.875%–8.000%, 01/15/15–03/15/20 | | | 1,000,850 | | | | 0.7 | |
| 200,000 | | | | # | | Mediacom LLC/ Mediacom Capital Corp., 7.250%, 02/15/22 | | | 203,000 | | | | 0.1 | |
| 500,000 | | | | | | Meritage Homes Corp., 6.250%, 03/15/15 | | | 508,500 | | | | 0.4 | |
| 125,000 | | | | # | | Meritage Homes Corp., 7.000%, 04/01/22 | | | 125,625 | | | | 0.1 | |
| 720,000 | | | | # | | Meritage Homes Corp., 7.731%, 04/30/17 | | | 691,200 | | | | 0.5 | |
| 500,000 | | | | | | MGM Resorts International, 7.750%, 03/15/22 | | | 510,000 | | | | 0.4 | |
| 500,000 | | | | # | | MGM Resorts International, 8.625%, 02/01/19 | | | 538,750 | | | | 0.4 | |
| 1,105,000 | | | | # | | Monitronics International, Inc., 9.125%, 04/01/20 | | | 1,124,338 | | | | 0.8 | |
| 825,000 | | | | | | NCL Corp. Ltd., 9.500%, 11/15/18 | | | 893,062 | | | | 0.6 | |
| 250,000 | | | | # | | NCL Corp. Ltd., 9.500%, 11/15/18 | | | 270,625 | | | | 0.2 | |
| 745,000 | | | | # | | Needle, 8.125%, 03/15/19 | | | 752,450 | | | | 0.5 | |
| 750,000 | | | | # | | Nord Anglia Education UK Holdings PLC, 10.250%, 04/01/17 | | | 771,562 | | | | 0.6 | |
| 425,000 | | | | # | | NPC International, Inc./ NPC Operating Co. A, Inc./NPC Operating Co. B, Inc., 10.500%, 01/15/20 | | | 465,375 | | | | 0.3 | |
| 615,000 | | | | # | | Number Merger Sub, Inc., 11.000%, 12/15/19 | | | 661,125 | | | | 0.5 | |
| 805,000 | | | | # | �� | Pittsburgh Glass Works LLC, 8.500%, 04/15/16 | | | 805,000 | | | | 0.6 | |
| 355,000 | | | | # | | Prestige Brands, Inc., 8.125%, 02/01/20 | | | 386,506 | | | | 0.3 | |
| 500,000 | | | | # | | Reynolds Group Issuer, Inc./Reynolds Group Issuer LLC/Reynolds Group Issuer Lu, 9.875%, 08/15/19 | | | 511,875 | | | | 0.4 | |
| 250,000 | | | | # | | Reynolds Group Issuer, Inc./Reynolds Group Issuer LLC/Reynolds Group Issuer Lu, 9.875%, 08/15/19 | | | 255,937 | | | | 0.2 | |
See Accompanying Notes to Financial Statements
41
| ING HIGH YIELD BOND FUND | SUMMARY PORTFOLIO OF INVESTMENTS
AS OF MARCH 31, 2012 (CONTINUED) |
Principal
Amount†
|
|
|
|
|
|
|
| Value
|
| Percentage
of Net
Assets
|
|---|
| |
CORPORATE BONDS/NOTES: (continued)
|
| Consumer Discretionary: (continued) |
| 577,000 | | | | # | | Seminole Indian Tribe of Florida, 7.750%, 10/01/17 | | $ | 628,209 | | | | 0.5 | |
| 300,000 | | | | # | | ServiceMaster Co/TN, 8.000%, 02/15/20 | | | 321,000 | | | | 0.2 | |
| 145,000 | | | | # | | Sirius XM Radio, Inc., 8.750%, 04/01/15 | | | 165,300 | | | | 0.1 | |
| 270,000 | | | | # | | Stoneridge, Inc., 9.500%, 10/15/17 | | | 287,887 | | | | 0.2 | |
| 1,000,000 | | | | # | | Taylor Morrison Communities, Inc./ Monarch Communities, Inc., 7.750%, 04/15/20 | | | 1,000,000 | | | | 0.7 | |
| 165,000 | | | | # | | UR Financing Escrow Corp., 5.750%, 07/15/18 | | | 169,331 | | | | 0.1 | |
| 285,000 | | | | # | | UR Financing Escrow Corp., 7.375%, 05/15/20 | | | 292,125 | | | | 0.2 | |
| 285,000 | | | | # | | UR Financing Escrow Corp., 7.625%, 04/15/22 | | | 293,550 | | | | 0.2 | |
| 290,000 | | | | # | | XM Satellite Radio, Inc., 7.625%, 11/01/18 | | | 314,650 | | | | 0.2 | |
| 11,366,716 | | | | | | Other Securities | | | 11,617,081 | | | | 8.3 | |
| | | | | | | | | | 39,437,901 | | | | 28.2 | |
| |
| |
| 615,000 | | | | # | | American Rock Salt Co. LLC/American Rock Capital Corp., 8.250%, 05/01/18 | | | 536,588 | | | | 0.4 | |
| 677,000 | | | | # | | Bumble Bee Acquisition Corp., 9.000%, 12/15/17 | | | 693,925 | | | | 0.5 | |
| 645,000 | | | | | | Eliz Arden, 7.375%, 03/15/21 | | | 703,050 | | | | 0.5 | |
| 700,000 | | | | | | Hertz Corp./The, 6.750%, 04/15/19 | | | 728,000 | | | | 0.5 | |
| 450,000 | | | | # | | JBS USA LLC/JBS USA Finance, Inc., 7.250%, 06/01/21 | | | 437,625 | | | | 0.3 | |
| 295,000 | | | | # | | Neff Rental LLC/Neff Finance Corp., 9.625%, 05/15/16 | | | 294,262 | | | | 0.2 | |
| 240,000 | | | | # | | Rite Aid Corp., 6.875%, 12/15/28 | | | 210,600 | | | | 0.1 | |
| 236,000 | | | | #, & | | ServiceMaster Co/The, 10.750%, 07/15/15 | | | 248,687 | | | | 0.2 | |
| 2,713,850 | | | | | | Other Securities | | | 2,771,263 | | | | 2.0 | |
| | | | | | | | | | 6,624,000 | | | | 4.7 | |
| |
| |
| 430,000 | | | | # | | Arch Coal, Inc., 7.000%, 06/15/19 | | | 398,825 | | | | 0.3 | |
| 385,000 | | | | # | | Arch Coal, Inc., 7.250%, 06/15/21 | | | 357,088 | | | | 0.3 | |
| 780,000 | | | | | | Berry Petroleum Co., 6.375%–10.250%, 06/01/14–09/15/22 | | | 865,150 | | | | 0.6 | |
| 500,000 | | | | # | | BreitBurn Energy Partners L.P./BreitBurn Finance Corp., 7.875%, 04/15/22 | | | 512,500 | | | | 0.4 | |
| |
CORPORATE BONDS/NOTES: (continued)
|
| |
| 590,000 | | | | # | | Calfrac Holdings L.P., 7.500%, 12/01/20 | | $ | 595,900 | | | | 0.4 | |
| 755,000 | | | | | | Chaparral Energy, Inc., 8.250%–9.875%, 02/01/17–09/01/21 | | | 810,000 | | | | 0.6 | |
| 705,000 | | | | # | | Chesapeake Oilfield Operating LLC/Chesapeake Oilfield Finance, Inc., 6.625%, 11/15/19 | | | 703,237 | | | | 0.5 | |
| 800,000 | | | | | | Cimarex Energy Co., 5.875%, 05/01/22 | | | 818,000 | | | | 0.6 | |
| 625,000 | | | | | | El Paso Corp., 7.250%, 06/01/18 | | | 702,626 | | | | 0.5 | |
| 375,000 | | | | # | | Hilcorp Energy I L.P./Hilcorp Finance Co., 8.000%, 02/15/20 | | | 406,875 | | | | 0.3 | |
| 295,000 | | | | # | | Linn Energy LLC/Linn Energy Finance Corp., 6.250%, 11/01/19 | | | 286,519 | | | | 0.2 | |
| 160,000 | | | | # | | Meg Energy, 6.500%, 03/15/21 | | | 168,400 | | | | 0.1 | |
| 325,000 | | | | # | | NFR Energy LLC/NFR Energy Finance Corp., 9.750%, 02/15/17 | | | 281,125 | | | | 0.2 | |
| 175,000 | | | | # | | Peabody Energy Corp., 6.000%, 11/15/18 | | | 172,375 | | | | 0.1 | |
| 250,000 | | | | # | | Peabody Energy Corp., 6.250%, 11/15/21 | | | 246,250 | | | | 0.2 | |
| 800,000 | | | | # | | PetroBakken Energy Ltd., 8.625%, 02/01/20 | | | 836,000 | | | | 0.6 | |
| 715,000 | | | | | | Stone Energy Corp., 8.625%, 02/01/17 | | | 750,750 | | | | 0.5 | |
| 600,000 | | | | | | Swift Energy Co., 8.875%, 01/15/20 | | | 657,000 | | | | 0.5 | |
| 230,000 | | | | # | | Swift Energy Co., 7.875%, 03/01/22 | | | 238,050 | | | | 0.1 | |
| 750,000 | | | | | | Thompson Creek Metals Co., Inc., 7.375%, 06/01/18 | | | 701,250 | | | | 0.5 | |
| 800,000 | | | | | | Vanguard Natural Resources, LLC, 7.875%, 04/01/20 | | | 794,192 | | | | 0.6 | |
| 719,000 | | | | | | W&T Offshore, Inc., 8.500%, 06/15/19 | | | 763,937 | | | | 0.6 | |
| 250,000 | | | | # | | Westmoreland Coal Co/Westmoreland Partners, 10.750%, 02/01/18 | | | 238,125 | | | | 0.2 | |
| 10,384,000 | | | | | | Other Securities | | | 10,527,545 | | | | 7.5 | |
| | | | | | | | | | 22,831,719 | | | | 16.4 | |
| |
| |
| 935,000 | | | | | | Ally Financial, Inc., 8.000%, 03/15/20 | | | 1,042,525 | | | | 0.7 | |
| 655,000 | | | | | | Ally Financial, Inc., 5.500%–8.300%, 02/12/15–02/15/17 | | | 696,926 | | | | 0.5 | |
See Accompanying Notes to Financial Statements
42
| ING HIGH YIELD BOND FUND | SUMMARY PORTFOLIO OF INVESTMENTS
AS OF MARCH 31, 2012 (CONTINUED) |
Principal
Amount†
|
|
|
|
|
|
|
| Value
|
| Percentage
of Net
Assets
|
|---|
| |
CORPORATE BONDS/NOTES: (continued)
|
| |
| 750,000 | | | | | | Atlantic Broadband Finance, LLC, 9.375%, 01/15/14 | | $ | 753,750 | | | | 0.5 | |
| 290,000 | | | | # | | CIT Group, In.c, 6.625%, 04/01/18 | | | 316,462 | | | | 0.2 | |
| 500,000 | | | | | | CIT Group, Inc., 5.250%, 03/15/18 | | | 510,625 | | | | 0.4 | |
| 710,000 | | | | # | | CIT Group, Inc., 7.000%, 05/02/16 | | | 713,550 | | | | 0.5 | |
| 400,000 | | | | # | | CIT Group, Inc., 7.000%, 05/02/17 | | | 401,500 | | | | 0.3 | |
| 602,000 | | | | | | Felcor Lodging L.P., 10.000%, 10/01/14 | | | 689,290 | | | | 0.5 | |
| 1,000,000 | | | | | | Ford Motor Credit Co. LLC, 5.000%–5.875%, 05/15/18–08/02/21 | | | 1,059,117 | | | | 0.8 | |
| 695,000 | | | | | | Ford Motor Credit Co., LLC, 8.125%, 01/15/20 | | | 842,433 | | | | 0.6 | |
| 250,000 | | | | # | | Hexion US Finance Corp., 6.625%, 04/15/20 | | | 256,875 | | | | 0.2 | |
| 500,000 | | | | # | | Realogy Corp., 7.625%, 01/15/20 | | | 525,000 | | | | 0.4 | |
| 3,610,000 | | | | | | Other Securities | | | 3,535,692 | | | | 2.5 | |
| | | | | | | | | | 11,343,745 | | | | 8.1 | |
| |
| |
| 500,000 | | | | # | | CHS/Community Health Systems, Inc., 8.000%, 11/15/19 | | | 520,000 | | | | 0.4 | |
| 740,000 | | | | | | DaVita, Inc., 6.375%–6.625%, 11/01/18–11/01/20 | | | 777,000 | | | | 0.6 | |
| 655,000 | | | | | | HCA Holdings, Inc., 7.750%, 05/15/21 | | | 680,381 | | | | 0.5 | |
| 800,000 | | | | | | HCA, Inc., 7.500%, 02/15/22 | | | 854,000 | | | | 0.6 | |
| 465,000 | | | | | | HCA, Inc., 7.250%–7.875%, 02/15/20–09/15/20 | | | 509,644 | | | | 0.4 | |
| 245,000 | | | | # | | Health Management Associates, Inc., 7.375%, 01/15/20 | | | 251,125 | | | | 0.2 | |
| 500,000 | | | | # | | Mylan, Inc., 6.000%, 11/15/18 | | | 525,000 | | | | 0.4 | |
| 170,000 | | | | # | | Mylan, Inc./PA, 7.875%, 07/15/20 | | | 190,400 | | | | 0.1 | |
| 1,000,000 | | | | # | | Physio-Control International, Inc., 9.875%, 01/15/19 | | | 1,055,000 | | | | 0.7 | |
| 400,000 | | | | # | | PSS World Medical, Inc., 6.375%, 03/01/22 | | | 413,000 | | | | 0.3 | |
| 280,000 | | | | # | | STHI Holding Corp., 8.000%, 03/15/18 | | | 298,200 | | | | 0.2 | |
| 420,000 | | | | | | Tenet Healthcare Corp., 8.000%, 08/01/20 | | | 434,700 | | | | 0.3 | |
| 395,000 | | | | # | | Tenet Healthcare Corp., 6.250%, 11/01/18 | | | 408,825 | | | | 0.3 | |
| 500,000 | | | | # | | USPI Finance Corp., 9.000%, 04/01/20 | | | 517,500 | | | | 0.4 | |
| |
CORPORATE BONDS/NOTES: (continued)
|
| |
| 525,000 | | | | # | | Valeant Pharmaceuticals International, 6.750%, 08/15/21 | | $ | 513,187 | | | | 0.3 | |
| 245,000 | | | | # | | Valeant Pharmaceuticals International, 7.000%, 10/01/20 | | | 245,000 | | | | 0.2 | |
| 5,318,000 | | | | | | Other Securities | | | 5,222,713 | | | | 3.7 | |
| | | | | | | | | | 13,415,675 | | | | 9.6 | |
| |
| |
| 455,000 | | | | # | | Amsted Industries, Inc., 8.125%, 03/15/18 | | | 489,125 | | | | 0.3 | |
| 635,000 | | | | | | Berry Plastics Corp., 9.750%, 01/15/21 | | | 696,913 | | | | 0.5 | |
| 310,000 | | | | # | | Bombardier, Inc., 7.500%, 03/15/18 | | | 342,550 | | | | 0.2 | |
| 185,000 | | | | # | | Building Materials Corp. of America, 7.500%, 03/15/20 | | | 197,025 | | | | 0.1 | |
| 670,000 | | | | | | Covanta Holding Corp., 7.250%, 12/01/20 | | | 724,060 | | | | 0.5 | |
| 880,000 | | | | # | | JM Huber Corp., 9.875%, 11/01/19 | | | 919,600 | | | | 0.7 | |
| 370,000 | | | | # | | Schaeffler Finance BV, 7.750%, 02/15/17 | | | 393,125 | | | | 0.3 | |
| 525,000 | | | | # | | Schaeffler Finance BV, 8.500%, 02/15/19 | | | 563,062 | | | | 0.4 | |
| 610,000 | | | | | | SPX Corp., 6.875%, 09/01/17 | | | 671,000 | | | | 0.5 | |
| 4,470,000 | | | | | | Other Securities | | | 4,690,513 | | | | 3.4 | |
| | | | | | | | | | 9,686,973 | | | | 6.9 | |
| |
| Information Technology: 4.8% |
| 545,000 | | | | # | | Emdeon, Inc., 11.000%, 12/31/19 | | | 618,575 | | | | 0.4 | |
| 145,000 | | | | # | | First Data Corp., 8.250%, 01/15/21 | | | 142,463 | | | | 0.1 | |
| 146,000 | | | | #, & | | First Data Corp., 8.750%, 01/15/22 | | | 141,620 | | | | 0.1 | |
| 773,684 | | | | & | | First Data Corp., 9.875%–12.625%, 09/24/15–01/15/21 | | | 736,375 | | | | 0.5 | |
| 460,000 | | | | | | Kemet Corp., 10.500%, 05/01/18 | | | 499,100 | | | | 0.4 | |
| 250,000 | | | | # | | Kemet Corp., 10.500%, 05/01/18 | | | 270,000 | | | | 0.2 | |
| 105,000 | | | | # | | Lawson Software, Inc., 9.375%, 04/01/19 | | | 108,937 | | | | 0.1 | |
| 500,000 | | | | # | | Lawson Software, Inc., 11.500%, 07/15/18 | | | 555,000 | | | | 0.4 | |
| 3,360,000 | | | | | | Other Securities | | | 3,605,675 | | | | 2.6 | |
| | | | | | | | | | 6,677,745 | | | | 4.8 | |
| |
| |
| 200,000 | | | | # | | Ardagh Packaging Finance Plc, 7.375%, 10/15/17 | | | 215,500 | | | | 0.2 | |
See Accompanying Notes to Financial Statements
43
| ING HIGH YIELD BOND FUND | SUMMARY PORTFOLIO OF INVESTMENTS
AS OF MARCH 31, 2012 (CONTINUED) |
Principal
Amount†
|
|
|
|
|
|
|
| Value
|
| Percentage
of Net
Assets
|
|---|
| |
CORPORATE BONDS/NOTES: (continued)
|
| |
| 250,000 | | | | # | | Ardagh Packaging Finance Plc/Ardagh MP Holdings USA, Inc., 9.125%, 10/15/20 | | $ | 263,125 | | | | 0.2 | |
| 365,000 | | | | # | | Building Materials Corp. of America, 6.750%, 05/01/21 | | | 388,269 | | | | 0.3 | |
| 250,000 | | | | # | | FMG Resources August 2006 Pty Ltd., 6.000%, 04/01/17 | | | 248,125 | | | | 0.2 | |
| 550,000 | | | | # | | Ineos Finance PLC, 8.375%, 02/15/19 | | | 583,000 | | | | 0.4 | |
| 500,000 | | | | # | | Ineos Group Holdings PLC, 8.500%, 02/15/16 | | | 475,000 | | | | 0.3 | |
| 330,000 | | | | # | | JMC Steel Group, 8.250%, 03/15/18 | | | 344,850 | | | | 0.3 | |
| 410,000 | | | | # | | Longview Fibre Paper & Packaging, Inc., 8.000%, 06/01/16 | | | 419,738 | | | | 0.3 | |
| 640,000 | | | | # | | LyondellBasell Industries NV, 6.000%, 11/15/21 | | | 675,200 | | | | 0.5 | |
| 290,000 | | | | # | | Plastipak Holdings, Inc., 10.625%, 08/15/19 | | | 332,050 | | | | 0.2 | |
| 307,000 | | | | # | | Rain CII Carbon LLC and CII Carbon Corp., 8.000%, 12/01/18 | | | 323,117 | | | | 0.2 | |
| 750,000 | | | | | | Taseko Mines Ltd, 7.750%, 04/15/19 | | | 718,125 | | | | 0.5 | |
| 75,000 | | | | # | | Vertellus Specialties, Inc., 9.375%, 10/01/15 | | | 57,375 | | | | 0.0 | |
| 4,774,775 | | | | | | Other Securities | | | 4,981,119 | | | | 3.6 | |
| | | | | | | | | | 10,024,593 | | | | 7.2 | |
| |
| Telecommunication Services: 6.5% |
| 460,000 | | | | | | CCO Holdings LLC/ CCO Holdings Capital Corp., 7.250%, 10/30/17 | | | 495,650 | | | | 0.4 | |
| 755,000 | | | | | | Freescale Semiconductor, Inc., 8.050%, 02/01/20 | | | 762,550 | | | | 0.6 | |
| 710,000 | | | | | | Frontier Communications Corp., 8.250%–8.500%, 04/15/17–04/15/20 | | | 755,325 | | | | 0.5 | |
| 250,000 | | | | #, & | | Intelsat Bermuda Ltd., 11.500%, 02/04/17 | | | 258,125 | | | | 0.2 | |
| 870,000 | | | | | | Intelsat Luxembourg S.A., 11.250%, 02/04/17 | | | 906,975 | | | | 0.7 | |
| 131,375 | | | | & | | Intelsat Luxembourg S.A., 11.500%, 02/04/17 | | | 136,958 | | | | 0.1 | |
| 500,000 | | | | # | | Sable International Finance Ltd., 8.750%, 02/01/20 | | | 532,500 | | | | 0.4 | |
| 400,000 | | | | # | | Sprint Nextel Corp., 7.000%, 03/01/20 | | | 407,000 | | | | 0.3 | |
| 665,000 | | | | # | | Sprint Nextel Corp., 9.000%, 11/15/18 | | | 731,500 | | | | 0.5 | |
| |
CORPORATE BONDS/NOTES: (continued)
|
| Telecommunication Services: (continued) |
| 425,000 | | | | # | | UPCB Finance VI Ltd., 6.875%, 01/15/22 | | $ | 440,938 | | | | 0.3 | |
| 870,000 | | | | | | Windstream Corp., 7.000%, 03/15/19 | | | 891,750 | | | | 0.6 | |
| 2,818,024 | | | | | | Other Securities | | | 2,712,545 | | | | 1.9 | |
| | | | | | | | | | 9,031,816 | | | | 6.5 | |
| |
| |
| 310,000 | | | | # | | AES Corp., 7.375%, 07/01/21 | | | 344,100 | | | | 0.3 | |
| 385,000 | | | | # | | Calpine Corp., 7.500%, 02/15/21 | | | 412,913 | | | | 0.3 | |
| 440,000 | | | | # | | Calpine Corp., 7.875%, 07/31/20 | | | 480,700 | | | | 0.3 | |
| 455,000 | | | | # | | Texas Competitive Electric Holdings Co. LLC / TCEH Finance, Inc., 11.500%, 10/01/20 | | | 299,162 | | | | 0.2 | |
| 1,415,000 | | | | | | Other Securities | | | 1,379,125 | | | | 1.0 | |
| | | | | | | | | | 2,916,000 | | | | 2.1 | |
| |
| | | | | | | Total Corporate
Bonds/Notes
(Cost $127,190,340) | | | 131,990,167 | | | | 94.5 | |
| |
ASSET-BACKED SECURITIES: 0.7% |
| Other Asset-Backed Securities: 0.7% |
| 912,979 | | | | # | | GSC Partners CDO Fund Ltd, 2.495%, 12/16/15 | | | 911,393 | | | | 0.7 | |
| |
| | | | | | | Total Asset-Backed Securities
(Cost $839,901) | | | 911,393 | | | | 0.7 | |
Shares
|
|
|
|
|
|
|
| Value
|
| Percentage
of Net
Assets
|
|---|
| |
COMMON STOCK: 0.0%
|
| Consumer Discretionary: 0.0% |
| 6,005 | | | | | | Other Securities | | | 2,535 | | | | 0.0 | |
| | | | | | | Total Common Stock
(Cost $136,656) | | | 2,535 | | | | 0.0 | |
| | | | | | | Total Long-Term Investments
(Cost $128,166,897) | | | 132,904,095 | | | | 95.2 | |
| |
SHORT-TERM INVESTMENTS: 3.6%
|
| |
| 5,063,000 | | | | | | BlackRock Liquidity Funds, TempFund, Institutional Class
(Cost $5,063,000) | | | 5,063,000 | | | | 3.6 | |
| | | | | | | Total Short-Term Investments | | | | | | | | |
| | | | | | | (Cost $5,063,000) | | | 5,063,000 | | | | 3.6 | |
| | | | | | | Total Investments in Securities
(Cost $133,229,897) | | $ | 137,967,095 | | | | 98.8 | |
| | | | | | | Assets in Excess of Other Liabilities | | | 1,653,038 | | | | 1.2 | |
| | | | | | | Net Assets | | $ | 139,620,133 | | | | 100.0 | |
See Accompanying Notes to Financial Statements
44
| ING HIGH YIELD BOND FUND | SUMMARY PORTFOLIO OF INVESTMENTS
AS OF MARCH 31, 2012 (CONTINUED) |
“Other Securities” represents issues not identified as the top 50 holdings in terms of market value and issues or issuers not exceeding 1% of net assets individually or in aggregate respectively as of March 31, 2012.
The following footnotes apply to either the individual securities noted or one or more of the securities aggregated and listed as a single line item.
| † | | Unless otherwise indicated, principal amount is shown in USD. |
| # | | Securities with purchases pursuant to Rule 144A or section 4(2), under the Securities Act of 1933 and may not be resold subject to that rule except to qualified institutional buyers. |
| Z | | Indicates Zero Coupon Bond; rate shown reflects current effective yield. |
| Cost for federal income tax purposes is $133,236,234. |
| Net unrealized appreciation consists of: | | | | | | |
| Gross Unrealized Appreciation | | | | $ | 6,359,908 | |
| Gross Unrealized Depreciation | | | | | (1,629,047 | ) |
| Net Unrealized Appreciation | | | | $ | 4,730,861 | |
Fair Value Measurementsˆ
The following is a summary of the fair valuations according to the inputs used as of March 31, 2012 in valuing the assets and liabilities:
| | | | Quoted Prices
in Active Markets
for Identical
Investments
(Level 1)
| | Significant
Other
Observable
Inputs
(Level 2)
| | Significant
Unobservable
Inputs
(Level 3)
| | Fair Value
at
3/31/2012
|
|---|
Asset Table | | | | | | | | | | | | | | | | | | |
Investments, at value | | | | | | | | | | | | | | | | | | |
| Common Stock | | | | | | | | | | | | | | | | | | |
| Consumer Discretionary | | | | $ | — | | | $ | — | | | $ | 2,535 | | | $ | 2,535 | |
| Total Common Stock | | | | | — | | | | — | | | | 2,535 | | | | 2,535 | |
| Corporate Bonds/Notes | | | | | — | | | | 131,990,167 | | | | — | | | | 131,990,167 | |
| Asset-Backed Securities | | | | | — | | | | 911,393 | | | | — | | | | 911,393 | |
| Short-Term Investments | | | | | 5,063,000 | | | | — | | | | — | | | | 5,063,000 | |
| Total Investments, at value | | | | $ | 5,063,000 | | | $ | 132,901,560 | | | $ | 2,535 | | | $ | 137,967,095 | |
| ˆ | | See Note 2, “Significant Accounting Policies” in the Notes to Financial Statements for additional information. |
There were no significant transfers between Level 1 and 2 during the year ended March 31, 2012.
Transfers in or out of Level 3 represent either the beginning value (for transfers in), or the ending value (for transfers out) of any security or derivative instrument where a change in the pricing level occurred from the beginning to the end of the period. Transfers are recognized at the end of the reporting period.
| | | | Beginning
Balance on
3/31/2011
| | Purchases
| | Sales
| | Accrued
Discounts/
(Premiums)
| | Total
Realized
Gain (Loss)
| | Total Unrealized
Appreciation
(Depreciation)
| | Transfers
into
Level 3
| | Transfers
Out of
Level 3
| | Ending
Balance on
3/31/2012
|
|---|
Asset Table | | | | | | | | | | | | | | | | | | | | | | | | | | | | | | | | | | | | | | |
Investments, at value | | | | | | | | | | | | | | | | | | | | | | | | | | | | | | | | | | | | | | |
| Common Stock | | | | $ | 2,541 | | | $ | — | | | $ | — | | | $ | — | | | $ | — | | | $ | (6 | ) | | $ | — | | | $ | — | | | $ | 2,535 | |
| Preferred Stock | | | | | — | | | | — | | | | — | | | | — | | | | — | | | | — | | | | — | | | | — | | | | — | |
| Warrants | | | | | — | | | | — | | | | — | | | | — | | | | — | | | | — | | | | — | | | | — | | | | — | |
| Total Investments, at value | | | | $ | 2,541 | | | $ | — | | | $ | — | | | $ | — | | | $ | — | | | $ | (6 | ) | | $ | — | | | $ | — | | | $ | 2,535 | |
As of March 31, 2012, total change in unrealized gain (loss) on Level 3 securities still held at year end and included in the change in net assets was $(6).
The effect of derivative instruments on the Fund’s Statement of Operations for the year ended March 31, 2012 was as follows:
| | | | Amount of Realized Gain or (Loss)
on Derivatives Recognized in Income
|
|---|
Derivatives not accounted for as hedging instruments
| | | | Swaps
|
|---|
| Credit contracts | | | | $ | 633,112 | |
Total | | | | $ | 633,112 | |
See Accompanying Notes to Financial Statements
45
| ING INTERMEDIATE BOND FUND | SUMMARY PORTFOLIO OF INVESTMENTS
AS OF MARCH 31, 2012 |
Principal
Amount†
|
|
|
|
|
|
|
| Value
|
| Percentage
of Net
Assets
|
|---|
| |
CORPORATE BONDS/NOTES: 33.2% |
| Consumer Discretionary: 5.5% |
| 1,180,000 | | | | # | | DIRECTV Holdings LLC/ DIRECTV Financing Co., Inc., 2.400%, 03/15/17 | | $ | 1,170,613 | | | | 0.2 | |
| 1,112,000 | | | | # | | DIRECTV Holdings LLC/ DIRECTV Financing Co., Inc., 3.800%, 03/15/22 | | | 1,098,536 | | | | 0.1 | |
| 732,000 | | | | # | | DIRECTV Holdings LLC/ DIRECTV Financing Co., Inc., 5.150%, 03/15/42 | | | 713,531 | | | | 0.1 | |
| 817,000 | | | | # | | Harley-Davidson Financial Services, Inc., 2.700%, 03/15/17 | | | 811,266 | | | | 0.1 | |
| 2,726,000 | | | | # | | Hyatt Hotels Corp., 6.875%, 08/15/19 | | | 3,146,641 | | | | 0.4 | |
| 1,030,000 | | | | # | | Lamar Media Corp., 5.875%, 02/01/22 | | | 1,053,175 | | | | 0.1 | |
| 1,025,000 | | | | #, L | | Mediacom LLC/ Mediacom Capital Corp., 7.250%, 02/15/22 | | | 1,040,375 | | | | 0.1 | |
| 245,000 | | | | # | | Meritage Homes Corp., 7.000%, 04/01/22 | | | 246,225 | | | | 0.0 | |
| 2,201,000 | | | | | | News America, Inc., 4.500%–6.650%, 02/15/21–11/15/37 | | | 2,470,633 | | | | 0.3 | |
| 310,000 | | | | #, L | | Odebrecht Finance Ltd., 7.500%, 09/29/49 | | | 318,463 | | | | 0.0 | |
| 900,000 | | | | # | | SABMiller Holdings, Inc., 2.450%, 01/15/17 | | | 912,109 | | | | 0.1 | |
| 900,000 | | | | # | | SABMiller Holdings, Inc., 4.950%, 01/15/42 | | | 933,011 | | | | 0.1 | |
| 2,783,000 | | | | | | Xerox Corp., 4.500%, 05/15/21 | | | 2,867,264 | | | | 0.4 | |
| 950,000 | | | | # | | XM Satellite Radio, Inc., 7.625%, 11/01/18 | | | 1,030,750 | | | | 0.1 | |
| 26,237,000 | | | | | | Other Securities (a) | | | 27,843,574 | | | | 3.4 | |
| | | | | | | | | | 45,656,166 | | | | 5.5 | |
| |
| |
| 558,000 | | | | # | | Cargill, Inc., 3.250%, 11/15/21 | | | 544,539 | | | | 0.0 | |
| 920,000 | | | | # | | Delphi Corp., 5.875%, 05/15/19 | | | 975,200 | | | | 0.1 | |
| 615,000 | | | | # | | JBS USA LLC/JBS USA Finance, Inc., 8.250%, 02/01/20 | | | 633,450 | | | | 0.1 | |
| 4,046,000 | | | | | | Other Securities | | | 4,793,499 | | | | 0.6 | |
| | | | | | | | | | 6,946,688 | | | | 0.8 | |
| |
| |
| 1,240,000 | | | | # | | BG Energy Capital PLC, 2.875%, 10/15/16 | | | 1,283,931 | | | | 0.1 | |
| 2,699,000 | | | | | | BP Capital Markets PLC, 2.248%–3.561%, 11/01/16–11/01/21 | | | 2,774,236 | | | | 0.3 | |
| |
CORPORATE BONDS/NOTES: (continued) |
| |
| 325,000 | | | | # | | Chesapeake Oilfield Operating LLC/Chesapeake Oilfield Finance, Inc., 6.625%, 11/15/19 | | $ | 324,187 | | | | 0.0 | |
| 600,000 | | | | # | | China Resources Gas Group Ltd, 4.500%, 04/05/22 | | | 590,606 | | | | 0.1 | |
| 1,467,000 | | | | # | | Dolphin Energy Ltd., 5.500%, 12/15/21 | | | 1,553,186 | | | | 0.2 | |
| 612,000 | | | | # | | Duquesne Light Holdings, Inc., 5.900%, 12/01/21 | | | 654,805 | | | | 0.1 | |
| 2,434,000 | | | | | | Energy Transfer Partners L.P., 4.650%–6.050%, 06/01/21–06/01/41 | | | 2,470,430 | | | | 0.3 | |
| 531,000 | | | | # | | KazMunaiGaz Finance Sub BV, 7.000%, 05/05/20 | | | 606,333 | | | | 0.1 | |
| 596,000 | | | | # | | Korea Gas Corp., 6.250%, 01/20/42 | | | 676,835 | | | | 0.1 | |
| 2,227,000 | | | | | | Petrobras International Finance Co.-Pifco, 3.500%–5.375%, 02/06/17–01/27/21 | | | 2,327,280 | | | | 0.3 | |
| 128,000 | | | | # | | Petroleos Mexicanos, 4.875%, 01/24/22 | | | 134,720 | | | | 0.0 | |
| 1,457,000 | | | | # | | Phillips 66, 2.950%, 05/01/17 | | | 1,482,289 | | | | 0.2 | |
| 2,029,000 | | | | # | | Phillips 66, 4.300%, 04/01/22 | | | 2,067,237 | | | | 0.2 | |
| 1,000,000 | | | | # | | Reliance Holdings USA, Inc., 5.400%, 02/14/22 | | | 996,302 | | | | 0.1 | |
| 1,331,000 | | | | # | | Schlumberger Investment SA, 1.950%, 09/14/16 | | | 1,347,924 | | | | 0.2 | |
| 2,364,000 | | | | | | Weatherford International Ltd., 4.500%–5.950%, 04/15/42–04/15/22 | | | 2,353,906 | | | | 0.3 | |
| 555,000 | | | | # | | WPX Energy, Inc., 6.000%, 01/15/22 | | | 557,775 | | | | 0.1 | |
| 30,422,000 | | | | | | Other Securities (a),(b) | | | 29,518,515 | | | | 3.6 | |
| | | | | | | | | | 51,720,497 | | | | 6.3 | |
| |
| |
| 856,000 | | | | # | | ABN Amro Bank NV, 4.250%, 02/02/17 | | | 870,561 | | | | 0.1 | |
| 2,460,000 | | | | | | American International Group, Inc., 5.850%–8.175%, 01/16/18–05/15/58 | | | 2,647,994 | | | | 0.3 | |
| BRL 2,887,000 | | | | # | | Banco Votorantim SA, 6.250%, 05/16/16 | | | 1,735,727 | | | | 0.2 | |
| 3,899,000 | | | | | | Bank of America Corp., 3.750%–8.000%, 07/12/16–12/29/49 | | | 3,992,514 | | | | 0.5 | |
See Accompanying Notes to Financial Statements
46
| ING INTERMEDIATE BOND FUND | SUMMARY PORTFOLIO OF INVESTMENTS
AS OF MARCH 31, 2012 (CONTINUED) |
Principal
Amount†
|
|
|
|
|
|
|
| Value
|
| Percentage
of Net
Assets
|
|---|
| |
CORPORATE BONDS/NOTES: (continued) |
| |
| 2,912,000 | | | | | | Citigroup, Inc., 3.953%, 06/15/16 | | $ | 2,994,835 | | | | 0.3 | |
| 2,169,000 | | | | | | Citigroup, Inc., 4.450%–5.875%, 01/10/17–01/30/42 | | | 2,249,004 | | | | 0.3 | |
| 1,660,000 | | | | # | | Cooperatieve Centrale Raiffeisen-Boerenleenbank BA/Netherlands, 11.000%, 12/29/49 | | | 2,118,900 | | | | 0.3 | |
| 2,262,000 | | | | | | General Electric Capital Corp., 5.300%, 02/11/21 | | | 2,453,309 | | | | 0.3 | |
| 2,772,000 | | | | | | General Electric Capital Corp., 3.350%–4.650%, 10/17/16–10/17/21 | | | 2,950,453 | | | | 0.3 | |
| 2,278,000 | | | | # | | Hyundai Capital America, 4.000%, 06/08/17 | | | 2,342,718 | | | | 0.3 | |
| 964,000 | | | | # | | Iberdrola Finance Ireland Ltd., 3.800%, 09/11/14 | | | 989,813 | | | | 0.1 | |
| 1,361,000 | | | | # | | ILFC E-Capital Trust II, 6.250%, 12/21/65 | | | 1,003,738 | | | | 0.1 | |
| 1,312,000 | | | | | | International Lease Finance Corp., 5.875%, 04/01/19 | | | 1,269,416 | | | | 0.2 | |
| 1,037,000 | | | | # | | International Lease Finance Corp., 7.125%, 09/01/18 | | | 1,135,515 | | | | 0.1 | |
| 559,000 | | | | # | | IPIC GMTN Ltd., 3.750%, 03/01/17 | | | 571,578 | | | | 0.1 | |
| 1,300,000 | | | | # | | IPIC GMTN Ltd., 5.500%, 03/01/22 | | | 1,343,875 | | | | 0.1 | |
| 625,000 | | | | # | | IPIC GMTN Ltd., 6.875%, 11/01/41 | | | 656,250 | | | | 0.1 | |
| 601,000 | | | | # | | Itau Unibanco Holding SA/Cayman Island, 6.200%, 12/21/21 | | | 631,050 | | | | 0.1 | |
| 2,271,000 | | | | | | JPMorgan Chase & Co., 4.350%, 08/15/21 | | | 2,323,914 | | | | 0.3 | |
| 1,279,000 | | | | | | JPMorgan Chase & Co., 4.500%–5.400%, 01/24/22–01/06/42 | | | 1,343,899 | | | | 0.1 | |
| 3,934,000 | | | | | | Morgan Stanley, 3.800%–5.500%, 04/29/16–07/28/21 | | | 3,862,975 | | | | 0.5 | |
| 2,403,000 | | | | | | Murray Street Investment Trust I, 4.647%, 03/09/17 | | | 2,406,878 | | | | 0.3 | |
| 2,347,000 | | | | | | The Bank of New York Mellon Corp., 3.550%, 09/23/21 | | | 2,407,792 | | | | 0.3 | |
| 37,446,616 | | | | | | Other Securities (b) | | | 36,066,739 | | | | 4.4 | |
| | | | | | | | | | 80,369,447 | | | | 9.7 | |
| |
| |
| 1,075,000 | | | | # | | Aristotle Holding, Inc., 2.100%, 02/12/15 | | | 1,089,001 | | | | 0.1 | |
| 1,018,000 | | | | # | | Aristotle Holding, Inc., 2.650%, 02/15/17 | | | 1,030,441 | | | | 0.1 | |
| |
CORPORATE BONDS/NOTES: (continued) |
| |
| 1,268,000 | | | | # | | Aristotle Holding, Inc., 3.500%, 11/15/16 | | $ | 1,325,617 | | | | 0.2 | |
| 425,000 | | | | # | | CHS/Community Health Systems, Inc., 8.000%, 11/15/19 | | | 439,875 | | | | 0.1 | |
| 685,000 | | | | # | | Mylan, Inc./PA, 7.875%, 07/15/20 | | | 767,200 | | | | 0.1 | |
| 915,000 | | | | # | | Valeant Pharmaceuticals International, 7.250%, 07/15/22 | | | 910,425 | | | | 0.1 | |
| 9,239,000 | | | | | | Other Securities | | | 8,618,527 | | | | 1.0 | |
| | | | | | | | | | 14,181,086 | | | | 1.7 | |
| |
| |
| 900,000 | | | | # | | Bombardier, Inc., 7.500%, 03/15/18 | | | 994,500 | | | | 0.1 | |
| 890,000 | | | | # | | Bombardier, Inc., 7.750%, 03/15/20 | | | 996,800 | | | | 0.1 | |
| 975,000 | | | | # | | Schaeffler Finance BV, 7.750%, 02/15/17 | | | 1,035,937 | | | | 0.1 | |
| 235,000 | | | | # | | Schaeffler Finance BV, 8.500%, 02/15/19 | | | 252,038 | | | | 0.1 | |
| 1,741,000 | | | | | | Other Securities | | | 1,806,945 | | | | 0.2 | |
| | | | | | | | | | 5,086,220 | | | | 0.6 | |
| |
| Information Technology: 1.1% |
| 635,000 | | | | # | | Fidelity National Information Services, Inc., 5.000%, 03/15/22 | | | 628,650 | | | | 0.1 | |
| 2,993,000 | | | | | | Hewlett-Packard Co., 2.600%–5.400%, 09/15/16–09/15/17 | | | 3,114,850 | | | | 0.4 | |
| 4,422,000 | | | | | | Other Securities | | | 4,858,844 | | | | 0.6 | |
| | | | | | | | | | 8,602,344 | | | | 1.1 | |
| |
| |
| 2,422,000 | | | | | | ArcelorMittal, 6.125%–9.850%, 06/01/18–06/01/19 | | | 2,792,781 | | | | 0.3 | |
| 1,267,000 | | | | # | | Barrick Gold Corp., 3.850%, 04/01/22 | | | 1,269,418 | | | | 0.1 | |
| 1,480,000 | | | | # | | Barrick Gold Corp., 5.250%, 04/01/42 | | | 1,476,924 | | | | 0.2 | |
| 702,000 | | | | # | | Chevron Phillips Chemical Co. LLC, 7.000%, 06/15/14 | | | 787,450 | | | | 0.1 | |
| 820,000 | | | | #, L | | FMG Resources August 2006 Pty Ltd., 6.000%, 04/01/17 | | | 813,850 | | | | 0.1 | |
| 460,000 | | | | # | | FMG Resources August 2006 Pty Ltd., 7.000%, 11/01/15 | | | 471,500 | | | | 0.0 | |
| 495,000 | | | | # | | Georgia-Pacific LLC, 5.400%, 11/01/20 | | | 553,327 | | | | 0.1 | |
| 460,000 | | | | # | | Sealed Air Corp., 8.375%, 09/15/21 | | | 519,225 | | | | 0.1 | |
See Accompanying Notes to Financial Statements
47
| ING INTERMEDIATE BOND FUND | SUMMARY PORTFOLIO OF INVESTMENTS
AS OF MARCH 31, 2012 (CONTINUED) |
Principal
Amount†
|
|
|
|
|
|
|
| Value
|
| Percentage
of Net
Assets
|
|---|
| |
CORPORATE BONDS/NOTES: (continued) |
| |
| 2,078,000 | | | | | | Vale Overseas Ltd., 4.625%, 09/15/20 | | $ | 2,195,428 | | | | 0.3 | |
| 860,000 | | | | # | | Volcan Cia Minera SAA, 5.375%, 02/02/22 | | | 892,250 | | | | 0.1 | |
| 827,000 | | | | # | | Xstrata Canada Financial Corp., 4.950%, 11/15/21 | | | 867,729 | | | | 0.1 | |
| 10,727,811 | | | | | | Other Securities (a) | | | 11,371,081 | | | | 1.4 | |
| | | | | | | | | | 24,010,963 | | | | 2.9 | |
| |
| Telecommunication Services: 2.4% |
| 770,000 | | | | # | | Sable International Finance Ltd., 8.750%, 02/01/20 | | | 820,050 | | | | 0.1 | |
| 2,826,000 | | | | # | | Telstra Corp. Ltd., 4.800%, 10/12/21 | | | 3,076,392 | | | | 0.4 | |
| 810,000 | | | | # | | UPCB Finance VI Ltd., 6.875%, 01/15/22 | | | 840,375 | | | | 0.1 | |
| 14,235,000 | | | | | | Other Securities | | | 14,736,172 | | | | 1.8 | |
| | | | | | | | | | 19,472,989 | | | | 2.4 | |
| |
| |
| 1,105,000 | | | | # | | Calpine Corp., 7.500%, 02/15/21 | | | 1,185,113 | | | | 0.1 | |
| 205,000 | | | | # | | Comision Federal de Electricidad, 5.750%, 02/14/42 | | | 206,845 | | | | 0.0 | |
| 1,249,000 | | | | # | | Duquesne Light Holdings, Inc., 6.400%, 09/15/20 | | | 1,382,016 | | | | 0.2 | |
| 873,000 | | | | # | | Empresa de Energia de Bogota SA, 6.125%, 11/10/21 | | | 929,745 | | | | 0.1 | |
| 2,068,000 | | | | L | | Gazprom OAO Via Gaz Capital SA, 6.212%–6.510%, 11/22/16–03/07/22 | | | 2,262,072 | | | | 0.3 | |
| 137,707 | | | | # | | Juniper Generation, LLC, 6.790%, 12/31/14 | | | 116,024 | | | | 0.0 | |
| 1,831,000 | | | | | | Oncor Electric Delivery Co., 6.800%–7.500%, 09/01/18–09/01/38 | | | 2,266,986 | | | | 0.3 | |
| 8,868,000 | | | | | | Other Securities | | | 10,076,801 | | | | 1.2 | |
| | | | | | | | | | 18,425,602 | | | | 2.2 | |
| |
| | | | | | | Total Corporate
Bonds/Notes
(Cost $267,518,452) | | | 274,472,002 | | | | 33.2 | |
| |
COLLATERALIZED MORTGAGE OBLIGATIONS: 11.2% |
| 1,039,000 | | | | # | | American General Mortgage Loan Trust, 5.650%, 03/25/58 | | | 1,094,730 | | | | 0.1 | |
| 2,753,000 | | | | # | | American General Mortgage Loan Trust, 5.750%, 09/25/48 | | | 2,831,858 | | | | 0.4 | |
| 900,000 | | | | # | | Arkle Master Issuer PLC, 2.215%, 05/17/60 | | | 901,034 | | | | 0.1 | |
| |
COLLATERALIZED MORTGAGE OBLIGATIONS: (continued) |
| 25,722,516 | | | | #, ˆ | | Banc of America Commercial Mortgage, Inc., 0.231%, 10/10/45 | | $ | 263,342 | | | | 0.0 | |
| 2,937,341 | | | | | | Banc of America Funding Corp., 5.500%, 02/25/35 | | | 2,945,205 | | | | 0.3 | |
| 2,227,750 | | | | # | | Banc of America Funding Corp., 5.250%, 08/26/35 | | | 2,255,058 | | | | 0.3 | |
| 738,213 | | | | # | | Banc of America Large Loan, Inc., 1.642%, 06/15/18 | | | 728,670 | | | | 0.1 | |
| 770,000 | | | | # | | Banc of America Merrill Lynch Commercial Mortgage, Inc., 5.498%, 07/10/43 | | | 747,286 | | | | 0.1 | |
| 392,713 | | | | # | | Banc of America Merrill Lynch Commercial Mortgage, Inc., 6.850%, 11/15/31 | | | 396,545 | | | | 0.0 | |
| 650,000 | | | | # | | Bank of America-First Union NB Commercial Mortgage, 6.250%, 04/11/37 | | | 608,229 | | | | 0.1 | |
| 660,000 | | | | # | | Bear Stearns Commercial Mortgage Securities, 5.541%, 04/12/38 | | | 611,173 | | | | 0.1 | |
| 240,000 | | | | # | | Bear Stearns Commercial Mortgage Securities, 5.640%, 02/14/31 | | | 238,461 | | | | 0.0 | |
| 347,192 | | | | # | | Bear Stearns Commercial Mortgage Securities, 6.500%, 02/15/32 | | | 347,315 | | | | 0.1 | |
| 1,290,000 | | | | | | Bear Stearns Commercial Mortgage Securities, 5.134%–6.500%, 02/15/32–02/13/42 | | | 1,123,764 | | | | 0.1 | |
| 730,000 | | | | # | | Bear Stearns Deutsche Bank Trust, 5.008%, 09/15/27 | | | 770,908 | | | | 0.1 | |
| 3,498,831 | | | | | | Citicorp Mortgage Securities, Inc., 6.000%, 06/25/36–08/25/36 | | | 3,426,703 | | | | 0.4 | |
| 419,601 | | | | | | Commercial Mortgage Pass Through Certificates, 5.811%, 12/10/49 | | | 421,786 | | | | 0.0 | |
| 609,494 | | | | # | | Commercial Mortgage Pass Through Certificates, 0.422%, 06/15/22 | | | 592,888 | | | | 0.1 | |
| 706,852 | | | | # | | Commercial Mortgage Pass Through Certificates, 0.692%, 12/15/20 | | | 651,061 | | | | 0.1 | |
| 567,227 | | | | # | | Commercial Mortgage Pass Through Certificates, 0.742%, 12/15/20 | | | 519,624 | | | | 0.1 | |
See Accompanying Notes to Financial Statements
48
| ING INTERMEDIATE BOND FUND | SUMMARY PORTFOLIO OF INVESTMENTS
AS OF MARCH 31, 2012 (CONTINUED) |
Principal
Amount†
|
|
|
|
|
|
|
| Value
|
| Percentage
of Net
Assets
|
|---|
| |
COLLATERALIZED MORTGAGE OBLIGATIONS: (continued) |
| 514,868 | | | | # | | Commercial Mortgage Pass Through Certificates, 0.842%, 12/15/20 | | $ | 469,088 | | | | 0.0 | |
| 1,853,289 | | | | # | | Commercial Mortgage Pass Through Certificates, 3.828%, 12/17/13 | | | 1,883,179 | | | | 0.2 | |
| 730,000 | | | | # | | Credit Suisse Mortgage Capital Certificates, 5.599%, 04/12/49 | | | 742,570 | | | | 0.1 | |
| 3,596,159 | | | | | | Freddie Mac, 5.000%–5.500%, 02/15/35–07/15/37 | | | 4,065,060 | | | | 0.5 | |
| 257,155 | | | | | | GS Mortgage Securities Corp. II, 5.479%, 11/10/39 | | | 258,745 | | | | 0.0 | |
| 2,430,000 | | | | # | | GS Mortgage Securities Corp. II, 5.309%, 01/10/40 | | | 2,453,982 | | | | 0.3 | |
| 2,100,000 | | | | # | | Holmes Master Issuer PLC, 2.165%, 10/15/54 | | | 2,119,839 | | | | 0.3 | |
| 37,748,398 | | | | #, ˆ | | LB-UBS Commercial Mortgage Trust, 0.199%, 09/15/39 | | | 661,624 | | | | 0.1 | |
| 54,636,005 | | | | #, ˆ | | LB-UBS Commercial Mortgage Trust, 0.649%, 11/15/38 | | | 1,266,135 | | | | 0.2 | |
| 740,000 | | | | # | | LB-UBS Commercial Mortgage Trust, 5.032%, 10/15/36 | | | 699,042 | | | | 0.1 | |
| 410,000 | | | | # | | LB-UBS Commercial Mortgage Trust, 5.750%, 01/15/36 | | | 410,611 | | | | 0.0 | |
| 24,806,361 | | | | ˆ | | LB-UBS Commercial Mortgage Trust, 0.169%–5.886%, 06/15/38–09/15/45 | | | 5,513,860 | | | | 0.6 | |
| 2,250,000 | | | | # | | Lehman Brothers Floating Rate Commercial Mortgage Trust, 0.592%, 06/15/22 | | | 2,137,961 | | | | 0.3 | |
| 510,000 | | | | # | | Merrill Lynch Mortgage Investors, Inc., 6.000%, 12/15/30 | | | 516,211 | | | | 0.1 | |
| 50,700,501 | | | | #, ˆ | | Merrill Lynch Mortgage Trust, 0.521%, 02/12/51 | | | 861,036 | | | | 0.1 | |
| 1,000,000 | | | | # | | Morgan Stanley Capital I, 5.397%, 01/13/41 | | | 963,797 | | | | 0.1 | |
| 1,580,000 | | | | # | | Morgan Stanley Capital I, 5.813%, 08/12/41 | | | 1,224,763 | | | | 0.2 | |
| 280,000 | | | | # | | Morgan Stanley Capital I, 7.350%, 07/15/32 | | | 286,814 | | | | 0.0 | |
| 10,569,189 | | | | | | Morgan Stanley Capital I, 5.073%–5.793%, 06/15/40–04/12/49 | | | 10,287,146 | | | | 1.2 | |
| 984,000 | | | | # | | Morgan Stanley Reremic Trust, 5.870%, 12/17/43 | | | 1,009,886 | | | | 0.1 | |
| 19,447,959 | | | | #, ˆ | | RBSCF Trust, 0.985%, 04/15/24 | | | 493,910 | | | | 0.1 | |
| |
COLLATERALIZED MORTGAGE OBLIGATIONS: (continued) |
| 2,580,000 | | | | # | | RBSCF Trust, 5.305%, 01/16/49 | | $ | 2,637,768 | | | | 0.3 | |
| 4,858,183 | | | | | | Residential Accredit Loans, Inc., 0.412%, 01/25/37 | | | 2,440,579 | | | | 0.3 | |
| 1,886,365 | | | | | | Residential Accredit Loans, Inc., 0.692%, 12/25/36 | | | 705,407 | | | | 0.1 | |
| 1,551,000 | | | | # | | Silverstone Master Issuer PLC, 1.792%, 01/21/55 | | | 1,562,169 | | | | 0.2 | |
| 490,000 | | | | # | | Wachovia Bank Commercial Mortgage Trust, 6.290%, 04/15/34 | | | 487,938 | | | | 0.1 | |
| 2,414,073 | | | | | | Wells Fargo Mortgage Backed Securities Trust, 2.664%, 06/25/35 | | | 2,365,204 | | | | 0.3 | |
| 29,925,542 | | | | | | Other Securities | | | 22,598,792 | | | | 2.7 | |
| |
| | | | | | | Total Collateralized Mortgage Obligations
(Cost $92,972,920) | | | 92,598,756 | | | | 11.2 | |
| |
U.S. GOVERNMENT AGENCY OBLIGATIONS: 30.9% |
| Federal Home Loan Mortgage
Corporation: 11.5%## |
| 10,955,160 | | | | ˆ | | 6.243%, due 06/15/36 | | | 1,743,037 | | | | 0.2 | |
| 5,791,900 | | | | | | 4.000%, due 10/01/41 | | | 6,069,964 | | | | 0.7 | |
| 7,389,692 | | | | | | 4.000%, due 12/01/41 | | | 7,744,464 | | | | 0.9 | |
| 3,503,387 | | | | | | 4.500%, due 08/01/41 | | | 3,718,041 | | | | 0.5 | |
| 3,604,152 | | | | | | 4.500%, due 08/01/41 | | | 3,824,979 | | | | 0.5 | |
| 3,876,203 | | | | | | 4.500%, due 09/01/41 | | | 4,113,699 | | | | 0.5 | |
| 5,289,661 | | | | | | 4.500%, due 10/01/41 | | | 5,613,759 | | | | 0.7 | |
| 2,236,706 | | | | ˆ | | 4.858%, due 03/15/33 | | | 2,357,805 | | | | 0.3 | |
| 5,958,593 | | | | | | 5.500%, due 08/15/20 | | | 6,033,586 | | | | 0.7 | |
| 2,330,696 | | | | | | 5.500%, due 11/15/22 | | | 2,535,642 | | | | 0.3 | |
| 3,074,295 | | | | | | 5.500%, due 12/15/32 | | | 3,410,949 | | | | 0.4 | |
| 10,877,101 | | | | | | 5.500%, due 02/15/36 | | | 12,208,268 | | | | 1.5 | |
| 3,767,000 | | | | | | 5.500%, due 06/15/37 | | | 4,243,458 | | | | 0.5 | |
| 3,680,203 | | | | | | 6.000%, due 10/15/37 | | | 4,284,691 | | | | 0.5 | |
| 25,800,354 | | | | ˆ | | 6.358%, due 09/15/34 | | | 3,084,492 | | | | 0.4 | |
| 29,080,127 | | | | ˆ, W | | 0.592%–7.500%, due 04/01/14–10/01/41 | | | 24,402,339 | | | | 2.9 | |
| | | | | | | | | | 95,389,173 | | | | 11.5 | |
|
| Federal National Mortgage
Association: 13.4%## |
| 18,624,000 | | | | W | | 3.500%, due 12/25/40 | | | 19,075,050 | | | | 2.3 | |
| 22,791,000 | | | | W | | 4.000%, due 02/25/39 | | | 23,852,206 | | | | 2.9 | |
| 5,230,616 | | | | | | 4.000%, due 09/01/41 | | | 5,491,778 | | | | 0.6 | |
| 6,022,000 | | | | W | | 4.500%, due 05/15/35 | | | 6,397,434 | | | | 0.8 | |
| 7,088,324 | | | | | | 4.500%, due 09/01/41 | | | 7,565,822 | | | | 0.9 | |
| 2,532,126 | | | | | | 4.500%, due 10/01/41 | | | 2,702,700 | | | | 0.3 | |
| 2,111,715 | | | | | | 5.000%, due 08/01/35 | | | 2,283,803 | | | | 0.3 | |
| 2,266,033 | | | | | | 5.000%, due 07/01/37 | | | 2,453,882 | | | | 0.3 | |
| 17,870,435 | | | | ˆ | | 6.508%, due 10/25/35 | | | 3,321,217 | | | | 0.4 | |
| 1,387,538 | | | | | | 32.241%, due 11/25/36 | | | 2,391,743 | | | | 0.3 | |
| 42,142,303 | | | | ˆ, W | | 0.642%–27.633%, due 08/01/16–03/01/42 | | | 35,075,358 | | | | 4.3 | |
| 475,000 | | | | W | | 4.500%, due 04/15/38 | | | 503,797 | | | | 0.0 | |
| | | | | | | | | | 111,114,790 | | | | 13.4 | |
See Accompanying Notes to Financial Statements
49
| ING INTERMEDIATE BOND FUND | SUMMARY PORTFOLIO OF INVESTMENTS
AS OF MARCH 31, 2012 (CONTINUED) |
Principal
Amount†
|
|
|
|
|
|
|
| Value
|
| Percentage
of Net
Assets
|
|---|
| |
U.S. GOVERNMENT AGENCY OBLIGATIONS: (continued) |
| Government National Mortgage
Association: 6.0% |
| 26,002,000 | | | | W | | 3.500%, due 10/15/41 | | $ | 27,021,765 | | | | 3.3 | |
| 81,361,904 | | | | ˆ | | 2.375%–8.008%, due 04/20/28–10/20/60 | | | 22,466,199 | | | | 2.7 | |
| | | | | | | | | | 49,487,964 | | | | 6.0 | |
| |
| | | | | | | Total U.S. Government Agency Obligations
(Cost $243,659,692) | | | 255,991,927 | | | | 30.9 | |
| |
ASSET-BACKED SECURITIES: 4.2% |
| Automobile Asset-Backed Securities: 0.1% |
| 778,000 | | | | | | Other Securities | | | 791,328 | | | | 0.1 | |
| |
| Home Equity Asset-Backed Securities: 0.0% |
| 352,873 | | | | | | Other Securities | | | 317,335 | | | | 0.0 | |
| |
| Other Asset-Backed Securities: 4.1% |
| 589,468 | | | | # | | ARES CLO Funds, 0.714%, 09/18/17 | | | 579,900 | | | | 0.1 | |
| 900,000 | | | | # | | ARES CLO Funds, 3.141%, 02/26/16 | | | 831,938 | | | | 0.1 | |
| 750,000 | | | | # | | ARES CLO Ltd., 1.841%, 02/26/16 | | | 703,233 | | | | 0.1 | |
| 500,000 | | | | # | | ARES CLO Ltd., 6.901%, 02/26/16 | | | 502,742 | | | | 0.0 | |
| 1,086,444 | | | | # | | Atrium CDO Corp., 0.821%, 10/27/16 | | | 1,066,588 | | | | 0.1 | |
| 1,533,382 | | | | # | | Atrium CDO Corp., 0.902%, 06/27/15 | | | 1,507,621 | | | | 0.2 | |
| 750,000 | | | | # | | Babson CLO Ltd/Cayman Islands, 6.812%, 11/15/16 | | | 748,545 | | | | 0.1 | |
| 345,905 | | | | # | | Callidus Debt Partners Fund Ltd., 1.003%, 05/15/15 | | | 342,767 | | | | 0.0 | |
| 553,686 | | | | # | | Carlyle High Yield Partners, 0.880%, 08/11/16 | | | 544,542 | | | | 0.1 | |
| 1,574,278 | | | | # | | Credit-Based Asset Servicing and Securitization, LLC, 5.746%, 12/25/37 | | | 1,552,363 | | | | 0.2 | |
| 1,188,000 | | | | # | | Credit-Based Asset Servicing and Securitization, LLC, 6.020%, 12/25/37 | | | 966,507 | | | | 0.1 | |
| 1,772,672 | | | | | | Credit-Based Asset Servicing and Securitization, LLC, 4.831%–5.501%, 08/25/35–12/25/36 | | | 1,436,091 | | | | 0.2 | |
| 800,000 | | | | # | | Dryden Leveraged Loan CDO 2002-II, 2.774%, 09/17/16 | | | 761,949 | | | | 0.1 | |
| 750,000 | | | | # | | Dryden Leveraged Loan CDO 2002-II, 6.184%, 12/22/15 | | | 765,769 | | | | 0.1 | |
| |
ASSET-BACKED SECURITIES: (continued) |
| Other Asset-Backed Securities: (continued) |
| 9,100,000 | | | | | | Fieldstone Mortgage Investment Corp., 0.402%–0.482%, 11/25/36 | | $ | 3,172,152 | | | | 0.4 | |
| 468,597 | | | | # | | First CLO Ltd., 0.907%, 07/27/16 | | | 467,323 | | | | 0.1 | |
| 1,100,000 | | | | # | | First CLO Ltd., 1.474%, 12/14/16 | | | 1,050,115 | | | | 0.1 | |
| 600,000 | | | | # | | First CLO Ltd., 2.857%, 07/27/16 | | | 563,541 | | | | 0.1 | |
| 1,250,000 | | | | # | | Galaxy CLO Ltd., 2.117%, 01/15/16 | | | 1,221,963 | | | | 0.1 | |
| 289,220 | | | | # | | Granite Ventures Ltd., 0.827%, 12/15/17 | | | 287,539 | | | | 0.0 | |
| 1,575,000 | | | | # | | Grayston CLO Ltd., 1.803%, 08/15/16 | | | 1,508,267 | | | | 0.2 | |
| 336,544 | | | | # | | Gulf Stream Compass CLO Ltd., 0.927%, 07/15/16 | | | 334,176 | | | | 0.0 | |
| 1,290,718 | | | | # | | Katonah Ltd., 0.794%, 09/20/16 | | | 1,275,363 | | | | 0.2 | |
| 1,550,000 | | | | # | | Landmark CDO Ltd., 1.417%, 01/15/16 | | | 1,539,302 | | | | 0.2 | |
| 814,355 | | | | # | | Lightpoint CLO Ltd., 0.734%, 09/15/17 | | | 784,879 | | | | 0.1 | |
| 10,178,000 | | | | | | Morgan Stanley ABS Capital I, 0.512%, 03/25/36 | | | 4,224,567 | | | | 0.5 | |
| 361,755 | | | | # | | Navigator CDO Ltd., 2.203%, 11/15/15 | | | 362,208 | | | | 0.0 | |
| 965,889 | | | | # | | Navigator CDO Ltd., 2.667%, 01/14/17 | | | 842,875 | | | | 0.1 | |
| 600,000 | | | | # | | Olympic CLO Ltd., 1.403%, 05/15/16 | | | 584,783 | | | | 0.1 | |
| 88,549 | | | | # | | Stanfield Carrera CLO Ltd., 0.954%, 03/15/15 | | | 88,106 | | | | 0.0 | |
| 1,250,000 | | | | # | | Veritas CLO Ltd., 1.800%, 09/05/16 | | | 1,146,305 | | | | 0.1 | |
| 1,315,943 | | | | # | | Wind River CLO Ltd., 0.804%, 12/19/16 | | | 1,278,474 | | | | 0.2 | |
| 583,957 | | | | | | Other Securities | | | 466,118 | | | | 0.1 | |
| | | | | | | | | | 33,508,611 | | | | 4.1 | |
| |
| | | | | | | Total Asset-Backed Securities
(Cost $35,924,739) | | | 34,617,274 | | | | 4.2 | |
| |
U.S. TREASURY OBLIGATIONS: 10.6% |
| U.S. Treasury Bonds: 3.9% |
| 21,190,000 | | | | | | 2.000%, due 02/15/22 | | | 20,776,138 | | | | 2.5 | |
| 12,244,000 | | | | | | 3.125%, due 11/15/41 | | | 11,700,673 | | | | 1.4 | |
| | | | | | | | | | 32,476,811 | | | | 3.9 | |
| |
| U.S. Treasury Notes: 6.7% |
| 23,419,000 | | | | | | 0.250%, due 03/31/14 | | | 23,380,593 | | | | 2.8 | |
| 7,590,000 | | | | | | 0.375%, due 03/15/15 | | | 7,562,129 | | | | 0.9 | |
See Accompanying Notes to Financial Statements
50
| ING INTERMEDIATE BOND FUND | SUMMARY PORTFOLIO OF INVESTMENTS
AS OF MARCH 31, 2012 (CONTINUED) |
Principal
Amount†
|
|
|
|
|
|
|
| Value
|
| Percentage
of Net
Assets
|
|---|
| |
U.S. TREASURY OBLIGATIONS: (continued) |
| U.S. Treasury Notes: (continued) |
| 11,209,000 | | | | | | 1.000%, due 03/31/17 | | $ | 11,184,486 | | | | 1.4 | |
| 12,995,000 | | | | | | 1.500%, due 03/31/19 | | | 12,893,483 | | | | 1.6 | |
| | | | | | | | | | 55,020,691 | | | | 6.7 | |
| |
| | | | | | | Total U.S. Treasury Obligations
(Cost $87,305,586) | | | 87,497,502 | | | | 10.6 | |
| |
FOREIGN GOVERNMENT BONDS: 7.2% | | |
| BRL 12,093,000 | | | | | | Brazil Notas do Tesouro Nacional Serie F, 10.000%, 01/01/14 | | | 6,823,805 | | | | 0.8 | |
| BRL 34,028,000 | | | | | | Brazil Notas do Tesouro Nacional Series F, 10.000%, 01/01/21 | | | 18,018,949 | | | | 2.2 | |
| 337,000 | | | | # | | Lithuania Government International Bond, 5.125%, 09/14/17 | | | 352,165 | | | | 0.1 | |
| 264,000 | | | | # | | Lithuania Government International Bond, 6.625%, 02/01/22 | | | 293,370 | | | | 0.0 | |
| 260,000 | | | | # | | Romanian Government International Bond, 6.750%, 02/07/22 | | | 273,000 | | | | 0.0 | |
| 1,686,010 | | | | # | | Russia Government Bond, 7.500%, 03/31/30 | | | 2,025,319 | | | | 0.3 | |
| 200,000 | | | | # | | Russian Foreign Bond-Eurobond, 5.625%, 04/04/42 | | | 199,400 | | | | 0.0 | |
| ZAR 125,621,080 | | | | | | South Africa Government Bond, 7.250%, 01/15/20 | | | 15,889,929 | | | | 1.9 | |
| 368,000 | | | | # | | Ukraine Government Bond, 7.650%, 06/11/13 | | | 356,500 | | | | 0.1 | |
| 300,000 | | | | # | | Ukraine Government International Bond, 6.250%, 06/17/16 | | | 262,500 | | | | 0.0 | |
| 13,587,613 | | | | | | Other Securities | | | 15,231,271 | | | | 1.8 | |
| |
| | | | | | | Total Foreign Government Bonds
(Cost $59,621,557) | | | 59,726,208 | | | | 7.2 | |
Shares
|
|
|
|
|
|
|
| Value
|
| Percentage
of Net
Assets
|
|---|
| |
PREFERRED STOCK: 0.3% |
| |
| 72,000 | | | | | | Other Securities | | | 1,957,910 | | | | 0.3 | |
| |
| | | | | | | Total Preferred Stock
(Cost $1,862,100) | | | 1,957,910 | | | | 0.3 | |
# of Contracts
|
|
|
|
|
|
|
| Value
|
| Percentage
of Net
Assets
|
|---|
| |
PURCHASED OPTIONS: 0.1% |
| Credit Default Swaption: 0.1% |
| 40,180,000 | | | | @ | | Payer Swaption-Fund buys credit default swap protection on CDX.NA.HY.17, Strike @ 96.000, Exp. 12/20/16 Counterparty: Morgan Stanley | | $ | 592,961 | | | | 0.1 | |
| |
| Options On Currencies: 0.0% |
| 19,600,000 | | | | @ | | EUR Put vs. USD Call Currency Option, Strike @ 1.310, Exp. 04/25/12 Counterparty: Morgan Stanley | | | 64,400 | | | | 0.0 | |
| |
| | | | | | | Total Purchased Options
(Cost $910,959) | | | 657,361 | | | | 0.1 | |
| |
| | | | | | | Total Long-Term Investments
(Cost $789,776,005) | | | 807,518,940 | | | | 97.7 | |
Principal
Amount†
|
|
|
|
|
|
|
| Value
|
| Percentage
of Net
Assets
|
|---|
| |
SHORT-TERM INVESTMENTS: 15.0% |
| Securities Lending Collateralcc(1): 4.0% |
| 1,672,576 | | | | | | BNP Paribas Bank, Repurchase Agreement dated 03/30/12, 0.16%, due 04/02/12 (Repurchase Amount $1,672,598, collateralized by various U.S. Government Agency Obligations, 3.000%–6.500%, Market Value plus accrued interest $1,706,028, due 01/01/22–03/01/42) | | | 1,672,576 | | | | 0.2 | |
| 7,944,726 | | | | | | Cantor Fitzgerald, Repurchase Agreement dated 03/30/12, 0.17%, due 04/02/12 (Repurchase Amount $7,944,837, collateralized by various U.S. Government and U.S. Government Agency Obligations, 0.000%–7.500%, Market Value plus accrued interest $8,103,620, due 03/31/12–04/01/42) | | | 7,944,726 | | | | 1.0 | |
See Accompanying Notes to Financial Statements
51
| ING INTERMEDIATE BOND FUND | SUMMARY PORTFOLIO OF INVESTMENTS
AS OF MARCH 31, 2012 (CONTINUED) |
Principal
Amount†
|
|
|
|
|
|
|
| Value
|
| Percentage
of Net
Assets
|
|---|
| |
SHORT-TERM INVESTMENTS: (continued) |
| Securities Lending Collateralcc(1): (continued) |
| 7,944,726 | | | | | | Citigroup, Inc., Repurchase Agreement dated 03/30/12, 0.18%, due 04/02/12 (Repurchase Amount $7,944,844, collateralized by various U.S. Government Agency Obligations, 1.992%–7.000%, Market Value plus accrued interest $8,103,621, due 03/01/18–04/15/43) | | $ | 7,944,726 | | | | 0.9 | |
| 7,944,726 | | | | | | Daiwa Capital Markets, Repurchase Agreement dated 03/30/12, 0.20%, due 04/02/12 (Repurchase Amount $7,944,857, collateralized by various U.S. Government and U.S. Government Agency Obligations, 0.000%–8.200%, Market Value plus accrued interest $8,103,621, due 07/19/12–04/01/42) | | | 7,944,726 | | | | 0.9 | |
| 7,944,726 | | | | | | Deutsche Bank AG, Repurchase Agreement dated 03/30/12, 0.15%, due 04/02/12 (Repurchase Amount $7,944,824, collateralized by various U.S. Government Agency Obligations, 3.500%–4.000%, Market Value plus accrued interest $8,103,622, due 10/01/20–12/01/40) | | | 7,944,726 | | | | 1.0 | |
| | | | | | | | | | 33,451,480 | | | | 4.0 | |
Shares
|
|
|
|
|
|
|
| Value
|
| Percentage
of Net
Assets
|
|---|
| |
| 90,591,565 | | | | | | BlackRock Liquidity Funds, TempFund, Institutional Class
(Cost $90,591,565) | | $ | 90,591,565 | | | | 11.0 | |
| |
| | | | | | | Total Short-Term Investments
(Cost $124,043,045) | | | 124,043,045 | | | | 15.0 | |
| |
| | | | | | | Total Investments in Securities
(Cost $913,819,050) | | $ | 931,561,985 | | | | 112.7 | |
| | | | | | | Liabilities in Excess of Other Assets | | | (104,622,984 | ) | | | (12.7 | ) |
| | | | | | | Net Assets | | $ | 826,939,001 | | | | 100.0 | |
“Other Securities” represents issues not identified as the top 50 holdings in terms of market value and issues or issuers not exceeding 1% of net assets individually or in aggregate respectively as of March 31, 2012.
The following footnotes apply to either the individual securities noted or one or more of the securities aggregated and listed as a single line item.
| † | | Unless otherwise indicated, principal amount is shown in USD. |
| # | | Securities with purchases pursuant to Rule 144A or section 4(2), under the Securities Act of 1933 and may not be resold subject to that rule except to qualified institutional buyers. |
| ## | | On September 7, 2008, the Federal Housing Finance Agency placed the Federal National Mortgage Association and the Federal Home Loan Mortgage Corporation into conservatorship and the U.S. Treasury guaranteed the debt issued by those organizations. |
| @ | | Non-income producing security |
| cc | | Securities purchased with cash collateral for securities loaned. |
| W | | Settlement is on a when-issued or delayed-delivery basis. |
| L | | Loaned security, a portion or all of the security is on loan at March 31, 2012. |
| ˆ | | Interest only securities represent the right to receive the monthly interest payments on an underlying pool of mortgage loans. Principal amount shown represents the notional amount on which current interest is calculated. Payments of principal on the pool reduce the value of the interest only security. |
| (1) | | Collateral received from brokers for securities lending was invested into these short-term investments. |
| (a) | | This grouping contains loaned securities. |
| (b) | | The grouping contains securities in default. |
| Cost for federal income tax purposes is $914,641,172. |
| Net unrealized appreciation consists of: | | | | | | |
| Gross Unrealized Appreciation | | | | $ | 29,551,529 | |
| Gross Unrealized Depreciation | | | | | (12,630,716 | ) |
| Net Unrealized Appreciation | | | | $ | 16,920,813 | |
See Accompanying Notes to Financial Statements
52
| ING INTERMEDIATE BOND FUND | SUMMARY PORTFOLIO OF INVESTMENTS
AS OF MARCH 31, 2012 (CONTINUED) |
Fair Value Measurementsˆ
The following is a summary of the fair valuations according to the inputs used as of March 31, 2012 in valuing the assets and liabilities:
| | | | Quoted Prices
in Active Markets
for Identical
Investments
(Level 1)
| | Significant
Other
Observable
Inputs
(Level 2)
| | Significant
Unobservable
Inputs
(Level 3)
| | Fair Value
at
3/31/2012
|
|---|
Asset Table | | | | | | | | | | | | | | | | | | |
Investments, at value | | | | | | | | | | | | | | | | | | |
| Preferred Stock | | | | $ | 1,957,910 | | | $ | — | | | $ | — | | | $ | 1,957,910 | |
| Purchased Options | | | | | — | | | | 657,361 | | | | — | | | | 657,361 | |
| Corporate Bonds/Notes | | | | | — | | | | 274,472,002 | | | | — | | | | 274,472,002 | |
| Collateralized Mortgage Obligations | | | | | — | | | | 92,598,756 | | | | — | | | | 92,598,756 | |
| Short-Term Investments | | | | | 90,591,565 | | | | 33,451,480 | | | | — | | | | 124,043,045 | |
| U.S. Treasury Obligations | | | | | — | | | | 87,497,502 | | | | — | | | | 87,497,502 | |
| Foreign Government Bonds | | | | | — | | | | 59,726,208 | | | | — | | | | 59,726,208 | |
| Asset-Backed Securities | | | | | — | | | | 33,021,547 | | | | 1,595,727 | | | | 34,617,274 | |
| U.S. Government Agency Obligations | | | | | ��� | | | | 255,991,927 | | | | — | | | | 255,991,927 | |
| Total Investments, at value | | | | $ | 92,549,475 | | | $ | 837,416,783 | | | $ | 1,595,727 | | | $ | 931,561,985 | |
| |
Other Financial Instruments+ | | | | | | | | | | | | | | | | | | |
| Swaps | | | | | — | | | | 645,549 | | | | — | | | | 645,549 | |
| Futures | | | | | 3,849,010 | | | | — | | | | — | | | | 3,849,010 | |
| Forward Foreign Currency Contracts | | | | | — | | | | 545,087 | | | | — | | | | 545,087 | |
| Total Assets | | | | $ | 96,398,485 | | | $ | 838,607,419 | | | $ | 1,595,727 | | | $ | 936,601,631 | |
| |
Liabilities Table | | | | | | | | | | | | | | | | | | |
Other Financial Instruments+ | | | | | | | | | | | | | | | | | | |
| Swaps | | | | $ | — | | | $ | (3,374,234 | ) | | $ | — | | | $ | (3,374,234 | ) |
| Futures | | | | | (3,933,232 | ) | | | — | | | | — | | | | (3,933,232 | ) |
| Written Options | | | | | — | | | | (25,000 | ) | | | — | | | | (25,000 | ) |
| Forward Foreign Currency Contracts | | | | | — | | | | (2,228,747 | ) | | | — | | | | (2,228,747 | ) |
| Total Liabilities | | | | $ | (3,933,232 | ) | | $ | (5,627,981 | ) | | $ | — | | | $ | (9,561,213 | ) |
| ˆ | | See Note 2, “Significant Accounting Policies” in the Notes to Financial Statements for additional information. |
| + | | Other Financial Instruments are derivatives not reflected in the Portfolio of Investments and may include open forward foreign currency contracts, equity forwards, futures, swaps, and written options. Forward foreign currency contracts, equity forwards and futures are valued at the unrealized gain (loss) on the instrument. Swaps and written options are valued at the fair value of the instrument. |
There were no significant transfers between Level 1 and 2 during the year ended March 31, 2012.
Transfers in or out of Level 3 represent either the beginning value (for transfers in), or the ending value (for transfers out) of any security or derivative instrument where a change in the pricing level occurred from the beginning to the end of the period. Transfers are recognized at the end of the reporting period.
| | | | Beginning
Balance on
3/31/2011
| | Purchases
| | Sales
| | Accrued
Discounts/
(Premiums)
| | Total
Realized
Gain (Loss)
| | Total Unrealized
Appreciation
(Depreciation)
| | Transfers
into
Level 3
| | Transfers
Out of
Level 3
| | Ending
Balance on
3/31/2012
|
|---|
Asset Table | | | | | | | | | | | | | | | | | | | | | | | | | | | | | | | | | | | | | | |
Investments, at value | | | | | | | | | | | | | | | | | | | | | | | | | | | | | | | | | | | | | | |
| Asset-Backed Securities | | | | $ | 10,152,584 | | | $ | — | | | $ | (3,439,599 | ) | | $ | 5,621 | | | $ | 43,652 | | | $ | (50 | ) | | $ | — | | | $ | (5,166,481 | ) | | $ | 1,595,727 | |
| Collateralized Mortgage Obligations | | | | | 562,285 | | | | — | | | | — | | | | — | | | | — | | | | — | | | | — | | | | (562,285 | ) | | | — | |
| U.S. Government Agency Obligations | | | | | 1,266,587 | | | | — | | | | — | | | | — | | | | — | | | | — | | | | — | | | | (1,266,587 | ) | | | — | |
| Preferred Stock | | | | | — | | | | — | | | | — | | | | — | | | | — | | | | — | | | | — | | | | — | | | | — | |
| Warrants | | | | | — | | | | — | | | | — | | | | — | | | | — | | | | — | | | | — | | | | — | | | | — | |
| Short-Term Investments | | | | | 2,663,885 | | | | — | | | | (2,663,885 | ) | | | — | | | | (665,971 | ) | | | 665,971 | | | | — | | | | — | | | | — | |
| Total Investments, at value | | | | $ | 14,645,341 | | | $ | — | | | $ | (6,103,484 | ) | | $ | 5,621 | | | $ | (622,319 | ) | | $ | 665,921 | | | $ | — | | | $ | (6,995,353 | ) | | $ | 1,595,727 | |
As of March 31, 2012, total change in unrealized gain (loss) on Level 3 securities still held at year end and included in the change in net assets was $(50).
See Accompanying Notes to Financial Statements
53
| ING INTERMEDIATE BOND FUND | SUMMARY PORTFOLIO OF INVESTMENTS
AS OF MARCH 31, 2012 (CONTINUED) |
At March 31, 2012 , the following forward foreign currency contracts were outstanding for the ING Intermediate Bond Fund:
Counterparty
| | | | Currency
| | Contract
Amount
| | Buy/Sell
| | Settlement
Date
| | In Exchange For
| | Fair Value
| | Unrealized
Appreciation
(Depreciation)
|
|---|
| Morgan Stanley | | | | Brazilian Real | | | 7,035,063 | | | | Buy | | | | 04/20/12 | | | $ | 3,875,000 | | | $ | 3,836,335 | | | $ | (38,665 | ) |
| Morgan Stanley | | | | Brazilian Real | | | 7,011,438 | | | | Buy | | | | 04/20/12 | | | | 3,892,000 | | | | 3,823,453 | | | | (68,547 | ) |
| Citigroup, Inc. | | | | EU Euro | | | 9,017,393 | | | | Buy | | | | 05/18/12 | | | | 11,836,212 | | | | 12,029,350 | | | | 193,138 | |
| Citigroup, Inc. | | | | Mexican Peso | | | 4,572,331 | | | | Buy | | | | 05/18/12 | | | | 353,027 | | | | 355,719 | | | | 2,692 | |
| Citigroup, Inc. | | | | South African Rand | | | 30,545,822 | | | | Buy | | | | 05/18/12 | | | | 3,900,878 | | | | 3,953,808 | | | | 52,930 | |
| | | | | | | | | | | | | | | | | | | | | | | | | | | $ | 141,548 | |
| HSBC | | | | Brazilian Real | | | 45,160,524 | | | | Sell | | | | 04/20/12 | | | $ | 23,992,330 | | | $ | 24,626,777 | | | $ | (634,447 | ) |
| Morgan Stanley | | | | Brazilian Real | | | 10,371,360 | | | | Sell | | | | 04/20/12 | | | | 5,952,000 | | | | 5,655,673 | | | | 296,327 | |
| Credit Suisse First Boston | | | | Mexican Peso | | | 71,875,713 | | | | Sell | | | | 05/18/12 | | | | 5,373,162 | | | | 5,591,803 | | | | (218,641 | ) |
| Citigroup, Inc. | | | | EU Euro | | | 8,899,103 | | | | Sell | | | | 05/18/12 | | | | 11,497,695 | | | | 11,871,550 | | | | (373,855 | ) |
| Deutsche Bank AG | | | | South African Rand | | | 152,250,937 | | | | Sell | | | | 05/18/12 | | | | 18,819,646 | | | | 19,707,146 | | | | (887,500 | ) |
| Deutsche Bank AG | | | | Mexican Peso | | | 14,236,505 | | | | Sell | | | | 05/18/12 | | | | 1,100,483 | | | | 1,107,575 | | | | (7,092 | ) |
| | | | | | | | | | | | | | | | | | | | | | | | | | | $ | (1,825,208 | ) |
ING Intermediate Bond Fund Open Futures Contracts on March 31, 2012:
Contract Description
| | | | Number
of Contracts
| | Expiration
Date
| | Notional
Value
| | Unrealized
Appreciation/
(Depreciation)
|
|---|
Long Contracts | | | | | | | | | | | | | | | | | | |
| U.S. Treasury 5-Year Note | | | | | 1,812 | | | | 06/29/12 | | | $ | 222,040,777 | | | $ | (1,547,566 ) | |
| U.S. Treasury Ultra Long Bond | | | | | 415 | | | | 06/20/12 | | | | 62,652,031 | | | | (2,385,666 ) | |
| | | | | | | | | | | | | $ | 284,692,808 | | | $ | (3,933,232 ) | |
Short Contracts | | | | | | | | | | | | | | | | | | |
| U.S. Treasury 10-Year Note | | | | | 1,368 | | | | 06/20/12 | | | $ | 177,134,632 | | | $ | 2,379,448 | |
| U.S. Treasury 2-Year Note | | | | | 139 | | | | 06/29/12 | | | | 30,599,546 | | | | 8,341 | |
| U.S. Treasury Long Bond | | | | | 477 | | | | 06/20/12 | | | | 65,706,750 | | | | 1,461,221 | |
| | | | | | | | | | | | | $ | 273,440,928 | | | $ | 3,849,010 | |
ING Intermediate Bond Fund Over-the-Counter Credit Default Swap Agreements Outstanding on March 31, 2012:
Credit Default Swaps on Corporate and Sovereign Issues — Buy Protection (1)
Counterparty
| | | | Reference
Entity/Obligation
| | Buy/Sell
Protection
| | (Pay)/Receive
Fixed Rate (%)
| | Termination
Date
| | Notional
Amount (2)
| | Fair
Value (3)
| | Upfront
Payments
Paid/(Received)
| | Unrealized
Appreciation/
(Depreciation)
|
|---|
| Citigroup, Inc. | | | | MBIA Inc. | | Buy | | (5.000) | | 09/20/13 | | | USD 1,311,000 | | | $ | 78,713 | | | $ | 125,124 | | | $ | (46,411 | ) |
| Citigroup, Inc. | | | | MBIA Inc. | | Buy | | (5.000) | | 09/20/13 | | | USD 640,000 | | | | 38,426 | | | | 63,645 | | | | (25,219 | ) |
| JPMorgan Chase & Co. | | | | MBIA Inc. | | Buy | | (5.000) | | 09/20/13 | | | USD 5,079,000 | | | | 304,945 | | | | 263,802 | | | | 41,143 | |
| | | | | | | | | | | | | | | | | $ | 422,084 | | | $ | 452,571 | | | $ | (30,487 | ) |
Credit Default Swaps on Corporate and Sovereign Issues — Sell Protection (4)
Counterparty
| | | | Reference
Entity/Obligation
| | Buy/Sell
Protection
| | (Pay)/Receive
Fixed Rate (%)
| | Termination
Date
| | Implied
Credit
Spread at
03/31/12
(%) (5)
| | Notional
Amount (2)
| | Fair
Value (3)
| | Upfront
Payments
Paid/
(Received)
| | Unrealized
Appreciation/
(Depreciation)
|
|---|
| Citigroup, Inc. | | | | MBIA Global Funding, LLC | | Sell | | 5.000 | | 09/20/13 | | | 17.000 | | | | USD 1,311,000 | | | $ | (188,989 | ) | | $ | (158,245 | ) | | $ | (30,744 | ) |
| Citigroup, Inc. | | | | MBIA Global Funding, LLC | | Sell | | 5.000 | | 09/20/13 | | | 17.000 | | | | USD 641,000 | | | | (92,404 | ) | | | (70,926 | ) | | | (21,478 | ) |
| Goldman Sachs & Co. | | | | MBIA Global Funding, LLC | | Sell | | 5.000 | | 09/20/13 | | | 17.000 | | | | USD 1,271,000 | | | | (183,223 | ) | | | (138,855 | ) | | | (44,368 | ) |
| JPMorgan Chase & Co. | | | | MBIA Global Funding, LLC | | Sell | | 5.000 | | 09/20/13 | | | 17.000 | | | | USD 2,540,000 | | | | (366,158 | ) | | | (139,257 | ) | | | (226,901 | ) |
| | | | | | | | | | | | | | | | | | | | | $ | (830,774 | ) | | $ | (507,283 | ) | | $ | (323,491 | ) |
| (1) | | If a Portfolio is a buyer of protection and a credit event occurs, as defined under the terms of that particular swap agreement, a Portfolio will either 1.) receive from the seller of protection an amount equal to the notional amount of the swap and deliver the referenced obligation, other deliverable obligations or underlying securities comprising the referenced index or 2.) receive a net settlement amount in the form of cash or securities equal to the notional amount of the swap less the recovery value of the referenced obligation or underlying securities comprising the referenced index. |
See Accompanying Notes to Financial Statements
54
| ING INTERMEDIATE BOND FUND | SUMMARY PORTFOLIO OF INVESTMENTS
AS OF MARCH 31, 2012 (CONTINUED) |
| (2) | | The maximum amount of future payments (undiscounted) that a Portfolio as seller of protection could be required to make or receive as a buyer of credit protection under a credit default swap agreement would be an amount equal to the notional amount of the agreement. |
| (3) | | The fair values for credit default swap agreements serve as an indicator of the current status of the payment/performance risk and represent the likelihood or risk of default for the credit derivative. Increasing fair values, in absolute terms, when compared to the notional amount of the agreement, represent a deterioration of the referenced obligation’s credit soundness and a greater likelihood or risk of default or other credit event occurring. |
| (4) | | If the Portfolio is a seller of protection, and a credit event occurs, as defined under the terms of that particular swap agreement, the Portfolio will generally either 1.) Pay to the buyer an amount equal to the notional amount of the swap and take delivery of the referenced obligation, other deliverable obligations, or underlying securities comprising a referenced index or 2.) Pay a net settlement amount in the form of cash or securities equal to the notional amount of the swap less the recovery value of the referenced obligation or underlying securities comprising a referenced index. |
| (5) | | Implied credit spreads, represented in absolute terms, utilized in determining the fair value of credit default swap agreements on corporate issues or sovereign issues are disclosed in each Portfolio’s Portfolio of Investment and serve as an indicator of the current status of the payment/performance risk and represent the likelihood or risk of default for the credit derivative. The implied credit spread of a particular referenced entity reflects the cost of buying/selling protection and may include upfront payments required to be made to enter into the agreement. For credit default swaps on asset-backed securities or credit indices, the quoted market prices and resulting market values serve as the indicator of the current status of the payment/performance risk. Wider credit spreads and increasing fair values, in absolute terms when compared to the notional amount of the swap, represent a deterioration of the referenced entity’s credit soundness and a greater likelihood or risk of default or other credit event occurring as defined under the terms of the agreement. |
ING Intermediate Bond Fund Over-the-Counter Interest Rate Swap Agreements Outstanding on March 31, 2012:
| | | | Termination
Date
| | Notional Amount
| | Fair
Value
| | Upfront
Payments
Paid/
(Received)
| | Unrealized
Appreciation/
(Depreciation)
|
|---|
Receive a floating rate based on the 1-day BRL-CDI and pay a fixed rate equal to 10.365%
Counterparty: Goldman Sachs & Co. | | | | 01/02/17 | | BRL 51,500,000 | | $ | 22,210 | | | $ | — | | | $ | 22,210 | |
Receive a floating rate based on the 3-month USD-LIBOR-BBA and pay a fixed rate equal to 3.478%
Counterparty: Citigroup, Inc. | | | | 05/11/20 | | USD 19,944,000 | | | (2,266,065 | ) | | | — | | | | (2,266,065 | ) |
Receive a fixed rate equal to 2.788% and pay a floating rate based on the 3-month USD-LIBOR-BBA
Counterparty: Morgan Stanley | | | | 03/16/20 | | USD 83,000,000 | | | 201,255 | | | | — | | | | 201,255 | |
Receive a floating rate based on the 3-month USD-LIBOR-BBA and pay a fixed rate equal to 3.453%
Counterparty: Morgan Stanley | | | | 03/16/45 | | USD 32,600,000 | | | (277,395 | ) | | | — | | | | (277,395 | ) |
| | | | | | | | | $ | (2,319,995 | ) | | $ | — | | | $ | (2,319,995 | ) |
ING Intermediate Bond Fund Written OTC Options on March 31, 2012:
# of Contracts
| | | | Counterparty
| | Description
| | Exercise
Price
| | Expiration
Date
| | Premiums
Received
| | Fair
Value
|
|---|
Options On Currencies | | | | | | | | | | | | | | | | | | | | | | | | | | |
| 19,600,000 | | | | Deutsche Bank AG | | USD Put vs. EUR Call Currency Option | | | 1.370 | | | | USD 04/25/12 | | | $ | 151,078 | | | $ | (25,000 ) | |
| Total Written OTC Options | $ | 151,078 | | | $ | (25,000 ) | |
A summary of derivative instruments by primary risk exposure is outlined in the following tables.
The fair value of derivative instruments as of March 31, 2012 was as follows:
Derivatives not accounted for as
hedging instruments
| | | | Location on Statement
of Assets and Liabilities
| | Fair Value
|
|---|
Asset Derivatives | | | | | | | | |
| Credit contracts | | | | Investments in securities at value* | | $ | 592,961 | |
| Foreign exchange contracts | | | | Investments in securities at value* | | | 64,400 | |
| Foreign exchange contracts | | | | Unrealized appreciation on forward foreign currency contracts | | | 545,087 | |
| Credit contracts | | | | Upfront payments paid on OTC swap agreements | | | 452,571 | |
| Credit contracts | | | | Unrealized appreciation on OTC swap agreements | | | 41,143 | |
| Interest rate contracts | | | | Unrealized appreciation on OTC swap agreements | | | 223,465 | |
| Interest rate contracts | | | | Net Assets- Unrealized appreciation** | | | 3,849,010 | |
Total Asset Derivatives | | | | | | $ | 5,768,637 | |
See Accompanying Notes to Financial Statements
55
| ING INTERMEDIATE BOND FUND | SUMMARY PORTFOLIO OF INVESTMENTS
AS OF MARCH 31, 2012 (CONTINUED) |
Derivatives not accounted for as
hedging instruments
| | | | Location on Statement
of Assets and Liabilities
| | Fair Value
|
|---|
Liability Derivatives
| | | | | | | | |
| Foreign exchange contracts | | | | Unrealized depreciation on forward foreign currency contracts | | $ | 2,228,747 | |
| Credit contracts | | | | Upfront payments received on OTC swap agreements | | | 507,283 | |
| Credit contracts | | | | Unrealized depreciation on OTC swap agreements | | | 395,121 | |
| Interest rate contracts | | | | Unrealized depreciation on OTC swap agreements | | | 2,543,460 | |
| Interest rate contracts | | | | Net Assets- Unrealized depreciation** | | | 3,933,232 | |
| Foreign exchange contracts | | | | Written options, at fair value | | | 25,000 | |
| Total Liability Derivatives | | | | | | $ | 9,632,843 | |
| * | | Includes purchased options. |
| ** | | Includes cumulative appreciation/depreciation of futures contracts as reported in the table following the Summary Portfolio of Investments. |
The effect of derivative instruments on the Fund’s Statement of Operations for the year ended March 31, 2012 was as follows:
| | | | Amount of Realized Gain or (Loss) on Derivatives Recognized in Income
| |
|---|
Derivatives not accounted for as
hedging instruments
| | | | Investments*
| | Foreign currency
related transactions**
| | Futures
| | Swaps
| | Written options
| | Total
|
|---|
| Credit contracts | | | | $ | 372,195 | | | $ | — | | | $ | — | | | $ | (1,750,600 | ) | | $ | 411,144 | | | $ | (967,261 | ) |
| Foreign exchange contracts | | | | | (378,732 | ) | | | 3,608,443 | | | | — | | | | — | | | | (190,937 | ) | | | 3,038,774 | |
| Interest rate contracts | | | | | (68,762 | ) | | | — | | | | (4,835,273 | ) | | | (35,091 | ) | | | 81,938 | | | | (4,857,188 | ) |
Total | | | | $ | (75,299 | ) | | $ | 3,608,443 | | | $ | (4,835,273 | ) | | $ | (1,785,691 | ) | | $ | 302,145 | | | $ | (2,785,675 | ) |
| | | | Change in Unrealized Appreciation or (Depreciation) on Derivatives Recognized in Income
| |
|---|
Derivatives not accounted for as
hedging instruments
| | | | Investments*
| | Foreign currency
related transactions**
| | Futures
| | Swaps
| | Written options
| | Total
|
|---|
| Credit contracts | | | | $ | (161,198 | ) | | $ | — | | | $ | — | | | $ | 595,928 | | | $ | — | | | $ | 434,730 | |
| Foreign exchange contracts | | | | | (92,400 | ) | | | (811,614 | ) | | | — | | | | — | | | | 126,078 | | | | (777,936 | ) |
| Interest rate contracts | | | | | (175,097 | ) | | | — | | | | (176,588 | ) | | | (2,329,002 | ) | | | 46,538 | | | | (2,634,149 | ) |
Total | | | | $ | (428,695 | ) | | $ | (811,614 | ) | | $ | (176,588 | ) | | $ | (1,733,074 | ) | | $ | 172,616 | | | $ | (2,977,355 | ) |
| * | | Amounts recognized for purchased options are included in net realized gain (loss) on investments and net change in unrealized appreciation or depreciation on investments. |
| ** | | Amounts recognized for forward foreign currency contracts are included in net realized gain (loss) on foreign currency related transactions and net change in unrealized appreciation or depreciation on foreign currency related transactions. |
See Accompanying Notes to Financial Statements
56
TAX INFORMATION (UNAUDITED)
Dividends and distributions paid during the year ended March 31, 2012 were as follows:
Fund Name
| | | | Type
| | Per Share Amount
|
|---|
| |
| ING GNMA Income Fund | | | | | | | | | | |
| Class A | | | | NII | | $ | 0.3371 | |
| Class B | | | | NII | | $ | 0.2678 | |
| Class C | | | | NII | | $ | 0.2706 | |
| Class I | | | | NII | | $ | 0.3628 | |
| Class W | | | | NII | | $ | 0.3596 | |
| All Classes | | | | LTCG | | $ | 0.0103 | |
| |
| ING High Yield Bond Fund | | | | | | | | | | |
| Class A | | | | NII | | $ | 0.5183 | |
| Class B | | | | NII | | $ | 0.4580 | |
| Class C | | | | NII | | $ | 0.4603 | |
| Class I | | | | NII | | $ | 0.5504 | |
| Class W | | | | NII | | $ | 0.4358 | |
| |
| ING Intermediate Bond Fund | | | | | | | | | | |
| Class A | | | | NII | | $ | 0.4333 | |
| Class B | | | | NII | | $ | 0.3562 | |
| Class C | | | | NII | | $ | 0.3582 | |
| Class I | | | | NII | | $ | 0.4601 | |
| Class O | | | | NII | | $ | 0.4336 | |
| Class R | | | | NII | | $ | 0.4095 | |
| Class W | | | | NII | | $ | 0.5648 | |
NII — Net investment income
LTCG — Long-term capital gain
Of the ordinary distributions made during the year ended March 31, 2012, the following percentage qualifies for the dividends received deduction (DRD) available to corporate shareholders:
| ING Intermediate Bond Fund | | | | | 0.40 | % |
For the year ended March 31, 2012, the following percentage of net investment income dividends paid by the Funds is designated as qualifying dividend income (QDI) subject to reduced income tax rates for individuals:
| ING Intermediate Bond Fund | | | | | 0.40 | % |
Pursuant to Internal Revenue Code Section 871(k)(1), the Funds designate the following percentages of net investment income distributions as interest-related dividends:
| ING GNMA Income Fund | | | | | 92.51 | % |
| ING High Yield Bond Fund | | | | | 98.53 | % |
| ING Intermediate Bond Fund | | | | | 99.48 | % |
Above figures may differ from those cited elsewhere in this report due to differences in the calculation of income and gains under U.S. generally accepted accounting principles (book) purposes and Internal Revenue Service (tax) purposes.
Shareholders are strongly advised to consult their own tax advisers with respect to the tax consequences of their investments in the Funds. In January, shareholders, excluding corporate shareholders, receive an IRS 1099-DIV regarding the federal tax status of the dividends and distributions they received in the calendar year.
57
TRUSTEE AND OFFICER INFORMATION (UNAUDITED)
The business and affairs of the Trust are managed under the direction of the Trust’s Board. A Trustee who is not an interested person of the Trust, as defined in the 1940 Act, is an independent trustee (“Independent Trustee”). The Trustees and Officers of the Trust are listed below. The Statement of Additional Information includes additional information about trustees of the Trust and is available, without charge, upon request at (800) 992-0180.
Name, Address and Age
| | | | Position(s)
Held with the
Trust
| | Term of Office
and Length of
Time Served(1)
| | Principal
Occupation(s)—
During the Past 5 Years
| | Number of
Funds in
Fund Complex
Overseen by
Trustee(2)
| | Other
Board
Positions
Held by
Trustee
|
|---|
| |
Independent Trustees: | | | | | | | | | | | | |
| |
Colleen D. Baldwin
7337 East Doubletree Ranch Rd.
Suite 100
Scottsdale, Arizona 85258
Age: 52 | | | | Trustee | | November 2007–Present | | President, Glantuam Partners, LLC, a business consulting firm (January 2009– Present). | | 138 | | None.
|
| |
John V. Boyer
7337 East Doubletree Ranch Rd.
Suite 100
Scottsdale, Arizona 85258
Age: 58 | | | | Trustee | | January 2005–Present | | President and Chief Executive Officer, Bechtler Arts Foundation, an arts and education foundation (January 2008–Present). Formerly, Consultant (July 2007–February 2008) and President and Chief Executive Officer, Franklin and Eleanor Roosevelt Institute, a public policy foundation (March 2006–July 2007). | | 138 | | None.
|
| |
Patricia W. Chadwick
7337 East Doubletree Ranch Rd.
Suite 100
Scottsdale, Arizona 85258
Age: 63 | | | | Trustee | | January 2006–Present | | Consultant and President, Ravengate Partners LLC, a consulting firm that provides advice regarding financial markets and the global economy (January 2000 –Present). | | 138 | | Wisconsin Energy Corporation (June 2006–Present) and The Royce Fund, (35 funds) (December 2009–Present). |
| |
Peter S. Drotch
7337 East Doubletree Ranch Rd.
Suite 100
Scottsdale, Arizona 85258
Age: 70 | | | | Trustee | | November 2007–Present | | Retired. | | 138 | | First Marblehead Corporation (September 2003–Present). |
| |
J. Michael Earley
7337 East Doubletree Ranch Rd.
Suite 100
Scottsdale, Arizona 85258
Age: 67 | | | | Trustee | | February 2002–Present | | Retired. Formerly, Banking President and Chief Executive Officer, Bankers Trust Company, N.A., Des Moines (June 1992–December 2008). | | 138 | | None.
|
| |
Patrick W. Kenny
7337 East Doubletree Ranch Rd.
Suite 100
Scottsdale, Arizona 85258
Age: 69 | | | | Trustee | | January 2005–Present | | Retired. Formerly, President and Chief Executive Officer, International Insurance Society (June 2001– June 2009). | | 138 | | Assured Guaranty Ltd. (April 2004–Present). |
| |
Sheryl K. Pressler
7337 East Doubletree Ranch Rd.
Suite 100
Scottsdale, Arizona 85258
Age: 61 | | | | Trustee | | January 2006–Present | | Consultant (May 2001 –Present). | | 138 | | Stillwater Mining Company (May 2002–Present). |
| |
Roger B. Vincent
7337 East Doubletree Ranch Rd.
Suite 100
Scottsdale, Arizona 85258
Age: 66 | | | | Chairperson/Trustee | | February 2002–Present | | Retired. Formerly, President, Springwell Corporation, a corporate finance firm (March 1989–August 2011). | | 138 | | UGI Corporation (February 2006–Present) and UGI Utilities, Inc. (February 2006–Present). |
58
TRUSTEE AND OFFICER INFORMATION (UNAUDITED) (CONTINUED)
Name, Address and Age
| | | | Position(s)
Held with the
Trust
| | Term of Office
and Length of
Time Served(1)
| | Principal
Occupation(s)—
During the Past 5 Years
| | Number of
Funds in
Fund Complex
Overseen by
Trustee(2)
| | Other
Board
Positions
Held by
Trustee
|
|---|
| |
Trustees who are “Interested Persons”: | | | | | | | |
| |
Robert W. Crispin(3)
7337 East Doubletree Ranch Rd.
Suite 100
Scottsdale, Arizona 85258
Age: 65 | | | | Trustee | | November 2007–Present | | Retired. Formerly, Chairman and Chief Executive Officer, ING Investment Management Co. (July 2001–December 2007). | | 138 | | Intact Financial Corporation (December 2004–Present) and PFM Group (November 2010–Present). |
| |
Shaun P. Mathews(3)
7337 East Doubletree Ranch Rd.
Suite 100
Scottsdale, Arizona 85258
Age: 56 | | | | Trustee | | November 2007–Present | | President and Chief Executive Officer, ING Investments, LLC (November 2006– Present). | | 176 | | ING Capital Corporation, LLC (December 2005–Present). |
(1) | | Trustees serve until their successors are duly elected and qualified. The tenure of each Trustee is subject to the Board’s retirement policy which states that each duly elected or appointed Trustee who is not an “interested person” of the Trust, as defined in the 1940 Act, as amended (“Independent Trustees”), shall retire from service as a Trustee at the conclusion of the first regularly scheduled quarterly meeting of the Board that is held after the Trustee reaches the age of 72. A unanimous vote of the Board may extend the retirement date of a Trustee for up to one year. An extension may be permitted if the retirement would trigger a requirement to hold a meeting of shareholders of the Trust under applicable law, whether for purposes of appointing a successor to the Trustee or if otherwise necessary under applicable law, in which case the extension would apply until such time as the shareholder meeting can be held or is no longer needed. |
(2) | | Except for Mr. Mathews and for the purposes of this table “ING Fund Complex” means the following investment companies: ING Asia Pacific High Dividend Equity Income Fund; ING Emerging Markets High Dividend Equity Fund; ING Emerging Markets Local Bond Fund; ING Equity Trust; ING Funds Trust; ING Global Equity Dividend and Premium Opportunity Fund; ING Global Advantage and Premium Opportunity Fund; ING Infrastructure, Industrials and Materials Fund; ING International High Dividend Equity Income Fund; ING Investors Trust; ING Mayflower Trust; ING Mutual Funds; ING Partners, Inc.; ING Prime Rate Trust; ING Risk Managed Natural Resources Fund; ING Senior Income Fund; ING Separate Portfolios Trust; ING Variable Insurance Trust; and ING Variable Products Trust. For Mr. Mathews, the ING Fund Complex also includes the following investment companies: ING Balanced Portfolio, Inc.; ING Intermediate Bond Portfolio; ING Money Market Portfolio; ING Series Fund, Inc.; ING Strategic Allocation Portfolios, Inc.; ING Variable Funds; and ING Variable Portfolios, Inc. Therefore, for the purposes of this table with reference to Mr. Mathews, “Fund Complex” includes these investment companies. The number of funds in the ING Fund Complex is as of April 30, 2012. |
(3) | | Messrs. Crispin and Matthews are deemed “Interested Persons” of the Trust because of their current or prior affiliation with ING Groep, N.V., the parent corporation of the Investment Adviser(s) and the Distributor. |
59
TRUSTEE AND OFFICER INFORMATION (UNAUDITED) (CONTINUED)
Name, Address and Age
| | | | Position(s)
Held With the
Company
| | Term of Office
and Length of
Time Served(1)
| | Principal
Occupation(s)—
During the Past 5 Years
|
|---|
| |
Shaun P. Mathews
7337 East Doubletree Ranch Rd.
Suite 100
Scottsdale, Arizona 85258
Age: 56 | | | | President and Chief Executive Officer | | November 2006–Present | | President and Chief Executive Officer, ING Investments, LLC (November 2006–Present). |
| |
Michael J. Roland
7337 East Doubletree Ranch Rd.
Suite 100
Scottsdale, Arizona 85258
Age: 54 | | | | Executive Vice President | | February 2002–Present | | Chief Compliance Officer, Directed Services LLC and ING Investments, LLC (March 2011–Present) and Executive Vice President and Chief Operating Officer, ING Investments, LLC and ING Funds Services, LLC (January 2007–Present). Formerly, Chief Compliance Officer, ING Funds (March 2011–February 2012). |
| |
Stanley D. Vyner
230 Park Avenue
New York, New York 10169
Age: 62 | | | | Executive Vice President
Chief Investment Risk Officer | | October 2000–Present
September 2009–Present | | Executive Vice President, ING Investments, LLC (July 2000–Present) and Chief Investment Risk Officer, ING Investments, LLC (January 2003 –Present). |
| |
Kevin M. Gleason
7337 East Doubletree Ranch Rd.
Suite 100
Scottsdale, Arizona 85258
Age: 45 | | | | Chief Compliance Officer | | February 2012–Present | | Senior Vice President, ING Investment Management, LLC (February 2012– Present). Formerly, Assistant General Counsel and Assistant Secretary, The Northwestern Mutual Life Insurance Company (June 2004–January 2012). |
| |
Kimberly A. Anderson
7337 East Doubletree Ranch Rd.
Suite 100
Scottsdale, Arizona 85258
Age: 47 | | | | Senior Vice President | | November 2003–Present | | Senior Vice President, ING Investments, LLC (October 2003 –Present). |
| |
Todd Modic
7337 East Doubletree Ranch Rd.
Suite 100
Scottsdale, Arizona 85258
Age: 44 | | | | Senior Vice President, Chief/Principal Financial Officer and Assistant Secretary | | March 2005–Present | | Senior Vice President, ING Funds Services, LLC (March 2005–Present). |
| |
Robert Terris
7337 East Doubletree Ranch Rd.
Suite 100
Scottsdale, Arizona 85258
Age: 41 | | | | Senior Vice President | | May 2006–Present | | Senior Vice President, Head of Division Operations, ING Funds Services, LLC (May 2006–Present). |
| |
Gregory K. Wilson
7337 East Doubletree Ranch Rd.
Suite 100
Scottsdale, Arizona 85258
Age: 52 | | | | Senior Vice President | | September 2011–Present | | Senior Vice President–Fund Compliance, ING Funds Services, LLC (March 2012–Present). Formerly, Vice President–Fund Compliance, ING Funds Services, LLC (October 2009 –March 2012) and Finance Director, ING Funds Services, LLC (September 2006–October 2009). |
| |
Robyn L. Ichilov
7337 East Doubletree Ranch Rd.
Suite 100
Scottsdale, Arizona 85258
Age: 44 | | | | Vice President | | October 2000–Present | | Vice President and Treasurer, ING Funds Services, LLC (November 1995 –Present) and ING Investments, LLC (August 1997–Present). Formerly, Treasurer, ING Funds (November 1999 –February 2012). |
| |
Maria M. Anderson
7337 East Doubletree Ranch Rd.
Suite 100
Scottsdale, Arizona 85258
Age: 54 | | | | Vice President | | September 2004–Present | | Vice President, ING Funds Services, LLC (September 2004–Present). |
60
TRUSTEE AND OFFICER INFORMATION (UNAUDITED) (CONTINUED)
Name, Address and Age
| | | | Position(s)
Held With the
Company
| | Term of Office
and Length of
Time Served(1)
| | Principal
Occupation(s)—
During the Past 5 Years
|
|---|
| |
Lauren D. Bensinger
7337 East Doubletree Ranch Rd.
Suite 100
Scottsdale, Arizona 85258
Age: 58 | | | | Vice President | | February 2003–Present | | Vice President, ING Investments, LLC and ING Funds Services, LLC (February 1996–Present); Director of Compliance, ING Investments, LLC (October 2004–Present); and Vice President and Money Laundering Reporting Officer, ING Investments Distributor, LLC (April 2010–Present). Formerly, Chief Compliance Officer, ING Investments Distributor, LLC (August 1995–April 2010). |
| |
William Evans
One Orange Way
Windsor, Connecticut 06095
Age: 39 | | | | Vice President | | September 2007–Present | | Senior Vice President (March 2010– Present) and Head of Manager Research and Selection Group, ING Investment Management (April 2007 –Present). |
| |
Denise Lewis
7337 East Doubletree Ranch Rd.
Suite 100
Scottsdale, Arizona 85258
Age: 48 | | | | Vice President
Treasurer | | January 2007–Present
February 2012–Present | | Vice President, ING Funds Services, LLC (December 2006–Present). |
| |
Kimberly K. Springer
7337 East Doubletree Ranch Rd.
Suite 100
Scottsdale, Arizona 85258
Age: 55 | | | | Vice President | | March 2006–Present | | Vice President, ING Investment Management — ING Funds (March 2010–Present); Vice President, ING Funds Services, LLC (March 2006–Present); and Managing Paralegal, Registration Statements (June 2003–Present). |
| |
Craig Wheeler
7337 East Doubletree Ranch Rd.
Suite 100
Scottsdale, Arizona 85258
Age: 43 | | | | Assistant Vice President | | May 2008–Present | | Assistant Vice President — Director of Tax, ING Funds Services, LLC (March 2008–Present). Formerly, Tax Manager, ING Funds Services, LLC (March 2005–March 2008). |
| |
Theresa K. Kelety
7337 East Doubletree Ranch Rd.
Suite 100
Scottsdale, Arizona 85258
Age: 49 | | | | Assistant Secretary | | August 2003–Present | | Vice President and Senior Counsel, ING Investment Management — ING Funds (March 2010–Present). Formerly, Senior Counsel, ING Americas, U.S. Legal Services (April 2008–March 2010) and Counsel, ING Americas, U.S. Legal Services (April 2003–April 2008). |
| |
Huey P. Falgout, Jr.
7337 East Doubletree Ranch Rd.
Suite 100
Scottsdale, Arizona 85258
Age: 48 | | | | Secretary | | August 2003–Present | | Senior Vice President and Chief Counsel, ING Investment Management — ING Funds (March 2010–Present). Formerly, Chief Counsel, ING Americas, U.S. Legal Services (October 2003–March 2010). |
| |
Paul Caldarelli
7337 East Doubletree Ranch Rd.
Suite 100
Scottsdale, Arizona 85258
Age: 60 | | | | Assistant Secretary | | June 2010–Present | | Vice President and Senior Counsel, ING Investment Management — ING Funds (March 2010–Present). Formerly, Senior Counsel, ING Americas, U.S. Legal Services (April 2008–March 2010) and Counsel, ING Americas, U.S. Legal Services (May 2005–April 2008). |
| |
Kathleen Nichols
7337 East Doubletree Ranch Rd.
Suite 100
Scottsdale, Arizona 85258
Age: 36 | | | | Assistant Secretary | | May 2008–Present | | Vice President and Counsel, ING Investment Management — ING Funds (March 2010–Present). Formerly, Counsel, ING Americas, U.S. Legal Services (February 2008–March 2010) and Associate, Ropes & Gray LLP (September 2005–February 2008). |
(1) | | The Officers hold office until the next annual meeting of the Board of Directors and until their successors shall have been elected and qualified. |
61
ADVISORY CONTRACT APPROVAL DISCUSSION (UNAUDITED)
BOARD CONSIDERATION AND RE-APPROVAL OF INVESTMENT ADVISORY AND SUB-ADVISORY CONTRACTS
Section 15(c) of the Investment Company Act of 1940, as amended (the “1940 Act”) provides that, after an initial period, the Funds’ existing investment advisory and sub-advisory contracts will remain in effect only if the Board of Trustees (the “Board”) of ING Funds Trust (the “Trust”), including a majority of Board members who have no direct or indirect interest in the advisory and sub-advisory contracts, and who are not “interested persons” of the Funds, as such term is defined under the 1940 Act (the “Independent Trustees”), annually review and approve them. Thus, at a meeting held on November 17, 2011, the Board, including a majority of the Independent Trustees, considered whether to renew the investment advisory contracts (the “Advisory Contracts”) between ING Investments, LLC (the “Adviser”) and the Funds and the sub-advisory contracts (“Sub-Advisory Contracts”) with ING Investment Management Co. (now known as ING Investment Management Co. LLC, the sub-adviser to each Funds (the “Sub-Adviser”).
The Independent Trustees also held separate meetings on October 12 and November 15, 2011 to consider the renewal of the Advisory Contracts and Sub-Advisory Contracts. As a result, subsequent references herein to factors considered and determinations made by the Independent Trustees include, as applicable, factors considered and determinations made on those earlier dates by the Independent Trustees.
At its November 17, 2011 meeting, the Board voted to renew the Advisory and Sub-Advisory Contracts for the Funds. In reaching these decisions, the Board took into account information furnished to it throughout the year at regular meetings of the Board and the Board’s committees, as well as information prepared specifically in connection with the annual renewal process. Determinations by the Independent Trustees also took into account various factors that they believed, in light of the legal advice furnished to them by K&L Gates LLP (“K&L Gates”), their independent legal counsel, and their own business judgment, to be relevant. Further, while the Board considered at the same meeting the advisory contracts and sub-advisory contracts that were subject to renewal for the funds under its jurisdiction, the Trustees considered each Fund’s advisory and sub-advisory relationships separately.
Provided below is an overview of the Board’s contract approval process in general, as well as a discussion of certain specific factors that the Board considered at its renewal meeting. While the Board gave its attention to the information furnished at the request of the Independent Trustees that was most relevant to its considerations, discussed below are a number of the primary factors relevant to the Board’s consideration as to whether to renew the Advisory and Sub-Advisory Contracts for the one-year period ending November 30, 2012. Each Board member may have accorded different weight to the various factors in reaching his or her conclusions with respect to each Fund’s advisory and sub-advisory arrangements.
Overview of the Contract Renewal and Approval Process
The Board follows a structured process pursuant to which it seeks and considers relevant information when it decides whether to approve new or existing advisory and sub-advisory arrangements for the investment companies in the ING Fund complex under its jurisdiction, including the Funds’ existing Advisory and Sub-Advisory Contracts. Among other actions, the Independent Trustees of the Board: retain the services of independent consultants with experience in the mutual fund industry to assist the Independent Trustees in working with the personnel employed by the Adviser or its affiliates who administer the Funds (“Management”) to identify the types of information presented to the Board to inform its deliberations with respect to advisory and sub-advisory relationships and to help evaluate that information; evaluate industry best practices in regards to the consideration of investment advisory and sub-advisory contracts; established a specific format in which certain requested information is provided to the Board; and determine the process for reviewing such information in connection with advisory and sub-advisory contract renewals and approvals. The result is a process (the “Contract Review Process”) employed by the Board and its Independent Trustees to review and analyze information in connection with the annual renewal of the ING Funds’ advisory and sub-advisory contracts, as well as the review and approval of new advisory and sub-advisory relationships.
Since the Contract Review Process was first implemented, the Board’s membership has changed substantially through periodic retirements of some Trustees and the appointment and election of new Trustees. In addition, the Independent Trustees have reviewed and refined the renewal and approval process at least annually in order to request additional information from Management and address certain unique characteristics related to the introduction of new Funds.
The Board has established two Investment Review Committees (each, an “IRC”), which meet
62
ADVISORY CONTRACT APPROVAL DISCUSSION (UNAUDITED) (CONTINUED)
independently and, at times, jointly, and a Contracts Committee. Among other matters, the Contracts Committee provides oversight with respect to the contracts renewal and approval process, and each Fund is assigned to an IRC which provides oversight regarding, among other matters, the investment performance of the Adviser and Sub-Adviser, as well as the oversight by the Adviser of the performance of the Sub-Adviser. The IRCs may apply a heightened level of scrutiny in cases where performance has lagged a Fund’s relevant benchmark and/or selected peer group of investment companies (“Selected Peer Groups”).
The type and format of the information provided to the Board or to legal counsel for the Independent Trustees in connection with the contract approval and renewal process has been codified in the ING Funds’ 15(c) Methodology Guide. This Guide was developed under the direction of the Independent Trustees and sets out a blueprint pursuant to which the Independent Trustees request certain information that they deem important to facilitate an informed review in connection with initial and annual approvals of advisory and sub-advisory contracts.
Management provides certain of the information requested by the 15(c) Methodology Guide in Fund Analysis and Comparison Tables (“FACT sheets”) prior to the Independent Trustees’ review of advisory and sub-advisory arrangements (including the Funds’ Advisory and Sub-Advisory Contracts). The Independent Trustees previously retained an independent firm to verify and test the accuracy of certain FACT sheet data for a representative sample of funds in the ING Fund complex. In addition, the Contracts Committee routinely employs the services of an independent consultant to assist in its review and analysis of, among other matters, the 15(c) Methodology Guide, the content and format of the FACT sheets, and Selected Peer Groups to be used by the Funds for certain comparison purposes during the renewal process. As part of an ongoing process, the Contracts Committee recommends or considers recommendations from Management for refinements to the 15(c) Methodology Guide and other aspects of the review process, and the Board’s IRCs review benchmarks used to assess the performance of funds in the ING Fund complex.
The Board employed its process for reviewing contracts when considering the renewals of the Funds’ Advisory and Sub-Advisory Contracts that would be effective through November 30, 2012. Set forth below is a discussion of many of the Board’s primary considerations and conclusions resulting from this process.
Nature, Extent and Quality of Service
In determining whether to approve the Advisory and Sub-Advisory Contracts for the Funds for the year ending November 30, 2012, the Independent Trustees received and evaluated such information as they deemed necessary regarding the nature, extent and quality of services provided to the Funds by the Adviser and Sub-Adviser. This included information regarding the Adviser and Sub-Adviser provided throughout the year at regular meetings of the Board and its committees, as well as information furnished in connection with the contract renewal meetings.
The materials requested by the Independent Trustees and provided to the Board, K&L Gates and/or independent consultants that assist the Independent Trustees prior to the November 17, 2011 Board meeting included, among other information, the following items for each Fund: (1) FACT sheets that provided information regarding the performance and expenses of the Fund and other similarly managed funds in its Selected Peer Group, as well as information regarding the Fund’s investment portfolio, objective and strategies; (2) reports providing risk and attribution analyses of the Fund; (3) the 15(c) Methodology Guide, which describes how the FACT sheets were prepared, including the manner in which each Fund’s benchmark and Selected Peer Group were selected and how profitability was determined; (4) responses from the Adviser and Sub-Adviser to a series of questions posed by K&L Gates on behalf of the Independent Trustees; (5) copies of the forms of Advisory and Sub-Advisory Contracts; (6) copies of the Forms ADV for the Adviser and Sub-Adviser; (7) financial statements for the Adviser and Sub-Adviser; (8) a draft of a narrative summary addressing key factors the Board customarily considers in evaluating the renewals of the ING Funds’ (including the Fund’s) advisory contracts and sub-advisory contracts, including a written analysis for the Fund of how performance, fees and expenses compare to its Selected Peer Group and/or designated benchmark(s); (9) independent analyses of Fund performance by the Trust’s Chief Investment Risk Officer; (10) for open-end Funds, information regarding net asset flows into and out of the Fund; and (11) other information relevant to the Board’s evaluations.
The Board also noted that ING Groep, N.V. the ultimate parent company of the Adviser and Sub-Adviser, has announced plans for the separation of its U.S.-based insurance, retirement services and investment management operations, which include the Adviser and Sub-Adviser, into an independent, standalone company by the end of 2013. The Board further noted
63
ADVISORY CONTRACT APPROVAL DISCUSSION (UNAUDITED) (CONTINUED)
that this separation may result in the Adviser and Sub-Adviser’s loss of access to the services and resources of their current ultimate parent company, which could adversely affect its businesses and profitability. The Board recognized that, if the separation plans are deemed to be a change of control, the investment advisory and subadvisory agreements for the Funds would terminate and trigger the necessity for new agreements, which would require the approval of the Board and, potentially, the shareholders of a Fund. The Board also recognized that there can be no assurance that the separation plan will be carried out. The Board considered the potential effects of the separation on the Funds and the Adviser, including its ability prior to, during and after the separation to perform the same level of service to the Funds as the Adviser currently provides. In this regard, the Board noted that the Adviser did not currently anticipate that the separation would have a material adverse impact on the Funds or their operations and administration.
For each Fund, Class A shares were used for purposes of certain comparisons between the Fund and its Selected Peer Group. Class A shares generally were selected so that a Fund’s share class with the longest performance history was compared to the analogous class of shares for each fund in its Selected Peer Group. The mutual funds included in the Funds’ Selected Peer Groups were selected based upon criteria designed to mirror the Fund share class being compared to the Selected Peer Groups.
In arriving at its conclusions with respect to the Advisory Contracts, the Board was mindful of the “manager-of-managers” platform of the ING Funds that has been developed by the Adviser. The Board recognized that the Adviser is responsible for monitoring the investment program and performance of the Sub-Adviser under this manager-of-managers arrangement. The Board also considered the techniques and resources that the Adviser has developed to provide ongoing oversight of the nature and quality of the services the Sub-Adviser provide to the applicable Funds and the Sub-Adviser’s compliance with applicable laws and regulations. The Board noted that to assist in the selection and monitoring of Sub-Adviser, the Adviser has developed an oversight process formulated by its Manager Research & Selection Group (“MRSG”), which analyzes both qualitative (such as in-person meetings and telephonic meetings with the Sub-Adviser and research on sub-advisers) and quantitative information (such as performance data, portfolio data and attribution analysis) about the Sub-Adviser and the Funds that it manages. The Board recognized that the MRSG also typically provides in-person reports to the IRCs at their meetings prior to any Sub-Adviser presentations. In addition, the Board noted that the MRSG prepares periodic due diligence reports regarding the Sub-Adviser based on on-site visits and information and analysis which team members use to attempt to gain and maintain an in-depth understanding of the Sub-Adviser’s investment process and to try to identify issues that may be relevant to the Sub-Adviser’s services to a Fund and/or its performance. The Board also noted that the MRSG provides written reports on these due diligence analyses to the pertinent IRC. The Board noted the resources that the Adviser and Management has committed to its services as a manager-of-managers, including resources for reporting to the Board and the IRCs to assist them with their assessment of the investment performance of the Funds on an on-going basis throughout the year. This includes the appointment of a Chief Investment Risk Officer and his staff, who report directly to the Board and who have developed attribution analyses and other metrics used by the IRCs to analyze the key factors underlying investment performance for the funds in the ING Fund complex.
The Board also considered the techniques that the Adviser has developed to screen and perform due diligence on new sub-advisers if and when the Adviser recommends to the Board a new sub-adviser to manage a Fund in the ING Fund complex. The Board noted that, for new non-ING-affiliated sub-advisers, the MSRG is responsible for: identifying qualified candidates; analyzing their investment process, personnel and resources; conducting due diligence on the candidates; and selecting the firm to propose as a new sub-adviser, as well as preparing written materials and reports to the Committees and the Board as part of the process of approving any new sub-adviser for a Fund.
The Board also considered that in the course of monitoring performance of the Sub-Adviser, the MRSG has developed, based on guidance from the IRCs, a methodology for comparing performance of each Fund to a Selected Peer Group. The Board also recognized that the MRSG provides the IRCs with regular updates on the Funds and alerts the IRCs to potential issues as they arise. The Board noted that another service provided by the MSRG is the preparation of the Fund Dispersion Report. This report seeks to monitor any dispersion between Funds managed by non-ING-affiliated Sub-Advisers and their similarly managed retail counterparts and again assists the Board in carrying out its general oversight duties. The Board also noted that the Adviser regularly monitors performance, personnel, compliance and myriad other issues that may arise on a day-to-day basis with regards to the Sub-Adviser and noted that, if issues are
64
ADVISORY CONTRACT APPROVAL DISCUSSION (UNAUDITED) (CONTINUED)
identified either through formal or informal processes, they are brought before the IRCs and the Board for consideration and action and the Adviser consistently makes its resources available to the Board and the Committees to assist with addressing any issues that arise.
The Board noted that the Funds also benefit from the services of the Adviser’s Investment Risk Management Department (the “IRMD”), under the leadership of the Chief Investment Risk Officer, the costs of which are shared by the Funds and the Adviser. The Board noted that the IRMD regularly presents written materials and reports to the IRCs that focus on the investment risks of the Funds. The Board also noted that the IRMD provides the IRCs with analyses that are developed to assist the IRCs in identifying trends in Fund performance and other areas over consecutive periods. The Board noted that the services provided by the IRMD are meant to provide an additional perspective for the benefit of the Committees, which may vary from the perspective of the MRSG.
The Board also noted the techniques used by the Adviser to monitor the performance of the Sub-Adviser and the proactive approach that the Adviser, working in cooperation with the IRCs, has taken to advocate or recommend, when it believed appropriate, changes designed to assist in improving the Funds’ performance.
In considering the Funds’ Advisory Contracts, the Board also considered the extent of benefits provided to the Funds’ shareholders, beyond advisory services, from being part of the ING family of funds. This includes, in most cases, the right to exchange or transfer investments, without a sales charge, between the same class of shares of such funds or among ING Funds available on a product platform, and the wide range of ING Funds available for exchange or transfer. The Board also took into account the Adviser’s ongoing efforts to reduce the expenses of the ING Funds through renegotiated arrangements with the ING Funds’ service providers. In addition, the Board considered the efforts of the Adviser and the expenses that it incurred in recent years to help make the ING Fund complex more balanced and efficient by the launch of new investment products and the combinations of similar funds.
Further, the Board received periodic reports showing that the investment policies and restrictions for each Fund were consistently complied with and other periodic reports covering matters such as compliance by Adviser and Sub-Adviser personnel with codes of ethics. The Board considered reports from the Trust’s Chief Compliance Officer (“CCO”) evaluating whether the regulatory compliance systems and procedures of the Adviser and each Sub-Adviser are reasonably designed to assure compliance with the federal securities laws, including those related to, among others, late trading and market timing, best execution, fair value pricing, proxy voting and trade allocation practices. The Board also took into account the CCO’s annual and periodic reports and recommendations with respect to service provider compliance programs. In this regard, the Board also considered the policies and procedures developed by the CCO in consultation with the Board’s Compliance Committee that guide the CCO’s compliance oversight function.
The Board reviewed the level of staffing, quality and experience of each Fund’s portfolio management team. The Board took into account the respective resources and reputations of the Adviser and Sub-Adviser, and evaluated the ability of the Adviser and the Sub-Adviser to attract and retain qualified investment advisory personnel. The Board also considered the adequacy of the resources committed to the Funds (and other relevant funds in the ING Fund complex) by the Adviser and Sub-Adviser, and whether those resources are commensurate with the needs of the Funds and are sufficient to sustain appropriate levels of performance and compliance needs. In this regard, the Board considered the financial stability of the Adviser and the Sub-Adviser.
Based on their deliberations and the materials presented to them, the Board concluded that the advisory and related services provided by the Adviser and each Sub-Adviser are appropriate in light of the Funds’ operations, the competitive landscape of the investment company business, and investor needs, and that the nature and quality of the overall services provided by the Adviser and the Sub-Adviser were appropriate.
Fund Performance
In assessing advisory and sub-advisory relationships, the Board placed emphasis on the investment returns of each Fund. While the Board considered the performance reports and discussions with portfolio managers at Board and committee meetings during the year, particular attention in assessing performance was given to the FACT sheets furnished in connection with the renewal process. The FACT sheet prepared for each Fund included its investment performance compared to the Fund’s Morningstar category median and/or Lipper category median, Selected Peer Group and primary benchmark. The FACT sheet performance data was as of June 30, 2011. In addition, the Board also considered at its November 17, 2011 meeting certain additional data regarding performance and Fund asset levels as of October 31, 2011. The Board’s findings
65
ADVISORY CONTRACT APPROVAL DISCUSSION (UNAUDITED) (CONTINUED)
specific to each Fund’s performance are discussed under “Fund-by-Fund Analysis” below.
Economies of Scale
When evaluating the reasonableness of advisory fee rates, the Board also considered whether economies of scale likely will be realized by the Adviser and Sub-Adviser as a Fund grows larger and the extent to which any such economies are reflected in contractual fee rates. In this regard, the Board noted any breakpoints in advisory fee schedules that will result in a lower advisory fee rate when a Fund achieves sufficient asset levels to receive a breakpoint discount. In the case of sub-advisory fees, the Board considered that breakpoints would inure to the benefit of the Adviser, except to the extent that there are corresponding advisory fee breakpoints or waivers. The Board also considered that some of the Portfolios that do not have advisory fee breakpoints do have fee waiver or expense reimbursement arrangements. In this connection, the Board considered the extent to which economies of scale could be realized through such fee waivers, expense reimbursements or other expense reductions. In evaluating fee breakpoint arrangements and economies of scale, the Independent Trustees also considered prior periodic management reports, industry information on this topic and the Funds’ investment performance.
Information Regarding Services to Other Clients
The Board requested and considered information regarding the nature of services and fee rates offered by the Adviser and Sub-Adviser to other clients, including other registered investment companies and relevant institutional accounts. When fee rates offered to other clients differed materially from those charged to a Fund, the Board considered any underlying rationale provided by the Adviser or the Sub-Adviser for these differences. The Board also noted that the fee rates charged to the Funds and other institutional clients of the Adviser or Sub-Adviser (including other investment companies) may differ materially due to, among other reasons: differences in services; different regulatory requirements associated with registered investment companies, such as the Funds, as compared to non-registered investment company clients; market differences in fee rates that existed when a Fund first was organized; differences in the original sponsors of Funds that now are managed by the Adviser; investment capacity constraints that existed when certain contracts were first agreed upon or that might exist at present; and different pricing structures that are necessary to be competitive in different marketing channels.
Fee Rates and Profitability
The Board reviewed and considered each contractual investment advisory fee rate, combined with the administrative fee rate, payable by each Fund to the Adviser. The Board also considered the contractual sub-advisory fee rate payable by the Adviser to each Sub-Adviser for sub-advisory services for each Fund, including the portion of the contractual advisory fees that are paid to each Sub-Adviser, as compared to the portion retained by the Adviser. In addition, the Board considered fee waivers and expense limitations applicable to the fees payable by the Funds.
The Board considered: (1) the fee structure of each Fund as it relates to the services provided under the contracts; and (2) the potential fall-out benefits to the Adviser and the Sub-Adviser and their respective affiliates from their association with the Funds. For each Fund, the Board separately determined that the fees payable to the Adviser and the fees payable to the Sub-Adviser are reasonable for the services that each performs, which were considered in light of the nature and quality of the services that each has performed and is expected to perform.
For each Fund, the Board considered information on revenues, costs and profits realized by the Adviser and the Sub-Adviser, which was prepared by Management in accordance with the allocation methodology (including related assumptions) specified in the 15(c) Methodology Guide. In analyzing the profitability of the Adviser in connection with its services to a Fund, the Board took into account the sub-advisory fee rate payable by the Adviser to each Sub-Adviser. In addition, the Board considered information that it requested and was provided by Management with respect to the profitability of service providers affiliated with the Adviser.
Although the 15(c) Methodology Guide establishes certain standards for profit calculation, the Board recognized that profitability analysis on a client-by-client basis is not an exact science and there is no uniform methodology within the asset management industry for determining profitability for this purpose. In this context, the Board realized that Management’s calculations regarding its costs incurred in establishing the infrastructure necessary for the Funds’ operations may not be fully reflected in the expenses allocated to each Fund in determining profitability, and that the information presented may not portray all of the costs borne by the Adviser and Management or capture their entrepreneurial risk associated with offering and managing a mutual fund complex in the current regulatory and market environment. In addition, the Board recognized that the use of different
66
ADVISORY CONTRACT APPROVAL DISCUSSION (UNAUDITED) (CONTINUED)
methodologies for purposes of calculating profit data can give rise to dramatically different profit and loss results.
In making its determinations, the Board based its conclusions as to the reasonableness of the advisory and sub-advisory fees of the Adviser and Sub-Adviser primarily on the factors described for each Fund below. At the request of the Board, the Adviser has from time to time agreed to implement remedial actions regarding certain Funds. These remedial actions have included, among others: reductions in fee rates; changes in Sub-Adviser or portfolio managers; and strategy modifications.
Fund-by-Fund Analysis
The following paragraphs outline certain of the specific factors that the Board considered, and the conclusions reached, at its November 17, 2011 meeting in relation to renewing each Fund’s current Advisory and Sub-Advisory Contracts. These specific factors are in addition to those considerations discussed above. In each case, the Fund’s performance was compared to its Morningstar category median and average, as well as its primary benchmark, a broad-based securities market index that appears in the Fund’s prospectus. With respect to Morningstar quintile rankings, the first quintile represents the highest (best) performance and the fifth quintile represents the lowest performance. Each Fund’s management fee and expense ratio were compared to the fees and expense ratios of the funds in its Selected Peer Group.
ING GNMA Income Fund
In considering whether to approve the renewal of the Advisory and Sub-Advisory Contracts for ING GNMA Income Fund, the Board considered that, based on performance data for the periods ended June 30, 2011: (1) the Fund outperformed its Morningstar category median for all periods presented; (2) the Fund outperformed its primary benchmark for the most recent calendar quarter, year-to-date, and one-year periods, but underperformed for the three-year, five-year, and ten-year periods; and (3) the Fund is ranked in the first (highest) quintile of its Morningstar category for the year-to-date and one-year periods, and the second quintile for the most recent calendar quarter, three-year, five-year, and ten-year periods.
In considering the fees payable under the Advisory and Sub-Advisory Contracts for the Fund, the Board took into account the factors described above and also considered: (1) the fairness of the compensation under an Advisory Contract with a breakpoint fee schedule where the asset level necessary to achieve a breakpoint discount had not been reached by the Fund; and (2) the pricing structure (including the expense ratio to be borne by shareholders) of the Fund, as compared to its Selected Peer Group, including that: (a) the management fee (inclusive of a 0.10% administration fee) for the Fund is above the median and the average management fees of the funds in its Selected Peer Group; and (b) the expense ratio for the Fund is above the median and the average expense ratios of the funds in its Selected Peer Group.
In analyzing this fee data, the Board took into account Management’s representations regarding the competitiveness of the fees payable by the Fund.
After its deliberation, the Board reached the following conclusions: (1) the Fund’s management fee rate is reasonable in the context of all factors considered by the Board; (2) the Fund’s expense ratio is reasonable in the context of all factors considered by the Board; (3) the Fund’s performance is reasonable in the context of all factors considered by the Board; and (4) the sub-advisory fee rate payable by the Adviser to the Sub-Adviser is reasonable in the context of all factors considered by the Board. Based on these conclusions and other factors, the Board voted to renew the Advisory and Sub-Advisory Contracts for the Fund for the year ending November 30, 2012. During this renewal process, different Board members may have given different weight to different individual factors and related conclusions.
ING High Yield Bond Fund
In considering whether to approve the renewal of the Advisory and Sub-Advisory Contracts for ING High Yield Bond Fund, the Board considered that, based on performance data for the periods ended June 30, 2011: (1) the Fund outperformed its Morningstar category median for the most recent calendar quarter, year-to-date, and one-year periods, but underperformed for the three-year, five-year, and ten-year periods; (2) the Fund underperformed its primary benchmark for all periods presented; and (3) the Fund is ranked in the first (highest) quintile of its Morningstar category for the most recent calendar quarter, the second quintile for the year-to-date and one-year periods, the fourth quintile for the three-year and five-year periods, and the fifth (lowest) quintile for the ten-year period.
In analyzing this performance data, the Board took into account: (1) Management’s representations that there was a change in the Fund’s portfolio management team and investment processes in 2010, and since then, the Fund’s performance had improved; (2) Management’s confidence in the current portfolio management team’s ability to execute the Fund’s strategies and its expectation that longer-term
67
ADVISORY CONTRACT APPROVAL DISCUSSION (UNAUDITED) (CONTINUED)
performance will improve; and (3) Management’s observations regarding favorable performance during certain periods.
In considering the fees payable under the Advisory and Sub-Advisory Contracts for the Fund, the Board took into account the factors described above and also considered: (1) the fairness of the compensation under an Advisory Contract with a breakpoint fee schedule where the asset level necessary to achieve a breakpoint discount had not been reached by the Fund; and (2) the pricing structure (including the expense ratio to be borne by shareholders) of the Fund, as compared to its Selected Peer Group, including that: (a) the management fee (inclusive of a 0.10% administration fee) for the Fund is below the median and the average management fees of the funds in its Selected Peer Group; and (b) the expense ratio for the Fund is below the median and the average expense ratios of the funds in its Selected Peer Group.
After its deliberation, the Board reached the following conclusions: (1) the Fund’s management fee rate is reasonable in the context of all factors considered by the Board; (2) the Fund’s expense ratio is reasonable in the context of all factors considered by the Board; (3) the Fund’s performance is reasonable in the context of all factors considered by the Board; and (4) the sub-advisory fee rate payable by the Adviser to the Sub-Adviser is reasonable in the context of all factors considered by the Board. Based on these conclusions and other factors, the Board voted to renew the Advisory and Sub-Advisory Contracts for the Fund for the year ending November 30, 2012. During this renewal process, different Board members may have given different weight to different individual factors and related conclusions.
ING Intermediate Bond Fund
In considering whether to approve the renewal of the Advisory and Sub-Advisory Contracts for ING Intermediate Bond Fund, the Board considered that, based on performance data for the periods ended June 30, 2011: (1) the Fund outperformed its Morningstar category median for the most recent calendar quarter, year-to-date, and one-year periods, but underperformed for the three-year, five-year, and ten-year periods; (2) the Fund outperformed its primary benchmark for the most recent calendar quarter, year-to-date, and one-year periods, but underperformed for the three-year, five-year, and ten-year periods; and (3) the Fund is ranked in the first (highest) quintile of its Morningstar category for the most recent calendar quarter, year-to-date, and one-year periods, the third quintile for the ten-year period, and the fourth quintile for the three-year and five-year periods.
In analyzing this performance data, the Board took into account: (1) Management’s representations that in August 2010 the Fund’s portfolio management team was modified and enhancements were made to the Fund’s investment process; (2) in September 2011 the Fund changed its investment objective; (3) that Management would continue to monitor, and the Board or its Investment Review Committee would periodically review, the Fund’s performance; and (4) Management’s expectation that the Fund’s longer-term performance will improve.
In considering the fees payable under the Advisory and Sub-Advisory Contracts for the Fund, the Board took into account the factors described above and also considered: (1) the fairness of the compensation under an Advisory Contract with a level fee rate that does not include breakpoints; (2) the pricing structure (including the expense ratio to be borne by shareholders) of the Fund, as compared to its Selected Peer Group, including that: (a) the management fee (inclusive of a 0.10% administration fee) for the Fund is below the median and the average management fees of the funds in its Selected Peer Group; and (b) the expense ratio for the Fund is below the median and the average expense ratios of the funds in its Selected Peer Group.
After its deliberation, the Board reached the following conclusions: (1) the Fund’s management fee rate is reasonable in the context of all factors considered by the Board; (2) the Fund’s expense ratio is reasonable in the context of all factors considered by the Board; (3) that Management would continue to monitor, and the Board or its Investment Review Committee would periodically review, the Fund’s performance, it is reasonable to allow the Sub-Adviser to continue to manage the Fund to assess whether performance continues to improve; and (4) the sub-advisory fee rate payable by the Adviser to the Sub-Adviser is reasonable in the context of all factors considered by the Board. Based on these conclusions and other factors, the Board voted to renew the Advisory and Sub-Advisory Contracts for the Fund for the year ending November 30, 2012. During this renewal process, different Board members may have given different weight to different individual factors and related conclusions.
68
(THIS PAGE INTENTIONALLY LEFT BLANK)
(THIS PAGE INTENTIONALLY LEFT BLANK)
(THIS PAGE INTENTIONALLY LEFT BLANK)
Investment Adviser
ING Investments, LLC
7337 East Doubletree Ranch Road, Suite 100
Scottsdale, Arizona 85258
Administrator
ING Funds Services, LLC
7337 East Doubletree Ranch Road, Suite 100
Scottsdale, Arizona 85258
Distributor
ING Investments Distributor, LLC
7337 East Doubletree Ranch Road, Suite 100
Scottsdale, Arizona 85258
Transfer Agent
BNY Mellon Investment Servicing (U.S.) Inc.
301 Bellevue Parkway
Wilmington, Delaware 19809
Independent Registered Public
Accounting Firm
KPMG LLP
Two Financial Center
60 South Street
Boston, Massachusetts 02111
Custodian
The Bank of New York Mellon
One Wall Street
New York, New York 10286
Legal Counsel
Dechert
1775 I Street, N.W.
Washington, D.C. 20006
For more complete information, or to obtain a prospectus on any ING Fund, please call your Investment Professional or ING Investments Distributor, LLC at (800) 992-0180 or log on to www.inginvestment.com. The prospectus should be read carefully before investing. Consider the fund’s investment objectives, risks, charges and expenses carefully before investing. The prospectus contains this information and other information about the fund.
 | AR-UFIALL (0312-052512) |
Annual Report
March 31, 2012
ING Floating Rate Fund
n Classes A, C, I, R and W
 E-Delivery Sign-up – details inside
This report is submitted for general information to shareholders of the ING Funds. It is not authorized for distribution to prospective shareholders unless accompanied or preceded by a prospectus which includes details regarding the fund’s investment objectives, risks, charges, expenses and other information. This information should be read carefully. |
TABLE OF CONTENTS
| President’s Letter | | | | | 1 | |
| Market Perspective | | | | | 2 | |
| Portfolio Managers’ Report | | | | | 4 | |
| Shareholder Expense Example | | | | | 7 | |
| Report of Independent Registered Public Accounting Firm | | | | | 8 | |
| Statement of Assets and Liabilities | | | | | 9 | |
| Statement of Operations | | | | | 10 | |
| Statements of Changes in Net Assets | | | | | 11 | |
| Financial Highlights | | | | | 12 | |
| Notes to Financial Statements | | | | | 13 | |
| Portfolio of Investments | | | | | 20 | |
| Tax Information | | | | | 27 | |
| Trustee and Officer Information | | | | | 28 | |
| Advisory Contract Approval Discussion | | | | | 32 | |
| | | | Go Paperless with E-Delivery!
| | |
| Sign up now for on-line prospectuses, fund reports, and proxy statements. In less than five minutes, you can help reduce paper mail and lower fund costs. |
| |
| Just go to www.inginvestment.com, click on the E-Delivery icon from the home page, follow the directions and complete the quick 5 Steps to Enroll. |
| |
| You will be notified by e-mail when these communications become available on the internet. Documents that are not available on the internet will continue to be sent by mail. |
PROXY VOTING INFORMATION
A description of the policies and procedures that the Fund uses to determine how to vote proxies related to portfolio securities is available: (1) without charge, upon request, by calling Shareholder Services toll-free at (800) 992-0180; (2) on the Fund’s website at www.inginvestment.com; and (3) on the U.S. Securities and Exchange Commission’s (“SEC”) website at www.sec.gov. Information regarding how the Fund voted proxies related to portfolio securities during the most recent 12-month period ended June 30 is available without charge on the Fund’s website at www.inginvestment.com and on the SEC’s website at www.sec.gov.
QUARTERLY PORTFOLIO HOLDINGS
The Fund files its complete schedule of portfolio holdings with the SEC for the first and third quarters of each fiscal year on Form N-Q. The Fund’s Forms N-Q are available on the SEC’s website at www.sec.gov. The Fund’s Forms N-Q may be reviewed and copied at the SEC’s Public Reference Room in Washington D.C., and information on the operation of the Public Reference Room may be obtained by calling (800) SEC-0330; and is available upon request from the Fund by calling Shareholder Services toll-free at (800) 992-0180.
Please note that your investment: is not a bank deposit, is not insured or guaranteed by the Federal Deposit Insurance Corporation (“FDIC”), the Federal Reserve Board or any other government agency, and is affected by market fluctuations. There is no guarantee that the Fund will achieve its investment objective.
(THIS PAGE INTENTIONALLY LEFT BLANK)
PRESIDENT’S LETTER
High and low dramaDear Shareholder,
In the theatre of the global financial markets, local crises and disasters have come and gone like poor players, strutting and fretting their moment on the stage, to be heard no more. Yet alongside these short-lived tragedies, bigger, more serious shows dominate the marquees, continuing their runs long after the others have closed.
About a year ago in our second quarter 2011 market review, we noted the similarity of then-current concerns to those of 2010: “In many ways, the second quarter of 2011 bore a strong resemblance to its 2010 counterpart, with the U.S. mired in an economic soft patch, the euro zone in a Greece-centered crisis and China trying to engineer a soft landing for its economy.” Variations on these dramas still command our attention today.
Despite these worries, markets have delivered, with risk assets of all types and domiciles posting gains. After its best first quarter since 1998, the S&P 500® Index has clawed its way back to 2008 levels, while the Nasdaq hasn’t seen its current surroundings since the early 2000s. The markets slackened a bit in early April before regaining momentum as strong first quarter earnings began to flow. As of this writing, about 200 companies in the S&P 500® Index have reported earnings; around 80% have beaten analysts’ forecasts, according to financial data provider FactSet, a rate superior to the trailing four-quarter average.
After slumping in the second and third quarters of 2011, the global economy has rebounded thanks to a more expansionary corporate sector and a positive feedback loop of confidence, financial conditions, growth and monetary policy easing. Does this mean the big global risks — the sovereign debt crisis in Europe, the meandering U.S. economy and a slowing China — are fading?
Maybe not, but it does mean that investors should not stand on the sidelines hoping to time an ideal reentry point. Opportunity turns up unpredictably. We therefore advocate staying invested in a globally diversified portfolio with a wide range of asset classes and risk/return characteristics. Don’t be intimidated by market theatrics: stick with your investment program and resist the urge to market time. As always, discuss any proposed changes to your goals or portfolio with your investment advisor before you take any action.
Thank you for your confidence in ING Funds. It is our privilege to serve your investment needs, and we look forward to continuing to do so in the future.
Shaun Mathews
President and Chief Executive Officer
ING Funds
April 27, 2012
The views expressed in the President’s Letter reflect those of the President as of the date of the letter. Any such views are subject to change at any time based upon market or other conditions and the ING Funds disclaim any responsibility to update such views. These views may not be relied on as investment advice and, because investment decisions for an ING Fund are based on numerous factors, may not be relied on as an indication of investment intent on behalf of any ING Fund. Reference to specific company securities should not be construed as recommendations or investment advice.For more complete information, or to obtain a prospectus for any ING Fund, please call your investment professional or ING Investments Distributor, LLC at (800) 992-0180 or log on to www.inginvestment.com. The prospectus should be read carefully before investing. Consider the fund’s investment objectives, risks, and charges and expenses carefully before investing. The prospectus contains this information and other information about the fund. Check with your investment professional to determine which funds are available for sale within their firm. Not all funds are available for sale at all firms.
1
MARKET PERSPECTIVE: YEAR ENDED MARCH 31, 2012
By the half way point in our fiscal year, global equities in the form of the MSCI World IndexSM, measured in local currencies including net reinvested dividends, were down more than 15%. But better news from the U.S. drove a rebound in October, which held to year-end and gathered new strength in 2012. For the whole tumultuous fiscal year, the MSCI World IndexSM squeezed out a gain of 1.45%. (The MSCI World IndexSM returned 0.56% for the year ended March 31, 2012, measured in U.S. dollars.)
In our semi-annual report we described how the domestic economy seemed to be on the brink of another recession and according to most commentators it was all about jobs. Healthy employment conditions, it was said, boost wages, consumer confidence, spending, house prices, and ultimately investment and Gross Domestic Product (“GDP”) itself. While the cause and effect relationships are arguably more complex, the fact remained that recent reports had shown no jobs created at all in August, the unemployment rate at 9.1%, GDP meandering up at a rate of 1.3% (quarter-over-quarter, annualized), wages & salaries and retail sales flat and home prices falling.
Markets were greatly relieved, therefore, when more positive data started to emerge in October, with the employment report showing 103,000 new jobs in September. Improvement continued into 2012 and in March, as the Bureau of Labor Statistics announced 243,000 jobs were created in February, with a three-month average of 245,000, and the unemployment rate down to 8.3%.
Investors’ relief at a healthier labor market was reinforced by the March results of the Federal Reserve’s stress tests on banks, which indicated that 15 out of 19 large banks could maintain adequate capital levels even in a pessimistic recession scenario. Reported fourth quarter 2011 GDP growth was much improved at 3.0%, and as the fiscal year ended, purchasing managers’ indices were clearly in expansion territory.
Not part of the brighter picture was the housing market, with uneven sales and falling prices, as represented by the S&P/Case-Shiller 20-City Composite Home Price Index, which ended the period at less than two-thirds of its July 2006 high level.
The euro zone’s sovereign debt crisis continued to move markets. The European Central Bank (“ECB”) started to buy Italian and Spanish bonds to restrain soaring yields in August and it was reluctantly accepted that Greece would need a second huge bailout to avoid default on bonds maturing in March.
As a step towards fiscal union, which would reduce the need for future bailouts, euro zone leaders reached agreement in December on a fiscal-discipline treaty. In addition, new ECB President Draghi announced that the ECB would lend unlimited funds to banks for three years at an interest rate of 1% in Longer Term Refinancing Operations (“LTRO”). On December 21, the ECB loaned €489 billion to 523 banks. At the end of February, 800 banks borrowed a further €530 billion.
The perceived effect of LTRO was to reduce greatly the risk of banks and the banking system failing in the short term for lack of liquidity. Sentiment and risk appetite quickly improved. Stock markets surged in the first three months of 2012 and the ten-year government bond yields of Italy, Portugal and Ireland fell150-200 basis points. (Ominously, Spain’s did not.)
In reality, LTRO buys time for banks, but does nothing to address the solvency of sovereigns or the uncompetitive markets and practices of the euro zone’s periphery.
In U.S. fixed income markets, the Barclays Capital U.S. Aggregate Bond Index of investment grade bonds rose 7.71% in the fiscal year. Both the corporate investment grade bond and Treasury sub-indices outperformed; investment grade corporates were seen as good value while Treasuries were supported during periods of risk-aversion in the first half of the fiscal year. Agency mortgage backed securities underperformed, on fears that measures to help the mortgage market would lead to a high volume of early repayments. The Barclays Capital High Yield Bond — 2% Issuer Constrained Composite Index returned 6.43% in the fiscal year.
U.S. equities, represented by the S&P 500® Index including dividends, rose by 8.54%, thanks to a 26% advance after September, as the perceived risk of recession eased. Technology led the way with a return of over 20%, followed by the consumer sectors, both of which returned over 17%. The laggard was energy, losing nearly 7%. It is also noteworthy that March was the first month-end since the index’s all-time record on October 9, 2007, at which the total return was positive: a wafer-thin 3 basis points per annum.
In currencies, the euro zone’s problems finally took their toll on the euro, which dropped sharply after October, before recovering. The dollar appreciated 5.99% over the fiscal year. The trading range was narrower against the pound, the dollar finally gaining 0.81%. But the dollar lost 0.45% against the yen, despite suspicions of heavy Bank of Japan intervention after Japan’s first trade deficit in 30 years.
In international markets, the MSCI Japan® Index fell 0.45% in the fiscal year, moderated by a 19% rebound in 2012. The economy contracted in four quarters out of the last five. But in mid-February, the Bank of Japan adopted an official inflation target and increased asset purchases, raising hopes that asset reflation may be under way at last. The MSCI Europe ex UK® Index lost 7.20%, relieved at better U.S. data and LTRO but depressed by falling fourth quarter GDP and unemployment perched at 10.7%, a euro-era high. The MSCI UK® Index added 1.60%. GDP fell 0.2% in the fourth quarter from the third, in the face of weak euro zone demand and fiscal austerity at home. But surprisingly, good purchasing managers’ indices suggested that a return to technical recession might yet be avoided.
Parentheses denote a negative number.
Past performance does not guarantee future results. The performance quoted represents past performance.
Investment return and principal value of an investment will fluctuate, and shares, when redeemed, may be worth more or less than their original cost. The Fund’s performance is subject to change since the period’s end and may be lower or higher than the performance data shown. Please call (800) 992-0180 or log on to www.inginvestment.com to obtain performance data current to the most recent month end.
Market Perspective reflects the views of ING’s Chief Investment Risk Officer only through the end of the period, and is subject to change based on market and other conditions.
2
BENCHMARK DESCRIPTIONS
| Index | | | | Description |
|---|
MSCI World IndexSM | | | | An unmanaged index that measures the performance of over 1,400 securities listed on exchanges in the U.S., Europe, Canada, Australia, New Zealand and the Far East. |
| S&P/Case-Shiller 20-City Composite Home Price Index | | | | A composite index of the home price index for the top 20 Metropolitan Statistical Areas in the United States. The index is published monthly by Standard & Poor’s. |
| Barclays Capital U.S. Aggregate Bond Index | | | | An unmanaged index of publicly issued investment grade U.S. Government, mortgage-backed, asset-backed and corporate debt securities. |
Barclays Capital High Yield Bond — 2% Issuer
Constrained Composite Index | | | | An unmanaged index that includes all fixed income securities having a maximum quality rating of Ba1, a minimum amount outstanding of $150 million, and at least one year to maturity. |
| S&P 500® Index | | | | An unmanaged index that measures the performance of securities of approximately 500 large-capitalization companies whose securities are traded on major U.S. stock markets. |
| MSCI Japan® Index | | | | A free float-adjusted market capitalization index that is designed to measure developed market equity performance in Japan. |
| MSCI Europe ex UK® Index | | | | A free float-adjusted market capitalization index that is designed to measure developed market equity performance in Europe, excluding the UK. |
| MSCI UK® Index | | | | A free float-adjusted market capitalization index that is designed to measure developed market equity performance in the UK. |
| The S&P/LSTA Leveraged Loan 100 Index | | | | The S&P/LSTA Leveraged Loan 100 Index is designed to reflect the largest facilities in the leveraged loan market. It mirrors the market-weighted performance of the largest institutional leveraged loans based upon market weightings, spreads, and interest payments. The index consists of 100 loan facilities drawn from a larger benchmark, the S&P/LSTA (Loan Syndications and Trading Association) Leveraged Loan Index (LLI), which covers more than 1,100 facilities and has a market value of more than $480 billion. |
3
| ING FLOATING RATE FUND | PORTFOLIO MANAGERS’ REPORT |
Dear Shareholders:
| | | Ratings Distribution
as of March 31, 2012 | |
|---|
| | | Ba | | | | | 48.0 | % |
| | | B | | | | | 47.6 | % |
| | | Caa and below | | | | | 2.3 | % |
| | | Not rated* | | | | | 2.1 | % |
| | | Ratings distribution shows the percentage of the Fund’s loan commitments (excluding cash and foreign cash) that are rated in each ratings category, based upon the categories provided by Moody’s Investors Service, Inc. Ratings distribution is based on Moody’s senior secured facility ratings. Moody’s ratings classification methodology: Aaa rating denotes the least credit risk; C rating denotes the greatest credit risk. Loans rated below Baa by Moody’s are considered to be below investment grade. Ratings can change from time to time, and current ratings may not fully reflect the actual credit condition or risks posed by a loan. |
| | | * Not rated includes loans to non-U.S. borrowers (which are typically unrated) and loans for which the rating has been withdrawn. |
| | | |
ING Floating Rate Fund (the “Fund”) seeks to provide investors with a high level of current income. The Fund is managed by Jeffrey A. Bakalar and Daniel A. Norman, Portfolio Managers of ING Investment Management Co. LLC — the Sub-Adviser.
Performance: For the one year ended March 31, 2012, the Fund’s Class A shares, excluding sales charges, provided a total return of 3.58% compared to the S&P/LSTA Leveraged Loan 100 Index (“L100”) which returned 2.48%, for the same period.
Portfolio Specifics: The past year in the loan market was marked by wide month-to-month swings in total return, as measured by the L100. There were eight months of positive returns and four of negative, one of which was the second worst total return on record for the asset class. Loan prices moved down seven percentage points during the first half of the fiscal year, and then recovered more than five percentage points during the latter. The European market (measured by the S&P European Leveraged Loan Index, or “ELLI”) followed a similar trend, with five months of negative performance, although it ended the 12-month period up only 57 basis points (bp) (a basis point equals one one-hundredth of one percent) vs. a positive 249 bp return for the United States as measured by the L100 Index. Europe was generally assumed throughout the year to be facing a recession, attracting investors to the U.S. for its safe haven status. This backdrop helped the U.S. loan market finish 2011 on a relatively good note. December saw the rare occurrence of the U.S. stock market and U.S. Treasuries both posting gains. At the time, these conditions were expected to continue as the loan pipeline was at a two-year low of $5.1 billion.
Year-to-date, global capital markets have kept the strong momentum that started with the New Year. Optimism was fueled by a regular flow of good news on the U.S. economy, in particular the labor market, and developments in Europe. The sovereign debt crisis moved into a quiet phase with investors seemingly relieved about the relatively full (if not voluntary) participation in Greece’s debt swap. The ELLI posted a positive return during the first quarter of 2012, as did the S&P/LSTA Leveraged Loan Index (the “Index”) and the L100.
The primary loan market has been fairly active in the U.S. year-to-date, although a vast majority of new loans have consisted of refinancings and thus added little net new supply to the loan universe. In fact, the total amount of loans outstanding actually contracted 1% during first quarter 2012. As a result, moderate fund flows into the asset class have had a meaningful impact on supporting secondary loan prices. While far from the feeding frenzy witnessed in the high yield market, retail funds took in a little over $500 million in March, the first positive monthly measure since July 2011. Net first quarter retail flows equaled a positive $288 million. The growing collateralized loan obligation pipeline also provided bid support to the market, as did a steady stream of reinvestment from existing vehicles looking to deploy year-end cash inflows.
The Fund outperformed the L100 during the year ended March 31, 2012. The Fund’s total return was closer to that of the broader S&P/LSTA Leveraged Loan Index, which returned 2.85% for the year. The major factor behind the Fund’s relative performance was its overweight position in BB rated loans, which was the highest total return category for the year, versus the L100. The Fund downsized overall exposure to BB rated loans by seven percentage points, and increased single B exposure by 11 percentage points, as it sought to increase yield over the one-year period. This shift allowed it to roll out of loans with lower spreads and into those with higher coupons as well as LIBOR floors.
TOP TEN LOAN ISSUERS
AS OF MARCH 31, 2012
AS A PERCENTAGE OF:
| |
|---|
| | | | TOTAL
ASSETS
| | NET
ASSETS
|
|---|
| Asurion, LLC | | | | 1.9% | | 2.0% |
| Reynolds Group Holdings Inc | | | | 1.8% | | 1.9% |
| BJs Wholesale Club | | | | 1.5% | | 1.6% |
| Chrysler Group LLC | | | | 1.1% | | 1.2% |
| Cumulus Media Holdings Inc. | | | | 1.1% | | 1.2% |
| Freescale Semiconductor, Inc. | | | | 1.1% | | 1.1% |
| Capital Automotive L.P. | | | | 1.0% | | 1.1% |
| Alere US Holdings, LLC | | | | 1.0% | | 1.1% |
| Schaeffler AG | | | | 1.0% | | 1.0% |
| First Data Corporation | | | | 1.0% | | 1.0% |
| Subject to change daily. |
Sector weightings remained fairly constant during the quarter, although the Fund did increase its allocation to healthcare, education and childcare to 13% (which is still underweight the L100’s 14.5% position). While finance remained one of the Fund’s lowest sector positions at just under 2%, the L100 benefited from an 8.5% weight in the category, which returned 4.44% for the year (5.36% in first quarter 2012 alone). This was offset by the L100’s 11% allocation to utilities, vs. the Fund’s 3% position, as utilities was the worst performing industry (total return of (10.56)% for the year).
As of March 31, the Fund had a weighted average nominal spread 4.30% compared to 3.34% at the same time last year and 3.93% for the L100. The Fund remains well diversified with 34 different industry sectors represented. Regarding specific issuer allocation, the Fund held positions in each of the five largest contributors to Index performance during the quarter. All were large flow name loans (e.g., Asurion Corporation, Chrysler Group, First Data Corporation, Harrah’s Entertainment and Reynolds Group Holding). Also, the Fund held two of the top detractors from Index performance, both of which are distressed credits. There was no new default activity during the quarter for the Fund or the Index, and the lagging 12-month default rate for the Index ended the period at 0.21%.
Current Strategy & Outlook: As we look ahead, the loan market investment waters look reasonably calm but always are subject to a sudden shift in prevailing winds, particularly out of Europe. What we do see from here is constructive for investors. First, an attractive absolute yield, which we believe looks that much better if one were to adjust for potential credit loss. Also, in
4
| ING FLOATING RATE FUND | PORTFOLIO MANAGERS’ REPORT |
our opinion, the market has a healthy overall technical balance, which we believe is unlikely to shift materially any time soon. Default rates, near their historical lows and with a reasonably sanguine outlook, are also important. And, lest we forget, we believe floating rate loans will continue to provide a natural hedge against the eventual rise in interest rates.
Portfolio holdings and characteristics are subject to change and may not be representative of current holdings and characteristics. The outlook for this Fund may differ from that presented for other ING Funds. Performance for the different classes of shares will vary based on differences in fees associated with each class. An index has no cash in its portfolio, imposes no sales charges and incurs no operating expenses. An investor cannot invest directly in an index.
The views expressed in this report reflect those of the portfolio managers, only through the end of the period as stated on the cover. The portfolio managers’ views are subject to change at any time based on market and other conditions.
Fund holdings are subject to change daily. This report contains statements that may be “forward-looking” statements. Actual results may differ materially from those projected in the “forward-looking” statements.
| | | | |
Jeffrey A. Bakalar
Senior Vice President
Senior Portfolio Manager
ING Investment Management Co. LLC | | | | Daniel A. Norman
Senior Vice President
Senior Portfolio Manager
ING Investment Management Co. LLC |
| | | | |
ING Floating Rate Fund
April 25, 2012 | | | | | | |
5
| ING FLOATING RATE FUND | PORTFOLIO MANAGERS’ REPORT |
Average Annual Returns for the Periods Ended March 31, 2012
|
|
|---|
| | | | 1 Year
| | Since Inception
of Classes A, C, I, R and W
August 17, 2010
|
|---|
Including Sales Charge: | | | | | | | | | | |
Class A(1) | | | | | 1.02 | % | | | 3.40 | % |
Class C(2) | | | | | 1.82 | % | | | 4.28 | % |
| Class I | | | | | 3.74 | % | | | 5.31 | % |
| Class R | | | | | 3.22 | % | | | 4.71 | % |
| Class W | | | | | 3.93 | % | | | 5.43 | % |
Excluding Sales Charge: | | | | | | | | | | |
| Class A | | | | | 3.58 | % | | | 5.05 | % |
| Class C | | | | | 2.80 | % | | | 4.28 | % |
| Class I | | | | | 3.74 | % | | | 5.31 | % |
| Class R | | | | | 3.22 | % | | | 4.71 | % |
| Class W | | | | | 3.93 | % | | | 5.43 | % |
S&P/LSTA Leveraged Loan 100 Index(3) | | | | | 2.48 | % | | | 6.75 | % |
Based on a $10,000 initial investment, the graph and table above illustrate the total return of ING Floating Rate Fund against the index indicated. An index is unmanaged and has no cash in its portfolio, imposes no sales charges and incurs no operating expenses. An investor cannot invest directly in an index.
The Fund’s performance is shown both with and without the imposition of sales charges.
The performance graph and table do not reflect the deduction of taxes that a shareholder will pay on Fund distributions or the redemption of Fund shares.
The performance shown may include the effect of fee waivers and/or expense reimbursements by the Investment Adviser and/or other service providers, which have the effect of increasing total return. Had all fees and expenses been considered, the total returns would have been lower.
Performance data represents past performance and is no assurance of future results. Investment return and principal value of an investment in the Fund will fluctuate. Shares, when sold, may be worth more or less than their original cost. The Fund’s current performance may be lower or higher than the performance data shown. Please log on to www.inginvestment.com or call (800) 992-0180 to get performance through the most recent month end.
This report contains statements that may be “forward-looking” statements. Actual results may differ materially from those projected in the “forward-looking” statements.
The views expressed in this report reflect those of the portfolio managers, only through the end of the period as stated on the cover. The portfolio managers’ views are subject to change at any time based on market and other conditions.
Fund holdings are subject to change daily.
(1) | | Reflects deduction of the maximum Class A sales charge of 2.50%. |
(2) | | Reflects deduction of the Class C deferred sales charge of 1% for the since inception return. |
(3) | | Since inception performance for index is shown from September 1, 2010. |
6
SHAREHOLDER EXPENSE EXAMPLE (UNAUDITED)
As a shareholder of the Fund, you incur two types of costs: (1) transaction costs, including redemption fees and exchange fees, and (2) ongoing costs, including management fees, distribution and/or service (12b-1) fees, and other Fund expenses. These Examples are intended to help you understand your ongoing costs (in dollars) of investing in the Fund and to compare these costs with the ongoing costs of investing in other mutual funds.
The Examples are based on an investment of $1,000 invested at the beginning of the period and held for the entire period from October 1, 2011 to March 31, 2012. The Fund’s expenses are shown without the imposition of any charges. Expenses would have been higher if such charges were included.
Actual Expenses
The left section of the table shown below, “Actual Fund Return,” provides information about actual account values and actual expenses. You may use the information in this section, together with the amount you invested, to estimate the expenses that you paid over the period. Simply divide your account value by $1,000 (for example, an $8,600 account value divided by $1,000 = 8.6), then multiply the result by the number in the first section under the heading entitled “Expenses Paid During the Period” to estimate the expenses you paid on your account during this period.
Hypothetical Example for Comparison Purposes
The right section of the table shown below, “Hypothetical (5% return before expenses),” provides information about hypothetical account values and hypothetical expenses based on the Fund’s actual expense ratio and an assumed rate of return of 5% per year before expenses, which is not the Fund’s actual return. The hypothetical account values and expenses may not be used to estimate the actual ending account balance or expenses you paid for the period. You may use this information to compare the ongoing costs of investing in the Fund and other funds. To do so, compare this 5% hypothetical example with the 5% hypothetical examples that appear in the shareholder reports of the other funds.
Please note that the expenses shown in the table are meant to highlight your ongoing costs only and do not reflect any transactional costs, such as redemption fees or exchange fees. Therefore, the hypothetical lines of the table are useful in comparing ongoing costs only, and will not help you determine the relative total costs of owning different funds. In addition, if these transactional costs were included, your costs would have been higher.
| | | | Actual Fund Return
| | Hypothetical (5% return before expenses)
| |
|---|
| | | | Beginning
Account
Value
October 1,
2011
| | Ending
Account
Value
March 31,
2012
| | Annualized
Expense
Ratio
| | Expenses Paid
During the
Period Ended
March 31,
2012*
| | Beginning
Account
Value
October 1,
2011
| | Ending
Account
Value
March 31,
2012
| | Annualized
Expense
Ratio
| | Expenses Paid
During the
Period Ended
March 31,
2012*
|
|---|
| |
| Class A | | | | $ | 1,000.00 | | | $ | 1,070.30 | | | | 1.01 | % | | | $5.23 | | | $ | 1,000.00 | | | $ | 1,019.95 | | | | 1.01 | % | | | $5.10 | |
| Class C | | | | | 1,000.00 | | | | 1,066.40 | | | | 1.76 | | | | 9.09 | | | | 1,000.00 | | | | 1,016.20 | | | | 1.76 | | | | 8.87 | |
| Class I | | | | | 1,000.00 | | | | 1,071.70 | | | | 0.76 | | | | 3.94 | | | | 1,000.00 | | | | 1,021.20 | | | | 0.76 | | | | 3.84 | |
| Class R | | | | | 1,000.00 | | | | 1,068.00 | | | | 1.26 | | | | 6.51 | | | | 1,000.00 | | | | 1,018.70 | | | | 1.26 | | | | 6.36 | |
| Class W | | | | | 1,000.00 | | | | 1,071.50 | | | | 0.76 | | | | 3.94 | | | | 1,000.00 | | | | 1,021.20 | | | | 0.76 | | | | 3.84 | |
| * | | Expenses are equal to the Fund’s respective annualized expense ratios multiplied by the average account value over the period, multiplied by 183/366 to reflect the most recent fiscal half-year. |
7
REPORT OF INDEPENDENT REGISTERED PUBLIC ACCOUNTING FIRM
The Shareholders and Board of Trustees
ING Funds Trust
We have audited the accompanying statement of assets and liabilities, including the portfolio of investments, of ING Floating Rate Fund, a series of ING Funds Trust, as of March 31, 2012, and the related statement of operations for the year then ended, and the statements of changes in net assets and the financial highlights for the year then ended and the period from August 17, 2010 (commencement of operations) to March 31, 2011. These financial statements and financial highlights are the responsibility of management. Our responsibility is to express an opinion on these financial statements and financial highlights based on our audits.
We conducted our audits in accordance with auditing standards generally accepted in the United States of America. Those standards require that we plan and perform the audit to obtain reasonable assurance about whether the financial statements and financial highlights are free of material misstatement. An audit includes examining, on a test basis, evidence supporting the amounts and disclosures in the financial statements. Our procedures included confirmation of securities owned as of March 31, 2012, by correspondence with the custodian, transfer agent, and brokers, or by other appropriate auditing procedures when replies from brokers were not received. An audit also includes assessing the accounting principles used and significant estimates made by management, as well as evaluating the overall financial statement presentation. We believe that our audits provide a reasonable basis for our opinion.
In our opinion, the financial statements and financial highlights referred to above present fairly, in all material respects, the financial position of ING Floating Rate Fund as of March 31, 2012, the results of its operations, the changes in its net assets, and the financial highlights for the periods specified in the first paragraph above, in conformity with U.S. generally accepted accounting principles.
Boston, Massachusetts
May 30, 2012
8
STATEMENT OF ASSETS AND LIABILITIES AS OF MARCH 31, 2012
ASSETS: | | | | | | |
| Investments in securities at fair value (Cost $252,761,457) | | | | $ | 253,347,885 | |
| Short-term investments at value (Cost $14,312,050) | | | | | 14,312,050 | |
| Cash | | | | | 517,163 | |
| Receivables: | | | | | | |
| Investment securities sold | | | | | 5,912,960 | |
| Fund shares sold | | | | | 1,286,800 | |
| Interest | | | | | 1,222,567 | |
| Unrealized appreciation on unfunded commitments | | | | | 87 | |
| Prepaid expenses | | | | | 36,347 | |
| Reimbursement due from manager | | | | | 18,479 | |
| Total assets | | | | | 276,654,338 | |
LIABILITIES: | | | | | | |
| Payable for investment securities purchased | | | | | 15,612,742 | |
| Payable for fund shares redeemed | | | | | 412,694 | |
| Income distribution payable | | | | | 68,383 | |
| Payable to affiliates | | | | | 154,820 | |
| Accrued trustees fees | | | | | 3,087 | |
| Other accrued expenses and liabilities | | | | | 139,141 | |
| Total liabilities | | | | | 16,390,867 | |
NET ASSETS | | | | $ | 260,263,471 | |
NET ASSETS WERE COMPRISED OF: | | | | | | |
| Paid-in capital | | | | | 260,403,591 | |
| Undistributed net investment income | | | | | 43,319 | |
| Accumulated net realized loss | | | | | (769,954 | ) |
| Net unrealized appreciation | | | | | 586,515 | |
NET ASSETS | | | | $ | 260,263,471 | |
Class A: | | | | | | |
| Net assets | | | | $ | 10,265,907 | |
| Shares authorized | | | | | unlimited | |
| Par value | | | | $ | 0.001 | |
| Shares outstanding | | | | | 1,016,725 | |
| Net asset value and redemption price per share | | | | $ | 10.10 | |
Maximum offering price per share (2.50%)(1) | | | | $ | 10.36 | |
Class C: | | | | | | |
| Net assets | | | | $ | 7,409,161 | |
| Shares authorized | | | | | unlimited | |
| Par value | | | | $ | 0.001 | |
| Shares outstanding | | | | | 733,649 | |
Net asset value and redemption price per share(2) | | | | $ | 10.10 | |
Class I: | | | | | | |
| Net assets | | | | $ | 173,721,916 | |
| Shares authorized | | | | | unlimited | |
| Par value | | | | $ | 0.001 | |
| Shares outstanding | | | | | 17,203,546 | |
Net asset value and redemption price per share(2) | | | | $ | 10.10 | |
Class R: | | | | | | |
| Net assets | | | | $ | 16,514,999 | |
| Shares authorized | | | | | unlimited | |
| Par value | | | | $ | 0.001 | |
| Shares outstanding | | | | | 1,636,130 | |
| Net asset value and redemption price per share | | | | $ | 10.09 | |
Class W: | | | | | | |
| Net assets | | | | $ | 52,351,488 | |
| Shares authorized | | | | | unlimited | |
| Par value | | | | $ | 0.001 | |
| Shares outstanding | | | | | 5,174,512 | |
| Net asset value and redemption price per share | | | | $ | 10.12 | |
| | | | | | |
(1) Maximum offering price is computed at 100/97.50 of net asset value. On purchases of $100,000 or more, the offering price is reduced. |
(2) Redemption price per share may be reduced for any applicable contingent deferred sales charge. |
See Accompanying Notes to Financial Statements
9
STATEMENT OF OPERATIONS FOR THE YEAR ENDED MARCH 31, 2012
INVESTMENT INCOME: | | | | | | |
| Interest | | | | $ | 12,254,949 | |
| Other | | | | | 579,779 | |
| Total investment income | | | | | 12,834,728 | |
EXPENSES: | | | | | | |
| Investment management fees | | | | | 1,300,682 | |
| Administration fees | | | | | 236,488 | |
| Distribution and service fees: | | | | | | |
| Class A | | | | | 36,753 | |
| Class C | | | | | 53,937 | |
| Class R | | | | | 64,614 | |
| Transfer agent fees: | | | | | | |
| Class A | | | | | 4,806 | |
| Class C | | | | | 2,161 | |
| Class I | | | | | 59,452 | |
| Class R | | | | | 5,329 | |
| Class W | | | | | 18,524 | |
| Shareholder reporting expense | | | | | 19,368 | |
| Custody and accounting expense | | | | | 141,828 | |
| Registration fees | | | | | 117,502 | |
| Professional fees | | | | | 58,918 | |
| Trustees fees | | | | | 5,848 | |
| Offering expense | | | | | 30,466 | |
| Structuring fee (Note 7) | | | | | 16,689 | |
| Commitment fee | | | | | 21,198 | |
| Miscellaneous expense | | | | | 19,616 | |
| Total expenses | | | | | 2,214,179 | |
| Net waived and reimbursed fees | | | | | (254,672 | ) |
| Net expenses | | | | | 1,959,507 | |
| Net investment income | | | | | 10,875,221 | |
REALIZED AND UNREALIZED LOSS: | | | | | | |
| Net realized loss on: | | | | | | |
| Investments | | | | | (700,049 | ) |
| Futures | | | | | (67,721 | ) |
| Net realized loss | | | | | (767,770 | ) |
| Net change in unrealized appreciation or depreciation on: | | | | | | |
| Investments | | | | | (1,391,950 | ) |
| Futures | | | | | (2,156 | ) |
| Unfunded commitments | | | | | (3,093 | ) |
| Net change in unrealized appreciation or depreciation | | | | | (1,397,199 | ) |
| Net realized and unrealized loss | | | | | (2,164,969 | ) |
| Increase in net assets resulting from operations | | | | $ | 8,710,252 | |
See Accompanying Notes to Financial Statements
10
STATEMENTS OF CHANGES IN NET ASSETS
| | | | Year
Ended
March 31, 2012
| | August 17, 2010(1) –
March 31,
2011
|
|---|
FROM OPERATIONS: | | | | | | | | | | |
| Net investment income | | | | $ | 10,875,221 | | | $ | 3,280,872 | |
| Net realized gain (loss) | | | | | (767,770 | ) | | | 1,452,578 | |
| Net change in unrealized appreciation or depreciation | | | | | (1,397,199 | ) | | | 1,983,714 | |
| Net increase in net assets resulting from operations | | | | | 8,710,252 | | | | 6,717,164 | |
FROM DISTRIBUTIONS TO SHAREHOLDERS: | | | | | | | | | | |
| Net investment income: | | | | | | | | | | |
| Class A | | | | | (639,356 | ) | | | (237,589 | ) |
| Class C | | | | | (203,884 | ) | | | (15,514 | ) |
| Class I | | | | | (7,478,743 | ) | | | (2,666,771 | ) |
| Class R | | | | | (561,087 | ) | | | (47,366 | ) |
| Class W | | | | | (2,211,548 | ) | | | (7,896 | ) |
| Net realized gains: | | | | | | | | | | |
| Class A | | | | | (37,398 | ) | | | (11,672 | ) |
| Class C | | | | | (30,562 | ) | | | (585 | ) |
| Class I | | | | | (922,011 | ) | | | (117,332 | ) |
| Class R | | | | | (87,338 | ) | | | (1,780 | ) |
| Class W | | | | | (296,000 | ) | | | (282 | ) |
| Total distributions | | | | | (12,467,927 | ) | | | (3,106,787 | ) |
FROM CAPITAL SHARE TRANSACTIONS: | | | | | | | | | | |
| Net proceeds from sale of shares | | | | | 148,313,137 | | | | 206,276,555 | |
| Reinvestment of distributions | | | | | 11,355,771 | | | | 2,877,210 | |
| | | | | | 159,668,908 | | | | 209,153,765 | |
| Cost of shares redeemed | | | | | (99,290,003 | ) | | | (9,121,901 | ) |
| Net increase in net assets resulting from capital share transactions | | | | | 60,378,905 | | | | 200,031,864 | |
| Net increase in net assets | | | | | 56,621,230 | | | | 203,642,241 | |
NET ASSETS: | | | | | | | | | | |
| Beginning of period | | | | | 203,642,241 | | | | — | |
| End of period | | | | $ | 260,263,471 | | | $ | 203,642,241 | �� |
| Undistributed net investment income at end of period | | | | $ | 43,319 | | | $ | 312,914 | |
| |
| | | | | | | | | | |
(1) Commencement of operations. |
See Accompanying Notes to Financial Statements
11
FINANCIAL HIGHLIGHTS
Selected data for a share of beneficial interest outstanding throughout each year or period.
| | | | Income (loss)
from investment
operations
| | | | Less distributions
| | | | Ratios to average net assets
| | Supplemental data
| |
|---|
| |
|---|
| | Net
asset
value,
beginning
of year
or period
| | Net
investment
income
(loss)
| | Net
realized
and
unrealized
gain
(loss)
| | Total
from
investment
operations
| | From
net
investment
income
| | From
net
realized
gains
| | From
return
of
capital
| | Total
distributions
| | Net
asset
value,
end of
year or
period
| | Total
Return(1)
| | Expenses
before
reductions/
additions(2)(3)
| | Expenses,
net of fee
waivers
and/or
recoupments,
if any(2)(3)
| | Expenses,
net of all
reductions/
additions(2)(3)
| | Net
investment
income
(loss)(2)(3)
| | Net
assets,
end of
year or
period
| | Portfolio
Turnover
rate
|
|---|
Year or period ended
| | ($)
| | ($)
| | ($)
| | ($)
| | ($)
| | ($)
| | ($)
| | ($)
| | ($)
| | (%)
| | (%)
| | (%)
| | (%)
| | (%)
| | ($000’s)
| | (%)
|
|---|
Class A | | | | | | | | | | | | | | | | | | | | | | | | | | | | | | | | | | | | | | | | | | | | | | | | | | | | | | | | | | | | | | | | |
| 03-31-12 | | | 10.26 | | | | 0.43 | * | | | (0.08 | ) | | | 0.35 | | | | 0.45 | | | | 0.06 | | | | — | | | | 0.51 | | | | 10.10 | | | | 3.58 | | | | 1.12 | | | | 1.01 | | | | 1.01 | | | | 4.23 | | | | 10,266 | | | | 79 | |
08-17-10(4)–03-31-11 | | | 10.00 | | | | 0.21 | * | | | 0.25 | | | | 0.46 | | | | 0.19 | | | | 0.01 | | | | — | | | | 0.20 | | | | 10.26 | | | | 4.57 | | | | 1.30 | | | | 1.02 | | | | 1.02 | | | | 3.49 | | | | 18,411 | | | | 73 | |
Class C | | | | | | | | | | | | | | | | | | | | | | | | | | | | | | | | | | | | | | | | | | | | | | | | | | | | | | | | | | | | | | | | |
| 03-31-12 | | | 10.26 | | | | 0.36 | * | | | (0.09 | ) | | | 0.27 | | | | 0.37 | | | | 0.06 | | | | — | | | | 0.43 | | | | 10.10 | | | | 2.80 | | | | 1.87 | | | | 1.76 | | | | 1.76 | | | | 3.71 | | | | 7,409 | | | | 79 | |
08-17-10(4)–03-31-11 | | | 10.00 | | | | 0.19 | * | | | 0.22 | | | | 0.41 | | | | 0.14 | | | | 0.01 | | | | — | | | | 0.15 | | | | 10.26 | | | | 4.11 | | | | 2.05 | | | | 1.77 | | | | 1.77 | | | | 3.46 | | | | 3,356 | | | | 73 | |
Class I | | | | | | | | | | | | | | | | | | | | | | | | | | | | | | | | | | | | | | | | | | | | | | | | | | | | | | | | | | | | | | | | |
| 03-31-12 | | | 10.27 | | | | 0.47 | * | | | (0.10 | ) | | | 0.37 | | | | 0.48 | | | | 0.06 | | | | — | | | | 0.54 | | | | 10.10 | | | | 3.74 | | | | 0.87 | | | | 0.76 | | | | 0.76 | | | | 4.65 | | | | 173,722 | | | | 79 | |
08-17-10(4)–03-31-11 | | | 10.00 | | | | 0.25 | * | | | 0.23 | | | | 0.48 | | | | 0.20 | | | | 0.01 | | | | — | | | | 0.21 | | | | 10.27 | | | | 4.83 | | | | 1.05 | | | | 0.77 | | | | 0.77 | | | | 3.93 | | | | 170,660 | | | | 73 | |
Class R | | | | | | | | | | | | | | | | | | | | | | | | | | | | | | | | | | | | | | | | | | | | | | | | | | | | | | | | | | | | | | | | |
| 03-31-12 | | | 10.26 | | | | 0.41 | * | | | (0.09 | ) | | | 0.32 | | | | 0.43 | | | | 0.06 | | | | — | | | | 0.49 | | | | 10.09 | | | | 3.22 | | | | 1.37 | | | | 1.26 | | | | 1.26 | | | | 4.26 | | | | 16,515 | | | | 79 | |
08-17-10(4)–03-31-11 | | | 10.00 | | | | 0.21 | * | | | 0.23 | | | | 0.44 | | | | 0.17 | | | | 0.01 | | | | — | | | | 0.18 | | | | 10.26 | | | | 4.39 | | | | 1.55 | | | | 1.27 | | | | 1.27 | | | | 3.87 | | | | 7,897 | | | | 73 | |
Class W | | | | | | | | | | | | | | | | | | | | | | | | | | | | | | | | | | | | | | | | | | | | | | | | | | | | | | | | | | | | | | | | |
| 03-31-12 | | | 10.27 | | | | 0.45 | * | | | (0.06 | ) | | | 0.39 | | | | 0.48 | | | | 0.06 | | | | — | | | | 0.54 | | | | 10.12 | | | | 3.93 | | | | 0.87 | | | | 0.76 | | | | 0.76 | | | | 4.74 | | | | 52,351 | | | | 79 | |
08-17-10(4)–03-31-11 | | | 10.00 | | | | 0.24 | | | | 0.24 | | | | 0.48 | | | | 0.20 | | | | 0.01 | | | | — | | | | 0.21 | | | | 10.27 | | | | 4.83 | | | | 1.05 | | | | 0.77 | | | | 0.77 | | | | 4.49 | | | | 3,319 | | | | 73 | |
(1) | | Total return is calculated assuming reinvestment of all dividends, capital gain distributions and return of capital distributions, if any, at net asset value and excluding the deduction of sales charges. Total return for periods less than one year is not annualized. |
(2) | | Annualized for periods less than one year. |
(3) | | Expense ratios reflect operating expenses of a Fund. Expenses before reductions/additions do not reflect amounts reimbursed by the Investment Adviser and/or Distributor or reductions from brokerage service arrangements or other expense offset arrangements and do not represent the amount paid by a Fund during periods when reimbursements or reductions occur. Expenses net of fee waivers reflect expenses after reimbursement by an Investment Adviser and/or Distributor but prior to reductions from brokerage service arrangements or other expense offset arrangements. Expenses net of all reductions/additions represent the net expenses paid by a Fund. Net investment income (loss) is net of all such additions or reductions. |
(4) | | Commencement of operations. |
| * | | Calculated using average number of shares outstanding throughout the period. |
See Accompanying Notes to Financial Statements
12
NOTES TO FINANCIAL STATEMENTS AS OF MARCH 31, 2012
NOTE 1 — ORGANIZATION
ING Funds Trust (“Trust”) is a Delaware statutory trust and is registered as an open-end management investment company under the Investment Company Act of 1940, as amended (“1940 Act” or the “Act”). The Trust was organized on August 6, 1998 and was established under a Trust Instrument dated July 30, 1998. It consists of four separately managed series one of which, ING Floating Rate Fund (“Floating Rate” or the “Fund”) is included in this report.
The investment objective of the Fund is described in the Fund’s prospectus.
The Fund offers the following classes of shares: Class A, Class C, Class I, Class R and Class W. The separate classes of shares differ principally in the applicable sales charges (if any), transfer agent fees, distribution fees and shareholder servicing fees. Generally, shareholders of each class also bear certain expenses that pertain to that particular class. All shareholders bear the common expenses of a Fund and earn income and realized gains/losses from the portfolio pro rata based on the average daily net assets of each class, without distinction between share classes. Differences in per share dividend rates generally result from the differences in separate class expenses, including distribution, and shareholder servicing fees.
NOTE 2 — SIGNIFICANT ACCOUNTING POLICIES
The following is a summary of the significant accounting policies consistently followed by the Fund in the preparation of its financial statements. The policies are in conformity with U.S. generally accepted accounting principles.
A. Loan and Other Security Valuation. Loans held by the Fund are normally valued at the average of the means of one or more bid and asked quotations obtained from a pricing service or other sources determined by the Board of Trustees (the “Board”) to be independent and believed to be reliable. Loans for which reliable market value quotations are not readily available may be valued with reference to another loan or a group of loans for which quotations are more readily available and whose characteristics are comparable to the loan being valued. Under this approach, the comparable loan or loans serve as a proxy for changes in value of the loan being valued. The Fund has engaged an independent pricing service to provide quotations from dealers in loans and to calculate values under the proxy procedure described above.
It is expected that most of the loans held by the Fund will be valued with reference to quotations from the independent pricing service or with reference to the proxy procedure described above. As of March 31, 2012, 100% of total loans were valued based on these procedures.
Prices from a pricing service may not be available for all loans and the Investment Adviser may believe that the price for a loan derived from market quotations or the proxy procedure described above is not reliable or accurate. Among other reasons, this may be the result of information about a particular loan or borrower known to the Investment Adviser that the Investment Adviser believes may not be known to the pricing service or reflected in a price quote. In this event, the loan is valued at fair value, as defined by the 1940 Act, as determined in good faith under procedures adopted by the Fund’s Board of Trustees and in accordance with the provisions of the 1940 Act. Under these procedures, fair value is determined by the Investment Adviser and monitored by the Fund’s Board through its Compliance Committee.
In fair valuing a loan, consideration is given to several factors, which may include, among others, the following: (i) the characteristics of and fundamental analytical data relating to the loan, including the cost, size, current interest rate, period until the next interest rate reset, maturity and base lending rate of the loan, the terms and conditions of the loan and any related agreements, and the position of the loan in the borrower’s debt structure; (ii) the nature, adequacy and value of the collateral, including the Fund’s rights, remedies and interests with respect to the collateral; (iii) the creditworthiness of the borrower and the cash flow coverage of outstanding principal and interest, based on an evaluation of its financial condition, financial statements and information about the borrower’s business, cash flows, capital structure and future prospects; (iv) information relating to the market for the loan, including price quotations for, and trading in, the loan and interests in similar loans and the market environment and investor attitudes towards the loan and interests in similar loans; (v) the reputation and financial condition of the agent for the loan and any intermediate participants in the loan; (vi) the borrower’s management; and (vii) the general economic and market conditions affecting the fair value of the loan. Securities other than loans for which reliable market value quotations are not readily available and all other assets will be valued at their respective fair values as determined in good faith by, and under procedures adopted by, the Board of the
13
NOTES TO FINANCIAL STATEMENTS AS OF MARCH 31, 2012 (CONTINUED)
NOTE 2 — SIGNIFICANT ACCOUNTING POLICIES (continued)
Fund. Investments in securities of sufficient credit quality, maturing in 60 days or less from date of acquisition, are valued at amortized cost which approximates fair value. To the extent the Fund invests in other registered companies, the Fund’s NAV is calculated based on the current NAV of the registered investment company in which the Fund invests. The prospectuses for those investment companies explain the circumstances under which they will use fair value pricing and the effects of using fair value pricing.
Fair value is defined as the price that the Fund would receive to sell an asset or pay to transfer a liability in an orderly transaction between market participants at the measurement date. Each investment asset or liability of the Fund is assigned a level at measurement date based on the significance and source of the inputs to its valuation. Quoted prices in active markets for identical securities are classified as “Level 1,” inputs other than quoted prices for an asset or liability that are observable are classified as “Level 2” and unobservable inputs, including the sub-adviser’s judgment about the assumptions that a market participant would use in pricing an asset or liability are classified as “Level 3.” The inputs used for valuing securities are not necessarily an indication of the risks associated with investing in those securities. Short-term securities of sufficient credit quality which are valued at amortized cost, which approximates fair value, are generally considered to be Level 2 securities under applicable accounting rules. A table summarizing the Fund’s investments under these levels of classification is included following the Portfolio of Investments.
For the period ended March 31, 2012, there have been no significant changes to the fair valuation methodologies.
B. Security Transactions and Revenue Recognition. Revolver and delayed draw loans are booked on a settlement date basis. Security transactions and loans are accounted for on trade date (date the order to buy or sell is executed). Realized gains or losses are reported on the basis of identified cost of securities sold. Interest income is recorded on an accrual basis at the then-current loan rate. The accrual of interest on loans is partially or fully discontinued when, in the opinion of management, there is an indication that the borrower may be unable to meet payments as they become due. If determined to be uncollectible, unpaid accrued interest is also written off. Cash collections on non-accrual loans are generally applied as a reduction to the recorded investment of the loan. Loans are generally returned to accrual status only after all past due amounts have been received and the borrower has demonstrated sustained performance. Loan premiums and discounts are amortized and/or accreted for financial reporting purposes. Arrangement fees received on revolving credit facilities, which represent non-refundable fees or purchase discounts associated with the acquisition of loans, are deferred and recognized using the effective yield for financial reporting purposes. No such fees are recognized on loans which have been placed on non-accrual status. Arrangement fees associated with all other loans, except revolving credit facilities, are treated as discounts and are accreted as described above. Dividend income is recorded on the ex-dividend date.
C. Distributions to Shareholders. The Fund declares and goes ex-dividend daily and pays dividends monthly from net investment income. Distributions from capital gains, if any, are declared and paid annually. The Fund may make additional distributions to comply with the distribution requirements of the Internal Revenue Code. The character and amounts of income and gains to be distributed are determined in accordance with federal income tax regulations, which may differ from U.S. generally accepted accounting principles for investment companies. The Fund records distributions to its shareholders on the ex-dividend date.
D. Futures Contracts. A futures contract is an agreement between a buyer or seller and an established futures exchange or its clearinghouse in which the buyer or seller agrees to take or make a delivery of a specific amount of a financial instrument at a specified price on a specific date (settlement date). During the year ended March 31, 2012, Floating Rate has sold futures contracts on various notes to decrease exposure to interest rate risk with an average notional value of $456,761.
Futures contracts are valued at the most recent settlement price. Upon entering into a futures contract, the Fund is required to deposit with a financial intermediary cash or securities (“initial margin”) in an amount equal to a certain percentage of the face value indicated in the futures contract. Subsequent payments (“variation margin”) are made or received by the Fund dependent upon the daily fluctuations in the value and are recorded as unrealized gains or losses by the Fund. Gains or losses are realized when the contract expires or is closed. Since all futures contracts are exchange-traded, counterparty risk is minimized as the exchange’s clearinghouse acts as the counterparty, and guarantees the futures against default.
Certain risks may arise upon entering into futures contracts, including the risk that an illiquid market will
14
NOTES TO FINANCIAL STATEMENTS AS OF MARCH 31, 2012 (CONTINUED)
NOTE 2 — SIGNIFICANT ACCOUNTING POLICIES (continued)
limit the Fund’s ability to close out a futures contract prior to the settlement date and that a change in the value of a futures contract may not correlate exactly with the changes in the value of the underlying hedged security, index or currency.
E. Federal Income Taxes. It is the policy of the Fund to comply with the requirements of subchapter M of the Internal Revenue Code that are applicable to regulated investment companies and to distribute substantially all of their net investment income and any net realized capital gains to their shareholders. Therefore, a federal income tax or excise tax provision is not required. Management has considered the sustainability of the Fund’s tax positions taken on federal income tax returns for all open tax years in making this determination. No capital gain distributions shall be made until the capital loss carryforwards have been fully utilized or expire.
F. Use of Estimates. The preparation of financial statements in conformity with U.S. generally accepted accounting principles requires management to make estimates and assumptions that affect the reported amounts of assets and liabilities and disclosure of contingent assets and liabilities at the date of the financial statements and the reported amounts of increases and decreases in net assets from operations during the reporting period. Actual results could differ from those estimates.
G. Foreign Currency Translation. The books and records of the Fund are maintained in U.S. dollars. Any foreign currency amounts are translated into U.S. dollars on the following basis:
| (1) | | Market value of investment securities, other assets and liabilities — at the exchange rates prevailing at the end of the day. |
| (2) | | Purchases and sales of investment securities, income and expenses — at the rates of exchange prevailing on the respective dates of such transactions. |
Although the net assets and the market values are presented at the foreign exchange rates at the end of the day, the Fund does not isolate the portion of the results of operations resulting from changes in foreign exchange rates on investments from the fluctuations arising from changes in market prices of securities held. Such fluctuations are included with the net realized and unrealized gains or losses from investments. For securities, which are subject to foreign withholding tax upon disposition, liabilities are recorded on the Statement of Assets and Liabilities for the estimated tax withholding based on the securities current market value. Upon disposition, realized gains or losses on such securities are recorded net of foreign withholding tax.
Reported net realized foreign exchange gains or losses arise from sales of foreign currencies, currency gains or losses realized between the trade and settlement dates on securities transactions, the difference between the amounts of dividends, interest, and foreign withholding taxes recorded on the Fund’s books, and the U.S. dollar equivalent of the amounts actually received or paid. Net unrealized foreign exchange gains and losses arise from changes in the value of assets and liabilities other than investments in securities at fiscal year end, resulting from changes in the exchange rate. Foreign security and currency transactions may involve certain considerations and risks not typically associated with investing in U.S. companies and the U.S. government. These risks include, but are not limited to, revaluation of currencies and future adverse political and economic developments which could cause securities and their markets to be less liquid and prices more volatile than those of comparable U.S. companies and U.S. government securities.
H. Offering Costs. Costs incurred with the offering of shares of the Fund are deferred and amortized over a twelve month period on a straight-line basis starting at the commencement of operations.
I. Indemnifications. In the normal course of business, the Trust may enter into contracts that provide certain indemnifications. The Trust’s maximum exposure under these arrangements is dependent on future claims that may be made against the Fund and, therefore, cannot be estimated; however, management believes based on experience, the risk of loss from such claims is considered remote.
NOTE 3 — INVESTMENTS
For the period ended March 31, 2012, the cost of purchases and the proceeds from principal repayment and sales of investments, excluding short-term investments, totaled $251,763,979 and $180,899,953, respectively. At March 31, 2012, the Fund held loans valued at $253,347,885 representing 94.7% of its total investments. The fair value of these assets is established as set forth in Note 2.
The loans acquired by the Fund typically take the form of a direct lending relationship with the borrower acquired through an assignment of another lender’s interest in a loan. The lead lender in a typical corporate
15
NOTES TO FINANCIAL STATEMENTS AS OF MARCH 31, 2012 (CONTINUED)
NOTE 3 — INVESTMENTS (continued)
loan syndicate administers the loan and monitors collateral. In the event that the lead lender becomes insolvent, enters FDIC receivership or, if not FDIC insured, enters into bankruptcy, the Fund may incur certain costs and delays in realizing payment, or may suffer a loss of principal and/or interest.
NOTE 4 — INVESTMENT MANAGEMENT AND ADMINISTRATION FEES
The Fund has entered into an investment management agreement (“Management Agreement”) with ING Investments, LLC (“ING Investments” or the “Investment Adviser”) to provide advisory and management services. The Management Agreement compensates the Investment Adviser with a fee, computed daily and payable monthly, at an annual rate of 0.55% of the Fund’s average daily net assets. The Fund is sub-advised by ING Investment Management Co. LLC (“ING IM”). Under the sub-advisory agreement, ING IM is responsible for managing the assets of the Fund in accordance with its investment objective and policies, subject to oversight by the Investment Adviser. Both ING IM and the Investment Adviser are indirect, wholly-owned subsidiaries of ING Groep N.V. (“ING Groep”) and affiliates of each other. ING Groep is a global financial institution of Dutch origin offering banking, investments, life insurance, and retirement services.
ING Groep has adopted a formal restructuring plan that was approved by the European Commission in November 2009 under which the ING life insurance businesses, including the retirement services and investment management businesses, which include the Adviser and its immediate affiliates, would be separated from ING Groep by the end of 2013. To achieve this goal, in a series of announcements beginning November 2010, ING Groep announced that it plans to pursue transactions to restructure certain businesses, including an initial public offering for its U.S. based insurance, retirement services, and investment management operations; and other transactions, which could include an initial public offering or other type of transaction, for its European based insurance and investment management operations and Asian based insurance and investment management operations. There can be no assurance that all or part of the restructuring plan will be carried out.
The restructuring plan and the uncertainty about its implementation, whether implemented through the planned public offerings or through other means, in whole or in part, may be disruptive to the businesses of ING entities, including the ING entities that service the Fund, and may cause, among other things, interruption or reduction of business and services, diversion of management’s attention from day-to-day operations, and loss of key employees or customers. A failure to complete the offerings or other means of implementation on favorable terms could have a material adverse impact on the operations of the businesses subject to the restructuring plan. The restructuring plan may result in the Investment Adviser’s loss of access to services and resources of ING Groep, which could adversely affect its businesses and profitability. In addition, the divestment of ING businesses, including the Investment Adviser, may potentially be deemed a “change of control” of each entity. A change of control would result in the termination of the Fund’s advisory and sub-advisory agreements, which would trigger the necessity for new agreements that would require approval of the board, and may trigger the need for shareholder approval. Currently, the Investment Adviser does not anticipate that the restructuring will have a material adverse impact on the Fund or its operations and administration.
The Fund has also entered into an Administration Agreement with ING Funds Services, LLC (the “Administrator”), an indirect, wholly-owned subsidiary of ING Groep, to provide administrative services. The Administrator is compensated with a fee, computed daily and payable monthly, at an annual rate of 0.10% of the Fund’s average daily net assets.
NOTE 5 — DISTRIBUTION AND SERVICE FEES
Each share class of the Fund, except Class I and Class W, has adopted a plan (each a “Plan” and collectively, the “Plans”), whereby ING Investments Distributor, LLC (the “Distributor”) is compensated by the Fund for expenses incurred in the distribution of the Fund’s shares (“Distribution Fees”). Pursuant to the Plans, the Distributor is entitled to a payment each month for actual expenses incurred in the distribution and promotion of the Fund’s shares, including expenses incurred in printing prospectuses and reports used for sales purposes, expenses incurred in preparing and printing sales literature and other such distribution related expenses, including any distribution or Shareholder Servicing Fees (“Service Fees”) paid to securities dealers who executed a distribution agreement with the Distributor. Under the Plans, each class of shares of the Fund pays the Distributor a combined Distribution and/or Service Fee based on average daily net assets at the following annual rates:
Class A
| | | | Class C
| | Class R
|
|---|
| 0.25% | | | | 1.00% | | 0.50% |
16
NOTES TO FINANCIAL STATEMENTS AS OF MARCH 31, 2012 (CONTINUED)
NOTE 5 — DISTRIBUTION AND SERVICE FEES (continued)
The Distributor may also retain the proceeds of the initial sales charge paid by shareholders upon the purchase of Class A shares of the Funds, and the contingent deferred sales charge paid by shareholders upon certain redemptions for Class A, Class B, and Class C shares. For the period ended March 31, 2012, the Distributor retained the following amounts in sales charges:
| | | | Class A
| | Class C
|
|---|
Initial Sales Charges | | | | $ | 4,477 | | | | — | |
Contingent Deferred Sales Charge | | | | | — | | | $ | 415 | |
NOTE 6 — EXPENSE LIMITATIONS
Pursuant to a written expense limitation agreement (“Expense Limitation Agreement”) with the Fund, the Investment Adviser has agreed to limit expenses, excluding interest, taxes, brokerage commissions, and extraordinary expenses (and acquired fund fees and expenses), to the levels listed below:
Maximum Operating Expense Limit
(as a percentage of average daily net assets)
Class A — 1.00%
Class C — 1.75%
Class I — 0.75%
Class R — 1.25%
Class W — 0.75%
The Investment Adviser may at a later date recoup from the Fund management fees waived and other expenses assumed by the Investment Adviser during the previous 36 months, but only if, after such recoupment, the Fund’s expense ratio does not exceed the percentage described above. Waived and reimbursed fees and any recoupment by the Investment Adviser of such waived and reimbursed fees are reflected on the accompanying Statement of Operations for the Fund.
The Expense Limitation Agreement is contractual and shall renew automatically for one-year terms unless ING Investments provides written notice of the termination of the Expense Limitation Agreement within 90 days of the end of the then current term.
As of September 30, 2011, the amount of waived and reimbursed fees that are subject to recoupment by the Investment Adviser, and the related expiration dates are as follows:
March 31,
| |
|---|
2013
| | | | 2014
| | 2015
| | Total
|
|---|
| $— | | | | $236,318 | | $254,672 | | $490,990 |
NOTE 7 — LINE OF CREDIT
Effective November 30, 2011, the Fund has entered into an unsecured committed revolving line of credit agreement (the “Credit Agreement”) with State Street Bank and Trust Company (“SSB”) for an aggregate amount of $25,000,000. The proceeds may be used only to: (1) temporarily finance the purchase and sale of securities; or (2) finance the redemption of shares of an investor in the Fund. The Fund pays a commitment fee equal to 0.10% per annum on the daily unused portion of the committed line amount payable quarterly in arrears. Prior to November 30, 2011, the aggregate amount of the Fund’s Credit Agreement was $15,000,000, the Fund paid a commitment fee equal to 0.125% on the daily unused portion of the committed line amount payable quarterly in arrears, and the Fund paid a structuring fee of $25,000. During the period ended March 31, 2012, the Fund did not have any loans outstanding under the line of credit.
NOTE 8 — TRANSACTIONS WITH AFFILIATES AND RELATED PARTIES
At March 31, 2012, the Fund had the following amounts recorded in payable to affiliates on the accompanying Statement of Assets and Liabilities (see Notes 4 and 5):
Accrued
Investment
Management
Fees
| | | | Accrued
Administrative
Fees
| | Accrued
Distribution
and Service
Fees
| | Total
|
|---|
| $118,350 | | | | $21,518 | | $14,952 | | $154,820 |
At March 31, 2012, the following ING Funds or indirect, wholly-owned subsidiaries of ING Groep owned more than 5% of the Fund:
ING Fund(s) or Subsidiary
| | | | Percentage
|
|---|
| ING National Trust | | | | | 6.34 | % |
| ING Solution 2015 Portfolio | | | | | 12.31 | % |
| ING Solution 2025 Portfolio | | | | | 15.10 | % |
| ING Solution 2035 Portfolio | | | | | 13.05 | % |
Control is defined by the 1940 Act as the beneficial ownership, either directly or through one or more controlled companies, of more than 25% of the voting securities of a company. The 1940 Act defines affiliates as companies that are under common control. Therefore, because the Fund has a common owner that owns over 25% of the outstanding securities of the Fund, they may be deemed to be affiliates of each other. Investment activities of these shareholders could have a material impact on the Fund.
17
NOTES TO FINANCIAL STATEMENTS AS OF MARCH 31, 2012 (CONTINUED)
NOTE 8 — TRANSACTIONS WITH AFFILIATES AND RELATED PARTIES (continued)
The Fund has adopted a Deferred Compensation Plan (the “Plan”), which allows eligible non-affiliated trustees as described in the Plan to defer the receipt of all or a portion of the trustees fees payable. Amounts deferred are treated as though invested in various “notional” funds advised by ING Investments until distribution in accordance with the Plan.
NOTE 9 — UNFUNDED COMMITMENTS
As of March 31, 2012, the Fund had unfunded loan commitments pursuant to the terms of the following loan agreements:
| | | | Principal Amount
|
|---|
| Tronox Pigments (Netherlands) BV | | | | $ | 139,286 | |
The unrealized appreciation on these commitments of $87 as of March 31, 2012 is reported as such on the Statement of Assets and Liabilities.
NOTE 10 — CAPITAL SHARES
Transactions in capital shares and dollars were as follows:
| | | | Shares
sold
| | Reinvestment
of
distributions
| | Shares
redeemed
| | Net increase
(decrease)
in shares
outstanding
| | Shares
sold
| | Reinvestment
of
distributions
| | Shares
redeemed
| | Net increase
(decrease)
|
|---|
Year or period ended
| | | | #
| | #
| | #
| | #
| | ($)
| | ($)
| | ($)
| | ($)
|
|---|
Class A | | | | | | | | | | | | | | | | | | | | | | | | | | | | | | | | | | |
| 03-31-12 | | | | | 1,272,962 | | | | 30,768 | | | | (2,080,550 | ) | | | (776,820 | ) | | | 12,866,971 | | | | 307,651 | | | | (20,777,385 | ) | | | (7,602,763 | ) |
08-17-10(1)–03-31-11 | | | | | 1,818,923 | | | | 4,088 | | | | (29,466 | ) | | | 1,793,545 | | | | 18,386,496 | | | | 41,889 | | | | (302,717 | ) | | | 18,125,668 | |
Class C | | | | | | | | | | | | | | | | | | | | | | | | | | | | | | | | | | |
| 03-31-12 | | | | | 693,794 | | | | 13,157 | | | | (300,251 | ) | | | 406,700 | | | | 7,013,924 | | | | 131,384 | | | | (2,975,715 | ) | | | 4,169,593 | |
08-17-10(1)–03-31-11 | | | | | 355,779 | | | | 1,018 | | | | (29,848 | ) | | | 326,949 | | | | 3,647,033 | | | | 10,428 | | | | (306,033 | ) | | | 3,351,428 | |
Class I | | | | | | | | | | | | | | | | | | | | | | | | | | | | | | | | | | |
| 03-31-12 | | | | | 5,491,577 | | | | 812,839 | | | | (5,722,597 | ) | | | 581,819 | | | | 54,719,863 | | | | 8,120,755 | | | | (57,523,526 | ) | | | 5,317,092 | |
08-17-10(1)–03-31-11 | | | | | 17,114,951 | | | | 270,737 | | | | (763,961 | ) | | | 16,621,727 | | | | 172,401,568 | | | | 2,767,647 | | | | (7,800,436 | ) | | | 167,368,779 | |
Class R | | | | | | | | | | | | | | | | | | | | | | | | | | | | | | | | | | |
| 03-31-12 | | | | | 1,015,920 | | | | 65,050 | | | | (214,604 | ) | | | 866,366 | | | | 10,227,972 | | | | 648,425 | | | | (2,151,049 | ) | | | 8,725,348 | |
08-17-10(1)–03-31-11 | | | | | 799,290 | | | | 4,793 | | | | (34,319 | ) | | | 769,764 | | | | 8,175,478 | | | | 49,127 | | | | (350,442 | ) | | | 7,874,163 | |
Class W | | | | | | | | | | | | | | | | | | | | | | | | | | | | | | | | | | |
| 03-31-12 | | | | | 6,227,811 | | | | 214,880 | | | | (1,591,193 | ) | | | 4,851,498 | | | | 63,484,407 | | | | 2,147,556 | | | | (15,862,328 | ) | | | 49,769,635 | |
08-17-10(1)–03-31-11 | | | | | 357,485 | | | | 791 | | | | (35,262 | ) | | | 323,014 | | | | 3,665,980 | | | | 8,119 | | | | (362,273 | ) | | | 3,311,826 | |
(1) | | Commencement of operations. |
NOTE 11 — FEDERAL INCOME TAXES
The amount of distributions from net investment income and net realized capital gains are determined in accordance with federal income tax regulations, which may differ from U.S. generally accepted accounting principles for investment companies. These book/tax differences may be either temporary or permanent. Permanent differences are reclassified within the capital accounts based on their federal tax-basis treatment; temporary differences are not reclassified. Key differences include the treatment of short-term capital gains and wash sale deferrals. Distributions in excess of net investment income and/or net realized capital gains for tax purposes are reported as return of capital.
The following permanent tax differences have been reclassified as of March 31, 2012:
Undistributed
Net Investment Income
| | | | Accumulated
Net Realized
Gains/(Losses)
|
|---|
| $(50,198) | | | | $50,198 |
Dividends paid by the Fund from net investment income and distributions of net realized short-term capital gains are, for federal income tax purposes, taxable as ordinary income to shareholders.
The tax composition of dividends and distributions to shareholders was as follows:
Year Ended March 31, 2012
| Year Ended
March 31, 2011
| |
|---|
Ordinary
Income
| | | | Long-term
Capital Gain
| | Ordinary
Income
|
|---|
| $12,464,242 | | | | $3,685 | | $3,106,787 |
18
NOTES TO FINANCIAL STATEMENTS AS OF MARCH 31, 2012 (CONTINUED)
NOTE 11 — FEDERAL INCOME TAXES (continued)
The tax-basis components of distributable earnings as of March 31, 2012 were:
| | | | | | | | Capital Loss Carryforwards
| |
|---|
Undistributed
Ordinary
Income
| | | | Post-October
Capital Losses
Deferred
| | Unrealized
Appreciation
| | Amount
| | Character
| | Expiration
|
|---|
| $112,237 | | | | $(731,959) | | $575,591 | | $(27,071) | | Long-term | | N/A |
The Fund’s major tax jurisdictions are federal and Arizona. The earliest tax year that remains subject to examination by these jurisdictions is 2010.
As of March 31, 2012, no provision for income tax is required in the Fund’s financial statements as a result of tax positions taken on federal and state income tax returns for open tax years. The Fund’s federal and state income and federal excise tax returns for tax years for which the applicable statutes of limitations have not expired are subject to examination by the Internal Revenue Service and state department of revenue.
The Regulated Investment Company Modernization Act of 2010 (the “Act”) was enacted on December 22, 2010. The Act made changes to several tax rules impacting the Fund. In general, the provisions of the Act were effective for the Fund’s tax year ended March 31, 2012. The Act provides several benefits, including the unlimited carryforward of post-enactment capital losses generated.
NOTE 12 — SUBSEQUENT EVENT
Dividends. Subsequent to March 31, 2012, the Fund declared dividends from net investment income of:
| | | | Per Share
Amount
| | Payable
Date
| | Record
Date
|
|---|
| Class A | | | | | $0.0415 | | | May 1, 2012 | | Daily |
| Class C | | | | | $0.0353 | | | May 1, 2012 | | Daily |
| Class I | | | | | $0.0435 | | | May 1, 2012 | | Daily |
| Class R | | | | | $0.0394 | | | May 1, 2012 | | Daily |
| Class W | | | | | $0.0435 | | | May 1, 2012 | | Daily |
The Fund has evaluated events occurring after the Statement of Assets and Liabilities date (subsequent events) to determine whether any subsequent events necessitated adjustment to or disclosure in the financial statements. Other than the above, no such subsequent events were identified.
19
| ING FLOATING RATE FUND | PORTFOLIO OF INVESTMENTS
AS OF MARCH 31, 2012 |
Principal Amount
|
|
|
|
|
| Borrower\Tranche Description
|
| Fair Value
|
|---|
Loans*: 97.3%
|
Aerospace & Defense: 2.3% |
| $2,487,500 | | | | | | Delta, New Term Loan, 5.500%, due 04/20/17 | | $ | 2,484,391 | |
| 445,500 | | | | | | Delta, Pacific Route First Lien Term Loan, 4.250%, due 03/07/16 | | | 431,021 | |
| 997,500 | | | | | | DigitalGlobe Inc., Term Loan B, 5.750%, due 10/07/18 | | | 961,008 | |
| 1,097,250 | | | | | | Transdigm, Inc., Add On Term Loan, 4.000%, due 02/14/17 | | | 1,099,536 | |
| 985,915 | | | | | | US Airways, Term Loan, 2.742%, due 03/21/14 | | | 911,610 | |
| | | | | | | | | | 5,887,566 | |
Automotive: 5.2% |
| 390,618 | | | | | | Avis Budget Car Rental, LLC, Incremental Term Loan, 6.250%, due 09/21/18 | | | 393,385 | |
| 1,986,616 | | | | (1) | | Avis Budget Car Rental, LLC, Tranche C Term Loan, 4.250%, due 03/15/19 | | | 1,984,961 | |
| 2,977,500 | | | | | | Chrysler Group LLC, Term Loan B, 6.000%, due 05/24/17 | | | 3,029,838 | |
| 1,641,750 | | | | | | Fram Group Holdings Inc., First Lien Term Loan, 6.500%, due 07/28/17 | | | 1,654,063 | |
| 498,690 | | | | | | Fram Group Holdings Inc., Second Lien Term Loan, 10.500%, due 01/29/18 | | | 491,833 | |
| 1,337,189 | | | | | | KAR Auction Services, Inc., Term Loan B, 5.000%, due 05/19/17 | | | 1,341,786 | |
| 1,386,000 | | | | | | Metaldyne, LLC, Term Loan B, 5.250%, due 05/18/17 | | | 1,390,043 | |
| 2,542,391 | | | | | | Tomkins, Inc., Term Loan B, 4.250%, due 09/21/16 | | | 2,546,097 | |
| 743,106 | | | | | | UCI International, Inc., Term Loan B, 5.500%, due 07/26/17 | | | 747,751 | |
| | | | | | | | | | 13,579,757 | |
Beverage & Tobacco: 0.8% |
| 387,826 | | | | | | Clement Pappas, $230mm Term Loan, 6.545%, due 08/14/17 | | | 387,988 | |
| 1,687,250 | | | | | | Del Monte Corporation, Term Loan B, 4.500%, due 03/08/18 | | | 1,685,141 | |
| | | | | | | | | | 2,073,129 | |
Brokers, Dealers & Investment Houses: 0.8% |
| 500,000 | | | | | | Nuveen Investments, Inc., 2nd Lien, 8.250%, due 05/12/19 | | | 510,000 | |
| 1,000,000 | | | | | | Nuveen Investments, Inc., First-Lien Incremental Term Loan, 7.250%, due 05/13/17 | | | 1,012,500 | |
| 500,000 | | | | | | Nuveen Investments, Inc., Term Loan Extended 2017, 5.754%, due 05/12/17 | | | 500,157 | |
| | | | | | | | | | 2,022,657 | |
Building & Development: 1.7% |
| 510,000 | | | | (1) | | Armstrong World Industries, Inc., Term Loan B add-on, due 03/09/18 | | | 509,171 | |
| 2,336,925 | | | | | | Capital Automotive L.P., Term Loan, 5.250%, due 03/10/17 | | | 2,317,451 | |
| 497,364 | | | | | | Capital Automotive L.P., Term Loan, 5.250%, due 03/11/17 | | | 493,219 | |
| 480,741 | | | | | | CB Richard Ellis, Term Loan C, 3.491%, due 03/05/18 | | | 478,737 | |
| 509,272 | | | | | | CB Richard Ellis, Term Loan D, 3.742%, due 09/04/19 | | | 507,150 | |
| 198,756 | | | | | | JMC Steel Group, Term Loan, 4.750%, due 04/01/17 | | | 199,253 | |
| | | | | | | | | | 4,504,981 | |
Business Equipment & Services: 8.1% |
| 350,000 | | | | (1) | | ACCO Brands Corporation, Term Loan B, due 04/15/19 | | | 350,656 | |
| 1,198,682 | | | | | | Acosta, Inc., Term Loan, 4.750%, due 03/01/18 | | | 1,195,685 | |
| 987,500 | | | | | | Advantage Sales & Marketing, Inc., First Lien Term Loan, 5.250%, due 12/18/17 | | | 987,747 | |
| 500,000 | | | | | | Advantage Sales & Marketing, Inc., Second Lien Term Loan, 9.250%, due 06/18/18 | | | 499,375 | |
| 1,648,515 | | | | | | Avaya Inc., Term Loan B-3, 4.991%, due 10/26/17 | | | 1,590,817 | |
| 1,236,900 | | | | | | Catalent Pharma Solutions, Inc., Incremental USD TLB-2, 5.250%, due 09/15/17 | | | 1,236,900 | |
| 995,000 | | | | | | CorpSource Finance Holdings, LLC, 1st Lien Term Loan, 6.628%, due 04/28/17 | | | 917,888 | |
| 1,500,000 | | | | | | First Data Corporation, Term Loan extended 3/2018, 4.242%, due 03/23/18 | | | 1,370,625 | |
| 833,942 | | | | | | First Data Corporation, Term Loan US B-1 9/2014, 2.992%, due 09/24/14 | | | 804,932 | |
| 120,459 | | | | | | First Data Corporation, Term Loan US B-2 9/2014, 2.992%, due 09/24/14 | | | 116,319 | |
| 358,867 | | | | | | First Data Corporation, Term Loan US B-3 9/2014, 2.992%, due 09/24/14 | | | 346,456 | |
| 1,251,833 | | | | | | Go Daddy Operating Company, LLC, 1st Lien Term Loan, 5.500%, due 12/17/18 | | | 1,256,528 | |
| 497,500 | | | | | | Information Resources, Inc., Term Loan B, 5.003%, due 12/01/17 | | | 497,603 | |
| 992,500 | | | | | | Mercury Payment Systems LLC, Term Loan B, 6.500%, due 07/03/17 | | | 997,463 | |
| 990,000 | | | | | | NDS Treasury (Americas), Term Loan B, 4.000%, due 03/12/18 | | | 992,723 | |
| 997,475 | | | | | | Property Data I, Inc., Term Loan B, 7.000%, due 12/21/16 | | | 896,064 | |
| 992,500 | | | | | | Quintiles Transnational Corp., Term Loan B, 5.000%, due 06/08/18 | | | 996,222 | |
| 1,384,193 | | | | | | Sungard Data Systems Inc, Term Loan B—B Tranche 2016, 3.975%, due 02/26/16 | | | 1,388,127 | |
| 371,250 | | | | | | Trans Union LLC, Term Loan B, 4.750%, due 02/12/18 | | | 375,315 | |
| 325,981 | | | | | | U.S. Security Associates Holdings, Inc., $75mm Delayed Draw Term Loan, 6.000%, due 07/28/17 | | | 327,340 | |
| 1,665,535 | | | | | | U.S. Security Associates Holdings, Inc., New Term Loan, 6.000%, due 07/28/17 | | | 1,672,475 | |
| 259,350 | | | | | | Verifone, Inc., Term Loan B, 4.250%, due 12/31/18 | | | 260,355 | |
See Accompanying Notes to Financial Statements
20
| ING FLOATING RATE FUND | PORTFOLIO OF INVESTMENTS
AS OF MARCH 31, 2012 (CONTINUED) |
Principal Amount
|
|
|
|
|
| Borrower\Tranche Description
|
| Fair Value
|
|---|
Business Equipment & Services: (continued) |
| $1,317,361 | | | | (1) | | Web.com Group, Inc., First Lien Term Loan, 7.000%, due 10/28/17 | | $ | 1,308,578 | |
| 707,585 | | | | | | West Corp, Term Loan B-5, 4.492%, due 07/15/16 | | | 711,418 | |
| | | | | | | | | | 21,097,611 | |
Cable & Satellite Television: 3.5% |
| 344,565 | | | | | | Atlantic Broadband, TLB, 4.000%, due 03/08/16 | | | 344,738 | |
| 445,500 | | | | | | Bresnan Communications, LLC, Term Loan B, 4.502%, due 12/14/17 | | | 445,593 | |
| 1,420,000 | | | | (1) | | Cequel Communications, LLC, Term Loan 2012, 4.000%, due 02/08/19 | | | 1,408,907 | |
| 41,021 | | | | | | Charter Communications Operating, LLC, TLB-1, 2.241%, due 03/06/14 | | | 40,903 | |
| 2,463,492 | | | | | | Charter Communications Operating, LLC, TLC, 3.720%, due 09/06/16 | | | 2,460,411 | |
| 1,985,000 | | | | | | Intelsat Jackson Holdings S.A., Term Loan B Facility, 5.250%, due 04/02/18 | | | 1,997,762 | |
| 885,550 | | | | | | San Juan Cable LLC, ‘1st Lien, 6.000%, due 06/09/17 | | | 872,267 | |
| 485,659 | | | | | | UPC Broadband Holding B.V, Term Loan T, 3.744%, due 12/30/16 | | | 484,445 | |
| 1,000,000 | | | | | | UPC Broadband Holding B.V, Term Loan X, 3.744%, due 12/29/17 | | | 995,625 | |
| | | | | | | | | | 9,050,651 | |
Chemicals & Plastics: 4.1% |
| 625,000 | | | | | | AZ Chem US Inc., Term Loan B, 7.250%, due 12/19/17 | | | 633,333 | |
| 250,000 | | | | | | Chemtura Corporation, Term Loan, 5.500%, due 08/27/16 | | | 251,641 | |
| 246,428 | | | | | | Houghton International, Inc., Term Loan B1, 6.750%, due 01/29/16 | | | 247,506 | |
| 1,014,422 | | | | | | Ineos US Finance LLC, Term Loan C2, 8.001%, due 12/16/14 | | | 1,054,048 | |
| 1,710,525 | | | | | | Momentive Specialty Chemicals Inc (a.k.a Hexion Specialty Chemicals Inc),
Term Loan C1B, 4.000%, due 05/05/15 | | | 1,701,972 | |
| 726,862 | | | | | | Momentive Specialty Chemicals Inc (a.k.a Hexion Specialty Chemicals Inc),
Term Loan C2B, 4.250%, due 05/05/15 | | | 723,228 | |
| 349,125 | | | | | | PolyOne Corporation, Term Loan B, 5.000%, due 11/17/17 | | | 350,980 | |
| 87,810 | | | | (1) | | Sonneborn, Inc., BV Tranche, due 03/31/18 | | | 88,030 | |
| 497,590 | | | | (1) | | Sonneborn, Inc., US Tranche, due 03/31/18 | | | 498,834 | |
| 842,132 | | | | | | Styron S.A.R.L., Term Loan B, 6.000%, due 08/02/17 | | | 771,603 | |
| 875,000 | | | | | | Taminco, TL USD, 6.250%, due 01/31/19 | | | 882,383 | |
| 510,714 | | | | | | Tronox Pigments (Netherlands) BV, Term Loan B, 4.250%, due 02/08/18 | | | 511,672 | |
| 2,273,725 | | | | | | Univar Inc., Term Loan B, 5.000%, due 06/30/17 | | | 2,281,541 | |
| 660,000 | | | | | | Vantage Specialties Inc., Term Loan B, 7.000%, due 02/10/18 | | | 663,300 | |
| | | | | | | | | | 10,660,071 | |
Clothing/Textiles: 0.7% |
| 1,327,830 | | | | | | Targus Group, Inc., New Senior Secured Term Loan, 11.002%, due 05/16/16 | | | 1,324,511 | |
| 46,641 | | | | | | Totes Isotoner Corporation, Delayed Draw 1st Ln TL, 7.296%, due 07/07/17 | | | 46,407 | |
| 449,727 | | | | | | Totes Isotoner Corporation, First Ln TL, 7.255%, due 07/07/17 | | | 447,478 | |
| | | | | | | | | | 1,818,396 | |
Conglomerates: 0.9% |
| 1,967,456 | | | | | | Affinion Group, Inc., First Lien Term Loan, 5.000%, due 10/10/16 | | | 1,869,699 | |
| 497,500 | | | | | | Waterpik, Term Loan, 6.753%, due 08/10/17 | | | 497,500 | |
| | | | | | | | | | 2,367,199 | |
Containers & Glass Products: 3.5% |
| 465,410 | | | | | | Bway Holding Corporation, Term Loan B, 4.500%, due 02/23/18 | | | 466,675 | |
| 42,903 | | | | | | Bway Holding Corporation, Term Loan C, 4.500%, due 02/23/18 | | | 43,019 | |
| 2,406,813 | | | | | | Husky Injection Molding Systems, Ltd, Term Loan B, 6.500%, due 06/30/18 | | | 2,427,382 | |
| 595,500 | | | | | | Pro Mach, Inc, Term Loan, 6.267%, due 07/06/17 | | | 584,334 | |
| 1,968,590 | | | | | | Reynolds Group Holdings Inc, Term Loan C, 6.500%, due 08/09/18 | | | 1,996,016 | |
| 2,937,965 | | | | | | Reynolds Group Holdings Inc, US Term Loan, 6.500%, due 02/09/18 | | | 2,978,897 | |
| 719,050 | | | | | | Sealed Air Corporation, Term Loan B, 4.750%, due 10/03/18 | | | 728,132 | |
| | | | | | | | | | 9,224,455 | |
Cosmetics/Toiletries: 0.2% |
| 497,500 | | | | | | Revlon Consumer Products Corporation, Term Loan, 4.753%, due 11/17/17 | | | 498,051 | |
| | | | | | | | | | 498,051 | |
Drugs: 0.2% |
| 481,061 | | | | | | Prestige Brands, Term loan B, 5.297%, due 01/31/19 | | | 484,819 | |
| | | | | | | | | | 484,819 | |
See Accompanying Notes to Financial Statements
21
| ING FLOATING RATE FUND | PORTFOLIO OF INVESTMENTS
AS OF MARCH 31, 2012 (CONTINUED) |
Principal Amount
|
|
|
|
|
| Borrower\Tranche Description
|
| Fair Value
|
|---|
Ecological Services & Equipment: 0.3% |
| $495,000 | | | | | | Waste Industries USA, Inc., Term loan, 4.750%, due 03/17/17 | | $ | 495,000 | |
| 300,000 | | | | | | WCA Waste Corporation, Term Loan B, 5.500%, due 02/28/18 | | | 301,875 | |
| | | | | | | | | | 796,875 | |
Electronics/Electrical: 8.9% |
| 661,603 | | | | | | Aspect Software, Inc., Term Loan, 6.250%, due 05/06/16 | | | 666,190 | |
| 1,511,250 | | | | | | Attachmate Corporation, 1st Lien Term Loan, 6.500%, due 04/27/17 | | | 1,507,945 | |
| 1,995,000 | | | | | | Blackboard Inc., 1st Lien Term Loan B, 7.500%, due 10/04/18 | | | 1,988,454 | |
| 500,000 | | | | | | Blackboard Inc., 2nd Lien Term Loan B, 11.500%, due 10/01/19 | | | 463,334 | |
| 1,704,733 | | | | | | CDW LLC, Extended Term Loan B, 4.000%, due 07/14/17 | | | 1,653,165 | |
| 1,491,244 | | | | | | Eagle Parent, Inc., Term Loan B, 5.000%, due 05/16/18 | | | 1,481,691 | |
| 2,000,000 | | | | | | Freescale Semiconductor, Inc., Incremental Term Loan B-2, 6.000%, due 02/28/19 | | | 1,996,036 | |
| 985,384 | | | | | | Freescale Semiconductor, Inc., Term Loan B-2, 4.494%, due 12/01/16 | | | 961,365 | |
| 629,630 | | | | | | Greeneden U.S. Holdings II, L.L.C., 1st Lien Term Loan, 6.750%, due 01/31/18 | | | 635,690 | |
| 847,875 | | | | | | Kronos Incorporated, Tranche C first-lien term loan, 6.250%, due 12/26/17 | | | 858,473 | |
| 2,239,997 | | | | | | Lawson Software, Inc., Term Loan, 6.750%, due 07/05/17 | | | 2,245,037 | |
| 1,522,472 | | | | | | Microsemi Corporation, Term Loan, 4.000%, due 02/02/18 | | | 1,525,327 | |
| 884,000 | | | | | | Open Link Financial, Inc., Term Loan, 7.752%, due 10/28/17 | | | 886,763 | |
| 1,341,497 | | | | | | Orbitz Worldwide, Inc., Term Loan, 3.316%, due 07/25/14 | | | 1,276,938 | |
| 751,875 | | | | (1) | | Rovi Solutions Corporation, Term Loan B, due 03/26/19 | | | 751,875 | |
| 997,375 | | | | | | Sabre Inc., Extended Term Loan, 6.078%, due 09/30/17 | | | 948,795 | |
| 981,129 | | | | | | Sabre Inc., First Lien Term Loan, 2.328%, due 09/30/14 | | | 922,670 | |
| 550,000 | | | | (1) | | Semtech Corporation, Term Loan B, due 03/19/17 | | | 550,000 | |
| 789,196 | | | | | | Spansion LLC, Term Loan, 4.750%, due 02/09/15 | | | 789,360 | |
| 1,046,451 | | | | | | Travelport, Inc., Delayed Draw Term Loan extended, 5.081%, due 08/21/15 | | | 956,195 | |
| | | | | | | | | | 23,065,303 | |
Equipment Leasing: 0.4% |
| 250,000 | | | | | | Brock Holdings, Inc., New 2nd Lien Term Loan, 10.000%, due 03/16/18 | | | 246,875 | |
| 768,471 | | | | | | Brock Holdings, Inc., New Term Loan B, 6.029%, due 03/16/17 | | | 768,471 | |
| | | | | | | | | | 1,015,346 | |
Financial Intermediaries: 1.9% |
| 187,105 | | | | | | BNY ConvergEx Group, LLC, Eze Borrower Term Loan, 5.000%, due 12/19/16 | | | 187,105 | |
| 424,890 | | | | | | BNY ConvergEx Group, LLC, Top Borrower Term Loan, 5.000%, due 12/19/16 | | | 424,890 | |
| 962,588 | | | | | | Fundtech, Term Loan, 7.500%, due 11/15/17 | | | 964,092 | |
| 1,120,000 | | | | (1) | | LPL Holdings, Inc., Term Loan B, due 03/23/19 | | | 1,120,700 | |
| 1,354,545 | | | | | | MIP Delaware, LLC, Term Loan, 5.500%, due 07/12/18 | | | 1,366,398 | |
| 871,795 | | | | | | MoneyGram International, Inc., First Lien Term Loan, 4.250%, due 11/17/17 | | | 870,160 | |
| | | | | | | | | | 4,933,345 | |
Food Products: 0.8% |
| 987,500 | | | | | | Advance Pierre Foods, First Lien Term Loan, 7.001%, due 09/30/16 | | | 988,734 | |
| 1,017,761 | | | | (1) | | NPC International, Term Loan (2012 refi), 5.250%, due 12/28/18 | | | 1,021,578 | |
| | | | | | | | | | 2,010,312 | |
Food Service: 1.2% |
| 978,947 | | | | | | Bojangles Restaurants, Inc., Term Loan, 8.008%, due 08/17/17 | | | 979,559 | |
| 760,000 | | | | | | Dennys, Inc, Term Loan B, 5.250%, due 09/30/16 | | | 763,325 | |
| 264,323 | | | | | | DineEquity Inc., Term Loan B, 4.250%, due 10/19/17 | | | 264,708 | |
| 1,146,894 | | | | | | Dunkin Brands, Inc., Term Loan B, 4.003%, due 11/23/17 | | | 1,147,967 | |
| | | | | | | | | | 3,155,559 | |
Health Care: 12.6% |
| 768,075 | | | | | | Alere US Holdings, LLC, Incremental Term Loan B, 4.500%, due 06/30/17 | | | 764,955 | |
| 1,995,000 | | | | | | Alere US Holdings, LLC, Term Loan B, 4.503%, due 06/30/17 | | | 1,986,896 | |
| 194,526 | | | | | | Bausch & Lomb, Inc., US Term Loan DD ($300mm), 3.491%, due 04/24/15 | | | 194,478 | |
| 796,120 | | | | | | Bausch & Lomb, Inc., US Term Loan, 3.670%, due 04/24/15 | | | 795,921 | |
| 1,736,687 | | | | | | Capsugel Holdings US, Inc., Term Loan B, 5.250%, due 08/01/18 | | | 1,753,512 | |
| 256,750 | | | | | | ConvaTec, TLB USD, 5.750%, due 12/22/16 | | | 256,108 | |
| 1,466,667 | | | | (1) | | DJO Finance LLC, Tranche B-3 Term Loan, due 09/15/17 | | | 1,464,528 | |
| 2,480,802 | | | | | | Drumm Corp., Term loan B, 5.000%, due 05/04/18 | | | 2,350,561 | |
| 698,250 | | | | | | Emdeon, Inc., Term loan B, 6.750%, due 10/15/18 | | | 709,335 | |
| 1,732,500 | | | | | | Emergency Medical Services Corporation, Term loan B, 5.250%, due 05/25/18 | | | 1,736,398 | |
See Accompanying Notes to Financial Statements
22
| ING FLOATING RATE FUND | PORTFOLIO OF INVESTMENTS
AS OF MARCH 31, 2012 (CONTINUED) |
Principal Amount
|
|
|
|
|
| Borrower\Tranche Description
|
| Fair Value
|
|---|
Health Care: (continued) |
| $1,435,964 | | | | | | Grifols S.A, TLB USD, 4.500%, due 06/01/17 | | $ | 1,439,554 | |
| 1,620,938 | | | | | | Health Management Associates, Inc., Term B, 4.500%, due 11/22/18 | | | 1,610,645 | |
| 439,226 | | | | | | HGI Holding, Inc., Senior Secured Term Loan B due 2016, 6.750%, due 09/29/16 | | | 440,141 | |
| 1,089,000 | | | | | | Iasis Healthcare LLC, Term Loan B, 5.000%, due 05/03/18 | | | 1,091,383 | |
| 995,000 | | | | | | Immucor, Inc., Term loan B, 7.250%, due 08/17/18 | | | 1,007,852 | |
| 1,484,512 | | | | | | IMS Health Incorporated, Term Loan B, 4.500%, due 08/25/17 | | | 1,491,006 | |
| 1,483,763 | | | | | | inVentiv Health Inc., Original term loan B, 6.500%, due 08/04/16 | | | 1,409,574 | |
| 272,938 | | | | | | inVentiv Health Inc., Term B-3, 6.750%, due 05/15/18 | | | 259,291 | |
| 1,296,750 | | | | | | Kinetic Concepts, Inc., Term Loan B-1, 7.000%, due 04/20/18 | | | 1,324,407 | |
| 454,380 | | | | | | Medassets, Inc., Term Loan B, 5.250%, due 11/16/16 | | | 457,930 | |
| 496,250 | | | | | | Medpace IntermediateCo, Inc., Term loan B, 6.500%, due 06/22/17 | | | 483,844 | |
| 1,939,922 | | | | | | Onex Carestream Finance LP, Term Loan B, 5.000%, due 02/25/17 | | | 1,905,975 | |
| 1,027,425 | | | | | | Pharmaceutical Product Development, Inc., Bank Term Loan B, 6.250%, due 11/30/18 | | | 1,041,017 | |
| 1,791,485 | | | | | | Rural/Metro Corporation, Term Loan B, 5.750%, due 06/29/18 | | | 1,789,246 | |
| 661,667 | | | | | | Sunquest Information Systems, Inc., Term Loan B, 6.250%, due 12/16/16 | | | 663,321 | |
| 446,625 | | | | | | Surgical Care Affiliates LLC, Incremental term loan, 5.500%, due 06/29/18 | | | 428,202 | |
| 1,000,000 | | | | (1) | | United Surgical Partners International, Inc., New Tranche B, due 04/01/19 | | | 993,125 | |
| 1,970,187 | | | | | | Vanguard Health Holdings Company Ii, LLC, Term Loan B, 5.000%, due 01/29/16 | | | 1,975,851 | |
| 452,571 | | | | | | Warner Chilcott Company LLC, Term B-1 (US), 4.250%, due 03/15/18 | | | 452,770 | |
| 226,286 | | | | | | Warner Chilcott Company LLC, Term B-2 (PR), 4.250%, due 03/15/18 | | | 226,385 | |
| 311,143 | | | | | | Warner Chilcott Company LLC, Term B-3 (LuxCo), 4.250%, due 03/15/18 | | | 311,279 | |
| | | | | | | | | | 32,815,490 | |
Home Furnishings: 1.0% |
| 247,483 | | | | | | Hillman Group (The), Inc., First Lien Term Loan, 5.000%, due 05/27/16 | | | 247,792 | |
| 850,000 | | | | | | Monitronics International, Inc., Term Loan B, 5.500%, due 03/31/18 | | | 851,771 | |
| 700,000 | | | | | | Protection One, Inc., Term Loan B, 5.750%, due 03/31/19 | | | 696,938 | |
| 776,386 | | | | | | Springs Window Fashions, LLC, First Lien Term Loan, 6.000%, due 05/31/17 | | | 765,224 | |
| | | | | | | | | | 2,561,725 | |
Industrial Equipment: 4.2% |
| 543,125 | | | | | | Edwards (Cayman Islands II) Limited (aka BOC Edwards), New Term Loan, 5.500%, due 05/31/16 | | | 539,222 | |
| 238,636 | | | | | | Goodman Global Inc., Second Lien Term Loan, 9.000%, due 10/30/17 | | | 242,344 | |
| 2,281,395 | | | | | | Goodman Global Inc., Term Loan B, 5.750%, due 10/28/16 | | | 2,298,097 | |
| 1,550,000 | | | | | | Rexnord Corporation / RBS Global, Inc., USD Term Loan, 5.000%, due 04/01/18 | | | 1,552,274 | |
| 2,630,000 | | | | (1) | | Schaeffler AG, TL C2 USD, due 01/31/17 | | | 2,645,451 | |
| 1,284,991 | | | | | | Sensus Metering Systems Inc., New First Lien Term Loan, 4.750%, due 05/09/17 | | | 1,288,203 | |
| 600,000 | | | | | | Sensus Metering Systems Inc., New Second Lien Term Loan, 8.500%, due 05/09/18 | | | 600,000 | |
| 1,880,550 | | | | | | Terex Corporation, Term Loan, 5.500%, due 04/28/17 | | | 1,899,944 | |
| | | | | | | | | | 11,065,535 | |
Insurance: 0.5% |
| 397,798 | | | | | | CCC Information Services Group, Inc., Term Loan B, 5.500%, due 11/11/15 | | | 399,661 | |
| 878,063 | | | | | | Sedgwick Holdings, Inc., Term Loan B-1, 5.000%, due 12/30/16 | | | 877,331 | |
| | | | | | | | | | 1,276,992 | |
Leisure Good/Activities/Movies: 3.6% |
| 1,476,219 | | | | | | 24 Hour Fitness Worldwide, Inc, Term Loan B, 7.500%, due 04/22/16 | | | 1,478,064 | |
| 150,681 | | | | (1) | | Bushnell, Inc., First Lien, 4.829%, due 08/23/13 | | | 146,663 | |
| 989,873 | | | | | | Cedar Fair, L.P., Term Loan B, 4.000%, due 12/15/17 | | | 993,623 | |
| 2,044,737 | | | | | | Getty Images, Inc, Term Loan B, 5.250%, due 11/07/16 | | | 2,057,515 | |
| 1,000,000 | | | | (1) | | SeaWorld Parks & Entertainment, Inc., Incremental Term Loan B, due 08/17/17 | | | 1,000,308 | |
| 1,515,936 | | | | | | SRAM, LLC, First Lien Term Loan, 4.753%, due 06/07/18 | | | 1,517,813 | |
| 185,000 | | | | | | SRAM, LLC, Second Lien Term Loan, 8.500%, due 12/07/18 | | | 187,197 | |
| 1,954,048 | | | | | | The Weather Channel, Term Loan B, 4.250%, due 02/13/17 | | | 1,958,640 | |
| | | | | | | | | | 9,339,823 | |
Lodging & Casinos: 2.6% |
| 584,100 | | | | | | Ameristar Casinos Inc., Term Loan B, 4.000%, due 04/14/18 | | | 585,454 | |
| 2,020,000 | | | | (1) | | Boyd Gaming Corporation, Incremental Term Loan, 6.000%, due 12/17/15 | | | 2,042,978 | |
| 2,432,288 | | | | | | Caesars Entertainment Operating Company, Inc., Term Loan B6, 5.492%, due 01/28/18 | | | 2,200,461 | |
| 700,000 | | | | | | Caesars Octavius, LLC, Term Loan, 9.250%, due 02/24/17 | | | 694,167 | |
| 495,000 | | | | | | Isle Of Capri Casinos, Inc., Term Loan B, 4.750%, due 11/01/13 | | | 497,630 | |
See Accompanying Notes to Financial Statements
23
| ING FLOATING RATE FUND | PORTFOLIO OF INVESTMENTS
AS OF MARCH 31, 2012 (CONTINUED) |
Principal Amount
|
|
|
|
|
| Borrower\Tranche Description
|
| Fair Value
|
|---|
Lodging & Casinos: (continued) |
| $934,233 | | | | | | Station Casinos LLC, Term Loan B-1, 3.241%, due 06/17/16 | | $ | 868,837 | |
| | | | | | | | | | 6,889,527 | |
Nonferrous Metals/Minerals: 2.0% |
| 2,174,000 | | | | | | Fairmount Minerals, Ltd., Term Loan B, 5.250%, due 03/15/17 | | | 2,180,794 | |
| 1,015,000 | | | | | | Noranda Aluminum Acquisition Corp., Term Loan B, 5.750%, due 02/28/19 | | | 1,023,881 | |
| 248,125 | | | | | | U.S. Silica Company, Term Loan, 4.750%, due 06/01/17 | | | 248,435 | |
| 1,666,454 | | | | (1) | | Walter Energy, Inc., Term Loan B, due 04/02/18 | | | 1,661,698 | |
| | | | | | | | | | 5,114,808 | |
Oil & Gas: 2.7% |
| 1,995,000 | | | | | | CCS Inc., Add-On Term Loan, 6.500%, due 11/14/14 | | | 2,004,975 | |
| 500,000 | | | | | | Crestwood Holdings LLC, Term Loan B, 9.750%, due 03/30/18 | | | 509,792 | |
| 2,000,000 | | | | | | Energy Transfer Equity, L.P., Term Loan, 2.750%, due 03/15/17 | | | 1,964,584 | |
| 2,498,334 | | | | | | Frac Tech International, LLC, Term Loan (HoldCo), 6.250%, due 05/06/16 | | | 2,493,649 | |
| | | | | | | | | | 6,973,000 | |
Publishing: 1.6% |
| 1,965,316 | | | | | | Cengage Learning, Inc., TLB, 2.490%, due 07/03/14 | | | 1,818,619 | |
| 1,062,253 | | | | | | Cenveo Corporation, TL B, 6.250%, due 12/21/16 | | | 1,065,566 | |
| 1,000,000 | | | | | | Merrill Communications, LLC, New TLB-DD, 7.500%, due 12/24/12 | | | 940,000 | |
| 850,019 | | | | | | R.H. Donnelley Corporation, TERM LOAN, 9.000%, due 10/24/14 | | | 380,383 | |
| | | | | | | | | | 4,204,568 | |
Radio & Television: 3.6% |
| 850,598 | | | | | | Barrington Broadcasting Group, Term loan B, 7.500%, due 06/30/17 | | | 859,104 | |
| 1,476,399 | | | | | | Clear Channel Communications, Inc., TL B, 3.891%, due 01/28/16 | | | 1,200,866 | |
| 1,993,962 | | | | | | Cumulus Media Holdings Inc., First Lien Term Loan B, 5.750%, due 09/17/18 | | | 2,003,434 | |
| 1,000,000 | | | | | | Cumulus Media Holdings Inc., Second Lien Term Loan B, 7.500%, due 02/11/19 | | | 1,016,569 | |
| 472,067 | | | | | | Entercom Communications Corporation, Term loan B, 6.277%, due 11/22/18 | | | 477,377 | |
| 876,809 | | | | | | FoxCo Acquisition, LLC, Term Loan B, 4.750%, due 07/14/15 | | | 878,826 | |
| 347,375 | | | | | | Raycom TV Broadcasting, LLC, Term Loan B, 4.500%, due 05/31/17 | | | 342,164 | |
| 2,706,090 | | | | | | Univision Communications, Inc., Extended TL, 4.491%, due 03/31/17 | | | 2,514,778 | |
| | | | | | | | | | 9,293,118 | |
Rail Industries: 0.4% |
| 1,000,000 | | | | | | RailAmerica, Inc., Term Loan B, 4.000%, due 02/28/19 | | | 1,000,938 | |
| | | | | | | | | | 1,000,938 | |
Retailers (Except Food & Drug): 9.7% |
| 648,375 | | | | | | 99 Cents Only Stores, Term Loan Facility, 7.750%, due 01/15/19 | | | 661,545 | |
| 1,596,000 | | | | | | Academy Ltd., Term Loan, 6.000%, due 08/03/18 | | | 1,605,137 | |
| 911,125 | | | | | | Amscan Holdings, Inc., Term Facility, 6.750%, due 12/04/17 | | | 914,349 | |
| 990,006 | | | | | | Bass Pro Group, LLC, Term Loan B, 5.317%, due 06/13/17 | | | 992,481 | |
| 3,046,125 | | | | | | BJs Wholesale Club, First Lien Term Loan (2012 refi), 5.250%, due 09/27/18 | | | 3,065,163 | |
| 1,031,250 | | | | | | BJs Wholesale Club, Second Lien TL, 10.000%, due 03/27/19 | | | 1,069,277 | |
| 957,500 | | | | | | Burlington Coat Factory, Term Loan B, 6.250%, due 02/23/17 | | | 962,838 | |
| 1,000,000 | | | | | | Guitar Center, Inc., Extended TL maturing 04/17, 5.730%, due 04/10/17 | | | 947,286 | |
| 890,756 | | | | | | J. Crew, Term Loan B, 4.750%, due 03/07/18 | | | 876,998 | |
| 1,749,423 | | | | | | Jo-Ann Stores, Inc., Term Loan B, 4.750%, due 03/16/18 | | | 1,741,551 | |
| 839,375 | | | | | | Leslies Poolmart, Inc., Tranche B Term Loan Facility, 4.500%, due 11/21/16 | | | 838,850 | |
| 1,624,494 | | | | | | Lord & Taylor, Term Loan Facility, 5.750%, due 01/09/18 | | | 1,636,000 | |
| 1,388,639 | | | | | | Michaels Stores, Inc., TLB-2 (extending), 5.073%, due 07/31/16 | | | 1,394,389 | |
| 1,992,420 | | | | | | Neiman Marcus Group, Inc, Term Loan, 4.750%, due 05/16/18 | | | 1,991,174 | |
| 1,150,000 | | | | | | Roundys Supermarkets, Inc., Term Loan B, 5.750%, due 02/14/19 | | | 1,158,625 | |
| 735,000 | | | | (1) | | Sleepy’s Holdings, LLC, Term Loan, due 03/19/19 | | | 733,163 | |
| 1,400,599 | | | | | | The Gymboree Corporation, Term Loan B, 5.002%, due 02/23/18 | | | 1,327,644 | |
| 1,728,725 | | | | | | Toys “R” Us, Inc., Term Loan B-1, 6.000%, due 09/01/16 | | | 1,735,979 | |
| 347,375 | | | | | | Toys “R” Us, Inc., Term Loan B-2, 5.250%, due 05/25/18 | | | 346,072 | |
| 1,375,000 | | | | (1) | | Yankee Candle Company, Inc., Term Loan B, due 04/02/19 | | | 1,382,161 | |
| | | | | | | | | | 25,380,682 | |
See Accompanying Notes to Financial Statements
24
| ING FLOATING RATE FUND | PORTFOLIO OF INVESTMENTS
AS OF MARCH 31, 2012 (CONTINUED) |
Principal Amount
|
|
|
|
|
| Borrower\Tranche Description
|
| Fair Value
|
|---|
Surface Transport: 0.7% |
| $995,000 | | | | | | Baker Tanks, Inc., Term Loan, 5.000%, due 06/01/18 | | $ | 998,731 | |
| 909,356 | | | | | | Inmar, Inc., Term Loan B, 6.500%, due 08/04/17 | | | 913,903 | |
| | | | | | | | | | 1,912,634 | |
Telecommunications: 4.0% |
| 1,422,273 | | | | | | Asurion, LLC, Add-On 1st Lien Term Loan, 5.500%, due 05/24/18 | | | 1,410,539 | |
| 2,367,802 | | | | | | Asurion, LLC, First Lien Term Loan, 5.500%, due 05/24/18 | | | 2,348,268 | |
| 1,400,000 | | | | | | Asurion, LLC, Second Lien Term Loan, 9.000%, due 05/24/19 | | | 1,421,350 | |
| 298,500 | | | | | | Cellular South, Inc., Term Loan B, 4.503%, due 07/27/17 | | | 299,993 | |
| 511,830 | | | | | | CommScope, Inc., Term Loan B, 4.250%, due 01/14/18 | | | 512,860 | |
| 498,750 | | | | | | Crown Castle Operating Company, Term Loan B, 4.000%, due 01/31/18 | | | 496,810 | |
| 748,125 | | | | | | Global Tel*Link Corporation, First Lien Term Loan, 7.000%, due 12/15/17 | | | 750,463 | |
| 750,000 | | | | | | Level 3 Financing, Inc, Term Loan B III, 5.750%, due 09/01/18 | | | 758,625 | |
| 995,000 | | | | | | Neustar, Inc., Term Loan, 5.000%, due 11/07/18 | | | 999,975 | |
| 1,122,050 | | | | | | Syniverse Holdings, Inc., Term Loan, 5.250%, due 12/21/17 | | | 1,128,137 | |
| 310,398 | | | | | | U.S. Telepacific Corp, First Lien Term Loan, 5.750%, due 02/23/17 | | | 298,370 | |
| | | | | | | | | | 10,425,390 | |
Utilities: 2.6% |
| 990,000 | | | | | | AES Corporation, Term Loan Facility, 4.250%, due 06/01/18 | | | 992,356 | |
| 891,000 | | | | | | Calpine Corp, Term Loan B-1, 4.500%, due 04/02/18 | | | 888,466 | |
| 995,000 | | | | | | Calpine Corp, Term Loan B-2, 4.500%, due 04/02/18 | | | 992,637 | |
| 1,492,500 | | | | | | Dynegy Midwest Generation, LLC (CoalCo)., Term Loan, 9.250%, due 08/04/16 | | | 1,531,678 | |
| 1,094,500 | | | | | | Dynegy Power (GasCo), Term Loan, 9.250%, due 08/04/16 | | | 1,147,857 | |
| 1,787,818 | | | | | | Texas Competitive Electric Holdings Company LLC, Extended Term Loans, 4.743%, due 10/10/17 | | | 998,386 | |
| 481,940 | | | | | | Texas Competitive Electric Holdings Company LLC, Term Loans, 3.743%, due 10/10/14 | | | 296,192 | |
| | | | | | | | | | 6,847,572 | |
| | | | | | | Total Loans | | | | |
| | | | | | | (Cost $252,761,457) | | | 253,347,885 | |
| |
Shares
| | | | | | | | Market Value |
Short-term Investments: 5.5% |
| |
| | | | | | | | | | | Mutual Fund: 5.5% | | | | | | | | |
| 14,312,050 | | | | | | | | | | State Street Institutional Liquid Reserves Fund — Institutional Class | | | | | | $ | 14,312,050 | |
| | | | | | | | | | | Total Mutual Fund
(Cost $14,312,050) | | | | | | | 14,312,050 | |
| | | | | | | | | | | Total Investments
(Cost $267,073,507)** | | | 102.8 | % | | $ | 267,659,935 | |
| | | | | | | | | | | Other Assets and Liabilities — Net | | | (2.8 | ) | | | (7,396,464 | ) |
| | | | | | | | | | | Net Assets | | | 100.0 | % | | $ | 260,263,471 | |
| | | | | | | | | * | | Loans, while exempt from registration under the Securities Act of 1933, as amended, contain certain restrictions on resale and cannot be sold publicly. These loans bear interest (unless otherwise noted) at rates that float periodically at a margin above the London Inter-Bank Offered Rate (“LIBOR”) and other short-term rates. |
| | | | | | | | | | | | | | | | | (1) | | All or a portion of the loan is pending settlement. Contract rates that are not disclosed do not take effect until settlement date and have yet to be determined. | | | | | | | | |
| | | | | | | | | ** | | For Federal Income Tax purposes cost of investments is $267,084,431. | | | | | | | | |
| |
| | | | | | | | | | | Net unrealized appreciation consists of the following: | | | | | | | | |
| |
| | | | | | | | | | | Gross Unrealized Appreciation | | | | | | $ | 2,909,369 | |
| | | | | | | | | | | Gross Unrealized Depreciation | | | | | | | (2,333,865 | ) |
| | | | | | | | | | | Net Unrealized Appreciation | | | | | | $ | 575,504 | |
See Accompanying Notes to Financial Statements
25
| ING FLOATING RATE FUND | PORTFOLIO OF INVESTMENTS
AS OF MARCH 31, 2012 (CONTINUED) |
| | | | Quoted Prices
in Active Markets
for Identical Investments
(Level 1)
| | Significant Other
Observable
Inputs
(Level 2)
| | Significant
Unobservable
Inputs
(Level 3)
| | Fair Value
at
3/31/12
|
|---|
Asset Table | | | | | | | | | | | | | | | | | | |
Investments, at value | | | | | | | | | | | | | | | | | | |
| Loans | | | | $ | — | | | $ | 253,347,885 | | | $ | — | | | $ | 253,347,885 | |
| Short-Term Investments | | | | | 14,312,050 | | | | — | | | | — | | | | 14,312,050 | |
| Total Investments, at value | | | | $ | 14,312,050 | | | $ | 253,347,885 | | | $ | — | | | $ | 267,659,935 | |
| |
Other Financial Instruments+ | | | | | | | | | | | | | | | | | | |
| Unfunded Commitments | | | | | — | | | | 87 | | | | — | | | | 87 | |
| Total Assets | | | | $ | 14,312,050 | | | $ | 253,347,972 | | | $ | — | | | $ | 267,660,022 | |
The effect of derivative instruments on the Fund’s Statement of Operations for the year ended March 31, 2012 was as follows:
| | | | Amount of Realized Gain or (Loss)
on Derivatives Recognized in Income |
|---|
Derivatives not accounted for as hedging instruments
| | | | Futures
|
|---|
| |
| Interest rate contracts | | | | $ | (67,721 | ) |
Total | | | | $ | (67,721 | ) |
| | | | Change in Unrealized Appreciation or
(Depreciation) on Derivatives Recognized in Income |
|---|
Derivatives not accounted for as hedging instruments
| | | | Futures
|
|---|
| |
| Interest rate contracts | | | | $ | (2,156 | ) |
Total | | | | $ | (2,156 | ) |
See Accompanying Notes to Financial Statements
26
TAX INFORMATION (UNAUDITED)
Dividends and distributions paid during the year ended March 31, 2012 were as follows:
Fund Name
| | | | Type
| | Per Share Amount
|
|---|
| ING Floating Rate Fund | | | | | | | | | | |
| Class A | | | | | NII | | | $ | 0.4502 | |
| Class C | | | | | NII | | | $ | 0.3744 | |
| Class I | | | | | NII | | | $ | 0.4755 | |
| Class R | | | | | NII | | | $ | 0.4250 | |
| Class W | | | | | NII | | | $ | 0.4755 | |
| All Classes | | | | | STCG | | | $ | 0.0589 | |
| All Classes | | | | | LTCG | | | $ | 0.0002 | |
NII — Net investment income
STCG — Short-term capital gain
LTCG — Long-term capital gain
Pursuant to Internal Revenue Code Section 871(k)(1), the Fund designates 96.42% of net investment income distributions as interest-related dividends.
The Fund designates 100% of its short-term capital gain distributions as short-term capital gain dividends as defined in Internal Revenue Code Section 871(k)(2).
Above figures may differ from those cited elsewhere in this report due to differences in the calculation of income and gains under U.S. generally accepted accounting principles (book) purposes and Internal Revenue Service (tax) purposes.
Shareholders are strongly advised to consult their own tax advisers with respect to the tax consequences of their investments in the Fund. In January, shareholders, excluding corporate shareholders, receive an IRS 1099-DIV regarding the federal tax status of the dividends and distributions they received in the calendar year.
27
TRUSTEE AND OFFICER INFORMATION (UNAUDITED)
The business and affairs of the Trust are managed under the direction of the Trust’s Board. A Trustee who is not an interested person of the Trust, as defined in the 1940 Act, is an independent trustee (“Independent Trustee”). The Trustees and Officers of the Trust are listed below. The Statement of Additional Information includes additional information about trustees of the Trust and is available, without charge, upon request at (800) 992-0180.
Name, Address and Age
| | | | Position(s)
Held with
the Trust
| | Term of Office and Length of Time Served(1)
| | Principal
Occupation(s)
—During the
Past 5 Years
| | Number
of Funds
in Fund
Complex
Overseen by
Trustee(2)
| | Other
Board Positions
Held by Trustee
|
|---|
| |
Independent Trustees | | | | | | | | | | | | | | | | | | | | | | |
| |
Colleen D. Baldwin
7337 East Doubletree Ranch Rd.
Suite 100
Scottsdale, Arizona 85258
Age: 52 | | | | Trustee | | November
2007–Present | | President, Glantuam Partners, LLC, a business consulting firm (January 2009–Present). | | 138 | | None.
|
| |
John V. Boyer
7337 East Doubletree Ranch Rd.
Suite 100
Scottsdale, Arizona 85258
Age: 58 | | | | Trustee | | January 2005–Present | | President and Chief Executive Officer, Bechtler Arts Foundation, an arts and education foundation (January 2008–Present). Formerly, Consultant (July 2007–February 2008) and President and Chief Executive Officer, Franklin and Eleanor Roosevelt Institute, a public policy foundation (March 2006–July 2007). | | 138 | | None.
|
| |
Patricia W. Chadwick
7337 East Doubletree Ranch Rd.
Suite 100
Scottsdale, Arizona 85258
Age: 63 | | | | Trustee | | January 2006–Present | | Consultant and President, Ravengate Partners LLC, a consulting firm that provides advice regarding financial markets and the global economy (January 2000–Present). | | 138 | | Wisconsin Energy Corporation (June 2006–Present) and The Royce Fund, (35 funds) (December 2009–Present). |
| |
Peter S. Drotch
7337 East Doubletree Ranch Rd.
Suite 100
Scottsdale, Arizona 85258
Age: 70 | | | | Trustee | | November 2007–Present | | Retired. | | 138 | | First Marblehead Corporation (September 2003–Present). |
| |
J. Michael Earley
7337 East Doubletree Ranch Rd.
Suite 100
Scottsdale, Arizona 85258
Age: 67 | | | | Trustee | | February 2002–Present | | Retired. Formerly, Banking President and Chief Executive Officer, Bankers Trust Company, N.A., Des Moines (June 1992–December 2008). | | 138 | | None.
|
| |
Patrick W. Kenny
7337 East Doubletree Ranch Rd.
Suite 100
Scottsdale, Arizona 85258
Age: 69 | | | | Trustee | | January 2005–Present | | Retired. Formerly, President and Chief Executive Officer, International Insurance Society (June 2001–June 2009). | | 138 | | Assured Guaranty Ltd. (April 2004–Present). |
| |
Sheryl K. Pressler
7337 East Doubletree Ranch Rd.
Suite 100
Scottsdale, Arizona 85258
Age: 61 | | | | Trustee | | January 2006–Present | | Consultant (May 2001–Present). | | 138 | | Stillwater Mining Company (May 2002–Present). |
| |
Roger B. Vincent
7337 East Doubletree Ranch Rd.
Suite 100
Scottsdale, Arizona 85258
Age: 66 | | | | Chairperson/Trustee | | February 2002–Present | | Retired. Formerly, President, Springwell Corporation, a corporate finance firm (March 1989–August 2011). | | 138 | | UGI Corporation (February 2006–Present) and UGI Utilities, Inc. (February 2006–Present). |
28
TRUSTEE AND OFFICER INFORMATION (UNAUDITED) (CONTINUED)
Name, Address and Age
| | | | Position(s)
Held with
the Trust
| | Term of Office and Length of Time Served(1)
| | Principal
Occupation(s)
—During the
Past 5 Years
| | Number
of Funds
in Fund
Complex
Overseen by
Trustee(2)
| | Other
Board Positions
Held by Trustee
|
|---|
| |
Trustees who are “Interested Persons” |
| |
Robert W. Crispin(3)
7337 East Doubletree Ranch Rd.
Suite 100
Scottsdale, Arizona 85258
Age: 65 | | | | Trustee | | November
2007–Present | | Retired. Formerly, Chairman and Chief Executive Officer, ING Investment Management Co. (July 2001–December 2007). | | 138 | | Intact Financial Corporation (December 2004–Present) and PFM Group (November 2010–Present). |
| |
Shaun P. Mathews(3)
7337 East Doubletree Ranch Rd.
Suite 100
Scottsdale, Arizona 85258
Age: 56 | | | | Trustee | | November
2007–Present | | President and Chief Executive Officer, ING Investments, LLC (November 2006–Present). | | 176 | | ING Capital Corporation, LLC (December 2005–Present). |
(1) | | Trustees serve until their successors are duly elected and qualified. The tenure of each Trustee is subject to the Board’s retirement policy which states that each duly elected or appointed Trustee who is not an “interested person” of the Trust, as defined in the 1940 Act, as amended (“Independent Trustees”), shall retire from service as a Trustee at the conclusion of the first regularly scheduled quarterly meeting of the Board that is held after the Trustee reaches the age of 72. A unanimous vote of the Board may extend the retirement date of a Trustee for up to one year. An extension may be permitted if the retirement would trigger a requirement to hold a meeting of shareholders of the Trust under applicable law, whether for purposes of appointing a successor to the Trustee or if otherwise necessary under applicable law, in which case the extension would apply until such time as the shareholder meeting can be held or is no longer needed. |
(2) | | Except for Mr. Mathews and for the purposes of this table “ING Fund Complex” means the following investment companies: ING Asia Pacific High Dividend Equity Income Fund; ING Emerging Markets High Dividend Equity Fund; ING Emerging Markets Local Bond Fund; ING Equity Trust; ING Funds Trust; ING Global Equity Dividend and Premium Opportunity Fund; ING Global Advantage and Premium Opportunity Fund; ING Infrastructure, Industrials and Materials Fund; ING International High Dividend Equity Income Fund; ING Investors Trust; ING Mayflower Trust; ING Mutual Funds; ING Partners, Inc.; ING Prime Rate Trust; ING Risk Managed Natural Resources Fund; ING Senior Income Fund; ING Separate Portfolios Trust; ING Variable Insurance Trust; and ING Variable Products Trust. For Mr. Mathews, the ING Fund Complex also includes the following investment companies: ING Balanced Portfolio, Inc.; ING Intermediate Bond Portfolio; ING Money Market Portfolio; ING Series Fund, Inc.; ING Strategic Allocation Portfolios, Inc.; ING Variable Funds; and ING Variable Portfolios, Inc. Therefore, for the purposes of this table with reference to Mr. Mathews, “Fund Complex” includes these investment companies. The number of funds in the ING Fund Complex is as of April 30, 2012. |
(3) | | Messrs. Crispin and Matthews are deemed “Interested Persons” of the Trust because of their current or prior affiliation with ING Groep, N.V., the parent corporation of the Investment Adviser(s) and the Distributor. |
29
TRUSTEE AND OFFICER INFORMATION (UNAUDITED) (CONTINUED)
Name, Address and Age
| | | | Position(s) Held
With the Company
| | Term of Office
and Length of
Time Served(1)
| | Principal Occupation(s)—
During the Past 5 Years
|
|---|
| |
Shaun P. Mathews
7337 East Doubletree Ranch Rd.
Suite 100
Scottsdale, Arizona 85258
Age: 56 | | | | President and Chief Executive Officer | | November 2006–Present | | President and Chief Executive Officer, ING Investments, LLC (November 2006–Present). |
| |
Michael J. Roland
7337 East Doubletree Ranch Rd.
Suite 100
Scottsdale, Arizona 85258
Age: 54 | | | | Executive Vice President | | February 2002–Present | | Chief Compliance Officer, Directed Services LLC and ING Investments, LLC (March 2011–Present) and Executive Vice President and Chief Operating Officer, ING Investments, LLC and ING Funds Services, LLC (January 2007–Present). Formerly, Chief Compliance Officer, ING Funds (March 2011–February 2012). |
| |
Stanley D. Vyner
230 Park Avenue
New York, New York 10169
Age: 62 | | | | Executive Vice President
Chief Investment Risk Officer | | October 2000–Present
September 2009–Present | | Executive Vice President, ING Investments, LLC (July 2000–Present) and Chief Investment Risk Officer, ING Investments, LLC (January 2003–Present). |
| |
Kevin M. Gleason
7337 East Doubletree Ranch Rd.
Suite 100
Scottsdale, Arizona 85258
Age: 45 | | | | Chief Compliance Officer | | February 2012–Present | | Senior Vice President, ING Investment Management, LLC (February 2012–Present). Formerly, Assistant General Counsel and Assistant Secretary, The Northwestern Mutual Life Insurance Company (June 2004–January 2012). |
| |
Kimberly A. Anderson
7337 East Doubletree Ranch Rd.
Suite 100
Scottsdale, Arizona 85258
Age: 47 | | | | Senior Vice President | | November 2003–Present | | Senior Vice President, ING Investments, LLC (October 2003–Present). |
| |
Todd Modic
7337 East Doubletree Ranch Rd.
Suite 100
Scottsdale, Arizona 85258
Age: 44 | | | | Senior Vice President, Chief/Principal Financial Officer and Assistant Secretary | | March 2005–Present | | Senior Vice President, ING Funds Services, LLC (March 2005–Present). |
| |
Robert Terris
7337 East Doubletree Ranch Rd.
Suite 100
Scottsdale, Arizona 85258
Age: 41 | | | | Senior Vice President | | May 2006–Present | | Senior Vice President, Head of Division Operations, ING Funds Services, LLC (May 2006–Present). |
| |
Gregory K. Wilson
7337 East Doubletree Ranch Rd.
Suite 100
Scottsdale, Arizona 85258
Age: 52 | | | | Senior Vice President | | September 2011–Present | | Senior Vice President — Fund Compliance, ING Funds Services, LLC (March 2012–Present). Formerly, Vice President — Fund Compliance, ING Funds Services, LLC (October 2009–March 2012) and Finance Director, ING Funds Services, LLC (September 2006–October 2009). |
| |
Robyn L. Ichilov
7337 East Doubletree Ranch Rd.
Suite 100
Scottsdale, Arizona 85258
Age: 44 | | | | Vice President | | October 2000–Present | | Vice President and Treasurer, ING Funds Services, LLC (November 1995–Present) and ING Investments, LLC (August 1997–Present). Formerly, Treasurer, ING Funds (November 1999–February 2012). |
| |
Maria M. Anderson
7337 East Doubletree Ranch Rd.
Suite 100
Scottsdale, Arizona 85258
Age: 54 | | | | Vice President | | September 2004–Present | | Vice President, ING Funds Services, LLC (September 2004–Present). |
| |
Lauren D. Bensinger
7337 East Doubletree Ranch Rd.
Suite 100
Scottsdale, Arizona 85258
Age: 58 | | | | Vice President | | February 2003–Present | | Vice President, ING Investments, LLC and ING Funds Services, LLC (February 1996–Present); Director of Compliance, ING Investments, LLC (October 2004–Present); and Vice President and Money Laundering Reporting Officer, ING Investments Distributor, LLC (April 2010–Present). Formerly, Chief Compliance Officer, ING Investments Distributor, LLC (August 1995–April 2010). |
| |
William Evans
One Orange Way
Windsor, Connecticut 06095
Age: 39 | | | | Vice President | | September 2007–Present | | Senior Vice President (March 2010–Present) and Head of Manager Research and Selection Group, ING Investment Management (April 2007–Present). |
30
TRUSTEE AND OFFICER INFORMATION (UNAUDITED) (CONTINUED)
Name, Address and Age
| | | | Position(s) Held
With the Company
| | Term of Office
and Length of
Time Served(1)
| | Principal Occupation(s)—
During the Past 5 Years
|
|---|
| |
Denise Lewis
7337 East Doubletree Ranch Rd.
Suite 100
Scottsdale, Arizona 85258
Age: 48 | | | | Vice President
Treasurer | | January 2007–Present
February 2012–Present | | Vice President, ING Funds Services, LLC (December 2006–Present). |
| |
Kimberly K. Springer
7337 East Doubletree Ranch Rd.
Suite 100
Scottsdale, Arizona 85258
Age: 55 | | | | Vice President | | March 2006–Present | | Vice President, ING Investment Management — ING Funds (March 2010–Present); Vice President, ING Funds Services, LLC (March 2006–Present); and Managing Paralegal, Registration Statements (June 2003–Present). |
| |
Craig Wheeler
7337 East Doubletree Ranch Rd.
Suite 100
Scottsdale, Arizona 85258
Age: 43 | | | | Assistant Vice President | | May 2008–Present | | Assistant Vice President — Director of Tax, ING Funds Services, LLC (March 2008–Present). Formerly, Tax Manager, ING Funds Services, LLC (March 2005–March 2008). |
| |
Theresa K. Kelety
7337 East Doubletree Ranch Rd.
Suite 100
Scottsdale, Arizona 85258
Age: 49 | | | | Assistant Secretary | | August 2003–Present | | Vice President and Senior Counsel, ING Investment Management — ING Funds (March 2010–Present). Formerly, Senior Counsel, ING Americas, U.S. Legal Services (April 2008–March 2010) and Counsel, ING Americas, U.S. Legal Services (April 2003–April 2008). |
| |
Huey P. Falgout, Jr.
7337 East Doubletree Ranch Rd.
Suite 100
Scottsdale, Arizona 85258
Age: 48 | | | | Secretary | | August 2003–Present | | Senior Vice President and Chief Counsel, ING Investment Management — ING Funds (March 2010–Present). Formerly, Chief Counsel, ING Americas, U.S. Legal Services (October 2003–March 2010). |
| |
Paul Caldarelli
7337 East Doubletree Ranch Rd.
Suite 100
Scottsdale, Arizona 85258
Age: 60 | | | | Assistant Secretary | | June 2010–Present | | Vice President and Senior Counsel, ING Investment Management — ING Funds (March 2010–Present). Formerly, Senior Counsel, ING Americas, U.S. Legal Services (April 2008–March 2010) and Counsel, ING Americas, U.S. Legal Services (May 2005–April 2008). |
| |
Kathleen Nichols
7337 East Doubletree Ranch Rd.
Suite 100
Scottsdale, Arizona 85258
Age: 36 | | | | Assistant Secretary | | May 2008–Present | | Vice President and Counsel, ING Investment Management — ING Funds (March 2010–Present). Formerly, Counsel, ING Americas, U.S. Legal Services (February 2008–March 2010) and Associate, Ropes & Gray LLP (September 2005–February 2008). |
(1) | | The Officers hold office until the next annual meeting of the Board of Directors and until their successors shall have been elected and qualified. |
31
ADVISORY CONTRACT APPROVAL DISCUSSION (UNAUDITED)
BOARD CONSIDERATION AND RE-APPROVAL OF INVESTMENT ADVISORY AND SUB-ADVISORY CONTRACTS
Section 15(c) of the Investment Company Act of 1940, as amended (the “1940 Act”) provides that, after an initial period, the existing investment advisory and sub-advisory contracts for ING Floating Rate Fund (the “Fund”), a series of ING Funds Trust (the “Trust”), will remain in effect only if the Board of Trustees (the “Board”) of the Trust, including a majority of Board members who have no direct or indirect interest in the advisory and sub-advisory contracts, and who are not “interested persons” of the Fund, as such term is defined under the 1940 Act (the “Independent Trustees”), annually review and approve them. Thus, at a meeting held on November 17, 2011, the Board, including a majority of the Independent Trustees, considered whether to renew the investment advisory contract (the “Advisory Contracts”) between ING Investments, LLC (the “Adviser”) and the Fund and the sub-advisory contract (“Sub-Advisory Contracts”) with ING Investment Management Co. (now known as ING Investment Management Co. LLC, the sub-adviser to the Fund (the “Sub-Adviser”).
The Independent Trustees also held separate meetings on October 12 and November 15, 2011 to consider the renewal of the Advisory and Sub-Advisory Contracts. As a result, subsequent references herein to factors considered and determinations made by the Independent Trustees include, as applicable, factors considered and determinations made on those earlier dates by the Independent Trustees.
At its November 17, 2011 meeting, the Board voted to renew the Advisory and Sub-Advisory Contracts for the Fund. In reaching these decisions, the Board took into account information furnished to it throughout the year at regular meetings of the Board and the Board’s committees, as well as information prepared specifically in connection with the annual renewal process. Determinations by the Independent Trustees also took into account various factors that they believed, in light of the legal advice furnished to them by K&L Gates LLP (“K&L Gates”), their independent legal counsel, and their own business judgment, to be relevant. Further, while the Board considered at the same meeting the advisory contracts and sub-advisory contracts that were subject to renewal for the funds under its jurisdiction, the Trustees considered the Fund’s advisory and sub-advisory relationships separately.
Provided below is an overview of the Board’s contract approval process in general, as well as a discussion of certain specific factors that the Board considered at its renewal meeting. While the Board gave its attention to the information furnished at the request of the Independent Trustees that was most relevant to its considerations, discussed below are a number of the primary factors relevant to the Board’s consideration as to whether to renew the Advisory and Sub-Advisory Contracts for the one-year period ending November 30, 2012. Each Board member may have accorded different weight to the various factors in reaching his or her conclusions with respect to the Fund’s advisory and sub-advisory arrangements.
Overview of the Contract Renewal and Approval Process
The Board follows a structured process pursuant to which it seeks and considers relevant information when it decides whether to approve new or existing advisory and sub-advisory arrangements for the investment companies in the ING Fund complex under its jurisdiction, including the Fund’s existing Advisory and Sub-Advisory Contracts. Among other actions, the Independent Trustees of the Board: retain the services of independent consultants with experience in the mutual fund industry to assist the Independent Trustees in working with the personnel employed by the Adviser or its affiliates who administer the Fund (“Management”) to identify the types of information presented to the Board to inform its deliberations with respect to advisory and sub-advisory relationships and to help evaluate that information; evaluate industry best practices in regards to the consideration of investment advisory and sub-advisory contracts; established a specific format in which certain requested information is provided to the Board; and determine the process for reviewing such information in connection with advisory and sub-advisory contract renewals and approvals. The result is a process (the “Contract Review Process”) employed by the Board and its Independent Trustees to review and analyze information in connection with the annual renewal of the ING Funds’ advisory and sub-advisory contracts, as well as the review and approval of new advisory and sub-advisory relationships.
Since the Contract Review Process was first implemented, the Board’s membership has changed substantially through periodic retirements of some Trustees and the appointment and election of new Trustees. In addition, the Independent Trustees have reviewed and refined the renewal and approval process at least annually in order to request additional information from Management and address certain unique characteristics related to the introduction of new ING Funds.
32
ADVISORY CONTRACT APPROVAL DISCUSSION (UNAUDITED) (CONTINUED)
The Board has established two Investment Review Committees (each, an “IRC”), which meet independently and, at times, jointly, and a Contracts Committee. Among other matters, the Contracts Committee provides oversight with respect to the contracts renewal and approval process, and the Fund is assigned to an IRC which provides oversight regarding, among other matters, the investment performance of the Adviser and Sub-Adviser, as well as the oversight by the Adviser of the performance of the Sub-Adviser. The IRCs may apply a heightened level of scrutiny in cases where performance has lagged the Fund’s relevant benchmark and/or selected peer group of investment companies (“Selected Peer Groups”).
The type and format of the information provided to the Board or to legal counsel for the Independent Trustees in connection with the contract approval and renewal process has been codified in the ING Funds’ 15(c) Methodology Guide. This Guide was developed under the direction of the Independent Trustees and sets out a blueprint pursuant to which the Independent Trustees request certain information that they deem important to facilitate an informed review in connection with initial and annual approvals of advisory and sub-advisory contracts.
Management provides certain of the information requested by the 15(c) Methodology Guide in Fund Analysis and Comparison Tables (“FACT sheets”) prior to the Independent Trustees’ review of advisory and sub-advisory arrangements (including the Fund’s Advisory and Sub-Advisory Contracts). The Independent Trustees previously retained an independent firm to verify and test the accuracy of certain FACT sheet data for a representative sample of funds in the ING Fund complex. In addition, the Contracts Committee routinely employs the services of an independent consultant to assist in its review and analysis of, among other matters, the 15(c) Methodology Guide, the content and format of the FACT sheets, and Selected Peer Groups to be used by the Fund for certain comparison purposes during the renewal process. As part of an ongoing process, the Contracts Committee recommends or considers recommendations from Management for refinements to the 15(c) Methodology Guide and other aspects of the review process, and the Board’s IRCs review benchmarks used to assess the performance of funds in the ING Fund complex.
The Board employed its process for reviewing contracts when considering the renewals of the Fund’s Advisory and Sub-Advisory Contracts that would be effective through November 30, 2012. Set forth below is a discussion of many of the Board’s primary considerations and conclusions resulting from this process.
Nature, Extent and Quality of Service
In determining whether to approve the Advisory and Sub-Advisory Contracts for the Fund for the year ending November 30, 2012, the Independent Trustees received and evaluated such information as they deemed necessary regarding the nature, extent and quality of services provided to the Fund by the Adviser and Sub-Adviser. This included information regarding the Adviser and Sub-Adviser provided throughout the year at regular meetings of the Board and its committees, as well as information furnished in connection with the contract renewal meetings.
The materials requested by the Independent Trustees and provided to the Board, K&L Gates and/or independent consultants that assist the Independent Trustees prior to the November 17, 2011 Board meeting included, among other information, the following items for the Fund: (1) FACT sheets that provided information regarding the performance and expenses of the Fund and other similarly managed funds in its Selected Peer Group, as well as information regarding the Fund’s investment portfolio, objective and strategies; (2) reports providing risk and attribution analyses of the Fund; (3) the 15(c) Methodology Guide, which describes how the FACT sheets were prepared, including the manner in which the Fund’s benchmark and Selected Peer Group were selected and how profitability was determined; (4) responses from the Adviser and Sub-Adviser to a series of questions posed by K&L Gates on behalf of the Independent Trustees; (5) copies of the forms of Advisory and Sub-Advisory Contracts; (6) copies of the Forms ADV for the Adviser and Sub-Adviser; (7) financial statements for the Adviser and Sub-Adviser; (8) a draft of a narrative summary addressing key factors the Board customarily considers in evaluating the renewals of the ING Funds’ (including the Fund’s) advisory contracts and sub-advisory contracts, including a written analysis for the Fund of how performance, fees and expenses compare to its Selected Peer Group and/or designated benchmark(s); (9) independent analyses of Fund performance by the Trust’s Chief Investment Risk Officer; (10) information regarding net asset flows into and out of the Fund; and (11) other information relevant to the Board’s evaluations.
The Board also noted that ING Groep, N.V. the ultimate parent company of the Adviser and Sub-Adviser, has announced plans for the separation of its U.S.-based insurance, retirement services and investment management operations, which include the Adviser and Sub-Adviser, into an independent, standalone
33
ADVISORY CONTRACT APPROVAL DISCUSSION (UNAUDITED) (CONTINUED)
company by the end of 2013. The Board further noted that this separation may result in the Adviser and Sub-Adviser’s loss of access to the services and resources of their current ultimate parent company, which could adversely affect its businesses and profitability. The Board recognized that, if the separation plans are deemed to be a change of control, the investment advisory and sub-advisory agreements for the Fund would terminate and trigger the necessity for new agreements, which would require the approval of the Board and, potentially, the shareholders of the Fund. The Board also recognized that there can be no assurance that the separation plan will be carried out. The Board considered the potential effects of the separation on the Fund and the Advise and Sub-Adviser, including its ability prior to, during and after the separation to perform the same level of service to the Funds as the Adviser and Sub-Adviser currently provides. In this regard, the Board noted that the Adviser and Sub-Adviser did not currently anticipate that the separation would have a material adverse impact on the Fund or their operations and administration.
Class A shares were used for purposes of certain comparisons between the Fund and its Selected Peer Group. Class A shares generally were selected so that the Fund’s share class with the longest performance history was compared to the analogous class of shares for the fund in its Selected Peer Group. The mutual funds included in the Fund’s Selected Peer Groups were selected based upon criteria designed to mirror the Fund share class being compared to the Selected Peer Groups.
In arriving at its conclusions with respect to the Advisory Contract, the Board was mindful of the “manager-of-managers” platform of the ING Funds that has been developed by the Adviser. The Board recognized that the Adviser is responsible for monitoring the investment program and performance of the Sub-Adviser under this manager-of-managers arrangement. The Board also considered the techniques and resources that the Adviser has developed to provide ongoing oversight of the nature and quality of the services the Sub-Adviser provides to the Fund and the Sub-Adviser’s compliance with applicable laws and regulations. The Board noted that to assist in the selection and monitoring of Sub-Adviser, the Adviser has developed an oversight process formulated by its Manager Research & Selection Group (“MRSG”), which analyzes both qualitative (such as in-person meetings and telephonic meetings with the Sub-Adviser and research on sub-advisers) and quantitative information (such as performance data, portfolio data and attribution analysis) about the Sub-Adviser and the Fund. The Board recognized that the MRSG also typically provides in-person reports to the IRCs at their meetings prior to any Sub-Adviser presentations. In addition, the Board noted that the MRSG prepares periodic due diligence reports regarding the Sub-Adviser based on on-site visits and information and analysis which team members use to attempt to gain and maintain an in-depth understanding of the Sub-Adviser’s investment process and to try to identify issues that may be relevant to the Sub-Adviser’s services to the Fund and/or its performance. The Board also noted that the MRSG provides written reports on these due diligence analyses to the pertinent IRC. The Board noted the resources that the Adviser and Management has committed to its services as a manager-of-managers, including resources for reporting to the Board and the IRCs to assist them with their assessment of the investment performance of the Fund on an on-going basis throughout the year. This includes the appointment of a Chief Investment Risk Officer and his staff, who report directly to the Board and who have developed attribution analyses and other metrics used by the IRCs to analyze the key factors underlying investment performance for the funds in the ING Fund complex.
The Board also considered the techniques that the Adviser has developed to screen and perform due diligence on new sub-advisers if and when the Adviser recommends to the Board a new sub-adviser to manage a fund in the ING Fund complex. The Board noted that, for new non-ING-affiliated sub-advisers, the MSRG is responsible for: identifying qualified candidates; analyzing their investment process, personnel and resources; conducting due diligence on the candidates; and selecting the firm to propose as a new sub-adviser, as well as preparing written materials and reports to the Committees and the Board as part of the process of approving any new sub-adviser for a fund.
The Board also considered that in the course of monitoring performance of the Sub-Adviser, the MRSG has developed, based on guidance from the IRCs, a methodology for comparing performance of the Fund to a Selected Peer Group. The Board also recognized that the MRSG provides the IRCs with regular updates on the Fund and alerts the IRCs to potential issues as they arise. The Board also noted that the Adviser regularly monitors performance, personnel, compliance and myriad other issues that may arise on a day-to-day basis with regards to the Sub-Adviser and noted that, if issues are identified either through formal or informal processes, they are brought before the IRCs and the Board for consideration and action and the Adviser consistently makes its resources
34
ADVISORY CONTRACT APPROVAL DISCUSSION (UNAUDITED) (CONTINUED)
available to the Board and the Committees to assist with addressing any issues that arise.
The Board noted that the Fund also benefits from the services of the Adviser’s Investment Risk Management Department (the “IRMD”), under the leadership of the Chief Investment Risk Officer, the costs of which are shared by the Fund and the Adviser. The Board noted that the IRMD regularly presents written materials and reports to the IRCs that focus on the investment risks of the Fund. The Board also noted that the IRMD provides the IRCs with analyses that are developed to assist the IRCs in identifying trends in Fund performance and other areas over consecutive periods. The Board noted that the services provided by the IRMD are meant to provide an additional perspective for the benefit of the Committees, which may vary from the perspective of the MRSG.
The Board also noted the techniques used by the Adviser to monitor the performance of the Sub-Adviser and the proactive approach that the Adviser, working in cooperation with the IRCs, has taken to advocate or recommend, when it believed appropriate, changes designed to assist in improving the Fund’s performance.
In considering the Fund’s Advisory Contract, the Board also considered the extent of benefits provided to the Fund’s shareholders, beyond advisory services, from being part of the ING family of funds. This includes, in most cases, the right to exchange or transfer investments, without a sales charge, between the same class of shares of such funds or among ING Funds available on a product platform, and the wide range of ING Funds available for exchange or transfer. The Board also took into account the Adviser’s ongoing efforts to reduce the expenses of the ING Funds through renegotiated arrangements with the ING Funds’ service providers. In addition, the Board considered the efforts of the Adviser and the expenses that it incurred in recent years to help make the ING Fund complex more balanced and efficient by the launch of new investment products and the combinations of similar funds.
Further, the Board received periodic reports showing that the investment policies and restrictions for the Fund were consistently complied with and other periodic reports covering matters such as compliance by Adviser and Sub-Adviser personnel with codes of ethics. The Board considered reports from the Trust’s Chief Compliance Officer (“CCO”) evaluating whether the regulatory compliance systems and procedures of the Adviser and the Sub-Adviser are reasonably designed to assure compliance with the federal securities laws, including those related to, among others, late trading and market timing, best execution, fair value pricing, proxy voting and trade allocation practices. The Board also took into account the CCO’s annual and periodic reports and recommendations with respect to service provider compliance programs. In this regard, the Board also considered the policies and procedures developed by the CCO in consultation with the Board’s Compliance Committee that guide the CCO’s compliance oversight function.
The Board reviewed the level of staffing, quality and experience of the Fund’s portfolio management team. The Board took into account the respective resources and reputations of the Adviser and Sub-Adviser, and evaluated the ability of the Adviser and the Sub-Adviser to attract and retain qualified investment advisory personnel. The Board also considered the adequacy of the resources committed to the Fund (and other relevant funds in the ING Fund complex) by the Adviser and Sub-Adviser, and whether those resources are commensurate with the needs of the Fund and are sufficient to sustain appropriate levels of performance and compliance needs. In this regard, the Board considered the financial stability of the Adviser and the Sub-Adviser.
Based on their deliberations and the materials presented to them, the Board concluded that the advisory and related services provided by the Adviser and the Sub-Adviser are appropriate in light of the Fund’s operations, the competitive landscape of the investment company business, and investor needs, and that the nature and quality of the overall services provided by the Adviser and the Sub-Adviser were appropriate.
Fund Performance
In assessing the advisory and sub-advisory relationship for the Fund, the Board placed emphasis on the investment returns of the Fund. While the Board considered the performance reports and discussions with portfolio managers at Board and committee meetings during the year, particular attention in assessing performance was given to the FACT sheets furnished in connection with the renewal process. The FACT sheet prepared for the Fund included its investment performance compared to the Fund’s Morningstar category median and/or Lipper category median, Selected Peer Group and primary benchmark. The FACT sheet performance data was as of June 30, 2011. In addition, the Board also considered at its November 17, 2011 meeting certain additional data regarding performance and Fund asset levels as of October 31, 2011.
The Fund’s performance was compared to its Morningstar category median and average, as well as
35
ADVISORY CONTRACT APPROVAL DISCUSSION (UNAUDITED) (CONTINUED)
its primary benchmark, a broad-based securities market index that appears in the Fund’s prospectus. With respect to Morningstar quintile rankings, the first quintile represents the highest (best) performance and the fifth quintile represents the lowest performance. The Fund’s management fee and expense ratio were compared to the fees and expense ratios of the funds in its Selected Peer Group.
In considering whether to approve the renewal of the Advisory and Sub-Advisory Contracts for the Fund, the Board considered that, based on performance data for the periods ended June 30, 2011: (1) the Fund underperformed its Morningstar category median for all periods presented; (2) the Fund outperformed its primary benchmark for the most recent calendar quarter, but underperformed for the year-to-date period; and (3) the Fund is ranked in the fourth quintile of its Morningstar category for the most recent calendar quarter, and the fifth (lowest) quintile for the year-to-date period.
In analyzing this performance data, the Board took into account: (1) that the Fund commenced operations in August 2010, and therefore had a limited operating history for the purpose of analyzing its performance; and (2) Management would continue to monitor, and the Board or its Investment Review Committee would periodically review, the Fund’s performance.
Economies of Scale
When evaluating the reasonableness of advisory fee rates, the Board also considered whether economies of scale likely will be realized by the Adviser and Sub-Adviser as the Fund grows larger and the extent to which any such economies are reflected in contractual fee rates. In this regard, the Board noted any breakpoints in advisory fee schedules that will result in a lower advisory fee rate when the Fund achieves sufficient asset levels to receive a breakpoint discount. In the case of sub-advisory fees, the Board considered that breakpoints would inure to the benefit of the Adviser, except to the extent that there are corresponding advisory fee breakpoints or waivers. The Board also considered that although the Fund does not have advisory fee breakpoints, it does have fee waiver or expense reimbursement arrangements. In this connection, the Board considered the extent to which economies of scale could be realized through such fee waivers, expense reimbursements or other expense reductions. In evaluating fee breakpoint arrangements and economies of scale, the Independent Trustees also considered prior periodic management reports, industry information on this topic and the Fund’s investment performance.
Information Regarding Services to Other Clients
The Board requested and considered information regarding the nature of services and fee rates offered by the Adviser and Sub-Adviser to other clients, including other registered investment companies and relevant institutional accounts. When fee rates offered to other clients differed materially from those charged to the Fund, the Board considered any underlying rationale provided by the Adviser or the Sub-Adviser for these differences. The Board also noted that the fee rates charged to the Fund and other institutional clients of the Adviser or Sub-Adviser (including other investment companies) may differ materially due to, among other reasons: differences in services; different regulatory requirements associated with registered investment companies, such as the Fund, as compared to non-registered investment company clients; market differences in fee rates that existed when the Fund first was organized; differences in the original sponsors of a Fund that now are managed by the Adviser; investment capacity constraints that existed when certain contracts were first agreed upon or that might exist at present; and different pricing structures that are necessary to be competitive in different marketing channels.
Fee Rates and Profitability
The Board reviewed and considered the contractual investment advisory fee rate, combined with the administrative fee rate, payable by the Fund to the Adviser. The Board also considered the contractual sub-advisory fee rate payable by the Adviser to the Sub-Adviser for sub-advisory services for the Fund, including the portion of the contractual advisory fees that are paid to the Sub-Adviser, as compared to the portion retained by the Adviser. In addition, the Board considered fee waivers and expense limitations applicable to the fees payable by the Fund.
The Board considered: (1) the fee structure of the Fund as it relates to the services provided under the contracts; and (2) the potential fall-out benefits to the Adviser and the Sub-Adviser and their respective affiliates from their association with the Fund. For the Fund, the Board separately determined that the fees payable to the Adviser and the fees payable to the Sub-Adviser are reasonable for the services that each performs, which were considered in light of the nature and quality of the services that each has performed and is expected to perform.
In considering the fees payable under the Advisory and Sub-Advisory Contracts for the Fund, the Board took into account the factors described above and also considered: (1) the fairness of the compensation under
36
ADVISORY CONTRACT APPROVAL DISCUSSION (UNAUDITED) (CONTINUED)
an Advisory Contract with a level fee rate that does not include breakpoints; and (2) the pricing structure (including the expense ratio to be borne by shareholders) of the Fund, as compared to its Selected Peer Group, including that: (a) the management fee (inclusive of a 0.10% administration fee) for the Fund is above the median and below the average management fees of the funds in its Selected Peer Group; and (b) the expense ratio for the Fund is below the median and the average expense ratios of the funds in its Selected Peer Group.
In analyzing the profitability of the Adviser and Sub-Adviser in connection with their services to the Fund, the Board considered information on revenues, costs and profits realized by the Adviser and the Sub-Adviser, which was prepared by Management in accordance with the allocation methodology (including related assumptions) specified in the 15(c) Methodology Guide. In analyzing the profitability of the Adviser in connection with its services to the Fund, the Board took into account the sub-advisory fee rate payable by the Adviser to the Sub-Adviser. In addition, the Board considered information that it requested and was provided by Management with respect to the profitability of service providers affiliated with the Adviser.
Although the 15(c) Methodology Guide establishes certain standards for profit calculation, the Board recognized that profitability analysis on a client-by-client basis is not an exact science and there is no uniform methodology within the asset management industry for determining profitability for this purpose. In this context, the Board realized that Management’s calculations regarding its costs incurred in establishing the infrastructure necessary for the Fund’s operations may not be fully reflected in the expenses allocated to the Fund in determining profitability, and that the information presented may not portray all of the costs borne by the Adviser and Management or capture their entrepreneurial risk associated with offering and managing a mutual fund complex in the current regulatory and market environment. In addition, the Board recognized that the use of different methodologies for purposes of calculating profit data can give rise to dramatically different profit and loss results.
In making its determinations, the Board based its conclusions as to the reasonableness of the advisory and sub-advisory fees of the Adviser and Sub-Adviser primarily on the factors described for the Fund herein. At the request of the Board, the Adviser has from time to time agreed to implement remedial actions regarding certain funds in the ING Funds Complex. These remedial actions have included, among others: reductions in fee rates; changes in Sub-Adviser or portfolio managers; and strategy modifications.
Conclusion
After its deliberation, the Board reached the following conclusions: (1) the Fund’s management fee rate is reasonable in the context of all factors considered by the Board; (2) the Fund’s expense ratio is reasonable in the context of all factors considered by the Board; (3) taking into account that the Fund commenced operations in August 2010, and therefore had a limited operating history for the purpose of analyzing its performance, and it is reasonable to permit the Fund time to establish a longer performance record for the purposes of evaluating investment performance; and (4) the sub-advisory fee rate payable by the Adviser to the Sub-Adviser is reasonable in the context of all factors considered by the Board. Based on these conclusions and other factors, the Board voted to renew the Advisory and Sub-Advisory Contracts for the Fund for the year ending November 30, 2012. During this renewal process, different Board members may have given different weight to different individual factors and related conclusions.
37
(THIS PAGE INTENTIONALLY LEFT BLANK)
(THIS PAGE INTENTIONALLY LEFT BLANK)
Investment Adviser
ING Investments, LLC
7337 East Doubletree Ranch Road, Suite 100
Scottsdale, Arizona 85258
Administrator
ING Funds Services, LLC
7337 East Doubletree Ranch Road, Suite 100
Scottsdale, Arizona 85258
Distributor
ING Investments Distributor, LLC
7337 East Doubletree Ranch Road, Suite 100
Scottsdale, Arizona 85258
Transfer Agent
BNY Mellon Investment Servicing (U.S.) Inc.
301 Bellevue Parkway
Wilmington, Delaware 19809
Independent Registered Public
Accounting Firm
KPMG LLP
Two Financial Center
60 South Street
Boston, Massachusetts 02111
Custodian
State Street Bank and Trust Company
801 Pennsylvania Avenue
Kansas City, Missouri 64105
Legal Counsel
Dechert LLP
1775 I Street, N.W.
Washington, D.C. 20006
Toll-Free Shareholder Information
Call us from 9:00 a.m. to 7:00 p.m. Eastern time on any business day for account or other information, at (800) 992-0180
For more complete information, or to obtain a prospectus on any ING Fund, please call your Investment Professional or ING Investments Distributor, LLC at (800) 992-0180 or log on to www.inginvestment.com. The prospectus should be read carefully before investing. Consider the fund’s investment objectives, risks, charges and expenses carefully before investing. The prospectus contains this information and other information about the fund.
| AR-UFR (0312-052512) |
Item 2. Code of Ethics.
As of the end of the period covered by this report, Registrant had adopted a code of ethics, as defined in Item 2 of Form N-CSR, that applies to the Registrant’s principal executive officer and principal financial officer. There were no amendments to the Code during the period covered by the report. The Registrant did not grant any waivers, including implicit waivers, from any provisions of the Code during the period covered by this report. The code of ethics is filed herewith pursuant to Item 10(a)(1), Exhibit 99.CODE ETH.
Item 3. Audit Committee Financial Expert.
The Board of Trustees has determined that J. Michael Early, Peter S. Drotch and Colleen Baldwin are an audit committee financial experts, as defined in Item 3 of Form N-CSR. Mr. Early, Mr. Drotch and Ms. Baldwin are “independent” for purposes of Item 3 of Form N-CSR.
Item 4. Principal Accountant Fees and Services.
| (a) | Audit Fees: The aggregate fees billed for each of the last two fiscal years for professional services rendered by KPMG LLP (“KPMG”), the principal accountant for the audit of the registrant’s annual financial statements, for services that are normally provided by the accountant in connection with statutory and regulatory filings or engagements for those fiscal years were $96,300 for year ended March 31, 2012 and $96,300 for year ended March 31, 2011. |
| (b) | Audit-Related Fees: The aggregate fees billed in the last fiscal year for assurance and related services by KPMG that are reasonably related to the performance of the audit of the registrant’s financial statements and are not reported under paragraph (a) of this Item were $9,600 for the year ended March 31, 2012 and $8,600 for year ended March 31, 2011. |
| (c) | Tax Fees: The aggregate fees billed in each of the last two fiscal years for professional services rendered by KPMG for tax compliance, tax advice, and tax planning were $36,957 in the year ended March 31, 2012 and $16,398 in the year ended March 31, 2011. Such services included review of excise distribution calculations (if applicable), preparation of the Funds’ federal, state and excise tax returns, tax services related to mergers and routine consulting. |
| (d) | All Other Fees: The aggregate fees billed in each of the last two fiscal years for products and services provided by KPMG, other than the services reported in paragraphs (a) through (c) of this Item. |
| (e) (1) | Audit Committee Pre-Approval Policies and Procedures |
AUDIT AND NON-AUDIT SERVICES
PRE-APPROVAL POLICY
I.
Statement of Principles
Under the Sarbanes-Oxley Act of 2002 (the “Act”), the Audit Committee of the Board of Directors or Trustees (the “Committee”) of the ING Funds (each a “Fund,” collectively, the “Funds”) set out on Exhibit A to this Audit and Non-Audit Services Pre-Approval Policy (“Policy”) is responsible for the oversight of the work of the Funds’ independent auditors. As part of its responsibilities, the Committee must pre-approve the audit and non-audit services performed by the auditors in order to assure that the provision of these services does not impair the auditors’ independence from the Funds. The Committee has adopted, and the Board has ratified, this Policy, which sets out the procedures and conditions under which the services of the independent auditors may be pre-approved.
Under Securities and Exchange Commission (“SEC”) rules promulgated in accordance with the Act, the Funds may establish two different approaches to pre-approving audit and non-audit services. The Committee may approve services without consideration of specific case-by-case services (“general pre-approval”) or it may pre-approve specific services (“specific pre-approval”). The Committee believes that the combination of these approaches contemplated in this Policy results in an effective and efficient method for pre-approving audit and non-audit services to be performed by the Funds’ independent auditors. Under this Policy, services that are not of a type that may receive general pre-approval require specific pre-approval by the Committee. Any proposed services that exceed pre-approved cost levels or budgeted amounts will also require the Committee’s specific pre-approval.
For both types of approval, the Committee considers whether the subject services are consistent with the SEC’s rules on auditor independence and that such services are compatible with maintaining the auditors independence. The Committee also considers whether a particular audit firm is in the best position to provide effective and efficient services to the Funds. Reasons that the auditors are in the best position include the auditors’ familiarity with the Funds’ business, personnel, culture, accounting systems, risk profile, and other factors, and whether the services will enhance the Funds’ ability to manage and control risk or improve audit quality. Such factors will be considered as a whole, with no one factor being determinative.
The appendices attached to this Policy describe the audit, audit-related, tax-related, and other services that have the Committee’s general pre-approval. For any service that has been approved through general pre-approval, the general pre-approval will remain in place for a period 12 months from the date of pre-approval, unless the Committee determines that a different period is appropriate. The Committee will annually review and pre-approve the services that may be provided by the independent auditors without specific pre-approval. The Committee will revise the list of services subject to general pre-approval as appropriate. This Policy does not serve as a delegation to Fund management of the Committee’s duty to pre-approve services performed by the Funds’ independent auditors.
II.
Audit Services
The annual audit services engagement terms and fees are subject to the Committee’s specific pre-approval. Audit services are those services that are normally provided by auditors in connection with statutory and regulatory filings or engagements or those that generally only independent auditors can reasonably provide. They include the Funds’ annual financial statement audit and procedures that the independent auditors must perform in order to form an opinion on the Funds’ financial statements (e.g., information systems and procedural reviews and testing). The Committee will monitor the audit services engagement and approve any changes in terms, conditions or fees deemed by the Committee to be necessary or appropriate.
The Committee may grant general pre-approval to other audit services, such as statutory audits and services associated with SEC registration statements, periodic reports and other documents filed with the SEC or issued in connection with securities offerings.
The Committee has pre-approved the audit services listed on Appendix A. The Committee must specifically approve all audit services not listed on Appendix A.
III.
Audit-related Services
Audit-related services are assurance and related services that are reasonably related to the performance of the audit or the review of the Funds’ financial statements or are traditionally performed by the independent auditors. The Committee believes that the provision of audit-related services will not impair the independent auditors’ independence, and therefore may grant pre-approval to audit-related services. Audit-related services include accounting consultations related to accounting, financial reporting or disclosure matters not classified as “audit services;” assistance with understanding and implementing new accounting and financial reporting guidance from rulemaking authorities; agreed-upon or expanded audit procedures relating to accounting and/or billing records required to respond to or comply with financial, accounting or regulatory reporting matters; and assistance with internal control reporting requirements under Form N-SAR or Form N-CSR.
The Committee has pre-approved the audit-related services listed on Appendix B. The Committee must specifically approve all audit-related services not listed on Appendix B.
IV.
Tax Services
The Committee believes the independent auditors can provide tax services to the Funds, including tax compliance, tax planning, and tax advice, without compromising the auditors’ independence. Therefore, the Committee may grant general pre-approval with respect to tax services historically provided by the Funds’ independent auditors that do not, in the Committee’s view, impair auditor independence and that are consistent with the SEC’s rules on auditor independence.
The Committee will not grant pre-approval if the independent auditors initially recommends a transaction the sole business purpose of which is tax avoidance and the tax treatment of which may not be supported in the Internal Revenue Code and related regulations. The Committee may consult
2
outside counsel to determine that tax planning and reporting positions are consistent with this Policy.
The Committee has pre-approved the tax-related services listed on Appendix C. The Committee must specifically approve all tax-related services not listed on Appendix C.
V.
Other Services
The Committee believes it may grant approval of non-audit services that are permissible services for independent auditors to a Fund. The Committee has determined to grant general pre-approval to other services that it believes are routine and recurring, do not impair auditor independence, and are consistent with SEC rules on auditor independence.
The Committee has pre-approved the non-audit services listed on Appendix D. The Committee must specifically approve all non-audit services not listed on Appendix D.
A list of the SEC’s prohibited non-audit services is attached to this Policy as Appendix E. The SEC’s rules and relevant guidance should be consulted to determine the precise definitions of these impermissible services and the applicability of exceptions to certain of the SEC’s prohibitions.
VI.
Pre-approval of Fee levels and Budgeted Amounts
The Committee will annually establish pre-approval fee levels or budgeted amounts for audit, audit-related, tax and non-audit services to be provided to the Funds by the independent auditors. Any proposed services exceeding these levels or amounts require the Committee’s specific pre-approval. The Committee considers fees for audit and non-audit services when deciding whether to pre-approve services. The Committee may determine, for a pre-approval period of 12 months, the appropriate ratio between the total amount of fees for the Fund’s audit, audit-related, and tax services (including fees for services provided to Fund affiliates that are subject to pre-approval), and the total amount of fees for certain permissible non-audit services for the Fund classified as other services (including any such services provided to Fund affiliates that are subject to pre-approval).
VII.
Procedures
Requests or applications for services to be provided by the independent auditors will be submitted to management. If management determines that the services do not fall within those services generally pre-approved by the Committee and set out in the appendices to these procedures, management will submit the services to the Committee or its delagee. Any such submission will include a detailed description of the services to be rendered. Notwithstanding this paragraph, the Committee will, on a quarterly basis, receive from the independent auditors a list of services provided for the previous calendar quarter on a cumulative basis by the auditors during the Pre-Approval Period.
3
VIII.
Delegation
The Committee may delegate pre-approval authority to one or more of the Committee’s members. Any member or members to whom such pre-approval authority is delegated must report any pre-approval decisions, including any pre-approved services, to the Committee at its next scheduled meeting. The Committee will identify any member to whom pre-approval authority is delegated in writing. The member will retain such authority for a period of 12 months from the date of pre-approval unless the Committee determines that a different period is appropriate. The period of delegated authority may be terminated by the Committee or at the option of the member.
IX.
Additional Requirements
The Committee will take any measures the Committee deems necessary or appropriate to oversee the work of the independent auditors and to assure the auditors’ independence from the Funds. This may include reviewing a formal written statement from the independent auditors delineating all relationships between the auditors and the Funds, consistent with Independence Standards Board No. 1, and discussing with the auditors their methods and procedures for ensuring independence.
Effective April 23, 2008, the KPMG LLP (“KPMG”) audit team for the ING Funds accepted the global responsibility for monitoring the auditor independence for KPMG relative to the ING Funds. Using a proprietary system called Sentinel, the audit team is able to identify and manage potential conflicts of interest across the member firms of the KPMG International Network and prevent the provision of prohibited services to the ING entities that would impair KPMG independence with the respect to the ING Funds. In addition to receiving pre-approval from the ING Funds Audit Committee for services provided to the ING Funds and for services for ING entities in the Investment Company Complex, the audit team has developed a process for periodic notification via email to the ING Funds’ Audit Committee Chairpersons regarding requests to provide services to ING Groep NV and its affiliates from KPMG offices worldwide. Additionally, KPMG provides a quarterly summary of the fees for services that have commenced for ING Groep NV and Affiliates at each Audit Committee Meeting.
4
Last Approved: November 17, 2011
5
Appendix A
Pre-Approved Audit Services for the Pre-Approval Period January 1, 2012 through December 31, 2012
| | |
Service |
| The Fund(s) | Fee Range |
Statutory audits or financial audits (including tax services associated with audit services) | √ | As presented to
Audit
Committee1 |
Services associated with SEC registration statements, periodic reports and other documents filed with the SEC or other documents issued in connection with securities offerings (e.g., consents), and assistance in responding to SEC comment letters. | √ | Not to exceed
$9,750 per
filing |
Consultations by Fund management with respect to accounting or disclosure treatment of transactions or events and/or the actual or potential effect of final or proposed rules, standards or interpretations by the SEC, Financial Accounting Standards Board, or other regulatory or standard setting bodies. | √ | Not to exceed
$8,000 during
the Pre-
Approval
Period |
Seed capital audit and related review and issuance of consent on the N-2 registration statement | √ | Not to exceed
$13,000 per
audit |
1
For new Funds launched during the Pre-Approval Period, the fee ranges pre-approved will be the same as those for existing Funds, pro-rated in accordance with inception dates as provided in the auditors’ Proposal or any Engagement Letter covering the period at issue. Fees in the Engagement Letter will be controlling.
6
Appendix B
Pre-Approved Audit-Related Services for the Pre-Approval Period January 1, 2012 through December 31, 2012
| | | |
Service |
| The Fund(s) | Fund Affiliates | Fee Range |
Services related to Fund mergers (Excludes tax services - See Appendix C for tax services associated with Fund mergers) | √ | √ | Not to exceed
$10,000 per
merger |
Consultations by Fund management with respect to accounting or disclosure treatment of transactions or events and/or the actual or potential effect of final or proposed rules, standards or interpretations by the SEC, Financial Accounting Standards Board, or other regulatory or standard setting bodies. [Note: Under SEC rules some consultations may be “audit” services and others may be “audit-related” services.] | √ | | Not to exceed
$5,000 per
occurrence during
the Pre-Approval
Period |
Review of the Funds’ semi-annual and quarterly financial statements | √ | | Not to exceed
$2,400 per set of
financial
statements per
fund |
Reports to regulatory or government agencies related to the annual engagement | √ | | Up to $5,000 per
occurrence during
the Pre-Approval
Period |
Regulatory compliance assistance | √ | √ | Not to exceed
$5,000 per quarter |
Training courses | | √ | Not to exceed
$2,000 per course |
For Prime Rate Trust, agreed upon procedures for quarterly reports to rating agencies | √ | | Not to exceed
$9,450 per quarter |
| | | |
7
Appendix C
Pre-Approved Tax Services for the Pre-Approval Period January 1, 2012 through December 31, 2012
| | | |
Service |
| The Fund(s) | Fund Affiliates | Fee Range |
Preparation of federal and state income tax returns and federal excise tax returns for the Funds including assistance and review with excise tax distributions | √ | | As presented to
Audit
Committee2 |
Review of IRC Sections 851(b) and 817(h) diversification testing on a real-time basis | √ | | As presented to
Audit
Committee2 |
Assistance and advice regarding year-end reporting for 1099’s | √ | | As presented to
Audit
Committee2 |
Tax assistance and advice regarding statutory, regulatory or administrative developments | √ | √ | Not to exceed
$5,000 for the
Funds or for the
Funds’
investment
adviser during
the Pre-
Approval Period |
2
For new Funds launched during the Pre-Approval Period, the fee ranges pre-approved will be the same as those for existing Funds, pro-rated in accordance with inception dates as provided in the auditors’ Proposal or any Engagement Letter covering the period at issue. Fees in the Engagement Letter will be controlling.
8
Appendix C, continued
| | | |
Service |
| The Fund(s) | Fund Affiliates | Fee Range |
Tax training courses | | √ | Not to exceed
$2,000 per
course during
the Pre-
Approval Period |
Tax services associated with Fund mergers | √ | √ | Not to exceed
$4,000 per fund
per merger
during the Pre-
Approval Period |
Other tax-related assistance and consultation, including, without limitation, assistance in evaluating derivative financial instruments and international tax issues, qualification and distribution issues, and similar routine tax consultations. | √ | | Not to exceed
$120,000 during
the Pre-
Approval Period |
9
Appendix D
Pre-Approved Other Services for the Pre-Approval Period January 1, 2012 through December 31, 2012
| | | |
Service |
| The Fund(s) | Fund Affiliates | Fee Range |
Agreed-upon procedures for Class B share 12b-1 programs | | √ | Not to exceed
$60,000
during the Pre-
Approval
Period |
Security counts performed pursuant to Rule 17f-2 of the 1940 Act (i.e., counts for Funds holding securities with affiliated sub-custodians) Cost to be borne 50% by the Funds and 50% by ING Investments, LLC. | √ | √ | Not to exceed
$5,000 per
Fund during
the Pre-
Approval
Period |
Agreed upon procedures for 15 (c) FACT Books | √ | | Not to exceed
$35,000
during the Pre-
Approval
Period |
10
Appendix E
Prohibited Non-Audit Services
Dated:
January 1, 2012 to December 31, 2012
·
Bookkeeping or other services related to the accounting records or financial statements of the Funds
·
Financial information systems design and implementation
·
Appraisal or valuation services, fairness opinions, or contribution-in-kind reports
·
Actuarial services
·
Internal audit outsourcing services
·
Management functions
·
Human resources
·
Broker-dealer, investment adviser, or investment banking services
·
Legal services
·
Expert services unrelated to the audit
·
Any other service that the Public Company Accounting Oversight Board determines, by regulation, is impermissible
11
EXHIBIT A
ING EQUITY TRUST
ING FUNDS TRUST
ING ASIA PACIFIC HIGH DIVIDEND EQUITY INCOME FUND
ING GLOBAL ADVANTAGE AND PREMIUM OPPORTUNITY FUND
ING GLOBAL EQUITY DIVIDEND AND PREMIUM OPPORTUNITY FUND
ING INTERNATIONAL HIGH DIVIDEND EQUITY INCOME FUND
ING INFRASTRUCTURE, INDUSTRIALS, AND MATERIALS FUND
ING RISK MANAGED NATURAL RESOURCES FUNDING INVESTORS TRUST
ING MAYFLOWER TRUST
ING MUTUAL FUNDS
ING PARTNERS, INC.
ING PRIME RATE TRUST
ING SENIOR INCOME FUND
ING SEPARATE PORTFOLIOS TRUST
ING VARIABLE INSURANCE TRUST
ING VARIABLE PRODUCTS TRUST
ING EMERGING MARKETS LOCAL BOND FUND
ING EMERING MARKETS HIGH DIVIDEND EQUITY FUND
| | |
| |
| (e)(2) | | Percentage of services referred to in (4)(b)-(4)(d) that were approved by the audit committee |
| |
| | 100% of the services were approved by the audit committee. |
| |
| (f) | | Percentage of hours expended attributable to work performed by other than full time employees of KPMG if greater than 50% |
| |
| | Not applicable |
| |
| (g) | | Non-Audit Fees: The non-audit fees billed by the registrant’s accountant for services rendered to the registrant, and rendered to the registrant’s investment adviser, and any entity controlling, controlled by, or under common control with the adviser that provides ongoing services to the registrant for each of the last two fiscal years of the registrant were $1,214,165 for year ended March 31, 2012 and $1,069,423 for fiscal year ended March 31, 2011. |
| |
| (h) | | Principal Accountants Independence: the Registrant’s Audit committee has considered whether the provision of non-audit services that were rendered to the registrant’s investment adviser and any entity controlling, controlled by, or under common control with the investment adviser that provides ongoing services to the registrant that were not pre-approved pursuant to Rule 2.01(c)(7)(ii) of Regulation S-X is compatible with maintaining KPMG’s independence. |
ITEM 5. AUDIT COMMITTEE OF LISTED REGISTRANTS.
Not applicable.
ITEM 6. SCHEDULE OF INVESTMENTS
Summary schedule or complete schedule of investments, if applicable, is included as part of the report to shareholders filed under Item 1 of this Form.
13
Report of Independent Registered Public Accounting Firm
The Shareholders and Board of Trustees
ING Funds Trust
We have audited, in accordance with the standards of the Public Company Accounting Oversight Board (United States), the statements of assets and liabilities, including the summary portfolios of investments, of ING GNMA Income Fund, ING High Yield Bond Fund, and ING Intermediate Bond Fund, each a series of ING Funds Trust, as of March 31, 2012, and the related statements of operations for the year then ended, the statements of changes in net assets for each of the years in the two-year period then ended, and the financial highlights for each of the years in the five-year period then ended and have issued our unqualified report thereon dated May 25, 2012 (which report and financial statements are included in Item 1 of this Certified Shareholder Report on Form N-CSR). In connection with our audits of the aforementioned financial statements and financial highlights, we also audited the related portfolios of investments included in Item 6 of this Form N-CSR. The portfolios of investments are the responsibility of management. Our responsibility is to express an opinion on the portfolios of investments based on our audits.
In our opinion, the portfolios of investments, when considered in relation to the basic financial statements taken as a whole, present fairly, in all material respects, the information set forth therein.
Boston, Massachusetts
May 29, 2012
PORTFOLIO OF INVESTMENTSAS OF MARCH 31, 2012
Principal
Amount†
|
|
|
|
|
|
|
| Value
|
| Percentage
of Net
Assets
|
|---|
U.S. GOVERNMENT AGENCY OBLIGATIONS: 101.8%
|
| | | | | | | Collateralized Mortgage Obligations: 0.1% |
| 1,056,408 | | | | | | 5.500%, due 01/16/33 | | | 1,253,038 | | | | 0.1 | |
| | | | | | | Federal Home Loan Mortgage Corporation: 5.1%## |
| 21,670,222 | | | | ˆ | | 0.500%, due 07/15/36 | | | 406,332 | | | | 0.1 | |
| 557,126 | | | | | | 5.450%, due 03/01/37 | | | 605,901 | | | | 0.1 | |
| 147,692 | | | | | | 5.450%, due 07/01/37 | | | 159,827 | | | | 0.0 | |
| 167,633 | | | | | | 5.450%, due 12/01/37 | | | 182,309 | | | | 0.0 | |
| 246,190 | | | | | | 5.450%, due 12/01/37 | | | 267,744 | | | | 0.0 | |
| 149,533 | | | | | | 5.450%, due 05/01/38 | | | 162,580 | | | | 0.0 | |
| 2,494,322 | | | | ˆ | | 5.500%, due 09/15/35 | | | 502,770 | | | | 0.1 | |
| 115,670 | | | | | | 5.625%, due 12/01/36 | | | 128,105 | | | | 0.0 | |
| 606,553 | | | | | | 5.625%, due 12/01/36 | | | 673,092 | | | | 0.1 | |
| 65,154 | | | | | | 5.625%, due 01/01/37 | | | 71,423 | | | | 0.0 | |
| 666,133 | | | | | | 5.625%, due 01/01/37 | | | 742,287 | | | | 0.1 | |
| 108,588 | | | | | | 5.625%, due 01/01/37 | | | 119,255 | | | | 0.0 | |
| 42,665 | | | | | | 5.625%, due 02/01/37 | | | 47,579 | | | | 0.0 | |
| 192,872 | | | | | | 5.625%, due 03/01/37 | | | 211,430 | | | | 0.0 | |
| 85,208 | | | | | | 5.625%, due 03/01/37 | | | 94,907 | | | | 0.0 | |
| 573,126 | | | | | | 5.625%, due 03/01/37 | | | 637,715 | | | | 0.1 | |
| 94,110 | | | | | | 5.625%, due 04/01/37 | | | 103,124 | | | | 0.0 | |
| 80,800 | | | | | | 5.625%, due 05/01/37 | | | 89,445 | | | | 0.0 | |
| 182,127 | | | | | | 5.625%, due 06/01/37 | | | 199,752 | | | | 0.0 | |
| 231,425 | | | | | | 5.625%, due 07/01/37 | | | 254,685 | | | | 0.0 | |
| 349,117 | | | | | | 5.625%, due 07/01/37 | | | 387,274 | | | | 0.1 | |
| 33,189 | | | | | | 5.625%, due 12/01/37 | | | 36,994 | | | | 0.0 | |
| 503,201 | | | | | | 5.625%, due 02/01/38 | | | 558,181 | | | | 0.1 | |
| 302,789 | | | | | | 5.650%, due 02/01/37 | | | 331,036 | | | | 0.0 | |
| 784,914 | | | | | | 5.650%, due 02/01/37 | | | 859,365 | | | | 0.1 | |
| 670,163 | | | | | | 5.700%, due 06/01/37 | | | 730,802 | | | | 0.1 | |
| 338,636 | | | | | | 5.700%, due 09/01/37 | | | 369,277 | | | | 0.0 | |
| 496,599 | | | | | | 5.700%, due 12/01/37 | | | 543,705 | | | | 0.1 | |
| 159,317 | | | | | | 5.700%, due 01/01/38 | | | 174,429 | | | | 0.0 | |
| 84,423 | | | | | | 5.700%, due 07/01/38 | | | 92,415 | | | | 0.0 | |
| 174,936 | | | | | | 5.700%, due 07/01/38 | | | 191,497 | | | | 0.0 | |
| 165,389 | | | | | | 5.790%, due 12/01/37 | | | 181,543 | | | | 0.0 | |
| 132,500 | | | | | | 5.790%, due 03/01/38 | | | 145,425 | | | | 0.0 | |
| 132,069 | | | | | | 5.800%, due 10/01/36 | | | 145,217 | | | | 0.0 | |
| 229,631 | | | | | | 5.800%, due 12/01/36 | | | 252,492 | | | | 0.0 | |
| 610,598 | | | | | | 6.000%, due 03/15/34 | | | 783,781 | | | | 0.1 | |
| 9,565,717 | | | | | | 6.000%, due 04/15/36 | | | 11,190,023 | | | | 1.2 | |
| 10,704,620 | | | | | | 6.000%, due 05/15/36 | | | 12,529,925 | | | | 1.3 | |
| 326,158 | | | | | | 6.050%, due 04/01/38 | | | 360,686 | | | | 0.0 | |
| 178,398 | | | | | | 6.090%, due 10/01/37 | | | 197,573 | | | | 0.0 | |
| 140,112 | | | | | | 6.090%, due 11/01/37 | | | 155,172 | | | | 0.0 | |
| 2,246,177 | | | | | | 6.090%, due 12/01/37 | | | 2,491,046 | | | | 0.3 | |
| 6,278 | | | | | | 7.000%, due 11/01/14 | | | 6,638 | | | | 0.0 | |
| 64,603 | | | | | | 7.500%, due 12/01/14 | | | 68,530 | | | | 0.0 | |
| 39,209 | | | | | | 7.500%, due 01/01/30 | | | 46,940 | | | | 0.0 | |
| 1,097,978 | | | | ˆ | | 7.750%, due 10/25/23 | | | 239,119 | | | | 0.0 | |
| 11,910 | | | | | | 8.000%, due 01/01/30 | | | 12,116 | | | | 0.0 | |
| 890,139 | | | | | | 9.000%, due 12/17/30 | | | 1,059,468 | | | | 0.1 | |
| 25,425 | | | | | | 9.500%, due 07/01/20 | | | 27,067 | | | | 0.0 | |
| 887,483 | | | | | | 21.090%, due 04/15/35 | | | 1,359,790 | | | | 0.1 | |
| 6,389,489 | | | | | | 27.633%, due 04/15/32 | | | 9,191,027 | | | | 0.9 | |
| | | | | | | | | | 50,378,815 | | | | 5.1 | |
| | | | | | | Federal National Mortgage Association: 11.8%## |
| 16,000,000 | | | | W | | 4.000%, due 12/15/39 | | | 17,127,500 | | | | 1.8 | |
| 17,172,513 | | | | | | 4.500%, due 09/01/41 | | | 18,329,321 | | | | 1.9 | |
| 32,327,681 | | | | | | 4.500%, due 09/01/41 | | | 34,505,402 | | | | 3.5 | |
| 15,899,989 | | | | | | 4.624%, due 11/25/33 | | | 15,898,049 | | | | 1.6 | |
| 455,034 | | | | | | 5.300%, due 09/01/36 | | | 500,195 | | | | 0.1 | |
| 223,134 | | | | | | 5.300%, due 10/01/36 | | | 245,389 | | | | 0.0 | |
| 117,174 | | | | | | 5.300%, due 10/01/36 | | | 128,242 | | | | 0.0 | |
| 444,102 | | | | | | 5.300%, due 12/01/36 | | | 488,761 | | | | 0.1 | |
| 622,090 | | | | | | 5.300%, due 12/01/36 | | | 683,391 | | | | 0.1 | |
| 242,761 | | | | | | 5.300%, due 02/01/37 | | | 264,314 | | | | 0.0 | |
| 448,490 | | | | | | 5.300%, due 04/01/37 | | | 492,685 | | | | 0.1 | |
| 351,894 | | | | | | 5.300%, due 05/01/37 | | | 386,569 | | | | 0.0 | |
| 132,421 | | | | | | 5.300%, due 06/01/37 | | | 144,200 | | | | 0.0 | |
| 894,872 | | | | | | 5.300%, due 08/01/37 | | | 983,052 | | | | 0.1 | |
| 77,449 | | | | | | 5.300%, due 10/01/37 | | | 84,486 | | | | 0.0 | |
| 5,174,938 | | | | | | 6.000%, due 06/25/29 | | | 5,825,098 | | | | 0.6 | |
| 2,526,531 | | | | | | 6.000%, due 10/25/37 | | | 2,977,873 | | | | 0.3 | |
| 735,007 | | | | | | 6.000%, due 01/25/44 | | | 826,729 | | | | 0.1 | |
| 8,802 | | | | | | 6.500%, due 06/01/14 | | | 9,248 | | | | 0.0 | |
| 256,706 | | | | | | 6.500%, due 02/01/29 | | | 298,723 | | | | 0.0 | |
| 4,984,858 | | | | | | 6.500%, due 07/25/34 | | | 5,592,260 | | | | 0.6 | |
| 1,075,682 | | | | | | 6.500%, due 12/25/41 | | | 1,269,531 | | | | 0.1 | |
| 2,349,586 | | | | | | 6.500%, due 12/25/42 | | | 2,743,243 | | | | 0.3 | |
| 2,065,339 | | | | | | 6.500%, due 02/25/44 | | | 2,351,566 | | | | 0.2 | |
| 311,384 | | | | | | 6.600%, due 07/01/27 | | | 357,459 | | | | 0.0 | |
| 123,976 | | | | | | 6.600%, due 09/01/27 | | | 142,640 | | | | 0.0 | |
| 51,782 | | | | | | 6.600%, due 11/01/27 | | | 59,578 | | | | 0.0 | |
| 42,063 | | | | | | 6.600%, due 03/01/28 | | | 48,395 | | | | 0.0 | |
| 103,955 | | | | | | 6.600%, due 06/01/28 | | | 120,232 | | | | 0.0 | |
| 11,644 | | | | | | 7.000%, due 03/01/15 | | | 12,049 | | | | 0.0 | |
| 56,912 | | | | | | 7.500%, due 05/01/28 | | | 61,310 | | | | 0.0 | |
| 2,152,326 | | | | | | 8.000%, due 12/25/45 | | | 2,641,153 | | | | 0.3 | |
| 14,966 | | | | | | 8.500%, due 08/01/15 | | | 15,039 | | | | 0.0 | |
| 19,901 | | | | | | 8.500%, due 09/01/15 | | | 21,681 | | | | 0.0 | |
| | | | | | | | | | 115,635,363 | | | | 11.8 | |
| | | | | | | Government National Mortgage Association: 84.8% |
| 72,375,019 | | | | ˆ | | 0.250%, due 06/20/36 | | | 365,472 | | | | 0.0 | |
| 22,785,208 | | | | | | 0.632%, due 07/20/41 | | | 22,798,055 | | | | 2.3 | |
| 12,381,310 | | | | ˆ | | 0.710%, due 02/16/48 | | | 362,871 | | | | 0.0 | |
| 66,972,427 | | | | ˆ | | 0.803%, due 11/16/46 | | | 2,284,121 | | | | 0.2 | |
| 88,609,000 | | | | ˆ | | 0.879%, due 01/16/50 | | | 4,360,981 | | | | 0.5 | |
| 24,323,083 | | | | | | 0.892%, due 06/20/40 | | | 24,380,751 | | | | 2.5 | |
| 98,690,151 | | | | ˆ | | 1.091%, due 01/16/51 | | | 5,122,019 | | | | 0.5 | |
| 20,605,720 | | | | | | 1.282%, due 03/20/39 | | | 20,938,517 | | | | 2.1 | |
| 25,860,493 | | | | ˆ | | 2.613%, due 10/16/52 | | | 2,327,444 | | | | 0.2 | |
| 87,900,000 | | | | W | | 3.500%, due 10/15/41 | | | 91,347,324 | | | | 9.3 | |
| 443,528 | | | | | | 4.000%, due 05/20/33 | | | 480,902 | | | | 0.1 | |
| 604,454 | | | | | | 4.000%, due 08/15/33 | | | 656,820 | | | | 0.1 | |
| 670,037 | | | | | | 4.000%, due 01/15/34 | | | 722,954 | | | | 0.1 | |
| 227,350 | | | | | | 4.000%, due 03/15/34 | | | 244,964 | | | | 0.0 | |
| 755,597 | | | | | | 4.000%, due 08/20/35 | | | 814,898 | | | | 0.1 | |
| 6,911,154 | | | | ˆ | | 4.000%, due 04/20/38 | | | 965,784 | | | | 0.1 | |
| 1,624,065 | | | | | | 4.000%, due 05/15/40 | | | 1,748,014 | | | | 0.2 | |
| 15,536,919 | | | | | | 4.000%, due 07/20/41 | | | 16,647,268 | | | | 1.7 | |
| 19,955,614 | | | | | | 4.000%, due 02/20/42 | | | 21,450,073 | | | | 2.2 | |
| 18,579,058 | | | | ˆ | | 4.500%, due 08/20/33 | | | 1,442,688 | | | | 0.2 | |
| 880,270 | | | | | | 4.500%, due 01/20/34 | | | 962,716 | | | | 0.1 | |
| 360,202 | | | | | | 4.500%, due 01/20/34 | | | 393,939 | | | | 0.0 | |
| 795,627 | | | | | | 4.500%, due 03/20/34 | | | 871,933 | | | | 0.1 | |
| 296,027 | | | | | | 4.500%, due 05/20/34 | | | 323,753 | | | | 0.0 | |
| 353,474 | | | | | | 4.500%, due 06/20/34 | | | 386,580 | | | | 0.0 | |
| 3,555,938 | | | | ˆ | | 4.500%, due 02/20/35 | | | 339,134 | | | | 0.0 | |
| 987,772 | | | | | | 4.500%, due 10/20/35 | | | 1,079,917 | | | | 0.1 | |
See Accompanying Notes to Financial Statements
1
PORTFOLIO OF INVESTMENTSAS OF MARCH 31, 2012 (CONTINUED)
Principal
Amount†
|
|
|
|
|
|
|
| Value
|
| Percentage
of Net
Assets
|
|---|
| 2,290,310 | | | | ˆ | | 4.500%, due 02/20/36 | | | 215,303 | | | | 0.0 | |
| 730,831 | | | | ˆ | | 4.500%, due 12/20/37 | | | 104,706 | | | | 0.0 | |
| 1,700,089 | | | | | | 4.500%, due 05/20/38 | | | 1,802,840 | | | | 0.2 | |
| 964,913 | | | | | | 4.500%, due 07/20/38 | | | 1,023,231 | | | | 0.1 | |
| 3,434,198 | | | | | | 4.500%, due 07/20/38 | | | 3,738,054 | | | | 0.4 | |
| 1,253,035 | | | | | | 4.500%, due 07/20/38 | | | 1,363,903 | | | | 0.1 | |
| 381,285 | | | | | | 4.500%, due 06/20/39 | | | 411,717 | | | | 0.1 | |
| 4,042,450 | | | | | | 4.500%, due 10/15/39 | | | 4,430,782 | | | | 0.5 | |
| 3,339,000 | | | | | | 4.500%, due 11/15/39 | | | 3,659,756 | | | | 0.4 | |
| 3,947,146 | | | | | | 4.500%, due 11/15/39 | | | 4,326,323 | | | | 0.4 | |
| 926,524 | | | | | | 4.500%, due 12/15/39 | | | 1,015,529 | | | | 0.1 | |
| 20,165,597 | | | | | | 4.500%, due 09/20/41 | | | 22,011,400 | | | | 2.3 | |
| 1,180,963 | | | | | | 4.500%, due 11/15/41 | | | 1,289,244 | | | | 0.1 | |
| 13,078,168 | | | | | | 4.660%, due 09/20/61 | | | 14,881,930 | | | | 1.5 | |
| 4,260,533 | | | | | | 4.861%, due 06/20/61 | | | 4,786,169 | | | | 0.5 | |
| 274,103 | | | | | | 5.000%, due 05/15/18 | | | 296,025 | | | | 0.0 | |
| 844,251 | | | | | | 5.000%, due 02/15/23 | | | 923,173 | | | | 0.1 | |
| 584,057 | | | | | | 5.000%, due 02/15/24 | | | 640,444 | | | | 0.1 | |
| 659,267 | | | | | | 5.000%, due 02/15/24 | | | 721,576 | | | | 0.1 | |
| 365,404 | | | | | | 5.000%, due 02/15/24 | | | 401,481 | | | | 0.0 | |
| 784,543 | | | | | | 5.000%, due 02/15/24 | | | 860,285 | | | | 0.1 | |
| 1,443,953 | | | | | | 5.000%, due 03/15/24 | | | 1,583,357 | | | | 0.2 | |
| 402,458 | | | | | | 5.000%, due 03/15/24 | | | 439,678 | | | | 0.1 | |
| 788,072 | | | | | | 5.000%, due 03/15/24 | | | 864,155 | | | | 0.1 | |
| 599,766 | | | | | | 5.000%, due 03/15/24 | | | 659,918 | | | | 0.1 | |
| 286,345 | | | | | | 5.000%, due 03/15/24 | | | 311,894 | | | | 0.0 | |
| 322,984 | | | | | | 5.000%, due 03/20/24 | | | 352,924 | | | | 0.0 | |
| 1,074,022 | | | | | | 5.000%, due 04/15/24 | | | 1,177,712 | | | | 0.1 | |
| 558,970 | | | | | | 5.000%, due 04/15/29 | | | 625,096 | | | | 0.1 | |
| 539,642 | | | | | | 5.000%, due 04/15/30 | | | 603,483 | | | | 0.1 | |
| 6,636,826 | | | | | | 5.000%, due 04/20/30 | | | 7,223,904 | | | | 0.7 | |
| 620,742 | | | | | | 5.000%, due 10/15/30 | | | 694,177 | | | | 0.1 | |
| 453,758 | | | | | | 5.000%, due 07/15/33 | | | 504,603 | | | | 0.1 | |
| 748,767 | | | | | | 5.000%, due 10/20/33 | | | 823,670 | | | | 0.1 | |
| 865,311 | | | | | | 5.000%, due 12/20/33 | | | 951,871 | | | | 0.1 | |
| 437,551 | | | | | | 5.000%, due 12/20/33 | | | 481,321 | | | | 0.1 | |
| 388,221 | | | | | | 5.000%, due 12/20/33 | | | 427,056 | | | | 0.1 | |
| 147,543 | | | | | | 5.000%, due 02/20/34 | | | 162,371 | | | | 0.0 | |
| 357,459 | | | | | | 5.000%, due 03/15/34 | | | 395,949 | | | | 0.0 | |
| 368,688 | | | | | | 5.000%, due 04/15/34 | | | 410,115 | | | | 0.0 | |
| 1,445,782 | | | | | | 5.000%, due 04/15/34 | | | 1,616,820 | | | | 0.2 | |
| 299,887 | | | | | | 5.000%, due 04/20/34 | | | 330,025 | | | | 0.0 | |
| 801,629 | | | | | | 5.000%, due 06/20/34 | | | 882,190 | | | | 0.1 | |
| 220,259 | | | | | | 5.000%, due 07/20/34 | | | 242,394 | | | | 0.0 | |
| 222,372 | | | | | | 5.000%, due 09/20/34 | | | 244,719 | | | | 0.0 | |
| 4,777,824 | | | | | | 5.000%, due 10/20/34 | | | 5,456,873 | | | | 0.6 | |
| 149,106 | | | | | | 5.000%, due 12/20/34 | | | 164,090 | | | | 0.0 | |
| 864,945 | | | | | | 5.000%, due 12/20/34 | | | 951,869 | | | | 0.1 | |
| 275,227 | | | | | | 5.000%, due 01/15/35 | | | 305,120 | | | | 0.0 | |
| 879,986 | | | | | | 5.000%, due 03/15/35 | | | 975,565 | | | | 0.1 | |
| 282,159 | | | | | | 5.000%, due 03/15/35 | | | 312,365 | | | | 0.0 | |
| 2,692,850 | | | | | | 5.000%, due 03/20/35 | | | 3,053,089 | | | | 0.3 | |
| 313,268 | | | | | | 5.000%, due 04/15/35 | | | 346,804 | | | | 0.0 | |
| 299,834 | | | | | | 5.000%, due 04/15/35 | | | 332,025 | | | | 0.0 | |
| 529,320 | | | | | | 5.000%, due 04/15/35 | | | 591,940 | | | | 0.1 | |
| 1,076,292 | | | | | | 5.000%, due 04/15/35 | | | 1,194,937 | | | | 0.1 | |
| 623,824 | | | | | | 5.000%, due 05/20/35 | | | 689,923 | | | | 0.1 | |
| 21,908,916 | | | | ˆ | | 5.000%, due 05/20/35 | | | 1,816,398 | | | | 0.2 | |
| 198,043 | | | | | | 5.000%, due 06/15/35 | | | 219,316 | | | | 0.0 | |
| 567,270 | | | | | | 5.000%, due 07/15/35 | | | 628,883 | | | | 0.1 | |
| 1,345,487 | | | | ˆ | | 5.000%, due 09/16/35 | | | 112,353 | | | | 0.0 | |
| 3,306,744 | | | | | | 5.000%, due 11/20/35 | | | 3,657,119 | | | | 0.4 | |
| 333,778 | | | | | | 5.000%, due 12/15/35 | | | 369,461 | | | | 0.0 | |
| 2,055,157 | | | | | | 5.000%, due 04/20/36 | | | 2,269,063 | | | | 0.2 | |
| 34,618,446 | | | | ˆ | | 5.000%, due 04/20/37 | | | 3,804,027 | | | | 0.4 | |
| 248,423 | | | | | | 5.000%, due 05/20/37 | | | 273,169 | | | | 0.0 | |
| 1,147,847 | | | | | | 5.000%, due 12/20/37 | | | 1,262,188 | | | | 0.1 | |
| 377,709 | | | | | | 5.000%, due 12/20/37 | | | 415,334 | | | | 0.1 | |
| 6,825,825 | | | | ˆ | | 5.000%, due 01/20/38 | | | 1,140,769 | | | | 0.1 | |
| 822,638 | | | | | | 5.000%, due 01/20/38 | | | 904,617 | | | | 0.1 | |
| 1,030,783 | | | | | | 5.000%, due 01/20/38 | | | 1,133,504 | | | | 0.1 | |
| 346,308 | | | | | | 5.000%, due 02/15/38 | | | 382,947 | | | | 0.0 | |
| 788,971 | | | | | | 5.000%, due 05/20/38 | | | 849,885 | | | | 0.1 | |
| 824,778 | | | | | | 5.000%, due 06/20/38 | | | 895,159 | | | | 0.1 | |
| 1,348,847 | | | | | | 5.000%, due 06/20/38 | | | 1,463,947 | | | | 0.2 | |
| 2,191,033 | | | | | | 5.000%, due 06/20/38 | | | 2,360,197 | | | | 0.2 | |
| 770,723 | | | | | | 5.000%, due 08/20/38 | | | 830,229 | | | | 0.1 | |
| 2,830,346 | | | | | | 5.000%, due 10/20/38 | | | 3,048,871 | | | | 0.3 | |
| 1,091,130 | | | | | | 5.000%, due 11/20/38 | | | 1,175,374 | | | | 0.1 | |
| 1,813,283 | | | | | | 5.000%, due 12/20/38 | | | 1,953,282 | | | | 0.2 | |
| 6,056,536 | | | | | | 5.000%, due 01/20/39 | | | 6,524,147 | | | | 0.7 | |
| 918,556 | | | | | | 5.000%, due 02/15/39 | | | 1,020,649 | | | | 0.1 | |
| 914,466 | | | | | | 5.000%, due 03/15/39 | | | 1,020,076 | | | | 0.1 | |
| 16,152,734 | | | | | | 5.000%, due 05/16/39 | | | 18,385,098 | | | | 1.9 | |
| 1,029,000 | | | | | | 5.000%, due 05/20/39 | | | 1,186,562 | | | | 0.1 | |
| 1,452,405 | | | | | | 5.000%, due 06/16/39 | | | 1,587,816 | | | | 0.2 | |
| 2,137,309 | | | | ˆ | | 5.000%, due 07/16/39 | | | 380,688 | | | | 0.0 | |
| 502,651 | �� | | | | | 5.000%, due 07/20/39 | | | 541,460 | | | | 0.1 | |
| 1,853,205 | | | | | | 5.000%, due 10/20/39 | | | 2,044,355 | | | | 0.2 | |
| 1,059,241 | | | | | | 5.000%, due 11/15/39 | | | 1,178,262 | | | | 0.1 | |
| 2,422,422 | | | | | | 5.000%, due 11/15/39 | | | 2,694,614 | | | | 0.3 | |
| 4,384,935 | | | | | | 5.000%, due 11/15/39 | | | 4,877,644 | | | | 0.5 | |
| 4,525,021 | | | | | | 5.000%, due 12/20/39 | | | 5,033,470 | | | | 0.5 | |
| 2,631,079 | | | | | | 5.000%, due 12/20/39 | | | 2,902,462 | | | | 0.3 | |
| 1,921,480 | | | | | | 5.000%, due 04/15/40 | | | 2,130,179 | | | | 0.2 | |
| 12,948,986 | | | | | | 5.000%, due 05/15/40 | | | 14,395,891 | | | | 1.5 | |
| 35,406,094 | | | | | | 5.000%, due 05/20/40 | | | 40,188,689 | | | | 4.1 | |
| 2,186,789 | | | | | | 5.000%, due 09/15/40 | | | 2,423,621 | | | | 0.3 | |
| 3,480,294 | | | | | | 5.000%, due 09/15/40 | | | 3,857,215 | | | | 0.4 | |
| 6,943,859 | | | | | | 5.000%, due 07/20/41 | | | 7,666,594 | | | | 0.8 | |
| 1,928,893 | | | | | | 5.000%, due 08/15/41 | | | 2,137,795 | | | | 0.2 | |
| 526,074 | | | | | | 5.100%, due 04/20/32 | | | 586,928 | | | | 0.1 | |
| 8,100,000 | | | | | | 5.250%, due 01/20/38 | | | 9,347,723 | | | | 1.0 | |
| 7,720,199 | | | | | | 5.368%, due 02/20/38 | | | 8,736,968 | | | | 0.9 | |
| 24,019,504 | | | | ˆ | | 5.438%, due 04/20/40 | | | 3,886,764 | | | | 0.4 | |
| 13,844,385 | | | | | | 5.473%, due 01/20/60 | | | 15,804,563 | | | | 1.6 | |
| 2,863,494 | | | | | | 5.486%, due 04/16/39 | | | 3,168,280 | | | | 0.3 | |
| 468,889 | | | | | | 5.500%, due 08/20/24 | | | 524,213 | | | | 0.1 | |
| 15,603 | | | | | | 5.500%, due 04/20/29 | | | 17,519 | | | | 0.0 | |
| 153,614 | | | | | | 5.500%, due 10/15/32 | | | 172,747 | | | | 0.0 | |
| 779,747 | | | | | | 5.500%, due 12/15/32 | | | 880,034 | | | | 0.1 | |
| 225,788 | | | | | | 5.500%, due 12/20/32 | | | 252,816 | | | | 0.0 | |
| 2,037,231 | | | | | | 5.500%, due 01/17/33 | | | 2,413,524 | | | | 0.3 | |
| 3,292,309 | | | | | | 5.500%, due 02/20/33 | | | 3,716,916 | | | | 0.4 | |
| 219,068 | | | | | | 5.500%, due 06/15/33 | | | 246,285 | | | | 0.0 | |
| 165,542 | | | | | | 5.500%, due 07/15/33 | | | 185,543 | | | | 0.0 | |
| 203,310 | | | | | | 5.500%, due 07/20/33 | | | 225,670 | | | | 0.0 | |
| 731,560 | | | | | | 5.500%, due 08/20/33 | | | 818,905 | | | | 0.1 | |
| 1,723,282 | | | | | | 5.500%, due 10/15/33 | | | 1,944,920 | | | | 0.2 | |
| 3,929,178 | | | | | | 5.500%, due 11/15/33 | | | 4,434,525 | | | | 0.5 | |
| 2,078,865 | | | | ˆ | | 5.500%, due 11/20/33 | | | 103,510 | | | | 0.0 | |
| 414,630 | | | | | | 5.500%, due 11/20/33 | | | 460,230 | | | | 0.1 | |
| 240,999 | | | | | | 5.500%, due 12/20/33 | | | 270,448 | | | | 0.0 | |
| 628,443 | | | | | | 5.500%, due 01/15/34 | | | 709,269 | | | | 0.1 | |
| 950,556 | | | | | | 5.500%, due 01/15/34 | | | 1,072,811 | | | | 0.1 | |
| 1,298,520 | | | | | | 5.500%, due 02/15/34 | | | 1,465,527 | | | | 0.2 | |
| 261,091 | | | | | | 5.500%, due 02/15/34 | | | 293,692 | | | | 0.0 | |
| 357,243 | | | | | | 5.500%, due 03/15/34 | | | 402,843 | | | | 0.0 | |
| 4,064,005 | | | | | | 5.500%, due 03/16/34 | | | 4,819,437 | | | | 0.5 | |
| 368,780 | | | | | | 5.500%, due 03/20/34 | | | 409,531 | | | | 0.0 | |
| 182,366 | | | | | | 5.500%, due 04/15/34 | | | 204,487 | | | | 0.0 | |
| 915,350 | | | | | | 5.500%, due 04/15/34 | | | 1,033,077 | | | | 0.1 | |
| 558,807 | | | | | | 5.500%, due 04/15/34 | | | 628,931 | | | | 0.1 | |
| 1,355,424 | | | | | | 5.500%, due 04/15/34 | | | 1,529,751 | | | | 0.2 | |
| 301,930 | | | | | | 5.500%, due 04/20/34 | | | 354,019 | | | | 0.0 | |
| 2,368,880 | | | | | | 5.500%, due 04/20/34 | | | 2,630,644 | | | | 0.3 | |
| 136,818 | | | | | | 5.500%, due 04/20/34 | | | 151,937 | | | | 0.0 | |
| 142,802 | | | | | | 5.500%, due 04/20/34 | | | 159,852 | | | | 0.0 | |
| 1,412,594 | | | | | | 5.500%, due 04/20/34 | | | 1,581,251 | | | | 0.2 | |
| 122,735 | | | | | | 5.500%, due 05/15/34 | | | 138,521 | | | | 0.0 | |
See Accompanying Notes to Financial Statements
2
PORTFOLIO OF INVESTMENTSAS OF MARCH 31, 2012 (CONTINUED)
Principal
Amount†
|
|
|
|
|
|
|
| Value
|
| Percentage
of Net
Assets
|
|---|
| 496,451 | | | | | | 5.500%, due 06/15/34 | | | 562,939 | | | | 0.1 | |
| 354,019 | | | | | | 5.500%, due 06/15/34 | | | 399,208 | | | | 0.0 | |
| 226,463 | | | | | | 5.500%, due 06/20/34 | | | 251,487 | | | | 0.0 | |
| 609,114 | | | | | | 5.500%, due 06/20/34 | | | 680,983 | | | | 0.1 | |
| 306,519 | | | | | | 5.500%, due 07/15/34 | | | 345,942 | | | | 0.0 | |
| 153,831 | | | | | | 5.500%, due 07/20/34 | | | 172,198 | | | | 0.0 | |
| 465,872 | | | | | | 5.500%, due 07/20/34 | | | 521,567 | | | | 0.1 | |
| 915,254 | | | | | | 5.500%, due 08/15/34 | | | 1,032,968 | | | | 0.1 | |
| 716,406 | | | | | | 5.500%, due 08/15/34 | | | 808,546 | | | | 0.1 | |
| 315,573 | | | | | | 5.500%, due 08/15/34 | | | 356,160 | | | | 0.0 | |
| 3,030,553 | | | | | | 5.500%, due 08/15/34 | | | 3,420,324 | | | | 0.4 | |
| 317,932 | | | | | | 5.500%, due 08/20/34 | | | 353,064 | | | | 0.0 | |
| 249,469 | | | | | | 5.500%, due 08/20/34 | | | 277,036 | | | | 0.0 | |
| 642,457 | | | | | | 5.500%, due 09/15/34 | | | 728,499 | | | | 0.1 | |
| 275,845 | | | | | | 5.500%, due 09/15/34 | | | 309,330 | | | | 0.0 | |
| 1,538,085 | | | | | | 5.500%, due 09/15/34 | | | 1,726,291 | | | | 0.2 | |
| 471,623 | | | | | | 5.500%, due 09/15/34 | | | 532,281 | | | | 0.1 | |
| 318,398 | | | | | | 5.500%, due 09/15/34 | | | 356,884 | | | | 0.0 | |
| 838,978 | | | | | | 5.500%, due 09/15/34 | | | 946,882 | | | | 0.1 | |
| 196,728 | | | | | | 5.500%, due 10/15/34 | | | 221,415 | | | | 0.0 | |
| 888,496 | | | | | | 5.500%, due 10/15/34 | | | 1,002,769 | | | | 0.1 | |
| 453,894 | | | | | | 5.500%, due 10/15/34 | | | 512,272 | | | | 0.1 | |
| 121,750 | | | | | | 5.500%, due 12/15/34 | | | 136,952 | | | | 0.0 | |
| 646,617 | | | | | | 5.500%, due 01/15/35 | | | 724,528 | | | | 0.1 | |
| 513,680 | | | | | | 5.500%, due 01/15/35 | | | 582,476 | | | | 0.1 | |
| 651,627 | | | | | | 5.500%, due 01/15/35 | | | 732,584 | | | | 0.1 | |
| 396,239 | | | | | | 5.500%, due 01/20/35 | | | 440,210 | | | | 0.1 | |
| 734,099 | | | | | | 5.500%, due 02/15/35 | | | 828,514 | | | | 0.1 | |
| 981,306 | | | | | | 5.500%, due 03/15/35 | | | 1,101,382 | | | | 0.1 | |
| 547,973 | | | | | | 5.500%, due 03/15/35 | | | 621,361 | | | | 0.1 | |
| 327,253 | | | | | | 5.500%, due 03/15/35 | | | 367,031 | | | | 0.0 | |
| 515,658 | | | | | | 5.500%, due 04/15/35 | | | 584,719 | | | | 0.1 | |
| 250,632 | | | | | | 5.500%, due 04/15/35 | | | 281,094 | | | | 0.0 | |
| 628,369 | | | | | | 5.500%, due 04/15/35 | | | 706,437 | | | | 0.1 | |
| 1,357,087 | | | | | | 5.500%, due 05/15/35 | | | 1,538,837 | | | | 0.2 | |
| 328,212 | | | | | | 5.500%, due 05/15/35 | | | 369,399 | | | | 0.0 | |
| 1,491,663 | | | | | | 5.500%, due 05/15/35 | | | 1,671,392 | | | | 0.2 | |
| 606,961 | | | | | | 5.500%, due 05/20/35 | | | 678,955 | | | | 0.1 | |
| 739,761 | | | | | | 5.500%, due 06/15/35 | | | 838,835 | | | | 0.1 | |
| 354,677 | | | | | | 5.500%, due 06/20/35 | | | 396,968 | | | | 0.0 | |
| 2,603,648 | | | | | | 5.500%, due 07/15/35 | | | 2,917,359 | | | | 0.3 | |
| 1,984,137 | | | | | | 5.500%, due 08/15/35 | | | 2,223,204 | | | | 0.2 | |
| 72,908 | | | | | | 5.500%, due 08/20/35 | | | 81,294 | | | | 0.0 | |
| 772,628 | | | | | | 5.500%, due 09/20/35 | | | 863,789 | | | | 0.1 | |
| 9,192,879 | | | | | | 5.500%, due 12/16/35 | | | 10,887,478 | | | | 1.1 | |
| 2,373,693 | | | | | | 5.500%, due 02/20/36 | | | 2,757,240 | | | | 0.3 | |
| 327,033 | | | | | | 5.500%, due 04/15/36 | | | 366,411 | | | | 0.0 | |
| 7,934,000 | | | | | | 5.500%, due 04/20/36 | | | 8,696,568 | | | | 0.9 | |
| 755,639 | | | | | | 5.500%, due 05/15/36 | | | 856,839 | | | | 0.1 | |
| 543,892 | | | | | | 5.500%, due 06/20/36 | | | 605,431 | | | | 0.1 | |
| 511,901 | | | | | | 5.500%, due 08/15/36 | | | 580,458 | | | | 0.1 | |
| 642,989 | | | | | | 5.500%, due 09/15/36 | | | 729,102 | | | | 0.1 | |
| 7,197,000 | | | | | | 5.500%, due 09/20/36 | | | 7,962,539 | | | | 0.8 | |
| 1,397,045 | | | | | | 5.500%, due 10/15/36 | | | 1,584,146 | | | | 0.2 | |
| 100,964 | | | | | | 5.500%, due 11/15/36 | | | 113,043 | | | | 0.0 | |
| 686,517 | | | | | | 5.500%, due 04/15/37 | | | 778,460 | | | | 0.1 | |
| 3,822,765 | | | | | | 5.500%, due 10/20/37 | | | 4,405,491 | | | | 0.5 | |
| 5,319,012 | | | | | | 5.500%, due 11/20/37 | | | 6,087,843 | | | | 0.6 | |
| 484,806 | | | | | | 5.500%, due 06/20/38 | | | 527,691 | | | | 0.1 | |
| 517,903 | | | | | | 5.500%, due 08/20/38 | | | 563,715 | | | | 0.1 | |
| 903,383 | | | | | | 5.500%, due 09/20/38 | | | 983,294 | | | | 0.1 | |
| 157,451 | | | | | | 5.500%, due 10/20/38 | | | 171,378 | | | | 0.0 | |
| 1,831,252 | | | | | | 5.500%, due 11/20/38 | | | 1,993,240 | | | | 0.2 | |
| 163,135 | | | | | | 5.500%, due 12/20/38 | | | 177,566 | | | | 0.0 | |
| 693,141 | | | | | | 5.500%, due 01/15/39 | | | 782,289 | | | | 0.1 | |
| 400,212 | | | | | | 5.500%, due 01/15/39 | | | 449,934 | | | | 0.1 | |
| 486,137 | | | | | | 5.500%, due 01/20/39 | | | 529,140 | | | | 0.1 | |
| 3,506,640 | | | | | | 5.500%, due 03/20/39 | | | 3,816,829 | | | | 0.4 | |
| 319,515 | | | | | | 5.500%, due 06/20/39 | | | 347,779 | | | | 0.0 | |
| 2,294,083 | | | | | | 5.500%, due 09/16/39 | | | 2,745,479 | | | | 0.3 | |
| 1,075,775 | | | | | | 5.500%, due 09/15/40 | | | 1,206,066 | | | | 0.1 | |
| 220,527 | | | | | | 5.500%, due 09/15/40 | | | 247,236 | | | | 0.0 | |
| 372,170 | | | | | | 5.500%, due 10/15/40 | | | 416,330 | | | | 0.1 | |
| 363,358 | | | | | | 5.600%, due 12/20/36 | | | 405,708 | | | | 0.0 | |
| 433,647 | | | | | | 5.600%, due 12/20/36 | | | 484,190 | | | | 0.1 | |
| 287,254 | | | | | | 5.600%, due 01/20/37 | | | 319,665 | | | | 0.0 | |
| 115,125 | | | | | | 5.600%, due 01/20/37 | | | 128,115 | | | | 0.0 | |
| 110,318 | | | | | | 5.600%, due 03/20/37 | | | 122,765 | | | | 0.0 | |
| 250,354 | | | | | | 5.600%, due 04/20/37 | | | 278,603 | | | | 0.0 | |
| 87,053 | | | | | | 5.600%, due 07/20/37 | | | 96,876 | | | | 0.0 | |
| 31,822 | | | | | | 5.600%, due 10/20/37 | | | 35,412 | | | | 0.0 | |
| 94,679 | | | | | | 5.600%, due 01/20/38 | | | 105,362 | | | | 0.0 | |
| 109,442 | | | | | | 5.600%, due 02/20/38 | | | 121,790 | | | | 0.0 | |
| 81,146 | | | | | | 5.600%, due 02/20/38 | | | 90,301 | | | | 0.0 | |
| 478,703 | | | | | | 5.680%, due 05/15/47 | | | 509,793 | | | | 0.1 | |
| 99,890 | | | | | | 5.750%, due 11/20/27 | | | 112,097 | | | | 0.0 | |
| 171,537 | | | | | | 5.750%, due 12/20/27 | | | 192,500 | | | | 0.0 | |
| 92,883 | | | | | | 5.750%, due 02/20/28 | | | 104,234 | | | | 0.0 | |
| 69,276 | | | | | | 5.750%, due 03/20/28 | | | 75,123 | | | | 0.0 | |
| 223,235 | | | | | | 5.750%, due 03/20/28 | | | 250,516 | | | | 0.0 | |
| 278,936 | | | | | | 5.750%, due 04/20/28 | | | 313,025 | | | | 0.0 | |
| 130,261 | | | | | | 5.750%, due 07/20/28 | | | 144,307 | | | | 0.0 | |
| 57,996 | | | | | | 5.750%, due 01/20/29 | | | 65,030 | | | | 0.0 | |
| 101,071 | | | | | | 5.750%, due 04/20/29 | | | 113,423 | | | | 0.0 | |
| 382,974 | | | | | | 5.750%, due 07/20/29 | | | 429,418 | | | | 0.1 | |
| 10,800,000 | | | | | | 5.750%, due 07/20/38 | | | 12,147,123 | | | | 1.2 | |
| 5,481,946 | | | | | | 5.950%, due 02/15/44 | | | 5,980,277 | | | | 0.6 | |
| 1,816,572 | | | | | | 5.970%, due 11/15/31 | | | 1,963,983 | | | | 0.2 | |
| 242,680 | | | | | | 6.000%, due 01/20/24 | | | 266,489 | | | | 0.0 | |
| 368,555 | | | | | | 6.000%, due 10/15/25 | | | 422,427 | | | | 0.1 | |
| 892,353 | | | | | | 6.000%, due 04/15/26 | | | 1,012,609 | | | | 0.1 | |
| 247,670 | | | | | | 6.000%, due 10/20/27 | | | 280,556 | | | | 0.0 | |
| 256,638 | | | | | | 6.000%, due 07/15/28 | | | 291,223 | | | | 0.0 | |
| 55,094 | | | | | | 6.000%, due 07/15/28 | | | 62,622 | | | | 0.0 | |
| 240,727 | | | | | | 6.000%, due 08/15/28 | | | 273,620 | | | | 0.0 | |
| 263,668 | | | | | | 6.000%, due 09/15/28 | | | 299,695 | | | | 0.0 | |
| 72,726 | | | | | | 6.000%, due 09/15/28 | | | 82,663 | | | | 0.0 | |
| 161,203 | | | | | | 6.000%, due 02/15/29 | | | 182,856 | | | | 0.0 | |
| 39,895 | | | | | | 6.000%, due 04/15/29 | | | 45,533 | | | | 0.0 | |
| 1,063,028 | | | | | | 6.000%, due 07/15/32 | | | 1,209,939 | | | | 0.1 | |
| 62,271 | | | | | | 6.000%, due 08/15/32 | | | 70,760 | | | | 0.0 | |
| 190,753 | | | | | | 6.000%, due 09/15/32 | | | 217,351 | | | | 0.0 | |
| 856,750 | | | | | | 6.000%, due 11/15/32 | | | 973,547 | | | | 0.1 | |
| 661,949 | | | | | | 6.000%, due 12/15/32 | | | 758,705 | | | | 0.1 | |
| 975,573 | | | | | | 6.000%, due 01/15/33 | | | 1,110,398 | | | | 0.1 | |
| 2,512,133 | | | | | | 6.000%, due 01/15/33 | | | 2,879,330 | | | | 0.3 | |
| 2,706,253 | | | | | | 6.000%, due 01/15/33 | | | 3,101,824 | | | | 0.3 | |
| 285,045 | | | | | | 6.000%, due 02/15/33 | | | 324,439 | | | | 0.0 | |
| 575,862 | | | | | | 6.000%, due 03/15/33 | | | 660,035 | | | | 0.1 | |
| 215,103 | | | | | | 6.000%, due 04/15/33 | | | 244,159 | | | | 0.0 | |
| 498,483 | | | | | | 6.000%, due 05/15/33 | | | 567,374 | | | | 0.1 | |
| 265,707 | | | | | | 6.000%, due 05/15/33 | | | 302,428 | | | | 0.0 | |
| 267,712 | | | | | | 6.000%, due 09/15/33 | | | 304,710 | | | | 0.0 | |
| 111,277 | | | | | | 6.000%, due 09/15/33 | | | 126,308 | | | | 0.0 | |
| 76,522 | | | | | | 6.000%, due 09/15/33 | | | 86,858 | | | | 0.0 | |
| 950,572 | | | | | | 6.000%, due 09/15/33 | | | 1,081,051 | | | | 0.1 | |
| 292,779 | | | | | | 6.000%, due 10/15/33 | | | 335,574 | | | | 0.0 | |
| 189,909 | | | | | | 6.000%, due 10/15/33 | | | 217,667 | | | | 0.0 | |
| 206,069 | | | | | | 6.000%, due 10/15/33 | | | 234,162 | | | | 0.0 | |
| 321,101 | | | | | | 6.000%, due 10/15/33 | | | 364,474 | | | | 0.0 | |
| 941,730 | | | | | | 6.000%, due 12/15/33 | | | 1,070,112 | | | | 0.1 | |
| 1,638,476 | | | | | | 6.000%, due 12/16/33 | | | 1,923,814 | | | | 0.2 | |
| 428,762 | | | | | | 6.000%, due 01/15/34 | | | 491,434 | | | | 0.1 | |
| 2,011,435 | | | | ˆ | | 6.000%, due 01/20/34 | | | 415,984 | | | | 0.1 | |
| 217,997 | | | | | | 6.000%, due 01/20/34 | | | 246,854 | | | | 0.0 | |
| 583,218 | | | | | | 6.000%, due 02/20/34 | | | 660,420 | | | | 0.1 | |
| 194,620 | | | | | | 6.000%, due 03/20/34 | | | 220,382 | | | | 0.0 | |
| 1,070,766 | | | | | | 6.000%, due 03/20/34 | | | 1,212,506 | | | | 0.1 | |
| 132,587 | | | | | | 6.000%, due 03/20/34 | | | 150,137 | | | | 0.0 | |
| 1,614,143 | | | | | | 6.000%, due 03/20/34 | | | 1,941,318 | | | | 0.2 | |
See Accompanying Notes to Financial Statements
3
PORTFOLIO OF INVESTMENTSAS OF MARCH 31, 2012 (CONTINUED)
Principal
Amount†
|
|
|
|
|
|
|
| Value
|
| Percentage
of Net
Assets
|
|---|
| 368,667 | | | | | | 6.000%, due 03/20/34 | | | 417,468 | | | | 0.1 | |
| 128,875 | | | | | | 6.000%, due 04/20/34 | | | 145,934 | | | | 0.0 | |
| 298,428 | | | | | | 6.000%, due 05/20/34 | | | 337,932 | | | | 0.0 | |
| 613,926 | | | | | | 6.000%, due 05/20/34 | | | 695,192 | | | | 0.1 | |
| 400,757 | | | | | | 6.000%, due 06/20/34 | | | 453,806 | | | | 0.1 | |
| 46,773 | | | | | | 6.000%, due 06/20/34 | | | 52,965 | | | | 0.0 | |
| 236,295 | | | | | | 6.000%, due 07/20/34 | | | 267,573 | | | | 0.0 | |
| 6,514,276 | | | | | | 6.000%, due 07/20/34 | | | 7,376,586 | | | | 0.8 | |
| 893,383 | | | | | | 6.000%, due 08/20/34 | | | 1,011,642 | | | | 0.1 | |
| 450,562 | | | | | | 6.000%, due 10/15/34 | | | 516,420 | | | | 0.1 | |
| 322,982 | | | | | | 6.000%, due 10/20/34 | | | 365,735 | | | | 0.0 | |
| 65,899 | | | | | | 6.000%, due 10/20/34 | | | 74,404 | | | | 0.0 | |
| 489,456 | | | | | | 6.000%, due 10/20/34 | | | 554,247 | | | | 0.1 | |
| 203,369 | | | | | | 6.000%, due 10/20/34 | | | 230,289 | | | | 0.0 | |
| 91,846 | | | | | | 6.000%, due 10/20/34 | | | 104,004 | | | | 0.0 | |
| 324,116 | | | | | | 6.000%, due 10/20/34 | | | 367,020 | | | | 0.0 | |
| 425,014 | | | | | | 6.000%, due 10/20/34 | | | 480,718 | | | | 0.1 | |
| 72,092 | | | | | | 6.000%, due 10/20/34 | | | 81,635 | | | | 0.0 | |
| 63,070 | | | | | | 6.000%, due 11/20/34 | | | 71,418 | | | | 0.0 | |
| 436,429 | | | | | | 6.000%, due 11/20/34 | | | 494,200 | | | | 0.1 | |
| 111,706 | | | | | | 6.000%, due 11/20/34 | | | 126,493 | | | | 0.0 | |
| 1,909,117 | | | | | | 6.000%, due 11/20/34 | | | 2,161,832 | | | | 0.2 | |
| 299,703 | | | | | | 6.000%, due 11/20/34 | | | 339,376 | | | | 0.0 | |
| 2,191,929 | | | | | | 6.000%, due 12/20/34 | | | 2,482,080 | | | | 0.3 | |
| 636,625 | | | | | | 6.000%, due 12/20/34 | | | 720,897 | | | | 0.1 | |
| 522,482 | | | | | | 6.000%, due 12/20/34 | | | 591,644 | | | | 0.1 | |
| 499,425 | | | | | | 6.000%, due 12/20/34 | | | 565,535 | | | | 0.1 | |
| 200,836 | | | | | | 6.000%, due 01/20/35 | | | 227,486 | | | | 0.0 | |
| 91,573 | | | | | | 6.000%, due 01/20/35 | | | 103,724 | | | | 0.0 | |
| 208,739 | | | | | | 6.000%, due 01/20/35 | | | 236,438 | | | | 0.0 | |
| 468,591 | | | | | | 6.000%, due 02/20/35 | | | 530,771 | | | | 0.1 | |
| 1,029,882 | | | | | | 6.000%, due 03/15/35 | | | 1,163,523 | | | | 0.1 | |
| 120,657 | | | | | | 6.000%, due 03/20/35 | | | 136,668 | | | | 0.0 | |
| 241,238 | | | | | | 6.000%, due 03/20/35 | | | 273,250 | | | | 0.0 | |
| 154,876 | | | | | | 6.000%, due 04/20/35 | | | 175,427 | | | | 0.0 | |
| 211,313 | | | | | | 6.000%, due 01/20/37 | | | 237,960 | | | | 0.0 | |
| 1,374,293 | | | | | | 6.000%, due 03/15/37 | | | 1,551,767 | | | | 0.2 | |
| 7,589,000 | | | | | | 6.000%, due 07/20/37 | | | 9,016,162 | | | | 0.9 | |
| 408,588 | | | | | | 6.000%, due 09/20/37 | | | 461,437 | | | | 0.1 | |
| 3,371,676 | | | | | | 6.000%, due 10/20/37 | | | 4,115,910 | | | | 0.4 | |
| 468,176 | | | | | | 6.000%, due 12/20/37 | | | 527,212 | | | | 0.1 | |
| 1,816,800 | | | | | | 6.000%, due 03/20/38 | | | 2,101,037 | | | | 0.2 | |
| 184,106 | | | | | | 6.000%, due 05/20/38 | | | 203,192 | | | | 0.0 | |
| 766,471 | | | | | | 6.000%, due 08/20/38 | | | 842,098 | | | | 0.1 | |
| 937,103 | | | | | | 6.000%, due 09/20/38 | | | 1,029,566 | | | | 0.1 | |
| 1,309,139 | | | | | | 6.000%, due 10/20/38 | | | 1,438,311 | | | | 0.2 | |
| 345,458 | | | | | | 6.000%, due 11/15/38 | | | 392,877 | | | | 0.0 | |
| 332,545 | | | | | | 6.000%, due 12/15/38 | | | 377,152 | | | | 0.0 | |
| 444,718 | | | | | | 6.000%, due 12/15/38 | | | 502,148 | | | | 0.1 | |
| 1,914,783 | | | | | | 6.000%, due 07/16/39 | | | 2,188,442 | | | | 0.2 | |
| 921,424 | | | | | | 6.000%, due 07/20/39 | | | 1,049,381 | | | | 0.1 | |
| 1,820,583 | | | | | | 6.000%, due 08/15/39 | | | 2,069,003 | | | | 0.2 | |
| 1,281,644 | | | | | | 6.000%, due 08/15/39 | | | 1,457,567 | | | | 0.2 | |
| 755,516 | | | | | | 6.000%, due 08/15/39 | | | 859,220 | | | | 0.1 | |
| 79,791 | | | | | | 6.050%, due 06/15/38 | | | 90,095 | | | | 0.0 | |
| 281,821 | | | | | | 6.050%, due 09/15/38 | | | 318,215 | | | | 0.0 | |
| 109,103 | | | | | | 6.050%, due 09/15/38 | | | 123,885 | | | | 0.0 | |
| 238,855 | | | | | | 6.050%, due 10/15/38 | | | 269,701 | | | | 0.0 | |
| 307,625 | | | | | | 6.090%, due 05/15/38 | | | 347,351 | | | | 0.0 | |
| 272,097 | | | | | | 6.090%, due 06/15/38 | | | 307,236 | | | | 0.0 | |
| 189,924 | | | | | | 6.090%, due 11/15/38 | | | 214,450 | | | | 0.0 | |
| 41,590,059 | | | | ˆ | | 6.108%, due 04/16/39 | | | 4,781,900 | | | | 0.5 | |
| 54,645 | | | | | | 6.125%, due 02/15/39 | | | 61,702 | | | | 0.0 | |
| 156,798 | | | | | | 6.125%, due 04/15/39 | | | 177,047 | | | | 0.0 | |
| 310,047 | | | | | | 6.250%, due 09/15/27 | | | 355,511 | | | | 0.0 | |
| 20,335 | | | | | | 6.250%, due 03/15/28 | | | 23,114 | | | | 0.0 | |
| 17,378 | | | | | | 6.250%, due 04/15/28 | | | 19,752 | | | | 0.0 | |
| 150,777 | | | | | | 6.250%, due 09/15/29 | | | 172,085 | | | | 0.0 | |
| 13,884,954 | | | | ˆ | | 6.258%, due 09/20/37 | | | 1,891,588 | | | | 0.2 | |
| 6,522,962 | | | | ˆ | | 6.258%, due 05/16/38 | | | 939,362 | | | | 0.1 | |
| 16,672,216 | | | | ˆ | | 6.258%, due 09/20/38 | | | 2,568,678 | | | | 0.3 | |
| 6,214,705 | | | | | | 6.417%, due 04/20/37 | | | 7,137,828 | | | | 0.7 | |
| 320,984 | | | | | | 6.490%, due 01/15/28 | | | 364,843 | | | | 0.0 | |
| 140,746 | | | | | | 6.500%, due 07/20/29 | | | 161,766 | | | | 0.0 | |
| 490,272 | | | | | | 6.500%, due 08/20/31 | | | 565,023 | | | | 0.1 | |
| 95,095 | | | | | | 6.500%, due 04/20/32 | | | 109,416 | | | | 0.0 | |
| 100,792 | | | | | | 6.500%, due 07/20/32 | | | 115,845 | | | | 0.0 | |
| 126,842 | | | | | | 6.500%, due 10/20/33 | | | 145,820 | | | | 0.0 | |
| 413,128 | | | | | | 6.500%, due 11/15/33 | | | 476,539 | | | | 0.1 | |
| 209,924 | | | | | | 6.500%, due 11/20/33 | | | 241,333 | | | | 0.0 | |
| 180,269 | | | | | | 6.500%, due 02/20/34 | | | 207,267 | | | | 0.0 | |
| 146,687 | | | | | | 6.500%, due 03/20/34 | | | 168,656 | | | | 0.0 | |
| 211,774 | | | | | | 6.500%, due 08/20/34 | | | 243,490 | | | | 0.0 | |
| 653,656 | | | | | | 6.500%, due 08/20/34 | | | 753,179 | | | | 0.1 | |
| 215,084 | | | | | | 6.500%, due 08/20/34 | | | 247,296 | | | | 0.0 | |
| 8,956 | | | | | | 6.500%, due 09/20/34 | | | 10,297 | | | | 0.0 | |
| 91,392 | | | | | | 6.500%, due 09/20/34 | | | 105,079 | | | | 0.0 | |
| 239,806 | | | | | | 6.500%, due 09/20/34 | | | 275,721 | | | | 0.0 | |
| 345,748 | | | | | | 6.500%, due 10/20/34 | | | 397,528 | | | | 0.0 | |
| 189,448 | | | | | | 6.500%, due 11/20/34 | | | 217,821 | | | | 0.0 | |
| 280,961 | | | | | | 6.500%, due 12/20/34 | | | 323,039 | | | | 0.0 | |
| 154,227 | | | | | | 6.500%, due 12/20/34 | | | 177,324 | | | | 0.0 | |
| 113,024 | | | | | | 6.500%, due 03/20/35 | | | 129,893 | | | | 0.0 | |
| 456,022 | | | | | | 6.500%, due 05/15/36 | | | 532,463 | | | | 0.1 | |
| 558,909 | | | | | | 6.500%, due 09/15/36 | | | 642,292 | | | | 0.1 | |
| 288,871 | | | | | | 6.500%, due 09/15/36 | | | 331,967 | | | | 0.0 | |
| 362,429 | | | | | | 6.500%, due 05/20/38 | | | 404,890 | | | | 0.0 | |
| 150,394 | | | | | | 6.500%, due 07/20/38 | | | 166,787 | | | | 0.0 | |
| 2,216,774 | | | | | | 6.500%, due 09/16/38 | | | 2,590,665 | | | | 0.3 | |
| 4,184,048 | | | | | | 6.500%, due 01/20/39 | | | 4,789,301 | | | | 0.5 | |
| 4,060 | | | | | | 6.750%, due 08/15/28 | | | 4,740 | | | | 0.0 | |
| 128,087 | | | | | | 6.750%, due 10/15/28 | | | 149,558 | | | | 0.0 | |
| 138,245 | | | | | | 6.750%, due 10/15/28 | | | 161,419 | | | | 0.0 | |
| 845,602 | | | | | | 7.000%, due 05/16/32 | | | 974,241 | | | | 0.1 | |
| 114,684 | | | | | | 7.000%, due 06/20/34 | | | 135,056 | | | | 0.0 | |
| 344,737 | | | | | | 7.000%, due 09/20/34 | | | 405,976 | | | | 0.0 | |
| 60,316 | | | | | | 7.000%, due 09/20/34 | | | 71,030 | | | | 0.0 | |
| 136,180 | | | | | | 7.000%, due 08/20/36 | | | 159,904 | | | | 0.0 | |
| 5,574,578 | | | | | | 7.000%, due 10/20/38 | | | 6,449,484 | | | | 0.7 | |
| 1,771,500 | | | | | | 7.000%, due 12/15/38 | | | 2,050,895 | | | | 0.2 | |
| 859,775 | | | | | | 7.000%, due 12/15/38 | | | 995,377 | | | | 0.1 | |
| 6,219,444 | | | | | | 7.200%, due 03/15/39 | | | 6,722,016 | | | | 0.7 | |
| 21,702 | | | | | | 7.250%, due 01/15/29 | | | 25,094 | | | | 0.0 | |
| 4,482,149 | | | | ˆ | | 7.258%, due 05/16/31 | | | 919,389 | | | | 0.1 | |
| 3,987,760 | | | | | | 7.350%, due 03/15/43 | | | 4,307,257 | | | | 0.4 | |
| 2,564,549 | | | | ˆ | | 7.358%, due 10/16/29 | | | 541,154 | | | | 0.1 | |
| 40,413 | | | | | | 7.500%, due 08/20/27 | | | 48,016 | | | | 0.0 | |
| 600,833 | | | | | | 7.500%, due 10/16/32 | | | 694,799 | | | | 0.1 | |
| 3,303,352 | | | | | | 7.500%, due 02/20/34 | | | 3,590,638 | | | | 0.4 | |
| 932,751 | | | | | | 7.500%, due 10/15/38 | | | 1,120,608 | | | | 0.1 | |
| 1,054,991 | | | | | | 7.500%, due 08/20/39 | | | 1,532,850 | | | | 0.2 | |
| 17,369 | | | | | | 7.800%, due 05/15/19 | | | 17,457 | | | | 0.0 | |
| 3,599 | | | | | | 8.000%, due 03/20/24 | | | 3,617 | | | | 0.0 | |
| 25,909 | | | | | | 8.000%, due 11/15/25 | | | 31,000 | | | | 0.0 | |
| 48,224 | | | | | | 8.000%, due 07/15/26 | | | 57,743 | | | | 0.0 | |
| 17,076 | | | | | | 8.000%, due 07/15/26 | | | 20,512 | | | | 0.0 | |
| 104,793 | | | | | | 8.000%, due 09/15/26 | | | 125,334 | | | | 0.0 | |
| 29,978 | | | | | | 8.000%, due 09/20/26 | | | 37,704 | | | | 0.0 | |
| 23,691 | | | | | | 8.000%, due 12/15/26 | | | 28,513 | | | | 0.0 | |
| 14,067 | | | | | | 8.000%, due 04/15/27 | | | 16,915 | | | | 0.0 | |
| 7,603 | | | | | | 8.000%, due 06/15/27 | | | 7,643 | | | | 0.0 | |
| 45,707 | | | | | | 8.000%, due 07/15/27 | | | 52,657 | | | | 0.0 | |
| 14,117 | | | | | | 8.000%, due 03/15/28 | | | 14,394 | | | | 0.0 | |
| 24,629 | | | | | | 8.050%, due 07/15/19 | | | 24,759 | | | | 0.0 | |
| 221,743 | | | | | | 8.758%, due 04/20/34 | | | 233,280 | | | | 0.0 | |
| 24,695 | | | | | | 9.000%, due 05/15/16 | | | 24,841 | | | | 0.0 | |
| 5,390 | | | | | | 9.000%, due 07/15/16 | | | 5,494 | | | | 0.0 | |
| 5,148 | | | | | | 9.500%, due 11/15/21 | | | 6,085 | | | | 0.0 | |
| 2,404,761 | | | | | | 13.817%, due 09/16/31 | | | 2,975,008 | | | | 0.3 | |
See Accompanying Notes to Financial Statements
4
PORTFOLIO OF INVESTMENTSAS OF MARCH 31, 2012 (CONTINUED)
Principal
Amount†
|
|
|
|
|
|
|
| Value
|
| Percentage
of Net
Assets
|
|---|
| 120,000 | | | | | | 15.517%, due 01/20/32 | | | 151,742 | | | | 0.0 | |
| 397,042 | | | | | | 19.480%, due 09/20/37 | | | 541,762 | | | | 0.1 | |
| 806,359 | | | | | | 24.414%, due 04/16/37 | | | 1,178,564 | | | | 0.1 | |
| 162,634 | | | | | | 31.539%, due 04/20/31 | | | 283,313 | | | | 0.0 | |
| | | | | | | | | | 830,872,770 | | | | 84.8 | |
| | | | | | | | | Total U.S. Government Agency Obligations
(Cost $954,000,073)
| |
998,139,986 | | | |
101.8 | |
| | | | | | | | | Liabilities in Excess of Other Assets
| | (17,643,331 | ) | | | (1.8 | ) |
| | | | | | | | | Net Assets
| $ | 980,496,655 | | | | 100.0 | |
| † | | Unless otherwise indicated, principal amount is shown in USD. |
| ## | | On September 7, 2008, the Federal Housing Finance Agency placed the Federal National Mortgage Association and the Federal Home Loan Mortgage Corporation into conservatorship and the U.S. Treasury guaranteed the debt issued by those organizations. |
| W | | Settlement is on a when-issued or delayed-delivery basis. |
| ˆ | | Interest only securities represent the right to receive the monthly interest payments on an underlying pool of mortgage loans. Principal amount shown represents the notional amount on which current interest is calculated. Payments of principal on the pool reduce the value of the interest only security. |
| Cost for federal income tax purposes is $954,002,681. | | | | | | |
| Net unrealized appreciation consists of: | | | | | | |
| Gross Unrealized Appreciation | | | | $ | 46,062,749 | |
| Gross Unrealized Depreciation | | | | | (1,925,444 | ) |
| Net Unrealized Appreciation | | | | $ | 44,137,305 | |
See Accompanying Notes to Financial Statements
5
PORTFOLIO OF INVESTMENTSAS OF MARCH 31, 2012
Principal
Amount†
|
|
|
|
|
|
|
| Value
|
| Percentage
of Net
Assets
|
|---|
CORPORATE BONDS/NOTES: 94.5%
|
| | | | | | | Consumer Discretionary: 28.2% |
| 355,000 | | | | | | Affinia Group, Inc., 9.000%, 11/30/14 | | | 360,325 | | | | 0.3 | |
| 223,000 | | | | # | | Affinia Group, Inc., 10.750%, 08/15/16 | | | 244,743 | | | | 0.2 | |
| 370,000 | | | | | | Allbritton Communications Co., 8.000%, 05/15/18 | | | 396,825 | | | | 0.3 | |
| 400,000 | | | | # | | Alliance Data Systems Corp., 6.375%, 04/01/20 | | | 409,000 | | | | 0.3 | |
| 950,000 | | | | | | AMC Entertainment, Inc., 9.750%, 12/01/20 | | | 900,125 | | | | 0.6 | |
| 34,781 | | | | # | | American Media, Inc., 13.500%, 06/15/18 | | | 26,434 | | | | 0.0 | |
| 360,000 | | | | | | Ameristar Casinos, Inc., 7.500%, 04/15/21 | | | 379,350 | | | | 0.3 | |
| 90,000 | | | | | | Asbury Automotive Group, Inc., 8.375%, 11/15/20 | | | 97,425 | | | | 0.1 | |
| 665,000 | | | | # | | Block Communications, Inc., 7.250%, 02/01/20 | | | 680,794 | | | | 0.5 | |
| 500,000 | | | | # | | Bresnan Broadband Holdings LLC, 8.000%, 12/15/18 | | | 517,500 | | | | 0.4 | |
| 581,000 | | | | | | Burlington Coat Factory Warehouse Corp., 10.000%, 02/15/19 | | | 607,145 | | | | 0.4 | |
| 720,000 | | | | | | Cablevision Systems Corp., 7.750%, 04/15/18 | | | 756,000 | | | | 0.5 | |
| 840,000 | | | | | | Caesars Entertainment Operating Co., Inc., 10.000%, 12/15/18 | | | 653,100 | | | | 0.5 | |
| 1,000,000 | | | | # | | Caesars Operating Escrow LLC / Caesars Escrow Corp., 8.500%, 02/15/20 | | | 1,020,000 | | | | 0.7 | |
| 400,000 | | | | | | CCO Holdings LLC / CCO Holdings Capital Corp., 6.500%, 04/30/21 | | | 416,000 | | | | 0.3 | |
| 205,000 | | | | # | | Cenveo Corp., 11.500%, 05/15/17 | | | 189,625 | | | | 0.1 | |
| 765,000 | | | | # | | Cequel Communications Holdings I, LLC and Cequel Capital Corp., 8.625%, 11/15/17 | | | 825,244 | | | | 0.6 | |
| 730,000 | | | | #,Z | | Checkout Holding Corp., 10.490%, 11/15/15 | | | 306,600 | | | | 0.2 | |
| 100,000 | | | | # | | Chester Downs & Marina LLC, 9.250%, 02/01/20 | | | 105,875 | | | | 0.1 | |
| 500,000 | | | | | | Chrysler Group LLC/CG Co-Issuer, Inc., 8.250%, 06/15/21 | | | 507,500 | | | | 0.4 | |
| 450,000 | | | | | | Chrysler Group LLC/CG Co-Issuer, Inc., 8.000%, 06/15/19 | | | 454,500 | | | | 0.3 | |
| 120,000 | | | | | | Cinemark USA, Inc., 7.375%, 06/15/21 | | | 129,300 | | | | 0.1 | |
| 185,000 | | | | | | CityCenter Holdings LLC / CityCenter Finance Corp., 7.625%, 01/15/16 | | | 196,100 | | | | 0.1 | |
| 83,720 | | | | & | | CityCenter Holdings LLC / CityCenter Finance Corp., 10.750%, 01/15/17 | | | 93,138 | | | | 0.1 | |
| 388,000 | | | | | | Clear Channel Communications, Inc., 9.000%, 03/01/21 | | | 351,140 | | | | 0.3 | |
| 105,000 | | | | # | | Clear Channel Worldwide Holdings, Inc., 7.625%, 03/15/20 | | | 101,850 | | | | 0.1 | |
| 480,000 | | | | # | | Clear Channel Worldwide Holdings, Inc., 7.625%, 03/15/20 | | | 472,800 | | | | 0.3 | |
| 1,000,000 | | | | # | | Codere Finance Luxembourg SA, 9.250%, 02/15/19 | | | 997,500 | | | | 0.7 | |
| 710,000 | | | | # | | Commercial Vehicle Group, Inc., 7.875%, 04/15/19 | | | 720,650 | | | | 0.5 | |
| 635,000 | | | | # | | Cumulus Media, Inc., 7.750%, 05/01/19 | | | 603,250 | | | | 0.4 | |
| 430,000 | | | | | | DineEquity, Inc., 9.500%, 10/30/18 | | | 473,000 | | | | 0.3 | |
| 480,000 | | | | | | DISH DBS Corp., 7.875%, 09/01/19 | | | 554,400 | | | | 0.4 | |
| 360,000 | | | | | | Ducommun, Inc., 9.750%, 07/15/18 | | | 383,400 | | | | 0.3 | |
| 778,000 | | | | | | Emergency Medical Services Corp., 8.125%, 06/01/19 | | | 803,285 | | | | 0.6 | |
| 645,000 | | | | | | Gray Television, Inc., 10.500%, 06/29/15 | | | 674,025 | | | | 0.5 | |
| 825,000 | | | | # | | Harron Communications L.P./Harron Finance Corp., 9.125%, 04/01/20 | | | 855,938 | | | | 0.6 | |
| 500,000 | | | | # | | Jaguar Holding Co. II / Jaguar Merger Sub, Inc., 9.500%, 12/01/19 | | | 545,000 | | | | 0.4 | |
| 250,000 | | | | | | KB Home, 5.875%, 01/15/15 | | | 247,500 | | | | 0.2 | |
| 750,000 | | | | | | KB Home, 6.250%, 06/15/15 | | | 738,750 | | | | 0.5 | |
| 215,000 | | | | | | KB Home, 7.250%, 06/15/18 | | | 207,475 | | | | 0.1 | |
| 550,000 | | | | | | KB Home, 8.000%, 03/15/20 | | | 545,875 | | | | 0.4 | |
| 243,000 | | | | | | Mediacom Broadband, LLC, 8.500%, 10/15/15 | | | 251,505 | | | | 0.2 | |
| 200,000 | | | | # | | Mediacom LLC / Mediacom Capital Corp., 7.250%, 02/15/22 | | | 203,000 | | | | 0.1 | |
| 285,000 | | | | | | Mediacom LLC / Mediacom Capital Corp., 9.125%, 08/15/19 | | | 311,006 | | | | 0.2 | |
| 500,000 | | | | | | Meritage Homes Corp., 6.250%, 03/15/15 | | | 508,500 | | | | 0.4 | |
| 125,000 | | | | # | | Meritage Homes Corp., 7.000%, 04/01/22 | | | 125,625 | | | | 0.1 | |
| 720,000 | | | | # | | Meritage Homes Corp., 7.731%, 04/30/17 | | | 691,200 | | | | 0.5 | |
See Accompanying Notes to Financial Statements
6
PORTFOLIO OF INVESTMENTSAS OF MARCH 31, 2012 (CONTINUED)
Principal
Amount†
|
|
|
|
|
|
|
| Value
|
| Percentage
of Net
Assets
|
|---|
| 500,000 | | | | | | MGM Mirage, 7.500%, 06/01/16 | | | 517,500 | | | | 0.4 | |
| 500,000 | | | | | | MGM Resorts International, 7.750%, 03/15/22 | | | 510,000 | | | | 0.4 | |
| 500,000 | | | | # | | MGM Resorts International, 8.625%, 02/01/19 | | | 538,750 | | | | 0.4 | |
| 405,000 | | | | + | | Michaels Stores, Inc., 13.000%, 11/01/16 | | | 428,287 | | | | 0.3 | |
| 1,105,000 | | | | # | | Monitronics International, Inc., 9.125%, 04/01/20 | | | 1,124,337 | | | | 0.8 | |
| 450,000 | | | | | | National CineMedia LLC, 7.875%, 07/15/21 | | | 481,500 | | | | 0.3 | |
| 825,000 | | | | | | NCL Corp. Ltd., 9.500%, 11/15/18 | | | 893,063 | | | | 0.6 | |
| 250,000 | | | | # | | NCL Corp. Ltd., 9.500%, 11/15/18 | | | 270,625 | | | | 0.2 | |
| 745,000 | | | | # | | Needle, 8.125%, 03/15/19 | | | 752,450 | | | | 0.5 | |
| 485,000 | | | | | | New Albertsons, Inc., 7.450%, 08/01/29 | | | 373,450 | | | | 0.3 | |
| 404,996 | | | | & | | Nexstar Broadcasting, Inc., 7.000%, 01/15/14 | | | 403,477 | | | | 0.3 | |
| 175,000 | | | | | | Nexstar Broadcasting, Inc. / Mission Broadcasting, Inc., 8.875%, 04/15/17 | | | 188,562 | | | | 0.1 | |
| 750,000 | | | | # | | Nord Anglia Education UK Holdings PLC, 10.250%, 04/01/17 | | | 771,562 | | | | 0.6 | |
| 425,000 | | | | # | | NPC International, Inc. / NPC Operating Co. A, Inc. / NPC Operating Co. B, Inc., 10.500%, 01/15/20 | | | 465,375 | | | | 0.3 | |
| 615,000 | | | | # | | Number Merger Sub, Inc., 11.000%, 12/15/19 | | | 661,125 | | | | 0.5 | |
| 400,000 | | | | | | Pinnacle Entertainment, Inc., 7.750%, 04/01/22 | | | 420,000 | | | | 0.3 | |
| 805,000 | | | | # | | Pittsburgh Glass Works LLC, 8.500%, 04/15/16 | | | 805,000 | | | | 0.6 | |
| 355,000 | | | | # | | Prestige Brands, Inc., 8.125%, 02/01/20 | | | 386,506 | | | | 0.3 | |
| 250,000 | | | | # | | Reynolds Group Issuer, Inc. / Reynolds Group Issuer LLC / Reynolds Group Issuer Lu, 9.875%, 08/15/19 | | | 255,938 | | | | 0.2 | |
| 500,000 | | | | # | | Reynolds Group Issuer, Inc. / Reynolds Group Issuer LLC / Reynolds Group Issuer Lu, 9.875%, 08/15/19 | | | 511,875 | | | | 0.4 | |
| 520,000 | | | | | | Scientific Games Corp., 8.125%, 09/15/18 | | | 568,750 | | | | 0.4 | |
| 577,000 | | | | # | | Seminole Indian Tribe of Florida, 7.750%, 10/01/17 | | | 628,209 | | | | 0.5 | |
| 300,000 | | | | # | | ServiceMaster Co/TN, 8.000%, 02/15/20 | | | 321,000 | | | | 0.2 | |
| 145,000 | | | | # | | Sirius XM Radio, Inc., 8.750%, 04/01/15 | | | 165,300 | | | | 0.1 | |
| 300,000 | | | | | | Sonic Automotive, Inc., 9.000%, 03/15/18 | | | 326,250 | | | | 0.2 | |
| 600,000 | | | | | | Standard Pacific Corp., 8.375%, 01/15/21 | | | 633,000 | | | | 0.5 | |
| 290,000 | | | | | | Star Gas Partners L.P./Star Gas Finance Co., 8.875%, 12/01/17 | | | 290,000 | | | | 0.2 | |
| 270,000 | | | | # | | Stoneridge, Inc., 9.500%, 10/15/17 | | | 287,887 | | | | 0.2 | |
| 1,000,000 | | | | # | | Taylor Morrison Communities, Inc. / Monarch Communities, Inc., 7.750%, 04/15/20 | | | 1,000,000 | | | | 0.7 | |
| 281,000 | | | | | | Tomkins LLC / Tomkins, Inc., 9.000%, 10/01/18 | | | 312,613 | | | | 0.2 | |
| 230,000 | | | | | | Toys R Us Property Co. I LLC, 10.750%, 07/15/17 | | | 253,000 | | | | 0.2 | |
| 430,000 | | | | | | Toys R Us Property Co. II LLC, 8.500%, 12/01/17 | | | 450,963 | | | | 0.3 | |
| 165,000 | | | | # | | UR Financing Escrow Corp., 5.750%, 07/15/18 | | | 169,331 | | | | 0.1 | |
| 285,000 | | | | # | | UR Financing Escrow Corp., 7.375%, 05/15/20 | | | 292,125 | | | | 0.2 | |
| 285,000 | | | | # | | UR Financing Escrow Corp., 7.625%, 04/15/22 | | | 293,550 | | | | 0.2 | |
| 410,000 | | | | | | Visant Corp., 10.000%, 10/01/17 | | | 384,888 | | | | 0.3 | |
| 315,000 | | | | | | Wynn Las Vegas LLC / Wynn Las Vegas Capital Corp., 7.750%, 08/15/20 | | | 347,681 | | | | 0.2 | |
| 290,000 | | | | # | | XM Satellite Radio, Inc., 7.625%, 11/01/18 | | | 314,650 | | | | 0.2 | |
| | | | | | | | | | 39,437,901 | | | | 28.2 | |
| | | | | | | Consumer Staples: 4.7% | | | | | | | | |
| 615,000 | | | | # | | American Rock Salt Co. LLC/American Rock Capital Corp., 8.250%, 05/01/18 | | | 536,588 | | | | 0.4 | |
| 445,000 | | | | | | Avis Budget Car Rental LLC / Avis Budget Finance, Inc., 9.625%, 03/15/18 | | | 485,050 | | | | 0.3 | |
| 677,000 | | | | # | | Bumble Bee Acquisition Corp., 9.000%, 12/15/17 | | | 693,925 | | | | 0.5 | |
| 153,850 | | | | & | | Ceridian Corp., 12.250%, 11/15/15 | | | 139,619 | | | | 0.1 | |
| 485,000 | | | | | | Cott Beverages, Inc., 8.375%, 11/15/17 | | | 526,831 | | | | 0.4 | |
| 645,000 | | | | | | Eliz Arden, 7.375%, 03/15/21 | | | 703,050 | | | | 0.5 | |
| 700,000 | | | | | | Hertz Corp./The, 6.750%, 04/15/19 | | | 728,000 | | | | 0.5 | |
| 450,000 | | | | # | | JBS USA LLC/JBS USA Finance, Inc., 7.250%, 06/01/21 | | | 437,625 | | | | 0.3 | |
| 365,000 | | | | | | McJunkin Red Man Corp., 9.500%, 12/15/16 | | | 399,675 | | | | 0.3 | |
| 295,000 | | | | # | | Neff Rental LLC/Neff Finance Corp., 9.625%, 05/15/16 | | | 294,263 | | | | 0.2 | |
| 655,000 | | | | | | Pilgrim’s Pride Corp., 7.875%, 12/15/18 | | | 656,637 | | | | 0.5 | |
See Accompanying Notes to Financial Statements
7
PORTFOLIO OF INVESTMENTSAS OF MARCH 31, 2012 (CONTINUED)
Principal
Amount†
|
|
|
|
|
|
|
| Value
|
| Percentage
of Net
Assets
|
|---|
| 240,000 | | | | # | | Rite Aid Corp., 6.875%, 12/15/28 | | | 210,600 | | | | 0.1 | |
| 190,000 | | | | | | RSC Equipment Rental, Inc./RSC Holdings III LLC, 8.250%, 02/01/21 | | | 203,300 | | | | 0.1 | |
| 420,000 | | | | | | ServiceMaster Co/The, 7.450%, 08/15/27 | | | 360,150 | | | | 0.3 | |
| 236,000 | | | | #,& | | ServiceMaster Co/The, 10.750%, 07/15/15 | | | 248,687 | | | | 0.2 | |
| | | | | | | | | | 6,624,000 | | | | 4.7 | |
| | | | | | | Energy: 16.4% | | | | | | | | |
| 555,000 | | | | | | Alta Mesa Holdings / Alta Mesa Finance Services Corp., 9.625%, 10/15/18 | | | 561,938 | | | | 0.4 | |
| 385,000 | | | | # | | Arch Coal, Inc., 7.250%, 06/15/21 | | | 357,088 | | | | 0.3 | |
| 430,000 | | | | # | | Arch Coal, Inc., 7.000%, 06/15/19 | | | 398,825 | | | | 0.3 | |
| 375,000 | | | | | | Basic Energy Services, Inc., 7.750%, 02/15/19 | | | 386,250 | | | | 0.3 | |
| 305,000 | | | | | | Berry Petroleum Co., 6.375%, 09/15/22 | | | 314,150 | | | | 0.2 | |
| 475,000 | | | | | | Berry Petroleum Co., 10.250%, 06/01/14 | | | 551,000 | | | | 0.4 | |
| 500,000 | | | | # | | BreitBurn Energy Partners L.P. / BreitBurn Finance Corp., 7.875%, 04/15/22 | | | 512,500 | | | | 0.4 | |
| 590,000 | | | | # | | Calfrac Holdings L.P., 7.500%, 12/01/20 | | | 595,900 | | | | 0.4 | |
| 175,000 | | | | | | Calumet Specialty Products Partners L.P./Calumet Finance Corp., 9.375%, 05/01/19 | | | 182,875 | | | | 0.1 | |
| 325,000 | | | | | | Calumet Specialty Products Partners L.P./Calumet Finance Corp., 9.375%, 05/01/19 | | | 339,625 | | | | 0.2 | |
| 145,000 | | | | | | Chaparral Energy, Inc., 8.250%, 09/01/21 | | | 155,150 | | | | 0.1 | |
| 405,000 | | | | | | Chaparral Energy, Inc., 8.875%, 02/01/17 | | | 425,250 | | | | 0.3 | |
| 205,000 | | | | | | Chaparral Energy, Inc., 9.875%, 10/01/20 | | | 229,600 | | | | 0.2 | |
| 325,000 | | | | | | Chesapeake Energy Corp., 6.125%, 02/15/21 | | | 323,375 | | | | 0.2 | |
| 200,000 | | | | | | Chesapeake Energy Corp., 6.625%, 08/15/20 | | | 204,500 | | | | 0.1 | |
| 705,000 | | | | # | | Chesapeake Oilfield Operating LLC/Chesapeake Oilfield Finance, Inc., 6.625%, 11/15/19 | | | 703,237 | | | | 0.5 | |
| 800,000 | | | | | | Cimarex Energy Co., 5.875%, 05/01/22 | | | 818,000 | | | | 0.6 | |
| 535,000 | | | | | | Clayton Williams Energy, Inc., 7.750%, 04/01/19 | | | 535,000 | | | | 0.4 | |
| 365,000 | | | | | | Concho Resources, Inc./Midland TX, 7.000%, 01/15/21 | | | 393,287 | | | | 0.3 | |
| 450,000 | | | | | | Consol Energy, Inc., 8.250%, 04/01/20 | | | 472,500 | | | | 0.3 | |
| 500,000 | | | | | | Crosstex Energy L.P. / Crosstex Energy Finance Corp., 8.875%, 02/15/18 | | | 533,750 | | | | 0.4 | |
| 405,000 | | | | | | Eagle Rock Energy Partners L.P. / Eagle Rock Energy Finance Corp., 8.375%, 06/01/19 | | | 419,175 | | | | 0.3 | |
| 625,000 | | | | | | El Paso Corp., 7.250%, 06/01/18 | | | 702,626 | | | | 0.5 | |
| 250,000 | | | | | | Energy Transfer Equity L.P., 7.500%, 10/15/20 | | | 278,750 | | | | 0.2 | |
| 585,000 | | | | | | Energy XXI Gulf Coast, Inc., 9.250%, 12/15/17 | | | 636,187 | | | | 0.5 | |
| 375,000 | | | | # | | Hilcorp Energy I L.P./Hilcorp Finance Co., 8.000%, 02/15/20 | | | 406,875 | | | | 0.3 | |
| 475,000 | | | | | | James River Coal Co., 7.875%, 04/01/19 | | | 325,375 | | | | 0.2 | |
| 295,000 | | | | # | | Linn Energy LLC/Linn Energy Finance Corp., 6.250%, 11/01/19 | | | 286,519 | | | | 0.2 | |
| 275,000 | | | | | | Linn Energy LLC/Linn Energy Finance Corp., 7.750%, 02/01/21 | | | 286,687 | | | | 0.2 | |
| 230,000 | | | | | | McMoRan Exploration Co., 11.875%, 11/15/14 | | | 243,800 | | | | 0.2 | |
| 160,000 | | | | # | | Meg Energy, 6.500%, 03/15/21 | | | 168,400 | | | | 0.1 | |
| 325,000 | | | | # | | NFR Energy LLC/NFR Energy Finance Corp., 9.750%, 02/15/17 | | | 281,125 | | | | 0.2 | |
| 360,000 | | | | | | Novelis, Inc./GA, 8.750%, 12/15/20 | | | 396,000 | | | | 0.3 | |
| 215,000 | | | | | | Oasis Petroleum, Inc., 6.500%, 11/01/21 | | | 217,150 | | | | 0.2 | |
| 385,000 | | | | | | Oasis Petroleum, Inc., 7.250%, 02/01/19 | | | 407,137 | | | | 0.3 | |
| 384,000 | | | | | | Patriot Coal Corp., 8.250%, 04/30/18 | | | 294,720 | | | | 0.2 | |
| 175,000 | | | | # | | Peabody Energy Corp., 6.000%, 11/15/18 | | | 172,375 | | | | 0.1 | |
| 250,000 | | | | # | | Peabody Energy Corp., 6.250%, 11/15/21 | | | 246,250 | | | | 0.2 | |
| 445,000 | | | | | | Penn Virginia Resource Partners L.P. / Penn Virginia Resource Finance Corp., 8.250%, 04/15/18 | | | 458,350 | | | | 0.3 | |
| 800,000 | | | | # | | PetroBakken Energy Ltd., 8.625%, 02/01/20 | | | 836,000 | | | | 0.6 | |
| 200,000 | | | | | | Plains Exploration & Production Co., 6.625%, 05/01/21 | | | 213,000 | | | | 0.1 | |
| 230,000 | | | | | | Plains Exploration & Production Co., 7.625%, 06/01/18 | | | 245,525 | | | | 0.2 | |
| 200,000 | | | | | | Range Resources Corp., 5.750%, 06/01/21 | | | 211,000 | | | | 0.1 | |
| 90,000 | | | | | | Range Resources Corp., 5.000%, 08/15/22 | | | 88,988 | | | | 0.1 | |
| 570,000 | | | | | | SM Energy Co., 6.500%, 11/15/21 | | | 609,900 | | | | 0.4 | |
See Accompanying Notes to Financial Statements
8
PORTFOLIO OF INVESTMENTSAS OF MARCH 31, 2012 (CONTINUED)
Principal
Amount†
|
|
|
|
|
|
|
| Value
|
| Percentage
of Net
Assets
|
|---|
| 715,000 | | | | | | Stone Energy Corp., 8.625%, 02/01/17 | | | 750,750 | | | | 0.5 | |
| 390,000 | | | | | | SunCoke Energy, Inc., 7.625%, 08/01/19 | | | 402,675 | | | | 0.3 | |
| 230,000 | | | | # | | Swift Energy Co., 7.875%, 03/01/22 | | | 238,050 | | | | 0.2 | |
| 600,000 | | | | | | Swift Energy Co., 8.875%, 01/15/20 | | | 657,000 | | | | 0.5 | |
| 270,000 | | | | | | Targa Resources Partners L.P. / Targa Resources Partners Finance Corp., 6.875%, 02/01/21 | | | 282,150 | | | | 0.2 | |
| 750,000 | | | | | | Thompson Creek Metals Co., Inc., 7.375%, 06/01/18 | | | 701,250 | | | | 0.5 | |
| 800,000 | | | | | | Vanguard Natural Resources, LLC, 7.875%, 04/01/20 | | | 794,192 | | | | 0.6 | |
| 390,000 | | | | | | Venoco, Inc., 8.875%, 02/15/19 | | | 358,800 | | | | 0.3 | |
| 719,000 | | | | | | W&T Offshore, Inc., 8.500%, 06/15/19 | | | 763,938 | | | | 0.5 | |
| 230,000 | | | | | | Westmoreland Coal Co/Westmoreland Partners, 10.750%, 02/01/18 | | | 219,075 | | | | 0.2 | |
| 250,000 | | | | # | | Westmoreland Coal Co/Westmoreland Partners, 10.750%, 02/01/18 | | | 238,125 | | | | 0.2 | |
| | | | | | | | | | 22,831,719 | | | | 16.4 | |
| | | | | | | Financials: 8.1% | | | | | | | | |
| 200,000 | | | | | | Ally Financial, Inc., 5.500%, 02/15/17 | | | 200,407 | | | | 0.1 | |
| 935,000 | | | | | | Ally Financial, Inc., 8.000%, 03/15/20 | | | 1,042,525 | | | | 0.7 | |
| 455,000 | | | | | | Ally Financial, Inc., 8.300%, 02/12/15 | | | 496,519 | | | | 0.3 | |
| 540,000 | | | | | | American General Finance Corp., 5.400%, 12/01/15 | | | 449,550 | | | | 0.3 | |
| 750,000 | | | | | | Atlantic Broadband Finance, LLC, 9.375%, 01/15/14 | | | 753,750 | | | | 0.5 | |
| 290,000 | | | | # | | CIT Group, In.c, 6.625%, 04/01/18 | | | 316,463 | | | | 0.2 | |
| 500,000 | | | | | | CIT Group, Inc., 5.250%, 03/15/18 | | | 510,625 | | | | 0.4 | |
| 710,000 | | | | # | | CIT Group, Inc., 7.000%, 05/02/16 | | | 713,550 | | | | 0.5 | |
| 400,000 | | | | # | | CIT Group, Inc., 7.000%, 05/02/17 | | | 401,500 | | | | 0.3 | |
| 602,000 | | | | | | Felcor Lodging L.P., 10.000%, 10/01/14 | | | 689,290 | | | | 0.5 | |
| 500,000 | | | | | | Fifth Third Capital Trust IV, 6.500%, 04/15/37 | | | 500,000 | | | | 0.4 | |
| 500,000 | | | | | | Ford Motor Credit Co. LLC, 5.000%, 05/15/18 | | | 519,042 | | | | 0.4 | |
| 500,000 | | | | | | Ford Motor Credit Co. LLC, 5.875%, 08/02/21 | | | 540,075 | | | | 0.4 | |
| 695,000 | | | | | | Ford Motor Credit Co., LLC, 8.125%, 01/15/20 | | | 842,433 | | | | 0.6 | |
| 250,000 | | | | # | | Hexion US Finance Corp., 6.625%, 04/15/20 | | | 256,875 | | | | 0.2 | |
| 210,000 | | | | | | International Lease Finance Corp., 6.250%, 05/15/19 | | | 207,280 | | | | 0.1 | |
| 470,000 | | | | | | International Lease Finance Corp., 8.250%, 12/15/20 | | | 518,111 | | | | 0.4 | |
| 635,000 | | | | | | MPT Operating Partnership L.P./MPT Finance Corp., 6.375%, 02/15/22 | | | 647,700 | | | | 0.5 | |
| 500,000 | | | | # | | Realogy Corp., 7.625%, 01/15/20 | | | 525,000 | | | | 0.4 | |
| 500,000 | | | | | | Regions Bank/Birmingham AL, 6.450%, 06/26/37 | | | 502,500 | | | | 0.4 | |
| 345,000 | | | | | | Springleaf Finance Corp., 6.900%, 12/15/17 | | | 270,825 | | | | 0.2 | |
| 410,000 | | | | | | Tops Holding Corp. / Tops Markets LLC, 10.125%, 10/15/15 | | | 439,725 | | | | 0.3 | |
| | | | | | | | | | 11,343,745 | | | | 8.1 | |
| | | | | | | Health Care: 9.6% | | | | | | | | |
| 193,000 | | | | | | Biomet, Inc., 11.625%, 10/15/17 | | | 209,646 | | | | 0.2 | |
| 500,000 | | | | # | | CHS/Community Health Systems, Inc., 8.000%, 11/15/19 | | | 520,000 | | | | 0.4 | |
| 145,000 | | | | | | DaVita, Inc., 6.375%, 11/01/18 | | | 152,250 | | | | 0.1 | |
| 595,000 | | | | | | DaVita, Inc., 6.625%, 11/01/20 | | | 624,750 | | | | 0.4 | |
| 168,000 | | | | | | Endo Pharmaceuticals Holdings, Inc., 7.250%, 01/15/22 | | | 180,600 | | | | 0.1 | |
| 153,000 | | | | | | Endo Pharmaceuticals Holdings, Inc., 7.000%, 07/15/19 | | | 164,092 | | | | 0.1 | |
| 455,000 | | | | | | Gentiva Health Services, Inc., 11.500%, 09/01/18 | | | 426,563 | | | | 0.3 | |
| 150,000 | | | | | | Grifols, Inc., 8.250%, 02/01/18 | | | 163,125 | | | | 0.1 | |
| 655,000 | | | | | | HCA Holdings, Inc., 7.750%, 05/15/21 | | | 680,381 | | | | 0.5 | |
| 360,000 | | | | | | HCA, Inc., 7.250%, 09/15/20 | | | 393,750 | | | | 0.3 | |
| 800,000 | | | | | | HCA, Inc., 7.500%, 02/15/22 | | | 854,000 | | | | 0.6 | |
| 105,000 | | | | | | HCA, Inc., 7.875%, 02/15/20 | | | 115,894 | | | | 0.1 | |
| 245,000 | | | | # | | Health Management Associates, Inc., 7.375%, 01/15/20 | | | 251,125 | | | | 0.2 | |
| 185,000 | | | | | | Healthsouth Corp., 7.250%, 10/01/18 | | | 198,412 | | | | 0.1 | |
| 260,000 | | | | | | Healthsouth Corp., 8.125%, 02/15/20 | | | 286,000 | | | | 0.2 | |
| 625,000 | | | | | | IASIS Healthcare LLC / IASIS Capital Corp., 8.375%, 05/15/19 | | | 610,938 | | | | 0.4 | |
| 480,000 | | | | | | Immucor, Inc., 11.125%, 08/15/19 | | | 535,800 | | | | 0.4 | |
| 500,000 | | | | # | | Mylan, Inc., 6.000%, 11/15/18 | | | 525,000 | | | | 0.4 | |
| 170,000 | | | | # | | Mylan, Inc./PA, 7.875%, 07/15/20 | | | 190,400 | | | | 0.1 | |
See Accompanying Notes to Financial Statements
9
PORTFOLIO OF INVESTMENTSAS OF MARCH 31, 2012 (CONTINUED)
Principal
Amount†
|
|
|
|
|
|
|
| Value
|
| Percentage
of Net
Assets
|
|---|
| 570,000 | | | | | | Omnicare, Inc., 7.750%, 06/01/20 | | | 635,550 | | | | 0.5 | |
| 1,000,000 | | | | # | | Physio-Control International, Inc., 9.875%, 01/15/19 | | | 1,055,000 | | | | 0.8 | |
| 400,000 | | | | # | | PSS World Medical, Inc., 6.375%, 03/01/22 | | | 413,000 | | | | 0.3 | |
| 205,000 | | | | | | Radnet Management, Inc., 10.375%, 04/01/18 | | | 205,000 | | | | 0.1 | |
| 167,000 | | | | | | Select Medical Corp., 7.625%, 02/01/15 | | | 165,956 | | | | 0.1 | |
| 650,000 | | | | | | Select Medical Holdings Corp., 6.494%, 09/15/15 | | | 585,000 | | | | 0.4 | |
| 280,000 | | | | # | | STHI Holding Corp., 8.000%, 03/15/18 | | | 298,200 | | | | 0.2 | |
| 395,000 | | | | # | | Tenet Healthcare Corp., 6.250%, 11/01/18 | | | 408,825 | | | | 0.3 | |
| 420,000 | | | | | | Tenet Healthcare Corp., 8.000%, 08/01/20 | | | 434,700 | | | | 0.3 | |
| 225,000 | | | | X | | U.S. Oncology Escrow, 87.500%, 12/31/49 | | | — | | | | — | |
| 220,000 | | | | | | United Surgical Partners International, Inc., 8.875%, 05/01/17 | | | 231,550 | | | | 0.2 | |
| 300,000 | | | | & | | United Surgical Partners International, Inc., 9.250%, 05/01/17 | | | 316,500 | | | | 0.2 | |
| 500,000 | | | | # | | USPI Finance Corp., 9.000%, 04/01/20 | | | 517,500 | | | | 0.4 | |
| 525,000 | | | | # | | Valeant Pharmaceuticals International, 6.750%, 08/15/21 | | | 513,188 | | | | 0.4 | |
| 245,000 | | | | # | | Valeant Pharmaceuticals International, 7.000%, 10/01/20 | | | 245,000 | | | | 0.2 | |
| 300,000 | | | | | | Vanguard Health Holding Co. II LLC / Vanguard Holding Co. II, Inc., 7.750%, 02/01/19 | | | 300,000 | | | | 0.2 | |
| 12,000 | | | | Z | | Vanguard Health Systems, Inc., 02/01/16 | | | 7,980 | | | | 0.0 | |
| | | | | | | | | | 13,415,675 | | | | 9.6 | |
| | | | | | | Industrials: 6.9% | | | | | | | | |
| 455,000 | | | | # | | Amsted Industries, Inc., 8.125%, 03/15/18 | | | 489,125 | | | | 0.4 | |
| 260,000 | | | | | | ArvinMeritor, Inc., 8.125%, 09/15/15 | | | 275,600 | | | | 0.2 | |
| 305,000 | | | | | | ArvinMeritor, Inc., 10.625%, 03/15/18 | | | 329,400 | | | | 0.2 | |
| 185,000 | | | | | | Atkore International, Inc., 9.875%, 01/01/18 | | | 194,713 | | | | 0.1 | |
| 635,000 | | | | | | Berry Plastics Corp., 9.750%, 01/15/21 | | | 696,913 | | | | 0.5 | |
| 310,000 | | | | # | | Bombardier, Inc., 7.500%, 03/15/18 | | | 342,550 | | | | 0.2 | |
| 185,000 | | | | # | | Building Materials Corp. of America, 7.500%, 03/15/20 | | | 197,025 | | | | 0.1 | |
| 245,000 | | | | | | Cenveo Corp., 8.875%, 02/01/18 | | | 233,975 | | | | 0.2 | |
| 280,000 | | | | | | Coleman Cable, Inc., 9.000%, 02/15/18 | | | 296,100 | | | | 0.2 | |
| 670,000 | | | | | | Covanta Holding Corp., 7.250%, 12/01/20 | | | 724,060 | | | | 0.5 | |
| 605,000 | | | | | | Florida East Coast Railway Corp., 8.125%, 02/01/17 | | | 620,125 | | | | 0.4 | |
| 110,000 | | | | | | Interface, Inc., 7.625%, 12/01/18 | | | 119,625 | | | | 0.1 | |
| 320,000 | | | | | | Iron Mountain, Inc., 8.000%, 06/15/20 | | | 339,200 | | | | 0.2 | |
| 210,000 | | | | | | Iron Mountain, Inc., 8.750%, 07/15/18 | | | 218,925 | | | | 0.2 | |
| 880,000 | | | | # | | JM Huber Corp., 9.875%, 11/01/19 | | | 919,600 | | | | 0.7 | |
| 130,000 | | | | | | Koppers, Inc., 7.875%, 12/01/19 | | | 139,425 | | | | 0.1 | |
| 300,000 | | | | | | MarkWest Energy Partners L.P. / MarkWest Energy Finance Corp., 6.500%, 08/15/21 | | | 320,250 | | | | 0.2 | |
| 585,000 | | | | | | Martin Midstream Partners L.P. / Martin Midstream Finance Corp., 8.875%, 04/01/18 | | | 605,475 | | | | 0.4 | |
| 190,000 | | | | | | Mobile Mini, Inc., 7.875%, 12/01/20 | | | 203,300 | | | | 0.2 | |
| 370,000 | | | | | | Polymer Group, Inc., 7.750%, 02/01/19 | | | 391,275 | | | | 0.3 | |
| 370,000 | | | | # | | Schaeffler Finance BV, 7.750%, 02/15/17 | | | 393,125 | | | | 0.3 | |
| 525,000 | | | | # | | Schaeffler Finance BV, 8.500%, 02/15/19 | | | 563,062 | | | | 0.4 | |
| 375,000 | | | | | | Severstal, 10.250%, 02/15/18 | | | 403,125 | | | | 0.3 | |
| 610,000 | | | | | | SPX Corp., 6.875%, 09/01/17 | | | 671,000 | | | | 0.5 | |
| | | | | | | | | | 9,686,973 | | | | 6.9 | |
| | | | | | | Information Technology: 4.8% | | | | | | | | |
| 605,000 | | | | | | Aspect Software, Inc., 10.625%, 05/15/17 | | | 648,863 | | | | 0.5 | |
| 425,000 | | | | | | CDW LLC / CDW Finance Corp., 8.500%, 04/01/19 | | | 453,688 | | | | 0.3 | |
| 250,000 | | | | | | CDW LLC / CDW Finance Corp., 12.535%, 10/12/17 | | | 272,813 | | | | 0.2 | |
| 545,000 | | | | # | | Emdeon, Inc., 11.000%, 12/31/19 | | | 618,575 | | | | 0.5 | |
| 300,000 | | | | | | Epicor Software Corp., 8.625%, 05/01/19 | | | 308,250 | | | | 0.2 | |
| 145,000 | | | | # | | First Data Corp., 8.250%, 01/15/21 | | | 142,462 | | | | 0.1 | |
| 146,000 | | | | #,& | | First Data Corp., 8.750%, 01/15/22 | | | 141,620 | | | | 0.1 | |
| 17,000 | | | | | | First Data Corp., 9.875%, 09/24/15 | | | 17,170 | | | | 0.0 | |
| 18,684 | | | | & | | First Data Corp., 10.550%, 09/24/15 | | | 19,058 | | | | 0.0 | |
| 445,000 | | | | | | First Data Corp., 11.250%, 03/31/16 | | | 404,950 | | | | 0.3 | |
| 293,000 | | | | | | First Data Corp., 12.625%, 01/15/21 | | | 295,197 | | | | 0.2 | |
| 460,000 | | | | | | Kemet Corp., 10.500%, 05/01/18 | | | 499,100 | | | | 0.4 | |
| 250,000 | | | | # | | Kemet Corp., 10.500%, 05/01/18 | | | 270,000 | | | | 0.2 | |
| 105,000 | | | | # | | Lawson Software, Inc., 9.375%, 04/01/19 | | | 108,937 | | | | 0.1 | |
See Accompanying Notes to Financial Statements
10
PORTFOLIO OF INVESTMENTSAS OF MARCH 31, 2012 (CONTINUED)
Principal
Amount†
|
|
|
|
|
|
|
| Value
|
| Percentage
of Net
Assets
|
|---|
| 500,000 | | | | # | | Lawson Software, Inc., 11.500%, 07/15/18 | | | 555,000 | | | | 0.4 | |
| 420,000 | | | | | | MedAssets, Inc., 8.000%, 11/15/18 | | | 443,100 | | | | 0.3 | |
| 250,000 | | | | | | Seagate HDD Cayman, 6.875%, 05/01/20 | | | 267,188 | | | | 0.2 | |
| 35,000 | | | | | | Seagate HDD Cayman, 7.750%, 12/15/18 | | | 38,500 | | | | 0.0 | |
| 525,000 | | | | | | SSI Investments II/SSI Co-Issuer LLC, 11.125%, 06/01/18 | | | 585,375 | | | | 0.4 | |
| 395,000 | | | | | | SunGard Data Systems, Inc., 7.375%, 11/15/18 | | | 421,662 | | | | 0.3 | |
| 155,000 | | | | | | SunGard Data Systems, Inc., 7.625%, 11/15/20 | | | 166,237 | | | | 0.1 | |
| | | | | | | | | | 6,677,745 | | | | 4.8 | |
| | | | | | | Materials: 7.2% | | | | | | | | |
| 500,000 | | | | | | AK Steel Corp., 8.375%, 04/01/22 | | | 487,500 | | | | 0.4 | |
| 200,000 | | | | # | | Ardagh Packaging Finance Plc, 7.375%, 10/15/17 | | | 215,500 | | | | 0.2 | |
| 250,000 | | | | # | | Ardagh Packaging Finance Plc / Ardagh MP Holdings USA, Inc., 9.125%, 10/15/20 | | | 263,125 | | | | 0.2 | |
| 85,000 | | | | | | Berry Plastics Holding Corp., 10.250%, 03/01/16 | | | 88,400 | | | | 0.1 | |
| 365,000 | | | | # | | Building Materials Corp. of America, 6.750%, 05/01/21 | | | 388,269 | | | | 0.3 | |
| 75,000 | | | | | | CF Industries, Inc., 6.875%, 05/01/18 | | | 86,812 | | | | 0.1 | |
| 75,000 | | | | | | CF Industries, Inc., 7.125%, 05/01/20 | | | 89,531 | | | | 0.1 | |
| 220,000 | | | | | | Chemtura Corp., 7.875%, 09/01/18 | | | 237,600 | | | | 0.2 | |
| 285,000 | | | | | | Darling International, Inc., 8.500%, 12/15/18 | | | 319,200 | | | | 0.2 | |
| 230,000 | | | | | | Ferro Corp., 7.875%, 08/15/18 | | | 235,750 | | | | 0.2 | |
| 250,000 | | | | # | | FMG Resources August 2006 Pty Ltd., 6.000%, 04/01/17 | | | 248,125 | | | | 0.2 | |
| 280,000 | | | | | | Hexion US Finance Corp. / Hexion Nova Scotia Finance ULC, 8.875%, 02/01/18 | | | 291,200 | | | | 0.2 | |
| 300,000 | | | | | | Hexion US Finance Corp. / Hexion Nova Scotia Finance ULC, 9.000%, 11/15/20 | | | 280,500 | | | | 0.2 | |
| 535,000 | | | | | | Huntsman International LLC, 8.625%, 03/15/21 | | | 603,212 | | | | 0.4 | |
| 550,000 | | | | # | | Ineos Finance PLC, 8.375%, 02/15/19 | | | 583,000 | | | | 0.4 | |
| 500,000 | | | | # | | Ineos Group Holdings PLC, 8.500%, 02/15/16 | | | 475,000 | | | | 0.3 | |
| 330,000 | | | | # | | JMC Steel Group, 8.250%, 03/15/18 | | | 344,850 | | | | 0.2 | |
| 370,000 | | | | | | Kraton Polymers LLC/Kraton Polymers Capital Corp., 6.750%, 03/01/19 | | | 383,875 | | | | 0.3 | |
| 410,000 | | | | # | | Longview Fibre Paper & Packaging, Inc., 8.000%, 06/01/16 | | | 419,738 | | | | 0.3 | |
| 125,000 | | | | | | Lyondell Chemical Co., 8.000%, 11/01/17 | | | 140,938 | | | | 0.1 | |
| 124,775 | | | | | | Lyondell Chemical Co., 11.000%, 05/01/18 | | | 138,500 | | | | 0.1 | |
| 640,000 | | | | # | | LyondellBasell Industries NV, 6.000%, 11/15/21 | | | 675,200 | | | | 0.5 | |
| 305,000 | | | | | | Momentive Performance Materials, Inc., 9.000%, 01/15/21 | | | 268,400 | | | | 0.2 | |
| 180,000 | | | | | | Novelis, Inc./GA, 8.375%, 12/15/17 | | | 196,200 | | | | 0.1 | |
| 460,000 | | | | | | Omnova Solutions, Inc., 7.875%, 11/01/18 | | | 442,750 | | | | 0.3 | |
| 290,000 | | | | # | | Plastipak Holdings, Inc., 10.625%, 08/15/19 | | | 332,050 | | | | 0.2 | |
| 275,000 | | | | | | PolyOne Corp., 7.375%, 09/15/20 | | | 292,187 | | | | 0.2 | |
| 307,000 | | | | # | | Rain CII Carbon LLC and CII Carbon Corp., 8.000%, 12/01/18 | | | 323,118 | | | | 0.2 | |
| 350,000 | | | | | | Solutia, Inc., 8.750%, 11/01/17 | | | 398,563 | | | | 0.3 | |
| 750,000 | | | | | | Taseko Mines Ltd, 7.750%, 04/15/19 | | | 718,125 | | | | 0.5 | |
| 75,000 | | | | # | | Vertellus Specialties, Inc., 9.375%, 10/01/15 | | | 57,375 | | | | 0.0 | |
| | | | | | | | | | 10,024,593 | | | | 7.2 | |
| | | | | | | Telecommunication Services: 6.5% | | | | | | | | |
| 460,000 | | | | | | CCO Holdings LLC / CCO Holdings Capital Corp., 7.250%, 10/30/17 | | | 495,650 | | | | 0.4 | |
| 220,000 | | | | | | Cincinnati Bell, Inc., 8.375%, 10/15/20 | | | 221,650 | | | | 0.2 | |
| 420,000 | | | | | | Cincinnati Bell, Inc., 8.750%, 03/15/18 | | | 394,275 | | | | 0.3 | |
| 510,000 | | | | | | Cricket Communications, Inc., 7.750%, 05/15/16 | | | 540,600 | | | | 0.4 | |
| 755,000 | | | | | | Freescale Semiconductor, Inc., 8.050%, 02/01/20 | | | 762,550 | | | | 0.5 | |
| 200,000 | | | | | | Frontier Communications Corp., 8.250%, 04/15/17 | | | 216,000 | | | | 0.2 | |
| 510,000 | | | | | | Frontier Communications Corp., 8.500%, 04/15/20 | | | 539,325 | | | | 0.4 | |
| 250,000 | | | | #,& | | Intelsat Bermuda Ltd., 11.500%, 02/04/17 | | | 258,125 | | | | 0.2 | |
| 200,000 | | | | | | Intelsat Jackson Holdings SA, 7.250%, 04/01/19 | | | 211,250 | | | | 0.2 | |
| 240,000 | | | | | | Intelsat Jackson Holdings SA, 7.500%, 04/01/21 | | | 253,500 | | | | 0.2 | |
| 870,000 | | | | | | Intelsat Luxembourg S.A., 11.250%, 02/04/17 | | | 906,975 | | | | 0.6 | |
| 131,375 | | | | & | | Intelsat Luxembourg S.A., 11.500%, 02/04/17 | | | 136,958 | | | | 0.1 | |
| 18,024 | | | | & | | iPCS, Inc., 3.797%, 05/01/14 | | | 17,033 | | | | 0.0 | |
See Accompanying Notes to Financial Statements
11
PORTFOLIO OF INVESTMENTSAS OF MARCH 31, 2012 (CONTINUED)
Principal
Amount†
|
|
|
|
|
|
|
| Value
|
| Percentage
of Net
Assets
|
|---|
| 630,000 | | | | | | MetroPCS Wireless, Inc., 6.625%, 11/15/20 | | | 627,638 | | | | 0.4 | |
| 500,000 | | | | # | | Sable International Finance Ltd., 8.750%, 02/01/20 | | | 532,500 | | | | 0.4 | |
| 580,000 | | | | | | Sprint Capital Corp., 6.875%, 11/15/28 | | | 446,600 | | | | 0.3 | |
| 400,000 | | | | # | | Sprint Nextel Corp., 7.000%, 03/01/20 | | | 407,000 | | | | 0.3 | |
| 665,000 | | | | # | | Sprint Nextel Corp., 9.000%, 11/15/18 | | | 731,500 | | | | 0.5 | |
| 425,000 | | | | # | | UPCB Finance VI Ltd., 6.875%, 01/15/22 | | | 440,937 | | | | 0.3 | |
| 870,000 | | | | | | Windstream Corp., 7.000%, 03/15/19 | | | 891,750 | | | | 0.6 | |
| | | | | | | | | | 9,031,816 | | | | 6.5 | |
| | | | | | | Utilities: 2.1% | | | | | | | | |
| 310,000 | | | | # | | AES Corp., 7.375%, 07/01/21 | | | 344,100 | | | | 0.2 | |
| 385,000 | | | | # | | Calpine Corp., 7.500%, 02/15/21 | | | 412,912 | | | | 0.3 | |
| 440,000 | | | | # | | Calpine Corp., 7.875%, 07/31/20 | | | 480,700 | | | | 0.3 | |
| 480,000 | | | | | | Energy Future Holdings Corp., 10.000%, 01/15/20 | | | 523,200 | | | | 0.4 | |
| 475,000 | | | | | | Mirant Americas Generation, LLC, 9.125%, 05/01/31 | | | 410,875 | | | | 0.3 | |
| 230,000 | | | | | | NRG Energy, Inc., 7.625%, 05/15/19 | | | 223,100 | | | | 0.2 | |
| 230,000 | | | | | | NRG Energy, Inc., 7.875%, 05/15/21 | | | 221,950 | | | | 0.2 | |
| 455,000 | | | | # | | Texas Competitive Electric Holdings Co. LLC / TCEH Finance, Inc., 11.500%, 10/01/20 | | | 299,163 | | | | 0.2 | |
| | | | | | | | | | 2,916,000 | | | | 2.1 | |
| | | | | | | | | Total Corporate Bonds/Notes
(Cost $127,190,340)
| |
131,990,167 | | | |
94.5 | |
ASSET-BACKED SECURITIES: 0.7%
|
| | | | | | | Other Asset-Backed Securities: 0.7%
|
| 912,979 | | | | # | | GSC Partners CDO Fund Ltd, 2.495%, 12/16/15 | | | 911,393 | | | | 0.7 | |
| | | | | | | | | Total Asset-Backed Securities
(Cost $839,901)
| |
911,393 | | | |
0.7 | |
Shares
|
|
|
|
|
|
|
| Value
|
| Percentage
of Net
Assets
|
|---|
COMMON STOCK: 0.0%
|
| | | | | | | Consumer Discretionary: 0.0%
|
| 195 | | | | @ | | American Media, Inc. | | | 2,535 | | | | 0.0 | |
| 5,810 | | | | @,X | | American Media, Inc., Stock Certificates | | | — | | | | — | |
| | | | | | | | | Total Common Stock
(Cost $136,656)
| |
2,535 | | | |
0.0 | |
| | | | | | | | | Total Long-Term Investments
(Cost $128,166,897)
| |
132,904,095 | | | |
95.2 | |
SHORT-TERM INVESTMENTS: 3.6%
|
| | | | | | | | | Mutual Funds: 3.6%
| | | | | | | |
| 5,063,000 | | | | | | | | BlackRock Liquidity Funds, TempFund, Institutional Class
(Cost $5,063,000)
| | 5,063,000 | | | | 3.6 | |
| | | | | | | | | Total Short-Term Investments
(Cost $5,063,000)
| | 5,063,000 | | | | 3.6 | |
| | | | | | | | | Total Investments in Securities
(Cost $133,229,897)
| $ |
137,967,095 | | | |
98.8 | |
| | | | | | | | | Assets in Excess of Other Liabilities
| | 1,653,038 | | | | 1.2 | |
| | | | | | | | | Net Assets
| $ | 139,620,133 | | | | 100.0 | |
| † | | Unless otherwise indicated, principal amount is shown in USD. |
| # | | Securities with purchases pursuant to Rule 144A or section 4(2), under the Securities Act of 1933 and may not be resold subject to that rule except to qualified institutional buyers. |
| @ | | Non-income producing security |
| + | | Step-up basis bonds. Interest rates shown reflect current and next coupon rates. |
| X | | Fair value determined by ING Funds Valuation Committee appointed by the Funds’ Board of Directors/Trustees. |
| Z | | Indicates Zero Coupon Bond; rate shown reflects current effective yield. |
| Cost for federal income tax purposes is $133,236,234. | | | | | | |
| Net unrealized appreciation consists of: | | | | | | |
| Gross Unrealized Appreciation | | | | $ | 6,359,908 | |
| Gross Unrealized Depreciation | | | | | (1,629,047 | ) |
| Net Unrealized Appreciation | | | | $ | 4,730,861 | |
See Accompanying Notes to Financial Statements
12
ING INTERMEDIATE BOND FUND
PORTFOLIO OF INVESTMENTSAS OF MARCH 31, 2012
Principal
Amount†
|
|
|
|
|
|
|
| Value
|
| Percentage
of Net
Assets
|
|---|
CORPORATE BONDS/NOTES: 33.2%
|
| | | | | | | Consumer Discretionary: 5.5%
|
| 1,110,000 | | | | | | AMC Entertainment, Inc., 8.750%, 06/01/19 | | | 1,168,275 | | | | 0.1 | |
| 1,030,000 | | | | | | Ameristar Casinos, Inc., 7.500%, 04/15/21 | | | 1,085,363 | | | | 0.1 | |
| 740,000 | | | | | | Cablevision Systems Corp., 8.625%, 09/15/17 | | | 809,375 | | | | 0.1 | |
| 1,107,000 | | | | | | CBS Corp., 3.375%, 03/01/22 | | | 1,070,387 | | | | 0.1 | |
| 890,000 | | | | | | CCO Holdings LLC / CCO Holdings Capital Corp., 6.500%, 04/30/21 | | | 925,600 | | | | 0.1 | |
| 385,000 | | | | | | CCO Holdings LLC / CCO Holdings Capital Corp., 7.000%, 01/15/19 | | | 410,025 | | | | 0.1 | |
| 1,180,000 | | | | # | | DIRECTV Holdings LLC / DIRECTV Financing Co., Inc., 2.400%, 03/15/17 | | | 1,170,613 | | | | 0.1 | |
| 1,112,000 | | | | # | | DIRECTV Holdings LLC / DIRECTV Financing Co., Inc., 3.800%, 03/15/22 | | | 1,098,536 | | | | 0.1 | |
| 732,000 | | | | # | | DIRECTV Holdings LLC / DIRECTV Financing Co., Inc., 5.150%, 03/15/42 | | | 713,531 | | | | 0.1 | |
| 260,000 | | | | | | DISH DBS Corp., 6.750%, 06/01/21 | | | 281,450 | | | | 0.0 | |
| 785,000 | | | | | | DISH DBS Corp., 7.875%, 09/01/19 | | | 906,675 | | | | 0.1 | |
| 1,013,000 | | | | | | Energizer Holdings, Inc., 4.700%, 05/19/21 | | | 1,055,076 | | | | 0.1 | |
| 927,000 | | | | | | Family Dollar Stores, Inc., 5.000%, 02/01/21 | | | 970,851 | | | | 0.1 | |
| 817,000 | | | | # | | Harley-Davidson Financial Services, Inc., 2.700%, 03/15/17 | | | 811,266 | | | | 0.1 | |
| 2,726,000 | | | | # | | Hyatt Hotels Corp., 6.875%, 08/15/19 | | | 3,146,641 | | | | 0.4 | |
| 435,000 | | | | | | Inergy L.P./Inergy Finance Corp., 6.875%, 08/01/21 | | | 420,862 | | | | 0.1 | |
| 1,035,000 | | | | | | KB Home, 5.875%, 01/15/15 | | | 1,024,650 | | | | 0.1 | |
| 798,000 | | | | | | Koninklijke Philips Electronics NV, 3.750%, 03/15/22 | | | 804,055 | | | | 0.1 | |
| 968,000 | | | | | | Koninklijke Philips Electronics NV, 5.000%, 03/15/42 | | | 966,610 | | | | 0.1 | |
| 1,030,000 | | | | # | | Lamar Media Corp., 5.875%, 02/01/22 | | | 1,053,175 | | | | 0.1 | |
| 1,105,000 | | | | | | Limited Brands, Inc., 8.500%, 06/15/19 | | | 1,312,187 | | | | 0.2 | |
| 827,000 | | | | | | Mattel, Inc., 2.500%, 11/01/16 | | | 846,737 | | | | 0.1 | |
| 827,000 | | | | | | Mattel, Inc., 5.450%, 11/01/41 | | | 861,729 | | | | 0.1 | |
| 1,025,000 | | | | #,L | | Mediacom LLC / Mediacom Capital Corp., 7.250%, 02/15/22 | | | 1,040,375 | | | | 0.1 | |
| 460,000 | | | | | | Meritage Homes Corp., 6.250%, 03/15/15 | | | 467,820 | | | | 0.1 | |
| 245,000 | | | | # | | Meritage Homes Corp., 7.000%, 04/01/22 | | | 246,225 | | | | 0.0 | |
| 979,000 | | | | | | News America, Inc., 4.500%, 02/15/21 | | | 1,045,474 | | | | 0.1 | |
| 1,222,000 | | | | | | News America, Inc., 6.650%, 11/15/37 | | | 1,425,159 | | | | 0.2 | |
| 1,065,000 | | | | | | Nielsen Finance LLC / Nielsen Finance Co., 7.750%, 10/15/18 | | | 1,179,487 | | | | 0.2 | |
| 1,525,000 | | | | L | | Odebrecht Finance Ltd, 7.000%, 04/21/20 | | | 1,707,695 | | | | 0.2 | |
| 310,000 | | | | #,L | | Odebrecht Finance Ltd., 7.500%, 09/29/49 | | | 318,463 | | | | 0.0 | |
| 795,000 | | | | | | Pinnacle Entertainment, Inc., 8.625%, 08/01/17 | | | 870,525 | | | | 0.1 | |
| 900,000 | | | | # | | SABMiller Holdings, Inc., 2.450%, 01/15/17 | | | 912,109 | | | | 0.1 | |
| 900,000 | | | | # | | SABMiller Holdings, Inc., 4.950%, 01/15/42 | | | 933,011 | | | | 0.1 | |
| 2,039,000 | | | | | | Target Corp., 2.900%, 01/15/22 | | | 2,018,696 | | | | 0.3 | |
| 1,374,000 | | | | | | The Gap, Inc., 5.950%, 04/12/21 | | | 1,388,487 | | | | 0.2 | |
| 295,000 | | | | | | Toll Brothers Finance Corp., 5.875%, 02/15/22 | | | 303,650 | | | | 0.0 | |
| 863,000 | | | | | | Toll Brothers Finance Corp., 6.750%, 11/01/19 | | | 940,308 | | | | 0.1 | |
| 1,120,000 | | | | | | Toys R Us Property Co. I LLC, 10.750%, 07/15/17 | | | 1,232,000 | | | | 0.2 | |
| 1,054,000 | | | | | | Wal-Mart Stores, Inc., 5.625%, 04/15/41 | | | 1,276,524 | | | | 0.2 | |
| 1,405,000 | | | | | | Wynn Las Vegas LLC / Wynn Las Vegas Capital Corp., 7.875%, 11/01/17 | | | 1,538,475 | | | | 0.2 | |
| 2,783,000 | | | | | | Xerox Corp., 4.500%, 05/15/21 | | | 2,867,264 | | | | 0.4 | |
| 950,000 | | | | # | | XM Satellite Radio, Inc., 7.625%, 11/01/18 | | | 1,030,750 | | | | 0.1 | |
| | | | | | | | | | 45,656,166 | | | | 5.5 | |
| | | | | | | Consumer Staples: 0.8% | | | | | | | | |
| 1,003,000 | | | | | | Altria Group, Inc., 9.700%, 11/10/18 | | | 1,364,317 | | | | 0.1 | |
| 558,000 | | | | # | | Cargill, Inc., 3.250%, 11/15/21 | | | 544,539 | | | | 0.1 | |
| 1,240,000 | | | | | | Constellation Brands, Inc., 7.250%, 05/15/17 | | | 1,410,500 | | | | 0.2 | |
| 920,000 | | | | # | | Delphi Corp., 5.875%, 05/15/19 | | | 975,200 | | | | 0.1 | |
| 615,000 | | | | # | | JBS USA LLC/JBS USA Finance, Inc., 8.250%, 02/01/20 | | | 633,450 | | | | 0.1 | |
| 1,026,000 | | | | | | Lorillard Tobacco Co., 6.875%, 05/01/20 | | | 1,207,041 | | | | 0.1 | |
| 777,000 | | | | | | Philip Morris International, Inc., 2.500%, 05/16/16 | | | 811,641 | | | | 0.1 | |
| | | | | | | | | | 6,946,688 | | | | 0.8 | |
| | | | | | | Energy: 6.3% | | | | | | | | |
| 825,000 | | | | L | | Alpha Natural Resources, Inc., 6.250%, 06/01/21 | | | 748,687 | | | | 0.1 | |
See Accompanying Notes to Financial Statements
13
ING INTERMEDIATE BOND FUND
PORTFOLIO OF INVESTMENTSAS OF MARCH 31, 2012 (CONTINUED)
Principal
Amount†
|
|
|
|
|
|
|
| Value
|
| Percentage
of Net
Assets
|
|---|
| 360,000 | | | | L | | Alpha Natural Resources, Inc., 6.000%, 06/01/19 | | | 327,600 | | | | 0.0 | |
| 870,000 | | | | | | Anadarko Petroleum Corp., 6.375%, 09/15/17 | | | 1,034,721 | | | | 0.1 | |
| 1,025,000 | | | | L | | Arch Coal, Inc., 8.750%, 08/01/16 | | | 1,081,375 | | | | 0.1 | |
| 1,240,000 | | | | # | | BG Energy Capital PLC, 2.875%, 10/15/16 | | | 1,283,931 | | | | 0.2 | |
| 1,979,000 | | | | | | BP Capital Markets PLC, 2.248%, 11/01/16 | | | 2,031,637 | | | | 0.3 | |
| 720,000 | | | | | | BP Capital Markets PLC, 3.561%, 11/01/21 | | | 742,599 | | | | 0.1 | |
| 375,000 | | | | | | Chesapeake Energy Corp., 6.625%, 08/15/20 | | | 383,437 | | | | 0.1 | |
| 325,000 | | | | # | | Chesapeake Oilfield Operating LLC/Chesapeake Oilfield Finance, Inc., 6.625%, 11/15/19 | | | 324,188 | | | | 0.0 | |
| 600,000 | | | | # | | China Resources Gas Group Ltd, 4.500%, 04/05/22 | | | 590,606 | | | | 0.1 | |
| 1,467,000 | | | | # | | Dolphin Energy Ltd., 5.500%, 12/15/21 | | | 1,553,186 | | | | 0.2 | |
| 612,000 | | | | # | | Duquesne Light Holdings, Inc., 5.900%, 12/01/21 | | | 654,805 | | | | 0.1 | |
| 1,523,000 | | | | | | Enbridge Energy Partners, 9.875%, 03/01/19 | | | 2,028,283 | | | | 0.2 | |
| 533,000 | | | | | | Enbridge Energy Partners L.P., 4.200%, 09/15/21 | | | 556,324 | | | | 0.1 | |
| 1,070,000 | | | | | | Energy Transfer Equity L.P., 7.500%, 10/15/20 | | | 1,193,050 | | | | 0.1 | |
| 1,244,000 | | | | | | Energy Transfer Partners, 9.700%, 03/15/19 | | | 1,592,135 | | | | 0.2 | |
| 1,217,000 | | | | | | Energy Transfer Partners L.P., 4.650%, 06/01/21 | | | 1,241,689 | | | | 0.2 | |
| 1,217,000 | | | | | | Energy Transfer Partners L.P., 6.050%, 06/01/41 | | | 1,228,740 | | | | 0.2 | |
| 1,800,000 | | | | ±,X | | Greater Ohio Ethanol, LLC, 6.301%, 12/31/13 | | | — | | | | — | |
| 2,200,000 | | | | ±,X | | Greater Ohio Ethanol, LLC, 12.630%, 12/31/13 | | | — | | | | — | |
| 531,000 | | | | # | | KazMunaiGaz Finance Sub BV, 7.000%, 05/05/20 | | | 606,333 | | | | 0.1 | |
| 285,000 | | | | | | KazMunayGas National Co., 7.000%, 05/05/20 | | | 325,433 | | | | 0.0 | |
| 596,000 | | | | # | | Korea Gas Corp., 6.250%, 01/20/42 | | | 676,835 | | | | 0.1 | |
| 1,442,000 | | | | | | Marathon Petroleum Corp., 6.500%, 03/01/41 | | | 1,558,544 | | | | 0.2 | |
| 986,000 | | | | | | Nexen, Inc., 7.500%, 07/30/39 | | | 1,211,290 | | | | 0.2 | |
| 1,025,000 | | | | | | Noble Holding International Ltd., 3.950%, 03/15/22 | | | 1,025,917 | | | | 0.1 | |
| 1,495,000 | | | | | | Petrobras International Finance Co.—Pifco, 3.500%, 02/06/17 | | | 1,535,725 | | | | 0.2 | |
| 732,000 | | | | | | Petrobras International Finance Co.—Pifco, 5.375%, 01/27/21 | | | 791,555 | | | | 0.1 | |
| 988,000 | | | | | | Petroleos de Venezuela SA, 8.500%, 11/02/17 | | | 880,802 | | | | 0.1 | |
| 128,000 | | | | # | | Petroleos Mexicanos, 4.875%, 01/24/22 | | | 134,720 | | | | 0.0 | |
| 739,000 | | | | | | Petroleos Mexicanos, 5.500%, 01/21/21 | | | 818,442 | | | | 0.1 | |
| 1,457,000 | | | | # | | Phillips 66, 2.950%, 05/01/17 | | | 1,482,289 | | | | 0.2 | |
| 2,029,000 | | | | # | | Phillips 66, 4.300%, 04/01/22 | | | 2,067,237 | | | | 0.3 | |
| 1,350,000 | | | | | | Pioneer Natural Resources Co., 7.500%, 01/15/20 | | | 1,657,445 | | | | 0.2 | |
| 1,091,000 | | | | | | Plains All American Pipeline L.P. / PAA Finance Corp., 3.650%, 06/01/22 | | | 1,072,868 | | | | 0.1 | |
| 1,148,000 | | | | | | Plains All American Pipeline L.P. / PAA Finance Corp., 5.150%, 06/01/42 | | | 1,122,163 | | | | 0.1 | |
| 830,000 | | | | | | Plains Exploration & Production Co., 8.625%, 10/15/19 | | | 935,825 | | | | 0.1 | |
| 1,387,000 | | | | | | Pride International, Inc., 7.875%, 08/15/40 | | | 1,859,984 | | | | 0.2 | |
| 1,055,000 | | | | | | Range Resources Corp., 5.750%, 06/01/21 | | | 1,113,025 | | | | 0.1 | |
| 1,000,000 | | | | # | | Reliance Holdings USA, Inc., 5.400%, 02/14/22 | | | 996,302 | | | | 0.1 | |
| 1,331,000 | | | | # | | Schlumberger Investment SA, 1.950%, 09/14/16 | | | 1,347,924 | | | | 0.2 | |
| 1,463,000 | | | | | | Sempra Energy, 2.300%, 04/01/17 | | | 1,482,211 | | | | 0.2 | |
| 1,594,000 | | | | L | | TNK-BP Finance SA, 7.875%, 03/13/18 | | | 1,864,980 | | | | 0.2 | |
| 790,000 | | | | | | Transcontinental Gas Pipe Line Corp., 6.400%, 04/15/16 | | | 923,888 | | | | 0.1 | |
| 1,455,000 | | | | | | Transocean, Inc., 6.375%, 12/15/21 | | | 1,639,530 | | | | 0.2 | |
| 1,182,000 | | | | | | Weatherford International Ltd., 4.500%, 04/15/22 | | | 1,180,286 | | | | 0.1 | |
| 1,182,000 | | | | | | Weatherford International Ltd., 5.950%, 04/15/42 | | | 1,173,620 | | | | 0.1 | |
| 969,000 | | | | | | Weatherford International Ltd. Bermuda, 6.750%, 09/15/40 | | | 1,080,556 | | | | 0.1 | |
| 555,000 | | | | # | | WPX Energy, Inc., 6.000%, 01/15/22 | | | 557,775 | | | | 0.1 | |
| | | | | | | | | | 51,720,497 | | | | 6.3 | |
| | | | | | | Financials: 9.7% | | | | | | | | |
| 856,000 | | | | # | | ABN Amro Bank NV, 4.250%, 02/02/17 | | | 870,561 | | | | 0.1 | |
| 3,513,600 | | | | | | Aegon NV, 2.204%, 12/31/49 | | | 1,923,292 | | | | 0.2 | |
| 617,000 | | | | | | Allstate Corp./The, 5.200%, 01/15/42 | | | 645,887 | | | | 0.1 | |
| 584,000 | | | | | | American Express Credit Corp., 2.375%, 03/24/17 | | | 585,444 | | | | 0.1 | |
| 1,203,000 | | | | | | American International Group, Inc., 5.850%, 01/16/18 | | | 1,311,175 | | | | 0.2 | |
See Accompanying Notes to Financial Statements
14
ING INTERMEDIATE BOND FUND
PORTFOLIO OF INVESTMENTSAS OF MARCH 31, 2012 (CONTINUED)
Principal
Amount†
|
|
|
|
|
|
|
| Value
|
| Percentage
of Net
Assets
|
|---|
| 1,257,000 | | | | | | American International Group, Inc., 8.175%, 05/15/58 | | | 1,336,819 | | | | 0.2 | |
| 694,000 | | | | | | American Tower Corp., 4.700%, 03/15/22 | | | 700,682 | | | | 0.1 | |
| BRL 2,887,000 | | | | # | | Banco Votorantim SA, 6.250%, 05/16/16 | | | 1,735,727 | | | | 0.2 | |
| 800,000 | | | | | | Bank of America Corp., 3.750%, 07/12/16 | | | 804,617 | | | | 0.1 | |
| 962,000 | | | | | | Bank of America Corp., 5.700%, 01/24/22 | | | 1,019,893 | | | | 0.1 | |
| 823,000 | | | | | | Bank of America Corp., 5.875%, 02/07/42 | | | 819,022 | | | | 0.1 | |
| 1,314,000 | | | | | | Bank of America Corp., 8.000%, 12/29/49 | | | 1,348,983 | | | | 0.2 | |
| 1,122,000 | | | | | | BB&T Corp., 3.950%, 03/22/22 | | | 1,126,755 | | | | 0.1 | |
| 739,000 | | | | | | Berkshire Hathaway, Inc., 1.900%, 01/31/17 | | | 748,142 | | | | 0.1 | |
| 816,000 | | | | | | Berkshire Hathaway, Inc., 3.400%, 01/31/22 | | | 824,962 | | | | 0.1 | |
| 777,000 | | | | | | Boston Properties L.P., 3.700%, 11/15/18 | | | 804,570 | | | | 0.1 | |
| 772,000 | | | | | | Citigroup Capital XXI, 8.300%, 12/21/57 | | | 781,264 | | | | 0.1 | |
| 2,912,000 | | | | | | Citigroup, Inc., 3.953%, 06/15/16 | | | 2,994,835 | | | | 0.4 | |
| 1,209,000 | | | | | | Citigroup, Inc., 4.450%, 01/10/17 | | | 1,267,520 | | | | 0.1 | |
| 441,000 | | | | | | Citigroup, Inc., 4.500%, 01/14/22 | | | 443,422 | | | | 0.0 | |
| 519,000 | | | | | | Citigroup, Inc., 5.875%, 01/30/42 | | | 538,062 | | | | 0.1 | |
| 1,660,000 | | | | # | | Cooperatieve Centrale Raiffeisen-Boerenleenbank BA/Netherlands, 11.000%, 12/29/49 | | | 2,118,900 | | | | 0.2 | |
| 1,056,000 | | | | | | Discover Bank/Greenwood DE, 8.700%, 11/18/19 | | | 1,315,605 | | | | 0.2 | |
| 1,485,000 | | | | | | ERP Operating L.P., 4.625%, 12/15/21 | | | 1,566,010 | | | | 0.2 | |
| 829,000 | | | | | | Fifth Third Bancorp, 3.500%, 03/15/22 | | | 811,361 | | | | 0.1 | |
| 1,285,000 | | | | | | Fifth Third Bancorp., 8.250%, 03/01/38 | | | 1,706,628 | | | | 0.2 | |
| 1,065,000 | | | | | | Ford Motor Credit Co., LLC, 8.125%, 01/15/20 | | | 1,290,923 | | | | 0.1 | |
| 1,043,000 | | | | | | General Electric Capital Corp., 3.350%, 10/17/16 | | | 1,107,398 | | | | 0.1 | |
| 1,729,000 | | | | | | General Electric Capital Corp., 4.650%, 10/17/21 | | | 1,843,055 | | | | 0.2 | |
| 2,262,000 | | | | | | General Electric Capital Corp., 5.300%, 02/11/21 | | | 2,453,309 | | | | 0.3 | |
| 1,443,000 | | | | | | Genworth Financial, Inc., 7.625%, 09/24/21 | | | 1,494,750 | | | | 0.2 | |
| 1,899,000 | | | | | | Goldman Sachs Group, Inc./The, 5.750%, 01/24/22 | | | 1,956,498 | | | | 0.2 | |
| 521,000 | | | | | | Hartford Financial Services Group, Inc., 5.500%, 03/30/20 | | | 557,512 | | | | 0.1 | |
| 610,000 | | | | | | Hartford Financial Services Group, Inc., 6.625%, 03/30/40 | | | 630,272 | | | | 0.1 | |
| 538,000 | | | | | | HCP, Inc., 3.750%, 02/01/19 | | | 535,473 | | | | 0.1 | |
| 1,301,000 | | | | | | HSBC Finance Corp., 6.676%, 01/15/21 | | | 1,390,586 | | | | 0.2 | |
| 418,000 | | | | | | HSBC Holdings PLC, 4.875%, 01/14/22 | | | 443,542 | | | | 0.0 | |
| 1,325,000 | | | | | | HSBC USA, Inc., 2.375%, 02/13/15 | | | 1,335,004 | | | | 0.2 | |
| 2,278,000 | | | | # | | Hyundai Capital America, 4.000%, 06/08/17 | | | 2,342,718 | | | | 0.3 | |
| 964,000 | | | | # | | Iberdrola Finance Ireland Ltd., 3.800%, 09/11/14 | | | 989,813 | | | | 0.1 | |
| 1,361,000 | | | | # | | ILFC E-Capital Trust II, 6.250%, 12/21/65 | | | 1,003,737 | | | | 0.1 | |
| 1,312,000 | | | | | | International Lease Finance Corp., 5.875%, 04/01/19 | | | 1,269,416 | | | | 0.1 | |
| 1,037,000 | | | | # | | International Lease Finance Corp., 7.125%, 09/01/18 | | | 1,135,515 | | | | 0.1 | |
| 559,000 | | | | # | | IPIC GMTN Ltd., 3.750%, 03/01/17 | | | 571,577 | | | | 0.1 | |
| 1,300,000 | | | | # | | IPIC GMTN Ltd., 5.500%, 03/01/22 | | | 1,343,875 | | | | 0.2 | |
| 625,000 | | | | # | | IPIC GMTN Ltd., 6.875%, 11/01/41 | | | 656,250 | | | | 0.1 | |
| 1,026,000 | | | | | | Itau Unibanco Holding SA/Cayman Island, 5.750%, 01/22/21 | | | 1,056,780 | | | | 0.1 | |
| 601,000 | | | | # | | Itau Unibanco Holding SA/Cayman Island, 6.200%, 12/21/21 | | | 631,050 | | | | 0.1 | |
| 1,072,000 | | | | | | JP Morgan Chase Capital XX, 6.550%, 09/29/36 | | | 1,082,720 | | | | 0.1 | |
| 2,271,000 | | | | | | JPMorgan Chase & Co., 4.350%, 08/15/21 | | | 2,323,914 | | | | 0.3 | |
| 732,000 | | | | | | JPMorgan Chase & Co., 4.500%, 01/24/22 | | | 762,735 | | | | 0.1 | |
| 547,000 | | | | | | JPMorgan Chase & Co., 5.400%, 01/06/42 | | | 581,163 | | | | 0.1 | |
| 509,000 | | | | | | JPMorgan Chase Capital XXII, 6.450%, 02/02/37 | | | 511,545 | | | | 0.1 | |
| 1,727,000 | | | | | | Merrill Lynch & Co., Inc., 6.050%, 05/16/16 | | | 1,819,709 | | | | 0.2 | |
| 1,301,000 | | | | | | Morgan Stanley, 3.800%, 04/29/16 | | | 1,267,350 | | | | 0.1 | |
| 832,000 | | | | | | Morgan Stanley, 4.750%, 03/22/17 | | | 833,007 | | | | 0.1 | |
| 1,801,000 | | | | | | Morgan Stanley, 5.500%, 07/28/21 | | | 1,762,619 | | | | 0.2 | |
| 545,000 | | | | | | MPT Operating Partnership L.P./MPT Finance Corp., 6.375%, 02/15/22 | | | 555,900 | | | | 0.1 | |
| 2,403,000 | | | | | | Murray Street Investment Trust I, 4.647%, 03/09/17 | | | 2,406,878 | | | | 0.3 | |
| 612,000 | | | | | | National Rural Utilities Cooperative Finance Corp., 3.050%, 02/15/22 | | | 607,953 | | | | 0.1 | |
| DKK 16 | | | | | | Nordea Kredit Realkreditaktieselskab, 6.000%, 07/01/29 | | | 3 | | | | 0.0 | |
| 1,300,000 | | | | | | Owens, 7.375%, 05/15/16 | | | 1,469,000 | | | | 0.2 | |
| 882,000 | | | | | | Simon Property Group L.P., 4.125%, 12/01/21 | | | 926,953 | | | | 0.1 | |
See Accompanying Notes to Financial Statements
15
ING INTERMEDIATE BOND FUND
PORTFOLIO OF INVESTMENTSAS OF MARCH 31, 2012 (CONTINUED)
Principal
Amount†
|
|
|
|
|
|
|
| Value
|
| Percentage
of Net
Assets
|
|---|
| 755,000 | | | | | | SLM Corp., 6.000%, 01/25/17 | | | 778,296 | | | | 0.1 | |
| 1,007,000 | | | | | | SLM Corp., 8.000%, 03/25/20 | | | 1,090,078 | | | | 0.1 | |
| 2,347,000 | | | | | | The Bank of New York Mellon Corp., 3.550%, 09/23/21 | | | 2,407,792 | | | | 0.3 | |
| 1,583,000 | | | | ±,X | | Twin Reefs Pass-through Trust, 1.390%, 12/10/49 | | | — | | | | — | |
| 1,190,000 | | | | | | Wells Fargo & Co., 3.500%, 03/08/22 | | | 1,173,466 | | | | 0.1 | |
| 1,829,000 | | | | | | Zions Bancorporation, 4.500%, 03/27/17 | | | 1,819,175 | | | | 0.2 | |
| | | | | | | | | | 80,369,447 | | | | 9.7 | |
| | | | | | | Health Care: 1.7% | | | | | | | | |
| 785,000 | | | | | | Amgen, Inc., 3.875%, 11/15/21 | | | 805,087 | | | | 0.1 | |
| 1,179,000 | | | | | | Amgen, Inc., 5.150%, 11/15/41 | | | 1,184,469 | | | | 0.1 | |
| 1,075,000 | | | | # | | Aristotle Holding, Inc., 2.100%, 02/12/15 | | | 1,089,001 | | | | 0.1 | |
| 1,018,000 | | | | # | | Aristotle Holding, Inc., 2.650%, 02/15/17 | | | 1,030,441 | | | | 0.1 | |
| 1,268,000 | | | | # | | Aristotle Holding, Inc., 3.500%, 11/15/16 | | | 1,325,617 | | | | 0.2 | |
| 425,000 | | | | # | | CHS/Community Health Systems, Inc., 8.000%, 11/15/19 | | | 439,875 | | | | 0.1 | |
| 1,025,000 | | | | | | DaVita, Inc., 6.625%, 11/01/20 | | | 1,076,250 | | | | 0.1 | |
| 1,477,000 | | | | | | Gilead Sciences, Inc., 4.400%, 12/01/21 | | | 1,552,761 | | | | 0.2 | |
| 1,395,000 | | | | | | HCA, Inc., 7.250%, 09/15/20 | | | 1,525,781 | | | | 0.2 | |
| 685,000 | | | | # | | Mylan, Inc./PA, 7.875%, 07/15/20 | | | 767,200 | | | | 0.1 | |
| 775,000 | | | | | | Omnicare, Inc., 7.750%, 06/01/20 | | | 864,125 | | | | 0.1 | |
| 1,054,000 | | | | X | | U.S. Oncology Escrow, 87.500%, 12/31/49 | | | — | | | | — | |
| 915,000 | | | | # | | Valeant Pharmaceuticals International, 7.250%, 07/15/22 | | | 910,425 | | | | 0.1 | |
| 1,549,000 | | | | | | WellPoint, Inc., 3.700%, 08/15/21 | | | 1,610,054 | | | | 0.2 | |
| | | | | | | | | | 14,181,086 | | | | 1.7 | |
| | | | | | | Industrials: 0.6% | | | | | | | | |
| 900,000 | | | | # | | Bombardier, Inc., 7.500%, 03/15/18 | | | 994,500 | | | | 0.1 | |
| 890,000 | | | | # | | Bombardier, Inc., 7.750%, 03/15/20 | | | 996,800 | | | | 0.1 | |
| 185,000 | | | | | | Celanese US Holdings LLC, 5.875%, 06/15/21 | | | 195,406 | | | | 0.0 | |
| 720,000 | | | | | | MarkWest Energy Partners L.P. / MarkWest Energy Finance Corp., 6.500%, 08/15/21 | | | 768,600 | | | | 0.1 | |
| 975,000 | | | | # | | Schaeffler Finance BV, 7.750%, 02/15/17 | | | 1,035,937 | | | | 0.1 | |
| 235,000 | | | | # | | Schaeffler Finance BV, 8.500%, 02/15/19 | | | 252,038 | | | | 0.1 | |
| 836,000 | | | | | | Syngenta Finance NV, 3.125%, 03/28/22 | | | 842,939 | | | | 0.1 | |
| | | | | | | | | | 5,086,220 | | | | 0.6 | |
| | | | | | | Information Technology: 1.1% | | | | | | | | |
| 150,000 | | | | | | Brocade Communications Systems, Inc., 6.625%, 01/15/18 | | | 158,250 | | | | 0.0 | |
| 1,120,000 | | | | | | Brocade Communications Systems, Inc., 6.875%, 01/15/20 | | | 1,240,400 | | | | 0.2 | |
| 635,000 | | | | # | | Fidelity National Information Services, Inc., 5.000%, 03/15/22 | | | 628,650 | | | | 0.1 | |
| 825,000 | | | | | | Hewlett-Packard Co., 2.600%, 09/15/17 | | | 825,325 | | | | 0.1 | |
| 1,543,000 | | | | | | Hewlett-Packard Co., 3.000%, 09/15/16 | | | 1,586,290 | | | | 0.2 | |
| 625,000 | | | | | | Hewlett-Packard Co., 5.400%, 03/01/17 | | | 703,235 | | | | 0.1 | |
| 1,365,000 | | | | | | Jabil Circuit, Inc., 7.750%, 07/15/16 | | | 1,562,925 | | | | 0.2 | |
| 835,000 | | | | | | Seagate Technology, Inc., 6.800%, 10/01/16 | | | 924,763 | | | | 0.1 | |
| 952,000 | | | | | | Symantec Corp., 4.200%, 09/15/20 | | | 972,506 | | | | 0.1 | |
| | | | | | | | | | 8,602,344 | | | | 1.1 | |
| | | | | | | Materials: 2.9% | | | | | | | | |
| 1,203,000 | | | | | | Alcoa, Inc., 6.150%, 08/15/20 | | | 1,296,704 | | | | 0.2 | |
| 816,000 | | | | | | ArcelorMittal, 6.125%, 06/01/18 | | | 858,256 | | | | 0.1 | |
| 1,606,000 | | | | | | ArcelorMittal, 9.850%, 06/01/19 | | | 1,934,525 | | | | 0.2 | |
| 1,267,000 | | | | # | | Barrick Gold Corp., 3.850%, 04/01/22 | | | 1,269,418 | | | | 0.1 | |
| 1,480,000 | | | | # | | Barrick Gold Corp., 5.250%, 04/01/42 | | | 1,476,924 | | | | 0.2 | |
| 1,175,000 | | | | | | Case New Holland, Inc., 7.875%, 12/01/17 | | | 1,371,813 | | | | 0.2 | |
| 702,000 | | | | # | | Chevron Phillips Chemical Co. LLC, 7.000%, 06/15/14 | | | 787,450 | | | | 0.1 | |
| 220,000 | | | | | | Evraz Group SA, 6.750%, 04/27/18 | | | 211,486 | | | | 0.0 | |
| 820,000 | | | | #,L | | FMG Resources August 2006 Pty Ltd., 6.000%, 04/01/17 | | | 813,850 | | | | 0.1 | |
| 460,000 | | | | # | | FMG Resources August 2006 Pty Ltd., 7.000%, 11/01/15 | | | 471,500 | | | | 0.1 | |
| 495,000 | | | | # | | Georgia-Pacific LLC, 5.400%, 11/01/20 | | | 553,327 | | | | 0.1 | |
| 1,100,000 | | | | L | | Huntsman International LLC, 8.625%, 03/15/21 | | | 1,240,250 | | | | 0.1 | |
| 381,811 | | | | | | Lyondell Chemical Co., 11.000%, 05/01/18 | | | 423,810 | | | | 0.0 | |
| 740,000 | | | | | | Newmont Mining Corp., 3.500%, 03/15/22 | | | 714,107 | | | | 0.1 | |
| 713,000 | | | | | | Newmont Mining Corp., 4.875%, 03/15/42 | | | 663,787 | | | | 0.1 | |
| 1,025,000 | | | | | | Nova Chemicals Corp., 8.375%, 11/01/16 | | | 1,142,875 | | | | 0.1 | |
| 2,107,000 | | | | | | Rio Tinto Finance USA PLC, 3.500%, 03/22/22 | | | 2,114,387 | | | | 0.3 | |
See Accompanying Notes to Financial Statements
16
ING INTERMEDIATE BOND FUND
PORTFOLIO OF INVESTMENTSAS OF MARCH 31, 2012 (CONTINUED)
Principal
Amount†
|
|
|
|
|
|
|
| Value
|
| Percentage
of Net
Assets
|
|---|
| 460,000 | | | | # | | Sealed Air Corp., 8.375%, 09/15/21 | | | 519,225 | | | | 0.1 | |
| 230,000 | | | | | | Southern Copper Corp., 5.375%, 04/16/20 | | | 253,462 | | | | 0.0 | |
| 825,000 | | | | | | Teck Resources Ltd., 5.200%, 03/01/42 | | | 783,156 | | | | 0.1 | |
| 1,008,000 | | | | | | Teck Resources Ltd., 10.250%, 05/15/16 | | | 1,155,244 | | | | 0.1 | |
| 2,078,000 | | | | | | Vale Overseas Ltd., 4.625%, 09/15/20 | | | 2,195,428 | | | | 0.3 | |
| 860,000 | | | | # | | Volcan Cia Minera SAA, 5.375%, 02/02/22 | | | 892,250 | | | | 0.1 | |
| 827,000 | | | | # | | Xstrata Canada Financial Corp., 4.950%, 11/15/21 | | | 867,729 | | | | 0.1 | |
| | | | | | | | | | 24,010,963 | | | | 2.9 | |
| | | | | | | Telecommunication Services: 2.4% | | | | | | | | |
| 1,410,000 | | | | | | American Tower Corp., 4.500%, 01/15/18 | | | 1,482,994 | | | | 0.2 | |
| 1,608,000 | | | | | | AT&T, Inc., 5.350%, 09/01/40 | | | 1,710,825 | | | | 0.2 | |
| 931,000 | | | | | | CenturyLink, Inc., 5.800%, 03/15/22 | | | 910,485 | | | | 0.1 | |
| 800,000 | | | | | | CenturyLink, Inc., 6.000%, 04/01/17 | | | 851,203 | | | | 0.1 | |
| 500,000 | | | | | | Frontier Communications Corp., 7.875%, 04/15/15 | | | 540,000 | | | | 0.1 | |
| 570,000 | | | | | | Frontier Communications Corp., 8.125%, 10/01/18 | | | 605,625 | | | | 0.1 | |
| 425,000 | | | | | | Hughes Satellite Systems Corp., 6.500%, 06/15/19 | | | 446,250 | | | | 0.0 | |
| 425,000 | | | | | | Intelsat Jackson Holdings SA, 7.250%, 10/15/20 | | | 447,844 | | | | 0.0 | |
| 450,000 | | | | | | Intelsat Jackson Holdings SA, 7.500%, 04/01/21 | | | 475,313 | | | | 0.1 | |
| 510,000 | | | | | | MetroPCS Wireless, Inc., 6.625%, 11/15/20 | | | 508,088 | | | | 0.1 | |
| 586,000 | | | | | | Qwest Communications International, Inc., 7.125%, 04/01/18 | | | 628,455 | | | | 0.1 | |
| 770,000 | | | | # | | Sable International Finance Ltd., 8.750%, 02/01/20 | | | 820,050 | | | | 0.1 | |
| 1,568,000 | | | | | | Telecom Italia Capital S.A., 5.250%, 11/15/13 | | | 1,615,040 | | | | 0.2 | |
| 1,428,000 | | | | | | Telefonica Emisiones SAU, 3.992%, 02/16/16 | | | 1,422,379 | | | | 0.2 | |
| 2,826,000 | | | | # | | Telstra Corp. Ltd., 4.800%, 10/12/21 | | | 3,076,392 | | | | 0.4 | |
| 810,000 | | | | # | | UPCB Finance VI Ltd., 6.875%, 01/15/22 | | | 840,375 | | | | 0.1 | |
| 1,197,000 | | | | | | Verizon Communications, Inc., 3.500%, 11/01/21 | | | 1,226,593 | | | | 0.1 | |
| 627,000 | | | | | | Verizon Communications, Inc., 4.750%, 11/01/41 | | | 635,078 | | | | 0.1 | |
| 1,200,000 | | | | | | Windstream Corp., 7.000%, 03/15/19 | | | 1,230,000 | | | | 0.1 | |
| | | | | | | | | | 19,472,989 | | | | 2.4 | |
| | | | | | | Utilities: 2.2% | | | | | | | | |
| 855,000 | | | | | | AES Corp., 8.000%, 10/15/17 | | | 967,219 | | | | 0.1 | |
| 1,191,000 | | | | | | Ameren Corp., 8.875%, 05/15/14 | | | 1,351,436 | | | | 0.2 | |
| 1,105,000 | | | | # | | Calpine Corp., 7.500%, 02/15/21 | | | 1,185,112 | | | | 0.1 | |
| 1,043,000 | | | | | | CMS Energy Corp., 6.250%, 02/01/20 | | | 1,144,187 | | | | 0.1 | |
| 205,000 | | | | # | | Comision Federal de Electricidad, 5.750%, 02/14/42 | | | 206,845 | | | | 0.0 | |
| 922,000 | | | | | | Commonwealth Edison Co., 3.400%, 09/01/21 | | | 952,172 | | | | 0.1 | |
| 1,249,000 | | | | # | | Duquesne Light Holdings, Inc., 6.400%, 09/15/20 | | | 1,382,016 | | | | 0.2 | |
| 873,000 | | | | # | | Empresa de Energia de Bogota SA, 6.125%, 11/10/21 | | | 929,745 | | | | 0.1 | |
| 782,000 | | | | | | Entergy Texas, Inc., 7.125%, 02/01/19 | | | 931,891 | | | | 0.1 | |
| 1,250,000 | | | | | | Gazprom OAO Via Gaz Capital SA, 6.212%, 11/22/16 | | | 1,366,362 | | | | 0.2 | |
| 818,000 | | | | L | | Gazprom OAO Via Gaz Capital SA, 6.510%, 03/07/22 | | | 895,710 | | | | 0.1 | |
| 137,707 | | | | # | | Juniper Generation, LLC, 6.790%, 12/31/14 | | | 116,024 | | | | 0.0 | |
| 618,000 | | | | | | Metropolitan Edison, 7.700%, 01/15/19 | | | 771,387 | | | | 0.1 | |
| 709,000 | | | | | | Nevada Power Co., 7.125%, 03/15/19 | | | 891,262 | | | | 0.1 | |
| 413,000 | | | | | | Nisource Finance Corp., 4.450%, 12/01/21 | | | 431,468 | | | | 0.1 | |
| 521,000 | | | | | | Nisource Finance Corp., 5.950%, 06/15/41 | | | 570,689 | | | | 0.1 | |
| 645,000 | | | | | | Nisource Finance Corp., 6.125%, 03/01/22 | | | 750,565 | | | | 0.1 | |
| 980,000 | | | | | | Oncor Electric Delivery Co., 6.800%, 09/01/18 | | | 1,185,945 | | | | 0.1 | |
| 851,000 | | | | | | Oncor Electric Delivery Co., 7.500%, 09/01/38 | | | 1,081,041 | | | | 0.1 | |
| 1,169,000 | | | | | | Southwestern Electric Power, 5.550%, 01/15/17 | | | 1,314,526 | | | | 0.2 | |
| | | | | | | | | | 18,425,602 | | | | 2.2 | |
| | | | | | | | | Total Corporate Bonds/Notes
(Cost $267,518,452)
| |
274,472,002 | | | |
33.2 | |
COLLATERALIZED MORTGAGE OBLIGATIONS: 11.2%
|
| 1,039,000 | | | | # | | American General Mortgage Loan Trust, 5.650%, 03/25/58 | | | 1,094,730 | | | | 0.1 | |
| 2,753,000 | | | | # | | American General Mortgage Loan Trust, 5.750%, 09/25/48 | | | 2,831,858 | | | | 0.3 | |
| 900,000 | | | | # | | Arkle Master Issuer PLC, 2.215%, 05/17/60 | | | 901,034 | | | | 0.1 | |
| 25,722,516 | | | | #,ˆ | | Banc of America Commercial Mortgage, Inc., 0.231%, 10/10/45 | | | 263,342 | | | | 0.0 | |
| 990,000 | | | | | | Banc of America Commercial Mortgage, Inc., 5.837%, 06/10/49 | | | 968,002 | | | | 0.1 | |
See Accompanying Notes to Financial Statements
17
ING INTERMEDIATE BOND FUND
PORTFOLIO OF INVESTMENTSAS OF MARCH 31, 2012 (CONTINUED)
Principal
Amount†
|
|
|
|
|
|
|
| Value
|
| Percentage
of Net
Assets
|
|---|
| 2,227,750 | | | | # | | Banc of America Funding Corp., 5.250%, 08/26/35 | | | 2,255,058 | | | | 0.3 | |
| 2,937,341 | | | | | | Banc of America Funding Corp., 5.500%, 02/25/35 | | | 2,945,205 | | | | 0.4 | |
| 738,213 | | | | # | | Banc of America Large Loan, Inc., 1.642%, 06/15/18 | | | 728,670 | | | | 0.1 | |
| 1,030,000 | | | | | | Banc of America Merrill Lynch Commercial Mortgage, Inc., 5.366%, 09/10/47 | | | 933,936 | | | | 0.1 | |
| 770,000 | | | | # | | Banc of America Merrill Lynch Commercial Mortgage, Inc., 5.498%, 07/10/43 | | | 747,286 | | | | 0.1 | |
| 392,713 | | | | # | | Banc of America Merrill Lynch Commercial Mortgage, Inc., 6.850%, 11/15/31 | | | 396,546 | | | | 0.0 | |
| 650,000 | | | | # | | Bank of America-First Union NB Commercial Mortgage, 6.250%, 04/11/37 | | | 608,229 | | | | 0.1 | |
| 541,285 | | | | | | Bear Stearns Alternative-A Trust, 0.882%, 07/25/34 | | | 423,452 | | | | 0.0 | |
| 740,000 | | | | | | Bear Stearns Commercial Mortgage Securities, 5.134%, 02/13/42 | | | 618,579 | | | | 0.1 | |
| 660,000 | | | | # | | Bear Stearns Commercial Mortgage Securities, 5.541%, 04/12/38 | | | 611,173 | | | | 0.1 | |
| 240,000 | | | | # | | Bear Stearns Commercial Mortgage Securities, 5.640%, 02/14/31 | | | 238,461 | | | | 0.0 | |
| 550,000 | | | | | | Bear Stearns Commercial Mortgage Securities, 6.500%, 02/15/32 | | | 505,185 | | | | 0.1 | |
| 347,192 | | | | # | | Bear Stearns Commercial Mortgage Securities, 6.500%, 02/15/32 | | | 347,315 | | | | 0.0 | |
| 730,000 | | | | # | | Bear Stearns Deutsche Bank Trust, 5.008%, 09/15/27 | | | 770,908 | | | | 0.1 | |
| 1,415,972 | | | | | | Chase Mortgage Finance Corp., 5.280%, 12/25/35 | | | 1,350,010 | | | | 0.2 | |
| 52,910 | | | | | | Chase Mortgage Finance Corp., 5.500%, 11/25/35 | | | 52,704 | | | | 0.0 | |
| 2,308,877 | | | | | | Citicorp Mortgage Securities, Inc., 6.000%, 06/25/36 | | | 2,277,644 | | | | 0.3 | |
| 1,189,955 | | | | | | Citicorp Mortgage Securities, Inc., 6.000%, 08/25/36 | | | 1,149,058 | | | | 0.1 | |
| 74,203 | | | | | | Citigroup Commercial Mortgage Trust, 5.378%, 10/15/49 | | | 74,759 | | | | 0.0 | |
| 609,494 | | | | # | | Commercial Mortgage Pass Through Certificates, 0.422%, 06/15/22 | | | 592,888 | | | | 0.1 | |
| 706,852 | | | | # | | Commercial Mortgage Pass Through Certificates, 0.692%, 12/15/20 | | | 651,061 | | | | 0.1 | |
| 567,227 | | | | # | | Commercial Mortgage Pass Through Certificates, 0.742%, 12/15/20 | | | 519,624 | | | | 0.1 | |
| 514,868 | | | | # | | Commercial Mortgage Pass Through Certificates, 0.842%, 12/15/20 | | | 469,088 | | | | 0.1 | |
| 1,853,289 | | | | # | | Commercial Mortgage Pass Through Certificates, 3.828%, 12/17/13 | | | 1,883,179 | | | | 0.2 | |
| 419,601 | | | | | | Commercial Mortgage Pass Through Certificates, 5.811%, 12/10/49 | | | 421,786 | | | | 0.0 | |
| 5,400,259 | | | | | | Countrywide Alternative Loan Trust, 0.642%, 05/25/36 | | | 2,188,547 | | | | 0.3 | |
| 1,024,955 | | | | | | Countrywide Home Loan Mortgage Pass-through Trust, 0.562%, 04/25/35 | | | 192,134 | | | | 0.0 | |
| 830,000 | | | | | | Credit Suisse First Boston Mortgage Securities Corp., 5.100%, 08/15/38 | | | 773,117 | | | | 0.1 | |
| 730,000 | | | | # | | Credit Suisse Mortgage Capital Certificates, 5.599%, 04/12/49 | | | 742,570 | | | | 0.1 | |
| 500,000 | | | | | | Credit Suisse Mortgage Capital Certificates, 5.714%, 06/15/39 | | | 541,679 | | | | 0.1 | |
| 2,151,305 | | | | | | Deutsche ALT-A Securities, Inc. Alternate Loan Trust, 0.362%, 08/25/36 | | | 985,102 | | | | 0.1 | |
| 2,606,070 | | | | | | Deutsche ALT-A Securities, Inc. Alternate Loan Trust, 0.432%, 10/25/36 | | | 1,096,560 | | | | 0.1 | |
| 1,251,345 | | | | | | First Horizon Asset Securities, Inc., 5.750%, 02/25/36 | | | 1,252,815 | | | | 0.1 | |
| 1,973,587 | | | | | | Freddie Mac, 5.000%, 02/15/35 | | | 2,204,881 | | | | 0.3 | |
| 1,622,572 | | | | | | Freddie Mac, 5.500%, 07/15/37 | | | 1,860,179 | | | | 0.2 | |
| 2,430,000 | | | | # | | GS Mortgage Securities Corp. II, 5.309%, 01/10/40 | | | 2,453,982 | | | | 0.3 | |
| 257,155 | | | | | | GS Mortgage Securities Corp. II, 5.479%, 11/10/39 | | | 258,745 | | | | 0.0 | |
| 82,928 | | | | | | GSR Mortgage Loan Trust, 0.742%, 06/25/35 | | | 73,391 | | | | 0.0 | |
| 950,547 | | | | | | GSR Mortgage Loan Trust, 5.500%, 07/25/35 | | | 942,699 | | | | 0.1 | |
| 2,100,000 | | | | # | | Holmes Master Issuer PLC, 2.165%, 10/15/54 | | | 2,119,839 | | | | 0.3 | |
See Accompanying Notes to Financial Statements
18
ING INTERMEDIATE BOND FUND
PORTFOLIO OF INVESTMENTSAS OF MARCH 31, 2012 (CONTINUED)
Principal
Amount†
|
|
|
|
|
|
|
| Value
|
| Percentage
of Net
Assets
|
|---|
| 271,958 | | | | | | Homebanc Mortgage Trust, 1.102%, 08/25/29 | | | 199,752 | | | | 0.0 | |
| 200,000 | | | | | | JP Morgan Chase Commercial Mortgage Securities Corp., 5.198%, 12/15/44 | | | 201,622 | | | | 0.0 | |
| 1,358,920 | | | | | | JP Morgan Chase Commercial Mortgage Securities Corp., 5.801%, 06/15/49 | | | 1,366,534 | | | | 0.2 | |
| 1,189,888 | | | | | | JP Morgan Commercial Mortgage Finance Corp., 8.271%, 08/15/32 | | | 1,229,062 | | | | 0.1 | |
| 452,363 | | | | | | JPMorgan Mortgage Trust, 5.315%, 07/25/35 | | | 459,434 | | | | 0.1 | |
| 18,576,361 | | | | ˆ | | LB-UBS Commercial Mortgage Trust, 0.169%, 11/15/40 | | | 24,222 | | | | 0.0 | |
| 37,748,398 | | | | #,ˆ | | LB-UBS Commercial Mortgage Trust, 0.199%, 09/15/39 | | | 661,624 | | | | 0.1 | |
| 54,636,005 | | | | #,ˆ | | LB-UBS Commercial Mortgage Trust, 0.649%, 11/15/38 | | | 1,266,135 | | | | 0.2 | |
| 1,110,000 | | | | | | LB-UBS Commercial Mortgage Trust, 4.924%, 07/15/40 | | | 991,552 | | | | 0.1 | |
| 670,000 | | | | | | LB-UBS Commercial Mortgage Trust, 4.983%, 07/15/40 | | | 443,440 | | | | 0.1 | |
| 740,000 | | | | # | | LB-UBS Commercial Mortgage Trust, 5.032%, 10/15/36 | | | 699,042 | | | | 0.1 | |
| 820,000 | | | | | | LB-UBS Commercial Mortgage Trust, 5.350%, 11/15/40 | | | 723,061 | | | | 0.1 | |
| 1,140,000 | | | | | | LB-UBS Commercial Mortgage Trust, 5.713%, 09/15/45 | | | 1,234,487 | | | | 0.1 | |
| 410,000 | | | | # | | LB-UBS Commercial Mortgage Trust, 5.750%, 01/15/36 | | | 410,611 | | | | 0.0 | |
| 2,490,000 | | | | | | LB-UBS Commercial Mortgage Trust, 5.886%, 06/15/38 | | | 2,097,099 | | | | 0.3 | |
| 2,250,000 | | | | # | | Lehman Brothers Floating Rate Commercial Mortgage Trust, 0.592%, 06/15/22 | | | 2,137,961 | | | | 0.3 | |
| 510,000 | | | | # | | Merrill Lynch Mortgage Investors, Inc., 6.000%, 12/15/30 | | | 516,212 | | | | 0.1 | |
| 352,364 | | | | | | Merrill Lynch Mortgage Investors, Inc., 6.250%, 12/10/29 | | | 357,504 | | | | 0.0 | |
| 50,700,501 | | | | #,ˆ | | Merrill Lynch Mortgage Trust, 0.521%, 02/12/51 | | | 861,036 | | | | 0.1 | |
| 1,220,000 | | | | | | Morgan Stanley Capital I, 5.073%, 08/13/42 | | | 1,220,940 | | | | 0.1 | |
| 1,690,000 | | | | | | Morgan Stanley Capital I, 5.172%, 08/13/42 | | | 1,589,924 | | | | 0.2 | |
| 850,000 | | | | | | Morgan Stanley Capital I, 5.202%, 08/13/42 | | | 755,418 | | | | 0.1 | |
| 1,390,000 | | | | | | Morgan Stanley Capital I, 5.302%, 01/14/42 | | | 1,372,710 | | | | 0.2 | |
| 1,080,000 | | | | | | Morgan Stanley Capital I, 5.336%, 01/14/42 | | | 1,049,696 | | | | 0.1 | |
| 850,000 | | | | | | Morgan Stanley Capital I, 5.300%, 06/15/40 | | | 786,083 | | | | 0.1 | |
| 1,000,000 | | | | # | | Morgan Stanley Capital I, 5.397%, 01/13/41 | | | 963,797 | | | | 0.1 | |
| 1,789,189 | | | | | | Morgan Stanley Capital I, 5.599%, 04/12/49 | | | 1,842,030 | | | | 0.2 | |
| 1,700,000 | | | | | | Morgan Stanley Capital I, 5.793%, 07/12/44 | | | 1,670,346 | | | | 0.2 | |
| 1,580,000 | | | | # | | Morgan Stanley Capital I, 5.813%, 08/12/41 | | | 1,224,763 | | | | 0.1 | |
| 280,000 | | | | # | | Morgan Stanley Capital I, 7.350%, 07/15/32 | | | 286,813 | | | | 0.0 | |
| 984,000 | | | | # | | Morgan Stanley Reremic Trust, 5.870%, 12/17/43 | | | 1,009,886 | | | | 0.1 | |
| 19,447,959 | | | | #,ˆ | | RBSCF Trust, 0.985%, 04/15/24 | | | 493,910 | | | | 0.1 | |
| 2,580,000 | | | | # | | RBSCF Trust, 5.305%, 01/16/49 | | | 2,637,767 | | | | 0.3 | |
| 4,858,183 | | | | | | Residential Accredit Loans, Inc., 0.412%, 01/25/37 | | | 2,440,578 | | | | 0.3 | |
| 1,886,365 | | | | | | Residential Accredit Loans, Inc., 0.692%, 12/25/36 | | | 705,407 | | | | 0.1 | |
| 267,457 | | | | | | Salomon Brothers Mortgage Securities VII, Inc., 6.784%, 12/18/35 | | | 268,018 | | | | 0.0 | |
| 292,283 | | | | | | Sequoia Mortgage Trust, 0.512%, 01/20/35 | | | 229,832 | | | | 0.0 | |
| 1,551,000 | | | | # | | Silverstone Master Issuer PLC, 1.792%, 01/21/55 | | | 1,562,169 | | | | 0.2 | |
| 489,718 | | | | | | Structured Adjustable Rate Mortgage Loan Trust, 2.742%, 09/25/34 | | | 471,052 | | | | 0.1 | |
| 617,425 | | | | | | Structured Asset Mortgage Investments, Inc., 0.482%, 04/19/35 | | | 498,512 | | | | 0.1 | |
| 866,173 | | | | | | Structured Asset Securities Corp., 5.500%, 05/25/35 | | | 877,363 | | | | 0.1 | |
| 934,626 | | | | | | Wachovia Bank Commercial Mortgage Trust, 5.030%, 01/15/41 | | | 948,850 | | | | 0.1 | |
| 630,000 | | | | | | Wachovia Bank Commercial Mortgage Trust, 5.383%, 12/15/43 | | | 592,898 | | | | 0.1 | |
| 490,000 | | | | # | | Wachovia Bank Commercial Mortgage Trust, 6.290%, 04/15/34 | | | 487,938 | | | | 0.1 | |
| 1,912,185 | | | | | | WaMu Mortgage Pass Through Certificates, 2.474%, 01/25/36 | | | 1,779,960 | | | | 0.2 | |
| 1,188,404 | | | | | | Washington Mutual Mortgage Pass-through Certificates, 6.000%, 06/25/34 | | | 1,269,492 | | | | 0.2 | |
| 2,414,073 | | | | | | Wells Fargo Mortgage Backed Securities Trust, 2.664%, 06/25/35 | | | 2,365,204 | | | | 0.3 | |
| | | | | | | | | Total Collateralized Mortgage Obligations
(Cost $92,972,920)
| |
92,598,756 | | | |
11.2 | |
U.S. GOVERNMENT AGENCY OBLIGATIONS: 31.0%
|
| | | | | | | Federal Home Loan Mortgage Corporation: 11.5%## | | | | | | | | |
| 10,955,160 | | | | ˆ | | 6.243%, due 06/15/36 | | | 1,743,037 | | | | 0.2 | |
| 149,168 | | | | | | 0.592%, due 02/15/32 | | | 149,545 | | | | 0.0 | |
See Accompanying Notes to Financial Statements
19
ING INTERMEDIATE BOND FUND
PORTFOLIO OF INVESTMENTSAS OF MARCH 31, 2012 (CONTINUED)
Principal
Amount†
|
|
|
|
|
|
|
| Value
|
| Percentage
of Net
Assets
|
|---|
| 1,093,041 | | | | | | 3.342%, due 03/15/38 | | | 1,137,783 | | | | 0.1 | |
| 1,459,000 | | | | W | | 3.500%, due 08/15/41 | | | 1,490,688 | | | | 0.2 | |
| 5,791,900 | | | | | | 4.000%, due 10/01/41 | | | 6,069,964 | | | | 0.7 | |
| 1,966,756 | | | | | | 4.000%, due 10/01/41 | | | 2,061,178 | | | | 0.3 | |
| 7,389,692 | | | | | | 4.000%, due 12/01/41 | | | 7,744,464 | | | | 0.9 | |
| 3,604,152 | | | | | | 4.500%, due 08/01/41 | | | 3,824,979 | | | | 0.5 | |
| 1,288,487 | | | | | | 4.500%, due 08/01/41 | | | 1,367,433 | | | | 0.2 | |
| 3,503,387 | | | | | | 4.500%, due 08/01/41 | | | 3,718,040 | | | | 0.5 | |
| 3,876,203 | | | | | | 4.500%, due 09/01/41 | | | 4,113,699 | | | | 0.5 | |
| 5,289,661 | | | | | | 4.500%, due 10/01/41 | | | 5,613,759 | | | | 0.7 | |
| 2,236,706 | | | | ˆ | | 4.858%, due 03/15/33 | | | 2,357,805 | | | | 0.3 | |
| 338,013 | | | | | | 4.892%, due 04/01/35 | | | 360,557 | | | | 0.0 | |
| 614,802 | | | | ˆ | | 5.000%, due 05/15/17 | | | 17,703 | | | | 0.0 | |
| 1,353,332 | | | | | | 5.000%, due 12/15/17 | | | 1,454,445 | | | | 0.2 | |
| 399,282 | | | | | | 5.000%, due 02/15/32 | | | 413,043 | | | | 0.1 | |
| 738,885 | | | | | | 5.000%, due 04/15/32 | | | 748,387 | | | | 0.1 | |
| 1,423,945 | | | | | | 5.000%, due 02/15/35 | | | 1,598,805 | | | | 0.2 | |
| 905,044 | | | | | | 5.000%, due 02/15/35 | | | 955,937 | | | | 0.1 | |
| 770,551 | | | | | | 5.000%, due 01/01/41 | | | 830,184 | | | | 0.1 | |
| 5,958,593 | | | | | | 5.500%, due 08/15/20 | | | 6,033,586 | | | | 0.7 | |
| 2,330,696 | | | | | | 5.500%, due 11/15/22 | | | 2,535,642 | | | | 0.3 | |
| 1,464,946 | | | | | | 5.500%, due 07/15/32 | | | 1,509,733 | | | | 0.2 | |
| 3,074,295 | | | | | | 5.500%, due 12/15/32 | | | 3,410,949 | | | | 0.4 | |
| 1,424,072 | | | | | | 5.500%, due 09/15/34 | | | 1,588,838 | | | | 0.2 | |
| 930,603 | | | | | | 5.500%, due 09/15/35 | | | 919,610 | | | | 0.1 | |
| 10,877,101 | | | | | | 5.500%, due 02/15/36 | | | 12,208,268 | | | | 1.5 | |
| 1,406,407 | | | | | | 5.500%, due 08/15/36 | | | 1,639,125 | | | | 0.2 | |
| 1,610,000 | | | | | | 5.500%, due 05/15/37 | | | 1,793,163 | | | | 0.2 | |
| 3,767,000 | | | | | | 5.500%, due 06/15/37 | | | 4,243,458 | | | | 0.5 | |
| 76,137 | | | | | | 5.674%, due 05/01/37 | | | 82,143 | | | | 0.0 | |
| 6,112,197 | | | | ˆ | | 5.808%, due 07/15/40 | | | 1,047,061 | | | | 0.1 | |
| 5,468 | | | | | | 6.000%, due 04/01/14 | | | 5,799 | | | | 0.0 | |
| 22,330 | | | | | | 6.000%, due 12/01/28 | | | 24,993 | | | | 0.0 | |
| 23,660 | | | | | | 6.000%, due 01/01/29 | | | 26,482 | | | | 0.0 | |
| 819,338 | | | | | | 6.000%, due 01/15/29 | | | 927,036 | | | | 0.1 | |
| 842,718 | | | | | | 6.000%, due 01/15/29 | | | 916,547 | | | | 0.1 | |
| 956,170 | | | | | | 6.000%, due 07/15/32 | | | 1,084,756 | | | | 0.1 | |
| 788,075 | | | | ˆ | | 6.000%, due 04/15/33 | | | 139,398 | | | | 0.0 | |
| 3,680,203 | | | | | | 6.000%, due 10/15/37 | | | 4,284,690 | | | | 0.5 | |
| 25,800,354 | | | | ˆ | | 6.358%, due 09/15/34 | | | 3,084,492 | | | | 0.4 | |
| 25,598 | | | | | | 6.500%, due 01/01/24 | | | 28,838 | | | | 0.0 | |
| 1,299 | | | | | | 6.500%, due 11/01/28 | | | 1,485 | | | | 0.0 | |
| 32,050 | | | | | | 6.500%, due 12/01/31 | | | 36,486 | | | | 0.0 | |
| 20,321 | | | | | | 7.000%, due 11/01/31 | | | 23,645 | | | | 0.0 | |
| 13,463 | | | | | | 7.000%, due 03/01/32 | | | 15,615 | | | | 0.0 | |
| 4,970 | | | | | | 7.500%, due 11/01/28 | | | 5,900 | | | | 0.0 | |
| | | | | | | | | | 95,389,173 | | | | 11.5 | |
| | | | | | | Federal National Mortgage Association: 13.5%## | | | | | | | | |
| 255,013 | | | | | | 0.642%, due 04/18/28 | | | 256,192 | | | | 0.0 | |
| 149,891 | | | | | | 0.700%, due 10/25/33 | | | 150,820 | | | | 0.0 | |
| 154,586 | | | | | | 0.792%, due 01/25/32 | | | 154,616 | | | | 0.0 | |
| 18,624,000 | | | | W | | 3.500%, due 12/25/40 | | | 19,075,050 | | | | 2.3 | |
| 1,321,903 | | | | ˆ | | 4.000%, due 11/01/18 | | | 96,467 | | | | 0.0 | |
| 22,791,000 | | | | W | | 4.000%, due 02/25/39 | | | 23,852,206 | | | | 2.9 | |
| 5,230,616 | | | | | | 4.000%, due 09/01/41 | | | 5,491,778 | | | | 0.7 | |
| 2,166,902 | | | | | | 4.000%, due 03/01/42 | | | 2,275,433 | | | | 0.3 | |
| 6,022,000 | | | | W | | 4.500%, due 05/15/35 | | | 6,397,434 | | | | 0.8 | |
| 1,390,467 | | | | | | 4.500%, due 11/01/40 | | | 1,481,527 | | | | 0.2 | |
| 1,905,658 | | | | | | 4.500%, due 11/01/40 | | | 2,030,458 | | | | 0.3 | |
| 18,756 | | | | | | 4.500%, due 12/01/40 | | | 19,985 | | | | 0.0 | |
| 29,211 | | | | | | 4.500%, due 12/01/40 | | | 31,124 | | | | 0.0 | |
| 29,343 | | | | | | 4.500%, due 01/01/41 | | | 31,264 | | | | 0.0 | |
| 38,499 | | | | | | 4.500%, due 01/01/41 | | | 41,020 | | | | 0.0 | |
| 7,088,324 | | | | | | 4.500%, due 09/01/41 | | | 7,565,822 | | | | 0.9 | |
| 2,532,126 | | | | | | 4.500%, due 10/01/41 | | | 2,702,700 | | | | 0.3 | |
| 1,021,984 | | | | | | 4.500%, due 11/01/41 | | | 1,090,829 | | | | 0.1 | |
| 56,680 | | | | | | 5.000%, due 07/01/23 | | | 61,319 | | | | 0.0 | |
| 1,009,788 | | | | | | 5.000%, due 05/25/32 | | | 1,047,388 | | | | 0.1 | |
| 834,625 | | | | | | 5.000%, due 06/01/33 | | | 903,814 | | | | 0.1 | |
| 932,698 | | | | | | 5.000%, due 07/25/34 | | | 979,381 | | | | 0.1 | |
| 1,250,451 | | | | | | 5.000%, due 07/01/35 | | | 1,353,525 | | | | 0.2 | |
| 2,111,715 | | | | | | 5.000%, due 08/01/35 | | | 2,283,803 | | | | 0.3 | |
| 372,279 | | | | | | 5.000%, due 10/01/35 | | | 402,616 | | | | 0.1 | |
| 1,357,399 | | | | | | 5.000%, due 01/01/36 | | | 1,468,016 | | | | 0.2 | |
| 892,938 | | | | | | 5.000%, due 02/01/36 | | | 965,705 | | | | 0.1 | |
| 1,800,359 | | | | | | 5.000%, due 07/01/36 | | | 1,949,605 | | | | 0.2 | |
| 1,009,000 | | | | W | | 5.000%, due 05/01/37 | | | 1,088,301 | | | | 0.1 | |
| 2,266,033 | | | | | | 5.000%, due 07/01/37 | | | 2,453,883 | | | | 0.3 | |
| 741,396 | | | | | | 5.000%, due 11/01/40 | | | 801,350 | | | | 0.1 | |
| 630,997 | | | | | | 5.000%, due 02/01/41 | | | 683,404 | | | | 0.1 | |
| 395,364 | | | | | | 5.000%, due 05/01/41 | | | 428,201 | | | | 0.1 | |
| 1,331,661 | | | | | | 5.000%, due 06/01/41 | | | 1,442,261 | | | | 0.2 | |
| 959,500 | | | | | | 5.000%, due 06/01/41 | | | 1,039,191 | | | | 0.1 | |
| 665,885 | | | | | | 5.014%, due 07/01/35 | | | 714,002 | | | | 0.1 | |
| 63,198 | | | | | | 5.500%, due 02/01/18 | | | 69,082 | | | | 0.0 | |
| 574,000 | | | | | | 5.500%, due 08/25/34 | | | 633,131 | | | | 0.1 | |
| 242,643 | | | | | | 5.500%, due 08/25/36 | | | 243,075 | | | | 0.0 | |
| 1,762,566 | | | | | | 5.500%, due 03/01/37 | | | 1,929,529 | | | | 0.2 | |
| 98,956 | | | | | | 5.500%, due 06/01/37 | | | 107,928 | | | | 0.0 | |
| 92,340 | | | | | | 6.000%, due 08/01/16 | | | 99,899 | | | | 0.0 | |
| 924 | | | | | | 6.000%, due 12/01/16 | | | 1,000 | | | | 0.0 | |
| 40,869 | | | | | | 6.000%, due 03/01/17 | | | 44,215 | | | | 0.0 | |
| 4,567 | | | | | | 6.000%, due 07/01/17 | | | 4,947 | | | | 0.0 | |
| 368,509 | | | | | | 6.000%, due 09/01/17 | | | 399,136 | | | | 0.1 | |
| 24,184 | | | | | | 6.000%, due 11/01/17 | | | 26,163 | | | | 0.0 | |
| 21,075 | | | | | | 6.000%, due 10/01/18 | | | 22,899 | | | | 0.0 | |
| 439,397 | | | | | | 6.000%, due 07/25/29 | | | 496,432 | | | | 0.1 | |
| 1,034,496 | | | | | | 6.000%, due 07/25/29 | | | 1,168,777 | | | | 0.2 | |
| 831,096 | | | | | | 6.000%, due 04/25/31 | | | 939,496 | | | | 0.1 | |
| 1,253,188 | | | | ˆ | | 6.000%, due 08/25/33 | | | 216,959 | | | | 0.0 | |
| 561,136 | | | | | | 6.000%, due 09/01/36 | | | 619,953 | | | | 0.1 | |
| 545,541 | | | | | | 6.000%, due 08/01/37 | | | 606,900 | | | | 0.1 | |
| 542,023 | | | | | | 6.000%, due 12/01/37 | | | 601,716 | | | | 0.1 | |
| 1,101,712 | | | | | | 6.000%, due 02/01/38 | | | 1,223,045 | | | | 0.2 | |
| 2,066,328 | | | | ˆ | | 6.458%, due 08/25/26 | | | 277,874 | | | | 0.0 | |
| 5,567,958 | | | | ˆ | | 6.498%, due 01/25/37 | | | 1,026,757 | | | | 0.1 | |
| 9,230 | | | | | | 6.500%, due 02/01/28 | | | 10,526 | | | | 0.0 | |
| 8,724 | | | | | | 6.500%, due 07/01/29 | | | 9,981 | | | | 0.0 | |
| 361 | | | | | | 6.500%, due 06/01/31 | | | 412 | | | | 0.0 | |
| 169,385 | | | | | | 6.500%, due 07/01/31 | | | 193,798 | | | | 0.0 | |
| 1,423 | | | | | | 6.500%, due 09/01/31 | | | 1,621 | | | | 0.0 | |
| 510 | | | | | | 6.500%, due 09/01/31 | | | 583 | | | | 0.0 | |
| 69,728 | | | | | | 6.500%, due 11/01/31 | | | 79,430 | | | | 0.0 | |
| 38,299 | | | | | | 6.500%, due 04/01/32 | | | 43,628 | | | | 0.0 | |
| 3,345 | | | | | | 6.500%, due 08/01/32 | | | 3,811 | | | | 0.0 | |
| 5,772 | | | | | | 6.500%, due 08/01/32 | | | 6,576 | | | | 0.0 | |
| 88,332 | | | | | | 6.500%, due 01/01/33 | | | 100,622 | | | | 0.0 | |
| 63,296 | | | | | | 6.500%, due 02/01/33 | | | 72,102 | | | | 0.0 | |
| 210,073 | | | | | | 6.500%, due 12/01/33 | | | 239,300 | | | | 0.0 | |
| 17,870,435 | | | | ˆ | | 6.508%, due 10/25/35 | | | 3,321,217 | | | | 0.4 | |
| 26,748 | | | | | | 7.000%, due 12/01/27 | | | 30,886 | | | | 0.0 | |
| 20,400 | | | | | | 7.000%, due 01/01/30 | | | 23,646 | | | | 0.0 | |
| 12,704 | | | | | | 7.000%, due 10/01/31 | | | 14,733 | | | | 0.0 | |
| 6,619 | | | | | | 7.000%, due 03/01/32 | | | 7,676 | | | | 0.0 | |
| 1,255,521 | | | | ˆ | | 7.444%, due 02/17/29 | | | 237,753 | | | | 0.0 | |
| 5,622 | | | | | | 7.500%, due 09/01/30 | | | 6,732 | | | | 0.0 | |
| 16,433 | | | | | | 7.500%, due 10/01/30 | | | 18,167 | | | | 0.0 | |
| 6,188 | | | | | | 7.500%, due 10/01/30 | | | 7,401 | | | | 0.0 | |
| 13,359 | | | | | | 7.500%, due 09/01/31 | | | 16,024 | | | | 0.0 | |
| 40,525 | | | | | | 7.500%, due 02/01/32 | | | 48,355 | | | | 0.0 | |
| 109,769 | | | | | | 27.633%, due 02/25/34 | | | 154,867 | | | | 0.0 | |
| 1,387,538 | | | | | | 32.241%, due 11/25/36 | | | 2,391,743 | | | | 0.3 | |
| 475,000 | | | | W | | 4.500%, due 04/15/38 | | | 503,797 | | | | 0.1 | |
| | | | | | | | | | 111,114,790 | | | | 13.5 | |
| | | | | | | Government National Mortgage Association: 6.0% | | | | | | | | |
| 6,428 | | | | | | 2.375%, due 04/20/28 | | | 6,659 | | | | 0.0 | |
| 26,002,000 | | | | W | | 3.500%, due 10/15/41 | | | 27,021,765 | | | | 3.3 | |
See Accompanying Notes to Financial Statements
20
ING INTERMEDIATE BOND FUND
PORTFOLIO OF INVESTMENTSAS OF MARCH 31, 2012 (CONTINUED)
Principal
Amount†
|
|
|
|
|
|
|
| Value
|
| Percentage
of Net
Assets
|
|---|
| 1,575,905 | | | | | | 4.000%, due 11/20/40 | | | 1,695,893 | | | | 0.2 | |
| 1,554,595 | | | | | | 4.500%, due 04/15/39 | | | 1,703,935 | | | | 0.2 | |
| 1,701,475 | | | | | | 4.500%, due 10/15/39 | | | 1,864,925 | | | | 0.2 | |
| 1,520,276 | | | | | | 4.500%, due 11/15/39 | | | 1,666,319 | | | | 0.2 | |
| 1,591,796 | | | | | | 4.500%, due 11/15/39 | | | 1,744,709 | | | | 0.2 | |
| 380,704 | | | | | | 4.500%, due 12/15/39 | | | 417,276 | | | | 0.1 | |
| 539,090 | | | | | | 4.500%, due 08/20/41 | | | 588,435 | | | | 0.1 | |
| 15,717,416 | | | | ˆ | | 5.000%, due 06/16/39 | | | 1,057,683 | | | | 0.1 | |
| 1,204,280 | | | | | | 5.140%, due 10/20/60 | | | 1,361,977 | | | | 0.2 | |
| 782,396 | | | | | | 5.288%, due 10/20/60 | | | 895,847 | | | | 0.1 | |
| 1,846,643 | | | | | | 5.290%, due 10/20/60 | | | 2,110,471 | | | | 0.3 | |
| 12,367,578 | | | | ˆ | | 5.608%, due 06/20/40 | | | 1,855,137 | | | | 0.2 | |
| 7,027,531 | | | | ˆ | | 5.958%, due 06/20/38 | | | 786,438 | | | | 0.1 | |
| 8,776,770 | | | | ˆ | | 5.958%, due 04/20/39 | | | 1,187,576 | | | | 0.2 | |
| 7,784,404 | | | | ˆ | | 6.058%, due 05/20/39 | | | 900,270 | | | | 0.1 | |
| 6,974,921 | | | | ˆ | | 6.158%, due 04/20/38 | | | 932,693 | | | | 0.1 | |
| 2,253,182 | | | | ˆ | | 6.258%, due 05/16/38 | | | 324,477 | | | | 0.0 | |
| 7,156,535 | | | | ˆ | | 6.308%, due 01/20/38 | | | 956,711 | | | | 0.1 | |
| 170,097 | | | | | | 6.500%, due 09/16/38 | | | 198,786 | | | | 0.0 | |
| 147,301 | | | | | | 7.500%, due 10/16/32 | | | 170,338 | | | | 0.0 | |
| 282,580 | | | | ˆ | | 8.008%, due 06/16/31 | | | 39,644 | | | | 0.0 | |
| | | | | | | | | | 49,487,964 | | | | 6.0 | |
| | | | | | | | | Total U.S. Government Agency Obligations
(Cost $243,659,692)
| |
255,991,927 | | | |
31.0 | |
ASSET-BACKED SECURITIES: 4.2%
|
| | | | | | | Automobile Asset-Backed Securities: 0.1% | | | | | | | | |
| 778,000 | | | | | | Honda Auto Receivables Owner Trust, 1.550%, 08/18/17 | | | 791,328 | | | | 0.1 | |
| | | | | | | Home Equity Asset-Backed Securities: 0.0% | | | | | | | | |
| 244,800 | | | | | | Freddie Mac Structured Pass-Through Securities, 0.492%, 05/25/31 | | | 239,804 | | | | 0.0 | |
| 49,491 | | | | | | Freddie Mac Structured Pass-Through Securities, 0.542%, 01/25/32 | | | 47,592 | | | | 0.0 | |
| 58,582 | | | | | | Residential Asset Securities Corp., 0.842%, 06/25/32 | | | 29,939 | | | | 0.0 | |
| | | | | | | | | | 317,335 | | | | 0.0 | |
| | | | | | | Other Asset-Backed Securities: 4.1% | | | | | | | | |
| 589,468 | | | | # | | ARES CLO Funds, 0.714%, 09/18/17 | | | 579,900 | | | | 0.1 | |
| 900,000 | | | | # | | ARES CLO Funds, 3.141%, 02/26/16 | | | 831,938 | | | | 0.1 | |
| 750,000 | | | | # | | ARES CLO Ltd., 1.841%, 02/26/16 | | | 703,233 | | | | 0.1 | |
| 500,000 | | | | # | | ARES CLO Ltd., 6.901%, 02/26/16 | | | 502,742 | | | | 0.1 | |
| 1,086,444 | | | | # | | Atrium CDO Corp., 0.821%, 10/27/16 | | | 1,066,588 | | | | 0.1 | |
| 1,533,382 | | | | # | | Atrium CDO Corp., 0.902%, 06/27/15 | | | 1,507,621 | | | | 0.2 | |
| 750,000 | | | | # | | Babson CLO Ltd/Cayman Islands, 6.812%, 11/15/16 | | | 748,545 | | | | 0.1 | |
| 345,905 | | | | # | | Callidus Debt Partners Fund Ltd., 1.003%, 05/15/15 | | | 342,767 | | | | 0.0 | |
| 553,686 | | | | # | | Carlyle High Yield Partners, 0.880%, 08/11/16 | | | 544,542 | | | | 0.1 | |
| 90,550 | | | | | | Chase Funding Mortgage Loan Asset-Backed Certificates, 0.842%, 07/25/33 | | | 77,001 | | | | 0.0 | |
| 895,015 | | | | + | | Credit-Based Asset Servicing and Securitization, LLC, 4.831%, 08/25/35 | | | 869,641 | | | | 0.1 | |
| 877,657 | | | | + | | Credit-Based Asset Servicing and Securitization, LLC, 5.501%, 12/25/36 | | | 566,450 | | | | 0.1 | |
| 1,574,278 | | | | # | | Credit-Based Asset Servicing and Securitization, LLC, 5.746%, 12/25/37 | | | 1,552,363 | | | | 0.2 | |
| 1,188,000 | | | | # | | Credit-Based Asset Servicing and Securitization, LLC, 6.020%, 12/25/37 | | | 966,508 | | | | 0.1 | |
| 800,000 | | | | # | | Dryden Leveraged Loan CDO 2002-II, 2.774%, 09/17/16 | | | 761,950 | | | | 0.1 | |
| 750,000 | | | | # | | Dryden Leveraged Loan CDO 2002-II, 6.184%, 12/22/15 | | | 765,769 | | | | 0.1 | |
| 4,350,000 | | | | | | Fieldstone Mortgage Investment Corp., 0.402%, 11/25/36 | | | 1,510,942 | | | | 0.2 | |
| 4,750,000 | | | | | | Fieldstone Mortgage Investment Corp., 0.482%, 11/25/36 | | | 1,661,210 | | | | 0.2 | |
| 468,597 | | | | # | | First CLO Ltd., 0.907%, 07/27/16 | | | 467,323 | | | | 0.1 | |
| 1,100,000 | | | | # | | First CLO Ltd., 1.474%, 12/14/16 | | | 1,050,115 | | | | 0.1 | |
| 600,000 | | | | # | | First CLO Ltd., 2.857%, 07/27/16 | | | 563,540 | | | | 0.1 | |
| 1,250,000 | | | | # | | Galaxy CLO Ltd., 2.117%, 01/15/16 | | | 1,221,963 | | | | 0.1 | |
| 289,220 | | | | # | | Granite Ventures Ltd., 0.827%, 12/15/17 | | | 287,539 | | | | 0.0 | |
| 1,575,000 | | | | # | | Grayston CLO Ltd., 1.803%, 08/15/16 | | | 1,508,267 | | | | 0.2 | |
| 336,544 | | | | # | | Gulf Stream Compass CLO Ltd., 0.927%, 07/15/16 | | | 334,176 | | | | 0.0 | |
| 1,290,718 | | | | # | | Katonah Ltd., 0.794%, 09/20/16 | | | 1,275,363 | | | | 0.2 | |
| 1,550,000 | | | | # | | Landmark CDO Ltd., 1.417%, 01/15/16 | | | 1,539,302 | | | | 0.2 | |
| 480,661 | | | | | | Lehman XS Trust, 0.522%, 08/25/35 | | | 376,452 | | | | 0.0 | |
| 814,355 | | | | # | | Lightpoint CLO Ltd., 0.734%, 09/15/17 | | | 784,879 | | | | 0.1 | |
| 10,178,000 | | | | | | Morgan Stanley ABS Capital I, 0.512%, 03/25/36 | | | 4,224,567 | | | | 0.5 | |
| 361,755 | | | | # | | Navigator CDO Ltd., 2.203%, 11/15/15 | | | 362,207 | | | | 0.0 | |
| 965,889 | | | | # | | Navigator CDO Ltd., 2.667%, 01/14/17 | | | 842,875 | | | | 0.1 | |
| 600,000 | | | | # | | Olympic CLO Ltd., 1.403%, 05/15/16 | | | 584,783 | | | | 0.1 | |
| 12,746 | | | | | | Residential Asset Mortgage Products, Inc., 0.512%, 07/25/35 | | | 12,665 | | | | 0.0 | |
| 88,549 | | | | # | | Stanfield Carrera CLO Ltd., 0.954%, 03/15/15 | | | 88,106 | | | | 0.0 | |
See Accompanying Notes to Financial Statements
21
ING INTERMEDIATE BOND FUND
PORTFOLIO OF INVESTMENTSAS OF MARCH 31, 2012 (CONTINUED)
Principal
Amount†
|
|
|
|
|
|
|
| Value
|
| Percentage
of Net
Assets
|
|---|
| 1,250,000 | | | | # | | Veritas CLO Ltd., 1.800%, 09/05/16 | | | 1,146,305 | | | | 0.1 | |
| 1,315,943 | | | | # | | Wind River CLO Ltd., 0.804%, 12/19/16 | | | 1,278,474 | | | | 0.2 | |
| | | | | | | | | | 33,508,611 | | | | 4.1 | |
| | | | | | | | | Total Asset-Backed Securities
(Cost $35,924,739)
| |
34,617,274 | | | |
4.2 | |
U.S. TREASURY OBLIGATIONS: 10.6%
|
| | | | | | | U.S. Treasury Bonds: 3.9% | | | | | | | | |
| 21,190,000 | | | | | | 2.000%, due 02/15/22 | | | 20,776,138 | | | | 2.5 | |
| 12,244,000 | | | | | | 3.125%, due 11/15/41 | | | 11,700,673 | | | | 1.4 | |
| | | | | | | | | | 32,476,811 | | | | 3.9 | |
| | | | | | | U.S. Treasury Notes: 6.7% | | | | | | | | |
| 23,419,000 | | | | | | 0.250%, due 03/31/14 | | | 23,380,593 | | | | 2.8 | |
| 7,590,000 | | | | | | 0.375%, due 03/15/15 | | | 7,562,129 | | | | 0.9 | |
| 11,209,000 | | | | | | 1.000%, due 03/31/17 | | | 11,184,486 | | | | 1.4 | |
| 12,995,000 | | | | | | 1.500%, due 03/31/19 | | | 12,893,483 | | | | 1.6 | |
| | | | | | | | | | 55,020,691 | | | | 6.7 | |
| | | | | | | | | Total U.S. Treasury Obligations
(Cost $87,305,586)
| |
87,497,502 | | | |
10.6 | |
FOREIGN GOVERNMENT BONDS: 7.2%
|
| 1,137,319 | | | | | | Argentina Government International Bond, 7.000%, 04/17/17 | | | 1,010,508 | | | | 0.1 | |
| 181,317 | | | | | | Argentina Government International Bond, 7.000%, 10/03/15 | | | 171,118 | | | | 0.0 | |
| 555,668 | | | | | | Argentina Government International Bond, 12/15/35 | | | 73,626 | | | | 0.0 | |
| 12,093,000 | | | | BRL | | Brazil Notas do Tesouro Nacional Serie F, 10.000%, 01/01/14 | | | 6,823,805 | | | | 0.8 | |
| 34,028,000 | | | | BRL | | Brazil Notas do Tesouro Nacional Series F, 10.000%, 01/01/21 | | | 18,018,949 | | | | 2.2 | |
| 647,000 | | | | | | Colombia Government International Bond, 6.125%, 01/18/41 | | | 795,810 | | | | 0.1 | |
| 157,000 | | | | | | Colombia Government International Bond, 7.375%, 09/18/37 | | | 221,370 | | | | 0.0 | |
| 985,000 | | | | | | Federal Republic of Brazil, 10.125%, 05/15/27 | | | 1,645,935 | | | | 0.2 | |
| 368,000 | | | | | | Hungary Government International Bond, 4.750%, 02/03/15 | | | 347,760 | | | | 0.0 | |
| 448,000 | | | | | | Hungary Government International Bond, 6.250%, 01/29/20 | | | 410,946 | | | | 0.1 | |
| 96,000 | | | | | | Hungary Government International Bond, 6.375%, 03/29/21 | | | 88,320 | | | | 0.0 | |
| 296,000 | | | | | | Indonesia Government International Bond, 6.625%, 02/17/37 | | | 367,040 | | | | 0.1 | |
| 405,000 | | | | | | Indonesia Government International Bond, 8.500%, 10/12/35 | | | 604,463 | | | | 0.1 | |
| 337,000 | | | | # | | Lithuania Government International Bond, 5.125%, 09/14/17 | | | 352,165 | | | | 0.1 | |
| 264,000 | | | | # | | Lithuania Government International Bond, 6.625%, 02/01/22 | | | 293,370 | | | | 0.0 | |
| 280,000 | | | | | | Mexico Government International Bond, 6.050%, 01/11/40 | | | 338,800 | | | | 0.0 | |
| 445,000 | | | | | | Panama Government International Bond, 5.200%, 01/30/20 | | | 512,417 | | | | 0.1 | |
| 354,000 | | | | | | Panama Government International Bond, 7.125%, 01/29/26 | | | 474,360 | | | | 0.1 | |
| 77,000 | | | | | | Panama Government International Bond, 9.375%, 04/01/29 | | | 123,700 | | | | 0.0 | |
| 456,000 | | | | | | Peru Government International Bond, 8.750%, 11/21/33 | | | 709,536 | | | | 0.1 | |
| 257,000 | | | | | | Peruvian Government International Bond, 5.625%, 11/18/50 | | | 289,125 | | | | 0.0 | |
| 1,298,000 | | | | | | Philippine Government International Bond, 4.000%, 01/15/21 | | | 1,358,033 | | | | 0.2 | |
| 200,000 | | | | | | Philippine Government International Bond, 5.000%, 01/13/37 | | | 209,500 | | | | 0.0 | |
| 483,000 | | | | | | Poland Government International Bond, 5.000%, 03/23/22 | | | 511,507 | | | | 0.1 | |
| 187,000 | | | | | | Poland Government International Bond, 6.375%, 07/15/19 | | | 218,323 | | | | 0.0 | |
| 101,000 | | | | | | Republic of the Philippines, 6.375%, 10/23/34 | | | 124,861 | | | | 0.0 | |
| 260,000 | | | | # | | Romanian Government International Bond, 6.750%, 02/07/22 | | | 273,000 | | | | 0.0 | |
| 1,686,010 | | | | # | | Russia Government Bond, 7.500%, 03/31/30 | | | 2,025,319 | | | | 0.3 | |
| 200,000 | | | | # | | Russian Foreign Bond—Eurobond, 5.625%, 04/04/42 | | | 199,400 | | | | 0.0 | |
| 337,497 | | | | + | | Russian Foreign Bond—Eurobond, 7.500%, 03/31/30 | | | 405,418 | | | | 0.1 | |
| 125,621,080 | | | | ZAR | | South Africa Government Bond, 7.250%, 01/15/20 | | | 15,889,928 | | | | 1.9 | |
| 680,000 | | | | | | South Africa Government International Bond, 5.500%, 03/09/20 | | | 761,600 | | | | 0.1 | |
| 312,000 | | | | | | Turkey Government International Bond, 5.125%, 03/25/22 | | | 310,440 | | | | 0.0 | |
| 200,000 | | | | | | Turkey Government International Bond, 6.250%, 09/26/22 | | | 216,000 | | | | 0.0 | |
| 617,000 | | | | | | Turkey Government International Bond, 7.500%, 11/07/19 | | | 726,517 | | | | 0.1 | |
| 268,000 | | | | | | Turkey Government International Bond, 7.000%, 09/26/16 | | | 302,840 | | | | 0.0 | |
See Accompanying Notes to Financial Statements
22
ING INTERMEDIATE BOND FUND
PORTFOLIO OF INVESTMENTSAS OF MARCH 31, 2012 (CONTINUED)
Principal
Amount†
|
|
|
|
|
|
|
| Value
|
| Percentage
of Net
Assets
|
|---|
| 368,000 | | | | # | | Ukraine Government Bond, 7.650%, 06/11/13 | | | 356,500 | | | | 0.1 | |
| 293,000 | | | | | | Ukraine Government International Bond, 6.250%, 06/17/16 | | | 256,375 | | | | 0.0 | |
| 300,000 | | | | # | | Ukraine Government International Bond, 6.250%, 06/17/16 | | | 262,500 | | | | 0.0 | |
| 415,000 | | | | | | Ukraine Government International Bond, 7.650%, 06/11/13 | | | 402,031 | | | | 0.1 | |
| 261,864 | | | | | | Uruguay Government International Bond, 6.875%, 09/28/25 | | | 340,423 | | | | 0.0 | |
| 205,048 | | | | | | Uruguay Government International Bond, 7.625%, 03/21/36 | | | 286,555 | | | | 0.0 | |
| 583,900 | | | | | | Venezuela Government International Bond, 12.750%, 08/23/22 | | | 616,015 | | | | 0.1 | |
| | | | | | | | | Total Foreign Government Bonds
(Cost $59,621,557)
| |
59,726,208 | | | |
7.2 | |
Shares
|
|
|
|
|
|
|
| Value
|
| Percentage
of Net
Assets
|
|---|
PREFERRED STOCK: 0.2%
|
| | | | | | | Financials: 0.2%
|
| 23,000 | | | | P | | Citigroup Capital XIII | | | 625,600 | | | | 0.1 | |
| 49,000 | | | | @,P | | US Bancorp | | | 1,332,310 | | | | 0.1 | |
| | | | | | | | | Total Preferred Stock
(Cost $1,862,100)
| |
1,957,910 | | | |
0.2 | |
# of
Contracts
|
|
|
|
|
|
|
| Value
|
| Percentage
of Net
Assets
|
|---|
PURCHASED OPTIONS: 0.1%
|
| | | | | | | Credit Default Swaption: 0.1%
|
| 40,180,000 | | | | @ | | Payer Swaption- Fund buys credit default swap protection on CDX.NA.HY.17, Strike @ 96.000, Exp. 12/20/16 Counterparty: Morgan Stanley | | | 592,961 | | | | 0.1 | |
| | | | | | | Options On Currencies: 0.0%
|
| 19,600,000 | | | | @ | | EUR Put vs. USD Call Currency Option, Strike @ 1.310, Exp. 04/25/12 Counterparty: Morgan Stanley | | | 64,400 | | | | 0.0 | |
| | | | | | | | | Total Purchased Options
(Cost $910,959)
| |
657,361 | | | |
0.1 | |
| | | | | | | | | Total Long-Term Investments
(Cost $789,776,005)
| |
807,518,940 | | | |
97.7 | |
Principal
Amount†
|
|
|
|
|
|
|
| Value
|
| Percentage
of Net
Assets
|
|---|
SHORT-TERM INVESTMENTS: 15.0%
|
| | | | | | | Securities Lending Collateralcc(1): 4.0%
|
| 1,672,576 | | | | | | BNP Paribas Bank, Repurchase Agreement dated 03/30/12, 0.16%, due 04/02/12 (Repurchase Amount $1,672,598, collateralized by various U.S. Government Agency Obligations, 3.000%-6.500%, Market Value plus accrued interest $1,706,028, due 01/01/22-03/01/42) | | | 1,672,576 | | | | 0.2 | |
| 7,944,726 | | | | | | Cantor Fitzgerald, Repurchase Agreement dated 03/30/12, 0.17%, due 04/02/12 (Repurchase Amount $7,944,837, collateralized by various U.S. Government and U.S. Government Agency Obligations, 0.000%-7.500%, Market Value plus accrued interest $8,103,620, due 03/31/12-04/01/42) | | | 7,944,726 | | | | 1.0 | |
| 7,944,726 | | | | | | Citigroup, Inc., Repurchase Agreement dated 03/30/12, 0.18%, due 04/02/12 (Repurchase Amount $7,944,844, collateralized by various U.S. Government Agency Obligations, 1.992%-7.000%, Market Value plus accrued interest $8,103,621, due 03/01/18-04/15/43) | | | 7,944,726 | | | | 0.9 | |
| 7,944,726 | | | | | | Daiwa Capital Markets, Repurchase Agreement dated 03/30/12, 0.20%, due 04/02/12 (Repurchase Amount $7,944,857, collateralized by various U.S. Government and U.S. Government Agency Obligations, 0.000%-8.200%, Market Value plus accrued interest $8,103,621, due 07/19/12-04/01/42) | | | 7,944,726 | | | | 0.9 | |
See Accompanying Notes to Financial Statements
23
ING INTERMEDIATE BOND FUND
PORTFOLIO OF INVESTMENTSAS OF MARCH 31, 2012 (CONTINUED)
Principal
Amount†
|
|
|
|
|
|
|
| Value
|
| Percentage
of Net
Assets
|
|---|
| 7,944,726 | | | | | | Deutsche Bank AG, Repurchase Agreement dated 03/30/12, 0.15%, due 04/02/12 (Repurchase Amount $7,944,824, collateralized by various U.S. Government Agency Obligations, 3.500%-4.000%, Market Value plus accrued interest $8,103,622, due 10/01/20-12/01/40) | | | 7,944,726 | | | | 1.0 | |
| | | | | | | | | | 33,451,480 | | | | 4.0 | |
Shares
|
|
|
|
|
|
|
| Value
|
| Percentage
of Net
Assets
|
|---|
| | | | | | | Mutual Funds: 11.0%
|
| 90,591,565 | | | | | | BlackRock Liquidity Funds, TempFund, Institutional Class
(Cost $90,591,565)
| | | 90,591,565 | | | | 11.0 | |
| | | | | | | | | Total Short-Term Investments
(Cost $124,043,045)
| |
124,043,045 | | | |
15.0 | |
| | | | | | | | | Total Investments in Securities
(Cost $913,819,050)
| $ |
931,561,985 | | | |
112.7 | |
| | | | | | | | | Liabilities in Excess of Other Assets
| | (104,622,984 | ) | | | (12.7 | ) |
| | | | | | | | | Net Assets
| $ | 826,939,001 | | | | 100.0 | |
| † | | Unless otherwise indicated, principal amount is shown in USD. |
| # | | Securities with purchases pursuant to Rule 144A or section 4(2), under the Securities Act of 1933 and may not be resold subject to that rule except to qualified institutional buyers. |
| ## | | On September 7, 2008, the Federal Housing Finance Agency placed the Federal National Mortgage Association and the Federal Home Loan Mortgage Corporation into conservatorship and the U.S. Treasury guaranteed the debt issued by those organizations. |
| @ | | Non-income producing security |
| + | | Step-up basis bonds. Interest rates shown reflect current and next coupon rates. |
| P | | Preferred Stock may be called prior to convertible date. |
| cc | | Securities purchased with cash collateral for securities loaned. |
| W | | Settlement is on a when-issued or delayed-delivery basis. |
| L | | Loaned security, a portion or all of the security is on loan at March 31, 2012. |
| X | | Fair value determined by ING Funds Valuation Committee appointed by the Funds’ Board of Directors/Trustees. |
| ˆ | | Interest only securities represent the right to receive the monthly interest payments on an underlying pool of mortgage loans. Principal amount shown represents the notional amount on which current interest is calculated. Payments of principal on the pool reduce the value of the interest only security. |
| (1) | | Collateral received from brokers for securities lending was invested into these short-term investments. |
Cost for federal income tax purposes is $914,641,172.
| | | | | | |
| Net unrealized appreciation consists of: | | | | | | |
| Gross Unrealized Appreciation | | | | $ | 29,551,529 | |
| Gross Unrealized Depreciation | | | | | (12,630,716 | ) |
| Net Unrealized Appreciation | | | | $ | 16,920,813 | |
See Accompanying Notes to Financial Statements
24
ITEM 7. DISCLOSURE OF PROXY VOTING POLICIES AND PROCEDURES FOR CLOSED-END MANAGEMENT INVESTMENT COMPANIES.
Not applicable.
ITEM 8. PURCHASES OF EQUITY SECURITIES BY CLOSED-END MANAGEMENT INVESTMENT COMPANY AND AFFILIATED PURCHASERS
Not applicable.
ITEM 9. SUBMISSION OF MATTERS TO A VOTE OF SECURITY HOLDERS.
Nominating Committee. The Nominating Committee operates pursuant to a Charter approved by the Board. The primary purpose of the Nominating Committee is to consider, evaluate and make recommendations to the Board with respect to the nomination and selection of Independent Trustees. In evaluating candidates, the Nominating Committee may consider a variety of factors, but specific qualifications of candidates for Board membership will be based on the needs of the Board at the time of nomination.
The Nominating Committee is willing to consider nominations received from shareholders and shall assess shareholder nominees in the same manner as it reviews nominees it identifies. A shareholder nominee for director should be submitted in writing to the Fund’s Secretary. Any such shareholder nomination should include sufficient background information concerning the candidate and should be received in a timely manner. At a minimum, the following information as to each individual proposed for nomination as director should be included: the individual’s written consent to be named in the proxy statement as a nominee (if nominated) and to serve as a director (if elected), and all information relating to such individual that is required to be disclosed in a solicitation of proxies for election of directors, or is otherwise required, in each case under applicable federal securities laws, rules and regulations.
The Secretary shall submit all nominations received in a timely manner to the Nominating Committee. To be timely, any such submission must be delivered to the Fund’s Secretary not earlier than the 90th day prior to such meeting and not later than the close of business on the later of the 60th day prior to such meeting or the 10th day following the day on which public announcement of the date of the meeting is first made, by either disclosure in a press release or in a document publicly filed by the Fund with the SEC.
In evaluating a candidate for the position of Independent Trustee, including any candidate recommended by
1
shareholders of the Fund, the Nominating Committee shall consider the following: (i) the candidate’s knowledge in matters relating to the mutual fund industry; (ii) any experience possessed by the candidate as a director or senior officer of other public companies; (iii) the candidate’s educational background, reputation for high ethical standards and professional integrity; (iv) any specific financial, technical or other expertise possessed by the candidate, and the extent to which such expertise would complement the Board’s existing mix of skills, core competencies and qualifications; (v) the candidate’s perceived ability to contribute to the ongoing functions of the Board, including the candidate’s ability and commitment to attend meetings regularly and work collaboratively with other members of the Board; (vi) the candidate’s ability to qualify as an Independent Trustee for purposes of the 1940 Act; and (vii) such other factors as the Committee determines to be relevant in light of the existing composition of the Board and any anticipated vacancies. Prior to making a final recommendation to the Board, the Committee shall conduct personal interviews with those candidates it concludes are the most qualified candidates.
ITEM 10. CONTROLS AND PROCEDURES.
| (a) | Based on our evaluation conducted within 90 days of the filing date, hereof, the design and operation of the registrant’s disclosure controls and procedures are effective to ensure that material information relating to the registrant is made known to the certifying officers by others within the appropriate entities, particularly during the period in which Forms N-CSR are being prepared, and the registrant’s disclosure controls and procedures allow timely preparation and review of the information for the registrant’s Form N-CSR and the officer certifications of such Form N-CSR. |
| (b) | There were no significant changes in the registrant’s internal controls that occurred during the second fiscal quarter of the period covered by this report that has materially affected, or is reasonably likely to materially affect, the registrant’s internal control over financial reporting. |
ITEM 11. EXHIBITS.
| (a)(1) | Code of Ethics pursuant to Item 2 of Form N-CSR is filed and attached hereto as EX-99.CODE ETH. |
| (a)(2) | A separate certification for each principal executive officer and principal financial officer of the registrant as required by Rule 30a-2 under the Act (17 CFR 270.30a-2) is attached hereto as EX-99.CERT. |
| (b) | The officer certifications required by Section 906 of the Sarbanes-Oxley Act of 2002 are attached hereto as EX-99.906CERT |
2
SIGNATURES
Pursuant to the requirements of the Securities Exchange Act of 1934 and the Investment Company Act of 1940, the registrant has duly caused this report to be signed on its behalf by the undersigned, thereunto duly authorized.
| | |
| (Registrant): ING Funds Trust |
| |
| By | | /s/ Shaun P. Mathews |
| | Shaun P. Mathews |
| | President and Chief Executive Officer |
|
| Date: June 7, 2012 |
Pursuant to the requirements of the Securities Exchange Act of 1934 and the Investment Company Act of 1940, this report has been signed below by the following persons on behalf of the registrant and in the capacities and on the dates indicated.
| | |
| By | | /s/ Shaun P. Mathews |
| | Shaun P. Mathews |
| | President and Chief Executive Officer |
|
| Date: June 7, 2012 |
| | |
| By | | /s/ Todd Modic |
| | Todd Modic |
| | Senior Vice President and Chief Financial Officer |
|
| Date: June 7, 2012 |