Table of Contents
OMB APPROVAL
OMB Number: 3235-0570
Expires: August 31, 2011
Estimated average burden hours per response: 18.9
UNITED STATES
SECURITIES AND EXCHANGE COMMISSION
Washington, D.C. 20549
FORM N-CSR
CERTIFIED SHAREHOLDER REPORT OF
REGISTERED MANAGEMENT INVESTMENT COMPANIES
Investment Company Act file number: 811-08895
ING Funds Trust
(Exact name of registrant as specified in charter)
| 7337 E. Doubletree Ranch Rd., Scottsdale, AZ | 85258 | |
| (Address of principal executive offices) | (Zip code) |
The Corporation Trust Company, 1209 Orange Street, Wilmington, DE 19801
(Name and address of agent for service)
Registrant’s telephone number, including area code: 1-800-992-0180
Date of fiscal year end: | March 31 | |
Date of reporting period: | March 31, 2011 | |
Table of Contents
Item 1. Reports to Stockholders.
The following is a copy of the report transmitted to stockholders pursuant to Rule 30e-1 under the Act (17 CFR 270.30e-1):
Table of Contents

Annual Report
March 31, 2011
Classes A, B, C, I, O, R and W
Fixed-Income Funds
| n | ING GNMA Income Fund |
| n | ING High Yield Bond Fund |
| n | ING Intermediate Bond Fund |
 | E-Delivery Sign-up – details inside |
This report is submitted for general information to shareholders of the ING Funds. It is not authorized for distribution to prospective shareholders unless accompanied or preceded by a prospectus which includes details regarding the funds’ investment objectives, risks, charges, expenses and other information. This information should be read carefully.
MUTUAL FUNDS |
|

Table of Contents
| 1 | ||||
| 2 | ||||
| 4 | ||||
| 10 | ||||
| 12 | ||||
| 13 | ||||
| 15 | ||||
| 16 | ||||
| 18 | ||||
| 21 | ||||
| 38 | ||||
| 60 | ||||
| 61 | ||||
| 65 | ||||
 | Go Paperless with E-Delivery! | | ||
Sign up now for on-line prospectuses, fund reports, and proxy statements. In less than five minutes, you can help reduce paper mail and lower fund costs.
Just go to www.ingfunds.com, click on the E-Delivery icon from the home page, follow the directions and complete the quick 5 Steps to Enroll.
You will be notified by e-mail when these communications become available on the internet. Documents that are not available on the internet will continue to be sent by mail.
| ||||
PROXY VOTING INFORMATION
A description of the policies and procedures that the Funds use to determine how to vote proxies related to portfolio securities is available: (1) without charge, upon request, by calling Shareholder Services toll-free at (800) 992-0180; (2) on the Funds’ website at www.ingfunds.com; and (3) on the U.S. Securities and Exchange Commission’s (“SEC”) website at www.sec.gov. Information regarding how the Funds voted proxies related to portfolio securities during the most recent 12-month period ended June 30 is available without charge on the Funds’ website at www.ingfunds.com and on the SEC’s website at www.sec.gov.
QUARTERLY PORTFOLIO HOLDINGS
The Funds file their complete schedule of portfolio holdings with the SEC for the first and third quarters of each fiscal year on Form N-Q. This report contains a summary portfolio of investments or portfolio of investments for the Funds. The Funds’ Forms N-Q are available on the SEC’s website at www.sec.gov. The Funds’ Form N-Q may be reviewed and copied at the SEC’s Public Reference Room in Washington, DC, and information on the operation of the Public Reference Room may be obtained by calling (800) SEC-0330. The Funds’ Forms N-Q, as well as a complete portfolio of investments, are available without charge upon request from the Fund by calling Shareholder Services toll-free at (800) 992-0180.
Table of Contents

Living in Interesting Times
Dear Shareholder,
To say that the 12 months ended March 31, 2011 were eventful would be an understatement. During that time the global economic boat was rocked by market troubles, sovereign debt crises, natural and man-made disasters, doubts about the sustainability of U.S. economic growth and worries that the central banks might not be able to keep things on an even keel. The final three months of the period were perhaps the most volatile, with political upheavals in the Middle East and Libya, the earthquake and tsunami in Japan and renewed fears of a sovereign debt crisis in Europe.
Despite all these challenges, corporate earnings were robust and markets sailed on to deliver solid returns. Investors shifted between “safe-harbor” assets such as fixed income and commodities as the storms appeared, but returned to “risk assets” such as stocks and high yield bonds when the seas got smoother.
Any uncertainty about economic recovery in the United States seemed to be mitigated by encouraging data. After period-end, however, came another challenge: ratings agency Standard & Poor’s lowered its outlook for the U.S. to “negative,” a warning that the AAA rating on U.S. Treasuries might be cut in the future.
We’ve heard the arguments — possibly correct — that credit agency ratings are poor predictors of sovereign debt defaults, currency collapses and other financial crises. But that argument misses an important point: any suggestion that the U.S. might become a bad credit risk is a scary thought, not only for our pocketbook concerns but for our stature in the world.
Though few investors needed to be told that the country’s debt trajectory is unsustainable, the markets were spooked in the immediate aftermath of the announcement. Sentiment began climbing back by the end of the day, though, and continued to rally as corporations began another (so-far) impressive reporting season. Perhaps in the current milieu of extreme events, even the prospect of a fiscally weakening superpower has to be put into perspective; after all, the U.S. dollar is still the main refuge of safety-seeking investors around the globe.
Remember that the ebb and flow of current events is noise that will diminish over time; it should not distract you from your long-term goals. We can’t predict the next trouble spot, but we can hew to a well-defined investment plan. As we’ve noted many times before, it’s important to discuss any proposed changes thoroughly with your advisor before taking action. Thank you for your continued confidence in ING Funds. We look forward to serving your investment needs in the future.
Sincerely,

Shaun Mathews
President and Chief Executive Officer
ING Funds
April 21, 2011
The views expressed in the President’s Letter reflect those of the President as of the date of the letter. Any such views are subject to change at any time based upon market or other conditions and the ING Funds disclaim any responsibility to update such views. These views may not be relied on as investment advice and, because investment decisions for an ING Fund are based on numerous factors, may not be relied on as an indication of investment intent on behalf of any ING Fund. Reference to specific company securities should not be construed as recommendations or investment advice.
For more complete information, or to obtain a prospectus for any ING Fund, please call your investment professional or ING Investments Distributor, LLC at (800) 992-0180 or log on to www.ingfunds.com. The prospectus should be read carefully before investing. Consider the fund’s investment objectives, risks, and charges and expenses carefully before investing. The prospectus contains this information and other information about the fund. Check with your investment professional to determine which funds are available for sale within their firm. Not all funds are available for sale at all firms.
1
Table of Contents
MARKET PERSPECTIVE: YEAR ENDED MARCH 31, 2011
In our semi annual report we described markets, from stocks to bonds to currencies, continually buffeted by news and events relating to three main themes: the fitful US economic recovery, the sovereign debt crisis in the Eurozone and growth dynamics in China. Most equities markets were down slightly, while fixed income enjoyed 6% to 7% returns. But in the second half of our fiscal year risk appetite recovered despite the grave concerns that remained — and new crises that emerged.
In the U.S., attention seemed fixated on employment and housing. Since the latest recession ended in June 2009, the unemployment rate had been stuck between 9.4% and 10.1%. At last employment reports showed improvement to 9.0% in January and 8.9% in February. But economists were baffled by the restrained pace of job creation, averaging 136,000 in the latest three months, and by the labor force participation rate, at 64.2%, the lowest since March 1984.
In housing, sales of new and existing homes slumped after the expiry in April of a program of tax credits for home buyers and languished thereafter. House prices (based on the S&P/Case-Shiller 20-city Composite Index), having shown annual increases from February 2010 started falling again in October and our fiscal year ended with the index less than 1% above the trough recorded in May 2009.
Brighter spots domestically included gross domestic product (“GDP”) growth, which accelerated to 3.1% annualized in the fourth quarter of 2010, eight straight months of rising consumer spending and purchasing managers’ indices signaling the busiest manufacturing and service sectors in years. The Federal Reserve in November announced a second round of quantitative easing and would buy $600 billion in Treasury notes and bonds. The mixed mid-term election results forced a “compromise” stimulus package worth an estimated $858 billion for 2011.
Internationally however, the Eurozone sovereign debt crisis lingered. The bail-outs started in May with fiscally profligate Greece facing default on its bonds, followed by Ireland in November, its banks laid low by excessive lending on property. As our fiscal year ended, chronically low-growth Portugal, its government newly toppled and credit rating cut to barely investment grade, looked to be next. Meanwhile Eurozone leaders squabbled about a European Stability Mechanism, created to resolve the crisis once and for all.
Investors also watched nervously as China, having grown at 10.3% in 2010, displacing Japan as the world’s second largest economy and the U.S. as the world’s biggest manufacturer, wrestled to restrain inflation near 5% and a housing bubble, but also boost domestic consumption. The authorities increased banks’ reserve ratio requirements seven times, raised interest rates three times and resolved to raise the minimum wage on average by 13% annually through 2015.
Then in January, popular revolt erupted in North Africa. In short order dictatorships in Tunisia and Egypt fell, to be replaced by… no-one knew exactly what. By March Libya, a significant oil producer, was effectively in a civil war, with western allies joining the fray on the rebels’ side. Unrest spread to the Middle East and the price of oil, already on an upward trajectory as demand improved, firmly established itself above $100 per barrel.
As if this were not enough, a massive earthquake and tsunami hit Japan on March 11, causing perhaps $300 billion in local damage,
disruption of global supplies of electrical and digital components and possible nuclear fall-out.
In U.S. fixed income markets the Barclays Capital U.S. Aggregate Bond Index of investment grade bonds returned 5.12% in the fiscal year, with a small loss in the second half as risk appetite returned. Within this the Barclays Capital U.S. Treasury Index returned 4.53%, underperforming the 7.46% on the Barclays Capital Corporate Investment Grade Bond Index. Both outperformed the 4.37% return on the Barclays Capital U.S. Mortgage Backed Securities (“MBS”) Index, which lagged after the end of the Federal Reserve’s first round of quantitative easing targeted at mortgage backed securities. But all paled against the Barclays Capital High Yield Bond -2% Issuer Constrained Composite Index which gained an equity-like14.25%.
U.S. equities, represented by the S&P 500® Index including dividends, rose 15.65% in the 12 months through March 2011, including its best September since 1939 and best December since 1991. Prices were supported by strong earnings reports, with operating earnings per share for S&P 500® companies recording their fifth straight quarter of annual growth. Equities also benefited from improved risk appetite through the quantitative easing initiative and stimulus package referred to above.
In currencies, Eurozone angst during the fiscal year vied with pessimism about the dollar in a stalling economy and the perceived dollar-negative threat of another energy crisis. In the end the dollar fell 3.01% against the euro, 6.84% against the pound and 9.91% to the yen, which briefly made a post-war high in anticipation of yen repatriation to fund earthquake-related damage.
In international markets, based on MSCI indices in local currencies with reinvested dividends, the MSCI Japan® Index lost 10.02%, mostly after the earthquake struck. Despite generally favorable corporate earnings, declining export-dependent GDP and 24 months of falling prices also depressed sentiment. The MSCI Europe ex UK® Index returned 4.39%, with Germany up 14.14% and Ireland, Greece, Italy and Spain all falling, broadly reflecting the two-tier economy that had developed, with economic statistics favoring more soundly based countries at the expense of the peripherals. Powered by its sizeable materials and energy sectors, the MSCI UK® Index advanced 7.45%, defying the prospect of severe public spending cuts intended to eliminate an 11% budget deficit, a shock 0.5% quarterly fall in fourth quarter GDP and inflation rising to 4.4%.
Parentheses denote a negative number.
Past performance does not guarantee future results. The performance quoted represents past performance. Investment return and principal value of an investment will fluctuate, and shares, when redeemed, may be worth more or less than their original cost. The Funds’ performance is subject to change since the period’s end and may be lower or higher than the performance data shown. Please call (800) 992-0180 or log on to www.ingfunds.com to obtain performance data current to the most recent month end.
Market Perspective reflects the views of ING’s Chief Investment Risk Officer only through the end of the period, and is subject to change based on market and other conditions.
2
Table of Contents
BENCHMARK DESCRIPTIONS
| Index | Description | |
| S&P/Case-Shiller 20-City Composite Home Price Index | A composite index of the home price index for the top 20 Metropolitan Statistical Areas in the United States. The index is published monthly by Standard & Poor’s. | |
| Barclays Capital U.S. Aggregate Bond Index | An unmanaged index of publicly issued investment grade U.S. Government, mortgage-backed, asset-backed and corporate debt securities. | |
| Barclays Capital U.S. Treasury Index | An unmanaged index that includes public obligations of the U.S. Treasury. Treasury bills, certain special issues, such as state and local government series bonds (SLGs), as well as U.S. Treasury TIPS and STRIPS, are excluded. | |
| Barclays Capital Corporate Investment Grade Bond Index | The corporate component of the Barclays Capital U.S. Credit Index. The U.S. Credit Index includes publicly-issued U.S. corporate and specified foreign debentures and secured notes that meet the specified maturity, liquidity, and quality requirements. The index includes both corporate and non-corporate sectors. The corporate sectors are industrial, utility and finance, which includes both U.S. and non-U.S. corporations. | |
| Barclays Capital U.S. MBS Index | An unmanaged index composed of fixed-income security mortgage pools sponsored by GNMA, FNMA and FHLMC, including GNMA Graduated Payment Mortgages. | |
| Barclays Capital High Yield Bond — 2% Issuer Constrained Composite Index | An unmanaged index that includes all fixed income securities having a maximum quality rating of Ba1, a minimum amount outstanding of $150 million, and at least one year to maturity. | |
| S&P 500® Index | An unmanaged index that measures the performance of securities of approximately 500 large-capitalization companies whose securities are traded on major U.S. stock markets. | |
| MSCI Japan® Index | A free float-adjusted market capitalization index that is designed to measure developed market equity performance in Japan. | |
| MSCI Europe ex UK® Index | A free float-adjusted market capitalization index that is designed to measure developed market equity performance in Europe, excluding the UK. | |
| MSCI UK® Index | A free float-adjusted market capitalization index that is designed to measure developed market equity performance in the UK. | |
| Barclays Capital Corporate High Yield Index | An unmanaged index that measures the performance of fixed-income securities generally representative of corporate bonds rated below investment grade. |
3
Table of Contents
| ING GNMA INCOME FUND | PORTFOLIO MANAGERS’ REPORT |
Investment Type Allocation
as of March 31, 2011
(as a percent of net assets)
U.S. Government Agency Obligations | 105.1% | |||
Other Assets and Liabilities — Net | (5.1)% | |||
Net Assets | 100.0% | |||
Portfolio holdings are subject to change daily.
ING GNMA Income Fund (the “Fund”) seeks a high level of current income, consistent with liquidity and safety of principal, through investment primarily in Government National Mortgage Association (“GNMA”) mortgage-backed securities (also known as GNMA Certificates) that are guaranteed as to the timely payment of principal and interest by the U.S. government. The Fund is managed by Peter Guan, Jeff Dutra and Justin McWhorter, Portfolio Managers of ING Investment Management Co. — the Sub-Adviser.
Securities issued by the U.S. Treasury are backed by the full faith and credit of the federal government. Securities issued by individual agencies and organizations may be backed by the full faith and credit of the federal government as to principal or interest but are not direct obligations of the U.S. Treasury. Securities of some agencies
and organizations are backed solely by the entity’s own resources or by the ability of the entity to borrow from the U.S. Treasury. Government securities also include certain mortgage-related securities that are sponsored by a U.S. government agency or organization and are not direct obligations of the U.S. government.
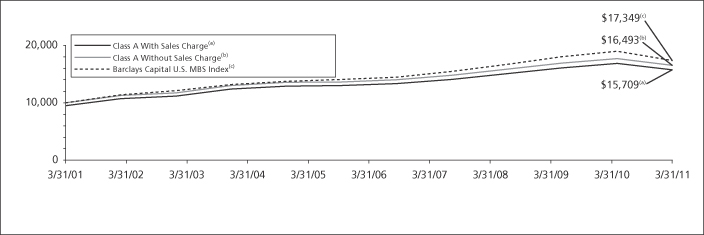
Performance: For the one year ended March 31, 2011, the Fund’s Class A shares, excluding sales charges, provided a total return of 5.26% compared to the Barclays Capital U.S. Mortgage-Backed Securities (“MBS”) Index which returned 4.37%, for the same period.
Portfolio Specifics: The portfolio was well positioned for an environment characterized by tight spreads and low rates, and took advantage the excess yield offered by premium securities. Despite historically low interest rates, higher coupon mortgages performed well due to relatively benign prepayments for most of the year. Additionally, GNMA mortgages benefitted from broad-based investor demand seeking explicit government credit guarantees. Finally, the Fund’s focus on securities with prepayment protection and high current income performed better than “generic” positions found in the index.
The fiscal year started with the conclusion of quantitative easing round one (QE 1): the dominating $1.5 billion mortgage-backed securities (“MBS”) purchase program by the U.S. Federal Reserve and U.S. Treasury department. Many investors fled mortgages toward the end of the program, expecting meaningful underperformance without government sponsorship. Mortgages spreads did not widen; instead they remained steadfast versus their U.S. Treasury equivalents as investors were flush with cash, underweight MBS exposure, and new supply of agency residential mortgage-backed securities (“RMBS”) remained light. For most of the year Ginnie Mae bonds outperformed agency MBS on broad-based support due to their explicit government guarantee and their superior prepayment experience.
Agency MBS showed some signs of stress in the middle of last year as persistently low interest rates ultimately led to an acceleration of prepayments for higher quality borrowers with home equity. Higher prepayments resulted in faster amortization of mortgage pools which, combined with high dollar prices, led to lower yields for investors. Mortgage securities repriced lower following this event. As 2010 ended the U.S. Treasury market demonstrated increased levels of volatility with 10-year Treasury rates rising 0.50% in December alone. “QE 2” was introduced to further support financial markets and keep mortgage rates relatively affordable. Mortgages weathered these events quite well and continued to provide investors with incremental yield.
As we close out this fiscal year, in our opinion, economic indicators point to modest improvements in the general economy and the elevated prepayment speeds experienced in fourth quarter 2010 have decreased substantially. We believe the market expects this decline in voluntary prepayments to continue as rates have returned to higher levels, housing prices continue to struggle and government stimulus programs fade. Throughout the year our security selection focused on MBS pools and collateralized mortgage obligations (“CMOs”) with implicit protection from prepays (newer pools whose prepayment risk is minimal for several months) and explicit protection (cash flows that are structurally locked out from near-term prepayments).
Current Strategy & Outlook: The housing market continues to struggle with prices expected to fall an additional 10% nationally over the next few quarters. To date, the government’s efforts to improve housing have been only modestly effective and further efforts to drive rates lower have had limited impact as mortgage rates are already at historically low levels. We believe foreclosure problems along with a weak job market are likely to weigh on the ability of non-prime borrowers and those without sufficient home equity to take full advantage of very low rates. These observations imply that only the best borrowers will continue to benefit from low rates and the divergence between good and marginal borrower prepayments will widen further.
With this in mind, we continue to manage the Fund seeking to benefit from high current income investments. The predominant focus remains on specified Ginnie Mae pools and CMOs that provide more attractive current income while minimizing prepayment risks. We are paying special attention to pools with lower loan balances, those with loans possessing more attractive credit characteristics and those that are sufficiently seasoned to reduce their prepayment sensitivity to interest rate movements. In addition, we will continue to seek Ginnie Mae CMOs that provide structural prepayment and extension protection.
Portfolio holdings and characteristics are subject to change and may not be representative of current holdings and characteristics. The outlook for this Fund may differ from that presented for other ING Funds. Performance for the different classes of shares will vary based on differences in fees associated with each class. An index has no cash in its portfolio, imposes no sales charges and incurs no operating expenses. An investor cannot invest directly in an index. The views expressed in this report reflect those of the portfolio managers, only through the end of the period as stated on the cover. The portfolio managers’ views are subject to change at any time based on market and other conditions.
Fund holdings are subject to change daily. This report contains statements that may be “forward-looking” statements. Actual results may differ materially from those projected in the “forward-looking” statements.
4
Table of Contents
| PORTFOLIO MANAGERS’ REPORT | ING GNMA INCOME FUND |
Average Annual Total Returns for the Periods Ended March 31, 2011 |
| |||||||||||||||||||||||||||
1 Year | 5 Year | 10 Year | Since | Since | ||||||||||||||||||||||||
Including Sales Charge: | ||||||||||||||||||||||||||||
Class A(1) | 2.68 | % | 4.83 | % | 4.62 | % | — | — | ||||||||||||||||||||
Class B(2) | (0.52 | )% | 4.73 | % | 4.34 | % | — | — | ||||||||||||||||||||
Class C(3) | 3.38 | % | 5.05 | % | 4.35 | % | — | — | ||||||||||||||||||||
Class I | 5.57 | % | 6.16 | % | — | 5.35 | % | — | ||||||||||||||||||||
Class W | 5.51 | % | — | — | — | 6.31 | % | |||||||||||||||||||||
Excluding Sales Charge: | ||||||||||||||||||||||||||||
Class A | 5.26 | % | 5.85 | % | 5.13 | % | — | — | ||||||||||||||||||||
Class B | 4.48 | % | 5.06 | % | 4.34 | % | — | — | ||||||||||||||||||||
Class C | 4.38 | % | 5.05 | % | 4.35 | % | — | — | ||||||||||||||||||||
Class I | 5.57 | % | 6.16 | % | — | 5.35 | % | — | ||||||||||||||||||||
Class W | 5.51 | % | — | — | — | 6.31 | % | |||||||||||||||||||||
Barclays Capital U.S. MBS Index | 4.37 | % | 6.48 | % | 5.66 | % | 5.54 | %(4) | 6.20 | %(5) | ||||||||||||||||||
Based on a $10,000 initial investment, the graph and table above illustrate the total return of ING GNMA Income Fund against the index indicated. An index is unmanaged and has no cash in its portfolio, imposes no sales charges and incurs no operating expenses. An investor cannot invest directly in an index. The Fund’s performance is shown both with and without the imposition of sales charges.
The performance graph and table do not reflect the deduction of taxes that a shareholder will pay on Fund distributions or the redemption of Fund shares.
The performance shown may include the effect of fee waivers and/or expense reimbursements by the Investment Adviser and/or other service providers, which have the effect of increasing total return. Had all fees and expenses been considered, the total returns would have been lower.
Performance data represents past performance and is no assurance of future results. Investment return and principal value of an investment in the Fund will fluctuate. Shares, when sold, may be worth more or less than their original cost. The Fund’s performance may be lower or higher than the performance data shown. Please log on to www.ingfunds.com or call (800) 992-0180 to get performance through the most recent month end.
This report contains statements that may be “forward-looking” statements. Actual results may differ materially from those projected in the “forward-looking” statements.
The views expressed in this report reflect those of the portfolio managers, only through the end of the period as stated on the cover. The portfolio managers’ views are subject to change at any time based on market and other conditions.
Fund holdings are subject to change daily.
| (1) | Reflects deduction of the maximum Class A sales charge of 4.75%. Effective July 31, 2006, the maximum Class A sales charge was lowered to 2.50%. |
| (2) | Reflects deduction of the Class B deferred sales charge of 5% and 2% for the 1 year and 5 year returns, respectively. |
| (3) | Reflects deduction of the Class C deferred sales charge of 1% for the 1 year return. |
| (4) | Since inception performance for index is shown from January 1, 2002. |
| (5) | Since inception performance for index is shown from January 1, 2008. |
5
Table of Contents
| ING HIGH YIELD BOND FUND | PORTFOLIO MANAGERS’ REPORT |
Industry Allocation
as of March 31, 2011
(as a percent of net assets)
Consumer Discretionary | 23.0% | |||
Energy | 13.9% | |||
Financials | 12.3% | |||
Telecommunication Services | 8.5% | |||
Health Care | 7.8% | |||
Industrials | 7.7% | |||
Materials | 6.1% | |||
Information Technology | 5.6% | |||
Consumer Staples | 5.4% | |||
Utilities | 2.6% | |||
Other Asset-Backed Securities | 0.7% | |||
Other Assets and Liabilities — Net* | 6.4% | |||
Net Assets | 100.0% | |||
| * | Includes short-term investments related to BlackRock Liquidity Funds, TempFund, Institutional Class. |
Portfolio holdings are subject to change daily.
ING High Yield Bond Fund (the “Fund”) seeks to provide investors with a high level of current income and total return. The Fund is managed by Randall Parrish, CFA, and Matthew Toms, Portfolio Managers of ING Investment Management Co. — the Sub-Adviser.
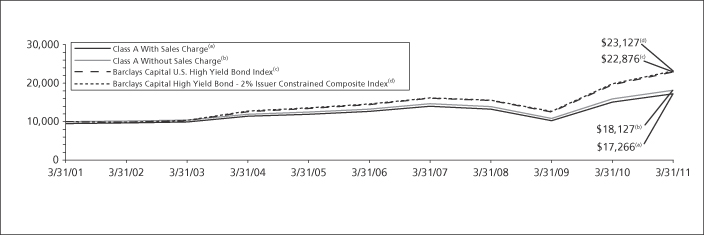
Performance: For the one year ended March 31, 2011, the Fund’s Class A shares, excluding sales charges, provided a total return of 14.22%, including a return of capital of $0.02 per share, compared to the Barclays Capital High Yield Bond — 2% Issuer Constrained Composite Index and the Barclays Capital Corporate High Yield Index, which returned 14.26% and 14.31%, respectively, for the same period.
Portfolio Specifics: High yield bonds posted significant gains for the fiscal period, driven by tightening of credit spreads and by a QE-2-induced gain in Treasuries. Lower quality bonds outperformed higher quality, though the differential was less than one might expect in a strong market due to the Treasury gains. There was also limited dispersion of returns across industry sectors, with only electric utilities significantly lagging the overall market and most of the outperforming sectors driven by issuer-specific gains. We have begun in recent months to see early signs of excesses in the credit markets and a few re-leveraging transactions, but this is not yet widespread and remains at least offset by credit-positive events such as initial public offerings (IPOs) and debt retirement.
Our expectations for the past 12 months were generally fulfilled, as the U.S. economic recovery remained on track and corporate fundamentals
continued to improve. The high yield market return for the period exceeded our expectations, largely due to a more favorable interest rate environment than we anticipated. The Fund’s overweight to lower quality bonds helped performance as credit spreads narrowed. The Fund also benefited from several sector-specific positions. Of note, we were overweight television broadcasters, a group that benefited from both the general economic recovery and a record political ad season, and underweight electric utilities — specifically independent power producers — that suffered from weak power pricing fundamentals. The Fund also benefited from security selection across a range of sectors including metals and mining (overweight coal producers), energy (overweight oil, underweight natural gas), automotive (overweight suppliers that benefited from a rebound in domestic sales and production) and healthcare.
Current Strategy & Outlook: We continue to believe the U.S. economic recovery is on track, a view that is supported by signs of increased hiring activity. Issuer fundamentals continue to improve, as evidenced by 19 consecutive months of ratings upgrades exceeding downgrades. The combination of improving fundamentals and wide open capital markets has resulted in a virtual absence of defaults that is likely to persist beyond 2011. Credit spreads appear to offer more than adequate compensation for default risk in the longer term, though high dollar prices and low all-in yields limit potential upside. Potential threats to this scenario include unrest in the Middle East and resulting higher oil prices, heightened sovereign concerns and increased concerns about inflation or a tightening of U.S. monetary or fiscal policy.
In keeping with our view of economic recovery and improving credit fundamentals, we continue to maintain a slight cyclical bias and an overweight to single-B rated credits (underweight BBs), though we modestly reduced credit risk into market strength in the March quarter. We continue to maintain an overweight to the energy space — particularly oil-focused exploration and production companies, as well as an overweight to coal stocks and an underweight to utilities. We have reduced the Fund’s position in television broadcasters as this 2010 investment theme has played out.
Portfolio holdings and characteristics are subject to change and may not be representative of current holdings and characteristics. The outlook for this Fund may differ from that presented for other ING Funds. Performance for the different classes of shares will vary based on differences in fees associated with each class. An index has no cash in its portfolio, imposes no sales charges and incurs no operating expenses. An investor cannot invest directly in an index.
The views expressed in this report reflect those of the portfolio managers, only through the end of the period as stated on the cover. The portfolio managers’ views are subject to change at any time based on market and other conditions.
Fund holdings are subject to change daily.
This report contains statements that may be “forward-looking” statements. Actual results may differ materially from those projected in the “forward-looking” statements.
Top Ten Holdings*
as of March 31, 2011
(as a percent of net assets)
CCO Holdings LLC / CCO Holdings Capital Corp., | 1.3% | |||
Ally Financial, Inc., 8.000%, due 03/15/20 | 1.2% | |||
Ford Motor Credit Co., LLC, 8.125%, due 01/15/20 | 0.9% | |||
Cequel Communications Holdings I, LLC and Cequel Capital Corp., 8.625%, due 11/15/17 | 0.8% | |||
HCA, Inc., 7.875%, due 02/15/20 | 0.8% | |||
Caesars Entertainment Operating Co., Inc., | 0.8% | |||
Foresight Energy LLC / Foresight Energy Corp., | 0.7% | |||
Intelsat Luxembourg S.A., 11.500%, due 02/04/17 | 0.7% | |||
HCA, Inc., 7.250%, due 09/15/20 | 0.7% | |||
GSC Partners CDO Fund Ltd., 2.237%, due 12/16/15 | 0.7% |
| * | Excludes short-term investments related to BlackRock Liquidity Funds, TempFund, Institutional Class. |
Portfolio holdings are subject to change daily.
6
Table of Contents
| PORTFOLIO MANAGERS’ REPORT | ING HIGH YIELD BOND FUND |
Average Annual Total Returns for the Periods Ended March 31, 2011 |
| |||||||||||||||||||||||
1 Year | 5 Year | 10 Year | Since | |||||||||||||||||||||
Including Sales Charge: | ||||||||||||||||||||||||
Class A(1) | 11.35 | % | 5.42 | % | 5.61 | % | — | |||||||||||||||||
Class B(2) | 8.35 | % | 5.34 | % | 5.34 | % | — | |||||||||||||||||
Class C(3) | 12.22 | % | 5.62 | % | 5.33 | % | — | |||||||||||||||||
Class I | 14.86 | % | — | — | 11.91 | % | ||||||||||||||||||
Excluding Sales Charge: | ||||||||||||||||||||||||
Class A | 14.22 | % | 6.44 | % | 6.13 | % | — | |||||||||||||||||
Class B | 13.35 | % | 5.63 | % | 5.34 | % | — | |||||||||||||||||
Class C | 13.22 | % | 5.62 | % | 5.33 | % | — | |||||||||||||||||
Class I | 14.86 | % | — | — | 11.91 | % | ||||||||||||||||||
Barclays Capital Corporate High Yield Index | 14.31 | % | 9.12 | % | 8.63 | % | 14.50 | %(4) | ||||||||||||||||
Barclays Capital High Yield Bond — 2% Issuer Constrained Composite Index | 14.26 | % | 9.18 | % | 8.75 | % | 14.61 | %(4) | ||||||||||||||||
Based on a $10,000 initial investment, the graph and table above illustrate the total return of ING High Yield Bond Fund against the indices indicated. An index is unmanaged and has no cash in its portfolio, imposes no sales charges and incurs no operating expenses. An investor cannot invest directly in an index. The Fund’s performance is shown both with and without the imposition of sales charges.
The performance graph and table do not reflect the deduction of taxes that a shareholder will pay on Fund distributions or the redemption of Fund shares.
The performance shown may include the effect of fee waivers and/or expense reimbursements by the Investment Adviser and/or other service providers, which have the effect of increasing total return. Had all fees and expenses been considered, the total returns would have been lower.
Performance data represents past performance and is no assurance of future results. Investment return and principal value of an investment in the Fund will fluctuate. Shares, when sold, may be worth more or less than their original cost. The Fund’s performance may be lower or higher than the performance data
shown. Please log on to www.ingfunds.com or call (800) 992-0180 to get performance through the most recent month end.
This report contains statements that may be “forward-looking” statements. Actual results may differ materially from those projected in the “forward-looking” statements.
The views expressed in this report reflect those of the portfolio managers, only through the end of the period as stated on the cover. The portfolio managers’ views are subject to change at any time based on market and other conditions.
Fund holdings are subject to change daily.
| (1) | Reflects deduction of the maximum Class A sales charge of 4.75%. Effective July 31, 2006, the maximum Class A sales charge was lowered to 2.50%. |
| (2) | Reflects deduction of the Class B deferred sales charge of 5% and 2% for the 1 year and 5 year returns, respectively. |
| (3) | Reflects deduction of the Class C deferred sales charge of 1% for the 1 year return. |
| (4) | Since inception performance for the indices is shown from August 1, 2008. |
7
Table of Contents
| ING INTERMEDIATE BOND FUND | PORTFOLIO MANAGERS’ REPORT |
Investment Type Allocation
as of March 31, 2011
(as a percent of net assets)
Corporate Bonds/Notes | 41.0% | |||
U.S. Government Agency Obligations | 25.8% | |||
Collateralized Mortgage Obligations | 14.1% | |||
Asset-Backed Securities | 9.5% | |||
U.S. Treasury Obligations | 8.9% | |||
Foreign Government Bonds | 6.3% | |||
Preferred Stock | 0.3% | |||
Municipal Bonds | 0.1% | |||
Purchased Options | 0.1% | |||
Other Assets and Liabilities — Net* | (6.1)% | |||
Net Assets | 100.0% | |||
| * | Includes short-term investments related to BlackRock Liquidity Funds, TempFund, Institutional Class and securities lending collateral. |
Portfolio holdings are subject to change daily.
ING Intermediate Bond Fund (the “Fund”) seeks to provide investors with a high level of current income, consistent with the preservation of capital and liquidity. The Fund is managed by Christine Hurtsellers, Matthew Toms and Michael Mata, Portfolio Managers of ING Investment Management Co. — the Sub-Adviser.
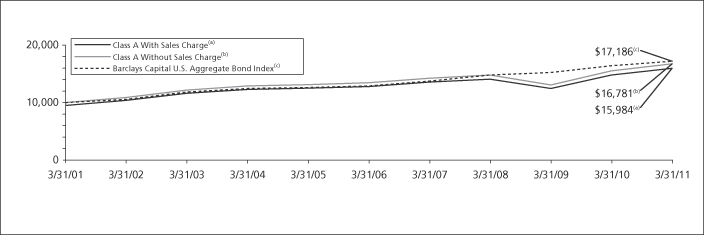
Performance: For the one year ended March 31, 2011, the Fund’s Class A shares, excluding sales charges, provided a total return of 8.00% compared to the Barclays Capital U.S. Aggregate Bond Index, which returned 5.12%, for the same period.
Portfolio Specifics: Our duration and yield curve positioning helped a bit in the first half of the year. Then our longer duration posture coming into the fourth quarter of 2010 detracted from performance materially, which led to an overall drag on performance for the Fund’s duration and yield curve positioning over the entire period. Futures, options and interest rate swaps were used in duration and yield curve management which in total had a slight negative relative return impact for the reporting period.
Sector allocation was a significant contributor to the Fund’s relative performance over the year. Outperformance of non-Treasury or spread sectors, where the Fund was overweight, helped results. Spread sectors such as high yield, commercial mortgage backed securities (“CMBS”) and investment grade credit outperformed as economic growth continued and risk assets moved higher in price. Our overweight allocations to these sectors consequently drove relative performance over the period. Underweight exposure to U.S. Treasury holdings and agency debentures, in order to fund spread allocations, helped performance. The Fund’s underweight to agency mortgages slightly hurt performance.
Security selection within investment grade corporate bonds, high yield, agency mortgages and CMBS were all significant contributors to the Fund’s outperformance throughout 2010, and as we began 2011. Our continued favoring of financials, industrials and cyclical
subsector issues among corporate bond holdings helped portfolio performance. Security selection was a contributor among asset-backed securities (“ABS”); however, it was a detractor within our allocation to U.S. Treasuries. Credit default swaps were used as part of our sector management and security selection which in total had a positive impact to the Fund’s relative outperformance of our benchmark.
Current Strategy & Outlook: As the Fund’s fiscal year comes to a close, we clearly see the global economy recovering at two speeds. Recovery in most emerging countries remains strong, while the recovery in developed markets is less pronounced. Even within developed countries, we see substantial variations in growth rates, with poor performance and bailouts occurring in peripheral Europe (Portugal, Italy, Ireland, Greece and Spain — referred to as the “PIIGS”). We see better, but still relatively weak economic growth in Japan, Great Britain and New Zealand. We believe Japan will recover from the tragic earthquake and tsunami. However, the country’s growth prospects, in our view, remain low and less than 1% over the next year. This leaves the United States, Canada, Australia and Germany as the bright spots among the developed countries.
Inflation pressure remains high in several emerging markets. The global outlook seems to be weighted to the downside, with tension in the Middle East, elevated oil prices, PIIGS still in trouble and growth in China slowing.
In the U.S., we have adjusted our growth forecast for first quarter gross domestic product (“GDP”) to 2-2.5%. This is in light of higher energy prices, instability in the Middle East and the impact following the natural disasters in Japan. However, we believe that several positive underpinnings remain that support an ongoing expansion in the U.S. The uptick in job growth (albeit slight) and decline in unemployment are positive for economic growth. The number of hours worked has also increased, which is positive for labor income. This, in turn, should help retail sales and the consumption component of GDP. Finally, interest rates remain relatively low, which reduces household debt obligations and supports balance sheet repair.
Continued expansion of the U.S. economy should support risk assets and could help them to perform well during the remainder of the year. Given this, the portfolio remains overweight to most spread sectors. In particular, we continue to like investment grade corporate credit and CMBS. Strong earnings and clean balance sheets make for attractive credit fundamentals of corporate debt. We also continue to overweight non-agency residential mortgage-backed securities, as we see their supply/demand technical factors remaining supportive and their underlying fundamentals as likely to continue to aid current valuations.
Agency mortgages continue to see good flows and demand. Interest rate volatility, news of the Treasury selling mortgages and convexity(1) selling have met with solid demand. Collectively, this has helped to keep periods of weakness contained and supportive for the asset class. Against this backdrop, the portfolio is slightly overweight the sector.
Elsewhere, credit fundamentals and technical factors remain positive for ABS. We are constructive in our view of the U.S. consumer and, reflecting this, the portfolio has an overweight to consumer-related ABS, such as credit card and auto receivables.
In off-Index sectors, we continue to see value in high yield and in emerging market debt (“EMD”). We believe the US economic expansion and strong corporate credit fundamentals are supportive for the high yield sector. In our opinion, corporate credit looks like it will continue to outperform as defaults remain low and we see no catalyst for a pick-up in defaults for 2011. Strong fundamentals remain intact in emerging markets. So far the political uncertainties in North Africa and Middle East remain mostly contained to regions and countries with modest direct economic impact to the markets. However, we continue to monitor this situation closely as we are with the situation in Japan. We are staying conservative in our sovereign and corporate selections in this space and favoring more liquid names and issues within this sector.
| (1) | Convexity is a measure of the rate at which duration changes as market interest rates change, and as a result a measure of the speed with which bond prices react to interest rate changes. |
Portfolio holdings and characteristics are subject to change and may not be representative of current holdings and characteristics. The outlook for this Fund may differ from that presented for other ING Funds. Performance for the different classes of shares will vary based on differences in fees associated with each class. An index has no cash in its portfolio, imposes no sales charges and incurs no operating expenses. An investor cannot invest directly in an index. The views expressed in this report reflect those of the portfolio managers, only through the end of the period as stated on the cover. The portfolio managers’ views are subject to change at any time based on market and other conditions. Fund holdings are subject to change daily. This report contains statements that may be “forward-looking” statements. Actual results may differ materially from those projected in the “forward-looking” statements.
Top Ten Holdings*
as of March 31, 2011
(as a percent of net assets)
Brazil Notas do Tesouro Nacional Series F, | 3.1% | |||
U.S. Treasury Note, 4.250%, due 11/15/40 | 2.6% | |||
U.S. Treasury Note, 3.625%, due 02/15/21 | 2.5% | |||
Federal Home Loan Mortgage Corporation, | 1.9% | |||
Federal National Mortgage Association, | 1.8% | |||
U.S. Treasury Note, 1.250%, due 03/15/14 | 1.8% | |||
Federal National Mortgage Association, | 1.7% | |||
MBNA Credit Card Master Note Trust, | 1.7% | |||
Federal Home Loan Mortgage Corporation, | 1.6% | |||
Mexican Udibonos, 4.000%, due 06/13/19 | 1.4% |
| * | Excludes short-term investments related to securities lending collateral. |
Portfolio holdings are subject to change daily.
8
Table of Contents
| PORTFOLIO MANAGERS’ REPORT | ING INTERMEDIATE BOND FUND |
Average Annual Total Returns for the Periods Ended March 31, 2011 |
| |||||||||||||||||||||||||||||||||||
1 Year | 5 Year | 10 Year | Since | Since | Since | Since | ||||||||||||||||||||||||||||||
Including Sales Charge: | ||||||||||||||||||||||||||||||||||||
Class A(1) | 5.26 | % | 3.49 | % | 4.80 | % | — | — | — | — | ||||||||||||||||||||||||||
Class B(2) | 2.21 | % | 3.40 | % | 4.50 | % | — | — | — | — | ||||||||||||||||||||||||||
Class C(3) | 6.21 | % | 3.73 | % | 4.51 | % | — | — | — | — | ||||||||||||||||||||||||||
Class I | 8.35 | % | 4.83 | % | — | 5.14 | % | — | — | — | ||||||||||||||||||||||||||
Class O | 8.00 | % | 4.51 | % | — | — | 4.03 | % | — | — | ||||||||||||||||||||||||||
Class R | 7.72 | % | 4.23 | % | — | — | — | 3.51 | % | — | ||||||||||||||||||||||||||
Class W | 8.29 | % | — | — | — | — | — | 4.59 | % | |||||||||||||||||||||||||||
Excluding Sales Charge: | ||||||||||||||||||||||||||||||||||||
Class A | 8.00 | % | 4.51 | % | 5.31 | % | — | — | — | — | ||||||||||||||||||||||||||
Class B | 7.21 | % | 3.73 | % | 4.50 | % | — | — | — | — | ||||||||||||||||||||||||||
Class C | 7.21 | % | 3.73 | % | 4.51 | % | — | — | — | — | ||||||||||||||||||||||||||
Class I | 8.35 | % | 4.83 | % | — | 5.14 | % | — | — | — | ||||||||||||||||||||||||||
Class O | 8.00 | % | 4.51 | % | — | — | 4.03 | % | — | — | ||||||||||||||||||||||||||
Class R | 7.72 | % | 4.23 | % | — | — | — | 3.51 | % | — | ||||||||||||||||||||||||||
Class W | 8.29 | % | — | — | — | — | — | 4.59 | % | |||||||||||||||||||||||||||
Barclays Capital U.S. Aggregate Bond Index | 5.12 | % | 6.03 | % | 5.56 | % | 5.44 | %(4) | 5.25 | %(5) | 4.77 | %(6) | 5.57 | %(7) | ||||||||||||||||||||||
Based on a $10,000 initial investment, the graph and table above illustrate the total return of ING Intermediate Bond Fund against the index indicated. An index is unmanaged and has no cash in its portfolio, imposes no sales charges and incurs no operating expenses. An investor cannot invest directly in an index. The Fund’s performance is shown both with and without the imposition of sales charges.
The performance graph and table do not reflect the deduction of taxes that a shareholder will pay on Fund distributions or the redemption of Fund shares.
The performance shown may include the effect of fee waivers and/or expense reimbursements by the Investment Adviser and/or other service providers, which have the effect of increasing total return. Had all fees and expenses been considered, the total returns would have been lower.
Performance data represents past performance and is no assurance of future results. Investment return and principal value of an investment in the Fund will fluctuate. Shares, when sold, may be worth more or less than their original cost. The Fund’s performance may be lower or higher than the performance data shown. Please log on to www.ingfunds.com or call (800) 992-0180 to get performance through the most recent month end.
This report contains statements that may be “forward-looking” statements. Actual results may differ materially from those projected in the “forward-looking” statements.
The views expressed in this report reflect those of the portfolio managers, only through the end of the period as stated on the cover. The portfolio managers’ views are subject to change at any time based on market and other conditions.
Fund holdings are subject to change daily.
| (1) | Reflects deduction of the maximum Class A sales charge of 4.75%. Effective July 31, 2006, the maximum Class A sales charge was lowered to 2.50%. |
| (2) | Reflects deduction of the Class B deferred sales charge of 5% and 2% for the 1 year and 5 year returns, respectively. |
| (3) | Reflects deduction of the Class C deferred sales charge of 1% for the 1 year return. |
| (4) | Since inception performance for index is shown from January 1, 2002. |
| (5) | Since inception performance for index is shown from August 1, 2004. |
| (6) | Since inception performance for index is shown from April 1, 2004. |
| (7) | Since inception performance for index is shown from January 1, 2008. |
9
Table of Contents
SHAREHOLDER EXPENSE EXAMPLES (UNAUDITED)
As a shareholder of a Fund, you incur two types of costs: (1) transaction costs, including sales charges (loads) on purchase payments, redemption fees, and exchange fees, and (2) ongoing costs, including management fees, distribution and/or service (12b-1) fees, and other Fund expenses. These Examples are intended to help you understand your ongoing costs (in dollars) of investing in a Fund and to compare these costs with the ongoing costs of investing in other mutual funds.
The Examples are based on an investment of $1,000 invested at the beginning of the period and held for the entire period from October 1, 2010 to March 31, 2011. The Funds’ expenses are shown without the imposition of any sales charges or fees. Expenses would have been higher if such charges were included.
Actual Expenses
The left section of the table shown below, “Actual Fund Return,” provides information about actual account values and actual expenses. You may use the information in this section, together with the amount you invested, to estimate the expenses that you paid over the period. Simply divide your account value by $1,000 (for example, an $8,600 account value divided by $1,000 = 8.6), then multiply the result by the number in the first section under the heading entitled “Expenses Paid During the Period” to estimate the expenses you paid on your account during this period.
Hypothetical Example for Comparison Purposes
The right section of the table shown below, “Hypothetical (5% return before expenses)” provides information about hypothetical account values and hypothetical expenses based on a Fund’s actual expense ratio and an assumed rate of return of 5% per year before expenses, which is not the Fund’s actual return. The hypothetical account values and expenses may not be used to estimate the actual ending account balance or expenses you paid for the period. You may use this information to compare the ongoing costs of investing in each Fund and other funds. To do so, compare this 5% hypothetical example with the 5% hypothetical examples that appear in the shareholder reports of the other funds.
Please note that the expenses shown in the table are meant to highlight your ongoing costs only and do not reflect any transactional costs, such as sales charges (loads), redemption fees, or exchange fees. Therefore, the hypothetical lines of the table are useful in comparing ongoing costs only, and will not help you determine the relative total costs of owning different funds. In addition, if these transactional costs were included, your costs would have been higher.
| Actual Fund Return | Hypothetical (5% return before expenses) | |||||||||||||||||||||||||||||||
Beginning | Ending | Annualized | Expenses Paid | Beginning | Ending | Annualized | Expenses Paid | |||||||||||||||||||||||||
ING GNMA Income Fund |
| |||||||||||||||||||||||||||||||
Class A | $ | 1,000.00 | $ | 1,013.50 | 0.93 | % | $ | 4.67 | $ | 1,000.00 | $ | 1,020.29 | 0.93 | % | $ | 4.68 | ||||||||||||||||
Class B | 1,000.00 | 1,009.70 | 1.68 | 8.42 | 1,000.00 | 1,016.55 | 1.68 | 8.45 | ||||||||||||||||||||||||
Class C | 1,000.00 | 1,008.70 | 1.68 | 8.41 | 1,000.00 | 1,016.55 | 1.68 | 8.45 | ||||||||||||||||||||||||
Class I | 1,000.00 | 1,015.00 | 0.63 | 3.16 | 1,000.00 | 1,021.79 | 0.63 | 3.18 | ||||||||||||||||||||||||
Class W | 1,000.00 | 1,014.70 | 0.68 | 3.42 | 1,000.00 | 1,021.54 | 0.68 | 3.43 | ||||||||||||||||||||||||
ING High Yield Bond Fund |
| |||||||||||||||||||||||||||||||
Class A | $ | 1,000.00 | $ | 1,072.80 | 1.10 | % | $ | 5.68 | $ | 1,000.00 | $ | 1,019.45 | 1.10 | % | $ | 5.54 | ||||||||||||||||
Class B | 1,000.00 | 1,068.70 | 1.85 | 9.54 | 1,000.00 | 1,015.71 | 1.85 | 9.30 | ||||||||||||||||||||||||
Class C | 1,000.00 | 1,067.40 | 1.85 | 9.54 | 1,000.00 | 1,015.71 | 1.85 | 9.30 | ||||||||||||||||||||||||
Class I | 1,000.00 | 1,075.40 | 0.73 | 3.78 | 1,000.00 | 1,021.29 | 0.73 | 3.68 | ||||||||||||||||||||||||
| * | Expenses are equal to each Fund’s respective annualized expense ratios multiplied by the average account value over the period, multiplied by 182/365 to reflect the most recent fiscal half-year. |
10
Table of Contents
SHAREHOLDER EXPENSE EXAMPLES (UNAUDITED) (CONTINUED)
| Actual Fund Return | Hypothetical (5% return before expenses) | |||||||||||||||||||||||||||||||
Beginning | Ending | Annualized | Expenses Paid | Beginning | Ending | Annualized | Expenses Paid | |||||||||||||||||||||||||
ING Intermediate Bond Fund |
| |||||||||||||||||||||||||||||||
Class A | $ | 1,000.00 | $ | 1,008.60 | 0.68 | % | $ | 3.41 | $ | 1,000.00 | $ | 1,021.54 | 0.68 | % | $ | 3.43 | ||||||||||||||||
Class B | 1,000.00 | 1,005.80 | 1.43 | 7.15 | 1,000.00 | 1,017.80 | 1.43 | 7.19 | ||||||||||||||||||||||||
Class C | 1,000.00 | 1,005.80 | 1.43 | 7.15 | 1,000.00 | 1,017.80 | 1.43 | 7.19 | ||||||||||||||||||||||||
Class I | 1,000.00 | 1,010.20 | 0.38 | 1.90 | 1,000.00 | 1,023.04 | 0.38 | 1.92 | ||||||||||||||||||||||||
Class O | 1,000.00 | 1,009.70 | 0.68 | 3.41 | 1,000.00 | 1,021.54 | 0.68 | 3.43 | ||||||||||||||||||||||||
Class R | 1,000.00 | 1,007.30 | 0.93 | 4.65 | 1,000.00 | 1,020.29 | 0.93 | 4.68 | ||||||||||||||||||||||||
Class W | 1,000.00 | 1,010.00 | 0.43 | 2.15 | 1,000.00 | 1,022.79 | 0.43 | 2.17 | ||||||||||||||||||||||||
| * | Expenses are equal to each Fund’s respective annualized expense ratios multiplied by the average account value over the period, multiplied by 182/365 to reflect the most recent fiscal half-year. |
11
Table of Contents
REPORT OF INDEPENDENT REGISTERED PUBLIC ACCOUNTING FIRM
The Shareholders and Board of Trustees
ING Funds Trust
We have audited the accompanying statements of assets and liabilities, including the portfolios of investments or summary portfolios of investments, as indicated, of ING GNMA Income Fund, ING High Yield Bond Fund, and ING Intermediate Bond Fund, each a series of ING Funds Trust, as of March 31, 2011, and the related statements of operations for the year then ended, the statements of changes in net assets for each of the years in the two-year period then ended, and the financial highlights for each of the years or periods in the five-year period then ended. These financial statements and financial highlights are the responsibility of management. Our responsibility is to express an opinion on these financial statements and financial highlights based on our audits.
We conducted our audits in accordance with the standards of the Public Company Accounting Oversight Board (United States). Those standards require that we plan and perform the audit to obtain reasonable assurance about whether the financial statements and financial highlights are free of material misstatement. An audit includes examining, on a test basis, evidence supporting the amounts and disclosures in the financial statements. Our procedures included confirmation of securities owned as of March 31, 2011, by correspondence with the custodian and brokers, or by other appropriate auditing procedures when replies from brokers were not received. An audit also includes assessing the accounting principles used and significant estimates made by management, as well as evaluating the overall financial statement presentation. We believe that our audits provide a reasonable basis for our opinion.
In our opinion, the financial statements and financial highlights referred to above present fairly, in all material respects, the financial position of the aforementioned funds as of March 31, 2011, and the results of their operations, the changes in their net assets, and the financial highlights for the periods specified in the first paragraph above, in conformity with U.S. generally accepted accounting principles.

Boston, Massachusetts
May 23, 2011
12
Table of Contents
STATEMENTS OF ASSETS AND LIABILITIES AS OF MARCH 31, 2011
ING GNMA Income Fund | ING High Yield Bond Fund | ING Intermediate Bond Fund | ||||||||||
ASSETS: | ||||||||||||
Investments in securities at value+* | $ | 824,601,202 | $ | 118,309,769 | $ | 795,221,709 | ||||||
Short-term investments at value** | — | 7,240,000 | 18,028,029 | |||||||||
Cash | 17,547,569 | 13,545 | 1,765,216 | |||||||||
Cash collateral for futures | — | — | 1,608,030 | |||||||||
Derivatives collateral (Note 2) | — | — | 1,124,000 | |||||||||
Foreign currencies at value*** | — | 13,424 | 1,605,951 | |||||||||
Receivables: | ||||||||||||
Investment securities sold | 1,983,268 | 250,850 | 17,617,103 | |||||||||
Investment securities sold on a delayed-delivery or when-issued basis | — | — | 28,206,852 | |||||||||
Fund shares sold | 849,878 | 129,005 | 762,928 | |||||||||
Dividends and interest | 3,825,497 | 2,505,050 | 6,912,152 | |||||||||
Unrealized appreciation on forward foreign currency contracts | — | — | 277,096 | |||||||||
Upfront payments made on swap agreements | — | — | 761,027 | |||||||||
Unrealized appreciation on swap agreements | — | — | 91,629 | |||||||||
Prepaid expenses | 47,895 | 43,051 | 58,373 | |||||||||
Total assets | 848,855,309 | 128,504,694 | 874,040,095 | |||||||||
LIABILITIES: | ||||||||||||
Payable for investment securities purchased | 1,167,122 | 1,257,288 | 23,319,616 | |||||||||
Payable for investment securities purchased on a delayed-delivery or when-issued basis | 61,253,682 | — | 79,118,398 | |||||||||
Payable for fund shares redeemed | 839,774 | 481,946 | 926,424 | |||||||||
Payable upon receipt of securities loaned | — | — | 17,095,000 | |||||||||
Unrealized depreciation on forward foreign currency contracts | — | — | 1,149,142 | |||||||||
Upfront payments received on swap agreements | — | — | 853,029 | |||||||||
Unrealized depreciation on swap agreements | — | — | 1,032,528 | |||||||||
Income distribution payable | — | 148,927 | 175,556 | |||||||||
Payable to affiliates | 604,025 | 102,452 | 339,123 | |||||||||
Payable for trustees fees | 4,040 | 582 | 3,930 | |||||||||
Other accrued expenses and liabilities | 232,064 | 104,437 | 324,918 | |||||||||
Written options, at fair value^ | — | — | 185,282 | |||||||||
Total liabilities | 64,100,707 | 2,095,632 | 124,522,946 | |||||||||
NET ASSETS | $ | 784,754,602 | $ | 126,409,062 | $ | 749,517,149 | ||||||
NET ASSETS WERE COMPRISED OF: | ||||||||||||
Paid-in capital | $ | 760,772,365 | $ | 165,216,298 | $ | 893,089,645 | ||||||
Undistributed (distributions in excess of) net investment income | 3,173,437 | (148,927 | ) | 20,849,573 | ||||||||
Accumulated net realized loss | (8,594,865 | ) | (47,037,827 | ) | (189,857,941 | ) | ||||||
Net unrealized appreciation | 29,403,665 | 8,379,518 | 25,435,872 | |||||||||
NET ASSETS | $ | 784,754,602 | $ | 126,409,062 | $ | 749,517,149 | ||||||
| ||||||||||||
+ Including securities loaned at value | $ | — | $ | — | $ | 16,762,640 | ||||||
* Cost of investments in securities | $ | 795,197,537 | $ | 109,930,768 | $ | 767,405,574 | ||||||
** Cost of short-term investments | $ | — | $ | 7,240,000 | $ | 18,694,000 | ||||||
*** Cost of foreign currencies | $ | — | $ | 12,907 | $ | 1,588,272 | ||||||
^ Premiums received on written options | $ | — | $ | — | $ | 138,744 | ||||||
See Accompanying Notes to Financial Statements
13
Table of Contents
STATEMENTS OF ASSETS AND LIABILITIESASOF MARCH 31, 2011 (CONTINUED)
ING GNMA Income Fund | ING High Yield Bond Fund | ING Intermediate Bond Fund | ||||||||||
Class A: | ||||||||||||
Net assets | $ | 593,080,019 | $ | 86,017,002 | $ | 315,999,882 | ||||||
Shares authorized | unlimited | unlimited | unlimited | |||||||||
Par value | $ | 0.001 | $ | 0.001 | $ | 0.001 | ||||||
Shares outstanding | 67,110,117 | 11,003,929 | 33,149,230 | |||||||||
Net asset value and redemption price per share | $ | 8.84 | $ | 7.82 | $ | 9.53 | ||||||
Maximum offering price per share (2.50%)(1) | $ | 9.07 | $ | 8.02 | $ | 9.77 | ||||||
Class B: | ||||||||||||
Net assets | $ | 11,262,318 | $ | 6,863,990 | $ | 9,378,956 | ||||||
Shares authorized | unlimited | unlimited | unlimited | |||||||||
Par value | $ | 0.001 | $ | 0.001 | $ | 0.001 | ||||||
Shares outstanding | 1,281,522 | 878,954 | 985,954 | |||||||||
Net asset value and redemption price per share(2) | $ | 8.79 | $ | 7.81 | $ | 9.51 | ||||||
Class C: | ||||||||||||
Net assets | $ | 104,196,036 | $ | 11,937,873 | $ | 33,994,317 | ||||||
Shares authorized | unlimited | unlimited | unlimited | |||||||||
Par value | $ | 0.001 | $ | 0.001 | $ | 0.001 | ||||||
Shares outstanding | 11,848,489 | 1,527,641 | 3,571,526 | |||||||||
Net asset value and redemption price per share(2) | $ | 8.79 | $ | 7.81 | $ | 9.52 | ||||||
Class I: | ||||||||||||
Net assets | $ | 68,995,622 | $ | 21,590,197 | $ | 332,193,292 | ||||||
Shares authorized | unlimited | unlimited | unlimited | |||||||||
Par value | $ | 0.001 | $ | 0.001 | $ | 0.001 | ||||||
Shares outstanding | 7,797,460 | 2,763,252 | 34,855,041 | |||||||||
Net asset value and redemption price per share | $ | 8.85 | $ | 7.81 | $ | 9.53 | ||||||
Class O: | ||||||||||||
Net assets | n/a | n/a | $ | 41,334,977 | ||||||||
Shares authorized | n/a | n/a | unlimited | |||||||||
Par value | n/a | n/a | $ | 0.001 | ||||||||
Shares outstanding | n/a | n/a | 4,334,556 | |||||||||
Net asset value and redemption price per share | n/a | n/a | $ | 9.54 | ||||||||
Class R: | ||||||||||||
Net assets | n/a | n/a | $ | 14,339,377 | ||||||||
Shares authorized | n/a | n/a | unlimited | |||||||||
Par value | n/a | n/a | $ | 0.001 | ||||||||
Shares outstanding | n/a | n/a | 1,502,297 | |||||||||
Net asset value and redemption price per share | n/a | n/a | $ | 9.54 | ||||||||
Class W: | ||||||||||||
Net assets | $ | 7,220,607 | n/a | $ | 2,276,348 | |||||||
Shares authorized | unlimited | n/a | unlimited | |||||||||
Par value | $ | 0.001 | n/a | $ | 0.001 | |||||||
Shares outstanding | 815,350 | n/a | 239,013 | |||||||||
Net asset value and redemption price per share | $ | 8.86 | n/a | $ | 9.52 | |||||||
| (1) | Maximum offering price is computed at 100/97.50 of net asset value. On purchases of $100,000 or more, the offering price is reduced. |
| (2) | Redemption price per share may be reduced for any applicable contingent deferred sales charges. |
See Accompanying Notes to Financial Statements
14
Table of Contents
STATEMENTS OF OPERATIONSFORTHE YEAR ENDED MARCH 31, 2011
ING GNMA Income Fund | ING High Yield Bond Fund | ING Intermediate Bond Fund | ||||||||||
INVESTMENT INCOME: | ||||||||||||
Dividends(1) | $ | — | $ | 7,655 | $ | 190,165 | ||||||
Interest, net of foreign taxes withheld* | 36,888,213 | 9,894,519 | 44,109,386 | |||||||||
Securities lending income, net | — | — | 30,314 | |||||||||
Total investment income | 36,888,213 | 9,902,174 | 44,329,865 | |||||||||
EXPENSES: | ||||||||||||
Investment management fees | 3,797,189 | 593,791 | 1,336,224 | |||||||||
Distribution and service fees: | ||||||||||||
Class A | 1,504,355 | 210,964 | 865,772 | |||||||||
Class B | 183,744 | 95,926 | 146,537 | |||||||||
Class C | 1,086,740 | 114,023 | 418,540 | |||||||||
Class O | — | — | 105,944 | |||||||||
Class R | — | — | 77,812 | |||||||||
Transfer agent fees: | ||||||||||||
Class A | 374,272 | 126,878 | 332,175 | |||||||||
Class B | 11,861 | 14,476 | 14,426 | |||||||||
Class C | 67,739 | 17,135 | 40,425 | |||||||||
Class I | 7,852 | 3,685 | 157,872 | |||||||||
Class O | — | — | 40,484 | |||||||||
Class R | — | — | 15,250 | |||||||||
Class W | 4,974 | — | 2,241 | |||||||||
Administrative service fees | 807,906 | 116,429 | 786,012 | |||||||||
Shareholder reporting expense | 67,599 | 11,587 | 62,115 | |||||||||
Registration fees | 98,510 | 84,501 | 107,991 | |||||||||
Professional fees | 79,491 | 12,584 | 63,071 | |||||||||
Custody and accounting expense | 96,986 | 22,163 | 160,855 | |||||||||
Trustee fees | 27,336 | 3,762 | 19,739 | |||||||||
Miscellaneous expense | 37,388 | 6,625 | 36,244 | |||||||||
Interest expense | — | 325 | 4,243 | |||||||||
Total expenses | 8,253,942 | 1,434,854 | 4,793,972 | |||||||||
Net recouped (waived and reimbursed) fees | — | (40,009 | ) | 37,746 | ||||||||
Net expenses | 8,253,942 | 1,394,845 | 4,831,718 | |||||||||
Net investment income | 28,634,271 | 8,507,329 | 39,498,147 | |||||||||
REALIZED AND UNREALIZED GAIN (LOSS): | ||||||||||||
Net realized gain (loss) on: | ||||||||||||
Investments | 6,946,705 | 4,791,701 | 27,376,800 | |||||||||
Foreign currency related transactions | — | — | (5,189,262 | ) | ||||||||
Futures | — | — | (3,913,986 | ) | ||||||||
Swaps | — | — | (1,807,626 | ) | ||||||||
Written options | — | — | 778,450 | |||||||||
Net realized gain | 6,946,705 | 4,791,701 | 17,244,376 | |||||||||
Net change in unrealized appreciation or depreciation on: | ||||||||||||
Investments | 3,703,788 | 2,145,736 | 4,209,708 | |||||||||
Foreign currency related transactions | — | 517 | (740,875 | ) | ||||||||
Futures | — | — | 293,525 | |||||||||
Swaps | — | — | 342,500 | |||||||||
Written options | — | — | (46,538 | ) | ||||||||
Net change in unrealized appreciation or depreciation | 3,703,788 | 2,146,253 | 4,058,320 | |||||||||
Net realized and unrealized gain | 10,650,493 | 6,937,954 | 21,302,696 | |||||||||
Increase in net assets resulting from operations | $ | 39,284,764 | $ | 15,445,283 | $ | 60,800,843 | ||||||
| ||||||||||||
* Foreign taxes withheld | $ | — | $ | — | $ | 1,530 | ||||||
(1) Dividends from affiliates | $ | — | $ | 5,813 | $ | 21,653 | ||||||
See Accompanying Notes to Financial Statements
15
Table of Contents
STATEMENTS OF CHANGES IN NET ASSETS
ING GNMA Income Fund | ING High Yield Bond Fund | |||||||||||||||
Year Ended 2011 | Year Ended 2010 | Year Ended 2011 | Year Ended 2010 | |||||||||||||
FROM OPERATIONS: | ||||||||||||||||
Net investment income | $ | 28,634,271 | $ | 29,543,007 | $ | 8,507,329 | $ | 8,892,559 | ||||||||
Net realized gain (loss) | 6,946,705 | 5,839,917 | 4,791,701 | (3,193,568 | ) | |||||||||||
Net change in unrealized appreciation or depreciation | 3,703,788 | (287,645 | ) | 2,146,253 | 30,507,815 | |||||||||||
Increase in net assets resulting from operations | 39,284,764 | 35,095,279 | 15,445,283 | 36,206,806 | ||||||||||||
FROM DISTRIBUTIONS TO SHAREHOLDERS: | ||||||||||||||||
Net investment income: | ||||||||||||||||
Class A | (24,627,310 | ) | (25,155,664 | ) | (6,170,719 | ) | (6,986,125 | ) | ||||||||
Class B | (637,962 | ) | (1,099,922 | ) | (641,089 | ) | (1,093,360 | ) | ||||||||
Class C | (3,671,286 | ) | (3,140,989 | ) | (746,145 | ) | (827,545 | ) | ||||||||
Class I | (3,133,728 | ) | (1,916,719 | ) | (798,345 | ) | (28,023 | ) | ||||||||
Class Q(1) | — | (2,079 | ) | — | — | |||||||||||
Class W | (346,694 | ) | (333,523 | ) | — | — | ||||||||||
Return of capital: | ||||||||||||||||
Class A | — | — | (181,532 | ) | (229,275 | ) | ||||||||||
Class B | — | — | (14,496 | ) | (38,943 | ) | ||||||||||
Class C | — | — | (25,403 | ) | (29,726 | ) | ||||||||||
Class I | — | — | (45,501 | ) | (1,015 | ) | ||||||||||
Total distributions | (32,416,980 | ) | (31,648,896 | ) | (8,623,230 | ) | (9,234,012 | ) | ||||||||
FROM CAPITAL SHARE TRANSACTIONS: | ||||||||||||||||
Net proceeds from sale of shares | 252,757,052 | 275,408,526 | 61,128,322 | 29,719,990 | ||||||||||||
Reinvestment of distributions | 27,473,342 | 26,412,537 | 6,221,442 | 5,568,334 | ||||||||||||
| 280,230,394 | 301,821,063 | 67,349,764 | 35,288,324 | |||||||||||||
Cost of shares redeemed | (282,047,139 | ) | (287,481,142 | ) | (55,515,327 | ) | (33,208,010 | ) | ||||||||
Net increase (decrease) in net assets resulting from |
| (1,816,745 | ) |
| 14,339,921 |
|
| 11,834,437 |
|
| 2,080,314 |
| ||||
Net increase in net assets | 5,051,039 | 17,786,304 | 18,656,490 | 29,053,108 | ||||||||||||
NET ASSETS: | ||||||||||||||||
Beginning of year | 779,703,563 | 761,917,259 | 107,752,572 | 78,699,464 | ||||||||||||
End of year | $ | 784,754,602 | $ | 779,703,563 | $ | 126,409,062 | $ | 107,752,572 | ||||||||
Undistributed (distributions in excess of) net investment income at end of year | $ | 3,173,437 | $ | 3,564,888 | $ | (148,927 | ) | $ | (305,010 | ) | ||||||
| ||||||||||||||||
(1) Effective November 20, 2009, Class Q shareholders of ING GNMA Income Fund converted into Class W shares of the Fund. |
| |||||||||||||||
See Accompanying Notes to Financial Statements
16
Table of Contents
STATEMENTS OF CHANGES IN NET ASSETS
ING Intermediate Bond Fund | ||||||||
Year Ended March 31, 2011 | Year Ended March 31, 2010 | |||||||
FROM OPERATIONS: | ||||||||
Net investment income | $ | 39,498,147 | $ | 44,636,689 | ||||
Net realized gain (loss) | 17,244,376 | (32,149,489 | ) | |||||
Net change in unrealized appreciation or depreciation | 4,058,320 | 143,166,080 | ||||||
Increase in net assets resulting from operations | 60,800,843 | 155,653,280 | ||||||
FROM DISTRIBUTIONS TO SHAREHOLDERS: | ||||||||
Net investment income: | ||||||||
Class A | (15,674,008 | ) | (27,470,003 | ) | ||||
Class B | (566,077 | ) | (1,318,758 | ) | ||||
Class C | (1,594,653 | ) | (2,996,473 | ) | ||||
Class I | (15,443,401 | ) | (23,534,860 | ) | ||||
Class O | (1,909,958 | ) | (2,840,820 | ) | ||||
Class R | (664,621 | ) | (1,102,439 | ) | ||||
Class W | (113,308 | ) | (164,336 | ) | ||||
Total distributions | (35,966,026 | ) | (59,427,689 | ) | ||||
FROM CAPITAL SHARE TRANSACTIONS: | ||||||||
Net proceeds from sale of shares | 183,546,425 | 145,033,805 | ||||||
Reinvestment of distributions | 29,932,608 | 47,744,888 | ||||||
| 213,479,033 | 192,778,693 | |||||||
Cost of shares redeemed | (279,861,986 | ) | (468,048,167 | ) | ||||
Net decrease in net assets resulting from capital share transactions | (66,382,953 | ) | (275,269,474 | ) | ||||
Net decrease in net assets | (41,548,136 | ) | (179,043,883 | ) | ||||
NET ASSETS: | ||||||||
Beginning of year | 791,065,285 | 970,109,168 | ||||||
End of year | $ | 749,517,149 | $ | 791,065,285 | ||||
Undistributed net investment income at end of year | $ | 20,849,573 | $ | 21,509,983 | ||||
See Accompanying Notes to Financial Statements
17
Table of Contents
+
Selected data for a share of beneficial interest outstanding throughout each year or period.
| Income (loss) from investment operations | Less distributions | Ratios to average net assets | Supplemental data | |||||||||||||||||||||||||||||||||||||||||||||||||||||||||||||
| Net asset value, beginning of year or period | Net investment income (loss) | Net realized and unrealized gain (loss) on investments | Total from investment operations | From net investment income | From net realized gains | From return of capital | Total distributions | Net asset value, end of year or period | Total Return(1) | Expenses before reductions/additions(2)(3) | Expenses net of fee waivers and/or recoupments, if any(2)(3) | Expenses net of all reductions/additions(2)(3) | Net investment income (loss)(2)(3) | Net assets, end of year or period | Portfolio turnover rate | |||||||||||||||||||||||||||||||||||||||||||||||||
Year or period ended | ($) | ($) | ($) | ($) | ($) | ($) | ($) | ($) | ($) | (%) | (%) | (%) | (%) | (%) | ($000’s) | (%) | ||||||||||||||||||||||||||||||||||||||||||||||||
ING GNMA Income Fund | ||||||||||||||||||||||||||||||||||||||||||||||||||||||||||||||||
Class A | ||||||||||||||||||||||||||||||||||||||||||||||||||||||||||||||||
03-31-11 | 8.75 | 0.32 | 0.13 | 0.45 | 0.36 | — | — | 0.36 | 8.84 | 5.26 | 0.93 | 0.93 | 0.93 | 3.63 | 593,080 | 193 | ||||||||||||||||||||||||||||||||||||||||||||||||
03-31-10 | 8.71 | 0.33 | • | 0.07 | 0.40 | 0.36 | — | — | 0.36 | 8.75 | 4.68 | 0.94 | 0.94 | 0.94 | 3.83 | 589,813 | 114 | |||||||||||||||||||||||||||||||||||||||||||||||
03-31-09 | 8.54 | 0.37 | 0.18 | 0.55 | �� | 0.38 | — | — | 0.38 | 8.71 | 6.62 | 0.96 | 0.96 | 0.96 | 4.33 | 606,856 | 39 | |||||||||||||||||||||||||||||||||||||||||||||||
03-31-08 | 8.35 | 0.37 | 0.20 | 0.57 | 0.38 | — | — | 0.38 | 8.54 | 7.00 | 0.96 | 0.96 | 0.96 | 4.45 | 515,916 | 32 | ||||||||||||||||||||||||||||||||||||||||||||||||
03-31-07 | 8.30 | 0.37 | 0.09 | 0.46 | 0.41 | — | — | 0.41 | 8.35 | 5.72 | 0.95 | 0.94 | 0.94 | 4.49 | 515,469 | 99 | ||||||||||||||||||||||||||||||||||||||||||||||||
Class B | ||||||||||||||||||||||||||||||||||||||||||||||||||||||||||||||||
03-31-11 | 8.70 | 0.26 | • | 0.13 | 0.39 | 0.30 | — | — | 0.30 | 8.79 | 4.48 | 1.68 | 1.68 | 1.68 | 2.90 | 11,262 | 193 | |||||||||||||||||||||||||||||||||||||||||||||||
03-31-10 | 8.66 | 0.27 | • | 0.06 | 0.33 | 0.29 | — | — | 0.29 | 8.70 | 3.89 | 1.69 | 1.69 | 1.69 | 3.08 | 25,704 | 114 | |||||||||||||||||||||||||||||||||||||||||||||||
03-31-09 | 8.49 | 0.30 | 0.18 | 0.48 | 0.31 | — | — | 0.31 | 8.66 | 5.86 | 1.71 | 1.71 | 1.71 | 3.57 | 38,718 | 39 | ||||||||||||||||||||||||||||||||||||||||||||||||
03-31-08 | 8.30 | 0.31 | 0.19 | 0.50 | 0.31 | — | — | 0.31 | 8.49 | 6.24 | 1.71 | 1.71 | 1.71 | 3.70 | 45,963 | 32 | ||||||||||||||||||||||||||||||||||||||||||||||||
03-31-07 | 8.26 | 0.30 | 0.09 | 0.39 | 0.35 | — | — | 0.35 | 8.30 | 4.84 | 1.70 | 1.69 | 1.69 | 3.73 | 58,568 | 99 | ||||||||||||||||||||||||||||||||||||||||||||||||
Class C | ||||||||||||||||||||||||||||||||||||||||||||||||||||||||||||||||
03-31-11 | 8.71 | 0.25 | 0.13 | 0.38 | 0.30 | — | — | 0.30 | 8.79 | 4.38 | 1.68 | 1.68 | 1.68 | 2.88 | 104,196 | 193 | ||||||||||||||||||||||||||||||||||||||||||||||||
03-31-10 | 8.67 | 0.27 | • | 0.06 | 0.33 | 0.29 | — | — | 0.29 | 8.71 | 3.92 | 1.69 | 1.69 | 1.69 | 3.09 | 103,103 | 114 | |||||||||||||||||||||||||||||||||||||||||||||||
03-31-09 | 8.50 | 0.30 | 0.18 | 0.48 | 0.31 | — | — | 0.31 | 8.67 | 5.88 | 1.71 | 1.71 | 1.71 | 3.59 | 73,209 | 39 | ||||||||||||||||||||||||||||||||||||||||||||||||
03-31-08 | 8.31 | 0.31 | 0.20 | 0.51 | 0.32 | — | — | 0.32 | 8.50 | 6.23 | 1.71 | 1.71 | 1.71 | 3.70 | 36,218 | 32 | ||||||||||||||||||||||||||||||||||||||||||||||||
03-31-07 | 8.27 | 0.31 | 0.08 | 0.39 | 0.35 | — | — | 0.35 | 8.31 | 4.85 | 1.70 | 1.69 | 1.69 | 3.73 | 37,280 | 99 | ||||||||||||||||||||||||||||||||||||||||||||||||
Class I | ||||||||||||||||||||||||||||||||||||||||||||||||||||||||||||||||
03-31-11 | 8.76 | 0.34 | 0.14 | 0.48 | 0.39 | — | — | 0.39 | 8.85 | 5.57 | 0.63 | 0.63 | 0.63 | 3.92 | 68,996 | 193 | ||||||||||||||||||||||||||||||||||||||||||||||||
03-31-10 | 8.72 | 0.36 | • | 0.07 | 0.43 | 0.39 | — | — | 0.39 | 8.76 | 5.00 | 0.64 | 0.64 | 0.64 | 4.15 | 52,880 | 114 | |||||||||||||||||||||||||||||||||||||||||||||||
03-31-09 | 8.55 | 0.39 | 0.18 | 0.57 | 0.40 | — | — | 0.40 | 8.72 | 6.95 | 0.65 | 0.65 | 0.65 | 4.64 | 38,908 | 39 | ||||||||||||||||||||||||||||||||||||||||||||||||
03-31-08 | 8.35 | 0.40 | 0.20 | 0.60 | 0.40 | — | — | 0.40 | 8.55 | 7.42 | 0.67 | 0.67 | 0.67 | 4.74 | 21,002 | 32 | ||||||||||||||||||||||||||||||||||||||||||||||||
03-31-07 | 8.31 | 0.40 | 0.08 | 0.48 | 0.44 | — | — | 0.44 | 8.35 | 5.92 | 0.65 | 0.65 | 0.65 | 4.77 | 14,181 | 99 | ||||||||||||||||||||||||||||||||||||||||||||||||
Class W | ||||||||||||||||||||||||||||||||||||||||||||||||||||||||||||||||
03-31-11 | 8.77 | 0.35 | 0.13 | 0.48 | 0.39 | — | — | 0.39 | 8.86 | 5.51 | 0.68 | 0.68 | 0.68 | 3.88 | 7,221 | 193 | ||||||||||||||||||||||||||||||||||||||||||||||||
03-31-10 | 8.73 | 0.36 | • | 0.06 | 0.42 | 0.38 | — | — | 0.38 | 8.77 | 4.97 | 0.66 | 0.66 | 0.66 | 4.15 | 8,204 | 114 | |||||||||||||||||||||||||||||||||||||||||||||||
03-31-09 | 8.55 | 0.39 | 0.19 | 0.58 | 0.40 | — | — | 0.40 | 8.73 | 7.03 | 0.65 | 0.65 | 0.65 | 4.70 | 4,180 | 39 | ||||||||||||||||||||||||||||||||||||||||||||||||
12-17-07(4) - 03-31-08 | 8.39 | 0.11 | 0.15 | 0.26 | 0.10 | — | — | 0.10 | 8.55 | 3.16 | 0.64 | 0.64 | 0.64 | 4.86 | 1 | 32 | ||||||||||||||||||||||||||||||||||||||||||||||||
ING High Yield Bond Fund | ||||||||||||||||||||||||||||||||||||||||||||||||||||||||||||||||
Class A | ||||||||||||||||||||||||||||||||||||||||||||||||||||||||||||||||
03-31-11 | 7.38 | 0.56 | 0.45 | 1.01 | 0.55 | — | 0.02 | 0.57 | 7.82 | 14.22 | 1.13 | 1.10 | † | 1.10 | † | 7.43 | † | 86,017 | 87 | |||||||||||||||||||||||||||||||||||||||||||||
03-31-10 | 5.52 | 0.62 | 1.89 | 2.51 | 0.63 | — | 0.02 | 0.65 | 7.38 | 46.88 | 1.24 | 1.10 | † | 1.10 | † | 9.17 | † | 83,034 | 103 | |||||||||||||||||||||||||||||||||||||||||||||
03-31-09 | 7.89 | 0.62 | (2.32 | ) | (1.70 | ) | 0.54 | — | 0.13 | 0.67 | 5.52 | (22.36 | ) | 1.25 | 1.10 | † | 1.10 | † | 9.30 | † | 59,307 | 75 | ||||||||||||||||||||||||||||||||||||||||||
03-31-08 | 8.99 | 0.67 | (1.10 | ) | (0.43 | ) | 0.67 | — | — | 0.67 | 7.89 | (5.10 | ) | 1.16 | 1.11 | † | 1.11 | † | 7.86 | † | 83,327 | 66 | ||||||||||||||||||||||||||||||||||||||||||
03-31-07 | 8.71 | 0.61 | 0.27 | 0.88 | 0.60 | — | — | 0.60 | 8.99 | 10.54 | 1.11 | 1.10 | 1.10 | 6.98 | 104,328 | 122 | ||||||||||||||||||||||||||||||||||||||||||||||||
See Accompanying Notes to Financial Statements
18
Table of Contents
FINANCIAL HIGHLIGHTS (CONTINUED)
Selected data for a share of beneficial interest outstanding throughout each year or period.
| Income (loss) from investment operations | Less distributions | Ratios to average net assets | Supplemental data | |||||||||||||||||||||||||||||||||||||||||||||||||||||||||||||
| Net asset value, beginning of year or period | Net investment income (loss) | Net realized and unrealized gain (loss) on investments | Total from investment operations | From net investment income | From net realized gains | From return of capital | Total distributions | Net asset value, end of year or period | Total Return(1) | Expenses before reductions/ additions(2)(3) | Expenses net of fee waivers and/or recoupments, if any(2)(3) | Expenses net of all reductions/ additions(2)(3) | Net investment income (loss)(2)(3) | Net assets, end of year or period | Portfolio turnover rate | |||||||||||||||||||||||||||||||||||||||||||||||||
Year or period ended | ($) | ($) | ($) | ($) | ($) | ($) | ($) | ($) | ($) | (%) | (%) | (%) | (%) | (%) | ($000’s) | (%) | ||||||||||||||||||||||||||||||||||||||||||||||||
ING High Yield Bond Fund (Continued) | ||||||||||||||||||||||||||||||||||||||||||||||||||||||||||||||||
Class B | ||||||||||||||||||||||||||||||||||||||||||||||||||||||||||||||||
03-31-11 | 7.37 | 0.51 | • | 0.44 | 0.95 | 0.49 | — | 0.02 | 0.51 | 7.81 | 13.35 | 1.88 | 1.85 | † | 1.85 | † | 6.74 | † | 6,864 | 87 | ||||||||||||||||||||||||||||||||||||||||||||
03-31-10 | 5.52 | 0.57 | 1.87 | 2.44 | 0.57 | — | 0.02 | 0.59 | 7.37 | 45.58 | 1.99 | 1.85 | † | 1.85 | † | 8.46 | † | 12,099 | 103 | |||||||||||||||||||||||||||||||||||||||||||||
03-31-09 | 7.88 | 0.58 | (2.32 | ) | (1.74 | ) | 0.49 | — | 0.13 | 0.62 | 5.52 | (22.86 | ) | 2.00 | 1.85 | † | 1.85 | † | 8.38 | † | 12,289 | 75 | ||||||||||||||||||||||||||||||||||||||||||
03-31-08 | 8.98 | 0.61 | (1.11 | ) | (0.50 | ) | 0.60 | — | — | 0.60 | 7.88 | (5.82 | ) | 1.91 | 1.86 | † | 1.86 | † | 7.08 | † | 24,994 | 66 | ||||||||||||||||||||||||||||||||||||||||||
03-31-07 | 8.70 | 0.53 | 0.29 | 0.82 | 0.54 | — | — | 0.54 | 8.98 | 9.72 | 1.86 | 1.85 | 1.85 | 6.18 | 43,427 | 122 | ||||||||||||||||||||||||||||||||||||||||||||||||
Class C | ||||||||||||||||||||||||||||||||||||||||||||||||||||||||||||||||
03-31-11 | 7.38 | 0.50 | 0.44 | 0.94 | 0.49 | — | 0.02 | 0.51 | 7.81 | 13.22 | 1.88 | 1.85 | † | 1.85 | † | 6.66 | † | 11,938 | 87 | |||||||||||||||||||||||||||||||||||||||||||||
03-31-10 | 5.52 | 0.57 | 1.89 | 2.46 | 0.58 | — | 0.02 | 0.60 | 7.38 | 45.82 | 1.99 | 1.85 | † | 1.85 | † | 8.40 | † | 11,038 | 103 | |||||||||||||||||||||||||||||||||||||||||||||
03-31-09 | 7.89 | 0.58 | (2.33 | ) | (1.75 | ) | 0.49 | — | 0.13 | 0.62 | 5.52 | (22.95 | ) | 2.00 | 1.85 | † | 1.85 | † | 8.57 | † | 7,101 | 75 | ||||||||||||||||||||||||||||||||||||||||||
03-31-08 | 8.99 | 0.61 | (1.11 | ) | (0.50 | ) | 0.60 | — | — | 0.60 | 7.89 | (5.81 | ) | 1.91 | 1.86 | † | 1.86 | † | 7.09 | † | 9,987 | 66 | ||||||||||||||||||||||||||||||||||||||||||
03-31-07 | 8.71 | 0.54 | 0.28 | 0.82 | 0.54 | — | — | 0.54 | 8.99 | 9.70 | 1.86 | 1.85 | 1.85 | 6.21 | 15,487 | 122 | ||||||||||||||||||||||||||||||||||||||||||||||||
Class I | ||||||||||||||||||||||||||||||||||||||||||||||||||||||||||||||||
03-31-11 | 7.37 | 0.57 | • | 0.48 | 1.05 | 0.59 | — | 0.02 | 0.61 | 7.81 | 14.86 | 0.76 | 0.73 | † | 0.73 | † | 7.53 | † | 21,590 | 87 | ||||||||||||||||||||||||||||||||||||||||||||
03-31-10 | 5.51 | 0.64 | • | 1.90 | 2.54 | 0.66 | — | 0.02 | 0.68 | 7.37 | 47.55 | 0.92 | 0.78 | † | 0.78 | † | 8.99 | † | 1,582 | 103 | ||||||||||||||||||||||||||||||||||||||||||||
07-31-08(4) - 03-31-09 | 7.64 | 0.37 | • | (1.92 | ) | (1.55 | ) | 0.49 | — | 0.09 | 0.58 | 5.51 | (20.35 | ) | 0.95 | 0.80 | † | 0.80 | † | 9.61 | † | 2 | 75 | |||||||||||||||||||||||||||||||||||||||||
ING Intermediate Bond Fund | ||||||||||||||||||||||||||||||||||||||||||||||||||||||||||||||||
Class A | ||||||||||||||||||||||||||||||||||||||||||||||||||||||||||||||||
03-31-11 | 9.23 | 0.47 | • | 0.26 | 0.73 | 0.43 | — | — | 0.43 | 9.53 | 8.00 | 0.68 | 0.68 | † | 0.68 | † | 4.97 | † | 316,000 | 384 | ||||||||||||||||||||||||||||||||||||||||||||
03-31-10 | 8.31 | 0.45 | • | 1.09 | 1.54 | 0.62 | — | — | 0.62 | 9.23 | 18.95 | 0.71 | 0.69 | † | 0.69 | † | 5.04 | † | 348,871 | 540 | ||||||||||||||||||||||||||||||||||||||||||||
03-31-09 | 10.13 | 0.45 | (1.60 | ) | (1.15 | ) | 0.45 | 0.22 | — | 0.67 | 8.31 | (11.65 | ) | 0.72 | 0.70 | † | 0.70 | † | 4.84 | † | 471,185 | 674 | ||||||||||||||||||||||||||||||||||||||||||
03-31-08 | 10.23 | 0.51 | (0.15 | ) | 0.36 | 0.46 | — | — | 0.46 | 10.13 | 3.61 | 0.73 | 0.69 | † | 0.69 | † | 4.98 | † | 799,369 | 435 | ||||||||||||||||||||||||||||||||||||||||||||
03-31-07 | 10.13 | 0.50 | 0.10 | 0.60 | 0.50 | — | — | 0.50 | 10.23 | 6.03 | 0.73 | 0.69 | † | 0.69 | † | 4.89 | † | 698,537 | 367 | |||||||||||||||||||||||||||||||||||||||||||||
Class B | ||||||||||||||||||||||||||||||||||||||||||||||||||||||||||||||||
03-31-11 | 9.21 | 0.40 | • | 0.26 | 0.66 | 0.36 | — | — | 0.36 | 9.51 | 7.21 | 1.43 | 1.43 | † | 1.43 | † | 4.24 | † | 9,379 | 384 | ||||||||||||||||||||||||||||||||||||||||||||
03-31-10 | 8.30 | 0.38 | • | 1.08 | 1.46 | 0.55 | — | — | 0.55 | 9.21 | 17.96 | 1.46 | 1.44 | † | 1.44 | † | 4.31 | † | 18,605 | 540 | ||||||||||||||||||||||||||||||||||||||||||||
03-31-09 | 10.11 | 0.38 | (1.59 | ) | (1.21 | ) | 0.38 | 0.22 | — | 0.60 | 8.30 | (12.26 | ) | 1.47 | 1.45 | † | 1.45 | † | 4.08 | † | 23,721 | 674 | ||||||||||||||||||||||||||||||||||||||||||
03-31-08 | 10.21 | 0.43 | (0.14 | ) | 0.29 | 0.39 | — | — | 0.39 | 10.11 | 2.84 | 1.48 | 1.44 | † | 1.44 | † | 4.26 | † | 41,078 | 435 | ||||||||||||||||||||||||||||||||||||||||||||
03-31-07 | 10.11 | 0.42 | 0.10 | 0.52 | 0.42 | — | — | 0.42 | 10.21 | 5.23 | 1.48 | 1.44 | † | 1.44 | † | 4.13 | † | 50,086 | 367 | |||||||||||||||||||||||||||||||||||||||||||||
Class C | ||||||||||||||||||||||||||||||||||||||||||||||||||||||||||||||||
03-31-11 | 9.22 | 0.40 | • | 0.26 | 0.66 | 0.36 | — | — | 0.36 | 9.52 | 7.21 | 1.43 | 1.43 | † | 1.43 | † | 4.22 | † | 33,994 | 384 | ||||||||||||||||||||||||||||||||||||||||||||
03-31-10 | 8.30 | 0.38 | • | 1.09 | 1.47 | 0.55 | — | — | 0.55 | 9.22 | 18.08 | 1.46 | 1.44 | † | 1.44 | † | 4.31 | † | 45,016 | 540 | ||||||||||||||||||||||||||||||||||||||||||||
03-31-09 | 10.12 | 0.38 | (1.60 | ) | (1.22 | ) | 0.38 | 0.22 | — | 0.60 | 8.30 | (12.35 | ) | 1.47 | 1.45 | † | 1.45 | † | 4.08 | † | 53,534 | 674 | ||||||||||||||||||||||||||||||||||||||||||
03-31-08 | 10.22 | 0.43 | (0.14 | ) | 0.29 | 0.39 | — | — | 0.39 | 10.12 | 2.85 | 1.48 | 1.44 | † | 1.44 | † | 4.24 | † | 83,232 | 435 | ||||||||||||||||||||||||||||||||||||||||||||
03-31-07 | 10.12 | 0.42 | 0.10 | 0.52 | 0.42 | — | — | 0.42 | 10.22 | 5.24 | 1.48 | 1.44 | † | 1.44 | † | 4.13 | † | 81,556 | 367 | |||||||||||||||||||||||||||||||||||||||||||||
See Accompanying Notes to Financial Statements
19
Table of Contents
FINANCIAL HIGHLIGHTS (CONTINUED)
Selected data for a share of beneficial interest outstanding throughout each year or period.
| Income (loss) from investment operations | Less distributions | Ratios to average net assets | Supplemental data | |||||||||||||||||||||||||||||||||||||||||||||||||||||||||||||
| Net asset value, beginning of year or period | Net investment income (loss) | Net realized and unrealized gain (loss) on investments | Total from investment operations | From net investment income | From net realized gains | From return of capital | Total distributions | Net asset value, end of year or period | Total Return(1) | Expenses before reductions/ additions(2)(3) | Expenses net of fee waivers and/or recoupments, if any(2)(3) | Expenses net of all reductions/ additions(2)(3) | Net investment income (loss)(2)(3) | Net assets, end of year or period | Portfolio turnover rate | |||||||||||||||||||||||||||||||||||||||||||||||||
Year or period ended | ($) | ($) | ($) | ($) | ($) | ($) | ($) | ($) | ($) | (%) | (%) | (%) | (%) | (%) | ($000’s) | (%) | ||||||||||||||||||||||||||||||||||||||||||||||||
ING Intermediate Bond Fund (Continued) | ||||||||||||||||||||||||||||||||||||||||||||||||||||||||||||||||
Class I | ||||||||||||||||||||||||||||||||||||||||||||||||||||||||||||||||
03-31-11 | 9.23 | 0.50 | 0.26 | 0.76 | 0.46 | — | — | 0.46 | 9.53 | 8.35 | 0.38 | 0.38 | † | 0.38 | † | 5.25 | † | 332,193 | 384 | |||||||||||||||||||||||||||||||||||||||||||||
03-31-10 | 8.31 | 0.48 | • | 1.09 | 1.57 | 0.65 | — | — | 0.65 | 9.23 | 19.33 | 0.39 | 0.37 | † | 0.37 | † | 5.37 | † | 316,209 | 540 | ||||||||||||||||||||||||||||||||||||||||||||
03-31-09 | 10.14 | 0.48 | (1.61 | ) | (1.13 | ) | 0.48 | 0.22 | — | 0.70 | 8.31 | (11.42 | ) | 0.39 | 0.37 | † | 0.37 | † | 5.17 | † | 362,162 | 674 | ||||||||||||||||||||||||||||||||||||||||||
03-31-08 | 10.23 | 0.54 | (0.13 | ) | 0.41 | 0.50 | — | — | 0.50 | 10.14 | 4.05 | 0.39 | 0.35 | † | 0.38 | † | 5.31 | † | 351,575 | 435 | ||||||||||||||||||||||||||||||||||||||||||||
03-31-07 | 10.14 | 0.53 | 0.09 | 0.62 | 0.53 | — | — | 0.53 | 10.23 | 6.26 | 0.40 | 0.36 | † | 0.36 | † | 5.22 | † | 266,596 | 367 | |||||||||||||||||||||||||||||||||||||||||||||
Class O | ||||||||||||||||||||||||||||||||||||||||||||||||||||||||||||||||
03-31-11 | 9.24 | 0.47 | • | 0.26 | 0.73 | 0.43 | — | — | 0.43 | 9.54 | 8.00 | 0.68 | 0.68 | † | 0.68 | † | 4.96 | † | 41,335 | 384 | ||||||||||||||||||||||||||||||||||||||||||||
03-31-10 | 8.32 | 0.46 | • | 1.08 | 1.54 | 0.62 | — | — | 0.62 | 9.24 | 18.94 | 0.71 | 0.69 | † | 0.69 | † | 5.09 | † | 41,860 | 540 | ||||||||||||||||||||||||||||||||||||||||||||
03-31-09 | 10.14 | 0.45 | (1.60 | ) | (1.15 | ) | 0.45 | 0.22 | — | 0.67 | 8.32 | (11.62 | ) | 0.72 | 0.70 | † | 0.70 | † | 4.84 | † | 39,188 | 674 | ||||||||||||||||||||||||||||||||||||||||||
03-31-08 | 10.24 | 0.51 | (0.15 | ) | 0.36 | 0.46 | — | — | 0.46 | 10.14 | 3.61 | 0.73 | 0.69 | † | 0.69 | † | 4.99 | † | 55,956 | 435 | ||||||||||||||||||||||||||||||||||||||||||||
03-31-07 | 10.14 | 0.50 | 0.09 | 0.59 | 0.49 | — | — | 0.49 | 10.24 | 6.02 | 0.73 | 0.69 | † | 0.69 | † | 4.88 | † | 53,096 | 367 | |||||||||||||||||||||||||||||||||||||||||||||
Class R | ||||||||||||||||||||||||||||||||||||||||||||||||||||||||||||||||
03-31-11 | 9.24 | 0.45 | • | 0.25 | 0.70 | 0.40 | — | — | 0.40 | 9.54 | 7.72 | 0.93 | 0.93 | † | 0.93 | † | 4.72 | † | 14,339 | 384 | ||||||||||||||||||||||||||||||||||||||||||||
03-31-10 | 8.32 | 0.43 | • | 1.09 | 1.52 | 0.60 | — | — | 0.60 | 9.24 | 18.64 | 0.96 | 0.94 | † | 0.94 | † | 4.83 | † | 18,417 | 540 | ||||||||||||||||||||||||||||||||||||||||||||
03-31-09 | 10.15 | 0.43 | (1.61 | ) | (1.18 | ) | 0.43 | 0.22 | — | 0.65 | 8.32 | (11.93 | ) | 0.97 | 0.95 | † | 0.95 | † | 4.59 | † | 18,240 | 674 | ||||||||||||||||||||||||||||||||||||||||||
03-31-08 | 10.25 | 0.48 | (0.14 | ) | 0.34 | 0.44 | — | — | 0.44 | 10.15 | 3.36 | 0.98 | 0.94 | † | 0.94 | † | 4.65 | † | 16,773 | 435 | ||||||||||||||||||||||||||||||||||||||||||||
03-31-07 | 10.15 | 0.47 | 0.10 | 0.57 | 0.47 | — | — | 0.47 | 10.25 | 5.75 | 0.98 | 0.94 | † | 0.94 | † | 4.63 | † | 5,572 | 367 | |||||||||||||||||||||||||||||||||||||||||||||
Class W | ||||||||||||||||||||||||||||||||||||||||||||||||||||||||||||||||
03-31-11 | 9.22 | 0.48 | 0.27 | 0.75 | 0.45 | — | — | 0.45 | 9.52 | 8.29 | 0.43 | 0.43 | † | 0.43 | † | 5.21 | † | 2,276 | 384 | |||||||||||||||||||||||||||||||||||||||||||||
03-31-10 | 8.31 | 0.48 | • | 1.08 | 1.56 | 0.65 | — | — | 0.65 | 9.22 | 19.15 | 0.42 | 0.40 | † | 0.40 | † | 5.42 | † | 2,087 | 540 | ||||||||||||||||||||||||||||||||||||||||||||
03-31-09 | 10.12 | 0.45 | (1.53 | ) | (1.08 | ) | 0.51 | 0.22 | — | 0.73 | 8.31 | (11.03 | ) | 0.39 | 0.37 | † | 0.37 | † | 5.09 | † | 2,079 | 674 | ||||||||||||||||||||||||||||||||||||||||||
12-17-07(4) - 03-31-08 | 10.21 | 0.15 | • | (0.05 | ) | 0.10 | 0.19 | — | — | 0.19 | 10.12 | 0.98 | 0.48 | 0.44 | † | 0.44 | † | 5.24 | † | 443 | 435 | |||||||||||||||||||||||||||||||||||||||||||
| (1) | Total return is calculated assuming reinvestment of all dividends, capital gain distributions and return of capital distributions, if any, at net asset value and excluding the deduction of sales charges. Total return for periods less than one year is not annualized. |
| (2) | Annualized for periods less than one year. |
| (3) | Expense ratios reflect operating expenses of a Fund. Expenses before reductions do not reflect amounts reimbursed by the Investment Adviser and/or Distributor or reductions from brokerage service arrangements or other expense offset arrangements and do not represent the amount paid by a Fund during periods when reimbursements or reductions occur. Expenses net of fee waivers reflect expenses after reimbursement by the Investment Adviser and/or Distributor but prior to reductions from brokerage commission recapture arrangements or other expense offset arrangements. Expenses net of all reductions represent the net expenses paid by a Fund. Net investment income (loss) is net of all such additions or reductions. |
| (4) | Commencement of operations. |
| † | Impact of waiving the advisory fee for the ING Institutional Prime Money Market Fund holding has less than 0.005% impact on the expense ratio and net investment income or loss ratio. |
| Ÿ | Calculated using average number of shares outstanding throughout the period. |
See Accompanying Notes to Financial Statements
20
Table of Contents
NOTES TO FINANCIAL STATEMENTSASOF MARCH 31, 2011
NOTE 1 — ORGANIZATION
Organization. ING Funds Trust (“Trust”) is a Delaware statutory trust and is registered as an open-end management investment company under the Investment Company Act of 1940, as amended (“1940 Act” or the “Act”). The Trust was organized on August 6, 1998 and was established under a Trust Instrument dated July 30, 1998. It consists of four separately managed series. This report is for: ING GNMA Income Fund (“GNMA Income”), ING High Yield Bond Fund (“High Yield Bond”) and ING Intermediate Bond Fund (“Intermediate Bond”) (each, a “Fund” and collectively, the “Funds”).
The investment objective of each Fund is described in each Fund’s prospectus.
Each Fund offers at least four of the following classes of shares: Class A, Class B, Class C, Class I, Class O, Class R and Class W. The separate classes of shares differ principally in the applicable sales charges (if any), transfer agent fees, distribution fees and shareholder servicing fees. Generally, shareholders of each class also bear certain expenses that pertain to that particular class. All shareholders bear the common expenses of a Fund and earn income and realized gains/losses from the portfolio pro rata based on the average daily net assets of each class, without distinction between share classes. Expenses that are specific to a fund or a class are charged directly to that fund or class. Other operating expenses shared by several funds are generally allocated among those funds based on average net assets. Differences in per share dividend rates generally result from the differences in separate class expenses, including distribution, and shareholder servicing fees. Class B shares, along with their pro rata reinvested dividend shares, automatically convert to Class A shares eight years after purchase.
Class B shares of the Funds are closed to new investment, provided that (1) Class B shares of the Funds may be purchased through the reinvestment of dividends issued by Class B shares of a Fund; and (2) subject to the terms and conditions of relevant exchange privileges and as permitted under their respective prospectuses, Class B shares of the Funds may be acquired through exchange of Class B shares of other funds in the ING mutual funds complex.
NOTE 2 — SIGNIFICANT ACCOUNTING POLICIES
The following significant accounting policies are consistently followed by the Funds in the preparation of their financial statements, and such policies are in
conformity with U.S. generally accepted accounting principles for investment companies.
A. Security Valuation. All investments in securities are recorded at their estimated fair value, as described below. Investments in equity securities traded on a national securities exchange are valued at the last reported sale price. Securities reported by the National Association of Securities Dealers Automated Quotation System (“NASDAQ”) will be valued at the NASDAQ official closing prices. Securities traded on an exchange or NASDAQ for which there has been no sale and securities traded in the over-the- counter-market are valued at the mean between the last reported bid and ask prices. All investments quoted in foreign currencies will be valued daily in U.S. dollars on the basis of the foreign currency exchange rates prevailing at that time. Debt securities with more than 60 days to maturity are valued using matrix pricing methods determined by an independent pricing service which takes into consideration such factors as yields, maturities, liquidity, ratings and traded prices in similar or identical securities. Securities for which valuations are not readily available from an independent pricing service may be valued by brokers which use prices provided by market makers or estimates of fair market value obtained from yield data relating to investments or securities with similar characteristics. Investments in open-end mutual funds are valued at the net asset value (“NAV”). Investments in securities of sufficient credit quality maturing in 60 days or less are valued at amortized cost which approximates fair value.
Securities and assets for which market quotations are not readily available (which may include certain restricted securities which are subject to limitations as to their sale) are valued at their fair values, as defined by the 1940 Act, as determined in good faith by or under the supervision of the Funds’ Board of Trustees (“Board”), in accordance with methods that are specifically authorized by the Board. Securities traded on exchanges, including foreign exchanges, which close earlier than the time that a Fund calculates its NAV may also be valued at their fair values as defined by the 1940 Act and as determined in good faith by or under the supervision of the Funds’ Board, in accordance with methods that are specifically authorized by the Board. If an event occurs after the time at which the market for foreign securities held by a Fund closes but before the time that a Fund’s NAV is calculated, such event may cause the closing price on the foreign exchange to not represent a readily available reliable market value quotation for such securities at the time a Fund
21
Table of Contents
NOTES TO FINANCIAL STATEMENTSASOF MARCH 31, 2011 (CONTINUED)
NOTE 2 — SIGNIFICANT ACCOUNTING POLICIES (continued)
determines its NAV. In such a case, a Fund will use the fair value of such securities as determined under a Fund’s valuation procedures. Events after the close of trading on a foreign market that could require a Fund to fair value some or all of its foreign securities include, among others, securities trading in the U.S. and other markets, corporate announcements, natural and other disasters, and political and other events. Among other elements of analysis in the determination of a security’s fair value, the Board has authorized the use of one or more independent research services to assist with such determinations. An independent research service may use statistical analyses and quantitative models to help determine fair value as of the time a Fund calculates its NAV. There can be no assurance that such models accurately reflect the behavior of the applicable markets or the effect of the behavior of such markets on the fair value of securities, or that such markets will continue to behave in a fashion that is consistent with such models. Unlike the closing price of a security on an exchange, fair value determinations employ elements of judgment. Consequently, the fair value assigned to a security may not represent the actual value that a Fund could obtain if it were to sell the security at the time of the close of the NYSE. Pursuant to procedures adopted by the Board, a Fund is not obligated to use the fair valuations suggested by any research service, and valuation recommendations provided by such research services may be overridden if other events have occurred or if other fair valuations are determined in good faith to be more accurate. Unless an event is such that it causes a Fund to determine that the closing prices for one or more securities do not represent readily available reliable fair value quotations at the time a Fund determines its NAV, events that occur between the time of the close of the foreign market on which they are traded and the close of regular trading on the NYSE will not be reflected in a Fund’s NAV.
Fair Value is defined as the price that the Fund would receive to sell an asset or pay to transfer a liability in an orderly transaction between market participants at the measurement date. Each investment asset or liability of the Funds is assigned a level at measurement date based on the significance and source of the inputs to its valuation. Quoted prices in active markets for identical securities are classified as “Level 1,” inputs other than quoted prices for an asset or liability that are observable are classified as “Level 2” and unobservable inputs, including the sub-adviser’s judgment about the
assumptions that a market participant would use in pricing an asset or liability are classified as “Level 3”. The inputs used for valuing securities are not necessarily an indication of the risks associated with investing in those securities. Short-term securities of sufficient credit quality which are valued at amortized cost, which approximates fair value, are generally considered to be Level 2 securities under applicable accounting rules. A table summarizing the Funds’ investments under these levels of classification is included following the Summary Portfolios of Investments.
For the year ended March 31, 2011, there have been no significant changes to the fair valuation methodologies.
B. Security Transactions and Revenue Recognition. Securities transactions are accounted for on the trade date. Realized gains and losses are reported on the basis of identified cost of securities sold. Interest income is recorded on an accrual basis. Dividend income is recorded on the ex-dividend date, or for certain foreign securities, when the information becomes available to the Funds. Premium amortization and discount accretion are determined by the effective yield method.
C. Foreign Currency Translation. The books and records of the Funds are maintained in U.S. dollars. Any foreign currency amounts are translated into U.S. dollars on the following basis:
(1) Market value of investment securities, other assets and liabilities — at the exchange rates prevailing at the end of the day.
(2) Purchases and sales of investment securities, income and expenses — at the rates of exchange prevailing on the respective dates of such transactions.
Although the net assets and the market values are presented at the foreign exchange rates at the end of the day, the Funds do not isolate the portion of the results of operations resulting from changes in foreign exchange rates on investments from the fluctuations arising from changes in market prices of securities held. Such fluctuations are included with the net realized and unrealized gains or losses from investments. For securities that are subject to foreign withholding tax upon disposition, liabilities are recorded on the Statements of Assets and Liabilities for the estimated tax withholding based on the securities’ current market values. Upon disposition, realized gains or losses on such securities are recorded net of foreign withholding tax.
22
Table of Contents
NOTES TO FINANCIAL STATEMENTSASOF MARCH 31, 2011 (CONTINUED)
NOTE 2 — SIGNIFICANT ACCOUNTING POLICIES (continued)
Reported net realized foreign exchange gains or losses arise from sales of foreign currencies, currency gains or losses realized between the trade and settlement dates on securities transactions, the difference between the amounts of dividends, interest, and foreign withholding taxes recorded on the Funds’ books, and the U.S. dollar equivalent of the amounts actually received or paid. Net unrealized foreign exchange gains and losses arise from changes in the value of assets and liabilities other than investments in securities at fiscal year end, resulting from changes in the exchange rate. Foreign security and currency transactions may involve certain considerations and risks not typically associated with investing in U.S. companies and U.S. government securities. These risks include, but are not limited to revaluation of currencies and future adverse political and economic developments which could cause securities and their markets to be less liquid and prices more volatile than those of comparable U.S. companies and U.S. government securities.
D. Risk Exposures and the use of Derivative Instruments. The Funds’ investment objectives permit them to enter into various types of derivatives contracts, including, but not limited to, forward foreign currency exchange contracts, futures, purchased options, written options, and swaps. In doing so, the Funds will employ strategies in differing combinations to permit them to increase or decrease the level of risk, or change the level or types of exposure to market risk factors. This may allow the Funds to pursue their objectives more quickly, and efficiently than if it were to make direct purchases or sales of securities capable of affecting a similar response to market factors.
Market Risk Factors. In pursuit of its investment objectives, the Funds may seek to use derivatives to increase or decrease their exposure to the following market risk factors:
Credit Risk. Credit risk relates to the ability of the issuer to meet interest and principal payments, or both, as they come due. In general, lower-grade, higher-yield bonds are subject to credit risk to a greater extent than lower-yield, higher-quality bonds.
Equity Risk. Equity risk relates to the change in value of equity securities as they relate to increases or decreases in the general market.
Foreign Exchange Rate Risk. Foreign exchange rate risk relates to the change in U.S. dollar value of a security
held that is denominated in a foreign currency. The U.S. dollar value of a foreign currency denominated security will decrease as the dollar appreciates against the currency, while the U.S. dollar value will increase as the dollar depreciates against the currency.
Interest Rate Risk. Interest rate risk refers to the fluctuations in value of fixed-income securities resulting from the inverse relationship between price and yield. For example, an increase in general interest rates will tend to reduce the market value of already issued fixed-income investments, and a decline in general interest rates will tend to increase their value. In addition, debt securities with longer durations, which tend to have higher yields, are subject to potentially greater fluctuations in value from changes in interest rates than obligations with shorter durations.
Risks of Investing in Derivatives. The Funds’ use of derivatives can result in losses due to unanticipated changes in the market risk factors and the overall market. In instances where the Funds are using derivatives to decrease, or hedge, exposures to market risk factors for securities held by a Fund, there are also risks that those derivatives may not perform as expected resulting in losses for the combined or hedged positions.
The use of these strategies involves certain special risks, including a possible imperfect correlation, or even no correlation, between price movements of derivative instruments and price movements of related investments. While some strategies involving derivative instruments can reduce the risk of loss, they can also reduce the opportunity for gain or even result in losses by offsetting favorable price movements in related investments or otherwise, due to the possible inability of the Funds to purchase or sell a portfolio security at a time that otherwise would be favorable or the possible need to sell a portfolio security at a disadvantageous time because the Funds are required to maintain asset coverage or offsetting positions in connection with transactions in derivative instruments. Additional associated risks from investing in derivatives also exist and potentially could have significant effects on the valuation of the derivatives and the Funds. Associated risks are not the risks that the Funds are attempting to increase or decrease exposure to, per its investment objectives, but are the additional risks from investing in derivatives. Examples of these associated risks are liquidity risk, which is the risk that the Funds will not be able to sell the derivative in the open market in a timely manner, and counterparty credit risk, which is the risk that the counterparty will not fulfill its
23
Table of Contents
NOTES TO FINANCIAL STATEMENTSASOF MARCH 31, 2011 (CONTINUED)
NOTE 2 — SIGNIFICANT ACCOUNTING POLICIES (continued)
obligation to the Funds. Associated risks can be different for each type of derivative and are discussed by each derivative type in the following notes.
Counterparty Credit Risk and Credit Related Contingent Features. Certain derivative positions are subject to counterparty credit risk, which is the risk that the counterparty will not fulfill its obligation to the Funds. The Funds derivative counterparties are financial institutions who are subject to market conditions that may weaken their financial position. The Funds intends to enter into financial transactions with counterparties that they believe to be creditworthy at the time of the transaction. To reduce this risk, the Funds generally enter into master netting arrangements, established within the Funds International Swap and Derivatives Association, Inc. (“ISDA”) Master Agreements (“Master Agreements”). These agreements are with select counterparties and they govern transactions, including certain over-the-counter (“OTC”) derivative and forward foreign currency contracts, entered into by the Funds and the counterparty. The Master Agreements maintain provisions for general obligations, representations, agreements, collateral, and events of default or termination. The occurrence of a specified event of termination may give a counterparty the right to terminate all of its contracts and affect settlement of all outstanding transactions under the applicable Master Agreement.
The Funds may also enter into collateral agreements with certain counterparties to further mitigate credit risk associated with OTC derivative and forward foreign currency contracts. Subject to established minimum levels, collateral is generally determined based on the net aggregate unrealized gain or loss on contracts with a certain counterparty. Collateral pledged to or from the Funds is held in a segregated account by a third-party agent and can be in the form of cash or debt securities issued by the U.S. government or related agencies.
As of March 31, 2011, the maximum amount of loss that Intermediate Bond would incur if the counterparties to its derivative transactions failed to perform would be $1,129,752, which represents the gross payments to be received by the Fund on open forward foreign currency contracts and swaps were they to be unwound as of March 31, 2011.
The Funds’ master agreements with derivative counterparties have credit related contingent features
that if triggered would allow its derivatives counterparties to close out and demand payment or additional collateral to cover their exposure from the Funds. Credit related contingent features are established between the Funds and their derivatives counterparties to reduce the risk that the Funds will not fulfill their payment obligations to their counterparties. These triggering features include, but are not limited to, a percentage decrease in the Funds net assets and or a percentage decrease in the Funds NAV, which could cause the Funds to accelerate payment of any net liability owed to the counterparty. The contingent features are established within the Funds Master Agreements.
As of March 31, 2011, Intermediate Bond had a net liability position of $3,034,699 on open forward foreign currency contracts, swaps and written options with credit related contingent features. If a contingent feature would have been triggered as of March 31, 2011, Intermediate Bond could have been required to pay this amount in cash to its counterparties. As of March 31, 2011 Intermediate Bond had posted $1,124,000 to its counterparties in cash collateral for its open derivatives transactions.
E. Foreign Currency Transactions and Futures Contracts. High Yield Bond and Intermediate Bond may enter into foreign currency exchange transactions to convert to and from different foreign currencies and to and from the U.S. dollar in connection with the planned purchases or sales of securities. The Funds either enter into these transactions on a spot basis at the spot rate prevailing in the foreign currency exchange market or use forward foreign currency contracts to purchase or sell foreign currencies. When the contract is fulfilled or closed, gains or losses are realized. Until then, the gain or loss is included in unrealized appreciation or depreciation. Risks may arise upon entering into forward contracts from the potential inability of counterparties to meet the terms of their forward contracts and from unanticipated movements in the value of foreign currencies relative to the U.S. dollar.
For the year ended March 31, 2011, Intermediate Bond has entered into forward foreign currency contracts with the obligation to buy and sell specified foreign currencies in the future at a currently negotiated forward rate in order to increase or decrease exposure to foreign exchange rate risk. The Fund uses forward foreign currency contracts primarily to protect its non-U.S. dollar-denominated holdings from adverse currency movements.
24
Table of Contents
NOTES TO FINANCIAL STATEMENTSASOF MARCH 31, 2011 (CONTINUED)
NOTE 2 — SIGNIFICANT ACCOUNTING POLICIES (continued)
During the year ended March 31, 2011, Intermediate Bond had average contract amounts on forward foreign currency contracts to buy and sell of $2,858,297 and $53,453,987, respectively.
High Yield Bond and Intermediate Bond may enter into futures contracts involving foreign currency, interest rates, securities and securities indices. A futures contract obligates the seller of the contract to deliver and the purchaser of the contract to take delivery of the type of foreign currency, financial instrument or security called for in the contract at a specified future time for a specified price. Upon entering into such a contract, a Fund is required to deposit and maintain as collateral such initial margin as required by the exchange on which the contract is traded. Pursuant to the contract, a Fund agrees to receive from or pay to the broker an amount equal to the daily fluctuations in the value of the contract. Such receipts or payments are known as variation margins and are recorded as unrealized gains or losses by the Fund. When the contract is closed, the Fund records a realized gain or loss equal to the difference between the value of the contract at the time it was opened and the value at the time it was closed.
Futures contracts are exposed to the market risk factor of the underlying financial instrument. During the year ended March 31, 2011, Intermediate Bond has both purchased and sold futures contracts on various bonds and notes to gain exposure to different parts of the yield curve while maintaining overall duration. Additional associated risks of entering into futures contracts include the possibility that there may be an illiquid market where the Fund is unable to liquidate the contract or enter into an offsetting position and, if used for hedging purposes, the risk that the price of the contract will correlate imperfectly with the prices of the Fund’s securities. With futures, there is minimal counterparty credit risk to the Fund since futures are exchange traded and the exchange’s clearinghouse, as counterparty to all exchange traded futures, guarantees the futures against default.
During the year ended March 31, 2011, Intermediate Bond had an average notional value of $129,336,205 and $209,738,413 on futures contracts purchased and sold, respectively.
F. Distributions to Shareholders. The Funds record distributions to their shareholders on the ex-dividend date. All Funds, with the exception of GNMA Income,
declare dividends daily and pay dividends monthly. GNMA Income declares and pays dividends monthly. The characteristics of income and gains to be distributed are determined in accordance with income tax regulations, which may differ from U.S. generally accepted accounting principles for investment companies.
G. Federal Income Taxes. It is the policy of the Funds to comply with the requirements of subchapter M of the Internal Revenue Code that are applicable to regulated investment companies and to distribute substantially all of their net investment income and any net realized capital gains to their shareholders. Therefore, a federal income tax or excise tax provision is not required. Management has considered the sustainability of the Funds’ tax positions taken on federal income tax returns for all open tax years in making this determination. No capital gain distributions shall be made until the capital loss carryforwards have been fully utilized or expire.
H. Use of Estimates. The preparation of financial statements in conformity with U.S. generally accepted accounting principles requires management to make estimates and assumptions that affect the reported amounts of assets and liabilities and disclosure of contingent assets and liabilities at the date of the financial statements and the reported amounts of increases and decreases in net assets from operations during the reporting period. Actual results could differ from those estimates.
I. Repurchase Agreements. Each Fund may invest in repurchase agreements only with government securities dealers recognized by the Board of Governors of the Federal Reserve System. Under such agreements, the seller of the security agrees to repurchase it at a mutually agreed upon time and price. The resale price is in excess of the purchase price and reflects an agreed upon interest rate for the period of time the agreement is outstanding. The period of the repurchase agreements is generally short, from possibly overnight to one week, (although it may extend over a number of months) while the underlying securities generally have longer maturities. Each Fund will receive as collateral securities acceptable to it whose market value is equal to at least 100% of the carrying amount of the repurchase agreements, plus accrued interest, being invested by a Fund. The underlying collateral is valued daily on a mark to market basis to assure that the value, including accrued interest is at least equal to the repurchase price. There would be potential loss to a Fund in the event a Fund is delayed or prevented from
25
Table of Contents
NOTES TO FINANCIAL STATEMENTSASOF MARCH 31, 2011 (CONTINUED)
NOTE 2 — SIGNIFICANT ACCOUNTING POLICIES (continued)
exercising its right to dispose of the collateral, and it may incur disposition costs in liquidating the collateral.
J. Securities Lending. Each Fund has the option to temporarily loan up to 33 1/3% of its total assets to brokers, dealers or other financial institutions in exchange for a negotiated lender’s fee. The borrower is required to fully collateralize the loans with cash or U.S. government securities. Generally, in the event of counterparty default, a Fund has the right to use collateral to offset losses incurred. There would be potential loss to a Fund in the event the Fund is delayed or prevented from exercising its right to dispose of the collateral. A Fund bears the risk of loss with respect to the investment of collateral. Engaging in securities lending could have a leveraging effect, which may intensify the credit, market and other risks associated with investing in a Fund.
K. Restricted Securities. Each Fund may invest in restricted securities which include those sold under Rule 144A of the Securities Act of 1933 (“1933 Act”) or securities offered pursuant to Section 4(2) of the 1933 Act, and/or are subject to legal or contractual restrictions on resale and may not be publicly sold without registration under the 1933 Act. Restricted securities are fair valued using market quotations when readily available. In the absence of market quotations, the securities are valued based upon their fair value determined in good faith under procedures approved by the Board.
L. Delayed-Delivery or When-Issued Transactions. The Funds may purchase or sell securities on a when-issued or a delayed-delivery basis. Each Fund (except GNMA Income) may enter into forward commitments. The price of the underlying securities and date when the securities will be delivered and paid for are fixed at the time the transaction is negotiated. The market value of such is identified in the Funds’ Summary Portfolio of investments. Losses may arise due to changes in the market value of the securities or from the inability of counterparties to meet the terms of the contract. In connection with such purchases, the Funds are required to segregate liquid assets with the Funds’ custodian sufficient to cover the purchase price.
M. Mortgage Dollar Roll Transactions. Each Fund may engage in dollar roll transactions with respect to mortgage-backed securities issued or to be issued by Government National Mortgage Association, Federal National Mortgage Association and Federal Home Loan
Mortgage Corp. In a dollar roll transaction, a Fund sells a mortgage-backed security to a financial institution, such as a bank or broker/dealer, and simultaneously agrees to repurchase a substantially similar (i.e., same type, coupon, and maturity) security from the institution on a delayed delivery basis at an agreed upon price. The mortgage-backed securities that are repurchased will bear the same interest rate as those sold, but generally will be collateralized by different pools of mortgages with different prepayment histories. The Funds account for dollar roll transactions as purchases and sales.
N. Options Contracts. The Funds (except GNMA Income) may write call and put options on futures, swaptions, securities, commodity or currencies it owns or in which it may invest. Writing put options tends to increase the Funds exposure to the underlying instrument. Writing call options tends to decrease the Funds exposure to the underlying instrument. When a Fund writes a call or put option, an amount equal to the premium received is recorded as a liability and subsequently marked to market to reflect the current value of the option written. These liabilities are reflected as written options outstanding on the Statements of Assets and Liabilities. Certain options may be written with premiums to be determined on a future date. Premiums received from writing options which expire are treated as realized gains. Premiums received from writing options which are exercised or closed are added to the proceeds or offset against amounts paid on the underlying futures, swap, security or currency transaction to determine the realized gain or loss. Each Fund as a writer of an option has no control over whether the underlying instrument may be sold (call) or purchased (put) and as a result bears the market risk of an unfavorable change in the price of the instrument underlying the written option. There is the risk the Funds may not be able to enter into a closing transaction because of an illiquid market.
The Funds may also purchase put and call options. Purchasing call options tends to increase the Funds exposure to the underlying instrument. Purchasing put options tends to decrease the Funds’ exposure to the underlying instrument. The Funds pay a premium which is included on the Statements of Assets and Liabilities as an investment and subsequently marked to market to reflect the current value of the option. Premiums paid for purchasing options which expire are treated as realized losses. Certain options may be purchased with premiums to be determined on a future date. The premiums for these options are based upon implied volatility parameters at specified terms. The risk
26
Table of Contents
NOTES TO FINANCIAL STATEMENTSASOF MARCH 31, 2011 (CONTINUED)
NOTE 2 — SIGNIFICANT ACCOUNTING POLICIES (continued)
associated with purchasing put and call options is limited to the premium paid. Premiums paid for purchasing options which are exercised or closed are added to the amounts paid or offset against the proceeds on the underlying investment transaction to determine the realized gain or loss.
During the year ended March 31, 2011, Intermediate Bond has purchased and written foreign currency options in order to hedge the value of its non-U.S. dollar-denominated holdings from adverse currency movements. There were no open foreign currency options at March 31, 2011.
During the year ended March 31, 2011, Intermediate Bond has purchased and written swaptions on credit default swap indices “CDX” in order to hedge the credit risk of the Portfolio. There were no open CDX swaptions at March 31, 2011.
During the year ended March 31, 2011, Intermediate Bond has written swaptions on interest rate swaps to increase exposure to long-term interest rates and potentially enhance the Fund’s yield. There were no open written swaptions at March 31, 2011.
During the year ended March 31, 2011, Intermediate Bond has purchased and written options on exchange-traded futures contracts on various bonds and notes as part of their duration strategy and to generate income. Please refer to the Summary Portfolio of Investments for open purchased options on exchange-traded futures contracts and the table following for open written options on exchange-traded futures contracts at March 31, 2011.
Please refer to Note 9 for the volume of both purchased and written options and swaptions activity during the year ended March 31, 2011.
O. Swap Agreements. High Yield Bond and Intermediate Bond may enter into swap agreements. A swap is an agreement between two parties pursuant to which each party agrees to make one or more payments to the other at specified future intervals based on the return of an asset (such as a stock, bond or currency) or non-asset reference (such as an interest rate or index). The swap agreement will specify the “notional” amount of the asset or non-asset reference to which the contract relates. Subsequent changes in fair value, if any, are calculated based upon changes in the performance of the asset or non-asset reference multiplied by the notional value of the contract. A Fund
may enter into credit default, interest rate, total return and currency swaps to manage its exposure to credit, currency and interest rate risk. All outstanding swap agreements are reported following each Fund’s Summary Portfolio of Investments.
Swaps are marked to market daily using quotations primarily from third party pricing services, counterparties or brokers. The fair value of the swap contract is recorded on each Fund’s Statement of Assets or Liabilities. During the term of the swap, changes in the fair value of the swap, if any, are recorded as unrealized gains or losses on the Statement of Operations. Upfront payments paid or received by a Fund when entering into the agreements are reported on the Statement of Assets and Liabilities and as a component of the changes in unrealized gains or losses on the Statement of Operations. These upfront payments represent the amounts paid or received when initially entering into the swap agreement to compensate for differences between the stated terms of the swap agreement and the prevailing market conditions. The upfront payments are included as a component in the realized gains or losses on each Fund’s Statement of Operations upon termination or maturity of the swap. A Fund also records net periodic payments paid or received on the swap contract as a realized gain or loss on the Statement of Operations.
Entering into swap agreements involves the risk that the maximum potential loss of an investment exceeds the current value of the investment as reported on each Fund’s Statement of Assets and Liabilities. Other risks involve the possibility that the counterparty to the agreements may default on its obligation to perform, that there will be no liquid market for these investments and that unfavorable changes in the market will have a negative impact on the value of the index or securities underlying the respective swap agreement.
Credit Default Swap Contracts. A credit default swap is a bilateral agreement between counterparties in which the buyer of the protection agrees to make a stream of periodic payments to the seller of protection in exchange for the right to receive a specified return in the event of a default or other credit event for a referenced entity, obligation or index. As a seller of protection on credit default swaps, a Fund will generally receive from the buyer a fixed payment stream based on the notional amount of the swap contract. This fixed payment stream will continue until the swap contract expires or a defined credit event occurs.
27
Table of Contents
NOTES TO FINANCIAL STATEMENTSASOF MARCH 31, 2011 (CONTINUED)
NOTE 2 — SIGNIFICANT ACCOUNTING POLICIES (continued)
A Fund is subject to credit risk in the normal course of pursuing its investment objectives. As a seller of protection in a credit default swap, a Fund may execute these contracts to manage its exposure to the market or certain sectors of the market. A Fund may also enter into credit default swaps to speculate on changes in an issuer’s credit quality, to take advantage of perceived spread advantages, or to offset an existing short equivalent (i.e. buying protection on an equivalent reference entity).
High Yield Bond and Intermediate Bond may sell credit default swaps which expose these Funds to the risk of loss from credit risk- related events specified in the contract. Although contract specific, credit events are generally defined as bankruptcy, failure to pay, restructuring, obligation acceleration, obligation default or repudiation/moratorium. If a Fund is a seller of protection, and a credit event occurs, as defined under the terms of that particular swap agreement, a Fund will generally either (i) pay to the buyer an amount equal to the notional amount of the swap and take delivery of the referenced obligation, other deliverable obligations, or underlying securities comprising a referenced index or (ii) pay a net settlement amount in the form of cash or securities equal to the notional amount of the swap less the recovery value of the referenced obligation or underlying securities comprising a referenced index. If a Fund is a buyer of protection and a credit event occurs, as defined under the terms of that particular swap agreement, a Fund will either (i) receive from the seller of protection an amount equal to the notional amount of the swap and deliver the referenced obligation, other deliverable obligations or underlying securities comprising the referenced index or (ii) receive a net settlement amount in the form of cash or securities equal to the notional amount of the swap less the recovery value of the referenced obligation or underlying securities comprising the referenced index. Recovery values are assumed by market makers considering either industry standard recovery rates or entity specific factors and considerations until a credit event occurs. If a credit event has occurred, the recovery value is determined by a facilitated auction whereby a minimum number of allowable broker bids, together with a specified valuation method, are used to calculate the settlement value.
Implied credit spreads, represented in absolute terms, utilized in determining the fair value of credit default
swap agreements on corporate issues or sovereign issues are disclosed in each Fund’s Summary Portfolio of Investments and serve as an indicator of the current status of the payment/performance risk and represent the likelihood or risk of default for the credit derivative. The implied credit spread of a particular referenced entity reflects the cost of buying/selling protection and may include upfront payments required to be made to enter into the agreement. For credit default swaps on asset-backed securities or credit indices, the quoted market prices and resulting fair values serve as the indicator of the current status of the payment/performance risk. Wider credit spreads and increasing fair values, in absolute terms when compared to the notional amount of the swap, represent a deterioration of the referenced entity’s credit soundness and a greater likelihood or risk of default or other credit event occurring as defined under the terms of the agreement.
The maximum amount of future payments (undiscounted) that a Fund as seller of protection could be required to make under a credit default swap agreement would be an amount equal to the notional amount of the agreement. Notional amounts of all credit default swap agreements outstanding as of March 31, 2011, for which a Fund is seller of protection, are disclosed in each Fund’s Summary Portfolio of Investments. These potential amounts would be partially offset by any recovery values of the respective referenced obligations, upfront payments received upon entering into the agreements, or net amounts received from the settlement of buy protection credit default swap agreements entered into by a Fund for the same referenced entity or entities.
For the year ended March 31, 2011, Intermediate Bond has purchased credit protection through credit default swaps to decrease exposure to the credit risk of individual securities and CDX indices and to hedge against anticipated potential credit events.
For the year ended March 31, 2011, Intermediate Bond has sold credit protection through credit default swaps to gain exposure to the credit risk of individual securities that are either unavailable or considered to be less attractive in the bond market.
For the year ended March 31, 2011, Intermediate Bond had average notional amounts of $16,428,000 and $6,278,200 on credit default swaps to buy protection and credit default swaps to sell protection, respectively.
Interest Rate Swap Contracts. An interest rate swap involves the agreement between counterparties to
28
Table of Contents
NOTES TO FINANCIAL STATEMENTSASOF MARCH 31, 2011 (CONTINUED)
NOTE 2 — SIGNIFICANT ACCOUNTING POLICIES (continued)
exchange periodic payments based on interest rates. One payment will be based on a floating rate of a specified interest rate while the other will be a fixed rate. Interest rate swaps are used to adjust interest rate and yield curve exposures and to substitute for physical securities. Risks involve the future fluctuations of interest rates in which a Portfolio may make payments that are greater than what a Portfolio received from the counterparty. Other risks include credit, liquidity and market risk. For the year ended March 31, 2011, Intermediate Bond had entered into interest rate swaps in which it pays a floating interest rate and receives a fixed interest rate (“Long interest rate swap”) in order to increase exposure to interest rate risk. Average notional amounts on long interest rate swaps was $15,111,332. For the year ended March 31, 2011, Intermediate Bond had entered into interest rate swaps in which it pays a fixed interest rate and receives a floating interest rate (“Short interest rate swap”) in order to decrease exposure to interest rate risk. Average notional amounts on short interest rate swaps was $15,955,200. Intermediate Bond entered into interest rate swaps to adjust interest rate and yield curve exposures and to substitute for physical fixed-income securities. Please refer to the table following the Summary Portfolio of Investments for open interest rate swaps at March 31, 2011.
P. Construction Loan Securities. GNMA Income may purchase construction loan securities, which are issued to finance building costs. The funds are disbursed as needed or in accordance with a prearranged plan. The securities provide for the timely payment to the registered holder of interest at the specified rate plus scheduled installments of principal. Upon completion of the construction phase, the construction loan securities are terminated and project loan securities are issued. It is GNMA Income’s policy to record these GNMA certificates on trade date, and to segregate assets to cover its commitments on trade date as well.
Q. Indemnifications. In the normal course of business, the Trust may enter into contracts that provide certain indemnifications. The Trust’s maximum exposure under these arrangements is dependent on future claims that may be made against the Funds and, therefore, cannot be estimated; however, based on experience, management considers risk of loss from such claims remote.
NOTE 3 — INVESTMENT TRANSACTIONS
For the year ended March 31, 2011, the cost of purchases and proceeds from the sales of securities excluding short-term and U.S. government securities, were as follows:
Purchases | Sales | |||||||
High Yield Bond | $ | 103,803,395 | $ | 97,514,188 | ||||
Intermediate Bond | 694,997,738 | 680,120,094 | ||||||
U.S. government securities not included above were as follows:
Purchases | Sales | |||||||
GNMA Income | $ | 1,643,418,416 | $ | 1,630,615,305 | ||||
Intermediate Bond | 2,486,725,011 | 2,530,899,404 | ||||||
NOTE 4 — INVESTMENT MANAGEMENT AND ADMINISTRATIVE FEES
ING Investments, LLC (“ING Investments” or the ”Investment Adviser”), an Arizona limited liability company, serves as the investment adviser to the Funds. The Investment Adviser serves pursuant to an investment management agreement (“Management Agreement”) between the Investment Adviser and the Trust, on behalf of the Funds.
The Management Agreement compensates the Investment Adviser with a fee, computed daily and payable monthly, based on the average daily net assets of each Fund, at the following annual rates:
For GNMA Income — 0.47% on first $1 billion, 0.40% on next $4 billion and 0.35% on assets thereafter; for High Yield Bond — 0.51% on first $500 million, 0.45% on next $4.5 billion and 0.40% on assets thereafter; and for Intermediate Bond — 0.17%.
ING Investment Management Co. (“ING IM”), a Connecticut corporation, serves as the sub-adviser to the Funds. The Investment Adviser has entered into a sub-advisory agreement with ING IM. Subject to such policies as the Board or the Investment Adviser may determine, ING IM manages the Funds’ assets in accordance with the Funds’ investment objectives, policies, and limitations.
During the period, ING Funds were permitted to invest end-of-day cash balances into Institutional Money Market. Investment management fees paid by the Funds will be reduced by an amount equal to the management fees paid indirectly to Institutional Money Market with respect to assets invested by the Funds. For the year ended March 31, 2011, High Yield Bond and Intermediate Bond waived $2,364 and $8,630, respectively. These fees are not subject to recoupment.
29
Table of Contents
NOTES TO FINANCIAL STATEMENTSASOF MARCH 31, 2011 (CONTINUED)
NOTE 4 — INVESTMENT MANAGEMENT AND ADMINISTRATIVE FEES (continued)
Effective December 20, 2010, ING Institutional Prime Money Market Fund was liquidated. As a result of this liquidation, the Funds will no longer invest end-of-day cash balances into ING Institutional Prime Money Market Fund.
ING Funds Services, LLC (“IFS”), acts as administrator and provides certain administrative and shareholder services necessary for Fund operations and is responsible for the supervision of other service providers. For its services, IFS is entitled to receive from each Fund a fee at an annual rate of 0.10% of its average daily net assets.
ING Investments Distributor, LLC (the “Distributor” or “IID”) is the principal underwriter of the Funds. The Distributor, IFS, ING Investments and ING IM are indirect, wholly-owned subsidiaries of ING Groep N.V. (“ING Groep”). ING Groep is a global financial institution of Dutch origin offering banking, investments, life insurance and retirement services.
ING Groep has adopted a formal restructuring plan that was approved by the European Commission in November 2009 under which the ING life insurance businesses, including the retirement services and investment management businesses, which include the Investment Adviser and its affiliates, would be divested by ING Groep by the end of 2013. To achieve this goal, ING Groep announced in November 2010 that it plans to pursue two separate Initial Public Offerings: one a U.S. focused offering that would include U.S. based insurance, retirement services, and investment management operations: and the other a European based offering for European and Asian based insurance and investment management operations. There can be no assurance that the restructuring plan will be carried out through two offerings or at all.
The restructuring plan and the uncertainty about its implementation, whether implemented through the planned Initial Public Offerings or through other means, in whole or in part, may be disruptive to the businesses of ING entities, including the ING entities that service the Funds, and may cause, among other things, interruption or reduction of business and services, diversion of management’s attention from day-to day operations, and loss of key employees or customers. A failure to complete the offerings or other means of implementation on favorable terms could have a material adverse impact on the operations of the businesses subject to the restructuring plan. The restructuring plan may result in the Investment Adviser’s and/or Sub-Adviser’s loss of access to services and resources of ING Groep, which could adversely affect their businesses and profitability. In addition, the
divestment of ING businesses, including the Investment Adviser and Sub-Adviser, may potentially be deemed a “change of control” of each entity. A change of control would result in the termination of the Funds’ advisory and sub-advisory agreements, which would trigger the necessity for new agreements that would require approval of the Board, and may trigger the need for shareholder approval. Currently, the Investment Adviser does not anticipate that the restructuring will have a material adverse impact on the Funds or their operations and administration.
NOTE 5 — DISTRIBUTION AND SERVICE FEES
Each share class of the Funds (except Class I and Class W and as otherwise noted below) has adopted a Distribution Plan pursuant to Rule 12b-1 under the 1940 Act and/or a Service Plan (the “Plans”), whereby the Distributor is reimbursed or compensated (depending on the class of shares) by certain of the Funds for expenses incurred in the distribution of each Fund’s shares (“Distribution Fees”). Pursuant to the Plans, the Distributor is entitled to payment each month for expenses incurred in the distribution and promotion of certain of each Fund’s shares, including expenses incurred in printing prospectuses and reports used for sales purposes, expenses incurred in preparing and printing sales literature and other such distribution related expenses, including any distribution or shareholder servicing fees (“Service Fees”) paid to securities dealers who have executed a distribution agreement with the Distributor. Under the Plans, each class of shares of each Fund pays the Distributor a Distribution and/or Service Fee based on average daily net assets at the following annual rates:
Class A | Class B | Class C | Class O | Class R | ||||||||||||||||
GNMA Income | 0.25 | % | 1.00 | % | 1.00 | % | N/A | N/A | ||||||||||||
High Yield Bond | 0.25 | % | 1.00 | % | 1.00 | % | N/A | N/A | ||||||||||||
Intermediate Bond | 0.25 | % | 1.00 | % | 1.00 | % | 0.25 | % | 0.50 | % | ||||||||||
The Distributor also receives the proceeds of the initial sales charge paid by shareholders upon the purchase of Class A shares of the Funds, and the contingent deferred sales charge paid by shareholders upon certain redemptions for Class A, Class B, and Class C shares. For the year ended March 31, 2011, the Distributor retained the following amounts in sales charges:
| Class A Shares | Class C Shares | |||||||
Initial Sales Charges: | ||||||||
GNMA | $ | 65,516 | N/A | |||||
High Yield | 12,312 | N/A | ||||||
Intermediate Bond | 14,741 | N/A | ||||||
Contingent Deferred Sales Charges: | ||||||||
GNMA | $ | 5,548 | $ | 18,769 | ||||
High Yield | — | 611 | ||||||
Intermediate Bond | 49 | 4,201 | ||||||
30
Table of Contents
NOTES TO FINANCIAL STATEMENTSASOF MARCH 31, 2011 (CONTINUED)
NOTE 6 — OTHER TRANSACTIONS WITH AFFILIATES AND RELATED PARTIES
At March 31, 2011, the Funds had the following amounts recorded as payable to affiliates on the accompanying Statements of Assets and Liabilities (see Notes 4 and 5):
Fund | Accrued | Accrued | Accrued | Total | ||||||||||||
GNMA Income | $ | 313,120 | $ | 66,621 | $ | 224,284 | $ | 604,025 | ||||||||
High Yield Bond | 57,465 | 10,411 | 34,576 | 102,452 | ||||||||||||
Intermediate Bond | 155,293 | 64,069 | 119,761 | 339,123 | ||||||||||||
At March 31, 2011, the following ING Funds or indirect, wholly-owned subsidiaries of ING Groep owned more than 5% of the following Funds:
ING Capital Allocation Fund — High Yield Bond (15.21%) and Intermediate Bond (6.73%).
ING Life Insurance & Annuity — GNMA Income (19.94%) and Intermediate Bond (19.67%).
ING National Trust — GNMA Income (14.47%) and Intermediate Bond (13.00%).
Control is defined by the 1940 Act as the beneficial ownership, either directly or through one or more controlled companies, of more than 25% of the voting securities of a company. The 1940 Act defines affiliates as companies that are under common control. Therefore, because the Funds have a common owner that owns over 25% of the outstanding securities of the Funds, they may be deemed to be affiliates of each other. Investment activities of these shareholders could have a material impact on the Funds.
The Funds have adopted a Deferred Compensation Plan (the “Plan”), which allows eligible non-affiliated trustees as described in the Plan to defer the receipt of all or a portion of the trustees fees payable. Amounts deferred are treated as though invested in various “notional” funds advised by ING Investments until distribution in accordance with the Plan.
NOTE 7 — EXPENSE LIMITATIONS
Pursuant to a written expense limitation agreement (“Expense Limitation Agreement”) with the Funds, the Investment Adviser has agreed to limit expenses of each Fund, excluding interest, taxes, brokerage commissions and extraordinary expenses (and acquired fund fees and expenses) to the levels listed below:
| Maximum Operating Expense Limit (as a percentage of average net assets) | ||||||||||||||||||||||||||||
Class A | Class B | Class C | Class I | Class O | Class R | Class W | ||||||||||||||||||||||
GNMA Income | 0.97 | % | 1.72 | % | 1.72 | % | 0.67 | % | N/A | N/A | 0.72 | % | ||||||||||||||||
High Yield Bond | 1.10 | % | 1.85 | % | 1.85 | % | 0.85 | % | N/A | N/A | N/A | |||||||||||||||||
Intermediate Bond | 0.75 | % | 1.50 | % | 1.50 | % | 0.50 | % | 0.75 | % | 1.00 | % | 0.50 | % | ||||||||||||||
The Investment Adviser may at a later date recoup from a Fund for management fees waived and other expenses assumed by the Investment Adviser during the previous 36 months, but only if, after such recoupment, a Fund’s expense ratio does not exceed the percentage described above. Waived and reimbursed fees net of any recoupment by the Investment Adviser of such waived and reimbursed fees are reflected on the accompanying Statements of Operations for each Fund. Amounts payable by the Investment Adviser are reflected on the accompanying Statements of Assets and Liabilities for each Fund.
As of March 31, 2011 the amounts of waived and reimbursed fees that are subject to possible recoupment by the Investment Adviser, and the related expiration dates are as follows:
| March 31, | ||||||||||||||||
2012 | 2013 | 2014 | Total | |||||||||||||
High Yield Bond | $ | 144,667 | $ | 136,047 | $ | 37,645 | $ | 318,359 | ||||||||
Intermediate Bond | 104,815 | 128,272 | — | 233,087 | ||||||||||||
The Expense Limitation Agreement is contractual and shall renew automatically for one-year terms unless ING Investments or the Trust provides written notice of the termination of the Expense Limitation Agreement within 90 days of the end of the then current term or upon termination of the Management Agreement.
NOTE 8 — LINE OF CREDIT
Each of the Funds included in this report with the exception of GNMA Income, in addition to certain other funds managed by the Investment Adviser, have entered into an unsecured committed revolving line of credit agreement (the “Credit Agreement”) with The Bank of New York Mellon (“BNY”) for an aggregate amount of $125,000,000. The proceeds may be used only to: (1) temporarily finance the purchase and sale of securities; or (2) finance the redemption of shares of an investor in the funds. The funds to which the line of credit is available pay a commitment fee equal to 0.15% per annum on the daily unused portion of the committed line amount payable quarterly in arrears.
Generally, borrowings under the Credit Agreement accrue interest at the federal funds rate plus a specified margin. Repayments generally must be made within 60 days after the date of a revolving credit advance.
31
Table of Contents
NOTES TO FINANCIAL STATEMENTSASOF MARCH 31, 2011 (CONTINUED)
NOTE 8 — LINE OF CREDIT (continued)
The following Funds utilized the line of credit during the year ended March 31, 2011:
Fund | Days Utilized | Approximate Average Daily Balance | Approximate Weighted Average Interest Rate | |||||||||
High Yield Bond | 6 | $ | 1,363,333 | 1.45 | % | |||||||
Intermediate Bond | 34 | 3,230,441 | 1.41 | |||||||||
NOTE 9 — PURCHASED AND WRITTEN OPTIONS
Transactions in purchased options on exchange-traded futures contracts for Intermediate Bond during the year ended March 31, 2011 were as follows:
Number of | Cost | |||||||
Balance at 03/31/10 | — | $ | — | |||||
Options Purchased | 242 | 342,935 | ||||||
Options Terminated in Closing Sell Transactions | — | — | ||||||
Options Exercised | — | — | ||||||
Options Expired | — | — | ||||||
Balance at 03/31/11 | 242 | $ | 342,935 | |||||
Transactions in purchased options on foreign currencies for Intermediate Bond during the year ended March 31, 2011 were as follows:
Notional | Cost | |||||||
Balance at 03/31/10 | — | $ | — | |||||
Options Purchased | 34,362,000 | 196,539 | ||||||
Options Terminated in Closing Sell Transactions | — | — | ||||||
Options Exercised | — | — | ||||||
Options Expired | (34,362,000 | ) | (196,539 | ) | ||||
Balance at 03/31/11 | — | $ | — | |||||
Transactions in purchased swaptions on CDX indices for Intermediate Bond during the year ended March 31, 2011 were as follows:
Notional | Cost | |||||||
Balance at 03/31/10 | — | $ | — | |||||
Options Purchased | 77,976,000 | 553,630 | ||||||
Options Terminated in Closing Sell Transactions | — | — | ||||||
Options Exercised | — | — | ||||||
Options Expired | (77,976,000 | ) | (553,630 | ) | ||||
Balance at 03/31/11 | — | $ | — | |||||
Transactions in written options on exchange-traded futures contracts for Intermediate Bond during the year ended March 31, 2011 were as follows:
Number of | Premiums | |||||||
Balance at 03/31/10 | — | $ | — | |||||
Options Written | 242 | 138,744 | ||||||
Options Terminated in Closing Purchase Transactions | — | — | ||||||
Options Exercised | — | — | ||||||
Options Expired | — | — | ||||||
Balance at 03/31/11 | 242 | $ | 138,744 | |||||
Transactions in written options on foreign currencies for Intermediate Bond during the year ended March 31, 2011 were as follows:
Notional | Premiums | |||||||
Balance at 03/31/10 | — | $ | — | |||||
Options Written | 34,362,000 | 156,154 | ||||||
Options Terminated in Closing Purchase Transactions | — | — | ||||||
Options Exercised | — | — | ||||||
Options Expired | (34,362,000 | ) | (156,154 | ) | ||||
Balance at 03/31/11 | — | $ | — | |||||
Transactions in written swaptions on interest rate swaps for Intermediate Bond during the year ended March 31, 2011 were as follows:
Notional | Premiums | |||||||
Balance at 03/31/10 | — | $ | — | |||||
Options Written | 49,845,000 | 1,434,134 | ||||||
Options Terminated in Closing Purchase Transactions | (49,845,000 | ) | (1,434,134 | ) | ||||
Options Exercised | — | — | ||||||
Options Expired | — | — | ||||||
Balance at 03/31/11 | — | $ | — | |||||
Transactions in written swaptions on CDX indices for Intermediate Bond during the year ended March 31, 2011 were as follows:
Notional | Premiums | |||||||
Balance at 03/31/10 | — | $ | — | |||||
Options Written | 155,952,000 | 323,600 | ||||||
Options Terminated in Closing Purchase Transactions | — | — | ||||||
Options Exercised | — | — | ||||||
Options Expired | (155,952,000 | ) | (323,600 | ) | ||||
Balance at 03/31/11 | — | $ | — | |||||
32
Table of Contents
NOTES TO FINANCIAL STATEMENTSASOF MARCH 31, 2011 (CONTINUED)
NOTE 10 — CAPITAL SHARES
| Shares sold | Proceeds from shares converted | Reinvest- ment of distribu- tions | Shares redeemed | Shares converted | Net increase (decrease) in shares outstanding | Shares sold | Proceeds from shares converted | Reinvest- ment of distribu- tions | Shares redeemed | Shares converted | Net increase (decrease) | |||||||||||||||||||||||||||||||||||||||||
Year or period ended | # | # | # | # | # | # | ($) | ($) | ($) | ($) | ($) | ($) | ||||||||||||||||||||||||||||||||||||||||
GNMA Income |
| |||||||||||||||||||||||||||||||||||||||||||||||||||
Class A | ||||||||||||||||||||||||||||||||||||||||||||||||||||
03-31-11 | 18,504,611 | — | 2,445,141 | (21,233,387 | ) | — | (283,635 | ) | 164,417,869 | — | 21,639,688 | (188,250,654 | ) | — | (2,193,097 | ) | ||||||||||||||||||||||||||||||||||||
03-31-10 | 19,576,866 | — | 2,478,996 | (24,320,182 | ) | — | (2,264,320 | ) | 170,536,214 | — | 21,550,033 | (211,744,101 | ) | — | (19,657,854 | ) | ||||||||||||||||||||||||||||||||||||
Class B | ||||||||||||||||||||||||||||||||||||||||||||||||||||
03-31-11 | 36,609 | — | 55,994 | (1,764,623 | ) | — | (1,672,020 | ) | 323,505 | — | 493,030 | (15,559,560 | ) | — | (14,743,025 | ) | ||||||||||||||||||||||||||||||||||||
03-31-10 | 124,001 | — | 94,320 | (1,734,225 | ) | — | (1,515,904 | ) | 1,074,963 | — | 815,731 | (15,015,734 | ) | — | (13,125,040 | ) | ||||||||||||||||||||||||||||||||||||
Class C | ||||||||||||||||||||||||||||||||||||||||||||||||||||
03-31-11 | 4,030,435 | — | 283,015 | (4,301,794 | ) | — | 11,656 | 35,705,363 | — | 2,494,291 | (37,914,742 | ) | — | 284,912 | ||||||||||||||||||||||||||||||||||||||
03-31-10 | 6,917,222 | — | 219,900 | (3,742,016 | ) | — | 3,395,106 | 59,949,807 | — | 1,904,907 | (32,451,078 | ) | — | 29,403,636 | ||||||||||||||||||||||||||||||||||||||
Class I | ||||||||||||||||||||||||||||||||||||||||||||||||||||
03-31-11 | 5,309,047 | — | 286,168 | (3,833,200 | ) | — | 1,762,015 | 47,286,190 | — | 2,536,951 | (33,952,716 | ) | — | 15,870,425 | ||||||||||||||||||||||||||||||||||||||
03-31-10 | 3,829,573 | — | 212,517 | (2,468,028 | ) | — | 1,574,062 | 33,449,988 | — | 1,849,714 | (21,534,212 | ) | — | 13,765,490 | ||||||||||||||||||||||||||||||||||||||
Class Q(1) | ||||||||||||||||||||||||||||||||||||||||||||||||||||
03-31-11 | — | — | — | — | — | — | — | — | — | — | — | — | ||||||||||||||||||||||||||||||||||||||||
03-31-10 | 3,612 | — | 155 | (407 | ) | (8,567 | ) | (5,207 | ) | 31,531 | — | 1,345 | (3,537 | ) | (75,518 | ) | (46,179 | ) | ||||||||||||||||||||||||||||||||||
Class W | ||||||||||||||||||||||||||||||||||||||||||||||||||||
03-31-11 | 563,741 | — | 34,877 | (718,850 | ) | — | (120,232 | ) | 5,024,125 | — | 309,382 | (6,369,467 | ) | — | (1,035,960 | ) | ||||||||||||||||||||||||||||||||||||
03-31-10 | 1,185,827 | 8,574 | 33,379 | (771,203 | ) | — | 456,577 | 10,366,023 | 75,518 | 290,807 | (6,732,480 | ) | — | 3,999,868 | ||||||||||||||||||||||||||||||||||||||
High Yield Bond |
| |||||||||||||||||||||||||||||||||||||||||||||||||||
Class A | ||||||||||||||||||||||||||||||||||||||||||||||||||||
03-31-11 | 4,221,124 | — | 582,319 | (5,052,976 | ) | — | (249,533 | ) | 31,528,957 | — | 4,400,242 | (37,776,855 | ) | — | (1,847,656 | ) | ||||||||||||||||||||||||||||||||||||
03-31-10 | 3,488,979 | — | 622,857 | (3,597,992 | ) | — | 513,844 | 23,171,133 | — | 4,283,036 | (24,366,521 | ) | — | 3,087,648 | ||||||||||||||||||||||||||||||||||||||
Class B | ||||||||||||||||||||||||||||||||||||||||||||||||||||
03-31-11 | 79,800 | — | 62,984 | (905,113 | ) | — | (762,329 | ) | 595,373 | — | 472,981 | (6,815,808 | ) | — | (5,747,454 | ) | ||||||||||||||||||||||||||||||||||||
03-31-10 | 133,732 | — | 104,520 | (824,097 | ) | — | (585,845 | ) | 891,376 | — | 714,386 | (5,528,456 | ) | — | (3,922,694 | ) | ||||||||||||||||||||||||||||||||||||
Class C | ||||||||||||||||||||||||||||||||||||||||||||||||||||
03-31-11 | 397,852 | — | 71,615 | (438,163 | ) | — | 31,304 | 3,011,775 | — | 540,373 | (3,314,772 | ) | — | 237,376 | ||||||||||||||||||||||||||||||||||||||
03-31-10 | 614,472 | — | 79,902 | (483,977 | ) | — | 210,397 | 4,069,056 | — | 550,305 | (3,288,533 | ) | — | 1,330,828 | ||||||||||||||||||||||||||||||||||||||
Class I | ||||||||||||||||||||||||||||||||||||||||||||||||||||
03-31-11 | 3,422,861 | — | 105,301 | (979,473 | ) | — | 2,548,689 | 25,992,217 | — | 807,846 | (7,607,892 | ) | — | 19,192,171 | ||||||||||||||||||||||||||||||||||||||
03-31-10 | 214,679 | — | 2,830 | (3,339 | ) | — | 214,170 | 1,588,425 | — | 20,607 | (24,500 | ) | — | 1,584,532 | ||||||||||||||||||||||||||||||||||||||
Intermediate Bond |
| |||||||||||||||||||||||||||||||||||||||||||||||||||
Class A | ||||||||||||||||||||||||||||||||||||||||||||||||||||
03-31-11 | 7,129,198 | — | 1,488,918 | (13,255,546 | ) | — | (4,637,430 | ) | 67,433,425 | — | 14,090,479 | (125,623,492 | ) | — | (44,099,588 | ) | ||||||||||||||||||||||||||||||||||||
03-31-10 | 6,958,052 | — | 2,568,754 | (28,415,769 | ) | — | (18,888,963 | ) | 62,494,813 | — | 23,169,031 | (253,003,731 | ) | — | (167,339,887 | ) | ||||||||||||||||||||||||||||||||||||
Class B | ||||||||||||||||||||||||||||||||||||||||||||||||||||
03-31-11 | 94,373 | — | 46,546 | (1,174,144 | ) | — | (1,033,225 | ) | 892,369 | — | 438,794 | (11,114,683 | ) | — | (9,783,520 | ) | ||||||||||||||||||||||||||||||||||||
03-31-10 | 113,544 | — | 107,747 | (1,060,985 | ) | — | (839,694 | ) | 1,019,849 | — | 971,311 | (9,503,906 | ) | — | (7,512,746 | ) | ||||||||||||||||||||||||||||||||||||
Class C | ||||||||||||||||||||||||||||||||||||||||||||||||||||
03-31-11 | 446,057 | — | 115,401 | (1,872,281 | ) | — | (1,310,823 | ) | 4,198,381 | — | 1,089,771 | (17,694,919 | ) | — | (12,406,767 | ) | ||||||||||||||||||||||||||||||||||||
03-31-10 | 669,093 | — | 213,733 | (2,448,543 | ) | — | (1,565,717 | ) | 6,018,663 | — | 1,928,786 | (21,811,456 | ) | — | (13,864,007 | ) | ||||||||||||||||||||||||||||||||||||
Class I | ||||||||||||||||||||||||||||||||||||||||||||||||||||
03-31-11 | 10,667,680 | — | 1,410,739 | (11,470,021 | ) | — | 608,398 | 101,428,879 | — | 13,357,971 | (108,520,351 | ) | — | 6,266,499 | ||||||||||||||||||||||||||||||||||||||
03-31-10 | 7,079,914 | — | 2,236,388 | (18,631,494 | ) | — | (9,315,192 | ) | 63,139,964 | — | 20,172,137 | (166,536,338 | ) | — | (83,224,237 | ) | ||||||||||||||||||||||||||||||||||||
Class O | ||||||||||||||||||||||||||||||||||||||||||||||||||||
03-31-11 | 510,135 | — | 19,848 | (727,653 | ) | — | (197,670 | ) | 4,836,398 | — | 187,918 | (6,903,950 | ) | — | (1,879,634 | ) | ||||||||||||||||||||||||||||||||||||
03-31-10 | 561,868 | — | 34,185 | (776,134 | ) | — | (180,081 | ) | 5,032,515 | — | 308,868 | (6,916,315 | ) | — | (1,574,932 | ) | ||||||||||||||||||||||||||||||||||||
Class R | ||||||||||||||||||||||||||||||||||||||||||||||||||||
03-31-11 | 391,554 | — | 69,698 | (951,226 | ) | — | (489,974 | ) | 3,722,992 | — | 660,288 | (8,985,020 | ) | — | (4,601,740 | ) | ||||||||||||||||||||||||||||||||||||
03-31-10 | 710,000 | — | 119,448 | (1,028,381 | ) | — | (198,933 | ) | 6,423,330 | — | 1,080,762 | (9,032,616 | ) | — | (1,528,524 | ) | ||||||||||||||||||||||||||||||||||||
Class W | ||||||||||||||||||||||||||||||||||||||||||||||||||||
03-31-11 | 108,973 | — | 11,343 | (107,526 | ) | — | 12,790 | 1,033,981 | — | 107,387 | (1,019,571 | ) | — | 121,797 | ||||||||||||||||||||||||||||||||||||||
03-31-10 | 101,459 | — | 12,622 | (138,116 | ) | — | (24,035 | ) | 904,671 | — | 113,993 | (1,243,805 | ) | — | (225,141 | ) | ||||||||||||||||||||||||||||||||||||
| (1) | Effective November 20, 2009, Class Q shareholders of GNMA Income converted into Class W shares of the Fund. |
33
Table of Contents
NOTES TO FINANCIAL STATEMENTSASOF MARCH 31, 2011 (CONTINUED)
NOTE 11 — CREDIT RISK AND DEFAULTED SECURITIES
Although each Fund has a diversified portfolio, High Yield Bond and Intermediate Bond may invest in lower rated and comparable quality unrated high yield securities. Investments in high-yield debt securities generally provide greater income and increased opportunity for capital appreciation than investments in higher quality debt securities, but they also typically entail greater potential price volatility and principal and income risk. High-yield debt securities are not considered investment grade, and are regarded as predominantly speculative with respect to the issuing company’s continuing ability to meet principal and interest payments. The prices of high-yield debt securities have been found to be less sensitive to interest rate changes than higher-rated investments, but more sensitive to adverse economic downturns or individual corporate developments. The risk of loss due to default by the issuer may be significantly greater for the holders of high yielding securities, because such securities are generally unsecured and are often subordinated to other creditors of the issuer. Intermediate Bond held the following defaulted securities at March 31, 2011:
Fund | Security | Fair Value | ||||
Intermediate Bond | Greater Ohio Ethanol, LLC, 6.301%, due 12/31/13 | $ | — | |||
Greater Ohio Ethanol, LLC, 12.630%, due 12/31/13 | — | |||||
Twin Reefs Pass-through Trust, 0.000%, due 12/10/49 | — | |||||
NOTE 12 — CONCENTRATION OF INVESTMENT RISKS
All mutual funds involve risk — some more than others — and there is always the chance that you could lose money or not earn as much as you hope. Each Fund’s risk profile is largely a factor of the principal securities in which it invests and investment techniques that it uses. For more information regarding the types of securities and investment techniques that may be used by each Fund and its corresponding risks, see each Fund’s most recent Prospectus and/or the Statement of Additional Information.
Credit Risk (All Funds). A Fund could lose money if a bond issuer (debtor) fails to repay interest and principal in a timely manner or if it goes bankrupt. This is especially true during periods of economic uncertainty or economic downturns. High-yield/high-risk bonds are especially subject to credit risk and are considered to be mostly speculative in nature.
Foreign Securities (High Yield Bond and Intermediate Bond). There are certain risks in owning foreign securities, including those resulting from: fluctuations in currency exchange rates; devaluation of currencies; political or economic developments and the possible imposition of currency exchange blockages or other foreign governmental laws or restrictions; reduced availability of public information concerning issuers; accounting, auditing and financial reporting standards or other regulatory practices and requirements that are not uniform when compared to those applicable to domestic companies; settlement and clearance procedures in some countries that may not be reliable and can result in delays in settlement; higher transaction and custody expenses than for domestic securities; and limitations on foreign ownership of equity securities. Also, securities of many foreign companies may be less liquid and the prices more volatile than those of domestic companies.
Emerging Markets Investments (High Yield Bond). Because of less developed markets and economies and, in some countries, less mature governments and governmental institutions, the risks of investing in foreign securities can be intensified in the case of investments in issuers domiciled or doing substantial business in emerging market countries. These risks include: high concentration of market capitalization and trading volume in a small number of issuers representing a limited number of industries, as well as a high concentration of investors and financial intermediaries; political and social uncertainties; overdependence on exports, especially with respect to primary commodities, making these economies vulnerable to changes in commodity prices; overburdened infrastructure and obsolete or unseasoned financial systems; environmental problems; less well-developed legal systems; and less reliable custodial services and settlement practices.
High-Yield, Lower-Grade Debt Securities Risk (High-Yield Bond and Intermediate Bond). High-yield debt securities (commonly referred to as “junk bonds”) generally present greater credit risk that an issuer cannot make timely payment of interest or principal payments than an issuer of a higher quality debt security, and typically have greater potential price volatility and principal and income risk. Changes in interest rates, the market’s perception of the issuers and the credit worthiness of the issuers may significantly affect the value of these bonds. High-yield bonds are not considered investment grade, and are regarded as predominantly speculative with respect to
34
Table of Contents
NOTES TO FINANCIAL STATEMENTSASOF MARCH 31, 2011 (CONTINUED)
NOTE 12 — CONCENTRATION OF INVESTMENT RISKS
(continued)
the issuing company’s continuing ability to meet principal and interest payments. The secondary market in which high-yield securities are traded may be less liquid than the market for higher grade bonds. It may be more difficult to value less liquid high-yield securities, and determination of their value may involve elements of judgment.
NOTE 13 — FEDERAL INCOME TAXES
The amount of distributions from net investment income and net realized capital gains are determined in accordance with federal income tax regulations, which may differ from U.S. generally accepted accounting principles for investment companies. These book/tax differences may be either temporary or permanent. Permanent differences are reclassified within the capital accounts based on their federal tax-basis treatment; temporary differences are not reclassified.
Key differences include the treatment of short-term capital gains, foreign currency transactions, wash sale deferrals and the expiration of capital loss carryforwards. Distributions in excess of net investment income and/or net realized capital gains for tax purposes are reported as return of capital.
The following permanent tax differences have been reclassified as of March 31, 2011:
Paid-in Capital | Undistributed | Accumulated (Losses) | ||||||||||
GNMA Income | $ | — | $ | 3,391,258 | $ | (3,391,258 | ) | |||||
High Yield Bond(1) | (65,743,424 | ) | 5,052 | 65,738,372 | ||||||||
Intermediate Bond | — | (4,192,531 | ) | 4,192,531 | ||||||||
| (1) | $65,743,424 relates to the expiration of capital loss carryforwards. |
Dividends paid by the Funds from net investment income and distributions of net realized short-term capital gains are, for federal income tax purposes, taxable as ordinary income to shareholders.
The tax composition of dividends and distributions to shareholders was as follows:
| Year Ended March 31, 2011 | Year Ended March 31, 2010 | |||||||||||||||
Ordinary | Return of | Ordinary | Return of | |||||||||||||
GNMA Income | $ | 32,416,980 | $ | — | $ | 31,648,896 | $ | — | ||||||||
High Yield Bond | 8,356,298 | 266,932 | 8,935,053 | 298,959 | ||||||||||||
Intermediate Bond | 35,966,026 | — | 59,427,689 | — | ||||||||||||
The tax-basis components of distributable earnings and the expiration dates of the capital loss carryforwards which may be used to offset future realized capital gains for federal income tax purposes as of March 31, 2011 were:
Undistributed | Unrealized | Post-October | Post-October | Capital Loss | Expiration | |||||||||||||||||||
GNMA Income | $ | 3,173,437 | $ | 29,399,440 | $ | (3,361,584 | ) | $ | — | $ | (2,328,715 | ) | 2014 | |||||||||||
| (1,506,711 | ) | 2016 | ||||||||||||||||||||||
| (1,393,630 | ) | 2017 | ||||||||||||||||||||||
| $ | (5,229,056 | ) | ||||||||||||||||||||||
High Yield Bond | — | 8,379,457 | — | — | (5,986,296 | ) | 2012 | |||||||||||||||||
| (126,079 | ) | 2014 | ||||||||||||||||||||||
| (16,938,959 | ) | 2015 | ||||||||||||||||||||||
| (9,006,267 | ) | 2017 | ||||||||||||||||||||||
| (14,980,165 | ) | 2018 | ||||||||||||||||||||||
| $ | (47,037,766 | ) | ||||||||||||||||||||||
Intermediate Bond | 22,582,814 | 26,672,661 | (816,435 | ) | (3,379,454 | ) | (188,456,343 | ) | 2018 | |||||||||||||||
The Funds’ major tax jurisdictions are federal and Arizona. The earliest tax year that remains subject to examination by these jurisdictions is 2006.
As of March 31, 2011, no provision for income tax is required in the Funds’ financial statements as a result of tax positions taken on federal and state income tax returns for open tax years. The Funds’ federal and state income and federal excise tax returns for tax years for which the applicable statutes of limitations have not expired are subject to examination by the Internal Revenue Service and state department of revenue.
35
Table of Contents
NOTES TO FINANCIAL STATEMENTSASOF MARCH 31, 2011 (CONTINUED)
NOTE 13 — FEDERAL INCOME TAXES (continued)
The Regulated Investment Company Modernization Act of 2010 (the “Act”) was enacted on December 22, 2010. The Act makes changes to several tax rules impacting the Funds. In general, the provisions of the Act will be effective for the Funds’ tax year ending March 31, 2012. Although the Act provides several benefits, including the unlimited carryforward of future capital losses, there may be a greater likelihood that all or a portion of the funds’ pre-enactment capital loss carryforwards may expire without being utilized due to the fact that post-enactment capital losses are required to be utilized before pre-enactment capital loss carryforwards. Relevant information regarding the impact of the Act on the Funds, if any, will be contained within the “Federal Income Taxes” section of the financial statement notes for the fiscal year ending March 31, 2012.
NOTE 14 — SECURITIES LENDING
Under an agreement with The Bank of New York Mellon (“BNY”), the Funds can lend their securities to approved brokers, dealers and other financial institutions. Loans are collateralized by cash and U.S. government securities. The collateral is equal to at least 105% of the market value of non-U.S. securities loaned and 102% of the market value of U.S. securities loaned. The market value of the loaned securities is determined at the close of business of the Funds at their last sale price or official closing price on the principal exchange or system on which they are traded and any additional collateral is delivered to the Funds on the next business day. The cash collateral received is invested in approved investments as defined in the Securities Lending Agreement with BNY (the “Agreement”). The Funds bear the risk of loss with respect to the investment of collateral. Currently, the cash collateral is invested in the BNY Mellon Overnight Government Fund (formerly, The BNY Institutional Cash Reserves Fund —Series A) and the BNY Institutional Cash Reserves Fund —Series B (“BICR —Series B”), each a series within the BNY Institutional Cash Reserves Trust (collectively, the “BICR Fund”). BNY serves as investment manager, custodian and operational trustee of the BICR Fund. As of March 31, 2011, and throughout the period covered by this report, BICR — Series B held certain defaulted securities issued by Lehman Brothers Holdings, Inc. (the “Lehman Securities”). The Lehman Securities have market values significantly below amortized cost. On
May 22, 2009, the Funds agreed to the terms of a capital support agreement (the “Capital Support Agreement”) extended by The Bank of New York Mellon Corporation (“BNYC”), an affiliated company of BNY, for the Lehman Securities held by BICR — Series B. Under the terms of the Capital Support Agreement, BNYC will support the value of the Lehman Securities up to 80% of the par value (the remaining 20% of the par value represents an unrealized loss to the Funds) and subject, in part, to the Funds’ continued participation in the BNY securities lending program through September 15, 2011. At September 15, 2011, if the Funds have complied with the requirements under the Capital Support Agreement to continue to participate in the BNY securities lending program and if such securities have not otherwise been sold, the Funds will have the right to sell the defaulted securities to BNYC at a price equal to 80% of par value. The recorded value of each Fund’s investment in BICR —Series B includes the value of the underlying securities held by BICR — Series B and the estimated value of the support to be provided by BNYC. The investments in the BNY Mellon Overnight Government Fund and in BICR —Series B are included in the Portfolio of Investments under Securities Lending Collateral and the unrealized loss on BICR — Series B is included in Net Unrealized Depreciation on the Statements of Assets and Liabilities.
Generally, in the event of counterparty default, the Funds have the right to use the collateral to offset losses incurred. The Agreement contains certain guarantees by BNY in the event of counterparty default and/or a borrower’s failure to return a loaned security; however, there would be a potential loss to the Funds in the event the Funds are delayed or prevented from exercising their right to dispose of the collateral. Engaging in securities lending could have a leveraging effect, which may intensify the credit, market and other risks associated with investing in a Fund. At March 31, 2011, the following Fund had securities on loan with the following market values:
Value of Securities Loaned | Cash Collateral Received* | |||||||
Intermediate Bond | $ | 16,762,640 | $ | 17,095,000 | ||||
| * | Cash collateral received was invested in the BICR Fund, the fair value of which is presented in the respective Fund’s Summary Portfolio of Investments. |
36
Table of Contents
NOTES TO FINANCIAL STATEMENTSASOF MARCH 31, 2011 (CONTINUED)
NOTE 15 — SUBSEQUENT EVENTS
Subsequent to March 31, 2011, the following Funds paid dividends of:
Type | Per Share | Payable Date | Record Date | |||||||||||||
GNMA Income | ||||||||||||||||
Class A | NII | $ | 0.0291 | April 4, 2011 | March 31, 2011 | |||||||||||
Class B | NII | $ | 0.0233 | April 4, 2011 | March 31, 2011 | |||||||||||
Class C | NII | $ | 0.0235 | April 4, 2011 | March 31, 2011 | |||||||||||
Class I | NII | $ | 0.0312 | April 4, 2011 | March 31, 2011 | |||||||||||
Class W | NII | $ | 0.0310 | April 4, 2011 | March 31, 2011 | |||||||||||
Class A | NII | $ | 0.0291 | May 3, 2011 | April 29, 2011 | |||||||||||
Class B | NII | $ | 0.0234 | May 3, 2011 | April 29, 2011 | |||||||||||
Class C | NII | $ | 0.0237 | May 3, 2011 | April 29, 2011 | |||||||||||
Class I | NII | $ | 0.0313 | May 3, 2011 | April 29, 2011 | |||||||||||
Class W | NII | $ | 0.0309 | May 3, 2011 | April 29, 2011 | |||||||||||
High Yield Bond |
| |||||||||||||||
Class A | NII | $ | 0.0431 | May 2, 2011 | Daily | |||||||||||
Class B | NII | $ | 0.0384 | May 2, 2011 | Daily | |||||||||||
Class C | NII | $ | 0.0383 | May 2, 2011 | Daily | |||||||||||
Class I | NII | $ | 0.0458 | May 2, 2011 | Daily | |||||||||||
Intermediate Bond |
| |||||||||||||||
Class A | NII | $ | 0.0388 | May 2, 2011 | Daily | |||||||||||
Class B | NII | $ | 0.0301 | May 2, 2011 | Daily | |||||||||||
Class C | NII | $ | 0.0309 | May 2, 2011 | Daily | |||||||||||
Class I | NII | $ | 0.0410 | May 2, 2011 | Daily | |||||||||||
Class O | NII | $ | 0.0388 | May 2, 2011 | Daily | |||||||||||
Class R | NII | $ | 0.0369 | May 2, 2011 | Daily | |||||||||||
Class W | NII | $ | 0.0406 | May 2, 2011 | Daily | |||||||||||
| NII | - Net investment income |
The Funds have evaluated events occurring after the Statements of Assets and Liabilities date (subsequent events) to determine whether any subsequent events necessitated adjustment to or disclosure in the financial statements. Other than the above, no such subsequent events were identified.
37
Table of Contents
| ING GNMA INCOME FUND | PORTFOLIO OF INVESTMENTS AS OF MARCH 31, 2011 |
| Principal Amount | Value | Percent of Net Assets | ||||||||||||||
| U.S. GOVERNMENT AGENCY OBLIGATIONS: 105.1% | ||||||||||||||||
| Federal Home Loan Mortgage Corporation##: 2.4% | ||||||||||||||||
| $ | 3,093,242 | ^ | 5.500%, due 09/15/35 | $ | 501,297 | 2.4 | ||||||||||
| 4,836,565 | 5.625%, due 12/01/36 - 02/01/38 | 5,303,823 | ||||||||||||||
| 9,748,874 | 6.000%, due 05/15/36 | 10,673,902 | ||||||||||||||
| 1,110,851 | 9.000%, due 12/17/30 | 1,323,927 | ||||||||||||||
| 26,799,651 | ^ | 0.500% - 9.500%, due 11/01/14 - 07/15/36 | 730,944 | |||||||||||||
| 18,533,893 | 2.4 | |||||||||||||||
| Federal National Mortgage Association##: 14.4% | ||||||||||||||||
| 18,599,000 | W | 4.000%, due 04/25/39 | 18,296,766 | 14.4 | ||||||||||||
| 42,486,000 | W | 4.500%, due 04/25/39 | 43,249,431 | |||||||||||||
| 43,458,683 | 4.500%, due 09/01/40 - 11/01/40 | 44,301,891 | ||||||||||||||
| 723,704 | 6.600%, due 07/01/27 - 06/01/28 | 828,227 | ||||||||||||||
| 2,482,592 | 8.000%, due 12/25/45 | 3,028,671 | ||||||||||||||
| 2,297,252 | 10.008%, due 09/25/42 | 2,818,952 | ||||||||||||||
| 442,140 | 6.500% - 8.500%, due 06/01/14 - 05/01/28 | 497,069 | ||||||||||||||
| 113,021,007 | 14.4 | |||||||||||||||
| Government National Mortgage Association: 88.3% | ||||||||||||||||
| 95,292,178 | ^ | 0.250%, due 06/20/36 | 598,625 | 88.3 | ||||||||||||
| 89,730,097 | ^ | 0.885%, due 01/16/50 | 4,371,390 | |||||||||||||
| 89,937,501 | ^ | 0.949%, due 11/16/46 | 3,502,346 | |||||||||||||
| 100,000,000 | ^ | 1.102%, due 01/16/51 | 5,450,000 | |||||||||||||
| 25,947,919 | ^ | 2.617%, due 10/16/52 | 3,243,054 | |||||||||||||
| 5,120,529 | 4.000%, due 05/20/33 - 05/15/40 | 5,151,080 | ||||||||||||||
| 7,757,737 | ^ | 4.500%, due 02/20/35 - 12/20/37 | 1,050,135 | |||||||||||||
| 31,112,852 | 4.500%, due 01/20/34 - 02/20/40 | 32,169,161 | ||||||||||||||
| 68,222,652 | ^ | 5.000%, due 05/20/35 - 04/20/37 | 10,086,164 | |||||||||||||
| 178,587,222 | 5.000%, due 05/15/18 - 01/15/41 | 189,779,731 | ||||||||||||||
| 540,702 | 5.100%, due 04/20/32 | 580,388 | ||||||||||||||
| 1,561,598 | 5.250%, due 11/20/36 - 01/20/38 | 1,695,006 | ||||||||||||||
| Principal Amount | Value | Percent of Net Assets | ||||||||||||||
| U.S. GOVERNMENT AGENCY OBLIGATIONS: (continued) | ||||||||||||||||
| Government National Mortgage Association: (continued) | ||||||||||||||||
| $ | 13,635,468 | 5.473%, due 01/20/60 | $ | 14,723,405 | ||||||||||||
| 164,006,463 | 5.500%, due 08/20/24 - 03/15/41 | 178,077,252 | ||||||||||||||
| 2,089,705 | 5.600%, due 12/20/36 - 02/20/38 | 2,283,902 | ||||||||||||||
| 2,767,187 | 5.625%, due 01/20/37 - 04/15/39 | 3,030,232 | ||||||||||||||
| 9,622,982 | 5.630%, due 07/15/45 | 10,041,873 | ||||||||||||||
| 482,628 | 5.680%, due 05/15/47 | 512,073 | ||||||||||||||
| 484,733 | 5.690%, due 11/15/42 | 512,890 | ||||||||||||||
| 12,481,521 | 5.750%, due 11/20/27 - 07/20/38 | 13,670,476 | ||||||||||||||
| 5,534,989 | 5.950%, due 02/15/44 | 5,923,729 | ||||||||||||||
| 1,862,340 | 5.970%, due 11/15/31 | 2,000,686 | ||||||||||||||
| 16,690,343 | 5.980%, due 01/20/30 - 07/20/34 | 18,182,650 | ||||||||||||||
| 92,926,118 | 6.000%, due 01/20/24 - 03/15/41 | 102,545,921 | ||||||||||||||
| 406,873 | 6.125%, due 02/15/39 - 04/15/39 | 450,852 | ||||||||||||||
| 3,387,533 | 6.200%, due 08/20/28 - 02/20/30 | 3,719,131 | ||||||||||||||
| 35,733,842 | ^ | 6.247%, due 09/20/37 - 09/20/38 | 4,690,893 | |||||||||||||
| 620,436 | 6.250%, due 09/15/27 - 09/15/29 | 694,844 | ||||||||||||||
| 562,885 | 6.280%, due 01/20/26 - 05/20/26 | 617,062 | ||||||||||||||
| 13,092,525 | 6.500%, due 03/15/28 - 07/20/38 | 14,781,400 | ||||||||||||||
| 2,681,654 | 6.600%, due 10/20/26 - 07/20/28 | 3,046,002 | ||||||||||||||
| 887,427 | 6.750%, due 08/15/28 - 04/20/37 | 1,009,862 | ||||||||||||||
| 27,603,351 | 7.000%, due 09/15/23 - 12/20/38 | 31,703,989 | ||||||||||||||
| 6,288,699 | 7.200%, due 03/15/39 | 6,754,330 | ||||||||||||||
| 5,144,478 | ^ | 7.247%, due 05/16/31 | 978,158 | |||||||||||||
| 3,054,844 | ^ | 7.347%, due 10/16/29 | 541,461 | |||||||||||||
| 4,018,482 | 7.350%, due 03/15/43 | 4,312,628 | ||||||||||||||
| 6,038,984 | 7.500%, due 08/20/27 - 10/15/38 | 6,696,204 | ||||||||||||||
| 395,489 | 8.000%, due 03/20/24 - 03/15/28 | 463,697 | ||||||||||||||
| 1,067,913 | 9.000%, due 05/15/16 - 01/15/31 | 1,156,341 | ||||||||||||||
| 7,528,652 | ^ | 5.450% - 31.484%, due 05/15/19 - 04/20/34 | 2,243,364 | |||||||||||||
| 693,042,387 | 88.3 | |||||||||||||||
See Accompanying Notes to Financial Statements
38
Table of Contents
| ING GNMA INCOME FUND | PORTFOLIO OF INVESTMENTS AS OF MARCH 31, 2011 (CONTINUED) |
| Principal Amount | Value | Percent of Net Assets | ||||||||||||||
| U.S. GOVERNMENT AGENCY OBLIGATIONS: (continued) | ||||||||||||||||
| Other U.S. Agency Obligations: 0.0% | ||||||||||||||||
| $ | 3,855 | Small Business Administration, 8.250%, due 11/01/11 | $ | 3,915 | 0.0 | |||||||||||
| Total Investments in Securities (Cost $795,197,537)* | $ | 824,601,202 | 105.1 | |||||||||||||
| Other Assets and Liabilities - Net | (39,846,600 | ) | (5.1 | ) | ||||||||||||
| Net Assets | $ | 784,754,602 | 100.0 | |||||||||||||
| ## | On September 7, 2008, the Federal Housing Finance Agency placed the Federal National Mortgage Association and the Federal Home Loan Mortgage Corporation into conservatorship and the U.S. Treasury guaranteed the debt issued by those organizations. |
| W | Settlement is on a when-issued or delayed-delivery basis. |
| ^ | Interest only securities represent the right to receive the monthly interest payments on an underlying pool of mortgage loans. Principal amount shown represents the notional amount on which current interest is calculated. Payments of principal on the pool reduce the value of the interest only security. |
| * | Cost for federal income tax purposes is $795,201,762. |
Net unrealized appreciation consists of: | ||||
Gross Unrealized Appreciation | $ | 32,600,678 | ||
Gross Unrealized Depreciation | (3,201,238 | ) | ||
Net Unrealized Appreciation | $ | 29,399,440 | ||
Fair Value Measurements^
The following is a summary of the fair valuations according to the inputs used as of March 31, 2011 in valuing the Fund’s assets and liabilities:
| Quoted Prices in Active Markets for Identical Investments (Level 1) | Other Observable Inputs (Level 2) | Significant Unobservable Inputs (Level 3) | Fair Value at 3/31/2011 | |||||||||||||
Asset Table | ||||||||||||||||
Investments, at value | ||||||||||||||||
U.S. Government Agency Obligations | $ | — | $ | 819,151,202 | $ | 5,450,000 | $ | 824,601,202 | ||||||||
Total Investments, at value | $ | — | $ | 819,151,202 | $ | 5,450,000 | $ | 824,601,202 | ||||||||
The following is a reconciliation of the fair valuations using significant unobservable inputs (Level 3) for the Fund’s assets and liabilities during the period ended March 31, 2011:
| Beginning Balance 3/31/2010 | Purchases | Sales | Accrued Discounts/ (Premiums) | Total Realized Gain/(Loss) | Total Unrealized Appreciation/ (Depreciation) | Transfers Into Level 3 | Transfers Out of Level 3 | Ending Balance 3/31/2011 | ||||||||||||||||||||||||||||
Asset Table | ||||||||||||||||||||||||||||||||||||
Investments, at value | ||||||||||||||||||||||||||||||||||||
U.S. Government Agency Obligations | $ | — | $ | 5,449,219 | $ | — | $ | (8,032 | ) | $ | — | $ | 8,813 | $ | — | $ | — | $ | 5,450,000 | |||||||||||||||||
Total Investments, at value | $ | — | $ | 5,449,219 | $ | — | $ | (8,032 | ) | $ | — | $ | 8,813 | $ | — | $ | — | $ | 5,450,000 | |||||||||||||||||
As of March 31, 2011, the net change in unrealized appreciation or depreciation on Level 3 investments still held at period end and included in the change in net assets was $8,813.
| ^ | See Note 2, “Significant Accounting Policies” in the Notes to Financial Statements for additional information. |
| Transfers in or out of Level 3 represent either the beginning value (for transfers in), or the ending value (for transfers out) of any security or derivative instrument where a change in the pricing level occurred from the beginning to the end of the period. It is the policy of the Portfolio to recognize transfers at the end of the reporting period. |
| There were no significant transfers between Level 1 and 2 during the period ending March 31, 2011. |
See Accompanying Notes to Financial Statements
39
Table of Contents
| ING HIGH YIELD BOND FUND | SUMMARY PORTFOLIO OF INVESTMENTS AS OF MARCH 31, 2011 |
| Principal Amount | Value | Percent of Net Assets | ||||||||||||||
| CORPORATE BONDS/NOTES: 92.9% | ||||||||||||||||
| Consumer Discretionary: 23.0% | ||||||||||||||||
| $ | 665,000 | Accuride Corp., 9.500%, due 08/01/18 | $ | 743,138 | 0.6 | |||||||||||
| 265,000 | Affinia Group, Inc., 9.000%, due 11/30/14 | 274,275 | 0.5 | |||||||||||||
| 90,000 | # | Affinia Group, Inc., 9.000%, due 11/30/14 | 93,150 | |||||||||||||
| 223,000 | # | Affinia Group, Inc., 10.750%, due 08/15/16 | 254,499 | |||||||||||||
| 700,000 | # | AMC Entertainment, Inc., 9.750%, due 12/01/20 | 752,500 | 0.6 | ||||||||||||
| 34,781 | # | American Media, Inc., 13.500%, due 06/15/18 | 35,824 | 0.0 | ||||||||||||
| 310,000 | # | Ameristar Casinos, Inc., 7.500%, due 04/15/21 | 307,288 | 0.7 | ||||||||||||
| 510,000 | Ameristar Casinos, Inc., 9.250%, due 06/01/14 | 562,913 | ||||||||||||||
| 90,000 | # | Asbury Automotive Group, Inc., 8.375%, due 11/15/20 | 94,050 | 0.1 | ||||||||||||
| 150,000 | # | Bresnan Broadband Holdings LLC, 8.000%, due 12/15/18 | 159,000 | 0.1 | ||||||||||||
| 231,000 | # | Burlington Coat Factory Warehouse Corp., 10.000%, due 02/15/19 | 225,225 | 0.2 | ||||||||||||
| 720,000 | Cablevision Systems Corp., 7.750%, due 04/15/18 | 781,200 | 1.0 | |||||||||||||
| 450,000 | Cablevision Systems Corp., 8.000%, due 04/15/20 | 492,750 | ||||||||||||||
| 840,000 | Caesars Entertainment Operating Co., Inc., 10.000%, due 12/15/18 | 770,700 | 1.4 | |||||||||||||
| 840,000 | Caesars Entertainment Operating Co., Inc., 11.250%, due 06/01/17 | 958,650 | ||||||||||||||
| 420,000 | # | Cedar Fair L.P./Canada’s Wonderland Co/Magnum Management Corp., 9.125%, due 08/01/18 | 457,800 | 0.4 | ||||||||||||
| 1,000,000 | # | Cequel Communications Holdings I, LLC and Cequel Capital Corp., 8.625%, due 11/15/17 | 1,047,500 | 0.8 | ||||||||||||
| 730,000 | #, Z | Checkout Holding Corp., 9.530%, due 11/15/15 | 479,063 | 0.4 | ||||||||||||
| 195,000 | # | Citadel Broadcasting Corp., 7.750%, due 12/15/18 | 212,306 | 0.2 | ||||||||||||
| Principal Amount | Value | Percent of Net Assets | ||||||||||||||
| CORPORATE BONDS/NOTES: (continued) | ||||||||||||||||
| Consumer Discretionary: (continued) | ||||||||||||||||
| $ | 185,000 | # | CityCenter Holdings LLC/CityCenter Finance Corp., 7.625%, due 01/15/16 | $ | 191,938 | 0.2 | ||||||||||
| 75,000 | &, # | CityCenter Holdings LLC/CityCenter Finance Corp., 10.750%, due 01/15/17 | 77,813 | |||||||||||||
| 493,000 | # | Clear Channel Communications, Inc., 9.000%, due 03/01/21 | 494,233 | 0.5 | ||||||||||||
| 115,000 | Clear Channel Communications, Inc., 10.750%, due 08/01/16 | 110,113 | ||||||||||||||
| 525,000 | Clear Channel Worldwide Holdings, Inc., 9.250%, due 12/15/17 | 577,781 | 0.4 | |||||||||||||
| 380,000 | # | DineEquity, Inc., 9.500%, due 10/30/18 | 414,200 | 0.3 | ||||||||||||
| 680,000 | DISH DBS Corp., 7.875%, due 09/01/19 | 739,500 | 0.6 | |||||||||||||
| 540,000 | # | Exide Technologies, 8.625%, due 02/01/18 | 579,150 | 0.5 | ||||||||||||
| 140,000 | # | Inergy L.P./Inergy Finance Corp., 6.875%, due 08/01/21 | 146,125 | 0.1 | ||||||||||||
| 365,000 | # | McJunkin Red Man Corp., 9.500%, due 12/15/16 | 371,388 | 0.3 | ||||||||||||
| 800,000 | MGM Resorts International, 9.000% - 10.375%, due 05/15/14 - 03/15/20 | 895,381 | 0.7 | |||||||||||||
| 570,000 | # | Michaels Stores, Inc., 7.750%, due 11/01/18 | 584,250 | 1.0 | ||||||||||||
| 685,000 | + | Michaels Stores, Inc., 0.000% - 11.375%, (step rate 13.000%), due 11/01/16 | 721,725 | |||||||||||||
| 75,000 | # | NCL Corp., Ltd., 9.500%, due 11/15/18 | 79,313 | 0.1 | ||||||||||||
| 470,000 | # | Needle Merger Sub Corp., 8.125%, due 03/15/19 | 477,050 | 0.4 | ||||||||||||
| 465,000 | # | Nielsen Finance LLC/Nielsen Finance Co., 7.750%, due 10/15/18 | 501,038 | 0.4 | ||||||||||||
| 450,000 | # | Petco Animal Supplies, Inc., 9.250%, due 12/01/18 | 483,750 | 0.4 | ||||||||||||
| 620,000 | Pinnacle Entertainment, Inc., 8.750%, due 05/15/20 | 647,900 | 0.5 | |||||||||||||
| 110,000 | # | Prestige Brands, Inc., 8.250%, due 04/01/18 | 116,600 | 0.3 | ||||||||||||
| 295,000 | Prestige Brands, Inc., 8.250%, due 04/01/18 | 312,700 | ||||||||||||||
| 305,000 | # | Rent-A-Center, Inc., 6.625%, due 11/15/20 | 301,950 | 0.2 | ||||||||||||
See Accompanying Notes to Financial Statements
40
Table of Contents
| ING HIGH YIELD BOND FUND | SUMMARY PORTFOLIO OF INVESTMENTS AS OF MARCH 31, 2011 (CONTINUED) |
| Principal Amount | Value | Percent of Net Assets | ||||||||||||||
| CORPORATE BONDS/NOTES: (continued) | ||||||||||||||||
| Consumer Discretionary: (continued) | ||||||||||||||||
| $ | 195,000 | # | Scientific Games Corp., 8.125%, due 09/15/18 | $ | 206,700 | 0.2 | ||||||||||
| 287,000 | # | Seminole Indian Tribe of Florida, 7.750%, due 10/01/17 | 304,938 | 0.2 | ||||||||||||
| 10,000 | # | Sinclair Television Group, Inc., 8.375%, due 10/15/18 | 10,625 | 0.3 | ||||||||||||
| 385,000 | # | Sinclair Television Group, Inc., 9.250%, due 11/01/17 | 431,200 | |||||||||||||
| 645,000 | # | Sirius XM Radio, Inc., 8.750%, due 04/01/15 | 728,850 | 0.6 | ||||||||||||
| 270,000 | # | Stoneridge, Inc., 9.500%, due 10/15/17 | 299,700 | 0.2 | ||||||||||||
| 695,000 | Universal City Development Partners Ltd./UCDP Finance, Inc., 8.875%, due 11/15/15 | 760,156 | 0.6 | |||||||||||||
| Other Securities | 8,845,732 | 7.0 | ||||||||||||||
| 29,113,630 | 23.0 | |||||||||||||||
| Consumer Staples: 5.4% | ||||||||||||||||
| 185,000 | # | Bumble Bee Acquisition Corp., 9.000%, due 12/15/17 | 193,325 | 0.2 | ||||||||||||
| 170,000 | &, # | Bumble Bee Holdco SCA, 9.625%, due 03/15/18 | 159,375 | 0.1 | ||||||||||||
| 285,000 | # | Darling International, Inc., 8.500%, due 12/15/18 | 311,363 | 0.2 | ||||||||||||
| 450,000 | # | Hertz Corp., 6.750%, due 04/15/19 | 448,313 | 0.7 | ||||||||||||
| 220,000 | # | Hertz Corp., 7.375%, due 01/15/21 | 226,050 | |||||||||||||
| 226,000 | Hertz Corp., 8.875%, due 01/01/14 | 232,780 | ||||||||||||||
| 650,000 | JBS USA LLC/JBS USA Finance, Inc., 11.625%, due 05/01/14 | 757,250 | 0.6 | |||||||||||||
| 255,000 | # | Pilgrim’s Pride Corp., 7.875%, due 12/15/18 | 248,625 | 0.2 | ||||||||||||
| 240,000 | # | Rite Aid Corp., 6.875%, due 12/15/28 | 146,400 | 0.1 | ||||||||||||
| 470,000 | # | RSC Equipment Rental, Inc., 10.000%, due 07/15/17 | 538,150 | 0.6 | ||||||||||||
| 190,000 | # | RSC Equipment Rental, Inc./RSC Holdings III LLC, 8.250%, due 02/01/21 | 198,550 | |||||||||||||
| 420,000 | ServiceMaster Co, 7.450%, due 08/15/27 | 341,250 | 1.0 | |||||||||||||
| Principal Amount | Value | Percent of Net Assets | ||||||||||||||
| CORPORATE BONDS/NOTES: (continued) | ||||||||||||||||
| Consumer Staples: (continued) | ||||||||||||||||
| $ | 820,000 | &, # | ServiceMaster Co., 10.750%, due 07/15/15 | $ | 875,350 | |||||||||||
| 150,000 | # | Stater Bros Holdings, Inc., 7.375%, due 11/15/18 | 156,375 | 0.1 | ||||||||||||
| Other Securities | 2,021,800 | 1.6 | ||||||||||||||
| 6,854,956 | 5.4 | |||||||||||||||
| Energy: 13.9% | ||||||||||||||||
| 555,000 | # | Alta Mesa Holdings/Alta Mesa Finance Services Corp., 9.625%, due 10/15/18 | 566,100 | 0.4 | ||||||||||||
| 90,000 | # | Basic Energy Services, Inc., 7.750%, due 02/15/19 | 92,925 | 0.1 | ||||||||||||
| 290,000 | # | Brigham Exploration Co., 8.750%, due 10/01/18 | 323,350 | 0.3 | ||||||||||||
| 340,000 | # | Calfrac Holdings L.P., 7.500%, due 12/01/20 | 352,750 | 0.3 | ||||||||||||
| 145,000 | # | Chaparral Energy, Inc., 8.250%, due 09/01/21 | 149,713 | 0.6 | ||||||||||||
| 205,000 | # | Chaparral Energy, Inc., 9.875%, due 10/01/20 | 228,575 | |||||||||||||
| 405,000 | Chaparral Energy, Inc., 8.875%, due 02/01/17 | 427,275 | ||||||||||||||
| 335,000 | # | Clayton Williams Energy, Inc., 7.750%, due 04/01/19 | 336,256 | 0.3 | ||||||||||||
| 625,000 | El Paso Corp., 7.250%, due 06/01/18 | 705,635 | 0.6 | |||||||||||||
| 410,000 | # | Energy XXI Gulf Coast, Inc., 9.250%, due 12/15/17 | 439,725 | 0.3 | ||||||||||||
| 865,000 | # | Foresight Energy LLC/Foresight Energy Corp., 9.625%, due 08/15/17 | 935,281 | 0.7 | ||||||||||||
| 625,000 | # | Hilcorp Energy I L.P./Hilcorp Finance Co., 8.000%, due 02/15/20 | 668,750 | 0.5 | ||||||||||||
| 200,000 | # | James River Escrow, Inc., 7.875%, due 04/01/19 | 208,000 | 0.2 | ||||||||||||
| 275,000 | # | Linn Energy LLC/Linn Energy Finance Corp., 7.750%, due 02/01/21 | 294,938 | 0.6 | ||||||||||||
| 360,000 | # | Linn Energy LLC/Linn Energy Finance Corp., 8.625%, due 04/15/20 | 401,400 | |||||||||||||
| 160,000 | # | MEG Energy Corp., 6.500%, due 03/15/21 | 162,800 | 0.1 | ||||||||||||
| 215,000 | # | Murray Energy Corp., 10.250%, due 10/15/15 | 232,200 | 0.2 | ||||||||||||
| 325,000 | # | NFR Energy LLC/NFR Energy Finance Corp., 9.750%, due 02/15/17 | 323,375 | 0.3 | ||||||||||||
See Accompanying Notes to Financial Statements
41
Table of Contents
| ING HIGH YIELD BOND FUND | SUMMARY PORTFOLIO OF INVESTMENTS AS OF MARCH 31, 2011 (CONTINUED) |
| Principal Amount | Value | Percent of Net Assets | ||||||||||||||
| CORPORATE BONDS/NOTES: (continued) | ||||||||||||||||
| Energy: (continued) | ||||||||||||||||
| $ | 210,000 | # | Oasis Petroleum, Inc., 7.250%, due 02/01/19 | $ | 213,150 | 0.2 | ||||||||||
| 535,000 | Pioneer Natural Resources Co., 7.500%, due 01/15/20 | 605,207 | 0.5 | |||||||||||||
| 730,000 | Plains Exploration & Production Co., 7.625%, due 06/01/18 | 784,750 | 0.8 | |||||||||||||
| 200,000 | Plains Exploration & Production Co., 6.625%, due 05/01/21 | 200,250 | ||||||||||||||
| 410,000 | # | SandRidge Energy, Inc., 8.000%, due 06/01/18 | 431,525 | 0.3 | ||||||||||||
| 600,000 | Swift Energy Co., 8.875%, due 01/15/20 | 658,500 | 0.7 | |||||||||||||
| 245,000 | Swift Energy Co., 7.125%, due 06/01/17 | 251,738 | ||||||||||||||
| 270,000 | # | Targa Resources Partners L.P./Targa Resources Partners Finance Corp., 6.875%, due 02/01/21 | 267,975 | 0.2 | ||||||||||||
| 120,000 | # | Venoco, Inc., 8.875%, due 02/15/19 | 120,150 | 0.1 | ||||||||||||
| 230,000 | # | Westmoreland Coal Co./Westmoreland Partners, 10.750%, due 02/01/18 | 227,988 | 0.2 | ||||||||||||
| Other Securities | 6,873,883 | 5.4 | ||||||||||||||
| 17,484,164 | 13.9 | |||||||||||||||
| Financials: 12.3% | ||||||||||||||||
| 380,000 | # | ABI Escrow Corp., 10.250%, due 10/15/18 | 421,800 | 0.3 | ||||||||||||
| 1,435,000 | Ally Financial, Inc., 8.000%, due 03/15/20 | 1,565,944 | 1.6 | |||||||||||||
| 455,000 | Ally Financial, Inc., 8.300%, due 02/12/15 | 499,931 | ||||||||||||||
| 790,000 | American General Finance Corp., 5.400%, due 12/01/15 | 724,825 | 0.8 | |||||||||||||
| 300,000 | American General Finance Corp., 5.850%, due 06/01/13 | 294,750 | ||||||||||||||
| 750,000 | Atlantic Broadband Finance, LLC, 9.375%, due 01/15/14 | 765,000 | 0.6 | |||||||||||||
| 640,000 | # | CIT Group, Inc., 6.625%, due 04/01/18 | 650,257 | 2.2 | ||||||||||||
| 595,000 | CIT Group, Inc., 7.000%, due 05/01/14 | 607,644 | ||||||||||||||
| 800,000 | CIT Group, Inc., 7.000%, due 05/01/17 | 803,000 | ||||||||||||||
| 695,000 | CIT Group, Inc., 7.000%, due 05/01/15 -05/01/16 | 701,244 | ||||||||||||||
| Principal Amount | Value | Percent of Net Assets | ||||||||||||||
| CORPORATE BONDS/NOTES: (continued) | ||||||||||||||||
| Financials: (continued) | ||||||||||||||||
| $ | 760,000 | Felcor Lodging L.P., 10.000%, due 10/01/14 | $ | 872,100 | 0.7 | |||||||||||
| 945,000 | Ford Motor Credit Co., LLC, 8.125%, due 01/15/20 | 1,084,180 | 1.5 | |||||||||||||
| 690,000 | Ford Motor Credit Co., LLC, 8.700%, due 10/01/14 | 783,857 | ||||||||||||||
| 298,000 | # | International Lease Finance Corp., 8.875%, due 09/15/15 | 328,545 | 1.3 | ||||||||||||
| 310,000 | # | International Lease Finance Corp., 9.000%, due 03/15/17 | 349,525 | |||||||||||||
| 870,000 | International Lease Finance Corp., 5.625% - 8.250%, due 09/20/13 - 12/15/20 | 901,606 | ||||||||||||||
| 370,000 | # | LBI Escrow Corp., 8.000%, due 11/01/17 | 408,850 | 0.3 | ||||||||||||
| 585,000 | # | Pinafore LLC/Pinafore, Inc., 9.000%, due 10/01/18 | 637,650 | 0.5 | ||||||||||||
| 250,000 | # | Realogy Corp., 7.875%, due 02/15/19 | 249,375 | 0.2 | ||||||||||||
| 660,000 | Tops Holding Corp./Tops Markets LLC, 10.125%, due 10/15/15 | 712,800 | 0.6 | |||||||||||||
| Other Securities | 2,130,785 | 1.7 | ||||||||||||||
| 15,493,668 | 12.3 | |||||||||||||||
| Health Care: 7.8% | ||||||||||||||||
| 135,000 | # | Endo Pharmaceuticals Holdings, Inc., 7.000%, due 12/15/20 | 140,231 | 0.1 | ||||||||||||
| 150,000 | # | Giant Funding Corp., 8.250%, due 02/01/18 | 154,688 | 0.1 | ||||||||||||
| 655,000 | # | HCA Holdings, Inc., 7.750%, due 05/15/21 | 686,113 | 0.5 | ||||||||||||
| 860,000 | HCA, Inc., 7.250%, due 09/15/20 | 924,500 | 1.5 | |||||||||||||
| 905,000 | HCA, Inc., 7.875%, due 02/15/20 | 988,713 | ||||||||||||||
| 625,000 | Healthsouth Corp., 7.250% - 8.125%, due 10/01/18 - 02/15/20 | 670,669 | 0.5 | |||||||||||||
| 370,000 | # | MedAssets, Inc., 8.000%, due 11/15/18 | 380,175 | 0.3 | ||||||||||||
| 170,000 | # | Mylan, Inc./PA, 7.875%, due 07/15/20 | 185,725 | 0.2 | ||||||||||||
| 570,000 | Omnicare, Inc., 7.750%, due 06/01/20 | 607,050 | �� | 0.5 | ||||||||||||
| 280,000 | # | STHI Holding Corp., 8.000%, due 03/15/18 | 291,200 | 0.2 | ||||||||||||
See Accompanying Notes to Financial Statements
42
Table of Contents
| ING HIGH YIELD BOND FUND | SUMMARY PORTFOLIO OF INVESTMENTS AS OF MARCH 31, 2011 (CONTINUED) |
| Principal Amount | Value | Percent of Net Assets | ||||||||||||||
| CORPORATE BONDS/NOTES: (continued) | ||||||||||||||||
| Health Care: (continued) | ||||||||||||||||
| $ | 670,000 | Tenet Healthcare Corp., 8.000%, due 08/01/20 | $ | 701,825 | 0.6 | |||||||||||
| 75,000 | # | Valeant Pharmaceuticals International, 6.750%, due 10/01/17 | 74,250 | 0.4 | ||||||||||||
| 175,000 | # | Valeant Pharmaceuticals International, 6.750%, due 08/15/21 | 166,906 | |||||||||||||
| 245,000 | # | Valeant Pharmaceuticals International, 7.000%, due 10/01/20 | 238,875 | |||||||||||||
| Other Securities | 3,610,668 | 2.9 | ||||||||||||||
| 9,821,588 | 7.8 | |||||||||||||||
| Industrials: 7.7% | ||||||||||||||||
| 455,000 | # | Amsted Industries, Inc., 8.125%, due 03/15/18 | 487,419 | 0.4 | ||||||||||||
| 310,000 | # | Bombardier, Inc., 7.500%, due 03/15/18 | 336,350 | 0.5 | ||||||||||||
| 310,000 | # | Bombardier, Inc., 7.750%, due 03/15/20 | 338,288 | |||||||||||||
| 185,000 | # | Building Materials Corp. of America, 7.500%, due 03/15/20 | 193,325 | 0.1 | ||||||||||||
| 160,000 | # | Case New Holland, Inc., 7.875%, due 12/01/17 | 178,600 | 0.1 | ||||||||||||
| 290,000 | # | Cenveo Corp., 10.500%, due 08/15/16 | 292,900 | 0.2 | ||||||||||||
| 355,000 | # | Florida East Coast Railway Corp., 8.125%, due 02/01/17 | 372,306 | 0.3 | ||||||||||||
| 70,000 | # | Geo Group, Inc., 6.625%, due 02/15/21 | 69,650 | 0.1 | ||||||||||||
| 105,000 | # | Great Lakes Dredge & Dock Corp., 7.375%, due 02/01/19 | 106,838 | 0.1 | ||||||||||||
| 270,000 | # | Griffon Corp., 7.125%, due 04/01/18 | 276,075 | 0.2 | ||||||||||||
| 110,000 | # | Interface, Inc., 7.625%, due 12/01/18 | 114,950 | 0.1 | ||||||||||||
| 585,000 | Martin Midstream Partners L.P./Martin Midstream Finance Corp., 8.875%, due 04/01/18 | 623,025 | 0.5 | |||||||||||||
| 190,000 | # | Mobile Mini, Inc., 7.875%, due 12/01/20 | 202,350 | 0.2 | ||||||||||||
| 370,000 | # | Polymer Group, Inc., 7.750%, due 02/01/19 | 383,413 | 0.3 | ||||||||||||
| 310,000 | # | SPX Corp., 6.875%, due 09/01/17 | 334,800 | 0.3 | ||||||||||||
| 360,000 | # | Swift Services Holdings, Inc., 10.000%, due 11/15/18 | 392,400 | 0.3 | ||||||||||||
| Principal Amount | Value | Percent of Net Assets | ||||||||||||||
| CORPORATE BONDS/NOTES: (continued) | ||||||||||||||||
| Industrials: (continued) | ||||||||||||||||
| $ | 665,000 | United Rentals North America, Inc., 8.375% - 9.250%, due 12/15/19 - 09/15/20 | $ | 717,825 | 0.6 | |||||||||||
| 615,000 | WCA Waste Corp., 9.250%, due 06/15/14 | 636,525 | 0.5 | |||||||||||||
| Other Securities | 3,656,387 | 2.9 | ||||||||||||||
| 9,713,426 | 7.7 | |||||||||||||||
| Information Technology: 5.6% | ||||||||||||||||
| 605,000 | # | Aspect Software, Inc., 10.625%, due 05/15/17 | 650,375 | 0.5 | ||||||||||||
| 310,000 | # | CDW Escrow Corp., 8.500%, due 04/01/19 | 311,163 | 0.2 | ||||||||||||
| 375,000 | # | CommScope, Inc., 8.250%, due 01/15/19 | 393,750 | 0.3 | ||||||||||||
| 145,000 | # | First Data Corp., 8.250%, due 01/15/21 | 145,363 | 0.7 | ||||||||||||
| 146,000 | &, # | First Data Corp., 8.750%, due 01/15/22 | 146,000 | |||||||||||||
| 293,000 | # | First Data Corp., 12.625%, due 01/15/21 | 319,370 | |||||||||||||
| 229,748 | & | First Data Corp., 9.875% - 11.250%, due 09/24/15 - 03/31/16 | 231,234 | |||||||||||||
| 440,000 | # | Freescale Semiconductor, Inc., 10.750%, due 08/01/20 | 496,100 | 0.4 | ||||||||||||
| 432,000 | # | Insight.com, 9.375%, due 07/15/18 | 481,680 | 0.4 | ||||||||||||
| 500,000 | # | NXP BV/NXP Funding, LLC, 9.750%, due 08/01/18 | 562,500 | 0.4 | ||||||||||||
| 235,000 | # | Seagate HDD Cayman, 7.750%, due 12/15/18 | 244,400 | 0.2 | ||||||||||||
| 395,000 | # | SunGard Data Systems, Inc., 7.375%, due 11/15/18 | 405,863 | 0.8 | ||||||||||||
| 155,000 | # | SunGard Data Systems, Inc., 7.625%, due 11/15/20 | 160,038 | |||||||||||||
| 396,000 | SunGard Data Systems, Inc., 10.250%, due 08/15/15 | 416,790 | ||||||||||||||
| Other Securities | 2,145,113 | 1.7 | ||||||||||||||
| 7,109,739 | 5.6 | |||||||||||||||
| Materials: 6.1% | ||||||||||||||||
| 355,000 | # | Aleris International, Inc., 7.625%, due 02/15/18 | 357,663 | 0.3 | ||||||||||||
| 190,000 | # | Associated Materials LLC, 9.125%, due 11/01/17 | 203,775 | 0.1 | ||||||||||||
See Accompanying Notes to Financial Statements
43
Table of Contents
| ING HIGH YIELD BOND FUND | SUMMARY PORTFOLIO OF INVESTMENTS AS OF MARCH 31, 2011 (CONTINUED) |
| Principal Amount | Value | Percent of Net Assets | ||||||||||||||
| CORPORATE BONDS/NOTES: (continued) | ||||||||||||||||
| Materials: (continued) | ||||||||||||||||
| $ | 185,000 | # | Atkore International, Inc., 9.875%, due 01/01/18 | $ | 198,413 | 0.1 | ||||||||||
| 220,000 | # | Chemtura Corp., 7.875%, due 09/01/18 | 233,200 | 0.2 | ||||||||||||
| 270,000 | # | Hexion US Finance Corp./ Hexion Nova Scotia Finance ULC, 9.000%, due 11/15/20 | 280,631 | 0.2 | ||||||||||||
| 535,000 | # | Huntsman International, LLC, 8.625%, due 03/15/21 | 585,825 | 0.6 | ||||||||||||
| 168,000 | Huntsman International, LLC, 7.375%, due 01/01/15 | 172,620 | ||||||||||||||
| 355,000 | # | JMC Steel Group, 8.250%, due 03/15/18 | 364,763 | 0.3 | ||||||||||||
| 120,000 | # | KRATON Polymers LLC/KRATON Polymers Capital Corp., 6.750%, due 03/01/19 | 122,400 | 0.1 | ||||||||||||
| 385,000 | # | Momentive Performance Materials, Inc., 9.000%, due 01/15/21 | 398,956 | 0.7 | ||||||||||||
| 451,000 | Momentive Performance Materials, Inc., 12.500%, due 06/15/14 | 502,865 | ||||||||||||||
| 180,000 | # | Novelis, Inc., 8.375%, due 12/15/17 | 195,750 | 0.5 | ||||||||||||
| 360,000 | # | Novelis, Inc., 8.750%, due 12/15/20 | 397,800 | |||||||||||||
| 260,000 | # | Omnova Solutions, Inc., 7.875%, due 11/01/18 | 264,550 | 0.2 | ||||||||||||
| 290,000 | # | Plastipak Holdings, Inc., 10.625%, due 08/15/19 | 332,050 | 0.3 | ||||||||||||
| 180,000 | # | Rain CII Carbon LLC and CII Carbon Corp., 8.000%, due 12/01/18 | 193,500 | 0.1 | ||||||||||||
| 75,000 | # | Verso Paper Holdings LLC/Verso Paper, Inc., 8.750%, due 02/01/19 | 78,375 | 0.2 | ||||||||||||
| 126,000 | Verso Paper Holdings LLC/ Verso Paper, Inc., 11.500%, due 07/01/14 | 138,285 | ||||||||||||||
| 75,000 | # | Vertellus Specialties, Inc., 9.375%, due 10/01/15 | 80,438 | 0.1 | ||||||||||||
| Other Securities | 2,646,520 | 2.1 | ||||||||||||||
| 7,748,379 | 6.1 | |||||||||||||||
| Telecommunication Services: 8.5% | ||||||||||||||||
| 250,000 | # | CCO Holdings LLC/CCO Holdings Capital Corp., 7.000%, due 01/15/19 | 256,875 | 1.5 | ||||||||||||
| Principal Amount | Value | Percent of Net Assets | ||||||||||||||
| CORPORATE BONDS/NOTES: (continued) | ||||||||||||||||
| Telecommunication Services: (continued) | ||||||||||||||||
| $ | 1,550,000 | CCO Holdings LLC/CCO Holdings Capital Corp., 7.250%, due 10/30/17 | $ | 1,627,473 | ||||||||||||
| 1,100,000 | Cincinnati Bell, Inc., 7.000%-8.750%, due 02/15/15 - 10/15/20 | 1,071,538 | 0.8 | |||||||||||||
| 270,000 | # | Clearwire Communications, LLC/Clearwire Finance, Inc., 12.000%, due 12/01/15 | 292,950 | 0.2 | ||||||||||||
| 680,000 | Frontier Communications Co., 9.000%, due 08/15/31 | 698,700 | 1.2 | |||||||||||||
| 710,000 | Frontier Communications Corp., 8.250% - 8.500%, due 04/15/17 - 04/15/20 | 772,263 | ||||||||||||||
| 45,000 | # | Intelsat Jackson Holdings Ltd., 8.500%, due 11/01/19 | 48,600 | 0.4 | ||||||||||||
| 200,000 | # | Intelsat Jackson Holdings SA, 7.250%, due 04/01/19 | 201,250 | |||||||||||||
| 240,000 | # | Intelsat Jackson Holdings SA, 7.500%, due 04/01/21 | 241,800 | |||||||||||||
| 841,375 | & | Intelsat Luxembourg S.A., 11.500%, due 02/04/17 | 927,616 | 1.0 | ||||||||||||
| 345,000 | Intelsat Luxembourg S.A., 11.250%, due 02/04/17 | 378,638 | ||||||||||||||
| 650,000 | Nextel Communications, I nc., 5.950%, due 03/15/14 | 654,875 | 1.0 | |||||||||||||
| 615,000 | Nextel Communications, Inc., 7.375%, due 08/01/15 | 620,381 | ||||||||||||||
| 190,000 | # | West Corp., 7.875%, due 01/15/19 | 194,038 | 0.5 | ||||||||||||
| 45,000 | # | West Corp., 8.625%, due 10/01/18 | 47,588 | |||||||||||||
| 330,000 | West Corp., 11.000%, due 10/15/16 | 356,400 | ||||||||||||||
| Other Securities | 2,365,699 | 1.9 | ||||||||||||||
| 10,756,684 | 8.5 | |||||||||||||||
| Utilities: 2.6% | ||||||||||||||||
| 580,000 | AES Corp., 8.000%, due 10/15/17 | 626,400 | 0.5 | |||||||||||||
| 385,000 | # | Calpine Corp., 7.500%, due 02/15/21 | 400,400 | 0.6 | ||||||||||||
| 290,000 | # | Calpine Corp., 7.875%, due 07/31/20 | 309,575 | |||||||||||||
See Accompanying Notes to Financial Statements
44
Table of Contents
| ING HIGH YIELD BOND FUND | SUMMARY PORTFOLIO OF INVESTMENTS AS OF MARCH 31, 2011 (CONTINUED) |
| Principal Amount | Value | Percent of Net Assets | ||||||||||||||
| CORPORATE BONDS/NOTES: (continued) | ||||||||||||||||
| Utilities: (continued) | ||||||||||||||||
| $ | 730,000 | Energy Future Holdings Corp., 10.000%, due 01/15/20 | $ | 777,213 | 0.6 | |||||||||||
| Other Securities | 1,178,669 | 0.9 | ||||||||||||||
| 3,292,257 | 2.6 | |||||||||||||||
| Total Corporate Bonds/Notes (Cost $108,893,534) | 117,388,491 | 92.9 | ||||||||||||||
| ASSET-BACKED SECURITIES: 0.7% | ||||||||||||||||
| Other Asset-Backed Securities: 0.7% | ||||||||||||||||
| 1,000,000 | # | GSC Partners CDO Fund Ltd., 2.237%, due 12/16/15 | 918,737 | 0.7 | ||||||||||||
| Total Asset-Backed Securities (Cost $900,578) | 918,737 | 0.7 | ||||||||||||||
| Shares | ||||||||||||||||
| COMMON STOCK: 0.0% | ||||||||||||||||
| Consumer Discretionary: 0.0% | ||||||||||||||||
| Other Securities | 2,541 | 0.0 | ||||||||||||||
| Total Common Stock (Cost $136,656) | 2,541 | 0.0 | ||||||||||||||
| Total Long-Term Investments (Cost $109,930,768) | 118,309,769 | 93.6 | ||||||||||||||
| SHORT-TERM INVESTMENTS: 5.7% | ||||||||||||||||
| Mutual Funds: 5.7% | ||||||||||||||||
| 7,240,000 | BlackRock Liquidity Funds, TempFund, Institutional Class | 7,240,000 | 5.7 | |||||||||||||
| Total Short-Term Investments (Cost $ 7,240,000) | 7,240,000 | 5.7 | ||||||||||||||
| Total Investments in Securities (Cost $117,170,768)* | $ | 125,549,769 | 99.3 | |||||||||||||
| Other Assets and Liabilities - Net | 859,293 | 0.7 | ||||||||||||||
| Net Assets | $ | 126,409,062 | 100.0 | |||||||||||||
“Other Securities” represents issues not identified as the top 50 holdings in terms of market value and issues or issuers not exceeding 1% of net assets individually or in aggregate respectively as of March 31, 2011.
The following footnotes apply to either the individual securities noted or one or more of the securities aggregated and listed as a single line item.
| & | Payment-in-kind |
| + | Step-up basis bonds. Interest rates shown reflect current and next coupon rates. |
| # | Securities with purchases pursuant to Rule 144A or section 4(2), under the Securities Act of 1933 and may not be resold subject to that rule except to qualified institutional buyers. |
| Z | Indicates Zero Coupon Bond; rate shown reflects current effective yield. |
| * | Cost for federal income tax purposes is $117,170,829. |
Net unrealized appreciation consists of: | ||||
Gross Unrealized Appreciation | $ | 8,665,574 | ||
Gross Unrealized Depreciation | (286,634 | ) | ||
Net Unrealized Appreciation | $ | 8,378,940 | ||
See Accompanying Notes to Financial Statements
45
Table of Contents
| ING HIGH YIELD BOND FUND | SUMMARY PORTFOLIO OF INVESTMENTS AS OF MARCH 31, 2011 (CONTINUED) |
Fair Value Measurements^
The following is a summary of the fair valuations according to the inputs used as of March 31, 2011 in valuing the Fund’s assets and liabilities:
| Quoted Prices in Active Markets for Identical Investments (Level 1) | Other Observable Inputs (Level 2) | Significant Unobservable Inputs (Level 3) | Fair Value at 3/31/2011 | |||||||||||||||||
Asset Table | ||||||||||||||||||||
Investments, at value | ||||||||||||||||||||
Common Stock* | $ | — | $ | — | $ | 2,541 | $ | 2,541 | ||||||||||||
Corporate Bonds/Notes | — | 117,388,491 | — | 117,388,491 | ||||||||||||||||
Asset-Backed Securities | — | 918,737 | — | 918,737 | ||||||||||||||||
Short-Term Investments | 7,240,000 | — | — | 7,240,000 | ||||||||||||||||
Total Investments, at value | $ | 7,240,000 | $ | 118,307,228 | $ | 2,541 | $ | 125,549,769 | ||||||||||||
| The following is a reconciliation of the fair valuations using significant unobservable inputs (Level 3) for the Fund’s assets and liabilities during the period ended March 31, 2011: |
| Beginning Balance 3/31/2010 | Purchases | Sales | Accrued Discounts/ (Premiums) | Total Realized Gain/ (Loss) | Total Unrealized Appreciation/ (Depreciation) | Transfers Into Level 3 | Transfers Out of Level 3 | Ending Balance 3/31/2011 | ||||||||||||||||||||||||||||||||
Asset Table | ||||||||||||||||||||||||||||||||||||||||
Investments, at value | ||||||||||||||||||||||||||||||||||||||||
Common Stock | $ | 6 | $ | 7,957 | $ | — | $ | — | $ | — | $ | (5,422 | ) | $ | — | $ | — | $ | 2,541 | |||||||||||||||||||||
Total Investments, at value | $ | 6 | $ | 7,957 | $ | — | $ | — | $ | — | $ | (5,422 | ) | $ | — | $ | — | $ | 2,541 | |||||||||||||||||||||
As of March 31, 2011, the net change in unrealized appreciation or depreciation on Level 3 investments still held at period end and included in the change in net assets was $(5,422).
| ^ | See Note 2, “Significant Accounting Policies” in the Notes to Financial Statements for additional information. |
| Transfers in or out of Level 3 represent either the beginning value (for transfers in), or the ending value (for transfers out) of any security or derivative instrument where a change in the pricing level occurred from the beginning to the end of the period. It is the policy of the Portfolio to recognize transfers at the end of the reporting period. |
| There were no significant transfers between Level 1 and 2 during the period ending March 31, 2011. |
| * | For further breakdown of Common Stock by Industry type, please refer to the Summary Portfolio of Investments. |
See Accompanying Notes to Financial Statements
46
Table of Contents
| ING INTERMEDIATE BOND FUND | SUMMARY PORTFOLIO OF INVESTMENTS AS OF MARCH 31, 2011 |
| Principal Amount | Value | Percent of Net Assets | ||||||||||||||
| CORPORATE BONDS/NOTES: 41.0% | ||||||||||||||||
| Consumer Discretionary: 5.8% | ||||||||||||||||
| $ | 456,000 | # | COX Communications, Inc., 6.250%, due 06/01/18 | $ | 509,190 | 0.1 | ||||||||||
| 277,000 | # | COX Communications, Inc., 6.950%, due 06/01/38 | 304,288 | |||||||||||||
| 2,978,000 | DIRECTV Holdings LLC/ DIRECTV Financing Co., Inc., 3.500% - 6.375%, due 03/01/16 - 03/01/41 | 2,996,823 | 0.4 | |||||||||||||
| 2,975,000 | # | Hyatt Hotels Corp., 6.875%, due 08/15/19 | 3,189,331 | 0.4 | ||||||||||||
| 2,207,000 | # | NBC Universal, Inc., 2.875%, due 04/01/16 | 2,158,517 | 0.6 | ||||||||||||
| 517,000 | # | NBC Universal, Inc., 3.650%, due 04/30/15 | 531,274 | |||||||||||||
| 865,000 | # | NBC Universal, Inc., 5.150%, due 04/30/20 | 893,122 | |||||||||||||
| 498,000 | # | NBC Universal, Inc., 6.400%, due 04/30/40 | 513,019 | |||||||||||||
| 979,000 | # | News America, Inc., 4.500%, due 02/15/21 | 961,044 | 0.4 | ||||||||||||
| 1,962,000 | S | News America, Inc., 6.150% - 6.650%, due 03/01/37 - 11/15/37 | 1,999,594 | |||||||||||||
| 290,000 | # | QVC, Inc., 7.375%, due 10/15/20 | 303,775 | 0.2 | ||||||||||||
| 805,000 | # | QVC, Inc., 7.500%, due 10/01/19 | 849,275 | |||||||||||||
| Other Securities | 27,964,389 | 3.7 | ||||||||||||||
| 43,173,641 | 5.8 | |||||||||||||||
| Consumer Staples: 0.9% | ||||||||||||||||
| 1,732,000 | # | JBS Finance II Ltd., 8.250%, due 01/29/18 | 1,788,290 | 0.2 | ||||||||||||
| 1,560,000 | &, # | ServiceMaster Co., 10.750%, due 07/15/15 | 1,665,300 | 0.2 | ||||||||||||
| Other Securities | 3,561,402 | 0.5 | ||||||||||||||
| 7,014,992 | 0.9 | |||||||||||||||
| Energy: 4.7% | ||||||||||||||||
| 2,747,000 | S | Enterprise Products Operating LLC, 5.200% - 6.450%, due 09/01/20 - 09/01/40 | 2,849,696 | 0.4 | ||||||||||||
| 860,000 | # | Gazprom Via Gaz Capital SA, 5.092%, due 11/29/15 | 901,882 | 0.1 | ||||||||||||
| 993,000 | # | KazMunaiGaz Finance Sub BV, 7.000%, due 05/05/20 | 1,074,923 | 0.1 | ||||||||||||
| Principal Amount | Value | Percent of Net Assets | ||||||||||||||
| CORPORATE BONDS/NOTES: (continued) | ||||||||||||||||
| Energy: (continued) | ||||||||||||||||
| $ | 1,442,000 | # | Marathon Petroleum Corp., 6.500%, due 03/01/41 | $ | 1,461,763 | 0.2 | ||||||||||
| 1,238,000 | # | Novatek Finance Ltd., 5.326%, due 02/03/16 | 1,279,331 | 0.3 | ||||||||||||
| 546,000 | # | Novatek Finance Ltd., 6.604%, due 02/03/21 | 576,033 | |||||||||||||
| 834,000 | #, L | Odebrecht Drilling Norbe VIII/IX Ltd., 6.350%, due 06/30/21 | 882,998 | 0.1 | ||||||||||||
| 803,000 | # | Reliance Holdings USA, Inc., 6.250%, due 10/19/40 | 762,159 | 0.1 | ||||||||||||
| 2,764,000 | S | Weatherford International Ltd. Bermuda, 5.125% - 6.750%, due 09/15/20 -09/15/40 | 2,793,379 | 0.4 | ||||||||||||
| Other Securities(a) | 22,686,312 | 3.0 | ||||||||||||||
| 35,268,476 | 4.7 | |||||||||||||||
| Financials: 14.9% | ||||||||||||||||
| 624,000 | #, L | Banco de Credito del Peru, 5.375%, due 09/16/20 | 592,800 | 0.1 | ||||||||||||
| 4,444,000 | S | Bank of America Corp., 5.625% - 8.000%, due 07/01/20 -12/29/49 | 4,646,572 | 0.6 | ||||||||||||
| 1,677,000 | # | Barclays Bank PLC, 5.926%, due 09/29/49 | 1,576,380 | 0.4 | ||||||||||||
| 1,015,000 | # | Barclays Bank PLC, 6.050%, due 12/04/17 | 1,058,947 | |||||||||||||
| 634,000 | S | Barclays Bank PLC, 5.140%, due 10/14/20 | 601,072 | |||||||||||||
| 3,218,000 | BP Capital Markets PLC, 3.200%, due 03/11/16 | 3,207,426 | 0.6 | |||||||||||||
| 1,132,000 | BP Capital Markets PLC, 4.742%, due 03/11/21 | 1,136,340 | ||||||||||||||
| EUR 6,178,000 | Citibank Credit Card Issuance Trust, 5.375%, due 04/11/11 | 8,759,825 | 1.2 | |||||||||||||
See Accompanying Notes to Financial Statements
47
Table of Contents
| ING INTERMEDIATE BOND FUND | SUMMARY PORTFOLIO OF INVESTMENTS AS OF MARCH 31, 2011 (CONTINUED) |
| Principal Amount | Value | Percent of Net Assets | ||||||||||||||
| CORPORATE BONDS/NOTES: (continued) | ||||||||||||||||
| Financials: (continued) | ||||||||||||||||
| $ | 3,513,000 | S | Citigroup, Inc., 5.375% - 8.500%, due 05/22/19 - 08/09/20 | $ | 3,923,191 | 0.5 | ||||||||||
| 1,660,000 | # | Cooperatieve Centrale Raiffeisen-Boerenleenbank BA/Netherlands, 11.000%, due 12/29/49 | 2,168,564 | 0.3 | ||||||||||||
| 1,277,000 | # | Corestates Capital Trust I, 8.000%, due 12/15/26 | 1,306,884 | 0.2 | ||||||||||||
| 1,705,000 | # | Fibria Overseas Finance Ltd., 7.500%, due 05/04/20 | 1,858,450 | 0.2 | ||||||||||||
| 2,970,000 | S | Fifth Third Bancorp., 8.250%, due 03/01/38 | 3,554,962 | 0.5 | ||||||||||||
| 5,837,000 | S | Goldman Sachs Group, Inc., 3.625% - 6.250%, due 02/07/16 - 02/01/41 | 6,053,192 | 0.8 | ||||||||||||
| 2,971,000 | S | Hartford Financial Services Group, Inc., 5.500% - 6.625%, due 01/15/19 - 03/30/40 | 3,070,026 | 0.4 | ||||||||||||
| 2,931,000 | # | HSBC Finance Corp., 6.676%, due 01/15/21 | 3,047,797 | 0.4 | ||||||||||||
| 250,000 | # | Hyundai Capital Services, Inc., 4.375%, due 07/27/16 | 251,624 | 0.0 | ||||||||||||
| 964,000 | # | Iberdrola Finance Ireland Ltd., 3.800%, due 09/11/14 | 979,320 | 0.6 | ||||||||||||
| 3,365,000 | # | Iberdrola Finance Ireland Ltd., 5.000%, due 09/11/19 | 3,279,302 | |||||||||||||
| 1,361,000 | #,L | ILFC E-Capital Trust II, 6.250%, due 12/21/65 | 1,150,045 | 0.2 | ||||||||||||
| 1,037,000 | # | International Lease Finance Corp., 7.125%, due 09/01/18 | 1,119,442 | 0.4 | ||||||||||||
| 2,028,000 | S | International Lease Finance Corp., 6.625% - 8.250%, due 11/15/13 - 12/15/20 | 2,181,053 | |||||||||||||
| 1,827,000 | # | Lloyds TSB Bank PLC, 6.500%, due 09/14/20 | 1,799,257 | 0.2 | ||||||||||||
| 1,700,000 | # | Lukoil International Finance BV, 6.125%, due 11/09/20 | 1,742,500 | 0.2 | ||||||||||||
| 1,622,000 | # | Macquarie Bank Ltd., 6.625%, due 04/07/21 | 1,618,837 | 0.2 | ||||||||||||
| 4,514,000 | S | Morgan Stanley, 3.450% - 5.750%, due 01/26/15 - 01/25/21 | 4,557,063 | 0.6 | ||||||||||||
| Principal Amount | Value | Percent of Net Assets | ||||||||||||||
| CORPORATE BONDS/NOTES: (continued) | ||||||||||||||||
| Financials: (continued) | ||||||||||||||||
| $ | 1,729,000 | # | Pacific Life Insurance Co., 9.250%, due 06/15/39 | $ | 2,299,985 | 0.3 | ||||||||||
| 90,632 | # | Power Receivable Finance, LLC, 6.290%, due 01/01/12 | 90,702 | 0.0 | ||||||||||||
| 2,395,000 | S | Protective Life Corp., 8.450%, due 10/15/39 | 2,679,181 | 0.4 | ||||||||||||
| 1,176,000 | # | Voto-Votorantim Ltd., 6.750%, due 04/05/21 | 1,252,440 | 0.2 | ||||||||||||
| 881,000 | # | Xstrata Finance Canada Ltd., 5.500%, due 11/16/11 | 906,458 | 0.1 | ||||||||||||
| Other Securities(a) | 39,394,480 | 5.3 | ||||||||||||||
| 111,864,117 | 14.9 | |||||||||||||||
| Health Care: 0.3% | ||||||||||||||||
| Other Securities | 2,138,738 | 0.3 | ||||||||||||||
| Industrials: 1.5% | ||||||||||||||||
| 900,000 | # | Bombardier, Inc., 7.500%, due 03/15/18 | 976,500 | 0.2 | ||||||||||||
| 900,000 | # | Bombardier, Inc., 7.750%, due 03/15/20 | 982,125 | |||||||||||||
| 754,000 | # | Kazatomprom, 6.250%, due 05/20/15 | 804,895 | 0.3 | ||||||||||||
| 1,280,000 | Kazatomprom, 6.250%, due 05/20/15 | 1,366,400 | ||||||||||||||
| 2,560,000 | S | RR Donnelley & Sons Co., 7.625% - 8.600%, due 08/15/16 - 06/15/20 | 2,865,936 | 0.4 | ||||||||||||
| Other Securities | 4,254,412 | 0.6 | ||||||||||||||
| 11,250,268 | 1.5 | |||||||||||||||
| Information Technology: 1.1% | ||||||||||||||||
| Other Securities | 8,625,915 | 1.1 | ||||||||||||||
| Materials: 4.7% | ||||||||||||||||
| 1,690,000 | # | ALROSA Finance SA, 7.750%, due 11/03/20 | 1,820,130 | 0.3 | ||||||||||||
| 2,481,000 | S | ArcelorMittal, 9.850%, due 06/01/19 | 3,152,433 | 1.0 | ||||||||||||
| 4,486,000 | S | ArcelorMittal, 5.250% - 6.750%, due 06/01/18 - 03/01/41 | 4,481,544 | |||||||||||||
| 745,000 | # | Cemex SAB de CV, 9.000%, due 01/11/18 | 785,044 | 0.1 | ||||||||||||
| 702,000 | # | Chevron Phillips Chemical Co. LLC, 7.000%, due 06/15/14 | 787,319 | 0.3 | ||||||||||||
| 1,109,000 | # | Chevron Phillips Chemical Co. LLC, 8.250%, due 06/15/19 | 1,326,086 | |||||||||||||
See Accompanying Notes to Financial Statements
48
Table of Contents
| ING INTERMEDIATE BOND FUND | SUMMARY PORTFOLIO OF INVESTMENTS AS OF MARCH 31, 2011 (CONTINUED) |
| Principal Amount | Value | Percent of Net Assets | ||||||||||||||
| CORPORATE BONDS/NOTES: (continued) | ||||||||||||||||
| Materials: (continued) | ||||||||||||||||
| $ | 4,345,000 | Ferrexpo Finance PLC, 7.875%, due 07/17/16 | $ | 4,345,000 | 0.6 | |||||||||||
| 495,000 | # | Georgia-Pacific LLC, 5.400%, due 11/01/20 | 489,702 | 0.1 | ||||||||||||
| 1,191,000 | �� | # | Gerdau Trade, Inc., 5.750%, due 01/30/21 | 1,211,843 | 0.2 | |||||||||||
| 1,865,000 | # | Gold Fields Ltd., 4.875%, due 10/07/20 | 1,793,073 | 0.2 | ||||||||||||
| 657,000 | # | Inversiones CMPC SA, 4.750%, due 01/19/18 | 648,301 | 0.2 | ||||||||||||
| 1,085,000 | # | Inversiones CMPC SA, 6.125%, due 11/05/19 | 1,145,726 | |||||||||||||
| Other Securities | 12,955,853 | 1.7 | ||||||||||||||
| 34,942,054 | 4.7 | |||||||||||||||
| Telecommunication Services: 3.2% | ||||||||||||||||
| 2,929,000 | S | American Tower Corp., 4.500%, due 01/15/18 | 2,880,680 | 0.4 | ||||||||||||
| 1,949,000 | #, S | Intelsat Subsidiary Holding Co., Ltd., 8.875%, due 01/15/15 | 2,012,343 | 0.3 | ||||||||||||
| 1,070,000 | # | Qtel International Finance Ltd., 4.750%, due 02/16/21 | 1,001,625 | 0.1 | ||||||||||||
| 3,441,000 | S | Telefonica Emisiones SAU, 3.992% - 5.462%, due 02/16/16 - 02/16/21 | 3,475,598 | 0.5 | ||||||||||||
| 594,000 | # | Vimpel Communications Via VIP Finance Ireland Ltd. OJSC, 6.493%, due 02/02/16 | 617,760 | 0.2 | ||||||||||||
| 499,000 | # | Vimpel Communications Via VIP Finance Ireland Ltd. OJSC, 7.748%, due 02/02/21 | 526,445 | |||||||||||||
| 378,000 | Vimpel Communications Via VIP Finance Ireland Ltd. OJSC, 9.125%, due 04/30/18 | 432,576 | ||||||||||||||
| Other Securities | 12,764,134 | 1.7 | ||||||||||||||
| 23,711,161 | 3.2 | |||||||||||||||
| Utilities: 3.9% | ||||||||||||||||
| 1,467,000 | # | Allegheny Energy Supply Co. LLC, 5.750%, due 10/15/19 | 1,498,777 | 0.2 | ||||||||||||
| 1,325,000 | # | Calpine Corp., 7.500%, due 02/15/21 | 1,378,000 | 0.2 | ||||||||||||
| Principal Amount | Value | Percent of Net Assets | ||||||||||||||
| CORPORATE BONDS/NOTES: (continued) | ||||||||||||||||
| Utilities: (continued) | ||||||||||||||||
| $ | 1,249,000 | # | Duquesne Light Holdings, Inc., 6.400%, due 09/15/20 | $ | 1,272,940 | 0.2 | ||||||||||
| 1,189,000 | # | EDP Finance BV, 4.900%, due 10/01/19 | 1,039,575 | 0.3 | ||||||||||||
| 991,000 | # | EDP Finance BV, 6.000%, due 02/02/18 | 941,485 | |||||||||||||
| 1,660,000 | # | Enel Finance International S.A., 6.000%, due 10/07/39 | 1,514,428 | 0.3 | ||||||||||||
| 995,000 | # | Enel Finance International S.A., 6.250%, due 09/15/17 | 1,091,092 | |||||||||||||
| 233,722 | # | Juniper Generation, LLC, 6.790%, due 12/31/14 | 220,734 | 0.0 | ||||||||||||
| 2,298,000 | Oncor Electric Delivery Co., 6.800% - 7.500%, due 09/01/18 - 09/01/38 | 2,702,263 | 0.4 | |||||||||||||
| Other Securities | 17,576,390 | 2.3 | ||||||||||||||
| 29,235,684 | 3.9 | |||||||||||||||
| Total Corporate Bonds/Notes (Cost $293,279,303) | 307,225,046 | 41.0 | ||||||||||||||
| U.S. GOVERNMENT AGENCY OBLIGATIONS: 25.8% | ||||||||||||||||
| Federal Home Loan Mortgage Corporation##: 11.2% | ||||||||||||||||
| 14,606,000 | W | 4.000%, due 12/15/40 | 14,300,180 | 11.2 | ||||||||||||
| 5,841,000 | W | 4.500%, due 05/01/38 | 5,916,752 | |||||||||||||
| 2,850,427 | ^ | 4.861%, due 03/15/33 | 2,938,617 | |||||||||||||
| 13,198,976 | 5.000%, due 08/15/16 - 01/01/41 | 13,865,456 | ||||||||||||||
| 35,839,894 | 5.500%, due 08/15/20 - 07/15/37 | 37,984,540 | ||||||||||||||
| 3,460,034 | 6.000%, due 04/01/14 - 07/15/32 | 3,794,123 | ||||||||||||||
| 22,727,812 | ^ | 0.605% - 7.500%, due 05/15/17 - 03/15/38 | 4,846,467 | |||||||||||||
| 83,646,135 | 11.2 | |||||||||||||||
| Federal National Mortgage Association##: 11.0% | ||||||||||||||||
| 12,742,000 | W | 4.000%, due 04/25/39 | 12,534,943 | 11.0 | ||||||||||||
| 13,116,000 | W | 4.500%, due 04/25/39 | 13,351,681 | |||||||||||||
| 12,336,120 | 4.500%, due 09/01/40 - 01/01/41 | 12,575,472 | ||||||||||||||
| 12,943,090 | 5.000%, due 07/01/23 - 02/01/41 | 13,620,203 | ||||||||||||||
| 6,549,530 | 5.500%, due 02/01/18 - 06/01/37 | 6,901,539 | ||||||||||||||
See Accompanying Notes to Financial Statements
49
Table of Contents
| ING INTERMEDIATE BOND FUND | SUMMARY PORTFOLIO OF INVESTMENTS AS OF MARCH 31, 2011 (CONTINUED) |
| Principal Amount | Value | Percent of Net Assets | ||||||||||||||
| U.S. GOVERNMENT AGENCY OBLIGATIONS: (continued) | ||||||||||||||||
| Federal National Mortgage Association##: (continued) | ||||||||||||||||
| $ | 10,518,830 | 6.000%, due 08/01/16 - 12/25/49 | $ | 11,572,181 | ||||||||||||
| 21,770,287 | ^ | 6.501%, due 10/25/35 | 3,235,023 | |||||||||||||
| 28,477,046 | W, ^ | 0.654% - 27.602%, due 11/01/18 - 05/01/37 | 8,867,195 | |||||||||||||
| 82,658,237 | 11.0 | |||||||||||||||
| Government National Mortgage Association: 3.6% | ||||||||||||||||
| 3,623,000 | W | 4.000%, due 10/15/39 | 3,624,130 | 3.6 | ||||||||||||
| 7,452,425 | 4.500%, due 04/15/39 - 12/15/39 | 7,718,305 | ||||||||||||||
| 29,193,817 | ^ | 5.000%, due 04/20/38 - 06/16/39 | 3,241,782 | |||||||||||||
| 58,277,961 | S, ^ | 3.375% - 7.997%, due 12/15/22 - 10/20/60 | 12,526,299 | |||||||||||||
| 27,110,516 | 3.6 | |||||||||||||||
| Total U.S. Government Agency Obligations (Cost $182,445,306) | 193,414,888 | 25.8 | ||||||||||||||
| U.S. TREASURY OBLIGATIONS: 8.9% | ||||||||||||||||
| U.S. Treasury Notes: 7.9% | ||||||||||||||||
| 13,342,000 | S, L | 1.250%, due 03/15/14 | 13,339,945 | 5.3 | ||||||||||||
| 4,712,000 | 2.750%, due 02/28/18 | 4,677,028 | ||||||||||||||
| 18,238,000 | S, L | 3.625%, due 02/15/21 | 18,500,171 | |||||||||||||
| 3,133,000 | S | 0.625% - 2.125%, due 02/28/13 - 02/29/16 | 3,128,214 | |||||||||||||
| 20,257,000 | S | 4.250%, due 11/15/40 | 19,377,097 | 2.6 | ||||||||||||
| 59,022,455 | 7.9 | |||||||||||||||
| Treasury Inflation Indexed Protected Securitiesip: 1.0% | ||||||||||||||||
| 7,393,000 | 0.500%, due 04/15/15 | 7,807,410 | 1.0 | |||||||||||||
| Total U.S. Treasury Obligations (Cost $66,676,148) | 66,829,865 | 8.9 | ||||||||||||||
| Principal Amount | Value | Percent of Net Assets | ||||||||||||||
| ASSET-BACKED SECURITIES: 9.5% | ||||||||||||||||
| Automobile Asset-Backed Securities: 1.0% | ||||||||||||||||
| $1,710,000 | # | Chrysler Financial Auto Securitization Trust, 5.570%, due 08/08/14 | $ | 1,770,637 | 1.0 | |||||||||||
| 2,038,000 | # | Chrysler Financial Auto Securitization Trust, 6.250%, due 05/08/14 | 2,118,135 | |||||||||||||
| 3,394,000 | # | Chrysler Financial Auto Securitization Trust, 6.540%, due 11/10/14 | 3,543,098 | |||||||||||||
| 7,431,870 | 1.0 | |||||||||||||||
| Credit Card Asset-Backed Securities: 4.7% | ||||||||||||||||
| 5,442,000 | Capital One Multi-Asset Execution Trust, 0.545%, due 03/17/14 | 5,437,287 | 2.0 | |||||||||||||
| 3,400,000 | Capital One Multi-Asset Execution Trust, 5.050%, due 12/17/18 | 3,752,198 | ||||||||||||||
| 2,400,000 | Capital One Multi-Asset Execution Trust, 5.750%, due 07/15/20 | 2,717,961 | ||||||||||||||
| 2,948,000 | Capital One Multi-Asset Execution Trust, 0.555% - 5.050%, due 11/17/14 - 02/15/16 | 2,963,789 | ||||||||||||||
| EUR 8,539,000 | MBNA Credit Card Master Note Trust, 5.600%, due 07/17/14 | 12,380,364 | 2.2 | |||||||||||||
| 3,380,000 | MBNA Credit Card Master Note Trust, 6.800%, due 07/15/14 | 3,538,900 | ||||||||||||||
| 571,000 | MBNA Credit Card Master Note Trust, 0.675% - 1.605%, due 10/15/14 - 07/15/15 | 568,730 | ||||||||||||||
| 1,021,000 | # | MBNA Master Credit Card Trust, 7.100%, due 09/15/13 | 1,023,293 | 0.1 | ||||||||||||
| Other Securities | 3,110,333 | 0.4 | ||||||||||||||
| 35,492,855 | 4.7 | |||||||||||||||
See Accompanying Notes to Financial Statements
50
Table of Contents
| ING INTERMEDIATE BOND FUND | SUMMARY PORTFOLIO OF INVESTMENTS AS OF MARCH 31, 2011 (CONTINUED) |
| Principal Amount | Value | Percent of Net Assets | ||||||||||||||
| ASSET-BACKED SECURITIES: (continued) | ||||||||||||||||
| Home Equity Asset-Backed Securities: 0.1% | ||||||||||||||||
| Other Securities | $ | 374,456 | 0.1 | |||||||||||||
| Other Asset-Backed Securities: 3.7% | ||||||||||||||||
| $ | 1,458,243 | # | ARES CLO Funds, 0.549%, due 09/18/17 | 1,410,754 | 0.2 | |||||||||||
| 1,877,372 | # | Atrium CDO Corp., 0.641%, due 10/27/16 | 1,816,358 | 0.6 | ||||||||||||
| 2,603,130 | # | Atrium CDO Corp., 0.649%, due 06/27/15 | 2,551,067 | |||||||||||||
| 1,036,481 | # | Callidus Debt Partners Fund Ltd., 0.813%, due 05/15/15 | 1,013,160 | 0.1 | ||||||||||||
| 1,163,907 | # | Carlyle High Yield Partners, 0.682%, due 08/11/16 | 1,103,841 | 0.1 | ||||||||||||
| 1,575,000 | # | Credit-Based Asset Servicing and Securitization, LLC, 5.746%, due 12/25/37 | 1,562,869 | 0.6 | ||||||||||||
| 1,188,000 | # | Credit-Based Asset Servicing and Securitization, LLC, 6.020%, due 12/25/37 | 1,028,424 | |||||||||||||
| 2,248,160 | Credit-Based Asset Servicing and Securitization, LLC, 4.831% - 5.501%, due 08/25/35 -12/25/36 | 1,952,693 | ||||||||||||||
| 1,929,412 | # | Endurance CLO I Ltd., 0.763%, due 02/15/14 | 1,894,648 | 0.3 | ||||||||||||
| 2,378,589 | # | First CLO Ltd., 0.654%, due 07/27/16 | 2,336,963 | 0.3 | ||||||||||||
| 639,182 | # | Granite Ventures Ltd., 0.563%, due 12/15/17 | 623,777 | 0.1 | ||||||||||||
| 2,585,429 | # | GSC Partners CDO Fund Ltd., 0.693%, due 11/20/16 | 2,525,256 | 0.3 | ||||||||||||
| 443,911 | # | Katonah Ltd., 0.859%, due 02/20/15 | 435,227 | 0.1 | ||||||||||||
| 1,412,460 | # | Magnetite IV CLO Ltd., 0.998%, due 10/10/15 | 1,369,040 | 0.2 | ||||||||||||
| 2,465,859 | # | Stanfield Carrera CLO Ltd., 0.790%, due 03/15/15 | 2,435,036 | 0.3 | ||||||||||||
| 1,917,571 | # | Wind River CLO Ltd., 0.639%, due 12/19/16 | 1,842,249 | 0.2 | ||||||||||||
| Other Securities | 2,098,327 | 0.3 | ||||||||||||||
| 27,999,689 | 3.7 | |||||||||||||||
| Total Asset-Backed Securities (Cost $71,852,802) | 71,298,870 | 9.5 | ||||||||||||||
| Principal Amount | Value | Percent of Net Assets | ||||||||||||||
| COLLATERALIZED MORTGAGE OBLIGATIONS: 14.1% | ||||||||||||||||
| $ | 2,753,000 | # | American General Mortgage Loan Trust, 5.750%, due 09/25/48 | $ | 2,811,753 | 0.4 | ||||||||||
| 5,220,000 | Banc of America Commercial Mortgage, Inc., 4.857% - 5.658%, due 07/10/43-06/10/49 | 5,333,123 | 0.7 | |||||||||||||
| 3,037,579 | # | Banc of America Funding Corp., 5.250%, due 08/26/35 | 3,107,068 | 0.4 | ||||||||||||
| 860,000 | # | Banc of America Large Loan, Inc., 5.340%, due 10/10/45 | 839,846 | 0.2 | ||||||||||||
| 970,000 | # | Banc of America Large Loan, Inc., 5.428%, due 10/10/45 | 942,952 | |||||||||||||
| 720,000 | # | Bear Stearns Commercial Mortgage Securities, 6.500%, due 02/15/32 | 699,481 | 0.2 | ||||||||||||
| 960,000 | Bear Stearns Commercial Mortgage Securities, 8.050%, due 10/15/32 | 976,417 | ||||||||||||||
| 3,281,000 | Citibank Credit Card Issuance Trust, 0.905%, due 07/15/13 | 3,277,427 | 1.7 | |||||||||||||
| 4,811,000 | Citibank Credit Card Issuance Trust, 6.300%, due 06/20/14 | 5,084,851 | ||||||||||||||
| 4,378,000 | Citibank Credit Card Issuance Trust, 6.950%, due 02/18/14 | 4,586,096 | ||||||||||||||
| 100,000 | Citibank Credit Card Issuance Trust, 4.850%, due 04/22/15 | 107,342 | ||||||||||||||
| 3,542,083 | # | Citigroup Mortgage Loan Trust, Inc., 18.975%, due 10/25/35 | 3,589,874 | 0.5 | ||||||||||||
| 65,554,862 | #, ^ | Credit Suisse First Boston Mortgage Securities Corp., 0.139%, due 02/15/38 | 616,399 | 0.1 | ||||||||||||
| 132,339,580 | #, ^ | Credit Suisse Mortgage Capital Certificates, 0.124%, due 09/15/40 | 840,145 | 0.1 | ||||||||||||
| 1,470,000 | # | DBUBS Mortgage Trust, 5.557%, due 11/10/46 | 1,397,006 | 0.2 | ||||||||||||
| 76,680,670 | #, ^ | Greenwich Capital Commercial Funding Corp., 0.088%, due 12/10/49 | 595,042 | 1.2 | ||||||||||||
See Accompanying Notes to Financial Statements
51
Table of Contents
| ING INTERMEDIATE BOND FUND | SUMMARY PORTFOLIO OF INVESTMENTS AS OF MARCH 31, 2011 (CONTINUED) |
| Principal Amount | Value | Percent of Net Assets | ||||||||||||||
| COLLATERALIZED MORTGAGE OBLIGATIONS: (continued) | ||||||||||||||||
| $ | 95,567,235 | #, ^ | Greenwich Capital Commercial Funding Corp., 0.309%, due 03/10/39 | $ | 1,231,986 | |||||||||||
| 2,790,000 | Greenwich Capital Commercial Funding Corp., 5.700%, due 12/10/49 | 2,949,386 | ||||||||||||||
| 3,840,000 | Greenwich Capital Commercial Funding Corp., 5.736% - 5.867%, due 12/10/49 | 3,889,659 | ||||||||||||||
| 1,630,000 | # | GS Mortgage Securities Corp. II, 5.865%, due 07/12/38 | 1,716,814 | 0.2 | ||||||||||||
| 1,820,000 | # | JPMorgan Chase Commercial Mortgage Securities Corp., 5.717%, due 03/12/39 | 1,872,634 | 1.1 | ||||||||||||
| 262,087,753 | ^ | JPMorgan Chase Commercial Mortgage Securities Corp., 0.152% - 5.987%, due 01/15/42 - 02/15/51 | 6,217,308 | |||||||||||||
| 4,370,000 | LB Commercial Conduit Mortgage Trust, 5.928% - 5.928%, due 07/15/44 | 4,471,022 | 0.6 | |||||||||||||
| 42,226,366 | #, ^ | LB-UBS Commercial Mortgage Trust, 0.247%, due 09/15/39 | 731,888 | 1.6 | ||||||||||||
| 61,085,417 | #, ^ | LB-UBS Commercial Mortgage Trust, 0.713%, due 11/15/38 | 1,562,846 | |||||||||||||
| 30,431,041 | ^ | LB-UBS Commercial Mortgage Trust, 0.175% - 5.896%, due 06/15/38 - 11/15/40 | 9,958,081 | |||||||||||||
| 52,182,695 | #, ^ | Merrill Lynch Mortgage Trust, 0.553%, due 02/12/51 | 1,099,714 | 0.2 | ||||||||||||
| 1,120,000 | # | Morgan Stanley Capital I, 5.238%, due 09/15/47 | 1,095,799 | 0.2 | ||||||||||||
| 650,000 | Morgan Stanley Capital I, 5.242%, due 01/14/42 | 668,241 | ||||||||||||||
| 280,000 | # | Morgan Stanley Dean Witter Capital I, 6.500%, due 11/15/36 | 124,023 | 0.2 | ||||||||||||
| 1,220,000 | # | Morgan Stanley Dean Witter Capital I, 7.280%, due 12/15/35 | 1,282,804 | |||||||||||||
| Principal Amount | Value | Percent of Net Assets | ||||||||||||||
| �� | ||||||||||||||||
| COLLATERALIZED MORTGAGE OBLIGATIONS: (continued) | ||||||||||||||||
| $ | 16,432,066 | #, ^ | RBSCF Trust, 1.000%, due 04/15/24 | $ | 562,285 | 0.3 | ||||||||||
| 1,980,000 | # | RBSCF Trust, 5.420%, due 01/19/49 | 2,033,480 | |||||||||||||
| 2,100,000 | # | Vornado DP LLC, 5.280%, due 09/13/28 | 2,066,398 | 0.5 | ||||||||||||
| 1,590,000 | # | Vornado DP LLC, 6.356%, due 09/13/28 | 1,599,118 | |||||||||||||
| 1,280,000 | # | Wachovia Bank Commercial Mortgage Trust, 5.125%, due 08/15/35 | 1,308,406 | 0.9 | ||||||||||||
| 2,610,000 | Wachovia Bank Commercial Mortgage Trust, 5.342%, due 12/15/43 | 2,706,520 | ||||||||||||||
| 2,690,000 | Wachovia Bank Commercial Mortgage Trust, 5.368% - 5.383%, due 12/15/43 - 11/15/48 | 2,498,466 | ||||||||||||||
| 3,779,686 | Washington Mutual Mortgage Pass-through Certificates, 2.582% - 6.000%, due 06/25/34 - 01/25/36 | 3,753,348 | 0.5 | |||||||||||||
| 2,889,885 | Wells Fargo Mortgage-Backed Securities Trust, 2.819%, due 06/25/35 | 2,790,233 | 0.4 | |||||||||||||
| 49,362 | Wells Fargo Mortgage-Backed Securities Trust, 4.854%, due 08/25/34 | 50,444 | ||||||||||||||
| Other Securities(d) | 12,476,464 | 1.7 | ||||||||||||||
| 14.1 | ||||||||||||||||
| Total Collateralized Mortgage Obligations (Cost $104,113,066) | 105,522,189 | 14.1 | ||||||||||||||
| MUNICIPAL BONDS: 0.1% | ||||||||||||||||
| Louisiana: 0.1% | ||||||||||||||||
| Other Securities | 1,101,177 | 0.1 | ||||||||||||||
| Total Municipal Bonds (Cost $1,106,122) | 1,101,177 | 0.1 | ||||||||||||||
See Accompanying Notes to Financial Statements
52
Table of Contents
| ING INTERMEDIATE BOND FUND | SUMMARY PORTFOLIO OF INVESTMENTS AS OF MARCH 31, 2011 (CONTINUED) |
| Principal Amount | Value | Percent of Net Assets | ||||||||||||
| OTHER BONDS: 6.3% | ||||||||||||||
| Foreign Government Bonds: 6.3% | ||||||||||||||
| BRL 39,274,000 | Brazil Notas do Tesouro Nacional Series F, 10.000%, due 01/01/14 | $ | 23,104,348 | 3.1 | ||||||||||
| $ 1,713,000 | # | Eskom Holdings Ltd., 5.750%, due 01/26/21 | 1,745,119 | 0.2 | ||||||||||
| MXN 121,468,157 | Mexican Udibonos, 4.000%, due 06/13/19 | 10,716,999 | 1.4 | |||||||||||
| ZAR 38,866,798 | South Africa Government International Bond, 2.750%, due 01/31/22 | 5,799,857 | 1.6 | |||||||||||
| ZAR 44,810,752 | South Africa Government International Bond, 7.250%, due 01/15/20 | 6,068,648 | ||||||||||||
| 6.3 | ||||||||||||||
| Total Other Bonds (Cost $ 45,808,017) | 47,434,971 | 6.3 | ||||||||||||
| Shares | ||||||||||||||
| PREFERRED STOCK:0.3% | ||||||||||||||
| Financials: 0.3% | ||||||||||||||
| Other Securities | 1,876,671 | 0.3 | ||||||||||||
| Total Preferred Stock (Cost $1,781,875) | 1,876,671 | 0.3 | ||||||||||||
| # of Contracts | ||||||||||||||
| POSITIONS IN PURCHASED OPTIONS: 0.1% | ||||||||||||||
| Options on Exchange-Traded Futures Contracts: 0.1% | ||||||||||||||
| 242 | @ | Put Option CBOT | ||||||||||||
| U.S. Treasury 10 -Year Note May Futures | ||||||||||||||
| Strike @ $121.000 - Exp 04/21/11 | 518,032 | 0.1 | ||||||||||||
| # of Contracts | Value | Percent of Net Assets | ||||||||||||
| POSITIONS IN PURCHASED OPTIONS: (continued) | ||||||||||||||
| Options on Exchange-Traded Futures Contracts: (continued) | ||||||||||||||
| Total Positions in Purchased Options (Cost $ 342,935) | $ | 518,032 | 0.1 | |||||||||||
| Total Long-Term Investments (Cost $ 767,405,574) | 795,221,709 | 106.1 | ||||||||||||
| Shares | ||||||||||||||
| SHORT-TERM INVESTMENTS: 2.4% | ||||||||||||||
| Mutual Funds: 0.2% | ||||||||||||||
| 1,599,000 | BlackRock Liquidity Funds, TempFund, Institutional Class | $ | 1,599,000 | 0.2 | ||||||||||
| Total Mutual Funds (Cost $ 1,599,000) | 1,599,000 | 0.2 | ||||||||||||
| Securities Lending Collateralcc: 2.2% | ||||||||||||||
| 13,765,144 | BNY Mellon Overnight Government Fund(1) | 13,765,144 | 1.8 | |||||||||||
| 3,329,856 | R | BNY Institutional Cash Reserves Fund, Series B(1)(2) | 2,663,885 | 0.4 | ||||||||||
| 2.2 | ||||||||||||||
| Total Securities Lending Collateral (Cost $ 17,095,000) | 16,429,029 | 2.2 | ||||||||||||
| Total Short-Term Investments (Cost $ 18,694,000) | 18,028,029 | 2.4 | ||||||||||||
| Total Investments in Securities (Cost $ 786,099,574)* | $ | 813,249,738 | 108.5 | |||||||||||
| Other Assets and Liabilities - Net | (63,732,589 | ) | (8.5 | ) | ||||||||||
| Net Assets | $ | 749,517,149 | 100.0 | |||||||||||
“Other Securities” represents issues not identified as the top 50 holdings in terms of market value and issues or issuers not exceeding 1% of net assets individually or in aggregate respectively as of March 31, 2011.
See Accompanying Notes to Financial Statements
53
Table of Contents
| ING INTERMEDIATE BOND FUND | SUMMARY PORTFOLIO OF INVESTMENTS AS OF MARCH 31, 2011 (CONTINUED) |
The following footnotes apply to either the individual securities noted or one or more of the securities aggregated and listed as a single line item.
| @ | Non-income producing security |
| & | Payment-in-kind |
| # | Securities with purchases pursuant to Rule 144A or section 4(2), under the Securities Act of 1933 and may not be resold subject to that rule except to qualified institutional buyers. |
| cc | Securities purchased with cash collateral for securities loaned. |
| (1) | Collateral received from brokers for securities lending was invested in these short-term investments. |
| (2) | On September 12, 2008, BNY established a separate sleeve of the Institutional Cash Reserves Fund (Series B) to hold certain Lehman Brothers defaulted debt obligations. The Fund’s position in Series B is being fair valued daily. Please see the accompanying Notes to Financial Statements for additional details on securities lending. |
| ## | On September 7, 2008, the Federal Housing Finance Agency placed the Federal National Mortgage Association and the Federal Home Loan Mortgage Corporation into conservatorship and the U.S. Treasury guaranteed the debt issued by those organizations. |
| W | Settlement is on a when-issued or delayed-delivery basis. |
| S | All or a portion of this security has been identified by the Fund to cover future collateral requirements for applicable futures, options, swaps, foreign currency contracts and/or when-issued or delayed-delivery securities. |
| R | Restricted security |
| L | Loaned security, a portion or all of the security is on loan at March 31, 2011. |
| ^ | Interest only securities represent the right to receive the monthly interest payments on an underlying pool of mortgage loans. Principal amount shown represents the notional amount on which current interest is calculated. Payments of principal on the pool reduce the value of the interest only security. |
| BRL | Brazilian Real |
| EUR | EU Euro |
| MXN | Mexican Peso |
| ZAR | South African Rand |
| (a) | The grouping contains securities in default. |
| (d) | The grouping contains Interest only securities. |
| * | Cost for federal income tax purposes is $786,600,414. |
Net unrealized appreciation consists of: | ||||
Gross Unrealized Appreciation | $ | 38,267,548 | ||
Gross Unrealized Depreciation | (11,618,224 | ) | ||
Net Unrealized Appreciation | $ | 26,649,324 | ||
See Accompanying Notes to Financial Statements
54
Table of Contents
| ING INTERMEDIATE BOND FUND | SUMMARY PORTFOLIO OF INVESTMENTS AS OF MARCH 31, 2011 (CONTINUED) |
Fair Value Measurements^
The following is a summary of the fair valuations according to the inputs used as of March 31, 2011 in valuing the Fund’s assets and liabilities:
| Quoted Prices in Active Markets for Identical Investments (Level 1) | Other Observable Inputs (Level 2) | Significant Unobservable Inputs (Level 3) | Fair Value at 3/31/2011 | |||||||||||||
Asset Table | ||||||||||||||||
Investments, at value | ||||||||||||||||
Preferred Stock | $ | — | $ | 1,876,671 | $ | — | $ | 1,876,671 | ||||||||
Positions In Purchased Options | 518,032 | — | — | 518,032 | ||||||||||||
Corporate Bonds/Notes | — | 307,225,046 | — | 307,225,046 | ||||||||||||
U.S. Government Agency Obligations | — | 192,148,301 | 1,266,587 | 193,414,888 | ||||||||||||
U.S. Treasury Obligations | — | 66,829,865 | — | 66,829,865 | ||||||||||||
Asset-Backed Securities | — | 61,146,286 | 10,152,584 | 71,298,870 | ||||||||||||
Collateralized Mortgage Obligations | — | 104,959,904 | 562,285 | 105,522,189 | ||||||||||||
Municipal Bonds | — | 1,101,177 | — | 1,101,177 | ||||||||||||
Other Bonds | — | 47,434,971 | — | 47,434,971 | ||||||||||||
Short-Term Investments | 15,364,144 | — | 2,663,885 | 18,028,029 | ||||||||||||
Total Investments, at value | $ | 15,882,176 | $ | 782,722,221 | $ | 14,645,341 | $ | 813,249,738 | ||||||||
Other Financial Instruments+: | ||||||||||||||||
Forward foreign currency contracts | — | 277,096 | — | 277,096 | ||||||||||||
Futures | 254,657 | — | — | 254,657 | ||||||||||||
Swaps, at fair value | — | 561,815 | — | 561,815 | ||||||||||||
Total Assets | $ | 16,136,833 | $ | 783,561,132 | $ | 14,645,341 | $ | 814,343,306 | ||||||||
Liabilities Table | ||||||||||||||||
Other Financial Instruments+: | ||||||||||||||||
Forward foreign currency contracts | $ | — | $ | (1,149,142 | ) | $ | — | $ | (1,149,142 | ) | ||||||
Futures | (162,291 | ) | — | — | (162,291 | ) | ||||||||||
Swaps, at fair value | — | (1,594,716 | ) | — | (1,594,716 | ) | ||||||||||
Written options | (185,282 | ) | — | — | (185,282 | ) | ||||||||||
Total Liabilities | $ | (347,573 | ) | $ | (2,743,858 | ) | $ | — | $ | (3,091,431 | ) | |||||
The following is a reconciliation of the fair valuations using significant unobservable inputs (Level 3) for the Fund’s assets and liabilities during the period ended March 31, 2011:
| Beginning Balance 3/31/2010 | Purchases | Sales | Accrued Discounts/ (Premiums) | Total Realized Gain/(Loss) | Total Unrealized Appreciation/ (Depreciation) | Transfers Into Level 3 | Transfers Out of Level 3 | Ending Balance 3/31/2011 | ||||||||||||||||||||||||||||
Asset Table | ||||||||||||||||||||||||||||||||||||
Investments, at value | ||||||||||||||||||||||||||||||||||||
Corporate Bonds/Notes | $ | 512,000 | $ | — | $ | — | $ | — | $ | — | $ | — | $ | — | $ | (512,000 | ) | $ | — | |||||||||||||||||
U.S. Government Agency Obligations | — | 1,317,132 | — | 1,287 | — | (51,832 | ) | — | — | 1,266,587 | ||||||||||||||||||||||||||
Asset-Backed Securities | 13,857 | 5,776,476 | (818,332 | ) | 2,338 | 1,573 | 10,191 | 5,166,481 | — | 10,152,584 | ||||||||||||||||||||||||||
Collateralized Mortgage Obligations | 15,747,247 | — | (4,625,051 | ) | (40,263 | ) | (2,011,269 | ) | 2,677,272 | — | (11,185,651 | ) | 562,285 | |||||||||||||||||||||||
Other Bonds | 4,614,962 | — | (4,628,742 | ) | — | 113,742 | (99,962 | ) | — | — | — | |||||||||||||||||||||||||
Short-Term Investments | 2,663,885 | — | — | — | — | — | — | — | 2,663,885 | |||||||||||||||||||||||||||
Total Investments, at value | $ | 23,551,951 | $ | 7,093,608 | $ | (10,072,125 | ) | $ | (36,638 | ) | $ | (1,895,954 | ) | $ | 2,535,669 | $ | 5,166,481 | $ | (11,697,651 | ) | $ | 14,645,341 | ||||||||||||||
As of March 31, 2011, the net change in unrealized appreciation or depreciation on Level 3 investments still held at period end and included in the change in net assets was $(70,639).
| ^ | See Note 2, “Significant Accounting Policies” in the Notes to Financial Statements for additional information. |
| + | Other Financial Instruments are derivatives not reflected in the Summary Portfolio of Investments and may include open forward foreign currency contracts, futures, swaps, and written options. |
See Accompanying Notes to Financial Statements
55
Table of Contents
| ING INTERMEDIATE BOND FUND | SUMMARY PORTFOLIO OF INVESTMENTS AS OF MARCH 31, 2011 (CONTINUED) |
| Forward foreign currency contracts and futures are reported at their unrealized gain/loss at measurement date which represents the amount due to/from the Fund. Swaps and written options are reported at their market value at measurement date. |
| Transfers in or out of Level 3 represent either the beginning value (for transfers in), or the ending value (for transfers out) of any security or derivative instrument where a change in the pricing level occurred from the beginning to the end of the period. It is the policy of the Portfolio to recognize transfers at the end of the reporting period. |
| There were no significant transfers between Level 1 and 2 during the period ending March 31, 2011. |
At March 31, 2011 the following forward foreign currency contracts were outstanding for the ING Intermediate Bond Fund:
Counterparty | Currency | Contract Amount | Buy/Sell | Settlement | In Exchange For | Fair Value | Unrealized | |||||||||||||||||
| Citigroup, Inc. | Mexican Peso MXN | 140,165,126 | SELL | 4/8/11 | $11,657,344 | $ | 11,775,252 | $ | (117,908 | ) | ||||||||||||||
| Citigroup, Inc. | South African Rand ZAR | 85,451,461 | SELL | 4/8/11 | 12,364,559 | 12,617,078 | (252,519 | ) | ||||||||||||||||
| Deutsche Bank AG | Japanese Yen JPY | 611,632,704 | SELL | 4/8/11 | 7,552,000 | 7,353,452 | 198,548 | |||||||||||||||||
| Morgan Stanley | EU Euro EUR | 15,805,832 | SELL | 4/8/11 | 22,133,144 | 22,396,621 | (263,477 | ) | ||||||||||||||||
| Morgan Stanley | Brazilian Real BRL | 36,160,661 | SELL | 5/9/11 | 21,538,305 | 21,973,800 | (435,495 | ) | ||||||||||||||||
| Morgan Stanley | EU Euro EUR | 13,414,199 | SELL | 4/8/11 | 18,927,971 | 19,007,714 | (79,743 | ) | ||||||||||||||||
| Morgan Stanley | Japanese Yen JPY | 307,623,431 | SELL | 4/8/11 | 3,777,000 | 3,698,452 | 78,548 | |||||||||||||||||
| $ | (872,046 | ) | ||||||||||||||||||||||
ING Intermediate Bond Fund Open Futures Contracts on March 31, 2011:
| Contract Description | Number of Contracts | Expiration Date | Notional Value | Unrealized Appreciation/ (Depreciation) | ||||||||||||
Long Contracts | ||||||||||||||||
U.S. Treasury 2-Year Note | 4 | 06/30/11 | $ | 872,500 | $ | 177 | ||||||||||
U.S. Treasury 5-Year Note | 710 | 06/30/11 | 82,920,233 | 37,051 | ||||||||||||
U.S. Treasury Ultra Long Bond | 391 | 06/21/11 | 48,312,937 | 217,429 | ||||||||||||
| $ | 132,105,670 | $ | 254,657 | |||||||||||||
Short Contracts | ||||||||||||||||
U.S. Treasury 10-Year Note | 1,002 | 06/21/11 | $ | 119,269,313 | $ | (130,240 | ) | |||||||||
U.S. Treasury Long Bond | 333 | 06/21/11 | 40,022,437 | (32,051 | ) | |||||||||||
| $ | 159,291,750 | $ | (162,291 | ) | ||||||||||||
ING Intermediate Bond Fund Credit Default Swap Agreements Outstanding on March 31, 2011:
Credit Default Swaps on Corporate and Sovereign Issues - Buy Protection (1)
Counterparty | Reference Entity/ | Buy/Sell | (Pay)/ | Termination | Notional | Fair | Upfront | Unrealized | ||||||||||||||||||||
Citigroup, Inc. | MBIA Inc. | Buy | (5.000) | 09/20/13 | USD | 640,000 | $ | 42,805 | $ | 107,022 | $ | (64,217 | ) | |||||||||||||||
Citigroup, Inc. | MBIA Inc. | Buy | (5.000) | 09/20/13 | USD | 1,311,000 | 87,683 | 210,404 | (122,721 | ) | ||||||||||||||||||
JPMorgan Chase & Co. | MBIA Inc. | Buy | (5.000) | 09/20/13 | USD | 5,079,000 | 339,698 | 443,601 | (103,903 | ) | ||||||||||||||||||
| $ | 470,186 | $ | 761,027 | $ | (290,841 | ) | ||||||||||||||||||||||
See Accompanying Notes to Financial Statements
56
Table of Contents
| ING INTERMEDIATE BOND FUND | SUMMARY PORTFOLIO OF INVESTMENTS AS OF MARCH 31, 2011 (CONTINUED) |
Credit Default Swaps on Corporate and Sovereign Issues - Sell Protection (2)
Counterparty | Reference Entity/ Obligation | Buy/Sell | (Pay)/ | Termination Date | Implied | Notional | Fair | Upfront | Unrealized | |||||||||||||||||||||||||
Citigroup, Inc. | MBIA Global Funding LLC | Sell | 5.000 | 09/20/13 | 19.055 | USD | 1,311,000 | $ | (343,979 | ) | $ | (266,099 | ) | $ | (77,880 | ) | ||||||||||||||||||
Citigroup, Inc. | MBIA Global Funding LLC | Sell | 5.000 | 09/20/13 | 19.055 | USD | 641,000 | (168,185 | ) | (119,267 | ) | (48,918 | ) | |||||||||||||||||||||
Goldman Sachs & Co. | MBIA Global Funding LLC | Sell | 5.000 | 09/20/13 | 19.055 | USD | 1,271,000 | (333,485 | ) | (233,494 | ) | (99,991 | ) | |||||||||||||||||||||
JPMorgan Chase & Co. | MBIA Global Funding LLC | Sell | 5.000 | 09/20/13 | 19.055 | USD | 2,540,000 | (666,445 | ) | (234,169 | ) | (432,276 | ) | |||||||||||||||||||||
| $ | (1,512,094 | ) | $ | (853,029 | ) | $ | (659,065 | ) | ||||||||||||||||||||||||||
| (1) | If a Fund is a buyer of protection and a credit event occurs, as defined under the terms of that particular swap agreement, a Fund will either 1.) receive from the seller of protection an amount equal to the notional amount of the swap and deliver the referenced obligation, other deliverable obligations or underlying securities comprising the referenced index or 2.) receive a net settlement amount in the form of cash or securities equal to the notional amount of the swap less the recovery value of the referenced obligation or underlying securities comprising the referenced index. |
| (2) | If the Fund is a seller of protection, and a credit event occurs, as defined under the terms of that particular swap agreement, the Fund will generally either 1.) Pay to the buyer an amount equal to the notional amount of the swap and take delivery of the referenced obligation, other deliverable obligations, or underlying securities comprising a referenced index or 2.) Pay a net settlement amount in the form of cash or securities equal to the notional amount of the swap less the recovery value of the referenced obligation or underlying securities comprising a referenced index. |
| (3) | Implied credit spreads, represented in absolute terms, utilized in determining the fair value of credit default swap agreements on corporate issues or sovereign issues are disclosed in each Fund’s Portfolio of Investments and serve as an indicator of the current status of the payment/performance risk and represent the likelihood or risk of default for the credit derivative. The implied credit spread of a particular referenced entity reflects the cost of buying/selling protection and may include upfront payments required to be made to enter into the agreement. For credit default swaps on asset-backed securities or credit indices, the quoted market prices and resulting fair values serve as the indicator of the current status of the payment/performance risk. Wider credit spreads and increasing fair values, in absolute terms when compared to the notional amount of the swap, represent a deterioration of the referenced entity’s credit soundness and a greater likelihood or risk of default or other credit event occurring as defined under the terms of the agreement. |
| (4) | The maximum amount of future payments (undiscounted) that a Fund as seller of protection could be required to make or receive as a buyer of credit protection under a credit default swap agreement would be an amount equal to the notional amount of the agreement. |
| (5) | The fair values for credit default swap agreements serve as an indicator of the current status of the payment/performance risk and represent the likelihood or risk of default for the credit derivative. Increasing fair values, in absolute terms, when compared to the notional amount of the agreement, represent a deterioration of the referenced obligation’s credit soundness and a greater likelihood or risk of default or other credit event occurring. |
ING Intermediate Bond Fund Interest Rate Swap Agreement Outstanding on March 31, 2011:
Termination Date | Notional Amount | Fair Value | Upfront Payments Paid/(Received) | Unrealized Appreciation/ (Depreciation) | ||||||||||||||||||||
Receive a fixed rate equal to 1.430% and pay a floating rate based on 6-month GBP-LIBOR-BBA Counterparty: Citigroup, Inc. | 05/17/12 | GBP | 47,099,000 | $ | 91,629 | $ | — | $ | 91,629 | |||||||||||||||
Pay a fixed rate equal to 3.478% and receive a floating rate based on the 3-month USD-LIBOR-BBA Counterparty: Citigroup, Inc. | 05/11/20 | USD | 19,944,000 | (82,622 | ) | — | (82,622 | ) | ||||||||||||||||
| $ | 9,007 | $ | — | $ | 9,007 | |||||||||||||||||||
See Accompanying Notes to Financial Statements
57
Table of Contents
| ING INTERMEDIATE BOND FUND | SUMMARY PORTFOLIO OF INVESTMENTS AS OF MARCH 31, 2011 (CONTINUED) |
ING Intermediate Bond Fund Written Options Open on March 31, 2011:
Options on Exchange-Traded Futures Contracts
Description/Name of Issuer | Exercise | Expiration | # of | Premiums | Value | |||||||||||
Put Option CBOT | ||||||||||||||||
U.S. Treasury 10-Year Note May Futures | 119.000 | USD | 04/21/11 | 242 | $ | 138,744 | $(185,282) | |||||||||
| $ | 138,744 | $(185,282) | ||||||||||||||
A summary of derivative instruments by primary risk exposure is outlined in the following tables.
The fair value of derivative instruments as of March 31, 2011 was as follows:
Derivatives not accounted for as hedging | Location on Statement of Assets and Liabilities | Fair Value | ||||||
Asset Derivatives | ||||||||
Interest rate contracts | Investments in securities at value* | $ | 518,032 | |||||
Foreign exchange contracts | | Unrealized appreciation on forward foreign currency contracts | | 277,096 | ||||
Credit contracts | | Upfront payments paid on swap agreements | | 761,027 | ||||
Interest rate contracts | | Unrealized appreciation swap agreements | | 91,629 | ||||
Interest rate contracts | Net Assets-Unrealized appreciation** | 254,657 | ||||||
Total Asset Derivatives | $ | 1,902,441 | ||||||
Liability Derivatives | ||||||||
Foreign exchange contracts | | Unrealized depreciation on forward foreign currency contracts | | $ | 1,149,142 | |||
Credit contracts | | Upfront payments received on swap agreements | | 853,029 | ||||
Credit contracts | | Unrealized depreciation on swap agreements | | 949,906 | ||||
Interest rate contracts | | Unrealized depreciation on swap agreements | | 82,622 | ||||
Interest rate contracts | | Net Assets- Unrealized depreciation** | | 162,291 | ||||
Interest rate contracts | Written options, at fair value | 185,282 | ||||||
Total Liability Derivatives | $ | 3,382,272 | ||||||
| * | Includes purchased options. |
| * | Includes cumulative appreciation/depreciation of futures contracts as reported in the table following the Summary Portfolio of Investments. |
See Accompanying Notes to Financial Statements
58
Table of Contents
| ING INTERMEDIATE BOND FUND | SUMMARY PORTFOLIO OF INVESTMENTS AS OF MARCH 31, 2011 (CONTINUED) |
The effect of derivative instruments on the Fund’s Statement of Operations for the year ended March 31, 2011 was as follows:
Derivatives not accounted for as hedging | Amount of Realized Gain or (Loss) on | |||||||||||||||||||||||
Investments* | Foreign currency | Futures | Swaps | Written | Total | |||||||||||||||||||
Credit contracts | $ | (553,630 | ) | $ | — | $ | — | (1,213,037 | ) | $ | 323,600 | $ | (1,443,067 | ) | ||||||||||
Foreign exchange contracts | (196,538 | ) | (6,093,796 | ) | — | — | 156,154 | (6,134,180 | ) | |||||||||||||||
Interest rate contracts | — | — | (3,913,986 | ) | (594,589 | ) | 298,696 | (4,209,879 | ) | |||||||||||||||
Total | $ | (750,168 | ) | $ | (6,093,796 | ) | $ | (3,913,986 | ) | $ | (1,807,626 | ) | $ | 778,450 | $ | (11,787,126 | ) | |||||||
Derivatives not accounted | Change in Unrealized Appreciation or Depreciation on Derivatives Recognized in Income | |||||||||||||||||||||||
Investments* | Foreign currency related transactions** | Futures | Swaps | Written options | Total | |||||||||||||||||||
Credit contracts | $ | — | $ | — | $ | — | $ | 333,493 | $ | — | $ | 333,493 | ||||||||||||
Foreign exchange contracts | — | (802,444 | ) | — | — | — | (802,444 | ) | ||||||||||||||||
Interest rate contracts | 175,097 | — | 293,525 | 9,007 | (46,538 | ) | 431,091 | |||||||||||||||||
Total | $ | 175,097 | $ | (802,444 | ) | $ | 293,525 | $ | 342,500 | $ | (46,538 | ) | $ | (37,860 | ) | |||||||||
| * | Amounts recognized for purchased options are included in net realized gain (loss) on investments and net change in unrealized appreciation or depreciation on investments. |
| ** | Amounts recognized for forward foreign currency contracts are included in net realized gain (loss) on foreign currency related transactions and net change in unrealized appreciation or depreciation on foreign currency related transactions. |
See Accompanying Notes to Financial Statements
59
Table of Contents
Dividends and distributions paid during the year ended March 31, 2011 were as follows:
Fund Name | Type | Per Share Amount | ||||
ING GNMA Income Fund | ||||||
Class A | NII | $ | 0.3636 | |||
Class B | NII | $ | 0.2959 | |||
Class C | NII | $ | 0.2977 | |||
Class I | NII | $ | 0.3904 | |||
Class W | NII | $ | 0.3858 | |||
ING High Yield Bond Fund | ||||||
Class A | NII | $ | 0.5510 | |||
Class B | NII | $ | 0.4922 | |||
Class C | NII | $ | 0.4938 | |||
Class I | NII | $ | 0.5929 | |||
All Classes | ROC | $ | 0.0165 | |||
ING Intermediate Bond Fund | ||||||
Class A | NII | $ | 0.4266 | |||
Class B | NII | $ | 0.3554 | |||
Class C | NII | $ | 0.3560 | |||
Class I | NII | $ | 0.4573 | |||
Class O | NII | $ | 0.4271 | |||
Class R | NII | $ | 0.4029 | |||
Class W | NII | $ | 0.4512 | |||
NII - Net investment income
ROC - Return of capital
Of the ordinary distributions made during the year ended March 31, 2011, the following percentage qualifies for the dividends received deduction (DRD) available to corporate shareholders:
ING Intermediate Bond Fund | 0.18 | % | ||
For the year ended March 31, 2011, the following percentage of net investment income dividends paid by the Funds is designated as qualifying dividend income (QDI) subject to reduced income tax rates for individuals:
ING Intermediate Bond Fund | 0.18 | % | ||
Pursuant to Internal Revenue Code Section 871(k)(1), the Funds designate the following percentages of net investment income distributions as interest-related dividends:
ING GNMA Income Fund | 97.69 | % | ||
ING High Yield Bond Fund | 100.00 | % | ||
ING Intermediate Bond Fund | 92.35 | % | ||
Above figures may differ from those cited elsewhere in this report due to differences in the calculation of income and gains under U.S. generally accepted accounting principles (book) purposes and Internal Revenue Service (tax) purposes.
Shareholders are strongly advised to consult their own tax advisers with respect to the tax consequences of their investments in the Funds. In January, shareholders, excluding corporate shareholders, receive an IRS 1099-DIV regarding the federal tax status of the dividends and distributions they received in the calendar year.
60
Table of Contents
TRUSTEE AND OFFICER INFORMATION (UNAUDITED)
The business and affairs of the Trust are managed under the direction of the Trust’s Board. A Trustee who is not an interested person of the Trust, as defined in the 1940 Act, is an independent trustee (“Independent Trustee”). The Trustees and Officers of the Trust are listed below. The Statement of Additional Information includes additional information about trustees of the Trust and is available, without charge, upon request at (800) 992-0180.
Name, Address and Age | Position(s) | Term of Office | Principal Occupation(s) – during the Past 5 Years | Number of | Other Board Positions | |||||||
Independent Trustees: | ||||||||||||
Colleen D. Baldwin 7337 East Doubletree Ranch Rd. Suite 100 Scottsdale, Arizona 85258 Age: 50 | Trustee | November 2007 - Present | President, Glantuam Partners, LLC, a business consulting firm (January 2009 - Present) and Consultant (January 2005 - Present). | 132 | None. | |||||||
John V. Boyer 7337 East Doubletree Ranch Rd. Suite 100 Scottsdale, Arizona 85258 Age: 57 | Trustee | January 2005 - Present | President and Chief Executive Officer, Bechtler Arts Foundation, an arts and education foundation (January 2008 - Present). Formerly, Consultant (July 2007 - February 2008); President and Chief Executive Officer, Franklin and Eleanor Roosevelt Institute, a public policy foundation (March 2006 - July 2007). | 132 | None. | |||||||
Patricia W. Chadwick 7337 East Doubletree Ranch Rd. Suite 100 Scottsdale, Arizona 85258 Age: 62 | Trustee | January 2006 - Present | Consultant and President, Ravengate Partners LLC, a consulting firm that provides advice regarding financial markets and the global economy (January 2000 - Present). | 132 | Wisconsin Energy Corp. (June 2006 - Present) and The Royce Fund (December 2009 - Present). | |||||||
Peter S. Drotch 7337 East Doubletree Ranch Rd. Suite 100 Scottsdale, Arizona 85258 Age: 69 | Trustee | November 2007 - Present | Retired. Formerly, Partner, PricewaterhouseCoopers LLP, an accounting firm, until July 2000. | 132 | First Marblehead Corporation (September 2003- Present). | |||||||
J. Michael Earley 7337 East Doubletree Ranch Rd. Suite 100 Scottsdale, Arizona 85258 Age: 66 | Trustee | February 2002 - Present | Retired. Formerly, Banking President and Chief Executive Officer, Bankers Trust Company, N.A., Des Moines (June 1992 - December 2008). | 132 | None. | |||||||
Patrick W. Kenny 7337 East Doubletree Ranch Rd. Suite 100 Scottsdale, Arizona 85258 Age: 68 | Trustee | January 2005 - Present | Retired. Formerly, President and Chief Executive Officer, International Insurance Society (June 2001 - June 2009). | 132 | Assured Guaranty Ltd. (April 2004 - Present). | |||||||
Sheryl K. Pressler 7337 East Doubletree Ranch Rd. Suite 100 Scottsdale, Arizona 85258 Age: 60 | Trustee | January 2006 - Present | Consultant (May 2001 - Present). | 132 | Stillwater Mining Company (May 2002 - Present). | |||||||
Roger B. Vincent 7337 East Doubletree Ranch Rd. Suite 100 Scottsdale, Arizona 85258 Age: 65 | Chairman/Trustee | February 2002 - Present | President, Springwell Corporation, a corporate finance firm (March 1989 - Present). | 132 | UGI Corporation (February 2006 - Present) and UGI Utilities, Inc. (February 2006 - Present). | |||||||
61
Table of Contents
TRUSTEE AND OFFICER INFORMATION (UNAUDITED) (CONTINUED)
Name, Address and Age | Position(s) | Term of Office | Principal Occupation(s) – during the Past 5 Years | Number of | Other Board Positions | |||||||
Trustees who are “Interested Persons”: | ||||||||||||
Robert W. Crispin(3) 7337 East Doubletree Ranch Rd. Suite 100 Scottsdale, Arizona 85258 Age: 64 | Trustee | November 2007 - Present | Retired. Formerly, Chairman and Chief Executive Officer, ING Investment Management Co. (July 2001 - December 2007). | 132 | Intact Financial Corporation (December 2004 - Present) and PFM Group (November 2010 - Present). | |||||||
Shaun P. Mathews(3)(4) 7337 East Doubletree Ranch Rd. Suite 100 Scottsdale, Arizona 85258 Age: 55 | Trustee | November 2007 - Present | President and Chief Executive Officer, ING Investments, LLC(5) (November 2006 - Present). Formerly, Head of ING Mutual Funds and Investment Products (November 2004 - November 2006). | 169 | ING Capital Corporation, LLC (December 2005 - Present). | |||||||
| (1) | The tenure of each Trustee is subject to the Board’s retirement policy, which states that each Independent Trustee shall retire from service as a Trustee at the conclusion of the first regularly scheduled meeting of the Board that is held after the Trustee reaches the age of 72. A unanimous vote of the Board may extend the retirement date of a Trustee for up to one year. An extension may be permitted if the retirement would trigger a requirement to hold a meeting of shareholders of the Fund under applicable law, whether for purposes of appointing a successor to the Trustee or if otherwise necessary under applicable law, in which case the extension would apply until such time as the shareholder meeting can be held or is no longer needed. |
| (2) | For the purposes of this table, “Fund Complex” means the following investment companies: ING Asia Pacific High Dividend Equity Income Fund; ING Emerging Markets High Dividend Equity Fund; ING Emerging Markets Local Bond Fund; ING Equity Trust; ING Funds Trust; ING Global Advantage and Premium Opportunity Fund; ING Global Equity Dividend and Premium Opportunity Fund; ING Infrastructure, Industrials and Materials Fund; ING International High Dividend Equity Income Fund; ING Investors Trust; ING Mayflower Trust; ING Mutual Funds; ING Partners, Inc.; ING Prime Rate Trust; ING Risk Managed Natural Resources Fund; ING Senior Income Fund; ING Separate Portfolios Trust; ING Variable Insurance Trust; and ING Variable Products Trust. |
| (3) | Messrs. Mathews and Crispin are deemed to be “interested persons” of the Fund as defined in the 1940 Act because of their affiliation with ING Groep, N.V., the parent corporation of the Investment Adviser, ING Investments, LLC and the Distributor, ING Investments Distributor, LLC. |
| (4) | For Mr. Mathews, the Fund Complex also includes the following investment companies: ING Balanced Portfolio, Inc.; ING Intermediate Bond Portfolio; ING Money Market Portfolio; ING Series Fund, Inc.; ING Strategic Allocation Portfolios, Inc.; ING Variable Funds; and ING Variable Portfolios, Inc. |
| (5) | ING Investments, LLC was previously named ING Pilgrim Investments, LLC. ING Pilgrim Investments, LLC is the successor in interest to ING Pilgrim Investments, Inc., which was previously known as Pilgrim Investments, Inc. and before it was known as Pilgrim America Investments, Inc. |
62
Table of Contents
TRUSTEE AND OFFICER INFORMATION (UNAUDITED) (CONTINUED)
Name, Address and Age | Position(s) Held With the Trust | Term of Office and Length of Time Served (1) | Principal Occupation(s) - during the Past 5 Years | |||
Shaun P. Mathews 7337 East Doubletree Ranch Rd. Suite 100 Scottsdale, Arizona 85258 Age: 55 | President and Chief Executive Officer | November 2006 - Present | President and Chief Executive Officer, ING Investments, LLC (2) (November 2006 - Present). Formerly, Head of ING Mutual Funds and Investment Products (November 2004 - November 2006). | |||
Michael J. Roland 7337 East Doubletree Ranch Rd. Suite 100 Scottsdale, Arizona 85258 Age: 53 | Executive Vice President Chief Compliance Officer | February 2002 - Present March 2011 - Present | Chief Compliance Officer of the ING Funds, Directed Services LLC(4) and ING Investments, LLC(2) (March 2011 - Present) and Executive Vice President and Chief Operating Officer, ING Investments, LLC(2) and ING Funds Services, LLC(3) (January 2007 - Present). Formerly, Executive Vice President, Head of Product Management, ING Investments, LLC(2) and ING Funds Services, LLC(3) (January 2005 - January 2007). | |||
Stanley D. Vyner 230 Park Avenue New York, New York 10169 Age: 61 | Executive Vice President Chief Investment Risk Officer | October 2000 - Present September 2009 - Present | Executive Vice President, ING Investments, LLC(2) (July 2000 - Present) and Chief Investment Risk Officer, ING Investments, LLC(2) (January 2003 - Present). | |||
Todd Modic 7337 East Doubletree Ranch Rd. Suite 100 Scottsdale, Arizona 85258 Age: 43 | Senior Vice President, Chief/Principal Financial Officer and Assistant Secretary | March 2005 - Present | Senior Vice President, ING Funds Services, LLC(3) (March 2005 - Present). | |||
Kimberly A. Anderson 7337 East Doubletree Ranch Rd. Suite 100 Scottsdale, Arizona 85258 Age: 46 | Senior Vice President | November 2003 - Present | Senior Vice President, ING Investments, LLC(2) (October 2003 - Present). | |||
Robert Terris 7337 East Doubletree Ranch Rd. Suite 100 Scottsdale, Arizona 85258 Age: 40 | Senior Vice President | May 2006 - Present | Senior Vice President, Head of Division Operations, ING Funds Services, LLC(3) (May 2006 - Present). Formerly, Vice President of Administration, ING Funds Services, LLC(3) (October 2001 - May 2006). | |||
Robyn L. Ichilov 7337 East Doubletree Ranch Rd. Suite 100 Scottsdale, Arizona 85258 Age: 43 | Vice President and Treasurer | October 2000 - Present March 2001 - Present | Vice President and Treasurer, ING Funds Services, LLC(3) (November 1995 - Present) and ING Investments, LLC(2) (August 1997 - Present). | |||
Lauren D. Bensinger 7337 East Doubletree Ranch Rd. Suite 100 Scottsdale, Arizona 85258 Age: 57 | Vice President | February 2003 - Present | Vice President, ING Investments, LLC(2) and ING Funds Services, LLC (3)(February 1996 - Present); Director of Compliance, ING Investments, LLC(2) (October 2004 - Present); and Vice President and Money Laundering Reporting Officer, ING Investments Distributor, LLC(5) ( April 2010 - Present);. Formerly, Chief Compliance Officer, ING Investments Distributor, LLC (5) (August 1995 - April 2010) | |||
William Evans 10 State House Square Hartford, Connecticut 06103 Age: 38 | Vice President | September 2007 - Present | Senior Vice President (March 2010 - Present) and Head of Manager Research and Selection Group (April 2007 - Present). Formerly, Vice President, U.S. Mutual Funds and Investment Products (May 2005 - April 2007). | |||
Maria M. Anderson 7337 East Doubletree Ranch Rd. Suite 100 Scottsdale, Arizona 85258 Age: 53 | Vice President | September 2004 - Present | Vice President, ING Funds Services, LLC(3) (September 2004 - Present). | |||
Denise Lewis 7337 East Doubletree Ranch Rd. Suite 100 Scottsdale, Arizona 85258 Age: 47 | Vice President | January 2007 - Present | Vice President, ING Funds Services, LLC(3) (December 2006 - Present). Formerly, Senior Vice President, UMB Investment Services Group, LLC (November 2003 - December 2006). | |||
Kimberly K. Springer 7337 East Doubletree Ranch Rd. Suite 100 Scottsdale, Arizona 85258 Age: 54 | Vice President | March 2006 - Present | Vice President, ING Investment Management -ING Funds (March 2010 - Present); Vice President, ING Funds Services, LLC(3) (March 2006 - Present) and Managing Paralegal, Registration Statements (June 2003 - Present). | |||
63
Table of Contents
TRUSTEE AND OFFICER INFORMATION (UNAUDITED) (CONTINUED)
Name, Address and Age | Position(s) Held With the Trust | Term of Office and Length of Time Served (1) | Principal Occupation(s) - during the Past 5 Years | |||
Craig Wheeler 7337 East Doubletree Ranch Rd. Suite 100 Scottsdale, Arizona 85258 Age: 42 | Assistant Vice President | May 2008 - Present | Assistant Vice President - Director of Tax, ING Funds Services, LLC(3) (March 2008 - Present). Formerly, Tax Manager, ING Funds Services, LLC(3) (March 2005 - March 2008). | |||
Huey P. Falgout, Jr. 7337 East Doubletree Ranch Rd. Suite 100 Scottsdale, Arizona 85258 Age: 47 | Secretary | August 2003 - Present | Senior Vice President and Chief Counsel, ING Investment Management -ING Funds (March 2010- Present). Formerly, Chief Counsel, ING Americas, U.S. Legal Services (October 2003 - March 2010). | |||
Theresa K. Kelety 7337 East Doubletree Ranch Rd. Suite 100 Scottsdale, Arizona 85258 Age: 48 | Assistant Secretary | August 2003 - Present | Vice President and Senior Counsel, ING Investment Management - ING Funds (March 2010-Present). Formerly, Senior Counsel, ING Americas, U.S. Legal Services (April 2008 - March 2010) and Counsel, ING Americas, U.S. Legal Services (April 2003 - April 2008). | |||
Paul Caldarelli 7337 East Doubletree Ranch Rd. Suite 100 Scottsdale, Arizona 85258 Age: 59 | Assistant Secretary | June 2010 - Present | Vice President and Senior Counsel, ING Investment Management -ING Funds (March 2010-Present). Formerly, Senior Counsel, ING Americas, U.S. Legal Services (April 2008 - March 2010) and Counsel, ING Americas, U.S. Legal Services (May 2005 - April 2008). | |||
Kathleen Nichols 7337 East Doubletree Ranch Rd. Suite 100 Scottsdale, Arizona 85258 Age: 35 | Assistant Secretary | May 2008 - Present | Vice President and Counsel, ING Investment Management - ING Funds (March 2010 - Present). Formerly, Counsel, ING Americas, U.S. Legal Services (February 2008 - March 2010) and Associate, Ropes & Gray LLP (September 2005 - February 2008) | |||
| (1) | The officers hold office until the next annual meeting of the Trustees and until their successors shall have been elected and qualified. |
| (2) | ING Investments, LLC was previously named ING Pilgrim Investments, LLC. ING Pilgrim Investments, LLC is the successor in interest to ING Pilgrim Investments, Inc., which was previously known as Pilgrim Investments, Inc. and before that was known as Pilgrim America Investments, Inc. |
| (3) | ING Funds Services, LLC was previously named ING Pilgrim Group, LLC. ING Pilgrim Group, LLC is the successor in interest to ING Pilgrim Group, Inc., which was previously known as Pilgrim Group, Inc. and before that was known as Pilgrim America Group, Inc. |
| (4) | Directed Services LLC is the successor in interest to Directed Services, Inc. |
| (5) | ING Investments Distributor, LLC was previously named ING Funds Distributor, LLC. ING Funds Distributor, LLC is the successor in interest to ING Funds Distributor, Inc., which was previously known as ING Pilgrim Securities, Inc., and before that, was known as Pilgrim Securities, Inc., and before that was known as Pilgrim America Securities, Inc. |
64
Table of Contents
ADVISORY CONTRACT APPROVAL DISCUSSION (UNAUDITED)
BOARD CONSIDERATION AND RE-APPROVAL OF INVESTMENT ADVISORY AND SUB-ADVISORY CONTRACTS
Section 15(c) of the Investment Company Act of 1940, as amended (the “1940 Act”) provides that, after an initial period, the Funds’ existing investment advisory and sub-advisory contracts will remain in effect only if the Board of Trustees (the “Board”) of ING Funds Trust (the “Trust”), including a majority of Board members who have no direct or indirect interest in the advisory and sub-advisory contracts, and who are not “interested persons” of the Funds, as such term is defined under the 1940 Act (the “Independent Trustees”), annually review and approve them. Thus, at a meeting held on November 18, 2010, the Board, including a majority of the Independent Trustees, considered whether to renew the investment advisory contracts (the “Advisory Contracts”) between ING Investments, LLC (the “Adviser”) and the Funds and the sub-advisory contracts (“Sub-Advisory Contracts”) with ING Investment Management, Co. the sub-adviser to each Fund (the “Sub-Adviser”).
The Independent Trustees also held separate meetings on October 21 and November 16, 2010 to consider the renewal of the Advisory Contracts and Sub-Advisory Contracts. As a result, subsequent references herein to factors considered and determinations made by the Independent Trustees include, as applicable, factors considered and determinations made on those earlier dates by the Independent Trustees.
At its November 18, 2010 meeting, the Board voted to renew the Advisory and Sub-Advisory Contracts for the Funds. In reaching these decisions, the Board took into account information furnished to it throughout the year at regular meetings of the Board and the Board’s committees, as well as information prepared specifically in connection with the annual renewal process. Determinations by the Independent Trustees also took into account various factors that they believed, in light of the legal advice furnished to them by K&L Gates LLP (“K&L Gates”), their independent legal counsel, and their own business judgment, to be relevant. Further, while the advisory contracts and sub-advisory Contracts for all the Funds were considered at the same Board meeting, the Trustees considered each Fund’s advisory and sub-advisory relationships separately.
Provided below is an overview of the Board’s contract approval process in general, as well as a discussion of certain specific factors that the Board considered at its renewal meeting. While the Board gave its attention to
the information furnished, at its request, that was most relevant to its considerations, discussed below are a number of the primary factors relevant to the Board’s consideration as to whether to renew the Advisory and Sub-Advisory Contracts for the one-year period ending November 30, 2011. Each Board member may have accorded different weight to the various factors in reaching his or her conclusions with respect to each Fund’s advisory and sub-advisory arrangements.
Overview of the Contract Renewal and Approval Process
Several years ago, the Independent Trustees instituted a revised process by which they seek and consider relevant information when they decide whether to approve new or existing advisory and sub-advisory arrangements for the investment companies in the ING Funds complex under their jurisdiction, including the Funds’ existing Advisory and Sub-Advisory Contracts. Among other actions, the Independent Trustees: retained the services of independent consultants with experience in the mutual fund industry to assist the Independent Trustees in working with the personnel employed by the Adviser or its affiliates who administer the Funds (“Management”) to identify the types of information presented to the Board to inform its deliberations with respect to advisory and sub-advisory relationships and to help evaluate that information; established a specific format in which certain requested information is provided to the Board; and determined the process for reviewing such information in connection with advisory and sub-advisory contract renewals and approvals. The end result was an enhanced process which is currently employed by the Independent Trustees to review and analyze information in connection with their annual renewal of the ING Funds’ advisory and sub-advisory contracts, as well as their review and approval of new advisory relationships.
Since the current renewal and approval process was first implemented, the Board’s membership has changed substantially through periodic retirements of some Trustees and the appointment and election of new Trustees. In addition, throughout this period the Independent Trustees have reviewed and refined the renewal and approval process at least annually. The Board also established a Contracts Committee and two Investment Review Committees, including the International/Balanced/Fixed Income Funds Investment Review Committee (the “I/B/F IRC”). Among other matters, the Contracts Committee provides oversight
65
Table of Contents
ADVISORY CONTRACT APPROVAL DISCUSSION (UNAUDITED) (CONTINUED)
with respect to the contracts renewal and approval process, and each Fund is assigned to the I/B/F IRC, which provides oversight regarding, among other matters, investment performance. The Investment Review Committees may apply a heightened level of scrutiny in cases where performance has lagged an ING Fund’s relevant benchmark and/or selected peer group of investment companies (“Selected Peer Groups”).
The type and format of the information provided to the Board or to legal counsel for the Independent Trustees in connection with the contract approval and renewal process has been codified in the ING Funds’ 15(c) Methodology Guide. This Guide was developed under the direction of the Independent Trustees and sets out a blueprint pursuant to which the Independent Trustees request certain information that they deem important to facilitate an informed review in connection with initial and annual approvals of advisory and sub-advisory contracts.
Management provides certain of the information requested by the 15(c) Methodology Guide in Fund Analysis and Comparison Tables (“FACT sheets”) prior to the Independent Trustees’ review of advisory and sub-advisory arrangements (including the Funds’ Advisory and Sub-Advisory Contracts). The Independent Trustees previously retained an independent firm to verify and test the accuracy of certain FACT sheet data for a representative sample of funds in the ING Funds complex. In addition, in recent years the Contracts Committee employed the services of an independent consultant to assist in its review and analysis of, among other matters, the 15(c) Methodology Guide, the content and format of the FACT sheets, and Selected Peer Groups to be used by the Funds for certain comparison purposes during the renewal process. As part of an ongoing process, the Contracts Committee recommends or considers recommendations from Management for refinements to the 15(c) Methodology Guide and other aspects of the review process, and the Board’s I/B/F IRC reviews benchmarks used to assess the performance of funds in the ING Funds complex.
The Board employed its process for reviewing contracts when considering the renewals of the Funds’ Advisory and Sub-Advisory Contracts that would be effective through November 30, 2011. Set forth below is a discussion of many of the Board’s primary considerations and conclusions resulting from this process.
Nature, Extent and Quality of Service
In determining whether to approve the Advisory and Sub-Advisory Contracts for the Funds for the year
ending November 30, 2011, the Independent Trustees received and evaluated such information as they deemed necessary regarding the nature, extent and quality of services provided to the Funds by the Adviser and Sub-Adviser. This included information regarding the Adviser and Sub-Adviser provided throughout the year at regular meetings of the Board and its committees, as well as information furnished in connection with the contract renewal meetings.
The materials requested by and provided to the Board and/or to K&L Gates prior to the November 18, 2010 Board meeting included, among other information, the following items for each Fund: (1) FACT sheets that provided information regarding the performance and expenses of the Fund and other similarly managed funds in its Selected Peer Group, as well as information regarding the Fund’s investment portfolio, objective and strategies; (2) reports providing risk and attribution analyses of the Fund; (3) the 15(c) Methodology Guide, which describes how the FACT sheets were prepared, including the manner in which each Fund’s benchmark and Selected Peer Group were selected and how profitability was determined; (4) responses from the Adviser and Sub-Adviser to a series of questions posed by K&L Gates on behalf of the Independent Trustees; (5) copies of the forms of Advisory and Sub-Advisory Contracts; (6) copies of the Forms ADV for the Adviser and Sub-Adviser; (7) financial statements for the Adviser and Sub-Adviser; (8) a draft of a narrative summary addressing key factors the Board customarily considers in evaluating the renewals of the ING Funds’ (including the Fund’s) advisory contracts and sub-advisory contracts, including a written analysis for the Fund of how performance, fees and expenses compare to its Selected Peer Group and/or designated benchmark; (9) independent analyses of Fund performance by the Trust’s Chief Investment Risk Officer; (10) information regarding net asset flows into and out of the Fund; and (11) other information relevant to the Board’s evaluations.
For each Fund Class A shares were used for purposes of certain comparisons between the Funds and their Selected Peer Groups. Class A shares generally were selected so that a Fund’s share class with the longest performance history was compared to the analogous class of shares for each fund in its Selected Peer Group. The mutual funds included in the Funds’ Selected Peer Groups were selected based upon criteria designed to mirror the Fund share class being compared to the Selected Peer Groups.
66
Table of Contents
ADVISORY CONTRACT APPROVAL DISCUSSION (UNAUDITED) (CONTINUED)
In arriving at its conclusions with respect to the Advisory Contracts, the Board was mindful of the “manager-of-managers” platform of the ING Funds that has been developed by Management. The Board also considered the techniques that the Adviser has developed, at the Board’s direction, to screen and perform due diligence on the Sub-Adviser that are recommended to the Board to manage the investment portfolios of the funds in the ING Funds complex. The Board noted the resources that the Adviser has committed to the Board and the I/B/F IRC to assist the Board and the I/B/F IRC with their assessment of the investment performance of the Funds on an on-going basis throughout the year. This includes the appointment of a Chief Investment Risk Officer and his staff, who report directly to the Board and who have developed attribution analyses and other metrics used by the Board’s Investment Review Committees to analyze the key factors underlying investment performance for the funds in the ING Funds complex.
The Board also noted the techniques used by the Adviser to monitor the performance of the Sub-Adviser and the proactive approach that the Adviser, working in cooperation with the I/B/F IRC, has taken to advocate or recommend, when it believed appropriate, changes designed to assist in improving the Funds’ performance.
In considering the Funds’ Advisory Contracts, the Board also considered the extent of benefits provided to the Funds’ shareholders, beyond advisory services, from being part of the ING family of funds. This includes, in most cases, the right to exchange or transfer investments, without a sales charge, between the same class of shares of such funds or among ING Funds available on a product platform, and the wide range of ING Funds available for exchange or transfer. The Board also took into account the Adviser’s efforts in recent years to reduce the expenses of the ING Funds through renegotiated arrangements with the ING Funds’ service providers. In addition, the Board considered the efforts of the Adviser and the expenses that it incurred in recent years to help make the ING Funds complex more efficient by combinations of similar funds.
Further, the Board received periodic reports showing that the investment policies and restrictions for each Fund were consistently complied with and other periodic reports covering matters such as compliance by Adviser and Sub-Adviser personnel with codes of ethics. The Board considered reports from the Trust’s Chief Compliance Officer (“CCO”) evaluating whether the regulatory compliance systems and procedures of the
Adviser and each Sub-Adviser are reasonably designed to assure compliance with the federal securities laws, including those related to, among others, late trading and market timing, best execution, fair value pricing, proxy voting and trade allocation practices. The Board also took into account the CCO’s annual and periodic reports and recommendations with respect to service provider compliance programs. In this regard, the Board also considered the policies and procedures developed by the CCO in consultation with the Board’s Compliance Committee that guide the CCO’s compliance oversight function.
The Board reviewed the level of staffing, quality and experience of each Fund’s portfolio management team. The Board took into account the respective resources and reputations of the Adviser and Sub-Adviser, and evaluated the ability of the Adviser and the Sub-Adviser to attract and retain qualified investment advisory personnel. The Board also considered the adequacy of the resources committed to the Funds (and other relevant funds in the ING Funds complex) by the Adviser and Sub-Adviser, and whether those resources are commensurate with the needs of the Funds and are sufficient to sustain appropriate levels of performance and compliance needs. In this regard, the Board considered the financial stability of the Adviser and the Sub-Adviser.
Based on their deliberations and the materials presented to them, the Board concluded that the advisory and related services provided by the Adviser and each Sub-Adviser are appropriate in light of the Funds’ operations, the competitive landscape of the investment company business, and investor needs, and that the nature and quality of the overall services provided by the Adviser and the Sub-Adviser were appropriate.
Fund Performance
In assessing advisory and sub-advisory relationships, the Board placed emphasis on the net investment returns of each Fund. While the Board considered the performance reports and discussions with portfolio managers at Board and committee meetings during the year, particular attention in assessing performance was given to the FACT sheets furnished in connection with the renewal process. The FACT sheet prepared for each Fund included its investment performance compared to the Fund’s Morningstar category median and/or Lipper category median, Selected Peer Group and primary benchmark. The FACT sheet performance data was as of June 30, 2010. In addition, the Board also considered
67
Table of Contents
ADVISORY CONTRACT APPROVAL DISCUSSION (UNAUDITED) (CONTINUED)
at its November 18, 2010 meeting certain additional data regarding performance and Fund asset levels as of September 30, 2010. The Board’s findings specific to each Fund’s performance are discussed under “Fund-by-Fund Analysis” below.
Economies of Scale
When evaluating the reasonableness of advisory fee rates, the Board also considered whether economies of scale will be realized by the Adviser and Sub-Adviser as a Fund grows larger and the extent to which any such economies are reflected in contractual fee rates. In this regard, the Board noted any breakpoints in advisory fee schedules that will result in a lower advisory fee rate when a Fund achieves sufficient asset levels to receive a breakpoint discount. In the case of sub-advisory fees, the Board considered that breakpoints would inure to the benefit of the Adviser, except to the extent that there are corresponding advisory fee breakpoints or waivers. The Board also considered that some of the Funds do not have advisory fee breakpoints do have fee waiver or expense reimbursement arrangements. In this connection, the Board considered the extent to which economies of scale could be realized through such fee waivers, expense reimbursements or other expense reductions. In evaluating fee breakpoint arrangements and economies of scale, the Independent Trustees also considered prior periodic management reports and industry information on this topic.
The Board considered that there has not been a full year recovery for many Funds from the substantial decline in assets caused by adverse economic conditions in recent years. As a result of these asset declines, the Board considered that there were fewer opportunities for certain of the Funds to realize economies of scale.
Information Regarding Services to Other Clients
The Board requested and considered information regarding the nature of services and fee rates offered by the Adviser and Sub-Adviser to other clients, including other registered investment companies and institutional accounts. When fee rates offered to other clients differed materially from those charged to the Funds, the Board considered any underlying rationale provided by the Adviser or a Sub-Adviser for these differences. The Board also noted that the fee rates charged to the Funds and other institutional clients of the Adviser or a Sub-Adviser (including other investment companies) may differ materially due to, among other reasons: differences in services; different
regulatory requirements associated with registered investment companies, such as the Funds, as compared to non-registered investment company clients; market differences in fee rates that existed when a Fund first was organized; differences in the original sponsors of Funds that now are managed by the Adviser; investment capacity constraints that existed when certain contracts were first agreed upon or that might exist at present; and different pricing structures that are necessary to be competitive in different marketing channels.
Fee Rates and Profitability
The Board reviewed and considered each contractual investment advisory fee rate, combined with the administrative fee rate, payable by each Fund to the Adviser. The Board also considered the contractual sub-advisory fee rate payable by the Adviser to each Sub-Adviser for sub-advisory services for each Fund. In addition, the Board considered fee waivers and expense limitations applicable to the fees payable by the Funds.
The Board considered: (1) the fee structure of each Fund as it relates to the services provided under the contracts; and (2) the potential fall-out benefits to the Adviser and the Sub-Adviser and their respective affiliates from their association with the Funds. For each Fund, the Board determined that the fees payable to the Adviser and the Sub-Adviser are reasonable for the services that each performs, which were considered in light of the nature and quality of the services that each has performed and is expected to perform.
For each Fund, the Board considered information on revenues, costs and profits realized by the Adviser and each affiliated Sub-Adviser, which was prepared by Management in accordance with the allocation methodology (including related assumptions) specified in the 15(c) Methodology Guide. In analyzing the profitability of the Adviser in connection with its services to a Fund, the Board took into account the sub-advisory fee rate payable by the Adviser to each Sub-Adviser. The Board also considered that there has not yet been a full recovery for many Funds from the substantial decline in assets caused by adverse economic conditions in recent years, which, in many cases, has adversely impacted profits realized by the Adviser and Sub-Adviser. In addition, the Board considered information that it requested and was provided by Management with respect to the profitability of service providers affiliated with the Adviser.
68
Table of Contents
ADVISORY CONTRACT APPROVAL DISCUSSION (UNAUDITED) (CONTINUED)
The Board recognized that profitability analysis is not an exact science and there is no uniform methodology for determining profitability for this purpose. In this context, the Board realized that Management’s calculations regarding its costs incurred in establishing the infrastructure necessary for the Funds’ operations may not be fully reflected in the expenses allocated to each Fund in determining profitability, and that the information presented may not portray all of the costs borne by Management or capture Management’s entrepreneurial risk associated with offering and managing a mutual fund complex in the current regulatory and market environment. In addition, the Board recognized that the use of different methodologies for purposes of calculating profit data can give rise to dramatically different profit and loss results.
In making its determinations, the Board based its conclusions on the reasonableness of the advisory and sub-advisory fees of the Adviser and affiliated Sub-Adviser primarily on the factors described for each Fund below. At the request of the Board, the Adviser has from time to time agreed to implement remedial actions from Certain Funds. These remedial actions have included, among others: reductions in fee rates; changes in Sub-Advisers or portfolio managers; and strategy modifications.
Fund-by-Fund Analysis
The following paragraphs outline certain of the specific factors that the Board considered, and the conclusions reached, at its November 18, 2010 meeting in relation to renewing each Fund’s current Advisory and Sub-Advisory Contracts. These specific factors are in addition to those considerations discussed above. In each case, the Fund’s performance was compared to its Morningstar category median and its primary benchmark, a broad-based securities market index that appears in the Fund’s prospectus. With respect to Morningstar quintile rankings, the first quintile represents the highest (best) performance and the fifth quintile represents the lowest performance. Each Fund’s management fee and expense ratio were compared to the fees and expense ratios of the funds in its Selected Peer Group.
ING GNMA Income Fund
In considering whether to approve the renewal of the Advisory and Sub-Advisory Contracts for the ING GNMA Income Fund, the Board considered that, based on performance data for the periods ended June 30, 2010: (1) the Fund outperformed its Morningstar category
median for all periods presented, with the exception of the most recent calendar quarter, during which it underperformed; (2) the Fund outperformed its primary benchmark for the most recent calendar quarter, year-to-date, and one-year periods, but underperformed for the three-year, five-year, and ten-year periods; and (3) the Fund is ranked in the second quintile of its Morningstar category for the three-year, five-year, and ten-year periods, the third quintile for the year-to-date and one-year periods, and the fourth quintile for the most recent calendar quarter.
In considering the fees payable under the Advisory and Sub-Advisory Contracts for the Fund, the Board took into account the factors described above and also considered: (1) the fairness of the compensation under an Advisory Contract with a breakpoint fee rate schedule where the asset level necessary to achieve a breakpoint discount had not been reached by the Fund; and (2) the pricing structure (including the expense ratio to be borne by shareholders) of the Fund, as compared to its Selected Peer Group, including that: (a) the management fee (inclusive of a 0.10% administration fee) for the Fund is above the median and the average management fees of the funds in its Selected Peer Group; and (b) the expense ratio for the Fund is above the median and the average expense ratios of the funds in its Selected Peer Group.
In analyzing this fee data, the Board took into account Management’s representations regarding the competitiveness of the fees payable by the Fund.
After its deliberation, the Board reached the following conclusions: (1) the Fund’s management fee rate is reasonable in the context of all factors considered by the Board; (2) the Fund’s expense ratio is reasonable in the context of all factors considered by the Board; (3) the Fund’s performance is reasonable in the context of all factors considered by the Board; and (4) the sub-advisory fee rate payable by the Adviser to the Sub-Adviser is reasonable in the context of all factors considered by the Board. Based on these conclusions and other factors, the Board voted to renew the Advisory and Sub-Advisory Contracts for the Fund for the year ending November 30, 2011. During this renewal process, different Board members may have given different weight to different individual factors and related conclusions.
ING High Yield Bond Fund
In considering whether to approve the renewal of the Advisory and Sub-Advisory Contracts for the ING High
69
Table of Contents
ADVISORY CONTRACT APPROVAL DISCUSSION (UNAUDITED) (CONTINUED)
Yield Bond Fund, the Board considered that, based on performance data for the periods ended June 30, 2010: (1) the Fund underperformed its Morningstar category median for all periods presented, with the exception of the most recent calendar quarter and one-year periods, during which it outperformed; (2) the Fund underperformed its primary benchmark for all periods presented; and (3) the Fund is ranked in the second quintile of its Morningstar category for the most recent calendar quarter, the third quintile for the one-year period, the fourth quintile for the year-to-date, three-year, and ten-year periods, and the fifth (lowest) quintile for the five-year period.
In analyzing this performance data, the Board took into account: (1) in March 2010, the Fund’s portfolio management team was modified; (2) Management’s representations regarding changes that had been made to the Fund’s investment process; (3) Management would continue to monitor, and the Board or its Investment Review Committee would periodically review, the Fund’s performance; and (4) Management’s expectation that the Fund’s longer-term performance will improve.
In considering the fees payable under the Advisory and Sub-Advisory Contracts for the Fund, the Board took into account the factors described above and also considered: (1) the fairness of the compensation under an Advisory Contract with a breakpoint fee rate schedule where the asset level necessary to achieve a breakpoint discount had not been reached by the Fund; and (2) the pricing structure (including the expense ratio to be borne by shareholders) of the Fund, as compared to its Selected Peer Group, including that: (a) the management fee (inclusive of a 0.10% administration fee) for the Fund is below the median and the average management fees of the funds in its Selected Peer Group; and (b) the expense ratio for the Fund is below the median and the average expense ratios of the funds in its Selected Peer Group.
After its deliberation, the Board reached the following conclusions: (1) the Fund’s management fee rate is reasonable in the context of all factors considered by the Board; (2) the Fund’s expense ratio is reasonable in the context of all factors considered by the Board; (3) the Fund’s portfolio management team was modified in March 2010 and modifications were made to the Fund’s investment process, and it is reasonable to permit the Fund to establish a longer performance record for purposes of evaluating performance; and (4) the sub-advisory fee rate payable by the Adviser to the Sub-Adviser is reasonable in the context of all
factors considered by the Board. Based on these conclusions and other factors, the Board voted to renew the Advisory and Sub-Advisory Contracts for the Fund for the year ending November 30, 2011. During this renewal process, different Board members may have given different weight to different individual factors and related conclusions.
ING Intermediate Bond
In considering whether to approve the renewal of the Advisory and Sub-Advisory Contracts for ING Intermediate Bond Fund, the Board considered that, based on performance data for the periods ended June 30, 2010: (1) the Fund outperformed its Morningstar category median for all periods presented, with the exception of the three-year and five-year periods, during which it underperformed; (2) the Fund underperformed its primary benchmark for all periods presented, with the exceptions of the year-to-date and one-year periods, during which it outperformed; and (3) the Fund is ranked in the first (highest) quintile of its Morningstar category for the year-to-date and one-year periods, the second quintile for the most recent calendar quarter and ten-year periods, the fourth quintile for the five-year period, and the fifth (lowest) quintile for the three-year period.
In analyzing this performance data, the Board took into account: (1) Management’s analysis regarding the effect that the 2008 market downturn and securities selection had on the Fund’s longer-term performance; (2) in August 2010, the Fund’s portfolio management team was changed and changes were made to the Fund’s investment process; (3) that Management would continue to monitor, and the Board or its Investment Review Committee would periodically review, the Fund’s performance; and (4) Management’s expectation that the Fund’s longer-term performance will improve.
In considering the fees payable under the Advisory and Sub-Advisory Contracts for the Fund, the Board took into account the factors described above and also considered: (1) the fairness of the compensation under an Advisory Contract with a level fee rate that does not include breakpoints; (2) the pricing structure (including the expense ratio to be borne by shareholders) of the Fund, as compared to its Selected Peer Group, including that: (a) the management fee (inclusive of a 0.10% administration fee) for the Fund is below the median and the average management fees of the funds in its Selected Peer Group; and (b) the expense ratio for the Fund is below the median and the average expense ratios of the funds in its Selected Peer Group.
70
Table of Contents
ADVISORY CONTRACT APPROVAL DISCUSSION (UNAUDITED) (CONTINUED)
After its deliberation, the Board reached the following conclusions: (1) the Fund’s management fee rate is reasonable in the context of all factors considered by the Board; (2) the Fund’s expense ratio is reasonable in the context of all factors considered by the Board; (3) the Fund’s portfolio management team and investment process was modified in August 2010, and it is reasonable to permit the Fund to establish a larger performance records for purposes of evaluating
performance; and (4) the sub-advisory fee rate payable by the Adviser to the Sub-Adviser is reasonable in the context of all factors considered by the Board. Based on these conclusions and other factors, the Board voted to renew the Advisory and Sub-Advisory Contracts for the Fund for the year ending November 30, 2011. During this renewal process, different Board members may have given different weight to different individual factors and related conclusions.
71
Table of Contents
ING Investments Distributor, LLC offers the funds listed below. Before investing in a fund, shareholders should carefully review the fund’s prospectus. Investors may obtain a copy of a prospectus of any ING Fund by calling (800) 992-0180 or by going to www.ingfunds.com.
Domestic Equity and Income Funds
ING Core Equity Research Fund
ING Real Estate Fund
Domestic Fund-of-Funds
ING Capital Allocation Fund
Domestic Equity Growth Funds
ING Corporate Leaders 100 Fund
ING Equity Dividend Fund
ING Growth Opportunities Fund
ING MidCap Opportunities Fund
ING Small Company Fund
ING SmallCap Opportunities Fund
ING Tactical Asset Allocation Fund
Domestic Equity Index Funds
ING Index Plus LargeCap Fund
ING Index Plus MidCap Fund
ING Index Plus SmallCap Fund
Domestic Equity Value Fund
ING Value Choice Fund
Fixed-lncome Funds
ING GNMA lncome Fund
ING High Yield Bond Fund
ING Intermediate Bond Fund
Global Equity Funds
ING Global Equity Dividend Fund
ING Global Natural Resources Fund
ING Global Real Estate Fund
ING Global Value Choice Fund
International Equity Funds
ING Alternative Beta Fund
ING Emerging Countries Fund
ING Global Opportunities Fund
ING Greater China Fund
ING Index Plus International Equity Fund
ING International Capital Appreciation Fund
ING International Core Fund
ING International Growth Fund
ING International Real Estate Fund
ING International SmallCap Multi-Manager Fund
ING International Value Fund
ING International Value Choice Fund
ING Russia Fund
Global Fixed-Income Fund
ING Global Bond Fund
International Funds-of-Funds
ING Diversified International Fund
ING Global Target Payment Fund
Loan Participation Funds
ING Senior lncome Fund
ING Floating Rate Fund
Money Market Fund*
ING Money Market Fund
| * | An investment in a fund is not insured or guaranteed by the Federal Deposit Insurance Corporation or any other government agency. Although the fund seeks to preserve the value of your investment at $1.00 per share, it is possible to lose money by investing in the fund. |
Table of Contents
Investment Adviser
ING Investments, LLC
7337 East Doubletree Ranch Road, Suite 100
Scottsdale, Arizona 85258
Administrator
ING Funds Services, LLC
7337 East Doubletree Ranch Road, Suite 100
Scottsdale, Arizona 85258
Distributor
ING Investments Distributor, LLC
7337 East Doubletree Ranch Road, Suite 100
Scottsdale, Arizona 85258
Transfer Agent
BNY Mellon Investment Servicing (U.S.) Inc.
301 Bellevue Parkway
Wilmington, Delaware 19809
Independent Registered Public Accounting Firm
KPMG LLP
Two Financial Center
60 South Street
Boston, Massachusetts 02111
Custodian
The Bank of New York Mellon
One Wall Street
New York, New York 10286
Legal Counsel
Dechert
1775 I Street, N.W.
Washington, D.C. 20006
For more complete information, or to obtain a prospectus on any ING Fund, please call your Investment Professional or ING Investments Distributor, LLC at (800) 992-0180 or log on to www.ingfunds.com. The prospectus should be read carefully before investing. Consider the fund’s investment objectives, risks, charges and expenses carefully before investing. The prospectus contains this information and other information about the fund.
 | AR-UFIALL | (0311-052011) |
Table of Contents

 E-Delivery Sign-up – details inside
This report is submitted for general information to shareholders of the ING Funds. It is not authorized for distribution to prospective shareholders unless accompanied or preceded by a prospectus which includes details regarding the fund’s investment objectives, risks, charges, expenses and other information. This information should be read carefully. |
| President’s Letter | 1 | |||||
| Market Perspective | 2 | |||||
| Portfolio Managers’ Report | 4 | |||||
| Shareholder Expense Example | 7 | |||||
| Report of Independent Registered Public Accounting Firm | 8 | |||||
| Statement of Assets and Liabilities | 9 | |||||
| Statement of Operations | 10 | |||||
| Statement of Changes in Net Assets | 11 | |||||
| Financial Highlights | 12 | |||||
| Notes to Financial Statements | 13 | |||||
| Portfolio of Investments | 20 | |||||
| Tax Information | 29 | |||||
| Trustee and Officer Information | 30 |
| Go Paperless with E-Delivery! | | |||||||||
| Sign up now for on-line prospectuses, fund reports, and proxy statements. In less than five minutes, you can help reduce paper mail and lower fund costs. | |||||||||||
| Just go to www.ingfunds.com, click on the E-Delivery icon from the home page, follow the directions and complete the quick 5 Steps to Enroll. | |||||||||||
| You will be notified by e-mail when these communications become available on the internet. Documents that are not available on the internet will continue to be sent by mail. | |||||||||||


President and Chief Executive Officer
ING Funds
April 21, 2011
The views expressed in the President’s Letter reflect those of the President as of the date of the letter. Any such views are subject to change at any time based upon market or other conditions and the ING Funds disclaim any responsibility to update such views. These views may not be relied on as investment advice and, because investment decisions for an ING Fund are based on numerous factors, may not be relied on as an indication of investment intent on behalf of any ING Fund. Reference to specific company securities should not be construed as recommendations or investment advice.
| Index | Description | |||||
|---|---|---|---|---|---|---|
| S&P/Case-Shiller 20-City Composite Home Price Index | A composite index of the home price index for the top 20 Metropolitan Statistical Areas in the United States. The index is published monthly by Standard & Poor’s. | |||||
| Barclays Capital U.S. Aggregate Bond Index | An unmanaged index of publicly issued investment grade U.S. Government, mortgage-backed, asset-backed and corporate debt securities. | |||||
| Barclays Capital U.S. Treasury Index | An unmanaged index that includes public obligations of the U.S. Treasury. Treasury bills, certain special issues, such as state and local government series bonds (SLGs), as well as U.S. Treasury TIPS and STRIPS, are excluded. | |||||
| Barclays Capital Corporate Investment Grade Bond Index | The corporate component of the Barclays Capital U.S. Credit Index. The U.S. Credit Index includes publicly-issued U.S. corporate and specified foreign debentures and secured notes that meet the specified maturity, liquidity, and quality requirements. The index includes both corporate and non-corporate sectors. The corporate sectors are industrial, utility and finance, which includes both U.S. and non-U.S. corporations. | |||||
| Barclays Capital MBS Index | The Barclays Capital MBS Index is an unmanaged index composed of fixed-income security mortgage pools sponsored by GNMA, FNMA and FHLMC, including GNMA Graduated Payment Mortgages. | |||||
| Barclays Capital High Yield Bond — 2% Issuer Constrained Composite Index | An unmanaged index that includes all fixed income securities having a maximum quality rating of Ba1, a minimum amount outstanding of $150 million, and at least one year to maturity. | |||||
S&P 500® Index | An unmanaged index that measures the performance of securities of approximately 500 large-capitalization companies whose securities are traded on major U.S. stock markets. | |||||
MSCI Japan® Index | A free float-adjusted market capitalization index that is designed to measure developed market equity performance in Japan. | |||||
MSCI Europe ex UK® Index | A free float-adjusted market capitalization index that is designed to measure developed market equity performance in Europe, excluding the UK. | |||||
MSCI UK® Index | A free float-adjusted market capitalization index that is designed to measure developed market equity performance in the UK. | |||||
| The S&P/LSTA Leveraged Loan 100 Index | The S&P/LSTA Leveraged Loan 100 Index is designed to reflect the largest facilities in the leveraged loan market. It mirrors the market-weighted performance of the largest institutional leveraged loans based upon market weightings, spreads, and interest payments. The index consists of 100 loan facilities drawn from a larger benchmark, the S&P/LSTA (Loan Syndications and Trading Association) Leveraged Loan Index (LLI), which covers more than 1,100 facilities and has a market value of more than $480 billion. | |||||
ING FLOATING RATE FUND | PORTFOLIO MANAGERS’ REPORT |
| Ratings Distribution as of March 31, 2011 | ||||||||
|---|---|---|---|---|---|---|---|---|
| Ba | 49.5 | % | ||||||
| B | 39.0 | % | ||||||
| Caa and below | 2.0 | % | ||||||
| Not rated* | 9.5 | % | ||||||
| Ratings distribution shows the percentage of the Fund’s loan commitments (excluding cash and foreign cash) that are rated in each ratings category, based upon the categories provided by Moody’s Investors Service, Inc. Ratings distribution is based on Moody’s senior secured facility ratings. Moody’s ratings classification methodology: Aaa rating denotes the least credit risk; C rating denotes the greatest credit risk. Loans rated below Baa by Moody’s are considered to be below investment grade. Ratings can change from time to time, and current ratings may not fully reflect the actual credit condition or risks posed by a loan. | ||||||||
| * Not rated includes loans to non-U.S. borrowers (which are typically unrated) and loans for which the rating has been withdrawn. | ||||||||
| TOP TEN LOAN HOLDINGS AS OF MARCH 31, 2011 AS A PERCENTAGE OF NET ASSETS: | ||||||||
|---|---|---|---|---|---|---|---|---|
NET ASSETS | ||||||||
| Univision Communications, Inc. | 1.3% | |||||||
| Affinion Group, Inc. | 1.2% | |||||||
| Georgia Pacific, LLC | 1.2% | |||||||
| VNU | 1.2% | |||||||
| Sungard Data Systems, Inc. | 1.2% | |||||||
| Delta Airlines | 1.2% | |||||||
| Graphic Packaging International, Inc. | 1.2% | |||||||
| ARAMARK | 1.2% | |||||||
| KAR Holdings, Inc. | 1.2% | |||||||
| Burger King Corporation | 1.1% | |||||||
Subject to change daily. | ||||||||
| | ||||||||
Portfolio holdings and characteristics are subject to change and may not be representative of current holdings and characteristics. The outlook for this Fund may differ from that presented for other ING Funds. Performance for the different classes of shares will vary based on differences in fees associated with each class. An index has no cash in its portfolio, imposes no sales charges and incurs no operating expenses. An investor cannot invest directly in an index.
ING FLOATING RATE FUND | PORTFOLIO MANAGERS’ REPORT |
 |  | |||||
Jeffrey A. Bakalar Senior Vice President Senior Portfolio Manager ING Investment Management Co. | Daniel A. Norman Senior Vice President Senior Portfolio Manager ING Investment Management Co. | |||||
 |  | |||||
| ING Floating Rate Fund April 26, 2011 | ||||||
ING FLOATING RATE FUND | PORTFOLIO MANAGERS’ REPORT |

| Cumulative Total Returns for the Period Ended March 31, 2011 | ||||||||
|---|---|---|---|---|---|---|---|---|
| Since Inception of Classes A, C, I, R and W August 17, 2010 | ||||||||
Including Sales Charge: | ||||||||
Class A(1) | 1.92 | % | ||||||
Class C(2) | 3.11 | % | ||||||
| Class I | 4.83 | % | ||||||
| Class R | 4.39 | % | ||||||
| Class W | 4.83 | % | ||||||
Excluding Sales Charge: | ||||||||
| Class A | 4.57 | % | ||||||
| Class C | 4.11 | % | ||||||
| Class I | 4.83 | % | ||||||
| Class R | 4.39 | % | ||||||
| Class W | 4.83 | % | ||||||
| S&P/LSTA Leveraged Loan 100 Index | 8.20 | %(3) | ||||||
(1) | Reflects deduction of the maximum Class A sales charge of 2.50%. |
(2) | Reflects deduction of the Class C deferred sales charge of 1% for the since inception return. |
(3) | Since inception performance for index is shown from September 1, 2010. |
| Actual Fund Return | Hypothetical (5% return before expenses) | ||||||||||||||||||||||||||||||||||
|---|---|---|---|---|---|---|---|---|---|---|---|---|---|---|---|---|---|---|---|---|---|---|---|---|---|---|---|---|---|---|---|---|---|---|---|
| Beginning Account Value October 1, 2010 | Ending Account Value March 31, 2011 | Annualized Expense Ratio | Expenses Paid During the Period Ended March 31, 2011* | Beginning Account Value October 1, 2010 | Ending Account Value March 31, 2011 | Annualized Expense Ratio | Expenses Paid During the Period Ended March 31, 2011* | ||||||||||||||||||||||||||||
| Class A | $ | 1,000.00 | $ | 1,040.50 | 1.02 | % | $ | 5.18 | $ | 1,000.00 | $ | 1,019.85 | 1.02 | % | $ | 5.13 | |||||||||||||||||||
| Class C | 1,000.00 | 1,037.00 | 1.77 | 8.99 | 1,000.00 | 1,016.11 | 1.77 | 8.90 | |||||||||||||||||||||||||||
| Class I | 1,000.00 | 1,042.00 | 0.77 | 3.92 | 1,000.00 | 1,021.09 | 0.77 | 3.88 | |||||||||||||||||||||||||||
| Class R | 1,000.00 | 1,039.80 | 1.27 | 6.46 | 1,000.00 | 1,018.60 | 1.27 | 6.39 | |||||||||||||||||||||||||||
| Class W | 1,000.00 | 1,042.00 | 0.77 | 3.92 | 1,000.00 | 1,021.09 | 0.77 | 3.88 | |||||||||||||||||||||||||||
| * | Expenses are equal to the Fund’s respective annualized expense ratios multiplied by the average account value over the period, multiplied by 182/365 to reflect the most recent fiscal half-year. |
ING Funds Trust

May 24, 2011
ASSETS: | |||||||
| Investments in securities at fair value (Cost $181,130,675) | $ | 183,109,053 | |||||
| Short-term investments at value (Cost $30,812,050) | 30,812,050 | ||||||
| Cash | 3,700,891 | ||||||
| Cash collateral for futures | 1,287 | ||||||
| Receivables: | |||||||
| Investment securities sold | 2,374,812 | ||||||
| Fund shares sold | 4,641,045 | ||||||
| Interest | 477,251 | ||||||
| Unrealized appreciation on unfunded commitments | 3,180 | ||||||
| Unrealized appreciation on futures contracts | 2,156 | ||||||
| Prepaid offering | 30,466 | ||||||
| Prepaid structuring fee (Note 7) | 16,689 | ||||||
| Prepaid other expenses | 90,598 | ||||||
| Reimbursement due from manager | 37,352 | ||||||
| Total assets | 225,296,830 | ||||||
LIABILITIES: | |||||||
| Payable for investment securities purchased | 21,243,078 | ||||||
| Payable for fund shares redeemed | 55,714 | ||||||
| Income distribution payable | 54,519 | ||||||
| Payable to affiliates | 109,193 | ||||||
| Accrued trustees fees | 2,003 | ||||||
| Other accrued expenses and liabilities | 190,082 | ||||||
| Total liabilities | 21,654,589 | ||||||
NET ASSETS | $ | 203,642,241 | |||||
NET ASSETS WERE COMPRISED OF: | |||||||
| Paid-in capital | 200,024,686 | ||||||
| Undistributed net investment income | 312,914 | ||||||
| Accumulated net realized gain | 1,320,927 | ||||||
| Net unrealized appreciation | 1,983,714 | ||||||
NET ASSETS | $ | 203,642,241 | |||||
Class A: | |||||||
| Net assets | $ | 18,410,739 | |||||
| Shares authorized | unlimited | ||||||
| Par value | $ | 0.001 | |||||
| Shares outstanding | 1,793,545 | ||||||
| Net asset value and redemption price per share | $ | 10.26 | |||||
Maximum offering price per share (2.50%)(1) | $ | 10.52 | |||||
Class C: | |||||||
| Net assets | $ | 3,355,796 | |||||
| Shares authorized | unlimited | ||||||
| Par value | $ | 0.001 | |||||
| Shares outstanding | 326,949 | ||||||
Net asset value and redemption price per share(2) | $ | 10.26 | |||||
Class I: | |||||||
| Net assets | $ | 170,659,987 | |||||
| Shares authorized | unlimited | ||||||
| Par value | $ | 0.001 | |||||
| Shares outstanding | 16,621,727 | ||||||
Net asset value and redemption price per share | $ | 10.27 | |||||
Class R: | |||||||
| Net assets | $ | 7,896,759 | |||||
| Shares authorized | unlimited | ||||||
| Par value | $ | 0.001 | |||||
| Shares outstanding | 769,764 | ||||||
| Net asset value and redemption price per share | $ | 10.26 | |||||
Class W: | |||||||
| Net assets | $ | 3,318,960 | |||||
| Shares authorized | unlimited | ||||||
| Par value | $ | 0.001 | |||||
| Shares outstanding | 323,014 | ||||||
| Net asset value and redemption price per share | $ | 10.27 | |||||
(1) Maximum offering price is computed at 100/97.50 of net asset value. On purchases of $100,000 or more, the offering price is reduced. | |||||||
(2) Redemption price per share may be reduced for any applicable contingent deferred sales charge. | |||||||
| August 17, 2010(1) – March 31, 2011 | |||||||
|---|---|---|---|---|---|---|---|
INVESTMENT INCOME: | |||||||
| Interest | $ | 3,756,422 | |||||
| Amendment fees | 75,953 | ||||||
| Other | 128,526 | ||||||
| Total investment income | 3,960,901 | ||||||
EXPENSES: | |||||||
| Investment management fees | 464,031 | ||||||
| Administration fees | 84,369 | ||||||
| Distribution and service fees: | |||||||
| Class A | 19,258 | ||||||
| Class C | 5,741 | ||||||
| Class I | — | ||||||
| Class R | 7,102 | ||||||
| Class W | — | ||||||
| Transfer agent fees: | |||||||
| Class A | 868 | ||||||
| Class C | 34 | ||||||
| Class I | 8,413 | ||||||
| Class R | 97 | ||||||
| Class W | 11 | ||||||
| Shareholder reporting expense | 35,204 | ||||||
| Custody and accounting expense | 68,454 | ||||||
| Registration fee | 28,584 | ||||||
| Professional fees | 73,913 | ||||||
| Trustees fees | 3,853 | ||||||
| Offering expense | 49,534 | ||||||
| Structuring fee (Note 7) | 8,311 | ||||||
| Miscellaneous expense | 58,570 | ||||||
| Total expenses | 916,347 | ||||||
| Net waived and reimbursed fees | (236,318 | ) | |||||
| Net expenses | 680,029 | ||||||
| Net investment income | 3,280,872 | ||||||
REALIZED AND UNREALIZED GAIN: | |||||||
| Net realized gain on: | |||||||
| Investments | 1,448,586 | ||||||
| Futures | 3,992 | ||||||
| Net realized gain | 1,452,578 | ||||||
| Net change in unrealized appreciation or depreciation on: | |||||||
| Investments | 1,978,378 | ||||||
| Futures | 2,156 | ||||||
| Unfunded commitments | 3,180 | ||||||
| Net change in unrealized appreciation or depreciation | 1,983,714 | ||||||
| Net realized and unrealized gain | 3,436,292 | ||||||
| Increase in net assets resulting from operations | $ | 6,717,164 | |||||
(1) Commencement of operations. | |||||||
| August 17, 2010(1) – March 31, 2011 | |||||||
|---|---|---|---|---|---|---|---|
FROM OPERATIONS: | |||||||
| Net investment income | $ | 3,280,872 | |||||
| Net realized gain | 1,452,578 | ||||||
| Net change in unrealized appreciation or depreciation | 1,983,714 | ||||||
| Net increase in net assets resulting from operations | 6,717,164 | ||||||
FROM DISTRIBUTIONS TO SHAREHOLDERS: | |||||||
| Net investment income: | |||||||
| Class A | (237,589 | ) | |||||
| Class C | (15,514 | ) | |||||
| Class I | (2,666,771 | ) | |||||
| Class R | (47,366 | ) | |||||
| Class W | (7,896 | ) | |||||
| Net realized gains: | |||||||
| Class A | (11,672 | ) | |||||
| Class C | (585 | ) | |||||
| Class I | (117,332 | ) | |||||
| Class R | (1,780 | ) | |||||
| Class W | (282 | ) | |||||
| Total distributions | (3,106,787 | ) | |||||
FROM CAPITAL SHARE TRANSACTIONS: | |||||||
| Net proceeds from sale of shares | 206,276,555 | ||||||
| Reinvestment of distributions | 2,877,210 | ||||||
| 209,153,765 | |||||||
| Cost of shares redeemed | (9,121,901 | ) | |||||
| Net increase in net assets resulting from capital share transactions | 200,031,864 | ||||||
| Net increase in net assets | 203,642,241 | ||||||
NET ASSETS: | |||||||
| Beginning of period | — | ||||||
| End of period | $ | 203,642,241 | |||||
| Undistributed net investment income at end of period | $ | 312,914 | |||||
(1) Commencement of operations. | |||||||
| Income (loss) from investment operations | Less distributions | Ratios to average net assets | Supplemental data | |||||||||||||||||||||||||||||||||||||||||||||||||||||||||||||||||
|---|---|---|---|---|---|---|---|---|---|---|---|---|---|---|---|---|---|---|---|---|---|---|---|---|---|---|---|---|---|---|---|---|---|---|---|---|---|---|---|---|---|---|---|---|---|---|---|---|---|---|---|---|---|---|---|---|---|---|---|---|---|---|---|---|---|---|---|---|
| Net asset value, beginning of year or period | Net investment income (loss) | Net realized and unrealized gain (loss) | Total from investment operations | From net investment income | From net realized gains | From return of capital | Total distributions | Net asset value, end of year or period | Total Return(1) | Expenses before reductions/ additions (2)(3) | Expenses, net of fee waivers and/or recoupments, if any (2)(3) | Expenses, net of all reductions/ additions (2)(3) | Net investment income (loss) (2)(3) | Net assets, end of year or period | Portfolio Turnover | |||||||||||||||||||||||||||||||||||||||||||||||||||||
| Year or period ended | ($) | ($) | ($) | ($) | ($) | ($) | ($) | ($) | ($) | (%) | (%) | (%) | (%) | (%) | ($000’s) | (%) | ||||||||||||||||||||||||||||||||||||||||||||||||||||
Class A | ||||||||||||||||||||||||||||||||||||||||||||||||||||||||||||||||||||
08-17-10(4)–03-31-11 | 10.00 | 0.21 | * | 0.25 | 0.46 | 0.19 | 0.01 | — | 0.20 | 10.26 | 4.57 | 1.30 | 1.02 | 1.02 | 3.49 | 18,411 | 73 | |||||||||||||||||||||||||||||||||||||||||||||||||||
Class C | ||||||||||||||||||||||||||||||||||||||||||||||||||||||||||||||||||||
08-17-10(4)–03-31-11 | 10.00 | 0.19 | * | 0.22 | 0.41 | 0.14 | 0.01 | — | 0.15 | 10.26 | 4.11 | 2.05 | 1.77 | 1.77 | 3.46 | 3,356 | 73 | |||||||||||||||||||||||||||||||||||||||||||||||||||
Class I | ||||||||||||||||||||||||||||||||||||||||||||||||||||||||||||||||||||
08-17-10(4)–03-31-11 | 10.00 | 0.25 | * | 0.23 | 0.48 | 0.20 | 0.01 | — | 0.21 | 10.27 | 4.83 | 1.05 | 0.77 | 0.77 | 3.93 | 170,660 | 73 | |||||||||||||||||||||||||||||||||||||||||||||||||||
Class R | ||||||||||||||||||||||||||||||||||||||||||||||||||||||||||||||||||||
08-17-10(4)–03-31-11 | 10.00 | 0.21 | * | 0.23 | 0.44 | 0.17 | 0.01 | — | 0.18 | 10.26 | 4.39 | 1.55 | 1.27 | 1.27 | 3.87 | 7,897 | 73 | |||||||||||||||||||||||||||||||||||||||||||||||||||
Class W | ||||||||||||||||||||||||||||||||||||||||||||||||||||||||||||||||||||
08-17-10(4)–03-31-11 | 10.00 | 0.24 | 0.24 | 0.48 | 0.20 | 0.01 | — | 0.21 | 10.27 | 4.83 | 1.05 | 0.77 | 0.77 | 4.49 | 3,319 | 73 | ||||||||||||||||||||||||||||||||||||||||||||||||||||
(1) | Total return is calculated assuming reinvestment of all dividends, capital gain distributions and return of capital distributions, if any, at net asset value and excluding the deduction of sales charges. Total return for periods less than one year is not annualized. |
(2) | Annualized for periods less than one year. |
(3) | Expense ratios reflect operating expenses of a Fund. Expenses before reductions/additions do not reflect amounts reimbursed by the Investment Adviser and/or Distributor or reductions from brokerage service arrangements or other expense offset arrangements and do not represent the amount paid by a Fund during periods when reimbursements or reductions occur. Expenses net of fee waivers reflect expenses after reimbursement by an Investment Adviser and/or Distributor but prior to reductions from brokerage service arrangements or other expense offset arrangements. Expenses net of all reductions/additions represent the net expenses paid by a Fund. Net investment income (loss) is net of all such additions or reductions. |
(4) | Commencement of operations. |
| * | Calculated using average number of shares outstanding throughout the period. |
Fund. Investments in securities of sufficient credit quality, maturing in 60 days or less from date of acquisition, are valued at amortized cost which approximates fair value. To the extent the Fund invests in other registered companies, the Fund’s NAV is calculated based on the current NAV of the registered investment company in which the Fund invests. The prospectuses for those investment companies explain the circumstances under which they will use fair value pricing and the effects of using fair value pricing.
| (1) | Market value of investment securities, other assets and liabilities — at the exchange rates prevailing at the end of the day. |
| (2) | Purchases and sales of investment securities, income and expenses — at the rates of exchange prevailing on the respective dates of such transactions. |
| Class A | Class C | Class R | ||||||
|---|---|---|---|---|---|---|---|---|
| 0.25% | 1.00% | 0.50% | ||||||
(as a percentage of average daily net assets)
Class C — 1.75%
Class I — 0.75%
Class R — 1.25%
Class W — 0.75%
| March 31, | ||||||||||||
|---|---|---|---|---|---|---|---|---|---|---|---|---|
| 2012 | 2013 | 2014 | Total | |||||||||
| $ — | $ — | $236,318 | $236,318 | |||||||||
| Accrued Investment Management Fees | Accrued Administrative Fees | Accrued Distribution and Service Fees | Total | |||||||||
|---|---|---|---|---|---|---|---|---|---|---|---|---|
| $84,655 | $15,392 | $9,146 | $109,193 | |||||||||
| ING Fund(s) or Subsidiary | Percentage | |||||
|---|---|---|---|---|---|---|
| ING Solution 2015 Portfolio | 20.50 | % | ||||
| ING Solution 2025 Portfolio | 25.92 | % | ||||
| ING Solution 2035 Portfolio | 16.62 | % | ||||
| ING Solution Income Portfolio | 5.81 | % | ||||
| Reliastar Life Insurance Company | 5.05 | % | ||||
| CB Richard Ellis Services, Inc. | $ | 735,000 | ||||
| CB Richard Ellis Services, Inc. | $ | 1,265,000 | ||||
| inVentiv Health, Inc. | $ | 1,000,000 |
| Shares sold | Reinvestment of distributions | Shares redeemed | Net increase (decrease) in shares outstanding | Shares sold | Reinvestment of distributions | Shares redeemed | Net increase (decrease) | |||||||||||||||||||||||||||
|---|---|---|---|---|---|---|---|---|---|---|---|---|---|---|---|---|---|---|---|---|---|---|---|---|---|---|---|---|---|---|---|---|---|---|
| Year or period ended | # | # | # | # | ($) | ($) | ($) | ($) | ||||||||||||||||||||||||||
Class A | ||||||||||||||||||||||||||||||||||
08-17-10(1)–03-31-11 | 1,818,923 | 4,088 | (29,466 | ) | 1,793,545 | 18,386,496 | 41,889 | (302,717 | ) | 18,125,668 | ||||||||||||||||||||||||
Class C | ||||||||||||||||||||||||||||||||||
08-17-10(1)–03-31-11 | 355,779 | 1,018 | (29,848 | ) | 326,949 | 3,647,033 | 10,428 | (306,033 | ) | 3,351,428 | ||||||||||||||||||||||||
Class I | ||||||||||||||||||||||||||||||||||
08-17-10(1)–03-31-11 | 17,114,951 | 270,737 | (763,961 | ) | 16,621,727 | 172,401,568 | 2,767,647 | (7,800,436 | ) | 167,368,779 | ||||||||||||||||||||||||
Class R | ||||||||||||||||||||||||||||||||||
08-17-10(1)–03-31-11 | 799,290 | 4,793 | (34,319 | ) | 769,764 | 8,175,478 | 49,127 | (350,442 | ) | 7,874,163 | ||||||||||||||||||||||||
Class W | ||||||||||||||||||||||||||||||||||
08-17-10(1)–03-31-11 | 357,485 | 791 | (35,262 | ) | 323,014 | 3,665,980 | 8,119 | (362,273 | ) | 3,311,826 | ||||||||||||||||||||||||
(1) | Commencement of operations. |
| Paid-in Capital | Undistributed Net Investment Income | |
|---|---|---|
| $(7,178) | $7,178 |
| Undistributed Ordinary Income | Undistributed Long-term Capital Gains | Unrealized Appreciation | ||||||
|---|---|---|---|---|---|---|---|---|
| $1,686,981 | $3,685 | $1,981,530 | ||||||
| Per Share Amount | Payable Date | Record Date | ||||||||||||
|---|---|---|---|---|---|---|---|---|---|---|---|---|---|---|
| Class A | $ | 0.0316 | May 2, 2011 | Daily | ||||||||||
| Class C | $ | 0.0253 | May 2, 2011 | Daily | ||||||||||
| Class I | $ | 0.0337 | May 2, 2011 | Daily | ||||||||||
| Class R | $ | 0.0295 | May 2, 2011 | Daily | ||||||||||
| Class W | $ | 0.0337 | May 2, 2011 | Daily | ||||||||||
| Bank Loan Ratings † (Unaudited) | |||||||||||||||||||||||||||
| Principal Amount | Borrow\Tranche Description | | Moody’s | | S&P | | Fair Value | | |||||||||||||||||||
Loans*: 89.9% | |||||||||||||||||||||||||||
Aerospace & Defense: 2.7% | |||||||||||||||||||||||||||
Delta Airlines | |||||||||||||||||||||||||||
| $ | 2,407,773 | Term Loan, 3.506%, maturing April 30, 2014 | B2 | B | $ | 2,387,081 | |||||||||||||||||||||
| 450,000 | Term Loan, 4.250%, maturing March 07, 2016 | Ba2 | BB– | 449,297 | |||||||||||||||||||||||
Transdigm, Inc. | Ba2 | BB– | |||||||||||||||||||||||||
| 1,097,250 | Term Loan, 4.000%, maturing February 14, 2017 | 1,107,022 | |||||||||||||||||||||||||
United Airlines, Inc. | Ba3 | BB– | |||||||||||||||||||||||||
| 1,489,087 | Term Loan, 2.313%, maturing February 03, 2014 | 1,455,461 | |||||||||||||||||||||||||
| 5,398,861 | |||||||||||||||||||||||||||
Automobile: 4.0% | |||||||||||||||||||||||||||
Federal-Mogul Corporation | Ba3 | B+ | |||||||||||||||||||||||||
| 657,069 | Term Loan, 2.196%, maturing December 29, 2014 | 642,167 | |||||||||||||||||||||||||
| 335,239 | Term Loan, 2.189%, maturing December 28, 2015 | 327,636 | |||||||||||||||||||||||||
Ford Motor Company | Baa3 | BB+ | |||||||||||||||||||||||||
| 1,643,530 | Term Loan, 3.010%, maturing December 16, 2013 | 1,644,675 | |||||||||||||||||||||||||
Hertz Corporation | Ba1 | BB | |||||||||||||||||||||||||
| 1,420,000 | (1) | Term Loan, maturing March 09, 2018 | 1,422,955 | ||||||||||||||||||||||||
KAR Holdings, Inc. | Ba3 | BB | |||||||||||||||||||||||||
| 2,346,260 | Term Loan, 3.000%, maturing October 18, 2013 | 2,344,062 | |||||||||||||||||||||||||
Tomkins, Inc. | Ba2 | BB | |||||||||||||||||||||||||
| 1,446,228 | Term Loan, 4.250%, maturing September 29, 2016 | 1,453,820 | |||||||||||||||||||||||||
UCI International, Inc. | Ba3 | B | |||||||||||||||||||||||||
| 249,375 | Term Loan, 5.500%, maturing July 26, 2017 | 251,128 | |||||||||||||||||||||||||
| 8,086,443 | |||||||||||||||||||||||||||
Beverage, Food & Tobacco: 3.1% | |||||||||||||||||||||||||||
ARAMARK | Ba3 | BB | |||||||||||||||||||||||||
| 154,267 | Term Loan, 3.494%, maturing July 26, 2016 | 154,518 | |||||||||||||||||||||||||
| 2,345,733 | Term Loan, 3.557%, maturing July 26, 2016 | 2,349,545 | |||||||||||||||||||||||||
Darling International, Inc. | Ba2 | BBB– | |||||||||||||||||||||||||
| 93,333 | Term Loan, 5.141%, maturing December 16, 2016 | 94,208 | |||||||||||||||||||||||||
Del Monte Corporation | Ba3 | B+ | |||||||||||||||||||||||||
| 1,200,000 | Term Loan, 4.500%, maturing March 08, 2018 | 1,202,344 | |||||||||||||||||||||||||
Michael Foods | B1 | BB– | |||||||||||||||||||||||||
| 600,000 | Term Loan, 4.250%, maturing February 23, 2018 | 604,200 | |||||||||||||||||||||||||
Pinnacle Foods Holding Corporation | Ba3 | B+ | |||||||||||||||||||||||||
| 2,000,000 | Term Loan, 2.761%, maturing April 02, 2014 | 1,995,416 | |||||||||||||||||||||||||
| 6,400,231 | |||||||||||||||||||||||||||
Buildings & Real Estate: 2.7% | |||||||||||||||||||||||||||
Armstrong World Industries, Inc. | B1 | BB– | |||||||||||||||||||||||||
| 375,000 | Term Loan, 4.000%, maturing March 09, 2018 | 377,344 | |||||||||||||||||||||||||
Capital Automotive, L.P. | Ba3 | B+ | |||||||||||||||||||||||||
| 1,997,723 | Term Loan, 5.000%, maturing March 10, 2017 | 1,982,740 | |||||||||||||||||||||||||
CB Richard Ellis | Ba1 | BB | |||||||||||||||||||||||||
| 997,500 | Term Loan, 3.513%, maturing November 06, 2016 | 996,877 | |||||||||||||||||||||||||
Goodman Global, Inc. | B1 | B+ | |||||||||||||||||||||||||
| 995,000 | Term Loan, 5.750%, maturing October 28, 2016 | 1,002,382 | |||||||||||||||||||||||||
Goodman Global, Inc. | B3 | B– | |||||||||||||||||||||||||
| 375,000 | Term Loan, 9.000%, maturing October 30, 2017 | 386,836 | |||||||||||||||||||||||||
JMC Steel Group | B1 | BB– | |||||||||||||||||||||||||
| 200,763 | Term Loan, 4.750%, maturing April 03, 2017 | 201,179 | |||||||||||||||||||||||||
Realogy Corporation | B1 | B- | |||||||||||||||||||||||||
| 500,000 | (1) | Term Loan, maturing October 10, 2013 | 474,532 | ||||||||||||||||||||||||
| 5,421,890 | |||||||||||||||||||||||||||
| Bank Loan Ratings † (Unaudited) | |||||||||||||||||||||||||||
| Principal Amount | Borrow\Tranche Description | | Moody’s | | S&P | | Fair Value | | |||||||||||||||||||
Chemicals, Plastics & Rubber: 4.3% | |||||||||||||||||||||||||||
Bway Holding Corporation | Ba3 | B | |||||||||||||||||||||||||
AZ Chem US, Inc. | B1 | B+ | |||||||||||||||||||||||||
| $ | 421,809 | (1) | Term Loan, 4.750%, maturing November 21, 2016 | $ | 424,708 | ||||||||||||||||||||||
Chemtura Corporation | Ba1 | BB+ | |||||||||||||||||||||||||
| 250,000 | Term Loan, 5.500%, maturing August 27, 2016 | 252,240 | |||||||||||||||||||||||||
Houghton International, Inc. | B1 | B | |||||||||||||||||||||||||
| 248,928 | Term Loan, 6.750%, maturing January 29, 2016 | 251,262 | |||||||||||||||||||||||||
Huntsman International, LLC | Ba2 | BB– | |||||||||||||||||||||||||
| 268,345 | Term Loan, 1.786%, maturing April 21, 2014 | 265,326 | |||||||||||||||||||||||||
| 731,655 | Term Loan, 2.786%, maturing April 19, 2017 | 727,692 | |||||||||||||||||||||||||
Ineos US Finance, LLC | B1 | B | |||||||||||||||||||||||||
| 480,110 | Term Loan, 7.501%, maturing December 16, 2013 | 494,964 | |||||||||||||||||||||||||
| 509,595 | Term Loan, 8.001%, maturing December 16, 2014 | 525,361 | |||||||||||||||||||||||||
ISP Chemco, Inc. | Ba3 | BB | |||||||||||||||||||||||||
| 992,268 | Term Loan, 1.782%, maturing June 04, 2014 | 979,245 | |||||||||||||||||||||||||
Momentive Specialty Chemicals, Inc. | Ba3 | B– | |||||||||||||||||||||||||
| 734,962 | (1) | Term Loan, 4.063%, maturing May 05, 2015 | 728,379 | ||||||||||||||||||||||||
| 1,746,181 | (1) | Term Loan, 4.063%, maturing May 05, 2015 | 1,730,539 | ||||||||||||||||||||||||
Nalco Company | Ba1 | BB+ | |||||||||||||||||||||||||
| 248,750 | Term Loan, 4.500%, maturing October 05, 2017 | 251,263 | |||||||||||||||||||||||||
Solutia, Inc. | Ba1 | BB+ | |||||||||||||||||||||||||
| 493,750 | Term Loan, 3.500%, maturing August 01, 2017 | 497,145 | |||||||||||||||||||||||||
Styron S.A.R.L. | B1 | B+ | |||||||||||||||||||||||||
| 354,113 | Term Loan, 6.000%, maturing August 02, 2017 | 356,584 | |||||||||||||||||||||||||
Univar, Inc. | B2 | B | |||||||||||||||||||||||||
| 1,296,750 | Term Loan, 5.000%, maturing June 30, 2017 | 1,303,466 | |||||||||||||||||||||||||
| 8,788,174 | |||||||||||||||||||||||||||
Containers, Packaging & Glass: 3.6% | |||||||||||||||||||||||||||
Bway Holding Corporation | Ba3 | B | |||||||||||||||||||||||||
| 44,737 | Term Loan, 4.500%, maturing February 23, 2018 | 44,905 | |||||||||||||||||||||||||
| 503,888 | Term Loan, 4.500%, maturing February 23, 2018 | 506,198 | |||||||||||||||||||||||||
Graham Packaging Company, L.P. | B1 | B+ | |||||||||||||||||||||||||
| 995,000 | Term Loan, 6.000%, maturing September 23, 2016 | 1,004,328 | |||||||||||||||||||||||||
Graphic Packaging International, Inc. | Ba3 | BB+ | |||||||||||||||||||||||||
| 2,351,511 | Term Loan, 3.053%, maturing May 16, 2014 | 2,352,165 | |||||||||||||||||||||||||
Reynolds Group Holdings, Ltd. | Ba3 | BB | |||||||||||||||||||||||||
| 2,000,000 | Term Loan, 4.250%, maturing February 09, 2018 | 2,011,610 | |||||||||||||||||||||||||
Rock-Tenn Company | Baa3 | BBB | |||||||||||||||||||||||||
| 1,500,000 | (1) | Term Loan, maturing March 28, 2018 | 1,510,848 | ||||||||||||||||||||||||
| 7,430,054 | |||||||||||||||||||||||||||
Data and Internet Services: 6.3% | |||||||||||||||||||||||||||
Attachmate Corporation | B1 | BB– | |||||||||||||||||||||||||
| 550,000 | (1) | Term Loan, maturing February 24, 2017 | 547,938 | ||||||||||||||||||||||||
Avaya, Inc. | B1 | B | |||||||||||||||||||||||||
| 331,504 | Term Loan, 3.061%, maturing October 24, 2014 | 321,352 | |||||||||||||||||||||||||
| 665,894 | Term Loan, 4.811%, maturing October 26, 2017 | 650,633 | |||||||||||||||||||||||||
Dealer Computer Services, Inc. | Ba2 | BB– | |||||||||||||||||||||||||
| 1,832,836 | Term Loan, 5.250%, maturing April 21, 2017 | 1,841,313 | |||||||||||||||||||||||||
Fifth Third Processing Solutions | Ba3 | BB– | |||||||||||||||||||||||||
| 498,750 | Term Loan, 5.500%, maturing November 03, 2016 | 503,738 | |||||||||||||||||||||||||
First Data Corporation | B1 | B+ | |||||||||||||||||||||||||
| 500,000 | Term Loan, 3.002%, maturing September 24, 2014 | 479,844 | |||||||||||||||||||||||||
| 997,324 | Term Loan, 3.002%, maturing September 24, 2014 | 956,531 | |||||||||||||||||||||||||
Open Text Corporation | Ba1 | BBB | |||||||||||||||||||||||||
| 496,103 | Term Loan, 2.496%, maturing October 02, 2013 | �� | 496,413 | ||||||||||||||||||||||||
Orbitz Worldwide, Inc. | B2 | B+ | |||||||||||||||||||||||||
| 1,439,612 | Term Loan, 3.277%, maturing July 25, 2014 | 1,358,634 | |||||||||||||||||||||||||
Sabre, Inc. | B1 | B | |||||||||||||||||||||||||
| 1,483,710 | Term Loan, 2.267%, maturing September 30, 2014 | 1,400,664 | |||||||||||||||||||||||||
| Bank Loan Ratings † (Unaudited) | |||||||||||||||||||||||||||
| Principal Amount | Borrow\Tranche Description | | Moody’s | | S&P | | Fair Value | | |||||||||||||||||||
Data and Internet Services: (continued) | |||||||||||||||||||||||||||
Sungard Data Systems, Inc. | Ba3 | BB | |||||||||||||||||||||||||
| $ | 2,438,666 | Term Loan, 3.933%, maturing February 26, 2016 | $ | 2,448,248 | |||||||||||||||||||||||
Trans Union, LLC | Ba3 | BB– | |||||||||||||||||||||||||
| 375,000 | Term Loan, 4.750%, maturing February 12, 2018 | 376,922 | |||||||||||||||||||||||||
Travelport, Inc. | Ba3 | B | |||||||||||||||||||||||||
| 1,488,402 | Term Loan, 4.963%, maturing August 21, 2015 | 1,474,216 | |||||||||||||||||||||||||
| 12,856,446 | |||||||||||||||||||||||||||
Diversified / Conglomerate Manufacturing: 1.0% | |||||||||||||||||||||||||||
Edwards (Cayman Islands II) Limited | B3 | B+ | |||||||||||||||||||||||||
| 548,625 | Second Lien Term Loan, 5.500%, maturing May 31, 2016 | 547,939 | |||||||||||||||||||||||||
Flextronics International, Ltd. | Ba1 | BB+ | |||||||||||||||||||||||||
| 221,078 | Term Loan, 2.504%, maturing October 01, 2014 | 220,091 | |||||||||||||||||||||||||
| 771,210 | Term Loan, 2.511%, maturing October 01, 2014 | 767,767 | |||||||||||||||||||||||||
| 1,535,797 | |||||||||||||||||||||||||||
Diversified / Conglomerate Service: 3.8% | |||||||||||||||||||||||||||
Affinion Group, Inc. | Ba3 | BB– | |||||||||||||||||||||||||
| 2,483,714 | Term Loan, 5.000%, maturing October 10, 2016 | 2,489,913 | |||||||||||||||||||||||||
Brock Holdings, Inc. | B1 | B+ | |||||||||||||||||||||||||
| 800,000 | Term Loan, 6.000%, maturing March 16, 2017 | 797,000 | |||||||||||||||||||||||||
Brock Holdings, Inc. | Caa1 | B– | |||||||||||||||||||||||||
| 250,000 | (1) | Term Loan, maturing March 16, 2018 | 255,000 | ||||||||||||||||||||||||
Catalina Marketing Corporation | Ba2 | BB– | |||||||||||||||||||||||||
| 938,557 | Term Loan, 2.996%, maturing October 01, 2014 | 935,038 | |||||||||||||||||||||||||
NDS Treasury (Americas) | Ba2 | BB– | |||||||||||||||||||||||||
| 1,000,000 | Term Loan, 3.000%, maturing March 12, 2018 | 998,438 | |||||||||||||||||||||||||
ServiceMaster Company | B1 | B+ | |||||||||||||||||||||||||
| 89,866 | Term Loan, 2.750%, maturing July 24, 2014 | 88,317 | |||||||||||||||||||||||||
| 902,402 | Term Loan, 2.771%, maturing July 24, 2014 | 886,852 | |||||||||||||||||||||||||
Vertafore, Inc. | B1 | B+ | |||||||||||||||||||||||||
| 299,250 | Term Loan, 5.250%, maturing July 29, 2016 | 299,998 | |||||||||||||||||||||||||
West Corporation | Ba3 | BB– | |||||||||||||||||||||||||
| 291,699 | Term Loan, 2.743%, maturing October 24, 2013 | 290,877 | |||||||||||||||||||||||||
| 709,452 | Term Loan, 4.618%, maturing July 15, 2016 | 712,113 | |||||||||||||||||||||||||
| 7,753,546 | |||||||||||||||||||||||||||
Diversified Nat’l Rsrcs, Precious Metals & Minerals: 1.2% | |||||||||||||||||||||||||||
Georgia Pacific, LLC | Ba1 | BBB+ | |||||||||||||||||||||||||
| 2,480,400 | Term Loan, 3.559%, maturing December 23, 2014 | 2,490,562 | |||||||||||||||||||||||||
| 2,490,562 | |||||||||||||||||||||||||||
Ecological: 0.2% | |||||||||||||||||||||||||||
Waste Industries USA, Inc. | B1 | B+ | |||||||||||||||||||||||||
| 500,000 | Term Loan, 4.750%, maturing March 17, 2017 | 502,807 | |||||||||||||||||||||||||
| 502,807 | |||||||||||||||||||||||||||
Electronics: 2.0% | |||||||||||||||||||||||||||
CDW, LLC | B2 | B | |||||||||||||||||||||||||
| 460,538 | Term Loan, 4.500%, maturing July 14, 2017 | 459,444 | |||||||||||||||||||||||||
Freescale Semiconductor, Inc. | B1 | B– | |||||||||||||||||||||||||
| 2,000,000 | (1) | Term Loan, maturing December 01, 2016 | 1,991,712 | ||||||||||||||||||||||||
Microsemi Corporation | Ba1 | BB+ | |||||||||||||||||||||||||
| 425,000 | Term Loan, 5.000%, maturing November 02, 2017 | 427,479 | |||||||||||||||||||||||||
Rovi Corporation | Ba1 | BB+ | |||||||||||||||||||||||||
| 250,000 | Term Loan, 4.000%, maturing February 07, 2018 | 252,031 | |||||||||||||||||||||||||
Spansion, LLC | Ba3 | BB– | |||||||||||||||||||||||||
| 841,249 | Term Loan, 6.250%, maturing January 08, 2015 | 848,610 | |||||||||||||||||||||||||
| 3,979,276 | |||||||||||||||||||||||||||
| Bank Loan Ratings † (Unaudited) | |||||||||||||||||||||||||||
| Principal Amount | Borrow\Tranche Description | | Moody’s | | S&P | | Fair Value | | |||||||||||||||||||
Finance: 0.3% | |||||||||||||||||||||||||||
BNY ConvergEx Group, LLC | B1 | B+ | |||||||||||||||||||||||||
| $ | 188,999 | Term Loan, 5.250%, maturing December 16, 2016 | $ | 190,228 | |||||||||||||||||||||||
| 450,423 | Term Loan, 5.250%, maturing December 19, 2016 | 453,351 | |||||||||||||||||||||||||
| 643,579 | |||||||||||||||||||||||||||
Gaming: 4.3% | |||||||||||||||||||||||||||
Harrahs Operating Company, Inc. | B3 | B | |||||||||||||||||||||||||
| 500,000 | Term Loan, 3.303%, maturing January 28, 2015 | 463,985 | |||||||||||||||||||||||||
| 500,000 | Term Loan, 3.303%, maturing January 28, 2015 | 463,985 | |||||||||||||||||||||||||
| 1,488,422 | Term Loan, 3.303%, maturing January 28, 2015 | 1,381,209 | |||||||||||||||||||||||||
Isle Of Capri Casinos, Inc. | Ba3 | BB– | |||||||||||||||||||||||||
| 500,000 | (1) | Term Loan, maturing March 24, 2017 | 502,913 | ||||||||||||||||||||||||
Las Vegas Sands, LLC | Ba3 | BB– | |||||||||||||||||||||||||
| 75,050 | Term Loan, 3.000%, maturing November 23, 2016 | 73,299 | |||||||||||||||||||||||||
| 424,761 | Term Loan, 3.000%, maturing November 23, 2016 | 414,726 | |||||||||||||||||||||||||
Penn National Gaming, Inc. | Ba2 | BB+ | |||||||||||||||||||||||||
| 2,000,000 | Term Loan, 2.028%, maturing October 03, 2012 | 1,994,438 | |||||||||||||||||||||||||
VML US FINANCE, LLC | Ba3 | BB– | |||||||||||||||||||||||||
| 1,936,989 | Term Loan, 4.790%, maturing May 27, 2013 | 1,937,392 | |||||||||||||||||||||||||
| 44,924 | Term Loan, 4.790%, maturing May 27, 2013 | 44,983 | |||||||||||||||||||||||||
Wynn Las Vegas, LLC | NR | NR | |||||||||||||||||||||||||
| 1,500,000 | Term Loan, 3.260%, maturing August 17, 2015 | 1,500,000 | |||||||||||||||||||||||||
| 8,776,930 | |||||||||||||||||||||||||||
Grocery: 0.7% | |||||||||||||||||||||||||||
Supervalu, Inc. | NR | BB | |||||||||||||||||||||||||
| 1,488,722 | Term Loan, 3.496%, maturing October 05, 2015 | 1,491,602 | |||||||||||||||||||||||||
| 1,491,602 | |||||||||||||||||||||||||||
Healthcare, Education and Childcare: 9.6% | |||||||||||||||||||||||||||
Biomet, Inc. | B1 | BB– | |||||||||||||||||||||||||
| 1,984,576 | Term Loan, 3.292%, maturing March 25, 2015 | 1,984,024 | |||||||||||||||||||||||||
CHS/Community Health Systems, Inc. | Ba3 | BB | |||||||||||||||||||||||||
| 1,279,418 | Term Loan, 2.561%, maturing July 25, 2014 | 1,267,320 | |||||||||||||||||||||||||
| 65,825 | Term Loan, 2.561%, maturing July 25, 2014 | 65,203 | |||||||||||||||||||||||||
| 1,142,842 | (1) | Term Loan, 3.811%, maturing January 25, 2017 | 1,142,057 | ||||||||||||||||||||||||
ConvaTec | Ba3 | B+ | |||||||||||||||||||||||||
| 259,350 | Term Loan, 5.750%, maturing December 22, 2016 | 260,402 | |||||||||||||||||||||||||
Davita, Inc. | Ba2 | BB | |||||||||||||||||||||||||
| 249,375 | Term Loan, 4.500%, maturing October 20, 2016 | 250,844 | |||||||||||||||||||||||||
Emdeon Business Services, LLC | Ba3 | BB | |||||||||||||||||||||||||
| 267,885 | Term Loan, 4.500%, maturing November 18, 2013 | 269,391 | |||||||||||||||||||||||||
Grifols S.A. | Ba3 | BB | |||||||||||||||||||||||||
| 875,000 | (1) | Term Loan, maturing November 23, 2016 | 882,471 | ||||||||||||||||||||||||
HCA, Inc. | Ba3 | BB | |||||||||||||||||||||||||
| 1,000,000 | Term Loan, 2.557%, maturing November 18, 2013 | 996,797 | |||||||||||||||||||||||||
| 2,000,000 | Term Loan, 3.557%, maturing March 31, 2017 | 1,998,472 | |||||||||||||||||||||||||
HGI Holding, Inc. | B1 | B+ | |||||||||||||||||||||||||
| 467,004 | Term Loan, 6.750%, maturing September 29, 2016 | 471,285 | |||||||||||||||||||||||||
IMS Health, Inc. | Ba3 | BB | |||||||||||||||||||||||||
| 1,500,000 | (1) | Term Loan, maturing August 25, 2017 | 1,508,282 | ||||||||||||||||||||||||
inVentiv Health, Inc. | Ba3 | BB– | |||||||||||||||||||||||||
| 500,000 | Term Loan, 4.750%, maturing August 04, 2016 | 502,188 | |||||||||||||||||||||||||
Medassets, Inc. | Ba3 | BB– | |||||||||||||||||||||||||
| 498,750 | Term Loan, 5.250%, maturing November 16, 2016 | 502,699 | |||||||||||||||||||||||||
Mylan Laboratories, Inc. | Baa3 | BBB | |||||||||||||||||||||||||
| 679,273 | Term Loan, 3.563%, maturing October 02, 2014 | 682,618 | |||||||||||||||||||||||||
Onex Carestream Finance, L.P. | B1 | BB– | |||||||||||||||||||||||||
| 960,000 | Term Loan, 5.000%, maturing February 25, 2017 | 940,950 | |||||||||||||||||||||||||
Royalty Pharma | Baa2 | BBB– | |||||||||||||||||||||||||
| 1,488,372 | Term Loan, 2.557%, maturing April 16, 2013 | 1,488,363 | |||||||||||||||||||||||||
| Bank Loan Ratings † (Unaudited) | |||||||||||||||||||||||||||
| Principal Amount | Borrow\Tranche Description | | Moody’s | | S&P | | Fair Value | | |||||||||||||||||||
Healthcare, Education and Childcare: (continued) | |||||||||||||||||||||||||||
Rural (Metro) Operating Company, LLC | B1 | B+ | |||||||||||||||||||||||||
| $ | 748,125 | Term Loan, 6.147%, maturing November 24, 2016 | $ | 753,736 | |||||||||||||||||||||||
Sunquest Information Systems, Inc. | Ba3 | B+ | |||||||||||||||||||||||||
| 666,667 | Term Loan, 6.250%, maturing December 16, 2016 | 670,417 | |||||||||||||||||||||||||
Vanguard Health Holdings Company II, LLC | Ba2 | BB– | |||||||||||||||||||||||||
| 1,990,013 | Term Loan, 5.000%, maturing January 29, 2016 | 1,998,287 | |||||||||||||||||||||||||
Warner Chilcott Company, LLC | Ba3 | BBB– | |||||||||||||||||||||||||
| 457,143 | (1) | Term Loan, maturing March 14, 2018 | 459,809 | ||||||||||||||||||||||||
| 228,571 | (1) | Term Loan, maturing March 14, 2018 | 229,905 | ||||||||||||||||||||||||
| 314,286 | (1) | Term Loan, maturing March 14, 2018 | 316,119 | ||||||||||||||||||||||||
| 19,641,639 | |||||||||||||||||||||||||||
Insurance: 0.4% | |||||||||||||||||||||||||||
Sedgwick Holdings, Inc. | B2 | B+ | |||||||||||||||||||||||||
| 883,509 | Term Loan, 5.000%, maturing December 30, 2016 | 885,707 | |||||||||||||||||||||||||
| 885,707 | |||||||||||||||||||||||||||
Leisure, Amusement, Entertainment: 4.0% | |||||||||||||||||||||||||||
24 Hour Fitness Worldwide, Inc. | Ba3 | B+ | |||||||||||||||||||||||||
| 1,491,244 | Term Loan, 6.750%, maturing April 22, 2016 | 1,477,823 | |||||||||||||||||||||||||
Cedar Fair, L.P. | Ba2 | BB– | |||||||||||||||||||||||||
| 498,750 | Term Loan, 4.000%, maturing December 15, 2017 | 501,819 | |||||||||||||||||||||||||
Cinemark USA, Inc. | Ba3 | BB– | |||||||||||||||||||||||||
| 1,984,925 | Term Loan, 3.534%, maturing April 29, 2016 | 1,997,507 | |||||||||||||||||||||||||
HIT Entertainment, Inc. | B2 | CCC+ | |||||||||||||||||||||||||
| 995,000 | Term Loan, 5.561%, maturing June 01, 2012 | 980,697 | |||||||||||||||||||||||||
Live Nation Entertainment, Inc. | Ba2 | BB– | |||||||||||||||||||||||||
| 1,488,722 | Term Loan, 4.500%, maturing November 07, 2016 | 1,495,235 | |||||||||||||||||||||||||
Regal Cinemas Corporation | Ba2 | BB– | |||||||||||||||||||||||||
| 1,745,625 | Term Loan, 3.557%, maturing August 23, 2017 | 1,750,710 | |||||||||||||||||||||||||
| 8,203,791 | |||||||||||||||||||||||||||
Mining, Steel, Iron & Nonprecious Metals: 2.5% | |||||||||||||||||||||||||||
Fairmount Minerals, Ltd. | B1 | BB– | |||||||||||||||||||||||||
| 1,800,000 | (1) | Term Loan, maturing March 01, 2017 | 1,804,219 | ||||||||||||||||||||||||
Novelis, Inc. | Ba2 | BB– | |||||||||||||||||||||||||
| 1,446,375 | Term Loan, 4.000%, maturing March 10, 2017 | 1,451,928 | |||||||||||||||||||||||||
Walter Energy, Inc. | B1 | BB– | |||||||||||||||||||||||||
| 1,750,000 | (1) | Term Loan, maturing March 05, 2018 | 1,763,563 | ||||||||||||||||||||||||
| 5,019,710 | |||||||||||||||||||||||||||
Non-North American Cable: 0.2% | |||||||||||||||||||||||||||
UPC Broadband Holding, B.V. | Ba3 | B+ | |||||||||||||||||||||||||
| 485,659 | Term Loan, 3.761%, maturing December 30, 2016 | 487,026 | |||||||||||||||||||||||||
| 487,026 | |||||||||||||||||||||||||||
North American Cable: 2.9% | |||||||||||||||||||||||||||
Atlantic Broadband | Ba3 | B+ | |||||||||||||||||||||||||
| 393,731 | Term Loan, 4.000%, maturing March 08, 2016 | 395,355 | |||||||||||||||||||||||||
Bresnan Communications, LLC | Ba3 | BB+ | |||||||||||||||||||||||||
| 448,875 | Term Loan, 4.500%, maturing December 14, 2017 | 452,382 | |||||||||||||||||||||||||
Cequel Communications, LLC | Ba2 | BB– | |||||||||||||||||||||||||
| 994,819 | Term Loan, 2.260%, maturing November 05, 2013 | 989,845 | |||||||||||||||||||||||||
Charter Communications Operating, LLC | Ba1 | BB+ | |||||||||||||||||||||||||
| 603,775 | Term Loan, 2.250%, maturing March 06, 2014 | 603,480 | |||||||||||||||||||||||||
| 1,488,693 | Term Loan, 3.560%, maturing September 06, 2016 | 1,494,685 | |||||||||||||||||||||||||
Insight Midwest Holdings, LLC | Ba3 | B+ | |||||||||||||||||||||||||
| 2,000,000 | Term Loan, 2.024%, maturing April 07, 2014 | 1,981,238 | |||||||||||||||||||||||||
| 5,916,985 | |||||||||||||||||||||||||||
| Bank Loan Ratings † (Unaudited) | |||||||||||||||||||||||||||
| Principal Amount | Borrow\Tranche Description | | Moody’s | | S&P | | Fair Value | | |||||||||||||||||||
Oil & Gas: 0.7% | |||||||||||||||||||||||||||
MEG Energy Corporation | Ba3 | BBB– | |||||||||||||||||||||||||
| $ | 1,490,000 | (1) | Term Loan, maturing March 16, 2018 | $ | 1,500,803 | ||||||||||||||||||||||
| 1,500,803 | |||||||||||||||||||||||||||
Other Broadcasting and Entertainment: 2.3% | |||||||||||||||||||||||||||
Getty Images, Inc | Ba3 | BB– | |||||||||||||||||||||||||
| 1,243,750 | Term Loan, 5.250%, maturing November 07, 2016 | 1,256,382 | |||||||||||||||||||||||||
The Weather Channel | Ba3 | BB– | |||||||||||||||||||||||||
| 997,500 | Term Loan, 4.250%, maturing February 13, 2017 | 1,006,021 | |||||||||||||||||||||||||
VNU | Ba2 | BB | |||||||||||||||||||||||||
| 2,481,250 | Term Loan, 4.009%, maturing May 02, 2016 | 2,488,230 | |||||||||||||||||||||||||
| 4,750,633 | |||||||||||||||||||||||||||
Other Telecommunications: 2.6% | |||||||||||||||||||||||||||
Asurion Corporation | Ba3 | B+ | |||||||||||||||||||||||||
| 1,984,887 | Term Loan, 3.267%, maturing July 03, 2014 | 1,974,254 | |||||||||||||||||||||||||
| 249,375 | Term Loan, 6.750%, maturing March 31, 2015 | 252,982 | |||||||||||||||||||||||||
MetroPCS Wireless, Inc. | Ba1 | BB | |||||||||||||||||||||||||
| 987,933 | Term Loan, 4.112%, maturing November 04, 2016 | 991,373 | |||||||||||||||||||||||||
tw telecom, Inc. | Ba1 | B+ | |||||||||||||||||||||||||
| 1,987,040 | Term Loan, 3.500%, maturing December 29, 2016 | 1,996,975 | |||||||||||||||||||||||||
| 5,215,584 | |||||||||||||||||||||||||||
Personal & Nondurable Consumer Products: 1.0% | |||||||||||||||||||||||||||
Advantage Sales & Marketing, Inc. | Ba3 | B+ | |||||||||||||||||||||||||
| 997,500 | Term Loan, 5.250%, maturing December 18, 2017 | 1,003,418 | |||||||||||||||||||||||||
Bushnell, Inc. | B2 | B– | |||||||||||||||||||||||||
| 499,330 | Term Loan, 4.553%, maturing August 24, 2013 | 489,344 | |||||||||||||||||||||||||
Jarden Corporation | Ba1 | BB+ | |||||||||||||||||||||||||
| 616,190 | Term Loan, 3.553%, maturing January 26, 2015 | 618,994 | |||||||||||||||||||||||||
| 2,111,756 | |||||||||||||||||||||||||||
Personal, Food & Miscellaneous: 5.3% | |||||||||||||||||||||||||||
Acosta, Inc. | Ba3 | B+ | |||||||||||||||||||||||||
| 1,225,000 | Term Loan, 4.750%, maturing March 01, 2018 | 1,229,083 | |||||||||||||||||||||||||
Advance Pierre Foods | B1 | B+ | |||||||||||||||||||||||||
| 995,000 | Term Loan, 7.000%, maturing September 30, 2016 | 1,001,426 | |||||||||||||||||||||||||
Burger King Corporation | Ba3 | BB– | |||||||||||||||||||||||||
| 2,314,629 | Term Loan, 4.500%, maturing October 19, 2016 | 2,314,414 | |||||||||||||||||||||||||
Dennys, Inc. | B1 | B+ | |||||||||||||||||||||||||
| 920,000 | Term Loan, 7.000%, maturing September 20, 2016 | 926,900 | |||||||||||||||||||||||||
DineEquity, Inc. | Ba2 | BB– | |||||||||||||||||||||||||
| 317,015 | Term Loan, 4.250%, maturing October 19, 2017 | 319,591 | |||||||||||||||||||||||||
Dunkin Brands, Inc. | B2 | B | |||||||||||||||||||||||||
| 1,167,075 | Term Loan, 4.250%, maturing November 23, 2017 | 1,174,265 | |||||||||||||||||||||||||
N.E.W. Customer Services Companies, Inc. | Ba3 | B+ | |||||||||||||||||||||||||
| 1,445,010 | Term Loan, 6.000%, maturing March 23, 2016 | 1,444,649 | |||||||||||||||||||||||||
NBTY, Inc. | Ba3 | BB– | |||||||||||||||||||||||||
| 1,396,500 | Term Loan, 4.250%, maturing October 02, 2017 | 1,401,301 | |||||||||||||||||||||||||
OSI Restaurant Partners, Inc. | B3 | B+ | |||||||||||||||||||||||||
| 83,094 | Term Loan, 4.035%, maturing June 14, 2013 | 80,827 | |||||||||||||||||||||||||
| 857,306 | Term Loan, 2.563%, maturing June 14, 2014 | 833,908 | |||||||||||||||||||||||||
| 10,726,364 | |||||||||||||||||||||||||||
Printing & Publishing: 3.2% | |||||||||||||||||||||||||||
Cengage Learning, Inc. | B2 | B+ | |||||||||||||||||||||||||
| 1,984,576 | Term Loan, 2.500%, maturing July 03, 2014 | 1,905,977 | |||||||||||||||||||||||||
Cenveo Corporation | Ba3 | BB– | |||||||||||||||||||||||||
| 793,013 | Term Loan, 6.250%, maturing December 21, 2016 | 797,473 | |||||||||||||||||||||||||
Merrill Communications, LLC | B2 | B– | |||||||||||||||||||||||||
| 1,000,000 | Term Loan, 7.500%, maturing December 24, 2012 | 1,000,000 | |||||||||||||||||||||||||
| Bank Loan Ratings † (Unaudited) | |||||||||||||||||||||||||||
| Principal Amount | Borrow\Tranche Description | | Moody’s | | S&P | | Fair Value | | |||||||||||||||||||
Printing & Publishing: (continued) | |||||||||||||||||||||||||||
Quad/Graphics, Inc. | Ba2 | BBB– | |||||||||||||||||||||||||
| $ | 1,987,494 | Term Loan, 5.500%, maturing April 14, 2016 | $ | 1,990,789 | |||||||||||||||||||||||
R.H. Donnelley Corporation | B1 | B | |||||||||||||||||||||||||
| 927,313 | Term Loan, 9.000%, maturing October 24, 2014 | 731,418 | |||||||||||||||||||||||||
| 6,425,657 | |||||||||||||||||||||||||||
Radio and TV Broadcasting: 1.9% | |||||||||||||||||||||||||||
Citadel Broadcasting Corporation | Baa3 | BB+ | |||||||||||||||||||||||||
| 297,000 | Term Loan, 4.250%, maturing December 30, 2016 | 297,593 | |||||||||||||||||||||||||
FoxCo Acquisition, LLC | B1 | B+ | |||||||||||||||||||||||||
| 1,000,000 | Term Loan, 4.750%, maturing July 16, 2015 | 1,001,875 | |||||||||||||||||||||||||
Univision Communications, Inc. | B2 | B | |||||||||||||||||||||||||
| 2,710,485 | (1) | Term Loan, 4.496%, maturing March 31, 2017 | 2,645,626 | ||||||||||||||||||||||||
| 3,945,094 | |||||||||||||||||||||||||||
Retail Stores: 9.7% | |||||||||||||||||||||||||||
Amscan Holdings, Inc. | B2 | B | |||||||||||||||||||||||||
| 920,375 | Term Loan, 6.750%, maturing December 04, 2017 | 927,738 | |||||||||||||||||||||||||
Burlington Coat Factory | B3 | B– | |||||||||||||||||||||||||
| 1,000,000 | Term Loan, 6.250%, maturing February 18, 2017 | 988,906 | |||||||||||||||||||||||||
Dollar General Corporation | Ba2 | BBB– | |||||||||||||||||||||||||
| 2,000,000 | Term Loan, 3.021%, maturing July 07, 2014 | 2,002,046 | |||||||||||||||||||||||||
General Nutrition Centers, Inc. | B1 | B+ | |||||||||||||||||||||||||
| 445,000 | Term Loan, 4.250%, maturing March 02, 2018 | 445,623 | |||||||||||||||||||||||||
Guitar Center, Inc. | Caa1 | B– | |||||||||||||||||||||||||
| 1,000,000 | (1) | Term Loan, maturing October 09, 2014 | 971,250 | ||||||||||||||||||||||||
J. Crew | B1 | B | |||||||||||||||||||||||||
| 1,400,000 | (1) | Term Loan, 4.750%, maturing March 07, 2018 | 1,397,120 | ||||||||||||||||||||||||
Jo-Ann Stores, Inc. | B1 | B+ | |||||||||||||||||||||||||
| 1,300,000 | Term Loan, 4.750%, maturing March 22, 2018 | 1,291,388 | |||||||||||||||||||||||||
Leslies Poolmart, Inc. | Ba3 | B+ | |||||||||||||||||||||||||
| 847,875 | Term Loan, 4.500%, maturing November 21, 2016 | 854,764 | |||||||||||||||||||||||||
Michaels Stores, Inc. | B2 | B+ | |||||||||||||||||||||||||
| 1,388,647 | Term Loan, 2.584%, maturing October 31, 2013 | 1,377,460 | |||||||||||||||||||||||||
| 1,388,639 | Term Loan, 4.834%, maturing July 31, 2016 | 1,394,957 | |||||||||||||||||||||||||
Neiman Marcus Group, Inc. | B2 | BB– | |||||||||||||||||||||||||
| 1,992,420 | (1) | Term Loan, 4.310%, maturing April 06, 2016 | 1,994,496 | ||||||||||||||||||||||||
Petco Animal Supplies, Inc. | B1 | B | |||||||||||||||||||||||||
| 1,386,000 | Term Loan, 4.500%, maturing November 24, 2017 | 1,391,563 | |||||||||||||||||||||||||
Pilot Travel Centers, LLC | Ba2 | BB+ | |||||||||||||||||||||||||
| 1,100,000 | (1) | Term Loan, maturing March 30, 2018 | 1,105,500 | ||||||||||||||||||||||||
Savers | Ba3 | B+ | |||||||||||||||||||||||||
| 500,000 | Term Loan, 4.250%, maturing March 03, 2017 | 503,750 | |||||||||||||||||||||||||
The Gymboree Corporation | B1 | B+ | |||||||||||||||||||||||||
| 1,911,210 | Term Loan, 5.000%, maturing February 23, 2018 | 1,913,201 | |||||||||||||||||||||||||
Toys “R” Us, Inc. | B1 | BB– | |||||||||||||||||||||||||
| 1,243,750 | Term Loan, 6.000%, maturing September 01, 2016 | 1,251,955 | |||||||||||||||||||||||||
| 19,811,717 | |||||||||||||||||||||||||||
Satellite: 0.5% | |||||||||||||||||||||||||||
Intelsat Jackson Holdings, S.A. | B1 | BB– | |||||||||||||||||||||||||
| 1,000,000 | Term Loan, 5.250%, maturing April 02, 2018 | 1,007,888 | |||||||||||||||||||||||||
| 1,007,888 | |||||||||||||||||||||||||||
Telecommunications Equipment: 0.6% | |||||||||||||||||||||||||||
CommScope, Inc. | Ba3 | BB | |||||||||||||||||||||||||
| 517,000 | Term Loan, 5.000%, maturing January 14, 2018 | 521,201 | |||||||||||||||||||||||||
Syniverse Holdings, Inc. | B1 | BB– | |||||||||||||||||||||||||
| 631,829 | Term Loan, 5.250%, maturing December 21, 2017 | 637,555 | |||||||||||||||||||||||||
| 1,158,756 | |||||||||||||||||||||||||||
| Bank Loan Ratings † (Unaudited) | |||||||||||||||||||||||||||
| Principal Amount | Borrow\Tranche Description | | Moody’s | | S&P | | Fair Value | | |||||||||||||||||||
Utilities: 2.3% | |||||||||||||||||||||||||||
Calpine Corporation | B1 | B+ | |||||||||||||||||||||||||
| $ | 900,000 | (1) | Term Loan, maturing April 02, 2018 | $ | 905,188 | ||||||||||||||||||||||
NRG Energy, Inc. | Baa3 | BB+ | |||||||||||||||||||||||||
| 1,654,167 | Term Loan, 3.502%, maturing August 31, 2015 | 1,664,634 | |||||||||||||||||||||||||
| 1,333,333 | Term Loan, 3.557%, maturing August 31, 2015 | 1,340,357 | |||||||||||||||||||||||||
Texas Competitive Electric Holdings Company, LLC | B2 | B– | |||||||||||||||||||||||||
| 496,144 | Term Loan, 3.759%, maturing October 10, 2014 | 418,104 | |||||||||||||||||||||||||
| 496,222 | Term Loan, 3.759%, maturing October 10, 2014 | 415,462 | |||||||||||||||||||||||||
| 4,743,745 | |||||||||||||||||||||||||||
Total Loans (Cost $181,130,675) | 183,109,053 | ||||||||||||||||||||||||||
Shares | Market Value | ||||||||||||||||||||||||||
| Short-term Investments: 15.1% | |||||||||||||||||||||||
Mutual Fund: 15.1% | |||||||||||||||||||||||
| 30,812,050 | State Street Institutional Liquid Reserves Fund — Institutional Class | $ | 30,812,050 | ||||||||||||||||||||
Total Mutual Fund (Cost $30,812,050) | 30,812,050 | ||||||||||||||||||||||
Total Investments (Cost $211,942,725)** | 105.0% | $ | 213,921,103 | ||||||||||||||||||||
Other Assets and Liabilities — Net | (5.0) | (10,278,862 | ) | ||||||||||||||||||||
Net Assets | 100.0% | $ | 203,642,241 | ||||||||||||||||||||
| * | Loans, while exempt from registration under the Securities Act of 1933, as amended, contain certain restrictions on resale and cannot be sold publicly. These loans bear interest (unless otherwise noted) at rates that float periodically at a margin above the London Inter-Bank Offered Rate (“LIBOR”) and other short-term rates. | ||||||||||||||||||||||
† | Bank Loans rated below Baa by Moody’s Investor Services, Inc. and BBB by Standard & Poor’s are considered to be below investment grade. | ||||||||||||||||||||||
| (1) | All or a portion of the loan is pending settlement. Contract rates do not take effect until settlement date. | ||||||||||||||||||||||
| ** | For Federal Income Tax purposes cost of investments is $211,942,760. | ||||||||||||||||||||||
| Net unrealized appreciation consists of the following: | |||||||||||||||||||||||
| Gross Unrealized Appreciation | $ | 2,186,751 | |||||||||||||||||||||
| Gross Unrealized Depreciation | (208,408 | ) | |||||||||||||||||||||
| Net Unrealized Appreciation | $ | 1,978,343 | |||||||||||||||||||||
| Quoted Prices in Active Markets for Identical Investments (Level 1) | Significant Other Observable Inputs (Level 2) | Significant Unobservable Inputs (Level 3) | Fair Value at 03/31/2011 | |||||||||||||||
|---|---|---|---|---|---|---|---|---|---|---|---|---|---|---|---|---|---|---|
Asset Table | ||||||||||||||||||
Investments, at value | ||||||||||||||||||
| Loans | $ | — | $ | 183,109,053 | $ | — | $ | 183,109,053 | ||||||||||
| Short-Term Investments | 30,812,050 | — | — | 30,812,050 | ||||||||||||||
| Total Investments, at value | $ | 30,812,050 | $ | 183,109,053 | $ | — | $ | 213,921,103 | ||||||||||
Other Financial Instruments+ | ||||||||||||||||||
| Futures | 2,156 | — | — | 2,156 | ||||||||||||||
| Unfunded Commitments | — | 3,180 | — | 3,180 | ||||||||||||||
| Total Assets | $ | 30,814,206 | $ | 183,112,233 | $ | — | $ | 213,926,439 | ||||||||||
| ˆ | See Note 2, “Significant Accounting Policies” in the Notes to Financial Statements for additional information. |
| + | Other Financial Instruments are securities or derivatives not reflected in the Portfolio of Investments and may include open forward foreign currency contracts, futures, swaps, unfunded commitments and written options. Forward foreign currency contracts, futures and unfunded commitments are reported at their unrealized gain/loss at measurement date which represents the amount due to/from the Fund. Swaps and written options are reported at their fair value at measurement date. |
| Contract Description | Number of Contracts | Expiration Date | Notional Value | Unrealized Appreciation | ||||||||||||||
|---|---|---|---|---|---|---|---|---|---|---|---|---|---|---|---|---|---|---|
Short Contracts | ||||||||||||||||||
| U.S. Treasury 5-Year Note | 3 | 06/21/11 | $350,367 | $2,156 | ||||||||||||||
| $350,367 | $2,156 | |||||||||||||||||
| Derivatives not accounted for as hedging instruments | Location on Statement of Assets and Liabilities | Fair Value | ||||||||
|---|---|---|---|---|---|---|---|---|---|---|
Asset Derivatives | ||||||||||
| Interest rate contracts | Net Assets — Unrealized appreciation** | $2,156 | ||||||||
Total Asset Derivatives | $2,156 | |||||||||
| * | Includes cumulative appreciation/depreciation of futures contracts as reported in the table following the Portfolio of Investments. |
| Amount of Realized Gain or (Loss) on Derivatives Recognized in Income | ||||||
|---|---|---|---|---|---|---|
| Derivatives not accounted for as hedging instruments | Futures | |||||
| Interest rate contracts | $ | 3,992 | ||||
Total | $ | 3,992 | ||||
| Change in Unrealized Appreciation or Depreciation on Derivatives Recognized in Income | ||||||
|---|---|---|---|---|---|---|
| Derivatives not accounted for as hedging instruments | Futures | |||||
| Interest rate contracts | $ | 2,156 | ||||
Total | $ | 2,156 | ||||
| Fund Name | Type | Per Share Amount | ||||||||
|---|---|---|---|---|---|---|---|---|---|---|
| ING Floating Rate Fund | ||||||||||
| Class A | NII | $0.1857 | ||||||||
| Class C | NII | $0.1406 | ||||||||
| Class I | NII | $0.2008 | ||||||||
| Class R | NII | $0.1682 | ||||||||
| Class W | NII | $0.2008 | ||||||||
| All Classes | STCG | $0.0092 | ||||||||
| Name, Address and Age | Position(s) Held with the Trust | Term of Office and Length of Time Served(1) | Principal Occupation(s) —During the Past 5 Years | Number of Funds in Fund Complex Overseen by Trustee(2) | Other Board Positions Held by Trustee | |||||||||||||||||
|---|---|---|---|---|---|---|---|---|---|---|---|---|---|---|---|---|---|---|---|---|---|---|
Independent Trustees | ||||||||||||||||||||||
| Colleen D. Baldwin 7337 East Doubletree Ranch Rd. Suite 100 Scottsdale, Arizona 85258 Age: 50 | Trustee | November 2007–Present | President, Glantuam Partners, LLC, a business consulting firm (January 2009–Present) and Consultant (January 2005–Present). | 132 | None. | |||||||||||||||||
| John V. Boyer 7337 East Doubletree Ranch Rd. Suite 100 Scottsdale, Arizona 85258 Age: 57 | Trustee | January 2005–Present | President and Chief Executive Officer, Bechtler Arts Foundation, an arts and education foundation (January 2008–Present). Formerly, Consultant (July 2007–February 2008); President and Chief Executive Officer, Franklin and Eleanor Roosevelt Institute, a public policy foundation (March 2006–July 2007). | 132 | None. | |||||||||||||||||
| Patricia W. Chadwick 7337 East Doubletree Ranch Rd. Suite 100 Scottsdale, Arizona 85258 Age: 62 | Trustee | January 2006–Present | Consultant and President, Ravengate Partners LLC, a consulting firm that provides advice regarding financial markets and the global economy (January 2000–Present). | 132 | Wisconsin Energy Corp. (June 2006–Present) and The Royce Fund (December 2009–Present). | |||||||||||||||||
| Peter S. Drotch 7337 East Doubletree Ranch Rd. Suite 100 Scottsdale, Arizona 85258 Age: 69 | Trustee | November 2007–Present | Retired. Formerly, Partner, PricewaterhouseCoopers LLP, an accounting firm, until July 2000. | 132 | First Marblehead Corporation (September 2003–Present). | |||||||||||||||||
| J. Michael Earley 7337 East Doubletree Ranch Rd. Suite 100 Scottsdale, Arizona 85258 Age: 66 | Trustee | February 2002–Present | Retired. Formerly, Banking President and Chief Executive Officer, Bankers Trust Company, N.A., Des Moines (June 1992–December 2008). | 132 | None. | |||||||||||||||||
| Patrick W. Kenny 7337 East Doubletree Ranch Rd. Suite 100 Scottsdale, Arizona 85258 Age: 68 | Trustee | January 2005–Present | Retired. Formerly, President and Chief Executive Officer, International Insurance Society (June 2001–June 2009). | 132 | Assured Guaranty Ltd. (April 2004–Present). | |||||||||||||||||
| Sheryl K. Pressler 7337 East Doubletree Ranch Rd. Suite 100 Scottsdale, Arizona 85258 Age: 60 | Trustee | January 2006–Present | Consultant (May 2001–Present). | 132 | Stillwater Mining Company (May 2002–Present). | |||||||||||||||||
| Roger B. Vincent 7337 East Doubletree Ranch Rd. Suite 100 Scottsdale, Arizona 85258 Age: 65 | Chairman/ Trustee | February 2002–Present | President, Springwell Corporation, a corporate finance firm (March 1989–Present). | 132 | UGI Corporation (February 2006–Present) and UGI Utilities, Inc. (February 2006–Present). | |||||||||||||||||
| Name, Address and Age | Position(s) Held with the Trust | Term of Office and Length of Time Served(1) | Principal Occupation(s) —During the Past 5 Years | Number of Funds in Fund Complex Overseen by Trustee(2) | Other Board Positions Held by Trustee | |||||||||||||||||
|---|---|---|---|---|---|---|---|---|---|---|---|---|---|---|---|---|---|---|---|---|---|---|
Robert W. Crispin(3) 7337 East Doubletree Ranch Rd. Suite 100 Scottsdale, Arizona 85258 Age: 64 | Trustee | November 2007–Present | Retired. Formerly, Chairman and Chief Executive Officer, ING Investment Management Co. (July 2001–December 2007). | 132 | Intact Financial Corporation (December 2004–Present) and PFM Group (November 2010–Present). | |||||||||||||||||
Shaun P. Mathews(3)(4) 7337 East Doubletree Ranch Rd. Suite 100 Scottsdale, Arizona 85258 Age: 55 | Trustee | November 2007–Present | President and Chief Executive Officer, ING Investments, LLC(5) (November 2006– Present). Formerly, Head of ING Mutual Funds and Investment Products (November 2004–November 2006). | 169 | ING Capital Corporation, LLC (December 2005–Present). | |||||||||||||||||
(1) | The tenure of each Trustee is subject to the Board’s retirement policy, which states that each Independent Trustee shall retire from service as a Trustee at the conclusion of the first regularly scheduled meeting of the Board that is held after the Trustee reaches the age of 72. A unanimous vote of the Board may extend the retirement date of a Trustee for up to one year. An extension may be permitted if the retirement would trigger a requirement to hold a meeting of shareholders of the Fund under applicable law, whether for purposes of appointing a successor to the Trustee or if otherwise necessary under applicable law, in which case the extension would apply until such time as the shareholder meeting can be held or is no longer needed. |
(2) | For the purposes of this table, “Fund Complex” means the following investment companies: ING Asia Pacific High Dividend Equity Income Fund; ING Emerging Markets High Dividend Equity Fund; ING Emerging Markets Local Bond Fund; ING Equity Trust; ING Funds Trust; ING Global Advantage and Premium Opportunity Fund; ING Global Equity Dividend and Premium Opportunity Fund; ING Infrastructure, Industrials and Materials Fund; ING International High Dividend Equity Income Fund; ING Investors Trust; ING Mayflower Trust; ING Mutual Funds; ING Partners, Inc.; ING Prime Rate Trust; ING Risk Managed Natural Resources Fund; ING Senior Income Fund; ING Separate Portfolios Trust; ING Variable Insurance Trust; and ING Variable Products Trust. |
(3) | Messrs. Mathews and Crispin are deemed to be “interested persons” of the Fund as defined in the 1940 Act because of their affiliation with ING Groep, N.V., the parent corporation of the Investment Adviser, ING Investments, LLC and the Distributor, ING Investments Distributor, LLC. |
(4) | For Mr. Mathews, the Fund Complex also includes the following investment companies: ING Balanced Portfolio, Inc.; ING Intermediate Bond Portfolio; ING Money Market Portfolio; ING Series Fund, Inc.; ING Strategic Allocation Portfolios, Inc.; ING Variable Funds; and ING Variable Portfolios, Inc. |
(5) | ING Investments, LLC was previously named ING Pilgrim Investments, LLC. ING Pilgrim Investments, LLC is the successor in interest to ING Pilgrim Investments, Inc., which was previously known as Pilgrim Investments, Inc. and before it was known as Pilgrim America Investments, Inc. |
| Name, Address and Age | Position(s) Held With the Trust | Term of Office and Length of Time Served(1) | Principal Occupation(s)— During the Past 5 Years | |||||||||||
|---|---|---|---|---|---|---|---|---|---|---|---|---|---|---|
| Shaun P. Mathews 7337 East Doubletree Ranch Rd. Suite 100 Scottsdale, Arizona 85258 Age: 55 | President and Chief Executive Officer | November 2006–Present | President and Chief Executive Officer, ING Investments, LLC(2) (November 2006–Present). Formerly, Head of ING Mutual Funds and Investment Products (November 2004–November 2006). | |||||||||||
| Michael J. Roland 7337 East Doubletree Ranch Rd. Suite 100 Scottsdale, Arizona 85258 Age: 53 | Executive Vice President Chief Compliance Officer | February 2002–Present March 2011–Present | Chief Compliance Officer of the ING Funds, Directed Services LLC(4) and ING Investments, LLC(2) (March 2011–Present) and Executive Vice President and Chief Operating Officer, ING Investments, LLC(2) and ING Funds Services, LLC(3) (January 2007–Present). Formerly, Executive Vice President, Head of Product Management, ING Investments, LLC(2) and ING Funds Services, LLC(3) (January 2005–January 2007). | |||||||||||
| Stanley D. Vyner 230 Park Avenue New York, New York 10169 Age: 61 | Executive Vice President Chief Investment Risk Officer | October 2000–Present September 2009–Present | Executive Vice President, ING Investments, LLC(2) (July 2000–Present) and Chief Investment Risk Officer, ING Investments, LLC(2) (January 2003–Present). | |||||||||||
| Todd Modic 7337 East Doubletree Ranch Rd. Suite 100 Scottsdale, Arizona 85258 Age: 43 | Senior Vice President, Chief/Principal Financial Officer and Assistant Secretary | March 2005–Present | Senior Vice President, ING Funds Services, LLC(3) (March 2005–Present). | |||||||||||
| Kimberly A. Anderson 7337 East Doubletree Ranch Rd. Suite 100 Scottsdale, Arizona 85258 Age: 46 | Senior Vice President | November 2003–Present | Senior Vice President, ING Investments, LLC(2) (October 2003–Present). | |||||||||||
| Robert Terris 7337 East Doubletree Ranch Rd. Suite 100 Scottsdale, Arizona 85258 Age: 40 | Senior Vice President | May 2006–Present | Senior Vice President, Head of Division Operations, ING Funds Services, LLC(3) (May 2006–Present). Formerly, Vice President of Administration, ING Funds Services, LLC(3) (October 2001–May 2006). | |||||||||||
| Robyn L. Ichilov 7337 East Doubletree Ranch Rd. Suite 100 Scottsdale, Arizona 85258 Age: 43 | Vice President and Treasurer | October 2000–Present March 2001–Present | Vice President and Treasurer, ING Funds Services, LLC(3) (November 1995–Present) and ING Investments, LLC(2) (August 1997–Present). | |||||||||||
| Lauren D. Bensinger 7337 East Doubletree Ranch Rd. Suite 100 Scottsdale, Arizona 85258 Age: 57 | Vice President | February 2003–Present | Vice President, ING Investments, LLC(2) and ING Funds Services, LLC (3) (February 1996–Present); Director of Compliance, ING Investments, LLC(2) (October 2004–Present); and Vice President and Money Laundering Reporting Officer, ING Investments Distributor, LLC(5) (April 2010–Present);. Formerly, Chief Compliance Officer, ING Investments Distributor, LLC(5) (August 1995–April 2010). | |||||||||||
| William Evans 10 State House Square Hartford, Connecticut 06103 Age: 38 | Vice President | September 2007–Present | Senior Vice President (March 2010–Present) and Head of Manager Research and Selection Group (April 2007–Present). Formerly, Vice President, U.S. Mutual Funds and Investment Products (May 2005–April 2007). | |||||||||||
| Maria M. Anderson 7337 East Doubletree Ranch Rd. Suite 100 Scottsdale, Arizona 85258 Age: 53 | Vice President | September 2004–Present | Vice President, ING Funds Services, LLC(3) (September 2004–Present). | |||||||||||
| Denise Lewis 7337 East Doubletree Ranch Rd. Suite 100 Scottsdale, Arizona 85258 Age: 47 | Vice President | January 2007–Present | Vice President, ING Funds Services, LLC(3) (December 2006–Present). Formerly, Senior Vice President, UMB Investment Services Group, LLC (November 2003–December 2006). | |||||||||||
| Name, Address and Age | Position(s) Held With the Trust | Term of Office and Length of Time Served(1) | Principal Occupation(s)— During the Past 5 Years | |||||||||||
|---|---|---|---|---|---|---|---|---|---|---|---|---|---|---|
| Kimberly K. Springer 7337 East Doubletree Ranch Rd. Suite 100 Scottsdale, Arizona 85258 Age: 54 | Vice President | March 2006–Present | Vice President, ING Investment Management — ING Funds (March 2010–Present); Vice President, ING Funds Services, LLC(3) (March 2006–Present) and Managing Paralegal, Registration Statements (June 2003–Present). | |||||||||||
| Craig Wheeler 7337 East Doubletree Ranch Rd. Suite 100 Scottsdale, Arizona 85258 Age: 42 | Assistant Vice President | May 2008–Present | Assistant Vice President — Director of Tax, ING Funds Services, LLC(3) (March 2008– Present). Formerly, Tax Manager, ING Funds Services, LLC(3) (March 2005–March 2008). | |||||||||||
| Huey P. Falgout, Jr. 7337 East Doubletree Ranch Rd. Suite 100 Scottsdale, Arizona 85258 Age: 47 | Secretary | August 2003–Present | Senior Vice President and Chief Counsel, ING Investment Management — ING Funds (March 2010–Present). Formerly, Chief Counsel, ING Americas, U.S. Legal Services (October 2003–March 2010). | |||||||||||
| Theresa K. Kelety 7337 East Doubletree Ranch Rd. Suite 100 Scottsdale, Arizona 85258 Age: 48 | Assistant Secretary | August 2003–Present | Vice President and Senior Counsel, ING Investment Management — ING Funds (March 2010–Present). Formerly, Senior Counsel, ING Americas, U.S. Legal Services (April 2008–March 2010) and Counsel, ING Americas, U.S. Legal Services (April 2003–April 2008). | |||||||||||
| Paul Caldarelli 7337 East Doubletree Ranch Rd. Suite 100 Scottsdale, Arizona 85258 Age: 59 | Assistant Secretary | June 2010–Present | Vice President and Senior Counsel, ING Investment Management — ING Funds (March 2010–Present). Formerly, Senior Counsel, ING Americas, U.S. Legal Services (April 2008–March 2010) and Counsel, ING Americas, U.S. Legal Services (May 2005–April 2008). | |||||||||||
| Kathleen Nichols 7337 East Doubletree Ranch Rd. Suite 100 Scottsdale, Arizona 85258 Age: 35 | Assistant Secretary | May 2008–Present | Vice President and Counsel, ING Investment Management–ING Funds (March 2010– Present). Formerly, Counsel, ING Americas, U.S. Legal Services (February 2008–March 2010) and Associate, Ropes & Gray LLP (September 2005–February 2008). | |||||||||||
(1) | The officers hold office until the next annual meeting of the Trustees and until their successors shall have been elected and qualified. |
(2) | ING Investments, LLC was previously named ING Pilgrim Investments, LLC. ING Pilgrim Investments, LLC is the successor in interest to ING Pilgrim Investments, Inc., which was previously known as Pilgrim Investments, Inc. and before that was known as Pilgrim America Investments, Inc. |
(3) | ING Funds Services, LLC was previously named ING Pilgrim Group, LLC. ING Pilgrim Group, LLC is the successor in interest to ING Pilgrim Group, Inc., which was previously known as Pilgrim Group, Inc. and before that was known as Pilgrim America Group, Inc. |
(4) | Directed Services LLC is the successor in interest to Directed Services, Inc. |
(5) | ING Investments Distributor, LLC was previously named ING Funds Distributor, LLC. ING Funds Distributor, LLC is the successor in interest to ING Funds Distributor, Inc., which was previously known as ING Pilgrim Securities, Inc., and before that, was known as Pilgrim Securities, Inc., and before that was known as Pilgrim America Securities, Inc. |
ING Core Equity Research Fund
ING Real Estate Fund
ING Capital Allocation Fund
ING Corporate Leaders 100 Fund
ING Equity Dividend Fund
ING Growth Opportunities Fund
ING MidCap Opportunities Fund
ING Small Company Fund
ING SmallCap Opportunities Fund
ING Tactical Asset Allocation Fund
ING Index Plus LargeCap Fund
ING Index Plus MidCap Fund
ING Index Plus SmallCap Fund
ING Value Choice Fund
ING GNMA Income Fund
ING High Yield Bond Fund
ING Intermediate Bond Fund
ING Global Equity Dividend Fund
ING Global Natural Resources Fund
ING Global Real Estate Fund
ING Global Value Choice Fund
ING Alternative Beta Fund
ING Emerging Countries Fund
ING Global Opportunities Fund
ING Greater China Fund
ING Index Plus International Equity Fund
ING International Capital Appreciation Fund
ING International Core Fund
ING International Growth Fund
ING International Real Estate Fund
ING International SmallCap Multi-Manager Fund
ING International Value Fund
ING International Value Choice Fund
ING Russia Fund
ING Global Bond Fund
ING Diversified International Fund
ING Global Target Payment Fund
ING Senior Income Fund
ING Floating Rate Fund
ING Money Market Fund
| * | An investment in the funds is not insured or guaranteed by the Federal Deposit Insurance Corporation or any other government agency. Although the fund seeks to preserve the value of your investment at $1.00 per share, it is possible to lose money by investing in the fund. |
ING Investments, LLC
7337 East Doubletree Ranch Road, Suite 100
Scottsdale, Arizona 85258
ING Funds Services, LLC
7337 East Doubletree Ranch Road, Suite 100
Scottsdale, Arizona 85258
ING Investments Distributor, LLC
7337 East Doubletree Ranch Road, Suite 100
Scottsdale, Arizona 85258
BNY Mellon Investment Servicing (U.S.) Inc.
301 Bellevue Parkway
Wilmington, Delaware 19809
KPMG LLP
Two Financial Center
60 South Street
Boston, Massachusetts 02111
State Street Bank and Trust Company
801 Pennsylvania Avenue
Kansas City, Missouri 64105
Dechert LLP
1775 I Street, N.W.
Washington, D.C. 20006
Call us from 9:00 a.m. to 7:00 p.m. Eastern time on any business day for account or other information, at (800) 992-0180
AR-UFR (0311-052411) |
Table of Contents
Item 2. Code of Ethics.
As of the end of the period covered by this report, Registrant had adopted a code of ethics, as defined in Item 2 of Form N-CSR, that applies to the Registrant’s principal executive officer and principal financial officer. There were no amendments to the Code during the period covered by the report. The Registrant did not grant any waivers, including implicit waivers, from any provisions of the Code during the period covered by this report. The code of ethics is filed herewith pursuant to Item 10(a)(1), Exhibit 99.CODE ETH.
Item 3. Audit Committee Financial Expert.
The Board of Trustees has determined that J. Michael Early and Peter S. Drotch are an audit committee financial experts, as defined in Item 3 of Form N-CSR. Mr. Early and Mr. Drotch are “independent” for purposes of Item 3 of Form N-CSR.
Item 4. Principal Accountant Fees and Services.
| (a) | Audit Fees: The aggregate fees billed for each of the last two fiscal years for professional services rendered by KPMG LLP (“KPMG”), the principal accountant for the audit of the registrant’s annual financial statements, for services that are normally provided by the accountant in connection with statutory and regulatory filings or engagements for those fiscal years were $96,300 for year ended March 31, 2011 and $88,000 for year ended March 31, 2010. |
| (b) | Audit-Related Fees: The aggregate fees billed in the last fiscal year for assurance and related services by KPMG that are reasonably related to the performance of the audit of the registrant’s financial statements and are not reported under paragraph (a) of this Item were $8,600 for the year ended March 31, 2011 and $10,750 for year ended March 31, 2010. |
| (c) | Tax Fees: The aggregate fees billed in each of the last two fiscal years for professional services rendered by KPMG for tax compliance, tax advice, and tax planning were $10,760 in the year ended March 31, 2011 and $39,025 in the year ended March 31, 2010. Such services included review of excise distribution calculations (if applicable), preparation of the Funds’ federal, state and excise tax returns, tax services related to mergers and routine consulting. |
| (d) | All Other Fees: The aggregate fees billed in each of the last two fiscal years for products and services provided by KPMG, other than the services reported in paragraphs (a) through (c) of this Item. |
| None. |
| (e) (1) | Audit Committee Pre-Approval Policies and Procedures |
Table of Contents
AUDIT AND NON-AUDIT SERVICES
PRE-APPROVAL POLICY
| I. | Statement of Principles |
Under the Sarbanes-Oxley Act of 2002 (the “Act”), the Audit Committee of the Board of Directors or Trustees (the “Committee”) of the ING Funds (each a “Fund,” collectively, the “Funds”) set out on Exhibit A to this Audit and Non-Audit Services Pre-Approval Policy (“Policy”) is responsible for the oversight of the work of the Funds’ independent auditors. As part of its responsibilities, the Committee must pre-approve the audit and non-audit services performed by the auditors in order to assure that the provision of these services does not impair the auditors’ independence from the Funds. The Committee has adopted, and the Board has ratified, this Policy, which sets out the procedures and conditions under which the services of the independent auditors may be pre-approved.
Under Securities and Exchange Commission (“SEC”) rules promulgated in accordance with the Act, the Funds may establish two different approaches to pre-approving audit and non-audit services. The Committee may approve services without consideration of specific case-by-case services (“general pre-approval”) or it may pre-approve specific services (“specific pre-approval”). The Committee believes that the combination of these approaches contemplated in this Policy results in an effective and efficient method for pre-approving audit and non-audit services to be performed by the Funds’ independent auditors. Under this Policy, services that are not of a type that may receive general pre-approval require specific pre-approval by the Committee. Any proposed services that exceed pre-approved cost levels or budgeted amounts will also require the Committee’s specific pre-approval.
For both types of approval, the Committee considers whether the subject services are consistent with the SEC’s rules on auditor independence and that such services are compatible with maintaining the auditors independence. The Committee also considers whether a particular audit firm is in the best position to provide effective and efficient services to the Funds. Reasons that the auditors are in the best position include the auditors’ familiarity with the Funds’ business, personnel, culture, accounting systems, risk profile, and other factors, and whether the services will enhance the Funds’ ability to manage and control risk or improve audit quality. Such factors will be considered as a whole, with no one factor being determinative.
The appendices attached to this Policy describe the audit, audit-related, tax-related, and other services that have the Committee’s general pre-approval. For any service that has been approved through general pre-approval, the general pre-approval will remain in place for a period 12 months from the date of pre-approval, unless the Committee determines that a different period is appropriate. The Committee will annually review and pre-approve the services that may be provided by the independent auditors without specific pre-approval. The Committee will revise the list of services subject to general pre-approval as appropriate. This Policy does not serve as a delegation to Fund management of the Committee’s duty to pre-approve services performed by the Funds’ independent auditors.
2
Table of Contents
| II. | Audit Services |
The annual audit services engagement terms and fees are subject to the Committee’s specific pre-approval. Audit services are those services that are normally provided by auditors in connection with statutory and regulatory filings or engagements or those that generally only independent auditors can reasonably provide. They include the Funds’ annual financial statement audit and procedures that the independent auditors must perform in order to form an opinion on the Funds’ financial statements (e.g., information systems and procedural reviews and testing). The Committee will monitor the audit services engagement and approve any changes in terms, conditions or fees deemed by the Committee to be necessary or appropriate.
The Committee may grant general pre-approval to other audit services, such as statutory audits and services associated with SEC registration statements, periodic reports and other documents filed with the SEC or issued in connection with securities offerings.
The Committee has pre-approved the audit services listed on Appendix A. The Committee must specifically approve all audit services not listed on Appendix A.
| III. | Audit-related Services |
Audit-related services are assurance and related services that are reasonably related to the performance of the audit or the review of the Funds’ financial statements or are traditionally performed by the independent auditors. The Committee believes that the provision of audit-related services will not impair the independent auditors’ independence, and therefore may grant pre-approval to audit-related services. Audit-related services include accounting consultations related to accounting, financial reporting or disclosure matters not classified as “audit services;” assistance with understanding and implementing new accounting and financial reporting guidance from rulemaking authorities; agreed-upon or expanded audit procedures relating to accounting and/or billing records required to respond to or comply with financial, accounting or regulatory reporting matters; and assistance with internal control reporting requirements under Form N-SAR or Form N-CSR.
The Committee has pre-approved the audit-related services listed on Appendix B. The Committee must specifically approve all audit-related services not listed on Appendix B.
| IV. | Tax Services |
The Committee believes the independent auditors can provide tax services to the Funds, including tax compliance, tax planning, and tax advice, without compromising the auditors’ independence. Therefore, the Committee may grant general pre-approval with respect to tax services historically provided by the Funds’ independent auditors that do not, in the Committee’s view, impair auditor independence and that are consistent with the SEC’s rules on auditor independence.
The Committee will not grant pre-approval if the independent auditors initially recommends a transaction the sole business purpose of which is tax avoidance and the tax treatment of which may not be supported in the Internal Revenue Code and related regulations. The Committee may consult
3
Table of Contents
outside counsel to determine that tax planning and reporting positions are consistent with this Policy.
The Committee has pre-approved the tax-related services listed on Appendix C. The Committee must specifically approve all tax-related services not listed on Appendix C.
| V. | Other Services |
The Committee believes it may grant approval of non-audit services that are permissible services for independent auditors to a Fund. The Committee has determined to grant general pre-approval to other services that it believes are routine and recurring, do not impair auditor independence, and are consistent with SEC rules on auditor independence.
The Committee has pre-approved the non-audit services listed on Appendix D. The Committee must specifically approve all non-audit services not listed on Appendix D.
A list of the SEC’s prohibited non-audit services is attached to this Policy as Appendix E. The SEC’s rules and relevant guidance should be consulted to determine the precise definitions of these impermissible services and the applicability of exceptions to certain of the SEC’s prohibitions.
| VI. | Pre-approval of Fee levels and Budgeted Amounts |
The Committee will annually establish pre-approval fee levels or budgeted amounts for audit, audit-related, tax and non-audit services to be provided to the Funds by the independent auditors. Any proposed services exceeding these levels or amounts require the Committee’s specific pre-approval. The Committee considers fees for audit and non-audit services when deciding whether to pre-approve services. The Committee may determine, for a pre-approval period of 12 months, the appropriate ratio between the total amount of fees for the Fund’s audit, audit-related, and tax services (including fees for services provided to Fund affiliates that are subject to pre-approval), and the total amount of fees for certain permissible non-audit services for the Fund classified as other services (including any such services provided to Fund affiliates that are subject to pre-approval).
| VII. | Procedures |
Requests or applications for services to be provided by the independent auditors will be submitted to management. If management determines that the services do not fall within those services generally pre-approved by the Committee and set out in the appendices to these procedures, management will submit the services to the Committee or its delagee. Any such submission will include a detailed description of the services to be rendered. Notwithstanding this paragraph, the Committee will, on a quarterly basis, receive from the independent auditors a list of services provided for the previous calendar quarter on a cumulative basis by the auditors during the Pre-Approval Period.
4
Table of Contents
| VIII. | Delegation |
The Committee may delegate pre-approval authority to one or more of the Committee’s members. Any member or members to whom such pre-approval authority is delegated must report any pre-approval decisions, including any pre-approved services, to the Committee at its next scheduled meeting. The Committee will identify any member to whom pre-approval authority is delegated in writing. The member will retain such authority for a period of 12 months from the date of pre-approval unless the Committee determines that a different period is appropriate. The period of delegated authority may be terminated by the Committee or at the option of the member.
| IX. | Additional Requirements |
The Committee will take any measures the Committee deems necessary or appropriate to oversee the work of the independent auditors and to assure the auditors’ independence from the Funds. This may include reviewing a formal written statement from the independent auditors delineating all relationships between the auditors and the Funds, consistent with Independence Standards Board No. 1, and discussing with the auditors their methods and procedures for ensuring independence.
Effective April 23, 2008, the KPMG LLP (“KPMG”) audit team for the ING Funds accepted the global responsibility for monitoring the auditor independence for KPMG relative to the ING Funds. Using a proprietary system called Sentinel, the audit team is able to identify and manage potential conflicts of interest across the member firms of the KPMG International Network and prevent the provision of prohibited services to the ING entities that would impair KPMG independence with the respect to the ING Funds. In addition to receiving pre-approval from the ING Funds Audit Committee for services provided to the ING Funds and for services for ING entities in the Investment Company Complex, the audit team has developed a process for periodic notification via email to the ING Funds’ Audit Committee Chairpersons regarding requests to provide services to ING Groep NV and its affiliates from KPMG offices worldwide. Additionally, KPMG provides a quarterly summary of the fees for services that have commenced for ING Groep NV and Affiliates at each Audit Committee Meeting.
Last Approved: September 29, 2010
5
Table of Contents
Appendix A
Pre-Approved Audit Services for the Pre-Approval Period September 29, 2010 through December 31, 2011
Service
| The Fund(s) | Fee Range | |||
| Statutory audits or financial audits (including tax services associated with audit services) | ü | As presented to Audit Committee1 | ||
| Services associated with SEC registration statements, periodic reports and other documents filed with the SEC or other documents issued in connection with securities offerings (e.g., consents), and assistance in responding to SEC comment letters. | ü | Not to exceed $9,750 per filing | ||
| Consultations by Fund management with respect to accounting or disclosure treatment of transactions or events and/or the actual or potential effect of final or proposed rules, standards or interpretations by the SEC, Financial Accounting Standards Board, or other regulatory or standard setting bodies. | ü | Not to exceed $8,000 during the Pre- Approval | ||
| Seed capital audit and related review and issuance of consent on the N-2 registration statement | ü | Not to exceed $13,000 per audit | ||
| 1 | For new Funds launched during the Pre-Approval Period, the fee ranges pre-approved will be the same as those for existing Funds, pro-rated in accordance with inception dates as provided in the auditors’ Proposal or any Engagement Letter covering the period at issue. Fees in the Engagement Letter will be controlling. |
6
Table of Contents
Appendix B
Pre-Approved Audit-Related Services for the Pre-Approval Period September 29, 2010 through December 31, 2011
Service
| The Fund(s) | Fund Affiliates | Fee Range | ||||
| Services related to Fund mergers (Excludes tax services - See Appendix C for tax services associated with Fund mergers) | ü | ü | Not to exceed $10,000 per merger | |||
| Consultations by Fund management with respect to accounting or disclosure treatment of transactions or events and/or the actual or potential effect of final or proposed rules, standards or interpretations by the SEC, Financial Accounting Standards Board, or other regulatory or standard setting bodies. [Note: Under SEC rules some consultations may be “audit” services and others may be “audit-related” services.] | ü | Not to exceed $5,000 per occurrence during the Pre-Approval Period | ||||
| Review of the Funds’ semi-annual and quarterly financial statements | ü | Not to exceed $2,400 per set of financial statements per fund | ||||
| Reports to regulatory or government agencies related to the annual engagement | ü | Up to $5,000 per occurrence during the Pre-Approval Period | ||||
| Regulatory compliance assistance | ü | ü | Not to exceed $5,000 per quarter | |||
| Training courses | ü | Not to exceed $2,000 per course | ||||
| For Prime Rate Trust, agreed upon procedures for quarterly reports to rating agencies | ü | Not to exceed $9,450 per quarter | ||||
7
Table of Contents
Appendix C
Pre-Approved Tax Services for the Pre-Approval Period September 29, 2010 through December 31, 2011
Service
| The Fund(s) | Fund Affiliates | Fee Range | ||||
| Preparation of federal and state income tax returns and federal excise tax returns for the Funds including assistance and review with excise tax distributions | ü | As presented to Audit Committee2 | ||||
| Review of IRC Sections 851(b) and 817(h) diversification testing on a real-time basis | ü | As presented to Audit Committee2 | ||||
| Assistance and advice regarding year-end reporting for 1099’s | ü | As presented to Audit Committee2 | ||||
| Tax assistance and advice regarding statutory, regulatory or administrative developments | ü | ü | Not to exceed $5,000 for the Funds or for the Funds’ investment adviser during the Pre-Approval Period | |||
| 2 | For new Funds launched during the Pre-Approval Period, the fee ranges pre-approved will be the same as those for existing Funds, pro-rated in accordance with inception dates as provided in the auditors’ Proposal or any Engagement Letter covering the period at issue. Fees in the Engagement Letter will be controlling. |
8
Table of Contents
Appendix C, continued
Service
| The Fund(s) | Fund Affiliates | Fee Range | ||||
| Tax training courses | ü | Not to exceed $2,000 per course during the Pre-Approval Period | ||||
| Tax services associated with Fund mergers | ü | ü | Not to exceed $4,000 per fund per merger during the Pre-Approval Period | |||
| Other tax-related assistance and consultation, including, without limitation, assistance in evaluating derivative financial instruments and international tax issues, qualification and distribution issues, and similar routine tax consultations. | ü | Not to exceed $120,000 during the Pre-Approval Period | ||||
9
Table of Contents
Appendix D
Pre-Approved Other Services for the Pre-Approval Period September 29 , 2010 through December 31, 2011
Service
| The Fund(s) | Fund Affiliates | Fee Range | ||||
| Agreed-upon procedures for Class B share 12b-1 programs | ü | Not to exceed $60,000 during | ||||
Security counts performed pursuant to Rule 17f-2 of the 1940 Act (i.e., counts for Funds holding securities with affiliated sub-custodians)
Cost to be borne 50% by the Funds and 50% by ING Investments, LLC. | ü | ü | Not to exceed $5,000 per Fund during | |||
| Agreed upon procedures for 15 (c) FACT Books | ü | Not to exceed $35,000 during | ||||
10
Table of Contents
Appendix E
Prohibited Non-Audit Services
Dated: September 29, 2010 to December 31, 2011
| • | Bookkeeping or other services related to the accounting records or financial statements of the Funds |
| • | Financial information systems design and implementation |
| • | Appraisal or valuation services, fairness opinions, or contribution-in-kind reports |
| • | Actuarial services |
| • | Internal audit outsourcing services |
| • | Management functions |
| • | Human resources |
| • | Broker-dealer, investment adviser, or investment banking services |
| • | Legal services |
| • | Expert services unrelated to the audit |
| • | Any other service that the Public Company Accounting Oversight Board determines, by regulation, is impermissible |
11
Table of Contents
EXHIBIT A
ING EQUITY TRUST
ING FUNDS TRUST
ING ASIA PACIFIC HIGH DIVIDEND EQUITY INCOME FUND
ING GLOBAL ADVANTAGE AND PREMIUM OPPORTUNITY FUND
ING GLOBAL EQUITY DIVIDEND AND PREMIUM OPPORTUNITY FUND
ING INTERNATIONAL HIGH DIVIDEND EQUITY INCOME FUND
ING INFRASTRUCTURE, INDUSTRIALS, AND MATERIALS FUND
ING RISK MANAGED NATURAL RESOURCES FUNDING INVESTORS TRUST
ING EMERGING MARKETS HIGH DIVIDEND EQUITY FUND
ING INVESTORS TRUST
ING MAYFLOWER TRUST
ING MUTUAL FUNDS
ING PARTNERS, INC.
ING PRIME RATE TRUST
ING SENIOR INCOME FUND
ING SEPARATE PORTFOLIOS TRUST
ING VARIABLE INSURANCE TRUST
ING VARIABLE PRODUCTS TRUST
12
Table of Contents
| (e)(2) | Percentage of services referred to in (4)(b)-(4)(d) that were approved by the audit committee | |
| 100% of the services were approved by the audit committee. | ||
| (f) | Percentage of hours expended attributable to work performed by other than full time employees of KPMG if greater than 50% | |
| Not applicable | ||
| (g) | Non-Audit Fees: The non-audit fees billed by the registrant’s accountant for services rendered to the registrant, and rendered to the registrant’s investment adviser, and any entity controlling, controlled by, or under common control with the adviser that provides ongoing services to the registrant for each of the last two fiscal years of the registrant were $1,069,423 for year ended March 31, 2011 and $1,613,771 for fiscal year ended March 31, 2010. | |
| (h) | Principal Accountants Independence: the Registrant’s Audit committee has considered whether the provision of non-audit services that were rendered to the registrant’s investment adviser and any entity controlling, controlled by, or under common control with the investment adviser that provides ongoing services to the registrant that were not pre-approved pursuant to Rule 2.01(c)(7)(ii) of Regulation S-X is compatible with maintaining KPMG’s independence. | |
ITEM 5. AUDIT COMMITTEE OF LISTED REGISTRANTS.
Not applicable.
ITEM 6. SCHEDULE OF INVESTMENTS
Summary schedule or complete schedule of investments, if applicable, is included as part of the report to shareholders filed under Item 1 of this Form.
13
Table of Contents
Report of Independent Registered Public Accounting Firm
The Shareholders and Board of Trustees
ING Funds Trust
We have audited, in accordance with the standards of the Public Company Accounting Oversight Board (United States), the statements of assets and liabilities, including the summary portfolios of investments, of ING High Yield Bond Fund and ING Intermediate Bond Fund as of March 31, 2011, and the related statements of operations for the year then ended, the statements of changes in net assets for each of the years in the two-year period then ended, and the financial highlights for each of the years or periods in the five-year period then ended and have issued our unqualified report thereon dated May 20, 2011 (which report and financial statements are included in Item 1 of this Certified Shareholder Report on Form N-CSR). In connection with our audits of the aforementioned financial statements and financial highlights, we also audited the related portfolios of investments included in Item 6 of this Form N-CSR. The portfolios of investments are the responsibility of management. Our responsibility is to express an opinion on the portfolios of investments based on our audits.
In our opinion, the portfolios of investments, when considered in relation to the basic financial statements taken as a whole, present fairly, in all material respects, the information set forth therein.
Boston, Massachusetts
May 20, 2011
Table of Contents
| PORTFOLIO OF INVESTMENTS | ||
| ING High Yield Bond Fund | as of March 30, 2011 |
| Principal Amount | Value | |||||||||||||||||
| CORPORATE BONDS/NOTES: | 92.9 | % | |||||||||||||||
Consumer Discretionary: | 23.0 | % | ||||||||||||||||
| $ | 665,000 | Accuride Corp., 9.500%, due 08/01/18 | $ | 743,138 | ||||||||||||||
| 90,000 | # | Affinia Group, Inc., 9.000%, due 11/30/14 | 93,150 | |||||||||||||||
| 265,000 | Affinia Group, Inc., 9.000%, due 11/30/14 | 274,275 | ||||||||||||||||
| 223,000 | # | Affinia Group, Inc., 10.750%, due 08/15/16 | 254,499 | |||||||||||||||
| 370,000 | Allbritton Communications Co., 8.000%, due 05/15/18 | 392,200 | ||||||||||||||||
| 700,000 | # | AMC Entertainment, Inc., 9.750%, due 12/01/20 | 752,500 | |||||||||||||||
| 315,000 | American Axle & Manufacturing, Inc., 5.250%, due 02/11/14 | 316,575 | ||||||||||||||||
| 34,781 | # | American Media, Inc., 13.500%, due 06/15/18 | 35,824 | |||||||||||||||
| 310,000 | # | Ameristar Casinos, Inc., 7.500%, due 04/15/21 | 307,288 | |||||||||||||||
| 510,000 | Ameristar Casinos, Inc., 9.250%, due 06/01/14 | 562,913 | ||||||||||||||||
| 90,000 | # | Asbury Automotive Group, Inc., 8.375%, due 11/15/20 | 94,050 | |||||||||||||||
| 405,000 | Bon-Ton Stores, Inc., 10.250%, due 03/15/14 | 417,150 | ||||||||||||||||
| 150,000 | # | Bresnan Broadband Holdings LLC, 8.000%, due 12/15/18 | 159,000 | |||||||||||||||
| 231,000 | # | Burlington Coat Factory Warehouse Corp., 10.000%, due 02/15/19 | 225,225 | |||||||||||||||
| 720,000 | Cablevision Systems Corp., 7.750%, due 04/15/18 | 781,200 | ||||||||||||||||
| 450,000 | Cablevision Systems Corp., 8.000%, due 04/15/20 | 492,750 | ||||||||||||||||
| 840,000 | Caesars Entertainment Operating Co., Inc., 10.000%, due 12/15/18 | 770,700 | ||||||||||||||||
| 840,000 | Caesars Entertainment Operating Co., Inc., 11.250%, due 06/01/17 | 958,650 | ||||||||||||||||
| 420,000 | # | Cedar Fair L.P./Canada’s Wonderland Co/Magnum Management Corp., 9.125%, due 08/01/18 | 457,800 | |||||||||||||||
| 1,000,000 | # | Cequel Communications Holdings I, LLC and Cequel Capital Corp., 8.625%, due 11/15/17 | 1,047,500 | |||||||||||||||
| 730,000 | #, Z | Checkout Holding Corp., 9.530%, due 11/15/15 | 479,063 | |||||||||||||||
| 195,000 | # | Citadel Broadcasting Corp., 7.750%, due 12/15/18 | 212,306 | |||||||||||||||
| 185,000 | # | CityCenter Holdings LLC / CityCenter Finance Corp., 7.625%, due 01/15/16 | 191,938 | |||||||||||||||
| 75,000 | &, # | CityCenter Holdings LLC / CityCenter Finance Corp., 10.750%, due 01/15/17 | 77,813 | |||||||||||||||
| 493,000 | # | Clear Channel Communications, Inc., 9.000%, due 03/01/21 | 494,233 | |||||||||||||||
| 115,000 | Clear Channel Communications, Inc., 10.750%, due 08/01/16 | 110,113 | ||||||||||||||||
| 525,000 | Clear Channel Worldwide Holdings, Inc., 9.250%, due 12/15/17 | 577,781 | ||||||||||||||||
| 85,000 | Dana Holding Corp., 6.500%, due 02/15/19 | 85,000 | ||||||||||||||||
| 70,000 | Dana Holding Corp., 6.750%, due 02/15/21 | 70,350 | ||||||||||||||||
| 380,000 | # | DineEquity, Inc., 9.500%, due 10/30/18 | 414,200 | |||||||||||||||
| 680,000 | DISH DBS Corp., 7.875%, due 09/01/19 | 739,500 | ||||||||||||||||
| 540,000 | # | Exide Technologies, 8.625%, due 02/01/18 | 579,150 | |||||||||||||||
| 395,000 | Gray Television, Inc., 10.500%, due 06/29/15 | 422,156 | ||||||||||||||||
| 190,000 | Hanesbrands, Inc., 6.375%, due 12/15/20 | 186,200 | ||||||||||||||||
| 270,000 | Hanesbrands, Inc., 8.000%, due 12/15/16 | 293,963 | ||||||||||||||||
| 140,000 | # | Inergy L.P./Inergy Finance Corp., 6.875%, due 08/01/21 | 146,125 | |||||||||||||||
| 258,000 | JC Penney Corp., Inc., 6.375%, due 10/15/36 | 233,813 | ||||||||||||||||
| 123,000 | KB Home, 6.375%, due 08/15/11 | 124,845 | ||||||||||||||||
| 215,000 | KB Home, 7.250%, due 06/15/18 | 211,775 | ||||||||||||||||
| 440,000 | Limited Brands, Inc., 8.500%, due 06/15/19 | 507,100 | ||||||||||||||||
| 395,000 | LIN Television Corp., 8.375%, due 04/15/18 | 431,538 | ||||||||||||||||
| 430,000 | Macys Retail Holdings, Inc., 6.375%, due 03/15/37 | 432,150 | ||||||||||||||||
| 105,000 | Macys Retail Holdings, Inc., 6.650%, due 07/15/24 | 107,625 | ||||||||||||||||
| 365,000 | # | McJunkin Red Man Corp., 9.500%, due 12/15/16 | 371,388 | |||||||||||||||
| 445,000 | Media General, Inc., 11.750%, due 02/15/17 | 490,613 | ||||||||||||||||
| 243,000 | Mediacom Broadband, LLC, 8.500%, due 10/15/15 | 253,328 | ||||||||||||||||
| 535,000 | Mediacom LLC / Mediacom Capital Corp., 9.125%, due 08/15/19 | 575,125 | ||||||||||||||||
| 505,000 | MGM Resorts International, 9.000%, due 03/15/20 | 556,131 | ||||||||||||||||
| 295,000 | MGM Resorts International, 10.375%, due 05/15/14 | 339,250 | ||||||||||||||||
| 405,000 | + | Michaels Stores, Inc., 0.000% (step rate 13.000%), due 11/01/16 | 415,125 | |||||||||||||||
| 570,000 | # | Michaels Stores, Inc., 7.750%, due 11/01/18 | 584,250 | |||||||||||||||
| 280,000 | Michaels Stores, Inc., 11.375%, due 11/01/16 | 306,600 | ||||||||||||||||
| 75,000 | # | NCL Corp., Ltd., 9.500%, due 11/15/18 | 79,313 | |||||||||||||||
| 470,000 | # | Needle Merger Sub Corp., 8.125%, due 03/15/19 | 477,050 | |||||||||||||||
| 36,087 | & | Neiman-Marcus Group, Inc., 9.000%, due 10/15/15 | 37,891 | |||||||||||||||
Table of Contents
| 485,000 | New Albertsons, Inc., 7.450%, due 08/01/29 | 385,575 | ||||||||||||
| 404,996 | & | Nexstar Broadcasting, Inc., 7.000%, due 01/15/14 | 395,884 | |||||||||||
| 175,000 | Nexstar Broadcasting, Inc. / Mission Broadcasting, Inc., 8.875%, due 04/15/17 | 190,313 | ||||||||||||
| 465,000 | # | Nielsen Finance LLC/Nielsen Finance Co., 7.750%, due 10/15/18 | 501,038 | |||||||||||
| 450,000 | # | Petco Animal Supplies, Inc., 9.250%, due 12/01/18 | 483,750 | |||||||||||
| 620,000 | Pinnacle Entertainment, Inc., 8.750%, due 05/15/20 | 647,900 | ||||||||||||
| 110,000 | # | Prestige Brands, Inc., 8.250%, due 04/01/18 | 116,600 | |||||||||||
| 295,000 | Prestige Brands, Inc., 8.250%, due 04/01/18 | 312,700 | ||||||||||||
| 305,000 | # | Rent-A-Center, Inc., 6.625%, due 11/15/20 | 301,950 | |||||||||||
| 195,000 | # | Scientific Games Corp., 8.125%, due 09/15/18 | 206,700 | |||||||||||
| 287,000 | # | Seminole Indian Tribe of Florida, 7.750%, due 10/01/17 | 304,938 | |||||||||||
| 220,000 | Service Corp. International, 6.750%, due 04/01/15 | 235,400 | ||||||||||||
| 10,000 | # | Sinclair Television Group, Inc., 8.375%, due 10/15/18 | 10,625 | |||||||||||
| 385,000 | # | Sinclair Television Group, Inc., 9.250%, due 11/01/17 | 431,200 | |||||||||||
| 645,000 | # | Sirius XM Radio, Inc., 8.750%, due 04/01/15 | 728,850 | |||||||||||
| 300,000 | Sonic Automotive, Inc., 9.000%, due 03/15/18 | 320,250 | ||||||||||||
| 215,000 | Star Gas Partners L.P./Star Gas Finance Co., 8.875%, due 12/01/17 | 221,988 | ||||||||||||
| 270,000 | # | Stoneridge, Inc., 9.500%, due 10/15/17 | 299,700 | |||||||||||
| 230,000 | Toys R Us Property Co. I LLC, 10.750%, due 07/15/17 | 262,200 | ||||||||||||
| 430,000 | Toys R Us Property Co. II LLC, 8.500%, due 12/01/17 | 464,400 | ||||||||||||
| 695,000 | Universal City Development Partners Ltd. / UCDP Finance, Inc., 8.875%, due 11/15/15 | 760,156 | ||||||||||||
| 410,000 | Visant Corp., 10.000%, due 10/01/17 | 444,850 | ||||||||||||
| 315,000 | Wynn Las Vegas LLC / Wynn Las Vegas Capital Corp., 7.750%, due 08/15/20 | 335,475 | ||||||||||||
| 29,113,630 | ||||||||||||||
| Consumer Staples: | 5.4 | % | ||||||||||||
| 350,000 | Avis Budget Car Rental LLC/Avis Budget Finance, Inc., 7.750%, due 05/15/16 | 362,688 | ||||||||||||
| 195,000 | Avis Budget Car Rental LLC/Avis Budget Finance, Inc., 9.625%, due 03/15/18 | 216,450 | ||||||||||||
| 185,000 | # | Bumble Bee Acquisition Corp., 9.000%, due 12/15/17 | 193,325 | |||||||||||
| 170,000 | &, # | Bumble Bee Holdco SCA, 9.625%, due 03/15/18 | 159,375 | |||||||||||
| 480,000 | Central Garden and Pet Co., 8.250%, due 03/01/18 | 505,200 | ||||||||||||
| 153,850 | & | Ceridian Corp., 12.250%, due 11/15/15 | 161,543 | |||||||||||
| 435,000 | Cott Beverages, Inc., 8.375%, due 11/15/17 | 466,538 | ||||||||||||
| 285,000 | # | Darling International, Inc., 8.500%, due 12/15/18 | 311,363 | |||||||||||
| 295,000 | Elizabeth Arden, Inc., 7.375%, due 03/15/21 | 309,381 | ||||||||||||
| 450,000 | # | Hertz Corp., 6.750%, due 04/15/19 | 448,313 | |||||||||||
| 220,000 | # | Hertz Corp., 7.375%, due 01/15/21 | 226,050 | |||||||||||
| 226,000 | Hertz Corp., 8.875%, due 01/01/14 | 232,780 | ||||||||||||
| 650,000 | JBS USA LLC/JBS USA Finance, Inc., 11.625%, due 05/01/14 | 757,250 | ||||||||||||
| 255,000 | # | Pilgrim’s Pride Corp., 7.875%, due 12/15/18 | 248,625 | |||||||||||
| 240,000 | # | Rite Aid Corp., 6.875%, due 12/15/28 | 146,400 | |||||||||||
| 470,000 | # | RSC Equipment Rental, Inc., 10.000%, due 07/15/17 | 538,150 | |||||||||||
| 190,000 | # | RSC Equipment Rental, Inc./RSC Holdings III LLC, 8.250%, due 02/01/21 | 198,550 | |||||||||||
| 420,000 | ServiceMaster Co, 7.450%, due 08/15/27 | 341,250 | ||||||||||||
| 820,000 | &, # | ServiceMaster Co., 10.750%, due 07/15/15 | 875,350 | |||||||||||
| 150,000 | # | Stater Bros Holdings, Inc., 7.375%, due 11/15/18 | 156,375 | |||||||||||
| 6,854,956 | ||||||||||||||
| Energy: | 13.9 | % | ||||||||||||
| 555,000 | # | Alta Mesa Holdings / Alta Mesa Finance Services Corp., 9.625%, due 10/15/18 | 566,100 | |||||||||||
| 390,000 | Anadarko Petroleum Corp., 6.450%, due 09/15/36 | 390,708 | ||||||||||||
| 200,000 | ATP Oil & Gas Corp./United States, 11.875%, due 05/01/15 | 211,000 | ||||||||||||
| 90,000 | # | Basic Energy Services, Inc., 7.750%, due 02/15/19 | 92,925 | |||||||||||
| 475,000 | Berry Petroleum Co., 10.250%, due 06/01/14 | 553,375 | ||||||||||||
| 400,000 | BreitBurn Energy Partners L.P. / BreitBurn Finance Corp., 8.625%, due 10/15/20 | 421,000 | ||||||||||||
| 290,000 | # | Brigham Exploration Co., 8.750%, due 10/01/18 | 323,350 | |||||||||||
| 340,000 | # | Calfrac Holdings L.P., 7.500%, due 12/01/20 | 352,750 | |||||||||||
| 145,000 | # | Chaparral Energy, Inc., 8.250%, due 09/01/21 | 149,713 | |||||||||||
| 405,000 | Chaparral Energy, Inc., 8.875%, due 02/01/17 | 427,275 | ||||||||||||
| 205,000 | # | Chaparral Energy, Inc., 9.875%, due 10/01/20 | 228,575 | |||||||||||
| 335,000 | # | Clayton Williams Energy, Inc., 7.750%, due 04/01/19 | 336,256 | |||||||||||
| 365,000 | Concho Resources, Inc., 7.000%, due 01/15/21 | 385,075 | ||||||||||||
| 200,000 | Consol Energy, Inc., 8.000%, due 04/01/17 | 220,000 | ||||||||||||
| 200,000 | Consol Energy, Inc., 8.250%, due 04/01/20 | 222,750 |
Table of Contents
| 200,000 | Copano Energy LLC / Copano Energy Finance Corp., 7.125%, due 04/01/21 | 203,000 | ||||||||||||
| 625,000 | El Paso Corp., 7.250%, due 06/01/18 | 705,635 | ||||||||||||
| 480,000 | Energy Transfer Equity L.P., 7.500%, due 10/15/20 | 524,400 | ||||||||||||
| 410,000 | # | Energy XXI Gulf Coast, Inc., 9.250%, due 12/15/17 | 439,725 | |||||||||||
| 865,000 | # | Foresight Energy LLC / Foresight Energy Corp., 9.625%, due 08/15/17 | 935,281 | |||||||||||
| 380,000 | Gibson Energy ULC / GEP Midstream Finance Corp., 11.750%, due 05/27/14 | 425,600 | ||||||||||||
| 625,000 | # | Hilcorp Energy I L.P./Hilcorp Finance Co., 8.000%, due 02/15/20 | 668,750 | |||||||||||
| 385,000 | International Coal Group, Inc., 9.125%, due 04/01/18 | 438,900 | ||||||||||||
| 200,000 | # | James River Escrow, Inc., 7.875%, due 04/01/19 | 208,000 | |||||||||||
| 275,000 | # | Linn Energy LLC/Linn Energy Finance Corp., 7.750%, due 02/01/21 | 294,938 | |||||||||||
| 360,000 | # | Linn Energy LLC/Linn Energy Finance Corp., 8.625%, due 04/15/20 | 401,400 | |||||||||||
| 555,000 | Massey Energy Co., 6.875%, due 12/15/13 | 568,875 | ||||||||||||
| 480,000 | McMoRan Exploration Co., 11.875%, due 11/15/14 | 530,400 | ||||||||||||
| 160,000 | # | MEG Energy Corp., 6.500%, due 03/15/21 | 162,800 | |||||||||||
| 215,000 | # | Murray Energy Corp., 10.250%, due 10/15/15 | 232,200 | |||||||||||
| 325,000 | # | NFR Energy LLC/NFR Energy Finance Corp., 9.750%, due 02/15/17 | 323,375 | |||||||||||
| 210,000 | # | Oasis Petroleum, Inc., 7.250%, due 02/01/19 | 213,150 | |||||||||||
| 290,000 | Patriot Coal Corp., 8.250%, due 04/30/18 | 310,300 | ||||||||||||
| 445,000 | Penn Virginia Resource Partners L.P. / Penn Virginia Resource Finance Corp., 8.250%, due 04/15/18 | 478,375 | ||||||||||||
| 400,000 | Petrohawk Energy Corp., 7.250%, due 08/15/18 | 414,000 | ||||||||||||
| 535,000 | Pioneer Natural Resources Co., 7.500%, due 01/15/20 | 605,207 | ||||||||||||
| 200,000 | Plains Exploration & Production Co., 6.625%, due 05/01/21 | 200,250 | ||||||||||||
| 730,000 | Plains Exploration & Production Co., 7.625%, due 06/01/18 | 784,750 | ||||||||||||
| 410,000 | # | SandRidge Energy, Inc., 8.000%, due 06/01/18 | 431,525 | |||||||||||
| 550,000 | Stone Energy Corp., 8.625%, due 02/01/17 | 576,125 | ||||||||||||
| 245,000 | Swift Energy Co., 7.125%, due 06/01/17 | 251,738 | ||||||||||||
| 600,000 | Swift Energy Co., 8.875%, due 01/15/20 | 658,500 | ||||||||||||
| 270,000 | # | Targa Resources Partners L.P. / Targa Resources Partners Finance Corp., 6.875%, due 02/01/21 | 267,975 | |||||||||||
| 120,000 | # | Venoco, Inc., 8.875%, due 02/15/19 | 120,150 | |||||||||||
| 230,000 | # | Westmoreland Coal Co./Westmoreland Partners, 10.750%, due 02/01/18 | 227,988 | |||||||||||
| 17,484,164 | ||||||||||||||
| Financials: | 12.3 | % | ||||||||||||
| 380,000 | # | ABI Escrow Corp., 10.250%, due 10/15/18 | 421,800 | |||||||||||
| 1,435,000 | Ally Financial, Inc., 8.000%, due 03/15/20 | 1,565,944 | ||||||||||||
| 455,000 | Ally Financial, Inc., 8.300%, due 02/12/15 | 499,931 | ||||||||||||
| 790,000 | American General Finance Corp., 5.400%, due 12/01/15 | 724,825 | ||||||||||||
| 300,000 | American General Finance Corp., 5.850%, due 06/01/13 | 294,750 | ||||||||||||
| 750,000 | Atlantic Broadband Finance, LLC, 9.375%, due 01/15/14 | 765,000 | ||||||||||||
| 640,000 | # | CIT Group, Inc., 6.625%, due 04/01/18 | 650,257 | |||||||||||
| 595,000 | CIT Group, Inc., 7.000%, due 05/01/14 | 607,644 | ||||||||||||
| 485,000 | CIT Group, Inc., 7.000%, due 05/01/15 | 490,456 | ||||||||||||
| 210,000 | CIT Group, Inc., 7.000%, due 05/01/16 | 210,788 | ||||||||||||
| 800,000 | CIT Group, Inc., 7.000%, due 05/01/17 | 803,000 | ||||||||||||
| 760,000 | Felcor Lodging L.P., 10.000%, due 10/01/14 | 872,100 | ||||||||||||
| 500,000 | Fifth Third Capital Trust IV, 6.500%, due 04/15/37 | 490,625 | ||||||||||||
| 945,000 | Ford Motor Credit Co., LLC, 8.125%, due 01/15/20 | 1,084,180 | ||||||||||||
| 690,000 | Ford Motor Credit Co., LLC, 8.700%, due 10/01/14 | 783,857 | ||||||||||||
| 325,000 | International Lease Finance Corp., 5.625%, due 09/20/13 | 331,906 | ||||||||||||
| 325,000 | International Lease Finance Corp., 5.650%, due 06/01/14 | 328,250 | ||||||||||||
| 220,000 | International Lease Finance Corp., 8.250%, due 12/15/20 | 241,450 | ||||||||||||
| 298,000 | # | International Lease Finance Corp., 8.875%, due 09/15/15 | 328,545 | |||||||||||
| 310,000 | # | International Lease Finance Corp., 9.000%, due 03/15/17 | 349,525 | |||||||||||
| 370,000 | # | LBI Escrow Corp., 8.000%, due 11/01/17 | 408,850 | |||||||||||
| 585,000 | # | Pinafore LLC/Pinafore, Inc., 9.000%, due 10/01/18 | 637,650 | |||||||||||
| 355,000 | Pinnacle Foods Finance LLC / Pinnacle Foods Finance Corp., 8.250%, due 09/01/17 | 372,750 | ||||||||||||
| 250,000 | # | Realogy Corp., 7.875%, due 02/15/19 | 249,375 | |||||||||||
| 500,000 | Regions Bank/Birmingham AL, 6.450%, due 06/26/37 | 461,386 | ||||||||||||
| 345,000 | Springleaf Finance Corp., 6.900%, due 12/15/17 | 316,969 | ||||||||||||
| 500,000 | SunTrust Capital VIII, 6.100%, due 12/15/36 | 489,055 | ||||||||||||
| 660,000 | Tops Holding Corp. / Tops Markets LLC, 10.125%, due 10/15/15 | 712,800 | ||||||||||||
| 15,493,668 | ||||||||||||||
Table of Contents
| Health Care: | 7.8 | % | ||||||||||||
| 295,000 | Apria Healthcare Group, Inc., 12.375%, due 11/01/14 | 321,919 | ||||||||||||
| 140,000 | & | Biomet, Inc., 10.375%, due 10/15/17 | 154,525 | |||||||||||
| 193,000 | Biomet, Inc., 11.625%, due 10/15/17 | 216,160 | ||||||||||||
| 145,000 | DaVita, Inc., 6.375%, due 11/01/18 | 146,813 | ||||||||||||
| 145,000 | DaVita, Inc., 6.625%, due 11/01/20 | 147,538 | ||||||||||||
| 135,000 | # | Endo Pharmaceuticals Holdings, Inc., 7.000%, due 12/15/20 | 140,231 | |||||||||||
| 455,000 | Gentiva Health Services, Inc., 11.500%, due 09/01/18 | 516,994 | ||||||||||||
| 150,000 | # | Giant Funding Corp., 8.250%, due 02/01/18 | 154,688 | |||||||||||
| 655,000 | # | HCA Holdings, Inc., 7.750%, due 05/15/21 | 686,113 | |||||||||||
| 860,000 | HCA, Inc., 7.250%, due 09/15/20 | 924,500 | ||||||||||||
| 905,000 | HCA, Inc., 7.875%, due 02/15/20 | 988,713 | ||||||||||||
| 185,000 | Healthsouth Corp., 7.250%, due 10/01/18 | 192,169 | ||||||||||||
| 440,000 | Healthsouth Corp., 8.125%, due 02/15/20 | 478,500 | ||||||||||||
| 370,000 | # | MedAssets, Inc., 8.000%, due 11/15/18 | 380,175 | |||||||||||
| 170,000 | # | Mylan, Inc./PA, 7.875%, due 07/15/20 | 185,725 | |||||||||||
| 570,000 | Omnicare, Inc., 7.750%, due 06/01/20 | 607,050 | ||||||||||||
| 205,000 | Radnet Management, Inc., 10.375%, due 04/01/18 | 208,331 | ||||||||||||
| 325,000 | Select Medical Corp., 6.211%, due 09/15/15 | 318,094 | ||||||||||||
| 315,000 | Select Medical Corp., 7.625%, due 02/01/15 | 322,088 | ||||||||||||
| 280,000 | # | STHI Holding Corp., 8.000%, due 03/15/18 | 291,200 | |||||||||||
| 670,000 | Tenet Healthcare Corp., 8.000%, due 08/01/20 | 701,825 | ||||||||||||
| 220,000 | United Surgical Partners International, Inc., 8.875%, due 05/01/17 | 231,825 | ||||||||||||
| 300,000 | & | United Surgical Partners International, Inc., 9.250%, due 05/01/17 | 318,750 | |||||||||||
| 225,000 | R, X | US Oncology, Inc. Escrow | — | |||||||||||
| 75,000 | # | Valeant Pharmaceuticals International, 6.750%, due 10/01/17 | 74,250 | |||||||||||
| 175,000 | # | Valeant Pharmaceuticals International, 6.750%, due 08/15/21 | 166,906 | |||||||||||
| 245,000 | # | Valeant Pharmaceuticals International, 7.000%, due 10/01/20 | 238,875 | |||||||||||
| 495,000 | Vanguard Health Holding Co. II LLC/Vanguard Holding Co. II, Inc., 8.000%, due 02/01/18 |
| 509,231 | |||||||||||
| 310,000 | Z | Vanguard Health Systems, 11.450%, due 02/01/16 | 198,400 | |||||||||||
| 9,821,588 | ||||||||||||||
| Industrials: | 7.7 | % | ||||||||||||
| 455,000 | # | Amsted Industries, Inc., 8.125%, due 03/15/18 | 487,419 | |||||||||||
| 260,000 | ArvinMeritor, Inc., 8.125%, due 09/15/15 | 271,700 | ||||||||||||
| 305,000 | ArvinMeritor, Inc., 10.625%, due 03/15/18 | 344,650 | ||||||||||||
| 310,000 | # | Bombardier, Inc., 7.500%, due 03/15/18 | 336,350 | |||||||||||
| 310,000 | # | Bombardier, Inc., 7.750%, due 03/15/20 | 338,288 | |||||||||||
| 185,000 | # | Building Materials Corp. of America, 7.500%, due 03/15/20 | 193,325 | |||||||||||
| 185,000 | Case New Holland, Inc., 7.750%, due 09/01/13 | 202,344 | ||||||||||||
| 160,000 | # | Case New Holland, Inc., 7.875%, due 12/01/17 | 178,600 | |||||||||||
| 245,000 | Cenveo Corp., 8.875%, due 02/01/18 | 246,838 | ||||||||||||
| 290,000 | # | Cenveo Corp., 10.500%, due 08/15/16 | 292,900 | |||||||||||
| 280,000 | Coleman Cable, Inc., 9.000%, due 02/15/18 | 296,100 | ||||||||||||
| 370,000 | Covanta Holding Corp., 7.250%, due 12/01/20 | 389,378 | ||||||||||||
| 355,000 | # | Florida East Coast Railway Corp., 8.125%, due 02/01/17 | 372,306 | |||||||||||
| 70,000 | # | Geo Group, Inc., 6.625%, due 02/15/21 | 69,650 | |||||||||||
| 105,000 | # | Great Lakes Dredge & Dock Corp., 7.375%, due 02/01/19 | 106,838 | |||||||||||
| 270,000 | # | Griffon Corp., 7.125%, due 04/01/18 | 276,075 | |||||||||||
| 155,000 | Harland Clarke Holdings Corp., 9.500%, due 05/15/15 | 154,031 | ||||||||||||
| 110,000 | # | Interface, Inc., 7.625%, due 12/01/18 | 114,950 | |||||||||||
| 320,000 | Iron Mountain, Inc., 8.000%, due 06/15/20 | 340,800 | ||||||||||||
| 210,000 | Iron Mountain, Inc., 8.750%, due 07/15/18 | 222,075 | ||||||||||||
| 130,000 | Koppers, Inc., 7.875%, due 12/01/19 | 141,700 | ||||||||||||
| 585,000 | Martin Midstream Partners L.P. / Martin Midstream Finance Corp., 8.875%, due 04/01/18 | 623,025 | ||||||||||||
| 190,000 | # | Mobile Mini, Inc., 7.875%, due 12/01/20 | 202,350 | |||||||||||
| 460,377 | Nortek, Inc., 11.000%, due 12/01/13 | 489,151 | ||||||||||||
| 370,000 | # | Polymer Group, Inc., 7.750%, due 02/01/19 | 383,413 | |||||||||||
| 134,000 | Sensata Technologies BV, 8.000%, due 05/01/14 | 141,370 | ||||||||||||
| 375,000 | Severstal Columbus LLC, 10.250%, due 02/15/18 | 416,250 | ||||||||||||
| 310,000 | # | SPX Corp., 6.875%, due 09/01/17 | 334,800 | |||||||||||
| 360,000 | # | Swift Services Holdings, Inc., 10.000%, due 11/15/18 | 392,400 | |||||||||||
| 375,000 | United Rentals North America, Inc., 8.375%, due 09/15/20 | 393,750 | ||||||||||||
| 290,000 | United Rentals North America, Inc., 9.250%, due 12/15/19 | 324,075 | ||||||||||||
Table of Contents
| 615,000 | WCA Waste Corp., 9.250%, due 06/15/14 | 636,525 | ||||||||||||||
| 9,713,426 | ||||||||||||||||
| Information Technology: | 5.6% | |||||||||||||||
| 605,000 | # | Aspect Software, Inc., 10.625%, due 05/15/17 | 650,375 | |||||||||||||
| 310,000 | # | CDW Escrow Corp., 8.500%, due 04/01/19 | 311,163 | |||||||||||||
| 180,000 | CDW LLC / CDW Finance Corp., 11.000%, due 10/12/15 | 196,200 | ||||||||||||||
| 180,000 | & | CDW LLC / CDW Finance Corp., 11.500%, due 10/12/15 | 195,300 | |||||||||||||
| 375,000 | # | CommScope, Inc., 8.250%, due 01/15/19 | 393,750 | |||||||||||||
| 145,000 | # | First Data Corp., 8.250%, due 01/15/21 | 145,363 | |||||||||||||
| 146,000 | &, # | First Data Corp., 8.750%, due 01/15/22 | 146,000 | |||||||||||||
| 17,000 | First Data Corp., 9.875%, due 09/24/15 | 17,510 | ||||||||||||||
| 17,748 | & | First Data Corp., 10.550%, due 09/24/15 | 18,480 | |||||||||||||
| 195,000 | First Data Corp., 11.250%, due 03/31/16 | 195,244 | ||||||||||||||
| 293,000 | # | First Data Corp., 12.625%, due 01/15/21 | 319,370 | |||||||||||||
| 440,000 | # | Freescale Semiconductor, Inc., 10.750%, due 08/01/20 | 496,100 | |||||||||||||
| 432,000 | # | Insight.com, 9.375%, due 07/15/18 | 481,680 | |||||||||||||
| 405,000 | Jabil Circuit, Inc., 7.750%, due 07/15/16 | 461,700 | ||||||||||||||
| 460,000 | Kemet Corp., 10.500%, due 05/01/18 | 520,950 | ||||||||||||||
| 500,000 | # | NXP BV/NXP Funding, LLC, 9.750%, due 08/01/18 | 562,500 | |||||||||||||
| 235,000 | # | Seagate HDD Cayman, 7.750%, due 12/15/18 | 244,400 | |||||||||||||
| 390,000 | Seagate Technology, Inc., 6.800%, due 10/01/16 | 410,963 | ||||||||||||||
| 320,000 | SSI Investments II/SSI Co.-Issuer LLC, 11.125%, due 06/01/18 | 360,000 | ||||||||||||||
| 395,000 | # | SunGard Data Systems, Inc., 7.375%, due 11/15/18 | 405,863 | |||||||||||||
| 155,000 | # | SunGard Data Systems, Inc., 7.625%, due 11/15/20 | 160,038 | |||||||||||||
| 396,000 | SunGard Data Systems, Inc., 10.250%, due 08/15/15 | 416,790 | ||||||||||||||
| 7,109,739 | ||||||||||||||||
| Materials: | 6.1% | |||||||||||||||
| 355,000 | # | Aleris International, Inc., 7.625%, due 02/15/18 | 357,663 | |||||||||||||
| 190,000 | # | Associated Materials LLC, 9.125%, due 11/01/17 | 203,775 | |||||||||||||
| 185,000 | # | Atkore International, Inc., 9.875%, due 01/01/18 | 198,413 | |||||||||||||
| 325,000 | Berry Plastics Corp., 8.250%, due 11/15/15 | 346,531 | ||||||||||||||
| 75,000 | CF Industries, Inc., 6.875%, due 05/01/18 | 84,375 | ||||||||||||||
| 75,000 | CF Industries, Inc., 7.125%, due 05/01/20 | 85,313 | ||||||||||||||
| 220,000 | # | Chemtura Corp., 7.875%, due 09/01/18 | 233,200 | |||||||||||||
| 230,000 | Ferro Corp., 7.875%, due 08/15/18 | 244,950 | ||||||||||||||
| 270,000 | Georgia-Pacific Corp., 7.750%, due 11/15/29 | 298,013 | ||||||||||||||
| 280,000 | Hexion US Finance Corp. / Hexion Nova Scotia Finance ULC, 8.875%, due 02/01/18 | 297,500 | ||||||||||||||
| 270,000 | # | Hexion US Finance Corp. / Hexion Nova Scotia Finance ULC, 9.000%, due 11/15/20 |
| 280,631 | ||||||||||||
| 168,000 | Huntsman International, LLC, 7.375%, due 01/01/15 | 172,620 | ||||||||||||||
| 535,000 | # | Huntsman International, LLC, 8.625%, due 03/15/21 | 585,825 | |||||||||||||
| 355,000 | # | JMC Steel Group, 8.250%, due 03/15/18 | 364,763 | |||||||||||||
| 120,000 | # | KRATON Polymers LLC/KRATON Polymers Capital Corp., 6.750%, due 03/01/19 |
| 122,400 | ||||||||||||
| 385,000 | # | Momentive Performance Materials, Inc., 9.000%, due 01/15/21 | 398,956 | |||||||||||||
| 451,000 | Momentive Performance Materials, Inc., 12.500%, due 06/15/14 | 502,865 | ||||||||||||||
| 240,000 | Nova Chemicals Corp., 8.375%, due 11/01/16 | 264,600 | ||||||||||||||
| 310,000 | Nova Chemicals Corp., 8.625%, due 11/01/19 | 348,363 | ||||||||||||||
| 180,000 | # | Novelis, Inc., 8.375%, due 12/15/17 | 195,750 | |||||||||||||
| 360,000 | # | Novelis, Inc., 8.750%, due 12/15/20 | 397,800 | |||||||||||||
| 260,000 | # | Omnova Solutions, Inc., 7.875%, due 11/01/18 | 264,550 | |||||||||||||
| 290,000 | # | Plastipak Holdings, Inc., 10.625%, due 08/15/19 | 332,050 | |||||||||||||
| 275,000 | PolyOne Corp., 7.375%, due 09/15/20 | 290,125 | ||||||||||||||
| 180,000 | # | Rain CII Carbon LLC and CII Carbon Corp., 8.000%, due 12/01/18 | 193,500 | |||||||||||||
| 350,000 | Solutia, Inc., 8.750%, due 11/01/17 | 386,750 | ||||||||||||||
| 75,000 | # | Verso Paper Holdings LLC / Verso Paper, Inc., 8.750%, due 02/01/19 | 78,375 | |||||||||||||
| 126,000 | Verso Paper Holdings LLC / Verso Paper, Inc., 11.500%, due 07/01/14 | 138,285 | ||||||||||||||
| 75,000 | # | Vertellus Specialties, Inc., 9.375%, due 10/01/15 | 80,438 | |||||||||||||
| 7,748,379 | ||||||||||||||||
| Telecommunication Services: | 8.5% | |||||||||||||||
| 250,000 | # | CCO Holdings LLC / CCO Holdings Capital Corp., 7.000%, due 01/15/19 | 256,875 | |||||||||||||
| 1,550,000 | CCO Holdings LLC / CCO Holdings Capital Corp., 7.250%, due 10/30/17 | 1,627,473 | ||||||||||||||
| 290,000 | Cincinnati Bell, Inc., 7.000%, due 02/15/15 | 295,075 | ||||||||||||||
| 220,000 | Cincinnati Bell, Inc., 8.375%, due 10/15/20 | 216,700 | ||||||||||||||
Table of Contents
| 590,000 | Cincinnati Bell, Inc., 8.750%, due 03/15/18 | 559,763 | ||||||||||||||||
| 270,000 | # | Clearwire Communications, LLC/Clearwire Finance, Inc., 12.000%, due 12/01/15 |
| 292,950 | ||||||||||||||
| 510,000 | Cricket Communications, Inc., 7.750%, due 05/15/16 | 544,425 | ||||||||||||||||
| 680,000 | Frontier Communications Co., 9.000%, due 08/15/31 | 698,700 | ||||||||||||||||
| 200,000 | Frontier Communications Corp., 8.250%, due 04/15/17 | 217,000 | ||||||||||||||||
| 510,000 | Frontier Communications Corp., 8.500%, due 04/15/20 | 555,263 | ||||||||||||||||
| 210,000 | Intelsat Intermediate Holding Co., Ltd., 9.500%, due 02/01/15 |
| 218,400 | |||||||||||||||
| 45,000 | # | Intelsat Jackson Holdings Ltd., 8.500%, due 11/01/19 | 48,600 | |||||||||||||||
| 200,000 | # | Intelsat Jackson Holdings SA, 7.250%, due 04/01/19 | 201,250 | |||||||||||||||
| 240,000 | # | Intelsat Jackson Holdings SA, 7.500%, due 04/01/21 | 241,800 | |||||||||||||||
| 305,000 | Intelsat Ltd., 6.500%, due 11/01/13 | 325,206 | ||||||||||||||||
| 345,000 | Intelsat Luxembourg S.A., 11.250%, due 02/04/17 | 378,638 | ||||||||||||||||
| 841,375 | & | Intelsat Luxembourg S.A., 11.500%, due 02/04/17 | 927,616 | |||||||||||||||
| 18,024 | & | iPCS, Inc., 3.554%, due 05/01/14 | 17,618 | |||||||||||||||
| 380,000 | MetroPCS Wireless, Inc., 6.625%, due 11/15/20 | 380,475 | ||||||||||||||||
| 185,000 | MetroPCS Wireless, Inc., 7.875%, due 09/01/18 | 198,875 | ||||||||||||||||
| 650,000 | Nextel Communications, Inc., 5.950%, due 03/15/14 | 654,875 | ||||||||||||||||
| 615,000 | Nextel Communications, Inc., 7.375%, due 08/01/15 | 620,381 | ||||||||||||||||
| 330,000 | Sprint Capital Corp., 6.875%, due 11/15/28 | 306,075 | ||||||||||||||||
| 190,000 | # | West Corp., 7.875%, due 01/15/19 | 194,038 | |||||||||||||||
| 45,000 | # | West Corp., 8.625%, due 10/01/18 | 47,588 | |||||||||||||||
| 330,000 | West Corp., 11.000%, due 10/15/16 | 356,400 | ||||||||||||||||
| 370,000 | Windstream Corp., 7.000%, due 03/15/19 | 374,625 | ||||||||||||||||
| 10,756,684 | ||||||||||||||||||
| Utilities: | 2.6 | % | ||||||||||||||||
| 580,000 | AES Corp., 8.000%, due 10/15/17 | 626,400 | ||||||||||||||||
| 385,000 | # | Calpine Corp., 7.500%, due 02/15/21 | 400,400 | |||||||||||||||
| 290,000 | # | Calpine Corp., 7.875%, due 07/31/20 | 309,575 | |||||||||||||||
| 120,000 | Edison Mission Energy, 7.625%, due 05/15/27 | 90,000 | ||||||||||||||||
| 730,000 | Energy Future Holdings Corp., 10.000%, due 01/15/20 | 777,213 | ||||||||||||||||
| 214,866 | Homer City Funding, LLC, 8.734%, due 10/01/26 | 191,231 | ||||||||||||||||
| 475,000 | Mirant Americas Generation, LLC, 9.125%, due 05/01/31 |
| 492,813 | |||||||||||||||
| 390,000 | NRG Energy, Inc., 7.375%, due 02/01/16 | 404,625 | ||||||||||||||||
| 3,292,257 | ||||||||||||||||||
Total Corporate Bonds/Notes (Cost $108,893,534) | 117,388,491 | |||||||||||||||||
| ASSET-BACKED SECURITIES: | 0.7 | % | ||||||||||||||||
| Other Asset-Backed Securities: | 0.7% | |||||||||||||||||
| 1,000,000 | # | GSC Partners CDO Fund Ltd., 2.237%, due 12/16/15 | 918,737 | |||||||||||||||
Total Asset-Backed Securities (Cost $900,578) | 918,737 | |||||||||||||||||
Shares | Value | |||||||||||||||||
| COMMON STOCK: | 0.0 | % | ||||||||||||||||
| Consumer Discretionary: | 0.0% | |||||||||||||||||
| 195 | @ | American Media Operations | $ | 2,535 | ||||||||||||||
| 5,810 | @, R, X | American Media Stock Certificates | 6 | |||||||||||||||
Total Common Stock (Cost $136,656) | 2,541 | |||||||||||||||||
Total Long-Term Investments (Cost $109,930,768) | 118,309,769 | |||||||||||||||||
| SHORT-TERM INVESTMENTS: | 5.7 | % | ||||||||||||||||
| Mutual Funds: | 5.7 | % | ||||||||||||||||
| 7,240,000 | BlackRock Liquidity Funds, TempFund, Institutional Class |
| 7,240,000 | |||||||||||||||
Total Short-Term Investments (Cost $7,240,000) | 7,240,000 | |||||||||||||||||
Table of Contents
Total Investments in Securities (Cost $117,170,768) * | 99.3 | % | $ | 125,549,769 | ||||||||||||||||
Other Assets and Liabilities - Net | 0.7 | 859,293 | ||||||||||||||||||
Net Assets | 100.0 | % | $ | 126,409,062 | ||||||||||||||||
| @ | Non-income producing security |
| & | Payment-in-kind |
| + | Step-up basis bonds. Interest rates shown reflect current and next coupon rates. |
| # | Securities with purchases pursuant to Rule 144A or section 4(2), under the Securities Act of 1933 and may not be resold subject to that rule except to qualified institutional buyers. Unless otherwise noted, these securities have been determined to be liquid under the guidelines established by the Funds’ Board of Directors/Trustees. |
| X | Fair value determined by ING Funds Valuation Committee appointed by the Funds’ Board of Directors/Trustees. |
| Z | Indicates Zero Coupon Bond; rate shown reflects current effective yield. |
| * | Cost for federal income tax purposes is |
Net unrealized appreciation consists of: | ||||
Gross Unrealized Appreciation | $ | 8,665,574 | ||
Gross Unrealized Depreciation | (286,573 | ) | ||
Net Unrealized Appreciation | $ | 8,379,001 | ||
See Accompanying Notes to Financial Statements
Table of Contents
| ING Intermediate Bond Fund | PORTFOLIO OF INVESTMENTS as of March 30, 2011 |
| Principal Amount | Value | |||||||||||||||||||
| CORPORATE BONDS/NOTES: | 41.0 | % | |||||||||||||||||
Consumer Discretionary: | 5.8 | % | ||||||||||||||||||
| $1,545,000 | S | AMC Entertainment, Inc., 8.750%, due 06/01/19 | $ | 1,684,050 | ||||||||||||||||
| 2,037,000 | S | AutoZone, Inc., 4.000%, due 11/15/20 | 1,898,464 | |||||||||||||||||
| 1,420,000 | Cablevision Systems Corp., 8.625%, due 09/15/17 | 1,586,850 | ||||||||||||||||||
| 419,000 | S | CBS Corp., 4.300%, due 02/15/21 | 396,832 | |||||||||||||||||
| 419,000 | S | CBS Corp., 5.750%, due 04/15/20 | 443,942 | |||||||||||||||||
| 2,000,000 | S | Comcast Corp., 5.700%, due 05/15/18 | 2,180,242 | |||||||||||||||||
| 456,000 | # | COX Communications, Inc., 6.250%, due 06/01/18 | 509,190 | |||||||||||||||||
| 277,000 | # | COX Communications, Inc., 6.950%, due 06/01/38 | 304,288 | |||||||||||||||||
| 1,322,000 | DIRECTV Holdings LLC / DIRECTV Financing Co., Inc., 3.500%, due 03/01/16 |
| 1,326,353 | |||||||||||||||||
| 288,000 | DIRECTV Holdings LLC / DIRECTV Financing Co., Inc., 5.000%, due 03/01/21 |
| 289,574 | |||||||||||||||||
| 1,368,000 | DIRECTV Holdings LLC / DIRECTV Financing Co., Inc., 6.375%, due 03/01/41 |
| 1,380,896 | |||||||||||||||||
| 1,080,000 | S | DISH DBS Corp., 7.125%, due 02/01/16 | 1,158,300 | |||||||||||||||||
| 927,000 | S | Family Dollar Stores, Inc., 5.000%, due 02/01/21 | 912,456 | |||||||||||||||||
| 1,415,000 | S | Hanesbrands, Inc., 8.000%, due 12/15/16 | 1,540,581 | |||||||||||||||||
| 768,000 | Home Depot, Inc., 4.400%, due 04/01/21 | 768,304 | ||||||||||||||||||
| 2,975,000 | # | Hyatt Hotels Corp., 6.875%, due 08/15/19 | 3,189,331 | |||||||||||||||||
| 1,885,000 | Limited Brands, Inc., 8.500%, due 06/15/19 | 2,172,463 | ||||||||||||||||||
| 2,207,000 | # | NBC Universal, Inc., 2.875%, due 04/01/16 | 2,158,517 | |||||||||||||||||
| 517,000 | # | NBC Universal, Inc., 3.650%, due 04/30/15 | 531,274 | |||||||||||||||||
| 865,000 | # | NBC Universal, Inc., 5.150%, due 04/30/20 | 893,122 | |||||||||||||||||
| 498,000 | # | NBC Universal, Inc., 6.400%, due 04/30/40 | 513,019 | |||||||||||||||||
| 979,000 | # | News America, Inc., 4.500%, due 02/15/21 | 961,044 | |||||||||||||||||
| 1,114,000 | S | News America, Inc., 6.150%, due 03/01/37 | 1,107,380 | |||||||||||||||||
| 848,000 | S | News America, Inc., 6.650%, due 11/15/37 | 892,214 | |||||||||||||||||
| 1,665,000 | S | Pinnacle Entertainment, Inc., 8.625%, due 08/01/17 | 1,823,175 | |||||||||||||||||
| 290,000 | # | QVC, Inc., 7.375%, due 10/15/20 | 303,775 | |||||||||||||||||
| 805,000 | # | QVC, Inc., 7.500%, due 10/01/19 | 849,275 | |||||||||||||||||
| 535,000 | S | Service Corp. International, 7.000%, due 06/15/17 | 575,125 | |||||||||||||||||
| 795,000 | S | Time Warner Cable, Inc., 5.875%, due 11/15/40 | 749,547 | |||||||||||||||||
| 1,255,000 | S | Time Warner Cable, Inc., 6.550%, due 05/01/37 | 1,281,374 | |||||||||||||||||
| 648,000 | Time Warner Entertainment Co. LP, 8.375%, due 07/15/33 |
| 794,893 | |||||||||||||||||
| 668,000 | Time Warner, Inc., 4.750%, due 03/29/21 | 664,898 | ||||||||||||||||||
| 562,000 | Time Warner, Inc., 6.250%, due 03/29/41 | 560,254 | ||||||||||||||||||
| 1,248,000 | S | Time Warner, Inc., 7.700%, due 05/01/32 | 1,459,426 | |||||||||||||||||
| 863,000 | S | Toll Brothers Finance Corp., 6.750%, due 11/01/19 | 892,693 | |||||||||||||||||
| 1,540,000 | S | Toys R Us Property Co. I LLC, 10.750%, due 07/15/17 | 1,755,600 | |||||||||||||||||
| 1,101,000 | S | Viacom, Inc., 4.250%, due 09/15/15 | 1,151,032 | |||||||||||||||||
| 1,405,000 | S | Wynn Las Vegas LLC / Wynn Las Vegas Capital Corp., 7.875%, due 11/01/17 |
| 1,513,888 | ||||||||||||||||
| 43,173,641 | ||||||||||||||||||||
Consumer Staples: | 0.9 | % | ||||||||||||||||||
| 1,003,000 | S | Altria Group, Inc., 9.700%, due 11/10/18 | 1,320,945 | |||||||||||||||||
| 1,732,000 | # | JBS Finance II Ltd., 8.250%, due 01/29/18 | 1,788,290 | |||||||||||||||||
| 1,754,000 | S | Lorillard Tobacco Co., 6.875%, due 05/01/20 | 1,900,257 | |||||||||||||||||
| 1,560,000 | &, | # | ServiceMaster Co., 10.750%, due 07/15/15 | 1,665,300 | ||||||||||||||||
| 315,000 | S | TreeHouse Foods, Inc., 7.750%, due 03/01/18 | 340,200 | |||||||||||||||||
| 7,014,992 | ||||||||||||||||||||
Energy: | 4.7 | % | ||||||||||||||||||
| 1,185,000 | S | Anadarko Petroleum Corp., 6.375%, due 09/15/17 | 1,306,061 | |||||||||||||||||
| 1,575,000 | Arch Coal, Inc., 8.750%, due 08/01/16 | 1,767,938 | ||||||||||||||||||
| 1,523,000 | S | Enbridge Energy Partners, 9.875%, due 03/01/19 | 1,993,612 | |||||||||||||||||
| 1,244,000 | Energy Transfer Partners, 9.700%, due 03/15/19 | 1,626,108 | ||||||||||||||||||
| 1,553,000 | S | Enterprise Products Operating LLC, 5.200%, due 09/01/20 |
| 1,604,850 | ||||||||||||||||
| 1,194,000 | S | Enterprise Products Operating LLC, 6.450%, due 09/01/40 |
| 1,244,846 | ||||||||||||||||
| 860,000 | # | Gazprom Via Gaz Capital SA, 5.092%, due 11/29/15 | 901,882 | |||||||||||||||||
Table of Contents
| 1,800,000 | ±, R, X | Greater Ohio Ethanol, LLC, 6.301%, due 12/31/13 | — | |||||||||||||
| 2,200,000 | ±, R, X | Greater Ohio Ethanol, LLC, 12.630%, due 12/31/13 | — | |||||||||||||
| 993,000 | # | KazMunaiGaz Finance Sub BV, 7.000%, due 05/05/20 | 1,074,923 | |||||||||||||
| 1,222,000 | Kinder Morgan Energy Partners L.P., 6.375%, due 03/01/41 | 1,236,673 | ||||||||||||||
| 1,442,000 | # | Marathon Petroleum Corp., 6.500%, due 03/01/41 | 1,461,763 | |||||||||||||
| 1,482,000 | Nexen, Inc., 7.500%, due 07/30/39 | 1,674,008 | ||||||||||||||
| 1,632,000 | S | Noble Energy, Inc., 6.000%, due 03/01/41 | 1,644,828 | |||||||||||||
| 1,238,000 | # | Novatek Finance Ltd., 5.326%, due 02/03/16 | 1,279,331 | |||||||||||||
| 546,000 | # | Novatek Finance Ltd., 6.604%, due 02/03/21 | 576,033 | |||||||||||||
| 834,000 | #, L | Odebrecht Drilling Norbe VIII/IX Ltd., 6.350%, due 06/30/21 | 882,998 | |||||||||||||
| 1,769,000 | S | Pemex Project Funding Master Trust, 6.625%, due 06/15/35 | 1,783,352 | |||||||||||||
| 615,000 | S | Petrobras International Finance Co. - Pifco, 5.375%, due 01/27/21 | 619,931 | |||||||||||||
| 656,000 | S | Petrobras International Finance Co. - Pifco, 6.750%, due 01/27/41 | 679,096 | |||||||||||||
| 1,350,000 | S | Pioneer Natural Resources Co., 7.500%, due 01/15/20 | 1,527,158 | |||||||||||||
| 1,717,000 | S | Plains All American Pipeline LP, 5.750%, due 01/15/20 | 1,840,845 | |||||||||||||
| 1,700,000 | Plains Exploration & Production Co., 8.625%, due 10/15/19 | 1,899,750 | ||||||||||||||
| 444,000 | S | Pride International, Inc., 6.875%, due 08/15/20 | 505,605 | |||||||||||||
| 1,387,000 | Pride International, Inc., 7.875%, due 08/15/40 | 1,673,069 | ||||||||||||||
| 803,000 | # | Reliance Holdings USA, Inc., 6.250%, due 10/19/40 | 762,159 | |||||||||||||
| 790,000 | Transcontinental Gas Pipe Line Corp., 6.400%, due 04/15/16 | 908,278 | ||||||||||||||
| 1,795,000 | S | Weatherford International Ltd. Bermuda, 5.125%, due 09/15/20 | 1,785,657 | |||||||||||||
| 969,000 | S | Weatherford International Ltd. Bermuda, 6.750%, due 09/15/40 | 1,007,722 | |||||||||||||
| 35,268,476 | ||||||||||||||||
| Financials: | 14.9 | % | ||||||||||||||
| 3,513,600 | Aegon NV, 3.535%, due 12/31/49 | 2,572,714 | ||||||||||||||
| 516,000 | Agile Property Holdings Ltd., 8.875%, due 04/28/17 | 506,351 | ||||||||||||||
| 1,203,000 | S | American International Group, Inc., 5.850%, due 01/16/18 | 1,256,590 | |||||||||||||
| 884,000 | S | American International Group, Inc., 8.175%, due 05/15/58 | 958,035 | |||||||||||||
| 784,000 | S | AvalonBay Communities, Inc., 5.700%, due 03/15/17 | 872,809 | |||||||||||||
| 555,000 | S | BAC Capital Trust VI, 5.625%, due 03/08/35 | 485,709 | |||||||||||||
| 624,000 | #, L | Banco de Credito del Peru, 5.375%, due 09/16/20 | 592,800 | |||||||||||||
| 2,425,000 | S | Bank of America Corp., 5.625%, due 07/01/20 | 2,494,159 | |||||||||||||
| 705,000 | S | Bank of America Corp., 5.875%, due 01/05/21 | 737,512 | |||||||||||||
| 1,314,000 | S | Bank of America Corp., 8.000%, due 12/29/49 | 1,414,901 | |||||||||||||
| 634,000 | S | Barclays Bank PLC, 5.140%, due 10/14/20 | 601,072 | |||||||||||||
| 1,677,000 | # | Barclays Bank PLC, 5.926%, due 09/29/49 | 1,576,380 | |||||||||||||
| 1,015,000 | # | Barclays Bank PLC, 6.050%, due 12/04/17 | 1,058,947 | |||||||||||||
| 3,218,000 | BP Capital Markets PLC, 3.200%, due 03/11/16 | 3,207,426 | ||||||||||||||
| 1,132,000 | BP Capital Markets PLC, 4.742%, due 03/11/21 | 1,136,340 | ||||||||||||||
| 1,458,000 | Capital One Bank USA NA, 8.800%, due 07/15/19 | 1,836,062 | ||||||||||||||
| 1,724,000 | S | Capital One Capital V, 10.250%, due 08/15/39 | 1,881,315 | |||||||||||||
| EUR | 6,178,000 | Citibank Credit Card Issuance Trust, 5.375%, due 04/11/11 | 8,759,825 | |||||||||||||
| $ | 2,045,000 | S | Citigroup, Inc., 5.375%, due 08/09/20 | 2,109,088 | ||||||||||||
| 1,468,000 | S | Citigroup, Inc., 8.500%, due 05/22/19 | 1,814,103 | |||||||||||||
| 1,660,000 | # | Cooperatieve Centrale Raiffeisen-Boerenleenbank BA/Netherlands, 11.000%, due 12/29/49 |
| 2,168,564 | ||||||||||||
| 1,277,000 | # | Corestates Capital Trust I, 8.000%, due 12/15/26 | 1,306,884 | |||||||||||||
| 905,000 | Country Garden Holdings Co., 11.250%, due 04/22/17 | 942,331 | ||||||||||||||
| 1,762,000 | S | Credit Suisse/Guernsey, 5.860%, due 12/31/49 | 1,717,950 | |||||||||||||
| 2,013,000 | S | Discover Bank/Greenwood DE, 8.700%, due 11/18/19 | 2,415,495 | |||||||||||||
| 1,705,000 | # | Fibria Overseas Finance Ltd., 7.500%, due 05/04/20 | 1,858,450 | |||||||||||||
| 2,970,000 | S | Fifth Third Bancorp., 8.250%, due 03/01/38 | 3,554,962 | |||||||||||||
| 1,589,000 | S | First Horizon National Corp., 5.375%, due 12/15/15 | 1,661,864 | |||||||||||||
| 1,675,000 | Ford Motor Credit Co., LLC, 8.125%, due 01/15/20 | 1,921,694 | ||||||||||||||
| 2,262,000 | S | General Electric Capital Corp., 5.300%, due 02/11/21 | 2,301,827 | |||||||||||||
| 799,000 | S | General Electric Capital Corp., 5.875%, due 01/14/38 | 791,467 | |||||||||||||
| 1,253,000 | S | Genworth Financial, Inc., 6.515%, due 05/22/18 | 1,241,336 | |||||||||||||
| 819,000 | Genworth Financial, Inc., 7.625%, due 09/24/21 | 823,087 | ||||||||||||||
| 1,257,000 | S | Goldman Sachs Group, Inc., 3.625%, due 02/07/16 | 1,246,491 | |||||||||||||
| 1,379,000 | S | Goldman Sachs Group, Inc., 5.375%, due 03/15/20 | 1,402,618 | |||||||||||||
| 2,116,000 | S | Goldman Sachs Group, Inc., 6.250%, due 09/01/17 | 2,319,942 | |||||||||||||
| 1,085,000 | S | Goldman Sachs Group, Inc., 6.250%, due 02/01/41 | 1,084,141 | |||||||||||||
Table of Contents
| 676,000 | S | Hartford Financial Services Group, Inc., 5.500%, due 03/30/20 | 688,710 | |||||||||||||
| 1,326,000 | S | Hartford Financial Services Group, Inc., 6.000%, due 01/15/19 | 1,395,976 | |||||||||||||
| 969,000 | S | Hartford Financial Services Group, Inc., 6.625%, due 03/30/40 | 985,340 | |||||||||||||
| 932,000 | Health Care REIT, Inc., 6.500%, due 03/15/41 | 902,835 | ||||||||||||||
| 2,931,000 | # | HSBC Finance Corp., 6.676%, due 01/15/21 | 3,047,797 | |||||||||||||
| 1,028,000 | S | Huntington BancShares, Inc., 7.000%, due 12/15/20 | 1,136,946 | |||||||||||||
| 250,000 | # | Hyundai Capital Services, Inc., 4.375%, due 07/27/16 | 251,624 | |||||||||||||
| 964,000 | # | Iberdrola Finance Ireland Ltd., 3.800%, due 09/11/14 | 979,320 | |||||||||||||
| 3,365,000 | # | Iberdrola Finance Ireland Ltd., 5.000%, due 09/11/19 | 3,279,302 | |||||||||||||
| 1,361,000 | #, L | ILFC E-Capital Trust II, 6.250%, due 12/21/65 | 1,150,045 | |||||||||||||
| 777,000 | S | International Lease Finance Corp., 6.625%, due 11/15/13 | 808,080 | |||||||||||||
| 1,037,000 | # | International Lease Finance Corp., 7.125%, due 09/01/18 | 1,119,442 | |||||||||||||
| 1,251,000 | S | International Lease Finance Corp., 8.250%, due 12/15/20 | 1,372,973 | |||||||||||||
| 997,000 | KeyCorp, 5.100%, due 03/24/21 | 992,762 | ||||||||||||||
| 732,000 | Lincoln National Corp., 8.750%, due 07/01/19 | 928,333 | ||||||||||||||
| 1,827,000 | # | Lloyds TSB Bank PLC, 6.500%, due 09/14/20 | 1,799,257 | |||||||||||||
| 1,700,000 | # | Lukoil International Finance BV, 6.125%, due 11/09/20 | 1,742,500 | |||||||||||||
| 1,622,000 | # | Macquarie Bank Ltd., 6.625%, due 04/07/21 | 1,618,837 | |||||||||||||
| 1,341,000 | S | Merrill Lynch & Co., Inc., 6.050%, due 05/16/16 | 1,418,845 | |||||||||||||
| 1,180,000 | S | Morgan Stanley, 3.450%, due 11/02/15 | 1,161,140 | |||||||||||||
| 1,500,000 | S | Morgan Stanley, 4.100%, due 01/26/15 | 1,541,430 | |||||||||||||
| 1,834,000 | S | Morgan Stanley, 5.750%, due 01/25/21 | 1,854,493 | |||||||||||||
| 337,000 | S | National City Preferred Capital Trust I, 12.000%, due 12/29/49 | 383,138 | |||||||||||||
| DKK | 15 | Nordea Kredit Realkreditaktieselskab, 6.000%, due 07/01/29 | 3 | |||||||||||||
| $ | 1,729,000 | # | Pacific Life Insurance Co., 9.250%, due 06/15/39 | 2,299,985 | ||||||||||||
| 90,632 | # | Power Receivable Finance, LLC, 6.290%, due 01/01/12 | 90,702 | |||||||||||||
| 2,395,000 | S | Protective Life Corp., 8.450%, due 10/15/39 | 2,679,181 | |||||||||||||
| 1,146,000 | Royal Bank of Scotland PLC, 4.375%, due 03/16/16 | 1,154,545 | ||||||||||||||
| 358,000 | S | SLM Corp., 5.375%, due 05/15/14 | 371,507 | |||||||||||||
| 944,000 | S | SLM Corp., 6.250%, due 01/25/16 | 985,140 | |||||||||||||
| 1,110,000 | S | SLM Corp., 8.000%, due 03/25/20 | 1,211,859 | |||||||||||||
| 2,096,000 | S | State Street Corp., 4.956%, due 03/15/18 | 2,163,005 | |||||||||||||
| 1,031,000 | S | SunTrust Capital VIII, 6.100%, due 12/15/36 | 1,008,431 | |||||||||||||
| 217,863 | Tengizchevroil Finance Co. SARL, 6.124%, due 11/15/14 | 230,934 | ||||||||||||||
| 1,583,000 | ±, R, X | Twin Reefs Pass-through Trust, due 12/10/49 | — | |||||||||||||
| 1,176,000 | # | Voto-Votorantim Ltd., 6.750%, due 04/05/21 | 1,252,440 | |||||||||||||
| 1,035,000 | VTB Bank Via VTB Capital SA, 6.250%, due 06/30/35 | 1,100,981 | ||||||||||||||
| 1,210,000 | S | Wells Fargo & Co., 3.676%, due 06/15/16 | 1,218,580 | |||||||||||||
| 881,000 | # | Xstrata Finance Canada Ltd., 5.500%, due 11/16/11 | 906,458 | |||||||||||||
| 111,864,117 | ||||||||||||||||
Health Care: | 0.3 | % | ||||||||||||||
| 1,395,000 | S | HCA, Inc., 7.250%, due 09/15/20 | 1,499,625 | |||||||||||||
| 585,000 | S | HCA, Inc., 7.875%, due 02/15/20 | 639,113 | |||||||||||||
| 1,054,000 | R, X | US Oncology, Inc. Escrow | — | |||||||||||||
| 2,138,738 | ||||||||||||||||
| Industrials: | 1.5 | % | ||||||||||||||
| 900,000 | # | Bombardier, Inc., 7.500%, due 03/15/18 | 976,500 | |||||||||||||
| 900,000 | # | Bombardier, Inc., 7.750%, due 03/15/20 | 982,125 | |||||||||||||
| 860,000 | S | CRH America, Inc., 4.125%, due 01/15/16 | 861,764 | |||||||||||||
| 838,000 | S | CRH America, Inc., 5.750%, due 01/15/21 | 861,505 | |||||||||||||
| 2,321,000 | S | General Electric Co., 5.250%, due 12/06/17 | 2,531,143 | |||||||||||||
| 754,000 | # | Kazatomprom, 6.250%, due 05/20/15 | 804,895 | |||||||||||||
| 1,280,000 | Kazatomprom, 6.250%, due 05/20/15 | 1,366,400 | ||||||||||||||
| 696,000 | S | RR Donnelley & Sons Co., 7.625%, due 06/15/20 | 733,460 | |||||||||||||
| 1,864,000 | RR Donnelley & Sons Co., 8.600%, due 08/15/16 | 2,132,476 | ||||||||||||||
| 11,250,268 | ||||||||||||||||
| Information Technology: | 1.1 | % | ||||||||||||||
| 150,000 | S | Brocade Communications Systems, Inc., 6.625%, due 01/15/18 | 159,563 | |||||||||||||
| 1,730,000 | L | Brocade Communications Systems, Inc., 6.875%, due 01/15/20 | 1,877,050 | |||||||||||||
| 1,365,000 | Jabil Circuit, Inc., 7.750%, due 07/15/16 | 1,556,100 | ||||||||||||||
| 1,935,000 | S | Seagate Technology, Inc., 6.800%, due 10/01/16 | 2,039,006 |
Table of Contents
| 2,091,000 | S | Symantec Corp., 4.200%, due 09/15/20 | 1,971,508 | |||||||||||||
| 657,000 | S | Xerox Corp., 4.250%, due 02/15/15 | 692,207 | |||||||||||||
| 307,000 | S | Xerox Corp., 5.625%, due 12/15/19 | 330,481 | |||||||||||||
| 8,625,915 | ||||||||||||||||
| Materials: | 4.7 | % | ||||||||||||||
| 1,028,000 | S | Agrium, Inc., 6.125%, due 01/15/41 | 1,073,048 | |||||||||||||
| 1,706,000 | S | Alcoa, Inc., 6.150%, due 08/15/20 | 1,805,987 | |||||||||||||
| 1,690,000 | # | ALROSA Finance SA, 7.750%, due 11/03/20 | 1,820,130 | |||||||||||||
| 185,000 | S | ArcelorMittal, 5.250%, due 08/05/20 | 181,261 | |||||||||||||
| 2,043,000 | ArcelorMittal, 5.500%, due 03/01/21 | 2,016,984 | ||||||||||||||
| 816,000 | S | ArcelorMittal, 6.125%, due 06/01/18 | 865,605 | |||||||||||||
| 1,442,000 | ArcelorMittal, 6.750%, due 03/01/41 | 1,417,694 | ||||||||||||||
| 2,481,000 | S | ArcelorMittal, 9.850%, due 06/01/19 | 3,152,433 | |||||||||||||
| 795,000 | Celulosa Arauco y Constitucion S.A., 7.250%, due 07/29/19 | 919,283 | ||||||||||||||
| 745,000 | # | Cemex SAB de CV, 9.000%, due 01/11/18 | 785,044 | |||||||||||||
| 702,000 | # | Chevron Phillips Chemical Co. LLC, 7.000%, due 06/15/14 | 787,319 | |||||||||||||
| 1,109,000 | # | Chevron Phillips Chemical Co. LLC, 8.250%, due 06/15/19 | 1,326,086 | |||||||||||||
| 1,054,000 | Domtar Corp., 10.750%, due 06/01/17 | 1,322,770 | ||||||||||||||
| 4,345,000 | Ferrexpo Finance PLC, 7.875%, due 07/17/16 | 4,345,000 | ||||||||||||||
| 495,000 | # | Georgia-Pacific LLC, 5.400%, due 11/01/20 | 489,702 | |||||||||||||
| 1,191,000 | # | Gerdau Trade, Inc., 5.750%, due 01/30/21 | 1,211,843 | |||||||||||||
| 1,865,000 | # | Gold Fields Ltd., 4.875%, due 10/07/20 | 1,793,073 | |||||||||||||
| 657,000 | # | Inversiones CMPC SA, 4.750%, due 01/19/18 | 648,301 | |||||||||||||
| 1,085,000 | # | Inversiones CMPC SA, 6.125%, due 11/05/19 | 1,145,726 | |||||||||||||
| 1,730,000 | S | Nova Chemicals Corp., 8.375%, due 11/01/16 | 1,907,325 | |||||||||||||
| 809,000 | Rio Tinto Finance USA Ltd., 8.950%, due 05/01/14 | 973,933 | ||||||||||||||
| 1,240,000 | S | Steel Dynamics, Inc., 7.750%, due 04/15/16 | 1,326,800 | |||||||||||||
| 406,000 | S | Teck Resources Ltd., 6.000%, due 08/15/40 | 410,291 | |||||||||||||
| 1,420,000 | S | Teck Resources Ltd., 10.250%, due 05/15/16 | 1,709,298 | |||||||||||||
| 983,000 | S | Vale Overseas Ltd., 4.625%, due 09/15/20 | 963,727 | |||||||||||||
| 506,000 | S | Vale Overseas Ltd., 6.875%, due 11/10/39 | 543,391 | |||||||||||||
| 34,942,054 | ||||||||||||||||
| Telecommunication Services: | 3.2 | % | ||||||||||||||
| 2,929,000 | S | American Tower Corp., 4.500%, due 01/15/18 | 2,880,680 | |||||||||||||
| 844,000 | S | AT&T, Inc., 6.550%, due 02/15/39 | 882,521 | |||||||||||||
| 800,000 | CenturyLink, Inc., 6.000%, due 04/01/17 | 855,629 | ||||||||||||||
| 1,620,000 | S | Crown Castle International Corp., 7.125%, due 11/01/19 | 1,705,050 | |||||||||||||
| 500,000 | Frontier Communications Corp., 7.875%, due 04/15/15 | 541,250 | ||||||||||||||
| 730,000 | Frontier Communications Corp., 8.125%, due 10/01/18 | 789,313 | ||||||||||||||
| 1,949,000 | #, S | Intelsat Subsidiary Holding Co., Ltd., 8.875%, due 01/15/15 | 2,012,343 | |||||||||||||
| 980,000 | S | Nextel Communications, Inc., 5.950%, due 03/15/14 | 987,350 | |||||||||||||
| 1,070,000 | # | Qtel International Finance Ltd., 4.750%, due 02/16/21 | 1,001,625 | |||||||||||||
| 1,015,000 | S | Qwest Communications International, Inc., 7.125%, due 04/01/18 | 1,100,006 | |||||||||||||
| 1,054,000 | S | Qwest Communications International, Inc., 7.500%, due 02/15/14 | 1,073,763 | |||||||||||||
| 481,000 | Qwest Corp., 6.500%, due 06/01/17 | 533,309 | ||||||||||||||
| 580,000 | S | Sprint Nextel Corp., 6.000%, due 12/01/16 | 585,075 | |||||||||||||
| 2,223,000 | Telecom Italia Capital S.A., 5.250%, due 11/15/13 | 2,348,793 | ||||||||||||||
| 1,812,000 | S | Telefonica Emisiones SAU, 3.992%, due 02/16/16 | 1,822,767 | |||||||||||||
| 1,629,000 | S | Telefonica Emisiones SAU, 5.462%, due 02/16/21 | 1,652,831 | |||||||||||||
| 594,000 | # | Vimpel Communications Via VIP Finance Ireland Ltd. OJSC, 6.493%, due 02/02/16 |
| 617,760 | ||||||||||||
| 499,000 | # | Vimpel Communications Via VIP Finance Ireland Ltd. OJSC, 7.748%, due 02/02/21 |
| 526,445 | ||||||||||||
| 378,000 | Vimpel Communications Via VIP Finance Ireland Ltd. OJSC, 9.125%, due 04/30/18 |
| 432,576 | |||||||||||||
| 1,270,000 | S | Windstream Corp., 8.125%, due 09/01/18 | 1,362,075 | |||||||||||||
| 23,711,161 | ||||||||||||||||
| Utilities: | 3.9 | % | ||||||||||||||
| 855,000 | S | AES Corp., 8.000%, due 10/15/17 | 923,400 | |||||||||||||
| 1,467,000 | # | Allegheny Energy Supply Co. LLC, 5.750%, due 10/15/19 | 1,498,777 | |||||||||||||
| 1,191,000 | Ameren Corp., 8.875%, due 05/15/14 | 1,371,010 | ||||||||||||||
| 309,000 | L | Ameren Energy Generating Co., 6.300%, due 04/01/20 | 304,242 | |||||||||||||
| 1,325,000 | # | Calpine Corp., 7.500%, due 02/15/21 | 1,378,000 | |||||||||||||
| 745,000 | China Resources Power Holdings Co., Ltd., 3.750%, due 08/03/15 | 722,283 | ||||||||||||||
Table of Contents
| 1,043,000 | S | CMS Energy Corp., 6.250%, due 02/01/20 | 1,094,510 | |||||||||||||||||
| 1,249,000 | # | Duquesne Light Holdings, Inc., 6.400%, due 09/15/20 | 1,272,940 | |||||||||||||||||
| 1,189,000 | # | EDP Finance BV, 4.900%, due 10/01/19 | 1,039,575 | |||||||||||||||||
| 991,000 | # | EDP Finance BV, 6.000%, due 02/02/18 | 941,485 | |||||||||||||||||
| 1,660,000 | # | Enel Finance International S.A., 6.000%, due 10/07/39 | 1,514,428 | |||||||||||||||||
| 995,000 | # | Enel Finance International S.A., 6.250%, due 09/15/17 | 1,091,092 | |||||||||||||||||
| 1,130,000 | S | Entergy Corp., 5.125%, due 09/15/20 | 1,104,839 | |||||||||||||||||
| 782,000 | Entergy Texas, Inc., 7.125%, due 02/01/19 | 912,157 | ||||||||||||||||||
| 2,126,000 | S | Exelon Generation Co. LLC, 4.000%, due 10/01/20 | 1,947,429 | |||||||||||||||||
| 696,000 | S | FirstEnergy Solutions Corp., 4.800%, due 02/15/15 | 730,798 | |||||||||||||||||
| 1,180,000 | Indiana Michigan Power, 7.000%, due 03/15/19 | 1,387,331 | ||||||||||||||||||
| 812,000 | S | Jersey Central Power and Light, 7.350%, due 02/01/19 | 965,521 | |||||||||||||||||
| 233,722 | # | Juniper Generation, LLC, 6.790%, due 12/31/14 | 220,734 | |||||||||||||||||
| 618,000 | Metropolitan Edison, 7.700%, due 01/15/19 | 731,847 | ||||||||||||||||||
| 709,000 | Nevada Power Co., 7.125%, due 03/15/19 | 835,820 | ||||||||||||||||||
| 645,000 | S | Nisource Finance Corp., 6.125%, due 03/01/22 | 703,260 | |||||||||||||||||
| 980,000 | Oncor Electric Delivery Co., 6.800%, due 09/01/18 | 1,118,650 | ||||||||||||||||||
| 1,318,000 | Oncor Electric Delivery Co., 7.500%, due 09/01/38 | 1,583,613 | ||||||||||||||||||
| 2,275,000 | Sempra Energy, 6.500%, due 06/01/16 | 2,599,338 | ||||||||||||||||||
| 1,169,000 | S | Southwestern Electric Power, 5.550%, due 01/15/17 | 1,242,605 | |||||||||||||||||
| 29,235,684 | ||||||||||||||||||||
Total Corporate Bonds/Notes (Cost $293,279,303) | 307,225,046 | |||||||||||||||||||
| U.S. GOVERNMENT AGENCY OBLIGATIONS: | 25.8 | % | |||||||||||||||||
| Federal Home Loan Mortgage Corporation##: | 11.2 | % | ||||||||||||||||||
| 175,690 | 0.605%, due 02/15/32 | 175,458 | ||||||||||||||||||
| 1,346,918 | 3.355%, due 03/15/38 | 1,359,160 | ||||||||||||||||||
| 14,606,000 | W | 4.000%, due 12/15/40 | 14,300,180 | |||||||||||||||||
| 5,841,000 | W | 4.500%, due 05/01/38 | 5,916,752 | |||||||||||||||||
| 2,850,427 | ^ | 4.861%, due 03/15/33 | 2,938,617 | |||||||||||||||||
| 379,169 | 4.917%, due 04/01/35 | 400,906 | ||||||||||||||||||
| 2,344,905 | ^ | 5.000%, due 05/15/17-01/15/29 | 87,657 | |||||||||||||||||
| 13,198,976 | 5.000%, due 08/15/16-01/01/41 | 13,865,456 | ||||||||||||||||||
| 35,839,894 | 5.500%, due 08/15/20-07/15/37 | 37,984,540 | ||||||||||||||||||
| 117,026 | 5.663%, due 05/01/37 | 125,729 | ||||||||||||||||||
| 1,021,204 | ^ | 6.000%, due 04/15/33 | 200,775 | |||||||||||||||||
| 3,460,034 | 6.000%, due 04/01/14-07/15/32 | 3,794,123 | ||||||||||||||||||
| 13,202,134 | ^ | 6.145%, due 10/15/37 | 1,797,342 | |||||||||||||||||
| 4,027,911 | ^ | 6.495%, due 05/15/35 | 570,960 | |||||||||||||||||
| 71,997 | 6.500%, due 01/01/24-12/01/31 | 81,368 | ||||||||||||||||||
| 35,612 | 7.000%, due 11/01/31-03/01/32 | 41,041 | ||||||||||||||||||
| 5,245 | 7.500%, due 11/01/28 | 6,071 | ||||||||||||||||||
| 83,646,135 | ||||||||||||||||||||
| Federal National Mortgage Association##: | 11.0 | % | ||||||||||||||||||
| 285,582 | 0.654%, due 04/18/28 | 285,788 | ||||||||||||||||||
| 193,518 | 0.700%, due 10/25/33 | 194,359 | ||||||||||||||||||
| 182,063 | 0.800%, due 01/25/32 | 182,088 | ||||||||||||||||||
| 12,742,000 | W | 4.000%, due 04/25/39 | 12,534,943 | |||||||||||||||||
| 1,816,434 | ^ | 4.000%, due 11/01/18 | 162,397 | |||||||||||||||||
| 13,116,000 | W | 4.500%, due 04/25/39 | 13,351,681 | |||||||||||||||||
| 12,336,120 | 4.500%, due 09/01/40-01/01/41 | 12,575,472 | ||||||||||||||||||
| 801,682 | 4.982%, due 07/01/35 | 852,225 | ||||||||||||||||||
| 1,570,000 | W | 5.000%, due 05/01/37 | 1,637,461 | |||||||||||||||||
| 12,943,090 | 5.000%, due 07/01/23-02/01/41 | 13,620,203 | ||||||||||||||||||
| 6,549,530 | 5.500%, due 02/01/18-06/01/37 | 6,901,539 | ||||||||||||||||||
| 1,463,368 | ^ | 6.000%, due 08/25/33 | 307,043 | |||||||||||||||||
| 10,518,830 | 6.000%, due 08/01/16-12/25/49 | 11,572,181 | ||||||||||||||||||
| 5,749,514 | ^ | 6.201%, due 04/25/37 | 752,882 | |||||||||||||||||
| 3,224,578 | ^ | 6.341%, due 06/25/36 | 551,710 | |||||||||||||||||
| 380,966 | ^ | 6.351%, due 08/25/25 | 4,268 | |||||||||||||||||
Table of Contents
| 2,786,684 | ^ | 6.451%, due 08/25/26 | 383,734 | |||||||||||||||
| 6,463,589 | ^ | 6.491%, due 01/25/37 | 879,472 | |||||||||||||||
| 817,352 | 6.500%, due 02/01/28-12/01/33 | 924,743 | ||||||||||||||||
| 21,770,287 | ^ | 6.501%, due 10/25/35 | 3,235,023 | |||||||||||||||
| 301,668 | 7.000%, due 12/01/27-03/01/32 | 348,654 | ||||||||||||||||
| 1,458,828 | ^ | 7.432%, due 02/17/29 | 258,676 | |||||||||||||||
| 844,615 | 7.500%, due 09/01/30-01/25/48 | 951,876 | ||||||||||||||||
| 136,606 | 27.602%, due 02/25/34 | 189,819 | ||||||||||||||||
| 82,658,237 | ||||||||||||||||||
Government National Mortgage Association: | 3.6 | % | ||||||||||||||||
| 7,051 | 3.375%, due 04/20/28 | 7,335 | ||||||||||||||||
| 3,623,000 | W | 4.000%, due 10/15/39 | 3,624,130 | |||||||||||||||
| 1,718,708 | 4.000%, due 11/20/40 | 1,722,020 | ||||||||||||||||
| 7,452,425 | 4.500%, due 04/15/39-12/15/39 | 7,718,305 | ||||||||||||||||
| 29,193,817 | ^ | 5.000%, due 04/20/38-06/16/39 | 3,241,782 | |||||||||||||||
| 1,197,039 | 5.140%, due 10/20/60 | 1,266,587 | ||||||||||||||||
| 822,083 | 5.288%, due 10/20/60 | 882,376 | ||||||||||||||||
| 1,849,242 | 5.290%, due 10/20/60 | 1,985,823 | ||||||||||||||||
| 20,418,543 | ^ | 5.947%, due 06/20/38-04/20/39 | 2,409,586 | |||||||||||||||
| 10,308,051 | ^ | 6.047%, due 05/20/39 | 1,141,299 | |||||||||||||||
| 8,888,206 | ^ | 6.147%, due 04/20/38 | 962,535 | |||||||||||||||
| 2,669,402 | ^ | 6.247%, due 05/16/38 | 417,025 | |||||||||||||||
| 9,582,730 | ^ | 6.297%, due 01/20/38 | 1,161,169 | |||||||||||||||
| 197,839 | 6.500%, due 01/15/29-09/15/32 | 224,084 | ||||||||||||||||
| 14,024 | S | 7.000%, due 02/15/28 | 16,219 | |||||||||||||||
| 67,013 | 7.000%, due 04/15/26-05/15/32 | 77,450 | ||||||||||||||||
| 169,311 | 7.500%, due 12/15/22-05/15/32 | 198,501 | ||||||||||||||||
| 368,718 | ^ | 7.997%, due 06/16/31 | 54,290 | |||||||||||||||
| 27,110,516 | ||||||||||||||||||
Total U.S. Government Agency Obligations | ||||||||||||||||||
(Cost $182,445,306) | 193,414,888 | |||||||||||||||||
| U.S. TREASURY OBLIGATIONS: | 8.9 | % | ||||||||||||||||
U.S. Treasury Notes: | 7.9 | % | ||||||||||||||||
| 832,000 | 0.625%, due 02/28/13 | 830,083 | ||||||||||||||||
| 1,690,000 | S | 0.750%, due 03/31/13 | 1,688,945 | |||||||||||||||
| 13,342,000 | S, L | 1.250%, due 03/15/14 | 13,339,945 | |||||||||||||||
| 611,000 | 2.125%, due 02/29/16 | 609,186 | ||||||||||||||||
| 4,712,000 | 2.750%, due 02/28/18 | 4,677,028 | ||||||||||||||||
| 18,238,000 | S, L | 3.625%, due 02/15/21 | 18,500,171 | |||||||||||||||
| 20,257,000 | S | 4.250%, due 11/15/40 | 19,377,097 | |||||||||||||||
| 59,022,455 | ||||||||||||||||||
Treasury Inflation Indexed Protected Securitiesip: | 1.0 | % | ||||||||||||||||
| 7,393,000 | 0.500%, due 04/15/15 | 7,807,410 | ||||||||||||||||
| 7,807,410 | ||||||||||||||||||
Total U.S. Treasury Obligations (Cost $66,676,148) | 66,829,865 | |||||||||||||||||
| ASSET-BACKED SECURITIES: | 9.5 | % | ||||||||||||||||
Automobile Asset-Backed Securities: | 1.0 | % | ||||||||||||||||
| 1,710,000 | # | Chrysler Financial Auto Securitization Trust, 5.570%, due 08/08/14 |
| 1,770,637 | ||||||||||||||
| 2,038,000 | # | Chrysler Financial Auto Securitization Trust, 6.250%, due 05/08/14 |
| 2,118,135 | ||||||||||||||
| 3,394,000 | # | Chrysler Financial Auto Securitization Trust, 6.540%, due 11/10/14 |
| 3,543,098 | ||||||||||||||
| 7,431,870 | ||||||||||||||||||
Credit Card Asset-Backed Securities: | 4.7 | % | ||||||||||||||||
| 459,000 | BA Credit Card Trust, 0.545%, due 06/16/14 | 456,624 | ||||||||||||||||
| 5,442,000 | Capital One Multi-Asset Execution Trust, 0.545%, due 03/17/14 |
| 5,437,287 | |||||||||||||||
| 2,546,000 | Capital One Multi-Asset Execution Trust, 0.555%, due 11/17/14 |
| 2,530,987 | |||||||||||||||
| 402,000 | Capital One Multi-Asset Execution Trust, 5.050%, due 02/15/16 |
| 432,802 | |||||||||||||||
| 3,400,000 | Capital One Multi-Asset Execution Trust, 5.050%, due 12/17/18 |
| 3,752,198 | |||||||||||||||
| 2,400,000 | Capital One Multi-Asset Execution Trust, 5.750%, due 07/15/20 |
| 2,717,961 | |||||||||||||||
Table of Contents
| 576,000 | Discover Card Master Trust, 5.650%, due 12/15/15 | 630,546 | ||||||||||||||||||
| 1,801,000 | Discover Card Master Trust, 5.650%, due 03/16/20 | 2,023,163 | ||||||||||||||||||
| 293,000 | MBNA Credit Card Master Note Trust, 0.675%, due 07/15/15 |
| 289,539 | |||||||||||||||||
| 278,000 | MBNA Credit Card Master Note Trust, 1.605%, due 10/15/14 |
| 279,191 | |||||||||||||||||
| EUR | 8,539,000 | MBNA Credit Card Master Note Trust, 5.600%, due 07/17/14 |
| 12,380,364 | ||||||||||||||||
| $ | 3,380,000 | MBNA Credit Card Master Note Trust, 6.800%, due 07/15/14 |
| 3,538,900 | ||||||||||||||||
| 1,021,000 | # | MBNA Master Credit Card Trust, 7.100%, due 09/15/13 |
| 1,023,293 | ||||||||||||||||
| 35,492,855 | ||||||||||||||||||||
Home Equity Asset-Backed Securities: | 0.1 | % | ||||||||||||||||||
| 258,846 | Freddie Mac Structured Pass-through Securities, 0.500%, due 05/25/31 |
| 253,036 | |||||||||||||||||
| 54,765 | Freddie Mac Structured Pass-through Securities, 0.550%, due 01/25/32 |
| 52,486 | |||||||||||||||||
| 40,189 | Merrill Lynch Mortgage Investors Trust, 0.610%, due 07/25/34 |
| 33,964 | |||||||||||||||||
| 62,731 | Residential Asset Securities Corp., 0.850%, due 06/25/32 |
| 34,970 | |||||||||||||||||
| 374,456 | ||||||||||||||||||||
Other Asset-Backed Securities: | 3.7 | % | ||||||||||||||||||
| 1,458,243 | # | ARES CLO Funds, 0.549%, due 09/18/17 | 1,410,754 | |||||||||||||||||
| 1,877,372 | # | Atrium CDO Corp., 0.641%, due 10/27/16 | 1,816,358 | |||||||||||||||||
| 2,603,130 | # | Atrium CDO Corp., 0.649%, due 06/27/15 | 2,551,067 | |||||||||||||||||
| 766,358 | Bear Stearns Asset-Backed Securities, Inc., 0.630%, due 06/25/36 |
| 592,535 | |||||||||||||||||
| 1,036,481 | # | Callidus Debt Partners Fund Ltd., 0.813%, due 05/15/15 |
| 1,013,160 | ||||||||||||||||
| 1,163,907 | # | Carlyle High Yield Partners, 0.682%, due 08/11/16 | 1,103,841 | |||||||||||||||||
| 886,012 | Castle Hill III CLO Ltd., 0.615%, due 09/15/15 | 868,667 | ||||||||||||||||||
| 106,861 | Chase Funding Mortgage Loan Asset-Backed Certificates, 0.850%, due 07/25/33 |
| 95,562 | |||||||||||||||||
| 1,284,020 | Credit-Based Asset Servicing and Securitization, LLC, 4.831%, due 08/25/35 |
| 1,272,095 | |||||||||||||||||
| 964,141 | Credit-Based Asset Servicing and Securitization, LLC, 5.501%, due 12/25/36 |
| 680,598 | |||||||||||||||||
| 1,575,000 | # | Credit-Based Asset Servicing and Securitization, LLC, 5.746%, due 12/25/37 |
| 1,562,869 | ||||||||||||||||
| 1,188,000 | # | Credit-Based Asset Servicing and Securitization, LLC, 6.020%, due 12/25/37 |
| 1,028,424 | ||||||||||||||||
| 1,929,412 | # | Endurance CLO I Ltd., 0.763%, due 02/15/14 | 1,894,648 | |||||||||||||||||
| 2,378,589 | # | First CLO Ltd., 0.654%, due 07/27/16 | 2,336,963 | |||||||||||||||||
| 639,182 | # | Granite Ventures Ltd., 0.563%, due 12/15/17 | 623,777 | |||||||||||||||||
| 2,585,429 | # | GSC Partners CDO Fund Ltd., 0.693%, due 11/20/16 | 2,525,256 | |||||||||||||||||
| 443,911 | # | Katonah Ltd., 0.859%, due 02/20/15 | 435,227 | |||||||||||||||||
| 566,289 | Lehman XS Trust, 0.530%, due 08/25/35 | 456,936 | ||||||||||||||||||
| 1,412,460 | # | Magnetite IV CLO Ltd., 0.998%, due 10/10/15 | 1,369,040 | |||||||||||||||||
| 86,976 | Residential Asset Mortgage Products, Inc., 0.520%, due 07/25/35 |
| 84,627 | |||||||||||||||||
| 2,465,859 | # | Stanfield Carrera CLO Ltd., 0.790%, due 03/15/15 | 2,435,036 | |||||||||||||||||
| 1,917,571 | # | Wind River CLO Ltd., 0.639%, due 12/19/16 | 1,842,249 | |||||||||||||||||
| 27,999,689 | ||||||||||||||||||||
Total Asset-Backed Securities (Cost $71,852,802) | 71,298,870 | |||||||||||||||||||
| COLLATERALIZED MORTGAGE OBLIGATIONS: | 14.1 | % | ||||||||||||||||||
| 112,865 | ABN Amro Mortgage Corp., 0.750%, due 03/25/18 | 111,678 | ||||||||||||||||||
| 2,753,000 | # | American General Mortgage Loan Trust, 5.750%, due 09/25/48 |
| 2,811,753 | ||||||||||||||||
| 77,944 | American Home Mortgage Assets, 1.102%, due 02/25/47 |
| 2,342 | |||||||||||||||||
| 940,000 | Banc of America Commercial Mortgage, Inc., 4.857%, due 07/10/43 |
| 1,004,116 | |||||||||||||||||
| 700,000 | Banc of America Commercial Mortgage, Inc., 5.067%, due 07/10/43 |
| 715,997 | |||||||||||||||||
| 1,150,000 | Banc of America Commercial Mortgage, Inc., 5.127%, due 07/10/43 |
| 1,159,625 | |||||||||||||||||
| 2,430,000 | Banc of America Commercial Mortgage, Inc., 5.658%, due 06/10/49 |
| 2,453,385 | |||||||||||||||||
| 3,037,579 | # | Banc of America Funding Corp., 5.250%, due 08/26/35 | 3,107,068 | |||||||||||||||||
| 860,000 | # | Banc of America Large Loan, Inc., 5.340%, due 10/10/45 |
| 839,846 | ||||||||||||||||
| 970,000 | # | Banc of America Large Loan, Inc., 5.428%, due 10/10/45 |
| 942,952 | ||||||||||||||||
| 610,126 | Bear Stearns Alternative-A Trust, 0.570%, due 07/25/34 |
| 486,303 | |||||||||||||||||
| 720,000 | # | Bear Stearns Commercial Mortgage Securities, 6.500%, due 02/15/32 |
| 699,481 | ||||||||||||||||
| 960,000 | Bear Stearns Commercial Mortgage Securities, 8.050%, due 10/15/32 |
| 976,417 | |||||||||||||||||
| 1,880,008 | Chase Mortgage Finance Corp., 5.401%, due 12/25/35 | 1,832,414 | ||||||||||||||||||
| 723,940 | Chase Mortgage Finance Corp., 5.500%, due 11/25/35 | 724,222 | ||||||||||||||||||
| 3,281,000 | Citibank Credit Card Issuance Trust, 0.905%, due 07/15/13 |
| 3,277,427 | |||||||||||||||||
| 100,000 | Citibank Credit Card Issuance Trust, 4.850%, due 04/22/15 |
| 107,342 | |||||||||||||||||
| 4,811,000 | Citibank Credit Card Issuance Trust, 6.300%, due 06/20/14 |
| 5,084,851 | |||||||||||||||||
Table of Contents
| 4,378,000 | Citibank Credit Card Issuance Trust, 6.950%, due 02/18/14 | 4,586,096 | ||||||||
| 3,542,083 | # | Citigroup Mortgage Loan Trust, Inc., 18.975%, due 10/25/35 | 3,589,874 | |||||||
| 1,118,850 | Countrywide Home Loan Mortgage Pass-through Trust, 0.570%, due 04/25/35 | 252,801 | ||||||||
| 65,554,862 | #, ^ | Credit Suisse First Boston Mortgage Securities Corp., 0.139%, due 02/15/38 | 616,399 | |||||||
| 132,339,580 | #, ^ | Credit Suisse Mortgage Capital Certificates, 0.124%, due 09/15/40 | 840,145 | |||||||
| 1,470,000 | # | DBUBS Mortgage Trust, 5.557%, due 11/10/46 | 1,397,006 | |||||||
| 737,468 | DLJ Commercial Mortgage Corp., 8.490%, due 06/10/33 | 737,010 | ||||||||
| 2,108,910 | First Horizon Asset Securities, Inc., 5.750%, due 02/25/36 | 2,125,696 | ||||||||
| 76,680,670 | #, ^ | Greenwich Capital Commercial Funding Corp., 0.088%, due 12/10/49 | 595,042 | |||||||
| 95,567,235 | #, ^ | Greenwich Capital Commercial Funding Corp., 0.309%, due 03/10/39 | 1,231,986 | |||||||
| 2,790,000 | Greenwich Capital Commercial Funding Corp., 5.700%, due 12/10/49 | 2,949,386 | ||||||||
| 1,400,000 | Greenwich Capital Commercial Funding Corp., 5.736%, due 12/10/49 | 1,482,932 | ||||||||
| 2,440,000 | Greenwich Capital Commercial Funding Corp., 5.867%, due 12/10/49 | 2,406,727 | ||||||||
| 8,370,000 | ^ | GS Mortgage Securities Corp. II, 1.345%, due 03/10/44 | 435,392 | |||||||
| 1,630,000 | # | GS Mortgage Securities Corp. II, 5.865%, due 07/12/38 | 1,716,814 | |||||||
| 428,553 | GSAA Trust, 5.242%, due 06/25/34 | 422,171 | ||||||||
| 149,950 | GSR Mortgage Loan Trust, 0.750%, due 06/25/35 | 147,180 | ||||||||
| 1,083,794 | GSR Mortgage Loan Trust, 5.500%, due 07/25/35 | 1,098,957 | ||||||||
| 281,772 | Homebanc Mortgage Trust, 1.110%, due 08/25/29 | 261,055 | ||||||||
| 1,530,000 | JP Morgan Chase Commercial Mortgage Securities Corp., 4.981%, due 01/15/42 | 1,427,741 | ||||||||
| 1,000,000 | JP Morgan Chase Commercial Mortgage Securities Corp., 5.372%, due 05/15/47 | 1,000,255 | ||||||||
| 257,347,753 | ^ | JPMorgan Chase Commercial Mortgage Securities Corp., 0.152%, due 02/15/51 | 1,442,537 | |||||||
| 1,820,000 | # | JPMorgan Chase Commercial Mortgage Securities Corp., 5.717%, due 03/12/39 | 1,872,634 | |||||||
| 2,210,000 | JPMorgan Chase Commercial Mortgage Securities Corp., 5.987%, due 02/15/51 | 2,346,775 | ||||||||
| 635,476 | JPMorgan Mortgage Trust, 5.387%, due 07/25/35 | 637,540 | ||||||||
| 2,170,000 | LB Commercial Conduit Mortgage Trust, 5.928%, due 07/15/44 | 2,113,133 | ||||||||
| 2,200,000 | LB Commercial Conduit Mortgage Trust, 5.928%, due 07/15/44 | 2,357,889 | ||||||||
| 20,551,041 | ^ | LB-UBS Commercial Mortgage Trust, 0.175%, due 11/15/40 | 72,757 | |||||||
| 42,226,366 | #, ^ | LB-UBS Commercial Mortgage Trust, 0.247%, due 09/15/39 | 731,888 | |||||||
| 61,085,417 | #, ^ | LB-UBS Commercial Mortgage Trust, 0.713%, due 11/15/38 | 1,562,846 | |||||||
| 560,000 | LB-UBS Commercial Mortgage Trust, 4.946%, due 12/15/39 | 548,300 | ||||||||
| 1,730,000 | LB-UBS Commercial Mortgage Trust, 4.986%, due 12/15/39 | 1,669,209 | ||||||||
| 1,320,000 | LB-UBS Commercial Mortgage Trust, 5.323%, due 11/15/40 | 1,322,958 | ||||||||
| 2,330,000 | LB-UBS Commercial Mortgage Trust, 5.424%, due 02/15/40 | 2,477,715 | ||||||||
| 1,450,000 | LB-UBS Commercial Mortgage Trust, 5.455%, due 02/15/40 | 1,453,039 | ||||||||
| 2,490,000 | LB-UBS Commercial Mortgage Trust, 5.896%, due 06/15/38 | 2,414,103 | ||||||||
| 52,182,695 | #, ^ | Merrill Lynch Mortgage Trust, 0.553%, due 02/12/51 | 1,099,714 | |||||||
| 1,120,000 | # | Morgan Stanley Capital I, 5.238%, due 09/15/47 | 1,095,799 | |||||||
| 650,000 | Morgan Stanley Capital I, 5.242%, due 01/14/42 | 668,241 | ||||||||
| 280,000 | # | Morgan Stanley Dean Witter Capital I, 6.500%, due 11/15/36 | 124,023 | |||||||
| 1,220,000 | # | Morgan Stanley Dean Witter Capital I, 7.280%, due 12/15/35 | 1,282,804 | |||||||
| 16,432,066 | #, ^ | RBSCF Trust, 1.000%, due 04/15/24 | 562,285 | |||||||
| 1,980,000 | # | RBSCF Trust, 5.420%, due 01/19/49 | 2,033,480 | |||||||
| 860,000 | Salomon Brothers Mortgage Securities VII, Inc., 6.784%, due 12/18/35 | 844,668 | ||||||||
| 313,483 | Sequoia Mortgage Trust, 0.524%, due 01/20/35 | 262,758 | ||||||||
| 611,736 | Structured Adjustable Rate Mortgage Loan Trust, 5.205%, due 09/25/34 | 601,269 | ||||||||
| 632,640 | Structured Asset Mortgage Investments, Inc., 0.494%, due 04/19/35 | 472,061 | ||||||||
| 983,879 | Structured Asset Securities Corp., 5.500%, due 05/25/35 | 1,020,947 | ||||||||
| 2,100,000 | # | Vornado DP LLC, 5.280%, due 09/13/28 | 2,066,398 | |||||||
| 1,590,000 | # | Vornado DP LLC, 6.356%, due 09/13/28 | 1,599,118 | |||||||
| 1,280,000 | # | Wachovia Bank Commercial Mortgage Trust, 5.125%, due 08/15/35 | 1,308,406 | |||||||
| 2,610,000 | Wachovia Bank Commercial Mortgage Trust, 5.342%, due 12/15/43 | 2,706,520 | ||||||||
| 1,520,000 | Wachovia Bank Commercial Mortgage Trust, 5.368%, due 11/15/48 | 1,399,308 | ||||||||
| 1,170,000 | Wachovia Bank Commercial Mortgage Trust, 5.383%, due 12/15/43 | 1,099,158 | ||||||||
| 2,467,585 | WaMu Mortgage Pass-Through Certificates, 2.582%, due 01/25/36 | 2,350,425 | ||||||||
| 1,312,101 | Washington Mutual Mortgage Pass-through Certificates, 6.000%, due 06/25/34 | 1,402,923 | ||||||||
| 2,889,885 | Wells Fargo Mortgage-Backed Securities Trust, 2.819%, due 06/25/35 | 2,790,233 | ||||||||
| 49,362 | Wells Fargo Mortgage-Backed Securities Trust, 4.854%, due 08/25/34 | 50,444 | ||||||||
Total Collateralized Mortgage Obligations (Cost $104,113,066) | 105,522,189 | |||||||||
Table of Contents
| MUNICIPAL BONDS: | 0.1 | % | ||||||||||||||||
Louisiana: | 0.1 | % | ||||||||||||||||
| 1,105,000 | Louisiana Local Government Environmental Facilities & Community Development Auth, 2.470%, due 02/01/19 |
| 1,101,177 | |||||||||||||||
Total Municipal Bonds (Cost $1,106,122) | 1,101,177 | |||||||||||||||||
| OTHER BONDS: | 6.3 | % | ||||||||||||||||
Foreign Government Bonds: | 6.3 | % | ||||||||||||||||
| BRL | 39,274,000 | Brazil Notas do Tesouro Nacional Series F, 10.000%, due 01/01/14 |
| 23,104,348 | ||||||||||||||
| $ | 1,713,000 | # | Eskom Holdings Ltd., 5.750%, due 01/26/21 | 1,745,119 | ||||||||||||||
| MXN | 121,468,157 | Mexican Udibonos, 4.000%, due 06/13/19 | 10,716,999 | |||||||||||||||
| ZAR | 38,866,798 | South Africa Government International Bond, 2.750%, due 01/31/22 |
| 5,799,857 | ||||||||||||||
| ZAR | 44,810,752 | South Africa Government International Bond, 7.250%, due 01/15/20 |
| 6,068,648 | ||||||||||||||
Total Other Bonds (Cost $45,808,017) | 47,434,971 | |||||||||||||||||
Shares | Value | |||||||||||||||||
| PREFERRED STOCK: | 0.3 | % | ||||||||||||||||
Financials: | 0.3 | % | ||||||||||||||||
| 71,275 | P | Citigroup Capital XII | $ | 1,876,671 | ||||||||||||||
Total Preferred Stock (Cost $1,781,875) | 1,876,671 | |||||||||||||||||
# of | Value | |||||||||||||||||
| POSITIONS IN PURCHASED OPTIONS: | 0.1 | % | ||||||||||||||||
Options on Exchange-Traded Futures Contracts: | 0.1 | % | ||||||||||||||||
| 242 | Put Option CBOT | |||||||||||||||||
U.S. Treasury 10-Year Note May Futures Strike @ $121.000 - Exp 04/21/11 | 518,032 | |||||||||||||||||
Total Positions in Purchased Options (Cost $342,935) | 518,032 | |||||||||||||||||
Total Long-Term Investments (Cost $767,405,574) | 2,394,703 | |||||||||||||||||
Shares | Value | |||||||||||||||||
| SHORT-TERM INVESTMENTS: | 2.4 | % | ||||||||||||||||
Mutual Funds: | 0.2 | % | ||||||||||||||||
| 1,599,000 | BlackRock Liquidity Funds, TempFund, Institutional Class |
| $ | 1,599,000 | ||||||||||||||
Total Mutual Funds (Cost $1,599,000) | 1,599,000 | |||||||||||||||||
Securities Lending Collateralcc: | 2.2 | % | ||||||||||||||||
| 13,765,144 | BNY Mellon Overnight Government Fund (1) | 13,765,144 | ||||||||||||||||
| 3,329,856 | R | BNY Institutional Cash Reserves Fund, Series B (1)(2) | 2,663,885 | |||||||||||||||
Total Securities Lending Collateral (Cost $17,095,000) | 16,429,029 | |||||||||||||||||
Total Short-Term Investments (Cost $18,694,000) | 18,028,029 | |||||||||||||||||
Table of Contents
Total Investments in Securities (Cost $786,099,574) * | 2.7 | % | $ | 20,422,732 | ||||||||
Other Assets and Liabilities - Net | 97.3 | 729,094,417 | ||||||||||
Net Assets | 100.0 | % | $ | 749,517,149 | ||||||||
| & | Payment-in-kind |
| # | Securities with purchases pursuant to Rule 144A or section 4(2), under the Securities Act of 1933 and may not be resold subject to that rule except to qualified institutional buyers. Unless otherwise noted, these securities have been determined to be liquid under the guidelines established by the Funds’ Board of Directors/Trustees. |
| P | Preferred Stock may be called prior to convertible date. |
| cc | Securities purchased with cash collateral for securities loaned. |
| (1) | Collateral received from brokers for securities lending was invested in these short-term investments. |
| (2) | On September 12, 2008, BNY established a separate sleeve of the Institutional Cash Reserves Fund (Series B) to hold certain Lehman Brothers defaulted debt obligations. The Fund’s position in Series B is being fair valued daily. Please see the accompanying Notes to Financial Statements for additional details on securities lending. |
| ip | Treasury inflation indexed protected security whose principal value is adjusted in accordance with changes to the Consumer Price Index. |
| ## | On September 7, 2008, the Federal Housing Finance Agency placed the Federal National Mortgage Association and the Federal Home Loan Mortgage Corporation into conservatorship and the U.S. Treasury guaranteed the debt issued by those organizations. |
| W | Settlement is on a when-issued or delayed-delivery basis. |
| S | All or a portion of this security has been identified by the Fund to cover future collateral requirements for applicable futures, options, swaps, foreign currency contracts and/or when-issued or delayed-delivery securities. |
| R | Restricted security |
| L | Loaned security, a portion or all of the security is on loan at March 30, 2011. |
| ± | Defaulted security |
| X | Fair value determined by ING Funds Valuation Committee appointed by the Funds’ Board of Directors/Trustees. |
| ^ | Interest only securities represent the right to receive the monthly interest payments on an underlying pool of mortgage loans. Principal amount shown represents the notional amount on which current interest is calculated. Payments of principal on the pool reduce the value of the interest only security. |
| BRL | Brazilian Real |
| DKK | Danish Krone |
| EUR | EU Euro |
| MXN | Mexican Peso |
| ZAR | South African Rand |
| * | Cost for federal income tax purposes is |
Net unrealized appreciation consists of: | ||||
Gross Unrealized Appreciation | $ | 38,442,645 | ||
Gross Unrealized Depreciation | (11,292,481 | ) | ||
Net Unrealized Appreciation | $ | 27,150,164 | ||
See Accompanying Notes to Financial Statements
Table of Contents
ITEM 7. DISCLOSURE OF PROXY VOTING POLICIES AND PROCEDURES FOR CLOSED-END MANAGEMENT INVESTMENT COMPANIES.
Not applicable.
ITEM 8. PURCHASES OF EQUITY SECURITIES BY CLOSED-END MANAGEMENT INVESTMENT COMPANY AND AFFILIATED PURCHASERS
Not applicable.
ITEM 9. SUBMISSION OF MATTERS TO A VOTE OF SECURITY HOLDERS.
Nominating Committee. The Nominating Committee operates pursuant to a Charter approved by the Board. The primary purpose of the Nominating Committee is to consider, evaluate and make recommendations to the Board with respect to the nomination and selection of Independent Trustees. In evaluating candidates, the Nominating Committee may consider a variety of factors, but specific qualifications of candidates for Board membership will be based on the needs of the Board at the time of nomination.
The Nominating Committee is willing to consider nominations received from shareholders and shall assess shareholder nominees in the same manner as it reviews nominees it identifies. A shareholder nominee for director should be submitted in writing to the Fund’s Secretary. Any such shareholder nomination should include sufficient background information concerning the candidate and should be received in a timely manner. At a minimum, the following information as to each individual proposed for nomination as director should be included: the individual’s written consent to be named in the proxy statement as a nominee (if nominated) and to serve as a director (if elected), and all information relating to such individual that is required to be disclosed in a solicitation of proxies for election of directors, or is otherwise required, in each case under applicable federal securities laws, rules and regulations.
The Secretary shall submit all nominations received in a timely manner to the Nominating Committee. To be timely, any such submission must be delivered to the Fund’s Secretary not earlier than the 90th day prior to such meeting and not later than the close of business on the later of the 60th day prior to such meeting or the 10th day following the day on which public announcement of the date of the meeting is first made, by either disclosure in a press release or in a document publicly filed by the Fund with the SEC.
In evaluating a candidate for the position of Independent Trustee, including any candidate recommended by
1
Table of Contents
shareholders of the Fund, the Nominating Committee shall consider the following: (i) the candidate’s knowledge in matters relating to the mutual fund industry; (ii) any experience possessed by the candidate as a director or senior officer of other public companies; (iii) the candidate’s educational background, reputation for high ethical standards and professional integrity; (iv) any specific financial, technical or other expertise possessed by the candidate, and the extent to which such expertise would complement the Board’s existing mix of skills, core competencies and qualifications; (v) the candidate’s perceived ability to contribute to the ongoing functions of the Board, including the candidate’s ability and commitment to attend meetings regularly and work collaboratively with other members of the Board; (vi) the candidate’s ability to qualify as an Independent Trustee for purposes of the 1940 Act; and (vii) such other factors as the Committee determines to be relevant in light of the existing composition of the Board and any anticipated vacancies. Prior to making a final recommendation to the Board, the Committee shall conduct personal interviews with those candidates it concludes are the most qualified candidates.
ITEM 10. CONTROLS AND PROCEDURES.
| (a) | Based on our evaluation conducted within 90 days of the filing date, hereof, the design and operation of the registrant’s disclosure controls and procedures are effective to ensure that material information relating to the registrant is made known to the certifying officers by others within the appropriate entities, particularly during the period in which Forms N-CSR are being prepared, and the registrant’s disclosure controls and procedures allow timely preparation and review of the information for the registrant’s Form N-CSR and the officer certifications of such Form N-CSR. |
| (b) | There were no significant changes in the registrant’s internal controls that occurred during the second fiscal quarter of the period covered by this report that has materially affected, or is reasonably likely to materially affect, the registrant’s internal control over financial reporting. |
ITEM 11. EXHIBITS.
| (a)(1) | Code of Ethics pursuant to Item 2 of Form N-CSR is filed and attached hereto as EX-99.CODE ETH. |
| (a)(2) | A separate certification for each principal executive officer and principal financial officer of the registrant as required by Rule 30a-2 under the Act (17 CFR 270.30a-2) is attached hereto as EX-99.CERT. |
| (b) | The officer certifications required by Section 906 of the Sarbanes-Oxley Act of 2002 are attached hereto as EX-99.906CERT |
| (3) | Not applicable. |
2
Table of Contents
SIGNATURES
Pursuant to the requirements of the Securities Exchange Act of 1934 and the Investment Company Act of 1940, the registrant has duly caused this report to be signed on its behalf by the undersigned, thereunto duly authorized.
| (Registrant): ING Funds Trust | ||
| By | /s/ Shaun P. Mathews | |
| Shaun P. Mathews | ||
| President and Chief Executive Officer | ||
| Date: June 3, 2011 | ||
Pursuant to the requirements of the Securities Exchange Act of 1934 and the Investment Company Act of 1940, this report has been signed below by the following persons on behalf of the registrant and in the capacities and on the dates indicated.
| By | /s/ Shaun P. Mathews | |
| Shaun P. Mathews | ||
| President and Chief Executive Officer | ||
| Date: June 3, 2011 | ||
| By | /s/ Todd Modic | |
| Todd Modic | ||
| Senior Vice President and Chief Financial Officer | ||
| Date: June 3, 2011 | ||