OMB APPROVAL
OMB Number: 3235-0570
Expires: August 31, 2010
Estimated average burden hours per response: 18.9
UNITED STATES
SECURITIES AND EXCHANGE COMMISSION
Washington, D.C. 20549
FORM N-CSR
CERTIFIED SHAREHOLDER REPORT OF
REGISTERED MANAGEMENT INVESTMENT COMPANIES
Investment Company Act file number: 811-08895
ING Funds Trust
(Exact name of registrant as specified in charter)
| | |
| 7337 E. Doubletree Ranch Rd., Scottsdale, AZ | | 85258 |
| (Address of principal executive offices) | | (Zip code) |
The Corporation Trust Company, 1209 Orange Street, Wilmington, DE 19801
(Name and address of agent for service)
Registrant’s telephone number, including area code: 1-800-992-0180
| | |
Date of fiscal year end: | | March 31 |
| |
Date of reporting period: | | March 31, 2009 |
Item 1. Reports to Stockholders.
The following is a copy of the report transmitted to stockholders pursuant to Rule 30e-1 under the Act (17 CFR 270.30e-1):

Annual Report
March 31, 2009
Classes A, B, C, I, IS, O, Q, R and W
Fixed-Income Funds
| n | ING High Yield Bond Fund |
| n | ING Intermediate Bond Fund |
Money Market Funds
| n | ING Classic Money Market Fund |
| n | ING Institutional Prime Money Market Fund |
| | |
 | | E-Delivery Sign-up – details inside |
This report is submitted for general information to shareholders of the ING Funds. It is not authorized for distribution to prospective shareholders unless accompanied or preceded by a prospectus which includes details regarding the funds’ investment objectives, risks, charges, expenses and other information. This information should be read carefully.
MUTUAL FUNDS | 
|
TABLE OF CONTENTS
| | | | |
| | | |
 | | Go Paperless with E-Delivery! | | |
Sign up now for on-line prospectuses, fund reports, and proxy statements. In less than five minutes, you can help reduce paper mail and lower fund costs. Just go to www.ingfunds.com, click on the E-Delivery icon from the home page, follow the directions and complete the quick 5 Steps to Enroll. You will be notified by e-mail when these communications become available on the internet. Documents that are not available on the internet will continue to be sent by mail. |
PROXY VOTING INFORMATION
A description of the policies and procedures that the Funds use to determine how to vote proxies related to portfolio securities is available: (1) without charge, upon request, by calling Shareholder Services toll-free at (800) 992-0180; (2) on the Funds’ website at www.ingfunds.com; and (3) on the U.S. Securities and Exchange Commission’s (“SEC”) website at www.sec.gov. Information regarding how the Funds voted proxies related to portfolio securities during the most recent 12-month period ended June 30 is available without charge on the Funds’ website at www.ingfunds.com and on the SEC’s website at www.sec.gov.
QUARTERLY PORTFOLIO HOLDINGS
The Funds file their complete schedule of portfolio holdings with the SEC for the first and third quarters of each fiscal year on Form N-Q. The Funds’ Forms N-Q are available on the website at www.sec.gov. The Funds’ Forms N-Q may be reviewed and copied at the SEC’s Public Reference Room in Washington, DC, and information on the operation of the Public Reference Room may be obtained by calling (800) SEC-0330; and is available upon request from the Funds by calling Shareholder Services toll-free at (800) 992-0180.
Please note that your investment in money market funds: is not a bank deposit, is not insured or guaranteed by the Federal Deposit Insurance Corporation (“FDIC”), the Federal Reserve Board or any other government agency, and is affected by market fluctuations. There is no guarantee that the ING Classic Money Market Fund or the ING Institutional Prime Money Market Fund will achieve its investment objective.
PRESIDENT’S LETTER

Dear Shareholder,
It’s spring again, and with the turn of the season come a few glimmers of hope for the economy and the financial markets. In March, the Obama administration unveiled two new rescue programs that could become important factors in our economic recovery.
The U.S. Treasury announced a plan to remove distressed assets from banks’ balance sheets. The plan aims to finance up to $1 trillion in purchases of distressed and illiquid assets through a Public-Private Investment Program. The Federal Reserve announced that it will purchase up to $300 billion of longer-term Treasury securities, and will substantially expand its existing programs to purchase agency mortgage-backed securities and debt. The aim of these purchases is to keep interest rates low for businesses and home buyers.
Initial market reactions to both announcements have been positive. Optimism has been lifted by the expectation that a comprehensive government effort will finally succeed in breaking a negative feedback loop from falling output and employment to credit market conditions and consumer demand.
Recent tentative signs of moderating decline in some economic indicators such as the U.S. purchasing managers survey, retail sales and housing starts suggest that the current sharp downturn may start decelerating in the next quarter. We expect policy actions to start producing positive effects by the second half of 2009 as financial sector healing begins.
During times of stress it’s important to keep sight of the longer view: your investment goals. You may have felt pressure to “do something” to shift your money into safer investments, which is certainly understandable. Remember, though, that to meet your long-term goals you will need an appropriate mix of capital accumulation potential, income potential and capital preservation potential. We encourage you to talk to your financial advisor to ensure your current portfolio solution reflects your goals and risk tolerance.
While recognizing that we’re still surrounded by troubles, we look ahead hopefully to improving conditions. At ING Funds we strive to offer our clients quality investments. I thank you for your continued support and confidence and we look forward to serving you in the future.
Sincerely,

Shaun Mathews,
President and Chief Executive Officer
ING Funds
April 24, 2009
The views expressed in the President’s Letter reflect those of the President as of the date of the letter. Any such views are subject to change at any time based upon market or other conditions and ING Funds disclaims any responsibility to update such views. These views may not be relied on as investment advice and because investment decisions for an ING Fund are based on numerous factors, may not be relied on as an indication of investment intent on behalf of any ING Fund. Reference to specific company securities should not be construed as recommendations or investment advice.
For more complete information, or to obtain a prospectus for any ING Fund, please call your investment professional or ING Funds Distributor, LLC at (800) 992-0180 or log on to www.ingfunds.com. The prospectus should be read carefully before investing. Consider the fund’s investment objectives, risks, and charges and expenses carefully before investing. The prospectus contains this information and other information about the fund. Check with your investment professional to determine which funds are available for sale within their firm. Not all funds are available for sale at all firms.
1
MARKET PERSPECTIVE: YEAR ENDED MARCH 31, 2009
In our semi-annual report we described global economies entering recession in the aftermath of a financial crisis rooted in unwise mortgage borrowing, lending and investment.
In the maelstrom of September 2008, the U.S. government had ended up as the reluctant arbiter of which major financial institutions would survive and in what form. But, in one case, it pointedly stood aside and let Lehman Brothers go under. This was soon recognized as a major mistake, as a credit crisis quickly lurched towards a credit market collapse. Lending all but seized up. Investors dumped risky asset classes to buy Treasuries or repay debt.
The policy response was huge but initially muddled. Congress passed the Troubled Assets Relief Program (“TARP”), intended to relieve banks’ balance sheets of enormous volumes of distressed loans and toxic assets of indeterminate value. But most of the money was used to recapitalize them.
Other government-sponsored programs did provide practical help, like support for the commercial paper market and a guarantee facility for money market funds. The announced intention to buy vast quantities of agency mortgage-backed bonds and debentures drove 30-year mortgage rates below 5% to record low levels. The newly-elected U.S. president promised a $1 trillion stimulus package. And in December, the Federal Open Market Committee (“FOMC”) reduced interest rates to between 0% and 0.25%.
Many were hopeful as 2009 dawned that these measures would help solidify melting economies and investment markets. But credit conditions remained tight, and equities resumed their fall.
Meanwhile in the real economy, unemployment reached 8.1%, the highest since 1983. The Standard & Poor’s (“S&P”)/Case-Shiller National U.S. Home Price Index(1) of house prices in 20 cities sank 19% year-over-year. New home sales in January set another record low. Gross domestic product (“GDP”) fell at an annualized rate of 6.3% in the fourth quarter of 2008, the worst performance since 1982. And at the end of February 2009, the U.S. Department of the Treasury (“Treasury”) announced that it would take a 36% stake in Citigroup amid a new wave of concern about major banks’ viability.
Yet in the final weeks of the fiscal year ended March 31, 2009, some of the news got better. Personal spending, retail sales (excluding autos), durable goods orders and at last, new home sales unexpectedly picked up from still poor levels. Some hard details were
announced about a new Public-Private Investment Program to relieve banks of their distressed securities: many people think it might work. And on March 10, 2009 stock markets soared when the above-mentioned Citigroup surprised everybody by saying that 2009 had been profitable so far. All of this paved the way for a rally in risky asset classes to the end of March.
While global equity markets reached the low point of the fiscal year on March 9, 2009, U.S. fixed income markets needed a day longer as the first reaction to sharply rising stocks that day was to sell bonds. But it was really a matter of risk appetite; from that point, high yield and long term bonds in particular registered strong gains. The Barclays Capital U.S. Aggregate Bond Index(2) of investment grade bonds returned 4.70% in the second half of the fiscal year, 3.13% for the entire fiscal year and 1.47% after March 10, 2009. High yield bonds, represented by the Barclays Capital High Yield Bond — 2% Issuer Constrained Composite Index(3) lost 12.64% in the second half of the fiscal year, lost 18.56% for the entire fiscal year, but gained 6.61% after March 10, 2009. The yield on the ten-year U.S. Treasury Note, having started the fiscal year at 3.43%, fell as risk appetite vanished by the end of 2008, to 2.24%, the lowest since 1954, but recovered to 2.68% by the end of March 2009. Similarly, the yield on the 90-day U.S. Treasury Bill started at 1.27%, briefly turned negative in December 2008 and ended our fiscal year at 0.20%, still very low historically.
In currencies, dollar weakness reversed itself in mid-July and the currency ultimately benefited from its safe haven status. In the second half of the fiscal year, the dollar gained 9.40% on the euro, 27.90% against the pound, but lost 8.20% to the yen, as much of the period evidenced the unwinding of carry trades against the yen (essentially short yen positions). For the fiscal year, the gains (losses) were 19.60%, 40.40% and (2.00)% against the euro, pound and yen, respectively.
U.S. equities, represented by the S&P 500® Composite Stock Price (“S&P 500®”) Index(4) including dividends, returned (30.50)% in the six months ended March 31, 2009, (down 38.10% for the entire fiscal year). The first quarter of 2009 would mark the seventh straight quarter of declining profits for S&P 500® companies. As with stock markets generally, March 9, 2009 marked the low point for the S&P 500® Index, closing at a level not seen since September 1996. From there, the S&P 500® Index recovered 18%, within which the financials component jumped 41%.
2
MARKET PERSPECTIVE: YEAR ENDED MARCH 31, 2009
In international markets, referring to MSCI indices in local currencies including net dividends, the MSCI Japan® Index(5) fell 29.40% for the six months ended March 31, 2009, (down 36.5% for the entire fiscal year). Export-dependent GDP receded at an annualized 12.10%, the worst since 1974, as exports halved in value in 12 months. The MSCI Europe ex UK® Index(6) slid 30.20% in the six months ended March 31, 2009, (down 40.90% for the entire fiscal year), also depressed by slumping exports, especially in Germany, the world’s biggest exporter. The European Central Bank raised rates as late as July, but ultimately cut back to 1.50%, still above other major central bank rates. The MSCI UK® Index(7) fell 18.20% for the six months ended March 31, 2009 (down 28.5% for the entire fiscal year), having allowed a bigger housing bubble than the United States and deeper personal indebtedness in an economy more dependent on the now suffering financial sector. The Bank of England repeatedly reduced rates to 0.5%, the lowest since its establishment in 1694.
(1) The S&P/Case-Shiller National U.S. Home Price Index tracks the value of single-family housing within the United States. The index is a composite of single-family home price indices for the nine U.S. Census divisions and is calculated quarterly.
(2) The Barclays Capital U.S. Aggregate Bond Index is an unmanaged index of publicly issued investment grade U.S. Government, mortgage-backed, asset-backed and corporate debt securities.
(3) The Barclays Capital High Yield Bond — 2% Issuer Constrained Composite Index is an unmanaged index that measures the performance of fixed-income securities.
(4) The S&P 500® Index is an unmanaged index that measures the performance of securities of approximately 500 large-capitalization companies whose securities are traded on major U.S. stock markets.
(5) The MSCI Japan® Index is a free float-adjusted market capitalization index that is designed to measure developed market equity performance in Japan.
(6) The MSCI Europe ex UK® Index is a free float-adjusted market capitalization index that is designed to measure developed market equity performance in Europe, excluding the UK.
(7) The MSCI UK® Index is a free float-adjusted market capitalization index that is designed to measure developed market equity performance in the UK.
All indices are unmanaged and investors cannot invest directly in an index.
Past performance does not guarantee future results. The performance quoted represents past performance. Investment return and principal value of an investment will fluctuate, and shares, when redeemed, may be worth more or less than their original cost. The Funds’ performance is subject to change since the period’s end and may be lower or higher than the performance data shown. Please call (800) 992-0180 or log on to www.ingfunds.com to obtain performance data current to the most recent month end.
Market Perspective reflects the views of ING’s Chief Investment Risk Officer only through the end of the period, and is subject to change based on market and other conditions.
3
| | |
| ING GNMA INCOME FUND | | PORTFOLIO MANAGERS’ REPORT |
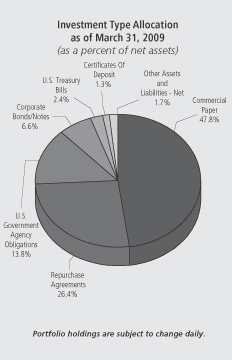
Investment Type Allocation
as of March 31, 2009
(as a percent of net assets)
| | |
U.S. Government Agency Obligations | | 99.4% |
U.S. Treasury Obligations | | 2.0% |
Other Bonds | | 0.0% |
Other Assets and Liabilities — Net | | (1.4)% |
| | |
Net Assets | | 100.0% |
| | |
Portfolio holdings are subject to change daily.
ING GNMA Income Fund (the “Fund”) seeks to generate a high level of current income, consistent with liquidity and safety of principal, through investment primarily in Government National Mortgage Association (“GNMA”) mortgage-backed securities (also known as GNMA Certificates) that are guaranteed as to the timely payment of principal and interest by the U.S. government. The Fund is managed by Denis P. Jamison*, CFA, Senior Vice President and Senior Portfolio Manager of ING Investment Management Co. — the Sub-Adviser.
Securities issued by the U.S. Treasury are backed by the full faith and credit of the federal government. Securities issued by individual agencies and organizations may be backed by the full faith and credit of the federal government as to principal or interest but are not direct obligations of the U.S. Treasury. Securities of some agencies and organizations are backed solely by the entity’s own resources or by the ability of the entity to borrow from the U.S. Treasury. Government securities also include certain mortgage-related securities that are sponsored by a U.S. government agency or organization and are not direct obligations of the U.S. government.
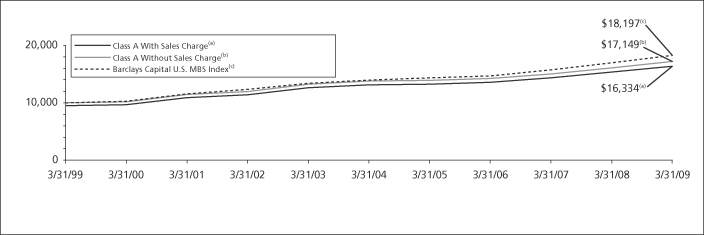
Performance: For the year ended March 31, 2009, the Fund’s Class A shares, excluding sales charges, provided a total return of 6.62% compared to the Barclays Capital U.S. Mortgage-Backed Securities (“MBS”) Index(1) which returned 8.09%, for the same period.
Portfolio Specifics: The fiscal year ended March 31, 2009 started out on a bad foot but steadily improved as the year wore on. The combination of investor risk aversion and rising price volatility depressed mortgage prices from March through September 2008. The yield spread between mortgages and U.S. Treasury obligations widened to levels not seen since the infancy of the mortgage pass-through market in the 1970s. During the reporting period, the Fund lagged its benchmark by about one-half percent per quarter.
Conditions improved as temperatures fell. Price volatility declined and mortgages began to show some traction. This was clearly helped along by the government plan to lift housing prices by buying mortgages. In December the Federal Reserve Board (the “Fed”) announced plans to buy $500 billion of agency-guaranteed mortgages during the first half of 2009. That plan was later extended. Accordingly, both the mortgage benchmark and the Fund recorded solid gains in the final six months of the fiscal year.
The lack of mortgage availability caused by the collapse of the private mortgage bankers during the first months of 2008 prompted the government to fill the mortgage void via the Government National Mortgage Association (“Ginnie Mae”). The agency began guaranteeing jumbo ($750,000) mortgages and repackaging defaulted or soon to be defaulted loans into new guaranteed products. Because investors were apprehensive about the new products, they were sold at sizeable price concessions. We took advantage of discounts and, over the course of the year, acquired over $90 million worth of these new securities. Gradually, as the year progressed, comfort levels regarding the new securities improved and price spreads narrowed.
While it was good to own mortgages last year, it was better to buy the securities issued by the Federal National Mortgage Association (“Fannie Mae”) and the Federal Home Loan Mortgage Corporation (“FHLMC”) rather than Ginnie Maes. The performance of the government-guaranteed variety of mortgage securities lagged that of Fannie Mae and Freddie Mac by one full percentage point in the first three quarters of the fiscal year. Even though relative performance improved a bit in the first quarter of 2009, the return from Ginnie Maes still fell 0.90% short of those of the other agencies. Part of the problem may have been the massive increase in Ginnie Mae issuance. With both Fannie Mae and Freddie Mac facing capital shortages, Ginnie Mae needed to fill the gap and issue lots of mortgages. Ginnie Mae’s share of the mortgage market, just 9.30% a year ago, reached 12.90% by March 31, 2009.
There were few bright spots among our individual holdings. The performance of Ginnie Mae mortgages lagged that of the broader mortgage-backed securities benchmark. Lower coupon investments outperformed those with higher coupons. Our lack of exposure to U.S. Treasury securities during the first quarter of calendar 2009 was a positive. However, that didn’t offset our lack of exposure during the fourth quarter of 2008.
The Fund holds over 500 individual Ginnie Mae guaranteed mortgage pools. Given this level of diversity, the uniform credit quality and the homogenous nature of these investments, no individual security can have a significant impact on the Fund’s performance. However, we do position the Fund for performance by managing the average coupon and type of Ginnie Mae mortgages selected for the portfolio. During the last 12 months, we maintained a high coupon bias. This limited our price gains as interest rates declined. For example, the Barclays Capital Market Indices recorded an 8.00% gain for Ginnie Mae mortgage securities with 5.0% and 5.5% coupons. While those with coupons of 6.00% or higher earned only a 7.30% return.
Current Outlook & Strategy: We are growing increasingly pessimistic regarding bond market prospects in an environment of extreme fiscal and monetary stimulation. Government borrowings and the massive increase in the Fed’s balance sheet are unprecedented. Clearly, these are measures needed to bolster an economy suffering from the withdrawal of private capital and credit. Nonetheless, once the economy recovers, these stimuli will need to be removed in a timely manner or we will face inflation risks. Accordingly, we are maintaining a high coupon, short maturity profile, limiting both our upside potential and our downside risk.
Portfolio holdings and characteristics are subject to change and may not be representative of current holdings and characteristics. The outlook for this Fund may differ from that presented for other ING Funds. Performance for the different classes of shares will vary based on differences in fees associated with each class.
| * | | Effective May 19, 2009, Peter Guan, Jeff Dutra and Justin McWhorten will join Denis Jamison as portfolio managers to the Fund. On September 30, 2009, Mr. Jamison will no longer manage the Fund. |
(1) | | Formerly known as the Lehman Brothers U.S. MBS Index. As of October 31, 2008 all Lehman Brothers indices were renamed: the words “Lehman Brothers” changed to “Barclays Capital.” The Barclays Capital U.S. MBS Index is an unmanaged index composed of fixed-income security mortgage pools sponsored by GNMA, FNMA and FHLMC, including GNMA Graduated Payment Mortgages. |
4
| | |
| PORTFOLIO MANAGERS’ REPORT | | ING GNMA INCOME FUND |
| | | | | | | | | | | | | | | | | | | | | | | | | | | | |
| | | |
| | | Average Annual Total Returns for the Periods Ended March 31, 2009 | | | |
| | | | | 1 Year | | | 5 Year | | | 10 Year | | | Since Inception of Class B October 6, 2000 | | | Since Inception of Class C October 13, 2000 | | | Since Inception of Class I January 7, 2002 | | | Since Inception of Class Q February 23, 2001 | | | Since Inception of Class W December 17, 2007 | | | |
| | | Including Sales Charge: | | | | | | | | | | | | | | | | | | | | | | | | | | |
| | | Class A(1) | | 3.94 | % | | 3.48 | % | | 5.03 | % | | — | | | — | | | — | | | — | | | — | | | |
| | | Class B(2) | | 0.86 | % | | 3.36 | % | | — | | | 4.99 | % | | — | | | — | | | — | | | — | | | |
| | | Class C(3) | | 4.88 | % | | 3.70 | % | | — | | | — | | | 4.96 | % | | — | | | — | | | — | | | |
| | | Class I | | 6.95 | % | | 4.80 | % | | — | | | — | | | — | | | 5.37 | % | | — | | | — | | | |
| | | Class Q | | 6.67 | % | | 4.55 | % | | — | | | — | | | — | | | — | | | 5.37 | % | | | | | |
| | | Class W | | 7.03 | % | | — | | | — | | | — | | | — | | | — | | | — | | | 8.00 | % | | |
| | | Excluding Sales Charge: | | | | | | | | | | | | | | | | | | | | | | | | | | |
| | | Class A | | 6.62 | % | | 4.49 | % | | 5.53 | % | | — | | | — | | | — | | | — | | | — | | | |
| | | Class B | | 5.86 | % | | 3.70 | % | | — | | | 4.99 | % | | — | | | — | | | — | | | — | | | |
| | | Class C | | 5.88 | % | | 3.70 | % | | — | | | — | | | 4.96 | % | | — | | | — | | | — | | | |
| | | Class I | | 6.95 | % | | 4.80 | % | | — | | | — | | | — | | | 5.37 | % | | — | | | — | | | |
| | | Class Q | | 6.67 | % | | 4.55 | % | | — | | | — | | | — | | | — | | | 5.37 | % | | | | | |
| | | Class W | | 7.03 | % | | — | | | — | | | — | | | — | | | — | | | — | | | 8.00 | % | | |
| | | Barclays Capital U.S. MBS Index(4) | | 8.09 | % | | 5.60 | % | | 6.17 | % | | 6.34 | %(5) | | 6.34 | %(5) | | 5.75 | %(6) | | 5.90 | %(7) | | 8.49 | %(8) | | |
Based on a $10,000 initial investment, the graph and table above illustrate the total return of ING GNMA Income Fund against the index indicated. An index is unmanaged and has no cash in its portfolio, imposes no sales charges and incurs no operating expenses. An investor cannot invest directly in an index. The Fund’s performance is shown both with and without the imposition of sales charges.
The performance graph and table do not reflect the deduction of taxes that a shareholder will pay on Fund distributions or the redemption of Fund shares.
The performance shown may include the effect of fee waivers and/or expense reimbursements by the Investment Adviser and/or other service providers, which have the effect of increasing total return. Had all fees and expenses been considered, the total returns would have been lower.
Performance data represents past performance and is no assurance of future results. Investment return and principal value of an investment in the Fund will fluctuate. Shares, when sold, may be worth more or less than their original cost. The Fund’s performance may be lower or higher than the performance data shown. Please log on to www.ingfunds.com or call (800) 992-0180 to get performance through the most recent month end.
This report contains statements that may be “forward-looking” statements. Actual results may differ materially from those projected in the “forward-looking” statements.
The views expressed in this report reflect those of the portfolio managers, only through the end of the period as stated on the cover. The portfolio managers’ views are subject to change at any time based on market and other conditions.
Fund holdings are subject to change daily.
(1) | | Reflects deduction of the maximum Class A sales charge of 4.75%. Effective July 31, 2006, the maximum Class A sales charge was lowered to 2.50%. |
(2) | | Reflects deduction of the Class B deferred sales charge of 5% and 2% for the 1 year and 5 year returns, respectively. |
(3) | | Reflects deduction of the Class C deferred sales charge of 1% for the 1 year return. |
(4) | | The Barclays Capital U.S. MBS Index is an unmanaged index composed of fixed-income security mortgage pools sponsored by GNMA, FNMA and FHLMC, including GNMA Graduated Payment Mortgages. |
(5) | | Since inception performance for index is shown from October 1, 2000. |
(6) | | Since inception performance for index is shown from January 1, 2002. |
(7) | | Since inception performance for index is shown from March 1, 2001. |
(8) | | Since inception performance for index is shown from January 1, 2008. |
5
| | |
| ING HIGH YIELD BOND FUND | | PORTFOLIO MANAGERS’ REPORT |
ING High Yield Bond Fund (the “Fund”) seeks to provide investors with a high level of current income and total return. The Fund is managed by Randall Parrish, CFA and Dan Doyle*, Portfolio Managers of ING Investment Management Co. — the Sub-Adviser.
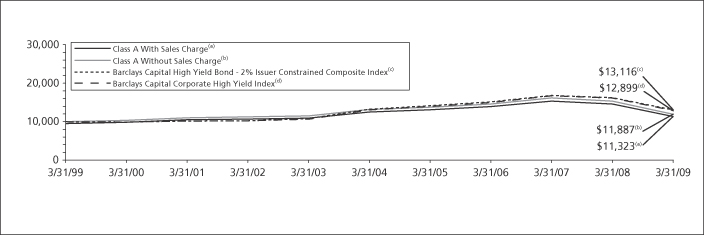
Performance: For the year ended March 31, 2009, the Fund’s Class A shares, excluding sales charges, provided a total return of (22.36)% compared to the Barclays Capital High Yield Bond — 2% Issuer Constrained Composite Index(1) and the Barclays Capital Corporate High Yield Index(2), which returned (18.56)% and (19.31)%, respectively, for the same period.
Portfolio Specifics: The past 12 months provided a painful reminder to holders of all risky assets of the difficulty in deflating an asset price bubble. A sharp contraction in economic activity, accelerating job losses and weak corporate earnings hurt all assets except Treasuries. The greatest pain, however, was felt in the assets that rely most heavily on credit availability and expanding valuation multiples — stocks and high yield bonds. In this environment, it is not surprising to see large negative returns.
What is perhaps surprising — or at least ironic — is that the U.S. government is now seeking to solve the country’s economic woes by re-inflating the asset price bubble that is blamed for the market pain in the first place. Policymakers have apparently determined that they would rather fight inflation down the road than deal with the negative impacts of deflation today. The success of this effort will be crucial in determining the path of high yield bond prices in coming quarters.
For the year ended March 31, 2009, the average spread of the Barclays Capital High Yield Bond — 2% Issuer Constrained Composite Index, which started the year at approximately 7% over Treasuries, ballooned to nearly 20% over Treasuries in the fall before settling back to 14.25% at March 31. Defaults increased sharply, with Moody’s U.S. default rate reaching 7.40% as of March 31, 2009, versus 1.80% a year ago. Not surprisingly, higher quality outperformed lower quality (BB-rated bonds -8.80% versus CCC-rated bonds -37.00%) and defensive sectors generally outperformed cyclicals.
We increased the Fund’s holdings of BB-rated bonds over the reporting period, but we were on average underweight BB- and overweight B-rated bonds for the period. This quality positioning hurt performance; however, the Fund benefited from its rotation out of cyclical sectors into more defensive sectors such as healthcare and
telecommunications. Performance was further hurt by positions in investment grade-rated bank hybrid capital issues. These securities dropped sharply in price as investors became concerned that the U.S. government would allow them to be impaired, as it had similar instruments issued by the Federal National Mortgage Assocation (“Fannie Mae”) and the Federal Home Loan Mortgage Corporation (“Freddie Mac”).
In a year such as the past one, “wins” in security selection come primarily from avoiding bonds that declined sharply in price. This was true for the Fund as well. Our largest holding, Ford Motor Credit, posted a negative return for the year but did significantly outperform the market despite the troubles at its parent company. The largest negative impacts on performance came from positions in directories publishers R.H. Donnelley & Sons Co. (“Donnelley”) and corporate jet maker Hawker Beechcraft Acquisition Co. (“Hawker”). We continue to own our Donnelley position, as we believe cash flows support the debt through the senior paper in the capital structure. We sold our position in Hawker, as we believe the corporate jet market will remain depressed for an extended time. Other detractors from results included chemical companies Huntsman Corp. and Hexion U.S. Finance Corp., when the companies canceled their planned merger; and a short-dated, long-risk credit default swap in auto supplier Visteon Corp., which is facing bankruptcy as a result of the dramatic decline in global auto sales.
Current Outlook & Strategy: We expect to see an increase in defaults given the current tight credit conditions and the weak state of the economy. We believe most high yield issuers are well positioned to weather the downturn, but risk remains extremely high for companies with marginal financial profiles. Spreads remain more than 4% tighter than their December widths, but we believe spreads still offer attractive compensation for eventual credit losses — especially in the higher quality industry sectors and stronger balance sheets. Despite the recent
short-term equity market rally and some initial signs that the pace of economic contraction may be slowing, we continue to favor a defensive posture in the near term. We continue to add exposure to names with more predictable cash flow streams and reasonable balance sheets, and to use market strength to reduce exposure to names where spreads do not adequately compensate us for heightened default risk.
Portfolio holdings and characteristics are subject to change and may not be representative of current holdings and characteristics. The outlook for this Fund may differ from that presented for other ING Funds. Performance for the different classes of shares will vary based on differences in fees associated with each class.
| * | | Effective January 13, 2009, Dan Doyle was added as a portfolio manager to the Fund. |
(1) | | Formerly known as the Lehman Brothers High Yield Bond — 2% Issuer Constrained Composite Index. As of October 31, 2008 all Lehman Brothers indices were renamed: the words “Lehman Brothers” changed to “Barclays Capital.” The Barclays Capital High Yield Bond — 2% Issuer Constrained Composite Index is an unmanaged index that measures the performance of fixed-income securities. |
(2) | | Formerly known as the Lehman Brothers High Yield Bond Index. As of October 31, 2008 all Lehman Brothers indices were renamed: the words “Lehman Brothers” changed to “Barclays Capital.” The Barclays Capital Corporate High Yield Index is an unmanaged index that measures the performance of fixed-income securities generally representative of corporate bonds rated below investment grade. |
Top Ten Holdings*
as of March 31, 2009
(as a percent of net assets)
| | |
General Motors Acceptance Corp.,
6.875%, due 09/15/11 | | 2.3% |
Charter Communications Operating, LLC,
8.375%, due 04/30/14 | | 1.5% |
Intelsat Jackson Holdings Ltd.,
11.250%, due 06/15/16 | | 1.3% |
Energy Future Holdings, 10.875%, due 11/01/17 | | 1.3% |
Ford Motor Credit Co., LLC, 5.544%, due 04/15/09 | | 1.3% |
Chesapeake Energy Corp., 6.625%, due 01/15/16 | | 1.3% |
MetroPCS Wireless, Inc., 9.250%, due 11/01/14 | | 1.3% |
Cricket Communications, Inc., 9.375%, due 11/01/14 | | 1.2% |
Qwest Communications International, Inc.,
7.500%, due 02/15/14 | | 1.2% |
DirecTV Holdings, LLC, 7.625%, due 05/15/16 | | 1.1% |
| | * | Excludes short-term investments related to ING Institutional Prime Money Market Fund — Class I. |
Portfolio holdings are subject to change daily.
6
| | |
| PORTFOLIO MANAGERS’ REPORT | | ING HIGH YIELD BOND FUND |
| | | | | | | | | | | | | | | | |
| | | |
| | | Average Annual Total Returns for the Periods Ended March 31, 2009 | | | |
| | | | | 1 Year | | | 5 Year | | | 10 Year | | | Since
Inception
of Class I
July 31,
2008 | | | |
| | | Including Sales Charge: | | | | | | | | | | | | | | |
| | | Class A(1) | | (24.28 | )% | | (2.93 | )% | | 1.25 | % | | — | | | |
| | | Class B(2) | | (26.36 | )% | | (3.00 | )% | | 1.01 | % | | — | | | |
| | | Class C(3) | | (23.64 | )% | | (2.73 | )% | | 1.00 | % | | — | | | |
| | | Class I | | — | | | — | | | — | | | (20.35 | )% | | |
| | | Excluding Sales Charge: | | | | | | | | | | | | | | |
| | | Class A | | (22.36 | )% | | (1.99 | )% | | 1.75 | % | | — | | | |
| | | Class B | | (22.86 | )% | | (2.72 | )% | | 1.01 | % | | — | | | |
| | | Class C | | (22.95 | )% | | (2.73 | )% | | 1.00 | % | | — | | | |
| | | Class I | | — | | | — | | | — | | | (20.35 | )% | | |
| | | Barclays Capital High Yield Bond — 2% Issuer Constrained Composite Index(4) | | (18.56 | )% | | (0.03 | )% | | 2.75 | % | | (19.10 | )%(6) | | |
| | | Barclays Capital Corporate High Yield Index(5) | | (19.31 | )% | | (0.11 | )% | | 2.58 | % | | (19.63 | )%(6) | | |
Based on a $10,000 initial investment, the graph and table above illustrate the total return of ING High Yield Bond Fund against the indices indicated. An index is unmanaged and has no cash in its portfolio, imposes no sales charges and incurs no operating expenses. An investor cannot invest directly in an index. The Fund’s performance is shown both with and without the imposition of sales charges.
The performance graph and table do not reflect the deduction of taxes that a shareholder will pay on Fund distributions or the redemption of Fund shares.
The performance shown may include the effect of fee waivers and/or expense reimbursements by the Investment Adviser and/or other service providers, which have the effect of increasing total return. Had all fees and expenses been considered, the total returns would have been lower.
Performance data represents past performance and is no assurance of future results. Investment return and principal value of an investment in the Fund will fluctuate. Shares, when sold, may be worth more or less than their original cost. The Fund’s performance may be lower or higher than the performance data shown. Please log on to www.ingfunds.com or call (800) 992-0180 to get performance through the most recent month end.
This report contains statements that may be “forward-looking” statements. Actual results may differ materially from those projected in the “forward-looking” statements.
The views expressed in this report reflect those of the portfolio managers, only through the end of the period as stated on the cover. The portfolio managers’ views are subject to change at any time based on market and other conditions.
Fund holdings are subject to change daily.
(1) | | Reflects deduction of the maximum Class A sales charge of 4.75%. Effective July 31, 2006, the maximum Class A sales charge was lowered to 2.50%. |
(2) | | Reflects deduction of the Class B deferred sales charge of 5% and 2% for the 1 year and 5 year returns, respectively. |
(3) | | Reflects deduction of the Class C deferred sales charge of 1% for the 1 year return. |
(4) | | The Barclays Capital High Yield Bond — 2% Issuer Constrained Composite Index is an unmanaged index that measures the performance of fixed-income securities. |
(5) | | The Barclays Capital Corporate High Yield Index is an unmanaged index that measures the performance of fixed-income securities generally representative of corporate bonds rated below investment grade. |
(6) | | Since inception performance for the indices is shown from August 1, 2008. |
7
| | |
| ING INTERMEDIATE BOND FUND | | PORTFOLIO MANAGERS’ REPORT |
Investment Type Allocation
as of March 31, 2009
(as a percent of net assets)
| | | |
U.S. Government Agency Obligations | | 38.2% | |
U.S. Treasury Obligations | | 35.4% | |
Corporate Bonds/Notes | | 32.9% | |
Collateralized Mortgage Obligations | | 14.1% | |
Asset-Backed Securities | | 1.9% | |
Municipal Bonds | | 0.4% | |
Preferred Stock | | 0.2% | |
Other Assets and Liabilities — Net* | | (23.1 | )% |
| | | |
Net Assets | | 100.0% | |
| | | |
| | * | Includes short-term investments related to ING Institutional Prime Money Market Fund — Class I and Securities Lending Collateral. |
Portfolio holdings are subject to change daily.
ING Intermediate Bond Fund (the “Fund”) seeks to provide investors with a high level of current income, consistent with the preservation of capital and liquidity. The Fund is managed by Christine Hurtsellers, Michael Hyman, Peter Guan and Chris Diaz, Portfolio Managers* of ING Investment Management Co. — the Sub-Adviser.
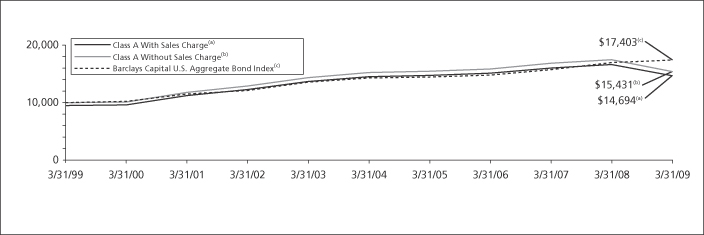
Performance: For the year ended March 31, 2009, the Fund’s Class A shares, excluding sales charges, provided a total return of (11.65)% compared to the Barclays Capital U.S. Aggregate Bond Index(1), which returned 3.13%, for the same period.
Portfolio Specifics: It is hard to recall that in the second quarter of 2008, investors were most worried about inflation as commodities prices spiraled higher with oil nearing $150 a barrel. Within a few short months, the specter haunting capital markets globally was deflation and the near meltdown of the banking and securitization engine worldwide. A number of banks, insurance companies, government sponsored enterprises and brokerages collapsed or were rescued by regulators from as far flung places as New York, London, Reykjavik, Dublin and continental Europe. Money market funds, structured investment vehicles (“SIVs”) and LIBOR seized up.
The Federal Reserve Board (the “Fed”) and the U.S. Department of the Treasury (“U.S. Treasury”) introduced a variety of multi-billion dollar programs to offset the wholesale collapse of lending markets and the distressed residential mortgage values. Home prices across the U.S. sank and foreclosures sky-rocketed. Domestic consumers reduced spending dramatically and exports dropped in response to waning demand.
By the first quarter of 2009, observers were ready to talk of “green shoots” of stabilization, and indeed there was some good news. A $787 billion “shovel ready” stimulus program passed Congress, and a number of companies issued $347 billion of new debt some of which had Federal Deposit Insurance Corporation (“FDIC”) guarantees. Additionally, the Fed started a purchase program of $500 billion of agency residential mortgage-backed securities (“RMBS”) and the outright purchase of U.S.Treasury debt.
For the reporting period, the largest source of positive returns was the U.S. Treasury sector. Non-Treasury returns were significantly worse. Non-agency RMBS were among the worst hit, given the national collapse in home sales/prices and rise in foreclosures. The Fund’s significant exposures to non-agency adjustable rate mortgages (“ARMs”), option ARMS and other RMBS not backed by the Federal National Mortgage Association (“Fannie Mae”), the Federal Home Loan Mortgage Corporation (“Freddie Mac”) or the Government National Mortgage Association (“Ginnie Mae”) were the largest detractors from results for the year. Additionally, exposure to other asset-backed securities, although generally less than the Barclays Capital U.S. Aggregate Bond Index, had a negative effect on portfolio performance.
For the period, exposure to anything but agency-backed RMBS, agency debentures and U.S. Treasuries was such a major drag on performance that it offset contributions from duration and yield curve exposures. The Fund’s exposure to financial institutions hurt results; the Fund had significant exposure to bank and insurance preferreds, which were particularly hard hit. Exposure to investment-grade credit also detracted from results.
Current Strategy & Outlook: The massive de-levering of the world continues but it seems as if the current government programs are starting to affect asset prices in a positive way. This does not change our view that in an environment with many competing investments for the few precious investment dollars it is as important as ever to do one’s homework and take advantage of these dislocations in order to find long-term value.
We believe the Fed will not be raising rates anytime soon. We plan to keep our long duration stance with a bias for a flatter yield curve, and will use small tactical moves as U.S. Treasury rates continue to move in their current range.
We believe U.S. investment grade bonds offer attractive value, but the recovery is not likely to be instantaneous or smooth, so we seek to add value by tactically trading our currently overweight position. A number of companies we own either have some sort of government support or their ratings allow them to sell commercial paper directly to the Fed. Within this theme we are selling some of the bank hybrid and preferred securities and moving them into a more senior position in the banks capital structure as we believe with the government support and a better structure the more senior bonds have a better return profile.
Another theme leads us to companies that belong to an extremely important sector for the economy such as utilities or telecommunications. Our holdings in Verizon Communications, Inc., AT&T Corp. and Duke Energy Carolinas, LLC fit this profile. Finally, we favor companies with strong cash flows and balance sheets, exemplified by the recent purchase of pharmaceutical maker Pfizer, Inc.
The Fund remains overweight RMBS. The areas where we believe value exists in non-agency mortgages include some securities backed by prime jumbo loans with low leverage and good borrower profiles and some front pay classes where cash flow via principal payments are currently flowing to the investor. The Fund generally owns many of these undervalued securities; we intend to hold most of our current holdings in the belief that we can unlock their value in the future.
We expect to remain underweight both commercial mortgage-backed securities (“CMBS”) and asset-backed securities (“ABS”) as we anticipate more fundamental deterioration in the sectors.
Portfolio holdings and characteristics are subject to change and may not be representative of current holdings and characteristics. The outlook for this Fund may differ from that presented for other ING Funds. Performance for the different classes of shares will vary based on differences in fees associated with each class.
| * | | Effective January 13, 2009, James Kauffmann was replaced by Christine Hurtsellers, Michael Hyman, Peter Guan and Chris Diaz as portfolio managers to the Fund. |
(1) | | Formerly known as the Lehman Brothers U.S. Aggregate Bond Index. As of October 31, 2008 all Lehman Brothers indices were renamed: the words “Lehman Brothers” changed to “Barclays Capital.” The Barclays Capital U.S. Aggregate Bond Index is a widely recognized, unmanaged index of publicly issued investment grade U.S. Government, mortgage-backed, asset-backed and corporate debt securities. |
Top Ten Holdings*
as of March 31, 2009
(as a percent of net assets)
| | |
U.S. Treasury Note, 1.875%, due 02/28/14 | | 13.2% |
U.S. Treasury Note, 0.875%, due 02/28/11 | | 7.7% |
Federal National Mortgage Association,
5.500%, due 05/01/37 | | 7.0% |
U.S. Treasury Bond, 2.750%, due 02/15/19 | | 5.4% |
U.S. Treasury Bond, 4.500%, due 05/15/38 | | 5.3% |
Federal National Mortgage Association,
6.000%, due 05/01/37 | | 4.4% |
Federal Home Loan Mortgage Corporation,
5.000%, due 05/01/37 | | 2.6% |
Federal National Mortgage Association,
5.000%, due 05/15/37 | | 2.2% |
U.S. Treasury Bond, 8.125%, due 08/15/19 | | 2.1% |
Federal National Mortgage Association,
4.500%, due 05/15/35 | | 1.8% |
| | * | Excludes short-term investments related to ING Institutional Prime Money Market Fund — Class I. |
Portfolio holdings are subject to change daily.
8
| | |
| PORTFOLIO MANAGERS’ REPORT | | ING INTERMEDIATE BOND FUND |
| | | | | | | | | | | | | | | | | | | | | | | | | |
| | | |
| | | Average Annual Total Returns for the Periods Ended March 31, 2009 | | | |
| | | | | 1 Year | | | 5 Year | | | 10 Year | | | Since
Inception
of Class I
January 8,
2002 | | | Since
Inception
of Class O
August 13,
2004 | | | Since
Inception
of Class R
March 16,
2004 | | | Since
Inception
of Class W
December 17,
2007 | | | |
| | | Including Sales Charge: | | | | | | | | | | | | | | | | | | | | | | | |
| | | Class A(1) | | (13.86 | )% | | (0.76 | )% | | 3.92 | % | | — | | | — | | | — | | | — | | | |
| | | Class B(2) | | (16.36 | )% | | (0.86 | )% | | 3.65 | % | | — | | | — | | | — | | | — | | | |
| | | Class C(3) | | (13.17 | )% | | (0.53 | )% | | 3.65 | % | | — | | | — | | | — | | | — | | | |
| | | Class I | | (11.42 | )% | | 0.53 | % | | — | | | 2.89 | % | | — | | | — | | | — | | | |
| | | Class O | | (11.62 | )% | | — | | | — | | | — | | | 0.25 | % | | — | | | — | | | |
| | | Class R | | (11.93 | )% | | 0.01 | % | | — | | | — | | | — | | | (0.04 | )% | | — | | | |
| | | Class W | | (11.03 | )% | | — | | | — | | | — | | | — | | | — | | | (7.98 | )% | | |
| | | Excluding Sales Charge: | | | | | | | | | | | | | | | | | | | | | | | |
| | | Class A | | (11.65 | )% | | 0.21 | % | | 4.43 | % | | — | | | — | | | — | | | — | | | |
| | | Class B | | (12.26 | )% | | (0.54 | )% | | 3.65 | % | | — | | | — | | | — | | | — | | | |
| | | Class C | | (12.35 | )% | | (0.53 | )% | | 3.65 | % | | — | | | — | | | — | | | — | | | |
| | | Class I | | (11.42 | )% | | 0.53 | % | | — | | | 2.89 | % | | — | | | — | | | — | | | |
| | | Class O | | (11.62 | )% | | — | | | — | | | — | | | 0.25 | % | | — | | | — | | | |
| | | Class R | | (11.93 | )% | | 0.01 | % | | — | | | — | | | — | | | (0.04 | )% | | | | | |
| | | Class W | | (11.03 | )% | | — | | | — | | | — | | | — | | | — | | | (7.98 | )% | | |
| | | Barclays Capital U.S. Aggregate Bond Index(4) | | 3.13 | % | | 4.13 | % | | 5.70 | % | | 5.18 | %(5) | | 4.76 | %(6) | | 4.13 | %(7) | | 4.27 | %(8) | | |
Based on a $10,000 initial investment, the graph and table above illustrate the total return of ING Intermediate Bond Fund against the index indicated. An index is unmanaged and has no cash in its portfolio, imposes no sales charges and incurs no operating expenses. An investor cannot invest directly in an index. The Fund’s performance is shown both with and without the imposition of sales charges.
The performance graph and table do not reflect the deduction of taxes that a shareholder will pay on Fund distributions or the redemption of Fund shares.
The performance shown may include the effect of fee waivers and/or expense reimbursements by the Investment Adviser and/or other service providers, which have the effect of increasing total return. Had all fees and expenses been considered, the total returns would have been lower.
Performance data represents past performance and is no assurance of future results. Investment return and principal value of an investment in the Fund will fluctuate. Shares, when sold, may be worth more or less than their original cost. The Fund’s performance may be lower or higher than the performance data shown. Please log on to www.ingfunds.com or call (800) 992-0180 to get performance through the most recent month end.
This report contains statements that may be “forward-looking” statements. Actual results may differ materially from those projected in the “forward-looking” statements.
The views expressed in this report reflect those of the portfolio managers, only through the end of the period as stated on the cover. The portfolio managers’ views are subject to change at any time based on market and other conditions.
Fund holdings are subject to change daily.
(1) | | Reflects deduction of the maximum Class A sales charge of 4.75%. Effective July 31, 2006, the maximum Class A sales charge was lowered to 2.50%. |
(2) | | Reflects deduction of the Class B deferred sales charge of 5% and 2% for the 1 year and 5 year returns, respectively. |
(3) | | Reflects deduction of the Class C deferred sales charge of 1% for the 1 year return. |
(4) | | The Barclays Capital U.S. Aggregate Bond Index is an unmanaged index of publicly issued investment grade U.S. Government, mortgage-backed, asset-backed and corporate debt securities. |
(5) | | Since inception performance for index is shown from January 1, 2002. |
(6) | | Since inception performance for index is shown from August 1, 2004. |
(7) | | Since inception performance for index is shown from April 1, 2004. |
(8) | | Since inception performance for index is shown from January 1, 2008. |
9
| | |
| ING CLASSIC MONEY MARKET FUND | | PORTFOLIO MANAGERS’ REPORT |
ING Classic Money Market Fund (the “Fund”) seeks to provide investors with a high level of current income, consistent with the preservation of capital and liquidity and the maintenance of a stable $1.00 net asset value per share. The Fund is managed by David S. Yealy, Portfolio Manager of ING Investment Management Co. — the Sub-Adviser.
Portfolio Specifics: The one year period ending March 31, 2009, proved to be one of the most difficult and challenging periods in history for money market funds.
The second quarter of 2008 turned out to be the quiet in the eye of the storm, despite somewhat volatile market conditions following the near collapse of Bear Stearns and the subsequent buyout by J.P.Morgan. Concern shifted from lower economic and lower short-term rates to inflation and the possibility of significant rate increases.
The third quarter of 2008 was marked by the seizing up of the credit markets and subsequent loss of confidence in issuers such as the Federal National Mortgage Association (“Fannie Mae”), the Federal Home Loan Mortgage Corporation (“Freddie Mac”), Lehman Brothers, Merrill Lynch and even market bellwethers General Electric, AIG and Wachovia. The systemic risk and capital market panic that ensued resulted in a worldwide multi-sector collapse of virtually all risk-based asset prices.
The markets for short-term funding by investors such as money market funds threatened to stop functioning. The Federal Open Market Committee (“FOMC”) made an emergency inter-meeting cut of the federal funds rate from 2.00% to 1.50% on October 8, 2008. This was followed by another 0.50% cut at the October 29, 2008 meeting and an unprecedented step at the December 15-16, 2008 meetings where the FOMC set a federal funds target rate range of 0% to 0.25%.
The first quarter of 2009 saw further global economic slowdown, increases in unemployment and declining home prices. With no end in sight to the credit crisis and tight lending conditions, the U.S. Department of the Treasury (“U.S. Treasury”) and the Federal Reserve Board (the “Fed”) introduced a raft of programs designed to jump start
the moribund credit markets and deal with “toxic assets” and the weakened balance sheets of financial intermediaries. Many of the programs targeted to the money markets were either extended or modified during the quarter.
Due to the extreme risks in the market, during the fiscal year the Fund’s focus was on preservation of capital, reducing risk and increasing liquidity, rather than maximizing yield or return.
The Fund did take on interest rate risk, primarily during the second half of 2008 and early in 2009, extending its weighted average maturity (“WAM”) by buying longer term U.S. Treasury and agency securities. The Fund sold most of those longer positions in late March at gains, as there was a flight to quality which drove down yields and increased prices. The Fund finished the quarter with a 58-day WAM, down from a peak WAM in the high 80-day range.
The Fund avoided additional credit risk but gave up some incremental yield by not buying higher yielding debt of more marginal issuers and structured securities not covered by the government programs. This strategy cushioned the impact of the rate cuts and declining yields and should continue to do so in the current low interest rate environment going forward.
Current Outlook & Strategy: It is our opinion that new programs such as the Term Asset-Backed Securities Loan Facility (“TALF”) and Public-Private Investment Program (“PPIP”) will help to stabilize the banking system and the economy, but may take longer to work and be less successful than the market anticipates. In the mean time, our emphasis continues to be on reducing overall credit risk and maintaining excess liquidity. We have been extending our asset-backed commercial paper (“ABCP”) maturities into May through October as availability allows, to lock in the higher yields offered there relative to shorter maturities of those issuers.
All of the ABCP holdings are currently eligible to be sold to the Fed. The Fund continues to reduce exposure to issuers that have not received direct central bank support or guarantees or are not covered by one of the various programs. We expect the federal funds rate to stay in the 0.00% to 0.25% range for the foreseeable future until economic and market conditions improve significantly. We would look to extend our WAM again by buying longer money market U.S. Government agency securities and U.S. Treasury securities that do not add significant credit risk.
We expect to eventually add back credit exposure as the economy and banking system stabilizes, the credit market stresses are reduced and the risks return to levels that are appropriate for a money market fund.
Principal Risk Factors: Although the Fund seeks to preserve the value of your investment at $1.00 per share, it is possible to lose money by investing in the Fund.
Please see Note 15 in the “Notes to Financial Statements” section for information regarding the Fund’s participation in the U.S. Treasury Department’s Temporary Money Market Guarantee Program.
Portfolio holdings and characteristics are subject to change and may not be representative of current holdings and characteristics. The outlook for this Fund may differ from that presented for other ING Funds.
The views expressed in this report reflect those of the portfolio managers only through the end of the period as stated on the cover. The portfolio managers’ views are subject to change at any time based on market and other conditions.
This report contains statements that may be “forward-looking” statements. Actual results may differ materially from those projected in the “forward-looking” statements.
10
| | |
| PORTFOLIO MANAGERS’ REPORT | | ING INSTITUTIONAL PRIME MONEY MARKET FUND |
Investment Type Allocation
as of March 31, 2009
(as a percent of net assets)
| | | |
Repurchase Agreement | | 49.7% | |
Commercial Paper | | 43.0% | |
U.S. Government Agency Obligations | | 4.6% | |
Corporate Bonds/Notes | | 2.4% | |
Certificates Of Deposit | | 1.2% | |
Other Assets and Liabilities — Net | | (0.9 | )% |
| | | |
Net Assets | | 100.0% | |
| | | |
Portfolio holdings are subject to change daily.
ING Institutional Prime Money Market Fund (the “Fund”) seeks to provide investors with a high level of current income, consistent with the preservation of capital and liquidity and the maintenance of a stable $1.00 net asset value per share. The Fund is managed by David S. Yealy, Portfolio Manager of ING Investment Management Co. — the Sub-Adviser.
Portfolio Specifics: The one year period ending March 31, 2009 proved to be one of the most difficult and challenging periods in history for money market funds.
The second quarter of 2008 turned out to be the quiet in the eye of the storm, despite somewhat volatile market conditions following the near collapse of Bear Stearns and the subsequent buyout by J.P.Morgan. Concern shifted from lower economic and lower short-term rates to inflation and the possibility of significant rate increases.
The third quarter of 2008 was marked by the seizing up of the credit markets and subsequent loss of confidence in issuers such as the Federal National Mortgage Association (“Fannie Mae”), the Federal Home Loan Mortgage Corporation (“Freddie Mac”), Lehman Brothers, Merrill Lynch and even market bellwethers General Electric, AIG
and Wachovia. The systemic risk and capital market panic that ensued resulted in a worldwide multi- sector collapse of virtually all risk-based asset prices.
The markets for short-term funding by investors such as money market funds threatened to stop functioning. The Federal Open Market Committee (“FOMC”) made an emergency inter-meeting cut of the federal funds rate from 2.00% to 1.50% on October 8, 2008. This was followed by another 0.50% cut at the October 29, 2008 meeting and an unprecedented step at the December 15-16, 2008 meetings where the FOMC set a federal funds target rate range of 0% to 0.25%.
The first quarter of 2009 saw further global economic slowdown, increases in unemployment and declining home prices. With no end in sight to the credit crisis and tight lending conditions, the U.S. Department of the Treasury (“U.S. Treasury”) and the Federal Reserve Board (the “Fed”) introduced a raft of programs designed to jump start the moribund credit markets and deal with “toxic assets” and the weakened balance sheets of financial intermediaries. Many of the programs targeted to the money markets were either extended or modified during the quarter.
Due to the extreme risks in the market, during the fiscal year the Fund’s focus was on preservation of capital, reducing risk and increasing liquidity, rather than maximizing yield or return.
The Fund did take on interest rate risk, primarily during the second half of 2008 and early in 2009, extending its weighted average maturity (“WAM”) by buying longer term U.S. Treasury and agency securities. The Fund sold most of those longer positions in late March at gains, as there was a flight to quality which drove down yields and increased prices. The Fund finished the quarter with a 28-day WAM, down from a peak WAM in the high 50-day range.
The Fund avoided additional credit risk but gave up some incremental yield by not buying higher yielding debt of more marginal issuers and structured securities not covered by the government programs. This strategy cushioned the impact of the rate cuts and declining yields and should continue to do so in the current low interest rate environment going forward.
Current Outlook & Strategy: It is our opinion that new programs such as the Term Asset-Backed Securities Loan Facility (“TALF”) and Public-Private Investment Program (“PPIP”) will help to stabilize the banking system and the economy, but may take longer to work and be less successful than the market anticipates. In the mean time, our emphasis continues to be on reducing overall credit risk and maintaining excess liquidity. We have been extending our asset-backed commercial paper (“ABCP”) maturities into May through October as availability allows, to lock in the higher yields offered there relative to shorter maturities of those issuers.
All of the ABCP holdings are currently eligible to be sold to the Fed. The Fund continues to reduce exposure to issuers that have not received direct central bank support or guarantees or are not covered by one of the various programs. We expect the federal funds rate to stay in the 0.00% to 0.25% range for the foreseeable future until economic and market conditions improve significantly. We would look to extend our WAM again by buying longer money market U.S. Government agency securities and U.S. Treasury securities that do not add significant credit risk.
We expect to eventually add back credit exposure as the economy and banking system stabilizes, the credit market stresses are reduced and the risks return to levels that are appropriate for a money market fund.
Principal Risk Factors: Although the Fund seeks to preserve the value of your investment at $1.00 per share, it is possible to lose money by investing in the Fund.
Please see Note 15 in the “Notes to Financial Statements” section for information regarding the Fund’s participation in the U.S. Treasury Department’s Temporary Money Market Guarantee Program.
Portfolio holdings and characteristics are subject to change and may not be representative of current holdings and characteristics. The outlook for this Fund may differ from that presented for other ING Funds.
The views expressed in this report reflect those of the portfolio managers only through the end of the period as stated on the cover. The portfolio managers’ views are subject to change at any time based on market and other conditions.
This report contains statements that may be “forward-looking” statements. Actual results may differ materially from those projected in the “forward-looking” statements.
11
SHAREHOLDER EXPENSE EXAMPLES (UNAUDITED)
As a shareholder of a Fund, you incur two types of costs: (1) transaction costs, including sales charges (loads) on purchase payments, redemption fees, and exchange fees; and (2) ongoing costs, including management fees, distribution and/or service (12b-1) fees, and other Fund expenses. These Examples are intended to help you understand your ongoing costs (in dollars) of investing in a Fund and to compare these costs with the ongoing costs of investing in other mutual funds.
The Examples are based on an investment of $1,000 invested at the beginning of the period and held for the entire period from October 1, 2008 to March 31, 2009. The Funds’ expenses are shown without the imposition of any sales charges or fees. Expenses would have been higher if such charges were included.
Actual Expenses
The first section of the table shown, “Actual Fund Return,” provides information about actual account values and actual expenses. You may use the information in this section, together with the amount you invested, to estimate the expenses that you paid over the period. Simply divide your account value by $1,000 (for example, an $8,600 account value divided by $1,000 = 8.6), then multiply the result by the number in the first section under the heading entitled “Expenses Paid During the Period” to estimate the expenses you paid on your account during this period.
Hypothetical Example for Comparison Purposes
The second section of the table shown, “Hypothetical (5% return before expenses)” provides information about hypothetical account values and hypothetical expenses based on a Fund’s actual expense ratio and an assumed rate of return of 5% per year before expenses, which is not the Fund’s actual return. The hypothetical account values and expenses may not be used to estimate the actual ending account balance or expenses you paid for the period. You may use this information to compare the ongoing costs of investing in each Fund and other funds. To do so, compare this 5% hypothetical example with the 5% hypothetical examples that appear in the shareholder reports of the other funds.
Please note that the expenses shown in the table are meant to highlight your ongoing costs only and do not reflect any transactional costs, such as sales charges (loads), redemption fees, or exchange fees. Therefore, the hypothetical lines of the table are useful in comparing ongoing costs only, and will not help you determine the relative total costs of owning different funds. In addition, if these transactional costs were included, your costs would have been higher.
| | | | | | | | | | | | | | | | | | | | | | | | |
| | | Actual Fund Return | | Hypothetical (5% return before expenses) |
| | | Beginning
Account
Value
October 1, 2008 | | Ending
Account Value
March 31, 2009 | | Annualized Expense Ratio | | | Expenses Paid
During the
Period Ended
March 31, 2009* | | Beginning
Account
Value
October 1, 2008 | | Ending
Account Value
March 31, 2009 | | Annualized Expense Ratio | | | Expenses Paid
During the
Period Ended
March 31, 2009* |
ING GNMA Income Fund | | | | | | | | | | | | | | | | | | | | | |
Class A | | $ | 1,000.00 | | $ | 1,061.60 | | 0.96 | % | | $ | 4.93 | | $ | 1,000.00 | | $ | 1,020.14 | | 0.96 | % | | $ | 4.84 |
Class B | | | 1,000.00 | | | 1,056.90 | | 1.71 | | | | 8.77 | | | 1,000.00 | | | 1,016.40 | | 1.71 | | | | 8.60 |
Class C | | | 1,000.00 | | | 1,057.00 | | 1.71 | | | | 8.77 | | | 1,000.00 | | | 1,016.40 | | 1.71 | | | | 8.60 |
Class I | | | 1,000.00 | | | 1,063.20 | | 0.65 | | | | 3.34 | | | 1,000.00 | | | 1,021.69 | | 0.65 | | | | 3.28 |
Class Q | | | 1,000.00 | | | 1,060.60 | | 0.90 | | | | 4.62 | | | 1,000.00 | | | 1,020.44 | | 0.90 | | | | 4.53 |
Class W | | | 1,000.00 | | | 1,064.30 | | 0.65 | | | | 3.35 | | | 1,000.00 | | | 1,021.69 | | 0.65 | | | | 3.28 |
ING High Yield Bond Fund | | | | | | | | | | | | | | | | | | | | | |
Class A | | $ | 1,000.00 | | $ | 837.50 | | 1.10 | % | | $ | 5.04 | | $ | 1,000.00 | | $ | 1,019.45 | | 1.10 | % | | $ | 5.54 |
Class B | | | 1,000.00 | | | 835.40 | | 1.85 | | | | 8.47 | | | 1,000.00 | | | 1,015.71 | | 1.85 | | | | 9.30 |
Class C | | | 1,000.00 | | | 834.30 | | 1.85 | | | | 8.46 | | | 1,000.00 | | | 1,015.71 | | 1.85 | | | | 9.30 |
Class I | | | 1,000.00 | | | 854.60 | | 0.80 | | | | 3.70 | | | 1,000.00 | | | 1,020.94 | | 0.80 | | | | 4.03 |
| * | | Expenses are equal to each Fund’s respective annualized expense ratios multiplied by the average account value over the period, multiplied by 182/365 to reflect the most recent fiscal half-year. |
12
SHAREHOLDER EXPENSE EXAMPLES (UNAUDITED) (CONTINUED)
| | | | | | | | | | | | | | | | | | | | | | | | |
| | | Actual Fund Return | | Hypothetical (5% return before expenses) |
| | | Beginning
Account
Value
October 1, 2008 | | Ending
Account Value
March 31, 2009 | | Annualized Expense Ratio | | | Expenses Paid
During the
Period Ended
March 31, 2009* | | Beginning
Account
Value
October 1, 2008 | | Ending
Account Value
March 31, 2009 | | Annualized Expense Ratio | | | Expenses Paid
During the
Period Ended
March 31, 2009* |
ING Intermediate Bond Fund | | | | | | | | | | | | | | | | | | | | | |
Class A | | $ | 1,000.00 | | $ | 939.40 | | 0.70 | % | | $ | 3.38 | | $ | 1,000.00 | | $ | 1,021.44 | | 0.70 | % | | $ | 3.53 |
Class B | | | 1,000.00 | | | 936.80 | | 1.45 | | | | 7.00 | | | 1,000.00 | | | 1,017.70 | | 1.45 | | | | 7.29 |
Class C | | | 1,000.00 | | | 936.80 | | 1.45 | | | | 7.00 | | | 1,000.00 | | | 1,017.70 | | 1.45 | | | | 7.29 |
Class I | | | 1,000.00 | | | 941.00 | | 0.37 | | | | 1.79 | | | 1,000.00 | | | 1,023.09 | | 0.37 | | | | 1.87 |
Class O | | | 1,000.00 | | | 940.60 | | 0.70 | | | | 3.39 | | | 1,000.00 | | | 1,021.44 | | 0.70 | | | | 3.53 |
Class R | | | 1,000.00 | | | 938.30 | | 0.95 | | | | 4.59 | | | 1,000.00 | | | 1,020.19 | | 0.95 | | | | 4.78 |
Class W | | | 1,000.00 | | | 942.30 | | 0.37 | | | | 1.79 | | | 1,000.00 | | | 1,023.09 | | 0.37 | | | | 1.87 |
ING Classic Money Market Fund | | | | | | | | | | | | |
Class A | | $ | 1,000.00 | | $ | 1,004.50 | | 0.79 | % | | $ | 3.95 | | $ | 1,000.00 | | $ | 1,020.99 | | 0.79 | % | | $ | 3.98 |
Class B | | | 1,000.00 | | | 1,002.30 | | 1.31 | | | | 6.54 | | | 1,000.00 | | | 1,018.40 | | 1.31 | | | | 6.59 |
Class C | | | 1,000.00 | | | 1,002.30 | | 1.31 | | | | 6.54 | | | 1,000.00 | | | 1,018.40 | | 1.31 | | | | 6.59 |
ING Institutional Prime Money Market Fund | | | | | | | | | | | | | | | | | | |
Class I | | $ | 1,000.00 | | $ | 1,005.90 | | 0.20 | % | | $ | 1.00 | | $ | 1,000.00 | | $ | 1,023.93 | | 0.20 | % | | $ | 1.01 |
Class IS | | | 1,000.00 | | | 1,007.00 | | 0.23 | | | | 1.15 | | | 1,000.00 | | | 1,023.78 | | 0.23 | | | | 1.16 |
| * | | Expenses are equal to each Fund’s respective annualized expense ratios multiplied by the average account value over the period, multiplied by 182/365 to reflect the most recent fiscal half-year. |
13
REPORT OF INDEPENDENT REGISTERED PUBLIC ACCOUNTING FIRM
The Shareholders and Board of Trustees
ING Funds Trust
We have audited the accompanying statements of assets and liabilities, including the portfolio of investments, of ING GNMA Income Fund, ING High Yield Bond Fund, ING Intermediate Bond Fund, ING Classic Money Market Fund, and ING Institutional Prime Money Market Fund, each a series of ING Funds Trust, as of March 31, 2009, and the related statements of operations for the year then ended, the statements of changes in net assets for each of the years in the two-year period then ended, and the financial highlights for each of the years or periods in the five-year period then ended. These financial statements and financial highlights are the responsibility of management. Our responsibility is to express an opinion on these financial statements and financial highlights based on our audits.
We conducted our audits in accordance with standards of the Public Company Accounting Oversight Board (United States). Those standards require that we plan and perform the audits to obtain reasonable assurance about whether the financial statements and financial highlights are free of material misstatement. An audit includes examining, on a test basis, evidence supporting the amounts and disclosures in the financial statements. Our procedures included confirmation of securities owned as of March 31, 2009, by correspondence with the custodian and brokers, or by other appropriate auditing procedures where replies from brokers were not received. An audit also includes assessing the accounting principles used and significant estimates made by management, as well as evaluating the overall financial statement presentation. We believe that our audits provide a reasonable basis for our opinion.
In our opinion, the financial statements and financial highlights referred to above present fairly, in all material respects, the financial position of the aforementioned funds as of March 31, 2009, and the results of their operations, the changes in their net assets, and the financial highlights for the periods specified in the first paragraph above, in conformity with U.S. generally accepted accounting principles.
Boston, Massachusetts
May 28, 2009
14
STATEMENTS OF ASSETS AND LIABILITIESASOF MARCH 31, 2009
| | | | | | | | | | | | |
| | | ING GNMA Income Fund | | | ING High Yield
Bond Fund | | | ING Intermediate Bond Fund | |
ASSETS: | | | | | | | | | | | | |
Investments in securities at value+* | | $ | 772,262,182 | | | $ | 74,883,962 | | | $ | 1,193,920,726 | |
Short-term investments** | | | — | | | | — | | | | 4,167,050 | |
Short-term investments in affiliates*** | | | — | | | | 2,822,000 | | | | 26,390,000 | |
Cash | | | 3,843,246 | | | | 554 | | | | 67,847 | |
Cash collateral for futures | | | — | | | | — | | | | 12,061,416 | |
Foreign currencies at value**** | | | — | | | | — | | | | 766,289 | |
Receivables: | | | | | | | | | | | | |
Investment securities sold | | | 236 | | | | 855,830 | | | | 7,761,909 | |
Investment securities sold on a delayed-delivery or when-issued basis | | | — | | | | — | | | | 298,296,364 | |
Fund shares sold | | | 4,239,379 | | | | 30,469 | | | | 1,080,249 | |
Dividends and interest | | | 3,390,925 | | | | 2,304,893 | | | | 7,877,286 | |
Receivable for collateral held at broker | | | — | | | | 260,000 | | | | 1,390,000 | |
Unrealized appreciation on forward foreign currency contracts | | | — | | | | — | | | | 831,873 | |
Upfront payments made on swap agreements | | | — | | | | — | | | | 1,376,254 | |
Unrealized appreciation on swap agreements | | | — | | | | 499,144 | | | | 1,741,238 | |
Prepaid expenses | | | 49,193 | | | | 49,466 | | | | 65,281 | |
Reimbursement due from manager | | | — | | | | 16,835 | | | | — | |
| | | | | | | | | | | | |
Total assets | | | 783,785,161 | | | | 81,723,153 | | | | 1,557,793,782 | |
| | | | | | | | | | | | |
LIABILITIES: | | | | | | | | | | | | |
Payable for investment securities purchased | | | 19,282,152 | | | | 656,089 | | | | 4,235,675 | |
Payable for investment securities purchased on a delayed-delivery or when-issued basis | | | — | | | | — | | | | 565,951,749 | |
Payable for fund shares redeemed | | | 1,781,155 | | | | 396,021 | | | | 3,120,343 | |
Payable upon receipt of securities loaned | | | — | | | | — | | | | 5,088,021 | |
Payable for terminated investment contracts (Note 10) | | | — | | | | 461,580 | | | | 1,368,703 | |
Unrealized depreciation on forward foreign currency contracts | | | — | | | | — | | | | 2,104,981 | |
Upfront payments received on swap agreements | | | — | | | | 232,500 | | | | 1,542,632 | |
Unrealized depreciation on swap agreements | | | — | | | | 786,218 | | | | 2,725,438 | |
Income distribution payable | | | — | | | | 328,461 | | | | 607,486 | |
Payable to affiliates | | | 572,263 | | | | 66,772 | | | | 425,964 | |
Payable for trustee fees | | | 19,721 | | | | 5,288 | | | | 11,777 | |
Other accrued expenses and liabilities | | | 212,611 | | | | 90,760 | | | | 501,845 | |
| | | | | | | | | | | | |
Total liabilities | | | 21,867,902 | | | | 3,023,689 | | | | 587,684,614 | |
| | | | | | | | | | | | |
NET ASSETS | | $ | 761,917,259 | | | $ | 78,699,464 | | | $ | 970,109,168 | |
| | | | | | | | | | | | |
NET ASSETS WERE COMPRISED OF: | | | | | | | | | | | | |
Paid-in capital | | $ | 748,249,189 | | | $ | 297,402,999 | | | $ | 1,234,742,072 | |
Undistributed net investment income (distributions in excess of net investment income) | | | 2,455,531 | | | | (41,387 | ) | | | 34,622,359 | |
Accumulated net realized loss on investments, foreign currency related transactions, futures, and swaps | | | (14,774,983 | ) | | | (194,387,598 | ) | | | (177,466,735 | ) |
Net unrealized appreciation or depreciation on investments, foreign currency related transactions, futures, and swaps | | | 25,987,522 | | | | (24,274,550 | ) | | | (121,788,528 | ) |
| | | | | | | | | | | | |
NET ASSETS | | $ | 761,917,259 | | | $ | 78,699,464 | | | $ | 970,109,168 | |
| | | | | | | | | | | | |
| | | | | | | | | | | | |
+ Including securities loaned at value | | $ | — | | | $ | — | | | $ | 4,978,777 | |
* Cost of investments in securities | | $ | 746,274,660 | | | $ | 98,871,438 | | | $ | 1,310,557,235 | |
** Cost of short-term investments | | $ | — | | | $ | — | | | $ | 5,088,021 | |
*** Cost of short-term investments in affiliates | | $ | — | | | $ | 2,822,000 | | | $ | 26,390,000 | |
****Cost of foreign currencies | | $ | — | | | $ | — | | | $ | 732,156 | |
See Accompanying Notes to Financial Statements
15
STATEMENTS OF ASSETS AND LIABILITIESASOF MARCH 31, 2009 (CONTINUED)
| | | | | | | | | |
| | | ING GNMA Income Fund | | ING High Yield Bond Fund | | ING Intermediate Bond Fund |
Class A: | | | | | | | | | |
Net assets | | $ | 606,856,351 | | $ | 59,307,373 | | $ | 471,184,991 |
Shares authorized | | | unlimited | | | unlimited | | | unlimited |
Par value | | $ | 0.001 | | $ | 0.001 | | $ | 0.001 |
Shares outstanding | | | 69,658,072 | | | 10,739,618 | | | 56,675,623 |
Net asset value and redemption price per share | | $ | 8.71 | | $ | 5.52 | | $ | 8.31 |
Maximum offering price per share (2.50%)(1) | | $ | 8.93 | | $ | 5.66 | | $ | 8.53 |
Class B: | | | | | | | | | |
Net assets | | $ | 38,717,885 | | $ | 12,289,127 | | $ | 23,721,257 |
Shares authorized | | | unlimited | | | unlimited | | | unlimited |
Par value | | $ | 0.001 | | $ | 0.001 | | $ | 0.001 |
Shares outstanding | | | 4,469,446 | | | 2,227,128 | | | 2,858,873 |
Net asset value and redemption price per share(2) | | $ | 8.66 | | $ | 5.52 | | $ | 8.30 |
Maximum offering price per share | | $ | 8.66 | | $ | 5.52 | | $ | 8.30 |
Class C: | | | | | | | | | |
Net assets | | $ | 73,209,047 | | $ | 7,100,799 | | $ | 53,533,614 |
Shares authorized | | | unlimited | | | unlimited | | | unlimited |
Par value | | $ | 0.001 | | $ | 0.001 | | $ | 0.001 |
Shares outstanding | | | 8,441,727 | | | 1,285,940 | | | 6,448,066 |
Net asset value and redemption price per share(2) | | $ | 8.67 | | $ | 5.52 | | $ | 8.30 |
Maximum offering price per share | | $ | 8.67 | | $ | 5.52 | | $ | 8.30 |
Class I: | | | | | | | | | |
Net assets | | $ | 38,908,087 | | $ | 2,165 | | $ | 362,162,094 |
Shares authorized | | | unlimited | | | unlimited | | | unlimited |
Par value | | $ | 0.001 | | $ | 0.001 | | $ | 0.001 |
Shares outstanding | | | 4,461,383 | | | 393 | | | 43,561,835 |
Net asset value and redemption price per share | | $ | 8.72 | | $ | 5.51 | | $ | 8.31 |
Maximum offering price per share | | $ | 8.72 | | $ | 5.51 | | $ | 8.31 |
Class O: | | | | | | | | | |
Net assets | | | n/a | | | n/a | | $ | 39,188,187 |
Shares authorized | | | n/a | | | n/a | | | unlimited |
Par value | | | n/a | | | n/a | | $ | 0.001 |
Shares outstanding | | | n/a | | | n/a | | | 4,712,307 |
Net asset value and redemption price per share | | | n/a | | | n/a | | $ | 8.32 |
Maximum offering price per share | | | n/a | | | n/a | | $ | 8.32 |
Class Q: | | | | | | | | | |
Net assets | | $ | 45,473 | | | n/a | | | n/a |
Shares authorized | | | unlimited | | | n/a | | | n/a |
Par value | | $ | 0.001 | | | n/a | | | n/a |
Shares outstanding | | | 5,207 | | | n/a | | | n/a |
Net asset value and redemption price per share | | $ | 8.73 | | | n/a | | | n/a |
Maximum offering price per share | | $ | 8.73 | | | n/a | | | n/a |
Class R: | | | | | | | | | |
Net assets | | | n/a | | | n/a | | $ | 18,240,364 |
Shares authorized | | | n/a | | | n/a | | | unlimited |
Par value | | | n/a | | | n/a | | $ | 0.001 |
Shares outstanding | | | n/a | | | n/a | | | 2,191,204 |
Net assets | | | n/a | | | n/a | | $ | 8.32 |
Maximum offering price per share | | | n/a | | | n/a | | $ | 8.32 |
Class W: | | | | | | | | | |
Net assets | | $ | 4,180,416 | | | n/a | | $ | 2,078,661 |
Shares authorized | | | unlimited | | | n/a | | | unlimited |
Par value | | $ | 0.001 | | | n/a | | $ | 0.001 |
Shares outstanding | | | 479,005 | | | n/a | | | 250,258 |
Net asset value and redemption price per share | | $ | 8.73 | | | n/a | | $ | 8.31 |
Maximum offering price per share | | $ | 8.73 | | | n/a | | $ | 8.31 |
(1) | | Maximum offering price is computed at 100/97.50 of net asset value. On purchases of $100,000 or more, the offering price is reduced. |
(2) | | Redemption price per share may be reduced for any applicable contingent deferred sales charges. |
See Accompanying Notes to Financial Statements
16
STATEMENTS OF ASSETS AND LIABILITIESASOF MARCH 31, 2009
| | | | | | | | |
| | | ING Classic Money Market Fund | | | ING Institutional Prime Money Market Fund | |
ASSETS: | | | | | | | | |
Short-term investments at amortized cost | | | 970,595,247 | | | | 617,215,534 | |
Repurchase agreements | | | 357,147,000 | | | | 599,863,000 | |
Cash | | | 1,720 | | | | 2,198 | |
Receivables: | | | | | | | | |
Investment securities sold | | | 29,645,148 | | | | 13,954,922 | |
Fund shares sold | | | 157,053 | | | | 14,492,699 | |
Dividends and interest | | | 1,241,852 | | | | 262,853 | |
Prepaid expenses | | | 337,656 | | | | 117,728 | |
| | | | | | | | |
Total assets | | | 1,359,125,676 | | | | 1,245,908,934 | |
| | | | | | | | |
LIABILITIES: | | | | | | | | |
Payable for fund shares redeemed | | | 7,482,593 | | | | 39,464,848 | |
Income distribution payable | | | 308 | | | | 316,192 | |
Payable to affiliates | | | 776,774 | | | | 78,445 | |
Payable for trustee fees | | | 23,226 | | | | 4,439 | |
Other accrued expenses and liabilities | | | 242,004 | | | | 140,650 | |
| | | | | | | | |
Total liabilities | | | 8,524,905 | | | | 40,004,574 | |
| | | | | | | | |
NET ASSETS | | $ | 1,350,600,771 | | | $ | 1,205,904,360 | |
| | | | | | | | |
NET ASSETS WERE COMPRISED OF: | | | | | | | | |
Paid-in capital | | $ | 1,348,826,435 | | | $ | 1,204,087,485 | |
Distributions in excess of net investment income | | | (308 | ) | | | (21,217 | ) |
Accumulated net realized gain on investments | | | 1,774,644 | | | | 1,838,092 | |
| | | | | | | | |
NET ASSETS | | $ | 1,350,600,771 | | | $ | 1,205,904,360 | |
| | | | | | | | |
See Accompanying Notes to Financial Statements
17
STATEMENTS OF ASSETS AND LIABILITIESASOF MARCH 31, 2009 (CONTINUED)
| | | | | | |
| | | ING Classic Money Market Fund | | ING Institutional Prime Money Market Fund |
Class A: | | | | | | |
Net assets | | $ | 1,323,511,789 | | | n/a |
Shares authorized | | | unlimited | | | n/a |
Par value | | $ | 0.001 | | | n/a |
Shares outstanding | | | 1,321,750,774 | | | n/a |
Net asset value and redemption price per share | | $ | 1.00 | | | n/a |
Maximum offering price per share | | $ | 1.00 | | | n/a |
Class B: | | | | | | |
Net assets | | $ | 16,159,515 | | | n/a |
Shares authorized | | | unlimited | | | n/a |
Par value | | $ | 0.001 | | | n/a |
Shares outstanding | | | 16,157,532 | | | n/a |
Net asset value and redemption price per share(1) | | $ | 1.00 | | | n/a |
Maximum offering price per share | | $ | 1.00 | | | n/a |
Class C: | | | | | | |
Net assets | | $ | 10,929,467 | | | n/a |
Shares authorized | | | unlimited | | | n/a |
Par value | | $ | 0.001 | | | n/a |
Shares outstanding | | | 10,918,731 | | | n/a |
Net asset value and redemption price per share(1) | | $ | 1.00 | | | n/a |
Maximum offering price per share | | $ | 1.00 | | | n/a |
Class I: | | | | | | |
Net assets | | | n/a | | $ | 1,205,903,359 |
Shares authorized | | | n/a | | | unlimited |
Par value | | | n/a | | $ | 0.001 |
Shares outstanding | | | n/a | | | 1,204,115,520 |
Net asset value and redemption price per share | | | n/a | | $ | 1.00 |
Maximum offering price per share | | | n/a | | $ | 1.00 |
Class IS: | | | | | | |
Net assets | | | n/a | | $ | 1,001 |
Shares authorized | | | n/a | | | unlimited |
Par value | | | n/a | | $ | 0.001 |
Shares outstanding | | | n/a | | | 1,001 |
Net asset value and redemption price per share | | | n/a | | $ | 1.00 |
Maximum offering price per share | | | n/a | | $ | 1.00 |
(1) | | Redemption price per share may be reduced for any applicable contingent deferred sales charges. |
See Accompanying Notes to Financial Statements
18
STATEMENTS OF OPERATIONSFORTHE YEAR ENDED MARCH 31, 2009
| | | | | | | | | | | |
| | | ING GNMA Income Fund | | ING High Yield Bond Fund | | | ING Intermediate Bond Fund | |
INVESTMENT INCOME: | | | | | | | | | | | |
Dividends(1) | | $ | — | | $ | 50,785 | | | $ | 3,399,309 | |
Interest | | | 33,530,163 | | | 10,011,715 | | | | 62,830,923 | |
Securities lending income, net | | | — | | | — | | | | 1,288,464 | |
| | | | | | | | | | | |
Total investment income | | | 33,530,163 | | | 10,062,500 | | | | 67,518,696 | |
| | | | | | | | | | | |
EXPENSES: | | | | | | | | | | | |
Investment management fees | | | 2,980,396 | | | 494,807 | | | | 2,070,569 | |
Distribution and service fees: | | | | | | | | | | | |
Class A | | | 1,305,582 | | | 175,085 | | | | 1,615,465 | |
Class B | | | 408,338 | | | 180,117 | | | | 319,597 | |
Class C | | | 448,784 | | | 88,389 | | | | 682,480 | |
Class O | | | — | | | — | | | | 120,138 | |
Class Q | | | 108 | | | — | | | | — | |
Class R | | | — | | | — | | | | 92,174 | |
Transfer agent fees: | | | | | | | | | | | |
Class A | | | 389,960 | | | 107,968 | | | | 797,143 | |
Class B | | | 30,379 | | | 27,751 | | | | 39,393 | |
Class C | | | 33,756 | | | 13,614 | | | | 84,073 | |
Class I | | | 3,557 | | | 157 | | | | 189,864 | |
Class O | | | — | | | — | | | | 59,133 | |
Class Q | | | 5 | | | — | | | | — | |
Class R | | | — | | | — | | | | 22,220 | |
Class W | | | 192 | | | — | | | | 2,221 | |
Administrative service fees | | | 634,121 | | | 97,020 | | | | 1,217,979 | |
Shareholder reporting expense | | | 124,339 | | | 100,078 | | | | 318,251 | |
Registration fees | | | 113,155 | | | 75,838 | | | | 136,782 | |
Professional fees | | | 51,972 | | | 23,032 | | | | 109,865 | |
Custody and accounting expense | | | 76,996 | | | 14,754 | | | | 180,025 | |
Trustee fees | | | 23,878 | | | 3,715 | | | | 41,850 | |
Overdraft expense | | | — | | | — | | | | 148,369 | |
Miscellaneous expense | | | 24,575 | | | 11,981 | | | | 34,344 | |
Interest expense | | | — | | | 3,624 | | | | 300 | |
| | | | | | | | | | | |
Total expenses | | | 6,650,093 | | | 1,417,930 | | | | 8,282,235 | |
Net waived and reimbursed fees | | | — | | | (146,718 | ) | | | (241,487 | ) |
| | | | | | | | | | | |
Net expenses | | | 6,650,093 | | | 1,271,212 | | | | 8,040,748 | |
| | | | | | | | | | | |
Net investment income | | | 26,880,070 | | | 8,791,288 | | | | 59,477,948 | |
| | | | | | | | | | | |
REALIZED AND UNREALIZED GAIN (LOSS) ON INVESTMENTS, FOREIGN CURRENCY RELATED TRANSACTIONS, FUTURES, SWAPS, SHORT POSITIONS AND PAYMENTS BY AFFILIATES: | | | | | | | | | | | |
Net realized gain (loss) on: | | | | | | | | | | | |
Investments | | | 395,796 | | | (19,597,818 | ) | | | (113,693,607 | ) |
Foreign currency related transactions | | | — | | | 103 | | | | 656,450 | |
Futures | | | — | | | — | | | | (21,637,480 | ) |
Swaps | | | — | | | 243,771 | | | | (4,851,160 | ) |
Payments by affiliates (Note 17) | | | — | | | 78,353 | | | | — | |
| | | | | | | | | | | |
Net realized gain (loss) on investments, foreign currency related transactions, futures, swaps, and payments by affiliates | | | 395,796 | | | (19,275,591 | ) | | | (139,525,797 | ) |
| | | | | | | | | | | |
Net change in unrealized appreciation or depreciation on: | | | | | | | | | | | |
Investments | | | 14,446,282 | | | (13,742,314 | ) | | | (52,715,097 | ) |
Foreign currency related transactions | | | — | | | — | | | | (555,382 | ) |
Futures | | | — | | | — | | | | (576,776 | ) |
Swaps | | | — | | | (1,060,793 | ) | | | (16,604,103 | ) |
Short positions | | | — | | | (3,750 | ) | | | — | |
| | | | | | | | | | | |
Net change in unrealized appreciation or depreciation on investments, foreign currency related transactions, futures, swaps and short positions | | | 14,446,282 | | | (14,806,857 | ) | | | (70,451,358 | ) |
| | | | | | | | | | | |
Net realized and unrealized gain (loss) on investments, foreign currency related transactions, futures, swaps, short positions and payments by affiliates | | | 14,842,078 | | | (34,082,448 | ) | | | (209,977,155 | ) |
| | | | | | | | | | | |
Increase (decrease) in net assets resulting from operations | | $ | 41,722,148 | | $ | (25,291,160 | ) | | $ | (150,499,207 | ) |
| | | | | | | | | | | |
| | | | | | | | | | | |
(1) Dividends from affiliates | | $ | — | | $ | 43,640 | | | $ | 2,335,995 | |
See Accompanying Notes to Financial Statements
19
STATEMENTS OF OPERATIONSFORTHE YEAR ENDED MARCH 31, 2009
| | | | | | | |
| | | ING Classic Money Market Fund | | | ING Institutional Prime Money Market Fund |
INVESTMENT INCOME: | | | | | | | |
Interest | | $ | 31,390,999 | | | $ | 21,620,359 |
| | | | | | | |
Total investment income | | | 31,390,999 | | | | 21,620,359 |
| | | | | | | |
EXPENSES: | | | | | | | |
Investment management fees | | | 3,551,143 | | | | 890,551 |
Distribution and service fees: | | | | | | | |
Class A | | | 10,431,258 | | | | — |
Class B | | | 170,140 | | | | — |
Class C | | | 126,104 | | | | — |
Transfer agent fees: | | | | | | | |
Class A | | | 133,192 | | | | — |
Class B | | | 1,629 | | | | — |
Class C | | | 1,207 | | | | — |
Class I | | | — | | | | 462,656 |
Shareholder reporting expense | | | 508,413 | | | | 69,142 |
Registration fees | | | 490,922 | | | | 85,518 |
Professional fees | | | 209,216 | | | | 137,636 |
Custody and accounting expense | | | 174,415 | | | | 104,859 |
Trustee fees | | | 42,664 | | | | 30,681 |
Guarantee fees (Note 15) | | | 304,103 | | | | 429,589 |
Miscellaneous expense | | | 37,169 | | | | 68,049 |
Interest expense | | | 1,868 | | | | — |
| | | | | | | |
Total expenses | | | 16,183,443 | | | | 2,278,681 |
Net waived and reimbursed fees | | | (4,816,307 | ) | | | — |
| | | | | | | |
Net expenses | | | 11,367,136 | | | | 2,278,681 |
| | | | | | | |
Net investment income | | | 20,023,863 | | | | 19,341,678 |
| | | | | | | |
REALIZED GAIN ON INVESTMENTS | | | | | | | |
Net realized gain on investments | | | 1,949,010 | | | | 2,061,974 |
| | | | | | | |
Increase in net assets resulting from operations | | $ | 21,972,873 | | | $ | 21,403,652 |
| | | | | | | |
See Accompanying Notes to Financial Statements
20
STATEMENTS OF CHANGES IN NET ASSETS
| | | | | | | | | | | | | | | | |
| | | ING GNMA Income Fund | | | ING High Yield Bond Fund | |
| | | Year Ended March 31, 2009 | | | Year Ended March 31, 2008 | | | Year Ended March 31, 2009 | | | Year Ended March 31, 2008 | |
FROM OPERATIONS: | | | | | | | | | | | | | | | | |
Net investment income | | $ | 26,880,070 | | | $ | 26,323,003 | | | $ | 8,791,288 | | | $ | 10,709,919 | |
Net realized gain (loss) on investments, foreign currency related transactions, swaps and payments by affiliates | | | 395,796 | | | | (557,710 | ) | | | (19,275,591 | ) | | | (3,519,737 | ) |
Net change in unrealized appreciation or depreciation on investments, foreign currency related transactions, swaps and short positions | | | 14,446,282 | | | | 14,431,867 | | | | (14,806,857 | ) | | | (14,311,005 | ) |
| | | | | | | | | | | | | | | | |
Increase (decrease) in net assets resulting from operations | | | 41,722,148 | | | | 40,197,160 | | | | (25,291,160 | ) | | | (7,120,823 | ) |
| | | | | | | | | | | | | | | | |
FROM DISTRIBUTIONS TO SHAREHOLDERS: | | | | | | | | | | | | | | | | |
Net investment income: | | | | | | | | | | | | | | | | |
Class A | | | (22,932,802 | ) | | | (22,746,437 | ) | | | (5,651,666 | ) | | | (7,399,555 | ) |
Class B | | | (1,526,184 | ) | | | (1,928,106 | ) | | | (1,292,734 | ) | | | (2,347,829 | ) |
Class C | | | (1,624,129 | ) | | | (1,327,518 | ) | | | (647,080 | ) | | | (879,834 | ) |
Class I | | | (1,151,718 | ) | | | (752,915 | ) | | | (12,515 | ) | | | — | |
Class Q | | | (1,935 | ) | | | (2,196 | ) | | | — | | | | — | |
Class W | | | (55,336 | ) | | | (13 | ) | | | — | | | | — | |
Return of capital: | | | | | | | | | | | | | | | | |
Class A | | | — | | | | — | | | | (1,363,089 | ) | | | — | |
Class B | | | — | | | | — | | | | (346,757 | ) | | | — | |
Class C | | | — | | | | — | | | | (174,874 | ) | | | — | |
Class I | | | — | | | | — | | | | (2,081 | ) | | | — | |
Class Q | | | — | | | | — | | | | — | | | | — | |
Class W | | | — | | | | — | | | | — | | | | — | |
| | | | | | | | | | | | | | | | |
Total distributions | | | (27,292,104 | ) | | | (26,757,185 | ) | | | (9,490,796 | ) | | | (10,627,218 | ) |
| | | | | | | | | | | | | | | | |
FROM CAPITAL SHARE TRANSACTIONS: | | | | | | | | | | | | | | | | |
Net proceeds from sale of shares | | | 295,311,177 | | | | 135,282,097 | | | | 34,528,518 | | | | 19,716,245 | |
Reinvestment of distributions | | | 22,747,989 | | | | 22,263,959 | | | | 4,988,124 | | | | 5,417,037 | |
| | | | | | | | | | | | | | | | |
| | | 318,059,166 | | | | 157,546,056 | | | | 39,516,642 | | | | 25,133,282 | |
Cost of shares redeemed | | | (189,713,958 | ) | | | (177,395,457 | ) | | | (44,343,192 | ) | | | (52,319,373 | ) |
| | | | | | | | | | | | | | | | |
Net increase (decrease) in net assets resulting from capital share transactions | | | 128,345,208 | | | | (19,849,401 | ) | | | (4,826,550 | ) | | | (27,186,091 | ) |
| | | | | | | | | | | | | | | | |
Net increase (decrease) in net assets | | | 142,775,252 | | | | (6,409,426 | ) | | | (39,608,506 | ) | | | (44,934,132 | ) |
| | | | | | | | | | | | | | | | |
NET ASSETS: | | | | | | | | | | | | | | | | |
Beginning of year | | | 619,142,007 | | | | 625,551,433 | | | | 118,307,970 | | | | 163,242,102 | |
| | | | | | | | | | | | | | | | |
End of year | | $ | 761,917,259 | | | $ | 619,142,007 | | | $ | 78,699,464 | | | $ | 118,307,970 | |
| | | | | | | | | | | | | | | | |
Undistributed net investment income (distributions in excess of net investment income) at end of year | | $ | 2,455,531 | | | $ | 1,469,185 | | | $ | (41,387 | ) | | $ | (130,281 | ) |
| | | | | | | | | | | | | | | | |
See Accompanying Notes to Financial Statements
21
STATEMENTS OF CHANGES IN NET ASSETS
| | | | | | | | | | | | | | | | |
| | | ING Intermediate Bond Fund | | | ING Classic Money Market Fund | |
| | | Year Ended March 31, 2009 | | | Year Ended March 31, 2008 | | | Year Ended March 31, 2009 | | | Year Ended March 31, 2008 | |
FROM OPERATIONS: | | | | | | | | | | | | | | | | |
Net investment income | | $ | 59,477,948 | | | $ | 62,064,522 | | | $ | 20,023,863 | | | $ | 48,689,912 | |
Net realized gain (loss) on investments, foreign currency related transactions, futures, and swaps | | | (139,525,797 | ) | | | 31,278,933 | | | | 1,949,010 | | | | 65,348 | |
Net change in unrealized appreciation or depreciation on investments foreign currency related transactions, futures and swaps | | | (70,451,358 | ) | | | (51,475,223 | ) | | | — | | | | — | |
| | | | | | | | | | | | | | | | |
Increase (decrease) in net assets resulting from operations | | | (150,499,207 | ) | | | 41,868,232 | | | | 21,972,873 | | | | 48,755,260 | |
| | | | | | | | | | | | | | | | |
FROM DISTRIBUTIONS TO SHAREHOLDERS: | | | | | | | | | | | | | | | | |
Net investment income: | | | | | | | | | | | | | | | | |
Class A | | | (31,202,947 | ) | | | (33,641,104 | ) | | | (19,850,192 | ) | | | (47,532,303 | ) |
Class B | | | (1,292,434 | ) | | | (1,711,825 | ) | | | (160,872 | ) | | | (798,518 | ) |
Class C | | | (2,767,063 | ) | | | (2,949,270 | ) | | | (119,890 | ) | | | (359,087 | ) |
Class I | | | (20,895,106 | ) | | | (15,026,825 | ) | | | — | | | | — | |
Class O | | | (2,322,681 | ) | | | (2,418,264 | ) | | | — | | | | — | |
Class R | | | (852,329 | ) | | | (483,427 | ) | | | — | | | | — | |
Class W | | | (296,146 | ) | | | (323 | ) | | | — | | | | — | |
Net realized gains: | | | | | | | | | | | | | | | | |
Class A | | | (13,734,278 | ) | | | — | | | | — | | | | — | |
Class B | | | (680,458 | ) | | | — | | | | — | | | | — | |
Class C | | | (1,469,140 | ) | | | — | | | | — | | | | — | |
Class I | | | (9,646,219 | ) | | | — | | | | — | | | | — | |
Class O | | | (1,051,523 | ) | | | — | | | | — | | | | — | |
Class R | | | (462,042 | ) | | | — | | | | — | | | | — | |
Class W | | | (165,327 | ) | | | — | | | | — | | | | — | |
| | | | | | | | | | | | | | | | |
Total distributions | | | (86,837,693 | ) | | | (56,231,038 | ) | | | (20,130,954 | ) | | | (48,689,908 | ) |
| | | | | | | | | | | | | | | | |
FROM CAPITAL SHARE TRANSACTIONS: | | | | | | | | | | | | | | | | |
Net proceeds from sale of shares | | | 417,193,674 | | | | 477,476,865 | | | | 651,983,951 | | | | 1,266,591,607 | |
Reinvestment of distributions | | | 67,885,769 | | | | 45,349,340 | | | | 19,963,168 | | | | 48,135,580 | |
| | | | | | | | | | | | | | | | |
| | | 485,079,443 | | | | 522,826,205 | | | | 671,947,119 | | | | 1,314,727,187 | |
Cost of shares redeemed | | | (626,057,809 | ) | | | (315,482,815 | ) | | | (856,507,525 | ) | | | (730,774,391 | ) |
| | | | | | | | | | | | | | | | |
Net increase (decrease) in net assets resulting from capital share transactions | | | (140,978,366 | ) | | | 207,343,390 | | | | (184,560,406 | ) | | | 583,952,796 | |
| | | | | | | | | | | | | | | | |
Net increase (decrease) in net assets | | | (378,315,266 | ) | | | 192,980,584 | | | | (182,718,487 | ) | | | 584,018,148 | |
| | | | | | | | | | | | | | | | |
NET ASSETS: | | | | | | | | | | | | | | | | |
Beginning of year | | | 1,348,424,434 | | | | 1,155,443,850 | | | | 1,533,319,258 | | | | 949,301,110 | |
| | | | | | | | | | | | | | | | |
End of year | | $ | 970,109,168 | | | $ | 1,348,424,434 | | | $ | 1,350,600,771 | | | $ | 1,533,319,258 | |
| | | | | | | | | | | | | | | | |
Undistributed net investment income (distributions in excess of net investment income) at end of year | | $ | 34,622,359 | | | $ | (2,083,493 | ) | | $ | (308 | ) | | $ | (1,585 | ) |
| | | | | | | | | | | | | | | | |
See Accompanying Notes to Financial Statements
22
STATEMENTS OF CHANGES IN NET ASSETS
| | | | | | | | |
| | | ING Institutional Prime Money Market Fund | |
| | | Year Ended March 31, 2009 | | | Year Ended March 31, 2008 | |
FROM OPERATIONS: | | | | | | | | |
Net investment income | | $ | 19,341,678 | | | $ | 43,858,903 | |
Net realized gain (loss) on investments | | | 2,061,974 | | | | (211,929 | ) |
| | | | | | | | |
Increase in net assets resulting from operations | | | 21,403,652 | | | | 43,646,974 | |
| | | | | | | | |
FROM DISTRIBUTIONS TO SHAREHOLDERS: | | | | | | | | |
Net investment income: | | | | | | | | |
Class I | | | (19,340,775 | ) | | | (43,858,890 | ) |
Class IS | | | (21 | ) | | | (13 | ) |
Net realized gains: | | | | | | | | |
Class I | | | — | | | | (66,392 | ) |
| | | | | | | | |
Total distributions | | | (19,340,796 | ) | | | (43,925,295 | ) |
| | | | | | | | |
FROM CAPITAL SHARE TRANSACTIONS: | | | | | | | | |
Net proceeds from sale of shares | | | 15,924,743,767 | | | | 12,985,911,059 | |
Reinvestment of distributions | | | 1,265,544 | | | | 7,988,771 | |
| | | | | | | | |
| | | 15,926,009,311 | | | | 12,993,899,830 | |
Cost of shares redeemed | | | (15,522,218,060 | ) | | | (12,917,901,065 | ) |
| | | | | | | | |
Net increase in net assets resulting from capital share transactions | | | 403,791,251 | | | | 75,998,765 | |
| | | | | | | | |
Net increase in net assets | | | 405,854,107 | | | | 75,720,444 | |
| | | | | | | | |
NET ASSETS: | | | | | | | | |
Beginning of year | | | 800,050,253 | | | | 724,329,809 | |
| | | | | | | | |
End of year | | $ | 1,205,904,360 | | | $ | 800,050,253 | |
| | | | | | | | |
Distributions in excess of net investment income at end of year | | $ | (21,217 | ) | | $ | (22,099 | ) |
| | | | | | | | |
See Accompanying Notes to Financial Statements
23
FINANCIAL HIGHLIGHTS
Selected data for a share of beneficial interest outstanding throughout each year or period.
| | | | | | | | | | | | | | | | | | | | | | | | | | | | | | | | | | | | | | | |
| | | | | Income (loss)
from
investment
operations | | | | | Less distributions | | | | | | | | | Ratios to average net assets | | | Supplemental
data | |
| | | | | | | | | | | | | | | | | | | | | | | | | | | | | | | | | | | | | | | |
| | | Net asset value, beginning of year or period | | Net investment income (loss) | | Net realized and unrealized gain (loss) on investments | | | Total from investment operations | | From net investment income | | From net realized gains | | From return of capital | | Total distributions | | Net asset value, end of year or period | | Total Return(1) | | | Expenses before reductions/additions(2)(3) | | | Expenses net of fee waivers and/or recoupments, if any(2)(3) | | | Expenses net of all reductions/additions(2)(3) | | | Net investment income (loss)(2)(3) | | | Net assets, end of year or period | | Portfolio turnover rate | |
| | | | | | | | | | | | | | | | | | | | | | | | | | | | | | | | | | | | | | | |
Year or period ended | | ($) | | ($) | | ($) | | | ($) | | ($) | | ($) | | ($) | | ($) | | ($) | | (%) | | | (%) | | | (%) | | | (%) | | | (%) | | | ($000’s) | | (%) | |
ING GNMA Income Fund | | | | | | | | | | | | | | | | | | | | | | | | | | | | | | | | | | | | | | | |
Class A | | | | | | | | | | | | | | | | | | | | | | | | | | | | | | | | | | | | | | | |
03-31-09 | | 8.54 | | 0.37 | | 0.18 | | | 0.55 | | 0.38 | | — | | — | | 0.38 | | 8.71 | | 6.62 | | | 0.96 | | | 0.96 | | | 0.96 | | | 4.33 | | | 606,856 | | 39 | |
03-31-08 | | 8.35 | | 0.37 | | 0.20 | | | 0.57 | | 0.38 | | — | | — | | 0.38 | | 8.54 | | 7.00 | | | 0.96 | | | 0.96 | | | 0.96 | | | 4.45 | | | 515,916 | | 32 | |
03-31-07 | | 8.30 | | 0.37 | | 0.09 | | | 0.46 | | 0.41 | | — | | — | | 0.41 | | 8.35 | | 5.72 | | | 0.95 | | | 0.94 | | | 0.94 | | | 4.49 | | | 515,469 | | 99 | |
03-31-06 | | 8.52 | | 0.40 | | (0.19 | ) | | 0.21 | | 0.43 | | — | | — | | 0.43 | | 8.30 | | 2.50 | | | 0.99 | | | 0.98 | | | 0.98 | | | 4.70 | | | 504,734 | | 39 | |
03-31-05 | | 8.91 | | 0.37 | | (0.31 | ) | | 0.06 | | 0.45 | | — | | — | | 0.45 | | 8.52 | | 0.74 | | | 0.98 | | | 0.98 | | | 0.98 | | | 4.27 | | | 521,688 | | 40 | |
Class B | | | | | | | | | | | | | | | | | | | | | | | | | | | | | | | | | | | | | | | |
03-31-09 | | 8.49 | | 0.30 | | 0.18 | | | 0.48 | | 0.31 | | — | | — | | 0.31 | | 8.66 | | 5.86 | | | 1.71 | | | 1.71 | | | 1.71 | | | 3.57 | | | 38,718 | | 39 | |
03-31-08 | | 8.30 | | 0.31 | | 0.19 | | | 0.50 | | 0.31 | | — | | — | | 0.31 | | 8.49 | | 6.24 | | | 1.71 | | | 1.71 | | | 1.71 | | | 3.70 | | | 45,963 | | 32 | |
03-31-07 | | 8.26 | | 0.30 | | 0.09 | | | 0.39 | | 0.35 | | — | | — | | 0.35 | | 8.30 | | 4.84 | | | 1.70 | | | 1.69 | | | 1.69 | | | 3.73 | | | 58,568 | | 99 | |
03-31-06 | | 8.48 | | 0.33 | | (0.18 | ) | | 0.15 | | 0.37 | | — | | — | | 0.37 | | 8.26 | | 1.75 | | | 1.74 | | | 1.73 | | | 1.73 | | | 3.95 | | | 78,823 | | 39 | |
03-31-05 | | 8.87 | | 0.29 | | (0.29 | ) | | — | | 0.39 | | — | | — | | 0.39 | | 8.48 | | (0.02 | ) | | 1.73 | | | 1.73 | | | 1.73 | | | 3.52 | | | 99,130 | | 40 | |
Class C | | | | | | | | | | | | | | | | | | | | | | | | | | | | | | | | | | | | | | | |
03-31-09 | | 8.50 | | 0.30 | | 0.18 | | | 0.48 | | 0.31 | | — | | — | | 0.31 | | 8.67 | | 5.88 | | | 1.71 | | | 1.71 | | | 1.71 | | | 3.59 | | | 73,209 | | 39 | |
03-31-08 | | 8.31 | | 0.31 | | 0.20 | | | 0.51 | | 0.32 | | — | | — | | 0.32 | | 8.50 | | 6.23 | | | 1.71 | | | 1.71 | | | 1.71 | | | 3.70 | | | 36,218 | | 32 | |
03-31-07 | | 8.27 | | 0.31 | | 0.08 | | | 0.39 | | 0.35 | | — | | — | | 0.35 | | 8.31 | | 4.85 | | | 1.70 | | | 1.69 | | | 1.69 | | | 3.73 | | | 37,280 | | 99 | |
03-31-06 | | 8.49 | | 0.33 | | (0.18 | ) | | 0.15 | | 0.37 | | — | | — | | 0.37 | | 8.27 | | 1.74 | | | 1.74 | | | 1.73 | | | 1.73 | | | 3.95 | | | 34,997 | | 39 | |
03-31-05 | | 8.88 | | 0.29 | | (0.29 | ) | | — | | 0.39 | | — | | — | | 0.39 | | 8.49 | | (0.03 | ) | | 1.73 | | | 1.73 | | | 1.73 | | | 3.51 | | | 43,094 | | 40 | |
Class I | | | | | | | | | | | | | | | | | | | | | | | | | | | | | | | | | | | | | | | |
03-31-09 | | 8.55 | | 0.39 | | 0.18 | | | 0.57 | | 0.40 | | — | | — | | 0.40 | | 8.72 | | 6.95 | �� | | 0.65 | | | 0.65 | | | 0.65 | | | 4.64 | | | 38,908 | | 39 | |
03-31-08 | | 8.35 | | 0.40 | | 0.20 | | | 0.60 | | 0.40 | | — | | — | | 0.40 | | 8.55 | | 7.42 | | | 0.67 | | | 0.67 | | | 0.67 | | | 4.74 | | | 21,002 | | 32 | |
03-31-07 | | 8.31 | | 0.40 | | 0.08 | | | 0.48 | | 0.44 | | — | | — | | 0.44 | | 8.35 | | 5.92 | | | 0.65 | | | 0.65 | | | 0.65 | | | 4.77 | | | 14,181 | | 99 | |
03-31-06 | | 8.53 | | 0.45 | | (0.21 | ) | | 0.24 | | 0.46 | | — | | — | | 0.46 | | 8.31 | | 2.82 | | | 0.67 | | | 0.67 | | | 0.67 | | | 4.96 | | | 18,287 | | 39 | |
03-31-05 | | 8.92 | | 0.41 | | (0.32 | ) | | 0.09 | | 0.48 | | — | | — | | 0.48 | | 8.53 | | 1.05 | | | 0.68 | | | 0.68 | | | 0.68 | | | 4.59 | | | 10,539 | | 40 | |
Class Q | | | | | | | | | | | | | | | | | | | | | | | | | | | | | | | | | | | | | | | |
03-31-09 | | 8.56 | | 0.37 | | 0.18 | | | 0.55 | | 0.38 | | — | | — | | 0.38 | | 8.73 | | 6.67 | | | 0.90 | | | 0.90 | | | 0.90 | | | 4.39 | | | 45 | | 39 | |
03-31-08 | | 8.37 | | 0.38 | | 0.19 | | | 0.57 | | 0.38 | | — | | — | | 0.38 | | 8.56 | | 7.06 | | | 0.92 | | | 0.92 | | | 0.92 | | | 4.49 | | | 43 | | 32 | |
03-31-07 | | 8.32 | | 0.36 | | 0.11 | | | 0.47 | | 0.42 | | — | | — | | 0.42 | | 8.37 | | 5.76 | | | 0.90 | | | 0.90 | | | 0.90 | | | 4.53 | | | 53 | | 99 | |
03-31-06 | | 8.53 | | 0.40 | | (0.18 | ) | | 0.22 | | 0.43 | | — | | — | | 0.43 | | 8.32 | | 2.65 | | | 0.92 | | | 0.92 | | | 0.92 | | | 4.77 | | | 82 | | 39 | |
03-31-05 | | 8.92 | | 0.39 | | (0.33 | ) | | 0.06 | | 0.45 | | — | | — | | 0.45 | | 8.53 | | 0.76 | | | 0.93 | | | 0.93 | | | 0.93 | | | 4.32 | | | 103 | | 40 | |
Class W | | | | | | | | | | | | | | | | | | | | | | | | | | | | | | | | | | | | | | | |
03-31-09 | | 8.55 | | 0.39 | | 0.19 | | | 0.58 | | 0.40 | | — | | — | | 0.40 | | 8.73 | | 7.03 | | | 0.65 | | | 0.65 | | | 0.65 | | | 4.70 | | | 4,180 | | 39 | |
12-17-07(4) - 03-31-08 | | 8.39 | | 0.11 | | 0.15 | | | 0.26 | | 0.10 | | — | | — | | 0.10 | | 8.55 | | 3.16 | | | 0.64 | | | 0.64 | | | 0.64 | | | 4.86 | | | 1 | | 32 | |
See Accompanying Notes to Financial Statements
24
FINANCIAL HIGHLIGHTS (CONTINUED)
Selected data for a share of beneficial interest outstanding throughout each year or period.
| | | | | | | | | | | | | | | | | | | | | | | | | | | | | | | | | | | | | | | |
| | | | | Income (loss)
from
investment
operations | | | | | | Less distributions | | | | | | | | | Ratios to average net assets | | | Supplemental
data |
| | | | | | | | | | | | | | | | | | | | | | | | | | | | | | | | | | | | | | | |
| | | Net asset value, beginning of year or period | | Net investment income (loss) | | | Net realized and unrealized gain (loss) on investments | | | Total from investment operations | | | From net investment income | | From net realized gains | | From return of capital
| | Total distributions | | Net asset value, end of year or period | | Total Return(1) | | | Expenses before reductions/ additions(2)(3) | | Expenses net of fee waivers and/or recoupments, if any(2)(3) | | | Expenses net of all reductions/ additions(2)(3) | | | Net investment income (loss)(2)(3) | | | Net assets, end of year or period | | Portfolio turnover rate |
| | | | | | | | | | | | | | | | | | | | | | | | | | | | | | | | | | | | | | | |
Year or period ended | | ($) | | ($) | | | ($) | | | ($) | | | ($) | | ($) | | ($) | | ($) | | ($) | | (%) | | | (%) | | (%) | | | (%) | | | (%) | | | ($000’s) | | (%) |
ING High Yield Bond Fund | | | | | | | | | | | | | | | | | | | | | | | | | | | | | | | | | | | | | | | |
Class A | | | | | | | | | | | | | | | | | | | | | | | | | | | | | | | | | | | | | | | |
03-31-09 | | 7.89 | | 0.62 | | | (2.32 | ) | | (1.70 | ) | | 0.54 | | — | | 0.13 | | 0.67 | | 5.52 | | (22.36 | )(a) | | 1.25 | | 1.10 | † | | 1.10 | † | | 9.30 | † | | 59,307 | | 75 |
03-31-08 | | 8.99 | | 0.67 | | | (1.10 | ) | | (0.43 | ) | | 0.67 | | — | | — | | 0.67 | | 7.89 | | (5.10 | ) | | 1.16 | | 1.11 | † | | 1.11 | † | | 7.86 | † | | 83,327 | | 66 |
03-31-07 | | 8.71 | | 0.61 | | | 0.27 | | | 0.88 | | | 0.60 | | — | | — | | 0.60 | | 8.99 | | 10.54 | | | 1.11 | | 1.10 | | | 1.10 | | | 6.98 | | | 104,328 | | 122 |
03-31-06 | | 8.75 | | 0.55 | | | (0.04 | ) | | 0.51 | | | 0.55 | | — | | — | | 0.55 | | 8.71 | | 6.01 | | | 1.31 | | 1.18 | | | 1.18 | | | 6.27 | | | 99,178 | | 111 |
03-31-05 | | 8.88 | | 0.54 | | | (0.13 | ) | | 0.41 | | | 0.54 | | — | | — | | 0.54 | | 8.75 | | 4.73 | | | 1.33 | | 1.22 | | | 1.22 | | | 6.12 | | | 110,683 | | 119 |
Class B | | | | | | | | | | | | | | | | | | | | | | | | | | | | | | | | | | | | | | | |
03-31-09 | | 7.88 | | 0.58 | | | (2.32 | ) | | (1.74 | ) | | 0.49 | | — | | 0.13 | | 0.62 | | 5.52 | | (22.86 | )(a) | | 2.00 | | 1.85 | † | | 1.85 | † | | 8.38 | † | | 12,289 | | 75 |
03-31-08 | | 8.98 | | 0.61 | | | (1.11 | ) | | (0.50 | ) | | 0.60 | | — | | — | | 0.60 | | 7.88 | | (5.82 | ) | | 1.91 | | 1.86 | † | | 1.86 | † | | 7.08 | † | | 24,994 | | 66 |
03-31-07 | | 8.70 | | 0.53 | | | 0.29 | | | 0.82 | | | 0.54 | | — | | — | | 0.54 | | 8.98 | | 9.72 | | | 1.86 | | 1.85 | | | 1.85 | | | 6.18 | | | 43,427 | | 122 |
03-31-06 | | 8.74 | | 0.47 | | | (0.03 | ) | | 0.44 | | | 0.48 | | — | | — | | 0.48 | | 8.70 | | 5.22 | | | 1.98 | | 1.94 | | | 1.94 | | | 5.50 | | | 75,940 | | 111 |
03-31-05 | | 8.88 | | 0.48 | | | (0.15 | ) | | 0.33 | | | 0.47 | | — | | — | | 0.47 | | 8.74 | | 3.83 | | | 1.98 | | 1.97 | | | 1.97 | | | 5.39 | | | 125,603 | | 119 |
Class C | | | | | | | | | | | | | | | | | | | | | | | | | | | | | | | | | | | | | | | |
03-31-09 | | 7.89 | | 0.58 | | | (2.33 | ) | | (1.75 | ) | | 0.49 | | — | | 0.13 | | 0.62 | | 5.52 | | (22.95 | )(a) | | 2.00 | | 1.85 | † | | 1.85 | † | | 8.57 | † | | 7,101 | | 75 |
03-31-08 | | 8.99 | | 0.61 | | | (1.11 | ) | | (0.50 | ) | | 0.60 | | — | | — | | 0.60 | | 7.89 | | (5.81 | ) | | 1.91 | | 1.86 | † | | 1.86 | † | | 7.09 | † | | 9,987 | | 66 |
03-31-07 | | 8.71 | | 0.54 | | | 0.28 | | | 0.82 | | | 0.54 | | — | | — | | 0.54 | | 8.99 | | 9.70 | | | 1.86 | | 1.85 | | | 1.85 | | | 6.21 | | | 15,487 | | 122 |
03-31-06 | | 8.75 | | 0.48 | | | (0.03 | ) | | 0.45 | | | 0.49 | | — | | — | | 0.49 | | 8.71 | | 5.22 | | | 1.98 | | 1.94 | | | 1.94 | | | 5.51 | | | 17,555 | | 111 |
03-31-05 | | 8.88 | | 0.48 | | | (0.13 | ) | | 0.35 | | | 0.48 | | — | | — | | 0.48 | | 8.75 | | 3.96 | | | 1.98 | | 1.97 | | | 1.97 | | | 5.37 | | | 26,330 | | 119 |
Class I | | | | | | | | | | | | | | | | | | | | | | | | | | | | | | | | | | | | | | | |
07-31-08(4) - 03-31-09 | | 7.64 | | 0.37 | Ÿ | | (1.92 | ) | | (1.55 | ) | | 0.49 | | — | | 0.09 | | 0.58 | | 5.51 | | (20.35 | )(a) | | 0.95 | | 0.80 | † | | 0.80 | † | | 9.61 | † | | 2 | | 75 |
| | | | | | | | | | | | | | | | |
ING Intermediate Bond Fund | | | | | | | | | | | | | | | | | | | | | | | | | | | | | | | | | | | | | | | |
Class A | | | | | | | | | | | | | | | | | | | | | | | | | | | | | | | | | | | | | | | |
03-31-09 | | 10.13 | | 0.45 | | | (1.60 | ) | | (1.15 | ) | | 0.45 | | 0.22 | | — | | 0.67 | | 8.31 | | (11.65 | ) | | 0.72 | | 0.70 | † | | 0.70 | † | | 4.84 | † | | 471,185 | | 674 |
03-31-08 | | 10.23 | | 0.51 | | | (0.15 | ) | | 0.36 | | | 0.46 | | — | | — | | 0.46 | | 10.13 | | 3.61 | | | 0.73 | | 0.69 | † | | 0.69 | † | | 4.98 | † | | 799,369 | | 435 |
03-31-07 | | 10.13 | | 0.50 | | | 0.10 | | | 0.60 | | | 0.50 | | — | | — | | 0.50 | | 10.23 | | 6.03 | | | 0.73 | | 0.69 | † | | 0.69 | † | | 4.89 | † | | 698,537 | | 367 |
03-31-06 | | 10.32 | | 0.41 | | | (0.14 | ) | | 0.27 | | | 0.42 | | 0.04 | | — | | 0.46 | | 10.13 | | 2.53 | | | 1.02 | | 0.93 | | | 0.93 | | | 3.92 | | | 572,196 | | 469 |
03-31-05 | | 10.67 | | 0.32 | | | (0.17 | ) | | 0.15 | | | 0.33 | | 0.17 | | — | | 0.50 | | 10.32 | | 1.52 | | | 1.14 | | 1.00 | | | 1.00 | | | 3.08 | | | 459,850 | | 417 |
Class B | | | | | | | | | | | | | | | | | | | | | | | | | | | | | | | | | | | | | | | |
03-31-09 | | 10.11 | | 0.38 | | | (1.59 | ) | | (1.21 | ) | | 0.38 | | 0.22 | | — | | 0.60 | | 8.30 | | (12.26 | ) | | 1.47 | | 1.45 | † | | 1.45 | † | | 4.08 | † | | 23,721 | | 674 |
03-31-08 | | 10.21 | | 0.43 | | | (0.14 | ) | | 0.29 | | | 0.39 | | — | | — | | 0.39 | | 10.11 | | 2.84 | | | 1.48 | | 1.44 | † | | 1.44 | † | | 4.26 | † | | 41,078 | | 435 |
03-31-07 | | 10.11 | | 0.42 | | | 0.10 | | | 0.52 | | | 0.42 | | — | | — | | 0.42 | | 10.21 | | 5.23 | | | 1.48 | | 1.44 | † | | 1.44 | † | | 4.13 | † | | 50,086 | | 367 |
03-31-06 | | 10.30 | | 0.32 | | | (0.13 | ) | | 0.19 | | | 0.34 | | 0.04 | | — | | 0.38 | | 10.11 | | 1.76 | | | 1.70 | | 1.69 | | | 1.69 | | | 3.14 | | | 60,526 | | 469 |
03-31-05 | | 10.65 | | 0.24 | | | (0.17 | ) | | 0.07 | | | 0.25 | | 0.17 | | — | | 0.42 | | 10.30 | | 0.75 | | | 1.79 | | 1.75 | | | 1.75 | | | 2.31 | | | 64,779 | | 417 |
See Accompanying Notes to Financial Statements
25
FINANCIAL HIGHLIGHTS (CONTINUED)
Selected data for a share of beneficial interest outstanding throughout each year or period.
| | | | | | | | | | | | | | | | | | | | | | | | | | | | | | | | | | | | | | | |
| | | | | Income (loss)
from
investment
operations | | | | | | Less distributions | | | | | | | | | Ratios to average net assets | | | Supplemental
data |
| | | | | | | | | | | | | | | | | | | | | | | | | | | | | | | | | | | | | | | |
| | | Net asset value, beginning of year or period | | Net investment income (loss) | | | Net realized and unrealized gain (loss) on investments | | | Total from investment operations | | | From net investment income | | From net realized gains | | From return of capital
| | Total distributions | | Net asset value, end of year or period | | Total Return(1) | | | Expenses before reductions/ additions(2)(3) | | Expenses net of fee waivers and/or recoupments, if any(2)(3) | | | Expenses net of all reductions/ additions(2)(3) | | | Net investment income (loss)(2)(3) | | | Net assets, end of year or period | | Portfolio turnover rate |
| | | | | | | | | | | | | | | | | | | | | | | | | | | | | | | | | | | | | | | |
Year or period ended | | ($) | | ($) | | | ($) | | | ($) | | | ($) | | ($) | | ($) | | ($) | | ($) | | (%) | | | (%) | | (%) | | | (%) | | | (%) | | | ($000’s) | | (%) |
ING Intermediate Bond Fund (Continued) | | | | | | | | | | | | | | | | | | | | | | | | | | | | | | | | | | | | | | | |
Class C | | | | | | | | | | | | | | | | | | | | | | | | | | | | | | | | | | | | | | | |
03-31-09 | | 10.12 | | 0.38 | | | (1.60 | ) | | (1.22 | ) | | 0.38 | | 0.22 | | — | | 0.60 | | 8.30 | | (12.35 | ) | | 1.47 | | 1.45 | † | | 1.45 | † | | 4.08 | † | | 53,534 | | 674 |
03-31-08 | | 10.22 | | 0.43 | | | (0.14 | ) | | 0.29 | | | 0.39 | | — | | — | | 0.39 | | 10.12 | | 2.85 | | | 1.48 | | 1.44 | † | | 1.44 | † | | 4.24 | † | | 83,232 | | 435 |
03-31-07 | | 10.12 | | 0.42 | | | 0.10 | | | 0.52 | | | 0.42 | | — | | — | | 0.42 | | 10.22 | | 5.24 | | | 1.48 | | 1.44 | † | | 1.44 | † | | 4.13 | † | | 81,556 | | 367 |
03-31-06 | | 10.31 | | 0.33 | | | (0.14 | ) | | 0.19 | | | 0.34 | | 0.04 | | — | | 0.38 | | 10.12 | | 1.77 | | | 1.70 | | 1.69 | | | 1.69 | | | 3.15 | | | 73,281 | | 469 |
03-31-05 | | 10.65 | | 0.24 | | | (0.16 | ) | | 0.08 | | | 0.25 | | 0.17 | | — | | 0.42 | | 10.31 | | 0.86 | | | 1.79 | | 1.75 | | | 1.75 | | | 2.31 | | | 71,648 | | 417 |
Class I | | | | | | | | | | | | | | | | | | | | | | | | | | | | | | | | | | | | | | | |
03-31-09 | | 10.14 | | 0.48 | | | (1.61 | ) | | (1.13 | ) | | 0.48 | | 0.22 | | — | | 0.70 | | 8.31 | | (11.42 | ) | | 0.39 | | 0.37 | † | | 0.37 | † | | 5.17 | † | | 362,162 | | 674 |
03-31-08 | | 10.23 | | 0.54 | | | (0.13 | ) | | 0.41 | | | 0.50 | | — | | — | | 0.50 | | 10.14 | | 4.05 | | | 0.39 | | 0.35 | † | | 0.38 | † | | 5.31 | † | | 351,575 | | 435 |
03-31-07 | | 10.14 | | 0.53 | | | 0.09 | | | 0.62 | | | 0.53 | | — | | — | | 0.53 | | 10.23 | | 6.26 | | | 0.40 | | 0.36 | † | | 0.36 | † | | 5.22 | † | | 266,596 | | 367 |
03-31-06 | | 10.32 | | 0.44 | | | (0.13 | ) | | 0.31 | | | 0.45 | | 0.04 | | — | | 0.49 | | 10.14 | | 2.94 | | | 0.61 | | 0.60 | | | 0.60 | | | 4.40 | | | 179,582 | | 469 |
03-31-05 | | 10.67 | | 0.36 | Ÿ | | (0.17 | ) | | 0.19 | | | 0.37 | | 0.17 | | — | | 0.54 | | 10.32 | | 1.85 | | | 0.72 | | 0.68 | | | 0.68 | | | 3.43 | | | 43,808 | | 417 |
Class O | | | | | | | | | | | | | | | | | | | | | | | | | | | | | | | | | | | | | | | |
03-31-09 | | 10.14 | | 0.45 | | | (1.60 | ) | | (1.15 | ) | | 0.45 | | 0.22 | | — | | 0.67 | | 8.32 | | (11.62 | ) | | 0.72 | | 0.70 | † | | 0.70 | † | | 4.84 | † | | 39,188 | | 674 |
03-31-08 | | 10.24 | | 0.51 | | | (0.15 | ) | | 0.36 | | | 0.46 | | — | | — | | 0.46 | | 10.14 | | 3.61 | | | 0.73 | | 0.69 | † | | 0.69 | † | | 4.99 | † | | 55,956 | | 435 |
03-31-07 | | 10.14 | | 0.50 | | | 0.09 | | | 0.59 | | | 0.49 | | — | | — | | 0.49 | | 10.24 | | 6.02 | | | 0.73 | | 0.69 | † | | 0.69 | † | | 4.88 | † | | 53,096 | | 367 |
03-31-06 | | 10.32 | | 0.40 | | | (0.13 | ) | | 0.27 | | | 0.41 | | 0.04 | | — | | 0.45 | | 10.14 | | 2.58 | | | 0.95 | | 0.94 | | | 0.94 | | | 3.91 | | | 43,171 | | 469 |
08-13-04(4) - 03-31-05 | | 10.41 | | 0.21 | | | (0.04 | ) | | 0.17 | | | 0.22 | | 0.04 | | — | | 0.26 | | 10.32 | | 1.61 | | | 1.00 | | 0.96 | | | 0.96 | | | 3.19 | | | 33,997 | | 417 |
Class R | | | | | | | | | | | | | | | | | | | | | | | | | | | | | | | | | | | | | | | |
03-31-09 | | 10.15 | | 0.43 | | | (1.61 | ) | | (1.18 | ) | | 0.43 | | 0.22 | | — | | 0.65 | | 8.32 | | (11.93 | ) | | 0.97 | | 0.95 | † | | 0.95 | † | | 4.59 | † | | 18,240 | | 674 |
03-31-08 | | 10.25 | | 0.48 | | | (0.14 | ) | | 0.34 | | | 0.44 | | — | | — | | 0.44 | | 10.15 | | 3.36 | | | 0.98 | | 0.94 | † | | 0.94 | † | | 4.65 | † | | 16,773 | | 435 |
03-31-07 | | 10.15 | | 0.47 | | | 0.10 | | | 0.57 | | | 0.47 | | — | | — | | 0.47 | | 10.25 | | 5.75 | | | 0.98 | | 0.94 | † | | 0.94 | † | | 4.63 | † | | 5,572 | | 367 |
03-31-06 | | 10.34 | | 0.38 | | | (0.14 | ) | | 0.24 | | | 0.39 | | 0.04 | | — | | 0.43 | | 10.15 | | 2.26 | | | 1.17 | | 1.16 | | | 1.16 | | | 3.79 | | | 799 | | 469 |
03-31-05 | | 10.67 | | 0.33 | | | (0.16 | ) | | 0.17 | | | 0.33 | | 0.17 | | — | | 0.50 | | 10.34 | | 1.64 | | | 1.21 | | 1.17 | | | 1.17 | | | 2.96 | | | 313 | | 417 |
03-16-04(4) - 03-31-04 | | 10.71 | | 0.01 | | | (0.05 | ) | | (0.04 | ) | | — | | — | | — | | — | | 10.67 | | (0.37 | ) | | 1.25 | | 1.25 | | | 1.25 | | | 3.20 | | | 1 | | 475 |
Class W | | | | | | | | | | | | | | | | | | | | | | | | | | | | | | | | | | | | | | | |
03-31-09 | | 10.12 | | 0.45 | | | (1.53 | ) | | (1.08 | ) | | 0.51 | | 0.22 | | — | | 0.73 | | 8.31 | | (11.03 | ) | | 0.39 | | 0.37 | † | | 0.37 | † | | 5.09 | † | | 2,079 | | 674 |
12-17-07(4) - 03-31-08 | | 10.21 | | 0.15 | Ÿ | | (0.05 | ) | | 0.10 | | | 0.19 | | — | | — | | 0.19 | | 10.12 | | 0.98 | | | 0.48 | | 0.44 | † | | 0.44 | † | | 5.24 | † | | 443 | | 435 |
See Accompanying Notes to Financial Statements
26
FINANCIAL HIGHLIGHTS (CONTINUED)
Selected data for a share of beneficial interest outstanding throughout each year or period.
| | | | | | | | | | | | | | | | | | | | | | | | | | | | | | | | | | |
| | | | | Income (loss)
from
investment
operations | | | | Less distributions | | | | | | | Ratios to average net assets | | Supplemental
data |
| | | | | | | | | | | | | | | | | | | | | | | | | | | | | | | | | | |
| | | Net asset value, beginning of year or period | | Net investment income (loss) | | Net realized and unrealized gain (loss) on investments | | Total from investment operations | | From net investment income | | From net realized gains | | | From return of capital
| | Total distributions | | Net asset value, end of year or period | | Total Return(1) | | | Expenses before reductions/ additions(2)(3) | | Expenses net of fee waivers and/or recoupments, if any(2)(3) | | Expenses net of all reductions/ additions(2)(3) | | Net investment income (loss)(2)(3) | | Net assets, end of year or period | | Portfolio turnover rate |
| | | | | | | | | | | | | | | | | | | | | | | | | | | | | | | | | | |
Year or period ended | | ($) | | ($) | | ($) | | ($) | | ($) | | ($) | | | ($) | | ($) | | ($) | | (%) | | | (%) | | (%) | | (%) | | (%) | | ($000’s) | | (%) |
ING Classic Money Market Fund | | | | | | | | | | | | | | | | | | | | | | | | | | | | | | | | | | |
Class A | | | | | | | | | | | | | | | | | | | | | | | | | | | | | | | | | | |
03-31-09 | | 1.00 | | 0.01 | | — | | 0.01 | | 0.01 | | — | | | — | | 0.01 | | 1.00 | | 1.43 | | | 1.13 | | 0.79 | | 0.79 | | 1.42 | | 1,323,512 | | — |
03-31-08 | | 1.00 | | 0.04 | | — | | 0.04 | | 0.04 | | — | | | — | | 0.04 | | 1.00 | | 4.39 | | | 1.11 | | 0.77 | | 0.77 | | 4.22 | | 1,498,016 | | — |
03-31-07 | | 1.00 | | 0.05 | | — | | 0.05 | | 0.05 | | — | | | — | | 0.05 | | 1.00 | | 4.63 | | | 1.11 | | 0.77 | | 0.77 | | 4.55 | | 921,623 | | — |
03-31-06 | | 1.00 | | 0.03 | | — | | 0.03 | | 0.03 | | — | | | — | | 0.03 | | 1.00 | | 3.07 | | | 1.10 | | 0.77 | | 0.77 | | 3.07 | | 656,731 | | — |
03-31-05 | | 1.00 | | 0.01 | | — | | 0.01 | | 0.01 | | — | | | — | | 0.01 | | 1.00 | | 1.02 | | | 1.08 | | 0.77 | | 0.77 | | 1.06 | | 550,091 | | — |
Class B | | | | | | | | | | | | | | | | | | | | | | | | | | | | | | | | | | |
03-31-09 | | 1.00 | | 0.01 | | — | | 0.01 | | 0.01 | | — | | | — | | 0.01 | | 1.00 | | 0.92 | | | 1.38 | | 1.29 | | 1.29 | | 0.94 | | 16,160 | | — |
03-31-08 | | 1.00 | | 0.04 | | — | | 0.04 | | 0.04 | | — | | | — | | 0.04 | | 1.00 | | 3.77 | | | 1.36 | | 1.36 | | 1.36 | | 3.74 | | 19,793 | | — |
03-31-07 | | 1.00 | | 0.04 | | — | | 0.04 | | 0.04 | | — | | | — | | 0.04 | | 1.00 | | 4.00 | | | 1.36 | | 1.36 | | 1.36 | | 3.95 | | 23,333 | | — |
03-31-06 | | 1.00 | | 0.02 | | — | | 0.02 | | 0.02 | | — | | | — | | 0.02 | | 1.00 | | 2.46 | | | 1.34 | | 1.34 | | 1.34 | | 2.43 | | 23,995 | | — |
03-31-05 | | 1.00 | | 0.01 | | — | | 0.01 | | 0.01 | | — | | | — | | 0.01 | | 1.00 | | 0.57 | | | 1.33 | | 1.33 | | 1.33 | | 0.94 | | 26,941 | | — |
Class C | | | | | | | | | | | | | | | | | | | | | | | | | | | | | | | | | | |
03-31-09 | | 1.00 | | 0.01 | | — | | 0.01 | | 0.01 | | — | | | — | | 0.01 | | 1.00 | | 0.92 | | | 1.38 | | 1.29 | | 1.29 | | 0.95 | | 10,929 | | — |
03-31-08 | | 1.00 | | 0.04 | | — | | 0.04 | | 0.04 | | — | | | — | | 0.04 | | 1.00 | | 3.76 | | | 1.36 | | 1.36 | | 1.36 | | 3.59 | | 15,511 | | — |
03-31-07 | | 1.00 | | 0.04 | | — | | 0.04 | | 0.04 | | — | | | — | | 0.04 | | 1.00 | | 3.99 | | | 1.36 | | 1.36 | | 1.36 | | 3.96 | | 4,345 | | — |
03-31-06 | | 1.00 | | 0.02 | | — | | 0.02 | | 0.02 | | — | | | — | | 0.02 | | 1.00 | | 2.46 | | | 1.34 | | 1.34 | | 1.34 | | 2.47 | | 4,868 | | — |
03-31-05 | | 1.00 | | 0.01 | | — | | 0.01 | | 0.01 | | — | | | — | | 0.01 | | 1.00 | | 0.58 | | | 1.33 | | 1.33 | | 1.33 | | 0.78 | | 3,932 | | — |
ING Institutional Prime Money Market Fund | | | | | | | | | | | | | | | | | | | | | | | | | | | | | | | | | | |
Class I | | | | | | | | | | | | | | | | | | | | | | | | | | | | | | | | | | |
03-31-09 | | 1.00 | | 0.02 | | — | | 0.02 | | 0.02 | | — | | | — | | 0.02 | | 1.00 | | 1.89 | | | 0.20 | | 0.20 | | 0.20 | | 1.74 | | 1,205,903 | | — |
03-31-08 | | 1.00 | | 0.05 | | — | | 0.05 | | 0.05 | | 0.00 | * | | — | | 0.05 | | 1.00 | | 5.00 | | | 0.12 | | 0.12 | | 0.12 | | 4.95 | | 800,049 | | — |
03-31-07 | | 1.00 | | 0.05 | | — | | 0.05 | | 0.05 | | — | | | — | | 0.05 | | 1.00 | | 5.25 | | | 0.16 | | 0.16 | | 0.16 | | 5.17 | | 724,330 | | — |
07-29-05(4) - 03-31-06 | | 1.00 | | 0.03 | | — | | 0.03 | | 0.03 | | — | | | — | | 0.03 | | 1.00 | | 2.70 | | | 0.19 | | 0.17 | | 0.17 | | 4.14 | | 179,659 | | — |
Class IS | | | | | | | | | | | | | | | | | | | | | | | | | | | | | | | | | | |
03-31-09 | | 1.00 | | 0.02 | | — | | 0.02 | | 0.02 | | — | | | — | | 0.02 | | 1.00 | | 2.05 | | | 0.23 | | 0.23 | | 0.23 | | 1.77 | | 1 | | — |
12-05-07(4) - 03-31-08 | | 1.00 | | 0.01 | | — | | 0.01 | | 0.01 | | — | | | — | | 0.01 | | 1.00 | | 1.35 | | | 0.22 | | 0.20 | | 0.20 | | 4.19 | | 1 | | — |
See Accompanying Notes to Financial Statements
27
FINANCIAL HIGHLIGHTS (CONTINUED)
(1) | | Total return is calculated assuming reinvestment of all dividends and capital gain distributions at net asset value and excluding the deduction of sales charges. Total return for periods less than one year is not annualized. |
(2) | | Annualized for periods less than one year. |
(3) | | Expense ratios reflect operating expenses of a Fund. Expenses before reductions do not reflect amounts reimbursed by the Investment Adviser and/or Distributor or reductions from brokerage service arrangements or other expense offset arrangements and do not represent the amount paid by a Fund during periods when reimbursements or reductions occur. Expenses net of fee waivers reflect expenses after reimbursement by the Investment Adviser and/or Distributor but prior to reductions from brokerage commission recapture arrangements or other expense offset arrangements. Expenses net of all reductions represent the net expenses paid by a Fund. Net investment income (loss) is net of all such additions or reductions. |
(4) | | Commencement of operations. |
† | | Impact of waiving the advisory fee for the ING Institutional Prime Money Market Fund holding has less than 0.005% impact on the expense ratio and net investment income or loss ratio. |
| * | | Amount is less than $0.005. |
| Ÿ | | Calculated using average number of shares outstanding throughout the period. |
(a) | | There was no impact on total return by the affiliate payment in Note 17. |
See Accompanying Notes to Financial Statements
28
NOTES TO FINANCIAL STATEMENTSASOF MARCH 31, 2009
NOTE 1 — ORGANIZATION
Organization. ING Funds Trust (“Trust”) is a Delaware statutory trust and is registered as an open-end management investment company under the Investment Company Act of 1940, as amended (“1940 Act”). The Trust was organized on August 6, 1998 and was established under a Trust Instrument dated July 30, 1998. It consists of five separately managed series: ING GNMA Income Fund (“GNMA Income”), ING High Yield Bond Fund (“High Yield Bond”), ING Intermediate Bond Fund (“Intermediate Bond”), ING Classic Money Market Fund (“Classic Money Market”) and ING Institutional Prime Money Market Fund (“Institutional Money Market”) (each, a “Fund” and collectively, the “Funds”).
The investment objective of each Fund is described in each Fund’s prospectus.
Each Fund, except Institutional Money Market, offers at least three of the following classes of shares: Class A, Class B, Class C, Class I, Class O, Class Q, Class R and Class W. Institutional Money Market offers Class I and Class IS shares. The separate classes of shares differ principally in the applicable sales charges (if any), transfer agent fees, distribution fees and shareholder servicing fees. Generally, shareholders of each class also bear certain expenses that pertain to that particular class. All shareholders bear the common expenses of a Fund and earn income and realized gains/losses from the portfolio pro rata based on the average daily net assets of each class, without distinction between share classes. Common expenses of the Funds (including custodial asset-based fees, legal and audit fees, printing and mailing expenses, transfer agency out-of-pocket expenses, and fees and expenses of the independent trustees) are allocated to each Fund in proportion to its relative daily net assets. Expenses directly attributable to a particular fund (including advisory, administration, custodial transaction-based, registration, other professional, distribution and/or service fees, certain taxes, and offering costs) are charged directly to that Fund. Differences in per share dividend rates generally result from the differences in separate class expenses, including distribution, and shareholder servicing fees. Class B shares, along with their pro rata reinvested dividend shares, automatically convert to Class A shares eight years after purchase.
Class B shares of the Funds (except Classic Money Market) are closed to new investment, provided that (1) Class B shares of the Funds may be purchased through the reinvestment of dividends issued by Class B shares of a Fund; (2) subject to the terms and conditions
of relevant exchange privileges and as permitted under their respective prospectuses, Class B shares of the Funds may be acquired through exchange of Class B shares of other funds in the ING mutual funds complex; and (3) certain qualified retirement plans may purchase Class B shares of the Funds, where the Funds have received information reasonably satisfactory indicating that intermediaries maintaining these plans are unable for administrative reasons to effect the closure immediately.
NOTE 2 — SIGNIFICANT ACCOUNTING POLICIES
The following significant accounting policies are consistently followed by the Funds in the preparation of their financial statements, and such policies are in conformity with U.S. generally accepted accounting principles for investment companies.
| A. | Security Valuation. Investments in equity securities traded on a national securities exchange are valued at the last reported sale price. Securities reported by the National Association of Securities Dealers Automated Quotation System (“NASDAQ”) will be valued at the NASDAQ official closing prices. Securities traded on an exchange or NASDAQ for which there has been no sale and securities traded in the over-the- counter-market are valued at the mean between the last reported bid and ask prices. All investments quoted in foreign currencies will be valued daily in U.S. dollars on the basis of the foreign currency exchange rates prevailing at that time. Debt securities are valued at prices obtained from independent services or from one or more dealers making markets in the securities and may be adjusted based on the Funds’ valuation procedures. U.S. government obligations are valued by using market quotations or independent pricing services that use prices provided by marketmakers or estimates of market values obtained from yield data relating to instruments or securities with similar characteristics. |
Securities and assets for which market quotations are not readily available (which may include certain restricted securities which are subject to limitations as to their sale) are valued at their fair values, as defined by the 1940 Act, as determined in good faith by or under the supervision of the Funds’ Board of Trustees (“Board”), in accordance with methods that are specifically authorized by the Board. Securities traded on exchanges, including foreign exchanges, which close earlier
29
NOTES TO FINANCIAL STATEMENTSASOF MARCH 31, 2009 (CONTINUED)
NOTE 2 — SIGNIFICANT ACCOUNTING POLICIES (continued)
than the time that a Fund calculates its net asset value (“NAV”) may also be valued at their fair values as defined by the 1940 Act and as determined in good faith by or under the supervision of the Funds’ Board, in accordance with methods that are specifically authorized by the Board. If an event occurs after the time at which the market for foreign securities held by a Fund closes but before the time that a Fund’s NAV is calculated, such event may cause the closing price on the foreign exchange to not represent a readily available reliable market value quotation for such securities at the time a Fund determines its NAV. In such a case, a Fund will use the fair value of such securities as determined under a Fund’s valuation procedures. Events after the close of trading on a foreign market that could require a Fund to fair value some or all of its foreign securities include, among others, securities trading in the U.S. and other markets, corporate announcements, natural and other disasters, and political and other events. Among other elements of analysis in the determination of a security’s fair value, the Board has authorized the use of one or more independent research services to assist with such determinations. An independent research service may use statistical analyses and quantitative models to help determine fair value as of the time a Fund calculates its NAV. There can be no assurance that such models accurately reflect the behavior of the applicable markets or the effect of the behavior of such markets on the fair value of securities, or that such markets will continue to behave in a fashion that is consistent with such models. Unlike the closing price of a security on an exchange, fair value determinations employ elements of judgment. Consequently, the fair value assigned to a security may not represent the actual value that a Fund could obtain if it were to sell the security at the time of the close of the NYSE. Pursuant to procedures adopted by the Board, a Fund is not obligated to use the fair valuations suggested by any research service, and valuation recommendations provided by such research services may be overridden if other events have occurred or if other fair valuations are determined in good faith to be more accurate. Unless an event is such that it causes a Fund to determine that the closing prices for one or more securities do not represent readily available reliable market value
quotations at the time a Fund determines its NAV, events that occur between the time of the close of the foreign market on which they are traded and the close of regular trading on the NYSE will not be reflected in a Fund’s NAV. Investments in securities maturing in 60 days or less from the date of acquisition are valued at amortized cost which approximates market value.
Classic Money Market and Institutional Money Market use the amortized cost method to value their portfolio securities, which approximates market value. The amortized cost method involves valuing a security at its cost and amortizing any discount or premium over the period until maturity regardless of the impact of fluctuating interest rates or the market value of the security.
Effective for fiscal years beginning after November 15, 2007, Financial Accounting Standards Board (“FASB”) Statement of Financial Accounting Standards No. 157, “Fair Value Measurements”, establishes a hierarchy for measuring fair value of assets and liabilities. As required by the standard, each investment asset or liability of the Funds is assigned a level at measurement date based on the significance and source of the inputs to its valuation. Quoted prices in active markets for identical securities are classified as “Level 1”, inputs other than quoted prices for an asset that are observable are classified as “Level 2” and unobservable inputs, including the sub-adviser’s judgment about the assumptions that a market participant would use in pricing an asset or liability are classified as “Level 3”. The inputs used for valuing securities are not necessarily an indication of the risks associated with investing in those securities. A table summarizing the Funds’ investments under these levels of classification is included following the Portfolios of Investments.
Effective for fiscal years and interim periods ending after November 15, 2008, the FASB issued FASB Staff Position (“FSP”) No. FAS 133-1 and FASB Interpretation Number (“FIN”) 45-4, “Disclosures about Credit Derivatives and Certain Guarantees: An Amendment of FASB Statement No. 133 and FASB Interpretation No. 45; and Clarification of the Effective Date of FASB Statement No. 161.” The amendments to FAS 133 require enhanced disclosure regarding credit derivatives sold, including (1) the nature and terms of the credit derivative, reasons for entering into the credit
30
NOTES TO FINANCIAL STATEMENTSASOF MARCH 31, 2009 (CONTINUED)
NOTE 2 — SIGNIFICANT ACCOUNTING POLICIES (continued)
derivative, the events or circumstances that would require the seller to perform under the credit derivative, and the current status of the payment/performance risk of the credit derivative, (2) the maximum potential amount of future payments (undiscounted) the seller could be required to make under the credit derivative, (3) the fair value of the credit derivative, and (4) the nature of any recourse provisions and assets held either as collateral or by third parties. The amendments to FIN 45 require additional disclosures about the current status of the payment/performance risk of a guarantee. All changes to accounting policies have been made in accordance with the FSP and incorporated for the current period as part of the Notes to Financial Statements and Portfolio of Investments.
| B. | Security Transactions and Revenue Recognition. Securities transactions are accounted for on the trade date. Realized gains and losses are reported on the basis of identified cost of securities sold. Interest income is recorded on an accrual basis. Dividend income is recorded on the ex-dividend date, or for certain foreign securities, when the information becomes available to the Funds. Premium amortization and discount accretion are determined by the effective yield method. |
| C. | Foreign Currency Translation. The books and records of the Funds are maintained in U.S. dollars. Any foreign currency amounts are translated into U.S. dollars on the following basis: |
| | (1) | Market value of investment securities, other assets and liabilities — at the exchange rates prevailing at the end of the day. |
| | (2) | Purchases and sales of investment securities, income and expenses — at the rates of exchange prevailing on the respective dates of such transactions. |
Although the net assets and the market values are presented at the foreign exchange rates at the end of the day, the Funds do not isolate the portion of the results of operations resulting from changes in foreign exchange rates on investments from the fluctuations arising from changes in market prices of securities held. Such fluctuations are included with the net realized and unrealized gains or losses from investments. For securities that are subject to foreign withholding tax upon disposition, liabilities are recorded on the Statements of Assets and Liabilities
for the estimated tax withholding based on the securities’ current market values. Upon disposition, realized gains or losses on such securities are recorded net of foreign withholding tax.
Reported net realized foreign exchange gains or losses arise from sales of foreign currencies, currency gains or losses realized between the trade and settlement dates on securities transactions, the difference between the amounts of dividends, interest, and foreign withholding taxes recorded on the Funds’ books, and the U.S. dollar equivalent of the amounts actually received or paid. Net unrealized foreign exchange gains and losses arise from changes in the value of assets and liabilities other than investments in securities at fiscal year end, resulting from changes in the exchange rate. Foreign security and currency transactions may involve certain considerations and risks not typically associated with investing in U.S. companies and U.S. government securities. These risks include, but are not limited to revaluation of currencies and future adverse political and economic developments which could cause securities and their markets to be less liquid and prices more volatile than those of comparable U.S. companies and U.S. government securities.
| D. | Foreign Currency Transactions and Futures Contracts. High Yield Bond and Intermediate Bond may enter into foreign currency exchange transactions to convert to and from different foreign currencies and to and from the U.S. dollar in connection with the planned purchases or sales of securities. The Funds either enter into these transactions on a spot basis at the spot rate prevailing in the foreign currency exchange market or use forward foreign currency contracts to purchase or sell foreign currencies. When the contract is fulfilled or closed, gains or losses are realized. Until then, the gain or loss is included in unrealized appreciation or depreciation. Risks may arise upon entering into forward contracts from the potential inability of counterparties to meet the terms of their forward contracts and from unanticipated movements in the value of foreign currencies relative to the U.S. dollar. |
High Yield Bond, Intermediate Bond and Institutional Money Market may enter into futures contracts involving foreign currency, interest rates, securities and securities indices. A futures contract obligates the seller of the contract to deliver and the purchaser of the contract to take delivery of
31
NOTES TO FINANCIAL STATEMENTSASOF MARCH 31, 2009 (CONTINUED)
NOTE 2 — SIGNIFICANT ACCOUNTING POLICIES (continued)
the type of foreign currency, financial instrument or security called for in the contract at a specified future time for a specified price. Upon entering into such a contract, a Fund is required to deposit and maintain as collateral such initial margin as required by the exchange on which the contract is traded. Pursuant to the contract, a Fund agrees to receive from or pay to the broker an amount equal to the daily fluctuations in the value of the contract. Such receipts or payments are known as variation margins and are recorded as unrealized gains or losses by the Fund. When the contract is closed, the Fund records a realized gain or loss equal to the difference between the value of the contract at the time it was opened and the value at the time it was closed.
| E. | Distributions to Shareholders. The Funds record distributions to their shareholders on the ex-dividend date. All Funds, with the exception of GNMA Income, declare dividends daily and pay dividends monthly. GNMA Income declares and pays dividends monthly. The characteristics of income and gains to be distributed are determined in accordance with income tax regulations, which may differ from U.S. generally accepted accounting principles for investment companies. |
| F. | Federal Income Taxes. It is the policy of the Funds to comply with Subchapter M of the Internal Revenue Code and related excise tax provisions applicable to regulated investment companies and to distribute substantially all of their net investment income and any net realized capital gains to their shareholders. Therefore, no federal income tax provision is required. Management has considered the sustainability of the Funds’ tax positions taken on federal income tax returns for all open tax years in making this determination. No capital gain distributions shall be made until any capital loss carryforwards have been fully utilized or expired. |
| G. | Use of Estimates. The preparation of financial statements in conformity with U.S. generally accepted accounting principles requires management to make estimates and assumptions that affect the reported amounts of assets and liabilities and disclosure of contingent assets and liabilities at the date of the financial statements and the reported amounts of increases and |
| | decreases in net assets from operations during the reporting period. Actual results could differ from those estimates. |
| H. | Repurchase Agreements. Each Fund may invest in repurchase agreements only with government securities dealers recognized by the Board of Governors of the Federal Reserve System. Under such agreements, the seller of the security agrees to repurchase it at a mutually agreed upon time and price. The resale price is in excess of the purchase price and reflects an agreed upon interest rate for the period of time the agreement is outstanding. The period of the repurchase agreements is generally short, from possibly overnight to one week, (although it may extend over a number of months) while the underlying securities generally have longer maturities. Each Fund will receive as collateral securities acceptable to it whose market value is equal to at least 100% of the carrying amount of the repurchase agreements, plus accrued interest, being invested by a Fund. The underlying collateral is valued daily on a mark to market basis to assure that the value, including accrued interest is at least equal to the repurchase price. There would be potential loss to a Fund in the event a Fund is delayed or prevented from exercising its right to dispose of the collateral, and it may incur disposition costs in liquidating the collateral. |
| I. | Securities Lending. Each Fund has the option to temporarily loan up to 30% of its total assets to brokers, dealers or other financial institutions in exchange for a negotiated lender’s fee. The borrower is required to fully collateralize the loans with cash or U.S. government securities. Generally, in the event of counterparty default, a Fund has the right to use collateral to offset losses incurred. There would be potential loss to a Fund in the event the Fund is delayed or prevented from exercising its right to dispose of the collateral. A Fund bears the risk of loss with respect to the investment of collateral. Engaging in securities lending could have a leveraging effect, which may intensify the credit, market and other risks associated with investing in a Fund. |
| J. | Illiquid and Restricted Securities. Classic Money Market and Institutional Money Market may not invest more than 10% of their net assets in illiquid securities and all other Funds may not invest more than 15% of their net assets in illiquid securities. Illiquid securities are not readily marketable. |
32
NOTES TO FINANCIAL STATEMENTSASOF MARCH 31, 2009 (CONTINUED)
NOTE 2 — SIGNIFICANT ACCOUNTING POLICIES (continued)
| | Disposing of illiquid investments may involve time- consuming negotiation and legal expenses, and it may be difficult or impossible for the Funds to sell them promptly at an acceptable price. Restricted securities are those sold under Rule 144A of the Securities Act of 1933 (“1933 Act”) or are securities offered pursuant to Section 4(2) of the 1933 Act, and are subject to legal or contractual restrictions on resale and may not be publicly sold without registration under the 1933 Act. Certain restricted securities may be considered liquid pursuant to procedures adopted by the Board or may be deemed illiquid because they may not be readily marketable. With the exception of Classic Money Market and Institutional Money Market, illiquid and restricted securities are valued using market quotations when readily available. In the absence of market quotations, the securities are valued based upon their fair value determined under procedures approved by the Board. |
| K. | Delayed-Delivery or When-Issued Transactions. The Funds may purchase or sell securities on a when-issued or a delayed-delivery basis. Each Fund (except GNMA Income) may enter into forward commitments. The price of the underlying securities and date when the securities will be delivered and paid for are fixed at the time the transaction is negotiated. The market value of such is identified in the Funds’ Portfolio of investments. Losses may arise due to changes in the market value of the securities or from the inability of counterparties to meet the terms of the contract. In connection with such purchases, the Funds are required to segregate liquid assets with the Funds’ custodian sufficient to cover the purchase price. |
| L. | Mortgage Dollar Roll Transactions. Each Fund may engage in dollar roll transactions with respect to mortgage-backed securities issued or to be issued by Government National Mortgage Association, Federal National Mortgage Association and Federal Home Loan Mortgage Corp. In a dollar roll transaction, a Fund sells a mortgage-backed security to a financial institution, such as a bank or broker/dealer, and simultaneously agrees to repurchase a substantially similar (i.e., same type, coupon, and maturity) security from the institution on a delayed delivery basis at an agreed upon price. The mortgage-backed securities that are repurchased |
| | will bear the same interest rate as those sold, but generally will be collateralized by different pools of mortgages with different prepayment histories. The Funds account for dollar roll transactions as purchases and sales. |
| M. | Swap Agreements. High Yield Bond and Intermediate Bond may enter into swap agreements. A swap is an agreement between two parties pursuant to which each party agrees to make one or more payments to the other at specified future intervals based on the return of an asset (such as a stock, bond or currency) or non-asset reference (such as an interest rate or index). The swap agreement will specify the “notional” amount of the asset or non-asset reference to which the contract relates. Subsequent changes in market value, if any, are calculated based upon changes in the performance of the asset or non-asset reference multiplied by the notional value of the contract. A Fund may enter into credit default, interest rate, total return and currency swaps to manage its exposure to credit, currency and interest rate risk. All outstanding swap agreements are reported following each Fund’s Portfolio of Investments. |
Swaps are marked to market daily using quotations primarily from third party pricing services, counterparties or brokers. The value of the swap contract is recorded on each Fund’s Statements of Assets or Liabilities. During the term of the swap, changes in the value of the swap, if any, are recorded as unrealized gains or losses on the Statements of Operations. Upfront payments paid or received by a Fund when entering into the agreements are reported on the Statements of Assets and Liabilities and as a component of the changes in unrealized gains or losses on the Statements of Operations. These upfront payments represent the amounts paid or received when initially entering into the swap agreement to compensate for differences between the stated terms of the swap agreement and the prevailing market conditions. The upfront payments are included as a component in the realized gains or losses on each Fund’s Statement of Operations upon termination or maturity of the swap. A Fund also records net periodic payments paid or received on the swap contract as a realized gain or loss on the Statements of Operations.
Entering into swap agreements involves the risk that the maximum potential loss of an investment exceeds the current value of the investment as
33
NOTES TO FINANCIAL STATEMENTSASOF MARCH 31, 2009 (CONTINUED)
NOTE 2 — SIGNIFICANT ACCOUNTING POLICIES (continued)
reported on each Fund’s Statements of Assets and Liabilities. Other risks involve the possibility that the counterparty to the agreements may default on its obligation to perform, that there will be no liquid market for these investments and that unfavorable changes in the market will have a negative impact on the value of the index or securities underlying the respective swap agreement.
Credit Default Swap Contracts. A credit default swap is a bilateral agreement between counterparties in which the buyer of the protection agrees to make a stream of periodic payments to the seller of protection in exchange for the right to receive a specified return in the event of a default or other credit event for a referenced entity, obligation or index. As a seller of protection on credit default swaps, a Fund will generally receive from the buyer a fixed payment stream based on the notional amount of the swap contract. This fixed payment stream will continue until the swap contract expires or a defined credit event occurs.
A Fund is subject to credit risk in the normal course of pursuing its investment objectives. As a seller of protection in a credit default swap, a Fund may execute these contracts to manage its exposure to the market or certain sectors of the market. A Fund may also enter into credit default swaps to speculate on changes in an issuer’s credit quality, to take advantage of perceived spread advantages, or to offset an existing short equivalent (i.e. buying protection on an equivalent reference entity).
High Yield Bond and Intermediate Bond may sell credit default swaps which expose these Funds to the risk of loss from credit risk- related events specified in the contract. Although contract specific, credit events are generally defined as bankruptcy, failure to pay, restructuring, obligation acceleration, obligation default or repudiation/moratorium. If a Fund is a seller of protection, and a credit event occurs, as defined under the terms of that particular swap agreement, a Fund will generally either (i) pay to the buyer an amount equal to the notional amount of the swap and take delivery of the referenced obligation, other deliverable obligations, or underlying securities comprising a referenced index or (ii) pay a net settlement amount in the form of cash or securities equal to
the notional amount of the swap less the recovery value of the referenced obligation or underlying securities comprising a referenced index. If a Fund is a buyer of protection and a credit event occurs, as defined under the terms of that particular swap agreement, a Fund will either (i) receive from the seller of protection an amount equal to the notional amount of the swap and deliver the referenced obligation, other deliverable obligations or underlying securities comprising the referenced index or (ii) receive a net settlement amount in the form of cash or securities equal to the notional amount of the swap less the recovery value of the referenced obligation or underlying securities comprising the referenced index. Recovery values are assumed by market makers considering either industry standard recovery rates or entity specific factors and considerations until a credit event occurs. If a credit event has occurred, the recovery value is determined by a facilitated auction whereby a minimum number of allowable broker bids, together with a specified valuation method, are used to calculate the settlement value.
Implied credit spreads, represented in absolute terms, utilized in determining the market value of credit default swap agreements on corporate issues or sovereign issues are disclosed in each Fund’s Portfolio of Investment and serve as an indicator of the current status of the payment/performance risk and represent the likelihood or risk of default for the credit derivative. The implied credit spread of a particular referenced entity reflects the cost of buying/selling protection and may include upfront payments required to be made to enter into the agreement. For credit default swaps on asset-backed securities or credit indices, the quoted market prices and resulting market values serve as the indicator of the current status of the payment/performance risk. Wider credit spreads and increasing market values, in absolute terms when compared to the notional amount of the swap, represent a deterioration of the referenced entity’s credit soundness and a greater likelihood or risk of default or other credit event occurring as defined under the terms of the agreement.
The maximum amount of future payments (undiscounted) that a Fund as seller of protection could be required to make under a credit default swap agreement would be an amount equal to the notional amount of the agreement. Notional amounts of all credit default swap agreements
34
NOTES TO FINANCIAL STATEMENTSASOF MARCH 31, 2009 (CONTINUED)
NOTE 2 — SIGNIFICANT ACCOUNTING POLICIES (continued)
outstanding as of March 31, 2009, for which a Fund is seller of protection, are disclosed in each Fund’s Portfolio of Investments. These potential amounts would be partially offset by any recovery values of the respective referenced obligations, upfront payments received upon entering into the agreements, or net amounts received from the settlement of buy protection credit default swap agreements entered into by a Fund for the same referenced entity or entities.
| N. | Construction Loan Securities. GNMA Income may purchase construction loan securities, which are issued to finance building costs. The funds are disbursed as needed or in accordance with a prearranged plan. The securities provide for the timely payment to the registered holder of interest at the specified rate plus scheduled installments of principal. Upon completion of the construction phase, the construction loan securities are terminated and project loan securities are issued. It is GNMA Income’s policy to record these GNMA certificates on trade date, and to segregate assets to cover its commitments on trade date as well. |
| O. | Indemnifications. In the normal course of business, the Trust may enter into contracts that provide certain indemnifications. The Trust’s maximum exposure under these arrangements is dependent on future claims that may be made against the Funds and, therefore, cannot be estimated; however, based on experience, the risk of loss from such claims is considered remote. |
NOTE 3 — INVESTMENT TRANSACTIONS
For the year ended March 31, 2009, the cost of purchases and proceeds from the sales of securities excluding short-term and U.S. government securities, were as follows:
| | | | | | |
| | | Purchases | | Sales |
GNMA Income | | $ | — | | $ | 2,018,634 |
High Yield Bond | | | 68,492,975 | | | 73,807,165 |
Intermediate Bond | | | 539,074,530 | | | 635,548,835 |
U.S. government securities not included above were as follows:
| | | | | | |
| | | Purchases | | Sales |
GNMA Income | | $ | 413,157,054 | | $ | 244,643,804 |
High Yield Bond | | | 1,234,887 | | | 1,312,322 |
Intermediate Bond | | | 8,614,786,586 | | | 8,365,735,286 |
NOTE 4 — INVESTMENT MANAGEMENT AND ADMINISTRATIVE FEES
ING Investments, LLC (“ING Investments” or the ”Investment Adviser”), an Arizona limited liability company, serves as the investment adviser to the Funds. The Investment Adviser serves pursuant to an investment management agreement (“Management Agreement”) between the Investment Adviser and the Trust, on behalf of the Funds.
The Management Agreement compensates the Investment Adviser with a fee, computed daily and payable monthly, based on the average daily net assets of each Fund, at the following annual rates:
For GNMA Income — 0.47% on first $1 billion, 0.40% on next $4 billion and 0.35% on assets thereafter; for High Yield Bond — 0.51% on first $1 billion, 0.45% on next $4 billion and 0.40% on assets thereafter; for Intermediate Bond — 0.17%; for Classic Money Market — 0.25%; and for Institutional Money Market — 0.08%.
ING Investment Management Co. (“ING IM”), a Connecticut corporation, serves as the sub-adviser to the Funds. The Investment Adviser has entered into a sub-advisory agreement with ING IM. Subject to such policies as the Board or the Investment Adviser may determine, ING IM manages the Funds’ assets in accordance with the Funds’ investment objectives, policies, and limitations.
ING Funds are permitted to invest end-of-day cash balances into Institutional Money Market. Investment management fees paid by the Funds will be reduced by an amount equal to the management fees paid indirectly to Institutional Money Market with respect to assets invested by the Funds. For the year ended March 31, 2009, High Yield Bond and Intermediate Bond waived $2,051 and $90,295, respectively. These fees are not subject to recoupment.
ING Funds Services, LLC (“IFS”), acts as administrator and provides certain administrative and shareholder services necessary for Fund operations and is responsible for the supervision of other service providers. For its services, IFS is entitled to receive from each Fund, with the exception of Classic Money Market and Institutional Money Market, a fee at an annual rate of 0.10% of its average daily net assets.
ING Funds Distributor, LLC (the “Distributor” or “IFD”) is the principal underwriter of the Funds. The Distributor, IFS, ING Investments and ING IM are indirect, wholly-owned subsidiaries of ING Groep N.V.
35
NOTES TO FINANCIAL STATEMENTSASOF MARCH 31, 2009 (CONTINUED)
NOTE 4 — INVESTMENT MANAGEMENT AND ADMINISTRATIVE FEES (continued)
(“ING Groep”). ING Groep is a global financial institution of Dutch origin offering banking, investments, life insurance and retirement services.
On October 19, 2008, ING Groep announced that it reached an agreement with the Dutch government to strengthen its capital position. ING Groep will issue non-voting core Tier-1 securities for a total consideration of EUR 10 billion to the Dutch State. The transaction boosts ING Bank’s core Tier-1 ratio, strengthens the insurance balance sheet and reduces ING Groep’s Debt/Equity ratio.
NOTE 5 — DISTRIBUTION AND SERVICE FEES
Each share class of the Funds (except Class I and Class W and as otherwise noted below) has adopted a Distribution Plan pursuant to Rule 12b-1 under the 1940 Act and/or a Service Plan (the “Plans”), whereby the Distributor is reimbursed or compensated (depending on the class of shares) by certain of the Funds for expenses incurred in the distribution of each Fund’s shares (“Distribution Fees”). Pursuant to the Plans, the Distributor is entitled to payment each month for expenses incurred in the distribution and promotion of certain of each Fund’s shares, including expenses incurred in printing prospectuses and reports used for sales purposes, expenses incurred in preparing and printing sales literature and other such distribution related expenses, including any distribution or shareholder servicing fees (“Service Fees”) paid to securities dealers who have executed a distribution agreement with the Distributor. Under the Plans, each class of shares of the Fund pays the Distributor a Distribution and/or Service Fee based on average daily net assets at the following annual rates:
| | | | | | | | | | | | | | | | | | | | | |
| | | Class A | | | Class B | | | Class C | | | Class IS | | | Class O | | | Class Q | | | Class R | |
GNMA Income | | 0.25 | % | | 1.00 | % | | 1.00 | % | | N/A | | | N/A | | | 0.25 | % | | N/A | |
High Yield Bond | | 0.25 | % | | 1.00 | % | | 1.00 | % | | N/A | | | N/A | | | N/A | | | N/A | |
Intermediate Bond | | 0.25 | % | | 1.00 | % | | 1.00 | % | | N/A | | | 0.25 | % | | N/A | | | 0.50 | % |
Classic Money Market(1) | | 0.75 | % | | 1.00 | % | | 1.00 | % | | N/A | | | N/A | | | N/A | | | N/A | |
Institutional Money Market | | N/A | | | N/A | | | N/A | | | 0.10 | % | | N/A | | | N/A | | | N/A | |
(1) | The Distributor has contractually agreed to waive a portion of the distribution fee for Class A of Classic Money Market to the extent necessary for expenses not to exceed 0.77%. The fee waiver will continue through at least August 1, 2009. There is no guarantee that this waiver will continue after that date. |
IFD and ING Investments have contractually agreed to waive a portion of their distribution and/or shareholder servicing fees and advisory fees, as applicable, and to reimburse certain expenses to the extent necessary to
assist Classic Money Market and Institutional Money Market in maintaining a yield of not less than zero. There is no guarantee that Classic Money Market and Institutional Money Market will maintain such a yield. Management fees waived or expenses reimbursed are subject to possible recoupment by ING Investments, as applicable, within three years. In no event will the amount of the recoupment on any day exceed 20% of the yield (net of all expenses) of a Fund on that day. Distribution and Servicing fees waived are not subject to recoupment. For the year ended March 31, 2009, Classic Money Market waived $27,571 of Distribution and Servicing fees. This expense waiver or reimbursement may be discontinued at any time. Please note that these waivers or reimbursements are in addition to existing contractual expense limitations, if any.
The Distributor also receives the proceeds of the initial sales charge paid by shareholders upon the purchase of Class A shares of the Funds, and the contingent deferred sales charge paid by shareholders upon certain redemptions for Class A, Class B, and Class C shares. For the year ended March 31, 2009, the Distributor retained the following amounts in sales charges:
| | | | | | |
| | | Class A Shares | | Class C Shares |
Initial Sales Charges | | | | | | |
GNMA Income | | $ | 61,503 | | | N/A |
High Yield Bond | | | 6,280 | | | N/A |
Intermediate Bond | | | 9,906 | | | N/A |
Contingent Deferred Sales Charge | | | | | | |
GNMA Income | | | 6,222 | | $ | 8,189 |
High Yield Bond | | | 220 | | | 1,373 |
Intermediate Bond | | | 25,125 | | | 10,887 |
Classic Money Market | | | 12,497 | | | 5,126 |
NOTE 6 — OTHER TRANSACTIONS WITH AFFILIATES AND RELATED PARTIES
At March 31, 2009, the Funds had the following amounts recorded in payable to affiliates on the accompanying Statements of Assets and Liabilities (see Notes 4 and 5):
| | | | | | | | | | | | | | | |
Fund | | Accrued
Investment
Management
Fees | | Accrued
Administrative
Fees | | Accrued
Shareholder
Service and
Distribution
Fees | | Accrued
Recoupment | | Total |
GNMA Income | | $ | 294,155 | | $ | 62,586 | | $ | 215,522 | | $ | — | | $ | 572,263 |
High Yield Bond | | | 32,256 | | | 6,349 | | | 28,167 | | | — | | | 66,772 |
Intermediate Bond | | | 138,127 | | | 82,927 | | | 183,657 | | | 21,253 | | | 425,964 |
Classic Money Market | | | 295,185 | | | — | | | 481,589 | | | — | | | 776,774 |
Institutional Money Market | | | 78,445 | | | — | | | — | | | — | | | 78,445 |
At March 31, 2009, the following ING Portfolios or indirect, wholly-owned subsidiaries of ING Groep owned more than 5% of the following Funds:
36
NOTES TO FINANCIAL STATEMENTSASOF MARCH 31, 2009 (CONTINUED)
NOTE 6 — OTHER TRANSACTIONS WITH AFFILIATES AND RELATED PARTIES (continued)
ING Life Insurance & Annuity — GNMA Income (21.51%) and Intermediate Bond (20.41%).
ING National Trust — GNMA Income (7.92%) and Intermediate Bond (18.13%).
ING Russell Large Cap Index — Institutional Money Market (8.18%).
Control is defined by the 1940 Act as the beneficial ownership, either directly or through one or more controlled companies, of more than 25% of the voting securities of a company. The 1940 Act defines affiliates as companies that are under common control. Therefore, because the Funds have a common owner that owns over 25% of the outstanding securities of the Funds, they may be deemed to be affiliates of each other. Investment activities of these shareholders could have a material impact on the Funds.
The Trust has adopted a retirement policy under which any Trustee, who as of May 9, 2007, had served for at least five (5) years as an Independent Trustee shall be entitled to a retirement payment (“Retirement Benefit”) if such Trustee: (a) retires in accordance with the retirement policy; (b) dies; or (c) becomes disabled. The Retirement Benefit shall be made promptly to, as applicable, the Trustee or the Trustee’s estate, after such retirement, death or disability in an amount equal to two times the annual compensation payable to such Trustee, as in effect at the time of his or her retirement, death or disability. The annual compensation determination shall be based upon the annual Board membership retainer fee (but not any separate annual retainer fees for chairpersons of committees and of the Board). This amount shall be paid by the Trust or ING Funds on whose Board the Trustee was serving at the time of his or her retirement. The retiring Trustee may elect to receive payment of his or her benefit in a lump sum or in three substantially equal payments.
NOTE 7 — EXPENSE LIMITATIONS
Pursuant to a written expense limitation agreement (“Expense Limitation Agreement”) with the Funds, the Investment Adviser has agreed to limit expenses of each Fund, excluding interest, taxes, brokerage commissions and extraordinary expenses (and acquired fund fees and expenses) to the levels listed below:
| | | | | | | | | | | | | | | | | | | | | | | | |
Maximum Operating Expense Limit
(as a percentage of average net assets) | | | | | | | | | | | | | |
| | | Class A | | | Class B | | | Class C | | | Class I | | | Class O | | | Class Q | | | Class R | | | Class W | |
GNMA Income | | 0.97 | % | | 1.72 | % | | 1.72 | % | | 0.67 | % | | N/A | | | 0.92 | % | | N/A | | | 0.72 | % |
High Yield Bond | | 1.10 | % | | 1.85 | % | | 1.85 | % | | 0.85 | % | | N/A | | | N/A | | | N/A | | | N/A | |
Intermediate Bond | | 0.69 | % | | 1.44 | % | | 1.44 | % | | 0.38 | % | | 0.69 | % | | N/A | | | 0.94 | % | | 0.44 | % |
Classic Money Market | | 0.77 | % | | 1.41 | % | | 1.41 | % | | N/A | | | N/A | | | N/A | | | N/A | | | N/A | |
The Investment Adviser has agreed to limit expenses, excluding interest, taxes, brokerage commissions, and extraordinary expenses to 0.17% and 0.20% of Institutional Money Market’s Class I and Class IS shares’ average daily net assets, respectively.
The Investment Adviser may at a later date recoup from a Fund for management fees waived and other expenses assumed by the Investment Adviser during the previous 36 months, but only if, after such recoupment, a Fund’s expense ratio does not exceed the percentage described above. Waived and reimbursed fees net of any recoupment by the Investment Adviser of such waived and reimbursed fees are reflected on the accompanying Statements of Operations for each Fund. Amounts payable by the Investment Adviser are reflected on the accompanying Statements of Assets and Liabilities for each Fund.
As of March 31, 2009, the amounts of waived and reimbursed fees that are subject to possible recoupment by the Investment Adviser, and the related expiration dates are as follows:
| | | | | | | | | | | | |
| | | March 31, | | |
| | | 2010 | | 2011 | | 2012 | | Total |
High Yield Bond | | $ | 4,936 | | $ | 76,385 | | $ | 144,667 | | $ | 225,988 |
Intermediate Bond | | | 410,687 | | | 449,032 | | | 151,192 | | | 1,010,911 |
The Expense Limitation Agreement is contractual and shall renew automatically for one-year terms unless ING Investments or the Registrant provides written notice of the termination of the Expense Limitation Agreement within 90 days of the end of the then current term or upon termination of the Management Agreement.
NOTE 8 — LINE OF CREDIT
All of the Funds included in this report with the exception of GNMA Income, in addition to certain other funds managed by the Investment Adviser, have entered into an unsecured committed revolving line of credit agreement (the “Credit Agreement”) with The Bank of New York Mellon (“BNY”) for an aggregate amount of $125,000,000. The proceeds may be used only to: (1) temporarily finance the purchase and sale
37
NOTES TO FINANCIAL STATEMENTSASOF MARCH 31, 2009 (CONTINUED)
NOTE 8 — LINE OF CREDIT (continued)
of securities; (2) finance the redemption of shares of an investor in the Funds; and (3) enable the Funds to meet other emergency expenses as defined in the Credit Agreement. The Funds to which the line of credit is available pay a commitment fee equal to 0.07% per annum on the daily unused portion of the committed line amount payable quarterly in arrears.
The following Funds utilized the line of credit during the year ended March 31, 2009:
| | | | | | | | |
Fund | | Days
Utilized | | Approximate Average Daily Balance | | Approximate Weighted Average Interest Rate | |
High Yield Bond | | 48 | | $ | 1,269,792 | | 2.17 | % |
Intermediate Bond | | 3 | | | 5,220,000 | | 0.70 | |
Classic Money Market | | 3 | | | 8,950,000 | | 2.54 | |
NOTE 9 — CAPITAL SHARES
Transactions in capital shares and dollars were as follows:
| | | | | | | | | | | | | | | | | | | | | | |
| | | Shares
sold | | Reinvestment
of
distributions | | Shares
redeemed | | | Net increase
(decrease) in
shares
outstanding | | | | | Shares
sold | | Reinvestment
of
distributions | | Shares
redeemed | | | Net increase
(decrease) | |
Year or period ended | | # | | # | | # | | | # | | | | | ($) | | ($) | | ($) | | | ($) | |
GNMA Income | | | | | | | | | | | | | | | | | | | | | | |
Class A | | | | | | | | | | | | | | | | | | | | | | |
03-31-09 | | 24,540,147 | | 2,318,672 | | (17,617,729 | ) | | 9,241,090 | | | | | 208,874,722 | | 19,556,282 | | (149,072,103 | ) | | 79,358,901 | |
03-31-08 | | 13,295,384 | | 2,332,664 | | (16,975,900 | ) | | (1,347,852 | ) | | | | 111,307,657 | | 19,443,233 | | (141,608,970 | ) | | (10,858,080 | ) |
Class B | | | | | | | | | | | | | | | | | | | | | | |
03-31-09 | | 698,344 | | 126,419 | | (1,767,305 | ) | | (942,542 | ) | | | | 5,875,386 | | 1,060,402 | | (14,809,716 | ) | | (7,873,928 | ) |
03-31-08 | | 437,820 | | 152,403 | | (2,233,087 | ) | | (1,642,864 | ) | | | | 3,652,586 | | 1,263,888 | | (18,492,001 | ) | | (13,575,527 | ) |
Class C | | | | | | | | | | | | | | | | | | | | | | |
03-31-09 | | 5,923,049 | | 113,194 | | (1,853,276 | ) | | 4,182,967 | | | | | 50,307,172 | | 951,996 | | (15,713,864 | ) | | 35,545,304 | |
03-31-08 | | 1,367,117 | | 96,868 | | (1,689,895 | ) | | (225,910 | ) | | | | 11,389,473 | | 804,733 | | (14,019,238 | ) | | (1,825,032 | ) |
Class I | | | | | | | | | | | | | | | | | | | | | | |
03-31-09 | | 3,052,829 | | 134,249 | | (1,182,703 | ) | | 2,004,375 | | | | | 26,002,333 | | 1,135,414 | | (9,924,183 | ) | | 17,213,564 | |
03-31-08 | | 1,058,318 | | 89,754 | | (389,044 | ) | | 759,028 | | | | | 8,931,369 | | 749,949 | | (3,262,020 | ) | | 6,419,298 | |
Class Q | | | | | | | | | | | | | | | | | | | | | | |
03-31-09 | | — | | 228 | | — | | | 228 | | | | | — | | 1,934 | | — | | | 1,934 | |
03-31-08 | | — | | 258 | | (1,575 | ) | | (1,317 | ) | | | | — | | 2,156 | | (13,228 | ) | | (11,072 | ) |
Class W | | | | | | | | | | | | | | | | | | | | | | |
03-31-09 | | 496,469 | | 4,947 | | (22,532 | ) | | 478,884 | | | | | 4,251,564 | | 41,961 | | (194,092 | ) | | 4,099,433 | |
12-17-07(1) - 03-31-08 | | 121 | | — | | — | | | 121 | | | | | 1,012 | | — | | — | | | 1,012 | |
High Yield Bond | | | | | | | | | | | | | | | | | | | | | | |
Class A | | | | | | | | | | | | | | | | | | | | | | |
03-31-09 | | 4,828,513 | | 566,516 | | (5,220,798 | ) | | 174,231 | | | | | 28,824,466 | | 3,638,861 | | (31,164,101 | ) | | 1,299,226 | |
03-31-08 | | 1,957,940 | | 437,243 | | (3,432,085 | ) | | (1,036,902 | ) | | | | 16,868,207 | | 3,732,494 | | (29,522,311 | ) | | (8,921,610 | ) |
Class B | | | | | | | | | | | | | | | | | | | | | | |
03-31-09 | | 149,683 | | 137,581 | | (1,231,788 | ) | | (944,524 | ) | | | | 922,538 | | 901,293 | | (8,416,365 | ) | | (6,592,534 | ) |
03-31-08 | | 164,500 | | 146,217 | | (1,972,463 | ) | | (1,661,746 | ) | | | | 1,437,462 | | 1,249,800 | | (17,052,526 | ) | | (14,365,264 | ) |
Class C | | | | | | | | | | | | | | | | | | | | | | |
03-31-09 | | 560,134 | | 68,826 | �� | (609,149 | ) | | 19,811 | | | | | 3,598,162 | | 440,112 | | (3,601,411 | ) | | 436,863 | |
03-31-08 | | 163,499 | | 50,854 | | (670,400 | ) | | (456,047 | ) | | | | 1,410,576 | | 434,743 | | (5,744,536 | ) | | (3,899,217 | ) |
Class I | | | | | | | | | | | | | | | | | | | | | | |
07-31-08(1) - 03-31-09 | | 203,842 | | 1,368 | | (204,817 | ) | | 393 | | | | | 1,183,352 | | 7,858 | | (1,161,315 | ) | | 29,895 | |
(1) | | Commencement of operations. |
38
NOTES TO FINANCIAL STATEMENTSASOF MARCH 31, 2009 (CONTINUED)
NOTE 9 — CAPITAL SHARES (continued)
| | | | | | | | | | | | | | | | | | | | | | |
| | | Shares
sold | | Reinvestment
of
distributions | | Shares
redeemed | | | Net increase
(decrease) in
shares
outstanding | | | | | Shares
sold | | Reinvestment
of
distributions | | Shares
redeemed | | | Net increase
(decrease) | |
Year or period ended | | # | | # | | # | | | # | | | | | ($) | | ($) | | ($) | | | ($) | |
Intermediate Bond | | | | | | | | | | | | | | | | | | | | |
Class A | | | | | | | | | | | | | | | | | | | | | | |
03-31-09 | | 15,146,115 | | 3,961,253 | | (41,322,105 | ) | | (22,214,737 | ) | | | | 141,875,251 | | 35,618,498 | | (380,896,966 | ) | | (203,403,217 | ) |
03-31-08 | | 28,480,011 | | 2,585,103 | | (20,443,641 | ) | | 10,621,473 | | | | | 291,815,645 | | 26,419,666 | | (208,958,106 | ) | | 109,277,205 | |
Class B | | | | | | | | | | | | | | | | | | | | | | |
03-31-09 | | 266,381 | | 155,855 | | (1,625,408 | ) | | (1,203,172 | ) | | | | 2,456,380 | | 1,391,842 | | (15,080,030 | ) | | (11,231,808 | ) |
03-31-08 | | 667,018 | | 111,904 | | (1,621,452 | ) | | (842,530 | ) | | | | 6,838,389 | | 1,140,978 | | (16,510,460 | ) | | (8,531,093 | ) |
Class C | | | | | | | | | | | | | | | | | | | | | | |
03-31-09 | | 1,601,530 | | 286,562 | | (3,665,713 | ) | | (1,777,621 | ) | | | | 14,931,464 | | 2,557,931 | | (34,030,972 | ) | | (16,541,577 | ) |
03-31-08 | | 2,826,619 | | 162,165 | | (2,743,516 | ) | | 245,268 | | | | | 28,975,277 | | 1,655,216 | | (27,976,194 | ) | | 2,654,299 | |
Class I | | | | | | | | | | | | | | | | | | | | | | |
03-31-09 | | 23,450,514 | | 2,791,452 | | (17,367,453 | ) | | 8,874,513 | | | | | 225,576,561 | | 25,061,205 | | (160,967,306 | ) | | 89,670,460 | |
03-31-08 | | 11,692,938 | | 1,312,640 | | (4,367,322 | ) | | 8,638,256 | | | | | 119,958,808 | | 13,418,464 | | (44,696,824 | ) | | 88,680,448 | |
Class O | | | | | | | | | | | | | | | | | | | | | | |
03-31-09 | | 944,652 | | 172,137 | | (1,924,796 | ) | | (808,007 | ) | | | | 8,762,295 | | 1,621,392 | | (17,822,830 | ) | | (7,439,143 | ) |
03-31-08 | | 1,596,051 | | 222,259 | | (1,485,374 | ) | | 332,936 | | | | | 16,381,132 | | 2,272,058 | | (15,169,338 | ) | | 3,483,852 | |
Class R | | | | | | | | | | | | | | | | | | | | | | |
03-31-09 | | 1,078,910 | | 141,607 | | (682,391 | ) | | 538,126 | | | | | 10,164,328 | | 1,262,369 | | (6,297,544 | ) | | 5,129,153 | |
03-31-08 | | 1,277,986 | | 43,112 | | (211,711 | ) | | 1,109,387 | | | | | 13,062,349 | | 442,337 | | (2,171,893 | ) | | 11,332,793 | |
Class W | | | | | | | | | | | | | | | | | | | | | | |
03-31-09 | | 1,415,327 | | 41,872 | | (1,250,680 | ) | | 206,519 | | | | | 13,427,395 | | 372,532 | | (10,962,161 | ) | | 2,837,766 | |
12-17-07(1) - 03-31-08 | | 43,677 | | 62 | | — | | | 43,739 | | | | | 445,265 | | 621 | | — | | | 445,886 | |
Classic Money Market | | | | | | | | | | | | | | | | | | | | |
Class A | | | | | | | | | | | | | | | | | | | | | | |
03-31-09 | | 623,180,311 | | 19,717,074 | | (819,203,765 | ) | | (176,306,380 | ) | | | | 623,180,311 | | 19,717,074 | | (819,203,765 | ) | | (176,306,380 | ) |
03-31-08 | | 1,226,855,371 | | 47,138,864 | | (697,664,762 | ) | | 576,329,473 | | | | | 1,226,855,371 | | 47,138,864 | | (697,664,762 | ) | | 576,329,473 | |
Class B | | | | | | | | | | | | | | | | | | | | | | |
03-31-09 | | 15,722,793 | | 142,190 | | (19,520,708 | ) | | (3,655,725 | ) | | | | 15,722,793 | | 142,190 | | (19,520,708 | ) | | (3,655,725 | ) |
03-31-08 | | 15,206,372 | | 698,221 | | (19,445,930 | ) | | (3,541,337 | ) | | | | 15,206,372 | | 698,221 | | (19,445,930 | ) | | (3,541,337 | ) |
Class C | | | | | | | | | | | | | | | | | | | | | | |
03-31-09 | | 13,080,847 | | 103,904 | | (17,783,052 | ) | | (4,598,301 | ) | | | | 13,080,847 | | 103,904 | | (17,783,052 | ) | | (4,598,301 | ) |
03-31-08 | | 24,529,864 | | 298,495 | | (13,663,699 | ) | | 11,164,660 | | | | | 24,529,864 | | 298,495 | | (13,663,699 | ) | | 11,164,660 | |
Institutional Money Market | | | | | | | | | | | | | | | | | | |
Class I | | | | | | | | | | | | | | | | | | | | | | |
03-31-09 | | 15,924,743,767 | | 1,265,544 | | (15,522,218,060 | ) | | 403,791,251 | | | | | 15,924,743,767 | | 1,265,544 | | (15,522,218,060 | ) | | 403,791,251 | |
03-31-08 | | 12,985,910,058 | | 7,988,771 | | (12,917,901,065 | ) | | 75,997,764 | | | | | 12,985,910,058 | | 7,988,771 | | (12,917,901,065 | ) | | 75,997,764 | |
Class IS | | | | | | | | | | | | | | | | | | | | | | |
03-31-09 | | — | | — | | — | | | — | | | | | — | | — | | — | | | — | |
12-05-07(1) - 03-31-08 | | 1,001 | | — | | — | | | 1,001 | | | | | 1,001 | | — | | — | | | 1,001 | |
(1) | | Commencement of operations. |
39
NOTES TO FINANCIAL STATEMENTSASOF MARCH 31, 2009 (CONTINUED)
NOTE 10 — CREDIT RISK AND DEFAULTED SECURITIES
Although each Fund has a diversified portfolio, High Yield Bond and Intermediate Bond may invest in lower rated and comparable quality unrated high yield securities. Investments in high-yield debt securities generally provide greater income and increased opportunity for capital appreciation than investments in higher quality debt securities, but they also typically entail greater potential price volatility and principal and income risk. High-yield debt securities are not considered investment grade, and are regarded as predominantly speculative with respect to the issuing company’s continuing ability to meet principal and interest payments. The prices of high-yield debt securities have been found to be less sensitive to interest rate changes than higher-rated investments, but more sensitive to adverse economic downturns or individual corporate developments. The risk of loss due to default by the issuer may be significantly greater for the holders of high yielding securities, because such securities are generally unsecured and are often subordinated to other creditors of the issuer. High Yield Bond and Intermediate Bond held the following defaulted securities at March 31, 2009:
| | | | | |
Fund | | Security | | Market Value |
High Yield Bond | | Charter Communications Operating, LLC,
8.375%, due 04/30/14 | | $ | 1,177,050 |
Intermediate Bond | | Twin Reefs Pass-through Trust, 1.386%, due 12/10/49 | | | 2,295 |
| | Greater Ohio Ethanol, LLC,
6.301%, due 12/31/13 | | | — |
| | Greater Ohio Ethanol, LLC,
12.630%, due 12/31/13 | | | — |
During the period, Lehman Brothers Holdings, Inc. (“LBHI”) and certain of its affiliates sought protection under the insolvency laws of their jurisdictions of organization, including the United States, the United Kingdom and Japan. For the year ended March 31, 2009, High Yield Bond and Intermediate Bond had outstanding securities trades with counterparties affiliated with LBHI. As a result of these events, LBHI’s affiliates were unable to fulfill their commitments and, in certain cases, High Yield Bond and Intermediate Bond may have terminated their trades and related agreements with the relevant entities and, where appropriate, is in the process of initiating claims for damages. Management has determined that the financial impact to the Funds relating to these events is immaterial.
NOTE 11 — CONCENTRATION OF INVESTMENT RISKS
Corporate Debt Securities (High Yield Bond, Intermediate Bond and Classic Money Market). Corporate debt securities are subject to the risk of the issuer’s inability to meet principal and interest payments on the obligation and may also be subject to price volatility due to such factors as interest rate sensitivity, market perception of the creditworthiness of the issuer and general market liquidity. When interest rates decline, the value of the Fund’s debt securities can be expected to rise, and when interest rates rise, the value of those securities can be expected to decline. Debt securities with longer maturities tend to be more sensitive to interest rate movements than those with shorter maturities.
Credit Risk (All Funds). A Fund could lose money if a bond issuer (debtor) fails to repay interest and principal in a timely manner or if it goes bankrupt. This is especially true during periods of economic uncertainty or economic downturns. High-yield/high-risk bonds are especially subject to credit risk and are considered to be mostly speculative in nature.
Foreign Securities (High Yield Bond, Intermediate Bond, Classic Money Market and Institutional Money Market). There are certain risks in owning foreign securities, including those resulting from: fluctuations in currency exchange rates; devaluation of currencies; political or economic developments and the possible imposition of currency exchange blockages or other foreign governmental laws or restrictions; reduced availability of public information concerning issuers; accounting, auditing and financial reporting standards or other regulatory practices and requirements that are not uniform when compared to those applicable to domestic companies; settlement and clearance procedures in some countries that may not be reliable and can result in delays in settlement; higher transaction and custody expenses than for domestic securities; and limitations on foreign ownership of equity securities. Also, securities of many foreign companies may be less liquid and the prices more volatile than those of domestic companies.
Emerging Markets Investments (High Yield Bond). Because of less developed markets and economies and, in some countries, less mature governments and governmental institutions, the risks of investing in foreign securities can be intensified in the case of investments in issuers domiciled or doing substantial business in emerging market countries. These risks include: high concentration of market capitalization
40
NOTES TO FINANCIAL STATEMENTSASOF MARCH 31, 2009 (CONTINUED)
NOTE 11 — CONCENTRATION OF INVESTMENT RISKS
(continued)
and trading volume in a small number of issuers representing a limited number of industries, as well as a high concentration of investors and financial intermediaries; political and social uncertainties; overdependence on exports, especially with respect to primary commodities, making these economies vulnerable to changes in commodity prices; overburdened infrastructure and obsolete or unseasoned financial systems; environmental problems; less well-developed legal systems; and less reliable custodial services and settlement practices.
High-Yield, Lower-Grade Debt Securities Risk (High-Yield Bond and Intermediate Bond). High-yield debt securities (commonly referred to as “junk bonds”) generally present greater credit risk that an issuer cannot make timely payment of interest or principal payments than an issuer of a higher quality debt security, and typically have greater potential price volatility and principal and income risk. Changes in interest rates, the market’s perception of the issuers and the credit worthiness of the issuers may significantly affect the value of these bonds. High-yield bonds are not considered investment grade, and are regarded as predominantly speculative with respect to the issuing company’s continuing ability to meet principal and interest payments. The secondary market in which high-yield securities are traded may be less liquid than the market for higher grade bonds. It may be more difficult to value less liquid high-yield securities, and determination of their value may involve elements of judgment.
NOTE 12 — FEDERAL INCOME TAXES
The amount of distributions from net investment income and net realized capital gains are determined in accordance with federal income tax regulations, which
may differ from U.S. generally accepted accounting principles for investment companies. These book/tax differences may be either temporary or permanent. Permanent differences are reclassified within the capital accounts based on their federal tax-basis treatment; temporary differences are not reclassified. Key differences include the treatment of short-term capital gains, foreign currency transactions, and wash sale deferrals. Distributions in excess of net investment income and/or net realized capital gains for tax purposes are reported as return of capital.
The following permanent tax differences have been reclassified as of March 31, 2009:
| | | | | | | | | | | | |
| | | Paid-in Capital | | | Undistributed Net Investment Income | | | Accumulated Net Realized Gains / (Losses) | |
GNMA Income | | $ | — | | | $ | 1,398,380 | | | $ | (1,398,380 | ) |
High Yield Bond | | | (115,139,656 | ) | | | (1,098,399 | ) | | | 116,238,055 | |
Intermediate Bond | | | — | | | | 36,856,611 | | | | (36,856,611 | ) |
Classic Money Market | | | — | | | | 108,368 | | | | (108,368 | ) |
Dividends paid by the Funds from net investment income and distributions of net realized short-term capital gains are, for federal income tax purposes, taxable as ordinary income to shareholders.
The tax composition of dividends and distributions to shareholders was as follows:
| | | | | | | | | |
| | | Year Ended
March 31, 2009 | | Year Ended
March 31, 2008 |
| | | Ordinary Income | | Return of Capital | | Ordinary Income |
GNMA Income | | $ | 27,292,104 | | $ | — | | $ | 26,757,185 |
High Yield Bond | | | 7,603,995 | | | 1,886,801 | | | 10,627,218 |
Intermediate Bond | | | 86,837,693 | | | — | | | 56,231,038 |
Classic Money Market | | | 20,130,954 | | | — | | | 48,689,908 |
Institutional Money Market | | | 19,340,796 | | | — | | | 43,925,295 |
The tax-basis components of distributable earnings and the expiration dates of the capital loss carryforwards which may be used to offset future realized capital gains for federal income tax purposes as of March 31, 2009 were:
| | | | | | | | | | | | | | | |
| | | Undistributed Ordinary Income | | Unrealized Appreciation/ (Depreciation) | | Post-October Capital
Losses Deferred | | Capital Loss Carryforwards | | | Expiration Dates |
GNMA Income | | $ | 2,455,531 | | $ | 25,965,036 | | $ | — | | $ | (527,639 | ) | | 2010 |
| | | | | | | | | | | | (1,081,784 | ) | | 2012 |
| | | | | | | | | | | | (6,961,357 | ) | | 2013 |
| | | | | | | | | | | | (3,281,376 | ) | | 2014 |
| | | | | | | | | | | | (1,506,711 | ) | | 2016 |
| | | | | | | | | | | | (1,393,630 | ) | | 2017 |
| | | | | | | | | | | | | | | |
| | | | | | | | | | | $ | (14,752,497 | ) | | |
| | | | | | | | | | | | | | | |
41
NOTES TO FINANCIAL STATEMENTSASOF MARCH 31, 2009 (CONTINUED)
NOTE 12 — FEDERAL INCOME TAXES (continued)
| | | | | | | | | | | | | | | | | |
| | | Undistributed Ordinary Income | | Unrealized Appreciation/ (Depreciation) | | | Post-October Capital Losses Deferred | | | Capital Loss Carryforwards | | | Expiration Dates |
High Yield Bond | | $ | — | | $ | (24,131,755 | ) | | $ | (13,089,984 | ) | | $ | (79,792,137 | ) | | 2010 |
| | | | | | | | | | | | | | (69,190,309 | ) | | 2011 |
| | | | | | | | | | | | | | (6,099,584 | ) | | 2012 |
| | | | | | | | | | | | | | (126,079 | ) | | 2014 |
| | | | | | | | | | | | | | (16,938,959 | ) | | 2015 |
| | | | | | | | | | | | | | (9,006,267 | ) | | 2017 |
| | | | | | | | | | | | | | | | | |
| | | | | | | | | | | | | $ | (181,153,335 | ) | | |
| | | | | | | | | | | | | | | | | |
Intermediate Bond | | | 32,972,538 | | | (118,345,476 | ) | | | (161,080,561 | ) | | | (17,571,919 | ) | | 2017 |
Classic Money Market | | | 1,774,644 | | | — | | | | — | | | | — | | | — |
Institutional Money Market | | | 2,133,067 | | | — | | | | — | | | | — | | | — |
The Funds’ major tax jurisdictions are federal and Arizona. The earliest tax year that remains subject to examination by these jurisdictions is 2004.
Management has analyzed the Funds’ tax positions taken on federal income tax returns for all open tax years and has concluded that as of March 31, 2009, no provisions for income tax would be required in the Funds’ financial statements. The Funds’ federal and state income and federal excise tax returns for tax years for which the applicable statutes of limitations have not expired are subject to examination by the Internal Revenue Service and stated departments of revenue.
NOTE 13 — ILLIQUID SECURITIES
Pursuant to guidelines adopted by the Funds’ Board, the following securities have been deemed to be illiquid. Except for GNMA Income, the Funds may invest up to 15% (10% for Classic Money Market and Institutional Money Market) of their net assets in illiquid securities. Fair value for certain securities was determined by ING Funds Valuation Committee appointed by the Funds’ Board and in accordance with the methods specifically authorized by the Board.
| | | | | | | | | | | | | | | |
Fund | | Security | | Principal Amount/ Shares | | Initial Acquisition Date | | Cost | | Value | | Percent of Net Assets | |
High Yield Bond | | Comforce Corp. | | 92,950 | | 10/24/04 | | $ | — | | $ | 930 | | 0.0 | % |
| | Dayton Superior Corp. | | 3,100 | | 10/24/04 | | | — | | | 31 | | 0.0 | % |
| | North Atlantic Trading Co. | | 17,906 | | 10/24/04 | | | 210,181 | | | 18 | | 0.0 | % |
| | | | | | | | | | | | | | | |
| | | | | | | | $ | 210,181 | | $ | 979 | | 0.0 | % |
| | | | | | | | | | | | | | | |
Intermediate Bond | | Hudson Mezzanine Funding, 1.314%, due 06/12/42 | | 2,720,000 | | 12/21/06 | | | 2,717,824 | | | 1,360 | | 0.0 | % |
| | Nordea Kredit Realkreditaktieselskab,
6.000%, due 07/01/29 | | 27 | | 04/16/04 | | | 4 | | | 5 | | 0.0 | % |
| | | | | | | | | | | | | | | |
| | | | | | | | $ | 2,717,828 | | $ | 1,365 | | 0.0 | % |
| | | | | | | | | | | | | | | |
NOTE 14 — SECURITIES LENDING
Under an agreement with The Bank of New York Mellon (“BNY”), the Funds can lend their securities to approved brokers, dealers and other financial institutions. Loans are collateralized by cash and U.S. government securities. The collateral is equal to at least 105% of the market value of non-U.S. securities loaned and 102% of the market value of U.S. securities loaned when the transaction is entered into and is adjusted daily for changes in the market values of the securities on loan. The cash collateral received is invested in approved investments as defined in the Securities Lending Agreement with BNY (the “Agreement”). The Funds bear the risk of loss with respect to the investment of collateral. Currently, the cash collateral is invested in the Bank of New York Mellon Corp. Institutional Cash Reserves Fund (“BICR Fund”). BNY serves as investment manager, custodian and operational trustee of the BICR Fund. As of March 31, 2009, the BICR Fund held certain defaulted securities that had market values significantly below amortized cost. The investment in the BICR Fund is included in the Portfolio of Investments under Securities Lending Collateral and the unrealized loss on such investment is included in Net Unrealized Depreciation on the Statements of Assets
42
NOTES TO FINANCIAL STATEMENTSASOF MARCH 31, 2009 (CONTINUED)
and Liabilities. The Funds agreed, in principle, to the terms of capital support extended by The Bank of New York Mellon Corporation (“BNYC”), an affiliated company of BNY, for the certain defaulted securities held by the BICR Fund. BNYC will support the value of these securities up to a certain amount and subject, in part, to the Funds’ continued lending of securities. The recorded value of each Fund’s investment in the BICR Fund includes the value of the underlying securities held by the BICR Fund and the estimated value of the support to be provided by BNYC.
Generally, in the event of counterparty default, the Funds have the right to use the collateral to offset losses incurred. The Agreement contains certain guarantees by BNY in the event of counterparty default and/or a borrower’s failure to return a loaned security; however, there would be a potential loss to the Funds in the event the Funds are delayed or prevented from exercising their right to dispose of the collateral. Engaging in securities lending could have a leveraging effect, which may intensify the credit, market and other risks associated with investing in a Fund. At March 31, 2009, the following Funds had securities on loan with the following market values:
| | | | | | |
| | | Value of Securities Loaned | | Cash Collateral Received* |
Intermediate Bond | | $ | 4,978,777 | | $ | 5,088,021 |
| * | Cash collateral received was invested in the BICR Fund, the fair value of which is presented in the respective Fund’s Portfolio of Investments. |
NOTE 15 — U.S. TREASURY TEMPORARY GUARANTEE PROGRAM
The U.S. Treasury Department notified Classic Money Market and Institutional Money Market that they were accepted to participate in the U.S. Treasury Temporary Guarantee Program for Money Market Funds (the “Program”). The Program guarantees shareholders of Classic Money Market and Institutional Money Market the lesser of: (1) the number of shares owned on September 19, 2008 multiplied by $1.00; or (2) the number of shares owned as of the time the Treasury’s obligation under the Program is triggered multiplied by $1.00. The Treasury’s obligation under the Program is triggered if Classic Money Market’s or Institutional Money Market’s net asset value per share falls below $0.995 and certain conditions are met including the liquidation of Classic Money Market or Institutional Money Market.
Coverage under the Program is limited to persons who were shareholders of Classic Money Market or Institutional Money Market as of the close of business
on September 19, 2008. Any increase in the number of shares held in an account after the close of business on September 19, 2008 will not be guaranteed. If the number of shares held in an account fluctuates (even if the number of shares held in an account is reduced to zero), shareholders will be covered for the lesser of the number of shares held as of the close of business on September 19, 2008 or the number of shares held at the time the Treasury’s obligation under the Program is triggered. If a shareholder closes his/her account with Classic Money Market and Institutional Money Market or broker-dealer, any future investment in Classic Money Market and Institutional Money Market will not be guaranteed.
Classic Money Market and Institutional Money Market each paid to participate in the Program for the initial three-month period, which expired on December 18, 2008. The fee of $139,473 and $198,272 for Classic Money Market and Institutional Money Market, respectively, was 0.01% of each fund’s net asset value on September 19, 2008 depending on the market based net asset value per share of each fund as of September 19, 2008 (the “Program Participation Payment”). On November 24, 2008, the U.S. Treasury Department announced that it would extend its Program from December 19, 2008 through April 30, 2009. The Board has approved the continued participation of Classic Money Market and Institutional Money Market in the Program. Classic Money Market and Institutional Money Market paid to extend their participation in the Program through April 30, 2009. The fee of $209,068 and $297,408 for Classic Money Market and Institutional Money Market, respectively, to extend its participation was 0.015% of each fund’s net asset value on September 19, 2008. The Board has determined that the Program Participation Payment is an extraordinary expense that will not be subject to any expense limitation agreement currently in effect for the Fund.
NOTE 16 — OTHER ACCOUNTING PRONOUNCEMENTS
On March 19, 2008, the FASB issued Statement of Financial Accounting Standards No. 161 (“SFAS No. 161”), “Disclosure about Derivative Instruments and Hedging Activities.” This new accounting statement requires enhanced disclosures about an entity’s derivative and hedging activities. Entities are required to provide enhanced disclosures about (a) how and why an entity invests in derivatives, (b) how derivatives are accounted for under SFAS No. 133, and (c) how derivatives affect an entity’s financial position, financial performance, and cash flows. SFAS No. 161
43
NOTES TO FINANCIAL STATEMENTSASOF MARCH 31, 2009 (CONTINUED)
NOTE 16 — OTHER ACCOUNTING PRONOUNCEMENTS (continued)
also requires enhanced disclosures regarding credit-risk-related contingent features of derivative instruments. SFAS No. 161 is effective for financial statements issued for fiscal years and interim periods beginning after November 15, 2008. As of March 31, 2009, management of the Funds is currently assessing the impact of the expanded financial statement disclosures that will result from adopting SFAS No. 161.
NOTE 17 — INFORMATION REGARDING TRADING OF ING’s U.S. MUTUAL FUNDS
As discussed in earlier supplements that were previously filed with the SEC, ING Investments, the adviser to the ING Funds, has reported to the Boards of Directors/Trustees (the “Boards”) of the ING Funds that, like many U.S. financial services companies, ING Investments and certain of its U.S. affiliates have received informal and formal requests for information since September 2003 from various governmental and self-regulatory agencies in connection with investigations related to mutual funds and variable insurance products. ING Investments has advised the Boards that it and its affiliates have cooperated fully with each request.
In addition to responding to regulatory and governmental requests, ING Investments reported that management of U.S. affiliates of ING Groep N.V., including ING Investments (collectively, “ING”), on their own initiative, have conducted, through independent special counsel and a national accounting firm, an extensive internal review of trading in ING insurance, retirement, and mutual fund products. The goal of this review was to identify any instances of inappropriate trading in those products by third parties or by ING investment professionals and other ING personnel. ING’s internal review related to mutual fund trading is now substantially completed. ING has reported that, of the millions of customer relationships that ING maintains, the internal review identified several isolated arrangements allowing third parties to engage in frequent trading of mutual funds within ING’s variable insurance and mutual fund products, and identified other circumstances where frequent trading occurred, despite measures taken by ING intended to combat market timing. ING further reported that each of these arrangements has been terminated and fully disclosed to regulators. The results of the internal review were also reported to the independent members of the Boards.
ING Investments has advised the Boards that most of the identified arrangements were initiated prior to
ING’s acquisition of the businesses in question in the U.S. ING Investments further reported that the companies in question did not receive special benefits in return for any of these arrangements, which have all been terminated.
Based on the internal review, ING Investments has advised the Boards that the identified arrangements do not represent a systemic problem in any of the companies that were involved.
Despite the extensive internal review conducted through independent special counsel and a national accounting firm, there can be no assurance that the instances of inappropriate trading reported to the Boards are the only instances of such trading respecting the ING Funds.
ING Investments reported to the Boards that ING is committed to conducting its business with the highest standards of ethical conduct with zero tolerance for noncompliance. Accordingly, ING Investments advised the Boards that ING management was disappointed that its voluntary internal review identified these situations. Viewed in the context of the breadth and magnitude of its U.S. business as a whole, ING management does not believe that ING’s acquired companies had systemic ethical or compliance issues in these areas. Nonetheless, ING Investments reported that given ING’s refusal to tolerate any lapses, it has taken the steps noted below, and will continue to seek opportunities to further strengthen the internal controls of its affiliates.
| • | | ING has agreed with the ING Funds to indemnify and hold harmless the ING Funds from all damages resulting from wrongful conduct by ING or its employees or from ING’s internal investigation, any investigations conducted by any governmental or self-regulatory agencies, litigation or other formal proceedings, including any proceedings by the SEC. ING Investments reported to the Boards that the indemnification commitments made by ING Funds related to mutual fund trading have been settled and restitution amounts prepared by an independent consultant have been paid to the affected ING Funds. The net aggregate settlement amount received by High Yield Bond on December 17, 2008 was $78,353. |
| • | | ING updated its Code of Conduct for employees reinforcing its employees’ obligation to conduct personal trading activity consistent with the law, disclosed limits, and other requirements. |
44
NOTES TO FINANCIAL STATEMENTSASOF MARCH 31, 2009 (CONTINUED)
NOTE 17 — INFORMATION REGARDING TRADING OF ING’s U.S. MUTUAL FUNDS (continued)
Other Regulatory Matters
The New York Attorney General and other federal and state regulators are also conducting broad inquiries and investigations involving the insurance industry. These initiatives currently focus on, among other things, compensation and other sales incentives; potential conflicts of interest; potential anti-competitive activity; reinsurance; marketing practices (including suitability); specific product types (including group annuities and indexed annuities); fund selection for investment products and brokerage sales; and disclosure. It is likely that the scope of these industry investigations will further broaden before they conclude. ING has received formal and informal requests in connection with such investigations, and is cooperating fully with each request.
Other federal and state regulators could initiate similar actions in this or other areas of ING’s businesses. These regulatory initiatives may result in new legislation and regulation that could significantly affect the financial services industry, including businesses in which ING is engaged. In light of these and other developments, ING continuously reviews whether modifications to its business practices are appropriate. At this time, in light of the current regulatory factors, ING U.S. is actively engaged in reviewing whether any modifications in our practices are appropriate for the future.
There can be no assurance that these matters, or the adverse publicity associated with them, will not result in increased fund redemptions, reduced sale of fund shares, or other adverse consequences to ING Funds.
NOTE 18 — SUBSEQUENT EVENTS
Subsequent to March 31, 2009, the following Funds declared dividends and distributions of:
| | | | | | | | | |
| | | Type | | Per Share Amount | | Payable Date | | Record Date |
GNMA Income | | | | | | | | | |
Class A | | NII | | $ | 0.0300 | | April 3, 2009 | | March 31, 2009 |
Class B | | NII | | $ | 0.0245 | | April 3, 2009 | | March 31, 2009 |
Class C | | NII | | $ | 0.0250 | | April 3, 2009 | | March 31, 2009 |
Class I | | NII | | $ | 0.0320 | | April 3, 2009 | | March 31, 2009 |
Class Q | | NII | | $ | 0.0301 | | April 3, 2009 | | March 31, 2009 |
Class W | | NII | | $ | 0.0320 | | April 3, 2009 | | March 31, 2009 |
Class A | | NII | | $ | 0.0300 | | May 4, 2009 | | April 30, 2009 |
Class B | | NII | | $ | 0.0246 | | May 4, 2009 | | April 30, 2009 |
Class C | | NII | | $ | 0.0250 | | May 4, 2009 | | April 30, 2009 |
Class I | | NII | | $ | 0.0322 | | May 4, 2009 | | April 30, 2009 |
Class Q | | NII | | $ | 0.0304 | | May 4, 2009 | | April 30, 2009 |
Class W | | NII | | $ | 0.0322 | | May 4, 2009 | | April 30, 2009 |
| | | | | | | | | |
| | | Type | | Per Share Amount | | Payable Date | | Record Date |
High Yield Bond | | | | | | | | | |
Class A | | NII | | $ | 0.0486 | | May 1, 2009 | | Daily |
Class B | | NII | | $ | 0.0444 | | May 1, 2009 | | Daily |
Class C | | NII | | $ | 0.0446 | | May 1, 2009 | | Daily |
Class I | | NII | | $ | 0.0335 | | May 1, 2009 | | Daily |
Intermediate Bond | | | | | | | | | |
Class A | | NII | | $ | 0.0171 | | May 1, 2009 | | Daily |
Class B | | NII | | $ | 0.0121 | | May 1, 2009 | | Daily |
Class C | | NII | | $ | 0.0121 | | May 1, 2009 | | Daily |
Class I | | NII | | $ | 0.0195 | | May 1, 2009 | | Daily |
Class O | | NII | | $ | 0.0172 | | May 1, 2009 | | Daily |
Class R | | NII | | $ | 0.0150 | | May 1, 2009 | | Daily |
Class W | | NII | | $ | 0.0197 | | May 1, 2009 | | Daily |
Classic Money Market | | | | | | | | | |
All Classes | | STCG | | $ | 0.0015 | | April 8, 2009 | | April 3, 2009 |
Institutional Money Market | | | | | | | | | |
Class I | | NII | | $ | 0.0002 | | May 1, 2009 | | Daily |
Class IS | | NII | | $ | 0.0004 | | May 1, 2009 | | Daily |
All Classes | | STCG | | $ | 0.0015 | | April 8, 2009 | | April 3, 2009 |
NII — Net investment income
STCG — Short-term capital gain
Effective April 20, 2009, PNC Global Investment Servicing (U.S.) Inc. assumed all account servicing and record-keeping responsibilities for the Funds, replacing DST Systems, Inc. as the transfer agent.
On April 7, 2009, the Board approved the continued participation of Classic Money Market and Institutional Money Market in the second extension of the U.S. Department of the Treasury (the “Treasury”) Temporary Guarantee Program for Money Market Funds (the “Program”). The original termination date for the Program was December 18, 2008 which was extended to April 30, 2009. The second extension of the Program begins May 1, 2009 and continues until September 18, 2009.
45
| | |
| ING GNMA INCOME FUND | | PORTFOLIO OF INVESTMENTS ASOF MARCH 31, 2009 |
| | | | | | | | |
Principal
Amount | | | | | | Value |
| | | | | | | | |
| | U.S. GOVERNMENT AGENCY OBLIGATIONS: 99.4% |
| | Federal Home Loan Mortgage Corporation##: 0.2% |
| $ | 73,314 | | | | 7.000%, due 11/01/14 | | $ | 77,295 |
| | 291,597 | | | | 7.500%, due 12/01/14-01/01/30 | | | 309,434 |
| | 12,648 | | S | | 8.000%, due 01/01/30 | | | 13,822 |
| | 1,055,632 | | | | 9.000%, due 01/15/31 | | | 1,139,614 |
| | 35,759 | | | | 9.500%, due 07/01/20 | | | 39,951 |
| | | | | | | | |
| | | | | | | | 1,580,116 |
| | | | | | | | |
| | Federal National Mortgage Association##: 0.2% |
| | 414,685 | | | | 6.500%, due 02/01/29 | | | 443,164 |
| | 41,128 | | S | | 6.500%, due 06/01/14 | | | 43,259 |
| | 818,626 | | | | 6.600%, due 07/01/27-06/01/28 | | | 882,007 |
| | 50,146 | | | | 7.000%, due 03/01/15 | | | 52,286 |
| | 95,188 | | | | 7.500%, due 05/01/28 | | | 103,355 |
| | 116,686 | | | | 8.500%, due 08/01/11-09/01/15 | | | 129,879 |
| | | | | | | | |
| | | | | | | | 1,653,950 |
| | | | | | | | |
| | Government National Mortgage Association: 99.0% |
| | 4,297,451 | | | | 4.000%, due 05/20/33-08/20/35 | | | 4,300,100 |
| | 11,357,711 | | | | 4.500%, due 03/20/34-05/20/38 | | | 11,625,705 |
| | 8,414,426 | | W | | 4.500%, due 07/20/38 | | | 8,586,498 |
| | 1,724,535 | | | | 4.500%, due 01/20/34 | | | 1,762,844 |
| | 1,858,901 | | S | | 4.590%, due 12/15/38 | | | 1,839,670 |
| | 38,889,386 | | | | 5.000%, due 05/15/18-05/20/38 | | | 40,435,189 |
| | 3,407,686 | | | | 5.000%, due 06/20/38 | | | 3,513,113 |
| | 4,904,204 | | | | 5.000%, due 06/20/38 | | | 5,085,047 |
| | 2,654,481 | | | | 5.000%, due 06/20/38 | | | 2,716,697 |
| | 30,785,087 | | | | 5.000%, due 10/20/38-02/15/39 | | | 31,925,641 |
| | 15,000,000 | | W | | 5.000%, due 04/15/39 | | | 15,534,405 |
| | 33,757,286 | | | | 5.000%, due 02/15/24-03/15/39 | | | 35,146,101 |
| | 2,465,559 | | | | 5.250%, due 11/20/36-01/20/38 | | | 2,553,146 |
| | 330,063 | | | | 5.450%, due 02/15/29-10/15/29 | | | 345,937 |
| | 87,289,559 | | | | 5.500%, due 08/20/24-07/15/38 | | | 91,000,870 |
| | 822,630 | | | | 5.500%, due 09/20/38 | | | 850,137 |
| | 137,452,946 | | | | 5.500%, due 11/15/38-03/15/39 | | | 143,310,623 |
| | 320,677 | | | | 5.550%, due 06/15/27 | | | 335,757 |
| | 3,589,590 | | | | 5.600%, due 03/20/37-02/20/38 | | | 3,727,056 |
| | 9,787,165 | | | | 5.630%, due 07/15/45 | | | 9,934,094 |
| | 489,813 | | | | 5.680%, due 05/15/47 | | | 509,721 |
| | 494,260 | | | | 5.690%, due 11/15/42 | | | 513,202 |
| | 2,392,420 | | | | 5.750%, due 11/20/27-03/20/28 | | | 2,500,345 |
| | 5,631,723 | | | | 5.950%, due 02/15/44 | | | 5,681,001 |
| | 1,945,783 | | | | 5.970%, due 11/15/31 | | | 2,067,185 |
| | 79,069,324 | | | | 6.000%, due 10/15/15-03/15/39 | | | 82,712,088 |
| | 17,284,526 | | S | | 6.000%, due 07/20/34 | | | 18,057,173 |
| | 87,336,591 | | | | 6.000%, due 07/15/28-12/15/38 | | | 91,539,256 |
| | 530,050 | | | | 6.250%, due 03/15/28-09/15/29 | | | 561,460 |
| | 5,041,838 | | | | 6.250%, due 02/15/39 | | | 5,161,582 |
| | 702,603 | | | | 6.280%, due 01/20/26-05/20/26 | | | 747,638 |
| | 718,557 | | | | 6.490%, due 01/15/28 | | | 773,369 |
| | 35,387,156 | | | | 6.500%, due 08/15/28-12/20/38 | | | 37,245,278 |
| | 2,628,019 | | S | | 6.500%, due 09/20/34 | | | 2,763,118 |
| | 17,866,537 | | | | 6.500%, due 03/15/28-02/15/37 | | | 18,785,701 |
| | 3,235,493 | | | | 6.600%, due 10/20/26-07/20/28 | | | 3,427,094 |
| | 57,759 | | | | 6.750%, due 11/15/28 | | | 61,617 |
| | 4,426 | | S | | 6.750%, due 08/15/28 | | | 4,722 |
| | 309,283 | | | | 6.750%, due 10/15/28 | | | 329,942 |
| | 47,026,131 | | | | 7.000%, due 09/15/23-12/15/38 | | | 49,844,569 |
| | 6,412,691 | | | | 7.200%, due 03/15/39 | | | 6,996,371 |
| | 24,828 | | | | 7.250%, due 01/15/29 | | | 26,601 |
| | 4,073,364 | | | | 7.350%, due 03/15/43 | | | 4,458,863 |
| | 3,798,018 | | | | 7.500%, due 08/20/27-01/15/31 | | | 4,027,428 |
| | | | | | | | |
Principal
Amount | | | | | | Value |
| | | | | | | | |
| | Government National Mortgage Association: (continued) |
| $ | 24,353 | | | | 7.800%, due 05/15/19-07/15/19 | | $ | 26,159 |
| | 488,159 | | | | 8.000%, due 03/20/24-07/15/26 | | | 530,096 |
| | 34,289 | | | | 8.050%, due 07/15/19 | | | 36,881 |
| | 61,235 | | | | 9.000%, due 05/15/16-07/15/16 | | | 66,137 |
| | 8,546 | | | | 9.500%, due 11/15/21 | | | 9,370 |
| | | | | | | | |
| | | | | | | | 753,992,597 |
| | | | | | | | |
| | Other U.S. Agency Obligations: 0.0% |
| | 10,689 | | C | | Small Business Administration, 8.250%, due 11/01/11 | | | 10,904 |
| | | | | | | | |
| | | | | | | | 10,904 |
| | | | | | | | |
| | | | | Total U.S. Government Agency Obligations
(Cost $731,255,937) | | | 757,237,568 |
| | | | | | | | |
| | U.S. TREASURY OBLIGATIONS: 2.0% |
| | U.S. Treasury Notes: 2.0% |
| | 15,000,000 | | | | 0.875%, due 03/31/11 | | | 15,024,615 |
| | | | | | | | |
| | | | | Total U.S. Treasury Obligations
(Cost $15,018,725) | | | 15,024,615 |
| | | | | | | | |
| | | | | | | | | | | |
| | | | Total Investments in Securities
(Cost $746,274,660)* | | 101.4 | % | | $ | 772,262,182 | |
| | | | Other Assets and Liabilities - Net | | (1.4 | ) | | | (10,344,923 | ) |
| | | | | | | | | | | |
| | | | Net Assets | | 100.0 | % | | $ | 761,917,259 | |
| | | | | | | | | | | |
| C | Bond may be called prior to maturity date. |
| ## | On September 7, 2008, the Federal Housing Finance Agency placed the Federal National Mortgage Association and the Federal Home Loan Mortgage Corporation into conservatorship and the U.S. Treasury guaranteed the debt issued by those organizations. |
| W | Settlement is on a when-issued or delayed-delivery basis. |
| S | All or a portion of this security is segregated to cover collateral requirements for applicable futures, options, swaps, foreign forward currency contracts and/or when-issued or delayed-delivery securities. |
| * | Cost for federal income tax purposes is $746,297,146. |
| | | | |
Net unrealized appreciation consists of: | | | | |
Gross Unrealized Appreciation | | $ | 26,013,863 | |
Gross Unrealized Depreciation | | | (48,827 | ) |
| | | | |
Net Unrealized Appreciation | | $ | 25,965,036 | |
| | | | |
The following table summarizes the inputs used as of March 31, 2009 in determining the Fund’s investments at fair value for purposes of SFAS 157:
| | | | | | |
| | | Investments in
Securities | | Other Financial
Instruments* |
Level 1 — Quoted Prices | | $ | — | | $ | — |
Level 2 — Other Significant Observable Inputs | | | 754,339,652 | | | — |
Level 3 — Significant Unobservable Inputs | | | 17,922,530 | | | — |
| | | | | | |
Total | | $ | 772,262,182 | | $ | — |
| | | | | | |
See Accompanying Notes to Financial Statements
46
| | |
| ING GNMA INCOME FUND | | PORTFOLIO OF INVESTMENTS ASOF MARCH 31, 2009 (CONTINUED) |
“Fair value” for purposes of SFAS 157 is different from “fair value” as used in the 1940 Act. The former generally implies market value, and can include market quotations as a source of value, and the latter refers to determinations of value in absence of available market quotations.
| * | Other financial instruments may include forward foreign currency contracts, futures, swaps, and written options. Forward foreign currency contracts and futures are reported at their unrealized gain/loss at year end. Swaps and written options are reported at their market value at year end. |
A roll forward of fair value measurements using significant unobservable inputs (Level 3) for the year ended March 31, 2009 was as follows:
| | | | | | |
| | | Investments in
Securities | | Other Financial
Instruments* |
Beginning Balance at 03/31/08 | | $ | — | | $ | — |
Net Purchases/(Sales) | | | 12,191,722 | | | — |
Accrued Discounts/(Premiums) | | | 1,659 | | | — |
Total Realized Gain/(Loss) | | | 22,031 | | | — |
Total Unrealized Appreciation/(Depreciation) | | | 545,536 | | | — |
Net Transfers In/(Out) of Level 3 | | | 5,161,582 | | | — |
| | | | | | |
Ending Balance at 03/31/09 | | $ | 17,922,530 | | $ | — |
| | | | | | |
| * | Other financial instruments may include forward foreign currency contracts, futures, swaps, and written options. Forward foreign currency contracts and futures are reported at their unrealized gain/loss at year end. Swaps and written options are reported at their market value at year end. |
For the year ended March 31, 2009, total change in unrealized gain (loss) on Level 3 securities included in the change in net assets was $545,721. Total unrealized gain (loss) for all securities (including Level 1 and Level 2) can be found on the accompanying Statement of Operations.
See Accompanying Notes to Financial Statements
47
| | |
| ING HIGH YIELD BOND FUND | | PORTFOLIO OF INVESTMENTS ASOF MARCH 31, 2009 |
| | | | | | | | |
Principal
Amount | | | | | | Value |
| | | | | | | | |
| | CORPORATE BONDS/NOTES: 94.7% |
| | Advertising: 2.2% |
| $ | 310,000 | | #, C | | Lamar Media Corp.,
9.750%, due 04/01/14 | | $ | 303,413 |
| | 1,258,000 | | #, C | | R.H. Donnelley, Inc.,
11.750%, due 05/15/15 | | | 169,830 |
| | 455,000 | | C | | Visant Corp.,
7.625%, due 10/01/12 | | | 433,388 |
| | 905,000 | | C, ^ | | Visant Holding Corp.,
10.250%, due 12/01/13 | | | 846,175 |
| | | | | | | | |
| | | | | | | | 1,752,806 |
| | | | | | | | |
| | Aerospace/Defense: 0.4% |
| | 405,000 | | C | | BE Aerospace, Inc.,
8.500%, due 07/01/18 | | | 338,681 |
| | | | | | | | |
| | | | | | | | 338,681 |
| | | | | | | | |
| | Auto Parts & Equipment: 0.2% |
| | 355,000 | | C | | United Components, Inc.,
9.375%, due 06/15/13 | | | 140,225 |
| | | | | | | | |
| | | | | | | | 140,225 |
| | | | | | | | |
| | Banks: 3.1% |
| | 200,000 | | C, S | | BAC Capital Trust VI,
5.625%, due 03/08/35 | | | 85,524 |
| | 505,000 | | C | | Bank of America Corp.,
8.000%, due 12/29/49 | | | 202,470 |
| | 224,000 | | # | | General Motors Acceptance Corp., 6.750%, due 12/01/14 | | | 130,308 |
| | 2,564,000 | | #, S | | General Motors Acceptance Corp., 6.875%, due 09/15/11 | | | 1,822,942 |
| | 380,000 | | C | | SunTrust Capital VIII,
6.100%, due 12/15/36 | | | 213,522 |
| | | | | | | | |
| | | | | | | | 2,454,766 |
| | | | | | | | |
| | Beverages: 1.6% |
| | 790,000 | | C | | Constellation Brands, Inc.,
7.250%, due 05/15/17 | | | 754,450 |
| | 505,000 | | C | | Constellation Brands, Inc.,
8.375%, due 12/15/14 | | | 510,050 |
| | | | | | | | |
| | | | | | | | 1,264,500 |
| | | | | | | | |
| | Building Materials: 0.4% |
| | 65,000 | | C | | Interline Brands, Inc.,
8.125%, due 06/15/14 | | | 58,500 |
| | 620,000 | | C | | Nortek, Inc.,
10.000%, due 12/01/13 | | | 261,950 |
| | | | | | | | |
| | | | | | | | 320,450 |
| | | | | | | | |
| | Chemicals: 1.1% |
| | 670,000 | | C | | Hexion US Finance Corp./Hexion Nova Scotia Finance ULC, 9.750%, due 11/15/14 | | | 150,750 |
| | 875,000 | | C | | Huntsman International, LLC, 7.875%, due 11/15/14 | | | 363,125 |
| | 849,043 | | &, C | | Momentive Performance Materials, Inc.,
10.125%, due 12/01/14 | | | 169,809 |
| | 450,000 | | C | | PolyOne Corp.,
8.875%, due 05/01/12 | | | 198,000 |
| | | | | | | | |
| | | | | | | | 881,684 |
| | | | | | | | |
| | | | | | | | |
Principal
Amount | | | | | | Value |
| | | | | | | | |
| | Coal: 0.2% |
| $ | 540,000 | | @@, #, C | | Griffin Coal Mining Co. Pty Ltd., 9.500%, due 12/01/16 | | $ | 193,050 |
| | | | | | | | |
| | | | | | | | 193,050 |
| | | | | | | | |
| | Commercial Services: 3.4% |
| | 710,000 | | C, S | | Alion Science and Technology Corp., 10.250%, due 02/01/15 | | | 177,500 |
| | 660,000 | | C | | Aramark Services, Inc.,
8.500%, due 02/01/15 | | | 610,500 |
| | 560,000 | | #, C | | Cenveo Corp.,
10.500%, due 08/15/16 | | | 317,100 |
| | 845,000 | | C | | Ceridian Corp.,
11.250%, due 11/15/15 | | | 359,125 |
| | 770,000 | | &, C | | Ceridian Corp.,
12.250%, due 11/15/15 | | | 296,450 |
| | 575,000 | | C | | Iron Mountain, Inc.,
8.000%, due 06/15/20 | | | 537,625 |
| | 220,000 | | C | | Service Corp. International, 6.750%, due 04/01/15 | | | 194,700 |
| | 210,000 | | C | | Service Corp. International, 7.000%, due 06/15/17 | | | 179,550 |
| | | | | | | | |
| | | | | | | | 2,672,550 |
| | | | | | | | |
| | Computers: 0.8% |
| | 175,000 | | @@, C | | Seagate Technology, Inc., 6.800%, due 10/01/16 | | | 102,375 |
| | 649,000 | | C | | Sungard Data Systems, Inc., 9.125%, due 08/15/13 | | | 567,875 |
| | | | | | | | |
| | | | | | | | 670,250 |
| | | | | | | | |
| | Distribution/Wholesale: 0.4% |
| | 535,000 | | C | | KAR Holdings, Inc.,
8.750%, due 05/01/14 | | | 286,225 |
| | | | | | | | |
| | | | | | | | 286,225 |
| | | | | | | | |
| | Diversified Financial Services: 5.1% |
| | 780,000 | | #, C | | Buffalo Thunder Development Authority,
9.375%, due 12/15/14 | | | 50,700 |
| | 455,000 | | S | | Ford Motor Credit Co., LLC, 4.010%, due 01/13/12 | | | 287,219 |
| | 1,030,000 | | | | Ford Motor Credit Co., LLC, 5.544%, due 04/15/09 | | | 1,018,919 |
| | 1,100,000 | | | | Ford Motor Credit Co., LLC, 7.250%, due 10/25/11 | | | 783,564 |
| | 625,000 | | | | Ford Motor Credit Co., LLC, 7.800%, due 06/01/12 | | | 423,844 |
| | 700,000 | | | | Ford Motor Credit Co., LLC, 9.875%, due 08/10/11 | | | 530,132 |
| | 980,000 | | &, #, C | | Local TV Finance, LLC,
9.250%, due 06/15/15 | | | 102,900 |
| | 280,000 | | | | SLM Corp.,
1.299%, due 07/27/09 | | | 269,792 |
| | 950,000 | | C | | Universal City Florida Holding Co. I/II,
5.920%, due 05/01/10 | | | 337,250 |
| | 610,000 | | #, C | | USB Realty Corp.,
6.091%, due 12/22/49 | | | 231,935 |
| | | | | | | | |
| | | | | | | | 4,036,255 |
| | | | | | | | |
See Accompanying Notes to Financial Statements
48
| | |
| ING HIGH YIELD BOND FUND | | PORTFOLIO OF INVESTMENTS ASOF MARCH 31, 2009 (CONTINUED) |
| | | | | | | | |
Principal
Amount | | | | | | Value |
| | | | | | | | |
| | Electric: 6.9% |
| $ | 610,000 | | C | | AES Corp.,
8.000%, due 10/15/17 | | $ | 526,125 |
| | 574,000 | | #, C | | AES Corp.,
8.750%, due 05/15/13 | | | 568,260 |
| | 180,000 | | #, C | | AES Corp.,
9.750%, due 04/15/16 | | | 170,100 |
| | 715,000 | | C | | Edison Mission Energy,
7.000%, due 05/15/17 | | | 525,525 |
| | 1,585,000 | | C, S | | Energy Future Holdings, 10.875%, due 11/01/17 | | | 1,030,250 |
| | 702,625 | | C | | Homer City Funding, LLC, 8.734%, due 10/01/26 | | | 572,639 |
| | 43,812 | | C | | Midwest Generation, LLC, 8.300%, due 07/02/09 | | | 43,155 |
| | 371,486 | | C | | Midwest Generation, LLC, 8.560%, due 01/02/16 | | | 334,338 |
| | 395,000 | | C | | Mirant North America, LLC, 7.375%, due 12/31/13 | | | 359,450 |
| | 910,000 | | C | | NRG Energy, Inc.,
7.375%, due 02/01/16 | | | 848,575 |
| | 560,000 | | C | | Reliant Energy, Inc.,
7.875%, due 06/15/17 | | | 445,200 |
| | | | | | | | |
| | | | | | | | 5,423,617 |
| | | | | | | | |
| | Electronics: 0.2% |
| | 135,000 | | @@, C | | Flextronics International Ltd., 6.500%, due 05/15/13 | | | 120,825 |
| | | | | | | | |
| | | | | | | | 120,825 |
| | | | | | | | |
| | Entertainment: 2.6% |
| | 825,000 | | C, S | | AMC Entertainment, Inc., 11.000%, due 02/01/16 | | | 754,875 |
| | 315,000 | | +, C | | Marquee Holdings, Inc.,
0.000% (step rate 9.505%), due 08/15/14 | | | 222,075 |
| | 435,000 | | #, C | | Mashantucket Western Pequot Tribe, 8.500%, due 11/15/15 | | | 76,125 |
| | 485,000 | | C | | Pinnacle Entertainment, Inc., 8.250%, due 03/15/12 | | | 426,800 |
| | 395,000 | | #, C | | Scientific Games Corp.,
7.875%, due 06/15/16 | | | 343,650 |
| | 255,000 | | #, C | | Shingle Springs Tribal Gaming Authority,
9.375%, due 06/15/15 | | | 107,100 |
| | 500,000 | | #, C | | Snoqualmie Entertainment Authority,
9.125%, due 02/01/15 | | | 132,500 |
| | | | | | | | |
| | | | | | | | 2,063,125 |
| | | | | | | | |
| | Environmental Control: 2.1% |
| | 460,000 | | C | | Allied Waste North America, Inc., 7.250%, due 03/15/15 | | | 435,212 |
| | 780,000 | | C | | Waste Services, Inc.,
9.500%, due 04/15/14 | | | 590,850 |
| | 865,000 | | C | | WCA Waste Corp.,
9.250%, due 06/15/14 | | | 637,938 |
| | | | | | | | |
| | | | | | | | 1,664,000 |
| | | | | | | | |
| | Food: 3.1% |
| | 340,000 | | C | | Dean Foods Co.,
7.000%, due 06/01/16 | | | 324,700 |
| | 795,000 | | | | Smithfield Foods, Inc.,
7.750%, due 07/01/17 | | | 496,875 |
| | | | | | | | |
Principal
Amount | | | | | | Value |
| | | | | | | | |
| | Food: (continued) |
| $ | 100,000 | | C | | Stater Brothers Holdings, 7.750%, due 04/15/15 | | $ | 96,500 |
| | 465,000 | | C | | Stater Brothers Holdings, 8.125%, due 06/15/12 | | | 460,350 |
| | 450,000 | | C | | Supervalu, Inc.,
7.500%, due 11/15/14 | | | 441,563 |
| | 595,000 | | #, C | | Tyson Foods, Inc.,
10.500%, due 03/01/14 | | | 609,875 |
| | | | | | | | |
| | | | | | | | 2,429,863 |
| | | | | | | | |
| | Forest Products & Paper: 1.9% |
| | 380,000 | | C | | Domtar Corp.,
5.375%, due 12/01/13 | | | 256,500 |
| | 565,000 | | C | | Domtar Corp.,
7.875%, due 10/15/11 | | | 460,475 |
| | 140,000 | | #, C | | Georgia-Pacific Corp.,
7.000%, due 01/15/15 | | | 131,600 |
| | 350,000 | | #, C | | Georgia-Pacific Corp.,
7.125%, due 01/15/17 | | | 325,500 |
| | 500,000 | | C | | NewPage Corp.,
12.000%, due 05/01/13 | | | 107,500 |
| | 145,000 | | C | | Verso Paper Holdings, LLC and Verson Paper, Inc.,
4.920%, due 08/01/14 | | | 42,775 |
| | 380,000 | | C | | Verso Paper Holdings, LLC and Verson Paper, Inc.,
9.125%, due 08/01/14 | | | 144,400 |
| | | | | | | | |
| | | | | | | | 1,468,750 |
| | | | | | | | |
| | Healthcare - Products: 2.4% |
| | 150,000 | | #, C | | Bausch & Lomb, Inc.,
9.875%, due 11/01/15 | | | 119,625 |
| | 525,000 | | &, C | | Biomet, Inc.,
10.375%, due 10/15/17 | | | 446,250 |
| | 673,000 | | C | | Biomet, Inc.,
11.625%, due 10/15/17 | | | 597,288 |
| | 150,000 | | C | | Boston Scientific Corp.,
5.450%, due 06/15/14 | | | 138,000 |
| | 625,000 | | C | | Boston Scientific Corp.,
6.250%, due 11/15/15 | | | 582,813 |
| | | | | | | | |
| | | | | | | | 1,883,976 |
| | | | | | | | |
| | Healthcare - Services: 8.0% |
| | 480,000 | | C | | Centene Corp.,
7.250%, due 04/01/14 | | | 427,200 |
| | 450,000 | | C | | Community Health Systems, Inc., 8.875%, due 07/15/15 | | | 427,500 |
| | 895,000 | | C | | DaVita, Inc.,
7.250%, due 03/15/15 | | | 864,794 |
| | 395,000 | | C | | HCA, Inc.,
7.875%, due 02/01/11 | | | 384,138 |
| | 280,000 | | C | | HCA, Inc.,
8.750%, due 09/01/10 | | | 280,000 |
| | 920,000 | | C | | HCA, Inc.,
9.250%, due 11/15/16 | | | 839,500 |
| | 930,000 | | &, C, S | | HCA, Inc.,
9.625%, due 11/15/16 | | | 744,000 |
| | 830,000 | | C | | Psychiatric Solutions, Inc., 7.750%, due 07/15/15 | | | 753,225 |
| | 905,000 | | C | | Select Medical Corp.,
7.625%, due 02/01/15 | | | 590,513 |
| | 325,000 | | C | | Select Medical Corp.,
7.654%, due 09/15/15 | | | 175,500 |
See Accompanying Notes to Financial Statements
49
| | |
| ING HIGH YIELD BOND FUND | | PORTFOLIO OF INVESTMENTS ASOF MARCH 31, 2009 (CONTINUED) |
| | | | | | | | |
Principal
Amount | | | | | | Value |
| | | | | | | | |
| | Healthcare - Services: (continued) |
| $ | 95,000 | | C | | Sun Healthcare Group, Inc., 9.125%, due 04/15/15 | | $ | 89,300 |
| | 220,000 | | C | | United Surgical Partners International, Inc.,
8.875%, due 05/01/17 | | | 171,600 |
| | 300,000 | | &, C | | United Surgical Partners International, Inc.,
9.250%, due 05/01/17 | | | 208,500 |
| | 420,000 | | C | | Vanguard Health Holding Co. II, LLC, 9.000%, due 10/01/14 | | | 372,750 |
| | | | | | | | |
| | | | | | | | 6,328,520 |
| | | | | | | | |
| | Holding Companies - Diversified: 0.8% |
| | 750,000 | | C | | Atlantic Broadband Finance, LLC, 9.375%, due 01/15/14 | | | 596,250 |
| | | | | | | | |
| | | | | | | | 596,250 |
| | | | | | | | |
| | Home Builders: 1.5% |
| | 130,000 | | C | | D.R. Horton, Inc.,
4.875%, due 01/15/10 | | | 127,075 |
| | 265,000 | | C | | D.R. Horton, Inc.,
6.000%, due 04/15/11 | | | 246,450 |
| | 115,000 | | | | D.R. Horton, Inc.,
7.875%, due 08/15/11 | | | 110,400 |
| | 585,000 | | C | | KB Home,
6.375%, due 08/15/11 | | | 529,425 |
| | 165,000 | | C | | Toll Corp.,
8.250%, due 12/01/11 | | | 160,875 |
| | | | | | | | |
| | | | | | | | 1,174,225 |
| | | | | | | | |
| | Home Furnishings: 0.5% |
| | 445,000 | | C | | Norcraft Cos. LP,
9.000%, due 11/01/11 | | | 380,475 |
| | | | | | | | |
| | | | | | | | 380,475 |
| | | | | | | | |
| | Household Products/Wares: 1.0% |
| | 525,000 | | #, C | | American Achievement Corp., 8.250%, due 04/01/12 | | | 383,250 |
| | 500,000 | | C | | Jarden Corp.,
7.500%, due 05/01/17 | | | 405,000 |
| | | | | | | | |
| | | | | | | | 788,250 |
| | | | | | | | |
| | Iron/Steel: 0.1% |
| | 267,073 | | &, C | | Metals USA Holdings Corp., 7.208%, due 07/01/12 | | | 64,098 |
| | | | | | | | |
| | | | | | | | 64,098 |
| | | | | | | | |
| | Leisure Time: 0.3% |
| | 740,000 | | C | | Travelport, LLC,
11.875%, due 09/01/16 | | | 222,000 |
| | | | | | | | |
| | | | | | | | 222,000 |
| | | | | | | | |
| | Lodging: 1.0% |
| | 155,001 | | #, C, S | | Harrah’s Operating Co., Inc., 10.000%, due 12/15/18 | | | 47,275 |
| | 678,000 | | C | | Harrah’s Operating Co., Inc., 10.750%, due 02/01/16 | | | 132,210 |
| | 645,000 | | C | | MGM Mirage,
7.500%, due 06/01/16 | | | 228,975 |
| | 185,000 | | C | | MGM Mirage,
7.625%, due 01/15/17 | | | 66,600 |
| | | | | | | | |
Principal
Amount | | | | | | Value |
| | | | | | | | |
| | Lodging: (continued) |
| $ | 675,000 | | C | | MGM Mirage,
8.500%, due 09/15/10 | | $ | 280,125 |
| | | | | | | | |
| | | | | | | | 755,185 |
| | | | | | | | |
| | Media: 11.1% |
| | 29,683 | | &, #, C | | American Media Operations, Inc., 9.000%, due 05/01/13 | | | 15,027 |
| | 306,110 | | &, #, C | | American Media Operations, Inc.,
14.000%, due 11/01/13 | | | 154,968 |
| | 510,000 | | C | | Cablevision Systems Corp., 8.000%, due 04/15/12 | | | 498,525 |
| | 1,330,000 | | #, ±, C, S | | Charter Communications Operating, LLC, 8.375%,
due 04/30/14 | | | 1,177,050 |
| | 455,000 | | #, C | | COX Communications, Inc., 6.250%, due 06/01/18 | | | 404,870 |
| | 360,000 | | C | | CSC Holdings, Inc.,
6.750%, due 04/15/12 | | | 348,300 |
| | 90,000 | | | | CSC Holdings, Inc.,
7.625%, due 07/15/18 | | | 81,450 |
| | 100,000 | | S | | CSC Holdings, Inc.,
7.875%, due 02/15/18 | | | 92,000 |
| | 630,000 | | #, C | | CSC Holdings, Inc.,
8.500%, due 04/15/14 | | | 623,700 |
| | 1,846,000 | | C | | Dex Media West, LLC, 9.875%, due 08/15/13 | | | 373,815 |
| | 885,000 | | C | | DirecTV Holdings, LLC, 7.625%, due 05/15/16 | | | 871,725 |
| | 710,000 | | C | | Echostar DBS Corp.,
6.375%, due 10/01/11 | | | 686,925 |
| | 420,000 | | C | | Echostar DBS Corp.,
6.625%, due 10/01/14 | | | 376,950 |
| | 568,965 | | &, #, C | | ION Media Networks, Inc., 7.344%, due 01/15/13 | | | 6,543 |
| | 960,000 | | C | | Mediacom Broadband, LLC, 8.500%, due 10/15/15 | | | 868,800 |
| | 479,386 | | C, ^ | | Nexstar Finance Holdings, LLC,
11.375%, due 04/01/13 | | | 174,976 |
| | 1,062,820 | | C | | Nexstar Finance, Inc.,
7.000%, due 01/15/14 | | | 463,647 |
| | 1,365,000 | | +, C | | Nielsen Finance LLC/Nielsen Finance Co.,
0.000% (step rate 12.500%), due 08/01/16 | | | 573,300 |
| | 235,000 | | C | | Nielsen Finance LLC/Nielsen Finance Co.,
10.000%, due 08/01/14 | | | 203,275 |
| | 140,000 | | #, C | | Nielsen Finance LLC/Nielsen Finance Co.,
11.625%, due 02/01/14 | | | 126,875 |
| | 950,000 | | C | | Radio One, Inc.,
6.375%, due 02/15/13 | | | 209,000 |
| | 365,000 | | #, C | | Rainbow National Services, LLC, 8.750%, due 09/01/12 | | | 366,825 |
| | 55,000 | | @@, #, C | | Videotron Ltd.,
9.125%, due 04/15/18 | | | 56,169 |
| | | | | | | | |
| | | | | | | | 8,754,715 |
| | | | | | | | |
See Accompanying Notes to Financial Statements
50
| | |
| ING HIGH YIELD BOND FUND | | PORTFOLIO OF INVESTMENTS ASOF MARCH 31, 2009 (CONTINUED) |
| | | | | | | | |
Principal
Amount | | | | | | Value |
| | | | | | | | |
| | Miscellaneous Manufacturing: 0.5% |
| $ | 415,000 | | C | | Harland Clarke Holdings Corp., 5.984%, due 05/15/15 | | $ | 147,325 |
| | 540,000 | | C | | Harland Clarke Holdings Corp., 9.500%, due 05/15/15 | | | 240,975 |
| | | | | | | | |
| | | | | | | | 388,300 |
| | | | | | | | |
| | Oil & Gas: 7.1% |
| | 505,000 | | #, C | | Atlas Energy Resources LLC, 10.750%, due 02/01/18 | | | 371,175 |
| | 595,000 | | C | | Berry Petroleum Co.,
8.250%, due 11/01/16 | | | 330,225 |
| | 635,000 | | C | | Chaparral Energy, Inc.,
8.875%, due 02/01/17 | | | 222,250 |
| | 1,200,000 | | C, S | | Chesapeake Energy Corp., 6.625%, due 01/15/16 | | | 1,005,000 |
| | 155,000 | | C, S | | Chesapeake Energy Corp., 6.875%, due 01/15/16 | | | 130,975 |
| | 345,000 | | | | Chesapeake Energy Corp., 9.500%, due 02/15/15 | | | 337,238 |
| | 405,000 | | C | | Denbury Resources, Inc., 7.500%, due 12/15/15 | | | 354,375 |
| | 565,000 | | #, C | | Forest Oil Corp.,
7.250%, due 06/15/19 | | | 449,175 |
| | 405,000 | | C | | McMoRan Exploration Co., 11.875%, due 11/15/14 | | | 281,475 |
| | 470,000 | | C | | Newfield Exploration Co., 7.125%, due 05/15/18 | | | 418,300 |
| | 575,000 | | @@, C | | OPTI Canada, Inc.,
8.250%, due 12/15/14 | | | 260,188 |
| | 710,000 | | C | | PetroHawk Energy Corp., 9.125%, due 07/15/13 | | | 685,150 |
| | 135,000 | | #, C | | PetroHawk Energy Corp., 10.500%, due 08/01/14 | | | 135,000 |
| | 730,000 | | C | | Plains Exploration & Production Co., 7.625%, due 06/01/18 | | | 594,950 |
| | | | | | | | |
| | | | | | | | 5,575,476 |
| | | | | | | | |
| | Packaging & Containers: 0.4% |
| | 80,000 | | C | | Graham Packaging Co., Inc., 8.500%, due 10/15/12 | | | 61,800 |
| | 400,000 | | #, C | | Plastipak Holdings, Inc.,
8.500%, due 12/15/15 | | | 282,000 |
| | | | | | | | |
| | | | | | | | 343,800 |
| | | | | | | | |
| | Pharmaceuticals: 0.8% |
| | 195,000 | | C | | Omnicare, Inc.,
6.125%, due 06/01/13 | | | 175,988 |
| | 125,000 | | C | | Omnicare, Inc.,
6.750%, due 12/15/13 | | | 114,063 |
| | 355,000 | | C | | Omnicare, Inc.,
6.875%, due 12/15/15 | | | 319,500 |
| | | | | | | | |
| | | | | | | | 609,551 |
| | | | | | | | |
| | Pipelines: 2.5% |
| | 500,000 | | C | | El Paso Corp.,
7.000%, due 06/15/17 | | | 428,341 |
| | 875,000 | | C | | El Paso Corp.,
7.250%, due 06/01/18 | | | 748,125 |
| | 725,000 | | @@, C | | Kinder Morgan Finance Co. ULC, 5.700%, due 01/05/16 | | | 612,625 |
| | | | | | | | |
Principal
Amount | | | | | | Value |
| | | | | | | | |
| | Pipelines: (continued) |
| $ | 185,000 | | # | | Williams Companies, Inc., 8.750%, due 01/15/20 | | $ | 184,392 |
| | | | | | | | |
| | | | | | | | 1,973,483 |
| | | | | | | | |
| | Retail: 2.7% |
| | 770,000 | | C | | Albertson’s, Inc.,
7.450%, due 08/01/29 | | | 642,950 |
| | 298,000 | | C | | Albertson’s, Inc.,
7.500%, due 02/15/11 | | | 296,883 |
| | 785,000 | | C | | Bon-Ton Stores, Inc.,
10.250%, due 03/15/14 | | | 137,375 |
| | 615,000 | | C | | GSC Holdings Corp.,
8.000%, due 10/01/12 | | | 624,225 |
| | 440,000 | | C | | Sally Holdings, LLC,
9.250%, due 11/15/14 | | | 419,100 |
| | | | | | | | |
| | | | | | | | 2,120,533 |
| | | | | | | | |
| | Telecommunications: 18.3% |
| | 396,000 | | C | | Centennial Cellular Communications Corp., 8.125%, due 02/01/14 | | | 409,860 |
| | 717,000 | | C | | Centennial Cellular Operating Co.,
10.125%, due 06/15/13 | | | 745,680 |
| | 340,000 | | C | | Centennial Communications Corp.,
10.000%, due 01/01/13 | | | 362,950 |
| | 500,000 | | C | | Cincinnati Bell, Inc.,
7.000%, due 02/15/15 | | | 462,500 |
| | 440,000 | | C | | Cincinnati Bell, Inc.,
8.375%, due 01/15/14 | | | 415,800 |
| | 995,000 | | C | | Cricket Communications, Inc., 9.375%, due 11/01/14 | | | 952,713 |
| | 465,000 | | C | | Frontier Communications Co., 6.625%, due 03/15/15 | | | 395,250 |
| | 380,000 | | C | | Frontier Communications Co., 9.000%, due 08/15/31 | | | 262,675 |
| | 460,000 | | C | | Frontier Communications Co., 9.250%, due 05/15/11 | | | 469,200 |
| | 250,000 | | #, C | | Intelsat Corp.,
9.250%, due 06/15/16 | | | 232,500 |
| | 395,000 | | @@, #, C | | Intelsat Jackson Holdings Ltd., 9.500%, due 06/15/16 | | | 373,275 |
| | 1,070,000 | | @@, C, S | | Intelsat Jackson Holdings Ltd.,
11.250%, due 06/15/16 | | | 1,043,250 |
| | 650,000 | | @@, #, C | | Intelsat Subsidiary Holding Co. Ltd.,
8.875%, due 01/15/15 | | | 609,375 |
| | 810,000 | | &, C | | iPCS, Inc.,
4.420%, due 05/01/14 | | | 498,150 |
| | 1,010,000 | | #, C | | MetroPCS Wireless, Inc., 9.250%, due 11/01/14 | | | 983,800 |
| | 845,000 | | C | | Nextel Communications, Inc., 5.950%, due 03/15/14 | | | 473,200 |
| | 520,000 | | C | | Nextel Communications, Inc., 7.375%, due 08/01/15 | | | 278,200 |
| | 835,000 | | C | | Qwest Capital Funding, Inc., 7.250%, due 02/15/11 | | | 801,600 |
| | 230,000 | | C | | Qwest Communications International, Inc.,
7.250%, due 02/15/11 | | | 223,100 |
See Accompanying Notes to Financial Statements
51
| | |
| ING HIGH YIELD BOND FUND | | PORTFOLIO OF INVESTMENTS ASOF MARCH 31, 2009 (CONTINUED) |
| | | | | | | | |
Principal
Amount | | | | | | Value |
| | | | | | | | |
| | Telecommunications: (continued) |
| $ | 1,075,000 | | C | | Qwest Communications International, Inc.,
7.500%, due 02/15/14 | | $ | 935,250 |
| | 495,000 | | C | | Qwest Corp.,
8.875%, due 03/15/12 | | | 491,288 |
| | 915,000 | | C | | Sprint Capital Corp.,
6.875%, due 11/15/28 | | | 562,725 |
| | 210,000 | | C | | Sprint Capital Corp.,
7.625%, due 01/30/11 | | | 195,300 |
| | 250,000 | | C | | Sprint Capital Corp.,
8.375%, due 03/15/12 | | | 226,250 |
| | 620,000 | | C | | Sprint Capital Corp.,
8.750%, due 03/15/32 | | | 418,500 |
| | 650,000 | | C | | West Corp.,
9.500%, due 10/15/14 | | | 455,813 |
| | 330,000 | | C | | West Corp.,
11.000%, due 10/15/16 | | | 221,100 |
| | 470,000 | | C | | Windstream Corp.,
7.000%, due 03/15/19 | | | 415,950 |
| | 515,000 | | C | | Windstream Corp.,
8.125%, due 08/01/13 | | | 509,850 |
| | | | | | | | |
| | | | | | | | 14,425,104 |
| | | | | | | | |
| | | | | Total Corporate Bonds/Notes (Cost $98,084,147) | | | 74,565,563 |
| | | | | | | | |
| | ASSET-BACKED SECURITIES: 0.4% |
| | Home Equity Asset-Backed Securities: 0.4% |
| | 305,921 | | C, S | | Ameriquest Mortgage Securities, Inc.,
1.872%, due 02/25/33 | | | 171,222 |
| | 217,911 | | C | | Morgan Stanley Capital, Inc., 1.722%, due 06/25/33 | | | 128,226 |
| | | | | | | | |
| | | | | Total Asset-Backed Securities (Cost $439,735) | | | 299,448 |
| | | | | | | | |
| | | |
| Shares | | | | | | Value |
| | COMMON STOCK: 0.0% |
| | Agriculture: 0.0% |
| | 17,906 | | I, X | | North Atlantic Trading Co. | | $ | 18 |
| | | | | | | | |
| | | | | | | | 18 |
| | | | | | | | |
| | Media: 0.0% |
| | 5,810 | | X | | American Media, Inc. | | | 6 |
| | | | | | | | |
| | | | | | | | 6 |
| | | | | | | | |
| | Telecommunications: 0.0% |
| | 264 | | @, @@ | | Completel Europe NV | | | 10,957 |
| | | | | | | | |
| | | | | | | | 10,957 |
| | | | | | | | |
| | | | | Total Common Stock
(Cost $338,880) | | | 10,981 |
| | | | | | | | |
| | PREFERRED STOCK: 0.0% |
| | Media: 0.0% |
| | 1 | | &, P | | ION Media Networks, Inc. | | | 7,009 |
| | | | | | | | |
| | | | | Total Preferred Stock
(Cost $8,676) | | | 7,009 |
| | | | | | | | |
| | WARRANTS: 0.0% |
| | Building Materials: 0.0% |
| | 3,100 | | #, I, X | | Dayton Superior Corp. | | | 31 |
| | | | | | | | |
| | | | | | | | 31 |
| | | | | | | | |
| | | | | | | |
| | | |
| Shares | | | | | | Value |
| | | | | | | |
| Commercial Services: 0.0% |
| 92,950 | | I, X | | Comforce Corp. | | $ | 930 |
| | | | | | | |
| | | | | | | 930 |
| | | | | | | |
| Telecommunications: 0.0% |
| 500 | | @@, #, X | | GT Group Telecom, Inc. | | | — |
| | | | | | | |
| | | | | | | — |
| | | | | | | |
| | | | Total Warrants
(Cost $— ) | | | 961 |
| | | | | | | |
| | | | Total Long-Term Investments
(Cost $98,871,438 ) | | | 74,883,962 |
| | | | | | | |
| SHORT-TERM INVESTMENTS: 3.6% |
| Affiliated Mutual Fund: 3.6% |
| 2,822,000 | | S | | ING Institutional Prime Money Market Fund - Class I | | | 2,822,000 |
| | | | | | | |
| | | | Total Short-Term Investments (Cost $2,822,000) | | | 2,822,000 |
| | | | | | | |
| | | | | | | | | | | | |
| | | | | | Total Investments in Securities (Cost $101,693,438)* | | 98.7 | % | | $ | 77,705,962 |
| | | | | | Other Assets and Liabilities - Net | | 1.3 | | | | 993,502 |
| | | | | | | | | | | | |
| | | | | | Net Assets | | 100.0 | % | | $ | 78,699,464 |
| | | | | | | | | | | | |
| @ | Non-income producing security |
| + | Step-up basis bonds. Interest rates shown reflect current and next coupon rates. |
| # | Securities with purchases pursuant to Rule 144A or section 4(2), under the Securities Act of 1933 and may not be resold subject to that rule except to qualified institutional buyers. Unless otherwise noted, these securities have been determined to be liquid under the guidelines established by the Funds’ Board of Directors/Trustees. |
| C | Bond may be called prior to maturity date. |
| P | Preferred Stock may be called prior to convertible date. |
| S | All or a portion of this security is segregated to cover collateral requirements for applicable futures, options, swaps, foreign forward currency contracts and/or when-issued or delayed-delivery securities. |
| X | Fair value determined by ING Funds Valuation Committee appointed by the Funds’ Board of Directors/Trustees. |
| * | Cost for federal income tax purposes is $101,837,717. |
| | | | |
Net unrealized depreciation consists of: | | | | |
Gross Unrealized Appreciation | | $ | 1,002,159 | |
Gross Unrealized Depreciation | | | (25,133,914 | ) |
| | | | |
Net Unrealized Depreciation | | $ | (24,131,755 | ) |
| | | | |
See Accompanying Notes to Financial Statements
52
| | |
| ING HIGH YIELD BOND FUND | | PORTFOLIO OF INVESTMENTS ASOF MARCH 31, 2009 (CONTINUED) |
The following table summarizes the inputs used as of March 31, 2009 in determining the Fund’s investments at fair value for purposes of SFAS 157:
| | | | | | | |
| | | Investments in
Securities | | Other Financial
Instruments* | |
Level 1 — Quoted Prices | | $ | 2,832,957 | | $ | — | |
Level 2 — Other Significant Observable Inputs | | | 74,865,012 | | | (519,574 | ) |
Level 3 — Significant Unobservable Inputs | | | 7,993 | | | — | |
| | | | | | | |
Total | | $ | 77,705,962 | | $ | (519,574 | ) |
| | | | | | | |
“Fair value” for purposes of SFAS 157 is different from “fair value” as used in the 1940 Act. The former generally implies market value, and can include market quotations as a source of value, and the latter refers to determinations of value in absence of available market quotations.
| * | Other financial instruments may include forward foreign currency contracts, futures, swaps, and written options. Forward foreign currency contracts and futures are reported at their unrealized gain/loss at year end. Swaps and written options are reported at their market value at year end. |
A roll forward of fair value measurements using significant unobservable inputs (Level 3) for the year ended March 31, 2009 was as follows:
| | | | | | | |
| | | Investments in
Securities | | | Other Financial
Instruments* |
Beginning Balance at 03/31/08 | | $ | 1,727,004 | | | $ | — |
Net Purchases/(Sales) | | | (1,228,076 | ) | | | — |
Accrued Discounts/(Premiums) | | | (1,259 | ) | | | — |
Total Realized Gain/(Loss) | | | (538,030 | ) | | | — |
Total Unrealized Appreciation/(Depreciation) | | | 48,348 | | | | — |
Net Transfers In/(Out) of Level 3 | | | 6 | | | | — |
| | | | | | | |
Ending Balance at 03/31/09 | | $ | 7,993 | | | $ | — |
| | | | | | | |
| * | Other financial instruments may include forward foreign currency contracts, futures, swaps, and written options. Forward foreign currency contracts and futures are reported at their unrealized gain/loss at year end. Swaps and written options are reported at their market value at year end. |
For the year ended March 31, 2009, total change in unrealized gain (loss) on Level 3 securities included in the change in net assets was $(128,693). Total unrealized gain (loss) for all securities (including Level 1 and Level 2) can be found on the accompanying Statement of Operations.
ING High Yield Bond Fund Credit Default Swap Agreements Outstanding on March 31, 2009:
Credit Default Swaps on Corporate and Sovereign Issues — Buy Protection(1)
| | | | | | | | | | | | | | | | | | | | | | | | |
Counterparty | | Reference Entity/
Obligation | | Buy/Sell
Protection | | (Pay)/Receive
Fixed Rate (%) | | | Termination
Date | | | | Notional
Amount(4) | | Market
Value(5) | | | Upfront
Premium
Paid/(Received) | | Unrealized
Appreciation/
(Depreciation) | |
JPMorgan Chase Bank N.A., New York | | Centex Corp.
5.250%, 06/15/15 | | Buy | | (6.050 | ) | | 12/20/13 | | USD | | 2,000,000 | | $ | (135,620 | ) | | $ | — | | $ | (135,620 | ) |
Goldman Sachs International | | Newell Rubbermaid Inc. 6.750%, 03/15/12 | | Buy | | (1.200 | ) | | 09/20/13 | | USD | | 2,000,000 | | | 117,269 | | | | — | | | 117,269 | |
JPMorgan Chase Bank N.A., New York | | Norbord Inc.
7.250%, 07/01/12 | | Buy | | (1.380 | ) | | 06/20/14 | | USD | | 2,000,000 | | | 381,875 | | | | — | | | 381,875 | |
JPMorgan Chase Bank N.A., New York | | Pulte Homes Inc. 5.250%, 01/15/14 | | Buy | | (3.700 | ) | | 12/20/13 | | USD | | 2,000,000 | | | (80,014 | ) | | | — | | | (80,014 | ) |
| | | | | | | | | | | | | | | | | | | | | | | | |
| | | | | | | | | | | | | | | $ | 283,510 | | | $ | — | | $ | 283,510 | |
| | | | | | | | | | | | | | | | | | | | | | | | |
See Accompanying Notes to Financial Statements
53
| | |
| ING HIGH YIELD BOND FUND | | PORTFOLIO OF INVESTMENTS ASOF MARCH 31, 2009 (CONTINUED) |
Credit Default Swaps on Corporate and Sovereign Issues — Sell Protection(2)
| | | | | | | | | | | | | | | | | | | | | | | | | | |
Counterparty | | Reference Entity/
Obligation | | Buy/Sell
Protection | | (Pay)/Receive
Fixed Rate (%) | | Termination
Date | | Implied Credit
Spread At
03/31/09 (%)(3) | | | | Notional
Amount(4) | | Market
Value(5) | | | Upfront
Premium
Paid/(Received) | | | Unrealized
Appreciation/
(Depreciation) | |
Morgan Stanley Capital Services Inc. | | Beazer Homes USA
6.500%, 11/15/13 | | Sell | | 5.000 | | 06/20/09 | | 66.10 | | USD | | 2,000,000 | | $ | (251,210 | ) | | $ | (80,000 | ) | | $ | (171,210 | ) |
Merrill Lynch International* | | GMAC LLC 6.875%, 08/28/12 | | Sell | | 5.000 | | 06/20/09 | | 30.14 | | USD | | 2,000,000 | | | (107,717 | ) | | | (97,500 | ) | | | (10,217 | ) |
Goldman Sachs International | | Harrah’s Operating Co. Inc.
5.625%, 06/01/15 | | Sell | | 5.000 | | 06/20/09 | | 81.97 | | USD | | 2,000,000 | | | (314,516 | ) | | | (15,000 | ) | | | (299,516 | ) |
JPMorgan Chase Bank N.A., New York | | K. Hovnanian Enterprises 6.500%, 01/15/14 | | Sell | | 5.000 | | 06/20/09 | | 35.38 | | USD | | 2,000,000 | | | (129,641 | ) | | | (40,000 | ) | | | (89,641 | ) |
| | | | | | | | | | | | | | | | | | | | | | | | | | |
| | | | | | | | | | | | | | | | $ | (803,084 | ) | | $ | (232,500 | ) | | $ | (570,584 | ) |
| | | | | | | | | | | | | | | | | | | | | | | | | | |
| * | Counterparty exposure guaranteed by Bank of America |
(1) | If a Fund is a buyer of protection and a credit event occurs, as defined under the terms of that particular swap agreement, a Fund will either 1.) receive from the seller of protection an amount equal to the notional amount of the swap and deliver the referenced obligation, other deliverable obligations or underlying securities comprising the referenced index or 2.) receive a net settlement amount in the form of cash or securities equal to the notional amount of the swap less the recovery value of the referenced obligation or underlying securities comprising the referenced index. |
(2) | If the Fund is a seller of protection, and a credit event occurs, as defined under the terms of that particular swap agreement, the Fund will generally either 1.) Pay to the buyer an amount equal to the notional amount of the swap and take delivery of the referenced obligation, other deliverable obligations, or underlying securities comprising a referenced index or 2.) Pay a net settlement amount in the form of cash or securities equal to the notional amount of the swap less the recovery value of the referenced obligation or underlying securities comprising a referenced index. |
(3) | Implied credit spreads, represented in absolute terms, utilized in determining the market value of credit default swap agreements on corporate issues or sovereign issues are disclosed for credit default swaps sold and serve as an indicator of the current status of the payment/performance risk and represent the likelihood or risk of default for the credit derivative. The implied credit spread of a particular referenced entity reflects the cost of buying/selling protection and may include upfront payments required to be made to enter into the agreement. For credit default swaps on asset-backed securities or credit indices, the quoted market prices and resulting market values, as well as the receive fixed rate, serve as indicators of the current status of the payment/performance risk. Wider credit spreads and increasing market values, in absolute terms when compared to the notional amount of the swap, and high receive fixed rate, represent a deterioration of the referenced entity’s credit soundness and a greater likelihood or risk of default or other credit event occurring as defined under the terms of the agreement. |
(4) | The maximum amount of future payments (undiscounted) that a Fund as seller of protection could be required to make or receive as a buyer of credit protection under a credit default swap agreement would be an amount equal to the notional amount of the agreement. |
(5) | The market values for credit default swap agreements serve as an indicator of the current status of the payment/performance risk and represent the likelihood or risk of default for the credit derivative. Increasing market values, in absolute terms, when compared to the notional amount of the agreement, represent a deterioration of the referenced obligation’s credit soundness and a greater likelihood or risk of default or other credit event occurring. |
See Accompanying Notes to Financial Statements
54
| | |
| ING INTERMEDIATE BOND FUND | | PORTFOLIO OF INVESTMENTS ASOF MARCH 31, 2009 |
| | | | | | | | |
Principal
Amount | | | | | | Value |
| | | | | | | | |
| | CORPORATE BONDS/NOTES: 32.9% | | | |
| | Agriculture: 0.8% | | | |
| $ | 2,239,000 | | | | Altria Group, Inc.,
9.250%, due 08/06/19 | | $ | 2,397,951 |
| | 3,610,000 | | | | Altria Group, Inc.,
10.200%, due 02/06/39 | | | 3,696,488 |
| | 234,000 | | | | Philip Morris International, Inc.,
5.650%, due 05/16/18 | | | 232,914 |
| | 1,257,000 | | | | Philip Morris International, Inc.,
6.875%, due 03/17/14 | | | 1,361,863 |
| | | | | | | | |
| | | | | | | | 7,689,216 |
| | | | | | | | |
| | Banks: 8.5% | | | |
| | 3,240,000 | | @@, C | | Australia & New Zealand Banking Group Ltd.,
3.588%, due 12/31/49 | | | 1,504,475 |
| | 12,861,000 | | | | Bank of America Corp.,
2.100%, due 04/30/12 | | | 12,896,689 |
| | 5,637,000 | | C | | Bank of America Corp.,
8.000%, due 12/29/49 | | | 2,260,042 |
| | 1,280,000 | | @@, C, ^^ | | Bank of Ireland,
1.482%, due 12/29/49 | | | 320,000 |
| | 570,000 | | @@, C, L | | Bank of Scotland PLC,
2.750%, due 12/31/49 | | | 263,625 |
| | 730,000 | | @@, C | | Barclays Bank PLC,
1.875%, due 08/29/49 | | | 292,000 |
| | 3,817,000 | | @@, # | | Barclays Bank PLC,
6.050%, due 12/04/17 | | | 3,006,449 |
| | 1,690,000 | | @@, C | | BNP Paribas,
1.928%, due 09/29/49 | | | 408,652 |
| | 11,817,000 | | | | Citigroup, Inc.,
2.125%, due 04/30/12 | | | 11,865,598 |
| | 3,791,000 | | | | Citigroup, Inc.,
5.000%, due 09/15/14 | | | 2,515,799 |
| | 2,986,000 | | #, C | | Dresdner Funding Trust I,
8.151%, due 06/30/31 | | | 388,380 |
| | 3,875,000 | | | | Fifth Third Bancorp.,
8.250%, due 03/01/38 | | | 2,379,397 |
| | 1,299,000 | | | | Goldman Sachs Group, Inc.,
5.250%, due 04/01/13 | | | 1,222,884 |
| | 3,866,000 | | | | Goldman Sachs Group, Inc.,
5.450%, due 11/01/12 | | | 3,723,959 |
| | 2,158,000 | | | | Goldman Sachs Group, Inc.,
5.500%, due 11/15/14 | | | 1,965,616 |
| | 2,150,000 | | @@, C | | Hongkong & Shanghai Banking Corp., Ltd.,
1.300%, due 07/29/49 | | | 774,000 |
| | 3,340,000 | | @@, C | | HSBC Bank PLC,
1.913%, due 06/29/49 | | | 1,369,400 |
| | 1,046,000 | | | | JPMorgan Chase & Co.,
4.750%, due 05/01/13 | | | 1,014,832 |
| | 1,812,000 | | | | JPMorgan Chase Bank NA,
5.875%, due 06/13/16 | | | 1,697,685 |
| | 2,100,000 | | @@, C | | Lloyds TSB Bank PLC,
1.438%, due 11/29/49 | | | 682,500 |
| | | | | | | | |
Principal
Amount | | | | | | Value |
| | | | | | | | |
| | Banks: (continued) | | | |
| $ | 2,570,000 | | @@, C | | Lloyds TSB Bank PLC,
1.877%, due 08/29/49 | | $ | 835,250 |
| | 2,630,000 | | @@, C | | Lloyds TSB Bank PLC,
2.125%, due 11/29/49 | | | 854,750 |
| | 3,735,000 | | | | Morgan Stanley,
2.250%, due 03/13/12 | | | 3,766,714 |
| | 849,000 | | C | | Morgan Stanley,
5.300%, due 03/01/13 | | | 817,071 |
| | 1,025,000 | | | | Morgan Stanley,
6.000%, due 04/28/15 | | | 968,923 |
| | 4,077,000 | | C | | Morgan Stanley,
6.750%, due 04/15/11 | | | 4,082,051 |
| | 7,882,000 | | C | | National City Preferred Capital Trust I,
12.000%, due 12/29/49 | | | 5,418,607 |
| | 340,000 | | @@, C, L | | National Westminster Bank PLC,
1.563%, due 11/29/49 | | | 98,600 |
| | 590,000 | | @@, C | | National Westminster Bank PLC,
2.000%, due 08/29/49 | | | 177,000 |
| | 4,650,000 | | @@, C | | Royal Bank of Scotland Group PLC,
2.063%, due 12/29/49 | | | 1,200,597 |
| | 1,190,000 | | @@, C | | Societe Generale,
2.625%, due 11/29/49 | | | 717,280 |
| | 6,300,000 | | | | State Street Corp.,
2.150%, due 04/30/12 | | | 6,330,599 |
| | 3,065,000 | | | | Wachovia Bank NA,
6.600%, due 01/15/38 | | | 2,430,698 |
| | 2,419,000 | | | | Wachovia Corp.,
5.500%, due 05/01/13 | | | 2,232,430 |
| | 2,146,000 | | C | | Wells Fargo & Company,
7.980%, due 03/15/18 | | | 1,009,832 |
| | 1,420,000 | | @@, C | | Westpac Banking Corp.,
1.913%, due 09/30/49 | | | 731,404 |
| | | | | | | | |
| | | | | | | | 82,223,788 |
| | | | | | | | |
| | Beverages: 0.5% | | | |
| | 2,896,000 | | #, C | | Anheuser-Busch Cos., Inc.,
7.750%, due 01/15/19 | | | 2,892,496 |
| | 1,410,000 | | C | | Dr Pepper Snapple Group, Inc.,
6.820%, due 05/01/18 | | | 1,332,969 |
| | 598,000 | | C | | Dr Pepper Snapple Group, Inc.,
7.450%, due 05/01/38 | | | 528,033 |
| | | | | | | | |
| | | | | | | | 4,753,498 |
| | | | | | | | |
| | Chemicals: 0.3% | | | |
| | 760,000 | | Z, X | | Stauffer Chemical,
9.940%, due 04/15/10 | | | 688,587 |
| | 1,570,000 | | Z, X | | Stauffer Chemical,
19.980%, due 04/15/17 | | | 596,992 |
| | 1,280,000 | | Z, X | | Stauffer Chemical,
21.440%, due 04/15/18 | | | 431,524 |
| | 1,995,000 | | | | Union Carbide Corp.,
7.750%, due 10/01/96 | | | 897,050 |
| | | | | | | | |
| | | | | | | | 2,614,153 |
| | | | | | | | |
See Accompanying Notes to Financial Statements
55
| | |
| ING INTERMEDIATE BOND FUND | | PORTFOLIO OF INVESTMENTS ASOF MARCH 31, 2009 (CONTINUED) |
| | | | | | | | |
Principal
Amount | | | | | | Value |
| | | | | | | | |
| | Computers: 0.4% | | | |
| $ | 2,536,000 | | C | | Hewlett-Packard Co.,
4.750%, due 06/02/14 | | $ | 2,566,622 |
| | 1,851,000 | | C | | Lexmark International, Inc.,
5.900%, due 06/01/13 | | | 1,571,980 |
| | | | | | | | |
| | | | | | | | 4,138,602 |
| | | | | | | | |
| | Diversified Financial Services: 5.2% | | | |
| | 4,862,000 | | @@, #, C | | Aiful Corp.,
4.450%, due 02/16/10 | | | 1,920,728 |
| | 2,300,000 | | | | American Express Co.,
7.000%, due 03/19/18 | | | 2,032,156 |
| | 1,796,000 | | | | American Express Credit Corp.,
7.300%, due 08/20/13 | | | 1,668,660 |
| | 2,542,000 | | | | Caterpillar Financial Services,
6.125%, due 02/17/14 | | | 2,471,147 |
| | 3,141,000 | | | | Caterpillar Financial Services,
7.150%, due 02/15/19 | | | 2,877,819 |
| | 1,277,000 | | #, C | | Corestates Capital Trust I,
8.000%, due 12/15/26 | | | 985,179 |
| | 2,261,000 | | | | Countrywide Financial Corp.,
5.800%, due 06/07/12 | | | 1,964,902 |
| | 2,858,000 | | | | FIA Card Services NA,
6.625%, due 06/15/12 | | | 2,654,310 |
| | 2,324,000 | | C | | Fund American Cos., Inc.,
5.875%, due 05/15/13 | | | 1,785,748 |
| | 7,822,000 | | | | General Electric Capital Corp.,
2.200%, due 06/08/12 | | | 7,878,530 |
| | 6,314,000 | | | | General Electric Capital Corp.,
2.250%, due 03/12/12 | | | 6,362,384 |
| | 2,892,000 | | | | General Electric Capital Corp.,
5.875%, due 01/14/38 | | | 2,071,569 |
| | 5,236,000 | | | | General Electric Capital Corp.,
6.875%, due 01/10/39 | | | 4,282,247 |
| | 4,385,000 | | | | International Lease Finance Corp.,
6.625%, due 11/15/13 | | | 2,430,930 |
| | 3,178,000 | | @@, # | | Mantis Reef Ltd.,
4.799%, due 11/03/09 | | | 3,178,165 |
| | 1,173,000 | | | | Merrill Lynch & Co., Inc.,
4.250%, due 02/08/10 | | | 1,107,181 |
| | 2,473,000 | | C | | National Rural Utilities Cooperative Finance Corp.,
10.375%, due 11/01/18 | | | 2,867,518 |
| | 27 | | DKK,@@, I | | Nordea Kredit Realkreditaktieselskab,
6.000%, due 07/01/29 | | | 5 |
| | 255,778 | | # | | Power Receivable Finance, LLC,
6.290%, due 01/01/12 | | | 250,479 |
| | | | | | | | |
Principal
Amount | | | | | | Value |
| | | | | | | | |
| | Diversified Financial Services: (continued) | | | |
| $ | 12,819,921 | | #, Z | | Toll Road Investors Partnership II LP,
27.470%, due 02/15/45 | | $ | 1,165,651 |
| | 1,583,000 | | #, ±, C, ^^ | | Twin Reefs Pass-through Trust,
1.386%, due 12/10/49 | | | 2,295 |
| | | | | | | | |
| | | | | | | | 49,957,603 |
| | | | | | | | |
| | Electric: 3.0% | | | |
| | 249,000 | | C | | Commonwealth Edison Co.,
6.150%, due 03/15/12 | | | 254,341 |
| | 5,312,000 | | C | | Commonwealth Edison Co.,
6.950%, due 07/15/18 | | | 4,979,851 |
| | 1,571,000 | | C | | DTE Energy Co.,
7.050%, due 06/01/11 | | | 1,586,932 |
| | 1,109,000 | | C | | Duke Energy Corp.,
6.300%, due 02/01/14 | | | 1,136,490 |
| | 1,282,000 | | C | | Entergy Texas, Inc.,
7.125%, due 02/01/19 | | | 1,255,479 |
| | 1,180,000 | | C | | Indiana Michigan Power,
7.000%, due 03/15/19 | | | 1,154,307 |
| | 812,000 | | C | | Jersey Central Power and Light,
7.350%, due 02/01/19 | | | 831,201 |
| | 441,253 | | #, C | | Juniper Generation, LLC,
6.790%, due 12/31/14 | | | 400,182 |
| | 2,391,000 | | C | | Metropolitan Edison,
7.700%, due 01/15/19 | | | 2,429,772 |
| | 709,000 | | C | | Nevada Power Co.,
7.125%, due 03/15/19 | | | 697,301 |
| | 3,977,000 | | C | | NorthWestern Corp.,
5.875%, due 11/01/14 | | | 4,018,524 |
| | 1,713,000 | | #, C | | Oncor Electric Delivery Co.,
6.800%, due 09/01/18 | | | 1,682,488 |
| | 2,318,000 | | #, C | | Oncor Electric Delivery Co.,
7.500%, due 09/01/38 | | | 2,201,050 |
| | 1,218,000 | | C | | Progress Energy, Inc.,
6.050%, due 03/15/14 | | | 1,228,136 |
| | 957,000 | | C | | Progress Energy, Inc.,
7.050%, due 03/15/19 | | | 976,748 |
| | 1,949,000 | | C | | Sierra Pacific Power Co.,
6.250%, due 04/15/12 | | | 1,972,862 |
| | 2,425,000 | | C | | Southwestern Electric Power,
5.550%, due 01/15/17 | | | 2,167,982 |
| | | | | | | | |
| | | | | | | | 28,973,646 |
| | | | | | | | |
| | Energy - Alternate Sources: 0.0% | | | |
| | 277,964 | | X | | Greater Ohio Ethanol, LLC,
0.000%, due 03/20/14 | | | 28 |
| | 1,800,000 | | ±, X | | Greater Ohio Ethanol, LLC,
6.301%, due 12/31/13 | | | — |
| | 2,200,000 | | ±, X | | Greater Ohio Ethanol, LLC,
12.630%, due 12/31/13 | | | — |
| | | | | | | | |
| | | | | | | | 28 |
| | | | | | | | |
See Accompanying Notes to Financial Statements
56
| | |
| ING INTERMEDIATE BOND FUND | | PORTFOLIO OF INVESTMENTS ASOF MARCH 31, 2009 (CONTINUED) |
| | | | | | | | |
Principal
Amount | | | | | | Value |
| | | | | | | | |
| | Food: 0.5% | | | |
| $ | 2,121,000 | | | | Kraft Foods, Inc.,
6.125%, due 02/01/18 | | $ | 2,129,382 |
| | 1,246,000 | | | | Kraft Foods, Inc.,
6.125%, due 08/23/18 | | | 1,251,195 |
| | 732,000 | | | | Kraft Foods, Inc.,
6.500%, due 08/11/17 | | | 754,978 |
| | 1,084,000 | | C | | Safeway, Inc.,
6.250%, due 03/15/14 | | | 1,138,682 |
| | | | | | | | |
| | | | | | | | 5,274,237 |
| | | | | | | | |
| | Forest Products & Paper: 0.1% | | | |
| | 581,000 | | C | | International Paper Co.,
7.400%, due 06/15/14 | | | 479,781 |
| | | | | | | | |
| | | | | | | | 479,781 |
| | | | | | | | |
| | Healthcare - Services: 0.5% | | | |
| | 4,048,000 | | #, C | | Roche Holdings, Inc.,
5.000%, due 03/01/14 | | | 4,147,722 |
| | 1,003,000 | | C | | Wellpoint, Inc.,
6.000%, due 02/15/14 | | | 1,004,761 |
| | | | | | | | |
| | | | | | | | 5,152,483 |
| | | | | | | | |
| | Insurance: 1.0% | | | |
| | 4,313,000 | | @@, C, ^^ | | Aegon NV,
2.568%, due 12/31/49 | | | 1,037,816 |
| | 3,058,000 | | | | American International Group, Inc.,
5.850%, due 01/16/18 | | | 1,198,754 |
| | 1,739,000 | | C | | Hartford Financial Services Group, Inc.,
5.250%, due 10/15/11 | | | 1,396,977 |
| | 3,574,000 | | C | | Metlife, Inc.,
7.717%, due 02/15/19 | | | 3,209,960 |
| | 886,000 | | | | Prudential Financial, Inc.,
5.700%, due 12/14/36 | | | 426,551 |
| | 1,562,000 | | | | Prudential Financial, Inc.,
6.000%, due 12/01/17 | | | 1,033,108 |
| | 2,894,000 | | | | Prudential Financial, Inc.,
6.625%, due 12/01/37 | | | 1,569,448 |
| | 867,000 | | @@, C | | XL Capital, Ltd.,
6.500%, due 12/31/49 | | | 164,859 |
| | | | | | | | |
| | | | | | | | 10,037,473 |
| | | | | | | | |
| | Media: 3.7% | | | |
| | 824,000 | | C | | Comcast Corp.,
5.300%, due 01/15/14 | | | 800,808 |
| | 1,215,000 | | C | | Comcast Corp.,
5.700%, due 05/15/18 | | | 1,141,590 |
| | 1,370,000 | | C | | Comcast Corp.,
5.850%, due 11/15/15 | | | 1,316,147 |
| | 769,000 | | C | | Comcast Corp.,
5.900%, due 03/15/16 | | | 743,866 |
| | 893,000 | | C | | Comcast Corp.,
6.300%, due 11/15/17 | | | 870,329 |
| | 1,254,000 | | C | | Comcast Corp.,
6.500%, due 01/15/17 | | | 1,243,224 |
| | 3,849,000 | | #, C | | COX Communications, Inc.,
6.250%, due 06/01/18 | | | 3,424,936 |
| | 1,416,000 | | #, C | | COX Communications, Inc.,
6.950%, due 06/01/38 | | | 1,146,585 |
| | 2,593,000 | | #, C | | Cox Communications, Inc.,
8.375%, due 03/01/39 | | | 2,439,248 |
| | | | | | | | |
Principal
Amount | | | | | | Value |
| | | | | | | | |
| | Media: (continued) | | | |
| $ | 1,255,000 | | #, C | | Cox Enterprises, Inc.,
7.375%, due 07/15/27 | | $ | 1,035,266 |
| | 1,971,000 | | C | | News America, Inc.,
6.150%, due 03/01/37 | | | 1,441,038 |
| | 1,598,000 | | C | | News America, Inc.,
6.650%, due 11/15/37 | | | 1,200,627 |
| | 3,204,000 | | #, C | | News America, Inc.,
6.900%, due 03/01/19 | | | 2,994,804 |
| | 2,452,000 | | C | | Time Warner Cable, Inc.,
6.750%, due 07/01/18 | | | 2,305,554 |
| | 4,414,000 | | C | | Time Warner Cable, Inc.,
8.750%, due 02/14/19 | | | 4,694,700 |
| | 648,000 | | | | Time Warner Entertainment Co. LP,
8.375%, due 07/15/33 | | | 614,551 |
| | 2,921,000 | | C | | Time Warner, Inc.,
5.500%, due 11/15/11 | | | 2,883,614 |
| | 2,656,000 | | C | | Time Warner, Inc.,
7.700%, due 05/01/32 | | | 2,394,408 |
| | 4,088,000 | | C | | Viacom, Inc.,
6.875%, due 04/30/36 | | | 2,990,110 |
| | | | | | | | |
| | | | | | | | 35,681,405 |
| | | | | | | | |
| | Miscellaneous Manufacturing: 0.7% | | | |
| | 3,321,000 | | | | General Electric Co.,
5.250%, due 12/06/17 | | | 3,076,511 |
| | 3,230,000 | | @@, C | | Tyco International Finance,
8.500%, due 01/15/19 | | | 3,339,494 |
| | | | | | | | |
| | | | | | | | 6,416,005 |
| | | | | | | | |
| | Oil & Gas: 0.4% | | | |
| | 1,171,000 | | C | | Hess Corp.,
8.125%, due 02/15/19 | | | 1,209,192 |
| | 2,020,000 | | C | | Marathon Oil Corp.,
6.500%, due 02/15/14 | | | 2,052,985 |
| | 1,005,000 | | C | | Marathon Oil Corp.,
7.500%, due 02/15/19 | | | 1,014,275 |
| | | | | | | | |
| | | | | | | | 4,276,452 |
| | | | | | | | |
| | Oil & Gas Services: 0.1% | | | |
| | 1,217,000 | | @@, C | | Weatherford International, Ltd.,
9.625%, due 03/01/19 | | | 1,260,767 |
| | | | | | | | |
| | | | | | | | 1,260,767 |
| | | | | | | | |
| | Pharmaceuticals: 0.8% |
| | 1,092,000 | | C | | Novartis Capital Corp.,
4.125%, due 02/10/14 | | | 1,117,130 |
| | 1,135,000 | | @@, C | | Novartis Securities Investment Ltd.,
5.125%, due 02/10/19 | | | 1,154,608 |
| | 3,228,000 | | C | | Pfizer, Inc.,
6.200%, due 03/15/19 | | | 3,446,561 |
| | 1,549,000 | | C | | Pfizer, Inc.,
7.200%, due 03/15/39 | | | 1,666,479 |
| | | | | | | | |
| | | | | | | | 7,384,778 |
| | | | | | | | |
| | Pipelines: 0.8% |
| | 2,023,000 | | C | | Enbridge Energy Partners,
9.875%, due 03/01/19 | | | 2,088,889 |
| | 1,744,000 | | C | | Energy Transfer Partners,
9.700%, due 03/15/19 | | | 1,855,047 |
See Accompanying Notes to Financial Statements
57
| | |
| ING INTERMEDIATE BOND FUND | | PORTFOLIO OF INVESTMENTS ASOF MARCH 31, 2009 (CONTINUED) |
| | | | | | | | |
Principal
Amount | | | | | | Value |
| | | | | | | | |
| | Pipelines: (continued) |
| $ | 906,000 | | C | | Northwest Pipeline Corp.,
7.000%, due 06/15/16 | | $ | 915,491 |
| | 776,000 | | @@, C | | Trans-Canada Pipelines,
7.125%, due 01/15/19 | | | 811,114 |
| | 861,000 | | @@, C | | Trans-Canada Pipelines,
7.625%, due 01/15/39 | | | 853,843 |
| | 1,262,000 | | C | | Transcontinental Gas Pipe Line Corp.,
6.400%, due 04/15/16 | | | 1,233,350 |
| | 249,000 | | # | | Williams Companies, Inc.,
8.750%, due 01/15/20 | | | 248,182 |
| | | | | | | | |
| | | | | | | | 8,005,916 |
| | | | | | | | |
| | Real Estate: 0.2% |
| | 1,719,000 | | C | | Liberty Property LP,
7.750%, due 04/15/09 | | | 1,716,514 |
| | | | | | | | |
| | | | | | | | 1,716,514 |
| | | | | | | | |
| | Retail: 0.5% |
| | 605,000 | | C | | CVS Caremark Corp.,
5.750%, due 06/01/17 | | | 590,919 |
| | 1,513,000 | | C | | CVS Caremark Corp.,
6.600%, due 03/15/19 | | | 1,527,732 |
| | 2,071,089 | | #, C | | CVS Lease Pass-through,
6.036%, due 12/10/28 | | | 1,560,410 |
| | 1,766,000 | | C | | Darden Restaurants, Inc.,
5.625%, due 10/15/12 | | | 1,650,308 |
| | | | | | | | |
| | | | | | | | 5,329,369 |
| | | | | | | | |
| | Telecommunications: 3.8% |
| | 2,472,000 | | C | | AT&T, Inc.,
6.550%, due 02/15/39 | | | 2,248,969 |
| | 3,844,000 | | C | | AT&T, Inc.,
6.700%, due 11/15/13 | | | 4,109,678 |
| | 2,479,000 | | | | Bellsouth Telecommunications, Inc.,
7.000%, due 12/01/95 | | | 1,961,774 |
| | 725,000 | | @@, C | | British Telecommunications PLC,
5.150%, due 01/15/13 | | | 673,442 |
| | 3,556,000 | | @@, C | | British Telecommunications PLC,
5.950%, due 01/15/18 | | | 2,898,841 |
| | 1,520,000 | | | | Cisco Systems, Inc.,
4.950%, due 02/15/19 | | | 1,498,360 |
| | 1,874,000 | | C | | Cisco Systems, Inc.,
5.900%, due 02/15/39 | | | 1,727,614 |
| | 827,000 | | @@, C | | Deutsche Telekom International Finance,
5.250%, due 07/22/13 | | | 825,266 |
| | 686,000 | | @@, C | | Deutsche Telekom International Finance BV,
5.875%, due 08/20/13 | | | 698,433 |
| | 1,466,000 | | C | | Embarq Corp.,
6.738%, due 06/01/13 | | | 1,368,252 |
| | 357,000 | | C | | Embarq Corp.,
7.995%, due 06/01/36 | | | 268,355 |
| | 1,251,000 | | @@, C | | Telefonica Emisones SAU,
5.855%, due 02/04/13 | | | 1,296,515 |
| | | | | | | | |
Principal
Amount | | | | | | Value |
| | | | | | | | |
| | Telecommunications: (continued) |
| $ | 2,022,000 | | @@, C | | Telefonica Emisones SAU,
6.421%, due 06/20/16 | | $ | 2,093,617 |
| | 2,389,000 | | C | | Verizon Communications, Inc.,
7.350%, due 04/01/39 | | | 2,333,936 |
| | 2,956,000 | | C | | Verizon Communications, Inc.,
8.950%, due 03/01/39 | | | 3,406,728 |
| | 3,314,000 | | #, C | | Verizon Wireless,
8.500%, due 11/15/18 | | | 3,792,041 |
| | 5,477,000 | | #, C | | Verizon Wireless Capital LLC,
5.550%, due 02/01/14 | | | 5,487,319 |
| | | | | | | | |
| | | | | | | | 36,689,140 |
| | | | | | | | |
| | Transportation: 1.1% |
| | 1,958,000 | | C | | CSX Corp.,
6.250%, due 04/01/15 | | | 1,782,091 |
| | 2,693,000 | | C | | CSX Corp.,
7.450%, due 04/01/38 | | | 2,219,616 |
| | 1,928,000 | | C | | Union Pacific Corp.,
5.125%, due 02/15/14 | | | 1,917,780 |
| | 1,916,000 | | C | | Union Pacific Corp.,
5.700%, due 08/15/18 | | | 1,826,963 |
| | 3,076,000 | | C | | Union Pacific Corp.,
7.875%, due 01/15/19 | | | 3,398,153 |
| | | | | | | | |
| | | | | | | | 11,144,603 |
| | | | | | | | |
| | | | | Total Corporate Bonds/Notes
(Cost $ 366,145,062) | | | 319,199,457 |
| | | | | | | | |
| | U.S. GOVERNMENT AGENCY OBLIGATIONS: 38.2% |
| | Federal Home Loan Mortgage Corporation##: 11.5% |
| | 7,120,125 | | C, S | | 0.906%, due 02/15/32-05/15/33 | | | 6,926,296 |
| | 599,163 | | C, S | | 1.206%, due 04/15/32 | | | 587,507 |
| | 462,180 | | S | | 4.969%, due 04/01/35 | | | 473,948 |
| | 75,687 | | C | | 5.000%, due 08/15/21 | | | 82,530 |
| | 30,781,135 | | C, S | | 5.000%, due 08/15/16-02/15/35 | | | 32,143,168 |
| | 24,214,000 | | W | | 5.000%, due 05/01/37 | | | 24,898,796 |
| | 28,806,261 | | C, S | | 5.500%, due 08/15/20-08/15/33 | | | 30,001,286 |
| | 5,851,121 | | C, S | | 6.000%, due 01/15/29 | | | 6,180,957 |
| | 72,148 | | S | | 6.000%, due 12/01/28-01/01/29 | | | 76,142 |
| | 5,376,000 | | W | | 6.000%, due 05/01/37 | | | 5,605,319 |
| | 44,921 | | S | | 6.500%, due 01/01/24 | | | 47,911 |
| | 4,000,000 | | W | | 6.500%, due 04/15/34 | | | 4,216,876 |
| | 96,783 | | S | | 7.000%, due 11/01/31-03/01/32 | | | 104,266 |
| | 6,658 | | S | | 7.500%, due 11/01/28 | | | 7,267 |
| | | | | | | | |
| | | | | | | | 111,352,269 |
| | | | | | | | |
| | Federal National Mortgage Association##: 20.0% |
| | 138,788 | | S | | 0.872%, due 08/25/33 | | | 134,635 |
| | 255,964 | | S | | 0.956%, due 04/18/28 | | | 248,936 |
| | 322,701 | | S | | 0.972%, due 10/25/33 | | | 316,141 |
| | 278,084 | | C, S | | 1.072%, due 01/25/32 | | | 276,533 |
| | 3,281,000 | | W | | 4.000%, due 04/25/39 | | | 3,298,687 |
| | 2,039,000 | | W | | 4.500%, due 05/01/24 | | | 2,093,798 |
See Accompanying Notes to Financial Statements
58
| | |
| ING INTERMEDIATE BOND FUND | | PORTFOLIO OF INVESTMENTS ASOF MARCH 31, 2009 (CONTINUED) |
| | | | | | | | |
Principal
Amount | | | | | | Value |
| | | | | | | | |
| | Federal National Mortgage Association##: (continued) |
| $ | 10,466,187 | | S | | 5.000%, due 02/25/29-01/01/36 | | $ | 10,843,458 |
| | 21,162,000 | | W | | 5.000%, due 05/01/37 | | | 21,780,332 |
| | 1,036,561 | | S | | 5.027%, due 07/01/35 | | | 1,068,037 |
| | 664,374 | | S | | 5.221%, due 08/01/35 | | | 685,666 |
| | 68,215,166 | | | | 5.500%, due 05/01/37-01/01/39 | | | 70,643,766 |
| | 7,574,915 | | S | | 5.500%, due 02/01/18-06/01/37 | | | 7,896,830 |
| | 14,863,620 | | S | | 6.000%, due 08/01/16-08/01/38 | | | 15,617,034 |
| | 41,263,000 | | W | | 6.000%, due 05/01/37 | | | 42,997,325 |
| | 1,267,121 | | S | | 6.500%, due 01/01/23-04/01/37 | | | 1,345,556 |
| | 12,310,309 | | W, S | | 6.500%, due 05/01/37 | | | 12,920,679 |
| | 336,809 | | S | | 7.000%, due 12/01/27-03/01/32 | | | 363,779 |
| | 2,076,232 | | S, ^ | | 7.130%, due 02/17/29 | | | 240,108 |
| | 811,868 | | C, S | | 7.500%, due 12/25/41-01/25/48 | | | 870,488 |
| | 101,231 | | S | | 7.500%, due 10/01/30-02/01/32 | | | 109,745 |
| | | | | | | | |
| | | | | | | | 193,751,533 |
| | | | | | | | |
| | Government National Mortgage Association: 6.7% |
| | 8,747,000 | | W | | 4.500%, due 05/15/39 | | | 8,919,211 |
| | 15,750,000 | | W | | 5.000%, due 05/15/35 | | | 16,274,176 |
| | 4,773 | | S | | 5.375%, due 04/20/28 | | | 4,863 |
| | 16,574,000 | | W | | 5.500%, due 04/01/39 | | | 17,249,904 |
| | 15,686,000 | | | | 6.000%, due 04/01/39 | | | 16,389,423 |
| | 5,482,000 | | | | 6.500%, due 04/01/39 | | | 5,751,819 |
| | 206,420 | | S | | 6.500%, due 02/15/26-09/15/32 | | | 219,678 |
| | 100,599 | | S | | 7.000%, due 04/15/26-05/15/32 | | | 107,868 |
| | 146,140 | | S | | 7.500%, due 12/15/22-05/15/32 | | | 156,898 |
| | 581,832 | | C, S, ^ | | 7.694%, due 06/16/31 | | | 61,443 |
| | | | | | | | |
| | | | | | | | 65,135,283 |
| | | | | | | | |
| | | | | Total U.S. Government Agency Obligations
(Cost $364,340,012) | | | 370,239,085 |
| | | | | | | | |
| | U.S. TREASURY OBLIGATIONS: 35.4% | | | |
| | U.S. Treasury Bonds: 12.8% | | | |
| | 52,003,000 | | | | 2.750%, due 02/15/19 | | | 52,303,733 |
| | 43,776,000 | | L | | 4.500%, due 05/15/38 | | | 51,122,182 |
| | 14,010,000 | | S | | 8.125%, due 08/15/19 | | | 20,318,885 |
| | | | | | | | |
| | | | | | | | 123,744,800 |
| | | | | | | | |
| | U.S. Treasury Notes: 22.6% | | | |
| | 75,006,000 | | S | | 0.875%, due 02/28/11 | | | 75,172,738 |
| | 15,632,000 | | S | | 1.375%, due 03/15/12 | | | 15,745,582 |
| | 535,000 | | | | 1.750%, due 03/31/14 | | | 537,007 |
| | 126,302,000 | | S | | 1.875%, due 02/28/14 | | | 127,723,276 |
| | | | | | | | |
| | | | | | | | 219,178,603 |
| | | | | | | | |
| | | | | Total U.S. Treasury Obligations
(Cost $340,189,345) | | | 342,923,403 |
| | | | | | | | |
| | | | | | | | |
Principal
Amount | | | | | | Value |
| | | | | | | | |
| | ASSET-BACKED SECURITIES: 1.9% | | | |
| | Automobile Asset-Backed Securities: 0.1% | | | |
| $ | 1,178,000 | | C, S | | Nissan Auto Receivables Owner Trust,
2.940%, due 07/15/11 | | $ | 1,170,656 |
| | | | | | | | |
| | | | | | | | 1,170,656 |
| | | | | | | | |
| | Home Equity Asset-Backed Securities: 0.9% | | | |
| | 305,886 | | C, S | | Freddie Mac Structured Pass-through Securities,
0.772%, due 05/25/31 | | | 201,168 |
| | 73,217 | | C, S | | Freddie Mac Structured Pass-through Securities,
0.822%, due 01/25/32 | | | 64,384 |
| | 352,000 | | C, S | | GMAC Mortgage Corp. Loan Trust,
6.249%, due 12/25/37 | | | 84,417 |
| | 3,762,432 | | C, S | | GSAA Trust,
5.242%, due 06/25/34 | | | 3,622,927 |
| | 1,384,000 | | #, C, S | | Irwin Home Equity,
5.960%, due 08/25/37 | | | 325,858 |
| | 40,848 | | C, S | | Merrill Lynch Mortgage Investors Trust,
0.882%, due 07/25/34 | | | 21,995 |
| | 1,011,196 | | C, S | | Morgan Stanley Capital, Inc.,
1.722%, due 06/25/33 | | | 595,021 |
| | 3,905,000 | | C, S | | Morgan Stanley Mortgage Loan Trust,
5.858%, due 01/25/47 | | | 2,030,550 |
| | 134,325 | | C, S | | Renaissance Home Equity Loan Trust,
4.456%, due 05/25/35 | | | 127,997 |
| | 79,549 | | C, S | | Residential Asset Securities Corp.,
1.122%, due 06/25/32 | | | 36,214 |
| | 1,411,000 | | C, S | | Residential Funding Mortgage Securities II, Inc.,
5.890%, due 05/25/37 | | | 1,032,158 |
| | 526,525 | | C, S | | Wells Fargo Home Equity Trust,
3.970%, due 05/25/34 | | | 489,291 |
| | | | | | | | |
| | | | | | | | 8,631,980 |
| | | | | | | | |
| | Other Asset-Backed Securities: 0.9% | | | |
| | 30,018 | | C, S | | Amortizing Residential Collateral Trust,
0.772%, due 05/25/32 | | | 12,359 |
| | 1,118,600 | | C, S | | Bear Stearns Asset-Backed Securities, Inc.,
0.902%, due 06/25/36 | | | 541,467 |
| | 181,737 | | S | | CenterPoint Energy Transition Bond Co., LLC,
4.192%, due 02/01/20 | | | 185,872 |
| | 169,813 | | C, S | | Chase Funding Mortgage Loan Asset-Backed Certificates,
0.822%, due 07/25/33 | | | 134,883 |
| | 44,683 | | C, S | | Chase Funding Mortgage Loan Asset-Backed Certificates,
4.045%, due 05/25/33 | | | 39,815 |
See Accompanying Notes to Financial Statements
59
| | |
| ING INTERMEDIATE BOND FUND | | PORTFOLIO OF INVESTMENTS ASOF MARCH 31, 2009 (CONTINUED) |
| | | | | | | | |
Principal
Amount | | | | | | Value |
| | | | | | | | |
| | Other Asset-Backed Securities: (continued) | | | |
| $ | 2,356,260 | | C, S | | Credit-Based Asset Servicing and Securitization, LLC,
4.831%, due 08/25/35 | | $ | 2,050,668 |
| | 1,716,612 | | C, S | | Credit-Based Asset Servicing and Securitization, LLC,
5.501%, due 12/25/36 | | | 1,301,859 |
| | 1,456,000 | | #, C, S | | Credit-Based Asset Servicing and Securitization, LLC,
5.746%, due 12/25/37 | | | 1,147,510 |
| | 1,188,000 | | #, C, S | | Credit-Based Asset Servicing and Securitization, LLC,
6.020%, due 12/25/37 | | | 696,837 |
| | 1,071,531 | | C, S | | Equity One, Inc.,
5.050%, due 09/25/33 | | | 797,600 |
| | 369,995 | | C, S | | Fannie Mae,
0.662%, due 04/25/35 | | | 334,909 |
| | 2,720,000 | | #, C, S, I | | Hudson Mezzanine Funding,
1.314%, due 06/12/42 | | | 1,360 |
| | 864,705 | | C, S | | Lehman XS Trust,
0.802%, due 08/25/35 | | | 390,471 |
| | 463,650 | | C, S | | Merrill Lynch Mortgage Investors Trust,
5.609%, due 03/25/37 | | | 237,727 |
| | 134,042 | | C, S | | Popular Mortgage Pass-through Trust,
4.000%, due 12/25/34 | | | 125,732 |
| | 302,491 | | C, S | | Residential Asset Mortgage Products, Inc.,
0.792%, due 07/25/35 | | | 262,192 |
| | 5,443 | | C, S | | Residential Asset Mortgage Products, Inc.,
1.142%, due 06/25/33 | | | 3,695 |
| | 1,087,470 | | C, S | | Structured Asset Securities Corp.,
4.910%, due 06/25/33 | | | 768,959 |
| | | | | | | | |
| | | | | | | | 9,033,915 |
| | | | | | | | |
| | | | | Total Asset-Backed Securities
(Cost $28,698,361) | | | 18,836,551 |
| | | | | | | | |
| | COLLATERALIZED MORTGAGE OBLIGATIONS: 14.1% |
| | 266,653 | | C, S | | ABN Amro Mortgage Corp.,
1.022%, due 03/25/18 | | | 225,201 |
| | 513,517 | | C, S | | American Home Mortgage Assets,
2.423%, due 02/25/47 | | | 81,140 |
| | 3,810,108 | | C, S | | American Home Mortgage Assets,
2.553%, due 11/25/46 | | | 1,130,959 |
| | 2,163,437 | | C, S | | American Home Mortgage Assets,
2.633%, due 09/25/46 | | | 511,738 |
| | | | | | | | |
Principal
Amount | | | | | | Value |
| | | | | | | | |
| | COLLATERALIZED MORTGAGE OBLIGATIONS: (continued) |
| $ | 4,498,245 | | C, S | | American Home Mortgage Investment Trust,
0.812%, due 11/25/45 | | $ | 1,830,772 |
| | 5,599,416 | | C, S | | American Home Mortgage Investment Trust,
0.902%, due 11/25/45 | | | 1,194,275 |
| | 3,983,706 | | C, S | | Banc of America Alternative Loan Trust,
6.251%, due 11/25/21 | | | 2,792,241 |
| | 3,206,455 | | C, S | | Banc of America Alternative Loan Trust,
6.474%, due 04/25/37 | | | 1,618,688 |
| | 57,916,162 | | C, S, ^ | | Banc of America Commercial Mortgage, Inc.,
0.288%, due 01/15/49 | | | 675,233 |
| | 110,000 | | C, S | | Banc of America Commercial Mortgage, Inc.,
4.429%, due 11/10/39 | | | 99,921 |
| | 1,063,953 | | C, S | | Banc of America Commercial Mortgage, Inc.,
4.772%, due 07/11/43 | | | 1,064,582 |
| | 4,064,176 | | C, S | | Banc of America Funding Corp.,
0.755%, due 06/20/47 | | | 1,597,716 |
| | 4,892,322 | | C, S | | Banc of America Funding Corp.,
5.255%, due 09/20/35 | | | 2,487,767 |
| | 2,249,341 | | C, S | | Banc of America Funding Corp.,
5.750%, due 09/20/34 | | | 1,844,819 |
| | 1,334,419 | | C, S | | Banc of America Funding Corp.,
7.000%, due 10/25/37 | | | 353,151 |
| | 2,346,760 | | C, S | | Banc of America Mortgage Securities, Inc.,
5.169%, due 09/25/35 | | | 1,758,391 |
| | 781,294 | | C, S | | Banc of America Mortgage Securities, Inc.,
5.500%, due 11/25/33 | | | 699,144 |
| | 1,307,078 | | C, S | | Banc of America Mortgage Securities, Inc.,
5.500%, due 06/25/35 | | | 1,221,798 |
| | 750,972 | | C, S | | Bear Stearns Alternative-A Trust,
0.842%, due 07/25/34 | | | 370,796 |
| | 696,000 | | C, S | | Bear Stearns Commercial Mortgage Securities,
4.565%, due 07/11/42 | | | 618,394 |
| | 118,197 | | C, S | | Bear Stearns Commercial Mortgage Securities,
5.415%, due 04/12/38 | | | 117,868 |
| | 1,180,228 | | C, S | | Chase Manhattan Bank-First Union National Bank,
7.439%, due 08/15/31 | | | 1,181,929 |
See Accompanying Notes to Financial Statements
60
| | |
| ING INTERMEDIATE BOND FUND | | PORTFOLIO OF INVESTMENTS ASOF MARCH 31, 2009 (CONTINUED) |
| | | | | | | | |
Principal
Amount | | | | | | Value |
| | | | | | | | |
| | COLLATERALIZED MORTGAGE OBLIGATIONS: (continued) |
| $ | 4,167,843 | | C, S | | Chase Mortgage Finance Corp.,
5.409%, due 12/25/35 | | $ | 3,090,567 |
| | 2,556,629 | | C, S | | Chase Mortgage Finance Corp.,
5.500%, due 11/25/35 | | | 2,327,957 |
| | 196,535 | | C, S | | Citicorp Mortgage Securities, Inc.,
0.972%, due 03/25/33 | | | 171,838 |
| | 873,689 | | C, S | | Citicorp Mortgage Securities, Inc.,
5.500%, due 02/25/22 | | | 694,379 |
| | 4,953,877 | | C, S | | Citigroup Mortgage Loan Trust, Inc.,
6.000%, due 11/25/35 | | | 3,291,444 |
| | 44,219 | | C, S | | Countrywide Alternative Loan Trust,
0.922%, due 02/25/33 | | | 41,608 |
| | 449,590 | | C, S | | Countrywide Alternative Loan Trust,
1.072%, due 04/25/33 | | | 363,287 |
| | 2,572,923 | | C, S | | Countrywide Alternative Loan Trust,
2.513%, due 11/25/46 | | | 619,376 |
| | 2,394,163 | | C, S | | Countrywide Alternative Loan Trust,
5.500%, due 02/25/25 | | | 1,818,532 |
| | 1,251,101 | | C, S | | Countrywide Home Loan Mortgage Pass-through Trust,
0.842%, due 04/25/35 | | | 185,046 |
| | 388,761 | | C, S | | Countrywide Home Loan Mortgage Pass-through Trust,
1.022%, due 04/25/18 | | | 268,595 |
| | 1,687,151 | | C, S | | Countrywide Home Loan Mortgage Pass-through Trust,
5.250%, due 10/25/35 | | | 1,292,376 |
| | 362,620 | | C, S | | Credit Suisse First Boston Mortgage Securities Corp.,
3.727%, due 03/15/35 | | | 348,520 |
| | 975,000 | | C, S | | Credit Suisse First Boston Mortgage Securities Corp.,
4.801%, due 03/15/36 | | | 871,778 |
| | 6,953,921 | | C, S | | Credit Suisse Mortgage Capital Certificates,
7.000%, due 08/25/36 | | | 3,324,841 |
| | 204,364 | | C, S | | DLJ Commercial Mortgage Corp.,
7.300%, due 06/10/32 | | | 203,996 |
| | 17,560,000 | | W | | Fannie Mae,
4.500%, due 05/15/35 | | | 17,894,729 |
| | 2,000,000 | | S | | Fannie Mae,
5.000%, due 05/25/32 | | | 2,076,478 |
| | 4,349,167 | | C, S | | First Horizon Alternative Mortgage Securities,
5.500%, due 08/25/35 | | | 2,998,861 |
| | 923,000 | | C, S | | First Horizon Asset Securities, Inc.,
5.750%, due 02/25/36 | | | 574,930 |
| | | | | | | | |
Principal
Amount | | | | | | Value |
| | | | | | | | |
| | COLLATERALIZED MORTGAGE OBLIGATIONS: (continued) |
| $ | 460,096 | | C, S | | First Horizon Mortgage Pass-through Trust,
5.394%, due 10/25/35 | | $ | 324,787 |
| | 1,473,952 | | C, S | | First Horizon Mortgage Pass-through Trust,
5.500%, due 12/25/35 | | | 1,205,060 |
| | 48,762,836 | | C, S, ^ | | GE Capital Commercial Mortgage Corp.,
0.479%, due 06/10/48 | | | 522,367 |
| | 500,000 | | C, S | | GE Capital Commercial Mortgage Corp.,
4.371%, due 01/10/38 | | | 484,691 |
| | 201,884 | | C, S | | GE Capital Commercial Mortgage Corp.,
5.560%, due 06/10/38 | | | 201,789 |
| | 1,439,211 | | C, S | | GMAC Mortgage Corp. Loan Trust,
4.587%, due 10/19/33 | | | 1,180,467 |
| | 3,112,235 | | C, S | | GMAC Mortgage Corp. Loan Trust,
5.264%, due 03/18/35 | | | 2,750,137 |
| | 1,770,701 | | C, S | | GMAC Mortgage Corp. Loan Trust,
5.467%, due 11/19/35 | | | 1,069,299 |
| | 67,221 | | C, S | | GMAC Mortgage Corp. Loan Trust,
5.500%, due 09/25/34 | | | 64,005 |
| | 46,147,919 | | #, C, S, ^ | | Greenwich Capital Commercial Funding Corp.,
0.322%, due 03/10/39 | | | 562,142 |
| | 517,810 | | #, C, S | | GSMPS Mortgage Loan Trust,
0.872%, due 01/25/35 | | | 417,707 |
| | 473,295 | | C, S | | GSR Mortgage Loan Trust,
1.022%, due 06/25/35 | | | 348,270 |
| | 1,233,656 | | C, S | | GSR Mortgage Loan Trust,
5.500%, due 07/25/35 | | | 1,098,481 |
| | 510,894 | | C, S | | GSR Mortgage Loan Trust,
6.500%, due 10/25/36 | | | 335,249 |
| | 522,660 | | C, S | | Harborview Mortgage Loan Trust,
0.906%, due 01/19/35 | | | 218,568 |
| | 291,264 | | C, S | | Homebanc Mortgage Trust,
1.382%, due 08/25/29 | | | 147,734 |
| | 222,453 | | C, S | | JPMorgan Alternative Loan Trust,
5.506%, due 01/25/36 | | | 127,248 |
| | 152,544,070 | | C, S, ^ | | JPMorgan Chase Commercial Mortgage Securities Corp.,
0.038%, due 01/12/43 | | | 118,618 |
| | 230,956 | | C, S | | JPMorgan Chase Commercial Mortgage Securities Corp.,
4.200%, due 07/12/35 | | | 227,187 |
See Accompanying Notes to Financial Statements
61
| | |
| ING INTERMEDIATE BOND FUND | | PORTFOLIO OF INVESTMENTS ASOF MARCH 31, 2009 (CONTINUED) |
| | | | | | | | |
Principal
Amount | | | | | | Value |
| | | | | | | | |
| | COLLATERALIZED MORTGAGE OBLIGATIONS: (continued) |
| $ | 825,608 | | C, S | | JPMorgan Chase Commercial Mortgage Securities Corp.,
4.275%, due 01/12/37 | | $ | 800,600 |
| | 124,398 | | C, S | | JPMorgan Chase Commercial Mortgage Securities Corp., 5.833%, due 04/15/45 | | | 124,536 |
| | 11,917,398 | | C, S, ^ | | LB-UBS Commercial Mortgage Trust,
0.505%, due 02/15/40 | | | 209,347 |
| | 225,000 | | C, S | | LB-UBS Commercial Mortgage Trust,
4.310%, due 02/15/30 | | | 213,432 |
| | 2,747,000 | | C, S | | LB-UBS Commercial Mortgage Trust,
5.403%, due 02/15/40 | | | 2,155,043 |
| | 3,000,000 | | C, S | | LB-UBS Commercial Mortgage Trust,
6.365%, due 12/15/28 | | | 2,998,847 |
| | 2,593,547 | | C, S | | LB-UBS Commercial Mortgage Trust,
7.370%, due 08/15/26 | | | 2,625,279 |
| | 1,493,056 | | C, S | | Luminent Mortgage Trust,
0.722%, due 10/25/46 | | | 616,225 |
| | 1,618,000 | | C, S | | MASTR Alternative Loans Trust,
6.250%, due 07/25/36 | | | 594,155 |
| | 19,295 | | C, S | | MASTR Alternative Loans Trust,
6.500%, due 05/25/33 | | | 16,475 |
| | 212,146 | | C, S | | MASTR Alternative Loans Trust,
8.500%, due 05/25/33 | | | 198,823 |
| | 604,497 | | C, S | | MASTR Asset Securitization Trust,
5.500%, due 06/25/33 | | | 550,297 |
| | 1,206,716 | �� | C, S | | MASTR Reperforming Loan Trust,
0.882%, due 07/25/35 | | | 1,011,629 |
| | 34,139,835 | | #, C, S, ^ | | Merrill Lynch Mortgage Trust,
0.155%, due 11/12/35 | | | 105,403 |
| | 42,746,350 | | S, ^ | | Merrill Lynch Mortgage Trust,
0.287%, due 10/12/41 | | | 572,301 |
| | 8,147,325 | | C, S, ^ | | Merrill Lynch/Countrywide Commercial Mortgage Trust,
0.539%, due 08/12/48 | | | 161,260 |
| | 760,568 | | C, S | | MLCC Mortgage Investors, Inc.,
0.752%, due 04/25/29 | | | 521,462 |
| | 484,690 | | C, S | | MLCC Mortgage Investors, Inc.,
0.842%, due 10/25/28 | | | 369,598 |
| | 263,725 | | C, S | | MLCC Mortgage Investors, Inc.,
0.842%, due 01/25/29 | | | 202,144 |
| | 384,078 | | C, S | | Morgan Stanley Dean Witter Capital I,
4.180%, due 03/12/35 | | | 370,680 |
| | | | | | | | |
Principal
Amount | | | | | | Value |
| | | | | | | | |
| | COLLATERALIZED MORTGAGE OBLIGATIONS: (continued) |
| $ | 1,621,000 | | C, S | | New York Mortgage Trust, Inc., 5.653%, due 05/25/36 | | $ | 898,385 |
| | 1,038,000 | | C, S | | Nomura Asset Securities Corp.,
6.690%, due 03/15/30 | | | 1,055,236 |
| | 192,067 | | C, S | | Prime Mortgage Trust,
1.022%, due 02/25/35 | | | 105,171 |
| | 1,792,858 | | C, S | | Prudential Commercial Mortgage Trust,
3.669%, due 02/11/36 | | | 1,754,144 |
| | 1,590,527 | | C, S | | Residential Accredit Loans, Inc., 0.762%, due 04/25/46 | | | 277,139 |
| | 6,909,600 | | C, S | | Residential Accredit Loans, Inc., 5.500%, due 05/25/34 | | | 4,884,324 |
| | 348,439 | | C, S | | Residential Funding Mortgage Sec I,
0.922%, due 11/25/17 | | | 244,354 |
| | 312,207 | | C, S | | Salomon Brothers Mortgage Securities VII,
7.520%, due 12/18/09 | | | 314,383 |
| | 354,098 | | C, S | | Sequoia Mortgage Trust,
0.815%, due 01/20/35 | | | 193,269 |
| | 483,709 | | C, S | | Structured Adjustable Rate Mortgage Loan Trust,
0.832%, due 07/25/35 | | | 197,738 |
| | 739,879 | | C, S | | Structured Asset Mortgage Investments, Inc.,
0.796%, due 04/19/35 | | | 374,645 |
| | 2,703,646 | | C, S | | Structured Asset Mortgage Investments, Inc.,
4.138%, due 12/27/35 | | | 816,634 |
| | 506,003 | | C, S | | Thornburg Mortgage Securities Trust,
0.872%, due 12/25/33 | | | 388,506 |
| | 1,663,542 | | C, S | | Thornburg Mortgage Securities Trust,
0.892%, due 09/25/44 | | | 1,341,925 |
| | 397,268 | | C, S | | Washington Mutual Mortgage Pass-through Certificates,
0.832%, due 01/25/45 | | | 159,702 |
| | 419,355 | | C, S | | Washington Mutual Mortgage Pass-through Certificates,
0.842%, due 08/25/45 | | | 179,040 |
| | 443,059 | | C, S | | Washington Mutual Mortgage Pass-through Certificates,
0.920%, due 06/25/44 | | | 237,864 |
| | 859,922 | | C, S | | Washington Mutual Mortgage Pass-through Certificates,
0.922%, due 08/25/45 | | | 295,146 |
| | 547,366 | | C, S | | Washington Mutual Mortgage Pass-through Certificates,
1.022%, due 01/25/18 | | | 384,341 |
| | 1,541,473 | | C, S | | Washington Mutual Mortgage Pass-through Certificates,
2.333%, due 03/25/47 | | | 492,572 |
See Accompanying Notes to Financial Statements
62
| | |
| ING INTERMEDIATE BOND FUND | | PORTFOLIO OF INVESTMENTS ASOF MARCH 31, 2009 (CONTINUED) |
| | | | | | | | |
Principal
Amount | | | | | | Value |
| | | | | | | | |
| | COLLATERALIZED MORTGAGE OBLIGATIONS: (continued) |
| $ | 2,529,368 | | C, S | | Washington Mutual Mortgage Pass-through Certificates,
2.383%, due 06/25/47 | | $ | 429,303 |
| | 314,626 | | C, S | | Washington Mutual Mortgage Pass-through Certificates,
2.393%, due 04/25/47 | | | 85,243 |
| | 456,208 | | C, S | | Washington Mutual Mortgage Pass-through Certificates,
2.403%, due 04/25/47 | | | 180,983 |
| | 2,651,952 | | C, S | | Washington Mutual Mortgage Pass-through Certificates,
2.403%, due 05/25/47 | | | 723,822 |
| | 2,820,948 | | C, S | | Washington Mutual Mortgage Pass-through Certificates,
2.443%, due 07/25/47 | | | 1,045,316 |
| | 4,156,127 | | C, S | | Washington Mutual Mortgage Pass-through Certificates,
2.443%, due 07/25/47 | | | 992,262 |
| | 2,067,917 | | C, S | | Washington Mutual Mortgage Pass-through Certificates,
2.473%, due 11/25/46 | | | 648,330 |
| | 1,277,925 | | C, S | | Washington Mutual Mortgage Pass-through Certificates,
2.593%, due 09/25/46 | | | 409,135 |
| | 130,735 | | C, S | | Washington Mutual Mortgage Pass-through Certificates,
2.603%, due 06/25/46 | | | 41,787 |
| | 5,152,754 | | C, S | | Washington Mutual Mortgage Pass-through Certificates,
2.623%, due 06/25/46 | | | 1,737,989 |
| | 755,061 | | C, S | | Washington Mutual Mortgage Pass-through Certificates,
3.133%, due 11/25/46 | | | 143,462 |
| | 2,028,000 | | C, S | | Washington Mutual Mortgage Pass-through Certificates,
3.789%, due 06/25/34 | | | 1,991,009 |
| | 699,599 | | C, S | | Washington Mutual Mortgage Pass-through Certificates,
3.955%, due 10/25/46 | | | 274,677 |
| | 2,989,000 | | C, S | | Washington Mutual Mortgage Pass-through Certificates,
5.813%, due 10/25/36 | | | 1,385,150 |
| | 1,447,018 | | C, S | | Washington Mutual Mortgage Pass-through Certificates,
6.000%, due 06/25/34 | | | 1,224,611 |
| | 3,298,000 | | C, S | | Wells Fargo Mortgage-Backed Securities Trust,
3.581%, due 06/25/35 | | | 3,281,712 |
| | | | | | | | |
Principal
Amount | | | | | | Value |
| | | | | | | | |
| | COLLATERALIZED MORTGAGE OBLIGATIONS: (continued) |
| $ | 3,691,000 | | C, S | | Wells Fargo Mortgage-Backed Securities Trust,
4.783%, due 07/25/34 | | $ | 3,008,128 |
| | 1,594,588 | | C, S | | Wells Fargo Mortgage-Backed Securities Trust,
4.886%, due 08/25/34 | | | 1,360,684 |
| | 4,014,260 | | C, S | | Wells Fargo Mortgage-Backed Securities Trust,
5.116%, due 03/25/36 | | | 2,682,045 |
| | 5,539,471 | | C, S | | Wells Fargo Mortgage-Backed Securities Trust,
5.387%, due 08/25/35 | | | 3,897,214 |
| | 2,748,159 | | C, S | | Wells Fargo Mortgage-Backed Securities Trust,
5.937%, due 10/25/36 | | | 1,540,911 |
| | 3,965,980 | | C, S | | Wells Fargo Mortgage-Backed Securities Trust,
6.000%, due 06/25/36 | | | 3,192,753 |
| | | | | | | | |
| | | | | Total Collateralized Mortgage Obligations
(Cost $200,923,073) | | | 136,628,047 |
| | | | | | | | |
| | MUNICIPAL BONDS: 0.4% |
| | California: 0.2% |
| | 2,693,000 | | C | | City of San Diego,
7.125%, due 06/01/32 | | | 1,693,251 |
| | | | | | | | |
| | | | | | | | 1,693,251 |
| | | | | | | | |
| | Michigan: 0.2% |
| | 3,835,000 | | S | | Michigan Tobacco Settlement Finance Authority,
7.309%, due 06/01/34 | | | 2,031,515 |
| | | | | | | | |
| | | | | | | | 2,031,515 |
| | | | | | | | |
| | | | | Total Municipal Bonds
(Cost $6,538,498) | | | 3,724,766 |
| | | | | | | | |
| | | |
| Shares | | | | | | Value |
| | PREFERRED STOCK: 0.2% |
| | Diversified Financial Services: 0.2% |
| | 3,450 | | #, P | | Zurich RegCaPS Funding Trust | | $ | 2,248,969 |
| | | | | | | | |
| | | | | | | | 2,248,969 |
| | | | | | | | |
| | Insurance: 0.0% |
| | 18,820 | | @@, P | | Aegon NV | | | 120,448 |
| | | | | | | | |
| | | | | | | | 120,448 |
| | | | | | | | |
| | | | | Total Preferred Stock
(Cost $3,722,883) | | | 2,369,417 |
| | | | | | | | |
| | | | | Total Long-Term Investments (Cost $1,310,557,235) | | | 1,193,920,726 |
| | | | | | | | |
| | SHORT-TERM INVESTMENTS: 3.1% |
| | Affiliated Mutual Fund: 2.7% |
| | 26,390,000 | | S | | ING Institutional Prime Money Market Fund -
Class I | | | 26,390,000 |
| | | | | | | | |
| | | | | Total Mutual Fund
(Cost $26,390,000) | | | 26,390,000 |
| | | | | | | | |
See Accompanying Notes to Financial Statements
63
| | |
| ING INTERMEDIATE BOND FUND | | PORTFOLIO OF INVESTMENTS ASOF MARCH 31, 2009 (CONTINUED) |
| | | | | | | | | | |
| | | |
Principal
Amount | | | | | | | Value | |
| | | | | | | | | | |
| | Securities Lending Collateralcc: 0.4% | |
| $ | 5,088,021 | | Bank of New York Mellon Corp. Institutional Cash Reserves | | | | | $ | 4,167,050 | |
| | | | | | | | | | |
| | | Total Securities Lending Collateral
(Cost $5,088,021) | | | | | | 4,167,050 | |
| | | | | | | | | | |
| | | Total Short-Term Investments
(Cost $31,478,021) | | | | | | 30,557,050 | |
| | | | | | | | | | |
| | | Total Investments in Securities
(Cost $1,342,035,256)* | | 126.2% | | | | $1,224,477,776 | |
| | | Other Assets and Liabilities - Net | | (26.2 | ) | | | (254,368,608 | ) |
| | | | | | | | | | |
| | | Net Assets | | 100.0 | % | | $ | 970,109,168 | |
| | | | | | | | | | |
| MASTR | Mortgage Asset Securitization Transaction, Inc. |
| # | Securities with purchases pursuant to Rule 144A or section 4(2), under the Securities Act of 1933 and may not be resold subject to that rule except to qualified institutional buyers. Unless otherwise noted, these securities have been determined to be liquid under the guidelines established by the Funds’ Board of Directors/Trustees. |
| C | Bond may be called prior to maturity date. |
| P | Preferred Stock may be called prior to convertible date. |
| cc | Securities purchased with cash collateral for securities loaned. |
| ## | On September 7, 2008, the Federal Housing Finance Agency placed the Federal National Mortgage Association and the Federal Home Loan Mortgage Corporation into conservatorship and the U.S. Treasury guaranteed the debt issued by those organizations. |
| W | Settlement is on a when-issued or delayed-delivery basis. |
| S | All or a portion of this security is segregated to cover collateral requirements for applicable futures, options, swaps, foreign forward currency contracts and/or when-issued or delayed-delivery securities. |
| L | Loaned security, a portion or all of the security is on loan at March 31, 2009. |
| X | Fair value determined by ING Funds Valuation Committee appointed by the Funds’ Board of Directors/Trustees. |
| ^ | Interest only securities represent the right to receive the monthly interest payments on an underlying pool of mortgage loans. Principal amount shown represents the notional amount on which current interest is calculated. Payments of principal on the pool reduce the value of the interest only security. |
| Z | Indicates Zero Coupon Bond; rate shown reflects current effective yield. |
| * | Cost for federal income tax purposes is $1,342,630,621 |
| | | | |
Net unrealized depreciation consists of: | | | | |
Gross Unrealized Appreciation | | $ | 16,828,162 | |
Gross Unrealized Depreciation | | | (134,981,007 | ) |
| | | | |
Net Unrealized Depreciation | | $ | (118,152,845 | ) |
| | | | |
The following table summarizes the inputs used as of March 31, 2009 in determining the Fund’s investments at fair value for purposes of SFAS 157:
| | | | | | | |
| | | Investments in
Securities | | Other Financial
Instruments* | |
Level 1 — Quoted Prices | | $ | 26,390,000 | | $ | (2,007,873 | ) |
Level 2 — Other Significant Observable Inputs | | | 1,193,737,462 | | | (2,423,686 | ) |
Level 3 — Significant Unobservable Inputs | | | 4,350,314 | | | — | |
| | | | | | | |
Total | | $ | 1,224,477,776 | | $ | (4,431,559 | ) |
| | | | | | | |
“Fair value” for purposes of SFAS 157 is different from “fair value” as used in the 1940 Act. The former generally implies market value, and can include market quotations as a source of value, and the latter refers to determinations of value in absence of available market quotations.
| * | Other financial instruments may include forward foreign currency contracts, futures, swaps, and written options. Forward foreign currency contracts and futures are reported at their unrealized gain/loss at year end. Swaps and written options are reported at their market value at year end. |
A roll forward of fair value measurements using significant unobservable inputs (Level 3) for the year ended March 31, 2009 was as follows:
| | | | | | | |
| | | Investments
in Securities | | | Other Financial
Instruments* |
Beginning Balance at 03/31/08 | | $ | 47,945,289 | | | $ | — |
Net Purchases/(Sales) | | | (19,696,521 | ) | | | — |
Accrued Discounts/(Premiums) | | | 137,595 | | | | — |
Total Realized Gain/(Loss) | | | (9,200,195 | ) | | | — |
Total Unrealized Appreciation/(Depreciation) | | | (4,000,439 | ) | | | — |
Net Transfers In/(Out) of Level 3 | | | (10,835,415 | ) | | | — |
| | | | | | | |
Ending Balance at 03/31/09 | | $ | 4,350,314 | | | $ | — |
| | | | | | | |
| * | Other financial instruments may include forward foreign currency contracts, futures, swaps, and written options. Forward foreign currency contracts and futures are reported at their unrealized gain/loss at year end. Swaps and written options are reported at their market value at year end. |
For the year ended March 31, 2009, total change in unrealized gain (loss) on Level 3 securities included in the change in net assets was $(8,181,146). Total unrealized gain (loss) for all securities (including Level 1 and Level 2) can be found on the accompanying Statement of Operations.
See Accompanying Notes to Financial Statements
64
| | |
| ING INTERMEDIATE BOND FUND | | PORTFOLIO OF INVESTMENTS ASOF MARCH 31, 2009 (CONTINUED) |
ING Intermediate Bond Fund Open Futures Contracts on March 31, 2009:
| | | | | | | | |
Contract Description | | Number
of
Contracts | | Expiration Date | | Unrealized
Appreciation/
(Depreciation) | |
Long Contracts | | | | | | | | |
U.S. Treasury 2-Year Note | | 314 | | 06/30/09 | | $ | 187,182 | |
U.S. Treasury 5-Year Note | | 104 | | 06/30/09 | | | (259 | ) |
| | | | | | | | |
| | | | | | $ | 186,923 | |
| | | | | | | | |
Short Contracts | | | | | | | | |
U.S. Treasury Long Bond | | 659 | | 06/19/09 | | $ | (2,194,796 | ) |
| | | | | | | | |
| | | | | | $ | (2,194,796 | ) |
| | | | | | | | |
ING Intermediate Bond Fund Credit Default Swap Agreements Outstanding on March 31, 2009:
Credit Default Swaps on Corporate and Sovereign Issues — Buy Protection(1)
| | | | | | | | | | | | | | | | | | | | | | | | |
Counterparty | | Reference Entity/
Obligation | | Buy/Sell
Protection | | (Pay)/Receive
Fixed Rate (%) | | | Termination
Date | | | | Notional
Amount(4) | | Market
Value(5) | | | Upfront
Premium
Paid/(Received) | | Unrealized
Appreciation/
(Depreciation) | |
Citibank N.A., New York | | Darden Restaurants Inc. 6.000%, 08/15/35 | | Buy | | (1.650 | ) | | 06/20/13 | | USD | | 500,000 | | $ | 2,753 | | | $ | — | | $ | 2,753 | |
Morgan Stanley Capital Services Inc. | | Domtar Inc.
7.875%, 10/15/11 | | Buy | | (2.650 | ) | | 09/20/11 | | USD | | 1,287,500 | | | 164,003 | | | | — | | | 164,003 | |
Goldman Sachs International | | Dow Chemical Co.
7.375%, 11/01/29 | | Buy | | (1.280 | ) | | 12/20/13 | | USD | | 3,460,000 | | | 527,160 | | | | — | | | 527,160 | |
Barclays Bank PLC | | GAP Inc.
8.800%, 12/15/08* | | Buy | | (1.200 | ) | | 06/20/13 | | USD | | 1,456,000 | | | (37,816 | ) | | | — | | | (37,816 | ) |
Citibank N.A., New York | | MBIA Inc.
6.625%, 10/01/28 | | Buy | | (5.000 | ) | | 09/20/13 | | USD | | 640,000 | | | 183,225 | | | | 193,541 | | | (10,316 | ) |
Citibank N.A., New York | | MBIA Inc.
6.625%, 10/01/28 | | Buy | | (5.000 | ) | | 09/20/13 | | USD | | 1,311,000 | | | 375,325 | | | | 380,498 | | | (5,173 | ) |
JPMorgan Chase Bank, N.A. New York | | MBIA Inc.
6.625%, 10/01/28 | | Buy | | (5.000 | ) | | 09/20/13 | | USD | | 5,079,000 | | | 1,454,064 | | | | 802,215 | | | 651,849 | |
Morgan Stanley Capital Services Inc. | | Temple-Inland Inc.
7.875%, 05/01/12 | | Buy | | (1.600 | ) | | 09/20/17 | | USD | | 2,401,000 | | | 395,473 | | | | — | | | 395,473 | |
Morgan Stanley Capital Services Inc. | | VF Corp.
8.500%, 10/01/10 | | Buy | | (0.850 | ) | | 09/20/13 | | USD | | 2,422,000 | | | (8,347 | ) | | | — | | | (8,347 | ) |
Citibank N.A., New York | | Weyerhaeuser Co.
7.125%, 07/15/23 | | Buy | | (3.150 | ) | | 12/20/13 | | USD | | 4,521,000 | | | (244,111 | ) | | | — | | | (244,111 | ) |
| | | | | | | | | | | | | | | | | | | | | | | | |
| | | | | | | | | | | | | | | $ | 2,811,729 | | | $ | 1,376,254 | | $ | 1,435,475 | |
| | | | | | | | | | | | | | | | | | | | | | | | |
See Accompanying Notes to Financial Statements
65
| | |
| ING INTERMEDIATE BOND FUND | | PORTFOLIO OF INVESTMENTS ASOF MARCH 31, 2009 (CONTINUED) |
Credit Default Swaps on Corporate and Sovereign Issues — Sell Protection(2)
| | | | | | | | | | | | | | | | | | | | | | | | | | |
Counterparty | | Reference Entity/
Obligation | | Buy/Sell
Protection | | (Pay)/Receive
Fixed Rate (%) | | Termination
Date | | Implied Credit
Spread At
03/31/09 (%)(3) | | | | Notional
Amount(4) | | Market
Value(5) | | | Upfront
Premium
Paid/(Received) | | | Unrealized
Appreciation/
(Depreciation) | |
UBS AG | | Domtar Inc.
7.875%, 10/15/11 | | Sell | | 2.600 | | 09/20/11 | | 8.94 | | USD | | 1,288,000 | | $ | (165,371 | ) | | $ | — | | | $ | (165,371 | ) |
Citibank N.A., New York | | MBIA Global Funding LLC, FRN, 10/06/10 | | Sell | | 5.000 | | 09/20/13 | | 52.05 | | USD | | 641,000 | | | (413,275 | ) | | | (215,685 | ) | | | (197,590 | ) |
Citibank N.A., New York | | MBIA Global Funding LLC, FRN, 10/06/10 | | Sell | | 5.000 | | 09/20/13 | | 52.05 | | USD | | 1,311,000 | | | (845,247 | ) | | | (481,218 | ) | | | (364,029 | ) |
Goldman Sachs International | | MBIA Global Funding LLC, FRN, 10/06/10 | | Sell | | 5.000 | | 09/20/13 | | 52.05 | | USD | | 1,271,000 | | | (819,458 | ) | | | (422,255 | ) | | | (397,203 | ) |
JPMorgan Chase Bank, N.A. New York | | MBIA Global Funding LLC, FRN, 10/06/10 | | Sell | | 5.000 | | 09/20/13 | | 52.05 | | USD | | 2,540,000 | | | (1,637,626 | ) | | | (423,474 | ) | | | (1,214,152 | ) |
Barclays Bank PLC | | Weyerhaeuser Co.
7.125%, 07/15/23 | | Sell | | 0.780 | | 09/20/12 | | 1.78 | | USD | | 2,478,000 | | | (81,329 | ) | | | — | | | | (81,329 | ) |
| | | | | | | | | | | | | | | | | | | | | | | | | | |
| | | | | | | | | | | | | | | | $ | (3,962,306 | ) | | $ | (1,542,632 | ) | | $ | (2,419,674 | ) |
| | | | | | | | | | | | | | | | | | | | | | | | | | |
| * | In the event of a default, if this bond is no longer available an equivalent bond will be delivered. |
(1) | If a Fund is a buyer of protection and a credit event occurs, as defined under the terms of that particular swap agreement, a Fund will either 1.) receive from the seller of protection an amount equal to the notional amount of the swap and deliver the referenced obligation, other deliverable obligations or underlying securities comprising the referenced index or 2.) receive a net settlement amount in the form of cash or securities equal to the notional amount of the swap less the recovery value of the referenced obligation or underlying securities comprising the referenced index. |
(2) | If the Fund is a seller of protection, and a credit event occurs, as defined under the terms of that particular swap agreement, the Fund will generally either 1.) Pay to the buyer an amount equal to the notional amount of the swap and take delivery of the referenced obligation, other deliverable obligations, or underlying securities comprising a referenced index or 2.) Pay a net settlement amount in the form of cash or securities equal to the notional amount of the swap less the recovery value of the referenced obligation or underlying securities comprising a referenced index. |
(3) | Implied credit spreads, represented in absolute terms, utilized in determining the market value of credit default swap agreements on corporate issues or sovereign issues are disclosed for credit default swaps sold and serve as an indicator of the current status of the payment/performance risk and represent the likelihood or risk of default for the credit derivative. The implied credit spread of a particular referenced entity reflects the cost of buying/selling protection and may include upfront payments required to be made to enter into the agreement. For credit default swaps on asset-backed securities or credit indices, the quoted market prices and resulting market values, as well as the receive fixed rate, serve as indicators of the current status of the payment/performance risk. Wider credit spreads and increasing market values, in absolute terms when compared to the notional amount of the swap, and high receive fixed rate, represent a deterioration of the referenced entity’s credit soundness and a greater likelihood or risk of default or other credit event occurring as defined under the terms of the agreement. |
(4) | The maximum amount of future payments (undiscounted) that a Fund as seller of protection could be required to make or receive as a buyer of credit protection under a credit default swap agreement would be an amount equal to the notional amount of the agreement. |
(5) | The market values for credit default swap agreements serve as an indicator of the current status of the payment/performance risk and represent the likelihood or risk of default for the credit derivative. Increasing market values, in absolute terms, when compared to the notional amount of the agreement, represent a deterioration of the referenced obligation’s credit soundness and a greater likelihood or risk of default or other credit event occurring. |
At March 31, 2009 the following forward foreign currency contracts were outstanding for the ING Intermediate Bond Fund:
| | | | | | | | | | | | | | | | |
Currency | | | | | | Buy/Sell | | Settlement
Date | | In Exchange For
USD | | Value | | Unrealized
Appreciation
(Depreciation) | |
EU Euro | | EUR | | 8,135,454 | | BUY | | 4/15/09 | | 10,971,717 | | 10,808,434 | | $ | (163,283 | ) |
EU Euro | | EUR | | 8,105,546 | | BUY | | 4/15/09 | | 10,931,626 | | 10,768,699 | | | (162,927 | ) |
EU Euro | | EUR | | 4,132,294 | | BUY | | 4/20/09 | | 5,575,828 | | 5,489,937 | | | (85,891 | ) |
EU Euro | | EUR | | 4,132,294 | | BUY | | 4/20/09 | | 5,575,787 | | 5,489,937 | | | (85,850 | ) |
See Accompanying Notes to Financial Statements
66
| | |
| ING INTERMEDIATE BOND FUND | | PORTFOLIO OF INVESTMENTS ASOF MARCH 31, 2009 (CONTINUED) |
| | | | | | | | | | | | | | | | |
Currency | | | | | | Buy/Sell | | Settlement
Date | | In Exchange For
USD | | Value | | Unrealized
Appreciation
(Depreciation) | |
EU Euro | | EUR | | 3,998,823 | | BUY | | 4/20/09 | | 5,466,719 | | 5,312,615 | | | (154,104 | ) |
EU Euro | | EUR | | 3,998,823 | | BUY | | 4/20/09 | | 5,466,639 | | 5,312,615 | | | (154,024 | ) |
British Pound | | GBP | | 7,414,800 | | BUY | | 4/15/09 | | 10,425,127 | | 10,639,537 | | | 214,410 | |
British Pound | | GBP | | 3,572,819 | | BUY | | 4/15/09 | | 5,029,500 | | 5,126,658 | | | 97,158 | |
British Pound | | GBP | | 3,575,542 | | BUY | | 4/15/09 | | 5,029,400 | | 5,130,564 | | | 101,164 | |
| | | | | | | | | | | | | | | | |
| | | | | | | | | | | | | | $ | (393,347 | ) |
| | | | | | | | | | | | | | | | |
| | | | | | | |
EU Euro | | EUR | | 8,120,500 | | SELL | | 4/15/09 | | 10,209,011 | | 10,788,566 | | $ | (579,555 | ) |
EU Euro | | EUR | | 8,120,500 | | SELL | | 4/15/09 | | 10,206,518 | | 10,788,566 | | | (582,048 | ) |
EU Euro | | EUR | | 8,131,117 | | SELL | | 4/20/09 | | 11,012,939 | | 10,802,552 | | | 210,387 | |
EU Euro | | EUR | | 3,998,823 | | SELL | | 4/20/09 | | 5,418,965 | | 5,312,615 | | | 106,350 | |
EU Euro | | EUR | | 4,132,294 | | SELL | | 4/20/09 | | 5,592,341 | | 5,489,937 | | | 102,404 | |
British Pound | | GBP | | 7,227,322 | | SELL | | 4/15/09 | | 10,302,186 | | 10,370,524 | | | (68,338 | ) |
British Pound | | GBP | | 7,335,839 | | SELL | | 4/15/09 | | 10,457,275 | | 10,526,236 | | | (68,961 | ) |
| | | | | | | | | | | | | | | | |
| | | | | | | | | | | | | | $ | (879,761 | ) |
| | | | | | | | | | | | | | | | |
See Accompanying Notes to Financial Statements
67
| | |
| ING CLASSIC MONEY MARKET FUND(1) | | PORTFOLIO OF INVESTMENTS ASOF MARCH 31, 2009 |
| | | | | | | | |
Principal Amount | | | | | | Value |
| | | | | | | | |
| | CERTIFICATES OF DEPOSIT: 1.3% | | | |
| $ | 5,750,000 | | @@ | | BNP Paribas,
0.410%, due 04/06/09 | | $ | 5,750,088 |
| | 11,500,000 | | @@ | | BNP Paribas,
1.461%, due 08/13/09 | | | 11,500,000 |
| | | | | | | | |
| | | | | Total Certificates of Deposit
(Cost $17,250,088) | | | 17,250,088 |
| | | | | | | | |
| | COMMERCIAL PAPER: 47.8% | | | |
| | 4,828,000 | | # | | Barton Capital, LLC,
0.350%, due 04/08/09 | | | 4,827,624 |
| | 4,500,000 | | # | | Barton Capital, LLC,
0.420%, due 04/13/09 | | | 4,499,325 |
| | 21,000,000 | | # | | Barton Capital, LLC,
0.420%, due 04/17/09 | | | 20,995,800 |
| | 7,000,000 | | | | Barton Capital, LLC,
0.510%, due 04/22/09 | | | 6,997,836 |
| | 4,000,000 | | # | | Barton Capital, LLC,
0.690%, due 06/12/09 | | | 3,994,400 |
| | 10,000,000 | | | | Cafco, LLC,
0.390%, due 04/15/09 | | | 9,998,367 |
| | 15,000,000 | | # | | Cafco, LLC,
0.440%, due 04/24/09 | | | 14,995,630 |
| | 13,000,000 | | | | Caisse Nationale des Caisses d’Epargne et de Prevoyance,
0.470%, due 04/30/09 | | | 12,994,869 |
| | 4,500,000 | | | | Caisse Nationale des Caisses d’Epargne et de Prevoyance,
0.510%, due 05/05/09 | | | 4,497,790 |
| | 19,500,000 | | # | | Ciesco, LLC,
0.400%, due 04/21/09 | | | 19,495,450 |
| | 24,000,000 | | # | | Ciesco, LLC,
0.400%, due 04/23/09 | | | 23,993,840 |
| | 22,000,000 | | # | | Concord Minutemen Capital Co., LLC,
1.800%, due 08/27/09 | | | 21,837,200 |
| | 26,500,000 | | # | | Concord Minutemen Capital Co., LLC,
2.310%, due 04/17/09 | | | 26,471,144 |
| | 20,500,000 | | # | | Crown Point Capital Co.,
1.800%, due 08/26/09 | | | 20,349,325 |
| | 27,000,000 | | # | | Crown Point Capital Co.,
2.310%, due 04/17/09 | | | 26,970,600 |
| | 12,000,000 | | # | | Danske Corporation,
0.610%, due 04/14/09 | | | 11,997,140 |
| | 17,250,000 | | | | Delaware Finance,
0.500%, due 05/29/09 | | | 17,235,826 |
| | 21,500,000 | | # | | Edison Asset Securities, LLC,
0.380%, due 04/23/09 | | | 21,494,744 |
| | 9,000,000 | | # | | Edison Asset Securities, LLC,
0.430%, due 04/29/09 | | | 8,996,850 |
| | 12,000,000 | | # | | Edison Asset Securities, LLC,
1.000%, due 08/05/09 | | | 11,958,000 |
| | 2,500,000 | | # | | Jupiter Securities Co., LLC,
0.230%, due 04/02/09 | | | 2,499,969 |
| | 20,000,000 | | # | | Jupiter Securities Co., LLC,
0.350%, due 04/08/09 | | | 19,998,444 |
| | 1,000,000 | | | | Jupiter Securities Co., LLC,
0.360%, due 04/10/09 | | | 999,900 |
| | 5,500,000 | | | | Jupiter Securities Co., LLC,
0.500%, due 04/24/09 | | | 5,498,173 |
| | | | | | | | |
Principal Amount | | | | | | Value |
| | | | | | | | |
| | COMMERCIAL PAPER: (continued) | | | |
| $ | 9,000,000 | | | | Jupiter Securities Co., LLC,
0.510%, due 05/06/09 | | $ | 8,995,450 |
| | 24,000,000 | | # | | Old Line Funding, LLC,
0.400%, due 04/20/09 | | | 23,994,680 |
| | 12,000,000 | | # | | Old Line Funding, LLC,
0.520%, due 04/21/09 | | | 11,996,333 |
| | 8,500,000 | | # | | Old Line Funding, LLC,
0.530%, due 04/22/09 | | | 8,497,273 |
| | 3,000,000 | | | | Old Line Funding, LLC,
0.590%, due 06/19/09 | | | 2,996,050 |
| | 5,200,000 | | # | | Park Avenue,
0.230%, due 04/02/09 | | | 5,199,935 |
| | 30,000,000 | | # | | Park Avenue,
0.320%, due 04/13/09 | | | 29,996,498 |
| | 8,000,000 | | # | | Park Avenue,
0.470%, due 04/16/09 | | | 7,998,333 |
| | 3,000,000 | | @@ | | Rabobank Nederland NV,
0.380%, due 04/06/09 | | | 2,999,808 |
| | 2,750,000 | | @@ | | Rabobank Nederland NV,
0.630%, due 06/29/09 | | | 2,745,649 |
| | 14,000,000 | | @@ | | Rabobank Nederland NV,
0.720%, due 05/11/09 | | | 13,988,489 |
| | 2,125,000 | | @@, # | | Rabobank Nederland NV,
1.413%, due 04/06/09 | | | 2,124,986 |
| | 6,000,000 | | | | Societe Generale,
0.600%, due 04/14/09 | | | 5,998,592 |
| | 15,000,000 | | # | | Societe Generale,
1.676%, due 09/04/09 | | | 15,000,000 |
| | 19,250,000 | | # | | Thunder Bay Funding, LLC,
0.400%, due 04/17/09 | | | 19,246,407 |
| | 6,500,000 | | | | Thunder Bay Funding, LLC,
0.420%, due 04/15/09 | | | 6,498,863 |
| | 9,000,000 | | # | | Thunder Bay Funding, LLC,
0.470%, due 04/10/09 | | | 8,998,830 |
| | 1,000,000 | | # | | Thunder Bay Funding, LLC,
0.620%, due 06/01/09 | | | 998,933 |
| | 7,000,000 | | # | | Thunder Bay Funding, LLC,
0.660%, due 06/19/09 | | | 6,989,708 |
| | 36,000,000 | | # | | Variable Funding Capital,
0.570%, due 04/22/09 | | | 35,987,400 |
| | 8,000,000 | | # | | Variable Funding Capital,
1.150%, due 08/10/09 | | | 7,966,522 |
| | 15,000,000 | | # | | Windmill Funding Corp.,
0.390%, due 04/07/09 | | | 14,998,875 |
| | 8,500,000 | | | | Windmill Funding Corp.,
0.400%, due 04/01/09 | | | 8,500,000 |
| | 15,000,000 | | | | Windmill Funding Corp.,
0.470%, due 04/16/09 | | | 14,996,875 |
| | 4,500,000 | | # | | Windmill Funding Corp.,
1.510%, due 04/17/09 | | | 4,496,800 |
| | 2,500,000 | | | | Yorktown Capital, LLC,
0.230%, due 04/02/09 | | | 2,499,969 |
| | 12,000,000 | | # | | Yorktown Capital, LLC,
0.400%, due 04/20/09 | | | 11,997,340 |
| | 26,566,000 | | | | Yorktown Capital, LLC,
0.480%, due 04/23/09 | | | 26,557,826 |
| | 8,500,000 | | # | | Yorktown Capital, LLC,
0.660%, due 05/18/09 | | | 8,492,565 |
| | | | | | | | |
| | | | | Total Commercial Paper
(Cost $645,357,235) | | | 645,357,235 |
| | | | | | | | |
See Accompanying Notes to Financial Statements
68
| | |
| ING CLASSIC MONEY MARKET FUND(1) | | PORTFOLIO OF INVESTMENTS ASOF MARCH 31, 2009 (CONTINUED) |
| | | | | | | | |
Principal Amount | | | | | | Value |
| | | | | | | | |
| | CORPORATE BONDS/NOTES: 6.6% | | | |
| $ | 4,500,000 | | # | | American Honda Finance Corp.,
4.500%, due 05/26/09 | | $ | 4,508,739 |
| | 18,500,000 | | @@, # | | Australia & New Zealand Banking Group Ltd.,
1.491%, due 09/02/09 | | | 18,500,000 |
| | 5,500,000 | | | | JPMorgan Chase & Co.,
0.571%, due 06/26/09 | | | 5,497,715 |
| | 10,900,000 | | | | Toyota Motor Credit Corp.,
0.660%, due 07/10/09 | | | 10,900,000 |
| | 4,100,000 | | | | US Bancorp.,
5.300%, due 04/28/09 | | | 4,106,312 |
| | 21,000,000 | | | | US Bank NA,
1.349%, due 08/24/09 | | | 21,000,000 |
| | 3,555,000 | | | | Wells Fargo & Co.,
3.125%, due 04/01/09 | | | 3,555,000 |
| | 8,500,000 | | | | Wells Fargo & Co.,
3.552%, due 05/01/09 | | | 8,500,354 |
| | 12,250,000 | | # | | Westpac Banking Corp., 1.506%, due 07/03/09 | | | 12,250,000 |
| | | | | | | | |
| | | | | Total Corporate Bonds/Notes
(Cost $88,818,120) | | | 88,818,120 |
| | | | | | | | |
| | U.S. GOVERNMENT AGENCY OBLIGATIONS: 13.8% |
| | 92,000,000 | | Z | | Federal Home Loan Bank, 0.700%, due 12/14/09 | | | 91,540,256 |
| | 15,000,000 | | Z | | Federal Home Loan Bank, 0.800%, due 11/18/09 | | | 14,923,000 |
| | 5,000,000 | | Z | | Federal Home Loan Bank, 0.850%, due 12/22/09 | | | 4,968,715 |
| | 6,250,000 | | | | Federal Home Loan Bank, 2.645%, due 08/07/09 | | | 6,293,394 |
| | 2,000,000 | | Z | | Federal Home Loan Mortgage Corporation, 0.570%, due 08/10/09 | | | 1,995,852 |
| | 4,000,000 | | Z | | Federal Home Loan Mortgage Corporation, 0.860%, due 01/05/10 | | | 3,973,340 |
| | 6,150,000 | | | | Federal Home Loan Mortgage Corporation, 4.875%, due 02/09/10 | | | 6,360,554 |
| | 26,000,000 | | Z | | Federal National Mortgage Association, 0.630%, due 12/01/09 | | | 25,888,506 |
| | 15,000,000 | | | | Federal National Mortgage Association, 4.625%, due 12/15/09 | | | 15,347,737 |
| | 15,000,000 | | | | Federal National Mortgage Association, 4.875%, due 04/15/09 | | | 15,010,713 |
| | | | | | | | |
| | | | | Total U.S. Government Agency Obligations
(Cost $186,302,067) | | | 186,302,067 |
| | | | | | | | |
| | U.S. TREASURY BILLS: 2.4% | | | |
| | 33,000,000 | | | | 0.620%, due 11/19/09 | | | 32,867,737 |
| | | | | | | | |
| | | | | Total U.S. Treasury Bills
(Cost $32,867,737) | | | 32,867,737 |
| | | | | | | | |
| | | | | | | | | |
Principal Amount | | | | | | | Value |
| | | | | | | | | |
| | REPURCHASE AGREEMENTS: 26.4% |
| $ | 84,000,000 | | Deutsche Bank Repurchase Agreement dated 03/25/09,
0.000%, due 04/01/09, $84,000,000 to be received upon repurchase | | | | | $ | 84,000,000 |
| | 60,000,000 | | Deutsche Bank Repurchase Agreement dated 03/26/09,
0.000%, due 04/02/09, $60,000,000 to be received upon repurchase | | | | | | 60,000,000 |
| | | Collateralized by $143,465,000 Federal National Mortgage Association, Discount Note-5.375%, Market Value $146,880,098, due 04/20/09-07/15/16^ | | | | | | |
| | 163,147,000 | | Goldman Sachs Repurchase Agreement dated 03/31/09,
0.150%, due 04/01/09, $163,147,680 to be received upon repurchase (Collateralized by $141,495,500 U.S. Treasury Obligations, 2.375%, Market Value $166,409,987, due 01/15/25) | | | | | | 163,147,000 |
| | 50,000,000 | | Morgan Stanley Repurchase Agreement dated 03/31/09,
0.200%, due 04/01/09, $50,000,278 to be received upon repurchase (Collateralized by $47,935,000 Federal Home Loan Bank, 4.000%, Market Value $51,243,847, due 09/06/13) | | | | | | 50,000,000 |
| | | | | | | | | |
| | | Total Repurchase Agreement
(Cost $357,147,000) | | | | | | 357,147,000 |
| | | | | | | | | |
| | | Total Investments in Securities
(Cost $1,327,742,247)* | | 98.3 | % | | $ | 1,327,742,247 |
| | | Other Assets and Liabilities - Net | | 1.7 | | | | 22,858,524 |
| | | | | | | | | |
| | | Net Assets | | 100.0 | % | | $ | 1,350,600,771 |
| | | | | | | | | |
(1) | All securities with a maturity date of greater than 13 months have either a variable rate, a demand feature, prerefunded, optional or mandatory put resulting in a maturity of one year or less. Rate shown reflects current rate. |
See Accompanying Notes to Financial Statements
69
| | |
| ING CLASSIC MONEY MARKET FUND(1) | | PORTFOLIO OF INVESTMENTS ASOF MARCH 31, 2009 (CONTINUED) |
| ^ | This collateral was allocated on a pro rata split basis such that sufficient collateral was applied to the respective repurchase agreements. |
| # | Securities with purchases pursuant to Rule144A or section 4(2), under the Securities Act of 1933 and may not be resold subject to that rule except to qualified institutional buyers. Unless otherwise noted, these securities have been determined to be liquid under the guidelines established by the Funds’ Board of Directors/Trustees. |
| Z | Indicates Zero Coupon Bond; rate shown reflects current effective yield. |
| * | Cost for federal income tax purposes is the same as for financial statement purposes. |
The following table summarizes the inputs used as of March 31, 2009 in determining the Fund’s investments at fair value for purposes of SFAS 157:
| | | | | | |
| | | Investments in Securities | | Other Financial Instruments* |
Level 1 — Quoted Prices | | $ | — | | $ | — |
Level 2 — Other Significant Observable Inputs | | | 1,327,742,247 | | | — |
Level 3 —Significant Unobservable Inputs | | | — | | | — |
| | | | | | |
Total | | $ | 1,327,742,247 | | $ | — |
| | | | | | |
“Fair value” for purposes of SFAS 157 is different from “fair value” as used in the 1940 Act. The former generally implies market value, and can include market quotations as a source of value, and the latter refers to determinations of value in absence of available market quotations.
Money market securities are valued using the amortized cost method, in accordance with rules under the 1940 Act. Generally, amortized cost approximates the market value of a security, but since the value is not obtained from a quoted price in an active market, such securities are reflected as Level 2.
| * | Other financial instruments may include forward foreign currency contracts, futures, swaps, and written options. Forward foreign currency contracts and futures are reported at their unrealized gain/loss at year end. Swaps and written options are reported at their market value at year end. |
See Accompanying Notes to Financial Statements
70
| | |
ING INSTITUTIONAL PRIME MONEY
MARKET FUND(1) | | PORTFOLIO OF INVESTMENTS ASOF MARCH 31, 2009 |
| | | | | | | | |
Principal
Amount | | | | | | Value |
| | | | | | | | |
| | CERTIFICATES OF DEPOSIT: 1.2% |
| $ | 9,000,000 | | @@ | | BNP Paribas,
0.410%, due 04/06/09 | | $ | 9,000,137 |
| | 5,000,000 | | @@ | | BNP Paribas,
1.461%, due 08/13/09 | | | 5,000,000 |
| | | | | | | | |
| | | | | Total Certificates of Deposit
(Cost $14,000,137) | | | 14,000,137 |
| | | | | | | | |
| | COMMERCIAL PAPER: 43.0% |
| | 2,500,000 | | # | | Barton Capital, LLC,
0.350%, due 04/08/09 | | | 2,499,806 |
| | 3,640,000 | | # | | Barton Capital, LLC,
0.420%, due 04/13/09 | | | 3,639,454 |
| | 7,110,000 | | # | | Barton Capital, LLC,
0.420%, due 04/17/09 | | | 7,108,578 |
| | 20,975,000 | | | | Barton Capital, LLC,
0.510%, due 04/22/09 | | | 20,968,515 |
| | 10,000,000 | | # | | Barton Capital, LLC,
0.690%, due 06/12/09 | | | 9,986,000 |
| | 16,000,000 | | # | | Cafco, LLC,
0.440%, due 04/24/09 | | | 15,995,017 |
| | 10,500,000 | | | | Caisse Nationale des Caisses d’Epargne et de Prevoyance,
0.470%, due 04/30/09 | | | 10,495,855 |
| | 4,000,000 | | | | Caisse Nationale des Caisses d’Epargne et de Prevoyance,
0.510%, due 05/05/09 | | | 3,998,036 |
| | 5,000,000 | | # | | Ciesco, LLC,
0.400%, due 04/21/09 | | | 4,998,833 |
| | 17,500,000 | | # | | Ciesco, LLC,
0.400%, due 04/23/09 | | | 17,495,508 |
| | 7,850,000 | | # | | Ciesco, LLC,
0.650%, due 04/01/09 | | | 7,850,000 |
| | 1,400,000 | | # | | Concord Minutemen Capital Co., LLC,
0.700%, due 04/01/09 | | | 1,400,000 |
| | 21,750,000 | | # | | Concord Minutemen Capital Co., LLC,
1.800%, due 08/27/09 | | | 21,589,050 |
| | 10,000,000 | | # | | Concord Minutemen Capital Co., LLC,
2.310%, due 04/17/09 | | | 9,989,111 |
| | 1,000,000 | | | | Crown Point Capital Co., 0.730%, due 04/07/09 | | | 999,858 |
| | 15,000,000 | | # | | Crown Point Capital Co., 1.800%, due 08/26/09 | | | 14,889,750 |
| | 16,000,000 | | # | | Crown Point Capital Co., 2.310%, due 04/17/09 | | | 15,982,578 |
| | 12,000,000 | | # | | Danske Corporation,
0.610%, due 04/14/09 | | | 11,997,140 |
| | 14,250,000 | | | | Delaware Finance,
0.500%, due 05/29/09 | | | 14,238,291 |
| | 29,000,000 | | # | | Edison Asset Securities, LLC, 0.380%, due 04/23/09 | | | 28,992,911 |
| | 5,000,000 | | # | | Edison Asset Securities, LLC, 0.430%, due 04/29/09 | | | 4,998,328 |
| | 8,000,000 | | # | | Edison Asset Securities, LLC, 1.000%, due 08/05/09 | | | 7,972,000 |
| | 21,000,000 | | # | | Jupiter Securities Co., LLC, 0.350%, due 04/08/09 | | | 20,998,367 |
| | | | | | | | |
Principal
Amount | | | | | | Value |
| | | | | | | | |
| | COMMERCIAL PAPER: (continued) |
| $ | 7,000,000 | | | | Jupiter Securities Co., LLC, 0.500%, due 04/24/09 | | $ | 6,997,674 |
| | 5,000,000 | | | | Jupiter Securities Co., LLC, 0.510%, due 05/06/09 | | | 4,997,472 |
| | 1,042,000 | | # | | Old Line Funding, LLC,
0.380%, due 04/06/09 | | | 1,041,935 |
| | 7,500,000 | | # | | Old Line Funding, LLC,
0.520%, due 04/21/09 | | | 7,497,708 |
| | 10,000,000 | | # | | Old Line Funding, LLC,
0.530%, due 04/22/09 | | | 9,996,792 |
| | 18,000,000 | | | | Old Line Funding, LLC,
0.590%, due 06/19/09 | | | 17,975,422 |
| | 20,000,000 | | # | | Park Avenue,
0.230%, due 04/02/09 | | | 19,999,750 |
| | 16,000,000 | | # | | Park Avenue,
0.470%, due 04/16/09 | | | 15,996,667 |
| | 3,750,000 | | @@ | | Rabobank Nederland NV, 0.630%, due 06/29/09 | | | 3,744,067 |
| | 10,000,000 | | @@ | | Rabobank Nederland NV, 0.720%, due 05/11/09 | | | 9,991,778 |
| | 4,275,000 | | | | Societe Generale,
0.300%, due 04/01/09 | | | 4,275,000 |
| | 2,000,000 | | | | Societe Generale,
0.600%, due 04/14/09 | | | 1,999,531 |
| | 6,000,000 | | # | | Societe Generale,
1.676%, due 09/04/09 | | | 6,000,000 |
| | 5,000,000 | | # | | Thunder Bay Funding, LLC, 0.400%, due 04/17/09 | | | 4,999,067 |
| | 3,500,000 | | | | Thunder Bay Funding, LLC, 0.420%, due 04/15/09 | | | 3,499,388 |
| | 8,000,000 | | # | | Thunder Bay Funding, LLC, 0.470%, due 04/10/09 | | | 7,998,960 |
| | 10,000,000 | | # | | Thunder Bay Funding, LLC, 0.620%, due 06/01/09 | | | 9,989,325 |
| | 10,000,000 | | # | | Thunder Bay Funding, LLC, 0.660%, due 06/19/09 | | | 9,985,297 |
| | 1,429,000 | | | | UBS AG,
0.540%, due 04/10/09 | | | 1,428,786 |
| | 34,000,000 | | # | | Variable Funding Capital, 0.570%, due 04/22/09 | | | 33,988,100 |
| | 5,000,000 | | # | | Variable Funding Capital, 1.150%, due 08/10/09 | | | 4,979,076 |
| | 8,500,000 | | | | Windmill Funding Corp., 0.400%, due 04/01/09 | | | 8,500,000 |
| | 9,500,000 | | | | Windmill Funding Corp., 0.470%, due 04/16/09 | | | 9,498,021 |
| | 17,500,000 | | # | | Windmill Funding Corp., 1.510%, due 04/17/09 | | | 17,487,556 |
| | 14,000,000 | | | | Yorktown Capital, LLC,
0.230%, due 04/02/09 | | | 13,999,825 |
| | 3,000,000 | | # | | Yorktown Capital, LLC,
0.400%, due 04/20/09 | | | 2,999,335 |
| | 1,000,000 | | | | Yorktown Capital, LLC,
0.480%, due 04/23/09 | | | 999,676 |
| | 19,000,000 | | # | | Yorktown Capital, LLC,
0.660%, due 05/18/09 | | | 18,983,380 |
| | | | | | | | |
| | | | | Total Commercial Paper
(Cost $518,932,574) | | | 518,932,574 |
| | | | | | | | |
See Accompanying Notes to Financial Statements
71
| | |
ING INSTITUTIONAL PRIME MONEY
MARKET FUND(1) | | PORTFOLIO OF INVESTMENTS ASOF MARCH 31, 2009 (CONTINUED) |
| | | | | | | | |
Principal
Amount | | | | | | Value |
| | | | | | | | |
| | CORPORATE BONDS/NOTES: 2.4% |
| $ | 2,000,000 | | # | | American Honda Finance Corp.,
4.500%, due 05/26/09 | | $ | 2,003,884 |
| | 2,500,000 | | | | JPMorgan Chase & Co.,
0.571%, due 06/26/09 | | | 2,498,961 |
| | 5,700,000 | | | | Toyota Motor Credit Corp., 0.660%, due 07/10/09 | | | 5,700,000 |
| | 1,000,000 | | | | US Bancorp.,
0.553%, due 04/28/09 | | | 999,881 |
| | 12,500,000 | | | | US Bank NA,
1.349%, due 08/24/09 | | | 12,500,000 |
| | 1,100,000 | | | | Wal-Mart Stores, Inc.,
6.875%, due 08/10/09 | | | 1,114,912 |
| | 1,000,000 | | | | Wells Fargo & Co.,
3.552%, due 05/01/09 | | | 1,000,042 |
| | 3,000,000 | | # | | Westpac Banking Corp.,
1.506%, due 07/03/09 | | | 3,000,000 |
| | | | | | | | |
| | | | | Total Corporate Bonds/Notes
(Cost $28,817,680) | | | 28,817,680 |
| | | | | | | | |
| | U.S. GOVERNMENT AGENCY OBLIGATIONS: 4.6% |
| | 3,750,000 | | Z | | Federal Home Loan Bank, 0.700%, due 12/14/09 | | | 3,731,260 |
| | 12,000,000 | | Z | | Federal Home Loan Bank, 0.800%, due 11/18/09 | | | 11,938,400 |
| | 6,000,000 | | | | Federal Home Loan Bank, 2.645%, due 08/07/09 | | | 6,041,658 |
| | 3,675,000 | | Z | | Federal Home Loan Mortgage Corporation,
0.570%, due 08/10/09 | | | 3,667,377 |
| | 2,500,000 | | Z | | Federal Home Loan Mortgage Corporation,
0.860%, due 01/05/10 | | | 2,483,338 |
| | 19,500,000 | | Z | | Federal National Mortgage Association,
0.630%, due 12/01/09 | | | 19,417,650 |
| | 8,000,000 | | | | Federal National Mortgage Association,
4.625%, due 12/15/09 | | | 8,185,460 |
| | | | | | | | |
| | | | | Total U.S. Government Agency Obligations
(Cost $55,465,143) | | | 55,465,143 |
| | | | | | | | |
| | | | | | | |
| REPURCHASE AGREEMENTS: 49.7% |
| | | | | | | |
| 75,000,000 | | Deutsche Bank Repurchase Agreement dated 03/25/09, 0.000%, due 04/01/09, $75,000,000 to be received upon repurchase | | | | | 75,000,000 |
| 462,263,000 | | Deutsche Bank Repurchase Agreement dated 03/31/09, 0.000%, due 04/01/09, $462,263,000 to be received upon repurchase | | | | | 462,263,000 |
| 62,600,000 | | Deutsche Bank Repurchase Agreement dated 03/26/09, 0.000%, due 04/02/09, $62,600,000 to be received upon repurchase | | | | | 62,600,000 |
| | Collateralized by $603,060,000 various U.S. Government Agency Obligations, Discount Note-4.000%, Market Value $611,860,780, due 02/10/10-03/27/19)^ | | | | | |
| | | | | | | |
| | Total Repurchase Agreement
(Cost $599,863,000) | | | | $ | 599,863,000 |
| | | | | | | |
| | | | | | | | | |
Principal
Amount | | | | | | | Value | |
| | | | | | | | | |
| REPURCHASE AGREEMENTS: (continued) | |
| | Total Investments in Securities
(Cost $1,217,078,534)* | | 100.9 | % | | $ | 1,217,078,534 | |
| | Other Assets and
Liabilities - Net | | (0.9 | ) | | | (11,174,174 | ) |
| | | | | | | | | |
| | Net Assets | | 100.0 | % | | $ | 1,205,904,360 | |
| | | | | | | | | |
(1) | All securities with a maturity date of greater than 13 months have either a variable rate, a demand feature, prerefunded, optional or mandatory put resulting in a maturity of one year or less. Rate shown reflects current rate. |
| ^ | This collateral was allocated on a pro rata basis such that sufficient collateral was applied to the respective repurchase agreements. |
| # | Securities with purchases pursuant to Rule144A or section 4(2), under the Securities Act of 1933 and may not be resold subject to that rule except to qualified institutional buyers. Unless otherwise noted, these securities have been determined to be liquid under the guidelines established by the Funds’ Board of Directors/Trustees. |
| Z | Indicates Zero Coupon Bond; rate shown reflects current effective yield. |
| * | Cost for federal income tax purposes is the same as for financial statement purposes. |
The following table summarizes the inputs used as of March 31, 2009 in determining the Fund’s investments at fair value for purposes of SFAS 157:
| | | | | | |
| | | Investments in Securities | | Other Financial Instruments* |
Level 1 — Quoted Prices | | $ | — | | $ | — |
Level 2 — Other Significant Observable Inputs | | | 1,217,078,534 | | | — |
Level 3 — Significant Unobservable Inputs | | | — | | | — |
| | | | | | |
Total | | $ | 1,217,078,534 | | $ | — |
| | | | | | |
“Fair value” for purposes of SFAS 157 is different from “fair value” as used in the 1940 Act. The former generally implies market value, and can include market quotations as a source of value, and the latter refers to determinations of value in absence of available market quotations.
Money market securities are valued using the amortized cost method, in accordance with rules under the 1940 Act. Generally, amortized cost approximates the market value of a security, but since the value is not obtained from a quoted price in an active market, such securities are reflected as Level 2.
| * | Other financial instruments may include forward foreign currency contracts, futures, swaps, and written options. Forward foreign currency contracts and futures are reported at their unrealized gain/loss at year end. Swaps and written options are reported at their market value at year end. |
See Accompanying Notes to Financial Statements
72
TAX INFORMATION (UNAUDITED)
Dividends paid during the year ended March 31, 2009 were as follows:
| | | | | |
Fund Name | | Type | | Per Share Amount |
| | |
ING GNMA Income Fund | | | | | |
Class A | | NII | | $ | 0.3750 |
Class B | | NII | | $ | 0.3118 |
Class C | | NII | | $ | 0.3143 |
Class I | | NII | | $ | 0.4014 |
Class Q | | NII | | $ | 0.3807 |
Class W | | NII | | $ | 0.3989 |
| | |
ING High Yield Bond Fund | | | | | |
Class A | | NII | | $ | 0.5409 |
Class B | | NII | | $ | 0.4889 |
Class C | | NII | | $ | 0.4908 |
Class I* | | NII | | $ | 0.4928 |
Class I* | | ROC | | $ | 0.0912 |
All Classes, except Class I | | ROC | | $ | 0.1332 |
| | |
ING Intermediate Bond Fund | | | | | |
Class A | | NII | | $ | 0.4506 |
Class B | | NII | | $ | 0.3779 |
Class C | | NII | | $ | 0.3782 |
Class I | | NII | | $ | 0.4834 |
Class O | | NII | | $ | 0.4509 |
Class R | | NII | | $ | 0.4288 |
Class W | | NII | | $ | 0.5065 |
All Classes | | STCG | | $ | 0.2193 |
| | |
ING Classic Money Market Fund | | | | | |
Class A | | NII | | $ | 0.0142 |
Class B | | NII | | $ | 0.0092 |
Class C | | NII | | $ | 0.0091 |
| | |
ING Institutional Prime Money Market Fund | | | | | |
Class I | | NII | | $ | 0.0188 |
Class IS | | NII | | $ | 0.0204 |
NII - Net investment income
ROC - Return of capital
STCG - Short-term capital gain
| * | Commenced operations July 31, 2008. |
Of the ordinary distributions made during the year ended March 31, 2009, the following percentage qualifies for the dividends received deduction (DRD) available to corporate shareholders:
| | | |
| |
ING Intermediate Bond Fund | | 0.49 | % |
For the year ended March 31, 2009, the following percentage of net investment income dividends paid by the Funds is designated as qualifying dividend income (QDI) subject to reduced income tax rates for individuals:
| | | |
| |
ING Intermediate Bond Fund | | 0.91 | % |
73
TAX INFORMATION (UNAUDITED) (CONTINUED)
Pursuant to Internal Revenue Code Section 871(k)(1), the Funds designate the following percentages of net investment income distributions as interest-related dividends:
| | | |
| |
ING GNMA Income Fund | | 98.25 | % |
| |
ING High Yield Bond Fund | | 99.50 | % |
| |
ING Intermediate Bond Fund | | 78.49 | % |
| |
ING Classic Money Market Fund | | 100.00 | % |
| |
ING Institutional Prime Money Market Fund | | 100.00 | % |
ING Intermediate Bond Fund designates 100% of its short-term capital gain distribution as short-term capital gain dividends as defined in Internal Revenue Code Section 871(k)(2).
Above figures may differ from those cited elsewhere in this report due to differences in the calculation of income and gains under U.S. generally accepted accounting principles (book) purposes and Internal Revenue Service (tax) purposes.
Shareholders are strongly advised to consult their own tax advisers with respect to the tax consequences of their investments in the Funds. In January, shareholders, excluding corporate shareholders, receive an IRS 1099-DIV regarding the federal tax status of the dividends and distributions they received in the calendar year.
74
TRUSTEE AND OFFICER INFORMATION (UNAUDITED)
The business and affairs of the Trustees are managed under the direction of the Trust’s Board. A Trustee who is not an interested person of the Trust, as defined in the 1940 Act, is an independent trustee (“Independent Trustee”). The Trustees and Officers of the Trust are listed below. The Statement of Additional Information includes additional information about Trustees of the Trust and is available, without charge, upon request at (800) 992-0180.
| | | | | | | | | | |
Name, Address and Age | | Position(s) Held With the Trust | | Term of Office and Length of Time Served(1) | | Principal Occupation(s) - During the Past 5 Years | | Number of Funds in Fund Complex Overseen by Trustee(2) | | Other Trusteeships Held by Trustee |
| | | | | |
Colleen D. Baldwin 7337 E. Doubletree Ranch Rd. Scottsdale, Arizona 85258 Age: 48 | | Trustee | | November 2007 - Present | | Consultant, Glantuam Partners, LLC (January 2009 - Present); President, National Charity League/Canaan Parish Board (June 2008 - Present) and Consultant (January 2005 - Present). Formerly, Chief Operating Officer, Ivy Asset Management Group (April 2002 - October 2004) | | 158 | | None. |
| | | | | |
John V. Boyer(4) 7337 E. Doubletree Ranch Rd. Scottsdale, Arizona 85258 Age: 55 | | Trustee | | January 2005 - Present | | President, Bechtler Arts Foundation (January 2008 - Present). Formerly, Consultant (July 2007 - February 2008); President and Chief Executive Officer, Franklin and Eleanor Roosevelt Institute (March 2006 - - July 2007); and Executive Director, The Mark Twain House & Museum (September 1989 - March 2006). | | 158 | | None. |
| | | | | |
Patricia W. Chadwick 7337 E. Doubletree Ranch Rd. Scottsdale, Arizona 85258 Age: 60 | | Trustee | | January 2006 - Present | | Consultant and President of self-owned company, Ravengate Partners LLC (January 2000 - Present). | | 158 | | Wisconsin Energy Corporation (June 2006 - Present). |
| | | | | |
Peter S. Drotch 7337 E. Doubletree Ranch Rd. Scottsdale, Arizona 85258 Age: 67 | | Trustee | | November 2007 - Present | | Retired partner, PricewaterhouseCoopers, LLP. | | 158 | | First Marblehead Corporation (September 2003 - Present). |
| | | | | |
J. Michael Earley 7337 E. Doubletree Ranch Rd. Scottsdale, Arizona 85258 Age: 63 | | Trustee | | February 2002 - Present | | Retired. Formerly, President and Chief Executive Officer, Bankers Trust Company, N.A., Des Moines (June 1992 - December 2008). | | 158 | | Bankers Trust Company, N.A., Des Moines (June 1992 - Present) and Midamerica Financial Corporation (December 2002 - Present). |
| | | | | |
Patrick W. Kenny 7337 E. Doubletree Ranch Rd. Scottsdale, Arizona 85258 Age: 66 | | Trustee | | January 2005 - Present | | President and Chief Executive Officer, International Insurance Society (June 2001 - Present). | | 158 | | Assured Guaranty Ltd. (April 2004 - Present) and Odyssey Re Holdings Corp (November 2006 - Present). |
| | | | | |
Sheryl K. Pressler 7337 E. Doubletree Ranch Rd. Scottsdale, Arizona 85258 Age: 58 | | Trustee | | January 2006 - Present | | Consultant (May 2001 - Present). | | 158 | | Stillwater Mining Company (May 2002 - Present). |
| | | | | |
Roger B. Vincent 7337 E. Doubletree Ranch Rd. Scottsdale, Arizona 85258 Age: 63 | | Chairman and Trustee | | February 2002 - Present | | President, Springwell Corporation (March 1989 - Present). | | 158 | | UGI Corporation (February 2006 - Present) and UGI Utilities, Inc. (February 2006 - Present). |
| | | | | |
Interested Trustees | | | | | | | | | | |
| | | | | |
Robert W. Crispin(5) 7337 E. Doubletree Ranch Rd. Scottsdale, Arizona 85258 Age: 61 | | Trustee | | November 2007- Present | | Retired. Chairman and Chief Executive Officer, ING Investment Management Co. (July 2001 - December 2007). | | 158 | | ING Canada Inc. (December 2004 - Present) and ING Bank, fsb (June 2001 - Present). |
75
TRUSTEE AND OFFICER INFORMATION (UNAUDITED) (CONTINUED)
| | | | | | | | | | |
Name, Address and Age | | Position(s) Held With the Trust | | Term of Office and Length of Time Served(1) | | Principal Occupation(s) - During the Past 5 Years | | Number of Funds in Fund Complex Overseen by Trustee(2) | | Other Trusteeships Held by Trustee |
| | | | | |
Shaun P. Mathews(3)(5) 7337 E. Doubletree Ranch Rd. Scottsdale, Arizona 85258 Age: 53 | | Trustee | | November 2007 - Present | | President and Chief Executive Officer, ING Investments, LLC(6) (November 2006 - Present). Formerly, President, ING Mutual Funds and Investment Products (November 2004 - November 2006); and Chief Marketing Officer, ING USFS (April 2002 - October 2004) | | 196 | | ING Services Holding Company, Inc. (May 2000 - Present); Southland Life Insurance Company (June 2002 - Present); and ING Capital Corporation, LLC, ING Funds Distributor, LLC(7), ING Funds Services, LLC(8), ING Investments, LLC(6) and ING Pilgrim Funding, Inc. (December 2005 - Present). |
(1) | | Trustees serve until their successors are duly elected and qualified. The tenure of each Trustee is subject to the Board’s retirement policy, which states that each Independent Trustee shall retire from service as a Trustee at the conclusion of the first regularly scheduled meeting of the Board that is held after (a) the Trustee reaches the age of 70, if that Trustee qualifies for a retirement benefit as discussed in the board’s retirement policy; or (b) the Trustee reaches the age of 72 or has served as a Trustee for 15 years, whichever comes first, if that Trustee does not qualify for the retirement benefit. A unanimous vote of the Board may extend the retirement date of a Trustee for up to one year. An extension may be permitted if the retirement would trigger a requirement to hold a meeting of shareholders of the Fund under applicable law, whether for purposes of appointing a successor to the Trustee or if otherwise necessary under applicable law, in which case the extension would apply until such time as the shareholder meeting can be held or is no longer needed. |
(2) | | For the purposes of this table (except for Mr. Mathews),”Fund Complex” means the following investment companies: ING Asia Pacific High Dividend Equity Income Fund, ING Equity Trust; ING Funds Trust; ING Global Equity Dividend and Premium Opportunity Fund; ING Global Advantage and Premium Opportunity Fund; ING International High Dividend Equity Income Fund; ING Investors Trust; ING Mayflower Trust; ING Mutual Funds; ING Prime Rate Trust; ING Risk Managed Natural Resources Fund; ING Senior Income Fund; ING Separate Portfolios Trust; ING Variable Insurance Trust; ING Variable Products Trust; and ING Partners, Inc. |
(3) | | For Mr. Mathews, the Fund Complex also includes the following investment companies: ING Series Fund, Inc.; ING Strategic Allocation Portfolios, Inc.; ING Variable Funds; ING Variable Portfolios, Inc.; ING VP Balanced Portfolio, Inc.; ING VP Intermediate Bond Portfolio; and ING VP Money Market Portfolio. |
(4) | | Mr. Boyer held a seat on the Board of Directors of The Mark Twain House & Museum from September 1989 to November 2005. ING Groep N.V. makes non-material, charitable contributions to The Mark Twain House & Museum. |
(5) | | Messrs. Mathews and Crispin are deemed to be “interested persons” of the Fund as defined in the 1940 Act because of their relationship with ING Groep, N.V., the parent corporation of the Manager, ING Investment Manager. |
(6) | | ING Investments, LLC was previously named ING Pilgrim Investments, LLC. ING Pilgrim Investments, LLC is the successor in interest to ING Pilgrim Investments, Inc., which was previously known as Pilgrim Investments, Inc. and before that was known as Pilgrim America Investments, Inc. |
(7) | | ING Funds Distributor, LLC is the successor in interest to ING Funds Distributor, Inc., which was previously known as ING Pilgrim Securities, Inc., and before that was known as Pilgrim Securities, Inc., and before that was known as Pilgrim America Securities, Inc. |
(8) | | ING Funds Services, LLC was previously named ING Pilgrim Group, LLC. ING Pilgrim Group, LLC is the successor in interest to ING Pilgrim Group, Inc., which was previously known as Pilgrim Group, Inc. and before that was known as Pilgrim America Group, Inc. |
76
TRUSTEE AND OFFICER INFORMATION (UNAUDITED) (CONTINUED)
| | | | | | |
Name, Address and Age | | Position(s) Held With the Trust | | Term of Office and Length of Time Served(1) | | Principal Occupation(s) - during the Past 5 Years |
| | | |
Shaun P. Mathews(5) 7337 East Doubletree Ranch Rd. Scottsdale, Arizona 85258 Age: 53 | | President and Chief Executive Officer | | November 2006 - Present | | President and Chief Executive Officer, ING Investments, LLC (November 2006 - Present). Formerly, President, ING Mutual Funds and Investment Products (November 2004 - November 2006); and Chief Marketing Officer, ING USFS (April 2002 - October 2004). |
| | | |
Michael J. Roland 7337 East Doubletree Ranch Rd. Scottsdale, Arizona 85258 Age: 50 | | Executive Vice President | | February 2002 - Present | | Head of Mutual Fund Platform (February 2007 - Present) and Executive Vice President, ING Investments, LLC(2) and ING Funds Services, LLC(3) (December 2001 - Present). Formerly, Executive Vice President, Head of Product Management (January 2005 - January 2007); Chief Compliance Officer, ING Investments, LLC(2) and Directed Services LLC(6) (October 2004) December 2005); and Chief Financial Officer and Treasurer, ING Investments, LLC(2) (December 2001 - March 2005). |
| | | |
Stanley D. Vyner 230 Park Avenue New York, New York 10169 Age: 58 | | Executive Vice President | | October 2000 - Present | | Executive Vice President, ING Investments, LLC(2) (July 2000 - Present) and Chief Investment Risk Officer, ING Investments, LLC(2) (January 2003 - Present). |
| | | |
Joseph M. O’Donnell 7337 East Doubletree Ranch Rd. Scottsdale, Arizona 85258 Age: 53 | | Executive Vice President and Chief Compliance Officer | | March 2006 - Present November 2004 - Present | | Chief Compliance Officer of the ING Funds (November 2004 - Present) and Executive Vice President of the ING Funds (March 2006 - Present). Formerly, Chief Compliance Officer of ING Investments, LLC(2) (March 2006 - July 2008); Investment Advisor Chief Compliance Officer, Directed Services LLC(6) (March 2006 - July 2008) ING Life Insurance and Annuity Company (March 2006 - December 2006); and Vice President, Chief Legal Counsel, Chief Compliance Officer and Secretary of Atlas Securities, Inc., Atlas Advisers, Inc. and Atlas Funds (October 2001 - October 2004). |
| | | |
Todd Modic 7337 East Doubletree Ranch Rd. Scottsdale, Arizona 85258 Age: 41 | | Senior Vice President, Chief/Principal Financial Officer and Assistant Secretary | | March 2005 - Present | | Senior Vice President, ING Funds Services, LLC(3) (March 2005 - Present). Formerly, Vice President, ING Funds Services, LLC(3) (September 2002 - March 2005). |
| | | |
Kimberly A. Anderson 7337 East Doubletree Ranch Rd. Scottsdale, Arizona 85258 Age: 44 | | Senior Vice President | | November 2003 - Present | | Senior Vice President, ING Investments, LLC(2) (October 2003 - Present). |
| | | |
Robert Terris 7337 East Doubletree Ranch Rd. Scottsdale, Arizona 85258 Age: 38 | | Senior Vice President | | May 2006 - Present | | Senior Vice President, Head of Division Operations, ING Funds Services, LLC(3) (May 2006 - Present). Formerly, Vice President of Administration, ING Funds Services, LLC(3) (October 2001 - March 2006). |
| | | |
Ernest J. C’DeBaca 7337 East Doubletree Ranch Rd. Scottsdale, Arizona 85258 Age: 39 | | Senior Vice President | | May 2006 - Present | | Chief Compliance Officer, ING Investments, LLC(2) (July 2008 - Present); Investment Advisor Chief Compliance Officer, Directed Services LLC(6) (July 2008 - Present); Head of Retail Compliance, ING Funds Distributor, LLC(4) and ING Funds Services, LLC(3), (July 2008 - Present); and Senior Vice President, ING Investments, LLC(2) (December 2006 - Present), ING Funds Services, LLC(3) (April 2006 - Present), ING Funds Distributor, LLC(4) (July 2008 - Present), and Directed Services LLC(6) (July 2008 - Present). Formerly, Counsel, ING Americas, U.S. Legal Services (January 2004 - March 2006). |
| | | |
Robyn L. Ichilov 7337 East Doubletree Ranch Rd. Scottsdale, Arizona 85258 Age: 41 | | Vice President and Treasurer | | October 2000 - Present March 2001 - Present | | Vice President and Treasurer, ING Funds Services, LLC(3) (November 1995 - Present) and ING Investments, LLC(2) (August 1997 - Present). |
| | | |
Lauren D. Bensinger 7337 East Doubletree Ranch Rd. Scottsdale, Arizona 85258 Age: 55 | | Vice President | | February 2003 - Present | | Vice President and Chief Compliance Officer, ING Funds Distributor, LLC(4) (August 1995 - Present); Vice President, ING Investments, LLC(2) and ING Funds Services, LLC(3) (February 1996 - Present); and Director of Compliance, ING Investments, LLC(2) (October 2004 - Present). Formerly, Chief Compliance Officer, ING Investments, LLC(2) (October 2001 - October 2004). |
77
TRUSTEE AND OFFICER INFORMATION (UNAUDITED) (CONTINUED)
| | | | | | |
Name, Address and Age | | Position(s) Held With the Trust | | Term of Office and Length of Time Served(1) | | Principal Occupation(s) - during the Past 5 Years |
| | | |
William Evans 10 State House Square Hartford, Connecticut 06103 Age: 36 | | Vice President | | September 2007 - Present | | Vice President, Head of Mutual Fund Advisory Group (April 2007 - Present). Formerly, Vice President, U.S. Mutual Funds and Investment Products (May 2005 - April 2007) and Senior Fund Analyst, U.S. Mutual Funds and Investment Products (May 2002 - May 2005). |
| | | |
Maria M. Anderson 7337 East Doubletree Ranch Rd. Scottsdale, Arizona 85258 Age: 50 | | Vice President | | September 2004 - Present | | Vice President, ING Funds Services, LLC(3) (September 2004 - Present). Formerly, Assistant Vice President, ING Funds Services, LLC(3) (October 2001 - September 2004). |
| | | |
Denise Lewis 7337 East Doubletree Ranch Rd. Scottsdale, Arizona 85258 Age: 45 | | Vice President | | January 2007 - Present | | Vice President, ING Funds Services, LLC (December 2006 - Present). Formerly, Senior Vice President, UMB Investment Services Group, LLC (November 2003 - December 2006). |
| | | |
Kimberly K. Springer 7337 East Doubletree Ranch Rd. Scottsdale, Arizona 85258 Age: 51 | | Vice President | | March 2006 - Present | | Vice President, ING Funds Services, LLC(3) (March 2006 - Present). Formerly, Assistant Vice President, ING Funds Services, LLC(3) (August 2004 - March 2006) and Manager, Registration Statements, ING Funds Services, LLC(3) (May 2003 - August 2004). |
| | | |
Susan P. Kinens 7337 East Doubletree Ranch Rd. Scottsdale, Arizona 85258 Age: 32 | | Assistant Vice President | | February 2003 - Present | | Assistant Vice President, ING Funds Services, LLC(3) (December 2002 - Present). |
| | | |
Craig Wheeler 7337 East Doubletree Ranch Rd. Scottsdale, Arizona 85258 Age: 40 | | Assistant Vice President | | May 2008 - Present | | Assistant Vice President - Director of Tax, ING Funds Services (March 2008 - Present). Formerly, Tax Manager, ING Funds Services (March 2005 - March 2008); Tax Senior, ING Funds Services (January 2004 - March 2005). |
| | | |
Huey P. Falgout, Jr. 7337 East Doubletree Ranch Rd. Scottsdale, Arizona 85258 Age: 45 | | Secretary (Unified) Assistant Secretary (Aetna) | | August 2003 - Present | | Chief Counsel, ING Americas, U.S. Legal Services (September 2003 - Present). |
| | | |
Theresa K. Kelety 7337 East Doubletree Ranch Rd. Scottsdale, Arizona 85258 Age: 46 | | Assistant Secretary (Unified) Secretary (Aetna) | | August 2003 - Present | | Senior Counsel, ING Americas, U.S. Legal Services (April 2008 - Present). Formerly, Counsel, ING Americas, U.S. Legal Services (April 2003 - April 2008). |
| | | |
Kathleen Nichols 7337 East Doubletree Ranch Rd. Scottsdale, Arizona 85258 Age: 33 | | Assistant Secretary | | May 2008 - Present | | Counsel, ING Americas, U.S. Legal Services (February 2008 - Present). Formerly, Associate, Ropes & Gray LLP (September 2005 - February 2008) |
(1) | | The officers hold office until the next annual meeting of the Trustees and until their successors shall have been elected and qualified. |
(2) | | ING Investments, LLC was previously named ING Pilgrim Investments, LLC. ING Pilgrim Investments, LLC is the sucessor in interest to ING Pilgrim Investments, Inc., which was previously known as Pilgrim Investments, Inc. and before that was known as Pilgrim America Investments, Inc. |
(3) | | ING Funds Services, LLC was previously named ING Pilgrim Group, LLC. ING Pilgrim Group, LLC is the successor in interest to ING Pilgrim Group, Inc., which was previously known as Pilgrim Group, Inc. and before that was known as Pilgrim America Group, Inc. |
(4) | | ING Funds Distributor, LLC is the successor in interest to ING Funds Distributor, Inc., which was previously known as ING Pilgrim Securities, Inc., and before that was known as Pilgrim Securities, Inc., and before that was known as Pilgrim America Securities, Inc. |
(5) | | Mr. Mathews commenced services as CEO and President of the ING Funds on November 11, 2006. |
(6) | | Directed Services LLC is the successor in interest to Directed Services, Inc. |
78
ADVISORY CONTRACT APPROVAL DISCUSSION (UNAUDITED)
BOARD CONSIDERATION AND RE-APPROVAL OF INVESTMENT ADVISORY AND SUB-ADVISORY CONTRACTS
Section 15(c) of the Investment Company Act of 1940, as amended (the “1940 Act”) provides that, after an initial period, the Funds’ existing investment advisory and sub-advisory contracts will remain in effect only if the Board of Trustees (the “Board”) of ING Funds Trust (the “Trust”), including a majority of Board members who have no direct or indirect interest in the advisory and sub-advisory contracts, and who are not “interested persons” of the Funds, as such term is defined under the 1940 Act (the “Independent Trustees”), annually review and approve them. Thus, at a meeting held on November 14, 2008, the Board, including a majority of the Independent Trustees, considered whether to renew the investment advisory contracts (the “Advisory Contracts”) between ING Investments, LLC (the “Adviser”) and the Funds and the sub-advisory contracts (“Sub-Advisory Contracts”) with ING Investment Management Co., the sub-adviser to each Fund (the “Sub-Adviser”).
The Independent Trustees also held separate meetings on October 24 and November 12, 2008 to consider the renewal of the Advisory Contracts and Sub-Advisory Contracts. As a result, subsequent references herein to factors considered and determinations made by the Independent Trustees include, as applicable, factors considered and determinations made on those earlier dates by the Independent Trustees.
At its November 14, 2008 meeting, the Board voted to renew the Advisory and Sub-Advisory Contracts for the Funds. In reaching these decisions, the Board took into account information furnished to it throughout the year at regular meetings of the Board and the Board’s committees, as well as information prepared specifically in connection with the annual renewal process. Determinations by the Independent Trustees also took into account various factors that they believed, in light of the legal advice furnished to them by K&L Gates LLP (“K&L Gates”), their independent legal counsel, and their own business judgment, to be relevant. Further, while the Advisory Contracts and Sub-Advisory Contracts for all the Funds were considered at the same Board meeting, the Trustees considered each Fund’s advisory and sub-advisory relationships separately.
Provided below is an overview of the Board’s contract approval process in general, as well as a discussion of certain specific factors that the Board considered at its renewal meeting. While the Board gave its attention to
the information furnished, at its request, that was most relevant to its considerations, discussed below are a number of the primary factors relevant to the Board’s consideration as to whether to renew the Advisory and Sub-Advisory Contracts for the one-year period ending November 30, 2009. Each Board member may have accorded different weight to the various factors in reaching his or her conclusions with respect to each Fund’s advisory and sub-advisory arrangements.
Overview of the Contract Renewal and Approval Process
Several years ago, the Independent Trustees instituted a revised process by which they seek and consider relevant information when they decide whether to approve new or existing advisory and sub-advisory arrangements for the investment companies in the ING Funds complex under their jurisdiction, including the Funds’ existing Advisory and Sub-Advisory Contracts. Among other actions, the Independent Trustees: retained the services of independent consultants with experience in the mutual fund industry to assist the Independent Trustees in working with the personnel employed by the Adviser or its affiliates who administer the Funds (“Management”) to identify the types of information presented to the Board to inform its deliberations with respect to advisory and sub-advisory relationships and to help evaluate that information; established a specific format in which certain requested information is provided to the Board; and determined the process for reviewing such information in connection with Advisory and Sub-Advisory Contract renewals and approvals. The end result was an enhanced process which is currently employed by the Independent Trustees to review and analyze information in connection with their annual renewal of the ING Funds’ advisory and sub-advisory contracts, as well as their review and approval of new advisory relationships.
Since the current renewal and approval process was first implemented, the Board’s membership has changed substantially through periodic retirements of some Trustees and the appointment and election of new Trustees. In addition, throughout this period the Independent Trustees have reviewed and refined the renewal and approval process at least annually. The Board also established a Contracts Committee and two Investment Review Committees, including the International/Balanced/Fixed Income Funds Investment Review Committee (the “I/B/F IRC”). Among other matters, the Contracts Committee provides oversight with respect to the contracts renewal process, and each
79
ADVISORY CONTRACT APPROVAL DISCUSSION (UNAUDITED) (CONTINUED)
Fund is assigned to the I/B/F IRC, which provides oversight regarding, among other matters, investment performance.
The type and format of the information provided to the Board or to legal counsel for the Independent Trustees in connection with the contract approval and renewal process has been codified in the Funds’ 15(c) Methodology Guide. This Guide was developed under the direction of the Independent Trustees and sets out a blueprint pursuant to which the Independent Trustees request certain information that they deem important to facilitate an informed review in connection with initial and annual approvals of advisory and sub-advisory contracts.
Management provides certain of the information requested by the 15(c) Methodology Guide in Fund Analysis and Comparison Tables (“FACT sheets”) prior to the Independent Trustees’ review of advisory and sub-advisory arrangements (including the Funds’ Advisory and Sub-Advisory Contracts). The Independent Trustees previously retained an independent firm to verify and test the accuracy of certain FACT sheet data for a representative sample of funds in the ING Funds complex. In addition, in 2007 and 2008, the Contracts Committee employed the services of an independent consultant to assist in its review and analysis of, among other matters, the 15(c) Methodology Guide, the content and format of the FACT sheets, and proposed selected peer groups of investment companies (“SPGs”) to be used by the Funds for certain comparison purposes during the renewal process.
As part of an ongoing process, the Contracts Committee recommends or considers recommendations from Management for refinements to the 15(c) Methodology Guide and other aspects of the review process, and the Board’s I/B/F IRC review benchmarks used to assess the performance of the funds in the ING Funds complex. The Investment Review Committees may apply a heightened level of scrutiny in cases where performance has lagged an ING Fund’s relevant benchmark and/or SPG.
The Board employed its process for reviewing contracts when considering the renewals of the Funds’ Advisory and Sub-Advisory Contracts that would be effective through November 30, 2009. Set forth below is a discussion of many of the Board’s primary considerations and conclusions resulting from this process.
Nature, Extent and Quality of Service
In determining whether to approve the Advisory and Sub-Advisory Contracts for the Funds for the year
ending November 30, 2009, the Independent Trustees received and evaluated such information as they deemed necessary regarding the nature, extent and quality of services provided to the Funds by the Adviser and Sub-Adviser. This included information regarding the Adviser and Sub-Adviser provided throughout the year at regular meetings of the Board and its committees, as well as information furnished in connection with the contract renewal meetings.
The materials requested by and provided to the Board and/or to K&L Gates prior to the November 14, 2008 Board meeting included, among other information, the following items for each Fund: (1) FACT sheets that provided information regarding the performance and expenses of the Fund and other similarly managed funds in its SPG, as well as information regarding the Fund’s investment portfolio, objective and strategies; (2) reports providing risk and attribution analyses of the Fund; (3) the 15(c) Methodology Guide, which describes how the FACT sheets were prepared, including the manner in which each Fund’s benchmark and SPG were selected and how profitability was determined; (4) responses from the Adviser and Sub-Adviser to a series of questions posed by K&L Gates on behalf of the Trustees; (5) copies of the forms of Advisory and Sub-Advisory Contracts; (6) copies of the Forms ADV for the Adviser and Sub-Adviser; (7) financial statements for the Adviser and Sub-Adviser; (8) a draft of a narrative summary addressing key factors the Board customarily considers in evaluating the renewals of the ING Funds’ (including the Funds’) advisory contracts and sub-advisory contracts, including a written analysis for each Fund of how performance, fees and expenses compare to its SPG and/or designated benchmark; (9) independent analyses of Fund performance by the Trust’s Chief Investment Risk Officer; (10) information regarding net asset flows into and out of the Fund; and (11) other information relevant to the Board’s evaluations.
For each Fund, except for ING Institutional Prime Money Market Fund, Class A shares were used for purposes of certain comparisons to the funds in its SPG. Class A shares generally were selected so that the Fund’s share class with the longest performance history was compared to the analogous class of shares for each fund in its SPG. ING Institutional Prime Money Market Fund has only one class of shares available and these were used for purposes of comparison. The mutual funds included in the Funds’ SPGs were selected based upon criteria designed to mirror the Fund share class being compared to the SPG.
80
ADVISORY CONTRACT APPROVAL DISCUSSION (UNAUDITED) (CONTINUED)
In arriving at its conclusions with respect to the Advisory Contracts, the Board was mindful of the “manager-of-managers” platform of the ING Funds that has been developed by Management. The Board also considered the techniques that the Adviser has developed, at the Board’s direction, to screen and perform due diligence on the Sub-Adviser that is recommended to the Board to manage the investment portfolios of the funds in the ING Funds complex. The Board noted the resources that the Adviser has committed to the Board and the I/B/F IRC to assist the Board and the I/B/F IRC with their assessment of the investment performance of the Funds on an ongoing basis throughout the year. This includes the appointment of a Chief Investment Risk Officer and his staff, who report directly to the Board and who have developed attribution analyses and other metrics used by the Board’s Investment Review Committees to analyze the key factors underlying investment performance for the funds in the ING Funds complex.
The Board also noted the techniques used by the Adviser to monitor the performance of the Sub-Adviser and the proactive approach that the Adviser, working in cooperation with the I/B/F IRC, has taken to advocate or recommend, when it believed appropriate, changes designed to assist in improving the Funds’ performance.
In considering the Funds’ Advisory Contracts, the Board also considered the extent of benefits provided to the Funds’ shareholders, beyond advisory services, from being part of the ING family of funds. This includes, in most cases, the right to exchange or transfer investments, without a sales charge, between the same class of shares of such funds or among ING Funds available on a product platform, and the wide range of ING Funds available for exchange or transfer. The Board also took into account the Adviser’s efforts in recent years to reduce the expenses of the ING Funds through renegotiated arrangements with the ING Funds’ service providers.
Further, the Board received periodic reports showing that the investment policies and restrictions for each Fund were consistently complied with and other periodic reports covering matters such as compliance by Adviser and Sub-Adviser personnel with codes of ethics. The Board considered reports from the Trust’s Chief Compliance Officer (“CCO”) evaluating whether the regulatory compliance systems and procedures of the Adviser and Sub-Adviser are reasonably designed to assure compliance with the federal securities laws, including those related to, among others, late trading and market timing, best execution, fair value pricing,
proxy voting and trade allocation practices. The Board also took into account the CCO’s annual and periodic reports and recommendations with respect to service provider compliance programs. In this regard, the Board also considered the policies and procedures developed by the CCO in consultation with the Board’s Compliance Committee that guide the CCO’s compliance oversight function.
The Board reviewed the level of staffing, quality and experience of each Fund’s portfolio management team. The Board took into account the respective resources and reputations of the Adviser and Sub-Adviser, and evaluated the ability of the Adviser and Sub-Adviser to attract and retain qualified investment advisory personnel. The Board also considered the adequacy of the resources committed to the Funds (and other relevant funds in the ING Funds complex) by the Adviser and Sub-Adviser, and whether those resources are commensurate with the needs of the Funds and are sufficient to sustain appropriate levels of performance and compliance needs.
Based on their deliberations and the materials presented to them, the Board concluded that the advisory and related services provided by the Adviser and Sub-Adviser are appropriate in light of the Funds’ operations, the competitive landscape of the investment company business, and investor needs, and that the nature and quality of the overall services provided by the Adviser and Sub-Adviser were appropriate.
Fund Performance
In assessing advisory and sub-advisory relationships, the Board placed emphasis on the net investment returns of each Fund. While the Board considered the performance reports and discussions with portfolio managers at Board and committee meetings during the year, particular attention in assessing performance was given to the FACT sheets furnished in connection with the renewal process. The FACT sheet prepared for each Fund included its investment performance compared to the Fund’s Morningstar category median and/or Lipper category median, SPG and primary benchmark. The FACT sheet performance data was as of June 30, 2008. In addition, the Board also considered at its November 14, 2008 meeting certain additional data regarding performance and Fund asset levels as of October 31, 2008. The Board’s findings specific to each Fund’s performance are discussed under “Fund-by-Fund Analysis” below.
81
ADVISORY CONTRACT APPROVAL DISCUSSION (UNAUDITED) (CONTINUED)
Economies of Scale
When evaluating the reasonableness of advisory fee rates, the Board also considered whether economies of scale will be realized by the Adviser and Sub-Adviser as a Fund grows larger and the extent to which any such economies are reflected in contractual fee rates. In this regard, the Board noted any breakpoints in advisory fee schedules that will result in a lower advisory fee rate when a Fund achieves sufficient asset levels to receive a breakpoint discount. In the case of sub-advisory fees, the Board considered that breakpoints would inure to the benefit of the Adviser, except to the extent that there are corresponding advisory fee breakpoints or waivers. For a Fund that did not have advisory fee breakpoints, but did benefit from waivers or reimbursements of advisory or other fees, the Board also considered the extent to which economies of scale could be realized through waivers, reimbursements or expense reductions.
In evaluating economies of scale, the Independent Trustees also considered prior periodic management reports and industry information on this topic, and the Independent Trustees who were Board members at that time also considered a November 2006 evaluation and analysis presented to them by an independent consultant regarding fee breakpoint arrangements and economies of scale.
The Board also considered that the Funds have experienced material declines in assets, especially during October 2008, due to general market declines precipitated by the credit crises and other generally adverse market developments. As a result of this asset decline, the Board considered that there were fewer opportunities to realize economies of scale.
Information Regarding Services to Other Clients
The Board requested and considered information regarding the nature of services and fee rates offered by the Adviser and Sub-Adviser to other clients, including other registered investment companies and institutional accounts. When fee rates offered to other clients differed materially from those charged to the Funds, the Board considered any underlying rationale provided by the Adviser or Sub-Adviser for these differences. The Board also noted that the fee rates charged to the Funds and other institutional clients of the Adviser or a Sub-Adviser (including other investment companies) may differ materially due to, among other reasons: differences in services; different regulatory requirements associated with registered
investment companies, such as the Funds, as compared to non-registered investment company clients; market differences in fee rates that existed when a Fund first was organized; differences in the original sponsors of Funds that now are managed by the Adviser; investment capacity constraints that existed when certain contracts were first agreed upon or that might exist at present; and different pricing structures that are necessary to be competitive in different marketing channels.
Fee Rates and Profitability
The Board reviewed and considered each contractual investment advisory fee rate, combined with the administrative fee rate, payable by each Fund to the Adviser. The Board also considered the contractual sub-advisory fee rate payable by the Adviser to the Sub-Adviser for sub-advisory services for each Fund. In addition, the Board considered fee waivers and expense limitations applicable to the fees payable by the Funds.
The Board considered the fee structure of each Fund as it relates to the services provided under the contracts and the potential fall-out benefits to the Adviser and Sub-Adviser and their respective affiliates from their association with the Funds. For each Fund, the Board determined that the fees payable to the Adviser and Sub-Adviser are reasonable for the services that each performs, which were considered in light of the nature and quality of the services that each has performed and is expected to perform.
For each Fund, the Board considered information on revenues, costs and profits realized by the Adviser, which was prepared by Management in accordance with the allocation methodology (including related assumptions) specified in the 15(c) Methodology Guide. In analyzing the profitability of the Adviser in connection with its services to a Fund, the Board took into account the sub-advisory fee rate payable by the Adviser to the Sub-Adviser. The Board also considered information that it requested and was provided by Management with respect to the profitability of service providers affiliated with the Adviser, as well as information provided by the Sub-Adviser with respect to its profitability. Further, the Board considered that the decline in asset levels of many Funds caused by recent adverse economic conditions was likely to cause a similar decline in any profits realized by the Adviser and Sub-Adviser.
The Board determined that it had requested and received sufficient information to gain a reasonable
82
ADVISORY CONTRACT APPROVAL DISCUSSION (UNAUDITED) (CONTINUED)
understanding regarding the Adviser’s and affiliated Sub-Adviser’s profitability. The Board also recognized that profitability analysis is not an exact science and there is no uniform methodology for determining profitability for this purpose. In this context, the Board realized that Management’s calculations regarding its costs incurred in establishing the infrastructure necessary for the Funds’ operations may not be fully reflected in the expenses allocated to each Fund in determining profitability, and that the information presented may not portray all of the costs borne by Management or capture Management’s entrepreneurial risk associated with offering and managing a mutual fund complex in the current regulatory and market environment.
Based on the information on revenues, costs, and profitability considered by the Board, and after considering the factors described in this section, the Board concluded that the profits, if any, realized by the Adviser and Sub-Adviser were not excessive. In making its determinations, the Board based its conclusions on the reasonableness of the advisory and sub-advisory fees of the Adviser and Sub-Adviser primarily on the factors described for each Fund below.
Fund-by-Fund Analysis
The following paragraphs outline certain of the specific factors that the Board considered, and the conclusions reached, at its November 14, 2008 meeting in relation to renewing each Fund’s current Advisory and Sub-Advisory Contracts for the year ending November 30, 2009. These specific factors are in addition to those considerations discussed above. In each case, the Fund’s performance was compared to its Morningstar category median, except for ING Classic Money Market Fund and ING Institutional Prime Money Market Fund, which were compared to their Lipper category medians, and its primary benchmark, a broad-based securities market index that appears in the Fund’s prospectus. With respect to Morningstar quintile rankings, the first quintile represents the highest (best) performance and the fifth quintile represents the lowest performance. Each Fund’s management fee and expense ratio were compared to the fees and expense ratios of the funds in its SPG.
ING Classic Money Market Fund
In considering whether to approve the renewal of the Advisory and Sub-Advisory Contracts for ING Classic Money Market Fund, the Board considered that, based on performance data for the periods ended
June 30, 2008: (1) the Fund outperformed its Lipper category median for all periods presented, with the exception of the most recent calendar quarter, during which the Fund matched the performance of its Lipper category median; (2) the Fund outperformed its primary benchmark for all periods presented, with the exception of the most recent calendar quarter, during which the Fund matched the performance of its benchmark; and (3) the Fund is ranked in the second quintile of its Lipper category for all periods presented, with the exception of the most recent calendar quarter, when it ranked in the third quintile.
In considering the fees payable under the Advisory and Sub-Advisory Contracts for the Fund, the Board took into account the factors described above and also considered: (1) the fairness of the compensation under an Advisory Contract with level fees that does not include breakpoints; and (2) the pricing structure (including the expense ratio to be borne by shareholders) of the Fund, as compared to its SPG, including that: (a) the management fee for the Fund is below the median and the average management fees of the funds in its SPG; and (b) the expense ratio for the Fund is below the median and equal to the average expense ratios of the funds in its SPG.
After its deliberation, the Board reached the following conclusions: (1) the Fund’s management fee rate is reasonable in the context of all factors considered by the Board; (2) the Fund’s expense ratio is reasonable in the context of all factors considered by the Board; (3) the Fund’s performance is reasonable in the context of all factors considered by the Board; and (4) the sub-advisory fee rate payable by the Adviser to the Sub-Adviser is reasonable in the context of all factors considered by the Board. Based on these conclusions and other factors, the Board voted to renew the Advisory and Sub-Advisory Contracts for the Fund for the year ending November 30, 2009. During this renewal process, different Board members may have given different weight to different individual factors and related conclusions.
ING GNMA Income Fund
In considering whether to approve the renewal of the Advisory and Sub-Advisory Contracts for ING GNMA Income Fund, the Board considered that, based on performance data for the periods ended June 30, 2008: (1) the Fund outperformed its Morningstar category median for all periods presented; (2) the Fund underperformed its primary benchmark for all periods presented; and (3) the Fund is ranked in the first
83
ADVISORY CONTRACT APPROVAL DISCUSSION (UNAUDITED) (CONTINUED)
(highest) quintile of its Morningstar category for the ten-year period, the second quintile for the most recent calendar quarter, year-to-date, three-year, and five-year periods, and the third quintile for the one-year period.
In considering the fees payable under the Advisory and Sub-Advisory Contracts for the Fund, the Board took into account the factors described above and also considered: (1) the fairness of the compensation under an Advisory Contract with a breakpoint fee schedule where the asset level necessary to achieve a breakpoint discount had not been reached by the Fund; and (2) the pricing structure (including the expense ratio to be borne by shareholders) of the Fund, as compared to its SPG, including that: (a) the management fee (inclusive of a 0.10% administration fee) for the Fund is above the median and the average management fees of the funds in its SPG; and (b) the expense ratio for the Fund is equal to the median and above the average expense ratios of the funds in its SPG.
After its deliberation, the Board reached the following conclusions: (1) the Fund’s management fee rate is reasonable in the context of all factors considered by the Board; (2) the Fund’s expense ratio is reasonable in the context of all factors considered by the Board; (3) the Fund’s performance is reasonable in the context of all factors considered by the Board; and (4) the sub-advisory fee rate payable by the Adviser to the Sub-Adviser is reasonable in the context of all factors considered by the Board. Based on these conclusions and other factors, the Board voted to renew the Advisory and Sub-Advisory Contracts for the Fund for the year ending November 30, 2009. During this renewal process, different Board members may have given different weight to different individual factors and related conclusions.
ING High Yield Bond Fund
In considering whether to approve the renewal of the Advisory and Sub-Advisory Contracts for ING High Yield Bond Fund, the Board considered that, based on performance data for the periods ended June 30, 2008: (1) the Fund underperformed its Morningstar category median for all periods presented; (2) the Fund underperformed its primary benchmark for all periods presented; and (3) the Fund is ranked in the fourth quintile of its Morningstar category for the most recent calendar quarter and three-year periods, and the fifth (lowest) quintile for the year-to-date, one-year, and five-year periods.
In analyzing this performance data, the Board took into account: (1) Management’s analysis regarding the
negative effect of sector allocation and stock selection on the Fund’s performance; (2) in March 2007 the Portfolio Manager changed; (3) in July 2007 the Fund’s investment strategy was changed in order to allow investments in senior and other loans and the ability to buy or sell foreign currencies and options contracts on such currencies; (4) that Management will continue to monitor, and the Board or its IRC would periodically review, the Fund’s investment performance; and (5) the Board’s discussion with Management with respect to options for addressing the Board’s concerns regarding the Fund’s performance and Management’s high degree of confidence in the portfolio management team.
In considering the fees payable under the Advisory and Sub-Advisory Contracts for the Fund, the Board took into account the factors described above and also considered: (1) the fairness of the compensation under an Advisory Contract with a breakpoint fee schedule where the asset level necessary to achieve a breakpoint discount had not been reached by the Fund; (2) the pricing structure (including the expense ratio to be borne by shareholders) of the Fund, as compared to its SPG, including that: (a) the management fee (inclusive of a 0.10% administration fee) for the Fund is below the median and the average management fees of the funds in its SPG; and (b) the expense ratio for the Fund is below the median and the average expense ratios of the funds in its SPG.
After its deliberation, the Board reached the following conclusions: (1) the Fund’s management fee rate is reasonable in the context of all factors considered by the Board; (2) the Fund’s expense ratio is reasonable in the context of all factors considered by the Board; (3) in March 2007 the Portfolio Manager changed and in July 2007 the Fund’s investment strategy was modified and it is reasonable to permit the Fund to establish a longer operating history for purposes of evaluating performance; and (4) the sub-advisory fee rate payable by the Adviser to the Sub-Adviser is reasonable in the context of all factors considered by the Board. Based on these conclusions and other factors, the Board voted to renew the Advisory and Sub-Advisory Contracts for the Fund for the year ending November 30, 2009. During this renewal process, different Board members may have given different weight to different individual factors and related conclusions.
ING Institutional Prime Money Market Fund
In considering whether to approve the renewal of the Advisory and Sub-Advisory Contracts for ING
84
ADVISORY CONTRACT APPROVAL DISCUSSION (UNAUDITED) (CONTINUED)
Institutional Prime Money Market Fund, the Board considered that, based on performance data for the periods ended June 30, 2008: (1) the Fund outperformed its Lipper category median for all periods presented; (2) the Fund outperformed its primary benchmark for all periods presented; and (3) the Fund is ranked in the first (highest) quintile of its Lipper category for the one-year period, the second quintile for all other periods presented.
In considering the fees payable under the Advisory and Sub-Advisory Contracts for the Fund, the Board took into account the factors described above and also considered: (1) the fairness of the compensation under an Advisory Contract with level fees that does not include breakpoints; and (2) the pricing structure (including the expense ratio to be borne by shareholders) of the Fund, as compared to its SPG, including that: (a) the management fee for the Fund is below the median and the average management fees of the funds in its SPG; and (b) the expense ratio for the Fund is below the median and the average expense ratios of the funds in its SPG.
After its deliberation, the Board reached the following conclusions: (1) the Fund’s management fee rate is reasonable in the context of all factors considered by the Board; (2) the Fund’s expense ratio is reasonable in the context of all factors considered by the Board; (3) the Fund’s performance is reasonable in the context of all factors considered by the Board; and (4) the sub-advisory fee rate payable by the Adviser to the Sub-Adviser is reasonable in the context of all factors considered by the Board. Based on these conclusions and other factors, the Board voted to renew the Advisory and Sub-Advisory Contracts for the Fund for the year ending November 30, 2009. During this renewal process, different Board members may have given different weight to different individual factors and related conclusions.
ING Intermediate Bond Fund
In considering whether to approve the renewal of the Advisory and Sub-Advisory Contracts for ING Intermediate Bond Fund, the Board considered that, based on performance data for the periods ended June 30, 2008: (1) the Fund outperformed its Morningstar category median for the most recent calendar quarter and five-year period, but
underperformed for the year-to-date, one-year, and three-year periods; (2) the Fund underperformed its primary benchmark for all periods presented, with the exception of the most recent calendar quarter, during which it outperformed; and (3) the Fund is ranked in the second quintile of its Morningstar category for the most recent calendar quarter, the third quintile for the three-year and five-year periods, and the fourth quintile for the year-to-date and one-year periods.
In analyzing this performance data, the Board took into account Management’s analysis regarding the negative effect sector allocation had on the Fund’s performance and Management’s high degree of confidence in the portfolio management team.
In considering the fees payable under the Advisory and Sub-Advisory Contracts for the Fund, the Board took into account the factors described above and also considered: (1) the fairness of the compensation under an Advisory Contract with level fees that does not include breakpoints; and (2) the pricing structure (including the expense ratio to be borne by shareholders) of the Fund, as compared to its SPG, including that: (a) the management fee rate (inclusive of 0.10% administration fee) for the Fund is below the median and the average management fees of the funds in its SPG; and (b) the expense ratio for the Fund is below the median and the average expense ratios of the funds in its SPG.
After its deliberation, the Board reached the following conclusions: (1) the Fund’s management fee rate is reasonable in the context of all factors considered by the Board; (2) the Fund’s expense ratio is reasonable in the context of all factors considered by the Board; (3) taking into account that the Board and Management will continue to actively monitor the Fund’s performance, the Fund’s performance is reasonable in the context of all factors by the Board; and (4) the sub-advisory fee rate payable by the Adviser to the Sub-Adviser is reasonable in the context of all factors considered by the Board. Based on these conclusions and other factors, the Board voted to renew the Advisory and Sub-Advisory Contracts for the Fund for the year ending November 30, 2009. During this renewal process, different Board members may have given different weight to different individual factors and related conclusions.
85
ING Funds Distributor, LLC offers the funds listed below. Before investing in a fund, shareholders should carefully review the fund’s prospectus. Investors may obtain a copy of a prospectus of any ING Fund by calling (800) 992-0180 or by going to www.ingfunds.com.
Domestic Equity and Income Funds
ING Balanced Fund
ING Growth and Income Fund
ING Real Estate Fund
Domestic Fund-of-Funds
ING Strategic Allocation Conservative Fund
ING Strategic Allocation Growth Fund
ING Strategic Allocation Moderate Fund
Domestic Equity Growth Funds
ING Corporate Leaders 100 Fund
ING Equity Dividend Fund
ING Growth Opportunities Fund
ING MidCap Opportunities Fund
ING Opportunistic LargeCap Fund
ING Small Company Fund
ING SmallCap Opportunities Fund
ING Tactical Asset Allocation Fund
Domestic Equity Index Funds
ING Index Plus LargeCap Equity Fund VIII
ING Index Plus LargeCap Equity Fund IX
ING Index Plus LargeCap Fund
ING Index Plus MidCap Fund
ING Index Plus SmallCap Fund
Domestic Equity Value Funds
ING SmallCap Value Multi-Manager Fund
ING Value Choice Fund
Fixed-lncome Funds
ING GNMA lncome Fund
ING High Yield Bond Fund
ING Intermediate Bond Fund
Global Equity Funds
ING Global Equity Dividend Fund
ING Global Natural Resources Fund
ING Global Real Estate Fund
ING Global Value Choice Fund
International Equity Funds
ING Asia-Pacific Real Estate Fund
ING Disciplined International SmallCap Fund
ING Emerging Countries Fund
ING European Real Estate Fund
ING Foreign Fund
ING Greater China Fund
ING Index Plus International Equity Fund
ING International Capital Appreciation Fund
ING International Equity Dividend Fund
ING International Growth Opportunities Fund
ING International Real Estate Fund
ING International SmallCap Multi-Manager Fund
ING International Value Fund
ING International Value Choice Fund
ING Russia Fund
Global and International Fixed-Income Funds
ING Emerging Markets Fixed Income Fund
ING Global Bond Fund
International Funds-of-Funds
ING Diversified International Fund
ING Global Target Payment Fund
Loan Participation Fund
ING Senior lncome Fund
Money Market Funds*
ING Classic Money Market Fund
ING Money Market Fund
| * | An investment in the funds are not insured or guaranteed by the Federal Deposit Insurance Corporation or any other government agency. Although the funds seek to preserve the value of your investment at $1.00 per share, it is possible to lose money by investing in the funds. Please see the “Notes to Financial Statements” section for the funds participation in the U.S. Treasury Department’s Temporary Guarantee Program for money market funds. |
Investment Adviser
ING Investments, LLC
7337 East Doubletree Ranch Road
Scottsdale, Arizona 85258
Administrator
ING Funds Services, LLC
7337 East Doubletree Ranch Road
Scottsdale, Arizona 85258
Distributor
ING Funds Distributor, LLC
7337 East Doubletree Ranch Road
Scottsdale, Arizona 85258
Transfer Agent
PNC Global Investment Servicing (U.S.) Inc.
301 Bellevue Parkway
Wilmington, Delaware 19809
Independent Registered Public Accounting Firm
KPMG LLP
99 High Street
Boston, Massachusetts 02110
Custodian
The Bank of New York Mellon
One Wall Street
New York, New York 10286
Legal Counsel
Dechert
1775 I Street, N.W.
Washington, D.C. 20006
For more complete information, or to obtain a prospectus on any ING fund, please call your Investment Professional or ING Funds Distributor, LLC at (800) 992-0180 or log on to www.ingfunds.com. The prospectus should be read carefully before investing. Consider the fund’s investment objectives, risks, charges and expenses carefully before investing. The prospectus contains this information and other information about the fund.
| | | | |
 | | PRAR-UFIALL | | (0309-052809) |
Item 2. Code of Ethics.
As of the end of the period covered by this report, Registrant had adopted a code of ethics, as defined in Item 2 of Form N-CSR, that applies to the Registrant’s principal executive officer and principal financial officer. There were no amendments to the Code during the period covered by the report. The Registrant did not grant any waivers, including implicit waivers, from any provisions of the Code during the period covered by this report. The code of ethics is filed herewith pursuant to Item 10(a)(1), Exhibit 99.CODE ETH.
Item 3. Audit Committee Financial Expert.
The Board of Trustees has determined that J. Michael Early and Peter S. Drotch are an audit committee financial experts, as defined in Item 3 of Form N-CSR. Mr. Early and Mr. Drotch are “independent” for purposes of Item 3 of Form N-CSR.
Item 4. Principal Accountant Fees and Services.
| (a) | Audit Fees: The aggregate fees billed for each of the last two fiscal years for professional services rendered by KPMG LLP (“KPMG”), the principal accountant for the audit of the registrant’s annual financial statements, for services that are normally provided by the accountant in connection with statutory and regulatory filings or engagements for those fiscal years were $88,000 for year ended March 31, 2009 and $106,000 for year ended March 31, 2008. |
| (b) | Audit-Related Fees: The aggregate fees billed in the last fiscal year for assurance and related services by KPMG that are reasonably related to the performance of the audit of the registrant’s financial statements and are not reported under paragraph (a) of this Item were $10,750 for the year ended March 31, 2009 and $12,450 for year ended March 31, 2008. |
| (c) | Tax Fees: The aggregate fees billed in each of the last two fiscal years for professional services rendered by KPMG for tax compliance, tax advice, and tax planning were $12,008 in the year ended March 31, 2009 and $47,111 in the year ended March 31, 2008. Such services included review of excise distribution calculations (if applicable), preparation of the Funds’ federal, state and excise tax returns, tax services related to mergers and routine consulting. |
| (d) | All Other Fees: The aggregate fees billed in each of the last two fiscal years for products and services provided by KPMG, other than the services reported in paragraphs (a) through (c) of this Item. |
| (e) (1) | Audit Committee Pre-Approval Policies and Procedures |
AUDIT AND NON-AUDIT SERVICES
PRE-APPROVAL POLICY
| I. | Statement of Principles |
Under the Sarbanes-Oxley Act of 2002 (the “Act”), the Audit Committee of the Board of Directors or Trustees (the “Committee”) of the ING Funds (each a “Fund,” collectively, the “Funds”) set out on Exhibit A to this Audit and Non-Audit Services Pre-Approval Policy (“Policy”) is responsible for the oversight of the work of the Funds’ independent auditors. As part of its responsibilities, the Committee must pre-approve the audit and non-audit services performed by the auditors in order to assure that the provision of these services does not impair the auditors’ independence from the Funds. The Committee has adopted, and the Board has ratified, this Policy, which sets out the procedures and conditions under which the services of the independent auditors may be pre-approved.
Under Securities and Exchange Commission (“SEC”) rules promulgated in accordance with the Act, the Funds may establish two different approaches to pre-approving audit and non-audit services. The Committee may approve services without consideration of specific case-by-case services (“general pre-approval”) or it may pre-approve specific services (“specific pre-approval”). The Committee believes that the combination of these approaches contemplated in this Policy results in an effective and efficient method for pre-approving audit and non-audit services to be performed by the Funds’ independent auditors. Under this Policy, services that are not of a type that may receive general pre-approval require specific pre-approval by the Committee. Any proposed services that exceed pre-approved cost levels or budgeted amounts will also require the Committee’s specific pre-approval.
For both types of approval, the Committee considers whether the subject services are consistent with the SEC’s rules on auditor independence and that such services are compatible with maintaining the auditors independence. The Committee also considers whether a particular audit firm is in the best position to provide effective and efficient services to the Funds. Reasons that the auditors are in the best position include the auditors’ familiarity with the Funds’ business, personnel, culture, accounting systems, risk profile, and other factors, and whether the services will enhance the Funds’ ability to manage and control risk or improve audit quality. Such factors will be considered as a whole, with no one factor being determinative.
The appendices attached to this Policy describe the audit, audit-related, tax-related, and other services that have the Committee’s general pre-approval. For any service that has been approved through general pre-approval, the general pre-approval will remain in place for a period 12 months from the date of pre-approval, unless the Committee determines that a different period is appropriate. The Committee will annually review and pre-approve the services that may be provided by the independent auditors without specific pre-approval. The Committee will revise the list of services subject to general pre-approval as appropriate. This Policy does not serve as a delegation to Fund management of the Committee’s duty to pre-approve services performed by the Funds’ independent auditors.
The annual audit services engagement terms and fees are subject to the Committee’s specific pre-approval. Audit services are those services that are normally provided by auditors in connection with statutory and regulatory filings or engagements or those that generally only independent auditors can reasonably provide. They include the Funds’ annual financial statement audit and procedures that the independent auditors must perform in order to form an opinion on the Funds’ financial statements (e.g., information systems and procedural reviews and testing). The Committee will monitor the audit services engagement and approve any changes in terms, conditions or fees deemed by the Committee to be necessary or appropriate.
The Committee may grant general pre-approval to other audit services, such as statutory audits and services associated with SEC registration statements, periodic reports and other documents filed with the SEC or issued in connection with securities offerings.
The Committee has pre-approved the audit services listed on Appendix A. The Committee must specifically approve all audit services not listed on Appendix A.
| III. | Audit-related Services |
Audit-related services are assurance and related services that are reasonably related to the performance of the audit or the review of the Funds’ financial statements or are traditionally performed by the independent auditors. The Committee believes that the provision of audit-related services will not impair the independent auditors’ independence, and therefore may grant pre-approval to audit-related services. Audit-related services include accounting consultations related to accounting, financial reporting or disclosure matters not classified as “audit services;” assistance with understanding and implementing new accounting and financial reporting guidance from rulemaking authorities; agreed-upon or expanded audit procedures relating to accounting and/or billing records required to respond to or comply with financial, accounting or regulatory reporting matters; and assistance with internal control reporting requirements under Form N-SAR or Form N-CSR.
The Committee has pre-approved the audit-related services listed on Appendix B. The Committee must specifically approve all audit-related services not listed on Appendix B.
The Committee believes the independent auditors can provide tax services to the Funds, including tax compliance, tax planning, and tax advice, without compromising the auditors’ independence. Therefore, the Committee may grant general pre-approval with respect to tax services historically provided by the Funds’ independent auditors that do not, in the Committee’s view, impair auditor independence and that are consistent with the SEC’s rules on auditor independence.
The Committee will not grant pre-approval if the independent auditors initially recommends a transaction the sole business purpose of which is tax avoidance and the tax treatment of which may not be supported in the Internal Revenue Code and related regulations. The Committee may consult outside counsel to determine that tax planning and reporting positions are consistent with this Policy.
2
The Committee has pre-approved the tax-related services listed on Appendix C. The Committee must specifically approve all tax-related services not listed on Appendix C.
The Committee believes it may grant approval of non-audit services that are permissible services for independent auditors to a Fund. The Committee has determined to grant general pre-approval to other services that it believes are routine and recurring, do not impair auditor independence, and are consistent with SEC rules on auditor independence.
The Committee has pre-approved the non-audit services listed on Appendix D. The Committee must specifically approve all non-audit services not listed on Appendix D.
A list of the SEC’s prohibited non-audit services is attached to this Policy as Appendix E. The SEC’s rules and relevant guidance should be consulted to determine the precise definitions of these impermissible services and the applicability of exceptions to certain of the SEC’s prohibitions.
| VI. | Pre-approval of Fee levels and Budgeted Amounts |
The Committee will annually establish pre-approval fee levels or budgeted amounts for audit, audit-related, tax and non-audit services to be provided to the Funds by the independent auditors. Any proposed services exceeding these levels or amounts require the Committee’s specific pre-approval. The Committee considers fees for audit and non-audit services when deciding whether to pre-approve services. The Committee may determine, for a pre-approval period of 12 months, the appropriate ratio between the total amount of fees for the Fund’s audit, audit-related, and tax services (including fees for services provided to Fund affiliates that are subject to pre-approval), and the total amount of fees for certain permissible non-audit services for the Fund classified as other services (including any such services provided to Fund affiliates that are subject to pre-approval).
Requests or applications for services to be provided by the independent auditors will be submitted to management. If management determines that the services do not fall within those services generally pre-approved by the Committee and set out in the appendices to these procedures, management will submit the services to the Committee or its delagee. Any such submission will include a detailed description of the services to be rendered. Notwithstanding this paragraph, the Committee will, on a quarterly basis, receive from the independent auditors a list of services provided for the previous calendar quarter on a cumulative basis by the auditors during the Pre-Approval Period.
3
The Committee may delegate pre-approval authority to one or more of the Committee’s members. Any member or members to whom such pre-approval authority is delegated must report any pre-approval decisions, including any pre-approved services, to the Committee at its next scheduled meeting. The Committee will identify any member to whom pre-approval authority is delegated in writing. The member will retain such authority for a period of 12 months from the date of pre-approval unless the Committee determines that a different period is appropriate. The period of delegated authority may be terminated by the Committee or at the option of the member.
| IX. | Additional Requirements |
The Committee will take any measures the Committee deems necessary or appropriate to oversee the work of the independent auditors and to assure the auditors’ independence from the Funds. This may include reviewing a formal written statement from the independent auditors delineating all relationships between the auditors and the Funds, consistent with Independence Standards Board No. 1, and discussing with the auditors their methods and procedures for ensuring independence.
Effective April 23, 2008, the KPMG LLP (“KPMG”) audit team for the ING Funds accepted the global responsibility for monitoring the auditor independence for KPMG relative to the ING Funds. Using a proprietary system called Sentinel, the audit team is able to identify and manage potential conflicts of interest across the member firms of the KPMG International Network and prevent the provision of prohibited services to the ING entities that would impair KPMG independence with the respect to the ING Funds. In addition to receiving pre-approval from the ING Funds Audit Committee for services provided to the ING Funds and for services for ING entities in the Investment Company Complex, the audit team has developed a process for periodic notification via email to the ING Funds’ Audit Committee Chairpersons regarding requests to provide services to ING Groep NV and its affiliates from KPMG offices worldwide. Additionally, KPMG provides a quarterly summary of the fees for services that have commenced for ING Groep NV and Affiliates at each Audit Committee Meeting.
4
Last Approved: November 13, 2008
5
Appendix A
Pre-Approved Audit Services for the Pre-Approval Period January 1, 2009 through December 31, 2009
Service
| | | | |
| | | The Fund(s) | | Fee Range |
| Statutory audits or financial audits (including tax services associated with audit services) | | ü | | As presented to Audit Committee1 |
| | |
| Services associated with SEC registration statements, periodic reports and other documents filed with the SEC or other documents issued in connection with securities offerings (e.g., consents), and assistance in responding to SEC comment letters. | | ü | | Not to exceed $9,750 per filing |
| | |
| Consultations by Fund management with respect to accounting or disclosure treatment of transactions or events and/or the actual or potential effect of final or proposed rules, standards or interpretations by the SEC, Financial Accounting Standards Board, or other regulatory or standard setting bodies. | | ü | | Not to exceed $8,000 during the Pre-Approval Period |
| | |
| Seed capital audit and related review and issuance of consent on the N-2 registration statement | | ü | | Not to exceed $12,600 per audit |
| 1 | For new Funds launched during the Pre-Approval Period, the fee ranges pre-approved will be the same as those for existing Funds, pro-rated in accordance with inception dates as provided in the auditors’ Proposal or any Engagement Letter covering the period at issue. Fees in the Engagement Letter will be controlling. |
6
Appendix B
Pre-Approved Audit-Related Services for the Pre-Approval Period January 1, 2009 through December 31, 2009
Service
| | | | | | |
| | | The Fund(s) | | Fund Affiliates | | Fee Range |
| Services related to Fund mergers (Excludes tax services - See Appendix C for tax services associated with Fund mergers) | | ü | | ü | | Not to exceed
$10,000 per merger |
| | | |
| Consultations by Fund management with respect to accounting or disclosure treatment of transactions or events and/or the actual or potential effect of final or proposed rules, standards or interpretations by the SEC, Financial Accounting Standards Board, or other regulatory or standard setting bodies. [Note: Under SEC rules some consultations may be “audit” services and others may be “audit- related” services.] | | ü | | | | Not to exceed
$5,000 per occurrence during the Pre-Approval Period |
| | | |
| Review of the Funds’ semi-annual financial statements | | ü | | | | Not to exceed
$2,200 per set of financial statements per fund |
| | | |
| Reports to regulatory or government agencies related to the annual engagement | | ü | | | | Up to $5,000 per
occurrence during
the Pre-Approval Period |
| | | |
| Regulatory compliance assistance | | ü | | ü | | Not to exceed
$5,000 per quarter |
| | | |
| Training courses | | | | ü | | Not to exceed
$2,000 per course |
| | | |
| For Prime Rate Trust, agreed upon procedures for quarterly reports to rating agencies | | ü | | | | Not to exceed
$9,450 per quarter |
| | | |
| For Prime Rate Trust and Senior Income Fund, agreed upon procedures for the Revolving Credit and Security Agreement with Citigroup | | ü | | | | Not to exceed
$21,000 per fund per year |
7
Appendix C
Pre-Approved Tax Services for the Pre-Approval Period January 1, 2009 through December 31, 2009
Service
| | | | | | |
| | | The Fund(s) | | Fund Affiliates | | Fee Range |
| Preparation of federal and state income tax returns and federal excise tax returns for the Funds including assistance and review with excise tax distributions | | ü | | | | As presented to
Audit Committee2 |
| | | |
| Review of IRC Sections 851(b) and 817(h) diversification testing on a real-time basis | | ü | | | | As presented to
Audit Committee2 |
| | | |
| Assistance and advice regarding year-end reporting for 1099’s | | ü | | | | As presented to
Audit Committee2 |
| | | |
| Tax assistance and advice regarding statutory, regulatory or administrative developments | | ü | | ü | | Not to exceed
$5,000 for the Funds or for the Funds’ investment adviser during the Pre-Approval Period |
| 2 | For new Funds launched during the Pre-Approval Period, the fee ranges pre-approved will be the same as those for existing Funds, pro-rated in accordance with inception dates as provided in the auditors’ Proposal or any Engagement Letter covering the period at issue. Fees in the Engagement Letter will be controlling. |
8
Appendix C, continued
Service
| | | | | | |
| | | The Fund(s) | | Fund Affiliates | | Fee Range |
| Tax training courses | | | | ü | | Not to exceed
$2,000 per course during the Pre-Approval
Period |
| | | |
| Tax services associated with Fund mergers | | ü | | ü | | Not to exceed
$4,000 per fund
per merger
during the Pre-Approval Period |
| | | |
| Other tax-related assistance and consultation, including, without limitation, assistance in evaluating derivative financial instruments and international tax issues, qualification and distribution issues, and similar routine tax consultations. | | ü | | | | Not to exceed
$120,000 during
the Pre-Approval
Period |
9
Appendix D
Pre-Approved Other Services for the Pre-Approval Period January 1, 2009 through December 31, 2009
Service
| | | | | | |
| | | The Fund(s) | | Fund Affiliates | | Fee Range |
| Agreed-upon procedures for Class B share 12b-1 programs | | | | ü | | Not to exceed
$60,000 during the Pre-Approval Period |
| | | |
| Security counts performed pursuant to Rule 17f-2 of the 1940 Act (i.e., counts for Funds holding securities with affiliated sub-custodians) Cost to be borne 50% by the Funds and 50% by ING Investments, LLC. | | ü | | ü | | Not to exceed
$5,000 per Fund during the Pre-Approval Period |
| | | |
| Agreed upon procedures for 15 (c) FACT Books | | ü | | | | Not to exceed
$35,000 during the Pre-Approval Period |
10
Appendix E
Prohibited Non-Audit Services
Dated: January 1, 2009
| | • | | Bookkeeping or other services related to the accounting records or financial statements of the Funds |
| | • | | Financial information systems design and implementation |
| | • | | Appraisal or valuation services, fairness opinions, or contribution-in-kind reports |
| | • | | Internal audit outsourcing services |
| | • | | Broker-dealer, investment adviser, or investment banking services |
| | • | | Expert services unrelated to the audit |
| | • | | Any other service that the Public Company Accounting Oversight Board determines, by regulation, is impermissible |
11
EXHIBIT A
ING EQUITY TRUST
ING FUNDS TRUST
ING ASIA PACIFIC HIGH DIVIDEND EQUITY INCOME FUND
ING GLOBAL ADVANTAGE AND PREMIUM OPPORTUNITY FUND
ING GLOBAL EQUITY DIVIDEND AND PREMIUM OPPORTUNITY FUND
ING INTERNATIONAL HIGH DIVIDEND EQUITY INCOME FUND
ING RISK MANAGED NATURAL RESOURCES FUND
ING INVESTORS TRUST
ING MAYFLOWER TRUST
ING MUTUAL FUNDS
ING PARTNERS, INC.
ING PRIME RATE TRUST
ING SENIOR INCOME FUND
ING SEPARATE PORTFOLIOS TRUST
ING VARIABLE INSURANCE TRUST
ING VARIABLE PRODUCTS TRUST
| | |
| |
| (e)(2) | | Percentage of services referred to in (4)(b)-(4)(d) that were approved by the audit committee |
| |
| | 100% of the services were approved by the audit committee. |
| |
| (f) | | Percentage of hours expended attributable to work performed by other than full time employees of KPMG if greater than 50% |
| |
| | Not applicable |
| |
| (g) | | Non-Audit Fees: The non-audit fees billed by the registrant’s accountant for services rendered to the registrant, and rendered to the registrant’s investment adviser, and any entity controlling, controlled by, or under common control with the adviser that provides ongoing services to the registrant for each of the last two fiscal years of the registrant were $2,040,485 for year ended March 31, 2009 and $1,235,180 for fiscal year ended March 31, 2008. |
| |
| (h) | | Principal Accountants Independence: the Registrant’s Audit committee has considered whether the provision of non-audit services that were rendered to the registrant’s investment adviser and any entity controlling, controlled by, or under common control with the investment adviser that provides ongoing services to the registrant that were not pre-approved pursuant to Rule 2.01(c)(7)(ii) of Regulation S-X is compatible with maintaining KPMG’s independence. |
SIGNATURES
Pursuant to the requirements of the Securities Exchange Act of 1934 and the Investment Company Act of 1940, the registrant has duly caused this report to be signed on its behalf by the undersigned, thereunto duly authorized.
| | |
| (Registrant): ING Funds Trust |
| |
| By | | /s/ Shaun P. Mathews |
| | Shaun P. Mathews |
| | President and Chief Executive Officer |
|
| Date: June 5, 2009 |
Pursuant to the requirements of the Securities Exchange Act of 1934 and the Investment Company Act of 1940, this report has been signed below by the following persons on behalf of the registrant and in the capacities and on the dates indicated.
| | |
| By | | /s/ Shaun P. Mathews |
| | Shaun P. Mathews |
| | President and Chief Executive Officer |
|
| Date: June 5, 2009 |
| | |
| By | | /s/ Todd Modic |
| | Todd Modic |
| | Senior Vice President and Chief Financial Officer |
|
| Date: June 5, 2009 |