Table of Contents
OMB APPROVAL
OMB Number: 3235-0570
Expires: September 30, 2007
Estimated average burden hours per response: 19.3
UNITED STATES
SECURITIES AND EXCHANGE COMMISSION
Washington, D.C. 20549
FORM N-CSR
CERTIFIED SHAREHOLDER REPORT OF
REGISTERED MANAGEMENT INVESTMENT COMPANIES
Investment Company Act file number: 811-08895
ING Funds Trust
(Exact name of registrant as specified in charter)
| 7337 E. Doubletree Ranch Rd., Scottsdale, AZ | 85258 | |
| (Address of principal executive offices) | (Zip code) |
The Corporation Trust Company, 1209 Orange Street, Wilmington, DE 19801
(Name and address of agent for service)
Registrant’s telephone number, including area code: 1-800-992-0180
Date of fiscal year end: | March 31 | |
Date of reporting period: | March 31, 2007 | |
Table of Contents
Item 1. Reports to Stockholders.
The following is a copy of the report transmitted to stockholders pursuant to Rule 30e-1 under the Act (17 CFR 270.30e-1):
Table of Contents

Funds
Annual Report
March 31, 2007
Classes A, B, C, I, O, Q and R
Fixed-Income Funds
| n | ING GNMA Income Fund |
| n | ING High Yield Bond Fund |
| n | ING Intermediate Bond Fund |
| n | ING National Tax-Exempt Bond Fund |
Money Market Funds
| n | ING Classic Money Market Fund |
| n | ING Institutional Prime Money Market Fund |
| E-Delivery Sign-up – details inside | |
This report is submitted for general information to shareholders of the ING Funds. It is not authorized for distribution to prospective shareholders unless accompanied or preceded by a prospectus which includes details regarding the funds’ investment objectives, risks, charges, expenses and other information. This information should be read carefully.

Table of Contents
| 1 | ||
| 2 | ||
| 4 | ||
| 14 | ||
| 16 | ||
| 17 | ||
| 21 | ||
| 23 | ||
| 26 | ||
| 39 | ||
| 56 | ||
| 88 | ||
| 90 | ||
| 94 | ||
| Go Paperless with E-Delivery! |  | ||
Sign up now for on-line prospectuses, fund reports, and proxy statements. In less than five minutes, you can help reduce paper mail and lower fund costs. Just go to www.ingfunds.com, click on the E-Delivery icon from the home page, follow the directions and complete the quick 5 Steps to Enroll. You will be notified by e-mail when these communications become available on the internet. Documents that are not available on the internet will continue to be sent by mail.
| ||||
PROXY VOTING INFORMATION
A description of the policies and procedures that the Funds use to determine how to vote proxies related to portfolio securities is available (1) without charge, upon request, by calling Shareholder Services toll-free at (800) 992-0180; (2) on the Funds’ website at www.ingfunds.com; and (3) on the SEC’s website at www.sec.gov. Information regarding how the Funds voted proxies related to portfolio securities during the most recent 12-month period ended June 30 is available without charge on the Funds’ website at www.ingfunds.com and on the SEC’s website at www.sec.gov.
QUARTERLY PORTFOLIO HOLDINGS
The Funds file their complete schedule of portfolio holdings with the SEC for the first and third quarters of each fiscal year on Form N-Q. The Funds’ Forms N-Q are available on the website at www.sec.gov. The Funds’ Forms N-Q may be reviewed and copied at the SEC’s Public Reference Room in Washington, DC, and information on the operation of the Public Reference Room may be obtained by calling (800) SEC-0330; and is available upon request from the Funds by calling Shareholder Services toll-free at (800) 992-0180.
Table of Contents

Dear Shareholder,
The year is far from over but already investors have witnessed some remarkable events. There were global market tremors that came on the heels of last February’s single-day freefall in Chinese stocks. Widespread ripples were also felt following a downturn in the U.S. sub-prime mortgage industry. But, there have also been many positive developments. The U.S. Federal Reserve Board appears confident about the future. The U.S. labor market continues to show strength and recently we have seen the Dow Jones Industrial Average(1) achieve a series of record-setting highs.
Meanwhile, investors seeking income should be especially pleased to know that U.S. bonds remain popular among overseas investors and long-term inflation expectations continue to dwindle. Such news is typically a good sign for bonds.
What do we make of all of these contrasting signals? When friends and colleagues in the industry voice concerns about such seemingly-divergent milestones, I remind them that such events underscore the importance of a well-diversified investment strategy. Study after study shows that a portfolio allocated across a diverse group of asset classes and investment sectors may provide an investor with solid footing for the long-term, despite the short-term commotions.
We at ING Funds remain committed to providing you, our investor, with a diverse and comprehensive line-up of innovative investment products, including a range of global investment solutions — all designed for the long-term. Whatever your investing goals, we look forward to continuing to serve you.
Sincerely,

Shaun P. Mathews
President
ING Funds
May 1, 2007
The views expressed in the President’s Letter reflect those of the President as of the date of the letter. Any such views are subject to change at any time based upon market or other conditions and ING Funds disclaims any responsibility to update such views. These views may not be relied on as investment advice and because investment decisions for an ING Fund are based on numerous factors, may not be relied on as an indication of investment intent on behalf of any ING Fund. Reference to specific company securities should not be construed as recommendations or investment advice.
For more complete information, or to obtain a prospectus for any ING Fund, please call your Investment Professional or ING Funds Distributor, LLC at (800) 992-0180 or log on to www.ingfunds.com. The prospectus should be read carefully investing. Consider the fund’s investment objectives, risks, and charges and expenses carefully before investing. The prospectus contains this information and other information about the fund. Check with your Investment Professional to determine which funds are available for sale within their firm. Not all funds are available for sale at all firms.
| (1) | The Dow Jones Industrial Average is a widely followed measurement of the stock market. The average is comprised of 30 stocks that represent leading companies in major industries. These stocks, widely held by both individual and institutional investors, are considered to be all blue-chip companies. |
1
Table of Contents
MARKET PERSPECTIVE: YEAR ENDED MARCH 31, 2007
In our semi-annual report, we described a weakening economy and an inactive U.S. Federal Reserve Board (“Fed”) after seventeen interest rate increases to 5.25%. From March 31, 2006 to September 30, 2006, the ten-year Treasury yield fell 22 basis points (0.22%) to 4.63% and the two-year Treasury yield 13 basis points (0.13%) to 4.69%. This yield curve inversion, suggested that fixed income investors anticipated declining interest rates, often associated with a pronounced economic slow down. In recent years, the booming housing market had been a powerful driver of growth through new construction and increased spending power generated by mortgage loan refinancing. However, this had deteriorated appreciably and continued to do so into the second half of our fiscal year, with home prices and the key new building permits measure falling sharply. Third quarter gross domestic product (“GDP”) growth came in at only 2% annualized. Even still, the Federal Open Market Committee (“FOMC”) in December, leaving rates at 5.25% for the fourth time, maintained that “some inflation risks remain.” Indeed, the last reported core inflation rate of 2.9% had been the largest in over ten years. Yet by December 2006, core Consumer Price Index (“CPI”) was being reported flat on a monthly basis and the trend was unmistakably to the downside. The yield on the ten-year Treasury plumbed its low point for the second half at 4.43% on December 4, 2006.
The rebound was swift. The housing market had started to show some signs of bottoming out and in the last few days of 2006, unexpectedly good new and existing home sales figures were reported, along with improved consumer confidence. The early data in 2007 sustained this view, with reassuringly strong employment, retail sales and confidence readings as well as robust increases in housing starts and pending home sales. The first estimate of fourth quarter GDP growth was an impressive 3.5%. The ten-year Treasury yield continued to rise, reaching its peak of 4.89% on January 29, 2007.
Yet seeds of doubt were planted, when it was reported on February 2, 2007, that the November 2006 default rate among sub-prime housing loans was higher than during the 2001 recession. It had long been feared that mortgage lending had become far too lax during the boom, particularly to those least able to repay and that the inevitable correction would be severe. Within weeks the country’s largest sub-prime mortgage lender, HSBC, increased its loss reserves by $1.76 billion and the second biggest, New Century Financial, was de-listed from the New York Stock Exchange on its way to Chapter 11. The apparent recovery in housing figures proved illusory, explained by the mild weather of early winter, as new starts and sales later plummeted and house prices started to fall. The ten-year Treasury yield fell back more than 30 basis points (0.30%) in February 2007, as fears of a slowing economy again dominated investor sentiment.
February 2007 was an unsettling month in other ways. The China stock market had practically doubled in 2006 and the long expected pull back eventually came on February 27th when the index fell 9%. The effect on sentiment was to shake relative risk strategies across asset classes. In fixed income markets, money left high yield bonds and went into investment grade bonds. Investors favored shorter terms over longer terms.
As for the Fed, interest rates were left unchanged throughout the period. But, policy bias had been towards further tightening and given the renewed pessimism and risk aversion, great interest had built up in how and when this bias might change. On March 21, 2007, with the news still full of sub-prime loan problems and GDP growth having been sharply revised down below 3%, we found out. Reference to a tightening bias was removed, but inflation was still named as the predominant concern! Bafflement was one unsurprising reaction. Another, was the elimination of some of the much-watched yield curve inversion. The two-year Treasury yield had exceeded the ten-year yield since August 2006. However, the removal of FOMC bias with inflation still not defeated was a recipe for longer rates to rise relative to shorter rates.
From September 30, 2006 to March 31, 2007, the ten-year Treasury yield rose just 2 basis points (0.02%) to 4.65%, having moved in a 46 basis point (0.46%) range. During the same period, the two-year Treasury yield fell 11 basis points (0.11%) to 4.58%. The broad Lehman Brothers® Aggregate Bond Index(1) (“LBAB”) of investment grade bonds, having gained 3.73% to September 30, 2006 added 2.76% in the second six months, while the Lehman Brothers® US Corporate High Yield Index(2) returned 6.95%, after 4.40% in the first half. For the year ended March 31, 2007, the LBAB returned 6.59% and the Lehman Brothers® US Corporate High Yield Index returned 11.58%.
Global equities in the form of the Morgan Stanley Capital International World IndexSM(3) (“MSCI World Index”) measured in local currencies, rose a paltry 1.8%
2
Table of Contents
MARKET PERSPECTIVE: YEAR ENDED MARCH 31, 2007
in the first half of our fiscal year including net reinvested dividends, but surged 9.3% in the second and for the year ended March 31, 2007, returned 15.44%. This was despite being hit hard by the sell-off in China, falling on average about 7% at the worst levels before recovering more than half of the loss.
U.S. equities, represented by the Standard & Poor’s 500® Composite Stock Price Index(4) (“S&P 500® Index”) gained 7.4% in the second half, after 4.1% in the first. Stocks stood up well to sub-prime mortgage lending issues as quarterly earnings figures indicated a 14th straight double digit increase.
Investors in international equities did even better based on MSCI local currency indices. In Japan after a 5.2% drop in the first half the market advanced 8.7% in the second, boosted by the fastest quarterly rate of GDP growth in three years. The European ex UK and the UK markets rose just 3.0% and 1.6% respectively in the first half. But in the second, investors were encouraged by the fastest GDP growth in years and widespread, large-scale merger and acquisition activity. Europe ex UK powered ahead 11.7% and UK stocks returned 8.2%.
(1) The LBAB Index is a widely recognized, unmanaged index of publicly issued investment grade U.S. Government, mortgage-backed, asset-backed and corporate debt securities.
(2) The Lehman Brothers® US Corporate High Yield Index is an unmanaged index that covers the US-denominated, non-investment grade, fixed-rate, taxable corporate bond market with securities having a maximum quality rating of Ba1.
(3) The MSCI World® Index is an unmanaged index that measures the performance of over 1,400 securities listed on exchanges in the U.S., Europe, Canada, Australia, New Zealand and the Far East.
(4) The S&P 500® Index is an unmanaged index that measures the performance of the securities of approximately 500 of the largest companies in the U.S.
All indices are unmanaged and investors cannot invest directly in an index.
Past performance does not guarantee future results. The performance quoted represents past performance. Investment return and principal value of an investment will fluctuate, and shares, when redeemed, may be worth more or less than their original cost. The Funds’ performance is subject to change since the period’s end and may be lower or higher than the performance data shown. Please call (800) 992-0180 or log on to www.ingfunds.com to obtain performance data current to the most recent month end.
Market Perspective reflects the views of the ING Chief Investment Risk Officer only through the end of the period, and is subject to change based on market and other conditions.
3
Table of Contents
| ING GNMA INCOME FUND | PORTFOLIO MANAGERS’ REPORT |
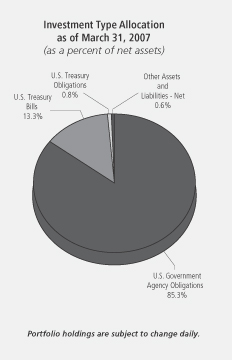
ING GNMA Income Fund (the “Fund”) seeks to generate a high level of current income, consistent with liquidity and safety of principal, through investment primarily in Government National Mortgage Association (“GNMA”) mortgage-backed securities (also known as GNMA Certificates) that are guaranteed as to the timely payment of principal and interest by the U.S. government. The Fund is managed by Denis P. Jamison, CFA, Senior Vice President and Senior Portfolio Manager of ING Investment Management Co. — the Sub-Adviser.
Securities issued by the U.S. Treasury are backed by the full faith and credit of the federal government. Securities issued by individual agencies and organizations may be backed by the full faith and credit of the federal government as to principal or interest but are not direct obligations of the U.S. Treasury. Securities of some agencies and organizations are backed solely by the entity’s own resources or by the ability of the entity to borrow from the U.S. Treasury. Government securities also include certain mortgage-related securities that are sponsored by a U.S. government agency or organization and are not direct obligations of the U.S. government.
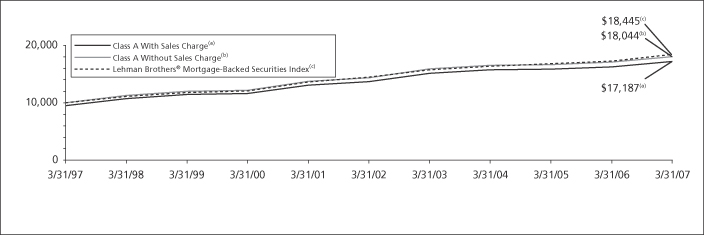
Performance: For the year ended March 31, 2007, the Fund’s Class A shares, excluding sales charges, provided a total return of 5.72% compared to the Lehman Brothers® Mortgage-Backed Securities Index, which returned 6.94% for the same period.
Portfolio Specifics: Mortgage securities performed reasonably well over the last twelve-months as low interest rate volatility helped reduce investor fear of principal prepayments. The yield spread narrowed between these securities and those of the U.S. Treasury. Unfortunately, investors were likewise complacent regarding credit risk and returns from agency-backed mortgage obligations far outpaced those earned by government backed GNMA securities. For example, Federal National Mortgage Association (“FNMA”) -backed mortgages returned 7.0% in the twelve-months ended March 31, 2007, while GNMA securities gained only 6.2%. The Fund must invest at least 80% of its assets in GNMA mortgages with the remainder allocated largely to those of the U.S. Treasury. The price spreads between comparable coupon FNMA-backed and GNMA- backed mortgages are now below historic norms. In our opinion, it is reasonable to presume that the underperformance of the GNMA sector is close to an end.
We gradually liquidated our $120 million GNMA multi-family mortgage loan portfolio during 2006. Valuations for these securities moved to extremes as the dealer community bid aggressively for collateral to place into structured mortgage securities. We recognized about $1.8 million in gains on our sales, adding about 0.25% to the Fund’s return over the last year. Our success in the U.S. Treasury bond arena was erratic. During the first nine months of the fiscal year, trading activity in long-term U.S. Treasury bonds and notes produced $2.1 million in realized capital gains. Unfortunately, we gave back $1.1 million of these gains in the first three months of 2007. The Fund usually holds $50 million to $100 million in U.S. Treasury securities. These assets are used to manage the Fund’s overall interest rate sensitivity.
GNMA mortgages underperformed FNMA and Federal Home Loan Mortgage Corporation (“FHLMC”) securities by about 0.80% during the last twelve-months. There has been a secular decline in GNMA issuance over the last 10 years while the publicly owned agencies have been on a growth binge. GNMA securities constituted 25% of the Lehman Brothers® Mortgage-Backed Securities Index in 1998. They now have less than an 8% share. As a result, index and GNMA returns are becoming less correlated. GNMA securities performed exceptionally well in 2005, outpacing the Lehman Brothers® Mortgage-Backed Securities Index by 0.59%. Last year, was an overreaction in the other direction.
In November, 2006, we acquired $15 million face value 30-year U.S. Treasury bonds, $15 million worth of 10-year notes, and $35 million two-year notes. The objective was to neutralize the Fund’s duration versus its peers while also better positioning the portfolio for a steepening in the yield curve. Losses mounted on the position through January and early February, at which point, we liquidated the holdings and recognized a $1.1 million loss. The market subsequently rallied. Had we held the positions, we would have been breakeven on the investments.
Current Strategy and Outlook: The bond market, as measured by the yield of 10-year U.S. Treasury notes, has been in a 0.50% trading range since August. As weak economic numbers are reported, we see sentiment build about an imminent U.S. Federal Reserve Board (“Fed”) easing and yields slide down to the 4.4% to 4.5% area. Then, on any signs of economic life, we climb back toward 4.8% to 4.9%. We believe this gridlock will continue until it becomes clear — as measured by the near term federal funds futures contracts — that the Fed will lower rates in two or three months. Meanwhile, we continue to add to our holdings of higher coupon GNMA securities and will deploy our cash into bonds at the top of the assumed range and return to cash when the market returns to lower yields.
Portfolio holdings and characteristics are subject to change and may not be representative of current holdings and characteristics. The outlook for this Fund may differ from that presented for other ING Funds. Performance for the different classes of shares will vary based on differences in fees associated with each class.
4
Table of Contents
| PORTFOLIO MANAGERS’ REPORT | ING GNMA INCOME FUND |
Average Annual Total Returns for the Periods Ended March 31, 2007 |
| |||||||||||||||||||||
| 1 Year | 5 Year | 10 Year | Since of Class B October 6, | Since of Class C October 13, | Since of Class I January 7, | Since of Class Q | ||||||||||||||||
Including Sales Charge: | ||||||||||||||||||||||
Class A(1) | 0.74% | 3.65% | 5.55% | — | — | — | — | |||||||||||||||
Class B(2) | (0.16)% | 3.53% | — | 4.65% | — | — | — | |||||||||||||||
Class C(3) | 3.85% | 3.86% | — | — | 4.60% | — | — | |||||||||||||||
Class I | 5.92% | 4.98% | — | — | — | 4.76% | — | |||||||||||||||
Class Q | 5.76% | 4.74% | — | — | — | — | 4.86% | |||||||||||||||
Excluding Sales Charge: | ||||||||||||||||||||||
Class A | 5.72% | 4.67% | 6.07% | — | — | — | — | |||||||||||||||
Class B | 4.84% | 3.87% | — | 4.65% | — | — | — | |||||||||||||||
Class C | 4.85% | 3.86% | — | — | 4.60% | — | — | |||||||||||||||
Class I | 5.92% | 4.98% | — | — | — | 4.76% | — | |||||||||||||||
Class Q | 5.76% | 4.74% | — | — | — | — | 4.86% | |||||||||||||||
Lehman Brothers® Mortgage-Backed Securities Index(4) | 6.94% | 4.97% | 6.31% | 5.85% | (5) | 5.65% | (5) | 4.92% | (6) | 4.92% | (7) | |||||||||||
Based on a $10,000 initial investment, the graph and table above illustrate the total return of ING GNMA Income Fund against the index indicated. An index is unmanaged and has no cash in its portfolio, imposes no sales charges and incurs no operating expenses. An investor cannot invest directly in an index. The Fund’s performance is shown both with and without the imposition of sales charges.
The performance graph and table do not reflect the deduction of taxes that a shareholder will pay on Fund distributions or the redemption of Fund shares.
The performance shown may include the effect of fee waivers and/or expense reimbursements by the Investment Adviser and/or other service providers, which have the effect of increasing total return. Had all fees and expenses been considered, the total returns would have been lower.
Performance data represents past performance and is no assurance of future results. Investment return and principal value of an investment in the Fund will fluctuate. Shares, when sold, may be worth more or less than their original cost. The Fund’s performance may be lower or higher than the performance data shown. Please log on to www.ingfunds.com or call (800) 992-0180 to get performance through the most recent month end.
This report contains statements that may be “forward-looking” statements. Actual results may differ materially from those projected in the “forward-looking” statements.
The views expressed in this report reflect those of the portfolio managers, only through the end of the period as stated on the cover. The portfolio managers’ views are subject to change at any time based on market and other conditions.
Fund holdings are subject to change daily.
(1) | Reflects deduction of the maximum Class A sales charge of 4.75%. Effective July 31, 2006, the maximum Class A sales charge has been lowered to 2.50%. |
(2) | Reflects deduction of the Class B deferred sales charge of 5% and 2% for the 1 year and 5 year returns, respectively. |
(3) | Reflects deduction of the Class C deferred sales charge of 1% for the 1 year return. |
(4) | The Lehman Brothers® Mortgage-Backed Securities Index is an unmanaged index composed of fixed-income security mortgage pools sponsored by GNMA, FNMA and FHLMC, including GNMA Graduated Payment Mortgages. |
(5) | Since Inception performance for index is shown from October 1, 2000. |
(6) | Since inception performance for index is shown from January 1, 2002. |
(7) | Since inception performance for index is shown from March 1, 2001. |
5
Table of Contents
| ING HIGH YIELD BOND FUND | PORTFOLIO MANAGERS’ REPORT |
Investment Type Allocation
as of March 31, 2007
(as a percent of net assets)
Corporate Bonds/Notes | 98.5% | |
Mutual Funds | 0.9% | |
Repurchase Agreement | 0.9% | |
Other Assets and Liabilities — Net | (0.3)% | |
Net Assets | 100.0% | |
Portfolio holdings are subject to change daily.
ING High Yield Bond Fund (the “Fund”) seeks to provide investors with a high level of current income and total return. The Fund is managed by Randall Parrish(1), CFA and Portfolio Manager of ING Investment Management Co. — the Sub-Adviser.
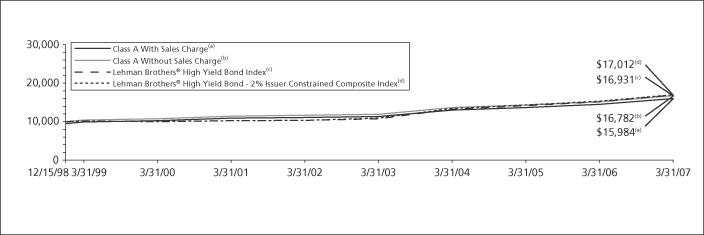
Performance: For the year ended March 31, 2007, the Fund’s Class A shares, excluding sales charges, provided a total return of 10.54% compared to the Lehman Brothers® High Yield Bond Index and the Lehman Brothers® High Yield Bond — 2% Issuer Constrained Composite Index, which returned 11.58% and 10.97%, respectively, for the same period.
Portfolio Specifics: After the high-yield market bottomed out at the end of June 2006, the Lehman Brothers High Yield Bond—2% Issuer Constrained Index posted seven consecutive months of total returns in excess of 1% from August through February 2007. The Fund’s conservative positioning, relative to the benchmark, resulted in its underperformance through October, as we did not adequately participate in the rally in lower quality, higher-yielding bonds. By late 2006, we had increased the risk profile of the Fund to bring it in line with the market as a whole, reflecting our generally constructive outlook for high yield. We remained underweight the highest-yielding portion of the index and the yield of the Fund was close enough to that of the benchmark to allow us to outperform based on individual security selection calls during the second half of the year. Specifically, the Fund benefited from an overweight position in the cable and energy sectors in the second half of 2006, as well as from specific issuer positions across a wide range of names. General Motors and General Motors Acceptance Corporation had the biggest positive impact on the portfolio as they rose in the lead up to GM’s sale of 51% of GMAC at the end of 2006. Bonds of both issuers significantly outperformed the benchmark through the second half of last year.
Current Strategy and Outlook: We remain constructive on the near-term prospects for the high-yield market. In our opinion, the underlying fundamentals continue to be strong, including high profit margins, strengthening balance sheets and excellent liquidity. The asset class also continues to attract capital-seeking yield. The risk premium in high yield (measured as spread versus Treasuries) remains low versus historical levels, but as long as defaults remain low and risk appetite high, it is difficult to envision a meaningful reversal. As a result, we believe high yield is likely to continue to outperform other fixed income asset classes in the near term as spreads remain near historically tight levels. In our opinion, the increase in lower-quality issuance over the past couple years will eventually cause an increase in defaults, but we continue to believe that occurrence is still several quarters away. The yield of the Fund remains in line with that of its benchmarks, as we have offset our underweight in the highest yielding – and highest risk – portion of the market with an underweight in the lowest yielding portion of the market. We continue to focus on fundamental analysis to drive individual security selection, seeking out companies that are showing positive operating momentum and those in which potential event risk skews toward a positive outcome for bondholders.
Portfolio holdings and characteristics are subject to change and may not be representative of current holdings and characteristics. The outlook for this Fund may differ from that presented for other ING Funds. Performance for the different classes of shares will vary based on differences in fees associated with each class.
| (1) | Effective March 1, 2007, Randall Parrish was named Portfolio Manager to the Fund and Greg Jacobs and Kurt Kringelis were removed as portfolio managers to the Fund. |
Top Ten Industries
as of March 31, 2007
(as a percent of net assets)
Media | 12.5% | |
Diversified Financial Services | 12.2% | |
Telecommunications | 7.9% | |
Chemicals | 6.6% | |
Commercial Services | 5.6% | |
Healthcare-Services | 4.5% | |
Retail | 4.5% | |
Oil & Gas | 4.3% | |
Forest Products & Paper | 4.2% | |
Electric | 3.0% |
Portfolio holdings are subject to change daily.
6
Table of Contents
| PORTFOLIO MANAGERS’ REPORT | ING HIGH YIELD BOND FUND |
Average Annual Total Returns for the Periods Ended March 31, 2007 |
| ||||||||||
| 1 Year | 5 Year | Since Inception of Classes A, B and C | |||||||||
Including Sales Charge: | |||||||||||
Class A(1) | 5.34% | 6.50% | 5.82% | ||||||||
Class B(2) | 4.72% | 6.42% | 5.65% | ||||||||
Class C(3) | 8.70% | 6.77% | 5.67% | ||||||||
Excluding Sales Charge: | |||||||||||
Class A | 10.54% | 7.55% | 6.44% | ||||||||
Class B | 9.72% | 6.73% | 5.65% | ||||||||
Class C | 9.70% | 6.77% | 5.67% | ||||||||
Lehman Brothers® High Yield Bond Index(4) | 11.58% | 10.39% | 6.52% | (6) | |||||||
Lehman Brothers® High Yield Bond—2% Issuer Constrained Composite Index(5) | 10.97% | 10.43% | 6.58% | (6) | |||||||
Based on a $10,000 initial investment, the graph and table above illustrate the total return of ING High Yield Bond Fund against the indices indicated. An index is unmanaged and has no cash in its portfolio, imposes no sales charges and incurs no operating expenses. An investor cannot invest directly in an index. The Fund’s performance is shown both with and without the imposition of sales charges.
The performance graph and table do not reflect the deduction of taxes that a shareholder will pay on Fund distributions or the redemption of Fund shares.
The performance shown may include the effect of fee waivers and/or expense reimbursements by the Investment Adviser and/or other service providers, which have the effect of increasing total return. Had all fees and expenses been considered, the total returns would have been lower.
Performance data represents past performance and is no assurance of future results. Investment return and principal value of an investment in the Fund will fluctuate. Shares, when sold, may be worth more or less than their original cost. The Fund’s performance may be lower or higher than the performance data shown. Please log on to www.ingfunds.com or call (800) 992-0180 to get performance through the most recent month end.
This report contains statements that may be “forward-looking” statements. Actual results may differ materially from those projected in the “forward-looking” statements.
The views expressed in this report reflect those of the portfolio managers, only through the end of the period as stated on the cover. The portfolio managers’ views are subject to change at any time based on market and other conditions.
Fund holdings are subject to change daily.
(1) | Reflects deduction of the maximum Class A sales charge of 4.75%. Effective July 31, 2006, the maximum Class A sales charge has been lowered to 2.50%. |
(2) | Reflects deduction of the Class B deferred sales charge of 5% and 2% for the 1 year and 5 year returns, respectively. |
(3) | Reflects deduction of the Class C deferred sales charge of 1% for the 1 year return. |
(4) | The Lehman Brothers® High Yield Bond Index is an unmanaged index that measures the performance of fixed-income securities generally representative of corporate bonds rated below investment grade. |
(5) | The Lehman Brothers® High Yield Bond — 2% Issuer Constrained Composite Index is an unmanaged index that measures the performance of fixed-income securities. The Composite Index more closely tracks the types of securities in which the Fund invests than the Lehman Brothers® High Yield Bond Index. |
(6) | Since inception performance for indices is shown from December 1, 1998. |
7
Table of Contents
| ING INTERMEDIATE BOND FUND | PORTFOLIO MANAGERS’ REPORT |
Investment Type Allocation
as of March 31, 2007
(as a percent of net assets)
Collateralized Mortgage Obligations | 34.2% | |
U.S. Government Agency Obligations | 28.7% | |
Corporate Bonds/Notes | 25.0% | |
U.S. Treasury Obligations | 9.0% | |
Asset-Backed Securities | 5.2% | |
Mutual Fund | 2.6% | |
Preferred Stock | 1.2% | |
Foreign Government Securities | 1.0% | |
Municipal Bonds | 1.0% | |
Other Bonds | 0.9% | |
Repurchase Agreement | 0.1% | |
Other Assets and Liabilities — Net* | (8.9)% | |
Net Assets | 100.0% | |
| * | Includes Securities Lending Collateral |
Portfolio holdings are subject to change daily.
ING Intermediate Bond Fund (the “Fund”) seeks to provide investors with a high level of current income, consistent with the preservation of capital and liquidity. The Fund is managed by James B. Kauffmann, Portfolio Manager of ING Investment Management Co. — the Sub-Adviser.
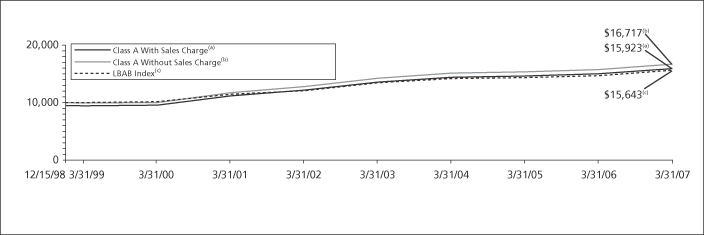
Performance: For the year ended March 31, 2007, the Fund’s Class A shares, excluding sales charges, provided a total return of 6.03% compared to Lehman Brothers® Aggregate Bond Index (“LBAB Index”), which returned 6.59% for the same period.
Portfolio Specifics: The year ended March 31, 2007 witnessed a bond market in transition as the U.S. Federal Reserve Board (“Fed”) moved from tightening short-term rates to holding them steady. Market expectations about future Fed activity was anything but steady as the consensus view seesawed between imminent easing by the Fed to a belief that the central bank would continue to hold rates at 5.25%. Mixed — yet declining — results for the residential real estate market vexed forecasters as warmer weather at the end of 2006 acted as a boon to the market and made year-over-year comparisons hard. Nevertheless, the widening problems in the sub-prime mortgage market in the first quarter of 2007 clearly concerned even the most optimistic pundits. While risk premiums became tighter, spasms of risk aversion briefly upset the markets in May 2006 and late February 2007. During the period, inflation remained above the Federal Open Market Committee’s comfort level, the economy continued to cool, and mergers and acquisitions continued at a torrid pace. Yet a record level of corporate debt was issued during the year. The period also witnessed the collapse of Amaranth, the $9.2 billion hedge fund, which saw its gamble on natural gas prices go wrong. As the largest hedge fund collapse to date, eclipsing Long Term Capital Management’s ignominious fall, the market seemingly took this in its stride. Despite bouts of capital market volatility, the LBAB Index posted a total return of 6.59% during the Fund’s fiscal year. All major sectors of the index outperformed like duration Treasuries, although mortgages and home equity loans encountered some resistance in early 2007. High yield returned 11.58% for the year ended March 31, 2007. Emerging market debt (“EMD”) returned 9.48% for the same period. The U.S. Treasury yield curve inverted leaving short-term interest rates higher than long-term rates, and the bellwether ten-year note declined 0.20% to close with a yield of 4.64%.
Several major themes dominated returns during the period. Tactical overweight positions to securitized assets such as mortgage-backed securities — especially 7/1 and 10/1 ARMs — asset-based securities and commercial mortgage-backed securities contributed positively. In contrast, a short-duration position acted as a drag in the last six months of the year. Generally, the Fund was underweight longer-dated corporate bonds in the face of miniscule spreads, or risk compensation. However, tactical allocations to longer maturity credit helped. The Fund managed to navigate the late May to early June risk hiccup in 2006 as well as the late February sub-prime mortgage sell off. In both instances, the sell off in riskier assets worldwide was brief. Throughout the fiscal year, we had small high yield and EMD positions. However, the strong performance of both sectors indicated that a more sizable commitment was warranted.
Current Outlook and Strategy: While we believe that risk aversion has disappeared, we remain cautious. The supposed epicenter of this flight from risk, the Shanghai stock market, has recovered from its -8.8% decline and is now touching new highs. Yet the most challenged of the U.S. sub-prime mortgage market is still an issue. Our caution is based on the potential for secondary after-shocks in a technically queasy market. It is not a concern about the wholesale contagion espoused by some pundits. Recent economic releases suggest weakened capital spending, elevated inflation, low unemployment, and a housing market in search of terra firma. We believe all of this adds up to a Fed waiting for more data — not a Fed on the brink of rescuing capital markets during bouts of risk aversion. In our opinion, to do this so early in his tenure as Chairman might put Ben Bernanke in the unenviable position of creating a moral hazard with long-term consequences.
Identifying bonds that trade at a discount to their intrinsic value is the hallmark of our security selection process, and now, after the risk aversion temblors, some value may exist, selectively, in the sub-prime arena. We are actively sifting through related markets for bonds that meet our credit criteria. In a corporate bond market offering thin risk premia, our credit team remains alert to leveraged buyout (“LBO”) and shareholder enhancement risks, such as the first quarter announcement of the largest ever LBO. We have positioned the term structure of the portfolio for rising ten- and thirty-year rates in the context of a neutral duration posture for the portfolio as a whole. This stance is the result of the potential for additional flight-to-quality episodes and an admittedly softer economic picture. Moreover, we have added Treasury Inflation-Protected Securities exposure in light of the steady upward creep of inflation.
We remain positive about EMD. As global markets moderate, we believe growth in Europe and Asia to help, particularly as inflation risks seem contained. For high yield, although it is unlikely that the volatility observed in late February and early March is fully behind us, our longer-term outlook remains positive. We believe concerns surrounding subprime mortgages, consumer spending and business investment are likely to produce short-term instability. However, we believe moderate but positive economic growth, low interest rates and a continuing absence of defaults bode well for high yield in the intermediate term.
Portfolio holdings and characteristics are subject to change and may not be representative of current holdings and characteristics. The outlook for this Fund may differ from that presented for other ING Funds. Performance for the different classes of shares will vary based on differences in fees associated with each class.
8
Table of Contents
| PORTFOLIO MANAGERS’ REPORT | ING INTERMEDIATE BOND FUND |
Average Annual Total Returns for the Periods Ended March 31, 2007 |
| |||||||||||||||||||
| 1 Year | 5 Year | Since Inception of Classes A, B and C December 15, | Since Inception of Class I January 8, 2002 | Since Inception of Class O August 13, 2004 | Since Inception March 16, | |||||||||||||||
Including Sales Charge: | ||||||||||||||||||||
Class A(1) | 0.95% | 4.47% | 5.77% | — | — | — | ||||||||||||||
Class B(2) | 0.23% | 4.34% | 5.58% | — | — | — | ||||||||||||||
Class C(3) | 4.24% | 4.70% | 5.60% | — | — | — | ||||||||||||||
Class I | 6.26% | 5.84% | — | 5.66% | — | — | ||||||||||||||
Class O | 6.02% | — | — | — | 3.87% | — | ||||||||||||||
Class R | 5.75% | — | — | — | — | 3.06% | ||||||||||||||
Excluding Sales Charge: | ||||||||||||||||||||
Class A | 6.03% | 5.48% | 6.39% | — | — | — | ||||||||||||||
Class B | 5.23% | 4.67% | 5.58% | — | — | — | ||||||||||||||
Class C | 5.24% | 4.70% | 5.60% | — | — | — | ||||||||||||||
Class I | 6.26% | 5.84% | — | 5.66% | — | — | ||||||||||||||
Class O | 6.02% | — | — | — | 3.87% | — | ||||||||||||||
Class R | 5.75% | — | — | — | — | 3.06% | ||||||||||||||
LBAB Index(4) | 6.59% | 5.35% | 5.52% | (5) | 5.11% | (6) | 4.31% | (7) | 3.31% | (8) | ||||||||||
Based on a $10,000 initial investment, the graph and table above illustrate the total return of ING Intermediate Bond Fund against the index indicated. An index is unmanaged and has no cash in its portfolio, imposes no sales charges and incurs no operating expenses. An investor cannot invest directly in an index. The Fund’s performance is shown both with and without the imposition of sales charges.
The performance graph and table do not reflect the deduction of taxes that a shareholder will pay on Fund distributions or the redemption of Fund shares.
The performance shown may include the effect of fee waivers and/or expense reimbursements by the Investment Adviser and/or other service providers, which have the effect of increasing total return. Had all fees and expenses been considered, the total returns would have been lower.
Performance data represents past performance and is no assurance of future results. Investment return and principal value of an investment in the Fund will fluctuate. Shares, when sold, may be worth more or less than their original cost. The Fund’s performance may be lower or higher than the performance data shown. Please log on to www.ingfunds.com or call (800) 992-0180 to get performance through the most recent month end.
This report contains statements that may be “forward-looking” statements. Actual results may differ materially from those projected in the “forward-looking” statements.
The views expressed in this report reflect those of the portfolio managers, only through the end of the period as stated on the cover. The portfolio managers’ views are subject to change at any time based on market and other conditions.
Fund holdings are subject to change daily.
(1) | Reflects deduction of the maximum Class A sales charge of 4.75%. Effective July 31, 2006, the maximum Class A sales charge has been lowered to 2.50%. |
(2) | Reflects deduction of the Class B deferred sales charge of 5% and 2% for the 1 year and 5 year returns, respectively. |
(3) | Reflects deduction of the Class C deferred sales charge of 1% for the 1 year return. |
(4) | The LBAB Index is an unmanaged index composed of securities from the Lehman Brothers Intermediate Government/Corporate Bond Index, Mortgage-Backed Securities Index, and the Asset Backed Securities Index including securities that are investment-grade quality or better and have at least one year to maturity. |
(5) | Since inception performance for index is shown from December 1, 1998. |
(6) | Since inception performance for index is shown from January 1, 2002. |
(7) | Since inception performance for index is shown from August 1, 2004. |
(8) | Since inception performance for index is shown from April 1, 2004. |
9
Table of Contents
| ING NATIONAL TAX-EXEMPT BOND FUND | PORTFOLIO MANAGERS’ REPORT |
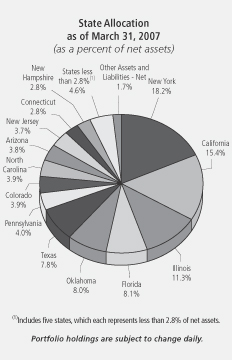
ING National Tax-Exempt Bond Fund (the “Fund”) seeks to provide investors with a high level of current income that is exempt from federal income taxes, consistent with the preservation of capital. The Fund is managed by Robert Schonbrunn, Karen Cronk, and Rick Kilbride, Portfolio Managers of ING Investment Management Co. — the Sub-Adviser.
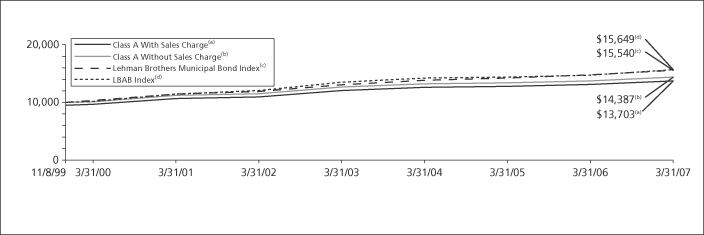
Performance: For the year ended March 31, 2007, the Fund’s Class A shares, excluding sales charges, provided a total return of 4.83% compared to the Lehman Brothers Municipal Bond Index and the Lehman Brothers® Aggregate Bond Index (“LBAB Index”), which returned 5.43% and 6.59%, respectively, for the same period.
Portfolio Specifics: Looking back to April 2006, the U.S. Federal Reserve Board (“Fed”) was still tightening credit by raising the federal funds rate, and longer-term interest rates were rising. We kept the Fund in a defensive posture with lower sensitivity to rising interest rates, which had the beneficial effect of preserving capital during a difficult period. Sensing the Fed was nearing the end of their tightening cycle in May and June, we began to shift assets into longer maturities to increase the sensitivity of the portfolio to lower rates in the future. This move paid off as rates declined and bond values increased during the third calendar quarter after the Fed signaled a pause in their tightening program. Since the drop in interest rates in July and August, rates stayed within a tight trading range, without a discernable trend, we became slightly more defensive.
During the past twelve months, bonds with longer-term maturities performed the best on the municipal bond yield curve. The yield curve or the difference between short-term interest rates and long-term interest rates flattened. Longer-term rates declined while rates at the shorter end remained relatively stable. Our holdings of longer-term bonds, which is part of our barbell yield curve strategy, performed well. Another trend that continued throughout the fiscal year was the outperformance of lower-quality bonds including those rated ‘BBB’ over bonds rated ‘AAA’. As investors tried to capture more yield, they bought more lower-rated, higher-yielding bonds, which narrowed the spread or difference between the differently rated bonds and caused the lower-quality issues to outperform. While the Fund maintained an overall ‘AA’ quality rating, our holdings of hospital, industrial revenue and tobacco bonds in the lower-rated categories added to returns. The Fund ended the fiscal year with a coupon of 5.44%, and a yield to maturity of 4.19%. Both of which were comparatively attractive rates.
Current Strategy and Outlook: We believe that the Fed has ended its tightening cycle and that interest rates will decline, but the timing is still not clear. The unwinding of the housing bubble and the weakness in capital spending are dampening economic growth, while inflation is remaining stubbornly higher than the Fed would like to see. We believe inflation will decline, and we are paying particular attention to labor costs. As we gain more confidence that the slowing economy will force interest rates lower, we will extend our bond maturities to raise the portfolio’s sensitivity to interest rate changes. We continue to search for attractively priced individual issues to add to the portfolio.
Portfolio holdings and characteristics are subject to change and may not be representative of current holdings and characteristics. The outlook for this Fund may differ from that presented for other ING Funds. Performance for the different classes of shares will vary based on differences in fees associated with each class.
Top Ten Holdings
as of March 31, 2007
(as a percent of net assets)
Pleasant Valley School District, CA, | 4.5 | % | |
Harris County Health Facilities Development | 4.4 | % | |
Payne County Economic Development Authority, OK, | 4.1 | % | |
Port Authority of New York & New Jersey, | 4.1 | % | |
Lebanon County Health Facilities Authority, PA, | 4.0 | % | |
City of New York, 5.000%, due 08/01/24 | 3.9 | % | |
Clovis Public Financing Authority, CA, | 3.9 | % | |
De Kalb-Ogle Etc Counties Community College | 3.9 | % | |
New York State Dormitory Authority, | 3.9 | % | |
Oklahoma Industries Authority, | 3.9 | % |
Portfolio holdings are subject to change daily.
10
Table of Contents
| PORTFOLIO MANAGERS’ REPORT | ING NATIONAL TAX-EXEMPT BOND FUND |
Average Annual Total Returns for the Periods Ended March 31, 2007 |
| ||||||||||
| 1 Year | 5 Year | Since Inception of Classes A, B and C November 8, 1999 | |||||||||
Including Sales Charge: | |||||||||||
Class A(1) | (0.13)% | 3.63% | 4.35% | ||||||||
Class B(2) | (0.95)% | 3.51% | 4.25% | ||||||||
Class C(3) | 3.04% | 3.85% | 4.27% | ||||||||
Excluding Sales Charge: | |||||||||||
Class A | 4.83% | 4.63% | 5.04% | ||||||||
Class B | 4.05% | 3.86% | 4.25% | ||||||||
Class C | 4.04% | 3.85% | 4.27% | ||||||||
Lehman Brothers Municipal Bond Index(4) | 5.43% | 5.50% | 6.12% | (6) | |||||||
LBAB Index(5) | 6.59% | 5.35% | 6.22% | (6) | |||||||
Based on a $10,000 initial investment, the graph and table above illustrate the total return of ING National Tax-Exempt Bond Fund against the indices indicated. An index is unmanaged and has no cash in its portfolio, imposes no sales charge and incurs no operating expenses. An investor cannot invest directly in an index. The Fund’s performance is shown both with and without the imposition of sales charges.
The performance graph and table do not reflect the deduction of taxes that a shareholder will pay (if any) on Fund distributions or the redemption of Fund shares.
The performance shown may include the effect of fee waivers and/or expense reimbursements by the Investment Adviser and/or other service providers, which have the effect of increasing total return. Had all fees and expenses been considered, the total returns would have been lower.
Performance data represents past performance and is no assurance of future results. Investment return and principal value of an investment in the Fund will fluctuate. Shares, when sold, may be worth more or less than their original cost. The Fund’s performance may be lower or higher than the performance data shown. Please log on to www.ingfunds.com or call (800) 992-0180 to get performance through the most recent month end.
This report contains statements that may be “forward-looking” statements. Actual results may differ materially from those projected in the “forward-looking” statements.
The views expressed in this report reflect those of the portfolio managers, only through the end of the period as stated on the cover. The portfolio managers’ views are subject to change at any time based on market and other conditions.
Fund holdings are subject to change daily.
(1) | Reflects deduction of the maximum Class A sales charge of 4.75%. |
(2) | Reflects deduction of the Class B deferred sales charge of 5% and 2% for the 1 year and 5 year returns, respectively. |
(3) | Reflects deduction of the Class C deferred sales charge of 1% for the 1 year return. |
(4) | The Lehman Brothers Municipal Bond Index is an unmanaged index of approximately 1,100 investment grade tax-exempt bonds classified into four sectors: general obligation, revenue, insured and pre-refunded. |
(5) | The LBAB Index in an unmanaged index composed of securities from the Lehman Brothers Intermediate Government/Corporate Bond Index, Mortgage-backed Securities Index, and the Asset Backed Securities Index including securities that are investment-grade quality or better and have at least one year to maturity. |
(6) | Since inception performance for indices is shown from November 1, 1999. |
11
Table of Contents
| ING CLASSIC MONEY MARKET FUND | PORTFOLIO MANAGERS’ REPORT |
ING Classic Money Market Fund (the “Fund”) seeks to provide investors with a high level of current income, consistent with the preservation of capital and liquidity and the maintenance of a stable $1.00 net asset value per share. The Fund is managed by David S. Yealy, Portfolio Manager of ING Investment Management Co. — the Sub-Adviser.
Portfolio Specifics: The Fund’s fiscal year ended March 31, 2007, can be separated into two distinct periods. The early period April to June 2006, which saw the Federal Open Market Committee (“FOMC”) raise the federal funds rate and discount rate 0.25% at both of its meetings. The majority of short-term money market investors, as indicated by federal funds futures pricing and London Interbank Offered Rates (“LIBOR”) rates, continued to expect the FOMC to increase rates during the second half of the year. Short-term money market rates increased in response to the FOMC rate actions and market expectations.
The later period was one characterized by the FOMC holding the federal funds rate and discount rate steady. The FOMC chose not to increase rates at their August 8, 2006 meeting for first time since May of 2004, ending a string of 0.25% increases at seventeen consecutive meetings. Economic growth slowed to a more moderate level due primarily to a slow down in the housing market. Despite inflation remaining above the U.S. Federal Reserve Board’s (“Fed”) 1%-2% comfort range, and a tight labor market, the market shifted from expecting future rate increases to pricing in future rate cuts by the FOMC.
Our primary investment strategy, which we had in place since the second half of 2004, did not change significantly during the early period of the year. The Fund benefited from a large amount of interest sensitive floating rate securities. In addition to our emphasis on floating rate securities, we
continued to focus new purchases on very short maturity securities that typically matured prior to the next FOMC meeting. Both performed well in the rising rate environment. We made selective purchases in the two- to three-month maturity range only when they fully priced in future Fed rate increases.
For a brief period in June, the market priced in a more aggressive Fed with 1-Year LIBOR nearing 5.80%. We took the opportunity to extend the Fund’s weighted average maturity (“WAM”) from approximately 20 days to approximately 40 days by investing about 5% of the Fund in fixed rate securities with maturities greater than six months. This maturity extension positioned the Fund to take advantage of the shift in the FOMC’s rate posture during the second half of 2006, and the market’s reaction to such a shift. The securities with maturities longer than six months added a yield premium over shorter securities. We elected to sell a portion of these longer-term securities at a gain during the third and fourth quarters of 2006 when the market priced in significant future Fed interest rate cuts. We added back longer-term securities when yields increased as rate cut expectations moderated during the first quarter of 2007. We ended the fiscal year with a WAM of 31 days.
Current Strategy and Outlook: During the first quarter of 2007, the short-term market, as represented by the trading of federal funds futures, had priced in the probability of at least three 0.25% rate cuts by the Fed in 2007, with the first rate cut coming as early as June. We do not agree with this market outlook, and therefore have been cautious in extending our WAM too much, preferring to take advantage of the swings in the market by extending on back-ups and selling when yields price in rate cuts for 2007. We believe the market has mostly ignored the high inflation, a tight U.S. labor market and Fed rhetoric outlining their inflation concerns, instead focusing on slower growth. We anticipate that upcoming economic data will be mixed or potentially surprise to the upside, as it relates to growth and or inflation, which we believe will lead to higher yields for longer-term money market securities. In our opinion, this will also allow the FOMC plenty of room to keep rates at current levels for a prolonged period. We believe there will be more opportunities in the near-term to add additional days to our WAM at yields above what is currently priced into the market for short-term money market securities.
Principal Risk Factor(s): An investment in the Fund is not insured or guaranteed by the Federal Deposit Insurance Corporation or any other government agency.
Although the Fund seeks to preserve the value of your investment at $1.00 per share, it is possible to lose money by investing in the Fund.
Portfolio holdings and characteristics are subject to change and may not be representative of current holdings and characteristics. The outlook for this Fund may differ from that presented for other ING Funds.
The views expressed in this report reflect those of the portfolio managers only through the end of the period as stated on the cover. The portfolio managers’ views are subject to change at any time based on market and other conditions.
Fund holdings are subject to change daily.
This report contains statements that may be “forward-looking” statements. Actual results may differ materially from those projected in the “forward-looking” statements.
12
Table of Contents
| PORTFOLIO MANAGERS’ REPORT | ING INSTITUTIONAL PRIME MONEY MARKET FUND |
ING Institutional Prime Money Market Fund (the “Fund”) seeks to provide investors with a high level of current income, consistent with the preservation of capital and liquidity and the maintenance of a stable $1.00 net asset value per share. The Fund is managed by David S. Yealy, Portfolio Manager of ING Investment Management Co. — the Sub-Adviser.
Portfolio Specifics: The Fund’s fiscal year ended March 31, 2007, can be separated into two distinct periods. The early period April to June 2006, which saw the Federal Open Market Committee (“FOMC”) raise the federal funds rate and discount rate 0.25% at both of its meetings. The majority of short-term money market investors, as indicated by federal funds futures pricing and London Interbank Offered Rates (“LIBOR”) rates, continued to expect the FOMC to increase rates during the second half of the year. Short-term money market rates increased in response to the FOMC rate actions and market expectations.
The later period was one characterized by the FOMC holding the federal funds rate and discount rate steady. The FOMC chose not to increase rates at their August 8, 2006 meeting for first time since May of 2004, ending a string of 0.25% increases at seventeen consecutive meetings. Economic growth slowed to a more moderate level due primarily to a slow down in the housing market. Despite inflation remaining above the U.S. Federal Reserve Board’s 1%-2% comfort range, and a tight labor market, the market shifted from expecting future rate increases to pricing in future rate cuts by the FOMC.
Our primary investment strategy, which we had in place since the second half of 2004, did not change significantly during the early period of the year. The Fund benefited from a large amount of interest sensitive floating rate securities. In addition to our emphasis on floating rate securities, we
continued to focus new purchases on very short maturity securities that typically matured prior to the next FOMC meeting. Both performed well in the rising rate environment. We made selective purchases in the two- to three-month maturity range only when they fully priced in future Fed rate increases.
For a brief period in June, the market priced in a more aggressive Fed with 1-Year LIBOR nearing 5.80%. We took the opportunity to extend the Fund’s weighted average maturity (“WAM”) from approximately 20 days to approximately 40 days by investing about 5% of the Fund in fixed rate securities with maturities greater than six months. This maturity extension positioned the Fund to take advantage of the shift in the FOMC’s rate posture during the second half of 2006, and the market’s reaction to such a shift. The securities with maturities longer than six months added a yield premium over shorter securities. We elected to sell a portion of these longer-term securities at a gain during the third and fourth quarters of 2006 when the market priced in significant future Fed interest rate cuts. We added back longer-term securities when yields increased as rate cut expectations moderated during the first quarter of 2007. We ended the fiscal year with a WAM of 28 days.
Current Strategy and Outlook: During the first quarter of 2007, the short-term market, as represented by the trading of federal funds futures, had priced in the probability of at least three 0.25% rate cuts by the Fed in 2007, with the first rate cut coming as early as June. We do not agree with this market outlook, and therefore have been cautious in extending our WAM too much, preferring to take advantage of the swings in the market by extending on back-ups and selling when yields price in rate cuts for 2007. We believe the market has mostly ignored the high inflation, a tight U.S. labor market and Fed rhetoric outlining their inflation concerns, instead focusing on slower growth. We anticipate that upcoming economic data will be mixed or potentially surprise to the upside, as it relates to growth and or inflation, which we believe will lead to higher yields for longer-term money market securities. In our opinion, this will also allow the FOMC plenty of room to keep rates at current levels for a prolonged period. We believe there will be more opportunities in the near-term to add additional days to our WAM at yields above what is currently priced into the market for short-term money market securities.
Principal Risk Factor(s): An investment in the Fund is not insured or guaranteed by the Federal Deposit Insurance Corporation or any other government agency.
Although the Fund seeks to preserve the value of your investment at $1.00 per share, it is possible to lose money by investing in the Fund.
Portfolio holdings and characteristics are subject to change and may not be representative of current holdings and characteristics. The outlook for this Fund may differ from that presented for other ING Funds.
The views expressed in this report reflect those of the portfolio managers only through the end of the period as stated on the cover. The portfolio managers’ views are subject to change at any time based on market and other conditions.
Fund holdings are subject to change daily.
This report contains statements that may be “forward-looking” statements. Actual results may differ materially from those projected in the “forward-looking” statements.
13
Table of Contents
SHAREHOLDER EXPENSE EXAMPLES (UNAUDITED)
As a shareholder of a Fund, you incur two types of costs: (1) transaction costs, including sales charges (loads) on purchase payments, redemption fees, and exchange fees; and (2) ongoing costs, including management fees, distribution and/or service (12b-1) fees, and other Fund expenses. These Examples are intended to help you understand your ongoing costs (in dollars) of investing in a Fund and to compare these costs with the ongoing costs of investing in other mutual funds.
The Examples are based on an investment of $1,000 invested at the beginning of the period and held for the entire period from October 1, 2006 to March 31, 2007. The Funds’ expenses are shown without the imposition of any sales charges or fees. Expenses would have been higher if such charges were included.
Actual Expenses
The first section of the table shown, “Actual Fund Return,” provides information about actual account values and actual expenses. You may use the information in this section, together with the amount you invested, to estimate the expenses that you paid over the period. Simply divide your account value by $1,000 (for example, an $8,600 account value divided by $1,000 = 8.6), then multiply the result by the number in the first section under the heading entitled “Expenses Paid During Period” to estimate the expenses you paid on your account during this period.
Hypothetical Example for Comparison Purposes
The second section of the table shown, “Hypothetical 5% Return,” provides information about hypothetical account values and hypothetical expenses based on the Fund’s actual expense ratio and an assumed rate of return of 5% per year before expenses, which is not the Fund’s actual return. The hypothetical account values and expenses may not be used to estimate the actual ending account balance or expenses you paid for the period. You may use this information to compare the ongoing costs of investing in each Fund and other funds. To do so, compare this 5% hypothetical example with the 5% hypothetical examples that appear in the shareholder reports of the other funds.
Please note that the expenses shown in the table are meant to highlight your ongoing costs only and do not reflect any transactional costs, such as sales charges (loads), redemption fees, or exchange fees. Therefore, the hypothetical lines of the table are useful in comparing ongoing costs only, and will not help you determine the relative total costs of owning different funds. In addition, if these transactional costs were included, your costs would have been higher.
ING GNMA Income Fund | Beginning Account Value October 1, 2006 | Ending Account Value March 31, 2007 | Annualized Expense Ratio | Expenses Paid During the Period Ended March 31, 2007* | ||||||||||
Actual Fund Return | ||||||||||||||
Class A | $ | 1,000.00 | $ | 1,025.50 | 0.94 | % | $ | 4.75 | ||||||
Class B | 1,000.00 | 1,020.50 | 1.69 | 8.51 | ||||||||||
Class C | 1,000.00 | 1,020.60 | 1.69 | 8.51 | ||||||||||
Class I | 1,000.00 | 1,025.80 | 0.65 | 3.28 | ||||||||||
Class Q | 1,000.00 | 1,026.80 | 0.90 | 4.55 | ||||||||||
Hypothetical (5% return before expenses) | ||||||||||||||
Class A | $ | 1,000.00 | $ | 1,020.24 | 0.94 | % | $ | 4.73 | ||||||
Class B | 1,000.00 | 1,016.50 | 1.69 | 8.50 | ||||||||||
Class C | 1,000.00 | 1,016.50 | 1.69 | 8.50 | ||||||||||
Class I | 1,000.00 | 1,021.69 | 0.65 | 3.28 | ||||||||||
Class Q | 1,000.00 | 1,020.44 | 0.90 | 4.53 | ||||||||||
| * | Expenses are equal to each Fund’s respective annualized expense ratios multiplied by the average account value over the period, multiplied by 182/365 to reflect the most recent fiscal half-year. |
14
Table of Contents
SHAREHOLDER EXPENSE EXAMPLES (UNAUDITED) (CONTINUED)
ING High Yield Bond Fund | Beginning Account Value October 1, 2006 | Ending Account Value March 31, 2007 | Annualized Expense Ratio | Expenses Paid During the Period Ended March 31, 2007* | ||||||||||
Actual Fund Return | ||||||||||||||
Class A | $ | 1,000.00 | $ | 1,071.20 | 1.10 | % | $ | 5.68 | ||||||
Class B | 1,000.00 | 1,066.00 | 1.85 | 9.53 | ||||||||||
Class C | 1,000.00 | 1,067.10 | 1.85 | 9.53 | ||||||||||
Hypothetical (5% return before expenses) | ||||||||||||||
Class A | $ | 1,000.00 | $ | 1,019.45 | 1.10 | % | $ | 5.54 | ||||||
Class B | 1,000.00 | 1,015.71 | 1.85 | 9.30 | ||||||||||
Class C | 1,000.00 | 1,015.71 | 1.85 | 9.30 | ||||||||||
ING Intermediate Bond Fund | ||||||||||||||
Actual Fund Return | ||||||||||||||
Class A | $ | 1,000.00 | $ | 1,028.30 | 0.69 | % | $ | 3.49 | ||||||
Class B | 1,000.00 | 1,024.40 | 1.44 | 7.27 | ||||||||||
Class C | 1,000.00 | 1,024.40 | 1.44 | 7.27 | ||||||||||
Class I | 1,000.00 | 1,030.00 | 0.36 | 1.82 | ||||||||||
Class O | 1,000.00 | 1,029.20 | 0.69 | 3.49 | ||||||||||
Class R | 1,000.00 | 1,026.80 | 0.94 | 4.75 | ||||||||||
Hypothetical (5% return before expenses) | ||||||||||||||
Class A | $ | 1,000.00 | $ | 1,021.49 | 0.69 | % | $ | 3.48 | ||||||
Class B | 1,000.00 | 1,017.75 | 1.44 | 7.24 | ||||||||||
Class C | 1,000.00 | 1,017.75 | 1.44 | 7.24 | ||||||||||
Class I | 1,000.00 | 1,023.14 | 0.36 | 1.82 | ||||||||||
Class O | 1,000.00 | 1,021.49 | 0.69 | 3.48 | ||||||||||
Class R | 1,000.00 | 1,020.24 | 0.94 | 4.73 | ||||||||||
ING National Tax-Exempt Bond Fund | ||||||||||||||
Actual Fund Return | ||||||||||||||
Class A | $ | 1,000.00 | $ | 1,016.70 | 0.87 | % | $ | 4.37 | ||||||
Class B | 1,000.00 | 1,012.90 | 1.62 | 8.13 | ||||||||||
Class C | 1,000.00 | 1,012.90 | 1.62 | 8.13 | ||||||||||
Hypothetical (5% return before expenses) | ||||||||||||||
Class A | $ | 1,000.00 | $ | 1,020.59 | 0.87 | % | $ | 4.38 | ||||||
Class B | 1,000.00 | 1,016.85 | 1.62 | 8.15 | ||||||||||
Class C | 1,000.00 | 1,016.85 | 1.62 | 8.15 | ||||||||||
ING Classic Money Market Fund | ||||||||||||||
Actual Fund Return | ||||||||||||||
Class A | $ | 1,000.00 | $ | 1,023.30 | 0.77 | % | $ | 3.88 | ||||||
Class B | 1,000.00 | 1,020.20 | 1.36 | 6.85 | ||||||||||
Class C | 1,000.00 | 1,020.20 | 1.36 | 6.85 | ||||||||||
Hypothetical (5% return before expenses) | ||||||||||||||
Class A | $ | 1,000.00 | $ | 1,021.09 | 0.77 | % | $ | 3.88 | ||||||
Class B | 1,000.00 | 1,018.15 | 1.36 | 6.84 | ||||||||||
Class C | 1,000.00 | 1,018.15 | 1.36 | 6.84 | ||||||||||
ING Institutional Prime Money Market Fund | ||||||||||||||
Actual Fund Return | $ | 1,000.00 | $ | 1,026.30 | 0.16 | % | $ | 0.81 | ||||||
Hypothetical (5% return before expenses) | $ | 1,000.00 | $ | 1,024.13 | 0.16 | % | $ | 0.81 | ||||||
| * | Expenses are equal to each Fund’s respective annualized expense ratios multiplied by the average account value over the period, multiplied by 182/365 to reflect the most recent fiscal half-year. |
15
Table of Contents
REPORT OF INDEPENDENT REGISTERED PUBLIC ACCOUNTING FIRM
The Shareholders and Board of Trustees
ING Funds Trust
We have audited the accompanying statements of assets and liabilities of ING GNMA Income Fund, ING High Yield Bond Fund, ING Intermediate Bond Fund, ING National Tax-Exempt Bond Fund, ING Classic Money Market Fund, and ING Institutional Prime Money Market Fund, each a series of ING Funds Trust (collectively, the “Funds”), including the portfolios of investments, as of March 31, 2007, and the related statements of operations for the year then ended, the statements of changes in net assets for each of the years in the two-year period then ended, and the financial highlights for each of the years or periods in the four-year period then ended. These financial statements and financial highlights are the responsibility of management. Our responsibility is to express an opinion on these financial statements and financial highlights based on our audits. The financial highlights for the year ended March 31, 2003, were audited by other independent registered public accountants whose reports dated May 23, 2003, expressed an unqualified opinion on those financial highlights.
We conducted our audits in accordance with the standards of the Public Company Accounting Oversight Board (United States). Those standards require that we plan and perform the audit to obtain reasonable assurance about whether the financial statements and financial highlights are free of material misstatement. An audit includes examining, on a test basis, evidence supporting the amounts and disclosures in the financial statements. Our procedures included confirmation of securities owned as of March 31, 2007, by correspondence with the custodian and brokers, or by other appropriate auditing procedures when replies from brokers were not received. An audit also includes assessing the accounting principles used and significant estimates made by management, as well as evaluating the overall financial statement presentation. We believe that our audits provide a reasonable basis for our opinion.
In our opinion, the financial statements and financial highlights referred to above present fairly, in all material respects, the financial position of ING GNMA Income Fund, ING High Yield Bond Fund, ING Intermediate Bond Fund, ING National Tax-Exempt Bond Fund, ING Classic Money Market Fund, and ING Institutional Prime Money Market Fund as of March 31, 2007, and the results of their operations, the changes in their net assets, and the financial highlights for the periods specified in the first paragraph above, in conformity with U.S. generally accepted accounting principles.
Boston, Massachusetts
May 25, 2007
16
Table of Contents
STATEMENTS OF ASSETS AND LIABILITIESASOF MARCH 31, 2007
| ING GNMA Income Fund | ING High Yield Bond Fund | ING Intermediate Bond Fund | ||||||||||
ASSETS: | ||||||||||||
Investments in securities at value+* | $ | 538,471,011 | $ | 160,802,690 | $ | 1,215,371,964 | ||||||
Investments in affiliates*** | — | 1,413,270 | — | |||||||||
Short-term investments**** | — | — | 11,268,316 | |||||||||
Short-term investments at amortized cost | 83,614,955 | 1,528,000 | 125,289,615 | |||||||||
Short-term investments in affiliates at amortized cost | — | — | 30,000,000 | |||||||||
Cash | 1,591,522 | 942,772 | 4,712,523 | |||||||||
Cash collateral for futures | — | — | 1,038,827 | |||||||||
Foreign currencies at value** | — | — | 2,865,684 | |||||||||
Receivables: | ||||||||||||
Investment securities sold | 194 | 921,501 | 23,502,303 | |||||||||
Fund shares sold | 902,233 | 44,492 | 2,236,244 | |||||||||
Dividends and interest | 2,578,059 | 3,289,921 | 9,211,859 | |||||||||
Variation margin | — | — | 85,600 | |||||||||
Upfront payments made on swap agreements | — | — | 79,229 | |||||||||
Unrealized appreciation on swap agreements | — | 126,366 | 1,372,197 | |||||||||
Prepaid expenses | 22,165 | 20,267 | 46,333 | |||||||||
Reimbursement due from manager | — | — | 227,992 | |||||||||
Total assets | 627,180,139 | 169,089,279 | 1,427,308,686 | |||||||||
LIABILITIES: | ||||||||||||
Payable for investment securities purchased | — | 4,559,175 | 142,628,093 | |||||||||
Payable for fund shares redeemed | 910,247 | 407,362 | 1,914,930 | |||||||||
Payable for futures variation margin | — | — | 90,522 | |||||||||
Payable upon receipt of securities loaned | — | — | 123,891,615 | |||||||||
Upfront payments received on swap agreements | — | — | 980,946 | |||||||||
Unrealized depreciation on swap agreements | — | 58,878 | 635,993 | |||||||||
Income distribution payable | — | 473,833 | 855,493 | |||||||||
Payable to affiliates | 495,183 | 222,892 | 537,102 | |||||||||
Payable for trustee fees | 5,050 | 6,715 | 3,024 | |||||||||
Other accrued expenses and liabilities | 218,226 | 118,322 | 327,118 | |||||||||
Total liabilities | 1,628,706 | 5,847,177 | 271,864,836 | |||||||||
NET ASSETS | $ | 625,551,433 | $ | 163,242,102 | $ | 1,155,443,850 | ||||||
NET ASSETS WERE COMPRISED OF: | ||||||||||||
Paid-in capital | $ | 642,623,566 | $ | 524,200,229 | $ | 1,168,377,048 | ||||||
Undistributed net investment income (distributions in excess of net investment income) | 540,901 | (78,894 | ) | (858,326 | ) | |||||||
Accumulated net realized loss on investments, foreign currency related transactions, futures and swaps | (14,722,407 | ) | (365,722,545 | ) | (12,212,925 | ) | ||||||
Net unrealized appreciation or depreciation on investments, foreign currency related transactions, futures and swaps | (2,890,627 | ) | 4,843,312 | 138,053 | ||||||||
NET ASSETS | $ | 625,551,433 | $ | 163,242,102 | $ | 1,155,443,850 | ||||||
+ Including securities loaned at value | $ | — | $ | — | $ | 121,165,025 | ||||||
* Cost of investments in securities | $ | 541,361,638 | $ | 156,099,916 | $ | 1,215,493,900 | ||||||
** Cost of foreign currencies | $ | — | $ | — | $ | 2,901,390 | ||||||
*** Cost of investments in affiliates | $ | — | $ | 1,340,220 | $ | — | ||||||
****Cost of short-term investments | $ | — | $ | — | $ | 11,335,994 | ||||||
See Accompanying Notes to Financial Statements
17
Table of Contents
STATEMENTS OF ASSETS AND LIABILITIESASOF MARCH 31, 2007 (CONTINUED)
ING GNMA Fund | ING High Yield Fund | ING Fund | |||||||
Class A: | |||||||||
Net assets | $ | 515,469,462 | $ | 104,327,747 | $ | 698,537,340 | |||
Shares authorized | unlimited | unlimited | unlimited | ||||||
Par value | $ | 0.001 | $ | 0.001 | $ | 0.001 | |||
Shares outstanding | 61,764,834 | 11,602,289 | 68,268,887 | ||||||
Net asset value and redemption price per share | $ | 8.35 | $ | 8.99 | $ | 10.23 | |||
Maximum offering price per share (2.50%)(1) | $ | 8.56 | $ | 9.22 | $ | 10.49 | |||
Class B: | |||||||||
Net assets | $ | 58,567,608 | $ | 43,427,067 | $ | 50,085,967 | |||
Shares authorized | unlimited | unlimited | unlimited | ||||||
Par value | $ | 0.001 | $ | 0.001 | $ | 0.001 | |||
Shares outstanding | 7,054,852 | 4,833,398 | 4,904,575 | ||||||
Net asset value and redemption price per share(2) | $ | 8.30 | $ | 8.98 | $ | 10.21 | |||
Maximum offering price per share | $ | 8.30 | $ | 8.98 | $ | 10.21 | |||
Class C: | |||||||||
Net assets | $ | 37,280,228 | $ | 15,487,288 | $ | 81,556,215 | |||
Shares authorized | unlimited | unlimited | unlimited | ||||||
Par value | $ | 0.001 | $ | 0.001 | $ | 0.001 | |||
Shares outstanding | 4,484,670 | 1,722,176 | 7,980,419 | ||||||
Net asset value and redemption price per share(2) | $ | 8.31 | $ | 8.99 | $ | 10.22 | |||
Maximum offering price per share | $ | 8.31 | $ | 8.99 | $ | 10.22 | |||
Class I: | |||||||||
Net assets | $ | 14,181,468 | n/a | $ | 266,596,338 | ||||
Shares authorized | unlimited | n/a | unlimited | ||||||
Par value | $ | 0.001 | n/a | $ | 0.001 | ||||
Shares outstanding | 1,697,980 | n/a | 26,049,066 | ||||||
Net asset value and redemption price per share | $ | 8.35 | n/a | $ | 10.23 | ||||
Maximum offering price per share | $ | 8.35 | n/a | $ | 10.23 | ||||
Class O: | |||||||||
Net assets | n/a | n/a | $ | 53,096,210 | |||||
Shares authorized | n/a | n/a | unlimited | ||||||
Par value | n/a | n/a | $ | 0.001 | |||||
Shares outstanding | n/a | n/a | 5,187,378 | ||||||
Net asset value and redemption price per share | n/a | n/a | $ | 10.24 | |||||
Maximum offering price per share | n/a | n/a | $ | 10.24 | |||||
Class Q: | |||||||||
Net assets | $ | 52,667 | n/a | n/a | |||||
Shares authorized | unlimited | n/a | n/a | ||||||
Par value | $ | 0.001 | n/a | n/a | |||||
Shares outstanding | 6,296 | n/a | n/a | ||||||
Net asset value and redemption price per share | $ | 8.37 | n/a | n/a | |||||
Maximum offering price per share | $ | 8.37 | n/a | n/a | |||||
Class R: | |||||||||
Net assets | n/a | n/a | $ | 5,571,780 | |||||
Shares authorized | n/a | n/a | unlimited | ||||||
Par value | n/a | n/a | $ | 0.001 | |||||
Shares outstanding | n/a | n/a | 543,691 | ||||||
Net asset value and redemption price per share | n/a | n/a | $ | 10.25 | |||||
Maximum offering price per share | n/a | n/a | $ | 10.25 | |||||
| (1) | Maximum offering price is computed at 100/97.50 of net asset value. On purchases of $100,000 or more, the offering price is reduced. |
| (2) | Redemption price per share may be reduced for any applicable contingent deferred sales charges. |
See Accompanying Notes to Financial Statements
18
Table of Contents
STATEMENTS OF ASSETS AND LIABILITIESASOF MARCH 31, 2007
ING National Tax- Exempt Bond Fund | ING Classic Money Market Fund | |||||||
ASSETS: | ||||||||
Investments in securities at value* | $ | 26,680,258 | $ | — | ||||
Short-term investments at amortized cost | — | 945,602,787 | ||||||
Cash | 230,757 | 601 | ||||||
Receivables: | ||||||||
Fund shares sold | — | 668,203 | ||||||
Dividends and interest | 321,432 | 3,632,367 | ||||||
Prepaid expenses | 13,920 | 286,382 | ||||||
Reimbursement due from manager | 2,227 | — | ||||||
Total assets | 27,248,594 | 950,190,340 | ||||||
LIABILITIES: | ||||||||
Payable for fund shares redeemed | 178 | 202,114 | ||||||
Income distribution payable | 74,649 | 36,373 | ||||||
Payable to affiliates | 17,991 | 535,889 | ||||||
Payable for trustee fees | 1,321 | 3,892 | ||||||
Other accrued expenses and liabilities | 25,894 | 110,962 | ||||||
Total liabilities | 120,033 | 889,230 | ||||||
NET ASSETS | $ | 27,128,561 | $ | 949,301,110 | ||||
NET ASSETS WERE COMPRISED OF: | ||||||||
Paid-in capital | $ | 26,596,283 | $ | 949,434,045 | ||||
Distributions in excess of net investment income | (1,212 | ) | (1,589 | ) | ||||
Accumulated net realized loss on investments | (6,816 | ) | (131,346 | ) | ||||
Net unrealized appreciation on investments | 540,306 | — | ||||||
NET ASSETS | $ | 27,128,561 | $ | 949,301,110 | ||||
* Cost of investments in securities | $ | 26,139,952 | $ | — | ||||
Class A: | ||||||||
Net assets | $ | 22,696,620 | $ | 921,622,811 | ||||
Shares authorized | unlimited | unlimited | ||||||
Par value | $ | 0.001 | $ | 0.001 | ||||
Shares outstanding | 2,204,585 | 921,727,681 | ||||||
Net asset value and redemption price per share | $ | 10.30 | $ | 1.00 | ||||
Maximum offering price per share (2.50%)(1) | $ | 10.56 | $ | 1.00 | ||||
Class B: | ||||||||
Net assets | $ | 2,574,083 | $ | 23,332,957 | ||||
Shares authorized | unlimited | unlimited | ||||||
Par value | $ | 0.001 | $ | 0.001 | ||||
Shares outstanding | 250,203 | 23,354,594 | ||||||
Net asset value and redemption price per share(2) | $ | 10.29 | $ | 1.00 | ||||
Maximum offering price per share | $ | 10.29 | $ | 1.00 | ||||
Class C: | ||||||||
Net assets | $ | 1,857,858 | $ | 4,345,342 | ||||
Shares authorized | unlimited | unlimited | ||||||
Par value | $ | 0.001 | $ | 0.001 | ||||
Shares outstanding | 180,441 | 4,352,372 | ||||||
Net asset value and redemption price per share(2) | $ | 10.30 | $ | 1.00 | ||||
Maximum offering price per share | $ | 10.30 | $ | 1.00 | ||||
| (1) | Maximum offering price is computed at 100/97.50 of net asset value. On purchases of $100,000 or more, the offering price is reduced. |
| (2) | Redemption price per share may be reduced for any applicable contingent deferred sales charges. |
See Accompanying Notes to Financial Statements
19
Table of Contents
STATEMENTS OF ASSETS AND LIABILITIESASOF MARCH 31, 2007
| ING Institutional Prime Money Market Fund | |||
ASSETS: | |||
Short-term investments at amortized cost | $ | 650,291,707 | |
Repurchase agreement | 73,790,000 | ||
Receivables: | |||
Fund shares sold | 19,000,000 | ||
Dividends and interest | 2,393,809 | ||
Prepaid expenses | 25,907 | ||
Total assets | 745,501,423 | ||
LIABILITIES: | |||
Payable for investment securities purchased | 2,550,552 | ||
Payable for fund shares redeemed | 16,316,000 | ||
Income distribution payable | 2,165,364 | ||
Payable to affiliates | 41,358 | ||
Payable to custodian due to bank overdraft | 28,288 | ||
Payable for trustee fees | 1,652 | ||
Other accrued expenses and liabilities | 68,400 | ||
Total liabilities | 21,171,614 | ||
NET ASSETS | $ | 724,329,809 | |
NET ASSETS WERE COMPRISED OF: | |||
Paid-in capital | $ | 724,297,469 | |
Undistributed net investment income | 31,120 | ||
Accumulated net realized gain on investments | 1,220 | ||
NET ASSETS | $ | 724,329,809 | |
Net assets | $ | 724,329,809 | |
Shares authorized | unlimited | ||
Par value | $ | 0.001 | |
Shares outstanding | 724,326,505 | ||
Net asset value and redemption price per share | $ | 1.00 | |
See Accompanying Notes to Financial Statements
20
Table of Contents
STATEMENTS OF OPERATIONSFORTHE YEAR ENDED MARCH 31, 2007
ING GNMA Fund | ING High Yield Fund | ING Fund | ||||||||||
INVESTMENT INCOME: | ||||||||||||
Dividends(1) | $ | — | $ | 127,746 | $ | 1,160,363 | ||||||
Interest | 33,624,742 | 13,934,134 | 55,814,924 | |||||||||
Securities lending income | — | — | 262,798 | |||||||||
Total investment income | 33,624,742 | 14,061,880 | 57,238,085 | |||||||||
EXPENSES: | ||||||||||||
Investment management fees | 2,914,849 | 888,977 | 1,745,077 | |||||||||
Distribution and service fees: | ||||||||||||
Class A | 1,250,471 | 251,671 | 1,589,100 | |||||||||
Class B | 669,719 | 573,791 | 544,405 | |||||||||
Class C | 354,065 | 162,609 | 752,923 | |||||||||
Class M(2) | 797 | — | — | |||||||||
Class O | — | — | 122,698 | |||||||||
Class Q | 178 | — | — | |||||||||
Class R | — | — | 7,886 | |||||||||
Transfer agent fees: | ||||||||||||
Class A | 338,800 | 150,529 | 882,901 | |||||||||
Class B | 45,622 | 85,140 | 74,592 | |||||||||
Class C | 23,878 | 24,249 | 104,499 | |||||||||
Class I | 2,480 | — | 130,595 | |||||||||
Class M(2) | 74 | — | — | |||||||||
Class O | — | — | 70,229 | |||||||||
Class Q | 9 | — | — | |||||||||
Class R | — | — | 2,508 | |||||||||
Administrative service fees | 620,176 | 174,307 | 1,026,520 | |||||||||
Shareholder reporting expense | 63,180 | 48,555 | 230,541 | |||||||||
Registration fees | 108,832 | 57,196 | 119,522 | |||||||||
Professional fees | 65,115 | 19,193 | 86,294 | |||||||||
Custody and accounting expense | 74,125 | 28,260 | 164,570 | |||||||||
Trustee fees | 19,344 | 3,483 | 28,562 | |||||||||
Miscellaneous expense | 53,310 | 12,581 | 59,857 | |||||||||
Interest expense | — | 13,450 | 5,314 | |||||||||
Total expenses | 6,605,024 | 2,493,991 | 7,748,593 | |||||||||
Net waived and reimbursed fees/recoupment | (65,055 | ) | (14,936 | ) | (402,716 | ) | ||||||
Net expenses | 6,539,969 | 2,479,055 | 7,345,877 | |||||||||
Net investment income | 27,084,773 | 11,582,825 | 49,892,208 | |||||||||
REALIZED AND UNREALIZED GAIN (LOSS) ON INVESTMENTS, | ||||||||||||
FOREIGN CURRENCY RELATED TRANSACTIONS, FUTURES AND SWAPS: | ||||||||||||
Net realized gain (loss) on: | ||||||||||||
Investments | 2,060,584 | (3,268,399 | ) | 1,627,211 | ||||||||
Foreign currency related transactions | — | — | (758,273 | ) | ||||||||
Futures and swaps | — | (290,422 | ) | (5,641,355 | ) | |||||||
Net realized gain (loss) on investments, foreign currency related transactions, futures and swaps | 2,060,584 | (3,558,821 | ) | (4,772,417 | ) | |||||||
Net change in unrealized appreciation or depreciation on: | ||||||||||||
Investments | 4,077,056 | 8,438,684 | 14,254,743 | |||||||||
Foreign currency related transactions | — | — | (35,617 | ) | ||||||||
Futures and swaps | — | 210,549 | 1,127,887 | |||||||||
Net change in unrealized appreciation or depreciation on investments, foreign currency related transactions, futures and swaps | 4,077,056 | 8,649,233 | 15,347,013 | |||||||||
Net realized and unrealized gain on investments, foreign currency related transactions, futures and swaps | 6,137,640 | 5,090,412 | 10,574,596 | |||||||||
Increase in net assets resulting from operations | $ | 33,222,413 | $ | 16,673,237 | $ | 60,466,804 | ||||||
| (1) | Dividends at March 31, 2007 include dividends from affiliates of $98,240 for ING High Yield Bond Fund. |
| (2) | Effective January 2, 2007, Class M shareholders of ING GNMA Income Fund were converted to Class A shares of the Fund. |
See Accompanying Notes to Financial Statements
21
Table of Contents
STATEMENTS OF OPERATIONSFORTHE YEAR ENDED MARCH 31, 2007
| ING National Tax- Exempt Bond Fund | ING Classic | ING Institutional Prime Money Market Fund | |||||||||
INVESTMENT INCOME: | |||||||||||
Interest | $ | 1,280,560 | $ | 42,679,724 | $ | 16,543,845 | |||||
Total investment income | 1,280,560 | 42,679,724 | 16,543,845 | ||||||||
EXPENSES: | |||||||||||
Investment management fees | 81,674 | 2,007,578 | 248,309 | ||||||||
Distribution and service fees: | |||||||||||
Class A | 56,698 | 5,799,834 | — | ||||||||
Class B | 27,783 | 241,373 | — | ||||||||
Class C | 17,675 | 55,824 | — | ||||||||
Transfer agent fees | — | — | 7,220 | ||||||||
Class A | 4,175 | 149,479 | — | ||||||||
Class B | 512 | 4,641 | — | ||||||||
Class C | 326 | 1,072 | — | ||||||||
Administrative service fees | 27,224 | — | — | ||||||||
Shareholder reporting expense | 7,595 | 162,017 | 33,584 | ||||||||
Registration fees | 50,750 | 385,294 | 64,550 | ||||||||
Professional fees | 9,181 | 49,625 | 38,437 | ||||||||
Custody and accounting expense | 1,374 | 89,060 | 43,297 | ||||||||
Trustee fees | 1,095 | 21,293 | 10,023 | ||||||||
Offering expense | — | — | 20,873 | ||||||||
Miscellaneous expense | 6,068 | 42,343 | 22,832 | ||||||||
Interest expense | 235 | — | — | ||||||||
Total expenses | 292,365 | 9,009,433 | 489,125 | ||||||||
Net waived and reimbursed fees | (21,520 | ) | (2,650,241 | ) | — | ||||||
Net expenses | 270,845 | 6,359,192 | 489,125 | ||||||||
Net investment income | 1,009,715 | 36,320,532 | 16,054,720 | ||||||||
REALIZED AND UNREALIZED GAIN ON INVESTMENTS: | |||||||||||
Net realized gain on investments | 199,698 | 59,824 | 9,378 | ||||||||
Net change in unrealized appreciation or depreciation on investments | 12,459 | — | — | ||||||||
Net realized and unrealized gain on investments | 212,157 | 59,824 | 9,378 | ||||||||
Increase in net assets resulting from operations | $ | 1,221,872 | $ | 36,380,356 | $ | 16,064,098 | |||||
See Accompanying Notes to Financial Statements
22
Table of Contents
STATEMENTS OF CHANGES IN NET ASSETS
| ING GNMA Income Fund | ING High Yield Bond Fund | |||||||||||||||
Year Ended 2007 | Year Ended 2006 | Year Ended 2007 | Year Ended 2006 | |||||||||||||
FROM OPERATIONS: | ||||||||||||||||
Net investment income | $ | 27,084,773 | $ | 29,983,281 | $ | 11,582,825 | $ | 13,310,738 | ||||||||
Net realized gain (loss) on investments, futures, and swaps | 2,060,584 | 3,622,049 | (3,558,821 | ) | (13,191,714 | ) | ||||||||||
Net change in unrealized appreciation or depreciation on investments and swaps | 4,077,056 | (17,878,273 | ) | 8,649,233 | 12,301,844 | |||||||||||
Net increase in net assets resulting from operations | 33,222,413 | 15,727,057 | 16,673,237 | 12,420,868 | ||||||||||||
FROM DISTRIBUTIONS TO SHAREHOLDERS: | ||||||||||||||||
Net investment income: | ||||||||||||||||
Class A | (24,757,907 | ) | (26,098,410 | ) | (6,941,636 | ) | (6,737,675 | ) | ||||||||
Class B | (2,891,035 | ) | (3,959,481 | ) | (3,496,316 | ) | (5,510,877 | ) | ||||||||
Class C | (1,498,660 | ) | (1,693,514 | ) | (993,583 | ) | (1,171,389 | ) | ||||||||
Class I | (915,994 | ) | (697,343 | ) | — | — | ||||||||||
Class M(1) | (5,358 | ) | (8,930 | ) | — | — | ||||||||||
Class Q | (3,646 | ) | (4,480 | ) | — | — | ||||||||||
Total distributions | (30,072,600 | ) | (32,462,158 | ) | (11,431,535 | ) | (13,419,941 | ) | ||||||||
FROM CAPITAL SHARE TRANSACTIONS: | ||||||||||||||||
Net proceeds from sale of shares | 122,343,215 | 99,407,124 | 35,632,305 | 41,472,047 | ||||||||||||
Proceeds issued in merger | — | 46,201,389 | — | — | ||||||||||||
Dividends reinvested | 24,814,234 | 27,137,387 | 5,505,836 | 6,353,721 | ||||||||||||
| 147,157,449 | 172,745,900 | 41,138,141 | 47,825,768 | |||||||||||||
Cost of shares redeemed | (161,872,015 | ) | (193,650,406 | ) | (75,810,714 | ) | (116,768,800 | ) | ||||||||
Net decrease in net assets resulting from capital share transactions | (14,714,566 | ) | (20,904,506 | ) | (34,672,573 | ) | (68,943,032 | ) | ||||||||
Net decrease in net assets | (11,564,753 | ) | (37,639,607 | ) | (29,430,871 | ) | (69,942,105 | ) | ||||||||
NET ASSETS: | ||||||||||||||||
Beginning of year | 637,116,186 | 674,755,793 | 192,672,973 | 262,615,078 | ||||||||||||
End of year | $ | 625,551,433 | $ | 637,116,186 | $ | 163,242,102 | $ | 192,672,973 | ||||||||
Undistributed net investment income (distributions in excess of net investment income) at end of year | $ | 540,901 | $ | 2,041,427 | $ | (78,894 | ) | $ | (331,166 | ) | ||||||
| (1) | Effective January 2, 2007, Class M shareholders of ING GNMA Income Fund were converted to Class A shares of the Fund. |
See Accompanying Notes to Financial Statements
23
Table of Contents
STATEMENTS OF CHANGES IN NET ASSETS
| ING Intermediate Bond Fund | ING National Tax-Exempt Bond Fund | |||||||||||||||
| Year Ended March 31, 2007 | Year Ended March 31, 2006 | Year Ended March 31, 2007 | Year Ended March 31, 2006 | |||||||||||||
FROM OPERATIONS: | ||||||||||||||||
Net investment income | $ | 49,892,208 | $ | 31,230,030 | $ | 1,009,715 | $ | 968,799 | ||||||||
Net realized gain (loss) on investments, foreign currency related transactions, futures, and swaps | (4,772,417 | ) | (5,972,981 | ) | 199,698 | 323,563 | ||||||||||
Net change in unrealized appreciation or depreciation on investments, foreign currency related transactions, futures, and swaps | 15,347,013 | (9,477,161 | ) | 12,459 | (628,923 | ) | ||||||||||
Net increase in net assets resulting from operations | 60,466,804 | 15,779,888 | 1,221,872 | 663,439 | ||||||||||||
FROM DISTRIBUTIONS TO SHAREHOLDERS: | ||||||||||||||||
Net investment income: | ||||||||||||||||
Class A | (31,032,270 | ) | (21,129,307 | ) | (869,673 | ) | (830,785 | ) | ||||||||
Class B | (2,250,414 | ) | (2,090,084 | ) | (85,769 | ) | (86,603 | ) | ||||||||
Class C | (3,109,875 | ) | (2,398,616 | ) | (54,285 | ) | (51,411 | ) | ||||||||
Class I | (10,979,278 | ) | (4,945,436 | ) | — | — | ||||||||||
Class O | (2,394,701 | ) | (1,591,398 | ) | — | — | ||||||||||
Class R | (72,583 | ) | (22,537 | ) | — | — | ||||||||||
Net realized gains: | ||||||||||||||||
Class A | — | (1,826,580 | ) | (157,342 | ) | (252,957 | ) | |||||||||
Class B | — | (215,404 | ) | (19,212 | ) | (32,530 | ) | |||||||||
Class C | — | (250,102 | ) | (14,604 | ) | (19,924 | ) | |||||||||
Class I | — | (527,267 | ) | — | — | |||||||||||
Class O | — | (139,818 | ) | — | — | |||||||||||
Class R | — | (2,543 | ) | — | — | |||||||||||
Total distributions | (49,839,121 | ) | (35,139,092 | ) | (1,200,885 | ) | (1,274,210 | ) | ||||||||
FROM CAPITAL SHARE TRANSACTIONS: | ||||||||||||||||
Net proceeds from sale of shares | 432,382,913 | 422,545,470 | 3,218,925 | 2,081,336 | ||||||||||||
Dividends reinvested | 40,670,307 | 28,286,436 | 139,725 | 163,656 | ||||||||||||
| 473,053,220 | 450,831,906 | 3,358,650 | 2,244,992 | |||||||||||||
Cost of shares redeemed | (257,792,788 | ) | (176,312,495 | ) | (3,812,399 | ) | (2,216,079 | ) | ||||||||
Net increase (decrease) in net assets resulting from capital share transactions | 215,260,432 | 274,519,411 | (453,749 | ) | 28,913 | |||||||||||
Net increase (decrease) in net assets | 225,888,115 | 255,160,207 | (432,762 | ) | (581,858 | ) | ||||||||||
NET ASSETS: | ||||||||||||||||
Beginning of year | 929,555,735 | 674,395,528 | 27,561,323 | 28,143,181 | ||||||||||||
End of year | $ | 1,155,443,850 | $ | 929,555,735 | $ | 27,128,561 | $ | 27,561,323 | ||||||||
Undistributed net investment income (distributions in excess of net investment income) at end of year | $ | (858,326 | ) | $ | 36,623 | $ | (1,212 | ) | $ | (1,275 | ) | |||||
See Accompanying Notes to Financial Statements
24
Table of Contents
STATEMENTS OF CHANGES IN NET ASSETS
| ING Classic Money Market Fund | ING Institutional Prime Money Market Fund | |||||||||||||||
Year Ended 2007 | Year Ended 2006 | Year Ended 2007 | July 28, 2005(1) to March 31, 2006 | |||||||||||||
FROM OPERATIONS: | ||||||||||||||||
Net investment income | $ | 36,320,532 | $ | 18,629,328 | $ | 16,054,720 | $ | 4,773,069 | ||||||||
Net realized gain (loss) on investments | 59,824 | (15,431 | ) | 9,378 | (6,394 | ) | ||||||||||
Net increase in net assets resulting from operations | 36,380,356 | 18,613,897 | 16,064,098 | 4,766,675 | ||||||||||||
FROM DISTRIBUTIONS TO SHAREHOLDERS: | ||||||||||||||||
Net investment income | — | — | (16,054,400 | ) | (4,773,069 | ) | ||||||||||
Class A | (35,149,030 | ) | (17,827,103 | ) | — | — | ||||||||||
Class B | (952,278 | ) | (680,890 | ) | — | — | ||||||||||
Class C | (220,809 | ) | (121,335 | ) | — | — | ||||||||||
Total distributions | (36,322,117 | ) | (18,629,328 | ) | (16,054,400 | ) | (4,773,069 | ) | ||||||||
FROM CAPITAL SHARE TRANSACTIONS: | ||||||||||||||||
Net proceeds from sale of shares | 623,159,627 | 534,990,330 | 2,451,588,496 | 462,400,001 | ||||||||||||
Dividends reinvested | 35,961,113 | 18,332,291 | 5,275,844 | 3,264,932 | ||||||||||||
| 659,120,740 | 553,322,621 | 2,456,864,340 | 465,664,933 | |||||||||||||
Cost of shares redeemed | (395,471,731 | ) | (448,676,993 | ) | (1,912,202,768 | ) | (286,000,000 | ) | ||||||||
Net increase in net assets resulting from capital share transactions | 263,649,009 | 104,645,628 | 544,661,572 | 179,664,933 | ||||||||||||
Net increase in net assets | 263,707,248 | 104,630,197 | 544,671,270 | 179,658,539 | ||||||||||||
NET ASSETS: | �� | |||||||||||||||
Beginning of year | 685,593,862 | 580,963,665 | 179,658,539 | — | ||||||||||||
End of year | $ | 949,301,110 | $ | 685,593,862 | $ | 724,329,809 | $ | 179,658,539 | ||||||||
Undistributed net investment income (distributions in excess of net investment income) at end of year | $ | (1,589 | ) | $ | (4 | ) | $ | 31,120 | $ | 29,036 | ||||||
| (1) | Commencement of operations |
See Accompanying Notes to Financial Statements
25
Table of Contents
| ING GNMA INCOME FUND | FINANCIAL HIGHLIGHTS |
Selected data for a share of beneficial interest outstanding throughout each year.
| Class A | ||||||||||||||
| Year Ended March 31, | ||||||||||||||
| 2007 | 2006 | 2005 | 2004 | 2003 | ||||||||||
Per Share Operating Performance: | ||||||||||||||
| Net asset value, beginning of year | $ | 8.30 | 8.52 | 8.91 | 9.00 | 8.53 | ||||||||
| Income (loss) from investment operations: | ||||||||||||||
| Net investment income | $ | 0.37 | 0.40 | 0.37 | 0.32 | 0.42 | ||||||||
| Net realized and unrealized gain (loss) on investments | $ | 0.09 | (0.19 | ) | (0.31 | ) | 0.02 | 0.49 | ||||||
| Total from investment operations | $ | 0.46 | 0.21 | 0.06 | 0.34 | 0.91 | ||||||||
| Lest distributions from: | ||||||||||||||
| Net investment income | $ | 0.41 | 0.43 | 0.45 | 0.43 | 0.44 | ||||||||
| Total distributions | $ | 0.41 | 0.43 | 0.45 | 0.43 | 0.44 | ||||||||
| Net asset value, end of year | $ | 8.35 | 8.30 | 8.52 | 8.91 | 9.00 | ||||||||
Total Return(1) | % | 5.72 | 2.50 | 0.74 | 3.88 | 10.82 | ||||||||
Ratios and Supplemental Data: | ||||||||||||||
| Net assets, end of year (000’s) | $ | 515,469 | 504,734 | 521,688 | 592,066 | 666,433 | ||||||||
| Ratios to average net assets: | ||||||||||||||
| Gross expenses prior to expense waiver | % | 0.95 | 0.99 | 0.98 | 1.04 | 1.13 | ||||||||
| Net expenses after expense waiver(2) | % | 0.94 | 0.98 | 0.98 | 1.04 | 1.13 | ||||||||
| Net investment income after expense waiver(2) | % | 4.49 | 4.70 | 4.27 | 3.57 | 4.78 | ||||||||
| Portfolio turnover rate | % | 99 | 39 | 40 | 128 | 75 | ||||||||
| Class B | ||||||||||||||
| Year Ended March 31, | ||||||||||||||
| 2007 | 2006 | 2005 | 2004 | 2003 | ||||||||||
Per Share Operating Performance: | ||||||||||||||
| Net asset value, beginning of year | $ | 8.26 | 8.48 | 8.87 | 8.96 | 8.50 | ||||||||
| Income (loss) from investment operations: | ||||||||||||||
| Net investment income | $ | 0.30 | 0.33 | 0.29 | 0.25 | 0.35 | ||||||||
| Net realized and unrealized gain (loss) on investments | $ | 0.09 | (0.18 | ) | (0.29 | ) | 0.02 | 0.48 | ||||||
| Total from investment operations | $ | 0.39 | 0.15 | — | 0.27 | 0.83 | ||||||||
| Lest distributions from: | ||||||||||||||
| Net investment income | $ | 0.35 | 0.37 | 0.39 | 0.36 | 0.37 | ||||||||
| Total distributions | $ | 0.35 | 0.37 | 0.39 | 0.36 | 0.37 | ||||||||
| Net asset value, end of year | $ | 8.30 | 8.26 | 8.48 | 8.87 | 8.96 | ||||||||
Total Return(1) | % | 4.84 | 1.75 | (0.02 | ) | 3.12 | 9.95 | |||||||
Ratios and Supplemental Data: | ||||||||||||||
| Net assets, end of year (000’s) | $ | 58,568 | 78,823 | 99,130 | 130,339 | 150,549 | ||||||||
| Ratios to average net assets: | ||||||||||||||
| Gross expenses prior to expense waiver | % | 1.70 | 1.74 | 1.73 | 1.79 | 1.88 | ||||||||
| Net expenses after expense waiver(2) | % | 1.69 | 1.73 | 1.73 | 1.79 | 1.88 | ||||||||
| Net investment income after expense waiver(2) | % | 3.73 | 3.95 | 3.52 | 2.84 | 3.98 | ||||||||
| Portfolio turnover rate | % | 99 | 39 | 40 | 128 | 75 | ||||||||
(1) | Total return is calculated assuming reinvestment of all dividends and capital gain distributions as net asset value and excluding the deduction of sales charges. |
(2) | The Investment Adviser has agreed to limit expenses (excluding interest, taxes, brokerage and extraordinary expenses) subject to possible recoupment by the Investment Adviser within three years of being incurred. |
See Accompanying Notes to Financial Statements
26
Table of Contents
| ING GNMA INCOME FUND (CONTINUED) | FINANCIAL HIGHLIGHTS |
Selected data for a share of beneficial interest outstanding throughout each year.
| Class C | ||||||||||||||
| Year Ended March 31, | ||||||||||||||
| 2007 | 2006 | 2005 | 2004 | 2003 | ||||||||||
Per Share Operating Performance: | ||||||||||||||
| Net asset value, beginning of year | $ | 8.27 | 8.49 | 8.88 | 8.97 | 8.51 | ||||||||
| Income (loss) from investment operations: | ||||||||||||||
| Net investment income | $ | 0.31 | 0.33 | 0.29 | 0.25 | 0.36 | ||||||||
| Net realized and unrealized gain (loss) on investments | $ | 0.08 | (0.18 | ) | (0.29 | ) | 0.02 | 0.47 | ||||||
| Total from investment operations | $ | 0.39 | 0.15 | — | 0.27 | 0.83 | ||||||||
| Less distributions from: | ||||||||||||||
| Net investment income | $ | 0.35 | 0.37 | 0.39 | 0.36 | 0.37 | ||||||||
| Total distributions | $ | 0.35 | 0.37 | 0.39 | 0.36 | 0.37 | ||||||||
| Net asset value, end of year | $ | 8.31 | 8.27 | 8.49 | 8.88 | 8.97 | ||||||||
Total Return(1) | % | 4.85 | 1.74 | (0.03 | ) | 3.11 | 9.95 | |||||||
Ratios and Supplemental Data: | ||||||||||||||
| Net assets, end of year (000’s) | $ | 37,280 | 34,997 | 43,094 | 65,762 | 87,970 | ||||||||
| Ratios to average net assets: | ||||||||||||||
| Gross expenses prior to expense waiver | % | 1.70 | 1.74 | 1.73 | 1.79 | 1.88 | ||||||||
| Net expenses after expense waiver(2) | % | 1.69 | 1.73 | 1.73 | 1.79 | 1.88 | ||||||||
| Net investment income after expense waiver(2) | % | 3.73 | 3.95 | 3.51 | 2.92 | 3.97 | ||||||||
| Portfolio turnover rate | % | 99 | 39 | 40 | 128 | 75 | ||||||||
| Class I | ||||||||||||||
| Year Ended March 31, | ||||||||||||||
| 2007 | 2006 | 2005 | 2004 | 2003 | ||||||||||
Per Share Operating Performance: | ||||||||||||||
| Net asset value, beginning of year | $ | 8.31 | 8.53 | 8.92 | 9.01 | 8.54 | ||||||||
| Income (loss) from investment operations: | ||||||||||||||
| Net investment income | $ | 0.40 | 0.45 | 0.41 | 0.35 | 0.44 | ||||||||
| Net realized and unrealized gain (loss) on investments | $ | 0.08 | (0.21 | ) | (0.32 | ) | 0.01 | 0.50 | ||||||
| Total from investment operations | $ | 0.48 | 0.24 | 0.09 | 0.36 | 0.94 | ||||||||
| Less distributions from: | ||||||||||||||
| Net investment income | $ | 0.44 | 0.46 | 0.48 | 0.45 | 0.47 | ||||||||
| Total distributions | $ | 0.44 | 0.46 | 0.48 | 0.45 | 0.47 | ||||||||
| Net asset value, end of year | $ | 8.35 | 8.31 | 8.53 | 8.92 | 9.01 | ||||||||
Total Return(1) | % | 5.92 | 2.82 | 1.05 | 4.21 | 11.18 | ||||||||
Ratios and Supplemental Data: | ||||||||||||||
| Net assets, end of year (000’s) | $ | 14,181 | 18,287 | 10,539 | 8,760 | 6,946 | ||||||||
| Ratios to average net assets: | ||||||||||||||
| Expenses(2) | % | 0.65 | 0.67 | 0.68 | 0.71 | 0.78 | ||||||||
| Net investment income | % | 4.77 | 4.96 | 4.59 | 3.94 | 5.00 | ||||||||
| Portfolio turnover rate | % | 99 | 39 | 40 | 128 | 75 | ||||||||
(1) | Total return is calculated assuming reinvestment of all dividends and capital gain distributions at net asset value and excluding the deduction of sales charges. |
(2) | The Investment Adviser has agreed to limit expenses (excluding interest, taxes, brokerage and extraordinary expenses) subject to possible recoupment by the Investment Adviser within three years of being incurred. |
See Accompanying Notes to Financial Statements
27
Table of Contents
| ING GNMA INCOME FUND (CONTINUED) | FINANCIAL HIGHLIGHTS |
Selected data for a share of beneficial interest outstanding throughout each year.
| Class Q | ||||||||||||||
| Year Ended March 31, | ||||||||||||||
| 2007 | 2006 | 2005 | 2004 | 2003 | ||||||||||
Per Share Operating Performance: | ||||||||||||||
| Net asset value, beginning of year | $ | 8.32 | 8.53 | 8.92 | 9.01 | 8.54 | ||||||||
| Income (loss) from investment operations: | ||||||||||||||
| Net investment income | $ | 0.36 | 0.40 | 0.39 | 0.32 | 0.44 | ||||||||
| Net realized and unrealized gain (loss) on investments | $ | 0.11 | (0.18 | ) | (0.33 | ) | 0.02 | 0.47 | ||||||
| Total from investment operations | $ | 0.47 | 0.22 | 0.06 | 0.34 | 0.91 | ||||||||
| Less distributions from: | ||||||||||||||
| Net investment income | $ | 0.42 | 0.43 | 0.45 | 0.43 | 0.44 | ||||||||
| Total distributions | $ | 0.42 | 0.43 | 0.45 | 0.43 | 0.44 | ||||||||
| Net asset value, end of year | $ | 8.37 | 8.32 | 8.53 | 8.92 | 9.01 | ||||||||
Total Return(1) | % | 5.76 | 2.65 | 0.76 | 3.94 | 10.90 | ||||||||
Ratios and Supplemental Data: | ||||||||||||||
| Net assets, end of year (000’s) | $ | 53 | 82 | 103 | 134 | 183 | ||||||||
| Ratios to average net assets: | ||||||||||||||
| Expenses(2) | % | 0.90 | 0.92 | 0.93 | 0.96 | 1.04 | ||||||||
| Net investment income | % | 4.53 | 4.77 | 4.32 | 3.62 | 4.89 | ||||||||
| Portfolio turnover rate | % | 99 | 39 | 40 | 128 | 75 | ||||||||
(1) | Total return is calculated assuming reinvestment of all dividends and capital gain distributions as net asset value and excluding the deduction of sales charges. |
(2) | The Investment Adviser has agreed to limit expenses (excluding interest, taxes, brokerage and extraordinary expenses) subject to possible recoupment by the Investment Adviser within three years of being incurred. |
See Accompanying Notes to Financial Statements
28
Table of Contents
| ING HIGH YIELD BOND FUND | FINANCIAL HIGHLIGHTS |
Selected data for a share of beneficial interest outstanding throughout each year.
| Class A | |||||||||||||||
| Year Ended March 31, | |||||||||||||||
| 2007 | 2006 | 2005 | 2004 | 2003 | |||||||||||
Per Share Operating Performance: | |||||||||||||||
| Net asset value, beginning of year | $ | 8.71 | 8.75 | 8.88 | 8.29 | 8.74 | |||||||||
| Income (loss) from investment operations: | |||||||||||||||
| Net investment income | $ | 0.61 | 0.55 | 0.54 | 0.59 | 0.61 | |||||||||
| Net realized and unrealized gain (loss) on investments | $ | 0.27 | (0.04 | ) | (0.13 | ) | 0.60 | (0.45 | ) | ||||||
| Total from investment operations | $ | 0.88 | 0.51 | 0.41 | 1.19 | 0.16 | |||||||||
| Less distributions from: | |||||||||||||||
| Net investment income | $ | 0.60 | 0.55 | 0.54 | 0.60 | 0.61 | |||||||||
| Total distributions | $ | 0.60 | 0.55 | 0.54 | 0.60 | 0.61 | |||||||||
| Net asset value, end of year | $ | 8.99 | 8.71 | 8.75 | 8.88 | 8.29 | |||||||||
Total Return(1) | % | 10.54 | 6.01 | 4.73 | 14.70 | 2.24 | |||||||||
Ratios and Supplemental Data: | |||||||||||||||
| Net assets, end of year (000’s) | $ | 104,328 | 99,178 | 110,683 | 44,009 | 43,375 | |||||||||
| Ratios to average net assets: | |||||||||||||||
| Gross expenses prior to expense reimbursement/recoupment | % | 1.11 | 1.31 | 1.33 | 1.33 | 1.43 | |||||||||
| Net expenses after expense reimbursement/recoupment(2) | % | 1.10 | 1.18 | 1.22 | 1.29 | 1.30 | |||||||||
| Net investment income after expense reimbursement/recoupment(2) | % | 6.98 | 6.27 | 6.12 | 6.81 | 7.48 | |||||||||
| Portfolio turnover rate | % | 122 | 111 | 119 | 105 | 122 | |||||||||
| Class B | |||||||||||||||
| Year Ended March 31, | |||||||||||||||
| 2007 | 2006 | 2005 | 2004 | 2003 | |||||||||||
Per Share Operating Performance: | |||||||||||||||
| Net asset value, beginning of year | $ | 8.70 | 8.74 | 8.88 | 8.28 | 8.74 | |||||||||
| Income (loss) from investment operations: | |||||||||||||||
| Net investment income | $ | 0.53 | 0.47 | 0.48 | 0.53 | 0.55 | |||||||||
| Net realized and unrealized gain (loss) on investments | $ | 0.29 | (0.03 | ) | (0.15 | ) | 0.60 | (0.46 | ) | ||||||
| Total from investment operations | $ | 0.82 | 0.44 | 0.33 | 1.13 | 0.09 | |||||||||
| Less distributions from: | |||||||||||||||
| Net investment income | $ | 0.54 | 0.48 | 0.47 | 0.53 | 0.55 | |||||||||
| Total distributions | $ | 0.54 | 0.48 | 0.47 | 0.53 | 0.55 | |||||||||
| Net asset value, end of year | $ | 8.98 | 8.70 | 8.74 | 8.88 | 8.28 | |||||||||
Total Return(1) | % | 9.72 | 5.22 | 3.83 | 14.01 | 1.37 | |||||||||
Ratios and Supplemental Data: | |||||||||||||||
| Net assets, end of year (000’s) | $ | 43,427 | 75,940 | 125,603 | 18,753 | 11,584 | |||||||||
| Ratios to average net assets: | |||||||||||||||
| Gross expenses prior to expense reimbursement/recoupment | % | 1.86 | 1.98 | 1.98 | 1.98 | 2.07 | |||||||||
| Net expenses after expense reimbursement/recoupment(2) | % | 1.85 | 1.94 | 1.97 | 2.04 | 2.05 | |||||||||
| Net investment income after expense reimbursement/recoupment(2) | % | 6.18 | 5.50 | 5.39 | 6.04 | 6.73 | |||||||||
| Portfolio turnover rate | % | 122 | 111 | 119 | 105 | 122 | |||||||||
(1) | Total return is calculated assuming reinvestment of all dividends and capital gain distributions at net asset value and excluding the deduction of sales charges. |
(2) | The Investment Adviser has agreed to limit expenses (excluding interest, taxes, brokerage and extraordinary expenses) subject to possible recoupment by the Investment Adviser within three years of being incurred. |
See Accompanying Notes to Financial Statements
29
Table of Contents
| ING HIGH YIELD BOND FUND (CONTINUED) | FINANCIAL HIGHLIGHTS |
Selected data for a share of beneficial interest outstanding throughout each year.
| Class C | |||||||||||||||
| Year Ended March 31, | |||||||||||||||
| 2007 | 2006 | 2005 | 2004 | 2003 | |||||||||||
Per Share Operating Performance: | |||||||||||||||
| Net asset value, beginning of year | $ | 8.71 | 8.75 | 8.88 | 8.28 | 8.74 | |||||||||
| Income (loss) from investment operations: | |||||||||||||||
| Net investment income | $ | 0.54 | 0.48 | 0.48 | 0.53 | 0.56 | |||||||||
| Net realized and unrealized gain (loss) on investments | $ | 0.28 | (0.03 | ) | (0.13 | ) | 0.60 | (0.46 | ) | ||||||
| Total from investment operations | $ | 0.82 | 0.45 | 0.35 | 1.13 | 0.10 | |||||||||
| Less distributions from: | |||||||||||||||
| Net investment income | $ | 0.54 | 0.49 | 0.48 | 0.53 | 0.56 | |||||||||
| Total distributions | $ | 0.54 | 0.49 | 0.48 | 0.53 | 0.56 | |||||||||
| Net asset value, end of year | $ | 8.99 | 8.71 | 8.75 | 8.88 | 8.28 | |||||||||
Total Return(1) | % | 9.70 | 5.22 | 3.96 | 14.03 | 1.43 | |||||||||
Ratios and Supplemental Data: | |||||||||||||||
| Net assets, end of year (000’s) | $ | 15,487 | 17,555 | 26,330 | 10,780 | 5,281 | |||||||||
| Ratios to average net assets: | |||||||||||||||
| Gross expenses prior to expense reimbursement/recoupment | % | 1.86 | 1.98 | 1.98 | 1.98 | 2.06 | |||||||||
| Net expenses after expense reimbursement/recoupment(2) | % | 1.85 | 1.94 | 1.97 | 2.04 | 2.04 | |||||||||
| Net investment income after expense reimbursement/recoupment(2) | % | 6.21 | 5.51 | 5.37 | 6.04 | 6.72 | |||||||||
| Portfolio turnover rate | % | 122 | 111 | 119 | 105 | 122 | |||||||||
(1) | Total return is calculated assuming reinvestment of all dividends and capital gain distributions at net asset value and excluding the deduction of sales charges. |
(2) | The Investment Adviser has agreed to limit expenses (excluding interest, taxes, brokerage and extraordinary expenses) subject to possible recoupment by the Investment Adviser within three years of being incurred. |
See Accompanying Notes to Financial Statements
30
Table of Contents
| ING INTERMEDIATE BOND FUND | FINANCIAL HIGHLIGHTS |
Selected data for a share of beneficial interest outstanding throughout each year.
| Class A | |||||||||||||||
| Year Ended March 31, | |||||||||||||||
| 2007 | 2006 | 2005 | 2004 | 2003 | |||||||||||
Per Share Operating Performance: | |||||||||||||||
| Net asset value, beginning of year | $ | 10.13 | 10.32 | 10.67 | 10.51 | 9.91 | |||||||||
| Income (loss) from investment operations: | |||||||||||||||
| Net investment income | $ | 0.50 | 0.41 | 0.32 | 0.31 | 0.35 | |||||||||
| Net realized and unrealized gain (loss) on investments | $ | 0.10 | (0.14 | ) | (0.17 | ) | 0.32 | 0.77 | |||||||
| Total from investment operations | $ | 0.60 | 0.27 | 0.15 | 0.63 | 1.12 | |||||||||
| Less distributions from: | |||||||||||||||
| Net investment income | $ | 0.50 | 0.42 | 0.33 | 0.33 | 0.37 | |||||||||
| Net realized gains on investments | $ | — | 0.04 | 0.17 | 0.14 | 0.15 | |||||||||
| Total distributions | $ | 0.50 | 0.46 | 0.50 | 0.47 | 0.52 | |||||||||
| Net asset value, end of year | $ | 10.23 | 10.13 | 10.32 | 10.67 | 10.51 | |||||||||
Total Return(1) | % | 6.03 | 2.53 | 1.52 | 6.16 | 11.48 | |||||||||
Ratios and Supplemental Data: | |||||||||||||||
| Net assets, end of year (000’s) | $ | 698,537 | 572,196 | 459,850 | 268,086 | 146,649 | |||||||||
| Ratios to average net assets: | |||||||||||||||
| Gross expenses prior to expense reimbursement | % | 0.73 | 1.02 | 1.14 | 1.18 | 1.24 | |||||||||
| Net expenses after expense reimbursement(2) | % | 0.69 | (3) | 0.93 | 1.00 | 1.10 | 1.14 | ||||||||
| Net investment income after expense reimbursement(2) | % | 4.89 | (3) | 3.92 | 3.08 | 2.91 | 3.21 | ||||||||
| Portfolio turnover rate | % | 367 | 469 | 417 | 475 | 639 | |||||||||
| Class B | |||||||||||||||
| Year Ended March 31, | |||||||||||||||
| 2007 | 2006 | 2005 | 2004 | 2003 | |||||||||||
Per Share Operating Performance: | |||||||||||||||
| Net asset value, beginning of year | $ | 10.11 | 10.30 | 10.65 | 10.50 | 9.90 | |||||||||
| Income (loss) from investment operations: | |||||||||||||||
| Net investment income | $ | 0.42 | 0.32 | 0.24 | 0.23 | 0.28 | |||||||||
| Net realized and unrealized gain (loss) on investments | $ | 0.10 | (0.13 | ) | (0.17 | ) | 0.31 | 0.76 | |||||||
| Total from investment operations | $ | 0.52 | 0.19 | 0.07 | 0.54 | 1.04 | |||||||||
| Less distributions from: | |||||||||||||||
| Net investment income | $ | 0.42 | 0.34 | 0.25 | 0.25 | 0.29 | |||||||||
| Net realized gains on investments | $ | — | 0.04 | 0.17 | 0.14 | 0.15 | |||||||||
| Total distributions | $ | 0.42 | 0.38 | 0.42 | 0.39 | 0.44 | |||||||||
| Net asset value, end of year | $ | 10.21 | 10.11 | 10.30 | 10.65 | 10.50 | |||||||||
Total Return(1) | % | 5.23 | 1.76 | 0.75 | 5.28 | 10.64 | |||||||||
Ratios and Supplemental Data: | |||||||||||||||
| Net assets, end of year (000’s) | $ | 50,086 | 60,526 | 64,779 | 67,402 | 61,544 | |||||||||
| Ratios to average net assets: | |||||||||||||||
| Gross expenses prior to expense reimbursement/recoupment | % | 1.48 | 1.70 | 1.79 | 1.83 | 1.89 | |||||||||
| Net expenses after expense reimbursement/recoupment(2) | % | 1.44 | (3) | 1.69 | 1.75 | 1.85 | 1.89 | ||||||||
| Net investment income after expense reimbursement/recoupment(2) | % | 4.13 | (3) | 3.14 | 2.31 | 2.16 | 2.39 | ||||||||
| Portfolio turnover rate | % | 367 | 469 | 417 | 475 | 639 | |||||||||
(1) | Total return is calculated assuming reinvestment of all dividends and capital gain distributions at net asset value and excluding the deduction of sales charges. |
(2) | The Investment Adviser has agreed to limit expenses, (excluding interest, taxes, brokerage and extraordinary expenses) subject to possible recoupment by the Investment Adviser within three years of being incurred. |
(3) | Impact of waiving the advisory fee for the ING Institutional Prime Money Market Fund holding has less than 0.01% impact on the expense ratio. |
See Accompanying Notes to Financial Statements
31
Table of Contents
| ING INTERMEDIATE BOND FUND (CONTINUED) | FINANCIAL HIGHLIGHTS |
Selected data for a share of beneficial interest outstanding throughout each year.
| Class C | |||||||||||||||
| Year Ended March 31, | |||||||||||||||
| 2007 | 2006 | 2005 | 2004 | 2003 | |||||||||||
Per Share Operating Performance: | |||||||||||||||
| Net asset value, beginning of year | $ | 10.12 | 10.31 | 10.65 | 10.50 | 9.90 | |||||||||
| Income (loss) from investment operations: | |||||||||||||||
| Net investment income | $ | 0.42 | 0.33 | 0.24 | 0.23 | 0.28 | |||||||||
| Net realized and unrealized gain (loss) on investments | $ | 0.10 | (0.14 | ) | (0.16 | ) | 0.31 | 0.76 | |||||||
| Total from investment operations | $ | 0.52 | 0.19 | 0.08 | 0.54 | 1.04 | |||||||||
| Less distributions from: | |||||||||||||||
| Net investment income | $ | 0.42 | 0.34 | 0.25 | 0.25 | 0.29 | |||||||||
| Net realized gains on investments | $ | — | 0.04 | 0.17 | 0.14 | 0.15 | |||||||||
| Total distributions | $ | 0.42 | 0.38 | 0.42 | 0.39 | 0.44 | |||||||||
| Net asset value, end of year | $ | 10.22 | 10.12 | 10.31 | 10.65 | 10.50 | |||||||||
Total Return(1) | % | 5.24 | 1.77 | 0.86 | 5.28 | 10.68 | |||||||||
Ratios and Supplemental Data: | |||||||||||||||
| Net assets, end of year (000’s) | $ | 81,556 | 73,281 | 71,648 | 71,228 | 52,979 | |||||||||
| Ratios to average net assets: | |||||||||||||||
| Gross expenses prior to expense reimbursement/recoupment | % | 1.48 | 1.70 | 1.79 | 1.83 | 1.90 | |||||||||
| Net expenses after expense reimbursement/recoupment(2) | % | 1.44 | (3) | 1.69 | 1.75 | 1.85 | 1.90 | ||||||||
| Net investment income after expense reimbursement/recoupment(2) | % | 4.13 | (3) | 3.15 | 2.31 | 2.16 | 2.36 | ||||||||
| Portfolio turnover rate | % | 367 | 469 | 417 | 475 | 639 | |||||||||
| Class I | |||||||||||||||
| Year Ended March 31, | |||||||||||||||
| 2007 | 2006 | 2005 | 2004 | 2003 | |||||||||||
Per Share Operating Performance: | |||||||||||||||
| Net asset value, beginning of year | $ | 10.14 | 10.32 | 10.67 | 10.51 | 9.91 | |||||||||
| Income (loss) from investment operations: | |||||||||||||||
| Net investment income | $ | 0.53 | 0.44 | 0.36 | * | 0.35 | 0.39 | ||||||||
| Net realized and unrealized gain (loss) on investments | $ | 0.09 | (0.13 | ) | (0.17 | ) | 0.33 | 0.76 | |||||||
| Total from investment operations | $ | 0.62 | 0.31 | 0.19 | 0.68 | 1.15 | |||||||||
| Less distributions from: | |||||||||||||||
| Net investment income | $ | 0.53 | 0.45 | 0.37 | 0.38 | 0.40 | |||||||||
| Net realized gains on investments | $ | — | 0.04 | 0.17 | 0.14 | 0.15 | |||||||||
| Total distributions | $ | 0.53 | 0.49 | 0.54 | 0.52 | 0.55 | |||||||||
| Net asset value, end of year | $ | 10.23 | 10.14 | 10.32 | 10.67 | 10.51 | |||||||||
Total Return(1) | % | 6.26 | 2.94 | 1.85 | 6.60 | 11.88 | |||||||||
Ratios and Supplemental Data: | |||||||||||||||
| Net assets, end of year (000’s) | $ | 266,596 | 179,582 | 43,808 | 14,548 | 15,046 | |||||||||
| Ratios to average net assets: | |||||||||||||||
| Gross expenses prior to expense reimbursement/recoupment | % | 0.40 | 0.61 | 0.72 | 0.68 | 0.73 | |||||||||
| Net expenses after expense reimbursement/recoupment(2) | % | 0.36 | (3) | 0.60 | 0.68 | 0.71 | 0.73 | ||||||||
| Net investment income after expense reimbursement/recoupment(2) | % | 5.22 | (3) | 4.40 | 3.43 | 3.30 | 3.70 | ||||||||
| Portfolio turnover rate | % | 367 | 469 | 417 | 475 | 639 | |||||||||
(1) | Total return is calculated assuming reinvestment of all dividends and capital gain distributions as net asset value and excluding the deduction of sales charges. |
(2) | The Investment Adviser has agreed to limit expenses, (excluding interest, taxes, brokerage and extraordinary expenses) subject to possible recoupment by the Investment Adviser within three years of being incurred. |
(3) | Impact of waiving the advisory fee for the ING Institutional Prime Money Market Fund holding has less than 0.01% impact on the expense ratio. |
| * | Per share numbers have been calculated using average number of shares outstanding throughout the period. |
See Accompanying Notes to Financial Statements
32
Table of Contents
| ING INTERMEDIATE BOND FUND (CONTINUED) | FINANCIAL HIGHLIGHTS |
Selected data for a share of beneficial interest outstanding throughout each period.
| Class O | |||||||||||
| Year Ended March 31, | August 13, 2004(1) to March 31, 2005 | ||||||||||
| 2007 | 2006 | ||||||||||
Per Share Operating Performance: | |||||||||||
| Net asset value, beginning of period | $ | 10.14 | 10.32 | 10.41 | |||||||
| Income (loss) from investment operations: | |||||||||||
| Net investment income | $ | 0.50 | 0.40 | 0.21 | |||||||
| Net realized and unrealized gain (loss) on investments | $ | 0.09 | (0.13 | ) | (0.04 | ) | |||||
| Total from investment operations | $ | 0.59 | 0.27 | 0.17 | |||||||
| Lest distributions from: | |||||||||||
| Net investment income | $ | 0.49 | 0.41 | 0.22 | |||||||
| Net realized gains on investments | $ | — | 0.04 | 0.04 | |||||||
| Total distributions | $ | 0.49 | 0.45 | 0.26 | |||||||
| Net asset value, end of period | $ | 10.24 | 10.14 | 10.32 | |||||||
Total Return(2) | % | 6.02 | 2.58 | 1.61 | |||||||
Ratios and Supplemental Data: | |||||||||||
| Net assets, end of period (000’s) | $ | 53,096 | 43,171 | 33,997 | |||||||
| Ratios to average net assets: | |||||||||||
| Gross expenses prior to expense reimbursement(3) | % | 0.73 | 0.95 | 1.00 | |||||||
| Net expenses after expense reimbursement(3)(4) | % | 0.69 | (5) | 0.94 | 0.96 | ||||||
| Net investment income after expense reimbursement(3)(4) | % | 4.88 | (5) | 3.91 | 3.19 | ||||||
| Portfolio turnover rate | % | 367 | 469 | 417 | |||||||
| Class R | ||||||||||||||
| Year Ended March 31, | March 16, 2004(1) to March 31, 2004 | |||||||||||||
| 2007 | 2006 | 2005 | ||||||||||||
Per Share Operating Performance: | ||||||||||||||
| Net asset value, beginning of period | $ | 10.15 | 10.34 | 10.67 | 10.71 | |||||||||
| Income (loss) from investment operations: | ||||||||||||||
| Net investment income | $ | 0.47 | 0.38 | 0.33 | 0.01 | |||||||||
| Net realized and unrealized gain (loss) on investments | $ | 0.10 | (0.14 | ) | (0.16 | ) | (0.05 | ) | ||||||
| Total from investment operations | $ | 0.57 | 0.24 | 0.17 | (0.04 | ) | ||||||||
| Lest distributions from: | ||||||||||||||
| Net investment income | $ | 0.47 | 0.39 | 0.33 | — | |||||||||
| Net realized gains on investments | $ | — | 0.04 | 0.17 | — | |||||||||
| Total distributions | $ | 0.47 | 0.43 | 0.50 | — | |||||||||
| Net asset value, end of period | $ | 10.25 | 10.15 | 10.34 | 10.67 | |||||||||
Total Return(2) | % | 5.75 | 2.26 | 1.64 | (0.37 | ) | ||||||||
Ratios and Supplemental Data: | ||||||||||||||
| Net assets, end of period (000’s) | $ | 5,572 | 799 | 313 | 1 | |||||||||
| Ratios to average net assets: | ||||||||||||||
| Gross expenses prior to expense reimbursement(3) | % | 0.98 | 1.17 | 1.21 | 1.25 | |||||||||
| Net expenses after expense reimbursement(3)(4) | % | 0.94 | (5) | 1.16 | 1.17 | 1.25 | ||||||||
| Net investment income after expense reimbursement(3)(4) | % | 4.63 | (5) | 3.79 | 2.96 | 3.20 | ||||||||
| Portfolio turnover rate | % | 367 | 469 | 417 | 475 | |||||||||
(1) | Commencement of operations. |
(2) | Total return is calculated assuming reinvestment of all dividends and capital gain distributions at net asset value. Total return for less than one year is not annualized. Total return for less than one year is not annualized. |
(3) | Annualized for periods less than one year. |
(4) | The Investment Adviser has agreed to limit expenses, (excluding interest, taxes, brokerage and extraordinary expenses) subject to possible recoupment by the Investment Adviser within three years of being incurred. |
(5) | Impact of waiving the advisory fee for the ING Institutional Prime Money Market Fund holding has less than 0.01% impact on the expense ratio. |
See Accompanying Notes to Financial Statements
33
Table of Contents
| ING NATIONAL TAX-EXEMPT BOND FUND | FINANCIAL HIGHLIGHTS |
Selected data for a share of beneficial interest outstanding throughout each year.
| Class A | ||||||||||||||
| Year Ended March 31, | ||||||||||||||
| 2007 | 2006 | 2005 | 2004 | 2003 | ||||||||||
Per Share Operating Performance: | ||||||||||||||
| Net asset value, beginning of year | $ | 10.28 | 10.50 | 10.78 | 10.87 | 10.32 | ||||||||
| Income (loss) from investment operations: | ||||||||||||||
| Net investment income | $ | 0.40 | 0.37 | 0.34 | 0.35 | 0.39 | ||||||||
| Net realized and unrealized gain (loss) on investments | $ | 0.09 | (0.11 | ) | (0.21 | ) | 0.12 | 0.67 | ||||||
| Total from investment operations | $ | 0.49 | 0.26 | 0.13 | 0.47 | 1.06 | ||||||||
| Less distributions from: | ||||||||||||||
| Net investment income | $ | 0.40 | 0.37 | 0.34 | 0.35 | 0.39 | ||||||||
| Net realized gains on investments | $ | 0.07 | 0.11 | 0.07 | 0.21 | 0.12 | ||||||||
| Total distributions | $ | 0.47 | 0.48 | 0.41 | 0.56 | 0.51 | ||||||||
| Net asset value, end of year | $ | 10.30 | 10.28 | 10.50 | 10.78 | 10.87 | ||||||||
Total Return(1) | % | 4.83 | 2.55 | 1.19 | 4.41 | 10.44 | ||||||||
Ratios and Supplemental Data: | ||||||||||||||
| Net assets, end of year (000’s) | $ | 22,697 | 22,864 | 23,296 | 24,082 | 23,647 | ||||||||
| Ratios to average net assets: | ||||||||||||||
| Gross expenses prior to expense reimbursement/recoupment | % | 0.95 | 1.13 | 1.13 | 1.27 | 1.28 | ||||||||
| Net expenses after expense reimbursement/recoupment(2) | % | 0.87 | 1.06 | 1.10 | 1.15 | 1.15 | ||||||||
| Net investment income after expense reimbursement/recoupment(2) | % | 3.83 | 3.55 | 3.19 | 3.23 | 3.64 | ||||||||
| Portfolio turnover rate | % | 47 | 32 | 22 | 31 | 22 | ||||||||
| Class B | ||||||||||||||
| Year Ended March 31, | ||||||||||||||
| 2007 | 2006 | 2005 | 2004 | 2003 | ||||||||||
Per Share Operating Performance: | ||||||||||||||
| Net asset value, beginning of year | $ | 10.27 | 10.50 | 10.77 | 10.86 | 10.31 | ||||||||
| Income (loss) from investment operations: | ||||||||||||||
| Net investment income | $ | 0.32 | 0.29 | 0.26 | 0.27 | 0.31 | ||||||||
| Net realized and unrealized gain (loss) on investments | $ | 0.09 | (0.12 | ) | (0.20 | ) | 0.12 | 0.67 | ||||||
| Total from investment operations | $ | 0.41 | 0.17 | 0.06 | 0.39 | 0.98 | ||||||||
| Less distributions from: | ||||||||||||||
| Net investment income | $ | 0.32 | 0.29 | 0.26 | 0.27 | 0.31 | ||||||||
| Net realized gains on investments | $ | 0.07 | 0.11 | 0.07 | 0.21 | 0.12 | ||||||||
| Total distributions | $ | 0.39 | 0.40 | 0.33 | 0.48 | 0.43 | ||||||||
| Net asset value, end of year | $ | 10.29 | 10.27 | 10.50 | 10.77 | 10.86 | ||||||||
Total Return(1) | % | 4.05 | 1.68 | 0.54 | 3.63 | 9.65 | ||||||||
Ratios and Supplemental Data: | ||||||||||||||
| Net assets, end of year (000’s) | $ | 2,574 | 3,032 | 3,041 | 2,643 | 2,792 | ||||||||
| Ratios to average net assets: | ||||||||||||||
| Gross expenses prior to expense reimbursement/recoupment | % | 1.70 | 1.78 | 1.78 | 1.92 | 1.94 | ||||||||
| Net expenses after expense reimbursement/recoupment(2) | % | 1.62 | 1.81 | 1.85 | 1.90 | 1.90 | ||||||||
| Net investment income after expense reimbursement/recoupment(2) | % | 3.09 | 2.79 | 2.44 | 2.48 | 2.86 | ||||||||
| Portfolio turnover rate | % | 47 | 32 | 22 | 31 | 22 | ||||||||
(1) | Total return is calculated assuming reinvestment of all dividends and capital gain distributions at net asset value and excluding the deduction of sales charges. |
(2) | The Investment Adviser has agreed to limit expenses, (excluding interest, taxes, brokerage and extraordinary expenses) subject to possible recoupment by the Investment Adviser within three years of being incurred. |
See Accompanying Notes to Financial Statements
34
Table of Contents
| ING NATIONAL TAX-EXEMPT BOND FUND (CONTINUED) | FINANCIAL HIGHLIGHTS |
Selected data for a share of beneficial interest outstanding throughout each year.
| Class C | ||||||||||||||
| Year Ended March 31, | ||||||||||||||
| 2007 | 2006 | 2005 | 2004 | 2003 | ||||||||||
Per Share Operating Performance: | ||||||||||||||
| Net asset value, beginning of year | $ | 10.28 | 10.50 | 10.78 | 10.87 | 10.33 | ||||||||
| Income (loss) from investment operations: | ||||||||||||||
| Net investment income | $ | 0.32 | 0.29 | 0.26 | 0.27 | 0.31 | ||||||||
| Net realized and unrealized gain (loss) on investments | $ | 0.09 | (0.11 | ) | (0.21 | ) | 0.12 | 0.66 | ||||||
| Total from investment operations | $ | 0.41 | 0.18 | 0.05 | 0.39 | 0.97 | ||||||||
| Less distributions from: | ||||||||||||||
| Net investment income | $ | 0.32 | 0.29 | 0.26 | 0.27 | 0.31 | ||||||||
| Net realized gains on investments | $ | 0.07 | 0.11 | 0.07 | 0.21 | 0.12 | ||||||||
| Total distributions | $ | 0.39 | 0.40 | 0.33 | 0.48 | 0.43 | ||||||||
| Net asset value, end of year | $ | 10.30 | 10.28 | 10.50 | 10.78 | 10.87 | ||||||||
Total Return(1) | % | 4.04 | 1.77 | 0.49 | 3.63 | 9.56 | ||||||||
Ratios and Supplemental Data: | ||||||||||||||
| Net assets, end of year (000’s) | $ | 1,858 | 1,665 | 1,806 | 1,104 | 1,065 | ||||||||
| Ratios to average net assets: | ||||||||||||||
| Gross expenses prior to expense reimbursement/recoupment | % | 1.70 | 1.80 | 1.78 | 1.92 | 1.94 | ||||||||
| Net expenses after expense reimbursement/recoupment(2) | % | 1.62 | 1.81 | 1.85 | 1.90 | 1.90 | ||||||||
| Net investment income after expense reimbursement/recoupment(2) | % | 3.07 | 2.80 | 2.44 | 2.49 | 2.84 | ||||||||
| Portfolio turnover rate | % | 47 | 32 | 22 | 31 | 22 | ||||||||
(1) | Total return is calculated assuming reinvestment of all dividends and capital gain distributions at net asset value and excluding the deduction of sales charges. |
(2) | The Investment Adviser has agreed to limit expenses, (excluding interest, taxes, brokerage and extraordinary expenses) subject to possible recoupment by the Investment Adviser within three years of being incurred. |
See Accompanying Notes to Financial Statements
35
Table of Contents
| ING CLASSIC MONEY MARKET FUND | FINANCIAL HIGHLIGHTS |
Selected data for a share of beneficial interest outstanding throughout each year.
| Class A | ||||||||||||||
| Year Ended March 31, | ||||||||||||||
| 2007 | 2006 | 2005 | 2004 | 2003 | ||||||||||
Per Share Operating Performance: | ||||||||||||||
| Net asset value, beginning of year | $ | 1.00 | 1.00 | 1.00 | 1.00 | 1.00 | ||||||||
| Income from investment operations: | ||||||||||||||
| Net investment income | $ | 0.05 | 0.03 | 0.01 | 0.00 | * | 0.01 | |||||||
| Total from investment operations | $ | 0.05 | 0.03 | 0.01 | 0.00 | * | 0.01 | |||||||
| Less distributions from: | ||||||||||||||
| Net investment income | $ | 0.05 | 0.03 | 0.01 | 0.00 | * | 0.01 | |||||||
| Total distributions | $ | 0.05 | 0.03 | 0.01 | 0.00 | * | 0.01 | |||||||
| Net asset value, end of year | $ | 1.00 | 1.00 | 1.00 | 1.00 | 1.00 | ||||||||
Total Return(1) | % | 4.63 | 3.07 | 1.02 | 0.44 | 1.06 | ||||||||
Ratios and Supplemental Data: | ||||||||||||||
| Net assets, end of year (000’s) | $ | 921,623 | 656,731 | 550,091 | 398,997 | 458,964 | ||||||||
| Ratios to average net assets: | ||||||||||||||
| Gross expenses prior to expense reimbursement | % | 1.21 | 1.10 | 1.08 | 1.16 | 1.27 | ||||||||
| Net expenses after expense reimbursement(2) | % | 0.77 | 0.77 | 0.77 | 0.77 | 0.77 | ||||||||
| Net investment income after expense reimbursement(2) | % | 4.55 | 3.07 | 1.06 | 0.44 | 1.06 | ||||||||
| Class B | ||||||||||||||
| Year Ended March 31, | ||||||||||||||
| 2007 | 2006 | 2005 | 2004 | 2003 | ||||||||||
Per Share Operating Performance: | ||||||||||||||
| Net asset value, beginning of year | $ | 1.00 | 1.00 | 1.00 | 1.00 | 1.00 | ||||||||
| Income from investment operations: | ||||||||||||||
| Net investment income | $ | 0.04 | 0.02 | 0.01 | 0.00 | * | 0.00 | * | ||||||
| Total from investment operations | $ | 0.04 | 0.02 | 0.01 | 0.00 | * | 0.00 | * | ||||||
| Less distributions from: | ||||||||||||||
| Net investment income | $ | 0.04 | 0.02 | 0.01 | 0.00 | * | 0.00 | * | ||||||
| Total distributions | $ | 0.04 | 0.02 | 0.01 | 0.00 | * | 0.00 | * | ||||||
| Net asset value, end of year | $ | 1.00 | 1.00 | 1.00 | 1.00 | 1.00 | ||||||||
Total Return(1) | % | 4.00 | 2.46 | 0.57 | 0.15 | 0.43 | ||||||||
Ratios and Supplemental Data: | ||||||||||||||
| Net assets, end of year (000’s) | $ | 23,333 | 23,995 | 26,941 | 816 | 1,156 | ||||||||
| Ratios to average net assets: | ||||||||||||||
| Gross expenses prior to expense reimbursement | % | 1.46 | 1.34 | 1.33 | 1.41 | 1.52 | ||||||||
| Net expenses after expense reimbursement(2) | % | 1.36 | 1.34 | 1.33 | 1.07 | 1.40 | ||||||||
| Net investment income after expense reimbursement(2) | % | 3.95 | 2.43 | 0.94 | 0.15 | 0.46 | ||||||||
(1) | Total return is calculated assuming reinvestment of all dividends and capital gain distributions at net asset value. |
(2) | The Investment Adviser has agreed to limit expenses, (excluding interest, taxes, brokerage and extraordinary expenses) subject to possible recoupment by the Investment Adviser within three years of being incurred. |
| * | Amount is less than $0.005. |
See Accompanying Notes to Financial Statements
36
Table of Contents
| ING CLASSIC MONEY MARKET FUND (CONTINUED) | FINANCIAL HIGHLIGHTS |
Selected data for a share of beneficial interest outstanding throughout each year.
| Class C | ||||||||||||||
| Year Ended March 31, | ||||||||||||||
| 2007 | 2006 | 2005 | 2004 | 2003 | ||||||||||
Per Share Operating Performance: | ||||||||||||||
| Net asset value, beginning of year | $ | 1.00 | 1.00 | 1.00 | 1.00 | 1.00 | ||||||||
| Income from investment operations: | ||||||||||||||
| Net investment income | $ | 0.04 | 0.02 | 0.01 | 0.00 | * | 0.00 | * | ||||||
| Total from investment operations | $ | 0.04 | 0.02 | 0.01 | 0.00 | * | 0.00 | * | ||||||
| Less distributions from: | ||||||||||||||
| Net investment income | $ | 0.04 | 0.02 | 0.01 | 0.00 | * | 0.00 | * | ||||||
| Total distributions | $ | 0.04 | 0.02 | 0.01 | 0.00 | * | 0.00 | * | ||||||
| Net asset value, end of year | $ | 1.00 | 1.00 | 1.00 | 1.00 | 1.00 | ||||||||
Total Return(1) | % | 3.99 | 2.46 | 0.58 | 0.14 | 0.42 | ||||||||
Ratios and Supplemental Data: | ||||||||||||||
| Net assets, end of year (000’s) | $ | 4,345 | 4,868 | 3,932 | 546 | 524 | ||||||||
| Ratios to average net assets: | ||||||||||||||
| Gross expenses prior to expense reimbursement | % | 1.46 | 1.34 | 1.33 | 1.41 | 1.52 | ||||||||
| Net expenses after expense reimbursement(2) | % | 1.36 | 1.34 | 1.33 | 1.07 | 1.40 | ||||||||
| Net investment income after expense reimbursement(2) | % | 3.96 | 2.47 | 0.78 | 0.15 | 0.42 | ||||||||
(1) | Total return is calculated assuming reinvestment of all dividends and capital gain distributions at net asset value. |
(2) | The Investment Adviser has agreed to limit expenses, (excluding interest, taxes, brokerage and extraordinary expenses) subject to possible recoupment by the Investment Adviser within three years of being incurred. |
| * | Amount is less than $0.005. |
See Accompanying Notes to Financial Statements
37
Table of Contents
| ING INSTITUTIONAL PRIME MONEY MARKET FUND | FINANCIAL HIGHLIGHTS |
Selected data for a share of beneficial interest outstanding throughout each period.
| Year Ended March 31, 2007 | July 28, 2005(1) to March 31, 2006 | |||||
Per Share Operating Performance: | ||||||
| Net asset value, beginning of period | $ | 1.00 | 1.00 | |||
| Income (loss) from investment operations: | ||||||
| Net investment income | $ | 0.05 | 0.03 | |||
| Total from investment operations | $ | 0.05 | 0.03 | |||
| Less distributions from: | ||||||
| Net investment income | $ | 0.05 | 0.03 | |||
| Total distributions | $ | 0.05 | 0.03 | |||
| Net asset value, end of period | $ | 1.00 | 1.00 | |||
Total Return(2) | % | 5.25 | 2.70 | |||
Ratios and Supplemental Data: | ||||||
| Net assets, end of period (000’s) | $ | 724,330 | 179,659 | |||
| Ratios to average net assets: | ||||||
| Gross expenses prior to expense reimbursement/recoupment(3) | % | 0.26 | 0.19 | |||
| Net expenses after expense reimbursement/recoupment(3)(4) | % | 0.16 | 0.17 | |||
| Net investment income after expense reimbursement/recoupment(3)(4) | % | 5.17 | 4.14 |
(1) | Commencement of operations. |
(2) | Total return is calculated assuming reinvestment of all dividends and capital gain distributions at net asset value. Total return for less than one year is not annualized. |
(3) | Annualized for periods less than one year. |
(4) | The Investment Adviser has agreed to limit expenses, (excluding interest taxes, brokerage and extraordinary expenses) subject to possible recoupment by the Investment Adviser within three years of being incurred. |
See Accompanying Notes to Financial Statements
38
Table of Contents
NOTES TO FINANCIAL STATEMENTSASOF MARCH 31, 2007
NOTE 1 — ORGANIZATION
Organization. ING Funds Trust (“Trust”) is a Delaware statutory trust and is registered as an open-end management investment company under the Investment Company Act of 1940, as amended (“1940 Act”). The Trust was organized on August 6, 1998 and was established under a Trust Instrument dated July 30, 1998. It consists of six separately managed series: ING GNMA Income Fund (“GNMA Income”), ING High Yield Bond Fund (“High Yield Bond”), ING Intermediate Bond Fund (“Intermediate Bond”), ING National Tax-Exempt Bond Fund (“National Tax-Exempt Bond”), ING Classic Money Market Fund (“Classic Money Market”) and ING Institutional Prime Money Market Fund (“Institutional Money Market”) (each, a “Fund” and collectively, the “Funds”).
The investment objective of each Fund is described in each Fund’s prospectus.
Each Fund, except Institutional Money Market, offers at least three of the following classes of shares: Class A, Class B, Class C, Class I, Class O, Class Q and Class R. The separate classes of shares differ principally in the applicable sales charges (if any), transfer agent fees, distribution fees and shareholder servicing fees. Shareholders of each class also bear certain expenses that pertain to that particular class. All shareholders bear the common expenses of a Fund and earn income and realized gains/losses from the portfolio pro rata based on the average daily net assets of each class, without distinction between share classes. Differences in per share dividend rates generally result from the differences in separate class expenses, including distribution, and shareholder servicing fees. Class B shares, along with their pro rata reinvested dividend shares, automatically convert to Class A shares approximately eight years after purchase.
Effective July 31, 2006, Class B shares of the Funds (except Classic Money Market) are closed to new investment, provided that (1) Class B shares of the Funds may be purchased through the reinvestment of dividends issued by Class B shares of a Fund; and (2) subject to the terms and conditions of relevant exchange privileges and as permitted under their respective prospectuses, Class B shares of the Funds may be acquired through exchange of Class B shares of other funds in the ING mutual funds complex.
Effective July 31, 2006, the maximum Class A sales charge for GNMA Income, High Yield Bond, Intermediate Bond and National Tax-Exempt Bond has been lowered to 2.50%. Return calculations with a starting date prior to July 31, 2006 are based on a 4.75% sales charge, while returns with a starting date on or after July 31, 2006 are based on a 2.50% sales charge.
Effective January 2, 2007, Class M shareholders of GNMA Income were converted to Class A shares of GNMA Income. In addition, GNMA Income does not impose any front-end sales charge (load) on purchases of Class A shares of the Fund by its former Class M shareholders.
NOTE 2 — SIGNIFICANT ACCOUNTING POLICIES
The following significant accounting policies are consistently followed by the Funds in the preparation of their financial statements, and such policies are in conformity with U.S. generally accepted accounting principles for investment companies.
| A. | Security Valuation. Investments in equity securities traded on a national securities exchange are valued at the last reported sale price. Securities reported by NASDAQ will be valued at the NASDAQ official closing prices. Securities traded on an exchange or NASDAQ for which there has been no sale and securities traded in the over-the- counter-market are valued at the mean between the last reported bid and ask prices. All investments quoted in foreign currencies will be valued daily in U.S. dollars on the basis of the foreign currency exchange rates prevailing at that time. Debt securities are valued at prices obtained from independent services or from one or more dealers making markets in the securities and may be adjusted based on the Funds’ valuation procedures. U.S. government obligations are valued by using market quotations or independent pricing services that use prices provided by marketmakers or estimates of market values obtained from yield data relating to instruments or securities with similar characteristics. |
Securities and assets for which market quotations are not readily available (which may include certain restricted securities which are subject to limitations as to their sale) are valued at their fair values as determined in good faith by or under the supervision of the Funds’ Board of Trustees (“Board”), in accordance with methods that are specifically authorized by the Board. Securities traded on exchanges, including foreign exchanges, which close earlier than the time that a Fund calculates its net asset value (“NAV”) may also be valued at their fair values as determined in good faith by or under the supervision of a Fund’s Board,
39
Table of Contents
NOTES TO FINANCIAL STATEMENTSASOF MARCH 31, 2007 (CONTINUED)
NOTE 2 — SIGNIFICANT ACCOUNTING POLICIES (continued)
in accordance with methods that are specifically
authorized by the Board. If an event occurs after the time at which the market for foreign securities held by a Fund closes but before the time that a Fund’s NAV is calculated, such event may cause the closing price on the foreign exchange to not represent a readily available reliable market value quotation for such securities at the time the Fund determines its NAV. In such a case, the Fund will use the fair value of such securities as determined under a Fund’s valuation procedures. Events after the close of trading on a foreign market that could require a Fund to fair value some or all of its foreign securities include, among others, securities trading in the U.S. and other markets, corporate announcements, natural and other disasters, and political and other events. Among other elements of analysis in the determination of a security’s fair value, the Board has authorized the use of one or more independent research services to assist with such determinations. An independent research service may use statistical analyses and quantitative models to help determine fair value as of the time a Fund calculates its NAV. There can be no assurance that such models accurately reflect the behavior of the applicable markets or the effect of the behavior of such markets on the fair value of securities, or that such markets will continue to behave in a fashion that is consistent with such models. Unlike the closing price of a security on an exchange, fair value determinations employ elements of judgment. Consequently, the fair value assigned to a security may not represent the actual value that a Fund could obtain if it were to sell the security at the time of the close of the NYSE. Pursuant to procedures adopted by the Board, a Fund is not obligated to use the fair valuations suggested by any research service, and valuation recommendations provided by such research services may be overridden if other events have occurred or if other fair valuations are determined in good faith to be more accurate. Unless an event is such that it causes a Fund to determine that the closing prices for one or more securities do not represent readily available reliable market value quotations at the time a Fund determines its NAV, events that occur between the time of the close of the foreign market on which they are traded and the close of regular trading on the NYSE will not be reflected in a Fund’s NAV. Investments in securities maturing in 60 days or less from the date of acquisition are valued at amortized cost, which, when combined with accrued interest, approximates market value.
Classic Money Market and Institutional Money Market use the amortized cost method to value their portfolio securities, which approximates market value. The amortized cost method involves valuing a security at its cost and amortizing any discount or premium over the period until maturity regardless of the impact of fluctuating interest rates or the market value of the security.
| B. | Security Transactions and Revenue Recognition. Securities transactions are accounted for on the trade date. Realized gains and losses are reported on the basis of identified cost of securities sold. Interest income is recorded on an accrual basis. Dividend income is recorded on the ex-dividend date, or for certain foreign securities, when the information becomes available to the Funds. Premium amortization and discount accretion are determined by the effective yield method. |
| C. | Foreign Currency Translation. The books and records of the Funds are maintained in U.S. dollars. Any foreign currency amounts are translated into U.S. dollars on the following basis: |
| (1) | Market value of investment securities, other assets and liabilities — at the exchange rates prevailing at the end of the day. |
| (2) | Purchases and sales of investment securities, income and expenses — at the rates of exchange prevailing on the respective dates of such transactions. |
Although the net assets and the market values are presented at the foreign exchange rates at the end of the day, the Funds do not isolate the portion of the results of operations resulting from changes in foreign exchange rates on investments from the fluctuations arising from changes in market prices of securities held. Such fluctuations are included with the net realized and unrealized gains or losses from investments. For securities that are subject to foreign withholding tax upon disposition, liabilities are recorded on the Statements of Assets and Liabilities for the estimated tax withholding based on the securities’ current market values. Upon disposition, realized gains or losses on such securities are recorded net of foreign withholding tax.
40
Table of Contents
NOTES TO FINANCIAL STATEMENTSASOF MARCH 31, 2007 (CONTINUED)
NOTE 2 — SIGNIFICANT ACCOUNTING POLICIES (continued)
Reported net realized foreign exchange gains or losses arise from sales of foreign currencies, currency gains or losses realized between the trade and settlement dates on securities transactions, the difference between the amounts of dividends, interest, and foreign withholding taxes recorded on the Funds’ books, and the U.S. dollar equivalent of the amounts actually received or paid. Net unrealized foreign exchange gains and losses arise from changes in the value of assets and liabilities other than investments in securities at fiscal year end, resulting from changes in the exchange rate. Foreign security and currency transactions may involve certain considerations and risks not typically associated with investing in U.S. companies and U.S. government securities. These risks include, but are not limited to revaluation of currencies and future adverse political and economic developments which could cause securities and their markets to be less liquid and prices more volatile than those of comparable U.S. companies and U.S. government securities.
| D. | Foreign Currency Transactions and Futures Contracts. High Yield Bond, Intermediate Bond and National Tax-Exempt Bond may enter into foreign currency exchange transactions to convert to and from different foreign currencies and to and from the U.S. dollar in connection with the planned purchases or sales of securities. The Funds either enter into these transactions on a spot basis at the spot rate prevailing in the foreign currency exchange market or use forward foreign currency contracts to purchase or sell foreign currencies. When the contract is fulfilled or closed, gains or losses are realized. Until then, the gain or loss is included in unrealized appreciation or depreciation. Risks may arise upon entering into forward contracts from the potential inability of counterparties to meet the terms of their forward contracts and from unanticipated movements in the value of foreign currencies relative to the U.S. dollar. |
High Yield Bond and Intermediate Bond may enter into futures contracts involving foreign currency, interest rates, securities and securities indices. A futures contract obligates the seller of the contract to deliver and the purchaser of the contract to take delivery of the type of foreign currency, financial instrument or security called for in the contract at a specified future time for a specified price. Upon entering into such a contract, a Fund is required to deposit and maintain as collateral such initial margin as required by the exchange on which the contract is traded. Pursuant to the contract, a Fund agrees to receive from or pay to the broker an amount equal to the daily fluctuations in the value of the contract. Such receipts or payments are known as variation margins and are recorded as unrealized gains or losses by the Fund. When the contract is closed, the Fund records a realized gain or loss equal to the difference between the value of the contract at the time it was opened and the value at the time it was closed.
| E. | Distributions to Shareholders. The Funds record distributions to their shareholders on the ex-dividend date. All Funds, with the exception of GNMA Income, declare dividends daily and pay dividends monthly. GNMA Income declares and pays dividends monthly. The Funds may make distributions on a more frequent basis to comply with the distribution requirements of the Internal Revenue Code. The characteristics of income and gains to be distributed are determined in accordance with income tax regulations, which may differ from U.S. generally accepted accounting principles for investment companies. |
| F. | Federal Income Taxes. It is the policy of the Funds to comply with Subchapter M of the Internal Revenue Code and related excise tax provisions applicable to regulated investment companies and to distribute substantially all of their net investment income and any net realized capital gains to their shareholders. Therefore, no federal income tax provision is required. No capital gain distributions shall be made until any capital loss carryforwards have been fully utilized or expire. |
| G. | Use of Estimates. The preparation of financial statements in conformity with U.S. generally accepted accounting principles requires management to make estimates and assumptions that affect the reported amounts of assets and liabilities and disclosure of contingent assets and liabilities at the date of the financial statements and the reported amounts of increases and decreases in net assets from operations during the reporting period. Actual results could differ from those estimates. |
| H. | Repurchase Agreements. Each Fund may invest in repurchase agreements only with government securities dealers recognized by the Board of |
41
Table of Contents
NOTES TO FINANCIAL STATEMENTSASOF MARCH 31, 2007 (CONTINUED)
NOTE 2 — SIGNIFICANT ACCOUNTING POLICIES (continued)
Governors of the Federal Reserve System. Under such agreements, the seller of the security agrees to repurchase it at a mutually agreed upon time and price. The resale price is in excess of the purchase price and reflects an agreed upon interest rate for the period of time the agreement is outstanding. The period of the repurchase agreements is usually short, from overnight to one week, while the underlying securities generally have longer maturities. Each Fund will receive as collateral securities acceptable to it whose market value is equal to at least 100% of the carrying amount of the repurchase agreements, plus accrued interest, being invested by the Fund. The underlying collateral is valued daily on a mark to market basis to assure that the value, including accrued interest is at least equal to the repurchase price. There would be potential loss to the Fund in the event the Fund is delayed or prevented from exercising its right to dispose of the collateral, and it may incur disposition costs in liquidating the collateral. |
| I. | Securities Lending. Each Fund (except GNMA Income) has the option to temporarily loan up to 30% of its total assets to brokers, dealers or other financial institutions in exchange for a negotiated lender’s fee. The borrower is required to fully collateralize the loans with cash or U.S. government securities. Generally, in the event of counterparty default, a Fund has the right to use collateral to offset losses incurred. There would be potential loss to the Fund in the event the Fund is delayed or prevented from exercising its right to dispose of the collateral. The Fund bears the risk of loss with respect to the investment of collateral. Engaging in securities lending could have a leveraging effect, which may intensify the credit, market and other risks associated with investing in a Fund. |
| J. | Illiquid and Restricted Securities. GNMA Income may not invest in illiquid securities. Classic Money Market and Institutional Money Market Funds may not invest more than 10% of their net assets in illiquid securities and all other Funds may not invest more than 15% of their net assets in illiquid securities. Illiquid securities are not readily marketable. Disposing of illiquid investments may involve time-consuming negotiation and legal expenses, and it may be difficult or impossible for the Funds to sell them promptly at an acceptable price. Restricted securities are those sold under Rule 144A of the Securities Act of 1933 (“1933 Act”) or are securities offered pursuant to Section 4(2) of the 1933 Act, and are subject to legal or contractual restrictions on resale and may not be publicly sold without registration under the 1933 Act. Certain restricted securities may be considered liquid pursuant to procedures adopted by the Board or may be deemed illiquid because they may not be readily marketable. With the exception to the Classic Money Market and Institutional Money Market Funds, illiquid and restricted securities are valued using market quotations when readily available. In the absence of market quotations, the securities are valued based upon their fair value determined under procedures approved by the Board. |
| K. | Delayed Delivery Transaction. The Funds may purchase or sell securities on a when-issued or a delayed delivery basis. Each Fund (except GNMA Income) may enter into forward commitments. The price of the underlying securities and date when the securities will be delivered and paid for are fixed at the time the transaction is negotiated. The market value of such is identified in the Funds’ Portfolio of investments. Losses may arise due to changes in the market value of the securities or from the inability of counterparties to meet the terms of the contract. In connection with such purchases, the Funds are required to hold liquid assets as collateral with the Funds’ custodian sufficient to cover the purchase price. |
| L. | Mortgage Dollar Roll Transactions. Each Fund (except National Tax-Exempt Bond, Classic Money Market and Institutional Money Market) may engage in dollar roll transactions with respect to mortgage-backed securities issued or to be issued by Government National Mortgage Association, Federal National Mortgage Association and Federal Home Loan Mortgage Corp. In a dollar roll transaction, a Fund sells a mortgage-backed security to a financial institution, such as a bank or broker/dealer, and simultaneously agrees to repurchase a substantially similar (i.e., same type, coupon, and maturity) security from the institution on a delayed delivery basis at an agreed upon price. The mortgage-backed securities that are repurchased will bear the same interest rate as those sold, but generally will be collateralized by different pools of mortgages with different prepayment histories. The Funds account for dollar roll transactions as purchases and sales. |
42
Table of Contents
NOTES TO FINANCIAL STATEMENTSASOF MARCH 31, 2007 (CONTINUED)
NOTE 2 — SIGNIFICANT ACCOUNTING POLICIES (continued)
| M. | Options Contracts. High Yield Bond and Intermediate Bond may purchase put and call options and may write (sell) put options and covered call options. High Yield Bond and Intermediate Bond may engage in option transactions as a hedge against adverse movements in the value of portfolio holdings or to increase market exposure. Option contracts are valued daily and unrealized gains or losses are recorded based upon the last sales price on the principal exchange on which the options are traded. High Yield Bond and Intermediate Bond will realize a gain or loss upon the expiration or closing of the option contract. When an option is exercised, the proceeds on sales of the underlying security for a written call option, the purchase cost of the security for a written put option, or the cost of the security for a purchased put or call option is adjusted by the amount of premium received or paid. Realized and unrealized gains or losses on option contracts are reflected in the accompanying financial statements. The risk in writing a call option is that High Yield Bond and Intermediate Bond give up the opportunity for profit if the market price of the security increases and the option is exercised. The risk in writing a put option is that High Yield Bond and Intermediate Bond may incur a loss if the market price of the security decreases and the option is exercised. The risk in buying an option is that High Yield Bond and Intermediate Bond pay a premium whether or not the option is exercised. Risks may also arise from an illiquid secondary market or from the inability of counterparties to meet the terms of the contract. |
| N. | Swap Contracts. High Yield Bond, Intermediate Bond and National Tax-Exempt Bond may enter into interest rate swaps, currency swaps and other types of swap agreements, including swaps on securities and indices. A swap is an agreement between two parties pursuant to which each party agrees to make one or more payments to the other on regularly scheduled dates over a stated term, based on different interest rates, currency exchange rates, security prices, the prices or rates of other types of financial instruments or assets or the levels of specified indices. During the term of the swap, changes in the value of the swap are recognized by marking-to-market the value of the swap. |
| O. | Construction Loan Securities. GNMA Income may purchase construction loan securities, which are issued to finance building costs. The funds are disbursed as needed or in accordance with a prearranged plan. The securities provide for the timely payment to the registered holder of interest at the specified rate plus scheduled installments of principal. Upon completion of the construction phase, the construction loan securities are terminated and project loan securities are issued. It is GNMA Income’s policy to record these GNMA certificates on trade date, and to segregate assets to cover its commitments on trade date as well. |
NOTE 3 — INVESTMENT TRANSACTIONS
For the year ended March 31, 2007, the cost of purchases and proceeds from the sales of securities excluding short-term securities, were as follows:
| Purchases | Sales | |||||
GNMA Income | $ | — | $ | 27,196 | ||
High Yield Bond | 207,423,347 | 234,804,432 | ||||
Intermediate Bond | 928,038,935 | 711,018,058 | ||||
National Tax-Exempt Bond | 12,518,709 | 12,811,445 | ||||
U.S. Government Securities not included above were as follows:
| Purchases | Sales | |||||
GNMA Income | $ | 558,444,315 | $ | 572,282,861 | ||
High Yield Bond | 1,520,640 | 1,519,980 | ||||
Intermediate Bond | 3,317,973,460 | 3,340,837,217 | ||||
NOTE 4 — INVESTMENT MANAGEMENT AND ADMINISTRATIVE FEES
ING Investments, LLC (“ING Investments” or the ”Investment Adviser”), an Arizona limited liability company, serves as the investment adviser to the Funds. The Investment Adviser serves pursuant to an investment management agreement (“Management Agreement”) between the Investment Adviser and the Trust, on behalf of the Funds.
The Management Agreement compensates the Investment Adviser with a fee, computed daily and payable monthly, based on the average daily net assets of each Fund, at the following annual rates:
For GNMA Income — 0.47% on first $1 billion, 0.40% on next $4 billion and 0.35% on assets thereafter; for High Yield Bond — 0.51% on first $1 billion, 0.45% on next $4 billion and 0.40% on assets thereafter; for Intermediate Bond — 0.17%; for National Tax-Exempt Bond — 0.30%; for Classic Money Market — 0.25%; and for Institutional Money Market — 0.08%.
43
Table of Contents
NOTES TO FINANCIAL STATEMENTSASOF MARCH 31, 2007 (CONTINUED)
NOTE 4 — INVESTMENT MANAGEMENT AND ADMINISTRATIVE FEES (continued)
ING Investment Management Co. (“ING IM”), a Connecticut corporation, serves as the sub-adviser to the Funds. The Investment Adviser has entered into a sub-advisory agreement with ING IM. Subject to such policies as the Board or the Investment Adviser may determine, ING IM manages the Funds’ assets in accordance with the Funds’ investment objectives, policies, and limitations.
Effective November 1, 2006, all ING Funds sub-advised by ING IM are permitted to invest end-of-day cash balances into affiliated ING money market funds, including Institutional Money Market. Investment management fees paid by the Funds will be reduced by an amount equal to the management fees paid indirectly to Institutional Money Market with respect to assets invested by the Funds. As of March 31, 2007, Intermediate Bond waived $9,374. These fees are not subject to recoupment.
ING Funds Services, LLC (“IFS”), acts as administrator and provides certain administrative and shareholder services necessary for Fund operations and is responsible for the supervision of other service providers. For its services, IFS is entitled to receive from each Fund, with the exception of Classic Money Market and Institutional Money Market, a fee at an annual rate of 0.10% of its average daily net assets.
ING Funds Distributor, LLC (the “Distributor” or “IFD”) is the principal underwriter of the Funds. The Distributor, IFS, ING Investments and ING IM are indirect, wholly-owned subsidiaries of ING Groep N.V. (“ING Groep”). ING Groep is one of the largest financial service organizations in the world, and offers an array of banking, insurance and asset management services to both individual and institutional investors.
NOTE 5 — DISTRIBUTION AND SERVICE FEES
Each share class of the Funds (except Class I and as otherwise noted below) has adopted a Distribution Plan pursuant to Rule 12b-1 under the 1940 Act and/or a Service Plan (the “Plans”), whereby the Distributor is reimbursed or compensated (depending on the class of shares) by certain of the Funds for expenses incurred in the distribution of each Fund’s shares (“Distribution Fees”). Pursuant to the Plans, the Distributor is entitled to payment each month for expenses incurred in the distribution and promotion of certain of each Fund’s shares, including expenses incurred in printing prospectuses and reports used for sales purposes, expenses incurred in preparing and printing sales literature and other such distribution related expenses, including any distribution or shareholder servicing fees (“Service Fees”) paid to securities dealers who have executed a distribution agreement with the Distributor. Under the Plans, each class of shares of the Fund pays the Distributor a Distribution and/or Service Fee based on average daily net assets at the following annual rates:
| Class A | Class B | Class C | Class O | Class Q | Class R | |||||||||||||
GNMA Income | 0.25 | % | 1.00 | % | 1.00 | % | N/A | 0.25 | % | N/A | ||||||||
High Yield Bond | 0.25 | % | 1.00 | % | 1.00 | % | N/A | N/A | N/A | |||||||||
Intermediate Bond | 0.25 | % | 1.00 | % | 1.00 | % | 0.25 | % | N/A | 0.50 | % | |||||||
National Tax-Exempt Bond | 0.25 | % | 1.00 | % | 1.00 | % | N/A | N/A | N/A | |||||||||
Classic Money Market(1) | 0.75 | % | 1.00 | % | 1.00 | % | N/A | N/A | N/A | |||||||||
Institutional Money Market | N/A | N/A | N/A | N/A | N/A | N/A |
| (1) | The Distributor has contractually agreed to waive a portion of the distribution fee for Class A of Classic Money Market to the extent necessary for expenses not to exceed 0.77%. The fee waiver will continue through at least August 1, 2007. There is no guarantee that this waiver will continue after that date. |
During the year ended March 31, 2007, the Distributor waived $54,011, $7,484, and $3,560 of the Class A, Class B, and Class C Distribution Fee, respectively, for GNMA Income.
During the year ended March 31, 2007, the Distributor voluntarily waived $2,650,241 of the Class A Distribution and Service Fees for Classic Money Market.
The Distributor also receives the proceeds of initial sales charge paid by shareholders upon the purchase of Class A shares of the Funds, and the contingent deferred sales charge paid by shareholders upon certain redemptions for Class A, Class B, and Class C shares. For the year ended March 31, 2007, the Distributor retained the following amounts in sales charges:
| Class A Shares | Class C Shares | ||||
Initial Sales Charges | |||||
GNMA Income | $ | 28,427 | N/A | ||
High Yield Bond | 6,072 | N/A | |||
Intermediate Bond | 44,029 | N/A | |||
National Tax-Exempt Bond | 2,038 | N/A | |||
Contingent Deferred Sales Charge | |||||
GNMA Income | 5,024 | 5,412 | |||
High Yield Bond | 1,165 | 1,744 | |||
Intermediate Bond | 58,890 | 8,595 | |||
Classic Money Market | 8,267 | 4,916 | |||
44
Table of Contents
NOTES TO FINANCIAL STATEMENTSASOF MARCH 31, 2007 (CONTINUED)
NOTE 6 — OTHER TRANSACTIONS WITH AFFILIATES AND RELATED PARTIES
At March 31, 2007, the Funds had the following amounts recorded in payable to affiliates on the accompanying Statements of Assets and Liabilities (see Notes 4 and 5):
Fund | Accrued Investment Management Fees | Accrued Administrative Fees | Accrued Shareholder Service and Distribution Fees | Accrued Recoupment | Total | ||||||||||
GNMA Income | $ | 250,123 | $ | 53,217 | $ | 191,843 | $ | — | $ | 495,183 | |||||
High Yield Bond | 71,141 | 13,949 | 72,962 | 64,840 | 222,892 | ||||||||||
Intermediate Bond | 164,935 | 98,131 | 274,036 | — | 537,102 | ||||||||||
National Tax- Exempt Bond | 6,983 | 2,328 | 8,680 | — | 17,991 | ||||||||||
Classic Money Market | 199,907 | — | 335,982 | — | 535,889 | ||||||||||
Institutional Money Market | 41,358 | — | — | — | 41,358 | ||||||||||
At March 31, 2007, the following ING Portfolios or indirect, wholly-owned subsidiaries of ING Groep owned more than 5% of the following Funds:
| ING Life Insurance and Annuity Company | — | GNMA Income (16.68%); Intermediate Bond (19.73%); and National Tax-Exempt Bond (71.96%). | ||
| ING National Trust | — | GNMA Income (6.39%) and Intermediate Bond (16.96%). | ||
| ING VP Balanced | — | Institutional Money Market (6.93%). | ||
| ING VP Growth and Income | — | Institutional Money Market (6.79%). | ||
| ING VP Index Plus MidCap | — | Institutional Money Market (5.41%). | ||
| ING VP Intermediate Bond | — | Institutional Money Market (21.91%). | ||
| Security Life of Denver | — | Institutional Money Market (6.93%). | ||
The Trust has adopted a Retirement Policy (“Policy”) covering all independent trustees of the Funds who will have served as an independent trustee for at least five years at the time of retirement. Benefits under this Policy are based on an annual rate as defined in the Policy.
The following is a summary of the transactions during the year ended March 31, 2007 in which the issuer was an affiliate of the ING Family of Funds.
High Yield Bond | Shares | Cost | Unrealized Gain on Investment Securities at 03/31/07 | Value at 03/31/07 | |||||||
ING Prime Rate Trust | 191,500 | $ | 1,340,220 | $ | 73,050 | $ | 1,413,270 | ||||
NOTE 7 — OTHER ACCRUED EXPENSES & LIABILITIES
At March 31, 2007, the Funds had the following payables included in Other Accrued Expenses and Liabilities on the Statements of Assets and Liabilities that exceeded 5% of total liabilities:
| Postage Fees | |||
National Tax-Exempt Bond | $ | 8,542 | |
NOTE 8 — EXPENSE LIMITATIONS
Pursuant to a written expense limitation agreement (“Expense Limitation Agreement”), the Investment Adviser has agreed to limit expenses, excluding interest, taxes, brokerage and extraordinary expenses to the following annual expenses to average daily net assets ratios:
| Class A | Class B | Class C | Class I | Class O | Class Q | Class R | |||||||||||||||
GNMA(1) Income | 0.97 | % | 1.72 | % | 1.72 | % | 0.67 | % | N/A | 0.92 | % | N/A | |||||||||
High Yield Bond | 1.10 | % | 1.85 | % | 1.85 | % | N/A | N/A | N/A | N/A | |||||||||||
Intermediate Bond | 0.69 | % | 1.44 | % | 1.44 | % | 0.38 | % | 0.69 | % | N/A | 0.94 | % | ||||||||
National Tax-Exempt Bond | 0.87 | % | 1.62 | % | 1.62 | % | N/A | N/A | N/A | N/A | |||||||||||
Classic Money Market | 0.77 | % | 1.41 | % | 1.41 | % | N/A | N/A | N/A | N/A |
| (1) | Effective December 5, 2005, the Distributor waived 0.02% of the distribution fee for GNMA Income Class A, Class B, and Class C. This waiver expired on August 1, 2006. |
The Investment Adviser has agreed to limit expenses, excluding interest, taxes, brokerage, and extraordinary expenses to 0.17% of Institutional Money Market’s average daily net assets.
The Investment Adviser may at a later date recoup from a Fund for management fees waived and other expenses assumed by the Investment Adviser during the previous 36 months, but only if, after such recoupment, a Fund’s expense ratio does not exceed the percentage described above. Waived and reimbursed fees net of any recoupment by the Investment Adviser of such waived and reimbursed fees are reflected on the accompanying Statements of Operations for each Fund. Amounts payable by the Investment Adviser are reflected on the accompanying Statements of Assets and Liabilities for each Fund.
45
Table of Contents
NOTES TO FINANCIAL STATEMENTSASOF MARCH 31, 2007 (CONTINUED)
NOTE 8 — EXPENSE LIMITATIONS (continued)
As of March 31, 2007, the amounts of waived and reimbursed fees that are subject to possible recoupment by the Investment Adviser, and the related expiration dates are as follows:
| March 31, | ||||||||||||
| 2008 | 2009 | 2010 | Total | |||||||||
High Yield Bond | $ | — | $ | 103,342 | $ | 14,936 | $ | 118,278 | ||||
Intermediate Bond | 233,692 | 77,333 | 410,687 | 721,712 | ||||||||
National Tax-Exempt Bond | — | 4,415 | 14,521 | 18,936 | ||||||||
Institutional Money Market | — | 22,801 | — | 22,801 | ||||||||
The Expense Limitation Agreement is contractual and shall renew automatically for one-year terms unless ING Investments or the Registrant provides written notice of the termination of the Expense Limitation Agreement within 90 days of the end of the then current term or upon termination of the Management Agreement.
NOTE 9 — LINE OF CREDIT
All of the Funds included in this report with the exception of GNMA Income, in addition to certain other funds managed by the Investment Adviser, have entered into an unsecured committed revolving line of credit agreement (the “Credit Agreement”) with The Bank of New York (“BNY”) for an aggregate amount of $125,000,000. The proceeds may be used only to: (1) temporarily finance the purchase and sale of securities; (2) finance the redemption of shares of an investor in the Funds; and (3) enable the Funds to meet other emergency expenses as defined in the Credit Agreement. The Funds to which the line of credit is available pay a commitment fee equal to 0.09% per annum on the daily unused portion of the committed line amount payable quarterly in arrears.
The following Funds utilized the line of credit during the year ended March 31, 2007:
Fund | Days Utilized | Approximate Average Daily Balance | Approximate Weighted Average Interest Rate | |||||
High Yield Bond | 70 | $ | 1,221,714 | 5.74 | % | |||
Intermediate Bond | 1 | 33,730,000 | 5.75 | |||||
National Tax-Exempt Bond | 3 | 500,000 | 5.72 | |||||
NOTE 10 — CAPITAL SHARES
Transactions in capital shares and dollars were as follows:
| Class A | Class B | Class C | ||||||||||||||||||||||
| Year Ended March 31, 2007 | Year Ended March 31, 2006 | Year Ended March 31, 2007 | Year Ended March 31, 2006 | Year Ended March 31, 2007 | Year Ended March 31, 2006 | |||||||||||||||||||
GNMA Income (Number of Shares) | ||||||||||||||||||||||||
Shares sold | 12,317,038 | 10,066,265 | 418,493 | 907,252 | 1,638,013 | 807,886 | ||||||||||||||||||
Shares issued from merger | — | 3,078,523 | — | 198,454 | — | 90,256 | ||||||||||||||||||
Shares converted | 16,260 | — | — | — | — | — | ||||||||||||||||||
Dividends reinvested | 2,562,078 | 2,715,779 | 219,336 | 300,193 | 110,704 | 118,917 | ||||||||||||||||||
Shares redeemed | (13,943,804 | ) | (16,266,683 | ) | (3,127,106 | ) | (3,549,930 | ) | (1,495,606 | ) | (1,860,040 | ) | ||||||||||||
Net increase (decrease) in shares outstanding | 951,572 | (406,116 | ) | (2,489,277 | ) | (2,144,031 | ) | 253,111 | (842,981 | ) | ||||||||||||||
GNMA Income ($) | ||||||||||||||||||||||||
Shares sold | $ | 102,165,092 | $ | 79,764,361 | $ | 3,440,663 | $ | 7,350,196 | $ | 13,544,694 | $ | 6,683,417 | ||||||||||||
Shares issued from merger | — | 30,711,195 | — | 1,981,002 | — | 900,531 | ||||||||||||||||||
Shares converted | 135,446 | — | — | — | — | — | ||||||||||||||||||
Dividends reinvested | 21,176,600 | 22,906,968 | 1,803,444 | 2,523,048 | 912,233 | 1,000,388 | ||||||||||||||||||
Shares redeemed | (115,414,682 | ) | (137,264,555 | ) | (25,729,304 | ) | (29,799,295 | ) | (12,329,180 | ) | (15,663,159 | ) | ||||||||||||
Net increase (decrease) | $ | 8,062,456 | $ | (3,882,031 | ) | $ | (20,485,197 | ) | $ | (17,945,049 | ) | $ | 2,127,747 | $ | (7,078,823 | ) | ||||||||
46
Table of Contents
NOTES TO FINANCIAL STATEMENTSASOF MARCH 31, 2007 (CONTINUED)
NOTE 10 — CAPITAL SHARES (continued)
| Class I | Class M(1) | Class Q | ||||||||||||||||||||||
| Year Ended March 31, 2007 | Year Ended March 31, 2006 | Year Ended March 31, 2007 | Year Ended March 31, 2006 | Year Ended March 31, 2007 | Year Ended March 31, 2006 | |||||||||||||||||||
GNMA Income (Number of Shares) | ||||||||||||||||||||||||
Shares sold | 388,666 | 918,436 | 21 | 11 | — | 6 | ||||||||||||||||||
Shares issued from merger | — | 1,261,704 | — | — | — | — | ||||||||||||||||||
Shares converted | — | — | (16,260 | ) | — | — | — | |||||||||||||||||
Dividends reinvested | 110,547 | 82,697 | 539 | 713 | 409 | 478 | ||||||||||||||||||
Shares redeemed | (1,002,531 | ) | (1,297,179 | ) | (7,596 | ) | (936 | ) | (3,921 | ) | (2,761 | ) | ||||||||||||
Net increase (decrease) in shares outstanding | (503,318 | ) | 965,658 | (23,296 | ) | (212 | ) | (3,512 | ) | (2,277 | ) | |||||||||||||
GNMA Income ($) | ||||||||||||||||||||||||
Shares sold | $ | 3,217,751 | $ | 5,608,472 | $ | 183 | $ | 468 | $ | — | $ | 210 | ||||||||||||
Shares issued from merger | — | 12,608,661 | — | — | — | — | ||||||||||||||||||
Shares converted | — | — | (135,446 | ) | — | — | — | |||||||||||||||||
Dividends reinvested | 914,120 | 696,912 | 4,454 | 6,027 | 3,383 | 4,044 | ||||||||||||||||||
Shares redeemed | (8,303,394 | ) | (10,891,793 | ) | (87,845 | ) | (8,021 | ) | (32,778 | ) | (23,583 | ) | ||||||||||||
Net increase (decrease) | $ | (4,171,523 | ) | $ | 8,022,252 | $ | (218,654 | ) | $ | (1,526 | ) | $ | (29,395 | ) | $ | (19,329 | ) | |||||||
| Class A | Class B | Class C | ||||||||||||||||||||||
| Year Ended March 31, 2007 | Year Ended March 31, 2006 | Year Ended March 31, 2007 | Year Ended March 31, 2006 | Year Ended March 31, 2007 | Year Ended March 31, 2006 | |||||||||||||||||||
High Yield Bond (Number of Shares) | ||||||||||||||||||||||||
Shares sold | 3,615,770 | 4,283,666 | 266,421 | 376,934 | 191,105 | 105,440 | ||||||||||||||||||
Dividends reinvested | 378,969 | 372,895 | 195,187 | 294,963 | 53,837 | 60,504 | ||||||||||||||||||
Shares redeemed | (3,780,937 | ) | (5,922,652 | ) | (4,352,976 | ) | (6,312,010 | ) | (538,454 | ) | (1,160,116 | ) | ||||||||||||
Net increase (decrease) in shares outstanding | 213,802 | (1,266,091 | ) | (3,891,368 | ) | (5,640,113 | ) | (293,512 | ) | (994,172 | ) | |||||||||||||
High Yield Bond ($) | ||||||||||||||||||||||||
Shares sold | $ | 31,635,027 | $ | 37,259,692 | $ | 2,319,953 | $ | 3,290,473 | $ | 1,677,325 | $ | 921,882 | ||||||||||||
Dividends reinvested | 3,326,451 | 3,253,464 | 1,707,325 | 2,572,262 | 472,060 | 527,995 | ||||||||||||||||||
Shares redeemed | (33,073,507 | ) | (51,709,974 | ) | (38,030,482 | ) | (54,978,481 | ) | (4,706,725 | ) | (10,080,345 | ) | ||||||||||||
Net increase (decrease) | $ | 1,887,971 | $ | (11,196,818 | ) | $ | (34,003,204 | ) | $ | (49,115,746 | ) | $ | (2,557,340 | ) | $ | (8,630,468 | ) | |||||||
| Class A | Class B | Class C | ||||||||||||||||||||||
| Year Ended March 31, 2007 | Year Ended March 31, 2006 | Year Ended March 31, 2007 | Year Ended March 31, 2006 | Year Ended March 31, 2007 | Year Ended March 31, 2006 | |||||||||||||||||||
Intermediate Bond (Number of Shares) | �� | |||||||||||||||||||||||
Shares sold | 25,965,894 | 20,627,121 | 656,261 | 1,166,619 | 2,984,740 | 1,904,289 | ||||||||||||||||||
Dividends reinvested | 2,435,262 | 1,775,655 | 147,555 | 147,654 | 168,367 | 139,301 | ||||||||||||||||||
Shares redeemed | (16,600,890 | ) | (10,476,981 | ) | (1,884,209 | ) | (1,616,224 | ) | (2,413,668 | ) | (1,751,216 | ) | ||||||||||||
Net increase (decrease) in shares outstanding | 11,800,266 | 11,925,795 | (1,080,393 | ) | (301,951 | ) | 739,439 | 292,374 | ||||||||||||||||
Intermediate Bond ($) | ||||||||||||||||||||||||
Shares sold | $ | 263,447,770 | $ | 213,494,520 | $ | 6,636,660 | $ | 12,066,655 | $ | 30,296,219 | $ | 19,701,478 | ||||||||||||
Dividends reinvested | 24,727,335 | 18,351,362 | 1,494,084 | 1,523,148 | 1,707,577 | 1,437,949 | ||||||||||||||||||
Shares redeemed | (168,607,669 | ) | (108,128,079 | ) | (19,047,257 | ) | (16,685,199 | ) | (24,468,594 | ) | (18,111,053 | ) | ||||||||||||
Net increase (decrease) | $ | 119,567,436 | $ | 123,717,803 | $ | (10,916,513 | ) | $ | (3,095,396 | ) | $ | 7,535,202 | $ | 3,028,374 | ||||||||||
(1) | Effective January 2, 2007, Class M shareholders of GNMA Income were converted to Class A shares of the Fund. |
47
Table of Contents
NOTES TO FINANCIAL STATEMENTSASOF MARCH 31, 2007 (CONTINUED)
NOTE 10 — CAPITAL SHARES (continued)
| Class I | Class O | Class R | ||||||||||||||||||||||
| Year Ended March 31, 2007 | Year Ended March 31, 2006 | Year Ended March 31, 2007 | Year Ended March 31, 2006 | Year Ended March 31, 2007 | Year Ended March 31, 2006 | |||||||||||||||||||
Intermediate Bond (Number of Shares) | ||||||||||||||||||||||||
Shares sold | 10,117,583 | 14,385,293 | 2,350,555 | 2,557,931 | 505,198 | 96,767 | ||||||||||||||||||
Dividends reinvested | 1,030,404 | 523,382 | 220,506 | 153,640 | 3,191 | — | ||||||||||||||||||
Shares redeemed | (2,816,154 | ) | (1,434,648 | ) | (1,642,376 | ) | (1,745,909 | ) | (43,432 | ) | (48,303 | ) | ||||||||||||
Net increase in shares outstanding | 8,331,833 | 13,474,027 | 928,685 | 965,662 | 464,957 | 48,464 | ||||||||||||||||||
Intermediate Bond ($) | ||||||||||||||||||||||||
Shares sold | $ | 103,002,028 | $ | 149,792,618 | $ | 23,813,433 | $ | 26,487,057 | $ | 5,186,803 | $ | 1,003,142 | ||||||||||||
Dividends reinvested | 10,468,517 | 5,386,015 | 2,240,145 | 1,587,962 | 32,649 | — | ||||||||||||||||||
Shares redeemed | (28,589,953 | ) | (14,825,960 | ) | (16,637,324 | ) | (18,063,082 | ) | (441,991 | ) | (499,122 | ) | ||||||||||||
Net increase | $ | 84,880,592 | $ | 140,352,673 | $ | 9,416,254 | $ | 10,011,937 | $ | 4,777,461 | $ | 504,020 | ||||||||||||
| Class A | Class B | Class C | ||||||||||||||||||||||
| Year Ended March 31, 2007 | Year Ended March 31, 2006 | Year Ended March 31, 2007 | Year Ended March 31, 2006 | Year Ended March 31, 2007 | Year Ended March 31, 2006 | |||||||||||||||||||
National Tax-Exempt Bond (Number of Shares) | ||||||||||||||||||||||||
Shares sold | 144,957 | 62,062 | 76,125 | 103,690 | 90,281 | 32,359 | ||||||||||||||||||
Dividends reinvested | 7,130 | 7,266 | 4,451 | 5,690 | 1,965 | 2,708 | ||||||||||||||||||
Shares redeemed | (172,352 | ) | (62,812 | ) | (125,551 | ) | (103,924 | ) | (73,821 | ) | (45,043 | ) | ||||||||||||
Net increase (decrease) in shares outstanding | (20,265 | ) | 6,516 | (44,975 | ) | 5,456 | 18,425 | (9,976 | ) | |||||||||||||||
National Tax-Exempt Bond ($) | ||||||||||||||||||||||||
Shares sold | $ | 1,495,877 | $ | 654,626 | $ | 785,282 | $ | 1,085,247 | $ | 937,766 | $ | 341,463 | ||||||||||||
Dividends reinvested | 73,567 | 75,964 | 45,884 | 59,389 | 20,274 | 28,303 | ||||||||||||||||||
Shares redeemed | (1,760,695 | ) | (660,992 | ) | (1,293,075 | ) | (1,084,774 | ) | (758,629 | ) | (470,313 | ) | ||||||||||||
Net increase (decrease) | $ | (191,251 | ) | $ | 69,598 | $ | (461,909 | ) | $ | 59,862 | $ | 199,411 | $ | (100,547 | ) | |||||||||
| Class A | Class B | Class C | ||||||||||||||||||||||
| Year Ended March 31, 2007 | Year Ended March 31, 2006 | Year Ended March 31, 2007 | Year Ended March 31, 2006 | Year Ended March 31, 2007 | Year Ended March 31, 2006 | |||||||||||||||||||
Classic Money Market (Number of Shares) | ||||||||||||||||||||||||
Shares sold | 606,768,162 | 494,264,073 | 11,233,378 | 34,975,633 | 5,158,087 | 5,750,624 | ||||||||||||||||||
Dividends reinvested | 34,927,509 | 17,618,283 | 842,041 | 596,983 | 191,563 | 117,025 | ||||||||||||||||||
Shares redeemed | (376,859,280 | ) | (405,226,116 | ) | (12,739,589 | ) | (38,519,102 | ) | (5,872,862 | ) | (4,931,775 | ) | ||||||||||||
Net increase (decrease) in shares outstanding | 264,836,391 | 106,656,240 | (664,170 | ) | (2,946,486 | ) | (523,212 | ) | 935,874 | |||||||||||||||
Classic Money Market ($) | ||||||||||||||||||||||||
Shares sold | $ | 606,768,162 | $ | 494,264,073 | $ | 11,233,378 | $ | 34,975,633 | $ | 5,158,087 | $ | 5,750,624 | ||||||||||||
Dividends reinvested | 34,927,509 | 17,618,283 | 842,041 | 596,983 | 191,563 | 117,025 | ||||||||||||||||||
Shares redeemed | (376,859,280 | ) | (405,226,116 | ) | (12,739,589 | ) | (38,519,102 | ) | (5,872,862 | ) | (4,931,775 | ) | ||||||||||||
Net increase (decrease) | $ | 264,836,391 | $ | 106,656,240 | $ | (664,170 | ) | $ | (2,946,486 | ) | $ | (523,212 | ) | $ | 935,874 | |||||||||
48
Table of Contents
NOTES TO FINANCIAL STATEMENTSASOF MARCH 31, 2007 (CONTINUED)
NOTE 10 — CAPITAL SHARES (continued)
| Year Ended March 31, 2007 | July 28, 2005(1) to March 31, 2006 | |||||||
Institutional Money Market (Number of Shares) | ||||||||
Shares sold | 2,451,588,496 | 462,400,001 | ||||||
Dividends reinvested | 5,275,844 | 3,264,932 | ||||||
Shares redeemed | (1,912,202,768 | ) | (286,000,000 | ) | ||||
Net increase in shares outstanding | 544,661,572 | 179,664,933 | ||||||
Institutional Money Market ($) | ||||||||
Shares sold | $ | 2,451,588,496 | $ | 462,400,001 | ||||
Dividends reinvested | 5,275,844 | 3,264,932 | ||||||
Shares redeemed | (1,912,202,768 | ) | (286,000,000 | ) | ||||
Net increase | $ | 544,661,572 | $ | 179,664,933 | ||||
(1) | Commencement of operations |
NOTE 11 — CREDIT RISK AND DEFAULTED SECURITIES
Although each Fund has a diversified portfolio, High Yield Bond and Intermediate Bond may invest in lower rated and comparable quality unrated high yield securities. Investments in high yield securities are accompanied by a greater degree of credit risk and such lower rated securities tend to be more sensitive to economic conditions than higher rated securities. The risk of loss due to default by the issuer may be significantly greater for the holders of high yielding securities, because such securities are generally unsecured and are often subordinated to other creditors of the issuer. At March 31, 2007, the Funds did not hold any defaulted securities.
For financial reporting purposes, it is each Fund’s accounting practice to discontinue the accrual of income and to provide an estimate for probable losses due to unpaid interest income on defaulted bonds for the current reporting period.
NOTE 12 — FEDERAL INCOME TAXES
The amount of distributions from net investment income and net realized capital gains are determined in accordance with federal income tax regulations, which may differ from U.S. generally accepted accounting principles for investment companies. These book/tax differences may be either temporary or permanent. Permanent differences are reclassified within the capital accounts based on their federal tax-basis treatment; temporary differences are not reclassified. Key differences include the treatment of short-term capital gains, foreign currency transactions, and wash sale deferrals. Distributions in excess of net investment income and/or net realized capital gains for tax purposes are reported as distributions of paid-in capital.
The following permanent tax differences have been reclassified as of March 31, 2007:
| Paid-in Capital | Undistributed Net Investment Income | Accumulated Net Realized Gains / (Losses) | ||||||||||
GNMA Income | $ | (1,114,919 | ) | $ | 1,487,301 | $ | (372,382 | ) | ||||
High Yield Bond | (27,206,911 | ) | 100,982 | 27,105,929 | ||||||||
Intermediate Bond | — | (948,036 | ) | 948,036 | ||||||||
National Tax-Exempt Bond | — | 75 | (75 | ) | ||||||||
Institutional Money Market | — | 1,764 | (1,764 | ) | ||||||||
Dividends paid by the Funds from net investment income and distributions of net realized short-term capital gains are, for federal income tax purposes, taxable as ordinary income to shareholders.
49
Table of Contents
NOTES TO FINANCIAL STATEMENTSASOF MARCH 31, 2007 (CONTINUED)
NOTE 12 — FEDERAL INCOME TAXES (continued)
The tax composition of dividends and distributions to shareholders was as follows:
| Year Ended March 31, 2007 | Year Ended March 31, 2006 | |||||||||||||||||
| Ordinary Income | Tax-Exempt Income | Long-Term Capital Gains | Ordinary Income | Tax-Exempt Income | Long-Term Capital Gains | |||||||||||||
GNMA Income | $ | 30,072,600 | $ | — | $ | — | $ | 32,462,158 | $ | — | $ | — | ||||||
High Yield Bond | 11,431,535 | — | — | 13,419,941 | — | — | ||||||||||||
Intermediate Bond | 49,839,121 | — | — | 34,140,572 | — | 998,520 | ||||||||||||
National Tax-Exempt Bond | 79,219 | 978,363 | 143,303 | 32,879 | 936,035 | 305,296 | ||||||||||||
Classic Money Market | 36,322,117 | — | — | 18,629,328 | — | — | ||||||||||||
Institutional Money Market | 16,054,400 | 4,773,069 | ||||||||||||||||
The tax-basis components of distributable earnings and the expiration dates of the capital loss carryforwards which may be used to offset future realized capital gains for federal income tax purposes as of March 31, 2007 were:
| Undistributed Ordinary Income | Undistributed Tax-Exempt Income | Unrealized Appreciation/ (Depreciation) | Post-October Capital Losses Deferred | Post-October Currency Losses Deferred | Capital Loss Carryforwards | Expiration Dates | ||||||||||||||||||
GNMA Income | $ | 540,901 | $ | — | $ | (2,890,694 | ) | $ | — | $ | — | $ | (2,870,184 | ) | 2008 | |||||||||
| (527,639 | ) | 2010 | ||||||||||||||||||||||
| (1,081,784 | ) | 2012 | ||||||||||||||||||||||
| (6,961,357 | ) | 2013 | ||||||||||||||||||||||
| (3,281,376 | ) | 2014 | ||||||||||||||||||||||
| $ | (14,722,340 | ) | ||||||||||||||||||||||
High Yield Bond | 462,426 | — | 4,724,147 | — | — | (78,500,574 | ) | 2008 | ||||||||||||||||
| (115,139,658 | ) | 2009 | ||||||||||||||||||||||
| (79,792,137 | ) | 2010 | ||||||||||||||||||||||
| (69,190,309 | ) | 2011 | ||||||||||||||||||||||
| (6,099,584 | ) | 2012 | ||||||||||||||||||||||
| (126,079 | ) | 2014 | ||||||||||||||||||||||
| (16,822,526 | ) | 2015 | ||||||||||||||||||||||
| $ | (365,670,867 | ) | ||||||||||||||||||||||
Intermediate Bond | 1,487,586 | — | (736,876 | ) | (5,286,715 | ) | (754,213 | ) | (6,787,487 | ) | 2015 | |||||||||||||
National Tax-Exempt Bond | — | 73,436 | 540,306 | (6,815 | ) | — | — | — | ||||||||||||||||
Classic Money Market | 34,784 | — | — | — | — | (6,927 | ) | 2011 | ||||||||||||||||
| (18,913 | ) | 2012 | ||||||||||||||||||||||
| (63,053 | ) | 2013 | ||||||||||||||||||||||
| (42,453 | ) | 2014 | ||||||||||||||||||||||
| $ | (131,346 | ) | ||||||||||||||||||||||
Institutional Money Market | 2,199,969 | — | — | (2,265 | ) | — | — | — | ||||||||||||||||
NOTE 13 — REORGANIZATIONS
On December 3, 2005, GNMA Income, as listed below (“Acquiring Fund”), acquired the assets and certain liabilities of ING Government Fund, also listed below (“Acquired Fund”), in a tax-free reorganization in exchange for shares of the Acquiring Fund, pursuant to a plan of reorganization approved by the Acquired Fund’s shareholders. The number and value of shares issued by the Acquiring Funds are presented in Note 10 — Capital Shares. Net assets and unrealized appreciation as of the reorganization date was as follows:
Acquiring | Acquired Fund | Total net assets of Acquired Fund (000) | Total net assets of Acquiring Fund (000) | Acquired Fund Unrealized Appreciation/ Depreciation (000) | Conversion Ratio | |||||||||
GNMA Income | ING Government Fund | $ | 46,201 | $ | 628,965 | $ | (624 | ) | 1.20 | |||||
The net assets of GNMA Income after the acquisition were $675,166,000.
50
Table of Contents
NOTES TO FINANCIAL STATEMENTSASOF MARCH 31, 2007 (CONTINUED)
NOTE 14 — ILLIQUID SECURITIES
Pursuant to guidelines adopted by the Funds’ Board, the following securities have been deemed to be illiquid. Except for GNMA Income, the Funds may invest up to 15% (10% for Classic Money Market and Institutional Money Market) of their net assets in illiquid securities. Fair value for certain of securities was determined by ING Funds Valuation Committee appointed by the Funds’ Board.
Fund | Security | Principal Amount/ Shares | Initial Acquisition Date | Cost | Value | Percent of Net Assets | |||||||||
High Yield Bond | Comforce Corp. | 92,950 | 10/24/04 | $ | — | $ | 930 | 0.0 | % | ||||||
| Dayton Superior Corp. | 3,100 | 10/24/04 | — | 31 | 0.0 | % | |||||||||
| GT Group Telecom, Inc. | 500 | 03/19/03 | — | — | 0.0 | % | |||||||||
| Jordan Tellecommunications | 2,350 | 10/24/04 | — | 48,974 | 0.0 | % | |||||||||
| North Atlantic Trading Co. | 17,906 | 10/24/04 | 210,181 | 18 | 0.0 | % | |||||||||
| $ | 210,181 | $ | 49,953 | 0.0 | % | ||||||||||
Intermediate Bond | Alpine III, 5.910%, due 08/16/14 | 527,000 | 08/04/04 | $ | 527,196 | $ | 528,579 | 0.1 | % | ||||||
| Alpine III, 6.310%, due 08/16/14 | 527,000 | 08/04/04 | 527,196 | 528,841 | 0.1 | % | |||||||||
| Alpine III, 8.110%, due 08/16/14 | 789,000 | 08/04/04 | 796,191 | 794,199 | 0.1 | % | |||||||||
| Alpine III, 11.360%, due 08/16/14 | 1,348,000 | 08/17/04 | 1,363,436 | 1,382,441 | 0.1 | % | |||||||||
| Cameron Highway Oil Pipeline System Project, 5.860%, due 12/15/17 | 4,067,000 | 12/05/05 | 4,067,000 | 4,007,266 | 0.4 | % | |||||||||
| Nordea Kredit Realkreditaktieselskab, 6.000%, due 07/01/29 | 35 | 04/16/04 | 6 | 7 | 0.0 | % | |||||||||
| $ | 7,281,025 | $ | 7,241,333 | 0.6 | % | ||||||||||
Classic Money Market | Goldman Sachs Group, Inc., 5.360%, due 05/11/07 | 10,000,000 | 04/11/06 | $ | 10,000,000 | $ | 10,000,000 | 1.1 | % | ||||||
| Newcastle CDO Ltd., 5.350%, due 09/24/07 | 5,400,000 | 09/22/05 | 5,400,000 | 5,400,000 | 0.6 | % | |||||||||
| Newcastle CDO Ltd., 5.350%, due 10/24/07 | 5,400,000 | 10/23/03 | 5,400,000 | 5,400,000 | 0.6 | % | |||||||||
| $ | 20,800,000 | $ | 20,800,000 | 2.3 | % | ||||||||||
Institutional Money Market | Goldman Sachs Group, Inc., 5.360%, due 05/11/07 | 1,000,000 | 04/11/06 | $ | 1,000,000 | $ | 1,000,000 | 0.1 | % | ||||||
| $ | 1,000,000 | $ | 1,000,000 | 0.1 | % | ||||||||||
NOTE 15 — SECURITIES LENDING
Under an agreement with BNY, the Funds (except GNMA Income) can lend their securities to approved brokers, dealers and other financial institutions. Loans are collateralized by cash and U.S. government securities. The collateral must be in an amount equal to at least 105% of the market value of non-U.S. securities loaned and 102% of the market value of U.S. securities loaned. The cash collateral received is invested in approved investments as defined in the Securities Lending Agreement with BNY (the “Agreement”). The securities purchased with cash collateral received are reflected in the Portfolio of Investments. Generally, in the event of counterparty default, the Funds have the right to use the collateral to offset losses incurred. The Agreement contains certain guarantees by BNY in the event of counterparty default and/or a borrower’s failure to return a loaned security; however, there would be a potential loss to the Funds in the event the Funds are delayed or prevented from exercising their right to dispose of the collateral. The Funds bear the risk of loss with respect to the investment of collateral. Engaging in securities lending could have a leveraging effect, which may intensify the credit, market and other risks associated with investing in a Fund. At March 31, 2007, the following Fund had securities on loan with the following market value:
Fund | Value of Securities Loaned | Value of Collateral | ||||
Intermediate Bond | $ | 121,165,025 | $ | 123,891,615 | ||
51
Table of Contents
NOTES TO FINANCIAL STATEMENTSASOF MARCH 31, 2007 (CONTINUED)
NOTE 16 — SUBSEQUENT EVENTS
Subsequent to March 31, 2007, the following Funds declared dividends from net investment income:
Per Share Amount | Payable Date | Record Date | |||||
GNMA Income | |||||||
Class A | $ | 0.0300 | April 4, 2007 | March 30, 2007 | |||
Class B | $ | 0.0246 | April 4, 2007 | March 30, 2007 | |||
Class C | $ | 0.0246 | April 4, 2007 | March 30, 2007 | |||
Class I | $ | 0.0321 | April 4, 2007 | March 30, 2007 | |||
Class Q | $ | 0.0309 | April 4, 2007 | March 30, 2007 | |||
Class A | $ | 0.0300 | May 3, 2007 | April 30, 2007 | |||
Class B | $ | 0.0248 | May 3, 2007 | April 30, 2007 | |||
Class C | $ | 0.0248 | May 3, 2007 | April 30, 2007 | |||
Class I | $ | 0.0320 | May 3, 2007 | April 30, 2007 | |||
Class Q | $ | 0.0303 | May 3, 2007 | April 30, 2007 | |||
High Yield Bond | |||||||
Class A | $ | 0.0508 | May 1, 2007 | Daily | |||
Class B | $ | 0.0452 | May 1, 2007 | Daily | |||
Class C | $ | 0.0453 | May 1, 2007 | Daily | |||
Intermediate Bond | |||||||
Class A | $ | 0.0438 | May 1, 2007 | Daily | |||
Class B | $ | 0.0374 | May 1, 2007 | Daily | |||
Class C | $ | 0.0375 | May 1, 2007 | Daily | |||
Class I | $ | 0.0467 | May 1, 2007 | Daily | |||
Class O | $ | 0.0436 | May 1, 2007 | Daily | |||
Class R | $ | 0.0419 | May 1, 2007 | Daily | |||
National Tax-Exempt Bond | |||||||
Class A | $ | 0.0325 | May 1, 2007 | Daily | |||
Class B | $ | 0.0262 | May 1, 2007 | Daily | |||
Class C | $ | 0.0262 | May 1, 2007 | Daily | |||
Classic Money Market | |||||||
Class A | $ | 0.0038 | May 1, 2007 | Daily | |||
Class B | $ | 0.0033 | May 1, 2007 | Daily | |||
Class C | $ | 0.0033 | May 1, 2007 | Daily | |||
Institutional Money Market | $ | 0.0043 | May 1, 2007 | Daily | |||
NOTE 17 — OTHER ACCOUNTING PRONOUNCEMENTS
In June 2006, the Financial Accounting Standards Board (“FASB”) issued FASB Interpretation No. 48 (“FIN 48”), “Accounting for Uncertainty in Income Taxes.” This standard defines the threshold for recognizing the benefits of tax-return positions in the financial statements as “more-likely-than-not” to be sustained upon challenge by the taxing authority and requires measurement of a tax position meeting the more-likely-than-not criterion, based on the largest benefit that is more than 50 percent likely to be realized. FIN 48 is effective for fiscal years beginning after December 15, 2006, with early application permitted if no interim financial statements have been issued. However, acknowledging the unique issues that FIN 48 presents for investment companies that calculate NAVs, the U.S. Securities and Exchange Commission (the “SEC”) has indicated that they would not object if a fund implements FIN 48 in its NAV calculation as late as its last NAV calculation in the first required financial statement reporting period for its fiscal year beginning after December 15, 2006. For March year-end funds, this would be no later than their September 30, 2007 NAV and the effects of FIN 48 would be reflected in the funds’ semi-annual financial statements contained in their Form N-CSR filing. At adoption, companies must adjust their financial statements to reflect only those tax positions that are more likely-than-not to be sustained as of the adoption date. Management of the Funds has assessed the impact of adopting FIN 48 and currently does not believe that there will be a material impact to the Funds.
On September 15, 2006, the FASB issued Statement of Financial Accounting Standards No. 157 (“SFAS No. 157”), “Fair Value Measurements.” The new accounting statement defines fair value, establishes a framework for measuring fair value in generally accepted accounting principles (“GAAP”), and expands disclosures about fair value measurements. SFAS No. 157 defines fair value as the price that would be received to sell an asset or paid to transfer a liability in an orderly transaction between market participants at the measurement date (an exit price). SFAS No. 157 also stipulates that, as a market-based measurement, fair value measurement should be determined based on the assumptions that market participants would use in pricing the asset or liability, and establishes a fair value hierarchy that distinguishes between (a) market participant assumptions developed based on market data obtained from sources independent of the reporting entity (observable inputs) and (b) the reporting entity’s own assumptions about market participant assumptions developed based on the best information available in the circumstances (unobservable inputs). SFAS No. 157 is effective for financial statements issued for fiscal years beginning after November 15, 2007. As of March 31, 2007, management of the Funds is currently assessing the impact, if any, that will result from adopting SFAS No. 157.
NOTE 18 — INFORMATION REGARDING TRADING OF ING’s U.S. MUTUAL FUNDS
In 2004, ING Investments reported to the Boards of Directors/Trustees (the “Boards”) of the ING Funds that, like many U.S. financial services companies, ING Investments and certain of its U.S. affiliates have received informal and formal requests for information since September 2003 from various governmental and self-regulatory agencies in connection with
52
Table of Contents
NOTES TO FINANCIAL STATEMENTSASOF MARCH 31, 2007 (CONTINUED)
NOTE 18 — INFORMATION REGARDING TRADING OF ING’s U.S. MUTUAL FUNDS (continued)
investigations related to mutual funds and variable insurance products. ING Investments has advised the Boards that it and its affiliates have cooperated fully with each request.
In addition to responding to regulatory and governmental requests, ING Investments reported that management of U.S. affiliates of ING Groep, including ING Investments (collectively, “ING”), on their own initiative, have conducted, through independent special counsel and a national accounting firm, an extensive internal review of trading in ING insurance, retirement, and mutual fund products. The goal of this review was to identify any instances of inappropriate trading in those products by third parties or by ING investment professionals and other ING personnel. ING’s internal review related to mutual fund trading is now substantially completed. ING has reported that, of the millions of customer relationships that ING maintains, the internal review identified several isolated arrangements allowing third parties to engage in frequent trading of mutual funds within ING’s variable insurance and mutual fund products, and identified other circumstances where frequent trading occurred, despite measures taken by ING intended to combat market timing. ING further reported that each of these arrangements has been terminated and fully disclosed to regulators. The results of the internal review were also reported to the independent members of the Boards.
ING Investments has advised the Boards that most of the identified arrangements were initiated prior to ING’s acquisition of the businesses in question in the U.S. ING Investments further reported that the companies in question did not receive special benefits in return for any of these arrangements, which have all been terminated.
Based on the internal review, ING Investments has advised the Boards that the identified arrangements do not represent a systemic problem in any of the companies that were involved.
In September 2005, IFD, the distributor of certain ING Funds, settled an administrative proceeding with the NASD regarding three arrangements, dating from 1995, 1996 and 1998, under which the administrator to the then-Pilgrim Funds, which subsequently became part of the ING Funds, entered into formal and informal arrangements that permitted frequent trading. Under the terms of the Letter of Acceptance, Waiver and Consent (“AWC”) with the NASD, under which IFD neither admitted nor denied the allegations or findings, IFD consented to the following sanctions: (i) a censure; (ii) a fine of $1.5 million; (iii) restitution of approximately $1.44 million to certain ING Funds for losses attributable to excessive trading described in the AWC; and (iv) agreement to make certification to NASD regarding the review and establishment of certain procedures.
In addition to the arrangements discussed above, in 2004, ING Investments reported to the Boards that, at this time, these instances include the following, in addition to the arrangements subject to the AWC discussed above:
| • | Aeltus Investment Management, Inc. (a predecessor entity to ING IM) identified two investment professionals who engaged in extensive frequent trading in certain ING Funds. One was subsequently terminated for cause and incurred substantial financial penalties in connection with this conduct and the second has been disciplined. |
| • | ReliaStar Life Insurance Company (“ReliaStar”) entered into agreements seven years ago permitting the owner of policies issued by the insurer to engage in frequent trading and to submit orders until 4pm Central Time. In 2001 ReliaStar also entered into a selling agreement with a broker-dealer that engaged in frequent trading. Employees of ING affiliates were terminated and/or disciplined in connection with these matters. |
| • | In 1998, Golden American Life Insurance Company entered into arrangements permitting a broker-dealer to frequently trade up to certain specific limits in a fund available in an ING variable annuity product. No employee responsible for this arrangement remains at the company. |
For additional information regarding these matters, you may consult the Form 8-K and Form 8-KA for each of four life insurance companies, ING USA Annuity and Life Insurance Company, ING Life Insurance and Annuity Company, ING Insurance Company of America, and ReliaStar Life Insurance Company of New York, each filed with the SEC on October 29, 2004 and September 8, 2004. These Forms 8-K and Forms 8-KA can be accessed through the SEC’s Web site at http://www.sec.gov. Despite the extensive internal review conducted through independent special counsel and a national accounting firm, there can be no assurance that the instances of inappropriate trading reported to the Boards are the only instances of such trading respecting the ING Funds.
53
Table of Contents
NOTES TO FINANCIAL STATEMENTSASOF MARCH 31, 2007 (CONTINUED)
NOTE 18 — INFORMATION REGARDING TRADING OF ING’s U.S. MUTUAL FUNDS (continued)
ING Investments reported to the Boards that ING is committed to conducting its business with the highest standards of ethical conduct with zero tolerance for noncompliance. Accordingly, ING Investments advised the Board that ING management was disappointed that its voluntary internal review identified these situations. Viewed in the context of the breadth and magnitude of its U.S. business as a whole, ING management does not believe that ING’s acquired companies had systemic ethical or compliance issues in these areas. Nonetheless, Investments reported that given ING’s refusal to tolerate any lapses, it has taken the steps noted below, and will continue to seek opportunities to further strengthen the internal controls of its affiliates.
| • | ING has agreed with the ING Funds to indemnify and hold harmless the ING Funds from all damages resulting from wrongful conduct by ING or its employees or from ING’s internal investigation, any investigations conducted by any governmental or self-regulatory agencies, litigation or other formal proceedings, including any proceedings by the Securities and Exchange Commission. ING Investments reported to the Board that ING management believes that the total amount of any indemnification obligations will not be material to ING or its U.S. business. |
| • | ING updated its Code of Conduct for employees reinforcing its employees’ obligation to conduct personal trading activity consistent with the law, disclosed limits, and other requirements. |
| • | The ING Funds, upon a recommendation from ING, updated their respective Codes of Ethics applicable to investment professionals with ING entities and certain other fund personnel, requiring such personnel to pre-clear any purchases or sales of ING Funds that are not systematic in nature (i.e., dividend reinvestment), and imposing minimum holding periods for shares of ING Funds. |
| • | ING instituted excessive trading policies for all customers in its variable insurance and retirement products and for shareholders of the ING Funds sold to the public through financial intermediaries. ING does not make exceptions to these policies. |
| • | ING reorganized and expanded its U.S. Compliance Department, and created an Enterprise Compliance team to enhance controls and consistency in regulatory compliance. |
Other Regulatory Matters
The New York Attorney General (the “NYAG”) and other federal and state regulators are also conducting broad inquiries and investigations involving the insurance industry. These initiatives currently focus on, among other things, compensation and other sales incentives; potential conflicts of interest; potential anti-competitive activity; reinsurance; marketing practices (including suitability); specific product types (including group annuities and indexed annuities); fund selection for investment products and brokerage sales; and disclosure. It is likely that the scope of these industry investigations will further broaden before they conclude. ING has received formal and informal requests in connection with such investigations, and is cooperating fully with each request. In connection with one such investigation, affiliates of ING Investments were named in a petition for relief and cease and desist order filed by the New Hampshire Bureau of Securities Regulation (the “NH Bureau”) concerning their administration of the New Hampshire state employees deferred compensation plan.
On October 10, 2006, an affiliate of ING Investments entered into an assurance of discontinuance with the NYAG (the “NYAG Agreement”) regarding the endorsement of its products by the New York State United Teachers Union Member Benefits Trust (“NYSUT”) and the sale of their products to NYSUT members. Under the terms of the NYAG Agreement, the affiliate of ING Investments, without admitting or denying the NYAG’s findings, will distribute $30 million to NYSUT members, and/or former NYSUT members, who participated in the NYSUT-endorsed products at any point between January 1, 2001 and June 30, 2006. The affiliate also agreed with the NYAG’s office to develop a one-page disclosure that will further improve transparency and disclosure regarding retirement product fees (the “One-Page Disclosure”). Pursuant to the terms of the NYAG Agreement, the affiliate has agreed for a five year period to provide its retirement product customers with the One-Page Disclosure.
In addition, on the same date, these affiliates of ING Investments entered into a consent agreement with the NH Bureau (the “NH Agreement”) to resolve this petition for relief and cease and desist order. Under the terms of the NH Agreement, these affiliates of ING Investments, without admitting or denying the NH Bureau’s claims, have agreed to pay $3 million to resolve the matter, and for a five year period to provide their retirement product customers with the One-Page Disclosure described above.
54
Table of Contents
NOTES TO FINANCIAL STATEMENTSASOF MARCH 31, 2007 (CONTINUED)
NOTE 18 — INFORMATION REGARDING TRADING OF ING’s U.S. MUTUAL FUNDS (continued)
Other federal and state regulators could initiate similar actions in this or other areas of ING’s businesses.
These regulatory initiatives may result in new legislation and regulation that could significantly affect the financial services industry, including businesses in which ING is engaged.
In light of these and other developments, ING continuously reviews whether modifications to its business practices are appropriate.
At this time, in light of the current regulatory factors, ING U.S. is actively engaged in reviewing whether any modifications in our practices are appropriate for the future.
There can be no assurance that these matters, or the adverse publicity associated with them, will not result in increased fund redemptions, reduced sale of fund shares, or other adverse consequences to ING Funds.
55
Table of Contents
| ING GNMA INCOME FUND | ASOF MARCH 31, 2007 |
| Principal Amount | Value | ||||||||
| U.S. GOVERNMENT AND AGENCY OBLIGATIONS: 85.3% | |||||||||
| Federal Home Loan Mortgage Corporation: 0.1% | |||||||||
| $ 94,191 | 7.000%, due 11/01/14 | $ | 97,257 | ||||||
| 383,484 | 7.500%, due 12/01/14 | 396,759 | |||||||
| 99,633 | 7.500%, due 01/01/30 | 104,426 | |||||||
| 54,118 | 8.000%, due 01/01/30 | 57,031 | |||||||
| 40,836 | 9.500%, due 07/01/20 | 44,560 | |||||||
| 700,033 | |||||||||
| Federal National Mortgage Corporation: 0.2% | |||||||||
| 77,568 | 6.500%, due 06/01/14 | 79,517 | |||||||
| 597,569 | 6.500%, due 02/01/29 | 615,582 | |||||||
| 97,782 | 7.000%, due 03/01/15 | 100,890 | |||||||
| 119,649 | 7.500%, due 05/01/28 | 125,508 | |||||||
| 101,784 | 8.500%, due 08/01/11 | 105,954 | |||||||
| 52,419 | 8.500%, due 05/01/15 | 56,051 | |||||||
| 34,587 | 8.500%, due 08/01/15 | 36,983 | |||||||
| 120,965 | 8.500%, due 09/01/15 | 129,347 | |||||||
| 1,249,832 | |||||||||
| Government National Mortgage Association: 85.0% | |||||||||
| 6,308,895 | 3.750%, due 05/20/34 | 6,272,756 | |||||||
| 797,123 | 4.000%, due 05/20/33 | 722,917 | |||||||
| 923,155 | 4.000%, due 01/15/34 | 840,693 | |||||||
| 895,444 | 4.000%, due 03/15/34 | 815,458 | |||||||
| 1,464,935 | 4.500%, due 01/20/34 | 1,378,365 | |||||||
| 332,016 | 4.500%, due 05/20/34 | 312,395 | |||||||
| 396,008 | 4.500%, due 06/20/34 | 372,606 | |||||||
| 2,345,503 | 4.500%, due 10/20/34 | 2,212,936 | |||||||
| 4,335,579 | 4.500%, due 08/15/35 | 4,106,540 | |||||||
| 568,093 | 4.500%, due 09/15/35 | 538,082 | |||||||
| 1,494,178 | 4.500%, due 10/20/35 | 1,404,904 | |||||||
| 4,349,959 | 4.500%, due 11/15/35 | 4,120,161 | |||||||
| 1,115,858 | 5.000%, due 04/15/29 | 1,088,537 | |||||||
| 1,263,292 | 5.000%, due 04/15/30 | 1,231,696 | |||||||
| 1,329,430 | 5.000%, due 10/15/30 | 1,296,180 | |||||||
| 923,327 | 5.000%, due 05/15/33 | 900,211 | |||||||
| 1,003,472 | 5.000%, due 06/15/33 | 978,350 | |||||||
| 2,161,602 | 5.000%, due 07/15/33 | 2,107,487 | |||||||
| 994,221 | 5.000%, due 10/15/33 | 969,331 | |||||||
| 1,570,312 | 5.000%, due 10/20/33 | 1,521,213 | |||||||
| 3,922,090 | 5.000%, due 12/20/33 | 3,799,456 | |||||||
| 1,056,559 | 5.000%, due 02/20/34 | 1,022,936 | |||||||
| 948,091 | 5.000%, due 03/15/34 | 923,831 | |||||||
| 3,007,642 | 5.000%, due 04/15/34 | 2,927,395 | |||||||
| 541,755 | �� | 5.000%, due 04/20/34 | 524,514 | ||||||
| 1,306,679 | 5.000%, due 06/20/34 | 1,265,096 | |||||||
| 1,032,134 | 5.000%, due 07/20/34 | 999,288 | |||||||
| 403,833 | 5.000%, due 09/20/34 | 390,982 | |||||||
| 1,935,119 | 5.000%, due 12/20/34 | 1,873,536 | |||||||
| 1,586,444 | 5.000%, due 03/15/35 | 1,545,018 | |||||||
| 2,675,029 | 5.000%, due 04/15/35 | 2,605,176 | |||||||
| 3,785,363 | 5.000%, due 05/15/35 | 3,686,516 | |||||||
| 1,628,660 | 5.000%, due 05/20/35 | 1,580,024 | |||||||
| 1,760,566 | 5.000%, due 06/15/35 | 1,714,592 | |||||||
| 26,719,967 | 5.000%, due 11/20/35 | 25,922,037 | |||||||
| 4,801,591 | 5.000%, due 04/20/36 | 4,655,698 | |||||||
| 4,499,948 | 5.000%, due 05/20/36 | 4,363,220 | |||||||
| 1,025,898 | 5.500%, due 08/20/24 | 1,023,079 | |||||||
| 35,891 | 5.500%, due 04/20/29 | 35,758 | |||||||
| Principal Amount | Value | ||||||||
| $ 507,634 | 5.500%, due 10/15/32 | $ | 505,774 | ||||||
| 1,730,904 | 5.500%, due 12/15/32 | 1,724,561 | |||||||
| 2,651,283 | 5.500%, due 03/15/33 | 2,641,055 | |||||||
| 2,587,784 | 5.500%, due 04/15/33 | 2,577,800 | |||||||
| 6,466,733 | 5.500%, due 05/15/33 | 6,441,786 | |||||||
| 2,873,486 | 5.500%, due 06/15/33 | 2,862,400 | |||||||
| 8,037,822 | 5.500%, due 07/15/33 | 8,005,431 | |||||||
| 563,629 | 5.500%, due 09/15/33 | 561,455 | |||||||
| 708,194 | 5.500%, due 10/15/33 | 705,462 | |||||||
| 11,401,990 | 5.500%, due 11/15/33 | 11,354,083 | |||||||
| 2,233,784 | 5.500%, due 12/15/33 | 2,224,249 | |||||||
| 642,721 | 5.500%, due 12/20/33 | 638,039 | |||||||
| 3,304,420 | 5.500%, due 01/15/34 | 3,287,505 | |||||||
| 556,907 | 5.500%, due 01/20/34 | 552,692 | |||||||
| 3,527,717 | 5.500%, due 02/15/34 | 3,509,658 | |||||||
| 966,213 | 5.500%, due 03/15/34 | 962,213 | |||||||
| 1,173,264 | 5.500%, due 03/20/34 | 1,164,384 | |||||||
| 10,962,528 | 5.500%, due 04/15/34 | 10,912,551 | |||||||
| 998,096 | 5.500%, due 04/20/34 | 991,450 | |||||||
| 375,161 | 5.500%, due 05/15/34 | 373,608 | |||||||
| 1,716,908 | 5.500%, due 06/15/34 | 1,709,801 | |||||||
| 785,809 | 5.500%, due 06/20/34 | 779,862 | |||||||
| 1,843,017 | 5.500%, due 07/15/34 | 1,835,388 | |||||||
| 847,362 | 5.500%, due 07/20/34 | 842,532 | |||||||
| 9,022,926 | 5.500%, due 08/15/34 | 8,985,577 | |||||||
| 881,883 | 5.500%, due 08/20/34 | 875,209 | |||||||
| 8,645,723 | 5.500%, due 09/15/34 | 8,609,934 | |||||||
| 5,493,623 | 5.500%, due 10/15/34 | 5,470,882 | |||||||
| 189,818 | 5.500%, due 12/15/34 | 189,033 | |||||||
| 255,682 | 5.500%, due 12/20/34 | 253,747 | |||||||
| 5,363,625 | 5.500%, due 01/15/35 | 5,339,102 | |||||||
| 579,868 | 5.500%, due 01/20/35 | 575,231 | |||||||
| 3,288,618 | 5.500%, due 02/15/35 | 3,273,582 | |||||||
| 3,905,423 | 5.500%, due 03/15/35 | 3,887,567 | |||||||
| 2,886,005 | 5.500%, due 04/15/35 | 2,872,810 | |||||||
| 5,512,276 | 5.500%, due 05/15/35 | 5,487,074 | |||||||
| 1,026,592 | 5.500%, due 06/15/35 | 1,021,898 | |||||||
| 1,459,709 | 5.500%, due 07/15/35 | 1,453,035 | |||||||
| 901,515 | 5.500%, due 11/15/35 | 897,393 | |||||||
| 3,462,181 | 5.500%, due 03/15/36 | 3,444,654 | |||||||
| 15,457,989 | 5.500%, due 03/20/36 | 15,353,035 | |||||||
| 995,600 | 5.500%, due 04/15/36 | 990,560 | |||||||
| 20,094,384 | 5.500%, due 04/20/36 | 19,961,314 | |||||||
| 2,382,018 | 5.500%, due 05/15/36 | 2,369,959 | |||||||
| 725,409 | 5.500%, due 06/15/36 | 721,737 | |||||||
| 26,209,662 | 5.500%, due 06/20/36 | 26,036,096 | |||||||
| 2,969,589 | 5.500%, due 07/15/36 | 2,954,556 | |||||||
| 626,274 | 5.500%, due 08/15/36 | 623,104 | |||||||
| 14,616,230 | 5.500%, due 08/20/36 | 14,519,438 | |||||||
| 912,590 | 5.500%, due 09/15/36 | 907,970 | |||||||
| 3,696,719 | 5.500%, due 10/15/36 | 3,678,005 | |||||||
| 3,452,682 | 5.500%, due 11/15/36 | 3,435,204 | |||||||
| 2,241,991 | 5.500%, due 12/15/36 | 2,230,641 | |||||||
| 5,348,580 | 5.500%, due 01/15/37 | 5,321,203 | |||||||
| 224,331 | 5.750%, due 11/20/27 | 225,969 | |||||||
| 299,635 | 5.750%, due 12/20/27 | 301,822 | |||||||
| 107,824 | 5.750%, due 02/20/28 | 108,584 | |||||||
| 850,072 | 5.750%, due 03/20/28 | 856,060 | |||||||
| 327,716 | 5.750%, due 04/20/28 | 330,025 | |||||||
| 194,633 | 5.750%, due 07/20/28 | 196,004 | |||||||
| 207,065 | 5.750%, due 01/20/29 | 208,451 | |||||||
| 117,630 | 5.750%, due 04/20/29 | 118,417 | |||||||
| 902,526 | 5.750%, due 07/20/29 | 908,569 | |||||||
See Accompanying Notes to Financial Statements
56
Table of Contents
| ING GNMA INCOME FUND | PORTFOLIO OF INVESTMENTS ASOF MARCH 31, 2007 (CONTINUED) |
| Principal Amount | Value | ||||||||
| Government National Mortgage Association (continued) | |||||||||
| $ 423,398 | 6.000%, due 10/15/15 | $ | 431,226 | ||||||
| 832,344 | 6.000%, due 10/15/25 | 844,992 | |||||||
| 1,922,859 | 6.000%, due 04/15/26 | 1,956,584 | |||||||
| 791,486 | 6.000%, due 07/15/28 | 805,158 | |||||||
| 499,918 | 6.000%, due 08/15/28 | 508,553 | |||||||
| 1,194,763 | 6.000%, due 09/15/28 | 1,215,400 | |||||||
| 461,279 | 6.000%, due 02/15/29 | 469,235 | |||||||
| 323,148 | 6.000%, due 04/15/29 | 328,636 | |||||||
| 369,571 | 6.000%, due 02/15/32 | 375,437 | |||||||
| 1,844,101 | 6.000%, due 07/15/32 | 1,873,372 | |||||||
| 4,845,989 | 6.000%, due 08/15/32 | 4,924,392 | |||||||
| 9,586,447 | 6.000%, due 09/15/32 | 9,738,613 | |||||||
| 1,711,004 | 6.000%, due 11/15/32 | 1,738,162 | |||||||
| 1,281,791 | 6.000%, due 12/15/32 | 1,302,136 | |||||||
| 14,614,003 | 6.000%, due 01/15/33 | 14,840,860 | |||||||
| 1,418,284 | 6.000%, due 02/15/33 | 1,440,300 | |||||||
| 1,930,314 | 6.000%, due 03/15/33 | 1,960,278 | |||||||
| 508,925 | 6.000%, due 04/15/33 | 516,825 | |||||||
| 2,108,430 | 6.000%, due 05/15/33 | 2,141,160 | |||||||
| 3,879,808 | 6.000%, due 09/15/33 | 3,940,036 | |||||||
| 5,122,792 | 6.000%, due 10/15/33 | 5,202,314 | |||||||
| 1,385,753 | 6.000%, due 12/15/33 | 1,407,265 | |||||||
| 1,044,069 | 6.000%, due 01/15/34 | 1,057,975 | |||||||
| 1,002,561 | 6.000%, due 01/20/34 | 1,014,187 | |||||||
| 320,334 | 6.000%, due 02/15/34 | 324,600 | |||||||
| 3,887,778 | 6.000%, due 03/20/34 | 3,932,864 | |||||||
| 530,685 | 6.000%, due 04/20/34 | 536,839 | |||||||
| 3,397,005 | 6.000%, due 05/20/34 | 3,436,399 | |||||||
| 185,516 | 6.000%, due 06/20/34 | 187,667 | |||||||
| 799,054 | 6.000%, due 07/20/34 | 808,320 | |||||||
| 3,063,035 | 6.000%, due 08/20/34 | 3,098,556 | |||||||
| 484,558 | 6.000%, due 09/15/34 | 491,510 | |||||||
| 971,920 | 6.000%, due 10/15/34 | 985,864 | |||||||
| 6,252,460 | 6.000%, due 10/20/34 | 6,324,966 | |||||||
| 10,168,748 | 6.000%, due 11/20/34 | 10,286,670 | |||||||
| 10,162,460 | 6.000%, due 12/20/34 | 10,280,309 | |||||||
| 2,716,393 | 6.000%, due 01/20/35 | 2,746,123 | |||||||
| 1,152,922 | 6.000%, due 02/20/35 | 1,165,540 | |||||||
| 1,750,023 | 6.000%, due 03/20/35 | 1,769,175 | |||||||
| 591,450 | 6.000%, due 04/20/35 | 597,923 | |||||||
| 254,333 | 6.000%, due 06/20/35 | 257,117 | |||||||
| 990,738 | 6.000%, due 05/15/36 | 1,003,982 | |||||||
| 1,986,913 | 6.000%, due 06/15/36 | 2,013,472 | |||||||
| 1,846,581 | 6.000%, due 07/15/36 | 1,871,265 | |||||||
| 1,298,415 | 6.000%, due 08/15/36 | 1,315,771 | |||||||
| 995,092 | 6.000%, due 09/15/36 | 1,008,393 | |||||||
| 1,750,474 | 6.000%, due 10/15/36 | 1,773,874 | |||||||
| 3,236,337 | 6.000%, due 01/20/37 | 3,270,539 | |||||||
| 138,682 | 6.250%, due 03/15/28 | 141,703 | |||||||
| 177,898 | 6.250%, due 04/15/28 | 181,773 | |||||||
| 209,720 | 6.280%, due 01/20/26 | 213,833 | |||||||
| 623,587 | 6.280%, due 05/20/26 | 635,818 | |||||||
| 310,176 | 6.500%, due 02/15/26 | 319,001 | |||||||
| 307,269 | 6.500%, due 03/15/28 | 316,531 | |||||||
| 208,219 | 6.500%, due 08/15/28 | 214,495 | |||||||
| 2,277,045 | 6.500%, due 11/15/28 | 2,345,684 | |||||||
| 367,600 | 6.500%, due 07/20/29 | 378,087 | |||||||
| 30,495 | 6.500%, due 05/15/31 | 31,385 | |||||||
| 1,407,966 | 6.500%, due 08/20/31 | 1,446,846 | |||||||
| 336,540 | 6.500%, due 09/15/31 | 346,359 | |||||||
| 2,171,058 | 6.500%, due 01/15/32 | 2,232,389 | |||||||
| 998,854 | 6.500%, due 02/15/32 | 1,027,071 | |||||||
| 103,824 | 6.500%, due 04/20/32 | 106,595 | |||||||
| Principal Amount | Value | ||||||||
| $ 374,545 | 6.500%, due 07/20/32 | $ | 384,541 | ||||||
| 778,467 | 6.500%, due 08/15/32 | 800,458 | |||||||
| 2,139,912 | 6.500%, due 11/15/33 | 2,196,779 | |||||||
| 1,100,907 | 6.500%, due 11/20/33 | 1,128,445 | |||||||
| 685,081 | 6.500%, due 01/20/34 | 701,563 | |||||||
| 654,396 | 6.500%, due 02/20/34 | 670,140 | |||||||
| 389,406 | 6.500%, due 03/20/34 | 398,774 | |||||||
| 456,374 | 6.500%, due 08/20/34 | 467,354 | |||||||
| 2,110,912 | 6.500%, due 09/20/34 | 2,161,699 | |||||||
| 1,675,862 | 6.500%, due 10/20/34 | 1,716,181 | |||||||
| 1,618,953 | 6.500%, due 11/20/34 | 1,657,903 | |||||||
| 1,362,922 | 6.500%, due 12/20/34 | 1,395,713 | |||||||
| 669,504 | 6.500%, due 03/20/35 | 685,567 | |||||||
| 1,463,275 | 6.500%, due 04/20/36 | 1,498,007 | |||||||
| 1,197,386 | 6.500%, due 05/15/36 | 1,228,872 | |||||||
| 6,868,210 | 6.500%, due 09/15/36 | 7,048,818 | |||||||
| 9,438,983 | 6.500%, due 09/20/36 | 9,672,469 | |||||||
| 3,435,846 | 6.500%, due 11/15/36 | 3,526,196 | |||||||
| 1,996,808 | 6.500%, due 12/15/36 | 2,049,316 | |||||||
| 9,304,961 | 6.500%, due 01/15/37 | 9,549,919 | |||||||
| 7,877,409 | 6.500%, due 02/15/37 | 8,084,786 | |||||||
| 1,409,062 | 6.500%, due 02/20/37 | 1,442,545 | |||||||
| 16,351 | 6.750%, due 08/15/28 | 16,992 | |||||||
| 407,441 | 6.750%, due 10/15/28 | 423,401 | |||||||
| 60,411 | 6.750%, due 11/15/28 | 62,778 | |||||||
| 90,501 | 7.000%, due 09/15/23 | 94,639 | |||||||
| 24,717 | 7.000%, due 12/15/23 | 25,848 | |||||||
| 51,436 | 7.000%, due 04/15/26 | 53,844 | |||||||
| 283,975 | 7.000%, due 01/15/27 | 297,280 | |||||||
| 194,332 | 7.000%, due 11/15/27 | 203,437 | |||||||
| 337,836 | 7.000%, due 07/15/28 | 353,514 | |||||||
| 28,352 | 7.000%, due 07/15/29 | 29,670 | |||||||
| 54,723 | 7.000%, due 10/15/30 | 57,264 | |||||||
| 68,701 | 7.000%, due 05/15/31 | 71,862 | |||||||
| 704,491 | 7.000%, due 06/15/31 | 737,198 | |||||||
| 367,945 | 7.000%, due 09/15/31 | 384,873 | |||||||
| 255,359 | 7.000%, due 11/15/31 | 265,483 | |||||||
| 169,669 | 7.000%, due 12/15/31 | 177,475 | |||||||
| 2,317,235 | 7.000%, due 01/15/32 | 2,424,428 | |||||||
| 4,420,063 | 7.000%, due 02/15/32 | 4,624,532 | |||||||
| 3,050,910 | 7.000%, due 03/15/32 | 3,192,043 | |||||||
| 4,155,451 | 7.000%, due 04/15/32 | 4,347,680 | |||||||
| 3,668,298 | 7.000%, due 05/15/32 | 3,837,991 | |||||||
| 2,327,402 | 7.000%, due 07/15/32 | 2,435,066 | |||||||
| 1,017,528 | 7.000%, due 08/20/36 | 1,053,449 | |||||||
| 46,695 | 7.250%, due 01/15/29 | 48,473 | |||||||
| 95,973 | 7.500%, due 08/20/27 | 99,933 | |||||||
| 265,860 | 7.500%, due 12/15/28 | 277,903 | |||||||
| 442,713 | 7.500%, due 10/15/30 | 462,390 | |||||||
| 49,551 | 7.500%, due 12/15/30 | 51,754 | |||||||
| 126,876 | 7.500%, due 01/15/31 | 132,492 | |||||||
| 162,321 | 7.500%, due 10/15/31 | 169,506 | |||||||
| 135,673 | 7.500%, due 01/15/32 | 141,524 | |||||||
| 24,768 | 7.800%, due 05/15/19 | 26,126 | |||||||
| 36,339 | 7.800%, due 07/15/19 | 38,333 | |||||||
| 12,181 | 8.000%, due 03/20/24 | 12,868 | |||||||
| 44,462 | 8.000%, due 11/15/25 | 47,180 | |||||||
| 128,562 | 8.000%, due 07/15/26 | 136,499 | |||||||
| 146,637 | 8.000%, due 09/15/26 | 155,690 | |||||||
| 62,267 | 8.000%, due 09/20/26 | 65,862 | |||||||
| 49,728 | 8.000%, due 12/15/26 | 52,799 | |||||||
| 28,639 | 8.000%, due 04/15/27 | 30,405 | |||||||
| 65,437 | 8.000%, due 06/15/27 | 69,471 | |||||||
See Accompanying Notes to Financial Statements
57
Table of Contents
| ING GNMA INCOME FUND | PORTFOLIO OF INVESTMENTS ASOF MARCH 31, 2007 (CONTINUED) |
| Principal Amount | Value | ||||||||
| Government National Mortgage Association (continued) | |||||||||
| $ 107,445 | 8.000%, due 07/15/27 | $ | 114,069 | ||||||
| 27,240 | 8.000%, due 03/15/28 | 28,932 | |||||||
| 41,897 | 8.050%, due 07/15/19 | 44,567 | |||||||
| 44,324 | 9.000%, due 05/15/16 | 47,537 | |||||||
| 43,816 | 9.000%, due 07/15/16 | 46,992 | |||||||
| 12,025 | 9.500%, due 11/15/21 | 13,138 | |||||||
| 531,615,799 | |||||||||
| Small Business Administration: 0.0% | |||||||||
| 34,143 | 8.250%, due 11/01/11 | 35,499 | |||||||
Total U.S. Government and Agency Obligations | 533,601,163 | ||||||||
| U.S. TREASURY OBLIGATIONS: 0.8% | |||||||||
| U.S. Treasury Notes: 0.8% | |||||||||
| 3,021,000 | 4.000%, due 08/31/07 | 3,009,436 | |||||||
| 1,868,000 | 4.250%, due 10/31/07 | 1,860,412 | |||||||
Total U.S. Treasury Obligations | 4,869,848 | ||||||||
Total Long-Term Investments | 538,471,011 | ||||||||
| Principal Amount | Value | |||||||
| SHORT-TERM INVESTMENTS: 13.3% | ||||||||
| U.S. Treasury Bills: 13.3% | ||||||||
| $ 4,000,000 | 5.130%, due 04/12/07 |
| $ | 3,993,173 | ||||
| 77,000,000 | 4.880%, due 05/03/07 |
| 76,657,232 | |||||
| 3,000,000 | 4.840%, due 06/28/07 |
| 2,964,550 | |||||
Total Short-Term Investments |
| 83,614,955 | ||||||
Total Investments in Securities |
| |||||||
(Cost $624,976,593)* | 99.4 | % | $ | 622,085,966 | ||||
Other Assets and Liabilities - Net | 0.6 | 3,465,467 | ||||||
Net Assets | 100.0 | % | $ | 625,551,433 | ||||
| C | Bond may be called prior to maturity date. |
| * | Cost for federal income tax purposes is $624,976,660. |
| Net unrealized depreciation consists of: | ||||||||
| Gross Unrealized Appreciation | $ | 2,897,925 | ||||||
| Gross Unrealized Depreciation | (5,788,619 | ) | ||||||
| Net Unrealized Depreciation | $ | (2,890,694 | ) | |||||
See Accompanying Notes to Financial Statements
58
Table of Contents
| ING HIGH YIELD BOND FUND | PORTFOLIO OF INVESTMENTS ASOF MARCH 31, 2007 |
| Principal Amount | Value | ||||||
| CORPORATE BONDS/NOTES: 98.5% | |||||||
| Advertising: 1.6% | |||||||
| $1,400,000 | C | R.H. Donnelley Corp., 6.875%, due 01/15/13 | $ | 1,368,500 | |||
| 385,000 | C | R.H. Donnelley Corp., 8.875%, due 01/15/16 | 410,988 | ||||
| 855,000 | C | Visant Corp., 7.625%, due 10/01/12 | 874,238 | ||||
| 2,653,726 | |||||||
| Aerospace/Defense: 0.5% | |||||||
| 795,0000 | C | DRS Technologies, Inc., 6.875%, due 11/01/13 | 806,925 | ||||
| 806,925 | |||||||
| Airlines: 1.3% | |||||||
| 800,000 | C | AMR Corp., 8.608%, due 04/01/11 | 846,500 | ||||
| 630,857 | C | Continental Airlines, Inc., 7.461%, due 04/01/15 | 658,852 | ||||
| 515,000 | United Air Lines, Inc., 6.932%, due 09/01/11 | 587,422 | |||||
| 2,092,774 | |||||||
| Apparel: 0.9% | |||||||
| 810,000 | C | Levi Strauss & Co., Discount Note, due 04/01/12 | 826,200 | ||||
| 630,000 | C | Phillips-Van Heusen, 8.125%, due 05/01/13 | 664,650 | ||||
| 1,490,850 | |||||||
| Auto Manufacturers: 2.6% | |||||||
| 1,700,000 | Ford Motor Co., Discount Note, due 11/29/13 | 1,709,206 | |||||
| 1,050,000 | C | General Motors Corp., 7.125%, due 07/15/13 | 984,375 | ||||
| 1,775,000 | C | General Motors Corp., 8.375%, due 07/15/33 | 1,601,938 | ||||
| 4,295,519 | |||||||
| Auto Parts & Equipment: 0.6% | |||||||
| 555,000 | #, C | TRW Automotive, Inc., 7.000%, due 03/15/14 | 546,675 | ||||
| 370,000 | #, C | TRW Automotive, Inc., 7.250%, due 03/15/17 | 364,450 | ||||
| 911,125 | |||||||
| Building Materials: 1.1% | |||||||
| 675,000 | C | Goodman Global Holding Co., Inc., | 681,750 | ||||
| 205,000 | C | Goodman Global Holding Co., Inc., | 207,050 | ||||
| 825,000 | C | Interline Brands, Inc., 8.125%, due 06/15/14 | 855,938 | ||||
| 1,744,738 | |||||||
| Chemicals: 6.6% | |||||||
| 745,000 | C | Equistar Chemicals LP, 10.625%, due 05/01/11 | 789,700 | ||||
| 925,000 | #, C | Huntsman International, LLC, 7.875%, due. 11/15/14 | 960,844 | ||||
| Principal Amount | Value | ||||||
| $1,690,000 | @@, #, C | Ineos Group Holdings PLC, 8.500%, due 02/15/16 | $ | 1,626,625 | |||
| 1,575,000 | C | Lyondell Chemical Co., 8.000%, due 09/15/14 | 1,657,688 | ||||
| 1,000,000 | C | Lyondell Chemical Co., 8.250%, due 09/15/16 | 1,075,000 | ||||
| 460,000 | #, C | MacDermid, Inc., 9.500%, due 04/15/17 | 473,800 | ||||
| 600,000 | #, C | Momentive Performance Materials, Inc., 9.750%, due 12/01/14 | 621,000 | ||||
| 1,000,000 | #, C | Momentive Performance Materials, Inc., 11.500%, due 12/01/16 | 1,030,000 | ||||
| 800,000 | @@, C | Nova Chemicals Corp., 8.502%, due 11/15/13 | 800,000 | ||||
| 800,000 | C | PolyOne Corp., 8.875%, due 05/01/12 | 808,000 | ||||
| 351,000 | C | Rockwood Specialties Group, Inc., 10.625%, due 05/15/11 | 372,060 | ||||
| 485,000 | #, C | Terra Capital, Inc., 7.000%, due 02/01/17 | 485,000 | ||||
| 10,699,717 | |||||||
| Commercial Services: 5.6% | |||||||
| 960,000 | #, C | Alion Science and Technology Corp., 10.250%, due 02/01/15 | 993,600 | ||||
| 660,000 | #, C | Aramark Corp., 8.500%, due 02/01/15 | 689,700 | ||||
| 440,000 | #, C | Aramark Corp., 8.860%, due 02/01/15 | 454,300 | ||||
| 1,390,000 | #, C | Ashtead Capital, Inc., 9.000%, due 08/15/16 | 1,487,300 | ||||
| 980,000 | #, C | Avis Budget Car Rental, LLC, 7.625%, due 05/15/14 | 1,004,500 | ||||
| 665,000 | #, C | Avis Budget Car Rental, LLC, 7.750%, due 05/15/16 | 679,963 | ||||
| 770,000 | C | Corrections Corp. of America, 7.500%, due 05/01/11 | 795,025 | ||||
| 930,000 | C | Hertz Corp., 8.875%, due 01/01/14 | 1,006,725 | ||||
| 1,130,000 | C | Hertz Corp., 10.500%, due 01/01/16 | 1,293,850 | ||||
| 740,000 | #, C | Rental Services Corp., 9.500%, due 12/01/14 | 791,800 | ||||
| 9,196,763 | |||||||
| Computers: 0.6% | |||||||
| 845,000 | C | Sungard Data Systems, Inc., 9.125%, due 08/15/13 | 910,488 | ||||
| 910,488 | |||||||
| Distribution/Wholesale: 0.8% | |||||||
| 1,185,000 | C | VWR International, Inc., 8.000%, due 04/15/14 | 1,241,288 | ||||
| 1,241,288 | |||||||
See Accompanying Notes to Financial Statements
59
Table of Contents
| ING HIGH YIELD BOND FUND | PORTFOLIO OF INVESTMENTS ASOF MARCH 31, 2007 (CONTINUED) |
| Principal Amount | Value | ||||||
| Diversified Financial Services: 12.2% | |||||||
| $ 705,000 | # | Astoria Depositor Corp., | $ | 773,910 | |||
| 685,000 | C | BCP Crystal US Holdings Corp., | 781,530 | ||||
| 655,000 | C | Crystal US Holdings 3, LLC, 10.500%, due 10/01/14 | 611,606 | ||||
| 2,200,000 | # | Ford Motor Credit Co., 9.750%, due 09/15/10 | 2,319,022 | ||||
| 1,030,000 | Ford Motor Credit Co., 9.806%, due 04/15/12 | 1,093,304 | |||||
| 2,295,000 | Ford Motor Credit Co., 9.875%, due 08/10/11 | 2,432,555 | |||||
| 950,000 | General Motors Acceptance Corp., | 935,312 | |||||
| 1,480,000 | General Motors Acceptance Corp., | 1,482,834 | |||||
| 460,000 | #, C | Hawker Beechcraft Acquisition Co., LLC, 8.500%, due 04/01/15 | 478,975 | ||||
| 460,000 | #, C | Hawker Beechcraft Acquisition Co., LLC, 9.750%, due 04/01/17 | 481,850 | ||||
| 670,000 | #, C | Hexion US Finance Corp., 9.750%, due 11/15/14 | 706,013 | ||||
| 1,580,000 | #, C | Idearc, Inc., 8.000%, due 11/15/16 | 1,633,325 | ||||
| 945,000 | #, C | PGS Solutions, Inc., 9.625%, due 02/15/15 | 957,409 | ||||
| 470,000 | #, C | Pinnacle Foods Finance, LLC, | 464,125 | ||||
| 280,000 | #, C | Pinnacle Foods Finance, LLC, | 276,850 | ||||
| 1,160,274 | #, C | Piper Jaffray Equipment Trust Securities, 6.750%, due 04/01/11 | 1,154,472 | ||||
| 670,000 | #, C | PNA Intermediate Holding Corp., | 690,100 | ||||
| 755,000 | #, C | Rainbow National Services, LLC, | 806,906 | ||||
| 880,000 | #, C | Tropicana Entertainment, 9.625%, due 12/15/14 | 887,700 | ||||
| 950,000 | C | Universal City Florida Holding Co. I/II, | 984,438 | ||||
| 19,952,236 | |||||||
| Electric: 3.0% | |||||||
| 495,000 | #, C | AES Corp., 8.750%, due 05/15/13 | 529,650 | ||||
| 665,000 | C | CMS Energy Corp., 8.500%, due 04/15/11 | 726,513 | ||||
| 713,575 | C | Homer City Funding, LLC, 8.734%, due 10/01/26 | 815,259 | ||||
| 905,998 | C | Midwest Generation, LLC, 8.300%, due 07/02/09 | 931,008 | ||||
| Principal Amount | Value | ||||||
| $ 997,586 | C | Midwest Generation, LLC, 8.560%, due 01/02/16 | $ | 1,091,733 | |||
| 860,000 | C | Mirant North America, LLC, 7.375%, due 12/31/13 | 885,800 | ||||
| 4,979,963 | |||||||
| Electronics: 0.5% | |||||||
| 900,000 | Sanmina-Sci Corp., | 904,311 | |||||
| 904,311 | |||||||
| Entertainment: 2.5% | |||||||
| 570,000 | C | AMC Entertainment, Inc., 8.625%, due 08/15/12 | 607,050 | ||||
| 1,125,000 | C | AMC Entertainment, Inc., 11.000%, due 02/01/16 | 1,286,719 | ||||
| 885,000 | C | Pinnacle Entertainment, Inc., | 915,975 | ||||
| 195,000 | C | Six Flags Theme Parks, Inc., 8.875%, due 02/01/10 | 197,438 | ||||
| 1,070,000 | C | Six Flags Theme Parks, Inc., 9.625%, due 06/01/14 | 1,011,150 | ||||
| 4,018,332 | |||||||
| Environmental Control: 1.8% | |||||||
| 660,000 | C | Allied Waste North America, Inc., | 664,950 | ||||
| 1,280,000 | C | Waste Services, Inc., 9.500%, due 04/15/14 | 1,347,200 | ||||
| 865,000 | C | WCA Waste Corp., 9.250%, due 06/15/14 | 923,388 | ||||
| 2,935,538 | |||||||
| Food: 1.2% | |||||||
| 770,000 | C | Albertson’s, Inc., 7.450%, due 08/01/29 | 761,324 | ||||
| 730,000 | C | Albertson’s, Inc., 7.500%, due 02/15/11 | 772,404 | ||||
| 425,000 | C | Stater Brothers Holdings, 8.125%, due 06/15/12 | 439,875 | ||||
| 1,973,603 | |||||||
| Forest Products & Paper: 4.2% | |||||||
| 798,000 | C | Abitibi-Consolidated Finance LP, | 802,988 | ||||
| 1,135,000 | C | Appleton Papers, Inc., 8.125%, due 06/15/11 | 1,171,888 | ||||
| 700,000 | @@, C | Catalyst Paper Corp., 8.625%, due 06/15/11 | 714,000 | ||||
| 760,000 | C | Exopack Holding Corp., 11.250%, due 02/01/14 | 817,000 | ||||
| 440,000 | #, C | Georgia-Pacific Corp., 7.000%, due 01/15/15 | 444,400 | ||||
| 740,000 | C | Georgia-Pacific Corp., 7.750%, due 11/15/29 | 736,300 | ||||
| 1,015,000 | C | NewPage Corp., 12.000%, due 05/01/13 | 1,106,350 | ||||
| 270,000 | #, C | Verso Paper Holdings, LLC and Verson Paper, Inc., 9.110%, due 08/01/14 | 278,100 | ||||
See Accompanying Notes to Financial Statements
60
Table of Contents
| ING HIGH YIELD BOND FUND | PORTFOLIO OF INVESTMENTS ASOF MARCH 31, 2007 (CONTINUED) |
| Principal Amount | Value | ||||||
| Forest Products & Paper (continued) | |||||||
| $ 685,000 | #, C | Verso Paper Holdings, LLC and Verson Paper, Inc., 9.125%, due 08/01/14 | $ | 715,825 | |||
| 6,786,851 | |||||||
| Healthcare-Products: 1.6% | |||||||
| 1,190,000 | C | Accellent, Inc., 10.500%, due 12/01/13 | 1,237,600 | ||||
| 185,000 | #, C | Advanced Medical Optics, Inc., | 187,313 | ||||
| 1,130,000 | #, C | CDRV Investors, Inc., 9.860%, due 12/01/11 | 1,124,350 | ||||
| 2,549,263 | |||||||
| Healthcare-Services: 4.5% | |||||||
| 470,000 | #, C | Centene Corp., 7.250%, due 04/01/14 | 474,700 | ||||
| 1,015,000 | C | DaVita, Inc., 7.250%, due 03/15/15 | 1,031,494 | ||||
| 1,915,000 | #, C | HCA, Inc., 9.250%, due 11/15/16 | 2,070,594 | ||||
| 805,000 | #, C | HCA, Inc., | 871,413 | ||||
| 830,000 | C | Psychiatric Solutions, Inc., 7.750%, due 07/15/15 | 846,600 | ||||
| 640,000 | #, C | Sun Healthcare Group, Inc., 9.125%, due 04/15/15 | 659,200 | ||||
| 530,000 | C | Tenet Healthcare Corp., 6.375%, due 12/01/11 | 498,200 | ||||
| 845,000 | C | Triad Hospitals, Inc., 7.000%, due 11/15/13 | 886,194 | ||||
| 7,338,395 | |||||||
| Holding Companies-Diversified: 0.5% | |||||||
| 750,000 | C | Atlantic Broadband Finance, LLC, | 770,625 | ||||
| 770,625 | |||||||
| Home Builders: 0.4% | |||||||
| 648,000 | C | Stanley-Martin Communities, LLC, | 584,010 | ||||
| 584,010 | |||||||
| Home Furnishings: 0.5% | |||||||
| 795,000 | C | Norcraft Cos. LP, 9.000%, due 11/01/11 | 822,825 | ||||
| 822,825 | |||||||
| Household Products/Wares: 1.2% | |||||||
| 925,000 | C | American Achievement Corp., | 948,125 | ||||
| 1,155,000 | +, C | Visant Holding Corp., 0.000%, (Step rate 10.125%), due 12/01/13 | 1,074,150 | ||||
| 2,022,275 | |||||||
| Principal Amount | Value | ||||||
| Leisure Time: 2.7% | |||||||
| $1,005,000 | @@, C | NCL Corp., 10.625%, due 07/15/14 | $ | 999,975 | |||
| 375,000 | @@ | Royal Caribbean Cruises Ltd., | 368,392 | ||||
| 265,000 | @@ | Royal Caribbean Cruises Ltd., | 283,164 | ||||
| 1,500,000 | #, C | Travelport Holdings Ltd., | 1,457,498 | ||||
| 1,250,000 | #, C | Travelport Ltd., 11.875%, due 09/01/16 | 1,376,563 | ||||
| 4,485,592 | |||||||
| Lodging: 1.9% | |||||||
| 1,000,000 | Green Valley Ranch Gaming, Discount Note, due 09/06/14 | 1,014,375 | |||||
| 900,000 | C | MGM Mirage, 5.875%, due 02/27/14 | 841,500 | ||||
| 700,000 | #, C | Seminole Hard Rock Entertainment, Inc., 7.848%, due 03/15/14 | 717,500 | ||||
| 615,000 | C | Station Casinos, Inc., 6.500%, due 02/01/14 | 568,875 | ||||
| 3,142,250 | |||||||
| Media: 12.5% | |||||||
| 1,000,000 | C | CBD Media, Inc., 8.625%, due 06/01/11 | 1,032,500 | ||||
| 528,000 | C | CCH I Holdings, LLC, 11.000%, due 10/01/15 | 547,800 | ||||
| 1,084,000 | C | CCH II, LLC, 10.250%, due 10/01/13 | 1,189,690 | ||||
| 785,000 | C | CCH I, LLC, 11.000%, due 10/01/15 | 818,363 | ||||
| 1,430,000 | #, C | Charter Communications Operating, LLC, 8.000%, due 04/30/12 | 1,496,138 | ||||
| 1,375,000 | #, C | Charter Communications Operating, LLC, 8.375%, due 04/30/14 | 1,438,594 | ||||
| 825,000 | #, C | CMP Susquehanna Corp., 9.875%, due 05/15/14 | 849,750 | ||||
| 445,000 | CSC Holdings, Inc., 7.625%, due 04/01/11 | 458,350 | |||||
| 765,000 | CSC Holdings, Inc., 7.625%, due 07/15/18 | 776,475 | |||||
| 760,000 | CSC Holdings, Inc., 8.125%, due 07/15/09 | 790,400 | |||||
| 495,000 | C | Dex Media, Inc., 8.000%, due 11/15/13 | 520,988 | ||||
| 1,074,000 | C | Dex Media West, LLC, 9.875%, due 08/15/13 | 1,177,373 | ||||
| 995,000 | C | Insight Communications Co., Inc., | 1,042,263 | ||||
| 1,105,000 | #, C | ION Media Networks, Inc., 11.606%, due 01/15/13 | 1,157,488 | ||||
| 940,000 | Liberty Media, LLC, 8.250%, due 02/01/30 | 944,426 | |||||
See Accompanying Notes to Financial Statements
61
Table of Contents
| ING HIGH YIELD BOND FUND | PORTFOLIO OF INVESTMENTS ASOF MARCH 31, 2007 (CONTINUED) |
| Principal Amount | Value | ||||||
| Media (continued) | |||||||
| $1,280,000 | C | Nexstar Finance, Inc., 7.000%, due 01/15/14 | $ | 1,235,200 | |||
| 750,000 | #, C | Nielsen Finance, LLC, 10.000%, due 08/01/14 | 821,250 | ||||
| 1,540,000 | C | Primedia, Inc., 10.735%, due 05/15/10 | 1,601,600 | ||||
| 1,320,000 | C | Radio One, Inc., 6.375%, due 02/15/13 | 1,280,400 | ||||
| 1,230,000 | C | Vertis, Inc., 9.750%, due 04/01/09 | 1,257,675 | ||||
| 20,436,723 | |||||||
| Mining: 1.0% | |||||||
| 369,000 | C | Freeport-McMoRan Copper & Gold, Inc., 8.250%, due 04/01/15 | 398,059 | ||||
| 1,164,000 | C | Freeport-McMoRan Copper & Gold, Inc., 8.375%, due 04/01/17 | 1,261,485 | ||||
| 1,659,544 | |||||||
| Miscellaneous Manufacturing: 1.6% | |||||||
| 975,000 | C | Indalex Holding Corp., 11.500%, due 02/01/14 | 1,014,000 | ||||
| 760,000 | C | RBS Global, Inc. and Rexnord Corp., 9.500%, due 08/01/14 | 794,200 | ||||
| 835,000 | #, C | Rexnord Corp., Discount Note, due 03/02/13 | 814,125 | ||||
| 2,622,325 | |||||||
| Oil & Gas: 4.3% | |||||||
| 440,000 | #, C | Chaparral Energy, Inc., 8.875%, due 02/01/17 | 444,400 | ||||
| 900,000 | C | Chesapeake Energy Corp., 6.625%, due 01/15/16 | 911,250 | ||||
| 230,000 | C | Denbury Resources, Inc., 7.500%, due 12/15/15 | 233,450 | ||||
| 1,065,000 | @@, #, C | Griffin Coal Mining Co. Pty Ltd., 9.500%, due 12/01/16 | 1,128,900 | ||||
| 25,000 | #, C | Hilcorp Energy I LP, 7.750%, due 11/01/15 | 24,688 | ||||
| 1,065,000 | #, C | Hilcorp Energy I LP, 9.000%, due 06/01/16 | 1,134,225 | ||||
| 870,000 | @@, #, C | OPTI Canada, Inc., 8.250%, due 12/15/14 | 909,150 | ||||
| 708,000 | C | Parker Drilling Co., 10.110%, due 09/01/10 | 725,700 | ||||
| 850,000 | C | PetroHawk Energy Corp., 9.125%, due 07/15/13 | 909,500 | ||||
| 650,000 | # | Sabine Pass LNG LP, 7.500%, due 11/30/16 | 656,500 | ||||
| 7,077,763 | |||||||
| Oil & Gas Services: 1.5% | |||||||
| 760,000 | @@, C | Compagnie Generale de Geophysique-Veritas, 7.750%, due 05/15/17 | 796,100 | ||||
| 840,000 | #, C | Complete Production Services, Inc., 8.000%, due 12/15/16 | 865,200 | ||||
| Principal Amount | Value | ||||||
| $ 750,000 | C | Hanover Equipment Trust, 8.750%, due 09/01/11 | $ | 783,750 | |||
| 2,445,050 | |||||||
| Packaging & Containers: 1.4% | |||||||
| 825,000 | C | Berry Plastics Holding Corp., 8.875%, due 09/15/14 | 847,688 | ||||
| 610,000 | C | Graham Packaging Co., Inc., | 622,200 | ||||
| 775,000 | C | Jefferson Smurfit Corp., 8.250%, due 10/01/12 | 778,875 | ||||
| 2,248,763 | |||||||
| Pipelines: 1.2% | |||||||
| 1,260,000 | C | Transcontinental Gas Pipe Line Corp., 7.250%, due 12/01/26 | 1,370,250 | ||||
| 560,000 | #, C | Williams Partners LP, 7.250%, due 02/01/17 | 595,000 | ||||
| 1,965,250 | |||||||
| Retail: 4.5% | |||||||
| 855,000 | C | Bon-Ton Stores, Inc., | 922,331 | ||||
| 920,000 | #, C | General Nutrition Centers, Inc., | 906,200 | ||||
| 815,000 | C | GSC Holdings Corp., 8.000%, due 10/01/12 | 867,975 | ||||
| 850,000 | #, C | Michaels Stores, Inc., 10.000%, due 11/01/14 | 913,750 | ||||
| 820,000 | #, C | Michaels Stores, Inc., 11.375%, due 11/01/16 | 887,650 | ||||
| 1,465,000 | C | Neiman-Marcus Group, Inc., 9.000%, due 10/15/15 | 1,611,500 | ||||
| 730,000 | C | NPC International, Inc., 9.500%, due 05/01/14 | 759,200 | ||||
| 475,000 | C | Rite Aid Corp., 7.500%, due 03/01/17 | 471,438 | ||||
| 7,340,044 | |||||||
| Semiconductors: 1.2% | |||||||
| 935,000 | #, C | Freescale Semiconductor, Inc., 8.875%, due 12/15/14 | 940,844 | ||||
| 905,000 | @@, C | STATS ChipPAC Ltd., 7.500%, due 07/19/10 | 957,038 | ||||
| 1,897,882 | |||||||
| Software: 0.5% | |||||||
| 810,000 | #, C | Open Solutions, Inc., 9.750%, due 02/01/15 | 838,350 | ||||
| 838,350 | |||||||
| Telecommunications: 7.9% | |||||||
| 330,000 | C | American Tower Corp., 7.125%, due 10/15/12 | 341,550 | ||||
| 720,000 | C | Centennial Cellular Operating Co., | 781,200 | ||||
See Accompanying Notes to Financial Statements
62
Table of Contents
| ING HIGH YIELD BOND FUND | PORTFOLIO OF INVESTMENTS ASOF MARCH 31, 2007 (CONTINUED) |
| Principal Amount | Value | ||||||
| Telecommunications (continued) | |||||||
| $ 390,000 | C | Centennial Communications Corp., 10.000%, due 01/01/13 | $ | 422,663 | |||
| 840,000 | C | Cincinnati Bell, Inc., 8.375%, due 01/15/14 | 863,100 | ||||
| 830,000 | C | Citizens Communications Co., | 913,000 | ||||
| 625,000 | C | Dobson Cellular Systems, 9.875%, due 11/01/12 | 684,375 | ||||
| 255,000 | C | Dobson Communications Corp., 9.606%, due 10/15/12 | 263,606 | ||||
| 800,000 | C | Hawaiian Telcom Communications, Inc., 9.750%, due 05/01/13 | 832,000 | ||||
| 500,000 | @@, #, C | Intelsat Bermuda Ltd., 8.872%, due 01/15/15 | 512,500 | ||||
| 1,185,000 | @@, #, C | Intelsat Bermuda Ltd., 11.250%, due 06/15/16 | 1,350,900 | ||||
| 860,000 | #, C | Intelsat Corp., 9.000%, due 06/15/16 | 951,375 | ||||
| 970,000 | @@, C | Intelsat Subsidiary Holding Co., Ltd., 8.625%, due 01/15/15 | 1,042,749 | ||||
| 260,000 | C | LCI International, Inc., 7.250%, due 06/15/07 | 260,650 | ||||
| 760,000 | #, C | Level 3 Financing, Inc., 8.750%, due 02/15/17 | 769,500 | ||||
| 790,000 | #, C | MetroPCS Wireless, Inc., 9.250%, due 11/01/14 | 839,375 | ||||
| 465,000 | Qwest Corp., 8.605%, due 06/15/13 | 509,175 | |||||
| 950,000 | C | SunCom Wireless Holdings, Inc., 8.500%, due 06/01/13 | 983,250 | ||||
| 570,000 | #, C | Windstream Corp., 7.000%, due 03/15/19 | 572,850 | ||||
| 12,893,818 | |||||||
Total Corporate Bonds/Notes (Cost $155,881,059) | 160,735,494 | ||||||
| Shares | Value | ||||||
| COMMON STOCK: 0.0% | |||||||
| Agriculture: 0.0% | |||||||
| 17,906 | I, X | North Atlantic Trading Co. | $ | 18 | |||
| 18 | |||||||
| Telecommunications: 0.0% | |||||||
| 264 | @, @@ | Completel Europe NV | 8,897 | ||||
| 2,350 | C, I, X | Jordan Tellecommunications | 48,974 | ||||
| 57,871 | |||||||
Total Common Stock (Cost $210,181) | 57,889 | ||||||
| MUTUAL FUNDS: 0.9% | |||||||
| Closed-End Funds: 0.9% | |||||||
| 191,500 | ** | ING Prime Rate Trust | 1,413,270 | ||||
Total Mutual Funds (Cost $1,340,220) | 1,413,270 | ||||||
| PREFERRED STOCK: 0.0% | |||||||
| Media: 0.0% | |||||||
| 1 | P | ION Media Networks, Inc. | 8,346 | ||||
Total Preferred Stock (Cost $8,676) | 8,346 | ||||||
| WARRANTS: 0.0% | |||||||
| Building Materials: 0.0% | |||||||
| 3,100 | I, X | Dayton Superior Corp. | 31 | ||||
| 31 | |||||||
| Commercial Services: 0.0% | |||||||
| 92,950 | I, X | Comforce Corp. | 930 | ||||
| 930 | |||||||
| Telecommunications: 0.0% | |||||||
| 500 | @@, I, X | GT Group Telecom, Inc. | — | ||||
| — | |||||||
Total Warrants | 961 | ||||||
Total Long-Term Investments (Cost $157,440,136) | 162,215,960 | ||||||
See Accompanying Notes to Financial Statements
63
Table of Contents
| ING HIGH YIELD BOND FUND | PORTFOLIO OF INVESTMENTS ASOF MARCH 31, 2007 (CONTINUED) |
| Principal Amount | Value | ||||||||
| SHORT-TERM INVESTMENTS: 0.9% | |||||||||
| Repurchase Agreement: 0.9% | |||||||||
| $1,528,000 | Goldman Sachs Repurchase Agreement dated 03/30/07, |
| $ | 1,528,000 | |||||
Total Short-Term Investments (Cost $1,528,000) | 1,528,000 | ||||||||
Total Investments in Securities |
| ||||||||
(Cost $158,968,136)* | 100.3 | % | $ | 163,743,960 | |||||
Other Assets and Liabilities - Net | (0.3 | ) | (501,858 | ) | |||||
Net Assets | 100.0 | % | $ | 163,242,102 | |||||
| + | Step-up basis bond. Interest rate shown reflects current coupon rate. |
| @ | Non-income producing security |
| @@ | Foreign Issuer |
| # | Securities with purchases pursuant to Rule 144A, under the Securities Act of 1933 and may not be resold subject to that rule except to qualified institutional buyers. These securities have been determined to be liquid under the guidelines established by the Fund’s Board of Directors/Trustees. |
| C | Bond may be called prior to maturity date. |
| P | Preferred Stock may be called prior to convertible date. |
| I | Illiquid security |
| ** | Investment in affiliate. |
| X | Fair value established by ING Funds Valuation Committee appointed by the Fund’s Board of Directors/Trustees. |
| * | Cost for federal income tax purposes is $159,019,814. |
Net unrealized appreciation consists of: | ||||
Gross Unrealized Appreciation | $ | 5,377,097 | ||
Gross Unrealized Depreciation | (652,950 | ) | ||
Net Unrealized Appreciation | $ | 4,724,147 | ||
Information concerning the Credit Default Swap Agreements outstanding for the ING High Yield Bond Fund at March 31, 2007 is shown below:
Counterparty | Reference Entity/Obligation | Buy/Sell | (Pay)/Receive Fixed Rate | Termination Date | Notional Amount | Unrealized Appreciation/ (Depreciation) | |||||||||||
Bear Stearns Credit Products, Inc. | Idearc, Inc. 8.000%, 11/15/16 | Buy | (1.660 | )% | 12/20/11 | USD | 1,900,000 | $ | (12,069 | ) | |||||||
Merrill Lynch International | Idearc, Inc. 8.000%, 11/15/16 | Buy | (1.730 | )% | 12/20/11 | USD | 1,900,000 | (46,809 | ) | ||||||||
JPMorgan Chase Bank N.A., New York | Norbord, Inc. 7.250%, 07/01/12 | Buy | (1.380 | )% | 06/20/14 | USD | 2,000,000 | 52,621 | |||||||||
Citibank N.A., New York | R.H. Donnelley Corp. 8.875%, 01/15/16 | Sell | 2.350 | % | 12/20/11 | USD | 1,900,000 | 20,274 | |||||||||
Goldman Sachs International | R.H. Donnelley Corp. 8.875%, 01/15/16 | Sell | 2.450 | % | 12/20/11 | USD | 1,900,000 | 47,354 | |||||||||
Goldman Sachs International | Temple-Inland, Inc. 7.875%, 05/01/12 | Buy | (1.040 | )% | 03/20/14 | USD | 900,000 | 6,117 | |||||||||
| $ | 67,488 | ||||||||||||||||
See Accompanying Notes to Financial Statements
64
Table of Contents
| ING INTERMEDIATE BOND FUND | PORTFOLIO OF INVESTMENTS ASOF MARCH 31, 2007 |
| Principal Amount | Value | |||||||
| CORPORATE BONDS/NOTES: 25.0% | ||||||||
| Airlines: 0.2% | ||||||||
| $ | 21,500 | C | Continental Airlines, Inc., | $ | 22,185 | |||
| 1,742,000 | United Air Lines, Inc., | 1,986,969 | ||||||
| 2,009,154 | ||||||||
| Auto Manufacturers: 0.3% | ||||||||
| 2,770,000 | Ford Motor Co., | 2,785,000 | ||||||
| 106,000 | L | Ford Motor Co., | 82,548 | |||||
| 575,000 | C, L | General Motors Corp., | 518,938 | |||||
| 3,386,486 | ||||||||
| Banks: 6.4% | ||||||||
| 3,050,000 | @@, C | Australia & New Zealand Banking Group Ltd., | 2,653,537 | |||||
| 669,062 | @@, # | Banco Itau SA, | 670,534 | |||||
| 2,617,000 | @@, #, C | Banco Mercantil del Norte SA, | 2,650,123 | |||||
| 1,878,000 | @@ | Banco Santander Chile SA, | 2,054,667 | |||||
| 1,190,000 | @@, C | Bank of Ireland, | 1,036,207 | |||||
| 1,280,000 | @@, C | Bank of Nova Scotia, | 1,085,434 | |||||
| 540,000 | @@ | Bank of Scotland, | 465,821 | |||||
| 177,000 | C | BankAmerica Capital II, | 184,510 | |||||
| 710,000 | @@, C | Barclays Bank PLC, | 620,394 | |||||
| 2,170,000 | @@, C | BNP Paribas, | 1,859,382 | |||||
| 3,100,000 | @@, #, C | Chuo Mitsui Trust & Banking Co., Ltd., | 2,998,624 | |||||
| 1,000,000 | @@, #, C | Danske Bank A/S, | 1,021,014 | |||||
| 1,490,000 | @@, C | Den Norske Bank ASA, | 1,273,950 | |||||
| 230,000 | @@, C | Den Norske Bank ASA, | 198,789 | |||||
| 2,290,000 | #, C | Dresdner Funding Trust I, | 2,733,266 | |||||
| 3,987,000 | @@, #, C | HBOS PLC, | 3,943,462 | |||||
| 1,800,000 | @@, C, L | Hongkong & Shanghai Banking Corp., Ltd., | 1,519,978 | |||||
| 3,010,000 | @@, C, L | HSBC Bank PLC, | 2,561,510 | |||||
| 2,390,000 | @@, C | HSBC Bank PLC, | 2,079,300 | |||||
| 2,370,000 | @@, C | Lloyds TSB Bank PLC, | 2,044,130 | |||||
| Principal Amount | Value | ||||||
| $ 230,000 | @@, C | Lloyds TSB Bank PLC, | $ | 200,138 | |||
| 1,450,000 | @@, C | Lloyds TSB Bank PLC, | 1,274,956 | ||||
| 61,000 | C | M&I Capital Trust A, | 63,062 | ||||
| 1,684,000 | C | Mellon Capital I, | 1,750,493 | ||||
| 2,485,000 | @@, C | Mizuho Financial Group Cayman Ltd., | 2,627,393 | ||||
| 1,100,000 | @@, C | National Australia Bank Ltd., | 954,133 | ||||
| 320,000 | @@, C | National Westminster Bank PLC, | 275,231 | ||||
| 390,000 | @@, C | National Westminster Bank PLC, | 336,781 | ||||
| 1,926,000 | #, C | Rabobank Capital Funding II, | 1,876,521 | ||||
| 1,736,000 | #, C | Rabobank Capital Funding Trust, | 1,676,427 | ||||
| 1,737,000 | C | RBS Capital Trust I, | 1,711,595 | ||||
| 2,850,000 | @@, #, C | Resona Bank Ltd., | 2,840,991 | ||||
| 4,330,000 | @@, C, L | Royal Bank of Scotland Group PLC, | 3,712,979 | ||||
| 1,090,000 | @@, C | Societe Generale, | 941,281 | ||||
| 1,060,000 | @@, C | Standard Chartered PLC, | 882,450 | ||||
| 3,220,000 | @@, C | Standard Chartered PLC, | 2,661,330 | ||||
| 520,000 | @@, C, L | Standard Chartered PLC, | 429,488 | ||||
| 5,150,000 | @@, C, L | Standard Chartered PLC, | 4,338,875 | ||||
| 2,777,000 | @@, C | Sumitomo Mitsui Banking Corp., | 2,871,804 | ||||
| 2,251,000 | C | Wachovia Capital Trust III, | 2,279,835 | ||||
| 1,340,000 | @@, C | Westpac Banking Corp., | 1,145,780 | ||||
| 1,108,000 | #, C | Westpac Capital Trust IV, | 1,065,108 | ||||
| 3,780,000 | @@, #, C | Woori Bank, | 3,876,326 | ||||
| 73,447,609 | |||||||
| Chemicals: 0.5% | |||||||
| 720,000 | Stauffer Chemical, | 613,886 | |||||
| 1,230,000 | Stauffer Chemical, | 660,572 | |||||
| 1,510,000 | Stauffer Chemical, | 858,797 | |||||
See Accompanying Notes to Financial Statements
65
Table of Contents
| ING INTERMEDIATE BOND FUND | PORTFOLIO OF INVESTMENTS ASOF MARCH 31, 2007 (CONTINUED) |
| Principal Amount | Value | ||||||
| Chemicals (continued) | |||||||
| $ 3,081,000 | Union Carbide Corp., | $ | 3,298,999 | ||||
| 5,432,254 | |||||||
| Diversified Financial Services: 6.8% | |||||||
| 5,630,000 | @@, #, C, L | Aiful Corp., | 5,461,235 | ||||
| 527,000 | @@, I | Alpine III, | 528,579 | ||||
| 527,000 | @@, I | Alpine III, | 528,841 | ||||
| 789,000 | @@, I | Alpine III, | 794,199 | ||||
| 1,348,000 | @@, I | Alpine III, | 1,382,441 | ||||
| 7,897,000 | # | Astoria Depositor Corp., | 8,668,892 | ||||
| 2,340,000 | #, C | Corestates Capital Trust I, | 2,432,835 | ||||
| 2,130,000 | @@ | Eksportfinans A/S, | 2,148,961 | ||||
| 1,245,000 | @@, C | Financiere CSFB NV, | 1,070,700 | ||||
| 3,513,000 | Ford Motor Credit Co., | 3,385,931 | |||||
| 1,512,000 | Ford Motor Credit Co., | 1,479,751 | |||||
| 2,914,000 | Ford Motor Credit Co., | 3,093,094 | |||||
| 2,538,000 | C | Fund American Cos., Inc., | 2,541,959 | ||||
| 3,807,000 | General Motors Acceptance Corp., | 3,831,224 | |||||
| 1,744,000 | #, C | HVB Funding Trust III, | 2,244,704 | ||||
| 3,618,000 | #, C | Mangrove Bay Pass-Through Trust, | 3,563,050 | ||||
| 3,178,000 | @@, # | Mantis Reef Ltd., | 3,139,254 | ||||
| 2,511,000 | C | Merrill Lynch & Co., Inc., | 2,442,512 | ||||
| 2,369,000 | @@, C | MUFG Capital Finance 1 Ltd., | 2,424,075 | ||||
| DKK 35 | @@, I | Nordea Kredit Realkreditaktieselskab, | 7 | ||||
| $ 1,296,000 | @@, C | Paribas, | 1,117,867 | ||||
| 673,833 | @@, #, C | Petroleum Export Ltd., | 667,072 | ||||
| 1,225,231 | @@, #, C | Petroleum Export Ltd., | 1,199,717 | ||||
| 2,660,210 | @@, #, C | PF Export Receivables Master Trust, | 2,715,077 | ||||
| 4,198,422 | #, C | Piper Jaffray Equipment Trust Securities, | 4,114,454 | ||||
| Principal Amount | Value | ||||||
| $ 3,341,588 | #, C | Piper Jaffray Equipment Trust Securities, | $ | 3,324,880 | |||
| 401,752 | # | Power Receivable Finance, LLC, | 406,300 | ||||
| 1,019,000 | C | Residential Capital Corp., | 1,029,686 | ||||
| 2,114,000 | C | Residential Capital, LLC, | 2,096,507 | ||||
| 3,821,000 | C | Southern Star Central Corp., | 3,840,105 | ||||
| 13,940,228 | # | Toll Road Investors Partnership II LP, | 1,840,263 | ||||
| 1,200,000 | #, C | Twin Reefs Pass-Through Trust, | 1,204,139 | ||||
| 2,623,000 | @@, C | UFJ Finance Aruba AEC, | 2,762,197 | ||||
| 1,085,000 | #, C | Wachovia Capital Trust V, | 1,130,950 | ||||
| 78,611,458 | |||||||
| Electric: 2.2% | |||||||
| 3,652,205 | C | CE Generation, LLC, | 3,836,473 | ||||
| 1,784,000 | C | Cleveland Electric Illuminating Co., | 1,705,925 | ||||
| 5,400,000 | C | Commonwealth Edison Co., | 5,368,010 | ||||
| 657,000 | @@ | Empresa Nacional de Electricidad SA, | 776,671 | ||||
| 2,568,000 | #, C | ITC Holdings Corp., | 2,586,536 | ||||
| 717,035 | #, C | Juniper Generation, LLC, | 699,561 | ||||
| 2,475,000 | C | Nevada Power Co., | 2,516,350 | ||||
| 3,845,000 | C | NorthWestern Corp., | 3,798,645 | ||||
| 336,945 | PPL Montana, LLC, | 373,872 | |||||
| 3,196,000 | C | Sierra Pacific Power Co., | 3,310,490 | ||||
| 24,972,533 | |||||||
| Energy - Alternate Sources: 0.3% | |||||||
| 1,800,000 | Greater Ohio Ethanol, LLC, | 1,796,625 | |||||
| 2,200,000 | Greater Ohio Ethanol, LLC, | 2,195,188 | |||||
| 3,991,813 | |||||||
See Accompanying Notes to Financial Statements
66
Table of Contents
| ING INTERMEDIATE BOND FUND | PORTFOLIO OF INVESTMENTS ASOF MARCH 31, 2007 (CONTINUED) |
| Principal Amount | Value | ||||||
| Food: 0.9% | |||||||
| $ 10,003,000 | C | HJ Heinz Finance Co., | $ | 10,489,986 | |||
| 10,489,986 | |||||||
| Gas: 0.9% | |||||||
| 2,882,000 | @@, #, C | Nakilat, Inc., | 2,788,626 | ||||
| 1,533,000 | @@, #, C | Nakilat, Inc., | 1,515,279 | ||||
| 6,408,000 | C, L | Southern Union Co., | 6,491,708 | ||||
| 10,795,613 | |||||||
| Insurance: 0.4% | |||||||
| 4,124,000 | @@, C | Aegon NV, | 3,536,847 | ||||
| 704,000 | #, C | Liberty Mutual Group, Inc., | 688,327 | ||||
| 817,000 | #, C | North Front Pass-Through Trust, 5.810%, due 12/15/24 | 808,695 | ||||
| 5,033,869 | |||||||
| Media: 0.4% | |||||||
| 4,350,000 | #, C | Charter Communications Operating, LLC, | 4,551,188 | ||||
| 4,551,188 | |||||||
| Mining: 0.3% | |||||||
| 3,536,000 | C | Southern Copper Corp., | 3,829,057 | ||||
| 3,829,057 | |||||||
| Miscellaneous Manufacturing: 0.1% | |||||||
| 1,103,000 | Honeywell International, Inc., | 1,071,367 | |||||
| 1,071,367 | |||||||
| Multi-National: 0.2% | |||||||
| 1,929,000 | @@ | Corp. Andina de Fomento CAF, | 1,880,968 | ||||
| 1,880,968 | |||||||
| Oil & Gas: 1.7% | |||||||
| 1,193,000 | @@, # | Empresa Nacional de Petroleo ENAP, | 1,147,061 | ||||
| 796,000 | @@, # | Empresa Nacional de Petroleo ENAP, | 845,844 | ||||
| 3,565,000 | C | Hess Corp., | 3,941,386 | ||||
| 2,087,000 | C, L | Pemex Project Funding Master Trust, | 2,152,219 | ||||
| 2,402,000 | # | Pemex Project Funding Master Trust, | 2,469,256 | ||||
| Principal Amount | Value | ||||||
| $ 2,147,000 | @@, #, C | Ras Laffan Liquefied Natural Gas Co., Ltd. II, | $ | 2,075,322 | |||
| 3,279,000 | # | Sabine Pass LNG LP, | 3,311,790 | ||||
| 3,521,000 | @@, # | TNK-BP Finance SA, | 3,723,458 | ||||
| 19,666,336 | |||||||
| Pipelines: 0.5% | |||||||
| 4,067,000 | C, I | Cameron Highway Oil Pipeline System Project, | 4,007,266 | ||||
| 906,000 | C, L | Northwest Pipeline Corp., | 975,083 | ||||
| 1,262,000 | C | Transcontinental Gas Pipe Line Corp., | 1,307,748 | ||||
| 6,290,097 | |||||||
| Real Estate Investment Trusts: 1.0% | |||||||
| 444,000 | C | Liberty Property LP, | 465,453 | ||||
| 1,583,000 | C | Liberty Property LP, | 1,656,120 | ||||
| 5,937,000 | #, C | Rouse Co. LP/TRC Co.-Issuer, Inc., | 6,080,272 | ||||
| 423,000 | C | Rouse Co., | 442,439 | ||||
| 2,319,000 | C | Simon Property Group LP, | 2,299,518 | ||||
| 10,943,802 | |||||||
| Retail: 0.4% | |||||||
| 3,237,000 | C | Home Depot, Inc., | 3,096,773 | ||||
| 1,981,000 | C | McDonald’s Corp., | 1,957,600 | ||||
| 5,054,373 | |||||||
| Telecommunications: 1.5% | |||||||
| 3,617,000 | Bellsouth Telecommunications, Inc., | 3,724,826 | |||||
| 6,287,000 | @@, C, L | Rogers Wireless, Inc., | 6,750,666 | ||||
| 847,000 | C | Sprint Capital Corp., | 845,873 | ||||
| 1,367,000 | C | Sprint Nextel Corp., | 1,347,705 | ||||
| 2,863,000 | @@, C | TELUS Corp., | 3,138,415 | ||||
| 489,000 | @@, C | Vodafone Group PLC, | 485,677 | ||||
| 1,225,000 | @@, C | Vodafone Group PLC, | 1,186,545 | ||||
| 17,479,707 | |||||||
Total Corporate Bonds/Notes | 288,937,670 | ||||||
See Accompanying Notes to Financial Statements
67
Table of Contents
| ING INTERMEDIATE BOND FUND | PORTFOLIO OF INVESTMENTS ASOF MARCH 31, 2007 (CONTINUED) |
| Principal Amount | Value | ||||||
| U.S. GOVERNMENT AND AGENCY OBLIGATIONS: 28.7% | |||||||
| Federal Home Loan Bank: 1.2% | |||||||
| $ 5,625,000 | 5.000%, due 10/02/09 | $ | 5,649,351 | ||||
| 5,455,000 | L | 5.375%, due 08/19/11 | 5,573,204 | ||||
| 2,720,000 | L | 5.625%, due 06/13/16 | 2,802,767 | ||||
| 14,025,322 | |||||||
| Federal Home Loan Mortgage Corporation: 11.9% | |||||||
| 1,321,591 | C | 4.500%, due 12/15/16 | 1,303,832 | ||||
| 3,422,000 | C, S | 4.500%, due 02/15/20 | 3,219,471 | ||||
| 11,570,000 | 5.000%, due 01/16/09 | 11,596,009 | |||||
| 4,647,009 | C, S | 5.000%, due 08/15/16 | 4,607,499 | ||||
| 4,105,000 | C, S | 5.000%, due 12/15/17 | 4,076,506 | ||||
| 869,000 | C | 5.000%, due 05/15/20 | 848,184 | ||||
| 3,151,751 | C, S | 5.000%, due 08/15/21 | 3,132,777 | ||||
| 3,513,000 | C, S | 5.000%, due 04/15/23 | 3,395,867 | ||||
| 2,606,000 | C, S | 5.000%, due 04/15/32 | 2,555,288 | ||||
| 3,699,103 | C, S | 5.000%, due 02/15/35 | 3,649,218 | ||||
| 640,616 | 5.042%, due 04/01/35 | 632,395 | |||||
| 8,529,000 | 5.125%, due 04/18/11 | 8,624,747 | |||||
| 11,351,000 | C | 5.375%, due 12/27/11 | 11,348,026 | ||||
| 10,444,128 | C, S | 5.500%, due 08/15/20 | 10,168,093 | ||||
| 1,663,000 | C | 5.500%, due 12/15/20 | 1,655,839 | ||||
| 6,362,000 | C | 5.500%, due 11/15/22 | 6,336,575 | ||||
| 3,931,000 | C | 5.500%, due 09/15/32 | 3,909,684 | ||||
| 996,000 | C | 5.500%, due 10/15/32 | 992,922 | ||||
| 887,000 | C | 5.500%, due 11/15/32 | 877,664 | ||||
| 2,872,000 | C, S | 5.500%, due 07/15/33 | 2,872,478 | ||||
| 17,811,000 | W | 5.500%, due 04/15/34 | 17,627,333 | ||||
| 1,326,430 | 5.500%, due 06/01/36 | 1,307,332 | |||||
| 381,625 | C | 5.670%, due 02/15/32 | 384,130 | ||||
| 5,363,000 | 5.750%, due 06/27/16 | 5,574,758 | |||||
| 7,514,408 | C, S | 6.000%, due 01/15/29 | 7,642,881 | ||||
| 10,406,000 | W | 6.000%, due 04/01/34 | 10,490,549 | ||||
| 8,754,000 | 6.625%, due 09/15/09 | 9,113,676 | |||||
| 8,110 | 7.500%, due 11/01/28 | 8,506 | |||||
| 137,952,239 | |||||||
| Federal National Mortgage Association: 15.5% | |||||||
| 2,900,033 | ^ | 2.365%, due 02/17/29 | 218,047 | ||||
| 68,000 | W | 4.500%, due 04/15/19 | 65,833 | ||||
| 105,000 | W | 4.500%, due 04/01/37 | 98,700 | ||||
| 1,743,471 | S | 4.592%, due 08/01/35 | 1,714,654 | ||||
| 597,473 | C | 4.750%, due 12/25/42 | 594,759 | ||||
| 2,013,191 | S | 4.818%, due 08/01/35 | 1,994,620 | ||||
| 3,286,000 | W | 5.000%, due 04/15/21 | 3,240,818 | ||||
| 3,154,933 | S | 5.000%, due 02/25/29 | 3,123,762 | ||||
| 53,671,000 | 5.000%, due 04/15/34 | 51,859,604 | |||||
| 10,026,000 | W | 5.000%, due 05/15/35 | 9,687,623 | ||||
| 4,177,191 | S | 5.000%, due 08/01/35 | 4,041,179 | ||||
| 928,807 | 5.000%, due 10/01/35 | 898,564 | |||||
| 1,193,053 | 5.069%, due 07/01/35 | 1,181,398 | |||||
| 2,880,498 | S | 5.154%, due 09/01/35 | 2,872,948 | ||||
| 921,352 | 5.229%, due 08/01/35 | 913,472 | |||||
| 11,495,000 | L | 5.250%, due 08/01/12 | 11,640,469 | ||||
| 6,575,000 | L | 5.250%, due 09/15/16 | 6,705,593 | ||||
| 5,801,000 | C | 5.400%, due 03/26/12 | 5,799,515 | ||||
| 1,698,000 | S | 5.500%, due 05/25/30 | 1,681,488 | ||||
| 1,883,609 | S | 5.500%, due 11/01/32 | 1,869,003 | ||||
| 10,329,183 | S | 5.500%, due 11/01/33 | 10,248,450 | ||||
| 566,000 | W | 5.500%, due 04/15/34 | 567,415 | ||||
| 5,272,205 | S | 5.500%, due 01/25/36 | 5,188,771 | ||||
| Principal Amount | Value | ||||||
| $ 620,000 | 5.500%, due 04/15/36 | $ | 613,607 | ||||
| 1,309,478 | 5.500%, due 07/01/36 | 1,290,624 | |||||
| 5,283,313 | S | 5.500%, due 12/25/36 | 5,197,013 | ||||
| 4,566,223 | S | 5.500%, due 02/25/37 | 4,538,757 | ||||
| 4,170,000 | C | 5.550%, due 03/29/10 | 4,168,332 | ||||
| 360,168 | 5.720%, due 04/18/28 | 363,476 | |||||
| 14,929 | 5.770%, due 12/25/29 | 14,947 | |||||
| 432,590 | 5.770%, due 10/25/33 | 435,545 | |||||
| 423,583 | C | 5.870%, due 01/25/32 | 423,916 | ||||
| 53,682 | 6.000%, due 08/01/16 | 54,664 | |||||
| 4,853 | 6.000%, due 12/01/16 | 4,942 | |||||
| 174,387 | 6.000%, due 03/01/17 | 177,579 | |||||
| 1,539,904 | 6.000%, due 09/01/17 | 1,567,811 | |||||
| 108,684 | 6.000%, due 11/01/17 | 110,673 | |||||
| 3,175,000 | 6.000%, due 04/01/18 | 3,227,584 | |||||
| 3,819,407 | S | 6.000%, due 07/25/29 | 3,890,428 | ||||
| 2,112,749 | S | 6.000%, due 04/25/31 | 2,164,266 | ||||
| 646,300 | 6.000%, due 08/01/33 | 650,757 | |||||
| 9,480,000 | 6.000%, due 04/15/34 | 9,551,100 | |||||
| 41,212 | 6.500%, due 07/01/29 | 42,510 | |||||
| 172,030 | 6.500%, due 08/01/29 | 177,446 | |||||
| 507,034 | 6.500%, due 04/01/30 | 522,999 | |||||
| 1,413,000 | 6.500%, due 04/01/31 | 1,441,701 | |||||
| 2,381 | 6.500%, due 06/01/31 | 2,453 | |||||
| 374,624 | 6.500%, due 07/01/31 | 386,652 | |||||
| 10,644 | 6.500%, due 09/01/31 | 10,967 | |||||
| 228,261 | 6.500%, due 11/01/31 | 235,187 | |||||
| 119,396 | 6.500%, due 04/01/32 | 122,791 | |||||
| 61,617 | 6.500%, due 07/01/32 | 63,369 | |||||
| 159,977 | 6.500%, due 08/01/32 | 164,525 | |||||
| 22,422 | 6.500%, due 11/01/32 | 23,060 | |||||
| 211,720 | 6.500%, due 01/01/33 | 217,739 | |||||
| 81,151 | 6.500%, due 02/01/33 | 83,356 | |||||
| 496,208 | 6.500%, due 12/01/33 | 509,695 | |||||
| 2,461,000 | L | 6.625%, due 11/15/30 | 2,910,226 | ||||
| 124,236 | 7.000%, due 01/01/30 | 128,414 | |||||
| 264,364 | 7.000%, due 06/01/31 | 275,614 | |||||
| 874,000 | 7.000%, due 05/15/34 | 900,766 | |||||
| 4,230,000 | L | 7.250%, due 01/15/10 | 4,498,055 | ||||
| 1,802 | 7.500%, due 09/01/30 | 1,887 | |||||
| 17,361 | 7.500%, due 10/01/30 | 18,176 | |||||
| 86,673 | 7.500%, due 02/01/32 | 90,880 | |||||
| 365,753 | C | 7.500%, due 12/25/41 | 381,221 | ||||
| 758,653 | C | 7.500%, due 01/25/48 | 789,542 | ||||
| 178,651,937 | |||||||
| Government National Mortgage Association: 0.1% | |||||||
| 893,221 | C, ^ | 2.930%, due 06/16/31 | 75,850 | ||||
| 8,858 | 5.375%, due 04/20/28 | 8,957 | |||||
| 1,211 | 6.500%, due 03/15/31 | 1,247 | |||||
| 18,004 | 6.500%, due 08/15/31 | 18,529 | |||||
| 40,726 | 6.500%, due 10/15/31 | 41,914 | |||||
| 19,837 | 6.500%, due 11/15/31 | 20,416 | |||||
| 17,312 | 6.500%, due 07/15/32 | 17,801 | |||||
| 96,499 | 6.500%, due 09/15/32 | 99,225 | |||||
| 51,788 | 7.000%, due 04/15/26 | 54,213 | |||||
| 24,260 | 7.000%, due 05/15/32 | 25,383 | |||||
| 80,026 | 7.500%, due 12/15/22 | 83,481 | |||||
| 5,854 | 7.500%, due 10/15/26 | 6,119 | |||||
| 18,617 | 7.500%, due 07/15/29 | 19,450 | |||||
| 130 | 7.500%, due 11/15/30 | 135 | |||||
| 20,115 | 7.500%, due 12/15/30 | 21,009 | |||||
See Accompanying Notes to Financial Statements
68
Table of Contents
| ING INTERMEDIATE BOND FUND | PORTFOLIO OF INVESTMENTS ASOF MARCH 31, 2007 (CONTINUED) |
| Principal Amount | Value | ||||||
| Government National Mortgage Association (continued) | |||||||
| $ 30,827 | 7.500%, due 12/15/31 | $ | 32,196 | ||||
| 50,963 | 7.500%, due 05/15/32 | 53,160 | |||||
| 579,085 | |||||||
Total U.S. Government and Agency Obligations (Cost $332,061,280) | 331,208,583 | ||||||
| U.S. TREASURY OBLIGATIONS: 9.0% | |||||||
| U.S. Treasury Bonds: 1.9% | |||||||
| 12,091,000 | L | 4.500%, due 02/15/36 | 11,403,336 | ||||
| 10,031,000 | L | 4.625%, due 02/15/17 | 10,013,767 | ||||
| 21,417,103 | |||||||
| U.S. Treasury Notes: 1.6% | |||||||
| 2,857,000 | 4.375%, due 03/31/12 | 2,853,094 | |||||
| 10,543,000 | L | 4.625%, due 02/29/12 | 10,585,425 | ||||
| 5,584,000 | L | 4.750%, due 02/15/10 | 5,617,593 | ||||
| 19,056,112 | |||||||
| Treasury Inflation Indexed Protected Securities: 5.5% | |||||||
| 5,836,544 | L | 2.000%, due 01/15/16 | 5,748,313 | ||||
| 9,364,171 | L | 2.000%, due 01/15/26 | 8,902,555 | ||||
| 10,672,207 | L | 2.375%, due 04/15/11 | 10,814,371 | ||||
| 16,975,082 | L | 2.375%, due 01/15/17 | 17,231,711 | ||||
| 6,041,424 | 2.375%, due 01/15/25 | 6,082,487 | |||||
| 14,122,174 | 3.875%, due 01/15/09 | 14,642,378 | |||||
| 63,421,815 | |||||||
Total U.S. Treasury Obligations | 103,895,030 | ||||||
| ASSET-BACKED SECURITIES: 5.2% | |||||||
| Automobile Asset-Backed Securities: 0.1% | |||||||
| 373,000 | C | AmeriCredit Automobile Receivables Trust, | 371,208 | ||||
| 125,625 | C | Capital One Auto Finance Trust, | 124,669 | ||||
| 73,991 | C | Daimler Chrysler Auto Trust, | 73,779 | ||||
| 289,976 | C | Honda Auto Receivables Owner Trust, | 288,775 | ||||
| 443,905 | C | Nissan Auto Receivables Owner Trust, | 442,441 | ||||
| 1,300,872 | |||||||
| Credit Card Asset-Backed Securities: 0.1% | |||||||
| 560,000 | C | Bank One Issuance Trust, | 556,389 | ||||
| 193,000 | C | Discover Card Master Trust I, | 193,110 | ||||
| 749,499 | |||||||
| Home Equity Asset-Backed Securities: 2.6% | |||||||
| 44,371 | C | Centex Home Equity, | 44,203 | ||||
| Principal Amount | Value | ||||||
| $ 1,018,000 | C | Citigroup Mortgage Loan Trust, Inc., | $ | 1,010,825 | |||
| 430,000 | C | Citigroup Mortgage Loan Trust, Inc., | 424,890 | ||||
| 451,531 | C | Freddie Mac Structured Pass-Through Securities, | 451,793 | ||||
| 124,546 | C | Freddie Mac Structured Pass-Through Securities, | 124,625 | ||||
| 4,851,000 | C, S | GSAA Trust, | 4,809,169 | ||||
| 9,517,000 | C, S | GSAA Trust, | 9,603,253 | ||||
| 6,608,000 | C, S | GSAA Trust, | 6,667,888 | ||||
| 40,848 | C | Merrill Lynch Mortgage Investors, Inc., | 40,959 | ||||
| 3,905,000 | C, S | Morgan Stanley Mortgage Loan Trust, | 3,943,441 | ||||
| 3,367 | C | New Century Home Equity Loan Trust, | 3,369 | ||||
| 638,000 | C | Renaissance Home Equity Loan Trust, | 633,868 | ||||
| 1,380,252 | C | Renaissance Home Equity Loan Trust, | 1,373,749 | ||||
| 143,397 | C | Residential Asset Securities Corp., | 143,527 | ||||
| 21,452 | C | Residential Funding Mortgage Sec I, | 21,360 | ||||
| 963,054 | C | Wells Fargo Home Equity Trust, | 941,911 | ||||
| 30,238,830 | |||||||
| Other Asset-Backed Securities: 2.4% | |||||||
| 36,324 | C | Amortizing Residential Collateral Trust, | 36,301 | ||||
| 276,943 | C | Caterpillar Financial Asset Trust, | 276,900 | ||||
| 10,558 | C | Chase Funding Mortgage Loan, | 10,461 | ||||
| 327,156 | C | Chase Funding Mortgage Loan, | 327,801 | ||||
| 951,000 | C | Countrywide Asset-Backed Certificates, | 944,976 | ||||
See Accompanying Notes to Financial Statements
69
Table of Contents
| ING INTERMEDIATE BOND FUND | PORTFOLIO OF INVESTMENTS ASOF MARCH 31, 2007 (CONTINUED) |
| Principal Amount | Value | ||||||
| Other Asset-Backed Securities (continued) | |||||||
| $ 2,871,000 | C, S | Credit-Based Asset Servicing and Securitization, LLC, | $ | 2,840,499 | |||
| 2,831,000 | C | Credit-Based Asset Servicing and Securitization, LLC, | 2,826,173 | ||||
| 1,456,000 | #, C | Credit-Based Asset Servicing and Securitization, LLC, | 1,464,190 | ||||
| 1,188,000 | #, C | Credit-Based Asset Servicing and Securitization, LLC, | 1,193,755 | ||||
| 1,355,000 | C | Equity One, Inc., | 1,338,860 | ||||
| 636,520 | C | Fannie Mae Grantor Trust, | 637,276 | ||||
| 2,720,000 | @@, #, C, S | Hudson Mezzanine Funding, | 1,972,000 | ||||
| 1,785,225 | C, S | Lehman XS Trust, | 1,791,806 | ||||
| 2,394,156 | C, S | Long Beach Mortgage Loan Trust, | 2,400,331 | ||||
| 3,846,000 | C, S | Merrill Lynch Mortgage Investors, Inc., | 3,846,333 | ||||
| 989,000 | C | Merrill Lynch Mortgage Investors, Inc., | 987,738 | ||||
| 415,941 | C | Popular Mortgage Pass-Through Trust, | 413,192 | ||||
| 698,000 | C | Popular Mortgage Pass-Through Trust, | 692,661 | ||||
| 698,000 | C | Renaissance Home Equity Loan Trust, | 698,315 | ||||
| 862,433 | C | Residential Asset Mortgage Products, Inc., | 863,721 | ||||
| 19,557 | C | Residential Asset Mortgage Products, Inc., | 19,574 | ||||
| 1,639,000 | C | Structured Asset Securities Corp., | 1,611,057 | ||||
| 512,001 | C | Structured Asset Securities Corp., | 510,823 | ||||
| 27,704,743 | |||||||
Total Asset-Backed Securities | 59,993,944 | ||||||
| Principal Amount | Value | ||||||
| COLLATERALIZED MORTGAGE OBLIGATIONS: 34.2% | |||||||
| $ 399,985 | C | ABN Amro Mortgage Corp., | $ | 399,845 | |||
| 2,732,086 | C, S | American Home Mortgage Assets, | 2,733,794 | ||||
| 6,523,668 | C, S | American Home Mortgage Investment Trust, | 6,551,227 | ||||
| 2,907,555 | # | Astoria Depositor Corp., 7.902%, due 05/01/21 | 3,064,257 | ||||
| 2,535,859 | C, S | Banc of America Alternative Loan Trust, | 2,534,838 | ||||
| 5,432,572 | C, S | Banc of America Alternative Loan Trust, | 5,504,741 | ||||
| 3,788,000 | C | Banc of America Alternative Loan Trust, | 3,848,371 | ||||
| 58,663,000 | C, ^ | Banc of America Commercial Mortgage, Inc., | 1,429,535 | ||||
| 110,000 | C | Banc of America Commercial Mortgage, Inc., | 107,043 | ||||
| 1,609,000 | C | Banc of America Commercial Mortgage, Inc., | 1,571,460 | ||||
| 1,114,000 | C | Banc of America Commercial Mortgage, Inc., | 1,104,432 | ||||
| 1,917,708 | C, S | Banc of America Commercial Mortgage, Inc., | 1,902,441 | ||||
| 2,210,000 | C, S | Banc of America Commercial Mortgage, Inc., | 2,184,768 | ||||
| 1,470,000 | C | Banc of America Commercial Mortgage, Inc., | 1,463,187 | ||||
| 270,000 | C | Banc of America Commercial Mortgage, Inc., | 281,494 | ||||
| 5,668,839 | C, S | Banc of America Funding Corp., | 5,592,331 | ||||
| 2,714,424 | C, S | Banc of America Funding Corp., | 2,697,656 | ||||
| 2,395,913 | C, S | Banc of America Funding Corp., | 2,401,390 | ||||
See Accompanying Notes to Financial Statements
70
Table of Contents
| ING INTERMEDIATE BOND FUND | PORTFOLIO OF INVESTMENTS ASOF MARCH 31, 2007 (CONTINUED) |
| Principal Amount | Value | ||||||
| COLLATERALIZED MORTGAGE OBLIGATIONS (continued) | |||||||
| $ 2,623,000 | C, S | Banc of America Mortgage Securities, Inc., | $ | 2,568,840 | |||
| 2,692,921 | C, S | Banc of America Mortgage Securities, Inc., | 2,656,578 | ||||
| 994,719 | C | Banc of America Mortgage Securities, Inc., | 993,020 | ||||
| 1,866,815 | C, S | Banc of America Mortgage Securities, Inc., | 1,857,181 | ||||
| 803,377 | C | Banc of America Mortgage Securities, Inc., | 792,745 | ||||
| 918,301 | C | Bank of America Alternative Loan Trust, | 931,502 | ||||
| 6,471,362 | C, S | Bank of America Alternative Loan Trust, | 6,582,778 | ||||
| 1,097,344 | C | Bear Stearns Alternative-A Trust, | 1,100,092 | ||||
| 1,524,000 | C | Bear Stearns Commercial Mortgage Securities, | 1,498,354 | ||||
| 391,000 | C | Bear Stearns Commercial Mortgage Securities, | 380,593 | ||||
| 1,058,362 | C | Bear Stearns Commercial Mortgage Securities, | 1,041,975 | ||||
| 696,000 | C | Bear Stearns Commercial Mortgage Securities, | 681,431 | ||||
| 1,666,407 | C | Bear Stearns Commercial Mortgage Securities, | 1,677,463 | ||||
| 2,537,000 | S | Bear Stearns Commercial Mortgage Securities, | 2,566,098 | ||||
| 668,795 | C | Capco America Securitization Corp., 6.170%, due 10/15/30 | 676,305 | ||||
| 456,000 | C | Capco America Securitization Corp., 6.460%, due 10/15/30 | 464,366 | ||||
| 1,950,000 | C, S | Chase Manhattan Bank-First Union National Bank, | 2,036,059 | ||||
| 5,646,886 | C, S | Chase Mortgage Finance Corp., | 5,591,298 | ||||
| 3,550,292 | C, S | Chase Mortgage Finance Corp., | 3,532,756 | ||||
| 4,758,824 | C, S | Chaseflex Trust, | 4,821,683 | ||||
| Principal Amount | Value | ||||||
| $ 279,250 | C | Citicorp Mortgage Securities, Inc., | $ | 280,665 | |||
| 390,000 | C | Citigroup Commercial Mortgage Trust, | 384,508 | ||||
| 3,698,810 | C, S | Citigroup Mortgage Loan Trust, Inc., | 3,729,400 | ||||
| 6,481,766 | C, S | Citigroup Mortgage Loan Trust, Inc., | 6,511,572 | ||||
| 11,439,714 | C, S | Citigroup Mortgage Loan Trust, Inc., | 11,498,754 | ||||
| 1,093,000 | C | Commercial Mortgage Pass-Through Certificates, | 1,066,061 | ||||
| 6,973,566 | C, S | Countrywide Alternative Loan Trust, | 6,892,854 | ||||
| 2,975,955 | C, S | Countrywide Alternative Loan Trust, | 2,984,427 | ||||
| 350,072 | C | Countrywide Alternative Loan Trust, | 351,598 | ||||
| 382,054 | C | Countrywide Alternative Loan Trust, | 382,402 | ||||
| 70,257 | C | Countrywide Alternative Loan Trust, | 70,416 | ||||
| 3,087,957 | C, S | Countrywide Alternative Loan Trust, | 3,083,016 | ||||
| 700,494 | C | Countrywide Alternative Loan Trust, | 705,640 | ||||
| 1,633,253 | C | Countrywide Alternative Loan Trust, | 1,649,626 | ||||
| 4,934,103 | C, S | Countrywide Alternative Loan Trust, | 4,943,530 | ||||
| 1,788,189 | C, S | Countrywide Home Loan Mortgage Pass-Through Trust, | 1,751,830 | ||||
| 582,378 | C | Countrywide Home Loan Mortgage Pass-Through Trust, | 584,030 | ||||
| 888,464 | C | Credit Suisse First Boston Mortgage Securities Corp., | 863,535 | ||||
| 416,053 | C | Credit Suisse First Boston Mortgage Securities Corp., | 400,383 | ||||
See Accompanying Notes to Financial Statements
71
Table of Contents
| ING INTERMEDIATE BOND FUND | PORTFOLIO OF INVESTMENTS ASOF MARCH 31, 2007 (CONTINUED) |
| Principal Amount | Value | ||||||
| COLLATERALIZED MORTGAGE OBLIGATIONS (continued) | |||||||
| $ 975,000 | C | Credit Suisse First Boston Mortgage Securities Corp., | $ | 955,760 | |||
| 8,632,704 | C, S | Credit Suisse Mortgage Capital Certificates, | 8,812,392 | ||||
| 686,569 | C | DLJ Commercial Mortgage Corp., | 712,632 | ||||
| 5,882,035 | C, S | First Horizon Alternative Mortgage Securities, | 5,844,219 | ||||
| 526,528 | C | First Horizon Asset Securities, Inc., | 526,889 | ||||
| 2,133,611 | C, S | First Horizon Asset Securities, Inc., | 2,119,563 | ||||
| 833,062 | C | Freddie Mac, | 843,671 | ||||
| 59,868,684 | C, ^ | GE Capital Commercial Mortgage Corp., | 1,147,300 | ||||
| 1,466,307 | C | GE Capital Commercial Mortgage Corp., | 1,441,479 | ||||
| 698,000 | C | GE Capital Commercial Mortgage Corp., | 684,276 | ||||
| 483,000 | C | GE Capital Commercial Mortgage Corp., | 478,221 | ||||
| 361,110 | C | GE Capital Commercial Mortgage Corp., | 364,451 | ||||
| 1,634,291 | C | GMAC Mortgage Corp. Loan Trust, | 1,604,052 | ||||
| 3,835,796 | C, S | GMAC Mortgage Corp. Loan Trust, | 3,784,028 | ||||
| 46,262,000 | #, C, ^ | Greenwich Capital Commercial Funding Corp., | 1,152,942 | ||||
| 2,451,000 | C, S | Greenwich Capital Commercial Funding Corp., | 2,453,305 | ||||
| 1,393,000 | C | Greenwich Capital Commercial Funding Corp., | 1,399,337 | ||||
| 705,000 | C | Greenwich Capital Commercial Funding Corp., | 708,224 | ||||
| 564,000 | C | Greenwich Capital Commercial Funding Corp., | 566,579 | ||||
| Principal Amount | Value | ||||||
| $ 1,949,000 | C, S | GS Mortgage Securities Corp. II, | $ | 1,967,164 | |||
| 655,306 | #, C | GSMPS 2005-RP1 1AF, | 658,113 | ||||
| 637,967 | C | GSR Mortgage Loan Trust, | 636,566 | ||||
| 1,437,832 | C | GSR Mortgage Loan Trust, | 1,438,013 | ||||
| 952,025 | C | Harborview Mortgage Loan Trust, | 954,962 | ||||
| 473,881 | C | Homebanc Mortgage Trust, | 474,459 | ||||
| 307,530 | JP Morgan Alternative Loan Trust, | 306,846 | |||||
| 177,515,966 | C, ^ | JP Morgan Chase Commercial Mortgage Securities Corp., | 409,867 | ||||
| 407,799 | C | JP Morgan Chase Commercial Mortgage Securities Corp., | 399,429 | ||||
| 1,700,000 | C | JP Morgan Chase Commercial Mortgage Securities Corp., | 1,662,065 | ||||
| 1,397,428 | C | JP Morgan Chase Commercial Mortgage Securities Corp., | 1,370,291 | ||||
| 433,000 | C | JP Morgan Chase Commercial Mortgage Securities Corp., | 434,069 | ||||
| 866,000 | C | JP Morgan Chase Commercial Mortgage Securities Corp., | 866,261 | ||||
| 198,280 | C | JP Morgan Chase Commercial Mortgage Securities Corp., | 201,356 | ||||
| 4,263,000 | C, S | JP Morgan Chase Commercial Mortgage Securities Corp., | 4,379,130 | ||||
| 1,226,000 | C | JP Morgan Chase Commercial Mortgage Securities Corp., | 1,262,801 | ||||
| 11,117,066 | C, S | JP Morgan Mortgage Trust, | 11,021,526 | ||||
| 11,987,000 | C, ^ | LB-UBS Commercial Mortgage Trust, | 436,981 | ||||
| 866,000 | C | LB-UBS Commercial Mortgage Trust, | 844,102 | ||||
See Accompanying Notes to Financial Statements
72
Table of Contents
| ING INTERMEDIATE BOND FUND | PORTFOLIO OF INVESTMENTS ASOF MARCH 31, 2007 (CONTINUED) |
| Principal Amount | Value | ||||||
| COLLATERALIZED MORTGAGE OBLIGATIONS (continued) | |||||||
| $ 1,921,000 | C, S | LB-UBS Commercial Mortgage Trust, | $ | 1,880,989 | |||
| 225,000 | C | LB-UBS Commercial Mortgage Trust, | 220,526 | ||||
| 695,000 | C | LB-UBS Commercial Mortgage Trust, | 678,196 | ||||
| 1,209,000 | C | LB-UBS Commercial Mortgage Trust, | 1,197,734 | ||||
| 1,179,000 | C | LB-UBS Commercial Mortgage Trust, | 1,171,639 | ||||
| 516,000 | C | LB-UBS Commercial Mortgage Trust, | 496,286 | ||||
| 520,000 | C | LB-UBS Commercial Mortgage Trust, | 517,579 | ||||
| 1,010,000 | C | LB-UBS Commercial Mortgage Trust, | 1,004,143 | ||||
| 1,469,000 | C | LB-UBS Commercial Mortgage Trust, | 1,470,263 | ||||
| 735,000 | C | LB-UBS Commercial Mortgage Trust, | 735,140 | ||||
| 1,845,000 | C, S | LB-UBS Commercial Mortgage Trust, | 1,830,160 | ||||
| 2,747,000 | C, S | LB-UBS Commercial Mortgage Trust, | 2,758,784 | ||||
| 1,014,000 | C | LB-UBS Commercial Mortgage Trust, 5.516%, due 11/15/38 | 1,009,719 | ||||
| 721,000 | C | LB-UBS Commercial Mortgage Trust, | 721,695 | ||||
| 1,442,000 | C | LB-UBS Commercial Mortgage Trust, | 1,442,394 | ||||
| 2,961,000 | C, S | LB-UBS Commercial Mortgage Trust, | 3,016,863 | ||||
| 6,432,000 | C, S | LB-UBS Commercial Mortgage Trust, | 6,726,964 | ||||
| 4,051,340 | C, S | LB-UBS Commercial Mortgage Trust, | 4,285,496 | ||||
| 2,641,248 | C, S | MASTR Alternative Loans Trust, | 2,659,669 | ||||
| 1,618,000 | C | MASTR Alternative Loans Trust, | 1,655,994 | ||||
| Principal Amount | Value | ||||||
| $ 144,814 | C | MASTR Alternative Loans Trust, | $ | 145,562 | |||
| 415,031 | C | MASTR Alternative Loans Trust, | 418,927 | ||||
| 44,846,049 | #, C, ^ | Merrill Lynch Mortgage Trust, | 920,550 | ||||
| 40,979,963 | #, C, ^ | Merrill Lynch Mortgage Trust, | 305,833 | ||||
| 981,000 | C | Merrill Lynch Mortgage Trust, | 971,142 | ||||
| 8,222,000 | C, ^ | Merrill Lynch/Countrywide Commercial Mortgage Trust, | 357,212 | ||||
| 625,000 | C | Merrill Lynch/Countrywide Commercial Mortgage Trust, | 622,251 | ||||
| 696,000 | C | Merrill Lynch/Countrywide Commercial Mortgage Trust, | 692,457 | ||||
| 1,395,582 | C | MLCC Mortgage Investors, Inc., | 1,396,951 | ||||
| 463,155 | C | MLCC Mortgage Investors, Inc., | 463,616 | ||||
| 968,806 | C | MLCC Mortgage Investors, Inc., | 968,869 | ||||
| 3,660,000 | C, S | Morgan Stanley Capital I, 5.007%, due 01/14/42 | 3,638,097 | ||||
| 218,520 | C | Morgan Stanley Capital I, 7.020%, due 03/15/32 | 223,188 | ||||
| 240,138 | C | Morgan Stanley Dean Witter Capital I, | 232,836 | ||||
| 1,419,689 | C | Mortgage Capital Funding, Inc., | 1,428,016 | ||||
| 1,621,000 | C | New York Mortgage Trust, Inc., | 1,637,305 | ||||
| 1,038,000 | C | Nomura Asset Securities Corp., | 1,090,186 | ||||
| 2,772,065 | C, S | Prudential Commercial Mortgage Trust, | 2,680,553 | ||||
| 5,712,670 | C, S | RAAC Series, | 5,672,198 | ||||
| 6,191,457 | C, S | Residential Accredit Loans, Inc., | 5,883,481 | ||||
| 3,826,905 | C, S | Residential Accredit Loans, Inc., | 3,833,036 | ||||
See Accompanying Notes to Financial Statements
73
Table of Contents
| ING INTERMEDIATE BOND FUND | PORTFOLIO OF INVESTMENTS ASOF MARCH 31, 2007 (CONTINUED) |
| Principal Amount | Value | ||||||
| COLLATERALIZED MORTGAGE OBLIGATIONS (continued) | |||||||
| $ 2,981,741 | C, S | Residential Accredit Loans, Inc., | $ | 2,991,999 | |||
| 5,520,026 | C, S | Residential Accredit Loans, Inc., | 5,536,962 | ||||
| 565,463 | C | Residential Funding Mortgage Sec I, | 567,290 | ||||
| 400,000 | C | Salomon Brothers Mortgage Securities VII, | 420,152 | ||||
| 605,040 | C | Sequoia Mortgage Trust, 5.590%, due 01/20/35 | 606,902 | ||||
| 830,074 | C | Structured Adjustable Rate Mortgage Loan Trust, | 833,616 | ||||
| 1,224,417 | C | Structured Asset Mortgage Investments, Inc., | 1,226,705 | ||||
| 4,498,541 | C, S | Structured Asset Mortgage Investments, Inc., | 4,573,701 | ||||
| 735,280 | C | Thornburg Mortgage Securities Trust, | 736,158 | ||||
| 2,980,631 | C, S | Thornburg Mortgage Securities Trust, | 2,991,524 | ||||
| 581,000 | #, C | Wachovia Bank Commercial Mortgage Trust, | 568,678 | ||||
| 4,930,000 | C, S | Wachovia Bank Commercial Mortgage Trust, | 4,831,912 | ||||
| 190,000 | C | Wachovia Bank Commercial Mortgage Trust, | 190,609 | ||||
| 1,235,000 | C | Washington Mutual Alternative Mortgage Pass-Through Certificates, | 1,235,000 | ||||
| 281,594 | C | Washington Mutual Mortgage Pass-Through Certificates, 5.570%, due 01/25/45 | 281,820 | ||||
| 706,005 | C | Washington Mutual Mortgage Pass-Through Certificates, 5.630%, due 01/25/45 | 707,469 | ||||
| 3,118,738 | C, S | Washington Mutual Mortgage Pass-Through Certificates, 5.633%, due 01/25/47 | 3,113,134 | ||||
| 504,903 | C | Washington Mutual Mortgage Pass-Through Certificates, 5.633%, due 02/25/47 | 504,213 | ||||
| Principal Amount | Value | ||||||
| $ 1,409,855 | C | Washington Mutual Mortgage Pass-Through Certificates, 5.720%, due 08/25/45 | $ | 1,416,899 | |||
| 7,499,891 | C, S | Washington Mutual Mortgage Pass-Through Certificates, 5.750%, due 02/25/36 | 7,563,822 | ||||
| 1,809,875 | C, S | Washington Mutual Mortgage Pass-Through Certificates, 5.773%, due 11/25/46 | 1,810,723 | ||||
| 902,823 | C | Washington Mutual Mortgage Pass-Through Certificates, 5.795%, due 06/25/44 | 906,150 | ||||
| 1,890,000 | C, S | Washington Mutual Mortgage Pass-Through Certificates, 5.800%, due 10/25/36 | 1,881,190 | ||||
| 821,899 | C | Washington Mutual Mortgage Pass-Through Certificates, 5.820%, due 01/25/18 | 824,442 | ||||
| 937,149 | C | Washington Mutual Mortgage Pass-Through Certificates, 5.900%, due 10/25/46 | 937,149 | ||||
| 435,133 | C | Washington Mutual Mortgage Pass-Through Certificates, 5.903%, due 06/25/46 | 435,847 | ||||
| 5,456,498 | C, S | Washington Mutual Mortgage Pass-Through Certificates, 5.923%, due 07/25/46 | 5,464,808 | ||||
| 1,804,881 | C, S | Washington Mutual Mortgage Pass-Through Certificates, | 1,806,856 | ||||
| 3,223,162 | C, S | Washington Mutual Mortgage Pass-Through Certificates, | 3,239,658 | ||||
| 2,045,000 | C, S | Washington Mutual Mortgage Pass-Through Certificates, 6.081%, due 09/25/36 | 2,057,704 | ||||
| 3,829,017 | C, S | Washington Mutual Mortgage Pass-Through Certificates, 6.290%, due 05/25/46 | 3,835,450 | ||||
| 2,028,000 | C, S | Washington Mutual, Inc., 3.801%, due 06/25/34 | 1,972,047 | ||||
| 1,922,104 | C, S | Washington Mutual, Inc., 5.633%, due 03/25/47 | 1,919,476 | ||||
| 2,003,965 | C, S | Washington Mutual, Inc., 5.646%, due 03/25/47 | 2,004,044 | ||||
| 400,000 | C | Washington Mutual, Inc., 5.746%, due 04/25/47 | 399,500 | ||||
| 580,000 | C | Washington Mutual, Inc., 5.753% due 04/25/47 | 580,000 | ||||
See Accompanying Notes to Financial Statements
74
Table of Contents
| ING INTERMEDIATE BOND FUND | PORTFOLIO OF INVESTMENTS ASOF MARCH 31, 2007 (CONTINUED) |
| Principal Amount | Value | ||||||
| COLLATERALIZED MORTGAGE OBLIGATIONS (continued) | |||||||
| $ 3,223,000 | C, S | Wells Fargo Mortgage-Backed Securities Trust, 3.500%, due 06/25/35 | $ | 3,166,430 | |||
| 8,623,000 | C, S | Wells Fargo Mortgage-Backed Securities Trust, 4.110%, due 06/25/35 | 8,476,007 | ||||
| 2,160,000 | C, S | Wells Fargo Mortgage-Backed Securities Trust, 4.500%, due 08/25/18 | 2,076,239 | ||||
| 3,625,000 | C, S | Wells Fargo Mortgage-Backed Securities Trust, 4.802%, due 07/25/34 | 3,552,992 | ||||
| 6,343,530 | C, S | Wells Fargo Mortgage-Backed Securities Trust, 5.386%, due 08/25/35 | 6,275,820 | ||||
| 4,557,098 | C, S | Wells Fargo Mortgage-Backed Securities Trust, 5.500%, due 01/25/36 | 4,462,397 | ||||
| 2,723,057 | C, S | Wells Fargo Mortgage-Backed Securities Trust, 5.500%, due 12/25/35 | 2,674,127 | ||||
| 9,818,836 | C, S | Wells Fargo Mortgage-Backed Securities Trust, 5.678%, due 12/25/36 | 9,853,265 | ||||
| 3,633,435 | C, S | Wells Fargo Mortgage-Backed Securities Trust, 5.950%, due 10/25/36 | 3,651,025 | ||||
| 4,163,721 | C, S | Wells Fargo Mortgage-Backed Securities Trust, 5.960%, due 11/25/36 | 4,183,877 | ||||
| 5,284,579 | C, S | Wells Fargo Mortgage-Backed Securities Trust, 6.000%, due 06/25/36 | 5,313,573 | ||||
Total Collateralized Mortgage Obligations | 395,003,355 | ||||||
| MUNICIPAL BONDS: 1.0% | |||||||
| California: 0.3% | |||||||
| 2,870,000 | C | City of San Diego, 7.125%, due 06/01/32 | 2,988,330 | ||||
| 2,988,330 | |||||||
| Louisiana: 0.3% | |||||||
| 3,846,000 | #, C | Tulane University of Louisiana, 6.174%, due 11/15/12 | 3,944,573 | ||||
| 3,944,573 | |||||||
| Michigan: 0.4% | |||||||
| 4,525,000 | Michigan Tobacco Settlement Finance Authority, 7.309%, due 06/01/34 | 4,734,462 | |||||
| 4,734,462 | |||||||
Total Municipal Bonds (Cost $11,287,878 ) | 11,667,365 | ||||||
| Principal Amount | Value | ||||||
| OTHER BONDS: 0.9% | |||||||
| Sovereign: 0.9% | |||||||
| ARS 12,426,000 | @@ | Argentina Bonos, 2.000%, due 09/30/14 | $ | 4,496,217 | |||
| $ 12,105,000 | @@ | Argentina Government International Bond, Discount Note, | 1,676,543 | ||||
| MXN 24,180,000 | @@ | Mexican Bonos, 8.000%, due 12/17/15 | 2,249,162 | ||||
| TRY 2,914,440 | @@ | Turkey Government International Bond, 10.000%, due 02/15/12 | 2,139,967 | ||||
Total Other Bonds (Cost $10,198,233 ) | 10,561,889 | ||||||
| Shares | Value | ||||||
| PREFERRED STOCK: 1.2% | |||||||
| Banks: 0.2% | |||||||
| 105,400 | @@, #, P | Santander Finance Preferred SA Unipersonal | $ | 2,605,362 | |||
| 2,605,362 | |||||||
| Diversified Financial Services: 0.3% | |||||||
| 125,050 | P | Merrill Lynch & Co., Inc. | 3,140,006 | ||||
| 3,140,006 | |||||||
| Insurance: 0.7% | |||||||
| 140,557 | @@, P | Aegon NV | 3,629,182 | ||||
| 54,306 | @@, P | Aegon NV - Series 1 | 1,397,836 | ||||
| 126,650 | P | Metlife, Inc. | 3,320,763 | ||||
| 8,347,781 | |||||||
Total Preferred Stock (Cost $13,874,889 ) | 14,093,149 | ||||||
| WARRANTS: 0.0% | |||||||
| Telecommunications: 0.0% | |||||||
| 20 | American Tower Corp. | 10,979 | |||||
Total Warrants | 10,979 | ||||||
Total Long-Term Investments (Cost $1,215,493,900) | 1,215,371,964 | ||||||
See Accompanying Notes to Financial Statements
75
Table of Contents
| ING INTERMEDIATE BOND FUND | PORTFOLIO OF INVESTMENTS ASOF MARCH 31, 2007 (CONTINUED) |
| Principal Amount | Value | ||||||
| SHORT-TERM INVESTMENTS: 14.4% | |||||||
| Mutual Fund: 2.6% | |||||||
| $ 30,000,000 | ** | ING Institutional Prime Money Market Fund | $ | 30,000,000 | |||
Total Mutual Fund (Cost $30,000,000) | 30,000,000 | ||||||
| Foreign Government Securities: 1.0% | |||||||
| JPY 330,000,000 | @@ | Japan Financing Bills, 0.566%, due 06/04/07 | 2,797,680 | ||||
| JPY 670,000,000 | @@ | Japan Financing Bills, 0.530%, due 05/28/07 | 5,680,778 | ||||
| JPY 330,000,000 | @@ | Japan Treasury Bill, 0.601%, due 11/02/07 | 2,789,858 | ||||
Total Foreign Government Securities (Cost $11,335,994) | 11,268,316 | ||||||
| Repurchase Agreement: 0.1% | |||||||
| $ 1,398,000 | Goldman Sachs Repurchase Agreement dated 03/30/07, 5.340%, due 04/02/07, $1,398,622 to be received upon repurchase (Collateralized by $1,393,000 U.S. Treasury, 1.625%, Market Value plus accrued interest $1,426,026, due 01/15/15) | 1,398,000 | |||||
Total Repurchase Agreement (Cost $1,398,000) | 1,398,000 | ||||||
| Securities Lending Collateralcc: 10.7% | |||||||||||
| 123,891,615 | The Bank of New York Institutional Cash Reserves Fund |
| 123,891,615 | ||||||||
Total Securities Lending Collateral |
| 123,891,615 | |||||||||
Total Short-Term Investments (Cost $166,625,609) |
| 166,557,931 | |||||||||
Total Investments in Securities |
| ||||||||||
(Cost $1,382,119,509)* | 119.6 | % | $ | 1,381,929,895 | |||||||
Other Assets and Liabilities - Net | (19.6 | ) | (226,486,045 | ) | |||||||
Net Assets | 100.0 | % | $ | 1,155,443,850 | |||||||
| @@ | Foreign Issuer |
| MASTR | Mortgage Asset Securitization Transaction, Inc. |
| # | Securities with purchases pursuant to Rule 144A, under the Securities Act of 1933 and may not be resold subject to that rule except to qualified institutional buyers. These securities have been determined to be liquid under the guidelines established by the Funds’ Board of Directors/Trustees. |
| C | Bond may be called prior to maturity date. |
| P | Preferred Stock may be called prior to convertible date. |
| cc | Securities purchased with cash collateral for securities loaned. |
| W | When-issued or delayed delivery security |
| S | Segregated securities for certain derivatives, when-issued or delayed delivery securities and forward currency exchange contracts. |
| I | Illiquid security |
| L | Loaned security, a portion or all of the security is on loan at March 31, 2007. |
| ** | Investment in affiliate |
| ^ | Interest Only (IO) Security. Rate shown reflects current effective yield. |
| * | Cost for federal income tax purposes is $1,382,466,203. |
Net unrealized depreciation consists of: | ||||
Gross Unrealized Appreciation | $ | 7,647,424 | ||
Gross Unrealized Depreciation | (8,183,732 | ) | ||
Net Unrealized Depreciation | $ | (536,308 | ) | |
Information concerning open future contracts for ING Intermediate Bond Fund at March 31, 2007 is shown below:
Contract Description | Number of Contracts | Notional Value ($) | Expiration Date | Unrealized Appreciation/ (Depreciation) | |||||||
Long Contracts | |||||||||||
90-Day Eurodollar | 924 | 218,837,850 | 06/18/07 | $ | 107,251 | ||||||
U.S. Treasury | 1,343 | 275,168,103 | 06/29/07 | (313,168 | ) | ||||||
U.S. Treasury | 297 | 31,421,673 | 06/29/07 | 58,063 | |||||||
U.S. Treasury 10-Year Note | 72 | 7,785,000 | 06/20/07 | (45,360 | ) | ||||||
| $ | (193,214 | ) | |||||||||
Short Contracts | |||||||||||
90-Day Eurodollar | 924 | (219,738,750 | ) | 12/17/07 | $ | (420,094 | ) | ||||
U.S. Treasury Long Bond | 200 | (22,250,000 | ) | 06/20/07 | 240,418 | ||||||
| $ | (179,676 | ) | |||||||||
See Accompanying Notes to Financial Statements
76
Table of Contents
| ING INTERMEDIATE BOND FUND | PORTFOLIO OF INVESTMENTS ASOF MARCH 31, 2007 (CONTINUED) |
Information concerning the Credit Default Swap Agreements outstanding for the ING Intermediate Bond Fund at March 31, 2007 is shown below:
Counterparty | Reference Entity/ Obligation | Buy/Sell Protection | (Pay)/Receive Fixed Rate | Termination Date | Notional Amount | Unrealized Appreciation/ (Depreciation) | |||||||||||
UBS AG | Bear Stearns Co., Inc. 5.300%, 10/30/15 | Sell | 0.240 | % | 03/20/12 | USD | 8,198,000 | $ | (40,636 | ) | |||||||
Citibank N.A., New York | Belo Corp., 8.000%, 11/01/08 | Buy | (0.800 | )% | 06/20/14 | USD | 2,172,000 | 9,183 | |||||||||
Citibank N.A., New York | Centurytel, Inc. 7.875%, 08/15/12 | Buy | (0.730 | )% | 09/20/12 | USD | 3,525,000 | (17,314 | ) | ||||||||
Citibank N.A., New York | Centurytel, Inc. 7.875%, 08/15/12 | Buy | (0.720 | )% | 09/20/12 | USD | 570,000 | (2,530 | ) | ||||||||
Merrill Lynch International | Centurytel, Inc. 7.875%, 08/15/12 | Buy | (0.740 | )% | 09/20/12 | USD | 1,342,000 | (10,039 | ) | ||||||||
Citibank N.A., New York | CMS Energy Corp. 6.875%, 12/15/15 | Sell | 0.820 | % | 03/20/12 | USD | 600,000 | (640 | ) | ||||||||
Merrill Lynch International | CMS Energy Corp. 6.875%, 12/15/15 | Sell | 0.840 | % | 03/20/12 | USD | 3,000,000 | 2,777 | |||||||||
UBS AG | Domtar, Inc. 7.875%, 10/15/11 | Sell | 2.600 | % | 09/20/11 | USD | 1,288,000 | 64,894 | |||||||||
Morgan Stanley Capital Services, Inc. | Domtar, Inc. 7.875%, 10/15/2011 | Buy | (2.650 | )% | 09/20/11 | USD | 1,287,500 | (65,345 | ) | ||||||||
Citibank N.A., New York | Dow Jones CDX.EM.6 Index | Buy | (1.400 | )% | 12/20/11 | USD | 3,865,000 | (29,009 | ) | ||||||||
Lehman Brothers Special | Dow Jones CDX.NA.HY.7 Index | Buy | (3.250 | )% | 12/20/11 | USD | 6,507,000 | 30,185 | |||||||||
UBS AG | Dow Jones CDX.NA.HY.7 Index | Buy | (3.250 | )% | 12/20/11 | USD | 3,940,200 | 33,656 | |||||||||
Citibank N.A., New York | Dow Jones CDX.NA.IG.6 Index (7-10% Tranche) | Sell | 1.0025 | % | 06/20/16 | USD | 7,646,400 | (46,834 | ) | ||||||||
Citibank N.A., New York | Dow Jones CDX.NA.IG.7 Index (30-100% Tranche) | Buy | (0.048 | )% | 12/20/16 | USD | 19,315,000 | 15,871 | |||||||||
Lehman Brothers Special | Dow Jones CDX.NA.IG.7 Index (30-100% Tranche) | Buy | (0.048 | )% | 12/20/16 | USD | 53,692,000 | 44,118 | |||||||||
Citibank N.A., New York | Dow Jones CDX.NA.IG.HVOL.7 Index | Buy | (0.750 | )% | 12/20/11 | USD | 10,767,200 | 42,489 | |||||||||
Goldman Sachs International | Dow Jones CDX.NA.IG.HVOL.7 Index | Buy | (0.750 | )% | 12/20/11 | USD | 25,982,000 | 28,039 | |||||||||
Lehman Brothers Special | Dow Jones CDX.NA.IG.HVOL.7 Index | Buy | (0.750 | )% | 12/20/11 | USD | 13,345,000 | 58,833 | |||||||||
Lehman Brothers Special | Dow Jones CDX.NA.IG.HVOL.7 Index | Buy | (0.750 | )% | 12/20/11 | USD | 26,564,000 | 150,623 | |||||||||
Citibank N.A., New York | Dow Jones CDX.NA.XO.7 Index | Buy | (1.650 | )% | 12/20/11 | USD | 11,662,000 | (7,013 | ) | ||||||||
Lehman Brothers Special | Dow Jones CDX.NA.XO.7 Index | Buy | (1.650 | )% | 12/20/11 | USD | 13,345,000 | 103,636 | |||||||||
UBS AG | Dow Jones CDX.NA.XO.7 Index | Buy | (1.650 | )% | 12/20/11 | USD | 12,469,000 | 87,696 | |||||||||
Citibank N.A., New York | Entergy Corp. 7.750%, 12/15/09 | Sell | 0.380 | % | 12/20/11 | USD | 4,343,000 | 3,178 | |||||||||
Lehman Brothers Special | Exelon Corp. 6.750%, 05/01/11 | Buy | (0.630 | )% | 06/20/12 | USD | 2,572,000 | 312 | |||||||||
Lehman Brothers Special | Exelon Corp. 6.750%, 05/01/11 | Buy | (0.640 | )% | 06/20/12 | USD | 2,572,000 | (719 | ) | ||||||||
Citibank N.A., New York | Gannett Co. 6.375%, 04/01/12 | Buy | (0.480 | )% | 06/20/14 | USD | 1,780,000 | 4,045 | |||||||||
Goldman Sachs International | Gannett Co. 6.375%, 04/01/12 | Buy | (0.480 | )% | 06/20/14 | USD | 2,574,000 | 10,555 | |||||||||
UBS AG | Goldman Sachs Group, Inc. 6.600%, 01/15/12 | Sell | 0.240 | % | 03/20/12 | USD | 8,198,000 | (22,760 | ) | ||||||||
Morgan Stanley Capital Services, Inc. | H.J. Heinz Co. 6.000%, 03/15/08 | Buy | (0.350 | )% | 09/20/11 | USD | 7,965,000 | (28,492 | ) | ||||||||
See Accompanying Notes to Financial Statements
77
Table of Contents
| ING INTERMEDIATE BOND FUND | PORTFOLIO OF INVESTMENTS ASOF MARCH 31, 2007 (CONTINUED) |
Counterparty | Reference Entity/ Obligation | Buy/Sell Protection | (Pay)/Receive Fixed Rate | Termination Date | Notional Amount | Unrealized Appreciation/ (Depreciation) | |||||||||||
Morgan Stanley Capital Services, Inc. | H.J. Heinz Co. 6.000%, 03/15/08 | Buy | (0.410 | )% | 09/20/11 | USD | 9,292,500 | $ | (55,847 | ) | |||||||
Morgan Stanley Capital Services, Inc. | HCA, Inc. LN Tranche Number: LN300285 | Buy | (1.700 | )% | 12/20/11 | USD | 2,708,000 | (54,718 | ) | ||||||||
Barclays Bank PLC | Kinder Morgan, Inc. 6.500%, 09/01/12 | Sell | 1.700 | % | 09/20/11 | USD | 515,000 | 19,756 | |||||||||
Merrill Lynch International | Kinder Morgan, Inc. 6.500%, 09/01/12 | Buy | (1.900 | )% | 09/20/11 | USD | 1,288,000 | (58,274 | ) | ||||||||
UBS AG | Kinder Morgan, Inc. 6.500%, 09/01/12 | Buy | (1.900 | )% | 09/20/11 | USD | 1,288,000 | (53,923 | ) | ||||||||
UBS AG | Lehman Brothers Holdings 6.625%, 01/18/12 | Sell | 0.240 | % | 03/20/12 | USD | 8,198,000 | (40,636 | ) | ||||||||
UBS AG | Morgan Stanley 6.600%, 04/01/12 | Sell | 0.260 | % | 03/20/12 | USD | 12,475,000 | (23,652 | ) | ||||||||
Barclays Bank PLC | Nisource Finance Corp. 7.875%, 11/15/10 | Sell | 0.410 | % | 03/20/12 | USD | 2,669,000 | 7,884 | |||||||||
Citibank N.A., New York | Nisource Finance Corp. 7.875%, 11/15/10 | Sell | 0.410 | % | 03/20/12 | USD | 1,253,000 | 2,605 | |||||||||
Merrill Lynch International | Nisource Finance Corp. 7.875%, 11/15/10 | Sell | 0.430 | % | 03/20/12 | USD | 2,669,000 | 7,939 | |||||||||
Credit Suisse First Boston | Norbord, Inc. 7.250%, 07/01/12 | Buy | (1.450 | )% | 06/20/14 | USD | 3,860,000 | 86,610 | |||||||||
JPMorgan Chase Bank N.A., New York | Norbord, Inc. 7.250%, 07/01/12 | Buy | (1.380 | )% | 06/20/14 | USD | 1,803,000 | 47,437 | |||||||||
Morgan Stanley Capital Services, Inc. | Norbord, Inc. 7.250%, 07/01/12 | Buy | (1.380 | )% | 06/20/14 | USD | 3,532,000 | 87,040 | |||||||||
UBS AG | Norbord, Inc. 7.250%, 07/01/12 | Buy | (1.360 | )% | 06/20/14 | USD | 1,449,000 | 43,816 | |||||||||
UBS AG | Rogers Wireless, Inc. 7.250%, 12/15/12 | Sell | 1.300 | % | 09/20/11 | USD | 2,568,000 | 93,372 | |||||||||
UBS AG | Russian Federation 5.000% Step, 03/31/30 | Sell | 0.310 | % | 08/20/07 | USD | 10,271,000 | 8,888 | |||||||||
UBS AG | Russian Federation 5.000% Step, 03/31/30 | Sell | 0.240 | % | 08/20/07 | USD | 6,267,000 | 2,814 | |||||||||
Goldman Sachs International | Temple-Inland, Inc. 7.875%, 05/01/12 | Buy | (1.040 | )% | 03/20/14 | USD | 872,000 | 5,927 | |||||||||
JPMorgan Chase Bank N.A., New York | Temple-Inland, Inc. 7.875%, 05/01/12 | Buy | (0.890 | )% | 03/20/14 | USD | 2,646,000 | 37,786 | |||||||||
JPMorgan Chase Bank N.A., New York | Temple-Inland, Inc. 7.875%, 05/01/12 | Buy | (1.020 | )% | 03/20/14 | USD | 2,493,000 | 24,643 | |||||||||
Morgan Stanley Capital Services, Inc. | Temple-Inland, Inc. 7.875%, 05/01/12 | Buy | (0.900 | )% | 03/20/14 | USD | 2,318,000 | 35,723 | |||||||||
UBS AG | Temple-Inland, Inc. 7.875%, 05/01/12 | Buy | (0.900 | )% | 03/20/14 | USD | 2,476,000 | 39,349 | |||||||||
Merrill Lynch International | Transocean, Inc. 7.375%, 04/15/18 | Buy | (0.330 | )% | 09/20/12 | USD | 2,855,000 | (6,815 | ) | ||||||||
UBS AG | Transocean, Inc. 7.375%, 04/15/18 | Buy | (0.340 | )% | 09/20/12 | USD | 2,850,000 | (7,720 | ) | ||||||||
Merrill Lynch International | TXU Energy Co. 7.000%, 03/15/13 | Buy | (1.200 | )% | 03/20/12 | USD | 3,911,000 | 36,070 | |||||||||
UBS AG | TXU Energy Co. 7.000%, 03/15/13 | Buy | (1.230 | )% | 03/20/12 | USD | 747,000 | 6,002 | |||||||||
Barclays Bank PLC | UST, Inc. 6.625%, 07/15/12 | Buy | (0.300 | )% | 03/20/14 | USD | 2,416,000 | (262 | ) | ||||||||
Bear Stearns Credit Products, Inc. | UST, Inc. 6.625%, 07/15/12 | Buy | (0.280 | )% | 03/20/14 | USD | 6,493,000 | (1,854 | ) | ||||||||
Bear Stearns Credit Products, Inc. | UST, Inc. 6.625%, 07/15/12 | Buy | (0.380 | )% | 03/20/17 | USD | 5,195,000 | 101 | |||||||||
Morgan Stanley Capital Services, Inc. | UST, Inc. 6.625%, 07/15/12 | Buy | (0.420 | )% | 03/20/17 | USD | 2,416,000 | (4,429 | ) | ||||||||
See Accompanying Notes to Financial Statements
78
Table of Contents
ING INTERMEDIATE BOND FUND | PORTFOLIO OF INVESTMENTS ASOF MARCH 31, 2007 (CONTINUED) |
Counterparty | Reference Entity/ Obligation | Buy/Sell Protection | (Pay)/Receive Fixed Rate | Termination Date | Notional Amount | Unrealized Appreciation/ (Depreciation) | |||||||||||
UBS AG | UST, Inc. 6.625%, 07/15/12 | Buy | (0.280 | )% | 03/20/14 | USD | 344,000 | $ | 526 | ||||||||
UBS AG | UST, Inc. 6.625%, 07/15/12 | Buy | (0.380 | )% | 03/20/17 | USD | 422,000 | 847 | |||||||||
Citibank N.A., New York | Weyerhaeuser Co. 6.750%, 03/15/12 | Buy | (0.580 | )% | 03/20/14 | USD | 461,000 | 5,446 | |||||||||
JPMorgan Chase Bank N.A., New York | Weyerhaeuser Co. 6.750%, 03/15/12 | Buy | (0.640 | )% | 03/20/14 | USD | 2,582,000 | 19,240 | |||||||||
Lehman Brothers Special Financing, Inc. | Weyerhaeuser Co. 6.750%, 03/15/12 | Buy | (0.570 | )% | 03/20/14 | USD | 2,646,000 | (5,446 | ) | ||||||||
Morgan Stanley Capital Services, Inc. | Weyerhaeuser Co. 6.750%, 03/15/12 | Buy | (0.600 | )% | 03/20/14 | USD | 4,904,000 | 34,550 | |||||||||
Morgan Stanley Capital Services, Inc. | Weyerhaeuser Co. 6.750%, 03/15/12 | Buy | (0.880 | )% | 03/20/17 | USD | 2,416,000 | 21,678 | |||||||||
Citibank N.A., New York | Williams Partners LP 7.500%, 06/15/11 | Sell | 1.030 | % | 03/20/12 | USD | 3,020,164 | 6,058 | |||||||||
UBS AG | XL Capital Ltd. 5.250%, 09/15/14 | Buy | (0.610 | )% | 09/20/16 | USD | 2,655,000 | (17,029 | ) | ||||||||
UBS AG | XL Capital Ltd. 5.250%, 09/15/14 | Buy | (0.610 | )% | 09/20/16 | USD | 5,310,000 | (34,057 | ) | ||||||||
| $ | 736,204 | ||||||||||||||||
See Accompanying Notes to Financial Statements
79
Table of Contents
| ING NATIONAL TAX-EXEMPT BOND FUND | PORTFOLIO OF INVESTMENTS ASOF MARCH 31, 2007 |
| Principal Amount | (Unaudited) Rating(1) | Value | |||||||
| MUNICIPAL BONDS: 98.3% | |||||||||
| Arizona: 3.8% | |||||||||
| $1,000,000 | C | Salt River Project Agricultural Improvement & Power District, 4.750%, due 01/01/35 | Aa1/AA | $ | 1,029,900 | ||||
| 1,029,900 | |||||||||
| California: 15.4% | |||||||||
| 350,000 | C | California Statewide Communities Development Authority, 5.500%, due 09/01/14 | Aaa/AAA | 380,713 | |||||
| 1,000,000 | C | Clovis Public Financing Authority, 5.000%, due 08/01/26 | Aaa/NR | 1,058,970 | |||||
| 1,000,000 | C | Golden State Tobacco Securitization Corp., 5.000%, due 06/01/33 | Baa3/BBB | 989,850 | |||||
| 1,000,000 | Pleasant Valley School District, | Aaa/AAA | 1,233,790 | ||||||
| 500,000 | C | San Marcos California Public Facility Authority Tax Allocation Reserve, 5.000%, due 08/01/21 | Aaa/AAA | 525,285 | |||||
| 4,188,608 | |||||||||
| Colorado: 3.9% | |||||||||
| 1,000,000 | C | Interlocken Metropolitan District, 5.750%, due 12/15/19 | NR/AA | 1,054,340 | |||||
| 1,054,340 | |||||||||
| Connecticut: 2.8% | |||||||||
| 185,000 | City of New Britain, | Aaa/AAA | 198,322 | ||||||
| 520,000 | C | Connecticut State Development Authority, | Aaa/AAA | 550,950 | |||||
| 749,272 | |||||||||
| Florida: 8.1% | |||||||||
| 750,000 | C | City of Gulf Breeze, | Aaa/AAA | 794,370 | |||||
| 250,000 | C | City of Tallahassee, | Baa2/NR | 266,893 | |||||
| 100,000 | C | County of Orange, | Aaa/AAA | 107,138 | |||||
| 500,000 | C | Florida State Board of Education, | Aa1/AAA | 533,575 | |||||
| 500,000 | C | Tampa Housing Authority, | NR/AAA | 510,340 | |||||
| 2,212,316 | |||||||||
| Principal Amount | (Unaudited) Rating(1) | Value | |||||||
| Illinois: 11.3% | |||||||||
| $1,000,000 | City of Chicago, | Aaa/AAA | $ | 1,032,020 | |||||
| 1,000,000 | C | De Kalb-Ogle Etc Counties Community College District | Aaa/NR | 1,054,660 | |||||
| 1,000,000 | C | Illinois Finance Authority, | NR/NR | 987,370 | |||||
| 3,074,050 | |||||||||
| New Hampshire: 2.8% | |||||||||
| 740,000 | C | New Hampshire Housing Finance Authority, | Aaa/NR | 752,247 | |||||
| 752,247 | |||||||||
| New Jersey: 3.7% | |||||||||
| 1,000,000 | C | New Jersey State Housing & Mortgage Finance Agency, | Aa2/AA | 1,003,750 | |||||
| 1,003,750 | |||||||||
| New Mexico: 2.0% | |||||||||
| 500,000 | C | New Mexico Finance Authority, | Aaa/AAA | 535,320 | |||||
| 535,320 | |||||||||
| New York: 18.2% | |||||||||
| 620,000 | Albany Industrial Development Agency, | NR/NR | 657,219 | ||||||
| 1,000,000 | C | City of New York, | A1/AA- | 1,054,640 | |||||
| 250,000 | C | Hudson Yards Infrastructure Corp., | A3/A | 262,080 | |||||
| 1,000,000 | C | New York State Dormitory Authority, | Aaa/AAA | 1,068,550 | |||||
| 1,000,000 | Port Authority of New York & New Jersey, | Aaa/AAA | 1,102,146 | ||||||
| 775,000 | C | Westchester County Industrial Development Agency, | NR/A | 794,631 | |||||
| 4,939,266 | |||||||||
See Accompanying Notes to Financial Statements
80
Table of Contents
| ING NATIONAL TAX-EXEMPT BOND FUND | PORTFOLIO OF INVESTMENTS ASOF MARCH 31, 2007 (CONTINUED) |
| Principal Amount | (Unaudited) Rating(1) | Value | |||||||
| North Carolina: 3.9% | |||||||||
| $ 295,000 | C | New Hanover County, | Aa2/AA | $ | 318,588 | ||||
| 710,000 | C | Raleigh North Carolina Certificates, | Aa2/AA+ | 744,414 | |||||
| 1,063,002 | |||||||||
| North Dakota: 0.9% | |||||||||
| 250,000 | C | Oliver County, | Aaa/AAA | 260,323 | |||||
| 260,323 | |||||||||
| Ohio: 0.2% | |||||||||
| 55,000 | Lakota Local School District, | Aaa/AAA | 61,261 | ||||||
| 61,261 | |||||||||
| Oklahoma: 8.0% | |||||||||
| 1,000,000 | C | Oklahoma Industries Authority, | Aaa/AAA | 1,058,708 | |||||
| 1,000,000 | C | Payne County Economic Development Authority, | Baa3/NR | 1,101,000 | |||||
| 2,159,708 | |||||||||
| Pennsylvania: 4.0% | |||||||||
| 1,000,000 | C | Lebanon County Health Facilities Authority, | Baa2/BBB | 1,085,690 | |||||
| 1,085,690 | |||||||||
| Rhode Island: 0.4% | |||||||||
| 35,000 | Dunns Corner Fire District, | NR/NR | 35,230 | ||||||
| 35,000 | Dunns Corner Fire District, | NR/NR | 36,607 | ||||||
| 35,000 | Dunns Corner Fire District, | NR/NR | 37,969 | ||||||
| 109,806 | |||||||||
| Principal Amount | (Unaudited) Rating(1) | Value | ||||||||
Texas: 7.8% | ||||||||||
| $ 500,000 | C | Alamo Community College District, | Aaa/AAA | $ | 530,310 | |||||
| 200,000 | C | Cleburne 4B Economic Development Corp., | Aaa/NR | 213,882 | ||||||
| 1,000,000 | C | Harris County Health Facilities Development Corp., | Aa3/AAA | 1,201,360 | ||||||
| 165,000 | C | Harris County-Houston Sports Authority, | Aaa/AAA | 167,381 | ||||||
| 2,112,933 | ||||||||||
| Virginia: 1.1% | ||||||||||
| 290,000 | C | Virginia Housing Development Authority, 4.500%, due 04/01/24 | Aaa/AAA | 288,466 | ||||||
| 288,466 | ||||||||||
Total Investments in Securities |
| |||||||||
(Cost $26,139,952)* | 98.3 | % | $ | 26,680,258 | ||||||
Other Assets and Liabilities - Net | 1.7 | 448,303 | ||||||||
Net Assets | 100.0 | % | $ | 27,128,561 | ||||||
| (1) | Credit ratings are provided by Moody’s Investor’s Service, Inc. and Standard’s and Poor’s Rating Group and are not audited. |
| C | Bond may be called prior to maturity date. |
| * | Cost for federal income tax purposes is the same as for financial statement purposes. |
Net unrealized appreciation consists of: | ||||
Gross Unrealized Appreciation | $ | 620,770 | ||
Gross Unrealized Depreciation | (80,464 | ) | ||
Net Unrealized Appreciation | $ | 540,306 | ||
See Accompanying Notes to Financial Statements
81
Table of Contents
| ING CLASSIC MONEY MARKET FUND(1) | PORTFOLIO OF INVESTMENTS ASOF MARCH 31, 2007 |
| Principal Amount | Value | ||||||
| CERTIFICATES OF DEPOSIT: 3.8% | |||||||
| $ 6,000,000 | Canadian Imperial Bank of Commerce, | $ | 5,999,527 | ||||
| 7,000,000 | Deutsche Bank AG, | 6,999,934 | |||||
| 3,000,000 | HBOS Treasury Services PLC, | 2,999,763 | |||||
| 20,000,000 | Mizuho Corporate Bank, | 20,000,000 | |||||
Total Certificates of Deposit | 35,999,224 | ||||||
| COLLATERALIZED MORTGAGE OBLIGATIONS: 2.7% | |||||||
| 6,000,000 | @@, #, C | Cheyne High Grade CDO Ltd., | 6,000,000 | ||||
| 5,400,000 | @@, C, I | Newcastle CDO Ltd., 5.350%, due 09/24/07 | 5,400,000 | ||||
| 5,400,000 | @@, C, I | Newcastle CDO Ltd., 5.350%, due 10/24/07 | 5,400,000 | ||||
| 9,000,000 | @@, #, C | Newcastle CDO Ltd., 5.350%, due 03/25/08 | 9,000,000 | ||||
Total Collateralized Mortgage Obligations (Cost $25,800,000) | 25,800,000 | ||||||
| COMMERCIAL PAPER: 39.3% | |||||||
| 2,000,000 | ANZ National, | 1,999,138 | |||||
| 5,000,000 | @@, # | ASB Finance Ltd., | 4,788,208 | ||||
| 16,000,000 | BHP Billiton Finance USA, | 15,931,818 | |||||
| 13,837,000 | Barton Capital Corp., | 13,822,655 | |||||
| 14,500,000 | Cargill Asia Pacific, | 14,482,922 | |||||
| 45,500,000 | # | Concord Minutemen Capital Co., | 45,309,833 | ||||
| 23,738,000 | Crown Point Capital Co., | 23,703,403 | |||||
| 8,000,000 | Crown Point Capital Co., | 7,987,044 | |||||
| 30,000,000 | @@, # | Duke Funding High Grade I Ltd., | 29,946,957 | ||||
| 7,500,000 | Master Funding, LLC, 5.300%, due 05/31/07 | 7,433,750 | |||||
| 45,519,000 | Monument Gardens Funding, LLC, | 45,175,745 | |||||
| 12,000,000 | Park Avenue Rece, | 11,968,321 | |||||
| 36,000,000 | Saint Germain Holdings Ltd., | 35,944,089 | |||||
| Principal Amount | Value | ||||||
| $ 9,000,000 | Swiss Re Financial Products, | $ | 8,966,969 | ||||
| 45,000,000 | Tulip Funding Corp., | 44,808,116 | |||||
| 13,500,000 | UBS Finance, | 13,368,353 | |||||
| 32,000,000 | # | Variable Funding Capital, | 31,948,324 | ||||
| 16,100,000 | Yorktown Capital, LLC, | 16,071,951 | |||||
Total Commercial Paper (Cost $373,657,596) | 373,657,596 | ||||||
| CORPORATE BONDS/NOTES: 47.8% | |||||||
| 2,000,000 | Alliance & Leicester, | 2,001,133 | |||||
| 5,300,000 | # | Allstate Life Global Funding II, | 5,300,012 | ||||
| 1,627,000 | Allstate Life Global GL, | 1,617,266 | |||||
| 4,000,000 | Allstate Life TR, | 4,000,507 | |||||
| 7,710,000 | American Express Bank, | 7,712,521 | |||||
| 2,200,000 | American Express Bank FSB, | 2,199,912 | |||||
| 4,945,000 | American Express Bank FSB, | 4,948,136 | |||||
| 4,000,000 | American Express Centurion, | 4,000,495 | |||||
| 2,710,000 | American Express Centurion, | 2,711,666 | |||||
| 9,500,000 | #, C | American General Finance, | 9,499,938 | ||||
| 14,518,000 | American General Finance, | 14,445,611 | |||||
| 3,500,000 | American General Finance, | 3,503,952 | |||||
| 3,000,000 | # | American Honda Finance, | 3,002,120 | ||||
| 4,425,000 | # | American Honda Finance, | 4,427,648 | ||||
| 4,600,000 | @@, # | Banco Santander Totta LN, | 4,600,285 | ||||
| 10,000,000 | Bank of America, N.A., | 9,999,961 | |||||
| 2,500,000 | Bank of America, N.A., | 2,500,000 | |||||
| 5,000,000 | Bank of America, N.A., | 4,999,688 | |||||
See Accompanying Notes to Financial Statements
82
Table of Contents
| ING CLASSIC MONEY MARKET FUND(1) | PORTFOLIO OF INVESTMENTS ASOF MARCH 31, 2007 (CONTINUED) |
| Principal Amount | Value | ||||||
| CORPORATE BONDS/NOTES (continued) | |||||||
| $ 3,750,000 | # | Bank of New York, Co., Inc., | $ | 3,750,000 | |||
| 2,500,000 | @@, # | Bank of Scotland TSY SRV, | 2,470,356 | ||||
| 3,013,000 | @@ | Bank of Scotland TSY SRV, | 3,013,024 | ||||
| 765,000 | Bank One, | 760,919 | |||||
| 1,000,000 | Bear Stearns Cos., Inc., | 1,008,925 | |||||
| 10,500,000 | Bear Stearns Cos., Inc., | 10,501,295 | |||||
| 5,725,000 | Bear Stearns Cos., Inc., | 5,725,000 | |||||
| 5,800,000 | Bear Stearns Cos., Inc., | 5,800,000 | |||||
| 4,427,000 | Bear Stearns Cos., Inc., | 4,428,562 | |||||
| 8,700,000 | Canadian Imperial Bank Comm, | 8,702,681 | |||||
| 8,000,000 | Citigroup Funding Inc., | 8,003,150 | |||||
| 1,650,000 | Credit Suisse FB USA, Inc., | 1,653,647 | |||||
| 10,000,000 | Credit Suisse, | 10,000,000 | |||||
| 8,600,000 | @@, # | Danske Bank A/S, | 8,599,083 | ||||
| 15,000,000 | @@, # | Duke Funding High Grade I Ltd., | 14,999,728 | ||||
| 11,890,000 | General Electric Capital Corp., | 11,892,326 | |||||
| 8,400,000 | General Electric Capital Corp., | 8,400,000 | |||||
| 10,000,000 | I | Goldman Sachs Group, Inc., | 10,000,000 | ||||
| 5,300,000 | # | Goldman Sachs Group, Inc., | 5,300,000 | ||||
| 9,000,000 | # | Goldman Sachs Group, Inc., | 9,004,451 | ||||
| 4,200,000 | @@, # | HBOS Treasury Services PLC, | 4,200,000 | ||||
| 16,085,000 | @@, # | HBOS Treasury Services PLC, | 16,087,734 | ||||
| 2,069,000 | HSBC Finance Corp., | 2,058,073 | |||||
| 5,181,000 | JPMorgan Chase & Co., | 5,179,846 | |||||
| 14,750,000 | Lehman Brothers Holdings, Inc., | 14,754,020 | |||||
| Principal Amount | Value | ||||||
| $13,075,000 | Lehman Brothers Holdings, Inc., | $ | 13,076,042 | ||||
| 4,000,000 | # | MBIA Global Funding, LLC, | 4,000,000 | ||||
| 18,500,000 | # | MBIA Global Funding, LLC, | 18,502,960 | ||||
| 4,500,000 | # | MBIA Global Funding, LLC, | 4,503,127 | ||||
| 20,500,000 | Merrill Lynch & Co., Inc., | 20,500,000 | |||||
| 5,000,000 | Morgan Stanley, | 5,001,309 | |||||
| 11,000,000 | Morgan Stanley, | 11,007,916 | |||||
| 12,000,000 | Morgan Stanley, | 12,000,000 | |||||
| 4,401,000 | C | Morgan Stanley, | 4,401,000 | ||||
| 3,000,000 | Morgan Stanley, | 3,001,500 | |||||
| 2,840,000 | Morgan Stanley, | 2,843,420 | |||||
| 8,500,000 | Natexis Banq Populair, | 8,498,870 | |||||
| 7,500,000 | Royal Bank of Canada, | 7,499,021 | |||||
| 10,000,000 | Royal Bank of Canada, | 10,000,000 | |||||
| 4,000,000 | Royal Bank of Scotland, | 3,995,814 | |||||
| 3,500,000 | @@, # | Santander US Debt SA UNI, | 3,500,576 | ||||
| 2,100,000 | @@, # | Santander US Debt SA UNI, | 2,100,434 | ||||
| 1,000,000 | Southtrust Bank NA, | 1,000,134 | |||||
| 3,000,000 | Suntrust Bank Sti Float, | 2,999,390 | |||||
| 16,000,000 | Toronto Dominion Bank, | 16,000,000 | |||||
| 10,000,000 | Toyota Motor Credit Corp., | 10,000,000 | |||||
| 7,000,000 | Washington Mutual Bank, | 6,999,763 | |||||
| 11,000,000 | Washington Mutual Bank, | 11,003,020 | |||||
| 3,300,000 | Westpac Banking Corp., | 3,300,000 | |||||
Total Corporate Bonds/Notes | 453,497,967 | ||||||
See Accompanying Notes to Financial Statements
83
Table of Contents
| ING CLASSIC MONEY MARKET FUND(1) | PORTFOLIO OF INVESTMENTS ASOF MARCH 31, 2007 (CONTINUED) |
| Principal Amount | Value | |||||||||
| REPURCHASE AGREEMENTS: 6.0% | ||||||||||
| $56,648,000 | Goldman Sachs Repurchase Agreement dated 03/30/07, |
| $ | 56,648,000 | ||||||
Total Repurchase Agreements (Cost $56,648,000) |
| 56,648,000 | ||||||||
Total Investments in Securities | ||||||||||
(Cost $945,602,787)* | 99.6 | % | $ | 945,602,787 | ||||||
Other Assets and | 0.4 | 3,698,323 | ||||||||
Net Assets | 100.0% | $ | 949,301,110 | |||||||
| (1) | All securities with a maturity date of greater than 13 months have either a variable rate, a demand feature, prerefunded, optional or mandatory put resulting in an effective maturity of one year or less. Rate shown reflects current rate. |
| CDO | Collateralized Debt Obligations |
| @@ | Foreign Issuer |
| # | Securities with purchases pursuant to Rule 144A, under the Securities Act of 1933 and may not be resold subject to that rule except to qualified institutional buyers. These securities have been determined to be liquid under the guidelines established by the Funds’ Board of Directors/Trustees. |
| C | Bond may be called prior to maturity date. |
| I | Illiquid security |
| * | Cost for federal income tax purposes is the same as for financial statement purposes. |
See Accompanying Notes to Financial Statements
84
Table of Contents
| ING INSTITUTIONAL PRIME MONEY MARKET FUND(1) | PORTFOLIO OF INVESTMENTS ASOF MARCH 31, 2007 |
| Principal Amount | Value | ||||||
| CERTIFICATES OF DEPOSIT: 6.8% | |||||||
| $ 2,080,000 | Abbey National Treasury Services, | $ | 2,079,960 | ||||
| 3,000,000 | Barclays Bank PLC, | 3,000,109 | |||||
| 1,000,000 | Canadian Import Bank Co., | 999,793 | |||||
| 4,000,000 | Deutsche Bank AG, | 3,999,962 | |||||
| 14,000,000 | HBOS Treasury Services PLC, | 14,000,540 | |||||
| 10,000,000 | Mizuho Corporate Bank, | 10,000,000 | |||||
| 11,000,000 | Rabobank Nederland NV, | 10,999,010 | |||||
| 1,000,000 | Royal Bank of Scotland, | 998,789 | |||||
| 1,000,000 | Societe Generale, | 998,189 | |||||
| 1,000,000 | Toronto Dominion Bank, | 999,739 | |||||
| 1,000,000 | UBS AG, | 998,380 | |||||
Total Certificates of Deposit | 49,074,471 | ||||||
| COLLATERALIZED MORTGAGE OBLIGATIONS: 1.4% | |||||||
| 2,000,000 | @@, #, C | Cheyne High Grade CDO Ltd., | 2,000,000 | ||||
| 8,500,000 | @@, #, C | Newcastle CDO Ltd., 5.350%, due 03/25/08 | 8,500,000 | ||||
Total Collateralized Mortgage Obligations | 10,500,000 | ||||||
| COMMERCIAL PAPER: 47.8% | |||||||
| 2,600,000 | Alliance & Leicester PLC, | 2,596,568 | |||||
| 2,750,000 | ANZ National, | 2,748,820 | |||||
| 4,350,000 | ASB Finance Ltd., | 4,305,339 | |||||
| 21,559,000 | Barton Capital Corp., | 21,529,027 | |||||
| 20,000,000 | BHP Billiton Finance USA, | 19,914,772 | |||||
| 500,000 | BNP Paribas, | 497,718 | |||||
| 1,153,000 | Cafco, LLC, | 1,150,125 | |||||
| 10,600,000 | Cargill, | 10,587,516 | |||||
| 1,000,000 | Concord Minutemen Capital Co., LLC — Series A, | 993,413 | |||||
| Principal Amount | Value | ||||||
| $20,739,000 | # | Concord Minutemen Capital Co., LLC — Series C, | $ | 20,695,535 | |||
| 22,000,000 | Crown Point Capital Co., | 21,980,768 | |||||
| 5,000,000 | Duke Funding High Grade I Ltd., | 4,986,040 | |||||
| 3,988,000 | Edison Asset Securitization Corp., | 3,958,607 | |||||
| 500,000 | General Electric Capital Corp., | 498,601 | |||||
| 16,724,000 | Greenwich Capital Holdings, | 16,721,482 | |||||
| 800,000 | HBOS Treasury Services PLC, | 798,243 | |||||
| 2,800,000 | IXIS, | 2,772,101 | |||||
| 5,000,000 | Master Funding, LLC, | 4,955,833 | |||||
| 10,000,000 | Monument Gardens, LLC, | 9,920,974 | |||||
| 11,489,000 | Old Line Funding, LLC, | 11,455,267 | |||||
| 26,704,000 | Park Avenue Receivables Corp., | 26,647,374 | |||||
| 1,000,000 | Societe Generale, | 988,457 | |||||
| 25,398,000 | St. Germain Holdings Ltd., | 25,354,421 | |||||
| 15,000,000 | Swiss Re Financial Products, | 14,944,948 | |||||
| 10,003,000 | Three Pillars Funding Corp., | 9,975,645 | |||||
| 20,354,000 | Thunder Bay Funding, LLC, | 20,305,691 | |||||
| 10,000,000 | Tulip Funding Corp., | 9,957,225 | |||||
| 14,666,000 | UBS Finance, | 14,550,549 | |||||
| 21,950,000 | Variable Funding Capital Corp., | 21,894,340 | |||||
| 1,000,000 | Westpac Banking Corp., | 995,633 | |||||
| 900,000 | Westpac Securities, | 896,958 | |||||
| 8,312,000 | Windmill Funding, | 8,294,042 | |||||
| 28,266,000 | Yorktown Capital, LLC, 5.260%, due 04/16/07 | 28,203,997 | |||||
Total Commercial Paper | 346,076,029 | ||||||
See Accompanying Notes to Financial Statements
85
Table of Contents
| ING INSTITUTIONAL PRIME MONEY MARKET FUND(1) | PORTFOLIO OF INVESTMENTS ASOF MARCH 31, 2007 (CONTINUED) |
| Principal Amount | Value | ||||||
| CORPORATE BONDS/NOTES: 33.8% | |||||||
| $ 9,200,000 | @@ | Abbey National North America, LLC, | $ | 9,200,940 | |||
| 2,500,000 | Allstate Life, | 2,500,317 | |||||
| 13,000,000 | American Express Bank FSB, | 13,001,610 | |||||
| 1,300,000 | American Express Bank FSB, | 1,300,182 | |||||
| 2,000,000 | American Express Bank FSB, | 2,000,662 | |||||
| 4,350,000 | American General Finance Corp., | 4,329,098 | |||||
| 1,000,000 | #, C | American General Finance Corp., | 999,987 | ||||
| 2,000,000 | American General Finance Corp., | 2,000,018 | |||||
| 12,000,000 | American General Finance Corp., | 12,006,480 | |||||
| 1,000,000 | # | American Honda Finance Corp., | 1,000,702 | ||||
| 3,500,000 | @@, # | Banco Santander, | 3,500,217 | ||||
| 9,800,000 | Bank of America, N.A., | 9,799,994 | |||||
| 4,047,000 | @@ | Bank of Scotland, | 4,047,032 | ||||
| 4,395,000 | Bear Stearns Cos., Inc., | 4,348,398 | |||||
| 500,000 | Bear Stearns Cos., Inc., | 500,000 | |||||
| 10,000,000 | Canadian Import Bank Co., | 10,003,083 | |||||
| 1,000,000 | Caterpillar Financial Services, | 1,000,681 | |||||
| 5,000,000 | Citigroup Funding, Inc., | 5,001,969 | |||||
| 5,000,000 | Credit Suisse, | 5,000,000 | |||||
| 10,000,000 | @@, # | Danske Bank A/S, | 9,998,934 | ||||
| 1,547,000 | General Electric Capital Corp., | 1,548,032 | |||||
| 519,000 | General Electric Capital Corp., | 519,173 | |||||
| 1,000,000 | I | Goldman Sachs Group, Inc., | 1,000,000 | ||||
| Principal Amount | Value | ||||||
| $ 4,000,000 | # | Goldman Sachs Group, Inc., | $ | 4,001,236 | |||
| 1,500,000 | Goldman Sachs Group, Inc., | 1,505,991 | |||||
| 1,000,000 | @@, # | HBOS Treasury Services PLC, | 993,381 | ||||
| 1,500,000 | @@, # | HBOS Treasury Services PLC, | 1,500,483 | ||||
| 1,000,000 | @@, # | HBOS Treasury Services PLC, | 994,619 | ||||
| 1,000,000 | HSBC Finance Corp., | 994,719 | |||||
| 1,000,000 | HSBC Finance Corp., | 1,002,520 | |||||
| 5,600,000 | HSBC Finance Corp., | 5,600,355 | |||||
| 1,800,000 | HSBC Finance Corp., | 1,794,675 | |||||
| 5,000,000 | HSBC Finance Corp., | 5,002,724 | |||||
| 4,006,000 | Lehman Brothers Holdings, Inc., | 3,966,815 | |||||
| 650,000 | Lehman Brothers Holdings, Inc., | 650,064 | |||||
| 5,500,000 | Lehman Brothers Holdings, Inc., | 5,500,428 | |||||
| 1,200,000 | Morgan Stanley, | 1,200,314 | |||||
| 8,000,000 | Morgan Stanley, | 8,005,553 | |||||
| 4,870,000 | Morgan Stanley, | 4,875,516 | |||||
| 2,000,000 | # | MBIA Global Funding, LLC, | 2,000,000 | ||||
| 13,500,000 | # | MBIA Global Funding, LLC, | 13,502,160 | ||||
| 2,000,000 | # | MBIA Global Funding, LLC, | 2,001,390 | ||||
| 3,000,000 | Merrill Lynch & Co., Inc., | 3,000,000 | |||||
| 1,400,000 | Merrill Lynch & Co., Inc., | 1,400,351 | |||||
| 800,000 | Merrill Lynch & Co., Inc., | 800,209 | |||||
| 10,000,000 | Natixis SA, | 9,998,671 | |||||
| 4,500,000 | Royal Bank of Canada, | 4,499,412 | |||||
| 5,250,000 | Royal Bank of Canada, | 5,250,000 | |||||
| 2,600,000 | @@, # | Royal Bank of Scotland Group PLC, | 2,600,365 | ||||
See Accompanying Notes to Financial Statements
86
Table of Contents
| ING INSTITUTIONAL PRIME MONEY MARKET FUND(1) | PORTFOLIO OF INVESTMENTS ASOF MARCH 31, 2007 (CONTINUED) |
| Principal Amount | Value | ||||||
| CORPORATE BONDS/NOTES (continued) | |||||||
| $ 5,000,000 | @@, # | Royal Bank of Scotland Group PLC, | $ | 4,996,108 | |||
| 6,500,000 | @@, # | Santander S/A, | 6,501,318 | ||||
| 800,000 | Societe Generale, | 799,837 | |||||
| 6,000,000 | Suntrust Bank, | 5,999,950 | |||||
| 1,000,000 | Suntrust Bank, | 1,000,012 | |||||
| 1,000,000 | Suntrust Bank, | 999,089 | |||||
| 5,000,000 | Toyota Motor Credit Corp., 5.310%, due 04/26/07 | 5,000,000 | |||||
| 10,000,000 | US Bank, | 10,002,942 | |||||
| 6,000,000 | Wachovia Corp., | 6,002,022 | |||||
| 3,000,000 | Washington Mutual Bank, 5.340%, due 09/17/07 | 2,999,898 | |||||
| 1,100,000 | C | Wells Fargo & Co., | 1,091,058 | ||||
| 2,000,000 | Westpac Banking Corp., 5.320%, due 01/15/08 | 1,999,513 | |||||
Total Corporate Bonds/Notes | 244,641,207 | ||||||
| Principal Amount | Value | |||||||||
| REPURCHASE AGREEMENTS: 10.2% | ||||||||||
| $73,790,000 | Deutsche Bank Repurchase Agreement date 03/30/07, 5.330%, due 04/02/07 $73,822,775 to be received upon repurchase (Collateralized by $75,461,000 various U.S. Government Agency obligations, 4.375%-4.625%, Market value plus accrued interest $75,268,730 due 03/17/10-05/01/13). |
| $ | 73,790,000 | ||||||
Total Repurchase Agreements |
| 73,790,000 | ||||||||
Total Investments in Securities |
| |||||||||
(Cost $724,081,707)* | 100.0 | % | $ | 724,081,707 | ||||||
Other Assets and Liabilities - Net | 0.0 | 248,102 | ||||||||
Net Assets | 100.0 | % | $ | 724,329,809 | ||||||
| (1) | All securities with a maturity date of greater than 13 months have either a variable rate, a demand feature, prerefunded, optional or mandatory put resulting in an effective maturity of one year or less. Rate shown reflects current rate. |
| CDO | Collateralized Debt Obligations |
| @@ | Foreign Issuer |
| # | Securities with purchases pursuant to Rule 144A, under the Securities Act of 1933 and may not be resold subject to that rule except to qualified institutional buyers. These securities have been determined to be liquid under the guidelines established by the Funds’ Board of Directors/Trustees. |
| C | Bond may be called prior to maturity date. |
| I | Illiquid security |
| * | Cost for federal income tax purposes is the same as for financial statement purposes. |
See Accompanying Notes to Financial Statements
87
Table of Contents
TAX INFORMATION (UNAUDITED)
Dividends paid during the year ended March 31, 2007 were as follows:
Fund Name | Type | Per Share Amount | |||
ING GNMA Income Fund | |||||
Class A | NII | $ | 0.4110 | ||
Class B | NII | $ | 0.3499 | ||
Class C | NII | $ | 0.3509 | ||
Class I | NII | $ | 0.4365 | ||
Class M(1) | NII | $ | 0.3152 | ||
Class Q | NII | $ | 0.4151 | ||
ING High Yield Bond Fund | |||||
Class A | NII | $ | 0.6033 | ||
Class B | NII | $ | 0.5366 | ||
Class C | NII | $ | 0.5359 | ||
ING Intermediate Bond Fund | |||||
Class A | NII | $ | 0.4957 | ||
Class B | NII | $ | 0.4176 | ||
Class C | NII | $ | 0.4188 | ||
Class I | NII | $ | 0.5282 | ||
Class O | NII | $ | 0.4946 | ||
Class R | NII | $ | 0.4692 | ||
ING National Tax-Exempt Bond Fund | |||||
Class A | NII | $ | 0.0123 | ||
Class B | NII | $ | 0.0099 | ||
Class C | NII | $ | 0.0099 | ||
Class A | TEI | $ | 0.3829 | ||
Class B | TEI | $ | 0.3080 | ||
Class C | TEI | $ | 0.3076 | ||
All Classes | STCG | $ | 0.0180 | ||
All Classes | LTCG | $ | 0.0538 | ||
ING Classic Money Market Fund | |||||
Class A | NII | $ | 0.0453 | ||
Class B | NII | $ | 0.0393 | ||
Class C | NII | $ | 0.0392 | ||
ING Institutional Prime Money Market Fund | NII | $ | 0.0512 | ||
NII - Net investment income
TEI - Tax-exempt income
STCG - Short-term capital gain
LTCG - Long-term capital gain
(1) | Effective January 2, 2007, Class M shareholders of ING GNMA Income Fund were converted to Class A shares of the Fund. |
Pursuant to Internal Revenue Code Section 871(k)(1), the Funds designate the following percentages of net investment income distributions as interest-related dividends:
ING GNMA Income Fund | 98.60 | % | |
ING High Yield Bond Fund | 99.65 | % | |
ING Intermediate Bond Fund | 97.08 | % | |
ING National Tax-Exempt Bond Fund | 100.00 | % | |
ING Classic Money Market Fund | 100.00 | % | |
ING Institutional Prime Money Market Fund | 99.98 | % | |
88
Table of Contents
TAX INFORMATION (UNAUDITED) (CONTINUED)
Pursuant to Internal Revenue Code Section 871(k)(2), ING National Tax-Exempt Bond Fund designates $0.0180 per share as short-term capital gain dividends.
Above figures may differ from those cited elsewhere in this report due to differences in the calculation of income and gains under U.S. generally accepted accounting principles (book) purposes and Internal Revenue Service (tax) purposes.
Shareholders are strongly advised to consult their own tax advisers with respect to the tax consequences of their investments in the Funds. In January, shareholders, excluding corporate shareholders, receive an IRS 1099-DIV regarding the federal tax status of the dividends and distributions they received in the calendar year.
89
Table of Contents
TRUSTEE AND OFFICER INFORMATION (UNAUDITED)
The business and affairs of the Trust are managed under the direction of the Board. A Trustee who is not an interested person of the Trust, as defined in the 1940 Act, is an independent trustee (“Independent Trustee”). The Trustees and Officers of the Trust are listed below. The Statement of Additional Information includes additional information about trustees of the trust, and is available, without charge, upon request at (800) 992-0180.
Name, Address and Age | Position(s) | Term of Office | Principal Occupation(s) during the Past Five Years | Number of Funds in Fund Complex Overseen by Trustee | Other Directorships | |||||
Independent Trustees: | ||||||||||
John V. Boyer(2) 7337 E. Doubletree Ranch Rd. Scottsdale, Arizona 85258 Age: 53 | Trustee | January 2005 - Present | President and Chief Executive Officer, Franklin and Eleanor Roosevelt Institute (March 2006 - Present). Formerly, Executive Director, The Mark Twain House & Museum(3) (September 1989 - November 2005). | 174 | None | |||||
Patricia W. Chadwick(2) 7337 E. Doubletree Ranch Rd. Scottsdale, Arizona 85258 Age: 58 | Trustee | January 2006 - Present | Consultant and President of self-owned company, Ravengate Partners LLC (January 2000 - Present). | 174 | Wisconsin Energy (June 2006 - Present). | |||||
J. Michael Earley(3) 7337 E. Doubletree Ranch Rd. Scottsdale, Arizona 85258 Age: 61 | Trustee | February 2002 - Present | President, Chief Executive Officer and Director, Bankers Trust Company, N.A. Des Moines (June 1992 - Present). | 174 | Midamerica Financial Corporation (December 2002 - Present). | |||||
R. Barbara Gitenstein(2) 7337 E. Doubletree Ranch Rd. Scottsdale, Arizona 85258 Age: 59 | Trustee | February 2002 - Present | President, College of New Jersey (January 1999 - Present). | 174 | None | |||||
Patrick W. Kenny(3) 7337 E. Doubletree Ranch Rd. Scottsdale, Arizona 85258 Age: 64 | Trustee | January 2005 - Present | President and Chief Executive Officer, International Insurance Society (June 2001 - Present). | 174 | Assured Guaranty Ltd. (April 2004 - Present); and Odyssey Reinsurance Holdings (November 2006 - Present). | |||||
Jock Patton(2) 7337 E. Doubletree Ranch Rd. Scottsdale, Arizona 85258 Age: 61 | Chairman and Trustee | February 2001 - Present | Private Investor (June 1997 - Present). | 174 | JDA Software Group, Inc. (January 1999 - Present); and Swift Transportation Co. (March 2004 - Present). | |||||
Sheryl K. Pressler(3) 7337 E. Doubletree Ranch Rd. Scottsdale, Arizona 85258 Age: 56 | Trustee | January 2006 - Present | Consultant (May 2001 - Present). | 174 | Stillwater Mining Company (May 2002 - Present); California Healthcare Foundation (June 1999 - Present); and Romanian-American Enterprise Fund (February 2004 - Present). | |||||
David W.C. Putnam(3) 7337 E. Doubletree Ranch Rd. Scottsdale, Arizona 85258 Age: 67 | Trustee | March 2001 - Present | Chair, Board of Directors and President, F.L. Putnam Securities Company, Inc. (June 1978 - Present). | 174 | Principled Equity Market Trust (December 1996 - Present); and Asian American Bank and Trust Company (June 1993 - Present). | |||||
Roger B. Vincent(3) 7337 E. Doubletree Ranch Rd. Scottsdale, Arizona 85258 Age: 61 | Trustee | February 2002 - Present | President, Springwell Corporation (March 1989 - Present). | 174 | UGI Corporation (February 2006 - Present); and UGI Utilities, Inc. (February 2006 - Present). | |||||
90
Table of Contents
TRUSTEE AND OFFICER INFORMATION (UNAUDITED) (CONTINUED)
Name, Address and Age | Position(s) | Term of Office | Principal Occupation(s) during the Past Five Years | Number of Funds in Fund Complex Overseen by Trustee | Other Directorships | |||||
Trustee who is an “Interested Person”: | ||||||||||
John G. Turner(4) 7337 E. Doubletree Ranch Rd. Scottsdale, Arizona 85258 Age: 67 | Trustee | March 2001 - Present | Retired. | 174 | Hormel Foods Corporation (March 2000 - Present); and Conseco, Inc. (September 2003 - Present). | |||||
(1) | Trustees serve until their successors are duly elected and qualified, subject to the Board’s retirement policy. |
(2) | Valuation, Proxy and Brokerage Committee member. |
(3) | Audit Committee member. |
(4) | Mr. Turner is an “interested person,” as defined under the 1940 Act, because of his affiliation with ING Groep, the parent corporation of the Investment Adviser, ING Investments, LLC and the Distributor, ING Funds Distributor, LLC. |
91
Table of Contents
TRUSTEE AND OFFICER INFORMATION (UNAUDITED) (CONTINUED)
Name, Address and Age | Position(s) Held | Term of Office | Principal Occupation(s) | |||
Officers: | ||||||
| Shaun P. Mathews 7337 E. Doubletree Ranch Rd. Scottsdale, Arizona 85258 Age: 51 | President and Chief Executive Officer | November 2006 - Present | President and Chief Executive Officer, ING Investments, LLC and ING Funds Services, LLC (December 2006 - Present); and Head of ING USFS Mutual Funds and Investment Products (October 2004 - Present). Formerly, CMO, ING USFS (April 2002 - October 2004); and Head of Rollover/Payout (October 2001 - December 2003). | |||
| Michael J. Roland 7337 E. Doubletree Ranch Rd. Scottsdale, Arizona 85258 Age: 48 | Executive Vice President | February 2002 - Present | Head of Mutual Fund Platform (February 2007 - Present); and Executive Vice President, ING Investments, LLC and ING Funds Services, LLC (December 2001 - Present). Formerly, Head of Product Management (January 2005 - January 2007); Chief Compliance Officer, ING Investments, LLC and Directed Services, LLC (October 2004 - December 2005); and Chief Financial Officer and Treasurer, ING Investments, LLC (December 2001 - March 2005). | |||
| Stanley D. Vyner 230 Park Ave. New York, New York 10169 Age: 56 | Executive Vice President | October 2000 - Present | Executive Vice President, ING Investments, LLC (July 2000 - Present); and Chief Investment Risk Officer, ING Investments, LLC (January 2003 - Present). Formerly, Chief Investment Officer of International Investments (August 2000 - January 2003). | |||
| Joseph M. O’Donnell 7337 E. Doubletree Ranch Rd. Scottsdale, Arizona 85258 Age: 52 | Chief Compliance Officer and Executive Vice President | November 2004 - Present March 2006 - Present | Chief Compliance Officer of the ING Funds (November 2004 - Present), ING Investments, LLC and Directed Services, LLC (March 2006 - Present); and Executive Vice President of the ING Funds (March 2006 - Present). Formerly, Chief Compliance Officer of ING Life Insurance and Annuity Company (March 2006 - December 2006); Vice President, Chief Legal Counsel, Chief Compliance Officer and Secretary of Atlas Securities, Inc., Atlas Advisers, Inc. and Atlas Funds (October 2001 - October 2004). | |||
| Robert S. Naka 7337 E. Doubletree Ranch Rd. Scottsdale, Arizona 85258 Age: 43 | Executive Vice President and Chief Operating Officer Assistant Secretary | March 2006 - Present October 2000 - Present | Executive Vice President and Chief Operating Officer, ING Funds Services, LLC and ING Investments, LLC (March 2006 - Present); and Assistant Secretary, ING Funds Services, LLC (October 2001 - Present). Formerly, Senior Vice President, ING Investments, LLC (August 1999 - March 2006). | |||
| Todd Modic 7337 E. Doubletree Ranch Rd. Scottsdale, Arizona 85258 Age: 39 | Senior Vice President, Chief, Principal Financial Officer and Assistant Secretary | March 2005 - Present | Senior Vice President, ING Funds Services, LLC (April 2005 - Present). Formerly, Vice President, ING Funds Services, LLC (September 2002 - March 2005); and Director of Financial Reporting, ING Investments, LLC (March 2001 - September 2002). | |||
Kimberly A. Anderson 7337 E. Doubletree Ranch Rd. Scottsdale, Arizona 85258 Age: 42 | Senior Vice President | November 2003 - Present | Senior Vice President, ING Investments, LLC (October 2003 - Present). Formerly, Vice President and Assistant Secretary, ING Investments, LLC (January 2001 - October 2003). | |||
Ernest J. C’DeBaca 7337 E. Doubletree Ranch Rd. Scottsdale, Arizona 85258 Age: 37 | Senior Vice President | May 2006 - Present | Senior Vice President, ING Investments, LLC (December 2006 - Present); and ING Funds Services, LLC (April 2006 - Present). Formerly, Counsel, ING Americas, U.S. Legal Services (January 2004 - March 2006); and Attorney-Adviser, U.S. Securities and Exchange Commission (May 2001 - December 2003). | |||
Robert Terris 7337 E. Doubletree Ranch Rd. Scottsdale, Arizona 85258 Age: 36 | Senior Vice President | May 2006 - Present | Senior Vice President, Head of Division Operations, ING Funds (May 2006 - Present); and Vice President, Head of Division Operations, ING Funds Services, LLC (March 2006 - Present). Formerly, Vice President of Administration, ING Funds Services, LLC (October 2001 - March 2006). | |||
Robyn L. Ichilov 7337 E. Doubletree Ranch Rd. Scottsdale, Arizona 85258 Age: 39 | Vice President Treasurer | October 2000 - Present March 2001 - Present | Vice President and Treasurer, ING Funds Services, LLC (October 2001 - Present) and ING Investments, LLC (August 1997 - Present). | |||
Lauren D. Bensinger 7337 E. Doubletree Ranch Rd. Scottsdale, Arizona 85258 Age: 53 | Vice President | February 2003 - Present | Vice President and Chief Compliance Officer, ING Funds Distributor, LLC (July 1995 - Present); and Vice President (February 1996 - Present); and Director of Compliance, ING Investments, LLC (October 2004 - - Present). Formerly, Chief Compliance Officer, ING Investments, LLC (October 2001 - October 2004). | |||
92
Table of Contents
TRUSTEE AND OFFICER INFORMATION (UNAUDITED) (CONTINUED)
Name, Address and Age | Position(s) Held | Term of Office | Principal Occupation(s) | |||
Maria M. Anderson 7337 E. Doubletree Ranch Rd. Scottsdale, Arizona 85258 Age: 48 | Vice President | September 2004 - Present | Vice President, ING Funds Services, LLC (September 2004 - Present). Formerly, Assistant Vice President, ING Funds Services, LLC (October 2001 - September 2004); and Manager of Fund Accounting and Fund Compliance, ING Investments, LLC (September 1999 - October 2001). | |||
Denise Lewis 7337 E. Doubletree Ranch Rd. Scottsdale, Arizona 85258 Age: 43 | Vice President | January 2007 - Present | Vice President, ING Funds Services, LLC (December 2006 - Present). Formerly, Senior Vice President, UMB Investment Services Group, LLC (November 2003 - December 2006); and Vice President, Wells Fargo Funds Management, LLC (December 2000 - August 2003). | |||
Kimberly K. Palmer 7337 E. Doubletree Ranch Rd. Scottsdale, Arizona 85258 Age: 49 | Vice President | March 2006 - Present | Vice President, ING Funds Services, LLC (March 2006 - Present). Formerly, Assistant Vice President, ING Funds Services, LLC (August 2004 - March 2006); Manager, Registration Statements, ING Funds Services, LLC (May 2003 - August 2004); Associate Partner, AMVESCAP PLC (October 2000 - May 2003); and Director of Federal Filings and Blue Sky Filings, INVESCO Funds Group, Inc. (March 1994 - May 2003). | |||
Susan P. Kinens 7337 E. Doubletree Ranch Rd. Scottsdale, Arizona 85258 Age: 30 | Assistant Vice President | February 2003 - Present | Assistant Vice President, ING Funds Services, LLC (December 2002- Present); and has held various other positions with ING Funds Services, LLC for more than the last five years. | |||
Huey P. Falgout, Jr. 7337 E. Doubletree Ranch Rd. Scottsdale, Arizona 85258 Age: 43 | Secretary | August 2003 - Present | Chief Counsel, ING Americas, U.S. Legal Services (September 2003 - Present). Formerly, Counsel, ING Americas, U.S. Legal Services (November 2002 - September 2003); and Associate General Counsel of AIG American General (January 1999 - November 2002). | |||
Theresa K. Kelety 7337 E. Doubletree Ranch Rd. Scottsdale, Arizona 85258 Age: 44 | Assistant Secretary | August 2003 - Present | Counsel, ING Americas, U.S. Legal Services (April 2003 - Present). Formerly, Senior Associate with Shearman & Sterling (February 2000 - April 2003). | |||
(1) | The officers hold office until the next annual meeting of the Trustees and until their successors have been elected and qualified. |
93
Table of Contents
ADVISORY CONTRACT APPROVAL DISCUSSION (UNAUDITED)
BOARD CONSIDERATION AND RE-APPROVAL OF INVESTMENT ADVISORY AND SUB-ADVISORY CONTRACTS
Section 15(c) of the 1940 Act provides that, after an initial period, the Funds’ existing investment advisory and sub-advisory contracts remain in effect only if the Board of Trustees (the “Board”) of ING Funds Trust (the “Trust”), including a majority of the Trustees who have no direct or indirect interest in the advisory and sub-advisory contracts, and who are not “interested persons” of the Funds, as such term is defined under the 1940 Act (the “Independent Trustees”), annually review and renew them. In this regard, at a meeting held on November 9, 2006 the Board, including a majority of the Independent Trustees, considered whether to renew the investment advisory contracts (“Advisory Contracts”) between ING Investments, LLC (the “Adviser”) and the Funds and the sub-advisory contracts (“Sub-Advisory Contracts”) with ING Investment Management Co., the sub-adviser to each Fund (“ING IM” or the “Sub-Adviser”).
The Independent Trustees also held separate meetings on October 12, 2006 and November 7, 2006 to consider renewals of the Advisory Contracts and Sub-Advisory Contracts. Thus, references herein to factors considered and determinations made by the Independent Trustees include, as applicable, factors considered and determinations made on those earlier dates.
At the November 9, 2006 meeting, the Board voted to renew the Advisory and Sub-Advisory Contracts for the Funds. In reaching these decisions, the Board took into account information furnished throughout the year at regular Board meetings, as well as information prepared specifically in connection with the annual review process. The Board’s determination took into account a number of factors that its members believed, in light of the legal advice furnished to them by Kirkpatrick & Lockhart Preston Gates Ellis LLP (“K&L Gates”), their independent legal counsel, and their own business judgment, to be relevant. Further, while the Advisory Contracts and Sub-Advisory Contracts for all the Funds were considered at the same Board meeting, the Trustees considered each Fund’s advisory and sub-advisory relationships separately.
Provided below is an overview of the Board’s contract approval process in general, as well as a discussion of certain of the specific factors the Board considered at the November 9, 2006 meeting. While the Board gave its attention to the information furnished, at its request, that was most relevant to its consideration, discussed below are a number of the primary factors relevant to the Board’s consideration as to whether to renew the Advisory and Sub-Advisory Contracts for the one-year period ending November 30, 2007. Each Trustee may have accorded different weight to the various factors in reaching his or her conclusions with respect to the Funds’ advisory and sub-advisory arrangements.
Overview of the Contract Renewal and Approval Process
In 2003, the Independent Trustees determined to undertake steps to further enhance the process under which the Board determines whether to renew existing advisory and sub-advisory arrangements for the funds in the ING Funds complex, including the Trust’s existing Advisory and Sub-Advisory Contracts, and to approve new advisory and sub-advisory arrangements. Among these measures, the Board: retained the services of an independent consultant with experience in the mutual fund industry to assist the Independent Trustees in working with the personnel employed by the Adviser or its affiliates who administer the Funds (“Management”) to identify the types of information presented to the Board to inform its deliberations with respect to advisory and sub-advisory relationships; established the format in which the information requested by the Board is provided to the Board; and determined the process for reviewing such information in connection with the Advisory and Sub-Advisory Contract renewal process. The end result was the implementation of the current process relied upon by the Board to review and analyze information in connection with the annual renewal of the Funds’ Advisory and Sub-Advisory Contracts, as well as its review and approval of new advisory relationships.
Since the foregoing approval and renewal process was implemented, the Board regularly has reviewed and refined the process. In addition, the Board established a Contracts Committee and two Investment Review Committees, including the International/Balanced/Fixed Income Funds Investment Review Committee (the “I/B/F IRC”). The type and format of the information provided to the Board or its counsel to inform its approval and annual review and renewal process has been codified in the Funds’ “15(c) Methodology Guide” (the “Methodology Guide”). The Methodology Guide was developed under the direction of the Independent Trustees, and sets out a written blueprint under which the Independent Trustees request certain information necessary to facilitate a thorough and
94
Table of Contents
ADVISORY CONTRACT APPROVAL DISCUSSION (UNAUDITED) (CONTINUED)
informed review in connection with the annual Advisory and Sub-Advisory Contract renewal process. Management provides Fund-specific information to the Independent Trustees based on the Methodology Guide through “Fund Analysis and Comparison Tables” or “FACT” sheets prior to the Independent Trustees’ review of Advisory and Sub-Advisory Contracts. In 2005, the Independent Trustees retained an independent firm to verify and test the accuracy of certain of this information for a representative sample of funds in the ING Funds complex. The Independent Trustees have determined to conduct such testing periodically.
As part of a regular on-going process, the Board’s Contracts Committee recommends or considers recommendations from Management for refinements and other changes to the Methodology Guide and other aspects of the review process, and the I/B/F IRC reviews benchmarks used to assess the performance of each Fund. The I/B/F IRC also meets regularly with the Adviser and periodically with ING IM. The I/B/F IRC may apply a heightened level of scrutiny in cases where performance has lagged a Fund’s relevant benchmark and/or peer group of investment companies.
The Board employed its process for reviewing contracts when considering the renewals of the Advisory and Sub-Advisory Contracts that would be effective through November 30, 2007. A number of the Board’s primary considerations and conclusions resulting from this process are discussed below.
Nature, Extent and Quality of Service
In determining whether to approve the Advisory Contracts and Sub-Advisory Contracts for the Funds for the year ending November 30, 2007, the Independent Trustees received and evaluated such information as they deemed necessary regarding the nature, extent and quality of services provided to the Funds by the Adviser and Sub-Adviser. This included information regarding the Adviser and ING IM provided throughout the year at regular Board meetings, as well as information furnished for the November 9, 2006 Board meeting, which was held specifically to consider contracts renewals for the period ending November 30, 2007. In addition, the Board’s Independent Trustees also held meetings on October 12 and November 7, prior to the November 9, 2006 meeting of the full Board, to consider the annual renewal of the Advisory and Sub-Advisory Contracts.
The materials requested by and provided to the Board and/or to K&L Gates prior to the November 2006 Board meeting included the following items: (1) FACT sheets for each Fund that provided information about the performance and expenses of the Fund and other similarly managed funds in a selected peer group (“Selected Peer Group”), as well as information about the Fund’s investment portfolio, objectives and strategies; (2) the Methodology Guide, which describes how the FACT sheets were prepared, including the manner in which benchmarks and Selected Peer Groups were selected and how profitability was determined; (3) responses from the Adviser and Sub-Adviser to a detailed series of questions posed by K&L Gates; (4) copies of each form of Advisory Contract and Sub-Advisory Contract; (5) copies of the Forms ADV for the Adviser and ING IM; (6) financial statements for the Adviser and ING IM; (7) drafts of narrative summaries addressing key factors the Board customarily considers in evaluating the renewals of Advisory Contracts and Sub-Advisory Contracts, including a written analysis for each Fund of how performance and fees compare to its Selected Peer Group and/or designated benchmarks; and (8) other information relevant to the Board’s evaluations.
For each Fund, except ING Institutional Prime Money Market Fund, its Class A shares were used for purposes of certain comparisons to the funds in its Selected Peer Group. Class A shares were selected, as general matter, so that the Fund class with the longest performance history was compared to the analogous class of shares for each fund in the Selected Peer Group. ING Institutional Prime Money Market Fund has only one class of shares available, and this class was used for purposes of comparison to the funds in its Selected Peer Group. The mutual funds chosen for inclusion in a Fund’s Selected Peer Group were selected based upon criteria designed to mirror the Fund class being compared to the Selected Peer Group.
In arriving at its conclusions with respect to the Advisory Contracts, the Board was mindful of the “manager-of-managers” platform of the ING Funds. The Board also noted the resources that the Adviser has committed to the Board and the I/B/F IRC to assist the Board and members of the I/B/F IRC with their assessment of the investment performance of the Funds on an ongoing basis throughout the year. This includes the appointment of a Chief Investment Risk Officer and his staff, who report directly to the Board and who have developed attribution analyses and other metrics used by the I/B/F IRC to analyze the key factors underlying investment performance for the Funds.
95
Table of Contents
ADVISORY CONTRACT APPROVAL DISCUSSION (UNAUDITED) (CONTINUED)
The Board also noted the techniques used by the Adviser to monitor the performance of ING IM and took note of the pro-active approach that the Adviser, working in cooperation with the I/B/F IRC, has taken to advocate or recommend, when it believed appropriate, changes intended to assist in improving the performance of the Funds.
In considering the Funds’ Advisory Contracts, the Board also considered the extent of benefits provided to the Funds’ shareholders, beyond advisory services, from being part of the ING family of Funds. This includes, in most cases, the right to exchange or transfer investments, without a sales charge, between the same class of shares of such Funds or among Funds available on a product platform, and the wide variety in the types of Funds available for exchange or transfer.
The Board also took into account the Adviser’s extensive efforts in recent years to reduce the expenses of the ING Funds through re-negotiated arrangements with the ING Funds’ service providers. Further, the Board received periodic reports showing that the investment policies and restrictions for each Fund were consistently complied with and other periodic reports covering matters such as compliance by Adviser and Sub-Adviser personnel with codes of ethics. The Board considered reports from the Funds’ Chief Compliance Officer (“CCO”) evaluating the regulatory compliance systems of the Adviser and the Sub-Adviser and procedures reasonably designed by them to assure compliance with the federal securities laws, including those related to late trading and market timing, best execution, fair value pricing, proxy voting procedures, and trade allocation, among others. The Board considered the implementation by the Adviser and ING IM of enhanced compliance policies and procedures in response to SEC rule changes and other regulatory initiatives. The Board also took into account the CCO’s annual and periodic reports with respect to service provider compliance and his recommendations regarding service providers’ compliance programs. In this regard, the Board also considered the policies and procedures developed by the CCO in consultation with the Board’s Compliance Committee that guide the CCO’s compliance oversight function.
The Board reviewed the level of staffing, quality and experience of each Fund’s portfolio management team. The Board took into account the respective resources and reputations of the Adviser and the Sub-Adviser, and evaluated the ability of the Adviser and ING IM to attract and retain qualified investment advisory personnel. The Board also considered the adequacy of the resources committed to the Funds (and other relevant funds in the ING Funds complex) by the Adviser and ING IM, and whether those resources are commensurate with the needs of the Funds and are appropriate to attempt to sustain expected levels of performance, compliance, and other needs.
Based on their deliberations and the materials presented to them, the Board concluded that the advisory and related services provided by the Adviser and Sub-Adviser are appropriate in light of the Funds’ operations, the competitive landscape of the investment company business, and investor needs, and that the nature and quality of the overall services provided by the Adviser and Sub-Adviser were appropriate.
Fund Performance
In assessing advisory and sub-advisory relationships, the Board placed emphasis on the investment performance of each Fund, taking into account the importance of such performance to Fund shareholders. While the Board considered the performance reports and discussions with portfolio managers at Board and Committee meetings during the year, particular attention in assessing performance was given to the Fund FACT sheets furnished in advance of the November meeting of the Independent Trustees. The FACT sheet prepared for each Fund included its investment performance compared to the Morningstar category median, Lipper category median, Selected Peer Group and Fund’s primary benchmark. The Board’s findings specific to each Fund’s performance are discussed under “Fund-by-Fund Analysis,” below.
Economies of Scale
In considering the reasonableness of advisory fees, the Board also considered whether economies of scale will be realized by the Adviser as a Fund grows larger and the extent to which this is reflected in the level of management fee rates charged. In the case of sub-advisory fees, the Board considered that breakpoints would inure to the benefit of the Adviser, except to the extent that these savings are passed through in the form of breakpoints on advisory fees that resulted in savings to the Funds. For a Fund that did not have breakpoint discounts on advisory fees, but did benefit from waivers to or reimbursements of advisory or other fees, the Board also considered the extent to which economies of scale could effectively be realized through such waivers, reimbursements, or expense reductions.
96
Table of Contents
ADVISORY CONTRACT APPROVAL DISCUSSION (UNAUDITED) (CONTINUED)
In evaluating economies of scale, the Independent Trustees considered a Management report presented to them and also considered an evaluation and analysis presented to them on November 8, 2006 by an independent consultant regarding fee breakpoint arrangements.
Information about Services to Other Clients
The Board requested, and if received considered, information about the nature of services and fee rates offered by the Adviser and the Sub-Adviser to other clients, including other registered investment companies and institutional accounts. When rates offered to other clients differed materially from those charged to the Funds, the Board considered the underlying rationale provided by the Adviser and/or the Sub-Adviser for these differences. The Board also noted that the fee rates charged to the Funds and similar institutional clients may differ materially due to the different services and additional regulatory overlay associated with registered investment companies, such as the Funds.
Fee Rates and Profitability
The Board reviewed and considered each contractual investment advisory fee rate, combined with the administrative fee rate, payable by each Fund to the Adviser. The Board also considered the contractual sub-advisory fee rates payable by the Adviser to ING IM for sub-advisory services. In addition, the Board reviewed and took into account existing and proposed fee waivers and expense limitations applicable to the fees payable by the Funds.
The Board considered the fee structures of the Funds as they relate to the services provided under the Contracts, and the potential fall-out benefits to the Adviser and Sub-Adviser, and their respective affiliates, from their association with the Funds. For each Fund, the Board determined that the fees payable to the Adviser and Sub-Adviser are reasonable for the services that each performs, which were considered in light of the nature and quality of the services that each has performed and is expected to perform through the year ending November 30, 2007.
For each Fund, the Board considered information on revenues, costs and profits realized by the Adviser, which was prepared by Management in accordance with the allocation methodology (including assumptions) specified in the Methodology Guide. In analyzing the profitability of the Adviser in connection with its services to a Fund, the Board took into account the sub-advisory fee rate payable by the Adviser to ING IM with respect to that Fund. The Board also considered information that it requested and was provided by Management with respect to the profitability of service providers affiliated with the Adviser, as well as information provided by ING IM with respect to its profitability.
The Board determined that it had requested and received sufficient information to gain a reasonable understanding regarding the Adviser’s and ING IM’s profitability. The Board also recognized that profitability analysis is not an exact science and there is no uniform methodology for determining profitability for this purpose. In this context, the Board realized that Management’s calculations regarding its costs incurred in establishing the infrastructure necessary for the Funds’ operations may not be fully reflected in the expenses allocated to each Fund in determining profitability, and that the information presented may not portray all of the costs borne by Management nor capture Management’s entrepreneurial risk associated with offering and managing a mutual fund complex in today’s regulatory environment.
In their review of advisory fee rates, the Independent Trustees have, from time to time, requested the Adviser, and the Adviser has agreed, to implement remedial actions for certain Funds. These remedial actions have included, among others: reductions in management fee rates; the addition of further breakpoints to fee schedules; reductions in 12b-1 fees payable by a Fund; and enhancements to the resources available to the Sub-Adviser when managing a Fund. The Independent Trustees have requested these adjustments primarily on the basis of: (a) a Fund’s performance, as compared to its Selected Peer Group; (b) the performance of a Fund, as compared to its benchmarks; or (c) a Fund’s expenses in relation to its Selected Peer Group.
Based on the information on revenues, costs, and profitability considered by the Board, after considering the factors described in this section, as well as any remedial actions requested by the Independent Trustees and agreed to by the Adviser, the Board concluded that the profits, if any, realized by the Adviser and ING IM were not excessive.
97
Table of Contents
ADVISORY CONTRACT APPROVAL DISCUSSION (UNAUDITED) (CONTINUED)
Fund-by-Fund Analysis
The following paragraphs outline certain of the specific factors that the Board considered, and the conclusions reached, at its November 2006 meeting in relation to renewing each Fund’s current Advisory Contract and its Sub-Advisory Contract for the year ending November 30, 2007. These specific factors are in addition to those considerations discussed above. In each case, the Fund’s performance was compared to its Morningstar category median and its primary benchmark, a broad-based securities market index that appears in the Fund’s prospectus. Each Fund’s management fee and expense ratio were compared to the fees and expense ratios of the funds in its Selected Peer Group.
ING Classic Money Market Fund
In considering whether to approve the renewal of the Advisory and Sub-Advisory Contracts for ING Classic Money Market Fund, the Board considered that, based on performance data for the periods ended June 30, 2006: (1) the Fund outperformed its Lipper category median and primary benchmark for all periods presented; and (2) under rankings available by Lipper, the Fund ranked in the second quintile for all periods presented.
In considering the fees payable under the Advisory and Sub-Advisory Contracts for ING Classic Money Market Fund, the Board took into account the factors described above and also considered: (1) the fairness of the compensation under an Advisory Contract with level fees that does not include breakpoints; and (2) the pricing structure (including the expense ratio to be borne by shareholders) of ING Classic Money Market Fund, as compared to its Selected Peer Group, including that: (a) the management fee for the Fund is below the median and the average management fees of the funds in its Selected Peer Group; and (b) the expense ratio for the Fund is below the median and the average expense ratios of the funds in its Selected Peer Group.
After its deliberation, the Board reached the following conclusions: (1) the Fund’s management fee rate is reasonable in the context of all factors considered by the Board; (2) the Fund’s expense ratio is reasonable in the context of all factors considered by the Board; (3) the Fund’s performance is reasonable in the context of all factors considered by the Board; and (4) the sub-advisory fee rate payable by the Adviser to the Sub-Adviser is reasonable in the context of all factors considered by the Board. Based on these conclusions and other factors, the Board voted to renew the Advisory and Sub-Advisory Contracts for the Fund for the year ending November 30, 2007. During this renewal process, different Board members may have given different weight to different individual factors and related conclusions.
ING GNMA Income Fund
In considering whether to approve the renewal of the Advisory and Sub-Advisory Contracts for ING GNMA Income Fund, the Board considered that, based on performance data for the periods ended June 30, 2006: (1) the Fund outperformed its Morningstar category median for all periods presented, but underperformed for the most recent calendar quarter; (2) the Fund underperformed its primary benchmark for all periods presented; and (3) the Fund is ranked in the first (highest) quintile of its Morningstar category for the one- and ten-year periods, the second quintile of its Morningstar category for the year-to-date, three- and five-year periods and the fourth quintile for the most recent calendar quarter.
In considering the fees payable under the Advisory and Sub-Advisory Contracts for the Fund, the Board took into account the factors described above and also considered: (1) the fairness of the compensation under an Advisory Contract with a breakpoint fee schedule where the asset level necessary to achieve a breakpoint discount had not been reached by the Fund; (2) the pricing structure (including the expense ratio to be borne by shareholders) of the Fund, as compared to its Selected Peer Group, including that: (a) the management fee (inclusive of the advisory fee and a 0.10% administration fee) for the Fund is above the median and the average management fees of the funds in its Selected Peer Group; and (b) the expense ratio for the Fund is above the median and the average expense ratios of the funds in its Selected Peer Group.
In analyzing this fee data, the Board took into consideration Management’s modification of the Fund’s management fee breakpoint schedule, which resulted in a lower management fee schedule for the Fund. The Board also took into account that, as a result of this change, the Fund’s expense limits were lowered.
98
Table of Contents
ADVISORY CONTRACT APPROVAL DISCUSSION (UNAUDITED) (CONTINUED)
After its deliberation, the Board reached the following conclusions: (1) the Fund’s management fee rate is reasonable in the context of all factors considered by the Board; (2) the Fund’s expense ratio is reasonable in the context of all factors considered by the Board; (3) the Fund’s performance is reasonable in the context of all factors considered by the Board; and (4) the sub-advisory fee rate payable by the Adviser to the Sub-Adviser is reasonable in the context of all factors considered by the Board. Based on these conclusions and other factors, the Board voted to renew the Advisory and Sub-Advisory Contracts for the Fund for the year ending November 30, 2007. During this renewal process, different Board members may have given different weight to different individual factors and related conclusions.
ING High Yield Bond Fund
In considering whether to approve the renewal of the Advisory and Sub-Advisory Contracts for ING High Yield Bond Fund, the Board considered that, based on performance data for the periods ended June 30, 2006: (1) the Fund underperformed its Morningstar category median for all periods presented; (2) the Fund underperformed its primary benchmark for all of the periods presented; and (3) the Fund is ranked in the third quintile of its Morningstar category for the most recent calendar quarter, in the fourth quintile of its Morningstar category for the year-to-date, one- and five-year periods, and in the fifth (lowest) quintile of its Morningstar category for the three-year period.
In analyzing this performance data, the Board took into account: (1) Management’s analysis regarding the measures implemented by the Sub-Adviser to address the Fund’s underperformance; and (2) that Management would continue to monitor, and the Board or the I/B/F IRC would periodically review, the Fund’s investment performance.
In considering the fees payable under the Advisory and Sub-Advisory Contracts for ING High Yield Bond Fund, the Board took into account the factors described above and also considered: (1) the fairness of the compensation under an Advisory Contract with a breakpoint fee schedule where the asset level necessary to achieve a breakpoint discount had not been reached by the Fund; (2) the pricing structure (including the expense ratio to be borne by shareholders) of the Fund, as compared to its Selected Peer Group, including that: (a) the management fee (inclusive of 0.10% administration fee) for the Fund is below the median and the average management fees of the funds in its Selected Peer Group; and (b) the expense ratio for the Fund is below the median and the average expense ratios of the funds in its Selected Peer Group.
In analyzing this fee data, the Board took into consideration Management’s modification of the Fund’s management fee breakpoint schedule, which resulted in a lower management fee schedule for the Fund. The Board also took into account that, as a result of this change, the Fund’s expense limits were lowered.
After its deliberation, the Board reached the following conclusions: (1) the Fund’s management fee rate is reasonable in the context of all factors considered by the Board; (2) the Fund’s expense ratio is reasonable in the context of all factors considered by the Board; (3) it is reasonable to permit the Sub-Adviser to continue to manage the Fund in order to assess whether performance improves as a result of the changes implemented by the Sub-Adviser; and (4) the sub-advisory fee rate payable by the Adviser to the Sub-Adviser is reasonable in the context of all factors considered by the Board. Based on these conclusions and other factors, the Board voted to renew the Advisory and Sub-Advisory Contracts for the Fund for the year ending November 30, 2007. During this renewal process, different Board members may have given different weight to different individual factors and related conclusions.
ING Institutional Prime Money Market Fund
In considering whether to approve the renewal of the Advisory and Sub-Advisory Contracts for ING Institutional Prime Money Market Fund, the Board considered that, based on performance data for the periods ended June 30, 2006: (1) the Fund outperformed its Lipper category median and primary benchmark for all periods presented; and (2) under rankings available by Lipper, the Fund is ranked in the first (highest) quintile for the all periods presented.
In considering the fees payable under the Advisory and Sub-Advisory Contracts for ING Institutional Prime Money Market Fund, the Board took into account the factors described above and also considered: (1) the fairness of the compensation under an Advisory Contract with level fees that does not include breakpoints; and (2) the pricing structure (including the expense ratio to be borne by shareholders) of the Fund, as compared to its Selected Peer
99
Table of Contents
ADVISORY CONTRACT APPROVAL DISCUSSION (UNAUDITED) (CONTINUED)
Group, including that: (a) the management fee for the Fund is below the median and the average management fees of the portfolios in its Selected Peer Group; and (b) the expense ratio for the Fund is below the median and average expense ratios of the portfolios in its Selected Peer Group.
After its deliberation, the Board reached the following conclusions: (1) the Fund’s management fee rate is reasonable in the context of all factors considered by the Board; (2) the Fund’s expense ratio is reasonable in the context of all factors considered by the Board; (3) the sub-advisory fee rate payable by the Adviser to the Sub-Adviser is reasonable in the context of all factors considered by the Board; and (4) the Fund’s performance is reasonable in the context of all factors considered by the Board. Based on these conclusions and other factors, the Board voted to renew the Advisory and Sub-Advisory Contracts for the Fund for the year ending November 30, 2007. During this renewal process, different Board members may have given different weight to different individual factors and related conclusions.
ING Intermediate Bond Fund
In considering whether to approve the renewal of the Advisory and Sub-Advisory Contracts for ING Intermediate Bond Fund, the Board considered that, based on performance data for the periods ended June 30, 2006: (1) the Fund outperformed its Morningstar category median for all periods presented; (2) the Fund outperformed its primary benchmark for all periods presented, except it underperformed for the most recent calendar quarter; and (3) the Fund is ranked in the first (highest) quintile of its Morningstar category for the five-year period, in the second quintile of its Morningstar category for the most recent calendar quarter, one- and three-year periods and in the third quintile of its Morningstar category for the year-to-date period.
In considering the fees payable under the Advisory and Sub-Advisory Contracts for the Fund, the Board took into account the factors described above and also considered: (1) the fairness of the compensation under an Advisory contract with level fees that does not include breakpoints; (2) the pricing structure (including the expense ratio to be borne by shareholders) of the Fund, as compared to its Selected Peer Group, including that: (a) the management fee (inclusive of the advisory fee and a 0.10% administration fee) for the Fund is below the median and the average management fees of the funds in its Selected Peer Group; and (b) the expense ratio for the Fund is below the median and the average expense ratios of the funds in its Selected Peer Group.
In analyzing this fee data, the Board took into consideration Management’s modification of the Fund’s management fee breakpoint schedule, which resulted in a lower, flat fee rate for the Fund. The Board also took into account that, as a result of this change, the Fund’s expense limits were lowered.
After its deliberation, the Board reached the following conclusions: (1) the Fund’s management fee rate is reasonable in the context of all factors considered by the Board; (2) the Fund’s expense ratio is reasonable in the context of all factors considered by the Board; (3) the Fund’s performance is reasonable in the context of all factors considered by the Board; and (4) the sub-advisory fee rate payable by the Adviser to the Sub-Adviser is reasonable in the context of all factors considered by the Board. Based on these conclusions and other factors, the Board voted to renew the Advisory and Sub-Advisory Contracts for the Fund for the year ending November 30, 2007. During this renewal process, different Board members may have given different weight to different individual factors and related conclusions.
ING National Tax-Exempt Bond Fund
In considering whether to approve the renewal of the Advisory and Sub-Advisory Contracts for ING National Tax-Exempt Bond Fund, the Board considered that, based on performance data for the periods ended June 30, 2006: (1) the Fund outperformed its Morningstar category median for the three- and five-year periods, but underperformed for the most recent calendar quarter, year-to-date, and one-year periods; (2) the Fund underperformed its primary benchmark for all periods presented; and (3) the Fund is ranked in the second quintile of its Morningstar category for the five-year period, in the third quintile of its Morningstar category for the three-year period, in the fourth quintile of its Morningstar category for the year-to-date and one-year periods, and in the fifth (lowest) quintile of its Morningstar category for the most recent calendar quarter.
100
Table of Contents
ADVISORY CONTRACT APPROVAL DISCUSSION (UNAUDITED) (CONTINUED)
In analyzing this performance data, the Board took into consideration: (1) Management’s analysis regarding the Sub-Adviser’s rationale for underperformance during more recent periods, including its discussion regarding the negative effect on year-to-date and one-year performance from overweighting long-term bonds and underweighting lower-quality securities; and (2) Management’s representations that the Sub-Adviser’s longer-term performance was reasonable.
In considering the fees payable under the Advisory and Sub-Advisory Contracts for ING National Tax-Exempt Bond Fund, the Board took into account the factors described above and also considered: (1) the fairness of the compensation under an Advisory Contract with level fees that does not include breakpoints; and (2) the pricing structure (including the expense ratio to be borne by shareholders) of ING National Tax-Exempt Bond Fund, as compared to its Selected Peer Group, including that: (a) the management fee (inclusive of the advisory fee and a 0.10% administration fee) for the Fund is below the median and the average management fees of the funds in its Selected Peer Group; and (b) the expense ratio for the Fund is below the median and the average expense ratios of the funds in its Selected Peer Group.
In analyzing this fee data, the Board took into consideration Management’s modification of the Fund’s management fee breakpoint schedule, which resulted in a lower, flat fee rate for the Fund. The Board also took into account that, as a result of this change, the Fund’s expense limits were lowered.
After its deliberation, the Board reached the following conclusions: (1) the Fund’s management fee rate is reasonable in the context of all factors considered by the Board; (2) the Fund’s expense ratio is reasonable in the context of all factors considered by the Board; (3) the Fund’s performance is reasonable in the context of all factors considered by the Board; and (4) the sub-advisory fee rate payable by the Adviser to the Sub-Adviser is reasonable in the context of all factors considered by the Board. Based on these conclusions and other factors, the Board voted to renew the Advisory and Sub-Advisory Contracts for the Fund for the year ending November 30, 2007. During this renewal process, different Board members may have given different weight to different individual factors and related conclusions.
101
Table of Contents
ING Funds Distributor, LLC offers the funds listed below. Before investing in a fund, shareholders should carefully review the fund’s prospectus. Investors may obtain a copy of a prospectus of any ING Fund by calling (800) 992-0180 or by going to www.ingfunds.com.
Domestic Equity and Income Funds ING Balanced Fund ING Growth and Income Fund ING Real Estate Fund Domestic Equity Growth Funds ING 130/30 Fundamental Research Fund ING Disciplined LargeCap Fund ING Fundamental Research Fund ING Growth Fund ING LargeCap Growth Fund ING MidCap Opportunities Fund ING Opportunistic LargeCap Fund ING Small Company Fund ING SmallCap Opportunities Fund Domestic Equity Index Funds ING Index Plus LargeCap Fund ING Index Plus MidCap Fund ING Index Plus SmallCap Fund Domestic Equity Value Funds ING Financial Services Fund ING LargeCap Value Fund ING MagnaCap Fund ING MidCap Value Fund ING SmallCap Value Fund ING SmallCap Value Choice Fund ING Value Choice Fund Fixed-lncome Funds ING GNMA lncome Fund ING High Yield Bond Fund ING Intermediate Bond Fund ING National Tax-Exempt Bond Fund | Global Equity Funds ING Global Equity Dividend Fund ING Global Natural Resources Fund ING Global Real Estate Fund ING Global Science and Technology Fund ING Global Value Choice Fund International Equity Funds ING Disciplined International SmallCap Fund ING Emerging Countries Fund ING Foreign Fund ING Greater China Fund ING Index Plus International Equity Fund ING International Capital Appreciation Fund ING International Equity Fund ING International Growth Opportunities Fund ING International Real Estate ING International SmallCap Fund ING International Value Fund ING International Value Choice Fund ING Russia Fund Global and International Fixed-Income Funds ING Emerging Markets Fixed Income Fund ING Global Bond Fund International Fund-of-Funds ING Diversified International Fund Loan Participation Fund ING Senior lncome Fund Money Market Funds* ING Money Market Fund ING Classic Money Market Fund Strategic Allocation Funds ING Strategic Allocation Conservative Fund ING Strategic Allocation Growth Fund ING Strategic Allocation Moderate Fund |
| * | An investment in the funds are not insured or guaranteed by the Federal Deposit Insurance Corporation or any other government agency. Although the funds seek to preserve the value of your investment at $1.00 per share, it is possible to lose money by investing in the funds. |
Table of Contents
Investment Adviser
ING Investments, LLC
7337 East Doubletree Ranch Road
Scottsdale, Arizona 85258
Administrator
ING Funds Services, LLC
7337 East Doubletree Ranch Road
Scottsdale, Arizona 85258
Distributor
ING Funds Distributor, LLC
7337 East Doubletree Ranch Road
Scottsdale, Arizona 85258
Transfer Agent
DST Systems, Inc.
330 West 9th Street
Kansas City, Missouri 64105
Independent Registered Public Accounting Firm
KPMG LLP
99 High Street
Boston, Massachusetts 02110
Custodian
The Bank of New York
One Wall Street
New York, New York 10286
Legal Counsel
Dechert
1775 I Street, N.W.
Washington, D.C. 20006
For more complete information, or to obtain a prospectus on any ING fund, please call your Investment Professional or ING Funds Distributor, LLC at (800) 992-0180 or log on to www.ingfunds.com. The prospectus should be read carefully before investing. Consider the fund’s investment objectives, risks, charges and expenses carefully before investing. The prospectus contains this information and other information about the fund.

PRAR-UFIABCIOQR (0307-053007)
Table of Contents
Item 2. Code of Ethics.
As of the end of the period covered by this report, Registrant had adopted a code of ethics, as defined in Item 2 of Form N-CSR, that applies to the Registrant’s principal executive officer and principal financial officer. There were no amendments to the Code during the period covered by the report. The Registrant did not grant any waivers, including implicit waivers, from any provisions of the Code during the period covered by this report. The code of ethics is filed herewith pursuant to Item 10(a)(1), Exhibit 99.CODE ETH.
Item 3. Audit Committee Financial Expert.
The Board of Trustees has determined that Patrick W. Kenny is an audit committee financial expert, as defined in Item 3 of Form N-CSR. Mr. Kenny is “independent” for purposes of Item 3 of Form N-CSR.
Item 4. Principal Accountant Fees and Services.
| (a) | Audit Fees: The aggregate fees billed for each of the last two fiscal years for professional services rendered by KPMG LLP (“KPMG”), the principal accountant for the audit of the registrant’s annual financial statements, for services that are normally provided by the accountant in connection with statutory and regulatory filings or engagements for those fiscal years were $104,000 for year ended March 31, 2007 and $83,750 for year ended March 31, 2006. |
| (b) | Audit-Related Fees: The aggregate fees billed in the last fiscal year for assurance and related services by KPMG that are reasonably related to the performance of the audit of the registrant’s financial statements and are not reported under paragraph (a) of this Item were $88,288 for the year ended March 31, 2007 and $9,500 for year ended March 31, 2006. |
| (c) | Tax Fees: The aggregate fees billed in each of the last two fiscal years for professional services rendered by KPMG for tax compliance, tax advice, and tax planning were $12,060 in the year ended March 31, 2007 and $18,030 in the year ended March 31, 2006. Such services included review of excise distribution calculations (if applicable), preparation of the Funds’ federal, state and excise tax returns, tax services related to mergers and routine consulting. |
| (d) | All Other Fees: The aggregate fees billed in each of the last two fiscal years for products and services provided by KPMG, other than the services reported in paragraphs (a) through (c) of this Item. |
| None. |
| (e) (1) | Audit Committee Pre-Approval Policies and Procedures |
Table of Contents
AUDIT AND NON-AUDIT SERVICES
PRE-APPROVAL POLICY
I. Statement of Principles
Under the Sarbanes-Oxley Act of 2002 (the “Act”), the Audit Committee of the Board of Directors or Trustees (the “Committee”) of the ING Funds (each a “Fund,” collectively, the “Funds”) set out on Exhibit A to this Audit and Non-Audit Services Pre-Approval Policy (“Policy”) is responsible for the oversight of the work of the Funds’ independent auditors. As part of its responsibilities, the Committee must pre-approve the audit and non-audit services performed by the auditors in order to assure that the provision of these services does not impair the auditors’ independence from the Funds. The Committee has adopted, and the Board has ratified, this Policy, which sets out the procedures and conditions under which the services of the independent auditors may be pre-approved.
Under Securities and Exchange Commission (“SEC”) rules promulgated in accordance with the Act, the Funds may establish two different approaches to pre-approving audit and non-audit services. The Committee may approve services without consideration of specific case-by-case services (“general pre-approval”) or it may pre-approve specific services (“specific pre-approval”). The Committee believes that the combination of these approaches contemplated in this Policy results in an effective and efficient method for pre-approving audit and non-audit services to be performed by the Funds’ independent auditors. Under this Policy, services that are not of a type that may receive general pre-approval require specific pre-approval by the Committee. Any proposed services that exceed pre-approved cost levels or budgeted amounts will also require the Committee’s specific pre-approval.
For both types of approval, the Committee considers whether the subject services are consistent with the SEC’s rules on auditor independence and that such services are compatible with maintaining the auditors independence. The Committee also considers whether a particular audit firm is in the best position to provide effective and efficient services to the Funds. Reasons that the auditors are in the best position include the auditors’ familiarity with the Funds’ business, personnel, culture, accounting systems, risk profile, and other factors, and whether the services will enhance the Funds’ ability to manage and control risk or improve audit quality. Such factors will be considered as a whole, with no one factor being determinative.
The appendices attached to this Policy describe the audit, audit-related, tax-related, and other services that have the Committee’s general pre-approval. For any service that has been approved through general pre-approval, the general pre-approval will remain in place for a period 12 months from the date of pre-approval, unless the Committee determines that a different period is appropriate. The Committee will annually review and pre-approve the services that may be provided by the independent auditors without specific pre-approval. The Committee will revise the list of services subject to general pre-approval as appropriate. This Policy does not serve as a delegation to Fund management of the Committee’s duty to pre-approve services performed by the Funds’ independent auditors.
II. Audit Services
The annual audit services engagement terms and fees are subject to the Committee’s specific pre-approval. Audit services are those services that are normally provided by auditors in connection with statutory and regulatory filings or engagements or those that generally only independent auditors can reasonably provide. They include the Funds’ annual financial statement audit and procedures that the independent auditors must perform in order to form an opinion on the Funds’ financial statements (e.g., information systems and procedural reviews and testing). The Committee will monitor the audit services engagement and approve any changes in terms, conditions or fees deemed by the Committee to be necessary or appropriate.
The Committee may grant general pre-approval to other audit services, such as statutory audits and services associated with SEC registration statements, periodic reports and other documents filed with the SEC or issued in connection with securities offerings.
The Committee has pre-approved the audit services listed on Appendix A. The Committee must specifically approve all audit services not listed on Appendix A.
III. Audit-related Services
Audit-related services are assurance and related services that are reasonably related to the performance of the audit or the review of the Funds’ financial statements or are traditionally performed by the independent auditors. The Committee believes that the provision of audit-related services will not impair the independent auditors’ independence, and therefore may grant pre-approval to audit-related services. Audit-related services include accounting consultations related to accounting, financial reporting or disclosure matters not classified as “audit services;” assistance with understanding and implementing new accounting and financial reporting guidance from rulemaking authorities; agreed-upon or expanded audit procedures relating to accounting and/or billing records required to respond to or comply with financial, accounting or regulatory reporting matters; and assistance with internal control reporting requirements under Form N-SAR or Form N-CSR.
The Committee has pre-approved the audit-related services listed on Appendix B. The Committee must specifically approve all audit-related services not listed on Appendix B.
IV. Tax Services
The Committee believes the independent auditors can provide tax services to the Funds, including tax compliance, tax planning, and tax advice, without compromising the auditors’ independence. Therefore, the Committee may grant general pre-approval with respect to tax services historically provided by the Funds’ independent auditors that do not, in the Committee’s view, impair auditor independence and that are consistent with the SEC’s rules on auditor independence.
The Committee will not grant pre-approval if the independent auditors initially recommends a transaction the sole business purpose of which is tax avoidance and the tax treatment of which may not be supported in the Internal Revenue Code and related regulations. The Committee may consult outside counsel to determine that tax planning and reporting positions are consistent with this Policy.
The Committee has pre-approved the tax-related services listed on Appendix C. The Committee must specifically approve all tax-related services not listed on Appendix C.
V. Other Services
The Committee believes it may grant approval of non-audit services that are permissible services for independent auditors to a Fund. The Committee has determined to grant general pre-approval to other services that it believes are routine and recurring, do not impair auditor independence, and are consistent with SEC rules on auditor independence.
The Committee has pre-approved the non-audit services listed on Appendix D. The Committee must specifically approve all non-audit services not listed on Appendix D.
A list of the SEC’s prohibited non-audit services is attached to this Policy as Appendix E. The SEC’s rules and relevant guidance should be consulted to determine the precise definitions of these impermissible services and the applicability of exceptions to certain of the SEC’s prohibitions.
VI. Pre-approval of Fee levels and Budgeted Amounts
The Committee will annually establish pre-approval fee levels or budgeted amounts for audit, audit-related, tax and non-audit services to be provided to the Funds by the independent auditors. Any proposed services exceeding these levels or amounts require the Committee’s specific pre-approval. The Committee considers fees for audit and non-audit services when deciding whether to pre-approve services. The Committee may determine, for a pre-approval period of 12 months, the appropriate ratio between the total amount of fees for the Fund’s audit, audit-related, and tax services (including fees for services provided to Fund affiliates that are subject to pre-approval), and the total amount of fees for certain permissible non-audit services for the Fund classified as other services (including any such services provided to Fund affiliates that are subject to pre-approval).
VII. Procedures
Requests or applications for services to be provided by the independent auditors will be submitted to management. If management determines that the services do not fall within those services generally pre-approved by the Committee and set out in the appendices to these procedures, management will submit the services to the Committee or its delagee. Any such submission will include a detailed description of the services to be rendered. Notwithstanding this paragraph, the Committee will, on a quarterly basis, receive from the independent auditors a list of services provided for the previous calendar quarter on a cumulative basis by the auditors during the Pre-Approval Period.
VIII. Delegation
The Committee may delegate pre-approval authority to one or more of the Committee’s members. Any member or members to whom such pre-approval authority is delegated must report any pre-approval decisions, including any pre-approved services, to the Committee at its next scheduled meeting. The Committee will identify any member to whom pre-approval authority is delegated in writing. The member will retain such authority for a period of 12 months from the date of pre-approval unless the Committee determines that a different period is appropriate. The period of delegated authority may be terminated by the Committee or at the option of the member.
IX. Additional Requirements
The Committee will take any measures the Committee deems necessary or appropriate to oversee the work of the independent auditors and to assure the auditors’ independence from the Funds. This may include reviewing a formal written statement from the independent auditors delineating all relationships between the auditors and the Funds, consistent with Independence Standards Board No. 1, and discussing with the auditors their methods and procedures for ensuring independence.
Amended: February 23, 2007
Table of Contents
Appendix A
Pre-Approved Audit Services for the Pre-Approval Period January 1, 2006 through December 31, 2007
| Service | ||||
| The Fund(s) | Fee Range | |||
Statutory audits or financial audits (including tax services associated with audit services) | ü | As presented to Audit Committee1 | ||
| Services associated with SEC registration statements, periodic reports and other documents filed with the SEC or other documents issued in connection with securities offerings (e.g., consents), and assistance in responding to SEC comment letters. | ü | Not to exceed $9,750 per filing | ||
| Consultations by Fund management with respect to accounting or disclosure treatment of transactions or events and/or the actual or potential effect of final or proposed rules, standards or interpretations by the SEC, Financial Accounting Standards Board, or other regulatory or standard setting bodies. | ü | Not to exceed $8,000 during the Pre- Approval Period | ||
| Seed capital audit and related review and issuance of consent on the N-2 registration statement | ü | Not to exceed $12,600 per audit | ||
1 | For new Funds launched during the Pre-Approval Period, the fee ranges pre-approved will be the same as those for existing Funds, pro-rated in accordance with inception dates as provided in the auditors’ Proposal or any Engagement Letter covering the period at issue. Fees in the Engagement Letter will be controlling. |
Table of Contents
Appendix B
Pre-Approved Audit-Related Services for the Pre-Approval Period January 1, 2007 through December 31, 2007
| Service | ||||||
| The Fund(s) | Fund Affiliates | Fee Range | ||||
| Services related to Fund mergers (Excludes tax services — See Appendix C for tax services associated with Fund mergers) | ü | ü | Not to exceed $10,000 per merger | |||
| Consultations by Fund management with respect to accounting or disclosure treatment of transactions or events and/or the actual or potential effect of final or proposed rules, standards or interpretations by the SEC, Financial Accounting Standards Board, or other regulatory or standard setting bodies. [Note: Under SEC rules some consultations may be “audit” services and others may be “audit-related” services.] | ü | Not to exceed $5,000 per occurrence during the Pre-Approval Period | ||||
| Review of the Funds’ semi-annual financial statements | ü | Not to exceed $2,200 per set of financial statements per fund | ||||
| Reports to regulatory or government agencies related to the annual engagement | ü | Up to $5,000 per occurrence during the Pre-Approval Period | ||||
| Regulatory compliance assistance | ü | ü | Not to exceed $5,000 per quarter | |||
| Training courses | ü | Not to exceed $2,000 per course | ||||
| For Prime Rate Trust, agreed upon procedures for quarterly reports to rating agencies | ü | Not to exceed $9,450 per quarter | ||||
| For Prime Rate Trust and Senior Income Fund, agreed upon procedures for the Revolving Credit and Security Agreement with Citigroup | ü | Not to exceed $21,000 per fund per year | ||||
Table of Contents
Appendix C
Pre-Approved Tax Services for the Pre-Approval Period January 1, 2007 through December 31, 2007
| Service | ||||||
| The Fund(s) | Fund Affiliates | Fee Range | ||||
| Preparation of federal and state income tax returns and federal excise tax returns for the Funds including assistance and review with excise tax distributions | ü | As presented to Audit Committee2 | ||||
| Review of IRC Sections 851(b) and 817(h) diversification testing on a real-time basis | ü | As presented to Audit Committee2 | ||||
| Assistance and advice regarding year-end reporting for 1099’s | ü | As presented to Audit Committee2 | ||||
| Tax assistance and advice regarding statutory, regulatory or administrative developments | ü | ü | Not to exceed $5,000 for the Funds or for the Funds’ investment adviser during the Pre-Approval Period | |||
| Tax training courses | ü | Not to exceed $2,000 per course during the Pre-Approval Period | ||||
| Tax services associated with Fund mergers | ü | ü | Not to exceed $4,000 per fund per merger during the Pre-Approval Period | |||
| Other tax-related assistance and consultation, including, without limitation, assistance in evaluating derivative financial instruments and international tax issues, qualification and distribution issues, and similar routine tax consultations. | ü | Not to exceed $120,000 during the Pre-Approval Period | ||||
2 | For new Funds launched during the Pre-Approval Period, the fee ranges pre-approved will be the same as those for existing Funds, pro-rated in accordance with inception dates as provided in the auditors’ Proposal or any Engagement Letter covering the period at issue. Fees in the Engagement Letter will be controlling. |
Table of Contents
Appendix D
Pre-Approved Other Services for the Pre-Approval Period January 1, 2007 through December 31, 2007
| Service | ||||||
| The Fund(s) | Fund Affiliates | Fee Range | ||||
| Agreed-upon procedures for Class B share 12b-1 programs | ü | Not to exceed $50,000 during the Pre- Approval Period | ||||
Security counts performed pursuant to Rule 17f-2 of the 1940 Act (i.e., counts for Funds holding securities with affiliated sub-custodians)
Cost to be borne 50% by the Funds and 50% by ING Investments, LLC. | ü | ü | Not to exceed $5,000 per Fund during the Pre- Approval Period | |||
| Agreed upon procedures for 15 (c) FACT Books | ü | Not to exceed $35,000 | ||||
Table of Contents
Appendix E
Prohibited Non-Audit Services
Dated: January 1, 2007
| • | Bookkeeping or other services related to the accounting records or financial statements of the Funds |
| • | Financial information systems design and implementation |
| • | Appraisal or valuation services, fairness opinions, or contribution-in-kind reports |
| • | Actuarial services |
| • | Internal audit outsourcing services |
| • | Management functions |
| • | Human resources |
| • | Broker-dealer, investment adviser, or investment banking services |
| • | Legal services |
| • | Expert services unrelated to the audit |
| • | Any other service that the Public Company Accounting Oversight Board determines, by regulation, is impermissible |
Table of Contents
EXHIBIT A
ING EQUITY TRUST
ING FUNDS TRUST
ING ASIA PACIFIC HIGH DIVIDEND EQUITY INCOME FUND
ING GLOBAL ADVANTAGE AND PREMIUM OPPORTUNITY FUND
ING GLOBAL EQUITY DIVIDEND AND PREMIUM OPPORTUNITY FUND
ING RISK MANAGED NATURAL RESOURCES FUND
ING INVESTMENT FUNDS, INC.
ING INVESTORS TRUST
ING MAYFLOWER TRUST
ING MUTUAL FUNDS
ING PARTNERS, INC.
ING PRIME RATE TRUST
ING SENIOR INCOME FUND
ING VARIABLE INSURANCE TRUST
ING VARIABLE PRODUCTS TRUST
ING VP NATURAL RESOURCES TRUST
Table of Contents
| (e)(2) | Percentage of services referred to in (4)(b)-(4)(d) that were approved by the audit committee | |
| 100% of the services were approved by the audit committee. | ||
| (f) | Percentage of hours expended attributable to work performed by other than full time employees of KPMG if greater than 50% | |
| Not applicable | ||
| (g) | Non-Audit Fees: The non-audit fees billed by the registrant’s accountant for services rendered to the registrant, and rendered to the registrant’s investment adviser, and any entity controlling, controlled by, or under common control with the adviser that provides ongoing services to the registrant for each of the last two fiscal years of the registrant were $963,560 for year ended March 31, 2007 and $359,654 for fiscal year ended March 31, 2006. | |
| (h) | Principal Accountants Independence: the Registrant’s Audit committee has considered whether the provision of non-audit services that were rendered to the registrant’s investment adviser and any entity controlling, controlled by, or under common control with the investment adviser that provides ongoing services to the registrant that were not pre-approved pursuant to Rule 2.01(c)(7)(ii) of Regulation S-X is compatible with maintaining KPMG’s independence. | |
Item 5. Audit Committee of Listed Registrants.
Not applicable.
Item 6. Schedule of Investments
Schedule is included as part of the report to shareholders filed under Item 1 of this Form.
Item 7. Disclosure of Proxy Voting Policies and Procedures for Closed-End Management Investment companies.
Not applicable.
Item 8. Purchases of Equity Securities by Closed-End Management Investment Company and Affiliated Purchasers
Not applicable.
Item 9. Submission of Matters to a Vote of Security Holders.
Nominating Committee. The Nominating Committee operates pursuant to a Charter approved by the Board. The primary purpose of the Nominating Committee is to consider, evaluate and make recommendations to the Board with respect to the nomination and selection of Independent Trustees. In evaluating candidates, the Nominating Committee may consider a variety of factors, but specific qualifications of candidates for Board membership will be based on the needs of the Board at the time of nomination.
The Nominating Committee is willing to consider nominations received from shareholders and shall assess shareholder nominees in the same manner as it reviews nominees it identifies. A shareholder nominee for director should be submitted in writing to the Fund’s Secretary. Any such shareholder nomination should include sufficient background information concerning the candidate and should be received in a timely manner. At a minimum, the following information as to each individual proposed for nomination as director should be included: the individual’s written consent to be named in the proxy statement as a nominee (if nominated) and to serve as a director (if elected), and all information relating to such individual that is required to be disclosed in a solicitation of proxies for election of directors, or is otherwise required, in each case under applicable federal securities laws, rules and regulations.
The Secretary shall submit all nominations received in a timely manner to the Nominating Committee. To be timely, any such submission must be delivered to the Fund’s Secretary not earlier than the 90th day prior to such meeting and not later than the close of business on the later of the 60th day prior to such meeting or the 10th day following the day on which public announcement of the date of the meeting is first made, by either disclosure in a press release or in a document publicly filed by the Fund with the SEC.
In evaluating a candidate for the position of Independent Trustee, including any candidate recommended by shareholders of the Fund, the Nominating Committee shall consider the following: (i) the candidate’s knowledge in matters relating to the mutual fund industry; (ii) any experience possessed by the candidate as a director or senior officer of other public companies; (iii) the candidate’s educational background, reputation for high ethical standards and professional integrity; (iv) any specific financial, technical or other expertise possessed by the candidate, and the extent to which such expertise would complement the Board’s existing mix of skills, core competencies and qualifications; (v) the candidate’s perceived ability to contribute to the ongoing functions of the Board, including the candidate’s ability and commitment to attend meetings regularly and work collaboratively with other members of the Board; (vi) the candidate’s ability to qualify as an Independent Trustee for purposes of the 1940 Act; and (vii) such other factors as the Committee determines to be relevant in light of the existing composition of the Board and any anticipated vacancies. Prior to making a final recommendation to the Board, the Committee shall conduct personal interviews with those candidates it concludes are the most qualified candidates.
Item 10. Controls and Procedures.
| (a) | Based on our evaluation conducted within 90 days of the filing date, hereof, the design and operation of the registrant’s disclosure controls and procedures are effective to ensure that material information relating to the registrant is made known to the certifying officers by others within the appropriate entities, particularly during the period in which Forms N-CSR are being prepared, and the registrant’s disclosure controls and procedures allow timely preparation and review of the information for the registrant’s Form N-CSR and the officer certifications of such Form N-CSR. |
| (b) | There were no significant changes in the registrant’s internal controls that occurred during the second fiscal quarter of the period covered by this report that has materially affected, or is reasonably likely to materially affect, the registrant’s internal control over financial reporting. |
Item 11. Exhibits.
| (a)(1) | Code of Ethics pursuant to Item 2 of Form N-CSR is filed and attached hereto as EX-99.CODE ETH. | |
| (a)(2) | A separate certification for each principal executive officer and principal financial officer of the registrant as required by Rule 30a-2 under the Act (17 CFR 270.30a-2) is attached hereto as EX-99.CERT. | |
| (b) | The officer certifications required by Section 906 of the Sarbanes-Oxley Act of 2002 are attached hereto as EX-99.906CERT | |
| (3) | Not applicable. | |
Table of Contents
SIGNATURES
Pursuant to the requirements of the Securities Exchange Act of 1934 and the Investment Company Act of 1940, the registrant has duly caused this report to be signed on its behalf by the undersigned, thereunto duly authorized.
| (Registrant): ING Funds Trust | ||
| By | /s/ Shaun P. Mathews | |
| Shaun P. Mathews | ||
| President and Chief Executive Officer | ||
| Date: June 8, 2007 | ||
Pursuant to the requirements of the Securities Exchange Act of 1934 and the Investment Company Act of 1940, this report has been signed below by the following persons on behalf of the registrant and in the capacities and on the dates indicated.
| By | /s/ Shaun P. Mathews | |
| Shaun P. Mathews | ||
| President and Chief Executive Officer | ||
| Date: June 8, 2007 | ||
| By | /s/ Todd Modic | |
| Todd Modic | ||
| Senior Vice President and Chief Financial Officer | ||
| Date: June 8, 2007 | ||