UNITED STATES
SECURITIES AND EXCHANGE COMMISSION
Washington, D.C. 20549
FORM N-CSR
CERTIFIED SHAREHOLDER REPORT OF REGISTERED
MANAGEMENT INVESTMENT COMPANIES
Investment Company Act file number | 811-08921 | ||||||||
| |||||||||
CREDIT SUISSE LARGE CAP BLEND FUND, INC. | |||||||||
(Exact name of registrant as specified in charter) | |||||||||
| |||||||||
466 Lexington Avenue, New York, New York |
| 10017-3140 | |||||||
(Address of principal executive offices) |
| (Zip code) | |||||||
| |||||||||
J. Kevin Gao, Esq. Credit Suisse Large Cap Blend Fund, Inc. 466 Lexington Avenue New York, New York 10017-3140 | |||||||||
(Name and address of agent for service) | |||||||||
| |||||||||
Registrant’s telephone number, including area code: | (212) 875-3500 |
| |||||||
| |||||||||
Date of fiscal year end: | December 31 |
| |||||||
| |||||||||
Date of reporting period: | January 1, 2006 to June 30, 2006 |
| |||||||
Item 1. Reports to Stockholders.

CREDIT SUISSE FUNDS
Semiannual Report
June 30, 2006
(unaudited)
n CREDIT SUISSE
LARGE CAP BLEND FUND
The Fund's investment objectives, risks, charges and expenses (which should be considered carefully before investing), and more complete information about the Fund, are provided in the Prospectus, which should be read carefully before investing. You may obtain additional copies by calling 800-927-2874 or by writing to Credit Suisse Funds, P.O. Box 55030, Boston, MA 02205-5030.
Credit Suisse Asset Management Securities, Inc., Distributor, is located at 466 Lexington Ave., New York, NY 10017-3140. Credit Suisse Funds are advised by Credit Suisse Asset Management, LLC.
Investors in the Credit Suisse Funds should be aware that they may be eligible to purchase Common Class and/or Advisor Class shares (where offered) directly or through certain intermediaries. Such shares are not subject to a sales charge but may be subject to an ongoing service and distribution fee of up to 0.50% of average daily net assets. Investors in the Credit Suisse Funds should also be aware that they may be eligible for a reduction or waiver of the sales charge with respect to Class A, B or C shares (where offered). For more information, please review the relevant prospectuses or consult your financial representative.
The views of the Fund's management are as of the date of the letter and the Fund holdings described in this document are as of June 30, 2006; these views and Fund holdings may have changed subsequent to these dates. Nothing in this document is a recommendation to purchase or sell securities.
Fund shares are not deposits or other obligations of Credit Suisse Asset Management, LLC ("Credit Suisse") or any affiliate, are not FDIC-insured and are not guaranteed by Credit Suisse or any affiliate. Fund investments are subject to investment risks, including loss of your investment.
Credit Suisse Large Cap Blend Fund
Semiannual Investment Adviser's Report
June 30, 2006 (unaudited)
July 21, 2006
Dear Shareholder:
Performance Summary
01/01/06 – 06/30/06
| Fund & Benchmark | Performance | ||||||
| Common1 | (1.06 | )% | |||||
| Class A1, 2 | (1.06 | )% | |||||
| Class B1, 2 | (1.43 | )% | |||||
| Class C1, 2 | (1.51 | )% | |||||
| S&P 500 Index3 | 2.71 | % | |||||
Performance for the Fund's Class A, Class B and Class C Shares is without the maximum sales charge of 5.75%, 4.00% and 1.00%, respectively.2
The Market: Positive despite turbulence
The period was a positive, though volatile, one for the stock market. Equities rose into early May, but hit turbulence on heightened inflation and interest-rate worries, turning sharply down into mid June. The market staged a late-period rally, however, after the US Federal Reserve hinted that an end to its monetary tightening cycle might be relatively near. From a sector standpoint, energy stocks outperformed, supported by high oil prices. Utilities also performed well, while the health care and technology sectors underperformed. Large cap stocks trailed small cap stocks, though the latter were more volatile. Value stocks outperformed growth stocks across the market capitalization range.
Strategic Review:
The Fund's underperformance was attributable in part to its technology holdings, several of which had declines on concerns over slowing demand, despite generally good earnings reports for these companies in the period. The Fund's health care stocks also underperformed. St. Jude Medical sold off on slower-than-expected growth in the US implantable cardiac device (ICD) market, along with competition concerns. We decided to eliminate the position in the period.
On the positive side, the Fund was aided by good stock selection in the consumer staples sector. Kellogg (1.8% of the Fund's net assets as of June 30, 2006) had a double-digit gain, aided by good pricing power, which has helped to offset higher input costs for grains. The Fund was also helped by its overweighting in the industrials sector, which outperformed, along with good stock selection in that sector. Good performers included Deere and United
1
Credit Suisse Large Cap Blend Fund
Semiannual Investment Adviser's Report (continued)
June 30, 2006 (unaudited)
Technologies (1.4% and 2.0% of the Fund's net assets, respectively, as of June 30, 2006).
In terms of noteworthy new positions, our purchases included General Mills (1.0% of the Fund's net assets as of June 30, 2006), a manufacturer of cereals and other consumer food products. We believe that the company's operating performance could continue to improve, driven by productivity enhancements to offset input cost inflation. In addition, a more favorable retail pricing environment, combined with an effective promotion and innovation mix, could accelerate profit growth.
Going forward, we will continue to seek companies we believe have good return-on-invested-capital trends, in a variety of industries. Our focus will remain on companies that appear committed to creating shareholder value via debt reduction, higher dividend payments, and/or share repurchase programs, factors that are often associated with capital-return improvements. We will continue to select stocks using value, growth and core criteria, consistent with our blend strategy.
Stephen J. Kaszynski
Portfolio Manager
The value of investments generally will fluctuate in response to market movements.
In addition to historical information, this report contains forward-looking statements, which may concern, among other things, domestic and foreign market, industry and economic trends and developments and government regulation and their potential impact on the Fund's investment portfolio. These statements are subject to risks and uncertainties and actual trends, developments and regulations in the future and their impact on the Fund could be materially different from those projected, anticipated or implied. The Fund has no obligation to update or revise forward-looking statements.
2
Credit Suisse Large Cap Blend Fund
Semiannual Investment Adviser's Report (continued)
June 30, 2006 (unaudited)
Average Annual Returns as of June 30, 20061
| 1 Year | 5 Years | Since Inception | Inception Date | ||||||||||||||||
| Common Class | 2.93 | % | (1.55 | )% | 3.32 | % | 10/30/98 | ||||||||||||
| Class A Without Sales Charge | 2.92 | % | — | (0.88 | )% | 7/31/01 | |||||||||||||
| Class A With Maximum Sales Charge | (2.99 | )% | — | (2.07 | )% | 7/31/01 | |||||||||||||
| Class B Without CDSC | 2.13 | % | — | (1.63 | )% | 7/31/01 | |||||||||||||
| Class B With CDSC | (1.79 | )% | — | (1.63 | )% | 7/31/01 | |||||||||||||
| Class C Without CDSC | 2.05 | % | — | (1.70 | )% | 7/31/01 | |||||||||||||
| Class C With CDSC | 1.07 | % | — | (1.70 | )% | 7/31/01 | |||||||||||||
Returns represent past performance and include change in share price and reinvestment of dividends and capital gains. Past performance cannot guarantee future results. The current performance of the Fund may be lower or higher than the figures shown. Returns and share price will fluctuate, and redemption value may be more or less than original cost. The performance results do not reflect the deduction of taxes that a shareholder would pay on fund distributions or the redemption of fund shares. Performance information current to the most recent month-end is available at www.credit-suisse.com/us.
1 Fee waivers and/or expense reimbursements may reduce expenses for the Fund, without which performance would be lower. Waivers and/or reimbursements may be discontinued at any time.
2 Total return for Class A shares for the reporting period, based on offering price (including maximum sales charge of 5.75%) was down 6.76%. Total return for Class B shares for the reporting period, based on redemption value (including contingent deferred sales charge of 4.00%), was down 5.37%. Total return for Class C shares for the reporting period, based on redemption value (including contingent deferred sales charge of 1.00%), was down 2.50%.
3 The Standard & Poor's 500 Index is an unmanaged index (with no defined investment objective) of common stocks, includes reinvestment of dividends, and is a registered trademark of McGraw-Hill Co., Inc. Investors cannot invest directly in an index.
3
Credit Suisse Large Cap Blend Fund
Semiannual Investment Adviser's Report (continued)
June 30, 2006 (unaudited)
Information About Your Fund's Expenses
As an investor of the Fund, you incur two types of costs: ongoing expenses and transaction costs. Ongoing expenses include management fees, distribution and service (12b-1) fees and other Fund expenses. Examples of transaction costs include sales charges (loads), redemption fees and account maintenance fees, which are not shown in this section and which would result in higher total expenses. The following table is intended to help you understand your ongoing expenses of investing in the Fund and to help you compare these expenses with the ongoing expenses of investing in other mutual funds. The table is based on an investment of $1,000 made at the beginning of the six month period ended June 30, 2006.
The table illustrates your Fund's expenses in two ways:
• Actual Fund Return. This helps you estimate the actual dollar amount of ongoing expenses paid on a $1,000 investment in the Fund using the Fund's actual return during the period. To estimate the expenses you paid over the period, simply divide your account value by $1,000 (for example, an $8,600 account value divided by $1,000 = 8.6), then multiply the result by the number in the "Expenses Paid per $1,000" line under the share class you hold.
• Hypothetical 5% Fund Return. This helps you to compare your Fund's ongoing expenses with those of other mutual funds using the Fund's actual expense ratio and a hypothetical rate of return of 5% per year before expenses. Examples using a 5% hypothetical fund return may be found in the shareholder reports of other mutual funds. The hypothetical account values and expenses may not be used to estimate the actual ending account balance or expenses you paid for the period.
Please note that the expenses shown in these tables are meant to highlight your ongoing expenses only and do not reflect any transaction costs, such as sales charges (loads) or redemption fees. If these transaction costs had been included, your costs would have been higher. The "Expenses Paid per $1,000" line of the tables is useful in comparing ongoing expenses only and will not help you determine the relative total expenses of owning different funds.
4
Credit Suisse Large Cap Blend Fund
Semiannual Investment Adviser's Report (continued)
June 30, 2006 (unaudited)
Expenses and Value of a $1,000 Investment
for the six month period ended June 30, 2006
| Actual Fund Return | Common Class | Class A | Class B | Class C | |||||||||||||||
| Beginning Account Value 1/1/06 | $ | 1,000.00 | $ | 1,000.00 | $ | 1,000.00 | $ | 1,000.00 | |||||||||||
| Ending Account Value 6/30/06 | $ | 989.40 | $ | 989.40 | $ | 985.70 | $ | 984.90 | |||||||||||
| Expenses Paid per $1,000* | $ | 6.41 | $ | 6.41 | $ | 10.09 | $ | 10.09 | |||||||||||
| Hypothetical 5% Fund Return | |||||||||||||||||||
| Beginning Account Value 1/1/06 | $ | 1,000.00 | $ | 1,000.00 | $ | 1,000.00 | $ | 1,000.00 | |||||||||||
| Ending Account Value 6/30/06 | $ | 1,018.35 | $ | 1,018.35 | $ | 1,014.63 | $ | 1,014.63 | |||||||||||
| Expenses Paid per $1,000* | $ | 6.51 | $ | 6.51 | $ | 10.24 | $ | 10.24 | |||||||||||
| Common Class | Class A | Class B | Class C | ||||||||||||||||
| Annualized Expense Ratios* | 1.30 | % | 1.30 | % | 2.05 | % | 2.05 | % | |||||||||||
* Expenses are equal to the Fund's annualized expense ratio for each share class, multiplied by the average account value over the period, multiplied by the number of days in the most recent fiscal half year period, then divided by 365.
The "Expense Paid per $1,000" and the "Annualized Expense Ratios" in the tables are based on actual expenses paid by the Fund during the period, net of fee waivers and/or expense reimbursements. If those fee waivers and/or expense reimbursements had not been in effect, the Fund's actual expenses would have been higher.
For more information, please refer to the Fund's prospectus.
5
Credit Suisse Large Cap Blend Fund
Semiannual Investment Adviser's Report (continued)
June 30, 2006 (unaudited)
SECTOR BREAKDOWN*
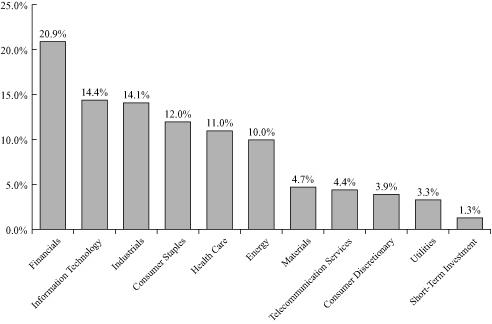
* Expressed as a percentage of total investments (excluding security lending collateral) and may vary over time.
6
Credit Suisse Large Cap Blend Fund
Schedule of Investments
June 30, 2006 (unaudited)
| Number of Shares | Value | ||||||||||
| COMMON STOCKS (98.7%) | |||||||||||
| Aerospace & Defense (7.5%) | |||||||||||
| Boeing Co. | 11,900 | $ | 974,729 | ||||||||
| Goodrich Corp. | 15,100 | 608,379 | |||||||||
| Lockheed Martin Corp. | 10,600 | 760,444 | |||||||||
| Precision Castparts Corp. | 16,700 | 997,992 | |||||||||
| United Technologies Corp. | 18,500 | 1,173,270 | |||||||||
| 4,514,814 | |||||||||||
| Banks (7.5%) | |||||||||||
| Bank of America Corp. | 38,701 | 1,861,518 | |||||||||
| Mercantile Bankshares Corp. | 8,100 | 288,927 | |||||||||
| U.S. Bancorp | 31,900 | 985,072 | |||||||||
| Wells Fargo & Co. | 20,200 | 1,355,016 | |||||||||
| 4,490,533 | |||||||||||
| Beverages (1.8%) | |||||||||||
| PepsiCo, Inc. | 17,400 | 1,044,696 | |||||||||
| Building Products (0.8%) | |||||||||||
| American Standard Companies, Inc. | 11,400 | 493,278 | |||||||||
| Chemicals (2.4%) | |||||||||||
| Dow Chemical Co. | 10,200 | 398,106 | |||||||||
| Monsanto Co. | 12,500 | 1,052,375 | |||||||||
| 1,450,481 | |||||||||||
| Commercial Services & Supplies (0.9%) | |||||||||||
| Avery Dennison Corp. | 9,400 | 545,764 | |||||||||
| Communications Equipment (2.3%) | |||||||||||
| Cisco Systems, Inc.* | 34,500 | 673,785 | |||||||||
| Motorola, Inc. | 36,000 | 725,400 | |||||||||
| 1,399,185 | |||||||||||
| Computers & Peripherals (5.0%) | |||||||||||
| Apple Computer, Inc.* | 9,500 | 542,640 | |||||||||
| Dell, Inc.* | 18,700 | 456,467 | |||||||||
| EMC Corp.* | 70,000 | 767,900 | |||||||||
| International Business Machines Corp. | 15,900 | 1,221,438 | |||||||||
| 2,988,445 | |||||||||||
| Containers & Packaging (1.5%) | |||||||||||
| Crown Holdings, Inc.* | 59,100 | 920,187 | |||||||||
| Diversified Financials (7.2%) | |||||||||||
| American Express Co. | 12,700 | 675,894 | |||||||||
| Capital One Financial Corp. | 8,500 | 726,325 | |||||||||
| Goldman Sachs Group, Inc. | 3,900 | 586,677 | |||||||||
| JPMorgan Chase & Co. | 18,500 | 777,000 | |||||||||
| Morgan Stanley | 9,800 | 619,458 | |||||||||
| SLM Corp. | 8,600 | 455,112 | |||||||||
| TD Ameritrade Holding Corp.§ | 30,600 | 453,186 | |||||||||
| 4,293,652 | |||||||||||
See Accompanying Notes to Financial Statements.
7
Credit Suisse Large Cap Blend Fund
Schedule of Investments (continued)
June 30, 2006 (unaudited)
| Number of Shares | Value | ||||||||||
| COMMON STOCKS | |||||||||||
| Diversified Telecommunication Services (3.9%) | |||||||||||
| ALLTEL Corp. | 13,000 | $ | 829,790 | ||||||||
| BellSouth Corp. | 14,600 | 528,520 | |||||||||
| Sprint Nextel Corp. | 48,800 | 975,512 | |||||||||
| 2,333,822 | |||||||||||
| Electric Utilities (3.3%) | |||||||||||
| Exelon Corp. | 23,800 | 1,352,554 | |||||||||
| PPL Corp. | 19,600 | 633,080 | |||||||||
| 1,985,634 | |||||||||||
| Electronic Equipment & Instruments (0.9%) | |||||||||||
| Broadcom Corp. Class A* | 18,800 | 564,940 | |||||||||
| Energy Equipment & Services (2.6%) | |||||||||||
| Grant Prideco, Inc.* | 11,700 | 523,575 | |||||||||
| Halliburton Co. | 13,600 | 1,009,256 | |||||||||
| 1,532,831 | |||||||||||
| Food & Drug Retailing (1.5%) | |||||||||||
| CVS Corp. | 28,400 | 871,880 | |||||||||
| Food Products (2.8%) | |||||||||||
| General Mills, Inc. | 11,600 | 599,256 | |||||||||
| Kellogg Co. | 22,000 | 1,065,460 | |||||||||
| 1,664,716 | |||||||||||
| Healthcare Equipment & Supplies (0.6%) | |||||||||||
| Dade Behring Holdings, Inc. | 8,700 | 362,268 | |||||||||
| Healthcare Providers & Services (1.0%) | |||||||||||
| Aetna, Inc. | 14,700 | 586,971 | |||||||||
| Household Products (1.6%) | |||||||||||
| Procter & Gamble Co. | 17,600 | 978,560 | |||||||||
| Industrial Conglomerates (3.4%) | |||||||||||
| 3M Co. | 8,100 | 654,237 | |||||||||
| General Electric Co. | 42,500 | 1,400,800 | |||||||||
| 2,055,037 | |||||||||||
| Insurance (6.1%) | |||||||||||
| Aflac, Inc. | 15,300 | 709,155 | |||||||||
| Genworth Financial, Inc. Class A | 29,600 | 1,031,264 | |||||||||
| Hartford Financial Services Group, Inc. | 11,600 | 981,360 | |||||||||
| St. Paul Travelers Companies, Inc. | 21,000 | 936,180 | |||||||||
| 3,657,959 | |||||||||||
| Internet Software & Services (1.2%) | |||||||||||
| Google, Inc. Class A* | 1,700 | 712,861 | |||||||||
See Accompanying Notes to Financial Statements.
8
Credit Suisse Large Cap Blend Fund
Schedule of Investments (continued)
June 30, 2006 (unaudited)
| Number of Shares | Value | ||||||||||
| COMMON STOCKS | |||||||||||
| IT Consulting & Services (1.8%) | |||||||||||
| CACI International, Inc. Class A*§ | 11,200 | $ | 653,296 | ||||||||
| NAVTEQ Corp.* | 9,900 | 442,332 | |||||||||
| 1,095,628 | |||||||||||
| Machinery (1.4%) | |||||||||||
| Deere & Co. | 10,100 | 843,249 | |||||||||
| Multiline Retail (3.0%) | |||||||||||
| Kohl's Corp.* | 10,500 | 620,760 | |||||||||
| Wal-Mart Stores, Inc. | 24,300 | 1,170,531 | |||||||||
| 1,791,291 | |||||||||||
| Oil & Gas (7.5%) | |||||||||||
| Chevron Corp. | 21,300 | 1,321,878 | |||||||||
| ConocoPhillips | 12,900 | 845,337 | |||||||||
| Exxon Mobil Corp. | 20,900 | 1,282,215 | |||||||||
| Hugoton Royalty Trust§ | 441 | 13,098 | |||||||||
| Newfield Exploration Co.* | 6,500 | 318,110 | |||||||||
| Noble Energy, Inc. | 15,000 | 702,900 | |||||||||
| 4,483,538 | |||||||||||
| Paper & Forest Products (0.7%) | |||||||||||
| International Paper Co. | 13,600 | 439,280 | |||||||||
| Pharmaceuticals (9.4%) | |||||||||||
| Abbott Laboratories | 21,400 | 933,254 | |||||||||
| Forest Laboratories, Inc.* | 14,800 | 572,612 | |||||||||
| Johnson & Johnson | 17,300 | 1,036,616 | |||||||||
| Medco Health Solutions, Inc.* | 13,500 | 773,280 | |||||||||
| Pfizer, Inc. | 54,300 | 1,274,421 | |||||||||
| Wyeth | 23,200 | 1,030,312 | |||||||||
| 5,620,495 | |||||||||||
| Semiconductor Equipment & Products (0.5%) | |||||||||||
| Applied Materials, Inc. | 16,800 | 273,504 | |||||||||
| Software (2.7%) | |||||||||||
| Electronic Arts, Inc.* | 11,000 | 473,440 | |||||||||
| Microsoft Corp. | 48,500 | 1,130,050 | |||||||||
| 1,603,490 | |||||||||||
| Specialty Retail (2.9%) | |||||||||||
| Abercrombie & Fitch Co. Class A | 8,700 | 482,241 | |||||||||
| Best Buy Company, Inc. | 10,100 | 553,884 | |||||||||
| Home Depot, Inc. | 19,500 | 697,905 | |||||||||
| 1,734,030 | |||||||||||
| Tobacco (2.5%) | |||||||||||
| Altria Group, Inc. | 20,000 | 1,468,600 | |||||||||
See Accompanying Notes to Financial Statements.
9
Credit Suisse Large Cap Blend Fund
Schedule of Investments (continued)
June 30, 2006 (unaudited)
| Number of Shares | Value | ||||||||||
| COMMON STOCKS | |||||||||||
| Wireless Telecommunication Services (0.5%) | |||||||||||
| American Tower Corp. Class A*§ | 9,300 | $ | 289,416 | ||||||||
| TOTAL COMMON STOCKS (Cost $55,005,425) | 59,091,035 | ||||||||||
| SHORT-TERM INVESTMENTS (3.7%) | |||||||||||
| State Street Navigator Prime Portfolio§§ | 1,441,776 | 1,441,776 | |||||||||
| Par (000) | |||||||||||
| State Street Bank and Trust Co. Euro Time Deposit, 4.100%, 7/03/06 | $ | 770 | 770,000 | ||||||||
| TOTAL SHORT-TERM INVESTMENTS (Cost $2,211,776) | 2,211,776 | ||||||||||
| TOTAL INVESTMENTS AT VALUE (102.4%) (Cost $57,217,201) | 61,302,811 | ||||||||||
| LIABILITIES IN EXCESS OF OTHER ASSETS (-2.4%) | (1,456,622 | ) | |||||||||
| NET ASSETS (100.0%) | $ | 59,846,189 | |||||||||
* Non-income producing security.
§ Security or portion thereof is out on loan.
§§ Represents security purchased with cash collateral received for securities on loan.
See Accompanying Notes to Financial Statements.
10
Credit Suisse Large Cap Blend Fund
Statement of Assets and Liabilities
June 30, 2006 (unaudited)
| Assets | |||||||
| Investments at value, including collateral for securities on loan of $1,441,776 (Cost $57,217,201) (Note 2) | $ | 61,302,8111 | |||||
| Cash | 769 | ||||||
| Dividend and interest receivable | 61,046 | ||||||
| Receivable for fund shares sold | 2,946 | ||||||
| Prepaid expenses and other assets | 47,631 | ||||||
| Total Assets | 61,415,203 | ||||||
| Liabilities | |||||||
| Advisory fee payable (Note 3) | 20,550 | ||||||
| Administrative services fee payable (Note 3) | 8,932 | ||||||
| Distribution fee payable (Note 3) | 16,736 | ||||||
| Payable upon return of securities loaned (Note 2) | 1,441,776 | ||||||
| Payable for fund shares redeemed | 11,184 | ||||||
| Other accrued expenses payable | 69,836 | ||||||
| Total Liabilities | 1,569,014 | ||||||
| Net Assets | |||||||
| Capital stock, $0.001 par value (Note 6) | 4,956 | ||||||
| Paid-in capital (Note 6) | 55,158,074 | ||||||
| Undistributed net investment income | 79,091 | ||||||
| Accumulated net realized gain on investments | 518,458 | ||||||
| Net unrealized appreciation from investments | 4,085,610 | ||||||
| Net Assets | $ | 59,846,189 | |||||
| Common Shares | |||||||
| Net assets | $ | 2,525,985 | |||||
| Shares outstanding | 208,834 | ||||||
| Net asset value, offering price, and redemption price per share | $ | 12.10 | |||||
| A Shares | |||||||
| Net assets | $ | 50,025,324 | |||||
| Shares outstanding | 4,125,412 | ||||||
| Net asset value and redemption price per share | $ | 12.13 | |||||
| Maximum offering price per share (net asset value/(1-5.75%)) | $ | 12.87 | |||||
| B Shares | |||||||
| Net assets | $ | 6,344,475 | |||||
| Shares outstanding | 540,164 | ||||||
| Net asset value and offering price per share | $ | 11.75 | |||||
| C Shares | |||||||
| Net assets | $ | 950,405 | |||||
| Shares outstanding | 81,136 | ||||||
| Net asset value and offering price per share | $ | 11.71 | |||||
1 Including $1,408,996 of securities on loan.
See Accompanying Notes to Financial Statements.
11
Credit Suisse Large Cap Blend Fund
Statement of Operations
For the Six Months Ended June 30, 2006 (unaudited)
| Investment Income (Note 2) | |||||||
| Dividends | $ | 519,698 | |||||
| Interest | 8,505 | ||||||
| Securities lending | 656 | ||||||
| Total investment income | 528,859 | ||||||
| Expenses | |||||||
| Investment advisory fees (Note 3) | 241,388 | ||||||
| Administrative services fees (Note 3) | 41,029 | ||||||
| Distribution fees (Note 3) | |||||||
| Common Class | 3,349 | ||||||
| Class A | 66,658 | ||||||
| Class B | 36,578 | ||||||
| Class C | 5,245 | ||||||
| Transfer agent fees (Note 3) | 57,933 | ||||||
| Registration fees | 29,629 | ||||||
| Printing fees (Note 3) | 15,435 | ||||||
| Directors' fees | 11,392 | ||||||
| Audit and tax fees | 10,398 | ||||||
| Custodian fees | 7,755 | ||||||
| Legal fees | 5,518 | ||||||
| Insurance expense | 2,513 | ||||||
| Commitment fees (Note 4) | 936 | ||||||
| Interest expense (Note 4) | 443 | ||||||
| Miscellaneous expense | 4,123 | ||||||
| Total expenses | 540,322 | ||||||
| Less: fees waived (Note 3) | (90,554 | ) | |||||
| Net expenses | 449,768 | ||||||
| Net investment income | 79,091 | ||||||
| Net Realized and Unrealized Gain (Loss) from Investments | |||||||
| Net realized gain from investments | 2,713,752 | ||||||
| Net change in unrealized appreciation (depreciation) from investments | (3,380,881 | ) | |||||
| Net realized and unrealized loss from investments | (667,129 | ) | |||||
| Net decrease in net assets resulting from operations | $ | (588,038 | ) | ||||
See Accompanying Notes to Financial Statements.
12
Credit Suisse Large Cap Blend Fund
Statements of Changes in Net Assets
| For the Six Months Ended June 30, 2006 (unaudited) | For the Year Ended December 31, 2005 | ||||||||||
| From Operations | |||||||||||
| Net investment income | $ | 79,091 | $ | 147,041 | |||||||
| Net realized gain from investments | 2,713,752 | 6,624,939 | |||||||||
| Net change in unrealized appreciation (depreciation) from investments | (3,380,881 | ) | (5,106,356 | ) | |||||||
| Net increase (decrease) in net assets resulting from operations | (588,038 | ) | 1,665,624 | ||||||||
| From Dividends and Distributions | |||||||||||
| Dividends from net investment income | |||||||||||
| Common Class shares | — | (16,332 | ) | ||||||||
| Class A shares | — | (310,397 | ) | ||||||||
| Class B shares | — | (4,698 | ) | ||||||||
| Class C shares | — | (623 | ) | ||||||||
| Distributions from net realized gains | |||||||||||
| Common Class shares | — | (110,598 | ) | ||||||||
| Class A shares | — | (2,237,090 | ) | ||||||||
| Class B shares | — | (333,667 | ) | ||||||||
| Class C shares | — | (46,449 | ) | ||||||||
| Net decrease in net assets resulting from dividends and distributions | — | (3,059,854 | ) | ||||||||
| From Capital Share Transactions (Note 6) | |||||||||||
| Proceeds from sale of shares | 891,342 | 2,342,378 | |||||||||
| Reinvestment of dividends and distributions | — | 2,668,195 | |||||||||
| Net asset value of shares redeemed | (9,917,601 | ) | (16,365,188 | ) | |||||||
| Net decrease in net assets from capital share transactions | (9,026,259 | ) | (11,354,615 | ) | |||||||
| Net decrease in net assets | (9,614,297 | ) | (12,748,845 | ) | |||||||
| Net Assets | |||||||||||
| Beginning of period | 69,460,486 | 82,209,331 | |||||||||
| End of period | $ | 59,846,189 | $ | 69,460,486 | |||||||
| Undistributed net investment income | $ | 79,091 | $ | — | |||||||
See Accompanying Notes to Financial Statements.
13
Credit Suisse Large Cap Blend Fund
Financial Highlights
(For a Common Class Share of the Fund Outstanding Throughout Each Period)
| For the Six Months Ended June 30, 2006 | For the Year Ended December 31, | For the Period September 1, 2004 to December 31, | For the Year Ended August 31, | ||||||||||||||||||||||||||||
| (unaudited) | 2005 | 20041 | 2004 | 2003 | 2002 | 2001 | |||||||||||||||||||||||||
| Per share data | |||||||||||||||||||||||||||||||
| Net asset value, beginning of period | $ | 12.23 | $ | 12.45 | $ | 12.01 | $ | 11.42 | $ | 10.66 | $ | 13.39 | $ | 19.13 | |||||||||||||||||
| INVESTMENT OPERATIONS | |||||||||||||||||||||||||||||||
| Net investment income | 0.022 | 0.042 | 0.052 | 0.032 | 0.01 | 0.012 | 0.02 | ||||||||||||||||||||||||
| Net gain (loss) on investments (both realized and unrealized) | (0.15 | ) | 0.30 | 1.21 | 0.57 | 0.76 | (2.71 | ) | (4.48 | ) | |||||||||||||||||||||
| Total from investment operations | (0.13 | ) | 0.34 | 1.26 | 0.60 | 0.77 | (2.70 | ) | (4.46 | ) | |||||||||||||||||||||
| LESS DIVIDENDS AND DISTRIBUTIONS | |||||||||||||||||||||||||||||||
| Dividends from net investment income | — | (0.07 | ) | (0.01 | ) | (0.01 | ) | (0.01 | ) | (0.01 | ) | (0.03 | ) | ||||||||||||||||||
| Distributions from net realized gains | — | (0.49 | ) | (0.81 | ) | — | — | (0.02 | ) | (1.25 | ) | ||||||||||||||||||||
| Total dividends and distributions | — | (0.56 | ) | (0.82 | ) | (0.01 | ) | (0.01 | ) | (0.03 | ) | (1.28 | ) | ||||||||||||||||||
| Net asset value, end of period | $ | 12.10 | $ | 12.23 | $ | 12.45 | $ | 12.01 | $ | 11.42 | $ | 10.66 | $ | 13.39 | |||||||||||||||||
| Total return3 | (1.06 | )% | 2.70 | % | 10.70 | % | 5.25 | % | 7.26 | % | (20.21 | )% | (24.68 | )% | |||||||||||||||||
| RATIOS AND SUPPLEMENTAL DATA | |||||||||||||||||||||||||||||||
| Net assets, end of period (000s omitted) | $ | 2,526 | $ | 2,809 | $ | 3,471 | $ | 4,383 | $ | 5,653 | $ | 4,545 | $ | 7,696 | |||||||||||||||||
| Ratio of expenses to average net assets | 1.30 | %4 | 1.30 | % | 1.30 | %4 | 1.30 | % | 1.25 | % | 1.19 | % | 1.22 | % | |||||||||||||||||
| Ratio of net investment income to average net assets | 0.35 | %4 | 0.32 | % | 1.37 | %4 | 0.23 | % | 0.17 | % | 0.12 | % | 0.09 | % | |||||||||||||||||
| Decrease reflected in above operating expense ratios due to waivers/reimbursements | 0.28 | %4 | 0.26 | % | 0.32 | %4 | 0.40 | % | 2.87 | % | 2.24 | % | 1.98 | % | |||||||||||||||||
| Portfolio turnover rate | 34 | % | 101 | % | 34 | % | 168 | % | 155 | % | 122 | % | 141 | % | |||||||||||||||||
1 The Fund changed its fiscal year end from August 31 to December 31.
2 Per share information is calculated using the average shares outstanding method.
3 Total returns are historical and assume changes in share price and reinvestment of all dividends and distributions. Had certain expenses not been reduced during the periods shown, total returns would have been lower. Total returns for periods less than one year are not annualized.
4 Annualized.
See Accompanying Notes to Financial Statements.
14
Credit Suisse Large Cap Blend Fund
Financial Highlights
(For a Class A Share of the Fund Outstanding Throughout Each Period)
| For the Six Months Ended June 30, 2006 | For the Year Ended December 31, | For the Period September 1, 2004 to December 31, | For the Year Ended August 31, | ||||||||||||||||||||||||||||
| (unaudited) | 2005 | 20041 | 2004 | 2003 | 2002 | 20012 | |||||||||||||||||||||||||
| Per share data | |||||||||||||||||||||||||||||||
| Net asset value, beginning of period | $ | 12.26 | $ | 12.48 | $ | 12.04 | $ | 11.44 | $ | 10.67 | $ | 13.39 | $ | 14.19 | |||||||||||||||||
| INVESTMENT OPERATIONS | |||||||||||||||||||||||||||||||
| Net investment income | 0.023 | 0.043 | 0.063 | 0.043 | 0.01 | 0.013 | 0.01 | ||||||||||||||||||||||||
| Net gain (loss) on investments (both realized and unrealized) | (0.15 | ) | 0.30 | 1.20 | 0.57 | 0.77 | (2.70 | ) | (0.81 | ) | |||||||||||||||||||||
| Total from investment operations | (0.13 | ) | 0.34 | 1.26 | 0.61 | 0.78 | (2.69 | ) | (0.80 | ) | |||||||||||||||||||||
| LESS DIVIDENDS AND DISTRIBUTIONS | |||||||||||||||||||||||||||||||
| Dividends from net investment income | — | (0.07 | ) | (0.01 | ) | (0.01 | ) | (0.01 | ) | (0.01 | ) | — | |||||||||||||||||||
| Distributions from net realized gains | — | (0.49 | ) | (0.81 | ) | — | — | (0.02 | ) | — | |||||||||||||||||||||
| Total dividends and distributions | — | (0.56 | ) | (0.82 | ) | (0.01 | ) | (0.01 | ) | (0.03 | ) | — | |||||||||||||||||||
| Net asset value, end of period | $ | 12.13 | $ | 12.26 | $ | 12.48 | $ | 12.04 | $ | 11.44 | $ | 10.67 | $ | 13.39 | |||||||||||||||||
| Total return4 | (1.06 | )% | 2.69 | % | 10.67 | % | 5.33 | % | 7.28 | % | (20.13 | )% | (5.64 | )% | |||||||||||||||||
| RATIOS AND SUPPLEMENTAL DATA | |||||||||||||||||||||||||||||||
| Net assets, end of period (000s omitted) | $ | 50,025 | $ | 57,200 | $ | 63,160 | $ | 61,089 | $ | 1,778 | $ | 566 | $ | 64 | |||||||||||||||||
| Ratio of expenses to average net assets | 1.30 | %5 | 1.30 | % | 1.30 | %5 | 1.30 | % | 1.25 | % | 1.19 | % | 1.19 | %5 | |||||||||||||||||
| Ratio of net investment income to average net assets | 0.35 | %5 | 0.32 | % | 1.37 | %5 | 0.32 | % | 0.22 | % | 0.09 | % | 0.77 | %5 | |||||||||||||||||
| Decrease reflected in above operating expense ratios due to waivers/reimbursements | 0.28 | %5 | 0.26 | % | 0.32 | %5 | 0.39 | % | 2.90 | % | 2.30 | % | 6.44 | %5 | |||||||||||||||||
| Portfolio turnover rate | 34 | % | 101 | % | 34 | % | 168 | % | 155 | % | 122 | % | 141 | % | |||||||||||||||||
1 The Fund changed its fiscal year end from August 31 to December 31.
2 For the period July 31, 2001 (inception date) through August 31, 2001.
3 Per share information is calculated using the average shares outstanding method.
4 Total returns are historical and assume changes in share price, reinvestment of all dividends and distributions and no sales charge. Had certain expenses not been reduced during the periods shown, total returns would have been lower. Total returns for periods less than one year are not annualized.
5 Annualized
See Accompanying Notes to Financial Statements.
15
Credit Suisse Large Cap Blend Fund
Financial Highlights
(For a Class B Share of the Fund Outstanding Throughout Each Period)
| For the Six Months Ended June 30, 2006 | For the Year Ended December 31, | For the Period September 1, 2004 to December 31, | For the Year Ended August 31, | ||||||||||||||||||||||||||||
| (unaudited) | 2005 | 20041 | 2004 | 2003 | 2002 | 20012 | |||||||||||||||||||||||||
| Per share data | |||||||||||||||||||||||||||||||
| Net asset value, beginning of period | $ | 11.92 | $ | 12.18 | $ | 11.78 | $ | 11.27 | $ | 10.59 | $ | 13.38 | $ | 14.19 | |||||||||||||||||
| INVESTMENT OPERATIONS | |||||||||||||||||||||||||||||||
| Net investment income (loss) | (0.02 | )3 | (0.05 | )3 | 0.023 | (0.05 | )3 | (0.06 | )3 | (0.06 | )3 | 0.004 | |||||||||||||||||||
| Net gain (loss) on investments (both realized and unrealized) | (0.15 | ) | 0.29 | 1.19 | 0.56 | 0.74 | (2.71 | ) | (0.81 | ) | |||||||||||||||||||||
| Total from investment operations | (0.17 | ) | 0.24 | 1.21 | 0.51 | 0.68 | (2.77 | ) | (0.81 | ) | |||||||||||||||||||||
| LESS DIVIDENDS AND DISTRIBUTIONS | |||||||||||||||||||||||||||||||
| Dividends from net investment income | — | (0.01 | ) | — | — | — | — | — | |||||||||||||||||||||||
| Distributions from net realized gains | — | (0.49 | ) | (0.81 | ) | — | — | (0.02 | ) | — | |||||||||||||||||||||
| Total dividends and distributions | — | (0.50 | ) | (0.81 | ) | — | — | (0.02 | ) | — | |||||||||||||||||||||
| Net asset value, end of period | $ | 11.75 | $ | 11.92 | $ | 12.18 | $ | 11.78 | $ | 11.27 | $ | 10.59 | $ | 13.38 | |||||||||||||||||
| Total return5 | (1.43 | )% | 1.91 | % | 10.44 | % | 4.53 | % | 6.42 | % | (20.75 | )% | (5.71 | )% | |||||||||||||||||
| RATIOS AND SUPPLEMENTAL DATA | |||||||||||||||||||||||||||||||
| Net assets, end of period (000s omitted) | $ | 6,344 | $ | 8,342 | $ | 13,714 | $ | 14,745 | $ | 1,109 | $ | 518 | $ | 1 | |||||||||||||||||
| Ratio of expenses to average net assets | 2.05 | %6 | 2.05 | % | 2.05 | %6 | 2.05 | % | 2.00 | % | 1.94 | % | 1.94 | %6 | |||||||||||||||||
| Ratio of net investment income (loss) to average net assets | (0.40 | )%6 | (0.44 | )% | 0.62 | %6 | (0.45 | )% | (0.55 | )% | (0.67 | )% | (0.31 | )%6 | |||||||||||||||||
| Decrease reflected in above operating expense ratios due to waivers/reimbursements | 0.28 | %6 | 0.26 | % | 0.32 | %6 | 0.39 | % | 2.90 | % | 2.25 | % | 6.47 | %6 | |||||||||||||||||
| Portfolio turnover rate | 34 | % | 101 | % | 34 | % | 168 | % | 155 | % | 122 | % | 141 | % | |||||||||||||||||
1 The Fund changed its fiscal year end from August 31 to December 31.
2 For the period July 31, 2001 (inception date) through August 31, 2001.
3 Per share information is calculated using the average shares outstanding method.
4 This amount represents less than $0.01 per share.
5 Total returns are historical and assume changes in share price, reinvestment of all dividends and distributions and no sales charge. Had certain expenses not been reduced during the periods shown, total returns would have been lower. Total returns for periods less than one year are not annualized.
6 Annualized.
See Accompanying Notes to Financial Statements.
16
Credit Suisse Large Cap Blend Fund
Financial Highlights
(For a Class C Share of the Fund Outstanding Throughout Each Period)
| For the Six Months Ended June 30, 2006 | For the Year Ended December 31, | For the Period September 1, 2004 to December 31, | For the Year Ended August 31, | ||||||||||||||||||||||||||||
| (unaudited) | 2005 | 20041 | 2004 | 2003 | 2002 | 20012 | |||||||||||||||||||||||||
| Per share data | |||||||||||||||||||||||||||||||
| Net asset value, beginning of period | $ | 11.89 | $ | 12.15 | $ | 11.75 | $ | 11.24 | $ | 10.56 | $ | 13.39 | $ | 14.19 | |||||||||||||||||
| INVESTMENT OPERATIONS | |||||||||||||||||||||||||||||||
| Net investment income (loss) | (0.02 | )3 | (0.05 | )3 | 0.033 | (0.06 | )3 | (0.06 | )3 | (0.06 | )3 | 0.004 | |||||||||||||||||||
| Net gain (loss) on investments (both realized and unrealized) | (0.16 | ) | 0.29 | 1.18 | 0.57 | 0.74 | (2.75 | ) | (0.80 | ) | |||||||||||||||||||||
| Total from investment operations | (0.18 | ) | 0.24 | 1.21 | 0.51 | 0.68 | (2.81 | ) | (0.80 | ) | |||||||||||||||||||||
| LESS DIVIDENDS AND DISTRIBUTIONS | |||||||||||||||||||||||||||||||
| Dividends from net investment income | — | (0.01 | ) | — | — | — | — | — | |||||||||||||||||||||||
| Distributions from net realized gains | — | (0.49 | ) | (0.81 | ) | — | — | (0.02 | ) | — | |||||||||||||||||||||
| Total dividends and distributions | — | (0.50 | ) | (0.81 | ) | — | — | (0.02 | ) | — | |||||||||||||||||||||
| Net asset value, end of period | $ | 11.71 | $ | 11.89 | $ | 12.15 | $ | 11.75 | $ | 11.24 | $ | 10.56 | $ | 13.39 | |||||||||||||||||
| Total return5 | (1.51 | )% | 1.91 | % | 10.47 | % | 4.54 | % | 6.44 | % | (21.03 | )% | (5.64 | )% | |||||||||||||||||
| RATIOS AND SUPPLEMENTAL DATA | |||||||||||||||||||||||||||||||
| Net assets, end of period (000s omitted) | $ | 950 | $ | 1,109 | $ | 1,864 | $ | 2,156 | $ | 441 | $ | 271 | $ | 102 | |||||||||||||||||
| Ratio of expenses to average net assets | 2.05 | %6 | 2.05 | % | 2.05 | %6 | 2.05 | % | 2.00 | % | 1.94 | % | 1.94 | %6 | |||||||||||||||||
| Ratio of net investment income (loss) to average net assets | (0.40 | )%6 | (0.44 | )% | 0.62 | %6 | (0.47 | )% | (0.55 | )% | (0.65 | )% | (0.25 | )%6 | |||||||||||||||||
| Decrease reflected in above operating expense ratios due to waivers/reimbursements | 0.28 | %6 | 0.26 | % | 0.32 | %6 | 0.39 | % | 2.90 | % | 2.25 | % | 6.43 | %6 | |||||||||||||||||
| Portfolio turnover rate | 34 | % | 101 | % | 34 | % | 168 | % | 155 | % | 122 | % | 141 | % | |||||||||||||||||
1 The Fund changed its fiscal year end from August 31 to December 31.
2 For the period July 31, 2001 (inception date) through August 31, 2001.
3 Per share information is calculated using the average shares outstanding method.
4 This amount represents less than $0.01 per share.
5 Total returns are historical and assume changes in share price, reinvestment of all dividends and distributions and no sales charge. Had certain expenses not been reduced during the periods shown, total returns would have been lower. Total returns for periods less than one year are not annualized.
6 Annualized.
See Accompanying Notes to Financial Statements.
17
Credit Suisse Large Cap Blend Fund
Notes to Financial Statements
June 30, 2006 (unaudited)
Note 1. Organization
Credit Suisse Large Cap Blend Fund, Inc. (the "Fund") is registered under the Investment Company Act of 1940, as amended (the "1940 Act"), as a diversified, open-end management investment company. The Fund's investment objective is long-term capital appreciation. The Fund was incorporated under the laws of the State of Maryland on July 31, 1998. The name of the Fund was changed from Credit Suisse Select Equity Fund, Inc. effective August 8, 2005.
The Fund is authorized to offer six classes of shares: Common Class shares, Advisor Class shares, Institutional Class shares, Class A shares, Class B shares and Class C shares. Each class of shares represents an equal pro rata interest in the Fund, except that they bear different expenses which reflect the differences in the range of services provided to them. The Fund currently offers Common Class shares, Class A shares, Class B shares and Class C shares. The Fund's Common Class shares are closed to new investors, other than (1) investors in employee retirement, stock, bonus, pension or profit-sharing plans, (2) investment advisory clients of Credit Suisse Asset Management, LLC ("Credit Suisse"), (3) certain registered investment advisers ("RIA"), (4) certain broker-dealers and RIAs with clients participating in comprehensive fee programs and (5) employees of Credit Suisse or its affiliates and current and former Directors or Trustees of fu nds advised by Credit Suisse or its affiliates, (6) Credit Suisse or its affiliates, and (7) a corporation, partnership, association, joint-stock company, trust, fund or any organized group of persons whether incorporated or not that has a formal or informal consulting or advisory relationship with Credit Suisse or a third party through which the investment is made. Any Common Class shareholder as of the close of business on December 12, 2001 can continue to buy Common Class shares of the Fund and open new accounts under the same social security number. Effective October 24, 2002, Institutional Class shares ceased operations. Class A shares are sold subject to a front-end sales charge of up to 5.75%. Class B shares are sold subject to a contingent deferred sales charge which declines from 4.00% to zero depending on the period of time the shares are held. Class C shares are sold subject to a contingent deferred sales charge of 1.00% if redeemed within the first year of purchase.
Note 2. Significant Accounting Policies
A) SECURITY VALUATION — The net asset value of the Fund is determined daily as of the close of regular trading on the New York Stock Exchange, Inc. (the "Exchange") on each day the Exchange is open for business. Equity investments are valued at market value, which is generally determined using
18
Credit Suisse Large Cap Blend Fund
Notes to Financial Statements (continued)
June 30, 2006 (unaudited)
Note 2. Significant Accounting Policies
the closing price on the exchange or market on which the security is primarily traded at the time of valuation (the "Valuation Time"). If no sales are reported, equity investments are generally valued at the most recent bid quotation as of the Valuation Time or at the lowest asked quotation in the case of a short sale of securities. Debt securities with a remaining maturity greater than 60 days are valued in accordance with the price supplied by a pricing service, which may use a matrix, formula or other objective method that takes into consideration market indices, yield curves and other specific adjustments. Debt obligations that will mature in 60 days or less are valued on the basis of amortized cost, which approximates market value, unless it is determined that using this method would not represent fair value. Investments in mutual funds are valued at the mutual fund's closing net asset value per share on the day of valuation. Securities and other assets for which market quotations are not readily available, or whose values have been materially affected by events occurring before the Fund's Valuation Time but after the close of the securities' primary markets, are valued at fair value as determined in good faith by, or under the direction of, the Board of Directors under procedures established by the Board of Directors. The Fund may utilize a service provided by an independent third party which has been approved by the Board of Directors to fair value certain securities. When fair-value pricing is employed, the prices of securities used by a fund to calculate its net asset value may differ from quoted or published prices for the same securities.
B) SECURITY TRANSACTIONS AND INVESTMENT INCOME — Security transactions are accounted for on a trade date basis. Interest income is recorded on the accrual basis. Dividends are recorded on the ex-dividend date. Certain expenses are class-specific expenses and vary by class. Income, expenses (excluding class-specific expenses) and realized/unrealized gains/losses are allocated proportionately to each class of shares based upon the relative net asset value of the outstanding shares of that class. The cost of investments sold is determined by use of the specific identification method for both financial reporting and income tax purposes.
C) DIVIDENDS AND DISTRIBUTIONS TO SHAREHOLDERS — Dividends from net investment income and distributions of net realized capital gains, if any, are declared and paid at least annually. However, to the extent that a net realized capital gain can be reduced by a capital loss carryforward, such gain will not be distributed. Income and capital gain distributions are determined in accordance with federal income tax regulations, which may differ from accounting principles generally accepted in the United States of America ("GAAP").
19
Credit Suisse Large Cap Blend Fund
Notes to Financial Statements (continued)
June 30, 2006 (unaudited)
Note 2. Significant Accounting Policies
D) FEDERAL INCOME TAXES — No provision is made for federal taxes as it is the Fund's intention to have the Fund continue to qualify for and elect the tax treatment applicable to regulated investment companies under the Internal Revenue Code of 1986, as amended, and to make the requisite distributions to its shareholders, which will be sufficient to relieve it from federal income and excise taxes.
E) USE OF ESTIMATES — The preparation of financial statements in conformity with GAAP requires management to make estimates and assumptions that affect the reported amounts of assets and liabilities and disclosure of contingent assets and liabilities at the date of the financial statements and the reported amounts of revenues and expenses during the reporting period. Actual results could differ from these estimates.
F) SHORT-TERM INVESTMENTS — The Fund, together with other funds/portfolios advised by Credit Suisse, an indirect, wholly-owned subsidiary of Credit Suisse Group, pools available cash into either a short-term variable rate time deposit issued by State Street Bank and Trust Company ("SSB"), the Fund's custodian, or a money market fund advised by Credit Suisse. The short-term time deposit issued by SSB is a variable rate account classified as a short-term investment.
G) SECURITIES LENDING — Loans of securities are required at all times to be secured by collateral at least equal to 102% of the market value of domestic securities on loan (including any accrued interest thereon) and 105% of the market value of foreign securities on loan (including any accrued interest thereon). Cash collateral received by the Fund in connection with securities lending activity may be pooled together with cash collateral for other funds/portfolios advised by Credit Suisse and may be invested in a variety of investments, including certain Credit Suisse-advised funds, funds advised by SSB, the Fund's securities lending agent, or money market instruments. However, in the event of default or bankruptcy by the other party to the agreement, realization and/or retention of the collateral may be subject to legal proceedings.
SSB has been engaged by the Fund to act as the Fund's securities lending agent. The Fund's securities lending arrangement provides that the Fund and SSB will share the net income earned from securities lending activities. During the six months ended June 30, 2006, total earnings from the Fund's investment in cash collateral received in connection with security lending arrangements were $42,392, of which $41,508 was rebated to borrowers (brokers). The Fund retained $656 in income from the cash collateral investment, and SSB, as
20
Credit Suisse Large Cap Blend Fund
Notes to Financial Statements (continued)
June 30, 2006 (unaudited)
Note 2. Significant Accounting Policies
lending agent, was paid $228. The Fund may also be entitled to certain minimum amounts of income from its securities lending activities. Securities lending income is accrued as earned.
Note 3. Transactions with Affiliates and Related Parties
Credit Suisse serves as investment adviser for the Fund. For its investment advisory services, Credit Suisse is entitled to receive a fee from the Fund at an annual rate of 0.75% of the Fund's average daily net assets. For the six months ended June 30, 2006, investment advisory fees earned and voluntarily waived for the Fund were $241,388 and $90,554, respectively. Fee waivers and reimbursements are voluntary and may be discontinued by Credit Suisse at any time.
Credit Suisse Asset Management Securities, Inc. ("CSAMSI"), an affiliate of Credit Suisse, and SSB serve as co-administrators to the Fund. For its co-administrative services, CSAMSI currently receives a fee calculated at an annual rate of 0.05% of the Fund's average daily net assets. For the six months ended June 30, 2006, co-administrative services fees earned by CSAMSI were $16,093.
For its co-administrative services, SSB receives a fee, exclusive of out-of-pocket expenses, calculated in total for all the Credit Suisse funds/portfolios co-administered by SSB and allocated based upon relative average net assets of each fund/portfolio, subject to an annual minimum fee. For the six months ended June 30, 2006, co-administrative services fees earned by SSB (including out-of-pocket expenses) were $24,936.
In addition to serving as the Fund's co-administrator, CSAMSI currently serves as distributor of the Fund's shares. Pursuant to distribution plans adopted by the Fund pursuant to Rule 12b-1 under the 1940 Act, CSAMSI receives fees for its distribution services. For the Common Class and Class A shares of the Fund, the fee is calculated at an annual rate of 0.25% of the average daily net assets. For Class B and Class C shares of the Fund, the fee is calculated at an annual rate of 1.00% of average daily net assets.
Certain brokers, dealers and financial representatives provide transfer agent related services to the Fund, and receive compensation from Credit Suisse. Credit Suisse is then reimbursed by the Fund. For the six months ended June 30, 2006, the Fund reimbursed Credit Suisse $627, which is included in the Fund's transfer agent expense.
21
Credit Suisse Large Cap Blend Fund
Notes to Financial Statements (continued)
June 30, 2006 (unaudited)
Note 3. Transactions with Affiliates and Related Parties
For the six months ended June 30, 2006, CSAMSI and its affiliates advised the Fund that they retained $565 from commissions earned on the sale of the Fund's Class A shares.
Merrill Corporation ("Merrill"), an affiliate of Credit Suisse, has been engaged by the Fund to provide certain financial printing and fulfillment services. For the six months ended June 30, 2006, Merrill was paid $174 for its services to the Fund.
Note 4. Line of Credit
The Fund, together with other funds/portfolios advised by Credit Suisse (collectively, the "Participating Funds"), participates in a $75 million committed, unsecured line of credit facility ("Credit Facility") for temporary or emergency purposes with Deutsche Bank, A.G. as administrative agent and syndication agent and SSB as operations agent. Under the terms of the Credit Facility, the Participating Funds pay an aggregate commitment fee at a rate of 0.10% per annum on the average unused amount of the Credit Facility, which is allocated among the Participating Funds in such manner as is determined by the governing Boards of the Participating Funds. In addition, the Participating Funds pay interest on borrowings at the Federal Funds rate plus 0.50%. At June 30, 2006, the Fund had no loans outstanding under the Credit Facility. During the six months ended June 30, 2006, the Fund had borrowings under the Credit Facility as follows:
| Average Daily Loan Balance | Weighted Average Interest Rate% | Maximum Daily Loan Outstanding | |||||||||
| $ | 1,046,333 | 5.082 | % | $ | 1,203,000 | ||||||
Note 5. Purchases and Sales of Securities
For the six months ended June 30, 2006, purchases and sales of investment securities (excluding short-term investments) were $22,031,059 and $31,034,527, respectively.
At June 30, 2006, the identified cost for federal income tax purposes, as well as the gross unrealized appreciation from investments for those securities having an excess of value over cost, gross unrealized depreciation from investments for those securities having an excess of cost over value and the net unrealized appreciation from investments were $57,217,201, $5,996,557, ($1,910,947) and $4,085,610, respectively.
22
Credit Suisse Large Cap Blend Fund
Notes to Financial Statements (continued)
June 30, 2006 (unaudited)
Note 6. Capital Share Transactions
The Fund is authorized to issue six billion full and fractional shares of capital stock, $.001 par value per share. Transactions in capital shares for each class were as follows:
| Common Class | |||||||||||||||||||
| For the Six Months Ended June 30, 2006 (unaudited) | For the Year Ended December 31, 2005 | ||||||||||||||||||
| Shares | Value | Shares | Value | ||||||||||||||||
| Shares sold | 4,177 | $ | 51,684 | 2,894 | $ | 35,694 | |||||||||||||
| Shares issued in reinvestment of dividends and distributions | — | — | 10,165 | 125,707 | |||||||||||||||
| Shares redeemed | (25,047 | ) | (311,600 | ) | (62,116 | ) | (767,303 | ) | |||||||||||
| Net decrease | (20,870 | ) | $ | (259,916 | ) | (49,057 | ) | $ | (605,902 | ) | |||||||||
| Class A | |||||||||||||||||||
| For the Six Months Ended June 30, 2006 (unaudited) | For the Year Ended December 31, 2005 | ||||||||||||||||||
| Shares | Value | Shares | Value | ||||||||||||||||
| Shares sold | 62,988 | $ | 791,395 | 176,736 | $ | 2,196,744 | |||||||||||||
| Shares issued in reinvestment of dividends and distributions | — | — | 177,984 | 2,206,481 | |||||||||||||||
| Shares redeemed | (602,529 | ) | (7,480,342 | ) | (748,706 | ) | (9,275,324 | ) | |||||||||||
| Net decrease | (539,541 | ) | $ | (6,688,947 | ) | (393,986 | ) | $ | (4,872,099 | ) | |||||||||
| Class B | |||||||||||||||||||
| For the Six Months Ended June 30, 2006 (unaudited) | For the Year Ended December 31, 2005 | ||||||||||||||||||
| Shares | Value | Shares | Value | ||||||||||||||||
| Shares sold | 3,498 | $ | 42,172 | 5,090 | $ | 61,068 | |||||||||||||
| Shares issued in reinvestment of dividends and distributions | — | — | 25,333 | 305,295 | |||||||||||||||
| Shares redeemed | (163,126 | ) | (1,972,843 | ) | (456,555 | ) | (5,522,816 | ) | |||||||||||
| Net decrease | (159,628 | ) | $ | (1,930,671 | ) | (426,132 | ) | $ | (5,156,453 | ) | |||||||||
| Class C | |||||||||||||||||||
| For the Six Months Ended June 30, 2006 (unaudited) | For the Year Ended December 31, 2005 | ||||||||||||||||||
| Shares | Value | Shares | Value | ||||||||||||||||
| Shares sold | 508 | $ | 6,091 | 4,098 | $ | 48,872 | |||||||||||||
| Shares issued in reinvestment of dividends and distributions | — | — | 2,555 | 30,712 | |||||||||||||||
| Shares redeemed | (12,684 | ) | (152,816 | ) | (66,794 | ) | (799,745 | ) | |||||||||||
| Net decrease | (12,176 | ) | $ | (146,725 | ) | (60,141 | ) | $ | (720,161 | ) | |||||||||
23
Credit Suisse Large Cap Blend Fund
Notes to Financial Statements (continued)
June 30, 2006 (unaudited)
Note 6. Capital Share Transactions
On June 30, 2006, the number of shareholders that held 5% or more of the outstanding shares of each class of the Fund was as follows:
| Number of Shareholders | Approximate Percentage of Outstanding Shares | ||||||||||
| Common Class | 3 | 42 | % | ||||||||
| Class C | 3 | 53 | % | ||||||||
Some of the shareholders are omnibus accounts, which hold shares on behalf of individual shareholders.
Note 7. Contingencies
In the normal course of business, the Fund may provide general indemnifications pursuant to certain contracts and organizational documents. The Fund's maximum exposure under these arrangements is dependent on future claims that may be made against the Fund and, therefore, cannot be estimated; however, based on experience, the risk of loss from such claims is considered remote.
24
Credit Suisse Large Cap Blend Fund
Privacy Policy Notice (unaudited)
Important Privacy Choices for Consumers
We are committed to maintaining the privacy of every current and prospective customer. We recognize that you entrust important personal information to us, and we wish to assure you that we take seriously our responsibilities in protecting and safeguarding this information.
In connection with making available investment products and services to current and potential customers, we may obtain nonpublic personal information about you. This information may include your name, address, e-mail address, social security number, account number, assets, income, financial situation, transaction history and other personal information.
We may collect nonpublic information about you from the following sources:
• Information we receive on applications, forms, questionnaires, web sites, agreements or in the course of establishing or maintaining a customer relationship; and
• Information about your transactions with us, our affiliates, or others.
We do not disclose any nonpublic personal information about our customers or former customers to anyone, except with your consent or as otherwise permitted by law.
In cases where we believe that additional products and services may be of interest to you, we may share the information described above with our affiliates.
We may also disclose this information to firms that perform services on our behalf. These agents and service providers are required to treat the information confidentially and use it only for the purpose for which it is provided.
We restrict access to nonpublic personal information about you to those employees, agents or other parties who need to know that information to provide products or services to you or in connection with your investments with or through us. We maintain physical, electronic and procedural safeguards that comply with federal standards to guard your nonpublic personal information.
Note: This Notice is provided to clients and prospective clients of Credit Suisse Asset Management, LLC ("Credit Suisse"), and Credit Suisse Asset Management Securities, Inc., and shareholders and prospective shareholders in Credit Suisse-sponsored and advised investment companies, including Credit Suisse Funds, and other consumers and customers, as applicable. This Notice is not intended to be incorporated in any offering materials but is merely a statement of our current Privacy Policy, and may be amended from time to time upon notice to you. This Notice is dated as of May 17, 2006.
25
Credit Suisse Large Cap Blend Fund
Proxy Voting and Portfolio Holdings Information (unaudited)
Information regarding how the Fund voted proxies related to its portfolio securities during the 12-month period ended June 30 of each year, as well as the policies and procedures that the Fund uses to determine how to vote proxies relating to its portfolio securities are available:
• By calling 1-800-927-2874
• On the Fund's website, www.credit-suisse.com/us
• On the website of the Securities and Exchange Commission, http://www.sec.gov.
The Fund files a complete schedule of its portfolio holdings for the first and third quarters of its fiscal year with the SEC on Form N-Q. The Fund's Forms N-Q are available on the SEC's website at http://www.sec.gov and may be reviewed and copied at the SEC's Public Reference Room in Washington, DC. Information on the operation of the SEC's Public Reference Room may be obtained by calling 1-202-551-8090.
26
This page intentionally left blank
This page intentionally left blank

P.O. BOX 55030, BOSTON, MA 02205-5030
800-927-2874 n www.credit-suisse.com/us
CREDIT SUISSE ASSET MANAGEMENT SECURITIES, INC., DISTRIBUTOR. LCB-SAR-0606
Item 2. Code of Ethics.
This item is inapplicable to a semi-annual report on Form N-CSR.
Item 3. Audit Committee Financial Expert.
This item is inapplicable to a semi-annual report on Form N-CSR.
Item 4. Principal Accountant Fees and Services.
This item is inapplicable to a semi-annual report on Form N-CSR.
Item 5. Audit Committee of Listed Registrants.
This item is not applicable to the registrant.
Item 6. Schedule of Investments.
Included as part of the report to shareholders filed under Item 1 of this Form.
Item 7. Disclosure of Proxy Voting Policies and Procedures for Closed-End Management Investment Companies.
This item is not applicable to the registrant.
Item 8. Portfolio Managers of Closed-End Management Investment Companies.
This item is not applicable to the registrant.
Item 9. Purchases of Equity Securities by Closed-End Management Investment Company and Affiliated Purchasers.
This item is not applicable to the registrant.
Item 10. Submission of Matters to a Vote of Security Holders.
The Nominating Committee recommends Board member candidates. Shareholders of the registrant may also submit nominees that will be considered by the Committee. Recommendations should be mailed to the registrant’s Secretary, c/o Credit Suisse Asset Management, LLC, 466 Lexington Avenue, New York, NY 10017. Any submission should include at a minimum the following information: the name, age, business address, residence address and principal occupation or employment of such individual; the class, series and number of shares of the registrant that are beneficially owned by such individual; the date such shares were acquired and the investment intent of such acquisition; whether such shareholder believes such individual is, or is not, an “interested person” of the registrant (as defined in the Investment Company Act of 1940 (the “Act”)) and information regarding such individual that is sufficient, in the Committee’s discretion, to make such determination; and all other information relating to such individual that is required to be disclosed in solicitation of proxies for election of directors in an election contest (even if an election contest is not involved) or is otherwise required pursuant to the rules for proxy materials under the Securities Exchange Act of 1934.
Item 11. Controls and Procedures.
(a) As of a date within 90 days from the filing date of this report, the principal executive officer and principal financial officer concluded that the registrant’s disclosure controls and procedures (as defined in Rule 30a-3(c) under the Investment Company Act of 1940) were effective based on their evaluation of the disclosure controls and procedures required by Rule 30a-3(b) under the Act and Rules 13a-15(b) or 15d-15(b) under the Securities Exchange Act of 1934.
(b) There were no changes in registrant’s internal control over financial reporting (as defined in Rule 30a-3(d) under the Act) that occurred during the registrant’s last fiscal half-year that have materially affected, or are reasonably likely to materially affect, the registrant’s internal control over financial reporting.
Item 12. Exhibits.
(a)(1) Not applicable.
(a)(2) The certifications of the registrant as required by Rule 30a-2(a) under the Act are exhibits to this report.
(a)(3) Not applicable.
(b) The certifications of the registrant as required by Rule 30a-2(b) under the Act are an exhibit to this report.
SIGNATURES
Pursuant to the requirements of the Securities Exchange Act of 1934 and the Investment Company Act of 1940, the registrant has duly caused this report to be signed on its behalf by the undersigned, thereunto duly authorized.
| CREDIT SUISSE LARGE CAP BLEND FUND, INC. | |
|
| |
| /s/ Steven B. Plump |
|
| Name: Steven B. Plump | |
| Title: Chief Executive Officer | |
| Date: September 5, 2006 | |
Pursuant to the requirements of the Securities Exchange Act of 1934 and the Investment Company Act of 1940, this report has been signed below by the following persons on behalf of the registrant and in the capacities and on the dates indicated.
| /s/ Steven B. Plump |
| |
| Name: Steven B. Plump | ||
| Title: Chief Executive Officer | ||
| Date: September 5, 2006 | ||
|
| ||
| /s/ Michael A. Pignataro |
| |
| Name: Michael A. Pignataro | ||
| Title: Chief Financial Officer | ||
| Date: September 5, 2006 | ||