UNITED STATES
SECURITIES AND EXCHANGE COMMISSION
Washington, D.C. 20549
FORM N-CSR
CERTIFIED SHAREHOLDER REPORT OF REGISTERED
MANAGEMENT INVESTMENT COMPANIES
Investment Company Act file number | 811-08921 | ||||||||
| |||||||||
CREDIT SUISSE LARGE CAP BLEND FUND, INC. | |||||||||
(Exact name of registrant as specified in charter) | |||||||||
| |||||||||
Eleven Madison Avenue, New York, New York |
| 10010 | |||||||
(Address of principal executive offices) |
| (Zip code) | |||||||
| |||||||||
J. Kevin Gao, Esq. Credit Suisse Large Cap Blend Fund, Inc. Eleven Madison Avenue New York, New York 10010 | |||||||||
(Name and address of agent for service) | |||||||||
| |||||||||
Registrant’s telephone number, including area code: | (212) 325-2000 |
| |||||||
| |||||||||
Date of fiscal year end: | December 31 |
| |||||||
| |||||||||
Date of reporting period: | January 1, 2009 to June 30, 2009 |
| |||||||
Item 1. Reports to Stockholders.

CREDIT SUISSE FUNDS
Semiannual Report
June 30, 2009
(unaudited)
n CREDIT SUISSE
LARGE CAP BLEND FUND
The Fund's investment objectives, risks, charges and expenses (which should be considered carefully before investing), and more complete information about the Fund, are provided in the Prospectus, which should be read carefully before investing. You may obtain additional copies by calling 877-870-2874 or by writing to Credit Suisse Funds, P.O. Box 55030, Boston, MA 02205-5030.
Credit Suisse Asset Management Securities, Inc., Distributor, is located at Eleven Madison Avenue, New York, NY 10010. Credit Suisse Funds are advised by Credit Suisse Asset Management, LLC.
Investors in the Credit Suisse Funds should be aware that they may be eligible to purchase Common Class and/or Advisor Class shares (where offered) directly or through certain intermediaries. Such shares are not subject to a sales charge but may be subject to an ongoing service and distribution fee of up to 0.50% of average daily net assets. Investors in the Credit Suisse Funds should also be aware that they may be eligible for a reduction or waiver of the sales charge with respect to Class A, B or C shares (where offered). For more information, please review the relevant prospectuses or consult your financial representative.
The views of the Fund's management are as of the date of the letter and the Fund holdings described in this document are as of June 30, 2009; these views and Fund holdings may have changed subsequent to these dates. Nothing in this document is a recommendation to purchase or sell securities.
Fund shares are not deposits or other obligations of Credit Suisse Asset Management, LLC ("Credit Suisse") or any affiliate, are not FDIC-insured and are not guaranteed by Credit Suisse or any affiliate. Fund investments are subject to investment risks, including loss of your investment.
Credit Suisse Large Cap Blend Fund
Semiannual Investment Adviser's Report
June 30, 2009 (unaudited)
July 22, 2009
Dear Shareholder:
Performance Summary
01/01/09 – 06/30/09
| Fund & Benchmark | Performance | ||||||
| Common1 | 5.97 | % | |||||
| Class A1,2 | 6.06 | % | |||||
| Class B1,2 | 5.65 | % | |||||
| Class C1,2 | 5.67 | % | |||||
| S&P 500 Index3 | 3.16 | % | |||||
Performance for the Fund's Class A, Class B and Class C Shares is shown without including the effect of the maximum sales charge of 5.75%, 4.00% and 1.00%, respectively.2
Market Review: A period with mixed results
The semiannual period ended June 30, 2009, was a volatile one that ended with mixed results. For example, the S&P 500 Total Return Index increased by 0.20% in June, bringing its year-to-date performance to 3.16%. The Dow Jones Industrial Average, however, declined by 0.41% in June, bringing its year-to-date performance to -2.01%.
The labor market continued to weaken during the period. Non-farm payrolls fell by 467,000 jobs in June, and the household unemployment rate remained nearly unchanged at 9.5%. Nevertheless, three out of ten sectors within the S&P 500 posted positive year-to-date returns. Information technology, which gained 24.08%, was the best performing sector, while materials increased by 12.28% and consumer discretionary increased by 7.52%. Industrials, on the other hand, was the worst performing sector year-to-date, down by 7.68%.
Strategic Review and Outlook: Anticipating continued near-term volatility
For the six-month period ended June 30, 2009, the Portfolio outperformed its benchmark, the S&P 500 Index. The primary contributors to performance included industrials (due to stock selection), consumer discretionary, and materials (both due to stock selection and sector weighting). Information technology (due to stock selection and sector weighting) and financials (due to sector weightings) detracted from performance.
1
Credit Suisse Large Cap Blend Fund
Semiannual Investment Adviser's Report (continued)
June 30, 2009 (unaudited)
Although we expect the market to remain difficult in the near term, we are comfortable with our proactive, long-term investment process going forward.
Jordan Low
Portfolio Manager
The value of investments generally will fluctuate in response to market movements.
In addition to historical information, this report contains forward-looking statements, which may concern, among other things, domestic and foreign market, industry and economic trends and developments and government regulation and their potential impact on the Fund's investments. These statements are subject to risks and uncertainties and actual trends, developments and regulations in the future, and their impact on the Fund could be materially different from those projected, anticipated or implied. The Fund has no obligation to update or revise forward-looking statements.
2
Credit Suisse Large Cap Blend Fund
Semiannual Investment Adviser's Report (continued)
June 30, 2009 (unaudited)
Average Annual Returns as of June 30, 20091
| 1 Year | 5 Years | 10 Years | Since Inception | Inception Date | |||||||||||||||||||
| Common Class | (21.26 | )% | (2.32 | )% | (1.85 | )% | 0.52 | % | 10/30/98 | ||||||||||||||
| Class A Without Sales Charge | (21.23 | )% | (2.32 | )% | — | (2.96 | )% | 07/31/01 | |||||||||||||||
| Class A With Maximum Sales Charge | (25.78 | )% | (3.46 | )% | — | (3.69 | )% | 07/31/01 | |||||||||||||||
| Class B Without CDSC | (21.84 | )% | (3.04 | )% | — | (3.70 | )% | 07/31/01 | |||||||||||||||
| Class B With CDSC | (24.94 | )% | (3.04 | )% | — | (3.70 | )% | 07/31/01 | |||||||||||||||
| Class C Without CDSC | (21.80 | )% | (3.03 | )% | — | (3.72 | )% | 07/31/01 | |||||||||||||||
| Class C With CDSC | (22.58 | )% | (3.03 | )% | — | (3.72 | )% | 07/31/01 | |||||||||||||||
Returns represent past performance and include change in share price and reinvestment of dividends and capital gains. Past performance cannot guarantee future results. The current performance of the Fund may be lower or higher than the figures shown. Returns and share price will fluctuate, and redemption value may be more or less than original cost. The performance results do not reflect the deduction of taxes that a shareholder would pay on fund distributions or the redemption of fund shares. Performance information current to the most recent month-end is available at www.credit-suisse.com/us.
The annualized gross expense ratios are 2.29% for Common Class shares, 2.29% for Class A shares, 3.05% for Class B shares and 3.05% for Class C shares. The annualized net expense ratios after fee waivers and/or expense reimbursements are 1.30% for Common Class shares, 1.30% for Class A shares, 2.05% for Class B shares and 2.05% for Class C shares.
1 Fee waivers and/or expense reimbursements may reduce expenses for the Fund, without which performance would be lower. Waivers and/or reimbursements may be discontinued at any time.
2 Total return for the Fund's Class A shares for the reporting period, based on offering price (including maximum sales charge of 5.75%), was 0.00%. Total return for the Fund's Class B shares for the reporting period, based on redemption value (including contingent deferred sales charge of 4.00%), was 1.65%. Total return for the Fund's Class C shares for the reporting period, based on redemption value (including contingent deferred sales charge of 1.00%), was 4.67%.
3 The Standard & Poor's 500 Index is an unmanaged index (with no defined investment objective) of common stocks, includes reinvestment of dividends, and is a registered trademark of The McGraw-Hill Companies, Inc. Investors cannot invest directly in an index.
3
Credit Suisse Large Cap Blend Fund
Semiannual Investment Adviser's Report (continued)
June 30, 2009 (unaudited)
Information About Your Fund's Expenses
As an investor of the Fund, you incur two types of costs: ongoing expenses and transaction costs. Ongoing expenses include management fees, distribution and service (12b-1) fees and other Fund expenses. Examples of transaction costs include sales charges (loads), redemption fees and account maintenance fees, which are not shown in this section and which would result in higher total expenses. The following table is intended to help you understand your ongoing expenses of investing in the Fund and to help you compare these expenses with the ongoing expenses of investing in other mutual funds. The table is based on an investment of $1,000 made at the beginning of the six month period ended June 30, 2009.
The table illustrates your Fund's expenses in two ways:
• Actual Fund Return. This helps you estimate the actual dollar amount of ongoing expenses paid on a $1,000 investment in the Fund using the Fund's actual return during the period. To estimate the expenses you paid over the period, simply divide your account value by $1,000 (for example, an $8,600 account value divided by $1,000 = 8.6), then multiply the result by the number in the "Expenses Paid per $1,000" line under the share class you hold.
• Hypothetical 5% Fund Return. This helps you to compare your Fund's ongoing expenses with those of other mutual funds using the Fund's actual expense ratio and a hypothetical rate of return of 5% per year before expenses. Examples using a 5% hypothetical fund return may be found in the shareholder reports of other mutual funds. The hypothetical account values and expenses may not be used to estimate the actual ending account balance or expenses you paid for the period.
Please note that the expenses shown in these tables are meant to highlight your ongoing expenses only and do not reflect any transaction costs, such as sales charges (loads) or redemption fees. If these transaction costs had been included, your costs would have been higher. The "Expenses Paid per $1,000" line of the tables is useful in comparing ongoing expenses only and will not help you determine the relative total expenses of owning different funds.
4
Credit Suisse Large Cap Blend Fund
Semiannual Investment Adviser's Report (continued)
June 30, 2009 (unaudited)
Expenses and Value for a $1,000 Investment
for the six month period ended June 30, 2009
| Actual Fund Return | Common Class | Class A | Class B | Class C | |||||||||||||||
| Beginning Account Value 1/1/09 | $ | 1,000.00 | $ | 1,000.00 | $ | 1,000.00 | $ | 1,000.00 | |||||||||||
| Ending Account Value 6/30/09 | $ | 1,059.70 | $ | 1,060.60 | $ | 1,056.50 | $ | 1,056.70 | |||||||||||
| Expenses Paid per $1,000* | $ | 6.64 | $ | 6.64 | $ | 10.45 | $ | 10.45 | |||||||||||
| Hypothetical 5% Fund Return | |||||||||||||||||||
| Beginning Account Value 1/1/09 | $ | 1,000.00 | $ | 1,000.00 | $ | 1,000.00 | $ | 1,000.00 | |||||||||||
| Ending Account Value 6/30/09 | $ | 1,018.35 | $ | 1,018.35 | $ | 1,014.63 | $ | 1,014.63 | |||||||||||
| Expenses Paid per $1,000* | $ | 6.51 | $ | 6.51 | $ | 10.24 | $ | 10.24 | |||||||||||
| Common Class | Class A | Class B | Class C | ||||||||||||||||
| Annualized Expense Ratios* | 1.30 | % | 1.30 | % | 2.05 | % | 2.05 | % | |||||||||||
* Expenses are equal to the Fund's annualized expense ratio for each share class, multiplied by the average account value over the period, multiplied by the number of days in the most recent fiscal half year period, then divided by 365.
The "Expenses Paid per $1,000" and the "Annualized Expense Ratios" in the tables are based on actual expenses paid by the Fund during the period, net of fee waivers and/or expense reimbursements. If those fee waivers and/or expense reimbursements had not been in effect, the Fund's actual expenses would have been higher.
For more information, please refer to the Fund's prospectus.
5
Credit Suisse Large Cap Blend Fund
Semiannual Investment Adviser's Report (continued)
June 30, 2009 (unaudited)
SECTOR BREAKDOWN*
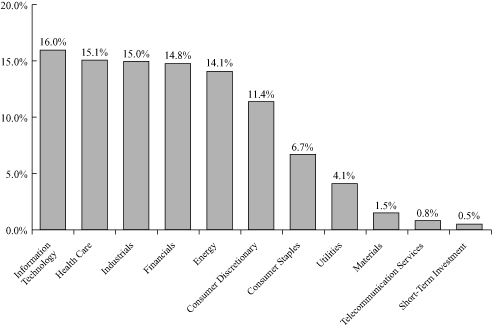
* Expressed as a percentage of total investments (excluding securities lending collateral if applicable) and may vary over time.
6
Credit Suisse Large Cap Blend Fund
Schedule of Investments
June 30, 2009 (unaudited)
| Number of Shares | Value | ||||||||||
| COMMON STOCKS (99.5%) | |||||||||||
| Aerospace & Defense (7.8%) | |||||||||||
| General Dynamics Corp. | 6,600 | $ | 365,574 | ||||||||
| Honeywell International, Inc. | 1,200 | 37,680 | |||||||||
| Northrop Grumman Corp. | 25,900 | 1,183,112 | |||||||||
| Raytheon Co. | 15,900 | 706,437 | |||||||||
| The Boeing Co. | 100 | 4,250 | |||||||||
| United Technologies Corp. | 3,900 | 202,644 | |||||||||
| 2,499,697 | |||||||||||
| Air Freight & Logistics (0.1%) | |||||||||||
| CH Robinson Worldwide, Inc. | 200 | 10,430 | |||||||||
| United Parcel Service, Inc. Class B | 100 | 4,999 | |||||||||
| UTi Worldwide, Inc.* | 100 | 1,140 | |||||||||
| 16,569 | |||||||||||
| Airlines (0.0%) | |||||||||||
| Copa Holdings SA Class A | 100 | 4,082 | |||||||||
| Auto Components (0.0%) | |||||||||||
| Johnson Controls, Inc. | 400 | 8,688 | |||||||||
| The Goodyear Tire & Rubber Co.* | 100 | 1,126 | |||||||||
| 9,814 | |||||||||||
| Automobiles (0.1%) | |||||||||||
| Ford Motor Co.* | 4,400 | 26,708 | |||||||||
| Harley-Davidson, Inc. | 100 | 1,621 | |||||||||
| 28,329 | |||||||||||
| Beverages (0.1%) | |||||||||||
| Brown-Forman Corp. Class B | 175 | 7,521 | |||||||||
| Molson Coors Brewing Co. Class B | 200 | 8,466 | |||||||||
| PepsiCo, Inc. | 100 | 5,496 | |||||||||
| 21,483 | |||||||||||
| Biotechnology (0.6%) | |||||||||||
| Amgen, Inc.* | 608 | 32,187 | |||||||||
| Biogen Idec, Inc.* | 3,300 | 148,995 | |||||||||
| Celgene Corp.* | 150 | 7,176 | |||||||||
| Myriad Genetics, Inc.* | 400 | 14,260 | |||||||||
| Myriad Pharmaceuticals, Inc.* | 500 | 2,325 | |||||||||
| PDL BioPharma, Inc. | 300 | 2,370 | |||||||||
| 207,313 | |||||||||||
| Building Products (0.0%) | |||||||||||
| Griffon Corp.* | 200 | 1,664 | |||||||||
See Accompanying Notes to Financial Statements.
7
Credit Suisse Large Cap Blend Fund
Schedule of Investments (continued)
June 30, 2009 (unaudited)
| Number of Shares | Value | ||||||||||
| COMMON STOCKS | |||||||||||
| Capital Markets (4.6%) | |||||||||||
| BlackRock, Inc. | 200 | $ | 35,084 | ||||||||
| E*TRADE Financial Corp.* | 400 | 512 | |||||||||
| Northern Trust Corp. | 900 | 48,312 | |||||||||
| State Street Corp. | 600 | 28,320 | |||||||||
| T. Rowe Price Group, Inc. | 8,700 | 362,529 | |||||||||
| TD Ameritrade Holding Corp.* | 8,800 | 154,352 | |||||||||
| The Bank of New York Mellon Corp. | 800 | 23,448 | |||||||||
| The Charles Schwab Corp. | 45,700 | 801,578 | |||||||||
| 1,454,135 | |||||||||||
| Chemicals (1.2%) | |||||||||||
| CF Industries Holdings, Inc. | 2,200 | 163,108 | |||||||||
| Ecolab, Inc. | 100 | 3,899 | |||||||||
| Monsanto Co. | 2,900 | 215,586 | |||||||||
| Olin Corp. | 100 | 1,189 | |||||||||
| Terra Industries, Inc. | 600 | 14,532 | |||||||||
| 398,314 | |||||||||||
| Commercial Banks (3.0%) | |||||||||||
| Huntington Bancshares, Inc. | 400 | 1,672 | |||||||||
| Marshall & Ilsley Corp. | 2,500 | 12,000 | |||||||||
| PNC Financial Services Group, Inc. | 3,800 | 147,478 | |||||||||
| Regions Financial Corp. | 900 | 3,636 | |||||||||
| U.S. Bancorp | 2,600 | 46,592 | |||||||||
| Wells Fargo & Co. | 30,500 | 739,930 | |||||||||
| Zions Bancorporation | 100 | 1,156 | |||||||||
| 952,464 | |||||||||||
| Commercial Services & Supplies (0.0%) | |||||||||||
| Mine Safety Appliances Co. | 100 | 2,410 | |||||||||
| Communications Equipment (1.5%) | |||||||||||
| Cisco Systems, Inc.* | 13,200 | 246,048 | |||||||||
| JDS Uniphase Corp.* | 100 | 572 | |||||||||
| Juniper Networks, Inc.* | 8,300 | 195,880 | |||||||||
| Motorola, Inc. | 3,600 | 23,868 | |||||||||
| QUALCOMM, Inc. | 200 | 9,040 | |||||||||
| Tellabs, Inc.* | 100 | 573 | |||||||||
| 475,981 | |||||||||||
| Computers & Peripherals (2.7%) | |||||||||||
| Apple, Inc.* | 3,600 | 512,748 | |||||||||
| Dell, Inc.* | 17,300 | 237,529 | |||||||||
| EMC Corp.* | 7,300 | 95,630 | |||||||||
| Intermec, Inc.* | 100 | 1,290 | |||||||||
| QLogic Corp.* | 1,600 | 20,288 | |||||||||
| Sun Microsystems, Inc.* | 200 | 1,844 | |||||||||
| Teradata Corp.* | 100 | 2,343 | |||||||||
| 871,672 | |||||||||||
See Accompanying Notes to Financial Statements.
8
Credit Suisse Large Cap Blend Fund
Schedule of Investments (continued)
June 30, 2009 (unaudited)
| Number of Shares | Value | ||||||||||
| COMMON STOCKS | |||||||||||
| Construction & Engineering (1.3%) | |||||||||||
| Fluor Corp. | 8,300 | $ | 425,707 | ||||||||
| Consumer Finance (0.0%) | |||||||||||
| American Express Co. | 200 | 4,648 | |||||||||
| Capital One Financial Corp. | 100 | 2,188 | |||||||||
| SLM Corp.* | 100 | 1,027 | |||||||||
| 7,863 | |||||||||||
| Containers & Packaging (0.0%) | |||||||||||
| Packaging Corp. of America | 100 | 1,620 | |||||||||
| Pactiv Corp.* | 500 | 10,850 | |||||||||
| Sealed Air Corp. | 100 | 1,845 | |||||||||
| 14,315 | |||||||||||
| Diversified Consumer Services (0.3%) | |||||||||||
| Apollo Group, Inc. Class A* | 1,300 | 92,456 | |||||||||
| Corinthian Colleges, Inc.* | 200 | 3,386 | |||||||||
| Regis Corp. | 200 | 3,482 | |||||||||
| 99,324 | |||||||||||
| Diversified Financial Services (1.8%) | |||||||||||
| Bank of America Corp. | 38,400 | 506,880 | |||||||||
| CIT Group, Inc. | 100 | 215 | |||||||||
| Citigroup, Inc. | 22,200 | 65,934 | |||||||||
| JPMorgan Chase & Co. | 100 | 3,411 | |||||||||
| 576,440 | |||||||||||
| Diversified Telecommunication Services (0.6%) | |||||||||||
| AT&T, Inc. | 6,700 | 166,428 | |||||||||
| Qwest Communications International, Inc. | 2,400 | 9,960 | |||||||||
| Verizon Communications, Inc. | 200 | 6,146 | |||||||||
| 182,534 | |||||||||||
| Electric Utilities (2.3%) | |||||||||||
| Duke Energy Corp. | 100 | 1,459 | |||||||||
| Edison International | 100 | 3,146 | |||||||||
| FPL Group, Inc. | 100 | 5,686 | |||||||||
| Hawaiian Electric Industries, Inc. | 100 | 1,906 | |||||||||
| PPL Corp. | 22,100 | 728,416 | |||||||||
| 740,613 | |||||||||||
| Electrical Equipment (0.0%) | |||||||||||
| Emerson Electric Co. | 100 | 3,240 | |||||||||
| Electronic Equipment, Instruments & Components (0.8%) | |||||||||||
| Corning, Inc. | 14,800 | 237,688 | |||||||||
| Jabil Circuit, Inc. | 100 | 742 | |||||||||
| Molex, Inc. | 100 | 1,555 | |||||||||
| Tyco Electronics, Ltd. | 300 | 5,577 | |||||||||
| 245,562 | |||||||||||
See Accompanying Notes to Financial Statements.
9
Credit Suisse Large Cap Blend Fund
Schedule of Investments (continued)
June 30, 2009 (unaudited)
| Number of Shares | Value | ||||||||||
| COMMON STOCKS | |||||||||||
| Energy Equipment & Services (2.8%) | |||||||||||
| Diamond Offshore Drilling, Inc. | 500 | $ | 41,525 | ||||||||
| Halliburton Co. | 100 | 2,070 | |||||||||
| Nabors Industries, Ltd.* | 100 | 1,558 | |||||||||
| Noble Corp. | 27,300 | 825,825 | |||||||||
| Smith International, Inc. | 200 | 5,150 | |||||||||
| Weatherford International, Ltd.* | 200 | 3,912 | |||||||||
| 880,040 | |||||||||||
| Food & Staples Retailing (2.0%) | |||||||||||
| Costco Wholesale Corp. | 100 | 4,570 | |||||||||
| Sysco Corp. | 16,900 | 379,912 | |||||||||
| The Kroger Co. | 1,500 | 33,075 | |||||||||
| Wal-Mart Stores, Inc. | 4,600 | 222,824 | |||||||||
| Walgreen Co. | 200 | 5,880 | |||||||||
| Whole Foods Market, Inc. | 100 | 1,898 | |||||||||
| 648,159 | |||||||||||
| Food Products (0.8%) | |||||||||||
| Archer-Daniels-Midland Co. | 7,700 | 206,129 | |||||||||
| Campbell Soup Co. | 100 | 2,942 | |||||||||
| ConAgra Foods, Inc. | 200 | 3,812 | |||||||||
| Del Monte Foods Co. | 12 | 113 | |||||||||
| General Mills, Inc. | 100 | 5,602 | |||||||||
| H.J. Heinz Co. | 100 | 3,570 | |||||||||
| Kellogg Co. | 100 | 4,657 | |||||||||
| Kraft Foods, Inc. Class A | 1,600 | 40,544 | |||||||||
| Sara Lee Corp. | 100 | 976 | |||||||||
| Unilever NV NY Shares | 100 | 2,418 | |||||||||
| 270,763 | |||||||||||
| Health Care Equipment & Supplies (2.3%) | |||||||||||
| Baxter International, Inc. | 100 | 5,296 | |||||||||
| Becton, Dickinson and Co. | 800 | 57,048 | |||||||||
| Boston Scientific Corp.* | 200 | 2,028 | |||||||||
| Covidien PLC | 1,300 | 48,672 | |||||||||
| Medtronic, Inc. | 7,765 | 270,921 | |||||||||
| St. Jude Medical, Inc.* | 3,100 | 127,410 | |||||||||
| Stryker Corp. | 5,600 | 222,544 | |||||||||
| Thoratec Corp.* | 100 | 2,678 | |||||||||
| 736,597 | |||||||||||
| Health Care Providers & Services (2.2%) | |||||||||||
| AmerisourceBergen Corp. | 200 | 3,548 | |||||||||
| Coventry Health Care, Inc.* | 100 | 1,871 | |||||||||
| Express Scripts, Inc.* | 4,200 | 288,750 | |||||||||
| Medco Health Solutions, Inc.* | 500 | 22,805 | |||||||||
| Quest Diagnostics, Inc. | 400 | 22,572 | |||||||||
| Tenet Healthcare Corp.* | 300 | 846 | |||||||||
| UnitedHealth Group, Inc. | 2,600 | 64,948 | |||||||||
| WellPoint, Inc.* | 5,600 | 284,984 | |||||||||
| 690,324 | |||||||||||
See Accompanying Notes to Financial Statements.
10
Credit Suisse Large Cap Blend Fund
Schedule of Investments (continued)
June 30, 2009 (unaudited)
| Number of Shares | Value | ||||||||||
| COMMON STOCKS | |||||||||||
| Hotels, Restaurants & Leisure (2.1%) | |||||||||||
| Carnival Corp. | 14,500 | $ | 373,665 | ||||||||
| Cracker Barrel Old Country Store, Inc. | 200 | 5,580 | |||||||||
| McDonald's Corp. | 4,200 | 241,458 | |||||||||
| Starbucks Corp.* | 2,900 | 40,281 | |||||||||
| 660,984 | |||||||||||
| Household Durables (0.1%) | |||||||||||
| Newell Rubbermaid, Inc. | 1,900 | 19,779 | |||||||||
| Household Products (1.9%) | |||||||||||
| Clorox Co. | 166 | 9,268 | |||||||||
| Colgate-Palmolive Co. | 100 | 7,074 | |||||||||
| The Procter & Gamble Co. | 11,800 | 602,980 | |||||||||
| 619,322 | |||||||||||
| Industrial Conglomerates (5.6%) | |||||||||||
| 3M Co. | 21,800 | 1,310,180 | |||||||||
| General Electric Co. | 11,600 | 135,952 | |||||||||
| Koninklijke Philips Electronics NV NY Shares | 4,100 | 75,522 | |||||||||
| Textron, Inc. | 100 | 966 | |||||||||
| Tyco International, Ltd. | 10,815 | 280,974 | |||||||||
| 1,803,594 | |||||||||||
| Insurance (5.0%) | |||||||||||
| ACE, Ltd. | 3,700 | 163,651 | |||||||||
| Aflac, Inc. | 12,100 | 376,189 | |||||||||
| Ambac Financial Group, Inc. | 100 | 92 | |||||||||
| American International Group, Inc. | 200 | 232 | |||||||||
| AON Corp. | 9,100 | 344,617 | |||||||||
| Arthur J. Gallagher & Co. | 100 | 2,134 | |||||||||
| CNA Financial Corp. | 100 | 1,547 | |||||||||
| Genworth Financial, Inc. Class A | 100 | 699 | |||||||||
| HCC Insurance Holdings, Inc. | 100 | 2,401 | |||||||||
| Loews Corp. | 8,400 | 230,160 | |||||||||
| Marsh & McLennan Cos., Inc. | 100 | 2,013 | |||||||||
| MBIA, Inc.* | 100 | 433 | |||||||||
| MetLife, Inc. | 2,000 | 60,020 | |||||||||
| Principal Financial Group, Inc. | 300 | 5,652 | |||||||||
| Prudential Financial, Inc. | 2,500 | 93,050 | |||||||||
| The Allstate Corp. | 7,500 | 183,000 | |||||||||
| The Chubb Corp. | 2,200 | 87,736 | |||||||||
| The Progressive Corp.* | 200 | 3,022 | |||||||||
| The Travelers Cos., Inc. | 1,200 | 49,248 | |||||||||
| 1,605,896 | |||||||||||
| Internet & Catalog Retail (1.2%) | |||||||||||
| Amazon.com, Inc.* | 4,300 | 359,738 | |||||||||
| Expedia, Inc.* | 900 | 13,599 | |||||||||
| 373,337 | |||||||||||
See Accompanying Notes to Financial Statements.
11
Credit Suisse Large Cap Blend Fund
Schedule of Investments (continued)
June 30, 2009 (unaudited)
| Number of Shares | Value | ||||||||||
| COMMON STOCKS | |||||||||||
| Internet Software & Services (1.6%) | |||||||||||
| Google, Inc. Class A* | 1,200 | $ | 505,908 | ||||||||
| Yahoo!, Inc.* | 400 | 6,264 | |||||||||
| 512,172 | |||||||||||
| IT Services (2.9%) | |||||||||||
| Accenture, Ltd. Class A | 13,400 | 448,364 | |||||||||
| Automatic Data Processing, Inc. | 3,300 | 116,952 | |||||||||
| Paychex, Inc. | 300 | 7,560 | |||||||||
| The Western Union Co. | 6,200 | 101,680 | |||||||||
| Unisys Corp.* | 300 | 453 | |||||||||
| Visa, Inc. Class A | 4,100 | 255,266 | |||||||||
| 930,275 | |||||||||||
| Leisure Equipment & Products (0.0%) | |||||||||||
| Callaway Golf Co. | 100 | 507 | |||||||||
| Eastman Kodak Co. | 100 | 296 | |||||||||
| 803 | |||||||||||
| Life Sciences Tools & Services (0.0%) | |||||||||||
| Life Technologies Corp.* | 175 | 7,301 | |||||||||
| Machinery (0.1%) | |||||||||||
| Danaher Corp. | 200 | 12,348 | |||||||||
| Eaton Corp. | 100 | 4,461 | |||||||||
| Federal Signal Corp. | 22 | 168 | |||||||||
| Illinois Tool Works, Inc. | 100 | 3,734 | |||||||||
| The Gorman-Rupp Co. | 100 | 2,017 | |||||||||
| The Manitowoc Co., Inc. | 400 | 2,104 | |||||||||
| 24,832 | |||||||||||
| Media (3.6%) | |||||||||||
| Comcast Corp. Class A | 23,800 | 344,862 | |||||||||
| Gannett Co., Inc. | 100 | 357 | |||||||||
| Interpublic Group of Cos., Inc.* | 100 | 505 | |||||||||
| News Corp. Class A | 23,100 | 210,441 | |||||||||
| Omnicom Group, Inc. | 5,100 | 161,058 | |||||||||
| The DIRECTV Group, Inc.* | 800 | 19,768 | |||||||||
| The McGraw-Hill Cos., Inc. | 12,900 | 388,419 | |||||||||
| The Walt Disney Co. | 200 | 4,666 | |||||||||
| Viacom, Inc. Class B* | 900 | 20,430 | |||||||||
| 1,150,506 | |||||||||||
| Metals & Mining (0.3%) | |||||||||||
| Newmont Mining Corp. | 1,900 | 77,653 | |||||||||
| Titanium Metals Corp. | 100 | 919 | |||||||||
| Worthington Industries, Inc. | 100 | 1,279 | |||||||||
| 79,851 | |||||||||||
See Accompanying Notes to Financial Statements.
12
Credit Suisse Large Cap Blend Fund
Schedule of Investments (continued)
June 30, 2009 (unaudited)
| Number of Shares | Value | ||||||||||
| COMMON STOCKS | |||||||||||
| Multi-Utilities (1.8%) | |||||||||||
| Dominion Resources, Inc. | 200 | $ | 6,684 | ||||||||
| NiSource, Inc. | 100 | 1,166 | |||||||||
| PG&E Corp. | 500 | 19,220 | |||||||||
| Public Service Enterprise Group, Inc. | 100 | 3,263 | |||||||||
| Sempra Energy | 10,800 | 536,004 | |||||||||
| Xcel Energy, Inc. | 100 | 1,841 | |||||||||
| 568,178 | |||||||||||
| Multiline Retail (0.3%) | |||||||||||
| 99 Cents Only Stores* | 100 | 1,358 | |||||||||
| Family Dollar Stores, Inc. | 400 | 11,320 | |||||||||
| Fred's, Inc. Class A | 100 | 1,260 | |||||||||
| Kohl's Corp.* | 1,700 | 72,675 | |||||||||
| 86,613 | |||||||||||
| Oil, Gas & Consumable Fuels (11.4%) | |||||||||||
| Anadarko Petroleum Corp. | 100 | 4,539 | |||||||||
| Apache Corp. | 100 | 7,215 | |||||||||
| Chesapeake Energy Corp. | 100 | 1,983 | |||||||||
| ConocoPhillips | 3,400 | 143,004 | |||||||||
| Consol Energy, Inc. | 100 | 3,396 | |||||||||
| El Paso Corp. | 100 | 923 | |||||||||
| EnCana Corp. | 100 | 4,947 | |||||||||
| Exxon Mobil Corp. | 36,200 | 2,530,742 | |||||||||
| Murphy Oil Corp. | 3,400 | 184,688 | |||||||||
| Nexen, Inc. | 100 | 2,165 | |||||||||
| Noble Energy, Inc. | 100 | 5,897 | |||||||||
| Occidental Petroleum Corp. | 7,300 | 480,413 | |||||||||
| Peabody Energy Corp. | 100 | 3,016 | |||||||||
| Petro-Canada | 6,100 | 234,362 | |||||||||
| Southwestern Energy Co.* | 400 | 15,540 | |||||||||
| Tesoro Corp. | 100 | 1,273 | |||||||||
| The Williams Cos., Inc. | 100 | 1,561 | |||||||||
| TransCanada Corp. | 100 | 2,691 | |||||||||
| 3,628,355 | |||||||||||
| Personal Products (0.0%) | |||||||||||
| Avon Products, Inc. | 200 | 5,156 | |||||||||
| Pharmaceuticals (10.0%) | |||||||||||
| Abbott Laboratories | 11,600 | 545,664 | |||||||||
| Allergan, Inc. | 100 | 4,758 | |||||||||
| Bristol-Myers Squibb Co. | 23,736 | 482,078 | |||||||||
| Eli Lilly & Co. | 800 | 27,712 | |||||||||
| Johnson & Johnson | 5,500 | 312,400 | |||||||||
| Pfizer, Inc. | 96,200 | 1,443,000 | |||||||||
| Schering-Plough Corp. | 14,400 | 361,728 | |||||||||
| Teva Pharmaceutical Industries, Ltd. ADR | 125 | 6,168 | |||||||||
| 3,183,508 | |||||||||||
See Accompanying Notes to Financial Statements.
13
Credit Suisse Large Cap Blend Fund
Schedule of Investments (continued)
June 30, 2009 (unaudited)
| Number of Shares | Value | ||||||||||
| COMMON STOCKS | |||||||||||
| Real Estate Investment Trusts (0.4%) | |||||||||||
| Developers Diversified Realty Corp. | 6 | $ | 30 | ||||||||
| Equity Residential | 400 | 8,892 | |||||||||
| HCP, Inc. | 400 | 8,476 | |||||||||
| Host Hotels & Resorts, Inc. | 800 | 6,712 | |||||||||
| Kimco Realty Corp. | 300 | 3,015 | |||||||||
| ProLogis | 100 | 806 | |||||||||
| Public Storage | 500 | 32,740 | |||||||||
| Simon Property Group, Inc. | 1,112 | 57,190 | |||||||||
| Vornado Realty Trust | 308 | 13,869 | |||||||||
| Walter Investment Management Corp.* | 36 | 478 | |||||||||
| 132,208 | |||||||||||
| Real Estate Management & Development (0.0%) | |||||||||||
| CB Richard Ellis Group, Inc. Class A* | 100 | 936 | |||||||||
| Semiconductors & Semiconductor Equipment (3.9%) | |||||||||||
| Advanced Micro Devices, Inc.* | 200 | 774 | |||||||||
| Applied Materials, Inc. | 100 | 1,097 | |||||||||
| ASML Holding NV | 100 | 2,165 | |||||||||
| Broadcom Corp. Class A* | 11,600 | 287,564 | |||||||||
| Intel Corp. | 1,500 | 24,825 | |||||||||
| LSI Corp.* | 200 | 912 | |||||||||
| Novellus Systems, Inc.* | 100 | 1,670 | |||||||||
| Nvidia Corp.* | 100 | 1,129 | |||||||||
| Texas Instruments, Inc. | 42,700 | 909,510 | |||||||||
| 1,229,646 | |||||||||||
| Software (2.6%) | |||||||||||
| Activision Blizzard, Inc.* | 16,900 | 213,447 | |||||||||
| Adobe Systems, Inc.* | 200 | 5,660 | |||||||||
| Autodesk, Inc.* | 1,400 | 26,572 | |||||||||
| Compuware Corp.* | 1,100 | 7,546 | |||||||||
| Micros Systems, Inc.* | 100 | 2,532 | |||||||||
| Microsoft Corp. | 16,100 | 382,697 | |||||||||
| Novell, Inc.* | 100 | 453 | |||||||||
| Oracle Corp. | 7,000 | 149,940 | |||||||||
| Red Hat, Inc.* | 100 | 2,013 | |||||||||
| Symantec Corp.* | 2,900 | 45,124 | |||||||||
| TiVo, Inc.* | 100 | 1,048 | |||||||||
| 837,032 | |||||||||||
| Specialty Retail (2.4%) | |||||||||||
| Best Buy Co., Inc. | 100 | 3,349 | |||||||||
| Foot Locker, Inc. | 100 | 1,047 | |||||||||
| GameStop Corp. Class A* | 700 | 15,407 | |||||||||
| Home Depot, Inc. | 200 | 4,726 | |||||||||
| Lowe's Cos., Inc. | 20,500 | 397,905 | |||||||||
| Office Depot, Inc.* | 100 | 456 | |||||||||
| RadioShack Corp. | 1,900 | 26,524 | |||||||||
See Accompanying Notes to Financial Statements.
14
Credit Suisse Large Cap Blend Fund
Schedule of Investments (continued)
June 30, 2009 (unaudited)
| Number of Shares | Value | ||||||||||
| COMMON STOCKS | |||||||||||
| Specialty Retail | |||||||||||
| Staples, Inc. | 200 | $ | 4,034 | ||||||||
| The Gap, Inc. | 12,100 | 198,440 | |||||||||
| TJX Cos., Inc. | 3,700 | 116,402 | |||||||||
| 768,290 | |||||||||||
| Textiles, Apparel & Luxury Goods (1.4%) | |||||||||||
| Coach, Inc. | 3,900 | 104,832 | |||||||||
| Hanesbrands, Inc.* | 100 | 1,501 | |||||||||
| NIKE, Inc. Class B | 6,400 | 331,392 | |||||||||
| The Warnaco Group, Inc.* | 100 | 3,240 | |||||||||
| VF Corp. | 100 | 5,535 | |||||||||
| 446,500 | |||||||||||
| Thrifts & Mortgage Finance (0.0%) | |||||||||||
| Astoria Financial Corp. | 100 | 858 | |||||||||
| Fannie Mae | 700 | 406 | |||||||||
| Freddie Mac | 400 | 248 | |||||||||
| Ocwen Financial Corp. | 100 | 1,297 | |||||||||
| Washington Mutual, Inc. | 1,100 | 111 | |||||||||
| 2,920 | |||||||||||
| Tobacco (1.8%) | |||||||||||
| Lorillard, Inc. | 6,200 | 420,174 | |||||||||
| Philip Morris International, Inc. | 3,800 | 165,756 | |||||||||
| Reynolds American, Inc. | 100 | 3,862 | |||||||||
| 589,792 | |||||||||||
| Wireless Telecommunication Services (0.2%) | |||||||||||
| Sprint Nextel Corp.* | 11,600 | 55,796 | |||||||||
| TOTAL COMMON STOCKS (Cost $31,036,665) | 31,788,990 | ||||||||||
| Par (000) | |||||||||||
| SHORT-TERM INVESTMENT (0.5%) | |||||||||||
| State Street Bank and Trust Co. Euro Time Deposit, 0.010%, 07/01/09 (Cost $160,000) | $ | 160 | 160,000 | ||||||||
| TOTAL INVESTMENTS AT VALUE (100.0%) (Cost $31,196,665) | 31,948,990 | ||||||||||
| LIABILITIES IN EXCESS OF OTHER ASSETS (-0.0%) | (4,381 | ) | |||||||||
| NET ASSETS (100.0%) | $ | 31,944,609 | |||||||||
INVESTMENT ABBREVIATION
ADR = American Depositary Receipt
* Non-income producing security.
See Accompanying Notes to Financial Statements.
15
Credit Suisse Large Cap Blend Fund
Statement of Assets and Liabilities
June 30, 2009 (unaudited)
| Assets | |||||||
| Investments at value (Cost $31,196,665) (Note 2) | $ | 31,948,990 | |||||
| Cash | 786 | ||||||
| Receivable for investments sold | 14,916,575 | ||||||
| Dividend receivable | 36,171 | ||||||
| Receivable from investment adviser (Note 3) | 10,396 | ||||||
| Receivable for fund shares sold | 967 | ||||||
| Prepaid expenses | 43,557 | ||||||
| Total Assets | 46,957,442 | ||||||
| Liabilities | |||||||
| Administrative services fee payable (Note 3) | 13,757 | ||||||
| Shareholder servicing/Distribution fee payable (Note 3) | 7,447 | ||||||
| Payable for investments purchased | 14,830,844 | ||||||
| Payable for fund shares redeemed | 80,426 | ||||||
| Directors' fee payable | 5,875 | ||||||
| Other accrued expenses payable | 74,484 | ||||||
| Total Liabilities | 15,012,833 | ||||||
| Net Assets | |||||||
| Capital stock, $.001 par value (Note 6) | 3,894 | ||||||
| Paid-in capital (Note 6) | 43,309,764 | ||||||
| Undistributed net investment income | 164,251 | ||||||
| Accumulated net realized loss on investments and foreign currency transactions | (12,285,622 | ) | |||||
| Net unrealized appreciation from investments and foreign currency translations | 752,322 | ||||||
| Net Assets | $ | 31,944,609 | |||||
| Common Shares | |||||||
| Net assets | $ | 1,264,502 | |||||
| Shares outstanding | 154,719 | ||||||
| Net asset value, offering price and redemption price per share | $ | 8.17 | |||||
| A Shares | |||||||
| Net assets | $ | 29,544,368 | |||||
| Shares outstanding | 3,594,196 | ||||||
| Net asset value and redemption price per share | $ | 8.22 | |||||
| Maximum offering price per share (net asset value/(1-5.75%)) | $ | 8.72 | |||||
| B Shares | |||||||
| Net assets | $ | 871,508 | |||||
| Shares outstanding | 110,993 | ||||||
| Net asset value and offering price per share | $ | 7.85 | |||||
| C Shares | |||||||
| Net assets | $ | 264,231 | |||||
| Shares outstanding | 33,754 | ||||||
| Net asset value and offering price per share | $ | 7.83 | |||||
See Accompanying Notes to Financial Statements.
16
Credit Suisse Large Cap Blend Fund
Statement of Operations
For the Six Months Ended June 30, 2009 (unaudited)
| Investment Income (Note 2) | |||||||
| Dividends | $ | 354,846 | |||||
| Interest | 7 | ||||||
| Foreign taxes withheld | (5,396 | ) | |||||
| Total investment income | 349,457 | ||||||
| Expenses | |||||||
| Investment advisory fees (Note 3) | 73,209 | ||||||
| Administrative services fees (Note 3) | 50,073 | ||||||
| Shareholder servicing/Distribution fees (Note 3) | |||||||
| Common Class | 1,421 | ||||||
| Class A | 33,686 | ||||||
| Class B | 4,755 | ||||||
| Class C | 1,233 | ||||||
| Custodian fees | 86,306 | ||||||
| Transfer agent fees (Note 3) | 35,343 | ||||||
| Printing fees (Note 3) | 21,471 | ||||||
| Audit and tax fees | 11,608 | ||||||
| Directors' fees | 6,578 | ||||||
| Legal fees | 6,285 | ||||||
| Registration fees | 3,715 | ||||||
| Insurance expense | 667 | ||||||
| Commitment fees (Note 4) | 231 | ||||||
| Miscellaneous expense | 3,793 | ||||||
| Total expenses | 340,374 | ||||||
| Less: fees waived and expenses reimbursed (Note 3) | (145,540 | ) | |||||
| Net expenses | 194,834 | ||||||
| Net investment income | 154,623 | ||||||
| Net Realized and Unrealized Gain (Loss) from Investments and Foreign Currency Related Items | |||||||
| Net realized loss from investments | (2,648,158 | ) | |||||
| Net realized gain from foreign currency transactions | 67 | ||||||
| Net change in unrealized appreciation (depreciation) from investments | 4,252,629 | ||||||
| Net change in unrealized appreciation (depreciation) from foreign currency translations | (6 | ) | |||||
| Net realized and unrealized gain from investments and foreign currency related items | 1,604,532 | ||||||
| Net increase in net assets resulting from operations | $ | 1,759,155 | |||||
See Accompanying Notes to Financial Statements.
17
Credit Suisse Large Cap Blend Fund
Statements of Changes in Net Assets
| For the Six Months Ended June 30, 2009 (unaudited) | For the Year Ended December 31, 2008 | ||||||||||
| From Operations | |||||||||||
| Net investment income | $ | 154,623 | $ | 442,610 | |||||||
| Net realized loss from investments and foreign currency transactions | (2,648,091 | ) | (8,196,021 | ) | |||||||
| Net change in unrealized appreciation (depreciation) from investments and foreign currency translations | 4,252,623 | (9,632,587 | ) | ||||||||
| Net increase (decrease) in net assets resulting from operations | 1,759,155 | (17,385,998 | ) | ||||||||
| From Dividends and Distributions | |||||||||||
| Dividends from net investment income | |||||||||||
| Common Class shares | — | (18,791 | ) | ||||||||
| Class A shares | — | (429,976 | ) | ||||||||
| Class B shares | — | (5,245 | ) | ||||||||
| Class C shares | — | (1,634 | ) | ||||||||
| Distributions from net realized gains | |||||||||||
| Common Class shares | — | (92 | ) | ||||||||
| Class A shares | — | (2,264 | ) | ||||||||
| Class B shares | — | (94 | ) | ||||||||
| Class C shares | — | (28 | ) | ||||||||
| Net decrease in net assets resulting from dividends and distributions | — | (458,124 | ) | ||||||||
| From Capital Share Transactions (Note 6) | |||||||||||
| Proceeds from sale of shares | 336,340 | 1,643,255 | |||||||||
| Reinvestment of dividends and distributions | — | 384,584 | |||||||||
| Net asset value of shares redeemed | (1,511,787 | ) | (6,099,312 | ) | |||||||
| Net decrease in net assets from capital share transactions | (1,175,447 | ) | (4,071,473 | ) | |||||||
| Net increase (decrease) in net assets | 583,708 | (21,915,595 | ) | ||||||||
| Net Assets | |||||||||||
| Beginning of period | 31,360,901 | 53,276,496 | |||||||||
| End of period | $ | 31,944,609 | $ | 31,360,901 | |||||||
| Undistributed net investment income | $ | 164,251 | $ | 9,628 | |||||||
See Accompanying Notes to Financial Statements.
18
Credit Suisse Large Cap Blend Fund
Financial Highlights
(For a Common Class Share of the Fund Outstanding Throughout Each Period)
| For the Six Months Ended June 30, 2009 | For the Year Ended December 31, | For the Period September 1, 2004 to December 31, | For the Year Ended August 31, | ||||||||||||||||||||||||||||
| (unaudited) | 2008 | 2007 | 2006 | 2005 | 20041 | 2004 | |||||||||||||||||||||||||
| Per share data | |||||||||||||||||||||||||||||||
| Net asset value, beginning of period | $ | 7.71 | $ | 11.95 | $ | 12.71 | $ | 12.23 | $ | 12.45 | $ | 12.01 | $ | 11.42 | |||||||||||||||||
| INVESTMENT OPERATIONS | |||||||||||||||||||||||||||||||
| Net investment income2 | 0.04 | 0.11 | 0.08 | 0.05 | 0.04 | 0.05 | 0.03 | ||||||||||||||||||||||||
| Net gain (loss) on investments and foreign currency related items (both realized and unrealized) | 0.42 | (4.23 | ) | 0.68 | 1.22 | 0.30 | 1.21 | 0.57 | |||||||||||||||||||||||
| Total from investment operations | 0.46 | (4.12 | ) | 0.76 | 1.27 | 0.34 | 1.26 | 0.60 | |||||||||||||||||||||||
| LESS DIVIDENDS AND DISTRIBUTIONS | |||||||||||||||||||||||||||||||
| Dividends from net investment income | — | (0.12 | ) | (0.06 | ) | (0.07 | ) | (0.07 | ) | (0.01 | ) | (0.01 | ) | ||||||||||||||||||
| Distributions from net realized gains | — | (0.00 | )3 | (1.46 | ) | (0.72 | ) | (0.49 | ) | (0.81 | ) | — | |||||||||||||||||||
| Total dividends and distributions | — | (0.12 | ) | (1.52 | ) | (0.79 | ) | (0.56 | ) | (0.82 | ) | (0.01 | ) | ||||||||||||||||||
| Net asset value, end of period | $ | 8.17 | $ | 7.71 | $ | 11.95 | $ | 12.71 | $ | 12.23 | $ | 12.45 | $ | 12.01 | |||||||||||||||||
| Total return4 | 5.97 | % | (34.46 | )% | 6.15 | % | 10.44 | % | 2.70 | % | 10.70 | % | 5.25 | % | |||||||||||||||||
| RATIOS AND SUPPLEMENTAL DATA | |||||||||||||||||||||||||||||||
| Net assets, end of period (000s omitted) | $ | 1,265 | $ | 1,237 | $ | 1,883 | $ | 2,202 | $ | 2,809 | $ | 3,471 | $ | 4,383 | |||||||||||||||||
| Ratio of expenses to average net assets | 1.30 | %5 | 1.30 | % | 1.28 | % | 1.30 | % | 1.30 | % | 1.30 | %5 | 1.30 | % | |||||||||||||||||
| Ratio of net investment income to average net assets | 1.08 | %5 | 1.10 | % | 0.58 | % | 0.40 | % | 0.32 | % | 1.37 | %5 | 0.23 | % | |||||||||||||||||
| Decrease reflected in above operating expense ratios due to waivers/reimbursements | 0.99 | %5 | 0.41 | % | 0.07 | % | 0.26 | % | 0.26 | % | 0.32 | %5 | 0.40 | % | |||||||||||||||||
| Portfolio turnover rate | 188 | % | 222 | % | 114 | % | 106 | % | 101 | % | 34 | % | 168 | % | |||||||||||||||||
1 The Fund changed its fiscal year end from August 31 to December 31.
2 Per share information is calculated using the average shares outstanding method.
3 This amount represents less than $(0.01) per share.
4 Total returns are historical and assume changes in share price and reinvestment of all dividends and distributions. Had certain expenses not been reduced during the periods shown, total returns would have been lower. Total returns for periods less than one year are not annualized.
5 Annualized.
See Accompanying Notes to Financial Statements.
19
Credit Suisse Large Cap Blend Fund
Financial Highlights
(For a Class A Share of the Fund Outstanding Throughout Each Period)
| For the Six Months Ended June 30, 2009 | For the Year Ended December 31, | For the Period September 1, 2004 to December 31, | For the Year Ended August 31, | ||||||||||||||||||||||||||||
| (unaudited) | 2008 | 2007 | 2006 | 2005 | 20041 | 2004 | |||||||||||||||||||||||||
| Per share data | |||||||||||||||||||||||||||||||
| Net asset value, beginning of period | $ | 7.75 | $ | 12.01 | $ | 12.78 | $ | 12.26 | $ | 12.48 | $ | 12.04 | $ | 11.44 | |||||||||||||||||
| INVESTMENT OPERATIONS | |||||||||||||||||||||||||||||||
| Net investment income2 | 0.04 | 0.11 | 0.08 | 0.05 | 0.04 | 0.06 | 0.04 | ||||||||||||||||||||||||
| Net gain (loss) on investments and foreign currency related items (both realized and unrealized) | 0.43 | (4.25 | ) | 0.67 | 1.23 | 0.30 | 1.20 | 0.57 | |||||||||||||||||||||||
| Total from investment operations | 0.47 | (4.14 | ) | 0.75 | 1.28 | 0.34 | 1.26 | 0.61 | |||||||||||||||||||||||
| LESS DIVIDENDS AND DISTRIBUTIONS | |||||||||||||||||||||||||||||||
| Dividends from net investment income | — | (0.12 | ) | (0.06 | ) | (0.04 | ) | (0.07 | ) | (0.01 | ) | (0.01 | ) | ||||||||||||||||||
| Distributions from net realized gains | — | (0.00 | )3 | (1.46 | ) | (0.72 | ) | (0.49 | ) | (0.81 | ) | — | |||||||||||||||||||
| Total dividends and distributions | — | (0.12 | ) | (1.52 | ) | (0.76 | ) | (0.56 | ) | (0.82 | ) | (0.01 | ) | ||||||||||||||||||
| Net asset value, end of period | $ | 8.22 | $ | 7.75 | $ | 12.01 | $ | 12.78 | $ | 12.26 | $ | 12.48 | $ | 12.04 | |||||||||||||||||
| Total return4 | 6.06 | % | (34.45 | )% | 6.03 | % | 10.48 | % | 2.69 | % | 10.67 | % | 5.33 | % | |||||||||||||||||
| RATIOS AND SUPPLEMENTAL DATA | |||||||||||||||||||||||||||||||
| Net assets, end of period (000s omitted) | $ | 29,544 | $ | 28,642 | $ | 47,691 | $ | 51,493 | $ | 57,200 | $ | 63,160 | $ | 61,089 | |||||||||||||||||
| Ratio of expenses to average net assets | 1.30 | %5 | 1.30 | % | 1.28 | % | 1.30 | % | 1.30 | % | 1.30 | %5 | 1.30 | % | |||||||||||||||||
| Ratio of net investment income to average net assets | 1.09 | %5 | 1.09 | % | 0.58 | % | 0.40 | % | 0.32 | % | 1.37 | %5 | 0.32 | % | |||||||||||||||||
| Decrease reflected in above operating expense ratios due to waivers/reimbursements | 0.99 | %5 | 0.40 | % | 0.07 | % | 0.26 | % | 0.26 | % | 0.32 | %5 | 0.39 | % | |||||||||||||||||
| Portfolio turnover rate | 188 | % | 222 | % | 114 | % | 106 | % | 101 | % | 34 | % | 168 | % | |||||||||||||||||
1 The Fund changed its fiscal year end from August 31 to December 31.
2 Per share information is calculated using the average shares outstanding method.
3 This amount represents less than $(0.01) per share.
4 Total returns are historical and assume changes in share price, reinvestment of all dividends and distributions and no sales charge. Had certain expenses not been reduced during the periods shown, total returns would have been lower. Total returns for periods less than one year are not annualized.
5 Annualized.
See Accompanying Notes to Financial Statements.
20
Credit Suisse Large Cap Blend Fund
Financial Highlights
(For a Class B Share of the Fund Outstanding Throughout Each Period)
| For the Six Months Ended June 30, 2009 | For the Year Ended December 31, | For the Period September 1, 2004 to December 31, | For the Year Ended August 31, | ||||||||||||||||||||||||||||
| (unaudited) | 2008 | 2007 | 2006 | 2005 | 20041 | 2004 | |||||||||||||||||||||||||
| Per share data | |||||||||||||||||||||||||||||||
| Net asset value, beginning of period | $ | 7.43 | $ | 11.49 | $ | 12.35 | $ | 11.92 | $ | 12.18 | $ | 11.78 | $ | 11.27 | |||||||||||||||||
| INVESTMENT OPERATIONS | |||||||||||||||||||||||||||||||
| Net investment income (loss)2 | 0.01 | 0.03 | (0.02 | ) | (0.04 | ) | (0.05 | ) | 0.02 | (0.05 | ) | ||||||||||||||||||||
| Net gain (loss) on investments and foreign currency related items (both realized and unrealized) | 0.41 | (4.05 | ) | 0.65 | 1.19 | 0.29 | 1.19 | 0.56 | |||||||||||||||||||||||
| Total from investment operations | 0.42 | (4.02 | ) | 0.63 | 1.15 | 0.24 | 1.21 | 0.51 | |||||||||||||||||||||||
| LESS DIVIDENDS AND DISTRIBUTIONS | |||||||||||||||||||||||||||||||
| Dividends from net investment income | — | (0.04 | ) | (0.03 | ) | — | (0.01 | ) | — | — | |||||||||||||||||||||
| Distributions from net realized gains | — | (0.00 | )3 | (1.46 | ) | (0.72 | ) | (0.49 | ) | (0.81 | ) | — | |||||||||||||||||||
| Total dividends and distributions | — | (0.04 | ) | (1.49 | ) | (0.72 | ) | (0.50 | ) | (0.81 | ) | — | |||||||||||||||||||
| Net asset value, end of period | $ | 7.85 | $ | 7.43 | $ | 11.49 | $ | 12.35 | $ | 11.92 | $ | 12.18 | $ | 11.78 | |||||||||||||||||
| Total return4 | 5.65 | % | (34.97 | )% | 5.24 | % | 9.67 | % | 1.91 | % | 10.44 | % | 4.53 | % | |||||||||||||||||
| RATIOS AND SUPPLEMENTAL DATA | |||||||||||||||||||||||||||||||
| Net assets, end of period (000s omitted) | $ | 872 | $ | 1,201 | $ | 3,087 | $ | 5,010 | $ | 8,342 | $ | 13,714 | $ | 14,745 | |||||||||||||||||
| Ratio of expenses to average net assets | 2.05 | %5 | 2.05 | % | 2.03 | % | 2.05 | % | 2.05 | % | 2.05 | %5 | 2.05 | % | |||||||||||||||||
| Ratio of net investment income (loss) to average net assets | 0.35 | %5 | 0.25 | % | (0.19 | )% | (0.35 | )% | (0.44 | )% | 0.62 | %5 | (0.45 | )% | |||||||||||||||||
| Decrease reflected in above operating expense ratios due to waivers/reimbursements | 1.00 | %5 | 0.35 | % | 0.06 | % | 0.26 | % | 0.26 | % | 0.32 | %5 | 0.39 | % | |||||||||||||||||
| Portfolio turnover rate | 188 | % | 222 | % | 114 | % | 106 | % | 101 | % | 34 | % | 168 | % | |||||||||||||||||
1 The Fund changed its fiscal year end from August 31 to December 31.
2 Per share information is calculated using the average shares outstanding method.
3 This amount represents less than $(0.01) per share.
4 Total returns are historical and assume changes in share price, reinvestment of all dividends and distributions and no sales charge. Had certain expenses not been reduced during the periods shown, total returns would have been lower. Total returns for periods less than one year are not annualized.
5 Annualized.
See Accompanying Notes to Financial Statements.
21
Credit Suisse Large Cap Blend Fund
Financial Highlights
(For a Class C Share of the Fund Outstanding Throughout Each Period)
| For the Six Months Ended June 30, 2009 | For the Year Ended December 31, | For the Period September 1, 2004 to December 31, | For the Year Ended August 31, | ||||||||||||||||||||||||||||
| (unaudited) | 2008 | 2007 | 2006 | 2005 | 20041 | 2004 | |||||||||||||||||||||||||
| Per share data | |||||||||||||||||||||||||||||||
| Net asset value, beginning of period | $ | 7.41 | $ | 11.45 | $ | 12.31 | $ | 11.89 | $ | 12.15 | $ | 11.75 | $ | 11.24 | |||||||||||||||||
| INVESTMENT OPERATIONS | |||||||||||||||||||||||||||||||
| Net investment income (loss)2 | 0.01 | 0.03 | (0.02 | ) | (0.04 | ) | (0.05 | ) | 0.03 | (0.06 | ) | ||||||||||||||||||||
| Net gain (loss) on investments and foreign currency related items (both realized and unrealized) | 0.41 | (4.03 | ) | 0.65 | 1.18 | 0.29 | 1.18 | 0.57 | |||||||||||||||||||||||
| Total from investment operations | 0.42 | (4.00 | ) | 0.63 | 1.14 | 0.24 | 1.21 | 0.51 | |||||||||||||||||||||||
| LESS DIVIDENDS AND DISTRIBUTIONS | |||||||||||||||||||||||||||||||
| Dividends from net investment income | — | (0.04 | ) | (0.03 | ) | — | (0.01 | ) | — | — | |||||||||||||||||||||
| Distributions from net realized gains | — | (0.00 | )3 | (1.46 | ) | (0.72 | ) | (0.49 | ) | (0.81 | ) | — | |||||||||||||||||||
| Total dividends and distributions | — | (0.04 | ) | (1.49 | ) | (0.72 | ) | (0.50 | ) | (0.81 | ) | — | |||||||||||||||||||
| Net asset value, end of period | $ | 7.83 | $ | 7.41 | $ | 11.45 | $ | 12.31 | $ | 11.89 | $ | 12.15 | $ | 11.75 | |||||||||||||||||
| Total return4 | 5.67 | % | (34.91 | )% | 5.26 | % | 9.61 | % | 1.91 | % | 10.47 | % | 4.54 | % | |||||||||||||||||
| RATIOS AND SUPPLEMENTAL DATA | |||||||||||||||||||||||||||||||
| Net assets, end of period (000s omitted) | $ | 264 | $ | 281 | $ | 616 | $ | 851 | $ | 1,109 | $ | 1,864 | $ | 2,156 | |||||||||||||||||
| Ratio of expenses to average net assets | 2.05 | %5 | 2.05 | % | 2.03 | % | 2.05 | % | 2.05 | % | 2.05 | %5 | 2.05 | % | |||||||||||||||||
| Ratio of net investment income (loss) to average net assets | 0.33 | %5 | 0.31 | % | (0.18 | )% | (0.35 | )% | (0.44 | )% | 0.62 | %5 | (0.47 | )% | |||||||||||||||||
| Decrease reflected in above operating expense ratios due to waivers/reimbursements | 1.00 | %5 | 0.38 | % | 0.06 | % | 0.26 | % | 0.26 | % | 0.32 | %5 | 0.39 | % | |||||||||||||||||
| Portfolio turnover rate | 188 | % | 222 | % | 114 | % | 106 | % | 101 | % | 34 | % | 168 | % | |||||||||||||||||
1 The Fund changed its fiscal year end from August 31 to December 31.
2 Per share information is calculated using the average shares outstanding method.
3 This amount represents less than $(0.01) per share.
4 Total returns are historical and assume changes in share price, reinvestment of all dividends and distributions and no sales charge. Had certain expenses not been reduced during the periods shown, total returns would have been lower. Total returns for periods less than one year are not annualized.
5 Annualized.
See Accompanying Notes to Financial Statements.
22
Credit Suisse Large Cap Blend Fund
Notes to Financial Statements
June 30, 2009 (unaudited)
Note 1. Organization
Credit Suisse Large Cap Blend Fund, Inc. (the "Fund") is registered under the Investment Company Act of 1940, as amended (the "1940 Act"), as a diversified, open-end management investment company that seeks long-term appreciation of capital. The Fund was incorporated under the laws of the State of Maryland on July 31, 1998.
The Fund is authorized to offer six classes of shares: Common Class shares, Advisor Class shares, Institutional Class shares, Class A shares, Class B shares and Class C shares. The Fund currently offers Common Class shares, Class A shares, Class B shares and Class C shares. The Fund's Common Class shares are closed to new investors, with certain exceptions as set forth in the prospectus. Each class of shares represents an equal pro rata interest in the Fund, except that they bear different expenses, which reflect the differences in the range of services provided to them. Effective October 24, 2002, Institutional Class shares ceased operations. Class A shares are sold subject to a front-end sales charge of 5.75%. Class B shares are sold subject to a contingent deferred sales charge which declines from 4.00% to zero depending on the period of time the shares are held. Class C shares are sold subject to a contingent deferred sales charge of 1.0 0% if the shares are redeemed within the first year of purchase.
Note 2. Significant Accounting Policies
A) SECURITY VALUATION — The net asset value of the Fund is determined daily as of the close of regular trading on the New York Stock Exchange, Inc. (the "Exchange") on each day the Exchange is open for business. Equity investments are valued at market value, which is generally determined using the closing price on the exchange or market on which the security is primarily traded at the time of valuation (the "Valuation Time"). If no sales are reported, equity investments are generally valued at the most recent bid quotation as of the Valuation Time or at the lowest asked quotation in the case of a short sale of securities. Debt securities with a remaining maturity greater than 60 days are valued in accordance with the price supplied by a pricing service, which may use a matrix, formula or other objective method that takes into consideration market indices, yield curves and other specific adjustments. Debt obligations that will mature in 60 days or less are valued on the basis of amortized cost, which approximates market value, unless it is determined that using this method would not represent fair value. Investments in mutual funds are valued at the mutual fund's closing net asset value per share on the day of valuation. Securities and other assets for which market quotations are not readily available, or whose values have been materially affected by events
23
Credit Suisse Large Cap Blend Fund
Notes to Financial Statements (continued)
June 30, 2009 (unaudited)
Note 2. Significant Accounting Policies
occurring before the Fund's Valuation Time but after the close of the securities' primary markets, are valued at fair value as determined in good faith by, or under the direction of, the Board of Directors under procedures established by the Board of Directors. The Fund may utilize a service provided by an independent third party which has been approved by the Board of Directors to fair value certain securities. When fair-value pricing is employed, the prices of securities used by a fund to calculate its net asset value may differ from quoted or published prices for the same securities.
The Fund adopted Financial Accounting Standards Board ("FASB") Statement of Financial Accounting Standards No. 157, Fair Value Measurements ("FAS 157"), effective January 1, 2008. In accordance with FAS 157, fair value is defined as the price that the Fund would receive upon selling an investment in a timely transaction to an independent buyer in the principal or most advantageous market of the investment. FAS 157 established a three-tier hierarchy to maximize the use of observable market data and minimize the use of unobservable inputs and to establish classification of fair value measurements for disclosure purposes. Inputs refer broadly to the assumptions that market participants would use in pricing the asset or liability, including assumptions about risk, for example, the risk inherent in a particular valuation technique used to measure fair value including such a pricing model and/or the risk inherent in the inputs to the valuation tec hnique. Inputs may be observable or unobservable. Observable inputs are inputs that reflect the assumptions market participants would use in pricing the asset or liability developed based on market data obtained from sources independent of the reporting entity. Unobservable inputs are inputs that reflect the reporting entity's own assumptions about the assumptions market participants would use in pricing the asset or liability developed based on the best information available in the circumstances. The three-tier hierarchy of inputs is summarized in the three broad Levels listed below.
• Level 1 – quoted prices in active markets for identical investments
• Level 2 – other significant observable inputs (including quoted prices for similar investments, interest rates, prepayment speeds, credit risk, etc.)
• Level 3 – significant unobservable inputs (including the Fund's own assumptions in determining the fair value of investments)
The inputs or methodology used for valuing securities are not necessarily an indication of the risk associated with investing in those securities.
24
Credit Suisse Large Cap Blend Fund
Notes to Financial Statements (continued)
June 30, 2009 (unaudited)
Note 2. Significant Accounting Policies
The following is a summary of the inputs used as of June 30, 2009 in valuing the Fund's investments carried at value:
| Level 1 | Level 2 | Level 3 | Total | ||||||||||||||||
| Investments in Securities | |||||||||||||||||||
| Equities | $ | 31,788,990 | $ | — | $ | — | $ | 31,788,990 | |||||||||||
| Short-Term Investment | — | 160,000 | — | 160,000 | |||||||||||||||
| Other Financial Instruments* | — | — | — | — | |||||||||||||||
| $ | 31,788,990 | $ | 160,000 | $ | — | $ | 31,948,990 | ||||||||||||
*Other financial instruments include futures, forwards and swap contracts.
B) DERIVATIVE INSTRUMENTS AND HEDGING ACTIVITIES — In March 2008, the FASB issued Statement of Financial Accounting Standards No. 161, Disclosures about Derivative Instruments and Hedging Activities ("FAS 161"), an amendment of FASB Statement No. 133. FAS 161 is effective for financial statements issued for fiscal years and interim periods beginning after November 15, 2008. FAS 161 requires enhanced disclosures about how and why a fund uses derivative instruments, how these affect a fund's financial position and results of operations. The Fund has not entered into any derivative or hedging activities during the period covered by this report.
C) SECURITY TRANSACTIONS AND INVESTMENT INCOME — Security transactions are accounted for on a trade date basis. Interest income is recorded on the accrual basis. Dividends are recorded on the ex-dividend date. Certain expenses are class-specific expenses and vary by class. Income, expenses (excluding class-specific expenses) and realized/unrealized gains/losses are allocated proportionately to each class of shares based upon the relative net asset value of the outstanding shares of that class. The cost of investments sold is determined by use of the specific identification method for both financial reporting and income tax purposes.
D) DIVIDENDS AND DISTRIBUTIONS TO SHAREHOLDERS — Dividends from net investment income and distributions of net realized capital gains, if any, are declared and paid at least annually. However, to the extent that a net realized capital gain can be reduced by a capital loss carryforward, such gain will not be distributed. Income and capital gain distributions are determined in accordance with federal income tax regulations, which may differ from accounting principles generally accepted in the United States of America ("GAAP").
E) FEDERAL INCOME TAXES — No provision is made for federal taxes as it is the Fund's intention to continue to qualify for and elect the tax treatment
25
Credit Suisse Large Cap Blend Fund
Notes to Financial Statements (continued)
June 30, 2009 (unaudited)
Note 2. Significant Accounting Policies
applicable to regulated investment companies under the Internal Revenue Code of 1986, as amended, and to make the requisite distributions to its shareholders, which will be sufficient to relieve it from federal income and excise taxes.
During June 2006, the FASB issued Interpretation 48 ("FIN 48" or the "Interpretation"), Accounting for Uncertainty in Income Taxes — an interpretation of FASB statement 109. The Fund has reviewed its current tax positions and has determined that no provision for income tax is required in the Fund's financial statements. The Fund's federal tax returns for the prior three fiscal years remain subject to examination by the Internal Revenue Service.
F) USE OF ESTIMATES — The preparation of financial statements in conformity with GAAP requires management to make estimates and assumptions that affect the reported amounts of assets and liabilities and disclosure of contingent assets and liabilities at the date of the financial statements and the reported amounts of income and expenses during the reporting period. Actual results could differ from these estimates.
G) SHORT-TERM INVESTMENTS — The Fund, together with other funds/portfolios advised by Credit Suisse Asset Management, LLC ("Credit Suisse"), an indirect, wholly-owned subsidiary of Credit Suisse Group AG, pools available cash into a short-term variable rate time deposit issued by State Street Bank and Trust Company ("SSB"), the Fund's custodian. The short-term time deposit issued by SSB is a variable rate account classified as a short-term investment.
H) SECURITIES LENDING — Loans of securities are required at all times to be secured by collateral at least equal to 102% of the market value of domestic securities on loan (including any accrued interest thereon) and 105% of the market value of foreign securities on loan (including any accrued interest thereon). Cash collateral received by the Fund in connection with securities lending activity may be pooled together with cash collateral for other funds/portfolios advised by Credit Suisse and may be invested in a variety of investments, including funds advised by SSB, the Fund's securities lending agent, or money market instruments. However, in the event of default or bankruptcy by the other party to the agreement, realization and/or retention of the collateral may be subject to legal proceedings.
SSB has been engaged by the Fund to act as the Fund's securities lending agent. The Fund's securities lending arrangement provides that the Fund and SSB will share the net income earned from securities lending activities. The
26
Credit Suisse Large Cap Blend Fund
Notes to Financial Statements (continued)
June 30, 2009 (unaudited)
Note 2. Significant Accounting Policies
Fund had no securities out on loan during the six months ended June 30, 2009. Securities lending income is accrued as earned.
Note 3. Transactions with Affiliates and Related Parties
Credit Suisse serves as investment adviser for the Fund. For its investment advisory services, Credit Suisse is entitled to receive a fee from the Fund at an annual rate of 0.50% of the Fund's average daily net assets. For the six months ended June 30, 2009, investment advisory fees earned, voluntarily waived and expenses reimbursed were as follows:
| Gross Advisory Fee | Waiver | Net Advisory Fee | Expense Reimbursement | ||||||||||||
| $ | 73,209 | $ | (73,209 | ) | $ | 0 | $ | (72,331 | ) | ||||||
Fee waivers and expense reimbursements are voluntary and may be discontinued by Credit Suisse at any time.
Credit Suisse Asset Management Securities, Inc. ("CSAMSI"), an affiliate of Credit Suisse, and SSB serve as co-administrators to the Fund. For its co-administrative services, CSAMSI currently receives a fee calculated at an annual rate of 0.09% of the Fund's average daily net assets. For the six months ended June 30, 2009, co-administrative services fees earned by CSAMSI were $13,177.
For its co-administrative services, SSB receives a fee, exclusive of out-of-pocket expenses, calculated in total for all the Credit Suisse funds/portfolios co-administered by SSB and allocated based upon the relative average net assets of each fund/portfolio, subject to an annual minimum fee. For the six months ended June 30, 2009, co-administrative services fees earned by SSB (including out-of-pocket expenses) were $36,896.
In addition to serving as the Fund's co-administrator, CSAMSI currently serves as distributor of the Fund's shares. Pursuant to distribution plans adopted by the Fund pursuant to Rule 12b-1 under the 1940 Act, CSAMSI receives fees for its distribution services. For the Common Class and Class A shares of the Fund, the fee is calculated at an annual rate of 0.25% of the average daily net assets. For Class B and Class C shares of the Fund, the fee is calculated at an annual rate of 1.00% of average daily net assets.
27
Credit Suisse Large Cap Blend Fund
Notes to Financial Statements (continued)
June 30, 2009 (unaudited)
Note 3. Transactions with Affiliates and Related Parties
Certain brokers, dealers and financial representatives provide transfer agent related services to the Fund and receive compensation from Credit Suisse. Credit Suisse is then reimbursed by the Fund. For the six months ended June 30, 2009, the Fund reimbursed Credit Suisse $296, which is included in the Fund's transfer agent expense. For the six months ended June 30, 2009, CSAMSI and its affiliates advised the Fund that it did not earn commissions on the sale of the Fund's Class A shares.
Merrill Corporation ("Merrill"), an affiliate of Credit Suisse, has been engaged by the Fund to provide certain financial printing and fulfillment services. For the six months ended June 30, 2009, Merrill was paid $9,017 for its services by the Fund.
Note 4. Line of Credit
The Fund, together with other funds/portfolios advised by Credit Suisse (collectively, the "Participating Funds"), participates in a $50 million committed, unsecured line of credit facility ("Credit Facility") for temporary or emergency purposes with SSB. Under the terms of the Credit Facility, the Participating Funds pay an aggregate commitment fee on the average unused amount of the Credit Facility, which is allocated among the Participating Funds in such manner as is determined by the governing Boards of the Participating Funds. In addition, the Participating Funds pay interest on borrowings at either the Overnight Federal Funds rate or the Overnight LIBOR rate plus a spread. At June 30, 2009, and during the six months ended June 30, 2009, the Fund had no borrowings under the Credit Facility.
Note 5. Purchases and Sales of Securities
For the six months ended June 30, 2009, purchases and sales of investment securities (excluding short-term investments) were $55,159,855 and $55,925,887, respectively.
At June 30, 2009, the identified cost for federal income tax purposes, as well as the gross unrealized appreciation from investments for those securities having an excess of value over cost, gross unrealized depreciation from investments for those securities having an excess of cost over value and the net unrealized appreciation from investments were $31,196,665, $1,581,304, $(828,979) and $752,325, respectively.
28
Credit Suisse Large Cap Blend Fund
Notes to Financial Statements (continued)
June 30, 2009 (unaudited)
Note 6. Capital Share Transactions
The Fund is authorized to issue six billion full and fractional shares of capital stock, $.001 par value per share. Transactions in capital shares for each class were as follows:
| Common Class | |||||||||||||||||||
| For the Six Months Ended June 30, 2009 (unaudited) | For the Year Ended December 31, 2008 | ||||||||||||||||||
| Shares | Value | Shares | Value | ||||||||||||||||
| Shares sold | 6,455 | $ | 48,698 | 17,042 | $ | 165,259 | |||||||||||||
| Shares issued in reinvestment of dividends and distributions | — | — | 2,195 | 16,384 | |||||||||||||||
| Shares redeemed | (12,164 | ) | (90,607 | ) | (16,441 | ) | (170,665 | ) | |||||||||||
| Net increase (decrease) | (5,709 | ) | $ | (41,909 | ) | 2,796 | $ | 10,978 | |||||||||||
| Class A | |||||||||||||||||||
| For the Six Months Ended June 30, 2009 (unaudited) | For the Year Ended December 31, 2008 | ||||||||||||||||||
| Shares | Value | Shares | Value | ||||||||||||||||
| Shares sold | 36,908 | $ | 271,265 | 104,498 | $ | 1,055,005 | |||||||||||||
| Shares issued in reinvestment of dividends and distributions | — | — | 48,264 | 362,640 | |||||||||||||||
| Shares redeemed | (137,753 | ) | (1,023,567 | ) | (427,565 | ) | (4,191,070 | ) | |||||||||||
| Net decrease | (100,845 | ) | $ | (752,302 | ) | (274,803 | ) | $ | (2,773,425 | ) | |||||||||
| Class B | |||||||||||||||||||
| For the Six Months Ended June 30, 2009 (unaudited) | For the Year Ended December 31, 2008 | ||||||||||||||||||
| Shares | Value | Shares | Value | ||||||||||||||||
| Shares sold | 2,344 | $ | 16,377 | 51,043 | $ | 393,049 | |||||||||||||
| Shares issued in reinvestment of dividends and distributions | — | — | 587 | 4,433 | |||||||||||||||
| Shares redeemed | (52,988 | ) | (370,418 | ) | (158,602 | ) | (1,567,675 | ) | |||||||||||
| Net decrease | (50,644 | ) | $ | (354,041 | ) | (106,972 | ) | $ | (1,170,193 | ) | |||||||||
| Class C | |||||||||||||||||||
| For the Six Months Ended June 30, 2009 (unaudited) | For the Year Ended December 31, 2008 | ||||||||||||||||||
| Shares | Value | Shares | Value | ||||||||||||||||
| Shares sold | — | $ | — | 4,420 | $ | 29,942 | |||||||||||||
| Shares issued in reinvestment of dividends and distributions | — | — | 150 | 1,127 | |||||||||||||||
| Shares redeemed | (4,135 | ) | (27,195 | ) | (20,442 | ) | (169,902 | ) | |||||||||||
| Net decrease | (4,135 | ) | $ | (27,195 | ) | (15,872 | ) | $ | (138,833 | ) | |||||||||
29
Credit Suisse Large Cap Blend Fund
Notes to Financial Statements (continued)
June 30, 2009 (unaudited)
Note 6. Capital Share Transactions
On June 30, 2009, the number of shareholders that held 5% or more of the outstanding shares of each class of the Fund was as follows:
| Number of Shareholders | Approximate Percentage of Outstanding Shares | ||||||||||
| Common Class | 3 | 36 | % | ||||||||
| Class B | 4 | 53 | % | ||||||||
| Class C | 4 | 54 | % | ||||||||
Some of the shareholders are omnibus accounts, which hold shares on behalf of individual shareholders.
Note 7. Contingencies
In the normal course of business, the Fund may provide general indemnifications pursuant to certain contracts and organizational documents. The Fund's maximum exposure under these arrangements is dependent on future claims that may be made against the Fund and, therefore, cannot be estimated; however, based on experience, the risk of loss from such claims is considered remote.
Note 8. Subsequent Events
In accordance with the provisions set forth in FASB Statement of Financial Accounting Standards No. 165 "Subsequent Events", adopted by the Fund as of June 30, 2009, management has evaluated the possibility of subsequent events existing in the Fund's financial statements through August 24, 2009. Management has determined that there are no material events that would require disclosure in the Fund's financial statements through this date.
30
Credit Suisse Large Cap Blend Fund
Notice of Privacy and Information Practices (unaudited)
At Credit Suisse, we know that you are concerned with how we protect and handle nonpublic personal information that identifies you. This notice is designed to help you understand what nonpublic personal information we collect from you and from other sources, and how we use that information in connection with your investments and investment choices that may be available to you. Except where otherwise noted, this notice is applicable only to consumers who are current or former investors, meaning individual persons whose investments are primarily for household, family or personal use ("individual investors"). Specified sections of this notice, however, also apply to other types of investors (called "institutional investors"). Where the notice applies to institutional investors, the notice expressly states so. This notice is being provided by Credit Suisse Funds, Credit Suisse Institutional Funds, and Credit Suisse Closed-End Funds. This notice applies solely to U.S. registered investment companies advised by Credit Suisse Asset Management, LLC.
Categories of information we may collect:
We may collect information about you, including nonpublic personal information, such as
• Information we receive from you on applications, forms, agreements, questionnaires, Credit Suisse websites and other websites that are part of our investment program, or in the course of establishing or maintaining a customer relationship, such as your name, address, e-mail address, Social Security number, assets, income, financial situation; and
• Information we obtain from your transactions and experiences with us, our affiliates, or others, such as your account balances or other investment information assets purchased and sold, and other parties to a transaction, where applicable.
Categories of information we disclose and parties to whom we disclose it:
• We do not disclose nonpublic personal information about our individual investors, except as permitted or required by law or regulation. Whether you are an individual investor or institutional investor, we may share the information described above with our affiliates that perform services on our behalf, and with our asset management and private banking affiliates; as well as with unaffiliated third parties that perform services on our behalf, such as our accountants, auditors, attorneys, broker-dealers, fund administrators, and other service providers.
31
Credit Suisse Large Cap Blend Fund
Notice of Privacy and Information Practices (unaudited) (continued)
• We want our investors to be informed about additional products or services. Whether you are an individual investor or an institutional investor, we may disclose information, including nonpublic personal information, regarding our transactions and experiences with you to our affiliates.
• In addition, whether you are an individual investor or an institutional investor, we reserve the right to disclose information, including nonpublic personal information, about you to any person or entity, including without limitation any governmental agency, regulatory authority or self-regulatory organization having jurisdiction over us or our affiliates, if (i) we determine in our discretion that such disclosure is necessary or advisable pursuant to or in connection with any United States federal, state or local, or non-U.S., court order (or other legal process), law, rule, regulation, or executive order or policy, including without limitation any anti-money laundering law or the USA PATRIOT Act of 2001; and (ii) such disclosure is not otherwise prohibited by law, rule, regulation, or executive order or policy.
Confidentiality and security
• To protect nonpublic personal information about individual investors, we restrict access to those employees and agents who need to know that information to provide products or services to us and to our investors. We maintain physical, electronic, and procedural safeguards to protect nonpublic personal information.
Other Disclosures
This notice is not intended to be incorporated in any offering materials, but is a statement of our current Notice of Privacy and Information Practices and may be amended from time to time. This notice is current as of May 12, 2009.
32
Credit Suisse Large Cap Blend Fund
Proxy Voting and Portfolio Holdings Information (unaudited)
Information regarding how the Fund voted proxies related to its portfolio securities during the 12 month period ended June 30 of each year, as well as the policies and procedures that the Fund uses to determine how to vote proxies relating to its portfolio securities are available:
• By calling 1-877-870-2874
• On the Fund's website, www.credit-suisse.com/us
• On the website of the Securities and Exchange Commission, www.sec.gov.
The Fund files a complete schedule of its portfolio holdings for the first and third quarters of its fiscal year with the SEC on Form N-Q. The Fund's Forms N-Q are available on the SEC's website at www.sec.gov and may be reviewed and copied at the SEC's Public Reference Room in Washington, DC. Information on the operation of the SEC's Public Reference Room may be obtained by calling 1-202-551-8090.
33

P.O. BOX 55030, BOSTON, MA 02205-5030
877-870-2874 n WWW.credit-suisse.com/us
CREDIT SUISSE ASSET MANAGEMENT SECURITIES, INC., DISTRIBUTOR. LCB-SAR-0609
Item 2. Code of Ethics.
This item is inapplicable to a semi-annual report on Form N-CSR.
Item 3. Audit Committee Financial Expert.
This item is inapplicable to a semi-annual report on Form N-CSR.
Item 4. Principal Accountant Fees and Services.
This item is inapplicable to a semi-annual report on Form N-CSR.
Item 5. Audit Committee of Listed Registrants.
This item is not applicable to the registrant.
Item 6. Schedule of Investments.
Included as part of the report to shareholders filed under Item 1 of this Form.
Item 7. Disclosure of Proxy Voting Policies and Procedures for Closed-End Management Investment Companies.
This item is not applicable to the registrant.
Item 8. Portfolio Managers of Closed-End Management Investment Companies.
This item is not applicable to the registrant.
Item 9. Purchases of Equity Securities by Closed-End Management Investment Company and Affiliated Purchasers.
This item is not applicable to the registrant.
Item 10. Submission of Matters to a Vote of Security Holders.
The Nominating Committee recommends Board member candidates. Shareholders of the registrant may also submit nominees that will be considered by the Committee. Recommendations should be mailed to the registrant’s Secretary, c/o Credit Suisse Asset Management, LLC, Eleven Madison Avenue, New York, NY 10010. Any submission should include at a minimum the following information: the name, age, business address, residence address and principal occupation or employment of such individual; the class, series and number of shares of the registrant that are beneficially owned by such individual; the date such shares were acquired and the investment intent of such acquisition; whether such shareholder believes such individual is, or is not, an “interested person” of the registrant (as defined in the Investment Company Act of 1940) and information regarding such individual that is sufficient, in the Committee’s discretion, to make such determination; and all other information relating to such individual that is required to be disclosed in solicitation of proxies for election of directors in an election contest (even if an election contest is not involved) or is otherwise required pursuant to the rules for proxy materials under the Securities Exchange Act of 1934.
Item 11. Controls and Procedures.
(a) As of a date within 90 days from the filing date of this report, the principal executive officer and principal financial officer concluded that the registrant’s disclosure controls and procedures (as defined in Rule 30a-3(c) under the Investment Company Act of 1940 (the “Act”)) were effective based on their evaluation of the disclosure controls and procedures required by Rule 30a-3(b) under the Act and Rules 13a-15(b) or 15d-15(b) under the Securities Exchange Act of 1934.
(b) There were no changes in registrant’s internal control over financial reporting (as defined in Rule 30a-3(d) under the Act) that occurred during the registrant’s last fiscal half-year that have materially affected, or are reasonably likely to materially affect, the registrant’s internal control over financial reporting.
Item 12. Exhibits.
(a)(1) Not applicable.
(a)(2) The certifications of the registrant as required by Rule 30a-2(a) under the Act are exhibits to this report.
(a)(3) Not applicable.
(b) The certifications of the registrant as required by Rule 30a-2(b) under the Act are an exhibit to this report.
SIGNATURES
Pursuant to the requirements of the Securities Exchange Act of 1934 and the Investment Company Act of 1940, the registrant has duly caused this report to be signed on its behalf by the undersigned, thereunto duly authorized.
CREDIT SUISSE LARGE CAP BLEND FUND, INC. |
/s/George R. Hornig |
| |
Name: | George R. Hornig |
|
Title: | Chief Executive Officer |
|
Date: | September 1, 2009 |
|
Pursuant to the requirements of the Securities Exchange Act of 1934 and the Investment Company Act of 1940, this report has been signed below by the following persons on behalf of the registrant and in the capacities and on the dates indicated.
/s/George R. Hornig |
| |
Name: | George R. Hornig |
|
Title: | Chief Executive Officer |
|
Date: | September 1, 2009 |
|
/s/Michael A. Pignataro |
| |
Name: | Michael A. Pignataro |
|
Title: | Chief Financial Officer |
|
Date: | September 1, 2009 |
|