UNITED STATES
SECURITIES AND EXCHANGE COMMISSION
Washington, D.C. 20549
FORM N-CSR
CERTIFIED SHAREHOLDER REPORT OF REGISTERED
MANAGEMENT INVESTMENT COMPANIES
Investment Company Act file number | 811-08921 | ||||||||
| |||||||||
CREDIT SUISSE LARGE CAP BLEND FUND, INC. | |||||||||
(Exact name of registrant as specified in charter) | |||||||||
| |||||||||
Eleven Madison Avenue, New York, New York |
| 10010 | |||||||
(Address of principal executive offices) |
| (Zip code) | |||||||
| |||||||||
J. Kevin Gao, Esq. Credit Suisse Large Cap Blend Fund, Inc. Eleven Madison Avenue New York, New York 10010 | |||||||||
(Name and address of agent for service) | |||||||||
| |||||||||
Registrant’s telephone number, including area code: | (212) 325-2000 |
| |||||||
| |||||||||
Date of fiscal year end: | December 31 |
| |||||||
| |||||||||
Date of reporting period: | January 1, 2007 to June 30, 2007 |
| |||||||
Item 1. Reports to Stockholders.

CREDIT SUISSE FUNDS
Semiannual Report
June 30, 2007
(unaudited)
n CREDIT SUISSE
LARGE CAP BLEND FUND
The Fund's investment objectives, risks, charges and expenses (which should be considered carefully before investing), and more complete information about the Fund, are provided in the Prospectus, which should be read carefully before investing. You may obtain additional copies by calling 800-927-2874 or by writing to Credit Suisse Funds, P.O. Box 55030, Boston, MA 02205-5030.
Credit Suisse Asset Management Securities, Inc., Distributor, is located at Eleven Madison Avenue, New York, NY 10010. Credit Suisse Funds are advised by Credit Suisse Asset Management, LLC.
Investors in the Credit Suisse Funds should be aware that they may be eligible to purchase Common Class and/or Advisor Class shares (where offered) directly or through certain intermediaries. Such shares are not subject to a sales charge but may be subject to an ongoing service and distribution fee of up to 0.50% of average daily net assets. Investors in the Credit Suisse Funds should also be aware that they may be eligible for a reduction or waiver of the sales charge with respect to Class A, B or C shares (where offered). For more information, please review the relevant prospectuses or consult your financial representative.
The views of the Fund's management are as of the date of the letter and the Fund holdings described in this document are as of June 30, 2007; these views and Fund holdings may have changed subsequent to these dates. Nothing in this document is a recommendation to purchase or sell securities.
Fund shares are not deposits or other obligations of Credit Suisse Asset Management, LLC ("Credit Suisse") or any affiliate, are not FDIC-insured and are not guaranteed by Credit Suisse or any affiliate. Fund investments are subject to investment risks, including loss of your investment.
Credit Suisse Large Cap Blend Fund
Semiannual Investment Adviser's Report
June 30, 2007 (unaudited)
July 23, 2007
Dear Shareholder:
Performance Summary
01/01/07 – 06/30/07
| Fund & Benchmark | Performance | ||||||
| Common1 | 6.85 | % | |||||
| Class A1, 2 | 6.81 | % | |||||
| Class B1, 2 | 6.40 | % | |||||
| Class C1, 2 | 6.42 | % | |||||
| S&P 500 Index3 | 6.96 | % | |||||
Performance for the Fund's Class A, Class B and Class C Shares is without the maximum sales charge of 5.75%, 4.00% and 1.00%, respectively.2
Market Review: Consumer confidence out of synch with the market
Despite a sudden sell-off in February, the U.S. equity market has continued its strong performance during the first six months of 2007. The S&P 500, a measure of the market and the Fund's benchmark, finished June above 1,500. Finally, most S&P 500 companies' first and second quarter 2007 earnings reports have exceeded investor expectations.
On the positive side, consumer spending held steady, due in part to a continued rise in employment. Additionally, manufacturing growth in the U.S. accelerated to the highest level in 14 months, boosted by an increase in production and new orders. In fact, the Institute for Supply Management (ISM Manufacturing) Index, an indicator of growth in the manufacturing industry, rose to 56 in June — its highest level since 2000. Additionally, the ISM's employment index for non-manufacturing industries rose to 55, the highest level since May 2006.
On the negative side, the first quarter of 2007 marked the slowest U.S. economic growth in four years. This was mainly due to the ongoing drop in residential investments (down by 17%) and the increased trade deficit. In fact, U.S. Gross Domestic Product grew only by 1.3% during the quarter.
During the second quarter, consumer spending, which accounts for about 70% of the U.S. economy, grew at an average rate of 4.2%, holding steady from the first quarter. For the period, the U.S. Federal Funds rate remained unchanged at 5.25%, and Fed policy makers reiterated that the economy is likely to expand at a "moderate pace." In addition, the estimated U.S. inflation target over the past 12 months is roughly 2.7% based on the latest Consumer Price Index. Though this may cause concern to consumers, it is within the comfort target range for the Fed.
1
Credit Suisse Large Cap Blend Fund
Semiannual Investment Adviser's Report (continued)
June 30, 2007 (unaudited)
Finally, toward the end of June, the U.S. dollar dropped to a 26-year low versus the British pound and approached its weakest level against the Euro. These issues combined with rising mortgage rates to cause U.S. consumer confidence to drop to a 10-month low at the end of June.
Strategic Review and Outlook: Expect moderate growth
Stock selection in industrials, consumer discretionary and financials were the largest contributors to performance. Conversely, the largest detractors to performance came from stock selection within information technology, healthcare and energy.
For the second half of 2007, we expect the U.S. economy to continue growing at a moderate rate. However, contradictory readings from major U.S. economic indicators point to a slim chance of a Federal Funds rate increase or decrease over this time. Additionally, throughout the remainder of 2007, we expect a further weakening in the housing market in general (and sub-prime loan performance in particular). Further, while the U.S. dollar is expected to continue weakening relative to the Euro, European equities are expected to outperform their U.S. counterparts.
We anticipate merger and acquisition activity to remain at high levels over the next six months. Additionally, we expect that stock market volatility, as measured by the VIX Index, will reach higher levels than those recorded during the first half of 2007. Finally, we anticipate the European economy will maintain its strong momentum of growth for the second half of the year.
The Credit Suisse Quantitative Strategies Group
Joseph Cherian
William Weng
Todd Jablonski
The value of investments generally will fluctuate in response to market movements.
In addition to historical information, this report contains forward-looking statements, which may concern, among other things, domestic and foreign market, industry and economic trends and developments and government regulation and their potential impact on the Fund's investments. These statements are subject to risks and uncertainties and actual trends, developments and regulations in the future, and their impact on the Fund could be materially different from those projected, anticipated or implied. The Fund has no obligation to update or revise forward-looking statements.
2
Credit Suisse Large Cap Blend Fund
Semiannual Investment Adviser's Report (continued)
June 30, 2007 (unaudited)
Average Annual Returns as of June 30, 20071
| 1 Year | 5 Years | Since Inception | Inception Date | ||||||||||||||||
| Common Class | 19.26 | % | 6.72 | % | 5.04 | % | 10/30/98 | ||||||||||||
| Class A Without Sales Charge | 19.27 | % | 6.74 | % | 2.27 | % | 7/31/01 | ||||||||||||
| Class A With Maximum Sales Charge | 12.41 | % | 5.49 | % | 1.25 | % | 7/31/01 | ||||||||||||
| Class B Without CDSC | 18.38 | % | 5.95 | % | 1.49 | % | 7/31/01 | ||||||||||||
| Class B With CDSC | 14.38 | % | 5.95 | % | 1.49 | % | 7/31/01 | ||||||||||||
| Class C Without CDSC | 18.44 | % | 5.89 | % | 1.45 | % | 7/31/01 | ||||||||||||
| Class C With CDSC | 17.44 | % | 5.89 | % | 1.45 | % | 7/31/01 | ||||||||||||
Returns represent past performance and include change in share price and reinvestment of dividends and capital gains. Past performance cannot guarantee future results. The current performance of the Fund may be lower or higher than the figures shown. Returns and share prices will fluctuate, and redemption value may be more or less than original cost. The performance results do not reflect the deduction of taxes that a shareholder would pay on fund distributions or the redemption of fund shares. Performance information current to the most recent month-end is available at www.credit-suisse.com/us.
1 Fee waivers and/or expense reimbursements may reduce expenses for the Fund, without which performance would be lower. Waivers and/or reimbursements may be discontinued at any time.
2 Total return for Class A shares for the reporting period, based on offering price (including maximum sales charge of 5.75%) was 0.66%. Total return for Class B shares for the reporting period, based on redemption value (including contingent deferred sales charge of 4.00%), was 2.40%. Total return for Class C shares for the reporting period, based on redemption value (including contingent deferred sales charge of 1.00%), was 5.42%.
3 The Standard & Poor's 500 Index is an unmanaged index (with no defined investment objective) of common stocks, includes reinvestment of dividends, and is a registered trademark of The McGraw-Hill Companies, Inc. Investors cannot invest directly in an index.
3
Credit Suisse Large Cap Blend Fund
Semiannual Investment Adviser's Report (continued)
June 30, 2007 (unaudited)
Information About Your Fund's Expenses
As an investor of the Fund, you incur two types of costs: ongoing expenses and transaction costs. Ongoing expenses include management fees, distribution and service (12b-1) fees and other Fund expenses. Examples of transaction costs include sales charges (loads), redemption fees and account maintenance fees, which are not shown in this section and which would result in higher total expenses. The following table is intended to help you understand your ongoing expenses of investing in the Fund and to help you compare these expenses with the ongoing expenses of investing in other mutual funds. The table is based on an investment of $1,000 made at the beginning of the six month period ended June 30, 2007.
The table illustrates your Fund's expenses in two ways:
• Actual Fund Return. This helps you estimate the actual dollar amount of ongoing expenses paid on a $1,000 investment in the Fund using the Fund's actual return during the period. To estimate the expenses you paid over the period, simply divide your account value by $1,000 (for example, an $8,600 account value divided by $1,000 = 8.6), then multiply the result by the number in the "Expenses Paid per $1,000" line under the share class you hold.
• Hypothetical 5% Fund Return. This helps you to compare your Fund's ongoing expenses with those of other mutual funds using the Fund's actual expense ratio and a hypothetical rate of return of 5% per year before expenses. Examples using a 5% hypothetical fund return may be found in the shareholder reports of other mutual funds. The hypothetical account values and expenses may not be used to estimate the actual ending account balance or expenses you paid for the period.
Please note that the expenses shown in these tables are meant to highlight your ongoing expenses only and do not reflect any transaction costs, such as sales charges (loads) or redemption fees. If these transaction costs had been included, your costs would have been higher. The "Expenses Paid per $1,000" line of the tables is useful in comparing ongoing expenses only and will not help you determine the relative total expenses of owning different funds.
4
Credit Suisse Large Cap Blend Fund
Semiannual Investment Adviser's Report (continued)
June 30, 2007 (unaudited)
Expenses and Value of a $1,000 Investment
for the six month period ended June 30, 2007
| Actual Fund Return | Common Class | Class A | Class B | Class C | |||||||||||||||
| Beginning Account Value 1/1/07 | $ | 1,000.00 | $ | 1,000.00 | $ | 1,000.00 | $ | 1,000.00 | |||||||||||
| Ending Account Value 6/30/07 | $ | 1,068.50 | $ | 1,068.10 | $ | 1,064.00 | $ | 1,064.20 | |||||||||||
| Expenses Paid per $1,000* | $ | 6.46 | $ | 6.46 | $ | 10.29 | $ | 10.29 | |||||||||||
| Hypothetical 5% Fund Return | |||||||||||||||||||
| Beginning Account Value 1/1/07 | $ | 1,000.00 | $ | 1,000.00 | $ | 1,000.00 | $ | 1,000.00 | |||||||||||
| Ending Account Value 6/30/07 | $ | 1,018.55 | $ | 1,018.55 | $ | 1,014.83 | $ | 1,014.83 | |||||||||||
| Expenses Paid per $1,000* | $ | 6.31 | $ | 6.31 | $ | 10.04 | $ | 10.04 | |||||||||||
| Common Class | Class A | Class B | Class C | ||||||||||||||||
| Annualized Expense Ratios* | 1.26 | % | 1.26 | % | 2.01 | % | 2.01 | % | |||||||||||
* Expenses are equal to the Fund's annualized expense ratio for each share class, multiplied by the average account value over the period, multiplied by the number of days in the most recent fiscal half year period, then divided by 365.
The "Expense Paid per $1,000" and the "Annualized Expense Ratios" in the tables are based on actual expenses paid by the Fund during the period, net of fee waivers and/or expense reimbursements. If those fee waivers and/or expense reimbursements had not been in effect, the Fund's actual expenses would have been higher.
For more information, please refer to the Fund's prospectus.
5
Credit Suisse Large Cap Blend Fund
Semiannual Investment Adviser's Report (continued)
June 30, 2007 (unaudited)
SECTOR BREAKDOWN*
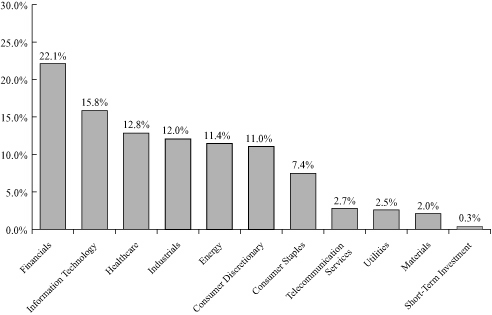
* Expressed as a percentage of total investments (excluding security lending collateral) and may vary over time.
6
Credit Suisse Large Cap Blend Fund
Schedule of Investments
June 30, 2007 (unaudited)
| Number of Shares | Value | ||||||||||
| COMMON STOCKS (99.7%) | |||||||||||
| Aerospace & Defense (3.5%) | |||||||||||
| Boeing Co. | 6,700 | $ | 644,272 | ||||||||
| L-3 Communications Holdings, Inc.§ | 4,100 | 399,299 | |||||||||
| Lockheed Martin Corp. | 2,700 | 254,151 | |||||||||
| Northrop Grumman Corp. | 3,700 | 288,119 | |||||||||
| Raytheon Co. | 8,300 | 447,287 | |||||||||
| 2,033,128 | |||||||||||
| Air Freight & Couriers (1.5%) | |||||||||||
| FedEx Corp. | 4,200 | 466,074 | |||||||||
| Ryder System, Inc.§ | 7,000 | 376,600 | |||||||||
| 842,674 | |||||||||||
| Auto Components (0.6%) | |||||||||||
| Autoliv, Inc.§ | 3,100 | 176,297 | |||||||||
| BorgWarner, Inc.§ | 2,300 | 197,892 | |||||||||
| 374,189 | |||||||||||
| Automobiles (0.3%) | |||||||||||
| Hertz Global Holdings, Inc.* | 5,500 | 146,135 | |||||||||
| Banks (4.7%) | |||||||||||
| Bank of America Corp. | 22,101 | 1,080,518 | |||||||||
| Bank of New York Mellon Corp., Inc.* | 2,700 | 111,888 | |||||||||
| Mellon Financial Corp. | 1,400 | 61,600 | |||||||||
| Northern Trust Corp. | 2,600 | 167,024 | |||||||||
| Wachovia Corp. | 2,200 | 112,750 | |||||||||
| Washington Mutual, Inc. | 6,300 | 268,632 | |||||||||
| Wells Fargo & Co. | 25,600 | 900,352 | |||||||||
| �� | 2,702,764 | ||||||||||
| Beverages (2.3%) | |||||||||||
| Coca-Cola Co. | 1,200 | 62,772 | |||||||||
| Molson Coors Brewing Co. Class B | 4,500 | 416,070 | |||||||||
| Pepsi Bottling Group, Inc. | 11,300 | 380,584 | |||||||||
| PepsiCo, Inc. | 7,300 | 473,405 | |||||||||
| 1,332,831 | |||||||||||
| Biotechnology (0.8%) | |||||||||||
| Amgen, Inc.* | 8,800 | 486,552 | |||||||||
| Chemicals (1.3%) | |||||||||||
| Ashland, Inc. | 5,300 | 338,935 | |||||||||
| Dow Chemical Co. | 8,100 | 358,182 | |||||||||
| Rohm and Haas Co. | 1,100 | 60,148 | |||||||||
| 757,265 | |||||||||||
| Commercial Services & Supplies (0.3%) | |||||||||||
| Steelcase, Inc. Class A§ | 10,200 | 188,700 | |||||||||
See Accompanying Notes to Financial Statements.
7
Credit Suisse Large Cap Blend Fund
Schedule of Investments (continued)
June 30, 2007 (unaudited)
| Number of Shares | Value | ||||||||||
| COMMON STOCKS | |||||||||||
| Communications Equipment (2.3%) | |||||||||||
| Cisco Systems, Inc.* | 32,400 | $ | 902,340 | ||||||||
| Harris Corp.§ | 7,400 | 403,670 | |||||||||
| 1,306,010 | |||||||||||
| Computers & Peripherals (4.4%) | |||||||||||
| Apple Computer, Inc.* | 600 | 73,224 | |||||||||
| Dell, Inc.* | 10,500 | 299,775 | |||||||||
| Hewlett-Packard Co. | 19,700 | 879,014 | |||||||||
| International Business Machines Corp.§ | 9,900 | 1,041,975 | |||||||||
| Network Appliance, Inc.* | 1,900 | 55,480 | |||||||||
| NVIDIA Corp.* | 1,600 | 66,096 | |||||||||
| Western Digital Corp.* | 7,100 | 137,385 | |||||||||
| 2,552,949 | |||||||||||
| Diversified Financials (10.3%) | |||||||||||
| Citigroup, Inc. | 25,400 | 1,302,766 | |||||||||
| Countrywide Financial Corp. | 9,200 | 334,420 | |||||||||
| Franklin Resources, Inc. | 900 | 119,223 | |||||||||
| Freddie Mac | 7,600 | 461,320 | |||||||||
| Goldman Sachs Group, Inc. | 3,400 | 736,950 | |||||||||
| JPMorgan Chase & Co. | 23,400 | 1,133,730 | |||||||||
| Lehman Brothers Holdings, Inc. | 3,600 | 268,272 | |||||||||
| Merrill Lynch & Company, Inc. | 8,000 | 668,640 | |||||||||
| Morgan Stanley | 8,500 | 712,980 | |||||||||
| Western Union Co. | 9,900 | 206,217 | |||||||||
| 5,944,518 | |||||||||||
| Diversified Telecommunication Services (2.7%) | |||||||||||
| AT&T, Inc. | 21,422 | 889,013 | |||||||||
| CenturyTel, Inc.§ | 1,900 | 93,195 | |||||||||
| Qwest Communications International, Inc.*§ | 21,900 | 212,430 | |||||||||
| Verizon Communications, Inc. | 8,500 | 349,945 | |||||||||
| 1,544,583 | |||||||||||
| Electric Utilities (2.5%) | |||||||||||
| Constellation Energy Group | 2,000 | 174,340 | |||||||||
| Edison International | 6,700 | 376,004 | |||||||||
| FirstEnergy Corp. | 6,100 | 394,853 | |||||||||
| PG&E Corp.§ | 10,600 | 480,180 | |||||||||
| 1,425,377 | |||||||||||
| Energy Equipment & Services (2.1%) | |||||||||||
| ENSCO International, Inc.§ | 6,900 | 420,969 | |||||||||
| Halliburton Co. | 6,200 | 213,900 | |||||||||
| National-Oilwell Varco, Inc.* | 800 | 83,392 | |||||||||
| Noble Corp.§ | 5,200 | 507,104 | |||||||||
| 1,225,365 | |||||||||||
See Accompanying Notes to Financial Statements.
8
Credit Suisse Large Cap Blend Fund
Schedule of Investments (continued)
June 30, 2007 (unaudited)
| Number of Shares | Value | ||||||||||
| COMMON STOCKS | |||||||||||
| Food & Drug Retailing (1.4%) | |||||||||||
| Kroger Co. | 12,300 | $ | 345,999 | ||||||||
| Safeway, Inc. | 13,100 | 445,793 | |||||||||
| 791,792 | |||||||||||
| Food Products (0.9%) | |||||||||||
| General Mills, Inc. | 4,600 | 268,732 | |||||||||
| Kellogg Co. | 4,600 | 238,234 | |||||||||
| 506,966 | |||||||||||
| Healthcare Equipment & Supplies (1.2%) | |||||||||||
| Baxter International, Inc. | 4,500 | 253,530 | |||||||||
| Becton, Dickinson & Co. | 5,100 | 379,950 | |||||||||
| Medtronic, Inc. | 1,400 | 72,604 | |||||||||
| 706,084 | |||||||||||
| Healthcare Providers & Services (3.7%) | |||||||||||
| Aetna, Inc. | 7,200 | 355,680 | |||||||||
| Coventry Health Care, Inc.* | 4,100 | 236,365 | |||||||||
| Humana, Inc.* | 6,400 | 389,824 | |||||||||
| McKesson Corp. | 6,500 | 387,660 | |||||||||
| UnitedHealth Group, Inc. | 8,100 | 414,234 | |||||||||
| WellCare Health Plans, Inc.* | 1,100 | 99,561 | |||||||||
| WellPoint, Inc.* | 2,800 | 223,524 | |||||||||
| 2,106,848 | |||||||||||
| Household Durables (1.2%) | |||||||||||
| American Greetings Corp. Class A§ | 9,300 | 263,469 | |||||||||
| Whirlpool Corp.§ | 4,000 | 444,800 | |||||||||
| 708,269 | |||||||||||
| Household Products (1.6%) | |||||||||||
| Clorox Co. | 1,800 | 111,780 | |||||||||
| Procter & Gamble Co. | 12,800 | 783,232 | |||||||||
| 895,012 | |||||||||||
| Industrial Conglomerates (3.6%) | |||||||||||
| General Electric Co. | 34,100 | 1,305,348 | |||||||||
| Honeywell International, Inc. | 2,700 | 151,956 | |||||||||
| Tyco International, Ltd. | 18,700 | 631,873 | |||||||||
| 2,089,177 | |||||||||||
| Insurance (6.3%) | |||||||||||
| ACE, Ltd. | 5,900 | 368,868 | |||||||||
| Aflac, Inc. | 3,900 | 200,460 | |||||||||
| Allstate Corp. | 2,800 | 172,228 | |||||||||
| American International Group, Inc. | 6,900 | 483,207 | |||||||||
| Genworth Financial, Inc. Class A | 7,600 | 261,440 | |||||||||
| Hartford Financial Services Group, Inc. | 5,600 | 551,656 | |||||||||
| MetLife, Inc. | 1,700 | 109,616 | |||||||||
See Accompanying Notes to Financial Statements.
9
Credit Suisse Large Cap Blend Fund
Schedule of Investments (continued)
June 30, 2007 (unaudited)
| Number of Shares | Value | ||||||||||
| COMMON STOCKS | |||||||||||
| Insurance | |||||||||||
| PartnerRe, Ltd.§ | 3,400 | $ | 263,500 | ||||||||
| Prudential Financial, Inc. | 5,200 | 505,596 | |||||||||
| Torchmark Corp. | 3,600 | 241,200 | |||||||||
| XL Capital, Ltd. Class A§ | 5,800 | 488,882 | |||||||||
| 3,646,653 | |||||||||||
| Internet Software & Services (0.5%) | |||||||||||
| Google, Inc. Class A* | 600 | 314,028 | |||||||||
| IT Consulting & Services (2.0%) | |||||||||||
| Accenture, Ltd. Class A | 9,500 | 407,455 | |||||||||
| Computer Sciences Corp.* | 4,800 | 283,920 | |||||||||
| Electronic Data Systems Corp. | 16,800 | 465,864 | |||||||||
| 1,157,239 | |||||||||||
| Leisure Equipment & Products (1.0%) | |||||||||||
| Hasbro, Inc.§ | 11,000 | 345,510 | |||||||||
| Mattel, Inc.§ | 9,200 | 232,668 | |||||||||
| 578,178 | |||||||||||
| Machinery (2.2%) | |||||||||||
| Cummins, Inc. | 4,400 | 445,324 | |||||||||
| Eaton Corp. | 4,500 | 418,500 | |||||||||
| Parker Hannifin Corp. | 4,400 | 430,804 | |||||||||
| 1,294,628 | |||||||||||
| Media (3.1%) | |||||||||||
| Citadel Broadcasting Corp. | 1,398 | 9,015 | |||||||||
| DIRECTV Group, Inc.* | 19,000 | 439,090 | |||||||||
| EchoStar Communications Corp. Class A* | 3,700 | 160,469 | |||||||||
| Netflix, Inc.*§ | 6,100 | 118,279 | |||||||||
| News Corp. Class A | 10,400 | 220,584 | |||||||||
| Time Warner, Inc. | 11,100 | 233,544 | |||||||||
| Walt Disney Co. | 18,200 | 621,348 | |||||||||
| 1,802,329 | |||||||||||
| Metals & Mining (0.6%) | |||||||||||
| Freeport-McMoRan Copper & Gold, Inc.§ | 2,976 | 246,472 | |||||||||
| Nucor Corp. | 1,800 | 105,570 | |||||||||
| 352,042 | |||||||||||
| Multiline Retail (1.6%) | |||||||||||
| Big Lots, Inc.*§ | 2,600 | 76,492 | |||||||||
| J.C. Penney Company, Inc. | 1,800 | 130,284 | |||||||||
| Kohl's Corp.* | 6,400 | 454,592 | |||||||||
| Wal-Mart Stores, Inc. | 5,900 | 283,849 | |||||||||
| 945,217 | |||||||||||
See Accompanying Notes to Financial Statements.
10
Credit Suisse Large Cap Blend Fund
Schedule of Investments (continued)
June 30, 2007 (unaudited)
| Number of Shares | Value | ||||||||||
| COMMON STOCKS | |||||||||||
| Oil & Gas (9.3%) | |||||||||||
| Chevron Corp. | 13,800 | $ | 1,162,512 | ||||||||
| ConocoPhillips | 11,300 | 887,050 | |||||||||
| Devon Energy Corp. | 1,600 | 125,264 | |||||||||
| Exxon Mobil Corp. | 28,900 | 2,424,132 | |||||||||
| Marathon Oil Corp. | 5,800 | 347,768 | |||||||||
| Valero Energy Corp. | 5,900 | 435,774 | |||||||||
| 5,382,500 | |||||||||||
| Paper & Forest Products (0.1%) | |||||||||||
| International Paper Co.§ | 1,500 | 58,575 | |||||||||
| Pharmaceuticals (7.1%) | |||||||||||
| Abbott Laboratories | 1,000 | 53,550 | |||||||||
| Forest Laboratories, Inc.* | 9,800 | 447,370 | |||||||||
| Johnson & Johnson | 17,700 | 1,090,674 | |||||||||
| King Pharmaceuticals, Inc.*§ | 6,300 | 128,898 | |||||||||
| Merck & Company, Inc. | 5,600 | 278,880 | |||||||||
| Mylan Laboratories, Inc.§ | 23,000 | 418,370 | |||||||||
| Pfizer, Inc. | 44,600 | 1,140,422 | |||||||||
| Schering-Plough Corp. | 15,200 | 462,688 | |||||||||
| Watson Pharmaceuticals, Inc.* | 1,800 | 58,554 | |||||||||
| 4,079,406 | |||||||||||
| Road & Rail (0.9%) | |||||||||||
| Union Pacific Corp. | 4,400 | 506,660 | |||||||||
| Semiconductor Equipment & Products (4.0%) | |||||||||||
| Applied Materials, Inc.§ | 21,700 | 431,179 | |||||||||
| Intel Corp. | 37,800 | 898,128 | |||||||||
| Novellus Systems, Inc.*§ | 9,800 | 278,026 | |||||||||
| Teradyne, Inc.* | 9,200 | 161,736 | |||||||||
| Texas Instruments, Inc. | 14,200 | 534,346 | |||||||||
| 2,303,415 | |||||||||||
| Software (2.6%) | |||||||||||
| Intuit, Inc.* | 6,100 | 183,488 | |||||||||
| Microsoft Corp. | 39,400 | 1,161,118 | |||||||||
| Oracle Corp.* | 4,700 | 92,637 | |||||||||
| Synopsys, Inc.* | 2,200 | 58,146 | |||||||||
| 1,495,389 | |||||||||||
| Specialty Retail (2.2%) | |||||||||||
| American Eagle Outfitters, Inc. | 2,200 | 56,452 | |||||||||
| Best Buy Company, Inc. | 9,200 | 429,364 | |||||||||
| RadioShack Corp.§ | 5,800 | 192,212 | |||||||||
| Sherwin-Williams Co.§ | 5,100 | 338,997 | |||||||||
| TJX Companies, Inc. | 9,400 | 258,500 | |||||||||
| 1,275,525 | |||||||||||
See Accompanying Notes to Financial Statements.
11
Credit Suisse Large Cap Blend Fund
Schedule of Investments (continued)
June 30, 2007 (unaudited)
| Number of Shares | Value | ||||||||||
| COMMON STOCKS | |||||||||||
| Textiles & Apparel (0.9%) | |||||||||||
| Nike, Inc. Class B | 8,500 | $ | 495,465 | ||||||||
| Tobacco (2.1%) | |||||||||||
| Altria Group, Inc. | 3,600 | 252,504 | |||||||||
| Loews Corp. | 9,400 | 479,212 | |||||||||
| Loews Corp. Carolina Group | 4,600 | 355,442 | |||||||||
| UST, Inc.§ | 2,300 | 123,533 | |||||||||
| 1,210,691 | |||||||||||
| TOTAL COMMON STOCKS (Cost $50,411,036) | 57,565,128 | ||||||||||
| SHORT-TERM INVESTMENTS (13.3%) | |||||||||||
| State Street Navigator Prime Portfolio§§ | 7,492,346 | $ | 7,492,346 | ||||||||
| Par (000) | |||||||||||
| State Street Bank and Trust Co. Euro Time Deposit, 4.100%, 7/02/07 | $ | 195 | 195,000 | ||||||||
| TOTAL SHORT-TERM INVESTMENTS (Cost $7,687,346) | 7,687,346 | ||||||||||
| TOTAL INVESTMENTS AT VALUE (113.0%) (Cost $58,098,382) | 65,252,474 | ||||||||||
| LIABILITIES IN EXCESS OF OTHER ASSETS (-13.0%) | (7,516,276 | ) | |||||||||
| NET ASSETS (100.0%) | $ | 57,736,198 | |||||||||
* Non-income producing security.
§ Security or portion thereof is out on loan.
§§ Represents security purchased with cash collateral received for securities on loan.
See Accompanying Notes to Financial Statements.
12
Credit Suisse Large Cap Blend Fund
Statement of Assets and Liabilities
June 30, 2007 (unaudited)
| Assets | |||||||
| Investments at value, including collateral for securities on loan of $7,492,346 (Cost $58,098,382) (Note 2) | $ | 65,252,4741 | |||||
| Cash | 929 | ||||||
| Dividend and interest receivable | 45,105 | ||||||
| Prepaid expenses and other assets | 43,158 | ||||||
| Total Assets | 65,341,666 | ||||||
| Liabilities | |||||||
| Advisory fee payable (Note 3) | 23,679 | ||||||
| Administrative services fee payable (Note 3) | 5,779 | ||||||
| Distribution fee payable (Note 3) | 15,224 | ||||||
| Payable upon return of securities loaned (Note 2) | 7,492,346 | ||||||
| Payable for fund shares redeemed | 59,033 | ||||||
| Directors' fee payable | 490 | ||||||
| Other accrued expenses payable | 8,917 | ||||||
| Total Liabilities | 7,605,468 | ||||||
| Net Assets | |||||||
| Capital stock, $0.001 par value (Note 6) | 4,245 | ||||||
| Paid-in capital (Note 6) | 46,155,233 | ||||||
| Undistributed net investment income | 140,298 | ||||||
| Accumulated net realized gain on investments | 4,282,330 | ||||||
| Net unrealized appreciation from investments | 7,154,092 | ||||||
| Net Assets | $ | 57,736,198 | |||||
| Common Shares | |||||||
| Net assets | $ | 1,875,614 | |||||
| Shares outstanding | 138,119 | ||||||
| Net asset value, offering price, and redemption price per share | $ | 13.58 | |||||
| A Shares | |||||||
| Net assets | $ | 50,921,576 | |||||
| Shares outstanding | 3,730,807 | ||||||
| Net asset value and redemption price per share | $ | 13.65 | |||||
| Maximum offering price per share (net asset value/(1-5.75%)) | $ | 14.48 | |||||
| B Shares | |||||||
| Net assets | $ | 4,169,868 | |||||
| Shares outstanding | 317,362 | ||||||
| Net asset value and offering price per share | $ | 13.14 | |||||
| C Shares | |||||||
| Net assets | $ | 769,140 | |||||
| Shares outstanding | 58,707 | ||||||
| Net asset value and offering price per share | $ | 13.10 | |||||
1 Including $7,319,249 of securities on loan.
See Accompanying Notes to Financial Statements.
13
Credit Suisse Large Cap Blend Fund
Statement of Operations
For the Six Months Ended June 30, 2007 (unaudited)
| Investment Income (Note 2) | |||||||
| Dividends | $ | 504,535 | |||||
| Interest | 7,375 | ||||||
| Securities lending | 3,100 | ||||||
| Total investment income | 515,010 | ||||||
| Expenses | |||||||
| Investment advisory fees (Note 3) | 145,809 | ||||||
| Administrative services fees (Note 3) | 40,025 | ||||||
| Distribution fees (Note 3) | |||||||
| Common Class | 2,486 | ||||||
| Class A | 63,883 | ||||||
| Class B | 22,161 | ||||||
| Class C | 3,981 | ||||||
| Transfer agent fees (Note 3) | 38,905 | ||||||
| Registration fees | 17,717 | ||||||
| Printing fees (Note 3) | 14,639 | ||||||
| Audit and tax fees | 10,388 | ||||||
| Directors' fees | 10,339 | ||||||
| Legal fees | 7,983 | ||||||
| Custodian fees | 6,338 | ||||||
| Insurance expense | 1,936 | ||||||
| Commitment fees (Note 4) | 802 | ||||||
| Miscellaneous expense | 322 | ||||||
| Total expenses | 387,714 | ||||||
| Less: fees waived (Note 3) | (603 | ) | |||||
| Net expenses | 387,111 | ||||||
| Net investment income | 127,899 | ||||||
| Net Realized and Unrealized Gain from Investments | |||||||
| Net realized gain from investments | 1,965,524 | ||||||
| Net change in unrealized appreciation (depreciation) from investments | 1,757,465 | ||||||
| Net realized and unrealized gain from investments | 3,722,989 | ||||||
| Net increase in net assets resulting from operations | $ | 3,850,888 | |||||
See Accompanying Notes to Financial Statements.
14
Credit Suisse Large Cap Blend Fund
Statements of Changes in Net Assets
| For the Six Months Ended June 30, 2007 (unaudited) | For the Year Ended December 31, 2006 | ||||||||||
| From Operations | |||||||||||
| Net investment income | $ | 127,899 | $ | 196,730 | |||||||
| Net realized gain from investments | 1,965,524 | 7,902,930 | |||||||||
| Net change in unrealized appreciation (depreciation) from investments | 1,757,465 | (2,069,864 | ) | ||||||||
| Net increase in net assets resulting from operations | 3,850,888 | 6,029,796 | |||||||||
| From Dividends and Distributions | |||||||||||
| Dividends from net investment income | |||||||||||
| Common Class shares | — | (12,718 | ) | ||||||||
| Class A shares | — | (171,613 | ) | ||||||||
| Distributions from net realized gains | |||||||||||
| Common Class shares | — | (118,301 | ) | ||||||||
| Class A shares | — | (2,784,526 | ) | ||||||||
| Class B shares | — | (286,047 | ) | ||||||||
| Class C shares | — | (47,762 | ) | ||||||||
| Net decrease in net assets resulting from dividends and distributions | — | (3,420,967 | ) | ||||||||
| From Capital Share Transactions (Note 6) | |||||||||||
| Proceeds from sale of shares | 601,318 | 1,730,284 | |||||||||
| Reinvestment of dividends and distributions | — | 2,949,178 | |||||||||
| Net asset value of shares redeemed | (6,272,116 | ) | (17,192,669 | ) | |||||||
| Net decrease in net assets from capital share transactions | (5,670,798 | ) | (12,513,207 | ) | |||||||
| Net decrease in net assets | (1,819,910 | ) | (9,904,378 | ) | |||||||
| Net Assets | |||||||||||
| Beginning of period | 59,556,108 | 69,460,486 | |||||||||
| End of period | $ | 57,736,198 | $ | 59,556,108 | |||||||
| Undistributed net investment income | $ | 140,298 | $ | 12,399 | |||||||
See Accompanying Notes to Financial Statements.
15
Credit Suisse Large Cap Blend Fund
Financial Highlights
(For a Common Class Share of the Fund Outstanding Throughout Each Period)
For the Six Months Ended | For the Year Ended | For the Period September 1, 2004 to | For the Year Ended | ||||||||||||||||||||||||||||
| June 30, 2007 | December 31, | December 31, | August 31, | ||||||||||||||||||||||||||||
| (unaudited) | 2006 | 2005 | 20041 | 2004 | 2003 | 2002 | |||||||||||||||||||||||||
| Per share data | |||||||||||||||||||||||||||||||
| Net asset value, beginning of period | $ | 12.71 | $ | 12.23 | $ | 12.45 | $ | 12.01 | $ | 11.42 | $ | 10.66 | $ | 13.39 | |||||||||||||||||
| INVESTMENT OPERATIONS | |||||||||||||||||||||||||||||||
| Net investment income | 0.032 | 0.052 | 0.042 | 0.052 | 0.032 | 0.01 | 0.012 | ||||||||||||||||||||||||
| Net gain (loss) on investments (both realized and unrealized) | 0.84 | 1.22 | 0.30 | 1.21 | 0.57 | 0.76 | (2.71 | ) | |||||||||||||||||||||||
| Total from investment operations | 0.87 | 1.27 | 0.34 | 1.26 | 0.60 | 0.77 | (2.70 | ) | |||||||||||||||||||||||
| LESS DIVIDENDS AND DISTRIBUTIONS | |||||||||||||||||||||||||||||||
| Dividends from net investment income | — | (0.07 | ) | (0.07 | ) | (0.01 | ) | (0.01 | ) | (0.01 | ) | (0.01 | ) | ||||||||||||||||||
| Distributions from net realized gains | — | (0.72 | ) | (0.49 | ) | (0.81 | ) | — | — | (0.02 | ) | ||||||||||||||||||||
| Total dividends and distributions | — | (0.79 | ) | (0.56 | ) | (0.82 | ) | (0.01 | ) | (0.01 | ) | (0.03 | ) | ||||||||||||||||||
| Net asset value, end of period | $ | 13.58 | $ | 12.71 | $ | 12.23 | $ | 12.45 | $ | 12.01 | $ | 11.42 | $ | 10.66 | |||||||||||||||||
| Total return3 | 6.85 | % | 10.44 | % | 2.70 | % | 10.70 | % | 5.25 | % | 7.26 | % | (20.21 | )% | |||||||||||||||||
| RATIOS AND SUPPLEMENTAL DATA | |||||||||||||||||||||||||||||||
| Net assets, end of period (000s omitted) | $ | 1,876 | $ | 2,202 | $ | 2,809 | $ | 3,471 | $ | 4,383 | $ | 5,653 | $ | 4,545 | |||||||||||||||||
| Ratio of expenses to average net assets | 1.26 | %4 | 1.30 | % | 1.30 | % | 1.30 | %4 | 1.30 | % | 1.25 | % | 1.19 | % | |||||||||||||||||
| Ratio of net investment income to average net assets | 0.50 | %4 | 0.40 | % | 0.32 | % | 1.37 | %4 | 0.23 | % | 0.17 | % | 0.12 | % | |||||||||||||||||
| Decrease reflected in above operating expense ratios due to waivers/reimbursements | 0.00 | %4,5 | 0.26 | % | 0.26 | % | 0.32 | %4 | 0.40 | % | 2.87 | % | 2.24 | % | |||||||||||||||||
| Portfolio turnover rate | 58 | % | 106 | % | 101 | % | 34 | % | 168 | % | 155 | % | 122 | % | |||||||||||||||||
1 The Fund changed its fiscal year end from August 31 to December 31.
2 Per share information is calculated using the average shares outstanding method.
3 Total returns are historical and assume changes in share price and reinvestment of all dividends and distributions. Had certain expenses not been reduced during the periods shown, total returns would have been lower. Total returns for periods less than one year are not annualized.
4 Annualized.
5 This amount represents less than 0.01%.
See Accompanying Notes to Financial Statements.
16
Credit Suisse Large Cap Blend Fund
Financial Highlights
(For a Class A Share of the Fund Outstanding Throughout Each Period)
For the Six Months Ended | For the Year Ended | For the Period September 1, 2004 to | For the Year Ended | ||||||||||||||||||||||||||||
| June 30, 2007 | December 31, | December 31, | August 31, | ||||||||||||||||||||||||||||
| (unaudited) | 2006 | 2005 | 20041 | 2004 | 2003 | 2002 | |||||||||||||||||||||||||
| Per share data | |||||||||||||||||||||||||||||||
| Net asset value, beginning of period | $ | 12.78 | $ | 12.26 | $ | 12.48 | $ | 12.04 | $ | 11.44 | $ | 10.67 | $ | 13.39 | |||||||||||||||||
| INVESTMENT OPERATIONS | |||||||||||||||||||||||||||||||
| Net investment income | 0.032 | 0.052 | 0.042 | 0.062 | 0.042 | 0.01 | 0.012 | ||||||||||||||||||||||||
| Net gain (loss) on investments (both realized and unrealized) | 0.84 | 1.23 | 0.30 | 1.20 | 0.57 | 0.77 | (2.70 | ) | |||||||||||||||||||||||
| Total from investment operations | 0.87 | 1.28 | 0.34 | 1.26 | 0.61 | 0.78 | (2.69 | ) | |||||||||||||||||||||||
| LESS DIVIDENDS AND DISTRIBUTIONS | |||||||||||||||||||||||||||||||
| Dividends from net investment income | — | (0.04 | ) | (0.07 | ) | (0.01 | ) | (0.01 | ) | (0.01 | ) | (0.01 | ) | ||||||||||||||||||
| Distributions from net realized gains | — | (0.72 | ) | (0.49 | ) | (0.81 | ) | — | — | (0.02 | ) | ||||||||||||||||||||
| Total dividends and distributions | — | (0.76 | ) | (0.56 | ) | (0.82 | ) | (0.01 | ) | (0.01 | ) | (0.03 | ) | ||||||||||||||||||
| Net asset value, end of period | $ | 13.65 | $ | 12.78 | $ | 12.26 | $ | 12.48 | $ | 12.04 | $ | 11.44 | $ | 10.67 | |||||||||||||||||
| Total return3 | 6.81 | % | 10.48 | % | 2.69 | % | 10.67 | % | 5.33 | % | 7.28 | % | (20.13 | )% | |||||||||||||||||
| RATIOS AND SUPPLEMENTAL DATA | |||||||||||||||||||||||||||||||
| Net assets, end of period (000s omitted) | $ | 50,922 | $ | 51,493 | $ | 57,200 | $ | 63,160 | $ | 61,089 | $ | 1,778 | $ | 566 | |||||||||||||||||
| Ratio of expenses to average net assets | 1.26 | %4 | 1.30 | % | 1.30 | % | 1.30 | %4 | 1.30 | % | 1.25 | % | 1.19 | % | |||||||||||||||||
| Ratio of net investment income to average net assets | 0.51 | %4 | 0.40 | % | 0.32 | % | 1.37 | %4 | 0.32 | % | 0.22 | % | 0.09 | % | |||||||||||||||||
| Decrease reflected in above operating expense ratios due to waivers/ reimbursements | 0.00 | %4,5 | 0.26 | % | 0.26 | % | 0.32 | %4 | 0.39 | % | 2.90 | % | 2.30 | % | |||||||||||||||||
| Portfolio turnover rate | 58 | % | 106 | % | 101 | % | 34 | % | 168 | % | 155 | % | 122 | % | |||||||||||||||||
1 The Fund changed its fiscal year end from August 31 to December 31.
2 Per share information is calculated using the average shares outstanding method.
3 Total returns are historical and assume changes in share price, reinvestment of all dividends and distributions and no sales charge. Had certain expenses not been reduced during the periods shown, total returns would have been lower. Total returns for periods less than one year are not annualized.
4 Annualized.
5 This amount represents less than 0.01%.
See Accompanying Notes to Financial Statements.
17
Credit Suisse Large Cap Blend Fund
Financial Highlights
(For a Class B Share of the Fund Outstanding Throughout Each Period)
For the Six Months Ended | For the Year Ended | For the Period September 1, 2004 to | For the Year Ended | ||||||||||||||||||||||||||||
| June 30, 2007 | December 31, | December 31, | August 31, | ||||||||||||||||||||||||||||
| (unaudited) | 2006 | 2005 | 20041 | 2004 | 2003 | 2002 | |||||||||||||||||||||||||
| Per share data | |||||||||||||||||||||||||||||||
| Net asset value, beginning of period | $ | 12.35 | $ | 11.92 | $ | 12.18 | $ | 11.78 | $ | 11.27 | $ | 10.59 | $ | 13.38 | |||||||||||||||||
| INVESTMENT OPERATIONS | |||||||||||||||||||||||||||||||
| Net investment income (loss)2 | (0.02 | ) | (0.04 | ) | (0.05 | ) | 0.02 | (0.05 | ) | (0.06 | ) | (0.06 | ) | ||||||||||||||||||
| Net gain (loss) on investments (both realized and unrealized) | 0.81 | 1.19 | 0.29 | 1.19 | 0.56 | 0.74 | (2.71 | ) | |||||||||||||||||||||||
| Total from investment operations | 0.79 | 1.15 | 0.24 | 1.21 | 0.51 | 0.68 | (2.77 | ) | |||||||||||||||||||||||
| LESS DIVIDENDS AND DISTRIBUTIONS | |||||||||||||||||||||||||||||||
| Dividends from net investment income | — | — | (0.01 | ) | — | — | — | — | |||||||||||||||||||||||
| Distributions from net realized gains | — | (0.72 | ) | (0.49 | ) | (0.81 | ) | — | — | (0.02 | ) | ||||||||||||||||||||
| Total dividends and distributions | — | (0.72 | ) | (0.50 | ) | (0.81 | ) | — | — | (0.02 | ) | ||||||||||||||||||||
| Net asset value, end of period | $ | 13.14 | $ | 12.35 | $ | 11.92 | $ | 12.18 | $ | 11.78 | $ | 11.27 | $ | 10.59 | |||||||||||||||||
| Total return3 | 6.40 | % | 9.67 | % | 1.91 | % | 10.44 | % | 4.53 | % | 6.42 | % | (20.75 | )% | |||||||||||||||||
| RATIOS AND SUPPLEMENTAL DATA | |||||||||||||||||||||||||||||||
| Net assets, end of period (000s omitted) | $ | 4,170 | $ | 5,010 | $ | 8,342 | $ | 13,714 | $ | 14,745 | $ | 1,109 | $ | 518 | |||||||||||||||||
| Ratio of expenses to average net assets | 2.01 | %4 | 2.05 | % | 2.05 | % | 2.05 | %4 | 2.05 | % | 2.00 | % | 1.94 | % | |||||||||||||||||
| Ratio of net investment income (loss) to average net assets | (0.24 | )%4 | (0.35 | )% | (0.44 | )% | 0.62 | %4 | (0.45 | )% | (0.55 | )% | (0.67 | )% | |||||||||||||||||
| Decrease reflected in above operating expense ratios due to waivers/ reimbursements | 0.00 | %4,5 | 0.26 | % | 0.26 | % | 0.32 | %4 | 0.39 | % | 2.90 | % | 2.25 | % | |||||||||||||||||
| Portfolio Turnover Rate | 58 | % | 106 | % | 101 | % | 34 | % | 168 | % | 155 | % | 122 | % | |||||||||||||||||
1 The Fund changed its fiscal year end from August 31 to December 31.
2 Per share information is calculated using the average shares outstanding method.
3 Total returns are historical and assume changes in share price, reinvestment of all dividends and distributions and no sales charge. Had certain expenses not been reduced during the periods shown, total returns would have been lower. Total returns for periods less than one year are not annualized.
4 Annualized
5 This amount represents less than 0.01%.
See Accompanying Notes to Financial Statements.
18
Credit Suisse Large Cap Blend Fund
Financial Highlights
(For a Class C Share of the Fund Outstanding Throughout Each Period)
For the Six Months Ended | For the Year Ended | For the Period September 1, 2004 to | For the Year Ended | ||||||||||||||||||||||||||||
| June 30, 2007 | December 31, | December 31, | August 31, | ||||||||||||||||||||||||||||
| (unaudited) | 2006 | 2005 | 20041 | 2004 | 2003 | 2002 | |||||||||||||||||||||||||
| Per share data | |||||||||||||||||||||||||||||||
| Net asset value, beginning of period | $ | 12.31 | $ | 11.89 | $ | 12.15 | $ | 11.75 | $ | 11.24 | $ | 10.56 | $ | 13.39 | |||||||||||||||||
| INVESTMENT OPERATIONS | |||||||||||||||||||||||||||||||
| Net investment income (loss)2 | (0.02 | ) | (0.04 | ) | (0.05 | ) | 0.03 | (0.06 | ) | (0.06 | ) | (0.06 | ) | ||||||||||||||||||
| Net gain (loss) on investments (both realized and unrealized) | 0.81 | 1.18 | 0.29 | 1.18 | 0.57 | 0.74 | (2.75 | ) | |||||||||||||||||||||||
| Total from investment operations | 0.79 | 1.14 | 0.24 | 1.21 | 0.51 | 0.68 | (2.81 | ) | |||||||||||||||||||||||
| LESS DIVIDENDS AND DISTRIBUTIONS | |||||||||||||||||||||||||||||||
| Dividends from net investment income | — | — | (0.01 | ) | — | — | — | — | |||||||||||||||||||||||
| Distributions from net realized gains | — | (0.72 | ) | (0.49 | ) | (0.81 | ) | — | — | (0.02 | ) | ||||||||||||||||||||
| Total dividends and distributions | — | (0.72 | ) | (0.50 | ) | (0.81 | ) | — | — | (0.02 | ) | ||||||||||||||||||||
| Net asset value, end of period | $ | 13.10 | $ | 12.31 | $ | 11.89 | $ | 12.15 | $ | 11.75 | $ | 11.24 | $ | 10.56 | |||||||||||||||||
| Total return3 | 6.42 | % | 9.61 | % | 1.91 | % | 10.47 | % | 4.54 | % | 6.44 | % | (21.03 | )% | |||||||||||||||||
| RATIOS AND SUPPLEMENTAL DATA | |||||||||||||||||||||||||||||||
| Net assets, end of period (000s omitted) | $ | 769 | $ | 851 | $ | 1,109 | $ | 1,864 | $ | 2,156 | $ | 441 | $ | 271 | |||||||||||||||||
| Ratio of expenses to average net assets | 2.01 | %4 | 2.05 | % | 2.05 | % | 2.05 | %4 | 2.05 | % | 2.00 | % | 1.94 | % | |||||||||||||||||
| Ratio of net investment income (loss) to average net assets | (0.24 | )%4 | (0.35 | )% | (0.44 | )% | 0.62 | %4 | (0.47 | )% | (0.55 | )% | (0.65 | )% | |||||||||||||||||
| Decrease reflected in above operating expense ratios due to waivers/ reimbursements | 0.00 | %4,5 | 0.26 | % | 0.26 | % | 0.32 | %4 | 0.39 | % | 2.90 | % | 2.25 | % | |||||||||||||||||
| Portfolio turnover rate | 58 | % | 106 | % | 101 | % | 34 | % | 168 | % | 155 | % | 122 | % | |||||||||||||||||
1 The Fund changed its fiscal year end from August 31 to December 31.
2 Per share information is calculated using the average shares outstanding method
3 Total returns are historical and assume changes in share price, reinvestment of all dividends and distributions and no sales charge. Had certain expenses not been reduced during the periods shown, total returns would have been lower. Total returns for periods less than one year are not annualized.
4 Annualized.
5 This amount represents less than 0.01%.
See Accompanying Notes to Financial Statements.
19
Credit Suisse Large Cap Blend Fund
Notes to Financial Statements
June 30, 2007 (unaudited)
Note 1. Organization
Credit Suisse Large Cap Blend Fund, Inc. (the "Fund") is registered under the Investment Company Act of 1940, as amended (the "1940 Act"), as a diversified, open-end management investment company. The Fund's investment objective is long-term capital appreciation. The Fund was incorporated under the laws of the State of Maryland on July 31, 1998. The name of the Fund was changed from Credit Suisse Select Equity Fund, Inc. effective August 8, 2005.
The Fund is authorized to offer six classes of shares: Common Class shares, Advisor Class shares, Institutional Class shares, Class A shares, Class B shares and Class C shares. The Fund currently offers Common Class shares, Class A shares, Class B shares and Class C shares. The Fund's Common Class shares are closed to new investors, with certain exceptions as set forth in the prospectus. Each class of shares represents an equal pro rata interest in the Fund, except that they bear different expenses which reflect the differences in the range of services provided to them. Effective October 24, 2002, Institutional Class shares ceased operations. Class A shares are sold subject to a front-end sales charge of up to 5.75%. Class B shares are sold subject to a contingent deferred sales charge which declines from 4.00% to zero depending on the period of time the shares are held. Class C shares are sold subject to a contingent deferred sales charge o f 1.00% if redeemed within the first year of purchase.
Note 2. Significant Accounting Policies
A) SECURITY VALUATION — The net asset value of the Fund is determined daily as of the close of regular trading on the New York Stock Exchange, Inc. (the "Exchange") on each day the Exchange is open for business. Equity investments are valued at market value, which is generally determined using the closing price on the exchange or market on which the security is primarily traded at the time of valuation (the "Valuation Time"). If no sales are reported, equity investments are generally valued at the most recent bid quotation as of the Valuation Time or at the lowest asked quotation in the case of a short sale of securities. Debt securities with a remaining maturity greater than 60 days are valued in accordance with the price supplied by a pricing service, which may use a matrix, formula or other objective method that takes into consideration market indices, yield curves and other specific adjustments. Debt obligations that will mature in 60 days or less are valued on the basis of amortized cost, which approximates market value, unless it is determined that using this method would not represent fair value. Investments in mutual funds are valued at the mutual fund's closing net asset value per share on the day of valuation. Securities and other assets for which market quotations are not readily available, or whose values have been materially affected by events
20
Credit Suisse Large Cap Blend Fund
Notes to Financial Statements (continued)
June 30, 2007 (unaudited)
Note 2. Significant Accounting Policies
occurring before the Fund's Valuation Time but after the close of the securities' primary markets, are valued at fair value as determined in good faith by, or under the direction of, the Board of Directors under procedures established by the Board of Directors. The Fund may utilize a service provided by an independent third party which has been approved by the Board of Directors to fair value certain securities. When fair-value pricing is employed, the prices of securities used by a fund to calculate its net asset value may differ from quoted or published prices for the same securities.
B) SECURITY TRANSACTIONS AND INVESTMENT INCOME — Security transactions are accounted for on a trade date basis. Interest income is recorded on the accrual basis. Dividends are recorded on the ex-dividend date. Certain expenses are class-specific expenses and vary by class. Income, expenses (excluding class-specific expenses) and realized/unrealized gains/losses are allocated proportionately to each class of shares based upon the relative net asset value of the outstanding shares of that class. The cost of investments sold is determined by use of the specific identification method for both financial reporting and income tax purposes.
C) DIVIDENDS AND DISTRIBUTIONS TO SHAREHOLDERS — Dividends from net investment income and distributions of net realized capital gains, if any, are declared and paid at least annually. However, to the extent that a net realized capital gain can be reduced by a capital loss carryforward, such gain will not be distributed. Income and capital gain distributions are determined in accordance with federal income tax regulations, which may differ from accounting principles generally accepted in the United States of America ("GAAP").
D) FEDERAL INCOME TAXES — No provision is made for federal taxes as it is the Fund's intention to continue to qualify for and elect the tax treatment applicable to regulated investment companies under the Internal Revenue Code of 1986, as amended, and to make the requisite distributions to its shareholders, which will be sufficient to relieve it from federal income and excise taxes.
E) USE OF ESTIMATES — The preparation of financial statements in conformity with GAAP requires management to make estimates and assumptions that affect the reported amounts of assets and liabilities and disclosure of contingent assets and liabilities at the date of the financial statements and the reported amounts of income and expenses during the reporting period. Actual results could differ from these estimates.
F) SHORT-TERM INVESTMENTS — The Fund, together with other funds/portfolios advised by Credit Suisse Asset Management, LLC ("Credit Suisse"), an indirect, wholly-owned subsidiary of Credit Suisse Group, pools
21
Credit Suisse Large Cap Blend Fund
Notes to Financial Statements (continued)
June 30, 2007 (unaudited)
Note 2. Significant Accounting Policies
available cash into either a short-term variable rate time deposit issued by State Street Bank and Trust Company ("SSB"), the Fund's custodian, or a money market fund advised by Credit Suisse. The short-term time deposit issued by SSB is a variable rate account classified as a short-term investment.
G) SECURITIES LENDING — Loans of securities are required at all times to be secured by collateral at least equal to 102% of the market value of domestic securities on loan (including any accrued interest thereon) and 105% of the market value of foreign securities on loan (including any accrued interest thereon). Cash collateral received by the Fund in connection with securities lending activity may be pooled together with cash collateral for other funds/portfolios advised by Credit Suisse and may be invested in a variety of investments, including certain Credit Suisse-advised funds, funds advised by SSB, the Fund's securities lending agent, or money market instruments. However, in the event of default or bankruptcy by the other party to the agreement, realization and/or retention of the collateral may be subject to legal proceedings.
SSB has been engaged by the Fund to act as the Fund's securities lending agent. The Fund's securities lending arrangement provides that the Fund and SSB will share the net income earned from securities lending activities. During the six months ended June 30, 2007, total earnings from the Fund's investment in cash collateral received in connection with securities lending arrangements were $174,097, of which $170,231 was rebated to borrowers (brokers). The Fund retained $3,100 in income from the cash collateral investment, and SSB, as lending agent, was paid $766. The Fund may also be entitled to certain minimum amounts of income from its securities lending activities. Securities lending income is accrued as earned.
Note 3. Transactions with Affiliates and Related Parties
Credit Suisse serves as investment adviser for the Fund. For its investment advisory services, Credit Suisse is entitled to receive a fee from the Fund at an annual rate of 0.50% of the Fund's average daily net assets. For the six months ended June 30, 2007, investment advisory fees earned and voluntarily waived for the Fund were $145,809 and $603, respectively. Fee waivers and reimbursements are voluntary and may be discontinued by Credit Suisse at any time.
Credit Suisse Asset Management Securities, Inc. ("CSAMSI"), an affiliate of Credit Suisse, and SSB serve as co-administrators to the Fund. For its co-administrative services, CSAMSI currently received a fee calculated at an annual rate of 0.09% of the Fund's average daily net assets. For the six months ended June 30, 2007, co-administrative services fees earned by CSAMSI were $26,246.
22
Credit Suisse Large Cap Blend Fund
Notes to Financial Statements (continued)
June 30, 2007 (unaudited)
Note 3. Transactions with Affiliates and Related Parties
For its co-administrative services, SSB receives a fee, exclusive of out-of-pocket expenses, calculated in total for all the Credit Suisse funds/portfolios co-administered by SSB and allocated based upon relative average net assets of each fund/portfolio, subject to an annual minimum fee. For the six months ended June 30, 2007, co-administrative services fees earned by SSB (including out-of-pocket expenses) were $13,779.
In addition to serving as the Fund's co-administrator, CSAMSI currently serves as distributor of the Fund's shares. Pursuant to distribution plans adopted by the Fund pursuant to Rule 12b-1 under the 1940 Act, CSAMSI receives fees for its distribution services. For the Common Class and Class A shares of the Fund, the fee is calculated at an annual rate of 0.25% of the average daily net assets. For Class B and Class C shares of the Fund, the fee is calculated at an annual rate of 1.00% of average daily net assets.
Certain brokers, dealers and financial representatives provide transfer agent related services to the Fund, and receive compensation from Credit Suisse. Credit Suisse is then reimbursed by the Fund. For the six months ended June 30, 2007, the Fund reimbursed Credit Suisse $652 which is included in the Fund's transfer agent expense. For the six months ended June 30, 2007, CSAMSI and its affiliates advised the Fund that they retained $336 from commissions earned on the sale of the Fund's Class A shares.
Merrill Corporation ("Merrill"), an affiliate of Credit Suisse, has been engaged by the Fund to provide certain financial printing and fulfillment services. For the six months ended June 30, 2007, Merrill was paid $24,896 for its services to the Fund.
Note 4. Line of Credit
The Fund, together with other funds/portfolios advised by Credit Suisse (collectively, the "Participating Funds"), participates in a $50 million committed, unsecured line of credit facility ("Credit Facility") for temporary or emergency purposes with Deutsche Bank, A.G. as administrative agent and syndication agent and SSB as operations agent. Under the terms of the Credit Facility, the Participating Funds pay an aggregate commitment fee at a rate of 0.10% per annum on the average unused amount of the Credit Facility, which is allocated among the Participating Funds in such manner as is determined by the governing Boards of the Participating Funds. In addition, the Participating Funds pay interest on borrowings at the Federal Funds rate plus 0.50%. At June 30, 2007, and during the six months ended June 30, 2007, the Fund had no borrowings under the Credit Facility.
23
Credit Suisse Large Cap Blend Fund
Notes to Financial Statements (continued)
June 30, 2007 (unaudited)
Note 5. Purchases and Sales of Securities
For the six months ended June 30, 2007, purchases and sales of investment securities (excluding short-term investments) were $34,050,763 and $38,903,952, respectively.
At June 30, 2007, the identified cost for federal income tax purposes, as well as the gross unrealized appreciation from investments for those securities having an excess of value over cost, gross unrealized depreciation from investments for those securities having an excess of cost over value and the net unrealized appreciation from investments were $58,098,382, $7,745,605, $(591,513) and $7,154,092, respectively.
Note 6. Capital Share Transactions
The Fund is authorized to issue six billion full and fractional shares of capital stock, $.001 par value per share. Transactions in capital shares for each class were as follows:
| Common Class | |||||||||||||||||||
| For the Six Months Ended June 30, 2007 (unaudited) | For the Year Ended December 31, 2006 | ||||||||||||||||||
| Shares | Value | Shares | Value | ||||||||||||||||
| Shares sold | 3,907 | $ | 50,217 | 10,061 | $ | 125,504 | |||||||||||||
| Shares issued in reinvestment of dividends and distributions | — | — | 10,187 | 129,287 | |||||||||||||||
| Shares redeemed | (38,995 | ) | (513,373 | ) | (76,744 | ) | (975,291 | ) | |||||||||||
| Net decrease | (35,088 | ) | $ | (463,156 | ) | (56,496 | ) | $ | (720,500 | ) | |||||||||
| Class A | |||||||||||||||||||
| For the Six Months Ended June 30, 2007 (unaudited) | For the Year Ended December 31, 2006 | ||||||||||||||||||
| Shares | Value | Shares | Value | ||||||||||||||||
| Shares sold | 39,164 | $ | 509,517 | 116,132 | $ | 1,455,066 | |||||||||||||
| Shares issued in reinvestment of dividends and distributions | — | — | 199,756 | 2,542,583 | |||||||||||||||
| Shares redeemed | (338,174 | ) | (4,479,308 | ) | (951,024 | ) | (11,923,669 | ) | |||||||||||
| Net decrease | (299,010 | ) | $ | (3,969,791 | ) | (635,136 | ) | $ | (7,926,020 | ) | |||||||||
| Class B | |||||||||||||||||||
| For the Six Months Ended June 30, 2007 (unaudited) | For the Year Ended December 31, 2006 | ||||||||||||||||||
| Shares | Value | Shares | Value | ||||||||||||||||
| Shares sold | 2,034 | $ | 25,489 | 7,768 | $ | 95,312 | |||||||||||||
| Shares issued in reinvestment of dividends and distributions | — | — | 19,948 | 244,363 | |||||||||||||||
| Shares redeemed | (90,487 | ) | (1,134,042 | ) | (321,693 | ) | (3,911,938 | ) | |||||||||||
| Net decrease | (88,453 | ) | $ | (1,108,553 | ) | (293,977 | ) | $ | (3,572,263 | ) | |||||||||
24
Credit Suisse Large Cap Blend Fund
Notes to Financial Statements (continued)
June 30, 2007 (unaudited)
Note 6. Capital Share Transactions
| Class C | |||||||||||||||||||
| For the Six Months Ended June 30, 2007 (unaudited) | For the Year Ended December 31, 2006 | ||||||||||||||||||
| Shares | Value | Shares | Value | ||||||||||||||||
| Shares sold | 1,341 | $ | 16,095 | 4,458 | $ | 54,402 | |||||||||||||
| Shares issued in reinvestment of dividends and distributions | — | — | 2,696 | 32,945 | |||||||||||||||
| Shares redeemed | (11,759 | ) | (145,393 | ) | (31,341 | ) | (381,771 | ) | |||||||||||
| Net decrease | (10,418 | ) | $ | (129,298 | ) | (24,187 | ) | $ | (294,424 | ) | |||||||||
On June 30, 2007, the number of shareholders that held 5% or more of the outstanding shares of each class of the Fund was as follows:
| Number of Shareholders | Approximate Percentage of Outstanding Shares | ||||||||||
| Common Class | 2 | 33 | % | ||||||||
| Class B | 2 | 11 | % | ||||||||
| Class C | 3 | 54 | % | ||||||||
Some of the shareholders are omnibus accounts, which hold shares on behalf of individual shareholders.
Note 7. Contingencies
In the normal course of business, the Fund may provide general indemnifications pursuant to certain contracts and organizational documents. The Fund's maximum exposure under these arrangements is dependent on future claims that may be made against the Fund and, therefore, cannot be estimated; however, based on experience, the risk of loss from such claims is considered remote.
Note 8. Recent Accounting Pronouncements
In July 2006, the Financial Accounting Standards Board ("FASB") released FASB Interpretation No. 48, Accounting for Uncertainty in Income Taxes ("FIN 48"), an interpretation of FASB Statement No. 109. FIN 48 provides guidance for how uncertain tax positions should be recognized, measured, presented and disclosed in the financial statements. FIN 48 requires the accounting and disclosure of tax positions taken or expected to be taken in the course of preparing the Fund's tax returns to determine whether the tax positions are "more likely than not" of being sustained by the applicable tax authority. Tax positions not deemed to meet the more likely than not threshold
25
Credit Suisse Large Cap Blend Fund
Notes to Financial Statements (continued)
June 30, 2007 (unaudited)
Note 8. Recent Accounting Pronouncements
would be recorded as a tax benefit or expense in the current year. Adoption of FIN 48 is effective during the first required financial reporting period for fiscal years beginning after December 15, 2006. Management adopted FIN 48 on June 29, 2007. There was no material impact to the financial statements or disclosures thereto as a result of the adoption of this pronouncement.
On September 20, 2006, the FASB released Statement of Financial Accounting Standards No. 157 "Fair Value Measurements" ("FAS 157"). FAS 157 establishes an authoritative definition of fair value, sets out a framework for measuring fair value, and requires additional disclosures about fair-value measurements. The application of FAS 157 is required for fiscal years, beginning after November 15, 2007 and interim periods within those fiscal years. At this time, management is evaluating the implication of FAS 157 and its impact on the financial statements has not yet been determined.
26
Credit Suisse Large Cap Blend Fund
Privacy Policy Notice (unaudited)
Important Privacy Choices for Consumers
We are committed to maintaining the privacy of every current and prospective customer. We recognize that you entrust important personal information to us, and we wish to assure you that we take seriously our responsibilities in protecting and safeguarding this information.
In connection with making available investment products and services to current and potential customers, we may obtain nonpublic personal information about you. This information may include your name, address, e-mail address, social security number, account number, assets, income, financial situation, transaction history and other personal information.
We may collect nonpublic information about you from the following sources:
• Information we receive on applications, forms, questionnaires, web sites, agreements or in the course of establishing or maintaining a customer relationship; and
• Information about your transactions with us, our affiliates, or others.
We do not disclose any nonpublic personal information about our customers or former customers to anyone, except with your consent or as otherwise permitted by law.
In cases where we believe that additional products and services may be of interest to you, we may share the information described above with our affiliates.
We may also disclose this information to firms that perform services on our behalf. These agents and service providers are required to treat the information confidentially and use it only for the purpose for which it is provided.
We restrict access to nonpublic personal information about you to those employees, agents or other parties who need to know that information to provide products or services to you or in connection with your investments with or through us. We maintain physical, electronic and procedural safeguards that comply with federal standards to guard your nonpublic personal information.
Note: This Notice is provided to clients and prospective clients of Credit Suisse Asset Management, LLC ("Credit Suisse"), and Credit Suisse Asset Management Securities, Inc., and shareholders and prospective shareholders in Credit Suisse-sponsored and advised investment companies, including Credit Suisse Funds, and other consumers and customers, as applicable. This Notice is not intended to be incorporated in any offering materials but is merely a statement of our current Privacy Policy, and may be amended from time to time upon notice to you. This Notice is dated as of June 5, 2007.
27
Credit Suisse Large Cap Blend Fund
Proxy Voting and Portfolio Holdings Information (unaudited)
Information regarding how the Fund voted proxies related to its portfolio securities during the 12 month period ended June 30 of each year, as well as the policies and procedures that the Fund uses to determine how to vote proxies relating to its portfolio securities are available:
• By calling 1-800-927-2874
• On the Fund's website, www.credit-suisse.com/us
• On the website of the Securities and Exchange Commission, www.sec.gov.
The Fund files a complete schedule of its portfolio holdings for the first and third quarters of its fiscal year with the SEC on Form N-Q. The Fund's Forms N-Q are available on the SEC's website at www.sec.gov and may be reviewed and copied at the SEC's Public Reference Room in Washington, DC. Information on the operation of the SEC's Public Reference Room may be obtained by calling 1-202-551-8090.
28

P.O. BOX 55030, BOSTON, MA 02205-5030
800-927-2874 n WWW.credit-suisse.com/us
CREDIT SUISSE ASSET MANAGEMENT SECURITIES, INC., DISTRIBUTOR. LCB-SAR-0607
Item 2. Code of Ethics.
This item is inapplicable to a semi-annual report on Form N-CSR.
Item 3. Audit Committee Financial Expert.
This item is inapplicable to a semi-annual report on Form N-CSR.
Item 4. Principal Accountant Fees and Services.
This item is inapplicable to a semi-annual report on Form N-CSR.
Item 5. Audit Committee of Listed Registrants.
This item is not applicable to the registrant.
Item 6. Schedule of Investments.
Included as part of the report to shareholders filed under Item 1 of this Form.
Item 7. Disclosure of Proxy Voting Policies and Procedures for Closed-End Management Investment Companies.
This item is not applicable to the registrant.
Item 8. Portfolio Managers of Closed-End Management Investment Companies.
This item is not applicable to the registrant.
Item 9. Purchases of Equity Securities by Closed-End Management Investment Company and Affiliated Purchasers.
This item is not applicable to the registrant.
Item 10. Submission of Matters to a Vote of Security Holders.
The Nominating Committee recommends Board member candidates. Shareholders of the registrant may also submit nominees that will be considered by the Committee. Recommendations should be mailed to the registrant’s Secretary, c/o Credit Suisse Asset Management, LLC, Eleven Madison Avenue, New York, NY 10010. Any submission should include at a minimum the following information: the name, age, business address, residence address and principal occupation or employment of such individual; the class, series and number of shares of the registrant that are beneficially owned by such individual; the date such shares were acquired and the investment intent of such acquisition; whether such shareholder believes such individual is, or is not, an “interested person” of the registrant (as defined in the Investment Company Act of 1940) and information regarding such individual that is sufficient, in the Committee’s discretion, to make such determination; and all other information relating to such individual that is required to be disclosed in solicitation of proxies for election of directors in an election contest (even if an election contest is not involved) or is otherwise required pursuant to the rules for proxy materials under the Securities Exchange Act of 1934.
Item 11. Controls and Procedures.
(a) As of a date within 90 days from the filing date of this report, the principal executive officer and principal financial officer concluded that the registrant’s disclosure controls and procedures (as defined in Rule 30a-3(c) under the Investment Company Act of 1940 (the “Act”)) were effective
based on their evaluation of the disclosure controls and procedures required by Rule 30a-3(b) under the Act and Rules 13a-15(b) or 15d-15(b) under the Securities Exchange Act of 1934.
(b) There were no changes in registrant’s internal control over financial reporting (as defined in Rule 30a-3(d) under the Act) that occurred during the registrant’s last fiscal half-year that have materially affected, or are reasonably likely to materially affect, the registrant’s internal control over financial reporting.
Item 12. Exhibits.
(a)(1) Not applicable.
(a)(2) The certifications of the registrant as required by Rule 30a-2(a) under the Act are exhibits to this report.
(a)(3) Not applicable.
(b) The certifications of the registrant as required by Rule 30a-2(b) under the Act are an exhibit to this report.
SIGNATURES
Pursuant to the requirements of the Securities Exchange Act of 1934 and the Investment Company Act of 1940, the registrant has duly caused this report to be signed on its behalf by the undersigned, thereunto duly authorized.
| CREDIT SUISSE LARGE CAP BLEND FUND, INC. | |
|
| |
| /s/Keith M. Schappert |
|
| Name: Keith M. Schappert | |
| Title: Chief Executive Officer | |
| Date: September 4, 2007 | |
Pursuant to the requirements of the Securities Exchange Act of 1934 and the Investment Company Act of 1940, this report has been signed below by the following persons on behalf of the registrant and in the capacities and on the dates indicated.
/s/Keith M. Schappert |
| |
| Name: Keith M. Schappert | |
| Title: Chief Executive Officer | |
| Date: September 4, 2007 | |
/s/Michael A. Pignataro |
| |
| Name: Michael A. Pignataro | |
| Title: Chief Financial Officer | |
| Date: September 4, 2007 | |