UNITED STATES
SECURITIES AND EXCHANGE COMMISSION
Washington, D.C. 20549
FORM N-CSR
CERTIFIED SHAREHOLDER REPORT OF REGISTERED
MANAGEMENT INVESTMENT COMPANIES
Investment Company Act file number | 811-08921 | ||||||||
| |||||||||
CREDIT SUISSE LARGE CAP BLEND FUND, INC. | |||||||||
(Exact name of registrant as specified in charter) | |||||||||
| |||||||||
Eleven Madison Avenue, New York, New York |
| 10010 | |||||||
(Address of principal executive offices) |
| (Zip code) | |||||||
| |||||||||
J. Kevin Gao, Esq. | |||||||||
(Name and address of agent for service) | |||||||||
| |||||||||
Registrant’s telephone number, including area code: | (212) 325-2000 |
| |||||||
| |||||||||
Date of fiscal year end: | December 31 |
| |||||||
| |||||||||
Date of reporting period: | January 1, 2008 to June 30, 2008 |
| |||||||
Item 1. Reports to Stockholders.

CREDIT SUISSE FUNDS
Semiannual Report
June 30, 2008
(unaudited)
n CREDIT SUISSE
LARGE CAP BLEND FUND
The Fund's investment objectives, risks, charges and expenses (which should be considered carefully before investing), and more complete information about the Fund, are provided in the Prospectus, which should be read carefully before investing. You may obtain additional copies by calling 800-927-2874 or by writing to Credit Suisse Funds, P.O. Box 55030, Boston, MA 02205-5030.
Credit Suisse Asset Management Securities, Inc., Distributor, is located at Eleven Madison Avenue, New York, NY 10010. Credit Suisse Funds are advised by Credit Suisse Asset Management, LLC.
Investors in the Credit Suisse Funds should be aware that they may be eligible to purchase Common Class and/or Advisor Class shares (where offered) directly or through certain intermediaries. Such shares are not subject to a sales charge but may be subject to an ongoing service and distribution fee of up to 0.50% of average daily net assets. Investors in the Credit Suisse Funds should also be aware that they may be eligible for a reduction or waiver of the sales charge with respect to Class A, B or C shares (where offered). For more information, please review the relevant prospectuses or consult your financial representative.
The views of the Fund's management are as of the date of the letter and the Fund holdings described in this document are as of June 30, 2008; these views and Fund holdings may have changed subsequent to these dates. Nothing in this document is a recommendation to purchase or sell securities.
Fund shares are not deposits or other obligations of Credit Suisse Asset Management, LLC ("Credit Suisse") or any affiliate, are not FDIC-insured and are not guaranteed by Credit Suisse or any affiliate. Fund investments are subject to investment risks, including loss of your investment.
Credit Suisse Large Cap Blend Fund
Semiannual Investment Adviser's Report
June 30, 2008 (unaudited)
August 12, 2008
Dear Shareholder:
Performance Summary
01/01/08 – 06/30/08
| Fund & Benchmark | Performance | ||||||
| Common1 | -11.80 | % | |||||
| Class A1,2 | -11.74 | % | |||||
| Class B1,2 | -12.10 | % | |||||
| Class C1,2 | -12.05 | % | |||||
| S&P 500 Index3 | -11.91 | % | |||||
Performance for the Fund's Class A, Class B and Class C Shares is without the maximum sales charge of 5.75%, 4.00% and 1.00%, respectively.2
Market Review: A tough period for consumers
The six-month period ended June 30, 2008, was a volatile one for equity markets.
On June 25, the Federal Reserve left its benchmark interest rate at 2%, ending the most aggressive series of rate cuts in two decades. The cuts began at an unscheduled meeting on January 22, when the Fed cut rates 75 basis points. They cut an additional 50 bps at the end of January, and 75 basis points at the March meeting (in an 8-2 vote) to bring the rate down to 2.25%. The Fed also lowered the discount rate 75 bps to 2.5%.
In April, the S&P/Case-Shiller Home Price Index reported a 15.3% drop from a year earlier. This was after a 14.3% decline in March. Home prices in 20 U.S. metropolitan areas fell in April by the highest percentage on record. All 20 cities in the index showed a year-over-year decrease in prices for April. However, eight of the cities showed an increase in month-over-month home prices.
Beginning in mid-July, the Federal Housing Administration will begin an expanded effort to help a larger group of troubled homeowners refinance their adjustable mortgages. Under the plan, homeowners would be eligible to refinance even if they have missed up to three monthly mortgage payments over the previous 12 months.
Nonfarm payrolls fell 62,000 in June, while the unemployment rate held at 5.5%. Employment continued to fall in construction, manufacturing, and employment services, while healthcare and mining added jobs. In May, the Consumer Price Index rose 4.2% — the average for the past decade was 2.7%.
1
Credit Suisse Large Cap Blend Fund
Semiannual Investment Adviser's Report (continued)
June 30, 2008 (unaudited)
The Conference Board's U.S. consumer confidence index fell to 50.4 in June — the lowest level in more than 16 years (since February 1992) — from a revised 58.1 in May. The report also showed that Americans forecast inflation to be 3.4% for the next five years, matching May's reading as the highest since 1995.
Additionally, crude oil futures grew approximately 40% in Q2 2008, causing a strain on household spending.
Strategic Review and Outlook: Expect continued volatility in the near term
For the six-month period, the Fund's Common and Class A shares slightly outperformed the benchmark. The largest contributors to relative performance came from stock selection in the financials, materials, and utilities sectors. Conversely, the largest detractors to performance came from stock selection in the healthcare, consumer staples, and energy sectors.
As of June 30, 2008, the Fund's largest overweights were in the industrials (+2.33%) and financials (+1.28%) sectors, while the largest underweights were in the information technology (-1.63%) and consumer discretionary (-1.36%) sectors. Despite the overall poor performance of the financials sector, the Portfolio was still overweight Financials with investments in specific securities and was able to achieve positive relative performance. Additionally, we were underweight risk-premium factors. This helped in the current market environment as it's been driven by recession and inflation fears.
Since the Fund's investment strategy changed to a quantitative approach, we now employ a quantitative research and portfolio management technique. Through this approach, we analyze and rank each stock in the universe based on how they measure up with regard to five factors that we believe drive performance: valuation, capital use, profitability, growth and price momentum. Our research has shown us that analyzing a company's value, how they reinvest their capital, their profit margins, growth prospects and stock price trends can help us reasonably predict how the company will perform in a range of scenarios. During this volatile period, we found that valuation, capital use, profitability and price momentum drivers provided positive returns.
These drivers continue to provide useful indication in our stock selection process as we enhance them for current market conditions. We believe that since our proprietary factor views result in long volatility and short leverage positions, our strategy is well positioned to benefit from the deterioration in the credit environment.
2
Credit Suisse Large Cap Blend Fund
Semiannual Investment Adviser's Report (continued)
June 30, 2008 (unaudited)
In regard to growth, the Federal Reserve believes that the substantial easing thus far, in combination with ongoing measures to foster market liquidity, should help to promote moderate growth over time and to mitigate the risks to economic activity. The Fed believes that the U.S. will grow "appreciably" below trend in 2008, and has therefore revised its economic outlooks. For 2008, the real gross domestic product (GDP) forecast was revised up from 0.3 – 1.2% in April's forecast to 1.0 – 1.6%. Despite the recent sharp increase to 5.5% in the unemployment rate, the projection for 2008 was unchanged at 5.5 – 5.7%. Not surprisingly, the headline personal consumption expenditures (PCE) price index's inflation forecast for 2008 was revised up to 3.8 – 4.2%, reflecting the continued rise in commodity prices. However, the projection for PCE core inflation remained unchanged at 2.2 – 2.4%. Inflation forecasts for 2009 and 201 0 saw only minor changes.
Wall Street analysts are divided on how higher energy costs may affect growth. The nearly 40% rise in oil prices this year absorbs more consumer dollars, pulling spending away from other goods and services. And, despite the federal government's $70.8 billion injection into the economy through tax rebates, this may add momentum to price increases. In addition, analysts believe that household spending will again ease after the tax rebates are spent.
On July 8, 2008, Federal Reserve Chairman, Ben Bernanke announced that the Fed may extend securities dealers' access to direct loans from the central bank into 2009 as long as emergency conditions continue to prevail. Bernanke also endorsed proposals to set up a federal liquidation process for failing investment banks.
The Fed remains concerned that the declining housing market will not reach its bottom, and that financial markets will not become more stable before some time next year. Additionally, they believe that the economy could continue to suffer as a result of declining consumer confidence, a sluggish global economy, and the widespread effects of the rapid jump in oil prices.
The survival of the two largest mortgage finance companies, Fannie Mae and Freddie Mac, has been questioned and will remain a topic of concern for the next months. The Federal Reserve said it would make one of its short-term lending programs available to the two companies. An official said that the Fed's decision to permit the companies to borrow from its so-called discount window was approved at the request of the Treasury, but that it was temporary and would probably end once Congress approves the Treasury's new plan. Some officials briefed on the plan said Congress could be asked to extend the total line of credit to these institutions up to $300 billion.
3
Credit Suisse Large Cap Blend Fund
Semiannual Investment Adviser's Report (continued)
June 30, 2008 (unaudited)
Although we expect the market to remain volatile in the short term, we are comfortable with our balanced investment process going forward.
Jordan Low
Portfolio Manager
The value of investments generally will fluctuate in response to market movements.
In addition to historical information, this report contains forward-looking statements, which may concern, among other things, domestic and foreign market, industry and economic trends and developments and government regulation and their potential impact on the Fund's investments. These statements are subject to risks and uncertainties and actual trends, developments and regulations in the future, and their impact on the Fund could be materially different from those projected, anticipated or implied. The Fund has no obligation to update or revise forward-looking statements.
4
Credit Suisse Large Cap Blend Fund
Semiannual Investment Adviser's Report (continued)
June 30, 2008 (unaudited)
Average Annual Returns as of June 30, 20081
| 1 Year | 5 Years | Since Inception | Inception Date | ||||||||||||||||
| Common Class | (12.38 | )% | 5.04 | % | 3.09 | % | 10/30/98 | ||||||||||||
| Class A Without Sales Charge | (12.38 | )% | 5.04 | % | 0.01 | % | 07/31/01 | ||||||||||||
| Class A With Maximum Sales Charge | (17.40 | )% | 3.80 | % | (0.85 | )% | 07/31/01 | ||||||||||||
| Class B Without CDSC | (13.05 | )% | 4.24 | % | (0.75 | )% | 07/31/01 | ||||||||||||
| Class B With CDSC | (16.12 | )% | 4.24 | % | (0.75 | )% | 07/31/01 | ||||||||||||
| Class C Without CDSC | (13.01 | )% | 4.27 | % | (0.78 | )% | 07/31/01 | ||||||||||||
| Class C With CDSC | (13.78 | )% | 4.27 | % | (0.78 | )% | 07/31/01 | ||||||||||||
Returns represent past performance and include change in share price and reinvestment of dividends and capital gains. Past performance cannot guarantee future results. The current performance of the Fund may be lower or higher than the figures shown. Returns and share prices will fluctuate, and redemption value may be more or less than original cost. The performance results do not reflect the deduction of taxes that a shareholder would pay on fund distributions or the redemption of fund shares. Performance information current to the most recent month-end is available at www.credit-suisse.com/us.
The annualized gross expense ratios are 1.51% for Common Class shares, 1.50% for Class A shares, 2.25% for Class B shares, and 2.26% for Class C shares. The annualized net expenses ratios after fee waivers and/or expense reimbursements are 1.30% for Common Class shares, 1.30% for Class A shares, 2.05% for Class B shares, and 2.05% for Class C shares.
1 Fee waivers and/or expense reimbursements may reduce expenses for the Fund, without which performance would be lower. Waivers and/or reimbursements may be discontinued at any time.
2 Total return for Class A shares for the reporting period, based on offering price (including maximum sales charge of 5.75%) was -16.80. Total return for Class B shares for the reporting period, based on redemption value (including contingent deferred sales charge of 4.00%), was -15.61%. Total return for Class C shares for the reporting period, based on redemption value (including contingent deferred sales charge of 1.00%), was -12.93%.
3 The Standard & Poor's 500 Index is an unmanaged index (with no defined investment objective) of common stocks, includes reinvestment of dividends, and is a registered trademark of The McGraw-Hill Companies, Inc. Investors cannot invest directly in an index.
5
Credit Suisse Large Cap Blend Fund
Semiannual Investment Adviser's Report (continued)
June 30, 2008 (unaudited)
Information About Your Fund's Expenses
As an investor of the Fund, you incur two types of costs: ongoing expenses and transaction costs. Ongoing expenses include management fees, distribution and service (12b-1) fees and other Fund expenses. Examples of transaction costs include sales charges (loads), redemption fees and account maintenance fees, which are not shown in this section and which would result in higher total expenses. The following table is intended to help you understand your ongoing expenses of investing in the Fund and to help you compare these expenses with the ongoing expenses of investing in other mutual funds. The table is based on an investment of $1,000 made at the beginning of the six month period ended June 30, 2008.
The table illustrates your Fund's expenses in two ways:
• Actual Fund Return. This helps you estimate the actual dollar amount of ongoing expenses paid on a $1,000 investment in the Fund using the Fund's actual return during the period. To estimate the expenses you paid over the period, simply divide your account value by $1,000 (for example, an $8,600 account value divided by $1,000 = 8.6), then multiply the result by the number in the "Expenses Paid per $1,000" line under the share class you hold.
• Hypothetical 5% Fund Return. This helps you to compare your Fund's ongoing expenses with those of other mutual funds using the Fund's actual expense ratio and a hypothetical rate of return of 5% per year before expenses. Examples using a 5% hypothetical Fund return may be found in the shareholder reports of other mutual funds. The hypothetical account values and expenses may not be used to estimate the actual ending account balance or expenses you paid for the period.
Please note that the expenses shown in these tables are meant to highlight your ongoing expenses only and do not reflect any transaction costs, such as sales charges (loads) or redemption fees. If these transaction costs had been included, your costs would have been higher. The "Expenses Paid per $1,000" line of the tables is useful in comparing ongoing expenses only and will not help you determine the relative total expenses of owning different funds.
6
Credit Suisse Large Cap Blend Fund
Semiannual Investment Adviser's Report (continued)
June 30, 2008 (unaudited)
Expenses and Value for a $1,000 Investment
for the six month period ended June 30, 2008
| Actual Fund Return | Common Class | Class A | Class B | Class C | |||||||||||||||
| Beginning Account Value 1/1/08 | $ | 1,000.00 | $ | 1,000.00 | $ | 1,000.00 | $ | 1,000.00 | |||||||||||
| Ending Account Value 6/30/08 | $ | 882.00 | $ | 882.60 | $ | 879.00 | $ | 879.50 | |||||||||||
| Expenses Paid per $1,000* | $ | 6.08 | $ | 6.09 | $ | 9.58 | $ | 9.58 | |||||||||||
| Hypothetical 5% Fund Return | |||||||||||||||||||
| Beginning Account Value 1/1/08 | $ | 1,000.00 | $ | 1,000.00 | $ | 1,000.00 | $ | 1,000.00 | |||||||||||
| Ending Account Value 6/30/08 | $ | 1,018.40 | $ | 1,018.40 | $ | 1,014.67 | $ | 1,014.67 | |||||||||||
| Expenses Paid per $1,000* | $ | 6.52 | $ | 6.52 | $ | 10.27 | $ | 10.27 | |||||||||||
| Common Class | Class A | Class B | Class C | ||||||||||||||||
| Annualized Expense Ratios* | 1.30 | % | 1.30 | % | 2.05 | % | 2.05 | % | |||||||||||
* Expenses are equal to the Fund's annualized expense ratio for each share class, multiplied by the average account value over the period, multiplied by the number of days in the most recent fiscal half year period, then divided by 366.
The "Expenses Paid per $1,000" and the "Annualized Expense Ratios" in the tables are based on actual expenses paid by the Fund during the period, net of fee waivers and/or expense reimbursements. If those fee waivers and/or expense reimbursements had not been in effect, the Fund's actual expenses would have been higher.
For more information, please refer to the Fund's prospectus.
7
Credit Suisse Large Cap Blend Fund
Semiannual Investment Adviser's Report (continued)
June 30, 2008 (unaudited)
SECTOR BREAKDOWN*
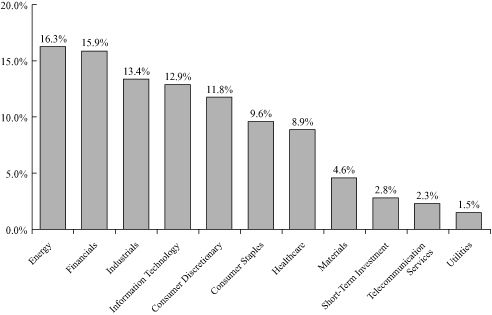
* Expressed as a percentage of total investments (excluding security lending collateral) and may vary over time.
8
Credit Suisse Large Cap Blend Fund
Schedule of Investments
June 30, 2008 (unaudited)
| Number of Shares | Value | ||||||||||
| COMMON STOCKS (97.1%) | |||||||||||
| Aerospace & Defense (4.1%) | |||||||||||
| General Dynamics Corp.§ | 1,500 | $ | 126,300 | ||||||||
| Goodrich Corp. | 3,000 | 142,380 | |||||||||
| L-3 Communications Holdings, Inc.§ | 1,100 | 99,957 | |||||||||
| Lockheed Martin Corp.§ | 1,300 | 128,258 | |||||||||
| Northrop Grumman Corp. | 2,700 | 180,630 | |||||||||
| Raytheon Co.§ | 400 | 22,512 | |||||||||
| Rockwell Collins, Inc. | 3,700 | 177,452 | |||||||||
| The Boeing Co. | 3,100 | 203,732 | |||||||||
| United Technologies Corp. | 12,200 | 752,740 | |||||||||
| 1,833,961 | |||||||||||
| Air Freight & Couriers (0.6%) | |||||||||||
| FedEx Corp.§ | 1,200 | 94,548 | |||||||||
| United Parcel Service, Inc. Class B | 2,900 | 178,263 | |||||||||
| 272,811 | |||||||||||
| Airlines (0.4%) | |||||||||||
| Continental Airlines, Inc. Class B*§ | 800 | 8,088 | |||||||||
| Southwest Airlines Co.§ | 12,700 | 165,608 | |||||||||
| 173,696 | |||||||||||
| Auto Components (0.5%) | |||||||||||
| Johnson Controls, Inc.§ | 7,600 | 217,968 | |||||||||
| Automobiles (0.1%) | |||||||||||
| Avis Budget Group, Inc.*§ | 1,400 | 11,718 | |||||||||
| General Motors Corp.§ | 2,000 | 23,000 | |||||||||
| 34,718 | |||||||||||
| Banks (4.8%) | |||||||||||
| Bank of America Corp. | 11,101 | 264,981 | |||||||||
| Bank of New York Mellon Corp. | 11,100 | 419,913 | |||||||||
| Cullen/Frost Bankers, Inc.§ | 3,600 | 179,460 | |||||||||
| Fifth Third Bancorp§ | 1,000 | 10,180 | |||||||||
| Hudson City Bancorp, Inc. | 12,400 | 206,832 | |||||||||
| National City Corp.§ | 2,700 | 12,879 | |||||||||
| Northern Trust Corp. | 4,500 | 308,565 | |||||||||
| Old National Bancorp§ | 200 | 2,852 | |||||||||
| PNC Financial Services Group, Inc. | 2,100 | 119,910 | |||||||||
| Regions Financial Corp.§ | 100 | 1,091 | |||||||||
| SunTrust Banks, Inc.§ | 2,600 | 94,172 | |||||||||
| U.S. Bancorp§ | 12,800 | 356,992 | |||||||||
| Washington Mutual, Inc.§ | 3,800 | 18,734 | |||||||||
| Wells Fargo & Co.§ | 5,600 | 133,000 | |||||||||
| 2,129,561 | |||||||||||
See Accompanying Notes to Financial Statements.
9
Credit Suisse Large Cap Blend Fund
Schedule of Investments (continued)
June 30, 2008 (unaudited)
| Number of Shares | Value | ||||||||||
| COMMON STOCKS | |||||||||||
| Beverages (4.3%) | |||||||||||
| Anheuser-Busch Companies, Inc.§ | 1,800 | $ | 111,816 | ||||||||
| Molson Coors Brewing Co. Class B | 1,900 | 103,227 | |||||||||
| PepsiAmericas, Inc.§ | 5,300 | 104,834 | |||||||||
| PepsiCo, Inc. | 8,600 | 546,874 | |||||||||
| The Coca-Cola Co. | 17,200 | 894,056 | |||||||||
| The Pepsi Bottling Group, Inc.§ | 4,800 | 134,016 | |||||||||
| 1,894,823 | |||||||||||
| Biotechnology (0.5%) | |||||||||||
| Amgen, Inc.* | 2,908 | 137,141 | |||||||||
| Celgene Corp.* | 50 | 3,194 | |||||||||
| Genentech, Inc.* | 500 | 37,950 | |||||||||
| Genzyme Corp.* | 550 | 39,611 | |||||||||
| Gilead Sciences, Inc.* | 400 | 21,180 | |||||||||
| 239,076 | |||||||||||
| Chemicals (2.7%) | |||||||||||
| Airgas, Inc. | 400 | 23,356 | |||||||||
| Eastman Chemical Co.§ | 1,700 | 117,062 | |||||||||
| Hercules, Inc.§ | 10,500 | 177,765 | |||||||||
| Monsanto Co.§ | 3,200 | 404,608 | |||||||||
| Praxair, Inc. | 2,500 | 235,600 | |||||||||
| The Dow Chemical Co.§ | 6,800 | 237,388 | |||||||||
| 1,195,779 | |||||||||||
| Commercial Services & Supplies (0.7%) | |||||||||||
| Bristow Group, Inc.*§ | 100 | 4,949 | |||||||||
| Corinthian Colleges, Inc.*§ | 1,200 | 13,932 | |||||||||
| FTI Consulting, Inc.*§ | 1,700 | 116,382 | |||||||||
| Herman Miller, Inc.§ | 1,900 | 47,291 | |||||||||
| Waste Management, Inc. | 3,300 | 124,443 | |||||||||
| 306,997 | |||||||||||
| Communications Equipment (2.2%) | |||||||||||
| Cisco Systems, Inc.* | 23,800 | 553,588 | |||||||||
| Corning, Inc. | 2,600 | 59,930 | |||||||||
| QUALCOMM, Inc. | 8,300 | 368,271 | |||||||||
| Tellabs, Inc.* | 800 | 3,720 | |||||||||
| 985,509 | |||||||||||
| Computers & Peripherals (3.3%) | |||||||||||
| Apple Computer, Inc.* | 1,300 | 217,672 | |||||||||
| Dell, Inc.* | 6,800 | 148,784 | |||||||||
| Hewlett-Packard Co. | 13,500 | 596,835 | |||||||||
| International Business Machines Corp. | 3,100 | 367,443 | |||||||||
| Teradata Corp.*§ | 500 | 11,570 | |||||||||
| Western Digital Corp.* | 3,000 | 103,590 | |||||||||
| 1,445,894 | |||||||||||
See Accompanying Notes to Financial Statements.
10
Credit Suisse Large Cap Blend Fund
Schedule of Investments (continued)
June 30, 2008 (unaudited)
| Number of Shares | Value | ||||||||||
| COMMON STOCKS | |||||||||||
| Construction & Engineering (0.3%) | |||||||||||
| Fluor Corp.* | 800 | $ | 148,864 | ||||||||
| Construction Materials (0.0%) | |||||||||||
| Vulcan Materials Co.§ | 200 | 11,956 | |||||||||
| Containers & Packaging (0.5%) | |||||||||||
| Ball Corp.§ | 2,400 | 114,576 | |||||||||
| Crown Holdings, Inc.* | 4,200 | 109,158 | |||||||||
| Temple-Inland, Inc.§ | 100 | 1,127 | |||||||||
| 224,861 | |||||||||||
| Diversified Financials (5.5%) | |||||||||||
| American Capital Strategies, Ltd.§ | 500 | 11,885 | |||||||||
| American Express Co. | 3,800 | 143,146 | |||||||||
| BlackRock, Inc.§ | 500 | 88,500 | |||||||||
| Capital One Financial Corp.§ | 500 | 19,005 | |||||||||
| CIT Group, Inc.§ | 200 | 1,362 | |||||||||
| Citigroup, Inc. | 9,600 | 160,896 | |||||||||
| Countrywide Financial Corp.§ | 2,000 | 8,500 | |||||||||
| Discover Financial Services§ | 1,700 | 22,389 | |||||||||
| E*TRADE Financial Corp.*§ | 1,600 | 5,024 | |||||||||
| Franklin Resources, Inc. | 3,400 | 311,610 | |||||||||
| Investment Technology Group, Inc.*§ | 600 | 20,076 | |||||||||
| JPMorgan Chase & Co.§ | 1,700 | 58,327 | |||||||||
| Marshall & Ilsley Corp.§ | 800 | 12,264 | |||||||||
| Morgan Stanley | 200 | 7,214 | |||||||||
| Principal Financial Group, Inc.§ | 2,500 | 104,925 | |||||||||
| Raymond James Financial, Inc. | 200 | 5,342 | |||||||||
| State Street Corp. | 3,200 | 204,768 | |||||||||
| T. Rowe Price Group, Inc.§ | 8,500 | 479,995 | |||||||||
| The Charles Schwab Corp.§ | 12,800 | 262,912 | |||||||||
| The Goldman Sachs Group, Inc. | 1,400 | 244,860 | |||||||||
| Waddell & Reed Financial, Inc. Class A | 7,200 | 252,072 | |||||||||
| Western Union Co.§ | 500 | 12,360 | |||||||||
| 2,437,432 | |||||||||||
| Diversified Telecommunication Services (2.3%) | |||||||||||
| AT&T, Inc. | 13,722 | 462,294 | |||||||||
| Qwest Communications International, Inc.§ | 5,700 | 22,401 | |||||||||
| Verizon Communications, Inc. | 11,600 | 410,640 | |||||||||
| Windstream Corp.§ | 9,100 | 112,294 | |||||||||
| 1,007,629 | |||||||||||
See Accompanying Notes to Financial Statements.
11
Credit Suisse Large Cap Blend Fund
Schedule of Investments (continued)
June 30, 2008 (unaudited)
| Number of Shares | Value | ||||||||||
| COMMON STOCKS | |||||||||||
| Electric Utilities (1.5%) | |||||||||||
| Edison International§ | 2,300 | $ | 118,174 | ||||||||
| Entergy Corp.§ | 1,100 | 132,528 | |||||||||
| FPL Group, Inc.§ | 2,600 | 170,508 | |||||||||
| PG&E Corp.§ | 2,400 | 95,256 | |||||||||
| Public Service Enterprise Group, Inc.§ | 3,000 | 137,790 | |||||||||
| 654,256 | |||||||||||
| Electrical Equipment (0.6%) | |||||||||||
| Emerson Electric Co. | 200 | 9,890 | |||||||||
| Energizer Holdings, Inc.*§ | 1,400 | 102,326 | |||||||||
| Rockwell Automation, Inc.§ | 2,400 | 104,952 | |||||||||
| Tyco Electronics, Ltd. | 1,700 | 60,894 | |||||||||
| 278,062 | |||||||||||
| Electronic Equipment & Instruments (0.2%) | |||||||||||
| FLIR Systems, Inc.*§ | 1,300 | 52,741 | |||||||||
| Thermo Fisher Scientific, Inc.* | 700 | 39,011 | |||||||||
| 91,752 | |||||||||||
| Energy Equipment & Services (4.1%) | |||||||||||
| Atwood Oceanics, Inc.*§ | 300 | 37,302 | |||||||||
| Baker Hughes, Inc.§ | 1,300 | 113,542 | |||||||||
| Cameron International Corp.*§ | 2,200 | 121,770 | |||||||||
| ENSCO International, Inc.§ | 565 | 45,618 | |||||||||
| FMC Technologies, Inc.* | 2,100 | 161,553 | |||||||||
| Halliburton Co.§ | 11,800 | 626,226 | |||||||||
| Helmerich & Payne, Inc.§ | 1,300 | 93,626 | |||||||||
| Patterson-UTI Energy, Inc.§ | 1,500 | 54,060 | |||||||||
| Schlumberger, Ltd. | 5,100 | 547,893 | |||||||||
| 1,801,590 | |||||||||||
| Food & Drug Retailing (1.3%) | |||||||||||
| CVS Caremark Corp. | 1,100 | 43,527 | |||||||||
| Kroger Co.§ | 3,500 | 101,045 | |||||||||
| Safeway, Inc. | 3,600 | 102,780 | |||||||||
| Sysco Corp.§ | 10,800 | 297,108 | |||||||||
| Whole Foods Market, Inc.§ | 300 | 7,107 | |||||||||
| 551,567 | |||||||||||
| Food Products (1.5%) | |||||||||||
| Campbell Soup Co.§ | 3,100 | 103,726 | |||||||||
| General Mills, Inc. | 3,400 | 206,618 | |||||||||
| H.J. Heinz Co. | 200 | 9,570 | |||||||||
| Kellogg Co. | 1,900 | 91,238 | |||||||||
| Kraft Foods, Inc. Class A | 8,100 | 230,445 | |||||||||
| 641,597 | |||||||||||
See Accompanying Notes to Financial Statements.
12
Credit Suisse Large Cap Blend Fund
Schedule of Investments (continued)
June 30, 2008 (unaudited)
| Number of Shares | Value | ||||||||||
| COMMON STOCKS | |||||||||||
| Forestry & Paper (0.0%) | |||||||||||
| Louisiana-Pacific Corp.§ | 300 | $ | 2,547 | ||||||||
| Healthcare Equipment & Supplies (1.6%) | |||||||||||
| Applied Biosystems, Inc. | 4,000 | 133,920 | |||||||||
| Baxter International, Inc. | 600 | 38,364 | |||||||||
| Becton, Dickinson and Co. | 100 | 8,130 | |||||||||
| Boston Scientific Corp.* | 1,400 | 17,206 | |||||||||
| Covidien, Ltd. | 1,700 | 81,413 | |||||||||
| Kinetic Concepts, Inc.*§ | 3,100 | 123,721 | |||||||||
| Medtronic, Inc.§ | 3,400 | 175,950 | |||||||||
| Millipore Corp.*§ | 219 | 14,861 | |||||||||
| Stryker Corp.§ | 2,100 | 132,048 | |||||||||
| 725,613 | |||||||||||
| Healthcare Providers & Services (1.9%) | |||||||||||
| Aetna, Inc. | 7,000 | 283,710 | |||||||||
| CIGNA Corp. | 6,700 | 237,113 | |||||||||
| Humana, Inc.* | 3,200 | 127,264 | |||||||||
| McKesson Corp. | 65 | 3,634 | |||||||||
| Quest Diagnostics, Inc.§ | 3,400 | 164,798 | |||||||||
| UnitedHealth Group, Inc. | 900 | 23,625 | |||||||||
| 840,144 | |||||||||||
| Hotels, Restaurants & Leisure (0.6%) | |||||||||||
| McDonald's Corp. | 4,700 | 264,234 | |||||||||
| Household Durables (0.6%) | |||||||||||
| D.R. Horton, Inc.§ | 100 | 1,085 | |||||||||
| KB Home§ | 100 | 1,693 | |||||||||
| Lennar Corp. Class A§ | 1,200 | 14,808 | |||||||||
| Snap-on, Inc. | 200 | 10,409 | |||||||||
| Tupperware Brands Corp.§ | 4,400 | 150,568 | |||||||||
| Whirlpool Corp.§ | 1,400 | 86,422 | |||||||||
| 264,985 | |||||||||||
| Household Products (1.2%) | |||||||||||
| Clorox Co.§ | 66 | 3,445 | |||||||||
| Colgate-Palmolive Co. | 100 | 6,910 | |||||||||
| The Procter & Gamble Co. | 8,900 | 541,209 | |||||||||
| 551,564 | |||||||||||
| Industrial Conglomerates (2.6%) | |||||||||||
| 3M Co. | 3,900 | 271,401 | |||||||||
| General Electric Co. | 21,000 | 560,490 | |||||||||
| Honeywell International, Inc. | 2,000 | 100,560 | |||||||||
| Reynolds American, Inc.§ | 2,300 | 107,341 | |||||||||
| Tyco International, Ltd.§ | 2,000 | 80,080 | |||||||||
| Walter Industries, Inc.§ | 300 | 32,631 | |||||||||
| 1,152,503 | |||||||||||
See Accompanying Notes to Financial Statements.
13
Credit Suisse Large Cap Blend Fund
Schedule of Investments (continued)
June 30, 2008 (unaudited)
| Number of Shares | Value | ||||||||||
| COMMON STOCKS | |||||||||||
| Insurance (4.6%) | |||||||||||
| ACE, Ltd. | 4,400 | $ | 242,396 | ||||||||
| Aflac, Inc. | 10,900 | 684,520 | |||||||||
| Ambac Financial Group, Inc.§ | 500 | 670 | |||||||||
| American International Group, Inc.§ | 1,600 | 42,336 | |||||||||
| Aon Corp. | 100 | 4,594 | |||||||||
| Assurant, Inc. | 200 | 13,192 | |||||||||
| Fidelity National Financial, Inc. Class A§ | 100 | 1,260 | |||||||||
| Loews Corp.§ | 1,200 | 56,280 | |||||||||
| MBIA, Inc.§ | 600 | 2,634 | |||||||||
| MetLife, Inc.§ | 4,300 | 226,911 | |||||||||
| MGIC Investment Corp.§ | 300 | 1,833 | |||||||||
| Prudential Financial, Inc.§ | 1,800 | 107,532 | |||||||||
| SAFECO Corp. | 1,800 | 120,888 | |||||||||
| StanCorp Financial Group, Inc.§ | 2,000 | 93,920 | |||||||||
| The Allstate Corp. | 1,300 | 59,267 | |||||||||
| The Chubb Corp. | 2,800 | 137,228 | |||||||||
| The Progressive Corp.§ | 400 | 7,488 | |||||||||
| The Travelers Companies, Inc. | 1,800 | 78,120 | |||||||||
| Unum Group | 6,000 | 122,700 | |||||||||
| W.R. Berkley Corp.§ | 600 | 14,496 | |||||||||
| 2,018,265 | |||||||||||
| Internet & Catalog Retail (0.0%) | |||||||||||
| Amazon.com, Inc.*§ | 200 | 14,666 | |||||||||
| Internet Software & Services (0.9%) | |||||||||||
| Google, Inc. Class A* | 500 | 263,210 | |||||||||
| Sohu.com, Inc.*§ | 300 | 21,132 | |||||||||
| Yahoo!, Inc.* | 5,000 | 103,300 | |||||||||
| 387,642 | |||||||||||
| IT Consulting & Services (0.5%) | |||||||||||
| Automatic Data Processing, Inc. | 4,500 | 188,550 | |||||||||
| IHS, Inc. Class A*§ | 400 | 27,840 | |||||||||
| Paychex, Inc. | 100 | 3,128 | |||||||||
| Unisys Corp.*§ | 1,200 | 4,740 | |||||||||
| 224,258 | |||||||||||
| Leisure Equipment & Products (0.1%) | |||||||||||
| Callaway Golf Co.§ | 1,700 | 20,111 | |||||||||
| Mattel, Inc. | 1,300 | 22,256 | |||||||||
| 42,367 | |||||||||||
See Accompanying Notes to Financial Statements.
14
Credit Suisse Large Cap Blend Fund
Schedule of Investments (continued)
June 30, 2008 (unaudited)
| Number of Shares | Value | ||||||||||
| COMMON STOCKS | |||||||||||
| Machinery (3.0%) | |||||||||||
| Caterpillar, Inc.§ | 1,500 | $ | 110,730 | ||||||||
| Cummins, Inc.§ | 4,100 | 268,632 | |||||||||
| Danaher Corp. | 2,600 | 200,980 | |||||||||
| Dover Corp.§ | 1,300 | 62,881 | |||||||||
| Eaton Corp. | 1,000 | 84,970 | |||||||||
| Gardner Denver, Inc.* | 1,700 | 96,560 | |||||||||
| Illinois Tool Works, Inc.§ | 5,600 | 266,056 | |||||||||
| Ingersoll-Rand Company, Ltd. Class A | 46 | 1,722 | |||||||||
| PACCAR, Inc.§ | 3,500 | 146,405 | |||||||||
| Parker Hannifin Corp.§ | 1,400 | 99,848 | |||||||||
| 1,338,784 | |||||||||||
| Media (4.2%) | |||||||||||
| Clear Channel Communications, Inc.§ | 1,600 | 56,320 | |||||||||
| DIRECTV Group, Inc.* | 8,700 | 225,417 | |||||||||
| DISH Network Corp. Class A* | 3,900 | 114,192 | |||||||||
| Liberty Media Corp. - Capital Series A*§ | 10,500 | 151,200 | |||||||||
| News Corp. Class A | 2,000 | 30,080 | |||||||||
| Omnicom Group, Inc.§ | 1,900 | 85,272 | |||||||||
| Regal Entertainment Group Class A§ | 7,200 | 110,016 | |||||||||
| The E.W. Scripps Co. Class A§ | 5,900 | 245,086 | |||||||||
| The Interpublic Group of Companies, Inc.* | 1,100 | 9,460 | |||||||||
| The New York Times Co. Class A§ | 300 | 4,617 | |||||||||
| The Walt Disney Co.§ | 18,400 | 574,080 | |||||||||
| Time Warner, Inc. | 18,200 | 269,360 | |||||||||
| 1,875,100 | |||||||||||
| Metals & Mining (1.3%) | |||||||||||
| AK Steel Holding Corp.§ | 200 | 13,800 | |||||||||
| Alpha Natural Resources, Inc.* | 2,300 | 239,867 | |||||||||
| Arch Coal, Inc.§ | 1,600 | 120,048 | |||||||||
| Freeport-McMoRan Copper & Gold, Inc. | 376 | 44,063 | |||||||||
| Newmont Mining Corp.§ | 1,600 | 83,456 | |||||||||
| Nucor Corp.§ | 48 | 3,584 | |||||||||
| Schnitzer Steel Industries, Inc. Class A§ | 300 | 34,380 | |||||||||
| Southern Copper Corp. | 300 | 31,989 | |||||||||
| Worthington Industries, Inc. | 100 | 2,081 | |||||||||
| 573,268 | |||||||||||
| Multiline Retail (3.8%) | |||||||||||
| Big Lots, Inc.*§ | 1,800 | 56,232 | |||||||||
| Costco Wholesale Corp.§ | 3,900 | 273,546 | |||||||||
| Dillard's, Inc. Class A§ | 100 | 1,157 | |||||||||
| Sears Holdings Corp.* | 100 | 7,366 | |||||||||
| Target Corp.§ | 2,000 | 92,980 | |||||||||
| Wal-Mart Stores, Inc. | 22,100 | 1,242,020 | |||||||||
| 1,673,301 | |||||||||||
See Accompanying Notes to Financial Statements.
15
Credit Suisse Large Cap Blend Fund
Schedule of Investments (continued)
June 30, 2008 (unaudited)
| Number of Shares | Value | ||||||||||
| COMMON STOCKS | |||||||||||
| Oil & Gas (12.2%) | |||||||||||
| Anadarko Petroleum Corp. | 1,400 | $ | 104,776 | ||||||||
| Chesapeake Energy Corp.§ | 400 | 26,384 | |||||||||
| Chevron Corp. | 19,000 | 1,883,470 | |||||||||
| Cimarex Energy Co. | 200 | 13,934 | |||||||||
| ConocoPhillips | 5,200 | 490,828 | |||||||||
| El Paso Corp.§ | 7,100 | 154,354 | |||||||||
| EOG Resources, Inc.§ | 400 | 52,480 | |||||||||
| Exxon Mobil Corp. | 19,500 | 1,718,535 | |||||||||
| Marathon Oil Corp. | 2,998 | 155,506 | |||||||||
| Occidental Petroleum Corp.§ | 5,100 | 458,286 | |||||||||
| Stone Energy Corp.*§ | 600 | 39,546 | |||||||||
| Tesoro Corp.§ | 300 | 5,931 | |||||||||
| Transocean, Inc.*§ | 1,000 | 152,390 | |||||||||
| XTO Energy, Inc.§ | 2,200 | 150,722 | |||||||||
| 5,407,142 | |||||||||||
| Personal Products (0.0%) | |||||||||||
| Avon Products, Inc.§ | 200 | 7,204 | |||||||||
| Pharmaceuticals (4.9%) | |||||||||||
| Abbott Laboratories | 7,000 | 370,790 | |||||||||
| Allergan, Inc.§ | 400 | 20,820 | |||||||||
| Bristol-Myers Squibb Co. | 5,536 | 113,654 | |||||||||
| Eli Lilly & Co. | 5,600 | 258,496 | |||||||||
| Forest Laboratories, Inc.* | 3,200 | 111,168 | |||||||||
| Johnson & Johnson | 11,200 | 720,608 | |||||||||
| Medco Health Solutions, Inc.* | 800 | 37,760 | |||||||||
| Merck & Co., Inc. | 6,602 | 248,830 | |||||||||
| Mylan, Inc.* | 600 | 7,242 | |||||||||
| Pfizer, Inc. | 14,900 | 260,303 | |||||||||
| 2,149,671 | |||||||||||
| Real Estate (0.9%) | |||||||||||
| Apartment Investment & Management Co. Class A§ | 200 | 6,812 | |||||||||
| AvalonBay Communities, Inc.§ | 200 | 17,832 | |||||||||
| Boston Properties, Inc.§ | 300 | 27,066 | |||||||||
| Developers Diversified Realty Corp.§ | 300 | 10,413 | |||||||||
| Equity Residential§ | 800 | 30,616 | |||||||||
| General Growth Properties, Inc.§ | 800 | 28,024 | |||||||||
| HCP, Inc.§ | 700 | 22,267 | |||||||||
| Host Hotels & Resorts, Inc.§ | 1,800 | 24,570 | |||||||||
| Kimco Realty Corp.§ | 800 | 27,616 | |||||||||
| Plum Creek Timber Company, Inc.§ | 500 | 21,355 | |||||||||
| ProLogis§ | 800 | 43,480 | |||||||||
| Public Storage§ | 300 | 24,237 | |||||||||
| Simon Property Group, Inc. | 700 | 62,923 | |||||||||
| Vornado Realty Trust | 400 | 35,200 | |||||||||
| 382,411 | |||||||||||
See Accompanying Notes to Financial Statements.
16
Credit Suisse Large Cap Blend Fund
Schedule of Investments (continued)
June 30, 2008 (unaudited)
| Number of Shares | Value | ||||||||||
| COMMON STOCKS | |||||||||||
| Road & Rail (0.6%) | |||||||||||
| Burlington Northern Santa Fe Corp.§ | 1,000 | $ | 99,890 | ||||||||
| Union Pacific Corp. | 1,900 | 143,450 | |||||||||
| 243,340 | |||||||||||
| Semiconductor Equipment & Products (3.2%) | |||||||||||
| Advanced Micro Devices, Inc.*§ | 1,000 | 5,830 | |||||||||
| Analog Devices, Inc.§ | 10,900 | 346,293 | |||||||||
| Applied Materials, Inc.§ | 4,600 | 87,814 | |||||||||
| Intel Corp. | 19,400 | 416,712 | |||||||||
| Microchip Technology, Inc. | 3,900 | 119,106 | |||||||||
| Texas Instruments, Inc. | 15,200 | 428,032 | |||||||||
| 1,403,787 | |||||||||||
| Software (3.1%) | |||||||||||
| Activision, Inc.* | 2,700 | 91,989 | |||||||||
| Autodesk, Inc.*§ | 600 | 20,286 | |||||||||
| BMC Software, Inc.* | 300 | 10,800 | |||||||||
| Microsoft Corp. | 34,900 | 960,099 | |||||||||
| Oracle Corp.* | 12,400 | 260,400 | |||||||||
| Symantec Corp.* | 400 | 7,740 | |||||||||
| 1,351,314 | |||||||||||
| Specialty Retail (1.3%) | |||||||||||
| Abercrombie & Fitch Co. Class A§ | 1,500 | 94,020 | |||||||||
| AutoZone, Inc.*§ | 170 | 20,572 | |||||||||
| Best Buy Company, Inc.§ | 2,800 | 110,880 | |||||||||
| Lowe's Companies, Inc.§ | 4,700 | 97,525 | |||||||||
| RadioShack Corp.§ | 100 | 1,227 | |||||||||
| Ross Stores, Inc. | 100 | 3,597 | |||||||||
| The Gap, Inc.§ | 5,800 | 96,686 | |||||||||
| The Home Depot, Inc. | 4,000 | 93,680 | |||||||||
| The TJX Companies, Inc. | 1,800 | 56,646 | |||||||||
| 574,833 | |||||||||||
| Textiles & Apparel (0.6%) | |||||||||||
| Coach, Inc.* | 900 | 25,992 | |||||||||
| NIKE, Inc. Class B | 4,200 | 250,362 | |||||||||
| 276,354 | |||||||||||
| Tobacco (1.4%) | |||||||||||
| Altria Group, Inc. | 7,700 | 158,312 | |||||||||
| Lorillard, Inc.* | 400 | 27,664 | |||||||||
| Philip Morris International, Inc.§ | 7,900 | 390,181 | |||||||||
| UST, Inc.§ | 600 | 32,766 | |||||||||
| 608,923 | |||||||||||
| TOTAL COMMON STOCKS (Cost $42,280,040) | 42,934,579 | ||||||||||
See Accompanying Notes to Financial Statements.
17
Credit Suisse Large Cap Blend Fund
Schedule of Investments (continued)
June 30, 2008 (unaudited)
| Number of Shares | Value | ||||||||||
| SHORT-TERM INVESTMENTS (32.2%) | |||||||||||
| State Street Navigator Prime Portfolio§§ | 13,041,172 | $ | 13,041,172 | ||||||||
| Par (000) | |||||||||||
| State Street Bank and Trust Co. Euro Time Deposit, 0.850%, 7/01/08 | $ | 1,212 | 1,212,000 | ||||||||
| TOTAL SHORT-TERM INVESTMENTS (Cost $14,253,172) | 14,253,172 | ||||||||||
| TOTAL INVESTMENTS AT VALUE (129.3%) (Cost $56,533,212) | 57,187,751 | ||||||||||
| LIABILITIES IN EXCESS OF OTHER ASSETS (-29.3%) | (12,964,488 | ) | |||||||||
| NET ASSETS (100.0%) | $ | 44,223,263 | |||||||||
* Non-income producing security.
§ Security or portion thereof is out on loan.
§§ Represents security purchased with cash collateral received for securities on loan.
See Accompanying Notes to Financial Statements.
18
Credit Suisse Large Cap Blend Fund
Statement of Assets and Liabilities
June 30, 2008 (unaudited)
| Assets | |||||||
| Investments at value, including collateral for securities on loan of $13,041,172 (Cost $56,533,212) (Note 2) | $ | 57,187,7511 | |||||
| Cash | 128 | ||||||
| Receivable for investments sold | 400,174 | ||||||
| Dividend and interest receivable | 63,361 | ||||||
| Receivable for fund shares sold | 620 | ||||||
| Prepaid expenses and other assets | 17,473 | ||||||
| Total Assets | 57,669,507 | ||||||
| Liabilities | |||||||
| Advisory fee payable (Note 3) | 10,487 | ||||||
| Distribution fee payable (Note 3) | 11,113 | ||||||
| Payable upon return of securities loaned (Note 2) | 13,041,172 | ||||||
| Payable for investments purchased | 343,800 | ||||||
| Directors' fee payable | 6,372 | ||||||
| Other accrued expenses payable | 33,300 | ||||||
| Total Liabilities | 13,446,244 | ||||||
| Net Assets | |||||||
| Capital stock, $.001 par value (Note 6) | 4,184 | ||||||
| Paid-in capital (Note 6) | 45,642,945 | ||||||
| Undistributed net investment income | 227,736 | ||||||
| Accumulated net realized loss on investments | (2,306,141 | ) | |||||
| Net unrealized appreciation from investments | 654,539 | ||||||
| Net Assets | $ | 44,223,263 | |||||
| Common Shares | |||||||
| Net assets | $ | 1,635,149 | |||||
| Shares outstanding | 155,129 | ||||||
| Net asset value, offering price and redemption price per share | $ | 10.54 | |||||
| A Shares | |||||||
| Net assets | $ | 40,262,526 | |||||
| Shares outstanding | 3,798,035 | ||||||
| Net asset value and redemption price per share | $ | 10.60 | |||||
| Maximum offering price per share (net asset value/(1-5.75%)) | $ | 11.25 | |||||
| B Shares | |||||||
| Net assets | $ | 1,850,943 | |||||
| Shares outstanding | 183,243 | ||||||
| Net asset value and offering price per share | $ | 10.10 | |||||
| C Shares | |||||||
| Net assets | $ | 474,645 | |||||
| Shares outstanding | 47,139 | ||||||
| Net asset value and offering price per share | $ | 10.07 | |||||
1 Including $12,744,785 of securities on loan.
See Accompanying Notes to Financial Statements.
19
Credit Suisse Large Cap Blend Fund
Statement of Operations
For the Six Months Ended June 30, 2008 (unaudited)
| Investment Income (Note 2) | |||||||
| Dividends | $ | 477,071 | |||||
| Interest | 6,372 | ||||||
| Securities lending | 34,430 | ||||||
| Total investment income | 517,873 | ||||||
| Expenses | |||||||
| Investment advisory fees (Note 3) | 119,014 | ||||||
| Administrative services fees (Note 3) | 28,393 | ||||||
| Distribution fees (Note 3) | |||||||
| Common Class | 2,151 | ||||||
| Class A | 53,193 | ||||||
| Class B | 11,962 | ||||||
| Class C | 2,653 | ||||||
| Transfer agent fees (Note 3) | 61,749 | ||||||
| Registration fees | 35,033 | ||||||
| Legal fees | 15,639 | ||||||
| Printing fees (Note 3) | 11,271 | ||||||
| Audit and tax fees | 10,445 | ||||||
| Directors' fees | 10,396 | ||||||
| Custodian fees | 5,573 | ||||||
| Commitment fees (Note 4) | 806 | ||||||
| Insurance expense | 561 | ||||||
| Miscellaneous expense | 44 | ||||||
| Total expenses | 368,883 | ||||||
| Less: fees waived (Note 3) | (48,486 | ) | |||||
| Net expenses | 320,397 | ||||||
| Net investment income | 197,476 | ||||||
| Net Realized and Unrealized Loss from Investments | |||||||
| Net realized loss from investments | (859,513 | ) | |||||
| Net change in unrealized appreciation (depreciation) from investments | (5,477,747 | ) | |||||
| Net realized and unrealized loss from investments | (6,337,260 | ) | |||||
| Net decrease in net assets resulting from operations | $ | (6,139,784 | ) | ||||
See Accompanying Notes to Financial Statements.
20
Credit Suisse Large Cap Blend Fund
Statements of Changes in Net Assets
| For the Six Months Ended June 30, 2008 (unaudited) | For the Year Ended December 31, 2007 | ||||||||||
| From Operations | |||||||||||
| Net investment income | $ | 197,476 | $ | 295,339 | |||||||
| Net realized gain (loss) from investments | (859,513 | ) | 2,416,403 | ||||||||
| Net change in unrealized appreciation (depreciation) from investments | (5,477,747 | ) | 735,659 | ||||||||
| Net increase (decrease) in net assets resulting from operations | (6,139,784 | ) | 3,447,401 | ||||||||
| From Dividends and Distributions | |||||||||||
| Dividends from net investment income | |||||||||||
| Common Class shares | — | (10,166 | ) | ||||||||
| Class A shares | — | (256,321 | ) | ||||||||
| Class B shares | — | (9,098 | ) | ||||||||
| Class C shares | — | (1,822 | ) | ||||||||
| Distributions from net realized gains | |||||||||||
| Common Class shares | — | (204,111 | ) | ||||||||
| Class A shares | — | (5,441,818 | ) | ||||||||
| Class B shares | — | (404,278 | ) | ||||||||
| Class C shares | — | (77,674 | ) | ||||||||
| Net decrease in net assets resulting from dividends and distributions | — | (6,405,288 | ) | ||||||||
| From Capital Share Transactions (Note 6) | |||||||||||
| Proceeds from sale of shares | 720,532 | 1,416,971 | |||||||||
| Reinvestment of dividends and distributions | — | 5,517,132 | |||||||||
| Net asset value of shares redeemed | (3,633,981 | ) | (10,255,828 | ) | |||||||
| Net decrease in net assets from capital share transactions | (2,913,449 | ) | (3,321,725 | ) | |||||||
| Net decrease in net assets | (9,053,233 | ) | (6,279,612 | ) | |||||||
| Net Assets | |||||||||||
| Beginning of period | 53,276,496 | 59,556,108 | |||||||||
| End of period | $ | 44,223,263 | $ | 53,276,496 | |||||||
| Undistributed net investment income | $ | 227,736 | $ | 30,260 | |||||||
See Accompanying Notes to Financial Statements.
21
Credit Suisse Large Cap Blend Fund
Financial Highlights
(For a Common Class Share of the Fund Outstanding Throughout Each Period)
| For the Six Months Ended June 30, 2008 | For the Year Ended December 31, | For the Period September 1, 2004 to December 31, | For the Year Ended August 31, | ||||||||||||||||||||||||||||
| (unaudited) | 2007 | 2006 | 2005 | 20041 | 2004 | 2003 | |||||||||||||||||||||||||
| Per share data | |||||||||||||||||||||||||||||||
| Net asset value, beginning of period | $ | 11.95 | $ | 12.71 | $ | 12.23 | $ | 12.45 | $ | 12.01 | $ | 11.42 | $ | 10.66 | |||||||||||||||||
| INVESTMENT OPERATIONS | |||||||||||||||||||||||||||||||
| Net investment income | 0.052 | 0.082 | 0.052 | 0.042 | 0.052 | 0.032 | 0.01 | ||||||||||||||||||||||||
| Net gain (loss) on investments (both realized and unrealized) | (1.46 | ) | 0.68 | 1.22 | 0.30 | 1.21 | 0.57 | 0.76 | |||||||||||||||||||||||
| Total from investment operations | (1.41 | ) | 0.76 | 1.27 | 0.34 | 1.26 | 0.60 | 0.77 | |||||||||||||||||||||||
| LESS DIVIDENDS AND DISTRIBUTIONS | |||||||||||||||||||||||||||||||
| Dividends from net investment income | — | (0.06 | ) | (0.07 | ) | (0.07 | ) | (0.01 | ) | (0.01 | ) | (0.01 | ) | ||||||||||||||||||
| Distributions from net realized gains | — | (1.46 | ) | (0.72 | ) | (0.49 | ) | (0.81 | ) | — | — | ||||||||||||||||||||
| Total dividends and distributions | — | (1.52 | ) | (0.79 | ) | (0.56 | ) | (0.82 | ) | (0.01 | ) | (0.01 | ) | ||||||||||||||||||
| Net asset value, end of period | $ | 10.54 | $ | 11.95 | $ | 12.71 | $ | 12.23 | $ | 12.45 | $ | 12.01 | $ | 11.42 | |||||||||||||||||
| Total return3 | (11.80 | )% | 6.15 | % | 10.44 | % | 2.70 | % | 10.70 | % | 5.25 | % | 7.26 | % | |||||||||||||||||
| RATIOS AND SUPPLEMENTAL DATA | |||||||||||||||||||||||||||||||
| Net assets, end of period (000s omitted) | $ | 1,635 | $ | 1,883 | $ | 2,202 | $ | 2,809 | $ | 3,471 | $ | 4,383 | $ | 5,653 | |||||||||||||||||
| Ratio of expenses to average net assets | 1.30 | %4 | 1.28 | % | 1.30 | % | 1.30 | % | 1.30 | %4 | 1.30 | % | 1.25 | % | |||||||||||||||||
| Ratio of net investment income to average net assets | 0.88 | %4 | 0.58 | % | 0.40 | % | 0.32 | % | 1.37 | %4 | 0.23 | % | 0.17 | % | |||||||||||||||||
| Decrease reflected in above operating expense ratios due to waivers/reimbursements | 0.21 | %4 | 0.07 | % | 0.26 | % | 0.26 | % | 0.32 | %4 | 0.40 | % | 2.87 | % | |||||||||||||||||
| Portfolio turnover rate | 111 | % | 114 | % | 106 | % | 101 | % | 34 | % | 168 | % | 155 | % | |||||||||||||||||
1 The Fund changed its fiscal year end from August 31 to December 31.
2 Per share information is calculated using the average shares outstanding method.
3 Total returns are historical and assume changes in share price and reinvestment of all dividends and distributions. Had certain expenses not been reduced during the periods shown, total returns would have been lower. Total returns for periods less than one year are not annualized.
4 Annualized.
See Accompanying Notes to Financial Statements.
22
Credit Suisse Large Cap Blend Fund
Financial Highlights
(For a Class A Share of the Fund Outstanding Throughout Each Period)
| For the Six Months Ended June 30, 2008 | For the Year Ended December 31, | For the Period September 1, 2004 to December 31, | For the Year Ended August 31, | ||||||||||||||||||||||||||||
| (unaudited) | 2007 | 2006 | 2005 | 20041 | 2004 | 2003 | |||||||||||||||||||||||||
| Per share data | |||||||||||||||||||||||||||||||
| Net asset value, beginning of period | $ | 12.01 | $ | 12.78 | $ | 12.26 | $ | 12.48 | $ | 12.04 | $ | 11.44 | $ | 10.67 | |||||||||||||||||
| INVESTMENT OPERATIONS | |||||||||||||||||||||||||||||||
| Net investment income | 0.052 | 0.082 | 0.052 | 0.042 | 0.062 | 0.042 | 0.01 | ||||||||||||||||||||||||
| Net gain (loss) on investments (both realized and unrealized) | (1.46 | ) | 0.67 | 1.23 | 0.30 | 1.20 | 0.57 | 0.77 | |||||||||||||||||||||||
| Total from investment operations | (1.41 | ) | 0.75 | 1.28 | 0.34 | 1.26 | 0.61 | 0.78 | |||||||||||||||||||||||
| LESS DIVIDENDS AND DISTRIBUTIONS | |||||||||||||||||||||||||||||||
| Dividends from net investment income | — | (0.06 | ) | (0.04 | ) | (0.07 | ) | (0.01 | ) | (0.01 | ) | (0.01 | ) | ||||||||||||||||||
| Distributions from net realized gains | — | (1.46 | ) | (0.72 | ) | (0.49 | ) | (0.81 | ) | — | — | ||||||||||||||||||||
| Total dividends and distributions | — | (1.52 | ) | (0.76 | ) | (0.56 | ) | (0.82 | ) | (0.01 | ) | (0.01 | ) | ||||||||||||||||||
| Net asset value, end of period | $ | 10.60 | $ | 12.01 | $ | 12.78 | $ | 12.26 | $ | 12.48 | $ | 12.04 | $ | 11.44 | |||||||||||||||||
| Total return3 | (11.74 | )% | 6.03 | % | 10.48 | % | 2.69 | % | 10.67 | % | 5.33 | % | 7.28 | % | |||||||||||||||||
| RATIOS AND SUPPLEMENTAL DATA | |||||||||||||||||||||||||||||||
| Net assets, end of period (000s omitted) | $ | 40,263 | $ | 47,691 | $ | 51,493 | $ | 57,200 | $ | 63,160 | $ | 61,089 | $ | 1,778 | |||||||||||||||||
| Ratio of expenses to average net assets | 1.30 | %4 | 1.28 | % | 1.30 | % | 1.30 | % | 1.30 | %4 | 1.30 | % | 1.25 | % | |||||||||||||||||
| Ratio of net investment income to average net assets | 0.88 | %4 | 0.58 | % | 0.40 | % | 0.32 | % | 1.37 | %4 | 0.32 | % | 0.22 | % | |||||||||||||||||
| Decrease reflected in above operating expense ratios due to waivers/reimbursements | 0.20 | %4 | 0.07 | % | 0.26 | % | 0.26 | % | 0.32 | %4 | 0.39 | % | 2.90 | % | |||||||||||||||||
| Portfolio turnover rate | 111 | % | 114 | % | 106 | % | 101 | % | 34 | % | 168 | % | 155 | % | |||||||||||||||||
1 The Fund changed its fiscal year end from August 31 to December 31.
2 Per share information is calculated using the average shares outstanding method.
3 Total returns are historical and assume changes in share price, reinvestment of all dividends and distributions and no sales charge. Had certain expenses not been reduced during the periods shown, total returns would have been lower. Total returns for periods less than one year are not annualized.
4 Annualized.
See Accompanying Notes to Financial Statements.
23
Credit Suisse Large Cap Blend Fund
Financial Highlights
(For a Class B Share of the Fund Outstanding Throughout Each Period)
| For the Six Months Ended June 30, 2008 | For the Year Ended December 31, | For the Period September 1, 2004 to December 31, | For the Year Ended August 31, | ||||||||||||||||||||||||||||
| (unaudited) | 2007 | 2006 | 2005 | 20041 | 2004 | 2003 | |||||||||||||||||||||||||
| Per share data | |||||||||||||||||||||||||||||||
| Net asset value, beginning of period | $ | 11.49 | $ | 12.35 | $ | 11.92 | $ | 12.18 | $ | 11.78 | $ | 11.27 | $ | 10.59 | |||||||||||||||||
| INVESTMENT OPERATIONS | |||||||||||||||||||||||||||||||
| Net investment income (loss) | 0.012 | (0.02 | )2 | (0.04 | )2 | (0.05 | )2 | 0.022 | (0.05 | )2 | (0.06 | )2 | |||||||||||||||||||
| Net gain (loss) on investments (both realized and unrealized) | (1.40 | ) | 0.65 | 1.19 | 0.29 | 1.19 | 0.56 | 0.74 | |||||||||||||||||||||||
| Total from investment operations | (1.39 | ) | 0.63 | 1.15 | 0.24 | 1.21 | 0.51 | 0.68 | |||||||||||||||||||||||
| LESS DIVIDENDS AND DISTRIBUTIONS | |||||||||||||||||||||||||||||||
| Dividends from net investment income | — | (0.03 | ) | — | (0.01 | ) | — | — | — | ||||||||||||||||||||||
| Distributions from net realized gains | — | (1.46 | ) | (0.72 | ) | (0.49 | ) | (0.81 | ) | — | — | ||||||||||||||||||||
| Total dividends and distributions | — | (1.49 | ) | (0.72 | ) | (0.50 | ) | (0.81 | ) | — | — | ||||||||||||||||||||
| Net asset value, end of period | $ | 10.10 | $ | 11.49 | $ | 12.35 | $ | 11.92 | $ | 12.18 | $ | 11.78 | $ | 11.27 | |||||||||||||||||
| Total return3 | (12.10 | )% | 5.24 | % | 9.67 | % | 1.91 | % | 10.44 | % | 4.53 | % | 6.42 | % | |||||||||||||||||
| RATIOS AND SUPPLEMENTAL DATA | |||||||||||||||||||||||||||||||
| Net assets, end of period (000s omitted) | $ | 1,851 | $ | 3,087 | $ | 5,010 | $ | 8,342 | $ | 13,714 | $ | 14,745 | $ | 1,109 | |||||||||||||||||
| Ratio of expenses to average net assets | 2.05 | %4 | 2.03 | % | 2.05 | % | 2.05 | % | 2.05 | %4 | 2.05 | % | 2.00 | % | |||||||||||||||||
| Ratio of net investment income (loss) to average net assets | 0.11 | %4 | (0.19 | )% | (0.35 | )% | (0.44 | )% | 0.62 | %4 | (0.45 | )% | (0.55 | )% | |||||||||||||||||
| Decrease reflected in above operating expense ratios due to waivers/reimbursements | 0.20 | %4 | 0.06 | % | 0.26 | % | 0.26 | % | 0.32 | %4 | 0.39 | % | 2.90 | % | |||||||||||||||||
| Portfolio turnover rate | 111 | % | 114 | % | 106 | % | 101 | % | 34 | % | 168 | % | 155 | % | |||||||||||||||||
1 The Fund changed its fiscal year end from August 31 to December 31.
2 Per share information is calculated using the average shares outstanding method.
3 Total returns are historical and assume changes in share price, reinvestment of all dividends and distributions and no sales charge. Had certain expenses not been reduced during the periods shown, total returns would have been lower. Total returns for periods less than one year are not annualized.
4 Annualized.
See Accompanying Notes to Financial Statements.
24
Credit Suisse Large Cap Blend Fund
Financial Highlights
(For a Class C Share of the Fund Outstanding Throughout Each Period)
| For the Six Months Ended June 30, 2008 | For the Year Ended December 31, | For the Period September 1, 2004 to December 31, | For the Year Ended August 31, | ||||||||||||||||||||||||||||
| (unaudited) | 2007 | 2006 | 2005 | 20041 | 2004 | 2003 | |||||||||||||||||||||||||
| Per share data | |||||||||||||||||||||||||||||||
| Net asset value, beginning of period | $ | 11.45 | $ | 12.31 | $ | 11.89 | $ | 12.15 | $ | 11.75 | $ | 11.24 | $ | 10.56 | |||||||||||||||||
| INVESTMENT OPERATIONS | |||||||||||||||||||||||||||||||
| Net investment income (loss) | 0.012 | (0.02 | )2 | (0.04 | )2 | (0.05 | )2 | 0.032 | (0.06 | )2 | (0.06 | )2 | |||||||||||||||||||
| Net gain (loss) on investments (both realized and unrealized) | (1.39 | ) | 0.65 | 1.18 | 0.29 | 1.18 | 0.57 | 0.74 | |||||||||||||||||||||||
| Total from investment operations | (1.38 | ) | 0.63 | 1.14 | 0.24 | 1.21 | 0.51 | 0.68 | |||||||||||||||||||||||
| LESS DIVIDENDS AND DISTRIBUTIONS | |||||||||||||||||||||||||||||||
| Dividends from net investment income | — | (0.03 | ) | — | (0.01 | ) | — | — | — | ||||||||||||||||||||||
| Distributions from net realized gains | — | (1.46 | ) | (0.72 | ) | (0.49 | ) | (0.81 | ) | — | — | ||||||||||||||||||||
| Total dividends and distributions | — | (1.49 | ) | (0.72 | ) | (0.50 | ) | (0.81 | ) | — | — | ||||||||||||||||||||
| Net asset value, end of period | $ | 10.07 | $ | 11.45 | $ | 12.31 | $ | 11.89 | $ | 12.15 | $ | 11.75 | $ | 11.24 | |||||||||||||||||
| Total return3 | (12.05 | )% | 5.26 | % | 9.61 | % | 1.91 | % | 10.47 | % | 4.54 | % | 6.44 | % | |||||||||||||||||
| RATIOS AND SUPPLEMENTAL DATA | |||||||||||||||||||||||||||||||
| Net assets, end of period (000s omitted) | $ | 475 | $ | 616 | $ | 851 | $ | 1,109 | $ | 1,864 | $ | 2,156 | $ | 441 | |||||||||||||||||
| Ratio of expenses to average net assets | 2.05 | %4 | 2.03 | % | 2.05 | % | 2.05 | % | 2.05 | %4 | 2.05 | % | 2.00 | % | |||||||||||||||||
| Ratio of net investment income (loss) to average net assets | 0.12 | %4 | (0.18 | )% | (0.35 | )% | (0.44 | )% | 0.62 | %4 | (0.47 | )% | (0.55 | )% | |||||||||||||||||
| Decrease reflected in above operating expense ratios due to waivers/reimbursements | 0.21 | %4 | 0.06 | % | 0.26 | % | 0.26 | % | 0.32 | %4 | 0.39 | % | 2.90 | % | |||||||||||||||||
| Portfolio turnover rate | 111 | % | 114 | % | 106 | % | 101 | % | 34 | % | 168 | % | 155 | % | |||||||||||||||||
1 The Fund changed its fiscal year end from August 31 to December 31.
2 Per share information is calculated using the average shares outstanding method.
3 Total returns are historical and assume changes in share price, reinvestment of all dividends and distributions and no sales charge. Had certain expenses not been reduced during the periods shown, total returns would have been lower. Total returns for periods less than one year are not annualized.
4 Annualized.
See Accompanying Notes to Financial Statements.
25
Credit Suisse Large Cap Blend Fund
Notes to Financial Statements
June 30, 2008 (unaudited)
Note 1. Organization
Credit Suisse Large Cap Blend Fund, Inc. (the "Fund") is registered under the Investment Company Act of 1940, as amended (the "1940 Act"), as a diversified, open-end management investment company which seeks long-term capital appreciation. The Fund was incorporated under the laws of the State of Maryland on July 31, 1998.
The Fund is authorized to offer six classes of shares: Common Class shares, Advisor Class shares, Institutional Class shares, Class A shares, Class B shares and Class C shares. The Fund currently offers Common Class shares, Class A shares, Class B shares and Class C shares. The Fund's Common Class shares are closed to new investors, with certain exceptions as set forth in the prospectus. Each class of shares represents an equal pro rata interest in the Fund, except that they bear different expenses, which reflect the difference in the range of services provided to them. Effective October 24, 2002, Institutional Class shares ceased operations. Class A shares are sold subject to a front-end sales charge of up to 5.75%. Class B shares are sold subject to a contingent deferred sales charge which declines from 4.00% to zero depending on the period of time the shares are held. Class C shares are sold subject to a contingent deferred sales charge o f 1.00% if redeemed within the first year of purchase.
Note 2. Significant Accounting Policies
A) SECURITY VALUATION — The net asset value of the Fund is determined daily as of the close of regular trading on the New York Stock Exchange, Inc. (the "Exchange") on each day the Exchange is open for business. Equity investments are valued at market value, which is generally determined using the closing price on the exchange or market on which the security is primarily traded at the time of valuation (the "Valuation Time"). If no sales are reported, equity investments are generally valued at the most recent bid quotation as of the Valuation Time or at the lowest asked quotation in the case of a short sale of securities. Debt securities with a remaining maturity greater than 60 days are valued in accordance with the price supplied by a pricing service, which may use a matrix, formula or other objective method that takes into consideration market indices, yield curves and other specific adjustments. Debt obligations that will mature in 60 days or less are valued on the basis of amortized cost, which approximates market value, unless it is determined that using this method would not represent fair value. Investments in mutual funds are valued at the mutual fund's closing net asset value per share on the day of valuation. Securities and other assets for which market quotations are not readily available, or whose values have been materially affected by events occurring before the Fund's Valuation Time but after the close of the securities'
26
Credit Suisse Large Cap Blend Fund
Notes to Financial Statements (continued)
June 30, 2008 (unaudited)
Note 2. Significant Accounting Policies
primary markets, are valued at fair value as determined in good faith by, or under the direction of, the Board of Directors under procedures established by the Board of Directors. The Fund may utilize a service provided by an independent third party which has been approved by the Board of Directors to fair value certain securities. When fair-value pricing is employed, the prices of securities used by a fund to calculate its net asset value may differ from quoted or published prices for the same securities.
The Fund adopted Financial Accounting Standards Board Statement of Financial Accounting Standards No. 157, Fair Value Measurements ("FAS 157"), effective January 1, 2008. In accordance with FAS 157, fair value is defined as the price that the Fund would receive upon selling an investment in a timely transaction to an independent buyer in the principal or most advantageous market of the investment. FAS 157 established a three-tier hierarchy to maximize the use of observable market data and minimize the use of unobservable inputs and to establish classification of fair value measurements for disclosure purposes. Inputs refer broadly to the assumptions that market participants would use in pricing the asset or liability, including assumptions about risk, for example, the risk inherent in a particular valuation technique used to measure fair value including such a pricing model and/or the risk inherent in the inputs to the valuation technique. I nputs may be observable or unobservable. Observable inputs are inputs that reflect the assumptions market participants would use in pricing the asset or liability developed based on market data obtained from sources independent of the reporting entity. Unobservable inputs are inputs that reflect the reporting entity's own assumptions about the assumptions market participants would use in pricing the asset or liability developed based on the best information available in the circumstances. The three-tier hierarchy of inputs is summarized in the three broad Levels listed below.
• Level 1 – quoted prices in active markets for identical investments
• Level 2 – other significant observable inputs (including quoted prices for similar investments, interest rates, prepayment speeds, credit risk, etc.)
• Level 3 – significant unobservable inputs (including the Fund's own assumptions in determining the fair value of investments)
The inputs or methodology used for valuing securities are not necessarily an indication of the risk associated with investing in those securities.
27
Credit Suisse Large Cap Blend Fund
Notes to Financial Statements (continued)
June 30, 2008 (unaudited)
Note 2. Significant Accounting Policies
The following is a summary of the inputs used as of June 30, 2008 in valuing the Fund's investments carried at value:
| Valuation Inputs | Investments in Securities | Other Financial Instruments* | |||||||||
| Level 1 – Quoted Prices | $ | 55,975,751 | $ | — | |||||||
| Level 2 – Other Significant Observable Inputs | 1,212,000 | — | |||||||||
| Level 3 – Significant Unobservable Inputs | — | — | |||||||||
| Total | $ | 57,187,751 | $ | — | |||||||
*Other financial instruments include futures, forwards and swap contracts.
B) SECURITY TRANSACTIONS AND INVESTMENT INCOME — Security transactions are accounted for on a trade date basis. Interest income is recorded on the accrual basis. Dividends are recorded on the ex-dividend date. Certain expenses are class-specific expenses and vary by class. Income, expenses (excluding class-specific expenses) and realized/unrealized gains/losses are allocated proportionately to each class of shares based upon the relative net asset value of the outstanding shares of that class. The cost of investments sold is determined by use of the specific identification method for both financial reporting and income tax purposes.
C) DIVIDENDS AND DISTRIBUTIONS TO SHAREHOLDERS — Dividends from net investment income and distributions of net realized capital gains, if any, are declared and paid at least annually. However, to the extent that a net realized capital gain can be reduced by a capital loss carryforward, such gain will not be distributed. Income and capital gain distributions are determined in accordance with federal income tax regulations, which may differ from accounting principles generally accepted in the United States of America ("GAAP").
D) FEDERAL INCOME TAXES — No provision is made for federal taxes as it is the Fund's intention to continue to qualify for and elect the tax treatment applicable to regulated investment companies under the Internal Revenue Code of 1986, as amended, and to make the requisite distributions to its shareholders, which will be sufficient to relieve it from federal income and excise taxes.
During June 2006, the Financial Accounting Standards Board ("FASB") issued FASB Interpretation 48 ("FIN 48" or the "Interpretation"), Accounting for Uncertainty in Income Taxes – an interpretation of FASB statement 109. The Fund has reviewed its' current tax positions and has determined that no provision for income tax is required in the Fund's financial statements. The Fund's federal
28
Credit Suisse Large Cap Blend Fund
Notes to Financial Statements (continued)
June 30, 2008 (unaudited)
Note 2. Significant Accounting Policies
tax returns for the prior three fiscal years remain subject to examination by the Internal Revenue Service.
E) USE OF ESTIMATES — The preparation of financial statements in conformity with GAAP requires management to make estimates and assumptions that affect the reported amounts of assets and liabilities and disclosure of contingent assets and liabilities at the date of the financial statements and the reported amounts of income and expenses during the reporting period. Actual results could differ from these estimates.
F) SHORT-TERM INVESTMENTS — The Fund, together with other funds/portfolios advised by Credit Suisse Asset Management, LLC ("Credit Suisse"), an indirect, wholly-owned subsidiary of Credit Suisse Group, pools available cash into either a short-term variable rate time deposit issued by State Street Bank and Trust Company ("SSB"), the Fund's custodian, or a money market fund advised by Credit Suisse. The short-term time deposit issued by SSB is a variable rate account classified as a short-term investment.
G) SECURITIES LENDING — Loans of securities are required at all times to be secured by collateral at least equal to 102% of the market value of domestic securities on loan (including any accrued interest thereon) and 105% of the market value of foreign securities on loan (including any accrued interest thereon). Cash collateral received by the Fund in connection with securities lending activity may be pooled together with cash collateral for other funds/portfolios advised by Credit Suisse and may be invested in a variety of investments, including certain Credit Suisse-advised funds, funds advised by SSB, the Fund's securities lending agent, or money market instruments. However, in the event of default or bankruptcy by the other party to the agreement, realization and/or retention of the collateral may be subject to legal proceedings.
SSB has been engaged by the Fund to act as the Fund's securities lending agent. The Fund's securities lending arrangement provides that the Fund and SSB will share the net income earned from securities lending activities. During the six months ended June 30, 2008, total earnings from the Fund's investment in cash collateral received in connection with securities lending arrangements was $198,882, of which $155,776 was rebated to borrowers (brokers). The Fund retained $34,430 in income from the cash collateral investment, and SSB, as lending agent, was paid $8,676. The Fund may also be entitled to certain minimum amounts of income from its securities lending activities. Securities lending income is accrued as earned.
29
Credit Suisse Large Cap Blend Fund
Notes to Financial Statements (continued)
June 30, 2008 (unaudited)
Note 3. Transactions with Affiliates and Related Parties
Credit Suisse serves as investment adviser for the Fund. For its investment advisory services, Credit Suisse is entitled to receive a fee from the Fund at an annual rate of 0.50% of the Fund's average daily net assets. For the six months ended June 30, 2008, investment advisory fees earned and voluntarily waived were $119,014 and $48,486, respectively. Fee waivers and reimbursements are voluntary and may be discontinued by Credit Suisse at any time.
Credit Suisse Asset Management Securities, Inc. ("CSAMSI"), an affiliate of Credit Suisse, and SSB serve as co-administrators to the Fund. For its co-administrative services, CSAMSI currently receives a fee calculated at an annual rate of 0.09% of the Fund's average daily net assets. For the six months ended June 30, 2008, co-administrative services fees earned by CSAMSI were $21,422.
For its co-administrative services, SSB receives a fee, exclusive of out-of-pocket expenses, calculated in total for all the Credit Suisse funds/portfolios co-administered by SSB and allocated based upon relative average net assets of each fund/portfolio, subject to an annual minimum fee. For the six months ended June 30, 2008, co-administrative services fees earned by SSB (including out-of-pocket expenses) were $6,971.
In addition to serving as the Fund's co-administrator, CSAMSI currently serves as distributor of the Fund's shares. Pursuant to distribution plans adopted by the Fund pursuant to Rule 12b-1 under the 1940 Act, CSAMSI receives fees for its distribution services. For the Common Class and Class A shares of the Fund, the fee is calculated at an annual rate of 0.25% of the average daily net assets. For Class B and Class C shares of the Fund, the fee is calculated at an annual rate of 1.00% of average daily net assets.
Certain brokers, dealers and financial representatives provide transfer agent related services to the Fund and receive compensation from Credit Suisse. Credit Suisse is then reimbursed by the Fund. For the six months ended June 30, 2008, the Fund reimbursed Credit Suisse $283 which is included in the Fund's transfer agent expense. For the six months ended June 30, 2008, CSAMSI and its affiliates advised the Fund that they retained $76 from commissions earned on the sale of the Fund's Class A shares.
Merrill Corporation ("Merrill"), an affiliate of Credit Suisse, has been engaged by the Fund to provide certain financial printing and fulfillment services. For the six months ended June 30, 2008, Merrill was paid $8,513 for its services to the Fund.
30
Credit Suisse Large Cap Blend Fund
Notes to Financial Statements (continued)
June 30, 2008 (unaudited)
Note 4. Line of Credit
The Fund, together with other funds/portfolios advised by Credit Suisse (collectively, the "Participating Funds"), participates in a $50 million committed, unsecured line of credit facility ("Credit Facility") for temporary or emergency purposes with Deutsche Bank, A.G. as administrative agent and syndication agent and SSB as operations agent. Under the terms of the Credit Facility, the Participating Funds pay an aggregate commitment fee at a rate of 0.10% per annum on the average unused amount of the Credit Facility, which is allocated among the Participating Funds in such manner as is determined by the governing Boards of the Participating Funds. In addition, the Participating Funds pay interest on borrowings at the Federal Funds rate plus 0.50%. Effective June 2008, Deutsche Bank, A.G. no longer serves as administrative agent and syndication agent to the credit facility. At June 30, 2008, and during the six months ended June 30, 2008, the Fund had no borrowings under the Credit Facility.
Note 5. Purchases and Sales of Securities
For the six months ended June 30, 2008, purchases and sales of investment securities (excluding short-term investments) were $51,863,643 and $55,619,402, respectively.
At June 30, 2008, the identified cost for federal income tax purposes, as well as the gross unrealized appreciation from investments for those securities having an excess of value over cost, gross unrealized depreciation from investments for those securities having an excess of cost over value and the net unrealized appreciation from investments were $56,533,212, $3,713,654, $(3,059,115) and $654,539, respectively.
Note 6. Capital Share Transactions
The Fund is authorized to issue six billion full and fractional shares of capital stock, $.001 par value per share. Transactions in capital shares for each class were as follows:
| Common Class | |||||||||||||||||||
| For the Six Months Ended June 30, 2008 (unaudited) | For the Year Ended December 31, 2007 | ||||||||||||||||||
| Shares | Value | Shares | Value | ||||||||||||||||
| Shares sold | 9,471 | $ | 106,163 | 16,964 | $ | 218,288 | |||||||||||||
| Shares issued in reinvestment of dividends and distributions | — | — | 17,277 | 210,141 | |||||||||||||||
| Shares redeemed | (11,974 | ) | (132,396 | ) | (49,817 | ) | (652,456 | ) | |||||||||||
| Net decrease | (2,503 | ) | $ | (26,233 | ) | (15,576 | ) | $ | (224,027 | ) | |||||||||
31
Credit Suisse Large Cap Blend Fund
Notes to Financial Statements (continued)
June 30, 2008 (unaudited)
Note 6. Capital Share Transactions
| Class A | |||||||||||||||||||
| For the Six Months Ended June 30, 2008 (unaudited) | For the Year Ended December 31, 2007 | ||||||||||||||||||
| Shares | Value | Shares | Value | ||||||||||||||||
| Shares sold | 49,772 | $ | 550,026 | 81,374 | $ | 1,065,293 | |||||||||||||
| Shares issued in reinvestment of dividends and distributions | — | — | 402,488 | 4,922,014 | |||||||||||||||
| Shares redeemed | (221,581 | ) | (2,458,746 | ) | (543,835 | ) | (7,149,355 | ) | |||||||||||
| Net decrease | (171,809 | ) | $ | (1,908,720 | ) | (59,973 | ) | $ | (1,162,048 | ) | |||||||||
| Class B | |||||||||||||||||||
| For the Six Months Ended June 30, 2008 (unaudited) | For the Year Ended December 31, 2007 | ||||||||||||||||||
| Shares | Value | Shares | Value | ||||||||||||||||
| Shares sold | 6,093 | $ | 63,867 | 7,564 | $ | 92,025 | |||||||||||||
| Shares issued in reinvestment of dividends and distributions | — | — | 28,316 | 331,808 | |||||||||||||||
| Shares redeemed | (91,459 | ) | (974,236 | ) | (173,086 | ) | (2,167,243 | ) | |||||||||||
| Net decrease | (85,366 | ) | $ | (910,369 | ) | (137,206 | ) | $ | (1,743,410 | ) | |||||||||
| Class C | |||||||||||||||||||
| For the Six Months Ended June 30, 2008 (unaudited) | For the Year Ended December 31, 2007 | ||||||||||||||||||
| Shares | Value | Shares | Value | ||||||||||||||||
| Share sold | 64 | $ | 476 | 3,468 | $ | 41,365 | |||||||||||||
| Shares issued in reinvestment of dividends and distributions | — | — | 4,553 | 53,169 | |||||||||||||||
| Shares redeemed | (6,686 | ) | (68,603 | ) | (23,385 | ) | (286,774 | ) | |||||||||||
| Net decrease | (6,622 | ) | $ | (68,127 | ) | (15,364 | ) | $ | (192,240 | ) | |||||||||
On June 30, 2008, the number of shareholders that held 5% or more of the outstanding shares of each class of the Fund was as follows:
| Number of Shareholders | Approximate Percentage of Outstanding Shares | ||||||||||
| Common Class | 3 | 38 | % | ||||||||
| Class B | 2 | 14 | % | ||||||||
| Class C | 4 | 57 | % | ||||||||
Some of the shareholders are omnibus accounts, which hold shares on behalf of individual shareholders.
32
Credit Suisse Large Cap Blend Fund
Notes to Financial Statements (continued)
June 30, 2008 (unaudited)
Note 7. Contingencies
In the normal course of business, the Fund may provide general indemnifications pursuant to certain contracts and organizational documents. The Fund's maximum exposure under these arrangements is dependent on future claims that may be made against the Fund and, therefore, cannot be estimated; however, based on experience, the risk of loss from such claims is considered remote.
Note 8. Recent Accounting Pronouncements
In March 2008, FASB issued Statement of Financial Accounting Standards No. 161, Disclosures about Derivative Instruments and Hedging Activities ("FAS 161"), an amendment of FASB Statement No. 133. FAS 161 requires enhanced disclosures about (a) how and why an entity uses derivative instruments, (b) how derivative instruments and hedging activities are accounted for, and (c) how derivative instruments and related hedging activities affect a fund's financial position, financial performance, and cash flows. Management of the Fund does not believe the adoption of FAS 161 will materially impact the financial statement amounts, but will require additional disclosures. This will include qualitative and quantitative disclosures on derivative positions existing at period end and the effect of using der ivatives during the reporting period. FAS 161 is effective for financial statements issued for fiscal years and interim periods beginning after November 15, 2008.
33
Credit Suisse Large Cap Blend Fund
Privacy Policy Notice (unaudited)
Important Privacy Choices for Consumers
We are committed to maintaining the privacy of every current and prospective customer. We recognize that you entrust important personal information to us, and we wish to assure you that we take seriously our responsibilities in protecting and safeguarding this information.
In connection with making available investment products and services to current and potential customers, we may obtain nonpublic personal information about you. This information may include your name, address, email address, social security number, account number, assets, income, financial situation, transaction history and other personal information.
We may collect nonpublic information about you from the following sources:
• Information we receive on applications, forms, questionnaires, web sites, agreements or in the course of establishing or maintaining a customer relationship; and
• Information about your transactions with us, our affiliates, or others.
We do not disclose any nonpublic personal information about our customers or former customers to anyone, except with your consent or as otherwise permitted by law.
In cases where we believe that additional products and services may be of interest to you, we may share the information described above with our affiliates.
We may also disclose this information to firms that perform services on our behalf. These agents and service providers are required to treat the information confidentially and use it only for the purpose for which it is provided.
We restrict access to nonpublic personal information about you to those employees, agents or other parties who need to know that information to provide products or services to you or in connection with your investments with or through us. We maintain physical, electronic and procedural safeguards that comply with federal standards to guard your nonpublic personal information.
Note: This Notice is provided to clients and prospective clients of Credit Suisse Asset Management, LLC ("Credit Suisse"), and Credit Suisse Asset Management Securities, Inc., and shareholders and prospective shareholders in Credit Suisse sponsored and advised investment companies, including Credit Suisse Funds, and other consumers and customers, as applicable. This Notice is not intended to be incorporated in any offering materials but is merely a statement of our current Privacy Policy, and may be amended from time to time upon notice to you. This Notice is dated as of May 13, 2008.
34
Credit Suisse Large Cap Blend Fund
Proxy Voting and Portfolio Holdings Information (unaudited)
Information regarding how the Fund voted proxies related to its portfolio securities during the 12 month period ended June 30 of each year, as well as the policies and procedures that the Fund uses to determine how to vote proxies relating to its portfolio securities are available:
• By calling 1-800-927-2874
• On the Fund's website, www.credit-suisse.com/us
• On the website of the Securities and Exchange Commission, www.sec.gov.
The Fund files a complete schedule of its portfolio holdings for the first and third quarters of its fiscal year with the SEC on Form N-Q. The Fund's Forms N-Q are available on the SEC's website at www.sec.gov and may be reviewed and copied at the SEC's Public Reference Room in Washington, DC. Information on the operation of the SEC's Public Reference Room may be obtained by calling 1-202-551-8090.
35
This page intentionally left blank

P.O. BOX 55030, BOSTON, MA 02205-5030
800-927-2874 n WWW.credit-suisse.com/us
CREDIT SUISSE ASSET MANAGEMENT SECURITIES, INC., DISTRIBUTOR. LCB-SAR-0608
Item 2. Code of Ethics.
This item is inapplicable to a semi-annual report on Form N-CSR.
Item 3. Audit Committee Financial Expert.
This item is inapplicable to a semi-annual report on Form N-CSR.
Item 4. Principal Accountant Fees and Services.
This item is inapplicable to a semi-annual report on Form N-CSR.
Item 5. Audit Committee of Listed Registrants.
This item is not applicable to the registrant.
Item 6. Schedule of Investments.
Included as part of the report to shareholders filed under Item 1 of this Form.
Item 7. Disclosure of Proxy Voting Policies and Procedures for Closed-End Management Investment Companies.
This item is not applicable to the registrant.
Item 8. Portfolio Managers of Closed-End Management Investment Companies.
This item is not applicable to the registrant.
Item 9. Purchases of Equity Securities by Closed-End Management Investment Company and Affiliated Purchasers.
This item is not applicable to the registrant.
Item 10. Submission of Matters to a Vote of Security Holders.
The Nominating Committee recommends Board member candidates. Shareholders of the registrant may also submit nominees that will be considered by the Committee. Recommendations should be mailed to the registrant’s Secretary, c/o Credit Suisse Asset Management, LLC, Eleven Madison Avenue, New York, NY 10010. Any submission should include at a minimum the following information: the name, age, business address, residence address and principal occupation or employment of such individual; the class, series and number of shares of the registrant that are beneficially owned by such individual; the date such shares were acquired and the investment intent of such acquisition; whether such shareholder believes such individual is, or is not, an “interested person” of the registrant (as defined in the Investment Company Act of 1940) and information regarding such individual that is sufficient, in the Committee’s discretion, to make such determination; and all other information relating to such individual that is required to be disclosed in solicitation of proxies for election of directors in an election contest (even if an election contest is not involved) or is otherwise required pursuant to the rules for proxy materials under the Securities Exchange Act of 1934.
Item 11. Controls and Procedures.
(a) As of a date within 90 days from the filing date of this report, the principal executive officer and principal financial officer concluded that the registrant’s disclosure controls and procedures (as defined in Rule 30a-3(c) under the Investment Company Act of 1940 (the “Act”)) were effective based on their evaluation of the disclosure controls and procedures required by Rule 30a-3(b) under the Act and Rules 13a-15(b) or 15d-15(b) under the Securities Exchange Act of 1934.
(b) There were no changes in registrant’s internal control over financial reporting (as defined in Rule 30a-3(d) under the Act) that occurred during the registrant’s last fiscal half-year that have materially affected, or are reasonably likely to materially affect, the registrant’s internal control over financial reporting.
Item 12. Exhibits.
(a)(1) Not applicable.
(a)(2) The certifications of the registrant as required by Rule 30a-2(a) under the Act are exhibits to this report.
(a)(3) Not applicable.
(b) The certifications of the registrant as required by Rule 30a-2(b) under the Act are an exhibit to this report.
SIGNATURES
Pursuant to the requirements of the Securities Exchange Act of 1934 and the Investment Company Act of 1940, the registrant has duly caused this report to be signed on its behalf by the undersigned, thereunto duly authorized.
CREDIT SUISSE LARGE CAP BLEND FUND, INC.
/s/George R. Hornig |
|
Name: George R. Hornig |
|
Title: Chief Executive Officer | |
Date: September 4, 2008 | |
Pursuant to the requirements of the Securities Exchange Act of 1934 and the Investment Company Act of 1940, this report has been signed below by the following persons on behalf of the registrant and in the capacities and on the dates indicated.
/s/George R. Hornig |
|
Name: George R. Hornig |
|
Title: Chief Executive Officer | |
Date: September 4, 2008 | |
/s/Michael A. Pignataro |
|
Name: Michael A. Pignataro |
|
Title: Chief Financial Officer | |
Date: September 4, 2008 | |