UNITED STATES
SECURITIES AND EXCHANGE COMMISSION
Washington, D.C. 20549
FORM N-CSR
CERTIFIED SHAREHOLDER REPORT OF REGISTERED MANAGEMENT
INVESTMENT COMPANIES
| Investment Company Act file number: | 811-09101 | |
| Exact name of registrant as specified in charter: | Dryden Tax-Managed Funds | |
| Address of principal executive offices: | Gateway Center 3, | |
| 100 Mulberry Street, | ||
| Newark, New Jersey 07102 | ||
| Name and address of agent for service: | Deborah A. Docs | |
| Gateway Center 3, | ||
| 100 Mulberry Street, | ||
| Newark, New Jersey 07102 | ||
| Registrant’s telephone number, including area code: | 800-225-1852 | |
| Date of fiscal year end: | 10/31/2008 | |
| Date of reporting period: | 10/31/2008 | |
Item 1 – Reports to Stockholders


| OCTOBER 31, 2008 | ANNUAL REPORT |
Dryden Large-Cap Core Equity Fund
FUND TYPE
Large-capitalization stock
OBJECTIVE
Long-term after-tax growth of capital
This report is not authorized for distribution to prospective investors unless preceded or accompanied by a current prospectus.
The views expressed in this report and information about the Fund’s portfolio holdings are for the period covered by this report and are subject to change thereafter.
JennisonDryden, Dryden, Prudential Financial and the Rock Prudential logo are registered service marks of The Prudential Insurance Company of America, Newark, NJ, and its affiliates.

December 15, 2008
Dear Shareholder:
We hope you find the annual report for the Dryden Large-Cap Core Equity Fund informative and useful. Because market volatility climbed sharply in 2008, we understand that this is a difficult time to be an investor. While it is impossible to predict what the future holds, we continue to believe a prudent response to uncertainty is to maintain a diversified portfolio, including stock and bond mutual funds consistent with your tolerance for risk, time horizon, and financial goals.
A diversified asset allocation offers two potential advantages: it limits your exposure to any particular asset class, plus it provides a better opportunity to invest some of your assets in the right place at the right time. Your financial professional can help you create a diversified investment plan that may include mutual funds covering all the basic asset classes and that reflects your personal investor profile and risk tolerance. Keep in mind that diversification and asset allocation strategies do not assure a profit or protect against loss in declining markets.
JennisonDryden Mutual Funds give you a wide range of choices that can help you make progress toward your financial goals. Our funds offer the experience, resources, and professional discipline of four leading asset managers. JennisonDryden equity funds are advised by Jennison Associates LLC, Quantitative Management Associates LLC (QMA), or PREI® (Prudential Real Estate Investors). Prudential Investment Management, Inc. (PIM) advises the JennisonDryden fixed income and money market funds through its unit Prudential Fixed Income Management. Jennison Associates, QMA, and PIM are registered investment advisers and Prudential Financial companies. PREI is a unit of PIM.
Thank you for choosing JennisonDryden Mutual Funds.
Sincerely,

Judy A. Rice, President
Dryden Large-Cap Core Equity Fund
| Dryden Large-Cap Core Equity Fund | 1 |
Your Fund’s Performance
Fund objective
The investment objective of the Dryden Large-Cap Core Equity Fund is long-term after-tax growth of capital. There can be no assurance that the Fund will achieve its investment objective.
Performance data quoted represent past performance. Past performance does not guarantee future results. The investment return and principal value of an investment will fluctuate, so that an investor’s shares, when redeemed, may be worth more or less than their original cost. Current performance may be lower or higher than the past performance data quoted. An investor may obtain performance data as of the most recent month-end by visiting our website at www.jennisondryden.com or by calling (800) 225-1852. Class A and Class L shares have a maximum initial sales charge of 5.50% and 5.75%, respectively. Gross operating expenses: Class A, 1.36%; Class B, 2.06%; Class C, 2.06%; Class L, 1.56%; Class M, 2.06%; Class X, 1.38%; Class Z, 1.06%. Net operating expenses apply to: Class A, 1.34%; Class B, 2.06%; Class C, 2.06%; Class L, 1.56%; Class M, 2.06%; Class X, 1.38%; Class Z, 1.06%, after contractual reduction through 2/28/2008.
| Cumulative Total Returns as of 10/31/08 | |||||||||
| One Year | Five Years | Since Inception1 | |||||||
Class A | –36.75 | % | 0.68 | % | –4.66 | % | |||
Class B | –37.22 | –2.98 | –11.23 | ||||||
Class C | –37.22 | –2.98 | –11.23 | ||||||
Class L | –36.94 | N/A | –28.93 | ||||||
Class M | –37.22 | N/A | –29.49 | ||||||
Class X | –36.51 | N/A | –28.70 | ||||||
Class Z | –36.64 | 1.91 | –2.27 | ||||||
S&P 500 Index2 | –36.08 | 1.31 | ** | ||||||
Lipper Large-Cap Core Funds Avg.3 | –36.22 | –1.50 | *** | ||||||
| 2 | Visit our website at www.jennisondryden.com |
| Average Annual Total Returns4 as of 9/30/08 | |||||||||
| One Year | Five Years | Since Inception1 | |||||||
Class A | –26.62 | % | 3.94 | % | 0.85 | % | |||
Class B | –26.79 | 4.15 | 0.70 | ||||||
Class B—Return After Taxes on Distribution | –26.80 | 4.15 | 0.70 | ||||||
Class B—Return After Taxes on | –17.39 | 3.57 | 0.60 | ||||||
Class C | –23.64 | 4.34 | 0.71 | ||||||
Class L | –26.99 | N/A | –13.03 | ||||||
Class M | –27.49 | N/A | –12.99 | ||||||
Class X | –27.01 | N/A | –12.62 | ||||||
Class Z | –22.17 | 5.36 | 1.71 | ||||||
S&P 500 Index2 | –21.96 | 5.17 | ** | ||||||
Lipper Large-Cap Core Funds Avg.3 | –21.95 | 4.30 | *** | ||||||
The cumulative total returns do not reflect the deduction of applicable sales charges. If reflected, the applicable sales charges would reduce the cumulative total returns performance quoted. The average annual total returns assume the payment of the maximum applicable sales charge. Class A shares and Class L shares are subject to a maximum front-end sales charge of 5.50% and 5.75%, respectively. Under certain circumstances, Class A shares may be subject to a contingent deferred sales charge (CDSC) of 1%. Class B, Class C, Class L, Class M, and Class X shares are subject to a maximum CDSC of 5%, 1%, 1%, 6%, and 6%, respectively. Class Z shares are not subject to a sales charge.
Source: Prudential Investments LLC and Lipper Inc. Performance figures may reflect fee waivers and/or expense reimbursements. In the absence of such fee waivers and/or expense reimbursements, total returns would be lower.
1Inception dates: Class A, Class B, Class C, and Class Z, 3/3/1999; Class L, Class M, and Class X, 3/19/2007. The Since Inception returns for the S&P 500 Index and the Lipper Large-Cap Core Funds Average (Lipper Average) are measured from the closest month-end to inception date, and not from the Fund’s actual inception date.
2The S&P 500 Index is an unmanaged index of 500 stocks of large U.S. public companies. It gives a broad look at how U.S. stock prices have performed.
3The Lipper Average represents returns based on an average return of all funds in the Lipper Large-Cap Core Funds category for the periods noted. Funds in the Lipper Average invest at least 75% of their equity assets in companies with market capitalizations (on a three-year weighted basis) greater than 300% of the dollar-weighted median market capitalization of the middle 1,000 securities of the S&P SuperComposite 1500 Index. Large-cap core funds have wide latitude in the companies in which they invest. These funds typically have a below-average price-to-earnings ratio, price-to-book ratio, and three-year sales-per-share growth value compared with the S&P 500 Index.
4The average annual total returns take into account applicable sales charges. Class A, Class B, Class C, Class L, Class M, and Class X shares are subject to an annual distribution and service (12b-1) fee of up to 0.30%, 1.00%, 1.00%, 0.50%, 1.00%, and 1.00%, respectively. Approximately seven years after purchase, Class B shares will automatically convert to Class A shares on a quarterly basis. Class Z shares are not subject
| Dryden Large-Cap Core Equity Fund | 3 |
Your Fund’s Performance (continued)
to a 12b-1 fee. The returns in the tables do not reflect the deduction of taxes that a shareholder would pay on Fund distributions or following the redemption of Fund shares.
**S&P 500 Index Closest Month-End to Inception cumulative total returns as of 10/31/08 are –8.12% for Class A, Class B, Class C, and Class Z; and –29.59% for Class L, Class M, and Class X. S&P 500 Index Closest Month-End to Inception average annual total returns as of 9/30/08 are 1.04% for Class A, Class B, Class C, and Class Z; and –10.54% for Class L, Class M, and Class X.
***Lipper Average Closest Month-End to Inception cumulative total returns as of 10/31/08 are –7.60% for Class A, Class B, Class C, and Class Z; and –29.61% for Class L, Class M, and Class X. Lipper Average Closest Month-End to Inception average annual total returns as of 9/30/08 are 0.87% for Class A, Class B, Class C, and Class Z; and –10.63% for Class L, Class M, and Class X.
Investors cannot invest directly in an index. The returns for the S&P 500 Index and the Lipper Average would be lower if they included the effects of sales charges, operating expenses of a mutual fund, or taxes. Returns for the Lipper Average reflect the deduction of operating expenses of a mutual fund, but not sales charges or taxes.
| Five Largest Holdings* expressed as a percentage of net assets as of 10/31/08 | |||
Exxon Mobil Corp., Oil, Gas & Consumable Fuels | 4.4 | % | |
Procter & Gamble Co., Household Products | 2.8 | ||
Chevron Corp., Oil, Gas & Consumable Fuels | 2.3 | ||
Microsoft Corp., Software | 2.1 | ||
Johnson & Johnson, Pharmaceuticals | 1.9 |
* Excludes securities purchased with cash received as a result of securities on loan.
Holdings are subject to change.
| Five Largest Sectors expressed as a percentage of net assets as of 10/31/08 | |||
Information Technology | 16.3 | % | |
Healthcare | 14.9 | ||
Financials | 13.4 | ||
Energy | 12.7 | ||
Consumer Staples | 12.0 |
Industry weightings are subject to change.
| 4 | Visit our website at www.jennisondryden.com |
Strategy and Performance Overview
How did the Fund perform?
The Dryden Large-Cap Core Equity Fund Class A shares declined 36.75% for the 12-month reporting period ended October 31, 2008, which was slightly more than the 36.08% decline of the benchmark S&P 500 Index and the 36.22% decline of the Lipper Large-Cap Core Funds Average.
How is the Fund managed?
Quantitative Management Associates LLC (QMA) actively manages the Fund using a quantitative process designed to identify attractive opportunities among stocks of both slow-growing and fast-growing companies. Valuation is one of the factors emphasized for slow-growing companies, and news is one of the factors emphasized for fast-growing companies.
Changes to the quantitative model occasionally occur as a result of ongoing research. All research must have solid theoretical underpinnings and undergo extensive testing before being included in the model. Initially, ideas are typically tested separately and then combined with other model parameters in simulations. New concepts are also typically tested side by side with the existing model in real-time monitoring before being fully included in the process. QMA also takes into consideration the tax consequences of trading on the portfolio.
What were conditions like in the U.S. stock market?
The environment for investing in stocks deteriorated as rising delinquencies and foreclosures on subprime mortgages in the United States caused commercial banks, Wall Street firms, and savings and loan institutions to take huge write-downs and losses related to the risky home loans. Banks grew increasingly reluctant to lend to each other, to businesses, and to consumers. Concern that the credit crisis would harm the broader economy had prompted the Federal Reserve (the Fed) to lower short-term interest rates twice shortly before the reporting period began. During the reporting period, the Fed tried to stimulate growth and calm financial markets by repeatedly cutting its target for the federal funds rate on overnight loans between banks, lowering the key rate from 4.50% to 1.00%. Yet a government report showed the U.S. economy contracted during the July–September 2008 period as consumer spending declined for the first time in 17 years.
The Fed also took unusual steps to support the nation’s financial system. For example, the Fed facilitated the hurried purchase of Bear Stearns Cos. at a deep discount by J.P. Morgan Chase & Co. as the former neared collapse in March 2008. Indeed, the events of September 2008 signaled an end to the era of large, independent Wall Street investment banks. Bank of America agreed to purchase Merrill Lynch & Co.,
| Dryden Large-Cap Core Equity Fund | 5 |
Strategy and Performance Overview (continued)
and Barclays Capital purchased some of Lehman Brothers Holdings Inc.’s North American businesses after it declared bankruptcy. The Fed allowed Morgan Stanley and Goldman Sachs Group, Inc. to become traditional bank holding companies.
During September 2008, the Treasury Department initially proposed a $700 billion bailout plan to purchase distressed mortgage-related assets from some financial institutions in order to free up banks to resume normal lending. A revised version of the plan that also called for directly injecting capital into the banking sector was signed into law in October 2008. (The plan continues to be revised.)
How did different sectors of the U.S. stock market perform?
All ten sectors of the S&P 500 Index ended the reporting period with double-digit losses. Four of the sectors—consumer staples, healthcare, utilities, and energy—outperformed the S&P 500 Index. Consumer staples posted the smallest loss, as it includes businesses such as food, beverage, and tobacco that tend to hold up relatively well during challenging economic times. The energy sector initially performed well, as the price of crude oil soared above $140 per barrel in July. But the energy sector finished in negative territory as a deteriorating outlook for global economic growth sent commodities prices tumbling, including crude oil, which ended the reporting period at about $67 per barrel. The remaining six sectors—telecommunications services, materials, information technology, industrials, consumer discretionary, and financials—underperformed the S&P 500 Index. Not surprisingly, the beleaguered financials sector posted the largest loss, down more than 50% for the reporting period.
Among rapidly growing companies, which stocks or related group of stocks contributed the most and detracted the most from the Fund’s return?
Among faster-growing companies, the news factor performed well. This helped the Fund to hold stocks with positive news, which in the difficult market environment generally meant shares that declined less than the overall market. Examples included Express Scripts (–4%) and QUALCOMM (–9%). Compared to the S&P 500 Index, the Fund also had underweight exposures to stocks such as Google (–49%), which had deteriorating news.
Among slowly growing companies, which stocks or related group of stocks contributed the most and detracted the most from the Fund’s return?
Among slower-growing companies, the performance of the valuation factors was mixed. The Fund benefited from having overweight exposures to Chevron (+14%) and Johnson & Johnson (+0.34%) compared with the S&P 500 Index. However, having overweight positions in certain financial stocks, such as Allstate (–48%) and Sunstone Hotel Investors (–74%), hurt the Fund’s performance.
| 6 | Visit our website at www.jennisondryden.com |
Fees and Expenses (Unaudited)
As a shareholder of the Fund, you incur two types of costs: (1) transaction costs, including sales charges (loads) on purchase payments and redemptions, as applicable, and (2) ongoing costs, including management fees, distribution and/or service (12b-1) fees, and other Fund expenses, as applicable. This example is intended to help you understand your ongoing costs (in dollars) of investing in the Fund and to compare these costs with the ongoing costs of investing in other mutual funds.
The example is based on an investment of $1,000 invested on May 1, 2008, at the beginning of the period, and held through the six-month period ended October 31, 2008. The example is for illustrative purposes only; you should consult the Prospectus for information on initial and subsequent minimum investment requirements.
The Fund’s transfer agent may charge additional fees to holders of certain accounts that are not included in the expenses shown in the table on the following page. These fees apply to individual retirement accounts (IRAs) and Section 403(b) accounts. As of the close of the six-month period covered by the table, IRA fees included an annual maintenance fee of $15 per account (subject to a maximum annual maintenance fee of $25 for all accounts held by the same shareholder). Section 403(b) accounts are charged an annual $25 fiduciary maintenance fee. Some of the fees may vary in amount, or may be waived, based on your total account balance or the number of JennisonDryden funds, including the Fund, that you own. You should consider the additional fees that were charged to your Fund account over the six-month period when you estimate the total ongoing expenses paid over the period and the impact of these fees on your ending account value, as these additional expenses are not reflected in the information provided in the expense table. Additional fees have the effect of reducing investment returns.
Actual Expenses
The first line for each share class in the table on the following page provides information about actual account values and actual expenses. You may use the information on this line, together with the amount you invested, to estimate the expenses that you paid over the period. Simply divide your account value by $1,000 (for example, an $8,600 account value ÷ $1,000 = 8.6), then multiply the result by the number on the first line under the heading “Expenses Paid During the Six-Month Period” to estimate the expenses you paid on your account during this period.
Hypothetical Example for Comparison Purposes
The second line for each share class in the table on the following page provides information about hypothetical account values and hypothetical expenses based on the Fund’s actual expense ratio and an assumed rate of return of 5% per year before
| Dryden Large-Cap Core Equity Fund | 7 |
Fees and Expenses (continued)
expenses, which is not the Fund’s actual return. The hypothetical account values and expenses may not be used to estimate the actual ending account balance or expenses you paid for the period. You may use this information to compare the ongoing costs of investing in the Fund and other funds. To do so, compare this 5% hypothetical example with the 5% hypothetical examples that appear in the shareholder reports of the other funds.
Please note that the expenses shown in the table are meant to highlight your ongoing costs only and do not reflect any transactional costs such as sales charges (loads). Therefore, the second line for each share class in the table is useful in comparing ongoing costs only and will not help you determine the relative total costs of owning different funds. In addition, if these transactional costs were included, your costs would have been higher.
| Dryden Large-Cap Core Equity Fund | Beginning Account Value May 1, 2008 | Ending Account Value October 31, 2008 | Annualized Expense Ratio Based on the Six-Month Period | Expenses Paid During the Six-Month Period* | ||||||||||
| Class A | Actual | $ | 1,000.00 | $ | 710.40 | 1.41 | % | $ | 6.06 | |||||
| Hypothetical | $ | 1,000.00 | $ | 1,018.05 | 1.41 | % | $ | 7.15 | ||||||
| Class B | Actual | $ | 1,000.00 | $ | 707.90 | 2.11 | % | $ | 9.06 | |||||
| Hypothetical | $ | 1,000.00 | $ | 1,014.53 | 2.11 | % | $ | 10.68 | ||||||
| Class C | Actual | $ | 1,000.00 | $ | 707.90 | 2.11 | % | $ | 9.06 | |||||
| Hypothetical | $ | 1,000.00 | $ | 1,014.53 | 2.11 | % | $ | 10.68 | ||||||
| Class L | Actual | $ | 1,000.00 | $ | 709.40 | 1.61 | % | $ | 6.92 | |||||
| Hypothetical | $ | 1,000.00 | $ | 1,017.04 | 1.61 | % | $ | 8.16 | ||||||
| Class M | Actual | $ | 1,000.00 | $ | 707.90 | 2.11 | % | $ | 9.06 | |||||
| Hypothetical | $ | 1,000.00 | $ | 1,014.53 | 2.11 | % | $ | 10.68 | ||||||
| Class X | Actual | $ | 1,000.00 | $ | 715.90 | 1.36 | % | $ | 5.87 | |||||
| Hypothetical | $ | 1,000.00 | $ | 1,018.30 | 1.36 | % | $ | 6.90 | ||||||
| Class Z | Actual | $ | 1,000.00 | $ | 711.50 | 1.11 | % | $ | 4.78 | |||||
| Hypothetical | $ | 1,000.00 | $ | 1,019.56 | 1.11 | % | $ | 5.63 | ||||||
* Fund expenses (net of fee waivers or subsidies, if any) for each share class are equal to the annualized expense ratio for each share class (provided in the table), multiplied by the average annual account value over the period, multiplied by the 184 days in the six-month period ended October 31, 2008, and divided by the 366 days in the Fund’s fiscal year ended October 31, 2008 (to reflect the six-month period). Expenses presented in the table include the expenses of any underlying portfolios in which the Fund may invest.
| 8 | Visit our website at www.jennisondryden.com |
Portfolio of Investments
as of October 31, 2008
| Shares | Description | Value (Note 1) | |||
LONG-TERM INVESTMENTS 97.5% | |||||
COMMON STOCKS | |||||
CONSUMER DISCRETIONARY 6.4% | |||||
Diversified Consumer Services 0.4% | |||||
| 6,000 | Apollo Group Inc., (Class A)(a) | $ | 417,060 | ||
| 8,400 | Jackson Hewitt Tax Service, Inc. | 115,752 | |||
| 20,900 | Service Corp. International | 144,210 | |||
| 677,022 | |||||
Hotels, Restaurants & Leisure 1.6% | |||||
| 1,700 | California Pizza Kitchen, Inc.(a) | 16,609 | |||
| 40,900 | Carnival Corp.(b) | 1,038,860 | |||
| 22,500 | McDonald’s Corp. | 1,303,425 | |||
| 12,600 | YUM! Brands, Inc. | 365,526 | |||
| 2,724,420 | |||||
Household Durables 0.2% | |||||
| 14,100 | Leggett & Platt, Inc. | 244,776 | |||
Media 1.4% | |||||
| 59,400 | DIRECTV Group, Inc. (The)(a)(b) | 1,300,266 | |||
| 23,500 | Gannett Co., Inc.(b) | 258,500 | |||
| 1,500 | Meredith Corp. | 29,055 | |||
| 16,400 | Time Warner, Inc. | 165,476 | |||
| 25,360 | Walt Disney Co. (The) | 656,824 | |||
| 2,410,121 | |||||
Multiline Retail 0.8% | |||||
| 29,000 | 99 Cents Only Stores Inc.(a) | 353,800 | |||
| 13,700 | Big Lots, Inc.(a)(b) | 334,691 | |||
| 13,200 | J.C. Penney Co., Inc.(b) | 315,744 | |||
| 8,700 | Kohl’s Corp.(a) | 305,631 | |||
| 1,309,866 | |||||
Specialty Retail 0.8% | |||||
| 17,400 | Gap, Inc. (The) | 225,156 | |||
| 16,600 | Home Depot, Inc. | 391,594 | |||
| 11,200 | Rent-A-Center, Inc.(a) | 163,520 | |||
| 19,800 | TJX Cos., Inc. (The)(b) | 529,848 | |||
| 1,310,118 | |||||
See Notes to Financial Statements.
| Dryden Large-Cap Core Equity Fund | 9 |
Portfolio of Investments
as of October 31, 2008 continued
| Shares | Description | Value (Note 1) | |||
COMMON STOCKS (Continued) | |||||
CONSUMER DISCRETIONARY (Continued) | |||||
Textiles, Apparel & Luxury Goods 1.2% | |||||
| 30,200 | Coach, Inc.(a) | $ | 622,120 | ||
| 35,900 | Jones Apparel Group, Inc. | 398,849 | |||
| 5,200 | Polo Ralph Lauren Corp. | 245,284 | |||
| 94,400 | Liz Claiborne, Inc.(b) | 769,360 | |||
| 2,035,613 | |||||
CONSUMER STAPLES 12.0% | |||||
Beverages 2.0% | |||||
| 2,200 | Anheuser-Busch Cos., Inc. | 136,466 | |||
| 46,200 | Coca-Cola Co. (The) | 2,035,572 | |||
| 22,200 | Coca-Cola Enterprises, Inc. | 223,110 | |||
| 3,000 | PepsiAmericas, Inc. | 56,790 | |||
| 17,394 | PepsiCo, Inc. | 991,632 | |||
| 3,443,570 | |||||
Food & Staples Retailing 2.9% | |||||
| 19,100 | Kroger Co. (The) | 524,486 | |||
| 30,000 | Safeway, Inc. | 638,100 | |||
| 39,200 | SYSCO Corp. | 1,027,040 | |||
| 46,970 | Wal-Mart Stores, Inc. | 2,621,396 | |||
| 4,811,022 | |||||
Food Products 0.5% | |||||
| 11,438 | Archer-Daniels-Midland Co.(b) | 237,110 | |||
| 6,000 | ConAgra Foods, Inc. | 104,520 | |||
| 2,100 | General Mills, Inc. | 142,254 | |||
| 12,030 | Kraft Foods, Inc. (Class A) | 350,554 | |||
| 834,438 | |||||
Household Products 4.3% | |||||
| 24,370 | Colgate-Palmolive Co. | 1,529,461 | |||
| 18,400 | Kimberly-Clark Corp. | 1,127,736 | |||
| 72,564 | Procter & Gamble Co.(b) | 4,683,280 | |||
| 7,340,477 | |||||
Tobacco 2.3% | |||||
| 70,200 | Altria Group, Inc. | 1,347,138 | |||
| 37,900 | Philip Morris International, Inc. | 1,647,513 | |||
See Notes to Financial Statements.
| 10 | Visit our website at www.jennisondryden.com |
| Shares | Description | Value (Note 1) | |||
COMMON STOCKS (Continued) | |||||
CONSUMER STAPLES (Continued) | |||||
Tobacco (cont’d.) | |||||
| 16,400 | Reynolds American, Inc. | $ | 802,944 | ||
| 3,797,595 | |||||
ENERGY 12.7% | |||||
Energy Equipment & Services 1.7% | |||||
| 3,500 | Complete Production Services(a) | 43,365 | |||
| 17,200 | ENSCO International, Inc. | 653,772 | |||
| 25,800 | Halliburton Co. | 510,582 | |||
| 25,800 | Noble Corp. | 831,018 | |||
| 4,200 | Pride International, Inc.(a) | 78,918 | |||
| 10,900 | Schlumberger, Ltd. | 562,985 | |||
| 2,200 | SEACOR Holdings, Inc.(a)(b) | 147,774 | |||
| 2,828,414 | |||||
Oil, Gas & Consumable Fuels 11.0% | |||||
| 7,300 | Apache Corp. | 601,009 | |||
| 52,784 | Chevron Corp. | 3,937,686 | |||
| 1,000 | Clayton Williams Energy, Inc.(a) | 48,430 | |||
| 46,000 | ConocoPhillips | 2,392,920 | |||
| 6,700 | Devon Energy Corp. | 541,762 | |||
| 100,774 | Exxon Mobil Corp. | 7,469,369 | |||
| 2,700 | Gulfport Energy Corp.(a) | 19,035 | |||
| 50,600 | Marathon Oil Corp. | 1,472,460 | |||
| 17,100 | Occidental Petroleum Corp. | 949,734 | |||
| 800 | Overseas Shipholding Group, Inc. | 30,064 | |||
| 6,800 | Peabody Energy Corp. | 234,668 | |||
| 8,600 | Sunoco, Inc. | 262,300 | |||
| 26,600 | Valero Energy Corp. | 547,428 | |||
| 18,506,865 | |||||
FINANCIALS 13.4% | |||||
Capital Markets 1.9% | |||||
| 12,200 | Charles Schwab Corp. (The) | 233,264 | |||
| 12,280 | Goldman Sachs Group, Inc. (The) | 1,135,900 | |||
| 21,100 | Merrill Lynch & Co., Inc.(b) | 392,249 | |||
| 27,000 | Morgan Stanley(b) | 471,690 | |||
| 21,500 | State Street Corp. | 932,025 | |||
| 3,165,128 | |||||
See Notes to Financial Statements.
| Dryden Large-Cap Core Equity Fund | 11 |
Portfolio of Investments
as of October 31, 2008 continued
| Shares | Description | Value (Note 1) | |||
COMMON STOCKS (Continued) | |||||
FINANCIALS (Continued) | |||||
Commercial Banks 3.1% | |||||
| 6,600 | Huntington Bancshares, Inc.(b) | $ | 62,370 | ||
| 14,900 | Oriental Financial Group, Inc. | 241,976 | |||
| 8,500 | PNC Financial Services Group, Inc. (The) | 566,695 | |||
| 92,500 | Regions Financial Corp. | 1,025,825 | |||
| 19,591 | U.S. Bancorp. | 584,008 | |||
| 39,900 | Wachovia Corp.(b) | 255,759 | |||
| 24,600 | Webster Financial Corp. | 456,084 | |||
| 58,220 | Wells Fargo & Co.(b) | 1,982,391 | |||
| 5,175,108 | |||||
Consumer Finance 1.3% | |||||
| 35,800 | American Express Co. | 984,500 | |||
| 15,100 | Capital One Financial Corp. | 590,712 | |||
| 46,400 | Discover Financial Services | 568,400 | |||
| 2,143,612 | |||||
Diversified Financial Services 3.1% | |||||
| 95,233 | Bank of America Corp. | 2,301,782 | |||
| 3,100 | CIT Group, Inc.(b) | 12,834 | |||
| 37,000 | Citigroup, Inc. | 505,050 | |||
| 61,100 | JPMorgan Chase & Co. | 2,520,375 | |||
| 5,340,041 | |||||
Insurance 3.3% | |||||
| 6,300 | Allied World Assurance Co. | 202,041 | |||
| 36,400 | Allstate Corp. (The) | 960,596 | |||
| 11,100 | American Physicians Capital Inc.(b) | 454,101 | |||
| 7,100 | Endurance Specialty Holdings, Ltd. | 214,704 | |||
| 2,300 | Genworth Financial, Inc. (Class A) | 11,132 | |||
| 19,300 | Hartford Financial Services Group, Inc. | 199,176 | |||
| 4,600 | IPC Holdings, Ltd. | 127,006 | |||
| 4,667 | Loews Corp. | 154,991 | |||
| 4,500 | MetLife, Inc. | 149,490 | |||
| 23,600 | Montpelier Re Holdings, Ltd. | 337,716 | |||
| 33,700 | Platinum Underwriters Holdings, Ltd. | 1,069,638 | |||
| 37,697 | Travelers Cos., Inc. (The) | 1,604,007 | |||
| 11,700 | XL Capital, Ltd. (Class A) (Bermuda) | 113,490 | |||
| 5,598,088 | |||||
See Notes to Financial Statements.
| 12 | Visit our website at www.jennisondryden.com |
| Shares | Description | Value (Note 1) | |||
COMMON STOCKS (Continued) | |||||
FINANCIALS (Continued) | |||||
Real Estate Investment Trusts 0.6% | |||||
| 28,400 | Brandywine Realty Trust | $ | 245,376 | ||
| 9,300 | CBL & Associates Properties, Inc.(b) | 85,839 | |||
| 15,900 | Lexington Corporate Properties Trust(b) | 127,677 | |||
| 17,300 | Pennsylvania Real Estate Investment Trust(b) | 218,845 | |||
| 600 | Simon Property Group, Inc.(b) | 40,218 | |||
| 40,400 | Sunstone Hotel Investors, Inc. | 264,620 | |||
| 982,575 | |||||
Real Estate Management & Development 0.1% | |||||
| 14,100 | C.B. Richard Ellis Group, Inc.(a)(b) | 98,841 | |||
HEALTHCARE 14.9% | |||||
Biotechnology 1.2% | |||||
| 30,900 | Amgen, Inc.(a)(b) | 1,850,601 | |||
| 4,800 | Biogen Idec, Inc.(a) | 204,240 | |||
| 2,054,841 | |||||
Healthcare Equipment & Supplies 3.5% | |||||
| 3,600 | Alcon, Inc. | 317,232 | |||
| 12,500 | Baxter International, Inc. | 756,125 | |||
| 19,500 | Becton, Dickinson & Co. | 1,353,300 | |||
| 76,000 | Boston Scientific Corp.(a) | 686,280 | |||
| 20,900 | Covidien, Ltd. | 925,661 | |||
| 46,000 | Medtronic, Inc. | 1,855,180 | |||
| 5,893,778 | |||||
Healthcare Providers & Services 1.8% | |||||
| 7,900 | Aetna, Inc. | 196,473 | |||
| 2,200 | CIGNA Corp. | 35,860 | |||
| 22,200 | Express Scripts, Inc.(a)(b) | 1,345,542 | |||
| 25,600 | Humana, Inc.(a) | 757,504 | |||
| 21,800 | UnitedHealth Group, Inc. | 517,314 | |||
| 2,200 | WellPoint, Inc.(a) | 85,514 | |||
| 2,938,207 | |||||
Life Sciences, Tools & Services 0.3% | |||||
| 13,100 | Charles River Laboratories International, Inc.(a) | 469,373 | |||
See Notes to Financial Statements.
| Dryden Large-Cap Core Equity Fund | 13 |
Portfolio of Investments
as of October 31, 2008 continued
| Shares | Description | Value (Note 1) | |||
COMMON STOCKS (Continued) | |||||
HEALTHCARE (Continued) | |||||
Pharmaceuticals 8.1% | |||||
| 11,100 | Abbott Laboratories | $ | 612,165 | ||
| 11,000 | Allergan, Inc.(b) | 436,370 | |||
| 94,000 | Bristol-Myers Squibb Co. | 1,931,700 | |||
| 34,800 | Eli Lilly & Co. | 1,176,936 | |||
| 3,200 | Forest Laboratories, Inc.(a) | 74,336 | |||
| 53,299 | Johnson & Johnson | 3,269,361 | |||
| 112,400 | King Pharmaceuticals, Inc.(a) | 987,996 | |||
| 8,600 | Medicines Co.(a)(b) | 149,898 | |||
| 51,000 | Merck & Co., Inc. | 1,578,450 | |||
| 102,710 | Pfizer, Inc. | 1,818,994 | |||
| 13,100 | Warner Chilcott, Ltd. (Class A)(a) | 181,697 | |||
| 45,000 | Wyeth | 1,448,100 | |||
| 13,666,003 | |||||
INDUSTRIALS 12.0% | |||||
Aerospace/Defense 4.1% | |||||
| 14,800 | Boeing Co. | 773,596 | |||
| 23,500 | General Dynamics Corp. | 1,417,520 | |||
| 15,800 | Honeywell International, Inc. | 481,110 | |||
| 7,300 | Lockheed Martin Corp. | 620,865 | |||
| 28,000 | Northrop Grumman Corp. | 1,312,920 | |||
| 27,500 | Raytheon Co. | 1,405,525 | |||
| 15,000 | United Technologies Corp. | 824,400 | |||
| 6,835,936 | |||||
Air Freight & Logistics | |||||
| 900 | United Parcel Service, Inc. (Class B) | 47,502 | |||
Building Products 0.1% | |||||
| 3,700 | NCI Buildings Systems, Inc.(a)(b) | 68,857 | |||
Commercial Services & Supplies 0.3% | |||||
| 17,200 | GeoEye, Inc.(a)(b) | 372,208 | |||
| 3,300 | Waste Management, Inc. | 103,059 | |||
| 475,267 | |||||
Construction & Engineering 0.3% | |||||
| 4,500 | Fluor Corp. | 179,685 | |||
See Notes to Financial Statements.
| 14 | Visit our website at www.jennisondryden.com |
| Shares | Description | Value (Note 1) | |||
COMMON STOCKS (Continued) | |||||
INDUSTRIALS (Continued) | |||||
Construction & Engineering (cont’d.) | |||||
| 7,500 | Jacobs Engineering Group, Inc.(a) | $ | 273,225 | ||
| 452,910 | |||||
Electrical Equipment 0.9% | |||||
| 38,300 | Emerson Electric Co.(b) | 1,253,559 | |||
| 8,900 | II-VI, Inc.(a) | 250,001 | |||
| 1,503,560 | |||||
Industrial Conglomerates 2.4% | |||||
| 151,200 | General Electric Co. | 2,949,912 | |||
| 46,200 | Tyco International, Ltd. (Bermuda) | 1,167,936 | |||
| 4,117,848 | |||||
Machinery 1.3% | |||||
| 11,900 | Bucyrus International Inc. (Class A) | 287,147 | |||
| 15,100 | Caterpillar, Inc.(b) | 576,367 | |||
| 32,400 | Cummins, Inc. | 837,540 | |||
| 11,900 | Deere & Co. | 458,864 | |||
| 6,500 | Titan International, Inc. | 75,140 | |||
| 2,235,058 | |||||
Road & Rail 2.6% | |||||
| 3,000 | Burlington Northern Santa Fe Corp. | 267,180 | |||
| 30,200 | CSX Corp. | 1,380,744 | |||
| 24,600 | Norfolk Southern Corp. | 1,474,524 | |||
| 13,400 | Ryder System, Inc. | 530,908 | |||
| 11,500 | Union Pacific Corp. | 767,855 | |||
| 4,421,211 | |||||
INFORMATION TECHNOLOGY 16.3% | |||||
Communications Equipment 3.0% | |||||
| 7,200 | Avocent Corp.(a) | 108,144 | |||
| 84,050 | Cisco Systems, Inc.(a) | 1,493,569 | |||
| 38,300 | Corning, Inc. | 414,789 | |||
| 21,900 | Harris Corp. | 787,305 | |||
| 3,400 | PC-Tel, Inc. | 19,958 | |||
| 59,300 | QUALCOMM, Inc. | 2,268,818 | |||
| 5,092,583 | |||||
See Notes to Financial Statements.
| Dryden Large-Cap Core Equity Fund | 15 |
Portfolio of Investments
as of October 31, 2008 continued
| Shares | Description | Value (Note 1) | |||
COMMON STOCKS (Continued) | |||||
INFORMATION TECHNOLOGY (Continued) | |||||
Computers & Peripherals 5.4% | |||||
| 6,890 | Apple, Inc.(a) | $ | 741,295 | ||
| 110,000 | Dell, Inc.(a)(b) | 1,336,500 | |||
| 21,500 | EMC Corp.(a) | 253,270 | |||
| 74,625 | Hewlett-Packard Co. | 2,856,645 | |||
| 30,170 | International Business Machines Corp. | 2,804,905 | |||
| 8,600 | Lexmark International, Inc.(a)(b) | 222,138 | |||
| 11,200 | NCR Corp.(a) | 204,736 | |||
| 2,400 | Network Appliance, Inc.(a) | 32,472 | |||
| 26,400 | QLogic Corp.(a)(b) | 317,328 | |||
| 11,200 | Synaptics, Inc.(a)(b) | 345,968 | |||
| 9,115,257 | |||||
Electronic Equipment & Instruments 0.2% | |||||
| 4,300 | Daktronics, Inc.(b) | 42,828 | |||
| 3,600 | Radisys Corp.(a)(b) | 22,932 | |||
| 18,500 | Tyco Electronics, Ltd. (Bermuda) | 359,640 | |||
| 425,400 | |||||
Internet Software & Services 0.7% | |||||
| 42,000 | EarthLink, Inc.(a) | 289,800 | |||
| 13,800 | eBay, Inc.(a) | 210,726 | |||
| 1,800 | Google, Inc. (Class A)(a) | 646,848 | |||
| 1,147,374 | |||||
IT Services 1.1% | |||||
| 13,000 | Accenture, Ltd. | 429,650 | |||
| 36,500 | Automatic Data Processing, Inc. | 1,275,675 | |||
| 5,300 | Integral Systems, Inc. | 130,221 | |||
| 1,835,546 | |||||
Office Electronics | |||||
| 8,100 | Xerox Corp. | 64,962 | |||
Semiconductors & Semiconductor Equipment 2.5% | |||||
| 64,300 | Broadcom Corp.(a) | 1,098,244 | |||
| 124,000 | Intel Corp.(b) | 1,984,000 | |||
| 12,300 | LSI Logic Corp.(a)(b) | 47,355 | |||
| 51,800 | National Semiconductor Corp. | 682,206 | |||
See Notes to Financial Statements.
| 16 | Visit our website at www.jennisondryden.com |
| Shares | Description | Value (Note 1) | |||
COMMON STOCKS (Continued) | |||||
INFORMATION TECHNOLOGY (Continued) | |||||
Semiconductors & Semiconductor Equipment (cont’d.) | |||||
| 6,000 | Silicon Laboratories, Inc.(a) | $ | 155,760 | ||
| 23,600 | Volterra Semiconductor Corp.(a)(b) | 222,784 | |||
| 4,190,349 | |||||
Software 3.4% | |||||
| 25,800 | Adobe Systems, Inc.(a) | 687,312 | |||
| 9,600 | CA, Inc. | 170,880 | |||
| 159,800 | Microsoft Corp.(b) | 3,568,334 | |||
| 16,100 | Oracle Corp.(a) | 294,469 | |||
| 77,200 | Symantec Corp.(a) | 971,176 | |||
| 5,692,171 | |||||
MATERIALS 2.0% | |||||
Chemicals 1.3% | |||||
| 7,200 | Air Products & Chemicals, Inc. | 418,536 | |||
| 4,500 | CF Industries Holding, Inc. | 288,855 | |||
| 10,800 | Dow Chemical Co. (The) | 288,036 | |||
| 11,100 | E.I. du Pont de Nemours & Co. | 355,200 | |||
| 3,000 | Mosaic Co. (The) | 118,230 | |||
| 11,300 | OM Group, Inc.(a) | 241,142 | |||
| 18,900 | Terra Industries, Inc. | 415,611 | |||
| 2,125,610 | |||||
Construction Materials 0.1% | |||||
| 20,600 | Headwaters, Inc.(a) | 218,360 | |||
Metals & Mining 0.6% | |||||
| 8,900 | Allegheny Technologies, Inc. | 236,206 | |||
| 40,000 | Century Aluminum Co.(a) | 502,800 | |||
| 30,500 | Steel Dynamics, Inc. | 363,560 | |||
| 1,102,566 | |||||
TELECOMMUNICATION SERVICES 3.4% | |||||
Diversified Telecommunication Services 3.4% | |||||
| 96,168 | AT&T, Inc. | 2,574,417 | |||
| 1,100 | Embarq Corp. | 33,000 | |||
| 1,700 | NTELOS Holdings Corp. | 44,200 | |||
See Notes to Financial Statements.
| Dryden Large-Cap Core Equity Fund | 17 |
Portfolio of Investments
as of October 31, 2008 continued
| Shares | Description | Value (Note 1) | |||
COMMON STOCKS (Continued) | |||||
TELECOMMUNICATION SERVICES (Continued) | |||||
Diversified Telecommunication Services (cont’d.) | |||||
| 88,900 | Verizon Communications, Inc. | $ | 2,637,663 | ||
| 59,900 | Windstream Corp. | 449,849 | |||
| 5,739,129 | |||||
UTILITIES 4.4% | |||||
Electric Utilities 2.4% | |||||
| 21,600 | American Electric Power Co., Inc. | 704,808 | |||
| 29,800 | Edison International | 1,060,582 | |||
| 8,500 | Entergy Corp. | 663,425 | |||
| 11,900 | Exelon Corp. | 645,456 | |||
| 10,900 | FirstEnergy Corp. | 568,544 | |||
| 1,300 | FPL Group, Inc. | 61,412 | |||
| 49,600 | Sierra Pacific Resources | 411,184 | |||
| 4,115,411 | |||||
Multi-Utilities 2.0% | |||||
| 2,700 | Ameren Corp. | 87,615 | |||
| 52,100 | Centerpoint Energy, Inc. | 600,192 | |||
| 19,900 | Dominion Resources, Inc. | 721,972 | |||
| 45,500 | NiSource, Inc. | 589,680 | |||
| 40,100 | Public Service Enterprise Group, Inc. | 1,128,815 | |||
| 5,300 | Sempra Energy | 225,727 | |||
| 3,354,001 | |||||
Total long-term investments | 164,176,780 | ||||
| Principal Amount (000) | |||||
SHORT-TERM INVESTMENTS 16.8% | |||||
United States Government Security 0.2% | |||||
| $ 405,000 | United States Treasury Bill 0.67%, 12/18/2008(c)(d) | 404,781 | |||
See Notes to Financial Statements.
| 18 | Visit our website at www.jennisondryden.com |
| Shares | Description | Value (Note 1) | ||||
Affiliated Money Market Mutual Fund 16.6% | ||||||
| 27,914,468 | Dryden Core Investment Fund-Taxable Money Market Series | $ | 27,914,468 | |||
Total short-term investments | 28,319,249 | |||||
Total Investments 114.3% | 192,496,029 | |||||
Liabilities in excess of other assets(g) (14.3%) | (24,057,973 | ) | ||||
Net Assets 100.0% | $ | 168,438,056 | ||||
| (a) | Non-income producing security. |
| (b) | All or a portion of security is on loan. The aggregate market value of such securities is $23,102,582; cash collateral of $23,770,858 (included in liabilities) was received with which the Fund purchased highly liquid short-term investments. |
| (c) | All or a portion of security segregated as collateral for financial futures contracts. |
| (d) | Rate quoted represents yield-to-maturity as of purchase date. |
| (e) | Represents security, or portion thereof, purchased with the cash collateral received for securities on loan. |
| (f) | Prudential Investments LLC, the manager of the Fund, also serves as the manager of the Dryden Core Investment Fund-Taxable Money Market Series. |
| (g) | Liabilities in excess of other assets include net unrealized appreciation on financial futures as follows: |
Open futures contracts outstanding at October 31, 2008:
| Number of Contracts | Type | Expiration Date | Value at October 31, 2008 | Value at Trade Date | Unrealized Appreciation | ||||||||
| Long Positions: | |||||||||||||
| 15 | S&P 500 Index | Dec. 2008 | $ | 3,627,375 | $ | 3,442,750 | $ | 184,625 | |||||
The industry classification of portfolio holdings and liabilities in excess of other assets shown as a percentage of net assets as of October 31, 2008 was as follows:
Affiliated Money Market Mutual Fund (including 14.1% of collateral received for securities on loan) | 16.6 | % | |
Information Technology | 16.3 | ||
Healthcare | 14.9 | ||
Financials | 13.4 | ||
Energy | 12.7 | ||
Consumer Staples | 12.0 | ||
Industrials | 12.0 | ||
Consumer Discretionary | 6.4 |
See Notes to Financial Statements.
| Dryden Large-Cap Core Equity Fund | 19 |
Portfolio of Investments
as of October 31, 2008 continued
Utilities | 4.4 | % | |
Telecommunication Services | 3.4 | ||
Materials | 2.0 | ||
United States Government Security | 0.2 | ||
| 114.3 | |||
Liabilities in excess of other assets | (14.3 | ) | |
| 100.0 | % | ||
See Notes to Financial Statements.
| 20 | Visit our website at www.jennisondryden.com |
Financial Statements
| OCTOBER 31, 2008 | ANNUAL REPORT |
Dryden Large-Cap Core Equity Fund
Statement of Assets and Liabilities
as of October 31, 2008
Assets | ||||
Investments at value, including securities on loan of $23,102,582: | ||||
Unaffiliated Investments (cost $173,260,355) | $ | 164,581,561 | ||
Affiliated Investments (cost $27,914,468) | 27,914,468 | |||
Cash | 31,157 | |||
Receivable for Fund shares sold | 413,353 | |||
Dividends and interest receivable | 272,247 | |||
Due from broker-variation margin | 26,000 | |||
Prepaid expenses | 4,394 | |||
Reclaim receivable | 1,806 | |||
Total assets | 193,244,986 | |||
Liabilities | ||||
Payable to broker for collateral for securities on loan (Note 3) | 23,770,858 | |||
Payable for Fund shares reacquired | 557,003 | |||
Accrued expenses | 138,099 | |||
Management fee payable | 91,527 | |||
Payable to Class X shareholders | 83,076 | |||
Distribution fee payable | 68,475 | |||
Affiliated transfer agent fee payable | 60,843 | |||
Payable to broker | 31,861 | |||
Deferred trustees’ fees | 5,188 | |||
Total liabilities | 24,806,930 | |||
Net Assets | $ | 168,438,056 | ||
Net assets were comprised of: | ||||
Shares of beneficial interest, at par | $ | 18,324 | ||
Paid-in capital in excess of par | 217,468,312 | |||
| 217,486,636 | ||||
Undistributed net investment income | 946,925 | |||
Accumulated net realized loss on investment transactions | (41,501,336 | ) | ||
Net unrealized depreciation investments | (8,494,169 | ) | ||
Net assets, October 31, 2008 | $ | 168,438,056 | ||
See Notes to Financial Statements.
| 22 | Visit our website at www.jennisondryden.com |
Class A | |||
Net asset value and redemption price per share | $ | 9.32 | |
Maximum sales charge (5.50% of offering price) | .54 | ||
Maximum offering price to public | $ | 9.86 | |
Class B | |||
Net asset value, offering price and redemption price per share | $ | 8.87 | |
Class C | |||
Net asset value, offering price and redemption price per share | $ | 8.87 | |
Class L | |||
Net asset value, offering price and redemption price per share | $ | 9.30 | |
Class M | |||
Net asset value, offering price and redemption price per share | $ | 8.87 | |
Class X | |||
Net asset value, offering price and redemption price per share | $ | 8.97 | |
Class Z | |||
Net asset value, offering price and redemption price per share | $ | 9.47 | |
See Notes to Financial Statements.
| Dryden Large-Cap Core Equity Fund | 23 |
Statement of Operations
Year Ended October 31, 2008
Net Investment Income | ||||
Income | ||||
Unaffiliated dividends (net of foreign withholding taxes of $1,853) | $ | 4,794,579 | ||
Affiliated income from securities loaned, net | 160,248 | |||
Affiliated dividend income | 84,549 | |||
Miscellaneous income | 8,093 | |||
Interest | 3,671 | |||
Total income | 5,051,140 | |||
Expenses | ||||
Management fee | 1,433,599 | |||
Distribution fee—Class A | 265,071 | |||
Distribution fee—Class B | 166,896 | |||
Distribution fee—Class C | 457,128 | |||
Distribution fee—Class L | 49,283 | |||
Distribution fee—Class M | 292,893 | |||
Distribution fee—Class X | 15,112 | |||
Transfer agent’s fees and expenses (including affiliated expenses of $228,200)(Note 3) | 416,000 | |||
Legal fees and expenses | 228,000 | |||
Registration fees | 65,000 | |||
Reports to shareholders | 60,000 | |||
Custodian’s fees and expenses | 54,000 | |||
Audit fee | 21,000 | |||
Trustees’ fees | 16,000 | |||
Loan interest expense (Note 7) | 4,477 | |||
Insurance | 4,000 | |||
Miscellaneous | 28,374 | |||
Total expenses | 3,576,833 | |||
Net investment income | 1,474,307 | |||
Realized And Unrealized Gain (Loss) On Investments | ||||
Net realized loss on: | ||||
Investment transactions | (15,222,704 | ) | ||
Financial futures transactions | (1,308,128 | ) | ||
| (16,530,832 | ) | |||
Net change in unrealized appreciation (depreciation) on: | ||||
Investments | (81,652,811 | ) | ||
Financial futures contracts | 128,400 | |||
| (81,524,411 | ) | |||
Net loss on investments | (98,055,243 | ) | ||
Net Decrease In Net Assets Resulting From Operations | $ | (96,580,936 | ) | |
See Notes to Financial Statements.
| 24 | Visit our website at www.jennisondryden.com |
Statement of Changes in Net Assets
| Year Ended October 31, | ||||||||
| 2008 | 2007 | |||||||
Increase (Decrease) In Net Assets | ||||||||
Operations | ||||||||
Net investment income | $ | 1,474,307 | $ | 770,669 | ||||
Net realized gain (loss) on investment transactions | (16,530,832 | ) | 20,798,022 | |||||
Net change in unrealized appreciation (depreciation) on investments | (81,524,411 | ) | 14,131,647 | |||||
Net increase (decrease) in net assets resulting from operations | (96,580,936 | ) | 35,700,338 | |||||
Dividends from net investment income (Note 1) | ||||||||
Class A | (822,096 | ) | (386,156 | ) | ||||
Class B | (17,208 | ) | — | |||||
Class C | (43,824 | ) | — | |||||
Class L | (68,350 | ) | — | |||||
Class M | (31,326 | ) | — | |||||
Class X | (21,753 | ) | (31,738 | ) | ||||
Class Z | (227,524 | ) | (134,402 | ) | ||||
| (1,232,081 | ) | (552,296 | ) | |||||
Capital contributions | ||||||||
Class X | 6,011 | 12,104 | ||||||
Fund share transactions (Net of share conversions) (Note 6) | ||||||||
Net proceeds from shares sold | 57,343,679 | 18,378,389 | ||||||
Net asset value of shares issued in connection with merger (Note 8) | — | 105,958,479 | ||||||
Net asset value of shares issued in reinvestment of dividends | 1,123,511 | 484,943 | ||||||
Cost of shares reacquired | (69,840,426 | ) | (49,371,066 | ) | ||||
Net increase (decrease) in net assets from Fund share transactions | (11,373,236 | ) | 75,450,745 | |||||
Total increase (decrease) | (109,180,242 | ) | 110,610,891 | |||||
Net Assets | ||||||||
Beginning of year | 277,618,298 | 167,007,407 | ||||||
End of year(a) | $ | 168,438,056 | $ | 277,618,298 | ||||
(a) Includes undistributed net investment income of: | $ | 946,925 | $ | 700,992 | ||||
See Notes to Financial Statements.
| Dryden Large-Cap Core Equity Fund | 25 |
Notes to Financial Statements
Dryden Large-Cap Core Equity Fund (the “Fund”) is a series of Dryden Tax-Managed Funds (the “Trust”), which is registered under the Investment Company Act of 1940, as amended, as a diversified, open-end management investment company. The Trust was organized as a business trust in Delaware on September 18, 1998. The Fund commenced investment operations on March 3, 1999.
The Fund’s investment objective is to seek long-term after-tax growth of capital. It invests in a portfolio of equity-related securities, such as common stock and convertible securities of U.S. companies.
Note 1. Accounting Policies
The following is a summary of significant accounting policies followed by the Fund in the preparation of its financial statements.
Securities Valuation: Securities listed on a securities exchange (other than options on securities and indices) are valued at the last sale price on such exchange on the day of valuation or, if there was no sale on such day, at the mean between the last reported bid and asked prices, or at the last bid price on such day in the absence of an asked price. Securities traded via Nasdaq are valued at the Nasdaq official closing price (NOCP) on the day of valuation, or if there was no NOCP, at the last sale price. Securities that are actively traded in the over-the-counter market, including listed securities for which the primary market is believed by Prudential Investments LLC (“PI” or “Manager”), in consultation with the subadvisers, to be over-the-counter, are valued at market value using prices provided by an independent pricing agent or principal market maker. Options on securities and indices traded on an exchange are valued at the last sale price as of the close of trading on the applicable exchange or, if there was no sale, at the mean between the most recently quoted bid and asked prices on such exchange. Futures contracts and options thereon traded on a commodities exchange or board of trade are valued at the last sale price at the close of trading on such exchange or board of trade or, if there was no sale on the applicable commodities exchange or board of trade on such day, at the mean between the most recently quoted bid and asked prices on such exchange or board of trade or at the last bid price in the absence of an asked price. Prices may be obtained from independent pricing services which use information provided by market makers or estimates of market values obtained from yield data relating to investments or securities with similar characteristics. Securities for which reliable market quotations
| 26 | Visit our website at www.jennisondryden.com |
are not readily available, or whose values have been affected by events occurring after the close of the security’s foreign market and before the Funds’ normal pricing time, are valued at fair value in accordance with the Board of Trustees approved fair valuation procedures. When determining the fair valuation of securities some of the factors influencing the valuation include, the nature of any restrictions on disposition of the securities; assessment of the general liquidity of the securities; the issuer’s financial condition and the markets in which it does business; the cost of the investment; the size of the holding and the capitalization of issuer; the prices of any recent transactions or bids/offers for such securities or any comparable securities; any available analyst media or other reports or information deemed reliable by the investment adviser regarding the issuer or the markets or industry in which it operates. Using fair value to price securities may result in a value that is different from a security’s most recent closing price and from the price used by other mutual funds to calculate their net asset values.
Investments in mutual funds are valued at their net asset value as of the close of the New York Stock Exchange on the date of valuation.
Short-term debt securities which mature in 60 days or less are valued at amortized cost, which approximates market value. The amortized cost method includes valuing a security at its cost on the date of purchase and thereafter assuming a constant amortization to maturity of the difference between the principal amount due at maturity and cost. Short-term debt securities which mature in more than 60 days are valued at current market quotations.
Securities Lending: The Fund may lend its portfolio securities to broker-dealers. The loans are secured by collateral at least equal at all times to the market value of the securities loaned. Loans are subject to termination at the option of the borrower or the Fund. Upon termination of the loan, the borrower will return to the Fund securities identical to the loaned securities. Should the borrower of the securities fail financially, the Fund has the right to repurchase the securities using the collateral in the open market. The Fund recognizes income, net of any rebate and securities lending agent fees, for lending its securities in the form of fees or interest on the investment of any cash received as collateral. The Fund also continues to receive interest and dividends or amounts equivalent thereto, on the securities loaned and recognizes any unrealized gain or loss in the market price of the securities loaned that may occur during the term of the loan.
Financial Futures Contracts: A financial futures contract is an agreement to purchase (long) or sell (short) an agreed amount of securities at a set price for delivery on a future date. Upon entering into a financial futures contract, the Fund is required to
| Dryden Large-Cap Core Equity Fund | 27 |
Notes to Financial Statements
continued
pledge to the broker an amount of cash and/or other assets equal to a certain percentage of the contract amount. This amount is known as the “initial margin”.
Subsequent payments, known as “variation margin”, are made or received by the Fund each day, depending on the daily fluctuations in the value of the underlying security. Such variation margin is recorded for financial statement purposes on a daily basis as unrealized gain or loss. When the contract expires or is closed, the gain or loss is realized and is presented in the Statement of Operations as net realized gain or loss on financial futures transactions.
The Fund invests in financial futures contracts in order to hedge its existing portfolio securities, or securities the Fund intends to purchase, against fluctuations in value caused by changes in prevailing interest rates or market conditions. Should interest rates move unexpectedly, the Fund may not achieve the anticipated benefits of the financial futures contracts and may realize a loss. The use of futures transactions involves the risk of imperfect correlation in movements in the price of futures contracts, interest rates and the underlying hedged assets.
Financial futures contracts involve elements of both market and credit risk in excess of the amounts reflected on the Statement of Assets and Liabilities.
Securities Transactions and Net Investment Income: Securities transactions are recorded on the trade date. Realized gains or losses on sales of securities are calculated on an identified cost basis. Dividend income is recorded on the ex-dividend date and interest income, including amortization of premium and accretion of discount on debt securities, as required, is recorded on an accrual basis. Expenses are recorded on the accrual basis. Net investment income or loss (other than distribution fees which are charged directly to the respective class) and unrealized and realized gains or losses are allocated daily to each class of shares based upon the relative proportion of net assets of each class at the beginning of the day.
Dividends and Distributions: The Fund expects to pay dividends of net investment income and distributions of net realized capital gains, if any, annually. Dividends and distributions to shareholders, which are determined in accordance with federal income tax regulations and which may differ from generally accepted accounting principles, are recorded on the ex-dividend date. Permanent book/tax differences relating to income and gains are reclassified amongst undistributed net investment income, accumulated net realized gain or loss and paid-capital in excess of par, as appropriate.
| 28 | Visit our website at www.jennisondryden.com |
Taxes: For federal income tax purposes, it is the Fund’s policy to continue to meet the requirements of the Internal Revenue Code applicable to regulated investment companies and to distribute all of its taxable net investment income and capital gains, if any, to shareholders. Therefore, no federal income tax provision is required.
Withholding taxes on foreign dividends are recorded net of reclaimable amounts, at the time related income is earned.
Estimates: The preparation of the financial statements requires management to make estimates and assumptions that affect the reported amounts and disclosures in the financial statements. Actual results could differ from those estimates.
Note 2. Agreements
The Trust has a management agreement for the Fund with PI. Pursuant to this agreement, PI has responsibility for all investment advisory services and supervises the subadviser’s performance of such services. PI has entered into a subadvisory agreement with Quantitative Management Associates LLC (“QMA”). The subadvisory agreement provides that QMA furnishes investment advisory services in connection with the management of the Fund. PI pays for the services of QMA, the cost of compensation of officers of the Fund, occupancy and certain clerical and bookkeeping costs of the Fund. The Fund bears all other costs and expenses.
The management fee paid to PI is computed daily and payable monthly at an annual rate of .65 of 1% of the average daily net assets of the Fund up to and including $500 million and .60 of 1% of such assets in excess of $500 million. The effective management fee rate was .65 of 1% for the year ended October 31, 2008.
The Fund has a distribution agreement with Prudential Investment Management Services LLC (“PIMS”), which acts as the distributor of the Class A, Class B, Class C, Class L, Class M, Class X and Class Z shares. The Fund compensates PIMS for distributing and servicing the Fund’s Class A, Class B, Class C, Class L, Class M, and Class X shares, pursuant to plans of distribution (the “Class A, B, C, L, M and X Plans”), regardless of expenses actually incurred. The distribution fees are accrued daily and payable monthly. No distribution or service fees are paid to PIMS as distributor of the Class Z shares of the fund.
Pursuant to the Class A, B, C, L, M, and X Plans, the Fund compensates PIMS for distribution related activities at an annual rate of up to .30 of 1%, 1%, 1%, .50 of 1%, 1% and 1% of the average daily net assets of the Class A, B, C, L, M and X shares,
| Dryden Large-Cap Core Equity Fund | 29 |
Notes to Financial Statements
continued
respectively. PIMS contractually agreed to limit such fees to .25 of 1% of the average daily net assets of the Class A shares through February 28, 2008. The effective distribution fee rate for Class A was .28% for the year ended October 31, 2008.
Management determined that Class X shareholders had been charged sales charges in excess of regulatory limits. The manager has agreed to pay for the overcharge. This amount is reflected as a reduction to current distribution expense and a contribution to capital. The impact of this matter has been reflected in the Statement of Changes in Net Assets and in the Financial Highlights for the year ended October 31, 2007.
PIMS has advised the Fund that it received approximately $41,200 in front-end sales charges resulting from sales of Class A shares during the year ended October 31, 2008. From these fees, PIMS paid such sales charges to affiliated broker-dealers, which in turn paid commissions to salespersons and incurred other distribution costs.
PIMS has advised the Fund that for the year ended October 31, 2008, it received approximately $200, $28,100, $1,000, $69,500 and $8,500 in contingent deferred sales charges imposed upon certain redemptions by Class A, B, C, M and X shareholders, respectively.
PI, QMA and PIMS are indirect, wholly-owned subsidiaries of Prudential Financial, Inc. (“Prudential”).
Note 3. Other Transactions with Affiliates
Prudential Mutual Fund Services LLC (“PMFS”), an affiliate of PI and an indirect, wholly-owned subsidiary of Prudential, serves as the Fund’s transfer agent. Transfer agent fees and expenses in the Statement of Operations include certain out-of-pocket expenses paid to non-affiliates, where applicable.
The Fund pays networking fees to affiliated and unaffiliated broker/dealers including fees relating to the services of Wachovia Securities, LLC (“Wachovia”) and First Clearing, LLC (“First Clearing”), affiliates of PI. These networking fees are payments made to broker/dealers that clear mutual fund transactions through a national clearing system. For the year ended October 31, 2008, the Fund incurred approximately $102,100 in total networking fees of which $33,800 was paid to First Clearing. These amounts are included in transfer agent’s fees and expenses in the Statement of Operations.
| 30 | Visit our website at www.jennisondryden.com |
Prudential Investment Management, Inc., (“PIM”), an indirect, wholly-owned subsidiary of Prudential, is the Fund’s security lending agent. For the year ended October 31, 2008, PIM has been compensated in the amount of approximately $68,800 for these services.
As a result of the bankruptcy filing by Lehman Brothers Holdings Inc., which was the parent company to the Portfolios’ Securities Lending Counter Party, Lehman Brothers Inc. (Lehman), the Portfolios’ Securities Lending Agent utilized collateral held on behalf of the Portfolios for securities out on loan to compensate the Portfolios for the failure of Lehman to return the securities.
The Fund invests in the Taxable Money Market Series (the “Portfolio”), a portfolio of Dryden Core Investment Fund, formerly Prudential Core Investment Fund. The Portfolio is a money market mutual fund registered under the Investment Company Act of 1940, as amended, and managed by PI.
Note 4. Portfolio Securities
Purchases and sales of investment securities, other than short-term investments, for the years ended October 31, 2008 were $211,913,581 and $226,247,578, respectively.
Note 5. Distributions and Tax Information
In order to present undistributed net investment income, accumulated net realized loss on investment transactions and paid-in capital in excess of par on the Statement of Assets and Liabilities that more closely represent their tax character, certain adjustments have been made to paid-in-capital in excess of par and undistributed net investment income. For the fiscal year ended October 31, 2008, the adjustments were to increase accumulated net investment income by $3,707 and to increase paid-in-capital in excess of par by $6,254 due to other book to tax differences. Net investment income, net realized loss and net assets were not affected by this change.
The tax character of dividends paid as reflected in the Statement of Changes in Net Assets were $1,215,145 and $520,558 of ordinary income for the years ended October 31, 2008 and October 31, 2007, respectively.
As of October 31, 2008, the accumulated undistributed income on a tax basis was $952,113 of ordinary income.
| Dryden Large-Cap Core Equity Fund | 31 |
Notes to Financial Statements
continued
The United States federal income tax basis of the Fund’s investments and the net unrealized appreciation as of October 31, 2008 were as follows:
Tax Basis of | Appreciation | Depreciation | Net | |||
| $202,060,624 | $18,877,409 | $(28,442,004) | $(9,564,595) |
The difference between book basis and tax basis is primarily attributable to deferred losses on wash sales and Lehman Brothers securities adjustments.
As of October 31, 2008, the Fund had a capital loss carryforward for tax purposes of approximately $40,431,000 of which $3,978,000 expires in 2009, $10,798,000 expires in 2010, $9,526,000 expires in 2011 and $16,129,000 expires in 2016. Certain portions of the capital loss carryforward were assumed by the Fund as a result of an acquisition. Utilization of these capital loss carryforwards may be limited in accordance with income tax regulations.
Management has analyzed the Fund’s tax positions taken on federal income tax returns for all open tax years and has concluded that as of October 31, 2008, no provision for income tax would be required in the Trust’s financial statements. The Trust’s federal and state income and federal excise tax returns for tax years for which the applicable statutes of limitations have not expired are subject to examination by the Internal Revenue Service and state departments of revenue.
Note 6. Capital
The Fund offers Class A, Class B, Class C, Class L, Class M, Class X and Class Z shares. Class A and Class L shares are sold with a front-end sales charge of up to 5.50% and 5.75%, respectively. All investors who purchase Class A or Class L shares in an amount of $1 million or more and sell these shares within 12 months of purchase are subject to a contingent deferred sales charge (CDSC) of 1%, including investors who purchase their shares through broker-dealers affiliated with Prudential. Class B shares are sold with a contingent deferred sales charge which declines from 5% to zero depending on the period of time the shares are held. Class M and Class X shares are sold with a contingent deferred sales charge which declines from 6% to zero depending on the period of time the shares are held. Class C shares are sold with
| 32 | Visit our website at www.jennisondryden.com |
a contingent deferred sales charge of 1% during the first 12 months. Class B shares automatically convert to Class A shares on a quarterly basis approximately seven years after purchase. A special exchange privilege is also available for shareholders who qualified to purchase Class A shares at net asset value. Class M and Class X shares will automatically convert to Class A shares approximately eight and ten years after purchase, respectively. Class L shares are closed to most new purchases (with the exception of reinvested dividends). Class M and Class X shares are closed to new initial purchases. Class L, Class M and Class X shares are only available through exchanges from the same class of shares of certain other JennisonDryden funds. Class Z shares are not subject to any sales or redemption charge and are offered exclusively for sale to a limited group of investors. The Fund has authorized an unlimited number of shares of beneficial interest at $.001 par value.
Class A | Shares | Amount | |||||
Year ended October 31, 2008: | |||||||
Shares sold | 640,405 | $ | 7,836,999 | ||||
Shares issued in reinvestment of dividends | 52,403 | 747,266 | |||||
Shares reacquired | (1,716,167 | ) | (21,260,802 | ) | |||
Net increase (decrease) in shares outstanding before conversion | (1,023,359 | ) | (12,676,537 | ) | |||
Shares issued upon conversion from Class B, M, X | 968,613 | 12,470,671 | |||||
Net increase (decrease) in shares outstanding | (54,746 | ) | $ | (205,866 | ) | ||
Year ended October 31, 2007: | |||||||
Shares sold | 600,181 | $ | 8,371,488 | ||||
Shares issued in connection with the merger | 1,107,054 | 14,562,579 | |||||
Shares issued in reinvestment of dividends | 26,556 | 352,926 | |||||
Shares reacquired | (1,189,982 | ) | (16,596,752 | ) | |||
Net increase (decrease) in shares outstanding before conversion | 543,809 | 6,690,241 | |||||
Shares issued upon conversion from Class B, M, X | 1,001,384 | 13,720,848 | |||||
Net increase (decrease) in shares outstanding | 1,545,193 | $ | 20,411,089 | ||||
Class B | |||||||
Year ended October 31, 2008: | |||||||
Shares sold | 105,932 | $ | 1,250,364 | ||||
Shares issued in reinvestment of dividends | 1,184 | 16,163 | |||||
Shares reacquired | (316,494 | ) | (3,752,853 | ) | |||
Net increase (decrease) in shares outstanding before conversion | (209,378 | ) | (2,486,326 | ) | |||
Shares reacquired upon conversion into Class A | (505,228 | ) | (6,288,027 | ) | |||
Net increase (decrease) in shares outstanding | (714,606 | ) | $ | (8,774,353 | ) | ||
Year ended October 31, 2007: | |||||||
Shares sold | 110,442 | $ | 1,475,183 | ||||
Shares issued in connection with the merger | 278,311 | 3,502,003 | |||||
Shares reacquired | (480,842 | ) | (6,369,235 | ) | |||
Net increase (decrease) in shares outstanding before conversion | (92,089 | ) | (1,392,049 | ) | |||
Shares reacquired upon conversion into Class A | (910,024 | ) | (11,839,799 | ) | |||
Net increase (decrease) in shares outstanding | (1,002,113 | ) | $ | (13,231,848 | ) | ||
| Dryden Large-Cap Core Equity Fund | 33 |
Notes to Financial Statements
continued
Class C | Shares | Amount | |||||
Year ended October 31, 2008: | |||||||
Shares sold | 135,120 | $ | 1,539,107 | ||||
Shares issued in reinvestment of dividends | 2,995 | 40,883 | |||||
Shares reacquired | (786,590 | ) | (9,281,100 | ) | |||
Net increase (decrease) in shares outstanding | (648,475 | ) | $ | (7,701,110 | ) | ||
Year ended October 31, 2007: | |||||||
Shares sold | 139,680 | $ | 1,860,461 | ||||
Shares issued in connection with the merger | 1,427,213 | 17,970,752 | |||||
Shares reacquired | (678,996 | ) | (9,044,597 | ) | |||
Net increase (decrease) in shares outstanding | 887,897 | $ | 10,786,616 | ||||
Class L | |||||||
Year ended October 31, 2008: | |||||||
Shares sold | 5,006 | $ | 64,752 | ||||
Shares issued in reinvestment of dividends | 4,635 | 66,100 | |||||
Shares reacquired | (226,564 | ) | (2,846,577 | ) | |||
Net increase (decrease) in shares outstanding | (216,923 | ) | $ | (2,715,725 | ) | ||
Period ended October 31, 2007:* | |||||||
Shares sold | 3,311 | $ | 48,374 | ||||
Shares issued in connection with the merger | 1,071,340 | 14,097,719 | |||||
Shares reacquired | (200,470 | ) | (2,852,245 | ) | |||
Net increase (decrease) in shares outstanding | 874,181 | $ | 11,293,848 | ||||
Class M | |||||||
Year ended October 31, 2008: | |||||||
Shares sold | 33,336 | $ | 426,150 | ||||
Shares issued in reinvestment of dividends | 1,737 | 23,711 | |||||
Shares reacquired | (824,322 | ) | (9,893,962 | ) | |||
Net increase (decrease) in shares outstanding before conversion | (789,249 | ) | (9,444,101 | ) | |||
Shares reacquired upon conversion into Class A | (506,567 | ) | (6,139,481 | ) | |||
Net increase (decrease) in shares outstanding | (1,295,816 | ) | $ | (15,583,582 | ) | ||
Period ended October 31, 2007:* | |||||||
Shares sold | 89,964 | $ | 1,229,556 | ||||
Shares issued in connection with the merger | 3,927,001 | 49,438,293 | |||||
Shares reacquired | (847,645 | ) | (11,508,209 | ) | |||
Net increase (decrease) in shares outstanding before conversion | 3,169,320 | 39,159,640 | |||||
Shares reacquired upon conversion into Class A | (134,556 | ) | (1,846,980 | ) | |||
Net increase (decrease) in shares outstanding | 3,034,764 | $ | 37,312,660 | ||||
| 34 | Visit our website at www.jennisondryden.com |
Class X | Shares | Amount | |||||
Year ended October 31, 2008: | |||||||
Shares sold | 6,932 | $ | 109,549 | ||||
Shares issued in reinvestment of dividends | 350 | 4,781 | |||||
Shares reacquired | (139,626 | ) | (1,698,250 | ) | |||
Net increase (decrease) in shares outstanding before conversion | (132,344 | ) | (1,583,920 | ) | |||
Shares reacquired upon conversion into Class A | (3,678 | ) | (43,163 | ) | |||
Net increase (decrease) in shares outstanding | (136,022 | ) | $ | (1,627,083 | ) | ||
Period ended October 31, 2007:* | |||||||
Shares sold | 35,454 | $ | 479,686 | ||||
Shares issued in connection with the merger | 507,290 | 6,387,133 | |||||
Shares reacquired | (95,980 | ) | (1,304,145 | ) | |||
Net increase (decrease) in shares outstanding before conversion | 446,764 | 5,562,674 | |||||
Shares reacquired upon conversion into Class A | (2,471 | ) | (34,069 | ) | |||
Net increase (decrease) in shares outstanding | 444,293 | $ | 5,528,605 | ||||
Class Z | |||||||
Year ended October 31, 2008: | |||||||
Shares sold | 3,954,028 | $ | 46,116,758 | ||||
Shares issued in reinvestment of dividends | 15,533 | 224,607 | |||||
Shares reacquired | (1,692,540 | ) | (21,106,882 | ) | |||
Net increase (decrease) in shares outstanding | 2,277,021 | $ | 25,234,483 | ||||
Year ended October 31, 2007: | |||||||
Shares sold | 349,848 | $ | 4,913,641 | ||||
Shares issued in reinvestment of dividends | 9,801 | 132,017 | |||||
Shares reacquired | (116,973 | ) | (1,695,883 | ) | |||
Net increase (decrease) in shares outstanding | 242,676 | $ | 3,349,775 | ||||
| * | Commenced operations on March 16, 2007. |
Note 7. Borrowing
The Trust, along with other affiliated registered investment companies (the “Funds”), is a party to a Syndicated Credit Agreement (“SCA”) with two banks. The SCA provides for a commitment of $500 million. Interest on any borrowings under the SCA is incurred at contracted market rates and a commitment fee for the unused amount is accrued daily and paid quarterly. Effective October 24, 2008, the Funds renewed SCA with the banks. The commitment under the renewed SCA continues to be $500 million. The Funds pay a commitment fee of .13 of 1% of the unused portion of the renewed SCA. The expiration date of the renewed SCA will be October 23, 2009. For the period from October 26, 2007 through October 23, 2008, the Funds paid a commitment fee of .06 of 1% of the unused portion of the agreement. The
| Dryden Large-Cap Core Equity Fund | 35 |
Notes to Financial Statements
continued
purpose of the SCA is to provide an alternative source of temporary funding for capital share redemptions.
The Trust utilized the SCA during the year ended October 31, 2008. The average daily balance for the 4 days the Trust had an outstanding balance was $15,204,000 at a weighted average interest rate of approximately 2.65%.
Note 8. Reorganization
On March 16, 2007, the Fund acquired all of the net assets of Strategic Partners Large Cap Core Fund pursuant to a plan of reorganization approved by the Strategic Partners Large Cap Core Fund shareholders on December 14, 2006. The acquisition was accomplished by a tax-free issue of Class A, Class B, Class C, Class L, Class M and Class X shares for the corresponding classes of Strategic Partners Large Cap Core Fund.
Strategic Partners Large Cap Core Fund | Dryden Large-Cap Core Equity Fund | ||||||||
Class | Shares | Shares | Value | ||||||
A | 1,371,165 | 1,107,054 | $ | 14,562,579 | |||||
B | 339,013 | 278,311 | 3,502,003 | ||||||
C | 1,739,666 | 1,427,213 | 17,970,752 | ||||||
L | 1,332,488 | 1,071,340 | 14,097,719 | ||||||
M | 4,785,895 | 3,927,001 | 49,438,293 | ||||||
X | 620,110 | 507,218 | 6,387,133 | ||||||
The aggregate net assets and unrealized appreciation of Strategic Partners Large Cap Core Fund immediately before the acquisition was $105,958,479 and $22,791,596, respectively. The aggregate net assets of Dryden Large-Cap Core Equity Fund immediately before the acquisition was $165,372,366.
The Fund acquired capital loss carryforward from the reorganization with Strategic Partners Large Cap Core Fund in the amount of $16,056,580 (amount included in Note 5). The future utilization of the acquired capital loss carryforwards may be limited under certain conditions defined in the Internal Revenue Code of 1986, as amended.
| 36 | Visit our website at www.jennisondryden.com |
Note 9. New Accounting Pronouncements
On September 20, 2006, the FASB released Statement of Financial Accounting Standards No. 157 “Fair Value Measurements” (“FAS 157”). FAS 157 establishes an authoritative definition of fair value, sets out a framework for measuring fair value, and requires additional disclosures about fair-value measurements. The application of FAS 157 is required for fiscal years beginning after November 15, 2007 and interim periods within those fiscal years. At this time, management is evaluating the implications of FAS 157 and its impact, if any, on the financial statements has not yet been determined.
In March 2008, the Financial Accounting Standards Board (“FASB”) released Statement of Financial Accounting Standards No. 161, “Disclosures about Derivative Instruments and Hedging Activities” (“FAS 161”). FAS 161 requires qualitative disclosures about objectives and strategies for using derivatives, quantitative disclosures about fair value amounts of and gains and losses on derivative instruments, and disclosures about credit-risk-related contingent features in derivative agreements. The application of FAS 161 is required for fiscal years beginning after November 15, 2008 and interim periods within those fiscal years. At this time, management is evaluating the implications of FAS 161 and its impact on the financial statements has not yet been determined.
On September 12, 2008, the FASB issued FASB Staff Position (“FSP”) No. FAS 133-1 and FASB Interpretation Number (“FIN”) 45-4 (“FSP 133-1 and FIN 45-4”), “Disclosures about Credit Derivatives and Certain Guarantees: An Amendment of FASB Statement No. 133 and FASB Interpretation No. 45; and Clarification of the Effective Date of FASB Statement No. 161”. The FSP is intended to improve disclosures about credit derivatives by requiring more information about the potential adverse effects of changes in credit risk on the financial position, financial performance, and cash flows of the sellers of credit derivatives. It amends FASB Statement No. 133, “Accounting for Derivative Instruments and Hedging Activities,” to require disclosures by sellers of credit derivatives, including credit derivatives embedded in hybrid instruments. The FSP also amends FIN 45, “Guarantor’s Accounting and Disclosure Requirements for Guarantees, Including Indirect Guarantees of Indebtedness to Others”, to require an additional disclosure about the current status of the payment/performance risk of a guarantee. FSP 133-1 and FIN 45-4 is effective for reporting periods (annual or interim) ending after November 15, 2008. At this time, management is evaluating the implications of FSP No. FAS 133-1 and FIN 45-4 and its impact, if any, on the financial statements has not yet been determined.
| Dryden Large-Cap Core Equity Fund | 37 |
Financial Highlights
| Class A | ||||
| Year Ended October 31, 2008(a) | ||||
Per Share Operating Performance: | ||||
Net Asset Value, Beginning Of Year | $ | 14.85 | ||
Income (loss) from investment operations: | ||||
Net investment income | .12 | |||
Net realized and unrealized gain (loss) on investment transactions | (5.54 | ) | ||
Total from investment operations | (5.42 | ) | ||
Less Dividends: | ||||
Dividends from net investment income | (.11 | ) | ||
Net asset value, end of year | $ | 9.32 | ||
Total Return(b): | (36.75 | )% | ||
Ratios/Supplemental Data: | ||||
Net assets, end of year (000) | $ | 68,021 | ||
Average net assets (000) | $ | 93,917 | ||
Ratios to average net assets(c): | ||||
Expenses, including distribution and service (12b-1) fees(d) | 1.34 | % | ||
Expenses, excluding distribution and service (12b-1) fees | 1.06 | % | ||
Net investment income | .94 | % | ||
Portfolio turnover rate | 96 | % | ||
| (a) | Calculated based upon average shares outstanding during the year. |
| (b) | Total return does not consider the effects of sales loads. Total return is calculated assuming a purchase of a share on the first day and a sale on the last day of each year reported, and includes reinvestment of dividends and distributions. Total return may reflect adjustments to conform to generally accepted accounting principles. |
| (c) | Does not include the expenses of the underlying funds in which the Fund invests. |
| (d) | The distributor of the Fund has contractually agreed to limit its distribution and service (12b-1) fees to .25 of 1% of the average daily net assets of the Class A shares through February 28, 2008. |
See Notes to Financial Statements.
| 38 | Visit our website at www.jennisondryden.com |
| Class A | ||||||||||||||
| Year Ended October 31, | ||||||||||||||
| 2007 | 2006 | 2005 | 2004 | |||||||||||
| $ | 13.01 | $ | 11.20 | $ | 10.36 | $ | 9.47 | |||||||
| .09 | .08 | (a) | .08 | .05 | ||||||||||
| 1.82 | 1.77 | .83 | .84 | |||||||||||
| 1.91 | 1.85 | .91 | .89 | |||||||||||
| (.07 | ) | (.04 | ) | (.07 | ) | — | ||||||||
| $ | 14.85 | $ | 13.01 | $ | 11.20 | $ | 10.36 | |||||||
| 14.72 | % | 16.54 | % | 8.84 | % | 9.40 | % | |||||||
| $ | 109,231 | $ | 75,578 | $ | 50,856 | $ | 49,979 | |||||||
| $ | 95,001 | $ | 64,957 | $ | 52,404 | $ | 48,763 | |||||||
| 1.16 | % | 1.22 | % | 1.22 | % | 1.16 | % | |||||||
| .91 | % | .97 | % | .97 | % | .91 | % | |||||||
| .67 | % | .68 | % | .75 | % | .47 | % | |||||||
| 90 | % | 72 | % | 74 | % | 73 | % | |||||||
See Notes to Financial Statements.
| Dryden Large-Cap Core Equity Fund | 39 |
Financial Highlights
continued
| Class B | ||||
| Year Ended October 31, 2008(a) | ||||
Per Share Operating Performance: | ||||
Net Asset Value, Beginning Of Year | $ | 14.14 | ||
Income (loss) from investment operations: | ||||
Net investment income (loss) | .03 | |||
Net realized and unrealized gain (loss) on investment transactions | (5.29 | ) | ||
Total from investment operations | (5.26 | ) | ||
Less Dividends: | ||||
Dividends from net investment income | (.01 | ) | ||
Net asset value, end of year | $ | 8.87 | ||
Total Return(c): | (37.22 | )% | ||
Ratios/Supplemental Data: | ||||
Net assets, end of year (000) | $ | 9,269 | ||
Average net assets (000) | $ | 16,689 | ||
Ratios to average net assets(d): | ||||
Expenses, including distribution and service (12b-1) fees | 2.06 | % | ||
Expenses, excluding distribution and service (12b-1) fees | 1.06 | % | ||
Net investment income (loss) | .25 | % | ||
| (a) | Calculated based upon average shares outstanding during the year. |
| (b) | Less than $.005 per share. |
| (c) | Total return does not consider the effects of sales loads. Total return is calculated assuming a purchase of a share on the first day and a sale on the last day of each year reported, and includes reinvestment of dividends and distributions. Total return may reflect adjustments to conform to generally accepted accounting principles. |
| (d) | Does not include the expenses of the underlying funds in which the Fund invests. |
See Notes to Financial Statements.
| 40 | Visit our website at www.jennisondryden.com |
| Class B | ||||||||||||||
| Year Ended October 31, | ||||||||||||||
| 2007 | 2006 | 2005 | 2004 | |||||||||||
| $ | 12.42 | $ | 10.73 | $ | 9.94 | $ | 9.15 | |||||||
| .01 | .01 | (a) | — | (b) | (.03 | ) | ||||||||
| 1.71 | 1.68 | .79 | .82 | |||||||||||
| 1.72 | 1.69 | .79 | .79 | |||||||||||
| — | — | — | — | |||||||||||
| $ | 14.14 | $ | 12.42 | $ | 10.73 | $ | 9.94 | |||||||
| 13.85 | % | 15.75 | % | 7.95 | % | 8.63 | % | |||||||
| $ | 24,883 | $ | 34,293 | $ | 71,436 | $ | 89,099 | |||||||
| $ | 28,960 | $ | 52,013 | $ | 83,027 | $ | 96,512 | |||||||
| 1.91 | % | 1.97 | % | 1.97 | % | 1.91 | % | |||||||
| .91 | % | .97 | % | .97 | % | .91 | % | |||||||
| (.03 | )% | .08 | % | .04 | % | (.28 | )% | |||||||
See Notes to Financial Statements.
| Dryden Large-Cap Core Equity Fund | 41 |
Financial Highlights
continued
| Class C | ||||
| Year Ended October 31, 2008(a) | ||||
Per Share Operating Performance: | ||||
Net Asset Value, Beginning Of Year | $ | 14.14 | ||
Income (loss) from investment operations: | ||||
Net investment income (loss) | .03 | |||
Net realized and unrealized gain (loss) on investment transactions | (5.29 | ) | ||
Total from investment operations | (5.26 | ) | ||
Less Dividends: | ||||
Dividends from net investment income | (.01 | ) | ||
Net asset value, end of year | $ | 8.87 | ||
Total Return(c): | (37.22 | )% | ||
Ratios/Supplemental Data: | ||||
Net assets, end of year (000) | $ | 30,243 | ||
Average net assets (000) | $ | 45,712 | ||
Ratios to average net assets(d): | ||||
Expenses, including distribution and service (12b-1) fees | 2.06 | % | ||
Expenses, excluding distribution and service (12b-1) fees | 1.06 | % | ||
Net investment income (loss) | .23 | % | ||
| (a) | Calculated based upon average shares outstanding during the year. |
| (b) | Less than $.005 per share or 0.005%. |
| (c) | Total return does not consider the effects of sales loads. Total return is calculated assuming a purchase of a share on the first day and a sale on the last day of each year reported, and includes reinvestment of dividends and distributions. Total return may reflect adjustments to conform to generally accepted accounting principles. |
| (d) | Does not include the expenses of the underlying funds in which the Fund invests. |
See Notes to Financial Statements.
| 42 | Visit our website at www.jennisondryden.com |
| Class C | ||||||||||||||
| Year Ended October 31, | ||||||||||||||
| 2007 | 2006 | 2005 | 2004 | |||||||||||
| $ | 12.42 | $ | 10.73 | $ | 9.94 | $ | 9.15 | |||||||
| (.01 | ) | — | (a)(b) | — | (b) | (.03 | ) | |||||||
| 1.73 | 1.69 | .79 | .82 | |||||||||||
| 1.72 | 1.69 | .79 | .79 | |||||||||||
| — | — | — | — | |||||||||||
| $ | 14.14 | $ | 12.42 | $ | 10.73 | $ | 9.94 | |||||||
| 13.85 | % | 15.75 | % | 7.95 | % | 8.63 | % | |||||||
| $ | 57,391 | $ | 39,368 | $ | 42,422 | $ | 50,042 | |||||||
| $ | 50,597 | $ | 40,441 | $ | 47,629 | $ | 53,868 | |||||||
| 1.91 | % | 1.97 | % | 1.97 | % | 1.91 | % | |||||||
| .91 | % | .97 | % | .97 | % | .91 | % | |||||||
| (.08 | )% | — | (b) | .03 | % | (.28 | )% | |||||||
See Notes to Financial Statements.
| Dryden Large-Cap Core Equity Fund | 43 |
Financial Highlights
continued
| Class L | ||||||||
| Year Ended October 31, 2008(e) | March 16, 2007(a) through October 31, 2007 | |||||||
Per Share Operating Performance: | ||||||||
Net Asset Value, Beginning Of Period | $ | 14.83 | $ | 13.16 | ||||
Income from investment operations: | ||||||||
Net investment income | .09 | .03 | ||||||
Net realized and unrealized gain (loss) on investment transactions | (5.54 | ) | 1.64 | |||||
Total from investment operations | (5.45 | ) | 1.67 | |||||
Less Dividends: | ||||||||
Dividends from net investment income | (.08 | ) | — | |||||
Net asset value, end of period | $ | 9.30 | $ | 14.83 | ||||
Total Return(b): | (36.94 | )% | 12.69 | % | ||||
Ratios/Supplemental Data: | ||||||||
Net assets, end of period (000) | $ | 6,113 | $ | 12,962 | ||||
Average net assets (000) | $ | 9,856 | $ | 8,583 | ||||
Ratios to average net assets(c): | ||||||||
Expenses, including distribution and service (12b-1) fees | 1.56 | % | 1.41 | %(d) | ||||
Expenses, excluding distribution and service (12b-1) fees | 1.06 | % | .91 | %(d) | ||||
Net investment income | .73 | % | .31 | %(d) | ||||
| (a) | Inception date of Class L shares. |
| (b) | Total return does not consider the effects of sales loads. Total return is calculated assuming a purchase of a share on the first day and a sale on the last day of each period reported, and includes reinvestment of dividends and distributions. Total return may reflect adjustments to conform to generally accepted accounting principles. Total returns for periods less than a full year are not annualized. |
| (c) | Does not include the expenses of the underlying funds in which the Fund invests. |
| (d) | Annualized. |
| (e) | Calculated based upon average shares outstanding during the year. |
See Notes to Financial Statements.
| 44 | Visit our website at www.jennisondryden.com |
| Class M | ||||||||
| Year Ended October 31, 2008(e) | March 16, 2007(a) through October 31, 2007 | |||||||
Per Share Operating Performance: | ||||||||
Net Asset Value, Beginning Of Period | $ | 14.14 | $ | 12.59 | ||||
Income (loss) from investment operations: | ||||||||
Net investment income (loss) | .03 | (.02 | ) | |||||
Net realized and unrealized gain (loss) on investment transactions | (5.29 | ) | 1.57 | |||||
Total from investment operations | (5.26 | ) | 1.55 | |||||
Less Dividends: | ||||||||
Dividends from net investment income | (.01 | ) | — | |||||
Net asset value, end of period | $ | 8.87 | $ | 14.14 | ||||
Total Return(b): | (37.22 | )% | 12.31 | % | ||||
Ratios/Supplemental Data: | ||||||||
Net assets, end of period (000) | $ | 15,423 | $ | 42,909 | ||||
Average net assets (000) | $ | 29,289 | $ | 29,146 | ||||
Ratios to average net assets(c): | ||||||||
Expenses, including distribution and service (12b-1) fees | 2.06 | % | 1.91 | %(d) | ||||
Expenses, excluding distribution and service (12b-1) fees | 1.06 | % | .91 | %(d) | ||||
Net investment income (loss) | .24 | % | (.19 | )%(d) | ||||
| (a) | Inception date of Class M shares. |
| (b) | Total return does not consider the effects of sales loads. Total return is calculated assuming a purchase of a share on the first day and a sale on the last day of each period reported, and includes reinvestment of dividends and distributions. Total return may reflect adjustments to conform to generally accepted accounting principles. Total returns for periods less than a full year are not annualized. |
| (c) | Does not include the expenses of the underlying funds in which the Fund invests. |
| (d) | Annualized. |
| (e) | Calculated based upon average shares outstanding during the year. |
See Notes to Financial Statements.
| Dryden Large-Cap Core Equity Fund | 45 |
Financial Highlights
continued
| Class X | ||||||||
| Year Ended October 31, 2008(f) | March 16, 2007(a) through October 31, 2007(d) | |||||||
Per Share Operating Performance: | ||||||||
Net Asset Value, Beginning Of Period | $ | 14.16 | $ | 12.60 | ||||
Income (loss) from investment operations: | ||||||||
Net investment income | .13 | .04 | ||||||
Net realized and unrealized gain (loss) on investment transactions | (5.28 | ) | 1.56 | |||||
Total from investment operations | (5.15 | ) | 1.60 | |||||
Dividends from net investment income | (.06 | ) | (.07 | ) | ||||
Capital contribution | .02 | .03 | ||||||
Net asset value, end of period | $ | 8.97 | $ | 14.16 | ||||
Total Return(b): | (36.25 | )% | 12.93 | %(g) | ||||
Ratios/Supplemental Data: | ||||||||
Net assets, end of period (000) | $ | 2,767 | $ | 6,283 | ||||
Average net assets (000) | $ | 4,698 | $ | 3,939 | ||||
Ratios to average net assets(c): | ||||||||
Expenses, including distribution and service (12b-1) fees | 1.38 | % | 1.29 | %(e) | ||||
Expenses, excluding distribution and service (12b-1) fees | 1.06 | % | .91 | %(e) | ||||
Net investment income | 1.08 | % | .42 | %(e) | ||||
| (a) | Inception date of Class X shares. |
| (b) | Total return does not consider the effects of sales loads. Total return is calculated assuming a purchase of a share on the first day and a sale on the last day of each period reported, and includes reinvestment of dividends and distributions. Total return may reflect adjustments to conform to generally accepted accounting principles. Total returns for periods less than a full year are not annualized. |
| (c) | Does not include the expenses of the underlying funds in which the Fund invests. |
| (d) | Certain information has been adjusted to reflect a manager payment for sales charges incurred by shareholders in excess of regulatory limits. |
| (e) | Annualized. |
| (f) | Calculated based upon average shares outstanding during the year. |
| (g) | Total return has been adjusted to reflect the manager payment for sales charges in excess of regulatory limits. |
See Notes to Financial Statements.
| 46 | Visit our website at www.jennisondryden.com |
This Page Intentionally Left Blank
Financial Highlights
continued
| Class Z | ||||
| Year Ended October 31, 2008(a) | ||||
Per Share Operating Performance: | ||||
Net Asset Value, Beginning Of Year | $ | 15.09 | ||
Income (loss) from investment operations: | ||||
Net investment income | .15 | |||
Net realized and unrealized gain (loss) on investment transactions | (5.63 | ) | ||
Total from investment operations | (5.48 | ) | ||
Less Dividends: | ||||
Dividends from net investment income | (.14 | ) | ||
Net asset value, end of year | $ | 9.47 | ||
Total Return(b): | (36.64 | )% | ||
Ratios/Supplemental Data: | ||||
Net assets, end of year (000) | $ | 36,602 | ||
Average net assets (000) | $ | 20,386 | ||
Ratios to average net assets(c): | ||||
Expenses, including distribution and service (12b-1) fees | 1.06 | % | ||
Expenses, excluding distribution and service (12b-1) fees | 1.06 | % | ||
Net investment income | 1.25 | % | ||
| (a) | Calculated based upon average shares outstanding during the year. |
| (b) | Total return is calculated assuming a purchase of a share on the first day and a sale on the last day of each year reported, and includes reinvestment of dividends and distributions. Total return may reflect adjustments to conform to generally accepted accounting principles. |
| (c) | Does not include the expenses of the underlying funds in which the Fund invests. |
See Notes to Financial Statements.
| 48 | Visit our website at www.jennisondryden.com |
| Class Z | ||||||||||||||
| Year Ended October 31, | ||||||||||||||
| 2007 | 2006 | 2005 | 2004 | |||||||||||
| $ | 13.21 | $ | 11.37 | $ | 10.52 | $ | 9.59 | |||||||
| .13 | .12 | (a) | .11 | .06 | ||||||||||
| 1.85 | 1.79 | .84 | .87 | |||||||||||
| 1.98 | 1.91 | .95 | .93 | |||||||||||
| (.10 | ) | (.07 | ) | (.10 | ) | — | ||||||||
| $ | 15.09 | $ | 13.21 | $ | 11.37 | $ | 10.52 | |||||||
| 15.06 | % | 16.83 | % | 9.06 | % | 9.70 | % | |||||||
| $ | 23,950 | $ | 17,764 | $ | 13,713 | $ | 11,457 | |||||||
| $ | 21,053 | $ | 15,784 | $ | 13,218 | $ | 8,905 | |||||||
| .91 | % | .97 | % | .97 | % | .91 | % | |||||||
| .91 | % | .97 | % | .97 | % | .91 | % | |||||||
| .93 | % | .97 | % | .96 | % | .73 | % | |||||||
See Notes to Financial Statements.
| Dryden Large-Cap Core Equity Fund | 49 |
Report of Independent Registered Public Accounting Firm
The Board of Directors and Shareholders
Dryden Large-Cap Core Equity Fund, Inc.:
We have audited the accompanying statement of assets and liabilities of Dryden Large-Cap Core Equity Fund, Inc. (hereafter referred to as the “Fund”), including the portfolio of investments, as of October 31, 2008, and the related statement of operations for the year then ended, the statement of changes in net assets for each of the years in the two-year period then ended and the financial highlights for each of the years in the five-year period then ended. These financial statements and financial highlights are the responsibility of the Fund’s management. Our responsibility is to express an opinion on these financial statements and financial highlights based on our audits.
We conducted our audits in accordance with the standards of the Public Company Accounting Oversight Board (United States). Those standards require that we plan and perform the audit to obtain reasonable assurance about whether the financial statements and financial highlights are free of material misstatement. An audit includes examining, on a test basis, evidence supporting the amounts and disclosures in the financial statements. Our procedures included confirmation of securities owned as of October 31, 2008, by correspondence with the custodian and brokers or by other appropriate auditing procedures where replies from brokers were not received. An audit also includes assessing the accounting principles used and significant estimates made by management, as well as evaluating the overall financial statement presentation. We believe that our audits provide a reasonable basis for our opinion.
In our opinion, the financial statements and financial highlights referred to above present fairly, in all material respects, the financial position of the Fund as of October 31, 2008, and the results of its operations for the year then ended, the changes in its net assets for each of the years in the two-year period then ended and the financial highlights for each of the years in the five-year period then ended, in conformity with U.S. generally accepted accounting principles.

New York, New York
December 23, 2008
| 50 | Visit our website at www.jennisondryden.com |
Tax Information
(Unaudited)
We are required by the Internal Revenue Code to advise you within 60 days of the Fund’s fiscal year end (October 31, 2008) as to the federal income tax status of dividends paid by the Fund during such fiscal period. We are advising you that during its fiscal year ended October 31, 2008, the Fund paid ordinary dividends for Class A of $0.11 per share, for Class B of $0.011 per share, for Class C of $0.011 per share, for Class L of $0.08 per share, for Class M of $0.011 per share, for Class X of $0.011 per share and Class Z of $0.14 per share, respectively, which represents net investment income.
Further, we wish to advise you that 100% of the ordinary income dividends paid in the fiscal period ended October 31, 2008 qualified for the corporate dividend received deduction available to corporate taxpayers.
The Fund designates 100% of ordinary income dividends, as qualified for the reduced tax rate under The Jobs and Growth Tax Relief Reconciliation Act of 2003.
In January 2008, you will be advised on IRS Form 1099-DIV or substitute 1099-DIV as to the federal tax status of the distributions received by you in calendar year 2007.
For more detailed information regarding your state and local taxes, you should contact your tax advisor or the state/local taxing authorities.
| Dryden Large-Cap Core Equity Fund | 51 |
MANAGEMENT OF THE FUND
(Unaudited)
Information about Fund Directors/Trustees (referred to herein as “Board Members”) and Fund Officers is set forth below. Board Members who are not deemed to be “interested persons,” as defined in the 1940 Act, are referred to as “Independent Board Members.” Board Members who are deemed to be “interested persons” are referred to as “Interested Board Members.” The Board Members are responsible for the overall supervision of the operations of the Fund and perform the various duties imposed on the directors or trustees of investment companies by the 1940 Act.
Independent Board Members
Name, Address, Age Position(s) Portfolios Overseen (1) | Principal Occupation(s) During Past Five Years | Other Directorships Held | ||
Kevin J. Bannon (56) Board Member Portfolios Overseen: 62 | Managing Director (since April 2008) of Highmount Capital LLC (registered investment adviser); formerly Executive Vice President and Chief Investment Officer (April 1993-August 2007) of Bank of New York Company; President (May 2003-May 2007) of BNY Hamilton Family of Mutual Funds. | Director of Urstadt Biddle Properties (since September 2008) | ||
Linda W. Bynoe (56) Board Member Portfolios Overseen: 62 | President and Chief Executive Officer (since March 1995) of Telemat Ltd. (management consulting); formerly Vice President at Morgan Stanley Co (broker- dealer). | Director of Simon Property Group, Inc. (real estate investment trust) (since May 2003); Director of Anixter International (communication products distributor) (since January 2006); Director of Northern Trust Corporation (banking) (since April 2006). | ||
David E.A. Carson (74) Board Member Portfolios Overseen: 62 | Director (since May 2008) of Liberty Bank; Director (since October 2007) of ICI Mutual Insurance Company; formerly President, Chairman and Chief Executive Officer of People’s Bank (1987 – 2000). | None. | ||
Michael S. Hyland, CFA (63) Board Member Portfolios Overseen: 62 | Independent Consultant (since February 2005); formerly Senior Managing Director (July 2001-February 2005) of Bear Stearns Co, Inc.; Global Partner, INVESCO (1999-2001); Managing Director and President Salomon Brothers Asset Management (1989-1999). | None. | ||
Robert E. La Blanc (74) Board Member Portfolios Overseen: 62 | President (since 1981) of Robert E. La Blanc Associates, Inc. (telecommunications). | Director of CA, Inc. (since 2002) (software company); FiberNet Telecom Group, Inc. (since 2003) (telecom company). | ||
Visit our website at www.jennisondryden.com
Douglas H. McCorkindale (69) Board Member Portfolios Overseen: 62 | Formerly Chairman (February 2001-June 2006), Chief Executive Officer (June 2000-July 2005), President (September 1997-July 2005) and Vice Chairman (March 1984-May 2000) of Gannett Co. Inc. (publishing and media). | Director of Continental Airlines, Inc. (since May 1993); Director of Lockheed Martin Corp. (aerospace and defense) (since May 2001). | ||
Stephen P. Munn (66) Board Member Portfolios Overseen: 62 | Lead Director (since 2007) and formerly Chairman (1993-2007) of Carlisle Companies Incorporated (manufacturer of industrial products). | None. | ||
Richard A. Redeker (65) Board Member Portfolios Overseen: 62 | Retired Mutual Fund Executive (36 years); Management Consultant; Director of Penn Tank Lines, Inc. (since 1999). | None. | ||
Robin B. Smith (69) Board Member & Independent Chair Portfolios Overseen: 62 | Chairman of the Board (since January 2003) of Publishers Clearing House (direct marketing); formerly Chairman and Chief Executive Officer (August 1996-January 2003) of Publishers Clearing House. | Formerly Director of BellSouth Corporation (telecommunications) (1992-2006). | ||
Stephen G. Stoneburn (65) Board Member Portfolios Overseen: 62 | President and Chief Executive Officer (since June 1996) of Quadrant Media Corp. (publishing company); formerly President (June 1995-June 1996) of Argus Integrated Media, Inc.; Senior Vice President and Managing Director (January 1993-1995) of Cowles Business Media; Senior Vice President of Fairchild Publications, Inc (1975-1989). | None. | ||
Interested Board Members
| ||||
Judy A. Rice (60) Board Member & President Portfolios Overseen: 62 | President, Chief Executive Officer, Chief Operating Officer and Officer-In-Charge (since February 2003) of Prudential Investments LLC; President, Chief Executive Officer and Officer-In-Charge (since April 2003) of Prudential Mutual Fund Services LLC; formerly Vice President (February 1999-April 2006) of Prudential Investment Management Services LLC; formerly President, Chief Executive Officer, Chief Operating Officer and Officer-In-Charge (May 2003-June 2005) and Director (May 2003-March 2006) and Executive Vice President (June 2005-March 2006) of AST Investment Services, Inc.; Member of Board of Governors of the Investment Company Institute. | None. | ||
Dryden Large-Cap Core Equity Fund
Robert F. Gunia (62) Board Member & Vice President Portfolios Overseen: 146 | Chief Administrative Officer (since September 1999) and Executive Vice President (since December 1996) of Prudential Investments LLC; President (since April 1999) of Prudential Investment Management Services LLC; Executive Vice President (since March 1999) and Treasurer (since May 2000) of Prudential Mutual Fund Services LLC; Chief Administrative Officer, Executive Vice President and Director (since May 2003) of AST Investment Services, Inc. | Director (since May 1989) of The Asia Pacific Fund, Inc. and Vice President (since January 2007) of The Greater China Fund, Inc. | ||
1 | The year that each individual joined the Fund’s Board is as follows: |
Linda W. Bynoe, 2005; David E.A. Carson, 2003; Robert E. La Blanc, 2003; Douglas H. McCorkindale, 1998; Richard A. Redeker, 1998; Robin B. Smith, 1998; Stephen G. Stoneburn, 2003; Kevin J. Bannon, 2008; Michael S. Hyland, 2008; Stephen P. Munn, 2008; Judy A. Rice, Board Member since 2000 and President since 2003; Robert F. Gunia, Board Member since 1998 and Vice President since 1999.
Visit our website at www.jennisondryden.com
Fund Officers (a)(1)
| ||
Name, Address and Age Position with Fund | Principal Occupation(s) During Past Five Years | |
Kathryn L. Quirk (56) Chief Legal Officer | Vice President and Corporate Counsel (since September 2004) of Prudential; Executive Vice President, Chief Legal Officer and Secretary (since July 2005) of PI and Prudential Mutual Fund Services LLC; Vice President and Corporate Counsel (since June 2005) and Secretary (since February 2006) of AST Investment Services, Inc.; formerly Senior Vice President and Assistant Secretary (November 2004-August 2005) of PI; formerly Assistant Secretary (June 2005-February 2006) of AST Investment Services, Inc.; formerly Managing Director, General Counsel, Chief Compliance Officer, Chief Risk Officer and Corporate Secretary (1997-2002) of Zurich Scudder Investments, Inc. | |
Deborah A. Docs (50) Secretary | Vice President and Corporate Counsel (since January 2001) of Prudential; Vice President (since December 1996) and Assistant Secretary (since March 1999) of PI; formerly Vice President and Assistant Secretary (May 2003-June 2005) of AST Investment Services, Inc. | |
Jonathan D. Shain (50) Assistant Secretary | Vice President and Corporate Counsel (since August 1998) of Prudential; Vice President and Assistant Secretary (since May 2001) of PI; Vice President and Assistant Secretary (since February 2001) of PMFS; formerly Vice President and Assistant Secretary (May 2003-June 2005) of AST Investment Services, Inc. | |
Claudia DiGiacomo (34) Assistant Secretary | Vice President and Corporate Counsel (since January 2005) of Prudential; Vice President and Assistant Secretary of PI (since December 2005); Associate at Sidley Austin LLP (1999-2004). | |
John P. Schwartz (37) Assistant Secretary | Vice President and Corporate Counsel (since April 2005) of Prudential; Vice President and Assistant Secretary of PI (since December 2005); Associate at Sidley Austin LLP (1997-2005). | |
Andrew R. French (46) Assistant Secretary | Director and Corporate Counsel (since May 2006) of Prudential; Vice President and Assistant Secretary (since January 2007) of PI; Vice President and Assistant Secretary (since January 2007) of PMFS; formerly Senior Legal Analyst of Prudential Mutual Fund Law Department (1997-2006). | |
Timothy J. Knierim (49) Chief Compliance Officer | Chief Compliance Officer of Prudential Investment Management, Inc. (PIM) (since July 2007); formerly Chief Risk Officer of PIM and PI (2002-2007) and formerly Chief Ethics Officer of PIM and PI (2006-2007). | |
Valerie M. Simpson (50) Deputy Chief Compliance Officer | Chief Compliance Officer (since April 2007) of PI and AST Investment Services, Inc.; formerly Vice President-Financial Reporting (June 1999-March 2006) for Prudential Life and Annuities Finance. | |
Theresa C. Thompson (46) Deputy Chief Compliance Officer | Vice President, Mutual Fund Compliance, PI (since April 2004); and Director, Compliance, PI (2001 - 2004). | |
Dryden Large-Cap Core Equity Fund
Noreen M. Fierro (44) Anti-Money Laundering Compliance Officer | Vice President, Corporate Compliance (since May 2006) of Prudential; formerly Corporate Vice President, Associate General Counsel (April 2002-May 2005) of UBS Financial Services, Inc., in their Money Laundering Prevention Group; Senior Manager (May 2005-May 2006) of Deloitte Financial Advisory Services, LLP, in their Forensic and Dispute Services, Anti-Money Laundering Group. | |
Grace C. Torres (49) Treasurer and Principal Financial and Accounting Officer | Assistant Treasurer (since March 1999) and Senior Vice President (since September 1999) of PI; Assistant Treasurer (since May 2003) and Vice President (since June 2005) of AST Investment Services, Inc.; Senior Vice President and Assistant Treasurer (since May 2003) of Prudential Annuities Advisory Services, Inc.; formerly Senior Vice President (May 2003-June 2005) of AST Investment Services, Inc. | |
M. Sadiq Peshimam (44) Assistant Treasurer | Vice President (since 2005) and Director (2000-2005) within Prudential Mutual Fund Administration. | |
Peter Parrella (50) Assistant Treasurer | Vice President (since 2007) and Director (2004-2007) within Prudential Mutual Fund Administration; formerly Tax Manager at SSB Citi Fund Management LLC (1997-2004). | |
(a) | Excludes interested Board Members who also serve as President or Vice President. |
1 | The year that each individual became an Officer of the Fund is as follows: |
Kathryn L. Quirk, 2005; Deborah A. Docs, 2005; Jonathan D. Shain, 2005; Claudia DiGiacomo, 2005; John P. Schwartz, 2006; Andrew R. French, 2006; Timothy J. Knierim, 2007; Valerie M. Simpson 2007; Theresa C. Thompson, 2008; Noreen M. Fierro, 2006, Grace C. Torres, 1998; M. Sadiq Peshimam, 2006; Peter Parrella, 2007.
Explanatory Notes
| • | Board Members are deemed to be “Interested,” as defined in the 1940 Act, by reason of their affiliation with Prudential Investments LLC and/or an affiliate of Prudential Investments LLC. |
| • | Unless otherwise noted, the address of all Board Members and Officers is c/o Prudential Investments LLC, Gateway Center Three, 100 Mulberry Street, Newark, New Jersey 07102. |
| • | There is no set term of office for Board Members or Officers. The Board Members have adopted a retirement policy, which calls for the retirement of Board Members on December 31st of the year in which they reach the age of 75. |
| • | “Other Directorships Held” includes only directorships of companies required to register or file reports with the SEC under the Securities Exchange Act of 1934 (that is, “public companies”) or other investment companies registered under the 1940 Act. |
| • | “Portfolios Overseen” includes all investment companies managed by Prudential Investments LLC. The investment companies for which PI serves as manager include the JennisonDryden Funds, Strategic Partners Funds, The Prudential Variable Contract Accounts, The Target Portfolio Trust, The Prudential Series Fund, The High Yield Income Fund, Inc., The High Yield Plus Fund, Inc., Nicholas-Applegate Fund, Inc., Prudential’s Gibraltar Fund, Inc. and the Advanced Series Trust. |
Visit our website at www.jennisondryden.com
Approval of Advisory Agreements
The Board of Trustees (the “Board”) of Dryden Tax-Managed Funds oversees the management of the Dryden Large-Cap Core Equity Fund (the “Fund”) and, as required by law, determines annually whether to renew the Fund’s management agreement with Prudential Investments LLC (“PI”) and the Fund’s subadvisory agreement with Quantitative Management Associates LLC (“QMA”). In considering the renewal of the agreements, the Board, including all of the Independent Trustees, met on June 3-5, 2008 and approved the renewal of the agreements through July 31, 2009, after concluding that renewal of the agreements was in the best interests of the Fund and its shareholders.
In advance of the meetings, the Board received materials relating to the agreements, and had the opportunity to ask questions and request further information in connection with their consideration. Among other things, the Board considered comparisons with other mutual funds in relevant Peer Universes and Peer Groups. The mutual funds included in each Peer Universe or Peer Group were objectively determined solely by Lipper Inc., an independent provider of mutual fund data. The comparisons placed the Fund in various quartiles over one-, three- and five-year periods ending December 31, 2007, with the first quartile being the best 25% of the mutual funds (for performance, the best performing mutual funds and, for expenses, the lowest cost mutual funds).
In approving the agreements, the Board, including the Independent Trustees advised by independent legal counsel, considered the factors they deemed relevant, including the nature, quality and extent of services provided, the performance of the Fund, the profitability of PI and its affiliates, expenses and fees, and the potential for economies of scale that may be shared with the Fund and its shareholders. In their deliberations, the Trustees did not identify any single factor which alone was responsible for the Board’s decision to approve the agreements with respect to the Fund. In connection with their deliberations, the Board considered information provided by PI throughout the year at regular Board meetings, presentations from portfolio managers and other information, as well as information furnished at or in advance of the meetings on June 3-5, 2008.
The Trustees determined that the overall arrangements between the Fund and PI, which serves as the Fund’s investment manager pursuant to a management agreement, and between PI and QMA, which serves as the Fund’s subadviser pursuant to the terms of a subadvisory agreement with PI, are fair and reasonable in light of the services performed, fees charged and such other matters as the Trustees considered relevant in the exercise of their business judgment.
| Dryden Large-Cap Core Equity Fund |
Approval of Advisory Agreements (continued)
The material factors and conclusions that formed the basis for the Trustees’ reaching their determinations to approve the continuance of the agreements are separately discussed below.
Nature, Quality, and Extent of Services
The Board received and considered information regarding the nature and extent of services provided to the Fund by PI and QMA. The Board considered the services provided by PI, including but not limited to the oversight of the subadviser for the Fund, as well as the provision of fund recordkeeping, compliance, and other services to the Fund. With respect to PI’s oversight of the subadviser, the Board noted that PI’s Strategic Investment Research Group (“SIRG”), which is a business unit of PI, is responsible for monitoring and reporting to PI’s senior management on the performance and operations of the subadviser. The Board also considered that PI pays the salaries of all of the officers and non-independent Trustees of the Fund. The Board also considered the investment subadvisory services provided by QMA, as well as adherence to the Fund’s investment restrictions and compliance with applicable Fund policies and procedures. The Board considered PI’s evaluation of the subadviser, as well as PI’s recommendation, based on its review of the subadviser, to renew the subadvisory agreement.
The Board reviewed the qualifications, backgrounds and responsibilities of PI’s senior management responsible for the oversight of the Fund and QMA, and also reviewed the qualifications, backgrounds and responsibilities of QMA’s portfolio managers who are responsible for the day-to-day management of the Fund’s portfolio. The Board was provided with information pertaining to PI’s and QMA’s organizational structure, senior management, investment operations, and other relevant information pertaining to both PI and QMA. The Board also noted that it received favorable compliance reports from the Fund’s Chief Compliance Officer (“CCO”) as to both PI and QMA. The Board noted that QMA is affiliated with PI.
The Board concluded that it was satisfied with the nature, extent and quality of the investment management services provided by PI and the subadvisory services provided to the Fund by QMA, and that there was a reasonable basis on which to conclude that the Fund benefits from the services provided by PI and QMA under the management and subadvisory agreements.
Performance of Dryden Large-Cap Core Equity Fund
The Board received and considered information about the Fund’s historical performance. The Board considered that the Fund’s gross performance in relation to its Peer Universe (the Lipper Large-Cap Core Funds Performance Universe) was in the
| Visit our website at www.jennisondryden.com |
second quartile over the one- and three-year periods, and in the first quartile over the five-year period. The Board also noted that the Fund outperformed its benchmark index over the same periods. The Board concluded that, in light of the Fund’s competitive performance, it would be in the interest of the Fund and its shareholders for the Fund to renew the agreements.
Fees and Expenses
The Board considered that the Fund’s actual management fee (which reflects any subsidies, expense caps or waivers) and the Fund’s total expenses both ranked in the Expense Group’s first quartile. The Board concluded that the management and subadvisory fees are reasonable in light of the services provided.
Costs of Services and Profits Realized by PI
The Board was provided with information on the profitability of PI and its affiliates in serving as the Fund’s investment manager. The Board discussed with PI the methodology utilized in assembling the information regarding profitability and considered its reasonableness. The Board recognized that it is difficult to make comparisons of profitability from fund management contracts because comparative information is not generally publicly available and is affected by numerous factors, including the structure of the particular adviser, the types of funds it manages, its business mix, numerous assumptions regarding allocations and the adviser’s capital structure and cost of capital. The Board did not separately consider the profitability of the subadviser, an affiliate of PI, as its profitability was reflected in the profitability report for PI. Taking these factors into account, the Board concluded that the profitability of PI and its affiliates in relation to the services rendered was not unreasonable.
Economies of Scale
The Board received and discussed information concerning whether PI realizes economies of scale as the Fund’s assets grow beyond current levels. The Board noted that the management fee schedule for the Fund includes breakpoints, which have the effect of decreasing the fee rate as assets increase, but at the current level of assets the Fund does not realize the effect of those rate reductions. The Board took note that the Fund’s fee structure would result in benefits to Fund shareholders when (and if) assets reach the levels at which the fee rate is reduced. These benefits will accrue whether or not PI is then realizing any economies of scale.
Other Benefits to PI and QMA
The Board considered potential ancillary benefits that might be received by PI and QMA and their affiliates as a result of their relationship with the Fund. The Board
| Dryden Large-Cap Core Equity Fund |
Approval of Advisory Agreements (continued)
concluded that potential benefits to be derived by PI included brokerage commissions received by affiliates of PI, transfer agency fees received by the Fund’s transfer agent (which is affiliated with PI), and benefits to the reputation as well as other intangible benefits resulting from PI’s association with the Fund. The Board concluded that the potential benefits to be derived by QMA included its ability to use soft dollar credits, brokerage commissions received by affiliates of QMA, as well as the potential benefits consistent with those generally resulting from an increase in assets under management, specifically, potential access to additional research resources and benefits to the reputation. The Board concluded that the benefits derived by PI and QMA were consistent with the types of benefits generally derived by investment managers and subadvisers to mutual funds.
After full consideration of these factors, the Board concluded that approval of the agreements was in the best interest of the Fund and its shareholders.
| Visit our website at www.jennisondryden.com |
Growth of a $10,000 Investment
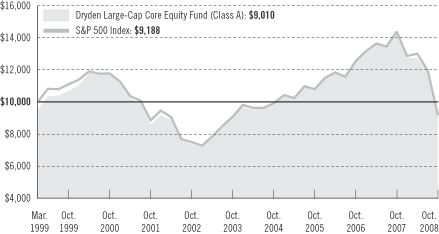
| Average Annual Total Returns (With Sales Charges) as of 10/31/08 | |||||||||
| One Year | Five Years | Since Inception | |||||||
Class A | –40.23 | % | –0.99 | % | –1.07 | % | |||
Class B | –40.36 | –0.80 | –1.22 | ||||||
Class C | –37.85 | –0.60 | –1.22 | ||||||
Class L | –40.56 | N/A | –21.88 | ||||||
Class M | –40.98 | N/A | –21.87 | ||||||
Class X | –40.32 | N/A | –21.33 | ||||||
Class Z | –36.64 | 0.38 | –0.24 | ||||||
| Average Annual Total Returns (Without Sales Charges) as of 10/31/08 | |||||||||
| One Year | Five Years | Since Inception | |||||||
Class A | –36.75 | % | 0.14 | % | –0.49 | % | |||
Class B | –37.22 | –0.60 | –1.22 | ||||||
Class C | –37.22 | –0.60 | –1.22 | ||||||
Class L | –36.94 | N/A | –18.97 | ||||||
Class M | –37.22 | N/A | –19.36 | ||||||
Class X | –36.51 | N/A | –18.81 | ||||||
Class Z | –36.64 | 0.38 | –0.24 | ||||||
Performance data quoted represent past performance. Past performance does not guarantee future results. The investment return and principal value of an investment will fluctuate, so that an investor’s shares, when redeemed, may be worth more or less than their original cost. Current performance may be lower or higher than the
| Visit our website at www.jennisondryden.com |
past performance data quoted. An investor may obtain performance data as of the most recent month-end by visiting our website at www.jennisondryden.com or by calling (800) 225-1852. Class A and Class L shares have a maximum initial sales charge of 5.50% and 5.75%, respectively. Gross operating expenses: Class A, 1.36%; Class B, 2.06%; Class C, 2.06%; Class L, 1.56%; Class M, 2.06%; Class X, 1.38%; Class Z, 1.06%. Net operating expenses apply to: Class A, 1.34%; Class B, 2.06%; Class C, 2.06%; Class L, 1.56%; Class M, 2.06%; Class X, 1.38%; Class Z, 1.06%, after contractual reduction through 2/28/2008.
The returns in the graph and the tables do not reflect the deduction of taxes that a shareholder would pay on Fund distributions or following the redemption of Fund shares.
Source: Prudential Investments LLC and Lipper Inc.
Inception dates: Class A, Class B, Class C, and Class Z, 3/3/99; Class L, Class M, Class X, 3/19/07.
The graph compares a $10,000 investment in the Dryden Large-Cap Core Equity Fund (Class A shares) with a similar investment in the S&P 500 Index by portraying the initial account values at the commencement of operations of Class A shares (March 3, 1999) and the account values at the end of the current fiscal year (October 31, 2008) as measured on a quarterly basis. The S&P 500 Index data is measured from the closest month-end to inception date and not from the Fund’s actual inception date. For purposes of the graph, and unless otherwise indicated, it has been assumed that (a) the maximum applicable front-end sales charge was deducted from the initial $10,000 investment in Class A shares; (b) all recurring fees (including management fees) were deducted; and (c) all dividends and distributions were reinvested. The line graph provides information for Class A shares only. As indicated in the tables provided earlier, performance for Class B, Class C, Class L, Class M, Class X, and Class Z shares will vary due to the differing charges and expenses applicable to each share class (as indicated in the following paragraphs). Without the distribution and service (12b-1) fee waiver of 0.05% for Class A shares in effect through February 28, 2008, the returns shown in the graph and for Class A shares in the tables would have been lower.
The S&P 500 Index is an unmanaged index of 500 stocks of large U.S. companies. It gives a broad look at how stock prices in the United States have performed. The S&P 500 Index’s total returns include the reinvestment of all dividends, but do not include the effects of sales charges, operating expenses of a mutual fund, or taxes. These returns would be lower if they included the effects of sales charges, operating expenses, or taxes. The securities that comprise the S&P 500 Index may differ substantially from the securities in the Fund. The S&P 500 Index is not the only index that may be used to characterize performance of large-capitalization stock funds. Other indexes may portray different comparative performance. Investors cannot invest directly in an index.
Class A and Class L shares are subject to a maximum front-end sales charge of 5.50%, and 5.75%, respectively, a 12b-1 fee of up to 0.30% and 0.50%, respectively, annually, and investors who purchase Class A shares in an amount of $1 million or more and sell these shares within 12 months of purchase are subject to a contingent deferred sales charge (CDSC) of 1% in certain circumstances. Class B shares are subject to a declining CDSC of 5%, 4%, 3%, 2%, 1%, and 1%, respectively, for the first six years after purchase and a 12b-1 fee of 1% annually. Approximately seven years after purchase, Class B shares will automatically convert to Class A shares on a quarterly basis. Class C shares are not subject to a front-end sales charge, but are subject to a CDSC of 1% for Class C shares sold within 12 months from the date of purchase, and an annual 12b-1 fee of 1%. Class M shares are subject to a CDSC of 6%, which decreases by 1% annually to 2% in the fifth and sixth years and 1% in the seventh year, a 12b-1 fee of 1% annually. Class M shares automatically convert to Class A shares approximately eight years after purchase. Class X shares are subject to a CDSC of 6%, which decreases by 1% annually to 4% in the third and fourth years, by 1% annually to 2% in the sixth and seventh years, and 1% in the eighth year, and a 12b-1 fee of 1% annually. Class Z shares are not subject to a sales charge or 12b-1 fees. The returns in the graph and tables reflect the share class expense structure in effect at the close of the fiscal period.
| Dryden Large-Cap Core Equity Fund |
| n MAIL | n TELEPHONE | n WEBSITE | ||
Gateway Center Three 100 Mulberry Street Newark, NJ 07102 | (800) 225-1852 | www.jennisondryden.com |
| PROXY VOTING |
| The Board of Trustees of the Fund has delegated to the Fund’s investment subadviser the responsibility for voting any proxies and maintaining proxy recordkeeping with respect to the Fund. A description of these proxy voting policies and procedures is available without charge, upon request, by calling (800) 225-1852 or by visiting the Securities and Exchange Commission’s website at www.sec.gov. Information regarding how the Fund voted proxies relating to portfolio securities during the most recent 12-month period ended June 30 is available on the Fund’s website and on the Commission’s website. |
| TRUSTEES |
| Kevin J. Bannon • Linda W. Bynoe • David E.A. Carson • Robert F. Gunia • Michael S. Hyland • Robert E. La Blanc • Douglas H. McCorkindale • Stephen P. Munn • Richard A. Redeker • Judy A. Rice • Robin B. Smith • Stephen G. Stoneburn |
| OFFICERS |
| Judy A. Rice, President • Robert F. Gunia, Vice President • Grace C. Torres, Treasurer and Principal Financial and Accounting Officer • Kathryn L. Quirk, Chief Legal Officer • Deborah A. Docs, Secretary • Timothy J. Knierim, Chief Compliance Officer • Valerie M. Simpson, Deputy Chief Compliance Officer • Theresa C. Thompson, Deputy Chief Compliance Officer • Noreen M. Fierro, Anti-Money Laundering Compliance Officer • Jonathan D. Shain, Assistant Secretary • Claudia DiGiacomo, Assistant Secretary • John P. Schwartz, Assistant Secretary • Andrew R. French, Assistant Secretary • M. Sadiq Peshimam, Assistant Treasurer • Peter Parrella, Assistant Treasurer |
| MANAGER | Prudential Investments LLC | Gateway Center Three 100 Mulberry Street Newark, NJ 07102 | ||
| ||||
| INVESTMENT SUBADVISER | Quantitative Management Associates LLC | Gateway Center Two 100 Mulberry Street Newark, NJ 07102 | ||
| ||||
| DISTRIBUTOR | Prudential Investment Management Services LLC | Gateway Center Three 100 Mulberry Street Newark, NJ 07102 | ||
| ||||
| CUSTODIAN | The Bank of New York Mellon | One Wall Street New York, NY 10286 | ||
| ||||
| TRANSFER AGENT | Prudential Mutual Fund Services LLC | PO Box 9658 Providence, RI 02940 | ||
| ||||
| INDEPENDENT REGISTERED PUBLIC ACCOUNTING FIRM | KPMG LLP | 345 Park Avenue New York, NY 10154 | ||
| ||||
| FUND COUNSEL | Willkie Farr & Gallagher LLP | 787 Seventh Avenue New York, NY 10019 | ||
An investor should consider the investment objectives, risks, charges, and expenses of the Fund carefully before investing. The prospectus for the Fund contains this and other information about the Fund. An investor may obtain a prospectus by visiting our website at www.jennisondryden.com or by calling (800) 225-1852. The prospectus should be read carefully before investing. |
| E-DELIVERY |
To receive your mutual fund documents on-line, go to www.icsdelivery.com/prudential/funds website address. |
| SHAREHOLDER COMMUNICATIONS WITH TRUSTEES |
| Shareholders can communicate directly with the Board of Trustees by writing to the Chair of the Board, Dryden Large-Cap Core Equity Fund, Prudential Investments, Attn: Board of Trustees, 100 Mulberry Street, Gateway Center Three, Newark, NJ 07102. Shareholders can communicate directly with an individual Trustee by writing to the same address. Communications are not screened before being delivered to the addressee. |
| AVAILABILITY OF PORTFOLIO SCHEDULE |
| The Fund files its complete schedule of portfolio holdings with the Securities and Exchange Commission for the first and third quarters of each fiscal year on Form N-Q. The Fund’s Forms N-Q are available on the Commission’s website at www.sec.gov. The Fund’s Forms N-Q may also be reviewed and copied at the Commission’s Public Reference Room in Washington, D.C. Information on the operation and location of the Public Reference Room may be obtained by calling (202) 551-8090. The Fund’s schedule of portfolio holdings is also available on the Fund’s website as of the end of each fiscal quarter. |
| The Fund’s Statement of Additional Information contains additional information about the Fund’s Trustees and is available without charge, upon request, by calling (800) 225-1852. |
Mutual Funds:
| ARE NOT INSURED BY THE FDIC OR ANY FEDERAL GOVERNMENT AGENCY | MAY LOSE VALUE | ARE NOT A DEPOSIT OF OR GUARANTEED BY ANY BANK OR ANY BANK AFFILIATE |

| Dryden Large-Cap Core Equity Fund | ||||||||||||||||||
| Share Class | A | B | C | L | M | X | Z | |||||||||||
NASDAQ | PTMAX | PTMBX | PTMCX | N/A | N/A | N/A | PTEZX | |||||||||||
CUSIP | 26248W106 | 26248W205 | 26248W304 | 26248W502 | 26248W601 | 26248W700 | 26248W403 | |||||||||||
MF187E IFS-A159562 Ed. 12/2008

Item 2 – Code of Ethics – – See Exhibit (a)
As of the end of the period covered by this report, the registrant has adopted a code of ethics (the “Section 406 Standards for Investment Companies – Ethical Standards for Principal Executive and Financial Officers”) that applies to the registrant’s Principal Executive Officer and Principal Financial Officer; the registrant’s Principal Financial Officer also serves as the Principal Accounting Officer.
The registrant hereby undertakes to provide any person, without charge, upon request, a copy of the code of ethics. To request a copy of the code of ethics, contact the registrant 800-225-1852, and ask for a copy of the Section 406 Standards for Investment Companies – Ethical Standards for Principal Executive and Financial Officers.
Item 3 – Audit Committee Financial Expert –
The registrant’s Board has determined that Mr. David E. A. Carson, member of the Board’s Audit Committee is an “audit committee financial expert,” and that he is “independent,” for purposes of this Item.
Item 4 – Principal Accountant Fees and Services –
(a) Audit Fees
For the fiscal years ended October 31, 2008 and October 31, 2007, KPMG LLP (“KPMG”), the Registrant’s principal accountant, billed the Registrant $20,869 and $19,859, respectively, for professional services rendered for the audit of the Registrant’s annual financial statements or services that are normally provided in connection with statutory and regulatory filings.
(b) Audit-Related Fees
None.
(c) Tax Fees
None.
(d) All Other Fees
None.
(e) (1) Audit Committee Pre-Approval Policies and Procedures
THE PRUDENTIAL MUTUAL FUNDS
AUDIT COMMITTEE POLICY
on
Pre-Approval of Services Provided by the Independent Accountants
The Audit Committee of each Prudential Mutual Fund is charged with the responsibility to monitor the independence of the Fund’s independent accountants. As part of this responsibility, the Audit Committee must pre-approve any independent accounting firm’s engagement to render audit and/or permissible non-audit services, as required by law. In evaluating a proposed engagement of the independent accountants, the Audit Committee will assess the effect that the engagement might reasonably be expected to have on the accountant’s independence. The Committee’s evaluation will be based on:
| • | a review of the nature of the professional services expected to be provided, |
| • | a review of the safeguards put into place by the accounting firm to safeguard independence, and |
| • | periodic meetings with the accounting firm. |
Policy for Audit and Non-Audit Services Provided to the Funds
On an annual basis, the scope of audits for each Fund, audit fees and expenses, and audit-related and non-audit services (and fees proposed in respect thereof) proposed to be performed by the Fund’s independent accountants will be presented by the Treasurer and the independent accountants to the Audit Committee for review and, as appropriate, approval prior to the initiation of such services. Such presentation shall be accompanied by confirmation by both the Treasurer and the independent accountants that the proposed services will not adversely affect the independence of the independent accountants. Proposed services shall be described in sufficient detail to enable the Audit Committee to assess the appropriateness of such services and fees, and the compatibility of the provision of such services with the auditor’s independence. The Committee shall receive periodic reports on the progress of the audit and other services which are approved by the Committee or by the Committee Chair pursuant to authority delegated in this Policy.
The categories of services enumerated under “Audit Services”, “Audit-related Services”, and “Tax Services” are intended to provide guidance to the Treasurer and the independent accountants as to those categories of services which the Committee believes are generally consistent with the independence of the independent accountants and which the Committee (or the Committee Chair) would expect upon the presentation of specific proposals to pre-approve. The enumerated categories are not intended as an exclusive list of audit, audit-related or tax services, which the Committee (or the Committee Chair) would consider for pre-approval.
Audit Services
The following categories of audit services are considered to be consistent with the role of the Fund’s independent accountants:
| • | Annual Fund financial statement audits |
| • | Seed audits (related to new product filings, as required) |
| • | SEC and regulatory filings and consents |
Audit-related Services
The following categories of audit-related services are considered to be consistent with the role of the Fund’s independent accountants:
| • | Accounting consultations |
| • | Fund merger support services |
| • | Agreed Upon Procedure Reports |
| • | Attestation Reports |
| • | Other Internal Control Reports |
Individual audit-related services that fall within one of these categories and are not presented to the Audit Committee as part of the annual pre-approval process will be subject to pre-approval by the Committee Chair (or any other Committee member on whom this responsibility has been delegated) so long as the estimated fee for those services does not exceed $50,000.
Tax Services
The following categories of tax services are considered to be consistent with the role of the Fund’s independent accountants:
| • | Tax compliance services related to the filing or amendment of the following: |
| • | Federal, state and local income tax compliance; and, |
| • | Sales and use tax compliance |
| • | Timely RIC qualification reviews |
| • | Tax distribution analysis and planning |
| • | Tax authority examination services |
| • | Tax appeals support services |
| • | Accounting methods studies |
| • | Fund merger support services |
| • | Tax consulting services and related projects |
Individual tax services that fall within one of these categories and are not presented to the Audit Committee as part of the annual pre-approval process will be subject to pre-approval by the Committee Chair (or any other Committee member on whom this responsibility has been delegated) so long as the estimated fee for those services does not exceed $50,000.
Other Non-audit Services
Certain non-audit services that the independent accountants are legally permitted to render will be subject to pre-approval by the Committee or by one or more Committee members to whom the Committee has delegated this authority and who will report to the full Committee any pre-approval decisions made pursuant to this Policy. Non-audit services presented for pre-approval pursuant to this paragraph will be accompanied by a confirmation from both the Treasurer and the independent accountants that the proposed services will not adversely affect the independence of the independent accountants.
Proscribed Services
The Fund’s independent accountants will not render services in the following categories of non-audit services:
| • | Bookkeeping or other services related to the accounting records or financial statements of the Fund |
| • | Financial information systems design and implementation |
| • | Appraisal or valuation services, fairness opinions, or contribution-in-kind reports |
| • | Actuarial services |
| • | Internal audit outsourcing services |
| • | Management functions or human resources |
| • | Broker or dealer, investment adviser, or investment banking services |
| • | Legal services and expert services unrelated to the audit |
| • | Any other service that the Public Company Accounting Oversight Board determines, by regulation, is impermissible. |
Pre-approval of Non-Audit Services Provided to Other Entities Within the Prudential Fund Complex
Certain non-audit services provided to Prudential Investments LLC or any of its affiliates that also provide ongoing services to the Prudential Mutual Funds will be subject to pre-approval by the Audit Committee. The only non-audit services provided to these entities that will require pre-approval are those related directly to the operations and financial reporting of the Funds. Individual projects that are not presented to the Audit Committee as part of the annual pre-approval process will be subject to pre-approval by the Committee Chair (or any other Committee member on whom this responsibility has been delegated) so long as the estimated fee for those services does not exceed $50,000. Services presented for pre-approval pursuant to this paragraph will be accompanied by a confirmation from both the Treasurer and the independent accountants that the proposed services will not adversely affect the independence of the independent accountants.
Although the Audit Committee will not pre-approve all services provided to Prudential Investments LLC and its affiliates, the Committee will receive an annual report from the Fund’s independent accounting firm showing the aggregate fees for all services provided to Prudential Investments and its affiliates.
(e) (2) Percentage of services referred to in 4(b) – 4(d) that were approved by the audit committee –
Not applicable.
(f) Percentage of hours expended attributable to work performed by other than full time employees of principal accountant if greater than 50%.
The percentage of hours expended on the principal accountant’s engagement to audit the registrant’s financial statements for the most recent fiscal year that were attributed to work performed by persons other than the principal accountant’s full-time, permanent employees was 0%.
(g) Non-Audit Fees
Not applicable to Registrant for the fiscal years 2008 and 2007. The aggregate non-audit fees billed by KPMG for services rendered to the registrant’s investment adviser and any entity controlling, controlled by, or under common control with the investment adviser that provides ongoing services to the registrant for the fiscal years 2008 and 2007 was $0 and $44,700, respectively.
(h) Principal Accountant’s Independence
Not applicable as KPMG has not provided non-audit services to the registrant’s investment adviser and any entity controlling, controlled by, or under common control with the investment adviser that provides ongoing services to the registrant that were not pre-approved pursuant to Rule 2-01(c)(7)(ii) of Regulation S-X.
Item 5 – Audit Committee of Listed Registrants – Not applicable.
Item 6 – Schedule of Investments – The schedule is included as part of the report to shareholders filed under Item 1 of this Form.
Item 7 – Disclosure of Proxy Voting Policies and Procedures for Closed-End Management Investment Companies – Not applicable.
Item 8 – Portfolio Managers of Closed-End Management Investment Companies – Not applicable.
Item 9 – Purchases of Equity Securities by Closed-End Management Investment Company and Affiliated Purchasers – Not applicable.
Item 10 – Submission of Matters to a Vote of Security Holders – Not applicable.
Item 11 – Controls and Procedures
| (a) | It is the conclusion of the registrant’s principal executive officer and principal financial officer that the effectiveness of the registrant’s current disclosure controls and procedures (such disclosure controls and procedures having been evaluated within 90 days of the date of this filing) provide reasonable assurance that the information required to be disclosed by the registrant has been recorded, processed, summarized and reported within the time period specified in the Commission’s rules and forms and that the information required to be disclosed by the registrant has been accumulated and communicated to the registrant’s principal executive officer and principal financial officer in order to allow timely decisions regarding required disclosure. |
| (b) | There has been no significant change in the registrant’s internal control over financial reporting that occurred during the registrant’s most recent fiscal quarter of the period covered by this report that has materially affected, or is likely to materially affect, the registrant’s internal control over financial reporting. |
Item 12 – Exhibits
| (a) | (1) Code of Ethics – Attached hereto as Exhibit EX-99.CODE-ETH |
| (2) | Certifications pursuant to Section 302 of the Sarbanes-Oxley Act – Attached hereto as Exhibit EX-99.CERT. |
| (3) | Any written solicitation to purchase securities under Rule 23c-1. – Not applicable. |
| (b) | Certifications pursuant to Section 906 of the Sarbanes-Oxley Act – Attached hereto as Exhibit EX-99.906CERT. |
SIGNATURES
Pursuant to the requirements of the Securities Exchange Act of 1934 and the Investment Company Act of 1940, the registrant has duly caused this report to be signed on its behalf by the undersigned, thereunto duly authorized.
| (Registrant) Dryden Tax-Managed Funds | ||||||
| By (Signature and Title)* | /s/ Deborah A. Docs | |||||
| Deborah A. Docs | ||||||
| Secretary | ||||||
Date December 19, 2008
Pursuant to the requirements of the Securities Exchange Act of 1934 and the Investment Company Act of 1940, this report has been signed below by the following persons on behalf of the registrant and in the capacities and on the dates indicated.
| By (Signature and Title)* | /s/ Judy A. Rice | |||||
| Judy A. Rice | ||||||
| President and Principal Executive Officer | ||||||
Date December 19, 2008
| By (Signature and Title)* | /s/ Grace C. Torres | |||||
| Grace C. Torres | ||||||
| Treasurer and Principal Financial Officer | ||||||
Date December 19, 2008
* | Print the name and title of each signing officer under his or her signature. |