UNITED STATES
SECURITIES AND EXCHANGE COMMISSION
Washington, D.C. 20549
FORM N-CSR
CERTIFIED SHAREHOLDER REPORT OF REGISTERED
MANAGEMENT INVESTMENT COMPANIES
| | |
| Investment Company Act file number: | | 811-09101 |
| |
| Exact name of registrant as specified in charter: | | Prudential Investment Portfolios 9 |
| |
| Address of principal executive offices: | | Gateway Center 3, |
| | 100 Mulberry Street, |
| | Newark, New Jersey 07102 |
| |
| Name and address of agent for service: | | Deborah A. Docs |
| | Gateway Center 3, |
| | 100 Mulberry Street, |
| | Newark, New Jersey 07102 |
| |
| Registrant’s telephone number, including area code: | | 800-225-1852 |
| |
| Date of fiscal year end: | | 10/31/2011 |
| |
| Date of reporting period: | | 10/31/2011 |
Item 1 – Reports to Stockholders

PRUDENTIAL INVESTMENTS»MUTUAL FUNDS
PRUDENTIAL INTERNATIONAL REAL ESTATE FUND
ANNUAL REPORT · OCTOBER 31, 2011
Fund Type
Sector stock
Objective
To seek capital appreciation and income
This report is not authorized for distribution to prospective investors unless preceded or accompanied by a current prospectus.
The views expressed in this report and information about the Fund’s portfolio holdings are for the period covered by this report and are subject to change thereafter.
Prudential Investments, Prudential, the Prudential logo, and the Rock symbol are service marks of Prudential Financial, Inc. and its related entities, registered in many jurisdictions worldwide.

December 15, 2011
Dear Shareholder:
After leading Prudential Investments for the past eight years, I have decided to retire at the end of 2011 from my positions as President of Prudential Investments and President and Trustee of the Prudential International Real Estate Fund (the Fund). Effective January 1, 2012, I will become Chairman of Prudential Investments and act as an advisor to the business during 2012 to help facilitate a smooth transition to my successor, Stuart Parker.
Stuart, who will become President of Prudential Investments and President and Trustee of the Fund on January 1, 2012, previously served as the Executive Vice President of Retail Mutual Fund Distribution at Prudential Investments. With more than 20 years of investment industry experience, Stuart brings a deep understanding of the needs and challenges facing today’s investors.
We hope you find the annual report for the Fund informative. We recognize that ongoing market volatility may make it a difficult time to be an investor. We continue to believe a prudent response to uncertainty is to maintain a diversified portfolio, including stock and bond mutual funds consistent with your tolerance for risk, time horizon, and financial goals.
Your financial professional can help you create a diversified investment plan that reflects your personal investor profile and risk tolerance. Keep in mind that diversification and asset allocation strategies do not assure a profit or protect against loss in declining markets. We encourage you to call your financial professional before making any investment decision.
Prudential Investments provides a wide range of mutual funds to choose from that can help you make progress toward your financial goals. Our funds offer the experience, resources, and professional discipline of Prudential Financial’s affiliated asset managers.
Finally, I’ve been privileged to have had the opportunity to help you address your investment needs, and I thank you for choosing the Prudential Investments family of mutual funds.
Sincerely,

Judy A. Rice, President
Prudential International Real Estate Fund
| | | | |
| Prudential International Real Estate Fund | | | 1 | |
Your Fund’s Performance
Performance data quoted represent past performance. Past performance does not guarantee future results. The investment return and principal value of an investment will fluctuate, so that an investor’s shares, when redeemed, may be worth more or less than their original cost. Current performance may be lower or higher than the past performance data quoted. An investor may obtain performance data as of the most recent month-end by visiting our website at www.prudentialfunds.com or by calling (800) 225-1852. Class A shares have a maximum initial sales charge of 5.50%. Gross operating expenses: Class A, 3.85%; Class B, 4.55%; Class C, 4.55%; Class Z, 3.55%. Net operating expenses: Class A, 1.60%; Class B, 2.35%; Class C, 1.96%; Class Z, 1.35%, after contractual reduction through 2/28/2013.
| | | | |
Cumulative Total Returns (Without Sales Charges) as of 10/31/11 | |
| | | Since Inception | |
Class A | | | –8.10 | % |
Class B | | | –9.30 | |
Class C | | | –9.10 | |
Class Z | | | –8.60 | |
FTSE EPRA/NAREIT Developed ex-U.S. Net Index | | | –7.33 | |
Lipper Average | | | –9.98 | |
| | | | |
Average Annual Total Returns (With Sales Charges) as of 9/30/11 | |
| | | Since Inception | |
Class A | | | N/A | |
Class B | | | N/A | |
Class C | | | N/A | |
Class Z | | | N/A | |
FTSE EPRA/NAREIT Developed ex-U.S. Net Index | | | N/A | |
Lipper Average | | | N/A | |
| | | | |
Average Annual Total Returns (With Sales Charges) as of 10/31/11 | |
| | | Since Inception | |
Class A | | | N/A | |
Class B | | | N/A | |
Class C | | | N/A | |
Class Z | | | N/A | |
| | |
| 2 | | Visit our website at www.prudentialfunds.com |
| | |
Average Annual Total Returns (Without Sales Charges) as of 10/31/11 |
| | | Since Inception |
Class A | | N/A |
Class B | | N/A |
Class C | | N/A |
Class Z | | N/A |
Growth of a $10,000 Investment
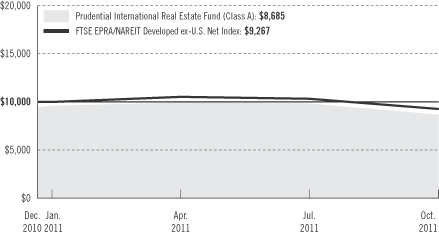
The graph compares a $10,000 investment in the Prudential International Real Estate Fund (Class A shares) with a similar investment in the FTSE EPRA/NAREIT Developed ex-U.S. Net Index by portraying the initial account values at the commencement of operations for Class A shares (December 21, 2010) and the account values at the end of the current fiscal period (October 31, 2011) as measured on a quarterly basis. For purposes of the graph, and unless otherwise indicated, it has been assumed that (a) the maximum applicable front-end sales charge was deducted from the initial $10,000 investment in Class A shares; (b) all recurring fees (including management fees) were deducted; and (c) all dividends and distributions were reinvested. The line graph provides information for Class A shares only. As indicated in the tables provided earlier, performance for Class B, Class C, and Class Z shares will vary due to the differing charges and expenses applicable to each share class (as indicated in the following paragraphs).
Total returns and the ending account values in the graph include changes in share price and reinvestment of dividends and capital gains distributions in a hypothetical investment for the periods shown. The Fund’s total returns do not reflect the deduction of income taxes on an individual’s investment. Taxes may reduce your actual investment returns on income or gains paid by the Fund or any gains you may realize if you sell your shares.
| | | | |
| Prudential International Real Estate Fund | | | 3 | |
Your Fund’s Performance (continued)
Source: Prudential Investments LLC and Lipper Inc. Performance figures may reflect fee waivers and/or expense reimbursements. In the absence of such fee waivers and/or expense reimbursements, total returns would be lower.
Inception date: 12/21/10
The average annual total returns take into account applicable sales charges. Class A, Class B, and Class C shares are subject to an annual distribution and service (12b-1) fee of up to 0.30%, 1.00%, and 1.00% respectively. Under certain limited circumstances, an exchange may be made from Class A, Class B, or Class C shares to Class Z shares of the Fund. Approximately seven years after purchase, Class B will automatically convert to Class A shares on a quarterly basis. All investors who purchase Class A shares in the amount of $1 million or more and sell these shares within 12 months of purchase are not subject to a front-end sales charge but are subject to a contingent deferred sales charge (CDSC) of 1%, including investors who purchase their shares through broker-dealers affiliated with Prudential. Class B and Class C shares are subject to a maximum CDSC of 5% and 1%, respectively. Class Z shares are not subject to a 12b-1 fee or a sales charge. The returns in the tables and graph do not reflect the deduction of taxes that a shareholder would pay on Fund distributions or following the redemption of Fund shares.
Benchmark Definitions
FTSE EPRA/NAREIT Developed ex-U.S. Net Index
The Financial Times Stock Exchange European Public Real Estate Association/National Association of Real Estate Investment Trusts (FTSE EPRA/NAREIT) Developed ex-U.S. Net Total Return Index is an unmanaged index that tracks the performance of listed REITs and real estate companies globally, excluding the U.S.
Lipper Equity International Real Estate Funds Average
Funds in the Lipper Equity International Real Estate Funds Average invest at least 75% of their equity portfolios in shares of companies engaged in the real estate industry that are strictly outside of the U.S. or whose securities are principally traded outside of the U.S.
Investors cannot invest directly in an index or average. The returns for the FTSE EPRA/NAREIT Developed ex-U.S. Net Index would be lower if they included the effects of sales charges, operating expenses of a mutual fund, or taxes. Returns for the Lipper Average reflect the deduction of operating expenses of a mutual fund, but not sales charges or taxes.
| | | | |
Five Largest Holdings expressed as a percentage of net assets as of 10/31/11 | | | | |
Sun Hung Kai Properties Ltd., Diversified Real Estate Activities | | | 6.3 | % |
Westfield Group, REIT, Retail REITs | | | 4.8 | |
Unibail-Rodamco, REIT, Retail REITs | | | 4.2 | |
Mitsui Fudosan Co. Ltd., Diversified Real Estate Activities | | | 4.0 | |
Mitsubishi Estate Co. Ltd., Diversified Real Estate Activities | | | 4.0 | |
Holdings reflect only long-term investments and are subject to change.
| | |
| 4 | | Visit our website at www.prudentialfunds.com |
| | | | |
Five Largest Industries expressed as a percentage of net assets as of 10/31/11 | | | | |
Diversified Real Estate Activities | | | 28.0 | % |
Retail REITs | | | 22.6 | |
Diversified REITs | | | 13.0 | |
Real Estate Operating Companies | | | 12.9 | |
Office REITs | | | 6.2 | |
Industry weightings reflect only long-term investments and are subject to change.
| | | | |
| Prudential International Real Estate Fund | | | 5 | |
Strategy and Performance Overview
How did the Fund perform?
For the reporting period December 21, 2010 to October 31, 2011, the Prudential International Real Estate Fund (the Fund) Class A shares declined by 8.10%, underperforming the 7.33% decline of the FTSE EPRA/NAREIT Developed ex-U.S. Net Index (the Index) and outperforming the 9.98% decline of the Lipper Equity International Real Estate Funds Average.
How is the Fund managed?
Prudential Real Estate Investors, also known as PREI®, manages the Fund, and is one of the largest, most experienced global real estate managers with more than 200 investment professionals in more than 20 locations worldwide. PREI combines a top-down approach that defines broad economic and market trends with bottom-up, company-by-company analysis.
PREI’s investment process involves a core understanding of real estate values. PREI evaluates each security held by the Fund daily to assess its risk-adjusted return potential. It also regularly analyzes and updates allocation of the Fund’s holdings based on geographic location and property type. This results in a portfolio that seeks the best of established markets, as well as new opportunities in regions with growing public real estate securities markets.
PREI’s specialists in private direct property investment work with the team that invests in publicly traded real estate stocks. PREI believes the exchange of information and ideas shared between the two teams helps provide a forward view of market activity. PREI believes the extent to which it has utilized both capabilities is uncommon, particularly on a global basis.
What were conditions like in the international real estate securities market?
| | • | | By region, 2011 returns in Canada and North America beat the UK, which outpaced Continental Europe. Asia Pacific stood as the weakest area. |
| | • | | In Europe, issues related to sovereign debt and slowing euro economies continued to challenge the equity markets. Speculation on the policies of finance ministers, central bankers and government leaders spurred considerable market volatility, far outweighing any company-specific positive news. The underlying condition of European banks served as an additional point of concern. |
| | • | | Greece, Spain, and Italy were the weakest performing markets during the reporting period. Non-euro zone participants such as the UK and Switzerland were less affected, with Switzerland standing as a top performer in 2011. |
| | |
| 6 | | Visit our website at www.prudentialfunds.com |
| | • | | Earnings estimates for some listed properties have softened due to broad economic concerns. However, estimates for those companies exposed to stronger markets have generally held up. These include companies with retail exposure in Paris and northern Europe. |
| | • | | For UK office companies, the distinction between prime (luxury) and less-than prime properties remains acute. A similar dichotomy exists for other property types and other markets. For now, prime assets are most likely to see improved leasing activity. |
| | • | | Investor interest continued to show strength in Germany. Activity in Central and Eastern Europe has shown continued improvement. This strength has been supported by cross-border investment, which increased considerably from a year ago. |
| | • | | Asian markets in the third quarter of 2011 were dominated by the U.S. debt gridlock and by the euro zone’s sovereign debt woes. However, mounting concerns over the extent of China’s slowdown, the risk of over-exposure of local governments to off-balance sheet financing vehicles, and the impact on the banking and real estate sectors also contributed to market volatility. |
| | • | | Japanese real estate developer stocks and Japanese Real Estate Investment Trusts (JREIT) outperformed their Hong Kong and Singapore counterparts. Japanese property stocks have also outperformed over the trailing year. Investors have sought refuge in the Japanese yen and improving fundamentals in the office and condo markets in Tokyo. |
| | • | | Property tightening measures in Hong Kong and Singapore have yet to moderate prices of mass market residential homes. There is increasing evidence pointing to a slowdown in the residential markets. Hong Kong mortgages in August declined 27% on a month-over-month basis, in response to rising mortgage rates. In Singapore, residential unit sales in the secondary and primary markets declined significantly from January to July 2011. Continued strong retail demand remains one of the bright spots in Hong Kong and Singapore. Retail sales in Singapore have also been buoyant. |
| | • | | China property prices in the top 10 cities declined for the first time in a year, indicating that the government’s tightening measures and economic slowdown are starting to take their toll on residential demand. China real estate stocks came off from their peak in early August following the announcement of housing purchase restrictions (HPR) targeted at second- and third-tier cities. |
| | | | |
| Prudential International Real Estate Fund | | | 7 | |
Strategy and Performance Overview (continued)
Which holdings or related groups of holdings made the largest positive and negative contribution to the Fund’s return?
| | • | | Near the end of the reporting period, the Fund held the greatest exposure to diversified companies, which invest in different types of real estate (residential and commercial), and retail property companies that manage shopping malls and other retail spaces. Asia Pacific accounted for a greater portion of diversified exposure, whereas Europe held the largest exposure to retail. |
| | • | | Residential property comprised a considerably smaller allocation in the Fund. However, exposure within this segment led to the most notable positive returns for the portfolio. The Hotel/Resort segment underperformed, yet stock selection mitigated the impact. |
| | • | | Companies such as Unibail-Rodamco (France), RioCan (Canada), and GPT Group (Australia) positively benefited the portfolio. Meanwhile, Sun Hung Kai Properties Ltd. (Hong Kong), Keppel Land Ltd. (Singapore), and Hongkong Land Holdings Ltd. (Hong Kong) negatively affected the portfolio. |
Did any tactical shifts in portfolio risk characteristics, including significant sales and purchases, affect the Fund?
| | • | | The Fund maintained a balanced approach between larger, more defensive companies and smaller names offering compelling real estate value. Earlier in the period, improving market conditions allowed the portfolio to add exposure to entities appropriately positioned to benefit from a market upswing. |
| | • | | Recently, PREI maintained slight overweights in Japan and Singapore and an underweight in Hong Kong. Within sectors, PREI remains cautious on developers due to risks of further tightening measures and slowdowns because of the ongoing debt crisis. PREI is keeping its exposure to retail and Japanese re-construction and selected Singapore Real Estate Investment Trusts (SREIT) for their defensive characteristics. |
| | • | | Concerns about volatility and more selective valuations brought a modest reduction in risk exposure. Companies with defensive demand characteristics (such as certain firms within the residential/multifamily area and those with longer lease terms) gained favor over those with more economic sensitivity (such as hotel/resorts). Volatility did present several opportunities in companies that appeared undervalued in the public market. |
What is PREI’s outlook for the international real estate securities markets?
| | • | | In the near-term, macro-oriented themes continue to drive investor sentiment. At some juncture, PREI believes that concerns regarding sovereign debt and broad-based weak economic conditions will diminish. |
| | |
| 8 | | Visit our website at www.prudentialfunds.com |
| | • | | Ultimately, property fundamentals and company-specific drivers should take on added importance. While challenging, near-term volatility does present opportunities to take advantage of potentially mispriced companies. For long-term investors with a core understanding of property values, the arbitrage opportunities can be meaningful. |
| | • | | Going forward, the performance distinction between top-tier assets in top markets and lesser quality assets could remain meaningful. Certainly job formation will be key in setting the pace of demand. However, historic low interest rates and similarly low levels of new supply could likely pose a positive environment for owners of existing property in many markets. Issues in Asia Pacific may be somewhat different. Asset inflation appears to have slowed, a positive for investors. Overall, PREI maintains a cautiously optimistic view on the market. |
| | | | |
| Prudential International Real Estate Fund | | | 9 | |
Comments on the Fund’s Five Largest Holdings
| 6.3% | Sun Hung Kai Properties Ltd., Diversified Real Estate Activities |
Sun Hung Kai Properties Ltd., through its subsidiaries, develops and invests in properties. The Company also operates hotels and manages properties, car parking, and transportation infrastructure. In addition, Sun Hung Kai operates a logistics business, construction, financial services, telecommunication, Internet infrastructure, and other services.
| 4.8% | Westfield Group, REIT, Retail REITs |
Westfield Group is a property trust that invests in, leases, and manages retail shopping centers in Australia, New Zealand, the United States, and the United Kingdom. The Group’s operations also include asset management, property development, and construction.
| 4.2% | Unibail-Rodamco, REIT, Retail REITs |
Unibail-Rodamco leases and rents building space, finances real estate investments, and renovates real estate for sale. The Company’s properties, mainly shopping centers, office buildings, and convention-exhibition centers, are primarily located in city centers or near major access routes.
| 4.0% | Mitsui Fudosan Co. Ltd., Diversified Real Estate Activities |
Mitsui Fudosan Co., Ltd. is a Japan-based real estate company that has eight business segments. The Leasing segment leases houses and commercial facilities.
| 4.0% | Mitsubishi Estate Co. Ltd., Diversified Real Estate Activities |
Mitsubishi Estate Co. Ltd. engages in real estate activities primarily in Japan, the United States, and internationally. It operates in eight segments: Building Business, Residential Business, Urban Development & Investment Management, International Business, Architectural Design & Engineering, Custom-Built Housing, Hotels Business, and Real Estate Services.
| | |
| 10 | | Visit our website at www.prudentialfunds.com |
Fees and Expenses (Unaudited)
As a shareholder of the Fund, you incur two types of costs: (1) transaction costs, including sales charges (loads) on purchase payments and redemptions, as applicable, and (2) ongoing costs, including management fees, distribution and/or service (12b-1) fees, and other Fund expenses, as applicable. This example is intended to help you understand your ongoing costs (in dollars) of investing in the Fund and to compare these costs with the ongoing costs of investing in other mutual funds.
The example is based on an investment of $1,000 invested on May 1, 2011, at the beginning of the period, and held through the six-month period ended October 31, 2011. The example is for illustrative purposes only; you should consult the Prospectus for information on initial and subsequent minimum investment requirements.
The Fund’s transfer agent may charge additional fees to holders of certain accounts that are not included in the expenses shown in the table on the following page. These fees apply to individual retirement accounts (IRAs) and Section 403(b) accounts. As of the close of the six-month period covered by the table, IRA fees included an annual maintenance fee of $15 per account (subject to a maximum annual maintenance fee of $25 for all accounts held by the same shareholder). Section 403(b) accounts are charged an annual $25 fiduciary maintenance fee. Some of the fees may vary in amount, or may be waived, based on your total account balance or the number of Prudential Investments funds, including the Fund, that you own. You should consider the additional fees that were charged to your Fund account over the six-month period when you estimate the total ongoing expenses paid over the period and the impact of these fees on your ending account value, as these additional expenses are not reflected in the information provided in the expense table. Additional fees have the effect of reducing investment returns.
Actual Expenses
The first line for each share class in the table on the following page provides information about actual account values and actual expenses. You may use the information on this line, together with the amount you invested, to estimate the expenses that you paid over the period. Simply divide your account value by $1,000 (for example, an $8,600 account value ÷ $1,000 = 8.6), then multiply the result by the number on the first line under the heading “Expenses Paid During the Six-Month Period” to estimate the expenses you paid on your account during this period.
Hypothetical Example for Comparison Purposes
The second line for each share class in the table on the following page provides information about hypothetical account values and hypothetical expenses based on the Fund’s actual expense ratio and an assumed rate of return of 5% per year before expenses, which is not the Fund’s actual return. The hypothetical account values and
| | | | |
| Prudential International Real Estate Fund | | | 11 | |
Fees and Expenses (continued)
expenses may not be used to estimate the actual ending account balance or expenses you paid for the period. You may use this information to compare the ongoing costs of investing in the Fund and other funds. To do so, compare this 5% hypothetical example with the 5% hypothetical examples that appear in the shareholder reports of the other funds.
Please note that the expenses shown in the table are meant to highlight your ongoing costs only and do not reflect any transactional costs such as sales charges (loads). Therefore, the second line for each share class in the table is useful in comparing ongoing costs only and will not help you determine the relative total costs of owning different funds. In addition, if these transactional costs were included, your costs would have been higher.
| | | | | | | | | | | | | | | | | | |
Prudential
International
Real Estate Fund | | Beginning Account
Value
May 1, 2011 | | | Ending Account
Value
October 31, 2011 | | | Annualized
Expense Ratio
Based on the
Six-Month Period | | | Expenses Paid
During the
Six-Month Period* | |
| | | | | | | | | | | | | | | | | | |
| Class A | | Actual | | $ | 1,000.00 | | | $ | 875.20 | | | | 1.60 | % | | $ | 7.56 | |
| | | Hypothetical | | $ | 1,000.00 | | | $ | 1,017.14 | | | | 1.60 | % | | $ | 8.13 | |
| | | | | | | | | | | | | | | | | | |
| Class B | | Actual | | $ | 1,000.00 | | | $ | 865.50 | | | | 2.35 | % | | $ | 11.05 | |
| | | Hypothetical | | $ | 1,000.00 | | | $ | 1,013.36 | | | | 2.35 | % | | $ | 11.93 | |
| | | | | | | | | | | | | | | | | | |
| Class C | | Actual | | $ | 1,000.00 | | | $ | 867.40 | | | | 1.86 | % | | $ | 8.75 | |
| | | Hypothetical | | $ | 1,000.00 | | | $ | 1,015.83 | | | | 1.86 | % | | $ | 9.45 | |
| | | | | | | | | | | | | | | | | | |
| Class Z | | Actual | | $ | 1,000.00 | | | $ | 869.60 | | | | 1.35 | % | | $ | 6.36 | |
| | | Hypothetical | | $ | 1,000.00 | | | $ | 1,018.40 | | | | 1.35 | % | | $ | 6.87 | |
* Fund expenses (net of fee waivers or subsidies, if any) for each share class are equal to the annualized expense ratio for each share class (provided in the table), multiplied by the average account value over the period, multiplied by the 184 days in the six-month period ended October 31, 2011, and divided by the 365 days in the Fund’s fiscal period ended October 31, 2011 (to reflect the six-month period). Expenses presented in the table include the expenses of any underlying funds in which the Fund may invest.
| | |
| 12 | | Visit our website at www.prudentialfunds.com |
Portfolio of Investments
as of October 31, 2011
| | | | | | |
| Shares | | Description | | Value (Note 1) | |
| | | | | | |
LONG-TERM INVESTMENTS 98.3% | |
COMMON STOCKS 98.3% | |
| |
Australia 16.7% | | | | |
| 100,400 | | CFS Retail Property Trust, REIT | | $ | 191,392 | |
| 27,000 | | Charter Hall Office, REIT | | | 95,808 | |
| 47,500 | | Charter Hall Retail, REIT | | | 162,918 | |
| 232,600 | | Dexus Property Group, REIT | | | 206,911 | |
| 63,500 | | FKP Property Group | | | 32,726 | |
| 340,100 | | Goodman Group, REIT | | | 221,010 | |
| 86,300 | | GPT Group, REIT | | | 284,815 | |
| 257,200 | | Investa Office Fund, REIT | | | 168,143 | |
| 91,800 | | Stockland, REIT | | | 303,142 | |
| 84,300 | | Westfield Group, REIT | | | 678,645 | |
| | | | | | |
| | | | | 2,345,510 | |
| |
Belgium 0.5% | | | | |
| 515 | | Cofinimmo, REIT | | | 62,781 | |
| |
Brazil 1.7% | | | | |
| 6,073 | | BR Malls Participacoes SA | | | 65,970 | |
| 9,564 | | Brookfield Incorporacoes SA | | | 37,268 | |
| 3,162 | | Multiplan Empreendimentos Imobiliarios SA | | | 63,853 | |
| 16,305 | | PDG Realty SA Empreendimentos e Participacoes | | | 71,988 | |
| | | | | | |
| | | | | 239,079 | |
| |
Canada 9.5% | | | | |
| 5,441 | | Boardwalk Real Estate Investment Trust, REIT | | | 265,732 | |
| 23,411 | | Brookfield Office Properties, Inc. | | | 384,253 | |
| 11,300 | | Canadian Apartment Properties, REIT | | | 229,231 | |
| 15,800 | | Chartwell Seniors Housing Real Estate Investment Trust, REIT | | | 123,166 | |
| 13,400 | | RioCan Real Estate Investment Trust, REIT | | | 339,991 | |
| | | | | | |
| | | | | 1,342,373 | |
| |
Finland 1.2% | | | | |
| 20,519 | | Citycon Oyj | | | 75,568 | |
| 22,848 | | Sponda Oyj | | | 99,260 | |
| | | | | | |
| | | | | 174,828 | |
| |
France 6.5% | | | | |
| 739 | | ICADE, REIT | | | 66,139 | |
| 8,677 | | Klepierre, REIT | | | 270,459 | |
See Notes to Financial Statements.
| | | | |
| Prudential International Real Estate Fund | | | 13 | |
Portfolio of Investments
as of October 31, 2011 continued
| | | | | | |
| Shares | | Description | | Value (Note 1) | |
| | | | | | |
COMMON STOCKS (Continued) | |
| |
France (cont’d.) | | | | |
| 2,942 | | Unibail-Rodamco, REIT | | $ | 584,897 | |
| | | | | | |
| | | | | 921,495 | |
| |
Germany | | | | |
| 410 | | DIC Asset AG | | | 3,740 | |
| |
Hong Kong 20.5% | | | | |
| 149,000 | | China Overseas Land & Investment Ltd. | | | 275,708 | |
| 102,000 | | Hang Lung Properties Ltd. | | | 371,465 | |
| 52,000 | | Henderson Land Development Co. Ltd. | | | 284,234 | |
| 72,000 | | Hongkong Land Holdings Ltd. | | | 381,600 | |
| 29,000 | | Hysan Development Co. Ltd. | | | 101,198 | |
| 8,500 | | Kerry Properties Ltd. | | | 31,194 | |
| 60,000 | | Link (The), REIT | | | 206,054 | |
| 212,000 | | New World China Land Ltd. | | | 48,369 | |
| 34,000 | | New World Development Co. Ltd. | | | 35,817 | |
| 94,000 | | Sino Land Co. Ltd. | | | 148,589 | |
| 64,000 | | Sun Hung Kai Properties Ltd. | | | 881,202 | |
| 23,000 | | Wharf Holdings Ltd. (The) | | | 122,343 | |
| | | | | | |
| | | | | 2,887,773 | |
| |
Italy 0.5% | | | | |
| 119,504 | | Beni Stabili SpA, REIT | | | 71,818 | |
| |
Japan 16.8% | | | | |
| 9,200 | | AEON Mall Co. Ltd. | | | 213,293 | |
| 2,100 | | Daito Trust Construction Co. Ltd. | | | 186,061 | |
| 10,000 | | Daiwa House Industry Co. Ltd. | | | 125,309 | |
| 33,000 | | Mitsubishi Estate Co. Ltd. | | | 558,922 | |
| 34,000 | | Mitsui Fudosan Co. Ltd. | | | 565,430 | |
| 8 | | Nippon Accommodations Fund, Inc., REIT | | | 53,011 | |
| 22 | | Nippon Building Fund, Inc., REIT | | | 212,448 | |
| 6,200 | | Nomura Real Estate Holdings, Inc. | | | 99,948 | |
| 17,000 | | Sumitomo Realty & Development Co. Ltd. | | | 352,361 | |
| | | | | | |
| | | | | 2,366,783 | |
| |
Netherlands 3.7% | | | | |
| 1,242 | | Corio NV, REIT | | | 63,116 | |
| 4,654 | | Eurocommercial Properties NV, REIT | | | 198,501 | |
| 1,563 | | VastNed Retail NV, REIT | | | 78,965 | |
See Notes to Financial Statements.
| | |
| 14 | | Visit our website at www.prudentialfunds.com |
| | | | | | |
| Shares | | Description | | Value (Note 1) | |
| | | | | | |
COMMON STOCKS (Continued) | |
| |
Netherlands (cont’d.) | | | | |
| 2,217 | | Wereldhave NV, REIT | | $ | 173,535 | |
| | | | | | |
| | | | | 514,117 | |
| |
Norway 0.7% | | | | |
| 63,872 | | Norwegian Property ASA(a) | | | 100,016 | |
| |
Singapore 7.9% | | | | |
| 34,000 | | Ascendas Real Estate Investment Trust, REIT | | | 55,316 | |
| 34,000 | | Cache Logistics Trust, REIT | | | 26,627 | |
| 62,000 | | CapitaCommercial Trust, REIT | | | 55,386 | |
| 43,000 | | Capitaland Ltd. | | | 92,641 | |
| 24,000 | | CapitaMall Trust, REIT | | | 35,659 | |
| 109,000 | | CDL Hospitality Trusts, REIT | | | 140,863 | |
| 28,000 | | City Developments Ltd. | | | 241,462 | |
| 25,000 | | Global Logistic Properties Ltd.(a) | | | 34,808 | |
| 90,000 | | Keppel Land Ltd. | | | 198,555 | |
| 122,000 | | Mapletree Commercial Trust, REIT | | | 84,236 | |
| 38,880 | | Mapletree Industrial Trust, REIT | | | 35,761 | |
| 109,000 | | Suntec Real Estate Investment Trust, REIT | | | 107,103 | |
| | | | | | |
| | | | | 1,108,417 | |
| |
Sweden 1.9% | | | | |
| 12,998 | | Hufvudstaden AB (Class A Stock) | | | 141,015 | |
| 18,760 | | Klovern AB | | | 78,287 | |
| 7,033 | | Kungsleden AB | | | 53,777 | |
| | | | | | |
| | | | | 273,079 | |
| |
United Kingdom 10.2% | | | | |
| 10,589 | | Atrium European Real Estate Ltd. | | | 53,375 | |
| 4,373 | | Big Yellow Group PLC, REIT | | | 18,363 | |
| 34,250 | | British Land Co. PLC, REIT | | | 280,203 | |
| 3,260 | | Derwent London PLC, REIT | | | 88,735 | |
| 29,894 | | Great Portland Estates PLC, REIT | | | 178,708 | |
| 38,196 | | Hammerson PLC, REIT | | | 249,538 | |
| 33,118 | | Land Securities Group PLC, REIT | | | 362,457 | |
| 52,331 | | SEGRO PLC, REIT | | | 204,634 | |
| | | | | | |
| | | | | 1,436,013 | |
| | | | | | |
| | TOTAL COMMON STOCKS
(cost $14,946,887) | | | 13,847,822 | |
| | | | | | |
See Notes to Financial Statements.
| | | | |
| Prudential International Real Estate Fund | | | 15 | |
Portfolio of Investments
as of October 31, 2011 continued
| | | | | | |
| Units | | Description | | Value (Note 1) | |
RIGHTS(a) | | | | | | |
| | |
Hong Kong | | | | | | |
| 17,000 | | New World Development Co. Ltd., expiring 11/22/11
(cost $0) | | $ | 5,799 | |
| | | | | | |
| | TOTAL LONG-TERM INVESTMENTS
(cost $14,946,887) | | | 13,853,621 | |
| | | | | | |
| |
| Shares | | | |
SHORT-TERM INVESTMENT 3.0% | | | | |
| |
AFFILIATED MONEY MARKET MUTUAL FUND | | | | |
| 417,115 | | Prudential Investment Portfolios 2 - Prudential Core Taxable Money Market Fund
(cost $417,115)(b) | | | 417,115 | |
| | | | | | |
| | TOTAL INVESTMENTS 101.3%
(cost $15,364,002; Note 5) | | | 14,270,736 | |
| | Liabilities in excess of other assets (1.3)% | | | (189,222 | ) |
| | | | | | |
| | NET ASSETS 100% | | $ | 14,081,514 | |
| | | | | | |
The following abbreviation is used in the Portfolio descriptions:
REIT—Real Estate Investment Trust
| (a) | Non-income producing security. |
| (b) | Prudential Investments LLC, the manager of the Fund, also serves as manager of the Prudential Investment Portfolios 2 - Prudential Core Taxable Money Market Fund. |
Various inputs are used in determining the value of the Fund’s investments. These inputs are summarized in the three broad levels listed below.
Level 1—quoted prices generally for securities actively traded on a regulated securities exchange and for open-end mutual funds which trade at daily net asset value.
Level 2—other significant observable inputs (including, but not limited to, quoted prices for similar securities, interest rates, prepayment speeds, foreign currency exchange rates, and amortized cost) generally for debt securities, swaps, forward foreign currency contracts and for foreign stocks priced using vendor modeling tools.
Level 3—significant unobservable inputs for securities valued in accordance with Board approved fair valuation procedures.
See Notes to Financial Statements.
| | |
| 16 | | Visit our website at www.prudentialfunds.com |
The following is a summary of the inputs used as of October 31, 2011 in valuing such portfolio securities:
| | | | | | | | | | | | |
| | | Level 1 | | | Level 2 | | | Level 3 | |
Investments in Securities | | | | | | | | | | | | |
Common Stocks: | | | | | | | | | | | | |
Australia | | $ | — | | | $ | 2,345,510 | | | $ | — | |
Belgium | | | — | | | | 62,781 | | | | — | |
Brazil | | | 239,079 | | | | — | | | | — | |
Canada | | | 1,342,373 | | | | — | | | | — | |
Finland | | | — | | | | 174,828 | | | | — | |
France | | | — | | | | 921,495 | | | | — | |
Germany | | | — | | | | 3,740 | | | | — | |
Hong Kong | | | 381,600 | | | | 2,506,173 | | | | — | |
Italy | | | — | | | | 71,818 | | | | — | |
Japan | | | — | | | | 2,366,783 | | | | — | |
Netherlands | | | — | | | | 514,117 | | | | — | |
Norway | | | — | | | | 100,016 | | | | — | |
Singapore | | | — | | | | 1,108,417 | | | | — | |
Sweden | | | — | | | | 273,079 | | | | — | |
United Kingdom | | | — | | | | 1,436,013 | | | | — | |
Rights—Hong Kong | | | — | | | | 5,799 | | | | — | |
Affiliated Money Market Mutual Fund | | | 417,115 | | | | — | | | | — | |
| | | | | | | | | | | | |
Total | | $ | 2,380,167 | | | $ | 11,890,569 | | | $ | — | |
| | | | | | | | | | | | |
The industry classification of investments and liabilities in excess of other assets shown as a percentage of net assets as of October 31, 2011 were as follows:
| | | | |
Diversified Real Estate Activities | | | 28.0 | % |
Retail REITs | | | 22.6 | |
Diversified REITs | | | 13.0 | |
Real Estate Operating Companies | | | 12.9 | |
Office REITs | | | 6.2 | |
Real Estate Development | | | 5.0 | |
Residential REITs | | | 3.9 | |
Industrial REITs | | | 3.9 | |
Affiliated Money Market Mutual Fund | | | 3.0 | % |
Specialized REITs | | | 2.0 | |
Homebuilding | | | 0.8 | |
| | | | |
| | | 101.3 | |
Liabilities in excess of other assets | | | (1.3 | ) |
| | | | |
| | | 100.0 | % |
| | | | |
The Fund invested in various derivative instruments during the reporting period. The primary types of risk associated with these derivative instruments were equity risk and foreign exchange risk.
See Notes to Financial Statements.
| | | | |
| Prudential International Real Estate Fund | | | 17 | |
Portfolio of Investments
as of October 31, 2011 continued
The effect of such derivative instruments on the Fund’s financial position and financial performance as reflected in the Statement of Assets and Liabilities and Statement of Operations is presented in the summary below.
Fair values of derivative instruments as of October 31, 2011 as presented in the Statement of Assets and Liabilities:
| | | | | | | | | | | | |
Derivatives not accounted for
as hedging instruments,
carried at fair value | | Asset Derivatives | | | Liability Derivatives | |
| | Balance
Sheet Location | | Fair
Value | | | Balance
Sheet Location | | Fair
Value | |
| Equity contracts | | Unaffiliated investments | | $ | 5,799 | | | — | | $ | — | |
| | | | | | | | | | | | |
The effects of derivative instruments on the Statement of Operations for the period December 21, 2010* through October 31, 2011 are as follows:
| | | | |
Amount of Realized Gain or (Loss) on Derivatives Recognized in Income | |
Derivatives not accounted for as hedging
instruments, carried at fair value | | Forward
Currency
Contracts | |
Foreign exchange contracts | | $ | 549 | |
| | | | |
|
Change in Unrealized Appreciation or (Depreciation) on Derivatives Recognized in Income | |
Derivatives not accounted for as hedging
instruments, carried at fair value | | Rights | |
Equity contracts | | $ | 5,799 | |
| | | | |
For the period ended October 31, 2011, the Fund’s average value at settlement date payable for foreign currency exchange purchase contracts was $4,198.
| * | Commencement of operations. |
See Notes to Financial Statements.
| | |
| 18 | | Visit our website at www.prudentialfunds.com |
Financial Statements
| | |
| OCTOBER 31, 2011 | | ANNUAL REPORT |
Prudential International Real Estate Fund
Statement of Assets and Liabilities
as of October 31, 2011
| | | | |
Assets | | | | |
Investments at value: | | | | |
Unaffiliated Investments (cost $14,946,887) | | $ | 13,853,621 | |
Affiliated Investments (cost $417,115) | | | 417,115 | |
Foreign currency, at value (cost $6,568) | | | 6,597 | |
Dividends receivable | | | 45,340 | |
Due from manager | | | 15,491 | |
Tax reclaim receivable | | | 5,271 | |
Prepaid expenses | | | 409 | |
| | | | |
Total assets | | | 14,343,844 | |
| | | | |
| |
Liabilities | | | | |
Payable for investments purchased | | | 209,233 | |
Accrued expenses | | | 52,857 | |
Distribution fee payable | | | 183 | |
Affiliated transfer agent fee payable | | | 57 | |
| | | | |
Total liabilities | | | 262,330 | |
| | | | |
| |
Net Assets | | $ | 14,081,514 | |
| | | | |
| | | | | |
Net assets were comprised of: | | | | |
Shares of beneficial interest, at par | | $ | 1,538 | |
Paid-in capital in excess of par | | | 15,194,489 | |
| | | | |
| | | 15,196,027 | |
Undistributed net investment income | | | 259,165 | |
Accumulated net realized loss on investment and foreign currency transactions | | | (279,797 | ) |
Net unrealized depreciation on investments and foreign currencies | | | (1,093,881 | ) |
| | | | |
Net Assets, October 31, 2011 | | $ | 14,081,514 | |
| | | | |
See Notes to Financial Statements.
| | |
| 20 | | Visit our website at www.prudentialfunds.com |
| | | | |
Class A | | | | |
Net asset value and redemption price per share
($813,904 ÷ 88,483 shares of beneficial interest issued and outstanding) | | $ | 9.20 | |
Maximum sales charge (5.50% of offering price) | | | 0.54 | |
| | | | |
Maximum offering price to public | | $ | 9.74 | |
| | | | |
| |
Class B | | | | |
Net asset value, offering price and redemption price per share
($4,452 ÷ 490.4 shares of beneficial interest issued and outstanding) | | $ | 9.08 | |
| | | | |
| |
Class C | | | | |
Net asset value, offering price and redemption price per share
($30,396 ÷ 3,341 shares of beneficial interest issued and outstanding) | | $ | 9.10 | |
| | | | |
| |
Class Z | | | | |
Net asset value, offering price and redemption price per share
($13,232,762 ÷ 1,446,164 shares of beneficial interest issued and outstanding) | | $ | 9.15 | |
| | | | |
See Notes to Financial Statements.
| | | | |
| Prudential International Real Estate Fund | | | 21 | |
Statement of Operations
December 21, 2010* through October 31, 2011
| | | | |
Net Investment Income | | | | |
Income | | | | |
Unaffiliated dividend income (net of foreign withholding taxes of $29,194) | | $ | 376,716 | |
Affiliated dividend income | | | 1,466 | |
| | | | |
Total income | | | 378,182 | |
| | | | |
| |
Expenses | | | | |
Management fee | | | 108,953 | |
Distribution fee—Class A | | | 760 | |
Distribution fee—Class B | | | 41 | |
Distribution fee—Class C | | | 123 | |
Registration fees | | | 92,000 | |
Custodian’s fees and expenses | | | 64,000 | |
Legal fees and expenses | | | 43,000 | |
Reports to shareholders | | | 25,000 | |
Audit fee | | | 25,000 | |
Trustees’ fees | | | 8,000 | |
Transfer agent’s fees and expenses (including affiliated expense of $300) (Note 3) | | | 1,000 | |
Loan interest expense (Note 7) | | | 39 | |
Miscellaneous | | | 19,591 | |
| | | | |
Total expenses | | | 387,507 | |
Expense reimbursement (Note 2) | | | (239,456 | ) |
| | | | |
Net expenses | | | 148,051 | |
| | | | |
Net investment income | | | 230,131 | |
| | | | |
| |
Realized And Unrealized Loss On Investments And Foreign Currencies | | | | |
Net realized loss on: | | | | |
Investment transactions | | | (254,384 | ) |
Foreign currency transactions | | | (18,215 | ) |
| | | | |
| | | (272,599 | ) |
| | | | |
Net change in unrealized appreciation (depreciation) on: | | | | |
Investments | | | (1,093,266 | ) |
Foreign currencies | | | (615 | ) |
| | | | |
| | | (1,093,881 | ) |
| | | | |
Net loss on investments and foreign currencies | | | (1,366,480 | ) |
| | | | |
Net Decrease In Net Assets Resulting From Operations | | $ | (1,136,349 | ) |
| | | | |
| * | Commencement of operations. |
See Notes to Financial Statements.
| | |
| 22 | | Visit our website at www.prudentialfunds.com |
Statement of Changes
| | | | |
| | | December 21, 2010*
through
October 31, 2011 | |
Increase (Decrease) In Net Assets | | | | |
Operations | | | | |
Net investment income | | $ | 230,131 | |
Net realized loss on investment and foreign currency transactions | | | (272,599 | ) |
Net change in unrealized appreciation (depreciation) on investments and foreign currencies | | | (1,093,881 | ) |
| | | | |
Net decrease in net assets resulting from operations | | | (1,136,349 | ) |
| | | | |
| |
Fund share transactions (Note 6) | | | | |
Net proceeds from shares sold | | | 17,868,451 | |
Cost of shares reacquired | | | (2,650,588 | ) |
| | | | |
Net increase in net assets resulting from Fund share transactions | | | 15,217,863 | |
| | | | |
Total increase | | | 14,081,514 | |
| |
Net Assets | | | | |
Beginning of period | | | — | |
| | | | |
End of period(a) | | $ | 14,081,514 | |
| | | | |
(a) Includes undistributed net investment income of: | | $ | 259,165 | |
| | | | |
| * | Commencement of operations. |
See Notes to Financial Statements.
| | | | |
| Prudential International Real Estate Fund | | | 23 | |
Notes to Financial Statements
Prudential Investment Portfolios 9 (the “Trust”) is registered under the Investment Company Act of 1940, as amended, (“1940 Act”), as an open-end, management investment company. The Trust currently consists of three portfolios: Prudential International Real Estate Fund, Prudential Large-Cap Core Equity Fund and Prudential Absolute Return Bond Fund. These financial statements relate only to Prudential International Real Estate Fund (the “Fund”). The financial statements of the other portfolios are not presented herein. The Trust was organized as a Delaware business trust on September 18, 1998. The Fund commenced investment operations on December 21, 2010. The Fund is non-diversified and its investment objective is to seek capital appreciation and income.
Note 1. Accounting Policies
The following is a summary of significant accounting policies followed by the Trust in the preparation of these financial statements.
Securities Valuation: Securities listed on a securities exchange (other than options on securities and indices) are valued at the last sale price on such exchange on the day of valuation or, if there was no sale on such day, at the mean between the last reported bid and asked prices, or at the last bid price on such day in the absence of an asked price. Securities traded via NASDAQ are valued at the NASDAQ official closing price (“NOCP”) on the day of valuation, or if there was no NOCP, at the last sale price. Securities that are actively traded in the over-the-counter market, including listed securities for which the primary market is believed by Prudential Investments LLC (“PI” or “Manager”), in consultation with the subadviser, to be over-the-counter, are valued at market value using prices provided by an independent pricing agent or principal market maker. Prices may be obtained from independent pricing services which use information provided by market makers or estimates of market values obtained from yield data relating to investments or securities with similar characteristics. Securities for which reliable market quotations are not readily available, or whose values have been affected by events occurring after the close of the security’s foreign market and before the Fund’s normal pricing time, are valued at fair value in accordance with the Board of Trustees’ approved fair valuation procedures. When determining the fair value of securities, some of the factors influencing the valuation include the nature of any restrictions on disposition of the securities; assessment of the general liquidity of the securities; the issuer’s financial condition and the markets in which it does business; the cost of the investment; the
| | |
| 24 | | Visit our website at www.prudentialfunds.com |
size of the holding and the capitalization of issuer; the prices of any recent transactions or bids/offers for such securities or any comparable securities; any available analyst media or other reports or information deemed reliable by the investment adviser regarding the issuer or the markets or industry in which it operates. Using fair value to price securities may result in a value that is different from a security’s most recent closing price and from the price used by other mutual funds to calculate their net asset values.
Investments in open-end, non exchange-traded mutual funds are valued at their net asset value as of the close of the New York Stock Exchange on the date of valuation.
Foreign Currency Translation: The books and records of the Fund are maintained in U.S. dollars. Foreign currency amounts are translated into U.S. dollars on the following basis:
(i) market value of investment securities, other assets and liabilities-at the current daily rates of exchange.
(ii) purchases and sales of investment securities, income and expenses-at the rates of exchange prevailing on the respective dates of such transactions.
Although the net assets of the Fund are presented at the foreign exchange rates and market values at the close of the fiscal period, the Fund does not isolate that portion of the results of operations arising as a result of changes in the foreign exchange rates from the fluctuations arising from changes in the market prices of portfolio securities held at the end of the fiscal period. Similarly, the Fund does not isolate the effect of changes in foreign exchange rates from the fluctuations arising from changes in the market prices of portfolio securities sold during the fiscal period. Accordingly, realized foreign currency gains or losses are included in the reported net realized gains or losses on investment transactions. Net realized gains or losses on foreign currency transactions represent net foreign exchange gains or losses from holdings of foreign currencies, currency gains or losses realized between the trade and settlement dates on security transactions, and the difference between the amounts of dividends, interest and foreign withholding taxes recorded on the Fund’s books and the U.S. dollar equivalent amounts actually received or paid. Net unrealized currency gains or losses from valuing foreign currency denominated assets and liabilities (other than investments) at period-end exchange rates are reflected as a component of net unrealized appreciation (depreciation) on foreign currencies.
Foreign security and currency transactions may involve certain considerations and risks not typically associated with those of domestic origin as a result of, among other
| | | | |
| Prudential International Real Estate Fund | | | 25 | |
Notes to Financial Statements
continued
factors, the possibility of political or economic instability, or the level of governmental supervision and regulation of foreign securities markets.
Forward Currency Contracts: A forward currency contract is a commitment to purchase or sell a foreign currency at a future date at a negotiated forward rate. The Fund enters into forward currency contracts in order to hedge its exposure to changes in foreign currency exchange rates on its foreign portfolio holdings or specific receivables and payables denominated in a foreign currency. The contracts are valued daily at current forward exchange rates and any unrealized gain or loss is included in net unrealized appreciation or depreciation on foreign currencies. Gain or loss is realized on the settlement date of the contract equal to the difference between the settlement value of the original and negotiated forward contracts. This gain or loss, if any, is included in net realized gain (loss) on foreign currency transactions. Risks may arise upon entering into these contracts from the potential inability of the counterparties to meet the terms of their contracts. Forward currency contracts involve elements of both market and credit risk in excess of the amounts reflected on the Statement of Assets and Liabilities. The Fund’s maximum risk of loss from counterparty credit risk is the net value of the cash flows to be received from the counterparty at the end of the contract’s life. A master netting agreement between the Fund and the counterparty permits the Fund to offset amounts payable by the Fund to the same counterparty against amounts to be received; and by the receipt of collateral from the counterparty by the Fund to cover the Fund’s exposure to the counterparty. However, there is no assurance that such mitigating factors are easily enforceable.
Warrants and Rights: The Fund may hold warrants and rights acquired either through a direct purchase, included as part of a private placement, or pursuant to corporate actions. Warrants and rights entitle the holder to buy a proportionate amount of common stock, or such other security that the issuer may specify, at a specific price and time through the expiration dates. Such warrants and rights are held as long positions by the Fund until exercised, sold or expired. Warrants and rights are valued at fair value in accordance with the Board of Trustees’ approved fair valuation procedures.
Securities Transactions and Net Investment Income: Securities transactions are recorded on the trade date. Realized gains or losses on sales of securities are calculated on the identified cost basis. Dividend income is recorded on the ex-dividend date. Interest income, including amortization of premium and accretion of discount on debt securities, as required, is recorded on the accrual basis. Expenses
| | |
| 26 | | Visit our website at www.prudentialfunds.com |
are recorded on the accrual basis which may require the use of certain estimates by management. Net investment income or loss (other than distribution fees, which are charged directly to the respective class) and unrealized and realized gains or losses are allocated daily to each class of shares based upon the relative proportion of net assets of each class at the beginning of the day.
The Fund invests in real estate investment trusts (“REITs”), which report information on the source of their distributions annually. A portion of distributions received from REITs during the period is estimated to be income and/or capital gain and a portion is estimated to be return of capital and is recorded as a reduction of their cost. These estimates are adjusted when the actual source of distributions is disclosed by the REITs.
Dividends and Distributions: The Fund expects to pay dividends of net investment income and distributions of net realized capital and currency gains, if any, annually.
Dividends and distributions to shareholders, which are determined in accordance with federal income tax regulations and which may differ from generally accepted accounting principles, are recorded on the ex-dividend date. Permanent book/tax differences relating to income and gains are reclassified amongst undistributed net investment income, accumulated net realized gain or loss and paid-in capital in excess of par as appropriate.
Taxes: It is the Fund’s policy to continue to meet the requirements of the Internal Revenue Code applicable to regulated investment companies and to distribute all of its taxable net investment income and capital gains, if any, to its shareholders. Therefore, no federal income tax provision is required.
Withholding taxes on foreign dividends are recorded, net of reclaimable amounts, at the time the related income is earned.
Estimates: The preparation of the financial statements requires management to make estimates and assumptions that affect the reported amounts and disclosures in the financial statements. Actual results could differ from those estimates.
Note 2. Agreements
The Fund has a management agreement with PI. Pursuant to this agreement, PI manages the investment operations of the Fund, administers the Fund’s affairs and supervises the Subadviser’s performance of all investment advisory services. PI has entered into a subadvisory agreement with Prudential Real Estate Investors (“PREI”),
| | | | |
| Prudential International Real Estate Fund | | | 27 | |
Notes to Financial Statements
continued
which is a business unit of Prudential Investment Management, Inc. (“PIM”). The subadvisory agreement provides that PREI will furnish investment advisory services in connection with the management of the Fund. In connection therewith, PREI is obligated to keep certain books and records of the Fund. Pursuant to the advisory agreement, PI pays for the services of PREI, the cost of compensation of officers of the Fund, occupancy and certain clerical and accounting costs of the Fund. The Fund bears all other costs and expenses.
The management fee paid to PI is computed daily and payable monthly at an annual rate of 1.00% of the Fund’s average daily net assets.
PI has contractually agreed through February 28, 2013 to limit net annual Fund operating expenses (exclusive of distribution and service (12b-1) fees, extraordinary and certain other expenses, such as taxes, interest and brokerage commissions) of each class of shares to 1.35% of the Fund’s average daily net assets.
The Fund has a distribution agreement with Prudential Investment Management Services LLC (“PIMS”), which acts as the distributor of the Class A, B, C and Z shares of the Fund. The Fund compensates PIMS for distributing and servicing the Fund’s Class A, B and C shares, pursuant to plans of distribution (the “Distribution Plans”), regardless of expenses actually incurred by PIMS. The distribution fees are accrued daily and payable monthly. No distribution or service fees are paid to PIMS as distributor of the Class Z shares of the Fund.
Pursuant to the Distribution Plans, the Fund compensates PIMS for distribution related activities at an annual rate of up to .30%, 1%, and 1% of the average daily net assets of the Class A, B, and C shares, respectively. PIMS has contractually agreed through February 28, 2013 to limit such fees to .25% of the average daily net assets of the Class A shares.
PIMS has advised the Fund that it has received $1,681 in front-end sales charges resulting from sales of Class A shares, during the fiscal period ended October 31, 2011. From these fees, PIMS paid such sales charges to affiliated broker-dealers, which in turn paid commissions to salespersons and incurred other distribution costs.
PIMS has advised the Fund that for the period ended October 31, 2011, there were no contingent deferred sales charges imposed.
| | |
| 28 | | Visit our website at www.prudentialfunds.com |
PI, PIM and PIMS are indirect, wholly-owned subsidiaries of Prudential Financial, Inc. (“Prudential”).
Note 3. Other Transactions with Affiliates
Prudential Mutual Fund Services LLC (“PMFS”), an affiliate of PI and an indirect, wholly-owned subsidiary of Prudential, serves as the Fund’s transfer agent. Transfer agent fees and expenses in the Statement of Operations include certain out-of-pocket expenses paid to non-affiliates, where applicable.
The Fund invests in the Prudential Core Taxable Money Market Fund (the “Core Fund”), a series of Prudential Investment Portfolios 2. The Core Fund is a money market mutual fund registered under the 1940 Act, as amended, and managed by PI. Earnings from the Core Fund are disclosed on the Statement of Operations as affiliated dividend income.
Note 4. Portfolio Securities
Purchases and sales of portfolio securities, other than short-term investments, for the period ended October 31, 2011, were $18,848,435 and $3,631,480, respectively.
Note 5. Tax Information
Distributions to shareholders, which are determined in accordance with federal income tax regulations and which may differ from generally accepted accounting principles, are recorded on the ex-dividend date. In order to present undistributed net investment income, accumulated net realized loss on investment and foreign currency transactions and paid-in capital in excess of par on the Statement of Assets and Liabilities that more closely represent their tax character, certain adjustments have been made to undistributed net investment income, accumulated net realized loss on investment and foreign currency transactions and paid-in capital in excess of par. For the period ended October 31, 2011, the adjustments were to increase undistributed net investment income by $29,034, increase accumulated net realized loss on investment and foreign currency transactions by $7,198 and decrease paid-in capital in excess of par by $21,836, due to the differences in the treatment for book and tax purposes of certain transactions involving investments in Passive Foreign Investment Companies, foreign securities and currencies, nondeductible expenses and other book to tax adjustments. Net investment income, net realized loss on investment and foreign currency transactions and net assets were not affected by this change.
For the period ended October 31, 2011, there were no distributions paid by the Fund.
| | | | |
| Prudential International Real Estate Fund | | | 29 | |
Notes to Financial Statements
continued
As of October 31, 2011, the accumulated undistributed earnings on a tax basis was $354,132 of ordinary income. This differs from the amount shown on the Statement of Assets and Liabilities primarily due to cumulative timing differences between financial and tax reporting.
The United States federal income tax basis of the Fund’s investments and the net unrealized depreciation as of October 31, 2011 were as follows:
| | | | | | | | | | |
Tax Basis | | Appreciation | | Depreciation | | Net
Unrealized
Depreciation | | Other
Cost Basis
Adjustments | | Total Net
Unrealized
Depreciation |
| $15,548,907 | | $154,528 | | $(1,432,699) | | $(1,278,171) | | $(615) | | $(1,278,786) |
The difference between book basis and tax basis was primarily attributable to deferred losses on wash sales. The other cost basis adjustments are primarily attributable to appreciation (depreciation) of foreign currency and forward currency transactions.
For federal income tax purposes, the Fund had a capital loss carryforward as of October 31, 2011 of approximately $190,000 which expires in 2019. Accordingly, no capital gains distributions are expected to be paid to shareholders until net gains have been realized in excess of such carryforward. Under the recently enacted Regulated Investment Company Modernization Act of 2010 (“the Act”), the Fund is permitted to carryforward capital losses incurred in taxable years beginning after December 22, 2010 (“post-enactment losses”) for an unlimited period. However, any post-enactment losses are required to be utilized before the utilization of losses incurred prior to the effective date of the Act. As a result of this ordering rule, capital loss carryforwards related to the taxable years beginning prior to the effective date of the Act may have an increased likelihood to expire unused. Additionally, post-enactment capital losses that are carried forward will retain their character as either short-term or long-term capital losses rather than being considered all short-term as under previous law.
Management has analyzed the Fund’s tax positions and has concluded that no provision for income tax is required in the Fund’s financial statements for the current reporting period.
| | |
| 30 | | Visit our website at www.prudentialfunds.com |
Note 6. Capital
The Fund offers Class A, Class B, Class C and Class Z shares. Class A shares are subject to a maximum front-end sales charge of 5.50%. Investors who purchase Class A shares in an amount of $1 million or more and sell these shares within 12 months of purchase are not subject to an initial sales charge but are subject to a contingent deferred sales charge (“CDSC”) of 1%. The Class A CDSC is waived for purchases by certain retirement and/or benefit plans. Under certain circumstances, an exchange may be made from Class A, Class B or Class C to Class Z shares of the Fund. Class B shares are sold with a CDSC which declines from 5% to zero depending on the period of time the shares are held. Class C shares are sold with a CDSC of 1% on shares redeemed within the first 12 months after purchase. Class B shares automatically convert to Class A shares on a quarterly basis approximately seven years after purchase. A special exchange privilege is also available for shareholders who qualified to purchase Class A shares at net asset value. Class Z shares are not subject to any sales or redemption charge and are offered exclusively for sale to a limited group of investors.
The Trust has authorized an unlimited number of shares of beneficial interest at $.001 par value per share.
As of October 31, 2011, Prudential owned 100 Class A shares, 100 Class B shares, 100 Class C shares and 1,000,100 Class Z shares of the Fund.
Transactions in shares of beneficial interest were as follows:
| | | | | | | | |
Class A | | Shares | | | Amount | |
Period December 21, 2010* through October 31, 2011: | | | | | | | | |
Shares sold | | | 144,845 | | | $ | 1,498,855 | |
Shares reacquired | | | (56,362 | ) | | | (570,029 | ) |
| | | | | | | | |
Net increase (decrease) in shares outstanding | | | 88,483 | | | $ | 928,826 | |
| | | | | | | | |
Class B | | | | | | |
Period December 21, 2010* through October 31, 2011: | | | | | | | | |
Shares sold | | | 864 | | | $ | 8,834 | |
Shares reacquired | | | (374 | ) | | | (3,533 | ) |
| | | | | | | | |
Net increase (decrease) in shares outstanding | | | 490 | | | $ | 5,301 | |
| | | | | | | | |
| * | Commencement of operations. |
| | | | |
| Prudential International Real Estate Fund | | | 31 | |
Notes to Financial Statements
continued
| | | | | | | | |
Class C | | Shares | | | Amount | |
Period December 21, 2010* through October 31, 2011: | | | | | | | | |
Shares sold | | | 3,341 | | | $ | 32,762 | |
Shares reacquired | | | — | | | | — | |
| | | | | | | | |
Net increase (decrease) in shares outstanding | | | 3,341 | | | $ | 32,762 | |
| | | | | | | | |
Class Z | | | | | | |
Period December 21, 2010* through October 31, 2011: | | | | | | | | |
Shares sold | | | 1,655,059 | | | $ | 16,328,000 | |
Shares reacquired | | | (208,895 | ) | | | (2,077,026 | ) |
| | | | | | | | |
Net increase (decrease) in shares outstanding | | | 1,446,164 | | | $ | 14,250,974 | |
| | | | | | | | |
| * | Commencement of operations. |
Note 7. Borrowings
The Fund, along with other affiliated registered investment companies (the “Companies”), are a party to a Syndicated Credit Agreement (“SCA”) with a group of banks. The purpose of the SCA is to provide an alternative source of temporary funding for capital share redemptions. The SCA provides for a commitment of $750 million for the period December 17, 2010 through December 16, 2011. The Companies pay an annualized commitment fee of .10% of the unused portion of the SCA. Interest on any borrowings under the SCA is paid at contracted market rates. The commitment fee for the unused amount is accrued daily and paid quarterly. The SCA has been renewed of substantially similar terms with an increase in the amount of commitment to $900 million.
The Fund utilized the line of credit during the period ended October 31, 2011. The average daily balance for the 3 days the Fund had debt outstanding during the period was $312,333 at a weighted average interest rate of approximately 1.50%.
| | |
| 32 | | Visit our website at www.prudentialfunds.com |
Note 8. Dividends to Shareholders
Subsequent to the fiscal period end, the Fund declared ordinary income dividends on December 12, 2011 to shareholders of record on December 13, 2011. The ex-dividend date was December 14, 2011. The per share amounts declared were as follows:
| | | | |
| | | Ordinary Income | |
Class A* | | $ | 0.2884 | |
Class B* | | $ | 0.2145 | |
Class C* | | $ | 0.2590 | |
Class Z* | | $ | 0.3114 | |
| * | Includes $0.0879 of Special Ordinary Income. |
Note 9. New Accounting Pronouncements
In April 2011, the Financial Accounting Standards Board (“FASB”) issued Accounting Standards Update (“ASU”) No. 2011-03 “Reconsideration of Effective control for Repurchase Agreements.” The objective of ASU No. 2011-03 is to improve the accounting for repurchase agreements and other agreements that both entitle and obligate a transferor to repurchase or redeem financial assets before their maturity. Under previous guidance, whether or not to account for a transaction as a sale was based on, in part, if the entity maintained effective control over the transferred financial assets. ASU No. 2011-03 removes the transferor’s ability criterion from the effective control assessment. This guidance is effective prospectively for interim and annual reporting periods beginning on or after December 15, 2011. At this time, management is evaluating the implications of ASU No. 2011-03 and its impact on the financial statements has not yet been determined.
In May 2011, the FASB issued ASU No. 2011-04 “Amendments to Achieve Common Fair Value Measurement and Disclosure Requirements in U.S. GAAP and IFRSs.” ASU No. 2011-04 includes common requirements for measurement of and disclosure about fair value between U.S. GAAP and IFRS. ASU No. 2011-04 will require reporting entities to disclose quantitative information about the unobservable inputs used in the fair value measurements categorized within Level 3 of the fair value hierarchy. In addition, ASU No. 2011-04 will require reporting entities to make disclosures about amounts and reasons for all transfers in and out of Level 1 and Level 2 fair value measurements. The new and revised disclosures are effective for interim and annual reporting periods beginning after December 15, 2011. At this time, management is evaluating the implications of ASU No. 2011-04 and its impact on the financial statements has not yet been determined.
| | | | |
| Prudential International Real Estate Fund | | | 33 | |
Financial Highlights
| | | | |
| Class A Shares | |
| | | December 21,
2010(e)
through
October 31,
2011(b) | |
| Per Share Operating Performance: | | | | |
| Net Asset Value, Beginning Of Period | | | $10.00 | |
| Income (loss) from investment operations: | | | | |
| Net investment income | | | .07 | |
| Net realized and unrealized loss on investments | | | (.87 | ) |
| Total from investment operations | | | (.80 | ) |
| Net asset value, end of period | | | $9.20 | |
| Total Return(a): | | | (8.00)% | |
| |
| Ratios/Supplemental Data: | | | |
| Net assets, end of period (000) | | | $814 | |
| Average net assets (000) | | | $353 | |
| Ratios to average net assets(d): | | | | |
| Expenses, including distribution and service (12b-1) fees(c) | | | 1.60% | (f)(h) |
| Expenses, excluding distribution and service (12b-1) fees | | | 1.35% | (f)(h) |
| Net investment income | | | .89% | (f)(h) |
| For Class A, B, C and Z shares: | | | | |
| Portfolio turnover rate | | | 30% | (g) |
(a) Total return does not consider the effects of sales loads. Total return is calculated assuming a purchase of a share on the first day and a sale on the last day of each period reported and includes reinvestment of dividends and distributions, if any. Total returns may reflect adjustments to conform to generally accepted accounting principles. Total returns for periods less than one full year are not annualized.
(b) Calculations are based on the average daily number of shares outstanding.
(c) The distributor of the Fund has contractually agreed to limit its distribution and service (12b-1) fees to .25% of the average daily net assets of the Class A shares.
(d) Does not include expenses of the underlying fund in which the Fund invests.
(e) Commencement of operations.
(f) Annualized.
(g) Not annualized.
(h) Net of expense reimbursement. If the investment manager had not reimbursed expenses, the expense ratios both including and excluding distribution and service (12b-1) fees and the net investment loss ratio would have been 3.80%, 3.55% and (1.31)%, respectively.
See Notes to Financial Statements.
| | |
| 34 | | Visit our website at www.prudentialfunds.com |
| | | | |
| Class B Shares | |
| | | December 21,
2010(d)
through
October 31,
2011(b) | |
| Per Share Operating Performance: | | | | |
| Net Asset Value, Beginning Of Period | | | $10.00 | |
| Income (loss) from investment operations: | | | | |
| Net investment income | | | .11 | |
| Net realized and unrealized loss on investments | | | (1.03 | ) |
| Total from investment operations | | | (.92 | ) |
| Net asset value, end of period | | | $9.08 | |
| Total Return(a): | | | (9.20)% | |
| |
| Ratios/Supplemental Data: | | | |
| Net assets, end of period (000) | | | $4 | |
| Average net assets (000) | | | $5 | |
| Ratios to average net assets(c): | | | | |
| Expenses, including distribution and service (12b-1) fees | | | 2.35% | (e)(f) |
| Expenses, excluding distribution and service (12b-1) fees | | | 1.35% | (e)(f) |
| Net investment income | | | 1.29% | (e)(f) |
(a) Total return does not consider the effects of sales loads. Total return is calculated assuming a purchase of a share on the first day and a sale on the last day of each period reported and includes reinvestment of dividends and distributions, if any. Total returns may reflect adjustments to conform to generally accepted accounting principles. Total returns for periods less than one full year are not annualized.
(b) Calculations are based on the average daily number of shares outstanding.
(c) Does not include expenses of the underlying fund in which the Fund invests.
(d) Commencement of operations.
(e) Annualized.
(f) Net of expense reimbursement. If the investment manager had not reimbursed expenses, the expense ratios both including and excluding distribution and service (12b-1) fees and the net investment loss ratio would have been 4.55%, 3.55% and (.91)%, respectively.
See Notes to Financial Statements.
| | | | |
| Prudential International Real Estate Fund | | | 35 | |
Financial Highlights
continued
| | | | |
| Class C Shares | |
| | | December 21,
2010(d)
through
October 31,
2011(b) | |
| Per Share Operating Performance: | | | | |
| Net Asset Value, Beginning Of Period | | | $10.00 | |
| Income (loss) from investment operations: | | | | |
| Net investment income | | | .14 | |
| Net realized and unrealized loss on investments | | | (1.04 | ) |
| Total from investment operations | | | (.90 | ) |
| Net asset value, end of period | | | $9.10 | |
| Total Return(a): | | | (9.00)% | |
| |
| Ratios/Supplemental Data: | | | |
| Net assets, end of period (000) | | | $30 | |
| Average net assets (000) | | | $23 | |
| Ratios to average net assets(c): | | | | |
| Expenses, including distribution and service (12b-1) fees | | | 1.96% | (e)(f) |
| Expenses, excluding distribution and service (12b-1) fees | | | 1.35% | (e)(f) |
| Net investment income | | | 1.68% | (e)(f) |
(a) Total return does not consider the effects of sales loads. Total return is calculated assuming a purchase of a share on the first day and a sale on the last day of each period reported and includes reinvestment of dividends and distributions, if any. Total returns may reflect adjustments to conform to generally accepted accounting principles. Total returns for periods less than one full year are not annualized.
(b) Calculations are based on the average daily number of shares outstanding.
(c) Does not include expenses of the underlying fund in which the Fund invests.
(d) Commencement of operations.
(e) Annualized.
(f) Net of expense reimbursement. If the investment manager had not reimbursed expenses, the expense ratios both including and excluding distribution and service (12b-1) fees and the net investment loss ratio would have been 4.16%, 3.55% and (.52)%, respectively.
See Notes to Financial Statements.
| | |
| 36 | | Visit our website at www.prudentialfunds.com |
| | | | |
| Class Z Shares | |
| | | December 21,
2010(d)
through
October 31,
2011(b) | |
| Per Share Operating Performance: | | | | |
| Net Asset Value, Beginning Of Period | | | $10.00 | |
| Income (loss) from investment operations: | | | | |
| Net investment income | | | .18 | |
| Net realized and unrealized loss on investments | | | (1.03 | ) |
| Total from investment operations | | | (.85 | ) |
| Net asset value, end of period | | | $9.15 | |
| Total Return(a): | | | (8.50)% | |
| |
| Ratios/Supplemental Data: | | | |
| Net assets, end of period (000) | | | $13,233 | |
| Average net assets (000) | | | $12,252 | |
| Ratios to average net assets(c): | | | | |
| Expenses, including distribution and service (12b-1) fees | | | 1.35% | (e)(f) |
| Expenses, excluding distribution and service (12b-1) fees | | | 1.35% | (e)(f) |
| Net investment income | | | 2.15% | (e)(f) |
(a) Total return is calculated assuming a purchase of a share on the first day and a sale on the last day of each period reported and includes reinvestment of dividends and distributions, if any. Total returns may reflect adjustments to conform to generally accepted accounting principles. Total returns for periods less than one full year are not annualized.
(b) Calculations are based on the average daily number of shares outstanding.
(c) Does not include expenses of the underlying fund in which the Fund invests.
(d) Commencement of operations.
(e) Annualized.
(f) Net of expense reimbursement. If the investment manager had not reimbursed expenses, the expense ratios both including and excluding distribution and service (12b-1) fees and the net investment loss ratio would have been 3.55%, 3.55% and (.05)%, respectively.
See Notes to Financial Statements.
| | | | |
| Prudential International Real Estate Fund | | | 37 | |
Report of Independent Registered Public
Accounting Firm
The Board of Trustees and Shareholders
Prudential Investment Portfolios 9:
We have audited the accompanying statement of assets and liabilities of Prudential International Real Estate Fund, a series of Prudential Investment Portfolios 9 (hereafter referred to as the “Fund”), including the portfolio of investments, as of October 31, 2011, and the related statements of operations, changes in net assets and the financial highlights for the period from December 21, 2010 (commencement of operations) to October 31, 2011. These financial statements and financial highlights are the responsibility of the Fund’s management. Our responsibility is to express an opinion on these financial statements and financial highlights based on our audit.
We conducted our audit in accordance with the standards of the Public Company Accounting Oversight Board (United States). Those standards require that we plan and perform the audit to obtain reasonable assurance about whether the financial statements and financial highlights are free of material misstatement. An audit includes examining, on a test basis, evidence supporting the amounts and disclosures in the financial statements. Our procedures included confirmation of securities owned as of October 31, 2011, by correspondence with the custodian, transfer agent and brokers or by other appropriate auditing procedures when replies from brokers were not received. An audit also includes assessing the accounting principles used and significant estimates made by management, as well as evaluating the overall financial statement presentation. We believe that our audit provides a reasonable basis for our opinion.
In our opinion, the financial statements and financial highlights referred to above present fairly, in all material respects, the financial position of the Fund as of October 31, 2011, and the results of its operations, the changes in its net assets and the financial highlights for the period from December 21, 2010 to October 31, 2011, in conformity with U.S. generally accepted accounting principles.

New York, New York
December 22, 2011
| | |
| 38 | | Visit our website at www.prudentialfunds.com |
INFORMATION ABOUT BOARD MEMBERS AND OFFICERS
(Unaudited)
Information about Board Members and Officers is set forth below. Board Members who are not deemed to be “interested persons” of the Fund, as defined in the 1940 Act, are referred to as “Independent Board Members.” Board Members who are deemed to be “interested persons” of the Fund are referred to as “Interested Board Members.” The Board Members are responsible for the overall supervision of the operations of the Fund and perform the various duties imposed on the directors of investment companies by the 1940 Act.
| | | | |
Independent Board Members(1) | | | | |
Name, Address, Age Position(s) Portfolios Overseen | | Principal Occupation(s) During Past Five Years | | Other Directorships Held |
Kevin J. Bannon (59) Board Member Portfolios Overseen: 58 | | Managing Director (since April 2008) and Chief Investment Officer (since October 2008) of Highmount Capital LLC (registered investment adviser); formerly Executive Vice President and Chief Investment Officer (April 1993-August 2007) of Bank of New York Company; President (May 2003-May 2007) of BNY Hamilton Family of Mutual Funds. | | Director of Urstadt Biddle Properties (since September 2008). |
Linda W. Bynoe (59) Board Member Portfolios Overseen: 58 | | President and Chief Executive Officer (since March 1995) and formerly Chief Operating Officer (December 1989-February 1995) of Telemat Ltd. (management consulting); formerly Vice President (January 1985-June 1989) at Morgan Stanley & Co (broker-dealer). | | Director of Simon Property Group, Inc. (retail real estate) (since May 2003); Director of Anixter International, Inc. (communication products distributor) (since January 2006); Director of Northern Trust Corporation (financial services) (since April 2006); Trustee of Equity Residential (residential real estate) (since December 2009); formerly Director of Dynegy Inc. (power generation) (September 2002-May 2006). |
Michael S. Hyland, CFA (66) Board Member Portfolios Overseen: 58 | | Independent Consultant (since February 2005); formerly Senior Managing Director (July 2001-February 2005) of Bear Stearns & Co, Inc.; Global Partner, INVESCO (1999-2001); Managing Director and President of Salomon Brothers Asset Management (1989-1999). | | None. |
Douglas H. McCorkindale (72) Board Member Portfolios Overseen: 58 | | Formerly Chairman (February 2001-June 2006), Chief Executive Officer (June 2000-July 2005), President (September 1997-July 2005) and Vice Chairman (March 1984-May 2000) of Gannett Co. Inc. (publishing and media). | | Director of Lockheed Martin Corp. (aerospace and defense) (since May 2001). |
Prudential International Real Estate Fund
| | | | |
Independent Board Members(1) | | | | |
Name, Address, Age Position(s) Portfolios Overseen | | Principal Occupation(s) During Past Five Years | | Other Directorships Held |
Stephen P. Munn (69) Board Member Portfolios Overseen: 58 | | Lead Director (since 2007) and formerly Chairman (1993-2007) of Carlisle Companies Incorporated (manufacturer of industrial products). | | Lead Director (since 2007) of Carlisle Companies Incorporated (manufacturer of industrial products). |
Richard A. Redeker (68) Board Member & Independent Chair Portfolios Overseen: 58 | | Retired Mutual Fund Senior Executive (43 years); Management Consultant; Independent Directors Council (organization of 2,800 Independent Mutual Fund Directors)-Executive Committee, Chair of Policy Steering Committee, Governing Council. | | None. |
Robin B. Smith (72) Board Member Portfolios Overseen: 58 | | Chairman of the Board (since January 2003) of Publishers Clearing House (direct marketing); Member of the Board of Directors of ADLPartner (marketing) (since December 2010); formerly Chairman and Chief Executive Officer (August 1996-January 2003) of Publishers Clearing House. | | Formerly Director of BellSouth Corporation (telecommunications) (1992-2006). |
Stephen G. Stoneburn (68) Board Member Portfolios Overseen: 58 | | President and Chief Executive Officer (since June 1996) of Quadrant Media Corp. (publishing company); formerly President (June 1995-June 1996) of Argus Integrated Media, Inc.; Senior Vice President and Managing Director (January 1993-1995) of Cowles Business Media; Senior Vice President of Fairchild Publications, Inc (1975-1989). | | None. |
Visit our website at www.prudentialfunds.com
| | | | |
| Interested Board Members(1) | | | | |
Name, Address, Age Position(s) Portfolios Overseen | | Principal Occupation(s) During Past Five Years | | Other Directorships Held |
Judy A. Rice* (63) Board Member & President Portfolios Overseen: 58 | | President, Chief Executive Officer, Chief Operating Officer and Officer-In-Charge (since February 2003) of Prudential Investments LLC; President, Chief Executive Officer and Officer-In-Charge (since April 2003) of Prudential Mutual Fund Services LLC; President, Chief Executive Officer (since May 2011) and Executive Vice President (since December 2008) of Prudential Investment Management Services LLC; Member of the Board of Directors of Jennison Associates LLC (since November 2010); formerly Vice President (February 1999-April 2006) of Prudential Investment Management Services LLC; President, COO, CEO and Manager of PIFM Holdco, LLC (since April 2006); formerly President, Chief Executive Officer, Chief Operating Officer and Officer-In-Charge (May 2003-June 2005) and Director (May 2003-March 2006) and Executive Vice President (June 2005-March 2006) of AST Investment Services, Inc.; Member of Board of Governors of the Investment Company Institute. | | None. |
Stuart S. Parker* (49) Board Member & President Portfolios Overseen: 58 | | President of Prudential Investments LLC (since January 2012); Executive Vice President of Jennison Associates LLC and Head of Retail Distribution of Prudential Investments LLC (June 2005 - December 2011). | | None. |
Scott E. Benjamin (38) Board Member & Vice President Portfolios Overseen: 58 | | Executive Vice President (since June 2009) of Prudential Investments LLC and Prudential Investment Management Services LLC; Executive Vice President (since September 2009) of AST Investment Services, Inc.; Senior Vice President of Product Development and Marketing, Prudential Investments (since February 2006); Vice President of Product Development and Product Management, Prudential Investments (2003-2006). | | None. |
* Ms. Rice has announced her retirement as President and Board Member effective December 31, 2011. Ms. Rice has been appointed as Vice President effective January 1, 2012. The Board has appointed Stuart S. Parker as President and Board Member effective January 1, 2012.
Prudential International Real Estate Fund
(1) The year that each individual joined the Fund’s Board is as follows:
Linda W. Bynoe, 2005; Douglas H. McCorkindale, 1998; Richard A. Redeker, 1998; Robin B. Smith, 1998; Stephen G. Stoneburn, 2003; Kevin J. Bannon, 2008; Michael S. Hyland, 2008; Stephen P. Munn, 2008; Judy A. Rice, Board Member since 2000 and President since 2003; Scott E. Benjamin, Board Member since 2010 and Vice President since 2009.
| | |
Fund Officers(a)(1) | | |
Name, Address and Age Position with Fund | | Principal Occupation(s) During Past Five Years |
Kathryn L. Quirk (59) Chief Legal Officer | | Vice President and Corporate Counsel (since September 2004) of Prudential; Executive Vice President, Chief Legal Officer and Secretary (since July 2005) of PI and Prudential Mutual Fund Services LLC; Vice President and Corporate Counsel (since June 2005) and Secretary (since February 2006) of AST Investment Services, Inc.; formerly Senior Vice President and Assistant Secretary (November 2004-August 2005) of PI; formerly Assistant Secretary (June 2005-February 2006) of AST Investment Services, Inc.; formerly Managing Director, General Counsel, Chief Compliance Officer, Chief Risk Officer and Corporate Secretary (1997-2002) of Zurich Scudder Investments, Inc. |
Deborah A. Docs (53) Secretary | | Vice President and Corporate Counsel (since January 2001) of Prudential; Vice President (since December 1996) and Assistant Secretary (since March 1999) of PI; formerly Vice President and Assistant Secretary (May 2003-June 2005) of AST Investment Services, Inc. |
Jonathan D. Shain (53) Assistant Secretary | | Vice President and Corporate Counsel (since August 1998) of Prudential; Vice President and Assistant Secretary (since May 2001) of PI; Vice President and Assistant Secretary (since February 2001) of PMFS; formerly Vice President and Assistant Secretary (May 2003-June 2005) of AST Investment Services, Inc. |
Claudia DiGiacomo (37) Assistant Secretary | | Vice President and Corporate Counsel (since January 2005) of Prudential; Vice President and Assistant Secretary of PI (since December 2005); Associate at Sidley Austin Brown & Wood LLP (1999-2004). |
John P. Schwartz (40) Assistant Secretary | | Vice President and Corporate Counsel (since April 2005) of Prudential; Vice President and Assistant Secretary of PI (since December 2005); Associate at Sidley Austin Brown & Wood LLP (1997-2005). |
Andrew R. French (49) Assistant Secretary | | Vice President and Corporate Counsel (since February 2010) of Prudential; formerly Director and Corporate Counsel (2006-2010) of Prudential; Vice President and Assistant Secretary (since January 2007) of PI; Vice President and Assistant Secretary (since January 2007) of PMFS. |
Timothy J. Knierim (52) Chief Compliance Officer | | Chief Compliance Officer of Prudential Investment Management, Inc. (since July 2007); formerly Chief Risk Officer of PIM and PI (2002-2007) and formerly Chief Ethics Officer of PIM and PI (2006-2007). |
Valerie M. Simpson (53) Deputy Chief Compliance Officer | | Chief Compliance Officer (since April 2007) of PI and AST Investment Services, Inc.; formerly Vice President-Financial Reporting (June 1999-March 2006) for Prudential Life and Annuities Finance. |
Visit our website at www.prudentialfunds.com
| | |
Fund Officers(a)(1) | | |
Name, Address and Age Position with Fund | | Principal Occupation(s) During Past Five Years |
Theresa C. Thompson (49) Deputy Chief Compliance Officer | | Vice President, Compliance, PI (since April 2004); and Director, Compliance, PI (2001-2004). |
Richard W. Kinville (43) Anti-Money Laundering Compliance Officer | | Vice President, Corporate Compliance, Anti-Money Laundering Unit (since January 2005) of Prudential; committee member of the American Council of Life Insurers Anti-Money Laundering and Critical Infrastructure Committee (since January 2007); formerly Investigator and Supervisor in the Special Investigations Unit for the New York Central Mutual Fire Insurance Company (August 1994-January 1999); Investigator in AXA Financial’s Internal Audit Department and Manager in AXA’s Anti-Money Laundering Office (January 1999-January 2005); first chair of the American Council of Life Insurers Anti-Money Laundering and Critical Infrastructure Committee (June 2007-December 2009). |
Grace C. Torres (52) Treasurer and Principal Financial and Accounting Officer | | Assistant Treasurer (since March 1999) and Senior Vice President (since September 1999) of PI; Assistant Treasurer (since May 2003) and Vice President (since June 2005) of AST Investment Services, Inc.; Senior Vice President and Assistant Treasurer (since May 2003) of Prudential Annuities Advisory Services, Inc.; formerly Senior Vice President (May 2003-June 2005) of AST Investment Services, Inc. |
M. Sadiq Peshimam (47) Assistant Treasurer | | Vice President (since 2005) of Prudential Investments LLC. |
Peter Parrella (53) Assistant Treasurer | | Vice President (since 2007) and Director (2004-2007) within Prudential Mutual Fund Administration; formerly Tax Manager at SSB Citi Fund Management LLC (1997-2004). |
(a) Excludes Ms. Rice and Mr. Benjamin, interested Board Members who also serve as President and Vice President, respectively.
(1) The year that each individual became an Officer of the Fund is as follows:
Kathryn L. Quirk, 2005; Deborah A. Docs, 2005; Jonathan D. Shain, 2005; Claudia DiGiacomo, 2005; John P. Schwartz, 2006; Andrew R. French, 2006; Timothy J. Knierim, 2007; Valerie M. Simpson 2007; Theresa C. Thompson, 2008; Richard W. Kinville, 2011, Grace C. Torres, 1998; M. Sadiq Peshimam, 2006; Peter Parrella, 2007.
Explanatory Notes to Tables:
| n | Board Members are deemed to be “Interested,” as defined in the 1940 Act, by reason of their affiliation with Prudential Investments LLC and/or an affiliate of Prudential Investments LLC. |
| n | Unless otherwise noted, the address of all Board Members and Officers is c/o Prudential Investments LLC, Gateway Center Three, 100 Mulberry Street, Newark, New Jersey 07102-4077. |
| n | There is no set term of office for Board Members or Officers. The Board Members have adopted a retirement policy, which calls for the retirement of Board Members on December 31 of the year in which they reach the age of 75. |
| n | “Other Directorships Held” includes only directorships of companies required to register or file reports with the SEC under the 1934 Act) (that is, “public companies”) or other investment companies registered under the 1940 Act. |
| n | “Portfolios Overseen” includes all investment companies managed by Prudential Investments LLC. The investment companies for which PI serves as manager include the Prudential Investments Mutual Funds, The Prudential Variable Contract Accounts, Target Mutual Funds, The Prudential Series Fund, Prudential’s Gibraltar Fund, Inc. and the Advanced Series Trust. |
Prudential International Real Estate Fund
| | | | |
| n MAIL | | n TELEPHONE | | n WEBSITE |
Gateway Center Three 100 Mulberry Street Newark, NJ 07102 | | (800) 225-1852 | | www.prudentialfunds.com |
|
| PROXY VOTING |
| The Board of Trustees of the Fund has delegated to the Fund’s investment subadviser the responsibility for voting any proxies and maintaining proxy recordkeeping with respect to the Fund. A description of these proxy voting policies and procedures is available without charge, upon request, by calling (800) 225-1852 or by visiting the Securities and Exchange Commission’s website at www.sec.gov. Information regarding how the Fund voted proxies relating to portfolio securities during the most recent 12-month period ended June 30 is available on the Fund’s website and on the Commission’s website. |
|
| TRUSTEES |
| Kevin J. Bannon • Scott E. Benjamin • Linda W. Bynoe • Michael S. Hyland • Douglas H. McCorkindale • Stephen P. Munn • Richard A. Redeker • Judy A. Rice • Robin B. Smith • Stephen G. Stoneburn |
|
| OFFICERS |
| Judy A. Rice, President • Scott E. Benjamin, Vice President • Grace C. Torres, Treasurer and Principal Financial and Accounting Officer • Kathryn L. Quirk, Chief Legal Officer • Deborah A. Docs, Secretary • Timothy J. Knierim, Chief Compliance Officer • Valerie M. Simpson, Deputy Chief Compliance Officer • Theresa C. Thompson, Deputy Chief Compliance Officer • Richard W. Kinville, Anti-Money Laundering Compliance Officer • Jonathan D. Shain, Assistant Secretary • Claudia DiGiacomo, Assistant Secretary • John P. Schwartz, Assistant Secretary • Andrew R. French, Assistant Secretary • M. Sadiq Peshimam, Assistant Treasurer • Peter Parrella, Assistant Treasurer |
| | | | |
| MANAGER | | Prudential Investments LLC | | Gateway Center Three
100 Mulberry Street
Newark, NJ 07102 |
|
| INVESTMENT SUBADVISER | | Prudential Real Estate Investors | | 8 Campus Drive
Parsippany, NJ 07054 |
|
| DISTRIBUTOR | | Prudential Investment
Management Services LLC | | Gateway Center Three
100 Mulberry Street
Newark, NJ 07102 |
|
| CUSTODIAN | | The Bank of New York Mellon | | One Wall Street
New York, NY 10286 |
|
| TRANSFER AGENT | | Prudential Mutual Fund
Services LLC | | PO Box 9658
Providence, RI 02940 |
|
INDEPENDENT REGISTERED
PUBLIC ACCOUNTING FIRM | | KPMG LLP | | 345 Park Avenue
New York, NY 10154 |
|
| FUND COUNSEL | | Willkie Farr & Gallagher LLP | | 787 Seventh Avenue
New York, NY 10019 |
|
| An investor should consider the investment objectives, risks, charges, and expenses of the Fund carefully before investing. The prospectus and summary prospectus contain this and other information about the Fund. An investor may obtain a prospectus and summary prospectus by visiting our website at www.prudentialfunds.com or by calling (800) 225-1852. The prospectus and summary prospectus should be read carefully before investing. |
|
| E-DELIVERY |
| To receive your mutual fund documents online, go to www.prudentialfunds.com/edelivery and enroll. Instead of receiving printed documents by mail, you will receive notification via email when new materials are available. You can cancel your enrollment or change your email address at any time by visiting the website address above. |
|
| SHAREHOLDER COMMUNICATIONS WITH TRUSTEES |
| Shareholders can communicate directly with the Board of Trustees by writing to the Chair of the Board, Prudential International Real Estate Fund, Prudential Investments, Attn: Board of Trustees, 100 Mulberry Street, Gateway Center Three, Newark, NJ 07102. Shareholders can communicate directly with an individual Trustee by writing to the same address. Communications are not screened before being delivered to the addressee. |
|
| AVAILABILITY OF PORTFOLIO SCHEDULE |
| The Fund files its complete schedule of portfolio holdings with the Securities and Exchange Commission for the first and third quarters of each fiscal year on Form N-Q. The Fund’s Forms N-Q are available on the Commission’s website at www.sec.gov. The Fund’s Forms N-Q may also be reviewed and copied at the Commission’s Public Reference Room in Washington, D.C. Information on the operation and location of the Public Reference Room may be obtained by calling (202) 551-8090. The Fund’s schedule of portfolio holdings is also available on the Fund’s website as of the end of each month. |
|
| The Fund’s Statement of Additional Information contains additional information about the Fund’s Trustees and is available without charge, upon request, by calling (800) 225-1852. |
Mutual Funds:
| | | | |
ARE NOT INSURED BY THE FDIC OR ANY
FEDERAL GOVERNMENT AGENCY | | MAY LOSE VALUE | | ARE NOT A DEPOSIT OF OR GUARANTEED
BY ANY BANK OR ANY BANK AFFILIATE |

PRUDENTIAL INTERNATIONAL REAL ESTATE FUND
| | | | | | | | |
| SHARE CLASS | | A | | B | | C | | Z |
| NASDAQ | | PUEAX | | PUEBX | | PUECX | | PUEZX |
| CUSIP | | 74441J803 | | 74441J886 | | 74441J878 | | 74441J860 |
MF210E 0215363-00001-00

PRUDENTIAL INVESTMENTS»MUTUAL FUNDS
PRUDENTIAL LARGE-CAP CORE EQUITY FUND
ANNUAL REPORT · OCTOBER 31, 2011
Fund Type
Large-cap stock
Objective
Long-term after-tax growth of capital
This report is not authorized for distribution to prospective investors unless preceded or accompanied by a current prospectus.
The views expressed in this report and information about the Fund’s portfolio holdings are for the period covered by this report and are subject to change thereafter.
Prudential Investments, Prudential, the Prudential logo, and the Rock symbol are service marks of Prudential Financial, Inc. and its related entities, registered in many jurisdictions worldwide.

December 15, 2011
Dear Shareholder:
After leading Prudential Investments for the past eight years, I have decided to retire at the end of 2011 from my positions as President of Prudential Investments and President and Trustee of the Prudential Large-Cap Core Equity Fund (the Fund). Effective January 1, 2012, I will become Chairman of Prudential Investments and act as an advisor to the business during 2012 to help facilitate a smooth transition to my successor, Stuart Parker.
Stuart, who will become President of Prudential Investments and President and Trustee of the Fund on January 1, 2012, previously served as the Executive Vice President of Retail Mutual Fund Distribution at Prudential Investments. With more than 20 years of investment industry experience, Stuart brings a deep understanding of the needs and challenges facing today’s investors.
We hope you find the annual report for the Fund informative. We recognize that ongoing market volatility may make it a difficult time to be an investor. We continue to believe a prudent response to uncertainty is to maintain a diversified portfolio, including stock and bond mutual funds consistent with your tolerance for risk, time horizon, and financial goals.
Your financial professional can help you create a diversified investment plan that reflects your personal investor profile and risk tolerance. Keep in mind that diversification and asset allocation strategies do not assure a profit or protect against loss in declining markets. We encourage you to call your financial professional before making any investment decision.
Prudential Investments provides a wide range of mutual funds to choose from that can help you make progress toward your financial goals. Our funds offer the experience, resources, and professional discipline of Prudential Financial’s affiliated asset managers.
Finally, I’ve been privileged to have had the opportunity to help you address your investment needs, and I thank you for choosing the Prudential Investments family of mutual funds.
Sincerely,

Judy A. Rice, President
Prudential Large-Cap Core Equity Fund
| | | | |
| Prudential Large-Cap Core Equity Fund | | | 1 | |
Your Fund’s Performance
Performance data quoted represent past performance. Past performance does not guarantee future results. The investment return and principal value of an investment will fluctuate, so that an investor’s shares, when redeemed, may be worth more or less than their original cost. Current performance may be lower or higher than the past performance data quoted. An investor may obtain performance data as of the most recent month-end by visiting our website at www.prudentialfunds.com or by calling (800) 225-1852. Class A and Class L shares have a maximum initial sales charge of 5.50% and 5.75%, respectively. Gross operating expenses: Class A, 1.69%; Class B, 2.38%; Class C, 2.39%; Class L, 1.89%; Class M, 2.36%; Class X, 1.63%; Class Z, 1.44%. Net operating expenses: Class A, 1.55%; Class B, 2.27%; Class C, 2.27%; Class L, 1.77%; Class M, 2.30%; Class X, 1.53%; Class Z, 1.42%, after contractual reduction through 2/28/2013 for Class A.
| | | | | | | | | | | | | | |
Cumulative Total Returns (Without Sales Charges) as of 10/31/11 |
| | | One Year | | | Five Years | | | Ten Years | | | Since Inception |
Class A | | | 7.71 | % | | | –6.17 | % | | | 36.10 | % | | — |
Class B | | | 6.97 | | | | –9.52 | | | | 26.41 | | | — |
Class C | | | 6.97 | | | | –9.44 | | | | 26.53 | | | — |
Class L | | | 7.45 | | | | N/A | | | | N/A | | | –8.62% (3/19/07) |
Class M | | | 6.97 | | | | N/A | | | | N/A | | | –10.66 (3/19/07) |
Class X | | | 7.84 | | | | N/A | | | | N/A | | | –7.15 (3/19/07) |
Class Z | | | 8.04 | | | | –4.89 | | | | 39.64 | | | — |
S&P 500 Index | | | 8.07 | | | | 1.25 | | | | 43.67 | | | — |
Lipper Average | | | 5.39 | | | | –0.94 | | | | 39.37 | | | — |
| | | | | | | | | | | | | | |
Average Annual Total Returns (With Sales Charges) as of 9/30/11 |
| | | One Year | | | Five Years | | | Ten Years | | | Since Inception |
Class A | | | –5.26 | % | | | –3.85 | % | | | 1.52 | % | | — |
Class B | | | –5.47 | | | | –3.65 | | | | 1.34 | | | — |
Class C | | | –1.49 | | | | –3.44 | | | | 1.35 | | | — |
Class L | | | –5.75 | | | | N/A | | | | N/A | | | –5.57% (3/19/07) |
Class M | | | –6.47 | | | | N/A | | | | N/A | | | –5.22 (3/19/07) |
Class X | | | –5.68 | | | | N/A | | | | N/A | | | –4.62 (3/19/07) |
Class Z | | | 0.41 | | | | –2.51 | | | | 2.35 | | | — |
S&P 500 Index | | | 1.13 | | | | –1.18 | | | | 2.82 | | | — |
Lipper Average | | | –1.51 | | | | –1.77 | | | | 2.32 | | | — |
| | |
| 2 | | Visit our website at www.prudentialfunds.com |
| | | | | | | | | | | | | | |
Average Annual Total Returns (With Sales Charges) as of 10/31/11 |
| | | One Year | | | Five Years | | | Ten Years | | | Since Inception |
Class A | | | 1.79 | % | | | –2.38 | % | | | 2.55 | % | | — |
Class B | | | 1.97 | | | | –2.18 | | | | 2.37 | | | — |
Class C | | | 5.97 | | | | –1.96 | | | | 2.38 | | | — |
Class L | | | 1.28 | | | | N/A | | | | N/A | | | –3.18% (3/19/07) |
Class M | | | 0.97 | | | | N/A | | | | N/A | | | –2.83 (3/19/07) |
Class X | | | 1.84 | | | | N/A | | | | N/A | | | –2.23 (3/19/07) |
Class Z | | | 8.04 | | | | –1.00 | | | | 3.39 | | | — |
| | | | | | | | | | | | | | |
Average Annual Total Returns (Without Sales Charges) as of 10/31/11 |
| | | One Year | | | Five Years | | | Ten Years | | | Since Inception |
Class A | | | 7.71 | % | | | –1.26 | % | | | 3.13 | % | | — |
Class B | | | 6.97 | | | | –1.98 | | | | 2.37 | | | — |
Class C | | | 6.97 | | | | –1.96 | | | | 2.38 | | | — |
Class L | | | 7.45 | | | | N/A | | | | N/A | | | –1.93% (3/19/07) |
Class M | | | 6.97 | | | | N/A | | | | N/A | | | –2.41 (3/19/07) |
Class X | | | 7.84 | | | | N/A | | | | N/A | | | –1.59 (3/19/07) |
Class Z | | | 8.04 | | | | –1.00 | | | | 3.39 | | | — |
Growth of a $10,000 Investment
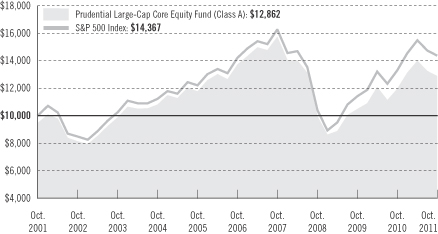
The graph compares a $10,000 investment in the Prudential Large-Cap Core Equity Fund (Class A shares) with a similar investment in the S&P 500 Index by portraying the initial account values at the beginning of the 10-year period for Class A shares (October 31, 2001) and the account values at the end of the current fiscal year
| | | | |
| Prudential Large-Cap Core Equity Fund | | | 3 | |
Your Fund’s Performance (continued)
(October 31, 2011) as measured on a quarterly basis. For purposes of the graph, and unless otherwise indicated, it has been assumed that (a) the maximum applicable front-end sales charge was deducted from the initial $10,000 investment in Class A shares; (b) all recurring fees (including management fees) were deducted; and (c) all dividends and distributions were reinvested. The line graph provides information for Class A shares only. As indicated in the tables provided earlier, performance for Class B, Class C, Class L, Class M, Class X, and Class Z shares will vary due to the differing charges and expenses applicable to each share class (as indicated in the following paragraphs).
Total returns and the ending account values in the graph include changes in share price and reinvestment of dividends and capital gains distributions in a hypothetical investment for the periods shown. The Fund’s total returns do not reflect the deduction of income taxes on an individual’s investment. Taxes may reduce your actual investment returns on income or gains paid by the Fund or any gains you may realize if you sell your shares.
Source: Prudential Investments LLC and Lipper Inc. Performance figures may reflect fee waivers and/or expense reimbursements. In the absence of such fee waivers and/or expense reimbursements, total returns would be lower.
Inception returns are provided for any share class with less than 10 calendar years of returns.
The average annual total returns take into account applicable sales charges. Class A and Class L shares are subject to a maximum front-end sales charge of 5.50% and 5.75%, respectively, and a 12b-1 fee of up to 0.30% and 0.50%, respectively, annually. All investors who purchase Class A shares in an amount of $1 million or more and sell these shares within 12 months of purchase are subject to a contingent deferred sales charge (CDSC) of 1%. Under certain limited circumstances, an exchange may be made from Class A or Class C to Class Z shares of the Fund. Class B shares are subject to a declining CDSC of 5%, 4%, 3%, 2%, 1%, and 1%, respectively, for the first six years after purchase and a 12b-1 fee of 1% annually. Approximately seven years after purchase, Class B will automatically convert to Class A shares on a quarterly basis. Class C shares are not subject to a front-end sales charge, but are subject to a CDSC of 1% for shares sold within 12 months from the date of purchase, and an annual 12b-1 fee of 1%. Class M shares are subject to a CDSC of 6%, which decreases by 1% annually to 2% in the fifth and sixth years and 1% in the seventh year, and a 12b-1 fee of 1% annually. Class M shares will automatically convert to Class A shares approximately eight years after purchase. Class X shares are subject to a CDSC of 6%, which decreases by 1% annually to 4% in the third and fourth years, by 1% annually to 2% in the sixth and seventh years, and to 1% in the eighth year, and a 12b-1 fee of 1% annually. Class X shares will automatically convert to Class A shares approximately ten years after purchase. Class L, Class M, and Class X shares are not offered to new purchasers and are available only through exchanges from the same share class of certain other Prudential Investments mutual funds. Class Z shares are not subject to a sales charge or 12b-1 fees. The returns in the tables and graph reflect the share class expense structure in effect at the close of the fiscal period.
| | |
| 4 | | Visit our website at www.prudentialfunds.com |
Benchmark Definitions
S&P 500 Index
The S&P 500 Index is an unmanaged index of 500 stocks of large U.S. public companies. It gives a broad look at how U.S. stock prices have performed. S&P 500 Index Closest Month-End to Inception cumulative total return as of 10/31/11 is –2.64% for Class L, Class M, and Class X. S&P 500 Index Closest Month-End to Inception average annual total return as of 9/30/11 is –2.86% for Class L, Class M, and Class X.
Lipper Large-Cap Core Funds Average
The Lipper Large-Cap Core Funds Average (Lipper Average) represents returns based on an average return of all funds in the Lipper Large-Cap Core Funds category for the periods noted. Funds in the Lipper Average invest at least 75% of their equity assets in companies with market capitalizations (on a three-year weighted basis) greater than 300% of the dollar-weighted median market capitalization of the middle 1,000 securities of the S&P SuperComposite 1500 Index. Large-cap core funds have wide latitude in the companies in which they invest. These funds typically have a below-average price-to-earnings ratio, price-to-book ratio, and three-year sales-per-share-growth value compared with the S&P 500 Index. Lipper Average Closest Month-End to Inception cumulative total return as of 10/31/11 is –4.93% for Class L, Class M, and Class X. Lipper Average Closest Month-End to Inception average annual total return as of 9/30/11 is –3.50% for Class L, Class M, and Class X.
Investors cannot invest directly in an index or average. The returns for the Index would be lower if they included the effects of sales charges, operating expenses of a mutual fund, or taxes. Returns for the Lipper Average reflect the deduction of operating expenses of a mutual fund, but not sales charges or taxes.
| | | | |
Five Largest Holdings expressed as a percentage of net assets as of 10/31/11 | | | | |
Exxon Mobil Corp., Oil, Gas & Consumable Fuels | | | 3.7 | % |
Apple, Inc., Computers & Peripherals | | | 3.5 | |
Chevron Corp., Oil, Gas & Consumable Fuels | | | 2.2 | |
AT&T, Inc., Diversified Telecommunication Services | | | 2.1 | |
Wells Fargo & Co., Commercial Banks | | | 1.8 | |
Excludes securities purchased with cash received as a result of securities on loan.
Holdings are subject to change.
| | | | |
Five Largest Sectors expressed as a percentage of net assets as of 10/31/11 | | | | |
Information Technology | | | 20.7 | % |
Energy | | | 13.3 | |
Healthcare | | | 12.8 | |
Financials | | | 12.6 | |
Industrials | | | 12.0 | |
Industry weightings are subject to change.
| | | | |
| Prudential Large-Cap Core Equity Fund | | | 5 | |
Strategy and Performance Overview
How did the Fund perform?
The Prudential Large-Cap Core Equity Fund’s Class A shares gained 7.71% for the 12-month reporting period ended October 31, 2011, underperforming the 8.07% gain of the benchmark S&P 500 Index (the Index), and outperforming the 5.39% gain of the Lipper Large-Cap Core Funds Average.
How is the Fund managed?
Quantitative Management Associates LLC (QMA) manages the Fund. The Fund’s investment objective is to seek superior long-term after-tax growth of capital. This means the Fund seeks investments that will appreciate over time. Since taxes are an influence on net returns, the Fund also tries to limit current and future taxes shareholders may pay on the Fund’s investment income and capital gains. Its goal is to outperform the returns of the S&P 500 Index on an after-tax basis over the long term.
The Fund invests in common stock and equity-related securities of large capitalization U.S. companies. The management team considers large capitalization companies to be those whose market capitalizations are within the range of companies included in the Russell 1000 Index or the S&P 500 Index. The team uses a quantitative stock selection model to help decide which common stocks to buy. The model evaluates growth potential, valuation, liquidity and investment risk.
As part of its strategy, the Fund seeks to remain fully invested. In order to accomplish this and to efficiently manage the Fund, QMA utilizes futures contracts based on the S&P 500 Index to provide liquidity for the Fund. The futures contracts are used to take a position from cash that has accrued, enabling the Fund to efficiently process large cash flows without requiring it to maintain large cash positions. During the reporting period, the Fund’s exposure to futures contracts did not have a material impact on its performance.
What were conditions like in the U.S. stock market?
| | • | | The stock market in the U.S., as measured by the S&P 500 Index, made strong gains for most of the first half of the reporting period, but lost traction in the second half. The highest gains occurred in late April and the deepest losses at the end in September. |
| | • | | Early in the period, stocks in the Index advanced on positive factors. Companies with international operations recorded strong profits in developing countries. Low interest rates helped companies with healthy balance sheets to use excess cash for acquisitions and to hike dividend payouts. |
| | |
| 6 | | Visit our website at www.prudentialfunds.com |
| | • | | In late January, a popular anti-government uprising in Tunisia broke out, inspiring similar action in other Middle Eastern and North African countries. This brought the fear factor back into play for investors, causing a brief flight to quality, but stocks held on to gains for the month. In February, regional flare-ups spread to other countries, including oil exporter Libya. Crude oil prices rose steadily, raising a caution flag to the markets. But despite the uncertainty of potential oil-price shocks, investors chose not to unload holdings in large-cap multi-national stocks, as the Index continued to rise. |
| | • | | In March, Japan’s nuclear disaster, caused by an earthquake and tsunami of historical magnitude, wreaked havoc on international markets, negatively affecting virtually all major indexes, and erasing year-to-date gains in several days. For U.S. equities, the disruption was temporary. The continued confidence in company fundamentals, coupled with positive signs of a U.S. economic recovery, pushed equities forward. The market rebounded, reaching highs for the year in late April. |
| | • | | In May, the sovereign debt crisis in the euro zone and weakness in the U.S. economy continued to weigh on equities. Plus, sluggishness in developing economies, which have fueled recent international growth, stalled stock markets. U.S. equities continued to experiences losses through May and most of June. This was followed by higher volatility in July. |
| | • | | In late July, the protracted partisan battle in Congress over extending the U.S. debt ceiling drained investor confidence, and the Index plunged. Congress finally agreed to raise the federal government’s borrowing limit. Soon after, the Standard & Poor’s rating agency downgraded the long-term debt rating of the United States for the first time in U.S. history to AA+ from AAA. The U.S. downgrade was another blow in a year that has experienced severe market shocks. |
| | • | | A slower economic growth forecast also contributed to the broad selloff in equities, as investors rushed into U.S. Treasurys. The Index fell significantly in August and further in September. All segments of the equity markets suffered. Stocks in large-cap companies were the most resilient, since these companies generally hold less debt, manage expenses efficiently, and have strong cash reserves. October saw the Index rebound sharply, and once again, large-cap stocks generally held up well in the face of widespread uncertainty. |
How did the sectors of the S&P 500 Index perform?
| | • | | As U.S. economic growth slowed, defensive stocks, those more resistant to the movement of the business cycle, gained ground. Utilities posted the highest return. Consumer staples, healthcare, and telecommunications services also rose. |
| | | | |
| Prudential Large-Cap Core Equity Fund | | | 7 | |
Strategy and Performance Overview (continued)
| | • | | Cyclical stocks, which are more sensitive to economic conditions, were mixed. Consumer discretionary, energy, and information technology posted mild gains. However, industrials, materials, and financials declined. |
How did the U.S. stock market perform with respect to investment styles?
| | • | | During the reporting period all stock-specific styles declined. Large-cap growth style stocks declined the least. Investors favored growth over value mainly because of more attractive valuations against value stocks. Growth stocks also feature more technology companies with overseas operations and hold more cash. Value-style stocks include many financial companies, which in the current environment have been out of favor. |
Among slowly growing companies, which stocks or related group of stocks contributed
the most and detracted the most from the Fund’s return?
| | • | | QMA places a heavier emphasis on valuation factors, such as price-to-earnings (P/E) and price-to-book value (P/B) ratios, when evaluating slower growing stocks. In slowly growing companies, financial stocks were among those that detracted the most. |
| | • | | With renewed concerns regarding the debt crisis in Europe, as well as continuing debt concerns in the U.S., cheap financials were viewed as riskier companies and continued to sell off. Also, many energy companies, which were attractively valued, performed poorly over concern about a slowing economy. |
| | • | | Adding to the Fund’s return was the portfolio’s underweight in several financials, such as Bank of America, which declined more than 40% over the reporting period. The portfolio was also overweight in LyondellBasell Industries, which advanced nearly 35% as prospects improved for the company and it began buying back its debt. |
| | • | | The portfolio’s holdings in healthcare also added to returns, as investors began to focus on higher-quality companies during the recent volatile market and economic environment. |
Among rapidly growing companies, which stocks or related group of stocks contributed
the most and detracted the most from the Fund’s return?
| | • | | For faster-growing stocks, QMA’s process places a heavier weighting on news factors, such as the direction of analyst estimates. This factor performed well over the past 12 months and added to the Fund’s return. |
| | • | | This process was particularly true among information technology stocks, most notably MasterCard and Visa, which advanced 45% and 20%, respectively, when government regulation was not as stringent as previously expected. |
| | |
| 8 | | Visit our website at www.prudentialfunds.com |
| | • | | Detracting from the Fund’s return were holdings in several faster-growing energy companies, which, despite having good news, sold off as the economy showed signs of slowing. The Fund was also underweight in Amazon.com, which, despite having downward estimate revisions, advanced 29%, as earnings exceeded expectations. |
How did the Fund’s tax management strategy affect its performance?
| | • | | Although difficult to quantify, the tax management objective affected performance over the course of the reporting period. Trading in the portfolio is not dictated by tax concerns, but the potential impact that trading can have on taxes is factored into investment decisions. |
| | • | | For example, a tax management strategy may result in a lower value exposure in the portfolio, as cheaper stocks are more likely to have been sold to realize tax losses. In an environment where value does not perform well, as was the case over the reporting period, this can help performance. |
| | • | | In any given year, the performance of the Fund may differ from that of one which does not have tax management as one of its objectives. Over the long term, QMA expects the performance differential between funds with and without a tax management objective to be minimal. |
Did the Fund hold derivatives and did they affect performance?
| | • | | The Fund held futures contracts on the S&P 500. |
| | • | | The manager utilizes these instruments as a means of holding a position and managing daily cash flows, and not as a means of adding value (see Fund Management section). Subsequently, the effect on performance was minimal. |
| | | | |
| Prudential Large-Cap Core Equity Fund | | | 9 | |
Fees and Expenses (Unaudited)
As a shareholder of the Fund, you incur two types of costs: (1) transaction costs, including sales charges (loads) on purchase payments and redemptions, as applicable, and (2) ongoing costs, including management fees, distribution and/or service (12b-1) fees, and other Fund expenses, as applicable. This example is intended to help you understand your ongoing costs (in dollars) of investing in the Fund and to compare these costs with the ongoing costs of investing in other mutual funds.
The example is based on an investment of $1,000 invested on May 1, 2011, at the beginning of the period, and held through the six-month period ended October 31, 2011. The example is for illustrative purposes only; you should consult the Prospectus for information on initial and subsequent minimum investment requirements.
The Fund’s transfer agent may charge additional fees to holders of certain accounts that are not included in the expenses shown in the table on the following page. These fees apply to individual retirement accounts (IRAs) and Section 403(b) accounts. As of the close of the six-month period covered by the table, IRA fees included an annual maintenance fee of $15 per account (subject to a maximum annual maintenance fee of $25 for all accounts held by the same shareholder). Section 403(b) accounts are charged an annual $25 fiduciary maintenance fee. Some of the fees may vary in amount, or may be waived, based on your total account balance or the number of Prudential Investments funds, including the Fund, that you own. You should consider the additional fees that were charged to your Fund account over the six-month period when you estimate the total ongoing expenses paid over the period and the impact of these fees on your ending account value, as these additional expenses are not reflected in the information provided in the expense table. Additional fees have the effect of reducing investment returns.
Actual Expenses
The first line for each share class in the table on the following page provides information about actual account values and actual expenses. You may use the information on this line, together with the amount you invested, to estimate the expenses that you paid over the period. Simply divide your account value by $1,000 (for example, an $8,600 account value ÷ $1,000 = 8.6), then multiply the result by the number on the first line under the heading “Expenses Paid During the Six-Month Period” to estimate the expenses you paid on your account during this period.
Hypothetical Example for Comparison Purposes
The second line for each share class in the table on the following page provides information about hypothetical account values and hypothetical expenses based on the Fund’s actual expense ratio and an assumed rate of return of 5% per year before expenses, which is not the Fund’s actual return. The hypothetical account values and
| | |
| 10 | | Visit our website at www.prudentialfunds.com |
expenses may not be used to estimate the actual ending account balance or expenses you paid for the period. You may use this information to compare the ongoing costs of investing in the Fund and other funds. To do so, compare this 5% hypothetical example with the 5% hypothetical examples that appear in the shareholder reports of the other funds.
Please note that the expenses shown in the table are meant to highlight your ongoing costs only and do not reflect any transactional costs such as sales charges (loads). Therefore, the second line for each share class in the table is useful in comparing ongoing costs only and will not help you determine the relative total costs of owning different funds. In addition, if these transactional costs were included, your costs would have been higher.
| | | | | | | | | | | | | | | | | | |
Prudential Large-Cap
Core Equity Fund | | Beginning Account
Value
May 1, 2011 | | | Ending Account
Value
October 31, 2011 | | | Annualized
Expense Ratio
Based on the
Six-Month Period | | | Expenses Paid
During the
Six-Month Period* | |
| | | | | | | | | | | | | | | | | | |
| Class A | | Actual | | $ | 1,000.00 | | | $ | 919.30 | | | | 1.33 | % | | $ | 6.43 | |
| | | Hypothetical | | $ | 1,000.00 | | | $ | 1,018.50 | | | | 1.33 | % | | $ | 6.77 | |
| | | | | | | | | | | | | | | | | | |
| Class B | | Actual | | $ | 1,000.00 | | | $ | 915.80 | | | | 2.06 | % | | $ | 9.95 | |
| | | Hypothetical | | $ | 1,000.00 | | | $ | 1,014.82 | | | | 2.06 | % | | $ | 10.46 | |
| | | | | | | | | | | | | | | | | | |
| Class C | | Actual | | $ | 1,000.00 | | | $ | 916.60 | | | | 2.05 | % | | $ | 9.90 | |
| | | Hypothetical | | $ | 1,000.00 | | | $ | 1,014.87 | | | | 2.05 | % | | $ | 10.41 | |
| | | | | | | | | | | | | | | | | | |
| Class L | | Actual | | $ | 1,000.00 | | | $ | 918.40 | | | | 1.56 | % | | $ | 7.54 | |
| | | Hypothetical | | $ | 1,000.00 | | | $ | 1,017.34 | | | | 1.56 | % | | $ | 7.93 | |
| | | | | | | | | | | | | | | | | | |
| Class M | | Actual | | $ | 1,000.00 | | | $ | 915.80 | | | | 2.10 | % | | $ | 10.14 | |
| | | Hypothetical | | $ | 1,000.00 | | | $ | 1,014.62 | | | | 2.10 | % | | $ | 10.66 | |
| | | | | | | | | | | | | | | | | | |
| Class X | | Actual | | $ | 1,000.00 | | | $ | 919.70 | | | | 1.31 | % | | $ | 6.34 | |
| | | Hypothetical | | $ | 1,000.00 | | | $ | 1,018.60 | | | | 1.31 | % | | $ | 6.67 | |
| | | | | | | | | | | | | | | | | | |
| Class Z | | Actual | | $ | 1,000.00 | | | $ | 920.40 | | | | 1.28 | % | | $ | 6.20 | |
| | | Hypothetical | | $ | 1,000.00 | | | $ | 1,018.75 | | | | 1.28 | % | | $ | 6.51 | |
* Fund expenses (net of fee waivers or subsidies, if any) for each share class are equal to the annualized expense ratio for each share class (provided in the table), multiplied by the average account value over the period, multiplied by the 184 days in the six-month period ended October 31, 2011, and divided by the 365 days in the Fund’s fiscal year ended October 31, 2011 (to reflect the six-month period). Expenses presented in the table include the expenses of any underlying portfolios in which the Fund may invest.
| | | | |
| Prudential Large-Cap Core Equity Fund | | | 11 | |
Portfolio of Investments
as of October 31, 2011
| | | | | | |
| Shares | | Description | | Value (Note 1) | |
| | | | | | |
LONG-TERM INVESTMENTS 99.3% | |
COMMON STOCKS | |
CONSUMER DISCRETIONARY 10.0% | |
| |
Auto Components 0.4% | | | | |
| 10,500 | | TRW Automotive Holdings Corp.(a) | | $ | 442,050 | |
| |
Automobiles 0.9% | | | | |
| 31,600 | | Ford Motor Co.(a)(b) | | | 369,088 | |
| 27,300 | | General Motors Co.(a)(b) | | | 705,705 | |
| | | | | | |
| | | | | 1,074,793 | |
| |
Distributors | | | | |
| 1,000 | | Genuine Parts Co. | | | 57,430 | |
| |
Diversified Consumer Services | | | | |
| 1,500 | | Capella Education Co.(a) | | | 52,215 | |
| |
Hotels, Restaurants & Leisure 1.5% | | | | |
| 15,700 | | McDonald’s Corp. | | | 1,457,745 | |
| 2,400 | | Panera Bread Co. (Class A Stock)(a) | | | 320,856 | |
| 600 | | Papa John’s International, Inc.(a) | | | 20,256 | |
| | | | | | |
| | | | | 1,798,857 | |
| |
Household Durables 0.2% | | | | |
| 800 | | Blyth, Inc. | | | 44,664 | |
| 1,200 | | Harman International Industries, Inc. | | | 51,792 | |
| 2,400 | | Tempur-Pedic International, Inc.(a) | | | 163,344 | |
| | | | | | |
| | | | | 259,800 | |
| |
Internet & Catalog Retail | | | | |
| 200 | | Amazon.com, Inc.(a) | | | 42,702 | |
| |
Leisure Equipment & Products 0.8% | | | | |
| 13,400 | | Polaris Industries, Inc. | | | 848,756 | |
| 5,100 | | Sturm, Ruger & Co., Inc. | | | 154,632 | |
| | | | | | |
| | | | | 1,003,388 | |
|
Media 3.1% | |
| 34,800 | | Comcast Corp. (Class A Stock) | | | 816,060 | |
| 8,600 | | DIRECTV (Class A Stock)(a) | | | 390,956 | |
| 5,200 | | Dish Network Corp. (Class A Stock)(a) | | | 125,684 | |
| 76,900 | | News Corp. (Class A Stock) | | | 1,347,288 | |
See Notes to Financial Statements.
| | | | |
| Prudential Large-Cap Core Equity Fund | | | 13 | |
Portfolio of Investments
as of October 31, 2011 continued
| | | | | | |
| Shares | | Description | | Value (Note 1) | |
| | | | | | |
CONSUMER DISCRETIONARY (Continued) | | | | |
| |
Media (cont’d.) | | | | |
| 6,000 | | Time Warner, Inc. | | $ | 209,940 | |
| 19,600 | | Viacom, Inc. (Class B Stock) | | | 859,460 | |
| 3,560 | | Walt Disney Co. (The) | | | 124,173 | |
| | | | | | |
| | | | | 3,873,561 | |
|
Multiline Retail 0.7% | |
| 16,300 | | Kohl’s Corp. | | | 864,063 | |
|
Specialty Retail 1.5% | |
| 11,700 | | Ross Stores, Inc. | | | 1,026,441 | |
| 14,500 | | TJX Cos., Inc. | | | 854,485 | |
| | | | | | |
| | | | | 1,880,926 | |
|
Textiles, Apparel & Luxury Goods 0.9% | |
| 16,600 | | Coach, Inc. | | | 1,080,162 | |
| 700 | | True Religion Apparel, Inc.(a) | | | 23,744 | |
| | | | | | |
| | | | | 1,103,906 | |
CONSUMER STAPLES 9.7% | |
|
Beverages 2.1% | |
| 17,200 | | Coca-Cola Co. (The)(b) | | | 1,175,104 | |
| 18,300 | | Coca-Cola Enterprises, Inc.(b) | | | 490,806 | |
| 300 | | Molson Coors Brewing Co. (Class B Stock) | | | 12,702 | |
| 13,694 | | PepsiCo, Inc. | | | 862,037 | |
| | | | | | |
| | | | | 2,540,649 | |
|
Food & Staples Retailing 3.2% | |
| 30,500 | | CVS Caremark Corp.(b) | | | 1,107,150 | |
| 40,100 | | Kroger Co. (The) | | | 929,518 | |
| 34,970 | | Wal-Mart Stores, Inc. | | | 1,983,499 | |
| | | | | | |
| | | | | 4,020,167 | |
|
Food Products 1.1% | |
| 19,338 | | Archer-Daniels-Midland Co. | | | 559,642 | |
| 6,300 | | Corn Products International, Inc. | | | 305,550 | |
| 4,000 | | Smithfield Foods, Inc.(a) | | | 91,440 | |
| 20,800 | | Tyson Foods, Inc. (Class A Stock) | | | 401,440 | |
| | | | | | |
| | | | | 1,358,072 | |
See Notes to Financial Statements.
| | |
| 14 | | Visit our website at www.prudentialfunds.com |
| | | | | | |
| Shares | | Description | | Value (Note 1) | |
| | | | | | |
CONSUMER STAPLES (Continued) | | | | |
|
Household Products 1.2% | |
| 5,100 | | Kimberly-Clark Corp.(b) | | $ | 355,521 | |
| 18,564 | | Procter & Gamble Co. (The) | | | 1,187,910 | |
| | | | | | |
| | | | | 1,543,431 | |
|
Personal Products 0.7% | |
| 14,300 | | Herbalife Ltd. | | | 891,748 | |
| 1,600 | | Medifast, Inc.(a)(b) | | | 26,304 | |
| | | | | | |
| | | | | 918,052 | |
|
Tobacco 1.4% | |
| 13,200 | | Altria Group, Inc. | | | 363,660 | |
| 2,300 | | Lorillard, Inc. | | | 254,518 | |
| 9,100 | | Philip Morris International, Inc. | | | 635,817 | |
| 12,100 | | Reynolds American, Inc. | | | 468,028 | |
| | | | | | |
| | | | | 1,722,023 | |
ENERGY 13.3% | |
| |
Energy Equipment & Services 1.8% | | | | |
| 1,500 | | Halliburton Co. | | | 56,040 | |
| 6,100 | | Helix Energy Solutions Group, Inc.(a) | | | 110,166 | |
| 11,300 | | Helmerich & Payne, Inc. | | | 600,934 | |
| 4,200 | | National Oilwell Varco, Inc. | | | 299,586 | |
| 25,700 | | RPC, Inc.(b) | | | 477,249 | |
| 5,300 | | Schlumberger Ltd. | | | 389,391 | |
| 3,300 | | SEACOR Holdings, Inc. | | | 280,995 | |
| | | | | | |
| | | | | 2,214,361 | |
| |
Oil, Gas & Consumable Fuels 11.5% | | | | |
| 8,800 | | Apache Corp. | | | 876,744 | |
| 26,484 | | Chevron Corp. | | | 2,782,144 | |
| 24,700 | | ConocoPhillips | | | 1,720,355 | |
| 5,400 | | Consol Energy, Inc. | | | 230,904 | |
| 5,800 | | Devon Energy Corp. | | | 376,710 | |
| 58,274 | | Exxon Mobil Corp. | | | 4,550,617 | |
| 13,700 | | Hess Corp. | | | 857,072 | |
| 30,500 | | Marathon Oil Corp. | | | 793,915 | |
| 15,250 | | Marathon Petroleum Corp. | | | 547,475 | |
| 7,200 | | Occidental Petroleum Corp. | | | 669,168 | |
| 36,400 | | Valero Energy Corp. | | | 895,440 | |
| | | | | | |
| | | | | 14,300,544 | |
See Notes to Financial Statements.
| | | | |
| Prudential Large-Cap Core Equity Fund | | | 15 | |
Portfolio of Investments
as of October 31, 2011 continued
| | | | | | |
| Shares | | Description | | Value (Note 1) | |
| | | | | | |
FINANCIALS 12.6% | |
| |
Capital Markets 1.3% | | | | |
| 37,200 | | Bank of New York Mellon Corp. (The) | | $ | 791,616 | |
| 1,080 | | Goldman Sachs Group, Inc. (The) | | | 118,314 | |
| 2,100 | | Janus Capital Group, Inc. | | | 13,776 | |
| 8,000 | | Morgan Stanley | | | 141,120 | |
| 4,500 | | Raymond James Financial, Inc. | | | 136,665 | |
| 10,300 | | State Street Corp. | | | 416,017 | |
| | | | | | |
| | | | | 1,617,508 | |
| |
Commercial Banks 3.9% | | | | |
| 10,700 | | BB&T Corp.(b) | | | 249,738 | |
| 18,500 | | First Horizon National Corp. | | | 129,315 | |
| 80,900 | | Huntington Bancshares, Inc. | | | 419,062 | |
| 34,700 | | KeyCorp | | | 244,982 | |
| 7,100 | | PNC Financial Services Group, Inc. | | | 381,341 | |
| 59,100 | | Regions Financial Corp. | | | 232,263 | |
| 33,800 | | SunTrust Banks, Inc. | | | 666,874 | |
| 13,691 | | U.S. Bancorp | | | 350,353 | |
| 85,264 | | Wells Fargo & Co. | | | 2,209,190 | |
| | | | | | |
| | | | | 4,883,118 | |
| |
Consumer Finance 1.1% | | | | |
| 3,000 | | Capital One Financial Corp.(b) | | | 136,980 | |
| 27,500 | | Discover Financial Services | | | 647,900 | |
| 14,000 | | Nelnet, Inc. (Class A Stock) | | | 300,720 | |
| 19,300 | | SLM Corp. | | | 263,831 | |
| | | | | | |
| | | | | 1,349,431 | |
| |
Diversified Financial Services 2.6% | | | | |
| 71,868 | | Bank of America Corp. | | | 490,859 | |
| 12,270 | | Citigroup, Inc. | | | 387,609 | |
| 900 | | CME Group, Inc. | | | 248,004 | |
| 61,900 | | JPMorgan Chase & Co. | | | 2,151,644 | |
| | | | | | |
| | | | | 3,278,116 | |
| |
Insurance 2.9% | | | | |
| 4,700 | | American International Group, Inc.(a) | | | 116,043 | |
| 24,100 | | Assurant, Inc. | | | 928,814 | |
| 9,500 | | Berkshire Hathaway, Inc. (Class B Stock)(a)(b) | | | 739,670 | |
| 12,700 | | Lincoln National Corp. | | | 241,935 | |
See Notes to Financial Statements.
| | |
| 16 | | Visit our website at www.prudentialfunds.com |
| | | | | | |
| Shares | | Description | | Value (Note 1) | |
| | | | | | |
FINANCIALS (Continued) | |
| |
Insurance (cont’d.) | | | | |
| 16,900 | | Travelers Cos., Inc. (The) | | $ | 986,115 | |
| 24,400 | | Unum Group | | | 581,696 | |
| | | | | | |
| | | | | 3,594,273 | |
| |
Real Estate Investment Trusts 0.7% | | | | |
| 2,000 | | Annaly Capital Management, Inc. | | | 33,700 | |
| 3,200 | | Ashford Hospitality Trust, Inc. | | | 28,480 | |
| 1,500 | | Chatham Lodging Trust | | | 16,875 | |
| 2,700 | | Commonwealth REIT | | | 52,245 | |
| 11,800 | | Hospitality Properties Trust | | | 283,554 | |
| 22,500 | | Inland Real Estate Corp. | | | 168,750 | |
| 3,200 | | PennyMac Mortgage Investment Trust | | | 54,720 | |
| 25,100 | | Winthrop Realty Trust | | | 227,155 | |
| | | | | | |
| | | | | 865,479 | |
| |
Real Estate Management & Development 0.1% | | | | |
| 1,600 | | Jones Lang LaSalle, Inc. | | | 103,392 | |
HEALTHCARE 12.8% | |
| |
Biotechnology 2.3% | | | | |
| 21,500 | | Amgen, Inc. | | | 1,231,305 | |
| 7,400 | | Biogen Idec, Inc.(a) | | | 861,064 | |
| 11,000 | | Celgene Corp.(a) | | | 713,130 | |
| | | | | | |
| | | | | 2,805,499 | |
| |
Healthcare Equipment & Supplies 1.6% | | | | |
| 4,100 | | Becton Dickinson and Co. | | | 320,743 | |
| 22,400 | | Covidien PLC | | | 1,053,696 | |
| 13,800 | | Stryker Corp.(b) | | | 661,158 | |
| | | | | | |
| | | | | 2,035,597 | |
| |
Healthcare Providers & Services 3.2% | | | | |
| 24,900 | | Aetna, Inc. | | | 990,024 | |
| 16,800 | | Coventry Health Care, Inc.(a) | | | 534,408 | |
| 4,200 | | Humana, Inc. | | | 356,538 | |
| 22,200 | | UnitedHealth Group, Inc.(b) | | | 1,065,378 | |
| 14,600 | | WellPoint, Inc. | | | 1,005,940 | |
| | | | | | |
| | | | | 3,952,288 | |
See Notes to Financial Statements.
| | | | |
| Prudential Large-Cap Core Equity Fund | | | 17 | |
Portfolio of Investments
as of October 31, 2011 continued
| | | | | | |
| Shares | | Description | | Value (Note 1) | |
| | | | | | |
HEALTHCARE (Continued) | |
| |
Life Sciences Tools & Services 0.7% | | | | |
| 18,300 | | Thermo Fisher Scientific, Inc.(a) | | $ | 919,941 | |
| |
Pharmaceuticals 5.0% | | | | |
| 31,700 | | Abbott Laboratories | | | 1,707,679 | |
| 18,499 | | Johnson & Johnson | | | 1,191,150 | |
| 31,900 | | Merck & Co., Inc. | | | 1,100,550 | |
| 114,634 | | Pfizer, Inc. | | | 2,207,851 | |
| | | | | | |
| | | | | 6,207,230 | |
INDUSTRIALS 12.0% | |
| |
Aerospace & Defense 3.0% | | | | |
| 1,600 | | Cubic Corp. | | | 75,392 | |
| 16,400 | | General Dynamics Corp. | | | 1,052,716 | |
| 6,800 | | Honeywell International, Inc. | | | 356,320 | |
| 1,400 | | Huntington Ingalls Industries, Inc.(a) | | | 41,300 | |
| 9,900 | | ITT Corp. | | | 451,440 | |
| 1,500 | | Lockheed Martin Corp.(b) | | | 113,850 | |
| 13,700 | | Northrop Grumman Corp. | | | 791,175 | |
| 1,700 | | Precision Castparts Corp. | | | 277,355 | |
| 7,500 | | United Technologies Corp.(b) | | | 584,850 | |
| | | | | | |
| | | | | 3,744,398 | |
| |
Air Freight & Logistics 1.0% | | | | |
| 7,500 | | FedEx Corp. | | | 613,725 | |
| 8,100 | | United Parcel Service, Inc. (Class B Stock) | | | 568,944 | |
| | | | | | |
| | | | | 1,182,669 | |
| |
Construction & Engineering | | | | |
| 3,100 | | URS Corp.(a) | | | 110,670 | |
| |
Electrical Equipment 1.0% | | | | |
| 17,200 | | Emerson Electric Co. | | | 827,664 | |
| 700 | | Franklin Electric Co., Inc. | | | 32,144 | |
| 4,000 | | Rockwell Automation, Inc. | | | 270,600 | |
| 1,800 | | Thomas & Betts Corp.(a) | | | 89,442 | |
| | | | | | |
| | | | | 1,219,850 | |
| |
Industrial Conglomerates 1.8% | | | | |
| 200 | | 3M Co. | | | 15,804 | |
| 131,500 | | General Electric Co. | | | 2,197,365 | |
| | | | | | |
| | | | | 2,213,169 | |
See Notes to Financial Statements.
| | |
| 18 | | Visit our website at www.prudentialfunds.com |
| | | | | | |
| Shares | | Description | | Value (Note 1) | |
| | | | | | |
INDUSTRIALS (Continued) | |
|
Machinery 2.8% | |
| 400 | | Caterpillar, Inc. | | $ | 37,784 | |
| 4,100 | | Cummins, Inc. | | | 407,663 | |
| 15,400 | | Deere & Co.(b) | | | 1,168,860 | |
| 11,200 | | Eaton Corp. | | | 501,984 | |
| 2,200 | | Gardner Denver, Inc. | | | 170,126 | |
| 19,800 | | Ingersoll-Rand PLC(b) | | | 616,374 | |
| 1,000 | | Nacco Industries, Inc. (Class A Stock) | | | 82,100 | |
| 6,400 | | Parker Hannifin Corp. | | | 521,920 | |
| | | | | | |
| | | | | 3,506,811 | |
|
Professional Services 0.1% | |
| 2,300 | | Equifax, Inc. | | | 80,845 | |
|
Road & Rail 2.3% | |
| 24,100 | | CSX Corp. | | | 535,261 | |
| 15,400 | | Norfolk Southern Corp. | | | 1,139,446 | |
| 12,200 | | Union Pacific Corp. | | | 1,214,754 | |
| | | | | | |
| | | | | 2,889,461 | |
INFORMATION TECHNOLOGY 20.7% | |
|
Communications Equipment 2.5% | |
| 500 | | Black Box Corp. | | | 13,995 | |
| 72,950 | | Cisco Systems, Inc. | | | 1,351,764 | |
| 4,600 | | Motorola Solutions, Inc. | | | 215,786 | |
| 2,900 | | Netgear, Inc.(a) | | | 102,834 | |
| 27,900 | | QUALCOMM, Inc. | | | 1,439,640 | |
| | | | | | |
| | | | | 3,124,019 | |
|
Computers & Peripherals 6.1% | |
| 10,690 | | Apple, Inc.(a) | | | 4,327,098 | |
| 69,400 | | Dell, Inc.(a) | | | 1,097,214 | |
| 47,400 | | EMC Corp.(a) | | | 1,161,774 | |
| 36,725 | | Hewlett-Packard Co. | | | 977,252 | |
| 1,400 | | Western Digital Corp.(a) | | | 37,296 | |
| | | | | | |
| | | | | 7,600,634 | |
|
Electronic Equipment, Instruments & Components 0.1% | |
| 4,700 | | Dolby Laboratories, Inc. (Class A Stock)(a) | | | 137,428 | |
| 800 | | SYNNEX Corp.(a) | | | 23,096 | |
| | | | | | |
| | | | | 160,524 | |
See Notes to Financial Statements.
| | | | |
| Prudential Large-Cap Core Equity Fund | | | 19 | |
Portfolio of Investments
as of October 31, 2011 continued
| | | | | | |
| Shares | | Description | | Value (Note 1) | |
| | | | | | |
INFORMATION TECHNOLOGY (Continued) | |
|
Internet Software & Services 1.2% | |
| 23,300 | | Akamai Technologies, Inc.(a) | | $ | 627,702 | |
| 1,400 | | Google, Inc. (Class A Stock)(a) | | | 829,696 | |
| | | | | | |
| | | | | 1,457,398 | |
| |
IT Services 3.6% | | | | |
| 4,600 | | Fiserv, Inc.(a) | | | 270,802 | |
| 8,970 | | International Business Machines Corp. | | | 1,656,131 | |
| 3,400 | | Mastercard, Inc. (Class A Stock) | | | 1,180,616 | |
| 2,800 | | Unisys Corp.(a) | | | 72,772 | |
| 14,400 | | Visa, Inc. (Class A Stock) | | | 1,342,944 | |
| | | | | | |
| | | | | 4,523,265 | |
| |
Semiconductors & Semiconductor Equipment 1.9% | | | | |
| 49,100 | | Applied Materials, Inc. | | | 604,912 | |
| 27,000 | | Intel Corp. | | | 662,580 | |
| 36,500 | | Texas Instruments, Inc. | | | 1,121,645 | |
| | | | | | |
| | | | | 2,389,137 | |
| |
Software 5.3% | | | | |
| 24,800 | | Activision Blizzard, Inc.(b) | | | 332,072 | |
| 17,600 | | Autodesk, Inc.(a) | | | 608,960 | |
| 7,900 | | BMC Software, Inc.(a) | | | 274,604 | |
| 19,200 | | Intuit, Inc. | | | 1,030,464 | |
| 53,200 | | Microsoft Corp. | | | 1,416,716 | |
| 65,600 | | Oracle Corp. | | | 2,149,712 | |
| 41,900 | | Symantec Corp.(a) | | | 712,719 | |
| | | | | | |
| | | | | 6,525,247 | |
MATERIALS 2.6% | | | | |
| |
Chemicals 1.1% | | | | |
| 900 | | A. Schulman, Inc. | | | 18,999 | |
| 3,500 | | CF Industries Holdings, Inc. | | | 567,945 | |
| 1,800 | | Eastman Chemical Co. | | | 70,722 | |
| 18,000 | | LyondellBasell Industries NV (Class A Stock) | | | 591,480 | |
| 2,500 | | Mosaic Co. (The) | | | 146,400 | |
| | | | | | |
| | | | | 1,395,546 | |
| |
Containers & Packaging 0.2% | | | | |
| 11,200 | | Sealed Air Corp. | | | 199,360 | |
See Notes to Financial Statements.
| | |
| 20 | | Visit our website at www.prudentialfunds.com |
| | | | | | |
| Shares | | Description | | Value (Note 1) | |
| | | | | | |
MATERIALS (Continued) | |
| |
Metals & Mining 1.3% | | | | |
| 42,100 | | Alcoa, Inc. | | $ | 452,996 | |
| 11,100 | | Coeur d’Alene Mines Corp.(a) | | | 283,827 | |
| 14,300 | | Freeport-McMoRan Copper & Gold, Inc. | | | 575,718 | |
| 1,700 | | Noranda Aluminum Holding Corp.(a) | | | 15,742 | |
| 1,800 | | Reliance Steel & Aluminum Co. | | | 79,542 | |
| 15,700 | | Steel Dynamics, Inc. | | | 196,093 | |
| | | | | | |
| | | | | 1,603,918 | |
TELECOMMUNICATION SERVICES 2.7% | |
| |
Diversified Telecommunication Services 2.6% | | | | |
| 87,468 | | AT&T, Inc. | | | 2,563,687 | |
| 19,100 | | Verizon Communications, Inc. | | | 706,318 | |
| | | | | | |
| | | | | 3,270,005 | |
| |
Wireless Telecommunication Services 0.1% | | | | |
| 18,400 | | MetroPCS Communications, Inc.(a) | | | 156,400 | |
UTILITIES 2.9% | |
|
Electric Utilities 0.9% | |
| 6,300 | | Duke Energy Corp. | | | 128,646 | |
| 6,600 | | Entergy Corp. | | | 456,522 | |
| 9,600 | | NextEra Energy, Inc. | | | 541,440 | |
| | | | | | |
| | | | | 1,126,608 | |
|
Gas Utilities 0.2% | |
| 10,000 | | UGI Corp. | | | 286,700 | |
|
Independent Power Producers & Energy Traders 0.3% | |
| 30,300 | | AES Corp. (The)(a) | | | 339,966 | |
|
Multi-Utilities 1.3% | |
| 16,000 | | Dominion Resources, Inc. | | | 825,440 | |
| 600 | | Public Service Enterprise Group, Inc. | | | 20,220 | |
| 13,600 | | Sempra Energy | | | 730,728 | |
| | | | | | |
| | | | | 1,576,388 | |
|
Water Utilities 0.2% | |
| 7,600 | | American Water Works Co., Inc. | | | 232,028 | |
| | | | | | |
| | Total long-term investments
(cost $101,004,869) | | | 123,597,878 | |
| | | | | | |
See Notes to Financial Statements.
| | | | |
| Prudential Large-Cap Core Equity Fund | | | 21 | |
Portfolio of Investments
as of October 31, 2011 continued
| | | | | | |
Principal
Amount (000) | | Description | | Value (Note 1) | |
| | | | | | |
SHORT-TERM INVESTMENTS 8.6% | |
|
United States Government Security 0.4% | |
| $ 550 | | United States Treasury Bill, 0.097%, 12/15/11
(cost $549,935)(c)(d) | | $ | 549,983 | |
| | | | | | |
| | |
| Shares | | | | | |
|
Affiliated Money Market Mutual Fund 8.2% | |
| 10,153,823 | | Prudential Investment Portfolios 2 - Prudential Core Taxable Money Market Fund
(cost $10,153,823; includes $9,636,954 of cash collateral received for securities on loan) (Note 3)(e)(f) | | | 10,153,823 | |
| | | | | | |
| | Total short-term investments
(cost $10,703,758) | | | 10,703,806 | |
| | | | | | |
| | Total Investments 107.9%
(cost $111,708,627; Note 5) | | | 134,301,684 | |
| | Liabilities in excess of other assets(g) (7.9%) | | | (9,828,440 | ) |
| | | | | | |
| | Net Assets 100.0% | | $ | 124,473,244 | |
| | | | | | |
| (a) | Non-income producing security. |
| (b) | All or a portion of security is on loan. The aggregate market value of such securities, including those sold and pending settlement, is $9,214,792; cash collateral of $9,636,954 (included in liabilities) was received with which the Fund purchased highly liquid short-term investments. |
| (c) | Rate quoted represents yield-to-maturity as of purchase date. |
| (d) | Represents security, or a portion thereof, segregated as collateral for futures contracts. |
| (e) | Prudential Investments LLC, the manager of the Fund, also serves as manager of the Prudential Investment Portfolios 2 - Prudential Core Taxable Money Market Fund. |
| (f) | Represents security, or a portion thereof, purchased with cash collateral received for securities on loan. |
| (g) | Includes net unrealized appreciation on the following derivative contracts held at reporting period end: |
Open future contracts outstanding at October 31, 2011:
| | | | | | | | | | | | | | | | | | | | |
Number of
Contracts | | | Type | | Expiration
Date | | | Value at
Trade
Date | | | Value at
October 31,
2011 | | | Unrealized
Appreciation | |
| | | | Long Position: | | | | | | | | | | | | | | | | |
| | 16 | | | E-mini S&P 500 Futures | | | Dec. 2011 | | | $ | 923,660 | | | $ | 999,440 | | | $ | 75,780 | |
| | | | | | | | | | | | | | | | | | | | |
See Notes to Financial Statements.
| | |
| 22 | | Visit our website at www.prudentialfunds.com |
Various inputs are used in determining the value of the Fund’s investments. These inputs are summarized in the three broad levels listed below.
Level 1—quoted prices generally for securities actively traded on a regulated securities exchange and for open-end mutual funds which trade at daily net asset value.
Level 2—other significant observable inputs (including, but not limited to, quoted prices for similar securities, interest rates, prepayment speeds, foreign currency exchange rates and amortized cost) generally for debt securities, swaps, forward foreign currency contracts and for foreign stocks priced using vendor modeling tools.
Level 3—significant unobservable inputs for securities valued in accordance with Board approved fair valuation procedures.
The following is a summary of the inputs used as of October 31, 2011 in valuing such portfolio securities:
| | | | | | | | | | | | |
| | | Level 1 | | | Level 2 | | | Level 3 | |
Investments in Securities | | | | | | | | | | | | |
Common Stocks | | $ | 123,597,878 | | | $ | — | | | $ | — | |
Affiliated Money Market Mutual Fund | | | 10,153,823 | | | | — | | | | — | |
United States Government Security | | | — | | | | 549,983 | | | | — | |
Other Financial Instruments* | | | | | | | | | | | | |
Futures | | | 75,780 | | | | — | | | | — | |
| | | | | | | | | | | | |
Total | | $ | 133,827,481 | | | $ | 549,983 | | | $ | — | |
| | | | | | | | | | | | |
| * | Other financial instruments are derivative instruments not reflected in the Portfolio of Investments, such as futures, forwards and swap contracts, which are recorded at the unrealized appreciation/depreciation on the instrument. |
The industry classification of portfolio holdings and liabilities in excess of other assets shown as a percentage of net assets as of October 31, 2011 were as follows:
| | | | |
Information Technology | | | 20.7 | % |
Energy | | | 13.3 | |
Healthcare | | | 12.8 | |
Financials | | | 12.6 | |
Industrials | | | 12.0 | |
Consumer Discretionary | | | 10.0 | |
Consumer Staples | | | 9.7 | |
Affiliated Money Market Mutual Fund (including 7.7% of collateral received for securities on loan) | | | 8.2 | |
Utilities | | | 2.9 | % |
Telecommunication Services | | | 2.7 | |
Materials | | | 2.6 | |
United States Government Security | | | 0.4 | |
| | | | |
| | | 107.9 | |
Liabilities in excess of other assets | | | (7.9 | ) |
| | | | |
| | | 100.0 | % |
| | | | |
See Notes to Financial Statements.
| | | | |
| Prudential Large-Cap Core Equity Fund | | | 23 | |
Portfolio of Investments
as of October 31, 2011 continued
The Fund invested in derivative instruments during the reporting period. The primary type of risk associated with these derivative instruments is equity risk. The effect of such derivative instruments on the Fund’s financial position and financial performance as reflected in the Statement of Assets and Liabilities and Statement of Operations is presented in the summary below.
Fair values of derivative instruments as of October 31, 2011 as presented in the Statement of Assets and Liabilities:
| | | | | | | | | | | | |
Derivatives not designated
as hedging instruments,
carried at fair value | | Asset Derivatives | | | Liability Derivatives | |
| | Balance
Sheet Location | | Fair
Value | | | Balance
Sheet Location | | Fair
Value | |
| Equity contracts | | — | | $ | — | | | Due to broker—variation margin | | $ | 75,780 | * |
| | | | | | | | | | | | |
| * | Includes cumulative appreciation/depreciation on futures contracts as reported in Portfolio of Investments. Only unsettled variation margin receivable (payable) is reported within the Statement of Assets and Liabilities. |
The effects of derivative instruments on the Statement of Operations for the year ended October 31, 2011 are as follows:
| | | | |
Amount of Realized Gain or (Loss) on Derivatives Recognized in Income | |
Derivatives not designated as hedging
instruments, carried at fair value | | Futures | |
Equity contracts | | $ | 352,378 | |
| | | | |
|
Change in Unrealized Appreciation or (Depreciation) on Derivatives Recognized in Income | |
Derivatives not designated as hedging
instruments, carried at fair value | | Futures | |
Equity contracts | | $ | (99,475 | ) |
| | | | |
For the year ended October 31, 2011, the Fund’s average value at trade date for futures long position was $4,404,950.
See Notes to Financial Statements.
| | |
| 24 | | Visit our website at www.prudentialfunds.com |
Financial Statements
| | |
| OCTOBER 31, 2011 | | ANNUAL REPORT |
Prudential Large-Cap Core Equity Fund
Statement of Assets and Liabilities
as of October 31, 2011
| | | | |
Assets | | | | |
Investments at value, including securities on loan of $9,214,792: | | | | |
Unaffiliated investments (cost $101,554,804) | | $ | 124,147,861 | |
Affiliated investments (cost $10,153,823) | | | 10,153,823 | |
Dividends and interest receivable | | | 152,411 | |
Receivable for Fund shares sold | | | 10,211 | |
Prepaid expenses | | | 1,965 | |
| | | | |
Total assets | | | 134,466,271 | |
| | | | |
| |
Liabilities | | | | |
Payable to broker for collateral for securities on loan | | | 9,636,954 | |
Payable for Fund shares reacquired | | | 166,360 | |
Accrued expenses | | | 85,634 | |
Distribution fee payable | | | 35,206 | |
Due to broker—variation margin | | | 32,752 | |
Management fee payable | | | 20,195 | |
Affiliated transfer agent fee payable | | | 15,926 | |
| | | | |
Total liabilities | | | 9,993,027 | |
| | | | |
| |
Net Assets | | $ | 124,473,244 | |
| | | | |
| | | | | |
Net assets were comprised of: | | | | |
Share of beneficial interest, at par | | $ | 10,593 | |
Paid-in capital in excess of par | | | 92,979,166 | |
| | | | |
| | | 92,989,759 | |
Undistributed net investment income | | | 829,801 | |
Accumulated net realized gain on investment and financial futures transactions | | | 7,984,847 | |
Net unrealized appreciation on investments | | | 22,668,837 | |
| | | | |
Net assets, October 31, 2011 | | $ | 124,473,244 | |
| | | | |
See Notes to Financial Statements.
| | |
| 26 | | Visit our website at www.prudentialfunds.com |
| | | | |
Class A | | | | |
Net asset value and redemption price per share
($61,961,376 ÷ 5,231,771 shares of beneficial interest issued and outstanding)
Maximum sales charge (5.50% of offering price) | | $
| 11.84
0.69 |
|
| | | | |
Maximum offering price to public | | $ | 12.53 | �� |
| | | | |
| |
Class B | | | | |
Net asset value, offering price and redemption price per share
($4,038,367 ÷ 360,487 shares of beneficial interest issued and outstanding) | | $ | 11.20 | |
| | | | |
| |
Class C | | | | |
Net asset value, offering price and redemption price per share
($20,635,876 ÷ 1,841,391 shares of beneficial interest issued and outstanding) | | $ | 11.21 | |
| | | | |
| |
Class L | | | | |
Net asset value, offering price and redemption price per share
($3,846,514 ÷ 325,348 shares of beneficial interest issued and outstanding) | | $ | 11.82 | |
| | | | |
| |
Class M | | | | |
Net asset value, offering price and redemption price per share
($735,026 ÷ 65,574 shares of beneficial interest issued and outstanding) | | $ | 11.21 | |
| | | | |
| |
Class X | | | | |
Net asset value, offering price and redemption price per share
($837,036 ÷ 73,051 shares of beneficial interest issued and outstanding) | | $ | 11.46 | |
| | | | |
| |
Class Z | | | | |
Net asset value, offering price and redemption price per share
($32,419,049 ÷ 2,695,470 shares of beneficial interest issued and outstanding) | | $ | 12.03 | |
| | | | |
See Notes to Financial Statements.
| | | | |
| Prudential Large-Cap Core Equity Fund | | | 27 | |
Statement of Operations
Year Ended October 31, 2011
| | | | |
Net Investment Income | | | | |
Income | | | | |
Unaffiliated dividends (net of foreign withholding taxes of $472) | | $ | 4,856,336 | |
Affiliated dividend income | | | 10,440 | |
Affiliated income from securities loaned, net | | | 8,682 | |
Interest | | | 880 | |
| | | | |
Total income | | | 4,876,338 | |
| | | | |
| |
Expenses | | | | |
Management fee | | | 1,592,360 | |
Distribution fee—Class A | | | 186,847 | |
Distribution fee—Class B | | | 48,862 | |
Distribution fee—Class C | | | 224,437 | |
Distribution fee—Class L | | | 20,906 | |
Distribution fee—Class M | | | 23,110 | |
Distribution fee—Class X | | | 2,843 | |
Transfer agent’s fees and expenses (including affiliated expense of $420,000) (Note 3) | | | 1,420,000 | |
Reports to shareholders | | | 170,000 | |
Registration fees | | | 115,000 | |
Custodian’s fees and expenses | | | 90,000 | |
Legal fees and expenses | | | 26,000 | |
Audit fee | | | 23,000 | |
Trustees’ fees | | | 17,000 | |
Insurance | | | 5,000 | |
Loan interest expense (Note 7) | | | 31 | |
Miscellaneous | | | 15,742 | |
| | | | |
Total expenses | | | 3,981,138 | |
Less: Management fee waiver (Note 2) | | | (149,168 | ) |
| | | | |
Net expenses | | | 3,831,970 | |
| | | | |
Net investment income | | | 1,044,368 | |
| | | | |
| |
Realized And Unrealized Gain (Loss) On Investments | | | | |
Net realized gain on: | | | | |
Investment transactions | | | 48,968,943 | |
Financial futures transactions | | | 352,378 | |
| | | | |
| | | 49,321,321 | |
| | | | |
Net change in unrealized appreciation (depreciation) on: | | | | |
Investments | | | (22,422,527 | ) |
Financial futures contracts | | | (99,475 | ) |
| | | | |
| | | (22,522,002 | ) |
| | | | |
Net gain on investments | | | 26,799,319 | |
| | | | |
Net Increase In Net Assets Resulting From Operations | | $ | 27,843,687 | |
| | | | |
See Notes to Financial Statements.
| | |
| 28 | | Visit our website at www.prudentialfunds.com |
Statement of Changes in Net Assets
| | | | | | | | |
| | | Year Ended October 31, | |
| | | 2011 | | | 2010 | |
Increase (Decrease) In Net Assets | | | | | | | | |
Operations | | | | | | | | |
Net investment income | | $ | 1,044,368 | | | $ | 1,333,264 | |
Net realized gain on investment transactions | | | 49,321,321 | | | | 41,025,007 | |
Net change in unrealized appreciation (depreciation) on investments | | | (22,522,002 | ) | | | (9,197,450 | ) |
| | | | | | | | |
Net increase in net assets resulting from operations | | | 27,843,687 | | | | 33,160,821 | |
| | | | | | | | |
| | |
Dividends from net investment income (Note 1) | | | | | | | | |
Class A | | | (107,588 | ) | | | (306,462 | ) |
Class L | | | — | | | | (14,916 | ) |
Class X | | | (2,994 | ) | | | (11,620 | ) |
Class Z | | | (638,260 | ) | | | (1,683,947 | ) |
| | | | | | | | |
| | | (748,842 | ) | | | (2,016,945 | ) |
| | | | | | | | |
| | |
Fund share transactions (Net of share conversions) (Note 6) | | | | | | | | |
Net proceeds from shares sold | | | 116,185,903 | | | | 153,410,690 | |
Net asset value of shares issued in reinvestment of dividends | | | 192,729 | | | | 460,243 | |
Cost of shares reacquired | | | (262,798,860 | ) | | | (253,061,019 | ) |
| | | | | | | | |
Net decrease in net assets from Fund share transactions | | | (146,420,228 | ) | | | (99,190,086 | ) |
| | | | | | | | |
| | |
Capital Contributions (Note 2) | | | | | | | | |
Class X | | | 247 | | | | 667 | |
| | | | | | | | |
Total decrease | | | (119,325,136 | ) | | | (68,045,543 | ) |
| | |
Net Assets: | | | | | | | | |
Beginning of year | | | 243,798,380 | | | | 311,843,923 | |
| | | | | | | | |
End of year(a) | | $ | 124,473,244 | | | $ | 243,798,380 | |
| | | | | | | | |
(a) Includes undistributed net investment income of: | | $ | 829,801 | | | $ | 534,275 | |
| | | | | | | | |
See Notes to Financial Statements.
| | | | |
| Prudential Large-Cap Core Equity Fund | | | 29 | |
Notes to Financial Statements
Prudential Investment Portfolios 9 (the “Trust”) is an open-end management investment company, registered under the Investment Company Act of 1940, as amended (“1940 Act”). The Trust currently consists of three funds: Prudential Large-Cap Core Equity Fund (the “Fund”), Prudential International Real Estate Fund and Prudential Absolute Return Bond Fund. These financial statements relate to Prudential Large-Cap Core Equity Fund, a diversified fund. The financial statements of the Prudential International Real Estate Fund and Prudential Absolute Return Bond Fund are not presented herein. The Trust was organized as a business trust in Delaware on September 18, 1998. The Fund commenced investment operations on March 3, 1999.
The Fund’s investment objective is to seek long-term after-tax growth of capital. It invests in a portfolio of equity-related securities, such as common stock and convertible securities of U.S. companies.
Note 1. Accounting Policies
The following is a summary of significant accounting policies followed by the Fund in the preparation of its financial statements.
Securities Valuation: Securities listed on a securities exchange (other than options on securities and indices) are valued at the last sale price on such exchange on the day of valuation or, if there was no sale on such day, at the mean between the last reported bid and asked prices, or at the last bid price on such day in the absence of an asked price. Securities traded via NASDAQ are valued at the NASDAQ official closing price (“NOCP”) on the day of valuation, or if there was no NOCP, at the last sale price. Securities that are actively traded in the over-the-counter market, including listed securities for which the primary market is believed by Prudential Investments LLC (“PI” or “Manager”), in consultation with the subadvisers, to be over-the-counter, are valued at market value using prices provided by an independent pricing agent or principal market maker. Options on securities and indices traded on an exchange are valued at the last sale price as of the close of trading on the applicable exchange or, if there was no sale, at the mean between the most recently quoted bid and asked prices on such exchange. Futures contracts and options thereon traded on a commodities exchange or board of trade are valued at the last sale price at the close of trading on such exchange or board of trade or, if there was no sale on the applicable commodities exchange or board of trade on such day, at the mean between the most recently quoted bid and asked prices on such exchange or board of
| | |
| 30 | | Visit our website at www.prudentialfunds.com |
trade or at the last bid price in the absence of an asked price. Prices may be obtained from independent pricing services which use information provided by market makers or estimates of market values obtained from yield data relating to investments or securities with similar characteristics. Securities for which reliable market quotations are not readily available, or whose values have been affected by events occurring after the close of the security’s foreign market and before the Funds’ normal pricing time, are valued at fair value in accordance with the Board of Trustees’ approved fair valuation procedures. When determining the fair valuation of securities some of the factors influencing the valuation include, the nature of any restrictions on disposition of the securities; assessment of the general liquidity of the securities; the issuer’s financial condition and the markets in which it does business; the cost of the investment; the size of the holding and the capitalization of issuer; the prices of any recent transactions or bids/offers for such securities or any comparable securities; any available analyst media or other reports or information deemed reliable by the investment adviser regarding the issuer or the markets or industry in which it operates. Using fair value to price securities may result in a value that is different from a security’s most recent closing price and from the price used by other mutual funds to calculate their net asset values.
Investments in open end, non exchange-traded mutual funds are valued at their net asset value as of the close of the New York Stock Exchange on the date of valuation.
Short-term debt securities of sufficient credit quality, which mature in sixty days or less, are valued at amortized cost, which approximates fair value. The amortized cost method includes valuing a security at its cost on the date of purchase and thereafter assuming a constant amortization to maturity of the difference between the principal amount due at maturity and cost. Short-term debt securities, which mature in more than sixty days, are valued at fair value.
Securities Lending: The Fund may lend its portfolio securities to broker-dealers. The loans are secured by collateral at least equal at all times to the market value of the securities loaned. Loans are subject to termination at the option of the borrower or the Fund. Upon termination of the loan, the borrower will return to the Fund securities identical to the loaned securities. Should the borrower of the securities fail financially, the Fund has the right to repurchase the securities using the collateral in the open market. The Fund recognizes income, net of any rebate and securities lending agent fees, for lending its securities in the form of fees or interest on the investment of any cash received as collateral. The Fund also continues to receive interest and dividends or amounts equivalent thereto, on the securities loaned and recognizes any unrealized gain or loss in the market price of the securities loaned that may occur during the term of the loan.
| | | | |
| Prudential Large-Cap Core Equity Fund | | | 31 | |
Notes to Financial Statements
continued
Financial Futures Contracts: A financial futures contract is an agreement to purchase (long) or sell (short) an agreed amount of securities at a set price for delivery on a future date. Upon entering into a financial futures contract, the Fund is required to pledge to the broker an amount of cash and/or other assets equal to a certain percentage of the contract amount. This amount is known as the “initial margin”.
Subsequent payments, known as “variation margin”, are made or received by the Fund each day, depending on the daily fluctuations in the value of the underlying security. Such variation margin is recorded for financial statement purposes on a daily basis as unrealized gain or loss. When the contract expires or is closed, the gain or loss is realized and is presented in the Statement of Operations as net realized gain or loss on financial futures transactions.
The Fund invests in financial futures contracts in order to hedge its existing portfolio securities, or securities the Fund intends to purchase, against fluctuations in value caused by changes in value of equities. The use of futures transactions involves the risk of imperfect correlation in movements in the price of futures contracts and the underlying hedged assets. Financial futures contracts involve elements of both market and credit risk in excess of the amounts reflected on the Statement of Assets and Liabilities.
With exchange-traded futures, there is a minimal counterparty credit risk to the Fund since the exchanges’ clearinghouse acts as counterparty to all exchange traded futures and guarantees the futures contracts against default.
Securities Transactions and Net Investment Income: Securities transactions are recorded on the trade date. Realized gains or losses on sales of securities are calculated on an identified cost basis. Dividend income is recorded on the ex-dividend date and interest income, including amortization of premium and accretion of discount on debt securities, as required, is recorded on an accrual basis. Expenses are recorded on the accrual basis. Net investment income or loss (other than distribution fees which are charged directly to the respective class) and unrealized and realized gains or losses are allocated daily to each class of shares based upon the relative proportion of net assets of each class at the beginning of the day.
Dividends and Distributions: The Fund expects to pay dividends of net investment income and distributions of net realized capital gains, if any, annually. Dividends and distributions to shareholders, which are determined in accordance with federal
| | |
| 32 | | Visit our website at www.prudentialfunds.com |
income tax regulations and which may differ from generally accepted accounting principles, are recorded on the ex-dividend date. Permanent book/tax differences relating to income and gains are reclassified amongst undistributed net investment income, accumulated net realized gain or loss and paid-capital in excess of par, as appropriate.
Taxes: For federal income tax purposes, the Fund is treated as a separate taxpaying entity. It is the Fund’s policy to continue to meet the requirements of the Internal Revenue Code applicable to regulated investment companies and to distribute all of its taxable net investment income and capital gains, if any, to shareholders. Therefore, no federal income tax provision is required.
Withholding taxes on foreign dividends are recorded net of reclaimable amounts, at the time related income is earned.
Estimates: The preparation of the financial statements requires management to make estimates and assumptions that affect the reported amounts and disclosures in the financial statements. Actual results could differ from those estimates.
Note 2. Agreements
The Trust has a management agreement for the Fund with PI. Pursuant to this agreement, PI has responsibility for all investment advisory services and supervises the subadvisor’s performance of such services. PI has entered into a subadvisory agreement with Quantitative Management Associates LLC (“QMA”). The subadvisory agreement provides that QMA will furnish investment advisory services in connection with the management of the Fund. PI pays for the services of QMA, the cost of compensation of officers of the Fund, occupancy and certain clerical and bookkeeping costs of the Fund. The Fund bears all other costs and expenses.
The management fee paid to PI is computed daily and payable monthly at an annual rate of .65% of the Fund’s average daily net assets up to and including $500 million and .60% of the Fund’s average daily net assets in excess of $500 million. The effective management fee rate was .65% for the year ended October 31, 2011.
Effective July 1, 2011, PI has contractually agreed through February 28, 2013 to waive a portion of the Fund’s management fees so that the Fund’s annual operating expenses (exclusive of distribution and service (12b-1) fees, and certain other expenses such as taxes, interest, and brokerage commissions) do not exceed .95% of the Fund’s average daily net assets.
| | | | |
| Prudential Large-Cap Core Equity Fund | | | 33 | |
Notes to Financial Statements
continued
The Fund has distribution agreements with Prudential Investment Management Services LLC (“PIMS”) and Prudential Annuities Distributors, Inc. (“PAD”). PIMS and PAD are both affiliates of PI and indirect, wholly-owned subsidiaries of Prudential. PIMS serves as the distributor of the Fund’s Class A, Class B, Class C, and Class Z shares. PIMS, together with PAD, serves as co-distributor of the Fund’s Class L, Class M, and Class X shares.
The Fund has adopted a separate Distribution and Service plan (each a “Plan” and collectively the “Plans”) for the Class A, Class B, Class C, Class L, Class M, and Class X shares of the Fund in accordance with Rule 12b-1 of the 1940 Act, as amended. No distribution or service fees are paid to PIMS as distributor for the Fund’s Class Z shares.
Under the Plans, the Fund compensates PIMS and PAD a distribution and service fee at the annual rate of .30%, 1.00%, 1.00%, .50%, 1.00%, and 1.00% of the average daily net assets of the Class A, B, C, L, M, and X shares, respectively. Through February 28, 2013, PIMS has contractually agreed to limit such fees to .25% of the average daily net assets of the Class A shares.
Management has received the maximum allowable amount of sales charges for Class X in accordance with regulatory limits. As such, any contingent deferred sales charges received by the manager are contributed back into the Fund and included in the Statement of Changes in Net Assets and Financial Highlights as a contribution to capital.
During the year ended October 31, 2008, management determined that Class X shareholders had been charged sales charges in excess of regulatory limits. The manager has paid this class for the overcharge which is reflected in the Financial Highlights for the years ended October 31, 2008 and October 31, 2007.
PIMS has advised the Fund that it received $18,442 in front-end sales charges resulting from sales of Class A shares during the year ended October 31, 2011. From these fees, PIMS paid such sales charges to affiliated broker-dealers, which in turn paid commissions to salespersons and incurred other distribution costs.
PIMS has advised the Fund that for the year ended October 31, 2011, it received $152, $7,387, $367, $485 and $1 in contingent deferred sales charges imposed upon certain redemptions by Class A, B, C, M and X shareholders, respectively.
| | |
| 34 | | Visit our website at www.prudentialfunds.com |
PI, QMA, PAD and PIMS are indirect, wholly-owned subsidiaries of Prudential Financial, Inc. (“Prudential”).
Note 3. Other Transactions with Affiliates
Prudential Mutual Fund Services LLC (“PMFS”), an affiliate of PI and an indirect, wholly-owned subsidiary of Prudential, serves as the Fund’s transfer agent. Transfer agent fees and expenses in the Statement of Operations include certain out-of-pocket expenses paid to non-affiliates, where applicable.
Prudential Investment Management, Inc., (“PIM”), an indirect, wholly-owned subsidiary of Prudential, is the Fund’s securities lending agent. For the year ended October 31, 2011, PIM has been compensated in the amount of approximately $2,593 for these services.
The Fund invests in the Prudential Core Taxable Money Market Fund (the “Core Fund”), a series of the Prudential Investment Portfolios 2 registered under the 1940 Act, as amended, and managed by PI. Earnings from the Core Fund are disclosed on the Statement of Operations as affiliated dividend income.
Note 4. Portfolio Securities
Purchases and sales of investment securities, other than short-term investments, for the year ended October 31, 2011 were $288,899,531 and $431,072,086, respectively.
Note 5. Distributions and Tax Information
Distributions to shareholders, which are determined in accordance with federal income tax regulations and which may differ from generally accepted accounting principles, are recorded on the ex-dividend date.
For the years ended October 31, 2011 and 2010, the tax character of dividends paid as reflected in the Statement of Changes in Net Assets were $748,842 and $2,016,945 from ordinary income, respectively.
As of October 31, 2011, the accumulated undistributed earnings on a tax basis were $829,801 of ordinary income and $8,311,378 of long term capital gains.
| | | | |
| Prudential Large-Cap Core Equity Fund | | | 35 | |
Notes to Financial Statements
continued
The United States federal income tax basis of the Fund’s investments and the net unrealized appreciation as of October 31, 2011 were as follows:
| | | | | | |
Tax Basis of
Investments | | Appreciation | | Depreciation | | Net
Unrealized Appreciation |
| $111,959,378 | | $24,502,396 | | $(2,160,090) | | $22,342,306 |
The difference between book basis and tax basis is primarily attributable to deferred losses on wash sales.
The Fund utilized capital loss carryforward to offset net taxable capital gains realized in the year ended October 31, 2011 of approximately $40,440,000.
Management has analyzed the Fund’s tax positions taken on federal income tax returns for all open tax years and has concluded that no provision for income tax is required in the Fund’s financial statements for the current reporting period. The Fund’s federal and state income and federal excise tax returns for tax years for which the applicable statutes of limitations have not expired are subject to examination by the Internal Revenue Service and state departments of revenue.
Note 6. Capital
The Fund offers Class A, Class B, Class C, Class L, Class M, Class X and Class Z shares. Class A and Class L shares are sold with a front-end sales charge of up to 5.50% and 5.75%, respectively. All investors who purchase Class A or Class L shares in an amount of $1 million or more and sell these shares within 12 months of purchase are subject to a contingent deferred sales charge (CDSC) of 1%. The Class A CDSC is waived for purchases by certain retirement and/or benefit plans. Class B shares are sold with a contingent deferred sales charge which declines from 5% to zero depending on the period of time the shares are held. Class C shares are sold with a contingent deferred sales charge of 1% on shares redeemed within the first 12 months after purchase. Class M and Class X shares are sold with a contingent deferred sales charge which declines from 6% to zero depending on the period of time the shares are held.
Class B shares automatically convert to Class A shares on a quarterly basis approximately seven years after purchase. In addition, under certain limited
| | |
| 36 | | Visit our website at www.prudentialfunds.com |
circumstances, an exchange may be made from Class A or Class C to Class Z shares of the Fund. A special exchange privilege is also available for shareholders who qualified to purchase Class A shares at net asset value. Class M and Class X shares will automatically convert to Class A shares approximately eight and ten years after purchase, respectively. Class L shares are closed to new initial purchases (with the exception of reinvested dividends). Class M and Class X shares are closed to new initial purchases. Class L, Class M and Class X shares are only available through exchanges from the same class of shares of certain other Prudential funds. Class Z shares are not subject to any sales or redemption charge and are offered exclusively for sale to a limited group of investors. The Fund has authorized an unlimited number of shares of beneficial interest at $.001 par value.
| | | | | | | | |
Class A | | Shares | | | Amount | |
Year ended October 31, 2011: | | | | | | | | |
Shares sold | | | 226,434 | | | $ | 2,718,176 | |
Shares issued in reinvestment of dividends | | | 8,951 | | | | 102,580 | |
Shares reacquired | | | (1,129,537 | ) | | | (13,433,437 | ) |
| | | | | | | | |
Net increase (decrease) in shares outstanding before conversion | | | (894,152 | ) | | | (10,612,681 | ) |
Shares issued upon conversion from Class B, M, X and Z | | | 333,907 | | | | 3,979,299 | |
Shares reacquired upon conversion into Class Z | | | (64,388 | ) | | | (789,446 | ) |
| | | | | | | | |
Net increase (decrease) in shares outstanding | | | (624,633 | ) | | $ | (7,422,828 | ) |
| | | | | | | | |
Year ended October 31, 2010: | | | | | | | | |
Shares sold | | | 469,101 | | | $ | 4,918,480 | |
Shares issued in reinvestment of dividends | | | 28,657 | | | | 293,450 | |
Shares reacquired | | | (1,550,323 | ) | | | (16,217,452 | ) |
| | | | | | | | |
Net increase (decrease) in shares outstanding before conversion | | | (1,052,565 | ) | | | (11,005,522 | ) |
Shares issued upon conversion from Class B, M and X | | | 450,243 | | | | 4,761,625 | |
| | | | | | | | |
Net increase (decrease) in shares outstanding | | | (602,322 | ) | | $ | (6,243,897 | ) |
| | | | | | | | |
Class B | | | | | | |
Year ended October 31, 2011: | | | | | | | | |
Shares sold | | | 36,242 | | | $ | 410,489 | |
Shares reacquired | | | (73,858 | ) | | | (828,131 | ) |
| | | | | | | | |
Net increase (decrease) in shares outstanding before conversion | | | (37,616 | ) | | | (417,642 | ) |
Shares reacquired upon conversion into Class A | | | (109,632 | ) | | | (1,218,226 | ) |
| | | | | | | | |
Net increase (decrease) in shares outstanding | | | (147,248 | ) | | $ | (1,635,868 | ) |
| | | | | | | | |
Year ended October 31, 2010: | | | | | | | | |
Shares sold | | | 48,796 | | | $ | 490,660 | |
Shares reacquired | | | (211,780 | ) | | | (2,125,053 | ) |
| | | | | | | | |
Net increase (decrease) in shares outstanding before conversion | | | (162,984 | ) | | | (1,634,393 | ) |
Shares reacquired upon conversion into Class A | | | (37,008 | ) | | | (366,457 | ) |
| | | | | | | | |
Net increase (decrease) in shares outstanding | | | (199,992 | ) | | $ | (2,000,850 | ) |
| | | | | | | | |
| | | | |
| Prudential Large-Cap Core Equity Fund | | | 37 | |
Notes to Financial Statements
continued
| | | | | | | | |
Class C | | Shares | | | Amount | |
Year ended October 31, 2011: | | | | | | | | |
Shares sold | | | 39,452 | | | $ | 443,412 | |
Shares reacquired | | | (344,619 | ) | | | (3,901,637 | ) |
| | | | | | | | |
Net increase (decrease) in shares outstanding before conversion | | | (305,167 | ) | | | (3,458,225 | ) |
Shares reacquired upon conversion into Class Z | | | (1,009 | ) | | | (11,062 | ) |
| | | | | | | | |
Net increase (decrease) in shares outstanding | | | (306,176 | ) | | $ | (3,469,287 | ) |
| | | | | | | | |
Year ended October 31, 2010: | | | | | | | | |
Shares sold | | | 65,898 | | | $ | 653,393 | |
Shares reacquired | | | (573,791 | ) | | | (5,733,429 | ) |
| | | | | | | | |
Net increase (decrease) in shares outstanding | | | (507,893 | ) | | $ | (5,080,036 | ) |
| | | | | | | | |
Class L | | | | | | |
Year ended October 31, 2011: | | | | | | | | |
Shares sold | | | 660 | | | $ | 7,600 | |
Shares reacquired | | | (59,311 | ) | | | (703,599 | ) |
| | | | | | | | |
Net increase (decrease) in shares outstanding | | | (58,651 | ) | | $ | (695,999 | ) |
| | | | | | | | |
Year ended October 31, 2010: | | | | | | | | |
Shares sold | | | 6,212 | | | $ | 62,655 | |
Shares issued in reinvestment of dividends | | | 1,420 | | | | 14,541 | |
Shares reacquired | | | (124,408 | ) | | | (1,292,185 | ) |
| | | | | | | | |
Net increase (decrease) in shares outstanding | | | (116,776 | ) | | $ | (1,214,989 | ) |
| | | | | | | | |
Class M | | | | | | |
Year ended October 31, 2011: | | | | | | | | |
Shares sold | | | 3,295 | | | $ | 37,625 | |
Shares reacquired | | | (135,762 | ) | | | (1,581,318 | ) |
| | | | | | | | |
Net increase (decrease) in shares outstanding before conversion | | | (132,467 | ) | | | (1,543,693 | ) |
Shares reacquired upon conversion into Class A | | | (193,614 | ) | | | (2,207,754 | ) |
| | | | | | | | |
Net increase (decrease) in shares outstanding | | | (326,081 | ) | | $ | (3,751,447 | ) |
| | | | | | | | |
Year ended October 31, 2010: | | | | | | | | |
Shares sold | | | 4,459 | | | $ | 43,364 | |
Shares reacquired | | | (138,228 | ) | | | (1,385,341 | ) |
| | | | | | | | |
Net increase (decrease) in shares outstanding before conversion | | | (133,769 | ) | | | (1,341,977 | ) |
Shares reacquired upon conversion into Class A | | | (343,723 | ) | | | (3,468,763 | ) |
| | | | | | | | |
Net increase (decrease) in shares outstanding | | | (477,492 | ) | | $ | (4,810,740 | ) |
| | | | | | | | |
| | |
| 38 | | Visit our website at www.prudentialfunds.com |
| | | | | | | | |
Class X | | Shares | | | Amount | |
Year ended October 31, 2011: | | | | | | | | |
Shares sold | | | 137 | | | $ | 1,592 | |
Shares issued in reinvestment of dividends | | | 270 | | | | 2,994 | |
Shares reacquired | | | (15,943 | ) | | | (182,574 | ) |
| | | | | | | | |
Net increase (decrease) in shares outstanding before conversion | | | (15,536 | ) | | | (177,988 | ) |
Shares reacquired upon conversion into Class A | | | (42,317 | ) | | | (496,947 | ) |
| | | | | | | | |
Net increase (decrease) in shares outstanding | | | (57,853 | ) | | $ | (674,935 | ) |
| | | | | | | | |
Year ended October 31, 2010: | | | | | | | | |
Shares sold | | | 22,073 | | | $ | 218,933 | |
Shares issued in reinvestment of dividends | | | 1,168 | | | | 11,547 | |
Shares reacquired | | | (25,866 | ) | | | (261,341 | ) |
| | | | | | | | |
Net increase (decrease) in shares outstanding before conversion | | | (2,625 | ) | | | (30,861 | ) |
Shares reacquired upon conversion into Class A | | | (89,544 | ) | | | (926,405 | ) |
| | | | | | | | |
Net increase (decrease) in shares outstanding | | | (92,169 | ) | | $ | (957,266 | ) |
| | | | | | | | |
Class Z | | | | | | |
Year ended October 31, 2011: | | | | | | | | |
Shares sold | | | 9,171,981 | | | $ | 112,567,009 | |
Shares issued in reinvestment of dividends | | | 7,501 | | | | 87,155 | |
Shares reacquired | | | (19,225,188 | ) | | | (242,168,164 | ) |
| | | | | | | | |
Net increase (decrease) in shares outstanding before conversion | | | (10,045,706 | ) | | | (129,514,000 | ) |
Shares issued upon conversion from Class A and C | | | 64,428 | | | | 800,508 | |
Shares reacquired upon conversion into Class A | | | (4,881 | ) | | | (56,372 | ) |
| | | | | | | | |
Net increase (decrease) in shares outstanding | | | (9,986,159 | ) | | $ | (128,769,864 | ) |
| | | | | | | | |
Year ended October 31, 2010: | | | | | | | | |
Shares sold | | | 13,879,842 | | | $ | 147,023,205 | |
Shares issued in reinvestment of dividends | | | 13,568 | | | | 140,705 | |
Shares reacquired | | | (21,780,541 | ) | | | (226,046,218 | ) |
| | | | | | | | |
Net increase (decrease) in shares outstanding | | | (7,887,131 | ) | | $ | (78,882,308 | ) |
| | | | | | | | |
Note 7. Borrowings
The Fund, along with other affiliated registered investment companies (the “Funds”), is a party to a syndicated credit agreement (“SCA”) with a group of banks. The purpose of the SCA is to provide an alternative source of temporary funding for capital share redemptions. The SCA provides for a commitment of $750 million for the period December 17, 2010 through December 16, 2011. The Funds pay an annualized commitment fee of 0.10% of the unused portion of the SCA. Prior to December 17, 2010, the Funds had another Syndicated Credit Agreement (the “Expired SCA”) of a $500 million commitment with an annualized commitment fee of 0.15% of the unused portion. Interest on any borrowings under these SCA’s is paid at
| | | | |
| Prudential Large-Cap Core Equity Fund | | | 39 | |
Notes to Financial Statements
continued
contracted market rates. The commitment fee for the unused amount is accrued daily and paid quarterly. The SCA has been renewed of substantially similar terms with an increase in the amount of commitment to $900 million.
The Fund utilized the line of credit during the year ended October 31, 2011. The average daily balance for the 3 days the Fund had loans outstanding during the period was approximately $252,000 at a weighted average interest rate of 1.49%. At October 31, 2011, the Fund did not have an outstanding loan amount.
Note 8. Dividends and Distributions to Shareholders
Subsequent to the fiscal year end, the Fund declared ordinary income dividends and long-term capital gain distributions on November 29, 2011 to shareholders of record on November 30, 2011. The ex-dividend date was December 1, 2011. The per share amounts declared were as follows:
| | | | | | | | |
| | | Ordinary Income | | | Long-Term
Capital Gains | |
Class A | | $ | 0.1146 | | | $ | 0.7907 | |
Class B | | $ | 0.0340 | | | $ | 0.7907 | |
Class C | | $ | 0.0340 | | | $ | 0.7907 | |
Class L | | $ | 0.0879 | | | $ | 0.7907 | |
Class M | | $ | 0.0340 | | | $ | 0.7907 | |
Class X | | $ | 0.1186 | | | $ | 0.7907 | |
Class Z | | $ | 0.1477 | | | $ | 0.7907 | |
Note 9. New Accounting Pronouncements
In April 2011, the Financial Accounting Standards Board (“FASB”) issued Accounting Standards Update (“ASU”) No. 2011-03 “Reconsideration of Effective control for Repurchase Agreements”. The objective of ASU 2011-03 is to improve the accounting for repurchase agreements and other agreements that both entitle and obligate a transferor to repurchase or redeem financial assets before their maturity. Under previous guidance, whether or not to account for a transaction as a sale was based on, in part, if the entity maintained effective control over the transferred financial assets. ASU 2011-03 removes the transferor’s ability criterion from the effective control assessment. This guidance is effective prospectively for interim and annual reporting periods beginning on or after December 15, 2011. At this time, management is
| | |
| 40 | | Visit our website at www.prudentialfunds.com |
evaluating the implications of ASU No. 2011-03 and its impact on the financial statements has not yet been determined.
In May 2011, the FASB issued ASU No. 2011-04 “Amendments to Achieve Common Fair Value Measurement and Disclosure Requirements in U.S. GAAP and IFRSs”. ASU No. 2011-04 includes common requirements for measurement of and disclosure about fair value between U.S. GAAP and IFRS. ASU No. 2011-04 will require reporting entities to disclose quantitative information about the unobservable inputs used in the fair value measurements categorized within Level 3 of the fair value hierarchy. In addition, ASU No. 2011-04 will require reporting entities to make disclosures about amounts and reasons for all transfers in and out of Level 1 and Level 2 fair value measurements. The new and revised disclosures are effective for interim and annual reporting periods beginning after December 15, 2011. At this time, management is evaluating the implications of ASU No. 2011-04 and its impact on the financial statements has not yet been determined.
| | | | |
| Prudential Large-Cap Core Equity Fund | | | 41 | |
Financial Highlights
| | | | | | | | | | | | | | | | | | | | |
| Class A Shares | |
| | | Year Ended October 31, | |
| | | 2011(a) | | | 2010(a) | | | 2009(a) | | | 2008(a) | | | 2007 | |
| Per Share Operating Performance: | | | | | | | | | | | | | | | | | | | | |
| Net Asset Value, Beginning Of Year | | | $11.01 | | | | $9.71 | | | | $9.32 | | | | $14.85 | | | | $13.01 | |
| Income (loss) from investment operations: | | | | | | | | | | | | | | | | | | | | |
| Net investment income | | | .05 | | | | .05 | | | | .09 | | | | .12 | | | | .09 | |
| Net realized and unrealized gain (loss) on investment transactions | | | .80 | | | | 1.30 | | | | .40 | | | | (5.54 | ) | | | 1.82 | |
| Total from investment operations | | | .85 | | | | 1.35 | | | | .49 | | | | (5.42 | ) | | | 1.91 | |
| Less Dividends: | | | | | | | | | | | | | | | | | | | | |
| Dividends from net investment income | | | (.02 | ) | | | (.05 | ) | | | (.10 | ) | | | (.11 | ) | | | (.07 | ) |
| Net asset value, end of year | | | $11.84 | | | | $11.01 | | | | $9.71 | | | | $9.32 | | | | $14.85 | |
| Total Return(b): | | | 7.71% | | | | 13.92% | | | | 5.40% | | | | (36.75)% | | | | 14.72% | |
| |
| Ratios/Supplemental Data: | |
| Net assets, end of year (000) | | | $61,961 | | | | $64,473 | | | | $62,739 | | | | $68,021 | | | | $109,231 | |
| Average net assets (000) | | | $65,724 | | | | $64,562 | | | | $58,578 | | | | $93,917 | | | | $95,001 | |
| Ratios to average net assets(c): | | | | | | | | | | | | | | | | | | | | |
| Expenses, including distribution and service (12b-1) fees | | | 1.55% | (d)(e) | | | 1.48% | | | | 1.55% | | | | 1.34% | | | | 1.16% | |
| Expenses, excluding distribution and service (12b-1) fees | | | 1.27% | (d) | | | 1.18% | | | | 1.25% | | | | 1.06% | | | | .91% | |
| Net investment income | | | .43% | (d) | | | .45% | | | | 1.10% | | | | .94% | | | | .67% | |
| For Class A, B, C, L, M, X and Z shares: | | | | | | | | | | | | | | | | | | | | |
| Portfolio turnover rate | | | 121% | | | | 116% | | | | 116% | | | | 96% | | | | 90% | |
(a) Calculated based on average shares outstanding during the year.
(b) Total return does not consider the effects of sales loads. Total return is calculated assuming a purchase of a share on the first day and a sale on the last day of each year reported, and includes reinvestment of dividends and distributions. Total return may reflect adjustments to conform to generally accepted accounting principles.
(c) Does not include the expenses of the underlying funds in which the Fund invests.
(d) Net of management fee waiver. If the investment manager had not waived expenses, the expense ratios including and excluding distribution and service (12b-1) fees and net investment income ratio would have been 1.67%, 1.39% and .31%, respectively, for the year ended October 31, 2011.
(e) Effective July 1, 2011, the distributor of the Fund contractually agreed to limit its distribution and service (12b-1) fees to .25% of the average daily net assets of the Class A shares through February 28, 2013.
See Notes to Financial Statements.
| | |
| 42 | | Visit our website at www.prudentialfunds.com |
| | | | | | | | | | | | | | | | | | | | |
| Class B Shares | |
| | | Year Ended October 31, | |
| | | 2011(a) | | | 2010(a) | | | 2009(a) | | | 2008(a) | | | 2007 | |
| Per Share Operating Performance: | | | | | | | | | | | | | | | | | | | | |
| Net Asset Value, Beginning Of Year | | | $10.47 | | | | $9.26 | | | | $8.87 | | | | $14.14 | | | | $12.42 | |
| Income (loss) from investment operations: | | | | | | | | | | | | | | | | | | | | |
| Net investment income (loss) | | | (.03 | ) | | | (.02 | ) | | | .04 | | | | .03 | | | | .01 | |
| Net realized and unrealized gain (loss) on investment transactions | | | .76 | | | | 1.23 | | | | .37 | | | | (5.29 | ) | | | 1.71 | |
| Total from investment operations | | | .73 | | | | 1.21 | | | | .41 | | | | (5.26 | ) | | | 1.72 | |
| Less Dividends: | | | | | | | | | | | | | | | | | | | | |
| Dividends from net investment income | | | - | | | | - | | | | (.02 | ) | | | (.01 | ) | | | - | |
| Net asset value, end of year | | | $11.20 | | | | $10.47 | | | | $9.26 | | | | $8.87 | | | | $14.14 | |
| Total Return(b): | | | 6.97% | | | | 13.07% | | | | 4.67% | | | | (37.22)% | | | | 13.85% | |
| |
| Ratios/Supplemental Data: | |
| Net assets, end of year (000) | | | $4,038 | | | | $5,317 | | | | $6,555 | | | | $9,269 | | | | $24,883 | |
| Average net assets (000) | | | $4,886 | | | | $5,904 | | | | $6,912 | | | | $16,689 | | | | $28,960 | |
| Ratios to average net assets(c): | | | | | | | | | | | | | | | | | | | | |
| Expenses, including distribution and service (12b-1) fees | | | 2.27% | (d) | | | 2.18% | | | | 2.25% | | | | 2.06% | | | | 1.91% | |
| Expenses, excluding distribution and service (12b-1) fees | | | 1.27% | (d) | | | 1.18% | | | | 1.25% | | | | 1.06% | | | | .91% | |
| Net investment income (loss) | | | (.28)% | (d) | | | (.22)% | | | | .48% | | | | .25% | | | | (.03)% | |
(a) Calculated based on average shares outstanding during the year.
(b) Total return does not consider the effects of sales loads. Total return is calculated assuming a purchase of a share on the first day and a sale on the last day of each year reported, and includes reinvestment of dividends and distributions. Total return may reflect adjustments to conform to generally accepted accounting principles.
(c) Does not include the expenses of the underlying funds in which the Fund invests.
(d) Net of management fee waiver. If the investment manager had not waived expenses, the expense ratios including and excluding distribution and service (12b-1) fees and net investment loss ratio would have been 2.38%, 1.38% and (.39)%, respectively, for the year ended October 31, 2011.
See Notes to Financial Statements.
| | | | |
| Prudential Large-Cap Core Equity Fund | | | 43 | |
Financial Highlights
continued
| | | | | | | | | | | | | | | | | | | | |
| Class C Shares | |
| | | Year Ended October 31, | |
| | | 2011(a) | | | 2010(a) | | | 2009(a) | | | 2008(a) | | | 2007 | |
| Per Share Operating Performance: | | | | | | | | | | | | | | | | | | | | |
| Net Asset Value, Beginning Of Year | | | $10.48 | | | | $9.26 | | | | $8.87 | | | | $14.14 | | | | $12.42 | |
| Income (loss) from investment operations: | | | | | | | | | | | | | | | | | | | | |
| Net investment income (loss) | | | (.03 | ) | | | (.02 | ) | | | .04 | | | | .03 | | | | (.01 | ) |
| Net realized and unrealized gain (loss) on investment | | | .76 | | | | 1.24 | | | | .37 | | | | (5.29 | ) | | | 1.73 | |
| Total from investment operations | | | .73 | | | | 1.22 | | | | .41 | | | | (5.26 | ) | | | 1.72 | |
| Less Dividends: | | | | | | | | | | | | | | | | | | | | |
| Dividends from net investment income | | | - | | | | - | | | | (.02 | ) | | | (.01 | ) | | | - | |
| Net asset value, end of year | | | $11.21 | | | | $10.48 | | | | $9.26 | | | | $8.87 | | | | $14.14 | |
| Total Return(b): | | | 6.97% | | | | 13.17% | | | | 4.67% | | | | (37.22)% | | | | 13.85% | |
| |
| Ratios/Supplemental Data: | | | | | | | | | | | | | | | |
| Net assets, end of year (000) | | | $20,636 | | | | $22,496 | | | | $24,601 | | | | $30,243 | | | | $57,391 | |
| Average net assets (000) | | | $22,444 | | | | $23,934 | | | | $24,715 | | | | $45,712 | | | | $50,597 | |
| Ratios to average net assets(c): | | | | | | | | | | | | | | | | | | | | |
| Expenses, including distribution and service (12b-1) fees | | | 2.27% | (d) | | | 2.18% | | | | 2.25% | | | | 2.06% | | | | 1.91% | |
| Expenses, excluding distribution and service (12b-1) fees | | | 1.27% | (d) | | | 1.18% | | | | 1.25% | | | | 1.06% | | | | .91% | |
| Net investment income (loss) | | | (.28)% | (d) | | | (.24)% | | | | .44% | | | | .23% | | | | (.08)% | |
(a) Calculated based on average shares outstanding during the year.
(b) Total return does not consider the effects of sales loads. Total return is calculated assuming a purchase of a share on the first day and a sale on the last day of each year reported, and includes reinvestment of dividends and distributions. Total return may reflect adjustments to conform to generally accepted accounting principles.
(c) Does not include the expenses of the underlying funds in which the Fund invests.
(d) Net of management fee waiver. If the investment manager had not waived expenses, the expense ratios including and excluding distribution and service (12b-1) fees and net investment loss ratio would have been 2.39%, 1.39% and (.40)%, respectively, for the year ended October 31, 2011.
See Notes to Financial Statements.
| | |
| 44 | | Visit our website at www.prudentialfunds.com |
| | | | | | | | | | | | | | | | | | | | | | |
| Class L Shares | |
| | | Year Ended October 31, | | | | | March 16,
2007(a)
through
October 31, | |
| | | 2011(e) | | | 2010(e) | | | 2009(e) | | | 2008(e) | | | | | 2007 | |
| Per Share Operating Performance: | | | | | | | | | | | | | | | | | | | | | | |
| Net Asset Value, Beginning Of Period | | | $11.00 | | | | $9.70 | | | | $9.30 | | | | $14.83 | | | | | | $13.16 | |
| Income (loss) from investment operations: | | | | | | | | | | | | | | | | | | | | | | |
| Net investment income | | | .03 | | | | .03 | | | | .08 | | | | .09 | | | | | | .03 | |
| Net realized and unrealized gain (loss) on investment transactions | | | .79 | | | | 1.30 | | | | .39 | | | | (5.54 | ) | | | | | 1.64 | |
| Total from investment operations | | | .82 | | | | 1.33 | | | | .47 | | | | (5.45 | ) | | | | | 1.67 | |
| Less Dividends: | | | | | | | | | | | | | | | | | | | | | | |
| Dividends from net investment income | | | - | | | | (.03 | ) | | | (.07 | ) | | | (.08 | ) | | | | | - | |
| Net asset value, end of period | | | $11.82 | | | | $11.00 | | | | $9.70 | | | | $9.30 | | | | | | $14.83 | |
| Total Return(b): | | | 7.45% | | | | 13.74% | | | | 5.21% | | | | (36.94 | )% | | | | | 12.69% | |
| |
| Ratios/Supplemental Data: | | | | | | | | | | | | | | | | | |
| Net assets, end of period (000) | | | $3,847 | | | | $4,222 | | | | $4,860 | | | | $6,113 | | | | | | $12,962 | |
| Average net assets (000) | | | $4,181 | | | | $4,625 | | | | $4,965 | | | | $9,856 | | | | | | $8,583 | |
| Ratios to average net assets(c): | | | | | | | | | | | | | | | | | | | | | | |
| Expenses, including distribution and service (12b-1) fees | | | 1.77% | (f) | | | 1.68% | | | | 1.75% | | | | 1.56% | | | | | | 1.41% | (d) |
| Expenses, excluding distribution and service (12b-1) fees | | | 1.27% | (f) | | | 1.18% | | | | 1.25% | | | | 1.06% | | | | | | .91% | (d) |
| Net investment income | | | .22% | (f) | | | .27% | | | | .94% | | | | .73% | | | | | | .31% | (d) |
(a) Commencement of offering.
(b) Total return does not consider the effects of sales loads. Total return is calculated assuming a purchase of a share on the first day and a sale on the last day of each period reported, and includes reinvestment of dividends and distributions. Total return may reflect adjustments to conform to generally accepted accounting principles. Total returns for periods less than a full year are not annualized.
(c) Does not include the expenses of the underlying funds in which the Fund invests.
(d) Annualized.
(e) Calculated based on average shares outstanding during the period.
(f) Net of management fee waiver. If the investment manager had not waived expenses, the expense ratios including and excluding distribution and service (12b-1) fees and net investment income ratio would have been 1.89%, 1.39% and .10%, respectively, for the year ended October 31, 2011.
See Notes to Financial Statements.
| | | | |
| Prudential Large-Cap Core Equity Fund | | | 45 | |
Financial Highlights
continued
| | | | | | | | | | | | | | | | | | | | | | |
| Class M Shares | |
| | | Year Ended October 31, | | | | | March 16,
2007(a)
through
October 31, | |
| | | 2011(e) | | | 2010(e) | | | 2009(e) | | | 2008(e) | | | | | 2007 | |
| Per Share Operating Performance: | | | | | | | | | | | | | | | | | | | | | | |
| Net Asset Value, Beginning Of Period | | | $10.48 | | | | $9.26 | | | | $8.87 | | | | $14.14 | | | | | | $12.59 | |
| Income (loss) from investment operations: | | | | | | | | | | | | | | | | | | | | | | |
| Net investment income (loss) | | | (.03 | ) | | | (.02 | ) | | | .04 | | | | .03 | | | | | | (.02 | ) |
| Net realized and unrealized gain (loss) on investment transactions | | | .76 | | | | 1.24 | | | | .37 | | | | (5.29 | ) | | | | | 1.57 | |
| Total from investment operations | | | .73 | | | | 1.22 | | | | .41 | | | | (5.26 | ) | | | | | 1.55 | |
| Less Dividends: | | | | | | | | | | | | | | | | | | | | | | |
| Dividends from net investment income | | | - | | | | - | | | | (.02 | ) | | | (.01 | ) | | | | | - | |
| Net asset value, end of period | | | $11.21 | | | | $10.48 | | | | $9.26 | | | | $8.87 | | | | | | $14.14 | |
| Total Return(b): | | | 6.97% | | | | 13.17% | | | | 4.67% | | | | (37.22)% | | | | | | 12.31% | |
| |
| Ratios/Supplemental Data: | |
| Net assets, end of period (000) | | | $735 | | | | $4,103 | | | | $8,052 | | | | $15,423 | | | | | | $42,909 | |
| Average net assets (000) | | | $2,311 | | | | $5,918 | | | | $10,385 | | | | $29,289 | | | | | | $29,146 | |
| Ratios to average net assets(c): | | | | | | | | | | | | | | | | | | | | | | |
| Expenses, including distribution and service (12b-1) fees | | | 2.30% | (f) | | | 2.18% | | | | 2.25% | | | | 2.06% | | | | | | 1.91% | (d) |
| Expenses, excluding distribution and service (12b-1) fees | | | 1.30% | (f) | | | 1.18% | | | | 1.25% | | | | 1.06% | | | | | | .91% | (d) |
| Net investment income (loss) | | | (.27)% | (f) | | | (.15)% | | | | .55% | | | | .24% | | | | | | (.19)% | (d) |
(a) Commencement of offering.
(b) Total return does not consider the effects of sales loads. Total return is calculated assuming a purchase of a share on the first day and a sale on the last day of each period reported, and includes reinvestment of dividends and distributions. Total return may reflect adjustments to conform to generally accepted accounting principles. Total returns for periods less than a full year are not annualized.
(c) Does not include the expenses of the underlying funds in which the Fund invests.
(d) Annualized.
(e) Calculated based on average shares outstanding during the period.
(f) Net of management fee waiver. If the investment manager had not waived expenses, the expense ratios including and excluding distribution and service (12b-1) fees and net investment loss ratio would have been 2.36%, 1.36% and (.33)%, respectively, for the year ended October 31, 2011.
See Notes to Financial Statements.
| | |
| 46 | | Visit our website at www.prudentialfunds.com |
| | | | | | | | | | | | | | | | | | | | | | |
| Class X Shares | |
| | | Year Ended October 31, | | | | | March 16,
2007(a)
through
October 31, | |
| | | 2011(f) | | | 2010(f) | | | 2009(f) | | | 2008(f) | | | | | 2007(d) | |
| Per Share Operating Performance: | | | | | | | | | | | | | | | | | | | | | | |
| Net Asset Value, Beginning Of Period | | | $10.65 | | | | $9.40 | | | | $8.97 | | | | $14.16 | | | | | | $12.60 | |
| Income (loss) from investment operations: | | | | | | | | | | | | | | | | | | | | | | |
| Net investment income | | | .05 | | | | .06 | | | | .12 | | | | .13 | | | | | | .04 | |
| Net realized and unrealized gain (loss) on investment transactions | | | .78 | | | | 1.24 | | | | .40 | | | | (5.28 | ) | | | | | 1.56 | |
| Total from investment operations | | | .83 | | | | 1.30 | | | | .52 | | | | (5.15 | ) | | | | | 1.60 | |
| Less Dividends: | | | | | | | | | | | | | | | | | | | | | | |
| Dividends from net investment income | | | (.02 | ) | | | (.05 | ) | | | (.10 | ) | | | (.06 | ) | | | | | (.07 | ) |
| Capital Contributions (Note 2): | | | - | (h) | | | - | (h) | | | .01 | | | | .02 | | | | | | .03 | |
| Net asset value, end of period | | | $11.46 | | | | $10.65 | | | | $9.40 | | | | $8.97 | | | | | | $14.16 | |
| Total Return(b): | | | 7.84% | | | | 13.91% | | | | 6.00% | | | | (36.25)% | | | | | | 12.93% | (g) |
| |
| Ratios/Supplemental Data: | | | | | | | | | | | | | | | | | |
| Net assets, end of period (000) | | | $837 | | | | $1,394 | | | | $2,096 | | | | $2,767 | | | | | | $6,283 | |
| Average net assets (000) | | | $1,137 | | | | $1,689 | | | | $2,245 | | | | $4,698 | | | | | | $3,939 | |
| Ratios to average net assets(c): | | | | | | | | | | | | | | | | | | | | | | |
Expenses, including distribution and
service (12b-1) fees | | | 1.53% | (i) | | | 1.43% | | | | 1.50% | | | | 1.38% | | | | | | 1.29% | (e) |
Expenses, excluding distribution and
service (12b-1) fees | | | 1.28% | (i) | | | 1.18% | | | | 1.25% | | | | 1.06% | | | | | | .91% | (e) |
| Net investment income | | | .46% | (i) | | | .56% | | | | 1.46% | | | | 1.08% | | | | | | .42% | (e) |
(a) Commencement of offering.
(b) Total return does not consider the effects of sales loads. Total return is calculated assuming a purchase of a share on the first day and a sale on the last day of each period reported, and includes reinvestment of dividends and distributions. Total return may reflect adjustments to conform to generally accepted accounting principles. Total returns for periods less than a full year are not annualized.
(c) Does not include the expenses of the underlying funds in which the Fund invests.
(d) Certain information has been adjusted to reflect a manager payment for sales charges incurred by shareholders in excess of regulatory limits.
(e) Annualized.
(f) Calculated based on average shares outstanding during the period.
(g) Total return has been adjusted to reflect the manager payment for sales charges in excess of regulatory limits.
(h) Less than $.005 per share.
(i) Net of management fee waiver. If the investment manager had not waived expenses, the expense ratios including and excluding distribution and service (12b-1) fees and net investment income ratio would have been 1.63%, 1.38% and .36%, respectively, for the year ended October 31, 2011.
See Notes to Financial Statements.
| | | | |
| Prudential Large-Cap Core Equity Fund | | | 47 | |
Financial Highlights
continued
| | | | | | | | | | | | | | | | | | | | |
| Class Z Shares | |
| | | Year Ended October 31, | |
| | | 2011(a) | | | 2010(a) | | | 2009(a) | | | 2008(a) | | | 2007 | |
| Per Share Operating Performance: | | | | | | | | | | | | | | | | | | | | |
| Net Asset Value, Beginning Of Year | | | $11.18 | | | | $9.87 | | | | $9.47 | | | | $15.09 | | | | $13.21 | |
| Income (loss) from investment operations: | | | | | | | | | | | | | | | | | | | | |
| Net investment income | | | .07 | | | | .08 | | | | .08 | | | | .15 | | | | .13 | |
| Net realized and unrealized gain (loss) on investment transactions | | | .83 | | | | 1.30 | | | | .45 | | | | (5.63 | ) | | | 1.85 | |
| Total from investment operations | | | .90 | | | | 1.38 | | | | .53 | | | | (5.48 | ) | | | 1.98 | |
| Less Dividends: | | | | | | | | | | | | | | | | | | | | |
| Dividends from net investment income | | | (.05 | ) | | | (.07 | ) | | | (.13 | ) | | | (.14 | ) | | | (.10 | ) |
| Net asset value, end of year | | | $12.03 | | | | $11.18 | | | | $9.87 | | | | $9.47 | | | | $15.09 | |
| Total Return(b): | | | 8.04% | | | | 14.09% | | | | 5.83% | | | | (36.64)% | | | | 15.06% | |
| |
| Ratios/Supplemental Data: | |
| Net assets, end of year (000) | | | $32,419 | | | | $141,793 | | | | $202,941 | | | | $36,602 | | | | $23,950 | |
| Average net assets (000) | | | $144,295 | | | | $145,193 | | | | $90,113 | | | | $20,386 | | | | $21,053 | |
| Ratios to average net assets(c): | | | | | | | | | | | | | | | | | | | | |
| Expenses, including distribution and service (12b-1) fees | | | 1.42% | (d) | | | 1.18% | | | | 1.25% | | | | 1.06% | | | | .91% | |
| Expenses, excluding distribution and service (12b-1) fees | | | 1.42% | (d) | | | 1.18% | | | | 1.25% | | | | 1.06% | | | | .91% | |
| Net investment income | | | .58% | (d) | | | .76% | | | | .96% | | | | 1.25% | | | | .93% | |
(a) Calculated based on average shares outstanding during the year.
(b) Total return is calculated assuming a purchase of a share on the first day and a sale on the last day of each year reported, and includes reinvestment of dividends and distributions. Total return may reflect adjustments to conform to generally accepted accounting principles.
(c) Does not include the expenses of the underlying funds in which the Fund invests.
(d) Net of management fee waiver. If the investment manager had not waived expenses, the expense ratios including and excluding distribution and service (12b-1) fees and net investment income ratio would have been 1.44%, 1.44% and .56%, respectively, for the year ended October 31, 2011.
See Notes to Financial Statements.
| | |
| 48 | | Visit our website at www.prudentialfunds.com |
Report of Independent Registered Public
Accounting Firm
The Board of Trustees and Shareholders
Prudential Investment Portfolios 9:
We have audited the accompanying statement of assets and liabilities of Prudential Large-Cap Core Equity Fund, a series of Prudential Investment Portfolios 9 (hereafter referred to as the “Fund”), including the portfolio of investments, as of October 31, 2011, and the related statement of operations for the year then ended, the statement of changes in net assets for each of the years in the two-year period then ended and the financial highlights for each of the years in the five-year period then ended. These financial statements and financial highlights are the responsibility of the Fund’s management. Our responsibility is to express an opinion on these financial statements and financial highlights based on our audits.
We conducted our audits in accordance with the standards of the Public Company Accounting Oversight Board (United States). Those standards require that we plan and perform the audit to obtain reasonable assurance about whether the financial statements and financial highlights are free of material misstatement. An audit includes examining, on a test basis, evidence supporting the amounts and disclosures in the financial statements. Our procedures included confirmation of securities owned as of October 31, 2011, by correspondence with the custodian, transfer agent and brokers or by other appropriate auditing procedures when replies from brokers were not received. An audit also includes assessing the accounting principles used and significant estimates made by management, as well as evaluating the overall financial statement presentation. We believe that our audits provide a reasonable basis for our opinion.
In our opinion, the financial statements and financial highlights referred to above present fairly, in all material respects, the financial position of the Fund as of October 31, 2011, and the results of its operations for the year then ended, the changes in its net assets for each of the years in the two-year period then ended and the financial highlights for each of the years in the five-year period then ended, in conformity with U.S. generally accepted accounting principles.

New York, New York
December 22, 2011
| | | | |
| Prudential Large-Cap Core Equity Fund | | | 49 | |
Tax Information
(Unaudited)
We are required by the Internal Revenue Code of 1986, as amended (“the Code”) to advise you within 60 days of the Fund’s fiscal year end (October 31, 2011) as to the federal income tax status of dividends paid by the Fund during such fiscal year. We are advising you that during its fiscal year ended October 31, 2011, the Fund paid ordinary income dividends for Class A and Class X shares of $0.02 per share and for Class Z shares of $0.05 per share.
For the fiscal year ended October 31, 2011, the Fund designates the maximum amount allowable, but not less than 100% of the ordinary income dividend paid during the year as eligible for the corporate dividends received deduction in accordance with Section 854 of the Internal Revenue Code.
For the fiscal year ended October 31, 2011, the Fund designates the maximum amount allowable, but not less than 100% of the ordinary income dividends paid during the year as qualified dividend income in accordance with Section 854 of the Internal Revenue Code.
In January 2012, you will be advised on IRS 1099 DIV or substitute 1099 DIV as to the federal tax status of the distributions received by you in calendar year 2011.
| | |
| 50 | | Visit our website at www.prudentialfunds.com |
INFORMATION ABOUT BOARD MEMBERS AND OFFICERS
(Unaudited)
Information about Board Members and Officers is set forth below. Board Members who are not deemed to be “interested persons” of the Fund, as defined in the 1940 Act, are referred to as “Independent Board Members.” Board Members who are deemed to be “interested persons” of the Fund are referred to as “Interested Board Members.” The Board Members are responsible for the overall supervision of the operations of the Fund and perform the various duties imposed on the directors of investment companies by the 1940 Act.
| | | | |
Independent Board Members(1) |
Name, Address, Age Position(s) Portfolios Overseen | | Principal Occupation(s) During Past Five Years | | Other Directorships Held |
Kevin J. Bannon (59) Board Member Portfolios Overseen: 58 | | Managing Director (since April 2008) and Chief Investment Officer (since October 2008) of Highmount Capital LLC (registered investment adviser); formerly Executive Vice President and Chief Investment Officer (April 1993-August 2007) of Bank of New York Company; President (May 2003-May 2007) of BNY Hamilton Family of Mutual Funds. | | Director of Urstadt Biddle Properties (since September 2008). |
Linda W. Bynoe (59) Board Member Portfolios Overseen: 58 | | President and Chief Executive Officer (since March 1995) and formerly Chief Operating Officer (December 1989-February 1995) of Telemat Ltd. (management consulting); formerly Vice President (January 1985-June 1989) at Morgan Stanley & Co (broker-dealer). | | Director of Simon Property Group, Inc. (retail real estate) (since May 2003); Director of Anixter International, Inc. (communication products distributor) (since January 2006); Director of Northern Trust Corporation (financial services) (since April 2006); Trustee of Equity Residential (residential real estate) (since December 2009); formerly Director of Dynegy Inc. (power generation) (September 2002-May 2006). |
Michael S. Hyland, CFA (66) Board Member Portfolios Overseen: 58 | | Independent Consultant (since February 2005); formerly Senior Managing Director (July 2001-February 2005) of Bear Stearns & Co, Inc.; Global Partner, INVESCO (1999-2001); Managing Director and President of Salomon Brothers Asset Management (1989-1999). | | None. |
Douglas H. McCorkindale (72) Board Member Portfolios Overseen: 58 | | Formerly Chairman (February 2001-June 2006), Chief Executive Officer (June 2000-July 2005), President (September 1997-July 2005) and Vice Chairman (March 1984-May 2000) of Gannett Co. Inc. (publishing and media). | | Director of Lockheed Martin Corp. (aerospace and defense) (since May 2001). |
Prudential Large-Cap Core Equity Fund
| | | | |
Independent Board Members(1) | | | | |
Name, Address, Age Position(s) Portfolios Overseen | | Principal Occupation(s) During Past Five Years | | Other Directorships Held |
Stephen P. Munn (69) Board Member Portfolios Overseen: 58 | | Lead Director (since 2007) and formerly Chairman (1993-2007) of Carlisle Companies Incorporated (manufacturer of industrial products). | | Lead Director (since 2007) of Carlisle Companies Incorporated (manufacturer of industrial products). |
Richard A. Redeker (68) Board Member & Independent Chair Portfolios Overseen: 58 | | Retired Mutual Fund Senior Executive (43 years); Management Consultant; Independent Directors Council (organization of 2,800 Independent Mutual Fund Directors)-Executive Committee, Chair of Policy Steering Committee, Governing Council. | | None. |
Robin B. Smith (72) Board Member Portfolios Overseen: 58 | | Chairman of the Board (since January 2003) of Publishers Clearing House (direct marketing); Member of the Board of Directors of ADLPartner (marketing) (since December 2010); formerly Chairman and Chief Executive Officer (August 1996-January 2003) of Publishers Clearing House. | | Formerly Director of BellSouth Corporation (telecommunications) (1992-2006). |
Stephen G. Stoneburn (68) Board Member Portfolios Overseen: 58 | | President and Chief Executive Officer (since June 1996) of Quadrant Media Corp. (publishing company); formerly President (June 1995-June 1996) of Argus Integrated Media, Inc.; Senior Vice President and Managing Director (January 1993-1995) of Cowles Business Media; Senior Vice President of Fairchild Publications, Inc (1975-1989). | | None. |
Visit our website at www.prudentialfunds.com
| | | | |
| Interested Board Members(1) | | | | |
Name, Address, Age Position(s) Portfolios Overseen | | Principal Occupation(s) During Past Five Years | | Other Directorships Held |
Judy A. Rice* (63) Board Member & President Portfolios Overseen: 58 | | President, Chief Executive Officer, Chief Operating Officer and Officer-In-Charge (since February 2003) of Prudential Investments LLC; President, Chief Executive Officer and Officer-In-Charge (since April 2003) of Prudential Mutual Fund Services LLC; President, Chief Executive Officer (since May 2011) and Executive Vice President (since December 2008) of Prudential Investment Management Services LLC; Member of the Board of Directors of Jennison Associates LLC (since November 2010); formerly Vice President (February 1999-April 2006) of Prudential Investment Management Services LLC; President, COO, CEO and Manager of PIFM Holdco, LLC (since April 2006); formerly President, Chief Executive Officer, Chief Operating Officer and Officer-In-Charge (May 2003-June 2005) and Director (May 2003-March 2006) and Executive Vice President (June 2005-March 2006) of AST Investment Services, Inc.; Member of Board of Governors of the Investment Company Institute. | | None. |
Stuart S. Parker* (49) Board Member & President Portfolios Overseen: 58 | | President of Prudential Investments LLC (since January 2012); Executive Vice President of Jennison Associates LLC and Head of Retail Distribution of Prudential Investments LLC (June 2005 - December 2011). | | None. |
Scott E. Benjamin (38) Board Member & Vice President Portfolios Overseen: 58 | | Executive Vice President (since June 2009) of Prudential Investments LLC and Prudential Investment Management Services LLC; Executive Vice President (since September 2009) of AST Investment Services, Inc.; Senior Vice President of Product Development and Marketing, Prudential Investments (since February 2006); Vice President of Product Development and Product Management, Prudential Investments (2003-2006). | | None. |
* Ms. Rice has announced her retirement as President and Board Member effective December 31, 2011. Ms. Rice has been appointed as Vice President effective January 1, 2012. The Board has appointed Stuart S. Parker as President and Board Member effective January 1, 2012.
Prudential Large-Cap Core Equity Fund
(1) The year that each individual joined the Fund’s Board is as follows:
Linda W. Bynoe, 2005; Douglas H. McCorkindale, 1998; Richard A. Redeker, 1998; Robin B. Smith, 1998; Stephen G. Stoneburn, 2003; Kevin J. Bannon, 2008; Michael S. Hyland, 2008; Stephen P. Munn, 2008; Judy A. Rice, Board Member since 2000 and President since 2003; Scott E. Benjamin, Board Member since 2010 and Vice President since 2009.
| | |
| Fund Officers(a)(1) | | |
Name, Address and Age Position with Fund | | Principal Occupation(s) During Past Five Years |
Kathryn L. Quirk (59) Chief Legal Officer | | Vice President and Corporate Counsel (since September 2004) of Prudential; Executive Vice President, Chief Legal Officer and Secretary (since July 2005) of PI and Prudential Mutual Fund Services LLC; Vice President and Corporate Counsel (since June 2005) and Secretary (since February 2006) of AST Investment Services, Inc.; formerly Senior Vice President and Assistant Secretary (November 2004-August 2005) of PI; formerly Assistant Secretary (June 2005-February 2006) of AST Investment Services, Inc.; formerly Managing Director, General Counsel, Chief Compliance Officer, Chief Risk Officer and Corporate Secretary (1997-2002) of Zurich Scudder Investments, Inc. |
Deborah A. Docs (53) Secretary | | Vice President and Corporate Counsel (since January 2001) of Prudential; Vice President (since December 1996) and Assistant Secretary (since March 1999) of PI; formerly Vice President and Assistant Secretary (May 2003-June 2005) of AST Investment Services, Inc. |
Jonathan D. Shain (53) Assistant Secretary | | Vice President and Corporate Counsel (since August 1998) of Prudential; Vice President and Assistant Secretary (since May 2001) of PI; Vice President and Assistant Secretary (since February 2001) of PMFS; formerly Vice President and Assistant Secretary (May 2003-June 2005) of AST Investment Services, Inc. |
Claudia DiGiacomo (37) Assistant Secretary | | Vice President and Corporate Counsel (since January 2005) of Prudential; Vice President and Assistant Secretary of PI (since December 2005); Associate at Sidley Austin Brown & Wood LLP (1999-2004). |
John P. Schwartz (40) Assistant Secretary | | Vice President and Corporate Counsel (since April 2005) of Prudential; Vice President and Assistant Secretary of PI (since December 2005); Associate at Sidley Austin Brown & Wood LLP (1997-2005). |
Andrew R. French (49) Assistant Secretary | | Vice President and Corporate Counsel (since February 2010) of Prudential; formerly Director and Corporate Counsel (2006-2010) of Prudential; Vice President and Assistant Secretary (since January 2007) of PI; Vice President and Assistant Secretary (since January 2007) of PMFS. |
Timothy J. Knierim (52) Chief Compliance Officer | | Chief Compliance Officer of Prudential Investment Management, Inc. (since July 2007); formerly Chief Risk Officer of PIM and PI (2002-2007) and formerly Chief Ethics Officer of PIM and PI (2006-2007). |
Valerie M. Simpson (53) Deputy Chief Compliance Officer | | Chief Compliance Officer (since April 2007) of PI and AST Investment Services, Inc.; formerly Vice President-Financial Reporting (June 1999-March 2006) for Prudential Life and Annuities Finance. |
Visit our website at www.prudentialfunds.com
| | |
| Fund Officers(a)(1) | | |
Name, Address and Age Position with Fund | | Principal Occupation(s) During Past Five Years |
Theresa C. Thompson (49) Deputy Chief Compliance Officer | | Vice President, Compliance, PI (since April 2004); and Director, Compliance, PI (2001-2004). |
Richard W. Kinville (43) Anti-Money Laundering Compliance Officer | | Vice President, Corporate Compliance, Anti-Money Laundering Unit (since January 2005) of Prudential; committee member of the American Council of Life Insurers Anti-Money Laundering and Critical Infrastructure Committee (since January 2007); formerly Investigator and Supervisor in the Special Investigations Unit for the New York Central Mutual Fire Insurance Company (August 1994-January 1999); Investigator in AXA Financial’s Internal Audit Department and Manager in AXA’s Anti-Money Laundering Office (January 1999-January 2005); first chair of the American Council of Life Insurers Anti-Money Laundering and Critical Infrastructure Committee (June 2007-December 2009). |
Grace C. Torres (52) Treasurer and Principal Financial and Accounting Officer | | Assistant Treasurer (since March 1999) and Senior Vice President (since September 1999) of PI; Assistant Treasurer (since May 2003) and Vice President (since June 2005) of AST Investment Services, Inc.; Senior Vice President and Assistant Treasurer (since May 2003) of Prudential Annuities Advisory Services, Inc.; formerly Senior Vice President (May 2003-June 2005) of AST Investment Services, Inc. |
M. Sadiq Peshimam (47) Assistant Treasurer | | Vice President (since 2005) of Prudential Investments LLC. |
Peter Parrella (53) Assistant Treasurer | | Vice President (since 2007) and Director (2004-2007) within Prudential Mutual Fund Administration; formerly Tax Manager at SSB Citi Fund Management LLC (1997-2004). |
(a) Excludes Ms. Rice and Mr. Benjamin, interested Board Members who also serve as President and Vice President, respectively.
(1) The year that each individual became an Officer of the Fund is as follows:
Kathryn L. Quirk, 2005; Deborah A. Docs, 2005; Jonathan D. Shain, 2005; Claudia DiGiacomo, 2005; John P. Schwartz, 2006; Andrew R. French, 2006; Timothy J. Knierim, 2007; Valerie M. Simpson 2007; Theresa C. Thompson, 2008; Richard W. Kinville, 2011, Grace C. Torres, 1998; M. Sadiq Peshimam, 2006; Peter Parrella, 2007.
Explanatory Notes to Tables:
| n | Board Members are deemed to be “Interested,” as defined in the 1940 Act, by reason of their affiliation with Prudential Investments LLC and/or an affiliate of Prudential Investments LLC. |
| n | Unless otherwise noted, the address of all Board Members and Officers is c/o Prudential Investments LLC, Gateway Center Three, 100 Mulberry Street, Newark, New Jersey 07102-4077. |
| n | There is no set term of office for Board Members or Officers. The Board Members have adopted a retirement policy, which calls for the retirement of Board Members on December 31 of the year in which they reach the age of 75. |
| n | “Other Directorships Held” includes only directorships of companies required to register or file reports with the SEC under the 1934 Act) (that is, “public companies”) or other investment companies registered under the 1940 Act. |
| n | “Portfolios Overseen” includes all investment companies managed by Prudential Investments LLC. The investment companies for which PI serves as manager include the Prudential Investments Mutual Funds, The Prudential Variable Contract Accounts, Target Mutual Funds, The Prudential Series Fund, Prudential’s Gibraltar Fund, Inc. and the Advanced Series Trust. |
Prudential Large-Cap Core Equity Fund
Approval of Advisory Agreements
The Fund’s Board of Trustees
The Board of Trustees (the “Board”) of Prudential Large-Cap Core Equity Fund (the “Fund”)1 consists of 10 individuals, eight of whom are not “interested persons” of the Fund, as defined in the Investment Company Act of 1940, as amended (the “1940 Act”) (the “Independent Trustees”). The Board is responsible for the oversight of the Fund and its operations, and performs the various duties imposed on the directors of investment companies by the 1940 Act. The Independent Trustees have retained independent legal counsel to assist them in connection with their duties. The Chair of the Board is an Independent Trustee. The Board has established three standing committees: the Audit Committee, the Nominating and Governance Committee, and the Investment Committee. Each committee is chaired by, and composed of, Independent Trustees.
Annual Approval of the Fund’s Advisory Agreements
As required under the 1940 Act, the Board determines annually whether to renew the Fund’s management agreement with Prudential Investments LLC (“PI”) and the Fund’s subadvisory agreement with Quantitative Management Associates LLC (“QMA”). In considering the renewal of the agreements, the Board, including all of the Independent Trustees, met on June 6-8, 2011 and approved the renewal of the agreements through July 31, 2012, after concluding that the renewal of the agreements was in the best interests of the Fund and its shareholders.
In advance of the meetings, the Board received materials relating to the agreements, and had the opportunity to ask questions and request further information in connection with its consideration. Among other things, the Board considered comparative fee information from PI and QMA. Also, the Board considered comparisons with other mutual funds in relevant Peer Universes and Peer Groups. The mutual funds included in each Peer Universe or Peer Group were objectively determined by Lipper Inc. (“Lipper”), an independent provider of mutual fund data. The comparisons placed the Fund in various quartiles over the one-, three-, five- and 10-year periods ending December 31, 2010, with the first quartile being the best 25% of the mutual funds (for performance, the best performing mutual funds and, for expenses, the lowest cost mutual funds). The Board also considered specific information provided by Lipper and QMA at the meetings, as well as additional materials relating to the performance and fees of the Fund.
In approving the agreements, the Board, including the Independent Trustees advised by independent legal counsel, considered the factors it deemed relevant, including the nature, quality and extent of services provided by PI and the subadviser, the
| 1 | Prudential Large-Cap Core Equity Fund is a series of Prudential Investment Portfolios 9. |
Prudential Large-Cap Core Equity Fund
Approval of Advisory Agreements (continued)
performance of the Fund, the profitability of PI and its affiliates, expenses and fees, and the potential for economies of scale that may be shared with the Fund and its shareholders as the Fund’s assets grow. In their deliberations, the Trustees did not identify any single factor which alone was responsible for the Board’s decision to approve the agreements with respect to the Fund. In connection with its deliberations, the Board considered information provided by PI throughout the year at regular Board meetings, presentations from portfolio managers and other information, as well as information furnished at or in advance of the meetings on June 6-8, 2011.
The Trustees determined that the overall arrangements between the Fund and PI, which serves as the Fund’s investment manager pursuant to a management agreement, and between PI and QMA, which serves as the Fund’s subadviser pursuant to the terms of a subadvisory agreement with PI, are in the interest of the Fund and its shareholders in light of the services performed, fees charged and such other matters as the Trustees considered relevant in the exercise of their business judgment.
The material factors and conclusions that formed the basis for the Trustees’ reaching their determinations to approve the continuance of the agreements are separately discussed below.
Nature, Quality and Extent of Services
The Board received and considered information regarding the nature, quality and extent of services provided to the Fund by PI and QMA. The Board considered the services provided by PI, including but not limited to the oversight of the subadviser for the Fund, as well as the provision of fund recordkeeping, compliance, and other services to the Fund. With respect to PI’s oversight of the subadviser, the Board noted that PI’s Strategic Investment Research Group (“SIRG”), which is a business unit of PI, is responsible for monitoring and reporting to PI’s senior management on the performance and operations of the subadviser. The Board also considered that PI pays the salaries of all of the officers and non-independent Trustees of the Fund. The Board also considered the investment subadvisory services provided by QMA, as well as adherence to the Fund’s investment restrictions and compliance with applicable Fund policies and procedures. The Board considered PI’s evaluation of the subadviser, as well as PI’s recommendation, based on its review of the subadviser, to renew the subadvisory agreement.
The Board reviewed the qualifications, backgrounds and responsibilities of PI’s senior management responsible for the oversight of the Fund and QMA, and also reviewed the qualifications, backgrounds and responsibilities of QMA’s portfolio managers who are responsible for the day-to-day management of the Fund’s portfolio. The Board was provided with information pertaining to PI’s and QMA’s organizational structure, senior management, investment operations, and other relevant information pertaining
Visit our website at www.prudentialfunds.com
to both PI and QMA. The Board also noted that it received favorable compliance reports from the Fund’s Chief Compliance Officer (“CCO”) as to both PI and QMA. The Board noted that QMA is affiliated with PI.
The Board concluded that it was satisfied with the nature, extent and quality of the investment management services provided by PI and the subadvisory services provided to the Fund by QMA, and that there was a reasonable basis on which to conclude that the Fund benefits from the services provided by PI and QMA under the management and subadvisory agreements.
Performance of the Fund
The Board received and considered information about the Fund’s historical performance. The Board considered that the Fund’s gross performance in relation to its Peer Universe (the Lipper Large-Cap Core Funds Performance Universe) was in the third quartile over the one-, five- and 10-year periods, and in the fourth quartile over the three-year period. The Board also noted that the Fund outperformed its benchmark index over the five- and 10-year periods, though it underperformed its benchmark index over the one- and three-year periods. The Board noted PI’s explanation that the Fund’s underperformance was attributable to the fact that, during the volatile market environment of the past several years, quantitative investment styles had struggled. The Board further noted that the Fund’s performance was in the first quartile for the first quarter of 2011. The Board concluded that, in light of the foregoing, it would be in the interest of the Fund and its shareholders for the Fund to renew the agreements.
Fees and Expenses
The Board considered that the Fund’s actual management fee (which reflects any subsidies, expense caps or waivers) ranked in the Expense Group’s second quartile, and that the Fund’s total expenses ranked in the Expense Group’s fourth quartile. The Board considered that PI has agreed to cap the Fund’s operating expenses at 0.95% (exclusive of 12b-1 fees and certain other fees) through February 29, 2012, which would result in the Fund’s total expenses ranking in the Expense Group’s second quartile. The Board concluded that the management fees (including subadvisory fees) and total expenses were reasonable in light of the services provided.
Costs of Services and Profits Realized by PI
The Board was provided with information on the profitability of PI and its affiliates in serving as the Fund’s investment manager. The Board discussed with PI the methodology utilized in assembling the information regarding profitability and considered its reasonableness. The Board recognized that it is difficult to make
Prudential Large-Cap Core Equity Fund
Approval of Advisory Agreements (continued)
comparisons of profitability from fund management contracts because comparative information is not generally publicly available and is affected by numerous factors, including the structure of the particular adviser, the types of funds it manages, its business mix, numerous assumptions regarding allocations and the adviser’s capital structure and cost of capital. The Board did not separately consider the profitability of the subadviser, an affiliate of PI, as its profitability was reflected in the profitability report for PI. Taking these factors into account, the Board concluded that the profitability of PI and its affiliates in relation to the services rendered was not unreasonable.
Economies of Scale
The Board received and discussed information concerning whether PI realizes economies of scale as the Fund’s assets grow beyond current levels. The Board noted that the management fee schedule for the Fund includes breakpoints, which have the effect of decreasing the fee rate as assets increase, but at the current level of assets, the Fund does not realize the effect of those rate reductions. The Board took note that the Fund’s fee structure would result in benefits to Fund shareholders when (and if) assets reach the levels at which the fee rate is reduced. These benefits will accrue whether or not PI is then realizing any economies of scale.
Other Benefits to PI and QMA
The Board considered potential ancillary benefits that might be received by PI and QMA and their affiliates as a result of their relationship with the Fund. The Board concluded that potential benefits to be derived by PI included fees received by affiliates of PI for serving as the Fund’s securities lending agent, transfer agency fees received by the Fund’s transfer agent (which is affiliated with PI), and benefits to the reputation as well as other intangible benefits resulting from PI’s association with the Fund. The Board concluded that the potential benefits to be derived by QMA included its ability to use soft dollar credits, as well as the potential benefits consistent with those generally resulting from an increase in assets under management, specifically, potential access to additional research resources and benefits to the reputation. The Board concluded that the benefits derived by PI and QMA were consistent with the types of benefits generally derived by investment managers and subadvisers to mutual funds.
After full consideration of these factors, the Board concluded that approval of the agreements was in the best interest of the Fund and its shareholders.
Visit our website at www.prudentialfunds.com
| | | | |
| n MAIL | | n TELEPHONE | | n WEBSITE |
Gateway Center Three 100 Mulberry Street Newark, NJ 07102 | | (800) 225-1852 | | www.prudentialfunds.com |
|
| PROXY VOTING |
| The Board of Trustees of the Fund has delegated to the Fund’s investment subadviser the responsibility for voting any proxies and maintaining proxy recordkeeping with respect to the Fund. A description of these proxy voting policies and procedures is available without charge, upon request, by calling (800) 225-1852 or by visiting the Securities and Exchange Commission’s website at www.sec.gov. Information regarding how the Fund voted proxies relating to portfolio securities during the most recent 12-month period ended June 30 is available on the Fund’s website and on the Commission’s website. |
|
| TRUSTEES |
| Kevin J. Bannon • Scott E. Benjamin • Linda W. Bynoe • Michael S. Hyland • Douglas H. McCorkindale • Stephen P. Munn • Richard A. Redeker • Judy A. Rice • Robin B. Smith • Stephen G. Stoneburn |
|
| OFFICERS |
| Judy A. Rice, President • Scott E. Benjamin, Vice President • Grace C. Torres, Treasurer and Principal Financial and Accounting Officer • Kathryn L. Quirk, Chief Legal Officer • Deborah A. Docs, Secretary • Timothy J. Knierim, Chief Compliance Officer • Valerie M. Simpson, Deputy Chief Compliance Officer • Theresa C. Thompson, Deputy Chief Compliance Officer • Richard W. Kinville, Anti-Money Laundering Compliance Officer • Jonathan D. Shain, Assistant Secretary • Claudia DiGiacomo, Assistant Secretary • John P. Schwartz, Assistant Secretary • Andrew R. French, Assistant Secretary • M. Sadiq Peshimam, Assistant Treasurer • Peter Parrella, Assistant Treasurer |
| | | | |
| MANAGER | | Prudential Investments LLC | | Gateway Center Three
100 Mulberry Street
Newark, NJ 07102 |
|
| INVESTMENT SUBADVISER | | Quantitative Management
Associates LLC | | Gateway Center Two
100 Mulberry Street
Newark, NJ 07102 |
|
| DISTRIBUTOR | | Prudential Investment
Management Services LLC | | Gateway Center Three
100 Mulberry Street
Newark, NJ 07102 |
|
| CUSTODIAN | | The Bank of New York Mellon | | One Wall Street
New York, NY 10286 |
|
| TRANSFER AGENT | | Prudential Mutual Fund
Services LLC | | PO Box 9658
Providence, RI 02940 |
|
INDEPENDENT REGISTERED
PUBLIC ACCOUNTING FIRM | | KPMG LLP | | 345 Park Avenue
New York, NY 10154 |
|
| FUND COUNSEL | | Willkie Farr & Gallagher LLP | | 787 Seventh Avenue
New York, NY 10019 |
|
| An investor should consider the investment objectives, risks, charges, and expenses of the Fund carefully before investing. The prospectus and summary prospectus contain this and other information about the Fund. An investor may obtain a prospectus and summary prospectus by visiting our website at www.prudentialfunds.com or by calling (800) 225-1852. The prospectus and summary prospectus should be read carefully before investing. |
|
| E-DELIVERY |
| To receive your mutual fund documents online, go to www.prudentialfunds.com/edelivery and enroll. Instead of receiving printed documents by mail, you will receive notification via email when new materials are available. You can cancel your enrollment or change your email address at any time by visiting the website address above. |
|
| SHAREHOLDER COMMUNICATIONS WITH TRUSTEES |
| Shareholders can communicate directly with the Board of Trustees by writing to the Chair of the Board, Prudential Large-Cap Core Equity Fund, Prudential Investments, Attn: Board of Trustees, 100 Mulberry Street, Gateway Center Three, Newark, NJ 07102. Shareholders can communicate directly with an individual Trustee by writing to the same address. Communications are not screened before being delivered to the addressee. |
|
| AVAILABILITY OF PORTFOLIO SCHEDULE |
| The Fund files its complete schedule of portfolio holdings with the Securities and Exchange Commission for the first and third quarters of each fiscal year on Form N-Q. The Fund’s Forms N-Q are available on the Commission’s website at www.sec.gov. The Fund’s Forms N-Q may also be reviewed and copied at the Commission’s Public Reference Room in Washington, D.C. Information on the operation and location of the Public Reference Room may be obtained by calling (202) 551-8090. The Fund’s schedule of portfolio holdings is also available on the Fund’s website as of the end of each month. |
|
| The Fund’s Statement of Additional Information contains additional information about the Fund’s Trustees and is available without charge, upon request, by calling (800) 225-1852. |
Mutual Funds:
| | | | |
ARE NOT INSURED BY THE FDIC OR ANY
FEDERAL GOVERNMENT AGENCY | | MAY LOSE VALUE | | ARE NOT A DEPOSIT OF OR GUARANTEED
BY ANY BANK OR ANY BANK AFFILIATE |

PRUDENTIAL LARGE-CAP CORE EQUITY FUND
| | | | | | | | | | | | | | |
| SHARE CLASS | | A | | B | | C | | L | | M | | X | | Z |
| NASDAQ | | PTMAX | | PTMBX | | PTMCX | | N/A | | N/A | | N/A | | PTEZX |
| CUSIP | | 74441J100 | | 74441J209 | | 74441J308 | | 74441J506 | | 74441J605 | | 74441J704 | | 74441J407 |
MF187E 0215359-00001-00

PRUDENTIAL INVESTMENTS»MUTUAL FUNDS
PRUDENTIAL ABSOLUTE RETURN BOND FUND
ANNUAL REPORT · OCTOBER 31, 2011
Fund Type
Absolute return bond
Objective
To seek positive returns over the long term, regardless of market conditions
This report is not authorized for distribution to prospective investors unless preceded or accompanied by a current prospectus.
The views expressed in this report and information about the Fund’s portfolio holdings are for the period covered by this report and are subject to change thereafter.
Prudential Investments, Prudential, the Prudential logo, and the Rock symbol are service marks of Prudential Financial, Inc. and its related entities, registered in many jurisdictions worldwide.

December 15, 2011
Dear Shareholder:
After leading Prudential Investments for the past eight years, I have decided to retire at the end of 2011 from my positions as President of Prudential Investments and President and Trustee of the Prudential Absolute Return Bond Fund (the Fund). Effective January 1, 2012, I will become Chairman of Prudential Investments and act as an advisor to the business during 2012 to help facilitate a smooth transition to my successor, Stuart Parker.
Stuart, who will become President of Prudential Investments and President and Trustee of the Fund on January 1, 2012, previously served as the Executive Vice President of Retail Mutual Fund Distribution at Prudential Investments. With more than 20 years of investment industry experience, Stuart brings a deep understanding of the needs and challenges facing today’s investors.
We hope you find the annual report for the Fund informative. We recognize that ongoing market volatility may make it a difficult time to be an investor. We continue to believe a prudent response to uncertainty is to maintain a diversified portfolio, including stock and bond mutual funds consistent with your tolerance for risk, time horizon, and financial goals.
Your financial professional can help you create a diversified investment plan that reflects your personal investor profile and risk tolerance. Keep in mind that diversification and asset allocation strategies do not assure a profit or protect against loss in declining markets. We encourage you to call your financial professional before making any investment decision.
Prudential Investments provides a wide range of mutual funds to choose from that can help you make progress toward your financial goals. Our funds offer the experience, resources, and professional discipline of Prudential Financial’s affiliated asset managers.
Finally, I’ve been privileged to have had the opportunity to help you address your investment needs, and I thank you for choosing the Prudential Investments family of mutual funds.
Sincerely,

Judy A. Rice, President
Prudential Absolute Return Bond Fund
| | | | |
| Prudential Absolute Return Bond Fund | | | 1 | |
Your Fund’s Performance
Performance data quoted represent past performance. Past performance does not guarantee future results. The investment return and principal value of an investment will fluctuate, so that an investor’s shares, when redeemed, may be worth more or less than their original cost. Current performance may be lower or higher than the past performance data quoted. An investor may obtain performance data as of the most recent month-end by visiting our website at www.prudentialfunds.com or by calling (800) 225-1852. Class A shares have a maximum initial sales charge of 4.50%. Gross operating expenses: Class A, 2.70%; Class C, 3.39%; Class Q, 2.45%; Class Z, 2.48%. Net operating expenses: Class A, 1.30%; Class C, 2.05%; Class Q, 1.05%; Class Z, 1.05%, after contractual reduction through 2/28/2013.
| | | | | | | | | | |
Cumulative Total Returns (Without Sales Charges) as of 10/31/11 | |
| | | | | | | | | Since Inception | |
Class A | | | | | | | | | –1.27 | % |
Class C | | | | | | | | | –1.74 | |
Class Q | | | | | | | | | –1.09 | |
Class Z | | | | | | | | | –1.14 | |
BofAML USD LIBOR 3-Month CM Index | | | | | | | | | 0.15 | |
Lipper Average | | | | | | | | | –3.04 | |
| | | | | | | | | | |
Average Annual Total Returns (With Sales Charges) as of 9/30/11 | |
| | | | | | | | | Since Inception | |
Class A | | | | | | | | | N/A | |
Class C | | | | | | | | | N/A | |
Class Q | | | | | | | | | N/A | |
Class Z | | | | | | | | | N/A | |
BofAML USD LIBOR 3-Month CM Index | | | | | | | | | N/A | |
Lipper Average | | | | | | | | | N/A | |
| | | | | | | | | | |
Average Annual Total Returns (With Sales Charges) as of 10/31/11 | |
| | | | | | | | | Since Inception | |
Class A | | | | | | | | | N/A | |
Class C | | | | | | | | | N/A | |
Class Q | | | | | | | | | N/A | |
Class Z | | | | | | | | | N/A | |
| | | | | | | | | | |
| | |
| 2 | | Visit our website at www.prudentialfunds.com |
| | | | | | | | |
Average Annual Total Returns (Without Sales Charges) as of 10/31/11 |
| | | | | | | | | Since Inception |
Class A | | | | | | | | N/A |
Class C | | | | | | | | N/A |
Class Q | | | | | | | | N/A |
Class Z | | | | | | | | N/A |
Growth of a $10,000 Investment
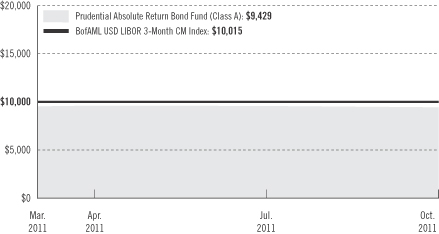
The graph compares a $10,000 investment in the Prudential Absolute Return Bond Fund (Class A shares) with a similar investment in the BofAML USD LIBOR 3-Month CM Index by portraying the initial account values at the commencement of operations for Class A shares (March 30, 2011) and the account values at the end of the current fiscal year (October 31, 2011) as measured on a quarterly basis. For purposes of the graph, and unless otherwise indicated, it has been assumed that (a) the maximum applicable front-end sales charge was deducted from the initial $10,000 investment in Class A shares; (b) all recurring fees (including management fees) were deducted; and (c) all dividends and distributions were reinvested. The line graph provides information for Class A shares only. As indicated in the tables provided earlier, performance for Class C, Class Q, and Class Z shares will vary due to the differing charges and expenses applicable to each share class (as indicated in the following paragraphs). Without a distribution and service (12b-1) fee waiver of 0.05% for Class A shares in effect through October 31, 2011, the returns shown in the graph and for Class A shares in the tables would have been lower.
Total returns and the ending account values in the graph include changes in share price and reinvestment of dividends and capital gains distributions in a hypothetical investment for the periods shown. The Fund’s total returns do not reflect the deduction of income taxes on an individual’s investment. Taxes may reduce your actual investment returns on income or gains paid by the Fund or any gains you may realize if you sell your shares.
| | | | |
| Prudential Absolute Return Bond Fund | | | 3 | |
Your Fund’s Performance (continued)
Source: Prudential Investments LLC and Lipper Inc. Performance figures may reflect fee waivers and/or expense reimbursements. In the absence of such fee waivers and/or expense reimbursements, total returns would be lower.
The performance data featured represents past performance for a period of less than one year. While past performance is never an indication of future results, short periods of performance may be particularly unrepresentative of long-term performance for certain types of funds.
Inception date: 3/30/11
The average annual total returns take into account applicable sales charges. Class A shares are subject to a maximum front-end sales charge of 4.50%, and an annual 12b-1 fee of up to 0.30%. Investors who purchase Class A shares in an amount of $1 million or more and sell these shares within 12 months of purchase are subject to a contingent deferred sales charge (CDSC) of 1%. The Class A CDSC is waived for purchases by certain retirement and/or benefit plans. Under certain limited circumstances, an exchange may be made from Class A or Class C to Class Z shares of the Fund. Class C shares are not subject to a front-end sales charge, but are subject to a CDSC of 1% for shares sold within 12 months from the date of purchase, and an annual 12b-1 fee of 1%. Class Q and Class Z shares are not subject to a sales charge or 12b-1 fees. The returns in the tables and graph reflect the share class expense structure in effect at the close of the fiscal period.
Benchmark Definitions
BofAML USD LIBOR 3-Month CM Index
The BofA Merrill Lynch US Dollar 3-Month LIBOR Constant Maturity (CM) Index is an unmanaged index which tracks the performance of a synthetic asset paying LIBOR to a stated maturity. The index is based on the assumed purchase at par of a synthetic instrument having exactly its stated maturity and with a coupon equal to that day’s fixing rate. That issue is assumed to be sold the following business day (priced at a yield equal to the current day fixing rate) and rolled into a new instrument.
Lipper Absolute Return Funds Average
Funds in the Lipper Absolute Return Funds Average aim for positive returns in all market conditions. The funds are not benchmarked against a traditional long-only market index but rather have the aim of outperforming a cash or risk-free benchmark.
Investors cannot invest directly in an index or average. The returns for the Index would be lower if they included the effects of sales charges, operating expenses of a mutual fund, or taxes. Returns for the Lipper Average reflect the deduction of operating expenses of a mutual fund, but not sales charges or taxes.
| | | | | | | | |
Distributions and Yields as of 10/31/11 | | | | | |
| | | Total Distributions
Paid during the Period | | | 30-Day
SEC Yield | |
Class A | | $ | 0.15 | | | | 3.29 | % |
Class C | | | 0.10 | | | | 2.70 | |
Class Q | | | 0.16 | | | | 3.69 | |
Class Z | | | 0.15 | | | | 3.68 | |
| | |
| 4 | | Visit our website at www.prudentialfunds.com |
| | | | |
Five Largest Holdings expressed as a percentage of net assets as of 10/31/11 | | | | |
Fraser Sullivan CLO Ltd. (Cayman Islands), Ser. 2011-6A, Class A1, 144A | | | 2.8 | % |
Trimaran CLO Ltd. (Cayman Islands), Ser. 2006-2A, Class A1L, 144A | | | 1.9 | |
LCM LP (Cayman Islands), Ser. 2010-8A, Class A, 144A | | | 1.4 | |
Bear Stearns Commercial Mortgage Securities, Ser. 2005-PWR7, Class A2 | | | 1.4 | |
Apidos CDO (Cayman Islands), Ser. 2006-4A, Class A1, 144A | | | 1.4 | |
Holdings reflect only long-term investments and are subject to change.
| | | | |
Credit Quality* expressed as a percentage of net assets as of 10/31/11 | | | | |
U.S. Government & Agency | | | 1.4 | % |
Aaa | | | 36.9 | |
Aa | | | 4.3 | |
A | | | 9.2 | |
Baa | | | 15.1 | |
Ba | | | 16.2 | |
B | | | 14.7 | |
Caa | | | 1.6 | |
Not Rated | | | 3.4 | |
Total Investments | | | 102.8 | |
Liabilities in excess of other assets | | | –2.8 | |
Net Assets | | | 100.0 | % |
| | | | |
*Source: Moody’s rating, defaulting to S&P when not rated by Moody’s.
Credit Quality is subject to change.
| | | | |
| Prudential Absolute Return Bond Fund | | | 5 | |
Strategy and Performance Overview
How did the Fund perform?
The Prudential Absolute Return Bond Fund Class A shares declined 1.27% for the reporting period, from inception on March 30, 2011 through October 31, 2011. The Class A shares underperformed the 0.15% gain of the BofAML USD 3-month LIBOR Constant Maturity Index (the Index) but outperformed the 3.04% decline of the Lipper Absolute Return Funds Average.
How is the Fund Managed?
Prudential Fixed Income manages the Fund, which seeks positive returns over the long term regardless of market conditions. It is designed to potentially mitigate downside risk in a bond portfolio. To achieve these results, portfolio managers apply their expertise in sector and security selection, while using strategies that seek to reduce the impact of interest rate changes on the Fund.
The Fund invests at least 80% of its investable assets in a diversified portfolio of U.S. and foreign fixed income securities that may include (but are not limited to) corporate bonds, commercial mortgage-backed securities, and government-related securities. It mostly looks for investment-grade debt securities denominated in U.S. dollars or foreign currencies. However, the Fund can also invest in high yield corporate bonds, commonly called “junk” bonds as they are rated below investment grade.
How did the U.S. fixed income market perform?
The U.S. fixed income market was characterized by dramatic changes in investor risk appetite that occurred in response to momentous economic and political developments around the world. Yet all sectors of the U.S. fixed income market finished the period in the black.
| | • | | The period began on an upbeat note, but the second quarter of 2011 was marked by increasing anxiety. Rising gas prices sapped consumption. Supply chain disruptions emanating from Japan in the aftermath of an earthquake, tsunami, and nuclear disaster, along with weather-related events in the United States, caused production slowdowns. Moreover, employment growth in the United States weakened dramatically in May, and a sovereign-debt crisis in the euro zone worsened. Against this negative economic backdrop, yields on U.S. Treasury securities declined and pushed up their prices, as bond prices move inversely to yields. |
| | • | | The flight to quality gained momentum in the third quarter of 2011. Investors increasingly sought refuge in Treasury securities and the U.S. dollar in response to signs of slower global economic growth and deepening concerns about the European sovereign-debt crisis. The Treasury securities rally strengthened in |
| | |
| 6 | | Visit our website at www.prudentialfunds.com |
| | September after the Federal Reserve announced it would, in October, begin selling $400 billion of short-term U.S. Treasuries and buying their longer-term counterparts in an effort to put downward pressure on longer-term rates. After the announcement, Treasury securities soared in value, even though Standard & Poor’s had recently downgraded the U.S. long-term credit rating to AA+ from AAA. |
| | • | | All other sectors of the U.S. fixed income market, such as investment-grade corporate bonds and commercial mortgage-backed securities, underperformed similar-maturity Treasury securities for the third quarter. Nevertheless, investor risk tolerance increased in October. Prices of Treasury securities declined, while investment-grade and high yield corporate bonds gained in value, as signs of strength in the U.S. economy quieted fear that it might lapse into a double-dip recession. Also, European leaders appeared to make progress on containing the region’s sovereign-debt crisis. |
Which strategy made the largest positive contribution to the Fund’s performance?
The Fund’s interest rate strategy made the largest positive contribution to its performance versus the Index.
| | • | | The Fund utilized interest rate swaps to shorten its duration, which measures the approximate price volatility of a bond portfolio for a given change in interest rates. This strategy helped reduce the impact of interest rate fluctuations on the Fund. Yet the Fund still had a longer duration than the Index, which benefited it as declining rates drove bond prices higher during the period. |
Which strategy detracted most from the Fund’s return?
The Fund’s sector allocation strategy avoided Treasury securities and emphasized spread sectors, which provides extra yield (spread) over similar-maturity Treasury securities to compensate for their greater credit risk. This approach detracted most from the Fund’s return, as spread sectors sharply underperformed comparable Treasury securities during the turbulent third quarter. Subsequently, in October, when the Fund did not recover all the ground it had lost during the third quarter, it ended the period with a slight loss.
| | • | | Investment-grade corporate bonds were a major detractor, largely due to the Fund’s emphasis on debt securities of banks that were pressured by uncertainty over their exposures to the euro-zone crisis. |
| | • | | Emerging market bonds detracted from the Fund’s return. These debt securities, as well as emerging market currencies, were hit particularly hard in the third quarter by the European sovereign-debt crisis and the potential for a double-dip recession in the United States. |
| | | | |
| Prudential Absolute Return Bond Fund | | | 7 | |
Fees and Expenses (Unaudited)
As a shareholder of the Fund, you incur two types of costs: (1) transaction costs, including sales charges (loads) on purchase payments and redemptions, as applicable, and (2) ongoing costs, including management fees, distribution and/or service (12b-1) fees, and other Fund expenses, as applicable. This example is intended to help you understand your ongoing costs (in dollars) of investing in the Fund and to compare these costs with the ongoing costs of investing in other mutual funds.
The example is based on an investment of $1,000 invested on May 1, 2011, at the beginning of the period, and held through the six-month period ended October 31, 2011. The example is for illustrative purposes only; you should consult the Prospectus for information on initial and subsequent minimum investment requirements.
The Fund’s transfer agent may charge additional fees to holders of certain accounts that are not included in the expenses shown in the table on the following page. These fees apply to individual retirement accounts (IRAs) and Section 403(b) accounts. As of the close of the six-month period covered by the table, IRA fees included an annual maintenance fee of $15 per account (subject to a maximum annual maintenance fee of $25 for all accounts held by the same shareholder). Section 403(b) accounts are charged an annual $25 fiduciary maintenance fee. Some of the fees may vary in amount, or may be waived, based on your total account balance or the number of Prudential Investments funds, including the Fund, that you own. You should consider the additional fees that were charged to your Fund account over the six-month period when you estimate the total ongoing expenses paid over the period and the impact of these fees on your ending account value, as these additional expenses are not reflected in the information provided in the expense table. Additional fees have the effect of reducing investment returns.
Actual Expenses
The first line for each share class in the table on the following page provides information about actual account values and actual expenses. You may use the information on this line, together with the amount you invested, to estimate the expenses that you paid over the period. Simply divide your account value by $1,000 (for example, an $8,600 account value ÷ $1,000 = 8.6), then multiply the result by the number on the first line under the heading “Expenses Paid During the Six-Month Period” to estimate the expenses you paid on your account during this period.
Hypothetical Example for Comparison Purposes
The second line for each share class in the table on the following page provides information about hypothetical account values and hypothetical expenses based on the Fund’s actual expense ratio and an assumed rate of return of 5% per year before expenses, which is not the Fund’s actual return. The hypothetical account values and
| | |
| 8 | | Visit our website at www.prudentialfunds.com |
expenses may not be used to estimate the actual ending account balance or expenses you paid for the period. You may use this information to compare the ongoing costs of investing in the Fund and other funds. To do so, compare this 5% hypothetical example with the 5% hypothetical examples that appear in the shareholder reports of the other funds.
Please note that the expenses shown in the table are meant to highlight your ongoing costs only and do not reflect any transactional costs such as sales charges (loads). Therefore, the second line for each share class in the table is useful in comparing ongoing costs only and will not help you determine the relative total costs of owning different funds. In addition, if these transactional costs were included, your costs would have been higher.
| | | | | | | | | | | | | | | | | | |
Prudential Absolute
Return Bond Fund | | Beginning Account
Value
May 1, 2011 | | | Ending Account
Value
October 31, 2011 | | | Annualized
Expense Ratio
Based on the
Six-Month Period | | | Expenses Paid
During the
Six-Month Period* | |
| | | | | | | | | | | | | | | | | | |
| Class A | | Actual | | $ | 1,000.00 | | | $ | 982.70 | | | | 1.30 | % | | $ | 6.50 | |
| | | Hypothetical | | $ | 1,000.00 | | | $ | 1,018.65 | | | | 1.30 | % | | $ | 6.61 | |
| | | | | | | | | | | | | | | | | | |
| Class C | | Actual | | $ | 1,000.00 | | | $ | 977.40 | | | | 2.05 | % | | $ | 10.22 | |
| | | Hypothetical | | $ | 1,000.00 | | | $ | 1,014.87 | | | | 2.05 | % | | $ | 10.41 | |
| | | | | | | | | | | | | | | | | | |
| Class Q | | Actual | | $ | 1,000.00 | | | $ | 981.80 | | | | 1.05 | % | | $ | 5.24 | |
| | | Hypothetical | | $ | 1,000.00 | | | $ | 1,019.91 | | | | 1.05 | % | | $ | 5.35 | |
| | | | | | | | | | | | | | | | | | |
| Class Z | | Actual | | $ | 1,000.00 | | | $ | 981.30 | | | | 1.05 | % | | $ | 5.24 | |
| | | Hypothetical | | $ | 1,000.00 | | | $ | 1,019.91 | | | | 1.05 | % | | $ | 5.35 | |
* Fund expenses (net of fee waivers or subsidies, if any) for each share class are equal to the annualized expense ratio for each share class (provided in the table), multiplied by the average account value over the period, multiplied by the 184 days in the six-month period ended October 31, 2011, and divided by the 365 days in the Fund’s fiscal year ended October 31, 2011 (to reflect the six-month period). Expenses presented in the table include the expenses of any underlying portfolios in which the Fund may invest.
| | | | |
| Prudential Absolute Return Bond Fund | | | 9 | |
Portfolio of Investments
as of October 31, 2011
| | | | | | | | | | | | | | | | |
| Description | | Moody’s
Ratings†
(Unaudited) | | Interest
Rate | | Maturity
Date | | | Principal
Amount (000)# | | | Value (Note 1) | |
| | | | | | | | | | | | | | | | |
LONG-TERM INVESTMENTS 100.6% | | | | | | | | | | | | |
ASSET-BACKED SECURITIES 23.2% | | | | | | | | | | | | | | |
|
Collateralized Loan Obligations, Debt Obligations and Other Asset-Backed Securities 13.8% | |
Apidos CDO (Cayman Islands),
Ser. 2006-4A, Class A1, 144A(a) | | Aaa | | 0.672% | | | 10/27/18 | | | $ | 500 | | | $ | 475,507 | |
Ser. 2011-8A, Class A1, 144A(a) | | Aaa | | 2.094 | | | 10/17/21 | | | | 250 | | | | 246,758 | |
Fraser Sullivan CLO Ltd. (Cayman Islands),
Ser. 2011-6A, Class A1, 144A(a) | | Aaa | | 2.020 | | | 11/22/22 | | | | 1,000 | | | | 987,500 | |
Fuel Trust,
Sec’d. Notes, 144A | | Baa2 | | 4.207 | | | 04/15/16 | | | | 200 | | | | 200,778 | |
Hewett’s Island CDO Ltd. (Cayman Islands),
Ser. 2004-1A, Class A1, 144A(a) | | Aaa | | 0.687 | | | 12/15/16 | | | | 262 | | | | 256,445 | |
LCM LP (Cayman Islands),
Ser. 2010-8A, Class A, 144A(a) | | AAA(b) | | 2.001 | | | 01/14/21 | | | | 500 | | | | 488,415 | |
Monument Park CDO Ltd. (Cayman Islands),
Ser. 2004-1A, Class A1, 144A(a) | | Aaa | | 0.959 | | | 01/20/16 | | | | 272 | | | | 263,918 | |
Morningside Park CLO Ltd. (Cayman Islands),
Ser. 2010-1A, Class A, 144A(a) | | Aaa | | 2.001 | | | 10/14/20 | | | | 250 | | | | 241,750 | |
Mountain Capital CLO Ltd. (Cayman Islands),
Ser. 2005-4A, Class A1L, 144A(a) | | Aaa | | 0.597 | | | 03/15/18 | | | | 494 | | | | 472,469 | |
Rosedale CLO Ltd.
(Cayman Islands),
Ser. I-A, Class A1S, 144A(a) | | Aaa | | 0.666 | | | 07/24/21 | | | | 234 | | | | 224,512 | |
Stanfield Vantage CLO Ltd. (Cayman Islands),
Ser. 2005-1A, Class A1, 144A(a) | | Aaa | | 0.653 | | | 03/21/17 | | | | 308 | | | | 297,890 | |
See Notes to Financial Statements.
| | | | |
| Prudential Absolute Return Bond Fund | | | 11 | |
Portfolio of Investments
as of October 31, 2011 continued
| | | | | | | | | | | | | | | | |
| Description | | Moody’s
Ratings†
(Unaudited) | | Interest
Rate | | Maturity
Date | | | Principal
Amount (000)# | | | Value (Note 1) | |
| | | | | | | | | | | | | | | | |
ASSET-BACKED SECURITIES (Continued) | | | | | | | | | | | | |
|
Collateralized Loan Obligations and Other Asset-Backed Securities (cont’d.) | |
Trimaran CLO Ltd.
(Cayman Islands),
Ser. 2006-2A, Class A1L, 144A(a) | | Aaa | | 0.504% | | | 11/01/18 | | | $ | 700 | | | $ | 662,201 | |
| | | | | | | | | | | | | | | | |
| | | | | | | | | | | | | | | 4,818,143 | |
| | |
Residential Mortgage-Backed Securities 9.4% | | | | | | | | | |
Argent Securities, Inc.,
Ser. 2003-W5, Class M1(a) | | Baa1 | | 0.945 | | | 10/25/33 | | | | 173 | | | | 131,688 | |
Bear Stearns Asset Backed Securities Trust,
Ser. 2003-3, Class A2(a) | | Aa2 | | 0.835 | | | 06/25/43 | | | | 263 | | | | 227,124 | |
Chase Funding Mortgage Loan Asset-Backed Certificates,
Ser. 2002-3, Class 2A1(a) | | A1 | | 0.885 | | | 08/25/32 | | | | 336 | | | | 248,053 | |
Citigroup Mortgage Loan Trust, Inc.,
Ser. 2005-OPT1, Class M1(a) | | Aa3 | | 0.665 | | | 02/25/35 | | | | 317 | | | | 244,999 | |
Countrywide Asset-Backed Certificates,
Ser. 2004-1, Class M1(a) | | Baa1 | | 0.995 | | | 03/25/34 | | | | 390 | | | | 274,420 | |
Credit-Based Asset Servicing and Securitization LLC,
Ser. 2003-CB3, Class AF1 | | A2 | | 3.379 | | | 12/25/32 | | | | 301 | | | | 248,646 | |
Ser. 2003-CB5, Class M1(a) | | Ba1 | | 1.265 | | | 11/25/33 | | | | 364 | | | | 277,653 | |
Finance America Mortgage Loan Trust,
Ser. 2003-1, Class M1(a) | | A2 | | 1.295 | | | 09/25/33 | | | | 387 | | | | 306,424 | |
HSBC Home Equity Loan Trust,
Ser. 2006-2, Class A2(a) | | Aaa | | 0.425 | | | 03/20/36 | | | | 255 | | | | 238,086 | |
Ser. 2007-3, Class A4(a) | | Aa2 | | 1.745 | | | 11/20/36 | | | | 250 | | | | 196,248 | |
Morgan Stanley ABS Capital I,
Ser. 2004-WMC1,
Class M1(a) | | B1 | | 1.175 | | | 06/25/34 | | | | 314 | | | | 230,944 | |
Residential Asset Securities Corp.,
Ser. 2005-KS8, Class M1(a) | | Baa3 | | 0.655 | | | 08/25/35 | | | | 300 | | | | 260,236 | |
See Notes to Financial Statements.
| | |
| 12 | | Visit our website at www.prudentialfunds.com |
| | | | | | | | | | | | | | | | |
| Description | | Moody’s
Ratings†
(Unaudited) | | Interest
Rate | | Maturity
Date | | | Principal
Amount (000)# | | | Value (Note 1) | |
| | | | | | | | | | | | | | | | |
ASSET-BACKED SECURITIES (Continued) | | | | | | | | | | | | |
|
Residential Mortgage-Backed Securities (cont’d.) | |
Specialty Underwriting & Residential Finance,
Ser. 2003-BC4, Class M1(a) | | Ba3 | | 1.145% | | | 11/25/34 | | | $ | 297 | | | $ | 225,880 | |
Structured Asset Securities Corp.,
Ser. 2005-WF4, Class M1(a) | | Baa3 | | 0.645 | | | 11/25/35 | | | | 250 | | | | 165,478 | |
| | | | | | | | | | | | | | | | |
| | | | | | | | | | | | | | | 3,275,879 | |
| | | | | | | | | | | | | | | | |
TOTAL ASSET-BACKED SECURITIES
(cost $8,277,038) | | | | | | | | | | | | | | | 8,094,022 | |
| | | | | | | | | | | | | | | | |
| | |
BANK LOANS(a) 7.6% | | | | | | | | | |
| | | | | |
Automotive 1.1% | | | | | | | | | | | | | | | | |
Autoparts Holdings Ltd. | | B1 | | 6.500 | | | 07/29/17 | | | | 75 | | | | 74,813 | |
Chrysler Group LLC | | Ba2 | | 6.000 | | | 05/24/17 | | | | 150 | | | | 141,084 | |
Delphi Corp. | | Baa3 | | 3.500 | | | 03/31/17 | | | | 171 | | | | 170,518 | |
| | | | | | | | | | | | | | | | |
| | | | | | | | | | | | | | | 386,415 | |
| | | | | |
Banking 0.3% | | | | | | | | | | | | | | | | |
JBS USA LLC | | Ba3 | | 4.250 | | | 05/25/18 | | | | 100 | | | | 97,755 | |
| | | | | |
Capital Goods 0.8% | | | | | | | | | | | | | | | | |
Dealer Computer Services, Inc. | | Ba2 | | 3.750 | | | 04/21/18 | | | | 100 | | | | 99,176 | |
Hertz Corp. | | Ba1 | | 3.750 | | | 03/12/18 | | | | 100 | | | | 92,500 | |
Terex Corp. | | Ba2 | | 5.500 | | | 04/28/17 | | | | 100 | | | | 99,938 | |
| �� | | | | | | | | | | | | | | | |
| | | | | | | | | | | | | | | 291,614 | |
| | | | | |
Chemicals 0.6% | | | | | | | | | | | | | | | | |
Ashland, Inc. | | Baa3 | | 3.750 | | | 11/30/18 | | | | 100 | | | | 100,313 | |
Houghton International, Inc. | | B1 | | 6.750 | | | 01/31/16 | | | | 99 | | | | 99,249 | |
| | | | | | | | | | | | | | | | |
| | | | | | | | | | | | | | | 199,562 | |
| | | | | |
Consumer 0.3% | | | | | | | | | | | | | | | | |
Visant Corp. | | Ba3 | | 5.250 | | | 12/22/16 | | | | 99 | | | | 94,026 | |
| | | | | |
Electric 0.4% | | | | | | | | | | | | | | | | |
AES Corp. | | Ba1 | | 4.250 | | | 05/27/18 | | | | 100 | | | | 99,251 | |
See Notes to Financial Statements.
| | | | |
| Prudential Absolute Return Bond Fund | | | 13 | |
Portfolio of Investments
as of October 31, 2011 continued
| | | | | | | | | | | | | | | | |
| Description | | Moody’s
Ratings†
(Unaudited) | | Interest
Rate | | Maturity
Date | | | Principal
Amount (000)# | | | Value (Note 1) | |
| | | | | | | | | | | | | | | | |
BANK LOANS(a) (Continued) | | | | | | | | | | | | |
| | | | | |
Electric (cont’d.) | | | | | | | | | | | | | | | | |
Texas Competitive Electric Holdings Co. LLC | | B2 | | 4.891% | | | 10/10/17 | | | $ | 48 | | | $ | 32,663 | |
| | | | | | | | | | | | | | | | |
| | | | | | | | | | | | | | | 131,914 | |
| | | | | |
Foods 0.5% | | | | | | | | | | | | | | | | |
Dole Food Co., Inc. | | Ba2 | | 5.000 | | | 07/08/18 | | | | 32 | | | | 32,432 | |
Dole Food Co., Inc. | | Ba2 | | 5.000 | | | 07/08/18 | | | | 17 | | | | 17,464 | |
OSI Restaurant Partners, Inc. | | B3 | | 2.483 | | | 06/14/13 | | | | 45 | | | | 42,857 | |
OSI Restaurant Partners, Inc. | | B3 | | 2.563 | | | 06/14/14 | | | | 104 | | | | 99,159 | |
| | | | | | | | | | | | | | | | |
| | | | | | | | | | | | | | | 191,912 | |
| | | | | |
Gaming 0.2% | | | | | | | | | | | | | | | | |
Venetian Macau Ltd. | | Ba3 | | 4.750 | | | 05/25/12 | | | | 27 | | | | 26,774 | |
Venetian Macau Ltd. | | Ba3 | | 4.750 | | | 05/25/13 | | | | 47 | | | | 46,218 | |
| | | | | | | | | | | | | | | | |
| | | | | | | | | | | | | | | 72,992 | |
| |
Healthcare & Pharmaceutical 1.9% | | | | | |
Capsugel Holdings US, Inc. | | B1 | | 5.250 | | | 08/01/18 | | | | 100 | | | | 100,125 | |
Drumm Investors LLC | | B1 | | 5.000 | | | 05/04/18 | | | | 100 | | | | 90,601 | |
HCA, Inc. | | Ba3 | | 3.619 | | | 03/31/17 | | | | 200 | | | | 193,750 | |
HCR Healthcare LLC | | Ba3 | | 5.000 | | | 04/06/18 | | | | 100 | | | | 89,301 | |
PTS Acquisitions Corp. | | Ba3 | | 2.496 | | | 04/10/14 | | | | 50 | | | | 47,378 | |
RPI Finance Trust | | Baa2 | | 4.000 | | | 05/31/18 | | | | 150 | | | | 148,409 | |
| | | | | | | | | | | | | | | | |
| | | | | | | | | | | | | | | 669,564 | |
| |
Real Estate Investment Trusts 0.3% | | | | | |
C.B. Richard Ellis Services, Inc. | | Ba1 | | 3.742 | | | 09/04/19 | | | | 100 | | | | 97,007 | |
| | | | | |
Retailers 0.3% | | | | | | | | | | | | | | | | |
Nieman Marcus Group, Inc. | | B2 | | 4.750 | | | 05/16/18 | | | | 100 | | | | 96,982 | |
| | | | | |
Technology 0.9% | | | | | | | | | | | | | | | | |
CDW LLC | | B2 | | 4.250 | | | 07/15/17 | | | | 100 | | | | 94,625 | |
First Data Corp. | | B1 | | 4.358 | | | 03/24/18 | | | | 141 | | | | 121,290 | |
See Notes to Financial Statements.
| | |
| 14 | | Visit our website at www.prudentialfunds.com |
| | | | | | | | | | | | | | | | |
| Description | | Moody’s
Ratings†
(Unaudited) | | Interest
Rate | | Maturity
Date | | | Principal
Amount (000)# | | | Value (Note 1) | |
| | | | | | | | | | | | | | | | |
BANK LOANS(a) (Continued) | | | | | | | | | | | | |
|
Technology (cont’d.) | |
Sensata Technologies, Inc. | | B1 | | 4.000% | | | 05/12/18 | | | $ | 100 | | | $ | 99,043 | |
| | | | | | | | | | | | | | | | |
| | | | | | | | | | | | | | | 314,958 | |
| | | | | | | | | | | | | | | | |
TOTAL BANK LOANS
(cost $2,726,689) | | | | | | | | | | | | | | | 2,644,701 | |
| | | | | | | | | | | | | | | | |
|
COMMERCIAL MORTGAGE-BACKED SECURITIES 24.8% | |
Banc of America Commercial Mortgage, Inc.,
Ser. 2006-1, Class A2(a) | | Aaa | | 5.334 | | | 09/10/45 | | | | 172 | | | | 172,033 | |
Ser. 2006-6, Class A2 | | Aaa | | 5.309 | | | 10/10/45 | | | | 376 | | | | 375,749 | |
Ser. 2007-1, Class A3 | | Aaa | | 5.449 | | | 01/15/49 | | | | 272 | | | | 285,969 | |
Ser. 2007-5, Class A3 | | AAA(b) | | 5.620 | | | 02/10/51 | | | | 30 | | | | 31,260 | |
Banc of America Merrill Lynch Commercial Mortgage, Inc.,
Ser. 2007-1, Class AAB | | Aaa | | 5.422 | | | 01/15/49 | | | | 40 | | | | 42,566 | |
Ser. 2007-2, Class A3(a) | | AAA(b) | | 5.618 | | | 04/10/49 | | | | 200 | | | | 215,295 | |
Bear Stearns Commercial Mortgage Securities,
Ser. 2005-PWR7, Class A2 | | Aaa | | 4.945 | | | 02/11/41 | | | | 478 | | | | 478,858 | |
Ser. 2006-PW11, Class A4(a) | | AAA(b) | | 5.452 | | | 03/11/39 | | | | 200 | | | | 222,715 | |
Ser. 2006-PW14, Class A2 | | AAA(b) | | 5.123 | | | 12/11/38 | | | | 80 | | | | 79,775 | |
Ser. 2007-PW17, Class A3 | | AAA(b) | | 5.736 | | | 06/11/50 | | | | 200 | | | | 211,276 | |
Ser. 2007-T26, Class A2 | | AAA(b) | | 5.330 | | | 01/12/45 | | | | 200 | | | | 201,126 | |
Citigroup Commercial Mortgage Trust, | | | | | | | | | | | | | | | | |
Ser. 2007-C6, Class A3(a) | | Aaa | | 5.697 | | | 12/10/49 | | | | 200 | | | | 214,209 | |
Citigroup/Deutsche Bank Commercial Mortgage Trust, | | | | | | | | | | | | | | | | |
Ser. 2006-CD2, Class A2 | | Aaa | | 5.408 | | | 01/15/46 | | | | 140 | | | | 140,264 | |
Ser. 2006-CD3, Class A2 | | Aaa | | 5.560 | | | 10/15/48 | | | | 233 | | | | 235,698 | |
Ser. 2007-CD4, Class A2B | | Aaa | | 5.205 | | | 12/11/49 | | | | 200 | | | | 203,591 | |
Ser. 2007-CD4, Class A3 | | Aaa | | 5.293 | | | 12/11/49 | | | | 200 | | | | 212,395 | |
Credit Suisse Mortgage Capital Certificates, Ser. 2007-C3, Class A2(a) | | Aaa | | 5.714 | | | 06/15/39 | | | | 167 | | | | 168,448 | |
Ser. 2007-C4, Class A3(a) | | Aaa | | 5.795 | | | 09/15/39 | | | | 200 | | | | 210,047 | |
CW Capital Cobalt Ltd.,
Ser. 2007-C2, Class A2 | | Aaa | | 5.334 | | | 04/15/47 | | | | 226 | | | | 230,202 | |
See Notes to Financial Statements.
| | | | |
| Prudential Absolute Return Bond Fund | | | 15 | |
Portfolio of Investments
as of October 31, 2011 continued
| | | | | | | | | | | | | | | | |
| Description | | Moody’s
Ratings†
(Unaudited) | | Interest
Rate | | Maturity
Date | | | Principal
Amount (000)# | | | Value (Note 1) | |
| | | | | | | | | | | | | | | | |
COMMERCIAL MORTGAGE-BACKED SECURITIES (Continued) | | | | | | | | | |
GE Capital Commercial Mortgage Corp.,
Ser. 2007-C1, Class AAB | | Aaa | | 5.477% | | | 12/10/49 | | | $ | 155 | | | $ | 162,817 | |
Greenwich Capital Commercial Funding Corp.,
Ser. 2005-GG3, Class A3 | | Aaa | | 4.569 | | | 08/10/42 | | | | 200 | | | | 204,213 | |
Ser. 2006-GG7, Class A2(a) | | Aaa | | 6.032 | | | 07/10/38 | | | | 87 | | | | 86,709 | |
Ser. 2007-GG9, Class A2 | | Aaa | | 5.381 | | | 03/10/39 | | | | 409 | | | | 411,030 | |
GS Mortgage Securities Corp. II,
Ser. 2006-GG6, Class A2(a) | | AAA(b) | | 5.506 | | | 04/10/38 | | | | 74 | | | | 75,044 | |
Ser. 2006-GG8, Class A2 | | Aaa | | 5.479 | | | 11/10/39 | | | | 65 | | | | 65,035 | |
Ser. 2006-GG8, Class A3 | | Aaa | | 5.542 | | | 11/10/39 | | | | 200 | | | | 207,725 | |
JPMorgan Chase Commercial Mortgage Securities Corp.,
Ser. 2004-CBX, Class AJ(a) | | Aa1 | | 4.951 | | | 01/12/37 | | | | 200 | | | | 198,150 | |
Ser. 2005-LDP4, Class AM(a) | | Aa2 | | 4.999 | | | 10/15/42 | | | | 200 | | | | 205,206 | |
Ser. 2006-LDP6, Class ASB(a) | | Aaa | | 5.490 | | | 04/15/43 | | | | 160 | | | | 169,629 | |
Ser. 2007-LD11, Class A3(a) | | Aaa | | 5.817 | | | 06/15/49 | | | | 218 | | | | 234,370 | |
Ser. 2007-LD12, Class A2 | | Aaa | | 5.827 | | | 02/15/51 | | | | 397 | | | | 405,713 | |
LB-UBS Commercial Mortgage Trust,
Ser. 2005-C3, Class A3 | | Aaa | | 4.647 | | | 07/15/30 | | | | 111 | | | | 111,405 | |
Ser. 2006-C3, Class A4(a) | | Aaa | | 5.661 | | | 03/15/39 | | | | 200 | | | | 223,228 | |
Ser. 2006-C6, Class A2 | | Aaa | | 5.262 | | | 09/15/39 | | | | 12 | | | | 12,043 | |
Ser. 2007-C2, Class A2 | | AAA(b) | | 5.303 | | | 02/15/40 | | | | 263 | | | | 264,805 | |
Merrill Lynch Mortgage Trust,
Ser. 2007-C1, Class A3(a) | | A+(b) | | 5.828 | | | 06/12/50 | | | | 200 | | | | 213,610 | |
Merrill Lynch/Countrywide Commercial Mortgage Trust, | | | | | | | | | | | | | | | | |
Ser. 2006-4, Class A2(a) | | Aaa | | 5.112 | | | 12/12/49 | | | | 102 | | | | 102,213 | |
Morgan Stanley Capital I,
Ser. 2006-HQ9, Class A2 | | AAA(b) | | 5.618 | | | 07/12/44 | | | | 144 | | | | 143,912 | |
Ser. 2007-HQ11, Class A2 | | Aaa | | 5.359 | | | 02/12/44 | | | | 120 | | | | 120,183 | |
Ser. 2007-HQ11, Class A31 | | Aaa | | 5.439 | | | 02/12/44 | | | | 160 | | | | 167,312 | |
Ser. 2007-IQ14, Class AAB(a) | | Aaa | | 5.654 | | | 04/15/49 | | | | 200 | | | | 212,383 | |
Wachovia Bank Commercial Mortgage Trust, | | | | | | | | | | | | | | | | |
Ser. 2006-C27, Class A2 | | Aaa | | 5.624 | | | 07/15/45 | | | | 271 | (c) | | | 270 | |
Ser. 2006-C29, Class A3 | | Aaa | | 5.313 | | | 11/15/48 | | | | 125 | | | | 131,038 | |
See Notes to Financial Statements.
| | |
| 16 | | Visit our website at www.prudentialfunds.com |
| | | | | | | | | | | | | | | | |
| Description | | Moody’s
Ratings†
(Unaudited) | | Interest
Rate | | Maturity
Date | | | Principal
Amount (000)# | | | Value (Note 1) | |
| | | | | | | | | | | | | | | | |
COMMERCIAL MORTGAGE-BACKED SECURITIES (Continued) | | | | | | | | | |
Ser. 2007-C30, Class A3 | | Aaa | | 5.246% | | | 12/15/43 | | | $ | 400 | | | $ | 402,825 | |
Ser. 2007-C33, Class A2(a) | | Aaa | | 5.854 | | | 02/15/51 | | | | 186 | | | | 188,172 | |
| | | | | | | | | | | | | | | | |
TOTAL COMMERCIAL MORTGAGE-BACKED SECURITIES
(cost $8,621,905) | | | | | | | | | | | | | | | 8,650,516 | |
| | | | | | | | | | | | | | | | |
| | | | | |
CORPORATE BONDS 37.5% | | | | | | | | | | | | | | | | |
| | | | | |
Aerospace & Defense 0.1% | | | | | | | | | | | | | | | | |
BE Aerospace, Inc., | | | | | | | | | | | | | | | | |
Sr. Unsec’d. Notes | | Ba3 | | 8.500 | | | 07/01/18 | | | | 35 | | | | 38,238 | |
| | | | | |
Airlines 0.7% | | | | | | | | | | | | | | | | |
Continental Airlines 2007-1 Class A Pass Through Trust, | | | | | | | | | | | | | | | | |
Pass-thru Certs., Ser. A | | Baa1 | | 5.983 | | | 04/19/22 | | | | 112 | | | | 113,768 | |
Delta Air Lines 2011-1 Class A Pass-Through Trust, | | | | | | | | | | | | | | | | |
Pass-thru Certs., Ser. A | | Baa2 | | 5.300 | | | 04/15/19 | | | | 130 | | | | 130,650 | |
| | | | | | | | | | | | | | | | |
| | | | | | | | | | | | | | | 244,418 | |
| | | | | |
Banking 5.5% | | | | | | | | | | | | | | | | |
Abbey National Treasury Services PLC (United Kingdom),
Gtd. Notes | | A1 | | 2.875 | | | 04/25/14 | | | | 50 | | | | 47,926 | |
American Express Co.,
Sr. Unsec’d. Notes | | A3 | | 8.125 | | | 05/20/19 | | | | 130 | | | | 167,328 | |
Bank of America Corp.,
Sr. Unsec’d. Notes | | Baa1 | | 5.875 | | | 01/05/21 | | | | 130 | | | | 127,287 | |
Capital One Financial Corp.,
Sub. Notes | | Baa2 | | 6.150 | | | 09/01/16 | | | | 110 | | | | 116,809 | |
Citigroup, Inc.,
Sr. Unsec’d. Notes | | A3 | | 6.125 | | | 05/15/18 | | | | 130 | | | | 144,049 | |
Sub. Notes | | Baa1 | | 5.000 | | | 09/15/14 | | | | 100 | | | | 101,899 | |
Goldman Sachs Group, Inc. (The),
Sr. Unsec’d. Notes | | A1 | | 5.125 | | | 01/15/15 | | | | 100 | | | | 104,473 | |
Sub. Notes | | A2 | | 5.625 | | | 01/15/17 | | | | 130 | | | | 134,632 | |
See Notes to Financial Statements.
| | | | |
| Prudential Absolute Return Bond Fund | | | 17 | |
Portfolio of Investments
as of October 31, 2011 continued
| | | | | | | | | | | | | | | | |
| Description | | Moody’s
Ratings†
(Unaudited) | | Interest
Rate | | Maturity
Date | | | Principal
Amount (000)# | | | Value (Note 1) | |
| | | | | | | | | | | | | | | | |
CORPORATE BONDS (Continued) | | | | | | | | | | | | |
|
Banking (cont’d.) | |
HSBC Bank PLC (United Kingdom),
Sr. Notes, 144A | | Aa2 | | 3.500% | | | 06/28/15 | | | $ | 120 | | | $ | 123,822 | |
JPMorgan Chase & Co.,
Jr. Sub Notes, Ser. 1(a) | | Baa1 | | 7.900 | | | 04/29/49 | | | | 130 | | | | 139,972 | |
Sr. Unsec’d. Notes | | Aa3 | | 3.150 | | | 07/05/16 | | | | 15 | | | | 15,026 | |
Sr. Unsec’d. Notes | | Aa3 | | 6.000 | | | 01/15/18 | | | | 130 | | | | 145,467 | |
Lloyds TSB Bank PLC (United Kingdom),
Gtd. Notes., 144A, MTN | | A1 | | 5.800 | | | 01/13/20 | | | | 100 | | | | 102,379 | |
Morgan Stanley,
Sr. Unsec’d. Notes, MTN | | A2 | | 5.625 | | | 09/23/19 | | | | 130 | | | | 128,365 | |
PNC Funding Corp.,
Gtd. Notes | | A3 | | 2.700 | | | 09/19/16 | | | | 50 | | | | 50,607 | |
Royal Bank of Scotland PLC (The) (United Kingdom),
Gtd. Notes | | A2 | | 4.875 | | | 03/16/15 | | | | 100 | | | | 101,624 | |
Santander Holdings USA, Inc.,
Sr. Unsec’d. Notes | | Baa1 | | 4.625 | | | 04/19/16 | | | | 35 | | | | 34,467 | |
US Bancorp,
Jr. Sub Notes | | A2 | | 3.442 | | | 02/01/16 | | | | 130 | | | | 133,419 | |
| | | | | | | | | | | | | | | | |
| | | | | | | | | | | | | | | 1,919,551 | |
| | | |
Building Materials & Construction 0.3% | | | | | | | | | | | | |
Country Garden Holdings Co. (Cayman Islands),
Sr. Unsec’d. Notes, 144A | | Ba3 | | 11.750 | | | 09/10/14 | | | | 100 | | | | 97,000 | |
| | | | | |
Cable 4.0% | | | | | | | | | | | | | | | | |
Charter Communications Operating LLC,
Sec’d. Notes, 144A | | Ba2 | | 8.000 | | | 04/30/12 | | | | 300 | | | | 306,750 | |
CSC Holdings LLC,
Sr. Unsec’d. Notes, 144A | | Ba3 | | 6.750 | | | 11/15/21 | | | | 50 | | | | 50,000 | |
Sr. Unsec’d. Notes | | Ba3 | | 8.500 | | | 04/15/14 | | | | 250 | | | | 274,375 | |
Sr. Unsec’d. Notes | | Ba3 | | 8.625 | | | 02/15/19 | | | | 35 | | | | 39,725 | |
See Notes to Financial Statements.
| | |
| 18 | | Visit our website at www.prudentialfunds.com |
| | | | | | | | | | | | | | | | |
| Description | | Moody’s
Ratings†
(Unaudited) | | Interest
Rate | | Maturity
Date | | | Principal
Amount (000)# | | | Value (Note 1) | |
| | | | | | | | | | | | | | | | |
CORPORATE BONDS (Continued) | | | | | | | | | | | | |
|
Cable (cont’d.) | |
DIRECTV Holdings LLC/DIRECTV Financing Co., Inc.,
Gtd. Notes | | Baa2 | | 3.500% | | | 03/01/16 | | | $ | 130 | | | $ | 135,298 | |
Echostar DBS Corp.,
Gtd. Notes | | Ba2 | | 6.625 | | | 10/01/14 | | | | 200 | | | | 208,500 | |
UPC Holding BV (Netherlands),
Sr. Sec’d. Notes, 144A | | B2 | | 9.875 | | | 04/15/18 | | | | 150 | | | | 163,125 | |
Videotron Ltee (Canada),
Gtd. Notes | | Ba1 | | 9.125 | | | 04/15/18 | | | | 200 | | | | 220,000 | |
| | | | | | | | | | | | | | | | |
| | | | | | | | | | | | | | | 1,397,773 | |
| | | | | |
Capital Goods 0.7% | | | | | | | | | | | | | | | | |
Case New Holland, Inc.,
Gtd. Notes | | Ba2 | | 7.750 | | | 09/01/13 | | | | 100 | | | | 106,500 | |
MHP SA (Luxembourg),
Gtd. Notes, 144A | | B3 | | 10.250 | | | 04/29/15 | | | | 100 | | | | 94,500 | |
Xylem, Inc.,
Gtd. Notes, 144A | | Baa2 | | 4.875 | | | 10/01/21 | | | | 50 | | | | 51,786 | |
| | | | | | | | | | | | | | | | |
| | | | | | | | | | | | | | | 252,786 | |
| | | | | |
Chemicals 1.1% | | | | | | | | | | | | | | | | |
Dow Chemical Co. (The),
Sr. Unsec’d. Notes | | Baa3 | | 5.900 | | | 02/15/15 | | | | 120 | | | | 133,541 | |
Lyondell Chemical Co.,
Sec’d. Notes | | Ba3 | | 11.000 | | | 05/01/18 | | | | 100 | | | | 111,375 | |
Rockwood Specialties Group, Inc.,
Gtd. Notes | | B1 | | 7.500 | | | 11/15/14 | | | | 150 | | | | 151,875 | |
| | | | | | | | | | | | | | | | |
| | | | | | | | | | | | | | | 396,791 | |
| | | | | |
Consumer 0.5% | | | | | | | | | | | | | | | | |
Sealy Mattress Co., | | | | | | | | | | | | | | | | |
Sr. Sec’d. Notes, 144A | | Ba3 | | 10.875 | | | 04/15/16 | | | | 140 | | | | 153,650 | |
VF Corp., | | | | | | | | | | | | | | | | |
Sr. Unsec’d. Notes | | A3 | | 3.500 | | | 09/01/21 | | | | 25 | | | | 25,356 | |
| | | | | | | | | | | | | | | | |
| | | | | | | | | | | | | | | 179,006 | |
See Notes to Financial Statements.
| | | | |
| Prudential Absolute Return Bond Fund | | | 19 | |
Portfolio of Investments
as of October 31, 2011 continued
| | | | | | | | | | | | | | | | |
| Description | | Moody’s
Ratings†
(Unaudited) | | Interest
Rate | | Maturity
Date | | | Principal
Amount (000)# | | | Value (Note 1) | |
| | | | | | | | | | | | | | | | |
CORPORATE BONDS (Continued) | | | | | | | | | | | | |
| | | | | |
Electric 0.4% | | | | | | | | | | | | | | | | |
DTE Energy Co., | | | | | | | | | | | | | | | | |
Sr. Unsec’d. Notes(a) | | Baa2 | | 1.031% | | | 06/03/13 | | | $ | 50 | | | $ | 49,979 | |
EDP Finance BV (Netherlands), | | | | | | | | | | | | | | | | |
Sr. Unsec’d. Notes, 144A | | Baa3 | | 5.375 | | | 11/02/12 | | | | 100 | | | | 99,777 | |
| | | | | | | | | | | | | | | | |
| | | | | | | | | | | | | | | 149,756 | |
| | | | | |
Energy - Other 2.2% | | | | | | | | | | | | | | | | |
Alliance Oil Co. Ltd. (Bermuda), | | | | | | | | | | | | | | | | |
Sr. Unsec’d. Notes, 144A | | B+(b) | | 9.875 | | | 03/11/15 | | | | 100 | | | | 102,500 | |
Anadarko Petroleum Corp., | | | | | | | | | | | | | | | | |
Sr. Unsec’d. Notes | | Ba1 | | 6.375 | | | 09/15/17 | | | | 100 | | | | 117,675 | |
Cameron International Corp., | | | | | | | | | | | | | | | | |
Sr. Unsec’d. Notes(a) | | Baa1 | | 1.257 | | | 06/02/14 | | | | 125 | | | | 125,585 | |
Dolphin Energy Ltd. (United Arab Emirates), | | | | | | | | | | | | | | | | |
Sr. Sec’d. Notes, 144A | | A1 | | 5.888 | | | 06/15/19 | | | | 88 | | | | 96,427 | |
Forest Oil Corp., | | | | | | | | | | | | | | | | |
Gtd. Notes | | B1 | | 8.500 | | | 02/15/14 | | | | 200 | | | | 216,000 | |
Weatherford International Ltd. (Bermuda),
Gtd. Notes | | Baa2 | | 5.150 | | | 03/15/13 | | | | 100 | | | | 104,616 | |
| | | | | | | | | | | | | | | | |
| | | | | | | | | | | | | | | 762,803 | |
| | | | | |
Foods 2.4% | | | | | | | | | | | | | | | | |
Anheuser-Busch InBev Worldwide, Inc., | | | | | | | | | | | | | | | | |
Gtd. Notes | | Baa1 | | 7.750 | | | 01/15/19 | | | | 100 | | | | 130,736 | |
ARAMARK Corp., | | | | | | | | | | | | | | | | |
Gtd. Notes | | B3 | | 8.500 | | | 02/01/15 | | | | 200 | | | | 207,500 | |
Dole Food Co., Inc., | | | | | | | | | | | | | | | | |
Sr. Sec’d. Notes | | B2 | | 13.875 | | | 03/15/14 | | | | 100 | | | | 116,750 | |
Kraft Foods, Inc., | | | | | | | | | | | | | | | | |
Sr. Unsec’d. Notes | | Baa2 | | 6.125 | | | 02/01/18 | | | | 120 | | | | 141,540 | |
Smithfield Foods, Inc., | | | | | | | | | | | | | | | | |
Sr. Sec’d. Notes | | Ba2 | | 10.000 | | | 07/15/14 | | | | 100 | | | | 116,250 | |
See Notes to Financial Statements.
| | |
| 20 | | Visit our website at www.prudentialfunds.com |
| | | | | | | | | | | | | | | | |
| Description | | Moody’s
Ratings†
(Unaudited) | | Interest
Rate | | Maturity
Date | | | Principal
Amount (000)# | | | Value (Note 1) | |
| | | | | | | | | | | | | | | | |
CORPORATE BONDS (Continued) | | | | | | | | | | | | |
|
Foods (cont’d.) | |
Stater Brothers Holdings, Inc., | | | | | | | | | | | | | | | | |
Gtd. Notes | | B2 | | 7.750% | | | 04/15/15 | | | $ | 125 | | | $ | 129,062 | |
| | | | | | | | | | | | | | | | |
| | | | | | | | | | | | | | | 841,838 | |
| | | | | |
Gaming 1.6% | | | | | | | | | | | | | | | | |
Marina District Finance Co., Inc., | | | | | | | | | | | | | | | | |
Sr. Sec’d. Notes | | B2 | | 9.875 | | | 08/15/18 | | | | 100 | | | | 98,750 | |
MGM Resorts International, | | | | | | | | | | | | | | | | |
Sr. Sec’d. Notes | | Ba3 | | 11.125 | | | 11/15/17 | | | | 200 | | | | 227,000 | |
Sr. Sec’d. Notes | | Ba3 | | 13.000 | | | 11/15/13 | | | | 100 | | | | 115,250 | |
Yonkers Racing Corp., | | | | | | | | | | | | | | | | |
Sec’d. Notes, 144A
(original cost $139,688; purchased 04/12/11)(d)(e) | | B1 | | 11.375 | | | 07/15/16 | | | | 125 | | | | 128,437 | |
| | | | | | | | | | | | | | | | |
| | | | | | | | | | | | | | | 569,437 | |
| | |
Healthcare & Pharmaceutical 1.2% | | | | | | | | | |
Apria Healthcare Group, Inc., | | | | | | | | | | | | | | | | |
Sr. Sec’d. Notes | | Ba3 | | 11.250 | | | 11/01/14 | | | | 125 | | | | 121,563 | |
HCA, Inc.,
Sr. Unsec’d. Notes | | B3 | | 7.190 | | | 11/15/15 | | | | 100 | | | | 98,000 | |
Sr. Unsec’d. Notes, MTN | | B3 | | 9.000 | | | 12/15/14 | | | | 200 | | | | 206,500 | |
| | | | | | | | | | | | | | | | |
| | | | | | | | | | | | | | | 426,063 | |
| | | | | |
Insurance 1.8% | | | | | | | | | | | | | | | | |
Allied World Assurance Co. Holdings Ltd. (Bermuda), | | | | | | | | | | | | | | | | |
Gtd. Notes | | Baa1 | | 7.500 | | | 08/01/16 | | | | 100 | | | | 114,238 | |
American International Group, Inc., | | | | | | | | | | | | | | | | |
Sr. Unsec’d. Notes | | Baa1 | | 6.400 | | | 12/15/20 | | | | 130 | | | | 136,155 | |
AON Corp., | | | | | | | | | | | | | | | | |
Sr. Unsec’d. Notes | | Baa2 | | 3.125 | | | 05/27/16 | | | | 110 | | | | 111,710 | |
Liberty Mutual Group, Inc., | | | | | | | | | | | | | | | | |
Sr. Unsec’d. Notes, 144A | | Baa2 | | 6.700 | | | 08/15/16 | | | | 115 | | | | 123,873 | |
See Notes to Financial Statements.
| | | | |
| Prudential Absolute Return Bond Fund | | | 21 | |
Portfolio of Investments
as of October 31, 2011 continued
| | | | | | | | | | | | | | | | |
| Description | | Moody’s
Ratings†
(Unaudited) | | Interest
Rate | | Maturity
Date | | | Principal
Amount (000)# | | | Value (Note 1) | |
| | | | | | | | | | | | | | | | |
CORPORATE BONDS (Continued) | | | | | | | | | | | | |
|
Insurance (cont’d.) | |
Markel Corp., | | | | | | | | | | | | | | | | |
Sr. Unsec’d. Notes | | Baa2 | | 7.125% | | | 09/30/19 | | | $ | 130 | | | $ | 148,997 | |
| | | | | | | | | | | | | | | | |
| | | | | | | | | | | | | | | 634,973 | |
| | | | | |
Lodging 0.4% | | | | | | | | | | | | | | | | |
Wyndham Worldwide Corp.,
Sr. Unsec’d. Notes | | Baa3 | | 5.750 | | | 02/01/18 | | | | 120 | | | | 125,913 | |
| | | |
Media & Entertainment 2.5% | | | | | | | | | | | | |
Intelsat Jackson Holdings SA (Luxembourg),
Gtd. Notes | | Caa2 | | 11.250 | | | 06/15/16 | | | | 100 | | | | 105,500 | |
Lamar Media Corp.,
Gtd. Notes | | Ba3 | | 9.750 | | | 04/01/14 | | | | 175 | | | | 192,500 | |
LIN Television Corp.,
Gtd. Notes | | Caa1 | | 6.500 | | | 05/15/13 | | | | 275 | | | | 275,000 | |
Nielsen Finance LLC/Nielsen Finance Co.,
Gtd. Notes | | B2 | | 11.625 | | | 02/01/14 | | | | 250 | | | | 287,500 | |
| | | | | | | | | | | | | | | | |
| | | | | | | | | | | | | | | 860,500 | |
| | | | | |
Metals 2.6% | | | | | | | | | | | | | | | | |
ArcelorMittal (Luxembourg),
Sr. Unsec’d. Notes | | Baa3 | | 9.850 | | | 06/01/19 | | | | 50 | | | | 59,317 | |
Bumi Capital Pte Ltd. (Singapore),
Sr. Sec’d. Notes, RegS | | Ba3 | | 12.000 | | | 11/10/16 | | | | 100 | | | | 105,000 | |
Century Aluminum Co.,
Sec’d. Notes | | B(b) | | 8.000 | | | 05/15/14 | | | | 125 | | | | 126,562 | |
Indo Integrated Energy II BV (Netherlands),
Sr. Sec’d. Notes, RegS | | B1 | | 9.750 | | | 11/05/16 | | | | 100 | | | | 108,500 | |
Raspadskaya OJSC Via Raspadskaya Securities Ltd. (Ireland),
Sec’d. Notes | | B1 | | 7.500 | | | 05/22/12 | | | | 100 | | | | 100,875 | |
Steel Dynamics, Inc.,
Gtd. Notes | | Ba2 | | 6.750 | | | 04/01/15 | | | | 150 | | | | 152,625 | |
See Notes to Financial Statements.
| | |
| 22 | | Visit our website at www.prudentialfunds.com |
| | | | | | | | | | | | | | | | |
| Description | | Moody’s
Ratings†
(Unaudited) | | Interest
Rate | | Maturity
Date | | | Principal
Amount (000)# | | | Value (Note 1) | |
| | | | | | | | | | | | | | | | |
CORPORATE BONDS (Continued) | | | | | | | | | | | | |
|
Metals (cont’d.) | |
Gtd. Notes | | Ba2 | | 7.375% | | | 11/01/12 | | | $ | 250 | | | $ | 259,063 | |
| | | | | | | | | | | | | | | | |
| | | | | | | | | | | | | | | 911,942 | |
| | | | | |
Non-Captive Finance 1.8% | | | | | | | | | | | | | | | | |
American General Finance Corp.,
Sr. Unsec’d. Notes,
Ser. H, MTN | | B3 | | 5.375 | | | 10/01/12 | | | | 100 | | | | 95,000 | |
CIT Group, Inc.,
Sec’d. Notes, 144A | | B2 | | 7.000 | | | 05/02/17 | | | | 150 | | | | 149,625 | |
General Electric Capital Corp.,
Sub. Notes | | Aa3 | | 5.300 | | | 02/11/21 | | | | 130 | | | | 138,354 | |
International Lease Finance Corp.,
Sr. Unsec’d. Notes | | B1 | | 5.750 | | | 05/15/16 | | | | 25 | | | | 23,587 | |
Sr. Unsec’d. Notes | | B1 | | 6.250 | | | 05/15/19 | | | | 25 | | | | 23,533 | |
Sr. Unsec’d. Notes | | B1 | | 8.625 | | | 09/15/15 | | | | 90 | | | | 94,500 | |
SLM Corp.,
Sr. Unsec’d. Notes, MTN | | Ba1 | | 8.000 | | | 03/25/20 | | | | 100 | | | | 104,000 | |
| | | | | | | | | | | | | | | | |
| | | | | | | | | | | | | | | 628,599 | |
| | | | | |
Paper 1.7% | | | | | | | | | | | | | | | | |
Georgia-Pacific LLC,
Gtd. Notes, 144A
(original cost $35,100; purchased 04/20/11)(d)(e) | | Baa3 | | 5.400 | | | 11/01/20 | | | | 35 | | | | 39,021 | |
Graphic Packaging International, Inc.,
Gtd. Notes | | B2 | | 9.500 | | | 06/15/17 | | | | 150 | | | | 163,875 | |
International Paper Co.,
Sr. Unsec’d. Notes | | Baa3 | | 9.375 | | | 05/15/19 | | | | 100 | | | | 128,232 | |
Rock-Tenn Co.,
Gtd. Notes | | Ba2 | | 9.250 | | | 03/15/16 | | | | 150 | | | | 159,375 | |
Verso Paper Holdings LLC/Verso Paper, Inc.,
Sr. Sec’d. Notes | | Ba2 | | 11.500 | | | 07/01/14 | | | | 100 | | | | 105,000 | |
| | | | | | | | | | | | | | | | |
| | | | | | | | | | | | | | | 595,503 | |
See Notes to Financial Statements.
| | | | |
| Prudential Absolute Return Bond Fund | | | 23 | |
Portfolio of Investments
as of October 31, 2011 continued
| | | | | | | | | | | | | | | | |
| Description | | Moody’s
Ratings†
(Unaudited) | | Interest
Rate | | Maturity
Date | | | Principal
Amount (000)# | | | Value (Note 1) | |
| | | | | | | | | | | | | | | | |
CORPORATE BONDS (Continued) | | | | | | | | | | | | |
| | | |
Real Estate Investment Trusts 0.4% | | | | | | | | | | | | |
Mack-Cali Realty LP,
Sr. Unsec’d. Notes | | Baa2 | | 4.600% | | | 06/15/13 | | | $ | 130 | | | $ | 133,541 | |
| | | | | |
Retailers 0.5% | | | | | | | | | | | | | | | | |
Sally Holdings LLC/Sally Capital, Inc.,
Gtd. Notes | | B2 | | 9.250 | | | 11/15/14 | | | | 150 | | | | 153,938 | |
| | | | | |
Technology 2.7% | | | | | | | | | | | | | | | | |
Applied Materials, Inc.,
Sr. Unsec’d. Notes | | A3 | | 2.650 | | | 06/15/16 | | | | 25 | | | | 25,758 | |
Fiserv, Inc.,
Gtd. Notes | | Baa2 | | 3.125 | | | 06/15/16 | | | | 35 | | | | 35,549 | |
NXP BV/NXP Funding LLC (Netherlands), | | | | | | | | | | | | | | | | |
Sr. Sec’d. Notes, Ser. EXcH(a) | | B2 | | 3.153 | | | 10/15/13 | | | | 300 | | | | 294,000 | |
Seagate Technology International (Cayman Islands), | | | | | | | | | | | | | | | | |
Sec’d. Notes, 144A | | Baa3 | | 10.000 | | | 05/01/14 | | | | 100 | | | | 113,750 | |
SunGard Data Systems, Inc.,
Gtd. Notes | | Caa1 | | 10.625 | | | 05/15/15 | | | | 150 | | | | 161,625 | |
Sr. Sec’d. Notes | | B3 | | 4.875 | | | 01/15/14 | | | | 100 | | | | 100,500 | |
Unisys Corp., | | | | | | | | | | | | | | | | |
Sr. Sec’d. Notes, 144A | | Ba1 | | 12.750 | | | 10/15/14 | | | | 100 | | | | 112,250 | |
Xerox Corp., | | | | | | | | | | | | | | | | |
Sr. Unsec’d. Notes(a) | | Baa2 | | 1.110 | | | 05/16/14 | | | | 100 | | | | 99,099 | |
| | | | | | | | | | | | | | | | |
| | | | | | | | | | | | | | | 942,531 | |
| | | | | |
Telecommunications 1.7% | | | | | | | | | | | | | | | | |
AT&T, Inc., | | | | | | | | | | | | | | | | |
Sr. Unsec’d. Notes | | A2 | | 2.400 | | | 08/15/16 | | | | 75 | | | | 76,671 | |
Digicel Ltd. (Bermuda), | | | | | | | | | | | | | | | | |
Sr. Unsec’d. Notes, 144A | | B1 | | 12.000 | | | 04/01/14 | | | | 100 | | | | 113,000 | |
Embarq Corp.,
Sr. Unsec’d. Notes (original cost $135,646; purchased 05/04/11 - 05/11/11)(d)(e) | | Baa3 | | 7.082 | | | 06/01/16 | | | | 120 | | | | 130,053 | |
See Notes to Financial Statements.
| | |
| 24 | | Visit our website at www.prudentialfunds.com |
| | | | | | | | | | | | | | | | |
| Description | | Moody’s
Ratings†
(Unaudited) | | Interest
Rate | | Maturity
Date | | | Principal
Amount (000)# | | | Value (Note 1) | |
| | | | | | | | | | | | | | | | |
CORPORATE BONDS (Continued) | | | | | | | | | | | | |
|
Telecommunications (cont’d.) | |
MTS International Funding Ltd. (Ireland),
Sec’d. Notes, 144A | | Ba2 | | 8.625% | | | 06/22/20 | | | $ | 100 | | | $ | 109,250 | |
Nextel Communications, Inc.,
Gtd. Notes, Ser. E | | B1 | | 6.875 | | | 10/31/13 | | | | 60 | | | | 59,250 | |
Telefonica Emisiones SAU (Spain),
Gtd. Notes | | Baa1 | | 3.992 | | | 02/16/16 | | | | 120 | | | | 118,054 | |
| | | | | | | | | | | | | | | | |
| | | | | | | | | | | | | | | 606,278 | |
| | | | | |
Tobacco 0.7% | | | | | | | | | | | | | | | | |
Altria Group, Inc.,
Gtd. Notes | | Baa1 | | 9.950 | | | 11/10/38 | | | | 60 | | | | 91,158 | |
Lorillard Tobacco Co.,
Gtd. Notes | | Baa2 | | 3.500 | | | 08/04/16 | | | | 15 | | | | 15,058 | |
Reynolds American, Inc.,
Gtd. Notes | | Baa3 | | 6.750 | | | 06/15/17 | | | | 115 | | | | 132,888 | |
| | | | | | | | | | | | | | | | |
| | | | | | | | | | | | | | | 239,104 | |
| | | | | | | | | | | | | | | | |
TOTAL CORPORATE BONDS
(cost $13,208,017) | | | | | | | | | | | | | | | 13,108,282 | |
| | | | | | | | | | | | | | | | |
| | | | | |
MUNICIPAL BOND 0.4% | | | | | | | | | | | | | | | | |
State of Illinois
(cost $125,919) | | A1 | | 3.321 | | | 01/01/13 | | | | 125 | | | | 127,344 | |
| | | | | | | | | | | | | | | | |
| | |
NON-CORPORATE FOREIGN AGENCIES 2.6% | | | | | | | | | |
Corp. Andina de Fomento (Supranational),
Sr. Unsec’d. Notes | | A1 | | 3.750 | | | 01/15/16 | | | | 70 | | | | 70,240 | |
Export-Import Bank of Korea (South Korea),
Sr. Unsec’d. Notes | | A1 | | 4.125 | | | 09/09/15 | | | | 100 | | | | 102,556 | |
Gazprom OAO Via Gazprom International SA (Luxembourg),
Gtd. Notes, 144A | | BBB+(b) | | 7.201 | | | 02/01/20 | | | | 68 | | | | 74,983 | |
See Notes to Financial Statements.
| | | | |
| Prudential Absolute Return Bond Fund | | | 25 | |
Portfolio of Investments
as of October 31, 2011 continued
| | | | | | | | | | | | | | | | |
| Description | | Moody’s
Ratings†
(Unaudited) | | Interest
Rate | | Maturity
Date | | | Principal
Amount (000)# | | | Value (Note 1) | |
| | | | | | | | | | | | | | | | |
NON-CORPORATE FOREIGN AGENCIES (Continued) | | | | | | | | | | | | |
KazMunayGas National Co. (Kazakhstan),
Sr. Unsec’d. Notes, 144A, MTN | | Baa3 | | 8.375% | | | 07/02/13 | | | $ | 100 | | | $ | 106,500 | |
Korea Hydro & Nuclear Power Co. Ltd. (South Korea),
Sr. Unsec’d. Notes, 144A | | A1 | | 6.250 | | | 06/17/14 | | | | 100 | | | | 108,761 | |
NAK Naftogaz Ukraine (Ukraine),
Gtd. Notes | | NR | | 9.500 | | | 09/30/14 | | | | 95 | | | | 94,050 | |
National Agricultural Cooperative Federation (South Korea),
Sr. Unsec’d. Notes, 144A, MTN | | A1 | | 3.500 | | | 02/08/17 | | | | 200 | | | | 195,658 | |
Petroleos de Venezuela SA (Venezuela),
Sr. Unsec’d. Notes, Ser. 2014 | | NR | | 4.900 | | | 10/28/14 | | | | 200 | | | | 152,000 | |
| | | | | | | | | | | | | | | | |
TOTAL NON-CORPORATE FOREIGN AGENCIES
(cost $922,842) | | | | | | | | | | | | | | | 904,748 | |
| | | | | | | | | | | | | | | | |
| | | | | |
SOVEREIGNS 3.1% | | | | | | | | | | | | | | | | |
Argentina Bonos (Argentina),
Sr. Unsec’d. Notes | | NR | | 7.000 | | | 10/03/15 | | | | 200 | | | | 177,295 | |
Indonesia Government International Bond (Indonesia),
Sr. Unsec’d. Notes, RegS | | Ba1 | | 6.750 | | | 03/10/14 | | | | 200 | | | | 217,500 | |
Ireland Government Bond (Ireland),
Bonds | | Ba1 | | 4.500 | | | 04/18/20 | | | EUR | 45 | | | | 49,191 | |
Mexican Bonos (Mexico), Bonds, Ser. M 30 | | Baa1 | | 10.000 | | | 11/20/36 | | | MXN | 500 | | | | 48,093 | |
Poland Government Bond (Poland), Bonds, Ser. 1019 | | A2 | | 5.500 | | | 10/25/19 | | | PLN | 00 | | | | 62,730 | |
See Notes to Financial Statements.
| | |
| 26 | | Visit our website at www.prudentialfunds.com |
| | | | | | | | | | | | | | | | |
| Description | | Moody’s
Ratings†
(Unaudited) | | Interest
Rate | | Maturity
Date | | | Principal
Amount (000)# | | | Value (Note 1) | |
| | | | | | | | | | | | | | | | |
SOVEREIGNS (Continued) | | | | | | | | | | | | |
Republic of Ghana (Ghana), Unsec’d. Notes, 144A | | B(b) | | 8.500% | | | 10/04/17 | | | $ | 200 | | | $ | 224,000 | |
South Africa Government Bond (South Africa),
Bonds, Ser. R213 | | A3 | | 7.000 | | | 02/28/31 | | | ZAR | 1,730 | | | | 181,731 | |
Turkey Government Bond (Turkey),
Bonds(f) | | B1 | | 6.770 | | | 11/16/11 | | | TRY | 230 | | | | 129,671 | |
| | | | | | | | | | | | | | | | |
TOTAL SOVEREIGNS
(cost $1,131,303) | | | | | | | | | | | | | | | 1,090,211 | |
| | | | | | | | | | | | | | | | |
| | | |
U.S. TREASURY OBLIGATIONS 1.4% | | | | | | | | | | | | |
U.S. Treasury Note | | | | 1.000 | | | 08/31/16 | | | | 30 | | | | 30,056 | |
U.S. Treasury Note | | | | 1.000 | | | 10/31/16 | | | | 395 | | | | 394,861 | |
U.S. Treasury Note | | | | 2.125 | | | 08/15/21 | | | | 85 | | | | 84,629 | |
| | | | | | | | | | | | | | | | |
TOTAL U.S. TREASURY OBLIGATIONS
(cost $505,459) | | | | | | | | | | | | | | | 509,546 | |
| | | | | | | | | | | | | | | | |
TOTAL LONG-TERM INVESTMENTS
(cost $35,519,172) | | | | | | | | | | | | | | | 35,129,370 | |
| | | | | | | | | | | | | | | | |
| | | | | |
| | | | | | | | | | Shares | | | | |
SHORT-TERM INVESTMENT 2.2% | | | | | | | | | |
| | |
AFFILIATED MONEY MARKET MUTUAL FUND | | | | | | | | | |
Prudential Investment Portfolios 2 - Prudential Core Taxable Money Market Fund(g)
(cost $783,730) | | | | | | | | | | | 783,730 | | | | 783,730 | |
| | | | | | | | | | | | | | | | |
TOTAL INVESTMENTS 102.8%
(cost $36,302,902; Note 5) | | | | | | | | | | | | | | | 35,913,100 | |
Liabilities in excess of other assets(h) (2.8)% | | | | | | | | | | | | | | | (981,741 | ) |
| | | | | | | | | | | | | | | | |
NET ASSETS 100.0% | | | | | | | | | | | | | | $ | 34,931,359 | |
| | | | | | | | | | | | | | | | |
See Notes to Financial Statements.
| | | | |
| Prudential Absolute Return Bond Fund | | | 27 | |
Portfolio of Investments
as of October 31, 2011 continued
The following abbreviations are used in the portfolio descriptions:
144A—Security was purchased pursuant to Rule 144A under the Securities Act of 1933 and may not be resold subject to that rule except to qualified institutional buyers. Unless otherwise noted, 144A securities are deemed to be liquid.
RegS—Regulation S. Security was purchased pursuant to Regulation S and may not be offered, sold or delivered within the United States or to, or for the account or benefit of, U.S. persons, except pursuant to an exemption from, or in a transaction not subject to the registration requirements of the Securities Act of 1933.
AUD—Australian Dollar
BBR—New Zealand Bank Bill Rate
BBSW—Bank Bill Swap Reference Rate
BRL—Brazilian Real
CAD—Canadian Dollar
CDO—Collateralized Debt Obligation
CHF—Swiss Franc
CLO—Collateralized Loan Obligation
CLP—Chilean Peso
CNY—Chinese Yuan Renminbi
COP—Columbian Peso
CZK—Czech Koruna
EUR—Euro
GBP—British Pound
HUF—Hungarian Forint
IDR—Indonesian Rupiah
ILS—Israeli New Shekel
INR—Indian Rupee
JIBAR—Johannesburg Interbank Agreed Rate
KRW—South Korean Won
LIBOR—London Interbank Offered Rate
MTN—Medium Term Note
MXN—Mexican Peso
MYR—Malaysian Ringgit
NOK—Norwegian Krone
NR—Not Rated by Moody’s or Standard & Poor’s
NZD—New Zealand Dollar
PEN— Peruvian Nuevo Sol
PHP—Philippine Peso
PLN—Polish Zloty
PRIBOR—Prague Interbank Offered Rate
RON—Romanian New Lei
RUB—Russian Rouble
SEK—Swedish Krona
SGD—Singapore Dollar
THB—Thai Baht
See Notes to Financial Statements.
| | |
| 28 | | Visit our website at www.prudentialfunds.com |
TRY—Turkish Lira
TWD—New Taiwan Dollar
ZAR—South African Rand
| † | The ratings reflected are as of October 31, 2011. Ratings of certain bonds may have changed subsequent to that date. |
| # | Principal amount is shown in U.S. dollars unless otherwise stated. |
| (a) | Variable rate instrument. The interest rate shown reflects the rate in effect at October 31, 2011. |
| (b) | Standard & Poor’s Rating. |
| (c) | Amount is actual; not rounded to thousands. |
| (d) | Indicates a security that has been deemed illiquid. |
| (e) | Indicates a restricted security; the aggregate original cost of such securities is $310,434. The aggregate value of $297,511 is approximately 0.9% of net assets. |
| (f) | Represents zero coupon bond. Rate shown reflects the effective yield at October 31, 2011. |
| (g) | Prudential Investments LLC, the manager of the Fund, also serves as manager of the Prudential Investment Portfolios 2 - Prudential Core Taxable Money Market Fund. |
| (h) | Includes net unrealized appreciation (depreciation) on the following derivative contracts held at reporting period end: |
Forward foreign currency contracts outstanding at October 31, 2011:
| | | | | | | | | | | | | | | | | | |
Foreign Currency
Contracts | | Counterparty | | Notional
Amount | | | Value at
Settlement
Date
Payable | | | Value at
October 31,
2011 | | | Unrealized
Appreciation/
(Depreciation) | |
Purchased: | | | | | | | | | | | | | | | | | | |
Australian Dollar
Expiring 11/18/11 | | Goldman Sachs Group LP | | AUD | 387,394 | | | $ | 397,186 | | | $ | 407,380 | | | $ | 10,194 | |
Brazilian Real | | | | | | | | | | | | | | | | | | |
Expiring 01/19/12 | | Citibank NA | | BRL | 128,721 | | | | 69,900 | | | | 73,610 | | | | 3,710 | |
Expiring 01/19/12 | | Citibank NA | | BRL | 124,420 | | | | 70,100 | | | | 71,151 | | | | 1,051 | |
Expiring 01/19/12 | | Citibank NA | | BRL | 121,721 | | | | 70,900 | | | | 69,607 | | | | (1,293 | ) |
Expiring 01/19/12 | | Citibank NA | | BRL | 66,637 | | | | 35,100 | | | | 38,107 | | | | 3,007 | |
Expiring 01/19/12 | | Citibank NA | | BRL | 65,403 | | | | 34,900 | | | | 37,401 | | | | 2,501 | |
Expiring 01/19/12 | | Citibank NA | | BRL | 65,350 | | | | 34,900 | | | | 37,371 | | | | 2,471 | |
Expiring 01/19/12 | | Citibank NA | | BRL | 65,246 | | | | 34,900 | | | | 37,311 | | | | 2,411 | |
Expiring 01/19/12 | | Citibank NA | | BRL | 64,908 | | | | 35,000 | | | | 37,118 | | | | 2,118 | |
Expiring 01/19/12 | | Citibank NA | | BRL | 64,602 | | | | 35,100 | | | | 36,943 | | | | 1,843 | |
Expiring 01/19/12 | | Citibank NA | | BRL | 64,435 | | | | 35,000 | | | | 36,848 | | | | 1,848 | |
Expiring 01/19/12 | | Citibank NA | | BRL | 61,969 | | | | 35,100 | | | | 35,438 | | | | 338 | |
British Pound | | | | | | | | | | | | | | | | | | |
Expiring 11/22/11 | | Citibank NA | | GBP | 55,359 | | | | 88,000 | | | | 88,993 | | | | 993 | |
Canadian Dollar | | | | | | | | | | | | | | | | | | |
Expiring 11/17/11 | | Goldman Sachs Group LP | | CAD | 53,597 | | | | 53,100 | | | | 53,751 | | | | 651 | |
See Notes to Financial Statements.
| | | | |
| Prudential Absolute Return Bond Fund | | | 29 | |
Portfolio of Investments
as of October 31, 2011 continued
| | | | | | | | | | | | | | | | | | |
Foreign Currency
Contracts | | Counterparty | | Notional
Amount | | | Value at
Settlement
Date
Payable | | | Value at
October 31,
2011 | | | Unrealized
Appreciation/
(Depreciation) | |
Purchased (cont’d.): | | | | | | | | | | | | | | | | | | |
Expiring 11/17/11 | | Morgan Stanley | | CAD | 253,799 | | | $ | 249,188 | | | $ | 254,529 | | | $ | 5,341 | |
Expiring 11/17/11 | | Morgan Stanley | | CAD | 53,567 | | | | 52,800 | | | | 53,721 | | | | 921 | |
Chilean Peso | | | | | | | | | | | | | | | | | | |
Expiring 12/02/11 | | Citibank NA | | CLP | 33,452,550 | | | | 71,933 | | | | 68,025 | | | | (3,908 | ) |
Expiring 12/02/11 | | Citibank NA | | CLP | 25,325,520 | | | | 54,300 | | | | 51,499 | | | | (2,801 | ) |
Expiring 12/02/11 | | Citibank NA | | CLP | 18,292,835 | | | | 34,900 | | | | 37,198 | | | | 2,298 | |
Expiring 12/02/11 | | Citibank NA | | CLP | 17,963,750 | | | | 35,000 | | | | 36,529 | | | | 1,529 | |
Expiring 12/02/11 | | Citibank NA | | CLP | 17,823,750 | | | | 35,000 | | | | 36,244 | | | | 1,244 | |
Expiring 01/09/12 | | Citibank NA | | CLP | 36,178,970 | | | | 70,600 | | | | 73,208 | | | | 2,608 | |
Expiring 01/09/12 | | Citibank NA | | CLP | 27,677,680 | | | | 52,400 | | | | 56,006 | | | | 3,606 | |
Expiring 01/09/12 | | Citibank NA | | CLP | 27,321,360 | | | | 52,800 | | | | 55,285 | | | | 2,485 | |
Expiring 01/09/12 | | Citibank NA | | CLP | 27,057,440 | | | | 52,600 | | | | 54,751 | | | | 2,151 | |
Expiring 01/09/12 | | Citibank NA | | CLP | 26,950,905 | | | | 53,100 | | | | 54,535 | | | | 1,435 | |
Expiring 01/09/12 | | Citibank NA | | CLP | 18,685,460 | | | | 34,900 | | | | 37,810 | | | | 2,910 | |
Expiring 01/09/12 | | Citibank NA | | CLP | 18,504,500 | | | | 35,000 | | | | 37,444 | | | | 2,444 | |
Expiring 01/09/12 | | Citibank NA | | CLP | 18,497,000 | | | | 34,900 | | | | 37,428 | | | | 2,528 | |
Expiring 01/09/12 | | Citibank NA | | CLP | 18,144,945 | | | | 35,100 | | | | 36,716 | | | | 1,616 | |
Expiring 01/09/12 | | Citibank NA | | CLP | 17,593,875 | | | | 35,100 | | | | 35,601 | | | | 501 | |
Chinese Yuan Renminbi | | | | | | | | | | | | | | | | | | |
Expiring 08/02/12 | | Morgan Stanley | | CNY | 1,112,831 | | | | 175,900 | | | | 175,795 | | | | (105 | ) |
Expiring 08/02/12 | | UBS AG | | CNY | 2,291,628 | | | | 361,000 | | | | 362,010 | | | | 1,010 | |
Expiring 08/02/12 | | UBS AG | | CNY | 2,194,275 | | | | 344,200 | | | | 346,631 | | | | 2,431 | |
Expiring 08/02/12 | | UBS AG | | CNY | 556,345 | | | | 87,900 | | | | 87,886 | | | | (14 | ) |
Colombian Peso | | | | | | | | | | | | | | | | | | |
Expiring 11/01/11 | | Morgan Stanley | | COP | 128,833,200 | | | | 71,100 | | | | 69,043 | | | | (2,057 | ) |
Expiring 11/01/11 | | Morgan Stanley | | COP | 95,375,020 | | | | 53,300 | | | | 51,112 | | | | (2,188 | ) |
Expiring 12/06/11 | | Citibank NA | | COP | 176,718,250 | | | | 99,700 | | | | 94,664 | | | | (5,036 | ) |
Expiring 12/06/11 | | Citibank NA | | COP | 167,732,100 | | | | 87,600 | | | | 89,850 | | | | 2,250 | |
Expiring 12/06/11 | | Citibank NA | | COP | 132,675,050 | | | | 70,600 | | | | 71,071 | | | | 471 | |
Expiring 12/06/11 | | Citibank NA | | COP | 102,586,100 | | | | 52,400 | | | | 54,953 | | | | 2,553 | |
Expiring 12/06/11 | | Citibank NA | | COP | 96,974,370 | | | | 54,300 | | | | 51,947 | | | | (2,353 | ) |
Expiring 12/06/11 | | Citibank NA | | COP | 69,004,280 | | | | 34,900 | | | | 36,964 | | | | 2,064 | |
Expiring 12/06/11 | | Citibank NA | | COP | 68,499,975 | | | | 34,900 | | | | 36,694 | | | | 1,794 | |
Expiring 12/06/11 | | Citibank NA | | COP | 68,299,300 | | | | 34,900 | | | | 36,586 | | | | 1,686 | |
Expiring 12/06/11 | | Citibank NA | | COP | 65,445,900 | | | | 34,600 | | | | 35,058 | | | | 458 | |
Expiring 12/06/11 | | Citibank NA | | COP | 48,248,040 | | | | 27,200 | | | | 25,845 | | | | (1,355 | ) |
Expiring 12/06/11 | | Citibank NA | | COP | 33,331,960 | | | | 18,204 | | | | 17,855 | | | | (349 | ) |
Expiring 12/06/11 | | UBS AG | | COP | 117,733,500 | | | | 64,600 | | | | 63,067 | | | | (1,533 | ) |
Czech Koruna | | | | | | | | | | | | | | | | | | |
Expiring 11/21/11 | | Citibank NA | | CZK | 1,806,915 | | | | 98,647 | | | | 100,541 | | | | 1,894 | |
See Notes to Financial Statements.
| | |
| 30 | | Visit our website at www.prudentialfunds.com |
| | | | | | | | | | | | | | | | | | |
Foreign Currency
Contracts | | Counterparty | | Notional
Amount | | | Value at
Settlement
Date
Payable | | | Value at
October 31,
2011 | | | Unrealized
Appreciation/
(Depreciation) | |
Purchased (cont’d.): | | | | | | | | | | | | | | | | | | |
Euro | | | | | | | | | | | | | | | | | | |
Expiring 11/22/11 | | UBS AG | | EUR | 27,401 | | | $ | 37,958 | | | $ | 37,906 | | | $ | (52 | ) |
Hungarian Forint | | | | | | | | | | | | | | | | | | |
Expiring 11/21/11 | | Citibank NA | | HUF | 11,333,235 | | | | 52,800 | | | | 51,279 | | | | (1,521 | ) |
Expiring 11/21/11 | | JPMorgan Chase Securities | | HUF | 11,208,150 | | | | 52,900 | | | | 50,713 | | | | (2,187 | ) |
Indian Rupee | | | | | | | | | | | | | | | | | | |
Expiring 12/23/11 | | Morgan Stanley | | INR | 5,873,115 | | | | 127,000 | | | | 119,486 | | | | (7,514 | ) |
Expiring 12/23/11 | | Morgan Stanley | | INR | 4,232,385 | | | | 87,900 | | | | 86,106 | | | | (1,794 | ) |
Expiring 12/23/11 | | Morgan Stanley | | INR | 2,603,608 | | | | 53,200 | | | | 52,969 | | | | (231 | ) |
Expiring 12/23/11 | | UBS AG | | INR | 3,373,568 | | | | 70,400 | | | | 68,634 | | | | (1,766 | ) |
Expiring 12/23/11 | | UBS AG | | INR | 2,507,000 | | | | 54,500 | | | | 51,004 | | | | (3,496 | ) |
Expiring 12/23/11 | | UBS AG | | INR | 1,736,046 | | | | 35,100 | | | | 35,319 | | | | 219 | |
Expiring 12/23/11 | | UBS AG | | INR | 1,734,291 | | | | 35,100 | | | | 35,284 | | | | 184 | |
Indonesian Rupiah | | | | | | | | | | | | | | | | | | |
Expiring 12/27/11 | | Morgan Stanley | | IDR | 468,344,900 | | | | 52,700 | | | | 52,575 | | | | (125 | ) |
Expiring 12/27/11 | | UBS AG | | IDR | 631,022,800 | | | | 70,600 | | | | 70,837 | | | | 237 | |
Expiring 12/27/11 | | UBS AG | | IDR | 326,315,000 | | | | 34,900 | | | | 36,631 | | | | 1,731 | |
Expiring 12/27/11 | | UBS AG | | IDR | 321,429,000 | | | | 34,900 | | | | 36,083 | | | | 1,183 | |
Israeli New Shekel | | | | | | | | | | | | | | | | | | |
Expiring 11/16/11 | | Goldman Sachs Group LP | | ILS | 322,313 | | | | 90,500 | | | | 88,844 | | | | (1,656 | ) |
Expiring 11/16/11 | | JPMorgan Chase Securities | | ILS | 376,010 | | | | 106,600 | | | | 103,645 | | | | (2,955 | ) |
Expiring 11/16/11 | | JPMorgan Chase Securities | | ILS | 255,331 | | | | 70,400 | | | | 70,381 | | | | (19 | ) |
Expiring 11/16/11 | | JPMorgan Chase Securities | | ILS | 193,077 | | | | 52,700 | | | | 53,221 | | | | 521 | |
Expiring 11/16/11 | | JPMorgan Chase Securities | | ILS | 134,501 | | | | 36,200 | | | | 37,075 | | | | 875 | |
Expiring 11/16/11 | | JPMorgan Chase Securities | | ILS | 127,332 | | | | 35,500 | | | | 35,098 | | | | (402 | ) |
Expiring 11/16/11 | | UBS AG | | ILS | 193,223 | | | | 52,800 | | | | 53,261 | | | | 461 | |
Malaysian Ringgit | | | | | | | | | | | | | | | | | | |
Expiring 11/14/11 | | UBS AG | | MYR | 192,992 | | | | 64,000 | | | | 62,853 | | | | (1,147 | ) |
Expiring 11/14/11 | | UBS AG | | MYR | 157,535 | | | | 51,600 | | | | 51,306 | | | | (294 | ) |
Expiring 12/20/11 | | UBS AG | | MYR | 217,606 | | | | 70,400 | | | | 70,740 | | | | 340 | |
Expiring 12/23/11 | | UBS AG | | MYR | 166,842 | | | | 52,400 | | | | 54,230 | | | | 1,830 | |
Expiring 12/23/11 | | UBS AG | | MYR | 163,031 | | | | 53,200 | | | | 52,991 | | | | (209 | ) |
See Notes to Financial Statements.
| | | | |
| Prudential Absolute Return Bond Fund | | | 31 | |
Portfolio of Investments
as of October 31, 2011 continued
| | | | | | | | | | | | | | | | | | |
Foreign Currency
Contracts | | Counterparty | | Notional
Amount | | | Value at
Settlement
Date
Payable | | | Value at
October 31,
2011 | | | Unrealized
Appreciation/
(Depreciation) | |
Purchased (cont’d.): | | | | | | | | | | | | | | | | | | |
Expiring 12/23/11 | | UBS AG | | MYR | 111,446 | | | $ | 34,900 | | | $ | 36,224 | | | $ | 1,324 | |
Expiring 12/23/11 | | UBS AG | | MYR | 110,999 | | | | 34,900 | | | | 36,079 | | | | 1,179 | |
Expiring 12/23/11 | | UBS AG | | MYR | 110,583 | | | | 35,100 | | | | 35,943 | | | | 843 | |
Expiring 12/23/11 | | UBS AG | | MYR | 109,095 | | | | 35,000 | | | | 35,460 | | | | 460 | |
Mexican Peso | | | | | | | | | | | | | | | | | | |
Expiring 11/17/11 | | JPMorgan Chase Securities | | MXN | 2,645,900 | | | | 196,308 | | | | 198,204 | | | | 1,896 | |
Expiring 11/17/11 | | JPMorgan Chase Securities | | MXN | 713,745 | | | | 53,100 | | | | 53,467 | | | | 367 | |
Expiring 11/17/11 | | JPMorgan Chase Securities | | MXN | 239,491 | | | | 17,700 | | | | 17,940 | | | | 240 | |
Expiring 11/17/11 | | Morgan Stanley | | MXN | 708,410 | | | | 52,900 | | | | 53,067 | | | | 167 | |
New Taiwan Dollar | | | | | | | | | | | | | | | | | | |
Expiring 12/09/11 | | Morgan Stanley | | TWD | 2,112,000 | | | | 70,400 | | | | 70,649 | | | | 249 | |
Expiring 12/09/11 | | UBS AG | | TWD | 2,277,107 | | | | 80,300 | | | | 76,172 | | | | (4,128 | ) |
Expiring 12/09/11 | | UBS AG | | TWD | 2,121,883 | | | | 70,600 | | | | 70,979 | | | | 379 | |
Expiring 12/09/11 | | UBS AG | | TWD | 1,587,678 | | | | 52,600 | | | | 53,110 | | | | 510 | |
Expiring 12/09/11 | | UBS AG | | TWD | 1,419,500 | | | | 50,000 | | | | 47,484 | | | | (2,516 | ) |
Expiring 12/09/11 | | UBS AG | | TWD | 1,067,813 | | | | 37,500 | | | | 35,719 | | | | (1,781 | ) |
Expiring 12/09/11 | | UBS AG | | TWD | 1,066,038 | | | | 38,100 | | | | 35,660 | | | | (2,440 | ) |
New Zealand Dollar | | | | | | | | | | | | | | | | | | |
Expiring 11/18/11 | | JPMorgan Chase Securities | | NZD | 380,662 | | | | 302,651 | | | | 307,460 | | | | 4,809 | |
Expiring 11/18/11 | | UBS AG | | NZD | 44,326 | | | | 35,200 | | | | 35,802 | | | | 602 | |
Norwegian Krone | | | | | | | | | | | | | | | | | | |
Expiring 11/21/11 | | Citibank NA | | NOK | 197,263 | | | | 35,200 | | | | 35,384 | | | | 184 | |
Expiring 11/21/11 | | UBS AG | | NOK | 1,826,221 | | | | 323,131 | | | | 327,574 | | | | 4,443 | |
Peruvian Nuevo Sol | | | | | | | | | | | | | | | | | | |
Expiring 01/13/12 | | Citibank NA | | PEN | 192,192 | | | | 70,400 | | | | 70,563 | | | | 163 | |
Expiring 01/13/12 | | Citibank NA | | PEN | 97,423 | | | | 34,900 | | | | 35,769 | | | | 869 | |
Philippine Peso | | | | | | | | | | | | | | | | | | |
Expiring 11/09/11 | | UBS AG | | PHP | 2,096,535 | | | | 48,700 | | | | 49,147 | | | | 447 | |
Expiring 11/22/11 | | Citibank NA | | PHP | 5,425,000 | | | | 128,600 | | | | 127,069 | | | | (1,531 | ) |
Expiring 11/22/11 | | UBS AG | | PHP | 4,716,585 | | | | 111,900 | | | | 110,476 | | | | (1,424 | ) |
Expiring 01/06/12 | | Morgan Stanley | | PHP | 2,276,208 | | | | 52,800 | | | | 53,214 | | | | 414 | |
Expiring 01/06/12 | | UBS AG | | PHP | 2,293,548 | | | | 52,400 | | | | 53,620 | | | | 1,220 | |
Expiring 01/06/12 | | UBS AG | | PHP | 2,289,152 | | | | 52,600 | | | | 53,517 | | | | 917 | |
Expiring 01/06/12 | | UBS AG | | PHP | 2,277,054 | | | | 52,600 | | | | 53,234 | | | | 634 | |
Expiring 01/06/12 | | UBS AG | | PHP | 1,528,969 | | | | 34,900 | | | | 35,745 | | | | 845 | |
See Notes to Financial Statements.
| | |
| 32 | | Visit our website at www.prudentialfunds.com |
| | | | | | | | | | | | | | | | | | |
Foreign Currency
Contracts | | Counterparty | | Notional
Amount | | | Value at
Settlement
Date
Payable | | | Value at
October 31,
2011 | | | Unrealized
Appreciation/
(Depreciation) | |
Purchased (cont’d.): | | | | | | | | | | | | | | | | | | |
Polish Zloty | | | | | | | | | | | | | | | | | | |
Expiring 11/21/11 | | Citibank NA | | PLN | 78,412 | | | $ | 25,594 | | | $ | 24,592 | | | $ | (1,002 | ) |
Expiring 11/21/11 | | JPMorgan Chase Securities | | PLN | 126,280 | | | | 38,992 | | | | 39,604 | | | | 612 | |
Romanian Leu | | | | | | | | | | | | | | | | | | |
Expiring 11/21/11 | | JPMorgan Chase Securities | | RON | 165,066 | | | | 52,800 | | | | 52,511 | | | | (289 | ) |
Russian Rouble | | | | | | | | | | | | | | | | | | |
Expiring 11/08/11 | | Morgan Stanley | | RUB | 4,282,904 | | | | 144,400 | | | | 140,990 | | | | (3,410 | ) |
Expiring 11/08/11 | | Morgan Stanley | | RUB | 3,200,325 | | | | 106,500 | | | | 105,353 | | | | (1,147 | ) |
Expiring 11/08/11 | | Morgan Stanley | | RUB | 1,416,333 | | | | 50,942 | | | | 46,625 | | | | (4,317 | ) |
Expiring 12/16/11 | | Citibank NA | | RUB | 1,617,627 | | | | 52,700 | | | | 52,893 | | | | 193 | |
Expiring 12/21/11 | | Barclays Capital | | RUB | 1,610,364 | | | | 53,200 | | | | 52,602 | | | | (598 | ) |
Expiring 12/21/11 | | Citibank NA | | RUB | 3,362,149 | | | | 105,100 | | | | 109,823 | | | | 4,723 | |
Expiring 12/21/11 | | Citibank NA | | RUB | 2,260,145 | | | | 70,300 | | | | 73,826 | | | | 3,526 | |
Expiring 12/21/11 | | Citibank NA | | RUB | 2,181,540 | | | | 70,600 | | | | 71,259 | | | | 659 | |
Expiring 12/21/11 | | Citibank NA | | RUB | 1,658,594 | | | | 54,300 | | | | 54,177 | | | | (123 | ) |
Expiring 12/21/11 | | Citibank NA | | RUB | 1,146,116 | | | | 34,900 | | | | 37,437 | | | | 2,537 | |
Expiring 12/21/11 | | Citibank NA | | RUB | 1,145,942 | | | | 34,900 | | | | 37,432 | | | | 2,532 | |
Expiring 12/21/11 | | Citibank NA | | RUB | 1,138,644 | | | | 35,100 | | | | 37,193 | | | | 2,093 | |
Expiring 12/21/11 | | Citibank NA | | RUB | 1,105,034 | | | | 35,200 | | | | 36,095 | | | | 895 | |
Expiring 12/21/11 | | Morgan Stanley | | RUB | 1,590,574 | | | | 53,200 | | | | 51,955 | | | | (1,245 | ) |
Singapore Dollar | | | | | | | | | | | | | | | | | | |
Expiring 11/18/11 | | UBS AG | | SGD | 609,164 | | | | 481,174 | | | | 485,464 | | | | 4,290 | |
South African Rand | | | | | | | | | | | | | | | | | | |
Expiring 11/28/11 | | Citibank NA | | ZAR | 276,572 | | | | 35,723 | | | | 34,707 | | | | (1,016 | ) |
Expiring 11/28/11 | | Citibank NA | | ZAR | 410,359 | | | | 53,200 | | | | 51,496 | | | | (1,704 | ) |
Expiring 11/28/11 | | Citibank NA | | ZAR | 561,086 | | | | 70,600 | | | | 70,411 | | | | (189 | ) |
South Korean Won | | | | | | | | | | | | | | | | | | |
Expiring 11/30/11 | | Morgan Stanley | | KRW | 59,867,200 | | | | 52,700 | | | | 53,900 | | | | 1,200 | |
Expiring 11/30/11 | | Morgan Stanley | | KRW | 40,360,320 | | | | 35,200 | | | | 36,338 | | | | 1,138 | |
Expiring 11/30/11 | | UBS AG | | KRW | 116,147,700 | | | | 108,600 | | | | 104,572 | | | | (4,028 | ) |
Expiring 11/30/11 | | UBS AG | | KRW | 78,102,325 | | | | 72,100 | | | | 70,318 | | | | (1,782 | ) |
Expiring 11/30/11 | | UBS AG | | KRW | 61,963,000 | | | | 52,400 | | | | 55,787 | | | | 3,387 | |
Expiring 11/30/11 | | UBS AG | | KRW | 61,542,000 | | | | 52,600 | | | | 55,408 | | | | 2,808 | |
Expiring 11/30/11 | | UBS AG | | KRW | 61,315,820 | | | | 52,600 | | | | 55,205 | | | | 2,605 | |
Expiring 11/30/11 | | UBS AG | | KRW | 41,107,500 | | | | 35,000 | | | | 37,010 | | | | 2,010 | |
Swedish Krona | | | | | | | | | | | | | | | | | | |
Expiring 11/21/11 | | Goldman Sachs Group LP | | SEK | 461,633 | | | | 70,800 | | | | 70,751 | | | | (49 | ) |
See Notes to Financial Statements.
| | | | |
| Prudential Absolute Return Bond Fund | | | 33 | |
Portfolio of Investments
as of October 31, 2011 continued
| | | | | | | | | | | | | | | | | | |
Foreign Currency
Contracts | | Counterparty | | Notional
Amount | | | Value at
Settlement
Date
Payable | | | Value at
October 31,
2011 | | | Unrealized
Appreciation/
(Depreciation) | |
Purchased (cont’d.): | | | | | | | | | | | | | | | | | | |
Expiring 11/21/11 | | Goldman Sachs Group LP | | SEK | 232,835 | | | $ | 35,200 | | | $ | 35,685 | | | $ | 485 | |
Expiring 11/21/11 | | Morgan Stanley | | SEK | 1,644,391 | | | | 246,184 | | | | 252,022 | | | | 5,838 | |
Swiss Franc | | | | | | | | | | | | | | | | | | |
Expiring 11/21/11 | | UBS AG | | CHF | 62,075 | | | | 70,700 | | | | 70,738 | | | | 38 | |
Thai Baht | | | | | | | | | | | | | | | | | | |
Expiring 11/30/11 | | Citibank NA | | THB | 2,599,862 | | | | 86,202 | | | | 84,329 | | | | (1,873 | ) |
Expiring 11/30/11 | | Morgan Stanley | | THB | 2,162,688 | | | | 70,400 | | | | 70,149 | | | | (251 | ) |
Expiring 11/30/11 | | UBS AG | | THB | 1,627,970 | | | | 52,600 | | | | 52,805 | | | | 205 | |
Expiring 11/30/11 | | UBS AG | | THB | 1,627,444 | | | | 52,600 | | | | 52,788 | | | | 188 | |
Expiring 11/30/11 | | UBS AG | | THB | 1,091,020 | | | | 35,000 | | | | 35,388 | | | | 388 | |
Turkish Lira | | | | | | | | | | | | | | | | | | |
Expiring 11/17/11 | | Goldman Sachs Group LP | | TRY | 63,181 | | | | 35,400 | | | | 35,592 | | | | 192 | |
Expiring 11/28/11 | | Morgan Stanley | | TRY | 38,446 | | | | 21,200 | | | | 21,604 | | | | 404 | |
Expiring 11/28/11 | | UBS AG | | TRY | 129,310 | | | | 70,600 | | | | 72,666 | | | | 2,066 | |
Expiring 11/28/11 | | UBS AG | | TRY | 125,719 | | | | 70,800 | | | | 70,648 | | | | (152 | ) |
Expiring 11/28/11 | | UBS AG | | TRY | 95,684 | | | | 53,100 | | | | 53,770 | | | | 670 | |
| | | | | | | | | | | | | | | | | | |
| | | | | | | | $ | 10,647,817 | | | $ | 10,722,250 | | | $ | 74,433 | |
| | | | | | | | | | | | | | | | | | |
| | | | | |
Foreign Currency
Contracts | | Counterparty | | Notional
Amount | | | Value at
Settlement
Date
Receivable | | | Value at
October 31,
2011 | | | Unrealized
Appreciation/
(Depreciation) | |
Sold: | | | | | | | | | | | | | | | | | | |
Australian Dollar | | | | | | | | | | | | | | | | | | |
Expiring 11/18/11 | | JPMorgan Chase Securities | | AUD | 101,490 | | | $ | 107,200 | | | $ | 106,727 | | | $ | 473 | |
Expiring 11/18/11 | | Morgan Stanley | | AUD | 52,248 | | | | 53,177 | | | | 54,944 | | | | (1,767 | ) |
Brazilian Real | | | | | | | | | | | | | | | | | | |
Expiring 01/19/12 | | Citibank NA | | BRL | 178,169 | | | | 98,300 | | | | 101,887 | | | | (3,587 | ) |
Expiring 01/19/12 | | Citibank NA | | BRL | 95,364 | | | | 48,842 | | | | 54,534 | | | | (5,692 | ) |
Expiring 01/19/12 | | Citibank NA | | BRL | 94,939 | | | | 52,700 | | | | 54,292 | | | | (1,592 | ) |
Expiring 01/19/12 | | Citibank NA | | BRL | 64,082 | | | | 35,200 | | | | 36,646 | | | | (1,446 | ) |
Expiring 01/19/12 | | UBS AG | | BRL | 129,043 | | | | 70,400 | | | | 73,794 | | | | (3,394 | ) |
Expiring 01/19/12 | | UBS AG | | BRL | 111,071 | | | | 61,878 | | | | 63,517 | | | | (1,639 | ) |
Expiring 01/19/12 | | UBS AG | | BRL | 99,023 | | | | 52,700 | | | | 56,627 | | | | (3,927 | ) |
Canadian Dollar | | | | | | | | | | | | | | | | | | |
Expiring 11/17/11 | | Morgan Stanley | | CAD | 70,930 | | | | 70,600 | | | | 71,134 | | | | (534 | ) |
See Notes to Financial Statements.
| | |
| 34 | | Visit our website at www.prudentialfunds.com |
| | | | | | | | | | | | | | | | | | |
Foreign Currency
Contracts | | Counterparty | | Notional
Amount | | | Value at
Settlement
Date
Receivable | | | Value at
October 31,
2011 | | | Unrealized
Appreciation/
(Depreciation) | |
Sold (cont’d.): | | | | | | | | | | | | | | | | | | |
Chilean Peso | | | | | | | | | | | | | | | | | | |
Expiring 12/02/11 | | Citibank NA | | CLP | 32,690,550 | | | $ | 67,501 | | | $ | 66,475 | | | $ | 1,026 | |
Expiring 12/02/11 | | Citibank NA | | CLP | 26,505,060 | | | | 49,533 | | | | 53,897 | | | | (4,364 | ) |
Expiring 12/02/11 | | Citibank NA | | CLP | 26,087,520 | | | | 54,400 | | | | 53,048 | | | | 1,352 | |
Expiring 12/02/11 | | UBS AG | | CLP | 27,575,275 | | | | 52,700 | | | | 56,073 | | | | (3,373 | ) |
Expiring 01/09/12 | | Citibank NA | | CLP | 73,415,945 | | | | 140,900 | | | | 148,557 | | | | (7,657 | ) |
Chinese Yuan Renminbi | | | | | | | | | | | | | | | | | | |
Expiring 08/02/12 | | Morgan Stanley | | CNY | 1,502,974 | | | | 236,950 | | | | 237,426 | | | | (476 | ) |
Expiring 08/02/12 | | UBS AG | | CNY | 1,503,211 | | | | 236,950 | | | | 237,463 | | | | (513 | ) |
Expiring 08/02/12 | | UBS AG | | CNY | 560,640 | | | | 87,600 | | | | 88,565 | | | | (965 | ) |
Expiring 08/02/12 | | UBS AG | | CNY | 453,365 | | | | 72,100 | | | | 71,618 | | | | 482 | |
Expiring 08/02/12 | | UBS AG | | CNY | 334,537 | | | | 53,300 | | | | 52,847 | | | | 453 | |
Colombian Peso | | | | | | | | | | | | | | | | | | |
Expiring 11/01/11 | | Citibank NA | | COP | 125,292,700 | | | | 67,109 | | | | 67,145 | | | | (36 | ) |
Expiring 11/01/11 | | Citibank NA | | COP | 98,915,520 | | | | 54,400 | | | | 53,009 | | | | 1,391 | |
Expiring 12/06/11 | | Citibank NA | | COP | 249,165,790 | | | | 136,511 | | | | 133,472 | | | | 3,039 | |
Expiring 12/06/11 | | Citibank NA | | COP | 130,306,330 | | | | 72,100 | | | | 69,802 | | | | 2,298 | |
Expiring 12/06/11 | | Citibank NA | | COP | 93,534,000 | | | | 52,400 | | | | 50,104 | | | | 2,296 | |
Expiring 12/06/11 | | Citibank NA | | COP | 65,445,900 | | | | 33,183 | | | | 35,058 | | | | (1,875 | ) |
Expiring 12/06/11 | | Morgan Stanley | | COP | 99,218,000 | | | | 53,200 | | | | 53,149 | | | | 51 | |
Czech Koruna | | | | | | | | | | | | | | | | | | |
Expiring 11/21/11 | | Citibank NA | | CZK | 958,840 | | | | 53,600 | | | | 53,352 | | | | 248 | |
Euro | | | | | | | | | | | | | | | | | | |
Expiring 11/22/11 | | Citibank NA | �� | EUR | 64,215 | | | | 89,400 | | | | 88,836 | | | | 564 | |
Hungarian Forint | | | | | | | | | | | | | | | | | | |
Expiring 11/21/11 | | Citibank NA | | HUF | 23,051,399 | | | | 106,300 | | | | 104,299 | | | | 2,001 | |
Indonesian Rupiah | | | | | | | | | | | | | | | | | | |
Expiring 12/27/11 | | UBS AG | | IDR | 383,670,000 | | | | 42,000 | | | | 43,070 | | | | (1,070 | ) |
Indian Rupee | | | | | | | | | | | | | | | | | | |
Expiring 12/23/11 | | UBS AG | | INR | 5,215,584 | | | | 105,600 | | | | 106,109 | | | | (509 | ) |
Expiring 12/23/11 | | UBS AG | | INR | 2,949,975 | | | | 61,638 | | | | 60,016 | | | | 1,622 | |
Expiring 12/23/11 | | UBS AG | | INR | 2,923,140 | | | | 61,800 | | | | 59,470 | | | | 2,330 | |
Expiring 12/23/11 | | UBS AG | | INR | 2,390,369 | | | | 48,398 | | | | 48,631 | | | | (233 | ) |
Expiring 12/23/11 | | UBS AG | | INR | 2,088,240 | | | | 42,000 | | | | 42,485 | | | | (485 | ) |
Expiring 12/23/11 | | UBS AG | | INR | 1,672,520 | | | | 35,791 | | | | 34,027 | | | | 1,764 | |
Expiring 12/23/11 | | UBS AG | | INR | 1,382,097 | | | | 27,406 | | | | 28,118 | | | | (712 | ) |
Expiring 12/23/11 | | UBS AG | | INR | 834,480 | | | | 18,000 | | | | 16,977 | | | | 1,023 | |
Israeli New Shekel | | | | | | | | | | | | | | | | | | |
Expiring 11/16/11 | | Citibank NA | | ILS | 191,341 | | | | 51,922 | | | | 52,742 | | | | (820 | ) |
See Notes to Financial Statements.
| | | | |
| Prudential Absolute Return Bond Fund | | | 35 | |
Portfolio of Investments
as of October 31, 2011 continued
| | | | | | | | | | | | | | | | | | |
Foreign Currency
Contracts | | Counterparty | | Notional
Amount | | | Value at
Settlement
Date
Receivable | | | Value at
October 31,
2011 | | | Unrealized
Appreciation/
(Depreciation) | |
Sold (cont’d.): | | | | | | | | | | | | | | | | | | |
Expiring 11/16/11 | | Citibank NA | | ILS | 169,674 | | | $ | 45,507 | | | $ | 46,770 | | | $ | (1,263 | ) |
Expiring 11/16/11 | | Goldman Sachs Group LP | | ILS | 130,972 | | | | 36,300 | | | | 36,102 | | | | 198 | |
Expiring 11/16/11 | | JPMorgan Chase Securities | | ILS | 376,010 | | | | 104,011 | | | | 103,645 | | | | 366 | |
Expiring 11/16/11 | | JPMorgan Chase Securities | | ILS | 351,128 | | | | 94,900 | | | | 96,787 | | | | (1,887 | ) |
Malaysian Ringgit | | | | | | | | | | | | | | | | | | |
Expiring 11/14/11 | | UBS AG | | MYR | 292,991 | | | | 96,700 | | | | 95,421 | | | | 1,279 | |
Expiring 11/14/11 | | UBS AG | | MYR | 57,535 | | | | 18,833 | | | | 18,738 | | | | 95 | |
Expiring 12/20/11 | | UBS AG | | MYR | 217,606 | | | | 68,269 | | | | 70,740 | | | | (2,471 | ) |
Expiring 12/23/11 | | UBS AG | | MYR | 279,837 | | | | 88,500 | | | | 90,957 | | | | (2,457 | ) |
Mexican Peso | | | | | | | | | | | | | | | | | | |
Expiring 11/17/11 | | Citibank NA | | MXN | 953,671 | | | | 70,700 | | | | 71,440 | | | | (740 | ) |
Expiring 11/17/11 | | Citibank NA | | MXN | 471,052 | | | | 35,700 | | | | 35,287 | | | | 413 | |
Expiring 11/17/11 | | JPMorgan Chase Securities | | MXN | 1,459,198 | | | | 105,700 | | | | 109,308 | | | | (3,608 | ) |
Expiring 11/17/11 | | JPMorgan Chase Securities | | MXN | 968,095 | | | | 70,400 | | | | 72,520 | | | | (2,120 | ) |
New Taiwan Dollar | | | | | | | | | | | | | | | | | | |
Expiring 12/09/11 | | UBS AG | | TWD | 2,121,883 | | | | 71,099 | | | | 70,979 | | | | 120 | |
Expiring 12/09/11 | | UBS AG | | TWD | 2,112,000 | | | | 69,705 | | | | 70,649 | | | | (944 | ) |
Expiring 12/09/11 | | UBS AG | | TWD | 1,587,678 | | | | 52,485 | | | | 53,110 | | | | (625 | ) |
Expiring 12/09/11 | | UBS AG | | TWD | 1,499,400 | | | | 52,500 | | | | 50,157 | | | | 2,343 | |
Expiring 12/09/11 | | UBS AG | | TWD | 1,426,508 | | | | 50,300 | | | | 47,718 | | | | 2,582 | |
Expiring 12/09/11 | | UBS AG | | TWD | 1,066,038 | | | | 37,092 | | | | 35,660 | | | | 1,432 | |
Expiring 12/09/11 | | UBS AG | | TWD | 1,060,805 | | | | 37,438 | | | | 35,485 | | | | 1,953 | |
Expiring 12/09/11 | | UBS AG | | TWD | 777,707 | | | | 27,164 | | | | 26,015 | | | | 1,149 | |
New Zealand Dollar | | | | | | | | | | | | | | | | | | |
Expiring 11/18/11 | | UBS AG | | NZD | 88,197 | | | | 71,500 | | | | 71,237 | | | | 263 | |
Norwegian Krone | | | | | | | | | | | | | | | | | | |
Expiring 11/21/11 | | Citibank NA | | NOK | 388,482 | | | | 71,500 | | | | 69,683 | | | | 1,817 | |
Expiring 11/21/11 | | UBS AG | | NOK | 394,871 | | | | 71,500 | | | | 70,829 | | | | 671 | |
Peruvian Nuevo Sol | | | | | | | | | | | | | | | | | | |
Expiring 01/13/12 | | Citibank NA | | PEN | 289,615 | | | | 105,487 | | | | 106,331 | | | | (844 | ) |
Philippine Peso | | | | | | | | | | | | | | | | | | |
Expiring 11/09/11 | | UBS AG | | PHP | 2,096,535 | | | | 48,130 | | | | 49,147 | | | | (1,017 | ) |
Expiring 11/22/11 | | UBS AG | | PHP | 4,492,343 | | | | 104,900 | | | | 105,224 | | | | (324 | ) |
See Notes to Financial Statements.
| | |
| 36 | | Visit our website at www.prudentialfunds.com |
| | | | | | | | | | | | | | | | | | |
Foreign Currency
Contracts | | Counterparty | | Notional
Amount | | | Value at
Settlement
Date
Receivable | | | Value at
October 31,
2011 | | | Unrealized
Appreciation/
(Depreciation) | |
Sold (cont’d.): | | | | | | | | | | | | | | | | | | |
Expiring 11/22/11 | | UBS AG | | PHP | 3,145,780 | | | $ | 72,400 | | | $ | 73,683 | | | $ | (1,283 | ) |
Expiring 11/22/11 | | UBS AG | | PHP | 2,503,463 | | | | 57,604 | | | | 58,638 | | | | (1,034 | ) |
Expiring 01/06/12 | | UBS AG | | PHP | 3,011,123 | | | | 70,900 | | | | 70,396 | | | | 504 | |
Polish Zloty | | | | | | | | | | | | | | | | | | |
Expiring 11/21/11 | | Citibank NA | | PLN | 228,503 | | | | 70,400 | | | | 71,663 | | | | (1,263 | ) |
Expiring 11/21/11 | | Citibank NA | | PLN | 182,169 | | | | 57,200 | | | | 57,132 | | | | 68 | |
Romanian Leu | | | | | | | | | | | | | | | | | | |
Expiring 11/21/11 | | Citibank NA | | RON | 165,066 | | | | 52,786 | | | | 52,511 | | | | 275 | |
Russian Rouble | | | | | | | | | | | | | | | | | | |
Expiring 11/08/11 | | Citibank NA | | RUB | 7,483,229 | | | | 250,372 | | | | 246,343 | | | | 4,029 | |
Expiring 11/08/11 | | Morgan Stanley | | RUB | 1,416,333 | | | | 48,224 | | | | 46,625 | | | | 1,599 | |
Expiring 12/16/11 | | Citibank NA | | RUB | 1,617,627 | | | | 50,712 | | | | 52,893 | | | | (2,181 | ) |
Expiring 12/21/11 | | Citibank NA | | RUB | 4,464,417 | | | | 140,900 | | | | 145,828 | | | | (4,928 | ) |
Expiring 12/21/11 | | Citibank NA | | RUB | 2,260,145 | | | | 68,328 | | | | 73,826 | | | | (5,498 | ) |
Expiring 12/21/11 | | Citibank NA | | RUB | 1,658,594 | | | | 53,598 | | | | 54,177 | | | | (579 | ) |
Singapore Dollar | | | | | | | | | | | | | | | | | | |
Expiring 11/18/11 | | Goldman Sachs Group LP | | SGD | 246,297 | | | | 196,600 | | | | 196,283 | | | | 317 | |
Expiring 11/18/11 | | JPMorgan Chase Securities | | SGD | 112,369 | | | | 88,014 | | | | 89,551 | | | | (1,537 | ) |
South African Rand | | | | | | | | | | | | | | | | | | |
Expiring 11/28/11 | | UBS AG | | ZAR | 1,217,173 | | | | 153,414 | | | | 152,744 | | | | 670 | |
South Korean Won | | | | | | | | | | | | | | | | | | |
Expiring 11/30/11 | | UBS AG | | KRW | 68,048,930 | | | | 61,700 | | | | 61,267 | | | | 433 | |
Expiring 11/30/11 | | UBS AG | | KRW | 66,583,545 | | | | 56,667 | | | | 59,947 | | | | (3,280 | ) |
Expiring 11/30/11 | | UBS AG | | KRW | 59,617,550 | | | | 54,500 | | | | 53,676 | | | | 824 | |
Swedish Krona | | | | | | | | | | | | | | | | | | |
Expiring 11/21/11 | | Citibank NA | | SEK | 451,264 | | | | 70,900 | | | | 69,162 | | | | 1,738 | |
Thailand Baht | | | | | | | | | | | | | | | | | | |
Expiring 11/30/11 | | UBS AG | | THB | 3,789,232 | | | | 121,567 | | | | 122,907 | | | | (1,340 | ) |
Expiring 11/30/11 | | UBS AG | | THB | 2,719,890 | | | | 87,900 | | | | 88,222 | | | | (322 | ) |
Expiring 11/30/11 | | UBS AG | | THB | 1,509,642 | | | | 49,685 | | | | 48,967 | | | | 718 | |
Expiring 11/30/11 | | UBS AG | | THB | 1,090,220 | | | | 36,100 | | | | 35,362 | | | | 738 | |
Turkish Lira | | | | | | | | | | | | | | | | | | |
Expiring 11/17/11 | | Citibank NA | | TRY | 125,604 | | | | 70,900 | | | | 70,758 | | | | 142 | |
See Notes to Financial Statements.
| | | | |
| Prudential Absolute Return Bond Fund | | | 37 | |
Portfolio of Investments
as of October 31, 2011 continued
| | | | | | | | | | | | | | | | | | |
Foreign Currency
Contracts | | Counterparty | | Notional
Amount | | | Value at
Settlement
Date
Receivable | | | Value at
October 31,
2011 | | | Unrealized
Appreciation/
(Depreciation) | |
Sold (cont’d.): | | | | | | | | | | | | | | | | | | |
Expiring 11/28/11 | | JPMorgan Chase Securities | | TRY | 231,389 | | | $ | 129,323 | | | $ | 130,029 | | | $ | (706 | ) |
| | | | | | | | | | | | | | | | | | |
| | | | | | | | $ | 6,792,703 | | | $ | 6,832,471 | | | $ | (39,768 | ) |
| | | | | | | | | | | | | | | | | | |
| | | | | | | | | | | | | | | | $ | 34,665 | |
| | | | | | | | | | | | | | | | | | |
Interest rate swap agreements outstanding at October 31, 2011:
| | | | | | | | | | | | | | | | | | | | | | | | |
Counterparty | | Termination
Date | | | Notional
Amount
(000)# | | | Fixed
Rate | | Floating
Rate | | Fair
Value | | | Upfront
Premiums
Paid/
(Received) | | | Unrealized
Appreciation/
(Depreciation) | |
Barclays Bank PLC(b) | | | 09/06/13 | | | $ | 3,950 | | | 0.518% | | 3 month LIBOR | | $ | (917 | ) | | $ | — | | | $ | (917 | ) |
Barclays Bank PLC(a) | | | 09/21/13 | | | | 2,450 | | | 0.493 | | 3 month LIBOR | | | 2,203 | | | | — | | | | 2,203 | |
Barclays Bank PLC(b) | | | 09/23/13 | | | | 1,000 | | | 0.503 | | 3 month LIBOR | | | (713 | ) | | | — | | | | (713 | ) |
Barclays Bank PLC(a) | | | 09/26/13 | | | | 1,400 | | | 0.524 | | 3 month LIBOR | | | 438 | | | | — | | | | 438 | |
Barclays Bank PLC(b) | | | 10/04/13 | | | | 1,750 | | | 0.559 | | 3 month LIBOR | | | 553 | | | | — | | | | 553 | |
Barclays Bank PLC(b) | | | 10/06/13 | | | | 500 | | | 0.605 | | 3 month LIBOR | | | 602 | | | | — | | | | 602 | |
Barclays Bank PLC(a) | | | 07/01/14 | | | | 600 | | | 1.095 | | 3 month LIBOR | | | (9,167 | ) | | | — | | | | (9,167 | ) |
Barclays Bank PLC(a) | | | 08/05/14 | | | | 900 | | | 0.821 | | 3 month LIBOR | | | (5,028 | ) | | | — | | | | (5,028 | ) |
Barclays Bank PLC(a) | | | 09/26/14 | | | | 2,000 | | | 0.640 | | 3 month LIBOR | | | 2,793 | | | | — | | | | 2,793 | |
Barclays Bank PLC(b) | | | 12/31/15 | | | | 1,700 | | | 1.705 | | 3 month LIBOR | | | 47,616 | | | | — | | | | 47,616 | |
Barclays Bank PLC(a) | | | 06/21/16 | | | | 100 | | | 1.870 | | 3 month LIBOR | | | (3,249 | ) | | | — | | | | (3,249 | ) |
Barclays Bank PLC(b) | | | 08/15/16 | | | | 2,350 | | | 1.220 | | 3 month LIBOR | | | 2,324 | | | | — | | | | 2,324 | |
Barclays Bank PLC(a) | | | 09/06/16 | | | | 3,200 | | | 1.165 | | 3 month LIBOR | | | 10,364 | | | | — | | | | 10,364 | |
Barclays Bank PLC(a) | | | 09/16/16 | | | | 500 | | | 1.205 | | 3 month LIBOR | | | 978 | | | | — | | | | 978 | |
Barclays Bank PLC(a) | | | 09/19/16 | | | | 1,000 | | | 1.245 | | 3 month LIBOR | | | 192 | | | | — | | | | 192 | |
Barclays Bank PLC(b) | | | 09/26/16 | | | | 3,000 | | | 1.113 | | 3 month LIBOR | | | (21,499 | ) | | | — | | | | (21,499 | ) |
Barclays Bank PLC(b) | | | 09/27/16 | | | | 1,400 | | | 1.115 | | 3 month LIBOR | | | (9,251 | ) | | | — | | | | (9,251 | ) |
Barclays Bank PLC(b) | | | 10/04/16 | | | | 400 | | | 1.255 | | 3 month LIBOR | | | (281 | ) | | | — | | | | (281 | ) |
Barclays Bank PLC(a) | | | 10/07/16 | | | | 450 | | | 1.301 | | 3 month LIBOR | | | (626 | ) | | | — | | | | (626 | ) |
Barclays Bank PLC(b) | | | 08/30/18 | | | | 2,000 | | | 1.867 | | 3 month LIBOR | | | 13,462 | | | | — | | | | 13,462 | |
Barclays Bank PLC(a) | | | 09/26/18 | | | | 1,400 | | | 1.555 | | 3 month LIBOR | | | 23,132 | | | | — | | | | 23,132 | |
Barclays Bank PLC(a) | | | 09/27/18 | | | | 750 | | | 1.538 | | 3 month LIBOR | | | 13,304 | | | | — | | | | 13,304 | |
Barclays Bank PLC(a) | | | 09/29/18 | | | | 300 | | | 1.710 | | 3 month LIBOR | | | 1,889 | | | | — | | | | 1,889 | |
Barclays Bank PLC(a) | | | 08/10/21 | | | | 400 | | | 2.568 | | 3 month LIBOR | | | (11,858 | ) | | | — | | | | (11,858 | ) |
Barclays Bank PLC(b) | | | 09/21/21 | | | | 500 | | | 2.160 | | 3 month LIBOR | | | (5,760 | ) | | | — | | | | (5,760 | ) |
Barclays Bank PLC(b) | | | 09/23/21 | | | | 175 | | | 2.134 | | 3 month LIBOR | | | (2,460 | ) | | | — | | | | (2,460 | ) |
Barclays Bank PLC(b) | | | 10/03/21 | | | | 150 | | | 2.133 | | 3 month LIBOR | | | (2,266 | ) | | | — | | | | (2,266 | ) |
See Notes to Financial Statements.
| | |
| 38 | | Visit our website at www.prudentialfunds.com |
| | | | | | | | | | | | | | | | | | | | | | | | |
Counterparty | | Termination
Date | | | Notional
Amount
(000)# | | | Fixed
Rate | | Floating
Rate | | Fair
Value | | | Upfront
Premiums
Paid/
(Received) | | | Unrealized
Appreciation/
(Depreciation) | |
Barclays Bank PLC(a) | | | 10/05/21 | | | $ | 250 | | | 2.084% | | 3 month LIBOR | | $ | 4,923 | | | $ | — | | | $ | 4,923 | |
Barclays Bank PLC(b) | | | 10/06/21 | | | | 100 | | | 1.960 | | 3 month LIBOR | | | (3,112 | ) | | | — | | | | (3,112 | ) |
Barclays Bank PLC(a) | | | 10/11/21 | | | | 200 | | | 2.285 | | 3 month LIBOR | | | 344 | | | | — | | | | 344 | |
Barclays Bank PLC(b) | | | 09/06/41 | | | | 220 | | | 3.005 | | 3 month LIBOR | | | 3,160 | | | | — | | | | 3,160 | |
Barclays Bank PLC(a) | | | 09/06/41 | | | | 100 | | | 3.244 | | 3 month LIBOR | | | (6,186 | ) | | | — | | | | (6,186 | ) |
Barclays Bank PLC(a) | | | 10/04/41 | | | | 70 | | | 2.740 | | 3 month LIBOR | | | 3,031 | | | | — | | | | 3,031 | |
Citibank NA(a) | | | 04/26/13 | | | | 2,000 | | | 0.845 | | 3 month LIBOR | | | (9,478 | ) | | | — | | | | (9,478 | ) |
Citibank NA(b) | | | 07/28/13 | | | | 4,000 | | | 0.625 | | 3 month LIBOR | | | 12,608 | | | | — | | | | 12,608 | |
Citibank NA(a) | | | 05/10/14 | | | | 1,000 | | | 1.288 | | 3 month LIBOR | | | (22,268 | ) | | | — | | | | (22,268 | ) |
Citibank NA(a) | | | 05/13/14 | | | | 1,000 | | | 1.258 | | 3 month LIBOR | | | (21,267 | ) | | | — | | | | (21,267 | ) |
Citibank NA(a) | | | 04/08/16 | | | | 2,000 | | | 2.520 | | 3 month LIBOR | | | (123,392 | ) | | | — | | | | (123,392 | ) |
Citibank NA(a) | | | 04/27/16 | | | | 2,000 | | | 2.313 | �� | 3 month LIBOR | | | (103,199 | ) | | | — | | | | (103,199 | ) |
Citibank NA(a) | | | 05/18/16 | | | | 1,000 | | | 2.040 | | 3 month LIBOR | | | (47,721 | ) | | | — | | | | (47,721 | ) |
Citibank NA(a) | | | 06/30/16 | | | | 2,000 | | | 1.821 | | 3 month LIBOR | | | (68,610 | ) | | | — | | | | (68,610 | ) |
Citibank NA(b) | | | 10/17/16 | | | | 370 | | | 1.425 | | 3 month LIBOR | | | 2,514 | | | | — | | | | 2,514 | |
Citibank NA(b) | | | 10/18/16 | | | | 460 | | | 1.440 | | 3 month LIBOR | | | 3,423 | | | | — | | | | 3,423 | |
Citibank NA(a) | | | 04/19/21 | | | | 1,000 | | | 3.514 | | 3 month LIBOR | | | (111,070 | ) | | | — | | | | (111,070 | ) |
Citibank NA(a) | | | 05/24/21 | | | | 600 | | | 3.247 | | 3 month LIBOR | | | (59,982 | ) | | | — | | | | (59,982 | ) |
Citibank NA(a) | | | 06/30/21 | | | | 1,000 | | | 3.078 | | 3 month LIBOR | | | (81,257 | ) | | | — | | | | (81,257 | ) |
Citibank NA(b) | | | 09/08/21 | | | | 700 | | | 2.150 | | 3 month LIBOR | | | (7,937 | ) | | | — | | | | (7,937 | ) |
Citibank NA(b) | | | 09/22/21 | | | | 200 | | | 2.180 | | 3 month LIBOR | | | (1,953 | ) | | | — | | | | (1,953 | ) |
Citibank NA(a) | | | 10/06/21 | | | | 300 | | | 2.049 | | 3 month LIBOR | | | 6,895 | | | | — | | | | 6,895 | |
Citibank NA(b) | | | 10/06/21 | | | | 140 | | | 2.033 | | 3 month LIBOR | | | (3,426 | ) | | | — | | | | (3,426 | ) |
Citibank NA(a) | | | 10/07/21 | | | | 250 | | | 2.108 | | 3 month LIBOR | | | 4,414 | | | | — | | | | 4,414 | |
Citibank NA(a) | | | 10/07/21 | | | | 200 | | | 2.083 | | 3 month LIBOR | | | 3,990 | | | | — | | | | 3,990 | |
Citibank NA(b) | | | 10/20/21 | | | | 200 | | | 2.308 | | 3 month LIBOR | | | (75 | ) | | | — | | | | (75 | ) |
Citibank NA(a) | | | 10/17/41 | | | | 90 | | | 2.920 | | 3 month LIBOR | | | 675 | | | | — | | | | 675 | |
Goldman Sachs International(a) | | | 09/21/18 | | | | 1,000 | | | 1.670 | | 3 month LIBOR | | | 8,378 | | | | — | | | | 8,378 | |
Morgan Stanley Capital Services(b) | | | 11/02/11 | | | | 16,500 | | | 0.443 | | 3 month LIBOR | | | 550 | | | | — | | | | 550 | |
Morgan Stanley Capital Services(a) | | | 07/22/13 | | | | 11,000 | | | 0.647 | | 3 month LIBOR | | | (39,406 | ) | | | — | | | | (39,406 | ) |
Morgan Stanley Capital Services(b) | | | 06/08/21 | | | | 400 | | | 4.640 | | 3 month LIBOR | | | 21,374 | | | | — | | | | 21,374 | |
Morgan Stanley Capital Services(b) | | | 08/11/21 | | | | 390 | | | 2.590 | | 3 month LIBOR | | | 12,330 | | | | — | | | | 12,330 | |
Morgan Stanley Capital Services(a) | | | 08/11/21 | | | | 200 | | | 2.425 | | 3 month LIBOR | | | (2,365 | ) | | | — | | | | (2,365 | ) |
See Notes to Financial Statements.
| | | | |
| Prudential Absolute Return Bond Fund | | | 39 | |
Portfolio of Investments
as of October 31, 2011 continued
| | | | | | | | | | | | | | | | | | | | | | | | |
Counterparty | | Termination
Date | | | Notional
Amount
(000)# | | | Fixed
Rate | | Floating
Rate | | Fair
Value | | | Upfront
Premiums
Paid/
(Received) | | | Unrealized
Appreciation/
(Depreciation) | |
Citibank NA(b) | | | 09/07/21 | | | AUD | 200 | | | 4.945% | | 6 month BBSW | | $ | (2,792 | ) | | $ | — | | | $ | (2,792 | ) |
Barclays Bank PLC(b) | | | 04/05/16 | | | CZK | 2,100 | | | 2.950 | | 6 month PRIBOR | | | 7,998 | | | | — | | | | 7,998 | |
Barclays Bank PLC(b) | | | 07/05/13 | | | MXN | 4,200 | | | 5.480 | | 28 day Mexican
Interbank Rate | | | 5,012 | | | | — | | | | 5,012 | |
Barclays Bank PLC(b) | | | 09/20/21 | | | MXN | 1,600 | | | 6.790 | | 28 day Mexican
Interbank Rate | | | 3,411 | | | | — | | | | 3,411 | |
Barclays Bank PLC(b) | | | 06/20/21 | | | NZD | 100 | | | 4.980 | | 3 month BBR | | | 2,995 | | | | — | | | | 2,995 | |
Barclays Bank PLC(b) | | | 06/17/16 | | | ZAR | 1,100 | | | 7.580 | | 3 month JIBAR | | | 6,431 | | | | — | | | | 6,431 | |
| | | | | | | | | | | | | | | | | | | | | | | | |
| | | | | | | | | | | | | | $ | (554,265 | ) | | $ | — | | | $ | (554,265 | ) |
| | | | | | | | | | | | | | | | | | | | | | | | |
| (a) | Fund pays the fixed rate and receives the floating rate. |
| (b) | Fund pays the floating rate and receives the fixed rate. |
| # | Notional amount is shown in U.S. dollars unless otherwise stated. |
Various inputs are used in determining the value of the Fund’s investments. These inputs are summarized in the three broad levels listed below.
Level 1—quoted prices generally for securities actively traded on a regulated securities exchange and for open-end mutual funds which trade at daily net asset value.
Level 2—other significant observable inputs (including, but not limited to, quoted prices for similar securities, interest rates, prepayment speeds, foreign currency exchange rates and amortized cost) generally for debt securities, swaps, forward foreign currency contracts and for foreign stocks priced using vendor modeling tools.
Level 3—significant unobservable inputs for securities valued in accordance with Board approved fair valuation procedures.
See Notes to Financial Statements.
| | |
| 40 | | Visit our website at www.prudentialfunds.com |
The following is a summary of the inputs used as of October 31, 2011 in valuing such portfolio securities:
| | | | | | | | | | | | |
| | | Level 1 | | | Level 2 | | | Level 3 | |
Investments in Securities | | | | | | | | | | | | |
Asset-Backed Securities | | | | | | | | | | | | |
CLO’s, CDO’s and Other Asset-Backed Securities | | $ | — | | | $ | 4,273,495 | | | $ | 544,648 | |
Residential Mortgage-Backed Securities | | | — | | | | 3,275,879 | | | | — | |
Bank Loans | | | — | | | | 2,282,626 | | | | 362,075 | |
Commercial Mortgage-Backed Securities | | | — | | | | 8,650,516 | | | | — | |
Corporate Bonds | | | — | | | | 13,108,282 | | | | — | |
Municipal Bond | | | — | | | | 127,344 | | | | — | |
Non-Corporate Foreign Agencies | | | — | | | | 904,748 | | | | — | |
Sovereigns | | | — | | | | 1,090,211 | | | | — | |
U.S. Treasury Obligations | | | — | | | | 509,546 | | | | — | |
Affiliated Money Market Mutual Fund | | | 783,730 | | | | — | | | | — | |
Other Financial Instruments* | | | | | | | | | | | | |
Forward Currency Contracts | | | — | | | | 34,665 | | | | — | |
Interest Rate Swap Agreements | | | — | | | | (554,265 | ) | | | — | |
| | | | | | | | | | | | |
Total | | $ | 783,730 | | | $ | 33,703,047 | | | $ | 906,723 | |
| | | | | | | | | | | | |
The following is a reconciliation of assets in which significant unobservable inputs (Level 3) were used in determining fair value:
| | | | | | | | |
| | | CLO’s, CDO’s and Other
Asset-Backed
Securities | | | Bank
Loans | |
Balance as of 03/30/11 (commencement of investment operations) | | $ | — | | | $ | — | |
Realized gain (loss) | | | — | | | | — | |
Change in unrealized appreciation (depreciation)** | | | (3,552 | ) | | | (10,052 | ) |
Purchases | | | 548,200 | | | | 372,127 | |
Sales | | | — | | | | — | |
Accrued discount/premium | | | — | | | | — | |
Transfers into Level 3 | | | — | | | | — | |
Transfers out of Level 3 | | | — | | | | — | |
| | | | | | | | |
Balance as of 10/31/11 | | $ | 544,648 | | | $ | 362,075 | |
| | | | | | | | |
| * | Other financial instruments are derivative instruments not reflected in the Portfolio of Investments, such as futures, forwards and swap contracts, which are recorded at the unrealized appreciation/depreciation on the instrument. |
| ** | Of which, $(13,604) was included in Net Assets relating to securities held at the reporting period end. |
See Notes to Financial Statements.
| | | | |
| Prudential Absolute Return Bond Fund | | | 41 | |
Portfolio of Investments
as of October 31, 2011 continued
The industry classification of portfolio holdings and liabilities in excess of other assets shown as a percentage of net assets as of October 31, 2011 were as follows:
| | | | |
Commercial Mortgage-Backed Securities | | | 24.8 | % |
Collateralized Loan Obligations, CDO’s and Other Asset-Backed Securities | | | 13.8 | |
Residential Mortgage-Backed Securities | | | 9.4 | |
Banking | | | 5.8 | |
Cable | | | 4.0 | |
Technology | | | 3.6 | |
Healthcare & Pharmaceutical | | | 3.1 | |
Sovereigns | | | 3.1 | |
Foods | | | 2.9 | |
Metals | | | 2.6 | |
Non-Corporate Foreign Agency | | | 2.6 | |
Media & Entertainment | | | 2.5 | |
Affiliated Money Market Mutual Fund | | | 2.2 | |
Energy—Other | | | 2.2 | |
Gaming | | | 1.8 | |
Insurance | | | 1.8 | |
Non-Captive Finance | | | 1.8 | |
Chemicals | | | 1.7 | |
Paper | | | 1.7 | % |
Telecommunications | | | 1.7 | |
Capital Goods | | | 1.5 | |
U.S. Treasury Obligations | | | 1.4 | |
Automotive | | | 1.1 | |
Consumer | | | 0.8 | |
Electric | | | 0.8 | |
Retailers | | | 0.8 | |
Airlines | | | 0.7 | |
Real Estate Investment Trusts | | | 0.7 | |
Tobacco | | | 0.7 | |
Lodging | | | 0.4 | |
Municipal Bond | | | 0.4 | |
Building Materials & Construction | | | 0.3 | |
Aerospace & Defense | | | 0.1 | |
| | | | |
| | | 102.8 | |
Liabilities in excess of other assets | | | (2.8 | ) |
| | | | |
| | | 100.0 | % |
| | | | |
The Fund invested in derivative instruments during the reporting period. The primary types of risk associated with these derivative instruments are foreign exchange risk, credit and interest rate risk. The effect of such derivative instruments on the Fund’s financial position and financial performance as reflected in the Statement of Assets and Liabilities and Statement of Operations is presented in the summary below.
Fair values of derivative instruments as of October 31, 2011 as presented in the Statement of Assets and Liabilities:
| | | | | | | | | | | | |
Derivatives not designated
as hedging instruments,
carried at fair value | | Asset Derivatives | | | Liability Derivatives | |
| | Balance
Sheet Location | | Fair
Value | | | Balance
Sheet Location | | Fair
Value | |
| Foreign exchange contracts | | Unrealized appreciation on forward currency contracts | | $ | 208,937 | | | Unrealized depreciation on forward currency contracts | | $ | 174,272 | |
| Interest rate contracts | | Unrealized appreciation on swap agreements | | | 234,306 | | | Unrealized depreciation on swap agreements | | | 788,571 | |
| | | | | | | | | | | | |
Total | | | | $ | 443,243 | | | | | $ | 962,843 | |
| | | | | | | | | | | | |
See Notes to Financial Statements.
| | |
| 42 | | Visit our website at www.prudentialfunds.com |
The effects of derivative instruments on the Statement of Operations for the period March 30, 2011* through October 31, 2011 are as follows:
| | | | | | | | | | | | | | | | |
Amount of Realized Gain or (Loss) on Derivatives Recognized in Income | |
Derivatives not designated as hedging
instruments, carried at fair value | | Futures | | | Forward
Currency
Contracts | | | Swaps | | | Total | |
Credit contracts | | $ | — | | | $ | — | | | $ | 51,374 | | | $ | 51,374 | |
Foreign exchange contracts | | | — | | | | (39,417 | ) | | | — | | | | (39,417 | ) |
Interest rate contracts | | | (33,924 | ) | | | — | | | | (77,416 | ) | | | (111,340 | ) |
| | | | | | | | | | | | | | | | |
Total | | $ | (33,924 | ) | | $ | (39,417 | ) | | $ | (26,042 | ) | | $ | (99,383 | ) |
| | | | | | | | | | | | | | | | |
| | | | | | | | | | | | |
Change in Unrealized Appreciation or (Depreciation) on Derivatives Recognized in Income | |
Derivatives not designated as hedging
instruments, carried at fair value | | Forward
Currency
Contracts | | | Swaps | | | Total | |
Foreign exchange contracts | | $ | 34,381 | | | $ | — | | | $ | 34,381 | |
Interest rate contracts | | | — | | | | (554,265 | ) | | | (554,265 | ) |
| | | | | | | | | | | | |
Total | | $ | 34,381 | | | $ | (554,265 | ) | | $ | (519,884 | ) |
| | | | | | | | | | | | |
| * | Commencement of operations. |
As of October 31, 2011, the Fund’s average volume of derivatives activities is as follows:
| | | | | | | | | | | | | | | | | | | | | | |
Futures
Short
Position
(Value at
Trade Date) | | | Forward
Currency
Contracts—
Purchased
(Value at
Settlement
Date Payable) | | | Forward
Currency
Contracts—
Sold
(Value at
Settlement
Date Receivable) | | | Interest
Rate
Swaps
(Notional
Amount in
USD (000)) | | | Credit
Default
Swaps
(Notional
Amount in
USD (000)) | | | Inflation
Swap
(Notional
Amount in
USD (000)) | |
| $ | 207,109 | | | $ | 6,723,500 | | | $ | 3,009,553 | | | $ | 42,882 | | | $ | 833 | | | $ | 157 | |
See Notes to Financial Statements.
| | | | |
| Prudential Absolute Return Bond Fund | | | 43 | |
Statement of Assets and Liabilities
as of October 31, 2011
| | | | |
Assets | | | | |
Investments at value: | | | | |
Unaffiliated Investments (cost $35,519,172) | | $ | 35,129,370 | |
Affiliated Investments (cost $783,730) | | | 783,730 | |
Cash | | | 685,766 | |
Receivable for investments sold | | | 1,361,812 | |
Dividends and interest receivable | | | 285,488 | |
Unrealized appreciation on swap agreements | | | 234,306 | |
Unrealized appreciation on forward foreign currency contracts | | | 208,937 | |
Receivable for Fund shares sold | | | 23,831 | |
Prepaid expenses | | | 1,481 | |
Foreign tax reclaim receivable | | | 692 | |
| | | | |
Total assets | | | 38,715,413 | |
| | | | |
| |
Liabilities | | | | |
Payable for investments purchased | | | 1,743,581 | |
Payable for Fund shares reacquired | | | 914,123 | |
Unrealized depreciation on swap agreements | | | 788,571 | |
Unrealized depreciation on forward foreign currency contracts | | | 174,272 | |
Accrued expenses | | | 134,818 | |
Management fee payable | | | 20,561 | |
Distribution fee payable | | | 4,043 | |
Due to custodian | | | 3,749 | |
Affiliated transfer agent fee payable | | | 336 | |
| | | | |
Total liabilities | | | 3,784,054 | |
| | | | |
| |
Net Assets | | $ | 34,931,359 | |
| | | | |
| | | | | |
Net assets were comprised of: | | | | |
Shares of beneficial interest, at par | | $ | 3,588 | |
Paid-in capital in excess of par | | | 35,823,911 | |
| | | | |
| | | 35,827,499 | |
Distributions in excess of net investment income | | | (78,080 | ) |
Accumulated net realized gain on investment and foreign currency transactions | | | 91,626 | |
Net unrealized depreciation on investments and foreign currencies | | | (909,686 | ) |
| | | | |
Net assets, October 31, 2011 | | $ | 34,931,359 | |
| | | | |
See Notes to Financial Statements.
| | |
| 44 | | Visit our website at www.prudentialfunds.com |
| | | | |
Class A | | | | |
Net asset value and redemption price per share | | | | |
($2,709,052 ÷ 278,743 shares of beneficial interest issued and outstanding) | | $ | 9.72 | |
Maximum sales charge (4.50% of offering price) | | | 0.46 | |
| | | | |
Maximum offering price to public | | $ | 10.18 | |
| | | | |
| |
Class C | | | | |
Net asset value, offering price and redemption price per share
($4,029,532 ÷ 414,133 shares of beneficial interest issued and outstanding) | | $ | 9.73 | |
| | | | |
| |
Class Q | | | | |
Net asset value, offering price and redemption price per share
($989 ÷ 101.6 shares of beneficial interest issued and outstanding) | | $ | 9.73 | |
| | | | |
| |
Class Z | | | | |
Net asset value, offering price and redemption price per share
($28,191,786 ÷ 2,894,623 shares of beneficial interest issued and outstanding) | | $ | 9.74 | |
| | | | |
See Notes to Financial Statements.
| | | | |
| Prudential Absolute Return Bond Fund | | | 45 | |
Statement of Operations
For the Period March 30, 2011* through October 31, 2011
| | | | |
Net Investment Income | | | | |
Income | | | | |
Unaffiliated interest income | | $ | 703,239 | |
Affiliated dividend income | | | 7,407 | |
| | | | |
Total income | | | 710,646 | |
| | | | |
| |
Expenses | | | | |
Management fee | | | 149,191 | |
Distribution fee—Class A | | | 3,314 | |
Distribution fee—Class C | | | 13,338 | |
Custodian’s fees and expenses | | | 90,000 | |
Registration fees | | | 68,000 | |
Audit fee | | | 60,000 | |
Legal fees and expenses | | | 39,000 | |
Reports to shareholders | | | 33,000 | |
Trustees’ fees | | | 7,000 | |
Transfer agent’s fees and expenses (including affiliated expense of $800) (Note 3) | | | 3,000 | |
Miscellaneous | | | 10,457 | |
| | | | |
Total expenses | | | 476,300 | |
Expense reimbursement (Note 2) | | | (264,546 | ) |
| | | | |
Net expenses | | | 211,754 | |
| | | | |
Net investment income | | | 498,892 | |
| | | | |
| |
Realized And Unrealized Gain (Loss) On Investment And Foreign Currency Transactions | | | | |
Net realized gain (loss) on: | | | | |
Investment transactions | | | 100,267 | |
Foreign currency transactions | | | (66,876 | ) |
Financial futures transactions | | | (33,924 | ) |
Swap agreement transactions | | | (26,042 | ) |
| | | | |
| | | (26,575 | ) |
| | | | |
Net change in unrealized appreciation (depreciation) on: | | | | |
Investments | | | (389,802 | ) |
Foreign currencies | | | 34,381 | |
Swap agreements | | | (554,265 | ) |
| | | | |
| | | (909,686 | ) |
| | | | |
Net loss on investment and foreign currency transactions | | | (936,261 | ) |
| | | | |
Net Decrease In Net Assets Resulting From Operations | | $ | (437,369 | ) |
| | | | |
| * | Commencement of investment operations. |
See Notes to Financial Statements.
| | |
| 46 | | Visit our website at www.prudentialfunds.com |
Statement of Changes in Net Assets
| | | | |
| | | March 30, 2011*
through
October 31, 2011 | |
Increase (Decrease) In Net Assets | | | | |
Operations | | | | |
Net investment income | | $ | 498,892 | |
Net realized loss on investment and foreign currency transactions | | | (26,575 | ) |
Net change in unrealized appreciation (depreciation) on investments and
foreign currencies | | | (909,686 | ) |
| | | | |
Net decrease in net assets resulting from operations | | | (437,369 | ) |
| | | | |
| |
Dividends from net investment income (Note 1) | | | | |
Class A | | | (36,420 | ) |
Class C | | | (26,946 | ) |
Class Q | | | (16 | ) |
Class Z | | | (407,867 | ) |
| | | | |
| | | (471,249 | ) |
| | | | |
| |
Fund share transactions (Note 6) | | | | |
Net proceeds from shares sold | | | 39,453,377 | |
Net asset value of shares issued in reinvestment of dividends | | | 457,824 | |
Cost of shares reacquired | | | (4,071,224 | ) |
| | | | |
Net increase in net assets from Fund share transactions | | | 35,839,977 | |
| | | | |
Total increase | | | 34,931,359 | |
| |
Net Assets: | | | | |
Beginning of period | | | — | |
| | | | |
End of period(a) | | $ | 34,931,359 | |
| | | | |
| * | Commencement of investment operations. |
See Notes to Financial Statements.
| | | | |
| Prudential Absolute Return Bond Fund | | | 47 | |
Notes to Financial Statements
Prudential Investment Portfolios 9 (the “Trust”) is an open-end management investment company, registered under the Investment Company Act of 1940, as amended (“1940 Act”). The Trust currently consists of three funds: Prudential Large-Cap Core Equity Fund, Prudential International Real Estate Fund and Prudential Absolute Return Bond Fund (the “Fund”). These financial statements relate to Prudential Absolute Return Bond Fund, a diversified fund. The financial statements of the Prudential Large-Cap Core Equity Fund and Prudential International Real Estate Fund are not presented herein. The Trust was organized as a business trust in Delaware on September 18, 1998. The Fund commenced investment operations on March 30, 2011.
The Fund’s investment objective is to seek positive returns over the long term, regardless of market conditions. It invests at least 80% of its investable assets in debt securities, including mortgage-related securities, asset-backed securities, floating rate loans, municipal securities, U.S. Government securities, corporate securities and foreign securities.
Note 1. Accounting Policies
The following is a summary of significant accounting policies followed by the Fund in the preparation of its financial statements.
Securities Valuation: Securities listed on a securities exchange (other than options on securities and indices) are valued at the last sale price on such exchange on the day of valuation or, if there was no sale on such day, at the mean between the last reported bid and asked prices, or at the last bid price on such day in the absence of an asked price. Securities traded via NASDAQ are valued at the NASDAQ official closing price (“NOCP”) on the day of valuation, or if there was no NOCP, at the last sale price. Securities that are actively traded in the over-the-counter market, including listed securities for which the primary market is believed by Prudential Investments LLC (“PI” or “Manager”), in consultation with the subadvisers, to be over-the-counter, are valued at market value using prices provided by an independent pricing agent or principal market maker. Futures contracts and options thereon traded on a commodities exchange or board of trade are valued at the last sale price at the close of trading on such exchange or board of trade or, if there was no sale on the applicable commodities exchange or board of trade on such day, at the mean between the most recently quoted bid and asked prices on such exchange or board of
| | |
| 48 | | Visit our website at www.prudentialfunds.com |
trade or at the last bid price in the absence of an asked price. Prices may be obtained from independent pricing services which use information provided by market makers or estimates of market values obtained from yield data relating to investments or securities with similar characteristics. Securities for which reliable market quotations are not readily available, or whose values have been affected by events occurring after the close of the security’s foreign market and before the Funds’ normal pricing time, are valued at fair value in accordance with the Board of Trustees’ approved fair valuation procedures. When determining the fair valuation of securities some of the factors influencing the valuation include, the nature of any restrictions on disposition of the securities; assessment of the general liquidity of the securities; the issuer’s financial condition and the markets in which it does business; the cost of the investment; the size of the holding and the capitalization of issuer; the prices of any recent transactions or bids/offers for such securities or any comparable securities; any available analyst media or other reports or information deemed reliable by the investment adviser regarding the issuer or the markets or industry in which it operates. Using fair value to price securities may result in a value that is different from a security’s most recent closing price and from the price used by other mutual funds to calculate their net asset values.
Investments in open-end, non-exchange-traded mutual funds are valued at their net asset value as of the close of the New York Stock Exchange on the date of valuation.
Short-term debt securities of sufficient credit quality, which mature in sixty days or less, are valued at amortized cost, which approximates fair value. The amortized cost method includes valuing a security at its cost on the date of purchase and thereafter assuming a constant amortization to maturity of the difference between the principal amount due at maturity and cost. Short-term debt securities, which mature in more than sixty days, are valued at fair value.
Foreign Currency Translation: The books and records of the Fund are maintained in U.S. dollars. Foreign currency amounts are translated into U.S. dollars on the following basis:
(i) market value of investment securities, other assets and liabilities-at the current rates of exchange;
(ii) purchases and sales of investment securities, income and expenses-at the rates of exchange prevailing on the respective dates of such transactions.
The Fund does not isolate that portion of the results of operations arising as a result of changes in the foreign exchange rates from the fluctuations arising from changes in the market prices of long term securities held at the end of the period. Similarly, the Fund
| | | | |
| Prudential Absolute Return Bond Fund | | | 49 | |
Notes to Financial Statements
continued
does not isolate the effect of changes in foreign exchange rates from the fluctuations arising from changes in the market prices of portfolio securities sold during the period. Accordingly, realized foreign currency gains or losses are included in the reported net realized gains or losses on investment transactions. Net realized gains or losses on foreign currency transactions represent net foreign exchange gains or losses from the holding of foreign currencies, currency gains or losses realized between the trade and settlement date on security transactions, and the difference between the amounts of dividends, interest and foreign withholding taxes recorded on the Fund’s books and the U.S. dollar equivalent amounts actually received or paid. Net unrealized currency gains or losses from valuing foreign currency denominated assets and liabilities (other than investments) at period end exchange rates are reflected as a component of net unrealized appreciation (depreciation) on foreign currencies.
Financial Futures Contracts: A financial futures contract is an agreement to purchase (long) or sell (short) an agreed amount of securities at a set price for delivery on a future date. Upon entering into a financial futures contract, the Fund is required to pledge to the broker an amount of cash and/or other assets equal to a certain percentage of the contract amount. This amount is known as the “initial margin.” Subsequent payments, known as “variation margin,” are made or received by the Fund each day, depending on the daily fluctuations in the value of the underlying security. Such variation margin is recorded for financial statement purposes on a daily basis as unrealized gain (loss). When the contract expires or is closed, the gain (loss) is realized and is presented in the Statement of Operations as net realized gain (loss) on financial futures transactions. Financial futures contracts involve elements of risk in excess of the amounts reflected on the Statement of Assets and Liabilities.
The Fund invests in financial futures contracts in order to hedge its existing portfolio securities, or securities the Fund intends to purchase, against fluctuations in value caused by changes in prevailing interest rates, value of equities or foreign currency exchange rates. Should interest rates move unexpectedly, the Fund may not achieve the anticipated benefits of the financial futures contracts and may realize a loss. The use of futures transactions involves the risk of imperfect correlation in movements in the price of futures contracts, interest rates and the underlying hedged assets.
With exchange-traded futures, there is a minimal counterparty credit risk to the Fund since the exchanges’ clearinghouse acts as counterparty to all exchange traded futures and guarantees the futures contracts against default.
| | |
| 50 | | Visit our website at www.prudentialfunds.com |
Forward Currency Contracts: A forward currency contract is a commitment to purchase or sell a foreign currency at a future date at a negotiated forward rate between two parties. The Fund enters into forward currency contracts in order to hedge its exposure to changes in foreign currency exchange rates on its foreign portfolio holdings or specific receivables and payables denominated in a foreign currency. The contracts are valued daily at current forward exchange rates and any unrealized gain or loss is included in net unrealized appreciation or depreciation on foreign currencies. Gain or loss is realized on the settlement date of the contract equal to the difference between the settlement value of the original and negotiated forward contracts. This gain or loss, if any, is included in net realized gain (loss) on foreign currency transactions. Risks may arise upon entering into these contracts from the potential inability of the counterparties to meet the terms of their contracts. Forward currency contracts involve risks from currency exchange rate and credit risk in excess of the amounts reflected on the Statement of Assets and Liabilities. The Fund’s maximum risk of loss from counterparty credit risk is the net value of the cash flows to be received from the counterparty at the end of the contract’s life. A master netting arrangement between the Fund and the counterparty which may permit the Fund to offset amounts payable by the Fund to the same counterparty against amounts to be received; and by the receipt of collateral from the counterparty by the Fund to cover the Fund’s exposure to the counterparty. However, there is no assurance that such mitigating factors are easily enforceable.
Swap Agreements: The Fund entered into interest rate swap agreements. A swap agreement is an agreement to exchange the return generated by one instrument for the return generated by another instrument. The swap agreements are valued daily at current market value and any change in value is included in the net unrealized appreciation or depreciation on investments. Payments received or paid by the Fund are recorded as realized gains or losses upon termination or maturity of the swap. Risk of loss may exceed amounts recognized on the statements of assets and liabilities. Swap agreements outstanding at period end, if any, are listed on the Portfolio of Investments.
Interest Rate Swaps: Interest rate swaps represent an agreement between counterparties to exchange cash flows based on the difference between two interest rates, applied to a notional principal amount for a specified period. The Fund is subject to interest rate risk exposure in the normal course of pursuing its investment objectives. The Fund used interest rate swaps to maintain its ability to generate steady cash flow by receiving a stream of fixed rate payments and to increase exposure to prevailing market rates by receiving floating rate payments using interest rate swap contracts. The Fund’s maximum risk of loss from counterparty credit risk is the discounted net value of the cash flows to be received from the counterparty over the
| | | | |
| Prudential Absolute Return Bond Fund | | | 51 | |
Notes to Financial Statements
continued
contract’s remaining life. A master netting arrangement between the Fund and the counterparty permits the Fund to offset amounts payable by the Fund to the same counterparty against amounts to be received; and by the receipt of collateral from the counterparty by the Fund to cover the Fund’s exposure to the counterparty. However, there is no assurance that such mitigating factors are easily enforceable.
In addition to each instrument’s primary underlying risk exposure (e.g. interest rate), swap agreements involve, to varying degrees, elements of credit, market and documentation risk. Such risks involve the possibility that there will be no liquid market for these agreements, that the counterparty to the agreement may default on its obligation to perform or disagree as to the meaning of the contractual terms in the agreement, and that there will be unfavorable changes in net interest rates. In connection with these agreements, securities in the portfolio may be identified as collateral or received as collateral from the counterparty in accordance with the terms of the respective swap agreements to provide or receive assets of value and serve as recourse in the event of default or bankruptcy/insolvency of either party. Such over-the-counter derivative agreements include conditions which when materialized, give the counterparty the right to cause an early termination of the transactions under those agreements. Any election by the counterparty for early termination of the contract(s) may impact the amounts reported on financial statements.
As of October 31, 2011, the Fund has not met conditions under such agreements, which give the counterparty the right to call for an early termination.
Forward currency contracts, financial futures contracts and swaps involve elements of both market and credit risk in excess of the amounts reflected on the Statement of Assets and Liabilities.
Concentration of Risk: The ability of issuers of debt securities (other than those issued or guaranteed by the U.S. Government) held by the Fund to meet their obligations may be affected by the economic or political developments in a specific industry, region or country. Foreign security and currency transactions may involve certain considerations and risks not typically associated with those of domestic origin as a result of, among other factors, the possibility of political and economic instability or the level of governmental supervision and regulation of foreign securities markets.
Restricted Securities: The Fund may hold up to 15% of its net assets in illiquid securities, including those which are restricted as to disposition under securities law
| | |
| 52 | | Visit our website at www.prudentialfunds.com |
(“restricted securities”). Restricted securities are valued pursuant to the valuation procedures noted above.
Securities Transactions and Net Investment Income: Securities transactions are recorded on the trade date. Realized gains or losses on sales of securities are calculated on the identified cost basis. Dividend income is recorded on the ex-dividend date and interest income is recorded on the accrual basis. The Fund amortizes premiums and accretes discounts on debt securities as adjustments to interest income. Net investment income or loss (other than distribution fees, which are charged to the respective class) and unrealized and realized gains or losses are allocated daily to each class of shares based upon the relative proportion of net assets of each class at the beginning of the day.
Dividends and Distributions: The Fund declares dividends of net investment income daily and payment is made monthly. Distributions of net realized capital and currency gains, if any, are made annually. Dividends and distributions are recorded on the ex-dividend date. Dividends and distributions are determined in accordance with federal income tax regulations which may differ from generally accepted accounting principles. Permanent book/tax differences relating to income and gains are reclassified amongst distribution in excess of net investment income, accumulated net realized gain or loss and paid-in-capital in excess of par, as appropriate.
Taxes: For federal income tax purposes it is the Fund’s policy to continue to meet the requirements of the Internal Revenue Code applicable to regulated investment companies and to distribute all of its taxable net income and capital gains, if any, to its shareholders. Therefore, no federal income tax provision is required.
Withholding taxes on foreign interest are recorded, net of reclaimable amounts, at the time the related income is earned.
Estimates: The preparation of the financial statements requires management to make estimates and assumptions that affect the reported amounts and disclosures in the financial statements. Actual results could differ from those amounts.
Note 2. Agreements
The Fund has a management agreement with PI. Pursuant to this agreement, PI has responsibility for all investment advisory services and supervises the subadvisor’s performance of such services. PI has entered into a subadvisory agreement with Prudential Investment Management, Inc. (“PIM”). The subadvisory agreement
| | | | |
| Prudential Absolute Return Bond Fund | | | 53 | |
Notes to Financial Statements
continued
provides that PIM will furnish investment advisory services in connection with the management of the Fund. In connection therewith, PIM is obligated to keep certain books and records of the Fund. PI pays for the services of PIM, the cost of compensation of officers of the Fund, occupancy and certain clerical and bookkeeping costs of the Fund. The Fund bears all other costs and expenses.
The management fee paid to PI is computed daily and payable monthly at an annual rate of .80% of the average daily net assets.
PI has contractually agreed through February 28, 2013 to limit net annual Fund operating expenses (excluding distribution and service (12b-1) fees, extraordinary and certain other expenses such as taxes, interest and brokerage commissions) to each class of shares to 1.05% of the Fund’s daily average net assets.
The Fund has a distribution agreement with Prudential Investment Management Services LLC (“PIMS”) who acts as the distributor of the Class A, Class C, Class Q and Class Z shares. The Fund compensates PIMS for distributing and servicing the Fund’s Class A and Class C shares, pursuant to plans of distribution (the “Class A and C Plans”), regardless of expenses actually incurred by PIMS. The distribution fees are accrued daily and payable monthly. No distribution or service fees are paid to PIMS as distributor of the Class Q and Class Z shares of the Fund.
Pursuant to the Class A and C Plans, the Fund compensates PIMS for distribution related activities at an annual rate of up to .30% and 1% of the average daily net assets of the Class A and C shares, respectively. PIMS has contractually agreed to limit such expenses to .25% of the average daily net assets of the Class A shares through February 28, 2013.
PIMS has advised the Fund that it received $26,179 in front-end sales charges resulting from sales of Class A shares during the period ended October 31, 2011. From these fees, PIMS paid such sales charges to affiliated broker-dealers, which in turn paid commissions to salespersons and incurred other distribution costs. PIMS has advised the Fund that for the period ended October 31, 2011, it has received $1,107, in contingent deferred sales charges imposed upon certain redemptions by Class C shareholders, respectively.
PI and PIMS are indirect, wholly-owned subsidiaries of Prudential Financial, Inc. (“Prudential”).
| | |
| 54 | | Visit our website at www.prudentialfunds.com |
Note 3. Other Transactions with Affiliates
Prudential Mutual Fund Services LLC (“PMFS”), an affiliate of PI and an indirect, wholly-owned subsidiary of Prudential, serves as the Fund’s transfer agent. Transfer agent fees and expenses in the Statement of Operations include certain out-of-pocket expenses paid to non-affiliates, where applicable.
The Fund invests in the Prudential Core Taxable Money Market Fund (the “Core Fund”), a series of the Prudential Investment Portfolios 2 registered under the 1940 Act, and managed by PI. Earnings from the Core Fund are disclosed on the Statement of Operations as affiliated dividend income.
Note 4. Portfolio Securities
Purchases and sales of investment securities, other than short-term investments and government securities, for the period ended October 31, 2011 were $63,178,492 and $28,274,427, respectively.
Note 5. Distributions and Tax Information
Distributions to shareholders, which are determined in accordance with federal income tax regulations and which may differ from generally accepted accounting principles, are recorded on the ex-dividend date. In order to present distributions in excess of net investment income, accumulated net realized gain on investment and foreign currency transactions and paid-in capital in excess of par on the Statement of Assets and Liabilities that more closely represent their tax character, certain adjustments have been made to distributions in excess of net investment income, accumulated net realized gain on investment and foreign currency transactions and paid-in capital in excess of par. For the fiscal period ended October 31, 2011, the adjustments were to increase distributions in excess of net investment income by $105,723, to increase accumulated net realized gain on investment and foreign currency transactions by $118,201 and to decrease paid-in capital in excess of par by $12,478, primarily due to the difference between financial and tax reporting purposes of premium amortization, certain transactions involving foreign currencies, paydown gains (losses), swaps and other book to tax adjustments. Net investment income, net realized loss and net assets were not affected by this change.
As of October 31, 2011, the accumulated undistributed ordinary income on a tax basis was $91,626.
| | | | |
| Prudential Absolute Return Bond Fund | | | 55 | |
Notes to Financial Statements
continued
For the fiscal period ended October 31, 2011 the tax character of dividends paid as reflected in the Statement of Changes in Net Assets was $471,249 from ordinary income.
The United States federal income tax basis of the Fund’s investments and the net unrealized depreciation as of October 31, 2011 were as follows:
| | | | | | | | | | |
Tax Basis | | Appreciation | | Depreciation | | Net
Unrealized
Depreciation | | Other Cost
Basis
Adjustments | | Total Net
Unrealized
Depreciation |
| $36,399,113 | | $178,200 | | $(664,213) | | $(486,013) | | $(499,218) | | $(985,231) |
The difference between book basis and tax basis were primarily attributable to the difference in the treatment of premium amortization. The other cost basis adjustments are primarily attributable to appreciation (depreciation) of swaps, futures and forward currency transactions.
Management has analyzed the Fund’s tax positions and has concluded that as of October 31, 2011, no provision for income tax would be required in the Fund’s financial statements for the current reporting period.
Note 6. Capital
The Fund offers Class A, Class C, Class Q and Class Z shares. Class A shares are sold with a front-end sales charge of up to 4.50%. All investors who purchase Class A shares in an amount of $1 million or more and sell these shares within 12 months of purchase are subject to a contingent deferred sales charge (CDSC) of 1%. The Class A CDSC is waived for purchases by certain retirement and/or benefit plans. Class C shares are sold with a contingent deferred sales charge of 1% on shares redeemed during the first 12 months after purchase. Under certain limited circumstances, an exchange may be made from Class A or Class C to Class Z shares of the Fund. A special exchange privilege is also available for shareholders who qualified to purchase Class A shares at net asset value. Class Q and Z shares are not subject to any sales or redemption charge and are offered exclusively for sale to a limited group of investors.
At October 31, 2011, Prudential Financial, Inc. through its affiliates owned 102 Class A shares, 101 Class C shares, 101.6 Class Q shares and 2,537,610 Class Z shares of the Fund.
| | |
| 56 | | Visit our website at www.prudentialfunds.com |
The Trust has authorized an unlimited number of shares of beneficial interest at $.001 par value.
Transactions in shares of beneficial interest were as follows:
| | | | | | | | |
Class A | | Shares | | | Amount | |
Period ended October 31, 2011*: | | | | | | | | |
Shares sold | | | 512,866 | | | $ | 5,075,110 | |
Shares issued in reinvestment of dividends | | | 3,438 | | | | 33,502 | |
Shares reacquired | | | (237,561 | ) | | | (2,329,557 | ) |
| | | | | | | | |
Net increase (decrease) in shares outstanding | | | 278,743 | | | $ | 2,779,055 | |
| | | | | | | | |
Class C | | | | | | |
Period ended October 31, 2011*: | | | | | | | | |
Shares sold | | | 427,911 | | | $ | 4,243,233 | |
Shares issued in reinvestment of dividends | | | 2,487 | | | | 24,212 | |
Shares reacquired | | | (16,265 | ) | | | (158,670 | ) |
| | | | | | | | |
Net increase (decrease) in shares outstanding | | | 414,133 | | | $ | 4,108,775 | |
| | | | | | | | |
Class Q | | | | | | |
Period ended October 31, 2011*: | | | | | | | | |
Shares sold | | | 100.0 | | | $ | 1,000 | |
Shares issued in reinvestment of dividends | | | 1.6 | | | | 16 | |
| | | | | | | | |
Net increase (decrease) in shares outstanding | | | 101.6 | | | $ | 1,016 | |
| | | | | | | | |
Class Z | | | | | | |
Period ended October 31, 2011*: | | | | | | | | |
Shares sold | | | 3,017,842 | | | $ | 30,134,034 | |
Shares issued in reinvestment of dividends | | | 40,769 | | | | 400,094 | |
Shares reacquired | | | (163,988 | ) | | | (1,582,997 | ) |
| | | | | | | | |
Net increase (decrease) in shares outstanding | | | 2,894,623 | | | $ | 28,951,131 | |
| | | | | | | | |
| * | Commenced operations on March 30, 2011. |
Note 7. Borrowings
The Fund, along with other affiliated registered investment companies (the “Funds”), is a party to a Syndicated Credit Agreement (“SCA”) with a group of banks. The purpose of the SCA is to provide an alternative source of temporary funding for capital share redemptions. The SCA provides for a commitment of $750 million for the period December 17, 2010 through December 16, 2011. The Funds pay an annualized commitment fee of 0.10% of the unused portion of the SCA. Prior to December 17, 2010, the Funds had another Syndicated Credit Agreement (the “Expired SCA”) of a $500 million commitment with an annualized commitment fee of
| | | | |
| Prudential Absolute Return Bond Fund | | | 57 | |
Notes to Financial Statements
continued
0.15% of the unused portion. Interest on any borrowings under these SCA’s is paid at contracted market rates. The commitment fee for the unused amount is accrued daily and paid quarterly. The SCA has been renewed of substantially similar terms with an increase in the amount of commitment to $900 million.
The Fund did not utilize the SCA during the period ended October 31, 2011.
Note 8. New Accounting Pronouncements
In April 2011, the Financial Accounting Standards Board (“FASB”) issued Accounting Standards Update (“ASU”) No. 2011-03 “Reconsideration of Effective Control for Repurchase Agreements.” The objective of ASU No. 2011-03 is to improve the accounting for repurchase agreements and other agreements that both entitle and obligate a transferor to repurchase or redeem financial assets before their maturity. Under previous guidance, whether or not to account for a transaction as a sale was based on, in part, if the entity maintained effective control over the transferred financial assets. ASU No. 2011-03 removes the transferor’s ability criterion from the effective control assessment. This guidance is effective prospectively for interim and annual reporting periods beginning on or after December 15, 2011. At this time, management is evaluating the implications of ASU No. 2011-03 and its impact on the financial statements has not been determined.
In May 2011, the FASB issued ASU No. 2011-04 “Amendments to Achieve Common Fair Value Measurement and Disclosure Requirements in U.S. GAAP and IFRSs.” ASU No. 2011-04 includes common requirements for measurement of and disclosure about fair value between U.S. GAAP and IFRS. ASU No. 2011-04 will require reporting entities to disclose quantitative information about the unobservable inputs used in the fair value measurements categorized within Level 3 of the fair value hierarchy. In addition, ASU No. 2011-04 will require reporting entities to make disclosures about amounts and reasons for all transfers in and out of Level 1 and Level 2 fair value measurements. The new and revised disclosures are effective for interim and annual reporting periods beginning after December 15, 2011. At this time, management is evaluating the implications of ASU No. 2011-04 and its impact on the financial statements has not been determined.
| | |
| 58 | | Visit our website at www.prudentialfunds.com |
Note 9. Dividends and Distributions to Shareholders
Subsequent to the fiscal period end, the Fund declared a short-term capital gain distribution on December 21, 2011 to shareholders of record on December 22, 2011. The ex-dividend date was December 23, 2011. The per share amounts declared were for Class A, C, Q and Z $0.0246. per share, respectively.
| | | | |
| Prudential Absolute Return Bond Fund | | | 59 | |
Financial Highlights
| | | | |
| Class A Shares | |
| | | March 30,
2011(a)
through
October 31,
2011(h) | |
| Per Share Operating Performance: | | | | |
| Net Asset Value, Beginning Of Period | | | $10.00 | |
| Income (loss) from investment operations: | | | | |
| Net investment income | | | .18 | |
| Net realized and unrealized loss on investment and foreign currency transactions | | | (.31 | ) |
| Total from investment operations | | | (.13 | ) |
| Less Dividends: | | | | |
| Dividends from net investment income | | | (.15 | ) |
| Net asset value, end of period | | | $9.72 | |
| Total Return(b): | | | (1.27)% | |
| |
| Ratios/Supplemental Data: | |
| Net assets, end of period (000) | | | $2,709 | |
| Average net assets (000) | | | $2,240 | |
| Ratios to average net assets(c): | | | | |
| Expenses, including distribution and service (12b-1) fees(d) | | | 1.30% | (e)(f) |
| Expenses, excluding distribution and service (12b-1) fees | | | 1.05% | (e)(f) |
| Net investment income | | | 2.90% | (e)(f) |
| For Class A, C, Q and Z shares: | | | | |
| Portfolio turnover rate | | | 112% | (g) |
(a) Commencement of operations.
(b) Total return does not consider the effects of sales loads. Total return is calculated assuming a purchase of a share on the first day and a sale on the last day of reporting period, and includes reinvestment of dividends and distributions. Total return may reflect adjustments to conform to generally accepted accounting principles. Total return for period less than a full year is not annualized.
(c) Does not include expenses of the underlying portfolios in which the Fund invests.
(d) The distributor of the Fund has contractually agreed to limit its distribution and service (12b-1) fees to .25% of the average daily net assets of the Class A shares.
(e) Net of expense waiver/reimbursement. If the investment manager had not waived/reimbursed expenses, the expense ratios including and excluding distribution and services (12b-1) fees and net investment income ratio would be 2.65%, 2.40% and 1.55%, respectively, for the period ended October 31, 2011.
(f) Annualized.
(g) Not annualized.
(h) Calculated based on average shares outstanding during the period.
See Notes to Financial Statements.
| | |
| 60 | | Visit our website at www.prudentialfunds.com |
| | | | |
| Class C Shares | |
| | | March 30,
2011(a)
through
October 31,
2011(f) | |
| Per Share Operating Performance: | | | | |
| Net Asset Value, Beginning Of Period | | | $10.00 | |
| Income (loss) from investment operations: | | | | |
| Net investment income | | | .13 | |
| Net realized and unrealized loss on investment and foreign currency transactions | | | (.30 | ) |
| Total from investment operations | | | (.17 | ) |
| Less Dividends: | | | | |
| Dividends from net investment income | | | (.10 | ) |
| Net asset value, end of period | | | $9.73 | |
| Total Return(b): | | | (1.74)% | |
| |
| Ratios/Supplemental Data: | |
| Net assets, end of period (000) | | | $4,030 | |
| Average net assets (000) | | | $2,254 | |
| Ratios to average net assets(c): | | | | |
| Expenses, including distribution and service (12b-1) fees | | | 2.05% | (d)(e) |
| Expenses, excluding distribution and service (12b-1) fees | | | 1.05% | (d)(e) |
| Net investment income | | | 2.17% | (d)(e) |
(a) Commencement of operations.
(b) Total return does not consider the effects of sales loads. Total return is calculated assuming a purchase of a share on the first day and a sale on the last day of reporting period, and includes reinvestment of dividends and distributions. Total return may reflect adjustments to conform to generally accepted accounting principles. Total return for period less than a full year is not annualized.
(c) Does not include expenses of the underlying portfolios in which the Fund invests.
(d) Net of expense waiver/reimbursement. If the investment manager had not waived/reimbursed expenses, the expense ratios including and excluding distribution and services (12b-1) fees and net investment loss ratio would be 3.39%, 2.39% and .83%, respectively, for the period ended October 31, 2011.
(e) Annualized.
(f) Calculated based on average shares outstanding during the period.
See Notes to Financial Statements.
| | | | |
| Prudential Absolute Return Bond Fund | | | 61 | |
Financial Highlights
continued
| | | | |
| Class Q Shares | |
| | | March 30,
2011(a)
through
October 31,
2011(f) | |
| Per Share Operating Performance: | | | | |
| Net Asset Value, Beginning Of Period | | | $10.00 | |
| Income (loss) from investment operations: | | | | |
| Net investment income | | | .16 | |
| Net realized and unrealized loss on investment and foreign currency transactions | | | (.27 | ) |
| Total from investment operations | | | (.11 | ) |
| Less Dividends: | | | | |
| Dividends from net investment income | | | (.16 | ) |
| Net asset value, end of period | | | $9.73 | |
| Total Return(b): | | | (1.09)% | |
| |
| Ratios/Supplemental Data: | |
| Net assets, end of period (000) | | | $1 | |
| Average net assets (000) | | | $1 | |
| Ratios to average net assets(c): | | | | |
| Expenses, including distribution and service (12b-1) fees | | | 1.05% | (d)(e) |
| Expenses, excluding distribution and service (12b-1) fees | | | 1.05% | (d)(e) |
| Net investment income | | | 2.74% | (d)(e) |
(a) Commencement of operations.
(b) Total return is calculated assuming a purchase of a share on the first day and a sale on the last day of reporting period, and includes reinvestment of dividends and distributions. Total return may reflect adjustments to conform to generally accepted accounting principles. Total return for periods less than a full year is not annualized.
(c) Does not include expenses of the underlying portfolios in which the Fund invests.
(d) Net of expense waiver/reimbursement. If the investment manager had not waived/reimbursed expenses, the expense ratios including and excluding distribution and services (12b-1) fees and net investment loss ratio would be 2.45%, 2.45% and 1.34%, respectively, for the period ended October 31, 2011.
(e) Annualized.
(f) Calculated based on average shares outstanding during the period.
See Notes to Financial Statements.
| | |
| 62 | | Visit our website at www.prudentialfunds.com |
| | | | |
| Class Z Shares | |
| | | March 30,
2011(a)
through
October 31,
2011(f) | |
| Per Share Operating Performance: | | | | |
| Net Asset Value, Beginning Of Period | | | $10.00 | |
| Income (loss) from investment operations: | | | | |
| Net investment income | | | .16 | |
| Net realized and unrealized loss on investment and foreign currency transactions | | | (.27 | ) |
| Total from investment operations | | | (.11 | ) |
| Less Dividends: | | | | |
| Dividends from net investment income | | | (.15 | ) |
| Net asset value, end of period | | | $9.74 | |
| Total Return(b): | | | (1.14)% | |
| |
| Ratios/Supplemental Data: | |
| Net assets, end of period (000) | | | $28,192 | |
| Average net assets (000) | | | $27,018 | |
| Ratios to average net assets(c): | | | | |
| Expenses, including distribution and service (12b-1) fees | | | 1.05% | (d)(e) |
| Expenses, excluding distribution and service (12b-1) fees | | | 1.05% | (d)(e) |
| Net investment income | | | 2.70% | (d)(e) |
(a) Commencement of operations.
(b) Total return is calculated assuming a purchase of a share on the first day and a sale on the last day of reporting period, and includes reinvestment of dividends and distributions. Total returns may reflect adjustments to conform to generally accepted accounting principles. Total return for period less than a full year is not annualized.
(c) Does not include expenses of the underlying portfolios in which the Fund invests.
(d) Net of expense waiver/reimbursement. If the investment manager had not waived/reimbursed expenses, the expense ratios including and excluding distribution and services (12b-1) fees and net investment loss ratio would be 2.48%, 2.48% and 1.26%, respectively, for the period ended October 30, 2011.
(e) Annualized.
(f) Calculated based on average shares outstanding during the period.
See Notes to Financial Statements.
| | | | |
| Prudential Absolute Return Bond Fund | | | 63 | |
Report of Independent Registered Public
Accounting Firm
The Board of Trustees and Shareholders
Prudential Investment Portfolios 9:
We have audited the accompanying statement of assets and liabilities of Prudential Absolute Return Bond Fund, a series of Prudential Investment Portfolios 9 (hereafter referred to as the “Fund”), including the portfolio of investments, as of October 31, 2011, and the related statements of operations, changes in net assets and the financial highlights for the period March 30, 2011 (commencement of operations) to October 31, 2011. These financial statements and financial highlights are the responsibility of the Fund’s management. Our responsibility is to express an opinion on these financial statements and financial highlights based on our audit.
We conducted our audit in accordance with the standards of the Public Company Accounting Oversight Board (United States). Those standards require that we plan and perform the audit to obtain reasonable assurance about whether the financial statements and financial highlights are free of material misstatement. An audit includes examining, on a test basis, evidence supporting the amounts and disclosures in the financial statements. Our procedures included confirmation of securities owned as of October 31, 2011, by correspondence with the custodian, transfer agent and brokers or by other appropriate auditing procedures when replies from brokers were not received. An audit also includes assessing the accounting principles used and significant estimates made by management, as well as evaluating the overall financial statement presentation. We believe that our audit provides a reasonable basis for our opinion.
In our opinion, the financial statements and financial highlights referred to above present fairly, in all material respects, the financial position of the Fund as of October 31, 2011, and the results of its operations, the changes in its net assets and the financial highlights for the period March 30, 2011 to October 31, 2011, in conformity with U.S. generally accepted accounting principles.

New York, New York
December 22, 2011
| | |
| 64 | | Visit our website at www.prudentialfunds.com |
Tax Information
(Unaudited)
For the fiscal period ended October 31, 2011, the Fund designates the maximum amount allowable but not less than 83.50% as interest related dividends in accordance with Section 871(k)(1) and 881(e)(1) of the Internal Revenue Code.
In January 2012, you will be advised on IRS 1099DIV or substitute Form 1099, as to the federal tax status of the dividends received by you in calendar year 2011.
| | | | |
| Prudential Absolute Return Bond Fund | | | 65 | |
INFORMATION ABOUT BOARD MEMBERS AND OFFICERS
(Unaudited)
Information about Board Members and Officers is set forth below. Board Members who are not deemed to be “interested persons” of the Fund, as defined in the 1940 Act, are referred to as “Independent Board Members.” Board Members who are deemed to be “interested persons” of the Fund are referred to as “Interested Board Members.” The Board Members are responsible for the overall supervision of the operations of the Fund and perform the various duties imposed on the directors of investment companies by the 1940 Act.
| | | | |
Independent Board Members(1) | | | | |
Name, Address, Age Position(s) Portfolios Overseen | | Principal Occupation(s) During Past Five Years | | Other Directorships Held |
Kevin J. Bannon (59) Board Member Portfolios Overseen: 58 | | Managing Director (since April 2008) and Chief Investment Officer (since October 2008) of Highmount Capital LLC (registered investment adviser); formerly Executive Vice President and Chief Investment Officer (April 1993-August 2007) of Bank of New York Company; President (May 2003-May 2007) of BNY Hamilton Family of Mutual Funds. | | Director of Urstadt Biddle Properties (since September 2008). |
Linda W. Bynoe (59) Board Member Portfolios Overseen: 58 | | President and Chief Executive Officer (since March 1995) and formerly Chief Operating Officer (December 1989-February 1995) of Telemat Ltd. (management consulting); formerly Vice President (January 1985-June 1989) at Morgan Stanley & Co (broker-dealer). | | Director of Simon Property Group, Inc. (retail real estate) (since May 2003); Director of Anixter International, Inc. (communication products distributor) (since January 2006); Director of Northern Trust Corporation (financial services) (since April 2006); Trustee of Equity Residential (residential real estate) (since December 2009); formerly Director of Dynegy Inc. (power generation) (September 2002-May 2006). |
Michael S. Hyland, CFA (66) Board Member Portfolios Overseen: 58 | | Independent Consultant (since February 2005); formerly Senior Managing Director (July 2001-February 2005) of Bear Stearns & Co, Inc.; Global Partner, INVESCO (1999-2001); Managing Director and President of Salomon Brothers Asset Management (1989-1999). | | None. |
Douglas H. McCorkindale (72) Board Member Portfolios Overseen: 58 | | Formerly Chairman (February 2001-June 2006), Chief Executive Officer (June 2000-July 2005), President (September 1997-July 2005) and Vice Chairman (March 1984-May 2000) of Gannett Co. Inc. (publishing and media). | | Director of Lockheed Martin Corp. (aerospace and defense) (since May 2001). |
Visit our website at www.prudentialfunds.com
| | | | |
Independent Board Members(1) | | | | |
Name, Address, Age Position(s) Portfolios Overseen | | Principal Occupation(s) During Past Five Years | | Other Directorships Held |
Stephen P. Munn (69) Board Member Portfolios Overseen: 58 | | Lead Director (since 2007) and formerly Chairman (1993-2007) of Carlisle Companies Incorporated (manufacturer of industrial products). | | Lead Director (since 2007) of Carlisle Companies Incorporated (manufacturer of industrial products). |
Richard A. Redeker (68) Board Member & Independent Chair Portfolios Overseen: 58 | | Retired Mutual Fund Senior Executive (43 years); Management Consultant; Independent Directors Council (organization of 2,800 Independent Mutual Fund Directors)-Executive Committee, Chair of Policy Steering Committee, Governing Council. | | None. |
Robin B. Smith (72) Board Member Portfolios Overseen: 58 | | Chairman of the Board (since January 2003) of Publishers Clearing House (direct marketing); Member of the Board of Directors of ADLPartner (marketing) (since December 2010); formerly Chairman and Chief Executive Officer (August 1996-January 2003) of Publishers Clearing House. | | Formerly Director of BellSouth Corporation (telecommunications) (1992-2006). |
Stephen G. Stoneburn (68) Board Member Portfolios Overseen: 58 | | President and Chief Executive Officer (since June 1996) of Quadrant Media Corp. (publishing company); formerly President (June 1995-June 1996) of Argus Integrated Media, Inc.; Senior Vice President and Managing Director (January 1993-1995) of Cowles Business Media; Senior Vice President of Fairchild Publications, Inc (1975-1989). | | None. |
Prudential Absolute Return Bond Fund
| | | | |
| Interested Board Members(1) | | | | |
Name, Address, Age Position(s) Portfolios Overseen | | Principal Occupation(s) During Past Five Years | | Other Directorships Held |
Judy A. Rice* (63) Board Member & President Portfolios Overseen: 58 | | President, Chief Executive Officer, Chief Operating Officer and Officer-In-Charge (since February 2003) of Prudential Investments LLC; President, Chief Executive Officer and Officer-In-Charge (since April 2003) of Prudential Mutual Fund Services LLC; President, Chief Executive Officer (since May 2011) and Executive Vice President (since December 2008) of Prudential Investment Management Services LLC; Member of the Board of Directors of Jennison Associates LLC (since November 2010); formerly Vice President (February 1999-April 2006) of Prudential Investment Management Services LLC; President, COO, CEO and Manager of PIFM Holdco, LLC (since April 2006); formerly President, Chief Executive Officer, Chief Operating Officer and Officer-In-Charge (May 2003-June 2005) and Director (May 2003-March 2006) and Executive Vice President (June 2005-March 2006) of AST Investment Services, Inc.; Member of Board of Governors of the Investment Company Institute. | | None. |
Stuart S. Parker* (49) Board Member & President Portfolios Overseen: 58 | | President of Prudential Investments LLC (since January 2012); Executive Vice President of Jennison Associates LLC and Head of Retail Distribution of Prudential Investments LLC (June 2005 - December 2011). | | None. |
Scott E. Benjamin (38) Board Member & Vice President Portfolios Overseen: 58 | | Executive Vice President (since June 2009) of Prudential Investments LLC and Prudential Investment Management Services LLC; Executive Vice President (since September 2009) of AST Investment Services, Inc.; Senior Vice President of Product Development and Marketing, Prudential Investments (since February 2006); Vice President of Product Development and Product Management, Prudential Investments (2003-2006). | | None. |
*Ms. Rice has announced her retirement as President and Board Member effective December 31, 2011. Ms. Rice has been appointed as Vice President effective January 1, 2012. The Board has appointed Stuart S. Parker as President and Board Member effective January 1, 2012.
Visit our website at www.prudentialfunds.com
(1) The year that each individual joined the Fund’s Board is as follows:
Linda W. Bynoe, 2005; Douglas H. McCorkindale, 1998; Richard A. Redeker, 1998; Robin B. Smith, 1998; Stephen G. Stoneburn, 2003; Kevin J. Bannon, 2008; Michael S. Hyland, 2008; Stephen P. Munn, 2008; Judy A. Rice, Board Member since 2000 and President since 2003; Scott E. Benjamin, Board Member since 2010 and Vice President since 2009.
| | |
| Fund Officers(a)(1) | | |
Name, Address and Age Position with Fund | | Principal Occupation(s) During Past Five Years |
Kathryn L. Quirk (59) Chief Legal Officer | | Vice President and Corporate Counsel (since September 2004) of Prudential; Executive Vice President, Chief Legal Officer and Secretary (since July 2005) of PI and Prudential Mutual Fund Services LLC; Vice President and Corporate Counsel (since June 2005) and Secretary (since February 2006) of AST Investment Services, Inc.; formerly Senior Vice President and Assistant Secretary (November 2004-August 2005) of PI; formerly Assistant Secretary (June 2005-February 2006) of AST Investment Services, Inc.; formerly Managing Director, General Counsel, Chief Compliance Officer, Chief Risk Officer and Corporate Secretary (1997-2002) of Zurich Scudder Investments, Inc. |
Deborah A. Docs (53) Secretary | | Vice President and Corporate Counsel (since January 2001) of Prudential; Vice President (since December 1996) and Assistant Secretary (since March 1999) of PI; formerly Vice President and Assistant Secretary (May 2003-June 2005) of AST Investment Services, Inc. |
Jonathan D. Shain (53) Assistant Secretary | | Vice President and Corporate Counsel (since August 1998) of Prudential; Vice President and Assistant Secretary (since May 2001) of PI; Vice President and Assistant Secretary (since February 2001) of PMFS; formerly Vice President and Assistant Secretary (May 2003-June 2005) of AST Investment Services, Inc. |
Claudia DiGiacomo (37) Assistant Secretary | | Vice President and Corporate Counsel (since January 2005) of Prudential; Vice President and Assistant Secretary of PI (since December 2005); Associate at Sidley Austin Brown & Wood LLP (1999-2004). |
John P. Schwartz (40) Assistant Secretary | | Vice President and Corporate Counsel (since April 2005) of Prudential; Vice President and Assistant Secretary of PI (since December 2005); Associate at Sidley Austin Brown & Wood LLP (1997-2005). |
Andrew R. French (49) Assistant Secretary | | Vice President and Corporate Counsel (since February 2010) of Prudential; formerly Director and Corporate Counsel (2006-2010) of Prudential; Vice President and Assistant Secretary (since January 2007) of PI; Vice President and Assistant Secretary (since January 2007) of PMFS. |
Timothy J. Knierim (52) Chief Compliance Officer | | Chief Compliance Officer of Prudential Investment Management, Inc. (since July 2007); formerly Chief Risk Officer of PIM and PI (2002-2007) and formerly Chief Ethics Officer of PIM and PI (2006-2007). |
Valerie M. Simpson (53) Deputy Chief Compliance Officer | | Chief Compliance Officer (since April 2007) of PI and AST Investment Services, Inc.; formerly Vice President-Financial Reporting (June 1999-March 2006) for Prudential Life and Annuities Finance. |
Prudential Absolute Return Bond Fund
| | |
| Fund Officers(a)(1) | | |
Name, Address and Age Position with Fund | | Principal Occupation(s) During Past Five Years |
Theresa C. Thompson (49) Deputy Chief Compliance Officer | | Vice President, Compliance, PI (since April 2004); and Director, Compliance, PI (2001-2004). |
Richard W. Kinville (43) Anti-Money Laundering Compliance Officer | | Vice President, Corporate Compliance, Anti-Money Laundering Unit (since January 2005) of Prudential; committee member of the American Council of Life Insurers Anti-Money Laundering and Critical Infrastructure Committee (since January 2007); formerly Investigator and Supervisor in the Special Investigations Unit for the New York Central Mutual Fire Insurance Company (August 1994-January 1999); Investigator in AXA Financial’s Internal Audit Department and Manager in AXA’s Anti-Money Laundering Office (January 1999-January 2005); first chair of the American Council of Life Insurers Anti-Money Laundering and Critical Infrastructure Committee (June 2007-December 2009). |
Grace C. Torres (52) Treasurer and Principal Financial and Accounting Officer | | Assistant Treasurer (since March 1999) and Senior Vice President (since September 1999) of PI; Assistant Treasurer (since May 2003) and Vice President (since June 2005) of AST Investment Services, Inc.; Senior Vice President and Assistant Treasurer (since May 2003) of Prudential Annuities Advisory Services, Inc.; formerly Senior Vice President (May 2003-June 2005) of AST Investment Services, Inc. |
M. Sadiq Peshimam (47) Assistant Treasurer | | Vice President (since 2005) of Prudential Investments LLC. |
Peter Parrella (53) Assistant Treasurer | | Vice President (since 2007) and Director (2004-2007) within Prudential Mutual Fund Administration; formerly Tax Manager at SSB Citi Fund Management LLC (1997-2004). |
(a) Excludes Ms. Rice and Mr. Benjamin, interested Board Members who also serve as President and Vice President, respectively.
(1) The year that each individual became an Officer of the Fund is as follows:
Kathryn L. Quirk, 2005; Deborah A. Docs, 2005; Jonathan D. Shain, 2005; Claudia DiGiacomo, 2005; John P. Schwartz, 2006; Andrew R. French, 2006; Timothy J. Knierim, 2007; Valerie M. Simpson 2007; Theresa C. Thompson, 2008; Richard W. Kinville, 2011, Grace C. Torres, 1998; M. Sadiq Peshimam, 2006; Peter Parrella, 2007.
Explanatory Notes to Tables:
| n | Board Members are deemed to be “Interested,” as defined in the 1940 Act, by reason of their affiliation with Prudential Investments LLC and/or an affiliate of Prudential Investments LLC. |
| n | Unless otherwise noted, the address of all Board Members and Officers is c/o Prudential Investments LLC, Gateway Center Three, 100 Mulberry Street, Newark, New Jersey 07102-4077. |
| n | There is no set term of office for Board Members or Officers. The Board Members have adopted a retirement policy, which calls for the retirement of Board Members on December 31 of the year in which they reach the age of 75. |
| n | “Other Directorships Held” includes only directorships of companies required to register or file reports with the SEC under the 1934 Act) (that is, “public companies”) or other investment companies registered under the 1940 Act. |
| n | “Portfolios Overseen” includes all investment companies managed by Prudential Investments LLC. The investment companies for which PI serves as manager include the Prudential Investments Mutual Funds, The Prudential Variable Contract Accounts, Target Mutual Funds, The Prudential Series Fund, Prudential’s Gibraltar Fund, Inc. and the Advanced Series Trust. |
Visit our website at www.prudentialfunds.com
| | | | |
| n MAIL | | n TELEPHONE | | n WEBSITE |
Gateway Center Three 100 Mulberry Street Newark, NJ 07102 | | (800) 225-1852 | | www.prudentialfunds.com |
|
| PROXY VOTING |
| The Board of Trustees of the Fund has delegated to the Fund’s investment subadviser the responsibility for voting any proxies and maintaining proxy recordkeeping with respect to the Fund. A description of these proxy voting policies and procedures is available without charge, upon request, by calling (800) 225-1852 or by visiting the Securities and Exchange Commission’s website at www.sec.gov. Information regarding how the Fund voted proxies relating to portfolio securities during the most recent 12-month period ended June 30 is available on the Fund’s website and on the Commission’s website. |
|
| TRUSTEES |
| Kevin J. Bannon • Scott E. Benjamin • Linda W. Bynoe • Michael S. Hyland • Douglas H. McCorkindale • Stephen P. Munn • Richard A. Redeker • Judy A. Rice • Robin B. Smith • Stephen G. Stoneburn |
|
| OFFICERS |
| Judy A. Rice, President • Scott E. Benjamin, Vice President • Grace C. Torres, Treasurer and Principal Financial and Accounting Officer • Kathryn L. Quirk, Chief Legal Officer • Deborah A. Docs, Secretary • Timothy J. Knierim, Chief Compliance Officer • Valerie M. Simpson, Deputy Chief Compliance Officer • Theresa C. Thompson, Deputy Chief Compliance Officer • Richard W. Kinville, Anti-Money Laundering Compliance Officer • Jonathan D. Shain, Assistant Secretary • Claudia DiGiacomo, Assistant Secretary • John P. Schwartz, Assistant Secretary • Andrew R. French, Assistant Secretary • M. Sadiq Peshimam, Assistant Treasurer • Peter Parrella, Assistant Treasurer |
| | | | |
| MANAGER | | Prudential Investments LLC | | Gateway Center Three
100 Mulberry Street
Newark, NJ 07102 |
|
| INVESTMENT SUBADVISER | | Prudential Investment
Management, Inc. | | Gateway Center Three
100 Mulberry Street
Newark, NJ 07102 |
|
| DISTRIBUTOR | | Prudential Investment
Management Services LLC | | Gateway Center Three
100 Mulberry Street
Newark, NJ 07102 |
|
| CUSTODIAN | | The Bank of New York Mellon | | One Wall Street
New York, NY 10286 |
|
| TRANSFER AGENT | | Prudential Mutual Fund
Services LLC | | PO Box 9658
Providence, RI 02940 |
|
INDEPENDENT REGISTERED
PUBLIC ACCOUNTING FIRM | | KPMG LLP | | 345 Park Avenue
New York, NY 10154 |
|
| FUND COUNSEL | | Willkie Farr & Gallagher LLP | | 787 Seventh Avenue
New York, NY 10019 |
|
| An investor should consider the investment objectives, risks, charges, and expenses of the Fund carefully before investing. The prospectus and summary prospectus contain this and other information about the Fund. An investor may obtain a prospectus and summary prospectus by visiting our website at www.prudentialfunds.com or by calling (800) 225-1852. The prospectus and summary prospectus should be read carefully before investing. |
|
| E-DELIVERY |
| To receive your mutual fund documents online, go to www.prudentialfunds.com/edelivery and enroll. Instead of receiving printed documents by mail, you will receive notification via email when new materials are available. You can cancel your enrollment or change your email address at any time by visiting the website address above. |
|
| SHAREHOLDER COMMUNICATIONS WITH TRUSTEES |
| Shareholders can communicate directly with the Board of Trustees by writing to the Chair of the Board, Prudential Absolute Return Bond Fund, Prudential Investments, Attn: Board of Trustees, 100 Mulberry Street, Gateway Center Three, Newark, NJ 07102. Shareholders can communicate directly with an individual Trustee by writing to the same address. Communications are not screened before being delivered to the addressee. |
|
| AVAILABILITY OF PORTFOLIO SCHEDULE |
| The Fund files its complete schedule of portfolio holdings with the Securities and Exchange Commission for the first and third quarters of each fiscal year on Form N-Q. The Fund’s Forms N-Q are available on the Commission’s website at www.sec.gov. The Fund’s Forms N-Q may also be reviewed and copied at the Commission’s Public Reference Room in Washington, D.C. Information on the operation and location of the Public Reference Room may be obtained by calling (202) 551-8090. The Fund’s schedule of portfolio holdings is also available on the Fund’s website as of the end of each month. |
|
| The Fund’s Statement of Additional Information contains additional information about the Fund’s Trustees and is available without charge, upon request, by calling (800) 225-1852. |
Mutual Funds:
| | | | |
ARE NOT INSURED BY THE FDIC OR ANY
FEDERAL GOVERNMENT AGENCY | | MAY LOSE VALUE | | ARE NOT A DEPOSIT OF OR GUARANTEED
BY ANY BANK OR ANY BANK AFFILIATE |

PRUDENTIAL ABSOLUTE RETURN BOND FUND
| | | | | | | | |
| SHARE CLASS | | A | | C | | Q | | Z |
| NASDAQ | | PADAX | | PADCX | | PADQX | | PADZX |
| CUSIP | | 74441J852 | | 74441J845 | | 74441J837 | | 74441J829 |
MF213E 0215337-00001-00
Item 2 – Code of Ethics — See Exhibit (a)
As of the end of the period covered by this report, the registrant has adopted a code of ethics (the “Section 406 Standards for Investment Companies – Ethical Standards for Principal Executive and Financial Officers”) that applies to the registrant’s Principal Executive Officer and Principal Financial Officer; the registrant’s Principal Financial Officer also serves as the Principal Accounting Officer.
The registrant hereby undertakes to provide any person, without charge, upon request, a copy of the code of ethics. To request a copy of the code of ethics, contact the registrant 800-225-1852, and ask for a copy of the Section 406 Standards for Investment Companies - Ethical Standards for Principal Executive and Financial Officers.
Item 3 – Audit Committee Financial Expert –
The registrant’s Board has determined that Mr. Stephen P. Munn, member of the Board’s Audit Committee is an “audit committee financial expert,” and that he is “independent,” for purposes of this Item.
Item 4 – Principal Accountant Fees and Services –
(a) Audit Fees
For the fiscal years ended October 31, 2011 and October 31, 2010, KPMG LLP (“KPMG”), the Registrant’s principal accountant, billed the Registrant $116,000 and $22,000, respectively, for professional services rendered for the audit of the Registrant’s annual financial statements or services that are normally provided in connection with statutory and regulatory filings.
(b) Audit-Related Fees
None.
(c) Tax Fees
None.
(d) All Other Fees
None.
(e) (1) Audit Committee Pre-Approval Policies and Procedures
THE PRUDENTIAL MUTUAL FUNDS
AUDIT COMMITTEE POLICY
on
Pre-Approval of Services Provided by the Independent Accountants
The Audit Committee of each Prudential Mutual Fund is charged with the responsibility to monitor the independence of the Fund’s independent accountants. As part of this responsibility, the Audit Committee must pre-approve any independent accounting firm’s engagement to render audit and/or permissible non-audit services, as required by law. In evaluating a proposed engagement of the independent accountants, the Audit Committee will assess the effect that the engagement might reasonably be expected to have on the accountant’s independence. The Committee’s evaluation will be based on:
| | • | | a review of the nature of the professional services expected to be provided, |
| | • | | a review of the safeguards put into place by the accounting firm to safeguard independence, and |
| | • | | periodic meetings with the accounting firm. |
Policy for Audit and Non-Audit Services Provided to the Funds
On an annual basis, the scope of audits for each Fund, audit fees and expenses, and audit-related and non-audit services (and fees proposed in respect thereof) proposed to be performed by the Fund’s independent accountants will be presented by the Treasurer and the independent accountants to the Audit Committee for review and, as appropriate, approval prior to the initiation of such services. Such presentation shall be accompanied by confirmation by both the Treasurer and the independent accountants that the proposed services will not adversely affect the independence of the independent accountants. Proposed services shall be described in sufficient detail to enable the Audit Committee to assess the appropriateness of such services and fees, and the compatibility of the provision of such services with the auditor’s independence. The Committee shall receive periodic reports on the progress of the audit and other services which are approved by the Committee or by the Committee Chair pursuant to authority delegated in this Policy.
The categories of services enumerated under “Audit Services”, “Audit-related Services”, and “Tax Services” are intended to provide guidance to the Treasurer and the independent accountants as to those categories of services which the Committee believes are generally consistent with the independence of the independent accountants and which the Committee (or the Committee Chair) would expect upon the presentation of specific proposals to pre-approve. The enumerated categories are not intended as an exclusive list of audit, audit-related or tax services, which the Committee (or the Committee Chair) would consider for pre-approval.
Audit Services
The following categories of audit services are considered to be consistent with the role of the Fund’s independent accountants:
| | • | | Annual Fund financial statement audits |
| | • | | Seed audits (related to new product filings, as required) |
| | • | | SEC and regulatory filings and consents |
Audit-related Services
The following categories of audit-related services are considered to be consistent with the role of the Fund’s independent accountants:
| | • | | Accounting consultations |
| | • | | Fund merger support services |
| | • | | Agreed Upon Procedure Reports |
| | • | | Other Internal Control Reports |
Individual audit-related services that fall within one of these categories and are not presented to the Audit Committee as part of the annual pre-approval process will be subject to pre-approval by the Committee Chair (or any other Committee member on whom this responsibility has been delegated) so long as the estimated fee for those services does not exceed $50,000.
Tax Services
The following categories of tax services are considered to be consistent with the role of the Fund’s independent accountants:
| | • | | Tax compliance services related to the filing or amendment of the following: |
| | • | | Federal, state and local income tax compliance; and, |
| | • | | Sales and use tax compliance |
| | • | | Timely RIC qualification reviews |
| | • | | Tax distribution analysis and planning |
| | • | | Tax authority examination services |
| | • | | Tax appeals support services |
| | • | | Accounting methods studies |
| | • | | Fund merger support services |
| | • | | Tax consulting services and related projects |
Individual tax services that fall within one of these categories and are not presented to the Audit Committee as part of the annual pre-approval process will be subject to pre-approval by the Committee Chair (or any other Committee member on whom this responsibility has been delegated) so long as the estimated fee for those services does not exceed $50,000.
Other Non-audit Services
Certain non-audit services that the independent accountants are legally permitted to render will be subject to pre-approval by the Committee or by one or more Committee members to whom the Committee has delegated this authority and who will report to the full Committee any pre-approval decisions made pursuant to this Policy. Non-audit services presented for pre-approval pursuant to this paragraph will be accompanied by a confirmation from both the Treasurer and the independent accountants that the proposed services will not adversely affect the independence of the independent accountants.
Proscribed Services
The Fund’s independent accountants will not render services in the following categories of non-audit services:
| | • | | Bookkeeping or other services related to the accounting records or financial statements of the Fund |
| | • | | Financial information systems design and implementation |
| | • | | Appraisal or valuation services, fairness opinions, or contribution-in-kind reports |
| | • | | Internal audit outsourcing services |
| | • | | Management functions or human resources |
| | • | | Broker or dealer, investment adviser, or investment banking services |
| | • | | Legal services and expert services unrelated to the audit |
| | • | | Any other service that the Public Company Accounting Oversight Board determines, by regulation, is impermissible. |
Pre-approval of Non-Audit Services Provided to Other Entities Within the Prudential Fund Complex
Certain non-audit services provided to Prudential Investments LLC or any of its affiliates that also provide ongoing services to the Prudential Mutual Funds will be subject to pre-approval by the Audit Committee. The only non-audit services provided to these entities that will require pre-approval are those related directly to the operations and financial reporting of the Funds. Individual projects that are not presented to the Audit Committee as part of the annual pre-approval process will be subject to pre-approval by the Committee Chair (or any other Committee member on whom this responsibility has been delegated) so long as the estimated fee for those services does not exceed $50,000. Services presented for pre-approval pursuant to this paragraph will be accompanied by a confirmation from both the Treasurer and the independent accountants that the proposed services will not adversely affect the independence of the independent accountants.
Although the Audit Committee will not pre-approve all services provided to Prudential Investments LLC and its affiliates, the Committee will receive an annual report from the Fund’s independent accounting firm showing the aggregate fees for all services provided to Prudential Investments and its affiliates.
(e) (2) Percentage of services referred to in 4(b) – 4(d) that were approved by the audit committee –
Not applicable.
(f) Percentage of hours expended attributable to work performed by other than full time employees of principal accountant if greater than 50%.
The percentage of hours expended on the principal accountant’s engagement to audit the registrant’s financial statements for the most recent fiscal year that were attributed to work performed by persons other than the principal accountant’s full-time, permanent employees was 0%.
(g) Non-Audit Fees
Not applicable to Registrant for the fiscal years 2011 and 2010. The aggregate non-audit fees billed by KPMG for services rendered to the registrant’s investment adviser and any entity controlling, controlled by, or under common control with the investment adviser that provides ongoing services to the registrant for the fiscal years 2011 and 2010 was $0 and $0, respectively.
(h) Principal Accountant’s Independence
Not applicable as KPMG has not provided non-audit services to the registrant’s investment adviser and any entity controlling, controlled by, or under common control with the investment adviser that provides ongoing services to the registrant that were not pre-approved pursuant to Rule 2-01(c)(7)(ii) of Regulation S-X.
| | |
| Item 5 – | | Audit Committee of Listed Registrants – Not applicable. |
| |
| Item 6 – | | Schedule of Investments – The schedule is included as part of the report to shareholders filed under Item 1 of this Form. |
| |
| Item 7 – | | Disclosure of Proxy Voting Policies and Procedures for Closed-End Management Investment Companies – Not applicable. |
| |
| Item 8 – | | Portfolio Managers of Closed-End Management Investment Companies – Not applicable. |
| |
| Item 9 – | | Purchases of Equity Securities by Closed-End Management Investment Company and Affiliated Purchasers – Not applicable. |
| |
| Item 10 – | | Submission of Matters to a Vote of Security Holders – Not applicable. |
| |
| Item 11 – | | Controls and Procedures |
| | (a) | It is the conclusion of the registrant’s principal executive officer and principal financial officer that the effectiveness of the registrant’s current disclosure controls and procedures (such disclosure controls and procedures having been evaluated within 90 days of the date of this filing) provide reasonable assurance that the information required to be disclosed by the registrant has been recorded, processed, summarized and reported within the time period specified in the Commission’s rules and forms and that the information required to be disclosed by the registrant has been accumulated and communicated to the registrant’s principal executive officer and principal financial officer in order to allow timely decisions regarding required disclosure. |
| | (b) | There has been no significant change in the registrant’s internal control over financial reporting that occurred during the registrant’s most recent fiscal quarter of the period covered by this report that has materially affected, or is likely to materially affect, the registrant’s internal control over financial reporting. |
Item 12 – Exhibits
| | | | | | | | | | |
| | | | | | (a) | | (1) | | Code of Ethics – Attached hereto as Exhibit EX-99.CODE-ETH |
| | | | | |
| | | | | | | | (2) | | Certifications pursuant to Section 302 of the Sarbanes-Oxley Act – Attached hereto as Exhibit EX-99.CERT. |
| | | | | |
| | | | | | | | (3) | | Any written solicitation to purchase securities under Rule 23c-1. – Not applicable. |
| | | | |
| | | | | | (b) | | Certifications pursuant to Section 906 of the Sarbanes-Oxley Act – Attached hereto as Exhibit EX-99.906CERT. |
SIGNATURES
Pursuant to the requirements of the Securities Exchange Act of 1934 and the Investment Company Act of 1940, the registrant has duly caused this report to be signed on its behalf by the undersigned, thereunto duly authorized.
| | |
| Registrant: | | Prudential Investment Portfolios 9 |
| |
| By: | | /s/ Deborah A. Docs |
| | Deborah A. Docs |
| | Secretary |
| |
| Date: | | December 20, 2011 |
Pursuant to the requirements of the Securities Exchange Act of 1934 and the Investment Company Act of 1940, this report has been signed below by the following persons on behalf of the registrant and in the capacities and on the dates indicated.
| | |
| By: | | /s/ Judy A. Rice |
| | Judy A. Rice |
| | President and Principal Executive Officer |
| |
| Date: | | December 20, 2011 |
| |
| By: | | /s/ Grace C. Torres |
| | Grace C. Torres |
| | Treasurer and Principal Financial Officer |
| |
| Date: | | December 20, 2011 |