UNITED STATES
SECURITIES AND EXCHANGE COMMISSION
Washington, D.C. 20549
FORM N-CSR
CERTIFIED SHAREHOLDER REPORT OF REGISTERED MANAGEMENT
INVESTMENT COMPANIES
| | |
| Investment Company Act file number: | | 811-09101 |
| |
| Exact name of registrant as specified in charter: | | Prudential Investment Portfolios 9 |
| |
| Address of principal executive offices: | | Gateway Center 3, |
| | 100 Mulberry Street, |
| | Newark, New Jersey 07102 |
| |
| Name and address of agent for service: | | Deborah A. Docs |
| | Gateway Center 3, |
| | 100 Mulberry Street, |
| | Newark, New Jersey 07102 |
| |
| Registrant’s telephone number, including area code: | | 800-225-1852 |
| |
| Date of fiscal year end: | | 10/31/2014 |
| |
| Date of reporting period: | | 10/31/2014 |
Item 1 – Reports to Stockholders –

PRUDENTIAL INVESTMENTS»MUTUAL FUNDS
PRUDENTIAL INTERNATIONAL REAL ESTATE FUND
ANNUAL REPORT · OCTOBER 31, 2014
Fund Type
Sector Stock
Objective
To seek capital appreciation and income
This report is not authorized for distribution to prospective investors unless preceded or accompanied by a current prospectus.
The views expressed in this report and information about the Fund’s portfolio holdings are for the period covered by this report and are subject to change thereafter.
Mutual funds are distributed by Prudential Investment Management Services LLC (PIMS). Prudential Real Estate Investors, also known as PREI®, is a unit of Prudential Investment Management, Inc. (PIM), a registered investment adviser. PIMS and PIM are Prudential Financial companies. © 2014 Prudential Financial, Inc. and its related entities. Prudential Investments LLC, Prudential, the Prudential logo, Bring Your Challenges, and the Rock symbol are service marks of Prudential Financial, Inc. and its related entities, registered in many jurisdictions worldwide.

December 15, 2014
Dear Shareholder:
We hope you find the annual report for the Prudential International Real Estate Fund informative and useful. The report covers performance for the 12-month period that ended October 31, 2014.
Since market conditions change over time, we believe it is important to maintain a diversified portfolio of funds consistent with your tolerance for risk, time horizon, and financial goals.
Your financial advisor can help you create a diversified investment plan that may include funds covering all the basic asset classes and that reflects your personal investor profile and risk tolerance. Keep in mind, however, that diversification and asset allocation strategies do not assure a profit or protect against loss in declining markets.
Prudential Investments® is dedicated to helping you solve your toughest investment challenges—whether it’s capital growth, reliable income, or protection from market volatility and other risks. We offer the expertise of Prudential Financial’s affiliated asset managers* that strive to be leaders in a broad range of funds to help you stay on course to the future you envision. They also manage money for major corporations and pension funds around the world, which means you benefit from the same expertise, innovation, and attention to risk demanded by today’s most sophisticated investors.
Thank you for choosing the Prudential Investments family of funds.
Sincerely,

Stuart S. Parker, President
Prudential International Real Estate Fund
*Most of Prudential Investments’ equity funds are advised by Jennison Associates LLC, Quantitative Management Associates LLC (QMA), or Prudential Real Estate Investors. Prudential Investments’ fixed income and money market funds are advised by Prudential Investment Management, Inc. (PIM) through its Prudential Fixed Income unit. Jennison Associates, QMA, and PIM are registered investment advisers and Prudential Financial companies. Prudential Real Estate Investors is a unit of PIM.
| | | | |
| Prudential International Real Estate Fund | | | 1 | |
Your Fund’s Performance (Unaudited)
Performance data quoted represent past performance. Past performance does not guarantee future results. The investment return and principal value of an investment will fluctuate, so that an investor’s shares, when redeemed, may be worth more or less than their original cost. Current performance may be lower or higher than the past performance data quoted. An investor may obtain performance data as of the most recent month-end by visiting our website at www.prudentialfunds.com or by calling (800) 225-1852.
| | | | | | | | |
Cumulative Total Returns (Without Sales Charges) as of 10/31/14 |
| | | | | One Year | | | Since Inception |
Class A | | | | | 3.27 | % | | 23.48% (12/21/10) |
Class B | | | | | 2.41 | | | 19.35 (12/21/10) |
Class C | | | | | 3.29 | | | 22.34 (12/21/10) |
Class Z | | | | | 3.55 | | | 24.06 (12/21/10) |
FTSE EPRA/NAREIT Developed ex-US Net Index | | | | | 2.57 | | | 28.60 |
MSCI EAFE ND Index | | | | | –0.60 | | | 32.95 |
Lipper Equity International Real Estate Funds Average | | | | | 3.53 | | | 27.03 |
| | | | | | | | |
Average Annual Total Returns (With Sales Charges) as of 9/30/14 |
| | | | | One Year | | | Since Inception |
Class A | | | | | –5.70 | % | | 3.05% (12/21/10) |
Class B | | | | | –5.85 | | | 3.23 (12/21/10) |
Class C | | | | | –1.19 | | | 4.34 (12/21/10) |
Class Z | | | | | 0.05 | | | 4.73 (12/21/10) |
FTSE EPRA/NAREIT Developed ex-US Net Index | | | | | 0.76 | | | 6.03 |
MSCI EAFE ND Index | | | | | 4.25 | | | 8.13 |
Lipper Equity International Real Estate Funds Average | | | | | 1.62 | | | 5.62 |
| | | | | | | | |
Average Annual Total Returns (With Sales Charges) as of 10/31/14 |
| | | | | One Year | | | Since Inception |
Class A | | | | | –2.41 | % | | 4.08% (12/21/10) |
Class B | | | | | –2.59 | | | 4.23 (12/21/10) |
Class C | | | | | 2.29 | | | 5.36 (12/21/10) |
Class Z | | | | | 3.55 | | | 5.74 (12/21/10) |
| | | | | | | | |
| | |
| 2 | | Visit our website at www.prudentialfunds.com |
| | | | | | | | |
Average Annual Total Returns (Without Sales Charges) as of 10/31/14 |
| | | | | One Year | | | Since Inception |
Class A | | | | | 3.27 | % | | 5.61% (12/21/10) |
Class B | | | | | 2.41 | | | 4.69 (12/21/10) |
Class C | | | | | 3.29 | | | 5.36 (12/21/10) |
Class Z | | | | | 3.55 | | | 5.74 (12/21/10) |
Growth of a $10,000 Investment
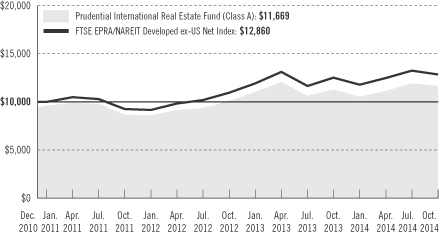
The graph compares a $10,000 investment in the Prudential International Real Estate Fund (Class A shares) with a similar investment in the FTSE EPRA/NAREIT Developed ex-US Net Index by portraying the initial account values at the commencement of operations for Class A shares (December 21, 2010) and the account values at the end of the current fiscal period (October 31, 2014) as measured on a quarterly basis. For purposes of the graph, and unless otherwise indicated, it has been assumed that (a) the maximum applicable front-end sales charge was deducted from the initial $10,000 investment in Class A shares; (b) all recurring fees (including management fees) were deducted; and (c) all dividends and distributions were reinvested. The line graph provides information for Class A shares only. As indicated in the tables provided earlier, performance for Class B, Class C, and Class Z shares will vary due to the differing charges and expenses applicable to each share class (as indicated in the following paragraphs). Without waiver of fees and/or expense reimbursement, if any, the returns would have been lower.
Past performance does not predict future performance. Total returns and the ending account values in the graph include changes in share price and reinvestment of dividends and capital gains distributions in a hypothetical investment for the periods shown. The Fund’s total returns do not reflect the deduction of income taxes on an individual’s investment. Taxes may reduce your actual investment returns on income or gains paid by the Fund or any gains you may realize if you sell your shares.
| | | | |
| Prudential International Real Estate Fund | | | 3 | |
Your Fund’s Performance (continued)
Source: Prudential Investments LLC and Lipper Inc.
Inception returns are provided for any share class with less than 10 calendar years of returns.
The returns in the tables do not reflect the deduction of taxes that a shareholder would pay on Fund distributions or following the redemption of Fund shares. The average annual total returns take into account applicable sales charges, which are described for each share class in the table below.
| | | | | | | | |
| | Class A | | Class B* | | Class C | | Class Z |
Maximum initial sales charge | | 5.5% of
the public
offering
price | | None | | None | | None |
Contingent deferred sales charge (CDSC) (as a percentage of the lower of original purchase price or net asset value at redemption) | | 1% on sales
of $1 million
or more
made within
12 months of
purchase | | 5% (Yr. 1)
4% (Yr. 2)
3% (Yr. 3)
2% (Yr. 4)
1% (Yr. 5/6)
0% (Yr. 7) | | 1% on sales
made within
12 months
of purchase | | None |
Annual distribution and service (12b-1) fees (shown as a percentage of average daily net assets) | | .30%
(.25%
currently) | | 1% | | 1% | | None |
*Class B shares are closed to all purchase activity and no additional Class B shares may be purchased or acquired except by exchange from Class B shares of another Fund or through dividend or capital gains reinvestment.
Benchmark Definitions
FTSE EPRA/NAREIT Developed ex-US Net Index
The Financial Times Stock Exchange European Public Real Estate Association/National Association of Real Estate Investment Trusts (FTSE EPRA/NAREIT) Developed ex-US Net Total Return Index is an unmanaged index that tracks the performance of listed REITs and real estate companies globally, excluding the US.
Morgan Stanley Capital International Europe, Australasia, and Far East Net Dividend Index
The Morgan Stanley Capital International Europe, Australasia, and Far East Net Dividend Index (MSCI EAFE ND Index) is an unmanaged, weighted index of performance that reflects stock price movements of developed-country markets in Europe, Australasia, and the Far East. The Net Dividend (ND) version of the MSCI EAFE Index reflects the impact of the maximum withholding taxes on reinvested dividends.
Lipper Equity International Real Estate Funds Average
The Lipper Equity International Real Estate Funds Average (Lipper Average) represents returns based on an average return of all funds in the Lipper Equity International Real Estate Funds category for the periods noted. Funds in the Lipper Average invest at least 75% of their equity portfolios in shares of companies engaged in the real estate industry that are strictly outside of the US or whose securities are principally traded outside of the US.
| | |
| 4 | | Visit our website at www.prudentialfunds.com |
Investors cannot invest directly in an index or average. The returns for the Index would be lower if they included the effects of sales charges, operating expenses of a mutual fund, or taxes. Returns for the Lipper Average reflect the deduction of operating expenses of a mutual fund, but not sales charges or taxes. The Since Inception returns for the Indexes and the Lipper Average are measured from the closest month-end to inception date, and not from the Fund’s actual inception date.
| | | | |
Five Largest Holdings expressed as a percentage of net assets as of 10/31/14 | | | | |
Mitsubishi Estate Co. Ltd., Diversified Real Estate Activities | | | 5.4 | % |
Mitsui Fudosan Co. Ltd., Diversified Real Estate Activities | | | 5.3 | |
Unibail-Rodamco SE, REIT, Retail REITs | | | 4.8 | |
Sun Hung Kai Properties Ltd., Diversified Real Estate Activities | | | 4.4 | |
Westfield Corp., REIT, Retail REITs | | | 3.0 | |
Holdings reflect only long-term investments and are subject to change.
| | | | |
Five Largest Industries expressed as a percentage of net assets as of 10/31/14 | | | | |
Diversified Real Estate Activities | | | 28.1 | % |
Retail REITs | | | 21.4 | |
Diversified REITs | | | 15.6 | |
Real Estate Operating Companies | | | 10.2 | |
Office REITs | | | 9.1 | |
Industry weightings reflect only long-term investments and are subject to change.
| | | | |
| Prudential International Real Estate Fund | | | 5 | |
Strategy and Performance Overview
How did the Fund perform?
For the 12-month reporting period ended October 31, 2014, the Prudential International Real Estate Fund’s (the Fund) Class A shares rose by 3.27%, outperforming the 2.57% gain of the FTSE EPRA/NAREIT Developed ex-US Net Index (the Index) but underperforming the 3.53% advance of the Lipper Equity International Real Estate Funds Average.
What were conditions like in the international real estate securities market?
| | • | | Europe, Asia, and North America, namely Canada, delivered positive total returns over the reporting period. Within Europe, Norway, the UK, Austria, and Germany led the performance in the region. In Asia, Australia and New Zealand were the outperformers. |
| | • | | In Asia, Australia led regional performance. Underlying economic data in the country is mixed. While firm home prices and strong job creation numbers are positive, consumer confidence and retail spending are down. Regional peers New Zealand and Hong Kong were close behind with favorable performance over the reporting period. |
| | • | | The European Central Bank (ECB) is slowly moving in the direction of large-scale asset-backed securities (ABS), and possibly corporate and government debt, purchases. The ECB has recently stated that it intends to add roughly another 1 trillion euros to its balance sheet through asset purchases. However, there is little evidence of positive effects from the measures the ECB has taken so far. Inflation figures remain extremely weak across the eurozone, and gross domestic product (GDP) forecasts continue to be revised downward for most countries. As a result, performance across the region has been mixed. |
Which holdings or related groups of holdings made the largest positive and negative contributions to the Fund’s return?
| | • | | The Fund’s performance relative to the benchmark was largely driven by security selection in each region, except for Brazil in South America. Asia was the most meaningful positive contributor, with security selection in Hong Kong contributing the most to relative performance in that region. In addition, security selection in Singapore, as well as an overweight to Japan and lack of exposure to China, contributed positively. Conversely, the largest detractor from relative performance came from security selection in Japan. |
| | • | | Europe also contributed positively to relative performance. The Fund benefited from an overweight allocation to France and from stock selection in that country, as well as from security selection in the UK. |
| | |
| 6 | | Visit our website at www.prudentialfunds.com |
| | • | | By region, the Fund was the most underweight in Europe, followed by Canada in North America, and then Asia. |
Did any tactical shifts in portfolio risk characteristics, including significant sales and purchases, affect the Fund?
| | • | | The most meaningful shift in the Fund’s exposure was a decrease in its allocation to Japan, resulting in a neutral weight in the country. The decreased allocation to Japan was the result of the GDP contraction which produced a drag on the market, particularly for real estate stocks, on concerns over the impact of a stalling economy on the real estate market. Investors are concerned that the hype over Prime Minister Abe’s policies (referred to as Abenomics) would prove to be another false start to expectations of a Japanese economic recovery. The Fund’s neutral weight rests on PREI’s, also known as Prudential Real Estate Investors, belief that Japan is on the cusp of a multi-year recovery in both its economy and stock market. |
| | • | | In Europe, the most notable tactical (short-term) shifts over the period included an increase in the Fund’s allocation to the UK and Germany. The increase in the allocation to the UK was largely attributable to evidence that the London real estate market is sustaining strong growth in both rents and values, and this momentum is beginning to carry over to other regions of the country and to more secondary assets. The increase in the allocation to Germany, primarily in multifamily residential companies, was largely due to real estate fundamentals continuing to look good, with supply generally under control and healthy tenant and investor demand. |
| | • | | In North America, the Fund increased its allocation to Canada when the Fund bought into Brookfield Canada Office Properties. |
What is PREI’s outlook for the international real estate securities markets?
| | • | | The European sector still trades at a discount to its attractive 2015 estimated net asset value (NAV). However, the UK has staged a strong recovery recently, which has moderated discounts in the country. Private market rental and transactional data remain very robust in the UK, as evidenced by third quarter corporate results. Real estate fundamentals continue to look good with supply generally under control and healthy tenant and investor demand in the UK and Ireland, and to a moderate extent in Germany, benefiting those markets. Elsewhere in the eurozone, and especially in France, the challenge is to generate meaningful rental growth, and PREI remains broadly cautious. |
| | | | |
| Prudential International Real Estate Fund | | | 7 | |
Strategy and Performance Overview (continued)
| | • | | In Asia, PREI believes that Japanese real estate stocks have yet to fully reflect the improved fundamentals in the market. Hong Kong’s current political impasse has lasted since September of 2014, and there are no signs that it can be resolved in the near term. PREI believes that once the current political overhang is removed, Hong Kong deserves a re-rating, and there should be more positive momentum for property stocks. PREI expects the Australian REIT sector to continue to do well, supported by another year of low interest rates. Australia appears to be one of the few markets in the Asia Pacific region that is attracting foreign capital into its real estate sector, given its relatively attractive capitalization rates (cap rate), or the rate of return on a property based on its expected income, that the property will generate. Investors are able to buy prime office assets in Sydney at cap rates of 6.3%, compared with prime cap rates of 3.4% in Singapore, and less than 3.0% in Hong Kong. Hence, Australia is currently one of the few markets that still offers a positive carry, or cash flow. |
| | |
| 8 | | Visit our website at www.prudentialfunds.com |
Comments on Largest Holdings
| 5.4% | Mitsubishi Estate Co. Ltd., Diversified Real Estate Activities |
Mitsubishi Estate Co. Ltd. engages in real estate activities, primarily in Japan, the United States, and internationally. It operates in multiple business segments.
| 5.3% | Mitsui Fudosan Co. Ltd., Diversified Real Estate Activities |
Mitsui Fudosan Co., Ltd. is a Japan-based real estate company that has multiple business segments.
| 4.8% | Unibail-Rodamco SE, REIT, Retail REITs |
Unibail-Rodamco SE leases and rents building space, finances real estate investments, and renovates real estate for sale. The company’s properties, mainly shopping centers, office buildings, and convention-exhibition centers, are primarily located in city centers or near major access routes.
| 4.4% | Sun Hung Kai Properties Ltd., Diversified Real Estate Activities |
Sun Hung Kai Properties Ltd., through its subsidiaries, develops and invests in properties in Asia. The company also operates hotels, and manages properties, car parking, and transportation infrastructure. In addition, Sun Hung Kai operates a logistics business, as well as construction, financial services, telecommunication, Internet infrastructure, and other services.
| 3.0% | Westfield Corp., REIT, Retail REITs |
Westfield Corp. is a property trust that invests in, leases, and manages retail shopping centers in Australia, New Zealand, the United States, and the UK. The group’s operations also include asset management, property development, and construction.
| | | | |
| Prudential International Real Estate Fund | | | 9 | |
Fees and Expenses (Unaudited)
As a shareholder of the Fund, you incur two types of costs: (1) transaction costs, including sales charges (loads) on purchase payments and redemptions, as applicable, and (2) ongoing costs, including management fees, distribution, and/or service (12b-1) fees, and other Fund expenses, as applicable. This example is intended to help you understand your ongoing costs (in dollars) of investing in the Fund and to compare these costs with the ongoing costs of investing in other mutual funds.
The example is based on an investment of $1,000 invested on May 1, 2014, at the beginning of the period, and held through the six-month period ended October 31, 2014. The example is for illustrative purposes only; you should consult the Prospectus for information on initial and subsequent minimum investment requirements.
Actual Expenses
The first line for each share class in the table on the following page provides information about actual account values and actual expenses. You may use the information on this line, together with the amount you invested, to estimate the expenses that you paid over the period. Simply divide your account value by $1,000 (for example, an $8,600 account value ÷ $1,000 = 8.6), then multiply the result by the number on the first line under the heading “Expenses Paid During the Six-Month Period” to estimate the expenses you paid on your account during this period.
Hypothetical Example for Comparison Purposes
The second line for each share class in the table on the following page provides information about hypothetical account values and hypothetical expenses based on the Fund’s actual expense ratio and an assumed rate of return of 5% per year before expenses, which is not the Fund’s actual return. The hypothetical account values and expenses may not be used to estimate the actual ending account balance or expenses you paid for the period. You may use this information to compare the ongoing costs of investing in the Fund and other funds. To do so, compare this 5% hypothetical example with the 5% hypothetical examples that appear in the shareholder reports of the other funds.
The Fund’s transfer agent may charge additional fees to holders of certain accounts that are not included in the expenses shown in the table on the following page. These fees apply to individual retirement accounts (IRAs) and Section 403(b) accounts. As of the close of the six-month period covered by the table, IRA fees included an annual maintenance fee of $15 per account (subject to a maximum annual maintenance fee of $25 for all accounts held by the same shareholder). Section 403(b) accounts are charged an annual $25 fiduciary maintenance fee. Some of the fees may vary in amount, or may be waived, based on your total account balance or the number of
| | |
| 10 | | Visit our website at www.prudentialfunds.com |
Prudential Investments funds, including the Fund, that you own. You should consider the additional fees that were charged to your Fund account over the six-month period when you estimate the total ongoing expenses paid over the period and the impact of these fees on your ending account value, as these additional expenses are not reflected in the information provided in the expense table. Additional fees have the effect of reducing investment returns.
Please note that the expenses shown in the table are meant to highlight your ongoing costs only and do not reflect any transactional costs such as sales charges (loads). Therefore, the second line for each share class in the table is useful in comparing ongoing costs only and will not help you determine the relative total costs of owning different funds. In addition, if these transactional costs were included, your costs would have been higher.
| | | | | | | | | | | | | | | | | | |
Prudential
International
Real Estate Fund | | Beginning Account
Value
May 1, 2014 | | | Ending Account
Value
October 31, 2014 | | | Annualized
Expense Ratio
Based on the
Six-Month Period | | | Expenses Paid
During the
Six-Month Period* | |
| | | | | | | | | | | | | | | | | | |
| Class A | | Actual | | $ | 1,000.00 | | | $ | 1,046.50 | | | | 1.60 | % | | $ | 8.25 | |
| | | Hypothetical | | $ | 1,000.00 | | | $ | 1,017.14 | | | | 1.60 | % | | $ | 8.13 | |
| | | | | | | | | | | | | | | | | | |
| Class B | | Actual | | $ | 1,000.00 | | | $ | 1,042.00 | | | | 2.35 | % | | $ | 12.10 | |
| | | Hypothetical | | $ | 1,000.00 | | | $ | 1,013.36 | | | | 2.35 | % | | $ | 11.93 | |
| | | | | | | | | | | | | | | | | | |
| Class C | | Actual | | $ | 1,000.00 | | | $ | 1,046.80 | | | | 1.60 | % | | $ | 8.25 | |
| | | Hypothetical | | $ | 1,000.00 | | | $ | 1,017.14 | | | | 1.60 | % | | $ | 8.13 | |
| | | | | | | | | | | | | | | | | | |
| Class Z | | Actual | | $ | 1,000.00 | | | $ | 1,047.70 | | | | 1.35 | % | | $ | 6.97 | |
| | | Hypothetical | | $ | 1,000.00 | | | $ | 1,018.40 | | | | 1.35 | % | | $ | 6.87 | |
*Fund expenses (net of fee waivers or subsidies, if any) for each share class are equal to the annualized expense ratio for each share class (provided in the table), multiplied by the average account value over the period, multiplied by the 184 days in the six-month period ended October 31, 2014, and divided by the 365 days in the Fund’s fiscal year ended October 31, 2014 (to reflect the six-month period). Expenses presented in the table include the expenses of any underlying portfolios in which the Fund may invest.
| | | | |
| Prudential International Real Estate Fund | | | 11 | |
Fees and Expenses (continued)
The Fund’s annual expense ratios for the year ended October 31, 2014, are as follows:
| | | | | | | | |
| Class | | Gross Operating Expenses | | | Net Operating Expenses | |
A | | | 2.48 | % | | | 1.60 | % |
B | | | 3.18 | | | | 2.35 | |
C | | | 2.43 | | | | 1.60 | |
Z | | | 2.18 | | | | 1.35 | |
Net operating expenses shown above reflect any fee waivers and/or expense reimbursements. Additional information on Fund expenses and any fee waivers and/or expense reimbursements can be found in the “Financial Highlights” tables in this report and in the Notes to the Financial Statements in this report.
| | |
| 12 | | Visit our website at www.prudentialfunds.com |
Portfolio of Investments
as of October 31, 2014
| | | | | | | | |
| Description | | Shares | | | Value (Note 1) | |
LONG-TERM INVESTMENTS 97.3% | | | | | | | | |
| | |
COMMON STOCKS 97.3% | | | | | | | | |
| | |
Australia 12.7% | | | | | | | | |
CFS Retail Property Trust Group, REIT | | | 126,775 | | | $ | 235,801 | |
Charter Hall Retail, REIT | | | 25,400 | | | | 91,082 | |
Dexus Property Group, REIT | | | 294,025 | | | | 314,257 | |
Federation Centres, REIT | | | 67,250 | | | | 161,494 | |
Goodman Group, REIT | | | 81,565 | | | | 398,218 | |
GPT Group, REIT | | | 109,000 | | | | 396,203 | |
Investa Office Fund, REIT | | | 63,325 | | | | 199,798 | |
Mirvac Group, REIT | | | 206,200 | | | | 327,140 | |
Scentre Group, REIT* | | | 156,530 | | | | 499,323 | |
Stockland, REIT | | | 51,125 | | | | 191,146 | |
Westfield Corp., REIT | | | 125,600 | | | | 882,594 | |
| | | | | | | | |
| | | | | | | 3,697,056 | |
| | |
Austria 0.8% | | | | | | | | |
CA Immobilien Anlagen AG* | | | 11,442 | | | | 219,464 | |
| | |
Canada 7.1% | | | | | | | | |
Boardwalk Real Estate Investment Trust, REIT | | | 11,527 | | | | 730,249 | |
Brookfield Canada Office Properties, REIT | | | 4,763 | | | | 114,315 | |
Canadian Apartment Properties, REIT | | | 18,459 | | | | 409,454 | |
Chartwell Retirement Residences | | | 26,537 | | | | 270,774 | |
RioCan Real Estate Investment Trust, REIT | | | 23,079 | | | | 543,674 | |
| | | | | | | | |
| | | | | | | 2,068,466 | |
| | |
France 6.8% | | | | | | | | |
Fonciere des Regions, REIT | | | 2,369 | | | | 217,795 | |
ICADE, REIT | | | 1,584 | | | | 126,027 | |
Klepierre, REIT | | | 5,406 | | | | 233,981 | |
Unibail-Rodamco SE, REIT | | | 5,481 | | | | 1,405,368 | |
| | | | | | | | |
| | | | | | | 1,983,171 | |
| | |
Germany 4.3% | | | | | | | | |
Alstria Office REIT-AG, REIT* | | | 12,648 | | | | 157,025 | |
Deutsche Annington Immobilien SE | | | 6,603 | | | | 191,136 | |
Deutsche Wohnen AG | | | 11,400 | | | | 257,317 | |
GAGFAH SA* | | | 14,514 | | | | 271,426 | |
LEG Immobilien AG* | | | 3,441 | | | | 237,823 | |
TLG Immobilien AG* | | | 4,820 | | | | 65,838 | |
See Notes to Financial Statements.
| | | | |
| Prudential International Real Estate Fund | | | 13 | |
Portfolio of Investments
as of October 31, 2014 continued
| | | | | | | | |
| Description | | Shares | | | Value (Note 1) | |
COMMON STOCKS (Continued) | | | | | | | | |
| | |
Germany (cont’d.) | | | | | | | | |
Westgrund AG* | | | 12,772 | | | $ | 55,522 | |
| | | | | | | | |
| | | | | | | 1,236,087 | |
| | |
Hong Kong 15.6% | | | | | | | | |
Hang Lung Properties Ltd. | | | 42,000 | | | | 131,155 | |
Henderson Land Development Co. Ltd. | | | 87,890 | | | | 593,765 | |
Hongkong Land Holdings Ltd. | | | 53,000 | | | | 369,410 | |
Hysan Development Co. Ltd. | | | 12,000 | | | | 54,754 | |
Kerry Properties Ltd. | | | 56,500 | | | | 193,819 | |
Link REIT (The), REIT | | | 103,000 | | | | 605,701 | |
Shimao Property Holdings Ltd. | | | 80,000 | | | | 172,179 | |
Sino Land Co. Ltd. | | | 248,400 | | | | 410,575 | |
Sun Hung Kai Properties Ltd. | | | 85,000 | | | | 1,268,294 | |
Swire Properties Ltd. | | | 11,000 | | | | 35,247 | |
Wharf Holdings Ltd. (The) | | | 95,000 | | | | 702,632 | |
| | | | | | | | |
| | | | | | | 4,537,531 | |
| | |
Ireland 0.8% | | | | | | | | |
Green REIT PLC, REIT* | | | 60,054 | | | | 94,823 | |
Hibernia REIT PLC, REIT* | | | 90,269 | | | | 124,433 | |
| | | | | | | | |
| | | | | | | 219,256 | |
| | |
Japan 26.1% | | | | | | | | |
Activia Properties, Inc., REIT | | | 31 | | | | 250,756 | |
AEON REIT Investment Corp., REIT | | | 181 | | | | 227,878 | |
Daito Trust Construction Co. Ltd. | | | 2,500 | | | | 311,502 | |
Daiwa House Industry Co. Ltd. | | | 10,200 | | | | 192,980 | |
Daiwa House REIT Investment Corp., REIT | | | 9 | | | | 40,086 | |
GLP J-REIT, REIT | | | 79 | | | | 89,643 | |
Hulic REIT, Inc., REIT | | | 10 | | | | 15,195 | |
Industrial & Infrastructure Fund Investment Corp., REIT | | | 2 | | | | 16,360 | |
Japan Excellent, Inc., REIT | | | 161 | | | | 213,614 | |
Japan Real Estate Investment Corp., REIT | | | 23 | | | | 125,333 | |
Japan Retail Fund Investment Corp., REIT | | | 116 | | | | 233,560 | |
Kenedix Office Investment Corp., REIT | | | 8 | | | | 42,779 | |
Mitsubishi Estate Co. Ltd. | | | 61,000 | | | | 1,553,960 | |
Mitsui Fudosan Co. Ltd. | | | 48,000 | | | | 1,543,989 | |
Nippon Building Fund, Inc., REIT | | | 107 | | | | 599,697 | |
Nippon Prologis REIT, Inc., REIT | | | 71 | | | | 164,754 | |
Nomura Real Estate Master Fund, Inc., REIT | | | 182 | | | | 220,038 | |
See Notes to Financial Statements.
| | | | | | | | |
| Description | | Shares | | | Value (Note 1) | |
COMMON STOCKS (Continued) | | | | | | | | |
| | |
Japan (cont’d.) | | | | | | | | |
NTT Urban Development Corp. | | | 25,100 | | | $ | 284,083 | |
Sumitomo Realty & Development Co. Ltd. | | | 23,000 | | | | 862,246 | |
Tokyo Tatemono Co. Ltd. | | | 28,000 | | | | 244,422 | |
Tokyu Fudosan Holdings Corp. | | | 28,000 | | | | 199,005 | |
United Urban Investment Corp., REIT | | | 93 | | | | 146,773 | |
| | | | | | | | |
| | | | | | | 7,578,653 | |
| | |
Netherlands 1.8% | | | | | | | | |
Atrium European Real Estate Ltd.* | | | 4,802 | | | | 25,148 | |
Corio NV, REIT | | | 2,461 | | | | 119,788 | |
Eurocommercial Properties NV | | | 4,259 | | | | 194,428 | |
Wereldhave NV, REIT | | | 2,350 | | | | 192,659 | |
| | | | | | | | |
| | | | | | | 532,023 | |
| | |
Singapore 6.8% | | | | | | | | |
Ascendas Real Estate Investment Trust, REIT | | | 130,000 | | | | 225,806 | |
Cache Logistics Trust, REIT | | | 199,000 | | | | 181,209 | |
CapitaLand Ltd. | | | 122,000 | | | | 301,208 | |
City Developments Ltd. | | | 5,000 | | | | 36,799 | |
Keppel REIT, REIT | | | 356,250 | | | | 338,559 | |
Mapletree Commercial Trust, REIT | | | 300,000 | | | | 333,811 | |
Mapletree Industrial Trust, REIT | | | 121,880 | | | | 139,983 | |
Suntec Real Estate Investment Trust, REIT | | | 306,000 | | | | 425,133 | |
| | | | | | | | |
| | | | | | | 1,982,508 | |
| | |
Sweden 1.6% | | | | | | | | |
Atrium Ljungberg AB (Class B Stock) | | | 9,613 | | | | 134,480 | |
Fabege AB | | | 14,365 | | | | 184,399 | |
Hufvudstaden AB (Class A Stock) | | | 11,500 | | | | 149,224 | |
| | | | | | | | |
| | | | | | | 468,103 | |
| | |
Switzerland 0.8% | | | | | | | | |
PSP Swiss Property AG* | | | 2,801 | | | | 240,401 | |
| | |
United Kingdom 12.1% | | | | | | | | |
Big Yellow Group PLC, REIT | | | 16,705 | | | | 146,018 | |
British Land Co. PLC, REIT | | | 58,505 | | | | 683,143 | |
Capital & Counties Properties PLC | | | 42,060 | | | | 230,092 | |
Derwent London PLC, REIT | | | 5,142 | | | | 244,643 | |
Great Portland Estates PLC, REIT | | | 27,674 | | | | 304,580 | |
See Notes to Financial Statements.
| | | | |
| Prudential International Real Estate Fund | | | 15 | |
Portfolio of Investments
as of October 31, 2014 continued
| | | | | | | | |
| Description | | Shares | | | Value (Note 1) | |
COMMON STOCKS (Continued) | | | | | | | | |
| | |
United Kingdom (cont’d.) | | | | | | | | |
Hammerson PLC, REIT | | | 50,666 | | | $ | 497,740 | |
Land Securities Group PLC, REIT | | | 45,016 | | | | 798,762 | |
SEGRO PLC, REIT | | | 58,431 | | | | 355,977 | |
Shaftesbury PLC, REIT | | | 17,823 | | | | 204,181 | |
Tritax Big Box REIT PLC, REIT | | | 18,223 | | | | 31,775 | |
| | | | | | | | |
| | | | | | | 3,496,911 | |
| | | | | | | | |
TOTAL COMMON STOCKS
(cost $24,414,377) | | | | | | | 28,259,630 | |
| | | | | | | | |
| | |
| | | Units | | | | |
| | |
WARRANTS* | | | | | | | | |
| | |
Hong Kong | | | | | | | | |
Sun Hung Kai Properties Ltd., Expiring 04/22/16
(cost $0) | | | 4,750 | | | | 10,314 | |
| | | | | | | | |
TOTAL LONG-TERM INVESTMENTS
(cost $24,414,377) | | | | | | | 28,269,944 | |
| | | | | | | | |
| | |
| | | Shares | | | | |
SHORT-TERM INVESTMENT 2.7% | | | | | | | | |
| | |
AFFILIATED MONEY MARKET MUTUAL FUND | | | | | | | | |
Prudential Investment Portfolios 2 - Prudential Core Taxable Money Market Fund
(cost $770,088) (Note 3)(a) | | | 770,088 | | | | 770,088 | |
| | | | | | | | |
TOTAL INVESTMENTS 100.0%
(cost $25,184,465; Note 5) | | | | | | | 29,040,032 | |
Liabilities in excess of other assets | | | | | | | (5,502 | ) |
| | | | | | | | |
NET ASSETS 100.0% | | | | | | $ | 29,034,530 | |
| | | | | | | | |
The following abbreviation is used in portfolio descriptions:
REIT—Real Estate Investment Trust
| * | Non-income producing security. |
| (a) | Prudential Investments LLC, the manager of the Fund, also serves as manager of the Prudential Investment Portfolios 2 - Prudential Core Taxable Money Market Fund. |
Various inputs are used in determining the value of the Fund’s investments. These inputs are summarized in the three broad levels listed below.
Level 1—quoted prices generally in active markets for identical securities.
See Notes to Financial Statements.
Level 2—quoted prices for similar securities, interest rates and yield curves, prepayment speeds, foreign currency exchange rates, and other significant observable inputs.
Level 3—significant unobservable inputs for securities valued in accordance with Board approved fair valuation procedures.
The following is a summary of the inputs used as of October 31, 2014 in valuing such portfolio securities:
| | | | | | | | | | | | |
| | | Level 1 | | | Level 2 | | | Level 3 | |
Investments in Securities | | | | | | | | | | | | |
Common Stocks | | | | | | | | | | | | |
Australia | | $ | — | | | $ | 3,697,056 | | | $ | — | |
Austria | | | — | | | | 219,464 | | | | — | |
Canada | | | 2,068,466 | | | | — | | | | — | |
France | | | 126,027 | | | | 1,857,144 | | | | — | |
Germany | | | 121,360 | | | | 1,114,727 | | | | — | |
Hong Kong | | | 369,410 | | | | 4,168,121 | | | | — | |
Ireland | | | 219,256 | | | | — | | | | — | |
Japan | | | — | | | | 7,578,653 | | | | — | |
Netherlands | | | 25,148 | | | | 506,875 | | | | — | |
Singapore | | | — | | | | 1,982,508 | | | | — | |
Sweden | | | 134,480 | | | | 333,623 | | | | — | |
Switzerland | | | — | | | | 240,401 | | | | — | |
United Kingdom | | | 31,775 | | | | 3,465,136 | | | | — | |
Warrants | | | | | | | | | | | | |
Hong Kong | | | 10,314 | | | | — | | | | — | |
Affiliated Money Market Mutual Fund | | | 770,088 | | | | — | | | | — | |
| | | | | | | | | | | | |
Total | | $ | 3,876,324 | | | $ | 25,163,708 | | | $ | — | |
| | | | | | | | | | | | |
Fair Value of Level 2 investments at October 31, 2013 was $18,828,553. Such fair values are used to reflect the impact of significant market movements between the time at which the Fund normally values its securities and the earlier closing of foreign markets. An amount of $338,504 was transferred from Level 1 into Level 2 at October 31, 2014 as a result of fair valuing such foreign securities using third party vendor modeling tools.
It is the Fund’s policy to recognize transfers in and out at the fair value as of the beginning of period.
See Notes to Financial Statements.
| | | | |
| Prudential International Real Estate Fund | | | 17 | |
Portfolio of Investments
as of October 31, 2014 continued
The industry classification of investments and liabilities in excess of other assets shown as a percentage of net assets as of October 31, 2014 was as follows (Unaudited):
| | | | |
Diversified Real Estate Activities | | | 28.1 | % |
Retail REITs | | | 21.4 | |
Diversified REITs | | | 15.6 | |
Real Estate Operating Companies | | | 10.2 | |
Office REITs | | | 9.1 | |
Industrial REITs | | | 5.6 | |
Residential REITs | | | 3.9 | |
Affiliated Money Market Mutual Fund | | | 2.7 | % |
Real Estate Development | | | 2.0 | |
Health Care REITs | | | 0.9 | |
Specialized REITs | | | 0.5 | |
| | | | |
| | | 100.0 | |
Liabilities in excess of other assets | | | — | * |
| | | | |
| | | 100.0 | % |
| | | | |
The Fund invested in various derivative instruments during the reporting period. The primary type of risk associated with these derivative instruments is equity risk. The effect of such derivative instruments on the Fund’s financial position and financial performance as reflected in the Statement of Assets and Liabilities and Statement of Operations is presented in the summary below.
Fair values of derivative instruments as of October 31, 2014 as presented in the Statement of Assets and Liabilities:
| | | | | | | | | | | | |
Derivatives not accounted for
as hedging instruments,
carried at fair value | | Asset Derivatives | | | Liability Derivatives | |
| | Balance
Sheet Location | | Fair
Value | | | Balance
Sheet Location | | Fair
Value | |
| Equity contracts | | Unaffiliated investments | | $ | 10,314 | | | — | | $ | — | |
| | | | | | | | | | | | |
The effects of derivative instruments on the Statement of Operations for the year ended October 31, 2014 are as follows:
| | | | |
Change in Unrealized Appreciation or (Depreciation) on Derivatives Recognized in Income | |
Derivatives not accounted for as hedging
instruments, carried at fair value | | Warrants(1) | |
Equity contracts | | $ | 10,314 | |
| | | | |
| (1) | Included in net change in unrealized appreciation (depreciation) on investments in the Statement of Operations. |
For the year ended October 31, 2014, the Fund did not have any realized gain (loss) on derivatives recognized in income.
See Notes to Financial Statements.
PRUDENTIAL INVESTMENTS»MUTUAL FUNDS
FINANCIAL STATEMENTS
ANNUAL REPORT · OCTOBER 31, 2014
Prudential International Real Estate Fund
Statement of Assets & Liabilities
as of October 31, 2014
| | | | |
Assets | | | | |
Investments at value: | | | | |
Unaffiliated investments (cost $24,414,377) | | $ | 28,269,944 | |
Affiliated investments (cost $770,088) | | | 770,088 | |
Receivable for investments sold | | | 106,931 | |
Dividends receivable | | | 83,031 | |
Receivable for Fund shares sold | | | 14,274 | |
Tax reclaim receivable | | | 13,147 | |
Due from Manager | | | 11,306 | |
Prepaid expenses | | | 603 | |
| | | | |
Total assets | | | 29,269,324 | |
| | | | |
| |
Liabilities | | | | |
Payable for investments purchased | | | 165,186 | |
Accrued expenses | | | 62,280 | |
Payable for Fund shares reacquired | | | 6,344 | |
Distribution fee payable | | | 706 | |
Affiliated transfer agent fee payable | | | 278 | |
| | | | |
Total liabilities | | | 234,794 | |
| | | | |
| |
Net Assets | | $ | 29,034,530 | |
| | | | |
| | | | | |
Net assets were comprised of: | | | | |
Shares of beneficial interest, at par | | $ | 2,641 | |
Paid-in capital in excess of par | | | 26,606,974 | |
| | | | |
| | | 26,609,615 | |
Undistributed net investment income | | | 419,092 | |
Accumulated net realized loss on investment and foreign currency transactions | | | (1,847,542 | ) |
Net unrealized appreciation on investments and foreign currencies | | | 3,853,365 | |
| | | | |
Net assets, October 31, 2014 | | $ | 29,034,530 | |
| | | | |
See Notes to Financial Statements.
| | | | |
Class A: | | | | |
Net asset value and redemption price per share,
($2,559,134 ÷ 231,940 shares of beneficial interest issued and outstanding) | | $ | 11.03 | |
Maximum sales charge (5.50% of offering price) | | | 0.64 | |
| | | | |
Maximum offering price to public | | $ | 11.67 | |
| | | | |
| |
Class B: | | | | |
Net asset value, offering price and redemption price per share,
($109,164 ÷ 10,001 shares of beneficial interest issued and outstanding) | | $ | 10.92 | |
| | | | |
| |
Class C: | | | | |
Net asset value, offering price and redemption price per share,
($542,433 ÷ 49,498 shares of beneficial interest issued and outstanding) | | $ | 10.96 | |
| | | | |
| |
Class Z: | | | | |
Net asset value, offering price and redemption price per share,
($25,823,799 ÷ 2,349,901 shares of beneficial interest issued and outstanding) | | $ | 10.99 | |
| | | | |
See Notes to Financial Statements.
| | | | |
| Prudential International Real Estate Fund | | | 21 | |
Statement of Operations
Year Ended October 31, 2014
| | | | |
Net Investment Income | | | | |
Income | | | | |
Unaffiliated dividend income (net of foreign withholding taxes of $73,134) | | $ | 740,113 | |
Affiliated dividend income | | | 1,155 | |
| | | | |
Total income | | | 741,268 | |
| | | | |
| |
Expenses | | | | |
Management fee | | | 239,386 | |
Distribution fee—Class A | | | 6,400 | |
Distribution fee—Class B | | | 1,173 | |
Distribution fee—Class C | | | 912 | |
Custodian’s fees and expenses | | | 87,000 | |
Registration fees | | | 80,000 | |
Audit fee | | | 30,000 | |
Reports to shareholders | | | 23,000 | |
Legal fees and expenses | | | 19,000 | |
Directors’ fees | | | 13,000 | |
Transfer agent’s fees and expenses (including affiliated expense of $1,500) | | | 4,000 | |
Insurance fees | | | 1,000 | |
Loan interest expense | | | 251 | |
Miscellaneous | | | 25,267 | |
| | | | |
Total expenses | | | 530,389 | |
Less: Management fee waiver and/or expense reimbursement | | | (198,482 | ) |
Distribution fee waiver—Class A | | | (1,067 | ) |
| | | | |
Net expenses | | | 330,840 | |
| | | | |
Net investment income | | | 410,428 | |
| | | | |
| |
Realized and Unrealized Gain (Loss) on Investment and Foreign Currencies | | | | |
Net realized gain (loss) on: | | | | |
Investment transactions | | | (374,128 | ) |
Foreign currency transactions | | | 3,262 | |
| | | | |
| | | (370,866 | ) |
| | | | |
Net change in unrealized appreciation (depreciation) on: | | | | |
Investments | | | 803,658 | |
Foreign currencies | | | (2,598 | ) |
| | | | |
| | | 801,060 | |
| | | | |
Net gain on investments and foreign currencies | | | 430,194 | |
| | | | |
Net Increase In Net Assets Resulting From Operations | | $ | 840,622 | |
| | | | |
See Notes to Financial Statements.
Statement of Changes in Net Assets
| | | | | | | | |
| | | Year Ended October 31, | |
| | | 2014 | | | 2013 | |
Increase (Decrease) in Net Assets | | | | | | | | |
Operations | | | | | | | | |
Net investment income | | $ | 410,428 | | | $ | 343,357 | |
Net realized gain (loss) on investment and foreign currency transactions | | | (370,866 | ) | | | 332,466 | |
Net change in unrealized appreciation (depreciation) on investments and foreign currencies | | | 801,060 | | | | 1,560,908 | |
| | | | | | | | |
Net increase in net assets resulting from operations | | | 840,622 | | | | 2,236,731 | |
| | | | | | | | |
| | |
Dividends from net investment income (Note 1) | | | | | | | | |
Class A | | | (33,232 | ) | | | (26,219 | ) |
Class B | | | (2,496 | ) | | | (6,041 | ) |
Class C | | | (6,466 | ) | | | (5,237 | ) |
Class Z | | | (550,941 | ) | | | (972,177 | ) |
| | | | | | | | |
| | | (593,135 | ) | | | (1,009,674 | ) |
| | | | | | | | |
| | |
Fund share transactions (Net of share conversions) (Note 6) | | | | | | | | |
Net proceeds from shares sold | | | 11,605,113 | | | | 7,891,720 | |
Net asset value of shares issued in reinvestment of dividends | | | 589,125 | | | | 1,007,331 | |
Cost of shares reacquired | | | (5,558,493 | ) | | | (7,502,053 | ) |
| | | | | | | | |
Net increase in net assets from Fund share transactions | | | 6,635,745 | | | | 1,396,998 | |
| | | | | | | | |
Total increase | | | 6,883,232 | | | | 2,624,055 | |
| | |
Net Assets: | | | | | | | | |
Beginning of year | | | 22,151,298 | | | | 19,527,243 | |
| | | | | | | | |
End of year(a) | | $ | 29,034,530 | | | $ | 22,151,298 | |
| | | | | | | | |
(a) Includes undistributed net investment income of: | | $ | 419,092 | | | $ | — | |
| | | | | | | | |
See Notes to Financial Statements.
| | | | |
| Prudential International Real Estate Fund | | | 23 | |
Notes to Financial Statements
Prudential Investment Portfolios 9 (the “Trust”) is an open-end management investment company, registered under the Investment Company Act of 1940, as amended, (“1940 Act”). The Trust currently consists of four portfolios: Prudential Select Real Estate, Prudential International Real Estate Fund, Prudential Large-Cap Core Equity Fund and Prudential Absolute Return Bond Fund. These financial statements relate only to Prudential International Real Estate Fund (the “Fund”). The financial statements of the other portfolios are not presented herein. The Fund’s investment objective is to seek capital appreciation and income.
Note 1. Accounting Policies
The following is a summary of significant accounting policies followed by the Fund in the preparation of the financial statements.
Security Valuation: The Fund holds securities and other assets that are fair valued at the close of each day the New York Stock Exchange (“NYSE”) is open for trading. Fair value is the price that would be received to sell an asset or paid to transfer a liability in an orderly transaction between market participants on the measurement date. The Board of Trustees (the “Board”) has adopted Valuation Procedures for security valuation under which fair valuation responsibilities have been delegated to Prudential Investments LLC (“PI” or “Manager”). Under the current Valuation Procedures, the established Valuation Committee is responsible for supervising the valuation of portfolio securities and other assets. The Valuation Procedures permit the Fund to utilize independent pricing vendor services, quotations from market makers, and alternative valuation methods when market quotations are either not readily available or not deemed representative of fair value. A record of the Valuation Committee’s actions is subject to the Board’s review, approval, and ratification at its next regularly-scheduled quarterly meeting.
Various inputs determine how the Fund’s investments are valued, all of which are categorized according to the three broad levels (Level 1, 2, or 3) detailed in the table following the Portfolio of Investments.
Common and preferred stocks, exchange-traded funds, and derivative instruments such as futures or options that are traded on a national securities exchange are valued at the last sale price as of the close of trading on the applicable exchange. Securities traded via NASDAQ are valued at the NASDAQ official closing price. To the extent these securities are valued at the last sale price or NASDAQ official closing price, they are classified as Level 1 in the fair value hierarchy.
In the event that no sale or official closing price on valuation date exists, these securities are generally valued at the mean between the last reported bid and ask prices, or at the last bid price in the absence of an ask price. These securities are classified as Level 2 in the fair value hierarchy, as the inputs are observable and considered to be significant to the valuation.
Common and preferred stocks traded on foreign securities exchanges are valued using pricing vendor services that provide model prices derived using adjustment factors based on information such as local closing price, relevant general and sector indices, currency fluctuations, depositary receipts, and futures, as applicable. Securities valued using such model prices are classified as Level 2 in the fair value hierarchy, as the adjustment factors are observable and considered to be significant to the valuation. Securities not valued using such model prices are valued in accordance with exchange-traded common and preferred stocks discussed above.
Investments in open-end, non-exchange-traded mutual funds are valued at their net asset values as of the close of the NYSE on the date of valuation. These securities are classified as Level 1 in the fair value hierarchy since they may be purchased or sold at their net asset values on the date of valuation.
Fixed income securities traded in the over-the-counter market are generally valued at prices provided by approved independent pricing vendors. The pricing vendors provide these prices after evaluating observable inputs including, but not limited to yield curves, yield spreads, credit ratings, deal terms, tranche level attributes, default rates, cash flows, prepayment speeds, broker/dealer quotations, and reported trades. Securities valued using such vendor prices are classified as Level 2 in the fair value hierarchy.
Over-the-counter derivative instruments are generally valued using pricing vendor services, which derive the valuation based on inputs such as underlying asset prices, indices, spreads, interest rates, and exchange rates. These instruments are categorized as Level 2 in the fair value hierarchy.
Centrally cleared swaps listed or traded on a multilateral or trade facility platform, such as a registered exchange, are valued at the daily settlement price determined by the respective exchange. These securities are classified as Level 2 in the fair value hierarchy, as the prices marked at the official settle are not public.
Securities and other assets that cannot be priced according to the methods described above are valued based on pricing methodologies approved by the Board. In the event that significant unobservable inputs are used when determining such valuations, the securities will be classified as Level 3 in the fair value hierarchy.
| | | | |
| Prudential International Real Estate Fund | | | 25 | |
Notes to Financial Statements
continued
When determining the fair value of securities, some of the factors influencing the valuation include: the nature of any restrictions on disposition of the securities; assessment of the general liquidity of the securities; the issuer’s financial condition and the markets in which it does business; the cost of the investment; the size of the holding and the capitalization of the issuer; the prices of any recent transactions or bids/offers for such securities or any comparable securities; any available analyst media or other reports or information deemed reliable by the investment adviser regarding the issuer or the markets or industry in which it operates. Using fair value to price securities may result in a value that is different from a security’s most recent closing price and from the price used by other mutual funds to calculate their net asset values.
Foreign Currency Translation: The books and records of the Fund are maintained in U.S. dollars. Foreign currency amounts are translated into U.S. dollars on the following basis:
(i) market value of investment securities, other assets and liabilities-at the current daily rates of exchange.
(ii) purchases and sales of investment securities, income and expenses-at the rates of exchange prevailing on the respective dates of such transactions.
Although the net assets of the Fund are presented at the foreign exchange rates and market values at the close of the period, the Fund does not isolate that portion of the results of operations arising as a result of changes in the foreign exchange rates from the fluctuations arising from changes in the market prices of long-term portfolio securities held at the end of the period. Similarly, the Fund does not isolate the effect of changes in foreign exchange rates from the fluctuations arising from changes in the market prices of long-term portfolio securities sold during the period. Accordingly, these realized foreign currency gains or losses are included in the reported net realized gains or losses on investment transactions.
Net realized gains or losses on foreign currency transactions represent net foreign exchange gains or losses from holdings of foreign currencies, forward currency contracts, disposition of foreign currencies, currency gains or losses realized between the trade and settlement dates on securities transactions, and the difference between the amounts of interest, dividends and foreign withholding taxes recorded on the Fund’s books and the U.S. dollar equivalent amounts actually received or paid. Net
unrealized currency gains or losses from valuing foreign currency denominated assets and liabilities (other than investments) at period end exchange rates are reflected as a component of net unrealized appreciation (depreciation) on foreign currencies.
Concentration of Risk: The ability of debt securities issuers (other than those issued or guaranteed by the U.S. Government) held by the Fund to meet its obligations may be affected by the economic or political developments in a specific industry, region or country. Foreign security and currency transactions may involve certain considerations and risks not typically associated with those of U.S. companies as a result of, among other factors, the possibility of political or economic instability or the level of governmental supervision and regulation of foreign securities markets.
Securities Transactions and Net Investment Income: Securities transactions are recorded on the trade date. Realized gains or losses from investment and currency transactions are calculated on the identified cost basis. Dividend income is recorded on the ex-dividend date. Interest income, including amortization of premium and accretion of discount on debt securities, as required, is recorded on the accrual basis. Expenses are recorded on an accrual basis, which may require the use of certain estimates by management, that may differ from actual.
Net investment income or loss (other than distribution fees which are charged directly to the respective class) and unrealized and realized gains or losses are allocated daily to each class of shares based upon the relative proportion of adjusted net assets of each class at the beginning of the day.
The Fund invests in real estate investment trusts (“REITs”), which report information on the source of their distributions annually. Based on current and historical information, a portion of distributions received from REITs during the year is estimated to be dividend income, capital gain or return of capital and is recorded accordingly. These estimates are adjusted when the actual source of distributions is disclosed by the REITs.
Dividends and Distributions: The Fund expects to pay dividends of net investment income and distributions of net realized capital and currency gains, if any, annually. Dividends and distributions to shareholders, which are determined in accordance with federal income tax regulations and which may differ from generally accepted accounting principles, are recorded on the ex-dividend date. Permanent book/tax differences relating to income and gains are reclassified amongst undistributed net investment income, accumulated net realized gain or loss and paid-in capital in excess of par as appropriate.
| | | | |
| Prudential International Real Estate Fund | | | 27 | |
Notes to Financial Statements
continued
Taxes: It is the Fund’s policy to continue to meet the requirements of the Internal Revenue Code applicable to regulated investment companies and to distribute all of its taxable net investment income and capital gains, if any, to its shareholders. Therefore, no federal income tax provision is required. Withholding taxes on foreign dividends are recorded, net of reclaimable amounts, at the time the related income is earned.
Estimates: The preparation of the financial statements requires management to make estimates and assumptions that affect the reported amounts and disclosures in the financial statements. Actual results could differ from those estimates.
Note 2. Agreements
The Fund has a management agreement with PI. Pursuant to this agreement, PI manages the investment operations of the Fund, administers the Fund’s affairs and supervises the Subadviser’s performance of all investment advisory services. PI has entered into a subadvisory agreement with Prudential Real Estate Investors (“PREI”), which is a business unit of Prudential Investment Management, Inc. (“PIM”). The subadvisory agreement provides that PREI will furnish investment advisory services in connection with the management of the Fund. In connection therewith, PREI is obligated to keep certain books and records of the Fund. Pursuant to the advisory agreement, PI pays for the services of PREI, the cost of compensation of officers of the Fund, occupancy and certain clerical and accounting costs of the Fund. The Fund bears all other costs and expenses.
The management fee paid to PI is accrued daily and payable monthly at an annual rate of 1.00% of the Fund’s average daily net assets.
PI has contractually agreed through February 28, 2015 to limit net annual Fund operating expenses (exclusive of distribution and service (12b-1) fees, extraordinary and certain other expenses, such as taxes, interest and brokerage commissions) of each class of shares to 1.35% of the Fund’s average daily net assets.
The Fund has a distribution agreement with Prudential Investment Management Services LLC (“PIMS”), which acts as the distributor of the Class A, B, C and Z shares of the Fund. The Fund compensates PIMS for distributing and servicing the Fund’s Class A, B and C shares, pursuant to plans of distribution (the “Distribution Plans”), regardless of expenses actually incurred by PIMS. The distribution fees are accrued
daily and payable monthly. No distribution or service fees are paid to PIMS as distributor of the Class Z shares of the Fund.
Pursuant to the Distribution Plans, the Fund compensates PIMS for distribution related activities at an annual rate of up to .30%, 1%, and 1% of the average daily net assets of the Class A, B, and C shares, respectively. PIMS has contractually agreed through February 28, 2015 to limit such fees to .25% of the average daily net assets of the Class A shares.
PIMS has advised the Fund that it has received $8,950 in front-end sales charges resulting from sales of Class A shares, during the year ended October 31, 2014. From these fees, PIMS paid such sales charges to affiliated broker-dealers, which in turn paid commissions to salespersons and incurred other distribution costs.
PIMS has advised the Fund that for the year ended October 31, 2014, it received $2,007 in contingent deferred sales charges imposed upon redemptions by certain Class B shareholders.
PI, PIM and PIMS are indirect, wholly-owned subsidiaries of Prudential Financial, Inc. (“Prudential”).
Note 3. Other Transactions with Affiliates
Prudential Mutual Fund Services LLC (“PMFS”), an affiliate of PI and an indirect, wholly-owned subsidiary of Prudential, serves as the Fund’s transfer agent. Transfer agent fees and expenses in the Statement of Operations include certain out-of-pocket expenses paid to non-affiliates, where applicable.
The Fund invests in the Prudential Core Taxable Money Market Fund (the “Core Fund”), a portfolio of the Prudential Investment Portfolios 2, registered under the Investment Company Act of 1940, and managed by PI. Earnings from the Core Fund are disclosed on the Statement of Operations as affiliated dividend income.
Note 4. Portfolio Securities
Purchases and sales of portfolio securities, other than short-term investments, for the year ended October 31, 2014, were $16,638,955 and $11,334,604, respectively.
| | | | |
| Prudential International Real Estate Fund | | | 29 | |
Notes to Financial Statements
continued
Note 5. Distributions and Tax Information
Distributions to shareholders, which are determined in accordance with federal income tax regulations and which may differ from generally accepted accounting principles, are recorded on the ex-dividend date. In order to present undistributed net investment income, accumulated net realized loss on investment and foreign currency transactions and paid-in capital in excess of par on the Statement of Assets and Liabilities that more closely represent their tax character, certain adjustments have been made to undistributed net investment income and accumulated net realized loss on investment and foreign currency transactions. For the year ended October 31, 2014, the adjustments were to increase undistributed net investment income and increase accumulated net realized loss on investment and foreign currency transactions by $707,190 due to differences in the treatment for book and tax purposes of certain transactions involving investments in passive foreign investment companies and foreign currencies. Net investment income, net realized loss on investment and foreign currency transactions and net assets were not affected by this change.
For the years ended October 31, 2014 and October 31, 2013, the tax character of dividends paid as reflected in the Statement of Changes in Net Assets were $593,135 and $1,009,674 of ordinary income, respectively.
As of October 31, 2014, the accumulated undistributed earnings on a tax basis was $1,125,181 of ordinary income. This differs from the amount shown on the Statement of Assets and Liabilities primarily due to cumulative timing differences between financial and tax reporting.
The United States federal income tax basis of the Fund’s investments and the net unrealized appreciation as of October 31, 2014 were as follows:
| | | | | | | | | | |
Tax Basis | | Appreciation | | Depreciation | | Net
Unrealized
Appreciation | | Other Cost
Basis
Adjustments | | Total Net
Unrealized
Appreciation |
| $26,114,979 | | $3,292,204 | | $(367,151) | | $2,925,053 | | $(2,202) | | $2,922,851 |
The difference between book basis and tax basis is primarily attributable to deferred losses on wash sales and investments in passive foreign investment companies. The other cost basis adjustments are primarily attributable to appreciation (depreciation) of foreign currencies.
Under the Regulated Investment Company Modernization Act of 2010 (“the Act”), the Fund is permitted to carryforward capital losses realized on or after November 1, 2011 (“post-enactment losses”) for an unlimited period. Post-enactment losses are required to be utilized before the utilization of losses incurred prior to the effective date of the Act. As a result of this ordering rule, capital loss carryforwards related to taxable years ending before October 31, 2012 (“pre-enactment losses”) may have an increased likelihood to expire unused. Additionally, post-enactment capital losses that are carried forward will retain their character as either short-term or long-term capital losses rather than being considered all short-term as under previous law. No capital gains distributions are expected to be paid to shareholders until net gains have been realized in excess of such losses. As of October 31, 2014, the pre and post-enactment losses were approximately:
| | | | |
Post-Enactment Losses: | | $ | 1,433,000 | |
| | | | |
Pre-Enactment Losses: | | | | |
Expiring 2019 | | $ | 190,000 | |
| | | | |
Management has analyzed the Fund’s tax positions taken on federal income tax returns for all open tax years and has concluded that no provision for income tax is required in the Fund’s financial statements for the current reporting period. The Fund’s federal and state income and federal excise tax returns for tax years for which the applicable statutes of limitations have not expired are subject to examination by the Internal Revenue Service and state departments of revenue.
Note 6. Capital
The Fund offers Class A, Class B, Class C and Class Z shares. Class A shares are sold subject to a maximum front-end sales charge of up to 5.50%. Investors who purchase Class A shares in an amount of $1 million or more and sell these shares within 12 months of purchase are not subject to an initial sales charge, but are subject to a contingent deferred sales charge (“CDSC”) of 1%. The Class A CDSC is waived for purchases by certain retirement and/or benefit plans. Class B shares are sold with a CDSC which declines from 5% to zero depending on the period of time the shares are held. Class C shares are sold with a CDSC of 1% on shares redeemed within the first 12 months after purchase. Class B shares automatically convert to Class A shares on a quarterly basis approximately seven years after purchase. A special exchange privilege is also available for shareholders who qualified to purchase Class A shares at net asset value. Class Z shares are not subject to any sales or redemption charge and are offered exclusively for sale to a limited group of investors.
| | | | |
| Prudential International Real Estate Fund | | | 31 | |
Notes to Financial Statements
continued
Under certain circumstances, an exchange may be made from specified share classes of the Fund to one or more other share classes of the Fund.
The Trust has authorized an unlimited number of shares of beneficial interest at $.001 par value per share.
As of October 31, 2014, Prudential owned 109 Class B shares, 112 Class C shares and 1,128,819 Class Z shares of the Fund.
Transactions in shares of beneficial interest were as follows:
| | | | | | | | |
Class A | | Shares | | | Amount | |
Year ended October 31, 2014: | | | | | | | | |
Shares sold | | | 179,150 | | | $ | 1,879,923 | |
Shares issued in reinvestment of dividends and distributions | | | 3,003 | | | | 30,600 | |
Shares reacquired | | | (33,462 | ) | | | (358,810 | ) |
| | | | | | | | |
Net increase (decrease) in shares outstanding before conversion | | | 148,691 | | | | 1,551,713 | |
Shares issued upon conversion from Class B | | | 1 | | | | 8 | |
Shares reacquired upon conversion into Class Z | | | (3,281 | ) | | | (37,106 | ) |
| | | | | | | | |
Net increase (decrease) in shares outstanding | | | 145,411 | | | $ | 1,514,615 | |
| | | | | | | | |
Year ended October 31, 2013: | | | | | | | | |
Shares sold | | | 86,235 | | | $ | 931,453 | |
Shares issued in reinvestment of dividends and distributions | | | 2,345 | | | | 24,409 | |
Shares reacquired | | | (37,815 | ) | | | (407,984 | ) |
| | | | | | | | |
Net increase (decrease) in shares outstanding before conversion | | | 50,765 | | | | 547,878 | |
Shares issued upon conversion from Class B | | | 2,266 | | | | 24,319 | |
| | | | | | | | |
Net increase (decrease) in shares outstanding | | | 53,031 | | | $ | 572,197 | |
| | | | | | | | |
| | | | | | | | |
Class B | | Shares | | | Amount | |
Year ended October 31, 2014: | | | | | | | | |
Shares sold | | | 2,592 | | | $ | 26,647 | |
Shares issued in reinvestment of dividends and distributions | | | 219 | | | | 2,223 | |
Shares reacquired | | | (6,086 | ) | | | (62,187 | ) |
| | | | | | | | |
Net increase (decrease) in shares outstanding before conversion | | | (3,275 | ) | | | (33,317 | ) |
Shares reacquired upon conversion into Class A | | | (1 | ) | | | (8 | ) |
| | | | | | | | |
Net increase (decrease) in shares outstanding | | | (3,276 | ) | | $ | (33,325 | ) |
| | | | | | | | |
Year ended October 31, 2013: | | | | | | | | |
Shares sold | | | 36,956 | | | $ | 400,282 | |
Shares issued in reinvestment of dividends and distributions | | | 588 | | | | 6,090 | |
Shares reacquired | | | (38,294 | ) | | | (393,337 | ) |
| | | | | | | | |
Net increase (decrease) in shares outstanding before conversion | | | (750 | ) | | | 13,035 | |
Shares reacquired upon conversion into Class A | | | (2,284 | ) | | | (24,319 | ) |
| | | | | | | | |
Net increase (decrease) in shares outstanding | | | (3,034 | ) | | $ | (11,284 | ) |
| | | | | | | | |
Class C | | | | | | |
Year ended October 31, 2014: | | | | | | | | |
Shares sold | | | 34,823 | | | $ | 378,311 | |
Shares issued in reinvestment of dividends and distributions | | | 611 | | | | 6,182 | |
Shares reacquired | | | (5,298 | ) | | | (53,842 | ) |
| | | | | | | | |
Net increase (decrease) in shares outstanding | | | 30,136 | | | $ | 330,651 | |
| | | | | | | | |
Year ended October 31, 2013: | | | | | | | | |
Shares sold | | | 48,152 | | | $ | 508,320 | |
Shares issued in reinvestment of dividends and distributions | | | 451 | | | | 4,655 | |
Shares reacquired | | | (31,207 | ) | | | (333,279 | ) |
| | | | | | | | |
Net increase (decrease) in shares outstanding | | | 17,396 | | | $ | 179,696 | |
| | | | | | | | |
Class Z | | | | | | |
Year ended October 31, 2014: | | | | | | | | |
Shares sold | | | 874,331 | | | $ | 9,320,232 | |
Shares issued in reinvestment of dividends and distributions | | | 54,306 | | | | 550,120 | |
Shares reacquired | | | (490,750 | ) | | | (5,083,654 | ) |
| | | | | | | | |
Net increase (decrease) in shares outstanding before conversion | | | 437,887 | | | | 4,786,698 | |
Shares issued upon conversion from Class A | | | 3,296 | | | | 37,106 | |
| | | | | | | | |
Net increase (decrease) in shares outstanding | | | 441,183 | | | $ | 4,823,804 | |
| | | | | | | | |
Year ended October 31, 2013: | | | | | | | | |
Shares sold | | | 569,729 | | | $ | 6,051,665 | |
Shares issued in reinvestment of dividends and distributions | | | 93,930 | | | | 972,177 | |
Shares reacquired | | | (601,785 | ) | | | (6,367,453 | ) |
| | | | | | | | |
Net increase (decrease) in shares outstanding | | | 61,874 | | | $ | 656,389 | |
| | | | | | | | |
| | | | |
| Prudential International Real Estate Fund | | | 33 | |
Notes to Financial Statements
continued
Note 7. Borrowings
The Fund, along with other affiliated registered investment companies (the “Funds”), is a party to a Syndicated Credit Agreement (“SCA”) with a group of banks. The purpose of the SCA is to provide an alternative source of temporary funding for capital share redemptions. The SCA provides for a commitment of $900 million for the period October 9, 2014 through October 8, 2015. The Funds pay an annualized commitment fee of .075% of the unused portion of the SCA. Prior to October 9, 2014, the Funds had another SCA that provided a commitment of $900 million and the Funds paid an annualized commitment fee of .08% of the unused portion of the SCA. Interest on any borrowings under the SCA is paid at contracted market rates. The commitment fee for the unused amount is accrued daily and paid quarterly.
The Fund borrowed an average balance of $1,073,667 for 6 days at an interest rate of 1.40% pursuant to the SCA during the year ended October 31, 2014.
Note 8. Notice of Dividends and Distributions to Shareholders
The Fund declared ordinary income dividends on December 12, 2014 to shareholders of record on December 15, 2014. The ex-dividend date was December 16, 2014. The per share amounts declared were as follows:
| | | | |
| | | Ordinary Income | |
Class A* | | $ | 0.41149 | |
Class B* | | $ | 0.33170 | |
Class C* | | $ | 0.41149 | |
Class Z* | | $ | 0.43847 | |
| * | Includes $0.16187 of Special Ordinary Income. |
Financial Highlights
| | | | | | | | | | | | | | | | | | |
| Class A Shares | |
| | | Year Ended October 31, | | | | | December 21,
2010(d)
through
October 31, | |
| | | 2014(b) | | | 2013(b) | | | 2012(b) | | | | | 2011(b) | |
| Per Share Operating Performance: | | | | | | | | | | | | | | | | | | |
| Net Asset Value, Beginning of Period | | | $10.96 | | | | $10.33 | | | | $9.20 | | | | | | $10.00 | |
| Income (loss) from investment operations: | | | | | | | | | | | | | | | | | | |
| Net investment income | | | .16 | | | | .14 | | | | .19 | | | | | | .07 | |
| Net realized and unrealized gain (loss) on investments | | | .18 | | | | 1.04 | | | | 1.23 | | | | | | (.87 | ) |
| Total from investment operations | | | .34 | | | | 1.18 | | | | 1.42 | | | | | | (.80 | ) |
| Less Dividends | | | | | | | | | | | | | | | | | | |
| Dividends from net investment income | | | (.27 | ) | | | (.55 | ) | | | (.29 | ) | | | | | - | |
| Net Asset Value, end of period | | | $11.03 | | | | $10.96 | | | | $10.33 | | | | | | $9.20 | |
| Total Return(a): | | | 3.27% | | | | 11.67% | | | | 16.39% | | | | | | (8.00 | )% |
| | | | | | | | | | | | | | | | | | |
| Ratios/Supplemental Data: | |
| Net assets, end of period (000) | | | $2,559 | | | | $948 | | | | $346 | | | | | | $814 | |
| Average net assets (000) | | | $2,133 | | | | $589 | | | | $228 | | | | | | $353 | |
| Ratios to average net assets(c): | | | | | | | | | | | | | | | | | | |
| Expenses after waivers and/or expense reimbursement | | | 1.60% | | | | 1.60% | | | | 1.60% | | | | | | 1.60% | (e) |
| Expenses before waivers and/or expense reimbursement | | | 2.48% | | | | 2.42% | | | | 2.93% | | | | | | 3.85% | (e) |
| Net investment income | | | 1.53% | | | | 1.33% | | | | 2.00% | | | | | | .89% | (e) |
| Portfolio turnover rate | | | 48% | | | | 37% | | | | 21% | | | | | | 30% | (f) |
(a) Total return does not consider the effect of sales loads. Total return is calculated assuming a purchase of a share on the first day and a sale on the last day of each period reported and includes reinvestment of dividends and distributions, if any. Total returns may reflect adjustments to conform to generally accepted accounting principles. Total returns for periods less than one full year are not annualized.
(b) Calculations are based on the average daily number of shares outstanding.
(c) Does not include expenses of the underlying fund in which the Fund invests.
(d) Commencement of operations.
(e) Annualized.
(f) Not annualized.
See Notes to Financial Statements.
| | | | |
| Prudential International Real Estate Fund | | | 35 | |
Financial Highlights
continued
| | | | | | | | | | | | | | | | | | |
| Class B Shares | |
| | | Year Ended October 31, | | | | | December 21,
2010(d) through
October 31, | |
| | | 2014(b) | | | 2013(b) | | | 2012(b) | | | | | 2011(b) | |
| Per Share Operating Performance: | | | | | | | | | | | | | | | | | | |
| Net Asset Value, Beginning of Period | | | $10.85 | | | | $10.22 | | | | $9.08 | | | | | | $10.00 | |
| Income (loss) from investment operations: | | | | | | | | | | | | | | | | | | |
| Net investment income | | | .08 | | | | .06 | | | | .08 | | | | | | .11 | |
| Net realized and unrealized gain (loss) on investments | | | .18 | | | | 1.04 | | | | 1.27 | | | | | | (1.03 | ) |
| Total from investment operations | | | .26 | | | | 1.10 | | | | 1.35 | | | | | | (.92 | ) |
| Less Dividends | | | | | | | | | | | | | | | | | | |
| Dividends from net investment income | | | (.19 | ) | | | (.47 | ) | | | (.21 | ) | | | | | - | |
| Net Asset Value, end of period | | | $10.92 | | | | $10.85 | | | | $10.22 | | | | | | $9.08 | |
| Total Return(a): | | | 2.50% | | | | 11.01% | | | | 15.63% | | | | | | (9.20 | )% |
| | | | | | | | | | | | | | | | | | |
| Ratios/Supplemental Data: | |
| Net assets, end of period (000) | | | $109 | | | | $144 | | | | $167 | | | | | | $4 | |
| Average net assets (000) | | | $117 | | | | $275 | | | | $52 | | | | | | $5 | |
| Ratios to average net assets(c): | | | | | | | | | | | | | | | | | | |
| Expenses after waivers and/or expense reimbursement | | | 2.35% | | | | 2.35% | | | | 2.35% | | | | | | 2.35% | (e) |
| Expenses before waivers and/or expense reimbursement | | | 3.18% | | | | 3.05% | | | | 3.74% | | | | | | 4.55% | (e) |
| Net investment income | | | .79% | | | | .61% | | | | .87% | | | | | | 1.29% | (e) |
| Portfolio turnover rate | | | 48% | | | | 37% | | | | 21% | | | | | | 30% | (f) |
(a) Total return does not consider the effect of sales loads. Total return is calculated assuming a purchase of a share on the first day and a sale on the last day of each period reported and includes reinvestment of dividends and distributions, if any. Total returns may reflect adjustments to conform to generally accepted accounting principles. Total returns for periods less than one full year are not annualized.
(b) Calculations are based on the average daily number of shares outstanding.
(c) Does not include expenses of the underlying fund in which the Fund invests.
(d) Commencement of operations.
(e) Annualized.
(f) Not annualized.
See Notes to Financial Statements.
| | | | | | | | | | | | | | | | | | |
| Class C Shares | |
| | | Year Ended October 31, | | | | | December 21,
2010(d)
through
October 31, | |
| | | 2014(b) | | | 2013(b) | | | 2012(b) | | | | | 2011(b) | |
| Per Share Operating Performance: | | | | | | | | | | | | | | | | | | |
| Net Asset Value, Beginning of Period | | | $10.89 | | | | $10.25 | | | | $9.10 | | | | | | $10.00 | |
| Income (loss) from investment operations: | | | | | | | | | | | | | | | | | | |
| Net investment income | | | .14 | | | | .16 | | | | .21 | | | | | | .14 | |
| Net realized and unrealized gain (loss) on investments | | | .20 | | | | 1.03 | | | | 1.20 | | | | | | (1.04 | ) |
| Total from investment operations | | | .34 | | | | 1.19 | | | | 1.41 | | | | | | (.90 | ) |
| Less Dividends | | | | | | | | | | | | | | | | | | |
| Dividends from net investment income | | | (.27 | ) | | | (.55 | ) | | | (.26 | ) | | | | | - | |
| Net Asset Value, end of period | | | $10.96 | | | | $10.89 | | | | $10.25 | | | | | | $9.10 | |
| Total Return(a): | | | 3.29% | | | | 11.86% | | | | 16.36% | | | | | | (9.00 | )% |
| | | | | | | | | | | | | | | | | | |
| Ratios/Supplemental Data: | |
| Net assets, end of period (000) | | | $542 | | | | $211 | | | | $20 | | | | | | $30 | |
| Average net assets (000) | | | $365 | | | | $222 | | | | $23 | | | | | | $23 | |
| Ratios to average net assets(c): | | | | | | | | | | | | | | | | | | |
| Expenses after waivers and/or expense reimbursement | | | 1.60% | | | | 1.60% | | | | 1.60% | | | | | | 1.96% | (e) |
| Expenses before waivers and/or expense reimbursement | | | 2.43% | | | | 2.31% | | | | 2.86% | | | | | | 4.16% | (e) |
| Net investment income | | | 1.35% | | | | 1.45% | | | | 2.31% | | | | | | 1.68% | (e) |
| Portfolio turnover rate | | | 48% | | | | 37% | | | | 21% | | | | | | 30% | (f) |
(a) Total return does not consider the effect of sales loads. Total return is calculated assuming a purchase of a share on the first day and a sale on the last day of each period reported and includes reinvestment of dividends and distributions, if any. Total returns may reflect adjustments to conform to generally accepted accounting principles. Total returns for periods less than one full year are not annualized.
(b) Calculations are based on the average daily number of shares outstanding.
(c) Does not include expenses of the underlying fund in which the Fund invests.
(d) Commencement of operations.
(e) Annualized.
(f) Not annualized.
See Notes to Financial Statements.
| | | | |
| Prudential International Real Estate Fund | | | 37 | |
Financial Highlights
continued
| | | | | | | | | | | | | | | | | | |
| Class Z Shares | |
| | | Year Ended October 31, | | | | | December 21,
2010(d)
through
October 31, | |
| | | 2014(b) | | | 2013(b) | | | 2012(b) | | | | | 2011(b) | |
| Per Share Operating Performance: | | | | | | | | | | | | | | | | | | |
| Net Asset Value, Beginning of Period | | | $10.92 | | | | $10.28 | | | | $9.15 | | | | | | $10.00 | |
| Income (loss) from investment operations: | | | | | | | | | | | | | | | | | | |
| Net investment income | | | .19 | | | | .17 | | | | .22 | | | | | | .18 | |
| Net realized and unrealized gain (loss) on investments | | | .17 | | | | 1.04 | | | | 1.22 | | | | | | (1.03 | ) |
| Total from investment operations | | | .36 | | | | 1.21 | | | | 1.44 | | | | | | (.85 | ) |
| Less Dividends | | | | | | | | | | | | | | | | | | |
| Dividends from net investment income | | | (.29 | ) | | | (.57 | ) | | | (.31 | ) | | | | | - | |
| Net Asset Value, end of period | | | $10.99 | | | | $10.92 | | | | $10.28 | | | | | | $9.15 | |
| Total Return(a): | | | 3.55% | | | | 12.08% | | | | 16.82% | | | | | | (8.50 | )% |
| | | | | | | | | | | | | | | | | | |
| Ratios/Supplemental Data: | |
| Net assets, end of period (000) | | | $25,824 | | | | $20,848 | | | | $18,994 | | | | | | $13,233 | |
| Average net assets (000) | | | $21,323 | | | | $20,388 | | | | $14,068 | | | | | | $12,252 | |
| Ratios to average net assets(c): | | | | | | | | | | | | | | | | | | |
| Expenses after waivers and/or expense reimbursement | | | 1.35% | | | | 1.35% | | | | 1.35% | | | | | | 1.35% | (e) |
| Expenses before waivers and/or expense reimbursement | | | 2.18% | | | | 2.08% | | | | 2.65% | | | | | | 3.55% | (e) |
| Net investment income | | | 1.74% | | | | 1.62% | | | | 2.39% | | | | | | 2.15% | (e) |
| Portfolio turnover rate | | | 48% | | | | 37% | | | | 21% | | | | | | 30% | (f) |
(a) Total return is calculated assuming a purchase of a share on the first day and a sale on the last day of each period reported and includes reinvestment of dividends and distributions, if any. Total returns may reflect adjustments to conform to generally accepted accounting principles. Total returns for periods less than one full year are not annualized.
(b) Calculations are based on the average daily number of shares outstanding.
(c) Does not include expenses of the underlying fund in which the Fund invests.
(d) Commencement of operations.
(e) Annualized.
(f) Not annualized.
See Notes to Financial Statements.
Report of Independent Registered Public
Accounting Firm
The Board of Trustees and Shareholders
Prudential Investment Portfolios 9:
We have audited the accompanying statement of assets and liabilities of Prudential International Real Estate Fund, a series of Prudential Investment Portfolios 9 (hereafter referred to as the “Fund”), including the portfolio of investments, as of October 31, 2014, and the related statement of operations for the year then ended, the statements of changes in net assets for each of the years in the two-year period then ended and the financial highlights for each of the years in the three-year period then ended and for the period December 21, 2010 (commencement of operations) to October 31, 2011. These financial statements and financial highlights are the responsibility of the Fund’s management. Our responsibility is to express an opinion on these financial statements and financial highlights based on our audits.
We conducted our audits in accordance with the standards of the Public Company Accounting Oversight Board (United States). Those standards require that we plan and perform the audit to obtain reasonable assurance about whether the financial statements and financial highlights are free of material misstatement. An audit includes examining, on a test basis, evidence supporting the amounts and disclosures in the financial statements. Our procedures included confirmation of securities owned as of October 31, 2014, by correspondence with the custodian and transfer agent. An audit also includes assessing the accounting principles used and significant estimates made by management, as well as evaluating the overall financial statement presentation. We believe that our audits provide a reasonable basis for our opinion.
In our opinion, the financial statements and financial highlights referred to above present fairly, in all material respects, the financial position of the Fund as of October 31, 2014, and the results of its operations for the year then ended, the changes in its net assets for each of the years in the two-year period then ended and the financial highlights for each of the years in the three-year period then ended and for the period December 21, 2010 to October 31, 2011, in conformity with U.S. generally accepted accounting principles.

New York, New York
December 19, 2014
| | | | |
| Prudential International Real Estate Fund | | | 39 | |
Tax Information
(Unaudited)
For the year ended October 31, 2014, the Fund reports the maximum amount allowable under Section 854 of the Internal Revenue Code but not less than the following percentage of the ordinary income dividends paid as qualified dividend income (QDI):
| | | | |
| | | QDI | |
| |
Prudential International Real Estate Fund | | | 49.59% | |
For the year ended October 31, 2014, the Fund made an election to pass through the maximum amount of the portion of the ordinary income dividends paid derived from foreign source income as well as any foreign taxes paid by the Fund in accordance with Section 853 of the Internal Revenue Code of the following amounts: $43,193 foreign tax credit from recognized foreign source income of $813,283.
In January 2015, you will be advised on IRS Form 1099-DIV or substitute 1099-DIV as to the federal tax status of distributions received by you in calendar year 2014.
INFORMATION ABOUT BOARD MEMBERS AND OFFICERS
(Unaudited)
Information about Board Members and Officers of the Fund is set forth below. Board Members who are not deemed to be “interested persons” of the Fund, as defined in the 1940 Act, are referred to as “Independent Board Members.” Board Members who are deemed to be “interested persons” of the Fund are referred to as “Interested Board Members.” The Board Members are responsible for the overall supervision of the operations of the Fund and perform the various duties imposed on the directors of investment companies by the 1940 Act. The Board in turn elects the Officers, who are responsible for administering the day-to-day operations of the Fund.
| | | | |
| Independent Board Members(1) |
| | | |
Name, Address, Age Position(s) Portfolios Overseen | | Principal Occupation(s) During Past Five Years | | Other Directorships Held |
Ellen S. Alberding (56) Board Member Portfolios Overseen: 69 | | President and Board Member, The Joyce Foundation (charitable foundation) (since 2002); Vice Chair, City Colleges of Chicago (community college system) (since 2011); Trustee, Skills for America’s Future (national initiative to connect employers to community colleges) (since 2011); Trustee, National Park Foundation (charitable foundation for national park system) (since 2009); Trustee, Economic Club of Chicago (since 2009). | | None. |
Kevin J. Bannon (62) Board Member Portfolios Overseen: 70 | | Managing Director (since April 2008) and Chief Investment Officer (October 2008-November 2013) of Highmount Capital LLC (registered investment adviser); formerly Executive Vice President and Chief Investment Officer (April 1993-August 2007) of Bank of New York Company; President (May 2003-May 2007) of BNY Hamilton Family of Mutual Funds. | | Director of Urstadt Biddle Properties (equity real estate investment trust) (since September 2008). |
Linda W. Bynoe (62) Board Member Portfolios Overseen: 70 | | President and Chief Executive Officer (since March 1995) and formerly Chief Operating Officer (December 1989-February 1995) of Telemat Ltd. (management consulting); formerly Vice President (January 1985-June 1989) at Morgan Stanley & Co (broker-dealer). | | Director of Simon Property Group, Inc. (retail real estate) (May 2003-May 2012); Director of Anixter International, Inc. (communication products distributor) (since January 2006); Director of Northern Trust Corporation (financial services) (since April 2006); Trustee of Equity Residential (residential real estate) (since December 2009). |
Prudential International Real Estate Fund
| | | | |
| Independent Board Members(1) |
| | | |
Name, Address, Age Position(s) Portfolios Overseen | | Principal Occupation(s) During Past Five Years | | Other Directorships Held |
Keith F. Hartstein (58) Board Member Portfolios Overseen: 70 | | Retired; Formerly President and Chief Executive Officer (2005-2012), Senior Vice President (2004-2005), Senior Vice President of Sales and Marketing (1997-2004), and various executive management positions (1990-1997), John Hancock Funds, LLC (asset management); Chairman, Investment Company Institute’s Sales Force Marketing Committee (2003-2008). | | None. |
Michael S. Hyland, CFA (69) Board Member Portfolios Overseen: 69 | | Retired (since February 2005); Formerly Senior Managing Director (July 2001-February 2005) of Bear Stearns & Co, Inc.; Global Partner, INVESCO (1999-2001); Managing Director and President of Salomon Brothers Asset Management (1989-1999). | | None. |
Douglas H. McCorkindale (75) Board Member Portfolios Overseen: 69 | | Retired; Formerly Chairman (February 2001-June 2006), Chief Executive Officer (June 2000-July 2005), President (September 1997-July 2005) and Vice Chairman (March 1984-May 2000) of Gannett Co. Inc. (publishing and media). | | Director of Lockheed Martin Corp. (aerospace and defense) (since May 2001). |
Stephen P. Munn (72) Board Member Portfolios Overseen: 70 | | Lead Director (since 2007) and formerly Chairman (1993-2007) of Carlisle Companies Incorporated (manufacturer of industrial products). | | Lead Director (since 2007) of Carlisle Companies Incorporated (manufacturer of industrial products). |
James E. Quinn (62) Board Member Portfolios Overseen: 69 | | Retired; Formerly President (2003-2012) and Director (2003-2008), and Vice Chairman and Director (1998-2003), Tiffany & Company (jewelry retailing); Director, Mutual of America Capital Management Corporation (asset management) (since 1996); Director, Hofstra University (since 2008); Vice Chairman, Museum of the City of New York (since 1994). | | Director of Deckers Outdoor Corporation (footwear manufacturer) (since 2011). |
Richard A. Redeker (71) Board Member & Independent Chair Portfolios Overseen: 70 | | Retired Mutual Fund Senior Executive (44 years); Management Consultant; Director, Mutual Fund Directors Forum (since 2014); Independent Directors Council (organization of 2,800 Independent Mutual Fund Directors)-Executive Committee, Chair of Policy Steering Committee, Governing Council. | | None. |
Visit our website at www.prudentialfunds.com
| | | | |
| Independent Board Members(1) |
| | | |
Name, Address, Age Position(s) Portfolios Overseen | | Principal Occupation(s) During Past Five Years | | Other Directorships Held |
Robin B. Smith (75) Board Member Portfolios Overseen:70 | | Chairman of the Board (since January 2003) of Publishers Clearing House (direct marketing); Member of the Board of Directors of ADLPartner (marketing) (since December 2010); formerly Chairman and Chief Executive Officer (August 1996-January 2003) of Publishers Clearing House. | | Formerly Director of BellSouth Corporation (telecommunications) (1992-2006). |
Stephen G. Stoneburn (71) Board Member Portfolios Overseen: 70 | | Chairman, (since July 2011), President and Chief Executive Officer (since June 1996) of Quadrant Media Corp. (publishing company); formerly President (June 1995-June 1996) of Argus Integrated Media, Inc.; Senior Vice President and Managing Director (January 1993-1995) of Cowles Business Media; Senior Vice President of Fairchild Publications, Inc. (1975-1989). | | None. |
| | | | |
| Interested Board Members(1) |
| | | |
Name, Address, Age Position(s) Portfolios Overseen | | Principal Occupation(s) During Past Five Years | | Other Directorships Held |
Stuart S. Parker (52) Board Member & President Portfolios Overseen: 64 | | President of Prudential Investments LLC (since January 2012); Executive Vice President of Prudential Investment Management Services LLC (since December 2012); Executive Vice President of Jennison Associates LLC and Head of Retail Distribution of Prudential Investments LLC (June 2005-December 2011). | | None. |
Scott E. Benjamin (41) Board Member & Vice President Portfolios Overseen: 70 | | Executive Vice President (since June 2009) of Prudential Investments LLC; Executive Vice President (June 2009-June 2012) and Vice President (since June 2012) of Prudential Investment Management Services LLC; Executive Vice President (since September 2009) of AST Investment Services, Inc.; Senior Vice President of Product Development and Marketing, Prudential Investments (since February 2006); Vice President of Product Development and Product Management, Prudential Investments (2003-2006). | | None. |
Prudential International Real Estate Fund
| | | | |
| Interested Board Members(1) |
| | | |
Name, Address, Age Position(s) Portfolios Overseen | | Principal Occupation(s) During Past Five Years | | Other Directorships Held |
Grace C. Torres* (55) Board Member Portfolios Overseen: 65 | | Retired; Formerly Treasurer and Principal Financial and Accounting Officer of the Prudential Investments Funds, Target Funds, Advanced Series Trust, Prudential Variable Contract Accounts and The Prudential Series Fund (1998-June 2014); Assistant Treasurer (March 1999-June 2014) and Senior Vice President (September 1999-June 2014) of Prudential Investments LLC; Assistant Treasurer (May 2003-June 2014) and Vice President (June 2005-June 2014) of AST Investment Services, Inc.; Senior Vice President and Assistant Treasurer (May 2003-June 2014) of Prudential Annuities Advisory Services, Inc. | | None. |
* Note: Prior to her retirement in 2014, Ms. Torres was employed by Prudential Investments LLC. Due to her prior employment, she is considered to be an “interested person” under the 1940 Act. Ms. Torres is a non-management Interested Board Member.
(1) The year that each individual joined the Fund’s Board is as follows:
Ellen S. Alberding, 2013; Linda W. Bynoe, 2005; Douglas H. McCorkindale, 1998; Richard A. Redeker, 1998; Robin B. Smith, 1998; Stephen G. Stoneburn, 2003; Kevin J. Bannon, 2008; Keith F. Hartstein, 2013; Michael S. Hyland, 2008; Stephen P. Munn, 2008; James E. Quinn, 2013; Stuart S. Parker, Board Member since 2012 and President since 2012; Scott E. Benjamin, Board Member since 2010 and Vice President since 2009; Grace C. Torres, 2014.
| | | | |
| Fund Officers(a) |
| | | |
Name, Address and Age Position with Fund | | Principal Occupation(s) During Past Five Years | | Length of Service as Fund Officer |
Raymond A. O’Hara (59) Chief Legal Officer | | Vice President and Corporate Counsel (since July 2010) of Prudential Insurance Company of America (Prudential); Vice President (March 2011-Present) of Pruco Life Insurance Company and Pruco Life Insurance Company of New Jersey; Vice President and Corporate Counsel (March 2011-Present) of Prudential Annuities Life Assurance Corporation; Chief Legal Officer of Prudential Investments LLC (since June 2012); Chief Legal Officer of Prudential Mutual Fund Services LLC (since June 2012) and Corporate Counsel of AST Investment Services, Inc. (since June 2012); formerly Assistant Vice President and Corporate Counsel (September 2008-July 2010) of The Hartford Financial Services Group, Inc.; formerly Associate (September 1980-December 1987) and Partner (January 1988–August 2008) of Blazzard & Hasenauer, P.C. (formerly, Blazzard, Grodd & Hasenauer, P.C.). | | Since 2012 |
Visit our website at www.prudentialfunds.com
| | | | |
| Fund Officers(a) |
| | | |
Name, Address and Age Position with Fund | | Principal Occupation(s) During Past Five Years | | Length of Service as Fund Officer |
Chad A. Earnst (39) Chief Compliance Officer | | Chief Compliance Officer (September 2014-Present) of Prudential Investments LLC; Chief Compliance Officer (September 2014-Present) of the Prudential Investments Funds, Target Funds, Advanced Series Trust, The Prudential Series Fund, Prudential’s Gibraltar Fund, Inc., Prudential Global Short Duration High Yield Income Fund, Inc., Prudential Short Duration High Yield Fund, Inc. and Prudential Jennison MLP Income Fund, Inc.; formerly Assistant Director (March 2010-August 2014) of the Asset Management Unit, Division of Enforcement, US Securities & Exchange Commission; Assistant Regional Director (January 2010-August 2014), Branch Chief (June 2006–December 2009) and Senior Counsel (April 2003-May 2006) of the Miami Regional Office, Division of Enforcement, US Securities & Exchange Commission. | | Since 2014 |
Deborah A. Docs (56) Secretary | | Vice President and Corporate Counsel (since January 2001) of Prudential; Vice President (since December 1996) and Assistant Secretary (since March 1999) of Prudential Investments LLC; formerly Vice President and Assistant Secretary (May 2003-June 2005) of AST Investment Services, Inc. | | Since 2004 |
Jonathan D. Shain (56) Assistant Secretary | | Vice President and Corporate Counsel (since August 1998) of Prudential; Vice President and Assistant Secretary (since May 2001) of Prudential Investments LLC; Vice President and Assistant Secretary (since February 2001) of Prudential Mutual Fund Services LLC; formerly Vice President and Assistant Secretary (May 2003-June 2005) of AST Investment Services, Inc. | | Since 2005 |
Claudia DiGiacomo (40) Assistant Secretary | | Vice President and Corporate Counsel (since January 2005) of Prudential; Vice President and Assistant Secretary of Prudential Investments LLC (since December 2005); Associate at Sidley Austin Brown & Wood LLP (1999-2004). | | Since 2005 |
Andrew R. French (52) Assistant Secretary | | Vice President and Corporate Counsel (since February 2010) of Prudential; formerly Director and Corporate Counsel (2006-2010) of Prudential; Vice President and Assistant Secretary (since January 2007) of Prudential Investments LLC; Vice President and Assistant Secretary (since January 2007) of Prudential Mutual Fund Services LLC. | | Since 2006 |
Amanda S. Ryan (36) Assistant Secretary | | Director and Corporate Counsel (since March 2012) of Prudential; Director and Assistant Secretary (since June 2012) of Prudential Investments LLC; Associate at Ropes & Gray LLP (2008-2012). | | Since 2012 |
Theresa C. Thompson (52) Deputy Chief Compliance Officer | | Vice President, Compliance, Prudential Investments LLC (since April 2004); and Director, Compliance, Prudential Investments LLC (2001-2004). | | Since 2008 |
Prudential International Real Estate Fund
| | | | |
| Fund Officers(a) |
| | | |
Name, Address and Age Position with Fund | | Principal Occupation(s) During Past Five Years | | Length of Service as Fund Officer |
Richard W. Kinville (46) Anti-Money Laundering Compliance Officer | | Vice President, Corporate Compliance, Anti-Money Laundering Unit (since January 2005) of Prudential; committee member of the American Council of Life Insurers Anti-Money Laundering and Critical Infrastructure Committee (since January 2007); formerly Investigator and Supervisor in the Special Investigations Unit for the New York Central Mutual Fire Insurance Company (August 1994-January 1999); Investigator in AXA Financial’s Internal Audit Department and Manager in AXA’s Anti-Money Laundering Office (January 1999-January 2005); first chair of the American Council of Life Insurers Anti-Money Laundering and Critical Infrastructure Committee (June 2007-December 2009). | | Since 2011 |
M. Sadiq Peshimam (50) Treasurer and Principal Financial and Accounting Officer | | Assistant Treasurer of funds in the Prudential Mutual Fund Complex (2006-2014); Vice President (since 2005) of Prudential Investments LLC. | | Since 2006 |
Peter Parrella (56) Assistant Treasurer | | Vice President (since 2007) and Director (2004-2007) within Prudential Mutual Fund Administration; formerly Tax Manager at SSB Citi Fund Management LLC (1997-2004). | | Since 2007 |
Lana Lomuti (47) Assistant Treasurer | | Vice President (since 2007) and Director (2005-2007), within Prudential Mutual Fund Administration; formerly Assistant Treasurer (December 2007-February 2014) of The Greater China Fund, Inc. | | Since 2014 |
Linda McMullin (53) Assistant Treasurer | | Vice President (since 2011) and Director (2008-2011) within Prudential Mutual Fund Administration. | | Since 2014 |
| (a) | Excludes Mr. Parker and Mr. Benjamin, interested Board Members who also serve as President and Vice President, respectively. |
Explanatory Notes to Tables:
| n | Board Members are deemed to be “Interested,” as defined in the 1940 Act, by reason of their affiliation with Prudential Investments LLC and/or an affiliate of Prudential Investments LLC. |
| n | Unless otherwise noted, the address of all Board Members and Officers is c/o Prudential Investments LLC, Gateway Center Three, 100 Mulberry Street, Newark, New Jersey 07102-4077. |
| n | There is no set term of office for Board Members or Officers. The Board Members have adopted a retirement policy, which calls for the retirement of Board Members on December 31 of the year in which they reach the age of 75. |
| n | “Other Directorships Held” includes only directorships of companies required to register or file reports with the SEC under the 1934 Act (that is, “public companies”) or other investment companies registered under the 1940 Act. |
| n | “Portfolios Overseen” includes all investment companies managed by Prudential Investments LLC. The investment companies for which Prudential Investments LLC serves as manager include the Prudential Investments Mutual Funds, The Prudential Variable Contract Accounts, Target Mutual Funds, Prudential Short Duration High Yield Fund, Inc., Prudential Global Short Duration High Yield Fund, Inc., The Prudential Series Fund, Prudential’s Gibraltar Fund, Inc. and the Advanced Series Trust. |
Visit our website at www.prudentialfunds.com
Approval of Advisory Agreements
The Fund’s Board of Trustees
The Board of Trustees (the “Board”) of Prudential International Real Estate Fund (the “Fund”)1 consists of thirteen individuals, eleven of whom are not “interested persons” of the Fund, as defined in the Investment Company Act of 1940, as amended (the “1940 Act”) (the “Independent Trustees”). The Board is responsible for the oversight of the Fund and its operations, and performs the various duties imposed on the directors of investment companies by the 1940 Act. The Independent Trustees have retained independent legal counsel to assist them in connection with their duties. The Chair of the Board is an Independent Trustee. The Board has established three standing committees: the Audit Committee, the Nominating and Governance Committee, and the Investment Committee. Each committee is chaired by, and composed of, Independent Trustees.
Annual Approval of the Fund’s Advisory Agreements
As required under the 1940 Act, the Board determines annually whether to renew the Fund’s management agreement with Prudential Investments LLC (“PI”) and the Fund’s subadvisory agreement with Prudential Investment Management, Inc. (“PIM”), which provides subadvisory services to the Fund through its Prudential Real Estate Investors unit (“PREI”). In considering the renewal of the agreements, the Board, including all of the Independent Trustees, met on June 9-11, 2014 and approved the renewal of the agreements through July 31, 2015, after concluding that the renewal of the agreements was in the best interests of the Fund and its shareholders.2
In advance of the meetings, the Board requested and received materials relating to the agreements, and had the opportunity to ask questions and request further information in connection with its consideration. Among other things, the Board considered comparative fee information from PI and PIM. Also, the Board considered comparisons with other mutual funds in relevant Peer Universes and Peer Groups, as is further discussed below.
In approving the agreements, the Board, including the Independent Trustees advised by independent legal counsel, considered the factors it deemed relevant, including the nature, quality and extent of services provided by PI and the subadviser, the performance of the Fund, the profitability of PI and its affiliates, expenses and fees, and the potential for economies of scale that may be shared with the Fund and its shareholders the Fund’s assets grow. In their deliberations, the Trustees did not
| 1 | Prudential International Real Estate Fund is a series of Prudential Investment Portfolios 9. |
| 2 | Grace C. Torres was elected to the Board as of December 2014, and therefore did not participate in the consideration of these approvals. |
Prudential International Real Estate Fund
Approval of Advisory Agreements (continued)
identify any single factor which alone was responsible for the Board’s decision to approve the agreements with respect to the Fund. In connection with its deliberations, the Board considered information provided by PI throughout the year at regular Board meetings, presentations from portfolio managers and other information, as well as information furnished at or in advance of the meetings on June 9-11, 2014.
The Trustees determined that the overall arrangements between the Fund and PI, which serves as the Fund’s investment manager pursuant to a management agreement, and between PI and PIM, pursuant to the terms of a subadvisory agreement with PI, are in the best interests of the Fund and its shareholders in light of the services performed, fees charged and such other matters as the Trustees considered relevant in the exercise of their business judgment.
The material factors and conclusions that formed the basis for the Trustees’ reaching their determinations to approve the continuance of the agreements are separately discussed below.
Nature, Quality and Extent of Services
The Board received and considered information regarding the nature, quality and extent of services provided to the Fund by PI and PREI. The Board considered the services provided by PI, including but not limited to the oversight of the subadviser for the Fund, as well as the provision of fund recordkeeping, compliance, and other services to the Fund. With respect to PI’s oversight of the subadviser, the Board noted that PI’s Strategic Investment Research Group (“SIRG”), which is a business unit of PI, is responsible for monitoring and reporting to PI’s senior management on the performance and operations of the subadviser. The Board also considered that PI pays the salaries of all of the officers and non-independent Trustees of the Fund. The Board also considered the investment subadvisory services provided by PREI, as well as adherence to the Fund’s investment restrictions and compliance with applicable Fund policies and procedures. The Board considered PI’s evaluation of the subadviser, as well as PI’s recommendation, based on its review of the subadviser, to renew the subadvisory agreement.
The Board considered the qualifications, backgrounds and responsibilities of PI’s senior management responsible for the oversight of the Fund and PREI, and also considered the qualifications, backgrounds and responsibilities of PREI’s portfolio managers who are responsible for the day-to-day management of the Fund’s portfolio. The Board was provided with information pertaining to PI’s, PIM’s and PREI’s organizational structure, senior management, investment operations, and other relevant information pertaining to PI, PIM and PREI. The Board also noted that it
Visit our website at www.prudentialfunds.com
received favorable compliance reports from the Fund’s Chief Compliance Officer (“CCO”) as to PI, PIM and PREI. The Board noted that PREI and PIM are affiliated with PI.
The Board concluded that it was satisfied with the nature, extent and quality of the investment management services provided by PI and the subadvisory services provided to the Fund by PIM through PREI, and that there was a reasonable basis on which to conclude that the Fund benefits from the services provided by PI and PIM through PREI under the management and subadvisory agreements.
Costs of Services and Profits Realized by PI
The Board was provided with information on the profitability of PI and its affiliates in serving as the Fund’s investment manager. The Board discussed with PI the methodology utilized in assembling the information regarding profitability and considered its reasonableness. The Board recognized that it is difficult to make comparisons of profitability from fund management contracts because comparative information is not generally publicly available and is affected by numerous factors, including the structure of the particular adviser, the types of funds it manages, its business mix, numerous assumptions regarding allocations and the adviser’s capital structure and cost of capital. However, the Board considered that the cost of services provided by PI exceeded the management fees received by PI, resulting in an operating loss to PI. The Board separately considered information regarding the profitability of the subadviser, an affiliate of PI. Taking these factors into account, the Board concluded that the profitability of PI and its affiliates in relation to the services rendered was not unreasonable.
Economies of Scale
In 2013, PI and the Board retained an outside business consulting firm, in order to assist the Board in its consideration of the renewal of the management and subadvisory agreements, by reviewing management fee breakpoint usage and trends in management fees across the mutual fund industry. The consulting firm’s analysis and conclusions with respect to the Funds’ management fee structures were presented to the Board and PI at the December 3-5, 2013 meeting, and were discussed extensively by the Board and PI over the following two quarters.
The Board noted that the management fee schedule for the Fund does not contain breakpoints that would reduce the fee rate on assets above specified levels. The Board received and discussed information concerning whether PI realizes economies of scale as the Fund’s assets grow beyond current levels. The Board also recognized the inherent limitations of any analysis of economies of scale, stemming largely from the
Prudential International Real Estate Fund
Approval of Advisory Agreements (continued)
Board’s understanding that most of PI’s costs are not specific to individual funds, but rather are incurred across a variety of products and services. In light of the Fund’s current size, performance and expense structure, the Board concluded that the absence of breakpoints in the Fund’s fee schedule is acceptable at this time.
Other Benefits to PI and PIM
The Board considered potential ancillary benefits that might be received by PI and PIM and their affiliates as a result of their relationship with the Fund. The Board concluded that potential benefits to be derived by PI included fees received by affiliates of PI for serving as the Fund’s securities lending agent, transfer agency fees received by the Fund’s transfer agent (which is affiliated with PI), and benefits to its reputation as well as other intangible benefits resulting from PI’s association with the Fund. The Board concluded that the potential benefits to be derived by PIM included its ability to use soft dollar credits, as well as the potential benefits consistent with those generally resulting from an increase in assets under management, specifically, potential access to additional research resources and benefits to its reputation. The Board concluded that the benefits derived by PI and PIM were consistent with the types of benefits generally derived by investment managers and subadvisers to mutual funds.
Performance of the Fund / Fees and Expenses
The Board considered certain additional specific factors and made related conclusions relating to the historical performance of the Fund for the one- and three-year periods ended December 31, 2013.
The Board also considered the Fund’s actual management fee, as well as the Fund’s net total expense ratio, for the fiscal year ended October 31, 2013. The Board considered the management fee for the Fund as compared to the management fee charged by PI to other funds and the fee charged by other advisers to comparable mutual funds in a Peer Group. The actual management fee represents the fee rate actually paid by Fund shareholders and includes any fee waivers or reimbursements. The net total expense ratio for the Fund represents the actual expense ratio incurred by Fund shareholders.
The mutual funds included in the Peer Universe (the Lipper Equity International Real Estate Funds Performance Universe) and the Peer Group were objectively determined by Lipper Inc. (“Lipper”), an independent provider of mutual fund data. The comparisons placed the Fund in various quartiles, with the first quartile being the best 25% of the mutual funds (for performance, the best performing mutual funds and, for expenses, the lowest cost mutual funds).
Visit our website at www.prudentialfunds.com
The section below summarizes key factors considered by the Board and the Board’s conclusions regarding the Fund’s performance, fees and overall expenses. The table sets forth gross performance comparisons (which do not reflect the impact on performance of fund expenses, or any subsidies, expense caps or waivers that may be applicable) with the Peer Universe, actual management fees with the Peer Group (which reflect the impact of any subsidies or fee waivers), and net total expenses with the Peer Group, each of which were key factors considered by the Board.
| | | | | | | | |
| Performance | | 1 Year | | 3 Years | | 5 Years | | 10 Years |
| | | 3rd Quartile | | 3rd Quartile | | N/A | | N/A |
| Actual Management Fees: 1st Quartile |
| Net Total Expenses: 3rd Quartile |
| | • | | The Board noted that the Fund underperformed its benchmark index over the one- and three-year periods. |
| | • | | The Board also noted information provided by PI indicating that the Fund’s performance had improved, with the Fund ranking in the second quartile of its Peer Universe and outperforming its benchmark for the three-month period ended April 30, 2014. |
| | • | | The Board also noted information provided by PI indicating that the Fund’s net expenses were 10 basis points higher than the median, after a waiver of expenses of 0.732%, of all funds included in the Peer Group. |
| | • | | The Board and PI agreed to continue the existing expense cap of 1.35% (exclusive of 12b-1 fees and certain other fees) through February 28, 2015. |
| | • | | The Board concluded that it was reasonable to closely monitor the Fund’s performance and that it would be in the best interests of the Fund and its shareholders to renew the agreements. |
| | • | | The Board concluded that the management fees (including subadvisory fees) and total expenses were reasonable in light of the services provided. |
* * *
After full consideration of these factors, the Board concluded that the approval of the agreements was in the best interests of the Fund and its shareholders.
Prudential International Real Estate Fund
| | | | |
| n MAIL | | n TELEPHONE | | n WEBSITE |
Gateway Center Three 100 Mulberry Street Newark, NJ 07102 | | (800) 225-1852 | | www.prudentialfunds.com |
|
| PROXY VOTING |
| The Board of Trustees of the Fund has delegated to the Fund’s investment subadviser the responsibility for voting any proxies and maintaining proxy recordkeeping with respect to the Fund. A description of these proxy voting policies and procedures is available without charge, upon request, by calling (800) 225-1852 or by visiting the Securities and Exchange Commission’s website at www.sec.gov. Information regarding how the Fund voted proxies relating to portfolio securities during the most recent 12-month period ended June 30 is available on the Fund’s website and on the Securities and Exchange Commission’s website. |
|
| TRUSTEES |
| Ellen S. Alberding • Kevin J. Bannon • Scott E. Benjamin • Linda W. Bynoe • Keith F. Hartstein • Michael S. Hyland • Douglas H. McCorkindale • Stephen P. Munn • Stuart S. Parker • James E. Quinn • Richard A. Redeker • Robin B. Smith • Stephen G. Stoneburn • Grace C. Torres |
|
| OFFICERS |
| Stuart S. Parker, President • Scott E. Benjamin, Vice President • M. Sadiq Peshimam, Treasurer and Principal Financial and Accounting Officer • Raymond A. O’Hara, Chief Legal Officer • Deborah A. Docs, Secretary • Chad A. Earnst, Chief Compliance Officer • Theresa C. Thompson, Deputy Chief Compliance Officer • Richard W. Kinville, Anti-Money Laundering Compliance Officer • Jonathan D. Shain, Assistant Secretary • Claudia DiGiacomo, Assistant Secretary • Amanda S. Ryan, Assistant Secretary • Andrew R. French, Assistant Secretary • Peter Parrella, Assistant Treasurer • Lana Lomuti, Assistant Treasurer • Linda McMullin, Assistant Treasurer |
| | | | |
| MANAGER | | Prudential Investments LLC | | Gateway Center Three
100 Mulberry Street
Newark, NJ 07102 |
|
| INVESTMENT SUBADVISER | | Prudential Real Estate Investors | | 7 Giralda Farms
Madison, NJ 07940 |
|
| DISTRIBUTOR | | Prudential Investment
Management Services LLC | | Gateway Center Three
100 Mulberry Street
Newark, NJ 07102 |
|
| CUSTODIAN | | The Bank of New York Mellon | | One Wall Street
New York, NY 10286 |
|
| TRANSFER AGENT | | Prudential Mutual Fund
Services LLC | | PO Box 9658
Providence, RI 02940 |
|
INDEPENDENT REGISTERED
PUBLIC ACCOUNTING FIRM | | KPMG LLP | | 345 Park Avenue
New York, NY 10154 |
|
| FUND COUNSEL | | Willkie Farr & Gallagher LLP | | 787 Seventh Avenue
New York, NY 10019 |
|
| An investor should consider the investment objectives, risks, charges, and expenses of the Fund carefully before investing. The prospectus and summary prospectus contain this and other information about the Fund. An investor may obtain a prospectus and summary prospectus by visiting our website at www.prudentialfunds.com or by calling (800) 225-1852. The prospectus and summary prospectus should be read carefully before investing. |
|
| E-DELIVERY |
| To receive your mutual fund documents online, go to www.prudentialfunds.com/edelivery and enroll. Instead of receiving printed documents by mail, you will receive notification via email when new materials are available. You can cancel your enrollment or change your email address at any time by visiting the website address above. |
|
| SHAREHOLDER COMMUNICATIONS WITH TRUSTEES |
| Shareholders can communicate directly with the Board of Trustees by writing to the Chair of the Board, Prudential International Real Estate Fund, Prudential Investments, Attn: Board of Trustees, 100 Mulberry Street, Gateway Center Three, Newark, NJ 07102. Shareholders can communicate directly with an individual Trustee by writing to the same address. Communications are not screened before being delivered to the addressee. |
|
| AVAILABILITY OF PORTFOLIO SCHEDULE |
| The Fund files its complete schedule of portfolio holdings with the Securities and Exchange Commission for the first and third quarters of each fiscal year on Form N-Q. The Fund’s Forms N-Q are available on the Commission’s website at www.sec.gov. The Fund’s Forms N-Q may also be reviewed and copied at the Commission’s Public Reference Room in Washington, D.C. Information on the operation and location of the Public Reference Room may be obtained by calling (202) 551-8090. The Fund’s schedule of portfolio holdings is also available on the Fund’s website as of the end of each month. |
|
| The Fund’s Statement of Additional Information contains additional information about the Fund’s Trustees and is available without charge, upon request, by calling (800) 225-1852. |
Mutual Funds:
| | | | |
ARE NOT INSURED BY THE FDIC OR ANY
FEDERAL GOVERNMENT AGENCY | | MAY LOSE VALUE | | ARE NOT A DEPOSIT OF OR GUARANTEED
BY ANY BANK OR ANY BANK AFFILIATE |

PRUDENTIAL INTERNATIONAL REAL ESTATE FUND
| | | | | | | | |
| SHARE CLASS | | A | | B | | C | | Z |
| NASDAQ | | PUEAX | | PUEBX | | PUECX | | PUEZX |
| CUSIP | | 74441J803 | | 74441J886 | | 74441J878 | | 74441J860 |
MF210E 0270915-00001-00

PRUDENTIAL INVESTMENTS»MUTUAL FUNDS
PRUDENTIAL LARGE-CAP CORE EQUITY FUND
ANNUAL REPORT · OCTOBER 31, 2014
Fund Type
Large-Cap Stock
Objective
Long-term after-tax growth of capital
This report is not authorized for distribution to prospective investors unless preceded or accompanied by a current prospectus.
The views expressed in this report and information about the Fund’s portfolio holdings are for the period covered by this report and are subject to change thereafter.
Mutual funds are distributed by Prudential Investment Management Services LLC, a Prudential Financial company. Quantitative Management Associates, LLC (QMA) is a wholly owned subsidiary of Prudential Investment Management, Inc. (PIM). QMA and PIM are registered investment advisers and Prudential Financial companies. © 2014 Prudential Financial, Inc. and its related entities. Prudential Investments LLC, Prudential, the Prudential logo, Bring Your Challenges, and the Rock symbol are service marks of Prudential Financial, Inc. and its related entities, registered in many jurisdictions worldwide.

December 15, 2014
Dear Shareholder:
We hope you find the annual report for the Prudential Large-Cap Core Equity Fund informative and useful. The report covers performance for the 12-month period that ended October 31, 2014.
Since market conditions change over time, we believe it is important to maintain a diversified portfolio of funds consistent with your tolerance for risk, time horizon, and financial goals.
Your financial advisor can help you create a diversified investment plan that may include funds covering all the basic asset classes and that reflects your personal investor profile and risk tolerance. Keep in mind, however, that diversification and asset allocation strategies do not assure a profit or protect against loss in declining markets.
Prudential Investments® is dedicated to helping you solve your toughest investment challenges—whether it’s capital growth, reliable income, or protection from market volatility and other risks. We offer the expertise of Prudential Financial’s affiliated asset managers* that strive to be leaders in a broad range of funds to help you stay on course to the future you envision. They also manage money for major corporations and pension funds around the world, which means you benefit from the same expertise, innovation, and attention to risk demanded by today’s most sophisticated investors.
Thank you for choosing the Prudential Investments family of funds.
Sincerely,

Stuart S. Parker, President
Prudential Large-Cap Core Equity Fund
*Most of Prudential Investments’ equity funds are advised by Jennison Associates LLC, Quantitative Management Associates LLC (QMA), or Prudential Real Estate Investors. Prudential Investments’ fixed income and money market funds are advised by Prudential Investment Management, Inc. (PIM) through its Prudential Fixed Income unit. Jennison Associates, QMA, and PIM are registered investment advisers and Prudential Financial companies. Prudential Real Estate Investors is a unit of PIM.
| | | | |
| Prudential Large-Cap Core Equity Fund | | | 1 | |
Your Fund’s Performance (Unaudited)
Performance data quoted represent past performance. Past performance does not guarantee future results. The investment return and principal value of an investment will fluctuate, so that an investor’s shares, when redeemed, may be worth more or less than their original cost. Current performance may be lower or higher than the past performance data quoted. An investor may obtain performance data as of the most recent month-end by visiting our website at www.prudentialfunds.com or by calling (800) 225-1852.
| | | | | | | | | | | | |
Cumulative Total Returns (Without Sales Charges) as of 10/31/14 | |
| | | One Year | | | Five Years | | | Ten Years | |
Class A | | | 18.09 | % | | | 112.07 | % | | | 105.70 | % |
Class B | | | 17.16 | | | | 104.25 | | | | 90.93 | |
Class C | | | 17.21 | | | | 104.46 | | | | 91.12 | |
Class Z | | | 18.39 | | | | 114.52 | | | | 110.90 | |
S&P 500 Index | | | 17.24 | | | | 116.27 | | | | 119.89 | |
Lipper Large-Cap Core Funds Average | | | 14.95 | | | | 102.60 | | | | 109.09 | |
| | | | | | | | | | | | |
Average Annual Total Returns (With Sales Charges) as of 9/30/14 | |
| | | One Year | | | Five Years | | | Ten Years | |
Class A | | | 12.90 | % | | | 13.85 | % | | | 6.72 | % |
Class B | | | 13.58 | | | | 14.19 | | | | 6.52 | |
Class C | | | 17.55 | | | | 14.33 | | | | 6.53 | |
Class Z | | | 19.77 | | | | 15.44 | | | | 7.59 | |
S&P 500 Index | | | 19.70 | | | | 15.69 | | | | 8.10 | |
Lipper Large-Cap Core Funds Average | | | 17.41 | | | | 14.20 | | | | 7.51 | |
| | | | | | | | | | | | |
| | | | | | | | | | | | |
Average Annual Total Returns (With Sales Charges) as of 10/31/14 | |
| | | One Year | | | Five Years | | | Ten Years | |
Class A | | | 11.59 | % | | | 14.92 | % | | | 6.87 | % |
Class B | | | 12.16 | | | | 15.24 | | | | 6.68 | |
Class C | | | 16.21 | | | | 15.38 | | | | 6.69 | |
Class Z | | | 18.39 | | | | 16.49 | | | | 7.75 | |
| | | | | | | | | | | | |
Average Annual Total Returns (Without Sales Charges) as of 10/31/14 | |
| | | One Year | | | Five Years | | | Ten Years | |
Class A | | | 18.09 | % | | | 16.22 | % | | | 7.48 | % |
Class B | | | 17.16 | | | | 15.35 | | | | 6.68 | |
Class C | | | 17.21 | | | | 15.38 | | | | 6.69 | |
Class Z | | | 18.39 | | | | 16.49 | | | | 7.75 | |
| | |
| 2 | | Visit our website at www.prudentialfunds.com |
Growth of a $10,000 Investment
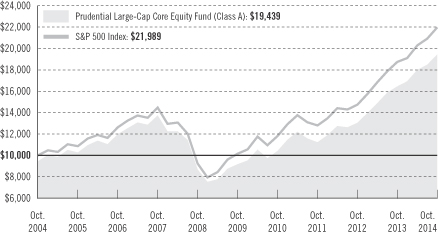
The graph compares a $10,000 investment in the Prudential Large-Cap Core Equity Fund (Class A shares) with a similar investment in the S&P 500 Index by portraying the initial account values at the beginning of the 10-year period for Class A shares (October 31, 2004) and the account values at the end of the current fiscal year (October 31, 2014) as measured on a quarterly basis. For purposes of the graph, and unless otherwise indicated, it has been assumed that (a) the maximum applicable front-end sales charge was deducted from the initial $10,000 investment in Class A shares; (b) all recurring fees (including management fees) were deducted; and (c) all dividends and distributions were reinvested. The line graph provides information for Class A shares only. As indicated in the tables provided earlier, performance for Class B, Class C, and Class Z shares will vary due to the differing charges and expenses applicable to each share class (as indicated in the following paragraphs). Without waiver of fees and/or expense reimbursement, if any, the returns would have been lower.
Past performance does not predict future performance. Total returns and the ending account values in the graph include changes in share price and reinvestment of dividends and capital gains distributions in a hypothetical investment for the periods shown. The Fund’s total returns do not reflect the deduction of income taxes on an individual’s investment. Taxes may reduce your actual investment returns on income or gains paid by the Fund or any gains you may realize if you sell your shares.
Source: Prudential Investments LLC and Lipper Inc.
| | | | |
| Prudential Large-Cap Core Equity Fund | | | 3 | |
Your Fund’s Performance (continued)
The returns in the tables do not reflect the deduction of taxes that a shareholder would pay on Fund distributions or following the redemption of Fund shares. The average annual total returns take into account applicable sales charges, which are described for each share class in the table below.
| | | | | | | | |
| | Class A | | Class B* | | Class C | | Class Z |
Maximum initial sales charge | | 5.50% of
the public
offering
price | | None | | None | | None |
Contingent deferred sales charge (CDSC)
(as a percentage of the lower of original purchase price or net asset value at redemption) | | 1% on sales
of $1 million
or more
made within
12 months of
purchase | | 5% (Yr. 1)
4% (Yr. 2)
3% (Yr. 3)
2% (Yr. 4)
1% (Yr. 5)
1% (Yr. 6)
0% (Yr. 7) | | 1% on sales
made within
12 months
of purchase | | None |
Annual distribution and service (12b-1) fees (shown as a percentage of average daily net assets) | | .30%
(.25%
currently) | | 1% | | 1% | | None |
*Class B shares are closed to all purchase activity and no additional Class B shares may be purchased or acquired except by exchange from Class B shares of another Fund or through dividend or capital gains reinvestment.
Benchmark Definitions
S&P 500 Index
The S&P 500 Index is an unmanaged index of 500 stocks of large US public companies. It gives a broad look at how US stock prices have performed.
Lipper Large-Cap Core Funds Average
The Lipper Large-Cap Core Funds Average (Lipper Average) represents returns based on an average return of all funds in the Lipper Large-Cap Core Funds category for the periods noted. Funds in the Lipper Average invest at least 75% of their equity assets in companies with market capitalizations (on a three-year weighted basis) greater than 300% of the dollar-weighted median market capitalization of the middle 1,000 securities of the S&P SuperComposite 1500 Index. Large-cap core funds have wide latitude in the companies in which they invest. These funds typically have a below-average price-to-earnings ratio, price-to-book ratio, and three-year sales-per-share-growth value compared with the S&P 500 Index.
Investors cannot invest directly in an index or average. The returns for the Index would be lower if they included the effects of sales charges, operating expenses of a mutual fund, or taxes. Returns for the Lipper Average reflect the deduction of operating expenses of a mutual fund, but not sales charges or taxes.
| | |
| 4 | | Visit our website at www.prudentialfunds.com |
| | | | |
Five Largest Holdings expressed as a percentage of net assets as of 10/31/14 | | | | |
Apple, Inc., Technology Hardware, Storage & Peripherals | | | 4.1 | % |
Exxon Mobil Corp., Oil, Gas & Consumable Fuels | | | 2.8 | |
Wells Fargo & Co., Banks | | | 2.1 | |
JPMorgan Chase & Co., Banks | | | 1.9 | |
Pfizer, Inc., Pharmaceuticals | | | 1.7 | |
Holdings reflect only long-term investments and are subject to change.
| | | | |
Five Largest Sectors expressed as a percentage of net assets as of 10/31/14 | | | | |
Information Technology | | | 20.6 | % |
Health Care | | | 15.5 | |
Financials | | | 14.9 | |
Consumer Discretionary | | | 11.6 | |
Industrials | | | 11.5 | |
Industry weightings reflect only long-term investments and are subject to change.
| | | | |
| Prudential Large-Cap Core Equity Fund | | | 5 | |
Strategy and Performance Overview
How did the Fund perform?
The Prudential Large-Cap Core Equity Fund’s Class A shares gained 18.09% for the 12-month reporting period ended October 31, 2014, outperforming the 17.24% gain of the benchmark S&P 500 Index (the Index), and significantly outperforming the 14.95% gain of the Lipper Large-Cap Core Funds Average.
What were conditions like in the US stock market?
| | • | | US equities began the 12-month reporting period by posting solid gains in November and December, capping off a banner year. Market volatility was modest, despite a partial government shutdown during October. In December, amid stronger economic growth, the Federal Reserve (the Fed) announced it would begin trimming the quantitative easing bond-buying program in January 2014. Investors greeted the news with enthusiasm and stocks rallied. |
| | • | | US equities slogged through a harsh winter and economic headwinds to generate a small gain in the first quarter of 2014. Weaker manufacturing growth in China led to a steep sell-off in January. Although stock prices rebounded to a record high the following month, prices again stumbled in March due to geopolitical tensions between Russia and Ukraine, concerns surrounding slowing US economic growth driven by unusually bad winter weather, and suggestions by new Fed chair Janet Yellen that the Fed might begin to increase interest rates shortly after the projected end of the quantitative easing program. |
| | • | | The stock market hit a new high the first week of the second quarter before falling back on continued geopolitical worries, largely about Ukraine, and uncertainty about corporate earnings. Positive sentiment in May led to a series of new market highs which continued into June even as the Fed continued to taper. Later in the month, a militant insurgency in Iraq briefly slowed market momentum and put oil markets on edge. Although first-quarter US economic growth was revised downward to its worst contraction in five years, US equities posted modest gains for the period. |
| | • | | US equity performance was tepid in the third quarter. A positive sentiment prevailed, driven by solid fundamentals and robust economic growth. US stocks shrugged off intensifying geopolitical conflicts in the Middle East and Ukraine to hit yet another record high in August. Volatility picked up in September as investors speculated that the Fed might raise interest rates sooner rather than later following October’s projected ending of the quantitative easing program. |
| | • | | Concerns about a global slowdown, a strengthening US dollar which could potentially hurt exports of multinational companies, and the anticipated |
| | |
| 6 | | Visit our website at www.prudentialfunds.com |
| | upcoming Fed rate increase roiled equity markets, resulting in a sharp, mid-October pullback. However, the Bank of Japan’s plans to boost its quantitative easing program and increase the government pension fund’s allocation into equities, and generally strong third-quarter US earnings reports coupled with upbeat US economic news, helped push the S&P 500 to close October at a record high. |
How did the sectors of the S&P 500 Index perform?
| | • | | All sectors of the Index posted positive absolute returns for the reporting period. The double-digit returns of the healthcare, information technology, financials, and industrials sectors were the largest, while the returns of the telecommunication services and energy sectors were the smallest. |
| | • | | The Fund’s sector weighting was close to that of the Index. While stock selection within all sectors with the exception of telecommunication services and utilities contributed positively, selections within industrials and healthcare were the primary contributors to overall Fund performance. |
How did the US stock market perform with respect to investment styles?
| | • | | The market primarily rewarded measures of earnings stability and quality, rather than size or style, over the reporting period. However, large-cap stocks outperformed small-caps by a wide margin and growth stocks narrowly outperformed value stocks. |
Among slowly growing companies, which stocks or related group of stocks contributed the most and detracted the most from the Fund’s return?
| | • | | QMA places a heavier emphasis on valuation factors, such as price-to-earnings (P/E) and price-to-book (P/B) ratios, when evaluating slower-growing stocks. |
| | • | | Valuation factors performed well over the past year and added to performance. |
| | • | | As an example, both General Dynamics and Hewlett-Packard appeared cheap based on valuation factors, and the stock prices advanced 65% and 50%, respectively, over the past twelve months, based on strong results and improving future growth prospects. |
| | • | | The Fund’s overweight positions in slower growing energy stocks, such as Phillips 66, which was up 29%, also performed better than the Index. |
| | • | | Conversely, QMA underweighted some seemingly expensive healthcare companies that subsequently outperformed. One example, Merck, advanced 33% after the company posted solid results. |
| | | | |
| Prudential Large-Cap Core Equity Fund | | | 7 | |
Strategy and Performance Overview (continued)
Among rapidly growing companies, which stocks or related group of stocks contributed the most and detracted the most from the Fund’s return?
| | • | | Among rapidly growing stocks, QMA emphasizes a growth factor, which measures the direction of analysts’ earnings estimates. This factor and QMA’s quality factors performed well. |
| | • | | The Fund did particularly well among consumer discretionary stocks. Consideration of growth factors led to overweights in Facebook, which advanced 37%, and Best Buy, which advanced 31%, on solid earnings and improving prospects. |
| | • | | The Fund also held an overweight position in Forest Laboratories, which advanced 110% on a takeover offer. |
| | • | | Fund performance also benefited from avoiding stocks like Amazon.com, which declined 16% after earnings disappointed. |
| | • | | However, the Fund held an overweight position in Nu Skin Enterprises, which declined 27% as the company’s sales practices in China came under government scrutiny. |
How did the Fund’s tax management strategy affect its performance?
| | • | | Although difficult to quantify, the Fund’s tax management objective affected performance over the course of the reporting period. Trading in the portfolio is not dictated by tax concerns, but the potential impact that trading can have on taxes is factored into investment decisions. |
| | • | | Over the reporting period, the Fund’s performance was lower than other similar strategies that did not have tax management as an objective. |
| | • | | The tax management strategy tends to result in a somewhat higher exposure to momentum, as the Fund may hold onto winning stocks longer to avoid taxes and sell losing stocks more quickly to realize the loss. Over the past year, momentum strategies underperformed, as past winners underperformed and past losers outperformed. |
Did the Fund hold derivatives and how did they affect performance?
| | • | | The Fund held futures contracts on the S&P 500. |
| | • | | QMA uses these instruments primarily to manage daily cash flows, provide liquidity, and equitize cash, and not as a means of adding to performance. Subsequently, the effect on performance was minimal. |
| | |
| 8 | | Visit our website at www.prudentialfunds.com |
Fees and Expenses (Unaudited)
As a shareholder of the Fund, you incur two types of costs: (1) transaction costs, including sales charges (loads) on purchase payments and redemptions, as applicable, and (2) ongoing costs, including management fees, distribution, and/or service (12b-1) fees, and other Fund expenses, as applicable. This example is intended to help you understand your ongoing costs (in dollars) of investing in the Fund and to compare these costs with the ongoing costs of investing in other mutual funds.
The example is based on an investment of $1,000 invested on May 1, 2014, at the beginning of the period, and held through the six-month period ended October 31, 2014. The example is for illustrative purposes only; you should consult the Prospectus for information on initial and subsequent minimum investment requirements.
Actual Expenses
The first line for each share class in the table on the following page provides information about actual account values and actual expenses. You may use the information on this line, together with the amount you invested, to estimate the expenses that you paid over the period. Simply divide your account value by $1,000 (for example, an $8,600 account value ÷ $1,000 = 8.6), then multiply the result by the number on the first line under the heading “Expenses Paid During the Six-Month Period” to estimate the expenses you paid on your account during this period.
Hypothetical Example for Comparison Purposes
The second line for each share class in the table on the following page provides information about hypothetical account values and hypothetical expenses based on the Fund’s actual expense ratio and an assumed rate of return of 5% per year before expenses, which is not the Fund’s actual return. The hypothetical account values and expenses may not be used to estimate the actual ending account balance or expenses you paid for the period. You may use this information to compare the ongoing costs of investing in the Fund and other funds. To do so, compare this 5% hypothetical example with the 5% hypothetical examples that appear in the shareholder reports of the other funds.
The Fund’s transfer agent may charge additional fees to holders of certain accounts that are not included in the expenses shown in the table on the following page. These fees apply to individual retirement accounts (IRAs) and Section 403(b) accounts. As of the close of the six-month period covered by the table, IRA fees included an annual maintenance fee of $15 per account (subject to a maximum annual maintenance fee of $25 for all accounts held by the same shareholder). Section 403(b) accounts are charged an annual $25 fiduciary maintenance fee. Some of the fees may vary in amount, or may be waived, based on your total account balance or the number of
| | | | |
| Prudential Large-Cap Core Equity Fund | | | 9 | |
Fees and Expenses (continued)
Prudential Investments funds, including the Fund, that you own. You should consider the additional fees that were charged to your Fund account over the six-month period when you estimate the total ongoing expenses paid over the period and the impact of these fees on your ending account value, as these additional expenses are not reflected in the information provided in the expense table. Additional fees have the effect of reducing investment returns.
Please note that the expenses shown in the table are meant to highlight your ongoing costs only and do not reflect any transactional costs such as sales charges (loads). Therefore, the second line for each share class in the table is useful in comparing ongoing costs only and will not help you determine the relative total costs of owning different funds. In addition, if these transactional costs were included, your costs would have been higher.
| | | | | | | | | | | | | | | | | | |
Prudential
Large-Cap Core
Equity Fund | | Beginning Account
Value
May 1, 2014 | | | Ending Account
Value
October 31, 2014 | | | Annualized
Expense Ratio
Based on the
Six-Month Period | | | Expenses Paid
During the
Six-Month Period* | |
| | | | | | | | | | | | | | | | | | |
| Class A | | Actual | | $ | 1,000.00 | | | $ | 1,079.60 | | | | 1.16 | % | | $ | 6.68 | |
| | | Hypothetical | | $ | 1,000.00 | | | $ | 1,019.36 | | | | 1.16 | % | | $ | 5.90 | |
| | | | | | | | | | | | | | | | | | |
| Class B | | Actual | | $ | 1,000.00 | | | $ | 1,075.30 | | | | 1.91 | % | | $ | 9.99 | |
| | | Hypothetical | | $ | 1,000.00 | | | $ | 1,015.58 | | | | 1.91 | % | | $ | 9.70 | |
| | | | | | | | | | | | | | | | | | |
| Class C | | Actual | | $ | 1,000.00 | | | $ | 1,075.90 | | | | 1.91 | % | | $ | 9.99 | |
| | | Hypothetical | | $ | 1,000.00 | | | $ | 1,015.58 | | | | 1.91 | % | | $ | 9.70 | |
| | | | | | | | | | | | | | | | | | |
| Class Z | | Actual | | $ | 1,000.00 | | | $ | 1,081.50 | | | | 0.91 | % | | $ | 4.77 | |
| | | Hypothetical | | $ | 1,000.00 | | | $ | 1,020.62 | | | | 0.91 | % | | $ | 4.63 | |
*Fund expenses (net of fee waivers or subsidies, if any) for each share class are equal to the annualized expense ratio for each share class (provided in the table), multiplied by the average account value over the period, multiplied by the 184 days in the six-month period ended October 31, 2014, and divided by the 365 days in the Fund’s fiscal year ended October 31, 2014 (to reflect the six-month period). Expenses presented in the table include the expenses of any underlying portfolios in which the Fund may invest.
| | |
| 10 | | Visit our website at www.prudentialfunds.com |
The Fund’s annualized expense ratios for the year ended October 31, 2014, are as follows:
| | | | | | | | |
| Class | | Gross Operating Expenses | | | Net Operating Expenses | |
A | | | 1.21 | % | | | 1.16 | % |
B | | | 1.91 | | | | 1.91 | |
C | | | 1.91 | | | | 1.91 | |
Z | | | 0.91 | | | | 0.91 | |
Net operating expenses shown above reflect any fee waivers and/or expense reimbursements. Additional information on Fund expenses and any fee waivers and/or expense reimbursements can be found in the “Financial Highlights” tables in this report and in the Notes to the Financial Statements in this report.
| | | | |
| Prudential Large-Cap Core Equity Fund | | | 11 | |
Portfolio of Investments
as of October 31, 2014
| | | | | | | | |
| Description | | Shares | | | Value (Note 1) | |
LONG-TERM INVESTMENTS 98.3% | | | | | | | | |
| | |
COMMON STOCKS | | | | | | | | |
| | |
CONSUMER DISCRETIONARY 11.6% | | | | | | | | |
| | |
Auto Components 0.7% | | | | | | | | |
Johnson Controls, Inc. | | | 25,200 | | | $ | 1,190,700 | |
| | |
Hotels, Restaurants & Leisure 2.2% | | | | | | | | |
Chipotle Mexican Grill, Inc.* | | | 1,600 | | | | 1,020,800 | |
DineEquity, Inc. | | | 700 | | | | 62,272 | |
Jack in the Box, Inc. | | | 3,600 | | | | 255,744 | |
Marriott Vacations Worldwide Corp. | | | 1,700 | | | | 118,048 | |
McDonald’s Corp. | | | 15,500 | | | | 1,452,815 | |
Sonic Corp.* | | | 4,200 | | | | 105,882 | |
Wyndham Worldwide Corp. | | | 10,300 | | | | 800,001 | |
| | | | | | | | |
| | | | | | | 3,815,562 | |
| | |
Household Durables 0.8% | | | | | | | | |
Whirlpool Corp. | | | 8,200 | | | | 1,410,810 | |
| | |
Leisure Products 0.7% | | | | | | | | |
Polaris Industries, Inc.(a) | | | 8,000 | | | | 1,206,880 | |
| | |
Media 3.2% | | | | | | | | |
Comcast Corp. (Class A Stock) | | | 15,600 | | | | 863,460 | |
DIRECTV* | | | 3,300 | | | | 286,407 | |
Time Warner, Inc. | | | 15,300 | | | | 1,215,891 | |
Twenty-First Century Fox, Inc. (Class A Stock) | | | 51,100 | | | | 1,761,928 | |
Viacom, Inc. (Class B Stock) | | | 15,500 | | | | 1,126,540 | |
Walt Disney Co. (The) | | | 3,460 | | | | 316,175 | |
| | | | | | | | |
| | | | | | | 5,570,401 | |
| | |
Multiline Retail 0.1% | | | | | | | | |
Macy’s, Inc. | | | 2,100 | | | | 121,422 | |
| | |
Specialty Retail 3.0% | | | | | | | | |
Best Buy Co., Inc. | | | 34,200 | | | | 1,167,588 | |
DSW, Inc. (Class A Stock) | | | 15,200 | | | | 450,680 | |
GameStop Corp. (Class A Stock) | | | 12,500 | | | | 534,500 | |
Murphy USA, Inc.* | | | 2,100 | | | | 120,330 | |
Ross Stores, Inc. | | | 15,300 | | | | 1,235,016 | |
TJX Cos., Inc. (The) | | | 24,900 | | | | 1,576,668 | |
| | | | | | | | |
| | | | | | | 5,084,782 | |
See Notes to Financial Statements.
| | | | |
| Prudential Large-Cap Core Equity Fund | | | 13 | |
Portfolio of Investments
as of October 31, 2014 continued
| | | | | | | | |
| Description | | Shares | | | Value (Note 1) | |
CONSUMER DISCRETIONARY (Continued) | | | | | | | | |
| | |
Textiles, Apparel & Luxury Goods 0.9% | | | | | | | | |
Michael Kors Holdings Ltd.* | | | 13,100 | | | $ | 1,029,529 | |
NIKE, Inc. (Class B Stock) | | | 6,000 | | | | 557,820 | |
| | | | | | | | |
| | | | | | | 1,587,349 | |
| | |
CONSUMER STAPLES 9.0% | | | | | | | | |
| | |
Beverages 2.1% | | | | | | | | |
Coca-Cola Co. (The) | | | 33,100 | | | | 1,386,228 | |
PepsiCo, Inc. | | | 22,794 | | | | 2,192,099 | |
| | | | | | | | |
| | | | | | | 3,578,327 | |
| | |
Food & Staples Retailing 3.0% | | | | | | | | |
CVS Health Corp. | | | 25,500 | | | | 2,188,155 | |
Kroger Co. (The) | | | 17,000 | | | | 947,070 | |
Wal-Mart Stores, Inc. | | | 26,470 | | | | 2,018,867 | |
| | | | | | | | |
| | | | | | | 5,154,092 | |
| | |
Food Products 2.5% | | | | | | | | |
Archer-Daniels-Midland Co. | | | 22,738 | | | | 1,068,686 | |
Bunge Ltd. | | | 9,300 | | | | 824,445 | |
Cal-Maine Foods, Inc. | | | 4,600 | | | | 403,834 | |
Hormel Foods Corp. | | | 8,300 | | | | 447,453 | |
Pilgrim’s Pride Corp.*(a) | | | 16,300 | | | | 463,083 | |
Tyson Foods, Inc. (Class A Stock)(a) | | | 28,400 | | | | 1,145,940 | |
| | | | | | | | |
| | | | | | | 4,353,441 | |
| | |
Household Products 0.5% | | | | | | | | |
Colgate-Palmolive Co. | | | 6,300 | | | | 421,344 | |
Procter & Gamble Co. (The) | | | 5,064 | | | | 441,935 | |
| | | | | | | | |
| | | | | | | 863,279 | |
| | |
Tobacco 0.9% | | | | | | | | |
Altria Group, Inc. | | | 11,200 | | | | 541,408 | |
Philip Morris International, Inc. | | | 9,100 | | | | 809,991 | |
Reynolds American, Inc. | | | 2,000 | | | | 125,820 | |
| | | | | | | | |
| | | | | | | 1,477,219 | |
See Notes to Financial Statements.
| | | | | | | | |
| Description | | Shares | | | Value (Note 1) | |
ENERGY 8.9% | | | | | | | | |
| | |
Energy Equipment & Services 0.5% | | | | | | | | |
Noble Corp. PLC | | | 31,600 | | | $ | 661,072 | |
Schlumberger Ltd. | | | 1,600 | | | | 157,856 | |
| | | | | | | | |
| | | | | | | 818,928 | |
| | |
Oil, Gas & Consumable Fuels 8.4% | | | | | | | | |
Anadarko Petroleum Corp. | | | 12,600 | | | | 1,156,428 | |
Apache Corp. | | | 4,900 | | | | 378,280 | |
Chevron Corp. | | | 10,184 | | | | 1,221,571 | |
ConocoPhillips | | | 12,800 | | | | 923,520 | |
EOG Resources, Inc. | | | 3,200 | | | | 304,160 | |
Exxon Mobil Corp. | | | 50,274 | | | | 4,861,998 | |
Marathon Oil Corp. | | | 27,700 | | | | 980,580 | |
Marathon Petroleum Corp. | | | 14,450 | | | | 1,313,505 | |
Occidental Petroleum Corp. | | | 1,400 | | | | 124,502 | |
Phillips 66 | | | 17,250 | | | | 1,354,125 | |
Tesoro Corp. | | | 9,800 | | | | 699,818 | |
Valero Energy Corp. | | | 22,400 | | | | 1,122,016 | |
| | | | | | | | |
| | | | | | | 14,440,503 | |
| | |
FINANCIALS 14.9% | | | | | | | | |
| | |
Banks 5.9% | | | | | | | | |
Bank of America Corp. | | | 50,768 | | | | 871,179 | |
CIT Group, Inc. | | | 8,400 | | | | 411,012 | |
Citigroup, Inc. | | | 11,470 | | | | 613,989 | |
JPMorgan Chase & Co. | | | 54,000 | | | | 3,265,920 | |
KeyCorp | | | 36,200 | | | | 477,840 | |
Regions Financial Corp. | | | 58,300 | | | | 578,919 | |
U.S. Bancorp | | | 8,391 | | | | 357,456 | |
Wells Fargo & Co. | | | 68,164 | | | | 3,618,827 | |
| | | | | | | | |
| | | | | | | 10,195,142 | |
| | |
Capital Markets 2.4% | | | | | | | | |
BlackRock, Inc. | | | 4,800 | | | | 1,637,328 | |
Goldman Sachs Group, Inc. (The) | | | 10,400 | | | | 1,975,896 | |
SEI Investments Co. | | | 2,000 | | | | 77,320 | |
State Street Corp. | | | 4,400 | | | | 332,024 | |
Waddell & Reed Financial, Inc. (Class A Stock) | | | 2,700 | | | | 128,898 | |
| | | | | | | | |
| | | | | | | 4,151,466 | |
See Notes to Financial Statements.
| | | | |
| Prudential Large-Cap Core Equity Fund | | | 15 | |
Portfolio of Investments
as of October 31, 2014 continued
| | | | | | | | |
| Description | | Shares | | | Value (Note 1) | |
FINANCIALS (Continued) | | | | | | | | |
| | |
Consumer Finance 2.1% | | | | | | | | |
Capital One Financial Corp. | | | 14,900 | | | $ | 1,233,273 | |
Discover Financial Services | | | 23,400 | | | | 1,492,452 | |
Nelnet, Inc. (Class A Stock) | | | 12,600 | | | | 599,634 | |
Synchrony Financial* | | | 8,700 | | | | 235,074 | |
| | | | | | | | |
| | | | | | | 3,560,433 | |
| | |
Diversified Financial Services 0.8% | | | | | | | | |
Berkshire Hathaway, Inc. (Class B Stock)* | | | 9,400 | | | | 1,317,504 | |
| | |
Insurance 1.9% | | | | | | | | |
American Financial Group, Inc. | | | 5,600 | | | | 335,048 | |
Genworth Financial, Inc. (Class A Stock)* | | | 32,900 | | | | 460,271 | |
MetLife, Inc. | | | 17,000 | | | | 922,080 | |
Symetra Financial Corp. | | | 2,200 | | | | 52,140 | |
Travelers Cos., Inc. (The) | | | 3,300 | | | | 332,640 | |
Unum Group | | | 26,100 | | | | 873,306 | |
XL Group PLC (Ireland) | | | 8,500 | | | | 287,980 | |
| | | | | | | | |
| | | | | | | 3,263,465 | |
| | |
Real Estate Investment Trusts (REITs) 1.1% | | | | | | | | |
American Capital Agency Corp. | | | 12,400 | | | | 281,976 | |
Annaly Capital Management, Inc. | | | 52,300 | | | | 596,743 | |
Chambers Street Properties | | | 11,800 | | | | 96,878 | |
Franklin Street Properties Corp. | | | 9,400 | | | | 112,706 | |
Hospitality Properties Trust | | | 13,700 | | | | 405,657 | |
Invesco Mortgage Capital, Inc. | | | 17,200 | | | | 284,488 | |
RLJ Lodging Trust | | | 3,400 | | | | 109,548 | |
| | | | | | | | |
| | | | | | | 1,887,996 | |
| | |
Real Estate Management & Development 0.7% | | | | | | | | |
CBRE Group, Inc. (Class A Stock)* | | | 10,600 | | | | 339,200 | |
Jones Lang LaSalle, Inc. | | | 6,100 | | | | 824,781 | |
| | | | | | | | |
| | | | | | | 1,163,981 | |
| | |
HEALTH CARE 15.5% | | | | | | | | |
| | |
Biotechnology 4.5% | | | | | | | | |
Alexion Pharmaceuticals, Inc.* | | | 2,100 | | | | 401,856 | |
Amgen, Inc. | | | 15,600 | | | | 2,530,008 | |
Biogen Idec, Inc.* | | | 5,700 | | | | 1,830,156 | |
Celgene Corp.* | | | 20,100 | | | | 2,152,509 | |
See Notes to Financial Statements.
| | | | | | | | |
| Description | | Shares | | | Value (Note 1) | |
HEALTH CARE (Continued) | | | | | | | | |
| | |
Biotechnology (cont’d.) | | | | | | | | |
Gilead Sciences, Inc.* | | | 7,900 | | | $ | 884,800 | |
| | | | | | | | |
| | | | | | | 7,799,329 | |
| | |
Health Care Equipment & Supplies 1.9% | | | | | | | | |
Abbott Laboratories | | | 31,900 | | | | 1,390,521 | |
C.R. Bard, Inc. | | | 2,200 | | | | 360,734 | |
Covidien PLC | | | 17,200 | | | | 1,589,968 | |
| | | | | | | | |
| | | | | | | 3,341,223 | |
| | |
Health Care Providers & Services 3.5% | | | | | | | | |
Aetna, Inc. | | | 17,300 | | | | 1,427,423 | |
Cigna Corp. | | | 5,500 | | | | 547,635 | |
Express Scripts Holding Co.* | | | 5,300 | | | | 407,146 | |
Laboratory Corp. of America Holdings* | | | 1,200 | | | | 131,148 | |
UnitedHealth Group, Inc. | | | 21,300 | | | | 2,023,713 | |
Universal Health Services, Inc. (Class B Stock) | | | 1,300 | | | | 134,823 | |
WellPoint, Inc. | | | 10,400 | | | | 1,317,576 | |
| | | | | | | | |
| | | | | | | 5,989,464 | |
| | |
Health Care Technology 0.1% | | | | | | | | |
Cerner Corp.* | | | 2,200 | | | | 139,348 | |
| | |
Life Sciences Tools & Services 0.8% | | | | | | | | |
Thermo Fisher Scientific, Inc. | | | 11,500 | | | | 1,352,055 | |
| | |
Pharmaceuticals 4.7% | | | | | | | | |
AbbVie, Inc. | | | 6,300 | | | | 399,798 | |
Allergan, Inc. | | | 2,800 | | | | 532,168 | |
Bristol-Myers Squibb Co. | | | 3,700 | | | | 215,303 | |
Eli Lilly & Co. | | | 4,700 | | | | 311,751 | |
Jazz Pharmaceuticals PLC* | | | 1,200 | | | | 202,608 | |
Johnson & Johnson | | | 24,399 | | | | 2,629,724 | |
Merck & Co., Inc. | | | 13,300 | | | | 770,602 | |
Pfizer, Inc. | | | 99,134 | | | | 2,969,064 | |
| | | | | | | | |
| | | | | | | 8,031,018 | |
| | |
INDUSTRIALS 11.5% | | | | | | | | |
| | |
Aerospace & Defense 3.6% | | | | | | | | |
Alliant Techsystems, Inc. | | | 3,700 | | | | 432,752 | |
General Dynamics Corp. | | | 12,500 | | | | 1,747,000 | |
See Notes to Financial Statements.
| | | | |
| Prudential Large-Cap Core Equity Fund | | | 17 | |
Portfolio of Investments
as of October 31, 2014 continued
| | | | | | | | |
| Description | | Shares | | | Value (Note 1) | |
INDUSTRIALS (Continued) | | | | | | | | |
| | |
Aerospace & Defense (cont’d.) | | | | | | | | |
Huntington Ingalls Industries, Inc. | | | 1,000 | | | $ | 105,820 | |
L-3 Communications Holdings, Inc. | | | 2,500 | | | | 303,650 | |
Northrop Grumman Corp. | | | 10,400 | | | | 1,434,784 | |
Raytheon Co. | | | 13,000 | | | | 1,350,440 | |
Spirit Aerosystems Holdings, Inc. (Class A Stock)* | | | 9,000 | | | | 354,060 | |
United Technologies Corp. | | | 4,000 | | | | 428,000 | |
| | | | | | | | |
| | | | | | | 6,156,506 | |
| | |
Air Freight & Logistics 0.8% | | | | | | | | |
FedEx Corp. | | | 8,200 | | | | 1,372,680 | |
| | |
Airlines 1.1% | | | | | | | | |
Southwest Airlines Co. | | | 21,600 | | | | 744,768 | |
Spirit Airlines, Inc.* | | | 3,400 | | | | 248,574 | |
United Continental Holdings, Inc.* | | | 18,000 | | | | 950,580 | |
| | | | | | | | |
| | | | | | | 1,943,922 | |
| | |
Building Products 0.2% | | | | | | | | |
AO Smith Corp. | | | 2,300 | | | | 122,705 | |
Allegion PLC | | | 2,700 | | | | 143,343 | |
| | | | | | | | |
| | | | | | | 266,048 | |
| | |
Electrical Equipment 0.4% | | | | | | | | |
Emerson Electric Co. | | | 11,900 | | | | 762,314 | |
| | |
Industrial Conglomerates 0.9% | | | | | | | | |
Carlisle Cos., Inc. | | | 1,700 | | | | 151,096 | |
General Electric Co. | | | 43,400 | | | | 1,120,154 | |
Roper Industries, Inc. | | | 1,500 | | | | 237,450 | |
| | | | | | | | |
| | | | | | | 1,508,700 | |
| | |
Machinery 1.7% | | | | | | | | |
Deere & Co.(a) | | | 14,200 | | | | 1,214,668 | |
Illinois Tool Works, Inc. | | | 8,100 | | | | 737,505 | |
Oshkosh Corp. | | | 19,400 | | | | 868,344 | |
| | | | | | | | |
| | | | | | | 2,820,517 | |
| | |
Road & Rail 2.4% | | | | | | | | |
AMERCO | | | 700 | | | | 189,784 | |
CSX Corp. | | | 13,200 | | | | 470,316 | |
See Notes to Financial Statements.
| | | | | | | | |
| Description | | Shares | | | Value (Note 1) | |
INDUSTRIALS (Continued) | | | | | | | | |
| | |
Road & Rail (cont’d.) | | | | | | | | |
Norfolk Southern Corp. | | | 10,900 | | | $ | 1,205,976 | |
Union Pacific Corp. | | | 19,700 | | | | 2,294,065 | |
| | | | | | | | |
| | | | | | | 4,160,141 | |
| | |
Trading Companies & Distributors 0.4% | | | | | | | | |
United Rentals, Inc.* | | | 6,200 | | | | 682,372 | |
| | |
INFORMATION TECHNOLOGY 20.6% | | | | | | | | |
| | |
Communications Equipment 2.2% | | | | | | | | |
Cisco Systems, Inc. | | | 85,650 | | | | 2,095,856 | |
QUALCOMM, Inc. | | | 22,000 | | | | 1,727,220 | |
| | | | | | | | |
| | | | | | | 3,823,076 | |
| | |
Electronic Equipment, Instruments & Components 0.2% | | | | | | | | |
Ingram Micro, Inc. (Class A Stock)* | | | 5,400 | | | | 144,936 | |
Jabil Circuit, Inc. | | | 13,000 | | | | 272,350 | |
| | | | | | | | |
| | | | | | | 417,286 | |
| | |
Internet Software & Services 4.1% | | | | | | | | |
Akamai Technologies, Inc.* | | | 20,700 | | | | 1,248,210 | |
Facebook, Inc. (Class A Stock)* | | | 29,700 | | | | 2,227,203 | |
Google, Inc. (Class A Stock)* | | | 2,670 | | | | 1,516,213 | |
Google, Inc. (Class C Stock)* | | | 3,570 | | | | 1,995,915 | |
| | | | | | | | |
| | | | | | | 6,987,541 | |
| | |
IT Services 2.3% | | | | | | | | |
DST Systems, Inc. | | | 600 | | | | 57,810 | |
International Business Machines Corp. | | | 7,470 | | | | 1,228,068 | |
MasterCard, Inc. (Class A Stock) | | | 9,800 | | | | 820,750 | |
Visa, Inc. (Class A Stock) | | | 7,400 | | | | 1,786,582 | |
| | | | | | | | |
| | | | | | | 3,893,210 | |
| | |
Semiconductors & Semiconductor Equipment 1.9% | | | | | | | | |
Intel Corp. | | | 44,700 | | | | 1,520,247 | |
Marvell Technology Group Ltd. | | | 45,700 | | | | 614,208 | |
Skyworks Solutions, Inc. | | | 2,300 | | | | 133,952 | |
Texas Instruments, Inc. | | | 20,200 | | | | 1,003,132 | |
| | | | | | | | |
| | | | | | | 3,271,539 | |
See Notes to Financial Statements.
| | | | |
| Prudential Large-Cap Core Equity Fund | | | 19 | |
Portfolio of Investments
as of October 31, 2014 continued
| | | | | | | | |
| Description | | Shares | | | Value (Note 1) | |
INFORMATION TECHNOLOGY (Continued) | | | | | | | | |
| | |
Software 3.9% | | | | | | | | |
Intuit, Inc. | | | 12,100 | | | $ | 1,064,921 | |
Manhattan Associates, Inc.* | | | 6,800 | | | | 272,748 | |
Microsoft Corp. | | | 48,300 | | | | 2,267,685 | |
Oracle Corp. | | | 61,800 | | | | 2,413,290 | |
Symantec Corp. | | | 25,300 | | | | 627,946 | |
| | | | | | | | |
| | | | | | | 6,646,590 | |
| | |
Technology Hardware, Storage & Peripherals 6.0% | | | | | | | | |
Apple, Inc. | | | 65,520 | | | | 7,076,160 | |
EMC Corp. | | | 44,900 | | | | 1,289,977 | |
Hewlett-Packard Co. | | | 51,600 | | | | 1,851,408 | |
| | | | | | | | |
| | | | | | | 10,217,545 | |
| | |
MATERIALS 3.0% | | | | | | | | |
| | |
Chemicals 2.1% | | | | | | | | |
Dow Chemical Co. (The) | | | 3,400 | | | | 167,960 | |
Eastman Chemical Co. | | | 6,200 | | | | 500,836 | |
LyondellBasell Industries NV (Class A Stock) | | | 15,000 | | | | 1,374,450 | |
PPG Industries, Inc. | | | 3,200 | | | | 651,808 | |
Westlake Chemical Corp. | | | 13,100 | | | | 924,205 | |
| | | | | | | | |
| | | | | | | 3,619,259 | |
| | |
Metals & Mining 0.9% | | | | | | | | |
Alcoa, Inc. | | | 72,900 | | | | 1,221,804 | |
Century Aluminum Co.* | | | 4,900 | | | | 143,472 | |
Globe Specialty Metals, Inc. | | | 5,400 | | | | 101,574 | |
| | | | | | | | |
| | | | | | | 1,466,850 | |
| | |
TELECOMMUNICATIONS SERVICES 1.0% | | | | | | | | |
| | |
Diversified Telecommunication Services 1.0% | | | | | | | | |
AT&T, Inc. | | | 14,768 | | | | 514,517 | |
Verizon Communications, Inc. | | | 24,000 | | | | 1,206,000 | |
| | | | | | | | |
| | | | | | | 1,720,517 | |
| | |
UTILITIES 2.3% | | | | | | | | |
| | |
Electric Utilities 0.7% | | | | | | | | |
Entergy Corp. | | | 8,500 | | | | 714,170 | |
PPL Corp. | | | 16,600 | | | | 580,834 | |
| | | | | | | | |
| | | | | | | 1,295,004 | |
See Notes to Financial Statements.
| | | | | | | | |
| Description | | Shares | | | Value (Note 1) | |
UTILITIES (Continued) | | | | | | | | |
| | |
Gas Utilities 0.6% | | | | | | | | |
AGL Resources, Inc. | | | 16,900 | | | $ | 911,079 | |
Questar Corp. | | | 5,500 | | | | 132,605 | |
| | | | | | | | |
| | | | | | | 1,043,684 | |
| | |
Independent Power & Renewable Electricity Producers 0.3% | | | | | | | | |
AES Corp. | | | 31,500 | | | | 443,205 | |
| | |
Multi-Utilities 0.7% | | | | | | | | |
Public Service Enterprise Group, Inc. | | | 18,400 | | | | 760,104 | |
SCANA Corp.(a) | | | 5,300 | | | | 290,917 | |
Vectren Corp.(a) | | | 2,000 | | | | 89,900 | |
| | | | | | | | |
| | | | | | | 1,140,921 | |
| | | | | | | | |
TOTAL LONG-TERM INVESTMENTS
(cost $100,344,090) | | | | | | | 168,525,546 | |
| | | | | | | | |
| | |
SHORT-TERM INVESTMENTS 4.5% | | | | | | | | |
| | |
AFFILIATED MONEY MARKET MUTUAL FUND 4.4% | | | | | | | | |
Prudential Investment Portfolios 2 - Prudential Core Taxable Money Market Fund (cost $7,470,217; includes $4,402,789 of cash collateral for securities on loan) (Note 3)(b)(c) | | | 7,470,217 | | | | 7,470,217 | |
| | | | | | | | |
| | |
| | | Principal
Amount (000)# | | | | |
U.S. TREASURY OBLIGATION 0.1% | | | | | | | | |
U.S. Treasury Bill, 0.050%, 03/19/15
(cost $199,966)(d)(e) | | | 200 | | | | 199,966 | |
| | | | | | | | |
TOTAL SHORT-TERM INVESTMENTS
(cost $7,670,183) | | | | | | | 7,670,183 | |
| | | | | | | | |
TOTAL INVESTMENTS 102.8%
(cost $108,014,273; Note 5) | | | | | | | 176,195,729 | |
Liabilities in excess of other assets(f) (2.8)% | | | | | | | (4,767,533 | ) |
| | | | | | | | |
NET ASSETS 100.0% | | | | | | $ | 171,428,196 | |
| | | | | | | | |
| # | Principal amount shown in U.S. dollars unless otherwise stated. |
| * | Non-income producing security. |
| (a) | All or a portion of security is on loan. The aggregate market value of such securities, including those sold and pending settlement, is $4,371,905; cash collateral of $4,402,789 (included in liabilities) was received with which the Fund purchased highly liquid short-term investments. Securities on loan are subject to contractual netting |
See Notes to Financial Statements.
| | | | |
| Prudential Large-Cap Core Equity Fund | | | 21 | |
Portfolio of Investments
as of October 31, 2014 continued
| | arrangements. Cash collateral is less than 102% of the market value of securities loaned due to significant market increases on the last business day of the reporting period. Collateral was subsequently received on the following business day and the Fund remained in compliance. |
| (b) | Represents security, or a portion thereof, purchased with cash collateral received for securities on loan. |
| (c) | Prudential Investments LLC, the manager of the Fund, also serves as manager of the Prudential Investment Portfolios 2 - Prudential Core Taxable Money Market Fund. |
| (d) | Represents security, or a portion thereof, segregated as collateral for futures contracts. |
| (e) | Rate quoted represents yield-to-maturity as of purchase date. |
| (f) | Includes net unrealized appreciation (depreciation) on the following derivative contracts held at reporting period end: |
Futures contracts outstanding at October 31, 2014:
| | | | | | | | | | | | | | | | | | | | |
Number of
Contracts | | | Type | | Expiration
Date | | | Value at
Trade Date | | | Value at
October 31,
2014 | | | Unrealized
Appreciation(1) | |
| | | | Long Position: | | | | | | | | | | | | | | | | |
| | 32 | | | S&P 500 E-Mini | | | Dec. 2014 | | | $ | 3,147,394 | | | $ | 3,218,240 | | | $ | 70,846 | |
| | | | | | | | | | | | | | | | | | | | |
| (1) | A U.S. Treasury obligation with a market value of $199,966 has been segregated with Goldman Sachs & Co. to cover requirements for open contracts at October 31, 2014. |
Various inputs are used in determining the value of the Fund’s investments. These inputs are summarized in the three broad levels listed below.
Level 1—quoted prices generally in active markets for identical securities.
Level 2—quoted prices for similar securities, interest rates and yield curves, prepayment speeds, foreign currency exchange rates and other significant observable inputs.
Level 3—significant unobservable inputs for securities valued in accordance with Board approved fair valuation procedures.
The following is a summary of the inputs used as of October 31, 2014 in valuing such portfolio securities:
| | | | | | | | | | | | |
| | | Level 1 | | | Level 2 | | | Level 3 | |
Investments in Securities | | | | | | | | | | | | |
Common Stocks | | | | | | | | | | | | |
Consumer Discretionary | | $ | 19,987,906 | | | $ | — | | | $ | — | |
Consumer Staples | | | 15,426,358 | | | | — | | | | — | |
See Notes to Financial Statements.
| | | | | | | | | | | | |
| | | Level 1 | | | Level 2 | | | Level 3 | |
Common Stocks (continued): | | | | | | | | | | | | |
Energy | | $ | 15,259,431 | | | $ | — | | | $ | — | |
Financials | | | 25,539,987 | | | | — | | | | — | |
Health Care | | | 26,652,437 | | | | — | | | | — | |
Industrials | | | 19,673,200 | | | | — | | | | — | |
Information Technology | | | 35,256,787 | | | | — | | | | — | |
Materials | | | 5,086,109 | | | | — | | | | — | |
Telecommunications Services | | | 1,720,517 | | | | — | | | | — | |
Utilities | | | 3,922,814 | | | | — | | | | — | |
Affiliated Money Market Mutual Fund | | | 7,470,217 | | | | — | | | | — | |
U.S. Treasury Obligation | | | — | | | | 199,966 | | | | — | |
Other Financial Instruments* | | | | | | | | | | | | |
Futures Contracts | | | 70,846 | | | | — | | | | — | |
| | | | | | | | | | | | |
Total | | $ | 176,066,609 | | | $ | 199,966 | | | $ | — | |
| | | | | | | | | | | | |
| * | Other financial instruments are derivative instruments not reflected in the Portfolio of Investments, such as futures, forwards and exchange-traded swap contracts, which are recorded at the unrealized appreciation/depreciation on the instrument, and over-the-counter swap contracts which are recorded at fair value. |
The industry classification of investments and liabilities in excess of other assets shown as a percentage of net assets as of October 31, 2014 was as follows (Unaudited):
| | | | |
Information Technology | | | 20.6 | % |
Health Care | | | 15.5 | |
Financials | | | 14.9 | |
Consumer Discretionary | | | 11.6 | |
Industrials | | | 11.5 | |
Consumer Staples | | | 9.0 | |
Energy | | | 8.9 | |
Affiliated Money Market Mutual Fund (including 2.6% of collateral for securities on loan) | | | 4.4 | |
Materials | | | 3.0 | % |
Utilities | | | 2.3 | |
Telecommunications Services | | | 1.0 | |
U.S. Treasury Obligation | | | 0.1 | |
| | | | |
| | | 102.8 | |
Liabilities in excess of other assets | | | (2.8 | ) |
| | | | |
| | | 100.0 | % |
| | | | |
The Fund invested in various derivative instruments during the reporting period. The primary types of risk associated with these derivative instruments is equity risk. The effect of such derivative instruments on the Fund’s financial position and financial performance as reflected in the Statement of Assets and Liabilities and Statement of Operations is presented in the summary below.
See Notes to Financial Statements.
| | | | |
| Prudential Large-Cap Core Equity Fund | | | 23 | |
Portfolio of Investments
as of October 31, 2014 continued
Fair values of derivative instruments as of October 31, 2014 as presented in the Statement of Assets and Liabilities:
| | | | | | | | | | | | |
Derivatives not accounted for
as hedging instruments,
carried at fair value | | Asset Derivatives | | | Liability Derivatives | |
| | Balance
Sheet Location | | Fair
Value | | | Balance
Sheet Location | | Fair
Value | |
| Equity contracts | | Due from/to broker—variation margin futures | | $ | 70,846 | * | | — | | $ | — | |
| | | | | | | | | | | | |
| * | Includes cumulative appreciation/depreciation as reported in schedule of open futures contracts. Only unsettled variation margin receivable (payable) is reported within the Statement of Assets and Liabilities. |
The effects of derivative instruments on the Statement of Operations for the year ended October 31, 2014 are as follows:
| | | | |
Amount of Realized Gain or (Loss) on Derivatives Recognized in Income | |
Derivatives not accounted for as hedging
instruments, carried at fair value | | Futures | |
Equity contracts | | $ | 359,820 | |
| | | | |
|
Change in Unrealized Appreciation or (Depreciation) on Derivatives Recognized in Income | |
Derivatives not accounted for as hedging
instruments, carried at fair value | | Futures | |
Equity contracts | | $ | 25,640 | |
| | | | |
For the year ended October 31, 2014, the Fund’s average value at trade date for futures long positions was $2,088,322.
See Notes to Financial Statements.
PRUDENTIAL INVESTMENTS»MUTUAL FUNDS
FINANCIAL STATEMENTS
ANNUAL REPORT · OCTOBER 31, 2014
Prudential Large-Cap Core Equity Fund
Statement of Assets & Liabilities
as of October 31, 2014
| | | | |
Assets | | | | |
Investments at value, including securities on loan of $4,371,905: | | | | |
Unaffiliated investments (cost $100,544,056) | | $ | 168,725,512 | |
Affiliated investments (cost $7,470,217) | | | 7,470,217 | |
Cash | | | 196 | |
Dividends and interest receivable | | | 121,230 | |
Due from broker—variation margin futures | | | 36,480 | |
Receivable for Fund shares sold | | | 8,187 | |
Prepaid expenses | | | 1,644 | |
| | | | |
Total Assets | | | 176,363,466 | |
| | | | |
| |
Liabilities | | | | |
Payable to broker for collateral for securities on loan | | | 4,402,789 | |
Payable for Fund shares reacquired | | | 271,941 | |
Accrued expenses | | | 108,459 | |
Management fee payable | | | 90,430 | |
Distribution fee payable | | | 51,112 | |
Affiliated transfer agent fee payable | | | 10,539 | |
| | | | |
Total Liabilities | | | 4,935,270 | |
| | | | |
| |
Net Assets | | $ | 171,428,196 | |
| | | | |
| | | | | |
Net assets were comprised of: | | | | |
Shares of beneficial interest, at par | | $ | 10,488 | |
Paid-in capital in excess of par | | | 89,984,885 | |
| | | | |
| | | 89,995,373 | |
Undistributed net investment income | | | 771,186 | |
Accumulated net realized gain on investment transactions | | | 12,409,335 | |
Net unrealized appreciation on investments | | | 68,252,302 | |
| | | | |
Net assets, October 31, 2014 | | $ | 171,428,196 | |
| | | | |
See Notes to Financial Statements.
| | | | |
Class A | | | | |
Net asset value and redemption price per share
($88,561,253 ÷ 5,351,798 shares of beneficial interest issued and outstanding) | | $ | 16.55 | |
Maximum sales charge (5.50% of offering price) | | | 0.96 | |
| | | | |
Maximum offering price to public | | $ | 17.51 | |
| | | | |
| |
Class B | | | | |
Net asset value, offering price and redemption price per share
($3,052,029 ÷ 197,756 shares of beneficial interest issued and outstanding) | | $ | 15.43 | |
| | | | |
| |
Class C | | | | |
Net asset value, offering price and redemption price per share
($37,681,419 ÷ 2,439,307 shares of beneficial interest issued and outstanding) | | $ | 15.45 | |
| | | | |
| |
Class Z | | | | |
Net asset value, offering price and redemption price per share
($42,133,495 ÷ 2,499,345 shares of beneficial interest issued and outstanding) | | $ | 16.86 | |
| | | | |
See Notes to Financial Statements.
| | | | |
| Prudential Large-Cap Core Equity Fund | | | 27 | |
Statement of Operations
Year Ended October 31, 2014
| | | | |
Net Investment Income | | | | |
Income | | | | |
Unaffiliated dividend income (net of foreign withholding taxes of $1,524) | | $ | 3,103,015 | |
Affiliated income from securities loaned, net | | | 3,291 | |
Affiliated dividend income | | | 2,791 | |
Interest income | | | 126 | |
| | | | |
Total income | | | 3,109,223 | |
| | | | |
| |
Expenses | | | | |
Management fee | | | 1,060,142 | |
Distribution fee—Class A | | | 258,141 | |
Distribution fee—Class B | | | 31,497 | |
Distribution fee—Class C | | | 358,166 | |
Distribution fee—Class X | | | 84 | |
Transfer agent’s fees and expenses (including affiliated expense of $46,900) | | | 199,000 | |
Custodian’s fees and expenses | | | 70,000 | |
Registration fees | | | 58,000 | |
Shareholders’ reports | | | 25,000 | |
Audit fee | | | 23,000 | |
Legal fees and expenses | | | 20,000 | |
Trustees’ fees | | | 18,000 | |
Insurance | | | 2,000 | |
Miscellaneous | | | 16,503 | |
| | | | |
Total expenses | | | 2,139,533 | |
Less: Distribution fee waiver—Class A | | | (43,023 | ) |
| | | | |
Net expenses | | | 2,096,510 | |
| | | | |
Net investment income | | | 1,012,713 | |
| | | | |
| |
Realized and Unrealized Gain on Investments | | | | |
Net realized gain on: | | | | |
Investment transactions | | | 12,209,226 | |
Futures transactions | | | 359,820 | |
| | | | |
| | | 12,569,046 | |
| | | | |
Net change in unrealized appreciation (depreciation) on: | | | | |
Investments | | | 13,193,499 | |
Futures | | | 25,640 | |
| | | | |
| | | 13,219,139 | |
| | | | |
Net gain on investment transactions | | | 25,788,185 | |
| | | | |
Net Increase In Net Assets Resulting From Operations | | $ | 26,800,898 | |
| | | | |
See Notes to Financial Statements.
Statement of Changes in Net Assets
| | | | | | | | |
| | | Year Ended October 31, | |
| | | 2014 | | | 2013 | |
Increase (Decrease) in Net Assets | | | | | | | | |
Operations | | | | | | | | |
Net investment income | | $ | 1,012,713 | | | $ | 1,284,866 | |
Net realized gain on investment transactions | | | 12,569,046 | | | | 11,245,174 | |
Net change in unrealized appreciation (depreciation) on investments | | | 13,219,139 | | | | 19,819,499 | |
| | | | | | | | |
Net increase in net assets resulting from operations | | | 26,800,898 | | | | 32,349,539 | |
| | | | | | | | |
| | |
Dividends and Distributions (Note 1) | | | | | | | | |
Dividends from net investment income | | | | | | | | |
Class A | | | (667,029 | ) | | | (726,945 | ) |
Class B | | | (6,073 | ) | | | (12,154 | ) |
Class C | | | (58,180 | ) | | | (79,585 | ) |
Class X | | | (940 | ) | | | (4,390 | ) |
Class Z | | | (360,553 | ) | | | (434,622 | ) |
| | | | | | | | |
| | | (1,092,775 | ) | | | (1,257,696 | ) |
| | | | | | | | |
Distributions from net realized gains | | | | | | | | |
Class A | | | (5,970,175 | ) | | | (2,653,620 | ) |
Class B | | | (255,432 | ) | | | (122,170 | ) |
Class C | | | (2,553,398 | ) | | | (806,651 | ) |
Class X | | | (8,284 | ) | | | (15,871 | ) |
Class Z | | | (2,511,745 | ) | | | (1,288,999 | ) |
| | | | | | | | |
| | | (11,299,034 | ) | | | (4,887,311 | ) |
| | | | | | | | |
| | |
Fund share transactions (Net of share conversions) (Note 6) | | | | | | | | |
Net proceeds from shares sold | | | 13,156,943 | | | | 19,935,052 | |
Net asset value of shares issued in reinvestment of dividends and distributions | | | 12,044,590 | | | | 6,008,550 | |
Cost of shares reacquired | | | (20,148,947 | ) | | | (28,841,167 | ) |
| | | | | | | | |
Net increase (decrease) in net assets from Fund share transactions | | | 5,052,586 | | | | (2,897,565 | ) |
| | | | | | | | |
Total increase | | | 19,461,675 | | | | 23,306,967 | |
| | |
Net Assets: | | | | | | | | |
Beginning of year | | | 151,966,521 | | | | 128,659,554 | |
| | | | | | | | |
End of year(a) | | $ | 171,428,196 | | | $ | 151,966,521 | |
| | | | | | | | |
(a) Includes undistributed net investment income of: | | $ | 771,186 | | | $ | 846,557 | |
| | | | | | | | |
See Notes to Financial Statements.
| | | | |
| Prudential Large-Cap Core Equity Fund | | | 29 | |
Notes to Financial Statements
Prudential Investment Portfolios 9 (the “Trust”) is an open-end management investment company, registered under the Investment Company Act of 1940 (“1940 Act”). The Trust currently consists of four funds: Prudential Large-Cap Core Equity Fund (the “Fund”), Prudential International Real Estate Fund, Prudential Absolute Return Bond Fund and Prudential Select Real Estate Fund. These financial statements relate to Prudential Large-Cap Core Equity Fund, a diversified fund. The financial statements of the Prudential International Real Estate Fund, Prudential Absolute Return Bond Fund and Prudential Select Real Estate Fund are not presented herein.
The Fund’s investment objective is long-term after-tax growth of capital.
Note 1. Accounting Policies
The following accounting policies conform to U.S. generally accepted accounting principles. The Fund consistently follows such policies in the preparation of its financial statements.
Securities Valuation: The Fund holds securities and other assets that are fair valued at the close of each day the New York Stock Exchange (“NYSE”) is open for trading. Fair value is the price that would be received to sell an asset or paid to transfer a liability in an orderly transaction between market participants on the measurement date. The Board of Trustees (the “Board”) has adopted Valuation Procedures for security valuation under which fair valuation responsibilities have been delegated to Prudential Investments LLC (“PI” or “Manager”). Under the current Valuation Procedures, the established Valuation Committee is responsible for supervising the valuation of portfolio securities and other assets. The Valuation Procedures permit the Fund to utilize independent pricing vendor services, quotations from market makers, and alternative valuation methods when market quotations are either not readily available or not deemed representative of fair value. A record of the Valuation Committee’s actions is subject to the Board’s review, approval, and ratification at its next regularly-scheduled quarterly meeting.
Various inputs determine how the Fund’s investments are valued, all of which are categorized according to the three broad levels (Level 1, 2, or 3) detailed in the table following the Portfolio of Investments.
Common and preferred stocks, exchange-traded funds, and derivative instruments such as futures or options that are traded on a national securities exchange are valued at the last sale price as of the close of trading on the applicable exchange. Securities traded via NASDAQ are valued at the NASDAQ official closing price. To the extent these securities are valued at the last sale price or NASDAQ official closing price, they are classified as Level 1 in the fair value hierarchy.
In the event that no sale or official closing price on valuation date exists, these securities are generally valued at the mean between the last reported bid and asked prices, or at the last bid price in the absence of an asked price. These securities are classified as Level 2 in the fair value hierarchy, as the inputs are observable and considered to be significant to the valuation.
Common and preferred stocks traded on foreign securities exchanges are valued using pricing vendor services that provide model prices derived using adjustment factors based on information such as local closing price, relevant general and sector indices, currency fluctuations, depositary receipts, and futures, as applicable. Securities valued using such model prices are classified as Level 2 in the fair value hierarchy, as the adjustment factors are observable and considered to be significant to the valuation. Securities not valued using such model prices are valued in accordance with exchange-traded common and preferred stocks discussed above.
Investments in open-end, non-exchange-traded mutual funds are valued at their net asset values as of the close of the NYSE on the date of valuation. These securities are classified as Level 1 in the fair value hierarchy since they may be purchased or sold at their net asset values on the date of valuation.
Fixed income securities traded in the over-the-counter market are generally valued at prices provided by approved independent pricing vendors. The pricing vendors provide these prices after evaluating observable inputs including, but not limited to yield curves, yield spreads, credit ratings, deal terms, tranche level attributes, default rates, cash flows, prepayment speeds, broker/dealer quotations, and reported trades. Securities valued using such vendor prices are classified as Level 2 in the fair value hierarchy.
Over-the-counter derivative instruments are generally valued using pricing vendor services, which derive the valuation based on inputs such as underlying asset prices, indices, spreads, interest rates, and exchange rates. These instruments are categorized as Level 2 in the fair value hierarchy.
| | | | |
| Prudential Large-Cap Core Equity Fund | | | 31 | |
Notes to Financial Statements
continued
Centrally cleared swaps listed or traded on a multilateral or trade facility platform, such as a registered exchange, are valued at the daily settlement price determined by the respective exchange. These securities are classified as Level 2 in the fair value hierarchy, as the prices marked at the official settle are not public.
Securities and other assets that cannot be priced according to the methods described above are valued based on pricing methodologies approved by the Board. In the event that significant unobservable inputs are used when determining such valuations, the securities will be classified as Level 3 in the fair value hierarchy.
When determining the fair value of securities, some of the factors influencing the valuation include: the nature of any restrictions on disposition of the securities; assessment of the general liquidity of the securities; the issuer’s financial condition and the markets in which it does business; the cost of the investment; the size of the holding and the capitalization of the issuer; the prices of any recent transactions or bids/offers for such securities or any comparable securities; any available analyst media or other reports or information deemed reliable by the investment adviser regarding the issuer or the markets or industry in which it operates. Using fair value to price securities may result in a value that is different from a security’s most recent closing price and from the price used by other mutual funds to calculate their net asset values.
Financial Futures Contracts: A financial futures contract is an agreement to purchase (long) or sell (short) an agreed amount of securities at a set price for delivery on a future date. Upon entering into a financial futures contract, the Fund is required to pledge to the broker an amount of cash and/or other assets equal to a certain percentage of the contract amount. This amount is known as the “initial margin”. Subsequent payments, known as “variation margin”, are made or received by the Fund each day, depending on the daily fluctuations in the value of the underlying security. Such variation margin is recorded for financial statement purposes on a daily basis as unrealized gain (loss). When the contract expires or is closed, the gain (loss) is realized and is presented in the Statement of Operations as net realized gain (loss) on financial futures transactions.
The Fund invested in financial futures contracts in order to hedge its existing portfolio securities, or securities the Fund intends to purchase, against fluctuations in value caused by changes in prevailing interest rates or foreign currency exchange rates.
Should interest rates move unexpectedly, the Fund may not achieve the anticipated benefits of the financial futures contracts and may realize a loss. The use of futures transactions involves the risk of imperfect correlation in movements in the price of futures contracts, interest rates and the underlying hedged assets. With exchange-traded futures contracts, there is minimal counterparty credit risk to the Fund since the exchanges’ clearing house acts as counterparty to all exchange-traded futures and guarantees the futures contracts against default.
Master Netting Arrangements: The Fund is subject to various Master Agreements, or netting arrangements, with select counterparties. A master netting arrangement between the Fund and the counterparty permits the Fund to offset amounts payable by the Fund to the same counterparty against amounts to be received; and by the receipt of collateral from the counterparty by the Fund to cover the Fund’s exposure to the counterparty. However, there is no assurance that such mitigating factors are easily enforceable. The right to set-off exists when all the conditions are met such that each of the parties owes the other a determinable amount, the reporting party has the right to set-off the amount owed with the amount owed by the other party, the reporting party intends to set-off, and the right of set-off is enforceable by law. During the reporting period, no instances occurred where the right to set-off existed and management has not elected to offset.
Securities Lending: The Fund may lend their portfolio securities to banks and broker-dealers. The loans are secured by collateral at least equal to the market value of the securities loaned. Collateral pledged by each borrower is invested in a highly liquid short-term money market fund and is marked to market daily, based on the previous day’s market value, such that the value of the collateral exceeds the value of the loaned securities. Loans are subject to termination at the option of the borrower or the Fund. Upon termination of the loan, the borrower will return to the Fund securities identical to the loaned securities. Should the borrower of the securities fail financially, the Fund has the right to repurchase the securities in the open market using the collateral. The Fund recognizes income, net of any rebate and securities lending agent fees, for lending its securities, and any interest on the investment of cash received as collateral. The Fund also continues to receive interest and dividends, or amounts equivalent thereto, on the securities loaned and recognizes any unrealized gain or loss in the market price of the securities loaned that may occur during the term of the loan.
REITs: The Fund invests in real estate investment trusts (“REITs”), which report information on the source of their distributions annually. Based on current and historical information, a portion of distributions received from REITs during the period is estimated to be dividend income, capital gain or return of capital and is recorded
| | | | |
| Prudential Large-Cap Core Equity Fund | | | 33 | |
Notes to Financial Statements
continued
accordingly. These estimates are adjusted when the actual source of distributions is disclosed by the REITs.
Securities Transactions and Net Investment Income: Securities transactions are recorded on the trade date. Realized gains or losses from investment transactions are calculated on an identified cost basis. Dividend income is recorded on the ex-dividend date. Interest income, including amortization of premium and accretion of discount on debt securities, as required, is recorded on an accrual basis. Expenses are recorded on the accrual basis, which may require the use of estimates by management that may differ from actual.
Net investment income or loss (other than distribution fees which are charged directly to the respective class) and unrealized and realized gains or losses are allocated daily to each class of shares based upon the relative proportion of adjusted net assets of each class at the beginning of the day.
Dividends and Distributions: The Fund expects to pay dividends of net investment income and distributions of net realized capital gains, if any, at least annually. Dividends and distributions to shareholders, which are determined in accordance with federal income tax regulations and which may differ from generally accepted accounting principles, are recorded on the ex-dividend date. Permanent book/tax differences relating to income and gains are reclassified amongst undistributed net investment income, accumulated net realized gain or loss and paid-capital in excess of par, as appropriate.
Taxes: For federal income tax purposes, the Fund is treated as a separate taxpaying entity. It is the Fund’s policy to continue to meet the requirements of the Internal Revenue Code applicable to regulated investment companies and to distribute all of its taxable net investment income and capital gains, if any, to shareholders. Therefore, no federal income tax provision is required. Withholding taxes on foreign dividends are recorded net of reclaimable amounts, at the time related income is earned.
Estimates: The preparation of the financial statements requires management to make estimates and assumptions that affect the reported amounts and disclosures in the financial statements. Actual results could differ from those estimates.
Note 2. Agreements
The Trust has a management agreement for the Fund with PI. Pursuant to this agreement, PI has responsibility for all investment advisory services and supervises the subadvisor’s performance of such services. PI has entered into a subadvisory agreement with Quantitative Management Associates LLC (“QMA”). The subadvisory agreement provides that QMA will furnish investment advisory services in connection with the management of the Fund. PI pays for the services of QMA, the cost of compensation of officers of the Fund, occupancy and certain clerical and bookkeeping costs of the Fund. The Fund bears all other costs and expenses.
The management fee paid to PI is computed daily and payable monthly at an annual rate of .65% of the Fund’s average daily net assets up to and including $500 million and .60% of the Fund’s average daily net assets in excess of $500 million. The effective management fee rate was .65% for the year ended October 31, 2014.
Effective July 1, 2011, PI has contractually agreed through February 29, 2016 to waive a portion of the Fund’s management fees so that the Fund’s annual operating expenses (exclusive of distribution and service (12b-1) fees, and certain other expenses such as taxes, interest, and brokerage commissions) do not exceed .95% of the Fund’s average daily net assets.
The Fund has distribution agreements with Prudential Investment Management Services LLC (“PIMS”) and Prudential Annuities Distributors, Inc. (“PAD”). PIMS and PAD are both affiliates of PI. PIMS serves as the distributor of the Fund’s Class A, Class B, Class C, and Class Z shares. PIMS, together with PAD, serves as co-distributor of the Fund’s Class X shares.
The Fund has adopted a separate Distribution and Service plan (each a “Plan” and collectively the “Plans”) for the Class A, Class B, Class C, and Class X shares of the Fund in accordance with Rule 12b-1 of the 1940 Act, as amended. No distribution or service fees are paid to PIMS as distributor for the Fund’s Class Z shares.
Under the Plans, the Fund compensates PIMS and PAD a distribution and service fee at the annual rate of .30%, 1%, 1%, and 1% of the average daily net assets of the Class A, Class B, Class C, and Class X shares, respectively. Through February 29, 2016, PIMS has contractually agreed to limit such fees to .25% of the average daily net assets of the Class A shares.
Management has received the maximum allowable amount of sales charges for Class X in accordance with regulatory limits. As such, any contingent deferred sales
| | | | |
| Prudential Large-Cap Core Equity Fund | | | 35 | |
Notes to Financial Statements
continued
charges received by the manager are contributed back into the Fund and included in the Financial Highlights as a contribution to capital.
PIMS has advised the Fund that it received $49,879 in front-end sales charges resulting from sales of Class A shares during the year ended October 31, 2014.
From these fees, PIMS paid such sales charges to affiliated broker-dealers, which in turn paid commissions to salespersons and incurred other distribution costs.
PIMS has advised the Fund that for the year ended October 31, 2014, it received $6, $5,966 and $523 in contingent deferred sales charges imposed upon certain redemptions by Class A, Class B and Class C shareholders, respectively.
PI, QMA, PAD and PIMS are indirect, wholly-owned subsidiaries of Prudential Financial, Inc. (“Prudential”).
Note 3. Other Transactions with Affiliates
Prudential Mutual Fund Services LLC (“PMFS”), an affiliate of PI and an indirect, wholly-owned subsidiary of Prudential, serves as the Fund’s transfer agent. Transfer agent fees and expenses in the Statement of Operations include certain out-of-pocket expenses paid to non-affiliates, where applicable.
Prudential Investment Management, Inc., (“PIM”), an indirect, wholly-owned subsidiary of Prudential, is the Fund’s securities lending agent. For the year ended October 31, 2014, PIM has been compensated in the amount of approximately $983 for these services.
The Fund invests in the Prudential Core Taxable Money Market Fund (the “Core Fund”), a portfolio of the Prudential Investment Portfolios 2, registered under the 1940 Act and managed by PI. Earnings from the Core Fund are disclosed on the Statement of Operations as affiliated dividend income.
Note 4. Portfolio Securities
Purchases and sales of investment securities, other than short-term investments, for the year ended October 31, 2014, were $147,470,531 and $156,301,415, respectively.
Note 5. Distributions and Tax Information
Distributions to shareholders, which are determined in accordance with federal income tax regulations and which may differ from generally accepted accounting principles, are recorded on the ex-dividend date. In order to present undistributed net investment income, accumulated net realized gain on investment transactions and paid-in capital in excess of par on the Statement of Assets and Liabilities that more closely represent their tax character, certain adjustments have been made to undistributed net investment income and accumulated net realized gain on investment transactions. For the year ended October 31, 2014, the adjustments were to increase undistributed net investment income and decrease accumulated net realized gain on investment transactions by $4,691 due to reclassification of distributions and other book to tax differences. Net investment income, net realized gain on investment transactions and net assets were not affected by this change.
The tax character of dividends paid by the Fund were $2,805,137 of ordinary income and $9,586,672 of long-term capital gains for the year ended October 31, 2014 and $1,199,312 of ordinary income and $4,945,695 of long-term capital gains for the year ended October 31, 2013, respectively.
As of October 31, 2014, the accumulated undistributed earnings on a tax basis were $2,368,329 of ordinary income and $10,945,455 of long-term capital gains.
The United States federal income tax basis of the Fund’s investments and the net unrealized appreciation as of October 31, 2014 were as follows:
| | | | | | |
Tax Basis | | Appreciation | | Depreciation | | Net Unrealized
Appreciation |
| $108,076,691 | | $68,466,606 | | $(347,568) | | $68,119,038 |
The difference between book basis and tax basis is primarily attributable to deferred losses on wash sales and other cost basis differences between financial and tax accounting.
Management has analyzed the Fund’s tax positions taken on federal income tax returns for all open tax years and has concluded that no provision for income tax is required in the Fund’s financial statements for the current reporting period. The Fund’s federal and state income and federal excise tax returns for tax years for which the applicable statutes of limitations have not expired are subject to examination by the Internal Revenue Service and state departments of revenue.
| | | | |
| Prudential Large-Cap Core Equity Fund | | | 37 | |
Notes to Financial Statements
continued
Note 6. Capital
The Fund offers Class A, Class B, Class C, Class X and Class Z shares. Class A shares are sold with a front-end sales charge of up to 5.50%. Purchases of $1 million or more are subject to a contingent deferred sales charge (“CDSC”) if shares are redeemed within 12 months of their purchase. The Class A shares CDSC is waived for purchases by certain retirement and/or benefit plans. Class B shares are sold with a CDSC which declines from 5% to zero depending upon the period of time the shares are held. Class B shares will automatically convert to Class A shares approximately seven years after purchase. Class B shares are closed to new purchases. Class C shares are sold with a CDSC of 1% on shares redeemed within the first 12 months of purchase. Class X shares will automatically convert to Class A shares approximately ten years after purchase. As of April 11, 2014, the last conversion of Class X shares to Class A shares was completed. There are no Class X shares outstanding and Class X shares are no longer being offered for sale. Class Z shares are not subject to any sales or redemption charge and are offered exclusively for a sale to a limited group of investors.
Under certain circumstances, an exchange may be made from specified share classes of the Fund to one or more other share classes of the Fund as presented in the table of transactions in shares of capital stock.
The Fund has authorized an unlimited number of shares of beneficial interest at $.001 par value.
Transactions in shares of common stock were as follows:
| | | | | | | | |
Class A | | Shares | | | Amount | |
Year ended October 31, 2014: | | | | | | | | |
Shares sold | | | 282,534 | | | $ | 4,350,008 | |
Shares issued in reinvestment of dividends and distributions | | | 448,760 | | | | 6,439,722 | |
Shares reacquired | | | (761,230 | ) | | | (11,729,114 | ) |
| | | | | | | | |
Net increase (decrease) in shares outstanding before conversion | | | (29,936 | ) | | | (939,384 | ) |
Shares issued upon conversion from Class B, Class C and Class X | | | 54,766 | | | | 835,407 | |
Shares reacquired upon conversion into Class Z | | | (27,137 | ) | | | (429,316 | ) |
| | | | | | | | |
Net increase (decrease) in shares outstanding | | | (2,307 | ) | | $ | (533,293 | ) |
| | | | | | | | |
Year ended October 31, 2013: | | | | | | | | |
Shares sold | | | 364,797 | | | $ | 4,938,234 | |
Shares issued in reinvestment of dividends and distributions | | | 269,781 | | | | 3,291,313 | |
Shares reacquired | | | (892,566 | ) | | | (12,198,754 | ) |
| | | | | | | | |
Net increase (decrease) in shares outstanding before conversion | | | (257,988 | ) | | | (3,969,207 | ) |
Shares issued upon conversion from Class B, Class X and Class Z | | | 75,436 | | | | 1,018,722 | |
Shares reacquired upon conversion into Class Z | | | (10,617 | ) | | | (148,013 | ) |
| | | | | | | | |
Net increase (decrease) in shares outstanding | | | (193,169 | ) | | $ | (3,098,498 | ) |
| | | | | | | | |
Class B | | | | | | |
Year ended October 31, 2014: | | | | | | | | |
Shares sold | | | 30,031 | | | $ | 433,740 | |
Shares issued in reinvestment of dividends and distributions | | | 18,185 | | | | 244,954 | |
Shares reacquired | | | (33,231 | ) | | | (475,115 | ) |
| | | | | | | | |
Net increase (decrease) in shares outstanding before conversion | | | 14,985 | | | | 203,579 | |
Shares reacquired upon conversion into Class A | | | (46,418 | ) | | | (665,515 | ) |
| | | | | | | | |
Net increase (decrease) in shares outstanding | | | (31,433 | ) | | $ | (461,936 | ) |
| | | | | | | | |
Year ended October 31, 2013: | | | | | | | | |
Shares sold | | | 52,733 | | | $ | 696,257 | |
Shares issued in reinvestment of dividends and distributions | | | 11,253 | | | | 129,638 | |
Shares reacquired | | | (36,694 | ) | | | (473,332 | ) |
| | | | | | | | |
Net increase (decrease) in shares outstanding before conversion | | | 27,292 | | | | 352,563 | |
Shares reacquired upon conversion into Class A | | | (51,453 | ) | | | (656,954 | ) |
| | | | | | | | |
Net increase (decrease) in shares outstanding | | | (24,161 | ) | | $ | (304,391 | ) |
| | | | | | | | |
| | | | |
| Prudential Large-Cap Core Equity Fund | | | 39 | |
Notes to Financial Statements
continued
| | | | | | | | |
Class C | | Shares | | | Amount | |
Year ended October 31, 2014: | | | | | | | | |
Shares sold | | | 263,378 | | | $ | 3,721,487 | |
Shares issued in reinvestment of dividends and distributions | | | 188,645 | | | | 2,542,944 | |
Shares reacquired | | | (239,156 | ) | | | (3,452,692 | ) |
| | | | | | | | |
Net increase (decrease) in shares outstanding before conversion | | | 212,867 | | | | 2,811,739 | |
Shares reacquired upon conversion into Class A and Class Z | | | (19,845 | ) | | | (301,354 | ) |
| | | | | | | | |
Net increase (decrease) in shares outstanding | | | 193,022 | | | $ | 2,510,385 | |
| | | | | | | | |
Year ended October 31, 2013: | | | | | | | | |
Shares sold | | | 682,397 | | | $ | 9,223,964 | |
Shares issued in reinvestment of dividends and distributions | | | 74,688 | | | | 861,139 | |
Shares reacquired | | | (190,238 | ) | | | (2,426,384 | ) |
| | | | | | | | |
Net increase (decrease) in shares outstanding before conversion | | | 566,847 | | | | 7,658,719 | |
Shares reacquired upon conversion into Class Z | | | (2,851 | ) | | | (39,228 | ) |
| | | | | | | | |
Net increase (decrease) in shares outstanding | | | 563,996 | | | $ | 7,619,491 | |
| | | | | | | | |
Class X | | | | | | |
Period ended April 11, 2014*: | | | | | | | | |
Shares issued in reinvestment of dividends and distributions | | | 625 | | | $ | 8,598 | |
Shares reacquired | | | (332 | ) | | | (4,699 | ) |
| | | | | | | | |
Net increase (decrease) in shares outstanding before conversion | | | 293 | | | | 3,899 | |
Shares reacquired upon conversion into Class A | | | (10,821 | ) | | | (155,705 | ) |
| | | | | | | | |
Net increase (decrease) in shares outstanding | | | (10,528 | ) | | $ | (151,806 | ) |
| | | | | | | | |
Year ended October 31, 2013: | | | | | | | | |
Shares sold | | | 246 | | | $ | 3,019 | |
Shares issued in reinvestment of dividends and distributions | | | 1,726 | | | | 20,261 | |
Shares reacquired | | | (2,587 | ) | | | (33,991 | ) |
| | | | | | | | |
Net increase (decrease) in shares outstanding before conversion | | | (615 | ) | | | (10,711 | ) |
Shares reacquired upon conversion into Class A | | | (27,195 | ) | | | (351,590 | ) |
| | | | | | | | |
Net increase (decrease) in shares outstanding | | | (27,810 | ) | | $ | (362,301 | ) |
| | | | | | | | |
| | | | | | | | |
Class Z | | Shares | | | Amount | |
Year ended October 31, 2014: | | | | | | | | |
Shares sold | | | 299,016 | | | $ | 4,651,708 | |
Shares issued in reinvestment of dividends and distributions | | | 192,486 | | | | 2,808,372 | |
Shares reacquired | | | (285,524 | ) | | | (4,487,327 | ) |
| | | | | | | | |
Net increase (decrease) in shares outstanding before conversion | | | 205,978 | | | | 2,972,753 | |
Shares issued upon conversion from Class A and C | | | 43,968 | | | | 716,483 | |
| | | | | | | | |
Net increase (decrease) in shares outstanding | | | 249,946 | | | $ | 3,689,236 | |
| | | | | | | | |
Year ended October 31, 2013: | | | | | | | | |
Shares sold | | | 372,381 | | �� | $ | 5,073,578 | |
Shares issued in reinvestment of dividends and distributions | | | 137,819 | | | | 1,706,199 | |
Shares reacquired | | | (949,135 | ) | | | (13,708,706 | ) |
| | | | | | | | |
Net increase (decrease) in shares outstanding before conversion | | | (438,935 | ) | | | (6,928,929 | ) |
Shares issued upon conversion from Class A and C | | | 13,084 | | | | 187,241 | |
Shares reacquired upon conversion into Class A | | | (768 | ) | | | (10,178 | ) |
| | | | | | | | |
Net increase (decrease) in shares outstanding | | | (426,619 | ) | | $ | (6,751,866 | ) |
| | | | | | | | |
| * | As of April 11, 2014, the last conversion of Class X shares to Class A shares was completed. There are no Class X shares outstanding and Class X shares are no longer being offered for sale. |
Note 7. Borrowings
The Fund, along with other affiliated registered investment companies (the “Funds”), is a party to a Syndicated Credit Agreement (“SCA”) with a group of banks. The purpose of the SCA is to provide an alternative source of temporary funding for capital share redemptions. The SCA provides for a commitment of $900 million for the period October 9, 2014 through October 8, 2015. The Funds pay an annualized commitment fee of .075% of the unused portion of the SCA. Prior to October 9, 2014, the Funds had another SCA that provided a commitment of $900 million and the Funds paid an annualized commitment fee of .08% of the unused portion of the SCA. Interest on any borrowings under the SCA is paid at contracted market rates. The commitment fee for the unused amount is accrued daily and paid quarterly.
The Fund did not utilize the SCA during the year ended October 31, 2014.
| | | | |
| Prudential Large-Cap Core Equity Fund | | | 41 | |
Financial Highlights
| | | | | | | | | | | | | | | | | | | | |
| Class A Shares | |
| | | Year Ended October 31, | |
| | | 2014 | | | 2013 | | | 2012 | | | 2011 | | | 2010 | |
| Per Share Operating Performance(a): | | | | | | | | | | | | | | | | | | | | |
| Net Asset Value, Beginning Of Year | | | $15.23 | | | | $12.70 | | | | $11.84 | | | | $11.01 | | | | $9.71 | |
| Income (loss) from investment operations: | | | | | | | | | | | | | | | | | | | | |
| Net investment income | | | .11 | | | | .14 | | | | .11 | | | | .05 | | | | .05 | |
| Net realized and unrealized gain (loss) on investment transactions | | | 2.46 | | | | 3.01 | | | | 1.65 | | | | .80 | | | | 1.30 | |
| Total from investment operations | | | 2.57 | | | | 3.15 | | | | 1.76 | | | | .85 | | | | 1.35 | |
| Less Dividends and Distributions: | | | | | | | | | | | | | | | | | | | | |
| Dividends from net investment income | | | (.13 | ) | | | (.13 | ) | | | (.11 | ) | | | (.02 | ) | | | (.05 | ) |
| Distributions from net realized gains | | | (1.12 | ) | | | (.49 | ) | | | (.79 | ) | | | - | | | | - | |
| Total dividends and distributions | | | (1.25 | ) | | | (.62 | ) | | | (.90 | ) | | | (.02 | ) | | | (.05 | ) |
| Net asset value, end of year | | | $16.55 | | | | $15.23 | | | | $12.70 | | | | $11.84 | | | | $11.01 | |
| Total Return(b): | | | 18.09% | | | | 26.00% | | | | 16.16% | | | | 7.71% | | | | 13.92% | |
| |
| Ratios/Supplemental Data: | |
| Net assets, end of year (000) | | | $88,561 | | | | $81,558 | | | | $70,475 | | | | $61,961 | | | | $64,473 | |
| Average net assets (000) | | | $86,047 | | | | $76,459 | | | | $65,277 | | | | $65,724 | | | | $64,562 | |
| Ratios to average net assets(c): | | | | | | | | | | | | | | | | | | | | |
| Expenses after waivers and/or expense reimbursement | | | 1.16% | | | | 1.20% | | | | 1.20% | | | | 1.55% | | | | 1.48% | |
| Expenses before waivers and/or expense reimbursement | | | 1.21% | | | | 1.30% | | | | 1.40% | | | | 1.69% | | | | 1.48% | |
| Net investment income | | | .74% | | | | .99% | | | | .95% | | | | .43% | | | | .45% | |
| Portfolio turnover rate | | | 91% | | | | 94% | | | | 89% | | | | 121% | | | | 116% | |
(a) Calculated based on average shares outstanding during the year.
(b) Total return does not consider the effects of sales loads. Total return is calculated assuming a purchase of a share on the first day and a sale on the last day of each year reported, and includes reinvestment of dividends and distributions. Total return may reflect adjustments to conform to generally accepted accounting principles.
(c) Does not include the expenses of the underlying funds in which the Fund invests.
See Notes to Financial Statements.
| | | | | | | | | | | | | | | | | | | | |
| Class B Shares | |
| | | Year Ended October 31, | |
| | | 2014 | | | 2013 | | | 2012 | | | 2011 | | | 2010 | |
| Per Share Operating Performance(a): | | | | | | | | | | | | | | | | | | | | |
| Net Asset Value, Beginning Of Year | | | $14.29 | | | | $11.96 | | | | $11.20 | | | | $10.47 | | | | $9.26 | |
| Income (loss) from investment operations: | | | | | | | | | | | | | | | | | | | | |
| Net investment income (loss) | | | - | (d) | | | .03 | | | | .03 | | | | (.03 | ) | | | (.02 | ) |
| Net realized and unrealized gain (loss) on investment transactions | | | 2.29 | | | | 2.84 | | | | 1.55 | | | | .76 | | | | 1.23 | |
| Total from investment operations | | | 2.29 | | | | 2.87 | | | | 1.58 | | | | .73 | | | | 1.21 | |
| Less Dividends and Distributions: | | | | | | | | | | | | | | | | | | | | |
| Dividends from net investment income | | | (.03 | ) | | | (.05 | ) | | | (.03 | ) | | | - | | | | - | |
| Distributions from net realized gains | | | (1.12 | ) | | | (.49 | ) | | | (.79 | ) | | | - | | | | - | |
| Total dividends and distributions | | | (1.15 | ) | | | (.54 | ) | | | (.82 | ) | | | - | | | | - | |
| Net asset value, end of year | | | $15.43 | | | | $14.29 | | | | $11.96 | | | | $11.20 | | | | $10.47 | |
| Total Return(b): | | | 17.16% | | | | 25.02% | | | | 15.29% | | | | 6.97% | | | | 13.07% | |
| |
| Ratios/Supplemental Data: | |
| Net assets, end of year (000) | | | $3,052 | | | | $3,275 | | | | $3,029 | | | | $4,038 | | | | $5,317 | |
| Average net assets (000) | | | $3,150 | | | | $3,085 | | | | $3,496 | | | | $4,886 | | | | $5,904 | |
| Ratios to average net assets(c): | | | | | | | | | | | | | | | | | | | | |
| Expenses after waivers and/or expense reimbursement | | | 1.91% | | | | 1.95% | | | | 1.95% | | | | 2.27% | | | | 2.18% | |
| Expenses before waivers and/or expense reimbursement | | | 1.91% | | | | 2.00% | | | | 2.11% | | | | 2.38% | | | | 2.18% | |
| Net investment income (loss) | | | -(e) | | | | .25% | | | | .22% | | | | (.28)% | | | | (.22)% | |
| Portfolio turnover rate | | | 91% | | | | 94% | | | | 89% | | | | 121% | | | | 116% | |
(a) Calculated based on average shares outstanding during the year.
(b) Total return does not consider the effects of sales loads. Total return is calculated assuming a purchase of a share on the first day and a sale on the last day of each year reported, and includes reinvestment of dividends and distributions. Total return may reflect adjustments to conform to generally accepted accounting principles.
(c) Does not include the expenses of the underlying funds in which the Fund invests.
(d) Less than $.005 per share.
(e) Less than .005%.
See Notes to Financial Statements.
| | | | |
| Prudential Large-Cap Core Equity Fund | | | 43 | |
Financial Highlights
continued
| | | | | | | | | | | | | | | | | | | | |
| Class C Shares | |
| | | Year Ended October 31, | |
| | | 2014 | | | 2013 | | | 2012 | | | 2011 | | | 2010 | |
| Per Share Operating Performance(a): | | | | | | | | | | | | | | | | | | | | |
| Net Asset Value, Beginning Of Year | | | $14.30 | | | | $11.97 | | | | $11.21 | | | | $10.48 | | | | $9.26 | |
| Income (loss) from investment operations: | | | | | | | | | | | | | | | | | | | | |
| Net investment income (loss) | | | - | (d) | | | .03 | | | | .02 | | | | (.03 | ) | | | (.02 | ) |
| Net realized and unrealized gain (loss) on investment transactions | | | 2.30 | | | | 2.84 | | | | 1.56 | | | | .76 | | | | 1.24 | |
| Total from investment operations | | | 2.30 | | | | 2.87 | | | | 1.58 | | | | .73 | | | | 1.22 | |
| Less Dividends and Distributions: | | | | | | | | | | | | | | | | | | | | |
| Dividends from net investment income | | | (.03 | ) | | | (.05 | ) | | | (.03 | ) | | | - | | | | - | |
| Distributions from net realized gains | | | (1.12 | ) | | | (.49 | ) | | | (.79 | ) | | | - | | | | - | |
| Total dividends and distributions | | | (1.15 | ) | | | (.54 | ) | | | (.82 | ) | | | - | | | | - | |
| Net asset value, end of year | | | $15.45 | | | | $14.30 | | | | $11.97 | | | | $11.21 | | | | $10.48 | |
| Total Return(b): | | | 17.21% | | | | 24.99% | | | | 15.28% | | | | 6.97% | | | | 13.17% | |
| |
| Ratios/Supplemental Data: | |
| Net assets, end of year (000) | | | $37,681 | | | | $32,128 | | | | $20,134 | | | | $20,636 | | | | $22,496 | |
| Average net assets (000) | | | $35,817 | | | | $23,702 | | | | $20,445 | | | | $22,444 | | | | $23,934 | |
| Ratios to average net assets(c): | | | | | | | | | | | | | | | | | | | | |
| Expenses after waivers and/or expense reimbursement | | | 1.91% | | | | 1.95% | | | | 1.95% | | | | 2.27% | | | | 2.18% | |
| Expenses before waivers and/or expense reimbursement | | | 1.91% | | | | 2.00% | | | | 2.10% | | | | 2.39% | | | | 2.18% | |
| Net investment income (loss) | | | (.01)% | | | | .20% | | | | .20% | | | | (.28)% | | | | (.24)% | |
| Portfolio turnover rate | | | 91% | | | | 94% | | | | 89% | | | | 121% | | | | 116% | |
(a) Calculated based on average shares outstanding during the year.
(b) Total return does not consider the effects of sales loads. Total return is calculated assuming a purchase of a share on the first day and a sale on the last day of each year reported, and includes reinvestment of dividends and distributions. Total return may reflect adjustments to conform to generally accepted accounting principles.
(c) Does not include the expenses of the underlying funds in which the Fund invests.
(d) Less than $.005 per share.
See Notes to Financial Statements.
| | | | | | | | | | | | | | | | | | | | | | | | | | |
| Class X Shares | |
| | | Period
Ended
April 11, | | | | | Year Ended October 31, | |
| | | 2014(g) | | | | 2013 | | | 2012 | | | 2011 | | | 2010 | | | 2009 | |
| Per Share Operating Performance(a): | | | | | | | | | | | | | | | | | | | | | | | | | | |
| Net Asset Value, Beginning Of Period | | | $14.66 | | | | | | $12.25 | | | | $11.46 | | | | $10.65 | | | | $9.40 | | | | $8.97 | |
| Income (loss) from investment operations: | | | | | | | | | | | | | | | | | | | | | | | | | | |
| Net investment income | | | .06 | | | | | | .15 | | | | .11 | | | | .05 | | | | .06 | | | | .12 | |
| Net realized and unrealized gain (loss) on investment transactions | | | .69 | | | | | | 2.88 | | | | 1.59 | | | | .78 | | | | 1.24 | | | | .40 | |
| Total from investment operations | | | .75 | | | | | | 3.03 | | | | 1.70 | | | | .83 | | | | 1.30 | | | | .52 | |
| Less Dividends and Distributions: | | | | | | | | | | | | | | | | | | | | | | | | | | |
| Dividends from net investment income | | | (.13 | ) | | | | | (.13 | ) | | | (.12 | ) | | | (.02 | ) | | | (.05 | ) | | | (.10 | ) |
| Distributions from net realized gains | | | (1.12 | ) | | | | | (.49 | ) | | | (.79 | ) | | | - | | | | - | | | | - | |
| Total dividends and distributions | | | (1.25 | ) | | | | | (.62 | ) | | | (.91 | ) | | | (.02 | ) | | | (.05 | ) | | | (.10 | ) |
| Capital Contributions (Note 2) | | | - | | | | | | - | | | | - | (d) | | | - | (d) | | | - | (d) | | | .01 | |
| Net asset value, end of period | | | $14.16 | | | | | | $14.66 | | | | $12.25 | | | | $11.46 | | | | $10.65 | | | | $9.40 | |
| Total Return(b): | | | 5.33% | | | | | | 25.99% | | | | 16.12% | | | | 7.84% | | | | 13.91% | | | | 6.00% | |
| |
| Ratios/Supplemental Data: | | | | | | | | | | | | | | | | | | | | |
| Net assets, end of period (000) | | | $19 | | | | | | $154 | | | | $470 | | | | $837 | | | | $1,394 | | | | $2,096 | |
| Average net assets (000) | | | $75 | | | | | | $284 | | | | $632 | | | | $1,137 | | | | $1,689 | | | | $2,245 | |
| Ratios to average net assets(c): | | | | | | | | | | | | | | | | | | | | | | | | | | |
| Expenses after waivers and/or expenses reimbursement | | | 1.19% | (e) | | | | | 1.20% | | | | 1.20% | | | | 1.53% | | | | 1.43% | | | | 1.50% | |
| Expenses before waivers and/or expenses reimbursement | | | 1.19% | (e) | | | | | 1.25% | | | | 1.37% | | | | 1.63% | | | | 2.18% | | | | 1.50% | |
| Net investment income | | | .95% | (e) | | | | | 1.14% | | | | .97% | | | | .46% | | | | .56% | | | | 1.46% | |
| Portfolio turnover rate | | | 91% | (f)(h) | | | | | 94% | | | | 89% | | | | 121% | | | | 116% | | | | 116% | |
(a) Calculated based on average shares outstanding during the period.
(b) Total return does not consider the effects of sales loads. Total return is calculated assuming a purchase of a share on the first day and a sale on the last day of each period reported, and includes reinvestment of dividends and distributions. Total return may reflect adjustments to conform to generally accepted accounting principles. Total returns for periods less than one full year are not annualized.
(c) Does not include the expenses of the underlying funds in which the Fund invests.
(d) Less than $.005 per share.
(e) Annualized.
(f) Not annualized.
(g) As of April 11, 2014, the last conversion of Class X shares to Class A shares was completed. There are no Class X shares outstanding and Class X shares are no longer being offered for sale.
(h) Calculated as of October 31, 2014.
See Notes to Financial Statements.
| | | | |
| Prudential Large-Cap Core Equity Fund | | | 45 | |
Financial Highlights
continued
| | | | | | | | | | | | | | | | | | | | |
| Class Z Shares | |
| | | Year Ended October 31, | |
| | | 2014 | | | 2013 | | | 2012 | | | 2011 | | | 2010 | |
| Per Share Operating Performance(a): | | | | | | | | | | | | | | | | | | | | |
| Net Asset Value, Beginning Of Year | | | $15.49 | | | | $12.91 | | | | $12.03 | | | | $11.18 | | | | $9.87 | |
| Income (loss) from investment operations: | | | | | | | | | | | | | | | | | | | | |
| Net investment income | | | .16 | | | | .17 | | | | .15 | | | | .07 | | | | .08 | |
| Net realized and unrealized gain (loss) on investment transactions | | | 2.49 | | | | 3.06 | | | | 1.67 | | | | .83 | | | | 1.30 | |
| Total from investment operations | | | 2.65 | | | | 3.23 | | | | 1.82 | | | | .90 | | | | 1.38 | |
| Less Dividends and Distributions: | | | | | | | | | | | | | | | | | | | | |
| Dividends from net investment income | | | (.16 | ) | | | (.16 | ) | | | (.15 | ) | | | (.05 | ) | | | (.07 | ) |
| Distributions from net realized gains | | | (1.12 | ) | | | (.49 | ) | | | (.79 | ) | | | - | | | | - | |
| Total dividends and distributions | | | (1.28 | ) | | | (.65 | ) | | | (.94 | ) | | | (.05 | ) | | | (.07 | ) |
| Net asset value, end of year | | | $16.86 | | | | $15.49 | | | | $12.91 | | | | $12.03 | | | | $11.18 | |
| Total Return(b): | | | 18.39% | | | | 26.28% | | | | 16.41% | | | | 8.04% | | | | 14.09% | |
| |
| Ratios/Supplemental Data: | |
| Net assets, end of year (000) | | | $42,134 | | | | $34,851 | | | | $34,551 | | | | $32,419 | | | | $141,793 | |
| Average net assets (000) | | | $38,052 | | | | $37,799 | | | | $32,953 | | | | $144,295 | | | | $145,193 | |
| Ratios to average net assets(c): | | | | | | | | | | | | | | | | | | | | |
| Expenses after waivers and/or expense reimbursement | | | .91% | | | | .95% | | | | .95% | | | | 1.42% | | | | 1.18% | |
| Expenses before waivers and/or expense reimbursement | | | .91% | | | | 1.00% | | | | 1.10% | | | | 1.44% | | | | 1.18% | |
| Net investment income | | | .99% | | | | 1.25% | | | | 1.21% | | | | .58% | | | | .76% | |
| Portfolio turnover rate | | | 91% | | | | 94% | | | | 89% | | | | 121% | | | | 116% | |
(a) Calculated based on average shares outstanding during the year.
(b) Total return is calculated assuming a purchase of a share on the first day and a sale on the last day of each year reported and includes reinvestment of dividends and distributions. Total returns may reflect adjustments to conform to generally accepted accounting principles.
(c) Does not include the expenses of the underlying funds in which the Fund invests.
See Notes to Financial Statements.
Report of Independent Registered Public
Accounting Firm
The Board of Trustees and Shareholders
Prudential Investment Portfolios 9:
We have audited the accompanying statement of assets and liabilities of Prudential Large Cap Core Equity Fund, a series of Prudential Investment Portfolios 9, (hereafter referred to as the “Fund”), including the portfolio of investments, as of October 31, 2014, and the related statement of operations for the year then ended, the statements of changes in net assets for each of the years in the two-year period then ended and the financial highlights for each of the years in the five-year period then ended. These financial statements and financial highlights are the responsibility of the Fund’s management. Our responsibility is to express an opinion on these financial statements and financial highlights based on our audits.
We conducted our audits in accordance with the standards of the Public Company Accounting Oversight Board (United States). Those standards require that we plan and perform the audit to obtain reasonable assurance about whether the financial statements and financial highlights are free of material misstatement. An audit includes examining, on a test basis, evidence supporting the amounts and disclosures in the financial statements. Our procedures included confirmation of securities owned as of October 31, 2014, by correspondence with the custodian, transfer agent and brokers or by other appropriate auditing procedures when replies from brokers were not received. An audit also includes assessing the accounting principles used and significant estimates made by management, as well as evaluating the overall financial statement presentation. We believe that our audits provide a reasonable basis for our opinion.
In our opinion, the financial statements and financial highlights referred to above present fairly, in all material respects, the financial position of the Fund as of October 31, 2014, and the results of its operations for the year then ended, the changes in its net assets for each of the years in the two-year period then ended and the financial highlights for each of the years in the five-year period then ended, in conformity with U.S. generally accepted accounting principles.

New York, New York
December 16, 2014
| | | | |
| Prudential Large-Cap Core Equity Fund | | | 47 | |
Tax Information
We are advising you that during the fiscal year ended October 31, 2014, the Fund reports the maximum amount allowed per share but not less than $0.95 for Class A, B, C, X and Z shares as a capital gain distribution in accordance with Section 852(b)(3)(C) of the Internal Revenue Code.
For the year ended October 31, 2014, the Fund reports the maximum amount allowable under Section 854 of the Internal Revenue Code, but not less than, the following percentages of the ordinary income dividends paid as 1) qualified dividend income (QDI); and 2) eligible for corporate dividends received deduction (DRD):
| | | | | | | | |
| | | QDI | | | DRD | |
Prudential Large-Cap Core Equity Fund | | | 94.64 | % | | | 92.89 | % |
In January 2015, you will be advised on IRS Form 1099-DIV or substitute 1099-DIV, as to the federal tax status of dividends and distributions received by you in calendar year 2014.
INFORMATION ABOUT BOARD MEMBERS AND OFFICERS
(Unaudited)
Information about Board Members and Officers of the Fund is set forth below. Board Members who are not deemed to be “interested persons” of the Fund, as defined in the 1940 Act, are referred to as “Independent Board Members.” Board Members who are deemed to be “interested persons” of the Fund are referred to as “Interested Board Members.” The Board Members are responsible for the overall supervision of the operations of the Fund and perform the various duties imposed on the directors of investment companies by the 1940 Act. The Board in turn elects the Officers, who are responsible for administering the day-to-day operations of the Fund.
| | | | |
| Independent Board Members(1) |
| | | |
Name, Address, Age Position(s) Portfolios Overseen | | Principal Occupation(s) During Past Five Years | | Other Directorships Held |
Ellen S. Alberding (56) Board Member Portfolios Overseen: 69 | | President and Board Member, The Joyce Foundation (charitable foundation) (since 2002); Vice Chair, City Colleges of Chicago (community college system) (since 2011); Trustee, Skills for America’s Future (national initiative to connect employers to community colleges) (since 2011); Trustee, National Park Foundation (charitable foundation for national park system) (since 2009); Trustee, Economic Club of Chicago (since 2009). | | None. |
Kevin J. Bannon (62) Board Member Portfolios Overseen: 70 | | Managing Director (since April 2008) and Chief Investment Officer (October 2008-November 2013) of Highmount Capital LLC (registered investment adviser); formerly Executive Vice President and Chief Investment Officer (April 1993-August 2007) of Bank of New York Company; President (May 2003-May 2007) of BNY Hamilton Family of Mutual Funds. | | Director of Urstadt Biddle Properties (equity real estate investment trust) (since September 2008). |
Linda W. Bynoe (62) Board Member Portfolios Overseen: 70 | | President and Chief Executive Officer (since March 1995) and formerly Chief Operating Officer (December 1989-February 1995) of Telemat Ltd. (management consulting); formerly Vice President (January 1985-June 1989) at Morgan Stanley & Co (broker-dealer). | | Director of Simon Property Group, Inc. (retail real estate) (May 2003-May 2012); Director of Anixter International, Inc. (communication products distributor) (since January 2006); Director of Northern Trust Corporation (financial services) (since April 2006); Trustee of Equity Residential (residential real estate) (since December 2009). |
Prudential Large-Cap Core Equity Fund
| | | | |
| Independent Board Members(1) |
| | | |
Name, Address, Age Position(s) Portfolios Overseen | | Principal Occupation(s) During Past Five Years | | Other Directorships Held |
Keith F. Hartstein (58) Board Member Portfolios Overseen: 70 | | Retired; Formerly President and Chief Executive Officer (2005-2012), Senior Vice President (2004-2005), Senior Vice President of Sales and Marketing (1997-2004), and various executive management positions (1990-1997), John Hancock Funds, LLC (asset management); Chairman, Investment Company Institute’s Sales Force Marketing Committee (2003-2008). | | None. |
Michael S. Hyland, CFA (69) Board Member Portfolios Overseen: 69 | | Retired (since February 2005); Formerly Senior Managing Director (July 2001-February 2005) of Bear Stearns & Co, Inc.; Global Partner, INVESCO (1999-2001); Managing Director and President of Salomon Brothers Asset Management (1989-1999). | | None. |
Douglas H. McCorkindale (75) Board Member Portfolios Overseen: 69 | | Retired; Formerly Chairman (February 2001-June 2006), Chief Executive Officer (June 2000-July 2005), President (September 1997-July 2005) and Vice Chairman (March 1984-May 2000) of Gannett Co. Inc. (publishing and media). | | Director of Lockheed Martin Corp. (aerospace and defense) (since May 2001). |
Stephen P. Munn (72) Board Member Portfolios Overseen: 70 | | Lead Director (since 2007) and formerly Chairman (1993-2007) of Carlisle Companies Incorporated (manufacturer of industrial products). | | Lead Director (since 2007) of Carlisle Companies Incorporated (manufacturer of industrial products). |
James E. Quinn (62) Board Member Portfolios Overseen: 69 | | Retired; Formerly President (2003-2012) and Director (2003-2008), and Vice Chairman and Director (1998-2003), Tiffany & Company (jewelry retailing); Director, Mutual of America Capital Management Corporation (asset management) (since 1996); Director, Hofstra University (since 2008); Vice Chairman, Museum of the City of New York (since 1994). | | Director of Deckers Outdoor Corporation (footwear manufacturer) (since 2011). |
Richard A. Redeker (71) Board Member & Independent Chair Portfolios Overseen: 70 | | Retired Mutual Fund Senior Executive (44 years); Management Consultant; Director, Mutual Fund Directors Forum (since 2014); Independent Directors Council (organization of 2,800 Independent Mutual Fund Directors)-Executive Committee, Chair of Policy Steering Committee, Governing Council. | | None. |
Visit our website at www.prudentialfunds.com
| | | | |
| Independent Board Members(1) |
| | | |
Name, Address, Age Position(s) Portfolios Overseen | | Principal Occupation(s) During Past Five Years | | Other Directorships Held |
Robin B. Smith (75) Board Member Portfolios Overseen:70 | | Chairman of the Board (since January 2003) of Publishers Clearing House (direct marketing); Member of the Board of Directors of ADLPartner (marketing) (since December 2010); formerly Chairman and Chief Executive Officer (August 1996-January 2003) of Publishers Clearing House. | | Formerly Director of BellSouth Corporation (telecommunications) (1992-2006). |
Stephen G. Stoneburn (71) Board Member Portfolios Overseen: 70 | | Chairman, (since July 2011), President and Chief Executive Officer (since June 1996) of Quadrant Media Corp. (publishing company); formerly President (June 1995-June 1996) of Argus Integrated Media, Inc.; Senior Vice President and Managing Director (January 1993-1995) of Cowles Business Media; Senior Vice President of Fairchild Publications, Inc. (1975-1989). | | None. |
| | | | |
| Interested Board Members(1) |
| | | |
Name, Address, Age Position(s) Portfolios Overseen | | Principal Occupation(s) During Past Five Years | | Other Directorships Held |
Stuart S. Parker (52) Board Member & President Portfolios Overseen: 64 | | President of Prudential Investments LLC (since January 2012); Executive Vice President of Prudential Investment Management Services LLC (since December 2012); Executive Vice President of Jennison Associates LLC and Head of Retail Distribution of Prudential Investments LLC (June 2005-December 2011). | | None. |
Scott E. Benjamin (41) Board Member & Vice President Portfolios Overseen: 70 | | Executive Vice President (since June 2009) of Prudential Investments LLC; Executive Vice President (June 2009-June 2012) and Vice President (since June 2012) of Prudential Investment Management Services LLC; Executive Vice President (since September 2009) of AST Investment Services, Inc.; Senior Vice President of Product Development and Marketing, Prudential Investments (since February 2006); Vice President of Product Development and Product Management, Prudential Investments (2003-2006). | | None. |
Prudential Large-Cap Core Equity Fund
| | | | |
| Interested Board Members(1) |
| | | |
Name, Address, Age Position(s) Portfolios Overseen | | Principal Occupation(s) During Past Five Years | | Other Directorships Held |
Grace C. Torres* (55) Board Member Portfolios Overseen: 65 | | Retired; Formerly Treasurer and Principal Financial and Accounting Officer of the Prudential Investments Funds, Target Funds, Advanced Series Trust, Prudential Variable Contract Accounts and The Prudential Series Fund (1998-June 2014); Assistant Treasurer (March 1999-June 2014) and Senior Vice President (September 1999-June 2014) of Prudential Investments LLC; Assistant Treasurer (May 2003-June 2014) and Vice President (June 2005-June 2014) of AST Investment Services, Inc.; Senior Vice President and Assistant Treasurer (May 2003-June 2014) of Prudential Annuities Advisory Services, Inc. | | None. |
* Note: Prior to her retirement in 2014, Ms. Torres was employed by Prudential Investments LLC. Due to her prior employment, she is considered to be an “interested person” under the 1940 Act. Ms. Torres is a non-management Interested Board Member.
(1) The year that each individual joined the Fund’s Board is as follows:
Ellen S. Alberding, 2013; Linda W. Bynoe, 2005; Douglas H. McCorkindale, 1998; Richard A. Redeker, 1998; Robin B. Smith, 1998; Stephen G. Stoneburn, 2003; Kevin J. Bannon, 2008; Keith F. Hartstein, 2013; Michael S. Hyland, 2008; Stephen P. Munn, 2008; James E. Quinn, 2013; Stuart S. Parker, Board Member since 2012 and President since 2012; Scott E. Benjamin, Board Member since 2010 and Vice President since 2009; Grace C. Torres, 2014.
| | | | |
| Fund Officers(a) |
| | | |
Name, Address and Age Position with Fund | | Principal Occupation(s) During Past Five Years | | Length of Service as Fund Officer |
Raymond A. O’Hara (59) Chief Legal Officer | | Vice President and Corporate Counsel (since July 2010) of Prudential Insurance Company of America (Prudential); Vice President (March 2011-Present) of Pruco Life Insurance Company and Pruco Life Insurance Company of New Jersey; Vice President and Corporate Counsel (March 2011-Present) of Prudential Annuities Life Assurance Corporation; Chief Legal Officer of Prudential Investments LLC (since June 2012); Chief Legal Officer of Prudential Mutual Fund Services LLC (since June 2012) and Corporate Counsel of AST Investment Services, Inc. (since June 2012); formerly Assistant Vice President and Corporate Counsel (September 2008-July 2010) of The Hartford Financial Services Group, Inc.; formerly Associate (September 1980-December 1987) and Partner (January 1988–August 2008) of Blazzard & Hasenauer, P.C. (formerly, Blazzard, Grodd & Hasenauer, P.C.). | | Since 2012 |
Visit our website at www.prudentialfunds.com
| | | | |
| Fund Officers(a) |
| | | |
Name, Address and Age Position with Fund | | Principal Occupation(s) During Past Five Years | | Length of Service as Fund Officer |
Chad A. Earnst (39) Chief Compliance Officer | | Chief Compliance Officer (September 2014-Present) of Prudential Investments LLC; Chief Compliance Officer (September 2014-Present) of the Prudential Investments Funds, Target Funds, Advanced Series Trust, The Prudential Series Fund, Prudential’s Gibraltar Fund, Inc., Prudential Global Short Duration High Yield Income Fund, Inc., Prudential Short Duration High Yield Fund, Inc. and Prudential Jennison MLP Income Fund, Inc.; formerly Assistant Director (March 2010-August 2014) of the Asset Management Unit, Division of Enforcement, US Securities & Exchange Commission; Assistant Regional Director (January 2010-August 2014), Branch Chief (June 2006–December 2009) and Senior Counsel (April 2003-May 2006) of the Miami Regional Office, Division of Enforcement, US Securities & Exchange Commission. | | Since 2014 |
Deborah A. Docs (56) Secretary | | Vice President and Corporate Counsel (since January 2001) of Prudential; Vice President (since December 1996) and Assistant Secretary (since March 1999) of Prudential Investments LLC; formerly Vice President and Assistant Secretary (May 2003-June 2005) of AST Investment Services, Inc. | | Since 2004 |
Jonathan D. Shain (56) Assistant Secretary | | Vice President and Corporate Counsel (since August 1998) of Prudential; Vice President and Assistant Secretary (since May 2001) of Prudential Investments LLC; Vice President and Assistant Secretary (since February 2001) of Prudential Mutual Fund Services LLC; formerly Vice President and Assistant Secretary (May 2003-June 2005) of AST Investment Services, Inc. | | Since 2005 |
Claudia DiGiacomo (40) Assistant Secretary | | Vice President and Corporate Counsel (since January 2005) of Prudential; Vice President and Assistant Secretary of Prudential Investments LLC (since December 2005); Associate at Sidley Austin Brown & Wood LLP (1999-2004). | | Since 2005 |
Andrew R. French (52) Assistant Secretary | | Vice President and Corporate Counsel (since February 2010) of Prudential; formerly Director and Corporate Counsel (2006-2010) of Prudential; Vice President and Assistant Secretary (since January 2007) of Prudential Investments LLC; Vice President and Assistant Secretary (since January 2007) of Prudential Mutual Fund Services LLC. | | Since 2006 |
Amanda S. Ryan (36) Assistant Secretary | | Director and Corporate Counsel (since March 2012) of Prudential; Director and Assistant Secretary (since June 2012) of Prudential Investments LLC; Associate at Ropes & Gray LLP (2008-2012). | | Since 2012 |
Theresa C. Thompson (52) Deputy Chief Compliance Officer | | Vice President, Compliance, Prudential Investments LLC (since April 2004); and Director, Compliance, Prudential Investments LLC (2001-2004). | | Since 2008 |
Prudential Large-Cap Core Equity Fund
| | | | |
| Fund Officers(a) |
| | | |
Name, Address and Age Position with Fund | | Principal Occupation(s) During Past Five Years | | Length of Service as Fund Officer |
Richard W. Kinville (46) Anti-Money Laundering Compliance Officer | | Vice President, Corporate Compliance, Anti-Money Laundering Unit (since January 2005) of Prudential; committee member of the American Council of Life Insurers Anti-Money Laundering and Critical Infrastructure Committee (since January 2007); formerly Investigator and Supervisor in the Special Investigations Unit for the New York Central Mutual Fire Insurance Company (August 1994-January 1999); Investigator in AXA Financial’s Internal Audit Department and Manager in AXA’s Anti-Money Laundering Office (January 1999-January 2005); first chair of the American Council of Life Insurers Anti-Money Laundering and Critical Infrastructure Committee (June 2007-December 2009). | | Since 2011 |
M. Sadiq Peshimam (50) Treasurer and Principal Financial and Accounting Officer | | Assistant Treasurer of funds in the Prudential Mutual Fund Complex (2006-2014); Vice President (since 2005) of Prudential Investments LLC. | | Since 2006 |
Peter Parrella (56) Assistant Treasurer | | Vice President (since 2007) and Director (2004-2007) within Prudential Mutual Fund Administration; formerly Tax Manager at SSB Citi Fund Management LLC (1997-2004). | | Since 2007 |
Lana Lomuti (47) Assistant Treasurer | | Vice President (since 2007) and Director (2005-2007), within Prudential Mutual Fund Administration; formerly Assistant Treasurer (December 2007-February 2014) of The Greater China Fund, Inc. | | Since 2014 |
Linda McMullin (53) Assistant Treasurer | | Vice President (since 2011) and Director (2008-2011) within Prudential Mutual Fund Administration. | | Since 2014 |
| (a) | Excludes Mr. Parker and Mr. Benjamin, interested Board Members who also serve as President and Vice President, respectively. |
Explanatory Notes to Tables:
| n | Board Members are deemed to be “Interested,” as defined in the 1940 Act, by reason of their affiliation with Prudential Investments LLC and/or an affiliate of Prudential Investments LLC. |
| n | Unless otherwise noted, the address of all Board Members and Officers is c/o Prudential Investments LLC, Gateway Center Three, 100 Mulberry Street, Newark, New Jersey 07102-4077. |
| n | There is no set term of office for Board Members or Officers. The Board Members have adopted a retirement policy, which calls for the retirement of Board Members on December 31 of the year in which they reach the age of 75. |
| n | “Other Directorships Held” includes only directorships of companies required to register or file reports with the SEC under the 1934 Act (that is, “public companies”) or other investment companies registered under the 1940 Act. |
| n | “Portfolios Overseen” includes all investment companies managed by Prudential Investments LLC. The investment companies for which Prudential Investments LLC serves as manager include the Prudential Investments Mutual Funds, The Prudential Variable Contract Accounts, Target Mutual Funds, Prudential Short Duration High Yield Fund, Inc., Prudential Global Short Duration High Yield Fund, Inc., The Prudential Series Fund, Prudential’s Gibraltar Fund, Inc. and the Advanced Series Trust. |
Visit our website at www.prudentialfunds.com
Approval of Advisory Agreements
The Fund’s Board of Trustees
The Board of Trustees (the “Board”) of Prudential Large-Cap Core Equity Fund (the “Fund”)1 consists of thirteen individuals, eleven of whom are not “interested persons” of the Fund, as defined in the Investment Company Act of 1940, as amended (the “1940 Act”) (the “Independent Trustees”). The Board is responsible for the oversight of the Fund and its operations, and performs the various duties imposed on the directors of investment companies by the 1940 Act. The Independent Trustees have retained independent legal counsel to assist them in connection with their duties. The Chair of the Board is an Independent Trustee. The Board has established three standing committees: the Audit Committee, the Nominating and Governance Committee, and the Investment Committee. Each committee is chaired by, and composed of, Independent Trustees.
Annual Approval of the Fund’s Advisory Agreements
As required under the 1940 Act, the Board determines annually whether to renew the Fund’s management agreement with Prudential Investments LLC (“PI”) and the Fund’s subadvisory agreement with Quantitative Management Associates LLC (“QMA”). In considering the renewal of the agreements, the Board, including all of the Independent Trustees, met on June 9-11, 2014 and approved the renewal of the agreements through July 31, 2015, after concluding that the renewal of the agreements was in the best interests of the Fund and its shareholders.2
In advance of the meetings, the Board received materials relating to the agreements, and had the opportunity to ask questions and request further information in connection with its consideration. Among other things, the Board considered comparative fee information from PI and QMA. Also, the Board considered comparisons with other mutual funds in relevant Peer Universes and Peer Groups, as is further discussed below.
In approving the agreements, the Board, including the Independent Trustees advised by independent legal counsel, considered the factors it deemed relevant, including the nature, quality and extent of services provided by PI and the subadviser, the performance of the Fund, the profitability of PI and its affiliates, expenses and fees, and the potential for economies of scale that may be shared with the Fund and its shareholders as the Fund’s assets grow. In their deliberations, the Trustees did not identify any single factor which alone was responsible for the Board’s decision to approve the agreements with respect to the Fund. In connection with its deliberations,
| 1 | Prudential Large-Cap Core Equity Fund is a series of Prudential Investment Portfolios 9. |
| 2 | Grace C. Torres was elected to the Board as of December 2014, and therefore did not participate in the consideration of these approvals. |
Prudential Large-Cap Core Equity Fund
Approval of Advisory Agreements (continued)
the Board considered information provided by PI throughout the year at regular Board meetings, presentations from portfolio managers and other information, as well as information furnished at or in advance of the meetings on June 9-11, 2014.
The Trustees determined that the overall arrangements between the Fund and PI, which serves as the Fund’s investment manager pursuant to a management agreement, and between PI and QMA, which serves as the Fund’s subadviser pursuant to the terms of a subadvisory agreement with PI, are in the best interests of the Fund and its shareholders in light of the services performed, fees charged and such other matters as the Trustees considered relevant in the exercise of their business judgment.
The material factors and conclusions that formed the basis for the Trustees’ reaching their determinations to approve the continuance of the agreements are separately discussed below.
Nature, Quality and Extent of Services
The Board received and considered information regarding the nature, quality and extent of services provided to the Fund by PI and QMA. The Board considered the services provided by PI, including but not limited to the oversight of the subadviser for the Fund, as well as the provision of fund recordkeeping, compliance, and other services to the Fund. With respect to PI’s oversight of the subadviser, the Board noted that PI’s Strategic Investment Research Group (“SIRG”), which is a business unit of PI, is responsible for monitoring and reporting to PI’s senior management on the performance and operations of the subadviser. The Board also considered that PI pays the salaries of all of the officers and non-independent Trustees of the Fund. The Board also considered the investment subadvisory services provided by QMA, as well as adherence to the Fund’s investment restrictions and compliance with applicable Fund policies and procedures. The Board considered PI’s evaluation of the subadviser, as well as PI’s recommendation, based on its review of the subadviser, to renew the subadvisory agreement.
The Board considered the qualifications, backgrounds and responsibilities of PI’s senior management responsible for the oversight of the Fund and QMA, and also considered the qualifications, backgrounds and responsibilities of QMA’s portfolio managers who are responsible for the day-to-day management of the Fund’s portfolio. The Board was provided with information pertaining to PI’s and QMA’s organizational structure, senior management, investment operations, and other relevant information pertaining to both PI and QMA. The Board also noted that it received favorable compliance reports from the Fund’s Chief Compliance Officer (“CCO”) as to both PI and QMA. The Board noted that QMA is affiliated with PI.
Visit our website at www.prudentialfunds.com
The Board concluded that it was satisfied with the nature, extent and quality of the investment management services provided by PI and the subadvisory services provided to the Fund by QMA, and that there was a reasonable basis on which to conclude that the Fund benefits from the services provided by PI and QMA under the management and subadvisory agreements.
Costs of Services and Profits Realized by PI
The Board was provided with information on the profitability of PI and its affiliates in serving as the Fund’s investment manager. The Board discussed with PI the methodology utilized in assembling the information regarding profitability and considered its reasonableness. The Board recognized that it is difficult to make comparisons of profitability from fund management contracts because comparative information is not generally publicly available and is affected by numerous factors, including the structure of the particular adviser, the types of funds it manages, its business mix, numerous assumptions regarding allocations and the adviser’s capital structure and cost of capital. The Board separately considered information regarding the profitability of the subadviser, an affiliate of PI. Taking these factors into account, the Board concluded that the profitability of PI and its affiliates in relation to the services rendered was not unreasonable.
Economies of Scale
In 2013, PI and the Board retained an outside business consulting firm, in order to assist the Board in its consideration of the renewal of the management and subadvisory agreements, by reviewing management fee breakpoint usage and trends in management fees across the mutual fund industry. The consulting firm’s analysis and conclusions with respect to the Funds’ management fee structures were presented to the Board and PI at the December 3-5, 2013 meeting, and were discussed extensively by the Board and PI over the following two quarters.
The Board received and discussed information concerning whether PI realizes economies of scale as the Fund’s assets grow beyond current levels. The Board noted that the management fee schedule for the Fund includes breakpoints, which have the effect of decreasing the fee rate as assets increase, but at the current level of assets, the Fund does not realize the effect of those rate reductions. The Board took note that the Fund’s fee structure would result in benefits to Fund shareholders when (and if) assets reach the levels at which the fee rate is reduced. These benefits will accrue whether or not PI is then realizing any economies of scale. The Board recognized the inherent limitations of any analysis of economies of scale, stemming largely from the Board’s understanding that most of PI’s costs are not specific to individual funds, but rather are incurred across a variety of products and services.
Prudential Large-Cap Core Equity Fund
Approval of Advisory Agreements (continued)
Other Benefits to PI and QMA
The Board considered potential ancillary benefits that might be received by PI and QMA and their affiliates as a result of their relationship with the Fund. The Board concluded that potential benefits to be derived by PI included fees received by affiliates of PI for serving as the Fund’s securities lending agent, transfer agency fees received by the Fund’s transfer agent (which is affiliated with PI), and benefits to its reputation as well as other intangible benefits resulting from PI’s association with the Fund. The Board concluded that the potential benefits to be derived by QMA included its ability to use soft dollar credits, as well as the potential benefits consistent with those generally resulting from an increase in assets under management, specifically, potential access to additional research resources and benefits to its reputation. The Board concluded that the benefits derived by PI and QMA were consistent with the types of benefits generally derived by investment managers and subadvisers to mutual funds.
Performance of the Fund / Fees and Expenses
The Board considered certain additional specific factors and made related conclusions relating to the historical performance of the Fund for the one-, three-, five- and ten-year periods ended December 31, 2013.
The Board also considered the Fund’s actual management fee, as well as the Fund’s net total expense ratio, for the fiscal year ended October 31, 2013. The Board considered the management fee for the Fund as compared to the management fee charged by PI to other funds and the fee charged by other advisers to comparable mutual funds in a Peer Group. The actual management fee represents the fee rate actually paid by Fund shareholders and includes any fee waivers or reimbursements. The net total expense ratio for the Fund represents the actual expense ratio incurred by Fund shareholders.
The mutual funds included in the Peer Universe (the Lipper Large-Cap Core Funds Performance Universe) and the Peer Group were objectively determined by Lipper Inc. (“Lipper”), an independent provider of mutual fund data. The comparisons placed the Fund in various quartiles, with the first quartile being the best 25% of the mutual funds (for performance, the best performing mutual funds and, for expenses, the lowest cost mutual funds).
The section below summarizes key factors considered by the Board and the Board’s conclusions regarding the Fund’s performance, fees and overall expenses. The table sets forth gross performance comparisons (which do not reflect the impact on performance of fund expenses, or any subsidies, expense caps or waivers that may be
Visit our website at www.prudentialfunds.com
applicable) with the Peer Universe, actual management fees with the Peer Group (which reflect the impact of any subsidies or fee waivers), and net total expenses with the Peer Group, each of which were key factors considered by the Board.
| | | | | | | | |
| Performance | | 1 Year | | 3 Years | | 5 Years | | 10 Years |
| | | 2nd Quartile | | 1st Quartile | | 2nd Quartile | | 2nd Quartile |
| Actual Management Fees: 1st Quartile |
| Net Total Expenses: 2nd Quartile |
| | • | | The Board noted that the Fund outperformed its benchmark index over all periods. |
| | • | | The Board and PI agreed to retain the existing expense cap of 0.95% (exclusive of 12b-1 and certain other fees) through February 28, 2015. |
| | • | | The Board concluded that, in light of the Fund’s strong performance, it would be in the best interests of the Fund and its shareholders to renew the agreements. |
| | • | | The Board concluded that the management fees (including subadvisory fees) and total expenses were reasonable in light of the services provided. |
* * *
After full consideration of these factors, the Board concluded that the approval of the agreements was in the best interests of the Fund and its shareholders.
Prudential Large-Cap Core Equity Fund
| | | | |
| n MAIL | | n TELEPHONE | | n WEBSITE |
Gateway Center Three 100 Mulberry Street Newark, NJ 07102 | | (800) 225-1852 | | www.prudentialfunds.com |
|
| PROXY VOTING |
| The Board of Trustees of the Fund has delegated to the Fund’s investment subadviser the responsibility for voting any proxies and maintaining proxy recordkeeping with respect to the Fund. A description of these proxy voting policies and procedures is available without charge, upon request, by calling (800) 225-1852 or by visiting the Securities and Exchange Commission’s website at www.sec.gov. Information regarding how the Fund voted proxies relating to portfolio securities during the most recent 12-month period ended June 30 is available on the Fund’s website and on the Securities and Exchange Commission’s website. |
|
| TRUSTEES |
| Ellen S. Alberding • Kevin J. Bannon • Scott E. Benjamin • Linda W. Bynoe • Keith F. Hartstein • Michael S. Hyland • Douglas H. McCorkindale • Stephen P. Munn • Stuart S. Parker • James E. Quinn • Richard A. Redeker • Robin B. Smith • Stephen G. Stoneburn • Grace C. Torres |
|
| OFFICERS |
Stuart S. Parker, President • Scott E. Benjamin, Vice President • M. Sadiq Peshimam, Treasurer and Principal Financial and Accounting Officer • Raymond A. O’Hara, Chief Legal Officer • Deborah A. Docs, Secretary • Chad A. Earnst, Chief Compliance Officer • Theresa C. Thompson, Deputy Chief Compliance Officer • Richard W. Kinville, Anti-Money Laundering Compliance Officer • Jonathan D. Shain, Assistant Secretary • Claudia DiGiacomo, Assistant Secretary •
Amanda S. Ryan, Assistant Secretary • Andrew R. French, Assistant Secretary • Peter Parrella, Assistant Treasurer • Lana Lomuti, Assistant Treasurer • Linda McMullin, Assistant Treasurer |
| | | | |
| MANAGER | | Prudential Investments LLC | | Gateway Center Three
100 Mulberry Street
Newark, NJ 07102 |
|
| INVESTMENT SUBADVISER | | Quantitative Management
Associates LLC | | Gateway Center Two
100 Mulberry Street
Newark, NJ 07102 |
|
| DISTRIBUTOR | | Prudential Investment
Management Services LLC | | Gateway Center Three
100 Mulberry Street
Newark, NJ 07102 |
|
| CUSTODIAN | | The Bank of New York Mellon | | One Wall Street
New York, NY 10286 |
|
| TRANSFER AGENT | | Prudential Mutual Fund
Services LLC | | PO Box 9658
Providence, RI 02940 |
|
INDEPENDENT REGISTERED
PUBLIC ACCOUNTING FIRM | | KPMG LLP | | 345 Park Avenue
New York, NY 10154 |
|
| FUND COUNSEL | | Willkie Farr & Gallagher LLP | | 787 Seventh Avenue
New York, NY 10019 |
|
| An investor should consider the investment objectives, risks, charges, and expenses of the Fund carefully before investing. The prospectus and summary prospectus contain this and other information about the Fund. An investor may obtain a prospectus and summary prospectus by visiting our website at www.prudentialfunds.com or by calling (800) 225-1852. The prospectus and summary prospectus should be read carefully before investing. |
|
| E-DELIVERY |
| To receive your mutual fund documents online, go to www.prudentialfunds.com/edelivery and enroll. Instead of receiving printed documents by mail, you will receive notification via email when new materials are available. You can cancel your enrollment or change your email address at any time by visiting the website address above. |
|
| SHAREHOLDER COMMUNICATIONS WITH TRUSTEES |
| Shareholders can communicate directly with the Board of Trustees by writing to the Chair of the Board, Prudential Large-Cap Core Equity Fund, Prudential Investments, Attn: Board of Trustees, 100 Mulberry Street, Gateway Center Three, Newark, NJ 07102. Shareholders can communicate directly with an individual Trustee by writing to the same address. Communications are not screened before being delivered to the addressee. |
|
| AVAILABILITY OF PORTFOLIO SCHEDULE |
| The Fund files its complete schedule of portfolio holdings with the Securities and Exchange Commission for the first and third quarters of each fiscal year on Form N-Q. The Fund’s Forms N-Q are available on the Commission’s website at www.sec.gov. The Fund’s Forms N-Q may also be reviewed and copied at the Commission’s Public Reference Room in Washington, D.C. Information on the operation and location of the Public Reference Room may be obtained by calling (202) 551-8090. The Fund’s schedule of portfolio holdings is also available on the Fund’s website as of the end of each month. |
|
| The Fund’s Statement of Additional Information contains additional information about the Fund’s Trustees and is available without charge, upon request, by calling (800) 225-1852. |
Mutual Funds:
| | | | |
ARE NOT INSURED BY THE FDIC OR ANY
FEDERAL GOVERNMENT AGENCY | | MAY LOSE VALUE | | ARE NOT A DEPOSIT OF OR GUARANTEED
BY ANY BANK OR ANY BANK AFFILIATE |

PRUDENTIAL LARGE-CAP CORE EQUITY FUND
| | | | | | | | |
| SHARE CLASS | | A | | B | | C | | Z |
| NASDAQ | | PTMAX | | PTMBX | | PTMCX | | PTEZX |
| CUSIP | | 74441J100 | | 74441J209 | | 74441J308 | | 74441J407 |
MF187E 0270909-00001-00

PRUDENTIAL INVESTMENTS»MUTUAL FUNDS
PRUDENTIAL ABSOLUTE RETURN BOND FUND
ANNUAL REPORT · OCTOBER 31, 2014
Fund Type
Absolute Return Bond
Objective
To seek positive returns over the long term, regardless of market conditions
This report is not authorized for distribution to prospective investors unless preceded or accompanied by a current prospectus.
The views expressed in this report and information about the Fund’s portfolio holdings are for the period covered by this report and are subject to change thereafter.
Mutual funds are distributed by Prudential Investment Management Services LLC (PIMS). Prudential Fixed Income is a unit of Prudential Investment Management, Inc. (PIM), a registered investment adviser. PIMS and PIM are Prudential Financial companies. © 2014 Prudential Financial, Inc. and its related entities. Prudential Investments LLC, Prudential, the Prudential logo, Bring Your Challenges, and the Rock symbol are service marks of Prudential Financial, Inc. and its related entities, registered in many jurisdictions worldwide.

December 15, 2014
Dear Shareholder:
We hope you find the annual report for the Prudential Absolute Return Bond Fund informative and useful. The report covers performance for the 12-month period that ended October 31, 2014.
Since market conditions change over time, we believe it is important to maintain a diversified portfolio of funds consistent with your tolerance for risk, time horizon, and financial goals.
Your financial advisor can help you create a diversified investment plan that may include funds covering all the basic asset classes and that reflects your personal investor profile and risk tolerance. Keep in mind, however, that diversification and asset allocation strategies do not assure a profit or protect against loss in declining markets.
Prudential Investments® is dedicated to helping you solve your toughest investment challenges—whether it’s capital growth, reliable income, or protection from market volatility and other risks. We offer the expertise of Prudential Financial’s affiliated asset managers* that strive to be leaders in a broad range of funds to help you stay on course to the future you envision. They also manage money for major corporations and pension funds around the world, which means you benefit from the same expertise, innovation, and attention to risk demanded by today’s most sophisticated investors.
Thank you for choosing the Prudential Investments family of funds.
Sincerely,

Stuart S. Parker, President
Prudential Absolute Return Bond Fund
*Most of Prudential Investments’ equity funds are advised by Jennison Associates LLC, Quantitative Management Associates LLC (QMA), or Prudential Real Estate Investors. Prudential Investments’ fixed income and money market funds are advised by Prudential Investment Management, Inc. (PIM) through its Prudential Fixed Income unit. Jennison Associates, QMA, and PIM are registered investment advisers and Prudential Financial companies. Prudential Real Estate Investors is a unit of PIM.
| | | | |
| Prudential Absolute Return Bond Fund | | | 1 | |
Your Fund’s Performance (Unaudited)
Performance data quoted represent past performance. Past performance does not guarantee future results. The investment return and principal value of an investment will fluctuate, so that an investor’s shares, when redeemed, may be worth more or less than their original cost. Current performance may be lower or higher than the past performance data quoted. An investor may obtain performance data as of the most recent month-end by visiting our website at www.prudentialfunds.com or by calling (800) 225-1852.
| | | | | | | | | | |
Cumulative Total Returns (Without Sales Charges) as of 10/31/14 | |
| | | | | One Year | | | Since Inception | |
Class A | | | | | 2.76 | % | | | 9.01% (3/30/11) | |
Class C | | | | | 1.97 | | | | 6.23 (3/30/11) | |
Class Q | | | | | 3.06 | | | | 10.30 (3/30/11) | |
Class Z | | | | | 3.00 | | | | 10.12 (3/30/11) | |
BofA ML USD LIBOR 3-Month CM Index | | | | | 0.24 | | | | 1.19 | |
Lipper Alternative Credit Focus Funds Average | | | | | 2.41 | | | | 10.82 | |
| | | | | | | | | | |
Average Annual Total Returns (With Sales Charges) as of 9/30/14 | |
| | | | | One Year | | | Since Inception | |
Class A | | | | | –1.22 | % | | | 1.06% (3/30/11) | |
Class C | | | | | 1.54 | | | | 1.63 (3/30/11) | |
Class Q | | | | | 3.73 | | | | 2.73 (3/30/11) | |
Class Z | | | | | 3.57 | | | | 2.66 (3/30/11) | |
BofA ML USD LIBOR 3-Month CM Index | | | | | 0.24 | | | | 0.33 | |
Lipper Alternative Credit Focus Funds Average | | | | | 3.34 | | | | 2.92 | |
| | | | | | | | | | |
Average Annual Total Returns (With Sales Charges) as of 10/31/14 | |
| | | | | One Year | | | Since Inception | |
Class A | | | | | –1.87 | % | | | 1.13% (3/30/11) | |
Class C | | | | | 0.97 | | | | 1.70 (3/30/11) | |
Class Q | | | | | 3.06 | | | | 2.77 (3/30/11) | |
Class Z | | | | | 3.00 | | | | 2.72 (3/30/11) | |
| | | | | | | | | | |
Average Annual Total Returns (Without Sales Charges) as of 10/31/14 | |
| | | | | One Year | | | Since Inception | |
Class A | | | | | 2.76 | % | | | 2.43% (3/30/11) | |
Class C | | | | | 1.97 | | | | 1.70 (3/30/11) | |
Class Q | | | | | 3.06 | | | | 2.77 (3/30/11) | |
Class Z | | | | | 3.00 | | | | 2.72 (3/30/11) | |
| | |
| 2 | | Visit our website at www.prudentialfunds.com |
Growth of a $10,000 Investment
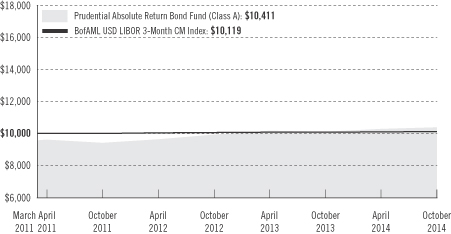
The graph compares a $10,000 investment in the Prudential Absolute Return Bond Fund (Class A shares) with a similar investment in the BofAML USD LIBOR 3-Month Constant Maturity (CM) Index by portraying the initial account values at the commencement of operations for Class A shares (March 30, 2011) and the account values at the end of the current fiscal year (October 31, 2014) as measured on a quarterly basis. For purposes of the graph, and unless otherwise indicated, it has been assumed that (a) the maximum applicable front-end sales charge was deducted from the initial $10,000 investment in Class A shares; (b) all recurring fees (including management fees) were deducted; and (c) all dividends and distributions were reinvested. The line graph provides information for Class A shares only. As indicated in the tables provided earlier, performance for Class C, Class Q, and Class Z shares will vary due to the differing charges and expenses applicable to each share class (as indicated in the following paragraphs). Without waiver of fees and/or expense reimbursement, if any, the returns would have been lower.
Past performance does not predict future performance. Total returns and the ending account values in the graph include changes in share price and reinvestment of dividends and capital gains distributions in a hypothetical investment for the periods shown. The Fund’s total returns do not reflect the deduction of income taxes on an individual’s investment. Taxes may reduce your actual investment returns on income or gains paid by the Fund or any gains you may realize if you sell your shares.
Source: Prudential Investments LLC and Lipper Inc.
Inception returns are provided for any share class with less than 10 years of returns.
| | | | |
| Prudential Absolute Return Bond Fund | | | 3 | |
Your Fund’s Performance (continued)
The returns in the tables do not reflect the deduction of taxes that a shareholder would pay on Fund distributions or following the redemption of Fund shares. The average annual total returns take into account applicable sales charges, which are described for each share class in the table below.
| | | | | | | | |
| | Class A | | Class C | | Class Q | | Class Z |
Maximum initial sales charge | | 4.5% of
the public
offering
price | | None | | None | | None |
Contingent deferred sales charge (CDSC) (as a percentage of the lower of original purchase price or net asset value at redemption) | | 1% on sales
of $1 million
or more
made within
12 months of
purchase | | 1% on sales
made within
12 months of
purchase | | None | | None |
Annual distribution and service (12b-1) fees (shown as a percentage of average daily net assets) | | .30%
(.25%
currently) | | 1% | | None | | None |
Benchmark Definitions
BofA ML USD LIBOR 3-Month CM Index
The BofA Merrill Lynch US Dollar LIBOR 3-Month Constant Maturity (CM) Index is an unmanaged index that tracks the performance of a synthetic asset paying LIBOR to a stated maturity. The index is based on the assumed purchase at par of a synthetic instrument having exactly its stated maturity and with a coupon equal to that day’s fixing rate. That issue is assumed to be sold the following business day (priced at a yield equal to the current day fixing rate) and rolled into a new instrument.
Lipper Alternative Credit Focus Funds Average
The Lipper Alternative Credit Focus Funds Average (Lipper Average) represents returns based on an average return of all funds in the Lipper Alternative Credit Focus Funds category for the periods noted. Funds in the Lipper Average are funds that, by prospectus language, invest in a wide range of credit-structured vehicles by using either fundamental credit research analysis or quantitative credit portfolio modeling trying to benefit from any changes in credit quality, credit spreads, and market liquidity.
Investors cannot invest directly in an index or average. The returns for the Index would be lower if they included the effects of sales charges, operating expenses of a mutual fund, or taxes. Returns for the Lipper Average reflect the deduction of operating expenses of a mutual fund, but not sales charges or taxes. The Since Inception returns for the Index and the Lipper Average are measured from the closest month-end to inception date, and not from the Fund’s actual inception date.
| | |
| 4 | | Visit our website at www.prudentialfunds.com |
| | | | | | | | |
Distributions and Yields as of 10/31/14 | | | | | |
| | | Total Distributions
Paid for 12 Months | | | 30-Day
SEC Yield | |
Class A | | $ | 0.30 | | | | 2.25 | % |
Class C | | | 0.22 | | | | 1.58 | |
Class Q | | | 0.33 | | | | 2.67 | |
Class Z | | | 0.32 | | | | 2.58 | |
| | | | |
Five Largest Holdings expressed as a percentage of net assets as of 10/31/14 | | | | |
US Treasury Notes, 1.500%, 10/31/2019 | | | 3.6 | % |
Anchorage Capital CLO Ltd., Series 2014-5A, 144A, 0.034%, 10/15/2026 | | | 0.9 | |
Galaxy CLO Ltd. (Cayman Islands), Series 2014-18A, Class A, 144A, 1.704%, 10/15/2026 | | | 0.9 | |
Voya CLO Ltd. (Cayman Islands), Series 2014-3A, Class A1, 144A, 1.649%, 07/25/2026 | | | 0.8 | |
Italy Government International Bond (Italy), Sr. Unsec’d. Notes, 3.125%, 01/26/2015 | | | 0.7 | |
Holdings reflect only long-term investments and are subject to change.
| | | | |
Credit Quality expressed as a percentage of total investments as of 10/31/14 | | | | |
AAA | | | 27.79 | % |
AA | | | 6.02 | |
A | | | 14.70 | |
BBB | | | 16.49 | |
BB | | | 23.12 | |
B | | | 8.32 | |
CCC | | | 0.04 | |
Not Rated | | | 0.80 | |
Cash/Cash Equivalents | | | 2.72 | |
Total Investments | | | 100.00 | % |
| | | | |
Source: PIM
Credit ratings reflect the highest rating assigned by Moody’s Investor Service, Inc. (Moody’s), Standard & Poor’s (S&P) or Fitch, Inc. (Fitch). Credit ratings reflect the common nomenclature used by both S&P and Fitch. Where applicable, Moody’s ratings are converted to the comparable S&P/Fitch rating tier nomenclature. These rating agencies are independent, nationally recognized statistical rating organizations and are widely used. The Not Rated category consists of securities that have not been rated by Moody’s, S&P or Fitch. Credit ratings are subject to change.
| | | | |
| Prudential Absolute Return Bond Fund | | | 5 | |
Strategy and Performance Overview
How did the Fund perform?
The Prudential Absolute Return Bond Fund’s Class A shares gained 2.76% for the 12-month reporting period that ended October 31, 2014, significantly outperforming the 0.24% return of the BofAML USD 3-Month LIBOR Constant Maturity Index (the Index). The Fund also outperformed the 2.41% gain of the Lipper Alternative Credit Focus Funds Average.
How did the US fixed income market perform?
The US fixed income market recorded solid gains during the reporting period, with spread sectors outperforming US Treasury securities. Spread sectors are commercial mortgage-backed securities, corporate bonds, and other types of debt securities that provide extra yield (spread) over similar-duration US Treasury securities to compensate for the greater credit risk associated with investing in them. During the period, US-dollar-denominated emerging markets debt, investment grade corporate bonds, and high yield corporate bonds generated the strongest returns. Commercial mortgage-backed securities (CMBS), asset-backed securities, and mortgage-backed securities also posted gains.
| | • | | When the period began, the Federal Reserve (Fed) was widely expected to announce the reduction (or tapering) of its quantitative easing asset purchase program. The fixed income markets performed poorly in anticipation that the Fed would combine a tapering announcement with a shift in its policy of low interest rates. The bellwether 10-year US Treasury yield rose, reaching a high of more than 3%. However, that increase was more gradual than the surge that followed Fed hints of a possible taper earlier in 2013. |
| | • | | In December, the Fed announced it would begin reducing its asset purchases in January 2014. After the Fed starting tapering asset purchases, longer-term US Treasury yields fell, continuing to decline during the period overall. |
| | • | | In the first quarter of 2014, severe weather hit much of the US, significantly depressing economic activity. The lull suggested the Fed might maintain lower interest rates for longer. Inflation remained muted. Longer-term interest rates fell, as market participants signaled their confidence in the Fed’s ability and willingness to control inflation over the long term. The fixed income market generated a positive return during the first quarter, with most sectors adding to their 2013 gains or erasing the majority of that calendar year’s losses. |
| | • | | Fixed income markets continued to record gains in the second quarter, despite mixed US economic data, weaker economic growth in China, and geopolitical turmoil in the Middle East and Russia/Ukraine. While US economic growth continued to recover from the effects of the harsh winter weather, market |
| | |
| 6 | | Visit our website at www.prudentialfunds.com |
| | participants seemed focused on weak first-quarter GDP, which was steadily revised lower during the second quarter—dampening growth projections for the 2014 calendar year. Meanwhile, as the US job market improved and inflation edged up, the Fed said it might raise short-term interest rates sooner than previously expected. |
| | • | | Events of the third quarter 2014 triggered a wave of risk aversion in the fixed income markets. Many spread sectors, including investment grade corporate bonds, high yield corporate debt, and emerging markets debt, underperformed US Treasuries. Although the global economic recovery remained sluggish, US growth continued at an annualized pace of approximately 2%. US unemployment also declined. As a result, the Fed appeared increasingly likely to hike short-term rates during 2015. |
| | • | | In October 2014, the Fed concluded its quantitative easing asset purchase program. |
Which strategies helped the Fund’s performance?
Prudential Fixed Income manages the Fund, which outperformed the Index by a significant amount because of effective management of duration and yield curve positioning as well as its sector allocation strategy and favorable security selection within a number of sectors. The Index does not include any bonds but closely tracks the three-month London interbank offered rate (LIBOR), the most widely used benchmark for short-term interest rates.
| | • | | The Fund employs an absolute return strategy that seeks to mitigate (or even eliminate) interest-rate risk when appropriate. During the reporting period, the Fund benefited from its strategy to manage duration, which is a measure of the interest rate sensitivity of a bond portfolio or debt securities that is expressed as a number of years. The Fund maintains an overall duration less than plus/minus three years. The longer the duration, the greater the potential risk and reward when interest rates move. The Fund had a long duration bias for most of the period, allowing it to benefit from falling US and global interest rates. |
| | • | | Also contributing positively was the Fund’s positioning for flatter yield curves. Yield curves are single line graphs that illustrate the relationship between the yields and maturities of fixed income securities. The slope of most yield curves flattened during the period, as shorter-term yields rose and longer-term yields fell. |
| | • | | Sector allocations also added to performance. Most notably, the Fund benefited from its allocations to high yield corporate bonds, US high yield loans, emerging market debt, investment grade corporate bonds, and CMBS. |
| | | | |
| Prudential Absolute Return Bond Fund | | | 7 | |
Strategy and Performance Overview (continued)
| | • | | Security selection among non-agency mortgage-backed securities, high yield corporate bonds, and developed markets sovereign bonds also contributed positively. |
Which strategies detracted from the Fund’s performance?
Security selection within high yield corporate bonds and high yield loans hampered results, as the Fund’s higher-quality, shorter-term holdings generally underperformed.
Did the Fund use derivatives and how did they affect performance?
The Fund uses derivatives when they facilitate implementation of the overall investment approach. During the reporting period, the Fund used interest rate futures and swaps to help manage US and global duration and yield curve exposure. These positions added modestly to performance. In addition, the Fund traded foreign exchange derivatives, which had positive returns.
| | |
| 8 | | Visit our website at www.prudentialfunds.com |
Fees and Expenses (Unaudited)
As a shareholder of the Fund, you incur two types of costs: (1) transaction costs, including sales charges (loads) on purchase payments and redemptions, as applicable, and (2) ongoing costs, including management fees, distribution and/or service (12b-1) fees, and other Fund expenses, as applicable. This example is intended to help you understand your ongoing costs (in dollars) of investing in the Fund and to compare these costs with the ongoing costs of investing in other mutual funds.
The example is based on an investment of $1,000 invested on May 1, 2014, at the beginning of the period, and held through the six-month period ended October 31, 2014. The example is for illustrative purposes only; you should consult the Prospectus for information on initial and subsequent minimum investment requirements.
Actual Expenses
The first line for each share class in the table on the following page provides information about actual account values and actual expenses. You may use the information on this line, together with the amount you invested, to estimate the expenses that you paid over the period. Simply divide your account value by $1,000 (for example, an $8,600 account value ÷ $1,000 = 8.6), then multiply the result by the number on the first line under the heading “Expenses Paid During the Six-Month Period” to estimate the expenses you paid on your account during this period.
Hypothetical Example for Comparison Purposes
The second line for each share class in the table on the following page provides information about hypothetical account values and hypothetical expenses based on the Fund’s actual expense ratio and an assumed rate of return of 5% per year before expenses, which is not the Fund’s actual return. The hypothetical account values and expenses may not be used to estimate the actual ending account balance or expenses you paid for the period. You may use this information to compare the ongoing costs of investing in the Fund and other funds. To do so, compare this 5% hypothetical example with the 5% hypothetical examples that appear in the shareholder reports of the other funds.
The Fund’s transfer agent may charge additional fees to holders of certain accounts that are not included in the expenses shown in the table on the following page. These fees apply to individual retirement accounts (IRAs) and Section 403(b) accounts. As of the close of the six-month period covered by the table, IRA fees included an annual maintenance fee of $15 per account (subject to a maximum annual maintenance fee of $25 for all accounts held by the same shareholder). Section 403(b) accounts are charged an annual $25 fiduciary maintenance fee. Some of the fees may vary in amount, or may be waived, based on your total account balance or the number of Prudential Investments funds, including the Fund, that you own. You should consider
| | | | |
| Prudential Absolute Return Bond Fund | | | 9 | |
Fees and Expenses (continued)
the additional fees that were charged to your Fund account over the six-month period when you estimate the total ongoing expenses paid over the period and the impact of these fees on your ending account value, as these additional expenses are not reflected in the information provided in the expense table. Additional fees have the effect of reducing investment returns.
Please note that the expenses shown in the table are meant to highlight your ongoing costs only and do not reflect any transactional costs such as sales charges (loads). Therefore, the second line for each share class in the table is useful in comparing ongoing costs only and will not help you determine the relative total costs of owning different funds. In addition, if these transactional costs were included, your costs would have been higher.
| | | | | | | | | | | | | | | | | | |
Prudential
Absolute
Return Bond Fund | | Beginning Account
Value
May 1, 2014 | | | Ending Account
Value
October 31, 2014 | | | Annualized
Expense Ratio
Based on the
Six-Month Period | | | Expenses Paid
During the
Six-Month Period* | |
| | | | | | | | | | | | | | | | | | |
Class A | | Actual | | $ | 1,000.00 | | | $ | 1,009.10 | | | | 1.15 | % | | $ | 5.82 | |
| | | Hypothetical | | $ | 1,000.00 | | | $ | 1,019.41 | | | | 1.15 | % | | $ | 5.85 | |
| | | | | | | | | | | | | | | | | | |
Class C | | Actual | | $ | 1,000.00 | | | $ | 1,006.20 | | | | 1.90 | % | | $ | 9.61 | |
| | | Hypothetical | | $ | 1,000.00 | | | $ | 1,015.63 | | | | 1.90 | % | | $ | 9.65 | |
| | | | | | | | | | | | | | | | | | |
Class Q | | Actual | | $ | 1,000.00 | | | $ | 1,010.70 | | | | 0.85 | % | | $ | 4.31 | |
| | | Hypothetical | | $ | 1,000.00 | | | $ | 1,020.92 | | | | 0.85 | % | | $ | 4.33 | |
| | | | | | | | | | | | | | | | | | |
Class Z | | Actual | | $ | 1,000.00 | | | $ | 1,011.40 | | | | 0.90 | % | | $ | 4.56 | |
| | | Hypothetical | | $ | 1,000.00 | | | $ | 1,020.67 | | | | 0.90 | % | | $ | 4.58 | |
*Fund expenses (net of fee waivers or subsidies, if any) for each share class are equal to the annualized expense ratio for each share class (provided in the table), multiplied by the average account value over the period, multiplied by the 184 days in the six-month period ended October 31, 2014, and divided by the 365 days in the Fund’s fiscal year ended October 31, 2014 (to reflect the six-month period). Expenses presented in the table include the expenses of any underlying portfolios in which the Fund may invest.
| | |
| 10 | | Visit our website at www.prudentialfunds.com |
The Fund’s annualized expense ratios for the year ended October 31, 2014, are as follows:
| | | | | | | | |
| Class | | Gross Operating Expenses | | | Net Operating Expenses | |
A | | | 1.27 | % | | | 1.15 | % |
C | | | 1.97 | | | | 1.90 | |
Q | | | 0.85 | | | | 0.85 | |
Z | | | 0.97 | | | | 0.90 | |
Net operating expenses shown above reflect any fee waivers and/or expense reimbursements. Additional information on Fund expenses and any fee waivers and/or expense reimbursements can be found in the “Financial Highlights” tables in this report and in the Notes to the Financial Statements in this report.
| | | | |
| Prudential Absolute Return Bond Fund | | | 11 | |
Portfolio of Investments
as of October 31, 2014
| | | | | | | | | | | | | | |
| Description | | Interest
Rate | | Maturity
Date | | | Principal
Amount (000)# | | | Value (Note 1) | |
LONG-TERM INVESTMENTS 96.3% | | | | | | | | | | | | | | |
| | | | |
ASSET-BACKED SECURITIES 20.7% | | | | | | | | | | | | | | |
| | | | |
Collateralized Debt Obligations 0.2% | | | | | | | | | | | | | | |
Atrium VII CDO Corp. (Cayman Islands), Series 7AR, Class BR, 144A | | 1.988%(a) | | | 11/16/22 | | | | 2,500 | | | $ | 2,458,955 | |
Landmark VIII CDO Ltd. (Cayman Islands), Series 2006-8A, Class A2, 144A | | 0.561(a) | | | 10/19/20 | | | | 2,500 | | | | 2,470,499 | |
| | | | | | | | | | | | | | |
| | | | | | | | | | | | | 4,929,454 | |
| | | | |
Collateralized Loan Obligations 11.1% | | | | | | | | | | | | | | |
A Voce CLO Ltd. (Cayman Islands), Series 2014-1A, Class A1A, 144A | | 1.684(a) | | | 07/15/26 | | | | 20,250 | | | | 20,048,162 | |
ACAS CLO Ltd. (Cayman Islands),
Series 2013-1A, Class A, 144A | | 1.411(a) | | | 04/20/25 | | | | 6,050 | | | | 5,943,861 | |
Series 2013-1A, Class B2, 144A | | 3.360 | | | 04/20/25 | | | | 700 | | | | 675,641 | |
AIMCO CLO (Cayman Islands),
Series 2014-AA, Class B1, 144A | | 2.223(a) | | | 07/20/26 | | | | 5,000 | | | | 4,812,502 | |
Series 2014-AA, Class B2, 144A | | 4.580 | | | 07/20/26 | | | | 1,000 | | | | 1,003,825 | |
ALM Loan Funding CLO (Cayman Islands),
Series 2014-11A, Class A2A, 144A | | 2.234(a) | | | 10/17/26 | | | | 750 | | | | 724,836 | |
Series 2014-14A, Class A2, 144A | | 2.334(a) | | | 07/28/26 | | | | 500 | | | | 485,654 | |
Anchorage Capital CLO Ltd. (Cayman Islands), Series 2013-1A, Class A1, 144A | | 1.420(a) | | | 07/13/25 | | | | 8,600 | | | | 8,446,155 | |
Anchorage Capital CLO Ltd., Series 2014-5A, 144A | | 0.034(b) | | | 10/15/26 | | | | 24,750 | | | | 24,651,000 | |
Atlas Senior Loan Fund CLO Ltd. (Cayman Islands), Series 2014-6A, Class A, 144A | | 1.796(a) | | | 10/15/26 | | | | 250 | | | | 247,866 | |
Babson CLO Ltd. (Cayman Islands),
Series 2013-IA, Class A, 144A | | 1.331(a) | | | 04/20/25 | | | | 320 | | | | 313,407 | |
Series 2013-IIA, Class A2, 144A | | 1.981(a) | | | 01/18/25 | | | | 8,300 | | | | 7,865,057 | |
Ballyrock CLO LLC (Cayman Islands), Series 2013-1A, Class A, 144A | | 1.412(a) | | | 05/20/25 | | | | 9,800 | | | | 9,624,605 | |
Battalion CLO IV Ltd. (Cayman Islands), Series 2013-4A, Class A1, 144A | | 1.632(a) | | | 10/22/25 | | | | 5,450 | | | | 5,393,227 | |
Battalion CLO VII Ltd. (Cayman Islands), Series 2014-7A, Class A1, 144A | | 1.831(a) | | | 10/17/26 | | | | 12,500 | | | | 12,487,500 | |
Benefit Street Partners CLO II Ltd. (Cayman Islands),
Series 2013-IIA, Class A1, 144A | | 1.431(a) | | | 07/15/24 | | | | 11,200 | | | | 11,001,633 | |
Series 2013-IIA, Class A2B, 144A | | 3.339 | | | 07/15/24 | | | | 10,000 | | | | 9,643,057 | |
See Notes to Financial Statements.
| | | | |
| Prudential Absolute Return Bond Fund | | | 13 | |
Portfolio of Investments
as of October 31, 2014 continued
| | | | | | | | | | | | | | |
| Description | | Interest
Rate | | Maturity
Date | | | Principal
Amount (000)# | | | Value (Note 1) | |
ASSET-BACKED SECURITIES (Continued) | |
|
Collateralized Loan Obligations (cont’d.) | |
Blue Hill CLO Ltd. (Cayman Islands), Series 2013-1A, Class A, 144A | | 1.711%(a) | | | 01/15/26 | | | | 6,300 | | | $ | 6,252,536 | |
BMI CLO I (Cayman Islands), Series 2013-1AR, Class A1R, 144A | | 1.172(a) | | | 08/01/21 | | | | 6,899 | | | | 6,858,541 | |
Brookside Mill CLO Ltd. (Cayman Islands),
Series 2013-1A, Class A1, 144A | | 1.378(a) | | | 04/17/25 | | | | 10,300 | | | | 10,108,267 | |
Series 2013-1A, Class B2, 144A | | 3.020 | | | 04/17/25 | | | | 6,200 | | | | 5,882,675 | |
Carlyle Global Market Strategies CLO (Cayman Islands),
Series 2012-4A, Class B1, 144A | | 2.481(a) | | | 01/20/25 | | | | 3,500 | | | | 3,424,373 | |
Series 2013-1A, Class A1, 144A | | 1.533(a) | | | 02/14/25 | | | | 9,700 | | | | 9,576,545 | |
Cavalry CLO II (Cayman Islands),
Series 2013-2A, Class A, 144A | | 1.578(a) | | | 01/17/24 | | | | 4,200 | | | | 4,152,698 | |
ECP CLO Ltd. (Cayman Islands), Series 2014-6A, Class A1A, 144A | | 1.685(a) | | | 07/15/26 | | | | 7,600 | | | | 7,523,910 | |
Fraser Sullivan CLO Ltd. (Cayman Islands), Series 2006-1A, Class B, 144A | | 0.704(a) | | | 03/15/20 | | | | 500 | | | | 494,912 | |
Galaxy CLO Ltd. (Cayman Islands), Series 2014-18A, Class A, 144A | | 1.704(a) | | | 10/15/26 | | | | 23,800 | | | | 23,582,701 | |
ING Investment Management CLO Ltd. (Cayman Islands), Series 2013-1A, Class A1, 144A | | 1.370(a) | | | 04/15/24 | | | | 4,100 | | | | 4,018,536 | |
ING Investment Management CLO Ltd., Series 2013-2A, Class A2B, 144A | | 3.070 | | | 04/25/25 | | | | 2,000 | | | | 1,900,451 | |
LightPoint Pan-European CLO PLC (Ireland), Series 2006-1A, Class A, 144A | | 0.338(a) | | | 01/31/22 | | | EUR | 226 | | | | 281,455 | |
Magnetite VI CLO Ltd. (Cayman Islands), Series 2012-6A, Class A, 144A | | 1.734(a) | | | 09/15/23 | | | | 12,900 | | | | 12,861,374 | |
Magnetite IX CLO Ltd. (Cayman Islands), Series 2014-9A, Class A1, 144A | | 1.700(a) | | | 07/25/26 | | | | 16,500 | | | | 16,311,032 | |
Marine Park CLO Ltd. (Cayman Islands), Series 2012-1A, Class A1A, 144A | | 1.701(a) | | | 05/18/23 | | | | 250 | | | | 248,940 | |
Mayport CLO Ltd. (Cayman Islands), Series 2006-1A, Class A1L, 144A | | 0.485(a) | | | 02/22/20 | | | | 466 | | | | 465,996 | |
Ocean Trails CLO IV (Cayman Islands), Series 2013-4A, Class A, 144A | | 1.534(a) | | | 08/13/25 | | | | 9,900 | | | | 9,760,668 | |
OCP CLO Ltd. (Cayman Islands), Series 2012-2A, Class A2, 144A | | 1.715(a) | | | 11/22/23 | | | | 500 | | | | 498,977 | |
See Notes to Financial Statements.
| | | | | | | | | | | | | | |
| Description | | Interest
Rate | | Maturity
Date | | | Principal
Amount (000)# | | | Value (Note 1) | |
ASSET-BACKED SECURITIES (Continued) | |
|
Collateralized Loan Obligations (cont’d.) | |
Shackleton CLO Ltd. (Cayman Islands), Series 2013-3A, Class B2, 144A | | 3.440% | | | 04/15/25 | | | | 2,800 | | | $ | 2,715,453 | |
Sheridan Square CLO Ltd. (Cayman Islands), Series 2013-1A, Class A1, 144A | | 1.281(a) | | | 04/15/25 | | | | 10,400 | | | | 10,159,605 | |
Silver Spring CLO Ltd. (Cayman Islands), Series 2014-1A, Class A, 144A | | 1.721(a) | | | 10/15/26 | | | | 2,750 | | | | 2,721,410 | |
Sound Point CLO Ltd. (Cayman Islands), Series 2012-1A, Class B, 144A | | 2.931(a) | | | 10/20/23 | | | | 550 | | | | 546,859 | |
THL Credit Wind River CLO Ltd. (Cayman Islands), Series 2013-2A, Class A1, 144A | | 1.681(a) | | | 01/18/26 | | | | 4,750 | | | | 4,707,626 | |
Tyron Park CLO Ltd. (Cayman Islands), Series 2013-1A, Class A1, 144A | | 1.351(a) | | | 07/15/25 | | | | 12,500 | | | | 12,258,211 | |
Voya CLO Ltd. (Cayman Islands), Series 2014-3A, Class A1, 144A | | 1.649(a) | | | 07/25/26 | | | | 23,000 | | | | 22,736,666 | |
| | | | | | | | | | | | | | |
| | | | | | | | | | | | | 303,418,405 | |
|
Non-Residential Mortgage-Backed Securities 0.7% | |
Chase Issuance Trust, Series 2007-C1, Class C1 | | 0.613(a) | | | 04/15/19 | | | | 1,000 | | | | 993,323 | |
Citibank Credit Card Issuance Trust, Series 2005-C2, Class C2 | | 0.623(a) | | | 03/24/17 | | | | 4,800 | | | | 4,799,117 | |
GEM Ligos III Ltd. (Cayman Islands), Series 2006-3A, Class A1, 144A | | 0.661(a) | | | 03/23/21 | | | | 804 | | | | 803,014 | |
Series 2006-3A, Class A2, 144A | | 0.881(a) | | | 03/23/21 | | | | 4,000 | | | | 3,857,129 | |
GEMC Ltd. (Cayman Islands), Series 2005-8A, Class A2, 144A | | 0.823(a) | | | 06/23/17 | | | | 1,242 | | | | 1,241,416 | |
Series 2005-8A, Class A3, 144A | | 1.123(a) | | | 06/23/17 | | | | 3,500 | | | | 3,487,795 | |
OZLM Funding IV Ltd. (Cayman Islands), Series 2013-4A, Class A1, 144A | | 1.382(a) | | | 07/22/25 | | | | 4,200 | | | | 4,117,079 | |
Sierra Timeshare Receivables Funding LLC, Series 2012-3A, Class A, 144A | | 1.870 | | | 08/20/29 | | | | 347 | | | | 349,438 | |
Slater Mill Loan Fund LP (Cayman Islands), Series 2012-1A, Class B, 144A | | 2.881(a) | | | 08/17/22 | | | | 250 | | | | 248,291 | |
SVO VOI Mortgage LLC, Series 2012-AA, Class A, 144A | | 2.000 | | | 09/20/29 | | | | 526 | | | | 527,275 | |
| | | | | | | | | | | | | | |
| | | | | | | | | | | | | 20,423,877 | |
See Notes to Financial Statements.
| | | | |
| Prudential Absolute Return Bond Fund | | | 15 | |
Portfolio of Investments
as of October 31, 2014 continued
| | | | | | | | | | | | | | |
| Description | | Interest
Rate | | Maturity
Date | | | Principal
Amount (000)# | | | Value (Note 1) | |
ASSET-BACKED SECURITIES (Continued) | |
|
Residential Mortgage-Backed Securities 8.7% | |
Accredited Mortgage Loan Trust,
Series 2004-3, Class 2A2 | | 1.352%(a) | | | 10/25/34 | | | | 5,348 | | | $ | 5,333,752 | |
Series 2004-3, Class 2A5 | | 1.232(a) | | | 10/25/34 | | | | 2,671 | | | | 2,628,722 | |
Series 2005-3, Class M1 | | 0.600(a) | | | 09/25/35 | | | | 2,000 | | | | 1,954,728 | |
ACE Securities Corp. Home Equity Loan Trust, Series 2004-FM1, Class M1 | | 1.052(a) | | | 09/25/33 | | | | 691 | | | | 645,527 | |
Aegis Asset-Backed Securities Trust Mortgage Pass-Through Certificates, Series 2004-4, Class A1 | | 0.872(a) | | | 10/25/34 | | | | 2,918 | | | | 2,869,021 | |
Ameriquest Mortgage Securities, Inc., Asset-Backed Pass-Through Certificates,
Series 2003-1, Class M1 | | 1.505(a) | | | 02/25/33 | | | | 2,531 | | | | 2,389,250 | |
Series 2003-10, Class AV1 | | 0.915(a) | | | 12/25/33 | | | | 5,535 | | | | 5,376,883 | |
Series 2005-R10, Class A2C | | 0.482(a) | | | 01/25/36 | | | | 564 | | | | 552,683 | |
Amortizing Residential Collateral Trust, Series 2002-BC8, Class A3 | | 1.152(a) | | | 11/25/32 | | | | 1,050 | | | | 1,014,768 | |
Argent Securities, Inc.,
Series 2003-W5, Class M1 | | 1.205(a) | | | 10/25/33 | | | | 83 | | | | 80,925 | |
Series 2003-W7, Class A2 | | 0.935(a) | | | 03/25/34 | | | | 1,535 | | | | 1,473,704 | |
Series 2003-W7, Class M1 | | 1.190(a) | | | 03/25/34 | | | | 1,912 | | | | 1,867,654 | |
Argent Securities, Inc., Asset-Backed Pass-Through Certificates,
Series 2003-W8, Class M1 | | 1.205(a) | | | 12/25/33 | | | | 1,191 | | | | 1,150,777 | |
Series 2003-W9, Class M1 | | 1.190(a) | | | 01/25/34 | | | | 1,536 | | | | 1,474,260 | |
Series 2004-W6, Class AF | | 4.123 | | | 05/25/34 | | | | 323 | | | | 327,628 | |
Series 2004-W6, Class AV5 | | 0.952(a) | | | 05/25/34 | | | | 587 | | | | 545,730 | |
Asset Backed Funding Certificates, Series 2004-OPT5, Class A1 | | 0.852(a) | | | 06/25/34 | | | | 1,704 | | | | 1,582,977 | |
Asset-Backed Pass-Through Certificates, Series 2004-R2, Class A1A | | 0.845(a) | | | 04/25/34 | | | | 4,541 | | | | 4,499,528 | |
Asset-Backed Securities Corp. Home Equity Loan Trust,
Series 2003-HE6, Class A2 | | 0.832(a) | | | 11/25/33 | | | | 1,758 | | | | 1,661,043 | |
Series 2003-HE6, Class A3B | | 1.112(a) | | | 11/25/33 | | | | 3,546 | | | | 3,371,713 | |
Series 2004-HE6, Class A2 | | 0.872(a) | | | 09/25/34 | | | | 1,665 | | | | 1,645,012 | |
Series 2005-HE1, Class M1 | | 0.902(a) | | | 03/25/35 | | | | 7,134 | | | | 6,847,501 | |
Bear Stearns Asset-Backed Securities I Trust,
Series 2004-FR2, Class M2 | | 1.172(a) | | | 06/25/34 | | | | 1,100 | | | | 988,487 | |
Series 2004-HE11, Class M2 | | 1.730(a) | | | 12/25/34 | | | | 6,280 | | | | 6,192,268 | |
See Notes to Financial Statements.
| | | | | | | | | | | | | | |
| Description | | Interest
Rate | | Maturity
Date | | | Principal
Amount (000)# | | | Value (Note 1) | |
ASSET-BACKED SECURITIES (Continued) | |
|
Residential Mortgage-Backed Securities (cont’d.) | |
Bear Stearns Asset-Backed Securities Trust,
Series 2002-2, Class A1 | | 0.812%(a) | | | 10/25/32 | | | | 1,317 | | | $ | 1,248,946 | |
Series 2003-3, Class A2 | | 0.742(a) | | | 06/25/43 | | | | 215 | | | | 211,671 | |
Series 2003-HE1, Class M1 | | 1.250(a) | | | 01/25/34 | | | | 2,418 | | | | 2,326,921 | |
Series 2004-HE5, Class M1 | | 1.007(a) | | | 07/25/34 | | | | 5,039 | | | | 4,780,313 | |
Chase Funding Trust,
Series 2002-3, Class 2A1 | | 0.792(a) | | | 08/25/32 | | | | 233 | | | | 211,668 | |
Series 2003-4, Class 1A5 | | 5.416 | | | 05/25/33 | | | | 1,326 | | | | 1,384,875 | |
Citigroup Mortgage Loan Trust, Inc.,
Series 2005-OPT1, Class M1 | | 0.782(a) | | | 02/25/35 | | | | 317 | | | | 303,779 | |
Series 2005-WF1, Class A5 | | 5.010(a) | | | 11/25/34 | | | | 474 | | | | 488,533 | |
Countrywide Asset-Backed Certificates,
Series 2003-BC4, Class M1 | | 1.202(a) | | | 07/25/33 | | | | 474 | | | | 446,690 | |
Series 2004-1, Class M1 | | 0.902(a) | | | 03/25/34 | | | | 337 | | | | 321,375 | |
Series 2004-3, Class 1A | | 0.572(a) | | | 08/25/34 | | | | 8,662 | | | | 7,927,749 | |
Series 2004-6, Class 1A1 | | 0.692(a) | | | 12/25/34 | | | | 2,463 | | | | 2,331,398 | |
Series 2004-BC4, Class M1 | | 1.202(a) | | | 11/25/34 | | | | 1,380 | | | | 1,288,829 | |
Credit-Based Asset Servicing and Securitization LLC,
Series 2003-CB3, Class AF1 | | 3.379 | | | 12/25/32 | | | | 242 | | | | 235,280 | |
Series 2003-CB5, Class M1 | | 1.175(a) | | | 11/25/33 | | | | 230 | | | | 218,740 | |
Series 2004-CB1, Class AF1 | | 4.520 | | | 10/25/32 | | | | 1,974 | | | | 1,966,124 | |
Encore Credit Receivables Trust, Series 2005-2, Class M2 | | 0.842(a) | | | 11/25/35 | | | | 3,075 | | | | 2,995,659 | |
EquiFirst Mortgage Loan Trust, Series 2005-1, Class M2 | | 0.602(a) | | | 04/25/35 | | | | 1,531 | | | | 1,424,410 | |
Finance America Mortgage Loan Trust,
Series 2003-1, Class M1 | | 1.202(a) | | | 09/25/33 | | | | 273 | | | | 256,766 | |
Series 2004-2, Class M1 | | 0.977(a) | | | 08/25/34 | | | | 8,574 | | | | 7,879,657 | |
First Franklin Mortgage Loan Trust,
Series 2004-FF5, Class A2 | | 0.912(a) | | | 08/25/34 | | | | 2,002 | | | | 1,827,963 | |
Series 2005-FF3, Class M3 | | 0.872(a) | | | 04/25/35 | | | | 6,500 | | | | 6,252,519 | |
First NLC Trust, Series 2005-2, Class M1 | | 0.632(a) | | | 09/25/35 | | | | 1,375 | | | | 1,299,841 | |
Fremont Home Loan Trust, Series 2004-4, Class M1 | | 0.947(a) | | | 03/25/35 | | | | 2,512 | | | | 2,337,788 | |
GSAMP Trust,
Series 2003-HE2, Class A1A, 144A | | 0.752(a) | | | 08/25/33 | | | | 1,257 | | | | 1,156,806 | |
Series 2004-AR1, Class A2B | | 1.352(a) | | | 06/25/34 | | | | 1,422 | | | | 1,385,284 | |
Series 2004-FM2, Class M1 | | 0.902(a) | | | 01/25/34 | | | | 2,673 | | | | 2,550,159 | |
Series 2004-NC2, Class A1B | | 1.052(a) | | | 10/25/34 | | | | 1,787 | | | | 1,652,884 | |
See Notes to Financial Statements.
| | | | |
| Prudential Absolute Return Bond Fund | | | 17 | |
Portfolio of Investments
as of October 31, 2014 continued
| | | | | | | | | | | | | | |
| Description | | Interest
Rate | | Maturity
Date | | | Principal
Amount (000)# | | | Value (Note 1) | |
ASSET-BACKED SECURITIES (Continued) | |
|
Residential Mortgage-Backed Securities (cont’d.) | |
Home Equity Asset Trust,
Series 2003-6, Class M1 | | 1.202%(a) | | | 02/25/34 | | | | 1,771 | | | $ | 1,669,469 | |
Series 2004-3, Class M1 | | 1.007(a) | | | 08/25/34 | | | | 1,959 | | | | 1,851,140 | |
Series 2004-7, Class A2 | | 0.992(a) | | | 01/25/35 | | | | 1,050 | | | | 989,846 | |
HSBC Home Equity Loan Trust,
Series 2006-1, Class A1 | | 0.317(a) | | | 01/20/36 | | | | 240 | | | | 238,414 | |
Series 2006-1, Class M1 | | 0.437(a) | | | 01/20/36 | | | | 900 | | | | 894,821 | |
Series 2006-2, Class A2 | | 0.337(a) | | | 03/20/36 | | | | 329 | | | | 326,681 | |
Series 2007-3, Class A4 | | 1.657(a) | | | 11/20/36 | | | | 1,020 | | | | 1,019,416 | |
JPMorgan Mortgage Acquisition Corp., Series 2005-OPT2, Class M1 | | 0.582(a) | | | 12/25/35 | | | | 916 | | | | 849,811 | |
Long Beach Mortgage Loan Trust,
Series 2003-4, Class AV1 | | 0.772(a) | | | 08/25/33 | | | | 1,464 | | | | 1,355,999 | |
Series 2004-2, Class A1 | | 0.595(a) | | | 06/25/34 | | | | 985 | | | | 914,304 | |
LSTAR Securities Investment Trust, Series 2014-1, Class NOTE, 144A | | 3.257(a) | | | 09/01/21 | | | | 12,391 | | | | 12,375,309 | |
Mastr Asset-Backed Securities Trust,
Series 2003-OPT1, Class M2 | | 2.927(a) | | | 12/25/32 | | | | 3,633 | | | | 3,535,630 | |
Series 2003-WMC2, Class M2 | | 2.630(a) | | | 08/25/33 | | | | 1,750 | | | | 1,712,757 | |
Series 2005-NC1, Class M1 | | 0.872(a) | | | 12/25/34 | | | | 8,247 | | | | 7,462,583 | |
Morgan Stanley ABS Capital I, Inc. Trust,
Series 2003-HE3, Class M1 | | 1.172(a) | | | 10/25/33 | | | | 6,203 | | | | 5,778,747 | |
Series 2003-NC6, Class M1 | | 1.352(a) | | | 06/25/33 | | | | 909 | | | | 883,961 | |
Series 2003-NC8, Class M1 | | 1.202(a) | | | 09/25/33 | | | | 1,001 | | | | 945,517 | |
Series 2003-NC10, Class M1 | | 1.172(a) | | | 10/25/33 | | | | 1,409 | | | | 1,325,122 | |
Series 2004-HE3, Class M1 | | 1.007(a) | | | 03/25/34 | | | | 972 | | | | 918,278 | |
Series 2004-HE4, Class M1 | | 1.052(a) | | | 05/25/34 | | | | 3,667 | | | | 3,449,267 | |
Series 2004-HE5, Class M1 | | 1.097(a) | | | 06/25/34 | | | | 1,408 | | | | 1,318,771 | |
Series 2004-NC3, Class M1 | | 0.947(a) | | | 03/25/34 | | | | 3,500 | | | | 3,318,019 | |
Series 2004-NC5, Class M1 | | 1.052(a) | | | 05/25/34 | | | | 443 | | | | 402,744 | |
Series 2004-NC6, Class M1 | | 1.052(a) | | | 07/25/34 | | | | 2,710 | | | | 2,553,193 | |
Series 2004-OP1, Class M1 | | 1.022(a) | | | 11/25/34 | | | | 1,941 | | | | 1,737,244 | |
Series 2004-WMC1, Class M1 | | 1.082(a) | | | 06/25/34 | | | | 220 | | | | 206,009 | |
Morgan Stanley Home Equity Loan Trust, Series 2006-1, Class A2C | | 0.482(a) | | | 12/25/35 | | | | 373 | | | | 350,851 | |
New Century Home Equity Loan Trust, Series 2005-3, Class M2 | | 0.642(a) | | | 07/25/35 | | | | 1,500 | | | | 1,427,712 | |
Option One Mortgage Accep Corp. Asset-Backed Certificates, Series 2003-3, Class A1 | | 0.732(a) | | | 06/25/33 | | | | 2,315 | | | | 2,174,005 | |
See Notes to Financial Statements.
| | | | | | | | | | | | | | |
| Description | | Interest
Rate | | Maturity
Date | | | Principal
Amount (000)# | | | Value (Note 1) | |
ASSET-BACKED SECURITIES (Continued) | |
|
Residential Mortgage-Backed Securities (cont’d.) | |
Option One Mortgage Loan Trust, Series 2003-4, Class A2 | | 0.792%(a) | | | 07/25/33 | | | | 969 | | | $ | 897,004 | |
Series 2004-1, Class M1 | | 1.052(a) | | | 01/25/34 | | | | 2,382 | | | | 2,214,512 | |
Series 2005-1, Class A4 | | 0.952(a) | | | 02/25/35 | | | | 782 | | | | 765,815 | |
Series 2005-3, Class M1 | | 0.622(a) | | | 08/25/35 | | | | 2,000 | | | | 1,910,100 | |
Park Place Securities, Inc., Asset-Backed Pass-Through Certificates,
Series 2005-WCH1, Class M3 | | 0.712(a) | | | 01/25/36 | | | | 1,500 | | | | 1,400,419 | |
Series 2005-WCW1, Class M1 | | 0.602(a) | | | 09/25/35 | | | | 2,500 | | | | 2,479,067 | |
RAMP Trust,
Series 2005-EFC2, Class M3 | | 0.642(a) | | | 07/25/35 | | | | 3,509 | | | | 3,380,286 | |
Series 2005-EFC3, Class M3 | | 0.642(a) | | | 08/25/35 | | | | 1,722 | | | | 1,641,374 | |
RASC Trust,
Series 2005-KS3, Class M4 | | 0.857(a) | | | 04/25/35 | | | | 2,000 | | | | 1,923,082 | |
Series 2005-KS8, Class M1 | | 0.562(a) | | | 08/25/35 | | | | 144 | | | | 143,088 | |
Series 2005-KS11, Class M1 | | 0.552(a) | | | 12/25/35 | | | | 800 | | | | 721,669 | |
Saxon Asset Securities Trust, Series 2005-3, Class M1 | | 0.615(a) | | | 11/25/35 | | | | 1,600 | | | | 1,568,582 | |
Securitized Asset-Backed Receivables LLC Trust,
Series 2004-NC1, Class M1 | | 0.932(a) | | | 02/25/34 | | | | 1,969 | | | | 1,820,881 | |
Series 2004-OP1, Class M1 | | 0.917(a) | | | 02/25/34 | | | | 6,414 | | | | 6,016,376 | |
Specialty Underwriting & Residential Finance Trust,
Series 2003-BC4, Class M1 | | 1.052(a) | | | 11/25/34 | | | | 2,570 | | | | 2,379,000 | |
Series 2004-BC2, Class M1 | | 0.977(a) | | | 05/25/35 | | | | 4,034 | | | | 3,822,478 | |
Series 2004-BC3, Class M1 | | 1.082(a) | | | 07/25/35 | | | | 2,425 | | | | 2,290,239 | |
Series 2004-BC4, Class A2C | | 1.132(a) | | | 10/25/35 | | | | 1,613 | | | | 1,553,546 | |
Structured Asset Investment Loan Trust, Series 2003-BC10, Class A4 | | 1.152(a) | | | 10/25/33 | | | | 2,658 | | | | 2,506,294 | |
Series 2004-1, Class A3 | | 0.952(a) | | | 02/25/34 | | | | 4,380 | | | | 4,163,101 | |
Series 2004-8, Class A8 | | 1.152(a) | | | 09/25/34 | | | | 2,123 | | | | 2,095,320 | |
Series 2004-9, Class A7 | | 1.152(a) | | | 10/25/34 | | | | 6,015 | | | | 5,943,444 | |
Series 2005-3, Class M2 | | 0.812(a) | | | 04/25/35 | | | | 2,000 | | | | 1,845,956 | |
Series 2005-4, Class M2 | | 0.812(a) | | | 05/25/35 | | | | 4,000 | | | | 3,864,848 | |
Structured Asset Securities Corp. Mortgage Loan Trust, Series 2005-WF4, Class M1 | | 0.552(a) | | | 11/25/35 | | | | 250 | | | | 240,869 | |
Vericrest Opportunity Loan Transferee, Series 2014-NPL7, Class A1, 144A | | 3.125 | | | 08/27/57 | | | | 6,000 | | | | 5,886,318 | |
| | | | | | | | | | | | | | |
| | | | | | | | | | | | | 238,646,456 | |
| | | | | | | | | | | | | | |
TOTAL ASSET-BACKED SECURITIES
(cost $568,408,147) | | | | | | | | | | | | | 567,418,192 | |
| | | | | | | | | | | | | | |
See Notes to Financial Statements.
| | | | |
| Prudential Absolute Return Bond Fund | | | 19 | |
Portfolio of Investments
as of October 31, 2014 continued
| | | | | | | | | | | | | | |
| Description | | Interest
Rate | | Maturity
Date | | | Principal
Amount (000)# | | | Value (Note 1) | |
BANK LOANS(a) 5.6% | | | | | | | | | | | | | | |
| | | | |
Aerospace & Defense | | | | | | | | | | | | | | |
Wesco Aircraft Hardware Corp. | | 2.660% | | | 12/07/17 | | | | 871 | | | $ | 865,680 | |
| | | | |
Airlines 0.1% | | | | | | | | | | | | | | |
United Airlines | | 3.500 | | | 04/01/19 | | | | 1,305 | | | | 1,277,065 | |
| | | | |
Automotive 0.1% | | | | | | | | | | | | | | |
Allison Transmision, Inc. | | 2.910 | | | 08/07/17 | | | | 265 | | | | 263,167 | |
Chrysler Group LLC | | 3.250 | | | 12/31/18 | | | | 2,487 | | | | 2,460,864 | |
Chrysler Group LLC | | 3.500 | | | 05/24/17 | | | | 81 | | | | 80,203 | |
| | | | | | | | | | | | | | |
| | | | | | | | | | | | | 2,804,234 | |
| | | | |
Brokerage 0.1% | | | | | | | | | | | | | | |
LPL Holdings, Inc. | | 3.250 | | | 03/29/19 | | | | 1,481 | | | | 1,458,985 | |
| | | | |
Cable 0.1% | | | | | | | | | | | | | | |
CSC Holdings LLC | | 2.733 | | | 04/17/20 | | | | 2,326 | | | | 2,273,316 | |
Virgin Media Investment Holdings Ltd. (United Kingdom) | | 3.500 | | | 06/08/20 | | | | 1,500 | | | | 1,478,125 | |
| | | | | | | | | | | | | | |
| | | | | | | | | | | | | 3,751,441 | |
| | | | |
Capital Goods 0.4% | | | | | | | | | | | | | | |
ADS Waste Holdings, Inc. | | 3.750 | | | 10/09/19 | | | | 1,481 | | | | 1,446,349 | |
Allflex Holdings III, Inc.
(original cost $990,000; purchased 06/07/13)(c)(d) | | 4.250 | | | 07/17/20 | | | | 990 | | | | 967,477 | |
OGF SA, Private Placement
(original cost $3,773,315; purchased 09/04/13)(c)(d) | | 4.004 | | | 10/30/20 | | | EUR | 2,885 | | | | 3,616,009 | |
RAC PLC
(original cost $505,875; purchased 03/06/14)(c)(d) | | 5.261 | | | 10/29/19 | | | GBP | 300 | | | | 478,708 | |
RBS Global, Inc./Rexnord LLC | | 4.000 | | | 08/21/20 | | | | 3,465 | | | | 3,409,931 | |
| | | | | | | | | | | | | | |
| | | | | | | | | | | | | 9,918,474 | |
| | | | |
Chemicals 0.2% | | | | | | | | | | | | | | |
Axalta Coating Systems US Holdings | | 3.750 | | | 02/03/20 | | | | 1,907 | | | | 1,874,337 | |
CeramTec GmbH (Germany) | | 4.750 | | | 08/31/20 | | | EUR | 1,700 | | | | 2,129,909 | |
Macdermid, Inc. | | 4.000 | | | 06/07/20 | | | | 988 | | | | 963,122 | |
See Notes to Financial Statements.
| | | | | | | | | | | | | | |
| Description | | Interest
Rate | | Maturity
Date | | | Principal
Amount (000)# | | | Value (Note 1) | |
BANK LOANS(a) (Continued) | |
|
Chemicals (cont’d.) | |
OXEA Finance & Cy SCA (Luxembourg)
(original cost $1,739,099; purchased 06/06/13)(c)(d) | | 4.500% | | | 01/15/20 | | | EUR | 1,320 | | | $ | 1,608,265 | |
| | | | | | | | | | | | | | |
| | | | | | | | | | | | | 6,575,633 | |
| | | | |
Consumer 0.2% | | | | | | | | | | | | | | |
Seaworld Parks & Entertainment, Inc. | | 3.000 | | | 05/14/20 | | | | 2,291 | | | | 2,188,013 | |
Spectrum Brands, Inc. | | 3.000 | | | 09/04/17 | | | | 1,907 | | | | 1,891,513 | |
| | | | | | | | | | | | | | |
| | | | | | | | | | | | | 4,079,526 | |
|
Electric 0.1% | |
Calpine Construction Finance Co. LP | | 3.000 | | | 05/04/20 | | | | 518 | | | | 502,723 | |
Calpine Corp. | | 4.000 | | | 10/09/19 | | | | 490 | | | | 484,335 | |
NRG Energy, Inc. | | 2.750 | | | 06/29/18 | | | | 1,716 | | | | 1,682,773 | |
| | | | | | | | | | | | | | |
| | | | | | | | | | | | | 2,669,831 | |
|
Energy - Other 0.1% | |
Seadrill Operating LP | | 4.000 | | | 02/19/21 | | | | 3,383 | | | | 3,193,272 | |
|
Food & Beverage 1.1% | |
B.C. Unlimited Liability Co. | | 4.500 | | | 10/27/21 | | | | 2,550 | | | | 2,546,458 | |
Albertsons Holdings LLC | | 4.000 | | | 08/23/19 | | | | 16,800 | | | | 16,750,994 | |
Darling International, Inc. | | 3.250 | | | 01/06/21 | | | | 1,493 | | | | 1,481,306 | |
Dunkin Brands, Inc. | | 3.250 | | | 02/08/21 | | | | 1,231 | | | | 1,206,367 | |
H.J. Heinz Co. | | 3.250 | | | 06/07/19 | | | | 1,975 | | | | 1,956,621 | |
H.J. Heinz Co. | | 3.500 | | | 06/05/20 | | | | 1,995 | | | | 1,980,819 | |
Pinnacle Foods Finance LLC | | 3.250 | | | 04/29/20 | | | | 1,656 | | | | 1,622,169 | |
US Foods, Inc. | | 4.500 | | | 03/29/19 | | | | 3,491 | | | | 3,480,978 | |
| | | | | | | | | | | | | | |
| | | | | | | | | | | | | 31,025,712 | |
|
Gaming 0.1% | |
Boyd Gaming Corp. | | 4.000 | | | 08/14/20 | | | | 801 | | | | 792,646 | |
CCM Merger, Inc.
(original cost $364,592; purchased 07/30/14)(c)(d) | | 4.500 | | | 08/06/21 | | | | 367 | | | | 365,510 | |
MGM Resorts International | | 2.983 | | | 12/20/17 | | | | 1,474 | | | | 1,461,960 | |
| | | | | | | | | | | | | | |
| | | | | | | | | | | | | 2,620,116 | |
See Notes to Financial Statements.
| | | | |
| Prudential Absolute Return Bond Fund | | | 21 | |
Portfolio of Investments
as of October 31, 2014 continued
| | | | | | | | | | | | | | |
| Description | | Interest
Rate | | Maturity
Date | | | Principal
Amount (000)# | | | Value (Note 1) | |
BANK LOANS(a) (Continued) | |
|
Healthcare & Pharmaceutical 1.3% | |
Alere, Inc. | | 3.154% | | | 06/30/16 | | | | 43 | | | $ | 43,008 | |
Biomet, Inc. | | 3.733 | | | 07/25/17 | | | | 7,050 | | | | 7,024,662 | |
Capsugel Holdings US, Inc. | | 3.500 | | | 08/01/18 | | | | 2,340 | | | | 2,308,968 | |
Catalent Pharma Solutions, Inc. | | 4.500 | | | 05/20/21 | | | | 571 | | | | 568,838 | |
Community Health Systems, Inc. | | 2.733 | | | 01/25/19 | | | | 4,833 | | | | 4,744,724 | |
Community Health Systems, Inc. | | 3.485 | | | 01/25/17 | | | | 2,080 | | | | 2,073,013 | |
Community Health Systems, Inc. | | 4.250 | | | 01/27/21 | | | | 361 | | | | 361,085 | |
DaVita Healthcare Partners, Inc. | | 3.500 | | | 06/24/21 | | | | 3,940 | | | | 3,897,910 | |
Grifols SA | | 3.235 | | | 02/26/21 | | | | 6,726 | | | | 6,631,446 | |
Hologic, Inc. | | 2.154 | | | 08/01/17 | | | | 219 | | | | 218,203 | |
Mallinckrodt International Finance | | 3.500 | | | 03/19/21 | | | | 3,050 | | | | 3,018,411 | |
Ortho Clinical Diagnostics | | 4.750 | | | 06/30/21 | | | | 2,244 | | | | 2,214,918 | |
Quintiles Transnational Corp. | | 3.750 | | | 06/08/18 | | | | 979 | | | | 969,498 | |
RPI Financial TR | | 3.250 | | | 05/09/18 | | | | 382 | | | | 380,456 | |
Valeant Pharmaceuticals International, Inc. | | 3.750 | | | 08/05/20 | | | | 2,000 | | | | 1,983,334 | |
| | | | | | | | | | | | | | |
| | | | | | | | | | | | | 36,438,474 | |
|
Leisure 0.1% | |
Activision Blizzard, Inc. | | 3.250 | | | 10/12/20 | | | | 2,250 | | | | 2,246,485 | |
|
Lodging 0.2% | |
Hilton Worldwide Finance LLC | | 3.500 | | | 10/26/20 | | | | 5,298 | | | | 5,241,456 | |
|
Media & Entertainment 0.2% | |
CBS Outdoor Americas CAP Co. | | 3.000 | | | 02/01/21 | | | | 3,600 | | | | 3,525,001 | |
Entravision Communications Corp. | | 3.500 | | | 05/29/20 | | | | 963 | | | | 934,433 | |
Nielsen Finance LLC | | 3.153 | | | 04/15/21 | | | | 336 | | | | 334,969 | |
| | | | | | | | | | | | | | |
| | | | | | | | | | | | | 4,794,403 | |
|
Non-Captive Finance 0.2% | |
RBS WorldPay, Inc. (United Kingdom) | | 4.500 | | | 11/29/19 | | | | 3,465 | | | | 3,430,350 | |
RBS WorldPay, Inc. (United Kingdom) | | 5.750 | | | 11/29/19 | | | GBP | 1,500 | | | | 2,400,739 | |
| | | | | | | | | | | | | | |
| | | | | | | | | | | | | 5,831,089 | |
|
Packaging | |
Berry Plastics Group, Inc. | | 3.750 | | | 01/06/21 | | | | 997 | | | | 979,622 | |
|
Pipelines & Other 0.1% | |
Ruby Western Pipeline Holdings LLC | | 3.500 | | | 03/27/20 | | | | 1,924 | | | | 1,913,832 | |
See Notes to Financial Statements.
| | | | | | | | | | | | | | |
| Description | | Interest
Rate | | Maturity
Date | | | Principal
Amount (000)# | | | Value (Note 1) | |
BANK LOANS(a) (Continued) | |
|
Retailers | |
Alliance Boots Ltd. (United Kingdom) | | 3.984% | | | 07/09/17 | | | GBP | 325 | | | $ | 519,250 | |
|
Technology 0.8% | |
Avago Technologies Finance Pte Ltd. (Indonesia) | | 3.750 | | | 05/06/21 | | | | 5,985 | | | | 5,962,556 | |
BMC Software Finance, Inc. | | 5.000 | | | 09/10/20 | | | | 2,244 | | | | 2,213,030 | |
CDW Corp. | | 3.250 | | | 04/29/20 | | | | 1,231 | | | | 1,202,628 | |
First Data Corp. | | 3.733 | | | 03/26/18 | | | | 141 | | | | 139,416 | |
First Data Corp. | | 3.733 | | | 09/24/18 | | | | 225 | | | | 222,750 | |
Freescale Semiconductor, Inc. | | 4.250 | | | 02/28/20 | | | | 99 | | | | 97,074 | |
Interactive Data Corp. | | 4.750 | | | 05/03/21 | | | | 2,920 | | | | 2,916,372 | |
NXP BV (Netherlands) | | 3.250 | | | 01/10/20 | | | | 421 | | | | 416,192 | |
Syniverse Holdings, Inc. | | 4.000 | | | 04/23/19 | | | | 970 | | | | 951,343 | |
TransUnion LLC/TransUnion Financing Corp. | | 4.000 | | | 04/09/21 | | | | 2,784 | | | | 2,740,014 | |
Vantiv LLC | | 2.233 | | | 06/13/19 | | | | 988 | | | | 970,219 | |
Vantiv LLC | | 3.750 | | | 06/11/21 | | | | 4,289 | | | | 4,249,575 | |
| | | | | | | | | | | | | | |
| | | | | | | | | | | | | 22,081,169 | |
|
Telecommunications 0.1% | |
Level 3 Finance, Inc. | | 4.000 | | | 01/15/20 | | | | 1,000 | | | | 991,000 | |
SBA Senior Finance II, LLC | | 3.250 | | | 03/24/21 | | | | 2,743 | | | | 2,690,548 | |
| | | | | | | | | | | | | | |
| | | | | | | | | | | | | 3,681,548 | |
| | | | | | | | | | | | | | |
TOTAL BANK LOANS
(cost $155,298,647) | | | | | | | | | | | | | 153,967,297 | |
| | | | | | | | | | | | | | |
|
COMMERCIAL MORTGAGE-BACKED SECURITIES 12.0% | |
Banc of America Commercial Mortgage Trust,
Series 2006-3, Class A4 | | 5.889(a) | | | 07/10/44 | | | | 678 | | | | 718,704 | |
Series 2006-6, Class A2 | | 5.309 | | | 10/10/45 | | | | 36 | | | | 36,421 | |
Series 2006-6, Class A4 | | 5.356 | | | 10/10/45 | | | | 2,988 | | | | 3,155,059 | |
Series 2007-1, Class A4 | | 5.451 | | | 01/15/49 | | | | 1,895 | | | | 2,044,213 | |
Series 2007-2, Class A1A | | 5.730(a) | | | 04/10/49 | | | | 2,014 | | | | 2,169,642 | |
Series 2007-2, Class A3 | | 5.754(a) | | | 04/10/49 | | | | 200 | | | | 203,286 | |
Series 2007-2, Class A4 | | 5.781(a) | | | 04/10/49 | | | | 5,000 | | | | 5,419,030 | |
Series 2007-5, Class A1A | | 5.361 | | | 02/10/51 | | | | 2,085 | | | | 2,280,384 | |
Series 2007-5, Class A3 | | 5.620 | | | 02/10/51 | | | | 1 | | | | 709 | |
Banc of America Merrill Lynch Commercial Mortgage, Inc., Series 2005-2, Class AM | | 4.913(a) | | | 07/10/43 | | | | 50 | | | | 50,703 | |
Bear Stearns Commercial Mortgage Securities, Series 2007-PW17, Class A3 | | 5.736 | | | 06/11/50 | | | | 122 | | | | 123,511 | |
See Notes to Financial Statements.
| | | | |
| Prudential Absolute Return Bond Fund | | | 23 | |
Portfolio of Investments
as of October 31, 2014 continued
| | | | | | | | | | | | | | |
| Description | | Interest
Rate | | Maturity
Date | | | Principal
Amount (000)# | | | Value (Note 1) | |
COMMERCIAL MORTGAGE-BACKED SECURITIES (Continued) | |
CD Commercial Mortgage Trust,
Series 2006-CD3, Class A5 | | 5.617% | | | 10/15/48 | | | | 18 | | | $ | 18,826 | |
Series 2007-CD4, Class A3 | | 5.293 | | | 12/11/49 | | | | 23 | | | | 23,603 | |
Series 2007-CD4, Class A4 | | 5.322 | | | 12/11/49 | | | | 6,325 | | | | 6,760,685 | |
Citigroup Commercial Mortgage Trust,
Series 2007-C6, Class A4 | | 5.710(a) | | | 12/10/49 | | | | 1,210 | | | | 1,327,143 | |
Series 2008-C7, Class A4 | | 6.133(a) | | | 12/10/49 | | | | 4,000 | | | | 4,432,288 | |
Series 2013-GC11, Class A3 | | 2.815 | | | 04/10/46 | | | | 2,700 | | | | 2,638,999 | |
Series 2014-GC21, Class A4 | | 3.575 | | | 05/10/47 | | | | 6,230 | | | | 6,403,748 | |
Cobalt CMBS Commercial Mortgage Trust, Series 2006-C1, Class A4 | | 5.223 | | | 08/15/48 | | | | 6,709 | | | | 7,116,705 | |
COMM Mortgage Trust,
Series 2012-CR1, Class A3 | | 3.391 | | | 05/15/45 | | | | 15 | | | | 15,504 | |
Series 2012-CR1, Class XA, IO | | 2.128(a) | | | 05/15/45 | | | | 14,903 | | | | 1,597,667 | |
Series 2012-CR5, Class A3 | | 2.540 | | | 12/10/45 | | | | 1,000 | | | | 961,496 | |
Series 2013-CR7, Class A3 | | 2.929 | | | 03/10/46 | | | | 265 | | | | 262,606 | |
Series 2013-CR10, Class A3 | | 3.923 | | | 08/10/46 | | | | 3,500 | | | | 3,706,707 | |
Series 2013-CR12, Class A2 | | 2.904 | | | 10/10/46 | | | | 10,200 | | | | 10,535,386 | |
Series 2014-CR18, Class A3 | | 3.528 | | | 07/15/47 | | | | 10,000 | | | | 10,338,550 | |
Series 2014-KYO, Class XCP, IO, 144A | | 0.969(a) | | | 06/11/27 | | | | 71,488 | | | | 773,037 | |
Series 2014-UBS2, Class XB, IO, 144A | | 0.139(a) | | | 03/10/47 | | | | 171,811 | | | | 2,210,520 | |
Series 2014-UBS3, Class A3 | | 3.546 | | | 06/10/47 | | | | 8,600 | | | | 8,793,715 | |
Series 2014-UBS4, Class A4 | | 3.420 | | | 08/10/47 | | | | 7,100 | | | | 7,160,165 | |
Commercial Mortgage Loan Trust, Series 2008-LS1, Class A1A | | 6.241(a) | | | 12/10/49 | | | | 1,274 | | | | 1,409,612 | |
Commercial Mortgage Trust,
Series 2005-GG3, Class A4 | | 4.799(a) | | | 08/10/42 | | | | 160 | | | | 160,049 | |
Series 2005-GG3, Class AJ | | 4.859(a) | | | 08/10/42 | | | | 1,200 | | | | 1,203,200 | |
Series 2005-GG5, Class A5 | | 5.224(a) | | | 04/10/37 | | | | 6,927 | | | | 7,077,704 | |
Series 2005-GG5, Class AAB | | 5.190(a) | | | 04/10/37 | | | | 17 | | | | 17,082 | |
Series 2007-GG9, Class A2 | | 5.381 | | | 03/10/39 | | | | 130 | | | | 131,136 | |
Credit Suisse Commercial Mortgage Trust,
Series 2006-C1, Class AM | | 5.463(a) | | | 02/15/39 | | | | 1,014 | | | | 1,061,930 | |
Series 2006-C3, Class A1A | | 5.806(a) | | | 06/15/38 | | | | 822 | | | | 871,377 | |
Series 2006-C5, Class A3 | | 5.311 | | | 12/15/39 | | | | 2,592 | | | | 2,753,104 | |
Credit Suisse First Boston Mortgage Securities Corp.,
Series 2005-C2, Class A4 | | 4.832 | | | 04/15/37 | | | | 3,337 | | | | 3,341,985 | |
Series 2005-C6, Class AM | | 5.230(a) | | | 12/15/40 | | | | 100 | | | | 103,575 | |
Federal National Mortgage Association, Series 2012-M8, Class X1, IO | | 2.191(a) | | | 12/25/19 | | | | 48,669 | | | | 3,353,019 | |
See Notes to Financial Statements.
| | | | | | | | | | | | | | |
| Description | | Interest
Rate | | Maturity
Date | | | Principal
Amount (000)# | | | Value (Note 1) | |
COMMERCIAL MORTGAGE-BACKED SECURITIES (Continued) | |
FHLMC Multifamily Structured Pass-Through Certificates,
Series K007, Class X1, IO | | 1.188%(a) | | | 04/25/20 | | | | 5,283 | | | $ | 252,969 | |
Series K008, Class X1, IO | | 1.656(a) | | | 06/25/20 | | | | 22,915 | | | | 1,610,433 | |
Series K010, Class X1, IO | | 0.366(a) | | | 10/25/20 | | | | 23,105 | | | | 336,368 | |
Series K018, Class X1, IO | | 1.445(a) | | | 01/25/22 | | | | 16,645 | | | | 1,349,129 | |
Series K020, Class X1, IO | | 1.467(a) | | | 05/25/22 | | | | 21,537 | | | | 1,892,039 | |
Series K021, Class X1, IO | | 1.507(a) | | | 06/25/22 | | | | 4,441 | | | | 402,906 | |
Series K025, Class X1, IO | | 0.901(a) | | | 10/25/22 | | | | 97,418 | | | | 5,558,370 | |
Series K036, Class X1, IO | | 0.801(a) | | | 10/25/23 | | | | 40,960 | | | | 2,339,380 | |
Series K501, Class X1A, IO | | 1.717(a) | | | 08/25/16 | | | | 342 | | | | 7,662 | |
Series K710, Class X1, IO | | 1.779(a) | | | 05/25/19 | | | | 492 | | | | 33,616 | |
Series K711, Class X1, IO | | 1.707(a) | | | 07/25/19 | | | | 3,959 | | | | 264,001 | |
GE Capital Commercial Mortgage Corp., Series 2005-C4, Class A4 | | 5.490(a) | | | 11/10/45 | | | | 4,000 | | | | 4,088,140 | |
GE Commercial Mortgage Corp., Series 2007-C1, Class AAB | | 5.477 | | | 12/10/49 | | | | 56 | | | | 57,467 | |
GMAC Commercial Mortgage Securities, Inc., Series 2005-C1, Class AM | | 4.754 | | | 05/10/43 | | | | 425 | | | | 429,869 | |
GS Mortgage Securities Corp. II,
Series 2013-GC10, Class XB, IO, 144A | | 0.500(a) | | | 02/10/46 | | | | 103,126 | | | | 3,989,326 | |
Series 2014-GC20, Class XB, IO | | 0.337(a) | | | 04/10/47 | | | | 28,307 | | | | 993,293 | |
GS Mortgage Securities Trust,
Series 2013-GC12, Class A3 | | 2.860 | | | 06/10/46 | | | | 4,000 | | | | 3,921,876 | |
Series 2013-GC12, Class XB, IO | | 0.545(a) | | | 06/10/46 | | | | 37,400 | | | | 1,582,394 | |
Series 2013-GC14, Class A4 | | 3.955 | | | 08/10/46 | | | | 6,700 | | | | 7,090,925 | |
JPMBB Commercial Mortgage Securities Trust,
Series 2013-C12, Class A3 | | 3.272 | | | 07/15/45 | | | | 4,413 | | | | 4,548,007 | |
Series 2014-C21, Class A4 | | 3.493 | | | 08/15/47 | | | | 7,100 | | | | 7,213,323 | |
Series 2014-C21, Class XB, IO | | 0.320(a) | | | 08/15/47 | | | | 45,056 | | | | 1,380,876 | |
JPMorgan Chase Commercial Mortgage Securities Corp.,
Series 2012-LC9, Class A3 | | 2.475 | | | 12/15/47 | | | | 1,000 | | | | 1,002,031 | |
Series 2012-LC9, Class A4 | | 2.611 | | | 12/15/47 | | | | 1,700 | | | | 1,640,764 | |
JPMorgan Chase Commercial Mortgage Securities Trust,
Series 2004-CBX, Class AJ | | 4.951(a) | | | 01/12/37 | | | | 200 | | | | 200,236 | |
Series 2005-CB13, Class A3A1 | | 5.244(a) | | | 01/12/43 | | | | 24 | | | | 23,756 | |
Series 2005-LDP2, Class AJ | | 4.842(a) | | | 07/15/42 | | | | 450 | | | | 458,583 | |
Series 2005-LDP2, Class AM | | 4.780 | | | 07/15/42 | | | | 1,746 | | | | 1,773,773 | |
Series 2005-LDP3, Class A4B | | 4.996(a) | | | 08/15/42 | | | | 180 | | | | 184,378 | |
See Notes to Financial Statements.
| | | | |
| Prudential Absolute Return Bond Fund | | | 25 | |
Portfolio of Investments
as of October 31, 2014 continued
| | | | | | | | | | | | | | |
| Description | | Interest
Rate | | Maturity
Date | | | Principal
Amount (000)# | | | Value (Note 1) | |
COMMERCIAL MORTGAGE-BACKED SECURITIES (Continued) | |
JPMorgan Chase Commercial Mortgage Securities Trust, (Continued) | | | | | | | | | | | | | | |
Series 2005-LDP3, Class AJ | | 4.996%(a) | | | 08/15/42 | | | | 500 | | | $ | 510,078 | |
Series 2005-LDP4, Class AM | | 4.999(a) | | | 10/15/42 | | | | 750 | | | | 770,452 | |
Series 2005-LDP5, Class A3 | | 5.265(a) | | | 12/15/44 | | | | 628 | | | | 628,559 | |
Series 2006-CB14, Class AM | | 5.617(a) | | | 12/12/44 | | | | 1,000 | | | | 1,045,428 | |
Series 2006-LDP6, Class ASB | | 5.490(a) | | | 04/15/43 | | | | 37 | | | | 37,723 | |
Series 2007-CB20, Class A4 | | 5.794(a) | | | 02/12/51 | | | | 60 | | | | 65,577 | |
Series 2007-LD11, Class A2 | | 5.771(a) | | | 06/15/49 | | | | 29 | | | | 29,331 | |
Series 2007-LD11, Class A3 | | 5.786(a) | | | 06/15/49 | | | | 218 | | | | 221,202 | |
Series 2007-LD11, Class A4 | | 5.786(a) | | | 06/15/49 | | | | 1,109 | | | | 1,202,246 | |
Series 2007-LD12, Class A3 | | 5.930(a) | | | 02/15/51 | | | | 171 | | | | 171,573 | |
Series 2007-LD12, Class A4 | | 5.882(a) | | | 02/15/51 | | | | 4,000 | | | | 4,372,904 | |
Series 2011-C3, Class A2, 144A | | 3.673 | | | 02/15/46 | | | | 348 | | | | 360,830 | |
Series 2012-C8, Class A2 | | 1.797 | | | 10/15/45 | | | | 2,000 | | | | 2,015,548 | |
Series 2013-C13, Class A3 | | 3.525 | | | 01/15/46 | | | | 4,630 | | | | 4,830,173 | |
Series 2013-FL3, Class XCP, IO, 144A | | 1.028(a) | | | 04/15/28 | | | | 36,923 | | | | 25,108 | |
Series 2013-LC11, Class A3 | | 2.592 | | | 04/15/46 | | | | 5,000 | | | | 4,985,030 | |
Series 2013-LC11, Class A4 | | 2.694 | | | 04/15/46 | | | | 6,350 | | | | 6,137,650 | |
Series 2013-LC11, Class XB, IO | | 0.585(a) | | | 04/15/46 | | | | 34,956 | | | | 1,475,224 | |
Series 2014-FL4, Class XCP, IO, 144A | | 0.673(a) | | | 12/15/15 | | | | 446,208 | | | | 349,470 | |
LB-UBS Commercial Mortgage Trust,
Series 2005-C7, Class AM | | 5.263(a) | | | 11/15/40 | | | | 70 | | | | 72,703 | |
Series 2006-C7, Class A2 | | 5.300 | | | 11/15/38 | | | | 141 | | | | 143,981 | |
Merrill Lynch Mortgage Trust,
Series 2005-LC1, Class AM | | 5.488(a) | | | 01/12/44 | | | | 102 | | | | 106,299 | |
Series 2006-C1, Class AM | | 5.862(a) | | | 05/12/39 | | | | 30 | | | | 31,687 | |
Series 2007-C1, Class A3 | | 5.835(a) | | | 06/12/50 | | | | 438 | | | | 439,556 | |
ML-CFC Commercial Mortgage Trust,
Series 2006-1, Class AM | | 5.701(a) | | | 02/12/39 | | | | 5,160 | | | | 5,402,391 | |
Series 2006-2, Class AM | | 6.071(a) | | | 06/12/46 | | | | 100 | | | | 106,717 | |
Series 2006-3, Class A4 | | 5.414(a) | | | 07/12/46 | | | | 4,200 | | | | 4,455,676 | |
Series 2006-4, Class A2 | | 5.112 | | | 12/12/49 | | | | 16 | | | | 15,958 | |
Series 2006-4, Class A2FL | | 0.274(a) | | | 12/12/49 | | | | 7 | | | | 7,029 | |
Series 2007-5, Class A4 | | 5.378 | | | 08/12/48 | | | | 9,654 | | | | 10,338,450 | |
Series 2007-7, Class A4 | | 5.744(a) | | | 06/12/50 | | | | 5,053 | | | | 5,502,050 | |
Morgan Stanley Bank of America Merrill Lynch Trust,
Series 2012-C5, Class XB, IO, 144A | | 0.235(a) | | | 08/15/45 | | | | 65,968 | | | | 1,244,091 | |
Series 2013-C7, Class A3 | | 2.655 | | | 02/15/46 | | | | 3,000 | | | | 2,901,342 | |
Series 2013-C8, Class A3 | | 2.863 | | | 12/15/48 | | | | 6,900 | | | | 6,774,910 | |
See Notes to Financial Statements.
| | | | | | | | | | | | | | |
| Description | | Interest
Rate | | Maturity
Date | | | Principal
Amount (000)# | | | Value (Note 1) | |
COMMERCIAL MORTGAGE-BACKED SECURITIES (Continued) | |
Morgan Stanley Bank of America Merrill Lynch Trust, (Continued) | | | | | | | | | | | | | | |
Series 2013-C8, Class XB, IO, 144A | | 0.497%(a) | | | 12/15/48 | | | | 68,276 | | | $ | 2,309,395 | |
Series 2013-C9, Class A3 | | 2.834 | | | 05/15/46 | | | | 5,400 | | | | 5,274,202 | |
Series 2013-C10, Class A3 | | 3.967(a) | | | 07/15/46 | | | | 10,000 | | | | 10,652,510 | |
Morgan Stanley Capital I Trust,
Series 2005-IQ10, Class A4B | | 5.251(a) | | | 09/15/42 | | | | 1,000 | | | | 1,030,565 | |
Series 2006-HQ9, Class AM | | 5.773(a) | | | 07/12/44 | | | | 200 | | | | 213,378 | |
Series 2007-HQ11, Class A4 | | 5.447(a) | | | 02/12/44 | | | | 4,100 | | | | 4,413,724 | |
Series 2007-HQ11, Class A31 | | 5.439 | | | 02/12/44 | | | | 28 | | | | 27,867 | |
Series 2007-HQ12, Class A2FX | | 5.592(a) | | | 04/12/49 | | | | 30 | | | | 30,214 | |
Series 2007-HQ12, Class A3 | | 5.592(a) | | | 04/12/49 | | | | 2,380 | | | | 2,424,282 | |
Series 2007-IQ13, Class A1A | | 5.312 | | | 03/15/44 | | | | 240 | | | | 258,371 | |
Series 2007-IQ14, Class AAB | | 5.654(a) | | | 04/15/49 | | | | 171 | | | | 175,875 | |
UBS-Barclays Commercial Mortgage Trust,
Series 2012-C4, Class A3 | | 2.533 | | | 12/10/45 | | | | 2,800 | | | | 2,775,539 | |
Series 2012-C4, Class A4 | | 2.792 | | | 12/10/45 | | | | 1,500 | | | | 1,475,937 | |
Series 2013-C5, Class A3 | | 2.920 | | | 03/10/46 | | | | 6,400 | | | | 6,315,488 | |
Series 2013-C6, Class A3 | | 2.971 | | | 04/10/46 | | | | 2,900 | | | | 2,873,932 | |
Series 2013-C6, Class XB, IO, 144A | | 0.406(a) | | | 04/10/46 | | | | 140,883 | | | | 4,365,964 | |
UBS-Citigroup Commercial Mortgage Trust, Series 2011-C1, Class A3 | | 3.595 | | | 01/10/45 | | | | 1,135 | | | | 1,187,994 | |
Wachovia Bank Commercial Mortgage Trust,
Series 2005-C16, Class AJ | | 4.896(a) | | | 10/15/41 | | | | 655 | | | | 654,652 | |
Series 2005-C17, Class AJ | | 5.224(a) | | | 03/15/42 | | | | 1,368 | | | | 1,376,308 | |
Series 2005-C21, Class AM | | 5.240(a) | | | 10/15/44 | | | | 321 | | | | 332,651 | |
Series 2005-C22, Class A4 | | 5.274(a) | | | 12/15/44 | | | | 3,685 | | | | 3,801,056 | |
Series 2006-C25, Class A5 | | 5.712(a) | | | 05/15/43 | | | | 4,000 | | | | 4,244,448 | |
Series 2006-C27, Class A3 | | 5.765(a) | | | 07/15/45 | | | | 7,374 | | | | 7,768,937 | |
Series 2006-C28, Class A4 | | 5.572 | | | 10/15/48 | | | | 4,667 | | | | 4,978,174 | |
Series 2007-C31, Class A4 | | 5.509 | | | 04/15/47 | | | | 2,500 | | | | 2,676,233 | |
Series 2007-C31, Class A5 | | 5.500 | | | 04/15/47 | | | | 3,415 | | | | 3,708,751 | |
Series 2007-C32, Class A1A | | 5.716(a) | | | 06/15/49 | | | | 2,620 | | | | 2,838,197 | |
Series 2007-C33, Class A4 | | 5.941(a) | | | 02/15/51 | | | | 250 | | | | 269,509 | |
Series 2007-C34, Class A1A | | 5.608(a) | | | 05/15/46 | | | | 5,786 | | | | 6,305,369 | |
Wells Fargo Commercial Mortgage Trust, Series 2014-LC6, Class A4 | | 3.548 | | | 08/15/50 | | | | 9,000 | | | | 9,211,590 | |
| | | | | | | | | | | | | | |
TOTAL COMMERCIAL MORTGAGE-BACKED SECURITIES
(cost $334,064,856) | | | | | | | | | | | 328,136,733 | |
| | | | | | | | | | | | | | |
See Notes to Financial Statements.
| | | | |
| Prudential Absolute Return Bond Fund | | | 27 | |
Portfolio of Investments
as of October 31, 2014 continued
| | | | | | | | | | | | | | |
| Description | | Interest
Rate | | Maturity
Date | | | Principal
Amount (000)# | | | Value (Note 1) | |
CORPORATE BONDS 42.6% | |
|
Aerospace & Defense 0.1% | |
B/E Aerospace, Inc., Sr. Unsec’d. Notes | | 5.250% | | | 04/01/22 | | | | 100 | | | $ | 111,250 | |
Bombardier, Inc. (Canada), Sr. Unsec’d. Notes, 144A | | 7.500 | | | 03/15/18 | | | | 2,200 | | | | 2,442,000 | |
Textron, Inc., Sr. Unsec’d. Notes | | 4.625 | | | 09/21/16 | | | | 500 | | | | 531,839 | |
| | | | | | | | | | | | | | |
| | | | | | | | | | | | | 3,085,089 | |
|
Airlines 0.3% | |
American Airlines, Pass-Through Trust, Series 2013-1, Class A, Pass Through Certificates | | 4.000 | | | 07/15/25 | | | | 3,406 | | | | 3,448,491 | |
Continental Airlines, Inc., Pass-Through Trust,
Series 2007-1, Class A, Pass-Through Certificates | | 5.983 | | | 04/19/22 | | | | 1,007 | | | | 1,112,988 | |
Series 2012-2, Class A, Pass-Through Certificates | | 4.000 | | | 10/29/24 | | | | 118 | | | | 118,935 | |
Delta Air Lines, Inc., Pass-Through Trust, Series 2007-1, Class A, Pass-Through Certificates | | 6.821 | | | 08/10/22 | | | | 906 | | | | 1,046,221 | |
Series 2011-1, Class A, Pass-Through Certificates | | 5.300 | | | 04/15/19 | | | | 89 | | | | 96,025 | |
United Airlines Pass-Through Trust, Series 2013-1, Class A, Pass-Through Certificates | | 4.300 | | | 08/15/25 | | | | 2,450 | | | | 2,529,625 | |
| | | | | | | | | | | | | | |
| | | | | | | | | | | | | 8,352,285 | |
| | | | |
Automotive 1.5% | | | | | | | | | | | | | | |
Chrysler Group LLC/CG Co-Issuer Inc., Sec’d. Notes | | 8.000 | | | 06/15/19 | | | | 1,500 | | | | 1,606,875 | |
Sec’d. Notes | | 8.250 | | | 06/15/21 | | | | 2,800 | | | | 3,129,000 | |
Daimler Finance North America LLC,
Gtd. Notes, 144A | | 2.375 | | | 08/01/18 | | | | 625 | | | | 633,426 | |
Gtd. Notes, 144A | | 2.950 | | | 01/11/17 | | | | 750 | | | | 777,724 | |
Dana Holding Corp.,
Sr. Unsec’d. Notes | | 5.375 | | | 09/15/21 | | | | 750 | | | | 780,000 | |
Sr. Unsec’d. Notes | | 6.500 | | | 02/15/19 | | | | 1,713 | | | | 1,779,379 | |
Sr. Unsec’d. Notes | | 6.750 | | | 02/15/21 | | | | 3,000 | | | | 3,187,500 | |
Ford Motor Co., Sr. Unsec’d. Notes | | 4.750 | | | 01/15/43 | | | | 1,670 | | | | 1,703,801 | |
Ford Motor Credit Co. LLC,
Sr. Unsec’d. Notes | | 2.375 | | | 01/16/18 | | | | 650 | | | | 656,222 | |
See Notes to Financial Statements.
| | | | | | | | | | | | | | |
| Description | | Interest
Rate | | Maturity
Date | | | Principal
Amount (000)# | | | Value (Note 1) | |
CORPORATE BONDS (Continued) | |
|
Automotive (cont’d.) | |
Ford Motor Credit Co. LLC, (Continued) | | | | | | | | | | | | | | |
Sr. Unsec’d. Notes | | 2.597% | | | 11/04/19 | | | | 7,050 | | | $ | 7,026,531 | |
Sr. Unsec’d. Notes | | 3.000 | | | 06/12/17 | | | | 410 | | | | 422,732 | |
Sr. Unsec’d. Notes | | 4.207 | | | 04/15/16 | | | | 200 | | | | 208,717 | |
Sr. Unsec’d. Notes | | 4.250 | | | 02/03/17 | | | | 6,470 | | | | 6,849,556 | |
General Motors Co.,
Sr. Unsec’d. Notes | | 4.875 | | | 10/02/23 | | | | 2,000 | | | | 2,142,500 | |
Sr. Unsec’d. Notes | | 6.250 | | | 10/02/43 | | | | 2,230 | | | | 2,653,700 | |
General Motors Financial Co., Inc.,
Gtd. Notes | | 2.750 | | | 05/15/16 | | | | 1,575 | | | | 1,596,656 | |
Gtd. Notes | | 3.250 | | | 05/15/18 | | | | 575 | | | | 587,937 | |
Gtd. Notes | | 4.250 | | | 05/15/23 | | | | 575 | | | | 592,250 | |
Harley-Davidson Financial Services, Inc., Gtd. Notes, MTN, 144A | | 2.700 | | | 03/15/17 | | | | 25 | | | | 25,757 | |
Johnson Controls, Inc., Sr. Unsec’d. Notes | | 4.250 | | | 03/01/21 | | | | 3,090 | | | | 3,329,296 | |
Lear Corp., Gtd. Notes | | 8.125 | | | 03/15/20 | | | | 976 | | | | 1,030,900 | |
| | | | | | | | | | | | | | |
| | | | | | | | | | | | | 40,720,459 | |
| | | | |
Banking 9.4% | | | | | | | | | | | | | | |
American Express Co., Sr. Unsec’d. Notes(e) | | 2.650 | | | 12/02/22 | | | | 3,099 | | | | 3,021,705 | |
Asian Development Bank (Supranational Bank), Sr. Unsec’d. Notes, GMTN | | 1.125 | | | 11/25/14 | | | | 10,000 | | | | 10,005,500 | |
Banco de Credito del Peru (Peru), Sr. Unsec’d. Notes, 144A | | 4.250 | | | 04/01/23 | | | | 263 | | | | 263,657 | |
Bank of America Corp.,
Jr. Sub. Notes | | 5.125(a) | | | 12/31/49 | | | | 2,175 | | | | 2,109,750 | |
Jr. Sub. Notes | | 8.000(a) | | | 12/29/49 | | | | 3,190 | | | | 3,433,237 | |
Jr. Sub. Notes | | 8.125(a) | | | 12/29/49 | | | | 1,000 | | | | 1,085,000 | |
Sr. Unsec’d. Notes | | 4.100 | | | 07/24/23 | | | | 3,450 | | | | 3,601,631 | |
Sr. Unsec’d. Notes | | 5.625 | | | 10/14/16 | | | | 160 | | | | 174,031 | |
Sr. Unsec’d. Notes | | 5.700 | | | 01/24/22 | | | | 2,945 | | | | 3,390,496 | |
Sr. Unsec’d. Notes | | 5.875 | | | 01/05/21 | | | | 450 | | | | 519,994 | |
Sr. Unsec’d. Notes(e) | | 6.000 | | | 09/01/17 | | | | 500 | | | | 557,615 | |
Sr. Unsec’d. Notes | | 7.625 | | | 06/01/19 | | | | 490 | | | | 594,341 | |
Sr. Unsec’d. Notes, MTN | | 3.300 | | | 01/11/23 | | | | 9,525 | | | | 9,443,752 | |
Sr. Unsec’d. Notes, MTN | | 4.000 | | | 04/01/24 | | | | 2,200 | | | | 2,273,194 | |
Sr. Unsec’d. Notes, MTN | | 5.000 | | | 01/21/44 | | | | 280 | | | | 305,969 | |
Sr. Unsec’d. Notes, MTN | | 5.875 | | | 02/07/42 | | | | 385 | | | | 470,377 | |
Sub. Notes, MTN(e) | | 4.200 | | | 08/26/24 | | | | 2,825 | | | | 2,845,230 | |
See Notes to Financial Statements.
| | | | |
| Prudential Absolute Return Bond Fund | | | 29 | |
Portfolio of Investments
as of October 31, 2014 continued
| | | | | | | | | | | | | | |
| Description | | Interest
Rate | | Maturity
Date | | | Principal
Amount (000)# | | | Value (Note 1) | |
CORPORATE BONDS (Continued) | |
|
Banking (cont’d.) | |
Bank of Tokyo-Mitsubishi UFJ Ltd. (The) (Japan), Sr. Unsec’d. Notes, 144A | | 3.750% | | | 03/10/24 | | | | 3,225 | | | $ | 3,335,572 | |
Barclays Bank PLC (United Kingdom), Sr. Unsec’d. Notes(e) | | 3.750 | | | 05/15/24 | | | | 4,225 | | | | 4,279,131 | |
BB&T Corp., Sr. Unsec’d. Notes, MTN | | 1.600 | | | 08/15/17 | | | | 25 | | | | 25,093 | |
BPCE SA (France), Gtd. Notes, MTN(e) | | 2.500 | | | 07/15/19 | | | | 5,950 | | | | 5,954,343 | |
Branch Banking & Trust Co.,
Sr. Unsec’d. Notes(f) | | 2.850 | | | 04/01/21 | | | | 5,425 | | | | 5,443,054 | |
Sub. Notes | | 0.554(a) | | | 09/13/16 | | | | 1,500 | | | | 1,496,805 | |
Capital One Bank USA NA,
Sr. Unsec’d. Notes | | 2.950 | | | 07/23/21 | | | | 5,775 | | | | 5,734,061 | |
Sub. Notes | | 3.375 | | | 02/15/23 | | | | 2,065 | | | | 2,045,060 | |
Capital One Financial Corp.,
Sr. Unsec’d. Notes | | 3.750 | | | 04/24/24 | | | | 4,125 | | | | 4,177,255 | |
Sr. Unsec’d. Notes | | 4.750 | | | 07/15/21 | | | | 300 | | | | 330,278 | |
Sub. Notes | | 6.150 | | | 09/01/16 | | | | 110 | | | | 119,709 | |
Citigroup, Inc.,
Sr. Unsec’d. Notes(e) | | 3.375 | | | 03/01/23 | | | | 7,400 | | | | 7,381,174 | |
Sr. Unsec’d. Notes(e) | | 3.875 | | | 10/25/23 | | | | 2,350 | | | | 2,419,177 | |
Sr. Unsec’d. Notes | | 4.500 | | | 01/14/22 | | | | 1,525 | | | | 1,654,465 | |
Sr. Unsec’d. Notes | | 8.125 | | | 07/15/39 | | | | 1,455 | | | | 2,189,742 | |
Sr. Unsec’d. Notes | | 8.500 | | | 05/22/19 | | | | 350 | | | | 439,152 | |
Sub. Notes(e) | | 3.500 | | | 05/15/23 | | | | 2,500 | | | | 2,447,582 | |
Sub. Notes | | 4.050 | | | 07/30/22 | | | | 550 | | | | 565,811 | |
Sub. Notes | | 4.875 | | | 05/07/15 | | | | 250 | | | | 255,303 | |
Sub. Notes | | 6.675 | | | 09/13/43 | | | | 1,000 | | | | 1,271,553 | |
Credit Suisse New York (Switzerland), Sr. Unsec’d. Notes, MTN | | 3.625 | | | 09/09/24 | | | | 2,375 | | | | 2,383,735 | |
Deutsche Bank AG (Germany), Sr. Unsec’d. Notes(e) | | 3.700 | | | 05/30/24 | | | | 3,275 | | | | 3,303,915 | |
Discover Bank,
Sr. Unsec’d. Notes | | 2.000 | | | 02/21/18 | | | | 1,200 | | | | 1,194,721 | |
Sr. Unsec’d. Notes | | 4.200 | | | 08/08/23 | | | | 5,500 | | | | 5,762,652 | |
Sub. Notes | | 7.000 | | | 04/15/20 | | | | 800 | | | | 946,885 | |
Fifth Third Bancorp, Sub. Notes(e) | | 4.300 | | | 01/16/24 | | | | 4,975 | | | | 5,176,677 | |
Fifth Third Bank,
Sr. Unsec’d. Notes | | 1.450 | | | 02/28/18 | | | | 2,275 | | | | 2,255,860 | |
Sr. Unsec’d. Notes | | 2.375 | | | 04/25/19 | | | | 1,075 | | | | 1,081,103 | |
See Notes to Financial Statements.
| | | | | | | | | | | | | | |
| Description | | Interest
Rate | | Maturity
Date | | | Principal
Amount (000)# | | | Value (Note 1) | |
CORPORATE BONDS (Continued) | |
|
Banking (cont’d.) | |
Goldman Sachs Group, Inc. (The),
Sr. Unsec’d. Notes | | 3.625% | | | 01/22/23 | | | | 6,000 | | | $ | 6,016,740 | |
Sr. Unsec’d. Notes | | 5.125 | | | 01/15/15 | | | | 100 | | | | 100,838 | |
Sr. Unsec’d. Notes | | 5.250 | | | 07/27/21 | | | | 1,840 | | | | 2,051,282 | |
Sr. Unsec’d. Notes | | 5.750 | | | 01/24/22 | | | | 4,590 | | | | 5,287,827 | |
Sr. Unsec’d. Notes | | 6.250 | | | 02/01/41 | | | | 345 | | | | 427,509 | |
Sr. Unsec’d. Notes, MTN | | 4.000 | | | 03/03/24 | | | | 1,875 | | | | 1,915,993 | |
Sr. Unsec’d. Notes, MTN | | 4.800 | | | 07/08/44 | | | | 2,105 | | | | 2,173,678 | |
Sr. Unsec’d. Notes, MTN | | 6.000 | | | 06/15/20 | | | | 4,450 | | | | 5,117,549 | |
Sub. Notes | | 5.625 | | | 01/15/17 | | | | 130 | | | | 141,020 | |
HSBC Bank PLC (United Kingdom), Sr. Unsec’d. Notes, 144A | | 3.500 | | | 06/28/15 | | | | 120 | | | | 122,342 | |
HSBC Holding PLC (United Kingdom),
Sr. Unsec’d. Notes | | 4.000 | | | 03/30/22 | | | | 1,600 | | | | 1,701,107 | |
Sub. Notes | | 6.500 | | | 05/02/36 | | | | 610 | | | | 763,239 | |
Huntington Bancshares, Inc., Sr. Unsec’d. Notes | | 2.600 | | | 08/02/18 | | | | 2,350 | | | | 2,385,452 | |
ING Bank NV (Netherlands), Sr. Unsec’d. Notes, 144A | | 2.000 | | | 09/25/15 | | | | 300 | | | | 303,451 | |
Intesa Sanpaolo SpA (Italy), Bank Gtd. Notes | | 3.125 | | | 01/15/16 | | | | 475 | | | | 484,978 | |
JPMorgan Chase & Co.,
Jr. Sub. Notes | | 5.150(a) | | | 12/31/49 | | | | 3,725 | | | | 3,529,437 | |
Jr. Sub. Notes | | 6.100(a) | | | 12/31/49 | | | | 3,400 | | | | 3,408,500 | |
Jr. Sub. Notes(e) | | 7.900(a) | | | 04/29/49 | | | | 130 | | | | 140,888 | |
Sr. Unsec’d. Notes | | 3.150 | | | 07/05/16 | | | | 15 | | | | 15,515 | |
Sr. Unsec’d. Notes | | 3.200 | | | 01/25/23 | | | | 9,500 | | | | 9,425,064 | |
Sr. Unsec’d. Notes | | 3.250 | | | 09/23/22 | | | | 2,115 | | | | 2,117,885 | |
Sr. Unsec’d. Notes | | 4.500 | | | 01/24/22 | | | | 720 | | | | 783,272 | |
Sr. Unsec’d. Notes | | 5.400 | | | 01/06/42 | | | | 600 | | | | 695,531 | |
Sr. Unsec’d. Notes | | 6.000 | | | 01/15/18 | | | | 130 | | | | 146,532 | |
Sub. Notes | | 3.375 | | | 05/01/23 | | | | 1,925 | | | | 1,879,782 | |
KeyBank NA, Sr. Unsec’d. Notes | | 1.650 | | | 02/01/18 | | | | 700 | | | | 698,268 | |
Lloyds Bank PLC (United Kingdom),
Bank Gtd. Notes | | 6.375 | | | 01/21/21 | | | | 4,570 | | | | 5,472,232 | |
Bank Gtd. Notes, MTN, 144A | | 5.800 | | | 01/13/20 | | | | 100 | | | | 116,022 | |
Lloyds TSB Bank PLC (United Kingdom), Bank Gtd. Notes | | 2.300 | | | 11/27/18 | | | | 1,100 | | | | 1,107,291 | |
Mizuho Bank Ltd. (Japan), Gtd. Notes, 144A | | 1.850 | | | 03/21/18 | | | | 675 | | | | 671,324 | |
Morgan Stanley,
Jr. Sub. Notes | | 5.450(a) | | | 12/31/49 | | | | 1,925 | | | | 1,934,024 | |
See Notes to Financial Statements.
| | | | |
| Prudential Absolute Return Bond Fund | | | 31 | |
Portfolio of Investments
as of October 31, 2014 continued
| | | | | | | | | | | | | | |
| Description | | Interest
Rate | | Maturity
Date | | | Principal
Amount (000)# | | | Value (Note 1) | |
CORPORATE BONDS (Continued) | |
|
Banking (cont’d.) | |
Morgan Stanley, (Continued) | | | | | | | | | | | | | | |
Sr. Unsec’d. Notes | | 3.750% | | | 02/25/23 | | | | 7,150 | | | $ | 7,241,556 | |
Sr. Unsec’d. Notes(e) | | 6.375 | | | 07/24/42 | | | | 700 | | | | 901,293 | |
Sr. Unsec’d. Notes, GMTN | | 5.450 | | | 01/09/17 | | | | 330 | | | | 358,090 | |
Sr. Unsec’d. Notes, MTN | | 2.125 | | | 04/25/18 | | | | 2,880 | | | | 2,887,978 | |
Sr. Unsec’d. Notes, MTN(e) | | 5.500 | | | 07/28/21 | | | | 1,900 | | | | 2,166,338 | |
Sr. Unsec’d. Notes, MTN | | 5.625 | | | 09/23/19 | | | | 680 | | | | 770,286 | |
Sr. Unsec’d. Notes, MTN | | 6.250 | | | 08/28/17 | | | | 1,930 | | | | 2,160,127 | |
Sr. Unsec’d. Notes, MTN | | 6.625 | | | 04/01/18 | | | | 100 | | | | 114,516 | |
Sub. Notes, MTN | | 4.100 | | | 05/22/23 | | | | 815 | | | | 822,606 | |
Sub. Notes, MTN | | 4.875 | | | 11/01/22 | | | | 930 | | | | 990,416 | |
Sub. Notes, MTN | | 5.000 | | | 11/24/25 | | | | 2,075 | | | | 2,205,441 | |
National Savings Bank, Sr. Unsec’d. Notes, RegS | | 8.875 | | | 09/18/18 | | | | 2,000 | | | | 2,267,600 | |
Nordea Bank AB (Sweden),
Sr. Unsec’d. Notes, 144A | | 1.625 | | | 05/15/18 | | | | 4,125 | | | | 4,099,223 | |
Sr. Unsec’d. Notes, 144A | | 3.125 | | | 03/20/17 | | | | 200 | | | | 208,482 | |
Northern Trust Corp., Sub. Notes | | 3.950 | | | 10/30/25 | | | | 4,375 | | | | 4,547,217 | |
People’s United Bank, Sub. Notes | | 4.000 | | | 07/15/24 | | | | 1,125 | | | | 1,125,834 | |
People’s United Financial, Inc., Sr. Unsec’d. Notes | | 3.650 | | | 12/06/22 | | | | 325 | | | | 328,209 | |
PNC Bank NA,
Sr. Unsec’d. Notes | | 3.300 | | | 10/30/24 | | | | 6,225 | | | | 6,201,401 | |
Sub. Notes | | 2.950 | | | 01/30/23 | | | | 900 | | | | 874,253 | |
Sub. Notes(f) | | 3.800 | | | 07/25/23 | | | | 2,425 | | | | 2,498,880 | |
Sub. Notes | | 4.200 | | | 11/01/25 | | | | 2,125 | | | | 2,247,073 | |
PNC Financial Services Group, Inc. (The),
Sr. Unsec’d. Notes | | 2.854(g) | | | 11/09/22 | | | | 125 | | | | 122,572 | |
Sub. Notes | | 3.900 | | | 04/29/24 | | | | 1,910 | | | | 1,935,583 | |
PNC Funding Corp., Bank Gtd. Notes | | 2.700 | | | 09/19/16 | | | | 50 | | | | 51,508 | |
Royal Bank of Scotland Group PLC (The)
(United Kingdom),
Bank Gtd. Notes | | 4.875 | | | 03/16/15 | | | | 100 | | | | 101,476 | |
Bank Gtd. Notes | | 6.125 | | | 01/11/21 | | | | 350 | | | | 411,510 | |
Sr. Unsec’d. Notes | | 2.550 | | | 09/18/15 | | | | 50 | | | | 50,714 | |
Santander Holdings USA, Inc.,
Sr. Unsec’d. Notes | | 3.000 | | | 09/24/15 | | | | 75 | | | | 76,266 | |
Sr. Unsec’d. Notes | | 4.625 | | | 04/19/16 | | | | 870 | | | | 915,128 | |
State Street Corp., Sr. Unsec’d. Notes | | 3.700 | | | 11/20/23 | | | | 3,850 | | | | 3,990,887 | |
See Notes to Financial Statements.
| | | | | | | | | | | | | | |
| Description | | Interest
Rate | | Maturity
Date | | | Principal
Amount (000)# | | | Value (Note 1) | |
CORPORATE BONDS (Continued) | |
|
Banking (cont’d.) | |
Sumitomo Mitsui Banking Corp. (Japan),
Bank Gtd. Notes | | 2.450% | | | 01/10/19 | | | | 1,925 | | | $ | 1,941,126 | |
Bank Gtd. Notes | | 3.000 | | | 01/18/23 | | | | 800 | | | | 793,082 | |
Gtd. Notes, GMTN | | 2.250 | | | 07/11/19 | | | | 2,175 | | | | 2,160,056 | |
SunTrust Bank, Sr. Unsec’d. Notes | | 2.750 | | | 05/01/23 | | | | 1,225 | | | | 1,175,476 | |
SunTrust Banks, Inc., Sr. Unsec’d. Notes | | 2.350 | | | 11/01/18 | | | | 2,000 | | | | 2,012,646 | |
US Bancorp,
Jr. Sub. Notes | | 3.442 | | | 02/01/16 | | | | 130 | | | | 133,889 | |
Sub. Notes, MTN | | 2.950 | | | 07/15/22 | | | | 25 | | | | 24,526 | |
Sub. Notes, MTN(e) | | 3.600 | | | 09/11/24 | | | | 3,175 | | | | 3,194,498 | |
Wells Fargo & Co.,
Sr. Unsec’d. Notes | | 0.433(a) | | | 10/28/15 | | | | 200 | | | | 200,131 | |
Sr. Unsec’d. Notes, MTN(f) | | 3.000 | | | 01/22/21 | | | | 3,700 | | | | 3,764,158 | |
Sr. Unsec’d. Notes, MTN | | 3.500 | | | 03/08/22 | | | | 930 | | | | 961,657 | |
Sr. Unsec’d. Notes, MTN | | 4.600 | | | 04/01/21 | | | | 250 | | | | 276,139 | |
Sub. Notes, MTN | | 4.125 | | | 08/15/23 | | | | 2,900 | | | | 3,024,706 | |
Sub. Notes | | 5.606 | | | 01/15/44 | | | | 1,460 | | | | 1,672,529 | |
Sub. Notes, MTN | | 4.650 | | | 11/04/44 | | | | 3,185 | | | | 3,174,544 | |
| | | | | | | | | | | | | | |
| | | | | | | | | | | | | 256,081,545 | |
|
Brokerage 0.2% | |
Ameriprise Financial, Inc., Sr. Unsec’d. Notes | | 3.700 | | | 10/15/24 | | | | 5,500 | | | | 5,577,555 | |
Jefferies Group LLC, Sr. Unsec’d. Notes | | 6.500 | | | 01/20/43 | | | | 175 | | | | 196,096 | |
Nomura Holdings, Inc. (Japan), Sr. Unsec’d. Notes, MTN | | 2.000 | | | 09/13/16 | | | | 540 | | | | 546,753 | |
| | | | | | | | | | | | | | |
| | | | | | | | | | | | | 6,320,404 | |
|
Building Materials & Construction 1.4% | |
Building Materials Corp. of America,
Sr. Unsec’d. Notes, 144A
(original cost $3,825,000; purchased 10/27/14)(c) | | 5.375 | | | 11/15/24 | | | | 3,825 | | | | 3,834,562 | |
Sr. Unsec’d. Notes, 144A
(original cost $1,090,000; purchased 12/06/13)(c)(d)(e) | | 6.750 | | | 05/01/21 | | | | 1,000 | | | | 1,072,500 | |
Sr. Unsec’d. Notes, 144A
(original cost $2,360,680; purchased 09/28/12-05/09/13)(c)(d) | | 6.875 | | | 08/15/18 | | | | 2,176 | | | | 2,259,776 | |
See Notes to Financial Statements.
| | | | |
| Prudential Absolute Return Bond Fund | | | 33 | |
Portfolio of Investments
as of October 31, 2014 continued
| | | | | | | | | | | | | | |
| Description | | Interest
Rate | | Maturity
Date | | | Principal
Amount (000)# | | | Value (Note 1) | |
CORPORATE BONDS (Continued) | |
|
Building Materials & Construction (cont’d.) | |
Cemex Espana Luxembourg (Mexico), Sr. Sec’d. Notes, RegS | | 9.875% | | | 04/30/19 | | | | 1,770 | | | $ | 1,973,904 | |
Cemex Finance LLC (Mexico), Sr. Sec’d. Notes, 144A | | 9.875 | | | 04/30/19 | | | | 2,300 | | | | 2,564,960 | |
Cemex SAB de CV (Mexico),
Sr. Sec’d. Notes, 144A | | 4.750 | | | 01/11/22 | | | EUR | 2,100 | | | | 2,618,454 | |
Sr. Sec’d. Notes, 144A | | 5.700 | | | 01/11/25 | | | | 1,000 | | | | 979,700 | |
Sr. Sec’d. Notes, 144A | | 6.500 | | | 12/10/19 | | | | 3,000 | | | | 3,213,750 | |
CeramTec Group GmbH (Germany), Gtd. Notes, 144A | | 8.250 | | | 08/15/21 | | | EUR | 500 | | | | 672,314 | |
HD Supply, Inc., Sr. Sec’d. Notes | | 8.125 | | | 04/15/19 | | | | 2,228 | | | | 2,406,240 | |
KB Home, Gtd. Notes(e) | | 7.500 | | | 09/15/22 | | | | 3,425 | | | | 3,690,438 | |
Mohawk Industries, Inc., Sr. Unsec’d. Notes | | 3.850 | | | 02/01/23 | | | | 104 | | | | 105,142 | |
Odebrecht Finance Ltd. (Brazil),
Gtd. Notes, 144A
(original cost $625,000; purchased 06/19/14)(c)(d) | | 5.250 | | | 06/27/29 | | | | 625 | | | | 596,875 | |
Gtd. Notes, 144A
(original cost $255,785; purchased 10/22/12)(c)(d)(e) | | 7.125 | | | 06/26/42 | | | | 220 | | | | 230,890 | |
Owens Corning, Inc., Gtd. Notes | | 4.200 | | | 12/15/22 | | | | 125 | | | | 125,834 | |
Standard Pacific Corp., Gtd. Notes | | 8.375 | | | 05/15/18 | | | | 3,178 | | | | 3,678,535 | |
Taylor Morrison Communities, Inc./Monarch Communities, Inc., 144A | | 5.250 | | | 04/15/21 | | | | 3,500 | | | | 3,524,955 | |
US Concrete, Inc., Sr. Sec’d. Notes | | 8.500 | | | 12/01/18 | | | | 3,600 | | | | 3,852,000 | |
| | | | | | | | | | | | | | |
| | | | | | | | | | | | | 37,400,829 | |
|
Cable 1.3% | |
CCO Holdings LLC/CCO Holdings Capital Corp.,
Gtd. Notes(e) | | 5.750 | | | 01/15/24 | | | | 1,100 | | | | 1,126,125 | |
Gtd. Notes | | 7.000 | | | 01/15/19 | | | | 4,150 | | | | 4,326,375 | |
Gtd. Notes | | 7.250 | | | 10/30/17 | | | | 3,000 | | | | 3,123,750 | |
Gtd. Notes | | 8.125 | | | 04/30/20 | | | | 3,000 | | | | 3,180,000 | |
CCOH Safari LLC, Sr. Unsec’d. Notes | | 5.750 | | | 12/01/24 | | | | 5,575 | | | | 5,606,360 | |
CSC Holdings LLC,
Sr. Unsec’d. Notes | | 7.875 | | | 02/15/18 | | | | 2,040 | | | | 2,305,200 | |
Sr. Unsec’d. Notes | | 8.625 | | | 02/15/19 | | | | 35 | | | | 41,081 | |
DIRECTV Holdings LLC/DIRECTV Financing Co., Inc., Gtd. Notes | | 3.500 | | | 03/01/16 | | | | 130 | | | | 134,353 | |
See Notes to Financial Statements.
| | | | | | | | | | | | | | |
| Description | | Interest
Rate | | Maturity
Date | | | Principal
Amount (000)# | | | Value (Note 1) | |
CORPORATE BONDS (Continued) | |
|
Cable (cont’d.) | |
DISH DBS Corp., Gtd. Notes | | 4.250% | | | 04/01/18 | | | | 1,500 | | | $ | 1,537,500 | |
Intelsat Jackson Holdings SA (Luxembourg), Gtd. Notes | | 5.500 | | | 08/01/23 | | | | 2,000 | | | | 2,005,000 | |
NET Servicos de Comunicacao SA (Brazil), Gtd. Notes | | 7.500 | | | 01/27/20 | | | | 2,057 | | | | 2,151,622 | |
Unitymedia Hessen GmbH & Co. KG/Unitymedia NRW GmbH (Germany),
Sr. Sec’d. Notes, 144A | | 5.500 | | | 09/15/22 | | | EUR | 160 | | | | 214,964 | |
Sr. Sec’d. Notes, MTN, 144A | | 5.125 | | | 01/21/23 | | | EUR | 620 | | | | 828,425 | |
UPCB Finance III Ltd. (Netherlands), Sr. Sec’d. Notes, 144A | | 6.625 | | | 07/01/20 | | | | 150 | | | | 157,875 | |
Videotron Ltd. (Canada),
Gtd. Notes | | 5.000 | | | 07/15/22 | | | | 4,500 | | | | 4,635,000 | |
Gtd. Notes | | 9.125 | | | 04/15/18 | | | | 71 | | | | 73,307 | |
Gtd. Notes, 144A | | 5.375 | | | 06/15/24 | | | | 2,400 | | | | 2,472,000 | |
Virgin Media Secured Finance PLC (United Kingdom), Sr. Sec’d. Notes, 144A | | 6.000 | | | 04/15/21 | | | GBP | 800 | | | | 1,337,471 | |
| | | | | | | | | | | | | | |
| | | | | | | | | | | | | 35,256,408 | |
| | | | |
Capital Goods 2.0% | | | | | | | | | | | | | | |
Actuant Corp., Gtd. Notes | | 5.625 | | | 06/15/22 | | | | 3,075 | | | | 3,190,312 | |
AP Moeller-Maersk A/S (Denmark), Unsec’d. Notes, 144A | | 2.550 | | | 09/22/19 | | | | 2,450 | | | | 2,470,337 | |
Ashtead Capital, Inc. (United Kingdom), Sec’d. Notes, 144A | | 6.500 | | | 07/15/22 | | | | 1,925 | | | | 2,079,000 | |
Caterpillar Financial Services Corp., Sr. Unsec’d. Notes, MTN | | 1.250 | | | 11/06/17 | | | | 325 | | | | 322,590 | |
CITIC Pacific Ltd. (China),
Sr. Unsec’d. Notes, MTN, RegS | | 6.875 | | | 01/21/18 | | | | 2,450 | | | | 2,737,949 | |
Sr. Unsec’d. Notes, RegS | | 6.800 | | | 01/17/23 | | | | 2,500 | | | | 2,875,100 | |
CNH Capital LLC, Gtd. Notes | | 3.875 | | | 11/01/15 | | | | 500 | | | | 506,250 | |
Columbus Mckinnon Corp., Gtd. Notes | | 7.875 | | | 02/01/19 | | | | 2,000 | | | | 2,090,000 | |
Deere & Co., Sr. Unsec’d. Notes | | 2.600 | | | 06/08/22 | | | | 50 | | | | 48,951 | |
ERAC USA Finance LLC,
Gtd. Notes, 144A (original cost $131,355; purchased 05/30/13)(c)(d) | | 6.700 | | | 06/01/34 | | | | 110 | | | | 139,585 | |
Gtd. Notes, 144A (original cost $2,232,116; purchased 05/14/13)(c)(d) | | 7.000 | | | 10/15/37 | | | | 1,725 | | | | 2,269,443 | |
See Notes to Financial Statements.
| | | | |
| Prudential Absolute Return Bond Fund | | | 35 | |
Portfolio of Investments
as of October 31, 2014 continued
| | | | | | | | | | | | | | |
| Description | | Interest
Rate | | Maturity
Date | | | Principal
Amount (000)# | | | Value (Note 1) | |
CORPORATE BONDS (Continued) | |
|
Capital Goods (cont’d.) | |
General Electric Co.,
Sr. Unsec’d. Notes | | 4.125% | | | 10/09/42 | | | | 50 | | | $ | 50,451 | |
Sr. Unsec’d. Notes | | 4.500 | | | 03/11/44 | | | | 75 | | | | 79,951 | |
Griffon Corp., Gtd. Notes | | 5.250 | | | 03/01/22 | | | | 6,450 | | | | 6,208,125 | |
H&E Equipment Services, Inc., Gtd. Notes | | 7.000 | | | 09/01/22 | | | | 2,000 | | | | 2,135,000 | |
Hertz Corp. (The), Gtd. Notes | | 6.750 | | | 04/15/19 | | | | 3,125 | | | | 3,257,812 | |
Penske Truck Leasing Co. LP/PTL Finance Corp., Sr. Unsec’d. Notes, 144A
(original cost $274,593; purchased 09/24/12)(c)(d) | | 2.500 | | | 03/15/16 | | | | 275 | | | | 280,316 | |
Sr. Unsec’d. Notes, 144A
(original cost $449,024; purchased 01/14/13)(c)(d) | | 2.875 | | | 07/17/18 | | | | 450 | | | | 458,339 | |
Unsec’d. Notes, 144A
(original cost $24,976; purchased 05/08/12)(c)(d) | | 3.125 | | | 05/11/15 | | | | 25 | | | | 25,288 | |
Pentair Finance SA,
Gtd. Notes | | 1.350 | | | 12/01/15 | | | | 325 | | | | 326,053 | |
Gtd. Notes | | 1.875 | | | 09/15/17 | | | | 50 | | | | 50,252 | |
Roper Industries, Inc., Sr. Unsec’d. Notes | | 1.850 | | | 11/15/17 | | | | 175 | | | | 176,256 | |
SPX Corp., Gtd. Notes(e) | | 6.875 | | | 09/01/17 | | | | 1,000 | | | | 1,092,500 | |
Terex Corp.,
Gtd. Notes | | 6.000 | | | 05/15/21 | | | | 5,050 | | | | 5,252,000 | |
Gtd. Notes(e) | | 6.500 | | | 04/01/20 | | | | 1,005 | | | | 1,057,763 | |
Unifrax I LLC/Unifrax Holding Co.,
Gtd. Notes, 144A
(original cost $3,299,400; purchased 06/30/14)(c)(d) | | 7.500 | | | 02/15/19 | | | | 3,120 | | | | 3,166,800 | |
United Rentals North America, Inc.,
Gtd. Notes | | 7.375 | | | 05/15/20 | | | | 1,500 | | | | 1,627,500 | |
Gtd. Notes | | 7.625 | | | 04/15/22 | | | | 6,444 | | | | 7,185,060 | |
Gtd. Notes(e) | | 8.375 | | | 09/15/20 | | | | 1,000 | | | | 1,082,500 | |
Sr. Unsec’d. Notes | | 8.250 | | | 02/01/21 | | | | 550 | | | | 599,500 | |
United Technologies Corp., Sr. Unsec’d. Notes | | 4.500 | | | 06/01/42 | | | | 140 | | | | 149,424 | |
Votorantim Cimentos SA (Brazil),
Gtd. Notes, RegS | | 7.250 | | | 04/05/41 | | | | 700 | | | | 727,650 | |
Gtd. Notes, RegS | | 7.250 | | | 04/05/41 | | | | 300 | | | | 311,850 | |
Xylem, Inc.,
Sr. Unsec’d. Notes | | 3.550 | | | 09/20/16 | | | | 1,635 | | | | 1,706,780 | |
Sr. Unsec’d. Notes | | 4.875 | | | 10/01/21 | | | | 50 | | | | 55,258 | |
| | | | | | | | | | | | | | |
| | | | | | | | | | | | | 55,791,945 | |
See Notes to Financial Statements.
| | | | | | | | | | | | | | |
| Description | | Interest
Rate | | Maturity
Date | | | Principal
Amount (000)# | | | Value (Note 1) | |
CORPORATE BONDS (Continued) | |
| | | | |
Chemicals 1.2% | | | | | | | | | | | | | | |
Agrium, Inc. (Canada),
Sr. Unsec’d. Notes(e) | | 4.900% | | | 06/01/43 | | | | 2,020 | | | $ | 2,047,864 | |
Sr. Unsec’d. Notes | | 6.125 | | | 01/15/41 | | | | 170 | | | | 202,496 | |
Ashland, Inc.,
Gtd. Notes | | 4.750 | | | 08/15/22 | | | | 700 | | | | 705,250 | |
Sr. Unsec’d. Notes | | 3.875 | | | 04/15/18 | | | | 4,624 | | | | 4,699,140 | |
CF Industries, Inc.,
Gtd. Notes | | 4.950 | | | 06/01/43 | | | | 1,765 | | | | 1,774,243 | |
Gtd. Notes | | 5.375 | | | 03/15/44 | | | | 1,300 | | | | 1,382,784 | |
Gtd. Notes | | 6.875 | | | 05/01/18 | | | | 160 | | | | 184,880 | |
Gtd. Notes | | 7.125 | | | 05/01/20 | | | | 125 | | | | 150,295 | |
Dow Chemical Co. (The),
Sr. Unsec’d. Notes(e) | | 3.000 | | | 11/15/22 | | | | 1,550 | | | | 1,512,089 | |
Sr. Unsec’d. Notes | | 4.250 | | | 11/15/20 | | | | 3,150 | | | | 3,387,469 | |
Sr. Unsec’d. Notes | | 4.625 | | | 10/01/44 | | | | 15 | | | | 14,747 | |
Sr. Unsec’d. Notes | | 5.250 | | | 11/15/41 | | | | 125 | | | | 134,360 | |
Sr. Unsec’d. Notes | | 9.400 | | | 05/15/39 | | | | 95 | | | | 151,609 | |
Eastman Chemical Co.,
Sr. Unsec’d. Notes | | 3.600 | | | 08/15/22 | | | | 500 | | | | 507,589 | |
Sr. Unsec’d. Notes(e) | | 4.650 | | | 10/15/44 | | | | 1,210 | | | | 1,177,459 | |
Ecolab, Inc., Sr. Unsec’d. Notes | | 1.450 | | | 12/08/17 | | | | 600 | | | | 597,802 | |
Huntsman International LLC, Gtd. Notes | | 8.625 | | | 03/15/20 | | | | 1,500 | | | | 1,609,140 | |
Koppers, Inc., Gtd. Notes | | 7.875 | | | 12/01/19 | | | | 1,600 | | | | 1,660,000 | |
LYB International Finance BV (Netherlands),
Gtd. Notes | | 4.875 | | | 03/15/44 | | | | 1,835 | | | | 1,897,533 | |
Gtd. Notes | | 5.250 | | | 07/15/43 | | | | 415 | | | | 452,082 | |
LyondellBasell Industries NV, Sr. Unsec’d. Notes | | 6.000 | | | 11/15/21 | | | | 700 | | | | 819,596 | |
Mexichem SAB de CV (Mexico), Gtd. Notes, 144A(e) | | 4.875 | | | 09/19/22 | | | | 970 | | | | 1,034,262 | |
Monsanto Co.,
Sr. Unsec’d. Notes | | 4.200 | | | 07/15/34 | | | | 475 | | | | 485,024 | |
Sr. Unsec’d. Notes | | 4.400 | | | 07/15/44 | | | | 575 | | | | 579,645 | |
Mosaic Co. (The),
Sr. Unsec’d. Notes | | 5.450 | | | 11/15/33 | | | | 710 | | | | 792,653 | |
Sr. Unsec’d. Notes(e) | | 5.625 | | | 11/15/43 | | | | 2,335 | | | | 2,634,828 | |
Sherwin-Williams Co. (The), Sr. Unsec’d. Notes | | 1.350 | | | 12/15/17 | | | | 350 | | | | 348,266 | |
Sibur Securities Ltd. (Russia), Gtd. Notes, 144A | | 3.914 | | | 01/31/18 | | | | 425 | | | | 394,719 | |
W.R. Grace & Co., Sr. Unsec’d. Notes, 144A | | 5.125 | | | 10/01/21 | | | | 1,975 | | | | 2,057,713 | |
| | | | | | | | | | | | | | |
| | | | | | | | | | | | | 33,395,537 | |
See Notes to Financial Statements.
| | | | |
| Prudential Absolute Return Bond Fund | | | 37 | |
Portfolio of Investments
as of October 31, 2014 continued
| | | | | | | | | | | | | | |
| Description | | Interest
Rate | | Maturity
Date | | | Principal
Amount (000)# | | | Value (Note 1) | |
CORPORATE BONDS (Continued) | |
| | | | |
Consumer 0.6% | | | | | | | | | | | | | | |
ADT Corp. (The), Sr. Unsec’d. Notes | | 2.250% | | | 07/15/17 | | | | 50 | | | $ | 49,063 | |
First Quality Finance Co., Inc.,
Sr. Unsec’d. Notes, 144A(e) | | 4.625 | | | 05/15/21 | | | | 5,400 | | | | 4,995,000 | |
Jarden Corp., Gtd. Notes | | 6.125 | | | 11/15/22 | | | | 500 | | | | 523,750 | |
Newell Rubbermaid, Inc., Sr. Unsec’d. Notes | | 2.050 | | | 12/01/17 | | | | 375 | | | | 375,849 | |
PVH Corp., Sr. Unsec’d. Notes(e) | | 4.500 | | | 12/15/22 | | | | 2,200 | | | | 2,183,500 | |
QVC, Inc.,
Sr. Sec’d. Notes | | 4.375 | | | 03/15/23 | | | | 2,000 | | | | 1,984,026 | |
Sr. Sec’d. Notes | | 5.125 | | | 07/02/22 | | | | 1,800 | | | | 1,893,533 | |
Scotts Miracle-Gro Co. (The), Gtd. Notes | | 6.625 | | | 12/15/20 | | | | 3,500 | | | | 3,683,750 | |
Service Corp. International, Sr. Unsec’d. Notes | | 4.500 | | | 11/15/20 | | | | 2,135 | | | | 2,092,300 | |
| | | | | | | | | | | | | | |
| | | | | | | | | | | | | 17,780,771 | |
| | | | |
Electric 1.4% | | | | | | | | | | | | | | |
AES Corp., Sr. Unsec’d. Notes | | 8.000 | | | 10/15/17 | | | | 1,655 | | | | 1,878,425 | |
American Electric Power Co., Inc.,
Sr. Unsec’d. Notes | | 2.950 | | | 12/15/22 | | | | 550 | | | | 537,925 | |
Calpine Corp.,
Sr. Unsec’d. Notes | | 5.375 | | | 01/15/23 | | | | 2,175 | | | | 2,196,750 | |
Sr. Unsec’d. Notes(e) | | 5.750 | | | 01/15/25 | | | | 2,325 | | | | 2,354,063 | |
Connecticut Light & Power Co. (The),
First Ref. Mtge. | | 2.500 | | | 01/15/23 | | | | 375 | | | | 361,196 | |
Covanta Holding Corp., Sr. Unsec’d. Notes | | 7.250 | | | 12/01/20 | | | | 3,100 | | | | 3,301,500 | |
DPL, Inc.,
Sr. Unsec’d. Notes(e) | | 7.250 | | | 10/15/21 | | | | 2,225 | | | | 2,364,063 | |
Sr. Unsec’d. Notes, 144A | | 6.750 | | | 10/01/19 | | | | 1,650 | | | | 1,703,625 | |
Duke Energy Carolinas LLC, First Ref. Mtge. | | 4.000 | | | 09/30/42 | | | | 50 | | | | 50,246 | |
Duke Energy Corp., Sr. Unsec’d. Notes | | 1.625 | | | 08/15/17 | | | | 225 | | | | 226,352 | |
Dynegy, Inc.,
Sr. Sec’d. Notes, 144A | | 6.750 | | | 11/01/19 | | | | 5,850 | | | | 6,054,750 | |
Sr. Sec’d. Notes, 144A(e) | | 7.375 | | | 11/01/22 | | | | 4,200 | | | | 4,441,500 | |
Entergy Arkansas, Inc., First Mtge. | | 3.050 | | | 06/01/23 | | | | 450 | | | | 446,639 | |
Entergy Corp., Sr. Unsec’d. Notes | | 4.700 | | | 01/15/17 | | | | 75 | | | | 79,785 | |
FirstEnergy Corp., Sr. Unsec’d. Notes | | 2.750 | | | 03/15/18 | | | | 950 | | | | 959,800 | |
FirstEnergy Transmission LLC,
Sr. Unsec’d. Notes, 144A | | 5.450 | | | 07/15/44 | | | | 800 | | | | 823,746 | |
NextEra Energy Capital Holdings, Inc., Gtd. Notes | | 3.625 | | | 06/15/23 | | | | 1,575 | | | | 1,603,589 | |
NRG Energy, Inc.,
Gtd. Notes | | 7.625 | | | 01/15/18 | | | | 4,406 | | | | 4,945,735 | |
Gtd. Notes, 144A(e) | | 6.250 | | | 05/01/24 | | | | 4,000 | | | | 4,130,000 | |
See Notes to Financial Statements.
| | | | | | | | | | | | | | |
| Description | | Interest
Rate | | Maturity
Date | | | Principal
Amount (000)# | | | Value (Note 1) | |
CORPORATE BONDS (Continued) | |
|
Electric (cont’d.) | |
Progress Energy, Inc., Sr. Unsec’d. Notes | | 3.150% | | | 04/01/22 | | | | 75 | | | $ | 75,592 | |
Public Service Electric & Gas Co.,
Sec’d. Notes, MTN | | 3.650 | | | 09/01/42 | | | | 200 | | | | 189,741 | |
South Carolina Electric & Gas Co., First Mtge. | | 4.350 | | | 02/01/42 | | | | 130 | | | | 134,202 | |
Techem Energy Metering Service GmbH & Co. KG (Germany), Gtd. Notes, MTN, 144A | | 7.875 | | | 10/01/20 | | | EUR | 125 | | | | 172,765 | |
Techem GmbH (Germany), Sr. Sec’d. Notes,
MTN, 144A | | 6.125 | | | 10/01/19 | | | EUR | 200 | | | | 268,349 | |
Westar Energy, Inc., First Mtge. | | 4.100 | | | 04/01/43 | | | | 325 | | | | 326,053 | |
| | | | | | | | | | | | | | |
| | | | | | | | | | | | | 39,626,391 | |
|
Energy - Integrated 0.9% | |
BP Capital Markets PLC (United Kingdom),
Gtd. Notes | | 1.846 | | | 05/05/17 | | | | 150 | | | | 152,107 | |
Cenovus Energy, Inc. (Canada),
Sr. Unsec’d. Notes | | 4.450 | | | 09/15/42 | | | | 1,070 | | | | 1,035,015 | |
Pacific Rubiales Energy Corp. (Colombia),
Gtd. Notes, 144A(e) | | 5.375 | | | 01/26/19 | | | | 6,540 | | | | 6,556,350 | |
Gtd. Notes, 144A | | 7.250 | | | 12/12/21 | | | | 5,750 | | | | 6,138,125 | |
Reliance Holding USA, Inc. (India),
Gtd. Notes, 144A | | 5.400 | | | 02/14/22 | | | | 2,000 | | | | 2,177,746 | |
Rosneft Finance SA (Russia),
Gtd. Notes, MTN, 144A | | 6.625 | | | 03/20/17 | | | | 180 | | | | 185,085 | |
Sasol Financing International PLC (South Africa), Gtd. Notes | | 4.500 | | | 11/14/22 | | | | 7,740 | | | | 7,894,800 | |
| | | | | | | | | | | | | | |
| | | | | | | | | | | | | 24,139,228 | |
|
Energy - Other 1.0% | |
Afren PLC (United Kingdom), Sr. Sec’d. Notes, RegS | | 10.250 | | | 04/08/19 | | | | 900 | | | | 936,180 | |
Anadarko Petroleum Corp.,
Sr. Unsec’d. Notes | | 6.375 | | | 09/15/17 | | | | 4,460 | | | | 5,035,291 | |
Sr. Unsec’d. Notes | | 6.450 | | | 09/15/36 | | | | 750 | | | | 925,645 | |
Bristow Group, Inc., Gtd. Notes | | 6.250 | | | 10/15/22 | | | | 2,625 | | | | 2,730,000 | |
California Resources Corp., Gtd. Notes, 144A(e) | | 6.000 | | | 11/15/24 | | | | 2,675 | | | | 2,728,500 | |
Cameron International Corp., Sr. Unsec’d. Notes | | 5.950 | | | 06/01/41 | | | | 100 | | | | 117,321 | |
Continental Resources, Inc., Gtd. Notes | | 5.000 | | | 09/15/22 | | | | 2,240 | | | | 2,374,400 | |
Denbury Resources, Inc., Gtd. Notes(e) | | 5.500 | | | 05/01/22 | | | | 2,000 | | | | 1,970,000 | |
Halliburton Co., Sr. Unsec’d. Notes | | 4.750 | | | 08/01/43 | | | | 3,100 | | | | 3,315,837 | |
See Notes to Financial Statements.
| | | | |
| Prudential Absolute Return Bond Fund | | | 39 | |
Portfolio of Investments
as of October 31, 2014 continued
| | | | | | | | | | | | | | |
| Description | | Interest
Rate | | Maturity
Date | | | Principal
Amount (000)# | | | Value (Note 1) | |
CORPORATE BONDS (Continued) | |
|
Energy - Other (cont’d.) | |
Nabors Industries, Inc.,
Gtd. Notes | | 4.625% | | | 09/15/21 | | | | 762 | | | $ | 803,866 | |
Gtd. Notes | | 6.150 | | | 02/15/18 | | | | 80 | | | | 90,103 | |
Noble Energy, Inc.,
Sr. Unsec’d. Notes | | 4.150 | | | 12/15/21 | | | | 500 | | | | 533,264 | |
Sr. Unsec’d. Notes | | 5.250 | | | 11/15/43 | | | | 395 | | | | 425,248 | |
Sr. Unsec’d. Notes | | 6.000 | | | 03/01/41 | | | | 1,390 | | | | 1,612,289 | |
Noble Holding International Ltd., Gtd. Notes | | 2.500 | | | 03/15/17 | | | | 25 | | | | 25,331 | |
Plains Exploration & Production Co., Gtd. Notes | | 6.500 | | | 11/15/20 | | | | 356 | | | | 388,752 | |
Schlumberger Norge AS, Gtd. Notes, 144A | | 1.250 | | | 08/01/17 | | | | 1,200 | | | | 1,198,918 | |
Transocean, Inc., Gtd. Notes | | 2.500 | | | 10/15/17 | | | | 150 | | | | 148,198 | |
WPX Energy, Inc., Sr. Unsec’d. Notes | | 5.250 | | | 09/15/24 | | | | 1,850 | | | | 1,803,750 | |
| | | | | | | | | | | | | | |
| | | | | | | | | | | | | 27,162,893 | |
|
Food & Beverage 1.8% | |
Anheuser-Busch InBev Finance, Inc. (Belgium), Gtd. Notes | | 4.000 | | | 01/17/43 | | | | 600 | | | | 570,679 | |
Anheuser-Busch InBev Worldwide, Inc. (Belgium),
Gtd. Notes | | 2.500 | | | 07/15/22 | | | | 200 | | | | 191,373 | |
Gtd. Notes | | 8.200 | | | 01/15/39 | | | | 250 | | | | 380,498 | |
ARAMARK Corp., Gtd. Notes(e) | | 5.750 | | | 03/15/20 | | | | 1,600 | | | | 1,672,000 | |
Bertin SA/Bertin Finance Ltd. (Brazil),
Gtd. Notes, 144A | | 10.250 | | | 10/05/16 | | | | 3,380 | | | | 3,800,066 | |
BRF SA (Brazil),
Gtd. Notes, 144A | | 5.875 | | | 06/06/22 | | | | 2,635 | | | | 2,898,500 | |
Sr. Unsec’d. Notes, 144A | | 3.950 | | | 05/22/23 | | | | 1,525 | | | | 1,441,125 | |
Sr. Unsec’d. Notes, 144A | | 4.750 | | | 05/22/24 | | | | 3,000 | | | | 3,003,750 | |
Coca-Cola Icecek A/S (Turkey), Sr. Unsec’d. Notes, 144A | | 4.750 | | | 10/01/18 | | | | 950 | | | | 1,010,563 | |
ConAgra Foods, Inc., Sr. Unsec’d. Notes | | 2.100 | | | 03/15/18 | | | | 179 | | | | 179,900 | |
Constellation Brands, Inc.,
Gtd. Notes | | 6.000 | | | 05/01/22 | | | | 450 | | | | 502,875 | |
Gtd. Notes | | 7.250 | | | 09/01/16 | | | | 550 | | | | 600,875 | |
Embotelladora Andina SA (Chile), Sr. Unsec’d. Notes, 144A | | 5.000 | | | 10/01/23 | | | | 1,050 | | | | 1,112,211 | |
Ingles Markets, Inc., Sr. Unsec’d. Notes | | 5.750 | | | 06/15/23 | | | | 3,000 | | | | 3,060,000 | |
JBS Finance II Ltd. (Brazil), Gtd. Notes, 144A | | 8.250 | | | 01/29/18 | | | | 1,400 | | | | 1,473,500 | |
See Notes to Financial Statements.
| | | | | | | | | | | | | | |
| Description | | Interest
Rate | | Maturity
Date | | | Principal
Amount (000)# | | | Value (Note 1) | |
CORPORATE BONDS (Continued) | |
|
Food & Beverage (cont’d.) | |
JBS Investments Gmbh (Brazil), Sr. Unsec’d. Notes, 144A | | 7.750% | | | 10/28/20 | | | | 2,650 | | | $ | 2,903,419 | |
JBS USA LLC/JBS USA Finance, Inc. (Brazil),
Gtd. Notes, 144A
(original cost $1,081,250; purchased 06/17/14)(c)(d) | | 7.250 | | | 06/01/21 | | | | 1,000 | | | | 1,065,000 | |
Gtd. Notes, RegS
(original cost $1,605,000; purchased 10/01/14)(c)(d) | | 8.250 | | | 02/01/20 | | | | 1,500 | | | | 1,605,000 | |
Kraft Foods Group, Inc.,
Sr. Unsec’d. Notes | | 6.125 | | | 08/23/18 | | | | 160 | | | | 183,469 | |
Sr. Unsec’d. Notes | | 6.500 | | | 02/09/40 | | | | 1,020 | | | | 1,266,868 | |
Minerva Luxembourg SA (Brazil), Gtd. Notes, 144A | | 12.250 | | | 02/10/22 | | | | 250 | | | | 288,750 | |
Molson Coors Brewing Co., Gtd. Notes | | 2.000 | | | 05/01/17 | | | | 50 | | | | 50,764 | |
Pilgrim’s Pride Corp., Gtd. Notes | | 7.875 | | | 12/15/18 | | | | 1,600 | | | | 1,668,000 | |
Smithfield Foods, Inc.,
Sr. Unsec’d. Notes | | 6.625 | | | 08/15/22 | | | | 2,000 | | | | 2,180,000 | |
Sr. Unsec’d. Notes, 144A | | 5.875 | | | 08/01/21 | | | | 2,400 | | | | 2,544,000 | |
Stretford 79 PLC (United Kingdom),
Sr. Sec’d. Notes, 144A | | 6.750 | | | 07/15/24 | | | GBP | 4,000 | | | | 5,374,968 | |
Tops Holding Corp./Tops Markets LLC,
Sr. Sec’d. Notes | | 8.875 | | | 12/15/17 | | | | 7,155 | | | | 7,351,762 | |
Tyson Foods, Inc., Gtd. Notes | | 6.600 | | | 04/01/16 | | | | 340 | | | | 366,080 | |
| | | | | | | | | | | | | | |
| | | | | | | | | | | | | 48,745,995 | |
|
Gaming 0.5% | |
Marina District Finance Co., Inc.,
Sr. Sec’d. Notes | | 9.875 | | | 08/15/18 | | | | 100 | | | | 105,250 | |
MGM Resorts International,
Gtd. Notes(e) | | 6.625 | | | 12/15/21 | | | | 1,000 | | | | 1,095,000 | |
Gtd. Notes | | 7.625 | | | 01/15/17 | | | | 500 | | | | 545,625 | |
Pinnacle Entertainment, Inc.,
Gtd. Notes(e) | | 6.375 | | | 08/01/21 | | | | 2,800 | | | | 2,996,000 | |
Gtd. Notes | | 7.500 | | | 04/15/21 | | | | 2,500 | | | | 2,668,750 | |
Gtd. Notes(e) | | 8.750 | | | 05/15/20 | | | | 1,400 | | | | 1,487,500 | |
Wynn Macau Ltd. (Macau), Sr. Unsec’d. Notes, 144A | | 5.250 | | | 10/15/21 | | | | 4,000 | | | | 4,000,000 | |
| | | | | | | | | | | | | | |
| | | | | | | | | | | | | 12,898,125 | |
See Notes to Financial Statements.
| | | | |
| Prudential Absolute Return Bond Fund | | | 41 | |
Portfolio of Investments
as of October 31, 2014 continued
| | | | | | | | | | | | | | |
| Description | | Interest
Rate | | Maturity
Date | | | Principal
Amount (000)# | | | Value (Note 1) | |
CORPORATE BONDS (Continued) | |
|
Healthcare & Pharmaceutical 2.7% | |
Actavis Funding SCS,
Gtd. Notes, 144A | | 3.850% | | | 06/15/24 | | | | 2,575 | | | $ | 2,506,250 | |
Gtd. Notes, 144A | | 4.850 | | | 06/15/44 | | | | 75 | | | | 70,724 | |
Actavis, Inc., Sr. Unsec’d. Notes | | 1.875 | | | 10/01/17 | | | | 2,500 | | | | 2,478,038 | |
Amgen, Inc., Sr. Unsec’d. Notes | | 5.375 | | | 05/15/43 | | | | 610 | | | | 675,760 | |
AstraZeneca PLC (United Kingdom),
Sr. Unsec’d. Notes | | 4.000 | | | 09/18/42 | | | | 130 | | | | 124,707 | |
Capsugel SA, Sr. Unsec’d. Notes, PIK, 144A | | 7.000 | | | 05/15/19 | | | | 2,500 | | | | 2,542,188 | |
CHS/Community Health Systems, Inc.,
Gtd. Notes | | 8.000 | | | 11/15/19 | | | | 5,300 | | | | 5,724,000 | |
Sr. Sec’d. Notes | | 5.125 | | | 08/15/18 | | | | 150 | | | | 156,000 | |
ConvaTec Finance International SA (Luxembourg), Sr. Unsec’d. Notes, PIK, 144A | | 8.250 | | | 01/15/19 | | | | 5,024 | | | | 5,131,388 | |
ConvaTec Healthcare E SA (Luxembourg),
Gtd. Notes, 144A | | 10.500 | | | 12/15/18 | | | | 3,684 | | | | 3,905,040 | |
Forest Laboratories, Inc.,
Sr. Unsec’d. Notes, 144A | | 4.875 | | | 02/15/21 | | | | 1,120 | | | | 1,194,359 | |
Sr. Unsec’d. Notes, 144A | | 5.000 | | | 12/15/21 | | | | 1,830 | | | | 1,960,942 | |
Fresenius Medical Care US Finance, Inc. (Germany), Gtd. Notes, 144A | | 6.500 | | | 09/15/18 | | | | 2,415 | | | | 2,674,613 | |
Gilead Sciences, Inc.,
Sr. Unsec’d. Notes | | 4.800 | | | 04/01/44 | | | | 1,390 | | | | 1,506,635 | |
Sr. Unsec’d. Notes | | 5.650 | | | 12/01/41 | | | | 145 | | | | 175,286 | |
GlaxoSmithKline Capital, Inc., Gtd. Notes(f) | | 6.375 | | | 05/15/38 | | | | 730 | | | | 954,026 | |
HCA, Inc.,
Gtd. Notes | | 5.875 | | | 05/01/23 | | | | 2,000 | | | | 2,150,000 | |
Gtd. Notes | | 8.000 | | | 10/01/18 | | | | 4,500 | | | | 5,163,750 | |
Sr Sec’d. Notes | | 4.250 | | | 10/15/19 | | | | 1,675 | | | | 1,702,219 | |
Sr. Sec’d. Notes | | 4.750 | | | 05/01/23 | | | | 3,400 | | | | 3,455,250 | |
Sr. Sec’d. Notes | | 5.250 | | | 04/15/25 | | | | 2,000 | | | | 2,072,500 | |
Sr. Sec’d. Notes | | 5.875 | | | 03/15/22 | | | | 3,425 | | | | 3,758,937 | |
Sr. Unsec’d. Notes | | 7.190 | | | 11/15/15 | | | | 100 | | | | 104,750 | |
Sr. Unsec’d. Notes, MTN | | 9.000 | | | 12/15/14 | | | | 200 | | | | 201,000 | |
Laboratory Corp. of America Holdings, Sr. Unsec’d. Notes | | 3.750 | | | 08/23/22 | | | | 25 | | | | 25,478 | |
LifePoint Hospitals, Inc., Gtd. Notes | | 5.500 | | | 12/01/21 | | | | 3,875 | | | | 4,059,062 | |
Medco Health Solutions, Inc., Gtd. Notes | | 7.125 | | | 03/15/18 | | | | 1,000 | | | | 1,163,858 | |
Merck & Co, Inc., Sr. Unsec’d. Notes | | 4.150 | | | 05/18/43 | | | | 2,650 | | | | 2,753,888 | |
See Notes to Financial Statements.
| | | | | | | | | | | | | | |
| Description | | Interest
Rate | | Maturity
Date | | | Principal
Amount (000)# | | | Value (Note 1) | |
CORPORATE BONDS (Continued) | |
|
Healthcare & Pharmaceutical (cont’d.) | |
Mylan, Inc.,
Gtd. Notes(e) | | 2.600% | | | 06/24/18 | | | | 1,200 | | | $ | 1,217,148 | |
Gtd. Notes, 144A | | 6.000 | | | 11/15/18 | | | | 550 | | | | 566,635 | |
Pfizer, Inc., Sr. Unsec’d. Notes(f) | | 4.300 | | | 06/15/43 | | | | 2,350 | | | | 2,369,082 | |
Roche Holdings, Inc. (Switzerland),
Gtd. Notes, 144A | | 7.000 | | | 03/01/39 | | | | 550 | | | | 802,761 | |
Tenet Healthcare Corp.,
Sr. Sec’d. Notes(e) | | 4.375 | | | 10/01/21 | | | | 2,750 | | | | 2,732,812 | |
Sr. Sec’d. Notes | | 6.250 | | | 11/01/18 | | | | 600 | | | | 651,750 | |
Sr. Unsec’d. Notes(e) | | 8.125 | | | 04/01/22 | | | | 1,700 | | | | 1,948,625 | |
Valeant Pharmaceuticals International,
Gtd. Notes, 144A | | 6.750 | | | 08/15/18 | | | | 3,570 | | | | 3,797,587 | |
Gtd. Notes, 144A | | 6.875 | | | 12/01/18 | | | | 500 | | | | 517,500 | |
Zoetis, Inc., Sr. Unsec’d. Notes | | 4.700 | | | 02/01/43 | | | | 20 | | | | 20,579 | |
| | | | | | | | | | | | | | |
| | | | | | | | | | | | | 73,015,127 | |
| | | | |
Healthcare Insurance 0.2% | | | | | | | | | | | | | | |
Aetna, Inc.,
Sr. Unsec’d. Notes | | 2.750 | | | 11/15/22 | | | | 450 | | | | 433,286 | |
Sr. Unsec’d. Notes | | 4.125 | | | 11/15/42 | | | | 325 | | | | 307,653 | |
Sr. Unsec’d. Notes | | 4.500 | | | 05/15/42 | | | | 530 | | | | 531,608 | |
Cigna Corp., Sr. Unsec’d. Notes | | 5.375 | | | 02/15/42 | | | | 350 | | | | 395,561 | |
Coventry Health Care, Inc., Sr. Unsec’d. Notes | | 5.950 | | | 03/15/17 | | | | 320 | | | | 353,955 | |
Humana, Inc., Sr. Unsec’d. Notes | | 2.625 | | | 10/01/19 | | | | 2,075 | | | | 2,077,938 | |
UnitedHealth Group, Inc.,
Sr. Unsec’d. Notes | | 3.950 | | | 10/15/42 | | | | 175 | | | | 164,536 | |
Sr. Unsec’d. Notes | | 4.375 | | | 03/15/42 | | | | 1,055 | | | | 1,064,047 | |
WellPoint, Inc.,
Sr. Unsec’d. Notes | | 4.650 | | | 01/15/43 | | | | 120 | | | | 121,497 | |
Sr. Unsec’d. Notes | | 5.100 | | | 01/15/44 | | | | 515 | | | | 560,000 | |
| | | | | | | | | | | | | | |
| | | | | | | | | | | | | 6,010,081 | |
| | | | |
Insurance 2.1% | | | | | | | | | | | | | | |
Allied World Assurance Co. Ltd., Gtd. Notes | | 7.500 | | | 08/01/16 | | | | 100 | | | | 110,394 | |
American International Group, Inc.,
Sr. Unsec’d. Notes | | 4.500 | | | 07/16/44 | | | | 2,800 | | | | 2,843,459 | |
Sr. Unsec’d. Notes(f) | | 6.400 | | | 12/15/20 | | | | 4,490 | | | | 5,361,733 | |
Sr. Unsec’d. Notes, MTN | | 5.450 | | | 05/18/17 | | | | 2,190 | | | | 2,408,873 | |
Aon Corp. (United Kingdom), Gtd. Notes | | 3.125 | | | 05/27/16 | | | | 110 | | | | 113,403 | |
See Notes to Financial Statements.
| | | | |
| Prudential Absolute Return Bond Fund | | | 43 | |
Portfolio of Investments
as of October 31, 2014 continued
| | | | | | | | | | | | | | |
| Description | | Interest
Rate | | Maturity
Date | | | Principal
Amount (000)# | | | Value (Note 1) | |
CORPORATE BONDS (Continued) | |
| | | | |
Insurance (cont’d.) | | | | | | | | | | | | | | |
Axis Capital Holdings Ltd., Sr. Unsec’d. Notes | | 5.750% | | | 12/01/14 | | | | 500 | | | $ | 502,104 | |
Berkshire Hathaway, Inc., Sr. Unsec’d. Notes(e) | | 4.500 | | | 02/11/43 | | | | 740 | | | | 768,927 | |
Dai-ichi Life Insurance Co. Ltd. (The) (Japan), Sub. Notes, 144A | | 5.100(a) | | | 12/29/49 | | | | 1,175 | | | | 1,205,550 | |
Hartford Financial Services Group, Inc. (The),
Sr. Unsec’d. Notes | | 4.300 | | | 04/15/43 | | | | 1,062 | | | | 1,027,184 | |
Sr. Unsec’d. Notes | | 5.125 | | | 04/15/22 | | | | 205 | | | | 229,083 | |
Sr. Unsec’d. Notes | | 5.950 | | | 10/15/36 | | | | 215 | | | | 257,828 | |
Sr. Unsec’d. Notes | | 6.100 | | | 10/01/41 | | | | 280 | | | | 348,944 | |
Liberty Mutual Group, Inc.,
Gtd. Notes, 144A | | 4.250 | | | 06/15/23 | | | | 1,975 | | | | 2,042,632 | |
Gtd. Notes, 144A | | 4.850 | | | 08/01/44 | | | | 5,425 | | | | 5,432,676 | |
Gtd. Notes, 144A | | 4.950 | | | 05/01/22 | | | | 75 | | | | 81,288 | |
Gtd. Notes, 144A | | 6.500 | | | 05/01/42 | | | | 1,530 | | | | 1,839,507 | |
Sr. Unsec’d. Notes, 144A | | 6.700 | | | 08/15/16 | | | | 115 | | | | 126,036 | |
Lincoln National Corp.,
Sr. Unsec’d. Notes | | 4.200 | | | 03/15/22 | | | | 70 | | | | 74,391 | |
Sr. Unsec’d. Notes | | 6.300 | | | 10/09/37 | | | | 175 | | | | 219,454 | |
Sr. Unsec’d. Notes | | 7.000 | | | 06/15/40 | | | | 4,550 | | | | 6,098,388 | |
Markel Corp.,
Sr. Unsec’d. Notes | | 4.900 | | | 07/01/22 | | | | 2,020 | | | | 2,205,569 | |
Sr. Unsec’d. Notes | | 5.000 | | | 03/30/43 | | | | 3,125 | | | | 3,235,819 | |
Sr. Unsec’d. Notes | | 7.125 | | | 09/30/19 | | | | 630 | | | | 753,718 | |
Massachusetts Mutual Life Insurance Co., Sub. Notes, 144A | | 5.375 | | | 12/01/41 | | | | 320 | | | | 357,605 | |
MetLife, Inc.,
Sr. Unsec’d. Notes(f) | | 4.368 | | | 09/15/23 | | | | 2,225 | | | | 2,401,578 | |
Sr. Unsec’d. Notes | | 4.875 | | | 11/13/43 | | | | 670 | | | | 727,028 | |
Metropolitan Life Global Funding I,
Sec’d. Notes, 144A | | 1.500 | | | 01/10/18 | | | | 725 | | | | 721,001 | |
Nippon Life Insurance Co. (Japan), Sub. Notes, 144A | | 5.100(a) | | | 10/16/44 | | | | 4,825 | | | | 5,030,063 | |
Northwestern Mutual Life Insurance Co. (The), Sub. Notes, 144A | | 6.063 | | | 03/30/40 | | | | 200 | | | | 248,415 | |
Principal Financial Group, Inc., Gtd. Notes | | 4.350 | | | 05/15/43 | | | | 975 | | | | 962,356 | |
Swiss Re Treasury US Corp., Gtd. Notes, 144A | | 4.250 | | | 12/06/42 | | | | 795 | | | | 782,099 | |
Teachers Insurance & Annuity Association of America,
Sub. Notes, 144A | | 4.900 | | | 09/15/44 | | | | 1,950 | | | | 2,067,226 | |
Sub. Notes, 144A | | 6.850 | | | 12/16/39 | | | | 640 | | | | 846,094 | |
See Notes to Financial Statements.
| | | | | | | | | | | | | | |
| Description | | Interest
Rate | | Maturity
Date | | | Principal
Amount (000)# | | | Value (Note 1) | |
CORPORATE BONDS (Continued) | |
| | | | |
Insurance (cont’d.) | | | | | | | | | | | | | | |
TIAA Asset Management Finance LLC, Sr. Unsec’d. Notes, 144A | | 2.950% | | | 11/01/19 | | | | 1,720 | | | $ | 1,723,280 | |
W.R. Berkley Corp.,
Sr. Unsec’d. Notes | | 4.625 | | | 03/15/22 | | | | 1,435 | | | | 1,536,031 | |
Sr. Unsec’d. Notes | | 5.375 | | | 09/15/20 | | | | 1,500 | | | | 1,689,377 | |
| | | | | | | | | | | | | | |
| | | | | | | | | | | | | 56,379,113 | |
| | | | |
Lodging 0.2% | | | | | | | | | | | | | | |
Carnival Corp.,
Gtd. Notes | | 1.200 | | | 02/05/16 | | | | 950 | | | | 951,111 | |
Gtd. Notes | | 1.875 | | | 12/15/17 | | | | 425 | | | | 423,740 | |
Marriott International, Inc.,
Sr. Unsec’d. Notes | | 3.000 | | | 03/01/19 | | | | 115 | | | | 118,073 | |
Sr. Unsec’d. Notes | | 3.250 | | | 09/15/22 | | | | 75 | | | | 75,102 | |
Starwood Hotels & Resorts Worldwide, Inc.,
Sr. Unsec’d. Notes | | 6.750 | | | 05/15/18 | | | | 150 | | | | 173,106 | |
Sr. Unsec’d. Notes | | 7.150 | | | 12/01/19 | | | | 550 | | | | 651,277 | |
Wyndham Worldwide Corp.,
Sr. Unsec’d. Notes | | 2.950 | | | 03/01/17 | | | | 3,820 | | | | 3,913,120 | |
Sr. Unsec’d. Notes | | 4.250 | | | 03/01/22 | | | | 475 | | | | 479,334 | |
| | | | | | | | | | | | | | |
| | | | | | | | | | | | | 6,784,863 | |
| | | | |
Media & Entertainment 2.1% | | | | | | | | | | | | | | |
21st Century Fox America, Inc.,
Gtd. Notes | | 6.150 | | | 03/01/37 | | | | 1,075 | | | | 1,312,667 | |
Gtd. Notes | | 6.150 | | | 02/15/41 | | | | 1,550 | | | | 1,908,484 | |
Gtd. Notes | | 8.000 | | | 10/17/16 | | | | 100 | | | | 113,118 | |
AMC Entertainment, Inc., Gtd. Notes | | 9.750 | | | 12/01/20 | | | | 3,450 | | | | 3,829,500 | |
AMC Networks, Inc.,
Gtd. Notes | | 4.750 | | | 12/15/22 | | | | 1,270 | | | | 1,260,475 | |
Gtd. Notes | | 7.750 | | | 07/15/21 | | | | 8,912 | | | | 9,714,080 | |
Carlson Travel Holdings, Inc., Sr. Unsec’d. Notes, PIK, 144A
(original cost $2,543,750; purchased 08/04/14)(c)(d) | | 7.500 | | | 08/15/19 | | | | 2,500 | | | | 2,506,250 | |
Cedar Fair LP/Canada’s Wonderland Co./Magnum Management Corp., Gtd. Notes, 144A | | 5.375 | | | 06/01/24 | | | | 900 | | | | 900,000 | |
Cinemark USA, Inc., Gtd. Notes | | 4.875 | | | 06/01/23 | | | | 6,500 | | | | 6,402,500 | |
Clear Channel Worldwide Holdings, Inc.,
Gtd. Notes(e) | | 6.500 | | | 11/15/22 | | | | 135 | | | | 139,050 | |
Gtd. Notes(e) | | 6.500 | | | 11/15/22 | | | | 365 | | | | 377,775 | |
See Notes to Financial Statements.
| | | | |
| Prudential Absolute Return Bond Fund | | | 45 | |
Portfolio of Investments
as of October 31, 2014 continued
| | | | | | | | | | | | | | |
| Description | | Interest
Rate | | Maturity
Date | | | Principal
Amount (000)# | | | Value (Note 1) | |
CORPORATE BONDS (Continued) | |
|
Media & Entertainment (cont’d.) | |
Gannett Co., Inc., Gtd. Notes, 144A | | 4.875% | | | 09/15/21 | | | | 1,625 | | | $ | 1,637,187 | |
Liberty Interactive LLC, Sr. Unsec’d. Notes | | 8.250 | | | 02/01/30 | | | | 2,500 | | | | 2,725,000 | |
LIN Television Corp., Gtd. Notes | | 8.375 | | | 04/15/18 | | | | 675 | | | | 702,844 | |
Myriad International Holdings BV (South Africa),
Gtd. Notes, 144A | | 6.000 | | | 07/18/20 | | | | 2,860 | | | | 3,103,100 | |
Gtd. Notes, 144A | | 6.375 | | | 07/28/17 | | | | 750 | | | | 813,750 | |
NAI Entertainment Holdings/NAI Entertainment Holdings Finance Corp., Sr. Sec’d. Notes, 144A
(original cost $4,724,606; purchased 09/22/14)(c)(d) | | 5.000 | | | 08/01/18 | | | | 4,615 | | | | 4,730,375 | |
Nielsen Finance LLC / Nielsen Finance Co. (Netherlands), Gtd. Notes, 144A | | 5.000 | | | 04/15/22 | | | | 3,274 | | | | 3,323,110 | |
Starz LLC/Starz Finance Corp., Gtd. Notes | | 5.000 | | | 09/15/19 | | | | 2,525 | | | | 2,600,750 | |
Telesat Canada/Telesat LLC (Canada), Gtd. Notes, 144A | | 6.000 | | | 05/15/17 | | | | 2,400 | | | | 2,473,800 | |
Time Warner, Inc., Gtd. Notes | | 6.200 | | | 03/15/40 | | | | 1,750 | | | | 2,072,304 | |
Univision Communications, Inc., Sr. Sec’d. Notes, 144A
(original cost $4,200,900; purchased 07/09/14)(c)(d) | | 7.875 | | | 11/01/20 | | | | 3,819 | | | | 4,129,294 | |
Vail Resorts, Inc., Gtd. Notes | | 6.500 | | | 05/01/19 | | | | 510 | | | | 532,950 | |
Viacom, Inc.,
Sr. Unsec’d. Notes
(original cost $250,635; purchased 01/02/13)(c)(d) | | 4.500 | | | 02/27/42 | | | | 250 | | | | 237,751 | |
Sr. Unsec’d. Notes
(original cost $358,712; purchased 02/11/14)(c)(d) | | 4.875 | | | 06/15/43 | | | | 380 | | | | 377,922 | |
Sr. Unsec’d. Notes
(original cost $117,747; purchased 07/17/12)(c)(d) | | 6.250 | | | 04/30/16 | | | | 100 | | | | 107,872 | |
| | | | | | | | | | | | | | |
| | | | | | | | | | | | | 58,031,908 | |
| | | | |
Metals 1.7% | | | | | | | | | | | | | | |
Alcoa, Inc., Sr. Unsec’d. Notes | | 5.125 | | | 10/01/24 | | | | 1,000 | | | | 1,055,717 | |
ArcelorMittal (Luxembourg),
Sr. Unsec’d. Notes | | 4.250 | | | 08/05/15 | | | | 475 | | | | 482,719 | |
Sr. Unsec’d. Notes(e) | | 5.000 | | | 02/25/17 | | | | 2,400 | | | | 2,508,000 | |
Sr. Unsec’d. Notes | | 6.125 | | | 06/01/18 | | | | 500 | | | | 535,000 | |
Sr. Unsec’d. Notes(e) | | 6.750 | | | 02/25/22 | | | | 3,425 | | | | 3,802,092 | |
See Notes to Financial Statements.
| | | | | | | | | | | | | | |
| Description | | Interest
Rate | | Maturity
Date | | | Principal
Amount (000)# | | | Value (Note 1) | |
CORPORATE BONDS (Continued) | |
|
Metals (cont’d.) | |
Berau Capital Resources (Singapore), Sr. Sec’d. Notes, RegS | | 12.500% | | | 07/08/15 | | | | 1,900 | | | $ | 1,463,000 | |
BHP Billiton Finance USA Ltd. (Australia), Gtd. Notes(f) | | 5.000 | | | 09/30/43 | | | | 1,700 | | | | 1,898,648 | |
Eldorado Gold Corp. (Canada), Sr. Unsec’d. Notes, 144A(e) | | 6.125 | | | 12/15/20 | | | | 2,375 | | | | 2,351,250 | |
Evraz Group SA (Russia),
Sr. Unsec’d. Notes, RegS | | 6.750 | | | 04/27/18 | | | | 1,000 | | | | 940,376 | |
Sr. Unsec’d. Notes, RegS | | 7.400 | | | 04/24/17 | | | | 1,000 | | | | 992,600 | |
First Quantum Minerals Ltd. (Canada),
Gtd. Notes, 144A | | 6.750 | | | 02/15/20 | | | | 891 | | | | 862,043 | |
Gtd. Notes, 144A(e) | | 7.000 | | | 02/15/21 | | | | 891 | | | | 874,294 | |
FMG Resources (August 2006) Pty Ltd. (Australia),
Gtd. Notes, 144A(e) | | 6.000 | | | 04/01/17 | | | | 5,700 | | | | 5,814,000 | |
Gtd. Notes, 144A(e) | | 6.875 | | | 02/01/18 | | | | 622 | | | | 637,778 | |
Freeport-McMoRan Copper & Gold, Inc., Sr. Unsec’d. Notes | | 2.150 | | | 03/01/17 | | | | 50 | | | | 50,847 | |
Goldcorp, Inc. (Canada), Sr. Unsec’d. Notes(e) | | 3.625 | | | 06/09/21 | | | | 1,650 | | | | 1,652,376 | |
GrafTech International Ltd., Gtd. Notes | | 6.375 | | | 11/15/20 | | | | 3,000 | | | | 2,797,800 | |
Kaiser Aluminum Corp., Gtd. Notes | | 8.250 | | | 06/01/20 | | | | 2,200 | | | | 2,409,000 | |
Peabody Energy Corp.,
Gtd. Notes | | 6.000 | | | 11/15/18 | | | | 100 | | | | 96,750 | |
Gtd. Notes(e) | | 6.250 | | | 11/15/21 | | | | 400 | | | | 378,750 | |
Southern Copper Corp.,
Sr. Unsec’d. Notes(e) | | 6.750 | | | 04/16/40 | | | | 2,575 | | | | 2,846,019 | |
Sr. Unsec’d. Notes | | 7.500 | | | 07/27/35 | | | | 800 | | | | 946,784 | |
Teck Resources Ltd. (Canada),
Gtd. Notes | | 2.500 | | | 02/01/18 | | | | 100 | | | | 99,755 | |
Sr. Unsec’d. Notes | | 4.750 | | | 01/15/22 | | | | 90 | | | | 91,475 | |
TMS International Corp., Sr. Unsec’d. Notes, 144A
(original cost $2,100,000; purchased 08/01/14)(c)(d) | | 7.625 | | | 10/15/21 | | | | 2,000 | | | | 2,090,000 | |
Vedanta Resources PLC, RegS | | 6.750 | | | 06/07/16 | | | | 1,245 | | | | 1,302,892 | |
Vedanta Resources PLC (India),
Sr. Unsec’d. Notes, 144A | | 6.000 | | | 01/31/19 | | | | 1,000 | | | | 1,020,000 | |
Volcan Cia Minera SAA (Peru),
Gtd. Notes, RegS(e) | | 5.375 | | | 02/02/22 | | | | 1,800 | | | | 1,784,250 | |
See Notes to Financial Statements.
| | | | |
| Prudential Absolute Return Bond Fund | | | 47 | |
Portfolio of Investments
as of October 31, 2014 continued
| | | | | | | | | | | | | | |
| Description | | Interest
Rate | | Maturity
Date | | | Principal
Amount (000)# | | | Value (Note 1) | |
CORPORATE BONDS (Continued) | |
|
Metals (cont’d.) | |
Westmoreland Coal Co./Westmoreland Partners, Sr. Sec’d. Notes | | 10.750% | | | 02/01/18 | | | | 3,250 | | | $ | 3,404,375 | |
Xstrata Finance Canada Ltd. (Canada),
Gtd. Notes, 144A | | 2.050 | | | 10/23/15 | | | | 1,675 | | | | 1,690,112 | |
Gtd. Notes, 144A | | 2.700 | | | 10/25/17 | | | | 350 | | | | 356,390 | |
| | | | | | | | | | | | | | |
| | | | | | | | | | | | | 47,235,092 | |
| | | | |
Non-Captive Finance 0.6% | | | | | | | | | | | | | | |
AerCap Ireland Capital Ltd/AerCap Global Aviation Trust (Netherlands), Gtd. Notes, 144A | | 4.500 | | | 05/15/21 | | | | 1,150 | | | | 1,161,500 | |
CIT Group, Inc.,
Sr. Unsec’d. Notes | | 3.875 | | | 02/19/19 | | | | 2,800 | | | | 2,817,500 | |
Sr. Unsec’d. Notes | | 5.000 | | | 05/15/17 | | | | 3,000 | | | | 3,142,500 | |
Sr. Unsec’d. Notes | | 5.250 | | | 03/15/18 | | | | 4,700 | | | | 4,958,500 | |
General Electric Capital Corp.,
Sr. Unsec’d. Notes, MTN | | 3.100 | | | 01/09/23 | | | | 295 | | | | 295,523 | |
Sr. Unsec’d. Notes, MTN(e) | | 5.875 | | | 01/14/38 | | | | 550 | | | | 674,880 | |
Sr. Unsec’d. Notes, MTN | | 6.875 | | | 01/10/39 | | | | 1,085 | | | | 1,486,088 | |
Sub. Notes, MTN(e) | | 5.300 | | | 02/11/21 | | | | 450 | | | | 511,047 | |
International Lease Finance Corp.,
Sr. Unsec’d. Notes | | 5.750 | | | 05/15/16 | | | | 25 | | | | 26,063 | |
Sr. Unsec’d. Notes | | 6.250 | | | 05/15/19 | | | | 25 | | | | 27,344 | |
Sr. Unsec’d. Notes | | 8.625 | | | 09/15/15 | | | | 90 | | | | 94,500 | |
NYSE Euronext, Gtd. Notes | | 2.000 | | | 10/05/17 | | | | 475 | | | | 481,704 | |
Schahin II Finance Co. SPV Ltd. (Brazil), Sr. Sec’d. Notes, 144A
(original cost $686,191; purchased 09/26/13)(c)(d)(e) | | 5.875 | | | 09/25/22 | | | | 719 | | | | 679,896 | |
SLM Corp., Sr. Unsec’d. Notes, MTN | | 3.875 | | | 09/10/15 | | | | 300 | | | | 303,000 | |
| | | | | | | | | | | | | | |
| | | | | | | | | | | | | 16,660,045 | |
| | | | |
Packaging 0.2% | | | | | | | | | | | | | | |
Ball Corp., Gtd. Notes | | 4.000 | | | 11/15/23 | | | | 500 | | | | 480,000 | |
Crown Americas LLC/Crown Americas Capital Corp. IV, Gtd. Notes | | 4.500 | | | 01/15/23 | | | | 525 | | | | 515,812 | |
Owens-Brockway Glass Container, Inc., Gtd. Notes | | 7.375 | | | 05/15/16 | | | | 900 | | | | 961,875 | |
Sealed Air Corp., Gtd. Notes, 144A | | 8.375 | | | 09/15/21 | | | | 2,550 | | | | 2,887,875 | |
| | | | | | | | | | | | | | |
| | | | | | | | | | | | | 4,845,562 | |
See Notes to Financial Statements.
| | | | | | | | | | | | | | |
| Description | | Interest
Rate | | Maturity
Date | | | Principal
Amount (000)# | | | Value (Note 1) | |
CORPORATE BONDS (Continued) | |
|
Paper 0.2% | |
Georgia-Pacific LLC,
Gtd. Notes, 144A
(original cost $35,100; purchased 04/20/11)(c)(d) | | 5.400% | | | 11/01/20 | | | | 35 | | | $ | 39,988 | |
Sr. Unsec’d. Notes
(original cost $544,908; purchased 12/20/12)(c)(d) | | 7.375 | | | 12/01/25 | | | | 400 | | | | 525,274 | |
International Paper Co.,
Sr. Unsec’d. Notes | | 6.000 | | | 11/15/41 | | | | 610 | | | | 702,980 | |
Sr. Unsec’d. Notes | | 9.375 | | | 05/15/19 | | | | 100 | | | | 128,719 | |
Rock-Tenn Co.,
Gtd. Notes | | 4.450 | | | 03/01/19 | | | | 35 | | | | 37,506 | |
Gtd. Notes | | 4.900 | | | 03/01/22 | | | | 1,190 | | | | 1,279,230 | |
Smurfit Kappa Acquisitions (Ireland), Sr. Sec’d. Notes, 144A | | 4.875 | | | 09/15/18 | | | | 3,647 | | | | 3,756,410 | |
| | | | | | | | | | | | | | |
| | | | | | | | | | | | | 6,470,107 | |
| | | | |
Pipelines & Other 1.1% | | | | | | | | | | | | | | |
AGL Capital Corp., Gtd. Notes | | 4.400 | | | 06/01/43 | | | | 1,375 | | | | 1,405,071 | |
Buckeye Partners LP, Sr. Unsec’d. Notes | | 4.150 | | | 07/01/23 | | | | 2,685 | | | | 2,698,256 | |
CenterPoint Energy Resources Corp., Sr. Unsec’d. Notes | | 5.850 | | | 01/15/41 | | | | 700 | | | | 860,562 | |
DCP Midstream LLC,
Sr. Unsec’d. Notes(e) | | 8.125 | | | 08/16/30 | | | | 3,350 | | | | 4,507,854 | |
Sr. Unsec’d. Notes, 144A | | 5.350 | | | 03/15/20 | | | | 1,270 | | | | 1,397,664 | |
DCP Midstream Operating LP,
Gtd. Notes | | 2.500 | | | 12/01/17 | | | | 225 | | | | 229,391 | |
Gtd. Notes | | 3.250 | | | 10/01/15 | | | | 2,000 | | | | 2,044,384 | |
Dominion Gas Holdings LLC, Sr. Unsec’d. Notes | | 4.800 | | | 11/01/43 | | | | 125 | | | | 135,290 | |
El Paso Pipeline Partners Operating Co. LLC, Gtd. Notes | | 6.500 | | | 04/01/20 | | | | 750 | | | | 857,979 | |
Enterprise Products Operating LLC,
Gtd. Notes | | 3.350 | | | 03/15/23 | | | | 2,100 | | | | 2,081,797 | |
Sr. Unsec’d. Notes | | 4.950 | | | 10/15/54 | | | | 5,200 | | | | 5,299,684 | |
Fermaca Enterprises S de RL de CV (Mexico), Sr. Sec’d. Notes, 144A | | 6.375 | | | 03/30/38 | | | | 985 | | | | 1,037,944 | |
Magellan Midstream Partners LP,
Sr. Unsec’d. Notes | | 4.200 | | | 12/01/42 | | | | 125 | | | | 116,405 | |
Sr. Unsec’d. Notes | | 4.250 | | | 02/01/21 | | | | 1,950 | | | | 2,113,090 | |
See Notes to Financial Statements.
| | | | |
| Prudential Absolute Return Bond Fund | | | 49 | |
Portfolio of Investments
as of October 31, 2014 continued
| | | | | | | | | | | | | | |
| Description | | Interest
Rate | | Maturity
Date | | | Principal
Amount (000)# | | | Value (Note 1) | |
CORPORATE BONDS (Continued) | |
|
Pipelines & Other (cont’d.) | |
Magellan Midstream Partners LP, (Continued) | | | | | | | | | | | | | | |
Sr. Unsec’d. Notes | | 5.150% | | | 10/15/43 | | | | 1,350 | | | $ | 1,464,743 | |
NiSource Finance Corp., Gtd. Notes | | 4.800 | | | 02/15/44 | | | | 1,970 | | | | 2,081,006 | |
Sempra Energy, Sr. Unsec’d. Notes | | 2.300 | | | 04/01/17 | | | | 50 | | | | 51,264 | |
Tesoro Logistics LP/Tesoro Logistics Finance Corp., Gtd. Notes | | 6.125 | | | 10/15/21 | | | | 1,700 | | | | 1,746,750 | |
Western Gas Partners LP, Sr. Unsec’d. Notes | | 4.000 | | | 07/01/22 | | | | 75 | | | | 77,329 | |
| | | | | | | | | | | | | | |
| | | | | | | | | | | | | 30,206,463 | |
| | | | |
Railroads 0.3% | | | | | | | | | | | | | | |
Burlington Northern Santa Fe LLC, Sr. Unsec’d. Notes | | 4.375 | | | 09/01/42 | | | | 180 | | | | 180,120 | |
CSX Corp., Sr. Unsec’d. Notes | | 7.375 | | | 02/01/19 | | | | 4,000 | | | | 4,831,664 | |
Norfolk Southern Railway Co., Sr. Unsec’d. Notes | | 9.750 | | | 06/15/20 | | | | 1,300 | | | | 1,759,611 | |
Union Pacific Corp.,
Sr. Unsec’d. Notes | | 4.300 | | | 06/15/42 | | | | 600 | | | | 616,974 | |
Sr. Unsec’d. Notes | | 6.250 | | | 05/01/34 | | | | 207 | | | | 267,627 | |
| | | | | | | | | | | | | | |
| | | | | | | | | | | | | 7,655,996 | |
| | | | |
Real Estate Investment Trusts 0.6% | | | | | | | | | | | | | | |
Aviv Healthcare Properties LP/Aviv Healthcare Capital Corp.,
Gtd. Notes | | 6.000 | | | 10/15/21 | | | | 3,226 | | | | 3,322,780 | |
Gtd. Notes | | 7.750 | | | 02/15/19 | | | | 600 | | | | 630,000 | |
Digital Realty Trust LP, Gtd. Notes | | 4.500 | | | 07/15/15 | | | | 1,300 | | | | 1,320,806 | |
Felcor Lodging LP,
Sr. Sec’d. Notes | | 5.625 | | | 03/01/23 | | | | 1,050 | | | | 1,047,375 | |
Sr. Sec’d. Notes | | 6.750 | | | 06/01/19 | | | | 3,270 | | | | 3,400,800 | |
Mack-Cali Realty LP, Sr. Unsec’d. Notes | | 2.500 | | | 12/15/17 | | | | 100 | | | | 101,678 | |
Omega Healthcare Investors, Inc., Gtd. Notes | | 7.500 | | | 02/15/20 | | | | 500 | | | | 525,000 | |
Realty Income Corp.,
Sr. Unsec’d. Notes | | 2.000 | | | 01/31/18 | | | | 200 | | | | 200,903 | |
Sr. Unsec’d. Notes | | 5.500 | | | 11/15/15 | | | | 50 | | | | 52,282 | |
Sabra Health Care LP/Sabra Capital Corp., Gtd. Notes | | 5.375 | | | 06/01/23 | | | | 1,965 | | | | 1,994,475 | |
Simon Property Group LP, Sr. Unsec’d.
Notes, 144A | | 1.500 | | | 02/01/18 | | | | 700 | | | | 695,631 | |
Trust F/1401 (Mexico), Sr. Unsec’d. Notes, 144A | | 5.250 | | | 12/15/24 | | | | 2,000 | | | | 2,110,000 | |
See Notes to Financial Statements.
| | | | | | | | | | | | | | |
| Description | | Interest
Rate | | Maturity
Date | | | Principal
Amount (000)# | | | Value (Note 1) | |
CORPORATE BONDS (Continued) | |
|
Real Estate Investment Trusts (cont’d.) | |
Ventas Realty LP/Ventas Capital Corp., Gtd. Notes | | 2.000% | | | 02/15/18 | | | | 150 | | | $ | 150,660 | |
| | | | | | | | | | | | | | |
| | | | | | | | | | | | | 15,552,390 | |
| | | | |
Retailers 0.8% | | | | | | | | | | | | | | |
Claire’s Stores, Inc., Sr. Sec’d. Notes, 144A(e) | | 9.000 | | | 03/15/19 | | | | 475 | | | | 484,500 | |
CVS Health Corp., Sr. Unsec’d. Notes(e) | | 5.300 | | | 12/05/43 | | | | 475 | | | | 545,372 | |
Dufry Finance SCA (Switzerland),
Gtd. Notes, 144A | | 5.500 | | | 10/15/20 | | | | 3,450 | | | | 3,519,345 | |
Home Depot, Inc. (The), Sr. Unsec’d. Notes | | 4.200 | | | 04/01/43 | | | | 700 | | | | 716,200 | |
Limited Brands, Inc., Gtd. Notes | | 5.625 | | | 02/15/22 | | | | 7,975 | | | | 8,553,187 | |
Lowe’s Cos, Inc., Sr. Unsec’d. Notes(e) | | 4.250 | | | 09/15/44 | | | | 900 | | | | 913,543 | |
Macy’s Retail Holdings, Inc.,
Gtd. Notes | | 3.875 | | | 01/15/22 | | | | 125 | | | | 130,375 | |
Gtd. Notes | | 4.300 | | | 02/15/43 | | | | 755 | | | | 709,609 | |
Picard Groupe SA (France), Sr. Sec’d.
Notes, 144A | | 4.336(a) | | | 08/01/19 | | | EUR | 1,650 | | | | 2,068,936 | |
Sally Holdings LLC/Sally Capital, Inc., Sr. Unsec’d. Notes | | 6.875 | | | 11/15/19 | | | | 3,300 | | | | 3,539,250 | |
Walgreen Co., Sr. Unsec’d. Notes | | 1.800 | | | 09/15/17 | | | | 150 | | | | 150,548 | |
| | | | | | | | | | | | | | |
| | | | | | | | | | | | | 21,330,865 | |
| | | | |
Technology 2.8% | | | | | | | | | | | | | | |
Arrow Electronics, Inc.,
Sr. Unsec’d. Notes | | 3.000 | | | 03/01/18 | | | | 1,400 | | | | 1,444,824 | |
Sr. Unsec’d. Notes | | 3.375 | | | 11/01/15 | | | | 50 | | | | 51,214 | |
Audatex North America, Inc., Gtd. Notes, 144A | | 6.000 | | | 06/15/21 | | | | 2,800 | | | | 2,961,000 | |
Avaya, Inc., Sec’d. Notes, 144A(e) | | 10.500 | | | 03/01/21 | | | | 600 | | | | 525,750 | |
Brightstar Corp., Sr. Unsec’d. Notes, 144A
(original cost $6,420,585; purchased
07/26/13 - 12/06/13)(c)(d) | | 7.250 | | | 08/01/18 | | | | 6,350 | | | | 6,826,250 | |
CDW LLC/CDW Finance Corp.,
Gtd. Notes(e) | | 6.000 | | | 08/15/22 | | | | 2,500 | | | | 2,637,500 | |
Gtd. Notes | | 8.500 | | | 04/01/19 | | | | 6,980 | | | | 7,398,800 | |
Ceridian Corp., Sr. Sec’d. Notes, 144A
(original cost $1,177,500; purchased 05/01/13)(c)(d) | | 8.875 | | | 07/15/19 | | | | 1,000 | | | | 1,105,000 | |
CommScope, Inc., Gtd. Notes, 144A | | 5.000 | | | 06/15/21 | | | | 2,275 | | | | 2,269,313 | |
See Notes to Financial Statements.
| | | | |
| Prudential Absolute Return Bond Fund | | | 51 | |
Portfolio of Investments
as of October 31, 2014 continued
| | | | | | | | | | | | | | |
| Description | | Interest
Rate | | Maturity
Date | | | Principal
Amount (000)# | | | Value (Note 1) | |
CORPORATE BONDS (Continued) | |
|
Technology (cont’d.) | |
First Data Corp.,
Gtd. Notes(e) | | 10.625% | | | 06/15/21 | | | | 1,548 | | | $ | 1,784,070 | |
Gtd. Notes | | 11.250 | | | 01/15/21 | | | | 3,000 | | | | 3,457,500 | |
Gtd. Notes | | 12.625 | | | 01/15/21 | | | | 7,700 | | | | 9,297,750 | |
Sr. Sec’d. Notes, 144A | | 7.375 | | | 06/15/19 | | | | 2,000 | | | | 2,120,000 | |
Fiserv, Inc., Gtd. Notes | | 3.125 | | | 06/15/16 | | | | 2,645 | | | | 2,732,208 | |
Jabil Circuit, Inc.,
Sr. Unsec’d. Notes | | 4.700 | | | 09/15/22 | | | | 1,045 | | | | 1,045,000 | |
Sr. Unsec’d. Notes | | 5.625 | | | 12/15/20 | | | | 6,400 | | | | 6,848,000 | |
KLA-Tencor Corp., Sr. Unsec’d. Notes | | 4.650 | | | 11/01/24 | | | | 1,005 | | | | 1,008,235 | |
Micron Technology, Inc., Sr. Unsec’d. Notes, 144A | | 5.500 | | | 02/01/25 | | | | 8,000 | | | | 8,100,000 | |
NCR Corp.,
Gtd. Notes | | 5.875 | | | 12/15/21 | | | | 625 | | | | 640,625 | |
Gtd. Notes(e) | | 6.375 | | | 12/15/23 | | | | 2,100 | | | | 2,215,500 | |
NXP BV/NXP Funding LLC (Netherlands),
Gtd. Notes, 144A | | 3.750 | | | 06/01/18 | | | | 4,150 | | | | 4,181,125 | |
Gtd. Notes, 144A | | 5.750 | | | 02/15/21 | | | | 1,500 | | | | 1,582,500 | |
Oracle Corp., Sr. Unsec’d. Notes(e) | | 4.300 | | | 07/08/34 | | | | 2,325 | | | | 2,392,325 | |
Sensata Technologies BV (Netherlands), Gtd. Notes, 144A | | 6.500 | | | 05/15/19 | | | | 1,500 | | | | 1,569,375 | |
Tyco Electronics Group SA (Switzerland), Gtd. Notes | | 6.550 | | | 10/01/17 | | | | 2,750 | | | | 3,130,410 | |
Xerox Corp., Sr. Unsec’d. Notes | | 4.250 | | | 02/15/15 | | | | 440 | | | | 444,558 | |
| | | | | | | | | | | | | | |
| | | | | | | | | | | | | 77,768,832 | |
| | | | |
Telecommunications 3.1% | | | | | | | | | | | | | | |
AT&T, Inc.,
Sr. Unsec’d. Notes | | 4.800 | | | 06/15/44 | | | | 750 | | | | 757,030 | |
Sr. Unsec’d. Notes | | 5.550 | | | 08/15/41 | | | | 670 | | | | 736,591 | |
Bharti Airtel International Netherlands BV (India),
Gtd. Notes, 144A | | 5.125 | | | 03/11/23 | | | | 3,225 | | | | 3,406,503 | |
Gtd. Notes, 144A | | 5.350 | | | 05/20/24 | | | | 1,550 | | | | 1,665,754 | |
British Telecommunications PLC
(United Kingdom),
Sr. Unsec’d. Notes | | 5.950 | | | 01/15/18 | | | | 170 | | | | 191,470 | |
Sr. Unsec’d. Notes | | 9.625 | | | 12/15/30 | | | | 340 | | | | 535,213 | |
CenturyLink, Inc., Sr. Unsec’d. Notes | | 5.150 | | | 06/15/17 | | | | 2,035 | | | | 2,157,100 | |
See Notes to Financial Statements.
| | | | | | | | | | | | | | |
| Description | | Interest
Rate | | Maturity
Date | | | Principal
Amount (000)# | | | Value (Note 1) | |
CORPORATE BONDS (Continued) | |
|
Telecommunications (cont’d.) | |
Crown Castle International Corp., Sr. Unsec’d. Notes | | 4.875% | | | 04/15/22 | | | | 3,325 | | | $ | 3,358,250 | |
Digicel Group Ltd., RegS | | 8.250 | | | 09/30/20 | | | | 1,500 | | | | 1,567,500 | |
Digicel Group Ltd. (Bermuda),
Sr. Unsec’d. Notes, 144A | | 8.250 | | | 09/01/17 | | | | 2,500 | | | | 2,559,375 | |
Sr. Unsec’d. Notes, 144A | | 8.250 | | | 09/30/20 | | | | 275 | | | | 287,375 | |
Eileme 2 AB (Poland),
Sr. Sec’d. Notes, 144A | | 11.625 | | | 01/31/20 | | | | 3,000 | | | | 3,435,000 | |
Sr. Sec’d. Notes, RegS | | 11.750 | | | 01/31/20 | | | EUR | 2,935 | | | | 4,234,287 | |
Embarq Corp.,
Sr. Unsec’d. Notes
(original cost $135,646; purchased
05/04/11 - 5/11/11)(c)(d) | | 7.082 | | | 06/01/16 | | | | 120 | | | | 130,318 | |
Sr. Unsec’d. Notes
(original cost $191,888; purchased
08/17/12 - 10/17/12)(c)(d) | | 7.995 | | | 06/01/36 | | | | 175 | | | | 194,250 | |
Grain Spectrum Funding II LLC,
Sec’d. Notes, 144A | | 3.290 | | | 10/10/19 | | | | 800 | | | | 804,429 | |
Indosat Palapa Co. BV (Indonesia),
Gtd. Notes, RegS | | 7.375 | | | 07/29/20 | | | | 4,850 | | | | 5,153,125 | |
SoftBank Corp. (Japan), Gtd. Notes, 144A(e) | | 4.500 | | | 04/15/20 | | | | 5,900 | | | | 5,973,750 | |
Sprint Capital Corp., Gtd. Notes | | 6.900 | | | 05/01/19 | | | | 4,100 | | | | 4,346,000 | |
Sprint Communications, Inc.,
Gtd. Notes, 144A | | 9.000 | | | 11/15/18 | | | | 5,000 | | | | 5,881,250 | |
Sr. Unsec’d. Notes | | 6.000 | | | 12/01/16 | | | | 1,900 | | | | 2,011,625 | |
Sr. Unsec’d. Notes | | 9.125 | | | 03/01/17 | | | | 1,500 | | | | 1,695,000 | |
Sprint Corp., Gtd. Notes, 144A(e) | | 7.125 | | | 06/15/24 | | | | 1,250 | | | | 1,284,375 | |
T-Mobile USA, Inc., Gtd. Notes(e) | | 6.464 | | | 04/28/19 | | | | 3,850 | | | | 4,013,625 | |
TBG Global Pte Ltd. (Indonesia),
Gtd. Notes, RegS | | 4.625 | | | 04/03/18 | | | | 1,885 | | | | 1,894,425 | |
Verizon Communications, Inc.,
Sr. Unsec’d. Notes | | 3.500 | | | 11/01/24 | | | | 7,790 | | | | 7,667,269 | |
Sr. Unsec’d. Notes | | 6.400 | | | 09/15/33 | | | | 1,814 | | | | 2,209,568 | |
Sr. Unsec’d. Notes | | 6.550 | | | 09/15/43 | | | | 4,515 | | | | 5,691,636 | |
Sr. Unsec’d. Notes, 144A | | 4.862 | | | 08/21/46 | | | | 1,884 | | | | 1,921,288 | |
Sr. Unsec’d. Notes, 144A | | 5.012 | | | 08/21/54 | | | | 6,110 | | | | 6,217,585 | |
Vimpel Communications Via VIP Finance Ireland Ltd. OJSC (Russia), Sr. Unsec’d. Notes, 144A | | 9.125 | | | 04/30/18 | | | | 1,300 | | | | 1,402,375 | |
See Notes to Financial Statements.
| | | | |
| Prudential Absolute Return Bond Fund | | | 53 | |
Portfolio of Investments
as of October 31, 2014 continued
| | | | | | | | | | | | | | |
| Description | | Interest
Rate | | Maturity
Date | | | Principal
Amount (000)# | | | Value (Note 1) | |
CORPORATE BONDS (Continued) | |
|
Telecommunications (cont’d.) | |
Vimpel Communications Via VIP Finance Ireland Ltd. OJSC (Russia), Sr. Unsec’d. Notes, RegS | | 9.125% | | | 04/30/18 | | | | 2,335 | | | $ | 2,518,881 | |
| | | | | | | | | | | | | | |
| | | | | | | | | | | | | 85,902,222 | |
| | | | |
Tobacco 0.3% | | | | | | | | | | | | | | |
Altria Group, Inc.,
Gtd. Notes | | 4.000 | | | 01/31/24 | | | | 1,550 | | | | 1,604,461 | |
Gtd. Notes | | 9.950 | | | 11/10/38 | | | | 314 | | | | 526,657 | |
Imperial Tobacco Finance PLC (United Kingdom), Gtd. Notes, 144A | | 2.050 | | | 02/11/18 | | | | 925 | | | | 924,156 | |
Lorillard Tobacco Co.,
Gtd. Notes | | 2.300 | | | 08/21/17 | | | | 475 | | | | 480,356 | |
Gtd. Notes | | 3.500 | | | 08/04/16 | | | | 235 | | | | 243,691 | |
Philip Morris International, Inc.,
Sr. Unsec’d. Notes | | 2.500 | | | 08/22/22 | | | | 200 | | | | 193,632 | |
Sr. Unsec’d. Notes | | 4.875 | | | 11/15/43 | | | | 2,550 | | | | 2,767,064 | |
Reynolds American, Inc., Gtd. Notes | | 6.750 | | | 06/15/17 | | | | 115 | | | | 129,663 | |
| | | | | | | | | | | | | | |
| | | | | | | | | | | | | 6,869,680 | |
| | | | | | | | | | | | | | |
TOTAL CORPORATE BONDS
(cost $1,157,310,668) | | | | | | | | | | | | | 1,167,476,250 | |
| | | | | | | | | | | | | | |
| | | | |
MORTGAGE-BACKED SECURITIES 0.3% | | | | | | | | | | | | | | |
Banc of America Funding Corp., Series 2014-R2, Class 2A1, 144A | | 0.362(a) | | | 05/26/37 | | | | 4,341 | | | | 4,023,344 | |
Chase Mortgage Finance Trust, Series 2007-A1, Class 1A3 | | 2.549(a) | | | 02/25/37 | | | | 432 | | | | 426,773 | |
JPMorgan Mortgage Trust, Series 2007-A1, Class 4A1 | | 2.490(a) | | | 07/25/35 | | | | 454 | | | | 458,192 | |
Structured Asset Securities Corp., Series 2003-37A, Class 3A7 | | 2.504(a) | | | 12/25/33 | | | | 1,588 | | | | 1,561,386 | |
Structured Asset Securities Corp. Mortgage Pass-Through Certificates, Series 2003-30, Class 2A1 | | 5.100(a) | | | 10/25/33 | | | | 774 | | | | 791,803 | |
Wells Fargo Mortgage-Backed Securities Trust, Series 2004-EE, Class 2A1 | | 2.612(a) | | | 12/25/34 | | | | 408 | | | | 410,318 | |
| | | | | | | | | | | | | | |
TOTAL MORTGAGE-BACKED SECURITIES
(cost $7,654,546) | | | | | | | | | | | | | 7,671,816 | |
| | | | | | | | | | | | | | |
See Notes to Financial Statements.
| | | | | | | | | | | | | | |
| Description | | Interest
Rate | | Maturity
Date | | | Principal
Amount (000)# | | | Value (Note 1) | |
MUNICIPAL BONDS 0.5% | |
|
California 0.2% | |
Bay Area Toll Authority, BABs, Revenue Bonds | | 6.263% | | | 04/01/49 | | | | 550 | | | $ | 757,905 | |
Los Angeles Department of Water & Power, BABs,
Revenue Bonds | | 6.008 | | | 07/01/39 | | | | 3,610 | | | | 4,506,110 | |
Revenue Bonds | | 6.574 | | | 07/01/45 | | | | 585 | | | | 835,895 | |
University of California, BABs, Revenue Bonds | | 5.770 | | | 05/15/43 | | | | 390 | | | | 479,252 | |
| | | | | | | | | | | | | | |
| | | | | | | | | | | | | 6,579,162 | |
| | | | |
Colorado 0.1% | | | | | | | | | | | | | | |
Regional Transportation District, BABs, Revenue Bonds, Series 2010B | | 5.844 | | | 11/01/50 | | | | 1,190 | | | | 1,597,028 | |
| | | | |
Illinois | | | | | | | | | | | | | | |
Chicago O’Hare International Airport, BABs, Revenue Bonds | | 6.395 | | | 01/01/40 | | | | 360 | | | | 456,282 | |
| | | | |
New Jersey | | | | | | | | | | | | | | |
Rutgers State University, BABs, Revenue Bonds | | 5.665 | | | 05/01/40 | | | | 200 | | | | 242,798 | |
| | | | |
New York | | | | | | | | | | | | | | |
Memorial Sloan-Kettering Cancer Center, Sr. Unsec’d. Notes | | 4.125 | | | 07/01/52 | | | | 75 | | | | 74,352 | |
New York City Water & Sewer System, BABs, Taxable, Revenue Bonds | | 5.882 | | | 06/15/44 | | | | 400 | | | | 520,788 | |
Port Authority of New York & New Jersey, Revenue Bonds | | 4.458 | | | 10/01/62 | | | | 100 | | | | 100,150 | |
| | | | | | | | | | | | | | |
| | | | | | | | | | | | | 695,290 | |
| | | | |
Ohio | | | | | | | | | | | | | | |
Ohio State University, Taxable, Revenue Bonds, Series A | | 4.800 | | | 06/01/2111 | | | | 180 | | | | 187,160 | |
| | | | |
Puerto Rico 0.2% | | | | | | | | | | | | | | |
Government Development Bank (Puerto Rico), Taxable, Revenue Bonds, Series A | | 3.448 | | | 02/01/15 | | | | 4,000 | | | | 3,932,920 | |
| | | | |
Texas | | | | | | | | | | | | | | |
City Public Service Board of San Antonio, BABs, Taxable, Revenue Bonds | | 4.427 | | | 02/01/42 | | | | 120 | | | | 128,789 | |
| | | | | | | | | | | | | | |
TOTAL MUNICIPAL BONDS
(cost $13,721,806) | | | | | | | | | | | | | 13,819,429 | |
| | | | | | | | | | | | | | |
See Notes to Financial Statements.
| | | | |
| Prudential Absolute Return Bond Fund | | | 55 | |
Portfolio of Investments
as of October 31, 2014 continued
| | | | | | | | | | | | | | |
| Description | | Interest
Rate | | Maturity
Date | | | Principal
Amount (000)# | | | Value (Note 1) | |
NON-CORPORATE FOREIGN AGENCIES 1.9% | |
Autonomous Community of Madrid (Spain),
Sr. Unsec’d. Notes | | 4.110% | | | 06/23/16 | | | EUR | 400 | | | $ | 526,924 | |
Sr. Unsec’d. Notes | | 4.622 | | | 06/23/15 | | | EUR | 400 | | | | 513,240 | |
Sr. Unsec’d. Notes | | 4.750 | | | 03/26/15 | | | EUR | 100 | | | | 127,182 | |
CDP Financial, Inc. (Canada), Sr. Unsec’d. Notes, 144A | | 3.150 | | | 07/24/24 | | | | 1,765 | | | | 1,770,842 | |
CNOOC Finance 2013 Ltd. (China), Gtd. Notes | | 3.000 | | | 05/09/23 | | | | 3,315 | | | | 3,144,573 | |
Comision Federal de Electricidad (Mexico), Sr. Unsec’d. Notes, 144A | | 4.875 | | | 01/15/24 | | | | 1,350 | | | | 1,424,250 | |
Comunidad De Madrid, Sr. Unsec’d. Notes | | 5.650 | | | 03/11/16 | | | EUR | 454 | | | | 602,847 | |
Ecopetrol SA (Colombia), Sr. Unsec’d. Notes | | 5.875 | | | 05/28/45 | | | | 1,075 | | | | 1,104,563 | |
Export Credit Bank of Turkey (Turkey), Sr. Unsec’d. Notes, 144A | | 5.375 | | | 11/04/16 | | | | 2,440 | | | | 2,568,710 | |
Gazprom OAO Via Gaz Capital SA (Russia),
Sr. Unsec’d. Notes, 144A | | 6.510 | | | 03/07/22 | | | | 2,200 | | | | 2,296,250 | |
Sr. Unsec’d. Notes, 144A | | 9.250 | | | 04/23/19 | | | | 1,950 | | | | 2,252,648 | |
KazMunayGas National Co. JSC (Kazakhstan),
Sr. Unsec’d. Notes, 144A | | 7.000 | | | 05/05/20 | | | | 4,355 | | | | 4,905,907 | |
Sr. Unsec’d. Notes, MTN, 144A | | 5.750 | | | 04/30/43 | | | | 1,175 | | | | 1,142,688 | |
Sr. Unsec’d. Notes, MTN, 144A | | 9.125 | | | 07/02/18 | | | | 3,610 | | | | 4,268,825 | |
Sr. Unsec’d. Notes, MTN, 144A | | 11.750 | | | 01/23/15 | | | | 410 | | | | 418,458 | |
Korea Development Bank (The) (South Korea), Sr. Unsec’d. Notes | | 8.350 | | | 06/18/15 | | | TRY | 3,000 | | | | 1,330,047 | |
Korea Hydro & Nuclear Power Co. Ltd.
(South Korea), Sr. Unsec’d. Notes, 144A | | 3.000 | | | 09/19/22 | | | | 950 | | | | 934,434 | |
Majapahit Holding BV (Indonesia),
Gtd. Notes, 144A | | 7.750 | | | 10/17/16 | | | | 200 | | | | 220,000 | |
Gtd. Notes, RegS | | 7.250 | | | 06/28/17 | | | | 1,500 | | | | 1,665,000 | |
Gtd. Notes, RegS | | 7.750 | | | 10/17/16 | | | | 3,203 | | | | 3,523,300 | |
Gtd. Notes, RegS | | 7.750 | | | 01/20/20 | | | | 2,180 | | | | 2,536,975 | |
Petroleos Mexicanos (Mexico),
Gtd. Notes | | 3.500 | | | 01/30/23 | | | | 750 | | | | 725,925 | |
Gtd. Notes | | 4.875 | | | 01/24/22 | | | | 250 | | | | 266,500 | |
Gtd. Notes | | 5.500 | | | 01/21/21 | | | | 1,900 | | | | 2,100,545 | |
Gtd. Notes | | 5.500 | | | 06/27/44 | | | | 2,190 | | | | 2,283,075 | |
Gtd. Notes | | 6.500 | | | 06/02/41 | | | | 1,000 | | | | 1,170,000 | |
Power Sector Assets & Liabilities Management Corp. (Philippines), Gov’t. Gtd. Notes, RegS | | 7.390 | | | 12/02/24 | | | | 2,200 | | | | 2,860,000 | |
See Notes to Financial Statements.
| | | | | | | | | | | | | | |
| Description | | Interest
Rate | | Maturity
Date | | | Principal
Amount (000)# | | | Value (Note 1) | |
NON-CORPORATE FOREIGN AGENCIES (Continued) | |
Russian Agricultural Bank OJSC Via RSHB Capital SA (Russia),
Sr. Unsec’d. Notes, 144A(e) | | 6.299% | | | 05/15/17 | | | | 325 | | | $ | 325,813 | |
Sr. Unsec’d. Notes, 144A | | 7.750 | | | 05/29/18 | | | | 1,485 | | | | 1,545,900 | |
State Bank of India (India), Sr. Unsec’d.
Notes, MTN, RegS | | 4.500 | | | 11/30/15 | | | EUR | 950 | | | | 1,230,396 | |
VTB Bank OJSC Via VTB Capital SA (Russia), Sr. Unsec’d. Notes, 144A | | 6.875 | | | 05/29/18 | | | | 1,425 | | | | 1,453,500 | |
| | | | | | | | | | | | | | |
TOTAL NON-CORPORATE FOREIGN AGENCIES
(cost $52,267,381) | | | | | | | | | | | | | 51,239,317 | |
| | | | | | | | | | | | | | |
| | | | |
SOVEREIGN BONDS 7.9% | | | | | | | | | | | | | | |
Brazilian Government International Bond (Brazil),
Sr. Unsec’d. Notes | | 7.875 | | | 03/07/15 | | | | 3,585 | | | | 3,669,247 | |
Unsec’d. Notes | | 11.000 | | | 06/26/17 | | | EUR | 6,100 | | | | 9,527,738 | |
Bulgaria Government International Bond (Bulgaria),
Sr. Unsec’d. Notes, RegS | | 4.250 | | | 07/09/17 | | | EUR | 3,500 | | | | 4,722,647 | |
Sr. Unsec’d. Notes, RegS | | 8.250 | | | 01/15/15 | | | | 4,500 | | | | 4,565,250 | |
China Government Bond (China), Sr. Unsec’d. Notes, RegS | | 2.560 | | | 06/29/17 | | | CNH | 7,000 | | | | 1,135,321 | |
Croatia Government International Bond (Croatia), Sr. Unsec’d. Notes | | 6.500 | | | 01/05/15 | | | EUR | 400 | | | | 505,936 | |
Cyprus Government International Bond (Cyprus),
Sr. Unsec’d. Notes, MTN, RegS | | 3.750 | | | 11/01/15 | | | EUR | 1,600 | | | | 1,974,962 | |
Sr. Unsec’d. Notes, MTN, RegS | | 4.625 | | | 02/03/20 | | | EUR | 300 | | | | 355,305 | |
Eurasian Development Bank (Supranational Bank), Sr. Unsec’d. Notes, 144A | | 5.000 | | | 09/26/20 | | | | 2,325 | | | | 2,344,855 | |
Hellenic Republic Government Bond (Greece),
Sr. Unsec’d. Notes | | 5.800 | | | 07/14/15 | | | JPY | 304,100 | | | | 2,707,322 | |
Sr. Unsec’d. Notes, RegS | | 4.750 | | | 04/17/19 | | | EUR | 4,700 | | | | 5,380,389 | |
Sr. Unsec’d. Notes, Series 9RG | | 5.800 | | | 07/14/15 | | | JPY | 101,800 | | | | 906,299 | |
Hellenic Republic Government International Bond (Greece),
Sr. Unsec’d. Notes, MTN | | 3.800 | | | 08/08/17 | | | JPY | 1,010,000 | | | | 8,376,719 | |
Sr. Unsec’d. Notes, Series 12RG | | 5.250 | | | 02/01/16 | | | JPY | 100,000 | | | | 842,422 | |
Hungary Government International Bond (Hungary),
Sr. Unsec’d. Notes | | 4.125 | | | 02/19/18 | | | | 3,490 | | | | 3,604,263 | |
Sr. Unsec’d. Notes | | 4.750 | | | 02/03/15 | | | | 5,000 | | | | 5,044,750 | |
Sr. Unsec’d. Notes | | 5.375 | | | 02/21/23 | | | | 1,250 | | | | 1,343,750 | |
Sr. Unsec’d. Notes | | 6.375 | | | 03/29/21 | | | | 2,250 | | | | 2,553,471 | |
See Notes to Financial Statements.
| | | | |
| Prudential Absolute Return Bond Fund | | | 57 | |
Portfolio of Investments
as of October 31, 2014 continued
| | | | | | | | | | | | | | |
| Description | | Interest
Rate | | Maturity
Date | | | Principal
Amount (000)# | | | Value (Note 1) | |
SOVEREIGN BONDS (Continued) | |
Hungary Government International Bond (Hungary), (Continued) | | | | | | | | | | | | | | |
Sr. Unsec’d. Notes(e) | | 7.625% | | | 03/29/41 | | | | 916 | | | $ | 1,183,930 | |
Sr. Unsec’d. Notes, MTN | | 4.000 | | | 05/20/16 | | | CHF | 700 | | | | 755,184 | |
Sr. Unsec’d. Notes, RegS | | 6.000 | | | 01/11/19 | | | EUR | 545 | | | | 786,265 | |
Indonesia Government International Bond (Indonesia),
Sr. Unsec’d. Notes, MTN, 144A | | 2.875 | | | 07/08/21 | | | EUR | 1,825 | | | | 2,321,301 | |
Sr. Unsec’d. Notes, RegS | | 5.875 | | | 03/13/20 | | | | 4,030 | | | | 4,508,562 | |
Sr. Unsec’d. Notes, RegS | | 6.875 | | | 01/17/18 | | | | 2,250 | | | | 2,539,800 | |
Italy Buoni Poliennali del Tesoro (Italy), Bonds | | 6.500 | | | 11/01/27 | | | EUR | 1,610 | | | | 2,804,381 | |
Italy Government International Bond (Italy),
Sr. Unsec’d. Notes | | 3.125 | | | 01/26/15 | | | | 20,000 | | | | 20,114,700 | |
Sr. Unsec’d. Notes | | 5.250 | | | 09/20/16 | | | | 100 | | | | 107,448 | |
Sr. Unsec’d. Notes | | 6.875 | | | 09/27/23 | | | | 800 | | | | 1,014,734 | |
Sr. Unsec’d. Notes, MTN | | 5.200 | | | 07/31/34 | | | EUR | 200 | | | | 302,607 | |
Sr. Unsec’d. Notes, MTN, RegS | | 2.500 | | | 03/02/15 | | | CHF | 1,000 | | | | 1,046,095 | |
Sr. Unsec’d. Notes, MTN, RegS | | 6.000 | | | 08/04/28 | | | GBP | 400 | | | | 755,701 | |
Sr. Unsec’d. Notes, RegS | | 3.450 | | | 03/24/17 | | | JPY | 190,000 | | | | 1,794,818 | |
Sr. Unsec’d. Notes, RegS | | 3.700 | | | 11/14/16 | | | JPY | 30,000 | | | | 282,695 | |
Sr. Unsec’d. Notes, RegS | | 4.500 | | | 06/08/15 | | | JPY | 415,000 | | | | 3,781,290 | |
Sr. Unsec’d. Notes, RegS | | 5.500 | | | 12/15/14 | | | JPY | 427,000 | | | | 3,823,267 | |
Kingdom of Belgium (Belgium),
Notes, 144A | | 8.875 | | | 12/01/24 | | | | 1,000 | | | | 1,439,142 | |
Notes, MTN | | 5.000 | | | 04/24/18 | | | GBP | 1,000 | | | | 1,763,412 | |
Lithuania Government International Bond (Lithuania), Sr. Unsec’d. Notes, RegS | | 6.750 | | | 01/15/15 | | | | 2,000 | | | | 2,023,000 | |
Mexico Government International Bond (Mexico),
Sr. Unsec’d. Notes | | 2.750 | | | 04/22/23 | | | EUR | 5,070 | | | | 6,683,843 | |
Sr. Unsec’d. Notes, MTN | | 4.250 | | | 07/14/17 | | | EUR | 3,200 | | | | 4,402,662 | |
Sr. Unsec’d. Notes, MTN | | 4.750 | | | 03/08/44 | | | | 3,000 | | | | 3,046,500 | |
Sr. Unsec’d. Notes, MTN | | 11.000 | | | 05/08/17 | | | ITL | 1,095,000 | | | | 885,851 | |
Panama Government International Bond (Panama), Sr. Unsec’d. Notes | | 5.200 | | | 01/30/20 | | | | 2,165 | | | | 2,392,325 | |
Peru Enhanced Pass-Through Finance Ltd. (Peru), Pass-Through Certificates, RegS | | 3.610(b) | | | 05/31/18 | | | | 430 | | | | 403,331 | |
Perusahaan Penerbit SBSN Indonesia (Indonesia), Sr. Unsec’d. Notes, RegS | | 4.000 | | | 11/21/18 | | | | 3,321 | | | | 3,433,084 | |
Peruvian Government International Bond (Peru),
Sr. Unsec’d. Notes | | 7.350 | | | 07/21/25 | | | | 1,000 | | | | 1,322,500 | |
Sr. Unsec’d. Notes | | 9.875 | | | 02/06/15 | | | | 605 | | | | 618,310 | |
See Notes to Financial Statements.
| | | | | | | | | | | | | | |
| Description | | Interest
Rate | | Maturity
Date | | | Principal
Amount (000)# | | | Value (Note 1) | |
SOVEREIGN BONDS (Continued) | |
Philippine Government International Bond (Philippines), Sr. Unsec’d. Notes | | 6.250% | | | 03/15/16 | | | EUR | 5,360 | | | $ | 7,186,319 | |
Poland Government International Bond (Poland),
Sr. Unsec’d. Notes, RegS | | 1.050 | | | 11/08/17 | | | JPY | 200,000 | | | | 1,810,895 | |
Sr. Unsec’d. Notes, RegS | | 2.340 | | | 11/13/14 | | | JPY | 100,000 | | | | 890,559 | |
Portugal Government International Bond (Portugal),
Sr. Unsec’d. Notes, MTN, RegS | | 3.500 | | | 03/25/15 | | | | 9,600 | | | | 9,692,170 | |
Unsec’d. Notes, MTN, 144A | | 5.125 | | | 10/15/24 | | | | 7,500 | | | | 7,724,220 | |
Unsec’d. Notes, MTN, RegS | | 5.125 | | | 10/15/24 | | | | 500 | | | | 514,948 | |
Portugal Obrigacoes do Tesouro OT (Portugal), Sr. Unsec’d. Notes, RegS | | 4.750 | | | 06/14/19 | | | EUR | 5,550 | | | | 7,834,361 | |
Qatar Government International Bond (Qatar), Sr. Unsec’d. Notes, 144A(e) | | 5.750 | | | 01/20/42 | | | | 1,500 | | | | 1,777,500 | |
Republic of Armenia, Sr. Unsec’d. Notes, 144A | | 6.000 | | | 09/30/20 | | | | 3,550 | | | | 3,709,750 | |
Republic of Brazil (Brazil),
Sr. Unsec’d. Notes | | 4.875 | | | 01/22/21 | | | | 2,575 | | | | 2,774,562 | |
Sr. Unsec’d. Notes(e) | | 5.625 | | | 01/07/41 | | | | 700 | | | | 757,750 | |
Sr. Unsec’d. Notes | | 7.125 | | | 01/20/37 | | | | 650 | | | | 820,625 | |
Sr. Unsec’d. Notes | | 8.250 | | | 01/20/34 | | | | 1,130 | | | | 1,565,050 | |
Republic of Colombia (Colombia), Sr. Unsec’d. Notes | | 7.375 | | | 09/18/37 | | | | 1,115 | | | | 1,502,462 | |
Republic of Latvia (Latvia), Sr. Unsec’d.
Notes, RegS | | 5.250 | | | 02/22/17 | | | | 2,300 | | | | 2,501,250 | |
Republic of Serbia (Serbia), Sr. Unsec’d.
Notes, RegS | | 6.750(g) | | | 11/01/24 | | | | 4,064 | | | | 4,122,365 | |
Romanian Government International Bond (Romania),
Sr. Unsec’d. Notes, MTN, 144A | | 4.875 | | | 01/22/24 | | | | 620 | | | | 668,050 | |
Sr. Unsec’d. Notes, RegS | | 5.000 | | | 03/18/15 | | | EUR | 3,400 | | | | 4,328,663 | |
Slovakia Government International Bond (Slovak Republic), Sr. Unsec’d. Notes, RegS | | 4.375 | | | 05/21/22 | | | | 4,000 | | | | 4,355,000 | |
Slovenia Government International Bond (Slovenia),
Bonds, 144A | | 4.125 | | | 02/18/19 | | | | 1,000 | | | | 1,052,500 | |
Bonds, 144A | | 5.850 | | | 05/10/23 | | | | 3,000 | | | | 3,365,640 | |
Sr. Unsec’d. Notes, 144A | | 4.750 | | | 05/10/18 | | | | 2,500 | | | | 2,684,375 | |
Sr. Unsec’d. Notes, RegS | | 4.750 | | | 05/10/18 | | | | 2,400 | | | | 2,577,000 | |
South Africa Government International Bond (South Africa),
Sr. Unsec’d. Notes | | 3.750 | | | 07/24/26 | | | EUR | 500 | | | | 655,553 | |
Sr. Unsec’d. Notes, MTN | | 4.500 | | | 04/05/16 | | | EUR | 1,500 | | | | 1,975,589 | |
See Notes to Financial Statements.
| | | | |
| Prudential Absolute Return Bond Fund | | | 59 | |
Portfolio of Investments
as of October 31, 2014 continued
| | | | | | | | | | | | | | |
| Description | | Interest
Rate | | Maturity
Date | | | Principal
Amount (000)# | | | Value (Note 1) | |
SOVEREIGN BONDS (Continued) | |
Turkey Government International Bond (Turkey),
Sr. Unsec’d. Notes | | 5.125% | | | 05/18/20 | | | EUR | 1,850 | | | $ | 2,606,377 | |
Sr. Unsec’d. Notes | | 5.875 | | | 04/02/19 | | | EUR | 900 | | | | 1,290,309 | |
United Mexican States (Mexico), Sr. Unsec’d. Notes, MTN | | 2.375 | | | 04/09/21 | | | EUR | 200 | | | | 261,407 | |
Uruguay Government International Bond (Uruguay), Sr. Unsec’d. Notes | | 6.875 | | | 01/19/16 | | | EUR | 100 | | | | 134,081 | |
| | | | | | | | | | | | | | |
TOTAL SOVEREIGN BONDS
(cost $219,942,246) | | | | | | | | | | | | | 217,036,714 | |
| | | | | | | | | | | | | | |
| | |
U.S. GOVERNMENT AGENCY OBLIGATIONS 1.0% | | | | | | | | | |
Federal Home Loan Bank | | 0.045(b) | | | 11/26/14 | | | | 1,250 | | | | 1,249,981 | |
Federal Home Loan Bank | | 0.050(b) | | | 12/03/14-12/19/14 | | | | 7,162 | | | | 7,161,772 | |
Federal Home Loan Bank | | 0.055(b) | | | 12/10/14 | | | | 200 | | | | 199,995 | |
Federal Home Loan Bank, Unsec’d. Notes | | 0.052(b) | | | 12/15/14 | | | | 292 | | | | 291,991 | |
Federal Home Loan Mortgage Corp. | | 0.050(b) | | | 12/04/14-12/22/14 | | | | 754 | | | | 753,976 | |
Federal Home Loan Mortgage Corp.,
Unsec’d. Notes | | 0.045(b) | | | 11/13/14 | | | | 45 | | | | 45,000 | |
Unsec’d. Notes | | 0.051(b) | | | 11/14/14 | | | | 18 | | | | 18,000 | |
Unsec’d. Notes | | 0.055(b) | | | 11/24/14 | | | | 242 | | | | 241,997 | |
Unsec’d. Notes | | 0.080(b) | | | 12/11/14 | | | | 300 | | | | 299,992 | |
Federal National Mortgage Assoc.,
Unsec’d. Notes | | 0.041 | | | 11/04/14 | | | | 87 | | | | 87,000 | |
Unsec’d. Notes | | 0.050(b) | | | 12/15/14 | | | | 16,700 | | | | 16,699,516 | |
Unsec’d. Notes | | 0.055(b) | | | 12/04/14 | | | | 15 | | | | 15,000 | |
| | | | | | | | | | | | | | |
TOTAL U.S. GOVERNMENT AGENCY OBLIGATIONS
(cost $27,063,426) | | | | | | | | | | | 27,064,220 | |
| | | | | | | | | | | | | | |
| | | |
U.S. TREASURY OBLIGATIONS 3.8% | | | | | | | | | | | | |
U.S. Treasury Bonds | | 3.375 | | | 05/15/44 | | | | 400 | | | | 424,344 | |
U.S. Treasury Notes | | 1.500 | | | 10/31/19 | | | | 100,000 | | | | 99,468,800 | |
U.S. Treasury Notes | | 2.375 | | | 08/15/24 | | | | 2,785 | | | | 2,795,878 | |
| | | | | | | | | | | | | | |
TOTAL U.S. TREASURY OBLIGATIONS
(cost $102,713,211) | | | | | | | | | | | | | 102,689,022 | |
| | | | | | | | | | | | | | |
TOTAL LONG-TERM INVESTMENTS
(cost $2,638,444,934) | | | | | | | | | | | | | 2,636,518,990 | |
| | | | | | | | | | | | | | |
See Notes to Financial Statements.
| | | | | | | | | | |
| Description | | | | Shares | | | Value (Note 1) | |
SHORT-TERM INVESTMENTS 14.1% | | | | | | | | |
| | |
AFFILIATED MONEY MARKET MUTUAL FUND 13.8% | | | | | | | | |
Prudential Investment Portfolios 2 - Prudential Core
Taxable Money Market Fund
(cost $377,879,149; includes $95,276,941 of cash
collateral for securities on loan)(h) | | | 377,879,149 | | | $ | 377,879,149 | |
| | | | | | | | | | |
| | | |
| | | | | Notional
Amount (000)# | | | | |
OPTIONS PURCHASED* 0.3% | | | | | |
| |
Call Options 0.3% | | | | | |
5 Year U.S. Treasury Notes Futures, expiring 11/21/14, Strike Price $118.75 | | | | | 534,700 | | | | 4,260,891 | |
U.S. Treasury Long Bond Futures,
expiring 11/21/14, Strike Price $143.00 | | | | | 77,900 | | | | 340,812 | |
U.S. Treasury Long Bond Futures,
expiring 11/21/14, Strike Price $149.00 | | | | | 77,900 | | | | 24,344 | |
U.S. Treasury Ultra Bonds Futures, expiring 11/21/14, Strike Price $150.00 | | | | | 39,900 | | | | 2,755,594 | |
U.S. Treasury Ultra Bonds Futures, expiring 11/21/14, Strike Price $156.00 | | | | | 39,900 | | | | 822,937 | |
| | | | | | | | | | |
| | | | | | | | | 8,204,578 | |
| |
Put Options | | | | | |
Eurodollars 1 Year Mid-Curve Futures,
expiring 12/12/14, Strike Price $98.38 | | | | | 646,250 | | | | 16,156 | |
Eurodollars 1 Year Mid-Curve Futures,
expiring 12/12/14, Strike Price $99.00 | | | | | 646,250 | | | | 177,719 | |
| | | | | | | | | | |
| | | | | | | | | 193,875 | |
| | | | | | | | | | |
TOTAL OPTIONS PURCHASED
(cost $6,519,167) | | | | | | | | | 8,398,453 | |
| | | | | | | | | | |
TOTAL SHORT-TERM INVESTMENTS
(cost $384,398,316) | | | | | | | | | 386,277,602 | |
| | | | | | | | | | |
| | |
TOTAL INVESTMENTS BEFORE OPTIONS WRITTEN 110.4%
(cost $3,022,843,250; Note 5) | | | | | | | 3,022,796,592 | |
| | | | | | | | | | |
See Notes to Financial Statements.
| | | | |
| Prudential Absolute Return Bond Fund | | | 61 | |
Portfolio of Investments
as of October 31, 2014 continued
| | | | | | | | | | |
| Description | | | | Notional
Amount (000)# | | | Value (Note 1) | |
OPTIONS WRITTEN* (0.2)% | | | | | | | | | | |
| | | |
Call Options (0.2)% | | | | | | | | | | |
5 Year U.S. Treasury Notes Futures, expiring 11/21/14, Strike Price $119.75 | | | | | 534,700 | | | $ | (1,127,883 | ) |
U.S. Treasury Long Bond Futures,
expiring 11/21/14, Strike Price $146.00 | | | | | 155,800 | | | | (146,062 | ) |
U.S. Treasury Ultra Bonds Futures, expiring 11/21/14, Strike Price $153.00 | | | | | 79,800 | | | | (3,341,625 | ) |
| | | | | | | | | | |
| | | | | | | | | (4,615,570 | ) |
| | | |
Put Options | | | | | | | | | | |
Eurodollars 1 Year Mid-Curve Futures,
expiring 12/12/14, Strike Price $98.63 | | | | | 646,250 | | | | (16,157 | ) |
Eurodollars 1 Year Mid-Curve Futures,
expiring 12/12/14, Strike Price $98.88 | | | | | 646,250 | | | | (80,781 | ) |
| | | | | | | | | | |
| | | | | | | | | (96,938 | ) |
| | | | | | | | | | |
TOTAL OPTIONS WRITTEN
(premiums received $3,735,020) | | | | (4,712,508 | ) |
| | | | | | | | | | |
TOTAL INVESTMENTS, NET OF OPTIONS WRITTEN 110.2%
(cost $3,019,108,230) | | | | 3,018,084,084 | |
Liabilities in excess of other assets(i) (10.2)% | | | | (279,929,624 | ) |
| | | | | | | | | | |
NET ASSETS 100.0% | | | | | | | | $ | 2,738,154,460 | |
| | | | | | | | | | |
The following abbreviations are used in the portfolio descriptions:
144A—Security was purchased pursuant to Rule 144A under the Securities Act of 1933 and may not be resold subject to that rule except to qualified institutional buyers. Unless otherwise noted, 144A securities are deemed to be liquid.
RegS—Regulation S. Security was purchased pursuant to Regulation S and may not be offered, sold or delivered within the United States or to, or for the account or benefit of, U.S. persons, except pursuant to an exemption from, or in a transaction not subject to, the registration requirements of the Securities Act of 1933.
ABS—Asset-Backed Security
AUD—Australian Dollar
BABs—Build America Bonds
BBR—New Zealand Bank Bill Rate
BBSW—Australian Bank Bill Swap Reference Rate
bps—Basis Points
BRL—Brazilian Real
BZDIOVER—Overnight Brazil Cetip Interbank Deposit
CAD—Canadian Dollar
See Notes to Financial Statements.
CDO—Collateralized Debt Obligation
CDS—Credit Default Swap
CDX—Credit Derivative Index
CHF—Swiss Franc
CLO—Collateralized Loan Obligation
CLP—Chilean Peso
CMBS—Collateralized Mortgage-Backed Security
CNH—Chinese Renminbi
COP—Colombian Peso
CZK—Czech Koruna
DKK—Danish Krone
EUR—Euro
EURIBOR—Euro Interbank Offered Rate
FHLMC—Federal Home Loan Mortgage Corp.
GBP—British Pound
GMTN—Global Medium Term Note
HKD—Hong Kong Dollar
HUF—Hungarian Forint
INR—Indian Rupee
IO—Interest Only
ITL—Italian Lira
JIBAR—Johannesburg Interbank Agreed Rate
JPY—Japanese Yen
LIBOR—London Interbank Offered Rate
MosPrime—Moscow Prime Offered Rate
MTN—Medium Term Note
MXN—Mexican Peso
MYR—Malaysian Ringgit
NOK—Norwegian Krone
NZD—New Zealand Dollar
OIS—Overnight Index Swap
PEN—Peruvian Nuevo Sol
PHP—Philippine Peso
PIK—Payment-in-Kind
PLN—Polish Zloty
RON—Romanian Leu
RUB—Russian Ruble
SEK—Swedish Krona
SGD—Singapore Dollar
SLM—Student Loan Mortgage
TELBOR—Tel Aviv Interbank Offered Rate
THB—Thai Baht
TRY—Turkish Lira
TWD—New Taiwanese Dollar
See Notes to Financial Statements.
| | | | |
| Prudential Absolute Return Bond Fund | | | 63 | |
Portfolio of Investments
as of October 31, 2014 continued
USD—United States Dollar
WIBOR—Warsaw Interbank Offered Rate
ZAR—South African Rand
| # | Principal or notional amount is shown in U.S. dollars unless otherwise stated. |
| * | Non-income producing security. |
| (a) | Variable rate instrument. The interest rate shown reflects the rate in effect at October 31, 2014. |
| (b) | Represents zero coupon bond or principal only securities. Rate represents yield to maturity at purchase date. |
| (c) | Indicates a restricted security; the aggregate cost of the restricted securities is $48,115,228. The aggregate value, $47,720,783, is approximately 1.7% of net assets. |
| (d) | Indicates a security that has been deemed illiquid. |
| (e) | All or a portion of security is on loan. The aggregate market value of such securities, including those sold and pending settlement, is $92,347,871; cash collateral of $95,276,941 (included in liabilities) was received with which the Fund purchased highly liquid short-term investments. Securities on loan are subject to contractual netting arrangements. |
| (f) | Represents security, or a portion thereof, segregated as collateral for swap agreements. |
| (g) | Represents step coupon bond. Rate shown reflects the rate in effect at October 31, 2014. |
| (h) | Prudential Investments LLC, the manager of the Fund also serves as manager of the Prudential Investment Portfolios 2 - Prudential Core Taxable Money Market Fund. |
| (i) | Includes net unrealized appreciation (depreciation) on the following derivative contracts held at reporting period end: |
Futures contracts outstanding at October 31, 2014:
| | | | | | | | | | | | | | | | | | | | |
Number of
Contracts | | | Type | | Expiration
Date | | | Value at
Trade Date | | | Value at
October 31,
2014 | | | Unrealized
Appreciation
(Depreciation)(1) | |
| | | | Long Position: | | | | | | | | | | | | | | | | |
| | 754 | | | 5 Year U.S. Treasury Notes | | | Dec. 2014 | | | $ | 90,386,210 | | | $ | 90,049,984 | | | $ | (336,226 | ) |
| | | | Short Positions: | | | | | | | | | | | | | | | | |
| | 200 | | | 3 Month Euro Swiss Franc | | | Mar. 2015 | | | | 51,986,482 | | | | 51,992,932 | | | | (6,450 | ) |
| | 713 | | | 2 Year U.S. Treasury Notes | | | Dec. 2014 | | | | 156,745,164 | | | | 156,548,063 | | | | 197,101 | |
| | 174 | | | 10 Year U.S. Treasury Notes | | | Dec. 2014 | | | | 22,128,914 | | | | 21,986,531 | | | | 142,383 | |
| | 109 | | | U.S. Ultra Treasury Bonds | | | Dec. 2014 | | | | 17,132,344 | | | | 17,092,563 | | | | 39,781 | |
| | | | | | | | | | | | | | | | | | | | |
| | | | | | | | | | | | | | | | | | | 372,815 | |
| | | | | | | | | | | | | | | | | | | | |
| | | | | | | | | | | | | | | | | | $ | 36,589 | |
| | | | | | | | | | | | | | | | | | | | |
| (1) | Cash of $80,000 has been segregated with Goldman Sachs & Co. to cover requirements for open futures contracts at October 31, 2014. |
See Notes to Financial Statements.
Forward foreign currency exchange contracts outstanding at October 31, 2014:
| | | | | | | | | | | | | | | | | | |
Purchase Contracts | | Counterparty | | Notional
Amount
(000) | | | Value at
Settlement
Date
Payable | | | Current
Value | | | Unrealized
Appreciation
(Depreciation) | |
Australian Dollar, | | | | | | | | | | | | | | | | | | |
Expiring 01/16/15 | | BNP Paribas | | AUD | 4,246 | | | $ | 3,711,000 | | | $ | 3,716,157 | | | $ | 5,157 | |
Expiring 01/16/15 | | Citigroup Global Markets | | AUD | 4,225 | | | | 3,690,500 | | | | 3,696,951 | | | | 6,451 | |
Expiring 01/16/15 | | Citigroup Global Markets | | AUD | 6,278 | | | | 5,444,990 | | | | 5,493,977 | | | | 48,987 | |
Expiring 01/16/15 | | UBS AG | | AUD | 3,333 | | | | 2,926,166 | | | | 2,916,940 | | | | (9,226 | ) |
Brazilian Real, | | | | | | | | | | | | | | | | | | |
Expiring 12/11/14 | | Barclays Capital Group | | BRL | 1,826 | | | | 732,000 | | | | 727,874 | | | | (4,126 | ) |
Expiring 12/11/14 | | Citigroup Global Markets | | BRL | 2,022 | | | | 817,500 | | | | 805,983 | | | | (11,517 | ) |
Expiring 12/11/14 | | Citigroup Global Markets | | BRL | 9,636 | | | | 3,925,679 | | | | 3,841,731 | | | | (83,948 | ) |
British Pound, | | | | | | | | | | | | | | | | | | |
Expiring 01/28/15 | | JPMorgan Chase | | GBP | 4,609 | | | | 7,409,500 | | | | 7,368,398 | | | | (41,102 | ) |
Expiring 01/28/15 | | JPMorgan Chase | | GBP | 14,489 | | | | 23,288,922 | | | | 23,161,780 | | | | (127,142 | ) |
Expiring 01/28/15 | | UBS AG | | GBP | 3,066 | | | | 4,954,400 | | | | 4,901,832 | | | | (52,568 | ) |
Canadian Dollar, | | | | | | | | | | | | | | | | | | |
Expiring 01/16/15 | | BNP Paribas | | CAD | 4,560 | | | | 4,087,700 | | | | 4,038,271 | | | | (49,429 | ) |
Expiring 01/16/15 | | Citigroup Global Markets | | CAD | 16,238 | | | | 14,428,161 | | | | 14,378,749 | | | | (49,412 | ) |
Expiring 01/16/15 | | JPMorgan Chase | | CAD | 4,148 | | | | 3,680,000 | | | | 3,672,784 | | | | (7,216 | ) |
Expiring 01/16/15 | | UBS AG | | CAD | 4,140 | | | | 3,690,500 | | | | 3,665,838 | | | | (24,662 | ) |
Chilean Peso, | | | | | | | | | | | | | | | | | | |
Expiring 01/12/15 | | Citigroup Global Markets | | CLP | 2,163,079 | | | | 3,685,600 | | | | 3,734,246 | | | | 48,646 | |
Expiring 01/15/15 | | Citigroup Global Markets | | CLP | 2,169,953 | | | | 3,715,800 | | | | 3,745,031 | | | | 29,231 | |
Expiring 01/15/15 | | Citigroup Global Markets | | CLP | 2,372,297 | | | | 4,087,700 | | | | 4,094,247 | | | | 6,547 | |
Chinese Renminbi, | | | | | | | | | | | | | | | | | | |
Expiring 01/15/15 | | Citigroup Global Markets | | CNH | 122,814 | | | | 19,849,878 | | | | 19,963,025 | | | | 113,147 | |
Expiring 01/15/15 | | Deutsche Bank AG | | CNH | 25,393 | | | | 4,104,172 | | | | 4,127,466 | | | | 23,294 | |
Expiring 01/15/15 | | Deutsche Bank AG | | CNH | 36,301 | | | | 5,899,492 | | | | 5,900,612 | | | | 1,120 | |
Expiring 01/15/15 | | Goldman Sachs & Co. | | CNH | 102,390 | | | | 16,550,616 | | | | 16,643,208 | | | | 92,592 | |
Expiring 01/15/15 | | Hong Kong & Shanghai
Bank | | CNH | 24,328 | | | | 3,932,320 | | | | 3,954,447 | | | | 22,127 | |
Expiring 01/15/15 | | JPMorgan Chase | | CNH | 74,401 | | | | 12,026,302 | | | | 12,093,583 | | | | 67,281 | |
Expiring 01/15/15 | | UBS AG | | CNH | 29,296 | | | | 4,734,994 | | | | 4,761,946 | | | | 26,952 | |
Colombian Peso, | | | | | | | | | | | | | | | | | | |
Expiring 12/11/14 | | Citigroup Global Markets | | COP | 2,523,708 | | | | 1,228,500 | | | | 1,220,886 | | | | (7,614 | ) |
Expiring 12/11/14 | | Citigroup Global Markets | | COP | 7,429,202 | | | | 3,716,459 | | | | 3,594,003 | | | | (122,456 | ) |
Hong Kong Dollar, | | | | | | | | | | | | | | | | | | |
Expiring 01/07/15 | | Citigroup Global Markets | | HKD | 81,248 | | | | 10,472,500 | | | | 10,477,165 | | | | 4,665 | |
See Notes to Financial Statements.
| | | | |
| Prudential Absolute Return Bond Fund | | | 65 | |
Portfolio of Investments
as of October 31, 2014 continued
| | | | | | | | | | | | | | | | | | |
Purchase Contracts | | Counterparty | | Notional
Amount
(000) | | | Value at
Settlement
Date
Payable | | | Current
Value | | | Unrealized
Appreciation
(Depreciation) | |
Hungarian Forint, | | | | | | | | | | | | | | | | | | |
Expiring 11/24/14 | | Barclays Capital Group | | HUF | 8,322,005 | | | $ | 34,603,289 | | | $ | 33,825,928 | | | $ | (777,361 | ) |
Expiring 01/22/15 | | Barclays Capital Group | | HUF | 1,000,117 | | | | 4,090,500 | | | | 4,059,665 | | | | (30,835 | ) |
Expiring 01/22/15 | | Deutsche Bank AG | | HUF | 726,225 | | | | 2,964,698 | | | | 2,947,886 | | | | (16,812 | ) |
Expiring 01/22/15 | | Deutsche Bank AG | | HUF | 904,063 | | | | 3,715,800 | | | | 3,669,764 | | | | (46,036 | ) |
Indian Rupee, | | | | | | | | | | | | | | | | | | |
Expiring 11/03/14 | | UBS AG | | INR | 193,135 | | | | 3,186,000 | | | | 3,143,541 | | | | (42,459 | ) |
Expiring 11/03/14 | | UBS AG | | INR | 260,109 | | | | 4,206,500 | | | | 4,233,628 | | | | 27,128 | |
Expiring 11/03/14 | | UBS AG | | INR | 260,627 | | | | 4,170,700 | | | | 4,242,061 | | | | 71,361 | |
Expiring 01/28/15 | | Barclays Capital Group | | INR | 713,871 | | | | 11,481,276 | | | | 11,404,826 | | | | (76,450 | ) |
Malaysian Ringgit, | | | | | | | | | | | | | | | | | | |
Expiring 01/09/15 | | Barclays Capital Group | | MYR | 12,423 | | | | 3,790,273 | | | | 3,757,052 | | | | (33,221 | ) |
Expiring 01/09/15 | | Citigroup Global Markets | | MYR | 7,993 | | | | 2,420,915 | | | | 2,417,488 | | | | (3,427 | ) |
Expiring 01/09/15 | | Goldman Sachs & Co. | | MYR | 11,990 | | | | 3,631,152 | | | | 3,626,232 | | | | (4,920 | ) |
Mexican Peso, | | | | | | | | | | | | | | | | | | |
Expiring 01/22/15 | | Deutsche Bank AG | | MXN | 38,972 | | | | 2,888,764 | | | | 2,879,626 | | | | (9,138 | ) |
Expiring 01/22/15 | | Goldman Sachs & Co. | | MXN | 160,869 | | | | 11,819,240 | | | | 11,886,547 | | | | 67,307 | |
Expiring 01/22/15 | | Toronto Dominion | | MXN | 160,869 | | | | 11,820,031 | | | | 11,886,548 | | | | 66,517 | |
New Taiwanese Dollar, | | | | | | | | | | | | | | | | | | |
Expiring 02/02/15 | | UBS AG | | TWD | 149,970 | | | | 4,954,400 | | | | 4,937,919 | | | | (16,481 | ) |
New Zealand Dollar, | | | | | | | | | | | | | | | | | | |
Expiring 01/16/15 | | Barclays Capital Group | | NZD | 10,353 | | | | 8,203,993 | | | | 8,007,970 | | | | (196,023 | ) |
Expiring 01/16/15 | | Deutsche Bank AG | | NZD | 5,258 | | | | 4,090,500 | | | | 4,067,324 | | | | (23,176 | ) |
Norwegian Krone, | | | | | | | | | | | | | | | | | | |
Expiring 01/26/15 | | BNP Paribas | | NOK | 48,688 | | | | 7,392,100 | | | | 7,196,789 | | | | (195,311 | ) |
Expiring 01/26/15 | | JPMorgan Chase | | NOK | 47,958 | | | | 7,229,623 | | | | 7,088,971 | | | | (140,652 | ) |
Philippine Peso, | | | | | | | | | | | | | | | | | | |
Expiring 11/14/14 | | Barclays Capital Group | | PHP | 37,259 | | | | 854,416 | | | | 829,877 | | | | (24,539 | ) |
Expiring 11/14/14 | | JPMorgan Chase | | PHP | 37,259 | | | | 850,846 | | | | 829,877 | | | | (20,969 | ) |
Expiring 11/14/14 | | JPMorgan Chase | | PHP | 278,568 | | | | 6,361,464 | | | | 6,204,688 | | | | (156,776 | ) |
Expiring 02/12/15 | | UBS AG | | PHP | 183,992 | | | | 4,206,500 | | | | 4,086,713 | | | | (119,787 | ) |
Polish Zloty, | | | | | | | | | | | | | | | | | | |
Expiring 01/26/15 | | Deutsche Bank AG | | PLN | 42,137 | | | | 12,596,100 | | | | 12,460,592 | | | | (135,508 | ) |
Romanian Leu, | | | | | | | | | | | | | | | | | | |
Expiring 01/26/15 | | JPMorgan Chase | | RON | 37,149 | | | | 10,632,639 | | | | 10,521,025 | | | | (111,614 | ) |
Russian Ruble, | | | | | | | | | | | | | | | | | | |
Expiring 12/17/14 | | BNP Paribas | | RUB | 16,015 | | | | 386,094 | | | | 366,826 | | | | (19,268 | ) |
Singapore Dollar, | | | | | | | | | | | | | | | | | | |
Expiring 01/23/15 | | Citigroup Global Markets | | SGD | 6,333 | | | | 4,979,876 | | | | 4,928,220 | | | | (51,656 | ) |
Expiring 01/23/15 | | Deutsche Bank AG | | SGD | 3,757 | | | | 2,942,832 | | | | 2,924,043 | | | | (18,789 | ) |
Expiring 01/23/15 | | Toronto Dominion | | SGD | 26,162 | | | | 20,490,574 | | | | 20,359,910 | | | | (130,664 | ) |
See Notes to Financial Statements.
| | | | | | | | | | | | | | | | | | |
Purchase Contracts | | Counterparty | | Notional
Amount
(000) | | | Value at
Settlement
Date
Payable | | | Current
Value | | | Unrealized
Appreciation
(Depreciation) | |
Thai Baht, | | | | | | | | | | | | | | | | | | |
Expiring 11/18/14 | | Barclays Capital Group | | THB | 167,794 | | | $ | 5,114,900 | | | $ | 5,147,588 | | | $ | 32,688 | |
Expiring 11/18/14 | | BNP Paribas | | THB | 163,874 | | | | 4,982,800 | | | | 5,027,331 | | | | 44,531 | |
| | | | | | | | | | | | | | | | | | |
| | | | | | | | $ | 387,850,146 | | | $ | 385,663,585 | | | $ | (2,186,561 | ) |
| | | | | | | | | | | | | | | | | | |
| | | | | | | | | | | | | | | | | | |
Sale Contracts | | Counterparty | | Notional
Amount
(000) | | | Value at
Settlement
Date
Receivable | | | Current
Value | | | Unrealized
Appreciation
(Depreciation) | |
Brazilian Real, | | | | | | | | | | | | | | | | | | |
Expiring 12/11/14 | | BNP Paribas | | BRL | 10,375 | | | $ | 4,147,100 | | | $ | 4,136,292 | | | $ | 10,808 | |
British Pound, | | | | | | | | | | | | | | | | | | |
Expiring 01/28/15 | | Bank of America | | GBP | 2,826 | | | | 4,554,060 | | | | 4,517,127 | | | | 36,933 | |
Expiring 01/28/15 | | Citigroup Global
Markets | | GBP | 12,065 | | | | 19,446,420 | | | | 19,286,427 | | | | 159,993 | |
Canadian Dollar, | | | | | | | | | | | | | | | | | | |
Expiring 01/16/15 | | UBS AG | | CAD | 16,308 | | | | 14,349,000 | | | | 14,440,770 | | | | (91,770 | ) |
Chinese Renminbi, | | | | | | | | | | | | | | | | | | |
Expiring 01/15/15 | | Barclay Capital Group | | CNH | 52,706 | | | | 8,518,068 | | | | 8,567,107 | | | | (49,039 | ) |
Czech Koruna, | | | | | | | | | | | | | | | | | | |
Expiring 01/26/15 | | Barclays Capital Group | | CZK | 185,942 | | | | 8,503,607 | | | | 8,384,486 | | | | 119,121 | |
Expiring 01/26/15 | | Deutsche Bank AG | | CZK | 161,649 | | | | 7,392,100 | | | | 7,289,063 | | | | 103,037 | |
Expiring 01/26/15 | | Deutsche Bank AG | | CZK | 80,538 | | | | 3,690,500 | | | | 3,631,610 | | | | 58,890 | |
Danish Krone, | | | | | | | | | | | | | | | | | | |
Expiring 01/26/15 | | UBS AG | | DKK | 163,702 | | | | 27,859,269 | | | | 27,579,277 | | | | 279,992 | |
Euro, | | | | | | | | | | | | | | | | | | |
Expiring 01/28/15 | | Citigroup Global
Markets | | EUR | 21,709 | | | | 27,496,760 | | | | 27,221,829 | | | | 274,931 | |
Expiring 01/28/15 | | UBS AG | | EUR | 85,550 | | | | 108,589,024 | | | | 107,273,247 | | | | 1,315,777 | |
Expiring 01/28/15 | | UBS AG | | EUR | 7,002 | | | | 8,842,914 | | | | 8,780,305 | | | | 62,609 | |
Expiring 01/28/15 | | UBS AG | | EUR | 165 | | | | 207,176 | | | | 207,227 | | | | (51 | ) |
Hungarian Forint, | | | | | | | | | | | | | | | | | | |
Expiring 01/22/15 | | Citigroup Global
Markets | | HUF | 4,104,740 | | | | 16,794,800 | | | | 16,661,927 | | | | 132,873 | |
Expiring 01/22/15 | | Deutsche Bank AG | | HUF | 2,763,769 | | | | 11,334,500 | | | | 11,218,670 | | | | 115,830 | |
Expiring 01/22/15 | | Goldman Sachs & Co. | | HUF | 1,808,629 | | | | 7,409,500 | | | | 7,341,574 | | | | 67,926 | |
Indian Rupee, | | | | | | | | | | | | | | | | | | |
Expiring 11/03/14 | | Barclays Capital Group | | INR | 713,871 | | | | 11,628,462 | | | | 11,626,568 | | | | 1,894 | |
See Notes to Financial Statements.
| | | | |
| Prudential Absolute Return Bond Fund | | | 67 | |
Portfolio of Investments
as of October 31, 2014 continued
| | | | | | | | | | | | | | | | | | |
Sale Contracts | | Counterparty | | Notional
Amount
(000) | | | Value at
Settlement
Date
Receivable | | | Current
Value | | | Unrealized
Appreciation
(Depreciation) | |
Japanese Yen, | | | | | | | | | | | | | | | | | | |
Expiring 01/28/15 | | JPMorgan Chase | | JPY | 801,403 | | | $ | 7,431,600 | | | $ | 7,142,330 | | | $ | 289,270 | |
Expiring 01/28/15 | | JPMorgan Chase | | JPY | 797,075 | | | | 7,392,100 | | | | 7,103,761 | | | | 288,339 | |
Expiring 01/28/15 | | Toronto Dominion | | JPY | 6,438,234 | | | | 59,582,825 | | | | 57,379,364 | | | | 2,203,461 | |
Expiring 01/28/15 | | UBS AG | | JPY | 636,714 | | | | 5,849,331 | | | | 5,674,578 | | | | 174,753 | |
New Taiwanese Dollar, | | | | | | | | | | | | | | | | | | |
Expiring 02/02/15 | | Citigroup Global Markets | | TWD | 406,618 | | | | 13,430,830 | | | | 13,388,362 | | | | 42,468 | |
Expiring 02/02/15 | | Citigroup Global Markets | | TWD | 342,057 | | | | 11,220,500 | | | | 11,262,605 | | | | (42,105 | ) |
Norwegian Krone, | | | | | | | | | | | | | | | | | | |
Expiring 01/26/15 | | UBS AG | | NOK | 45,423 | | | | 6,812,900 | | | | 6,714,264 | | | | 98,636 | |
Expiring 01/26/15 | | UBS AG | | NOK | 19,589 | | | | 2,913,763 | | | | 2,895,599 | | | | 18,164 | |
Peruvian Nuevo Sol, | | | | | | | | | | | | | | | | | | |
Expiring 04/10/15 | | BNP Paribas | | PEN | 1,320 | | | | 445,506 | | | | 443,654 | | | | 1,852 | |
Philippine Peso, | | | | | | | | | | | | | | | | | | |
Expiring 11/14/14 | | BNP Paribas | | PHP | 74,517 | | | | 1,698,201 | | | | 1,659,754 | | | | 38,447 | |
Polish Zloty, | | | | | | | | | | | | | | | | | | |
Expiring 01/26/15 | | Barclays Capital Group | | PLN | 54,652 | | | | 16,332,477 | | | | 16,161,366 | | | | 171,111 | |
South African Rand, | | | | | | | | | | | | | | | | | | |
Expiring 01/23/15 | | Citigroup Global Markets | | ZAR | 10,796 | | | | 969,065 | | | | 964,652 | | | | 4,413 | |
Swedish Krona, | | | | | | | | | | | | | | | | | | |
Expiring 01/26/15 | | Bank of America | | SEK | 31,400 | | | | 4,319,941 | | | | 4,253,155 | | | | 66,786 | |
Expiring 01/26/15 | | Citigroup Global Markets | | SEK | 26,817 | | | | 3,690,500 | | | | 3,632,458 | | | | 58,042 | |
Thai Baht, | | | | | | | | | | | | | | | | | | |
Expiring 11/18/14 | | Citigroup Global Markets | | THB | 20,205 | | | | 624,380 | | | | 619,846 | | | | 4,534 | |
Expiring 11/18/14 | | Credit Suisse First Boston
Corp. | | THB | 167,951 | | | | 4,951,000 | | | | 5,152,389 | | | | (201,389 | ) |
Expiring 12/04/14 | | BNP Paribas | | THB | 142,161 | | | | 4,432,280 | | | | 4,358,008 | | | | 74,272 | |
Turkish Lira, | | | | | | | | | | | | | | | | | | |
Expiring 01/20/15 | | JPMorgan Chase | | TRY | 124,302 | | | | 54,421,722 | | | | 54,918,484 | | | | (496,762 | ) |
| | | | | | | | | | | | | | | | | | |
| | | | | | | | $ | 497,282,181 | | | $ | 491,888,135 | | | $ | 5,394,046 | |
| | | | | | | | | | | | | | | | | | |
| | | | | | | | | | | | | | | | $ | 3,207,485 | |
| | | | | | | | | | | | | | | | | | |
See Notes to Financial Statements.
Cross currency exchange contracts outstanding at October 31, 2014:
| | | | | | | | | | | | | | | | |
Settlement | | Type | | Notional
Amount
(000) | | | In Exchange
For (000) | | | Unrealized
Appreciation
(Depreciation) | | | Counterparty |
Expiring 01/16/15 | | Buy | | CAD | 4,158 | | | EUR | 2,919 | | | $ | 22,422 | | | Citigroup Global Markets |
Expiring 01/26/15 | | Buy | | EUR | 2,922 | | | SEK | 27,129 | | | | (10,905 | ) | | UBS AG |
Expiring 01/26/15 | | Buy | | EUR | 11,695 | | | NOK | 99,066 | | | | 21,003 | | | UBS AG |
Expiring 01/26/15 | | Buy | | EUR | 2,914 | | | SEK | 27,328 | | | | (47,601 | ) | | BNP Paribas |
Expiring 01/26/15 | | Buy | | EUR | 5,839 | | | NOK | 49,396 | | | | 19,808 | | | UBS AG |
Expiring 01/26/15 | | Buy | | EUR | 5,831 | | | CHF | 7,031 | | | | (2,557 | ) | | JPMorgan Chase |
Expiring 01/26/15 | | Buy | | SEK | 60,273 | | | CHF | 7,832 | | | | 17,693 | | | Barclays Capital Group |
Expiring 01/20/15 | | Buy | | TRY | 9,178 | | | EUR | 3,241 | | | | (8,693 | ) | | Deutsche Bank AG |
| | | | | | | | | | | | | | | | |
| | | | | | | | | | | | $ | 11,170 | | | |
| | | | | | | | | | | | | | | | |
Currency swap agreements outstanding at October 31, 2014:
| | | | | | | | | | | | | | | | | | | | | | | | | | | | |
Notional
Amount
(000)# | | | Fund
Receives | | Notional
Amount
(000) | | Fund Pays | | Counterparty | | Termination
Date | | | Fair
Value | | | Upfront
Premiums
Paid
(Received) | | | Unrealized
Appreciation
(Depreciation) | |
| Over-the-counter swap agreements: | |
| | 800 | | | 3 Month CHF LIBOR minus 13.30 bps | | CHF | | 700 | | 3 Month LIBOR | | Hong Kong & Shanghai Bank | | | 03/21/16 | | | $ | 73,109 | | | $ | — | | | $ | 73,109 | |
| | 7,932 | | | 3 Month LIBOR | | EUR | | 5,980 | | 3 Month EURIBOR minus 26.25 bps | | Barclays Capital Group | | | 01/25/15 | | | | 442,551 | | | | — | | | | 442,551 | |
| | 2,243 | | | 3 Month LIBOR | | EUR | | 1,700 | | 3 Month EURIBOR minus 28.25 bps | | Barclays Capital Group | | | 01/04/16 | | | | 117,608 | | | | — | | | | 117,608 | |
| | 364 | | | 3 Month LIBOR | | EUR | | 280 | | 3 Month EURIBOR minus 30.50 bps | | Barclays Capital Group | | | 12/04/14 | | | | 12,936 | | | | — | | | | 12,936 | |
| | 196 | | | 3 Month LIBOR | | EUR | | 150 | | 3 Month EURIBOR minus 31.70 bps | | Barclays Capital Group | | | 12/14/15 | | | | 8,142 | | | | — | | | | 8,142 | |
| | 1,817 | | | 3 Month LIBOR | | GBP | | 1,200 | | 3 Month GBP LIBOR minus 14.25 bps | | Barclays Capital Group | | | 04/05/18 | | | | (94,357 | ) | | | — | | | | (94,357 | ) |
| | 602 | | | 3 Month LIBOR | | JPY | | 60,000 | | 3 Month JPY LIBOR minus 54.00 bps | | Barclays Capital Group | | | 10/12/16 | | | | 70,056 | | | | — | | | | 70,056 | |
| | 6,619 | | | 3 Month LIBOR | | EUR | | 4,975 | | 3 Month EURIBOR minus 26.00 bps | | Citigroup Global Markets | | | 01/25/15 | | | | 388,042 | | | | — | | | | 388,042 | |
| | 1,079 | | | 3 Month LIBOR | | EUR | | 820 | | 3 Month EURIBOR minus 30.00 bps | | Citigroup Global Markets | | | 12/18/15 | | | | 54,089 | | | | — | | | | 54,089 | |
| | 254 | | | 3 Month LIBOR | | EUR | | 200 | | 3 Month EURIBOR minus 31.25 bps | | Citigroup Global Markets | | | 11/15/15 | | | | 3,880 | | | | — | | | | 3,880 | |
| | 1,622 | | | 3 Month LIBOR | | JPY | | 158,135 | | 3 Month JPY LIBOR minus 32.75 bps | | Citigroup Global Markets | | | 05/02/15 | | | | 215,074 | | | | — | | | | 215,074 | |
| | 2,013 | | | 3 Month LIBOR | | JPY | | 200,000 | | 3 Month JPY LIBOR minus 53.25 bps | | Citigroup Global Markets | | | 04/24/17 | | | | 240,118 | | | | — | | | | 240,118 | |
| | 6,211 | | | 3 Month LIBOR | | EUR | | 4,700 | | 3 Month EURIBOR minus 29.75 bps | | Deutsche Bank AG | | | 12/31/15 | | | | 335,620 | | | | — | | | | 335,620 | |
See Notes to Financial Statements.
| | | | |
| Prudential Absolute Return Bond Fund | | | 69 | |
Portfolio of Investments
as of October 31, 2014 continued
| | | | | | | | | | | | | | | | | | | | | | | | | | | | |
Notional
Amount
(000)# | | | Fund
Receives | | Notional
Amount
(000) | | Fund Pays | | Counterparty | | Termination
Date | | | Fair
Value | | | Upfront
Premiums
Paid
(Received) | | | Unrealized
Appreciation
(Depreciation) | |
| | 9,427 | | | 3 Month LIBOR | | JPY | | 961,510 | | 3 Month JPY LIBOR minus 31.25 bps | | Deutsche Bank AG | | | 05/14/17 | | | $ | 857,585 | | | $ | — | | | $ | 857,585 | |
| | 1,070 | | | 3 Month LIBOR | | CHF | | 1,000 | | 3 Month CHF LIBOR minus 29.00 bps | | Hong Kong & Shanghai Bank | | | 04/24/15 | | | | 31,173 | | | | — | | | | 31,173 | |
| | 1,800 | | | 3 Month LIBOR | | EUR | | 1,350 | | 3 Month EURIBOR minus 25.75 bps | | Hong Kong & Shanghai Bank | | | 01/17/15 | | | | 108,610 | | | | — | | | | 108,610 | |
| | 3,211 | | | 3 Month LIBOR | | EUR | | 2,420 | | 3 Month EURIBOR minus 26.00 bps | | Hong Kong & Shanghai Bank | | | 01/25/15 | | | | 180,283 | | | | — | | | | 180,283 | |
| | 2,618 | | | 3 Month LIBOR | | EUR | | 2,000 | | 3 Month EURIBOR minus 26.00 bps | | Hong Kong & Shanghai Bank | | | 04/16/15 | | | | 114,352 | | | | — | | | | 114,352 | |
| | 724 | | | 3 Month LIBOR | | EUR | | 550 | | 3 Month EURIBOR minus 30.25 bps | | Hong Kong & Shanghai Bank | | | 12/19/15 | | | | 36,577 | | | | — | | | | 36,577 | |
| | 1,686 | | | 3 Month LIBOR | | EUR | | 1,290 | | 3 Month EURIBOR minus 30.50 bps | | Hong Kong & Shanghai Bank | | | 12/17/15 | | | | 79,409 | | | | — | | | | 79,409 | |
| | 2,656 | | | 3 Month LIBOR | | GBP | | 1,745 | | 3 Month GBP LIBOR minus 9.50 bps | | Hong Kong & Shanghai Bank | | | 06/04/18 | | | | (128,422 | ) | | | — | | | | (128,422 | ) |
| | 1,305 | | | 3 Month LIBOR | | EUR | | 1,000 | | 3 Month EURIBOR minus 25.25 bps | | JPMorgan Chase | | | 04/11/15 | | | | 52,978 | | | | — | | | | 52,978 | |
| | 127 | | | 3 Month LIBOR | | EUR | | 100 | | 3 Month EURIBOR minus 31.25 bps | | JPMorgan Chase | | | 11/15/14 | | | | 1,827 | | | | — | | | | 1,827 | |
| | 1,061 | | | 3 Month LIBOR | | JPY | | 105,000 | | 3 Month JPY LIBOR minus 37.00 bps | | JPMorgan Chase | | | 04/11/15 | | | | 126,788 | | | | — | | | | 126,788 | |
| | 43 | | | 3 Month LIBOR plus 208 bps | | EUR | | 35 | | 4.250% | | Citigroup Global Markets | | | 07/14/17 | | | | (4,206 | ) | | | (4,000 | ) | | | (206 | ) |
| | 79 | | | 3 Month LIBOR plus 220 bps | | EUR | | 65 | | 4.250% | | Citigroup Global Markets | | | 07/14/17 | | | | (7,790 | ) | | | (6,770 | ) | | | (1,020 | ) |
| | 257 | | | 3 Month LIBOR plus 313 bps | | JPY | | 20,000 | | 4.500% | | Citigroup Global Markets | | | 06/08/15 | | | | 76,765 | | | | (11,240 | ) | | | 88,005 | |
| | 256 | | | 3 Month LIBOR plus 333 bps | | JPY | | 20,000 | | 4.500% | | Citigroup Global Markets | | | 06/08/15 | | | | 76,277 | | | | (10,063 | ) | | | 86,340 | |
| | 123 | | | 3 Month LIBOR plus 398 bps | | EUR | | 100 | | 4.500% | | JPMorgan Chase | | | 11/30/15 | | | | (7,819 | ) | | | (2,121 | ) | | | (5,698 | ) |
| | 121 | | | 3 Month LIBOR plus 412 bps | | EUR | | 100 | | 4.500% | | Citigroup Global Markets | | | 11/30/15 | | | | (8,999 | ) | | | (1,140 | ) | | | (7,859 | ) |
| | 64 | | | 3 Month LIBOR plus 432 bps | | JPY | | 5,000 | | 3.450% | | Citigroup Global Markets | | | 03/24/17 | | | | 21,846 | | | | 311 | | | | 21,535 | |
| | TRY 10,920 | | | 7.70% | | | | 5,672 | | 3 Month LIBOR | | Barclays Capital Group | | | 07/22/18 | | | | (761,167 | ) | | | — | | | | (761,167 | ) |
| | TRY 11,530 | | | 7.71% | | | | 5,996 | | 3 Month LIBOR | | Barclays Capital Group | | | 07/23/18 | | | | (809,170 | ) | | | — | | | | (809,170 | ) |
| | TRY 40,000 | | | 8.68% | | | | 19,498 | | 3 Month LIBOR | | Hong Kong & Shanghai Bank | | | 09/05/15 | | | | (1,218,825 | ) | | | — | | | | (1,218,825 | ) |
| | TRY 59,000 | | | 8.69% | | | | 28,393 | | 3 Month LIBOR | | Hong Kong & Shanghai Bank | | | 09/09/15 | | | | (1,450,637 | ) | | | — | | | | (1,450,637 | ) |
| | | | | | | | | | | | | | | | | | | | | | | | | | | | |
| | | | | | | | | | | | | | | | | | $ | (765,697 | ) | | $ | (35,023 | ) | | $ | (730,674 | ) |
| | | | | | | | | | | | | | | | | | | | | | | | | | | | |
See Notes to Financial Statements.
Interest rate swap agreements outstanding at October 31, 2014:
| | | | | | | | | | | | | | | | | | | | | | | | |
Notional
Amount
(000)# | | | Termination
Date | | | Fixed
Rate | | | Floating
Rate | | Value at
Trade
Date | | | Value at
October 31,
2014 | | | Unrealized
Appreciation
(Depreciation) | |
| Exchange-traded swap agreements: | |
| MXN | 15,000 | | | | 12/02/15 | | | | 5.080% | | | 28 Day Mexican Interbank Rate(2) | | $ | (388 | ) | | $ | 19,273 | | | $ | 19,661 | |
| ZAR | 234,400 | | | | 03/04/16 | | | | 7.200% | | | 3 Month JIBAR(2) | | | (11,299 | ) | | | 196,970 | | | | 208,269 | |
| | 35,555 | | | | 06/30/16 | | | | 0.618% | | | 3 Month LIBOR(1) | | | 239 | | | | (36,793 | ) | | | (37,032 | ) |
| | 112,690 | | | | 06/30/16 | | | | 0.655% | | | 3 Month LIBOR(1) | | | 432 | | | | (186,235 | ) | | | (186,667 | ) |
| | 80,000 | | | | 08/01/16 | | | | 0.743% | | | 3 Month LIBOR(1) | | | 306 | | | | (207,541 | ) | | | (207,847 | ) |
| | 50,000 | | | | 08/04/16 | | | | 0.733% | | | 3 Month LIBOR(1) | | | 275 | | | | (119,313 | ) | | | (119,588 | ) |
| | 460,000 | | | | 08/06/16 | | | | 0.677% | | | 3 Month LIBOR(1) | | | 1,300 | | | | (618,104 | ) | | | (619,404 | ) |
| | 900,000 | | | | 08/07/16 | | | | 0.689% | | | 3 Month LIBOR(1) | | | 130,834 | | | | (1,390,003 | ) | | | (1,520,837 | ) |
| | 55,800 | | | | 09/30/16 | | | | 0.877% | | | 3 Month LIBOR(1) | | | 290 | | | | (160,843 | ) | | | (161,133 | ) |
| | 38,000 | | | | 10/02/16 | | | | 0.834% | | | 3 Month LIBOR(1) | | | 245 | | | | (119,964 | ) | | | (120,209 | ) |
| | 61,500 | | | | 10/07/16 | | | | 0.805% | | | 3 Month LIBOR(1) | | | 304 | | | | (155,782 | ) | | | (156,086 | ) |
| | 171,500 | | | | 10/08/16 | | | | 0.815% | | | 3 Month LIBOR(1) | | | (431,465 | ) | | | (454,143 | ) | | | (22,678 | ) |
| EUR | 16,000 | | | | 08/13/17 | | | | 0.099% | | | 1 Day EUR OIS(1) | | | 3,342 | | | | (67,634 | ) | | | (70,976 | ) |
| | 23,955 | | | | 12/24/17 | | | | 1.384% | | | 3 Month LIBOR(1) | | | 2,745 | | | | (143,999 | ) | | | (146,744 | ) |
| PLN | 85,000 | | | | 09/03/18 | | | | 3.985% | | | 6 Month WIBOR(2) | | | (181,351 | ) | | | 1,964,196 | | | | 2,145,547 | |
| MXN | 200,000 | | | | 04/18/19 | | | | 5.480% | | | 28 Day Mexican Interbank Rate(2) | | | (12,031 | ) | | | 309,024 | | | | 321,055 | |
| EUR | 13,800 | | | | 08/01/19 | | | | 0.346% | | | 1 Day EUR OIS(1) | | | 9,653 | | | | (208,860 | ) | | | (218,513 | ) |
| | 48,650 | | | | 10/01/19 | | | | 1.934% | | | 3 Month LIBOR(1) | | | (236,826 | ) | | | (455,331 | ) | | | (218,505 | ) |
| | 263,500 | | | | 05/15/21 | | | | 2.202% | | | 3 Month LIBOR(1) | | | 1,731 | | | | (2,328,493 | ) | | | (2,330,224 | ) |
| | 2,570 | | | | 07/31/21 | | | | 2.290% | | | 3 Month LIBOR(1) | | | (50,205 | ) | | | (24,283 | ) | | | 25,922 | |
| MXN | 2,900 | | | | 05/25/22 | | | | 6.370% | | | 28 Day Mexican Interbank Rate(2) | | | (337 | ) | | | 8,073 | | | | 8,410 | |
| | 24,000 | | | | 04/03/23 | | | | 2.015% | | | 3 Month LIBOR(1) | | | — | | | | 565,405 | | | | 565,405 | |
| | 16,300 | | | | 06/20/23 | | | | 2.604% | | | 3 Month LIBOR(1) | | | 238 | | | | (343,290 | ) | | | (343,528 | ) |
| NZD | 9,130 | | | | 08/19/23 | | | | 4.850% | | | 3 Month NZD LIBOR(2) | | | (20,702 | ) | | | 259,746 | | | | 280,448 | |
| | 101,900 | | | | 09/24/23 | | | | 2.903% | | | 3 Month LIBOR(1) | | | 965 | | | | (4,466,479 | ) | | | (4,467,444 | ) |
| ZAR | 11,500 | | | | 10/22/23 | | | | 7.625% | | | 3 Month JIBAR(2) | | | 691 | | | | (5,358 | ) | | | (6,049 | ) |
| ZAR | 88,600 | | | | 11/14/23 | | | | 8.190% | | | 3 Month JIBAR(2) | | | (22,772 | ) | | | 253,040 | | | | 275,812 | |
| EUR | 6,250 | | | | 08/04/24 | | | | 1.054% | | | 1 Day EUR OIS(1) | | | (191,880 | ) | | | (261,006 | ) | | | (69,126 | ) |
| MXN | 86,950 | | | | 08/13/24 | | | | 6.120% | | | 28 Day Mexican Interbank Rate(2) | | | 439 | | | | 2,334 | | | | 1,895 | |
| | 98,000 | | | | 08/15/24 | | | | 2.559% | | | 3 Month LIBOR(1) | | | 934 | | | | (884,287 | ) | | | (885,221 | ) |
| | 56,550 | | | | 09/09/24 | | | | 2.558% | | | 3 Month LIBOR(1) | | | 602 | | | | (471,611 | ) | | | (472,213 | ) |
| AUD | 6,500 | | | | 03/07/29 | | | | 4.743% | | | 6 Month BBSW(2) | | | (22,089 | ) | | | 513,371 | | | | 535,460 | |
See Notes to Financial Statements.
| | | | |
| Prudential Absolute Return Bond Fund | | | 71 | |
Portfolio of Investments
as of October 31, 2014 continued
| | | | | | | | | | | | | | | | | | | | | | | | |
Notional
Amount
(000)# | | | Termination
Date | | | Fixed
Rate | | | Floating
Rate | | Value at
Trade
Date | | | Value at
October 31,
2014 | | | Unrealized
Appreciation
(Depreciation) | |
| Exchange-traded swap agreements (cont’d.): | |
| MXN | 47,600 | | | | 07/27/34 | | | | 6.720% | | | 28 Day Mexican Interbank Rate(2) | | $ | 856 | | | $ | (123,390 | ) | | $ | (124,246 | ) |
| | 8,500 | | | | 02/15/40 | | | | 3.193% | | | 3 Month LIBOR(1) | | | 197 | | | | (282,851 | ) | | | (283,048 | ) |
| | 1,300 | | | | 12/12/42 | | | | 2.590% | | | 3 Month LIBOR(1) | | | 23 | | | | 115,534 | | | | 115,511 | |
| | 13,400 | | | | 08/21/44 | | | | 3.190% | | | 3 Month LIBOR(1) | | | 385 | | | | (397,044 | ) | | | (397,429 | ) |
| | | | | | | | | | | | | | | | | | | | | | | | |
| | | | | | | | | | | | | | $ | (1,024,319 | ) | | $ | (9,705,671 | ) | | $ | (8,681,352 | ) |
| | | | | | | | | | | | | | | | | | | | | | | | |
| | | | | | | | | | | | | | | | | | | | | | | | | | |
Notional
Amount
(000)# | | | Termination
Date | | | Fixed
Rate | | | Floating Rate | | Fair
Value | | | Upfront
Premiums
Paid
(Received) | | | Unrealized
Appreciation
(Depreciation) | | | Counterparty |
| Over-the-counter swap agreements: |
| BRL | 2,166 | | | | 01/01/17 | | | | 8.330% | | | 1 Day BZDIOVER(2) | | $ | (90,795 | ) | | $ | — | | | $ | (90,795 | ) | | Citigroup Global Markets |
| BRL | 1,026 | | | | 01/01/17 | | | | 9.130% | | | 1 Day BZDIOVER(2) | | | (27,252 | ) | | | — | | | | (27,252 | ) | | Barclays Capital Group |
| BRL | 73,728 | | | | 01/02/17 | | | | 10.580% | | | 1 Day BZDIOVER(2) | | | (836,611 | ) | | | — | | | | (836,611 | ) | | Hong Kong & Shanghai Bank |
| | 100,250 | | | | 11/30/17 | | | | 1.170% | | | 3 Month LIBOR(1) | | | (472,578 | ) | | | — | | | | (472,578 | ) | | Credit Suisse First Boston Corp. |
| BRL | 63,579 | | | | 01/01/18 | | | | 11.770% | | | 1 Day BZDIOVER(2) | | | (246,508 | ) | | | — | | | | (246,508 | ) | | Deutsche Bank AG |
| MXN | 143,100 | | | | 06/20/18 | | | | 6.020% | | | 28 Day Mexican Interbank Rate(2) | | | 502,984 | | | | — | | | | 502,984 | | | Credit Suisse First Boston Corp. |
| ZAR | 119,800 | | | | 06/25/18 | | | | 7.420% | | | 3 Month JIBAR(2) | | | 159,333 | | | | — | | | | 159,333 | | | Barclays Capital Group |
| PLN | 56,900 | | | | 06/28/18 | | | | 3.736% | | | 6 Month WIBOR(2) | | | 1,206,084 | | | | — | | | | 1,206,084 | | | Citigroup Global Markets |
| MXN | 173,100 | | | | 11/09/18 | | | | 5.410% | | | 28 Day Mexican Interbank Rate(2) | | | 301,108 | | | | — | | | | 301,108 | | | Deutsche Bank AG |
| | 23,800 | | | | 01/24/20 | | | | 1.348% | | | 3 Month LIBOR(1) | | | 473,053 | | | | — | | | | 473,053 | | | Credit Suisse First Boston Corp. |
| | 50,000 | | | | 02/25/20 | | | | 1.478% | | | 3 Month LIBOR(1) | | | 799,406 | | | | — | | | | 799,406 | | | Bank of America |
| BRL | 20,873 | | | | 01/01/21 | | | | 12.640% | | | 1 Day BZDIOVER(2) | | | 620,118 | | | | — | | | | 620,118 | | | Deutsche Bank AG |
| BRL | 26,447 | | | | 01/01/21 | | | | 11.300% | | | 1 Day BZDIOVER(2) | | | (258,296 | ) | | | — | | | | (258,296 | ) | | Barclays Capital Group |
| MXN | 164,100 | | | | 04/28/23 | | | | 5.100% | | | 28 Day Mexican Interbank Rate(2) | | | (751,744 | ) | | | — | | | | (751,744 | ) | | Barclays Capital Group |
| RUB | 150,000 | | | | 05/17/23 | | | | 7.250% | | | 3 Month MosPrime(2) | | | (764,284 | ) | | | — | | | | (764,284 | ) | | Credit Suisse First Boston Corp. |
See Notes to Financial Statements.
| | | | | | | | | | | | | | | | | | | | | | | | | | |
Notional
Amount
(000)# | | | Termination
Date | | | Fixed
Rate | | | Floating
Rate | | Fair
Value | | | Upfront
Premiums
Paid
(Received) | | | Unrealized
Appreciation
(Depreciation) | | | Counterparty |
| Over-the-counter swap agreements (cont’d.): |
| RUB | 150,000 | | | | 05/17/23 | | | | 7.250% | | | 3 Month MosPrime(2) | | $ | (765,589 | ) | | $ | — | | | $ | (765,589 | ) | | Credit Suisse First Boston Corp. |
| NZD | 3,435 | | | | 08/12/23 | | | | 4.648% | | | 3 Month BBR(2) | | | 69,329 | | | | — | | | | 69,329 | | | Citigroup Global Markets |
| NZD | 2,495 | | | | 08/13/23 | | | | 4.668% | | | 3 Month BBR(2) | | | 53,369 | | | | — | | | | 53,369 | | | Citigroup Global Markets |
| MXN | 98,000 | | | | 10/20/23 | | | | 6.540% | | | 28 Day Mexican Interbank Rate(2) | | | 284,393 | | | | — | | | | 284,393 | | | Deutsche Bank AG |
| MXN | 6,100 | | | | 10/20/23 | | | | 6.550% | | | 28 Day Mexican Interbank Rate(2) | | | 18,046 | | | | — | | | | 18,046 | | | Citigroup Global Markets |
| AUD | 360 | | | | 12/19/32 | | | | 4.423% | | | 6 Month BBSW(2) | | | 13,884 | | | | — | | | | 13,884 | | | Barclays Capital Group |
| AUD | 450 | | | | 12/20/32 | | | | 4.420% | | | 6 Month BBSW(2) | | | 16,760 | | | | — | | | | 16,760 | | | Citigroup Global Markets |
| ZAR | 20,000 | | | | 09/03/33 | | | | 8.970% | | | 3 Month JIBAR(2) | | | 140,178 | | | | — | | | | 140,178 | | | Hong Kong & Shanghai Bank |
| | | | | | | | | | | | | | | | | | | | | | | | | | |
| | | | | | | | | | | | | | $ | 444,388 | | | $ | — | | | $ | 444,388 | | | |
| | | | | | | | | | | | | | | | | | | | | | | | | | |
| (1) | The Fund pays the fixed rate and receives the floating rate. |
| (2) | The Fund pays the floating rate and receives the fixed rate. |
| # | Notional amount is shown in U.S. dollars unless otherwise stated. |
Credit default swap agreements outstanding at October 31, 2014:
| | | | | | | | | | | | | | | | | | | | | | | | |
Reference Entity/
Obligation | | Termination
Date | | | Fixed
Rate | | | Notional
Amount
(000)#(3) | | | Value at
Trade
Date | | | Value at
October 31,
2014 | | | Unrealized
Depreciation | |
Exchange-traded credit default swaps on credit indices—Buy Protection(1): | |
CDX.NA.IG.22.V1 | | | 06/20/19 | | | | 1.000% | | | | 435,000 | | | $ | (7,746,406 | ) | | $ | (8,643,114 | ) | | $ | (896,708 | ) |
| | | | | | | | | | | | | | | | | | | | | | | | |
| | | | | | | | | | | | | | | | | | | | | | | | |
Reference Entity/
Obligation | | Termination
Date | | | Fixed
Rate | | | Notional
Amount
(000)#(3) | | | Value at
Trade
Date | | | Value at
October 31,
2014 | | | Unrealized
Appreciation
(Depreciation) | |
Exchange-traded credit default swaps on credit indices—Sell Protection(2): | |
CDX.NA.HY.17.V6 | | | 12/20/16 | | | | 5.000% | | | | 76,000 | | | $ | 6,122,777 | | | $ | 4,739,075 | | | $ | (1,383,702 | ) |
CDX.NA.HY.18.V3 | | | 06/20/17 | | | | 5.000% | | | | 14,700 | | | | 1,351,799 | | | | 1,057,665 | | | | (294,134 | ) |
CDX.NA.HY.22.V2 | | | 06/20/19 | | | | 5.000% | | | | 90,585 | | | | 5,976,329 | | | | 6,841,092 | | | | 864,763 | |
CDX.NA.HY.23.V1 | | | 12/20/19 | | | | 5.000% | | | | 73,800 | | | | 4,870,888 | | | | 5,154,931 | | | | 284,043 | |
| | | | | | | | | | | | | | | | | | | | | | | | |
| | | | | | | | | | | | | | $ | 18,321,793 | | | $ | 17,792,763 | | | $ | (529,030 | ) |
| | | | | | | | | | | | | | | | | | | | | | | | |
See Notes to Financial Statements.
| | | | |
| Prudential Absolute Return Bond Fund | | | 73 | |
Portfolio of Investments
as of October 31, 2014 continued
| | | | | | | | | | | | | | | | | | | | | | | | | | |
Reference
Entity/
Obligation | | Termination
Date | | | Fixed
Rate | | | Notional
Amount
(000)#(3) | | | Fair
Value(4) | | | Upfront
Premiums
Paid
(Received) | | | Unrealized
Appreciation | | | Counterparty |
Over-the-counter credit default swaps on credit indices—Sell Protection(2): |
CDX.NA.HY.17.V6 | | | 12/20/16 | | | | 5.000% | | | | 5,463 | | | $ | 378,153 | | | $ | 239,364 | | | $ | 138,789 | | | Deutsche Bank AG |
CDX.NA.HY.17.V6 | | | 12/20/16 | | | | 5.000% | | | | 3,325 | | | | 230,180 | | | | 139,465 | | | | 90,715 | | | Credit Suisse First Boston Corp. |
CDX.NA.HY.17.V6 | | | 12/20/16 | | | | 5.000% | | | | 8,788 | | | | 608,332 | | | | 379,571 | | | | 228,761 | | | Deutsche Bank AG |
CDX.NA.HY.17.V6 | | | 12/20/16 | | | | 5.000% | | | | 6,175 | | | | 427,477 | | | | 282,163 | | | | 145,314 | | | Deutsche Bank AG |
CDX.NA.HY.18.V3 | | | 06/20/17 | | | | 5.000% | | | | 1,960 | | | | 152,765 | | | | (40,289 | ) | | | 193,054 | | | Goldman Sachs & Co. |
CDX.NA.HY.18.V3 | | | 06/20/17 | | | | 5.000% | | | | 2,940 | | | | 229,149 | | | | (78,808 | ) | | | 307,957 | | | Citigroup Global Markets |
CDX.NA.HY.18.V3 | | | 06/20/17 | | | | 5.000% | | | | 980 | | | | 76,383 | | | | (76,494 | ) | | | 152,877 | | | Citigroup Global Markets |
| | | | | | | | | | | | | | | | | | | | | | | | | | |
| | | | | | | | | | | | | | $ | 2,102,439 | | | $ | 844,972 | | | $ | 1,257,467 | | | |
| | | | | | | | | | | | | | | | | | | | | | | | | | |
Cash of $24,554,733 has been segregated with Citigroup Global Markets to cover requirements for open exchange-traded and cleared swap contracts at October 31, 2014.
The Fund entered into credit default swaps (“CDS”) to provide a measure of protection against defaults or to take an active long or short position with respect to the likelihood of a particular issuer’s default or the reference entity’s credit soundness. CDS contracts generally trade based on a spread which represents the cost a protection buyer has to pay the protection seller. The protection buyer is said to be short the credit as the value of the contract rises the more credit deteriorates. The value of the CDS contract increases for the protection buyer if the spread increases.
| (1) | If the Fund is a buyer of protection, it pays the fixed rate. When a credit event occurs, as defined under the terms of that particular swap agreement, the Fund will either (i) receive from the seller of protection an amount equal to the notional amount of the swap and make delivery of the referenced obligation or underlying securities comprising the referenced index or (ii) receive a net settlement amount in the form of cash or securities equal to the notional amount of the swap less the recovery value of the referenced obligation or underlying securities comprising the referenced index. |
| (2) | If the Fund is a seller of protection, it receives the fixed rate. When a credit event occurs, as defined under the terms of that particular swap agreement, the Fund will either (i) pay to the buyer of protection an amount equal to the notional amount of the swap and take delivery of the referenced obligation or underlying securities comprising the referenced index or (ii) pay a net settlement amount in the form of cash or securities equal to the notional amount of the swap less the recovery value of the referenced obligation or underlying securities comprising the referenced index. |
| (3) | Notional amount represents the maximum potential amount the Fund could be required to pay as a seller of credit protection or receive as a buyer of credit protection if a credit event occurs as defined under the terms of that particular swap agreement. |
| (4) | The fair value of credit default swap agreements on credit indices serves as an indicator of the current status of the payment/performance risk and represents the likelihood of an expected liability (or profit) for the credit derivative should the notional amount of the swap agreement be closed/sold as of the reporting date. Increasing fair value in absolute terms when compared to the notional amount of the swap, represents a deterioration of the referenced entity’s credit soundness and a greater likelihood of risk of default or other credit event occurring as defined under the terms of the agreement. |
| # | Notional amount is shown in U.S. dollars unless otherwise stated. |
See Notes to Financial Statements.
Various inputs are used in determining the value of the Fund’s investments. These inputs are summarized in the three broad levels listed below.
Level 1—quoted prices generally in active markets for identical securities.
Level 2—quoted prices for similar securities, interest rates and yield curves, prepayment speeds, foreign currency exchange rates and other significant observable inputs.
Level 3—significant unobservable inputs for securities valued in accordance with Board approved fair valuation procedures.
The following is a summary of the inputs used as of October 31, 2014 in valuing such portfolio securities:
| | | | | | | | | | | | |
| | | Level 1 | | | Level 2 | | | Level 3 | |
Investments in Securities | |
Asset-Backed Securities | | | | | | | | | | | | |
Collateralized Debt Obligations | | $ | — | | | $ | 4,929,454 | | | $ | — | |
Collateralized Loan Obligations | | | — | | | | 266,279,905 | | | | 37,138,500 | |
Non-Residential Mortgage-Backed Securities | | | — | | | | 20,423,877 | | | | — | |
Residential Mortgage-Backed Securities | | | — | | | | 220,384,829 | | | | 18,261,627 | |
Bank Loans | | | — | | | | 150,017,697 | | | | 3,949,600 | |
Commercial Mortgage-Backed Securities | | | — | | | | 328,136,733 | | | | — | |
Corporate Bonds | | | — | | | | 1,159,123,965 | | | | 8,352,285 | |
Mortgage-Backed Securities | | | — | | | | 7,671,816 | | | | — | |
Municipal Bonds | | | — | | | | 13,819,429 | | | | — | |
Non-Corporate Foreign Agencies | | | — | | | | 51,239,317 | | | | — | |
Sovereign Bonds | | | — | | | | 217,036,714 | | | | — | |
U.S. Government Agency Obligations | | | — | | | | 27,064,220 | | | | — | |
U.S. Treasury Obligations | | | — | | | | 102,689,022 | | | | — | |
Affiliated Money Market Mutual Fund | | | 377,879,149 | | | | — | | | | — | |
Options Purchased | | | 8,398,453 | | | | — | | | | — | |
Options Written | | | (4,712,508 | ) | | | — | | | | — | |
Other Financial Instruments* | | | | | | | | | | | | |
Futures Contracts | | | 36,589 | | | | — | | | | — | |
Forward Foreign Currency Exchange Contracts | | | — | | | | 3,207,485 | | | | — | |
Cross Currency Exchange Contracts | | | — | | | | 11,170 | | | | — | |
Currency Swap Agreements | | | — | | | | (765,697 | ) | | | — | |
Exchange-traded interest rate swaps | | | — | | | | (8,681,352 | ) | | | — | |
Over-the-counter interest rate swaps | | | — | | | | 444,388 | | | | — | |
Exchange-traded credit default swaps | | | — | | | | (1,425,738 | ) | | | — | |
Over-the-counter credit default swaps | | | — | | | | 2,102,439 | | | | — | |
| | | | | | | | | | | | |
Total | | $ | 381,601,683 | | | $ | 2,563,709,673 | | | $ | 67,702,012 | |
| | | | | | | | | | | | |
See Notes to Financial Statements.
| | | | |
| Prudential Absolute Return Bond Fund | | | 75 | |
Portfolio of Investments
as of October 31, 2014 continued
The following is a reconciliation of assets in which significant unobservable inputs (Level 3) were used in determining fair value:
| | | | | | | | | | | | | | | | | | | | |
| | | Asset-
Backed
Securities | | | Bank
Loans | | | Commercial
Mortgage-Backed
Securities | | | Corporate
Bonds | | | Sovereigns | |
Balance as of 10/31/13 | | $ | 22,061,118 | | | $ | 8,775,211 | | | $ | 10,506,000 | | | $ | 7,235,184 | | | $ | 925,455 | |
Realized gain (loss) | | | (2,888 | ) | | | (815 | ) | | | — | | | | — | | | | — | |
Change in unrealized appreciation (depreciation)** | | | (104,651 | ) | | | (171,253 | ) | | | — | | | | 336,244 | | | | — | |
Purchases | | | 55,630,905 | | | | — | | | | — | | | | 1,057,966 | | | | — | |
Sales | | | (6,876,319 | ) | | | (6,127,292 | ) | | | — | | | | (289,604 | ) | | | — | |
Accrued discount/premium | | | — | | | | 11,524 | | | | — | | | | 12,495 | | | | — | |
Transfer into Level 3 | | | — | | | | 3,508,750 | | | | — | | | | — | | | | — | |
Transfer out of Level 3 | | | (15,308,038 | ) | | | (2,046,525 | ) | | | (10,506,000 | ) | | | — | | | | (925,455 | ) |
| | | | | | | | | | | | | | | | | | | | |
Balance as of 10/31/14 | | $ | 55,400,127 | | | $ | 3,949,600 | | | $ | — | | | $
| 8,352,285
|
| | $ | — | |
| | | | | | | | | | | | | | | | | | | | |
| * | Other financial instruments are derivative instruments not reflected in the Portfolio of Investments, such as futures, forwards and exchange-traded swaps contracts, which are recorded at the unrealized appreciation/depreciation of the instrument, and over-the-counter swap contracts which are recorded at fair value. |
| ** | Of which, $167,027 was included in Net Assets relating to securities held at the reporting period end. |
It is the Fund’s policy to recognize transfers in and transfers out at the fair value as of the beginning of the period. At the reporting period end, 2 Asset-Backed Securities, 2 Bank Loans, 1 Commercial Mortgage-Backed Security and 1 Sovereign Bond transferred out of Level 3 as a result of being valued by an independent pricing vendor and 1 Bank Loan transferred into Level 3 as a result of being valued using a single broker quote.
Level 3 securities as presented in the table above are being fair valued using pricing methodologies approved by the Board of Trustees, which contain unobservable inputs. Such methodologies include, but are not limited to, using pricing provided by a single broker/dealer, the cost of the investment, and prices of any recent transactions or bids/offers for such securities or any comparable securities.
See Notes to Financial Statements.
The industry classification of investments and liabilities in excess of other assets shown as a percentage of net assets as of October 31, 2014 was as follows (Unaudited):
| | | | |
Affiliated Money Market Mutual Fund (including 3.5% of collateral for securities on loan) | | | 13.8 | % |
Commercial Mortgage-Backed Securities | | | 12.0 | |
Collateralized Loan Obligations | | | 11.1 | |
Banking | | | 9.4 | |
Residential Mortgage-Backed Securities | | | 8.7 | |
Sovereign Bonds | | | 7.9 | |
Healthcare & Pharmaceutical | | | 4.0 | |
U.S. Treasury Obligations | | | 3.8 | |
Technology | | | 3.6 | |
Telecommunications | | | 3.2 | |
Food & Beverage | | | 2.9 | |
Capital Goods | | | 2.4 | |
Media & Entertainment | | | 2.3 | |
Insurance | | | 2.1 | |
Non-Corporate Foreign Agencies | | | 1.9 | |
Metals | | | 1.7 | |
Automotive | | | 1.6 | |
Electric | | | 1.5 | |
Chemicals | | | 1.4 | |
Cable | | | 1.4 | |
Building Materials & Construction | | | 1.4 | |
Pipelines & Other | | | 1.2 | |
Energy—Other | | | 1.1 | |
U.S. Government Agency Obligations | | | 1.0 | |
Energy—Integrated | | | 0.9 | |
Non-Captive Finance | | | 0.8 | % |
Consumer | | | 0.8 | |
Retailers | | | 0.8 | |
Non-Residential Mortgage-Backed Securities | | | 0.7 | |
Real Estate Investment Trusts | | | 0.6 | |
Gaming | | | 0.6 | |
Municipal Bonds | | | 0.5 | |
Lodging | | | 0.4 | |
Airlines | | | 0.4 | |
Options Purchased | | | 0.3 | |
Brokerage | | | 0.3 | |
Mortgage-Backed Securities | | | 0.3 | |
Railroads | | | 0.3 | |
Tobacco | | | 0.3 | |
Paper | | | 0.2 | |
Healthcare Insurance | | | 0.2 | |
Packaging | | | 0.2 | |
Collateralized Debt Obligations | | | 0.2 | |
Aerospace & Defense | | | 0.1 | |
Leisure | | | 0.1 | |
Options Written | | | (0.2 | ) |
| | | | |
| | | 110.2 | |
Liabilities in excess of other assets | | | (10.2 | ) |
| | | | |
| | | 100.0 | % |
| | | | |
The Fund invested in derivative instruments during the reporting period. The primary types of risk associated with these derivative instruments are credit risk, foreign exchange risk and interest rate risk. The effect of such derivative instruments on the Fund’s financial position and financial performance as reflected in the Statement of Assets and Liabilities and Statement of Operations is presented in the summary below.
See Notes to Financial Statements.
| | | | |
| Prudential Absolute Return Bond Fund | | | 77 | |
Portfolio of Investments
as of October 31, 2014 continued
Fair values of derivative instruments as of October 31, 2014 as presented in the Statement of Assets and Liabilities:
| | | | | | | | | | | | |
Derivatives not accounted
for as hedging instruments,
carried at fair value | | Asset Derivatives | | | Liability Derivatives | |
| | Balance Sheet
Location | | Fair
Value | | | Balance Sheet
Location | | Fair
Value | |
| Credit contracts | | Unrealized appreciation on over-the-counter swap agreements | | $ | 1,257,467 | | | — | | $ | — | |
| Credit contracts | | Premiums paid for swap agreements | | | 1,040,563 | | | Premiums received for swap agreements | | | 195,591 | |
| Credit contracts | | Due to broker—variation margin swaps | | | 1,148,806 | * | | Due to broker—variation margin swaps | | | 2,574,544 | * |
| Foreign exchange contracts | | Unrealized appreciation on forward foreign currency contracts | | | 7,080,891 | | | Unrealized depreciation on forward foreign currency contracts | | | 3,873,406 | |
| Foreign exchange contracts | | Unrealized appreciation on cross currency exchange contracts | | | 80,926 | | | Unrealized depreciation on cross currency exchange contracts | | | 69,756 | |
| Interest rate contracts | | Due to broker—variation margin futures | | | 379,265 | | | Due to broker—variation margin futures | | | 342,676 | |
| Interest rate contracts | | Due to broker—variation margin swaps | | | 4,503,395 | * | | Due to broker—variation margin swaps | | | 13,184,747 | * |
| Interest rate contracts | | Unrealized appreciation on over-the-counter swap agreements | | | 8,404,732 | | | Unrealized depreciation on swap agreements | | | 8,691,018 | |
| Interest rate contracts | | Premiums paid for swap agreements | | | 311 | | | Premiums received for swap agreements | | | 35,334 | |
| Interest rate contracts | | Unaffiliated investments | | | 8,398,453 | | | Options written outstanding, at value | | | 4,712,508 | |
| | | | | | | | | | | | |
Total | | | | $ | 32,294,809 | | | | | $ | 33,679,580 | |
| | | | | | | | | | | | |
| * | Includes cumulative appreciation/depreciation as reported in the schedule of open futures contracts. Only unsettled variation margin receivable (payable) is reported within the Statement of Assets and Liabilities. |
See Notes to Financial Statements.
The effects of derivative instruments on the Statement of Operations for the year ended October 31, 2014 are as follows:
| | | | | | | | | | | | | | | | | | | | | | | | | | | | |
Amount of Realized Gain or (Loss) on Derivatives Recognized in Income | |
Derivatives not
accounted for
as hedging
instruments,
carried at
fair value | | Options
Purchased* | | | Options
Written | | | Futures | | | Forward
and Cross
Currency
Contracts** | | | Forward
Rate
Agreements | | | Swaps | | | Total | |
Credit contracts | | $ | — | | | $ | — | | | $ | — | | | $ | — | | | $ | — | | | $ | (7,061,678 | ) | | $ | (7,061,678 | ) |
Foreign exchange contracts | | | — | | | | — | | | | — | | | | 7,266,126 | | | | — | | | | — | | | | 7,266,126 | |
Interest rate contracts | | | (1,709,840 | ) | | | 137,039 | | | | (4,454,191 | ) | | | — | | | | 510,370 | | | | 4,926,369 | | | | (590,253 | ) |
| | | | | | | | | | | | | | | | | | | | | | | | | | | | |
Total | | $ | (1,709,840 | ) | | $ | 137,039 | | | $ | (4,454,191 | ) | | $ | 7,266,126 | | | $ | 510,370 | | | $ | (2,135,309 | ) | | $ | (385,805 | ) |
| | | | | | | | | | | | | | | | | | | | | | | | | | | | |
| * | Included in net realized gain (loss) on investment transactions in the Statement of Operations. |
| ** | Included in net realized gain (loss) on foreign currency transactions in the Statement of Operations. |
| | | | | | | | | | | | | | | | | | | | | | | | |
Change in Unrealized Appreciation or (Depreciation) on Derivatives Recognized in Income | |
Derivatives not
accounted for as
hedging instruments,
carried at fair value | | Options
Purchased* | | | Options
Written | | | Futures | | | Forward
and Cross
Currency
Contracts** | | | Swaps | | | Total | |
Credit contracts | | $ | — | | | $ | — | | | $ | — | | | $ | — | | | $ | (1,476,547 | ) | | $ | (1,476,547 | ) |
Foreign exchange contracts | | | — | | | | — | | | | — | | | | 3,632,788 | | | | — | | | | 3,632,788 | |
Interest rate contracts | | | 1,879,286 | | | | (977,488 | ) | | | (1,007,861 | ) | | | — | | | | (16,549,891 | ) | | | (16,655,954 | ) |
| | | | | | | | | | | | | | | | | | | | | | | | |
Total | | $ | 1,879,286 | | | $ | (977,488 | ) | | $ | (1,007,861 | ) | | $ | 3,632,788 | | | $ | (18,026,438 | ) | | $ | (14,499,713 | ) |
| | | | | | | | | | | | | | | | | | | | | | | | |
| * | Included in net change in unrealized appreciation (depreciation) on investments in the Statement of Operations. |
| ** | Included in net change in unrealized appreciation (depreciation) on foreign currencies in the Statement of Operations. |
See Notes to Financial Statements.
| | | | |
| Prudential Absolute Return Bond Fund | | | 79 | |
Portfolio of Investments
as of October 31, 2014 continued
As of October 31, 2014, the Fund’s average volume of derivatives activities is as follows:
| | | | | | | | | | | | | | | | | | | | | | |
Options
Purchased
(Cost) | | | Options
Written
(Notional
Amount in
USD (000)) | | | Futures
Long
Positions
(Value at
Trade Date) | | | Futures
Short
Positions
(Value at
Trade Date) | | | Forward
Currency
Contracts—
Purchased
(Value at
Settlement
Date Payable) | | | Forward
Currency
Contracts—
Sold (Value at
Settlement
Date Receivable) | |
| $ | 2,426,941 | | | $ | 412,560 | | | $ | 134,779,030 | | | $ | 213,961,792 | | | $ | 438,621,838 | | | $ | 497,177,637 | |
| | | | | | | | | | | | | | | | | | | | | | |
Forward
Rate
Agreements
(Notional
Amount in
USD (000)) | | | Cross
Currency
Exchange
Contracts
(Notional
Amount in
USD (000)) | | | Currency
Swaps
(Notional
Amount in
USD (000)) | | | Interest
Rate
Swaps
(Notional
Amount in
USD (000)) | | | Credit
Default
Swaps as
Buyer
(Notional
Amount in
USD (000)) | | | Credit
Default
Swaps as
Writer
(Notional
Amount in
USD (000)) | |
| $ | 393,549 | | | $ | 30,458 | | | $ | 114,965 | | | $ | 2,193,133 | | | $ | 115,869 | | | $ | 189,013 | |
Offsetting of over-the-counter (OTC) derivative assets and liabilities:
The Fund invested in OTC derivatives during the reporting period that are either offset in accordance with current requirements or are subject to enforceable master netting arrangements or similar agreements that permit offsetting. The information about offsetting and related netting arrangements for OTC derivatives, where the legal right to set-off exists, is presented in the summary below.
| | | | | | | | | | | | | | | | |
Counterparty | | Gross
Amounts of
Recognized
Assets(1) | | | Gross
Amounts
Available
for Offset | | | Collateral
Received(3) | | | Net
Amount | |
Bank of America | | $ | 903,125 | | | $ | — | | | $ | (679,713 | ) | | $ | 223,412 | |
Barclays Capital Group | | | 1,167,017 | | | | (1,167,017 | ) | | | — | | | | — | |
BNP Paribas | | | 175,067 | | | | (175,067 | ) | | | — | | | | — | |
Citigroup Global Markets | | | 3,879,166 | | | | (660,530 | ) | | | (2,940,000 | ) | | | 278,636 | |
Credit Suisse First Boston Corp. | | | 1,206,217 | | | | (1,206,217 | ) | | | — | | | | — | |
Deutsche Bank AG | | | 4,114,957 | | | | (504,660 | ) | | | (3,768,066 | ) | | | — | |
Goldman Sachs & Co. | | | 420,879 | | | | (45,209 | ) | | | (305,368 | ) | | | 70,302 | |
Hong Kong & Shanghai Bank | | | 785,818 | | | | (785,818 | ) | | | — | | | | — | |
JPMorgan Chase | | | 826,483 | | | | (826,483 | ) | | | — | | | | — | |
See Notes to Financial Statements.
| | | | | | | | | | | | | | | | |
Counterparty | | Gross
Amounts of
Recognized
Assets(1) | | | Gross
Amounts
Available
for Offset | | | Collateral
Received(3) | | | Net
Amount | |
Toronto Dominion | | $ | 2,269,978 | | | $ | (130,664 | ) | | $ | (463,391 | ) | | $ | 1,675,923 | |
UBS AG | | | 2,116,183 | | | | (367,909 | ) | | | (318,583 | ) | | | 1,429,691 | |
| | | | | | | | | | | | | | | | |
| | $ | 17,864,890 | | | | | | | | | | | | | |
| | | | | | | | | | | | | | | | |
| | | | |
Counterparty | | Gross
Amounts of
Recognized
Liabilities(2) | | | Gross
Amounts
Available
for Offset | | | Collateral
Pledged(3) | | | Net
Amount | |
Bank of America | | $ | — | | | $ | — | | | $ | — | | | $ | — | |
Barclays Capital Group | | | (3,893,580 | ) | | | 1,167,017 | | | | 2,325,695 | | | | (400,868 | ) |
BNP Paribas | | | (311,609 | ) | | | 175,067 | | | | — | | | | (136,542 | ) |
Citigroup Global Markets | | | (660,530 | ) | | | 660,530 | | | | — | | | | — | |
Credit Suisse First Boston Corp. | | | (2,203,840 | ) | | | 1,206,217 | | | | 2,578,934 | | | | — | |
Deutsche Bank AG | | | (504,660 | ) | | | 504,660 | | | | — | | | | — | |
Goldman Sachs & Co. | | | (45,209 | ) | | | 45,209 | | | | — | | | | — | |
Hong Kong & Shanghai Bank | | | (3,634,495 | ) | | | 785,818 | | | | 2,887,370 | | | | — | |
JPMorgan Chase | | | (1,112,609 | ) | | | 826,483 | | | | 133,167 | | | | (152,959 | ) |
Toronto Dominion | | | (130,664 | ) | | | 130,664 | | | | — | | | | — | |
UBS AG | | | (367,909 | ) | | | 367,909 | | | | — | | | | — | |
| | | | | | | | | | | | | | | | |
| | $ | (12,865,105 | ) | | | | | | | | | | | | |
| | | | | | | | | | | | | | | | |
| (1) | Includes unrealized appreciation on swaps and forwards, premiums paid on swap agreements and market value of purchased options. |
| (2) | Includes unrealized depreciation on swaps and forwards, premiums received on swap agreements and market value of written options. |
| (3) | Amounts shown reflect actual collateral received or pledged by the Fund. Such amounts are applied up to 100% of the Fund’s OTC derivative exposure by counterparty. |
See Notes to Financial Statements.
| | | | |
| Prudential Absolute Return Bond Fund | | | 81 | |
Statement of Assets & Liabilities
as of October 31, 2014
| | | | |
Assets | | | | |
Investments at value, including securities on loan of $92,347,871: | | | | |
Unaffiliated investments (cost $2,644,964,101) | | $ | 2,644,917,443 | |
Affiliated investments (cost $377,879,149) | | | 377,879,149 | |
Cash | | | 757,076 | |
Foreign currency, at value (cost $486,002) | | | 482,187 | |
Due from Broker | | | 31,050,000 | |
Dividends and interest receivable | | | 23,235,268 | |
Receivable for investments sold | | | 13,774,702 | |
Receivable for Fund shares sold | | | 10,004,037 | |
Unrealized appreciation on over-the-counter swap agreements | | | 9,662,199 | |
Unrealized appreciation on forward foreign currency exchange contracts | | | 7,080,891 | |
Due from broker—variation margin swaps | | | 2,417,073 | |
Premium paid for swap agreements | | | 1,040,874 | |
Unrealized appreciation on cross currency exchange contracts | | | 80,926 | |
Prepaid expenses | | | 23,098 | |
| | | | |
Total assets | | | 3,122,404,923 | |
| | | | |
| |
Liabilities | | | | |
Payable for investments purchased | | | 257,180,215 | |
Payable to broker for collateral for securities on loan | | | 95,276,941 | |
Payable for Fund shares reacquired | | | 9,249,682 | |
Unrealized depreciation on over-the-counter swap agreements | | | 8,691,018 | |
Options written outstanding, at value (premiums received $3,735,020) | | | 4,712,508 | |
Unrealized depreciation on forward foreign currency exchange contracts | | | 3,873,406 | |
Dividends payable | | | 2,444,938 | |
Management fee payable | | | 1,407,834 | |
Accrued expenses | | | 737,157 | |
Distribution fee payable | | | 259,472 | |
Premium received for swap agreements | | | 230,925 | |
Affiliated transfer agent fee payable | | | 78,888 | |
Unrealized depreciation on cross currency exchange contracts | | | 69,756 | |
Due to broker—variation margin futures | | | 36,655 | |
Loan interest payable | | | 1,068 | |
| | | | |
Total liabilities | | | 384,250,463 | |
| | | | |
| |
Net Assets | | $ | 2,738,154,460 | |
| | | | |
| | | | | |
Net assets were comprised of: | | | | |
Shares of beneficial interest, at par | | $ | 278,740 | |
Paid-in capital in excess of par | | | 2,759,855,124 | |
| | | | |
| | | 2,760,133,864 | |
Distributions in excess of net investment income | | | (12,757,045 | ) |
Accumulated net realized loss on investment and foreign currency transactions | | | (2,058,117 | ) |
Net unrealized depreciation on investments and foreign currencies | | | (7,164,242 | ) |
| | | | |
Net assets, October 31, 2014 | | $ | 2,738,154,460 | |
| | | | |
See Notes to Financial Statements.
| | | | |
Class A | | | | |
Net asset value and redemption price per share
($452,955,523 ÷ 46,251,346 shares of beneficial interest issued and outstanding) | | $ | 9.79 | |
Maximum sales charge (4.50% of offering price) | | | 0.46 | |
| | | | |
Maximum offering price to public | | $ | 10.25 | |
| | | | |
| |
Class C | | | | |
Net asset value, offering price and redemption price per share
($195,311,878 ÷ 19,886,841 shares of beneficial interest issued and outstanding) | | $ | 9.82 | |
| | | | |
| |
Class Q | | | | |
Net asset value, offering price and redemption price per share
($19,025,100 ÷ 1,940,274 shares of beneficial interest issued and outstanding) | | $ | 9.81 | |
| | | | |
| |
Class Z | | | | |
Net asset value, offering price and redemption price per share
($2,070,861,959 ÷ 210,661,531 shares of beneficial interest issued and outstanding) | | $ | 9.83 | |
| | | | |
See Notes to Financial Statements.
| | | | |
| Prudential Absolute Return Bond Fund | | | 83 | |
Statement of Operations
Year Ended October 31, 2014
| | | | |
Net Investment Income | | | | |
Income | | | | |
Interest income (net of foreign withholding taxes of $5,395) | | $ | 80,142,019 | |
Affiliated income from securities loaned, net | | | 80,642 | |
Affiliated dividend income | | | 74,831 | |
| | | | |
Total income | | | 80,297,492 | |
| | | | |
| |
Expenses | | | | |
Management fee | | | 17,361,418 | |
Distribution fee—Class A | | | 1,449,582 | |
Distribution fee—Class C | | | 1,837,379 | |
Transfer agent’s fees and expenses (including affiliated expense of $371,800) | | | 2,572,000 | |
Custodian’s fees and expenses | | | 483,000 | |
Registration fees | | | 209,000 | |
Shareholders’ reports | | | 179,000 | |
Audit fee | | | 61,000 | |
Trustees’ fees | | | 59,000 | |
Legal fees and expenses | | | 33,000 | |
Insurance expenses | | | 23,000 | |
Loan Interest expense | | | 1,068 | |
Miscellaneous | | | 23,854 | |
| | | | |
Total expenses | | | 24,292,301 | |
Less: Management fee waiver and/or expense reimbursement | | | (1,480,427 | ) |
Distribution fee waiver—Class A | | | (241,597 | ) |
| | | | |
Net expenses | | | 22,570,277 | |
| | | | |
Net investment income | | | 57,727,215 | |
| | | | |
| |
Realized And Unrealized Gain (Loss) On Investment And Foreign Currency Transactions | | | | |
Net realized gain (loss) on: | | | | |
Investment transactions | | | 7,775,068 | |
Futures transactions | | | (4,454,191 | ) |
Options written transactions | | | 137,039 | |
Forward rate agreement transactions | | | 510,370 | |
Swap agreement transactions | | | (2,135,309 | ) |
Foreign currency transactions | | | 7,643,658 | |
| | | | |
| | | 9,476,635 | |
| | | | |
Net change in unrealized appreciation (depreciation) on: | | | | |
Investments | | | 8,357,625 | |
Futures | | | (1,007,861 | ) |
Options written | | | (977,488 | ) |
Swap agreements | | | (18,026,438 | ) |
Foreign currencies | | | 3,428,871 | |
| | | | |
| | | (8,225,291 | ) |
| | | | |
Net gain on investment and foreign currency transactions | | | 1,251,344 | |
| | | | |
Net Increase In Net Assets Resulting From Operations | | $ | 58,978,559 | |
| | | | |
See Notes to Financial Statements.
Statement of Changes in Net Assets
| | | | | | | | |
| | | Year Ended October 31, | |
| | | 2014 | | | 2013 | |
Increase (Decrease) in Net Assets | | | | | | | | |
Operations | | | | | | | | |
Net investment income | | $ | 57,727,215 | | | $ | 24,372,046 | |
Net realized gain (loss) on investment and foreign currency transactions | | | 9,476,635 | | | | (11,874,164 | ) |
Net change in unrealized appreciation (depreciation) on investments and foreign currencies | | | (8,225,291 | ) | | | (189,762 | ) |
| | | | | | | | |
Net increase in net assets resulting from operations | | | 58,978,559 | | | | 12,308,120 | |
| | | | | | | | |
| | |
Dividends & Distributions (Note 1) | | | | | | | | |
Dividends from net investment income | | | | | | | | |
Class A | | | (14,610,353 | ) | | | (7,276,650 | ) |
Class C | | | (4,128,278 | ) | | | (1,722,557 | ) |
Class Q | | | (615,679 | ) | | | (93,879 | ) |
Class Z | | | (47,979,931 | ) | | | (17,559,659 | ) |
| | | | | | | | |
| | | (67,334,241 | ) | | | (26,652,745 | ) |
| | | | | | | | |
| | |
Tax return of capital | | | | | | | | |
Class A | | | — | | | | (1,385,177 | ) |
Class C | | | — | | | | (327,906 | ) |
Class Q | | | — | | | | (17,869 | ) |
Class Z | | | — | | | | (3,342,641 | ) |
| | | | | | | | |
| | | — | | | | (5,073,593 | ) |
| | | | | | | | |
| | |
Fund share transactions (Net of share conversions) (Note 6) | | | | | | | | |
Net proceeds from shares sold | | | 1,710,468,796 | | | | 2,236,633,995 | |
Net asset value of shares issued in reinvestment of dividends and tax return of capital | | | 35,761,238 | | | | 18,312,304 | |
Cost of shares reacquired | | | (860,861,393 | ) | | | (576,709,754 | ) |
| | | | | | | | |
Net increase in net assets from Fund share transactions | | | 885,368,641 | | | | 1,678,236,545 | |
| | | | | | | | |
Total increase | | | 877,012,959 | | | | 1,658,818,327 | |
| | |
Net Assets: | | | | | | | | |
Beginning of year | | | 1,861,141,501 | | | | 202,323,174 | |
| | | | | | | | |
End of year | | $ | 2,738,154,460 | | | $ | 1,861,141,501 | |
| | | | | | | | |
See Notes to Financial Statements.
| | | | |
| Prudential Absolute Return Bond Fund | | | 85 | |
Notes to Financial Statements
Prudential Investment Portfolios 9 (the “Trust”) is an open-end management investment company, registered under the Investment Company Act of 1940, as amended (“1940 Act”). The Trust currently consists of three funds: Prudential Large-Cap Core Equity Fund, Prudential International Real Estate Fund and Prudential Absolute Return Bond Fund (the “Fund”). These financial statements relate to Prudential Absolute Return Bond Fund, a diversified fund. The financial statements of the Prudential Large-Cap Core Equity Fund and Prudential International Real Estate Fund are not presented herein. The Trust was organized as a business trust in Delaware on September 18, 1998. The Fund commenced investment operations on March 30, 2011.
The Fund’s investment objective is to seek positive returns over the long term, regardless of market conditions.
Note 1. Accounting Policies
The following accounting policies conform to U.S. generally accepted accounting principles. The Fund consistently follows such policies in the preparation of its the financial statements.
Securities Valuation: The Fund holds securities and other assets that are fair valued at the close of each day the New York Stock Exchange (“NYSE”) is open for trading. Fair value is the price that would be received to sell an asset or paid to transfer a liability in an orderly transaction between market participants on the measurement date. The Board of Trustees (the “Board”) has adopted Valuation Procedures for security valuation under which fair valuation responsibilities have been delegated to Prudential Investments LLC (“PI” or “Manager”). Under the current Valuation Procedures, the established Valuation Committee is responsible for supervising the valuation of portfolio securities and other assets. The Valuation Procedures permit the Fund to utilize independent pricing vendor services, quotations from market makers, and alternative valuation methods when market quotations are either not readily available or not deemed representative of fair value. A record of the Valuation Committee’s actions is subject to the Board’s review, approval, and ratification at its next regularly-scheduled quarterly meeting.
Various inputs determine how the Fund’s investments are valued, all of which are categorized according to the three broad levels (Level 1, 2, or 3) detailed in the table following the Portfolio of Investments.
Common and preferred stocks, exchange-traded funds, and derivative instruments such as futures or options that are traded on a national securities exchange are valued at the last sale price as of the close of trading on the applicable exchange. Securities traded via NASDAQ are valued at the NASDAQ official closing price. To the extent these securities are valued at the last sale price or NASDAQ official closing price, they are classified as Level 1 in the fair value hierarchy.
In the event that no sale or official closing price on valuation date exists, these securities are generally valued at the mean between the last reported bid and ask prices, or at the last bid price in the absence of an ask price. These securities are classified as Level 2 in the fair value hierarchy, as the inputs are observable and considered to be significant to the valuation.
Common and preferred stocks traded on foreign securities exchanges are valued using pricing vendor services that provide model prices derived using adjustment factors based on information such as local closing price, relevant general and sector indices, currency fluctuations, depositary receipts, and futures, as applicable. Securities valued using such model prices are classified as Level 2 in the fair value hierarchy, as the adjustment factors are observable and considered to be significant to the valuation. Securities not valued using such model prices are valued in accordance with exchange-traded common and preferred stocks discussed above.
Investments in open-end, non-exchange-traded mutual funds are valued at their net asset values as of the close of the NYSE on the date of valuation. These securities are classified as Level 1 in the fair value hierarchy since they may be purchased or sold at their net asset values on the date of valuation.
Fixed income securities traded in the over-the-counter market are generally valued at prices provided by approved independent pricing vendors. The pricing vendors provide these prices after evaluating observable inputs including, but not limited to yield curves, yield spreads, credit ratings, deal terms, tranche level attributes, default rates, cash flows, prepayment speeds, broker/dealer quotations, and reported trades. Securities valued using such vendor prices are classified as Level 2 in the fair value hierarchy.
Over-the-counter derivative instruments are generally valued using pricing vendor services, which derive the valuation based on inputs such as underlying asset prices, indices, spreads, interest rates, and exchange rates. These instruments are categorized as Level 2 in the fair value hierarchy.
| | | | |
| Prudential Absolute Return Bond Fund | | | 87 | |
Notes to Financial Statements
continued
Centrally cleared swaps listed or traded on a multilateral or trade facility platform, such as a registered exchange, are valued at the daily settlement price determined by the respective exchange. These securities are classified as Level 2 in the fair value hierarchy, as the prices marked at the official settle are not public.
Securities and other assets that cannot be priced according to the methods described above are valued based on pricing methodologies approved by the Board. In the event that significant unobservable inputs are used when determining such valuations, the securities will be classified as Level 3 in the fair value hierarchy.
When determining the fair value of securities, some of the factors influencing the valuation include: the nature of any restrictions on disposition of the securities; assessment of the general liquidity of the securities; the issuer’s financial condition and the markets in which it does business; the cost of the investment; the size of the holding and the capitalization of the issuer; the prices of any recent transactions or bids/offers for such securities or any comparable securities; any available analyst media or other reports or information deemed reliable by the investment adviser regarding the issuer or the markets or industry in which it operates. Using fair value to price securities may result in a value that is different from a security’s most recent closing price and from the price used by other mutual funds to calculate their net asset values.
Restricted and Illiquid Securities: Subject to guidelines adopted by the Board, the Fund may invest up to 15% of its net assets in illiquid securities, including those which are restricted as to disposition under securities law (“restricted securities”). Restricted securities are valued pursuant to the valuation procedures noted above. Illiquid securities are those that, because of the absence of a readily available market or due to legal or contractual restrictions on resale, cannot be sold within seven days in the ordinary course of business at approximately the amount at which the Fund has valued the investment. Therefore, the Fund may find it difficult to sell illiquid securities at the time considered most advantageous by its Subadviser and may incur expenses that would not be incurred in the sale of securities that were freely marketable. Certain securities that would otherwise be considered illiquid because of legal restrictions on resale to the general public may be traded among qualified institutional buyers under Rule 144A of the Securities Act of 1933. These Rule 144A securities, as well as commercial paper that is sold in private placements under Section 4(2) of the Securities Act, may be deemed liquid by the Fund’s Subadviser
under the guidelines adopted by the Trustees of the Fund. However, the liquidity of the Fund’s investments in Rule 144A securities could be impaired if trading does not develop or declines.
Foreign Currency Translation: The books and records of the Fund are maintained in U.S. dollars. Foreign currency amounts are translated into U.S. dollars on the following basis:
(i) market value of investment securities, other assets and liabilities-at the current rates of exchange.
(ii) purchases and sales of investment securities, income and expenses-at the rates of exchange prevailing on the respective dates of such transactions.
Although the net assets of the Fund are presented at the foreign exchange rates and market values at the close of the period, the Fund does not isolate that portion of the results of operations arising as a result of changes in the foreign exchange rates from the fluctuations arising from changes in the market prices of long-term securities held at the end of the period. Similarly, the Fund does not isolate the effect of changes in foreign exchange rates from the fluctuations arising from changes in the market prices of long-term portfolio securities sold during the period. Accordingly, these realized foreign currency gains or losses are included in the reported net realized gains or losses on investment transactions.
Net realized gains or losses on foreign currency transactions represent net foreign exchange gains or losses from holdings of foreign currencies, forward currency contracts, disposition of foreign currencies, currency gains or losses realized between the trade and settlement dates on securities transactions, and the difference between the amounts of interest, dividends and foreign withholding taxes recorded on the Fund’s books and the U.S. dollar equivalent amounts actually received or paid. Net unrealized currency gains or losses from valuing foreign currency denominated assets and liabilities (other than investments) at period end exchange rates are reflected as a component of net unrealized appreciation (depreciation) on foreign currencies.
Concentration of Risk: The ability of debt securities issuers (other than those issued or guaranteed by the U.S. Government) held by the Fund to meet their obligations may be affected by the economic or political developments in a specific industry, region or country. Foreign security and currency transactions may involve certain considerations and risks not typically associated with those of U.S. companies as a result of, among other factors, the possibility of political and economic instability or the level of governmental supervision and regulation of foreign securities markets.
| | | | |
| Prudential Absolute Return Bond Fund | | | 89 | |
Notes to Financial Statements
continued
Financial Futures Contracts: A financial futures contract is an agreement to purchase (long) or sell (short) an agreed amount of securities at a set price for delivery on a future date. Upon entering into a financial futures contract, the Fund is required to pledge to the broker an amount of cash and/or other assets equal to a certain percentage of the contract amount. This amount is known as the “initial margin.” Subsequent payments, known as “variation margin,” are made or received by the Fund each day, depending on the daily fluctuations in the value of the underlying security. Such variation margin is recorded for financial statement purposes on a daily basis as unrealized gain (loss). When the contract expires or is closed, the gain (loss) is realized and is presented in the Statement of Operations as net realized gain (loss) on financial futures transactions.
The Fund invested in financial futures contracts in order to hedge its existing portfolio securities, or securities the Fund intends to purchase, against fluctuations in value caused by changes in prevailing interest rates or foreign currency exchange rates. Should interest rates move unexpectedly, the Fund may not achieve the anticipated benefits of the financial futures contracts and may realize a loss. The use of futures transactions involves the risk of imperfect correlation in movements in the price of futures contracts, interest rates and the underlying hedged assets. With exchange-traded futures contracts, there is minimal counterparty credit risk to the Fund since the exchanges’ clearing house acts as counterparty to all exchange-traded futures and guarantees the futures contracts against default.
Forward Currency Contracts: A forward currency contract is a commitment to purchase or sell a foreign currency at a future date at a negotiated forward rate between two parties. The Fund enters into forward currency contracts in order to hedge its exposure to changes in foreign currency exchange rates on its foreign portfolio holdings or specific receivables and payables denominated in a foreign currency. The contracts are valued daily at current exchange rates and any unrealized gain or loss is included in net unrealized appreciation or depreciation on foreign currencies. Gain or loss is realized on the settlement date of the contract equal to the difference between the settlement value of the original and negotiated forward contracts. This gain or loss, if any, is included in net realized gain (loss) on foreign currency transactions. Risks may arise upon entering into these contracts from the potential inability of the counterparties to meet the terms of their contracts. Forward currency contracts involve risks from currency exchange rate and credit risk in excess of the amounts reflected on the Statement of Assets and Liabilities. The Fund’s
maximum risk of loss from counterparty credit risk is the net value of the cash flows to be received from the counterparty at the end of the contract’s life.
Options: The Fund purchased and wrote options in order to hedge against adverse market movements or fluctuations in value caused by changes in prevailing interest rates or foreign currency exchange rates, with respect to securities which the Fund currently owns or intends to purchase. The Fund’s principal reason for writing options is to realize, through receipt of premiums, a greater current return than would be realized on the underlying security alone. When the Fund purchases an option, it pays a premium and an amount equal to that premium is recorded as an asset. When the Fund writes an option, it receives a premium and an amount equal to that premium is recorded as a liability. The asset or liability is adjusted daily to reflect the current market value of the option. If an option expires unexercised, the Fund realizes a gain or loss to the extent of the premium received or paid. If an option is exercised, the premium received or paid is recorded as an adjustment to the proceeds from the sale or the cost of the purchase in determining whether the Fund has realized a gain or loss. The difference between the premium and the amount received or paid at the closing of a purchase or sale transaction is also treated as a realized gain or loss. Gain or loss on purchased options is included in net realized gain or loss on investment transactions. Gain or loss on written options is presented separately as net realized gain or loss on options written transactions. The Fund, as writer of an option, may have no control over whether the underlying securities may be sold (called) or purchased (put). As a result, the Fund bears the market risk of an unfavorable change in the price of the security underlying the written option. The Fund, as purchaser of an over-the-counter option, bears the risk of the potential inability of the counterparties to meet the terms of their contracts. With exchange-traded options contracts, there is minimal counterparty credit risk to the Fund since the exchanges’ clearinghouse acts as counterparty to all exchange-traded options and guarantees the options contracts against default.
Forward Rate Agreements: Forward rate agreements represent an agreement between counterparties to exchange cash flows based on the difference between two interest rates, applied to a notional principal amount on a fixed future date. The Fund entered into forward rate agreements to gain yield exposure based on anticipated market conditions at the specified termination date of the agreement.
Swap Agreements: The Fund entered into credit default, interest rate, and other forms of swap agreements. A swap agreement is an agreement to exchange the return generated by one instrument for the return generated by another instrument. Swap agreements are negotiated in the over-the-counter market and may be executed either directly with counterparty (“OTC-traded”) or through a central clearing facility, such
| | | | |
| Prudential Absolute Return Bond Fund | | | 91 | |
Notes to Financial Statements
continued
as a registered commodities exchange (“Exchange-traded”). Swap agreements are valued daily at current market value and any change in value is included in the net unrealized appreciation or depreciation on investments. Exchange-traded swaps pay or receive an amount known as “variation margin”, based on daily changes in the valuation of the swap contract. Payments received or paid by the Fund are recorded as realized gains or losses upon termination or maturity of the swap. Risk of loss may exceed amounts recognized on the Statement of Assets and Liabilities. Swap agreements outstanding at period end, if any, are listed on the Portfolio of Investments.
Cross Currency Exchange Contracts: A cross currency contract is a forward contract where a specified amount of one currency will be exchanged for a specified amount of another currency.
Credit Default Swaps: Credit default swaps (“CDS”) involve one party (the protection buyer) making a stream of payments to another party (the protection seller) in exchange for the right to receive a specified payment in the event of a default or as a result of a default (collectively a “credit event”) for the referenced entity (typically corporate issues or sovereign issues of an emerging country) on its obligation; or in the event of a write-down, principal shortfall, interest shortfall or default of all or part of the referenced entities comprising a credit index.
The Fund is subject to credit risk in the normal course of pursuing its investment objectives. The Fund entered into CDS contracts to provide a measure of protection against defaults or to take an active long or short position with respect to the likelihood of a particular issuer’s default or the reference entity’s credit soundness. CDS contracts generally trade based on a spread which represents the cost a protection buyer has to pay the protection seller. The protection buyer is said to be short the credit as the value of the contract rises the more the credit deteriorates. The value of the CDS contract increases for the protection buyer if the spread increases. The Fund sold protection using credit default swaps to take an active short position with respect to the likelihood of a particular issuer’s default. The Fund’s maximum risk of loss from counterparty credit risk for purchased credit default swaps is the inability of the counterparty to honor the contract up to the notional value due to a credit event.
As a seller of protection on credit default swap agreements, the Fund generally receives an agreed upon payment from the buyer of protections throughout the term
of the swap, provided no credit event occurs. As the seller, the Fund effectively increases its investment risk because, in addition to its total net assets, the Fund may be subject to investment exposure on the notional amount of the swap.
The maximum amount of the payment that the Fund, as a seller of protection, could be required to make under a credit default swap agreement would be equal to the notional amount of the underlying security or index contract as a result of a credit event. This potential amount will be partially offset by any recovery values of the respective referenced obligations, or net amounts received from the settlement of buy protection credit default swap agreements which the Fund entered into for the same referenced entity or index. As a buyer of protection, the Fund generally receives an amount up to the notional value of the swap if a credit event occurs.
Implied credit spreads, represented in absolute terms, utilized in determining the market value of credit default swap agreements on corporate or sovereign issues of an emerging country as of period end are disclosed in the footnotes to the Portfolio of Investments, if applicable. These spreads serve as indicators of the current status of the payment/performance risk and represent the likelihood of default risk for the credit derivative. The implied credit spread of a particular referenced entity reflects the cost of buying/selling protection and may include upfront payments required to enter into the agreement. For credit default swap agreements on asset-backed securities and credit indices, the quoted market prices and resulting values serve as indicators of the current status of the payment/performance risk. Wider credits spreads and increased market value in absolute terms, when compared to the notional amount of the swap, represent a deterioration of the referenced entity’s credit soundness and a greater likelihood of risk of default or other credit event occurring as defined under the terms of the agreement.
Interest Rate Swaps: Interest rate swaps represent an agreement between counterparties to exchange cash flows based on the difference between two interest rates, applied to a notional principal amount for a specified period. The Fund used interest rate swaps to maintain its ability to generate steady cash flow by receiving a stream of fixed-rate payments and to increase exposure to prevailing market rates by receiving floating rate payments. The Fund is subject to interest rate risk exposure in the normal course of pursuing its investment objectives.
Currency Swaps: The Fund entered into currency swap agreements primarily to gain yield exposure on foreign bonds. Currency swap agreements involve two parties exchanging two different currencies with an agreement to reverse the exchange at a later date at specified exchange rates.
| | | | |
| Prudential Absolute Return Bond Fund | | | 93 | |
Notes to Financial Statements
continued
Master Netting Arrangements: The Fund is subject to various Master Agreements or netting arrangements, with select counterparties. A master netting arrangement between the Fund and the counterparty permits the Fund to offset amounts payable by the Fund to the same counterparty against amounts to be received; and by the receipt of collateral from the counterparty by the Fund to cover the Fund’s exposure to the counterparty. However, there is no assurance that such mitigating factors are easily enforceable. The right to set-off exists when all the conditions are met such that each of the parties owes the other determinable amounts, the reporting party has the right to set-off the amount owed with the amount owed by the other party, the reporting party intends to set-off and the right of set-off is enforceable by law. During the reporting period, there were no instances where the right of set-off existed and management has not elected to offset.
The Fund is a party to ISDA (International Swaps and Derivatives Association, Inc.) Master Agreements with certain counterparties that govern over-the-counter derivative and foreign exchange contracts entered into from time to time. The Master Agreements may contain provisions regarding, among other things, the parties’ general obligations, representations, agreements, collateral requirements, events of default and early termination. With respect to certain counterparties, in accordance with the terms of the Master Agreements, collateral posted to the Fund is held in a segregated account by the Fund’s custodian and with respect to those amounts which can be sold or re-pledged, is presented in the Portfolio of Investments. Collateral pledged by the Fund is segregated by the Fund’s custodian and identified in the Portfolio of Investments. Collateral can be in the form of cash or debt securities issued by the U.S. Government or related agencies or other securities as agreed to by the Fund and the applicable counterparty. Collateral requirements are determined based on the Fund’s net position with each counterparty. Termination events applicable to the Fund may occur upon a decline in the Fund’s net assets below a specified threshold over a certain period of time. Termination events applicable to counterparties may occur upon a decline in the counterparty’s long-term and short term credit ratings below a specified level. In each case, upon occurrence, the other party may elect to terminate early and cause settlement of all derivative and foreign exchange contracts outstanding, including the payment of any losses and costs resulting from such early termination, as reasonably determined by the terminating party. Any decision by one or more of the Fund’s counterparties to elect early termination could impact the Fund’s future derivative activity.
In addition to each instrument’s primary underlying risk exposure (e.g. interest rate, credit, equity or foreign exchange, etc.), swap agreements involve, to varying degrees, elements of credit, market and documentation risk. Such risks involve the possibility that no liquid market for these agreements will exist, the counterparty to the agreement may default on its obligation to perform or disagree on the contractual terms of the agreement, and changes in net interest rates will be unfavorable. In connection with these agreements, securities in the portfolio may be identified or received as collateral from the counterparty in accordance with the terms of the respective swap agreements to provide or receive assets of value and to serve as recourse in the event of default or bankruptcy/insolvency of either party. Such over-the-counter derivative agreements include conditions which, when materialized, give the counterparty the right to cause an early termination of the transactions under those agreements. Any election by the counterparty for early termination of the contract(s) may impact the amounts reported on financial statements.
As of October 31, 2014, the Fund has not met conditions under such agreements which give the counterparty the right to call for an early termination.
Forward currency contracts, forward rate agreements, written options, swaps and financial futures contracts involve elements of both market and credit risk in excess of the amounts reflected on the Statement of Assets and Liabilities. Such risks may be mitigated by engaging in master netting arrangements.
Loan Participations: The Fund may invest in loan participations, another type of restricted security. When the Fund purchases a loan participation, the Fund typically enters into a contractual relationship with the lender or third party selling such participations (“Selling Participant”), but not the borrower. As a result, the Fund assumes the credit risk of the borrower, the Selling Participant and any other persons interpositioned between the Fund and the borrower. The Fund may not directly benefit from the collateral supporting the senior loan in which it has purchased the loan participation.
Payment In Kind Securities: The Fund may invest in open market or receive pursuant to debt restructuring, securities that pay in kind (PIK) the interest due on such debt instruments. The PIK interest, computed at the contractual rate specified, is added to the existing principal balance of the debt when issued bonds have same terms as the bond or recorded as a separate bond when terms are different from the existing debt, and is recorded as interest income. The interest rate on PIK debt is paid out over time.
Securities Lending: The Fund may lend its portfolio securities to banks and broker-dealers. The loans are secured by collateral at least equal to the market value of the securities loaned. Collateral pledged by each borrower is invested in a highly liquid short-term money market fund and is marked to market daily, based on the previous
| | | | |
| Prudential Absolute Return Bond Fund | | | 95 | |
Notes to Financial Statements
continued
day’s market value, such that the value of the collateral exceeds the value of the loaned securities. Loans are subject to termination at the option of the borrower or the Fund. Upon termination of the loan, the borrower will return to the Fund securities identical to the loaned securities. Should the borrower of the securities fail financially, the Fund has the right to repurchase the securities in the open market using the collateral. The Fund recognizes income, net of any rebate and securities lending agent fees, for lending its securities, and any interest on the investment of cash received as collateral. The Fund also continues to receive interest and dividends or amounts equivalent thereto, on the securities loaned and recognizes any unrealized gain or loss in the market price of the securities loaned that may occur during the term of the loan.
Securities Transactions and Net Investment Income: Securities transactions are recorded on the trade date. Realized gains or losses from investment and currency transactions are calculated on the identified cost basis. Dividend income is recorded on the ex-dividend date. Interest income, including amortization of premium and accretion of discount on debt securities, as required, is recorded on the accrual basis. Expenses are recorded on the accrual basis, which may require the use of certain estimates by management that may differ from actual.
Net investment income or loss (other than distribution fees which are charged directly to the respective class and transfer agency fees specific to Class Q shares which are charged to the share class), and unrealized and realized gains or losses are allocated daily to each class of shares based upon the relative proportion of adjusted net assets of each class at the beginning of the day.
Dividends and Distributions: The Fund declares daily and pays dividends of net investment income monthly. Distributions of net realized capital and currency gains, if any, are made annually. Dividends and distributions to shareholders, which are determined in accordance with federal income tax regulations which may differ from generally accepted accounting principles, are recorded on the ex-dividend date. Permanent book/tax differences relating to income and gains are reclassified amongst undistributed net investment income, accumulated net realized gain or loss and paid-in-capital in excess of par, as appropriate.
Taxes: For federal income tax purposes, the Fund is treated as a separate taxpaying entity. It is the Fund’s policy to continue to meet the requirements of the Internal Revenue Code applicable to regulated investment companies and to distribute all of its taxable net income and capital gains, if any, to its shareholders. Therefore, no federal income tax provision is required.
Withholding taxes on foreign interest are recorded, net of reclaimable amounts, at the time the related income is earned.
Estimates: The preparation of the financial statements requires management to make estimates and assumptions that affect the reported amounts and disclosures in the financial statements. Actual results could differ from those estimates.
Note 2. Agreements
The Fund has a management agreement with PI. Pursuant to this agreement, PI has responsibility for all investment advisory services and supervises the subadviser’s performance of such services. PI has entered into a subadvisory agreement with Prudential Investment Management, Inc. (“PIM”). The subadvisory agreement provides that PIM will furnish investment advisory services in connection with the management of the Fund. In connection therewith, PIM is obligated to keep certain books and records of the Fund. PI pays for the services of PIM, the cost of compensation of officers of the Fund, occupancy and certain clerical and bookkeeping costs of the Fund. The Fund bears all other costs and expenses.
The management fee paid to PI is accrued daily and payable monthly at an annual rate of .80% of the Fund’s average daily net assets up to $2.5 billion, .775% of the average daily net assets up to $5 billion and .75% of the average daily net assets in excess of $5 billion. Prior to July 1, 2014, the management fee paid to PI was accrued daily and payable monthly at an annual rate of .80% of the Fund’s average daily net assets. The effective management fee rate was .80% for the year ended October 31, 2014.
Effective March 1, 2013, PI has contractually agreed to limit net annual Fund operating expenses (exclusive of distribution and service (12b-1) fees, extraordinary and certain other expenses such as taxes, interest and brokerage commissions) of each class of shares to .90% of the Fund’s average daily net assets until February 29, 2016. Prior to this agreement, PI contractually agreed to limit net annual Fund operating expenses (exclusive of distribution and service (12b-1) fees, extraordinary and certain other expenses such as taxes, interest and brokerage commissions) of each class of shares to .85% of the Fund’s average daily net assets.
The Fund has a distribution agreement with Prudential Investment Management Services LLC (“PIMS”) which acts as the distributor of the Class A, Class C, Class Q and Class Z shares of the Fund. The Fund compensates PIMS for distributing and servicing the Fund’s Class A and Class C shares, pursuant to plans of distribution (the “Distribution Plans”), regardless of expenses actually incurred by PIMS. The distribution fees are accrued daily and payable monthly. No distribution or service fees are paid to PIMS as distributor of the Class Q and Class Z shares of the Fund.
| | | | |
| Prudential Absolute Return Bond Fund | | | 97 | |
Notes to Financial Statements
continued
Pursuant to the Distribution Plans, the Fund compensates PIMS for distribution related activities at an annual rate of up to .30% and 1% of the average daily net assets of the Class A and C shares, respectively. For the year ended October 31, 2014, PIMS has contractually agreed to limit such fees to .25% of the average daily net assets of the Class A shares.
PIMS has advised the Fund that it received $508,702 in front-end sales charges resulting from sales of Class A shares during the year ended October 31, 2014. From these fees, PIMS paid such sales charges to affiliated broker-dealers, which in turn paid commissions to salespersons and incurred other distribution costs.
PIMS has advised the Fund that for the year ended October 31, 2014, it received $89,286 and $57,323, in contingent deferred sales charges imposed upon certain redemptions by Class A and Class C shareholders.
PI, PIM and PIMS are indirect, wholly-owned subsidiaries of Prudential Financial, Inc. (“Prudential”).
Note 3. Other Transactions with Affiliates
Prudential Mutual Fund Services LLC (“PMFS”), an affiliate of PI and an indirect, wholly-owned subsidiary of Prudential, serves as the Fund’s transfer agent. Transfer agent fees and expenses in the Statement of Operations include certain out-of-pocket expenses paid to non-affiliates, where applicable.
Prudential Investment Management, Inc., (“PIM”), an indirect, wholly-owned subsidiary of Prudential, is the Fund’s securities lending agent. For the year ended October 31, 2014, PIM has been compensated approximately $24,100 for these services.
The Fund invests in the Prudential Core Taxable Money Market Fund (the “Core Fund”), a portfolio of the Prudential Investment Portfolios 2, registered under the 1940 Act and managed by PI. Earnings from the Core Fund are disclosed on the Statement of Operations as affiliated dividend income.
Note 4. Portfolio Securities
Purchases and sales of portfolio securities, other than short-term investments and U.S. government securities, for the year ended October 31, 2014, were $1,370,789,056 and $687,291,224, respectively.
Transactions in options written during the year ended October 31, 2014, were as follows:
| | | | | | | | |
| | | Notional
Amount | | | Premiums
Received | |
Options outstanding at October 31, 2013 | | $ | — | | | $ | — | |
Options written | | | (4,621,540,480 | ) | | | (5,805,144 | ) |
Options terminated in closing purchase transactions | | | 2,162,340,480 | | | | 1,033,452 | |
Options expired | | | 396,400,000 | | | | 1,036,672 | |
| | | | | | | | |
Options outstanding at October 31, 2014 | | $ | (2,062,800,000 | ) | | $ | (3,735,020 | ) |
| | | | | | | | |
Note 5. Distributions and Tax Information
Distributions to shareholders, which are determined in accordance with federal income tax regulations and which may differ from generally accepted accounting principles, are recorded on the ex-dividend date. In order to present distributions in excess of net investment income, accumulated net realized loss on investment and foreign currency transactions and paid-in capital in excess of par on the Statement of Assets and Liabilities that more closely represent their tax character, certain adjustments have been made to distributions in excess of net investment income and accumulated net realized loss on investment and foreign currency transactions. For the year ended October 31, 2014, the adjustments were to decrease distributions in excess of net investment income and increase accumulated net realized loss on investment and foreign currency transactions by $10,372,165 primarily due to the difference between financial and tax reporting purposes of premium amortization, certain transactions involving foreign currencies, paydown gains (losses), swaps and other book to tax adjustments. Net investment income, net realized gain (loss) on investment and foreign currency transactions and net assets were not affected by this change.
For the year ended October 31, 2014, the tax character of dividends paid as reflected in the Statement of Changes in Net Assets was $67,334,241 of ordinary income. For the year ended October 31, 2013, the tax character of dividends paid as reflected in the Statement of Changes in Net Assets were $26,442,872 of ordinary income, $209,873 of long-term capital gains and $5,073,593 of tax return of capital.
As of October 31, 2014, the accumulated undistributed earnings on a tax basis was $10,231,819.
The United States federal income tax basis of the Fund’s investments and the net unrealized depreciation as of October 31, 2014 were as follows:
| | | | | | | | | | |
Tax Basis | | Appreciation | | Depreciation | | Net
Unrealized
Depreciation | | Other Cost
Basis
Adjustments | | Total Net
Unrealized
Depreciation |
| $3,039,412,358 | | $27,069,400 | | $(43,685,166) | | $(16,615,766) | | $(12,260,451) | | $(28,876,217) |
| | | | |
| Prudential Absolute Return Bond Fund | | | 99 | |
Notes to Financial Statements
continued
The difference between book basis and tax basis is primarily attributable to deferred losses on wash sales, difference in the treatment of premium amortization and other book to tax differences. The other cost basis adjustments are primarily attributable to appreciation (depreciation) of foreign currencies, swaps, futures, forward currency transactions and mark-to-market of receivables and payables.
For federal income tax purposes, the Fund had a capital loss carryforward as of October 31, 2014 of approximately $888,000 which can be carried forward for an unlimited period. No capital gains distributions are expected to be paid to shareholders until net gains have been realized in excess of such losses.
Management has analyzed the Fund’s tax positions taken on federal income tax returns for all open tax years and has concluded that no provision for income tax is required in the Fund’s financial statements for the current reporting period. The Fund’s federal and state income and federal excise tax returns for tax years for which the applicable statutes of limitations have not expired are subject to examination by the Internal Revenue Service and state departments of revenue.
Note 6. Capital
The Fund offers Class A, Class C, Class Q and Class Z shares. Class A shares are sold with a front-end sales charge of up to 4.50%. All investors who purchase Class A shares in an amount of $1 million or more and sell these shares within 12 months of purchase are subject to a contingent deferred sales charge (“CDSC”) of 1%. The Class A CDSC is waived for purchases by certain retirement and/or benefit plans. Class C shares are sold with a CDSC of 1% on shares redeemed during the first 12 months after purchase. A special exchange privilege is also available for shareholders who qualified to purchase Class A shares at net asset value. Class Q and Class Z shares are not subject to any sales or redemption charge and are offered exclusively for sale to a limited group of investors.
Under certain circumstances, an exchange may be made from specified share classes of the Fund to one or more other share classes of the Fund as presented in the table of transactions in shares of beneficial interest.
At October 31, 2014, Prudential Financial, Inc. through its affiliates owned 113 Class Q shares of the Fund.
The Trust has authorized an unlimited number of shares of beneficial interest at $.001 par value.
Transactions in shares of beneficial interest were as follows:
| | | | | | | | |
Class A | | Shares | | | Amount | |
Year ended October 31, 2014: | | | | | | | | |
Shares sold | | | 25,860,898 | | | $ | 254,052,917 | |
Shares issued in reinvestment of dividends and distributions | | | 1,099,582 | | | | 10,810,098 | |
Shares reacquired | | | (21,255,359 | ) | | | (208,835,533 | ) |
| | | | | | | | |
Net increase (decrease) in shares outstanding before conversion | | | 5,705,121 | | | | 56,027,482 | |
Shares issued upon conversion from Class C and Class Z | | | 202,124 | | | | 1,986,540 | |
Shares reacquired upon conversion into Class Z | | | (7,469,736 | ) | | | (73,591,315 | ) |
| | | | | | | | |
Net increase (decrease) in shares outstanding | | | (1,562,491 | ) | | $ | (15,577,293 | ) |
| | | | | | | | |
Year ended October 31, 2013: | | | | | | | | |
Shares sold | | | 48,546,885 | | | $ | 480,859,340 | |
Shares issued in reinvestment of dividends and tax return of capital | | | 663,764 | | | | 6,536,425 | |
Shares reacquired | | | (10,595,616 | ) | | | (104,246,576 | ) |
| | | | | | | | |
Net increase (decrease) in shares outstanding before conversion | | | 38,615,033 | | | | 383,149,189 | |
Shares reacquired upon conversion into Class Z | | | (2,915 | ) | | | (28,980 | ) |
| | | | | | | | |
Net increase (decrease) in shares outstanding | | | 38,612,118 | | | $ | 383,120,209 | |
| | | | | | | | |
Class C | | | | | | |
Year ended October 31, 2014: | | | | | | | | |
Shares sold | | | 7,236,195 | | | $ | 71,257,263 | |
Shares issued in reinvestment of dividends and distributions | | | 324,244 | | | | 3,188,800 | |
Shares reacquired | | | (4,917,325 | ) | | | (48,458,069 | ) |
| | | | | | | | |
Net increase (decrease) in shares outstanding before conversion | | | 2,643,114 | | | | 25,987,994 | |
Shares reacquired upon conversion into Class A and Class Z | | | (253,166 | ) | | | (2,495,813 | ) |
| | | | | | | | |
Net increase (decrease) in shares outstanding | | | 2,389,948 | | | $ | 23,492,181 | |
| | | | | | | | |
Year ended October 31, 2013: | | | | | | | | |
Shares sold | | | 16,433,529 | | | $ | 163,052,219 | |
Shares issued in reinvestment of dividends and tax return of capital | | | 163,938 | | | | 1,615,376 | |
Shares reacquired | | | (1,989,398 | ) | | | (19,580,417 | ) |
| | | | | | | | |
Net increase (decrease) in shares outstanding | | | 14,608,069 | | | $ | 145,087,178 | |
| | | | | | | | |
Class Q | | | | | | |
Year ended October 31, 2014: | | | | | | | | |
Shares sold | | | 160,554 | | | $ | 1,580,555 | |
Shares issued in reinvestment of dividends and distributions | | | 62,563 | | | | 615,625 | |
Shares reacquired | | | (96,009 | ) | | | (943,122 | ) |
| | | | | | | | |
Net increase (decrease) in shares outstanding | | | 127,108 | | | $ | 1,253,058 | |
| | | | | | | | |
Year ended October 31, 2013: | | | | | | | | |
Shares sold | | | 1,801,643 | | | $ | 17,557,026 | |
Shares issued in reinvestment of dividends and tax return of capital | | | 11,420 | | | | 111,748 | |
Shares reacquired | | | (2 | ) | | | (21 | ) |
| | | | | | | | |
Net increase (decrease) in shares outstanding | | | 1,813,061 | | | $ | 17,668,753 | |
| | | | | | | | |
| | | | |
| Prudential Absolute Return Bond Fund | | | 101 | |
Notes to Financial Statements
continued
| | | | | | | | |
Class Z | | Shares | | | Amount | |
Year ended October 31, 2014: | | | | | | | | |
Shares sold | | | 140,346,834 | | | $ | 1,383,578,061 | |
Shares issued in reinvestment of dividends and distributions | | | 2,143,568 | | | | 21,146,715 | |
Shares reacquired | | | (61,172,542 | ) | | | (602,624,669 | ) |
| | | | | | | | |
Net increase (decrease) in shares outstanding before conversion | | | 81,317,860 | | | | 802,100,107 | |
Shares issued upon conversion from Class A and Class C | | | 7,691,040 | | | | 76,072,618 | |
Shares reacquired upon conversion into Class A | | | (199,878 | ) | | | (1,972,030 | ) |
| | | | | | | | |
Net increase (decrease) in shares outstanding | | | 88,809,022 | | | $ | 876,200,695 | |
| | | | | | | | |
Year ended October 31, 2013: | | | | | | | | |
Shares sold | | | 158,561,138 | | | $ | 1,575,165,410 | |
Shares issued in reinvestment of dividends and tax return of capital | | | 1,018,650 | | | | 10,048,755 | |
Shares reacquired | | | (46,004,620 | ) | | | (452,882,740 | ) |
| | | | | | | | |
Net increase (decrease) in shares outstanding before conversion | | | 113,575,168 | | | | 1,132,331,425 | |
Shares issued upon conversion from Class A | | | 2,904 | | | | 28,980 | |
| | | | | | | | |
Net increase (decrease) in shares outstanding | | | 113,578,072 | | | $ | 1,132,360,405 | |
| | | | | | | | |
Note 7. Borrowings
The Fund, along with other affiliated registered investment companies (the “Funds”), is a party to a Syndicated Credit Agreement (“SCA”) with a group of banks. The purpose of the SCA is to provide an alternative source of temporary funding for capital share redemptions. The SCA provides for a commitment of $900 million for the period October 9, 2014 through October 8, 2015. The Funds pay an annualized commitment fee of .075% of the unused portion of the SCA. Prior to October 9, 2014, the Funds had another SCA that provided a commitment of $900 million and the Funds paid an annualized commitment fee of .08% of the unused portion of the SCA. Interest on any borrowings under the SCA is paid at contracted market rates. The commitment fee for the unused amount is accrued daily and paid quarterly.
The Fund utilized the SCA during the year ended October 31, 2014. The average daily balance for the 5 days that the Fund had loans outstanding during the period was approximately $5,229,400, borrowed at a weighted average interest rate of 1.40%. At October 31, 2014, the Fund did not have an outstanding loan amount.
Note 8. Dividends and Distributions to Shareholders
Subsequent to the fiscal year end, the Fund declared special ordinary income dividends on November 24, 2014 to shareholders of record on November 25, 2014. The ex-dividend date was November 26, 2014. The per share amounts declared were as follows:
| | | | |
| | | Special Ordinary Income | |
Class A | | $ | 0.02887 | |
Class C | | $ | 0.02887 | |
Class Q | | $ | 0.02887 | |
Class Z | | $ | 0.02887 | |
| | | | |
| Prudential Absolute Return Bond Fund | | | 103 | |
Financial Highlights
| | | | | | | | | | | | | | | | | | |
| Class A Shares | |
| | | Year Ended October 31, | | | | | March 30,
2011(d)
through
October 31, | |
| | | 2014 | | | 2013 | | | 2012 | | | | | 2011 | |
| Per Share Operating Performance(a): | | | | | | | | | | | | | | | | | | |
| Net Asset Value, Beginning Of Period | | | $9.82 | | | | $9.92 | | | | $9.72 | | | | | | $10.00 | |
| Income (loss) from investment operations: | | | | | | | | | | | | | | | | | | |
| Net investment income | | | .25 | | | | .21 | | | | .22 | | | | | | .18 | |
| Net realized and unrealized gain (loss) on investment transactions | | | .02 | | | | (.03 | ) | | | .30 | | | | | | (.31 | ) |
| Total from investment operations | | | .27 | | | | .18 | | | | .52 | | | | | | (.13 | ) |
| Less Dividends and Distributions: | | | | | | | | | | | | | | | | | | |
| Dividends from net investment income | | | (.30 | ) | | | (.23 | ) | | | (.30 | ) | | | | | (.15 | ) |
| Tax return of capital | | | - | | | | (.05 | ) | | | - | | | | | | - | |
| Distributions from net realized gains | | | - | | | | - | | | | (.02 | ) | | | | | - | |
| Total dividends and distributions | | | (.30 | ) | | | (.28 | ) | | | (.32 | ) | | | | | (.15 | ) |
| Net asset value, end of period | | | $9.79 | | | | $9.82 | | | | $9.92 | | | | | | $9.72 | |
| Total Return(b): | | | 2.76% | | | | 1.86% | | | | 5.49% | | | | | | (1.27 | )% |
| |
| Ratios/Supplemental Data: | |
| Net assets, end of period (000) | | | $452,955 | | | | $469,604 | | | | $91,250 | | | | | | $2,709 | |
| Average net assets (000) | | | $483,199 | | | | $303,234 | | | | $18,023 | | | | | | $2,240 | |
| Ratios to average net assets(c): | | | | | | | | | | | | | | | | | | |
| Expenses after waivers and/or expense reimbursement | | | 1.15% | | | | 1.14% | | | | 1.11% | | | | | | 1.30% | (e) |
| Expenses before waivers and/or expense reimbursement | | | 1.27% | | | | 1.28% | | | | 1.54% | | | | | | 2.70% | (e) |
| Net investment income | | | 2.58% | | | | 2.17% | | | | 2.53% | | | | | | 2.90% | (e) |
| Portfolio turnover rate | | | 64% | | | | 125% | | | | 152% | | | | | | 112% | (f) |
(a) Calculated based on average shares outstanding during the period.
(b) Total return does not consider the effects of sales loads. Total return is calculated assuming a purchase of a share on the first day and a sale on the last day of each period reported and includes reinvestment of dividends and distributions. Total returns may reflect adjustments to conform to generally accepted accounting principles. Total returns for periods less than a full year are not annualized.
(c) Does not include expenses of the underlying portfolio in which the Fund invests.
(d) Commencement of operations.
(e) Annualized.
(f) Not annualized.
See Notes to Financial Statements.
| | | | | | | | | | | | | | | | | | |
| Class C Shares | |
| | | Year Ended October 31, | | | | | March 30,
2011(d)
through
October 31, | |
| | | 2014 | | | 2013 | | | 2012 | | | | | 2011 | |
| Per Share Operating Performance(a): | | | | | | | | | | | | | | | | | | |
| Net Asset Value, Beginning Of Period | | | $9.85 | | | | $9.94 | | | | $9.73 | | | | | | $10.00 | |
| Income (loss) from investment operations: | | | | | | | | | | | | | | | | | | |
| Net investment income | | | .18 | | | | .14 | | | | .16 | | | | | | .13 | |
| Net realized and unrealized gain (loss) on investment transactions | | | .01 | | | | (.02 | ) | | | .29 | | | | | | (.30 | ) |
| Total from investment operations | | | .19 | | | | .12 | | | | .45 | | | | | | (.17 | ) |
| Less Dividends and Distributions: | | | | | | | | | | | | | | | | | | |
| Dividends from net investment income | | | (.22 | ) | | | (.16 | ) | | | (.22 | ) | | | | | (.10 | ) |
| Tax return of capital | | | - | | | | (.05 | ) | | | - | | | | | | - | |
| Distributions from net realized gains | | | - | | | | - | | | | (.02 | ) | | | | | - | |
| Total dividends and distributions | | | (.22 | ) | | | (.21 | ) | | | (.24 | ) | | | | | (.10 | ) |
| Net asset value, end of period | | | $9.82 | | | | $9.85 | | | | $9.94 | | | | | | $9.73 | |
| Total Return(b): | | | 1.97% | | | | 1.18% | | | | 4.78% | | | | | | (1.74)% | |
| |
| Ratios/Supplemental Data: | |
| Net assets, end of period (000) | | | $195,312 | | | | $172,326 | | | | $28,708 | | | | | | $4,030 | |
| Average net assets (000) | | | $183,745 | | | | $97,736 | | | | $7,066 | | | | | | $2,254 | |
| Ratios to average net assets(c): | | | | | | | | | | | | | | | | | | |
| Expenses after waivers and/or expense reimbursement | | | 1.90% | | | | 1.89% | | | | 1.88% | | | | | | 2.05% | (e) |
| Expenses before waivers and/or expense reimbursement | | | 1.97% | | | | 1.98% | | | | 2.39% | | | | | | 3.39% | (e) |
| Net investment income | | | 1.81% | | | | 1.41% | | | | 1.86% | | | | | | 2.17% | (e) |
| Portfolio turnover rate | | | 64% | | | | 125% | | | | 152% | | | | | | 112% | (f) |
(a) Calculated based on average shares outstanding during the period.
(b) Total return does not consider the effects of sales loads. Total return is calculated assuming a purchase of a share on the first day and a sale on the last day of each period reported and includes reinvestment of dividends and distributions. Total returns may reflect adjustments to conform to generally accepted accounting principles. Total returns for periods less than a full year are not annualized.
(c) Does not include expenses of the underlying portfolio in which the Fund invests.
(d) Commencement of operations.
(e) Annualized.
(f) Not annualized.
See Notes to Financial Statements.
| | | | |
| Prudential Absolute Return Bond Fund | | | 105 | |
Financial Highlights
continued
| | | | | | | | | | | | | | | | | | |
| Class Q Shares | |
| | | Year Ended October 31, | | | | | March 30,
2011(d)
through
October 31, | |
| | | 2014 | | | 2013 | | | 2012 | | | | | 2011 | |
| Per Share Operating Performance(a): | | | | | | | | | | | | | | | | | | |
| Net Asset Value, Beginning Of Period | | | $9.83 | | | | $9.94 | | | | $9.73 | | | | | | $10.00 | |
| Income (loss) from investment operations: | | | | | | | | | | | | | | | | | | |
| Net investment income | | | .28 | | | | .27 | | | | .30 | | | | | | .16 | |
| Net realized and unrealized gain (loss) on investment transactions | | | .03 | | | | (.06 | ) | | | .26 | | | | | | (.27 | ) |
| Total from investment operations | | | .31 | | | | .21 | | | | .56 | | | | | | (.11 | ) |
| Less Dividends and Distributions: | | | | | | | | | | | | | | | | | | |
| Dividends from net investment income | | | (.33 | ) | | | (.27 | ) | | | (.33 | ) | | | | | (.16 | ) |
| Tax return of capital | | | - | | | | (.05 | ) | | | - | | | | | | - | |
| Distributions from net realized gains | | | - | | | | - | | | | (.02 | ) | | | | | - | |
| Total dividends and distributions | | | (.33 | ) | | | (.32 | ) | | | (.35 | ) | | | | | (.16 | ) |
| Net asset value, end of period | | | $9.81 | | | | $9.83 | | | | $9.94 | | | | | | $9.73 | |
| Total Return(b): | | | 3.16% | | | | 2.10% | | | | 5.99% | | | | | | (1.09)% | |
| |
| Ratios/Supplemental Data: | |
| Net assets, end of period (000) | | | $19,025 | | | | $17,829 | | | | $1 | | | | | | $1 | |
| Average net assets (000) | | | $18,604 | | | | $3,144 | | | | $1 | | | | | | $1 | |
| Ratios to average net assets(c): | | | | | | | | | | | | | | | | | | |
| Expenses after waivers and/or expense reimbursement | | | .85% | | | | .90% | | | | .89% | | | | | | 1.05% | (e) |
| Expenses before waivers and/or expense reimbursement | | | .85% | | | | .94% | | | | 1.54% | | | | | | 2.45% | (e) |
| Net investment income | | | 2.87% | | | | 2.87% | | | | 3.11% | | | | | | 2.74% | (e) |
| Portfolio turnover rate | | | 64% | | | | 125% | | | | 152% | | | | | | 112% | (f) |
(a) Calculated based on average shares outstanding during the period.
(b) Total return is calculated assuming a purchase of a share on the first day and a sale on the last day of each period reported and includes reinvestment of dividends and distributions. Total returns may reflect adjustments to conform to generally accepted accounting principles. Total returns for periods less than a full year are not annualized.
(c) Does not include expenses of the underlying portfolio in which the Fund invests.
(d) Commencement of operations.
(e) Annualized.
(f) Not annualized.
See Notes to Financial Statements.
| | | | | | | | | | | | | | | | | | |
| Class Z Shares | |
| | | Year Ended October 31, | | | | | March 30,
2011(d)
through
October 31, | |
| | | 2014 | | | 2013 | | | 2012 | | | | | 2011 | |
| Per Share Operating Performance(a): | | | | | | | | | | | | | | | | | | |
| Net Asset Value, Beginning Of Period | | | $9.86 | | | | $9.95 | | | | $9.74 | | | | | | $10.00 | |
| Income (loss) from investment operations: | | | | | | | | | | | | | | | | | | |
| Net investment income | | | .27 | | | | .24 | | | | .27 | | | | | | .16 | |
| Net realized and unrealized gain (loss) on investment transactions | | | .02 | | | | (.02 | ) | | | .28 | | | | | | (.27 | ) |
| Total from investment operations | | | .29 | | | | .22 | | | | .55 | | | | | | (.11 | ) |
| Less Dividends and Distributions: | | | | | | | | | | | | | | | | | | |
| Dividends from net investment income | | | (.32 | ) | | | (.26 | ) | | | (.32 | ) | | | | | (.15 | ) |
| Tax return of capital | | | - | | | | (.05 | ) | | | - | | | | | | - | |
| Distributions from net realized gains | | | - | | | | - | | | | (.02 | ) | | | | | - | |
| Total dividends and distributions | | | (.32 | ) | | | (.31 | ) | | | (.34 | ) | | | | | (.15 | ) |
| Net asset value, end of period | | | $9.83 | | | | $9.86 | | | | $9.95 | | | | | | $9.74 | |
| Total Return(b): | | | 3.00% | | | | 2.21% | | | | 5.81% | | | | | | (1.14)% | |
| |
| Ratios/Supplemental Data: | |
| Net assets, end of period (000) | | | $2,070,862 | | | | $1,201,383 | | | | $82,364 | | | | | | $28,192 | |
| Average net assets (000) | | | $1,484,697 | | | | $672,382 | | | | $34,383 | | | | | | $27,018 | |
| Ratios to average net assets(c): | | | | | | | | | | | | | | | | | | |
| Expenses after waivers and/or expense reimbursement | | | .90% | | | | .90% | | | | .89% | | | | | | 1.05% | (e) |
| Expenses before waivers and/or expense reimbursement | | | .97% | | | | .99% | | | | 1.50% | | | | | | 2.48% | (e) |
| Net investment income | | | 2.79% | | | | 2.43% | | | | 2.92% | | | | | | 2.70% | (e) |
| Portfolio turnover rate | | | 64% | | | | 125% | | | | 152% | | | | | | 112% | (f) |
(a) Calculated based on average shares outstanding during the period.
(b) Total return is calculated assuming a purchase of a share on the first day and a sale on the last day of each period reported and includes reinvestment of dividends and distributions. Total returns may reflect adjustments to conform to generally accepted accounting principles. Total returns for periods less than a full year are not annualized.
(c) Does not include expenses of the underlying portfolio in which the Fund invests.
(d) Commencement of operations.
(e) Annualized.
(f) Not annualized.
See Notes to Financial Statements.
| | | | |
| Prudential Absolute Return Bond Fund | | | 107 | |
Report of Independent Registered Public
Accounting Firm
The Board of Trustees and Shareholders
Prudential Investment Portfolios 9:
We have audited the accompanying statement of assets and liabilities of Prudential Absolute Return Bond Fund, a series of Prudential Investment Portfolios 9, (hereafter referred to as the “Fund”), including the portfolio of investments, as of October 31, 2014, and the related statement of operations for the year then ended, the statements of changes in net assets for each of the years in the two-year period then ended and the financial highlights for each of the years in the three-year period then ended and the period March 30, 2011 (commencement of operations) to October 31, 2011. These financial statements and financial highlights are the responsibility of the Fund’s management. Our responsibility is to express an opinion on these financial statements and financial highlights based on our audits.
We conducted our audits in accordance with the standards of the Public Company Accounting Oversight Board (United States). Those standards require that we plan and perform the audit to obtain reasonable assurance about whether the financial statements and financial highlights are free of material misstatement. An audit includes examining, on a test basis, evidence supporting the amounts and disclosures in the financial statements. Our procedures included confirmation of securities owned as of October 31, 2014, by correspondence with the custodian, transfer agent and brokers or by other appropriate auditing procedures when replies from brokers were not received. An audit also includes assessing the accounting principles used and significant estimates made by management, as well as evaluating the overall financial statement presentation. We believe that our audits provide a reasonable basis for our opinion.
In our opinion, the financial statements and financial highlights referred to above present fairly, in all material respects, the financial position of the Fund as of October 31, 2014, and the results of its operations, the changes in its net assets and the financial highlights for the periods described in the first paragraph above, in conformity with U.S. generally accepted accounting principles.

New York, New York
December 18, 2014
Tax Information
(Unaudited)
For the year ended October 31, 2014, the Fund reports the maximum amount allowable but not less than 62.14% as interest related dividends in accordance with Section 871(k)(1) and 881(e)(1) of the Internal Revenue Code.
Interest-related dividends do not include any distributions paid by a fund with respect to Fund tax years beginning after October 31, 2014. Consequently, this provision expires with respect to such distributions paid after the Fund’s fiscal year end.
In January 2015, you will be advised on IRS Form 1099-DIV or substitute Form 1099-DIV as to the federal tax status of the distributions received by you in calendar year 2014.
| | | | |
| Prudential Absolute Return Bond Fund | | | 109 | |
INFORMATION ABOUT BOARD MEMBERS AND OFFICERS
(Unaudited)
Information about Board Members and Officers of the Fund is set forth below. Board Members who are not deemed to be “interested persons” of the Fund, as defined in the 1940 Act, are referred to as “Independent Board Members.” Board Members who are deemed to be “interested persons” of the Fund are referred to as “Interested Board Members.” The Board Members are responsible for the overall supervision of the operations of the Fund and perform the various duties imposed on the directors of investment companies by the 1940 Act. The Board in turn elects the Officers, who are responsible for administering the day-to-day operations of the Fund.
| | | | |
| Independent Board Members(1) |
| | | |
Name, Address, Age Position(s) Portfolios Overseen | | Principal Occupation(s) During Past Five Years | | Other Directorships Held |
Ellen S. Alberding (56) Board Member Portfolios Overseen: 69 | | President and Board Member, The Joyce Foundation (charitable foundation) (since 2002); Vice Chair, City Colleges of Chicago (community college system) (since 2011); Trustee, Skills for America’s Future (national initiative to connect employers to community colleges) (since 2011); Trustee, National Park Foundation (charitable foundation for national park system) (since 2009); Trustee, Economic Club of Chicago (since 2009). | | None. |
Kevin J. Bannon (62) Board Member Portfolios Overseen: 70 | | Managing Director (since April 2008) and Chief Investment Officer (October 2008-November 2013) of Highmount Capital LLC (registered investment adviser); formerly Executive Vice President and Chief Investment Officer (April 1993-August 2007) of Bank of New York Company; President (May 2003-May 2007) of BNY Hamilton Family of Mutual Funds. | | Director of Urstadt Biddle Properties (equity real estate investment trust) (since September 2008). |
Linda W. Bynoe (62) Board Member Portfolios Overseen: 70 | | President and Chief Executive Officer (since March 1995) and formerly Chief Operating Officer (December 1989-February 1995) of Telemat Ltd. (management consulting); formerly Vice President (January 1985-June 1989) at Morgan Stanley & Co (broker-dealer). | | Director of Simon Property Group, Inc. (retail real estate) (May 2003-May 2012); Director of Anixter International, Inc. (communication products distributor) (since January 2006); Director of Northern Trust Corporation (financial services) (since April 2006); Trustee of Equity Residential (residential real estate) (since December 2009). |
Prudential Absolute Return Bond Fund
| | | | |
| Independent Board Members(1) |
| | | |
Name, Address, Age Position(s) Portfolios Overseen | | Principal Occupation(s) During Past Five Years | | Other Directorships Held |
Keith F. Hartstein (58) Board Member Portfolios Overseen: 70 | | Retired; Formerly President and Chief Executive Officer (2005-2012), Senior Vice President (2004-2005), Senior Vice President of Sales and Marketing (1997-2004), and various executive management positions (1990-1997), John Hancock Funds, LLC (asset management); Chairman, Investment Company Institute’s Sales Force Marketing Committee (2003-2008). | | None. |
Michael S. Hyland, CFA (69) Board Member Portfolios Overseen: 69 | | Retired (since February 2005); Formerly Senior Managing Director (July 2001-February 2005) of Bear Stearns & Co, Inc.; Global Partner, INVESCO (1999-2001); Managing Director and President of Salomon Brothers Asset Management (1989-1999). | | None. |
Douglas H. McCorkindale (75) Board Member Portfolios Overseen: 69 | | Retired; Formerly Chairman (February 2001-June 2006), Chief Executive Officer (June 2000-July 2005), President (September 1997-July 2005) and Vice Chairman (March 1984-May 2000) of Gannett Co. Inc. (publishing and media). | | Director of Lockheed Martin Corp. (aerospace and defense) (since May 2001). |
Stephen P. Munn (72) Board Member Portfolios Overseen: 70 | | Lead Director (since 2007) and formerly Chairman (1993-2007) of Carlisle Companies Incorporated (manufacturer of industrial products). | | Lead Director (since 2007) of Carlisle Companies Incorporated (manufacturer of industrial products). |
James E. Quinn (62) Board Member Portfolios Overseen: 69 | | Retired; Formerly President (2003-2012) and Director (2003-2008), and Vice Chairman and Director (1998-2003), Tiffany & Company (jewelry retailing); Director, Mutual of America Capital Management Corporation (asset management) (since 1996); Director, Hofstra University (since 2008); Vice Chairman, Museum of the City of New York (since 1994). | | Director of Deckers Outdoor Corporation (footwear manufacturer) (since 2011). |
Richard A. Redeker (71) Board Member & Independent Chair Portfolios Overseen: 70 | | Retired Mutual Fund Senior Executive (44 years); Management Consultant; Director, Mutual Fund Directors Forum (since 2014); Independent Directors Council (organization of 2,800 Independent Mutual Fund Directors)-Executive Committee, Chair of Policy Steering Committee, Governing Council. | | None. |
Visit our website at www.prudentialfunds.com
| | | | |
| Independent Board Members(1) |
| | | |
Name, Address, Age Position(s) Portfolios Overseen | | Principal Occupation(s) During Past Five Years | | Other Directorships Held |
Robin B. Smith (75) Board Member Portfolios Overseen:70 | | Chairman of the Board (since January 2003) of Publishers Clearing House (direct marketing); Member of the Board of Directors of ADLPartner (marketing) (since December 2010); formerly Chairman and Chief Executive Officer (August 1996-January 2003) of Publishers Clearing House. | | Formerly Director of BellSouth Corporation (telecommunications) (1992-2006). |
Stephen G. Stoneburn (71) Board Member Portfolios Overseen: 70 | | Chairman, (since July 2011), President and Chief Executive Officer (since June 1996) of Quadrant Media Corp. (publishing company); formerly President (June 1995-June 1996) of Argus Integrated Media, Inc.; Senior Vice President and Managing Director (January 1993-1995) of Cowles Business Media; Senior Vice President of Fairchild Publications, Inc. (1975-1989). | | None. |
| | | | |
| Interested Board Members(1) |
| | | |
Name, Address, Age Position(s) Portfolios Overseen | | Principal Occupation(s) During Past Five Years | | Other Directorships Held |
Stuart S. Parker (52) Board Member & President Portfolios Overseen: 64 | | President of Prudential Investments LLC (since January 2012); Executive Vice President of Prudential Investment Management Services LLC (since December 2012); Executive Vice President of Jennison Associates LLC and Head of Retail Distribution of Prudential Investments LLC (June 2005-December 2011). | | None. |
Scott E. Benjamin (41) Board Member & Vice President Portfolios Overseen: 70 | | Executive Vice President (since June 2009) of Prudential Investments LLC; Executive Vice President (June 2009-June 2012) and Vice President (since June 2012) of Prudential Investment Management Services LLC; Executive Vice President (since September 2009) of AST Investment Services, Inc.; Senior Vice President of Product Development and Marketing, Prudential Investments (since February 2006); Vice President of Product Development and Product Management, Prudential Investments (2003-2006). | | None. |
Prudential Absolute Return Bond Fund
| | | | |
| Interested Board Members(1) |
| | | |
Name, Address, Age Position(s) Portfolios Overseen | | Principal Occupation(s) During Past Five Years | | Other Directorships Held |
Grace C. Torres* (55) Board Member Portfolios Overseen: 65 | | Retired; Formerly Treasurer and Principal Financial and Accounting Officer of the Prudential Investments Funds, Target Funds, Advanced Series Trust, Prudential Variable Contract Accounts and The Prudential Series Fund (1998-June 2014); Assistant Treasurer (March 1999-June 2014) and Senior Vice President (September 1999-June 2014) of Prudential Investments LLC; Assistant Treasurer (May 2003-June 2014) and Vice President (June 2005-June 2014) of AST Investment Services, Inc.; Senior Vice President and Assistant Treasurer (May 2003-June 2014) of Prudential Annuities Advisory Services, Inc. | | None. |
* Note: Prior to her retirement in 2014, Ms. Torres was employed by Prudential Investments LLC. Due to her prior employment, she is considered to be an “interested person” under the 1940 Act. Ms. Torres is a non-management Interested Board Member.
(1) The year that each individual joined the Fund’s Board is as follows:
Ellen S. Alberding, 2013; Linda W. Bynoe, 2005; Douglas H. McCorkindale, 1998; Richard A. Redeker, 1998; Robin B. Smith, 1998; Stephen G. Stoneburn, 2003; Kevin J. Bannon, 2008; Keith F. Hartstein, 2013; Michael S. Hyland, 2008; Stephen P. Munn, 2008; James E. Quinn, 2013; Stuart S. Parker, Board Member since 2012 and President since 2012; Scott E. Benjamin, Board Member since 2010 and Vice President since 2009; Grace C. Torres, 2014.
| | | | |
| Fund Officers(a) |
| | | |
Name, Address and Age Position with Fund | | Principal Occupation(s) During Past Five Years | | Length of Service as Fund Officer |
Raymond A. O’Hara (59) Chief Legal Officer | | Vice President and Corporate Counsel (since July 2010) of Prudential Insurance Company of America (Prudential); Vice President (March 2011-Present) of Pruco Life Insurance Company and Pruco Life Insurance Company of New Jersey; Vice President and Corporate Counsel (March 2011-Present) of Prudential Annuities Life Assurance Corporation; Chief Legal Officer of Prudential Investments LLC (since June 2012); Chief Legal Officer of Prudential Mutual Fund Services LLC (since June 2012) and Corporate Counsel of AST Investment Services, Inc. (since June 2012); formerly Assistant Vice President and Corporate Counsel (September 2008-July 2010) of The Hartford Financial Services Group, Inc.; formerly Associate (September 1980-December 1987) and Partner (January 1988–August 2008) of Blazzard & Hasenauer, P.C. (formerly, Blazzard, Grodd & Hasenauer, P.C.). | | Since 2012 |
Visit our website at www.prudentialfunds.com
| | | | |
| Fund Officers(a) |
| | | |
Name, Address and Age Position with Fund | | Principal Occupation(s) During Past Five Years | | Length of Service as Fund Officer |
Chad A. Earnst (39) Chief Compliance Officer | | Chief Compliance Officer (September 2014-Present) of Prudential Investments LLC; Chief Compliance Officer (September 2014-Present) of the Prudential Investments Funds, Target Funds, Advanced Series Trust, The Prudential Series Fund, Prudential’s Gibraltar Fund, Inc., Prudential Global Short Duration High Yield Income Fund, Inc., Prudential Short Duration High Yield Fund, Inc. and Prudential Jennison MLP Income Fund, Inc.; formerly Assistant Director (March 2010-August 2014) of the Asset Management Unit, Division of Enforcement, US Securities & Exchange Commission; Assistant Regional Director (January 2010-August 2014), Branch Chief (June 2006–December 2009) and Senior Counsel (April 2003-May 2006) of the Miami Regional Office, Division of Enforcement, US Securities & Exchange Commission. | | Since 2014 |
Deborah A. Docs (56) Secretary | | Vice President and Corporate Counsel (since January 2001) of Prudential; Vice President (since December 1996) and Assistant Secretary (since March 1999) of Prudential Investments LLC; formerly Vice President and Assistant Secretary (May 2003-June 2005) of AST Investment Services, Inc. | | Since 2004 |
Jonathan D. Shain (56) Assistant Secretary | | Vice President and Corporate Counsel (since August 1998) of Prudential; Vice President and Assistant Secretary (since May 2001) of Prudential Investments LLC; Vice President and Assistant Secretary (since February 2001) of Prudential Mutual Fund Services LLC; formerly Vice President and Assistant Secretary (May 2003-June 2005) of AST Investment Services, Inc. | | Since 2005 |
Claudia DiGiacomo (40) Assistant Secretary | | Vice President and Corporate Counsel (since January 2005) of Prudential; Vice President and Assistant Secretary of Prudential Investments LLC (since December 2005); Associate at Sidley Austin Brown & Wood LLP (1999-2004). | | Since 2005 |
Andrew R. French (52) Assistant Secretary | | Vice President and Corporate Counsel (since February 2010) of Prudential; formerly Director and Corporate Counsel (2006-2010) of Prudential; Vice President and Assistant Secretary (since January 2007) of Prudential Investments LLC; Vice President and Assistant Secretary (since January 2007) of Prudential Mutual Fund Services LLC. | | Since 2006 |
Amanda S. Ryan (36) Assistant Secretary | | Director and Corporate Counsel (since March 2012) of Prudential; Director and Assistant Secretary (since June 2012) of Prudential Investments LLC; Associate at Ropes & Gray LLP (2008-2012). | | Since 2012 |
Theresa C. Thompson (52) Deputy Chief Compliance Officer | | Vice President, Compliance, Prudential Investments LLC (since April 2004); and Director, Compliance, Prudential Investments LLC (2001-2004). | | Since 2008 |
Prudential Absolute Return Bond Fund
| | | | |
| Fund Officers(a) |
| | | |
Name, Address and Age Position with Fund | | Principal Occupation(s) During Past Five Years | | Length of Service as Fund Officer |
Richard W. Kinville (46) Anti-Money Laundering Compliance Officer | | Vice President, Corporate Compliance, Anti-Money Laundering Unit (since January 2005) of Prudential; committee member of the American Council of Life Insurers Anti-Money Laundering and Critical Infrastructure Committee (since January 2007); formerly Investigator and Supervisor in the Special Investigations Unit for the New York Central Mutual Fire Insurance Company (August 1994-January 1999); Investigator in AXA Financial’s Internal Audit Department and Manager in AXA’s Anti-Money Laundering Office (January 1999-January 2005); first chair of the American Council of Life Insurers Anti-Money Laundering and Critical Infrastructure Committee (June 2007-December 2009). | | Since 2011 |
M. Sadiq Peshimam (50) Treasurer and Principal Financial and Accounting Officer | | Assistant Treasurer of funds in the Prudential Mutual Fund Complex (2006-2014); Vice President (since 2005) of Prudential Investments LLC. | | Since 2006 |
Peter Parrella (56) Assistant Treasurer | | Vice President (since 2007) and Director (2004-2007) within Prudential Mutual Fund Administration; formerly Tax Manager at SSB Citi Fund Management LLC (1997-2004). | | Since 2007 |
Lana Lomuti (47) Assistant Treasurer | | Vice President (since 2007) and Director (2005-2007), within Prudential Mutual Fund Administration; formerly Assistant Treasurer (December 2007-February 2014) of The Greater China Fund, Inc. | | Since 2014 |
Linda McMullin (53) Assistant Treasurer | | Vice President (since 2011) and Director (2008-2011) within Prudential Mutual Fund Administration. | | Since 2014 |
| (a) | Excludes Mr. Parker and Mr. Benjamin, interested Board Members who also serve as President and Vice President, respectively. |
Explanatory Notes to Tables:
| n | Board Members are deemed to be “Interested,” as defined in the 1940 Act, by reason of their affiliation with Prudential Investments LLC and/or an affiliate of Prudential Investments LLC. |
| n | Unless otherwise noted, the address of all Board Members and Officers is c/o Prudential Investments LLC, Gateway Center Three, 100 Mulberry Street, Newark, New Jersey 07102-4077. |
| n | There is no set term of office for Board Members or Officers. The Board Members have adopted a retirement policy, which calls for the retirement of Board Members on December 31 of the year in which they reach the age of 75. |
| n | “Other Directorships Held” includes only directorships of companies required to register or file reports with the SEC under the 1934 Act (that is, “public companies”) or other investment companies registered under the 1940 Act. |
| n | “Portfolios Overseen” includes all investment companies managed by Prudential Investments LLC. The investment companies for which Prudential Investments LLC serves as manager include the Prudential Investments Mutual Funds, The Prudential Variable Contract Accounts, Target Mutual Funds, Prudential Short Duration High Yield Fund, Inc., Prudential Global Short Duration High Yield Fund, Inc., The Prudential Series Fund, Prudential’s Gibraltar Fund, Inc. and the Advanced Series Trust. |
Visit our website at www.prudentialfunds.com
Approval of Advisory Agreements
The Fund’s Board of Trustees
The Board of Trustees (the “Board”) of Prudential Absolute Return Bond Fund (the “Fund”)1 consists of thirteen individuals, eleven of whom are not “interested persons” of the Fund, as defined in the Investment Company Act of 1940, as amended (the “1940 Act”) (the “Independent Trustees”). The Board is responsible for the oversight of the Fund and its operations, and performs the various duties imposed on the Trustees of investment companies by the 1940 Act. The Independent Trustees have retained independent legal counsel to assist them in connection with their duties. The Chair of the Board is an Independent Trustee. The Board has established three standing committees: the Audit Committee, the Nominating and Governance Committee, and the Investment Committee. Each committee is chaired by, and composed of, Independent Trustees.
Annual Approval of the Fund’s Advisory Agreements
As required under the 1940 Act, the Board determines annually whether to renew the Fund’s management agreement with Prudential Investments LLC (“PI”) and the Fund’s subadvisory agreement with Prudential Investment Management, Inc. (“PIM”). In considering the renewal of the agreements, the Board, including all of the Independent Trustees, met on June 9-11, 2014 and approved the renewal of the agreements through July 31, 2015, after concluding that the renewal of the agreements was in the best interests of the Fund and its shareholders.2
In advance of the meetings, the Board requested and received materials relating to the agreements, and had the opportunity to ask questions and request further information in connection with its consideration. Among other things, the Board considered comparative fee information from PI and PIM. Also, the Board considered comparisons with other mutual funds in relevant Peer Universes and Peer Groups, as is further discussed below.
In approving the agreements, the Board, including the Independent Trustees advised by independent legal counsel, considered the factors it deemed relevant, including the nature, quality and extent of services provided by PI and the subadviser, the performance of the Fund, the profitability of PI and its affiliates, expenses and fees, and the potential for economies of scale that may be shared with the Fund and its shareholders as the Fund’s assets grow. In their deliberations, the Trustees did not identify any single factor which alone was responsible for the Board’s decision to
| 1 | Prudential Absolute Return Bond Fund is a series of Prudential Investment Portfolios 9. |
| 2 | Grace C. Torres was elected to the Board as of December 2014, and therefore did not participate in the consideration of these approvals. |
Prudential Absolute Return Bond Fund
Approval of Advisory Agreements (continued)
approve the agreements with respect to the Fund. In connection with its deliberations, the Board considered information provided by PI throughout the year at regular Board meetings, presentations from portfolio managers and other information, as well as information furnished at or in advance of the meetings on June 9-11, 2014.
The Trustees determined that the overall arrangements between the Fund and PI, which serves as the Fund’s investment manager pursuant to a management agreement, and between PI and PIM, which serves as the Fund’s subadviser pursuant to the terms of a subadvisory agreement with PI, are in the best interests of the Fund and its shareholders in light of the services performed, fees charged and such other matters as the Trustees considered relevant in the exercise of their business judgment.
The material factors and conclusions that formed the basis for the Trustees’ reaching their determinations to approve the continuance of the agreements are separately discussed below.
Nature, quality and extent of services
The Board received and considered information regarding the nature, quality and extent of services provided to the Fund by PI and PIM. The Board considered the services provided by PI, including but not limited to the oversight of the subadviser for the Fund, as well as the provision of fund recordkeeping, compliance, and other services to the Fund. With respect to PI’s oversight of the subadviser, the Board noted that PI’s Strategic Investment Research Group (“SIRG”), which is a business unit of PI, is responsible for monitoring and reporting to PI’s senior management on the performance and operations of the subadviser. The Board also considered that PI pays the salaries of all of the officers and non-independent Trustees of the Fund. The Board also considered the investment subadvisory services provided by PIM, including investment research and security selection, as well as adherence to the Fund’s investment restrictions and compliance with applicable Fund policies and procedures. The Board considered PI’s evaluation of the subadviser, as well as PI’s recommendation, based on its review of the subadviser, to renew the subadvisory agreement.
The Board considered the qualifications, backgrounds and responsibilities of PI’s senior management responsible for the oversight of the Fund and PIM, and also considered the qualifications, backgrounds and responsibilities of PIM’s portfolio managers who are responsible for the day-to-day management of the Fund’s portfolio. The Board was provided with information pertaining to PI’s and PIM’s organizational structure, senior management, investment operations, and other relevant information pertaining to both PI and PIM. The Board also noted that it received favorable compliance reports from the Fund’s Chief Compliance Officer (“CCO”) as to both PI and PIM. The Board noted that PIM is affiliated with PI.
Visit our website at www.prudentialfunds.com
The Board concluded that it was satisfied with the nature, extent and quality of the investment management services provided by PI and the subadvisory services provided to the Fund by PIM, and that there was a reasonable basis on which to conclude that the Fund benefits from the services provided by PI and PIM under the management and subadvisory agreements.
Costs of Services and Profits Realized by PI
The Board was provided with information on the profitability of PI and its affiliates in serving as the Fund’s investment manager. The Board discussed with PI the methodology utilized in assembling the information regarding profitability and considered its reasonableness. The Board recognized that it is difficult to make comparisons of profitability from fund management contracts because comparative information is not generally publicly available and is affected by numerous factors, including the structure of the particular adviser, the types of funds it manages, its business mix, numerous assumptions regarding allocations and the adviser’s capital structure and cost of capital. The Board separately considered information regarding the profitability of the subadviser, an affiliate of PI. Taking these factors into account, the Board concluded that the profitability of PI and its affiliates in relation to the services rendered was not unreasonable.
Economies of Scale
In 2013, PI and the Board retained an outside business consulting firm, in order to assist the Board in its consideration of the renewal of the management and subadvisory agreements, by reviewing management fee breakpoint usage and trends in management fees across the mutual fund industry. The consulting firm’s analysis and conclusions with respect to the Funds’ management fee structures were presented to the Board and PI at the December 3-5, 2013 meeting, and were discussed extensively by the Board and PI over the following two quarters.
The Board noted that the management fee schedule for the Fund does not contain breakpoints that would reduce the fee rate on assets above specified levels. In light of the Fund’s current size and expense structure, the Board negotiated with PI to implement breakpoints to the contractual management fee schedule. The Board took note that the Fund’s fee structure would result in benefits to Fund shareholders when (and if) assets reach the levels at which the fee rate is reduced. These benefits will accrue whether or not PI is then realizing any economies of scale. The Board recognized the inherent limitations of any analysis of economies of scale, stemming largely from the Board’s understanding that most of PI’s costs are not specific to individual funds, but rather are incurred across a variety of products and services.
Prudential Absolute Return Bond Fund
Approval of Advisory Agreements (continued)
Other Benefits to PI and PIM
The Board considered potential ancillary benefits that might be received by PI and PIM and their affiliates as a result of their relationship with the Fund. The Board concluded that potential benefits to be derived by PI included fees received by affiliates of PI for serving as the Fund’s securities lending agent, transfer agency fees received by the Fund’s transfer agent (which is affiliated with PI), as well as benefits to its reputation or other intangible benefits resulting from PI’s association with the Fund. The Board concluded that the potential benefits to be derived by PIM included the ability to use soft dollar credits, as well as the potential benefits consistent with those generally resulting from an increase in assets under management, specifically, potential access to additional research resources and benefits to its reputation. The Board concluded that the benefits derived by PI and PIM were consistent with the types of benefits generally derived by investment managers and subadvisers to mutual funds.
Performance of the Fund / Fees and Expenses
The Board considered certain additional specific factors and made related conclusions relating to the historical performance of the Fund for the one-year period ended December 31, 2013. The Board considered that the Fund commenced operations on March 30, 2011 and that longer-term performance was not yet available.
The Board also considered the Fund’s actual management fee, as well as the Fund’s net total expense ratio, for the fiscal year ended October 31, 2013. The Board considered the management fee for the Fund as compared to the management fee charged by PI to other funds and the fee charged by other advisers to comparable mutual funds in a Peer Group. The actual management fee represents the fee rate actually paid by Fund shareholders and includes any fee waivers or reimbursements. The net total expense ratio for the Fund represents the actual expense ratio incurred by Fund shareholders.
The mutual funds included in the Peer Universe (the fixed-income funds within the Lipper Alternative Credit Focused Funds Performance Universe) and the Peer Group were objectively determined by Lipper Inc. (“Lipper”), an independent provider of mutual fund data. The comparisons placed the Fund in various quartiles, with the first quartile being the best 25% of the mutual funds (for performance, the best performing mutual funds and, for expenses, the lowest cost mutual funds).
The section below summarizes key factors considered by the Board and the Board’s conclusions regarding the Fund’s performance, fees and overall expenses. The table
Visit our website at www.prudentialfunds.com
sets forth gross performance comparisons (which do not reflect the impact on performance of fund expenses, or any subsidies, expense caps or waivers that may be applicable) with the Peer Universe, actual management fees with the Peer Group (which reflect the impact of any subsidies or fee waivers), and net total expenses with the Peer Group, each of which were key factors considered by the Board.
| | | | | | | | |
| Performance | | 1 Year | | 3 Years | | 5 Years | | 10 Years |
| | | 2nd Quartile | | N/A | | N/A | | N/A |
| Actual Management Fees: 2nd Quartile |
| Net Total Expenses: 2nd Quartile |
| | • | | The Board noted that the Fund outperformed its benchmark index over the one-year period. |
| | • | | The Board and PI agreed to continue the existing expense cap of 0.90% (exclusive of 12b-1 fees and certain other fees) through February 28, 2015. |
| | • | | The Board noted PI’s agreement to implement two contractual management fee breakpoints of 0.775% on assets over $2.5 billion and up to $5 billion and 0.75% on assets over $5 billion, in addition to the existing contractual management fee of 0.80% on assets up to $2.5 billion. |
| | • | | The Board concluded that, in light of the Fund’s competitive performance against its benchmark index and Peer Universe, it would be in the best interests of the Fund and its shareholders to renew the agreements. |
| | • | | The Board concluded that the management fees (including subadvisory fees) and total expenses were reasonable in light of the services provided. |
* * *
After full consideration of these factors, the Board concluded that the approval of the agreements was in the best interests of the Fund and its shareholders.
Prudential Absolute Return Bond Fund
| | | | |
| n MAIL | | n TELEPHONE | | n WEBSITE |
Gateway Center Three 100 Mulberry Street Newark, NJ 07102 | | (800) 225-1852 | | www.prudentialfunds.com |
|
| PROXY VOTING |
| The Board of Trustees of the Fund has delegated to the Fund’s investment subadviser the responsibility for voting any proxies and maintaining proxy recordkeeping with respect to the Fund. A description of these proxy voting policies and procedures is available without charge, upon request, by calling (800) 225-1852 or by visiting the Securities and Exchange Commission’s website at www.sec.gov. Information regarding how the Fund voted proxies relating to portfolio securities during the most recent 12-month period ended June 30 is available on the Fund’s website and on the Securities and Exchange Commission’s website. |
|
| TRUSTEES |
| Ellen S. Alberding • Kevin J. Bannon • Scott E. Benjamin • Linda W. Bynoe • Keith F. Hartstein • Michael S. Hyland • Douglas H. McCorkindale • Stephen P. Munn • Stuart S. Parker • James E. Quinn • Richard A. Redeker • Robin B. Smith • Stephen G. Stoneburn • Grace C. Torres |
|
| OFFICERS |
| Stuart S. Parker, President • Scott E. Benjamin, Vice President • M. Sadiq Peshimam, Treasurer and Principal Financial and Accounting Officer • Raymond A. O’Hara, Chief Legal Officer • Deborah A. Docs, Secretary • Chad A. Earnst, Chief Compliance Officer • Theresa C. Thompson, Deputy Chief Compliance Officer • Richard W. Kinville, Anti-Money Laundering Compliance Officer • Jonathan D. Shain, Assistant Secretary • Claudia DiGiacomo, Assistant Secretary • Amanda S. Ryan, Assistant Secretary • Andrew R. French, Assistant Secretary • Peter Parrella, Assistant Treasurer • Lana Lomuti, Assistant Treasurer • Linda McMullin, Assistant Treasurer |
| | | | |
| MANAGER | | Prudential Investments LLC | | Gateway Center Three
100 Mulberry Street
Newark, NJ 07102 |
|
| INVESTMENT SUBADVISER | | Prudential Investment
Management, Inc. | | Gateway Center Three
100 Mulberry Street
Newark, NJ 07102 |
|
| DISTRIBUTOR | | Prudential Investment
Management Services LLC | | Gateway Center Three
100 Mulberry Street
Newark, NJ 07102 |
|
| CUSTODIAN | | The Bank of New York Mellon | | One Wall Street
New York, NY 10286 |
|
| TRANSFER AGENT | | Prudential Mutual Fund
Services LLC | | PO Box 9658
Providence, RI 02940 |
|
INDEPENDENT REGISTERED
PUBLIC ACCOUNTING FIRM | | KPMG LLP | | 345 Park Avenue
New York, NY 10154 |
|
| FUND COUNSEL | | Willkie Farr & Gallagher LLP | | 787 Seventh Avenue
New York, NY 10019 |
|
| An investor should consider the investment objectives, risks, charges, and expenses of the Fund carefully before investing. The prospectus and summary prospectus contain this and other information about the Fund. An investor may obtain a prospectus and summary prospectus by visiting our website at www.prudentialfunds.com or by calling (800) 225-1852. The prospectus and summary prospectus should be read carefully before investing. |
|
| E-DELIVERY |
| To receive your mutual fund documents online, go to www.prudentialfunds.com/edelivery and enroll. Instead of receiving printed documents by mail, you will receive notification via email when new materials are available. You can cancel your enrollment or change your email address at any time by visiting the website address above. |
|
| SHAREHOLDER COMMUNICATIONS WITH TRUSTEES |
| Shareholders can communicate directly with the Board of Trustees by writing to the Chair of the Board, Prudential Absolute Return Bond Fund, Prudential Investments, Attn: Board of Trustees, 100 Mulberry Street, Gateway Center Three, Newark, NJ 07102. Shareholders can communicate directly with an individual Trustee by writing to the same address. Communications are not screened before being delivered to the addressee. |
|
| AVAILABILITY OF PORTFOLIO SCHEDULE |
| The Fund files its complete schedule of portfolio holdings with the Securities and Exchange Commission for the first and third quarters of each fiscal year on Form N-Q. The Fund’s Forms N-Q are available on the Commission’s website at www.sec.gov. The Fund’s Forms N-Q may also be reviewed and copied at the Commission’s Public Reference Room in Washington, D.C. Information on the operation and location of the Public Reference Room may be obtained by calling (202) 551-8090. The Fund’s schedule of portfolio holdings is also available on the Fund’s website as of the end of each month. |
|
| The Fund’s Statement of Additional Information contains additional information about the Fund’s Trustees and is available without charge, upon request, by calling (800) 225-1852. |
Mutual Funds:
| | | | |
ARE NOT INSURED BY THE FDIC OR ANY
FEDERAL GOVERNMENT AGENCY | | MAY LOSE VALUE | | ARE NOT A DEPOSIT OF OR GUARANTEED
BY ANY BANK OR ANY BANK AFFILIATE |

PRUDENTIAL ABSOLUTE RETURN BOND FUND
| | | | | | | | |
| SHARE CLASS | | A | | C | | Q | | Z |
| NASDAQ | | PADAX | | PADCX | | PADQX | | PADZX |
| CUSIP | | 74441J852 | | 74441J845 | | 74441J837 | | 74441J829 |
MF213E 0270919-00001-00

PRUDENTIAL INVESTMENTS»MUTUAL FUNDS
PRUDENTIAL SELECT
REAL ESTATE FUND
ANNUAL REPORT · OCTOBER 31, 2014
Fund Type
Sector Stock
Objective
Capital appreciation and income
This report is not authorized for distribution to prospective investors unless preceded or accompanied by a current prospectus.
The views expressed in this report and information about the Fund’s portfolio holdings are for the period covered by this report and are subject to change thereafter.
Mutual funds are distributed by Prudential Investment Management Services LLC (PIMS). Prudential Real Estate Investors, also known as PREl®, is a unit of Prudential Investment Management, Inc. (PIM), a registered investment adviser. PIMS and PIM are Prudential Financial companies. ©2014 Prudential Financial, Inc. and its related entities. Prudential Investments, Prudential, the Prudential logo, Bring Your Challenges, and the Rock symbol are service marks of Prudential Financial, Inc. and its related entities, registered in many jurisdictions worldwide.

December 15, 2014
Dear Shareholder:
We hope you find the annual report for the Prudential Select Real Estate Fund informative and useful. The report covers performance since the Fund’s inception on August 1, 2014 through October 31, 2014.
Since market conditions change over time, we believe it is important to maintain a diversified portfolio of funds consistent with your tolerance for risk, time horizon, and financial goals.
Your financial advisor can help you create a diversified investment plan that may include funds covering all the basic asset classes and that reflects your personal investor profile and risk tolerance. Keep in mind, however, that diversification and asset allocation strategies do not assure a profit or protect against loss in declining markets.
Prudential Investments® is dedicated to helping you solve your toughest investment challenges—whether it’s capital growth, reliable income, or protection from market volatility and other risks. We offer the expertise of Prudential Financial’s affiliated asset managers* that strive to be leaders in a broad range of funds to help you stay on course to the future you envision. They also manage money for major corporations and pension funds around the world, which means you benefit from the same expertise, innovation, and attention to risk demanded by today’s most sophisticated investors.
Thank you for choosing the Prudential Investments family of funds.
Sincerely,

Stuart S. Parker, President
Prudential Select Real Estate Fund
*Most of Prudential Investments’ equity funds are advised by Jennison Associates LLC, Quantitative Management Associates LLC (QMA), or Prudential Real Estate Investors. Prudential Investments’ fixed income and money market funds are advised by Prudential Investment Management, Inc. (PIM) through its Prudential Fixed Income unit. Jennison Associates LLC, QMA, and PIM are registered investment advisers and Prudential Financial companies. Prudential Real Estate Investors is a unit of PIM.
| | | | |
| Prudential Select Real Estate Fund | | | 1 | |
Your Fund’s Performance (Unaudited)
Performance data quoted represent past performance. Past performance does not guarantee future results. The investment return and principal value of an investment will fluctuate, so that an investor’s shares, when redeemed, may be worth more or less than their original cost. Current performance may be lower or higher than the past performance data quoted. An investor may obtain performance data as of the most recent month-end by visiting our website at www.prudentialfunds.com or by calling (800) 225-1852.
| | | | |
Cumulative Total Returns (Without Sales Charges) as of 10/31/14 |
| | | | | Since Inception |
Class A | | | | 3.00% (8/1/14) |
Class C | | | | 2.80 (8/1/14) |
Class Q | | | | 3.10 (8/1/14) |
Class Z | | | | 3.10 (8/1/14) |
S&P Developed Property Net Index | | | | 0.91 |
FTSE EPRA/NAREIT Developed Real Estate Index | | | | 1.41 |
Lipper Global Real Estate Funds Average | | | | 1.79 |
| | | | |
Average Annual Total Returns (With Sales Charges) as of 9/30/14 |
| | | | | Since Inception |
Class A | | | | N/A (8/1/14) |
Class C | | | | N/A (8/1/14) |
Class Q | | | | N/A (8/1/14) |
Class Z | | | | N/A (8/1/14) |
S&P Developed Property Net Index | | | | N/A |
FTSE EPRA/NAREIT Developed Real Estate Index | | | | N/A |
Lipper Global Real Estate Funds Average | | | | N/A |
| | | | |
Average Annual Total Returns (With Sales Charges) as of 10/31/14 |
| | | | | Since Inception |
Class A | | | | N/A (8/1/14) |
Class C | | | | N/A (8/1/14) |
Class Q | | | | N/A (8/1/14) |
Class Z | | | | N/A (8/1/14) |
| | | | |
| | |
| 2 | | Visit our website at www.prudentialfunds.com |
| | | | |
Average Annual Total Returns (Without Sales Charges) as of 10/31/14 |
| | | | | Since Inception |
Class A | | | | N/A (8/1/14) |
Class C | | | | N/A (8/1/14) |
Class Q | | | | N/A (8/1/14) |
Class Z | | | | N/A (8/1/14) |
Growth of a $10,000 Investment
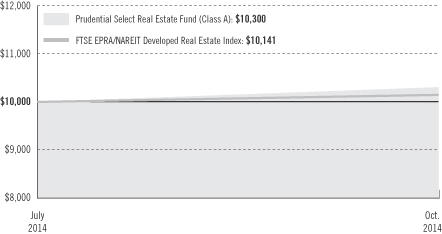
The graph compares a $10,000 investment in the Prudential Select Real Estate Fund (Class A shares) with a similar investment in the FTSE EPRA/NAREIT Developed Real Estate Index, by portraying the initial account values at the commencement of operations for Class A shares (August 1, 2014) and the account values at the end of the current fiscal year (October 31, 2014) as measured on a quarterly basis. For purposes of the graph, and unless otherwise indicated, it has been assumed that (a) the maximum applicable front-end sales charge was deducted from the initial $10,000 investment in Class A shares; (b) all recurring fees (including management fees) were deducted; and (c) all dividends and distributions were reinvested. The line graph provides information for Class A shares only. As indicated in the tables provided earlier, performance for Class C, Class Q, and Class Z shares will vary due to the differing charges and expenses applicable to each share class (as explained in the following paragraphs). Without waiver of fees and/or expense reimbursements, if any, the returns would have been lower.
Past performance does not predict future performance. Total returns and the ending account values in the graph include changes in share price and reinvestment of dividends and capital gains distributions in a hypothetical investment for the periods shown. The Fund’s total returns do not reflect the deduction of income taxes on an individual’s investment. Taxes may reduce your actual investment returns on income or gains paid by the Fund or any gains you may realize if you sell your shares.
| | | | |
| Prudential Select Real Estate Fund | | | 3 | |
Your Fund’s Performance (continued)
Source: Prudential Investments LLC and Lipper Inc.
Inception returns are provided for any share class with less than 10 calendar years of returns.
The returns in the tables do not reflect the deduction of taxes that a shareholder would pay on Fund distributions or following the redemption of Fund shares. The average annual total returns take into account applicable sales charges, which are described for each share class in the table below.
| | | | | | | | |
| | Class A | | Class C | | Class Q | | Class Z |
Maximum initial sales charge | | 5.50% of
the public
offering
price | | None | | None | | None |
Contingent deferred sales charge (CDSC) (as a percentage of the lower of original purchase price or net asset value at redemption) | | 1% on sales
of $1 million
or more
made within
12 months of
purchase | | 1% on sales
made within
12 months
of purchase | | None | | None |
Annual distribution and service (12b-1) fees (shown as a percentage of average daily net assets) | | .30% (.25%
currently) | | 1% | | None | | None |
Benchmark Definitions
S&P Developed Property Net Index
The S&P Developed Property Net Index is an unmanaged, weighted index which measures the investable universe of publicly traded property companies and domiciled in developed markets.
FTSE EPRA/NAREIT Developed Real Estate Index
The FTSE EPRA/NAREIT Developed Real Estate Index is unmanaged and designed to track the performance of listed real estate companies and REITs worldwide.
Lipper Global Real Estate Funds Average
The Lipper Global Real Estate Funds Average includes funds that invest at least 25% but less than 75% of their equity portfolio in shares of companies engaged in the real estate industry that are strictly outside of the US or whose securities are principally traded outside of the US.
Investors cannot invest directly in an index or average. The returns for the Index would be lower if they included the effects of sales charges, operating expenses of a mutual fund, or taxes. Returns for the Lipper Average reflect the deduction of operating expenses, but not sales charges or taxes. The Since Inception returns for the Indexes and Lipper Average are measured from the closest month-end to inception date, and not from the Fund’s actual inception date.
| | |
| 4 | | Visit our website at www.prudentialfunds.com |
| | | | |
Five Largest Holdings expressed as a percentage of net assets as of 10/31/14 | | | | |
Mitsui Fudosan Co. Ltd.(Japan), Diversified Real Estate Activities | | | 5.2 | % |
Sun Hung Kai Properties Ltd.(Hong Kong), Diversified Real Estate Activities | | | 4.8 | |
Empire State Realty Trust, Inc., Diversified REITs | | | 4.0 | |
Boston Properties, Inc., Office REITs | | | 4.0 | |
Camden Property Trust, Residential REITs | | | 3.8 | |
Holdings reflect only long-term investments and are subject to change.
| | | | |
Five Largest Industries expressed as a percentage of net assets as of 10/31/14 | | | | |
Diversified REITs | | | 17.4 | % |
Office REITs | | | 16.8 | |
Diversified Real Estate Activities | | | 15.0 | |
Retail REITs | | | 12.1 | |
Hotel & Resort REITs | | | 7.5 | |
Industry weightings reflect only long-term investments and are subject to change.
| | | | |
| Prudential Select Real Estate Fund | | | 5 | |
Fees and Expenses (Unaudited)
As a shareholder of the Fund, you incur two types of costs: (1) transaction costs, including sales charges (loads) on purchase payments and redemptions, as applicable, and (2) ongoing costs, including management fees, distribution, and/or service (12b-1) fees, and other Fund expenses, as applicable. This example is intended to help you understand your ongoing costs (in dollars) of investing in the Fund and to compare these costs with the ongoing costs of investing in other mutual funds.
The example is based on an investment of $1,000 invested on August 1, 2014, at the Fund’s commencement of operations, and held through the initial fiscal period ended October 31, 2014. The example is for illustrative purposes only; you should consult the Prospectus for information on initial and subsequent minimum investment requirements.
Actual Expenses
The first line for each share class in the table on the following page provides information about actual account values and actual expenses. You may use the information on this line, together with the amount you invested, to estimate the expenses that you paid over the period. Simply divide your account value by $1,000 (for example, an $8,600 account value ÷ $1,000 = 8.6), then multiply the result by the number on the first line under the heading “Expenses Paid During the Six-Month Period” to estimate the expenses you paid on your account during this period.
Hypothetical Example for Comparison Purposes
The second line for each share class in the table on the following page provides information about hypothetical account values and hypothetical expenses based on the Fund’s actual expense ratio and an assumed rate of return of 5% per year before expenses, which is not the Fund’s actual return. The hypothetical account values and expenses may not be used to estimate the actual ending account balance or expenses you paid for the period. You may use this information to compare the ongoing costs of investing in the Fund and other funds. To do so, compare this 5% hypothetical example with the 5% hypothetical examples that appear in the shareholder reports of the other funds.
The Fund’s transfer agent may charge additional fees to holders of certain accounts that are not included in the expenses shown in the table on the following page. These fees apply to individual retirement accounts (IRAs) and Section 403(b) accounts. As of the close of the period covered by the table, IRA fees included an annual maintenance fee of $15 per account (subject to a maximum annual maintenance fee of $25 for all accounts held by the same shareholder). Section 403(b) accounts are charged an annual $25 fiduciary maintenance fee. Some of the fees may vary in amount, or may be waived, based on your total account balance or the number of
| | |
| 6 | | Visit our website at www.prudentialfunds.com |
Prudential Investments funds, including the Fund, that you own. You should consider the additional fees that were charged to your Fund account over the six-month period when you estimate the total ongoing expenses paid over the period and the impact of these fees on your ending account value, as these additional expenses are not reflected in the information provided in the expense table. Additional fees have the effect of reducing investment returns.
Please note that the expenses shown in the table are meant to highlight your ongoing costs only and do not reflect any transactional costs such as sales charges (loads). Therefore, the second line for each share class in the table is useful in comparing ongoing costs only and will not help you determine the relative total costs of owning different funds. In addition, if these transactional costs were included, your costs would have been higher.
| | | | | | | | | | | | | | | | | | |
Prudential
Select Real
Estate Fund | | Beginning Account
Value
August 1, 2014 | | | Ending Account
Value
October 31, 2014 | | | Annualized
Expense Ratio
Based on the
Six-Month Period | | | Expenses Paid
During the
Six-Month Period* | |
| | | | | | | | | | | | | | | | | | |
| Class A | | Actual** | | $ | 1,000.00 | | | $ | 1,030.00 | | | | 1.35 | % | | $ | 3.45 | |
| | | Hypothetical | | $ | 1,000.00 | | | $ | 1,018.40 | | | | 1.35 | % | | $ | 6.87 | |
| | | | | | | | | | | | | | | | | | |
| Class C | | Actual** | | $ | 1,000.00 | | | $ | 1,028.00 | | | | 2.10 | % | | $ | 5.37 | |
| | | Hypothetical | | $ | 1,000.00 | | | $ | 1,014.62 | | | | 2.10 | % | | $ | 10.66 | |
| | | | | | | | | | | | | | | | | | |
| Class Q | | Actual** | | $ | 1,000.00 | | | $ | 1,031.00 | | | | 1.10 | % | | $ | 2.82 | |
| | | Hypothetical | | $ | 1,000.00 | | | $ | 1,019.66 | | | | 1.10 | % | | $ | 5.60 | |
| | | | | | | | | | | | | | | | | | |
| Class Z | | Actual** | | $ | 1,000.00 | | | $ | 1,031.00 | | | | 1.10 | % | | $ | 2.82 | |
| | | Hypothetical | | $ | 1,000.00 | | | $ | 1,019.66 | | | | 1.10 | % | | $ | 5.60 | |
*Fund expenses (net of fee waivers or subsidies, if any) for each share class are equal to the annualized expense ratio for each share class (provided in the table), multiplied by the average account value over the period, multiplied by the 184 days in the six-month period ended October 31, 2014, and divided by 365 days. Expenses presented in the table include the expenses of any underlying portfolios in which the Fund may invest.
**“Actual” expenses are calculated using the 92 day period ended October 31, 2014 due to the Fund’s inception date of August 1, 2014.
| | | | |
| Prudential Select Real Estate Fund | | | 7 | |
Fees and Expenses (continued)
The Fund’s annualized expense ratios for the period August 1, 2014 through October 31, 2014, are as follows:
| | | | | | | | |
| Class | | Gross Operating Expenses* | | | Net Operating Expenses | |
A | | | 20.58 | % | | | 1.35 | % |
C | | | 20.42 | | | | 2.10 | |
Q | | | 14.06 | | | | 1.10 | |
Z | | | 19.50 | | | | 1.10 | |
*Please note that the smaller asset base of the Fund, as well as, its brief track record have inflated the gross expense ratios for the Fund for the period ending October 31, 2014. Please note that the Fund’s net expense ratios are what the shareholders of the Fund would ultimately experience.
Net operating expenses shown above reflect any fee waivers and/or expense reimbursements. Additional information on Fund expenses and any fee waivers and/or expense reimbursements can be found in the “Financial Highlights” tables in this report and in the Notes to the Financial Statements in this report.
| | |
| 8 | | Visit our website at www.prudentialfunds.com |
Portfolio of Investments
as of October 31, 2014
| | | | | | | | |
| | | Shares | | | Value (Note 1) | |
LONG-TERM INVESTMENTS 95.0% | | | | | | | | |
| | |
COMMON STOCKS | | | | | | | | |
| | |
Diversified Real Estate Activities 15.0% | | | | | | | | |
Mitsubishi Estate Co. Ltd. (Japan) | | | 4,610 | | | $ | 117,438 | |
Mitsui Fudosan Co. Ltd. (Japan) | | | 8,470 | | | | 272,450 | |
Sun Hung Kai Properties Ltd. (Hong Kong) | | | 16,770 | | | | 250,227 | |
Westgrund AG (Germany)* | | | 11,000 | | | | 47,819 | |
Wharf Holdings Ltd. (The) (Hong Kong) | | | 12,670 | | | | 93,709 | |
| | | | | | | | |
| | | | | | | 781,643 | |
| | |
Diversified REITs 17.4% | | | | | | | | |
British Land Co. PLC (The) (United Kingdom) | | | 6,300 | | | | 73,563 | |
Duke Realty Corp. | | | 4,300 | | | | 81,528 | |
Empire State Realty Trust, Inc. (Class A Stock) | | | 13,200 | | | | 210,672 | |
First Potomac Realty Trust | | | 11,550 | | | | 144,375 | |
Green REIT PLC (Ireland)* | | | 46,580 | | | | 73,548 | |
Hibernia REIT PLC (Ireland)* | | | 17,142 | | | | 23,630 | |
Lexington Realty Trust | | | 10,100 | | | | 110,696 | |
Spirit Realty Capital, Inc. | | | 9,500 | | | | 113,050 | |
Suntec Real Estate Investment Trust (Singapore) | | | 52,950 | | | | 73,565 | |
| | | | | | | | |
| | | | | | | 904,627 | |
| | |
Health Care REITs 2.2% | | | | | | | | |
Physicians Realty Trust | | | 7,430 | | | | 113,976 | |
| | |
Hotel & Resort REITs 7.5% | | | | | | | | |
Chesapeake Lodging Trust | | | 4,261 | | | | 140,783 | |
Hersha Hospitality Trust | | | 15,060 | | | | 109,787 | |
Strategic Hotels & Resorts, Inc.* | | | 10,890 | | | | 139,937 | |
| | | | | | | | |
| | | | | | | 390,507 | |
| | |
Hotels, Resorts & Cruise Lines 6.4% | | | | | | | | |
Hilton Worldwide Holdings, Inc.* | | | 5,210 | | | | 131,500 | |
Morgans Hotel Group* | | | 7,000 | | | | 55,930 | |
Starwood Hotels & Resorts Worldwide, Inc. | | | 1,900 | | | | 145,654 | |
| | | | | | | | |
| | | | | | | 333,084 | |
| | |
Industrial REITs 6.3% | | | | | | | | |
First Industrial Realty Trust, Inc. | | | 8,320 | | | | 162,490 | |
Mapletree Industrial Trust (Singapore) | | | 44,000 | | | | 50,535 | |
See Notes to Financial Statements.
| | | | |
| Prudential Select Real Estate Fund | | | 9 | |
Portfolio of Investments
as of October 31, 2014 continued
| | | | | | | | |
| | | Shares | | | Value (Note 1) | |
COMMON STOCKS (Continued) | | | | | | | | |
| | |
Industrial REITs (cont’d.) | | | | | | | | |
Prologis, Inc. | | | 2,700 | | | $ | 112,455 | |
| | | | | | | | |
| | | | | | | 325,480 | |
| | |
Office REITs 16.8% | | | | | | | | |
Alstria Office REIT - AG (Germany)* | | | 5,902 | | | | 73,273 | |
Boston Properties, Inc. | | | 1,650 | | | | 209,138 | |
Brookfield Canada Office Properties (Canada) | | | 4,100 | | | | 98,403 | |
Columbia Property Trust, Inc. | | | 6,010 | | | | 151,632 | |
Great Portland Estates PLC (United Kingdom) | | | 9,470 | | | | 104,227 | |
Keppel REIT (Singapore) | | | 108,930 | | | | 103,521 | |
Mack - Cali Realty Corp. | | | 4,680 | | | | 87,656 | |
New York REIT, Inc. | | | 4,200 | | | | 47,124 | |
| | | | | | | | |
| | | | | | | 874,974 | |
| | |
Real Estate Operating Companies 3.9% | | | | | | | | |
Hongkong Land Holdings Ltd. (Hong Kong) | | | 21,650 | | | | 150,901 | |
TLG Immobilien AG (Germany)* | | | 3,674 | | | | 50,184 | |
| | | | | | | | |
| | | | | | | 201,085 | |
| | |
Residential REITs 6.4% | | | | | | | | |
Camden Property Trust | | | 2,580 | | | | 197,809 | |
Post Properties, Inc. | | | 2,400 | | | | 134,256 | |
| | | | | | | | |
| | | | | | | 332,065 | |
| | |
Retail REITs 12.1% | | | | | | | | |
DDR Corp. | | | 5,780 | | | | 104,849 | |
General Growth Properties, Inc. | | | 2,140 | | | | 55,447 | |
Hammerson PLC (United Kingdom) | | | 8,200 | | | | 80,556 | |
Klepierre (France) | | | 1,070 | | | | 46,312 | |
Simon Property Group, Inc. | | | 910 | | | | 163,081 | |
Taubman Centers, Inc. | | | 2,390 | | | | 181,760 | |
| | | | | | | | |
| | | | | | | 632,005 | |
| | |
Specialized REITs 1.0% | | | | | | | | |
Big Yellow Group PLC (United Kingdom) | | | 6,000 | | | | 52,446 | |
| | | | | | | | |
TOTAL LONG-TERM INVESTMENTS
(cost $4,837,543) | | | | | | | 4,941,892 | |
| | | | | | | | |
See Notes to Financial Statements.
| | | | | | | | |
| | | Shares | | | Value (Note 1) | |
SHORT-TERM INVESTMENT 4.9% | | | | | | | | |
| | |
AFFILIATED MONEY MARKET MUTUAL FUND | | | | | | | | |
Prudential Investment Portfolios 2 - Prudential Core Taxable Money Market Fund
(cost $255,973) (Note 3)(a) | | | 255,973 | | | $ | 255,973 | |
| | | | | | | | |
TOTAL INVESTMENTS 99.9%
(cost $5,093,516; Note 5) | | | | | | | 5,197,865 | |
Other assets in excess of liabilities 0.1% | | | | | | | 4,974 | |
| | | | | | | | |
NET ASSETS 100.0% | | | | | | $ | 5,202,839 | |
| | | | | | | | |
The following abbreviation is used in the portfolio descriptions:
REIT—Real Estate Investment Trust
| * | Non-income producing security. |
| (a) | Prudential Investments LLC, the manager of the Fund, also serves as manager of the Prudential Investment Portfolios 2 - Prudential Core Taxable Money Market Fund. |
Various inputs are used in determining the value of the Fund’s investments. These inputs are summarized in the three broad levels listed below.
Level 1—quoted prices generally in active markets for identical securities.
Level 2—quoted prices for similar securities, interest rates and yield curves, prepayment speeds, foreign currency exchange rates, and other significant observable inputs.
Level 3—significant unobservable inputs for securities valued in accordance with Board approved fair valuation procedures.
The following is a summary of the inputs used as of October 31, 2014 in valuing such portfolio securities:
| | | | | | | | | | | | |
| | | Level 1 | | | Level 2 | | | Level 3 | |
Investments in Securities | | | | | | | | | | | | |
Common Stocks | | | | | | | | | | | | |
Diversified Real Estate Activities | | $ | 47,819 | | | $ | 733,824 | | | $ | — | |
Diversified REITs | | | 757,499 | | | | 147,128 | | | | — | |
Health Care REITs | | | 113,976 | | | | — | | | | — | |
Hotel & Resort REITs | | | 390,507 | | | | — | | | | — | |
Hotels, Resorts & Cruise Lines | | | 333,084 | | | | — | | | | — | |
Industrial REITs | | | 274,945 | | | | 50,535 | | | | — | |
See Notes to Financial Statements.
| | | | |
| Prudential Select Real Estate Fund | | | 11 | |
Portfolio of Investments
as of October 31, 2014 continued
| | | | | | | | | | | | |
| | | Level 1 | | | Level 2 | | | Level 3 | |
Common Stocks (continued): | | | | | | | | | | | | |
Office REITs | | $ | 593,953 | | | $ | 281,021 | | | $ | — | |
Real Estate Operating Companies | | | 201,085 | | | | — | | | | — | |
Residential REITs | | | 332,065 | | | | — | | | | — | |
Retail REITs | | | 505,137 | | | | 126,868 | | | | — | |
Specialized REITs | | | — | | | | 52,446 | | | | — | |
Affiliated Money Market Mutual Fund | | | 255,973 | | | | — | | | | — | |
| | | | | | | | | | | | |
Total | | $ | 3,806,043 | | | $ | 1,391,822 | | | $ | — | |
| | | | | | | | | | | | |
The industry classification of investments and other assets in excess of liabilities shown as a percentage of net assets as of October 31, 2014 was as follows (Unaudited):
| | | | |
Diversified REITs | | | 17.4 | % |
Office REITs | | | 16.8 | |
Diversified Real Estate Activities | | | 15.0 | |
Retail REITs | | | 12.1 | |
Hotel & Resort REITs | | | 7.5 | |
Hotels, Resorts & Cruise Lines | | | 6.4 | |
Residential REITs | | | 6.4 | |
Industrial REITs | | | 6.3 | |
Affiliated Money Market Mutual Fund | | | 4.9 | % |
Real Estate Operating Companies | | | 3.9 | |
Health Care REITs | | | 2.2 | |
Specialized REITs | | | 1.0 | |
| | | | |
| | | 99.9 | |
Other assets in excess of liabilities | | | 0.1 | |
| | | | |
| | | 100.0 | % |
| | | | |
See Notes to Financial Statements.
PRUDENTIAL INVESTMENTS»MUTUAL FUNDS
FINANCIAL STATEMENTS
ANNUAL REPORT · OCTOBER 31, 2014
Prudential Select Real Estate Fund
Statement of Assets & Liabilities
as of October 31, 2014
| | | | |
Assets | | | | |
Investments at value: | | | | |
Unaffiliated investments (cost $4,837,543) | | $ | 4,941,892 | |
Affiliated investments (cost $255,973) | | | 255,973 | |
Due from Manager | | | 54,840 | |
Receivable for investments sold | | | 51,289 | |
Dividends receivable | | | 5,294 | |
Tax reclaim receivable | | | 94 | |
Prepaid expenses | | | 603 | |
| | | | |
Total assets | | | 5,309,985 | |
| | | | |
| |
Liabilities | | | | |
Accrued expenses and other liabilities | | | 84,406 | |
Payable for investments purchased | | | 22,704 | |
Affiliated transfer agent fee payable | | | 24 | |
Distribution fee payable | | | 12 | |
| | | | |
Total liabilities | | | 107,146 | |
| | | | |
| |
Net Assets | | $ | 5,202,839 | |
| | | | |
| | | | | |
Net assets were comprised of: | | | | |
Shares of beneficial interest, at par | | $ | 5,047 | |
Paid-in capital in excess of par | | | 5,037,502 | |
| | | | |
| | | 5,042,549 | |
Undistributed net investment income | | | 13,975 | |
Accumulated net realized gain on investment and foreign currency transactions | | | 41,979 | |
Net unrealized appreciation on investments and foreign currencies | | | 104,336 | |
| | | | |
Net assets, October 31, 2014 | | $ | 5,202,839 | |
| | | | |
See Notes to Financial Statements.
| | | | |
Class A | | | | |
Net Asset value and redemption price per share, ($17,666 ÷ 1,715 shares of common stock issued and outstanding) | | $ | 10.30 | |
Maximum sales charge (5.50% of offering price) | | | 0.61 | |
| | | | |
Maximum offering price to public | | $ | 10.91 | |
| | | | |
| |
Class C | | | | |
Net asset value, offering price and redemption price per share, ($10,283 ÷ 1,000 shares of common stock issued and outstanding) | | $ | 10.28 | |
| | | | |
| |
Class Q | | | | |
Net asset value, offering price and redemption price per share, ($5,164,581 ÷ 501,000 shares of common stock issued and outstanding) | | $ | 10.31 | |
| | | | |
| |
Class Z | | | | |
Net asset value, offering price and redemption price per share, ($10,309 ÷ 1,000 shares of common stock issued and outstanding) | | $ | 10.31 | |
| | | | |
See Notes to Financial Statements.
| | | | |
| Prudential Select Real Estate Fund | | | 15 | |
Statement of Operations
Period from August 1, 2014* to October 31, 2014
| | | | |
Net Investment Income | | | | |
Income | | | | |
Unaffiliated dividend income (net of foreign withholding taxes of $454) | | $ | 23,156 | |
Affiliated dividend income | | | 211 | |
| | | | |
Total income | | | 23,367 | |
| | | | |
| |
Expenses | | | | |
Management fee | | | 12,015 | |
Distribution fee—Class A | | | 11 | |
Distribution fee—Class C | | | 25 | |
Registration fees | | | 62,000 | |
Legal fees and expenses | | | 25,000 | |
Audit fee | | | 25,000 | |
Reports to shareholders | | | 23,000 | |
Custodian’s fees and expenses | | | 21,000 | |
Directors’ fees | | | 4,000 | |
Transfer agent’s fees and expenses (including affiliated expense of $43) | | | 500 | |
Miscellaneous | | | 5,843 | |
| | | | |
Total expenses | | | 178,394 | |
Less: Management fee waiver and/or expense reimbursements | | | (164,444 | ) |
Distribution fee waiver—Class A | | | (2 | ) |
| | | | |
Net expenses | | | 13,948 | |
| | | | |
Net investment income | | | 9,419 | |
| | | | |
| |
Realized and Unrealized Gain (Loss) on Investments and Foreign Currencies | | | | |
Net realized gain on: | | | | |
Investment transactions | | | 41,979 | |
Foreign currency transactions | | | 19 | |
| | | | |
| | | 41,998 | |
| | | | |
Net change in unrealized appreciation (depreciation) on: | | | | |
Investments | | | 104,349 | |
Foreign currencies | | | (13 | ) |
| | | | |
| | | 104,336 | |
| | | | |
Net gain on investments and foreign currencies | | | 146,334 | |
| | | | |
Net Increase In Net Assets Resulting From Operations | | $ | 155,753 | |
| | | | |
| * | Commencement of Operations. |
See Notes to Financial Statements.
Statement of Changes in Net Assets
| | | | |
| | | Period from
August 1, 2014* to
October 31, 2014 | |
Increase in Net Assets | | | | |
Operations | | | | |
Net investment income | | $ | 9,419 | |
Net realized gain on investment and foreign currency transactions | | | 41,998 | |
Net change in unrealized appreciation on investments and foreign currencies | | | 104,336 | |
| | | | |
Net increase in net assets resulting from operations | | | 155,753 | |
| | | | |
| |
Fund share transactions (Note 6) | | | | |
Net proceeds from shares sold | | | 5,047,086 | |
| | | | |
Net increase in net assets from Fund share transactions | | | 5,047,086 | |
| | | | |
Total increase | | | 5,202,839 | |
| |
Net Assets: | | | | |
Beginning of period | | | — | |
| | | | |
End of period(a) | | $ | 5,202,839 | |
| | | | |
(a) Includes undistributed net investment income of: | | $ | 13,975 | |
| | | | |
| * | Commencement of operations. |
See Notes to Financial Statements.
| | | | |
| Prudential Select Real Estate Fund | | | 17 | |
Notes to Financial Statements
Prudential Investment Portfolios 9 (the “Trust”) is an open-end management investment company, registered under the Investment Company Act of 1940, as amended, (“1940 Act”). The Trust currently consists of four portfolios: Prudential Select Real Estate (the “Fund”), Prudential International Real Estate Fund, Prudential Large-Cap Core Equity Fund and Prudential Absolute Return Bond Fund. These financial statements relate only to Prudential Select Real Estate Fund. The financial statements of the other portfolios are not presented herein. The Trust was organized as a Delaware business trust on September 18, 1998. The Fund commenced operations on August 1, 2014. The Fund’s investment objective is to seek capital appreciation and income.
Note 1. Accounting Policies
The following accounting policies conform to U.S. generally accepted accounting principles. The Fund consistently follows such policies in the preparation of its financial statements.
Securities Valuation: The Fund holds securities and other assets that are fair valued at the close of each day the New York Stock Exchange (“NYSE”) is open for trading. Fair value is the price that would be received to sell an asset or paid to transfer a liability in an orderly transaction between market participants on the measurement date. The Board of Trustees (the “Board”) has adopted Valuation Procedures for security valuation under which fair valuation responsibilities have been delegated to Prudential Investments LLC (“PI” or “Manager”). Under the current Valuation Procedures, the established Valuation Committee is responsible for supervising the valuation of portfolio securities and other assets. The Valuation Procedures permit the Fund to utilize independent pricing vendor services, quotations from market makers, and alternative valuation methods when market quotations are either not readily available or not deemed representative of fair value. A record of the Valuation Committee’s actions is subject to the Board’s review, approval, and ratification at its next regularly-scheduled quarterly meeting.
Various inputs determine how the Fund’s investments are valued, all of which are categorized according to the three broad levels (Level 1, 2, or 3) detailed in the table following the Portfolio of Investments.
Common and preferred stocks, exchange-traded funds, and derivative instruments such as futures or options that are traded on a national securities exchange are valued
at the last sale price as of the close of trading on the applicable exchange. Securities traded via NASDAQ are valued at the NASDAQ official closing price. To the extent these securities are valued at the last sale price or NASDAQ official closing price, they are classified as Level 1 in the fair value hierarchy.
In the event that no sale or official closing price on valuation date exists, these securities are generally valued at the mean between the last reported bid and asked prices, or at the last bid price in the absence of an asked price. These securities are classified as Level 2 in the fair value hierarchy, as the inputs are observable and considered to be significant to the valuation.
Common and preferred stocks traded on foreign securities exchanges are valued using pricing vendor services that provide model prices derived using adjustment factors based on information such as local closing price, relevant general and sector indices, currency fluctuations, depositary receipts, and futures, as applicable. Securities valued using such model prices are classified as Level 2 in the fair value hierarchy, as the adjustment factors are observable and considered to be significant to the valuation. Securities not valued using such model prices are valued in accordance with exchange-traded common and preferred stocks discussed above.
Investments in open-end, non-exchange-traded mutual funds are valued at their net asset values as of the close of the NYSE on the date of valuation. These securities are classified as Level 1 in the fair value hierarchy since they may be purchased or sold at their net asset values on the date of valuation.
Fixed income securities traded in the over-the-counter market are generally valued at prices provided by approved independent pricing vendors. The pricing vendors provide these prices after evaluating observable inputs including, but not limited to yield curves, yield spreads, credit ratings, deal terms, tranche level attributes, default rates, cash flows, prepayment speeds, broker/dealer quotations, and reported trades. Securities valued using such vendor prices are classified as Level 2 in the fair value hierarchy.
Over-the-counter derivative instruments are generally valued using pricing vendor services, which derive the valuation based on inputs such as underlying asset prices, indices, spreads, interest rates, and exchange rates. These instruments are categorized as Level 2 in the fair value hierarchy.
Centrally cleared swaps listed or traded on a multilateral or trade facility platform, such as a registered exchange, are valued at the daily settlement price determined by the respective exchange. These securities are classified as Level 2 in the fair value hierarchy, as the prices marked at the official settle are not public.
| | | | |
| Prudential Select Real Estate Fund | | | 19 | |
Notes to Financial Statements
continued
Securities and other assets that cannot be priced according to the methods described above are valued based on pricing methodologies approved by the Board. In the event that significant unobservable inputs are used when determining such valuations, the securities will be classified as Level 3 in the fair value hierarchy.
When determining the fair value of securities, some of the factors influencing the valuation include: the nature of any restrictions on disposition of the securities; assessment of the general liquidity of the securities; the issuer’s financial condition and the markets in which it does business; the cost of the investment; the size of the holding and the capitalization of the issuer; the prices of any recent transactions or bids/offers for such securities or any comparable securities; any available analyst media or other reports or information deemed reliable by the investment adviser regarding the issuer or the markets or industry in which it operates. Using fair value to price securities may result in a value that is different from a security’s most recent closing price and from the price used by other mutual funds to calculate their net asset values.
Foreign Currency Translation: The books and records of the Fund are maintained in U.S. dollars. Foreign currency amounts are translated into U.S. dollars on the following basis:
(i) market value of investment securities, other assets and liabilities-at the current daily rates of exchange.
(ii) purchases and sales of investment securities, income and expenses-at the rates of exchange prevailing on the respective dates of such transactions.
Although the net assets of the Fund are presented at the foreign exchange rates and market values at the close of the period, the Fund does not isolate that portion of the results of operations arising as a result of changes in the foreign exchange rates from the fluctuations arising from changes in the market prices of long-term portfolio securities held at the end of the period. Similarly, the Fund does not isolate the effect of changes in foreign exchange rates from the fluctuations arising from changes in the market prices of long-term portfolio securities sold during the period. Accordingly, these realized foreign currency gains or losses are included in the reported net realized gains or losses on investment transactions.
Net realized gains or losses on foreign currency transactions represent net foreign exchange gains or losses from holdings of foreign currencies, forward currency
contracts, disposition of foreign currencies, currency gains or losses realized between the trade and settlement dates on securities transactions, and the difference between the amounts of interest, dividends and foreign withholding taxes recorded on the Fund’s books and the U.S. dollar equivalent amounts actually received or paid. Net unrealized currency gains or losses from valuing foreign currency denominated assets and liabilities (other than investments) at period end exchange rates are reflected as a component of net unrealized appreciation (depreciation) on foreign currencies.
Concentration of Risk: Foreign security and currency transactions may involve certain considerations and risks not typically associated with those of domestic origin as a result of, among other factors, the possibility of political and economic instability and the level of governmental supervision and regulation of foreign securities markets.
Securities Transactions and Net Investment Income: Securities transactions are recorded on the trade date. Realized gains or losses from investment and currency transactions are calculated on the identified cost basis. Dividend income is recorded on the ex-dividend date. Interest income, including amortization of premium and accretion of discount on debt securities, as required, is recorded on the accrual basis.
Expenses are recorded on an accrual basis, which may require the use of certain estimates by management, that may differ from actual.
Net investment income or loss (other than distribution fees which are charged directly to the respective class and transfer agency fees specific to Class Q shares which are charged to that share class) and unrealized and realized gains or losses are allocated daily to each class of shares based upon the relative proportion of adjusted net assets of each class at the beginning of the day.
The Fund invests in real estate investment trusts (“REITs”), which report information on the source of their distributions annually. Based on current and historical information, a portion of distributions received from REITs during the year is estimated to be dividend income, capital gain or return of capital and is recorded accordingly. These estimates are adjusted when the actual source of distributions is disclosed by the REITs.
Dividends and Distributions: The Fund expects to pay dividends of net investment income and distributions of net realized capital and currency gains, if any, annually. Dividends and distributions to shareholders, which are determined in accordance with federal income tax regulations and which may differ from generally accepted accounting principles, are recorded on the ex-dividend date. Permanent book/tax differences relating to income and gains are reclassified amongst undistributed net
| | | | |
| Prudential Select Real Estate Fund | | | 21 | |
Notes to Financial Statements
continued
investment income, accumulated net realized gain or loss and paid-in capital in excess of par as appropriate.
Taxes: For federal income tax purposes, the Fund is treated as a separate taxpaying entity. It is the Fund’s policy to meet the requirements of the Internal Revenue Code applicable to regulated investment companies and to distribute all of its taxable net investment income and capital gains, if any, to its shareholders. Therefore, no federal income tax provision is required. Withholding taxes on foreign dividends are recorded, net of reclaimable amounts, at the time the related income is earned.
Estimates: The preparation of the financial statements requires management to make estimates and assumptions that affect the reported amounts and disclosures in the financial statements. Actual results could differ from those estimates.
Note 2. Agreements
The Fund has a management agreement with PI. Pursuant to this agreement, PI manages the investment operations of the Fund, administers the Fund’s affairs and supervises the Subadviser’s performance of all investment advisory services. PI has entered into a subadvisory agreement with Prudential Real Estate Investors (“PREI”), which is a business unit of Prudential Investment Management, Inc. (“PIM”). The subadvisory agreement provides that PREI will furnish investment advisory services in connection with the management of the Fund. In connection therewith, PREI is obligated to keep certain books and records of the Fund. Pursuant to the advisory agreement, PI pays for the services of PREI, the cost of compensation of officers of the Fund, occupancy and certain clerical and accounting costs of the Fund. The Fund bears all other costs and expenses.
The management fee paid to PI is accrued daily and payable monthly at an annual rate of 0.95% of the Fund’s average daily net assets.
PI has contractually agreed through February 29, 2016 to limit net annual Fund operating expenses (exclusive of distribution and service (12b-1) fees, extraordinary and certain other expenses, such as taxes, interest and brokerage commissions) of each class of shares to 1.10% of the Fund’s average daily net assets.
The Fund has a distribution agreement with Prudential Investment Management Services LLC (“PIMS”), which acts as the distributor of the Class A, C, Q and Z shares
of the Fund. The Fund compensates PIMS for distributing and servicing the Fund’s Class A and C shares, pursuant to plans of distribution (the “Distribution Plans”), regardless of expenses actually incurred by PIMS. The distribution fees are accrued daily and payable monthly. No distribution or service fees are paid to PIMS as distributor of the Class Q or Class Z shares of the Fund.
Pursuant to the Distribution Plans, the Fund compensates PIMS for distribution related activities at an annual rate of up to .30% and 1% of the average daily net assets of the Class A and C shares, respectively. PIMS has contractually agreed through February 29, 2016 to limit such fees to .25% of the average daily net assets of the Class A shares.
PIMS has advised the Fund that it has received $414 in front-end sales charges resulting from sales of Class A shares, during the period ended October 31, 2014. From these fees, PIMS paid such sales charges to affiliated broker-dealers, which in turn paid commissions to salespersons and incurred other distribution costs.
PIMS has advised the Fund that for the period ended October 31, 2014, there were no contingent deferred sales charges imposed.
PI, PIM and PIMS are indirect, wholly-owned subsidiaries of Prudential Financial, Inc. (“Prudential”).
Note 3. Other Transactions with Affiliates
Prudential Mutual Fund Services LLC (“PMFS”), an affiliate of PI and an indirect, wholly-owned subsidiary of Prudential, serves as the Fund’s transfer agent. Transfer agent fees and expenses in the Statement of Operations include certain out-of-pocket expenses paid to non-affiliates, where applicable.
The Fund invests in the Prudential Core Taxable Money Market Fund (the “Core Fund”), a portfolio of the Prudential Investment Portfolios 2, registered under the 1940 Act, and managed by PI. Earnings from the Core Fund are disclosed on the Statement of Operations as affiliated dividend income.
Note 4. Portfolio Securities
Purchases and sales of portfolio securities, other than short-term investments, for the period ended October 31, 2014, were $5,648,491 and $842,680, respectively.
| | | | |
| Prudential Select Real Estate Fund | | | 23 | |
Notes to Financial Statements
continued
Note 5. Tax Information
Distributions to shareholders, which are determined in accordance with federal income tax regulations and which may differ from generally accepted accounting principles, are recorded on the ex-dividend date. In order to present undistributed net investment income, accumulated net realized gain on investment and foreign currency transactions and paid-in capital in excess of par on the Statement of Assets and Liabilities that more closely represent their tax character, certain adjustments have been made to undistributed net investment income, accumulated net realized gain on investment and foreign currency transactions and paid-in capital in excess of par. For the period ended October 31, 2014, the adjustments were to increase undistributed net investment income by $4,556, decrease accumulated net realized gain on investment and foreign currency transactions by $19 and decrease paid-in capital in excess of par by $4,537 due to differences in the treatment for book and tax purposes of certain transactions involving foreign currencies and other book to tax differences. Net investment income, net realized gain on investment transactions and net assets were not affected by this change.
For the period ended October 31, 2014, there were no dividends paid by the Fund.
As of October 31, 2014, the accumulated undistributed earnings on a tax basis were $55,046 of ordinary income and $3,282 of long-term capital gains. This differs from the amount shown on the Statement of Assets and Liabilities primarily due to cumulative timing differences between financial and tax reporting.
The United States federal income tax basis of the Fund’s investments and the net unrealized appreciation as of October 31, 2014 were as follows:
| | | | | | | | | | |
Tax Basis | | Appreciation | | Depreciation | | Net
Unrealized
Appreciation | | Other Cost
Basis
Adjustments | | Total Net
Unrealized
Appreciation |
| $5,095,890 | | $167,741 | | $(65,766) | | $101,975 | | $(13) | | $101,962 |
The difference between book basis and tax basis is primarily attributable to deferred losses on wash sales and investments in passive foreign investment companies. The other cost basis adjustments are primarily attributable to appreciation (depreciation) of foreign currencies and mark-to-market of receivables and payables.
Management has analyzed the Fund’s tax positions and has concluded that as of October 31, 2014, no provision for income tax is required in the Fund’s financial statements for the current reporting period.
Note 6. Capital
The Fund offers Class A, Class C, Class Q and Class Z shares. Class A shares are subject to a maximum front-end sales charge of up to 5.50%. Investors who purchase Class A shares in an amount of $1 million or more and sell these shares within 12 months of purchase are not subject to an initial sales charge, but are subject to a contingent deferred sales charge (“CDSC”) of 1%. The Class A CDSC is waived for purchases by certain retirement or benefit plans. Class C shares are sold with a CDSC of 1% on shares redeemed within the first 12 months after purchase. A special exchange privilege is also available for shareholders who qualified to purchase Class A shares at net asset value. Class Q and Class Z shares are not subject to any sales or redemption charge and are offered exclusively for sale to a limited group of investors.
Under certain circumstances, an exchange may be made from specified share classes of the Fund to one or more other share classes of the Fund as presented in the table of transactions in shares of beneficial interest.
The Trust has authorized an unlimited number of shares of beneficial interest at $.001 par value per share.
As of October 31, 2014, Prudential owned 1,000 Class A shares, 1,000 Class C shares, 501,000 Class Q shares and 1,000 Class Z shares of the Fund.
Transactions in shares of beneficial interest were as follows:
| | | | | | | | |
Class A | | Shares | | | Amount | |
Period ended October 31, 2014*: | | | | | | | | |
Shares sold | | | 1,715 | | | $ | 17,086 | |
Shares issued in reinvestment of dividends and distributions | | | — | | | | — | |
Shares reacquired | | | — | | | | — | |
| | | | | | | | |
Net increase (decrease) in shares outstanding | | | 1,715 | | | $ | 17,086 | |
| | | | | | | | |
Class C | | | | | | |
Period ended October 31, 2014*: | | | | | | | | |
Shares sold | | | 1,000 | | | $ | 10,000 | |
Shares issued in reinvestment of dividends and distributions | | | — | | | | — | |
Shares reacquired | | | — | | | | — | |
| | | | | | | | |
Net increase (decrease) in shares outstanding | | | 1,000 | | | $ | 10,000 | |
| | | | | | | | |
| | | | |
| Prudential Select Real Estate Fund | | | 25 | |
Notes to Financial Statements
continued
| | | | | | | | |
Class Q | | Shares | | | Amount | |
Period ended October 31, 2014*: | | | | | | | | |
Shares sold | | | 501,000 | | | $ | 5,010,000 | |
Shares issued in reinvestment of dividends and distributions | | | — | | | | — | |
Shares reacquired | | | — | | | | — | |
| | | | | | | | |
Net increase (decrease) in shares outstanding | | | 501,000 | | | $ | 5,010,000 | |
| | | | | | | | |
Class Z | | | | | | |
Period ended October 31, 2014*: | | | | | | | | |
Shares sold | | | 1,000 | | | $ | 10,000 | |
Shares issued in reinvestment of dividends and distributions | | | — | | | | — | |
Shares reacquired | | | — | | | | — | |
| | | | | | | | |
Net increase (decrease) in shares outstanding | | | 1,000 | | | $ | 10,000 | |
| | | | | | | | |
| * | Commencement of operations was August 1, 2014. |
Note 7. Borrowings
The Fund, along with other affiliated registered investment companies (the “Funds”), is a party to a Syndicated Credit Agreement (“SCA”) with a group of banks. The purpose of the SCA is to provide an alternative source of temporary funding for capital share redemptions. The SCA provides for a commitment of $900 million for the period October 9, 2014 through October 8, 2015. The Funds pay an annualized commitment fee of .075% of the unused portion of the SCA. Prior to October 9, 2014, the Funds had another SCA that provided a commitment of $900 million and the Funds paid an annualized commitment fee of .08% of the unused portion of the SCA. Interest on any borrowings under the SCA is paid at contracted market rates. The commitment fee for the unused amount is accrued daily and paid quarterly.
The Fund did not utilize the SCA during the period ended October 31, 2014.
Financial Highlights
| | | | |
| Class A Shares | |
| | | August 1, 2014(b)
through October 31, 2014(c) | |
| Per Share Operating Performance: | | | | |
| Net Asset Value, Beginning of Period | | | $10.00 | |
| Income (loss) from investment operations: | | | | |
| Net investment income | | | .01 | |
| Net realized and unrealized gain on investments | | | .29 | |
| Total from investment operations | | | .30 | |
| Net asset value, end of period | | | $10.30 | |
| Total Return(a): | | | 3.00% | |
| | | | |
| Ratios/Supplemental Data: | |
| Net assets, end of period (000) | | | $18 | |
| Average net assets (000) | | | $15 | |
| Ratios to average net assets(d): | | | | |
| Expenses after waivers and/or expense reimbursement | | | 1.35% | (e) |
| Expenses before waivers and/or expense reimbursement | | | 20.58% | (e) |
| Net investment income | | | .46% | (e) |
| Portfolio turnover rate | | | 18% | (f) |
(a) Total return does not consider the effect of sales load. Total return is calculated assuming a purchase of a share on the first day and a sale on the last day of each period reported and includes reinvestment of dividends and distributions. Total returns may reflect adjustments to conform to generally accepted accounting principles. Total returns for periods less than one full year are not annualized.
(b) Commencement of operations.
(c) Calculated based on the average shares outstanding during the period.
(d) Does not include expenses of the underlying portfolio in which the Fund invests.
(e) Annualized.
(f) Not annualized.
See Notes to Financial Statements.
| | | | |
| Prudential Select Real Estate Fund | | | 27 | |
Financial Highlights
continued
| | | | |
| Class C Shares | | | |
| | | August 1, 2014(b)
through
October 31, 2014(c) | |
| Per Share Operating Performance: | | | | |
| Net Asset Value, Beginning of Period | | | $10.00 | |
| Income (loss) from investment operations: | | | | |
| Net investment loss | | | (.01) | |
| Net realized and unrealized gain on investments | | | .29 | |
| Total from investment operations | | | .28 | |
| Net asset value, end of period | | | $10.28 | |
| Total Return(a): | | | 2.80% | |
| | | | |
| Ratios/Supplemental Data: | |
| Net assets, end of period (000) | | | $10 | |
| Average net assets (000) | | | $10 | |
| Ratios to average net assets(d): | | | | |
| Expenses after waivers and/or expense reimbursement | | | 2.10% | (e) |
| Expenses before waivers and/or expense reimbursement | | | 20.42% | (e) |
| Net investment loss | | | (.26)% | (e) |
| Portfolio turnover rate | | | 18% | (f) |
(a) Total return does not consider the effect of sales load. Total return is calculated assuming a purchase of a share on the first day and a sale on the last day of each period reported and includes reinvestment of dividends and distributions. Total returns may reflect adjustments to conform to generally accepted accounting principles. Total returns for periods less than one full year are not annualized.
(b) Commencement of operations.
(c) Calculated based on the average shares outstanding during the period.
(d) Does not include expenses of the underlying portfolio in which the Fund invests.
(e) Annualized.
(f) Not annualized.
See Notes to Financial Statements.
| | | | |
| Class Q Shares | | | |
| | | August 1, 2014(b)
through
October 31, 2014(c) | |
| Per Share Operating Performance: | | | | |
| Net Asset Value, Beginning of Period | | | $10.00 | |
| Income (loss) from investment operations: | | | | |
| Net investment income | | | .02 | |
| Net realized and unrealized gain on investments | | | .29 | |
| Total from investment operations | | | .31 | |
| Net asset value, end of period | | | $10.31 | |
| Total Return(a): | | | 3.10% | |
| | | | |
| Ratios/Supplemental Data: | |
| Net assets, end of period (000) | | | $5,165 | |
| Average net assets (000) | | | $4,983 | |
| Ratios to average net assets(d): | | | | |
| Expenses after waivers and/or expense reimbursement | | | 1.10% | (e) |
| Expenses before waivers and/or expense reimbursement | | | 14.06% | (e) |
| Net investment income | | | .75% | (e) |
| Portfolio turnover rate | | | 18% | (f) |
(a) Total return is calculated assuming a purchase of a share on the first day and a sale on the last day of each period reported and includes reinvestment of dividends and distributions. Total returns may reflect adjustments to conform to generally accepted accounting principles. Total returns for periods less than one full year are not annualized.
(b) Commencement of operations.
(c) Calculated based on the average shares outstanding during the period.
(d) Does not include expenses of the underlying portfolio in which the Fund invests.
(e) Annualized.
(f) Not annualized.
See Notes to Financial Statements.
| | | | |
| Prudential Select Real Estate Fund | | | 29 | |
Financial Highlights
continued
| | | | |
| Class Z Shares | |
| | | August 1, 2014(b)
through
October 31, 2014(c) | |
| Per Share Operating Performance: | | | | |
| Net Asset Value, Beginning of Period | | | $10.00 | |
| Income (loss) from investment operations: | | | | |
| Net investment income | | | .02 | |
| Net realized and unrealized gain on investments | | | .29 | |
| Total from investment operations | | | .31 | |
| Net asset value, end of period | | | $10.31 | |
| Total Return(a): | | | 3.10% | |
| | | | |
| Ratios/Supplemental Data: | |
| Net assets, end of period (000) | | | $10 | |
| Average net assets (000) | | | $10 | |
| Ratios to average net assets(d): | | | | |
| Expenses after waivers and/or expense reimbursement | | | 1.10% | (e) |
| Expenses before waivers and/or expense reimbursement | | | 19.50% | (e) |
| Net investment income | | | .77% | (e) |
| Portfolio turnover rate | | | 18% | (f) |
(a) Total return is calculated assuming a purchase of a share on the first day and a sale on the last day of each period reported and includes reinvestment of dividends and distributions. Total returns may reflect adjustments to conform to generally accepted accounting principles. Total returns for periods less than one full year are not annualized.
(b) Commencement of operations.
(c) Calculated based on the average shares outstanding during the period.
(d) Does not include expenses of the underlying portfolio in which the Fund invests.
(e) Annualized.
(f) Not annualized.
See Notes to Financial Statements.
Report of Independent Registered Public
Accounting Firm
The Board of Trustees and Shareholders
Prudential Investment Portfolios 9:
We have audited the accompanying statement of assets and liabilities of Prudential Select Real Estate Fund, a series of Prudential Investment Portfolios 9, (hereafter referred to as the “Fund”), including the portfolio of investments, as of October 31, 2014, and the related statement of operations, the statement of changes in net assets and the financial highlights for the period August 1, 2014 (commencement of operations) to October 31, 2014. These financial statements and financial highlights are the responsibility of the Fund’s management. Our responsibility is to express an opinion on these financial statements and financial highlights based on our audit.
We conducted our audits in accordance with the standards of the Public Company Accounting Oversight Board (United States). Those standards require that we plan and perform the audit to obtain reasonable assurance about whether the financial statements and financial highlights are free of material misstatement. An audit includes examining, on a test basis, evidence supporting the amounts and disclosures in the financial statements. Our procedures included confirmation of securities owned as of October 31, 2014, by correspondence with the custodian, transfer agent and brokers or by other appropriate auditing procedures when replies from brokers were not received. An audit also includes assessing the accounting principles used and significant estimates made by management, as well as evaluating the overall financial statement presentation. We believe that our audit provides a reasonable basis for our opinion.
In our opinion, the financial statements and financial highlights referred to above present fairly, in all material respects, the financial position of the Fund as of October 31, 2014, and the results of its operations, the changes in its net assets and the financial highlights for the period August 1, 2014 (commencement of operations) to October 31, 2014, in conformity with U.S. generally accepted accounting principles.

New York, New York
December 16, 2014
| | | | |
| Prudential Select Real Estate Fund | | | 31 | |
INFORMATION ABOUT BOARD MEMBERS AND OFFICERS
(Unaudited)
Information about Board Members and Officers of the Fund is set forth below. Board Members who are not deemed to be “interested persons” of the Fund, as defined in the 1940 Act, are referred to as “Independent Board Members.” Board Members who are deemed to be “interested persons” of the Fund are referred to as “Interested Board Members.” The Board Members are responsible for the overall supervision of the operations of the Fund and perform the various duties imposed on the directors of investment companies by the 1940 Act. The Board in turn elects the Officers, who are responsible for administering the day-to-day operations of the Fund.
| | | | |
| Independent Board Members(1) |
| | | |
Name, Address, Age Position(s) Portfolios Overseen | | Principal Occupation(s) During Past Five Years | | Other Directorships Held |
Ellen S. Alberding (56) Board Member Portfolios Overseen: 69 | | President and Board Member, The Joyce Foundation (charitable foundation) (since 2002); Vice Chair, City Colleges of Chicago (community college system) (since 2011); Trustee, Skills for America’s Future (national initiative to connect employers to community colleges) (since 2011); Trustee, National Park Foundation (charitable foundation for national park system) (since 2009); Trustee, Economic Club of Chicago (since 2009). | | None. |
Kevin J. Bannon (62) Board Member Portfolios Overseen: 70 | | Managing Director (since April 2008) and Chief Investment Officer (October 2008-November 2013) of Highmount Capital LLC (registered investment adviser); formerly Executive Vice President and Chief Investment Officer (April 1993-August 2007) of Bank of New York Company; President (May 2003-May 2007) of BNY Hamilton Family of Mutual Funds. | | Director of Urstadt Biddle Properties (equity real estate investment trust) (since September 2008). |
Linda W. Bynoe (62) Board Member Portfolios Overseen: 70 | | President and Chief Executive Officer (since March 1995) and formerly Chief Operating Officer (December 1989-February 1995) of Telemat Ltd. (management consulting); formerly Vice President (January 1985-June 1989) at Morgan Stanley & Co (broker-dealer). | | Director of Simon Property Group, Inc. (retail real estate) (May 2003-May 2012); Director of Anixter International, Inc. (communication products distributor) (since January 2006); Director of Northern Trust Corporation (financial services) (since April 2006); Trustee of Equity Residential (residential real estate) (since December 2009). |
Prudential Select Real Estate Fund
| | | | |
| Independent Board Members(1) |
| | | |
Name, Address, Age Position(s) Portfolios Overseen | | Principal Occupation(s) During Past Five Years | | Other Directorships Held |
Keith F. Hartstein (58) Board Member Portfolios Overseen: 70 | | Retired; Formerly President and Chief Executive Officer (2005-2012), Senior Vice President (2004-2005), Senior Vice President of Sales and Marketing (1997-2004), and various executive management positions (1990-1997), John Hancock Funds, LLC (asset management); Chairman, Investment Company Institute’s Sales Force Marketing Committee (2003-2008). | | None. |
Michael S. Hyland, CFA (69) Board Member Portfolios Overseen: 69 | | Retired (since February 2005); Formerly Senior Managing Director (July 2001-February 2005) of Bear Stearns & Co, Inc.; Global Partner, INVESCO (1999-2001); Managing Director and President of Salomon Brothers Asset Management (1989-1999). | | None. |
Douglas H. McCorkindale (75) Board Member Portfolios Overseen: 69 | | Retired; Formerly Chairman (February 2001-June 2006), Chief Executive Officer (June 2000-July 2005), President (September 1997-July 2005) and Vice Chairman (March 1984-May 2000) of Gannett Co. Inc. (publishing and media). | | Director of Lockheed Martin Corp. (aerospace and defense) (since May 2001). |
Stephen P. Munn (72) Board Member Portfolios Overseen: 70 | | Lead Director (since 2007) and formerly Chairman (1993-2007) of Carlisle Companies Incorporated (manufacturer of industrial products). | | Lead Director (since 2007) of Carlisle Companies Incorporated (manufacturer of industrial products). |
James E. Quinn (62) Board Member Portfolios Overseen: 69 | | Retired; Formerly President (2003-2012) and Director (2003-2008), and Vice Chairman and Director (1998-2003), Tiffany & Company (jewelry retailing); Director, Mutual of America Capital Management Corporation (asset management) (since 1996); Director, Hofstra University (since 2008); Vice Chairman, Museum of the City of New York (since 1994). | | Director of Deckers Outdoor Corporation (footwear manufacturer) (since 2011). |
Richard A. Redeker (71) Board Member & Independent Chair Portfolios Overseen: 70 | | Retired Mutual Fund Senior Executive (44 years); Management Consultant; Director, Mutual Fund Directors Forum (since 2014); Independent Directors Council (organization of 2,800 Independent Mutual Fund Directors)-Executive Committee, Chair of Policy Steering Committee, Governing Council. | | None. |
Visit our website at www.prudentialfunds.com
| | | | |
| Independent Board Members(1) |
| | | |
Name, Address, Age Position(s) Portfolios Overseen | | Principal Occupation(s) During Past Five Years | | Other Directorships Held |
Robin B. Smith (75) Board Member Portfolios Overseen:70 | | Chairman of the Board (since January 2003) of Publishers Clearing House (direct marketing); Member of the Board of Directors of ADLPartner (marketing) (since December 2010); formerly Chairman and Chief Executive Officer (August 1996-January 2003) of Publishers Clearing House. | | Formerly Director of BellSouth Corporation (telecommunications) (1992-2006). |
Stephen G. Stoneburn (71) Board Member Portfolios Overseen: 70 | | Chairman, (since July 2011), President and Chief Executive Officer (since June 1996) of Quadrant Media Corp. (publishing company); formerly President (June 1995-June 1996) of Argus Integrated Media, Inc.; Senior Vice President and Managing Director (January 1993-1995) of Cowles Business Media; Senior Vice President of Fairchild Publications, Inc. (1975-1989). | | None. |
| | | | |
| Interested Board Members(1) |
| | | |
Name, Address, Age Position(s) Portfolios Overseen | | Principal Occupation(s) During Past Five Years | | Other Directorships Held |
Stuart S. Parker (52) Board Member & President Portfolios Overseen: 64 | | President of Prudential Investments LLC (since January 2012); Executive Vice President of Prudential Investment Management Services LLC (since December 2012); Executive Vice President of Jennison Associates LLC and Head of Retail Distribution of Prudential Investments LLC (June 2005-December 2011). | | None. |
Scott E. Benjamin (41) Board Member & Vice President Portfolios Overseen: 70 | | Executive Vice President (since June 2009) of Prudential Investments LLC; Executive Vice President (June 2009-June 2012) and Vice President (since June 2012) of Prudential Investment Management Services LLC; Executive Vice President (since September 2009) of AST Investment Services, Inc.; Senior Vice President of Product Development and Marketing, Prudential Investments (since February 2006); Vice President of Product Development and Product Management, Prudential Investments (2003-2006). | | None. |
Prudential Select Real Estate Fund
| | | | |
| Interested Board Members(1) |
| | | |
Name, Address, Age Position(s) Portfolios Overseen | | Principal Occupation(s) During Past Five Years | | Other Directorships Held |
Grace C. Torres* (55) Board Member Portfolios Overseen: 65 | | Retired; Formerly Treasurer and Principal Financial and Accounting Officer of the Prudential Investments Funds, Target Funds, Advanced Series Trust, Prudential Variable Contract Accounts and The Prudential Series Fund (1998-June 2014); Assistant Treasurer (March 1999-June 2014) and Senior Vice President (September 1999-June 2014) of Prudential Investments LLC; Assistant Treasurer (May 2003-June 2014) and Vice President (June 2005-June 2014) of AST Investment Services, Inc.; Senior Vice President and Assistant Treasurer (May 2003-June 2014) of Prudential Annuities Advisory Services, Inc. | | None. |
* Note: Prior to her retirement in 2014, Ms. Torres was employed by Prudential Investments LLC. Due to her prior employment, she is considered to be an “interested person” under the 1940 Act. Ms. Torres is a non-management Interested Board Member.
(1) The year that each individual joined the Fund’s Board is as follows:
Ellen S. Alberding, 2013; Linda W. Bynoe, 2005; Douglas H. McCorkindale, 1998; Richard A. Redeker, 1998; Robin B. Smith, 1998; Stephen G. Stoneburn, 2003; Kevin J. Bannon, 2008; Keith F. Hartstein, 2013; Michael S. Hyland, 2008; Stephen P. Munn, 2008; James E. Quinn, 2013; Stuart S. Parker, Board Member since 2012 and President since 2012; Scott E. Benjamin, Board Member since 2010 and Vice President since 2009; Grace C. Torres, 2014.
| | | | |
| Fund Officers(a) |
| | | |
Name, Address and Age Position with Fund | | Principal Occupation(s) During Past Five Years | | Length of Service as Fund Officer |
Raymond A. O’Hara (59) Chief Legal Officer | | Vice President and Corporate Counsel (since July 2010) of Prudential Insurance Company of America (Prudential); Vice President (March 2011-Present) of Pruco Life Insurance Company and Pruco Life Insurance Company of New Jersey; Vice President and Corporate Counsel (March 2011-Present) of Prudential Annuities Life Assurance Corporation; Chief Legal Officer of Prudential Investments LLC (since June 2012); Chief Legal Officer of Prudential Mutual Fund Services LLC (since June 2012) and Corporate Counsel of AST Investment Services, Inc. (since June 2012); formerly Assistant Vice President and Corporate Counsel (September 2008-July 2010) of The Hartford Financial Services Group, Inc.; formerly Associate (September 1980-December 1987) and Partner (January 1988–August 2008) of Blazzard & Hasenauer, P.C. (formerly, Blazzard, Grodd & Hasenauer, P.C.). | | Since 2012 |
Visit our website at www.prudentialfunds.com
| | | | |
| Fund Officers(a) |
| | | |
Name, Address and Age Position with Fund | | Principal Occupation(s) During Past Five Years | | Length of Service as Fund Officer |
Chad A. Earnst (39) Chief Compliance Officer | | Chief Compliance Officer (September 2014-Present) of Prudential Investments LLC; Chief Compliance Officer (September 2014-Present) of the Prudential Investments Funds, Target Funds, Advanced Series Trust, The Prudential Series Fund, Prudential’s Gibraltar Fund, Inc., Prudential Global Short Duration High Yield Income Fund, Inc., Prudential Short Duration High Yield Fund, Inc. and Prudential Jennison MLP Income Fund, Inc.; formerly Assistant Director (March 2010-August 2014) of the Asset Management Unit, Division of Enforcement, US Securities & Exchange Commission; Assistant Regional Director (January 2010-August 2014), Branch Chief (June 2006–December 2009) and Senior Counsel (April 2003-May 2006) of the Miami Regional Office, Division of Enforcement, US Securities & Exchange Commission. | | Since 2014 |
Deborah A. Docs (56) Secretary | | Vice President and Corporate Counsel (since January 2001) of Prudential; Vice President (since December 1996) and Assistant Secretary (since March 1999) of Prudential Investments LLC; formerly Vice President and Assistant Secretary (May 2003-June 2005) of AST Investment Services, Inc. | | Since 2004 |
Jonathan D. Shain (56) Assistant Secretary | | Vice President and Corporate Counsel (since August 1998) of Prudential; Vice President and Assistant Secretary (since May 2001) of Prudential Investments LLC; Vice President and Assistant Secretary (since February 2001) of Prudential Mutual Fund Services LLC; formerly Vice President and Assistant Secretary (May 2003-June 2005) of AST Investment Services, Inc. | | Since 2005 |
Claudia DiGiacomo (40) Assistant Secretary | | Vice President and Corporate Counsel (since January 2005) of Prudential; Vice President and Assistant Secretary of Prudential Investments LLC (since December 2005); Associate at Sidley Austin Brown & Wood LLP (1999-2004). | | Since 2005 |
Andrew R. French (52) Assistant Secretary | | Vice President and Corporate Counsel (since February 2010) of Prudential; formerly Director and Corporate Counsel (2006-2010) of Prudential; Vice President and Assistant Secretary (since January 2007) of Prudential Investments LLC; Vice President and Assistant Secretary (since January 2007) of Prudential Mutual Fund Services LLC. | | Since 2006 |
Amanda S. Ryan (36) Assistant Secretary | | Director and Corporate Counsel (since March 2012) of Prudential; Director and Assistant Secretary (since June 2012) of Prudential Investments LLC; Associate at Ropes & Gray LLP (2008-2012). | | Since 2012 |
Theresa C. Thompson (52) Deputy Chief Compliance Officer | | Vice President, Compliance, Prudential Investments LLC (since April 2004); and Director, Compliance, Prudential Investments LLC (2001-2004). | | Since 2008 |
Prudential Select Real Estate Fund
| | | | |
| Fund Officers(a) |
| | | |
Name, Address and Age Position with Fund | | Principal Occupation(s) During Past Five Years | | Length of Service as Fund Officer |
Richard W. Kinville (46) Anti-Money Laundering Compliance Officer | | Vice President, Corporate Compliance, Anti-Money Laundering Unit (since January 2005) of Prudential; committee member of the American Council of Life Insurers Anti-Money Laundering and Critical Infrastructure Committee (since January 2007); formerly Investigator and Supervisor in the Special Investigations Unit for the New York Central Mutual Fire Insurance Company (August 1994-January 1999); Investigator in AXA Financial’s Internal Audit Department and Manager in AXA’s Anti-Money Laundering Office (January 1999-January 2005); first chair of the American Council of Life Insurers Anti-Money Laundering and Critical Infrastructure Committee (June 2007-December 2009). | | Since 2011 |
M. Sadiq Peshimam (50) Treasurer and Principal Financial and Accounting Officer | | Assistant Treasurer of funds in the Prudential Mutual Fund Complex (2006-2014); Vice President (since 2005) of Prudential Investments LLC. | | Since 2006 |
Peter Parrella (56) Assistant Treasurer | | Vice President (since 2007) and Director (2004-2007) within Prudential Mutual Fund Administration; formerly Tax Manager at SSB Citi Fund Management LLC (1997-2004). | | Since 2007 |
Lana Lomuti (47) Assistant Treasurer | | Vice President (since 2007) and Director (2005-2007), within Prudential Mutual Fund Administration; formerly Assistant Treasurer (December 2007-February 2014) of The Greater China Fund, Inc. | | Since 2014 |
Linda McMullin (53) Assistant Treasurer | | Vice President (since 2011) and Director (2008-2011) within Prudential Mutual Fund Administration. | | Since 2014 |
| (a) | Excludes Mr. Parker and Mr. Benjamin, interested Board Members who also serve as President and Vice President, respectively. |
Explanatory Notes to Tables:
| n | Board Members are deemed to be “Interested,” as defined in the 1940 Act, by reason of their affiliation with Prudential Investments LLC and/or an affiliate of Prudential Investments LLC. |
| n | Unless otherwise noted, the address of all Board Members and Officers is c/o Prudential Investments LLC, Gateway Center Three, 100 Mulberry Street, Newark, New Jersey 07102-4077. |
| n | There is no set term of office for Board Members or Officers. The Board Members have adopted a retirement policy, which calls for the retirement of Board Members on December 31 of the year in which they reach the age of 75. |
| n | “Other Directorships Held” includes only directorships of companies required to register or file reports with the SEC under the 1934 Act (that is, “public companies”) or other investment companies registered under the 1940 Act. |
| n | “Portfolios Overseen” includes all investment companies managed by Prudential Investments LLC. The investment companies for which Prudential Investments LLC serves as manager include the Prudential Investments Mutual Funds, The Prudential Variable Contract Accounts, Target Mutual Funds, Prudential Short Duration High Yield Fund, Inc., Prudential Global Short Duration High Yield Fund, Inc., The Prudential Series Fund, Prudential’s Gibraltar Fund, Inc. and the Advanced Series Trust. |
Visit our website at www.prudentialfunds.com
Approval of Advisory Agreements
Initial Approval of the Fund’s Advisory Agreements
As required by the Investment Company Act of 1940 (the 1940 Act), the Board of Trustees (the Board) of Prudential Investment Portfolios 9 considered the proposed management agreement with Prudential Investments LLC (the Manager) and the proposed subadvisory agreement with Prudential Real Estate Investors (PREI or the Subadviser), a business unit of Prudential Investment Management, Inc., with respect to the Prudential Select Real Estate Fund (the Fund) prior to the Fund’s commencement of operations. The Board, including a majority of the Independent Trustees, met on June 9-11, 2014 and approved the agreements for an initial two year period, after concluding that approval of the agreements was in the best interests of the Fund.1
In advance of the meetings, the Board requested and received materials relating to the agreements, and had the opportunity to ask questions and request further information in connection with its consideration.
In approving the agreements, the Board, including the Independent Trustees advised by independent legal counsel, considered the factors it deemed relevant, including the nature, quality and extent of services to be provided to the Fund by the Manager and the Subadviser; any relevant comparable performance and the Subadviser’s qualifications and track record in serving other affiliated mutual funds; the fees proposed to be paid by the Fund to the Manager and by the Manager to the Subadviser under the agreements; and the potential for economies of scale that may be shared with the Fund and its shareholders. In connection with its deliberations, the Board considered information provided by the Manager and the Subadviser at or in advance of the meetings on April 30, 2014 and June 9-11, 2014. The Board also considered information provided by the Manager with respect to other funds managed by the Manager and the Subadviser, which information had been provided throughout the year at regular Board meetings. In their deliberations, the Trustees did not identify any single factor which alone was responsible for the Board’s decision to approve the agreements with respect to the Fund.
The Trustees determined that the overall arrangements between the Fund and the Manager, which will serve as the Fund’s investment manager pursuant to a management agreement, and between the Manager and the Subadviser, which will serve as the Fund’s subadviser pursuant to the terms of a subadvisory agreement, were in the best interests of the Fund in light of the services to be performed and the fees to be charged under the agreements and such other matters as the Trustees considered relevant in the exercise of their business judgment.
| 1 | Grace C. Torres was elected to the Board as of December 2014, and therefore did not participate in the consideration of these approvals. |
Prudential Select Real Estate Fund
Approval of Advisory Agreements (continued)
The material factors and conclusions that formed the basis for the Trustees’ reaching their determinations to approve the agreements are separately discussed below.
Nature, Quality and Extent of Services
With respect to the Manager, the Board noted that it had received and considered information about the Manager at the June 9-11, 2014 meetings in connection with the renewal of the management agreements between the Manager and the other Prudential Retail Funds. The Board also noted that it received and considered information at other regular meetings throughout the year, regarding the nature, quality and extent of services provided by the Manager. The Board considered the services to be provided by the Manager, including but not limited to the oversight of the Subadviser, as well as the provision of fund recordkeeping, compliance and other services to the Fund. With respect to the Manager’s oversight of the Subadviser, the Board noted that the Manager’s Strategic Investment Research Group, which is a business unit of the Manager, is responsible for monitoring and reporting to the Manager’s senior management on the performance and operations of the Subadviser. The Board also noted that the Manager pays the salaries of all the officers and non-independent Trustees of the Fund. The Board reviewed the qualifications, backgrounds and responsibilities of the Manager’s senior management responsible for the oversight of the Fund and the Subadviser, and was also provided with information pertaining to the Manager’s organizational structure, senior management, investment operations and other relevant information. The Board further noted that it received favorable compliance reports from the Fund’s Chief Compliance Officer as to the Manager. The Board noted that it had concluded that it was satisfied with the nature, quality and extent of the services provided by the Manager to the other Prudential Retail Funds and determined that it was reasonable to conclude that the nature, quality and extent of services to be provided by the Manager under the management agreement for the Fund would be similar in nature to those provided under the other management agreements.
With respect to the Subadviser, the Board noted that it had received and considered information about the Subadviser at the June 9-11, 2014 meetings in connection with the renewal of the subadvisory agreements between the Manager and the Subadviser with respect to other Prudential Retail Funds. The Board also noted that it received and considered information at other regular meetings throughout the year, regarding the nature, quality and extent of services provided by the Subadviser. The Board considered, among other things, the qualifications, background and experience of the Subadviser’s portfolio managers who will be responsible for the day-to-day management of the Fund’s portfolio, as well as information on the Subadviser’s organizational structure, senior management, investment operations and other
Visit our website at www.prudentialfunds.com
relevant information. The Board further noted that it received favorable compliance reports from the Fund’s Chief Compliance Officer as to the Subadviser. The Board noted that it was satisfied with the nature, quality and extent of services provided by the Subadviser with respect to the other Prudential Retail Funds served by the Subadviser and determined that it was reasonable to conclude that the nature, quality and extent of services to be provided by the Subadviser under the subadvisory agreement for the Fund would be similar in nature to those provided under the other subadvisory agreements. The Board noted that the Subadviser is affiliated with the Manager.
Performance
Because the Fund had not yet commenced operations and the actual asset base of the Fund has not yet been determined, no investment performance for the Fund existed for Board review. Nevertheless, as noted above, the Board did consider the background and professional experience of the proposed portfolio management team for the Fund. The Manager will provide information relating to performance to the Board in connection with future annual reviews of the management agreement and subadvisory agreement.
Fee Rates
The Board considered the proposed management fees of 0.95% of the Fund’s average daily net assets to be paid by the Fund to the Manager and the proposed subadvisory fees at the annual rate of 0.475% of the Fund’s average daily net assets to be paid by the Manager to the Subadviser.
The Board considered information provided by the Manager comparing the Fund’s proposed management fee rate and total expenses for Class A shares to the Lipper 15(c) Peer Group. The Board noted that the Fund’s contractual management fee was in the third quartile of the Lipper Peer Group (first quartile being the lowest fee). The Board further noted that the anticipated net total expenses for Class A shares were in the second quartile of the Lipper Peer Group (first quartile being the lowest expenses).
The Board noted that the Fund’s other expenses were expected to be higher than those of other Prudential Retail Funds (although they were expected to be in line with the other expenses of Prudential International Real Estate Fund, another fund subadvised by the Subadviser) due to the type of investments required by the Fund’s investment strategy and the Fund’s initial asset size. The Board further noted that the Manager had contractually agreed through February 29, 2016 to limit net annual Fund operating expenses (exclusive of distribution and service (12b-1) fees, interest, taxes, acquired fund fees and expenses, brokerage, extraordinary and certain other expenses) of each class of shares to 1.10% of the Fund’s average daily net assets.
Prudential Select Real Estate Fund
Approval of Advisory Agreements (continued)
The Board noted that the Fund’s contractual management fee of 0.95% was higher than the median fee of the Peer Group but that the Fund’s actual management fee is expected to be 0.09%, which is below the median actual management fee, due to waivers and reimbursements required to support the net total expense limitation, given that the Fund’s initial assets will be low. The Board concluded that the proposed management fee and total expenses were reasonable in light of the services to be provided.
Profitability
Because the Fund had not yet commenced operations and the actual asset base of the Fund has not yet been determined, the Board noted that there was no historical profitability information with respect to the Fund to be reviewed. The Board noted that it would review profitability information in connection with the annual renewal of the advisory and subadvisory agreements.
Economies of Scale
Because the Fund had not yet commenced operations and the actual asset base of the Fund has not yet been determined, the Board noted that there was no historical information regarding economies of scale with respect to the Fund to be reviewed. The Board noted that it would review such information in connection with the annual renewal of the advisory and subadvisory agreements.
Other Benefits to the Manager and the Subadviser
The Board considered potential “fall-out” or ancillary benefits anticipated to be received by the Manager and the Subadviser. The Board concluded that any potential benefits to be derived by the Manager were similar to benefits derived by the Manager in connection with its management of the other Prudential Retail Funds, which are reviewed on an annual basis. The Board also concluded that any potential benefits to be derived by the Subadviser were consistent with those generally derived by subadvisers to the Prudential Retail Funds, and that those benefits are reviewed on an annual basis. The Board concluded that any potential benefits derived by the Manager and the Subadviser were consistent with the types of benefits generally derived by investment managers and subadvisers to mutual funds.
* * *
After full consideration of these factors, the Board concluded that the approval of the agreements was in the interests of the Fund.
Visit our website at www.prudentialfunds.com
| | | | |
| n MAIL | | n TELEPHONE | | n WEBSITE |
Gateway Center Three 100 Mulberry Street Newark, NJ 07102 | | (800) 225-1852 | | www.prudentialfunds.com |
|
| PROXY VOTING |
| The Board of Trustees of the Fund has delegated to the Fund’s investment subadviser the responsibility for voting any proxies and maintaining proxy recordkeeping with respect to the Fund. A description of these proxy voting policies and procedures is available without charge, upon request, by calling (800) 225-1852. Information regarding how the Fund voted proxies relating to portfolio securities during the most recent 12-month period ended June 30 is available on the Fund’s website and on the Securities and Exchange Commission’s website. |
|
| TRUSTEES |
| Ellen S. Alberding • Kevin J. Bannon • Scott E. Benjamin • Linda W. Bynoe • Keith F. Hartstein • Michael S. Hyland • Douglas H. McCorkindale • Stephen P. Munn • Stuart S. Parker • James E. Quinn • Richard A. Redeker • Robin B. Smith • Stephen G. Stoneburn • Grace C. Torres |
|
| OFFICERS |
| Stuart S. Parker, President • Scott E. Benjamin, Vice President • M. Sadiq Peshimam, Treasurer and Principal Financial and Accounting Officer • Raymond A. O’Hara, Chief Legal Officer • Chad A. Earnst, Chief Compliance Officer • Deborah A. Docs, Secretary • Theresa C. Thompson, Deputy Chief Compliance Officer • Richard W. Kinville, Anti-Money Laundering Compliance Officer • Jonathan D. Shain, Assistant Secretary • Claudia DiGiacomo, Assistant Secretary • Amanda S. Ryan, Assistant Secretary • Andrew R. French, Assistant Secretary • Peter Parrella, Assistant Treasurer • Lana Lomuti, Assistant Treasurer • Linda McMullin, Assistant Treasurer |
| | | | |
| MANAGER | | Prudential Investments LLC | | Gateway Center Three
100 Mulberry Street
Newark, NJ 07102 |
|
| INVESTMENT SUBADVISER | | Prudential Real Estate Investors | | 7 Giralda Farms
Madison, NJ 07940 |
|
| DISTRIBUTOR | | Prudential Investment
Management Services LLC | | Gateway Center Three
100 Mulberry Street
Newark, NJ 07102 |
|
| CUSTODIAN | | The Bank of New York Mellon | | One Wall Street
New York, NY 10286 |
|
| TRANSFER AGENT | | Prudential Mutual Fund
Services LLC | | PO Box 9658
Providence, RI 02940 |
|
| INDEPENDENT REGISTERED PUBLIC ACCOUNTING FIRM | | KPMG LLP | | 345 Park Avenue
New York, NY 10154 |
|
| FUND COUNSEL | | Willkie Farr & Gallagher LLP | | 787 Seventh Avenue
New York, NY 10019 |
|
| An investor should consider the investment objectives, risks, charges, and expenses of the Fund carefully before investing. The prospectus and summary prospectus contain this and other information about the Fund. An investor may obtain a prospectus and summary prospectus by visiting our website at www.prudentialfunds.com or by calling (800) 225-1852. The prospectus and summary prospectus should be read carefully before investing. |
|
| E-DELIVERY |
| To receive your mutual fund documents online, go to www.prudentialfunds.com/edelivery and enroll. Instead of receiving printed documents by mail, you will receive notification via email when new materials are available. You can cancel your enrollment or change your email address at any time by visiting the website address above. |
|
| SHAREHOLDER COMMUNICATIONS WITH TRUSTEES |
| Shareholders can communicate directly with the Board of Trustees by writing to the Chair of the Board, Prudential Select Real Estate Fund, Prudential Investments, Attn: Board of Trustees, 100 Mulberry Street, Gateway Center Three, Newark, NJ 07102. Shareholders can communicate directly with an individual Director by writing to the same address. Communications are not screened before being delivered to the addressee. |
|
| AVAILABILITY OF PORTFOLIO SCHEDULE |
| The Fund files its complete schedule of portfolio holdings with the Securities and Exchange Commission for the first and third quarters of each fiscal year on Form N-Q. The Fund’s Forms N-Q are available on the Commission’s website at www.sec.gov. The Fund’s Forms N-Q may also be reviewed and copied at the Commission’s Public Reference Room in Washington, D.C. Information on the operation and location of the Public Reference Room may be obtained by calling (202) 551-8090. The Fund’s schedule of portfolio holdings is also available on the Fund’s website as of the end of each month. |
|
| The Fund’s Statement of Additional Information contains additional information about the Fund’s Trustees and is available without charge, upon request, by calling (800) 225-1852. |
Mutual Funds:
| | | | |
| ARE NOT INSURED BY THE FDIC OR ANY FEDERAL GOVERNMENT AGENCY | | MAY LOSE VALUE | | ARE NOT A DEPOSIT OF OR GUARANTEED BY ANY BANK OR ANY BANK AFFILIATE |

PRUDENTIAL SELECT REAL ESTATE FUND
| | | | | | | | |
| SHARE CLASS | | A | | C | | Q | | Z |
| NASDAQ | | SREAX | | SRECX | | SREQX | | SREZX |
| CUSIP | | 74441J811 | | 74441J795 | | 74441J787 | | 74441J779 |
MF223E 0270925-00003-00
Item 2 – Code of Ethics — See Exhibit (a)
As of the end of the period covered by this report, the registrant has adopted a code of ethics (the “Section 406 Standards for Investment Companies – Ethical Standards for Principal Executive and Financial Officers”) that applies to the registrant’s Principal Executive Officer and Principal Financial Officer; the registrant’s Principal Financial Officer also serves as the Principal Accounting Officer.
The registrant hereby undertakes to provide any person, without charge, upon request, a copy of the code of ethics. To request a copy of the code of ethics, contact the registrant 800-225-1852, and ask for a copy of the Section 406 Standards for Investment Companies - Ethical Standards for Principal Executive and Financial Officers.
Item 3 – Audit Committee Financial Expert –
The registrant’s Board has determined that Mr. Stephen P. Munn, member of the Board’s Audit Committee is an “audit committee financial expert,” and that he is “independent,” for purposes of this Item.
Item 4 – Principal Accountant Fees and Services –
(a) Audit Fees
For the fiscal years ended October 31, 2014 and October 31, 2013, KPMG LLP (“KPMG”), the Registrant’s principal accountant, billed the Registrant $131,630 and $112,000, respectively, for professional services rendered for the audit of the Registrant’s annual financial statements or services that are normally provided in connection with statutory and regulatory filings.
(b) Audit-Related Fees
None.
(c) Tax Fees
None.
(d) All Other Fees
None.
(e) (1) Audit Committee Pre-Approval Policies and Procedures
THE PRUDENTIAL MUTUAL FUNDS
AUDIT COMMITTEE POLICY
on
Pre-Approval of Services Provided by the Independent Accountants
The Audit Committee of each Prudential Mutual Fund is charged with the responsibility to monitor the independence of the Fund’s independent accountants. As part of this responsibility, the Audit Committee must pre-approve any independent accounting firm’s engagement to render audit and/or permissible non-audit services, as required by law. In evaluating a proposed engagement of the independent accountants, the Audit Committee will assess the effect that the engagement might reasonably be expected to have on the accountant’s independence. The Committee’s evaluation will be based on:
| | • | | a review of the nature of the professional services expected to be provided, |
| | • | | a review of the safeguards put into place by the accounting firm to safeguard independence, and |
| | • | | periodic meetings with the accounting firm. |
Policy for Audit and Non-Audit Services Provided to the Funds
On an annual basis, the scope of audits for each Fund, audit fees and expenses, and audit-related and non-audit services (and fees proposed in respect thereof) proposed to be performed by the Fund’s independent accountants will be presented by the Treasurer and the independent accountants to the Audit Committee for review and, as appropriate, approval prior to the initiation of such services. Such presentation shall be accompanied by confirmation by both the Treasurer and the independent accountants that the proposed services will not adversely affect the independence of the independent accountants. Proposed services shall be described in sufficient detail to enable the Audit Committee to assess the appropriateness of such services and fees, and the compatibility of the provision of such services with the auditor’s independence. The Committee shall receive periodic reports on the progress of the audit and other services which are approved by the Committee or by the Committee Chair pursuant to authority delegated in this Policy.
The categories of services enumerated under “Audit Services”, “Audit-related Services”, and “Tax Services” are intended to provide guidance to the Treasurer and the independent accountants as to those categories of services which the Committee believes are generally consistent with the independence of the independent accountants and which the Committee (or the Committee Chair) would expect upon the presentation of specific proposals to pre-approve. The enumerated categories are not intended as an exclusive list of audit, audit-related or tax services, which the Committee (or the Committee Chair) would consider for pre-approval.
Audit Services
The following categories of audit services are considered to be consistent with the role of the Fund’s independent accountants:
| | Ø | Annual Fund financial statement audits |
| | Ø | Seed audits (related to new product filings, as required) |
| | Ø | SEC and regulatory filings and consents |
Audit-related Services
The following categories of audit-related services are considered to be consistent with the role of the Fund’s independent accountants:
| | Ø | Accounting consultations |
| | Ø | Fund merger support services |
| | Ø | Agreed Upon Procedure Reports |
| | Ø | Other Internal Control Reports |
Individual audit-related services that fall within one of these categories and are not presented to the Audit Committee as part of the annual pre-approval process will be subject to pre-approval by the Committee Chair (or any other Committee member on whom this responsibility has been delegated) so long as the estimated fee for those services does not exceed $50,000.
Tax Services
The following categories of tax services are considered to be consistent with the role of the Fund’s independent accountants:
| | Ø | Tax compliance services related to the filing or amendment of the following: |
| | ¡ | Federal, state and local income tax compliance; and, |
| | ¡ | Sales and use tax compliance |
| | Ø | Timely RIC qualification reviews |
| | Ø | Tax distribution analysis and planning |
| | Ø | Tax authority examination services |
| | Ø | Tax appeals support services |
| | Ø | Accounting methods studies |
| | Ø | Fund merger support services |
| | Ø | Tax consulting services and related projects |
Individual tax services that fall within one of these categories and are not presented to the Audit Committee as part of the annual pre-approval process will be subject to pre-approval by the Committee Chair (or any other Committee member on whom this responsibility has been delegated) so long as the estimated fee for those services does not exceed $50,000.
Other Non-audit Services
Certain non-audit services that the independent accountants are legally permitted to render will be subject to pre-approval by the Committee or by one or more Committee members to whom the Committee has delegated this authority and who will report to the full Committee any pre-approval decisions made pursuant to this Policy. Non-audit services presented for pre-approval pursuant to this paragraph will be accompanied by a confirmation from both the Treasurer and the independent accountants that the proposed services will not adversely affect the independence of the independent accountants.
Proscribed Services
The Fund’s independent accountants will not render services in the following categories of non-audit services:
| | Ø | Bookkeeping or other services related to the accounting records or financial statements of the Fund |
| | Ø | Financial information systems design and implementation |
| | Ø | Appraisal or valuation services, fairness opinions, or contribution-in-kind reports |
| | Ø | Internal audit outsourcing services |
| | Ø | Management functions or human resources |
| | Ø | Broker or dealer, investment adviser, or investment banking services |
| | Ø | Legal services and expert services unrelated to the audit |
| | Ø | Any other service that the Public Company Accounting Oversight Board determines, by regulation, is impermissible. |
Pre-approval of Non-Audit Services Provided to Other Entities Within the Prudential Fund Complex
Certain non-audit services provided to Prudential Investments LLC or any of its affiliates that also provide ongoing services to the Prudential Mutual Funds will be subject to pre-approval by the Audit Committee. The only non-audit services provided to these entities that will require pre-approval are those related directly to the operations and financial reporting of the Funds. Individual projects that are not presented to the Audit Committee as part of the annual pre-approval process will be subject to pre-approval by the Committee Chair (or any other Committee member on whom this responsibility has been delegated) so long as the estimated fee for those services does not exceed $50,000. Services presented for pre-approval pursuant to this paragraph will be accompanied by a confirmation from both the Treasurer and the independent accountants that the proposed services will not adversely affect the independence of the independent accountants.
Although the Audit Committee will not pre-approve all services provided to Prudential Investments LLC and its affiliates, the Committee will receive an annual report from the Fund’s independent accounting firm showing the aggregate fees for all services provided to Prudential Investments and its affiliates.
(e) (2) Percentage of services referred to in 4(b) – 4(d) that were approved by the audit committee –
Not applicable.
(f) Percentage of hours expended attributable to work performed by other than full time employees of principal accountant if greater than 50%.
The percentage of hours expended on the principal accountant’s engagement to audit the registrant’s financial statements for the most recent fiscal year that were attributed to work performed by persons other than the principal accountant’s full-time, permanent employees was 0%.
(g) Non-Audit Fees
Not applicable to Registrant for the fiscal years 2014 and 2013. The aggregate non-audit fees billed by KPMG for services rendered to the registrant’s investment adviser and any entity controlling, controlled by, or under common control with the investment adviser that provides ongoing services to the registrant for the fiscal years 2014 and 2013 was $0 and $0, respectively.
(h) Principal Accountant’s Independence
Not applicable as KPMG has not provided non-audit services to the registrant’s investment adviser and any entity controlling, controlled by, or under common control with the investment adviser that provides ongoing services to the registrant that were not pre-approved pursuant to Rule 2-01(c)(7)(ii) of Regulation S-X.
| | | | |
| | |
| Item 5 | | – | | Audit Committee of Listed Registrants – Not applicable. |
| | |
| Item 6 | | – | | Schedule of Investments – The schedule is included as part of the report to shareholders filed under Item 1 of this Form. |
| | |
| Item 7 | | – | | Disclosure of Proxy Voting Policies and Procedures for Closed-End Management Investment Companies – Not applicable. |
| | |
| Item 8 | | – | | Portfolio Managers of Closed-End Management Investment Companies – Not applicable. |
| | |
| Item 9 | | – | | Purchases of Equity Securities by Closed-End Management Investment Company and Affiliated Purchasers – Not applicable. |
| | |
| Item 10 | | – | | Submission of Matters to a Vote of Security Holders – Not applicable. |
| | |
| Item 11 | | – | | Controls and Procedures |
| | (a) | It is the conclusion of the registrant’s principal executive officer and principal financial officer that the effectiveness of the registrant’s current disclosure controls and procedures (such disclosure controls and procedures having been evaluated within 90 days of the date of this filing) provide reasonable assurance that the information required to be disclosed by the registrant has been recorded, processed, summarized and reported within the time period specified in the Commission’s rules and forms and that the information required to be disclosed by the registrant has been accumulated and communicated to the registrant’s principal executive officer and principal financial officer in order to allow timely decisions regarding required disclosure. |
| | (b) | There has been no significant change in the registrant’s internal control over financial reporting that occurred during the registrant’s most recent fiscal quarter of the period covered by this report that has materially affected, or is likely to materially affect, the registrant’s internal control over financial reporting. |
| | | | |
| | |
| Item 12 | | – | | Exhibits |
| | |
| | (a) | | (1) Code of Ethics – Attached hereto as Exhibit EX-99.CODE-ETH |
| | |
| | | | (2) Certifications pursuant to Section 302 of the Sarbanes-Oxley Act – Attached hereto as Exhibit EX-99.CERT. |
| | |
| | | | (3) Any written solicitation to purchase securities under Rule 23c-1. – Not applicable. |
| | |
| | (b) | | Certifications pursuant to Section 906 of the Sarbanes-Oxley Act – Attached hereto as Exhibit EX-99.906CERT. |
SIGNATURES
Pursuant to the requirements of the Securities Exchange Act of 1934 and the Investment Company Act of 1940, the registrant has duly caused this report to be signed on its behalf by the undersigned, thereunto duly authorized.
| | | | |
| Registrant: | | Prudential Investment Portfolios 9 | | |
| | |
| By: | | /s/Deborah A. Docs | | |
| | Deborah A. Docs | | |
| | Secretary | | |
| | |
| Date: | | December 18, 2014 | | |
|
Pursuant to the requirements of the Securities Exchange Act of 1934 and the Investment Company Act of 1940, this report has been signed below by the following persons on behalf of the registrant and in the capacities and on the dates indicated. |
| | |
| By: | | /s/Stuart S. Parker | | |
| | Stuart S. Parker | | |
| | President and Principal Executive Officer | | |
| | |
| Date: | | December 18, 2014 | | |
| | |
| By: | | /s/M. Sadiq Peshimam | | |
| | M. Sadiq Peshimam | | |
| | Treasurer and Principal Financial and Accounting Officer | | |
| | |
| Date: | | December 18, 2014 | | |