UNITED STATES
SECURITIES AND EXCHANGE COMMISSION
Washington, D.C. 20549
FORM N-CSR
CERTIFIED SHAREHOLDER REPORT OF REGISTERED MANAGEMENT
INVESTMENT COMPANIES
| | |
| Investment Company Act file number: | | 811-09101 |
| |
| Exact name of registrant as specified in charter: | | Prudential Investment Portfolios 9 |
| |
| Address of principal executive offices: | | Gateway Center 3, |
| | 100 Mulberry Street, |
| | Newark, New Jersey 07102 |
| |
| Name and address of agent for service: | | Deborah A. Docs |
| | Gateway Center 3, |
| | 100 Mulberry Street, |
| | Newark, New Jersey 07102 |
| |
| Registrant’s telephone number, including area code: | | 800-225-1852 |
| |
| Date of fiscal year end: | | 10/31/2012 |
| |
| Date of reporting period: | | 10/31/2012 |
Item 1 – Reports to Stockholders

PRUDENTIAL INVESTMENTS»MUTUAL FUNDS
PRUDENTIAL INTERNATIONAL REAL ESTATE FUND
ANNUAL REPORT · OCTOBER 31, 2012
Fund Type
Sector Stock
Objective
To seek capital appreciation and income
This report is not authorized for distribution to prospective investors unless preceded or accompanied by a current prospectus.
The views expressed in this report and information about the Fund’s portfolio holdings are for the period covered by this report and are subject to change thereafter.
Prudential Investments, Prudential, the Prudential logo, the Rock symbol, and Bring Your Challenges are service marks of Prudential Financial, Inc. and its related entities, registered in many jurisdictions worldwide.

December 14, 2012
Dear Shareholder:
We hope you find the annual report for the Prudential International Real Estate Fund informative and useful. The report covers performance for the 12-month period that ended October 31, 2012.
We recognize that ongoing market volatility may make it a difficult time to be an investor. We continue to believe a prudent response to uncertainty is to maintain a diversified portfolio of funds consistent with your tolerance for risk, time horizon, and financial goals.
Your financial advisor can help you create a diversified investment plan that may include funds covering all the basic asset classes and that reflects your personal investor profile and risk tolerance. Keep in mind, however, that diversification and asset allocation strategies do not assure a profit or protect against loss in declining markets.
Prudential Investments® is dedicated to helping you solve your toughest investment challenges—whether it’s capital growth, reliable income, or protection from market volatility and other risks. We offer the expertise of Prudential Financial’s affiliated asset managers* that strive to be leaders in a broad range of funds to help you stay on course to the future you envision. They also manage money for major corporations and pension funds around the world, which means you benefit from the same expertise, innovation, and attention to risk demanded by today’s most sophisticated investors.
Thank you for choosing the Prudential Investments family of funds.
Sincerely,

Stuart S. Parker, President
Prudential International Real Estate Fund
*Most of Prudential Investments’ equity funds are advised by Jennison Associates LLC, Quantitative Management Associates LLC (QMA), or Prudential Real Estate Investors. Prudential Investments’ fixed income and money market funds are advised by Prudential Investment Management, Inc. (PIM) through its Prudential Fixed Income unit. Jennison Associates, QMA, and PIM are registered investment advisers and Prudential Financial companies. Prudential Real Estate Investors is a unit of PIM.
| | | | |
| Prudential International Real Estate Fund | | | 1 | |
Your Fund’s Performance
Performance data quoted represent past performance. Past performance does not guarantee future results. The investment return and principal value of an investment will fluctuate, so that an investor’s shares, when redeemed, may be worth more or less than their original cost. Current performance may be lower or higher than the past performance data quoted. An investor may obtain performance data as of the most recent month-end by visiting our website at www.prudentialfunds.com or by calling (800) 225-1852. Class A shares have a maximum initial sales charge of 5.50%. Gross operating expenses: Class A, 2.93%; Class B, 3.74%; Class C, 3.61%; Class Z, 2.65%. Net operating expenses: Class A, 1.60%; Class B, 2.35%; Class C, 1.60%; Class Z, 1.35%, after contractual reduction through 2/28/2014.
| | | | | | |
Cumulative Total Returns (Without Sales Charges) as of 10/31/12 |
| | | One Year | | | Since Inception |
Class A | | | 16.52 | % | | 7.08% (12/21/2010) |
Class B | | | 15.76 | | | 4.99 (12/21/2010) |
Class C | | | 16.49 | | | 5.89 (12/21/2010) |
Class Z | | | 16.95 | | | 6.89 (12/21/2010) |
FTSE EPRA/NAREIT Developed ex-U.S. Net Index | | | 18.43 | | | 9.75 |
Lipper Equity International Real Estate Funds Average | | | 20.68 | | | 7.59 |
| | | | | | |
Average Annual Total Returns (With Sales Charges) as of 9/30/12 |
| | | One Year | | | Since Inception |
Class A | | | 18.28 | % | | –0.76% (12/21/2010) |
Class B | | | 19.43 | | | –0.83 (12/21/2010) |
Class C | | | 24.22 | | | 1.84 (12/21/2010) |
Class Z | | | 25.80 | | | 2.39 (12/21/2010) |
FTSE EPRA/NAREIT Developed ex-U.S. Net Index | | | 28.69 | | | 4.13 |
Lipper Equity International Real Estate Funds Average | | | 31.03 | | | 2.76 |
| | | | | | |
Average Annual Total Returns (With Sales Charges) as of 10/31/12 |
| | | One Year | | | Since Inception |
Class A | | | 10.11 | % | | 0.64% (12/21/2010) |
Class B | | | 10.76 | | | 0.53 (12/21/2010) |
Class C | | | 15.49 | | | 3.12 (12/21/2010) |
Class Z | | | 16.95 | | | 3.64 (12/21/2010) |
| | |
| 2 | | Visit our website at www.prudentialfunds.com |
| | | | | | |
Average Annual Total Returns (Without Sales Charges) as of 10/31/12 |
| | | One Year | | | Since Inception |
Class A | | | 16.52 | % | | 3.74% (12/21/2010) |
Class B | | | 15.76 | | | 2.65 (12/21/2010) |
Class C | | | 16.49 | | | 3.12 (12/21/2010) |
Class Z | | | 16.95 | | | 3.64 (12/21/2010) |
Growth of a $10,000 Investment
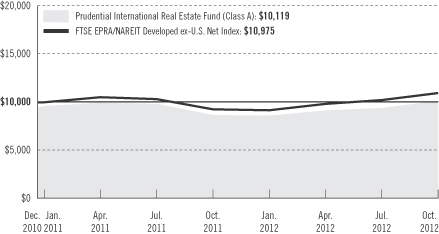
The graph compares a $10,000 investment in the Prudential International Real Estate Fund (Class A shares) with a similar investment in the FTSE EPRA/NAREIT Developed ex-U.S. Net Index by portraying the initial account values at the commencement of operations for Class A shares (December 21, 2010) and the account values at the end of the current fiscal period (October 31, 2012) as measured on a quarterly basis. For purposes of the graph, and unless otherwise indicated, it has been assumed that (a) the maximum applicable front-end sales charge was deducted from the initial $10,000 investment in Class A shares; (b) all recurring fees (including management fees) were deducted; and (c) all dividends and distributions were reinvested. The line graph provides information for Class A shares only. As indicated in the tables provided earlier, performance for Class B, Class C, and Class Z shares will vary due to the differing charges and expenses applicable to each share class (as indicated in the following paragraphs). Without waiver of fees and/or expense reimbursement, if any, the returns would have been lower.
Total returns and the ending account values in the graph include changes in share price and reinvestment of dividends and capital gains distributions in a hypothetical investment for the periods shown. The Fund’s total returns do not reflect the deduction of income taxes on an individual’s investment. Taxes may reduce your actual investment returns on income or gains paid by the Fund or any gains you may realize if you sell your shares.
| | | | |
| Prudential International Real Estate Fund | | | 3 | |
Your Fund’s Performance (continued)
Source: Prudential Investments LLC and Lipper Inc.
Inception returns are provided for any share class with less than 10 calendar years of returns.
The average annual total returns take into account applicable sales charges. Class A shares are subject to a maximum front-end sales charge of 5.50%. Class A, Class B, and Class C shares are subject to an annual distribution and service (12b-1) fee of 0.30%, 1.00%, and 1.00%, respectively. Under certain circumstances, an exchange may be made from specified share classes of the Fund to one or more other share classes of the Fund. Approximately seven years after purchase, Class B shares will automatically convert to Class A shares on a quarterly basis. All investors who purchase Class A shares in the amount of $1 million or more and sell these shares within 12 months of purchase are subject to a contingent deferred sales charge (CDSC) of 1%. The Class A CDSC is waived for purchases by certain retirement or benefit plans. Class B and Class C shares are subject to a maximum CDSC of 5% and 1%, respectively. Class C shares purchased are not subject to a front-end sales charge but are subject to a CDSC of 1% for Class C shares sold within 12 months from the date of purchase. Class Z shares are not subject to a 12b-1 fee or a sales charge. The returns in the tables and graph do not reflect the deduction of taxes that a shareholder would pay on Fund distributions or following the redemption of Fund shares.
Benchmark Definitions
FTSE EPRA/NAREIT Developed ex-U.S. Net Index
The Financial Times Stock Exchange European Public Real Estate Association/National Association of Real Estate Investment Trusts (FTSE EPRA/NAREIT) Developed ex-U.S. Net Total Return Index is an unmanaged index that tracks the performance of listed REITs and real estate companies globally, excluding the U.S.
Lipper Equity International Real Estate Funds Average
Funds in the Lipper Equity International Real Estate Funds Average invest at least 75% of their equity portfolios in shares of companies engaged in the real estate industry that are strictly outside of the U.S. or whose securities are principally traded outside of the U.S.
Investors cannot invest directly in an index or average. The returns for the Index would be lower if they included the effects of sales charges, operating expenses of a mutual fund, or taxes. Returns for the Lipper Average reflect the deduction of operating expenses of a mutual fund, but not sales charges or taxes.
| | | | |
Five Largest Holdings expressed as a percentage of net assets as of 10/31/12 | | | | |
Westfield Group, REIT, Retail REITs | | | 5.7 | % |
Sun Hung Kai Properties Ltd., Diversified Real Estate Activities | | | 4.3 | |
Unibail-Rodamco, REIT, Retail REITs | | | 4.0 | |
Mitsubishi Estate Co. Ltd., Diversified Real Estate Activities | | | 4.0 | |
Mitsui Fudosan Co. Ltd., Diversified Real Estate Activities | | | 3.7 | |
Holdings reflect only long-term investments and are subject to change.
| | |
| 4 | | Visit our website at www.prudentialfunds.com |
| | | | |
Five Largest Industries expressed as a percentage of net assets as of 10/31/12 | | | | |
Diversified Real Estate Activities | | | 26.7 | % |
Retail REITs | | | 22.9 | |
Diversified REITs | | | 14.2 | |
Real Estate Operating Companies | | | 10.7 | |
Real Estate Development | | | 4.8 | |
Industry weightings reflect only long-term investments and are subject to change.
| | | | |
| Prudential International Real Estate Fund | | | 5 | |
Strategy and Performance Overview
How did the Fund perform?
For the 12-month reporting period ended October 31, 2012, the Prudential International Real Estate Fund (the Fund) Class A shares rose by 16.52%, underperforming the 18.43% gain of the FTSE EPRA/NAREIT Developed ex-U.S. Net Index (the Index) and the 20.68% advance of the Lipper Equity International Real Estate Funds Average.
What were conditions like in the international real estate securities market?
| | • | | All regions within the Fund, with the exception of South America (Brazil), were positive performers that outpaced the benchmark. Asia Pacific was the best-performing region, followed by North America (Canada), Europe, and then South America. Within Europe, the U.K. outperformed the continent. In Brazil, the lone emerging markets allocation in the Fund, performance was negative over the period. |
| | • | | Asian real estate securities strongly outperformed their respective broader markets on the back of the recovery in the U.S. economy and continued liquidity injection by central banks in the U.S., Europe, and Japan. Concerns of a sharper-than-expected slowdown in the Chinese economy in the first half of 2012 abated as we moved into the third quarter, providing further support to regional equities. |
| | • | | The European market was significantly influenced by macroeconomic and credit-market developments over the whole period. The unfolding euro zone debt crisis, now two years old, explained a significant amount of the underperformance of the southern European countries and of the euro zone as a whole over the period. The macroeconomic growth outlook for the region also progressively worsened, as the expectation of low interest rates was extended further into the future. |
Which holdings or related groups of holdings made the largest positive and negative contributions to the Fund’s return?
| | • | | The Fund’s largest overweights were primarily in Europe, with the Netherlands, Finland, the U.K., and Norway among the top five. Hong Kong was the only overweight in the Asia-Pacific region. The Fund was most underweight in Switzerland, Sweden, and Singapore. |
| | • | | The Fund’s largest relative overweights by sector were the multifamily and retail sectors. |
| | • | | The Fund’s performance versus the benchmark was largely driven by security selection in each region. In particular, the Fund benefited the most from its security selection in Hong Kong, Australia, Canada, and France. The main |
| | |
| 6 | | Visit our website at www.prudentialfunds.com |
| | factors that detracted from relative performance were an allocation to Brazil, the overweight in the Netherlands, and security selection in Japan. |
| | • | | The holdings with the largest positive impact included diversified companies such as China Overseas Land & Investment (Hong Kong) and New World China Land (Hong Kong), as well as multifamily company Boardwalk REIT (Canada). The holdings with the largest negative impact included Wereldhave (Netherlands), PDG Realty (Brazil), and Brookfield Incorporacoes (Brazil). |
Did any tactical shifts in portfolio risk characteristics, including significant sales and purchases, affect the Fund?
| | • | | The Portfolio managers increased exposure to China in response to a more benign government policy environment and a stabilized residential real estate market. |
| | • | | During the period, the Fund’s Portfolio managers increased their allocation to Germany with the addition of German residential stock GSW and German office stocks DIC Asset and Prime Office REIT. |
| | • | | Swiss Holding PSP was sold over the period, resulting in a notable underweight in Switzerland relative to the benchmark. |
What is PREI’s outlook for the international real estate securities markets?
| | • | | In the medium term, macroeconomic factors, in particular the economic status of countries in the euro zone, are expected to continue to drive equity price performance. |
| | • | | In Asia, the impact of the global slowdown on China’s growth is expected to be closely watched by the market, as well as any shift in economic policy by the new Chinese political leadership. Property policy risk, which was a key theme in Asia in 2011 and 2012, is expected to abate, given that the Hong Kong and Singapore governments have already implemented very tight regulations to cool the residential property sector. Asian property stocks are therefore likely to be driven by transaction volumes and property price movements. However, uncertainty and risk premium to property companies could remain elevated, as a fall in real estate transaction volumes could translate into price declines. |
| | • | | In Europe, while risks of a near-term euro zone breakup have diminished, as governments have made gradual progress in the direction of a solution, PREI feels that macro themes will probably continue to be a major driver of investor sentiment. Though the European public real estate market recovered substantially during the period, share prices could be vulnerable to short-term corrections from continued negative news around underlying economic developments and renewed flare-ups of the euro zone debt crisis. |
| | | | |
| Prudential International Real Estate Fund | | | 7 | |
Comments on Largest Holdings
| 5.7% | Westfield Group, REIT, Retail REITs |
Westfield Group is a property trust that invests in, leases, and manages retail shopping centers in Australia, New Zealand, the United States, and the United Kingdom. The group’s operations also include asset management, property development, and construction.
| 4.3% | Sun Hung Kai Properties Ltd., Diversified Real Estate Activities |
Sun Hung Kai Properties Ltd., through its subsidiaries, develops and invests in properties. The company also operates hotels, and manages properties, car parking, and transportation infrastructure. In addition, Sun Hung Kai operates a logistics business and provides construction, financial services, telecommunication, Internet infrastructure, and other services.
| 4.0% | Unibail-Rodamco, REIT, Retail REITs |
Unibail-Rodamco leases and rents building space, finances real estate investments, and renovates real estate for sale. The company’s properties, mainly shopping centers, office buildings, and convention-exhibition centers, are primarily located in city centers or near major access routes.
| 4.0% | Mitsubishi Estate Co. Ltd., Diversified Real Estate Activities |
Mitsubishi Estate Co. Ltd. engages in real estate activities, primarily in Japan, the United States, and internationally. It operates in eight segments: building business, residential business, urban development & investment management, international business, architectural design & engineering, custom-built housing, hotels business, and real estate services.
| 3.7% | Mitsui Fudosan Co. Ltd., Diversified Real Estate Activities |
Mitsui Fudosan Co. Ltd. is a Japan-based real estate company that has multiple business segments.
| | |
| 8 | | Visit our website at www.prudentialfunds.com |
Fees and Expenses (Unaudited)
As a shareholder of the Fund, you incur two types of costs: (1) transaction costs, including sales charges (loads) on purchase payments and redemptions, as applicable, and (2) ongoing costs, including management fees, distribution, and/or service (12b-1) fees, and other Fund expenses, as applicable. This example is intended to help you understand your ongoing costs (in dollars) of investing in the Fund and to compare these costs with the ongoing costs of investing in other mutual funds.
The example is based on an investment of $1,000 invested on May 1, 2012, at the beginning of the period, and held through the six-month period ended October 31, 2012. The example is for illustrative purposes only; you should consult the Prospectus for information on initial and subsequent minimum investment requirements.
The Fund’s transfer agent may charge additional fees to holders of certain accounts that are not included in the expenses shown in the table on the following page. These fees apply to individual retirement accounts (IRAs) and Section 403(b) accounts. As of the close of the six-month period covered by the table, IRA fees included an annual maintenance fee of $15 per account (subject to a maximum annual maintenance fee of $25 for all accounts held by the same shareholder). Section 403(b) accounts are charged an annual $25 fiduciary maintenance fee. Some of the fees may vary in amount, or may be waived, based on your total account balance or the number of Prudential Investments funds, including the Fund, that you own. You should consider the additional fees that were charged to your Fund account over the six-month period when you estimate the total ongoing expenses paid over the period and the impact of these fees on your ending account value, as these additional expenses are not reflected in the information provided in the expense table. Additional fees have the effect of reducing investment returns.
Actual Expenses
The first line for each share class in the table on the following page provides information about actual account values and actual expenses. You may use the information on this line, together with the amount you invested, to estimate the expenses that you paid over the period. Simply divide your account value by $1,000 (for example, an $8,600 account value ÷ $1,000 = 8.6), then multiply the result by the number on the first line under the heading “Expenses Paid During the Six-Month Period” to estimate the expenses you paid on your account during this period.
Hypothetical Example for Comparison Purposes
The second line for each share class in the table on the following page provides information about hypothetical account values and hypothetical expenses based on the Fund’s actual expense ratio and an assumed rate of return of 5% per year before
| | | | |
| Prudential International Real Estate Fund | | | 9 | |
Fees and Expenses (continued)
expenses, which is not the Fund’s actual return. The hypothetical account values and expenses may not be used to estimate the actual ending account balance or expenses you paid for the period. You may use this information to compare the ongoing costs of investing in the Fund and other funds. To do so, compare this 5% hypothetical example with the 5% hypothetical examples that appear in the shareholder reports of the other funds.
Please note that the expenses shown in the table are meant to highlight your ongoing costs only and do not reflect any transactional costs such as sales charges (loads). Therefore, the second line for each share class in the table is useful in comparing ongoing costs only and will not help you determine the relative total costs of owning different funds. In addition, if these transactional costs were included, your costs would have been higher.
| | | | | | | | | | | | | | | | | | |
Prudential
International
Real Estate Fund | | Beginning Account
Value
May 1, 2012 | | | Ending Account
Value
October 31, 2012 | | | Annualized
Expense Ratio
Based on the
Six-Month Period | | | Expenses Paid
During the
Six-Month Period* | |
| | | | | | | | | | | | | | | | | | |
| Class A | | Actual | | $ | 1,000.00 | | | $ | 1,107.20 | | | | 1.60 | % | | $ | 8.47 | |
| | | Hypothetical | | $ | 1,000.00 | | | $ | 1,017.09 | | | | 1.60 | % | | $ | 8.11 | |
| | | | | | | | | | | | | | | | | | |
| Class B | | Actual | | $ | 1,000.00 | | | $ | 1,102.50 | | | | 2.35 | % | | $ | 12.42 | |
| | | Hypothetical | | $ | 1,000.00 | | | $ | 1,013.32 | | | | 2.35 | % | | $ | 11.89 | |
| | | | | | | | | | | | | | | | | | |
| Class C | | Actual | | $ | 1,000.00 | | | $ | 1,106.90 | | | | 1.60 | % | | $ | 8.47 | |
| | | Hypothetical | | $ | 1,000.00 | | | $ | 1,017.09 | | | | 1.60 | % | | $ | 8.11 | |
| | | | | | | | | | | | | | | | | | |
| Class Z | | Actual | | $ | 1,000.00 | | | $ | 1,107.80 | | | | 1.35 | % | | $ | 7.15 | |
| | | Hypothetical | | $ | 1,000.00 | | | $ | 1,018.35 | | | | 1.35 | % | | $ | 6.85 | |
*Fund expenses (net of fee waivers or subsidies, if any) for each share class are equal to the annualized expense ratio for each share class (provided in the table), multiplied by the average account value over the period, multiplied by the 184 days in the six-month period ended October 31, 2012, and divided by the 366 days in the Fund’s fiscal year ended October 31, 2012 (to reflect the six-month period). Expenses presented in the table include the expenses of any underlying funds in which the Fund may invest.
| | |
| 10 | | Visit our website at www.prudentialfunds.com |
Portfolio of Investments
as of October 31, 2012
| | | | | | |
| Shares | | Description | | Value (Note 1) | |
LONG-TERM INVESTMENTS 94.1% | |
COMMON STOCKS 94.0% | |
|
Australia 14.3% | |
| 13,600 | | Australand Property Group, REIT | | $ | 42,635 | |
| 101,400 | | CFS Retail Property Trust, REIT | | | 205,781 | |
| 42,300 | | Charter Hall Retail, REIT | | | 159,392 | |
| 235,100 | | Dexus Property Group, REIT | | | 240,386 | |
| 119,229 | | FKP Property Group | | | 27,538 | |
| 68,740 | | Goodman Group, REIT | | | 316,107 | |
| 87,200 | | GPT Group, REIT | | | 322,245 | |
| 64,875 | | Investa Office Fund, REIT | | | 200,011 | |
| 6,000 | | Mirvac Group, REIT | | | 9,374 | |
| 43,100 | | Stockland, REIT | | | 154,801 | |
| 100,400 | | Westfield Group, REIT | | | 1,110,993 | |
| | | | | | |
| | | | | 2,789,263 | |
|
Belgium 0.4% | |
| 615 | | Cofinimmo, REIT | | | 69,940 | |
|
Brazil 1.3% | |
| 6,073 | | BR Malls Participacoes SA | | | 79,835 | |
| 20,064 | | Brookfield Incorporacoes SA | | | 35,069 | |
| 5,971 | | Brookfield Incorporacoes SA (Receipt)(a) | | | 10,495 | |
| 3,162 | | Multiplan Empreendimentos Imobiliarios SA | | | 92,632 | |
| 22,105 | | PDG Realty SA Empreendimentos e Participacoes | | | 37,222 | |
| | | | | | |
| | | | | 255,253 | |
|
Canada 9.1% | |
| 7,120 | | Boardwalk Real Estate Investment Trust, REIT | | | 458,175 | |
| 20,281 | | Brookfield Office Properties, Inc. | | | 312,312 | |
| 14,000 | | Canadian Apartment Properties, REIT | | | 343,149 | |
| 20,150 | | Chartwell Seniors Housing Real Estate Investment Trust, REIT | | | 207,200 | |
| 16,700 | | RioCan Real Estate Investment Trust, REIT | | | 455,477 | |
| | | | | | |
| | | | | 1,776,313 | |
|
Finland 1.2% | |
| 29,214 | | Citycon Oyj | | | 95,421 | |
| 30,207 | | Sponda Oyj | | | 133,902 | |
| | | | | | |
| | | | | 229,323 | |
See Notes to Financial Statements.
| | | | |
| Prudential International Real Estate Fund | | | 11 | |
Portfolio of Investments
as of October 31, 2012 continued
| | | | | | |
| Shares | | Description | | Value (Note 1) | |
COMMON STOCKS (Continued) | |
|
France 6.6% | |
| 486 | | Fonciere des Regions, REIT | | $ | 39,068 | |
| 839 | | ICADE, REIT | | | 75,502 | |
| 10,670 | | Klepierre, REIT | | | 395,603 | |
| 95 | | Societe de la Tour Eiffel, REIT | | | 5,242 | |
| 3,455 | | Unibail-Rodamco, REIT | | | 778,530 | |
| | | | | | |
| | | | | 1,293,945 | |
|
Germany 1.2% | |
| 5,315 | | DIC Asset AG | | | 49,594 | |
| 3,804 | | GSW Immobilien AG | | | 156,520 | |
| 6,986 | | Prime Office REIT-AG, REIT | | | 29,075 | |
| | | | | | |
| | | | | 235,189 | |
|
Hong Kong 18.9% | |
| 129,000 | | China Overseas Land & Investment Ltd. | | | 337,895 | |
| 18,000 | | China Resources Land Ltd. | | | 41,109 | |
| 75,000 | | Hang Lung Properties Ltd. | | | 260,805 | |
| 45,000 | | Henderson Land Development Co. Ltd. | | | 311,804 | |
| 42,000 | | Hysan Development Co. Ltd. | | | 185,612 | |
| 28,500 | | Kerry Properties Ltd. | | | 141,396 | |
| 67,000 | | Link (The), REIT | | | 333,269 | |
| 590,000 | | New World China Land Ltd. | | | 271,779 | |
| 152,000 | | New World Development Co. Ltd. | | | 234,961 | |
| 122,400 | | Sino Land Co. Ltd. | | | 219,213 | |
| 60,000 | | Sun Hung Kai Properties Ltd. | | | 835,349 | |
| 60,000 | | Wharf Holdings Ltd. (The) | | | 410,707 | |
| 23,000 | | Wheelock & Co. Ltd. | | | 100,606 | |
| | | | | | |
| | | | | 3,684,505 | |
|
Italy 0.5% | |
| 166,400 | | Beni Stabili SpA, REIT | | | 93,540 | |
|
Japan 15.8% | |
| 24 | | Activia Properties, Inc., REIT | | | 152,424 | |
| 36 | | Advance Residence Investment, REIT | | | 78,016 | |
| 5,100 | | AEON Mall Co. Ltd. | | | 132,307 | |
| 100 | | Daito Trust Construction Co. Ltd. | | | 10,096 | |
| 7,000 | | Daiwa House Industry Co. Ltd. | | | 106,013 | |
| 7 | | Frontier Real Estate Investment Corp., REIT | | | 61,819 | |
| 39,000 | | Mitsubishi Estate Co. Ltd. | | | 771,402 | |
See Notes to Financial Statements.
| | |
| 12 | | Visit our website at www.prudentialfunds.com |
| | | | | | |
| Shares | | Description | | Value (Note 1) | |
COMMON STOCKS (Continued) | |
|
Japan (cont’d.) | |
| 36,000 | | Mitsui Fudosan Co. Ltd. | | $ | 727,396 | |
| 22 | | Nippon Building Fund, Inc., REIT | | | 236,177 | |
| 11,900 | | Nomura Real Estate Holdings, Inc. | | | 213,612 | |
| 31 | | NTT Urban Development Corp. | | | 25,513 | |
| 21,000 | | Sumitomo Realty & Development Co. Ltd. | | | 579,782 | |
| | | | | | |
| | | | | 3,094,557 | |
|
Netherlands 4.3% | |
| 2,267 | | Corio NV, REIT | | | 101,006 | |
| 5,554 | | Eurocommercial Properties NV, REIT | | | 217,871 | |
| 2,309 | | VastNed Retail NV, REIT | | | 106,962 | |
| 7,110 | | Wereldhave NV, REIT | | | 420,553 | |
| | | | | | |
| | | | | 846,392 | |
|
Norway 0.6% | |
| 82,891 | | Norwegian Property ASA | | | 124,308 | |
|
Singapore 9.7% | |
| 65,000 | | Ascendas Real Estate Investment Trust, REIT | | | 125,758 | |
| 43,000 | | Cache Logistics Trust, REIT | | | 43,360 | |
| 95,000 | | Capitaland Ltd. | | | 254,673 | |
| 43,000 | | CapitaMall Trust, REIT | | | 74,381 | |
| 21,000 | | CDL Hospitality Trusts, REIT | | | 33,313 | |
| 20,000 | | City Developments Ltd. | | | 187,900 | |
| 42,000 | | Far East Hospitality Trust, REIT | | | 33,915 | |
| 27,000 | | Frasers Centrepoint Trust, REIT | | | 43,273 | |
| 75,000 | | Global Logistic Properties Ltd. | | | 158,018 | |
| 65,000 | | Hongkong Land Holdings Ltd. | | | 412,750 | |
| 172,250 | | K-REIT Asia, REIT | | | 168,042 | |
| 23,000 | | Keppel Land Ltd. | | | 64,109 | |
| 134,000 | | Mapletree Commercial Trust, REIT | | | 132,923 | |
| 37,880 | | Mapletree Industrial Trust, REIT | | | 43,476 | |
| 89,000 | | Suntec Real Estate Investment Trust, REIT | | | 117,105 | |
| | | | | | |
| | | | | 1,892,996 | |
| |
Sweden 0.5% | | | | |
| 24,031 | | Klovern AB | | | 93,111 | |
|
United Kingdom 9.6% | |
| 13,817 | | Atrium European Real Estate Ltd. | | | 78,100 | |
See Notes to Financial Statements.
| | | | |
| Prudential International Real Estate Fund | | | 13 | |
Portfolio of Investments
as of October 31, 2012 continued
| | | | | | |
| Shares | | Description | | Value (Note 1) | |
COMMON STOCKS (Continued) | |
|
United Kingdom (cont’d.) | |
| 13,233 | | Big Yellow Group PLC, REIT | | $ | 73,034 | |
| 41,450 | | British Land Co. PLC, REIT | | | 353,516 | |
| 3,197 | | Derwent London PLC, REIT | | | 106,383 | |
| 8,874 | | Great Portland Estates PLC, REIT | | | 66,963 | |
| 59,376 | | Hammerson PLC, REIT | | | 452,073 | |
| 38,917 | | Land Securities Group PLC, REIT | | | 504,934 | |
| 63,231 | | SEGRO PLC, REIT | | | 242,446 | |
| | | | | | |
| | | | | 1,877,449 | |
| | | | | | |
| | TOTAL COMMON STOCKS
(cost $16,864,211) | | | 18,356,084 | |
| | | | | | |
PREFERRED STOCK 0.1% | |
|
Sweden | |
| 495 | | Klovern AB (PRFC)
(cost $10,736) | | | 10,448 | |
| | | | | | |
| | TOTAL LONG-TERM INVESTMENTS
(cost $16,874,947) | | | 18,366,532 | |
| | | | | | |
SHORT-TERM INVESTMENT 6.0% | |
|
AFFILIATED MONEY MARKET MUTUAL FUND | |
| 1,175,296 | | Prudential Investment Portfolios 2 - Prudential Core Taxable Money Market Fund
(cost $1,175,296) (Note 3)(b) | | | 1,175,296 | |
| | | | | | |
| | TOTAL INVESTMENTS 100.1%
(cost $18,050,243; Note 5) | | | 19,541,828 | |
| | Liabilities in excess of other assets (0.1)% | | | (14,585 | ) |
| | | | | | |
| | NET ASSETS 100% | | $ | 19,527,243 | |
| | | | | | |
The following abbreviations are used in the Portfolio descriptions:
PRFC—Preference Shares
REIT—Real Estate Investment Trust
| (a) | Non-income producing security. |
| (b) | Prudential Investments LLC, the manager of the Fund, also serves as manager of the Prudential Investment Portfolios 2 - Prudential Core Taxable Money Market Fund. |
See Notes to Financial Statements.
| | |
| 14 | | Visit our website at www.prudentialfunds.com |
Various inputs are used in determining the value of the Fund’s investments. These inputs are summarized in the three broad levels listed below.
Level 1—quoted prices generally in active markets for identical securities.
Level 2—other significant observable inputs including, but not limited to, quoted prices for similar securities, interest rates and yield curves, prepayment speeds, foreign currency exchange rates, and amortized cost.
Level 3—significant unobservable inputs for securities valued in accordance with Board approved fair valuation procedures.
The following is a summary of the inputs used as of October 31, 2012 in valuing such portfolio securities:
| | | | | | | | | | | | |
| | | Level 1 | | | Level 2 | | | Level 3 | |
Investments in Securities | | | | | | | | | | | | |
Common Stocks: | | | | | | | | | | | | |
Australia | | $ | 2,789,263 | | | $ | — | | | $ | — | |
Belgium | | | 69,940 | | | | — | | | | — | |
Brazil | | | 255,253 | | | | — | | | | — | |
Canada | | | 1,776,313 | | | | — | | | | — | |
Finland | | | 229,323 | | | | — | | | | — | |
France | | | 1,293,945 | | | | — | | | | — | |
Germany | | | 235,189 | | | | — | | | | — | |
Hong Kong | | | 3,684,505 | | | | — | | | | — | |
Italy | | | 93,540 | | | | — | | | | — | |
Japan | | | 3,094,557 | | | | — | | | | — | |
Netherlands | | | 846,392 | | | | — | | | | — | |
Norway | | | 124,308 | | | | — | | | | — | |
Singapore | | | 1,892,996 | | | | — | | | | — | |
Sweden | | | 93,111 | | | | — | | | | — | |
United Kingdom | | | 1,877,449 | | | | — | | | | — | |
Preferred Stock—Sweden | | | 10,448 | | | | — | | | | — | |
Affiliated Money Market Mutual Fund | | | 1,175,296 | | | | — | | | | — | |
| | | | | | | | | | | | |
Total | | $ | 19,541,828 | | | $ | — | | | $ | — | |
| | | | | | | | | | | | |
Fair value of Level 2 investments at 10/31/11 was $11,890,569, which was a result of valuing investments using third party vendor modeling tools. An amount of $11,485,773 was transferred from Level 2 into Level 1 at 10/31/12 as a result of using quoted prices in active market for such foreign securities.
It is the Fund’s policy to recognize transfers in and transfers out at the fair value as of the beginning of period.
See Notes to Financial Statements.
| | | | |
| Prudential International Real Estate Fund | | | 15 | |
Portfolio of Investments
as of October 31, 2012 continued
The industry classification of investments and liabilities in excess of other assets shown as a percentage of net assets as of October 31, 2012 were as follows:
| | | | |
Diversified Real Estate Activities | | | 26.7 | % |
Retail REITs | | | 22.9 | |
Diversified REITs | | | 14.2 | |
Real Estate Operating Companies | | | 10.7 | |
Affiliated Money Market Mutual Fund | | | 6.0 | |
Real Estate Development | | | 4.8 | |
Residential REITs | | | 4.5 | |
Office REITs | | | 4.1 | |
Industrial REITs | | | 3.8 | % |
Specialized REITs | | | 1.9 | |
Homebuilding | | | 0.5 | |
| | | | |
| | | 100.1 | |
Liabilities in excess of other assets | | | (0.1 | ) |
| | | | |
| | | 100.0 | % |
| | | | |
The Fund invested in various derivative instruments during the reporting period. The primary type of risk associated with these derivative instruments was equity contracts risk. The effect of such derivative instruments on the Fund’s financial position and financial performance as reflected in the Statement of Assets and Liabilities and Statement of Operations is presented in the summary below.
The Fund did not hold any derivative instruments as of October 31, 2012, accordingly, no derivative positions were presented in the Statements of Assets and Liabilities.
The effects of derivative instruments on the Statement of Operations for the year ended October 31, 2012 are as follows:
| | | | |
Amount of Realized Gain or (Loss) on Derivatives Recognized in Income | |
Derivatives not accounted for as hedging instruments, carried at fair value | | Rights | |
Equity contracts | | $ | 3,555 | |
| | | | |
|
Change in Unrealized Appreciation or (Depreciation) on Derivatives Recognized in Income | |
Derivatives not accounted for as hedging instruments, carried at fair value | | Rights | |
Equity contracts | | $ | (5,799 | ) |
| | | | |
See Notes to Financial Statements.
| | |
| 16 | | Visit our website at www.prudentialfunds.com |
PRUDENTIAL INVESTMENTS»MUTUAL FUNDS
FINANCIAL STATEMENTS
ANNUAL REPORT · OCTOBER 31, 2012
Prudential International Real Estate Fund
Statement of Assets and Liabilities
as of October 31, 2012
| | | | |
Assets | |
Investments at value: | | | | |
Unaffiliated investments (cost $16,874,947) | | $ | 18,366,532 | |
Affiliated investments (cost $1,175,296) | | | 1,175,296 | |
Cash | | | 5,765 | |
Foreign currency, at value (cost $3,992) | | | 4,032 | |
Dividends receivable | | | 32,433 | |
Receivable for Fund shares sold | | | 18,063 | |
Tax reclaim receivable | | | 12,804 | |
Due from manager | | | 6,931 | |
Prepaid expenses | | | 561 | |
| | | | |
Total assets | | | 19,622,417 | |
| | | | |
| |
Liabilities | | | | |
Accrued expenses | | | 90,826 | |
Payable for Fund shares reacquired | | | 4,000 | |
Distribution fee payable | | | 213 | |
Affiliated transfer agent fee payable | | | 135 | |
| | | | |
Total liabilities | | | 95,174 | |
| | | | |
| |
Net Assets | | $ | 19,527,243 | |
| | | | |
Net assets were comprised of: | | | | |
Shares of beneficial interest, at par | | $ | 1,899 | |
Paid-in capital in excess of par | | | 18,574,973 | |
| | | | |
| | | 18,576,872 | |
Undistributed net investment income | | | 191,880 | |
Accumulated net realized loss on investment and foreign currency transactions | | | (732,906 | ) |
Net unrealized appreciation on investments and foreign currencies | | | 1,491,397 | |
| | | | |
Net Assets, October 31, 2012 | | $ | 19,527,243 | |
| | | | |
See Notes to Financial Statements.
| | |
| 18 | | Visit our website at www.prudentialfunds.com |
| | | | |
Class A: | |
Net asset value and redemption price per share
($345,951 ÷ 33,498 shares of beneficial interest issued and outstanding) | | $ | 10.33 | |
Maximum sales charge (5.50% of offering price) | | | 0.60 | |
| | | | |
Maximum offering price to public | | $ | 10.93 | |
| | | | |
| |
Class B: | | | | |
Net asset value, offering price and redemption price per share
($166,738 ÷ 16,311 shares of beneficial interest issued and outstanding) | | $ | 10.22 | |
| | | | |
| |
Class C: | | | | |
Net asset value, offering price and redemption price per share
($20,164 ÷ 1,966.3 shares of beneficial interest issued and outstanding) | | $ | 10.25 | |
| | | | |
| |
Class Z: | | | | |
Net asset value, offering price and redemption price per share
($18,994,390 ÷ 1,846,844 shares of beneficial interest issued and outstanding) | | $ | 10.28 | |
| | | | |
See Notes to Financial Statements.
| | | | |
| Prudential International Real Estate Fund | | | 19 | |
Statement of Operations
Year Ended October 31, 2012
| | | | |
Net Investment Income | |
Income | |
Unaffiliated dividend income (net of foreign withholding taxes of $45,776) | | $ | 535,520 | |
Affiliated dividend income | | | 1,290 | |
| | | | |
Total income | | | 536,810 | |
| | | | |
| |
Expenses | | | | |
Advisory fee | | | 143,709 | |
Distribution fee—Class A | | | 571 | |
Distribution fee—Class B | | | 519 | |
Distribution fee—Class C | | | 57 | |
Custodian’s fees and expenses | | | 67,000 | |
Registration fees | | | 51,000 | |
Audit fee | | | 39,000 | |
Reports to shareholders | | | 28,000 | |
Legal fees and expenses | | | 18,000 | |
Trustees’ fees | | | 10,000 | |
Insurance fees | | | 1,000 | |
Transfer agent’s fees and expenses (including affiliated expense of $500) (Note 3) | | | 1,000 | |
Loan interest expense (Note 7) | | | 61 | |
Miscellaneous | | | 22,736 | |
| | | | |
Total expenses | | | 382,653 | |
Expense reimbursement (Note 2) | | | (187,437 | ) |
| | | | |
Net expenses | | | 195,216 | |
| | | | |
Net investment income | | | 341,594 | |
| | | | |
|
Realized And Unrealized Gain (Loss) On Investment And Foreign Currencies | |
Net realized loss on: | | | | |
Investment transactions | | | (434,360 | ) |
Foreign currency transactions | | | (1,927 | ) |
| | | | |
| | | (436,287 | ) |
| | | | |
Net change in unrealized appreciation (depreciation) on: | | | | |
Investments | | | 2,584,851 | |
Foreign currencies | | | 427 | |
| | | | |
| | | 2,585,278 | |
| | | | |
Net gain on investments and foreign currencies | | | 2,148,991 | |
| | | | |
Net Increase In Net Assets Resulting From Operations | | $ | 2,490,585 | |
| | | | |
See Notes to Financial Statements.
| | |
| 20 | | Visit our website at www.prudentialfunds.com |
Statement of Changes in Net Assets
| | | | | | | | |
| | | Year Ended Ended October 31, 2012 | | | December 21, 2010*
through October 31, 2011 | |
Increase (Decrease) in Net Assets | | | | | | | | |
Operations | | | | | | | | |
Net investment income | | $ | 341,594 | | | $ | 230,131 | |
Net realized loss on investment and foreign currency transactions | | | (436,287 | ) | | | (272,599 | ) |
Net change in unrealized appreciation (depreciation) on investments and foreign currencies | | | 2,585,278 | | | | (1,093,881 | ) |
| | | | | | | | |
Net increase (decrease) in net assets resulting from operations | | | 2,490,585 | | | | (1,136,349 | ) |
| | | | | | | | |
| | |
Dividends (Note 1) | | | | | | | | |
Dividends from net investment income | | | | | | | | |
Class A | | | (4,411 | ) | | | — | |
Class B | | | (105 | ) | | | — | |
Class C | | | (955 | ) | | | — | |
Class Z | | | (420,230 | ) | | | — | |
| | | | | | | | |
| | | (425,701 | ) | | | — | |
| | | | | | | | |
| | |
Fund share transactions (Note 6) | | | | | | | | |
Net proceeds from shares sold | | | 6,420,938 | | | | 17,868,451 | |
Net asset value of shares issued in reinvestment of dividends | | | 425,701 | | | | — | |
Cost of shares reacquired | | | (3,465,794 | ) | | | (2,650,588 | ) |
| | | | | | | | |
Net increase in net assets resulting from Fund share transactions | | | 3,380,845 | | | | 15,217,863 | |
| | | | | | | | |
Total increase | | | 5,445,729 | | | | 14,081,514 | |
| | |
Net Assets | | | | | | | | |
Beginning of period | | | 14,081,514 | | | | — | |
| | | | | | | | |
End of period(a) | | $ | 19,527,243 | | | $ | 14,081,514 | |
| | | | | | | | |
(a) Includes undistributed net investment income of: | | $ | 191,880 | | | $ | 259,165 | |
| | | | | | | | |
| * | Commencement of operations. |
See Notes to Financial Statements.
| | | | |
| Prudential International Real Estate Fund | | | 21 | |
Notes to Financial Statements
Prudential Investment Portfolios 9 (the “Trust”) is registered under the Investment Company Act of 1940, as amended, (“1940 Act”), as an open-end, management investment company. The Trust currently consists of three portfolios: Prudential International Real Estate Fund, Prudential Large-Cap Core Equity Fund and Prudential Absolute Return Bond Fund. These financial statements relate only to Prudential International Real Estate Fund (the “Fund”). The financial statements of the other portfolios are not presented herein. The Trust was organized as a Delaware business trust on September 18, 1998. The Fund commenced investment operations on December 21, 2010. The Fund is non-diversified and its investment objective is to seek capital appreciation and income.
Note 1. Accounting Policies
The following is a summary of significant accounting policies followed by the Trust in the preparation of these financial statements.
Securities Valuation: The Fund holds portfolio securities and other assets that are fair valued at the close of each day the New York Stock Exchange (“NYSE”) is open for trading. Fair value is the price that would be received to sell an asset or paid to transfer a liability in an orderly transaction between market participants on the measurement date. The Board of Trustees (the “Board”) has delegated fair valuation responsibilities to Prudential Investments LLC (“PI” or “Manager”) through the adoption of Valuation Procedures for valuation of the Fund’s securities. Under the current Valuation Procedures, a Valuation Committee is established and responsible for supervising the valuation of portfolio securities and other assets. The Valuation Procedures allow the Fund to utilize independent pricing vendor services, quotations from market makers and other valuation methods in events when market quotations are not readily available or not representative of the fair value of the securities. A record of the Valuation Committee’s actions is subject to review, approval and ratification by the Board at its next regularly scheduled quarterly meeting.
Various inputs are used in determining the value of the Fund’s investments, which are summarized in the three broad level hierarchies based on any observable inputs used as described in the table following the Fund’s Portfolio of Investments. The valuation methodologies and significant inputs used in determining the fair value of securities and other assets classified as Level 1, Level 2 and Level 3 of the hierarchy are as follows:
Common stocks, exchange-traded funds and financial derivative instruments (including futures contracts and certain options and swap contracts on securities), that are traded
| | |
| 22 | | Visit our website at www.prudentialfunds.com |
on a national securities exchange are valued at the last sale price as of the close of trading on the applicable exchange. Securities traded via NASDAQ are valued at the NASDAQ official closing price. To the extent these securities are valued at the last sale price or NASDAQ official closing price, they are classified as Level 1 of the fair value hierarchy.
In the event there is no sale or official closing price on such day, these securities are valued at the mean between the last reported bid and asked prices, or at the last bid price in the absence of an asked price. These securities are classified as Level 2 of the fair value hierarchy as these inputs are considered as significant other observable inputs to the valuation.
For common stocks traded on foreign securities exchanges, certain valuation adjustments will be applied when events occur after the close of the security’s foreign market and before the Fund’s normal pricing time. These securities are valued using pricing vendor services that provide model prices derived using adjustment factors based on information such as local closing price, relevant general and sector indices, currency fluctuations, depositary receipts, and futures, as applicable. Securities valued using such model prices are classified as Level 2 of the fair value hierarchy as the adjustment factors are considered as significant other observable inputs to the valuation.
Investments in open-end, non-exchange-traded mutual funds are valued at their net asset values as of the close of the NYSE on the date of valuation. These securities are classified as Level 1 as they have the ability to be purchased or sold at their net asset values on the date of valuation.
Fixed income securities traded in the over-the-counter market, such as corporate bonds, municipal bonds, U.S. Government agencies issues and guaranteed obligations, U.S. Treasury obligations and sovereign issues are usually valued at prices provided by approved independent pricing vendors. The pricing vendors provide these prices usually after evaluating observable inputs including yield curves, credit rating, yield spreads, default rates, cash flows as well as broker/dealer quotations and reported trades. Securities valued using such vendor prices are classified as Level 2 of the fair value hierarchy.
Asset-backed and mortgage-related securities are usually valued by approved independent pricing vendors. The pricing vendors provide the prices using their internal pricing model with input from deal terms, tranche level attributes, yield curves, prepayment speeds, default rates and broker/dealer quotes. Securities valued using such vendor prices are classified as Level 2 of the fair value hierarchy.
| | | | |
| Prudential International Real Estate Fund | | | 23 | |
Notes to Financial Statements
continued
Short-term debt securities of sufficient credit quality, which mature in sixty days or less, are valued using amortized cost method, which approximates fair value. The amortized cost method involves valuing a security at its cost on the date of purchase and thereafter assuming a constant amortization to maturity of the difference between the principal amount due at maturity and cost. These securities are categorized as Level 2 of the fair value hierarchy.
Over-the-counter financial derivative instruments, such as option contracts, foreign currency contracts and swaps agreements, are usually valued using pricing vendor services, which derive the valuation based on underlying asset prices, indices, spreads, interest rates, exchange rates and other inputs. These instruments are categorized as Level 2 of the fair value hierarchy.
Securities and other assets that cannot be priced using the methods described above are valued with pricing methodologies approved by the Valuation Committee. In the event there are unobservable inputs used when determining such valuations, the securities will be classified as Level 3 of the fair value hierarchy.
When determining the fair value of securities, some of the factors influencing the valuation include: the nature of any restrictions on disposition of the securities; assessment of the general liquidity of the securities; the issuer’s financial condition and the markets in which it does business; the cost of the investment; the size of the holding and the capitalization of the issuer; the prices of any recent transactions or bids/offers for such securities or any comparable securities; any available analyst media or other reports or information deemed reliable by the investment adviser regarding the issuer or the markets or industry in which it operates. Using fair value to price securities may result in a value that is different from a security’s most recent closing price and from the price used by other mutual funds to calculate their net asset values.
Foreign Currency Translation: The books and records of the Fund are maintained in U.S. dollars. Foreign currency amounts are translated into U.S. dollars on the following basis:
(i) market value of investment securities, other assets and liabilities-at the current daily rates of exchange.
(ii) purchases and sales of investment securities, income and expenses-at the rates of exchange prevailing on the respective dates of such transactions.
| | |
| 24 | | Visit our website at www.prudentialfunds.com |
Although the net assets of the Fund are presented at the foreign exchange rates and market values at the close of the fiscal year, the Fund does not isolate that portion of the results of operations arising as a result of changes in the foreign exchange rates from the fluctuations arising from changes in the market prices of portfolio securities held at the end of the fiscal year. Similarly, the Fund does not isolate the effect of changes in foreign exchange rates from the fluctuations arising from changes in the market prices of portfolio securities sold during the fiscal year. Accordingly, realized foreign currency gains or losses are included in the reported net realized gains or losses on investment transactions. Net realized gains or losses on foreign currency transactions represent net foreign exchange gains or losses from holdings of foreign currencies, currency gains or losses realized between the trade and settlement dates on security transactions, and the difference between the amounts of dividends, interest and foreign withholding taxes recorded on the Fund’s books and the U.S. dollar equivalent amounts actually received or paid. Net unrealized currency gains or losses from valuing foreign currency denominated assets and liabilities (other than investments) at year-end exchange rates are reflected as a component of net unrealized appreciation (depreciation) on foreign currencies.
Foreign security and currency transactions may involve certain considerations and risks not typically associated with those of domestic origin as a result of, among other factors, the possibility of political or economic instability, or the level of governmental supervision and regulation of foreign securities markets.
Forward Currency Contracts: A forward currency contract is a commitment to purchase or sell a foreign currency at a future date at a negotiated forward rate. The Fund enters into forward currency contracts in order to hedge its exposure to changes in foreign currency exchange rates on its foreign portfolio holdings or specific receivables and payables denominated in a foreign currency. The contracts are valued daily at current forward exchange rates and any unrealized gain or loss is included in net unrealized appreciation or depreciation on foreign currencies. Gain or loss is realized on the settlement date of the contract equal to the difference between the settlement value of the original and negotiated forward contracts. This gain or loss, if any, is included in net realized gain (loss) on foreign currency transactions. Risks may arise upon entering into these contracts from the potential inability of the counterparties to meet the terms of their contracts. Forward currency contracts involve elements of both market and credit risk in excess of the amounts reflected on the Statement of Assets and Liabilities. The Fund’s maximum risk of loss from counterparty credit risk is the net value of the cash flows to be received from the counterparty at the end of the contract’s life. A master netting agreement between the Fund and the counterparty permits the Fund to offset amounts payable by the Fund to the same counterparty against amounts to be received; and by the receipt of collateral
| | | | |
| Prudential International Real Estate Fund | | | 25 | |
Notes to Financial Statements
continued
from the counterparty by the Fund to cover the Fund’s exposure to the counterparty. However, there is no assurance that such mitigating factors are easily enforceable.
Warrants and Rights: The Fund may hold warrants and rights acquired either through a direct purchase, included as part of a private placement, or pursuant to corporate actions. Warrants and rights entitle the holder to buy a proportionate amount of common stock, or such other security that the issuer may specify, at a specific price and time through the expiration dates. Such warrants and rights are held as long positions by the Fund until exercised, sold or expired. Warrants and rights are valued at fair value in accordance with the Board of Trustees’ approved fair valuation procedures.
Securities Transactions and Net Investment Income: Securities transactions are recorded on the trade date. Realized gains or losses from investment and currency transactions are calculated on the identified cost basis. Dividend income is recorded on the ex-dividend date. Interest income, including amortization of premium and accretion of discount on debt securities, as required, is recorded on the accrual basis. Expenses are recorded on an accrual basis, which may require the use of certain estimates by management, that may differ from actual.
Net investment income or loss (other than distribution fees which are charged directly to the respective class) and unrealized and realized gains or losses are allocated daily to each class of shares based upon the relative proportion of adjusted net assets of each class at the beginning of the day.
The Fund invests in real estate investment trusts (“REITs”), which report information on the source of their distributions annually. Based on current and historical information, a portion of distributions received from REITs during the year is estimated to be dividend income, capital gain or return of capital and is recorded accordingly. These estimates are adjusted when the actual source of distributions is disclosed by the REITs.
Dividends and Distributions: The Fund expects to pay dividends of net investment income and distributions of net realized capital and currency gains, if any, annually.
Dividends and distributions to shareholders, which are determined in accordance with federal income tax regulations and which may differ from generally accepted accounting principles, are recorded on the ex-dividend date. Permanent book/tax differences relating to income and gains are reclassified amongst undistributed net
| | |
| 26 | | Visit our website at www.prudentialfunds.com |
investment income, accumulated net realized gain or loss and paid-in capital in excess of par as appropriate.
Taxes: It is the Fund’s policy to continue to meet the requirements of the Internal Revenue Code applicable to regulated investment companies and to distribute all of its taxable net investment income and capital gains, if any, to its shareholders. Therefore, no federal income tax provision is required.
Withholding taxes on foreign dividends are recorded, net of reclaimable amounts, at the time the related income is earned.
Estimates: The preparation of the financial statements requires management to make estimates and assumptions that affect the reported amounts and disclosures in the financial statements. Actual results could differ from those estimates.
Note 2. Agreements
The Fund has a management agreement with PI. Pursuant to this agreement, PI manages the investment operations of the Fund, administers the Fund’s affairs and supervises the Subadviser’s performance of all investment advisory services. PI has entered into a subadvisory agreement with Prudential Real Estate Investors (“PREI”), which is a business unit of Prudential Investment Management, Inc. (“PIM”). The subadvisory agreement provides that PREI will furnish investment advisory services in connection with the management of the Fund. In connection therewith, PREI is obligated to keep certain books and records of the Fund. Pursuant to the advisory agreement, PI pays for the services of PREI, the cost of compensation of officers of the Fund, occupancy and certain clerical and accounting costs of the Fund. The Fund bears all other costs and expenses.
The management fee paid to PI is computed daily and payable monthly at an annual rate of 1.00% of the Fund’s average daily net assets.
PI has contractually agreed through February 28, 2014 to limit net annual Fund operating expenses (exclusive of distribution and service (12b-1) fees, extraordinary and certain other expenses, such as taxes, interest and brokerage commissions) of each class of shares to 1.35% of the Fund’s average daily net assets.
The Fund has a distribution agreement with Prudential Investment Management Services LLC (“PIMS”), which acts as the distributor of the Class A, B, C and Z shares of the Fund. The Fund compensates PIMS for distributing and servicing the Fund’s
| | | | |
| Prudential International Real Estate Fund | | | 27 | |
Notes to Financial Statements
continued
Class A, B and C shares, pursuant to plans of distribution (the “Distribution Plans”), regardless of expenses actually incurred by PIMS. The distribution fees are accrued daily and payable monthly. No distribution or service fees are paid to PIMS as distributor of the Class Z shares of the Fund.
Pursuant to the Distribution Plans, the Fund compensates PIMS for distribution related activities at an annual rate of up to .30%, 1%, and 1% of the average daily net assets of the Class A, B, and C shares, respectively. PIMS has contractually agreed through February 28, 2014 to limit such fees to .25% of the average daily net assets of the Class A shares.
PIMS has advised the Fund that it has received $1,880 in front-end sales charges resulting from sales of Class A shares, during the year ended October 31, 2012. From these fees, PIMS paid such sales charges to affiliated broker-dealers, which in turn paid commissions to salespersons and incurred other distribution costs.
PIMS has advised the Fund that for the year ended October 31, 2012, there were no contingent deferred sales charges imposed.
PI, PIM and PIMS are indirect, wholly-owned subsidiaries of Prudential Financial, Inc. (“Prudential”).
Note 3. Other Transactions with Affiliates
Prudential Mutual Fund Services LLC (“PMFS”), an affiliate of PI and an indirect, wholly-owned subsidiary of Prudential, serves as the Fund’s transfer agent. Transfer agent fees and expenses in the Statement of Operations include certain out-of-pocket expenses paid to non-affiliates, where applicable.
The Fund invests in the Prudential Core Taxable Money Market Fund (the “Core Fund”), a portfolio of the Prudential Investment Portfolios 2, registered under the Investment Company 1940 Act, and managed by PI. Earnings from the Core Fund are disclosed on the Statement of Operations as affiliated dividend income.
| | |
| 28 | | Visit our website at www.prudentialfunds.com |
Note 4. Portfolio Securities
Purchases and sales of portfolio securities, other than short-term investments, for the year ended October 31, 2012, were $5,349,615 and $2,987,958, respectively.
Note 5. Distributions and Tax Information
Distributions to shareholders, which are determined in accordance with federal income tax regulations and which may differ from generally accepted accounting principles, are recorded on the ex-dividend date. In order to present undistributed net investment income, accumulated net realized loss on investment and foreign currency transactions and paid-in capital in excess of par on the Statement of Assets and Liabilities that more closely represent their tax character, certain adjustments have been made to undistributed net investment income and accumulated net realized loss on investment and foreign currency transactions. For the year ended October 31, 2012, the adjustments were to increase undistributed net investment income and increase accumulated net realized loss on investment and foreign currency transactions by $16,822 due to differences in the treatment for book and tax purposes of certain transactions involving investments in passive foreign investment companies and foreign currencies. Net investment income, net realized loss on investment and foreign currency transactions and net assets were not affected by this change.
For the year ended October 31, 2012, the tax character of dividends paid as reflected in the Statement of Changes in Net Assets was $425,701. There were no distributions paid by the Fund for the period ended October 31, 2011.
As of October 31, 2012, the accumulated undistributed earnings on a tax basis was $931,067 of ordinary income. This differs from the amount shown on the Statement of Assets and Liabilities primarily due to cumulative timing differences between financial and tax reporting.
The United States federal income tax basis of the Fund’s investments and the net unrealized appreciation as of October 31, 2012 were as follows:
| | | | | | | | | | |
Tax Basis | | Appreciation | | Depreciation | | Net
Unrealized
Appreciation | | Other Cost
Basis
Adjustments | | Total Net
Unrealized
Appreciation |
| $18,908,897 | | $1,414,860 | | $(781,929) | | $632,931 | | $(188) | | $632,743 |
| | | | |
| Prudential International Real Estate Fund | | | 29 | |
Notes to Financial Statements
continued
The difference between book basis and tax basis is primarily attributable to deferred losses on wash sales and investments in passive foreign investment companies. The other cost basis adjustments are primarily attributable to appreciation (depreciation) of foreign currencies.
Under the Regulated Investment Company Modernization Act of 2010 (“the Act”), the Fund is permitted to carryforward capital losses incurred in the fiscal year ended October 31, 2012 (“post-enactment losses”) for an unlimited period. Post-enactment losses are required to be utilized before the utilization of losses incurred prior to the effective date of the Act. As a result of this ordering rule, capital loss carryforwards related to taxable years ending before October 31, 2012 (“pre-enactment losses”) may have an increased likelihood to expire unused. Additionally, post-enactment capital losses that are carried forward will retain their character as either short-term or long-term capital losses rather than being considered all short-term as under previous law. No capital gains distributions are expected to be paid to shareholders until net gains have been realized in excess of such losses. As of October 31, 2012, the pre and post-enactment losses were approximately:
| | | | |
Post-Enactment Losses: | | $ | 423,000 | |
| | | | |
Pre-Enactment Losses: | | | | |
Expiring 2019 | | $ | 190,000 | |
| | | | |
Management has analyzed the Fund’s tax positions taken on federal income tax returns for all open tax years and has concluded that no provision for income tax is required in the Fund’s financial statements for the current reporting period. The Fund’s federal and state income and federal excise tax returns for tax years for which the applicable statutes of limitations have not expired are subject to examination by the Internal Revenue Service and state departments of revenue.
Note 6. Capital
The Fund offers Class A, Class B, Class C and Class Z shares. Class A shares are sold subject to a maximum front-end sales charge of up to 5.50%. Investors who purchase Class A shares in an amount of $1 million or more and sell these shares within 12 months of purchase are not subject to an initial sales charge, but are subject to a contingent deferred sales charge (“CDSC”) of 1%. The Class A CDSC is waived for purchases by certain retirement and/or benefit plans. Class B shares are sold with a
| | |
| 30 | | Visit our website at www.prudentialfunds.com |
CDSC which declines from 5% to zero depending on the period of time the shares are held. Class C shares are sold with a CDSC of 1% on shares redeemed within the first 12 months after purchase. Class B shares automatically convert to Class A shares on a quarterly basis approximately seven years after purchase. A special exchange privilege is also available for shareholders who qualified to purchase Class A shares at net asset value. Class Z shares are not subject to any sales or redemption charge and are offered exclusively for sale to a limited group of investors.
Under certain circumstances, an exchange may be made from specified share classes of the Fund to one or more other share classes of the Fund.
The Trust has authorized an unlimited number of shares of beneficial interest at $.001 par value per share.
As of October 31, 2012, Prudential owned 104 Class A shares, 103 Class B shares, 103 Class C shares and 1,039,874 Class Z shares of the Fund.
Transactions in shares of beneficial interest were as follows:
| | | | | | | | |
Class A | | Shares | | | Amount | |
Year ended October 31, 2012: | | | | | | | | |
Shares sold | | | 19,755 | | | $ | 187,815 | |
Shares issued in reinvestment of dividends and distributions | | | 560 | | | | 4,411 | |
Shares reacquired | | | (75,300 | ) | | | (675,175 | ) |
| | | | | | | | |
Net increase (decrease) in shares outstanding | | | (54,985 | ) | | $ | (482,949 | ) |
| | | | | | | | |
Period December 21, 2010* through October 31, 2011: | | | | | | | | |
Shares sold | | | 144,845 | | | $ | 1,498,855 | |
Shares reacquired | | | (56,362 | ) | | | (570,029 | ) |
| | | | | | | | |
Net increase (decrease) in shares outstanding | | | 88,483 | | | $ | 928,826 | |
| | | | | | | | |
Class B | | | | | | |
Year ended October 31, 2012: | | | | | | | | |
Shares sold | | | 16,157 | | | $ | 154,445 | |
Shares issued in reinvestment of dividends and distributions | | | 13 | | | | 105 | |
Shares reacquired | | | (349 | ) | | | (3,500 | ) |
| | | | | | | | |
Net increase (decrease) in shares outstanding | | | 15,821 | | | $ | 151,050 | |
| | | | | | | | |
Period December 21, 2010* through October 31, 2011: | | | | | | | | |
Shares sold | | | 864 | | | $ | 8,834 | |
Shares reacquired | | | (374 | ) | | | (3,533 | ) |
| | | | | | | | |
Net increase (decrease) in shares outstanding | | | 490 | | | $ | 5,301 | |
| | | | | | | | |
| * | Commencement of operations. |
| | | | |
| Prudential International Real Estate Fund | | | 31 | |
Notes to Financial Statements
continued
| | | | | | | | |
Class C | | Shares | | | Amount | |
Year ended October 31, 2012: | | | | | | | | |
Shares sold | | | 12,709 | | | $ | 117,395 | |
Shares issued in reinvestment of dividends and distributions | | | 122 | | | | 955 | |
Shares reacquired | | | (14,206 | ) | | | (128,361 | ) |
| | | | | | | | |
Net increase (decrease) in shares outstanding | | | (1,375 | ) | | $ | (10,011 | ) |
| | | | | | | | |
Period December 21, 2010* through October 31, 2011: | | | | | | | | |
Shares sold | | | 3,341 | | | $ | 32,762 | |
Shares reacquired | | | — | | | | — | |
| | | | | | | | |
Net increase (decrease) in shares outstanding | | | 3,341 | | | $ | 32,762 | |
| | | | | | | | |
Class Z | | | | | | |
Year ended October 31, 2012: | | | | | | | | |
Shares sold | | | 642,247 | | | $ | 5,961,283 | |
Shares issued in reinvestment of dividends and distributions | | | 53,669 | | | | 420,230 | |
Shares reacquired | | | (295,236 | ) | | | (2,658,758 | ) |
| | | | | | | | |
Net increase (decrease) in shares outstanding | | | 400,680 | | | $ | 3,722,755 | |
| | | | | | | | |
Period December 21, 2010* through October 31, 2011: | | | | | | | | |
Shares sold | | | 1,655,059 | | | $ | 16,328,000 | |
Shares reacquired | | | (208,895 | ) | | | (2,077,026 | ) |
| | | | | | | | |
Net increase (decrease) in shares outstanding | | | 1,446,164 | | | $ | 14,250,974 | |
| | | | | | | | |
| * | Commencement of operations. |
Note 7. Borrowings
The Fund, along with other affiliated registered investment companies (the “Funds”), is a party to a Syndicated Credit Agreement (“SCA”) with a group of banks. The purpose of the SCA is to provide an alternative source of temporary funding for capital share redemptions. The SCA provides for a commitment of $900 million for the period December 16, 2011 through November 14, 2012. The SCA has been renewed effective November 15, 2012 at substantially similar terms through November 14, 2013. The Funds pay an annualized commitment fee of .08% on the unused portion of the SCA. Prior to December 16, 2011, the Funds had another SCA of a $750 million commitment with an annualized commitment fee of .10% on the unused portion. Interest on any borrowings under the SCA is paid at contracted market rates. The commitment fee for the unused amount is accrued daily and paid quarterly.
| | |
| 32 | | Visit our website at www.prudentialfunds.com |
The Fund utilized the SCA during the year ended October 31, 2012. The average daily balance for the 5 days the Fund had debt outstanding during the year was $290,200 at a weighted average interest rate of approximately 1.50%. At October 31, 2012, the Fund did not have an outstanding loan amount.
Note 8. Notice of Dividends to Shareholders
The Fund declared ordinary income dividends on December 20, 2012 to shareholders of record on December 21, 2012. The ex-dividend date was December 24, 2012. The per share amounts declared were as follows:
| | | | |
| | | Ordinary
Income | |
| Class A* | | $ | 0.54622 | |
| Class B* | | $ | 0.47247 | |
| Class C* | | $ | 0.54622 | |
| Class Z* | | $ | 0.57056 | |
| * | Includes $0.37396 of Special Ordinary Income. |
Note 9. New Accounting Pronouncement
In December 2011, the Financial Accounting Standards Board (“FASB”) issued Accounting Standards Update (“ASU”) No. 2011-11 regarding “Disclosures about Offsetting Assets and Liabilities.” The amendments, which will be effective for annual reporting periods beginning on or after January 1, 2013 and interim periods within those annual periods, require an entity to disclose information about offsetting and related arrangements for assets and liabilities, financial instruments and derivatives that are either currently offset in accordance with current requirements or are subject to enforceable master netting arrangements or similar agreements. At this time, management is evaluating the implications of ASU No. 2011-11 and its impact on the financial statements has not yet been determined.
| | | | |
| Prudential International Real Estate Fund | | | 33 | |
Financial Highlights
| | | | | | | | | | |
| Class A Shares | |
| | | Year Ended
October 31,
2012(b) | | | | | December 21,
2010(e)
through
October 31,
2011(b) | |
| Per Share Operating Performance: | | | | | | | | | | |
| Net Asset Value, Beginning of Period | | | $9.20 | | | | | | $10.00 | |
| Income (loss) from investment operations: | | | | | | | | | | |
| Net investment income | | | .19 | | | | | | .07 | |
| Net realized and unrealized gain (loss) on investments | | | 1.23 | | | | | | (.87 | ) |
| Total from investment operations | | | 1.42 | | | | | | (.80 | ) |
| Less Dividends and Distributions: | | | | | | | | | | |
| Dividends from net investment income | | | (.29 | ) | | | | | - | |
| Total dividends and distributions | | | (.29 | ) | | | | | - | |
| Net Asset Value, end of period | | | $10.33 | | | | | | $9.20 | |
| Total Return(a): | | | 16.39% | | | | | | (8.00 | )% |
| |
| Ratios/Supplemental Data: | |
| Net assets, end of period (000) | | | $346 | | | | | | $814 | |
| Average net assets (000) | | | $228 | | | | | | $353 | |
| Ratios to average net assets(d): | | | | | | | | | | |
| Expenses, including distribution and service (12b-1) fees(c) | | | 1.60% | (h) | | | | | 1.60% | (f)(h) |
| Expenses, excluding distribution and service (12b-1) fees | | | 1.35% | (h) | | | | | 1.35% | (f)(h) |
| Net investment income | | | 2.00% | (h) | | | | | .89% | (f)(h) |
| Portfolio turnover rate | | | 21% | | | | | | 30% | (g) |
(a) Total return does not consider the effect of sales loads. Total return is calculated assuming a purchase of a share on the first day and a sale on the last day of each period reported and includes reinvestment of dividends and distributions, if any. Total returns may reflect adjustments to conform to generally accepted accounting principles. Total returns for periods less than one full year are not annualized.
(b) Calculations are based on the average daily number of shares outstanding.
(c) The distributor of the Fund has contractually agreed to limit its distribution and service (12b-1) fees to .25% of the average daily net assets of the Class A shares.
(d) Does not include expenses of the underlying fund in which the Fund invests.
(e) Commencement of operations.
(f) Annualized.
(g) Not annualized.
(h) Net of expense reimbursement. If the investment manager had not reimbursed expenses, the expense ratios both including and excluding distribution and service (12b-1) fees and the net investment income (loss) ratio would have been 2.88%, 2.63%, and .72%, respectively, for the year ended October 31, 2012 and 3.80%, 3.55% and (1.31)%, respectively, for the period ended October 31, 2011.
See Notes to Financial Statements.
| | |
| 34 | | Visit our website at www.prudentialfunds.com |
| | | | | | | | | | |
| Class B Shares | |
| | | Year Ended
October 31,
2012(b) | | | | | December 21,
2010(d)
through
October 31,
2011(b) | |
| Per Share Operating Performance: | | | | | | | | | | |
| Net Asset Value, Beginning of Period | | | $9.08 | | | | | | $10.00 | |
| Income (loss) from investment operations: | | | | | | | | | | |
| Net investment income | | | .08 | | | | | | .11 | |
| Net realized and unrealized gain (loss) on investments | | | 1.27 | | | | | | (1.03 | ) |
| Total from investment operations | | | 1.35 | | | | | | (.92 | ) |
| Less Dividends and Distributions: | | | | | | | | | | |
| Dividends from net investment income | | | (.21 | ) | | | | | - | |
| Total dividends and distributions | | | (.21 | ) | | | | | - | |
| Net Asset Value, end of period | | | $10.22 | | | | | | $9.08 | |
| Total Return(a): | | | 15.63% | | | | | | (9.20 | )% |
| |
| Ratios/Supplemental Data: | |
| Net assets, end of period (000) | | | $167 | | | | | | $4 | |
| Average net assets (000) | | | $52 | | | | | | $5 | |
| Ratios to average net assets(c): | | | | | | | | | | |
| Expenses, including distribution and service (12b-1) fees | | | 2.35% | (f) | | | | | 2.35% | (e)(f) |
| Expenses, excluding distribution and service (12b-1) fees | | | 1.35% | (f) | | | | | 1.35% | (e)(f) |
| Net investment income | | | .87% | (f) | | | | | 1.29% | (e)(f) |
| Portfolio turnover rate | | | 21% | | | | | | 30% | (g) |
(a) Total return does not consider the effect of sales loads. Total return is calculated assuming a purchase of a share on the first day and a sale on the last day of each period reported and includes reinvestment of dividends and distributions, if any. Total returns may reflect adjustments to conform to generally accepted accounting principles. Total returns for periods less than one full year are not annualized.
(b) Calculations are based on the average daily number of shares outstanding.
(c) Does not include expenses of the underlying fund in which the Fund invests.
(d) Commencement of operations.
(e) Annualized.
(f) Net of expense reimbursement. If the investment manager had not reimbursed expenses, the expense ratios both including and excluding distribution and service (12b-1) fees and the net investment income (loss) ratio would have been 3.74%, 2.74%, and (.52)%, respectively, for the year ended October 31, 2012 and 4.55%, 3.55%, and (.91)%, respectively, for the period ended October 31, 2011.
(g) Not annualized.
See Notes to Financial Statements.
| | | | |
| Prudential International Real Estate Fund | | | 35 | |
Financial Highlights
continued
| | | | | | | | | | |
| Class C Shares | |
| | | Year Ended
October 31,
2012(b) | | | | | December 21,
2010(d)
through
October 31,
2011(b) | |
| Per Share Operating Performance: | | | | | | | | | | |
| Net Asset Value, Beginning of Period | | | $9.10 | | | | | | $10.00 | |
| Income (loss) from investment operations: | | | | | | | | | | |
| Net investment income | | | .21 | | | | | | .14 | |
| Net realized and unrealized gain (loss) on investments | | | 1.20 | | | | | | (1.04 | ) |
| Total from investment operations | | | 1.41 | | | | | | (.90 | ) |
| Less Dividends and Distributions: | | | | | | | | | | |
| Dividends from net investment income | | | (.26 | ) | | | | | - | |
| Total dividends and distributions | | | (.26 | ) | | | | | - | |
| Net Asset Value, end of period | | | $10.25 | | | | | | $9.10 | |
| Total Return(a): | | | 16.36% | | | | | | (9.00 | )% |
| |
| Ratios/Supplemental Data: | |
| Net assets, end of period (000) | | | $20 | | | | | | $30 | |
| Average net assets (000) | | | $23 | | | | | | $23 | |
| Ratios to average net assets(c): | | | | | | | | | | |
| Expenses, including distribution and service (12b-1) fees | | | 1.60% | (f) | | | | | 1.96% | (e)(f) |
| Expenses, excluding distribution and service (12b-1) fees | | | 1.35% | (f) | | | | | 1.35% | (e)(f) |
| Net investment income | | | 2.31% | (f) | | | | | 1.68% | (e)(f) |
| Portfolio turnover rate | | | 21% | | | | | | 30% | (g) |
(a) Total return does not consider the effect of sales loads. Total return is calculated assuming a purchase of a share on the first day and a sale on the last day of each period reported and includes reinvestment of dividends and distributions, if any. Total returns may reflect adjustments to conform to generally accepted accounting principles. Total returns for periods less than one full year are not annualized.
(b) Calculations are based on the average daily number of shares outstanding.
(c) Does not include expenses of the underlying fund in which the Fund invests.
(d) Commencement of operations.
(e) Annualized.
(f) Net of expense reimbursement. If the investment manager had not reimbursed expenses, the expense ratios both including and excluding distribution and service (12b-1) fees and the net investment income (loss) ratio would have been 2.86%, 2.61%, and 1.05%, respectively, for the year ended October 31, 2012, and 4.16%, 3.55%, and (.52)%, respectively, for the period ended October 31, 2011.
(g) Not annualized.
See Notes to Financial Statements.
| | |
| 36 | | Visit our website at www.prudentialfunds.com |
| | | | | | | | | | |
| Class Z Shares | |
| | | Year Ended
October 31,
2012(b) | | | | | December 21,
2010(d)
through
October 31,
2011(b) | |
| Per Share Operating Performance: | | | | | | | | | | |
| Net Asset Value, Beginning of Period | | | $9.15 | | | | | | $10.00 | |
| Income (loss) from investment operations: | | | | | | | | | | |
| Net investment income | | | .22 | | | | | | .18 | |
| Net realized and unrealized gain (loss) on investments | | | 1.22 | | | | | | (1.03 | ) |
| Total from investment operations | | | 1.44 | | | | | | (.85 | ) |
| Less Dividends and Distributions: | | | | | | | | | | |
| Dividends from net investment income | | | (.31 | ) | | | | | - | |
| Total dividends and distributions | | | (.31 | ) | | | | | - | |
| Net Asset Value, end of period | | | $10.28 | | | | | | $9.15 | |
| Total Return(a): | | | 16.82% | | | | | | (8.50 | )% |
| |
| Ratios/Supplemental Data: | |
| Net assets, end of period (000) | | | $18,994 | | | | | | $13,233 | |
| Average net assets (000) | | | $14,068 | | | | | | $12,252 | |
| Ratios to average net assets(c): | | | | | | | | | | |
| Expenses, including distribution and service (12b-1) fees | | | 1.35% | (f) | | | | | 1.35% | (e)(f) |
| Expenses, excluding distribution and service (12b-1) fees | | | 1.35% | (f) | | | | | 1.35% | (e)(f) |
| Net investment income | | | 2.39% | (f) | | | | | 2.15% | (e)(f) |
| Portfolio turnover rate | | | 21% | | | | | | 30% | (g) |
(a) Total return is calculated assuming a purchase of a share on the first day and a sale on the last day of each period reported and includes reinvestment of dividends and distributions, if any. Total returns may reflect adjustments to conform to generally accepted accounting principles. Total returns for periods less than one full year are not annualized.
(b) Calculations are based on the average daily number of shares outstanding.
(c) Does not include expenses of the underlying fund in which the Fund invests.
(d) Commencement of operations.
(e) Annualized.
(f) Net of expense reimbursement. If the investment manager had not reimbursed expenses, the expense ratios both including and excluding distribution and service (12b-1) fees and the net investment income (loss) ratio would have been 2.65%, 2.65%, and 1.09%, respectively, for the year ended October 31, 2012 and 3.55%, 3.55%, and (.05)%, respectively, for the period ended October 31, 2011.
(g) Not annualized.
See Notes to Financial Statements.
| | | | |
| Prudential International Real Estate Fund | | | 37 | |
Report of Independent Registered Public
Accounting Firm
The Board of Trustees and Shareholders
Prudential Investment Portfolios 9:
We have audited the accompanying statement of assets and liabilities of Prudential International Real Estate Fund, a series of Prudential Investment Portfolios 9 (hereafter referred to as the “Fund”), including the portfolio of investments, as of October 31, 2012, and the related statements of operations, changes in net assets and the financial highlights for the year then ended and for the period from December 21, 2010 to October 31, 2011. These financial statements and financial highlights are the responsibility of the Fund’s management. Our responsibility is to express an opinion on these financial statements and financial highlights based on our audit.
We conducted our audit in accordance with the standards of the Public Company Accounting Oversight Board (United States). Those standards require that we plan and perform the audit to obtain reasonable assurance about whether the financial statements and financial highlights are free of material misstatement. An audit includes examining, on a test basis, evidence supporting the amounts and disclosures in the financial statements. Our procedures included confirmation of securities owned as of October 31, 2012, by correspondence with the custodian, transfer agent and brokers or by other appropriate auditing procedures when replies from brokers were not received. An audit also includes assessing the accounting principles used and significant estimates made by management, as well as evaluating the overall financial statement presentation. We believe that our audit provides a reasonable basis for our opinion.
In our opinion, the financial statements and financial highlights referred to above present fairly, in all material respects, the financial position of the Fund as of October 31, 2012, and the results of its operations, the changes in its net assets and the financial highlights for the year then ended and for the period December 21, 2010 to October 31, 2011, in conformity with U.S. generally accepted accounting principles.

New York, New York
December 21, 2012
| | |
| 38 | | Visit our website at www.prudentialfunds.com |
Tax Information
(Unaudited)
For the year ended October 31, 2012, the Fund reports the maximum amount allowable under Section 854 of the Internal Revenue Code but not less than the following percentage of the ordinary income distributions paid as qualified dividend income (QDI):
| | | | |
| | | QDI | |
| |
Prudential International Real Estate Fund | | | 44.96% | |
For the year ended October 31, 2012, the Fund made an election to pass through the maximum amount of the portion of the ordinary income dividends paid derived from foreign source income as well as any foreign taxes paid by the Fund in accordance with Section 853 of the Internal Revenue Code of the following amounts: $27,400 foreign tax credit from recognized foreign source income of $581,932.
In January 2013, you will be advised on IRS Form 1099-DIV or substitute 1099-DIV as to the federal tax status of distributions received by you in calendar year 2012.
| | | | |
| Prudential International Real Estate Fund | | | 39 | |
INFORMATION ABOUT BOARD MEMBERS AND OFFICERS
(Unaudited)
Information about Board Members and Officers of the Fund is set forth below. Board Members who are not deemed to be “interested persons” of the Fund, as defined in the 1940 Act, are referred to as “Independent Board Members.” Board Members who are deemed to be “interested persons” of the Fund are referred to as “Interested Board Members.” The Board Members are responsible for the overall supervision of the operations of the Fund and perform the various duties imposed on the directors of investment companies by the 1940 Act. The Board in turn elects the Officers, who are responsible for administering the day-to-day operations of the Fund.
| | | | |
| Independent Board Members(1) |
Name, Address, Age Position(s) Portfolios Overseen | | Principal Occupation(s) During Past Five Years | | Other Directorships Held |
Kevin J. Bannon (60) Board Member Portfolios Overseen: 63 | | Managing Director (since April 2008) and Chief Investment Officer (since October 2008) of Highmount Capital LLC (registered investment adviser); formerly Executive Vice President and Chief Investment Officer (April 1993-August 2007) of Bank of New York Company; President (May 2003-May 2007) of BNY Hamilton Family of Mutual Funds. | | Director of Urstadt Biddle Properties (since September 2008). |
Linda W. Bynoe (60) Board Member Portfolios Overseen: 63 | | President and Chief Executive Officer (since March 1995) and formerly Chief Operating Officer (December 1989-February 1995) of Telemat Ltd. (management consulting); formerly Vice President (January 1985-June 1989) at Morgan Stanley & Co (broker-dealer). | | Director of Simon Property Group, Inc. (retail real estate) (May 2003-May 2012); Director of Anixter International, Inc. (communication products distributor) (since January 2006); Director of Northern Trust Corporation (financial services) (since April 2006); Trustee of Equity Residential (residential real estate) (since December 2009). |
Michael S. Hyland, CFA (67) Board Member Portfolios Overseen: 63 | | Independent Consultant (since February 2005); formerly Senior Managing Director (July 2001-February 2005) of Bear Stearns & Co, Inc.; Global Partner, INVESCO (1999-2001); Managing Director and President of Salomon Brothers Asset Management (1989-1999). | | None. |
Douglas H. McCorkindale (73) Board Member Portfolios Overseen: 63 | | Formerly Chairman (February 2001-June 2006), Chief Executive Officer (June 2000-July 2005), President (September 1997-July 2005) and Vice Chairman (March 1984-May 2000) of Gannett Co. Inc. (publishing and media). | | Director of Lockheed Martin Corp. (aerospace and defense) (since May 2001). |
Visit our website at www.prudentialfunds.com
| | | | |
| Independent Board Members(1) |
Name, Address, Age Position(s) Portfolios Overseen | | Principal Occupation(s) During Past Five Years | | Other Directorships Held |
Stephen P. Munn (70) Board Member Portfolios Overseen: 63 | | Lead Director (since 2007) and formerly Chairman (1993-2007) of Carlisle Companies Incorporated (manufacturer of industrial products). | | Lead Director (since 2007) of Carlisle Companies Incorporated (manufacturer of industrial products). |
Richard A. Redeker (69) Board Member & Independent Chair Portfolios Overseen: 63 | | Retired Mutual Fund Senior Executive (44 years); Management Consultant; Independent Directors Council (organization of 2,800 Independent Mutual Fund Directors)-Executive Committee, Chair of Policy Steering Committee, Governing Council. | | None. |
Robin B. Smith (73) Board Member Portfolios Overseen: 63 | | Chairman of the Board (since January 2003) of Publishers Clearing House (direct marketing); Member of the Board of Directors of ADLPartner (marketing) (since December 2010); formerly Chairman and Chief Executive Officer (August 1996-January 2003) of Publishers Clearing House. | | Formerly Director of BellSouth Corporation (telecommunications) (1992-2006). |
Stephen G. Stoneburn (69) Board Member Portfolios Overseen: 63 | | Chairman, (since July 2011), President and Chief Executive Officer (since June 1996) of Quadrant Media Corp. (publishing company); formerly President (June 1995-June 1996) of Argus Integrated Media, Inc.; Senior Vice President and Managing Director (January 1993-1995) of Cowles Business Media; Senior Vice President of Fairchild Publications, Inc. (1975-1989). | | None. |
| | | | |
| Interested Board Members(1) |
Name, Address, Age Position(s) Portfolios Overseen | | Principal Occupation(s) During Past Five Years | | Other Directorships Held |
Stuart S. Parker (50) Board Member & President Portfolios Overseen: 63 | | President of Prudential Investments LLC (since January 2012); Executive Vice President of Jennison Associates LLC and Head of Retail Distribution of Prudential Investments LLC (June 2005 - December 2011). | | None. |
Prudential International Real Estate Fund
| | | | |
| Interested Board Members(1) |
Name, Address, Age Position(s) Portfolios Overseen | | Principal Occupation(s) During Past Five Years | | Other Directorships Held |
Scott E. Benjamin (39) Board Member & Vice President Portfolios Overseen: 63 | | Executive Vice President (since June 2009) of Prudential Investments LLC; Executive Vice President (June 2009-June 2012) and Vice President (since June 2012) of Prudential Investment Management Services LLC; Executive Vice President (since September 2009) of AST Investment Services, Inc.; Senior Vice President of Product Development and Marketing, Prudential Investments (since February 2006); Vice President of Product Development and Product Management, Prudential Investments (2003-2006). | | None. |
(1) The year that each individual joined the Fund’s Board is as follows:
Linda W. Bynoe, 2005; Douglas H. McCorkindale, 1998; Richard A. Redeker, 1998; Robin B. Smith, 1998; Stephen G. Stoneburn, 2003; Kevin J. Bannon, 2008; Michael S. Hyland, 2008; Stephen P. Munn, 2008; Stuart S. Parker, Board Member since 2012 and President since 2012; Scott E. Benjamin, Board Member since 2010 and Vice President since 2009.
| | |
| Fund Officers(a)(1) |
Name, Address and Age Position with Fund | | Principal Occupation(s) During Past Five Years |
Judy A. Rice (64) Vice President | | Chairman of Prudential Investments LLC (since January 2012); President, Chief Executive Officer (May 2011-Present) and Executive Vice President (December 2008-May 2011) of Prudential Investment Management Services LLC; formerly President, Chief Executive Officer, Chief Operating Officer and Officer-In-Charge (February 2003-December 2011) of Prudential Investments LLC; formerly President, Chief Executive Officer and Officer-In-Charge (April 2003-December 2011) of Prudential Mutual Fund Services LLC (PMFS); formerly Member of the Board of Directors of Jennison Associates LLC (November 2010-December 2011); formerly Vice President (February 1999-April 2006) of Prudential Investment Management Services LLC; formerly President, COO, CEO and Manager of PIFM Holdco, LLC (April 2006-December 2011); formerly President, Chief Executive Officer, Chief Operating Officer and Officer-In-Charge (May 2003-June 2005) and Director (May 2003-March 2006) and Executive Vice President (June 2005-March 2006) of AST Investment Services, Inc.; Member of Board of Governors of the Investment Company Institute. |
Visit our website at www.prudentialfunds.com
| | |
| Fund Officers(a)(1) |
Name, Address and Age Position with Fund | | Principal Occupation(s) During Past Five Years |
Raymond A. O’Hara (57) Chief Legal Officer | | Vice President and Corporate Counsel (since July 2010) of Prudential Insurance Company of America (Prudential); Vice President (March 2011-Present) of Pruco Life Insurance Company and Pruco Life Insurance Company of New Jersey; Vice President and Corporate Counsel (March 2011-Present) of Prudential Annuities Life Assurance Corporation; Chief Legal Officer of Prudential Investments LLC (since June 2012); Chief Legal Officer of PMFS (since June 2012) and Corporate Counsel of AST Investment Services, Inc. (since June 2012); formerly Assistant Vice President and Corporate Counsel (September 2008-July 2010) of The Hartford Financial Services Group, Inc.; formerly Associate (September 1980-December 1987) and Partner (January 1988–August 2008) of Blazzard & Hasenauer, P.C. (formerly, Blazzard, Grodd & Hasenauer, P.C.). |
Deborah A. Docs (54) Secretary | | Vice President and Corporate Counsel (since January 2001) of Prudential; Vice President (since December 1996) and Assistant Secretary (since March 1999) of Prudential Investments LLC; formerly Vice President and Assistant Secretary (May 2003-June 2005) of AST Investment Services, Inc. |
Jonathan D. Shain (54) Assistant Secretary | | Vice President and Corporate Counsel (since August 1998) of Prudential; Vice President and Assistant Secretary (since May 2001) of Prudential Investments LLC; Vice President and Assistant Secretary (since February 2001) of PMFS; formerly Vice President and Assistant Secretary (May 2003-June 2005) of AST Investment Services, Inc. |
Claudia DiGiacomo (38) Assistant Secretary | | Vice President and Corporate Counsel (since January 2005) of Prudential; Vice President and Assistant Secretary of Prudential Investments LLC (since December 2005); Associate at Sidley Austin Brown & Wood LLP (1999-2004). |
Andrew R. French (50) Assistant Secretary | | Vice President and Corporate Counsel (since February 2010) of Prudential; formerly Director and Corporate Counsel (2006-2010) of Prudential; Vice President and Assistant Secretary (since January 2007) of Prudential Investments LLC; Vice President and Assistant Secretary (since January 2007) of PMFS. |
Amanda S. Ryan (34) Assistant Secretary | | Director and Corporate Counsel (since March 2012) of Prudential; Director and Assistant Secretary (since June 2012) of Prudential Investments LLC; Associate at Ropes & Gray (2008-2012). |
Timothy J. Knierim (53) Chief Compliance Officer | | Chief Compliance Officer of Prudential Investment Management, Inc. (since July 2007); formerly Chief Risk Officer of Prudential Investment Management, Inc. and Prudential Investments LLC (2002-2007) and formerly Chief Ethics Officer of Prudential Investment Management, Inc. and Prudential Investments LLC (2006-2007). |
Valerie M. Simpson (54) Deputy Chief Compliance Officer | | Chief Compliance Officer (since April 2007) of Prudential Investments LLC and AST Investment Services, Inc.; formerly Vice President-Financial Reporting (June 1999-March 2006) for Prudential Life and Annuities Finance. |
Prudential International Real Estate Fund
| | |
| Fund Officers(a)(1) | | |
Name, Address and Age Position with Fund | | Principal Occupation(s) During Past Five Years |
Theresa C. Thompson (50) Deputy Chief Compliance Officer | | Vice President, Compliance, Prudential Investments LLC (since April 2004); and Director, Compliance, Prudential Investments LLC (2001-2004). |
Richard W. Kinville (44) Anti-Money Laundering Compliance Officer | | Vice President, Corporate Compliance, Anti-Money Laundering Unit (since January 2005) of Prudential; committee member of the American Council of Life Insurers Anti-Money Laundering and Critical Infrastructure Committee (since January 2007); formerly Investigator and Supervisor in the Special Investigations Unit for the New York Central Mutual Fire Insurance Company (August 1994-January 1999); Investigator in AXA Financial’s Internal Audit Department and Manager in AXA’s Anti-Money Laundering Office (January 1999-January 2005); first chair of the American Council of Life Insurers Anti-Money Laundering and Critical Infrastructure Committee (June 2007-December 2009). |
Grace C. Torres (53) Treasurer and Principal Financial and Accounting Officer | | Assistant Treasurer (since March 1999) and Senior Vice President (since September 1999) of Prudential Investments LLC; Assistant Treasurer (since May 2003) and Vice President (since June 2005) of AST Investment Services, Inc.; Senior Vice President and Assistant Treasurer (since May 2003) of Prudential Annuities Advisory Services, Inc.; formerly Senior Vice President (May 2003-June 2005) of AST Investment Services, Inc. |
M. Sadiq Peshimam (48) Assistant Treasurer | | Vice President (since 2005) of Prudential Investments LLC. |
Peter Parrella (54) Assistant Treasurer | | Vice President (since 2007) and Director (2004-2007) within Prudential Mutual Fund Administration; formerly Tax Manager at SSB Citi Fund Management LLC (1997-2004). |
(a) Excludes Mr. Parker and Mr. Benjamin, interested Board Members who also serve as President and Vice President, respectively.
(1) The year that each individual became an Officer of the Fund is as follows:
Judy A. Rice, 2012; Raymond A. O’Hara, 2012; Deborah A. Docs, 2005; Jonathan D. Shain, 2005; Claudia DiGiacomo, 2005; Andrew R. French, 2006; Amanda S. Ryan, 2012; Timothy J. Knierim, 2007; Valerie M. Simpson 2007; Theresa C. Thompson, 2008; Richard W. Kinville, 2011, Grace C. Torres, 1998; M. Sadiq Peshimam, 2006; Peter Parrella, 2007.
Explanatory Notes to Tables:
| | n | Board Members are deemed to be “Interested,” as defined in the 1940 Act, by reason of their affiliation with Prudential Investments LLC and/or an affiliate of Prudential Investments LLC. |
| | n | Unless otherwise noted, the address of all Board Members and Officers is c/o Prudential Investments LLC, Gateway Center Three, 100 Mulberry Street, Newark, New Jersey 07102-4077. |
| | n | There is no set term of office for Board Members or Officers. The Board Members have adopted a retirement policy, which calls for the retirement of Board Members on December 31 of the year in which they reach the age of 75. |
| | n | “Other Directorships Held” includes only directorships of companies required to register or file reports with the SEC under the 1934 Act (that is, “public companies”) or other investment companies registered under the 1940 Act. |
| | n | “Portfolios Overseen” includes all investment companies managed by Prudential Investments LLC. The investment companies for which PI serves as manager include the Prudential Investments Mutual Funds, The Prudential Variable Contract Accounts, Target Mutual Funds, Prudential Short Duration High Yield Fund, Inc., The Prudential Series Fund, Prudential’s Gibraltar Fund, Inc. and the Advanced Series Trust. |
Visit our website at www.prudentialfunds.com
Approval of Advisory Agreements
The Fund’s Board of Trustees
The Board of Trustees (the “Board”) of Prudential International Real Estate Fund (the “Fund”)1 consists of ten individuals, eight of whom are not “interested persons” of the Fund, as defined in the Investment Company Act of 1940, as amended (the “1940 Act”) (the “Independent Trustees”). The Board is responsible for the oversight of the Fund and its operations, and performs the various duties imposed on the directors of investment companies by the 1940 Act. The Independent Trustees have retained independent legal counsel to assist them in connection with their duties. The Chair of the Board is an Independent Trustee. The Board has established three standing committees: the Audit Committee, the Nominating and Governance Committee, and the Investment Committee. Each committee is chaired by, and composed of, Independent Trustees.
Annual Approval of the Fund’s Advisory Agreements
As required under the 1940 Act, the Board determines annually whether to renew the Fund’s management agreement with Prudential Investments LLC (“PI”) and the Fund’s subadvisory agreement with Prudential Investment Management, Inc. (“PIM”), which provides subadvisory services to the Fund through its Prudential Real Estate Investors unit (“PREI”). In considering the renewal of the agreements, the Board, including all of the Independent Trustees, met on June 5-7, 2012 and approved the renewal of the agreements through July 31, 2013, after concluding that the renewal of the agreements was in the best interests of the Fund and its shareholders.
In advance of the meetings, the Board requested and received materials relating to the agreements, and had the opportunity to ask questions and request further information in connection with its consideration. Among other things, the Board considered comparative fee information from PI and PIM. Also, the Board considered comparisons with other mutual funds in relevant Peer Universes and Peer Groups, as is further discussed below.
In approving the agreements, the Board, including the Independent Trustees advised by independent legal counsel, considered the factors it deemed relevant, including the nature, quality and extent of services provided by PI and the subadviser, the performance of the Fund, the profitability of PI and its affiliates, expenses and fees, and the potential for economies of scale that may be shared with the Fund and its shareholders the Fund’s assets grow. In their deliberations, the Trustees did not identify any single factor which alone was responsible for the Board’s decision to approve the agreements with respect to the Fund. In connection with its deliberations, the Board considered information provided by PI throughout the year at regular Board
| 1 | Prudential International Real Estate Fund is a series of Prudential Investment Portfolios 9. |
Prudential International Real Estate Fund
Approval of Advisory Agreements (continued)
meetings, presentations from portfolio managers and other information, as well as information furnished at or in advance of the meetings on June 5-7, 2012.
The Trustees determined that the overall arrangements between the Fund and PI, which serves as the Fund’s investment manager pursuant to a management agreement, and between PI and PIM, pursuant to the terms of a subadvisory agreement with PI, are in the best interests of the Fund and its shareholders in light of the services performed, fees charged and such other matters as the Trustees considered relevant in the exercise of their business judgment.
The material factors and conclusions that formed the basis for the Trustees’ reaching their determinations to approve the continuance of the agreements are separately discussed below.
Nature, Quality and Extent of Services
The Board received and considered information regarding the nature, quality and extent of services provided to the Fund by PI and PREI. The Board considered the services provided by PI, including but not limited to the oversight of the subadviser for the Fund, as well as the provision of fund recordkeeping, compliance, and other services to the Fund. With respect to PI’s oversight of the subadviser, the Board noted that PI’s Strategic Investment Research Group (“SIRG”), which is a business unit of PI, is responsible for monitoring and reporting to PI’s senior management on the performance and operations of the subadviser. The Board also considered that PI pays the salaries of all of the officers and non-independent Trustees of the Fund. The Board also considered the investment subadvisory services provided by PREI, as well as adherence to the Fund’s investment restrictions and compliance with applicable Fund policies and procedures. The Board considered PI’s evaluation of the subadviser, as well as PI’s recommendation, based on its review of the subadviser, to renew the subadvisory agreement.
The Board reviewed the qualifications, backgrounds and responsibilities of PI’s senior management responsible for the oversight of the Fund and PREI, and also reviewed the qualifications, backgrounds and responsibilities of PREI’s portfolio managers who are responsible for the day-to-day management of the Fund’s portfolio. The Board was provided with information pertaining to PI’s, PIM’s and PREI’s organizational structure, senior management, investment operations, and other relevant information pertaining to PI, PIM and PREI. The Board also noted that it received favorable compliance reports from the Fund’s Chief Compliance Officer (“CCO”) as to PI, PIM and PREI. The Board noted that PREI and PIM are affiliated with PI.
Visit our website at www.prudentialfunds.com
The Board concluded that it was satisfied with the nature, extent and quality of the investment management services provided by PI and the subadvisory services provided to the Fund by PIM through PREI, and that there was a reasonable basis on which to conclude that the Fund benefits from the services provided by PI and PIM through PREI under the management and subadvisory agreements.
Costs of Services and Profits Realized by PI
The Board was provided with information on the profitability of PI and its affiliates in serving as the Fund’s investment manager. The Board discussed with PI the methodology utilized in assembling the information regarding profitability and considered its reasonableness. The Board recognized that it is difficult to make comparisons of profitability from fund management contracts because comparative information is not generally publicly available and is affected by numerous factors, including the structure of the particular adviser, the types of funds it manages, its business mix, numerous assumptions regarding allocations and the adviser’s capital structure and cost of capital. However, the Board considered that the cost of services provided by PI exceeded the management fees received by PI, resulting in an operating loss to PI. The Board did not separately consider the profitability of the subadviser, an affiliate of PI, as its profitability was reflected in the profitability report for PI. Taking these factors into account, the Board concluded that the profitability of PI and its affiliates in relation to the services rendered was not unreasonable.
Economies of Scale
The Board noted that the management fee schedule for the Fund does not contain breakpoints that would reduce the fee rate on assets above specified levels. The Board received and discussed information concerning whether PI realizes economies of scale as the Fund’s assets grow beyond current levels. The Board also recognized the inherent limitations of any analysis of economies of scale, stemming largely from the Board’s understanding that most of PI’s costs are not specific to individual funds, but rather are incurred across a variety of products and services. In light of the Fund’s current size, performance and expense structure, the Board concluded that the absence of breakpoints in the Fund’s fee schedule is acceptable at this time.
Other Benefits to PI and PIM
The Board considered potential ancillary benefits that might be received by PI and PIM and their affiliates as a result of their relationship with the Fund. The Board concluded that potential benefits to be derived by PI included fees received by affiliates of PI for serving as the Fund’s securities lending agent, transfer agency fees received by the Fund’s transfer agent (which is affiliated with PI), and benefits to its reputation as well as other intangible benefits resulting from PI’s association with the
Prudential International Real Estate Fund
Approval of Advisory Agreements (continued)
Fund. The Board concluded that the potential benefits to be derived by PIM included its ability to use soft dollar credits, as well as the potential benefits consistent with those generally resulting from an increase in assets under management, specifically, potential access to additional research resources and benefits to its reputation. The Board concluded that the benefits derived by PI and PIM were consistent with the types of benefits generally derived by investment managers and subadvisers to mutual funds.
Performance of the Fund / Fees and Expenses
The Board considered certain additional specific factors and made related conclusions relating to the historical performance of the Fund for the one-year period ended December 31, 2011.
The Board also considered the Fund’s actual management fee, as well as the Fund’s net total expense ratio, for the fiscal year ended October 31, 2011. The Board considered the management fee for the Fund as compared to the management fee charged by PI to other funds and the fee charged by other advisers to comparable mutual funds in a Peer Group. The actual management fee represents the fee rate actually paid by Fund shareholders and includes any fee waivers or reimbursements. The net total expense ratio for the Fund represents the actual expense ratio incurred by Fund shareholders.
The mutual funds included in the Peer Universe (the Lipper International Real Estate Funds Performance Universe) and the Peer Group were objectively determined by Lipper Inc. (“Lipper”), an independent provider of mutual fund data. The comparisons placed the Fund in various quartiles, with the first quartile being the best 25% of the mutual funds (for performance, the best performing mutual funds and, for expenses, the lowest cost mutual funds).
The section below summarizes key factors considered by the Board and the Board’s conclusions regarding the Fund’s performance, fees and overall expenses. The table sets forth gross performance comparisons (which do not reflect the impact on performance of fund expenses, or any subsidies, expense caps or waivers that may be applicable) with the Peer Universe, actual management fees with the Peer Group (which reflect the impact of any subsidies or fee waivers), and net total expenses with the Peer Group, each of which were key factors considered by the Board.
| | | | | | | | |
| Performance | | 1 Year | | 3 Years | | 5 Years | | 10 Years |
| | | 2nd Quartile | | N/A | | N/A | | N/A |
| Actual Management Fees: 1st Quartile |
| Net Total Expenses: 2nd Quartile |
Visit our website at www.prudentialfunds.com
| | • | | The Board noted that the Fund underperformed its benchmark index over the one-year period. |
| | • | | The Board accepted PI’s recommendation to continue the existing expense cap of 1.35% (exclusive of 12b-1 fees and certain other fees) through June 30, 2013. |
| | • | | The Board concluded that, in light of the Fund’s recent inception date and competitive performance, it would be in the best interests of the Fund and its shareholders to renew the agreements. |
| | • | | The Board concluded that the management fees (including subadvisory fees) and total expenses were reasonable in light of the services provided. |
* * *
After full consideration of these factors, the Board concluded that the approval of the agreements was in the best interests of the Fund and its shareholders.
Prudential International Real Estate Fund
| | | | |
| n MAIL | | n TELEPHONE | | n WEBSITE |
Gateway Center Three 100 Mulberry Street Newark, NJ 07102 | | (800) 225-1852 | | www.prudentialfunds.com |
|
| PROXY VOTING |
| The Board of Trustees of the Fund has delegated to the Fund’s investment subadviser the responsibility for voting any proxies and maintaining proxy recordkeeping with respect to the Fund. A description of these proxy voting policies and procedures is available without charge, upon request, by calling (800) 225-1852 or by visiting the Securities and Exchange Commission’s website at www.sec.gov. Information regarding how the Fund voted proxies relating to portfolio securities during the most recent 12-month period ended June 30 is available on the Fund’s website and on the Securities and Exchange Commission’s website. |
|
| TRUSTEES |
| Kevin J. Bannon • Scott E. Benjamin • Linda W. Bynoe • Michael S. Hyland • Douglas H. McCorkindale • Stephen P. Munn • Stuart S. Parker • Richard A. Redeker • Robin B. Smith • Stephen G. Stoneburn |
|
| OFFICERS |
| Stuart S. Parker, President • Judy A. Rice, Vice President • Scott E. Benjamin, Vice President • Grace C. Torres, Treasurer and Principal Financial and Accounting Officer • Raymond A. O’Hara, Chief Legal Officer • Deborah A. Docs, Secretary • Timothy J. Knierim, Chief Compliance Officer • Valerie M. Simpson, Deputy Chief Compliance Officer • Theresa C. Thompson, Deputy Chief Compliance Officer • Richard W. Kinville, Anti-Money Laundering Compliance Officer • Jonathan D. Shain, Assistant Secretary • Claudia DiGiacomo, Assistant Secretary • Amanda S. Ryan, Assistant Secretary • Andrew R. French, Assistant Secretary • M. Sadiq Peshimam, Assistant Treasurer • Peter Parrella, Assistant Treasurer |
| | | | |
| MANAGER | | Prudential Investments LLC | | Gateway Center Three
100 Mulberry Street
Newark, NJ 07102 |
|
| INVESTMENT SUBADVISER | | Prudential Real Estate Investors | | 7 Giralda Farms
Madison, NJ 07940 |
|
| DISTRIBUTOR | | Prudential Investment
Management Services LLC | | Gateway Center Three
100 Mulberry Street
Newark, NJ 07102 |
|
| CUSTODIAN | | The Bank of New York Mellon | | One Wall Street
New York, NY 10286 |
|
| TRANSFER AGENT | | Prudential Mutual Fund
Services LLC | | PO Box 9658
Providence, RI 02940 |
|
INDEPENDENT REGISTERED
PUBLIC ACCOUNTING FIRM | | KPMG LLP | | 345 Park Avenue
New York, NY 10154 |
|
| FUND COUNSEL | | Willkie Farr & Gallagher LLP | | 787 Seventh Avenue
New York, NY 10019 |
|
| An investor should consider the investment objectives, risks, charges, and expenses of the Fund carefully before investing. The prospectus and summary prospectus contain this and other information about the Fund. An investor may obtain a prospectus and summary prospectus by visiting our website at www.prudentialfunds.com or by calling (800) 225-1852. The prospectus and summary prospectus should be read carefully before investing. |
|
| E-DELIVERY |
| To receive your mutual fund documents online, go to www.prudentialfunds.com/edelivery and enroll. Instead of receiving printed documents by mail, you will receive notification via email when new materials are available. You can cancel your enrollment or change your email address at any time by visiting the website address above. |
|
| SHAREHOLDER COMMUNICATIONS WITH TRUSTEES |
| Shareholders can communicate directly with the Board of Trustees by writing to the Chair of the Board, Prudential International Real Estate Fund, Prudential Investments, Attn: Board of Trustees, 100 Mulberry Street, Gateway Center Three, Newark, NJ 07102. Shareholders can communicate directly with an individual Trustee by writing to the same address. Communications are not screened before being delivered to the addressee. |
|
| AVAILABILITY OF PORTFOLIO SCHEDULE |
| The Fund files its complete schedule of portfolio holdings with the Securities and Exchange Commission for the first and third quarters of each fiscal year on Form N-Q. The Fund’s Forms N-Q are available on the Commission’s website at www.sec.gov. The Fund’s Forms N-Q may also be reviewed and copied at the Commission’s Public Reference Room in Washington, D.C. Information on the operation and location of the Public Reference Room may be obtained by calling (202) 551-8090. The Fund’s schedule of portfolio holdings is also available on the Fund’s website as of the end of each month. |
|
| The Fund’s Statement of Additional Information contains additional information about the Fund’s Trustees and is available without charge, upon request, by calling (800) 225-1852. |
Mutual Funds:
| | | | |
ARE NOT INSURED BY THE FDIC OR ANY
FEDERAL GOVERNMENT AGENCY | | MAY LOSE VALUE | | ARE NOT A DEPOSIT OF OR GUARANTEED
BY ANY BANK OR ANY BANK AFFILIATE |

PRUDENTIAL INTERNATIONAL REAL ESTATE FUND
| | | | | | | | |
| SHARE CLASS | | A | | B | | C | | Z |
| NASDAQ | | PUEAX | | PUEBX | | PUECX | | PUEZX |
| CUSIP | | 74441J803 | | 74441J886 | | 74441J878 | | 74441J860 |
MF210E 0236582-00001-00

PRUDENTIAL INVESTMENTS»MUTUAL FUNDS
PRUDENTIAL LARGE-CAP CORE EQUITY FUND
ANNUAL REPORT · OCTOBER 31, 2012
Fund Type
Large-Cap Stock
Objective
Long-term after-tax growth of capital
This report is not authorized for distribution to prospective investors unless preceded or accompanied by a current prospectus.
The views expressed in this report and information about the Fund’s portfolio holdings are for the period covered by this report and are subject to change thereafter.
Prudential Investments, Prudential, the Prudential logo, the Rock symbol, and Bring Your Challenges are service marks of Prudential Financial, Inc. and its related entities, registered in many jurisdictions worldwide.

December 14, 2012
Dear Shareholder:
We hope you find the annual report for the Prudential Large-Cap Core Equity Fund informative and useful. The report covers performance for the 12-month period that ended October 31, 2012.
We recognize that ongoing market volatility may make it a difficult time to be an investor. We continue to believe a prudent response to uncertainty is to maintain a diversified portfolio of funds consistent with your tolerance for risk, time horizon, and financial goals.
Your financial advisor can help you create a diversified investment plan that may include funds covering all the basic asset classes and that reflects your personal investor profile and risk tolerance. Keep in mind, however, that diversification and asset allocation strategies do not assure a profit or protect against loss in declining markets.
Prudential Investments® is dedicated to helping you solve your toughest investment challenges—whether it’s capital growth, reliable income, or protection from market volatility and other risks. We offer the expertise of Prudential Financial’s affiliated asset managers* that strive to be leaders in a broad range of funds to help you stay on course to the future you envision. They also manage money for major corporations and pension funds around the world, which means you benefit from the same expertise, innovation, and attention to risk demanded by today’s most sophisticated investors.
Thank you for choosing the Prudential Investments family of funds.
Sincerely,

Stuart S. Parker, President
Prudential Large-Cap Core Equity Fund
*Most of Prudential Investments’ equity funds are advised by Jennison Associates LLC, Quantitative Management Associates LLC (QMA), or Prudential Real Estate Investors. Prudential Investments’ fixed income and money market funds are advised by Prudential Investment Management, Inc. (PIM) through its Prudential Fixed Income unit. Jennison Associates, QMA, and PIM are registered investment advisers and Prudential Financial companies. Prudential Real Estate Investors is a unit of PIM.
| | | | |
| Prudential Large-Cap Core Equity Fund | | | 1 | |
Your Fund’s Performance
Performance data quoted represent past performance. Past performance does not guarantee future results. The investment return and principal value of an investment will fluctuate, so that an investor’s shares, when redeemed, may be worth more or less than their original cost. Current performance may be lower or higher than the past performance data quoted. An investor may obtain performance data as of the most recent month-end by visiting our website at www.prudentialfunds.com or by calling (800) 225-1852. Class A shares have a maximum initial sales charge of 5.50%. Gross operating expenses: Class A, 1.40%; Class B, 2.11%; Class C, 2.10%; Class X, 1.37%; Class Z, 1.10%. Net operating expenses: Class A, 1.20%; Class B, 1.95%; Class C, 1.95%; Class X, 1.20%; Class Z, 0.95%, after contractual reduction through 2/28/2014.
| | | | | | | | | | | | | | |
Cumulative Total Returns (Without Sales Charges) as of 10/31/12 |
| | | One Year | | | Five Years | | | Ten Years | | | Since Inception |
Class A | | | 16.16 | % | | | –4.99 | % | | | 83.86 | % | | — |
Class B | | | 15.29 | | | | –8.37 | | | | 70.71 | | | — |
Class C | | | 15.28 | | | | –8.30 | | | | 70.84 | | | — |
Class X | | | 16.12 | | | | –4.00 | | | | N/A | | | 7.82% (3/19/2007) |
Class Z | | | 16.41 | | | | –3.77 | | | | 88.34 | | | — |
S&P 500 Index | | | 15.19 | | | | 1.81 | | | | 94.92 | | | — |
Lipper Large-Cap Core Funds Average | | | 13.15 | | | | –2.78 | | | | 86.06 | | | — |
| | | | | | | | | | | | | | |
Average Annual Total Returns (With Sales Charges) as of 9/30/12 |
| | | One Year | | | Five Years | | | Ten Years | | | Since Inception |
Class A | | | 24.64 | % | | | –1.42 | % | | | 6.66 | % | | — |
Class B | | | 25.90 | | | | –1.21 | | | | 6.48 | | | — |
Class C | | | 29.86 | | | | –1.01 | | | | 6.49 | | | — |
Class X | | | 25.82 | | | | –0.65 | | | | N/A | | | 1.33% (3/19/2007) |
Class Z | | | 32.27 | | | | –0.04 | | | | 7.54 | | | — |
S&P 500 Index | | | 30.17 | | | | 1.05 | | | | 8.01 | | | — |
Lipper Large-Cap Core Funds Average | | | 27.49 | | | | 0.01 | | | | 7.17 | | | — |
| | | | | | | | | | | | | | |
Average Annual Total Returns (With Sales Charges) as of 10/31/12 |
| | | One Year | | | Five Years | | | Ten Years | | | Since Inception |
Class A | | | 9.77 | % | | | –2.13 | % | | | 5.68 | % | | — |
Class B | | | 10.29 | | | | –1.91 | | | | 5.49 | | | — |
Class C | | | 14.28 | | | | –1.72 | | | | 5.50 | | | — |
Class X | | | 10.12 | | | | –1.36 | | | | N/A | | | 1.02% (3/19/2007) |
Class Z | | | 16.41 | | | | –0.77 | | | | 6.54 | | | — |
| | |
| 2 | | Visit our website at www.prudentialfunds.com |
| | | | | | | | | | | | | | |
Average Annual Total Returns (Without Sales Charges) as of 10/31/12 | |
| | | One Year | | Five Years | | | Ten Years | | | Since Inception | |
Class A | | 16.16% | | | –1.02 | % | | | 6.28 | % | | | — | |
Class B | | 15.29 | | | –1.73 | | | | 5.49 | | | | — | |
Class C | | 15.28 | | | –1.72 | | | | 5.50 | | | | — | |
Class X | | 16.12 | | | –0.81 | | | | N/A | | | | 1.35% (3/19/2007) | |
Class Z | | 16.41 | | | –0.77 | | | | 6.54 | | | | — | |
Growth of a $10,000 Investment
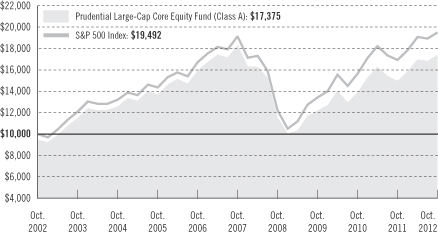
The graph compares a $10,000 investment in the Prudential Large-Cap Core Equity Fund (Class A shares) with a similar investment in the S&P 500 Index by portraying the initial account values at the beginning of the 10-year period for Class A shares (October 31, 2002) and the account values at the end of the current fiscal year (October 31, 2012) as measured on a quarterly basis. For purposes of the graph, and unless otherwise indicated, it has been assumed that (a) the maximum applicable front-end sales charge was deducted from the initial $10,000 investment in Class A shares; (b) all recurring fees (including management fees) were deducted; and (c) all dividends and distributions were reinvested. The line graph provides information for Class A shares only. As indicated in the tables provided earlier, performance for Class B, Class C, Class X, and Class Z shares will vary due to the differing charges and expenses applicable to each share class (as indicated in the following paragraphs). Without waiver of fees and/or expense reimbursement, if any, the returns would have been lower.
Total returns and the ending account values in the graph include changes in share price and reinvestment of dividends and capital gains distributions in a hypothetical investment for the periods shown. The Fund’s total returns do not reflect the deduction of income taxes on an individual’s investment. Taxes may reduce your actual investment returns on income or gains paid by the Fund or any gains you may realize if you sell your shares.
| | | | |
| Prudential Large-Cap Core Equity Fund | | | 3 | |
Your Fund’s Performance (continued)
Source: Prudential Investments LLC and Lipper Inc.
Inception returns are provided for any share class with less than 10 calendar years of returns.
The average annual total returns take into account applicable sales charges. Class A shares are subject to a maximum front-end sales charge of 5.50%, and a 12b-1 fee of 0.30% annually. All investors who purchase Class A shares in an amount of $1 million or more and sell these shares within 12 months of purchase are subject to a contingent deferred sales charge (CDSC) of 1%. The Class A CDSC is waived for purchases by certain retirement or benefit plans. Under certain circumstances, an exchange may be made from specified share classes of the Fund to one or more other share classes of the Fund. Class B shares are subject to a declining CDSC of 5%, 4%, 3%, 2%, 1%, and 1%, respectively, for the first six years after purchase and a 12b-1 fee of 1% annually. Approximately seven years after purchase, Class B shares will automatically convert to Class A shares on a quarterly basis. Class C shares are not subject to a front-end sales charge, but are subject to a CDSC of 1% for shares sold within 12 months from the date of purchase, and an annual 12b-1 fee of 1%. Class X shares are subject to a CDSC of 6%, which decreases by 1% annually to 4% in the third and fourth years, by 1% annually to 2% in the sixth and seventh years, and to 1% in the eighth year after purchase, and a 12b-1 fee of 1% annually. Class X shares will automatically convert to Class A shares approximately 10 years after purchase. Class X shares are not offered to new purchasers and are available only through exchanges from the same share class of certain other Prudential Investments mutual funds. Class Z shares are not subject to a sales charge or 12b-1 fees. The returns in the tables and graph reflect the share class expense structure in effect at the close of the fiscal period. The returns in the tables and graph do not reflect the deduction of taxes that a shareholder would pay on Fund distributions or the redemption of Fund shares.
Benchmark Definitions
S&P 500 Index
The S&P 500 Index is an unmanaged index of 500 stocks of large U.S. public companies. It gives a broad look at how U.S. stock prices have performed. S&P 500 Index Closest Month-End to Inception cumulative total return as of 10/31/12 is 12.15% for Class X. S&P 500 Index Closest Month-End to Inception average annual total return as of 9/30/12 is 2.45% for Class X.
Lipper Large-Cap Core Funds Average
The Lipper Large-Cap Core Funds Average (Lipper Average) represents returns based on an average return of all funds in the Lipper Large-Cap Core Funds category for the periods noted. Funds in the Lipper Average invest at least 75% of their equity assets in companies with market capitalizations (on a three-year weighted basis) greater than 300% of the dollar-weighted median market capitalization of the middle 1,000 securities of the S&P SuperComposite 1500 Index. Large-cap core funds have wide latitude in the companies in which they invest. These funds typically have a below-average price-to-earnings ratio, price-to-book ratio, and three-year sales-per-share-growth value compared with the S&P 500 Index. Lipper Average Closest Month-End to Inception cumulative total return as of 10/31/12 is 7.60% for Class X. Lipper Average Closest Month-End to Inception average annual total return as of 9/30/12 is 1.52% for Class X.
Investors cannot invest directly in an index or average. The returns for the Index would be lower if they included the effects of sales charges, operating expenses of a mutual fund, or taxes. Returns for the Lipper Average reflect the deduction of operating expenses of a mutual fund, but not sales charges or taxes.
| | |
| 4 | | Visit our website at www.prudentialfunds.com |
| | | | |
Five Largest Holdings expressed as a percentage of net assets as of 10/31/12 | | | | |
Apple, Inc., Computers & Peripherals | | | 4.6 | % |
Exxon Mobil Corp., Oil, Gas & Consumable Fuels | | | 4.0 | |
Chevron Corp., Oil, Gas & Consumable Fuels | | | 2.2 | |
Pfizer, Inc., Pharmaceuticals | | | 2.2 | |
Procter & Gamble Co. (The), Household Products | | | 2.0 | |
Excludes securities purchased with cash received as a result of securities on loan.
Holdings are subject to change.
| | | | |
Five Largest Sectors expressed as a percentage of net assets as of 10/31/12 | | | | |
Information Technology | | | 19.9 | % |
Financials | | | 13.7 | |
Healthcare | | | 13.4 | |
Consumer Discretionary | | | 12.4 | |
Energy | | | 11.6 | |
Industry weightings are subject to change.
| | | | |
| Prudential Large-Cap Core Equity Fund | | | 5 | |
Strategy and Performance Overview
How did the Fund perform?
Prudential Large-Cap Core Equity Fund’s Class A shares gained 16.16% for the 12-month reporting period ended October 31, 2012, outperforming the 15.19% gain of the benchmark S&P 500 Index (the Index), and outperforming the 13.15% gain of the Lipper Large-Cap Core Funds Average.
What were conditions like in the U.S. stock market?
| | • | | The U.S. stock market advanced despite significant headwinds in the form of slowing global growth, European sovereign debt concerns, and uncertainty surrounding government policy at home and abroad. |
| | • | | During the first quarter of 2012, improving economic data including a strong jobs market which created over 200,000 jobs for three months in a row (December, January, and February), combined with the Federal Reserve’s upgrade of the U.S. economic growth trajectory from modest to moderate, and pushed market indexes to multi-year highs. Stock market performance in the first three months of 2012 ranked among the best quarterly returns since 1998. |
| | • | | After this strong beginning, a series of disappointments shook the stock market. Waning job numbers and the Federal Reserve’s (the Fed) failure to immediately act upon them disappointed investors until breakthroughs by European policymakers reenergized global financial markets on the last day of the quarter. The S&P 500 posted its largest single-day gain of the year, although stocks remained down for the quarter due to the plunge in May. A volatile quarter aside, most broad market averages remained positive for the year. |
| | • | | In September, central banks around the world slashed target interest rates and the U.S. and Europe announced open-ended bond buying programs to prop up faltering economies. The Fed indicated that Quantitative Easing 3 (QE3) would remain in effect until employment improved. The program, as did two previous rounds of quantitative easing, favored equities and helped pushed investors into riskier assets, thereby lifting the stock markets. |
| | • | | After reaching highs in early October, the U.S. stock market subsequently sold off for the remainder of the month, driven by uncertainty surrounding the outcome of the presidential election and its impact on the looming “fiscal cliff” (expiring tax cuts and stimulus programs and mandatory budget cuts), coupled with concerns about anemic economic growth. Then events were compounded when Hurricane Sandy, which left widespread flooding and blackouts in lower Manhattan, shut down the stock market for two days. Although the S&P 500 was down almost 2% for the month, the Index still posted a double-digit return for the reporting period. |
| | |
| 6 | | Visit our website at www.prudentialfunds.com |
How did the sectors of the S&P 500 Index perform?
| | • | | With investor sentiment moving between optimism and pessimism throughout the year, no dominant theme emerged among sector performance. However, as U.S. economic growth continued to slow, defensive sectors, those more resistant to the movement of the business cycle, including telecommunications, healthcare, and consumer staples, performed strongly although one defensive sector—utilities—underperformed. |
| | • | | Some cyclical stocks, those more closely tied to the economic cycle, also performed well. Consumer discretionary stocks rose. Financial stocks also outperformed, despite many challenges still facing the industry. Several economically sensitive sectors, including materials and energy, underperformed. |
| | • | | The Fund’s sector weighting was close to that of the Index and sector allocation did not have a meaningful impact on performance. Stock selection was positive in most sectors. Stock selection in the energy, financials, materials and technology sectors positively contributed to the Fund performance, while selection in the consumer staples sector detracted. |
How did the U.S. stock market perform with respect to investment styles?
| | • | | Over the past 12 months, all investments styles advanced. Large-cap value indexes outperformed large-cap growth indexes. Within the value indexes, financials, which are heavily weighted, performed strongly. Within the growth indexes, technology stocks, which are heavily weighted, underperformed. In general, economic uncertainty pushed risk-averse investors into the relative safety of larger companies, and larger stocks outperformed smaller stocks. |
Among slowly growing companies, which stocks or related group of stocks contributed the most and detracted the most from the Fund’s return?
| | • | | QMA places a heavier emphasis on valuation factors, such as price-to-earnings (P/E) and price-to-book (P/B) ratios, when evaluating slower-growing stocks. Valuation factors performed well over the past year and contributed to the Fund’s return. |
| | • | | Among slowly growing companies, financial stocks were some of the best performing, benefitting from the strong performance of the sector’s valuation factors. Healthcare stocks were also a strong performer among slower-growing companies, as investors flocked to the sector in search of safety. |
| | • | | Slower-growing stocks that the Fund did not hold also contributed to performance. For example, the Fund was underweight Hewlett-Packard. Although the stock appeared cheap, the price fell nearly 47% on declining earnings estimates. |
| | | | |
| Prudential Large-Cap Core Equity Fund | | | 7 | |
Strategy and Performance Overview (continued)
| | • | | Some of the Fund’s technology stock holdings, including an overweight to Dell, detracted from performance. Although Dell looked inexpensive, the stock declined 41% as its earnings prospects deteriorated. |
Among rapidly growing companies, which stocks or related group of stocks contributed the most and detracted the most from the Fund’s return?
| | • | | For faster-growing stocks, QMA’s process places a heavier weighting on news factors, such as the direction of analyst estimates. This factor also performed well during the reporting period and contributed to the Fund’s return, although not as significantly as the valuation factors. |
| | • | | The focus on news factors benefited performance, particularly among technology stocks, which were some of the Fund’s best performers among rapidly growing stocks. For example, the Fund held an overweight in Apple based on rising analyst estimates. The stock advanced nearly 48% over the past year. Overweights in other stocks based on rising analysts estimates, including Visa and Akamai Technologies which advanced 50% and 41%, respectively, also positively contributed to performance. |
| | • | | Stocks whose respective analyst estimates changed direction from increasing to decreasing detracted from Fund performance. Overweights in Cummins Inc. and Helmerich & Payne, which fell 4% and 10%, respectively, hurt performance when the direction of their respective estimate revisions changed. |
How did the Fund’s tax management strategy affect its performance?
| | • | | Although difficult to quantify, the Fund’s tax management objective affected performance over the course of the reporting period. Trading in the portfolio is not dictated by tax concerns, but the potential impact that trading can have on taxes is factored into investment decisions. |
| | • | | For example, a tax management strategy may result in a higher exposure to momentum in the portfolio, as stocks that have been outperforming may be held due to tax consequences, and stocks that have been underperforming may be sold to generate a tax loss. In an environment where momentum performs well, as was the case over the reporting period, this can help performance. |
| | • | | In any given year, the performance of the Fund may differ from that of one which does not have tax management as one of its objectives. Over the long term, QMA expects the performance differential between funds with and without a tax management objective to be minimal. |
| | |
| 8 | | Visit our website at www.prudentialfunds.com |
Did the Fund hold derivatives, and did they affect performance?
| | • | | The Fund held futures contracts on the S&P 500. |
| | • | | QMA utilizes these instruments as a means of holding a position and managing daily cash flows, and not as a means of adding value. Subsequently, the effect on performance was minimal. |
| | | | |
| Prudential Large-Cap Core Equity Fund | | | 9 | |
Fees and Expenses (Unaudited)
As a shareholder of the Fund, you incur two types of costs: (1) transaction costs, including sales charges (loads) on purchase payments and redemptions, as applicable, and (2) ongoing costs, including management fees, distribution, and/or service (12b-1) fees, and other Fund expenses, as applicable. This example is intended to help you understand your ongoing costs (in dollars) of investing in the Fund and to compare these costs with the ongoing costs of investing in other mutual funds.
The example is based on an investment of $1,000 invested on May 1, 2012, at the beginning of the period, and held through the six-month period ended October 31, 2012. The example is for illustrative purposes only; you should consult the Prospectus for information on initial and subsequent minimum investment requirements.
The Fund’s transfer agent may charge additional fees to holders of certain accounts that are not included in the expenses shown in the table on the following page. These fees apply to individual retirement accounts (IRAs) and Section 403(b) accounts. As of the close of the six-month period covered by the table, IRA fees included an annual maintenance fee of $15 per account (subject to a maximum annual maintenance fee of $25 for all accounts held by the same shareholder). Section 403(b) accounts are charged an annual $25 fiduciary maintenance fee. Some of the fees may vary in amount, or may be waived, based on your total account balance or the number of Prudential Investments funds, including the Fund, that you own. You should consider the additional fees that were charged to your Fund account over the six-month period when you estimate the total ongoing expenses paid over the period and the impact of these fees on your ending account value, as these additional expenses are not reflected in the information provided in the expense table. Additional fees have the effect of reducing investment returns.
Actual Expenses
The first line for each share class in the table on the following page provides information about actual account values and actual expenses. You may use the information on this line, together with the amount you invested, to estimate the expenses that you paid over the period. Simply divide your account value by $1,000 (for example, an $8,600 account value ÷ $1,000 = 8.6), then multiply the result by the number on the first line under the heading “Expenses Paid During the Six-Month Period” to estimate the expenses you paid on your account during this period.
Hypothetical Example for Comparison Purposes
The second line for each share class in the table on the following page provides information about hypothetical account values and hypothetical expenses based on the Fund’s actual expense ratio and an assumed rate of return of 5% per year before expenses, which is not the Fund’s actual return. The hypothetical account values and
| | |
| 10 | | Visit our website at www.prudentialfunds.com |
expenses may not be used to estimate the actual ending account balance or expenses you paid for the period. You may use this information to compare the ongoing costs of investing in the Fund and other funds. To do so, compare this 5% hypothetical example with the 5% hypothetical examples that appear in the shareholder reports of the other funds.
Please note that the expenses shown in the table are meant to highlight your ongoing costs only and do not reflect any transactional costs such as sales charges (loads). Therefore, the second line for each share class in the table is useful in comparing ongoing costs only and will not help you determine the relative total costs of owning different funds. In addition, if these transactional costs were included, your costs would have been higher.
| | | | | | | | | | | | | | | | | | |
Prudential
Large-Cap Core
Equity Fund | | Beginning Account
Value
May 1, 2012 | | | Ending Account
Value
October 31, 2012 | | | Annualized
Expense Ratio
Based on the
Six-Month Period | | | Expenses Paid
During the
Six-Month Period* | |
| | | | | | | | | | | | | | | | | | |
| Class A | | Actual | | $ | 1,000.00 | | | $ | 1,024.20 | | | | 1.20 | % | | $ | 6.11 | |
| | | Hypothetical | | $ | 1,000.00 | | | $ | 1,019.10 | | | | 1.20 | % | | $ | 6.09 | |
| | | | | | | | | | | | | | | | | | |
| Class B | | Actual | | $ | 1,000.00 | | | $ | 1,021.30 | | | | 1.95 | % | | $ | 9.91 | |
| | | Hypothetical | | $ | 1,000.00 | | | $ | 1,015.33 | | | | 1.95 | % | | $ | 9.88 | |
| | | | | | | | | | | | | | | | | | |
| Class C | | Actual | | $ | 1,000.00 | | | $ | 1,021.30 | | | | 1.95 | % | | $ | 9.91 | |
| | | Hypothetical | | $ | 1,000.00 | | | $ | 1,015.33 | | | | 1.95 | % | | $ | 9.88 | |
| | | | | | | | | | | | | | | | | | |
| Class X | | Actual | | $ | 1,000.00 | | | $ | 1,025.10 | | | | 1.20 | % | | $ | 6.11 | |
| | | Hypothetical | | $ | 1,000.00 | | | $ | 1,019.10 | | | | 1.20 | % | | $ | 6.09 | |
| | | | | | | | | | | | | | | | | | |
| Class Z | | Actual | | $ | 1,000.00 | | | $ | 1,026.20 | | | | 0.95 | % | | $ | 4.84 | |
| | | Hypothetical | | $ | 1,000.00 | | | $ | 1,020.36 | | | | 0.95 | % | | $ | 4.82 | |
*Fund expenses (net of fee waivers or subsidies, if any) for each share class are equal to the annualized expense ratio for each share class (provided in the table), multiplied by the average account value over the period, multiplied by the 184 days in the six-month period ended October 31, 2012, and divided by the 366 days in the Fund’s fiscal year ended October 31, 2012 (to reflect the six-month period). Expenses presented in the table include the expenses of any underlying funds in which the Fund may invest.
| | | | |
| Prudential Large-Cap Core Equity Fund | | | 11 | |
Portfolio of Investments
as of October 31, 2012
| | | | | | |
| Shares | | Description | | Value (Note 1) | |
LONG-TERM INVESTMENTS 99.2% | |
COMMON STOCKS | | | | |
CONSUMER DISCRETIONARY 12.4% | | | | |
| |
Auto Components 0.1% | | | | |
| 6,300 | | Delphi Automotive PLC* | | $ | 198,072 | |
| |
Automobiles 0.1% | | | | |
| 2,300 | | Thor Industries, Inc. | | | 87,469 | |
| |
Diversified Consumer Services | | | | |
| 900 | | Apollo Group, Inc. (Class A Stock)* | | | 18,072 | |
| |
Hotels, Restaurants & Leisure 1.5% | | | | |
| 15,700 | | McDonald’s Corp. | | | 1,362,760 | |
| 3,100 | | Panera Bread Co. (Class A Stock)* | | | 522,784 | |
| | | | | | |
| | | | | 1,885,544 | |
| |
Household Durables 0.9% | | | | |
| 800 | | NACCO Industries, Inc. (Class A Stock) | | | 40,512 | |
| 2,400 | | Tempur-Pedic International, Inc.*(a) | | | 63,456 | |
| 11,300 | | Whirlpool Corp. | | | 1,103,784 | |
| | | | | | |
| | | | | 1,207,752 | |
| |
Internet & Catalog Retail 0.2% | | | | |
| 200 | | Amazon.com, Inc.* | | | 46,564 | |
| 3,700 | | HSN, Inc. | | | 192,474 | |
| | | | | | |
| | | | | 239,038 | |
| |
Leisure Equipment & Products 0.9% | | | | |
| 11,400 | | Polaris Industries, Inc. | | | 963,300 | |
| 5,100 | | Sturm, Ruger & Co., Inc.(a) | | | 240,873 | |
| | | | | | |
| | | | | 1,204,173 | |
| |
Media 2.6% | | | | |
| 13,700 | | Comcast Corp. (Class A Stock) | | | 513,887 | |
| 2,200 | | McGraw-Hill Cos., Inc. (The) | | | 121,616 | |
| 59,800 | | News Corp. (Class A Stock) | | | 1,430,416 | |
| 6,000 | | Time Warner, Inc.(a) | | | 260,700 | |
| 16,300 | | Viacom, Inc. (Class B Stock) | | | 835,701 | |
| 3,560 | | Walt Disney Co. (The)(a) | | | 174,689 | |
| | | | | | |
| | | | | 3,337,009 | |
See Notes to Financial Statements.
| | | | |
| Prudential Large-Cap Core Equity Fund | | | 13 | |
Portfolio of Investments
as of October 31, 2012 continued
| | | | | | |
| Shares | | Description | | Value (Note 1) | |
CONSUMER DISCRETIONARY (Continued) | | | | |
| |
Multiline Retail 1.3% | | | | |
| 6,800 | | Dillard’s, Inc. (Class A Stock) | | $ | 523,600 | |
| 9,200 | | Dollar Tree, Inc.* | | | 366,804 | |
| 21,400 | | Macy’s, Inc. | | | 814,698 | |
| | | | | | |
| | | | | 1,705,102 | |
| |
Specialty Retail 3.6% | | | | |
| 5,000 | | Ascena Retail Group, Inc.* | | | 99,000 | |
| 4,500 | | Finish Line, Inc. (The) (Class A Stock) | | | 93,623 | |
| 7,900 | | Foot Locker, Inc. | | | 264,650 | |
| 21,600 | | Gap, Inc. (The) | | | 771,552 | |
| 12,200 | | Home Depot, Inc. (The) | | | 748,836 | |
| 8,300 | | PetSmart, Inc. | | | 551,037 | |
| 15,500 | | Ross Stores, Inc. | | | 944,725 | |
| 27,300 | | TJX Cos., Inc. | | | 1,136,499 | |
| | | | | | |
| | | | | 4,609,922 | |
| |
Textiles, Apparel & Luxury Goods 1.2% | | | | |
| 15,100 | | Coach, Inc. | | | 846,355 | |
| 7,200 | | Crocs, Inc.* | | | 90,720 | |
| 6,500 | | Nike, Inc. (Class B Stock) | | | 593,970 | |
| | | | | | |
| | | | | 1,531,045 | |
CONSUMER STAPLES 9.7% | | | | |
| |
Beverages 1.7% | | | | |
| 33,600 | | Coca-Cola Co. (The) | | | 1,249,248 | |
| 2,200 | | Dr Pepper Snapple Group, Inc. | | | 94,270 | |
| 11,394 | | PepsiCo, Inc. | | | 788,921 | |
| | | | | | |
| | | | | 2,132,439 | |
| |
Food & Staples Retailing 3.6% | | | | |
| 30,500 | | CVS Caremark Corp. | | | 1,415,200 | |
| 28,500 | | Walgreen Co. | | | 1,004,055 | |
| 26,870 | | Wal-Mart Stores, Inc. | | | 2,015,787 | |
| 1,700 | | Whole Foods Market, Inc. | | | 161,041 | |
| | | | | | |
| | | | | 4,596,083 | |
| |
Food Products 1.0% | | | | |
| 3,038 | | Archer-Daniels-Midland Co. | | | 81,540 | |
| 1,700 | | Bunge Ltd. | | | 120,751 | |
See Notes to Financial Statements.
| | |
| 14 | | Visit our website at www.prudentialfunds.com |
| | | | | | |
| Shares | | Description | | Value (Note 1) | |
CONSUMER STAPLES (Continued) | | | | |
| |
Food Products (cont’d.) | | | | |
| 8,300 | | Darling International, Inc.* | | $ | 137,199 | |
| 2,100 | | Dean Foods Co.* | | | 35,364 | |
| 6,300 | | Ingredion, Inc. | | | 387,198 | |
| 12,200 | | Kraft Foods Group, Inc.* | | | 554,856 | |
| | | | | | |
| | | | | 1,316,908 | |
| |
Household Products 2.1% | | | | |
| 1,300 | | Kimberly-Clark Corp. | | | 108,485 | |
| 37,364 | | Procter & Gamble Co. (The) | | | 2,587,083 | |
| | | | | | |
| | | | | 2,695,568 | |
| |
Personal Products | | | | |
| 1,300 | | Prestige Brands Holdings, Inc.* | | | 22,607 | |
| 500 | | USANA Health Sciences, Inc.*(a) | | | 21,570 | |
| | | | | | |
| | | | | 44,177 | |
| |
Tobacco 1.3% | | | | |
| 10,400 | | Altria Group, Inc. | | | 330,720 | |
| 2,300 | | Lorillard, Inc. | | | 266,823 | |
| 9,100 | | Philip Morris International, Inc. | | | 805,896 | |
| 6,100 | | Reynolds American, Inc.(a) | | | 254,004 | |
| | | | | | |
| | | | | 1,657,443 | |
ENERGY 11.6% | | | | |
| |
Energy Equipment & Services 0.7% | | | | |
| 1,600 | | Ensco PLC (Class A Stock) | | | 92,512 | |
| 400 | | Geospace Technologies Corp.* | | | 25,892 | |
| 2,100 | | Helmerich & Payne, Inc. | | | 100,380 | |
| 3,600 | | Oceaneering International, Inc. | | | 188,388 | |
| 3,100 | | Oil States International, Inc.* | | | 226,610 | |
| 4,400 | | Schlumberger Ltd. | | | 305,932 | |
| | | | | | |
| | | | | 939,714 | |
| |
Oil, Gas & Consumable Fuels 10.9% | | | | |
| 4,500 | | Apache Corp. | | | 372,375 | |
| 8,200 | | Cabot Oil & Gas Corp. | | | 385,236 | |
| 25,384 | | Chevron Corp. | | | 2,797,571 | |
| 19,100 | | ConocoPhillips | | | 1,104,935 | |
| 56,474 | | Exxon Mobil Corp. | | | 5,148,735 | |
See Notes to Financial Statements.
| | | | |
| Prudential Large-Cap Core Equity Fund | | | 15 | |
Portfolio of Investments
as of October 31, 2012 continued
| | | | | | |
| Shares | | Description | | Value (Note 1) | |
ENERGY (Continued) | | | | |
| |
Oil, Gas & Consumable Fuels (cont’d.) | | | | |
| 6,100 | | Hess Corp. | | $ | 318,786 | |
| 30,500 | | Marathon Oil Corp. | | | 916,830 | |
| 18,450 | | Marathon Petroleum Corp. | | | 1,013,458 | |
| 8,600 | | Murphy Oil Corp. | | | 516,000 | |
| 300 | | Occidental Petroleum Corp. | | | 23,688 | |
| 17,150 | | Phillips 66 | | | 808,794 | |
| 10,000 | | Tesoro Corp. | | | 377,100 | |
| 5,800 | | Valero Energy Corp. | | | 168,780 | |
| | | | | | |
| | | | | 13,952,288 | |
FINANCIALS 13.7% | | | | |
| |
Capital Markets 2.4% | | | | |
| 4,900 | | BlackRock, Inc. | | | 929,432 | |
| 900 | | Franklin Resources, Inc. | | | 115,020 | |
| 11,200 | | Goldman Sachs Group, Inc. (The) | | | 1,370,768 | |
| 3,700 | | Jefferies Group, Inc. | | | 52,688 | |
| 20,000 | | Morgan Stanley | | | 347,600 | |
| 5,000 | | State Street Corp. | | | 222,850 | |
| | | | | | |
| | | | | 3,038,358 | |
| |
Commercial Banks 4.2% | | | | |
| 26,900 | | BB&T Corp. | | | 778,755 | |
| 72,400 | | Huntington Bancshares, Inc. | | | 462,636 | |
| 5,100 | | KeyCorp | | | 42,942 | |
| 3,700 | | PNC Financial Services Group, Inc. | | | 215,303 | |
| 59,200 | | Regions Financial Corp. | | | 385,984 | |
| 1,000 | | Sterling Financial Corp. | | | 21,260 | |
| 25,491 | | US Bancorp | | | 846,556 | |
| 76,664 | | Wells Fargo & Co. | | | 2,582,810 | |
| | | | | | |
| | | | | 5,336,246 | |
| |
Consumer Finance 1.1% | | | | |
| 27,500 | | Discover Financial Services | | | 1,127,500 | |
| 12,800 | | Nelnet, Inc. (Class A Stock) | | | 312,448 | |
| | | | | | |
| | | | | 1,439,948 | |
| |
Diversified Financial Services 2.1% | | | | |
| 27,368 | | Bank of America Corp. | | | 255,070 | |
| 5,070 | | Citigroup, Inc. | | | 189,567 | |
See Notes to Financial Statements.
| | |
| 16 | | Visit our website at www.prudentialfunds.com |
| | | | | | |
| Shares | | Description | | Value (Note 1) | |
FINANCIALS (Continued) | | | | |
| |
Diversified Financial Services (cont’d.) | | | | |
| 54,800 | | JPMorgan Chase & Co. | | $ | 2,284,064 | |
| | | | | | |
| | | | | 2,728,701 | |
| |
Insurance 2.4% | | | | |
| 4,700 | | ACE Ltd. | | | 369,655 | |
| 600 | | Allied World Assurance Co. Holdings AG | | | 48,180 | |
| 18,500 | | American International Group, Inc.* | | | 646,205 | |
| 9,500 | | Berkshire Hathaway, Inc. (Class B Stock)* | | | 820,325 | |
| 1,800 | | Chubb Corp. (The) | | | 138,564 | |
| 1,400 | | Primerica, Inc. | | | 39,564 | |
| 1,000 | | ProAssurance Corp. | | | 89,400 | |
| 2,200 | | Symetra Financial Corp. | | | 26,290 | |
| 24,400 | | Unum Group | | | 494,832 | |
| 18,700 | | XL Group PLC | | | 462,638 | |
| | | | | | |
| | | | | 3,135,653 | |
| |
Real Estate Investment Trusts 1.5% | | | | |
| 2,800 | | American Capital Agency Corp. | | | 92,456 | |
| 3,100 | | CommonWealth REIT | | | 42,501 | |
| 5,800 | | Franklin Street Properties Corp. | | | 66,178 | |
| 14,900 | | General Growth Properties, Inc. | | | 292,934 | |
| 2,100 | | HCP, Inc. | | | 93,030 | |
| 6,900 | | Hospitality Properties Trust | | | 159,528 | |
| 18,000 | | Inland Real Estate Corp. | | | 147,060 | |
| 7,000 | | Piedmont Office Realty Trust, Inc. (Class A Stock) | | | 124,600 | |
| 13,000 | | Resource Capital Corp. | | | 76,180 | |
| 2,600 | | RLJ Lodging Trust | | | 46,332 | |
| 2,300 | | Simon Property Group, Inc. | | | 350,083 | |
| 3,200 | | Vornado Realty Trust | | | 256,672 | |
| 16,100 | | Winthrop Realty Trust | | | 176,134 | |
| | | | | | |
| | | | | 1,923,688 | |
HEALTHCARE 13.4% | | | | |
| |
Biotechnology 2.8% | | | | |
| 900 | | Alexion Pharmaceuticals, Inc.* | | | 81,342 | |
| 17,600 | | Amgen, Inc. | | | 1,523,192 | |
| 6,800 | | Biogen Idec, Inc.* | | | 939,896 | |
| 14,600 | | Celgene Corp.* | | | 1,070,472 | |
| | | | | | |
| | | | | 3,614,902 | |
See Notes to Financial Statements.
| | | | |
| Prudential Large-Cap Core Equity Fund | | | 17 | |
Portfolio of Investments
as of October 31, 2012 continued
| | | | | | |
| Shares | | Description | | Value (Note 1) | |
HEALTHCARE (Continued) | | | | |
| |
Healthcare Equipment & Supplies 1.1% | | | | |
| 2,500 | | CareFusion Corp.* | | $ | 66,400 | |
| 21,100 | | Covidien PLC | | | 1,159,445 | |
| 2,300 | | St. Jude Medical, Inc. | | | 87,998 | |
| 1,100 | | Stryker Corp. | | | 57,860 | |
| | | | | | |
| | | | | 1,371,703 | |
| |
Healthcare Providers & Services 3.1% | | | | |
| 23,200 | | Aetna, Inc.(a) | | | 1,013,840 | |
| 16,800 | | Coventry Health Care, Inc. | | | 733,152 | |
| 3,000 | | Humana, Inc. | | | 222,810 | |
| 22,400 | | UnitedHealth Group, Inc. | | | 1,254,400 | |
| 11,700 | | WellPoint, Inc. | | | 716,976 | |
| | | | | | |
| | | | | 3,941,178 | |
| |
Life Sciences Tools & Services 0.4% | | | | |
| 9,500 | | Thermo Fisher Scientific, Inc. | | | 580,070 | |
| |
Pharmaceuticals 6.0% | | | | |
| 20,400 | | Abbott Laboratories | | | 1,336,608 | |
| 23,700 | | Eli Lilly & Co. | | | 1,152,531 | |
| 17,799 | | Johnson & Johnson(a) | | | 1,260,525 | |
| 26,700 | | Merck & Co., Inc. | | | 1,218,321 | |
| 111,534 | | Pfizer, Inc. | | | 2,773,851 | |
| | | | | | |
| | | | | 7,741,836 | |
INDUSTRIALS 10.9% | | | | |
| |
Aerospace & Defense 2.5% | | | | |
| 3,700 | | Alliant Techsystems, Inc. | | | 211,973 | |
| 2,100 | | Esterline Technologies Corp.* | | | 121,359 | |
| 14,500 | | General Dynamics Corp. | | | 987,160 | |
| 9,900 | | Honeywell International, Inc. | | | 606,276 | |
| 4,600 | | Huntington Ingalls Industries, Inc. | | | 194,948 | |
| 12,400 | | Northrop Grumman Corp. | | | 851,756 | |
| 2,700 | | Raytheon Co. | | | 152,712 | |
| 700 | | United Technologies Corp. | | | 54,712 | |
| | | | | | |
| | | | | 3,180,896 | |
See Notes to Financial Statements.
| | |
| 18 | | Visit our website at www.prudentialfunds.com |
| | | | | | |
| Shares | | Description | | Value (Note 1) | |
INDUSTRIALS (Continued) | | | | |
| |
Air Freight & Logistics 0.9% | | | | |
| 7,500 | | FedEx Corp. | | $ | 689,925 | |
| 6,200 | | United Parcel Service, Inc. (Class B Stock) | | | 454,150 | |
| | | | | | |
| | | | | 1,144,075 | |
| |
Building Products 0.1% | | | | |
| 1,500 | | Lennox International, Inc. | | | 75,075 | |
| |
Commercial Services & Supplies | | | | |
| 1,600 | | Copart, Inc.* | | | 46,064 | |
| |
Construction & Engineering 0.6% | | | | |
| 18,100 | | KBR, Inc. | | | 504,266 | |
| 7,500 | | URS Corp. | | | 251,100 | |
| | | | | | |
| | | | | 755,366 | |
| |
Electrical Equipment 0.9% | | | | |
| 3,200 | | Babcock & Wilcox Co. (The)* | | | 82,464 | |
| 18,200 | | Emerson Electric Co. | | | 881,426 | |
| 5,900 | | EnerSys, Inc.* | | | 203,432 | |
| | | | | | |
| | | | | 1,167,322 | |
| |
Industrial Conglomerates 1.6% | | | | |
| 99,300 | | General Electric Co. | | | 2,091,258 | |
| |
Machinery 1.9% | | | | |
| 3,800 | | AGCO Corp.* | | | 172,938 | |
| 14,800 | | Deere & Co. | | | 1,264,512 | |
| 800 | | Hyster-Yale Materials Handling, Inc. (Class B Stock)* | | | 32,864 | |
| 8,200 | | Ingersoll-Rand PLC | | | 385,646 | |
| 1,500 | | Mueller Industries, Inc. | | | 65,700 | |
| 9,700 | | Oshkosh Corp.* | | | 290,806 | |
| 5,500 | | Timken Co. | | | 217,195 | |
| 700 | | Toro Co. (The) | | | 29,554 | |
| | | | | | |
| | | | | 2,459,215 | |
| |
Professional Services 0.2% | | | | |
| 4,700 | | Equifax, Inc. | | | 235,188 | |
See Notes to Financial Statements.
| | | | |
| Prudential Large-Cap Core Equity Fund | | | 19 | |
Portfolio of Investments
as of October 31, 2012 continued
| | | | | | |
| Shares | | Description | | Value (Note 1) | |
INDUSTRIALS (Continued) | | | | |
| |
Road & Rail 2.2% | | | | |
| 39,100 | | CSX Corp. | | $ | 800,377 | |
| 11,200 | | Norfolk Southern Corp. | | | 687,120 | |
| 11,000 | | Union Pacific Corp. | | | 1,353,330 | |
| | | | | | |
| | | | | 2,840,827 | |
| |
Trading Companies & Distributors | | | | |
| 900 | | DXP Enterprises, Inc.* | | | 44,307 | |
INFORMATION TECHNOLOGY 19.9% | | | | |
| |
Communications Equipment 2.1% | | | | |
| 6,800 | | Brocade Communications Systems, Inc.* | | | 36,040 | |
| 88,450 | | Cisco Systems, Inc. | | | 1,516,033 | |
| 4,400 | | Harris Corp. | | | 201,432 | |
| 17,400 | | QUALCOMM, Inc. | | | 1,019,205 | |
| | | | | | |
| | | | | 2,772,710 | |
| |
Computers & Peripherals 5.5% | | | | |
| 9,960 | | Apple, Inc. | | | 5,927,196 | |
| 46,000 | | EMC Corp.* | | | 1,123,320 | |
| | | | | | |
| | | | | 7,050,516 | |
| |
Internet Software & Services 1.8% | | | | |
| 23,300 | | Akamai Technologies, Inc.* | | | 885,167 | |
| 2,000 | | Ancestry.com, Inc.*(a) | | | 63,200 | |
| 1,400 | | Google, Inc. (Class A Stock)* | | | 951,678 | |
| 4,200 | | IAC/InterActiveCorp | | | 203,070 | |
| 14,700 | | Yahoo!, Inc.* | | | 247,107 | |
| | | | | | |
| | | | | 2,350,222 | |
| |
IT Services 5.1% | | | | |
| 15,700 | | Accenture PLC (Class A Stock) | | | 1,058,337 | |
| 16,900 | | CoreLogic, Inc.* | | | 402,220 | |
| 3,700 | | Global Payments, Inc. | | | 158,175 | |
| 7,770 | | International Business Machines Corp. | | | 1,511,498 | |
| 7,600 | | Lender Processing Services, Inc. | | | 183,236 | |
| 3,100 | | Mastercard, Inc. (Class A Stock) | | | 1,428,883 | |
| 15,200 | | SAIC, Inc. | | | 167,048 | |
| 12,000 | | Visa, Inc. (Class A Stock) | | | 1,665,120 | |
| | | | | | |
| | | | | 6,574,517 | |
See Notes to Financial Statements.
| | |
| 20 | | Visit our website at www.prudentialfunds.com |
| | | | | | |
| Shares | | Description | | Value (Note 1) | |
INFORMATION TECHNOLOGY (Continued) | | | | |
| |
Semiconductors & Semiconductor Equipment 0.7% | | | | |
| 27,000 | | Intel Corp. | | $ | 583,875 | |
| 46,300 | | LSI Corp.* | | | 317,155 | |
| | | | | | |
| | | | | 901,030 | |
| |
Software 4.7% | | | | |
| 23,100 | | CA, Inc. | | | 520,212 | |
| 1,600 | | Fair Isaac Corp. | | | 74,560 | |
| 18,300 | | Intuit, Inc. | | | 1,087,386 | |
| 75,200 | | Microsoft Corp. | | | 2,145,832 | |
| 65,600 | | Oracle Corp. | | | 2,036,880 | |
| 3,600 | | Parametric Technology Corp.* | | | 72,648 | |
| 4,200 | | Symantec Corp.* | | | 76,398 | |
| 300 | | VMware, Inc. (Class A Stock)* | | | 25,431 | |
| | | | | | |
| | | | | 6,039,347 | |
MATERIALS 2.5% | | | | |
| |
Chemicals 2.1% | | | | |
| 3,800 | | CF Industries Holdings, Inc. | | | 779,722 | |
| 13,600 | | Eastman Chemical Co. | | | 805,664 | |
| 1,000 | | LSB Industries, Inc.* | | | 40,270 | |
| 4,700 | | LyondellBasell Industries NV (Class A Stock) | | | 250,933 | |
| 5,500 | | Sherwin-Williams Co. (The) | | | 784,190 | |
| | | | | | |
| | | | | 2,660,779 | |
| |
Construction Materials 0.1% | | | | |
| 2,100 | | Eagle Materials, Inc.(a) | | | 111,237 | |
| |
Metals & Mining 0.3% | | | | |
| 5,800 | | Coeur d’Alene Mines Corp.* | | | 179,278 | |
| 6,200 | | Southern Copper Corp.(a) | | | 236,220 | |
| | | | | | |
| | | | | 415,498 | |
TELECOMMUNICATION SERVICES 2.7% | | | | |
| |
Diversified Telecommunication Services | | | | |
| 39,768 | | AT&T, Inc. | | | 1,375,575 | |
| 45,800 | | Verizon Communications, Inc. | | | 2,044,512 | |
| | | | | | |
| | | | | 3,420,087 | |
See Notes to Financial Statements.
| | | | |
| Prudential Large-Cap Core Equity Fund | | | 21 | |
Portfolio of Investments
as of October 31, 2012 continued
| | | | | | |
| Shares | | Description | | Value (Note 1) | |
UTILITIES 2.4% | | | | |
| |
Electric Utilities 0.9% | | | | |
| 16,100 | | Duke Energy Corp. | | $ | 1,057,609 | |
| 900 | | El Paso Electric Co. | | | 30,591 | |
| 1,900 | | Xcel Energy, Inc. | | | 53,675 | |
| | | | | | |
| | | | | 1,141,875 | |
| |
Gas Utilities 0.2% | | | | |
| 8,100 | | UGI Corp. | | | 261,549 | |
| |
Independent Power Producers & Energy Traders 0.1% | | | | |
| 17,500 | | AES Corp. (The) | | | 182,875 | |
| |
Multi-Utilities 0.8% | | | | |
| 4,300 | | Alliant Energy Corp. | | | 192,210 | |
| 13,800 | | Ameren Corp. | | | 453,744 | |
| 11,900 | | Public Service Enterprise Group, Inc. | | | 381,276 | |
| | | | | | |
| | | | | 1,027,230 | |
| |
Water Utilities 0.4% | | | | |
| 12,000 | | American Water Works Co., Inc. | | | 440,880 | |
| | | | | | |
| | Total long-term investments
(cost $92,363,077) | | | 127,600,046 | |
| | | | | | |
| |
Principal
Amount (000) | | | |
SHORT-TERM INVESTMENTS 3.7% | | | | |
| |
United States Government Security 0.1% | | | | |
| $ 160 | | United States Treasury Bill
0.101%, 12/20/12
(cost $159,978)(b)(c) | | | 159,978 | |
| |
| Shares | | | |
| |
Affiliated Money Market Mutual Fund 3.6% | | | | |
| 4,637,679 | | Prudential Investment Portfolios - 2 Prudential Core Taxable
Money Market Fund
(cost $4,637,679; includes $3,673,094 of cash collateral received for securities on loan)(d)(e) | | | 4,637,679 | |
| | | | | | |
| | Total short-term investments
(cost $4,797,657) | | | 4,797,657 | |
| | | | | | |
See Notes to Financial Statements.
| | |
| 22 | | Visit our website at www.prudentialfunds.com |
| | | | | | |
| | | Description | | Value (Note 1) | |
| | Total Investments 102.9%
(cost $97,160,734; Note 5) | | $ | 132,397,703 | |
| | Liabilities in excess of other assets(f) (2.9%) | | | (3,738,149 | ) |
| | | | | | |
| | Net Assets 100.0% | | $ | 128,659,554 | |
| | | | | | |
The following abbreviation is used in the portfolio descriptions:
REIT—Real Estate Investment Trust
| * | Non-income producing security. |
| (a) | All or a portion of security is on loan. The aggregate market value of such securities, including those sold and pending settlement, is $3,585,965; cash collateral of $3,673,094 (included in liabilities) was received with which the Fund purchased highly liquid short-term investments. |
| (b) | Rate quoted represents yield-to-maturity as of purchase date. |
| (c) | Represents security, or a portion thereof, segregated as collateral for futures contract. |
| (d) | Prudential Investments LLC, the manager of the Fund, also serves as manager of the Prudential Investment Portfolios 2 - Prudential Core Taxable Money Market Fund. |
| (e) | Represents security, or a portion thereof, purchased with cash collateral received for securities on loan. |
| (f) | Includes net unrealized depreciation on the following derivative contracts held at reporting period end: |
Open future contracts outstanding at October 31, 2012:
| | | | | | | | | | | | | | | | | | | | |
Number of
Contracts | | | Type | | Expiration
Date | | | Value at
Trade
Date | | | Value at
October 31,
2012 | | | Unrealized
Depreciation | |
| | | | Long Position: | | | | | | | | | | | | | | | | |
| | 18 | | | E-mini S&P 500 Futures | | | Dec. 2012 | | | $ | 1,289,425 | | | $ | 1,266,120 | | | $ | (23,305 | ) |
| | | | | | | | | | | | | | | | | | | | |
Various inputs are used in determining the value of the Fund’s investments. These inputs are summarized in the three broad levels listed below.
Level 1—quoted prices generally in active markets for identical securities.
Level 2—other significant observable inputs including, but not limited to, quoted prices for similar securities, interest rates and yield curves, prepayment speeds, foreign currency exchange rates, and amortized cost.
Level 3—significant unobservable inputs for securities valued in accordance with Board approved fair valuation procedures.
See Notes to Financial Statements.
| | | | |
| Prudential Large-Cap Core Equity Fund | | | 23 | |
Portfolio of Investments
as of October 31, 2012 continued
The following is a summary of the inputs used as of October 31, 2012 in valuing such portfolio securities:
| | | | | | | | | | | | |
| | | Level 1 | | | Level 2 | | | Level 3 | |
Investments in Securities | | | | | | | | | | | | |
Common Stocks | | $ | 127,567,182 | | | $ | 32,864 | | | $ | — | |
United States Government Security | | | — | | | | 159,978 | | | | — | |
Affiliated Money Market Mutual Fund | | | 4,637,679 | | | | — | | | | — | |
Other Financial Instruments* | | | | | | | | | | | | |
Futures | | | (23,305 | ) | | | — | | | | — | |
| | | | | | | | | | | | |
Total | | $ | 132,181,556 | | | $ | 192,842 | | | $ | — | |
| | | | | | | | | | | | |
The industry classification of portfolio holdings and liabilities in excess of other assets shown as a percentage of net assets as of October 31, 2012 were as follows:
| | | | |
Information Technology | | | 19.9 | % |
Financials | | | 13.7 | |
Healthcare | | | 13.4 | |
Consumer Discretionary | | | 12.4 | |
Energy | | | 11.6 | |
Industrials | | | 10.9 | |
Consumer Staples | | | 9.7 | |
Affiliated Money Market Mutual Fund (including 2.9% of collateral received for securities on loan) | | | 3.6 | |
Telecommunication Services | | | 2.7 | % |
Materials | | | 2.5 | |
Utilities | | | 2.4 | |
United States Government Security | | | 0.1 | |
| | | | |
| | | 102.9 | |
Liabilities in excess of other assets | | | (2.9 | ) |
| | | | |
| | | 100.0 | % |
| | | | |
See Notes to Financial Statements.
| | |
| 24 | | Visit our website at www.prudentialfunds.com |
The Fund invested in derivative instruments during the reporting period. The primary type of risk associated with these derivative instruments is equity risk. The effect of such derivative instruments on the Fund’s financial position and financial performance as reflected in the Statement of Assets and Liabilities and Statement of Operations is presented in the summary below.
Fair values of derivative instruments as of October 31, 2012 as presented in the Statement of Assets and Liabilities:
| | | | | | | | | | | | |
Derivatives not designated
as hedging instruments,
carried at fair value | | Asset Derivatives | | | Liability Derivatives | |
| | Balance
Sheet Location | | Fair
Value | | | Balance
Sheet Location | | Fair
Value | |
| Equity contracts | | — | | $ | — | | | Due to broker—variation margin | | $ | 23,305 | * |
| | | | | | | | | | | | |
| * | Includes cumulative appreciation/depreciation on futures contracts as reported in Portfolio of Investments. Only unsettled variation margin receivable (payable) is reported within the Statement of Assets and Liabilities. |
The effects of derivative instruments on the Statement of Operations for the year ended October 31, 2012 are as follows:
| | | | |
Amount of Realized Gain or (Loss) on Derivatives Recognized in Income | |
Derivatives not designated as hedging
instruments, carried at fair value | | Futures | |
Equity contracts | | $ | 324,774 | |
| | | | |
|
Change in Unrealized Appreciation or (Depreciation) on Derivatives Recognized in Income | |
Derivatives not designated as hedging
instruments, carried at fair value | | Futures | |
Equity contracts | | $ | (99,085 | ) |
| | | | |
For the year ended October 31, 2012, the Fund’s average value at trade date for futures long position was $1,603,735.
See Notes to Financial Statements.
| | | | |
| Prudential Large-Cap Core Equity Fund | | | 25 | |
Statement of Assets and Liabilities
as of October 31, 2012
| | | | |
Assets | | | | |
Investments at value, including securities on loan of $3,585,965: | | | | |
Unaffiliated investments (cost $92,523,055) | | $ | 127,760,024 | |
Affiliated investments (cost $4,637,679) | | | 4,637,679 | |
Dividends and interest receivable | | | 166,665 | |
Receivable for Fund shares sold | | | 31,772 | |
Prepaid expenses | | | 2,521 | |
| | | | |
Total assets | | | 132,598,661 | |
| | | | |
| |
Liabilities | | | | |
Payable to broker for collateral for securities on loan | | | 3,673,094 | |
Accrued expenses | | | 103,237 | |
Management fee payable | | | 84,818 | |
Distribution fee payable | | | 35,378 | |
Payable for Fund shares reacquired | | | 28,578 | |
Affiliated transfer agent fee payable | | | 13,282 | |
Due to broker—variation margin | | | 720 | |
| | | | |
Total liabilities | | | 3,939,107 | |
| | | | |
| |
Net Assets | | $ | 128,659,554 | |
| | | | |
| | | | | |
Net assets were comprised of: | | | | |
Shares of beneficial interest, at par | | $ | 10,197 | |
Paid-in capital in excess of par | | | 87,830,155 | |
| | | | |
| | | 87,840,352 | |
Undistributed net investment income | | | 829,041 | |
Accumulated net realized gain on investment and financial futures transactions | | | 4,776,497 | |
Net unrealized appreciation on investments | | | 35,213,664 | |
| | | | |
Net assets, October 31, 2012 | | $ | 128,659,554 | |
| | | | |
See Notes to Financial Statements.
| | |
| 26 | | Visit our website at www.prudentialfunds.com |
| | | | |
Class A | | | | |
Net asset value and redemption price per share | | | | |
($70,475,484 ÷ 5,547,274 shares of beneficial interest issued and outstanding) | | $ | 12.70 | |
Maximum sales charge (5.50% of offering price) | | | 0.74 | |
| | | | |
Maximum offering price to public | | $ | 13.44 | |
| | | | |
| |
Class B | | | | |
Net asset value, offering price and redemption price per share | | | | |
($3,029,438 ÷ 253,350 shares of beneficial interest issued and outstanding) | | $ | 11.96 | |
| | | | |
| |
Class C | | | | |
Net asset value, offering price and redemption price per share | | | | |
($20,133,605 ÷ 1,682,289 shares of beneficial interest issued and outstanding) | | $ | 11.97 | |
| | | | |
| |
Class X | | | | |
Net asset value, offering price and redemption price per share | | | | |
($469,728 ÷ 38,338 shares of beneficial interest issued and outstanding) | | $ | 12.25 | |
| | | | |
| |
Class Z | | | | |
Net asset value, offering price and redemption price per share | | | | |
($34,551,299 ÷ 2,676,018 shares of beneficial interest issued and outstanding) | | $ | 12.91 | |
| | | | |
See Notes to Financial Statements.
| | | | |
| Prudential Large-Cap Core Equity Fund | | | 27 | |
Statement of Operations
Year Ended October 31, 2012
| | | | |
Net Investment Income | | | | |
Income | | | | |
Unaffiliated dividends (net of foreign withholding taxes of $13,859) | | $ | 2,702,785 | |
Affiliated income from securities loaned, net | | | 14,848 | |
Affiliated dividend income | | | 2,541 | |
Interest | | | 168 | |
| | | | |
Total income | | | 2,720,342 | |
| | | | |
| |
Expenses | | | | |
Management fee | | | 820,489 | |
Distribution fee—Class A | | | 163,224 | |
Distribution fee—Class B | | | 34,965 | |
Distribution fee—Class C | | | 204,489 | |
Distribution fee—Class L | | | 16,072 | |
Distribution fee—Class M | | | 1,551 | |
Distribution fee—Class X | | | 1,582 | |
Transfer agent’s fees and expenses (including affiliated expense of $68,200) (Note 3) | | | 275,000 | |
Registration fees | | | 89,000 | |
Custodian’s fees and expenses | | | 85,000 | |
Reports to shareholders | | | 45,000 | |
Audit fee | | | 23,000 | |
Legal fees and expenses | | | 22,000 | |
Trustees’ fees | | | 14,000 | |
Insurance | | | 2,000 | |
Loan interest expense (Note 7) | | | 165 | |
Miscellaneous | | | 15,123 | |
| | | | |
Total expenses | | | 1,812,660 | |
Less: Management fee waiver (Note 2) | | | (190,485 | ) |
| | | | |
Net expenses | | | 1,622,175 | |
| | | | |
Net investment income | | | 1,098,167 | |
| | | | |
| |
Realized And Unrealized Gain (Loss) On Investments | | | | |
Net realized gain on: | | | | |
Investment transactions | | | 4,773,946 | |
Financial futures transactions | | | 324,774 | |
| | | | |
| | | 5,098,720 | |
| | | | |
Net change in unrealized appreciation (depreciation) on: | | | | |
Investments | | | 12,643,912 | |
Financial futures contracts | | | (99,085 | ) |
| | | | |
| | | 12,544,827 | |
| | | | |
Net gain on investments | | | 17,643,547 | |
| | | | |
Net Increase In Net Assets Resulting From Operations | | $ | 18,741,714 | |
| | | | |
See Notes to Financial Statements.
| | |
| 28 | | Visit our website at www.prudentialfunds.com |
Statement of Changes in Net Assets
| | | | | | | | |
| | | Year Ended October 31, | |
| | | 2012 | | | 2011 | |
Increase (Decrease) In Net Assets | | | | | | | | |
Operations | | | | | | | | |
Net investment income | | $ | 1,098,167 | | | $ | 1,044,368 | |
Net realized gain on investment transactions | | | 5,098,720 | | | | 49,321,321 | |
Net change in unrealized appreciation (depreciation) on investments | | | 12,544,827 | | | | (22,522,002 | ) |
| | | | | | | | |
Net increase in net assets resulting from operations | | | 18,741,714 | | | | 27,843,687 | |
| | | | | | | | |
| | |
Dividends and Distributions (Note 1) | | | | | | | | |
Dividends from net investment income | | | | | | | | |
Class A | | | (595,220 | ) | | | (107,588 | ) |
Class B | | | (12,057 | ) | | | — | |
Class C | | | (62,241 | ) | | | — | |
Class L | | | (28,457 | ) | | | — | |
Class M | | | (1,808 | ) | | | — | |
Class X | | | (8,207 | ) | | | (2,994 | ) |
Class Z | | | (395,158 | ) | | | (638,260 | ) |
| | | | | | | | |
| | | (1,103,148 | ) | | | (748,842 | ) |
| | | | | | | | |
Distributions from net realized gains | | | | | | | | |
Class A | | | (4,106,809 | ) | | | — | |
Class B | | | (280,388 | ) | | | — | |
Class C | | | (1,447,462 | ) | | | — | |
Class L | | | (255,983 | ) | | | — | |
Class M | | | (42,040 | ) | | | — | |
Class X | | | (54,719 | ) | | | — | |
Class Z | | | (2,115,448 | ) | | | — | |
| | | | | | | | |
| | | (8,302,849 | ) | | | — | |
| | | | | | | | |
| | |
Fund share transactions (Net of share conversions) (Note 6) | | | | | | | | |
Net proceeds from shares sold | | | 8,861,788 | | | | 116,185,903 | |
Net asset value of shares issued in reinvestment of dividends
and distributions | | | 9,057,492 | | | | 192,729 | |
Cost of shares reacquired | | | (23,068,721 | ) | | | (262,798,860 | ) |
| | | | | | | | |
Net decrease in net assets from Fund share transactions | | | (5,149,441 | ) | | | (146,420,228 | ) |
| | | | | | | | |
| | |
Capital Contributions (Note 2) | | | | | | | | |
Class X | | | 34 | | | | 247 | |
| | | | | | | | |
Total increase (decrease) | | | 4,186,310 | | | | (119,325,136 | ) |
| | |
Net Assets: | | | | | | | | |
Beginning of year | | | 124,473,244 | | | | 243,798,380 | |
| | | | | | | | |
End of year(a) | | $ | 128,659,554 | | | $ | 124,473,244 | |
| | | | | | | | |
(a) Includes undistributed net investment income of: | | $ | 829,041 | | | $ | 829,801 | |
| | | | | | | | |
See Notes to Financial Statements.
| | | | |
| Prudential Large-Cap Core Equity Fund | | | 29 | |
Notes to Financial Statements
Prudential Investment Portfolios 9 (the “Trust”) is an open-end management investment company, registered under the Investment Company Act of 1940 (“1940 Act”). The Trust currently consists of three funds: Prudential Large-Cap Core Equity Fund (the “Fund”), Prudential International Real Estate Fund and Prudential Absolute Return Bond Fund. These financial statements relate to Prudential Large-Cap Core Equity Fund, a diversified fund. The financial statements of the Prudential International Real Estate Fund and Prudential Absolute Return Bond Fund are not presented herein.
The Fund’s investment objective is to seek long-term after-tax growth of capital.
Note 1. Accounting Policies
The following is a summary of significant accounting policies followed by the Fund in the preparation of its financial statements.
Securities Valuation: The Fund holds portfolio securities and other assets that are fair valued at the close of each day the New York Stock Exchange (“NYSE”) is open for trading. Fair value is the price that would be received to sell an asset or paid to transfer a liability in an orderly transaction between market participants on the measurement date. The Board of Trustees (the “Board”) has delegated fair valuation responsibilities to Prudential Investments LLC (“PI” or “Manager”) through the adoption of Valuation Procedures for valuation of the Fund’s securities. Under the current Valuation Procedures, a Valuation Committee is established and responsible for supervising the valuation of portfolio securities and other assets. The Valuation Procedures allow the Fund to utilize independent pricing vendor services, quotations from market makers and other valuation methods in events when market quotations are not readily available or not representative of the fair values of the securities. A record of the Valuation Committee’s actions is subject to review, approval and ratification by the Board at its next regularly scheduled quarterly meeting.
Various inputs are used in determining the value of the Fund’s investments, which are summarized in the three broad level hierarchies based on any observable inputs used as described in the table following the Portfolio of Investments. The valuation
| | |
| 30 | | Visit our website at www.prudentialfunds.com |
methodologies and significant inputs used in determining the fair value of securities and other assets classified as Level 1, Level 2 and Level 3 of the hierarchy are as follows:
Common stocks, exchange-traded funds and financial derivative instruments (including futures contracts and certain options and swap contracts on securities), that are traded on a national securities exchange are valued at the last sale price as of the close of trading on the applicable exchange. Securities traded via NASDAQ are valued at the NASDAQ official closing price. To the extent these securities are valued at the last sale price or NASDAQ official closing price, they are classified as Level 1 of the fair value hierarchy.
In the event there is no sale or official closing price on such day, these securities are valued at the mean between the last reported bid and asked prices, or at the last bid price in absence of an asked price. These securities are classified as Level 2 of the fair value hierarchy as these inputs are considered as significant other observable inputs to the valuation.
For common stocks traded on foreign securities exchanges, certain valuation adjustments will be applied when events occur after the close of the security’s foreign market and before the Fund’s normal pricing time. These securities are valued using pricing vendor services that provide model prices derived using adjustment factors based on information such as local closing price, relevant general and sector indices, currency fluctuations, depositary receipts, and futures, as applicable. Securities valued using such model prices are classified as Level 2 of the fair value hierarchy as the adjustment factors are considered as significant other observable inputs to the valuation.
Investments in open-end, non-exchange-traded mutual funds are valued at their net asset value as of the close of the NYSE on the date of valuation. These securities are classified as Level 1 as these securities have the ability to be purchased or sold at their net asset value on the date of valuation.
Fixed income securities traded in the over-the-counter market, such as corporate bonds, municipal bonds, U.S. Government agencies, issued and guaranteed obligations, U.S. Treasury obligations and sovereign issues are usually valued at prices provided by approved independent pricing vendors. The pricing vendors provide these prices usually after evaluating observable inputs including yield curves, credit rating, yield spreads, default rates, cash flows as well as broker/dealer quotations and reported trades. Securities valued using such vendor prices are classified as Level 2 of the fair value hierarchy.
| | | | |
| Prudential Large-Cap Core Equity Fund | | | 31 | |
Notes to Financial Statements
continued
Asset-backed and mortgage-related securities are usually valued by approved independent pricing vendors. The pricing vendors provide the prices using their internal pricing models with input from deal terms, tranche level attributes, yield curves, prepayment speeds, default rates and broker/dealer quotes. Securities valued using such vendor prices are classified as Level 2 of the fair value hierarchy.
Short-term debt securities of sufficient credit quality, which mature in sixty days or less, are valued at amortized cost, which approximates fair value. The amortized cost method involves valuing a security at its cost on the date of purchase and thereafter assuming a constant amortization to maturity of the difference between the principal amount due at maturity and cost. These securities are categorized as Level 2 of the fair value hierarchy.
Over-the-counter financial derivative instruments, such as option contracts, foreign currency contracts and swaps agreements, are usually valued using pricing vendor services, which derive the valuation based on underlying asset prices, indices, spreads, interest rates, exchange rates and other inputs. These instruments are categorized as Level 2 of the fair value hierarchy.
Securities and other assets that cannot be priced using the methods described above are valued with pricing methodologies approved by the Valuation Committee. In the event there are unobservable inputs used when determining such valuations, the securities will be classified as Level 3 of the fair value hierarchy.
When determining the fair value of securities, some of the factors influencing the valuation include: the nature of any restrictions on disposition of the securities; assessment of the general liquidity of the securities; the issuer’s financial condition and the markets in which it does business; the cost of the investment; the size of the holding and the capitalization of the issuer; the prices of any recent transactions or bids/offers for such securities or any comparable securities; any available analyst media or other reports or information deemed reliable by the investment adviser regarding the issuer or the markets or industry in which it operates. Using fair value to price securities may result in a value that is different from a security’s most recent closing price and from the price used by other mutual funds to calculate their net asset values.
Securities Lending: The Fund may lend its portfolio securities to banks and broker-dealers. The loans are secured by collateral at least equal to the market value of the
| | |
| 32 | | Visit our website at www.prudentialfunds.com |
securities loaned. Collateral pledged by each borrower is invested in a highly liquid short-term money market fund and is marked to market daily, based on the previous day’s market value, such that the value of the collateral exceeds the value of the loaned securities. Loans are subject to termination at the option of the borrower or the Fund. Upon termination of the loan, the borrower will return to the Fund securities identical to the loaned securities. Should the borrower of the securities fail financially, the Fund has the right to repurchase the securities using the collateral in the open market. The Fund recognizes income, net of any rebate and securities lending agent fees, for lending its securities, and any interest on the investment of cash received as collateral. The Fund also continues to receive interest and dividends or amounts equivalent thereto, on the securities loaned and recognizes any unrealized gain or loss in the market price of the securities loaned that may occur during the term of the loan.
Financial Futures Contracts: A financial futures contract is an agreement to purchase (long) or sell (short) an agreed amount of securities at a set price for delivery on a future date. Upon entering into a financial futures contract, the Fund is required to pledge to the broker an amount of cash and/or other assets equal to a certain percentage of the contract amount. This amount is known as the “initial margin”.
Subsequent payments, known as “variation margin”, are made or received by the Fund each day, depending on the daily fluctuations in the value of the underlying security. Such variation margin is recorded for financial statement purposes on a daily basis as unrealized gain or loss. When the contract expires or is closed, the gain or loss is realized and is presented in the Statement of Operations as net realized gain or loss on financial futures transactions.
The Fund invests in financial futures contracts in order to hedge its existing portfolio securities, or securities the Fund intends to purchase, against fluctuations in value caused by changes in value of equities. The use of futures transactions involves the risk of imperfect correlation in movements in the price of futures contracts and the underlying hedged assets. Financial futures contracts involve elements of both market and credit risk in excess of the amounts reflected on the Statement of Assets and Liabilities.
With exchange-traded futures, there is a minimal counterparty credit risk to the Fund since the exchanges’ clearinghouse acts as counterparty to all exchange traded futures and guarantees the futures contracts against default.
Securities Transactions and Net Investment Income: Securities transactions are recorded on the trade date. Realized gains or losses from investment transactions are
| | | | |
| Prudential Large-Cap Core Equity Fund | | | 33 | |
Notes to Financial Statements
continued
calculated on an identified cost basis. Dividend income is recorded on the ex-dividend date. Interest income, including amortization of premium and accretion of discount on debt securities, as required, is recorded on an accrual basis. Expenses are recorded on the accrual basis, which may require the use of estimates by management, that may differ from actual.
Net investment income or loss (other than distribution fees which are charged directly to the respective class) and unrealized and realized gains or losses are allocated daily to each class of shares based upon the relative proportion of adjusted net assets of each class at the beginning of the day.
Dividends and Distributions: The Fund expects to pay dividends of net investment income and distributions of net realized capital gains, if any, annually. Dividends and distributions to shareholders, which are determined in accordance with federal income tax regulations and which may differ from generally accepted accounting principles, are recorded on the ex-dividend date. Permanent book/tax differences relating to income and gains are reclassified amongst undistributed net investment income, accumulated net realized gain or loss and paid-capital in excess of par, as appropriate.
Taxes: For federal income tax purposes, the Fund is treated as a separate taxpaying entity. It is the Fund’s policy to continue to meet the requirements of the Internal Revenue Code applicable to regulated investment companies and to distribute all of its taxable net investment income and capital gains, if any, to shareholders. Therefore, no federal income tax provision is required.
Withholding taxes on foreign dividends are recorded net of reclaimable amounts, at the time related income is earned.
Estimates: The preparation of the financial statements requires management to make estimates and assumptions that affect the reported amounts and disclosures in the financial statements. Actual results could differ from those estimates.
Note 2. Agreements
The Trust has a management agreement for the Fund with PI. Pursuant to this agreement, PI has responsibility for all investment advisory services and supervises
| | |
| 34 | | Visit our website at www.prudentialfunds.com |
the subadvisor’s performance of such services. PI has entered into a subadvisory agreement with Quantitative Management Associates LLC (“QMA”). The subadvisory agreement provides that QMA will furnish investment advisory services in connection with the management of the Fund. PI pays for the services of QMA, the cost of compensation of officers of the Fund, occupancy and certain clerical and bookkeeping costs of the Fund. The Fund bears all other costs and expenses.
The management fee paid to PI is computed daily and payable monthly at an annual rate of .65% of the Fund’s average daily net assets up to and including $500 million and .60% of the Fund’s average daily net assets in excess of $500 million. The effective management fee rate was .65% for the year ended October 31, 2012.
Effective July 1, 2011, PI has contractually agreed through February 28, 2014 to waive a portion of the Fund’s management fees so that the Fund’s annual operating expenses (exclusive of distribution and service (12b-1) fees, and certain other expenses such as taxes, interest, and brokerage commissions) do not exceed .95% of the Fund’s average daily net assets.
The Fund has distribution agreements with Prudential Investment Management Services LLC (“PIMS”) and Prudential Annuities Distributors, Inc. (“PAD”). PIMS and PAD are both affiliates of PI and indirect, wholly-owned subsidiaries of Prudential. PIMS serves as the distributor of the Fund’s Class A, Class B, Class C, and Class Z shares. PIMS, together with PAD, serves as co-distributor of the Fund’s Class X shares.
The Fund has adopted a separate Distribution and Service plan (each a “Plan” and collectively the “Plans”) for the Class A, Class B, Class C, and Class X shares of the Fund in accordance with Rule 12b-1 of the 1940 Act, as amended. No distribution or service fees are paid to PIMS as distributor for the Fund’s Class Z shares.
Under the Plans, the Fund compensates PIMS and PAD a distribution and service fee at the annual rate of .30%, 1.00%, 1.00%, and 1.00% of the average daily net assets of the Class A, B, C, and X shares, respectively. Through February 28, 2014, PIMS has contractually agreed to limit such fees to .25% of the average daily net assets of the Class A shares.
Management has received the maximum allowable amount of sales charges for Class X in accordance with regulatory limits. As such, any contingent deferred sales charges received by the manager are contributed back into the Fund and included in the Statement of Changes in Net Assets and Financial Highlights as a contribution to capital.
| | | | |
| Prudential Large-Cap Core Equity Fund | | | 35 | |
Notes to Financial Statements
continued
PIMS has advised the Fund that it received $25,932 in front-end sales charges resulting from sales of Class A shares during the year ended October 31, 2012. From these fees, PIMS paid such sales charges to affiliated broker-dealers, which in turn paid commissions to salespersons and incurred other distribution costs.
PIMS has advised the Fund that for the year ended October 31, 2012, it received $205, $5,380, and $250 in contingent deferred sales charges imposed upon certain redemptions by Class A, B, and C, shareholders, respectively.
PI, QMA, PAD and PIMS are indirect, wholly-owned subsidiaries of Prudential Financial, Inc. (“Prudential”).
Note 3. Other Transactions with Affiliates
Prudential Mutual Fund Services LLC (“PMFS”), an affiliate of PI and an indirect, wholly-owned subsidiary of Prudential, serves as the Fund’s transfer agent. Transfer agent fees and expenses in the Statement of Operations include certain out-of-pocket expenses paid to non-affiliates, where applicable.
Prudential Investment Management, Inc., (“PIM”), an indirect, wholly-owned subsidiary of Prudential, is the Fund’s securities lending agent. For the year ended October 31, 2012, PIM has been compensated in the amount of approximately $4,400 for these services.
The Fund invests in the Prudential Core Taxable Money Market Fund (the “Core Fund”), a portfolio of the Prudential Investment Portfolios 2, registered under the 1940 Act and managed by PI. Earnings from the Core Fund are disclosed on the Statement of Operations as affiliated dividend income.
Note 4. Portfolio Securities
Purchases and sales of investment securities, other than short-term investments, for the year ended October 31, 2012, were $111,585,510 and $124,803,075, respectively.
| | |
| 36 | | Visit our website at www.prudentialfunds.com |
Note 5. Distributions and Tax Information
Distributions to shareholders, which are determined in accordance with federal income tax regulations and which may differ from generally accepted accounting principles, are recorded on the ex-dividend date. In order to present undistributed net investment income, accumulated net realized gain on investment transactions and paid-in capital in excess of par on the Statement of Assets and Liabilities that more closely represent their tax character, certain adjustments have been made to undistributed net investment income and accumulated net realized gain on investment transactions. For the year ended October 31, 2012, the adjustments were to increase undistributed net investment income and decrease accumulated net realized gain on investment transactions by $4,221 due to reclassification of distributions and other book to tax differences. Net investment income, net realized gain on investment transactions and net assets were not affected by this change.
The tax character of dividends paid as reflected in the Statement of Changes in Net Assets were $1,094,619 of ordinary income and $8,311,378 of long-term capital gains for the year ended October 31, 2012 and $748,842 of ordinary income for the year ended October 31, 2011, respectively.
As of October 31, 2012, the accumulated undistributed earnings on a tax basis were $829,041 of ordinary income and $4,885,044 of long-term capital gains.
The United States federal income tax basis of the Fund’s investments and the net unrealized appreciation as of October 31, 2012 were as follows:
| | | | | | |
Tax Basis | | Appreciation | | Depreciation | | Net
Unrealized
Appreciation |
| $97,292,587 | | $35,661,334 | | $(556,218) | | $35,105,116 |
The difference between book basis and tax basis is primarily attributable to deferred losses on wash sales.
Management has analyzed the Fund’s tax positions taken on federal income tax returns for all open tax years and has concluded that no provision for income tax is required in the Fund’s financial statements for the current reporting period. The Fund’s federal and state income and federal excise tax returns for tax years for which the applicable statutes of limitations have not expired are subject to examination by the Internal Revenue Service and state departments of revenue.
| | | | |
| Prudential Large-Cap Core Equity Fund | | | 37 | |
Notes to Financial Statements
continued
Note 6. Capital
The Fund offers Class A, Class B, Class C, Class X and Class Z shares. Class A shares are sold with a front-end sales charge of up to 5.50%. Purchases of $1 million or more are subject to a contingent deferred sales charge (“CDSC”) if shares are redeemed within 12 months of their purchase. The Class A shares CDSC is waived for purchases by certain retirement and/or benefit plans. Class B shares are sold with a CDSC which declines from 5% to zero depending upon the period of time the shares are held. Class B shares will automatically convert to Class A shares approximately seven years after purchase. Class C shares are sold with a CDSC of 1% on shares redeemed within the first 12 months of purchase. Class X shares are closed to new purchases. Class X shares will automatically convert to Class A shares approximately ten years after purchase. The last conversion of Class M and Class L shares to Class A shares was completed as of April 13, 2012 and August 24, 2012, respectively. There are no Class M and Class L shares outstanding and Class M and Class L shares are no longer being offered for sale. Class Z shares are not subject to any sales or redemption charge and are offered exclusively for a sale to a limited group of investors.
Under certain circumstances, an exchange may be made from specified share classes of the Fund to one or more other share classes of the Fund as presented in the table of transactions in shares of capital stock.
The Fund has authorized an unlimited number of shares of beneficial interest at $.001 par value.
| | |
| 38 | | Visit our website at www.prudentialfunds.com |
Transactions in shares of common stock were as follows:
| | | | | | | | |
Class A | | Shares | | | Amount | |
Year ended October 31, 2012: | | | | | | | | |
Shares sold | | | 342,118 | | | $ | 4,156,661 | |
Shares issued in reinvestment of dividends and distributions | | | 412,010 | | | | 4,499,152 | |
Shares reacquired | | | (963,525 | ) | | | (11,523,902 | ) |
| | | | | | | | |
Net increase (decrease) in shares outstanding before conversion | | | (209,397 | ) | | | (2,868,089 | ) |
Shares issued upon conversion from Class B, L, M, X and Z | | | 528,491 | | | | 6,505,425 | |
Shares reacquired upon conversion into Class Z | | | (3,591 | ) | | | (43,726 | ) |
| | | | | | | | |
Net increase (decrease) in shares outstanding | | | 315,503 | | | $ | 3,593,610 | |
| | | | | | | | |
Year ended October 31, 2011: | | | | | | | | |
Shares sold | | | 226,434 | | | $ | 2,718,176 | |
Shares issued in reinvestment of dividends and distributions | | | 8,951 | | | | 102,580 | |
Shares reacquired | | | (1,129,537 | ) | | | (13,433,437 | ) |
| | | | | | | | |
Net increase (decrease) in shares outstanding before conversion | | | (894,152 | ) | | | (10,612,681 | ) |
Shares issued upon conversion from Class B, M, X and Z | | | 333,907 | | | | 3,979,299 | |
Shares reacquired upon conversion into Class Z | | | (64,388 | ) | | | (789,446 | ) |
| | | | | | | | |
Net increase (decrease) in shares outstanding | | | (624,633 | ) | | $ | (7,422,828 | ) |
| | | | | | | | |
Class B | | | | | | |
Year ended October 31, 2012: | | | | | | | | |
Shares sold | | | 41,138 | | | $ | 471,324 | |
Shares issued in reinvestment of dividends and distributions | | | 26,935 | | | | 278,772 | |
Shares reacquired | | | (50,973 | ) | | | (579,463 | ) |
| | | | | | | | |
Net increase (decrease) in shares outstanding before conversion | | | 17,100 | | | | 170,633 | |
Shares reacquired upon conversion into Class A | | | (124,237 | ) | | | (1,399,463 | ) |
| | | | | | | | |
Net increase (decrease) in shares outstanding | | | (107,137 | ) | | $ | (1,228,830 | ) |
| | | | | | | | |
Year ended October 31, 2011: | | | | | | | | |
Shares sold | | | 36,242 | | | $ | 410,489 | |
Shares reacquired | | | (73,858 | ) | | | (828,131 | ) |
| | | | | | | | |
Net increase (decrease) in shares outstanding before conversion | | | (37,616 | ) | | | (417,642 | ) |
Shares reacquired upon conversion into Class A | | | (109,632 | ) | | | (1,218,226 | ) |
| | | | | | | | |
Net increase (decrease) in shares outstanding | | | (147,248 | ) | | $ | (1,635,868 | ) |
| | | | | | | | |
| | | | |
| Prudential Large-Cap Core Equity Fund | | | 39 | |
Notes to Financial Statements
continued
| | | | | | | | |
Class C | | Shares | | | Amount | |
Year ended October 31, 2012: | | | | | | | | |
Shares sold | | | 63,033 | | | $ | 710,705 | |
Shares issued in reinvestment of dividends and distributions | | | 138,334 | | | | 1,433,144 | |
Shares reacquired | | | (357,707 | ) | | | (4,006,440 | ) |
| | | | | | | | |
Net increase (decrease) in shares outstanding before conversion | | | (156,340 | ) | | | (1,862,591 | ) |
Shares reacquired upon conversion into Class Z | | | (2,762 | ) | | | (32,878 | ) |
| | | | | | | | |
Net increase (decrease) in shares outstanding | | | (159,102 | ) | | $ | (1,895,469 | ) |
| | | | | | | | |
Year ended October 31, 2011: | | | | | | | | |
Shares sold | | | 39,452 | | | $ | 443,412 | |
Shares reacquired | | | (344,619 | ) | | | (3,901,637 | ) |
| | | | | | | | |
Net increase (decrease) in shares outstanding before conversion | | | (305,167 | ) | | | (3,458,225 | ) |
Shares reacquired upon conversion into Class Z | | | (1,009 | ) | | | (11,062 | ) |
| | | | | | | | |
Net increase (decrease) in shares outstanding | | | (306,176 | ) | | $ | (3,469,287 | ) |
| | | | | | | | |
Class L | | | | | | |
Period ended August 24, 2012:* | | | | | | | | |
Shares sold | | | 62 | | | $ | 728 | |
Shares issued in reinvestment of dividends and distributions | | | 25,537 | | | | 278,864 | |
Shares reacquired | | | (32,770 | ) | | | (390,254 | ) |
| | | | | | | | |
Net increase (decrease) in shares outstanding before conversion | | | (7,171 | ) | | | (110,662 | ) |
Shares reacquired upon conversion into Class A | | | (318,177 | ) | | | (4,007,434 | ) |
| | | | | | | | |
Net increase (decrease) in shares outstanding | | | (325,348 | ) | | $ | (4,118,096 | ) |
| | | | | | | | |
Year ended October 31, 2011: | | | | | | | | |
Shares sold | | | 660 | | | $ | 7,600 | |
Shares reacquired | | | (59,311 | ) | | | (703,599 | ) |
| | | | | | | | |
Net increase (decrease) in shares outstanding | | | (58,651 | ) | | $ | (695,999 | ) |
| | | | | | | | |
Class M | | | | | | |
Period ended April 13, 2012:** | | | | | | | | |
Shares sold | | | 14 | | | $ | 154 | |
Shares issued in reinvestment of dividends and distributions | | | 3,887 | | | | 40,276 | |
Shares reacquired | | | (2,084 | ) | | | (22,170 | ) |
| | | | | | | | |
Net increase (decrease) in shares outstanding before conversion | | | 1,817 | | | | 18,260 | |
Shares reacquired upon conversion into Class A | | | (67,391 | ) | | | (744,750 | ) |
| | | | | | | | |
Net increase (decrease) in shares outstanding | | | (65,574 | ) | | $ | (726,490 | ) |
| | | | | | | | |
Year ended October 31, 2011: | | | | | | | | |
Shares sold | | | 3,295 | | | $ | 37,625 | |
Shares reacquired | | | (135,762 | ) | | | (1,581,318 | ) |
| | | | | | | | |
Net increase (decrease) in shares outstanding before conversion | | | (132,467 | ) | | | (1,543,693 | ) |
Shares reacquired upon conversion into Class A | | | (193,614 | ) | | | (2,207,754 | ) |
| | | | | | | | |
Net increase (decrease) in shares outstanding | | | (326,081 | ) | | $ | (3,751,447 | ) |
| | | | | | | | |
| | |
| 40 | | Visit our website at www.prudentialfunds.com |
| | | | | | | | |
Class X | | Shares | | | Amount | |
Year ended October 31, 2012: | | | | | | | | |
Shares sold | | | 64 | | | $ | 738 | |
Shares issued in reinvestment of dividends and distributions | | | 5,974 | | | | 62,910 | |
Shares reacquired | | | (10,613 | ) | | | (122,332 | ) |
| | | | | | | | |
Net increase (decrease) in shares outstanding before conversion | | | (4,575 | ) | | | (58,684 | ) |
Shares reacquired upon conversion into Class A | | | (30,138 | ) | | | (349,136 | ) |
| | | | | | | | |
Net increase (decrease) in shares outstanding | | | (34,713 | ) | | $ | (407,820 | ) |
| | | | | | | | |
Year ended October 31, 2011: | | | | | | | | |
Shares sold | | | 137 | | | $ | 1,592 | |
Shares issued in reinvestment of dividends and distributions | | | 270 | | | | 2,994 | |
Shares reacquired | | | (15,943 | ) | | | (182,574 | ) |
| | | | | | | | |
Net increase (decrease) in shares outstanding before conversion | | | (15,536 | ) | | | (177,988 | ) |
Shares reacquired upon conversion into Class A | | | (42,317 | ) | | | (496,947 | ) |
| | | | | | | | |
Net increase (decrease) in shares outstanding | | | (57,853 | ) | | $ | (674,935 | ) |
| | | | | | | | |
Class Z | | | | | | |
Year ended October 31, 2012: | | | | | | | | |
Shares sold | | | 283,238 | | | $ | 3,521,478 | |
Shares issued in reinvestment of dividends and distributions | | | 222,617 | | | | 2,464,374 | |
Shares reacquired | | | (531,038 | ) | | | (6,424,160 | ) |
| | | | | | | | |
Net increase (decrease) in shares outstanding before conversion | | | (25,183 | ) | | | (438,308 | ) |
Shares issued upon conversion from Class A and C | | | 6,103 | | | | 76,604 | |
Shares reacquired upon conversion into Class A | | | (372 | ) | | | (4,642 | ) |
| | | | | | | | |
Net increase (decrease) in shares outstanding | | | (19,452 | ) | | $ | (366,346 | ) |
| | | | | | | | |
Year ended October 31, 2011: | | | | | | | | |
Shares sold | | | 9,171,981 | | | $ | 112,567,009 | |
Shares issued in reinvestment of dividends and distributions | | | 7,501 | | | | 87,155 | |
Shares reacquired | | | (19,225,188 | ) | | | (242,168,164 | ) |
| | | | | | | | |
Net increase (decrease) in shares outstanding before conversion | | | (10,045,706 | ) | | | (129,514,000 | ) |
Shares issued upon conversion from Class A and C | | | 64,428 | | | | 800,508 | |
Shares reacquired upon conversion into Class A | | | (4,881 | ) | | | (56,372 | ) |
| | | | | | | | |
Net increase (decrease) in shares outstanding | | | (9,986,159 | ) | | $ | (128,769,864 | ) |
| | | | | | | | |
| * | As of August 24, 2012, the last conversion of Class L shares to Class A shares was completed. There are no Class L shares outstanding and Class L shares are no longer being offered for sale. |
| ** | As of April 13, 2012, the last conversion of Class M shares to Class A shares was completed. There are no Class M shares outstanding and Class M shares are no longer being offered for sale. |
Note 7. Borrowings
The Fund, along with other affiliated registered investment companies (the “Funds”), is a party to a Syndicated Credit Agreement (“SCA”) with a group of banks. The purpose of the SCA is to provide an alternative source of temporary funding for capital share redemptions. The SCA provides for a commitment of $900 million for the period December 16, 2011 through November 14, 2012. The SCA has been
| | | | |
| Prudential Large-Cap Core Equity Fund | | | 41 | |
Notes to Financial Statements
continued
renewed effective November 15, 2012 at substantially similar terms through November 14, 2013. The Funds pay an annualized commitment fee of 0.08% of the unused portion of the SCA. Prior to December 16, 2011, the Funds had another SCA of a $750 million commitment with an annualized commitment fee of 0.10% of the unused portion. Interest on any borrowings under the SCA is paid at contracted market rates. The commitment fee for the unused amount is accrued daily and paid quarterly.
The Fund utilized the SCA during the year ended October 31, 2012. The average daily balance for the 13 days the Fund had loans outstanding during the period was approximately $298,000, borrowed at a weighted average interest rate of 1.53%. At October 31, 2012, the Fund did not have an outstanding loan amount.
Note 8. Notice of Dividends and Distributions to Shareholders
The Fund declared ordinary income dividends and capital gain distributions on December 11, 2012 to shareholders of record on December 12, 2012. The ex-dividend date was December 13, 2012. The per share amounts declared were as follows:
| | | | |
| | | Ordinary Income | | Long-Term
Capital Gains |
| Class A | | $0.1330 | | $0.4855 |
| Class B | | $0.0483 | | $0.4855 |
| Class C | | $0.0479 | | $0.4855 |
| Class X | | $0.1343 | | $0.4855 |
| Class Z | | $0.1637 | | $0.4855 |
Note 9. New Accounting Pronouncement
In December 2011, the Financial Accounting Standards Board (“FASB”) issued Accounting Standards Update (“ASU”) No. 2011-11 regarding “Disclosures about Offsetting Assets and Liabilities”. The amendments, which will be effective for annual reporting periods beginning on or after January 1, 2013 and interim periods within those annual periods, require an entity to disclose information about offsetting and related arrangements for assets and liabilities, financial instruments and derivatives that are either currently offset in accordance with current requirements or are subject to enforceable master netting arrangements or similar agreements. At this time, management is evaluating the implications of ASU No. 2011-11 and its impact on the financial statements has not yet been determined.
| | |
| 42 | | Visit our website at www.prudentialfunds.com |
Financial Highlights
| | | | | | | | | | | | | | | | | | | | |
| Class A Shares | | | |
| | | Year Ended October 31, | |
| | | 2012 | | | 2011 | | | 2010 | | | 2009 | | | 2008 | |
| Per Share Operating Performance(a): | | | | | | | | | | | | | | | | | | | | |
| Net Asset Value, Beginning Of Year | | | $11.84 | | | | $11.01 | | | | $9.71 | | | | $9.32 | | | | $14.85 | |
| Income (loss) from investment operations: | | | | | | | | | | | | | | | | | | | | |
| Net investment income | | | .11 | | | | .05 | | | | .05 | | | | .09 | | | | .12 | |
Net realized and unrealized gain (loss) on
investment transactions | | | 1.65 | | | | .80 | | | | 1.30 | | | | .40 | | | | (5.54 | ) |
| Total from investment operations | | | 1.76 | | | | .85 | | | | 1.35 | | | | .49 | | | | (5.42 | ) |
| Less Dividends and Distributions: | | | | | | | | | | | | | | | | | | | | |
| Dividends from net investment income | | | (.11 | ) | | | (.02 | ) | | | (.05 | ) | | | (.10 | ) | | | (.11 | ) |
| Distributions from net realized gains | | | (.79 | ) | | | - | | | | - | | | | - | | | | - | |
| Total dividends and distributions | | | (.90 | ) | | | (.02 | ) | | | (.05 | ) | | | (.10 | ) | | | (.11 | ) |
| Net asset value, end of year | | | $12.70 | | | | $11.84 | | | | $11.01 | | | | $9.71 | | | | $9.32 | |
| Total Return(b): | | | 16.16% | | | | 7.71% | | | | 13.92% | | | | 5.40% | | | | (36.75)% | |
| |
| Ratios/Supplemental Data: | | | | | | | | | | | | | | | |
| Net assets, end of year (000) | | | $70,475 | | | | $61,961 | | | | $64,473 | | | | $62,739 | | | | $68,021 | |
| Average net assets (000) | | | $65,277 | | | | $65,724 | | | | $64,562 | | | | $58,578 | | | | $93,917 | |
| Ratios to average net assets(c): | | | | | | | | | | | | | | | | | | | | |
Expenses, including distribution and
service (12b-1) fees | | | 1.20% | (d)(e) | | | 1.55% | (d)(e) | | | 1.48% | | | | 1.55% | | | | 1.34% | |
Expenses, excluding distribution and
service (12b-1) fees | | | .95% | (d) | | | 1.27% | (d) | | | 1.18% | | | | 1.25% | | | | 1.06% | |
| Net investment income | | | .95% | (d) | | | .43% | (d) | | | .45% | | | | 1.10% | | | | .94% | |
| Portfolio turnover rate | | | 89% | | | | 121% | | | | 116% | | | | 116% | | | | 96% | |
(a) Calculated based on average shares outstanding during the year.
(b) Total return does not consider the effects of sales loads. Total return is calculated assuming a purchase of a share on the first day and a sale on the last day of each year reported, and includes reinvestment of dividends and distributions. Total return may reflect adjustments to conform to generally accepted accounting principles.
(c) Does not include the expenses of the underlying funds in which the Fund invests.
(d) Net of management fee waiver. If the investment manager had not waived expenses, the expense ratios including and excluding distribution and service (12b-1) fees and net investment income ratios would have been 1.35%, 1.10%, and .80%, respectively, for the year ended October 31, 2012 and 1.67%, 1.39% and .31%, respectively, for the year ended October 31, 2011.
(e) Effective July 1, 2011, the distributor of the Fund contractually agreed to limit its distribution and service (12b-1) fees to .25% of the average daily net assets of the Class A shares through February 28, 2014.
See Notes to Financial Statements.
| | | | |
| Prudential Large-Cap Core Equity Fund | | | 43 | |
Financial Highlights
continued
| | | | | | | | | | | | | | | | | | | | |
| Class B Shares | |
| | | Year Ended October 31, | |
| | | 2012 | | | 2011 | | | 2010 | | | 2009 | | | 2008 | |
| Per Share Operating Performance(a): | | | | | | | | | | | | | | | | | | | | |
| Net Asset Value, Beginning Of Year | | | $11.20 | | | | $10.47 | | | | $9.26 | | | | $8.87 | | | | $14.14 | |
| Income (loss) from investment operations: | | | | | | | | | | | | | | | | | | | | |
| Net investment income (loss) | | | .03 | | | | (.03 | ) | | | (.02 | ) | | | .04 | | | | .03 | |
| Net realized and unrealized gain (loss) on investment transactions | | | 1.55 | | | | .76 | | | | 1.23 | | | | .37 | | | | (5.29 | ) |
| Total from investment operations | | | 1.58 | | | | .73 | | | | 1.21 | | | | .41 | | | | (5.26 | ) |
| Less Dividends and Distributions: | | | | | | | | | | | | | | | | | | | | |
| Dividends from net investment income | | | (.03 | ) | | | - | | | | - | | | | (.02 | ) | | | (.01 | ) |
| Distributions from net realized gains | | | (.79 | ) | | | - | | | | - | | | | - | | | | - | |
| Total dividends and distributions | | | (.82 | ) | | | - | | | | - | | | | (.02 | ) | | | (.01 | ) |
| Net asset value, end of year | | | $11.96 | | | | $11.20 | | | | $10.47 | | | | $9.26 | | | | $8.87 | |
| Total Return(b): | | | 15.29% | | | | 6.97% | | | | 13.07% | | | | 4.67% | | | | (37.22)% | |
| |
| Ratios/Supplemental Data: | |
| Net assets, end of year (000) | | | $3,029 | | | | $4,038 | | | | $5,317 | | | | $6,555 | | | | $9,269 | |
| Average net assets (000) | | | $3,496 | | | | $4,886 | | | | $5,904 | | | | $6,912 | | | | $16,689 | |
| Ratios to average net assets(c): | | | | | | | | | | | | | | | | | | | | |
Expenses, including distribution and
service (12b-1) fees | | | 1.95% | (d) | | | 2.27% | (d) | | | 2.18% | | | | 2.25% | | | | 2.06% | |
Expenses, excluding distribution and
service (12b-1) fees | | | .95% | (d) | | | 1.27% | (d) | | | 1.18% | | | | 1.25% | | | | 1.06% | |
| Net investment income (loss) | | | .22% | (d) | | | (.28)% | (d) | | | (.22)% | | | | .48% | | | | .25% | |
| Portfolio turnover rate | | | 89% | | | | 121% | | | | 116% | | | | 116% | | | | 96% | |
(a) Calculated based on average shares outstanding during the year.
(b) Total return does not consider the effects of sales loads. Total return is calculated assuming a purchase of a share on the first day and a sale on the last day of each year reported, and includes reinvestment of dividends and distributions. Total return may reflect adjustments to conform to generally accepted accounting principles.
(c) Does not include the expenses of the underlying funds in which the Fund invests.
(d) Net of management fee waiver. If the investment manager had not waived expenses, the expense ratios including and excluding distribution and service (12b-1) fees and net investment income (loss) ratios would have been 2.11%, 1.11%, and .06%, respectively, for the year ended October 31, 2012 and 2.38%, 1.38% and (.39)%, respectively, for the year ended October 31, 2011.
See Notes to Financial Statements.
| | |
| 44 | | Visit our website at www.prudentialfunds.com |
| | | | | | | | | | | | | | | | | | | | |
| Class C Shares | | | | | | | |
| | | Year Ended October 31, | |
| | | 2012 | | | 2011 | | | 2010 | | | 2009 | | | 2008 | |
| Per Share Operating Performance(a): | | | | | | | | | | | | | | | | | | | | |
| Net Asset Value, Beginning Of Year | | | $11.21 | | | | $10.48 | | | | $9.26 | | | | $8.87 | | | | $14.14 | |
| Income (loss) from investment operations: | | | | | | | | | | | | | | | | | | | | |
| Net investment income (loss) | | | .02 | | | | (.03 | ) | | | (.02 | ) | | | .04 | | | | .03 | |
Net realized and unrealized gain (loss) on
investment transactions | | | 1.56 | | | | .76 | | | | 1.24 | | | | .37 | | | | (5.29 | ) |
| Total from investment operations | | | 1.58 | | | | .73 | | | | 1.22 | | | | .41 | | | | (5.26 | ) |
| Less Dividends and Distributions: | | | | | | | | | | | | | | | | | | | | |
| Dividends from net investment income | | | (.03 | ) | | | - | | | | - | | | | (.02 | ) | | | (.01 | ) |
| Distributions from net realized gains | | | (.79 | ) | | | - | | | | - | | | | - | | | | - | |
| Total dividends and distributions | | | (.82 | ) | | | - | | | | - | | | | (.02 | ) | | | (.01 | ) |
| Net asset value, end of year | | | $11.97 | | | | $11.21 | | | | $10.48 | | | | $9.26 | | | | $8.87 | |
| Total Return(b): | | | 15.28% | | | | 6.97% | | | | 13.17% | | | | 4.67% | | | | (37.22)% | |
| |
| Ratios/Supplemental Data: | | | | | | | | | | | | | | | |
| Net assets, end of year (000) | | | $20,134 | | | | $20,636 | | | | $22,496 | | | | $24,601 | | | | $30,243 | |
| Average net assets (000) | | | $20,445 | | | | $22,444 | | | | $23,934 | | | | $24,715 | | | | $45,712 | |
| Ratios to average net assets(c): | | | | | | | | | | | | | | | | | | | | |
Expenses, including distribution and
service (12b-1) fees | | | 1.95% | (d) | | | 2.27% | (d) | | | 2.18% | | | | 2.25% | | | | 2.06% | |
Expenses, excluding distribution and
service (12b-1) fees | | | .95% | (d) | | | 1.27% | (d) | | | 1.18% | | | | 1.25% | | | | 1.06% | |
| Net investment income (loss) | | | .20% | (d) | | | (.28)% | (d) | | | (.24)% | | | | .44% | | | | .23% | |
| Portfolio turnover rate | | | 89% | | | | 121% | | | | 116% | | | | 116% | | | | 96% | |
(a) Calculated based on average shares outstanding during the year.
(b) Total return does not consider the effects of sales loads. Total return is calculated assuming a purchase of a share on the first day and a sale on the last day of each year reported, and includes reinvestment of dividends and distributions. Total return may reflect adjustments to conform to generally accepted accounting principles.
(c) Does not include the expenses of the underlying funds in which the Fund invests.
(d) Net of management fee waiver. If the investment manager had not waived expenses, the expense ratios including and excluding distribution and service (12b-1) fees and net investment income (loss) ratios would have been 2.10%, 1.10%, and .05%, respectively, for the year ended October 31, 2012 and 2.39%, 1.39% and (.40)%, respectively, for the year ended October 31, 2011.
See Notes to Financial Statements.
| | | | |
| Prudential Large-Cap Core Equity Fund | | | 45 | |
Financial Highlights
continued
| | | | | | | | | | | | | | | | | | | | | | |
| Class L Shares | |
| | | Period Ended
August 24, | | | | | Year Ended October 31, | |
| | | 2012(d) | | | | | 2011 | | | 2010 | | | 2009 | | | 2008 | |
| Per Share Operating Performance(a): | | | | | | | | | | | | | | | | | | | | | | |
| Net Asset Value, Beginning Of Period | | | $11.82 | | | | | | $11.00 | | | | $9.70 | | | | $9.30 | | | | $14.83 | |
| Income (loss) from investment operations: | | | | | | | | | | | | | | | | | | | | | | |
| Net investment income | | | .08 | | | | | | .03 | | | | .03 | | | | .08 | | | | .09 | |
| Net realized and unrealized gain (loss) on investment transactions | | | 1.57 | | | | | | .79 | | | | 1.30 | | | | .39 | | | | (5.54 | ) |
| Total from investment operations | | | 1.65 | | | | | | .82 | | | | 1.33 | | | | .47 | | | | (5.45 | ) |
| Less Dividends and Distributions: | | | | | | | | | | | | | | | | | | | | | | |
| Dividends from net investment income | | | (.09 | ) | | | | | - | | | | (.03 | ) | | | (.07 | ) | | | (.08 | ) |
| Distributions from net realized gains | | | (.79 | ) | | | | | - | | | | - | | | | - | | | | - | |
| Total dividends and distributions | | | (.88 | ) | | | | | - | | | | (.03 | ) | | | (.07 | ) | | | (.08 | ) |
| Net asset value, end of period | | | $12.59 | | | | | | $11.82 | | | | $11.00 | | | | $9.70 | | | | $9.30 | |
| Total Return(b): | | | 15.08% | | | | | | 7.45% | | | | 13.74% | | | | 5.21% | | | | (36.94)% | |
| |
| Ratios/Supplemental Data: | | | | | | | | | | | | | | | | | |
| Net assets, end of period (000) | | | $4,009 | | | | | | $3,847 | | | | $4,222 | | | | $4,860 | | | | $6,113 | |
| Average net assets (000) | | | $3,947 | | | | | | $4,181 | | | | $4,625 | | | | $4,965 | | | | $9,856 | |
| Ratios to average net assets(c): | | | | | | | | | | | | | | | | | | | | | | |
Expenses, including distribution and
service (12b-1) fees | | | 1.46% | (e)(f) | | | | | 1.77% | (e) | | | 1.68% | | | | 1.75% | | | | 1.56% | |
Expenses, excluding distribution and
service (12b-1) fees | | | .96% | (e)(f) | | | | | 1.27% | (e) | | | 1.18% | | | | 1.25% | | | | 1.06% | |
| Net investment income | | | .79% | (e)(f) | | | | | .22% | (e) | | | .27% | | | | .94% | | | | .73% | |
| Portfolio turnover rate | | | 89% | (g)(h) | | | | | 121% | | | | 116% | | | | 116% | | | | 96% | |
(a) Calculated based on average shares outstanding during the period.
(b) Total return does not consider the effects of sales loads. Total return is calculated assuming a purchase of a share on the first day and a sale on the last day of each period reported, and includes reinvestment of dividends and distributions. Total return may reflect adjustments to conform to generally accepted accounting principles. Total returns for periods less than a full year are not annualized.
(c) Does not include the expenses of the underlying funds in which the Fund invests.
(d) As of August 24, 2012, the last conversion of Class L shares to Class A shares was completed. There are no Class L shares outstanding and Class L shares are no longer being offered for sale.
(e) Net of management fee waiver. If the investment manager had not waived expenses, the expense ratios including and excluding distribution and service (12b-1) fees and net investment income ratios would have been 1.65%, 1.15%, and .60%, respectively, for the year ended October 31, 2012 and 1.89%, 1.39% and .10%, respectively, for the year ended October 31, 2011.
(f) Annualized.
(g) Not annualized.
(h) Calculated as of October 31, 2012.
See Notes to Financial Statements.
| | |
| 46 | | Visit our website at www.prudentialfunds.com |
| | | | | | | | | | | | | | | | | | | | | | |
| Class M Shares | | | | |
| | | Period Ended
April 13, | | | | | Year Ended October 31, | |
| | | 2012(d) | | | | | 2011 | | | 2010 | | | 2009 | | | 2008 | |
| Per Share Operating Performance(a): | | | | | | | | | | | | | | | | | | | | | | |
| Net Asset Value, Beginning Of Period | | | $11.21 | | | | | | $10.48 | | | | $9.26 | | | | $8.87 | | | | $14.14 | |
| Income (loss) from investment operations: | | | | | | | | | | | | | | | | | | | | | | |
| Net investment income (loss) | | | .02 | | | | | | (.03 | ) | | | (.02 | ) | | | .04 | | | | .03 | |
| Net realized and unrealized gain (loss) on investment transactions | | | 1.15 | | | | | | .76 | | | | 1.24 | | | | .37 | | | | (5.29 | ) |
| Total from investment operations | | | 1.17 | | | | | | .73 | | | | 1.22 | | | | .41 | | | | (5.26 | ) |
| Less Dividends and Distributions: | | | | | | | | | | | | | | | | | | | | | | |
| Dividends from net investment income | | | (.03 | ) | | | | | - | | | | - | | | | (.02 | ) | | | (.01 | ) |
| Distributions from net realized gains | | | (.79 | ) | | | | | - | | | | - | | | | - | | | | - | |
| Total dividends and distributions | | | (.82 | ) | | | | | - | | | | - | | | | (.02 | ) | | | (.01 | ) |
| Net asset value, end of period | | | $11.56 | | | | | | $11.21 | | | | $10.48 | | | | $9.26 | | | | $8.87 | |
| Total Return(b) | | | 11.33% | | | | | | 6.97% | | | | 13.17% | | | | 4.67% | | | | (37.22)% | |
| |
| Ratios/Supplemental Data: | | | | | | | | | | | | | | | | | |
| Net assets, end of period (000) | | | $33 | | | | | | $735 | | | | $4,103 | | | | $8,052 | | | | $15,423 | |
| Average net assets (000) | | | $344 | | | | | | $2,311 | | | | $5,918 | | | | $10,385 | | | | $29,289 | |
| Ratios to average net assets(c): | | | | | | | | | | | | | | | | | | | | | | |
Expenses, including distribution and
service (12b-1) fees | | | 1.94% | (e)(f) | | | | | 2.30% | (e) | | | 2.18% | | | | 2.25% | | | | 2.06% | |
Expenses, excluding distribution and
service (12b-1) fees | | | .94% | (e)(f) | | | | | 1.30% | (e) | | | 1.18% | | | | 1.25% | | | | 1.06% | |
| Net investment income (loss) | | | .41% | (e)(f) | | | | | (.27)% | (e) | | | (.15)% | | | | .55% | | | | .24% | |
| Portfolio turnover rate | | | 89% | (g)(h) | | | | | 121% | | | | 116% | | | | 116% | | | | 96% | |
(a) Calculated based on average shares outstanding during the period.
(b) Total return does not consider the effects of sales loads. Total return is calculated assuming a purchase of a share on the first day and a sale on the last day of each period reported, and includes reinvestment of dividends and distributions. Total return may reflect adjustments to conform to generally accepted accounting principles. Total returns for periods less than a full year are not annualized.
(c) Does not include the expenses of the underlying funds in which the Fund invests.
(d) As of April 13, 2012, the last conversion of Class M shares to Class A shares was completed. There are no Class M shares outstanding and Class M shares are no longer being offered for sale.
(e) Net of management fee waiver. If the investment manager had not waived expenses, the expense ratios including and excluding distribution and service (12b-1) fees and net investment income (loss) ratios would have been 2.17%, 1.17%, and .18%, respectively, for the year ended October 31, 2012 and 2.36%, 1.36% and (.33)%, respectively, for the year ended October 31, 2011.
(f) Annualized.
(g) Not annualized.
(h) Calculated as of October 31, 2012.
See Notes to Financial Statements.
| | | | |
| Prudential Large-Cap Core Equity Fund | | | 47 | |
Financial Highlights
continued
| | | | | | | | | | | | | | | | | | | | |
| Class X Shares | | | | | | | |
| | | Year Ended October 31, | |
| | | 2012 | | | 2011 | | | 2010 | | | 2009 | | | 2008 | |
| Per Share Operating Performance(a): | | | | | | | | | | | | | | | | | | | | |
| Net Asset Value, Beginning Of Year | | | $11.46 | | | | $10.65 | | | | $9.40 | | | | $8.97 | | | | $14.16 | |
| Income (loss) from investment operations: | | | | | | | | | | | | | | �� | | | | | | |
| Net investment income | | | .11 | | | | .05 | | | | .06 | | | | .12 | | | | .13 | |
Net realized and unrealized gain (loss) on
investment transactions | | | 1.59 | | | | .78 | | | | 1.24 | | | | .40 | | | | (5.28 | ) |
| Total from investment operations | | | 1.70 | | | | .83 | | | | 1.30 | | | | .52 | | | | (5.15 | ) |
| Less Dividends and Distributions: | | | | | | | | | | | | | | | | | | | | |
| Dividends from net investment income | | | (.12 | ) | | | (.02 | ) | | | (.05 | ) | | | (.10 | ) | | | (.06 | ) |
| Distributions from net realized gains | | | (.79 | ) | | | - | | | | - | | | | - | | | | - | |
| Total dividends and distributions | | | (.91 | ) | | | (.02 | ) | | | (.05 | ) | | | (.10 | ) | | | (.06 | ) |
| Capital Contributions (Note 2): | | | - | (d) | | | - | (d) | | | - | (d) | | | .01 | | | | .02 | |
| Net asset value, end of year | | | $12.25 | | | | $11.46 | | | | $10.65 | | | | $9.40 | | | | $8.97 | |
| Total Return(b): | | | 16.12% | | | | 7.84% | | | | 13.91% | | | | 6.00% | | | | (36.25)% | |
| |
| Ratios/Supplemental Data: | | | | | | | | | | | | | | | |
| Net assets, end of year (000) | | | $470 | | | | $837 | | | | $1,394 | | | | $2,096 | | | | $2,767 | |
| Average net assets (000) | | | $632 | | | | $1,137 | | | | $1,689 | | | | $2,245 | | | | $4,698 | |
| Ratios to average net assets(c): | | | | | | | | | | | | | | | | | | | | |
Expenses, including distribution and
service (12b-1) fees | | | 1.20% | (e) | | | 1.53% | (e) | | | 1.43% | | | | 1.50% | | | | 1.38% | |
Expenses, excluding distribution and
service (12b-1) fees | | | .95% | (e) | | | 1.28% | (e) | | | 1.18% | | | | 1.25% | | | | 1.06% | |
| Net investment income | | | .97% | (e) | | | .46% | (e) | | | .56% | | | | 1.46% | | | | 1.08% | |
| Portfolio turnover rate | | | 89% | | | | 121% | | | | 116% | | | | 116% | | | | 96% | |
(a) Calculated based on average shares outstanding during the year.
(b) Total return does not consider the effects of sales loads. Total return is calculated assuming a purchase of a share on the first day and a sale on the last day of each year reported, and includes reinvestment of dividends and distributions. Total return may reflect adjustments to conform to generally accepted accounting principles.
(c) Does not include the expenses of the underlying funds in which the Fund invests.
(d) Less than $.005 per share.
(e) Net of management fee waiver. If the investment manager had not waived expenses, the expense ratios including and excluding distribution and service (12b-1) fees and net investment income ratios would have been 1.37%, 1.12%, and .80%, respectively, for the year ended October 31, 2012 and 1.63%, 1.38% and .36%, respectively, for the year ended October 31, 2011.
See Notes to Financial Statements.
| | |
| 48 | | Visit our website at www.prudentialfunds.com |
| | | | | | | | | | | | | | | | | | | | |
| Class Z Shares | | | | | | | |
| | | Year Ended October 31, | |
| | | 2012 | | | 2011 | | | 2010 | | | 2009 | | | 2008 | |
| Per Share Operating Performance(a): | | | | | | | | | | | | | | | | | | | | |
| Net Asset Value, Beginning Of Year | | | $12.03 | | | | $11.18 | | | | $9.87 | | | | $9.47 | | | | $15.09 | |
| Income (loss) from investment operations: | | | | | | | | | | | | | | | | | | | | |
| Net investment income | | | .15 | | | | .07 | | | | .08 | | | | .08 | | | | .15 | |
Net realized and unrealized gain (loss) on
investment transactions | | | 1.67 | | | | .83 | | | | 1.30 | | | | .45 | | | | (5.63 | ) |
| Total from investment operations | | | 1.82 | | | | .90 | | | | 1.38 | | | | .53 | | | | (5.48 | ) |
| Less Dividends and Distributions: | | | | | | | | | | | | | | | | | | | | |
| Dividends from net investment income | | | (.15 | ) | | | (.05 | ) | | | (.07 | ) | | | (.13 | ) | | | (.14 | ) |
| Distributions from net realized gains | | | (.79 | ) | | | - | | | | - | | | | - | | | | - | |
| Total dividends and distributions | | | (.94 | ) | | | (.05 | ) | | | (.07 | ) | | | (.13 | ) | | | (.14 | ) |
| Net asset value, end of year | | | $12.91 | | | | $12.03 | | | | $11.18 | | | | $9.87 | | | | $9.47 | |
| Total Return(b): | | | 16.41% | | | | 8.04% | | | | 14.09% | | | | 5.83% | | | | (36.64)% | |
| |
| Ratios/Supplemental Data: | | | | | | | |
| Net assets, end of year (000) | | | $34,551 | | | | $32,419 | | | | $141,793 | | | | $202,941 | | | | $36,602 | |
| Average net assets (000) | | | $32,953 | | | | $144,295 | | | | $145,193 | | | | $90,113 | | | | $20,386 | |
| Ratios to average net assets(c): | | | | | | | | | | | | | | | | | | | | |
Expenses, including distribution and
service (12b-1) fees | | | .95% | (d) | | | 1.42% | (d) | | | 1.18% | | | | 1.25% | | | | 1.06% | |
Expenses, excluding distribution and
service (12b-1) fees | | | .95% | (d) | | | 1.42% | (d) | | | 1.18% | | | | 1.25% | | | | 1.06% | |
| Net investment income | | | 1.21% | (d) | | | .58% | (d) | | | .76% | | | | .96% | | | | 1.25% | |
| Portfolio turnover rate | | | 89% | | | | 121% | | | | 116% | | | | 116% | | | | 96% | |
(a) Calculated based on average shares outstanding during the year.
(b) Total return is calculated assuming a purchase of a share on the first day and a sale on the last day of each year reported, and includes reinvestment of dividends and distributions. Total return may reflect adjustments to conform to generally accepted accounting principles.
(c) Does not include the expenses of the underlying funds in which the Fund invests.
(d) Net of management fee waiver. If the investment manager had not waived expenses, the expense ratios including and excluding distribution and service (12b-1) fees and net investment income ratios would have been 1.10%, 1.10%, and 1.06%, respectively, for the year ended October 31, 2012 and 1.44%, 1.44% and ..56%, respectively, for the year ended October 31, 2011.
See Notes to Financial Statements.
| | | | |
| Prudential Large-Cap Core Equity Fund | | | 49 | |
Report of Independent Registered Public
Accounting Firm
The Board of Trustees and Shareholders
Prudential Investment Portfolios 9:
We have audited the accompanying statement of assets and liabilities of Prudential Large-Cap Core Equity Fund, a series of Prudential Investment Portfolios 9 (hereafter referred to as the “Fund”), including the portfolio of investments, as of October 31, 2012, and the related statement of operations for the year then ended, the statement of changes in net assets for each of the years in the two-year period then ended and the financial highlights for each of the years in the five-year period then ended. These financial statements and financial highlights are the responsibility of the Fund
’s management. Our responsibility is to express an opinion on these financial statements and financial highlights based on our audits.
We conducted our audits in accordance with the standards of the Public Company Accounting Oversight Board (United States). Those standards require that we plan and perform the audit to obtain reasonable assurance about whether the financial statements and financial highlights are free of material misstatement. An audit includes examining, on a test basis, evidence supporting the amounts and disclosures in the financial statements. Our procedures included confirmation of securities owned as of October 31, 2012, by correspondence with the custodian, transfer agent and brokers or by other appropriate auditing procedures when replies from brokers were not received. An audit also includes assessing the accounting principles used and significant estimates made by management, as well as evaluating the overall financial statement presentation. We believe that our audits provide a reasonable basis for our opinion.
In our opinion, the financial statements and financial highlights referred to above present fairly, in all material respects, the financial position of the Fund as of October 31, 2012, and the results of its operations for the year then ended, the changes in its net assets for each of the years in the two-year period then ended and the financial highlights for each of the years in the five-year period then ended, in conformity with U.S. generally accepted accounting principles.

New York, New York
December 21, 2012
| | |
| 50 | | Visit our website at www.prudentialfunds.com |
Tax Information
(Unaudited)
We are advising you that during the fiscal year ended October 31, 2012, the Fund reports the maximum amount allowed per share but not less than $0.79 for Class A, B, C, L, M, X and Z shares as a capital gain distribution in accordance with Section 852(b)(3)(C) of the Internal Revenue Code.
For the year ended October 31, 2012, the Fund reports, in accordance with Section 854 of the Internal Revenue Code, the following percentages of the ordinary income distributions paid as 1) qualified dividend income (QDI); and 2) eligible for corporate dividends received deduction (DRD):
| | | | | | | | |
| | | QDI | | | DRD | |
| | |
Prudential Large-Cap Core Equity Fund | | | 100 | % | | | 100 | % |
In January 2013, you will be advised on IRS Form 1099-DIV or substitute 1099-DIV, as to the federal tax status of distributions received by you in calendar year 2012.
| | | | |
| Prudential Large-Cap Core Equity Fund | | | 51 | |
INFORMATION ABOUT BOARD MEMBERS AND OFFICERS
(Unaudited)
Information about Board Members and Officers of the Fund is set forth below. Board Members who are not deemed to be “interested persons” of the Fund, as defined in the 1940 Act, are referred to as “Independent Board Members.” Board Members who are deemed to be “interested persons” of the Fund are referred to as “Interested Board Members.” The Board Members are responsible for the overall supervision of the operations of the Fund and perform the various duties imposed on the directors of investment companies by the 1940 Act. The Board in turn elects the Officers, who are responsible for administering the day-to-day operations of the Fund.
| | | | |
| Independent Board Members(1) |
Name, Address, Age Position(s) Portfolios Overseen | | Principal Occupation(s) During Past Five Years | | Other Directorships Held |
Kevin J. Bannon (60) Board Member Portfolios Overseen: 63 | | Managing Director (since April 2008) and Chief Investment Officer (since October 2008) of Highmount Capital LLC (registered investment adviser); formerly Executive Vice President and Chief Investment Officer (April 1993-August 2007) of Bank of New York Company; President (May 2003-May 2007) of BNY Hamilton Family of Mutual Funds. | | Director of Urstadt Biddle Properties (since September 2008). |
Linda W. Bynoe (60) Board Member Portfolios Overseen: 63 | | President and Chief Executive Officer (since March 1995) and formerly Chief Operating Officer (December 1989-February 1995) of Telemat Ltd. (management consulting); formerly Vice President (January 1985-June 1989) at Morgan Stanley & Co (broker-dealer). | | Director of Simon Property Group, Inc. (retail real estate) (May 2003-May 2012); Director of Anixter International, Inc. (communication products distributor) (since January 2006); Director of Northern Trust Corporation (financial services) (since April 2006); Trustee of Equity Residential (residential real estate) (since December 2009). |
Michael S. Hyland, CFA (67) Board Member Portfolios Overseen: 63 | | Independent Consultant (since February 2005); formerly Senior Managing Director (July 2001-February 2005) of Bear Stearns & Co, Inc.; Global Partner, INVESCO (1999-2001); Managing Director and President of Salomon Brothers Asset Management (1989-1999). | | None. |
Douglas H. McCorkindale (73) Board Member Portfolios Overseen: 63 | | Formerly Chairman (February 2001-June 2006), Chief Executive Officer (June 2000-July 2005), President (September 1997-July 2005) and Vice Chairman (March 1984-May 2000) of Gannett Co. Inc. (publishing and media). | | Director of Lockheed Martin Corp. (aerospace and defense) (since May 2001). |
Visit our website at www.prudentialfunds.com
| | | | |
| Independent Board Members(1) |
Name, Address, Age Position(s) Portfolios Overseen | | Principal Occupation(s) During Past Five Years | | Other Directorships Held |
Stephen P. Munn (70) Board Member Portfolios Overseen: 63 | | Lead Director (since 2007) and formerly Chairman (1993-2007) of Carlisle Companies Incorporated (manufacturer of industrial products). | | Lead Director (since 2007) of Carlisle Companies Incorporated (manufacturer of industrial products). |
Richard A. Redeker (69) Board Member & Independent Chair Portfolios Overseen: 63 | | Retired Mutual Fund Senior Executive (44 years); Management Consultant; Independent Directors Council (organization of 2,800 Independent Mutual Fund Directors)-Executive Committee, Chair of Policy Steering Committee, Governing Council. | | None. |
Robin B. Smith (73) Board Member Portfolios Overseen: 63 | | Chairman of the Board (since January 2003) of Publishers Clearing House (direct marketing); Member of the Board of Directors of ADLPartner (marketing) (since December 2010); formerly Chairman and Chief Executive Officer (August 1996-January 2003) of Publishers Clearing House. | | Formerly Director of BellSouth Corporation (telecommunications) (1992-2006). |
Stephen G. Stoneburn (69) Board Member Portfolios Overseen: 63 | | Chairman, (since July 2011), President and Chief Executive Officer (since June 1996) of Quadrant Media Corp. (publishing company); formerly President (June 1995-June 1996) of Argus Integrated Media, Inc.; Senior Vice President and Managing Director (January 1993-1995) of Cowles Business Media; Senior Vice President of Fairchild Publications, Inc. (1975-1989). | | None. |
| | | | |
| Interested Board Members(1) |
Name, Address, Age Position(s) Portfolios Overseen | | Principal Occupation(s) During Past Five Years | | Other Directorships Held |
Stuart S. Parker (50) Board Member & President Portfolios Overseen: 63 | | President of Prudential Investments LLC (since January 2012); Executive Vice President of Jennison Associates LLC and Head of Retail Distribution of Prudential Investments LLC (June 2005 - December 2011). | | None. |
Prudential Large-Cap Core Equity Fund
| | | | |
| Interested Board Members(1) |
Name, Address, Age Position(s) Portfolios Overseen | | Principal Occupation(s) During Past Five Years | | Other Directorships Held |
Scott E. Benjamin (39) Board Member & Vice President Portfolios Overseen: 63 | | Executive Vice President (since June 2009) of Prudential Investments LLC; Executive Vice President (June 2009-June 2012) and Vice President (since June 2012) of Prudential Investment Management Services LLC; Executive Vice President (since September 2009) of AST Investment Services, Inc.; Senior Vice President of Product Development and Marketing, Prudential Investments (since February 2006); Vice President of Product Development and Product Management, Prudential Investments (2003-2006). | | None. |
| (1) | The year that each individual joined the Fund’s Board is as follows: |
Linda W. Bynoe, 2005; Douglas H. McCorkindale, 1998; Richard A. Redeker, 1998; Robin B. Smith, 1998; Stephen G. Stoneburn, 2003; Kevin J. Bannon, 2008; Michael S. Hyland, 2008; Stephen P. Munn, 2008; Stuart S. Parker, Board Member since 2012 and President since 2012; Scott E. Benjamin, Board Member since 2010 and Vice President since 2009.
| | |
| Fund Officers(a)(1) |
Name, Address and Age Position with Fund | | Principal Occupation(s) During Past Five Years |
Judy A. Rice (64) Vice President | | Chairman of Prudential Investments LLC (since January 2012); President, Chief Executive Officer (May 2011-Present) and Executive Vice President (December 2008-May 2011) of Prudential Investment Management Services LLC; formerly President, Chief Executive Officer, Chief Operating Officer and Officer-In-Charge (February 2003-December 2011) of Prudential Investments LLC; formerly President, Chief Executive Officer and Officer-In-Charge (April 2003-December 2011) of Prudential Mutual Fund Services LLC (PMFS); formerly Member of the Board of Directors of Jennison Associates LLC (November 2010-December 2011); formerly Vice President (February 1999-April 2006) of Prudential Investment Management Services LLC; formerly President, COO, CEO and Manager of PIFM Holdco, LLC (April 2006-December 2011); formerly President, Chief Executive Officer, Chief Operating Officer and Officer-In-Charge (May 2003-June 2005) and Director (May 2003-March 2006) and Executive Vice President (June 2005-March 2006) of AST Investment Services, Inc.; Member of Board of Governors of the Investment Company Institute. |
Visit our website at www.prudentialfunds.com
| | |
| Fund Officers(a)(1) |
Name, Address and Age Position with Fund | | Principal Occupation(s) During Past Five Years |
Raymond A. O’Hara (57) Chief Legal Officer | | Vice President and Corporate Counsel (since July 2010) of Prudential Insurance Company of America (Prudential); Vice President (March 2011-Present) of Pruco Life Insurance Company and Pruco Life Insurance Company of New Jersey; Vice President and Corporate Counsel (March 2011-Present) of Prudential Annuities Life Assurance Corporation; Chief Legal Officer of Prudential Investments LLC (since June 2012); Chief Legal Officer of PMFS (since June 2012) and Corporate Counsel of AST Investment Services, Inc. (since June 2012); formerly Assistant Vice President and Corporate Counsel (September 2008-July 2010) of The Hartford Financial Services Group, Inc.; formerly Associate (September 1980-December 1987) and Partner (January 1988– August 2008) of Blazzard & Hasenauer, P.C. (formerly, Blazzard, Grodd & Hasenauer, P.C.). |
Deborah A. Docs (54) Secretary | | Vice President and Corporate Counsel (since January 2001) of Prudential; Vice President (since December 1996) and Assistant Secretary (since March 1999) of Prudential Investments LLC; formerly Vice President and Assistant Secretary (May 2003-June 2005) of AST Investment Services, Inc. |
Jonathan D. Shain (54) Assistant Secretary | | Vice President and Corporate Counsel (since August 1998) of Prudential; Vice President and Assistant Secretary (since May 2001) of Prudential Investments LLC; Vice President and Assistant Secretary (since February 2001) of PMFS; formerly Vice President and Assistant Secretary (May 2003-June 2005) of AST Investment Services, Inc. |
Claudia DiGiacomo (38) Assistant Secretary | | Vice President and Corporate Counsel (since January 2005) of Prudential; Vice President and Assistant Secretary of Prudential Investments LLC (since December 2005); Associate at Sidley Austin Brown & Wood LLP (1999-2004). |
Andrew R. French (50) Assistant Secretary | | Vice President and Corporate Counsel (since February 2010) of Prudential; formerly Director and Corporate Counsel (2006-2010) of Prudential; Vice President and Assistant Secretary (since January 2007) of Prudential Investments LLC; Vice President and Assistant Secretary (since January 2007) of PMFS. |
Amanda S. Ryan (34) Assistant Secretary | | Director and Corporate Counsel (since March 2012) of Prudential; Director and Assistant Secretary (since June 2012) of Prudential Investments LLC; Associate at Ropes & Gray (2008-2012). |
Timothy J. Knierim (53) Chief Compliance Officer | | Chief Compliance Officer of Prudential Investment Management, Inc. (since July 2007); formerly Chief Risk Officer of Prudential Investment Management, Inc. and Prudential Investments LLC (2002-2007) and formerly Chief Ethics Officer of Prudential Investment Management, Inc. and Prudential Investments LLC (2006-2007). |
Valerie M. Simpson (54) Deputy Chief Compliance Officer | | Chief Compliance Officer (since April 2007) of Prudential Investments LLC and AST Investment Services, Inc.; formerly Vice President-Financial Reporting (June 1999-March 2006) for Prudential Life and Annuities Finance. |
Prudential Large-Cap Core Equity Fund
| | |
| Fund Officers(a)(1) |
Name, Address and Age Position with Fund | | Principal Occupation(s) During Past Five Years |
Theresa C. Thompson (50) Deputy Chief Compliance Officer | | Vice President, Compliance, Prudential Investments LLC (since April 2004); and Director, Compliance, Prudential Investments LLC (2001-2004). |
Richard W. Kinville (44) Anti-Money Laundering Compliance Officer | | Vice President, Corporate Compliance, Anti-Money Laundering Unit (since January 2005) of Prudential; committee member of the American Council of Life Insurers Anti-Money Laundering and Critical Infrastructure Committee (since January 2007); formerly Investigator and Supervisor in the Special Investigations Unit for the New York Central Mutual Fire Insurance Company (August 1994-January 1999); Investigator in AXA Financial’s Internal Audit Department and Manager in AXA’s Anti-Money Laundering Office (January 1999-January 2005); first chair of the American Council of Life Insurers Anti-Money Laundering and Critical Infrastructure Committee (June 2007-December 2009). |
Grace C. Torres (53) Treasurer and Principal Financial and Accounting Officer | | Assistant Treasurer (since March 1999) and Senior Vice President (since September 1999) of Prudential Investments LLC; Assistant Treasurer (since May 2003) and Vice President (since June 2005) of AST Investment Services, Inc.; Senior Vice President and Assistant Treasurer (since May 2003) of Prudential Annuities Advisory Services, Inc.; formerly Senior Vice President (May 2003-June 2005) of AST Investment Services, Inc. |
M. Sadiq Peshimam (48) Assistant Treasurer | | Vice President (since 2005) of Prudential Investments LLC. |
Peter Parrella (54) Assistant Treasurer | | Vice President (since 2007) and Director (2004-2007) within Prudential Mutual Fund Administration; formerly Tax Manager at SSB Citi Fund Management LLC (1997-2004). |
| (a) | Excludes Mr. Parker and Mr. Benjamin, interested Board Members who also serve as President and Vice President, respectively. |
| (1) | The year that each individual became an Officer of the Fund is as follows: |
Judy A. Rice, 2012; Raymond A. O’Hara, 2012; Deborah A. Docs, 2005; Jonathan D. Shain, 2005; Claudia DiGiacomo, 2005; Andrew R. French, 2006; Amanda S. Ryan, 2012; Timothy J. Knierim, 2007; Valerie M. Simpson 2007; Theresa C. Thompson, 2008; Richard W. Kinville, 2011, Grace C. Torres, 1998; M. Sadiq Peshimam, 2006; Peter Parrella, 2007.
Explanatory Notes to Tables:
| | n | Board Members are deemed to be “Interested,” as defined in the 1940 Act, by reason of their affiliation with Prudential Investments LLC and/or an affiliate of Prudential Investments LLC. |
| | n | Unless otherwise noted, the address of all Board Members and Officers is c/o Prudential Investments LLC, Gateway Center Three, 100 Mulberry Street, Newark, New Jersey 07102-4077. |
| | n | There is no set term of office for Board Members or Officers. The Board Members have adopted a retirement policy, which calls for the retirement of Board Members on December 31 of the year in which they reach the age of 75. |
| | n | “Other Directorships Held” includes only directorships of companies required to register or file reports with the SEC under the 1934 Act (that is, “public companies”) or other investment companies registered under the 1940 Act. |
| | n | “Portfolios Overseen” includes all investment companies managed by Prudential Investments LLC. The investment companies for which PI serves as manager include the Prudential Investments Mutual Funds, The Prudential Variable Contract Accounts, Target Mutual Funds, Prudential Short Duration High Yield Fund, Inc., The Prudential Series Fund, Prudential’s Gibraltar Fund, Inc. and the Advanced Series Trust. |
Visit our website at www.prudentialfunds.com
Approval of Advisory Agreements
The Fund’s Board of Trustees
The Board of Trustees (the “Board”) of Prudential Large-Cap Core Equity Fund (the “Fund”)1 consists of ten individuals, eight of whom are not “interested persons” of the Fund, as defined in the Investment Company Act of 1940, as amended (the “1940 Act”) (the “Independent Trustees”). The Board is responsible for the oversight of the Fund and its operations, and performs the various duties imposed on the directors of investment companies by the 1940 Act. The Independent Trustees have retained independent legal counsel to assist them in connection with their duties. The Chair of the Board is an Independent Trustee. The Board has established three standing committees: the Audit Committee, the Nominating and Governance Committee, and the Investment Committee. Each committee is chaired by, and composed of, Independent Trustees.
Annual Approval of the Fund’s Advisory Agreements
As required under the 1940 Act, the Board determines annually whether to renew the Fund’s management agreement with Prudential Investments LLC (“PI”) and the Fund’s subadvisory agreement with Quantitative Management Associates LLC (“QMA”). In considering the renewal of the agreements, the Board, including all of the Independent Trustees, met on June 5-7, 2012 and approved the renewal of the agreements through July 31, 2013, after concluding that the renewal of the agreements was in the best interests of the Fund and its shareholders.
In advance of the meetings, the Board received materials relating to the agreements, and had the opportunity to ask questions and request further information in connection with its consideration. Among other things, the Board considered comparative fee information from PI and QMA. Also, the Board considered comparisons with other mutual funds in relevant Peer Universes and Peer Groups, as is further discussed below.
In approving the agreements, the Board, including the Independent Trustees advised by independent legal counsel, considered the factors it deemed relevant, including the nature, quality and extent of services provided by PI and the subadviser, the performance of the Fund, the profitability of PI and its affiliates, expenses and fees, and the potential for economies of scale that may be shared with the Fund and its shareholders as the Fund’s assets grow. In their deliberations, the Trustees did not identify any single factor which alone was responsible for the Board’s decision to approve the agreements with respect to the Fund. In connection with its deliberations, the Board considered information provided by PI throughout the year at regular Board
| 1 | Prudential Large-Cap Core Equity Fund is a series of Prudential Investment Portfolios 9. |
Prudential Large-Cap Core Equity Fund
Approval of Advisory Agreements (continued)
meetings, presentations from portfolio managers and other information, as well as information furnished at or in advance of the meetings on June 5-7, 2012.
The Trustees determined that the overall arrangements between the Fund and PI, which serves as the Fund’s investment manager pursuant to a management agreement, and between PI and QMA, which serves as the Fund’s subadviser pursuant to the terms of a subadvisory agreement with PI, are in the best interests of the Fund and its shareholders in light of the services performed, fees charged and such other matters as the Trustees considered relevant in the exercise of their business judgment.
The material factors and conclusions that formed the basis for the Trustees’ reaching their determinations to approve the continuance of the agreements are separately discussed below.
Nature, Quality and Extent of Services
The Board received and considered information regarding the nature, quality and extent of services provided to the Fund by PI and QMA. The Board considered the services provided by PI, including but not limited to the oversight of the subadviser for the Fund, as well as the provision of fund recordkeeping, compliance, and other services to the Fund. With respect to PI’s oversight of the subadviser, the Board noted that PI’s Strategic Investment Research Group (“SIRG”), which is a business unit of PI, is responsible for monitoring and reporting to PI’s senior management on the performance and operations of the subadviser. The Board also considered that PI pays the salaries of all of the officers and non-independent Trustees of the Fund. The Board also considered the investment subadvisory services provided by QMA, as well as adherence to the Fund’s investment restrictions and compliance with applicable Fund policies and procedures. The Board considered PI’s evaluation of the subadviser, as well as PI’s recommendation, based on its review of the subadviser, to renew the subadvisory agreement.
The Board reviewed the qualifications, backgrounds and responsibilities of PI’s senior management responsible for the oversight of the Fund and QMA, and also reviewed the qualifications, backgrounds and responsibilities of QMA’s portfolio managers who are responsible for the day-to-day management of the Fund’s portfolio. The Board was provided with information pertaining to PI’s and QMA’s organizational structure, senior management, investment operations, and other relevant information pertaining to both PI and QMA. The Board also noted that it received favorable compliance reports from the Fund’s Chief Compliance Officer (“CCO”) as to both PI and QMA. The Board noted that QMA is affiliated with PI.
Visit our website at www.prudentialfunds.com
The Board concluded that it was satisfied with the nature, extent and quality of the investment management services provided by PI and the subadvisory services provided to the Fund by QMA, and that there was a reasonable basis on which to conclude that the Fund benefits from the services provided by PI and QMA under the management and subadvisory agreements.
Costs of Services and Profits Realized by PI
The Board was provided with information on the profitability of PI and its affiliates in serving as the Fund’s investment manager. The Board discussed with PI the methodology utilized in assembling the information regarding profitability and considered its reasonableness. The Board recognized that it is difficult to make comparisons of profitability from fund management contracts because comparative information is not generally publicly available and is affected by numerous factors, including the structure of the particular adviser, the types of funds it manages, its business mix, numerous assumptions regarding allocations and the adviser’s capital structure and cost of capital. The Board did not separately consider the profitability of the subadviser, an affiliate of PI, as its profitability was reflected in the profitability report for PI. Taking these factors into account, the Board concluded that the profitability of PI and its affiliates in relation to the services rendered was not unreasonable.
Economies of Scale
The Board received and discussed information concerning whether PI realizes economies of scale as the Fund’s assets grow beyond current levels. The Board noted that the management fee schedule for the Fund includes breakpoints, which have the effect of decreasing the fee rate as assets increase, but at the current level of assets, the Fund does not realize the effect of those rate reductions. The Board took note that the Fund’s fee structure would result in benefits to Fund shareholders when (and if) assets reach the levels at which the fee rate is reduced. These benefits will accrue whether or not PI is then realizing any economies of scale. The Board recognized the inherent limitations of any analysis of economies of scale, stemming largely from the Board’s understanding that most of PI’s costs are not specific to individual funds, but rather are incurred across a variety of products and services.
Other Benefits to PI and QMA
The Board considered potential ancillary benefits that might be received by PI and QMA and their affiliates as a result of their relationship with the Fund. The Board concluded that potential benefits to be derived by PI included fees received by affiliates of PI for serving as the Fund’s securities lending agent, transfer agency fees received by the Fund’s transfer agent (which is affiliated with PI), and benefits to its reputation as well as other intangible benefits resulting from PI’s association with the
Prudential Large-Cap Core Equity Fund
Approval of Advisory Agreements (continued)
Fund. The Board concluded that the potential benefits to be derived by QMA included its ability to use soft dollar credits, as well as the potential benefits consistent with those generally resulting from an increase in assets under management, specifically, potential access to additional research resources and benefits to its reputation. The Board concluded that the benefits derived by PI and QMA were consistent with the types of benefits generally derived by investment managers and subadvisers to mutual funds.
Performance of the Fund / Fees and Expenses
The Board considered certain additional specific factors and made related conclusions relating to the historical performance of the Fund for the one-, three-, five- and ten-year periods ended December 31, 2011.
The Board also considered the Fund’s actual management fee, as well as the Fund’s net total expense ratio, for the fiscal year ended October 31, 2011. The Board considered the management fee for the Fund as compared to the management fee charged by PI to other funds and the fee charged by other advisers to comparable mutual funds in a Peer Group. The actual management fee represents the fee rate actually paid by Fund shareholders and includes any fee waivers or reimbursements. The net total expense ratio for the Fund represents the actual expense ratio incurred by Fund shareholders.
The mutual funds included in the Peer Universe (the Lipper Large-Cap Core Funds Performance Universe) and the Peer Group were objectively determined by Lipper Inc. (“Lipper”), an independent provider of mutual fund data. The comparisons placed the Fund in various quartiles, with the first quartile being the best 25% of the mutual funds (for performance, the best performing mutual funds and, for expenses, the lowest cost mutual funds).
The section below summarizes key factors considered by the Board and the Board’s conclusions regarding the Fund’s performance, fees and overall expenses. The table sets forth gross performance comparisons (which do not reflect the impact on performance of fund expenses, or any subsidies, expense caps or waivers that may be applicable) with the Peer Universe, actual management fees with the Peer Group (which reflect the impact of any subsidies or fee waivers), and net total expenses with the Peer Group, each of which were key factors considered by the Board.
| | | | | | | | |
| Performance | | 1 Year | | 3 Years | | 5 Years | | 10 Years |
| | | 2nd Quartile | | 3rd Quartile | | 3rd Quartile | | 2nd Quartile |
| Actual Management Fees: 1st Quartile |
| Net Total Expenses: 4th Quartile |
Visit our website at www.prudentialfunds.com
| | • | | The Board noted that the Fund outperformed its benchmark index over the one- and ten-year periods, though it underperformed its benchmark index over the three- and five-year periods. |
| | • | | The Board accepted PI’s recommendation to retain the existing expense cap of 0.95% (exclusive of 12b-1 and certain other fees) through February 28, 2013. |
| | • | | The Board also noted PI’s explanation that, due to the fact that the expense cap had not been in place for a full fiscal year, the full impact of the expense cap was not reflected in the Fund’s expense ranking. The Board noted that PI provided information indicating that the Fund’s net expenses would have ranked in the third quartile if the expense cap had been in effect for the full fiscal year. |
| | • | | The Board concluded that, in light of the Fund’s strong recent performance and competitive long-term performance, it would be in the best interests of the Fund and its shareholders to renew the agreements. |
| | • | | The Board concluded that the management fees (including subadvisory fees) and total expenses were reasonable in light of the services provided. |
* * *
After full consideration of these factors, the Board concluded that the approval of the agreements was in the best interests of the Fund and its shareholders.
Prudential Large-Cap Core Equity Fund
| | | | |
| n MAIL | | n TELEPHONE | | n WEBSITE |
Gateway Center Three 100 Mulberry Street Newark, NJ 07102 | | (800) 225-1852 | | www.prudentialfunds.com |
|
| PROXY VOTING |
| The Board of Trustees of the Fund has delegated to the Fund’s investment subadviser the responsibility for voting any proxies and maintaining proxy recordkeeping with respect to the Fund. A description of these proxy voting policies and procedures is available without charge, upon request, by calling (800) 225-1852 or by visiting the Securities and Exchange Commission’s website at www.sec.gov. Information regarding how the Fund voted proxies relating to portfolio securities during the most recent 12-month period ended June 30 is available on the Fund’s website and on the Securities and Exchange Commission’s website. |
|
| TRUSTEES |
| Kevin J. Bannon • Scott E. Benjamin • Linda W. Bynoe • Michael S. Hyland • Douglas H. McCorkindale • Stephen P. Munn • Stuart S. Parker • Richard A. Redeker • Robin B. Smith • Stephen G. Stoneburn |
|
| OFFICERS |
Stuart S. Parker, President • Judy A. Rice, Vice President • Scott E. Benjamin, Vice President • Grace C. Torres, Treasurer and Principal Financial and Accounting Officer • Raymond A. O’Hara, Chief Legal Officer • Deborah A. Docs, Secretary • Timothy J. Knierim, Chief Compliance Officer • Valerie M. Simpson, Deputy Chief Compliance Officer • Theresa C. Thompson, Deputy Chief Compliance Officer • Richard W. Kinville, Anti-Money Laundering Compliance Officer • Jonathan D. Shain, Assistant Secretary • Claudia DiGiacomo, Assistant Secretary •
Amanda S. Ryan, Assistant Secretary • Andrew R. French, Assistant Secretary • M. Sadiq Peshimam, Assistant Treasurer • Peter Parrella, Assistant Treasurer |
| | | | |
| MANAGER | | Prudential Investments LLC | | Gateway Center Three
100 Mulberry Street
Newark, NJ 07102 |
|
| INVESTMENT SUBADVISER | | Quantitative Management
Associates LLC | | Gateway Center Two
100 Mulberry Street
Newark, NJ 07102 |
|
| DISTRIBUTOR | | Prudential Investment
Management Services LLC | | Gateway Center Three
100 Mulberry Street
Newark, NJ 07102 |
|
| CUSTODIAN | | The Bank of New York Mellon | | One Wall Street
New York, NY 10286 |
|
| TRANSFER AGENT | | Prudential Mutual Fund
Services LLC | | PO Box 9658
Providence, RI 02940 |
|
INDEPENDENT REGISTERED
PUBLIC ACCOUNTING FIRM | | KPMG LLP | | 345 Park Avenue
New York, NY 10154 |
|
| FUND COUNSEL | | Willkie Farr & Gallagher LLP | | 787 Seventh Avenue
New York, NY 10019 |
|
| An investor should consider the investment objectives, risks, charges, and expenses of the Fund carefully before investing. The prospectus and summary prospectus contain this and other information about the Fund. An investor may obtain a prospectus and summary prospectus by visiting our website at www.prudentialfunds.com or by calling (800) 225-1852. The prospectus and summary prospectus should be read carefully before investing. |
|
| E-DELIVERY |
| To receive your mutual fund documents online, go to www.prudentialfunds.com/edelivery and enroll. Instead of receiving printed documents by mail, you will receive notification via email when new materials are available. You can cancel your enrollment or change your email address at any time by visiting the website address above. |
|
| SHAREHOLDER COMMUNICATIONS WITH TRUSTEES |
| Shareholders can communicate directly with the Board of Trustees by writing to the Chair of the Board, Prudential Large-Cap Core Equity Fund, Prudential Investments, Attn: Board of Trustees, 100 Mulberry Street, Gateway Center Three, Newark, NJ 07102. Shareholders can communicate directly with an individual Trustee by writing to the same address. Communications are not screened before being delivered to the addressee. |
|
| AVAILABILITY OF PORTFOLIO SCHEDULE |
| The Fund files its complete schedule of portfolio holdings with the Securities and Exchange Commission for the first and third quarters of each fiscal year on Form N-Q. The Fund’s Forms N-Q are available on the Commission’s website at www.sec.gov. The Fund’s Forms N-Q may also be reviewed and copied at the Commission’s Public Reference Room in Washington, D.C. Information on the operation and location of the Public Reference Room may be obtained by calling (202) 551-8090. The Fund’s schedule of portfolio holdings is also available on the Fund’s website as of the end of each month. |
|
| The Fund’s Statement of Additional Information contains additional information about the Fund’s Trustees and is available without charge, upon request, by calling (800) 225-1852. |
Mutual Funds:
| | | | |
ARE NOT INSURED BY THE FDIC OR ANY
FEDERAL GOVERNMENT AGENCY | | MAY LOSE VALUE | | ARE NOT A DEPOSIT OF OR GUARANTEED
BY ANY BANK OR ANY BANK AFFILIATE |

PRUDENTIAL LARGE-CAP CORE EQUITY FUND
| | | | | | | | | | |
| SHARE CLASS | | A | | B | | C | | X | | Z |
| NASDAQ | | PTMAX | | PTMBX | | PTMCX | | N/A | | PTEZX |
| CUSIP | | 74441J100 | | 74441J209 | | 74441J308 | | 74441J704 | | 74441J407 |
MF187E 0236581-00001-00

PRUDENTIAL INVESTMENTS»MUTUAL FUNDS
PRUDENTIAL ABSOLUTE RETURN BOND FUND
ANNUAL REPORT · OCTOBER 31, 2012
Fund Type
Absolute Return Bond
Objective
To seek positive returns over the long term, regardless of market conditions
This report is not authorized for distribution to prospective investors unless preceded or accompanied by a current prospectus.
The views expressed in this report and information about the Fund’s portfolio holdings are for the period covered by this report and are subject to change thereafter.
Prudential Investments, Prudential, the Prudential logo, the Rock symbol, and Bring Your Challenges are service marks of Prudential Financial, Inc. and its related entities, registered in many jurisdictions worldwide.

December 14, 2012
Dear Shareholder:
We hope you find the annual report for the Prudential Absolute Return Bond Fund informative and useful. The report covers performance for the 12-month period that ended October 31, 2012.
We recognize that ongoing market volatility may make it a difficult time to be an investor. We continue to believe a prudent response to uncertainty is to maintain a diversified portfolio of funds consistent with your tolerance for risk, time horizon, and financial goals.
Your financial advisor can help you create a diversified investment plan that may include funds covering all the basic asset classes and that reflects your personal investor profile and risk tolerance. Keep in mind, however, that diversification and asset allocation strategies do not assure a profit or protect against loss in declining markets.
Prudential Investments® is dedicated to helping you solve your toughest investment challenges—whether it’s capital growth, reliable income, or protection from market volatility and other risks. We offer the expertise of Prudential Financial’s affiliated asset managers* that strive to be leaders in a broad range of funds to help you stay on course to the future you envision. They also manage money for major corporations and pension funds around the world, which means you benefit from the same expertise, innovation, and attention to risk demanded by today’s most sophisticated investors.
Thank you for choosing the Prudential Investments family of funds.
Sincerely,

Stuart S. Parker, President
Prudential Absolute Return Bond Fund
*Most of Prudential Investments’ equity funds are advised by Jennison Associates LLC, Quantitative Management Associates LLC (QMA), or Prudential Real Estate Investors. Prudential Investments’ fixed income and money market funds are advised by Prudential Investment Management, Inc. (PIM) through its Prudential Fixed Income unit. Jennison Associates, QMA, and PIM are registered investment advisers and Prudential Financial companies. Prudential Real Estate Investors is a unit of PIM.
| | | | |
| Prudential Absolute Return Bond Fund | | | 1 | |
Your Fund’s Performance
Performance data quoted represent past performance. Past performance does not guarantee future results. The investment return and principal value of an investment will fluctuate, so that an investor’s shares, when redeemed, may be worth more or less than their original cost. Current performance may be lower or higher than the past performance data quoted. An investor may obtain performance data as of the most recent month-end by visiting our website at www.prudentialfunds.com or by calling (800) 225-1852. Class A shares have a maximum initial sales charge of 4.50%. Gross operating expenses: Class A, 1.54%; Class C, 2.39%; Class Q, 1.54%; Class Z, 1.50%. Net operating expenses: Class A, 1.11%; Class C, 1.88%; Class Q, 0.89%; Class Z, 0.89%, after contractual reduction through 2/28/2014.
| | | | | | | | | | |
Cumulative Total Returns (Without Sales Charges) as of 10/31/12 | |
| | | | | One Year | | | Since Inception | |
Class A | | | | | 5.49 | % | | | 4.16% | |
Class C | | | | | 4.78 | | | | 2.96 | |
Class Q | | | | | 5.99 | | | | 4.83 | |
Class Z | | | | | 5.81 | | | | 4.61 | |
BofAML USD LIBOR 3-Month CM Index | | | | | 0.50 | | | | 0.65 | |
Lipper Absolute Return Funds Average | | | | | 2.79 | | | | 0.11 | |
| | | | | | | | | | |
Average Annual Total Returns (With Sales Charges) as of 9/30/12 | |
| | | | | One Year | | | Since Inception | |
Class A | | | | | 2.43 | % | | | –0.73% | |
Class C | | | | | 5.43 | | | | 1.62 | |
Class Q | | | | | 7.65 | | | | 2.77 | |
Class Z | | | | | 7.47 | | | | 2.63 | |
BofAML USD LIBOR 3-Month CM Index | | | | | 0.48 | | | | 0.40 | |
Lipper Absolute Return Funds Average | | | | | 4.73 | | | | 0.07 | |
| | | | | | | | | | |
Average Annual Total Returns (With Sales Charges) as of 10/31/12 | |
| | | | | One Year | | | Since Inception | |
Class A | | | | | 0.74 | % | | | –0.33 | % |
Class C | | | | | 3.78 | | | | 1.85 | |
Class Q | | | | | 5.99 | | | | 3.00 | |
Class Z | | | | | 5.81 | | | | 2.87 | |
| | | | | | | | | | |
| | |
| 2 | | Visit our website at www.prudentialfunds.com |
| | | | | | | | | | |
Average Annual Total Returns (Without Sales Charges) as of 10/31/12 | |
| | | | | One Year | | | Since Inception | |
Class A | | | | | 5.49 | % | | | 2.59 | % |
Class C | | | | | 4.78 | | | | 1.85 | |
Class Q | | | | | 5.99 | | | | 3.00 | |
Class Z | | | | | 5.81 | | | | 2.87 | |
Inception date: 3/30/11
Growth of a $10,000 Investment
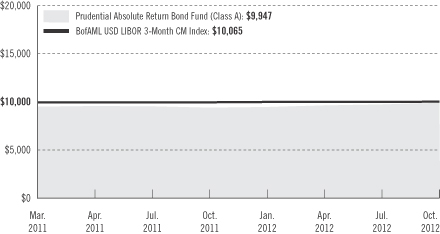
The graph compares a $10,000 investment in the Prudential Absolute Return Bond Fund (Class A shares) with a similar investment in the BofAML USD LIBOR 3-Month Constant Maturity (CM) Index by portraying the initial account values at the commencement of operations for Class A shares (March 30, 2011) and the account values at the end of the current fiscal year (October 31, 2012) as measured on a quarterly basis. For purposes of the graph, and unless otherwise indicated, it has been assumed that (a) the maximum applicable front-end sales charge was deducted from the initial $10,000 investment in Class A shares; (b) all recurring fees (including management fees) were deducted; and (c) all dividends and distributions were reinvested. The line graph provides information for Class A shares only. As indicated in the tables provided earlier, performance for Class C, Class Q, and Class Z shares will vary due to the differing charges and expenses applicable to each share class (as indicated in the following paragraphs). Without waiver of fees and/or expense reimbursement, if any, the returns would have been lower.
Total returns and the ending account values in the graph include changes in share price and reinvestment of dividends and capital gains distributions in a hypothetical investment for the periods shown. The Fund’s total returns do not reflect the deduction of income taxes on an individual’s investment. Taxes may reduce your actual investment returns on income or gains paid by the Fund or any gains you may realize if you sell your shares.
Source: Prudential Investments LLC and Lipper Inc.
Inception returns are provided for any share class with less than 10 calendar years of returns.
| | | | |
| Prudential Absolute Return Bond Fund | | | 3 | |
Your Fund’s Performance (continued)
The average annual total returns take into account applicable sales charges. Class A shares are subject to a maximum front-end sales charge of 4.50%, and an annual 12b-1 fee of 0.30%. Investors who purchase Class A shares in an amount of $1 million or more and sell these shares within 12 months of purchase are subject to a contingent deferred sales charge (CDSC) of 1%. The Class A CDSC is waived for purchases by certain retirement and/or benefit plans. Under certain circumstances, an exchange may be made from specified share classes of the Fund to one or more other share classes of the Fund. Class C shares are not subject to a front-end sales charge, but are subject to a CDSC of 1% for shares sold within 12 months from the date of purchase, and an annual 12b-1 fee of 1%. Class Q and Class Z shares are not subject to a sales charge or 12b-1 fees. The returns in the tables and graph reflect the share class expense structure in effect at the close of the fiscal period. The returns in the tables and graph do not reflect the deduction of taxes that a shareholder would pay on Fund distributions or following the redemption of Fund shares.
Benchmark Definitions
BofAML USD LIBOR 3-Month CM Index
The BofA Merrill Lynch US Dollar LIBOR 3-Month Constant Maturity (CM) Index is an unmanaged index which tracks the performance of a synthetic asset paying LIBOR to a stated maturity. The index is based on the assumed purchase at par of a synthetic instrument having exactly its stated maturity and with a coupon equal to that day’s fixing rate. That issue is assumed to be sold the following business day (priced at a yield equal to the current day fixing rate) and rolled into a new instrument.
Lipper Absolute Return Funds Average
Funds in the Lipper Absolute Return Funds Average aim for positive returns in all market conditions. The funds are not benchmarked against a traditional long-only market index but rather have the aim of outperforming a cash or risk-free benchmark.
Investors cannot invest directly in an index or average. The returns for the Index would be lower if they included the effects of sales charges, operating expenses of a mutual fund, or taxes. Returns for the Lipper Average reflect the deduction of operating expenses of a mutual fund, but not sales charges or taxes.
| | | | | | | | |
Distributions and Yields as of 10/31/12 | | | | | |
| | | Total Distributions
Paid for 12 Months | | | 30-Day
SEC Yield | |
Class A | | $ | 0.32 | | | | 1.64 | % |
Class C | | | 0.24 | | | | 0.91 | |
Class Q | | | 0.35 | | | | 1.97 | |
Class Z | | | 0.34 | | | | 1.96 | |
| | | | |
Five Largest Holdings expressed as a percentage of net assets as of 10/31/12 | | | | |
U.S. Treasury Bonds, 5.500%, 08/15/28 | | | 2.8 | % |
Atrium CDO Corp. (Cayman Islands), Ser. 4A, Class A1A, 144A, 0.658%, 06/08/19 | | | 1.8 | |
Federal National Mortgage Association, 3.000%, TBA 30 YR | | | 1.0 | |
Federal Home Loan Mortgage Corp., 2.375%, 01/13/22 | | | 1.0 | |
Morgan Stanley Bank of America Merrill Lynch Trust, Ser. 2012-C6, Class A2, 1.868%, 11/15/45 | | | 1.0 | |
Holdings reflect only long-term investments and are subject to change.
| | |
| 4 | | Visit our website at www.prudentialfunds.com |
| | | | |
Credit Quality* expressed as a percentage of net assets as of 10/31/12 | | | | |
U.S. Government & Agency | | | 8.4 | % |
Aaa | | | 19.0 | |
Aa | | | 5.7 | |
A | | | 8.1 | |
Baa | | | 20.2 | |
Ba | | | 15.4 | |
B | | | 8.4 | |
Caa | | | 1.3 | |
Not Rated** | | | 19.2 | |
Total Investments | | | 105.7 | |
Liabilities in excess of other assets | | | -5.7 | |
Net Assets | | | 100.0 | % |
| | | | |
*Source: Moody’s rating, defaulting to S&P when not rated by Moody’s.
**Approximately 18.0% of Not Rated is invested in affiliated money market mutual fund.
Credit Quality is subject to change.
| | | | |
| Prudential Absolute Return Bond Fund | | | 5 | |
Strategy and Performance Overview
How did the Fund perform?
The Prudential Absolute Return Bond Fund’s Class A shares gained 5.49% for the 12-month reporting period that ended October 31, 2012, significantly outperforming the 0.50% return of the BofAML USD 3-Month LIBOR Constant Maturity Index (the Index) and the 2.79% gain of the Lipper Absolute Return Funds Average.
How did the U.S. investment-grade fixed income market perform?
The reporting period that began November 1, 2011, proved bullish for the U.S. investment-grade bond market as all sectors delivered gains. From time to time, market conditions were volatile, however. This reflected key concerns such as a deteriorating global economic picture and uncertainty about the course of an ongoing European sovereign-debt crisis, which periodically threatened to spiral out of control.
| | • | | The market was sometimes dominated by a “risk off” sentiment that favored safe-havens such as U.S. Treasury securities. At other times, it was dominated by a “risk on” sentiment that favored “spread sectors,” which are commercial mortgage-backed securities, corporate bonds, and other types of debt securities that provide extra yield (spread) over similar-duration U.S. Treasury securities to compensate for the greater credit risk associated with investing in them. |
| | • | | Frustration with a high jobless rate in the United States drove the Federal Reserve (the Fed) to add $40 billion per month of net new purchases of agency mortgage-backed securities. This was in addition to it already reinvesting principal paydowns from its portfolio of agency mortgage-backed securities and federal agency securities back into agency mortgage-backed securities. The program, which has an “open ended” commitment to buy until the economy is much better, is designed to inject money into the financial markets and support economic growth. |
| | • | | The Fed also expects to keep short-term interest rates low into 2015, and will continue selling short-term U.S. Treasury securities, while purchasing longer-term U.S. Treasury securities, until the end of 2012. |
| | • | | U.S. Treasury securities returned 3.66% overall for the period, with long-term U.S. Treasury securities outperforming their shorter-term counterparts. |
| | • | | Agency securities delivered a single-digit gain for the period that outperformed similar-duration U.S. Treasury securities. The sector benefited from a low net supply of federal agency securities and strong demand by investors for bonds of AAA quality. |
| | • | | Investment-grade corporate bonds posted a double-digit gain for the period that significantly outperformed similar-duration U.S. Treasury securities. Late in |
| | |
| 6 | | Visit our website at www.prudentialfunds.com |
| | the period, accommodative monetary policies worldwide provided support to the corporate bond market, as investors searching for more attractive returns shifted from low-yielding government debt securities into corporate bonds. |
| | • | | The three securitized spread sectors—agency mortgage-backed securities, commercial mortgage-backed securities, and asset-backed securities—delivered single-digit gains that enabled each to outperform similar-duration U.S. Treasury securities for the period. (Asset-backed securities are created from credit card receivables, auto loans, and certain other types of loans.) |
How did the U.S. high yield corporate bond market perform?
The reporting period was also bullish for high yield corporate bonds, commonly called “junk” bonds for their below-investment-grade ratings. High yield bonds also delivered a double-digit return for the period that sharply outperformed similar-duration U.S. Treasury securities.
Some of the strongest gains in the high yield arena were in industries such as home construction, building materials, and wireless telecommunications. Late in the period, momentum in the high yield market was driven primarily by strong technical factors (a favorable supply/demand balance) as investors’ thirst for attractive yields outweighed signs of slowing global economic growth.
Which strategies made the largest positive contribution to the Fund’s performance?
Prudential Fixed Income, a unit of Prudential Investment Management, Inc., manages the Fund, which outperformed the Index by a significant amount primarily due to its sector allocation strategy and favorable security selection within certain sectors. The Index does not include any types of bonds but closely tracks the three-month London interbank offered rate (LIBOR), the most widely used benchmark for short-term interest rates.
| | • | | The Fund invested in many sectors of the fixed income markets in the United States and abroad. Its sector allocation strategy deemphasized U.S. Treasury securities but emphasized high yield corporate bonds, investment-grade corporate bonds, commercial mortgage-backed securities, asset-backed securities, and debt securities of issuers from emerging market nations. This worked well as each of these spread sectors outperformed similar-duration U.S. Treasury securities. |
| | • | | Strong security selection in high yield corporate bonds, investment-grade corporate bonds, commercial mortgage-backed securities, asset-backed securities, and emerging market bonds was the other major positive contributor to the Fund’s performance. |
| | | | |
| Prudential Absolute Return Bond Fund | | | 7 | |
Strategy and Performance Overview (continued)
What other strategies helped the Fund’s performance?
The Fund employs an absolute return strategy that seeks to mitigate (or even eliminate) interest-rate risk when appropriate. During the period, it benefited from its strategy to manage duration, which is a measure of the interest-rate sensitivity of a bond portfolio or debt securities that is expressed as a number of years. The Fund maintains an overall duration of plus/minus three years. The more positive or negative duration is, the greater the potential risk and reward when interest rates move.
| | • | | The Fund had a slightly longer duration than the Index that benefited its performance as interest rates generally declined and pushed bond prices higher. (Bond prices move inversely to interest rates.) |
| | • | | The Fund also benefited from having a mild bias in favor of flatter yield curves, which are single line graphs that illustrate the relationship between the yields and maturities of fixed income securities. They are created by plotting the yields of different maturities for the same type of bonds. The slope of some yield curves flattened during the period as prices of longer-term bonds rose sharply and pushed down their yields. |
What strategy detracted most from the Fund’s performance?
The Fund had overweight exposures to foreign currencies that subtracted from its return for the period.
| | • | | Currency markets were volatile. From time to time, concern about the European sovereign-debt crisis sent investors flocking to the U.S. dollar, which overall finished the period little changed versus a basket of key currencies. That said, the greenback ended stronger against the euro and gained sharply versus riskier currencies including the Brazilian real, the Argentinian peso, the Indian rupee, and the South African rand. But the U.S. dollar ended the period weaker against the Mexican peso, the New Zealand dollar, and certain other currencies. |
| | |
| 8 | | Visit our website at www.prudentialfunds.com |
Fees and Expenses (Unaudited)
As a shareholder of the Fund, you incur two types of costs: (1) transaction costs, including sales charges (loads) on purchase payments and redemptions, as applicable, and (2) ongoing costs, including management fees, distribution and/or service (12b-1) fees, and other Fund expenses, as applicable. This example is intended to help you understand your ongoing costs (in dollars) of investing in the Fund and to compare these costs with the ongoing costs of investing in other mutual funds.
The example is based on an investment of $1,000 invested on May 1, 2012, at the beginning of the period, and held through the six-month period ended October 31, 2012. The example is for illustrative purposes only; you should consult the Prospectus for information on initial and subsequent minimum investment requirements.
The Fund’s transfer agent may charge additional fees to holders of certain accounts that are not included in the expenses shown in the table on the following page. These fees apply to individual retirement accounts (IRAs) and Section 403(b) accounts. As of the close of the six-month period covered by the table, IRA fees included an annual maintenance fee of $15 per account (subject to a maximum annual maintenance fee of $25 for all accounts held by the same shareholder). Section 403(b) accounts are charged an annual $25 fiduciary maintenance fee. Some of the fees may vary in amount, or may be waived, based on your total account balance or the number of Prudential Investments funds, including the Fund, that you own. You should consider the additional fees that were charged to your Fund account over the six-month period when you estimate the total ongoing expenses paid over the period and the impact of these fees on your ending account value, as these additional expenses are not reflected in the information provided in the expense table. Additional fees have the effect of reducing investment returns.
Actual Expenses
The first line for each share class in the table on the following page provides information about actual account values and actual expenses. You may use the information on this line, together with the amount you invested, to estimate the expenses that you paid over the period. Simply divide your account value by $1,000 (for example, an $8,600 account value ÷ $1,000 = 8.6), then multiply the result by the number on the first line under the heading “Expenses Paid During the Six-Month Period” to estimate the expenses you paid on your account during this period.
Hypothetical Example for Comparison Purposes
The second line for each share class in the table on the following page provides information about hypothetical account values and hypothetical expenses based on the Fund’s actual expense ratio and an assumed rate of return of 5% per year before
| | | | |
| Prudential Absolute Return Bond Fund | | | 9 | |
Fees and Expenses (continued)
expenses, which is not the Fund’s actual return. The hypothetical account values and expenses may not be used to estimate the actual ending account balance or expenses you paid for the period. You may use this information to compare the ongoing costs of investing in the Fund and other funds. To do so, compare this 5% hypothetical example with the 5% hypothetical examples that appear in the shareholder reports of the other funds.
Please note that the expenses shown in the table are meant to highlight your ongoing costs only and do not reflect any transactional costs such as sales charges (loads). Therefore, the second line for each share class in the table is useful in comparing ongoing costs only and will not help you determine the relative total costs of owning different funds. In addition, if these transactional costs were included, your costs would have been higher.
| | | | | | | | | | | | | | | | | | |
Prudential Absolute
Return Bond Fund | | Beginning Account
Value
May 1, 2012 | | | Ending Account
Value
October 31, 2012 | | | Annualized
Expense Ratio
Based on the
Six-Month Period | | | Expenses Paid
During the
Six-Month Period* | |
| | | | | | | | | | | | | | | | | | |
| Class A | | Actual | | $ | 1,000.00 | | | $ | 1,030.40 | | | | 1.10 | % | | $ | 5.61 | |
| | | Hypothetical | | $ | 1,000.00 | | | $ | 1,019.61 | | | | 1.10 | % | | $ | 5.58 | |
| | | | | | | | | | | | | | | | | | |
| Class C | | Actual | | $ | 1,000.00 | | | $ | 1,026.50 | | | | 1.85 | % | | $ | 9.42 | |
| | | Hypothetical | | $ | 1,000.00 | | | $ | 1,015.84 | | | | 1.85 | % | | $ | 9.37 | |
| | | | | | | | | | | | | | | | | | |
| Class Q | | Actual | | $ | 1,000.00 | | | $ | 1,032.10 | | | | 0.85 | % | | $ | 4.34 | |
| | | Hypothetical | | $ | 1,000.00 | | | $ | 1,020.86 | | | | 0.85 | % | | $ | 4.32 | |
| | | | | | | | | | | | | | | | | | |
| Class Z | | Actual | | $ | 1,000.00 | | | $ | 1,031.60 | | | | 0.85 | % | | $ | 4.34 | |
| | | Hypothetical | | $ | 1,000.00 | | | $ | 1,020.86 | | | | 0.85 | % | | $ | 4.32 | |
*Fund expenses (net of fee waivers or subsidies, if any) for each share class are equal to the annualized expense ratio for each share class (provided in the table), multiplied by the average account value over the period, multiplied by the 184 days in the six-month period ended October 31, 2012, and divided by the 366 days in the Fund’s fiscal year ended October 31, 2012 (to reflect the six-month period). Expenses presented in the table include the expenses of any underlying funds in which the Fund may invest.
| | |
| 10 | | Visit our website at www.prudentialfunds.com |
Portfolio of Investments
as of October 31, 2012
| | | | | | | | | | | | | | | | |
| Description | | Moody’s
Ratings†
(Unaudited) | | Interest
Rate | | Maturity
Date | | | Principal
Amount (000)# | | | Value (Note 1) | |
LONG-TERM INVESTMENTS 87.3% | | | | | | | | | | | | |
ASSET-BACKED SECURITIES 13.2% | | | | | | | | | | | | |
|
Collateralized Loan Obligations, Debt Obligations and Other Asset-Backed Securities 10.6% | |
Apidos CDO (Cayman Islands), Ser. 2011-8A, Class A1, 144A(a) | | Aaa | | 1.830% | | | 10/17/21 | | | $ | 250 | | | $ | 250,077 | |
ARES CLO Ltd. (Cayman Islands), Ser. 2012-2A, Class B1, 144A(a) | | AA(c) | | 3.428 | | | 10/12/23 | | | | 400 | | | | 404,700 | |
Atrium CDO Corp. (Cayman Islands), Ser. 4A, Class A1A, 144A(a) | | Aaa | | 0.658 | | | 06/08/19 | | | | 3,787 | | | | 3,722,429 | |
BA Credit Card Trust, Ser. 2008-C5, Class C5(a) | | A3 | | 4.964 | | | 03/15/16 | | | | 1,200 | | | | 1,249,375 | |
Battalion CLO Ltd. (Cayman Islands), Ser. 2012-2A, Class A1, 144A(a) | | Aaa | | 1.537 | | | 11/15/19 | | | | 500 | | | | 497,671 | |
Cent CDO XI Ltd. (Cayman Islands), Ser. 2006-11A, Class A1, 144A(a) | | Aaa | | 0.575 | | | 04/25/19 | | | | 456 | | | | 444,020 | |
Citibank Credit Card Issuance Trust, Ser. 2005-C2, Class C2(a) | | Baa2 | | 0.681 | | | 03/24/17 | | | | 500 | | | | 495,925 | |
Fraser Sullivan CLO Ltd. (Cayman Islands), Ser. 2006-1A, Class B, 144A(a) | | Aa1 | | 0.859 | | | 03/15/20 | | | | 500 | | | | 477,414 | |
Grosvenor Place CLO BV (Netherlands), Ser. I-X, Class A1, RegS(a) | | Aaa | | 0.455 | | | 07/20/21 | | | EUR | 467 | | | | 581,689 | |
Gulf Stream-Sextant CLO Ltd. (Cayman Islands), Ser. 2006-1A, Class A1A, 144A(a) | | Aaa | | 0.665 | | | 08/21/20 | | | | 214 | | | | 211,498 | |
See Notes to Financial Statements.
| | | | |
| Prudential Absolute Return Bond Fund | | | 11 | |
Portfolio of Investments
as of October 31, 2012 continued
| | | | | | | | | | | | | | | | |
| Description | | Moody’s
Ratings†
(Unaudited) | | Interest
Rate | | Maturity
Date | | | Principal
Amount (000)# | | | Value (Note 1) | |
ASSET-BACKED SECURITIES (Continued) | | | | | | | | | | | | |
|
Collateralized Loan Obligations, Debt Obligations and Other Asset-Backed Securities (cont’d.) | |
Hewett’s Island CDO Ltd. (Cayman Islands), Ser. 2004-1A, Class A1, 144A(a) | | Aaa | | 0.729% | | | 12/15/16 | | | $ | 72 | | | $ | 72,102 | |
Highlander Euro CDO Cayman Ltd. (Netherlands), Ser. 2008-4A, Class C, 144A(a) | | Baa1 | | 5.439 | | | 08/01/16 | | | EUR | 250 | | | | 294,174 | |
Lafayette CLO Ltd. (Cayman Islands), Ser. 2012-1A, Class A, 144A(a) | | AAA(c) | | 1.751 | | | 09/06/22 | | | | 931 | | | | 930,389 | |
LCM LP (Cayman Islands),
Ser. 2005-3A, Class A, 144A(a) | | Aaa | | 0.678 | | | 06/01/17 | | | | 435 | | | | 427,449 | |
Ser. 2010-8A, Class A, 144A(a) | | AAA(c) | | 1.940 | | | 01/14/21 | | | | 500 | | | | 505,143 | |
Lightpoint CLO Ltd. (Cayman Islands), Ser. 2005-3A, Class A1A, 144A(a) | | Aaa | | 0.649 | | | 09/15/17 | | | | 281 | | | | 275,902 | |
Lightpoint Pan-European CLO PLC (Ireland), Ser. 2006-1A, Class A, 144A(a) | | Aaa | | 0.446 | | | 01/31/22 | | | EUR | 999 | | | | 1,242,249 | |
Marine Park CLO Ltd. (Cayman Islands),
Ser. 2012-1A, Class A1A, 144A(a) | | Aaa | | 2.003 | | | 05/18/23 | | | | 500 | | | | 500,440 | |
Ser. 2012-1A, Class A2, 144A(a) | | AA(c) | | 2.783 | | | 05/18/23 | | | | 700 | | | | 698,613 | |
Monument Park CDO Ltd. (Cayman Islands), Ser. 2004-1A, Class A1,
144A(a) | | Aaa | | 0.869 | | | 01/20/16 | | | | 80 | | | | 79,880 | |
See Notes to Financial Statements.
| | |
| 12 | | Visit our website at www.prudentialfunds.com |
| | | | | | | | | | | | | | | | |
| Description | | Moody’s
Ratings†
(Unaudited) | | Interest
Rate | | Maturity
Date | | | Principal
Amount (000)# | | | Value (Note 1) | |
ASSET-BACKED SECURITIES (Continued) | | | | | | | | | | | | |
|
Collateralized Loan Obligations, Debt Obligations and Other Asset-Backed Securities (cont’d.) | |
Mountain Capital CLO Ltd. (Cayman Islands),
Ser. 2004-3A, Class A2L,
144A(a) | | Aaa | | 1.235% | | | 02/15/16 | | | $ | 200 | | | $ | 199,411 | |
Ser. 2005-4A, Class A1L, 144A(a) | | Aaa | | 0.639 | | | 03/15/18 | | | | 394 | | | | 382,724 | |
OCP CLO Ltd.,
Ser. 2012-2A, Class B, 144A(a) | | AA(c) | | 0.000(b) | | | 11/22/23 | | | | 900 | | | | 873,000 | |
Ser. 2012-2A, Class A2,
144A(a) | | Aaa | | 0.000(b) | | | 11/22/23 | | | | 1,700 | | | | 1,700,000 | |
OZLM Funding Ltd. (Cayman Islands), Ser. 2012-2A, Class A2, 144A(a) | | AA(c) | | 3.378 | | | 10/30/23 | | | | 1,250 | | | | 1,250,000 | |
Rosedale CLO Ltd. (Cayman Islands), Ser. I-A, Class A1S, 144A(a) | | Aaa | | 0.566 | | | 07/24/21 | | | | 165 | | | | 160,473 | |
Sierra Receivables Funding Co. LLC, Ser. 2012-3A, Class A, 144A | | A+(c) | | 1.870 | | | 08/20/29 | | | | 1,000 | | | | 988,625 | |
Slater Mill Loan Fund LP (Cayman Islands), Ser. 2012-1A, Class B, 144A(a) | | AA(c) | | 3.085 | | | 08/17/22 | | | | 250 | | | | 248,305 | |
Sound Point CLO Ltd., Ser. 2012-1A, Class B, 144A(a) | | AA(c) | | 3.084 | | | 10/20/23 | | | | 550 | | | | 557,749 | |
Stanfield Vantage CLO Ltd. (Cayman Islands), Ser. 2005-1A, Class A1, 144A(a) | | Aaa | | 0.676 | | | 03/21/17 | | | | 135 | | | | 134,139 | |
SVO VOI Mortgage Corp., Ser. 2012-AA, Class A, 144A | | A+(c) | | 2.000 | | | 09/20/29 | | | | 1,000 | | | | 1,000,057 | |
Trimaran CLO Ltd. (Cayman Islands), Ser. 2006-2A, Class A1L, 144A(a) | | Aaa | | 0.695 | | | 11/01/18 | | | | 600 | | | | 590,507 | |
| | | | | | | | | | | | | | | | |
| | | | | | | | | | | | | | | 21,446,129 | |
| | | | | | | | | | | | | | | | |
See Notes to Financial Statements.
| | | | |
| Prudential Absolute Return Bond Fund | | | 13 | |
Portfolio of Investments
as of October 31, 2012 continued
| | | | | | | | | | | | | | | | |
| Description | | Moody’s
Ratings†
(Unaudited) | | Interest
Rate | | Maturity
Date | | | Principal
Amount (000)# | | | Value (Note 1) | |
ASSET-BACKED SECURITIES (Continued) | | | | | | | | | | | | |
| |
Residential Mortgage-Backed Securities 2.6% | | | | | |
Ameriquest Mortgage Securities, Inc., Ser. 2005-R10, Class A2C(a) | | A3 | | 0.541% | | | 01/25/36 | | | $ | 564 | | | $ | 530,052 | |
Argent Securities, Inc.,
Ser. 2003-W5, Class M1(a) | | Baa1 | | 1.261 | | | 10/25/33 | | | | 142 | | | | 132,539 | |
Ser. 2004-W6, Class AV5(a) | | Aaa | | 0.611 | | | 05/25/34 | | | | 587 | | | | 515,712 | |
Bear Stearns Asset Backed Securities Trust,
Ser. 2003-3, Class A2(a) | | A3 | | 0.801 | | | 06/25/43 | | | | 248 | | | | 237,953 | |
Ser. 2003-HE1, Class M1(a) | | Aa3 | | 1.306 | | | 01/25/34 | | | | 806 | | | | 684,529 | |
Chase Funding Mortgage Loan Asset-Backed Certificates, Ser. 2002-3, Class 2A1(a) | | A1 | | 0.851 | | | 08/25/32 | | | | 295 | | | | 230,496 | |
Citigroup Mortgage Loan Trust, Inc.,
Ser. 2005-OPT1, Class M1(a) | | Aa3 | | 0.631 | | | 02/25/35 | | | | 317 | | | | 274,369 | |
Countrywide Asset-Backed Certificates, Ser. 2004-1,
Class M1(a) | | Ba1 | | 0.961 | | | 03/25/34 | | | | 390 | | | | 351,354 | |
Credit-Based Asset Servicing and Securitization LLC,
Ser. 2003-CB3, Class AF1(d) | | A2 | | 3.379 | | | 12/25/32 | | | | 301 | | | | 275,028 | |
Ser. 2003-CB5, Class M1(a) | | B2 | | 1.231 | | | 11/25/33 | | | | 316 | | | | 279,140 | |
Finance America Mortgage Loan Trust, Ser. 2003-1, Class M1(a) | | Ba1 | | 1.261 | | | 09/25/33 | | | | 343 | | | | 302,085 | |
HSBC Home Equity Loan Trust,
Ser. 2006-2, Class A2(a) | | Aaa | | 0.391 | | | 03/20/36 | | | | 220 | | | | 212,515 | |
See Notes to Financial Statements.
| | |
| 14 | | Visit our website at www.prudentialfunds.com |
| | | | | | | | | | | | | | | | |
| Description | | Moody’s
Ratings†
(Unaudited) | | Interest
Rate | | Maturity
Date | | | Principal
Amount (000)# | | | Value (Note 1) | |
ASSET-BACKED SECURITIES (Continued) | | | | | | | | | | | | |
| |
Residential Mortgage-Backed Securities (cont’d.) | | | | | |
Ser. 2007-3, Class A4(a) | | Aa2 | | 1.711% | | | 11/20/36 | | | $ | 250 | | | $ | 217,834 | |
Morgan Stanley ABS Capital I,
Ser. 2004-WMC1, Class M1(a) | | Ba1 | | 1.141 | | | 06/25/34 | | | | 276 | | | | 232,289 | |
Residential Asset Securities Corp., Ser. 2005-KS8, Class M1(a) | | Baa3 | | 0.621 | | | 08/25/35 | | | | 300 | | | | 280,439 | |
Specialty Underwriting & Residential Finance, Ser. 2003-BC4, Class M1(a) | | Ba3 | | 1.111 | | | 11/25/34 | | | | 262 | | | | 228,489 | |
Structured Asset Securities Corp., Ser. 2005-WF4,
Class M1(a) | | Baa3 | | 0.611 | | | 11/25/35 | | | | 250 | | | | 220,160 | |
| | | | | | | | | | | | | | | | |
| | | | | | | | | | | | | | | 5,204,983 | |
| | | | | | | | | | | | | | | | |
TOTAL ASSET-BACKED SECURITIES
(cost $26,300,034) | | | | | | | | | | | | | | | 26,651,112 | |
| | | | | | | | | | | | | | | | |
| | | | | |
BANK LOANS(a) 6.0% | | | | | | | | | | | | | | | | |
| | | | | |
Aerospace & Defense | | | | | | | | | | | | | | | | |
Booz Allen & Hamilton, Inc. | | Ba3 | | 2.961 | | | 12/31/17 | | | | 50 | | | | 49,719 | |
| | | | | |
Automotive 0.2% | | | | | | | | | | | | | | | | |
Chrysler LLC | | Ba2 | | 6.000 | | | 05/24/17 | | | | 82 | | | | 84,144 | |
Delphi Corp. | | Baa2 | | 3.500 | | | 03/31/17 | | | | 163 | | | | 163,103 | |
Schaeffler AG (Germany) | | Ba3 | | 6.000 | | | 01/27/17 | | | | 100 | | | | 100,938 | |
| | | | | | | | | | | | | | | | |
| | | | | | | | | | | | | | | 348,185 | |
| | | | | |
Cable 0.1% | | | | | | | | | | | | | | | | |
Cequel Communications Holdings LLC | | Ba2 | | 4.000 | | | 02/14/19 | | | | 253 | | | | 252,814 | |
Kabel Deutschland Vertrieb und Service GmbH (Germany) | | BB-(c) | | 3.695 | | | 02/01/19 | | | | 25 | | | | 24,560 | |
| | | | | | | | | | | | | | | | |
| | | | | | | | | | | | | | | 277,374 | |
See Notes to Financial Statements.
| | | | |
| Prudential Absolute Return Bond Fund | | | 15 | |
Portfolio of Investments
as of October 31, 2012 continued
| | | | | | | | | | | | | | | | |
| Description | | Moody’s
Ratings†
(Unaudited) | | Interest
Rate | | Maturity
Date | | | Principal
Amount (000)# | | | Value (Note 1) | |
BANK LOANS(a) (Continued) | | | | | | | | | | | | | | |
| | | | | |
Capital Goods 0.5% | | | | | | | | | | | | | | | | |
Dealer Computer Services, Inc. | | Ba2 | | 3.750% | | | 04/21/18 | | | $ | 64 | | | $ | 64,321 | |
Hertz Corp. | | Ba1 | | 3.750 | | | 03/11/18 | | | | 299 | | | | 298,025 | |
Hertz Corp. | | Ba1 | | 3.750 | | | 03/12/18 | | | | 100 | | | | 99,125 | |
RAC PLC (United Kingdom), (original cost $480,900; purchased 10/24/12)(e)(f) | | B2 | | 5.270 | | | 09/30/19 | | | GBP | 300 | | | | 483,523 | |
| | | | | | | | | | | | | | | | |
| | | | | | | | | | | | | | | 944,994 | |
| | | | | |
Chemicals 0.1% | | | | | | | | | | | | | | | | |
Ashland, Inc. | | Baa3 | | 3.750 | | | 08/23/18 | | | | 74 | | | | 74,413 | |
Houghton International, Inc. | | B1 | | 6.750 | | | 01/29/16 | | | | 88 | | | | 88,913 | |
Rockwood Holdings, Inc. | | Baa3 | | 3.500 | | | 02/09/18 | | | | 31 | | | | 30,637 | |
| | | | | | | | | | | | | | | | |
| | | | | | | | | | | | | | | 193,963 | |
| | | | | |
Consumer 0.6% | | | | | | | | | | | | | | | | |
Pilot Travel Centers LLC | | Ba2 | | 3.750 | | | 03/30/18 | | | | 250 | | | | 251,042 | |
Pilot Travel Centers LLC | | Ba2 | | 4.250 | | | 08/07/19 | | | | 500 | | | | 503,125 | |
Seaworld Parks & Entertainment, Inc. | | Ba3 | | 4.000 | | | 08/17/17 | | | | 387 | | | | 388,888 | |
Visant Corp. | | Ba3 | | 5.250 | | | 12/22/16 | | | | 94 | | | | 90,782 | |
| | | | | | | | | | | | | | | | |
| | | | | | | | | | | | | | | 1,233,837 | |
| | | | | |
Electric 0.3% | | | | | | | | | | | | | | | | |
AES Corp. | | Ba1 | | 4.250 | | | 06/01/18 | | | | 99 | | | | 98,993 | |
Calpine Corp. | | B1 | | 4.500 | | | 04/01/18 | | | | 27 | | | | 26,874 | |
Calpine Corp. | | B1 | | 4.500 | | | 04/01/18 | | | | 27 | | | | 26,887 | |
Calpine Corp. | | B1 | | 4.500 | | | 10/09/19 | | | | 500 | | | | 500,375 | |
| | | | | | | | | | | | | | | | |
| | | | | | | | | | | | | | | 653,129 | |
| | | | | |
Foods 0.2% | | | | | | | | | | | | | | | | |
Dunkin Brands, Inc. | | B2 | | 4.000 | | | 11/23/17 | | | | 249 | | | | 249,862 | |
JBS USA LLC | | Ba3 | | 4.250 | | | 05/25/18 | | | | 99 | | | | 98,256 | |
| | | | | | | | | | | | | | | | |
| | | | | | | | | | | | | | | 348,118 | |
See Notes to Financial Statements.
| | |
| 16 | | Visit our website at www.prudentialfunds.com |
| | | | | | | | | | | | | | | | |
| Description | | Moody’s
Ratings†
(Unaudited) | | Interest
Rate | | Maturity
Date | | | Principal
Amount (000)# | | | Value (Note 1) | |
BANK LOANS(a) (Continued) | | | | | | | | | | | | | | |
| | | | | |
Gaming 0.4% | | | | | | | | | | | | | | | | |
Penn National Gaming, Inc. | | Ba1 | | 3.750% | | | 07/16/18 | | | $ | 199 | | | $ | 200,212 | |
Scientific Games Corp. | | Ba1 | | 2.970 | | | 06/30/15 | | | | 598 | | | | 594,871 | |
| | | | | | | | | | | | | | | | |
| | | | | | | | | | | | | | | 795,083 | |
| | | |
Healthcare & Pharmaceutical 2.3% | | | | | | | | | | | | |
Alere, Inc. | | Ba3 | | 3.360 | | | 06/30/16 | | | | 48 | | | | 47,886 | |
Alere, Inc. | | Ba3 | | 4.750 | | | 06/30/17 | | | | 46 | | | | 46,554 | |
Alere, Inc. | | B2 | | 4.750 | | | 06/30/17 | | | | 17 | | | | 17,122 | |
Community Health Systems, Inc. | | Ba3 | | 3.921 | | | 01/25/17 | | | | 500 | | | | 501,525 | |
DaVita, Inc. | | Ba2 | | 2.720 | | | 10/31/17 | | | | 750 | | | | 741,562 | |
DaVita, Inc. | | Ba2 | | 4.000 | | | 10/31/19 | | | | 102 | | | | 102,128 | |
Drumm Investors LLC | | B1 | | 4.023 | | | 05/04/18 | | | | 99 | | | | 94,833 | |
Endo Pharmaceuticals Holdings, Inc. | | Ba1 | | 2.250 | | | 06/17/16 | | | | 490 | | | | 489,239 | |
HCA, Inc. | | Ba3 | | 3.612 | | | 03/31/17 | | | | 200 | | | | 200,070 | |
HCR HealthCare LLC | | Ba3 | | 5.000 | | | 04/06/18 | | | | 99 | | | | 97,084 | |
Health Management Associates, Inc. | | Ba3 | | 2.940 | | | 11/18/16 | | | | 490 | | | | 489,209 | |
Hologic, Inc. | | Ba2 | | 3.455 | | | 08/01/17 | | | | 247 | | | | 246,875 | |
LifePoint Hospital, Inc. | | Ba1 | | 2.064 | | | 07/24/17 | | | | 600 | | | | 591,749 | |
PTS Acquisition Corp. | | Ba3 | | 4.389 | | | 09/15/16 | | | | 49 | | | | 49,344 | |
RPI Finance Trust | | Baa2 | | 3.500 | | | 05/09/18 | | | | 397 | | | | 395,965 | |
Universal Health Services, Inc. | | Ba2 | | 2.119 | | | 08/15/16 | | | | 500 | | | | 497,500 | |
| | | | | | | | | | | | | | | | |
| | | | | | | | | | | | | | | 4,608,645 | |
| | | |
Pipelines & Other 0.4% | | | | | | | | | | | | |
Energy Transfer Equity LP | | Ba2 | | 3.750 | | | 03/24/17 | | | | 750 | | | | 748,541 | |
| | | |
Real Estate Investment Trusts 0.1% | | | | | | | | | | | | |
C.B. Richard Ellis Services, Inc. | | Ba1 | | 3.714 | | | 09/04/19 | | | | 223 | | | | 223,062 | |
| | | |
Retailers 0.2% | | | | | | | | | | | | |
Alliance Boots Ltd. (United Kingdom) | | Ba1 | | 3.771 | | | 07/09/15 | | | GBP | 325 | | | | 506,214 | |
See Notes to Financial Statements.
| | | | |
| Prudential Absolute Return Bond Fund | | | 17 | |
Portfolio of Investments
as of October 31, 2012 continued
| | | | | | | | | | | | | | | | |
| Description | | Moody’s
Ratings†
(Unaudited) | | Interest
Rate | | Maturity
Date | | | Principal
Amount (000)# | | | Value (Note 1) | |
BANK LOANS(a) (Continued) | | | | | | | | | | | | | | |
| | | |
Technology 0.6% | | | | | | | | | | | | |
CDW LLC | | B1 | | 4.000% | | | 07/15/17 | | | $ | 87 | | | $ | 86,021 | |
Fidelity National Information Services, Inc. | | Ba1 | | 2.362 | | | 03/30/17 | | | | 494 | | | | 492,437 | |
First Data Corp. | | B1 | | 2.961 | | | 09/24/14 | | | | 12 | | | | 11,599 | |
First Data Corp. | | B1 | | 4.211 | | | 03/26/18 | | | | 141 | | | | 134,475 | |
First Data Corp. | | B1 | | 5.211 | | | 09/24/18 | | | | 225 | | | | 220,172 | |
Flextronics International Ltd. (Singapore) | | Ba1 | | 2.462 | | | 10/01/14 | | | | 43 | | | | 43,241 | |
Freescale Semiconductor, Inc. | | B1 | | 4.465 | | | 12/01/16 | | | | 100 | | | | 97,625 | |
Sensata Technologies BV (Netherlands) | | Ba2 | | 4.000 | | | 05/12/18 | | | | 99 | | | | 98,926 | |
| | | | | | | | | | | | | | | | |
| | | | | | | | | | | | | | | 1,184,496 | |
| | | | | | | | | | | | | | | | |
TOTAL BANK LOANS
(cost $12,078,389) | | | | | | | | | | | | | | | 12,115,360 | |
| | | | | | | | | | | | | | | | |
|
COMMERCIAL MORTGAGE-BACKED SECURITIES 16.4% | |
Banc of America Commercial Mortgage, Inc.,
Ser. 2006-6, Class A2 | | Aaa | | 5.309 | | | 10/10/45 | | | | 349 | | | | 355,319 | |
Ser. 2007-1, Class A3 | | Aaa | | 5.449 | | | 01/15/49 | | | | 246 | | | | 259,207 | |
Banc of America Merrill Lynch Commercial Mortgage, Inc.,
Ser. 2005-2, Class AM | | Aaa | | 4.913 | | | 07/10/43 | | | | 50 | | | | 54,207 | |
Ser. 2007-1, Class AAB | | Aaa | | 5.422 | | | 01/15/49 | | | | 34 | | | | 36,001 | |
Ser. 2007-2, Class A3(a) | | AAA(c) | | 5.604 | | | 04/10/49 | | | | 200 | | | | 222,561 | |
Ser. 2007-5, Class A3 | | AAA(c) | | 5.620 | | | 02/10/51 | | | | 30 | | | | 31,833 | |
Bear Stearns Commercial Mortgage Securities,
Ser. 2005-PWR7, Class A2 | | Aaa | | 4.945 | | | 02/11/41 | | | | 36 | | | | 36,375 | |
Ser. 2006-PW11, Class A4(a) | | AAA(c) | | 5.452 | | | 03/11/39 | | | | 200 | | | | 226,765 | |
Ser. 2006-PW12, Class A4(a) | | Aaa | | 5.712 | | | 09/11/38 | | | | 265 | | | | 304,170 | |
See Notes to Financial Statements.
| | |
| 18 | | Visit our website at www.prudentialfunds.com |
| | | | | | | | | | | | | | | | |
| Description | | Moody’s
Ratings†
(Unaudited) | | Interest
Rate | | Maturity
Date | | | Principal
Amount (000)# | | | Value (Note 1) | |
COMMERCIAL MORTGAGE-BACKED SECURITIES (Continued) | |
Ser. 2006-PW14, Class A2 | | AAA(c) | | 5.123% | | | 12/11/38 | | | $ | 44 | | | $ | 44,090 | |
Ser. 2007-PW17, Class A3 | | AAA(c) | | 5.736 | | | 06/11/50 | | | | 262 | | | | 269,055 | |
Ser. 2007-T26, Class A2 | | AAA(c) | | 5.330 | | | 01/12/45 | | | | 14 | | | | 14,414 | |
Citigroup Commercial Mortgage Trust, Ser. 2007-C6, Class A4(a) | | Aaa | | 5.699 | | | 12/10/49 | | | | 1,210 | | | | 1,434,672 | |
Citigroup/Deutsche Bank Commercial Mortgage Trust,
Ser. 2006-CD3, Class A5 | | Aaa | | 5.617 | | | 10/15/48 | | | | 20 | | | | 23,102 | |
Ser. 2007-CD4, Class A2B | | Aaa | | 5.205 | | | 12/11/49 | | | | 43 | | | | 43,314 | |
Ser. 2007-CD4, Class A3 | | Aaa | | 5.293 | | | 12/11/49 | | | | 200 | | | | 208,031 | |
Ser. 2007-CD4, Class A4 | | Aa3 | | 5.322 | | | 12/11/49 | | | | 1,515 | | | | 1,741,092 | |
COMM 2012-CCRE1 Mortgage Trust, Ser. 2012-CR1, Class A3 | | Aaa | | 3.391 | | | 05/15/45 | | | | 15 | | | | 16,193 | |
Commercial Mortgage Pass-Through Certificates,
Ser. 2006-C7, Class A4(a) | | AAA(c) | | 5.748 | | | 06/10/46 | | | | 85 | | | | 97,299 | |
Ser. 2012-CR3, Class A3 | | Aaa | | 2.822 | | | 11/15/45 | | | | 1,000 | | | | 1,028,677 | |
Credit Suisse First Boston Mortgage Securities Corp.,
Ser. 2005-C2, Class A4 | | Aa2 | | 4.832 | | | 04/15/37 | | | | 97 | | | | 104,673 | |
Ser. 2005-C6, Class AM(a) | | Aaa | | 5.230 | | | 12/15/40 | | | | 100 | | | | 110,529 | |
Credit Suisse Mortgage Capital Certificates,
Ser. 2006-C1, Class AM(a) | | AA-(c) | | 5.410 | | | 02/15/39 | | | | 614 | | | | 685,911 | |
Ser. 2007-C4, Class A3(a) | | Aaa | | 5.762 | | | 09/15/39 | | | | 200 | | | | 208,790 | |
CW Capital Cobalt Ltd., Ser. 2006-C1, Class A4 | | AA-(c) | | 5.223 | | | 08/15/48 | | | | 40 | | | | 44,869 | |
See Notes to Financial Statements.
| | | | |
| Prudential Absolute Return Bond Fund | | | 19 | |
Portfolio of Investments
as of October 31, 2012 continued
| | | | | | | | | | | | | | | | |
| Description | | Moody’s
Ratings†
(Unaudited) | | Interest
Rate | | Maturity
Date | | | Principal
Amount (000)# | | | Value (Note 1) | |
COMMERCIAL MORTGAGE-BACKED SECURITIES (Continued) | |
FHLMC Multifamily Structured Pass-Through Certificates,
Ser. K008, Class X1, I/O(a) | | AA+(c) | | 1.676% | | | 06/25/20 | | | $ | 1,303 | | | $ | 125,185 | |
Ser. K010,
Class X1, I/O(a) | | AA+(c) | | 0.409 | | | 10/25/20 | | | | 25,125 | | | | 520,488 | |
Ser. K012, Class A2 | | AA+(c) | | 4.186 | | | 12/25/20 | | | | 366 | | | | 426,527 | |
Ser. K020,
Class X1, I/O(a) | | AA+(c) | | 1.479 | | | 05/25/22 | | | | 1,999 | | | | 216,707 | |
Ser. K021, Class X1, I/O | | AA+(c) | | 0.000(b) | | | 06/25/22 | | | | 4,500 | | | | 507,829 | |
Ser. K501,
Class X1A, I/O(a) | | AA+(c) | | 1.756 | | | 08/25/16 | | | | 397 | | | | 19,616 | |
Ser. K710,
Class X1, I/O(a) | | AA+(c) | | 1.785 | | | 05/25/19 | | | | 500 | | | | 48,816 | |
GE Capital Commercial Mortgage Corp., Ser. 2007-C1, Class AAB | | Aaa | | 5.477 | | | 12/10/49 | | | | 135 | | | | 142,579 | |
GMAC Commercial Mortgage Securities, Inc.,
Ser. 2005-C1, Class AM | | AAA(c) | | 4.754 | | | 05/10/43 | | | | 425 | | | | 456,698 | |
Ser. 2006-C1, Class A4 | | AAA(c) | | 5.238 | | | 11/10/45 | | | | 30 | | | | 33,289 | |
Greenwich Capital Commercial Funding Corp.,
Ser. 2005-GG3, Class A3 | | Aaa | | 4.569 | | | 08/10/42 | | | | 104 | | | | 104,384 | |
Ser. 2005-GG3, Class AJ | | Baa1 | | 4.859 | | | 08/10/42 | | | | 200 | | | | 212,189 | |
Ser. 2005-GG5,
Class AAB(a) | | Aaa | | 5.190 | | | 04/10/37 | | | | 134 | | | | 140,586 | |
Ser. 2007-GG9, Class A2 | | Aaa | | 5.381 | | | 03/10/39 | | | | 316 | | | | 326,232 | |
Ser. 2007-GG11, Class A3 | | AAA(c) | | 5.716 | | | 12/10/49 | | | | 200 | | | | 211,558 | |
GS Mortgage Securities Corp. II,
Ser. 2005-GG4, Class AABA | | Aaa | | 4.680 | | | 07/10/39 | | | | 39 | | | | 39,156 | |
Ser. 2006-GG6, Class A2(a) | | AAA(c) | | 5.506 | | | 04/10/38 | | | | 51 | | | | 51,136 | |
Ser. 2006-GG6, Class A4 | | AA-(c) | | 5.553 | | | 04/10/38 | | | | 105 | | | | 118,811 | |
Ser. 2006-GG8, Class A2 | | Aaa | | 5.479 | | | 11/10/39 | | | | 40 | | | | 40,505 | |
See Notes to Financial Statements.
| | |
| 20 | | Visit our website at www.prudentialfunds.com |
| | | | | | | | | | | | | | | | |
| Description | | Moody’s
Ratings†
(Unaudited) | | Interest
Rate | | Maturity
Date | | | Principal
Amount (000)# | | | Value (Note 1) | |
COMMERCIAL MORTGAGE-BACKED SECURITIES (Continued) | |
Ser. 2006-GG8, Class A3 | | Aaa | | 5.542% | | | 11/10/39 | | | $ | 200 | | | $ | 204,430 | |
Ser. 2006-GG8, Class A4 | | Aaa | | 5.560 | | | 11/10/39 | | | | 1,500 | | | | 1,737,929 | |
JPMorgan Chase Commercial Mortgage Securities Corp.,
Ser. 2004-CBX, Class AJ | | Aa1 | | 4.951 | | | 01/12/37 | | | | 200 | | | | 205,298 | |
Ser. 2005-CB13,
Class A2FL(a) | | Aaa | | 0.339 | | | 01/12/43 | | | | 9 | | | | 8,574 | |
Ser. 2005-CB13, Class A3A1(a) | | Aaa | | 5.290 | | | 01/12/43 | | | | 47 | | | | 47,065 | |
Ser. 2005-LDP3, Class A4B | | Aaa | | 4.996 | | | 08/15/42 | | | | 180 | | | | 197,171 | |
Ser. 2005-LDP4, Class AM(a) | | Aa2 | | 4.999 | | | 10/15/42 | | | | 750 | | | | 816,287 | |
Ser. 2005-LDP5, Class A3(a) | | Aaa | | 5.229 | | | 12/15/44 | | | | 1,140 | | | | 1,177,963 | |
Ser. 2006-LDP6,
Class ASB(a) | | Aaa | | 5.490 | | | 04/15/43 | | | | 118 | | | | 124,882 | |
Ser. 2007-LD11, Class A2(a) | | Aaa | | 5.798 | | | 06/15/49 | | | | 1,561 | | | | 1,612,252 | |
Ser. 2007-LD11, Class A3(a) | | Aaa | | 5.813 | | | 06/15/49 | | | | 218 | | | | 234,608 | |
Ser. 2007-LD12, Class A2 | | Aaa | | 5.827 | | | 02/15/51 | | | | 253 | | | | 259,348 | |
Ser. 2012-C8, Class A2 | | AAA(c) | | 1.797 | | | 10/15/45 | | | | 2,000 | | | | 2,048,641 | |
LB Commercial Conduit Mortgage Trust,
Ser. 2007-C3, Class A3(a) | | Aaa | | 5.879 | | | 07/15/44 | | | | 172 | | | | 181,459 | |
LB-UBS Commercial Mortgage Trust,
Ser. 2004-C6, Class A6(a) | | AAA(c) | | 5.020 | | | 08/15/29 | | | | 20 | | | | 21,200 | |
Ser. 2005-C7, Class AM | | AA(c) | | 5.263 | | | 11/15/40 | | | | 70 | | | | 77,225 | |
Ser. 2006-C3, Class A4 | | Aaa | | 5.661 | | | 03/15/39 | | | | 200 | | | | 227,896 | |
Ser. 2006-C6, Class A2 | | Aaa | | 5.262 | | | 09/15/39 | | | | 3 | | | | 3,111 | |
Ser. 2006-C7, Class A2 | | AAA(c) | | 5.300 | | | 11/15/38 | | | | 157 | | | | 161,105 | |
Ser. 2007-C2, Class A2 | | AAA(c) | | 5.303 | | | 02/15/40 | | | | 46 | | | | 46,154 | |
Merrill Lynch Mortgage Trust,
Ser. 2005-LC1, Class AM(a) | | Aaa | | 5.323 | | | 01/12/44 | | | | 63 | | | | 70,054 | |
See Notes to Financial Statements.
| | | | |
| Prudential Absolute Return Bond Fund | | | 21 | |
Portfolio of Investments
as of October 31, 2012 continued
| | | | | | | | | | | | | | | | |
| Description | | Moody’s
Ratings†
(Unaudited) | | Interest
Rate | | Maturity
Date | | | Principal
Amount (000)# | | | Value (Note 1) | |
COMMERCIAL MORTGAGE-BACKED SECURITIES (Continued) | |
Ser. 2006-C1, Class AM(a) | | A(c) | | 5.685% | | | 05/12/39 | �� | | $ | 30 | | | $ | 33,517 | |
Ser. 2007-C1, Class A3(a) | | A+(c) | | 5.847 | | | 06/12/50 | | | | 945 | | | | 1,012,664 | |
Merrill Lynch/Countrywide Commercial Mortgage Trust,
Ser. 2006-1, Class AM(a) | | A(c) | | 5.532 | | | 02/12/39 | | | | 20 | | | | 22,166 | |
Ser. 2006-2, Class AM(a) | | Aa2 | | 5.899 | | | 06/12/46 | | | | 100 | | | | 110,534 | |
Ser. 2006-3, Class A4 | | Aaa | | 5.414 | | | 07/12/46 | | | | 225 | | | | 259,486 | |
Ser. 2006-4, Class A2 | | Aaa | | 5.112 | | | 12/12/49 | | | | 32 | | | | 32,473 | |
Ser. 2006-4, Class A2FL(a) | | Aaa | | 0.334 | | | 12/12/49 | | | | 14 | | | | 14,125 | |
Morgan Stanley Bank of America Merrill Lynch Trust,
Ser. 2012-C6, Class A2 | | Aaa | | 1.868 | | | 11/15/45 | | | | 2,000 | | | | 2,059,111 | |
Morgan Stanley Capital I Trust, Ser. 2005-IQ10, Class A4B(a) | | Aaa | | 5.284 | | | 09/15/42 | | | | 1,000 | | | | 1,102,928 | |
Ser. 2006-HQ9, Class AM(a) | | AAA(c) | | 5.773 | | | 07/12/44 | | | | 200 | | | | 224,506 | |
Ser. 2007-HQ11, Class A2 | | Aaa | | 5.359 | | | 02/12/44 | | | | 85 | | | | 85,076 | |
Ser. 2007-HQ11, Class A31 | | Aaa | | 5.439 | | | 02/12/44 | | | | 160 | | | | 168,088 | |
Ser. 2007-HQ12,
Class A2FX(a) | | BBB(c) | | 5.576 | | | 04/12/49 | | | | 58 | | | | 60,475 | |
Ser. 2007-IQ14, Class AAB(a) | | Aaa | | 5.654 | | | 04/15/49 | | | | 313 | | | | 338,656 | |
UBS-Citigroup Commercial Mortgage Trust,
Ser. 2011-C1, Class A3 | | Aaa | | 3.595 | | | 01/10/45 | | | | 135 | | | | 148,411 | |
Wachovia Bank Commercial Mortgage Trust,
Ser. 2003-C3, Class B | | AAA(c) | | 4.973 | | | 02/15/35 | | | | 1,000 | | | | 1,004,902 | |
Ser. 2004-C10, Class A4 | | Aaa | | 4.748 | | | 02/15/41 | | | | 21 | | | | 22,181 | |
See Notes to Financial Statements.
| | |
| 22 | | Visit our website at www.prudentialfunds.com |
| | | | | | | | | | | | | | | | |
| Description | | Moody’s
Ratings†
(Unaudited) | | Interest
Rate | | Maturity
Date | | | Principal
Amount (000)# | | | Value (Note 1) | |
COMMERCIAL MORTGAGE-BACKED SECURITIES (Continued) | |
Ser. 2005-C17, Class AJ(a) | | Aa2 | | 5.224% | | | 03/15/42 | | | $ | 500 | | | $ | 533,068 | |
Ser. 2005-C20, Class AMFX(a) | | Aa1 | | 5.179 | | | 07/15/42 | | | | 167 | | | | 182,464 | |
Ser. 2005-C21, Class AM(a) | | Aaa | | 5.240 | | | 10/15/44 | | | | 321 | | | | 354,499 | |
Ser. 2006-C23, Class A5(a) | | Aaa | | 5.416 | | | 01/15/45 | | | | 500 | | | | 567,548 | |
Ser. 2006-C25, Class A5(a) | | Aaa | | 5.737 | | | 05/15/43 | | | | 500 | | | | 579,280 | |
Ser. 2006-C27, Class A3 | | Aaa | | 5.765 | | | 07/15/45 | | | | 1,500 | | | | 1,729,073 | |
Ser. 2006-C28, Class A4 | | Aaa | | 5.572 | | | 10/15/48 | | | | 1,500 | | | | 1,724,613 | |
Ser. 2007-C33, Class A2(a) | | Aaa | | 5.878 | | | 02/15/51 | | | | 11 | | | | 10,895 | |
| | | | | | | | | | | | | | | | |
TOTAL COMMERCIAL MORTGAGE-BACKED SECURITIES
(cost $32,972,930) | | | | | | | | | | | | | | | 33,186,831 | |
| | | | | | | | | | | | | | | | |
| | | |
CORPORATE BONDS 36.4% | | | | | | | | | | | | |
| |
Aerospace & Defense 0.4% | | | | | |
B/E Aerospace, Inc.,
Sr. Unsec’d. Notes | | Ba2 | | 5.250 | | | 04/01/22 | | | | 100 | | | | 104,250 | |
Esterline Technologies Corp., Gtd. Notes | | Ba2 | | 6.625 | | | 03/01/17 | | | | 150 | | | | 155,250 | |
Moog, Inc.,
Sr. Sub. Notes | | Ba3 | | 7.250 | | | 06/15/18 | | | | 75 | | | | 79,500 | |
Textron, Inc.,
Sr. Unsec’d. Notes | | Baa3 | | 4.625 | | | 09/21/16 | | | | 500 | | | | 546,477 | |
| | | | | | | | | | | | | | | | |
| | | | | | | | | | | | | | | 885,477 | |
| | | | | |
Airlines 0.2% | | | | | | | | | | | | | | | | |
Continental Airlines, Inc. Pass Through Trust, Pass-thru Certs.,
Ser. 2007-1, Class A | | Baa2 | | 5.983 | | | 04/19/22 | | | | 107 | | | | 119,696 | |
Ser. 2012-2, Class A | | Baa2 | | 4.000 | | | 10/29/24 | | | | 125 | | | | 130,001 | |
See Notes to Financial Statements.
| | | | |
| Prudential Absolute Return Bond Fund | | | 23 | |
Portfolio of Investments
as of October 31, 2012 continued
| | | | | | | | | | | | | | | | |
| Description | | Moody’s
Ratings†
(Unaudited) | | Interest
Rate | | Maturity
Date | | | Principal
Amount (000)# | | | Value (Note 1) | |
CORPORATE BONDS (Continued) | | | | | | | | | | | | |
| | | | | |
Airlines (cont’d.) | | | | | | | | | | | | | | | | |
Delta Air Lines Pass Through Trust, Pass-thru Certs., Ser. 2011-1, Class A | | Baa2 | | 5.300% | | | 04/15/19 | | | $ | 112 | | | $ | 123,167 | |
| | | | | | | | | | | | | | | | |
| | | | | | | | | | | | | | | 372,864 | |
| | | | | |
Automotive 0.8% | | | | | | | | | | | | | | | | |
American Axle & Manufacturing Holdings, Inc.,
Sr. Sec’d. Notes, 144A | | Ba1 | | 9.250 | | | 01/15/17 | | | | 500 | | | | 559,375 | |
Daimler Finance North America LLC,
Gtd. Notes, 144A | | A3 | | 1.300 | | | 07/31/15 | | | | 275 | | | | 276,999 | |
Ford Motor Credit Co. LLC,
Sr. Unsec’d. Notes | | Baa3 | | 3.000 | | | 06/12/17 | | | | 410 | | | | 419,304 | |
Sr. Unsec’d. Notes | | Baa3 | | 4.207 | | | 04/15/16 | | | | 200 | | | | 213,003 | |
Harley-Davidson Financial Services, Inc.,
Gtd. Notes, 144A, MTN | | Baa1 | | 2.700 | | | 03/15/17 | | | | 25 | | | | 25,872 | |
Lear Corp., Gtd. Notes | | Ba2 | | 7.875 | | | 03/15/18 | | | | 107 | | | | 116,229 | |
| | | | | | | | | | | | | | | | |
| | | | | | | | | | | | | | | 1,610,782 | |
| | | | | |
Banking 4.6% | | | | | | | | | | | | | | | | |
Abbey National Treasury Services PLC (United Kingdom),
Gtd. Notes. | | A2 | | 2.875 | | | 04/25/14 | | | | 50 | | | | 50,876 | |
American Express Co.,
Sr. Unsec’d. Notes | | A3 | | 7.000 | | | 03/19/18 | | | | 165 | | | | 209,276 | |
Sr. Unsec’d. Notes | | A3 | | 8.125 | | | 05/20/19 | | | | 130 | | | | 175,876 | |
Banco de Credito del Peru (Peru),
Sr. Unsec’d. Notes, 144A | | Baa2 | | 4.750 | | | 03/16/16 | | | | 240 | | | | 256,200 | |
Bangkok Bank PCL (Thailand),
Sr. Unsec’d. Notes, 144A | | A3 | | 3.875 | | | 09/27/22 | | | | 350 | | | | 355,433 | |
See Notes to Financial Statements.
| | |
| 24 | | Visit our website at www.prudentialfunds.com |
| | | | | | | | | | | | | | | | |
| Description | | Moody’s
Ratings†
(Unaudited) | | Interest
Rate | | Maturity
Date | | | Principal
Amount (000)# | | | Value (Note 1) | |
CORPORATE BONDS (Continued) | | | | | | | | | | | | |
| | | | | |
Banking (cont’d.) | | | | | | | | | | | | | | | | |
Bank of America Corp.,
Sr. Unsec’d. Notes | | Baa2 | | 5.625% | | | 10/14/16 | | | $ | 160 | | | $ | 182,431 | |
Sr. Unsec’d. Notes | | Baa2 | | 5.700 | | | 01/24/22 | | | | 645 | | | | 767,379 | |
Sr. Unsec’d. Notes | | Baa2 | | 5.875 | | | 01/05/21 | | | | 130 | | | | 152,405 | |
BB&T Corp.,
Sr. Unsec’d. Notes, MTN | | A2 | | 1.600 | | | 08/15/17 | | | | 25 | | | | 25,449 | |
Capital One Bank USA NA, Sub. Notes | | Baa1 | | 8.800 | | | 07/15/19 | | | | 250 | | | | 332,747 | |
Capital One Financial Corp.,
Sub. Notes | | Baa2 | | 6.150 | | | 09/01/16 | | | | 110 | | | | 125,993 | |
Citigroup, Inc.,
Sr. Unsec’d. Notes | | Baa2 | | 4.500 | | | 01/14/22 | | | | 625 | | | | 689,967 | |
Sr. Unsec’d. Notes | | Baa2 | | 6.125 | | | 05/15/18 | | | | 330 | | | | 394,316 | |
Sub. Notes | | Baa3 | | 4.875 | | | 05/07/15 | | | | 250 | | | | 268,624 | |
Sub. Notes | | Baa3 | | 5.000 | | | 09/15/14 | | | | 100 | | | | 105,857 | |
Goldman Sachs Group, Inc. (The),
Sr. Unsec’d. Notes | | A3 | | 5.125 | | | 01/15/15 | | | | 100 | | | | 107,862 | |
Sr. Unsec’d. Notes | | A3 | | 5.750 | | | 01/24/22 | | | | 790 | | | | 917,092 | |
Sub. Notes | | Baa1 | | 5.625 | | | 01/15/17 | | | | 130 | | | | 144,134 | |
HSBC Bank PLC (United Kingdom),
Sr. Notes, 144A | | Aa3 | | 3.500 | | | 06/28/15 | | | | 120 | | | | 127,720 | |
ING Bank NV (Netherlands),
Unsec’d. Notes, 144A | | A2 | | 2.000 | | | 09/25/15 | | | | 300 | | | | 302,440 | |
JPMorgan Chase & Co.,
Jr. Sub. Notes, Ser. 1(a) | | Ba1 | | 7.900 | | | 04/29/49 | | | | 130 | | | | 149,725 | |
Sr. Unsec’d. Notes | | A2 | | 3.150 | | | 07/05/16 | | | | 15 | | | | 15,882 | |
Sr. Unsec’d. Notes | | A2 | | 3.250 | | | 09/23/22 | | | | 365 | | | | 374,132 | |
Sr. Unsec’d. Notes | | A2 | | 4.500 | | | 01/24/22 | | | | 420 | | | | 474,513 | |
Sr. Unsec’d. Notes | | A2 | | 6.000 | | | 01/15/18 | | | | 130 | | | | 154,717 | |
Lloyds TSB Bank PLC (United Kingdom),
Gtd. Notes., 144A, MTN | | A2 | | 5.800 | | | 01/13/20 | | | | 100 | | | | 117,655 | |
Morgan Stanley,
Sr. Unsec’d. Notes, Ser. G, MTN | | Baa1 | | 4.100 | | | 01/26/15 | | | | 130 | | | | 135,389 | |
See Notes to Financial Statements.
| | | | |
| Prudential Absolute Return Bond Fund | | | 25 | |
Portfolio of Investments
as of October 31, 2012 continued
| | | | | | | | | | | | | | | | |
| Description | | Moody’s
Ratings†
(Unaudited) | | Interest
Rate | | Maturity
Date | | | Principal
Amount (000)# | | | Value (Note 1) | |
CORPORATE BONDS (Continued) | | | | | | | | | | | | |
| | | | | |
Banking (cont’d.) | | | | | | | | | | | | | | | | |
Sr. Unsec’d. Notes, Ser. G | | Baa1 | | 5.500% | | | 07/28/21 | | | $ | 400 | | | $ | 444,569 | |
Sr. Unsec’d. Notes, MTN | | Baa1 | | 5.625 | | | 09/23/19 | | | | 130 | | | | 144,362 | |
Sr. Unsec’d. Notes, MTN | | Baa1 | | 5.750 | | | 10/18/16 | | | | 365 | | | | 406,394 | |
Sr. Unsec’d. Notes, MTN | | Baa1 | | 6.625 | | | 04/01/18 | | | | 100 | | | | 116,308 | |
Nordea Bank AB (Sweden),
Sr. Unsec’d. Notes, 144A | | Aa3 | | 3.125 | | | 03/20/17 | | | | 200 | | | | 210,680 | |
PNC Funding Corp.,
Gtd. Notes. | | A3 | | 2.700 | | | 09/19/16 | | | | 50 | | | | 53,066 | |
Royal Bank of Scotland Group PLC (The) (United Kingdom),
Sr. Unsec’d. Notes | | Baa1 | | 2.550 | | | 09/18/15 | | | | 50 | | | | 51,256 | |
Royal Bank of Scotland PLC (The) (United Kingdom),
Gtd. Notes. | | A3 | | 4.875 | | | 03/16/15 | | | | 100 | | | | 107,410 | |
Santander Holdings USA, Inc.,
Sr. Unsec’d. Notes | | Baa2 | | 3.000 | | | 09/24/15 | | | | 75 | | | | 76,436 | |
Sr. Unsec’d. Notes | | Baa2 | | 4.625 | | | 04/19/16 | | | | 35 | | | | 36,589 | |
US Bancorp,
Jr. Sub. Notes | | A2 | | 3.442 | | | 02/01/16 | | | | 130 | | | | 136,563 | |
Sub. Notes, MTN | | A1 | | 2.950 | | | 07/15/22 | | | | 25 | | | | 25,791 | |
Wells Fargo & Co.,
Sr. Unsec’d. Notes(a) | | A2 | | 0.513 | | | 10/28/15 | | | | 200 | | | | 197,939 | |
Sr. Unsec’d. Notes, MTN | | A2 | | 2.100 | | | 05/08/17 | | | | 100 | | | | 102,982 | |
Sr. Unsec’d. Notes, MTN | | A2 | | 3.500 | | | 03/08/22 | | | | 30 | | | | 32,031 | |
| | | | | | | | | | | | | | | | |
| | | | | | | | | | | | | | | 9,256,466 | |
| |
Building Materials & Construction 1.1% | | | | | |
Building Materials Corp. of America, Sr. Notes, 144A (original cost $648,750; purchased 09/28/12)(e)(f) | | Ba3 | | 6.875 | | | 08/15/18 | | | | 600 | | | | 643,500 | |
Cemex Finance LLC,
Sr. Sec’d. Notes, RegS | | B-(c) | | 9.500 | | | 12/14/16 | | | | 500 | | | | 530,625 | |
Desarrolladora Homex SAB de CV (Mexico),
Gtd. Notes | | Ba3 | | 7.500 | | | 09/28/15 | | | | 105 | | | | 104,213 | |
See Notes to Financial Statements.
| | |
| 26 | | Visit our website at www.prudentialfunds.com |
| | | | | | | | | | | | | | | | |
| Description | | Moody’s
Ratings†
(Unaudited) | | Interest
Rate | | Maturity
Date | | | Principal
Amount (000)# | | | Value (Note 1) | |
CORPORATE BONDS (Continued) | | | | | | | | | | | | |
| |
Building Materials & Construction (cont’d.) | | | | | |
Odebrecht Finance Ltd. (Cayman Islands),
Gtd. Notes, 144A | | Baa3 | | 5.125% | | | 06/26/22 | | | $ | 400 | | | $ | 435,000 | |
Gtd. Notes, 144A | | Baa3 | | 7.000 | | | 04/21/20 | | | | 100 | | | | 115,750 | |
Gtd. Notes, 144A | | Baa3 | | 7.125 | | | 06/26/42 | | | | 220 | | | | 254,650 | |
Owens Corning, Gtd. Notes | | Ba1 | | 4.200 | | | 12/15/22 | | | | 125 | | | | 126,343 | |
| | | | | | | | | | | | | | | | |
| | | | | | | | | | | | | | | 2,210,081 | |
| | | | | |
Cable 1.7% | | | | | | | | | | | | | | | | |
Bresnan Broadband Holdings LLC,
Gtd. Notes, 144A | | B3 | | 8.000 | | | 12/15/18 | | | | 300 | | | | 322,500 | |
Cequel Communications Holdings I LLC and Cequel Capital Corp.,
Sr. Unsec’d. Notes, 144A | | B3 | | 8.625 | | | 11/15/17 | | | | 500 | | | | 535,000 | |
Columbus International, Inc. (Barbados),
Sr. Sec’d. Notes, 144A(original cost $388,063; purchased 09/13/12)(e)(f) | | B2 | | 11.500 | | | 11/20/14 | | | | 350 | | | | 392,000 | |
Comcast Corp.,
Gtd. Notes | | Baa1 | | 6.450 | | | 03/15/37 | | | | 70 | | | | 92,146 | |
Gtd. Notes | | Baa1 | | 6.500 | | | 01/15/17 | | | | 100 | | | | 122,005 | |
CSC Holdings LLC,
Sr. Unsec’d. Notes, 144A | | Ba3 | | 6.750 | | | 11/15/21 | | | | 50 | | | | 55,625 | |
Sr. Unsec’d. Notes | | Ba3 | | 8.625 | | | 02/15/19 | | | | 35 | | | | 41,475 | |
DIRECTV Holdings LLC/DIRECTV Financing Co., Inc.,
Gtd. Notes | | Baa2 | | 3.500 | | | 03/01/16 | | | | 130 | | | | 139,027 | |
Dish DBS Corp.,
Gtd. Notes | | Ba2 | | 6.625 | | | 10/01/14 | | | | 200 | | | | 217,000 | |
NET Servicos de Comunicacao SA (Brazil), Gtd. Notes | | Baa3 | | 7.500 | | | 01/27/20 | | | | 100 | | | | 115,500 | |
Time Warner Cable, Inc., Gtd. Notes | | Baa2 | | 6.550 | | | 05/01/37 | | | | 75 | | | | 97,623 | |
See Notes to Financial Statements.
| | | | |
| Prudential Absolute Return Bond Fund | | | 27 | |
Portfolio of Investments
as of October 31, 2012 continued
| | | | | | | | | | | | | | | | |
| Description | | Moody’s
Ratings†
(Unaudited) | | Interest
Rate | | Maturity
Date | | | Principal
Amount (000)# | | | Value (Note 1) | |
CORPORATE BONDS (Continued) | | | | | | | | | | | | |
| |
Cable (cont’d.) | | | | | |
Unitymedia Hessen GmbH & Co. KG/Unitymedia NRW GmbH (Germany),
Sr. Sec’d. Notes, 144A | | Ba3 | | 5.500% | | | 09/15/22 | | | EUR | 160 | | | $ | 204,013 | |
UPC Holding BV (Netherlands),
Sec’d. Notes, 144A | | B2 | | 9.875 | | | 04/15/18 | | | | 150 | | | | 168,375 | |
UPCB Finance III Ltd. (Cayman Islands),
Sr. Sec’d. Notes, 144A | | Ba3 | | 6.625 | | | 07/01/20 | | | | 150 | | | | 160,500 | |
Videotron Ltee (Canada), Gtd. Notes | | Ba2 | | 9.125 | | | 04/15/18 | | | | 700 | | | | 755,126 | |
| | | | | | | | | | | | | | | | |
| | | | | | | | | | | | | | | 3,417,915 | |
| | | | | |
Capital Goods 2.2% | | | | | | | | | | | | | | | | |
Actuant Corp.,
Gtd. Notes | | Ba2 | | 5.625 | | | 06/15/22 | | | | 75 | | | | 77,438 | |
ADT Corp. (The),
Gtd. Notes, 144A | | Baa2 | | 2.250 | | | 07/15/17 | | | | 50 | | | | 50,411 | |
Altra Holdings, Inc., Sec’d. Notes | | Ba3 | | 8.125 | | | 12/01/16 | | | | 700 | | | | 745,500 | |
Avis Budget Car Rental LLC/Avis Budget Finance, Inc.,
Gtd. Notes | | B2 | | 9.625 | | | 03/15/18 | | | | 550 | | | | 612,562 | |
Case New Holland, Inc., Gtd. Notes | | Ba2 | | 7.750 | | | 09/01/13 | | | | 100 | | | | 105,000 | |
CNH Capital LLC,
Sr. Notes, 144A | | Ba2 | | 3.875 | | | 11/01/15 | | | | 500 | | | | 512,500 | |
Deere & Co.,
Sr. Unsec’d. Notes | | A2 | | 2.600 | | | 06/08/22 | | | | 50 | | | | 51,612 | |
ERAC USA Finance LLC,
Gtd. Notes, 144A
(original cost $44,987; purchased 03/12/12)(e)(f) | | Baa1 | | 2.750 | | | 03/15/17 | | | | 45 | | | | 47,045 | |
See Notes to Financial Statements.
| | |
| 28 | | Visit our website at www.prudentialfunds.com |
| | | | | | | | | | | | | | | | |
| Description | | Moody’s
Ratings†
(Unaudited) | | Interest
Rate | | Maturity
Date | | | Principal
Amount (000)# | | | Value (Note 1) | |
CORPORATE BONDS (Continued) | | | | | | | | | | | | |
| |
Capital Goods (cont’d.) | | | | | |
Gtd. Notes, 144A
(original cost $107,597; purchased 10/10/12)(e)(f) | | Baa1 | | 5.625% | | | 03/15/42 | | | $ | 100 | | | $ | 114,050 | |
General Electric Co.,
Sr. Unsec’d. Notes | | Aa3 | | 4.125 | | | 10/09/42 | | | | 125 | | | | 130,982 | |
Hertz Holdings Netherlands BV (Netherlands),
Sr. Sec’d. Notes, RegS | | B1 | | 8.500 | | | 07/31/15 | | | EUR | 100 | | | | 140,567 | |
Penske Truck Leasing Co. LP/PTL Finance Corp.,
Sr. Notes, 144A
(original cost $24,990; purchased 07/10/12)(e)(f) | | Baa3 | | 2.500 | | | 07/11/14 | | | | 25 | | | | 25,274 | |
Sr. Notes, 144A
(original cost $274,593; purchased 09/24/12)(e)(f) | | Baa3 | | 2.500 | | | 03/15/16 | | | | 275 | | | | 274,074 | |
Unsec’d. Notes, 144A
(original cost $24,976; purchased 05/08/12)(e)(f) | | Baa3 | | 3.125 | | | 05/11/15 | | | | 25 | | | | 25,514 | |
Pentair Finance SA (Luxembourg),
Gtd. Notes, 144A | | Baa2 | | 1.875 | | | 09/15/17 | | | | 50 | | | | 50,154 | |
United Technologies Corp.,
Sr. Unsec’d. Notes | | A2 | | 1.800 | | | 06/01/17 | | | | 50 | | | | 51,908 | |
Sr. Unsec’d. Notes | | A2 | | 4.500 | | | 06/01/42 | | | | 140 | | | | 161,024 | |
UR Merger Sub Corp.,
Sr. Unsec’d. Notes | | B3 | | 8.250 | | | 02/01/21 | | | | 550 | | | | 607,750 | |
Sr. Unsec’d. Notes | | B3 | | 9.250 | | | 12/15/19 | | | | 240 | | | | 272,400 | |
Votorantim Cimentos SA (Brazil),
Gtd. Notes, RegS | | Baa3 | | 7.250 | | | 04/05/41 | | | | 300 | | | | 339,000 | |
Xylem, Inc.,
Sr. Unsec’d. Notes | | Baa2 | | 4.875 | | | 10/01/21 | | | | 50 | | | | 57,127 | |
| | | | | | | | | | | | | | | | |
| | | | | | | | | | | | | | | 4,451,892 | |
See Notes to Financial Statements.
| | | | |
| Prudential Absolute Return Bond Fund | | | 29 | |
Portfolio of Investments
as of October 31, 2012 continued
| | | | | | | | | | | | | | | | |
| Description | | Moody’s
Ratings†
(Unaudited) | | Interest
Rate | | Maturity
Date | | | Principal
Amount (000)# | | | Value (Note 1) | |
CORPORATE BONDS (Continued) | | | | | | | | | | | | |
| | | | | |
Chemicals 1.3% | | | | | | | | | | | | | | | | |
Agrium, Inc. (Canada),
Sr. Unsec’d. Notes | | Baa2 | | 6.125% | | | 01/15/41 | | | $ | 170 | | | $ | 217,620 | |
CF Industries, Inc.,
Gtd. Notes | | Baa3 | | 6.875 | | | 05/01/18 | | | | 330 | | | | 405,235 | |
Dow Chemical Co. (The),
Sr. Unsec’d. Notes | | Baa3 | | 5.250 | | | 11/15/41 | | | | 125 | | | | 142,970 | |
Sr. Unsec’d. Notes | | Baa3 | | 5.900 | | | 02/15/15 | | | | 120 | | | | 133,553 | |
Sr. Unsec’d. Notes | | Baa3 | | 9.400 | | | 05/15/39 | | | | 120 | | | | 202,747 | |
LyondellBasell Industries NV (Netherlands),
Sr. Unsec’d. Notes | | Ba2 | | 6.000 | | | 11/15/21 | | | | 700 | | | | 809,374 | |
Nova Chemicals Corp. (Canada),
Sr. Unsec’d. Notes | | Ba2 | | 8.625 | | | 11/01/19 | | | | 100 | | | | 113,250 | |
Reliance Holdings USA, Inc.,
Gtd. Notes, 144A | | Baa2 | | 5.400 | | | 02/14/22 | | | | 600 | | | | 667,173 | |
| | | | | | | | | | | | | | | | |
| | | | | | | | | | | | | | | 2,691,922 | |
| | | | | |
Consumer 0.6% | | | | | | | | | | | | | | | | |
Clorox Co. (The),
Sr. Unsec’d. Notes | | Baa1 | | 3.050 | | | 09/15/22 | | | | 25 | | | | 25,874 | |
Jarden Corp.,
Gtd. Notes | | Ba3 | | 6.125 | | | 11/15/22 | | | | 500 | | | | 537,500 | |
PVH Corp.,
Sr. Unsec’d. Notes | | Ba3 | | 7.375 | | | 05/15/20 | | | | 505 | | | | 565,600 | |
Sealy Mattress Co.,
Sr. Sec’d. Notes, 144A | | Ba3 | | 10.875 | | | 04/15/16 | | | | 122 | | | | 132,828 | |
| | | | | | | | | | | | | | | | |
| | | | | | | | | | | | | | | 1,261,802 | |
| | | | | |
Electric 0.9% | | | | | | | | | | | | | | | | |
Calpine Corp.,
Sr. Sec’d. Notes, 144A | | B1 | | 7.250 | | | 10/15/17 | | | | 100 | | | | 106,000 | |
DTE Energy Co.,
Sr. Unsec’d. Notes(a) | | Baa2 | | 1.118 | | | 06/03/13 | | | | 50 | | | | 50,120 | |
See Notes to Financial Statements.
| | |
| 30 | | Visit our website at www.prudentialfunds.com |
| | | | | | | | | | | | | | | | |
| Description | | Moody’s
Ratings†
(Unaudited) | | Interest
Rate | | Maturity
Date | | | Principal
Amount (000)# | | | Value (Note 1) | |
CORPORATE BONDS (Continued) | | | | | | | | | | | | |
| | | | | |
Electric (cont’d.) | | | | | | | | | | | | | | | | |
Dubai Electricity & Water Authority (United Arab Emirates),
Sr. Unsec’d. Notes, 144A | | Baa3 | | 8.500% | | | 04/22/15 | | | $ | 380 | | | $ | 430,825 | |
Duke Energy Carolinas LLC First Ref. Mtge. | | A1 | | 4.000 | | | 09/30/42 | | | | 50 | | | | 53,318 | |
Duke Energy Corp.,
Sr. Unsec’d. Notes | | Baa2 | | 1.625 | | | 08/15/17 | | | | 225 | | | | 226,654 | |
EDP Finance BV (Netherlands),
Sr. Unsec’d. Notes, 144A | | Ba1 | | 5.375 | | | 11/02/12 | | | | 100 | | | | 100,015 | |
Entergy Corp.,
Sr. Unsec’d. Notes | | Baa3 | | 4.700 | | | 01/15/17 | | | | 75 | | | | 82,424 | |
Progress Energy, Inc.,
Sr. Unsec’d. Notes | | Baa2 | | 3.150 | | | 04/01/22 | | | | 75 | | | | 77,244 | |
South Carolina Electric & Gas Co.,
First Mtge. Bonds | | A3 | | 4.350 | | | 02/01/42 | | | | 130 | | | | 140,526 | |
Techem Energy Metering Service GmbH & Co. KG (Germany),
Sr. Sub. Notes, 144A, MTN | | B3 | | 7.875 | | | 10/01/20 | | | EUR | 125 | | | | 171,131 | |
Techem GmbH (Germany), Sr. Sec’d. Notes,
144A, MTN | | Ba3 | | 6.125 | | | 10/01/19 | | | EUR | 200 | | | | 271,542 | |
| | | | | | | | | | | | | | | | |
| | | | | | | | | | | | | | | 1,709,799 | |
| | | |
Energy - Integrated 0.6% | | | | | | | | | | | | |
BP Capital Markets PLC (United Kingdom),
Gtd. Notes | | A2 | | 1.846 | | | 05/05/17 | | | | 150 | | | | 154,466 | |
Cenovus Energy, Inc. (Canada),
Sr. Unsec’d. Notes | | Baa2 | | 3.000 | | | 08/15/22 | | | | 175 | | | | 181,220 | |
Sr. Unsec’d. Notes | | Baa2 | | 4.450 | | | 09/15/42 | | | | 60 | | | | 64,742 | |
See Notes to Financial Statements.
| | | | |
| Prudential Absolute Return Bond Fund | | | 31 | |
Portfolio of Investments
as of October 31, 2012 continued
| | | | | | | | | | | | | | | | |
| Description | | Moody’s
Ratings†
(Unaudited) | | Interest
Rate | | Maturity
Date | | | Principal
Amount (000)# | | | Value (Note 1) | |
CORPORATE BONDS (Continued) | | | | | | | | | | | | |
| |
Energy - Integrated (cont’d.) | | | | | |
Pacific Rubiales Energy Corp. (Canada),
Gtd. Notes, 144A | | Ba2 | | 7.250% | | | 12/12/21 | | | $ | 600 | | | $ | 710,999 | |
| | | | | | | | | | | | | | | | |
| | | | | | | | | | | | | | | 1,111,427 | |
| | | | | |
Energy - Other 1.3% | | | | | | | | | | | | | | | | |
Anadarko Petroleum Corp.,
Sr. Unsec’d. Notes | | Baa3 | | 5.950 | | | 09/15/16 | | | | 200 | | | | 232,322 | |
Sr. Unsec’d. Notes | | Baa3 | | 6.375 | | | 09/15/17 | | | | 100 | | | | 121,226 | |
Sr. Unsec’d. Notes | | Baa3 | | 6.450 | | | 09/15/36 | | | | 100 | | | | 128,619 | |
Cameron International Corp.,
Sr. Unsec’d. Notes(a) | | Baa1 | | 1.351 | | | 06/02/14 | | | | 125 | | | | 124,936 | |
Sr. Unsec’d. Notes | | Baa1 | | 4.500 | | | 06/01/21 | | | | 340 | | | | 383,883 | |
Devon Energy Corp.,
Sr. Unsec’d. Notes | | Baa1 | | 1.875 | | | 05/15/17 | | | | 75 | | | | 76,808 | |
Forest Oil Corp.,
Gtd. Notes | | B2 | | 8.500 | | | 02/15/14 | | | | 106 | | | | 114,215 | |
Nabors Industries, Inc.,
Gtd. Notes | | Baa2 | | 4.625 | | | 09/15/21 | | | | 240 | | | | 263,941 | |
Gtd. Notes | | Baa2 | | 6.150 | | | 02/15/18 | | | | 80 | | | | 94,938 | |
Noble Energy, Inc.,
Sr. Unsec’d. Notes | | Baa2 | | 6.000 | | | 03/01/41 | | | | 150 | | | | 189,665 | |
Noble Holding International Ltd. (Cayman Islands), Gtd. Notes | | Baa1 | | 2.500 | | | 03/15/17 | | | | 25 | | | | 25,896 | |
Phillips 66,
Gtd. Notes, 144A | | Baa1 | | 2.950 | | | 05/01/17 | | | | 25 | | | | 26,663 | |
Pioneer Natural Resources Co., Sr. Unsec’d. Notes | | Baa3 | | 7.500 | | | 01/15/20 | | | | 310 | | | | 397,197 | |
Transocean, Inc. (Cayman Islands),
Gtd. Notes | | Baa3 | | 2.500 | | | 10/15/17 | | | | 75 | | | | 75,959 | |
Gtd. Notes | | Baa3 | | 5.050 | | | 12/15/16 | | | | 75 | | | | 83,999 | |
See Notes to Financial Statements.
| | |
| 32 | | Visit our website at www.prudentialfunds.com |
| | | | | | | | | | | | | | | | |
| Description | | Moody’s
Ratings†
(Unaudited) | | Interest
Rate | | Maturity
Date | | | Principal
Amount (000)# | | | Value (Note 1) | |
CORPORATE BONDS (Continued) | | | | | | | | | | | | |
| | | | | |
Energy - Other (cont’d.) | | | | | | | | | | | | | | | | |
Weatherford International Ltd. (Bermuda),
Gtd. Notes | | Baa2 | | 5.150% | | | 03/15/13 | | | $ | 100 | | | $ | 101,430 | |
Gtd. Notes | | Baa2 | | 5.950 | | | 04/15/42 | | | | 160 | | | | 175,705 | |
| | | | | | | | | | | | | | | | |
| | | | | | | | | | | | | | | 2,617,402 | |
| | | | | |
Foods 1.5% | | | | | | | | | | | | | | | | |
Anheuser-Busch InBev Worldwide, Inc.,
Gtd. Notes | | A3 | | 2.500 | | | 07/15/22 | | | | 200 | | | | 203,350 | |
ARAMARK Corp.,
Gtd. Notes | | B3 | | 8.500 | | | 02/01/15 | | | | 200 | | | | 203,252 | |
Beam, Inc.,
Sr. Unsec’d. Notes | | Baa2 | | 1.875 | | | 05/15/17 | | | | 50 | | | | 51,338 | |
ConAgra Foods, Inc.,
Sr. Unsec’d. Notes | | Baa2 | | 2.100 | | | 03/15/18 | | | | 225 | | | | 227,683 | |
Constellation Brands, Inc., Gtd. Notes | | Ba1 | | 7.250 | | | 09/01/16 | | | | 550 | | | | 635,250 | |
Darling International, Inc., Gtd. Notes | | Ba2 | | 8.500 | | | 12/15/18 | | | | 100 | | | | 113,625 | |
Dole Food Co., Inc.,
Sec’d. Notes | | B2 | | 13.875 | | | 03/15/14 | | | | 100 | | | | 112,500 | |
Ingles Markets, Inc.,
Sr. Unsec’d. Notes | | B1 | | 8.875 | | | 05/15/17 | | | | 525 | | | | 565,031 | |
Kraft Foods Group, Inc.,
Sr. Unsec’d. Notes, 144A | | Baa2 | | 2.250 | | | 06/05/17 | | | | 50 | | | | 51,937 | |
Minerva Luxembourg SA (Luxembourg),
Gtd. Notes, 144A | | B2 | | 12.250 | | | 02/10/22 | | | | 250 | | | | 297,500 | |
Molson Coors Brewing Co., Gtd. Notes | | Baa2 | | 2.000 | | | 05/01/17 | | | | 50 | | | | 51,643 | |
Stater Bros. Holdings, Inc., Gtd. Notes | | B2 | | 7.750 | | | 04/15/15 | | | | 125 | | | | 127,500 | |
Tyson Foods, Inc., Gtd. Notes(d) | | Baa3 | | 6.600 | | | 04/01/16 | | | | 340 | | | | 391,894 | |
| | | | | | | | | | | | | | | | |
| | | | | | | | | | | | | | | 3,032,503 | |
See Notes to Financial Statements.
| | | | |
| Prudential Absolute Return Bond Fund | | | 33 | |
Portfolio of Investments
as of October 31, 2012 continued
| | | | | | | | | | | | | | | | |
| Description | | Moody’s
Ratings†
(Unaudited) | | Interest
Rate | | Maturity
Date | | | Principal
Amount (000)# | | | Value (Note 1) | |
CORPORATE BONDS (Continued) | | | | | | | | | | | | |
| | | | | |
Gaming 0.6% | | | | | | | | | | | | | | | | |
Marina District Finance Co., Inc.,
Sr. Sec’d. Notes | | B2 | | 9.875% | | | 08/15/18 | | | $ | 100 | | | $ | 101,250 | |
MGM Resorts International,
Gtd. Notes | | B3 | | 7.625 | | | 01/15/17 | | | | 500 | | | | 526,250 | |
Sr. Sec’d. Notes | | Ba2 | | 11.125 | | | 11/15/17 | | | | 200 | | | | 220,500 | |
Sr. Sec’d. Notes | | Ba2 | | 13.000 | | | 11/15/13 | | | | 100 | | | | 111,500 | |
Sugarhouse HSP Gaming Prop Mezz LP/Sugarhouse HSP Gaming Finance Corp.,
Sec’d. Notes, 144A | | B2 | | 8.625 | | | 04/15/16 | | | | 100 | | | | 107,125 | |
Yonkers Racing Corp., Sec’d. Notes, 144A (original cost $139,688; purchased 04/12/11)(e)(f) | | B1 | | 11.375 | | | 07/15/16 | | | | 125 | | | | 132,500 | |
| | | | | | | | | | | | | | | | |
| | | | | | | | | | | | | | | 1,199,125 | |
| | |
Healthcare & Pharmaceutical 1.7% | | | | | | | | | |
Amgen, Inc.,
Sr. Unsec’d. Notes | | Baa1 | | 2.125 | | | 05/15/17 | | | | 125 | | | | 129,996 | |
Sr. Unsec’d. Notes | | Baa1 | | 5.375 | | | 05/15/43 | | | | 160 | | | | 192,097 | |
AstraZeneca PLC (United Kingdom),
Sr. Unsec’d. Notes | | A1 | | 4.000 | | | 09/18/42 | | | | 130 | | | | 136,671 | |
Celgene Corp.,
Sr. Unsec’d. Notes | | Baa2 | | 1.900 | | | 08/15/17 | | | | 50 | | | | 50,768 | |
CHS/Community Health Systems, Inc.,
Sr. Sec’d. Notes | | Ba3 | | 5.125 | | | 08/15/18 | | | | 150 | | | | 155,625 | |
Express Scripts Holding Co.,
Gtd. Notes, 144A | | Baa3 | | 2.100 | | | 02/12/15 | | | | 50 | | | | 51,140 | |
Gilead Sciences, Inc.,
Sr. Unsec’d. Notes | | Baa1 | | 5.650 | | | 12/01/41 | | | | 150 | | | | 193,928 | |
HCA, Inc.,
Sr. Unsec’d. Notes | | B3 | | 7.190 | | | 11/15/15 | | | | 100 | | | | 110,000 | |
See Notes to Financial Statements.
| | |
| 34 | | Visit our website at www.prudentialfunds.com |
| | | | | | | | | | | | | | | | |
| Description | | Moody’s
Ratings†
(Unaudited) | | Interest
Rate | | Maturity
Date | | | Principal
Amount (000)# | | | Value (Note 1) | |
CORPORATE BONDS (Continued) | | | | | | | | | | | | |
| |
Healthcare & Pharmaceutical (cont’d.) | | | | | |
Sr. Unsec’d. Notes, MTN | | B3 | | 9.000% | | | 12/15/14 | | | $ | 200 | | | $ | 222,500 | |
Laboratory Corp. of America Holdings,
Sr. Unsec’d. Notes | | Baa2 | | 3.750 | | | 08/23/22 | | | | 25 | | | | 26,577 | |
Mylan, Inc.,
Gtd. Notes, 144A | | Ba2 | | 6.000 | | | 11/15/18 | | | | 550 | | | | 585,750 | |
Gtd. Notes, 144A | | Ba2 | | 7.625 | | | 07/15/17 | | | | 100 | | | | 111,500 | |
Tenet Healthcare Corp.,
Sr. Sec’d. Notes | | B1 | | 6.250 | | | 11/01/18 | | | | 600 | | | | 649,501 | |
Valeant Pharmaceuticals International,
Gtd. Notes, 144A | | B1 | | 6.500 | | | 07/15/16 | | | | 680 | | | | 715,700 | |
Watson Pharmaceuticals, Inc.,
Sr. Unsec’d. Notes | | Baa3 | | 4.625 | | | 10/01/42 | | | | 75 | | | | 80,563 | |
| | | | | | | | | | | | | | | | |
| | | | | | | | | | | | | | | 3,412,316 | |
| |
Healthcare Insurance 0.5% | | | | | |
Aetna, Inc.,
Sr. Unsec’d. Notes | | Baa1 | | 6.000 | | | 06/15/16 | | | | 50 | | | | 58,330 | |
Cigna Corp.,
Sr. Unsec’d. Notes | | Baa2 | | 5.375 | | | 02/15/42 | | | | 150 | | | | 176,910 | |
Coventry Health Care, Inc., Sr. Unsec’d. Notes | | Baa3 | | 5.950 | | | 03/15/17 | | | | 320 | | | | 373,768 | |
UnitedHealth Group, Inc.,
Sr. Unsec’d. Notes | | A3 | | 3.950 | | | 10/15/42 | | | | 75 | | | | 75,996 | |
Sr. Unsec’d. Notes | | A3 | | 4.375 | | | 03/15/42 | | | | 210 | | | | 227,408 | |
WellPoint, Inc.,
Sr. Unsec’d. Notes | | Baa2 | | 4.650 | | | 01/15/43 | | | | 100 | | | | 107,376 | |
| | | | | | | | | | | | | | | | |
| | | | | | | | | | | | | | | 1,019,788 | |
| | | | | |
Insurance 1.9% | | | | | | | | | | | | | | | | |
Allied World Assurance Co. Holdings Ltd. (Bermuda), Gtd. Notes | | Baa1 | | 7.500 | | | 08/01/16 | | | | 100 | | | | 119,017 | |
American International Group, Inc.,
Sr. Unsec’d. Notes | | Baa1 | | 6.400 | | | 12/15/20 | | | | 510 | | | | 626,331 | |
See Notes to Financial Statements.
| | | | |
| Prudential Absolute Return Bond Fund | | | 35 | |
Portfolio of Investments
as of October 31, 2012 continued
| | | | | | | | | | | | | | | | |
| Description | | Moody’s
Ratings†
(Unaudited) | | Interest
Rate | | Maturity
Date | | | Principal
Amount (000)# | | | Value (Note 1) | |
CORPORATE BONDS (Continued) | | | | | | | | | | | | |
| |
Insurance (cont’d.) | | | | | |
AON Corp.,
Sr. Unsec’d. Notes | | Baa2 | | 3.125% | | | 05/27/16 | | | $ | 110 | | | $ | 116,352 | |
Hartford Financial Services Group, Inc.,
Sr. Unsec’d. Notes | | Baa3 | | 5.125 | | | 04/15/22 | | | | 205 | | | | 233,429 | |
Liberty Mutual Group, Inc.,
Gtd. Notes, 144A | | Baa2 | | 4.950 | | | 05/01/22 | | | | 75 | | | | 81,905 | |
Gtd. Notes, 144A | | Baa2 | | 6.500 | | | 05/01/42 | | | | 150 | | | | 170,947 | |
Sr. Unsec’d. Notes, 144A | | Baa2 | | 6.700 | | | 08/15/16 | | | | 115 | | | | 130,413 | |
Lincoln National Corp.,
Sr. Unsec’d. Notes | | Baa2 | | 4.200 | | | 03/15/22 | | | | 70 | | | | 73,960 | |
Sr. Unsec’d. Notes | | Baa2 | | 6.300 | | | 10/09/37 | | | | 175 | | | | 206,258 | |
Markel Corp.,
Sr. Unsec’d. Notes | | Baa2 | | 4.900 | | | 07/01/22 | | | | 320 | | | | 349,946 | |
Sr. Unsec’d. Notes | | Baa2 | | 7.125 | | | 09/30/19 | | | | 130 | | | | 157,906 | |
Massachusetts Mutual Life Insurance Co.,
Sub. Notes, 144A | | A1 | | 5.375 | | | 12/01/41 | | | | 320 | | | | 377,717 | |
MetLife, Inc.,
Sr. Unsec’d. Notes(a) | | A3 | | 3.048 | | | 12/15/22 | | | | 225 | | | | 228,186 | |
Sr. Unsec’d. Notes | | A3 | | 4.125 | | | 08/13/42 | | | | 90 | | | | 91,094 | |
Nippon Life Insurance Co. (Japan),
Sub. Notes, 144A(a) | | A2 | | 5.000 | | | 10/18/42 | | | | 200 | | | | 206,333 | |
Northwestern Mutual Life Insurance Co. (The),
Sub. Notes, 144A | | Aa2 | | 6.063 | | | 03/30/40 | | | | 200 | | | | 262,903 | |
Teachers Insurance & Annuity Association of America,
Sub. Notes, 144A | | Aa2 | | 6.850 | | | 12/16/39 | | | | 200 | | | | 276,974 | |
W.R. Berkley Corp.,
Sr. Unsec’d. Notes | | Baa2 | | 4.625 | | | 03/15/22 | | | | 75 | | | | 80,838 | |
| | | | | | | | | | | | | | | | |
| | | | | | | | | | | | | | | 3,790,509 | |
| | | | | |
Lodging 0.5% | | | | | | | | | | | | | | | | |
FelCor Lodging LP,
Sr. Sec’d. Notes | | B2 | | 10.000 | | | 10/01/14 | | | | 125 | | | | 143,438 | |
See Notes to Financial Statements.
| | |
| 36 | | Visit our website at www.prudentialfunds.com |
| | | | | | | | | | | | | | | | |
| Description | | Moody’s
Ratings†
(Unaudited) | | Interest
Rate | | Maturity
Date | | | Principal
Amount (000)# | | | Value (Note 1) | |
CORPORATE BONDS (Continued) | | | | | | | | | | | | |
| |
Lodging (cont’d.) | | | | | |
Host Hotels & Resorts LP,
Gtd. Notes | | Baa3 | | 9.000% | | | 05/15/17 | | | $ | 150 | | | $ | 162,750 | |
Marriott International, Inc.,
Sr. Unsec’d. Notes | | Baa2 | | 3.000 | | | 03/01/19 | | | | 115 | | | | 117,594 | |
Sr. Unsec’d. Notes | | Baa2 | | 3.250 | | | 09/15/22 | | | | 75 | | | | 76,329 | |
Starwood Hotels & Resorts Worldwide, Inc.,
Sr. Unsec’d. Notes | | Baa3 | | 6.750 | | | 05/15/18 | | | | 150 | | | | 181,386 | |
Wyndham Worldwide Corp.,
Sr. Unsec’d. Notes | | Baa3 | | 4.250 | | | 03/01/22 | | | | 25 | | | | 26,079 | |
Sr. Unsec’d. Notes | | Baa3 | | 5.750 | | | 02/01/18 | | | | 120 | | | | 134,246 | |
Sr. Unsec’d. Notes | | Baa3 | | 7.375 | | | 03/01/20 | | | | 135 | | | | 161,898 | |
| | | | | | | | | | | | | | | | |
| | | | | | | | | | | | | | | 1,003,720 | |
| |
Media & Entertainment 2.7% | | | | | |
Belo Corp.,
Gtd. Notes | | Ba1 | | 8.000 | | | 11/15/16 | | | | 552 | | | | 603,060 | |
CBS Corp.,
Gtd. Notes(e) | | Baa2 | | 1.950 | | | 07/01/17 | | | | 50 | | | | 51,223 | |
Gtd. Notes(e) | | Baa2 | | 8.875 | | | 05/15/19 | | | | 220 | | | | 302,772 | |
Cedar Fair LP/Canada’s Wonderland Co./Magnum Management Corp.,
Gtd. Notes | | B2 | | 9.125 | | | 08/01/18 | | | | 600 | | | | 678,750 | |
Intelsat Luxembourg SA (Bermuda),
Gtd. Notes | | Caa3 | | 11.250 | | | 02/04/17 | | | | 250 | | | | 262,500 | |
Lamar Media Corp.,
Gtd. Notes | | Ba2 | | 9.750 | | | 04/01/14 | | | | 475 | | | | 527,250 | |
NBCUniversal Media LLC,
Sr. Unsec’d. Notes | | Baa2 | | 5.950 | | | 04/01/41 | | | | 230 | | | | 286,433 | |
News America, Inc.,
Gtd. Notes | | Baa1 | | 8.000 | | | 10/17/16 | | | | 100 | | | | 125,034 | |
Gtd. Notes | | Baa1 | | 8.250 | | | 08/10/18 | | | | 430 | | | | 568,852 | |
Nielsen Finance LLC/Nielsen Finance Co.,
Gtd. Notes | | B2 | | 11.625 | | | 02/01/14 | | | | 250 | | | | 281,250 | |
See Notes to Financial Statements.
| | | | |
| Prudential Absolute Return Bond Fund | | | 37 | |
Portfolio of Investments
as of October 31, 2012 continued
| | | | | | | | | | | | | | | | |
| Description | | Moody’s
Ratings†
(Unaudited) | | Interest
Rate | | Maturity
Date | | | Principal
Amount (000)# | | | Value (Note 1) | |
CORPORATE BONDS (Continued) | | | | | | | | | | | | |
| |
Media & Entertainment (cont’d.) | | | | | |
Sinclair Television Group, Inc.,
Sec’d. Notes, 144A | | Ba3 | | 9.250% | | | 11/01/17 | | | $ | 600 | | | $ | 664,500 | |
Starz LLC/Starz Finance Corp.,
Sr. Notes, 144A | | Ba2 | | 5.000 | | | 09/15/19 | | | | 200 | | | | 204,500 | |
Telesat Canada/Telesat LLC (Canada),
Sr. Unsec’d. Notes, 144A | | B3 | | 6.000 | | | 05/15/17 | | | | 400 | | | | 417,000 | |
Viacom, Inc.,
Sr. Unsec’d. Notes | | Baa1 | | 6.250 | | | 04/30/16 | | | | 100 | | | | 117,135 | |
WMG Acquisition Corp.,
Sr. Sec’d. Notes | | Ba2 | | 9.500 | | | 06/15/16 | | | | 300 | | | | 329,625 | |
Sr. Sec’d. Notes | | Ba2 | | 9.500 | | | 06/15/16 | | | | 100 | | | | 110,125 | |
| | | | | | | | | | | | | | | | |
| | | | | | | | | | | | | | | 5,530,009 | |
| | | | | |
Metals 1.9% | | | | | | | | | | | | | | | | |
ArcelorMittal (Luxembourg),
Sr. Unsec’d. Notes(d) | | Baa3 | | 10.350 | | | 06/01/19 | | | | 35 | | | | 41,146 | |
ArcelorMittal USA LLC,
Gtd. Notes | | Baa3 | | 6.500 | | | 04/15/14 | | | | 598 | | | | 623,599 | |
Berau Capital Resources Pte Ltd. (Singapore),
Sr. Sec’d. Notes, RegS | | B1 | | 12.500 | | | 07/08/15 | | | | 400 | | | | 420,500 | |
Bumi Capital Pte Ltd. (Singapore),
Sr. Sec’d. Notes, RegS | | B1 | | 12.000 | | | 11/10/16 | | | | 100 | | | | 85,500 | |
CONSOL Energy, Inc.,
Gtd. Notes | | B1 | | 8.000 | | | 04/01/17 | | | | 575 | | | | 608,063 | |
Freeport-McMoRan Copper & Gold, Inc.,
Sr. Unsec’d. Notes | | Baa3 | | 2.150 | | | 03/01/17 | | | | 50 | | | | 50,776 | |
Indo Integrated Energy II BV (Netherlands),
Sr. Sec’d. Notes, RegS | | B1 | | 9.750 | | | 11/05/16 | | | | 100 | | | | 109,620 | |
Inmet Mining Corp. (Canada),
Gtd. Notes, 144A | | B1 | | 8.750 | | | 06/01/20 | | | | 250 | | | | 259,375 | |
See Notes to Financial Statements.
| | |
| 38 | | Visit our website at www.prudentialfunds.com |
| | | | | | | | | | | | | | | | |
| Description | | Moody’s
Ratings†
(Unaudited) | | Interest
Rate | | Maturity
Date | | | Principal
Amount (000)# | | | Value (Note 1) | |
CORPORATE BONDS (Continued) | | | | | | | | | | | | |
| |
Metals (cont’d.) | | | | | |
Peabody Energy Corp.,
Gtd. Notes | | Ba1 | | 6.000% | | | 11/15/18 | | | $ | 100 | | | $ | 103,750 | |
Southern Copper Corp.,
Sr. Unsec’d. Notes | | Baa2 | | 7.500 | | | 07/27/35 | | | | 300 | | | | 380,300 | |
Steel Dynamics, Inc.,
Gtd. Notes | | Ba2 | | 6.750 | | | 04/01/15 | | | | 150 | | | | 152,250 | |
Teck Resources Ltd. (Canada),
Gtd. Notes | | Baa2 | | 2.500 | | | 02/01/18 | | | | 100 | | | | 101,153 | |
Gtd. Notes | | Baa2 | | 3.000 | | | 03/01/19 | | | | 125 | | | | 127,170 | |
Xstrata Finance Canada Ltd. (Canada), | | | | | | | | | | | | | | | | |
Gtd. Notes, 144A | | Baa2 | | 1.800 | | | 10/23/15 | | | | 325 | | | | 325,655 | |
Gtd. Notes, 144A | | Baa2 | | 2.450 | | | 10/25/17 | | | | 350 | | | | 349,104 | |
Gtd. Notes, 144A | | Baa2 | | 2.850 | | | 11/10/14 | | | | 50 | | | | 51,299 | |
| | | | | | | | | | | | | | | | |
| | | | | | | | | | | | | | | 3,789,260 | |
| |
Non-Captive Finance 1.1% | | | | | |
General Electric Capital Corp.,
Sr. Unsec’d. Notes, MTN | | A1 | | 2.300 | | | 04/27/17 | | | | 100 | | | | 103,298 | |
Sub. Notes | | A2 | | 5.300 | | | 02/11/21 | | | | 450 | | | | 523,611 | |
International Lease Finance Corp., | | | | | | | | | | | | | | | | |
Sr. Unsec’d. Notes | | Ba3 | | 5.750 | | | 05/15/16 | | | | 25 | | | | 26,397 | |
Sr. Unsec’d. Notes | | Ba3 | | 6.250 | | | 05/15/19 | | | | 25 | | | | 26,944 | |
Sr. Unsec’d. Notes(a) | | Ba3 | | 8.625 | | | 09/15/15 | | | | 90 | | | | 101,340 | |
NYSE Euronext,
Sr. Unsec’d. Notes | | A3 | | 2.000 | | | 10/05/17 | | | | 475 | | | | 483,607 | |
Schahin II Finance Co. SPV Ltd. (Cayman Islands), Sr. Sec’d. Notes, 144A | | Baa3 | | 5.875 | | | 09/25/22 | | | | 250 | | | | 265,000 | |
SLM Corp., | | | | | | | | | | | | | | | | |
Notes, MTN | | Ba1 | | 4.625 | | | 09/25/17 | | | | 405 | | | | 415,526 | |
Sr. Unsec’d. Notes, MTN | | Ba1 | | 8.000 | | | 03/25/20 | | | | 100 | | | | 115,812 | |
Springleaf Finance Corp., Sr. Unsec’d. Notes, MTN | | Caa1 | | 6.900 | | | 12/15/17 | | | | 300 | | | | 264,000 | |
| | | | | | | | | | | | | | | | |
| | | | | | | | | | | | | | | 2,325,535 | |
See Notes to Financial Statements.
| | | | |
| Prudential Absolute Return Bond Fund | | | 39 | |
Portfolio of Investments
as of October 31, 2012 continued
| | | | | | | | | | | | | | | | |
| Description | | Moody’s
Ratings†
(Unaudited) | | Interest
Rate | | Maturity
Date | | | Principal
Amount (000)# | | | Value (Note 1) | |
CORPORATE BONDS (Continued) | | | | | | | | | | | | |
| | | | | |
Packaging 0.1% | | | | | | | | | | | | | | | | |
Owens-Brockway Glass Container, Inc.,
Gtd. Notes | | Ba3 | | 7.375% | | | 05/15/16 | | | $ | 100 | | | $ | 114,500 | |
| | | | | | | | | | | | | | | | |
| | | | | |
Paper 0.8% | | | | | | | | | | | | | | | | |
Georgia-Pacific LLC,
Gtd. Notes, 144A (original cost $35,100; purchased 04/20/11)(e)(f) | | Baa3 | | 5.400 | | | 11/01/20 | | | | 35 | | | | 41,540 | |
Graphic Packaging International, Inc.,
Gtd. Notes | | B2 | | 9.500 | | | 06/15/17 | | | | 650 | | | | 710,124 | |
International Paper Co., | | | | | | | | | | | | | | | | |
Sr. Unsec’d. Notes | | Baa3 | | 6.000 | | | 11/15/41 | | | | 210 | | | | 257,062 | |
Sr. Unsec’d. Notes | | Baa3 | | 9.375 | | | 05/15/19 | | | | 100 | | | | 137,637 | |
Rock-Tenn Co., | | | | | | | | | | | | | | | | |
Gtd. Notes, 144A | | Ba1 | | 4.000 | | | 03/01/23 | | | | 75 | | | | 77,222 | |
Unsec’d. Notes, 144A | | Ba1 | | 4.450 | | | 03/01/19 | | | | 35 | | | | 37,952 | |
Unsec’d. Notes, 144A | | Ba1 | | 4.900 | | | 03/01/22 | | | | 190 | | | | 206,486 | |
Smurfit Kappa Acquisitions (Ireland),
Sr. Sec’d. Notes, 144A | | Ba2 | | 4.875 | | | 09/15/18 | | | | 250 | | | | 250,000 | |
| | | | | | | | | | | | | | | | |
| | | | | | | | | | | | | | | 1,718,023 | |
| | | | | |
Pipelines & Other 0.2% | | | | | | | | | | | | | | | | |
Enterprise Products Operating LLC,
Gtd. Notes | | Baa2 | | 5.700 | | | 02/15/42 | | | | 50 | | | | 60,412 | |
Kinder Morgan Energy Partners LP,
Sr. Unsec’d. Notes | | Baa2 | | 3.450 | | | 02/15/23 | | | | 200 | | | | 209,759 | |
ONEOK Partners LP,
Gtd. Notes | | Baa2 | | 2.000 | | | 10/01/17 | | | | 50 | | | | 51,023 | |
Sempra Energy,
Sr. Unsec’d. Notes | | Baa1 | | 2.300 | | | 04/01/17 | | | | 50 | | | | 52,210 | |
See Notes to Financial Statements.
| | |
| 40 | | Visit our website at www.prudentialfunds.com |
| | | | | | | | | | | | | | | | |
| Description | | Moody’s
Ratings†
(Unaudited) | | Interest
Rate | | Maturity
Date | | | Principal
Amount (000)# | | | Value (Note 1) | |
CORPORATE BONDS (Continued) | | | | | | | | | | | | |
| | | | | |
Pipelines & Other (cont’d.) | | | | | | | | | | | | | | | | |
Western Gas Partners LP,
Sr. Unsec’d. Notes | | Baa3 | | 4.000% | | | 07/01/22 | | | $ | 75 | | | $ | 79,628 | |
| | | | | | | | | | | | | | | | |
| | | | | | | | | | | | | | | 453,032 | |
| | | | | |
Railroads 0.4% | | | | | | | | | | | | | | | | |
Brunswick Rail Finance Ltd. (Russia),
Gtd. Notes, 144A | | Ba3 | | 6.500 | | | 11/01/17 | | | | 200 | | | | 202,936 | |
Burlington Northern Santa Fe LLC,
Sr. Unsec’d. Notes | | A3 | | 4.375 | | | 09/01/42 | | | | 180 | | | | 195,378 | |
CSX Corp.,
Sr. Unsec’d. Notes | | Baa2 | | 4.100 | | | 03/15/44 | | | | 175 | | | | 177,342 | |
Union Pacific Corp.,
Sr. Unsec’d. Notes | | Baa1 | | 6.250 | | | 05/01/34 | | | | 207 | | | | 277,560 | |
| | | | | | | | | | | | | | | | |
| | | | | | | | | | | | | | | 853,216 | |
| |
Real Estate Investment Trusts 0.8% | | | | | |
Aviv Healthcare Properties LP/Aviv Healthcare Capital Corp., | | | | | | | | | | | | | | | | |
Gtd. Notes | | B1 | | 7.750 | | | 02/15/19 | | | | 600 | | | | 632,250 | |
Mack-Cali Realty LP,
Sr. Unsec’d. Notes | | Baa2 | | 4.600 | | | 06/15/13 | | | | 130 | | | | 132,453 | |
Omega Healthcare Investors, Inc.,
Gtd. Notes | | Ba2 | | 7.500 | | | 02/15/20 | | | | 500 | | | | 549,999 | |
Realty Income Corp.,
Sr. Unsec’d. Notes | | Baa1 | | 2.000 | | | 01/31/18 | | | | 200 | | | | 201,706 | |
Sr. Unsec’d. Notes | | Baa1 | | 5.500 | | | 11/15/15 | | | | 50 | | | | 55,600 | |
Simon Property Group LP, Sr. Unsec’d. Notes | | A3 | | 6.125 | | | 05/30/18 | | | | 60 | | | | 73,639 | |
| | | | | | | | | | | | | | | | |
| | | | | | | | | | | | | | | 1,645,647 | |
| | | | | |
Retailers 1.2% | | | | | | | | | | | | | | | | |
AutoZone, Inc.,
Sr. Unsec’d. Notes | | Baa2 | | 3.700 | | | 04/15/22 | | | | 50 | | | | 53,267 | |
See Notes to Financial Statements.
| | | | |
| Prudential Absolute Return Bond Fund | | | 41 | |
Portfolio of Investments
as of October 31, 2012 continued
| | | | | | | | | | | | | | | | |
| Description | | Moody’s
Ratings†
(Unaudited) | | Interest
Rate | | Maturity
Date | | | Principal
Amount (000)# | | | Value (Note 1) | |
CORPORATE BONDS (Continued) | | | | | | | | | | | | |
| | | | | |
Retailers (cont’d.) | | | | | | | | | | | | | | | | |
Claire’s Stores, Inc.,
Sr. Sec’d. Notes, 144A | | B2 | | 9.000% | | | 03/15/19 | | | $ | 475 | | | $ | 495,781 | |
CVS Caremark Corp.,
Sr. Unsec’d. Notes | | Baa2 | | 5.750 | | | 05/15/41 | | | | 150 | | | | 194,298 | |
Kohl’s Corp.,
Sr. Unsec’d. Notes | | Baa1 | | 3.250 | | | 02/01/23 | | | | 150 | | | | 150,182 | |
Ltd. Brands, Inc.,
Gtd. Notes | | Ba1 | | 5.625 | | | 02/15/22 | | | | 550 | | | | 593,312 | |
Macy’s Retail Holdings, Inc.,
Gtd. Notes | | Baa3 | | 3.875 | | | 01/15/22 | | | | 125 | | | | 137,373 | |
Gtd. Notes | | Baa3 | | 5.900 | | | 12/01/16 | | | | 100 | | | | 117,816 | |
QVC, Inc.,
Sr. Sec’d. Notes, 144A | | Ba2 | | 7.500 | | | 10/01/19 | | | | 525 | | | | 578,873 | |
Walgreen Co.,
Sr. Unsec’d. Notes | | Baa1 | | 1.800 | | | 09/15/17 | | | | 150 | | | | 151,995 | |
| | | | | | | | | | | | | | | | |
| | | | | | | | | | | | | | | 2,472,897 | |
| | | | | |
Technology 2.3% | | | | | | | | | | | | | | | | |
Arrow Electronics, Inc.,
Sr. Unsec’d. Notes | | Baa3 | | 3.375 | | | 11/01/15 | | | | 50 | | | | 52,386 | |
CDW LLC/CDW Finance Corp.,
Gtd. Notes | | Caa1 | | 12.535 | | | 10/12/17 | | | | 1,000 | | | | 1,071,250 | |
CommScope, Inc.,
Gtd. Notes, 144A
(original cost $378,000; purchased 09/28/12)(e)(f) | | B3 | | 8.250 | | | 01/15/19 | | | | 350 | | | | 377,125 | |
DuPont Fabros Technology LP,
Gtd. Notes | | Ba1 | | 8.500 | | | 12/15/17 | | | | 300 | | | | 329,999 | |
First Data Corp.,
Gtd. Notes | | Caa1 | | 12.625 | | | 01/15/21 | | | | 250 | | | | 258,125 | |
Fiserv, Inc.,
Gtd. Notes | | Baa2 | | 3.125 | | | 06/15/16 | | | | 275 | | | | 289,507 | |
Interactive Data Corp.,
Gtd. Notes | | Caa1 | | 10.250 | | | 08/01/18 | | | | 400 | | | | 447,000 | |
See Notes to Financial Statements.
| | |
| 42 | | Visit our website at www.prudentialfunds.com |
| | | | | | | | | | | | | | | | |
| Description | | Moody’s
Ratings†
(Unaudited) | | Interest
Rate | | Maturity
Date | | | Principal
Amount (000)# | | | Value (Note 1) | |
CORPORATE BONDS (Continued) | | | | | | | | | | | | |
| | | | | |
Technology (cont’d.) | | | | | | | | | | | | | | | | |
Jabil Circuit, Inc.,
Sr. Unsec’d. Notes | | Ba1 | | 4.700% | | | 09/15/22 | | | $ | 75 | | | $ | 75,000 | |
NXP BV/NXP Funding LLC (Netherlands),
Sr. Sec’d. Notes, Ser. EXcH(a) | | B3 | | 3.090 | | | 10/15/13 | | | | 75 | | | | 74,906 | |
Seagate HDD Cayman (Cayman Islands), Gtd. Notes | | Ba1 | | 7.750 | | | 12/15/18 | | | | 600 | | | | 651,000 | |
Seagate Technology International (Cayman Islands),
Sec’d. Notes, 144A | | Baa3 | | 10.000 | | | 05/01/14 | | | | 100 | | | | 108,500 | |
STATS ChipPAC Ltd. (Singapore),
Gtd. Notes, 144A | | Ba1 | | 7.500 | | | 08/12/15 | | | | 200 | | | | 212,500 | |
Gtd. Notes, RegS | | Ba1 | | 7.500 | | | 08/12/15 | | | | 300 | | | | 318,750 | |
SunGard Data Systems, Inc.,
Sr. Sec’d. Notes | | B3 | | 4.875 | | | 01/15/14 | | | | 100 | | | | 103,000 | |
TransUnion LLC/TransUnion Financing Corp.,
Gtd. Notes | | Ba3 | | 11.375 | | | 06/15/18 | | | | 150 | | | | 174,000 | |
Xerox Corp.,
Sr. Unsec’d. Notes(a) | | Baa2 | | 1.257 | | | 05/16/14 | | | | 100 | | | | 99,876 | |
| | | | | | | | | | | | | | | | |
| | | | | | | | | | | | | | | 4,642,924 | |
| | | | | |
Telecommunications 1.7% | | | | | | | | | | | | | | | | |
AT&T, Inc.,
Sr. Unsec’d. Notes | | A2 | | 5.350 | | | 09/01/40 | | | | 240 | | | | 294,352 | |
British Telecommunications PLC (United Kingdom),
Sr. Unsec’d. Notes | | Baa2 | | 5.950 | | | 01/15/18 | | | | 170 | | | | 204,119 | |
Sr. Unsec’d. Notes(a) | | Baa2 | | 9.625 | | | 12/15/30 | | | | 90 | | | | 146,959 | |
Digicel Group Ltd. (Bermuda),
Sr. Unsec’d. Notes, 144A | | Caa1 | | 8.250 | | | 09/30/20 | | | | 275 | | | | 296,313 | |
Digicel Ltd. (Bermuda),
Sr. Unsec’d. Notes, 144A | | B1 | | 12.000 | | | 04/01/14 | | | | 100 | | | | 110,500 | |
See Notes to Financial Statements.
| | | | |
| Prudential Absolute Return Bond Fund | | | 43 | |
Portfolio of Investments
as of October 31, 2012 continued
| | | | | | | | | | | | | | | | |
| Description | | Moody’s
Ratings†
(Unaudited) | | Interest
Rate | | Maturity
Date | | | Principal
Amount (000)# | | | Value (Note 1) | |
CORPORATE BONDS (Continued) | | | | | | | | | | | | |
| |
Telecommunications (cont’d.) | | | | | |
Eileme 2 AB (Sweden),
Sr. Sec’d. Notes, 144A | | B3 | | 11.625% | | | 01/31/20 | | | $ | 400 | | | $ | 449,499 | |
Embarq Corp.,
Sr. Unsec’d. Notes
(original cost $135,646; purchased 05/04/11-05/11/11)(e)(f) | | Baa3 | | 7.082 | | | 06/01/16 | | | | 120 | | | | 141,353 | |
Sr. Unsec’d. Notes
(original cost $265,017; purchased 08/17/12-10/17/12)(e)(f) | | Baa3 | | 7.995 | | | 06/01/36 | | | | 240 | | | | 259,068 | |
Qwest Corp.,
Sr. Unsec’d. Notes | | Baa3 | | 7.500 | | | 10/01/14 | | | | 40 | | | | 44,503 | |
SK Telecom Co. Ltd. (South Korea),
Sr. Unsec’d. Notes, 144A, MTN | | A3 | | 2.125 | | | 05/01/18 | | | | 200 | | | | 199,588 | |
Sprint Nextel Corp.,
Sr. Unsec’d. Notes | | B3 | | 6.000 | | | 12/01/16 | | | | 400 | | | | 429,999 | |
Verizon Communications, Inc.,
Sr. Unsec’d. Notes | | A3 | | 7.350 | | | 04/01/39 | | | | 125 | | | | 192,505 | |
Vimpel Communications Via VIP Finance Ireland Ltd. OJSC (Ireland),
Sr. Unsec’d. Notes, 144A(e) | | Ba3 | | 9.125 | | | 04/30/18 | | | | 200 | | | | 234,206 | |
Wind Acquisition Finance SA (Luxembourg),
Sec’d. Notes, RegS | | B3 | | 11.750 | | | 07/15/17 | | | EUR | 300 | | | | 377,178 | |
| | | | | | | | | | | | | | | | |
| | | | | | | | | | | | | | | 3,380,142 | |
| | | | | |
Tobacco 0.8% | | | | | | | | | | | | | | | | |
Altria Group, Inc.,
Gtd. Notes | | Baa1 | | 9.950 | | | 11/10/38 | | | | 300 | | | | 518,492 | |
Lorillard Tobacco Co.,
Gtd. Notes | | Baa2 | | 2.300 | | | 08/21/17 | | | | 75 | | | | 75,868 | |
Gtd. Notes | | Baa2 | | 3.500 | | | 08/04/16 | | | | 235 | | | | 249,717 | |
See Notes to Financial Statements.
| | |
| 44 | | Visit our website at www.prudentialfunds.com |
| | | | | | | | | | | | | | | | |
| Description | | Moody’s
Ratings†
(Unaudited) | | Interest
Rate | | Maturity
Date | | | Principal
Amount (000)# | | | Value (Note 1) | |
CORPORATE BONDS (Continued) | | | | | | | | | | | | |
| |
Tobacco (cont’d.) | | | | | |
Philip Morris International, Inc.,
Sr. Unsec’d. Notes | | A2 | | 2.500% | | | 08/22/22 | | | $ | 200 | | | $ | 203,030 | |
Reynolds American, Inc.,
Gtd. Notes | | Baa2 | | 3.250 | | | 11/01/22 | | | | 400 | | | | 404,570 | |
Gtd. Notes | | Baa2 | | 6.750 | | | 06/15/17 | | | | 115 | | | | 138,972 | |
| | | | | | | | | | | | | | | | |
| | | | | | | | | | | | | | | 1,590,649 | |
| | | | | | | | | | | | | | | | |
TOTAL CORPORATE BONDS
(cost $72,446,459) | | | | | | | | | | | | | | | 73,571,624 | |
| | | | | | | | | | | | | | | | |
|
MORTGAGE-BACKED SECURITIES 2.1% | |
Federal National Mortgage Association | | | | 3.000 | | | TBA 30 YR | | | | 2,000 | | | | 2,097,188 | |
Federal National Mortgage Association | | | | 3.500 | | | TBA 30 YR | | | | 1,000 | | | | 1,065,156 | |
Federal National Mortgage Association | | | | 3.500 | | | TBA 30 YR | | | | 1,000 | | | | 1,063,281 | |
| | | | | | | | | | | | | | | | |
TOTAL MORTGAGE-BACKED SECURITIES
(cost $4,226,563) | | | | | | | | | | | | | | | 4,225,625 | |
| | | | | | | | | | | | | | | | |
|
MUNICIPAL BONDS 0.2% | |
City of Chicago IL, O’Hare International Airport, BABs, Revenue Bonds | | A2 | | 6.395 | | | 01/01/40 | | | | 140 | | | | 182,669 | |
Port Authority of New York & New Jersey | | Aa3 | | 4.458 | | | 10/01/62 | | | | 100 | | | | 98,707 | |
State of Illinois, GO | | A2 | | 3.321 | | | 01/01/13 | | | | 125 | | | | 125,525 | |
| | | | | | | | | | | | | | | | |
TOTAL MUNICIPAL BONDS
(cost $408,913) | | | | | | | | | | | | | | | 406,901 | |
| | | | | | | | | | | | | | | | |
|
NON-CORPORATE FOREIGN AGENCIES 3.1% | |
Corp. Andina de Fomento (Supranational), | | | | | | | | | | | | | | | | |
Sr. Unsec’d. Notes | | Aa3 | | 3.750 | | | 01/15/16 | | | | 70 | | | | 73,516 | |
See Notes to Financial Statements.
| | | | |
| Prudential Absolute Return Bond Fund | | | 45 | |
Portfolio of Investments
as of October 31, 2012 continued
| | | | | | | | | | | | | | | | |
| Description | | Moody’s
Ratings†
(Unaudited) | | Interest
Rate | | Maturity
Date | | | Principal
Amount (000)# | | | Value (Note 1) | |
NON-CORPORATE FOREIGN AGENCIES (Continued) | |
Export Credit Bank of Turkey (Turkey), | | | | | | | | | | | | | | | | |
Unsec’d. Notes, 144A | | Ba1 | | 5.375% | | | 11/04/16 | | | $ | 475 | | | $ | 507,371 | |
Gazprom OAO Via Gazprom International SA (Luxembourg), | | | | | | | | | | | | | | | | |
Sr. Unsec’d. Notes, 144A | | BBB+(c) | | 7.201 | | | 02/01/20 | | | | 528 | | | | 591,141 | |
KazMunayGas National Co. (Kazakhstan), | | | | | | | | | | | | | | | | |
Sr. Unsec’d. Notes, 144A, MTN | | Baa3 | | 11.750 | | | 01/23/15 | | | | 310 | | | | 371,746 | |
Korea Development Bank (The) (South Korea), | | | | | | | | | | | | | | | | |
Sr. Unsec’d. Notes | | Aa3 | | 3.500 | | | 08/22/17 | | | | 260 | | | | 278,797 | |
Sr. Unsec’d. Notes, Ser. E, MTN | | Aa3 | | 2.150 | | | 08/06/13 | | | HKD | 1,000 | | | | 129,449 | |
Korea Finance Corp. (South Korea), | | | | | | | | | | | | | | | | |
Sr. Unsec’d. Notes, Ser. E, MTN, RegS | | Aa3 | | 1.600 | | | 12/28/12 | | | SGD | 500 | | | | 409,959 | |
Korea Hydro & Nuclear Power Co. Ltd. (South Korea), | | | | | | | | | | | | | | | | |
Sr. Unsec’d. Notes, 144A(e) | | A1 | | 3.000 | | | 09/19/22 | | | | 350 | | | | 350,409 | |
Sr. Unsec’d. Notes, RegS | | A1 | | 3.125 | | | 09/16/15 | | | | 500 | | | | 523,045 | |
Sr. Unsec’d. Notes, 144A, MTN | | A1 | | 6.250 | | | 06/17/14 | | | | 100 | | | | 107,749 | |
Majapahit Holding BV (Netherlands), | | | | | | | | | | | | | | | | |
Gtd. Notes, 144A | | Baa3 | | 7.750 | | | 10/17/16 | | | | 200 | | | | 238,000 | |
Gtd. Notes, RegS | | Baa3 | | 7.750 | | | 10/17/16 | | | | 413 | | | | 491,470 | |
National Agricultural Cooperative Federation (South Korea), | | | | | | | | | | | | | | | | |
Sr. Unsec’d. Notes, 144A, MTN | | A1 | | 3.500 | | | 02/08/17 | | | | 200 | | | | 211,219 | |
Petroleos Mexicanos (Mexico), | | | | | | | | | | | | | | | | |
Gtd. Notes | | Baa1 | | 4.875 | | | 01/24/22 | | | | 50 | | | | 56,000 | |
See Notes to Financial Statements.
| | |
| 46 | | Visit our website at www.prudentialfunds.com |
| | | | | | | | | | | | | | | | |
| Description | | Moody’s
Ratings†
(Unaudited) | | Interest
Rate | | Maturity
Date | | | Principal
Amount (000)# | | | Value (Note 1) | |
NON-CORPORATE FOREIGN AGENCIES (Continued) | |
Petroleos de Venezuela SA (Venezuela), | | | | | | | | | | | | | | | | |
Sr. Unsec’d. Notes, Ser. 2014 | | NR | | 4.900% | | | 10/28/14 | | | $ | 200 | | | $ | 185,500 | |
Power Sector Assets & Liabilities Management Corp. (Philippines), | | | | | | | | | | | | | | | | |
Gov’t. Gtd. Notes, RegS | | Ba1 | | 7.390 | | | 12/02/24 | | | | 200 | | | | 280,500 | |
RSHB Capital SA For OJSC Russian Agricultural Bank (Luxembourg), | | | | | | | | | | | | | | | | |
Sr. Unsec’d. Notes, 144A | | Baa1 | | 6.299 | | | 05/15/17 | | | | 175 | | | | 194,049 | |
Sr. Unsec’d. Notes, 144A | | Baa1 | | 7.750 | | | 05/29/18 | | | | 285 | | | | 339,804 | |
State Bank of India (India), | | | | | | | | | | | | | | | | |
Sr. Unsec’d. Notes, RegS, MTN | | Baa2 | | 4.500 | | | 11/30/15 | | | EUR | 300 | | | | 404,883 | |
VTB Bank OJSC Via VTB Capital SA (Luxembourg), | | | | | | | | | | | | | | | | |
Sr. Unsec’d. Notes, 144A | | Baa1 | | 6.875 | | | 05/29/18 | | | | 475 | | | | 512,458 | |
| | | | | | | | | | | | | | | | |
TOTAL NON-CORPORATE FOREIGN AGENCIES
(cost $6,140,620) | | | | | | | | | | | | | | | 6,257,065 | |
| | | | | | | | | | | | | | | | |
| | | | | |
SOVEREIGNS 4.6% | | | | | | | | | | | | | | | | |
Belgium Government International Bond (Belgium), | | | | | | | | | | | | | | | | |
Sr. Unsec’d. Notes, Ser. E, MTN | | NR | | 2.750 | | | 03/05/15 | | | | 70 | | | | 72,958 | |
Brazilian Government International Bond (Brazil), | | | | | | | | | | | | | | | | |
Sr. Unsec’d. Notes | | Baa2 | | 4.875 | | | 01/22/21 | | | | 175 | | | | 209,563 | |
Sr. Unsec’d. Notes | | Baa2 | | 7.375 | | | 02/03/15 | | | EUR | 50 | | | | 74,172 | |
Unsec’d. Notes | | Baa2 | | 11.000 | | | 06/26/17 | | | EUR | 420 | | | | 765,725 | |
See Notes to Financial Statements.
| | | | |
| Prudential Absolute Return Bond Fund | | | 47 | |
Portfolio of Investments
as of October 31, 2012 continued
| | | | | | | | | | | | | | | | |
| Description | | Moody’s
Ratings†
(Unaudited) | | Interest
Rate | | Maturity
Date | | | Principal
Amount (000)# | | | Value (Note 1) | |
SOVEREIGNS (Continued) | | | | | | | | | | | | | | | | |
Indonesia Government International Bond (Indonesia), | | | | | | | | | | | | | | | | |
Sr. Unsec’d. Notes, 144A | | Baa3 | | 3.750% | | | 04/25/22 | | | $ | 200 | | | $ | 211,500 | |
Sr. Unsec’d. Notes, RegS | | Baa3 | | 6.750 | | | 03/10/14 | | | | 200 | | | | 213,500 | |
Ireland Government Bond (Ireland), | | | | | | | | | | | | | | | | |
Bonds | | Ba1 | | 4.500 | | | 04/18/20 | | | EUR | 320 | | | | 410,452 | |
Bonds | | Ba1 | | 5.900 | | | 10/18/19 | | | EUR | 150 | | | | 209,788 | |
Sr. Unsub. Bonds | | Ba1 | | 4.400 | | | 06/18/19 | | | EUR | 30 | | | | 38,670 | |
Italy Buoni Poliennali del Tesoro (Italy), | | | | | | | | | | | | | | | | |
Bonds | | Baa2 | | 4.750 | | | 05/01/17 | | | EUR | 225 | | | | 304,494 | |
Bonds | | Baa2 | | 6.500 | | | 11/01/27 | | | EUR | 310 | | | | 447,949 | |
Italy Government International Bond (Italy),
Sr. Unsec’d. Notes, RegS | | Baa2 | | 3.450 | | | 03/24/17 | | | JPY | 5,000 | | | | 60,659 | |
Sr. Unsec’d. Notes | | Baa2 | | 4.500 | | | 06/08/15 | | | JPY | 40,000 | | | | 512,476 | |
Unsec’d. Notes | | NR | | 4.375 | | | 06/15/13 | | | | 50 | | | | 50,935 | |
Mexico Government International Bond (Mexico),
Sr. Unsec’d. Notes, Ser. G, MTN | | Baa1 | | 4.250 | | | 06/16/15 | | | EUR | 50 | | | | 70,199 | |
Sr. Unsec’d. Notes, Ser. G, MTN | | Baa1 | | 4.250 | | | 07/14/17 | | | EUR | 550 | | | | 786,305 | |
Sr. Unsec’d. Notes, Ser. G, MTN | | Baa1 | | 5.500 | | | 02/17/20 | | | EUR | 300 | | | | 463,792 | |
Peruvian Government International Bond (Peru),
Sr. Unsec’d. Notes, RegS | | Baa2 | | 7.500 | | | 10/14/14 | | | EUR | 250 | | | | 364,540 | |
Philippine Government International Bond (Philippines), Sr. Unsec’d. Notes | | Ba1 | | 6.250 | | | 03/15/16 | | | EUR | 130 | | | | 189,467 | |
Sr. Unsec’d. Notes | | Ba1 | | 8.000 | | | 01/15/16 | | | | 300 | | | | 361,875 | |
See Notes to Financial Statements.
| | |
| 48 | | Visit our website at www.prudentialfunds.com |
| | | | | | | | | | | | | | | | |
| Description | | Moody’s
Ratings†
(Unaudited) | | Interest
Rate | | Maturity
Date | | | Principal
Amount (000)# | | | Value (Note 1) | |
SOVEREIGNS (Continued) | | | | | | | | | | | | | | | | |
Poland Government International Bond (Poland),
Sr. Unsec’d. Notes | | A2 | | 3.000% | | | 03/17/23 | | | $ | 625 | | | $ | 615,988 | |
Portugal Obrigacoes Do Tesouro OT (Portugal),
Sr. Unsec’d. Notes | | Ba3 | | 3.850 | | | 04/15/21 | | | EUR | 120 | | | | 116,233 | |
Sr. Unsec’d. Notes | | Ba3 | | 4.100 | | | 04/15/37 | | | EUR | 55 | | | | 43,734 | |
Sr. Unsec’d. Notes | | Ba3 | | 4.750 | | | 06/14/19 | | | EUR | 340 | | | | 368,795 | |
Sr. Unsec’d. Notes | | Ba3 | | 4.800 | | | 06/15/20 | | | EUR | 50 | | | | 52,656 | |
South Africa Government Bond (South Africa),
Bonds, Ser. R214 | | Baa1 | | 6.500 | | | 02/28/41 | | | ZAR | 1,670 | | | | 150,865 | |
South Africa Government International Bond (South Africa),
Unsec’d. Notes, Ser. E, MTN | | Baa1 | | 4.500 | | | 04/05/16 | | | EUR | 250 | | | | 350,769 | |
Spain Government Bond (Spain), Bonds | | Baa3 | | 4.250 | | | 10/31/16 | | | EUR | 345 | | | | 448,555 | |
Sr. Unsub. Notes | | Baa3 | | 4.700 | | | 07/30/41 | | | EUR | 50 | | | | 50,748 | |
Sr. Unsub. Notes | | Baa3 | | 5.850 | | | 01/31/22 | | | EUR | 220 | | | | 289,391 | |
Spain Government International Bond (Spain),
Sr. Unsec’d. Notes, Ser. E, MTN | | Baa3 | | 3.625 | | | 06/17/13 | | | | 700 | | | | 699,791 | |
Turkey Government Bond (Turkey), Bonds(g) | | BBB-(c) | | 6.510 | | | 07/17/13 | | | TRY | 400 | | | | 213,168 | |
| | | | | | | | | | | | | | | | |
TOTAL SOVEREIGNS
(cost $8,992,076) | | | | | | | | | | | | | | | 9,219,712 | |
| | | | | | | | | | | | | | | | |
|
U.S. GOVERNMENT AGENCY OBLIGATIONS 1.9% | |
Federal Home Loan Mortgage Corp. | | | | 1.250 | | | 10/02/19 | | | | 745 | | | | 742,929 | |
Federal Home Loan Mortgage Corp. | | | | 2.375 | | | 01/13/22 | | | | 2,000 | | | | 2,096,035 | |
Federal National Mortgage Association | | | | 0.875 | | | 12/20/17 | | | | 1,100 | | | | 1,099,198 | |
| | | | | | | | | | | | | | | | |
TOTAL U.S. GOVERNMENT AGENCY OBLIGATIONS
(cost $3,898,963) | | | | | | | | | | | | | | | 3,938,162 | |
| | | | | | | | | | | | | | | | |
See Notes to Financial Statements.
| | | | |
| Prudential Absolute Return Bond Fund | | | 49 | |
Portfolio of Investments
as of October 31, 2012 continued
| | | | | | | | | | | | | | | | |
| Description | | Moody’s
Ratings†
(Unaudited) | | Interest
Rate | | Maturity
Date | | | Principal
Amount (000)# | | | Value (Note 1) | |
U.S. TREASURY OBLIGATIONS 3.4% | | | | | |
U.S. Treasury Bonds(h) | | | | 5.500% | | | 08/15/28 | | | $ | 4,000 | | | $ | 5,706,247 | |
U.S. Treasury Notes | | | | 0.250 | | | 10/15/15 | | | | 185 | | | | 184,292 | |
U.S. Treasury Notes | | | | 0.625 | | | 09/30/17 | | | | 30 | | | | 29,895 | |
U.S. Treasury Notes(i) | | | | 0.750 | | | 12/15/13 | | | | 1,000 | | | | 1,005,820 | |
U.S. Treasury Notes | | | | 1.000 | | | 09/30/19 | | | | 15 | | | | 14,884 | |
| | | | | | | | | | | | | | | | |
TOTAL U.S. TREASURY OBLIGATIONS
(cost $6,873,763) | | | | | | | | | | | | | | | 6,941,138 | |
| | | | | | | | | | | | | | | | |
TOTAL LONG-TERM INVESTMENTS
(cost $174,338,710) | | | | | | | | | | | | | | | 176,513,530 | |
| | | | | | | | | | | | | | | | |
| |
SHORT-TERM INVESTMENTS 18.4% | | | | | |
| | | | | |
SOVEREIGN 0.4% | | | | | | | | | | | | | | | | |
Bank of Thailand(j)
(cost $793,127) | | NR | | 2.910 | | | 11/01/12 | | | THB | 25,000 | | | | 815,595 | |
| | | | | | | | | | | | | | | | |
| | | | | |
| | | | | | | | | | Shares | | | | |
AFFILIATED MONEY MARKET MUTUAL FUND 18.0% | | | | | |
Prudential Investment Portfolios 2 -
Prudential Core Taxable
Money Market Fund(k)
(cost $36,446,800) | | | | | | | 36,446,800 | | | | 36,446,800 | |
| | | | | | | | | | | | |
TOTAL SHORT-TERM INVESTMENTS
(cost $37,239,927) | | | | | | | | | | | 37,262,395 | |
| | | | | | | | | | | | |
TOTAL INVESTMENTS 105.7%
(cost $211,578,637; Note 5) | | | | | | | | | | | 213,775,925 | |
Liabilities in excess of other assets(l) (5.7)% | | | | | | | | | | | (11,452,751 | ) |
| | | | | | | | | | | | |
NET ASSETS 100.0% | | | | | | | | | | $ | 202,323,174 | |
| | | | | | | | | | | | | | | | |
See Notes to Financial Statements.
| | |
| 50 | | Visit our website at www.prudentialfunds.com |
| The | following abbreviations are used in portfolio descriptions: |
144A—Security was purchased pursuant to Rule 144A under the Securities Act of 1933 and may not be resold subject to that rule except to qualified institutional buyers. Unless otherwise noted, 144A securities are deemed to be liquid.
RegS—Regulation S. Security was purchased pursuant to Regulation S and may not be offered, sold or delivered within the United States or to, or for the account or benefit of, U.S. persons, except pursuant to an exemption from, or in a transaction not subject to, the registration requirements of the Securities Act of 1933.
ABS—Asset-Backed Security
AUD—Australian Dollar
BABs—Build America Bonds
BBR—New Zealand Bank Bill Rate
BRL—Brazilian Real
BTP—Buoni del Tesoro Poliennali — Long Term Italian fixed-rate Treasury Bonds and Notes
BZDIOVER—Brazil Cetip Interbank Deposit Overnight Rate
CAD—Canadian Dollar
CDO—Collateralized Debt Obligation
CLO—Collateralized Loan Obligation
CLP—Chilean Peso
CNY—Chinese Yuan Renminbi
CZK—Czech Koruna
EUR—Euro
EURIBOR—Euro Interbank Offered Rate
FHLMC—Federal Home Loan Mortgage Corporation
GBP—British Pound
GO—General Obligation
HKD—Hong Kong Dollar
HUF—Hungarian Forint
INR—Indian Rupee
IO—Interest Only
JPY—Japanese Yen
KRW—South Korean Won
LIBOR—London Interbank Offered Rate
MTN—Medium Term Note
MXN—Mexican Peso
MYR—Malaysian Ringgit
NA—Not Applicable
NOK—Norwegian Krone
NR—Not Rated by Moody’s or Standard & Poor’s
NZD—New Zealand Dollar
PEN—Peruvian Nuevo Sol
PHP—Philippine Peso
PLN—Polish Zloty
RUB—Russian Ruble
SEK—Swedish Krona
See Notes to Financial Statements.
| | | | |
| Prudential Absolute Return Bond Fund | | | 51 | |
Portfolio of Investments
as of October 31, 2012 continued
SGD—Singapore Dollar
TBA—To Be Announced
THB—Thailand Baht
TRY—Turkish Lira
TWD—Taiwan Dollar
ZAR—South African Rand
| † | The ratings reflected are as of October 31, 2012. Ratings of certain bonds may have changed subsequent to that date. The Fund’s current Statement of Additional Information contains a description of Moody’s and Standard & Poor’s ratings. |
| # | Principal amount is shown in U.S. dollars unless otherwise stated. |
| (a) | Variable rate instrument. The interest rate shown reflects the rate in effect at October 31, 2012. |
| (b) | New issue security. Variable rate in effect upon settlement. |
| (c) | Standard & Poor’s Rating. |
| (d) | Represents step coupon bond. Rate shown reflects the current coupon at October 31, 2012. |
| (e) | Indicates a security that has been deemed illiquid. |
| (f) | Indicates a restricted security; the aggregate original cost of such securities is $2,948,307. The aggregate value of $2,956,566 is approximately 1.5% of net assets. |
| (g) | Represents zero coupon bond. Rate shown reflects the effective yield on October 31, 2012. |
| (h) | Represents security, or a portion thereof, segregated as collateral for swap agreements. |
| (i) | Represents security, or a portion thereof, segregated as collateral for futures contracts. |
| (j) | Rate quoted represents yield-to-maturity as of purchase date. |
| (k) | Prudential Investments LLC, the manager of the Fund, also serves as manager of the Prudential Investment Portfolios 2 - Prudential Core Taxable Money Market Fund. |
| (l) | Includes net unrealized appreciation (depreciation) on the following derivative contracts held at reporting period end: |
Open futures contracts outstanding at October 31, 2012:
| | | | | | | | | | | | | | | | | | | | |
Number of
Contracts | | | Type | | Expiration
Date | | | Value at
Trade
Date | | | Value at
October 31,
2012 | | | Unrealized
Appreciation/
(Depreciation) | |
| | | | Long Positions: | | | | | | | | | | | | | | | | |
| | 2 | | | Euro-BTP Italian Government Bond | | | Dec. 2012 | | | $ | 257,037 | | | $ | 278,826 | | | $ | 21,789 | |
| | 74 | | | 5 Year U.S. Treasury Notes | | | Dec. 2012 | | | | 9,191,948 | | | | 9,194,500 | | | | 2,552 | |
| | 18 | | | U.S. Long Bond | | | Dec. 2012 | | | | 2,670,540 | | | | 2,687,625 | | | | 17,085 | |
| | 1 | | | U.S. Long Bond | | | Mar. 2013 | | | | 145,221 | | | | 147,937 | | | | 2,716 | |
| | | | | | | | | | | | | | | | | | | | |
| | | | | | | | | | | | | | | | | | | 44,142 | |
| | | | | | | | | | | | | | | | | | | | |
| | | | Short Positions: | | | | | | | | | | | | | | | | |
| | 30 | | | 2 Year U.S. Treasury Notes | | | Dec. 2012 | | | | 6,613,886 | | | | 6,609,844 | | | | 4,042 | |
| | 16 | | | 10 Year U.S. Treasury Notes | | | Dec. 2012 | | | | 2,132,808 | | | | 2,128,500 | | | | 4,308 | |
| | 30 | | | U.S. Ultra Bond | | | Dec. 2012 | | | | 4,884,276 | | | | 4,952,812 | | | | (68,536 | ) |
| | | | | | | | | | | | | | | | | | | | |
| | | | | | | | | | | | | | | | | | | (60,186 | ) |
| | | | | | | | | | | | | | | | | | | | |
| | | | | | | | | | | | | | | | | | $ | (16,044 | ) |
| | | | | | | | | | | | | | | | | | | | |
See Notes to Financial Statements.
| | |
| 52 | | Visit our website at www.prudentialfunds.com |
Forward foreign currency exchange contracts outstanding at October 31, 2012:
| | | | | | | | | | | | | | | | | | |
Purchase Contracts | | Counterparty | | Notional
Amount | | | Value at
Settlement
Date
Payable | | | Value at
October 31,
2012 | | | Unrealized
Appreciation/
(Depreciation) | |
Australian Dollar | | | | | | | | | | | | | | | | | | |
Expiring 01/23/13 | | Citibank NA | | AUD | 190,280 | | | $ | 196,100 | | | $ | 196,166 | | | $ | 66 | |
Expiring 01/23/13 | | HSBC Bank USA NA | | AUD | 192,379 | | | | 198,300 | | | | 198,330 | | | | 30 | |
Expiring 01/23/13 | | JPMorgan Chase Securities | | AUD | 253,607 | | | | 261,200 | | | | 261,452 | | | | 252 | |
Expiring 01/23/13 | | JPMorgan Chase Securities | | AUD | 194,928 | | | | 201,200 | | | | 200,958 | | | | (242 | ) |
Expiring 01/23/13 | | JPMorgan Chase Securities | | AUD | 192,330 | | | | 198,300 | | | | 198,280 | | | | (20 | ) |
Expiring 01/23/13 | | JPMorgan Chase Securities | | AUD | 160,285 | | | | 163,400 | | | | 165,244 | | | | 1,844 | |
Expiring 01/23/13 | | Morgan Stanley | | AUD | 192,620 | | | | 200,400 | | | | 198,579 | | | | (1,821 | ) |
Expiring 01/23/13 | | Morgan Stanley | | AUD | 177,721 | | | | 182,600 | | | | 183,218 | | | | 618 | |
Expiring 01/23/13 | | UBS AG | | AUD | 229,032 | | | | 237,000 | | | | 236,117 | | | | (883 | ) |
Brazilian Real | | | | | | | | | | | | | | | | | | |
Expiring 11/26/12 | | Citibank NA | | BRL | 493,219 | | | | 237,296 | | | | 241,968 | | | | 4,672 | |
Expiring 01/18/13 | | Citibank NA | | BRL | 345,718 | | | | 167,800 | | | | 168,348 | | | | 548 | |
British Pound | | | | | | | | | | | | | | | | | | |
Expiring 01/25/13 | | Citibank NA | | GBP | 227,758 | | | | 365,100 | | | | 367,440 | | | | 2,340 | |
Expiring 01/25/13 | | Deutsche Bank AG | | GBP | 227,269 | | | | 366,600 | | | | 366,652 | | | | 52 | |
Expiring 01/25/13 | | JPMorgan Chase Securities | | GBP | 160,407 | | | | 259,696 | | | | 258,783 | | | | (913 | ) |
Canadian Dollar | | | | | | | | | | | | | | | | | | |
Expiring 01/22/13 | | Citibank NA | | CAD | 180,394 | | | | 181,600 | | | | 180,290 | | | | (1,310 | ) |
Expiring 01/22/13 | | Citibank NA | | CAD | 145,566 | | | | 149,000 | | | | 145,483 | | | | (3,517 | ) |
Expiring 01/22/13 | | Citibank NA | | CAD | 145,167 | | | | 147,400 | | | | 145,084 | | | | (2,316 | ) |
Expiring 01/22/13 | | Citibank NA | | CAD | 43,033 | | | | 43,700 | | | | 43,008 | | | | (692 | ) |
Expiring 01/22/13 | | JPMorgan Chase Securities | | CAD | 655,502 | | | | 671,163 | | | | 655,126 | | | | (16,037 | ) |
Expiring 01/22/13 | | JPMorgan Chase Securities | | CAD | 181,289 | | | | 182,600 | | | | 181,185 | | | | (1,415 | ) |
Expiring 01/22/13 | | Morgan Stanley | | CAD | 230,359 | | | | 235,000 | | | | 230,227 | | | | (4,773 | ) |
Chilean Peso | | | | | | | | | | | | | | | | | | |
Expiring 11/19/12 | | Citibank NA | | CLP | 195,344,857 | | | | 401,366 | | | | 404,878 | | | | 3,512 | |
Expiring 11/19/12 | | Citibank NA | | CLP | 160,085,700 | | | | 337,200 | | | | 331,799 | | | | (5,401 | ) |
Chinese Yuan Renminbi | | | | | | | | | | | | | | | | | | |
Expiring 03/12/13 | | UBS AG | | CNY | 3,410,954 | | | | 534,800 | | | | 540,585 | | | | 5,785 | |
Expiring 03/20/13 | | Citibank NA | | CNY | 3,870,941 | | | | 612,200 | | | | 613,156 | | | | 956 | |
Expiring 03/20/13 | | UBS AG | | CNY | 1,161,014 | | | | 183,400 | | | | 183,904 | | | | 504 | |
Expiring 10/29/13 | | UBS AG | | CNY | 3,139,506 | | | | 494,800 | | | | 491,435 | | | | (3,365 | ) |
Czech Koruna | | | | | | | | | | | | | | | | | | |
Expiring 01/24/13 | | Citibank NA | | CZK | 6,491,201 | | | | 338,937 | | | | 335,469 | | | | (3,468 | ) |
Expiring 01/24/13 | | Citibank NA | | CZK | 2,821,602 | | | | 147,400 | | | | 145,822 | | | | (1,578 | ) |
Expiring 01/24/13 | | Citibank NA | | CZK | 2,542,962 | | | | 133,600 | | | | 131,422 | | | | (2,178 | ) |
Expiring 01/24/13 | | Credit Suisse International | | CZK | 3,246,203 | | | | 171,700 | | | | 167,766 | | | | (3,934 | ) |
Expiring 01/24/13 | | JPMorgan Chase Securities | | CZK | 3,238,396 | | | | 170,100 | | | | 167,362 | | | | (2,738 | ) |
See Notes to Financial Statements.
| | | | |
| Prudential Absolute Return Bond Fund | | | 53 | |
Portfolio of Investments
as of October 31, 2012 continued
| | | | | | | | | | | | | | | | | | |
Purchase Contracts | | Counterparty | | Notional
Amount | | | Value at
Settlement
Date
Payable | | | Value at
October 31,
2012 | | | Unrealized
Appreciation/
(Depreciation) | |
Euro | | | | | | | | | | | | | | | | | | |
Expiring 01/24/13 | | Citibank NA | | EUR | 170,500 | | | $ | 220,554 | | | $ | 221,191 | | | $ | 637 | |
Expiring 01/25/13 | | HSBC Bank USA NA | | EUR | 198,046 | | | | 257,800 | | | | 256,928 | | | | (872 | ) |
Expiring 01/25/13 | | JPMorgan Chase Securities | | EUR | 199,136 | | | | 261,200 | | | | 258,343 | | | | (2,857 | ) |
Expiring 01/25/13 | | JPMorgan Chase Securities | | EUR | 11,280 | | | | 14,600 | | | | 14,633 | | | | 33 | |
Hungarian Forint | | | | | | | | | | | | | | | | | | |
Expiring 01/24/13 | | Barclays Bank PLC | | HUF | 36,711,220 | | | | 170,100 | | | | 166,143 | | | | (3,957 | ) |
Expiring 01/24/13 | | Citibank NA | | HUF | 39,194,212 | | | | 178,800 | | | | 177,380 | | | | (1,420 | ) |
Indian Rupee | | | | | | | | | | | | | | | | | | |
Expiring 01/07/13 | | Citibank NA | | INR | 2,893,376 | | | | 54,300 | | | | 53,095 | | | | (1,205 | ) |
Expiring 01/07/13 | | Citibank NA | | INR | 1,919,181 | | | | 36,300 | | | | 35,218 | | | | (1,082 | ) |
Expiring 01/07/13 | | UBS AG | | INR | 4,688,100 | | | | 90,000 | | | | 86,029 | | | | (3,971 | ) |
Expiring 01/07/13 | | UBS AG | | INR | 3,885,402 | | | | 72,300 | | | | 71,299 | | | | (1,001 | ) |
Expiring 01/07/13 | | UBS AG | | INR | 3,134,016 | | | | 57,600 | | | | 57,511 | | | | (89 | ) |
Expiring 01/14/13 | | UBS AG | | INR | 9,726,238 | | | | 179,600 | | | | 178,260 | | | | (1,340 | ) |
Japanese Yen | | | | | | | | | | | | | | | | | | |
Expiring 01/25/13 | | Citibank NA | | JPY | 3,060,698 | | | | 39,400 | | | | 38,375 | | | | (1,025 | ) |
Expiring 01/25/13 | | JPMorgan Chase Securities | | JPY | 2,083,721 | | | | 26,700 | | | | 26,126 | | | | (574 | ) |
Malaysian Ringgit | | | | | | | | | | | | | | | | | | |
Expiring 12/10/12 | | Citibank NA | | MYR | 522,535 | | | | 171,700 | | | | 171,025 | | | | (675 | ) |
Expiring 12/10/12 | | Citibank NA | | MYR | 314,707 | | | | 100,900 | | | | 103,003 | | | | 2,103 | |
Expiring 12/10/12 | | UBS AG | | MYR | 2,743,606 | | | | 898,100 | | | | 897,978 | | | | (122 | ) |
Expiring 12/10/12 | | UBS AG | | MYR | 1,194,811 | | | | 391,100 | | | | 391,060 | | | | (40 | ) |
Expiring 12/10/12 | | UBS AG | | MYR | 652,127 | | | | 210,700 | | | | 213,440 | | | | 2,740 | |
Expiring 12/10/12 | | UBS AG | | MYR | 354,693 | | | | 113,100 | | | | 116,090 | | | | 2,990 | |
Expiring 12/10/12 | | UBS AG | | MYR | 270,172 | | | | 86,900 | | | | 88,427 | | | | 1,527 | |
Expiring 12/10/12 | | UBS AG | | MYR | 216,691 | | | | 68,400 | | | | 70,923 | | | | 2,523 | |
Expiring 12/10/12 | | UBS AG | | MYR | 204,129 | | | | 63,900 | | | | 66,811 | | | | 2,911 | |
Expiring 12/10/12 | | UBS AG | | MYR | 204,120 | | | | 64,300 | | | | 66,808 | | | | 2,508 | |
Expiring 12/10/12 | | UBS AG | | MYR | 171,875 | | | | 54,900 | | | | 56,255 | | | | 1,355 | |
Mexican Peso | | | | | | | | | | | | | | | | | | |
Expiring 01/22/13 | | Citibank NA | | MXN | 9,900,000 | | | | 758,698 | | | | 749,588 | | | | (9,110 | ) |
Expiring 01/22/13 | | Citibank NA | | MXN | 2,607,676 | | | | 198,300 | | | | 197,443 | | | | (857 | ) |
Expiring 01/22/13 | | Citibank NA | | MXN | 31,884,405 | | | | 145,500 | | | | 142,680 | | | | (2,820 | ) |
Expiring 01/22/13 | | Citibank NA | | MXN | 652,064 | | | | 50,400 | | | | 49,372 | | | | (1,028 | ) |
Expiring 01/22/13 | | Citibank NA | | MXN | 300,487 | | | | 23,168 | | | | 22,752 | | | | (416 | ) |
Expiring 01/22/13 | | Citibank NA | | MXN | 5,809 | | | | 446 | | | | 440 | | | | (6 | ) |
Expiring 01/22/13 | | JPMorgan Chase Securities | | MXN | 3,225,596 | | | | 248,200 | | | | 244,229 | | | | (3,971 | ) |
See Notes to Financial Statements.
| | |
| 54 | | Visit our website at www.prudentialfunds.com |
| | | | | | | | | | | | | | | | | | |
Purchase Contracts | | Counterparty | | Notional
Amount | | | Value at
Settlement
Date
Payable | | | Value at
October 31,
2012 | | | Unrealized
Appreciation/
(Depreciation) | |
New Zealand Dollar | | | | | | | | | | | | | | | | | | |
Expiring 01/23/13 | | Citibank NA | | NZD | 225,282 | | | $ | 182,600 | | | $ | 184,229 | | | $ | 1,629 | |
Expiring 01/23/13 | | Citibank NA | | NZD | 176,804 | | | | 145,500 | | | | 144,585 | | | | (915 | ) |
Expiring 01/23/13 | | HSBC Bank USA NA | | NZD | 242,506 | | | | 198,300 | | | | 198,314 | | | | 14 | |
Expiring 01/23/13 | | JPMorgan Chase Securities | | NZD | 242,349 | | | | 198,300 | | | | 198,186 | | | | (114 | ) |
Expiring 01/23/13 | | JPMorgan Chase Securities | | NZD | 223,791 | | | | 183,300 | | | | 183,010 | | | | (290 | ) |
Expiring 01/23/13 | | UBS AG | | NZD | 509,880 | | | | 418,524 | | | | 416,965 | | | | (1,559 | ) |
Expiring 01/23/13 | | UBS AG | | NZD | 320,309 | | | | 261,200 | | | | 261,939 | | | | 739 | |
Norwegian Krone | | | | | | | | | | | | | | | | | | |
Expiring 01/24/13 | | Barclays Bank PLC | | NOK | 3,203,343 | | | | 556,523 | | | | 560,059 | | | | 3,536 | |
Expiring 01/24/13 | | Barclays Bank PLC | | NOK | 1,272,161 | | | | 220,513 | | | | 222,419 | | | | 1,906 | |
Expiring 01/24/13 | | Citibank NA | | NOK | 1,132,105 | | | | 198,300 | | | | 197,933 | | | | (367 | ) |
Expiring 01/24/13 | | Citibank NA | | NOK | 970,655 | | | | 171,700 | | | | 169,705 | | | | (1,995 | ) |
Expiring 01/24/13 | | Credit Suisse International | | NOK | 1,134,273 | | | | 198,300 | | | | 198,311 | | | | 11 | |
Expiring 01/24/13 | | JPMorgan Chase Securities | | NOK | 757,978 | | | | 132,400 | | | | 132,522 | | | | 122 | |
Expiring 01/24/13 | | JPMorgan Chase Securities | | NOK | 670,097 | | | | 116,400 | | | | 117,157 | | | | 757 | |
Expiring 01/24/13 | | UBS AG | | NOK | 967,555 | | | | 170,100 | | | | 169,163 | | | | (937 | ) |
Peruvian Nuevo Sol | | | | | | | | | | | | | | | | | | |
Expiring 12/06/12 | | Citibank NA | | PEN | 739,498 | | | | 285,300 | | | | 284,722 | | | | (578 | ) |
Expiring 12/06/12 | | Citibank NA | | PEN | 547,470 | | | | 208,640 | | | | 210,788 | | | | 2,148 | |
Philippine Peso | | | | | | | | | | | | | | | | | | |
Expiring 11/05/12 | | UBS AG | | PHP | 8,127,924 | | | | 193,200 | | | | 197,291 | | | | 4,091 | |
Expiring 11/05/12 | | UBS AG | | PHP | 7,028,852 | | | | 166,245 | | | | 170,613 | | | | 4,368 | |
Expiring 11/05/12 | | UBS AG | | PHP | 6,575,385 | | | | 157,400 | | | | 159,606 | | | | 2,206 | |
Expiring 11/05/12 | | UBS AG | | PHP | 5,496,360 | | | | 130,400 | | | | 133,414 | | | | 3,014 | |
Expiring 11/05/12 | | UBS AG | | PHP | 4,199,482 | | | | 100,200 | | | | 101,935 | | | | 1,735 | |
Expiring 01/22/13 | | JPMorgan Chase Securities | | PHP | 21,081,261 | | | | 510,999 | | | | 511,345 | | | | 346 | |
Expiring 03/18/13 | | UBS AG | | PHP | 24,474,624 | | | | 595,200 | | | | 593,363 | | | | (1,837 | ) |
Polish Zloty | | | | | | | | | | | | | | | | | | |
Expiring 01/24/13 | | Citibank NA | | PLN | 1,166,893 | | | | 363,800 | | | | 361,953 | | | | (1,847 | ) |
Expiring 01/24/13 | | Citibank NA | | PLN | 754,250 | | | | 238,100 | | | | 233,957 | | | | (4,143 | ) |
Expiring 01/24/13 | | Citibank NA | | PLN | 703,884 | | | | 221,100 | | | | 218,335 | | | | (2,765 | ) |
Expiring 01/24/13 | | Citibank NA | | PLN | 429,288 | | | | 133,600 | | | | 133,159 | | | | (441 | ) |
Expiring 01/24/13 | | UBS AG | | PLN | 1,090,389 | | | | 338,766 | | | | 338,223 | | | | (543 | ) |
Russian Ruble | | | | | | | | | | | | | | | | | | |
Expiring 12/27/12 | | Citibank NA | | RUB | 3,033,950 | | | | 91,200 | | | | 95,705 | | | | 4,505 | |
Expiring 03/25/13 | | Citibank NA | | RUB | 10,229,508 | | | | 323,100 | | | | 318,413 | | | | (4,687 | ) |
Expiring 03/25/13 | | Citibank NA | | RUB | 6,378,331 | | | | 200,400 | | | | 198,538 | | | | (1,862 | ) |
Expiring 03/25/13 | | Citibank NA | | RUB | 5,411,469 | | | | 171,700 | | | | 168,442 | | | | (3,258 | ) |
Expiring 03/25/13 | | Citibank NA | | RUB | 4,690,415 | | | | 147,400 | | | | 145,998 | | | | (1,402 | ) |
Expiring 03/25/13 | | Citibank NA | | RUB | 4,303,445 | | | | 134,900 | | | | 133,953 | | | | (947 | ) |
Expiring 03/25/13 | | Citibank NA | | RUB | 4,289,189 | | | | 134,100 | | | | 133,509 | | | | (591 | ) |
See Notes to Financial Statements.
| | | | |
| Prudential Absolute Return Bond Fund | | | 55 | |
Portfolio of Investments
as of October 31, 2012 continued
| | | | | | | | | | | | | | | | | | |
Purchase Contracts | | Counterparty | | Notional
Amount | | | Value at
Settlement
Date
Payable | | | Value at
October 31,
2012 | | | Unrealized
Appreciation/
(Depreciation) | |
Singapore Dollar | | | | | | | | | | | | | | | | | | |
Expiring 01/23/13 | | Citibank NA | | SGD | 180,936 | | | $ | 147,400 | | | $ | 148,332 | | | $ | 932 | |
Expiring 01/23/13 | | Citibank NA | | SGD | 71,516 | | | | 58,200 | | | | 58,629 | | | | 429 | |
Expiring 01/23/13 | | JPMorgan Chase Securities | | SGD | 866,058 | | | | 706,594 | | | | 709,995 | | | | 3,401 | |
Expiring 01/23/13 | | JPMorgan Chase Securities | | SGD | 241,922 | | | | 198,300 | | | | 198,328 | | | | 28 | |
Expiring 01/23/13 | | Morgan Stanley | | SGD | 504,947 | | | | 413,600 | | | | 413,956 | | | | 356 | |
South African Rand | | | | | | | | | | | | | | | | | | |
Expiring 01/30/13 | | Citibank NA | | ZAR | 1,123,078 | | | | 134,900 | | | | 127,738 | | | | (7,162 | ) |
Expiring 01/30/13 | | Citibank NA | | ZAR | 149,862 | | | | 17,000 | | | | 17,045 | | | | 45 | |
Expiring 01/30/13 | | JPMorgan Chase Securities | | ZAR | 1,129,372 | | | | 134,900 | | | | 128,454 | | | | (6,446 | ) |
South Korean Won | | | | | | | | | | | | | | | | | | |
Expiring 01/14/13 | | Citibank NA | | KRW | 283,171,800 | | | | 253,171 | | | | 258,592 | | | | 5,421 | |
Expiring 01/14/13 | | Citibank NA | | KRW | 165,486,850 | | | | 149,000 | | | | 151,123 | | | | 2,123 | |
Expiring 01/14/13 | | UBS AG | | KRW | 393,037,500 | | | | 352,500 | | | | 358,922 | | | | 6,422 | |
Expiring 03/18/13 | | UBS AG | | KRW | 258,951,500 | | | | 233,500 | | | | 235,782 | | | | 2,282 | |
Expiring 03/18/13 | | UBS AG | | KRW | 189,363,825 | | | | 170,100 | | | | 172,421 | | | | 2,321 | |
Swedish Krona | | | | | | | | | | | | | | | | | | |
Expiring 01/24/13 | | Barclays Bank PLC | | SEK | 3,406,723 | | | | 517,682 | | | | 512,324 | | | | (5,358 | ) |
Expiring 01/24/13 | | Citibank NA | | SEK | 1,311,628 | | | | 196,100 | | | | 197,251 | | | | 1,151 | |
Expiring 01/24/13 | | Citibank NA | | SEK | 979,201 | | | | 147,400 | | | | 147,258 | | | | (142 | ) |
Expiring 01/24/13 | | Citibank NA | | SEK | 898,458 | | | | 136,992 | | | | 135,115 | | | | (1,877 | ) |
Expiring 01/24/13 | | Credit Suisse International | | SEK | 1,317,505 | | | | 198,300 | | | | 198,134 | | | | (166 | ) |
Expiring 01/24/13 | | Morgan Stanley | | SEK | 824,814 | | | | 126,247 | | | | 124,041 | | | | (2,206 | ) |
Expiring 01/24/13 | | UBS AG | | SEK | 2,286,689 | | | | 348,200 | | | | 343,886 | | | | (4,314 | ) |
Expiring 01/24/13 | | UBS AG | | SEK | 2,032,342 | | | | 306,100 | | | | 305,636 | | | | (464 | ) |
Expiring 01/24/13 | | UBS AG | | SEK | 1,313,821 | | | | 198,300 | | | | 197,580 | | | | (720 | ) |
Taiwan Dollar | | | | | | | | | | | | | | | | | | |
Expiring 11/05/12 | | UBS AG | | TWD | 1,956,848 | | | | 65,600 | | | | 66,986 | | | | 1,386 | |
Expiring 03/12/13 | | UBS AG | | TWD | 6,291,869 | | | | 213,900 | | | | 215,567 | | | | 1,667 | |
Expiring 03/12/13 | | UBS AG | | TWD | 3,043,284 | | | | 103,700 | | | | 104,267 | | | | 567 | |
Thai Baht | | | | | | | | | | | | | | | | | | |
Expiring 11/30/12 | | Citibank NA | | THB | 7,615,145 | | | | 247,400 | | | | 247,961 | | | | 561 | |
Expiring 11/30/12 | | Citibank NA | | THB | 4,071,035 | | | | 132,400 | | | | 132,560 | | | | 160 | |
Expiring 11/30/12 | | UBS AG | | THB | 8,429,960 | | | | 269,500 | | | | 274,493 | | | | 4,993 | |
Expiring 11/30/12 | | UBS AG | | THB | 1,509,728 | | | | 47,400 | | | | 49,159 | | | | 1,759 | |
Expiring 11/30/12 | | UBS AG | | THB | 1,252,455 | | | | 39,400 | | | | 40,782 | | | | 1,382 | |
Expiring 11/30/12 | | UBS AG | | THB | 1,251,858 | | | | 39,300 | | | | 40,763 | | | | 1,463 | |
See Notes to Financial Statements.
| | |
| 56 | | Visit our website at www.prudentialfunds.com |
| | | | | | | | | | | | | | | | | | |
Purchase Contracts | | Counterparty | | Notional
Amount | | | Value at
Settlement
Date
Payable | | | Value at
October 31,
2012 | | | Unrealized
Appreciation/
(Depreciation) | |
Turkish Lira | | | | | | | | | | | | | | | | | | |
Expiring 01/30/13 | | Citibank NA | | TRY | 216,041 | | | $ | 118,500 | | | $ | 119,075 | | | $ | 575 | |
Expiring 01/30/13 | | Citibank NA | | TRY | 196,395 | | | | 107,900 | | | | 108,246 | | | | 346 | |
Expiring 01/30/13 | | Citibank NA | | TRY | 104,739 | | | | 57,141 | | | | 57,729 | | | | 588 | |
Expiring 01/30/13 | | Deutsche Bank AG | | TRY | 503,913 | | | | 277,700 | | | | 277,740 | | | | 40 | |
Expiring 01/30/13 | | Morgan Stanley | | TRY | 600,000 | | | | 328,815 | | | | 330,700 | | | | 1,885 | |
Expiring 01/30/13 | | Morgan Stanley | | TRY | 242,607 | | | | 132,400 | | | | 133,717 | | | | 1,317 | |
| | | | | | | | | | | | | | | | | | |
| | | | | | | | $ | 29,202,176 | | | $ | 29,162,437 | | | $ | (39,739 | ) |
| | | | | | | | | | | | | | | | | | |
| | | | | | | | | | | | | | | | | | |
Sale Contracts | | Counterparty | | Notional
Amount | | | Value at
Settlement
Date
Receivable | | | Value at
October 31,
2012 | | | Unrealized
Appreciation/
(Depreciation) | |
Australian Dollar | | | | | | | | | | | | | | | | | | |
Expiring 01/23/13 | | Citibank NA | | AUD | 359,884 | | | $ | 367,300 | | | $ | 371,016 | | | $ | (3,716 | ) |
Expiring 01/23/13 | | JPMorgan Chase Securities | | AUD | 294,797 | | | | 302,000 | | | | 303,916 | | | | (1,916 | ) |
Brazilian Real | | | | | | | | | | | | | | | | | | |
Expiring 11/26/12 | | Citibank NA | | BRL | 378,396 | | | | 182,800 | | | | 185,637 | | | | (2,837 | ) |
Expiring 11/26/12 | | Citibank NA | | BRL | 114,823 | | | | 54,900 | | | | 56,331 | | | | (1,431 | ) |
British Pound | | | | | | | | | | | | | | | | | | |
Expiring 01/25/13 | | Citibank NA | | GBP | 307,046 | | | | 496,237 | | | | 495,355 | | | | 882 | |
Expiring 01/25/13 | | Morgan Stanley | | GBP | 464,816 | | | | 745,000 | | | | 749,884 | | | | (4,884 | ) |
Expiring 01/25/13 | | Morgan Stanley | | GBP | 162,241 | | | | 261,900 | | | | 261,742 | | | | 158 | |
Canadian Dollar | | | | | | | | | | | | | | | | | | |
Expiring 01/22/13 | | Citibank NA | | CAD | 360,656 | | | | 364,500 | | | | 360,449 | | | | 4,051 | |
Expiring 01/22/13 | | Citibank NA | | CAD | 259,848 | | | | 259,900 | | | | 259,699 | | | | 201 | |
Expiring 01/22/13 | | Citibank NA | | CAD | 119,187 | | | | 120,700 | | | | 119,119 | | | | 1,581 | |
Expiring 01/22/13 | | JPMorgan Chase Securities | | CAD | 214,837 | | | | 215,500 | | | | 214,714 | | | | 786 | |
Expiring 01/22/13 | | UBS AG | | CAD | 350,828 | | | | 353,300 | | | | 350,626 | | | | 2,674 | |
Chilean Peso | | | | | | | | | | | | | | | | | | |
Expiring 12/11/12 | | Citibank NA | | CLP | 132,522,600 | | | | 272,400 | | | | 273,787 | | | | (1,387 | ) |
Expiring 12/11/12 | | Citibank NA | | CLP | 17,199,690 | | | | 35,900 | | | | 35,534 | | | | 366 | |
Chinese Yuan Renminbi | | | | | | | | | | | | | | | | |
Expiring 03/20/13 | | UBS AG | | CNY | 1,161,014 | | | | 181,493 | | | | 183,904 | | | | (2,411 | ) |
Czech Koruna | | | | | | | | | | | | | | | | | | |
Expiring 01/24/13 | | Barclays Bank PLC | | CZK | 5,065,671 | | | | 265,000 | | | | 261,797 | | | | 3,203 | |
Expiring 01/24/13 | | Barclays Bank PLC | | CZK | 4,225,363 | | | | 219,100 | | | | 218,369 | | | | 731 | |
Expiring 01/24/13 | | Barclays Bank PLC | | CZK | 3,166,321 | | | | 165,900 | | | | 163,637 | | | | 2,263 | |
Expiring 01/24/13 | | UBS AG | | CZK | 5,991,862 | | | | 310,300 | | | | 309,663 | | | | 637 | |
See Notes to Financial Statements.
| | | | |
| Prudential Absolute Return Bond Fund | | | 57 | |
Portfolio of Investments
as of October 31, 2012 continued
| | | | | | | | | | | | | | | | | | |
Sale Contracts | | Counterparty | | Notional
Amount | | | Value at
Settlement
Date
Receivable | | | Value at
October 31,
2012 | | | Unrealized
Appreciation/
(Depreciation) | |
Euro | | | | | | | | | | | | | | | | | | |
Expiring 01/25/13 | | Barclays Bank PLC | | EUR | 298,674 | | | $ | 384,982 | | | $ | 387,475 | | | $ | (2,493 | ) |
Expiring 01/25/13 | | Citibank NA | | EUR | 2,977,414 | | | | 3,847,697 | | | | 3,862,655 | | | | (14,958 | ) |
Expiring 01/25/13 | | Citibank NA | | EUR | 651,284 | | | | 842,341 | | | | 844,923 | | | | (2,582 | ) |
Expiring 01/25/13 | | Citibank NA | | EUR | 355,124 | | | | 460,610 | | | | 460,709 | | | | (99 | ) |
Expiring 01/25/13 | | Citibank NA | | EUR | 239,761 | | | | 312,585 | | | | 311,046 | | | | 1,539 | |
Expiring 01/25/13 | | Citibank NA | | EUR | 180,597 | | | | 233,300 | | | | 234,291 | | | | (991 | ) |
Expiring 01/25/13 | | Citibank NA | | EUR | 157,034 | | | | 203,341 | | | | 203,723 | | | | (382 | ) |
Expiring 01/25/13 | | Citibank NA | | EUR | 112,435 | | | | 146,829 | | | | 145,864 | | | | 965 | |
Expiring 01/25/13 | | Citibank NA | | EUR | 81,516 | | | | 105,000 | | | | 105,752 | | | | (752 | ) |
Expiring 01/25/13 | | JPMorgan Chase Securities | | EUR | 699,428 | | | | 900,057 | | | | 907,381 | | | | (7,324 | ) |
Expiring 01/25/13 | | JPMorgan Chase Securities | | EUR | 426,554 | | | | 556,900 | | | | 553,377 | | | | 3,523 | |
Expiring 01/25/13 | | JPMorgan Chase Securities | | EUR | 144,345 | | | | 186,778 | | | | 187,261 | | | | (483 | ) |
Expiring 01/25/13 | | UBS AG | | EUR | 48,156 | | | | 62,298 | | | | 62,474 | | | | (176 | ) |
Hong Kong Dollar | | | | | | | | | | | | | | | | | | |
Expiring 01/23/13 | | Barclays Bank PLC | | HKD | 1,008,702 | | | | 130,096 | | | | 130,179 | | | | (83 | ) |
Hungarian Forint | | | | | | | | | | | | | | | | | | |
Expiring 01/24/13 | | Citibank NA | | HUF | 76,616,320 | | | | 353,300 | | | | 346,741 | | | | 6,559 | |
Indian Rupee | | | | | | | | | | | | | | | | | | |
Expiring 01/07/13 | | Citibank NA | | INR | 2,918,100 | | | | 54,800 | | | | 53,548 | | | | 1,252 | |
Expiring 01/07/13 | | UBS AG | | INR | 5,279,593 | | | | 100,900 | | | | 96,883 | | | | 4,017 | |
Expiring 01/07/13 | | UBS AG | | INR | 4,688,100 | | | | 88,388 | | | | 86,029 | | | | 2,359 | |
Expiring 01/07/13 | | UBS AG | | INR | 3,634,282 | | | | 69,148 | | | | 66,691 | | | | 2,457 | |
Malaysian Ringgit | | | | | | | | | | | | | | | | | | |
Expiring 12/10/12 | | HSBC Bank USA NA | | MYR | 2,520,000 | | | | 818,182 | | | | 824,793 | | | | (6,611 | ) |
Expiring 12/10/12 | | UBS AG | | MYR | 270,640 | | | | 87,600 | | | | 88,580 | | | | (980 | ) |
Expiring 12/10/12 | | UBS AG | | MYR | 217,519 | | | | 67,500 | | | | 71,194 | | | | (3,694 | ) |
Mexican Peso | | | | | | | | | | | | | | | | | | |
Expiring 01/22/13 | | Citibank NA | | MXN | 2,581,412 | | | | 196,100 | | | | 195,454 | | | | 646 | |
Expiring 01/22/13 | | Citibank NA | | MXN | 1,701,524 | | | | 129,900 | | | | 128,832 | | | | 1,068 | |
New Zealand Dollar | | | | | | | | | | | | | | | | | | |
Expiring 01/23/13 | | Citibank NA | | NZD | 271,320 | | | | 221,100 | | | | 221,877 | | | | (777 | ) |
Expiring 01/23/13 | | Citibank NA | | NZD | 268,799 | | | | 218,700 | | | | 219,816 | | | | (1,116 | ) |
Norwegian Krone | | | | | | | | | | | | | | | | | | |
Expiring 01/24/13 | | Citibank NA | | NOK | 1,044,679 | | | | 181,600 | | | | 182,647 | | | | (1,047 | ) |
Expiring 01/24/13 | | JPMorgan Chase Securities | | NOK | 576,614 | | | | 100,100 | | | | 100,813 | | | | (713 | ) |
Expiring 01/24/13 | | UBS AG | | NOK | 1,398,074 | | | | 241,300 | | | | 244,433 | | | | (3,133 | ) |
Peruvian Nuevo Sol | | | | | | | | | | | | | | | | | | |
Expiring 01/10/13 | | Citibank NA | | PEN | 338,454 | | | | 129,900 | | | | 130,061 | | | | (161 | ) |
See Notes to Financial Statements.
| | |
| 58 | | Visit our website at www.prudentialfunds.com |
| | | | | | | | | | | | | | | | | | |
Sale Contracts | | Counterparty | | Notional
Amount | | | Value at
Settlement
Date
Receivable | | | Value at
October 31,
2012 | | | Unrealized
Appreciation/
(Depreciation) | |
Philippine Peso | | | | | | | | | | | | | | | | | | |
Expiring 11/05/12 | | JPMorgan Chase Securities | | PHP | 21,081,261 | | | $ | 510,195 | | | $ | 511,710 | | | $ | (1,515 | ) |
Expiring 11/05/12 | | UBS AG | | PHP | 7,582,199 | | | | 179,100 | | | | 184,044 | | | | (4,944 | ) |
Expiring 11/05/12 | | UBS AG | | PHP | 1,406,328 | | | | 33,258 | | | | 34,136 | | | | (878 | ) |
Expiring 11/05/12 | | UBS AG | | PHP | 1,358,215 | | | | 32,300 | | | | 32,968 | | | | (668 | ) |
Polish Zloty | | | | | | | | | | | | | | | | | | |
Expiring 01/24/13 | | Citibank NA | | PLN | 835,587 | | | | 255,000 | | | | 259,187 | | | | (4,187 | ) |
Expiring 01/24/13 | | Citibank NA | | PLN | 827,999 | | | | 261,200 | | | | 256,833 | | | | 4,367 | |
Expiring 01/24/13 | | Citibank NA | | PLN | 709,930 | | | | 220,554 | | | | 220,210 | | | | 344 | |
Expiring 01/24/13 | | Citibank NA | | PLN | 572,685 | | | | 177,700 | | | | 177,639 | | | | 61 | |
Expiring 01/24/13 | | Citibank NA | | PLN | 562,060 | | | | 176,700 | | | | 174,343 | | | | 2,357 | |
Expiring 01/24/13 | | JPMorgan Chase Securities | | PLN | 642,147 | | | | 199,800 | | | | 199,185 | | | | 615 | |
Russian Ruble | | | | | | | | | | | | | | | | | | |
Expiring 12/27/12 | | Citibank NA | | RUB | 3,033,950 | | | | 89,653 | | | | 95,705 | | | | (6,052 | ) |
Singapore Dollar | | | | | | | | | | | | | | | | | | |
Expiring 01/23/13 | | Citibank NA | | SGD | 502,973 | | | | 409,783 | | | | 412,338 | | | | (2,555 | ) |
Expiring 01/23/13 | | Citibank NA | | SGD | 269,602 | | | | 218,700 | | | | 221,020 | | | | (2,320 | ) |
Expiring 01/23/13 | | JPMorgan Chase Securities | | SGD | 226,534 | | | | 183,800 | | | | 185,712 | | | | (1,912 | ) |
South African Rand | | | | | | | | | | | | | | | | | | |
Expiring 01/30/13 | | Goldman Sachs International | | ZAR | 1,359,382 | | | | 162,328 | | | | 154,615 | | | | 7,713 | |
Expiring 01/30/13 | | JPMorgan Chase Securities | | ZAR | 2,332,008 | | | | 277,500 | | | | 265,241 | | | | 12,259 | |
Swedish Krona | | | | | | | | | | | | | | | | | | |
Expiring 01/24/13 | | Citibank NA | | SEK | 2,456,659 | | | | 366,600 | | | | 369,447 | | | | (2,847 | ) |
Expiring 01/24/13 | | Citibank NA | | SEK | 1,467,578 | | | | 218,700 | | | | 220,703 | | | | (2,003 | ) |
Expiring 01/24/13 | | Citibank NA | | SEK | 1,211,362 | | | | 181,600 | | | | 182,172 | | | | (572 | ) |
Expiring 01/24/13 | | UBS AG | | SEK | 2,444,584 | | | | 365,100 | | | | 367,631 | | | | (2,531 | ) |
Expiring 01/24/13 | | UBS AG | | SEK | 1,746,238 | | | | 262,600 | | | | 262,610 | | | | (10 | ) |
Taiwan Dollar | | | | | | | | | | | | | | | | | | |
Expiring 11/05/12 | | UBS AG | | TWD | 1,956,848 | | | | 65,228 | | | | 66,986 | | | | (1,758 | ) |
Expiring 03/12/13 | | Citibank NA | | TWD | 1,082,207 | | | | 37,100 | | | | 37,078 | | | | 22 | |
Thai Baht | | | | | | | | | | | | | | | | | | |
Expiring 11/01/12 | | Citibank NA | | THB | 25,000,000 | | | | 788,980 | | | | 815,661 | | | | (26,681 | ) |
Expiring 11/30/12 | | Citibank NA | | THB | 24,130,182 | | | | 784,849 | | | | 785,718 | | | | (869 | ) |
See Notes to Financial Statements.
| | | | |
| Prudential Absolute Return Bond Fund | | | 59 | |
Portfolio of Investments
as of October 31, 2012 continued
| | | | | | | | | | | | | | | | | | |
Sale Contracts | | Counterparty | | Notional
Amount | | | Value at
Settlement
Date
Receivable | | | Value at
October 31,
2012 | | | Unrealized
Appreciation/
(Depreciation) | |
Turkish Lira | | | | | | | | | | | | | | | | | | |
Expiring 01/30/13 | | Citibank NA | | TRY | 288,912 | | | $ | 156,300 | | | $ | 159,239 | | | $ | (2,939 | ) |
Expiring 01/30/13 | | Citibank NA | | TRY | 288,111 | | | | 156,300 | | | | 158,798 | | | | (2,498 | ) |
Expiring 01/30/13 | | UBS AG | | TRY | 395,019 | | | | 216,632 | | | | 217,721 | | | | (1,089 | ) |
| | | | | | | | | | | | | | | | | | |
| | | | | | | | $ | 23,593,022 | | | $ | 23,659,331 | | | $ | (66,309 | ) |
| | | | | | | | | | | | | | | | | | |
| | | | | | | | | | | | | | | | $ | (106,048 | ) |
| | | | | | | | | | | | | | | | | | |
Currency swap agreements outstanding as of October 31, 2012:
| | | | | | | | | | | | | | | | | | | | | | | | |
Notional
Amount
(000) | | | Termination
Date | | | Fixed
Rate | | Floating
Rate | | Fair
Value | | | Upfront
Premiums
Paid/
(Received) | | | Unrealized
Appreciation/
(Depreciation) | | | Counterparty |
| Over-the-counter swap agreements: |
| EUR | 950 | | | | 10/19/14 | | | NA | | 3 month LIBOR(1) | | $ | 6,789 | | | $ | — | | | $ | 6,789 | | | JPMorgan Chase Bank |
| EUR | 100 | | | | 11/30/15 | | | 4.500% | | 3 month LIBOR(2) | | | (15,541 | ) | | | (1,140 | ) | | | (14,401 | ) | | Citibank NA |
| EUR | 100 | | | | 11/30/15 | | | 4.500 | | 3 month LIBOR(3) | | | (14,606 | ) | | | (2,121 | ) | | | (12,485 | ) | | JPMorgan Chase Bank |
| EUR | 65 | | | | 07/14/17 | | | 4.250 | | 3 month LIBOR(4) | | | (13,581 | ) | | | (6,770 | ) | | | (6,811 | ) | | Citibank NA |
| EUR | 35 | | | | 07/14/17 | | | 4.250 | | 3 month LIBOR(5) | | | (7,423 | ) | | | (4,000 | ) | | | (3,423 | ) | | Citibank NA |
| JPY | 20,000 | | | | 06/08/15 | | | 4.500 | | 3 month LIBOR(6) | | | (9,134 | ) | | | (10,063 | ) | | | 929 | | | Citibank NA |
| JPY | 20,000 | | | | 06/08/15 | | | 4.500 | | 3 month LIBOR(7) | | | (9,536 | ) | | | (11,240 | ) | | | 1,704 | | | Citibank NA |
| JPY | 5,000 | | | | 03/24/17 | | | 3.450 | | 3 month LIBOR(8) | | | 2,335 | | | | 1 | | | | 2,334 | | | Citibank NA |
| | | | | | | | | | | | | | | | | | | | | | | | |
| | | | | | | | | | | | $ | (60,697 | ) | | $ | (35,333 | ) | | $ | (25,364 | ) | | |
| | | | | | | | | | | | | | | | | | | | | | | | |
| (1) | The Fund pays a floating rate of 3 month EURIBOR + 28.375 basis points based on a notional amount of EUR 950,000. The Fund receives a floating rate based on a notional amount of $1,246,400. |
| (2) | The Fund pays a fixed rate based on a notional amount of EUR 100,000. The Fund receives a floating rate based on a notional amount of $121,310. |
| (3) | The Fund pays a fixed rate based on a notional amount of EUR 100,000. The Fund receives a floating rate based on a notional amount of $122,560. |
See Notes to Financial Statements.
| | |
| 60 | | Visit our website at www.prudentialfunds.com |
| (4) | The Fund pays a fixed rate based on a notional amount of EUR 65,000. The Fund receives a floating rate based on a notional amount of $79,261. |
| (5) | The Fund pays a fixed rate based on a notional amount of EUR 35,000. The Fund receives a floating rate based on a notional amount of $42,802. |
| (6) | The Fund pays a fixed rate based on a notional amount of JPY 20,000,000. The Fund receives a floating rate based on a notional amount of $255,951. |
| (7) | The Fund pays a fixed rate based on a notional amount of JPY 20,000,000. The Fund receives a floating rate based on a notional amount of $256,805. |
| (8) | The Fund pays a fixed rate based on a notional amount of JPY 5,000,000. The Fund receives a floating rate based on a notional amount of $64,210. |
Interest rate swap agreements outstanding at October 31, 2012:
| | | | | | | | | | | | | | | | | | | | | | | | | | |
Notional
Amount
(000)# | | | Termination
Date | | | Fixed
Rate | | | Floating Rate | | Fair
Value | | | Upfront
Premiums
Paid/
(Received) | | | Unrealized
Appreciation/
(Depreciation) | | | Counterparty |
| Over-the-counter swap agreements: |
| $ | 10,000 | | | | 07/22/13 | | | | 0.647% | | | 3 month LIBOR(1) | | $ | (41,315 | ) | | $ | — | | | $ | (41,315 | ) | | Morgan Stanley Capital Services |
| | 4,000 | | | | 07/28/13 | | | | 0.625 | | | 3 month LIBOR(2) | | | 15,872 | | | | — | | | | 15,872 | | | Citibank NA |
| | 3,950 | | | | 09/06/13 | | | | 0.518 | | | 3 month LIBOR(2) | | | 6,342 | | | | — | | | | 6,342 | | | Barclays Bank PLC |
| | 2,450 | | | | 09/21/13 | | | | 0.493 | | | 3 month LIBOR(1) | | | (3,472 | ) | | | — | | | | (3,472 | ) | | Barclays Bank PLC |
| | 1,400 | | | | 09/26/13 | | | | 0.524 | | | 3 month LIBOR(1) | | | (2,588 | ) | | | — | | | | (2,588 | ) | | Barclays Bank PLC |
| | 1,750 | | | | 10/04/13 | | | | 0.559 | | | 3 month LIBOR(2) | | | 3,783 | | | | — | | | | 3,783 | | | Barclays Bank PLC |
| | 1,000 | | | | 05/10/14 | | | | 1.288 | | | 3 month LIBOR(1) | | | (19,448 | ) | | | — | | | | (19,448 | ) | | Citibank NA |
| | 1,000 | | | | 05/13/14 | | | | 1.258 | | | 3 month LIBOR(1) | | | (18,799 | ) | | | — | | | | (18,799 | ) | | Citibank NA |
| | 600 | | | | 07/01/14 | | | | 1.095 | | | 3 month LIBOR(1) | | | (9,247 | ) | | | — | | | | (9,247 | ) | | Barclays Bank PLC |
| | 900 | | | | 08/05/14 | | | | 0.821 | | | 3 month LIBOR(1) | | | (8,121 | ) | | | — | | | | (8,121 | ) | | Barclays Bank PLC |
| | 3,800 | | | | 08/24/14 | | | | 0.475 | | | 3 month LIBOR(1) | | | (7,597 | ) | | | — | | | | (7,597 | ) | | Citibank NA |
| | 2,000 | | | | 09/26/14 | | | | 0.640 | | | 3 month LIBOR(1) | | | (10,603 | ) | | | — | | | | (10,603 | ) | | Barclays Bank PLC |
| | 1,050 | | | | 11/09/14 | | | | 0.710 | | | 3 month LIBOR(1) | | | (9,553 | ) | | | — | | | | (9,553 | ) | | Citibank NA |
| | 5,000 | | | | 08/24/15 | | | | 0.573 | | | 3 month LIBOR(1) | | | (17,377 | ) | | | — | | | | (17,377 | ) | | Citibank NA |
| | 1,300 | | | | 12/31/15 | | | | 1.705 | | | 3 month LIBOR(2) | | | 56,156 | | | | — | | | | 56,156 | | | Barclays Bank PLC |
| | 2,000 | | | | 04/08/16 | | | | 2.520 | | | 3 month LIBOR(1) | | | (137,508 | ) | | | — | | | | (137,508 | ) | | Citibank NA |
| | 2,000 | | | | 04/27/16 | | | | 2.313 | | | 3 month LIBOR(1) | | | (123,047 | ) | | | — | | | | (123,047 | ) | | Citibank NA |
| | 1,000 | | | | 05/18/16 | | | | 2.040 | | | 3 month LIBOR(1) | | | (60,650 | ) | | | — | | | | (60,650 | ) | | Citibank NA |
| | 2,000 | | | | 06/30/16 | | | | 1.821 | | | 3 month LIBOR(1) | | | (102,387 | ) | | | — | | | | (102,387 | ) | | Citibank NA |
| | 2,350 | | | | 08/15/16 | | | | 1.220 | | | 3 month LIBOR(2) | | | 59,311 | | | | — | | | | 59,311 | | | Barclays Bank PLC |
| | 2,070 | | | | 08/31/16 | | | | 0.934 | | | 3 month LIBOR(2) | | | 28,289 | | | | — | | | | 28,289 | | | Credit Suisse International |
| | 645 | | | | 08/31/16 | | | | 0.975 | | | 3 month LIBOR(1) | | | (9,860 | ) | | | — | | | | (9,860 | ) | | JPMorgan Chase Bank |
See Notes to Financial Statements.
| | | | |
| Prudential Absolute Return Bond Fund | | | 61 | |
Portfolio of Investments
as of October 31, 2012 continued
| | | | | | | | | | | | | | | | | | | | | | | | | | |
Notional
Amount
(000)# | | | Termination
Date | | | Fixed
Rate | | | Floating Rate | | Fair
Value | | | Upfront
Premiums
Paid/
(Received) | | | Unrealized
Appreciation/
(Depreciation) | | | Counterparty |
| Over-the-counter swap agreements (cont’d.): |
| $ | 645 | | | | 08/31/16 | | | | 0.978% | | | 3 month LIBOR(1) | | $ | (9,950 | ) | | $ | — | | | $ | (9,950 | ) | | JPMorgan Chase Bank |
| | 3,200 | | | | 09/06/16 | | | | 1.165 | | | 3 month LIBOR(1) | | | (72,109 | ) | | | — | | | | (72,109 | ) | | Barclays Bank PLC |
| | 500 | | | | 09/16/16 | | | | 1.205 | | | 3 month LIBOR(1) | | | (11,961 | ) | | | — | | | | (11,961 | ) | | Barclays Bank PLC |
| | 1,000 | | | | 09/19/16 | | | | 1.245 | | | 3 month LIBOR(1) | | | (25,434 | ) | | | — | | | | (25,434 | ) | | Barclays Bank PLC |
| | 3,000 | | | | 09/26/16 | | | | 1.113 | | | 3 month LIBOR(2) | | | 60,386 | | | | — | | | | 60,386 | | | Barclays Bank PLC |
| | 1,400 | | | | 09/27/16 | | | | 1.115 | | | 3 month LIBOR(2) | | | 28,847 | | | | — | | | | 28,847 | | | Barclays Bank PLC |
| | 2,315 | | | | 11/30/16 | | | | 0.913 | | | 3 month LIBOR(1) | | | (26,715 | ) | | | — | | | | (26,715 | ) | | JPMorgan Chase Bank |
| | 470 | | | | 12/22/16 | | | | 1.265 | | | 3 month LIBOR(1) | | | (13,721 | ) | | | — | | | | (13,721 | ) | | Citibank NA |
| | 470 | | | | 01/09/17 | | | | 1.255 | | | 3 month LIBOR(2) | | | 13,288 | | | | — | | | | 13,288 | | | Citibank NA |
| | 350 | | | | 01/17/17 | | | | 1.128 | | | 3 month LIBOR(1) | | | (7,875 | ) | | | — | | | | (7,875 | ) | | Citibank NA |
| | 350 | | | | 01/17/17 | | | | 1.151 | | | 3 month LIBOR(1) | | | (8,245 | ) | | | — | | | | (8,245 | ) | | Citibank NA |
| | 570 | | | | 01/30/17 | | | | 1.065 | | | 3 month LIBOR(1) | | | (11,082 | ) | | | — | | | | (11,082 | ) | | Citibank NA |
| | 300 | | | | 02/07/17 | | | | 0.968 | | | 3 month LIBOR(1) | | | (4,104 | ) | | | — | | | | (4,104 | ) | | Citibank NA |
| | 24,900 | | | | 02/28/17 | | | | 0.687 | | | 3 month LIBOR(1) | | | 12,777 | | | | — | | | | 12,777 | | | Credit Suisse International |
| | 2,500 | | | | 08/24/17 | | | | 0.944 | | | 3 month LIBOR(1) | | | (21,932 | ) | | | — | | | | (21,932 | ) | | Citibank NA |
| | 12,000 | | | | 09/10/17 | | | | 0.845 | | | 3 month LIBOR(1) | | | (39,079 | ) | | | — | | | | (39,079 | ) | | Morgan Stanley Capital Services |
| | 1,100 | | | | 12/20/17 | | | | 0.904 | | | 3 month LIBOR(1) | | | (3,504 | ) | | | — | | | | (3,504 | ) | | Deutsche Bank AG |
| | 2,000 | | | | 08/30/18 | | | | 1.867 | | | 3 month LIBOR(2) | | | 104,820 | | | | — | | | | 104,820 | | | Barclays Bank PLC |
| | 300 | | | | 09/21/18 | | | | 1.670 | | | 3 month LIBOR(1) | | | (11,867 | ) | | | — | | | | (11,867 | ) | | Goldman Sachs International |
| | 1,400 | | | | 09/26/18 | | | | 1.555 | | | 3 month LIBOR(1) | | | (45,679 | ) | | | — | | | | (45,679 | ) | | Barclays Bank PLC |
| | 750 | | | | 09/27/18 | | | | 1.538 | | | 3 month LIBOR(1) | | | (23,682 | ) | | | — | | | | (23,682 | ) | | Barclays Bank PLC |
| | 300 | | | | 11/04/18 | | | | 1.766 | | | 3 month LIBOR(1) | | | (15,249 | ) | | | — | | | | (15,249 | ) | | Barclays Bank PLC |
| | 400 | | | | 11/09/18 | | | | 1.720 | | | 3 month LIBOR(2) | | | 19,021 | | | | — | | | | 19,021 | | | Citibank NA |
| | 11,110 | | | | 08/15/19 | | | | 1.231 | | | 3 month LIBOR(1) | | | (10,797 | ) | | | — | | | | (10,797 | ) | | Credit Suisse International |
| | 745 | | | | 10/02/19 | | | | 1.188 | | | 3 month LIBOR(1) | | | 1,104 | | | | — | | | | 1,104 | | | Bank of Nova Scotia |
| | 1,000 | | | | 04/19/21 | | | | 3.514 | | | 3 month LIBOR(1) | | | (164,672 | ) | | | — | | | | (164,672 | ) | | Citibank NA |
| | 600 | | | | 05/24/21 | | | | 3.247 | | | 3 month LIBOR(1) | | | (93,236 | ) | | | — | | | | (93,236 | ) | | Citibank NA |
| | 1,000 | | | | 06/30/21 | | | | 3.078 | | | 3 month LIBOR(1) | | | (138,384 | ) | | | — | | | | (138,384 | ) | | Citibank NA |
| | 400 | | | | 08/10/21 | | | | 2.568 | | | 3 month LIBOR(1) | | | (36,159 | ) | | | — | | | | (36,159 | ) | | Barclays Bank PLC |
| | 700 | | | | 09/08/21 | | | | 2.150 | | | 3 month LIBOR(2) | | | 36,711 | | | | — | | | | 36,711 | | | Citibank NA |
| | 500 | | | | 09/21/21 | | | | 2.160 | | | 3 month LIBOR(2) | | | 26,219 | | | | — | | | | 26,219 | | | Barclays Bank PLC |
| | 200 | | | | 09/22/21 | | | | 2.180 | | | 3 month LIBOR(2) | | | 10,818 | | | | — | | | | 10,818 | | | Citibank NA |
| | 300 | | | | 10/06/21 | | | | 2.049 | | | 3 month LIBOR(1) | | | (12,607 | ) | | | — | | | | (12,607 | ) | | Citibank NA |
See Notes to Financial Statements.
| | |
| 62 | | Visit our website at www.prudentialfunds.com |
| | | | | | | | | | | | | | | | | | | | | | | | | | |
Notional
Amount
(000)# | | | Termination
Date | | | Fixed
Rate | | | Floating Rate | | Fair
Value | | | Upfront
Premiums
Paid/
(Received) | | | Unrealized
Appreciation/
(Depreciation) | | | Counterparty |
| Over-the-counter swap agreements (cont’d.): |
| $ | 140 | | | | 10/06/21 | | | | 2.033% | | | 3 month LIBOR(2) | | $ | 5,673 | | | $ | — | | | $ | 5,673 | | | Citibank NA |
| | 250 | | | | 10/07/21 | | | | 2.108 | | | 3 month LIBOR(1) | | | (11,745 | ) | | | — | | | | (11,745 | ) | | Citibank NA |
| | 200 | | | | 10/07/21 | | | | 2.083 | | | 3 month LIBOR(1) | | | (8,967 | ) | | | — | | | | (8,967 | ) | | Citibank NA |
| | 200 | | | | 10/20/21 | | | | 2.308 | | | 3 month LIBOR(2) | | | 12,649 | | | | — | | | | 12,649 | | | Citibank NA |
| | 100 | | | | 11/10/21 | | | | 2.180 | | | 3 month LIBOR(2) | | | 6,053 | | | | — | | | | 6,053 | | | Citibank NA |
| | 250 | | | | 01/06/22 | | | | 2.086 | | | 3 month LIBOR(2) | | | 12,045 | | | | — | | | | 12,045 | | | Citibank NA |
| | 350 | | | | 01/11/22 | | | | 2.113 | | | 3 month LIBOR(2) | | | 17,578 | | | | — | | | | 17,578 | | | Citibank NA |
| | 150 | | | | 01/11/22 | | | | 2.070 | | | 3 month LIBOR(2) | | | 6,958 | | | | — | | | | 6,958 | | | Citibank NA |
| | 2,000 | | | | 01/13/22 | | | | 1.781 | | | 3 month LIBOR(1) | | | (34,041 | ) | | | — | | | | (34,041 | ) | | Barclays Bank PLC |
| | 150 | | | | 01/17/22 | | | | 2.010 | | | 3 month LIBOR(1) | | | (6,089 | ) | | | — | | | | (6,089 | ) | | Citibank NA |
| | 300 | | | | 01/30/22 | | | | 2.060 | | | 3 month LIBOR(2) | | | 13,275 | | | | — | | | | 13,275 | | | Citibank NA |
| | 300 | | | | 02/03/22 | | | | 1.946 | | | 3 month LIBOR(1) | | | (9,742 | ) | | | — | | | | (9,742 | ) | | Citibank NA |
| | 200 | | | | 02/06/22 | | | | 1.916 | | | 3 month LIBOR(2) | | | 5,896 | | | | — | | | | 5,896 | | | Citibank NA |
| | 225 | | | | 02/07/22 | | | | 2.049 | | | 3 month LIBOR(1) | | | (9,337 | ) | | | — | | | | (9,337 | ) | | Citibank NA |
| | 255 | | | | 02/14/22 | | | | 2.063 | | | 3 month LIBOR(2) | | | 10,745 | | | | — | | | | 10,745 | | | Citibank NA |
| | 2,400 | | | | 08/24/22 | | | | 1.855 | | | 3 month LIBOR(1) | | | (41,358 | ) | | | — | | | | (41,358 | ) | | Citibank NA |
| | 1,560 | | | | 08/15/28 | | | | 2.367 | | | 3 month LIBOR(1) | | | (16,508 | ) | | | — | | | | (16,508 | ) | | JPMorgan Chase Bank |
| | 150 | | | | 12/16/41 | | | | 2.672 | | | 3 month LIBOR(2) | | | 4,385 | | | | — | | | | 4,385 | | | Citibank NA |
| | 100 | | | | 12/22/41 | | | | 2.570 | | | 3 month LIBOR(2) | | | 697 | | | | — | | | | 697 | | | Citibank NA |
| | 150 | | | | 01/11/42 | | | | 2.739 | | | 3 month LIBOR(1) | | | (6,321 | ) | | | — | | | | (6,321 | ) | | Citibank NA |
| | 150 | | | | 01/17/42 | | | | 2.674 | | | 3 month LIBOR(2) | | | 4,171 | | | | — | | | | 4,171 | | | Citibank NA |
| | 100 | | | | 01/20/42 | | | | 2.678 | | | 3 month LIBOR(1) | | | (2,841 | ) | | | — | | | | (2,841 | ) | | Citibank NA |
| | 100 | | | | 01/26/42 | | | | 2.843 | | | 3 month LIBOR(1) | | | (6,357 | ) | | | — | | | | (6,357 | ) | | Citibank NA |
| | 150 | | | | 01/30/42 | | | | 2.815 | | | 3 month LIBOR(2) | | | 8,621 | | | | — | | | | 8,621 | | | Citibank NA |
| | 120 | | | | 02/02/42 | | | | 2.696 | | | 3 month LIBOR(2) | | | 3,645 | | | | — | | | | 3,645 | | | Citibank NA |
| | 100 | | | | 02/03/42 | | | | 2.678 | | | 3 month LIBOR(1) | | | (2,643 | ) | | | — | | | | (2,643 | ) | | Citibank NA |
| | 100 | | | | 02/06/42 | | | | 2.730 | | | 3 month LIBOR(1) | | | (3,742 | ) | | | — | | | | (3,742 | ) | | Citibank NA |
| | 120 | | | | 02/09/42 | | | | 2.815 | | | 3 month LIBOR(2) | | | 6,651 | | | | — | | | | 6,651 | | | Citibank NA |
| | 130 | | | | 02/16/42 | | | | 2.766 | | | 3 month LIBOR(2) | | | 5,780 | | | | — | | | | 5,780 | | | Citibank NA |
| | 170 | | | | 02/21/42 | | | | 2.800 | | | 3 month LIBOR(2) | | | 8,732 | | | | — | | | | 8,732 | | | Citibank NA |
| | 700 | | | | 08/24/42 | | | | 2.620 | | | 3 month LIBOR(1) | | | (8,314 | ) | | | — | | | | (8,314 | ) | | Citibank NA |
| | 4,765 | | | | 10/11/42 | | | | 2.708 | | | 3 month LIBOR(1) | | | (132,932 | ) | | | — | | | | (132,932 | ) | | Bank of Nova Scotia |
| BRL | 1,026 | | | | 01/01/17 | | | | 0.000 | | | 1 day BZDIOVER(2) | | | 17,798 | | | | — | | | | 17,798 | | | Barclays Bank PLC |
| MXN | 4,200 | | | | 07/05/13 | | | | 5.480 | | | 28 day Mexican Interbank Rate(2) | | | 1,313 | | | | — | | | | 1,313 | | | Barclays Bank PLC |
See Notes to Financial Statements.
| | | | |
| Prudential Absolute Return Bond Fund | | | 63 | |
Portfolio of Investments
as of October 31, 2012 continued
| | | | | | | | | | | | | | | | | | | | | | | | | | |
Notional
Amount
(000)# | | | Termination
Date | | | Fixed
Rate | | | Floating Rate | | Fair Value | | | Upfront
Premiums
Paid/
(Received) | | | Unrealized
Appreciation/
(Depreciation) | | | Counterparty |
| Over-the-counter swap agreements (cont’d.): |
| MXN | 1,500 | | | | 02/18/22 | | | | 6.600% | | | 28 day Mexican Interbank Rate(2) | | $ | 6,283 | | | $ | — | | | $ | 6,283 | | | Barclays Bank PLC |
| MXN | 1,600 | | | | 04/15/22 | | | | 6.380 | | | 28 day Mexican Interbank Rate(2) | | | 4,561 | | | | — | | | | 4,561 | | | JPMorgan Chase Bank |
| MXN | 2,900 | | | | 05/25/22 | | | | 6.370 | | | 28 day Mexican Interbank Rate(2) | | | 8,214 | | | | — | | | | 8,214 | | | Morgan Stanley Capital Services |
| NZD | 1,000 | | | | 08/09/16 | | | | 3.125 | | | 3 month BBR(2) | | | 8,563 | | | | — | | | | 8,563 | | | Citibank NA |
| NZD | 130 | | | | 03/26/17 | | | | 3.810 | | | 3 month BBR(2) | | | 3,884 | | | | — | | | | 3,884 | | | HSBC Bank USA NA |
| NZD | 230 | | | | 09/25/22 | | | | 3.790 | | | 3 month BBR(2) | | | 1,987 | | | | — | | | | 1,987 | | | Citibank NA |
| | | | | | | | | | | | | | | | | | | | | | | | | | |
| | | | | | | | | | | | | | $ | (1,020,651 | ) | | $ | — | | | $ | (1,020,651 | ) | | |
| | | | | | | | | | | | | | | | | | | | | | | | | | |
| (1) | Fund pays the fixed rate and receives the floating rate. |
| (2) | Fund pays the floating rate and receives the fixed rate. |
| # | Notional amount is shown in U.S. dollars unless otherwise stated. |
Credit default swap agreements outstanding at October 31, 2012:
| | | | | | | | | | | | | | | | | | | | | | | | |
Reference
Entity/
Obligation | | Termination
Date | | | Fixed
Rate | | | Notional
Amount
(000)#(4) | | Fair
Value | | | Upfront
Premiums
Paid/
(Received) | | | Unrealized
Depreciation | | | Counterparty |
Over-the-counter credit default swap on credit indices—Buy Protection(1): |
| ITRAXX.EUR.18.V1 | | | 12/20/17 | | | | 1.000% | | | EUR 1,600 | | $ | 27,081 | | | $ | 31,837 | | | $ | (4,756 | ) | | Deutsche Bank AG |
| | | | | | | | | | | | | | | | | | | | | | | | |
| | | | | | | | | | | | | | | | | | | | | | | | | | |
Reference
Entity/
Obligation | | Termination
Date | | | Fixed
Rate | | | Notional
Amount
(000)#(4) | | | Fair
Value(3) | | | Upfront
Premiums
Paid/
(Received) | | | Unrealized
Appreciation | | | Counterparty |
Over-the-counter credit default swap on credit indices—Sell Protection(2): |
CDX.NA.HY.18.V2 | | | 06/20/17 | | | | 5.000% | | | $ | 2,970 | | | $ | 18,819 | | | $ | (79,613 | ) | | $ | 98,432 | | | Citibank NA |
CDX.NA.HY.18.V2 | | | 06/20/17 | | | | 5.000 | | | | 1,980 | | | | 12,547 | | | | (40,700 | ) | | | 53,247 | | | Goldman Sachs International |
CDX.NA.HY.18.V2 | | | 06/20/17 | | | | 5.000 | | | | 990 | | | | 6,273 | | | | (77,275 | ) | | | 83,548 | | | Citibank NA |
| | | | | | | | | | | | | | | | | | | | | | | | | | |
| | | | | | | | | | | | | | $ | 37,639 | | | $ | (197,588 | ) | | $ | 235,227 | | | |
| | | | | | | | | | | | | | | | | | | | | | | | | | |
See Notes to Financial Statements.
| | |
| 64 | | Visit our website at www.prudentialfunds.com |
| | | | | | | | | | | | | | | | | | | | | | | | | | | | |
Reference
Entity/
Obligation | | Termination
Date | | | Fixed
Rate | | | Notional
Amount
(000)#(4) | | | Implied
Credit
Spread at
October 31,
2012(5) | | | Fair
Value | | | Upfront
Premiums
Paid/
(Received) | | | Unrealized
Appreciation | | Counterparty |
Over-the-counter credit default swaps on sovereign issues—Sell Protection(2): |
Kingdom of Netherlands | | | 03/20/13 | | | | 0.250% | | | $ | 200 | | | | 0.029 | % | | $ | 230 | | | $ | (840 | ) | | $1,070 | | Morgan Stanley Capital Services |
Republic of Austria | | | 03/20/13 | | | | 1.000 | | | | 200 | | | | 0.032 | | | | 985 | | | | (902 | ) | | 1,887 | | Morgan Stanley Capital Services |
Republic of France | | | 03/20/13 | | | | 0.250 | | | | 200 | | | | 0.076 | | | | 193 | | | | (2,138 | ) | | 2,331 | | Morgan Stanley Capital Services |
| | | | | | | | | | | | | | | | | | | | | | | | | | | | |
| | | | | | | | | | | | | | | | | | $ | 1,408 | | | $ | (3,880 | ) | | $5,288 | | |
| | | | | | | | | | | | | | | | | | | | | | | | | | | | |
The Fund entered into credit default swaps as the protection seller on credit indices and sovereign issues to take an active short position with respect to the likelihood of a particular issuer’s default or the referenced entity’s credit soundness.
| (1) | If the Fund is a buyer of protection, it pays the fixed rate. When a credit event occurs, as defined under the terms of that particular swap agreement, the Fund will either (i) receive from the seller of protection an amount equal to the notional amount of the swap and make delivery of the referenced obligation or underlying securities comprising the referenced index or (ii) receive a net settlement amount in the form of cash or securities equal to the notional amount of the swap less the recovery value of the referenced obligation or underlying securities comprising the referenced index. |
| (2) | If the Fund is a seller of protection, it receives the fixed rate. When a credit event occurs, as defined under the terms of that particular swap agreement, the Fund will either (i) pay to the buyer of protection an amount equal to the notional amount of the swap and take delivery of the referenced obligation or underlying securities comprising the referenced index or (ii) pay a net settlement amount in the form of cash or securities equal to the notional amount of the swap less the recovery value of the referenced obligation or underlying securities comprising the referenced index. |
| (3) | The fair value of credit default swap agreements on asset-backed securities and credit indices serves as an indicator of the current status of the payment/performance risk and represents the likelihood of an expected liability (or profit) for the credit derivative should the notional amount of the swap agreement be closed/sold as of the reporting date. Increasing fair value in absolute terms, represents a deterioration of the referenced entity’s credit soundness and a greater likelihood of risk of default or other credit event occurring as defined under the terms of the agreement. |
| (4) | Notional amount represents the maximum potential amount the Fund could be required to pay as a seller of credit protection or receive as a buyer of credit protection if a credit event occurs as defined under the terms of that particular swap agreement. |
| (5) | Implied credit spreads, represented in absolute terms, utilized in determining the fair value of credit default swap agreements on corporate issues or sovereign issues of an emerging country as of the reporting date serve as an indicator of the current status of the payment/performance risk and represent the likelihood of risk of default for the credit derivative. The implied credit spread of a particular referenced entity reflects the cost of buying/selling |
See Notes to Financial Statements.
| | | | |
| Prudential Absolute Return Bond Fund | | | 65 | |
Portfolio of Investments
as of October 31, 2012 continued
| | protection and may include up-front payments required to be made to enter into the agreement. Wider credit spreads represent a deterioration of the referenced entity’s credit soundness and a greater likelihood of risk of default or other credit event occurring as defined under the terms of the agreement. |
| # | Notional amount is shown in U.S. dollars unless otherwise stated. |
Various inputs are used in determining the value of the Fund’s investments. These inputs are summarized in the three broad levels listed below.
Level 1—quoted prices generally in active markets for identical securities.
Level 2—other significant observable inputs including, but not limited to, quoted prices for similar securities, interest rates and yield curves, prepayment speeds, foreign currency exchange rates, and amortized cost.
Level 3—significant unobservable inputs for securities valued in accordance with Board approved fair valuation procedures.
The following is a summary of the inputs used as of October 31, 2012 in valuing such portfolio securities:
| | | | | | | | | | | | |
| | | Level 1 | | | Level 2 | | | Level 3 | |
Investments in Securities | | | | | | | | | | | | |
Asset-Backed Securities | | | | | | | | | | | | |
CLO’s, CDO’s and Other Asset-Backed Securities | | $ | — | | | $ | 17,623,129 | | | $ | 3,823,000 | |
Residential Mortgage-Backed Securities | | | — | | | | 5,204,983 | | | | — | |
Bank Loans | | �� | — | | | | 12,017,104 | | | | 98,256 | |
Commercial Mortgage-Backed Securities | | | — | | | | 33,186,831 | | | | — | |
Corporate Bonds | | | — | | | | 73,198,760 | | | | 372,864 | |
Mortgage-Backed Securities | | | — | | | | 4,225,625 | | | | — | |
Municipal Bonds | | | — | | | | 406,901 | | | | — | |
Non-Corporate Foreign Agencies | | | — | | | | 6,257,065 | | | | — | |
Sovereigns | | | — | | | | 10,035,307 | | | | — | |
U.S. Government Agency Obligations | | | — | | | | 3,938,162 | | | | — | |
U.S. Treasury Obligations | | | — | | | | 6,941,138 | | | | — | |
Affiliated Money Market Mutual Fund | | | 36,446,800 | | | | — | | | | — | |
Other Financial Instruments* | | | | | | | | | | | | |
Futures Contracts | | | (16,044 | ) | | | — | | | | — | |
Forward Foreign Currency Exchange Contracts | | | — | | | | (106,048 | ) | | | — | |
Currency Swap Agreements | | | — | | | | (25,364 | ) | | | — | |
Interest Rate Swap Agreements | | | — | | | | (1,020,651 | ) | | | — | |
Credit Default Swap Agreements | | | — | | | | 235,759 | | | | — | |
| | | | | | | | | | | | |
Total | | $ | 36,430,756 | | | $ | 172,118,701 | | | $ | 4,294,120 | |
| | | | | | | | | | | | |
See Notes to Financial Statements.
| | |
| 66 | | Visit our website at www.prudentialfunds.com |
The following is a reconciliation of assets in which significant unobservable inputs (Level 3) were used in determining fair value:
| | | | | | | | | | | | |
| | | CLO’s, CDO’s and
Other Asset-Backed
Securities | | | Bank
Loans | | | Corporate
Bonds | |
Balance as of 10/31/11 | | $ | 544,648 | | | $ | 362,075 | | | $ | — | |
Realized gain (loss) | | | — | | | | 990 | | | | — | |
Change in unrealized appreciation (depreciation)** | | | — | | | | 1,309 | | | | 25,428 | |
Purchases | | | 3,823,000 | | | | — | | | | 125,000 | |
Sales | | | — | | | | (76,611 | ) | | | (21,982 | ) |
Accrued discount/premium | | | — | | | | — | | | | — | |
Transfers into Level 3 | | | — | | | | — | | | | 244,418 | |
Transfers out of Level 3 | | | (544,648 | ) | | | (189,507 | ) | | | — | |
| | | | | | | | | | | | |
Balance as of 10/31/12 | | $ | 3,823,000 | | | $ | 98,256 | | | $ | 372,864 | |
| | | | | | | | | | | | |
| * | Other financial instruments are derivative instruments not reflected in the Portfolio of Investments, such as futures, forwards and swap contracts, which are recorded at the unrealized appreciation/depreciation on the instrument. |
| ** | Of which, $26,925 was included in Net Assets relating to securities held at the reporting period end. |
It is the Fund’s policy to recognize transfers in and transfers out at the fair value as of the beginning of period. At the reporting period end, 1 CDO, 1 CLO and 2 bank loans transferred out of Level 3 as a result of being valued by an independent pricing source and 2 corporate bonds transferred into Level 3 as a result of using single broker quotes.
Level 3 securities as presented in the table above are being fair valued using pricing methodologies approved by the Valuation Committee, which contain unobservable inputs. Such methodologies include, but are not limited to, using prices provided by a single broker/dealer, the cost of the investment, and prices of any recent transactions or bids/offers for such securities or any comparable securities.
See Notes to Financial Statements.
| | | | |
| Prudential Absolute Return Bond Fund | | | 67 | |
Portfolio of Investments
as of October 31, 2012 continued
The industry classification of portfolio holdings and liabilities in excess of other assets shown as a percentage of net assets as of October 31, 2012 were as follows:
| | | | |
Affiliated Money Market Mutual Fund | | | 18.0 | % |
Commercial Mortgage-Backed Securities | | | 16.4 | |
CLO’s, CDO’s and Other Asset-Backed Securities | | | 10.6 | |
Sovereigns | | | 5.0 | |
Banking | | | 4.6 | |
Healthcare & Pharmaceutical | | | 4.0 | |
U.S. Treasury Obligations | | | 3.4 | |
Non-Corporate Foreign Agencies | | | 3.1 | |
Technology | | | 2.9 | |
Capital Goods | | | 2.7 | |
Media & Entertainment | | | 2.7 | |
Residential Mortgage-Backed Securities | | | 2.6 | |
Mortgage-Backed Securities | | | 2.1 | |
Insurance | | | 1.9 | |
Metals | | | 1.9 | |
U.S. Government Agency Obligations | | | 1.9 | |
Cable | | | 1.8 | |
Foods | | | 1.7 | |
Telecommunications | | | 1.7 | |
Chemicals | | | 1.4 | |
Retailers | | | 1.4 | |
Energy—Other | | | 1.3 | |
Consumer | | | 1.2 | % |
Electric | | | 1.2 | |
Building Materials & Construction | | | 1.1 | |
Non-Captive Finance | | | 1.1 | |
Automotive | | | 1.0 | |
Gaming | | | 1.0 | |
Real Estate Investment Trusts | | | 0.9 | |
Paper | | | 0.8 | |
Tobacco | | | 0.8 | |
Energy—Integrated | | | 0.6 | |
Pipelines & Other | | | 0.6 | |
Healthcare Insurance | | | 0.5 | |
Lodging | | | 0.5 | |
Aerospace & Defense | | | 0.4 | |
Railroads | | | 0.4 | |
Airlines | | | 0.2 | |
Municipal Bonds | | | 0.2 | |
Packaging | | | 0.1 | |
| | | | |
| | | 105.7 | |
Other liabilities in excess of assets | | | (5.7 | ) |
| | | | |
| | | 100.0 | % |
| | | | |
See Notes to Financial Statements.
| | |
| 68 | | Visit our website at www.prudentialfunds.com |
The Fund invested in derivative instruments during the reporting period. The primary types of risk associated with these derivative instruments are credit risk, foreign exchange risk and interest rate risk. The effect of such derivative instruments on the Fund’s financial position and financial performance as reflected in the Statement of Assets and Liabilities and Statement of Operations is presented in the summary below.
Fair values of derivative instruments as of October 31, 2012 as presented in the Statement of Assets and Liabilities:
| | | | | | | | | | | | |
Derivatives not designated
as hedging instruments,
carried at fair value | | Asset Derivatives | | | Liability Derivatives | |
| | Balance
Sheet Location | | Fair
Value | | | Balance
Sheet Location | | Fair
Value | |
| Credit contracts | | Unrealized appreciation on swap agreements | | $ | 240,515 | | | Unrealized depreciation on swap agreements | | $ | 4,756 | |
| Credit contracts | | Premiums paid for swap agreements | | | 31,837 | | | Premiums received for swap agreements | | | 201,468 | |
| Foreign exchange contracts | | Unrealized appreciation on forward foreign currency contracts | | | 184,889 | | | Unrealized depreciation on forward foreign currency contracts | | | 290,937 | |
| Interest rate contracts | | Due to broker—variation margin | | | 52,492 | * | | Due to broker—variation margin | | | 68,536 | * |
| Interest rate contracts | | Unrealized appreciation on swap agreements | | | 681,657 | | | Unrealized depreciation on swap agreements | | | 1,727,672 | |
| Interest rate contracts | | Premiums paid for swap agreements | | | 1 | | | Premiums received for swap agreements | | | 35,334 | |
| | | | | | | | | | | | |
Total | | | | $ | 1,191,391 | | | | | $ | 2,328,703 | |
| | | | | | | | | | | | |
| * | Includes cumulative appreciation/depreciation as reported in the schedule of open futues contracts. Only unsettled variation margin receivable (payable) is reported within the Statement of Assets and Liabilities. |
The effects of derivative instruments on the Statement of Operations for the year ended October 31, 2012 are as follows:
| | | | | | | | | | | | | | | | | | | | | | | | |
Amount of Realized Gain or (Loss) on Derivatives Recognized in Income | |
Derivatives not designated
as hedging instruments,
carried at fair value | | Options
Purchased | | | Options
Written | | | Futures | | | Forward
Currency
Contracts | | | Swaps | | | Total | |
Credit contracts | | $ | — | | | $ | — | | | $ | — | | | $ | — | | | $ | 19,717 | | | $ | 19,717 | |
Foreign exchange contracts | | | — | | | | — | | | | — | | | | (192,034 | ) | | | — | | | | (192,034 | ) |
Interest rate contracts | | | 66,970 | | | | (14,327 | ) | | | (36,093 | ) | | | — | | | | (99,869 | ) | | | (83,319 | ) |
| | | | | | | | | | | | | | | | | | | | | | | | |
| | $ | 66,970 | | | $ | (14,327 | ) | | $ | (36,093 | ) | | $ | (192,034 | ) | | $ | (80,152 | ) | | $ | (255,636 | ) |
| | | | | | | | | | | | | | | | | | | | | | | | |
See Notes to Financial Statements.
| | | | |
| Prudential Absolute Return Bond Fund | | | 69 | |
Portfolio of Investments
as of October 31, 2012 continued
| | | | | | | | | | | | | | | | |
Change in Unrealized Appreciation or (Depreciation) on Derivatives Recognized in Income | |
Derivatives not designated as hedging
instruments, carried at fair value | | Futures | | | Forward
Currency
Contracts | | | Swaps | | | Total | |
Credit contracts | | $ | — | | | $ | — | | | $ | 235,759 | | | $ | 235,759 | |
Foreign exchange contracts | | | — | | | | (140,713 | ) | | | — | | | | (140,713 | ) |
Interest rate contracts | | | (16,044 | ) | | | — | | | | (491,750 | ) | | | (507,794 | ) |
| | | | | | | | | | | | | | | | |
| | $ | (16,044 | ) | | $ | (140,713 | ) | | $ | (255,991 | ) | | $ | (412,748 | ) |
| | | | | | | | | | | | | | | | |
As of October 31, 2012, the Fund’s average volume of derivative activities is as follows:
| | | | | | | | | | | | | | | | | | |
Options
Purchased
(Cost) | | | Futures
Long
Positions
(Value at
Trade
Date) | | | Futures
Short
Positions
(Value at
Trade
Date) | | | Forward
Currency
Contracts—
Purchased
(Value at
Settlement
Date
Payable) | | | Forward
Currency
Contracts—
Sold
(Value at
Settlement
Date
Receivable) | |
| | $578 | | | | $4,657,539 | | | | $4,394,892 | | | | $12,449,713 | | | | $8,985,840 | |
| | | | |
Currency
Swaps
(Notional
Amount in
USD (000)) | | | Inflation
Swap
(Notional
Amount in
USD (000)) | | | Interest
Rate
Swaps
(Notional
Amount in
USD (000)) | | | Credit
Default
Swaps as
Buyer
(Notional
Amount in
USD (000)) | | | Credit
Default
Swaps as
Writer
(Notional
Amount in
USD (000)) | |
| | $510 | | | | $18 | | | | $97,097 | | | | $809 | | | | $2,207 | |
See Notes to Financial Statements.
| | |
| 70 | | Visit our website at www.prudentialfunds.com |
PRUDENTIAL INVESTMENTS»MUTUAL FUNDS
FINANCIAL STATEMENTS
ANNUAL REPORT · October 31, 2012
Prudential Absolute Return Bond Fund
Statement of Assets and Liabilities
as of October 31, 2012
| | | | |
Assets | | | | |
Investments at value: | | | | |
Unaffiliated Investments (cost $175,131,837) | | $ | 177,329,125 | |
Affiliated Investments (cost $36,446,800) | | | 36,446,800 | |
Cash | | | 2,289,221 | |
Foreign currency, at value (cost $1,305,519) | | | 1,303,870 | |
Receivable for Fund shares sold | | | 4,255,921 | |
Receivable for investments sold | | | 2,317,007 | |
Dividends and interest receivable | | | 1,678,827 | |
Unrealized appreciation on swap agreements | | | 922,172 | |
Unrealized appreciation on forward foreign currency contracts | | | 184,889 | |
Premiums paid for swap agreements | | | 31,838 | |
Prepaid expenses | | | 946 | |
| | | | |
Total assets | | | 226,760,616 | |
| | | | |
| |
Liabilities | | | | |
Payable for investments purchased | | | 21,609,823 | |
Unrealized depreciation on swap agreements | | | 1,732,428 | |
Unrealized depreciation on forward foreign currency contracts | | | 290,937 | |
Premiums received for swap agreements | | | 236,802 | |
Payable for Fund shares reacquired | | | 168,005 | |
Accrued expenses | | | 124,936 | |
Dividends payable | | | 104,584 | |
Management fee payable | | | 87,439 | |
Due to broker—variation margin | | | 45,301 | |
Distribution fee payable | | | 36,048 | |
Affiliated transfer agent fee payable | | | 1,139 | |
| | | | |
Total liabilities | | | 24,437,442 | |
| | | | |
| |
Net Assets | | $ | 202,323,174 | |
| | | | |
| | | | | |
Net assets were comprised of: | | | | |
Shares of beneficial interest, at par | | $ | 20,365 | |
Paid-in capital in excess of par | | | 201,497,018 | |
| | | | |
| | | 201,517,383 | |
Distributions in excess of net investment income | | | (436,291 | ) |
Accumulated net realized loss on investment and foreign currency transactions | | | (8,729 | ) |
Net unrealized appreciation on investments and foreign currencies | | | 1,250,811 | |
| | | | |
Net assets, October 31, 2012 | | $ | 202,323,174 | |
| | | | |
See Notes to Financial Statements.
| | |
| 72 | | Visit our website at www.prudentialfunds.com |
| | | | |
Class A | | | | |
Net asset value and redemption price per share
($91,250,117 ÷ 9,201,719 shares of beneficial interest issued and outstanding) | | $ | 9.92 | |
Maximum sales charge (4.50% of offering price) | | | 0.47 | |
| | | | |
Maximum offering price to public | | $ | 10.39 | |
| | | | |
| |
Class C | | | | |
Net asset value, offering price and redemption price per share
($28,707,951 ÷ 2,888,824 shares of beneficial interest issued and outstanding) | | $ | 9.94 | |
| | | | |
| |
Class Q | | | | |
Net asset value, offering price and redemption price per share
($1,048 ÷ 105.4 shares of beneficial interest issued and outstanding) | | $ | 9.94 | |
| | | | |
| |
Class Z | | | | |
Net asset value, offering price and redemption price per share
($82,364,058 ÷ 8,274,437 shares of beneficial interest issued and outstanding) | | $ | 9.95 | |
| | | | |
See Notes to Financial Statements.
| | | | |
| Prudential Absolute Return Bond Fund | | | 73 | |
Statement of Operations
Year Ended October 31, 2012
| | | | |
Net Investment Income | | | | |
Income | | | | |
Unaffiliated interest income (net of foreign withholding taxes of $2,733) | | $ | 2,211,899 | |
Affiliated dividend income | | | 19,085 | |
| | | | |
Total income | | | 2,230,984 | |
| | | | |
| |
Expenses | | | | |
Management fee | | | 476,211 | |
Distribution fee—Class A | | | 45,064 | |
Distribution fee—Class C | | | 70,655 | |
Custodian’s fees and expenses | | | 154,000 | |
Registration fees | | | 58,000 | |
Audit fee | | | 55,000 | |
Reports to shareholders | | | 27,000 | |
Transfer agent’s fees and expenses (including affiliated expense of $3,500) (Note 3) | | | 24,000 | |
Legal fees and expenses | | | 19,000 | |
Trustees’ fees | | | 11,000 | |
Insurance | | | 1,000 | |
Miscellaneous | | | 11,410 | |
| | | | |
Total expenses | | | 952,340 | |
Expense reimbursement (Note 2) | | | (314,417 | ) |
| | | | |
Net expenses | | | 637,923 | |
| | | | |
Net investment income | | | 1,593,061 | |
| | | | |
| |
Realized And Unrealized Gain (Loss) On Investment And Foreign Currency Transactions | | | | |
Net realized gain (loss) on: | | | | |
Investment transactions | | | 100,721 | |
Foreign currency transactions | | | (181,792 | ) |
Financial futures transactions | | | (36,093 | ) |
Swap agreement transactions | | | (80,152 | ) |
Options written transactions | | | (14,327 | ) |
| | | | |
| | | (211,643 | ) |
| | | | |
Net change in unrealized appreciation (depreciation) on: | | | | |
Investments | | | 2,587,090 | |
Foreign currencies | | | (154,558 | ) |
Financial futures contracts | | | (16,044 | ) |
Swap agreements | | | (255,991 | ) |
| | | | |
| | | 2,160,497 | |
| | | | |
Net gain on investment and foreign currency transactions | | | 1,948,854 | |
| | | | |
Net Increase In Net Assets Resulting From Operations | | $ | 3,541,915 | |
| | | | |
See Notes to Financial Statements.
| | |
| 74 | | Visit our website at www.prudentialfunds.com |
Statement of Changes in Net Assets
| | | | | | | | |
| | | Year
Ended
October 31, 2012 | | | March 30, 2011*
through
October 31, 2011 | |
Increase (Decrease) In Net Assets | | | | | | | | |
Operations | | | | | | | | |
Net investment income | | $ | 1,593,061 | | | $ | 498,892 | |
Net realized loss on investment and foreign currency transactions | | | (211,643 | ) | | | (26,575 | ) |
Net change in unrealized appreciation (depreciation) on investments and foreign currencies | | | 2,160,497 | | | | (909,686 | ) |
| | | | | | | | |
Net increase (decrease) in net assets resulting from operations | | | 3,541,915 | | | | (437,369 | ) |
| | | | | | | | |
| | |
Dividends and Distributions (Note 1) | | | | | | | | |
Dividends from net investment income | | | | | | | | |
Class A | | | (511,595 | ) | | | (36,420 | ) |
Class C | | | (155,703 | ) | | | (26,946 | ) |
Class Q | | | (35 | ) | | | (16 | ) |
Class Z | | | (1,104,600 | ) | | | (407,867 | ) |
| | | | | | | | |
| | | (1,771,933 | ) | | | (471,249 | ) |
| | | | | | | | |
Distributions from net realized gains | | | | | | | | |
Class A | | | (7,914 | ) | | | — | |
Class C | | | (10,670 | ) | | | — | |
Class Q | | | (2 | ) | | | — | |
Class Z | | | (73,142 | ) | | | — | |
| | | | | | | | |
| | | (91,728 | ) | | | — | |
| | | | | | | | |
| | |
Fund share transactions (Note 6) | | | | | | | | |
Net proceeds from shares sold | | | 205,702,874 | | | | 39,453,377 | |
Net asset value of shares issued in reinvestment of dividends and distributions | | | 1,631,105 | | | | 457,824 | |
Cost of shares reacquired | | | (41,620,418 | ) | | | (4,071,224 | ) |
| | | | | | | | |
Net increase in net assets from Fund share transactions | | | 165,713,561 | | | | 35,839,977 | |
| | | | | | | | |
Total increase | | | 167,391,815 | | | | 34,931,359 | |
| | |
Net Assets: | | | | | | | | |
Beginning of period | | | 34,931,359 | | | | — | |
| | | | | | | | |
End of period | | $ | 202,323,174 | | | $ | 34,931,359 | |
| | | | | | | | |
| * | Commencement of investment operations. |
See Notes to Financial Statements.
| | | | |
| Prudential Absolute Return Bond Fund | | | 75 | |
Notes to Financial Statements
Prudential Investment Portfolios 9 (the “Trust”) is an open-end management investment company, registered under the Investment Company Act of 1940 (“1940 Act”). The Trust currently consists of three funds: Prudential Large-Cap Core Equity Fund, Prudential International Real Estate Fund and Prudential Absolute Return Bond Fund (the “Fund”). These financial statements relate to Prudential Absolute Return Bond Fund, a diversified fund. The financial statements of the Prudential Large-Cap Core Equity Fund and Prudential International Real Estate Fund are not presented herein. The Trust was organized as a business trust in Delaware on September 18, 1998. The Fund commenced investment operations on March 30, 2011.
The Fund’s investment objective is to seek positive returns over the long term, regardless of market conditions.
Note 1. Accounting Policies
The following is a summary of significant accounting policies followed by the Fund in the preparation of the financial statements.
Securities Valuation: The Fund holds portfolio securities and other assets that are fair valued at the close of each day the New York Stock Exchange (“NYSE”) is open for trading. Fair value is the price that would be received to sell an asset or paid to transfer a liability in an orderly transaction between market participants on the measurement date. The Board of Trustees (the “Board”) has delegated fair valuation responsibilities to Prudential Investments LLC (“PI” or “Manager”) through the adoption of Valuation Procedures for valuation of the Fund’s securities. Under the current Valuation Procedures, a Valuation Committee is established and responsible for supervising the valuation of portfolio securities and other assets. The Valuation Procedures allow the Fund to utilize independent pricing vendor services, quotations from market makers and other valuation methods in events when market quotations are not readily available or not representative of the fair value of the securities. A record of the Valuation Committee’s actions is subject to review, approval and ratification by the Board at its next regularly scheduled quarterly meeting.
Various inputs are used in determining the value of the Fund’s investments, which are summarized in the three broad level hierarchies based on any observable inputs used as described in the table following the Portfolio of Investments. The valuation
| | |
| 76 | | Visit our website at www.prudentialfunds.com |
methodologies and significant inputs used in determining the fair value of securities and other assets classified as Level 1, Level 2 and Level 3 of the hierarchy are as follows:
Common stocks, exchange-traded funds and financial derivative instruments (including futures contracts and certain options and swap contracts on securities), that are traded on a national securities exchange are valued at the last sale price as of the close of trading on the applicable exchange. Securities traded via NASDAQ are valued at the NASDAQ official closing price. To the extent these securities are valued at the last sale price or NASDAQ official closing price, they are classified as Level 1 of the fair value hierarchy.
In the event there is no sale or official closing price on such day, these securities are valued at the mean between the last reported bid and asked prices, or at the last bid price in absence of an asked price. These securities are classified as Level 2 of the fair value hierarchy as these inputs are considered as significant other observable inputs to the valuation.
For common stocks traded on foreign securities exchanges, certain valuation adjustments will be applied when events occur after the close of the security’s foreign market and before the Fund’s normal pricing time. These securities are valued using pricing vendor services that provide model prices derived using adjustment factors based on information such as local closing price, relevant general and sector indices, currency fluctuations, depositary receipts, and futures, as applicable. Securities valued using such model prices are classified as Level 2 of the fair value hierarchy as the adjustment factors are considered as significant other observable inputs to the valuation.
Investments in open-end, non-exchange-traded mutual funds are valued at their net asset values as of the close of the NYSE on the date of valuation. These securities are classified as Level 1 as they have the ability to be purchased or sold at their net asset values on the date of valuation.
Fixed income securities traded in the over-the-counter market, such as corporate bonds, municipal bonds, U.S. Government agencies issues and guaranteed obligations, U.S. Treasury obligations and sovereign issues are usually valued at prices provided by approved independent pricing vendors. The pricing vendors provide these prices usually after evaluating observable inputs including yield curves, credit rating, yield spreads, default rates, cash flows as well as broker/dealer quotations and reported trades. Securities valued using such vendor prices are classified as Level 2 of the fair value hierarchy.
| | | | |
| Prudential Absolute Return Bond Fund | | | 77 | |
Notes to Financial Statements
continued
Asset-backed and mortgage-related securities are usually valued by approved independent pricing vendors. The pricing vendors provide the prices using their internal pricing models with input from deal terms, tranche level attributes, yield curves, prepayment speeds, default rates and broker/dealer quotes. Securities valued using such vendor prices are classified as Level 2 of the fair value hierarchy.
Short-term debt securities of sufficient credit quality, which mature in sixty days or less, are valued using amortized cost method, which approximates fair value. The amortized cost method involves valuing a security at its cost on the date of purchase and thereafter assuming a constant amortization to maturity of the difference between the principal amount due at maturity and cost. These securities are categorized as Level 2 of the fair value hierarchy.
Over-the-counter financial derivative instruments, such as option contracts, foreign currency contracts and swaps agreements, are usually valued using pricing vendor services, which derive the valuation based on underlying asset prices, indices, spreads, interest rates, exchange rates and other inputs. These instruments are categorized as Level 2 of the fair value hierarchy.
Securities and other assets that cannot be priced using the methods described above are valued with pricing methodologies approved by the Valuation Committee. In the event there are unobservable inputs used when determining such valuations, the securities will be classified as Level 3 of the fair value hierarchy.
When determining the fair value of securities, some of the factors influencing the valuation include: the nature of any restrictions on disposition of the securities; assessment of the general liquidity of the securities; the issuer’s financial condition and the markets in which it does business; the cost of the investment; the size of the holding and the capitalization of the issuer; the prices of any recent transactions or bids/offers for such securities or any comparable securities; any available analyst media or other reports or information deemed reliable by the investment adviser regarding the issuer or the markets or industry in which it operates. Using fair value to price securities may result in a value that is different from a security’s most recent closing price and from the price used by other mutual funds to calculate their net asset values.
| | |
| 78 | | Visit our website at www.prudentialfunds.com |
Foreign Currency Translation: The books and records of the Fund are maintained in U.S. dollars. Foreign currency amounts are translated into U.S. dollars on the following basis:
(i) market value of investment securities, other assets and liabilities-at the current rates of exchange;
(ii) purchases and sales of investment securities, income and expenses-at the rates of exchange prevailing on the respective dates of such transactions.
The Fund does not isolate that portion of the results of operations arising as a result of changes in the foreign exchange rates from the fluctuations arising from changes in the market prices of long term securities held at the end of the period. Similarly, the Fund does not isolate the effect of changes in foreign exchange rates from the fluctuations arising from changes in the market prices of portfolio securities sold during the period. Accordingly, realized foreign currency gains or losses are included in the reported net realized gains or losses on investment transactions. Net realized gains or losses on foreign currency transactions represent net foreign exchange gains or losses from the holding of foreign currencies, currency gains or losses realized between the trade and settlement date on security transactions, and the difference between the amounts of dividends, interest and foreign withholding taxes recorded on the Fund’s books and the U.S. dollar equivalent amounts actually received or paid. Net unrealized currency gains or losses from valuing foreign currency denominated assets and liabilities (other than investments) at period end exchange rates are reflected as a component of net unrealized appreciation (depreciation) on foreign currencies.
Financial Futures Contracts: A financial futures contract is an agreement to purchase (long) or sell (short) an agreed amount of securities at a set price for delivery on a future date. Upon entering into a financial futures contract, the Fund is required to pledge to the broker an amount of cash and/or other assets equal to a certain percentage of the contract amount. This amount is known as the “initial margin.” Subsequent payments, known as “variation margin,” are made or received by the Fund each day, depending on the daily fluctuations in the value of the underlying security. Such variation margin is recorded for financial statement purposes on a daily basis as unrealized gain (loss). When the contract expires or is closed, the gain (loss) is realized and is presented in the Statement of Operations as net realized gain (loss) on financial futures transactions. Financial futures contracts involve elements of risk in excess of the amounts reflected on the Statement of Assets and Liabilities.
The Fund invests in financial futures contracts in order to hedge its existing portfolio securities, or securities the Fund intends to purchase, against fluctuations in value
| | | | |
| Prudential Absolute Return Bond Fund | | | 79 | |
Notes to Financial Statements
continued
caused by changes in prevailing interest rates, value of equities or foreign currency exchange rates. Should interest rates move unexpectedly, the Fund may not achieve the anticipated benefits of the financial futures contracts and may realize a loss. The use of futures transactions involves the risk of imperfect correlation in movements in the price of futures contracts, interest rates and the underlying hedged assets.
Forward Currency Contracts: A forward currency contract is a commitment to purchase or sell a foreign currency at a future date at a negotiated forward rate between two parties. The Fund enters into forward currency contracts in order to hedge its exposure to changes in foreign currency exchange rates on its foreign portfolio holdings or specific receivables and payables denominated in a foreign currency. The contracts are valued daily at current forward exchange rates and any unrealized gain or loss is included in net unrealized appreciation or depreciation on foreign currencies. Gain or loss is realized on the settlement date of the contract equal to the difference between the settlement value of the original and negotiated forward contracts. This gain or loss, if any, is included in net realized gain (loss) on foreign currency transactions. Risks may arise upon entering into these contracts from the potential inability of the counterparties to meet the terms of their contracts. Forward currency contracts involve risks from currency exchange rate and credit risk in excess of the amounts reflected on the Statement of Assets and Liabilities. The Fund’s maximum risk of loss from counterparty credit risk is the net value of the cash flows to be received from the counterparty at the end of the contract’s life. Such credit risk may be mitigated by entering into a master netting arrangement between the Fund and the counterparty which may permit the Fund to offset amounts payable by the Fund to the same counterparty against amounts to be received; and by the receipt of collateral from the counterparty by the Fund to cover the Fund’s exposure to the counterparty. However, there are no assurances that such mitigating factors are easily enforceable.
Options: The Fund purchased and wrote options in order to hedge against adverse market movements or fluctuations in value caused by changes in prevailing interest rates with respect to securities which the Fund currently owns or intends to purchase. The Fund’s principal reason for writing options is to realize, through receipt of premiums, a greater current return than would be realized on the underlying security alone. When the Fund purchases an option, it pays a premium and an amount equal to that premium is recorded as an asset. When the Fund writes an option, it receives a premium and an amount equal to that premium is recorded as a liability. The asset or
| | |
| 80 | | Visit our website at www.prudentialfunds.com |
liability is adjusted daily to reflect the current market value of the option. If an option expires unexercised, the Fund realizes a gain or loss to the extent of the premium received or paid. If an option is exercised, the premium received or paid is recorded as an adjustment to the proceeds from the sale or the cost of the purchase in determining whether the Fund has realized a gain or loss. The difference between the premium and the amount received or paid on effecting a closing purchase or sale transaction is also treated as a realized gain or loss. Gain or loss on purchased options is included in net realized gain or loss on investment transactions. Gain or loss on written options is presented separately as net realized gain or loss on options written. The Fund, as writer of an option, may have no control over whether the underlying securities may be sold (called) or purchased (put). As a result, the Fund bears the market risk of an unfavorable change in the price of the security underlying the written option. Over-the-counter options involve the risk of the potential inability of the counterparties to meet the terms of their contracts.
With exchange-traded futures and options contracts, there is minimal counterparty credit risk to the Fund since the exchanges’ clearinghouse acts as counterparty to all exchange traded futures and options and guarantees the futures and options contracts against default.
Swap Agreements: The Fund entered into credit default, interest rate swap and other forms of swap agreements. A swap agreement is an agreement to exchange the return generated by one instrument for the return generated by another instrument. Swap agreements are negotiated in the over-the-counter market and may be executed either directly with counterparty (“OTC Traded”) or through a central clearing facility, such as a registered commodities exchange (“Exchange Traded”). Swap agreements are valued daily at current market value and any change in value is included in the net unrealized appreciation or depreciation on investments. Payments received or paid by the Fund are recorded as realized gains or losses upon termination or maturity of the swap. Risk of loss may exceed amounts recognized on the statements of assets and liabilities. Swap agreements outstanding at period end, if any, are listed on the Portfolio of Investments.
Credit Default Swaps: Credit default swaps involve one party (the protection buyer) making a stream of payments to another party (the protection seller) in exchange for the right to receive a specified payment in the event of a default or as a result of a default (“credit event”) for the referenced party, typically corporate issues or sovereign issues of an emerging country, on its obligation; or in the event of a write-down, principal shortfall, interest shortfall or default of all or part of the referenced entities comprising a credit index.
| | | | |
| Prudential Absolute Return Bond Fund | | | 81 | |
Notes to Financial Statements
continued
The Fund is subject to credit risk in the normal course of pursuing its investment objectives. The Fund purchased credit default swaps to provide a measure of protection against defaults of the issuers. The Fund’s maximum risk of loss from counterparty credit risk for purchased credit default swaps is the notional value of a credit default swap agreement. Such credit risk may be mitigated by entering into a master netting arrangement between the Fund and the counterparty which may permit the Fund to offset amounts payable by the Fund to the same counterparty against amounts to be received; and by the receipt of collateral from the counterparty by the Fund to cover the Fund’s exposure to the counterparty. However, there are no assurances that such mitigating factors are easily enforceable.
As a seller of protection on credit default swap agreements, the Fund will generally receive from the buyer of protection an agreed upon payment throughout the term of the swap provided that there is no credit event. As the seller, the Fund would effectively increase investment risk to its portfolio because, in addition to its total net assets, the Fund may be subject to investment exposure on the notional amount of the swap.
The maximum amount of the payment that the Fund as a seller of protection could be required to make under a credit default swap agreement would be equal to the notional amount of the underlying security or index contract as a result of a credit event. These potential amounts will be partially offset by any recovery values of the respective referenced obligations, or net amounts received from the settlement of buy protection credit default swap agreements entered into by the Fund for the same referenced entity or index. As a buyer of protection, the Fund generally receives an amount up to the notional value of the swap if a credit event occurs.
Implied credit spreads, represented in absolute terms, utilized in determining the market value of credit default swap agreements on corporate issues or sovereign issues of an emerging country as of period end are disclosed in the footnotes to the Portfolio of Investments, if applicable, and serve as an indicator of the current status of the payment/performance risk and represent the likelihood of risk of default for the credit derivative. The implied credit spread of a particular referenced entity reflects the cost of buying/selling protection and may include upfront payments required to enter into the agreement. For credit default swap agreements on asset-backed securities and credit indices, the quoted market prices and resulting values serve as the indicator of the current status of the payment/performance risk. Wider credits
| | |
| 82 | | Visit our website at www.prudentialfunds.com |
spreads and increasing market value in absolute terms, when compared to the notional amount of the swap, represent a deterioration of the referenced entity’s credit soundness and a greater likelihood of risk of default or other credit event occurring as defined under the terms of the agreement.
Interest Rate Swaps: Interest rate swaps represent an agreement between counterparties to exchange cash flows based on the difference between two interest rates, applied to a notional principal amount for a specified period. The Fund is subject to interest rate risk exposure in the normal course of pursuing its investment objectives. The Fund used interest rate swaps to maintain its ability to generate steady cash flow by receiving a stream of fixed rate payments and to increase exposure to prevailing market rates by receiving floating rate payments using interest rate swap contracts. The Fund’s maximum risk of loss from counterparty credit risk is the discounted net value of the cash flows to be received from the counterparty over the contract’s remaining life. Such credit risk may be mitigated by entering into a master netting arrangement between the Fund and the counterparty which may permit the Fund to offset amounts payable by the Fund to the same counterparty against amounts to be received; and by the receipt of collateral from the counterparty by the Fund to cover the Fund’s exposure to the counterparty. However, there are no assurances that such mitigating factors are easily enforceable.
Currency Swaps: The Fund entered into currency swap agreements primarily to gain yield exposure on foreign bonds. Currency swap agreements involve two parties exchanging two different currencies with an agreement to reverse the exchange at a later date at specified exchange rates.
The Fund’s maximum risk of loss from counterparty credit risk is the discounted net value of the cash flows to be received from the counterparty over the contract’s remaining life. A master netting arrangement between the Fund and the counterparty permits the Fund to offset amounts payable by the Fund to the same counterparty against amounts to be received; and by the receipt of collateral from the counterparty by the Fund to cover the Fund’s exposure to the counterparty. However, there is no assurance that such mitigating factors are easily enforceable.
In addition to each instrument’s primary underlying risk exposure (e.g. interest rate), swap agreements involve, to varying degrees, elements of credit, market and documentation risk. Such risks involve the possibility that there will be no liquid market for these agreements, that the counterparty to the agreement may default on its obligation to perform or disagree as to the meaning of the contractual terms in the agreement, and that there will be unfavorable changes in net interest rates. In connection with these agreements, securities in the portfolio may be identified as
| | | | |
| Prudential Absolute Return Bond Fund | | | 83 | |
Notes to Financial Statements
continued
collateral or received as collateral from the counterparty in accordance with the terms of the respective swap agreements to provide or receive assets of value and serve as recourse in the event of default or bankruptcy/insolvency of either party. Such over-the-counter derivative agreements include conditions which when materialized, give the counterparty the right to cause an early termination of the transactions under those agreements. Any election by the counterparty for early termination of the contract(s) may impact the amounts reported on financial statements.
As of October 31, 2012, the Fund has not met conditions under such agreements, which give the counterparty the right to call for an early termination.
Forward currency contracts, financial futures contracts and swaps involve elements of both market and credit risk in excess of the amounts reflected on the Statement of Assets and Liabilities.
Concentration of Risk: The ability of issuers of debt securities (other than those issued or guaranteed by the U.S. Government) held by the Fund to meet their obligations may be affected by the economic or political developments in a specific industry, region or country. Foreign security and currency transactions may involve certain considerations and risks not typically associated with those of domestic origin as a result of, among other factors, the possibility of political and economic instability or the level of governmental supervision and regulation of foreign securities markets.
Restricted and Illiquid Securities: The Fund may invest up to 15% of its net assets in illiquid securities. Illiquid securities are those that, because of the absence of a readily available market or due to legal or contractual restrictions on resale, cannot be sold within seven days in the ordinary course of business at approximately the amount at which the Fund has valued the investment. Therefore, the Fund may find it difficult to sell illiquid securities at the time considered most advantageous by its Subadviser and may incur expenses that would not be incurred in the sale of securities that were freely marketable. Certain securities that would otherwise be considered illiquid because of legal restrictions on resale to the general public may be traded among qualified institutional buyers under Rule 144A of the Securities Act of 1933. These Rule 144A securities, as well as commercial paper that is sold in private placements under Section 4(2) of the Securities Act, may be deemed liquid by the Fund’s Subadviser under the guidelines adopted by the Fund. However, the liquidity of the Fund’s investments in Rule 144A securities could be impaired if trading does not develop or declines.
| | |
| 84 | | Visit our website at www.prudentialfunds.com |
Securities Transactions and Net Investment Income: Securities transactions are recorded on the trade date. Realized gains or losses from investment and currency transactions on sales of portfolio securities are calculated on the identified cost basis. Dividend income is recorded on the ex-dividend date. Interest income, including amortization of premium and accretion of discount on debt securities, as required, is recorded on an accrual basis. Expenses are recorded on the accrual basis, which may require the use of certain estimates by management, that may differ from actual.
Net investment income or loss (other than distribution fees which are charged to the respective class), and unrealized and realized gains or losses are allocated daily to each class of shares based upon the relative proportion of adjusted net assets of each class at the beginning of the day.
Dividends and Distributions: The Fund declares dividends of net investment income daily and payment is made monthly. Distributions of net realized capital and currency gains, if any, are made annually. Dividends and distributions are recorded on the ex-dividend date. Dividends and distributions are determined in accordance with federal income tax regulations which may differ from generally accepted accounting principles. Permanent book/tax differences relating to income and gains are reclassified amongst distribution in excess of net investment income, accumulated net realized gain or loss and paid-in-capital in excess of par, as appropriate.
Taxes: For federal income tax purposes it is the Fund’s policy to continue to meet the requirements of the Internal Revenue Code applicable to regulated investment companies and to distribute all of its taxable net income and capital gains, if any, to its shareholders. Therefore, no federal income tax provision is required.
Withholding taxes on foreign interest are recorded, net of reclaimable amounts, at the time the related income is earned.
Estimates: The preparation of the financial statements requires management to make estimates and assumptions that affect the reported amounts and disclosures in the financial statements. Actual results could differ from those amounts.
Note 2. Agreements
The Fund has a management agreement with PI. Pursuant to this agreement, PI has responsibility for all investment advisory services and supervises the subadviser’s performance of such services. PI has entered into a subadvisory agreement with Prudential Investment Management, Inc. (“PIM”). The subadvisory agreement provides that PIM will furnish investment advisory services in connection with the
| | | | |
| Prudential Absolute Return Bond Fund | | | 85 | |
Notes to Financial Statements
continued
management of the Fund. In connection therewith, PIM is obligated to keep certain books and records of the Fund. PI pays for the services of PIM, the cost of compensation of officers of the Fund, occupancy and certain clerical and bookkeeping costs of the Fund. The Fund bears all other costs and expenses.
The management fee paid to PI is computed daily and payable monthly at an annual rate of .80% of the average daily net assets.
Effective March 1, 2013 PI has contractually agreed to limit net annual Fund operating expenses (exclusive of distribution and service (12b-1) fees, extraordinary and certain other expenses such as taxes, interest and brokerage commissions) of each class of shares to .90% of the Fund’s average daily net assets until February 28, 2014. Prior to this agreement, PI contractually agreed to limit net annual Fund operating expenses (exclusive of distribution and service (12b-1) fees, extraordinary and certain other expenses such as taxes, interest and brokerage commissions) of each class of shares to .85% of the Fund’s average daily net assets.
The Fund has a distribution agreement with Prudential Investment Management Services LLC (“PIMS”) who acts as the distributor of the Class A, Class C, Class Q and Class Z shares. The Fund compensates PIMS for distributing and servicing the Fund’s Class A and Class C shares, pursuant to plans of distribution (the “Class A and C Plans”), regardless of expenses actually incurred by PIMS. The distribution fees are accrued daily and payable monthly. No distribution or service fees are paid to PIMS as distributor of the Class Q and Class Z shares of the Fund.
Pursuant to the Class A and C Plans, the Fund compensates PIMS for distribution related activities at an annual rate of up to .30% and 1% of the average daily net assets of the Class A and C shares, respectively. For the year ended October 31, 2012, PIMS has contractually agreed to limit such expenses to .25% of the average daily net assets of the Class A shares.
PIMS has advised the Fund that it received $255,381 in front-end sales charges resulting from sales of Class A shares during the year ended October 31, 2012. From these fees, PIMS paid such sales charges to affiliated broker-dealers, which in turn paid commissions to salespersons and incurred other distribution costs. PIMS has advised the Fund that for the year ended October 31, 2012, it has received $2,464, in contingent deferred sales charges imposed upon certain redemptions by Class C shareholders.
| | |
| 86 | | Visit our website at www.prudentialfunds.com |
PI and PIMS are indirect, wholly-owned subsidiaries of Prudential Financial, Inc. (“Prudential”).
Note 3. Other Transactions with Affiliates
Prudential Mutual Fund Services LLC (“PMFS”), an affiliate of PI and an indirect, wholly-owned subsidiary of Prudential, serves as the Fund’s transfer agent. Transfer agent fees and expenses in the Statement of Operations include certain out-of-pocket expenses paid to non-affiliates, where applicable.
The Fund invests in the Prudential Core Taxable Money Market Fund (the “Core Fund”), a portfolio of the Prudential Investment Portfolios 2, registered under the 1940 Act and managed by PI. Earnings from the Core Fund are disclosed on the Statement of Operations as affiliated dividend income.
Note 4. Portfolio Securities
Purchases and sales of portfolio securities, other than short-term investments and U.S. government securities, for the year ended October 31, 2012, were $154,121,674 and $22,483,251, respectively.
Transactions in options written during the year ended October 31, 2012, were as follows:
| | | | | | | | |
| | | Contracts | | | Premiums
Received | |
Options outstanding at October 31, 2011 | | | — | | | $ | — | |
Options written | | | 17 | | | | 2,884 | |
Options terminated in closing purchase transactions | | | (17 | ) | | | (2,884 | ) |
Options expired | | | — | | | | — | |
| | | | | | | | |
Options outstanding at October 31, 2012 | | | — | | | $ | — | |
| | | | | | | | |
Note 5. Distributions and Tax Information
Distributions to shareholders, which are determined in accordance with federal income tax regulations and which may differ from generally accepted accounting principles, are recorded on the ex-dividend date. In order to present distributions in excess of net investment income, accumulated net realized loss on investment and foreign currency transactions and paid-in capital in excess of par on the Statement of Assets and Liabilities that more closely represent their tax character, certain adjustments have been made to distributions in excess of net investment income,
| | | | |
| Prudential Absolute Return Bond Fund | | | 87 | |
Notes to Financial Statements
continued
accumulated net realized loss on investment and foreign currency transactions and paid-in capital in excess of par. For the year ended October 31, 2012, the adjustments were to increase distributions in excess of net investment income by $179,339, decrease accumulated net realized loss on investment and foreign currency transactions by $203,016 and decrease paid-in capital in excess of par by $23,677, primarily due to the difference between financial and tax reporting purposes of premium amortization, certain transactions involving foreign currencies, paydown gains (losses), swaps, reclassification of distributions and other book to tax adjustments. Net investment income, net realized loss on investment and foreign currency transactions and net assets were not affected by this change.
For the year ended October 31, 2012 and period ended October 31, 2011, the tax character of dividends paid as reflected in the Statement of Changes in Net Assets were $1,863,661 and $471,249 of ordinary income, respectively.
As of October 31, 2012, the Fund did not have any distributable earnings on a tax basis.
The United States federal income tax basis of the Fund’s investments and the net unrealized appreciation as of October 31, 2012 were as follows:
| | | | | | | | | | |
Tax Basis | | Appreciation | | Depreciation | | Net
Unrealized
Appreciation | | Other Cost
Basis
Adjustments | | Total Net
Unrealized
Appreciation |
| $212,226,436 | | $2,135,732 | | $(586,243) | | $1,549,489 | | $(821,138) | | $728,351 |
The difference between book basis and tax basis is primarily attributable to deferred losses on wash sales and difference in the treatment of amortization of premiums. The other cost basis adjustments are primarily attributable to appreciation (depreciation) of foreign currencies, swaps, futures, forward currency transactions and mark-to-market of receivables and payables.
Management has analyzed the Fund’s tax positions taken on federal income tax returns for all open tax years and has concluded that no provision for income tax is required in the Fund’s financial statements for the current reporting period. The Fund’s federal and state income and federal excise tax returns for tax years for which the applicable statutes of limitations have not expired are subject to examination by the Internal Revenue Service and state departments of revenue.
| | |
| 88 | | Visit our website at www.prudentialfunds.com |
Note 6. Capital
The Fund offers Class A, Class C, Class Q and Class Z shares. Class A shares are sold with a front-end sales charge of up to 4.50%. All investors who purchase Class A shares in an amount of $1 million or more and sell these shares within 12 months of purchase are subject to a contingent deferred sales charge (CDSC) of 1%. The Class A CDSC is waived for purchases by certain retirement and/or benefit plans. Class C shares are sold with a contingent deferred sales charge of 1% on shares redeemed during the first 12 months after purchase. A special exchange privilege is also available for shareholders who qualified to purchase Class A shares at net asset value. Class Q and Z shares are not subject to any sales or redemption charge and are offered exclusively for sale to a limited group of investors.
Under certain circumstances, an exchange may be made from specified share classes of the Fund to one or more other share classes of the Fund as presented in the table of transactions in shares of beneficial interest. For the fiscal year ended 10/31/2012, no such exchanges were made.
At October 31, 2012, Prudential Financial, Inc. through its affiliates owned 105 Class A shares, 104 Class C shares, 105 Class Q shares and 105 Class Z shares of the Fund.
The Trust has authorized an unlimited number of shares of beneficial interest at $.001 par value.
Transactions in shares of beneficial interest were as follows:
| | | | | | | | |
Class A | | Shares | | | Amount | |
Year ended October 31, 2012: | | | | | | | | |
Shares sold | | | 9,518,943 | | | $ | 93,730,024 | |
Shares issued in reinvestment of dividends and distributions | | | 45,961 | | | | 452,847 | |
Shares reacquired | | | (641,928 | ) | | | (6,297,287 | ) |
| | | | | | | | |
Net increase (decrease) in shares outstanding | | | 8,922,976 | | | $ | 87,885,584 | |
| | | | | | | | |
Period ended October 31, 2011*: | | | | | | | | |
Shares sold | | | 512,866 | | | $ | 5,075,110 | |
Shares issued in reinvestment of dividends | | | 3,438 | | | | 33,502 | |
Shares reacquired | | | (237,561 | ) | | | (2,329,557 | ) |
| | | | | | | | |
Net increase (decrease) in shares outstanding | | | 278,743 | | | $ | 2,779,055 | |
| | | | | | | | |
| | | | |
| Prudential Absolute Return Bond Fund | | | 89 | |
Notes to Financial Statements
continued
| | | | | | | | |
Class C | | Shares | | | Amount | |
Year ended October 31, 2012: | | | | | | | | |
Shares sold | | | 2,600,357 | | | $ | 25,728,166 | |
Shares issued in reinvestment of dividends and distributions | | | 14,607 | | | | 143,179 | |
Shares reacquired | | | (140,273 | ) | | | (1,374,474 | ) |
| | | | | | | | |
Net increase (decrease) in shares outstanding | | | 2,474,691 | | | $ | 24,496,871 | |
| | | | | | | | |
Period ended October 31, 2011*: | | | | | | | | |
Shares sold | | | 427,911 | | | $ | 4,243,233 | |
Shares issued in reinvestment of dividends | | | 2,487 | | | | 24,212 | |
Shares reacquired | | | (16,265 | ) | | | (158,670 | ) |
| | | | | | | | |
Net increase (decrease) in shares outstanding | | | 414,133 | | | $ | 4,108,775 | |
| | | | | | | | |
Class Q | | | | | | |
Year ended October 31, 2012: | | | | | | | | |
Shares issued in reinvestment of dividends and distributions | | | 3.8 | | | $ | 37 | |
| | | | | | | | |
Net increase (decrease) in shares outstanding | | | 3.8 | | | $ | 37 | |
| | | | | | | | |
Period ended October 31, 2011*: | | | | | | | | |
Shares sold | | | 100.0 | | | $ | 1,000 | |
Shares issued in reinvestment of dividends | | | 1.6 | | | | 16 | |
| | | | | | | | |
Net increase (decrease) in shares outstanding | | | 101.6 | | | $ | 1,016 | |
| | | | | | | | |
Class Z | | | | | | |
Year ended October 31, 2012: | | | | | | | | |
Shares sold | | | 8,697,989 | | | $ | 86,244,684 | |
Shares issued in reinvestment of dividends and distributions | | | 105,876 | | | | 1,035,042 | |
Shares reacquired | | | (3,424,051 | ) | | | (33,948,657 | ) |
| | | | | | | | |
Net increase (decrease) in shares outstanding | | | 5,379,814 | | | $ | 53,331,069 | |
| | | | | | | | |
Period ended October 31, 2011*: | | | | | | | | |
Shares sold | | | 3,017,842 | | | $ | 30,134,034 | |
Shares issued in reinvestment of dividends | | | 40,769 | | | | 400,094 | |
Shares reacquired | | | (163,988 | ) | | | (1,582,997 | ) |
| | | | | | | | |
Net increase (decrease) in shares outstanding | | | 2,894,623 | | | $ | 28,951,131 | |
| | | | | | | | |
| * | Commenced operations on March 30, 2011. |
Note 7. Borrowings
The Fund, along with other affiliated registered investment companies (the “Funds”), is a party to a Syndicated Credit Agreement (“SCA”) with a group of banks. The purpose of the SCA is to provide an alternative source of temporary funding for capital share
| | |
| 90 | | Visit our website at www.prudentialfunds.com |
redemptions. The SCA provides for a commitment of $900 million for the period December 16, 2011 through November 14, 2012. The SCA has been renewed effective November 15, 2012 at substantially similar terms through November 14, 2013. The Funds pay an annualized commitment fee of 0.08% on the unused portion of the SCA. Prior to December 16, 2011, the Funds had another SCA of a $750 million commitment with an annualized commitment fee of 0.10% of the unused portion. Interest on any borrowings under the SCA is paid at contracted market rates. The commitment fee for the unused amount is accrued daily and paid quarterly.
The Fund did not utilize the SCA during the year ended October 31, 2012.
Note 8. New Accounting Pronouncement
In December 2011, the Financial Accounting Standards Board issued Accounting Standards Update (“ASU”) No. 2011-11 regarding “Disclosures about Offsetting Assets and Liabilities”. The amendments, which will be effective for annual reporting periods beginning on or after January 1, 2013 and interim periods within those annual periods, require an entity to disclose information about offsetting and related arrangements for assets and liabilities, financial instruments and derivatives that are either currently offset in accordance with current requirements or are subject to enforceable master netting arrangements or similar agreements. At this time, management is evaluating the implications of ASU No. 2011-11 and its impact on the financial statements has not yet been determined.
| | | | |
| Prudential Absolute Return Bond Fund | | | 91 | |
Financial Highlights
| | | | | | | | | | |
| Class A Shares | |
| | | Year Ended
October 31,
2012 | | | | | March 30,
2011(e)
through
October 31,
2011 | |
| Per Share Operating Performance(a): | | | | | | | | | | |
| Net Asset Value, Beginning Of Period | | | $9.72 | | | | | | $10.00 | |
| Income (loss) from investment operations: | | | | | | | | | | |
| Net investment income | | | .22 | | | | | | .18 | |
| Net realized and unrealized gain (loss) on investment and foreign currency transactions | | | .30 | | | | | | (.31 | ) |
| Total from investment operations | | | .52 | | | | | | (.13 | ) |
| Less Dividends and Distributions: | | | | | | | | | | |
| Dividends from net investment income | | | (.30 | ) | | | | | (.15 | ) |
| Distributions from net realized gains | | | (.02 | ) | | | | | - | |
| Total dividends and distributions | | | (.32 | ) | | | | | (.15 | ) |
| Net asset value, end of period | | | $9.92 | | | | | | $9.72 | |
| Total Return(b): | | | 5.49% | | | | | | (1.27)% | |
| |
| Ratios/Supplemental Data: | |
| Net assets, end of period (000) | | | $91,250 | | | | | | $2,709 | |
| Average net assets (000) | | | $18,023 | | | | | | $2,240 | |
| Ratios to average net assets(c): | | | | | | | | | | |
| Expenses, including distribution and service (12b-1) fees(d) | | | 1.11% | (f) | | | | | 1.30% | (f)(g) |
| Expenses, excluding distribution and service (12b-1) fees | | | .86% | (f) | | | | | 1.05% | (f)(g) |
| Net investment income | | | 2.53% | (f) | | | | | 2.90% | (f)(g) |
| Portfolio turnover rate | | | 152% | | | | | | 112% | (h) |
(a) Calculated based on average shares outstanding during the period.
(b) Total return does not consider the effects of sales loads. Total return is calculated assuming a purchase of a share on the first day and a sale on the last day of each period reported, and includes reinvestment of dividends and distributions. Total returns may reflect adjustments to conform to generally accepted accounting principles. Total returns for period less than a full year are not annualized.
(c) Does not include expenses of the underlying portfolio in which the Fund invests.
(d) The distributor of the Fund has contractually agreed to limit its distribution and service (12b-1) fees to .25% of the average daily net assets of the Class A shares.
(e) Commencement of operations.
(f) Net of expense waiver/reimbursement. If the investment manager had not waived/reimbursed expenses, the expense ratios including and excluding distribution and service (12b-1) fees and net investment income ratios would have been 1.49%, 1.24% and 2.16%, respectively, for the year ended October 31, 2012 and 2.65%, 2.40% and 1.55%, respectively, for the period ended October 31, 2011.
(g) Annualized.
(h) Not annualized.
See Notes to Financial Statements.
| | |
| 92 | | Visit our website at www.prudentialfunds.com |
| | | | | | | | | | |
| Class C Shares | | | |
| | | Year Ended
October 31,
2012 | | | | | March 30,
2011(d)
through
October 31,
2011 | |
| Per Share Operating Performance(a): | | | | | | | | | | |
| Net Asset Value, Beginning Of Period | | | $9.73 | | | | | | $10.00 | |
| Income (loss) from investment operations: | | | | | | | | | | |
| Net investment income | | | .16 | | | | | | .13 | |
| Net realized and unrealized gain (loss) on investment and foreign currency transactions | | | .29 | | | | | | (.30 | ) |
| Total from investment operations | | | .45 | | | | | | (.17 | ) |
| Less Dividends and Distributions: | | | | | | | | | | |
| Dividends from net investment income | | | (.22 | ) | | | | | (.10 | ) |
| Distributions from net realized gains | | | (.02 | ) | | | | | - | |
| Total dividends and distributions | | | (.24 | ) | | | | | (.10 | ) |
| Net asset value, end of period | | | $9.94 | | | | | | $9.73 | |
| Total Return(b): | | | 4.78% | | | | | | (1.74)% | |
| |
| Ratios/Supplemental Data: | | | | | | | | |
| Net assets, end of period (000) | | | $28,708 | | | | | | $4,030 | |
| Average net assets (000) | | | $7,066 | | | | | | $2,254 | |
| Ratios to average net assets(c): | | | | | | | | | | |
| Expenses, including distribution and service (12b-1) fees | | | 1.88% | (e) | | | | | 2.05% | (e)(f) |
| Expenses, excluding distribution and service (12b-1) fees | | | .88% | (e) | | | | | 1.05% | (e)(f) |
| Net investment income | | | 1.86% | (e) | | | | | 2.17% | (e)(f) |
| Portfolio turnover rate | | | 152% | | | | | | 112% | (g) |
(a) Calculated based on average shares outstanding during the period.
(b) Total return does not consider the effects of sales loads. Total return is calculated assuming a purchase of a share on the first day and a sale on the last day of each period reported, and includes reinvestment of dividends and distributions. Total returns may reflect adjustments to conform to generally accepted accounting principles. Total returns for period less than a full year are not annualized.
(c) Does not include expenses of the underlying portfolio in which the Fund invests.
(d) Commencement of operations.
(e) Net of expense waiver/reimbursement. If the investment manager had not waived/reimbursed expenses, the expense ratios including and excluding distribution and service (12b-1) fees and net investment income ratios would have been 2.39%, 1.39% and 1.34%, respectively, for the year ended October 31, 2012 and 3.39%, 2.39% and .83%, respectively, for the period ended October 31, 2011.
(f) Annualized.
(g) Not annualized.
See Notes to Financial Statements.
| | | | |
| Prudential Absolute Return Bond Fund | | | 93 | |
Financial Highlights
continued
| | | | | | | | | | |
| Class Q Shares | | | |
| | | Year Ended
October 31,
2012 | | | | | March 30,
2011(d)
through
October 31,
2011 | |
| Per Share Operating Performance(a): | | | | | | | | | | |
| Net Asset Value, Beginning Of Period | | | $9.73 | | | | | | $10.00 | |
| Income (loss) from investment operations: | | | | | | | | | | |
| Net investment income | | | .30 | | | | | | .16 | |
| Net realized and unrealized gain (loss) on investment and foreign currency transactions | | | .26 | | | | | | (.27 | ) |
| Total from investment operations | | | .56 | | | | | | (.11 | ) |
| Less Dividends and Distributions: | | | | | | | | | | |
| Dividends from net investment income | | | (.33 | ) | | | | | (.16 | ) |
| Distributions from net realized gains | | | (.02 | ) | | | | | - | |
| Total dividends and distributions | | | (.35 | ) | | | | | (.16 | ) |
| Net asset value, end of period | | | $9.94 | | | | | | $9.73 | |
| Total Return(b): | | | 5.99% | | | | | | (1.09)% | |
| |
| Ratios/Supplemental Data: | | | | | | | | |
| Net assets, end of period (000) | | | $1 | | | | | | $1 | |
| Average net assets (000) | | | $1 | | | | | | $1 | |
| Ratios to average net assets(c): | | | | | | | | | | |
| Expenses, including distribution and service (12b-1) fees | | | .89% | (e) | | | | | 1.05% | (e)(f) |
| Expenses, excluding distribution and service (12b-1) fees | | | .89% | (e) | | | | | 1.05% | (e)(f) |
| Net investment income | | | 3.11% | (e) | | | | | 2.74% | (e)(f) |
| Portfolio turnover rate | | | 152% | | | | | | 112% | (g) |
(a) Calculated based on average shares outstanding during the period.
(b) Total return is calculated assuming a purchase of a share on the first day and a sale on the last day of each period reported, and includes reinvestment of dividends and distributions. Total returns may reflect adjustments to conform to generally accepted accounting principles. Total returns for periods less than a full year are not annualized.
(c) Does not include expenses of the underlying portfolio in which the Fund invests.
(d) Commencement of operations.
(e) Net of expense waiver/reimbursement. If the investment manager had not waived/reimbursed expenses, the expense ratios including and excluding distribution and service (12b-1) fees and net investment income ratios would have been 1.54%, 1.54% and 2.46%, respectively, for the year ended October 31, 2012 and 2.45%, 2.45% and 1.34%, respectively, for the period ended October 31, 2011.
(f) Annualized.
(g) Not annualized.
See Notes to Financial Statements.
| | |
| 94 | | Visit our website at www.prudentialfunds.com |
| | | | | | | | | | |
| Class Z Shares | |
| | | Year Ended
October 31,
2012 | | | | | March 30,
2011(d)
through
October 31,
2011 | |
| Per Share Operating Performance(a): | | | | | | | | | | |
| Net Asset Value, Beginning Of Period | | | $9.74 | | | | | | $10.00 | |
| Income (loss) from investment operations: | | | | | | | | | | |
| Net investment income | | | .27 | | | | | | .16 | |
| Net realized and unrealized gain (loss) on investment and foreign currency transactions | | | .28 | | | | | | (.27 | ) |
| Total from investment operations | | | .55 | | | | | | (.11 | ) |
| Less Dividends and Distributions: | | | | | | | | | | |
| Dividends from net investment income | | | (.32 | ) | | | | | (.15 | ) |
| Distributions from net realized gains | | | (.02 | ) | | | | | - | |
| Total dividends and distributions | | | (.34 | ) | | | | | (.15 | ) |
| Net asset value, end of period | | | $9.95 | | | | | | $9.74 | |
| Total Return(b): | | | 5.81% | | | | | | (1.14)% | |
| |
| Ratios/Supplemental Data: | |
| Net assets, end of period (000) | | | $82,364 | | | | | | $28,192 | |
| Average net assets (000) | | | $34,383 | | | | | | $27,018 | |
| Ratios to average net assets(c): | | | | | | | | | | |
| Expenses, including distribution and service (12b-1) fees | | | .89% | (e) | | | | | 1.05% | (e)(f) |
| Expenses, excluding distribution and service (12b-1) fees | | | .89% | (e) | | | | | 1.05% | (e)(f) |
| Net investment income | | | 2.92% | (e) | | | | | 2.70% | (e)(f) |
| Portfolio turnover rate | | | 152% | | | | | | 112% | (g) |
(a) Calculated based on average shares outstanding during the period.
(b) Total return is calculated assuming a purchase of a share on the first day and a sale on the last day of each period reported, and includes reinvestment of dividends and distributions. Total returns may reflect adjustments to conform to generally accepted accounting principles. Total returns for period less than a full year are not annualized.
(c) Does not include expenses of the underlying portfolio in which the Fund invests.
(d) Commencement of operations.
(e) Net of expense waiver/reimbursement. If the investment manager had not waived/reimbursed expenses, the expense ratios including and excluding distribution and service (12b-1) fees and net investment income ratios would have been 1.50%, 1.50% and 2.31%, respectively, for the year ended October 31, 2012 and 2.48%, 2.48% and 1.26%, respectively, for the period ended October 30, 2011.
(f) Annualized.
(g) Not annualized.
See Notes to Financial Statements.
| | | | |
| Prudential Absolute Return Bond Fund | | | 95 | |
Report of Independent Registered Public
Accounting Firm
The Board of Trustees and Shareholders
Prudential Investment Portfolios 9:
We have audited the accompanying statement of assets and liabilities of Prudential Absolute Return Bond Fund, a series of Prudential Investment Portfolios 9 (hereafter referred to as the “Fund”), including the portfolio of investments, as of October 31, 2012, and the related statement of operations for the year then ended, the statement of changes in net assets and the financial highlights for the year then ended and for the period March 30, 2011 (commencement of operations) to October 31, 2011. These financial statements and financial highlights are the responsibility of the Fund’s management. Our responsibility is to express an opinion on these financial statements and financial highlights based on our audits.
We conducted our audits in accordance with the standards of the Public Company Accounting Oversight Board (United States). Those standards require that we plan and perform the audit to obtain reasonable assurance about whether the financial statements and financial highlights are free of material misstatement. An audit includes examining, on a test basis, evidence supporting the amounts and disclosures in the financial statements. Our procedures included confirmation of securities owned as of October 31, 2012, by correspondence with the custodian, transfer agent and brokers or by other appropriate auditing procedures when replies from brokers were not received. An audit also includes assessing the accounting principles used and significant estimates made by management, as well as evaluating the overall financial statement presentation. We believe that our audits provide a reasonable basis for our opinion.
In our opinion, the financial statements and financial highlights referred to above present fairly, in all material respects, the financial position of the Fund as of October 31, 2012, and the results of its operations for the year then ended, the changes in its net assets and the financial highlights for the year then ended and for the period March 30, 2011 to October 31, 2011, in conformity with U.S. generally accepted accounting principles.

New York, New York
December 21, 2012
| | |
| 96 | | Visit our website at www.prudentialfunds.com |
Tax Information
(Unaudited)
For the year ended October 31, 2012, the Fund reports the maximum amount allowable but not less than 75.10% as interest related dividends in accordance with Section 871(k)(1) and 881(e)(1) of the Internal Revenue Code.
Interest-related dividends do not include any distributions paid by a fund with respect to Fund tax years beginning after October 31, 2012. Consequently, this provision expires with respect to such distributions paid after the Fund’s fiscal year end.
In January 2013, you will be advised on IRS 1099-DIV or substitute Form 1099-DIV as to the federal tax status of the distributions received by you in calendar year 2012.
| | | | |
| Prudential Absolute Return Bond Fund | | | 97 | |
INFORMATION ABOUT BOARD MEMBERS AND OFFICERS
(Unaudited)
Information about Board Members and Officers of the Fund is set forth below. Board Members who are not deemed to be “interested persons” of the Fund, as defined in the 1940 Act, are referred to as “Independent Board Members.” Board Members who are deemed to be “interested persons” of the Fund are referred to as “Interested Board Members.” The Board Members are responsible for the overall supervision of the operations of the Fund and perform the various duties imposed on the directors of investment companies by the 1940 Act. The Board in turn elects the Officers, who are responsible for administering the day-to-day operations of the Fund.
| | | | |
| Independent Board Members(1) |
Name, Address, Age Position(s) Portfolios Overseen | | Principal Occupation(s) During Past Five Years | | Other Directorships Held |
Kevin J. Bannon (60) Board Member Portfolios Overseen: 63 | | Managing Director (since April 2008) and Chief Investment Officer (since October 2008) of Highmount Capital LLC (registered investment adviser); formerly Executive Vice President and Chief Investment Officer (April 1993-August 2007) of Bank of New York Company; President (May 2003-May 2007) of BNY Hamilton Family of Mutual Funds. | | Director of Urstadt Biddle Properties (since September 2008). |
Linda W. Bynoe (60) Board Member Portfolios Overseen: 63 | | President and Chief Executive Officer (since March 1995) and formerly Chief Operating Officer (December 1989-February 1995) of Telemat Ltd. (management consulting); formerly Vice President (January 1985-June 1989) at Morgan Stanley & Co (broker-dealer). | | Director of Simon Property Group, Inc. (retail real estate) (May 2003-May 2012); Director of Anixter International, Inc. (communication products distributor) (since January 2006); Director of Northern Trust Corporation (financial services) (since April 2006); Trustee of Equity Residential (residential real estate) (since December 2009). |
Michael S. Hyland, CFA (67) Board Member Portfolios Overseen: 63 | | Independent Consultant (since February 2005); formerly Senior Managing Director (July 2001-February 2005) of Bear Stearns & Co, Inc.; Global Partner, INVESCO (1999-2001); Managing Director and President of Salomon Brothers Asset Management (1989-1999). | | None. |
Douglas H. McCorkindale (73) Board Member Portfolios Overseen: 63 | | Formerly Chairman (February 2001-June 2006), Chief Executive Officer (June 2000-July 2005), President (September 1997-July 2005) and Vice Chairman (March 1984-May 2000) of Gannett Co. Inc. (publishing and media). | | Director of Lockheed Martin Corp. (aerospace and defense) (since May 2001). |
Visit our website at www.prudentialfunds.com
| | | | |
| Independent Board Members(1) |
Name, Address, Age Position(s) Portfolios Overseen | | Principal Occupation(s) During Past Five Years | | Other Directorships Held |
Stephen P. Munn (70) Board Member Portfolios Overseen: 63 | | Lead Director (since 2007) and formerly Chairman (1993-2007) of Carlisle Companies Incorporated (manufacturer of industrial products). | | Lead Director (since 2007) of Carlisle Companies Incorporated (manufacturer of industrial products). |
Richard A. Redeker (69) Board Member & Independent Chair Portfolios Overseen: 63 | | Retired Mutual Fund Senior Executive (44 years); Management Consultant; Independent Directors Council (organization of 2,800 Independent Mutual Fund Directors)-Executive Committee, Chair of Policy Steering Committee, Governing Council. | | None. |
Robin B. Smith (73) Board Member Portfolios Overseen: 63 | | Chairman of the Board (since January 2003) of Publishers Clearing House (direct marketing); Member of the Board of Directors of ADLPartner (marketing) (since December 2010); formerly Chairman and Chief Executive Officer (August 1996-January 2003) of Publishers Clearing House. | | Formerly Director of BellSouth Corporation (telecommunications) (1992-2006). |
Stephen G. Stoneburn (69) Board Member Portfolios Overseen: 63 | | Chairman, (since July 2011), President and Chief Executive Officer (since June 1996) of Quadrant Media Corp. (publishing company); formerly President (June 1995-June 1996) of Argus Integrated Media, Inc.; Senior Vice President and Managing Director (January 1993-1995) of Cowles Business Media; Senior Vice President of Fairchild Publications, Inc. (1975-1989). | | None. |
| | | | |
| Interested Board Members(1) |
Name, Address, Age Position(s) Portfolios Overseen | | Principal Occupation(s) During Past Five Years | | Other Directorships Held |
Stuart S. Parker (50) Board Member & President Portfolios Overseen: 63 | | President of Prudential Investments LLC (since January 2012); Executive Vice President of Jennison Associates LLC and Head of Retail Distribution of Prudential Investments LLC (June 2005 - December 2011). | | None. |
Prudential Absolute Return Bond Fund
| | | | |
| Interested Board Members(1) |
Name, Address, Age Position(s) Portfolios Overseen | | Principal Occupation(s) During Past Five Years | | Other Directorships Held |
Scott E. Benjamin (39) Board Member & Vice President Portfolios Overseen: 63 | | Executive Vice President (since June 2009) of Prudential Investments LLC; Executive Vice President (June 2009-June 2012) and Vice President (since June 2012) of Prudential Investment Management Services LLC; Executive Vice President (since September 2009) of AST Investment Services, Inc.; Senior Vice President of Product Development and Marketing, Prudential Investments (since February 2006); Vice President of Product Development and Product Management, Prudential Investments (2003-2006). | | None. |
(1) The year that each individual joined the Fund’s Board is as follows:
Linda W. Bynoe, 2005; Douglas H. McCorkindale, 1998; Richard A. Redeker, 1998; Robin B. Smith, 1998; Stephen G. Stoneburn, 2003; Kevin J. Bannon, 2008; Michael S. Hyland, 2008; Stephen P. Munn, 2008; Stuart S. Parker, Board Member since 2012 and President since 2012; Scott E. Benjamin, Board Member since 2010 and Vice President since 2009.
| | |
| Fund Officers(a)(1) |
Name, Address and Age Position with Fund | | Principal Occupation(s) During Past Five Years |
Judy A. Rice (64) Vice President | | Chairman of Prudential Investments LLC (since January 2012); President, Chief Executive Officer (May 2011-Present) and Executive Vice President (December 2008-May 2011) of Prudential Investment Management Services LLC; formerly President, Chief Executive Officer, Chief Operating Officer and Officer-In-Charge (February 2003-December 2011) of Prudential Investments LLC; formerly President, Chief Executive Officer and Officer-In-Charge (April 2003-December 2011) of Prudential Mutual Fund Services LLC (PMFS); formerly Member of the Board of Directors of Jennison Associates LLC (November 2010-December 2011); formerly Vice President (February 1999-April 2006) of Prudential Investment Management Services LLC; formerly President, COO, CEO and Manager of PIFM Holdco, LLC (April 2006-December 2011); formerly President, Chief Executive Officer, Chief Operating Officer and Officer-In-Charge (May 2003-June 2005) and Director (May 2003-March 2006) and Executive Vice President (June 2005-March 2006) of AST Investment Services, Inc.; Member of Board of Governors of the Investment Company Institute. |
Visit our website at www.prudentialfunds.com
| | |
| Fund Officers(a)(1) |
Name, Address and Age Position with Fund | | Principal Occupation(s) During Past Five Years |
Raymond A. O’Hara (57) Chief Legal Officer | | Vice President and Corporate Counsel (since July 2010) of Prudential Insurance Company of America (Prudential); Vice President (March 2011-Present) of Pruco Life Insurance Company and Pruco Life Insurance Company of New Jersey; Vice President and Corporate Counsel (March 2011-Present) of Prudential Annuities Life Assurance Corporation; Chief Legal Officer of Prudential Investments LLC (since June 2012); Chief Legal Officer of PMFS (since June 2012) and Corporate Counsel of AST Investment Services, Inc. (since June 2012); formerly Assistant Vice President and Corporate Counsel (September 2008-July 2010) of The Hartford Financial Services Group, Inc.; formerly Associate (September 1980-December 1987) and Partner (January 1988–August 2008) of Blazzard & Hasenauer, P.C. (formerly, Blazzard, Grodd & Hasenauer, P.C.). |
Deborah A. Docs (54) Secretary | | Vice President and Corporate Counsel (since January 2001) of Prudential; Vice President (since December 1996) and Assistant Secretary (since March 1999) of Prudential Investments LLC; formerly Vice President and Assistant Secretary (May 2003-June 2005) of AST Investment Services, Inc. |
Jonathan D. Shain (54) Assistant Secretary | | Vice President and Corporate Counsel (since August 1998) of Prudential; Vice President and Assistant Secretary (since May 2001) of Prudential Investments LLC; Vice President and Assistant Secretary (since February 2001) of PMFS; formerly Vice President and Assistant Secretary (May 2003-June 2005) of AST Investment Services, Inc. |
Claudia DiGiacomo (38) Assistant Secretary | | Vice President and Corporate Counsel (since January 2005) of Prudential; Vice President and Assistant Secretary of Prudential Investments LLC (since December 2005); Associate at Sidley Austin Brown & Wood LLP (1999-2004). |
Andrew R. French (50) Assistant Secretary | | Vice President and Corporate Counsel (since February 2010) of Prudential; formerly Director and Corporate Counsel (2006-2010) of Prudential; Vice President and Assistant Secretary (since January 2007) of Prudential Investments LLC; Vice President and Assistant Secretary (since January 2007) of PMFS. |
Amanda S. Ryan (34) Assistant Secretary | | Director and Corporate Counsel (since March 2012) of Prudential; Director and Assistant Secretary (since June 2012) of Prudential Investments LLC; Associate at Ropes & Gray (2008-2012). |
Timothy J. Knierim (53) Chief Compliance Officer | | Chief Compliance Officer of Prudential Investment Management, Inc. (since July 2007); formerly Chief Risk Officer of Prudential Investment Management, Inc. and Prudential Investments LLC (2002-2007) and formerly Chief Ethics Officer of Prudential Investment Management, Inc. and Prudential Investments LLC (2006-2007). |
Valerie M. Simpson (54) Deputy Chief Compliance Officer | | Chief Compliance Officer (since April 2007) of Prudential Investments LLC and AST Investment Services, Inc.; formerly Vice President-Financial Reporting (June 1999-March 2006) for Prudential Life and Annuities Finance. |
Prudential Absolute Return Bond Fund
| | |
| Fund Officers(a)(1) |
Name, Address and Age Position with Fund | | Principal Occupation(s) During Past Five Years |
Theresa C. Thompson (50) Deputy Chief Compliance Officer | | Vice President, Compliance, Prudential Investments LLC (since April 2004); and Director, Compliance, Prudential Investments LLC (2001-2004). |
Richard W. Kinville (44) Anti-Money Laundering Compliance Officer | | Vice President, Corporate Compliance, Anti-Money Laundering Unit (since January 2005) of Prudential; committee member of the American Council of Life Insurers Anti-Money Laundering and Critical Infrastructure Committee (since January 2007); formerly Investigator and Supervisor in the Special Investigations Unit for the New York Central Mutual Fire Insurance Company (August 1994-January 1999); Investigator in AXA Financial’s Internal Audit Department and Manager in AXA’s Anti-Money Laundering Office (January 1999-January 2005); first chair of the American Council of Life Insurers Anti-Money Laundering and Critical Infrastructure Committee (June 2007-December 2009). |
Grace C. Torres (53) Treasurer and Principal Financial and Accounting Officer | | Assistant Treasurer (since March 1999) and Senior Vice President (since September 1999) of Prudential Investments LLC; Assistant Treasurer (since May 2003) and Vice President (since June 2005) of AST Investment Services, Inc.; Senior Vice President and Assistant Treasurer (since May 2003) of Prudential Annuities Advisory Services, Inc.; formerly Senior Vice President (May 2003-June 2005) of AST Investment Services, Inc. |
M. Sadiq Peshimam (48) Assistant Treasurer | | Vice President (since 2005) of Prudential Investments LLC. |
Peter Parrella (54) Assistant Treasurer | | Vice President (since 2007) and Director (2004-2007) within Prudential Mutual Fund Administration; formerly Tax Manager at SSB Citi Fund Management LLC (1997-2004). |
(a) Excludes Mr. Parker and Mr. Benjamin, interested Board Members who also serve as President and Vice President, respectively.
(1) The year that each individual became an Officer of the Fund is as follows:
Judy A. Rice, 2012; Raymond A. O’Hara, 2012; Deborah A. Docs, 2005; Jonathan D. Shain, 2005; Claudia DiGiacomo, 2005; Andrew R. French, 2006; Amanda S. Ryan, 2012; Timothy J. Knierim, 2007; Valerie M. Simpson 2007; Theresa C. Thompson, 2008; Richard W. Kinville, 2011, Grace C. Torres, 1998; M. Sadiq Peshimam, 2006; Peter Parrella, 2007.
Explanatory Notes to Tables:
| | n | Board Members are deemed to be “Interested,” as defined in the 1940 Act, by reason of their affiliation with Prudential Investments LLC and/or an affiliate of Prudential Investments LLC. |
| | n | Unless otherwise noted, the address of all Board Members and Officers is c/o Prudential Investments LLC, Gateway Center Three, 100 Mulberry Street, Newark, New Jersey 07102-4077. |
| | n | There is no set term of office for Board Members or Officers. The Board Members have adopted a retirement policy, which calls for the retirement of Board Members on December 31 of the year in which they reach the age of 75. |
| | n | “Other Directorships Held” includes only directorships of companies required to register or file reports with the SEC under the 1934 Act (that is, “public companies”) or other investment companies registered under the 1940 Act. |
| | n | “Portfolios Overseen” includes all investment companies managed by Prudential Investments LLC. The investment companies for which PI serves as manager include the Prudential Investments Mutual Funds, The Prudential Variable Contract Accounts, Target Mutual Funds, Prudential Short Duration High Yield Fund, Inc., The Prudential Series Fund, Prudential’s Gibraltar Fund, Inc. and the Advanced Series Trust. |
Visit our website at www.prudentialfunds.com
Approval of Advisory Agreements
The Fund’s Board of Trustees
The Board of Trustees (the “Board”) of Prudential Absolute Return Bond Fund (the “Fund”)1 consists of ten individuals, eight of whom are not “interested persons” of the Fund, as defined in the Investment Company Act of 1940, as amended (the “1940 Act”) (the “Independent Trustees”). The Board is responsible for the oversight of the Fund and its operations, and performs the various duties imposed on the Trustees of investment companies by the 1940 Act. The Independent Trustees have retained independent legal counsel to assist them in connection with their duties. The Chair of the Board is an Independent Director. The Board has established three standing committees: the Audit Committee, the Nominating and Governance Committee, and the Investment Committee. Each committee is chaired by, and composed of, Independent Trustees.
Annual Approval of the Fund’s Advisory Agreements
As required under the 1940 Act, the Board determines annually whether to renew the Fund’s management agreement with Prudential Investments LLC (“PI”) and the Fund’s subadvisory agreement with Prudential Investment Management, Inc. (“PIM”). In considering the renewal of the agreements, the Board, including all of the Independent Trustees, met on June 5-7, 2012 and approved the renewal of the agreements through July 31, 2013, after concluding that the renewal of the agreements was in the best interests of the Fund and its shareholders.
In advance of the meetings, the Board requested and received materials relating to the agreements, and had the opportunity to ask questions and request further information in connection with its consideration. Among other things, the Board considered comparative fee information from PI and PIM. Also, the Board considered comparisons with other mutual funds in relevant Peer Universes and Peer Groups, as is further discussed below.
In approving the agreements, the Board, including the Independent Trustees advised by independent legal counsel, considered the factors it deemed relevant, including the nature, quality and extent of services provided by PI and the subadviser, the performance of the Fund, the profitability of PI and its affiliates, expenses and fees, and the potential for economies of scale that may be shared with the Fund and its shareholders as the Fund’s assets grow. In their deliberations, the Trustees did not identify any single factor which alone was responsible for the Board’s decision to approve the agreements with respect to the Fund. In connection with its deliberations, the Board considered information provided by PI throughout the year at regular Board
| 1 | Prudential Absolute Return Bond Fund is a series of Prudential Investment Portfolios 9. |
Prudential Absolute Return Bond Fund
Approval of Advisory Agreements (continued)
meetings, presentations from portfolio managers and other information, as well as information furnished at or in advance of the meetings on June 5-7, 2012.
The Trustees determined that the overall arrangements between the Fund and PI, which serves as the Fund’s investment manager pursuant to a management agreement, and between PI and PIM, which serves as the Fund’s subadviser pursuant to the terms of a subadvisory agreement with PI, are in the best interests of the Fund and its shareholders in light of the services performed, fees charged and such other matters as the Trustees considered relevant in the exercise of their business judgment.
The material factors and conclusions that formed the basis for the Trustees’ reaching their determinations to approve the continuance of the agreements are separately discussed below.
Nature, Quality and Extent of Services
The Board received and considered information regarding the nature, quality and extent of services provided to the Fund by PI and PIM. The Board considered the services provided by PI, including but not limited to the oversight of the subadviser for the Fund, as well as the provision of fund recordkeeping, compliance, and other services to the Fund. With respect to PI’s oversight of the subadviser, the Board noted that PI’s Strategic Investment Research Group (“SIRG”), which is a business unit of PI, is responsible for monitoring and reporting to PI’s senior management on the performance and operations of the subadviser. The Board also considered that PI pays the salaries of all of the officers and non-independent Trustees of the Fund. The Board also considered the investment subadvisory services provided by PIM, including investment research and security selection, as well as adherence to the Fund’s investment restrictions and compliance with applicable Fund policies and procedures. The Board considered PI’s evaluation of the subadviser, as well as PI’s recommendation, based on its review of the subadviser, to renew the subadvisory agreement.
The Board reviewed the qualifications, backgrounds and responsibilities of PI’s senior management responsible for the oversight of the Fund and PIM, and also reviewed the qualifications, backgrounds and responsibilities of PIM’s portfolio managers who are responsible for the day-to-day management of the Fund’s portfolio. The Board was provided with information pertaining to PI’s and PIM’s organizational structure, senior management, investment operations, and other relevant information pertaining to both PI and PIM. The Board also noted that it received favorable compliance reports from the Fund’s Chief Compliance Officer (“CCO”) as to both PI and PIM. The Board noted that PIM is affiliated with PI.
Visit our website at www.prudentialfunds.com
The Board concluded that it was satisfied with the nature, extent and quality of the investment management services provided by PI and the subadvisory services provided to the Fund by PIM, and that there was a reasonable basis on which to conclude that the Fund benefits from the services provided by PI and PIM under the management and subadvisory agreements.
Costs of Services and Profits Realized by PI
The Board was provided with information on the profitability of PI and its affiliates in serving as the Fund’s investment manager. The Board discussed with PI the methodology utilized in assembling the information regarding profitability and considered its reasonableness. The Board recognized that it is difficult to make comparisons of profitability from fund management contracts because comparative information is not generally publicly available and is affected by numerous factors, including the structure of the particular adviser, the types of funds it manages, its business mix, numerous assumptions regarding allocations and the adviser’s capital structure and cost of capital. However, the Board considered that the cost of services provided by PI exceeded the management fees received by PI, resulting in an operating loss to PI. The Board did not separately consider the profitability of the subadviser, an affiliate of PI, as its profitability was reflected in the profitability report for PI. Taking these factors into account, the Board concluded that the profitability of PI and its affiliates in relation to the services rendered was not unreasonable.
Economies of Scale
The Board noted that the management fee schedule for the Fund does not contain breakpoints that would reduce the fee rate on assets above specified levels. The Board received and discussed information concerning whether PI realizes economies of scale as the Fund’s assets grow beyond current levels. The Board recognized the inherent limitations of any analysis of economies of scale, stemming largely from the Board’s understanding that most of PI’s costs are not specific to any individual funds, but rather are incurred across a variety of products and services. In light of the Fund’s current size, performance and expense structure, the Board concluded that the absence of breakpoints in the Fund’s fee schedule is acceptable at this time.
Other Benefits to PI and PIM
The Board considered potential ancillary benefits that might be received by PI and PIM and their affiliates as a result of their relationship with the Fund. The Board concluded that potential benefits to be derived by PI included fees received by affiliates of PI for serving as the Fund’s securities lending agent, transfer agency fees received by the Fund’s transfer agent (which is affiliated with PI), as well as benefits to its reputation or other intangible benefits resulting from PI’s association with the Fund.
Prudential Absolute Return Bond Fund
Approval of Advisory Agreements (continued)
The Board concluded that the potential benefits to be derived by PIM included the ability to use soft dollar credits, as well as the potential benefits consistent with those generally resulting from an increase in assets under management, specifically, potential access to additional research resources and benefits to its reputation. The Board concluded that the benefits derived by PI and PIM were consistent with the types of benefits generally derived by investment managers and subadvisers to mutual funds.
Performance of the Fund / Fees and Expenses
The Board considered certain additional specific factors and made related conclusions relating to the historical performance of the Fund for the fourth calendar quarter ended December 31, 2011. The Board considered that the Fund commenced operations on March 30, 2011 and that longer-term performance was not yet available.
The Board also considered the Fund’s actual management fee, as well as the Fund’s net total expense ratio, for the fiscal period ended October 31, 2011. The Board considered the management fee for the Fund as compared to the management fee charged by PI to other funds and the fee charged by other advisers to comparable mutual funds in a Peer Group. The actual management fee represents the fee rate actually paid by Fund shareholders and includes any fee waivers or reimbursements. The net total expense ratio for the Fund represents the actual expense ratio incurred by Fund shareholders.
The mutual funds included in the Peer Universe (the fixed-income funds within the Lipper Absolute Return Funds Performance Universe)2 and the Peer Group were objectively determined by Lipper Inc. (“Lipper”), an independent provider of mutual fund data. To the extent that PI deemed appropriate, and for reasons addressed in detail with the Board, PI may have provided supplemental data compiled by Lipper for the Board’s consideration. The comparisons placed the Fund in various quartiles, with the first quartile being the best 25% of the mutual funds (for performance, the best performing mutual funds and, for expenses, the lowest cost mutual funds).
The section below summarizes key factors considered by the Board and the Board’s conclusions regarding the Fund’s performance, fees and overall expenses. The table sets forth gross performance comparisons (which do not reflect the impact on
Visit our website at www.prudentialfunds.com
| 2 | The Fund was compared to the fixed-income funds within the Lipper Absolute Return Funds Performance Universe, although Lipper classifies the Fund as an Absolute Return Fund. The Fund was compared to the fixed-income funds within the Lipper Absolute Return Funds Performance Universe because PI believes that the fixed-income funds included in this Universe provide a more appropriate basis for Fund performance comparisons. |
performance of fund expenses, or any subsidies, expense caps or waivers that may be applicable) with the Peer Universe, actual management fees with the Peer Group (which reflect the impact of any subsidies or fee waivers), and net total expenses with the Peer Group, each of which were key factors considered by the Board.
| | | | | | | | | | |
| Performance | | Q4 2011 | | 1 Year | | 3 Years | | 5 Years | | 10 Years |
| | | 1st Quartile | | N/A | | N/A | | N/A | | N/A |
| Actual Management Fees: 1st Quartile |
| Net Total Expenses: 3rd Quartile |
| | • | | The Board noted that the Fund outperformed its benchmark index for the fourth quarter of 2011. |
| | • | | The Board accepted PI’s recommendation to continue the existing expense cap of 0.85% (exclusive of 12b-1 fees and certain other fees) through February 28, 2013. |
| | • | | The Board concluded that, in light of the Fund’s strong short-term performance and recent inception date, it would be in the best interests of the Fund and its shareholders to renew the agreements. |
| | • | | The Board concluded that the management fees (including subadvisory fees) and total expenses were reasonable in light of the services provided. |
* * *
After full consideration of these factors, the Board concluded that the approval of the agreements was in the best interests of the Fund and its shareholders.
Prudential Absolute Return Bond Fund
| | | | |
| n MAIL | | n TELEPHONE | | n WEBSITE |
Gateway Center Three 100 Mulberry Street Newark, NJ 07102 | | (800) 225-1852 | | www.prudentialfunds.com |
|
| PROXY VOTING |
| The Board of Trustees of the Fund has delegated to the Fund’s investment subadviser the responsibility for voting any proxies and maintaining proxy recordkeeping with respect to the Fund. A description of these proxy voting policies and procedures is available without charge, upon request, by calling (800) 225-1852 or by visiting the Securities and Exchange Commission’s website at www.sec.gov. Information regarding how the Fund voted proxies relating to portfolio securities during the most recent 12-month period ended June 30 is available on the Fund’s website and on the Securities and Exchange Commission’s website. |
|
| TRUSTEES |
| Kevin J. Bannon • Scott E. Benjamin • Linda W. Bynoe • Michael S. Hyland • Douglas H. McCorkindale • Stephen P. Munn • Stuart S. Parker • Richard A. Redeker • Robin B. Smith • Stephen G. Stoneburn |
|
| OFFICERS |
| Stuart S. Parker, President • Judy A. Rice, Vice President • Scott E. Benjamin, Vice President • Grace C. Torres, Treasurer and Principal Financial and Accounting Officer • Raymond A. O’Hara, Chief Legal Officer • Deborah A. Docs, Secretary • Timothy J. Knierim, Chief Compliance Officer • Valerie M. Simpson, Deputy Chief Compliance Officer • Theresa C. Thompson, Deputy Chief Compliance Officer • Richard W. Kinville, Anti-Money Laundering Compliance Officer • Jonathan D. Shain, Assistant Secretary • Claudia DiGiacomo, Assistant Secretary • Amanda S. Ryan, Assistant Secretary • Andrew R. French, Assistant Secretary • M. Sadiq Peshimam, Assistant Treasurer • Peter Parrella, Assistant Treasurer |
| | | | |
| MANAGER | | Prudential Investments LLC | | Gateway Center Three
100 Mulberry Street
Newark, NJ 07102 |
|
| INVESTMENT SUBADVISER | | Prudential Investment
Management, Inc. | | Gateway Center Three
100 Mulberry Street
Newark, NJ 07102 |
|
| DISTRIBUTOR | | Prudential Investment
Management Services LLC | | Gateway Center Three
100 Mulberry Street
Newark, NJ 07102 |
|
| CUSTODIAN | | The Bank of New York Mellon | �� | One Wall Street
New York, NY 10286 |
|
| TRANSFER AGENT | | Prudential Mutual Fund
Services LLC | | PO Box 9658
Providence, RI 02940 |
|
INDEPENDENT REGISTERED
PUBLIC ACCOUNTING FIRM | | KPMG LLP | | 345 Park Avenue
New York, NY 10154 |
|
| FUND COUNSEL | | Willkie Farr & Gallagher LLP | | 787 Seventh Avenue
New York, NY 10019 |
|
| An investor should consider the investment objectives, risks, charges, and expenses of the Fund carefully before investing. The prospectus and summary prospectus contain this and other information about the Fund. An investor may obtain a prospectus and summary prospectus by visiting our website at www.prudentialfunds.com or by calling (800) 225-1852. The prospectus and summary prospectus should be read carefully before investing. |
|
| E-DELIVERY |
| To receive your mutual fund documents online, go to www.prudentialfunds.com/edelivery and enroll. Instead of receiving printed documents by mail, you will receive notification via email when new materials are available. You can cancel your enrollment or change your email address at any time by visiting the website address above. |
|
| SHAREHOLDER COMMUNICATIONS WITH TRUSTEES |
| Shareholders can communicate directly with the Board of Trustees by writing to the Chair of the Board, Prudential Absolute Return Bond Fund, Prudential Investments, Attn: Board of Trustees, 100 Mulberry Street, Gateway Center Three, Newark, NJ 07102. Shareholders can communicate directly with an individual Trustee by writing to the same address. Communications are not screened before being delivered to the addressee. |
|
| AVAILABILITY OF PORTFOLIO SCHEDULE |
| The Fund files its complete schedule of portfolio holdings with the Securities and Exchange Commission for the first and third quarters of each fiscal year on Form N-Q. The Fund’s Forms N-Q are available on the Commission’s website at www.sec.gov. The Fund’s Forms N-Q may also be reviewed and copied at the Commission’s Public Reference Room in Washington, D.C. Information on the operation and location of the Public Reference Room may be obtained by calling (202) 551-8090. The Fund’s schedule of portfolio holdings is also available on the Fund’s website as of the end of each month. |
|
| The Fund’s Statement of Additional Information contains additional information about the Fund’s Trustees and is available without charge, upon request, by calling (800) 225-1852. |
Mutual Funds:
| | | | |
ARE NOT INSURED BY THE FDIC OR ANY
FEDERAL GOVERNMENT AGENCY | | MAY LOSE VALUE | | ARE NOT A DEPOSIT OF OR GUARANTEED
BY ANY BANK OR ANY BANK AFFILIATE |

PRUDENTIAL ABSOLUTE RETURN BOND FUND
| | | | | | | | |
| SHARE CLASS | | A | | C | | Q | | Z |
| NASDAQ | | PADAX | | PADCX | | PADQX | | PADZX |
| CUSIP | | 74441J852 | | 74441J845 | | 74441J837 | | 74441J829 |
MF213E 0236583-00001-00
Item 2 – Code of Ethics — See Exhibit (a)
As of the end of the period covered by this report, the registrant has adopted a code of ethics (the “Section 406 Standards for Investment Companies – Ethical Standards for Principal Executive and Financial Officers”) that applies to the registrant’s Principal Executive Officer and Principal Financial Officer; the registrant’s Principal Financial Officer also serves as the Principal Accounting Officer.
The registrant hereby undertakes to provide any person, without charge, upon request, a copy of the code of ethics. To request a copy of the code of ethics, contact the registrant 800-225-1852, and ask for a copy of the Section 406 Standards for Investment Companies - Ethical Standards for Principal Executive and Financial Officers.
Item 3 – Audit Committee Financial Expert –
The registrant’s Board has determined that Mr. Stephen P. Munn, member of the Board’s Audit Committee is an “audit committee financial expert,” and that he is “independent,” for purposes of this Item.
Item 4 – Principal Accountant Fees and Services –
(a) Audit Fees
For the fiscal years ended October 31, 2012 and October 31, 2011, KPMG LLP (“KPMG”), the Registrant’s principal accountant, billed the Registrant $107,000 and $116,000, respectively, for professional services rendered for the audit of the Registrant’s annual financial statements or services that are normally provided in connection with statutory and regulatory filings.
(b) Audit-Related Fees
None.
(c) Tax Fees
During the fiscal year ended October 31, 2012, KPMG billed the Registrant $1,375 for professional services rendered in connection with a preliminary analysis of certain United States federal tax matters affecting a potential investment in real estate mezzanine debt. Not applicable for the fiscal year ended October 31, 2011.
(d) All Other Fees
None.
(e) (1) Audit Committee Pre-Approval Policies and Procedures
THE PRUDENTIAL MUTUAL FUNDS
AUDIT COMMITTEE POLICY
on
Pre-Approval of Services Provided by the Independent Accountants
The Audit Committee of each Prudential Mutual Fund is charged with the responsibility to monitor the independence of the Fund’s independent accountants. As part of this responsibility, the Audit Committee must pre-approve any independent accounting firm’s engagement to render audit and/or permissible non-audit services, as required by law. In evaluating a proposed engagement of the independent accountants, the Audit Committee will assess the effect that the engagement might reasonably be expected to have on the accountant’s independence. The Committee’s evaluation will be based on:
| | • | | a review of the nature of the professional services expected to be provided, |
| | • | | a review of the safeguards put into place by the accounting firm to safeguard independence, and |
| | • | | periodic meetings with the accounting firm. |
Policy for Audit and Non-Audit Services Provided to the Funds
On an annual basis, the scope of audits for each Fund, audit fees and expenses, and audit-related and non-audit services (and fees proposed in respect thereof) proposed to be performed by the Fund’s independent accountants will be presented by the Treasurer and the independent accountants to the Audit Committee for review and, as appropriate, approval prior to the initiation of such services. Such presentation shall be accompanied by confirmation by both the Treasurer and the independent accountants that the proposed services will not adversely affect the independence of the independent accountants. Proposed services shall be described in sufficient detail to enable the Audit Committee to assess the appropriateness of such services and fees, and the compatibility of the provision of such services with the auditor’s independence. The Committee shall receive periodic reports on the progress of the audit and other services which are approved by the Committee or by the Committee Chair pursuant to authority delegated in this Policy.
The categories of services enumerated under “Audit Services”, “Audit-related Services”, and “Tax Services” are intended to provide guidance to the Treasurer and the independent accountants as to those categories of services which the Committee believes are generally consistent with the independence of the independent accountants and which the Committee (or the Committee Chair) would expect upon the presentation of specific proposals to pre-approve. The enumerated categories are not intended as an exclusive list of audit, audit-related or tax services, which the Committee (or the Committee Chair) would consider for pre-approval.
Audit Services
The following categories of audit services are considered to be consistent with the role of the Fund’s independent accountants:
| | • | | Annual Fund financial statement audits |
| | • | | Seed audits (related to new product filings, as required) |
| | • | | SEC and regulatory filings and consents |
Audit-related Services
The following categories of audit-related services are considered to be consistent with the role of the Fund’s independent accountants:
| | • | | Accounting consultations |
| | • | | Fund merger support services |
| | • | | Agreed Upon Procedure Reports |
| | • | | Other Internal Control Reports |
Individual audit-related services that fall within one of these categories and are not presented to the Audit Committee as part of the annual pre-approval process will be subject to pre-approval by the Committee Chair (or any other Committee member on whom this responsibility has been delegated) so long as the estimated fee for those services does not exceed $50,000.
Tax Services
The following categories of tax services are considered to be consistent with the role of the Fund’s independent accountants:
| | • | | Tax compliance services related to the filing or amendment of the following: |
| | • | | Federal, state and local income tax compliance; and, |
| | • | | Sales and use tax compliance |
| | • | | Timely RIC qualification reviews |
| | • | | Tax distribution analysis and planning |
| | • | | Tax authority examination services |
| | • | | Tax appeals support services |
| | • | | Accounting methods studies |
| | • | | Fund merger support services |
| | • | | Tax consulting services and related projects |
Individual tax services that fall within one of these categories and are not presented to the Audit Committee as part of the annual pre-approval process will be subject to pre-approval by the Committee Chair (or any other Committee member on whom this responsibility has been delegated) so long as the estimated fee for those services does not exceed $50,000.
Other Non-audit Services
Certain non-audit services that the independent accountants are legally permitted to render will be subject to pre-approval by the Committee or by one or more Committee members to whom the Committee has delegated this authority and who will report to the full Committee any pre-
approval decisions made pursuant to this Policy. Non-audit services presented for pre-approval pursuant to this paragraph will be accompanied by a confirmation from both the Treasurer and the independent accountants that the proposed services will not adversely affect the independence of the independent accountants.
Proscribed Services
The Fund’s independent accountants will not render services in the following categories of non-audit services:
| | • | | Bookkeeping or other services related to the accounting records or financial statements of the Fund |
| | • | | Financial information systems design and implementation |
| | • | | Appraisal or valuation services, fairness opinions, or contribution-in-kind reports |
| | • | | Internal audit outsourcing services |
| | • | | Management functions or human resources |
| | • | | Broker or dealer, investment adviser, or investment banking services |
| | • | | Legal services and expert services unrelated to the audit |
| | • | | Any other service that the Public Company Accounting Oversight Board determines, by regulation, is impermissible. |
Pre-approval of Non-Audit Services Provided to Other Entities Within the Prudential Fund Complex
Certain non-audit services provided to Prudential Investments LLC or any of its affiliates that also provide ongoing services to the Prudential Mutual Funds will be subject to pre-approval by the Audit Committee. The only non-audit services provided to these entities that will require pre-approval are those related directly to the operations and financial reporting of the Funds. Individual projects that are not presented to the Audit Committee as part of the annual pre-approval process will be subject to pre-approval by the Committee Chair (or any other Committee member on whom this responsibility has been delegated) so long as the estimated fee for those services does not exceed $50,000. Services presented for pre-approval pursuant to this paragraph will be accompanied by a confirmation from both the Treasurer and the independent accountants that the proposed services will not adversely affect the independence of the independent accountants.
Although the Audit Committee will not pre-approve all services provided to Prudential Investments LLC and its affiliates, the Committee will receive an annual report from the Fund’s independent accounting firm showing the aggregate fees for all services provided to Prudential Investments and its affiliates.
(e) (2) Percentage of services referred to in 4(b) – 4(d) that were approved by the audit committee –
One hundred percent of the services described in Item 4(c) was approved by the audit committee.
(f) Percentage of hours expended attributable to work performed by other than full time employees of principal accountant if greater than 50%.
The percentage of hours expended on the principal accountant’s engagement to audit the registrant’s financial statements for the most recent fiscal year that were attributed to work performed by persons other than the principal accountant’s full-time, permanent employees was 0%.
(g) Non-Audit Fees
Not applicable to Registrant for the fiscal years 2012 and 2011. The aggregate non-audit fees billed by KPMG for services rendered to the registrant’s investment adviser and any entity controlling, controlled by, or under common control with the investment adviser that provides ongoing services to the registrant for the fiscal years 2012 and 2011 was $0 and $0, respectively.
(h) Principal Accountant’s Independence
Not applicable as KPMG has not provided non-audit services to the registrant’s investment adviser and any entity controlling, controlled by, or under common control with the investment adviser that provides ongoing services to the registrant that were not pre-approved pursuant to Rule 2-01(c)(7)(ii) of Regulation S-X.
Item 5 – Audit Committee of Listed Registrants – Not applicable.
Item 6 – Schedule of Investments – The schedule is included as part of the report to shareholders filed under Item 1 of this Form.
Item 7 – Disclosure of Proxy Voting Policies and Procedures for Closed-End Management Investment Companies – Not applicable.
Item 8 – Portfolio Managers of Closed-End Management Investment Companies – Not applicable.
Item 9 – Purchases of Equity Securities by Closed-End Management Investment Company and Affiliated Purchasers – Not applicable.
Item 10 – Submission of Matters to a Vote of Security Holders – Not applicable.
Item 11 – Controls and Procedures
| | (a) | It is the conclusion of the registrant’s principal executive officer and principal financial officer that the effectiveness of the registrant’s current disclosure controls and procedures (such disclosure controls and procedures having been evaluated within 90 days of the date of this filing) provide reasonable assurance that the information required to be disclosed by the registrant has been recorded, processed, summarized and reported within the time period specified in the Commission’s rules and forms and that the information required to be disclosed by the registrant has been accumulated and communicated to the registrant’s principal executive officer and principal financial officer in order to allow timely decisions regarding required disclosure. |
| | (b) | There has been no significant change in the registrant’s internal control over financial reporting that occurred during the registrant’s most recent fiscal quarter of the period covered by this report that has materially affected, or is likely to materially affect, the registrant’s internal control over financial reporting. |
Item 12 – Exhibits
| | (a) | (1) Code of Ethics – Attached hereto as Exhibit EX-99.CODE-ETH |
(2) Certifications pursuant to Section 302 of the Sarbanes-Oxley Act – Attached hereto as Exhibit EX-99.CERT.
(3) Any written solicitation to purchase securities under Rule 23c-1. – Not applicable.
| | (b) | Certifications pursuant to Section 906 of the Sarbanes-Oxley Act – Attached hereto as Exhibit EX-99.906CERT. |
SIGNATURES
Pursuant to the requirements of the Securities Exchange Act of 1934 and the Investment Company Act of 1940, the registrant has duly caused this report to be signed on its behalf by the undersigned, thereunto duly authorized.
| | |
| Registrant: | | Prudential Investment Portfolios 9 |
| |
| By: | | /s/ Deborah A. Docs |
| | Deborah A. Docs |
| | Secretary |
| |
| Date: | | December 20, 2012 |
Pursuant to the requirements of the Securities Exchange Act of 1934 and the Investment Company Act of 1940, this report has been signed below by the following persons on behalf of the registrant and in the capacities and on the dates indicated.
| | |
| By: | | /s/ Stuart S. Parker |
| | Stuart S. Parker |
| | President and Principal Executive Officer |
| |
| Date: | | December 20, 2012 |
| |
| By: | | /s/ Grace C. Torres |
| | Grace C. Torres |
| | Treasurer and Principal Financial Officer |
| |
| Date: | | December 20, 2012 |