UNITED STATES
SECURITIES AND EXCHANGE COMMISSION
Washington, D.C. 20549
FORM N-CSR
CERTIFIED SHAREHOLDER REPORT OF REGISTERED
MANAGEMENT INVESTMENT COMPANIES
| | |
| Investment Company Act file number: | | 811-09101 |
| |
| Exact name of registrant as specified in charter: | | Prudential Investment Portfolios 9 |
| |
| Address of principal executive offices: | | Gateway Center 3, |
| | 100 Mulberry Street, |
| | Newark, New Jersey 07102 |
| |
| Name and address of agent for service: | | Deborah A. Docs |
| | Gateway Center 3, |
| | 100 Mulberry Street, |
| | Newark, New Jersey 07102 |
| |
| Registrant’s telephone number, including area code: | | 800-225-1852 |
| |
| Date of fiscal year end: | | 10/31/2010 |
| |
| Date of reporting period: | | 10/31/2010 |
Item 1 – Reports to Stockholders

| | |
ANNUAL REPORT | | October 31,2010 |
Prudential Large-Cap Core Equity Fund
| | | | |
Fund Type Large-cap stock Objective Long-term after-tax growth of capital | | | | This report is not authorized for distribution to prospective investors unless preceded or accompanied by a current prospectus. The views expressed in this report and information about the Fund’s portfolio holdings are for the period covered by this report and are subject to change thereafter. Prudential Investments, Prudential, the Prudential logo and the Rock symbol are service marks of Prudential Financial, Inc. and its related entities, registered in many jurisdictions worldwide. |
| | |

| | To enroll in e-delivery, go to www.prudentialfunds.com/edelivery |
December 15, 2010
Dear Shareholder:
We hope you find the annual report for the Prudential Large-Cap Core Equity Fund informative and useful. Because of ongoing market volatility, we understand that this is a difficult time to be an investor. While it is impossible to predict what the future holds, we continue to believe a prudent response to uncertainty is to maintain a diversified portfolio, including stock and bond mutual funds consistent with your tolerance for risk, time horizon, and financial goals.
A diversified asset allocation offers two potential advantages: It limits your exposure to any particular asset class; plus it provides a better opportunity to invest some of your assets in the right place at the right time. Your financial professional can help you create a diversified investment plan that may include mutual funds covering all the basic asset classes and that reflects your personal investor profile and risk tolerance. Keep in mind that diversification and asset allocation strategies do not assure a profit or protect against loss in declining markets.
Prudential Investments® provides a wide range of mutual funds to choose from that can help you make progress toward your financial goals. Our funds offer the experience, resources, and professional discipline of Prudential Financial’s affiliated asset managers. Most of Prudential Investments’ equity funds are advised by Jennison Associates LLC, Quantitative Management Associates LLC (QMA), or Prudential Real Estate Investors. Prudential Investment Management, Inc. (PIM) advises the Prudential Investments fixed income and money market funds through its Prudential Fixed Income unit. Jennison Associates, QMA, and PIM are registered investment advisers and Prudential Financial companies. Prudential Real Estate Investors is a unit of PIM.
Thank you for choosing the Prudential Investments family of mutual funds.
Sincerely,

Judy A. Rice, President
Prudential Large-Cap Core Equity Fund
| | | | |
| Prudential Large-Cap Core Equity Fund | | | 1 | |
Your Fund’s Performance
Performance data quoted represent past performance. Past performance does not guarantee future results. The investment return and principal value of an investment will fluctuate, so that an investor’s shares, when redeemed, may be worth more or less than their original cost. Current performance may be lower or higher than the past performance data quoted. An investor may obtain performance data as of the most recent month-end by visiting our website at www.prudentialfunds.com or by calling (800) 225-1852. Class A and Class L shares have a maximum initial sales charge of 5.50% and 5.75%, respectively. Gross operating expenses: Class A, 1.48%; Class B, 2.18%; Class C, 2.18%; Class L, 1.68%; Class M, 2.18%; Class X, 2.18%; Class Z, 1.18%. Net operating expenses: Class A, 1.48%; Class B, 2.18%; Class C, 2.18%; Class L, 1.68%; Class M, 2.18%; Class X, 1.43%; Class Z, 1.18%.
| | | | | | | | | | | | | | | | |
Cumulative Total Returns (Without Sales Charges) as of 10/31/10 | |
| | | One Year | | | Five Years | | | Ten Years | | | Since Inception | |
Class A | | | 13.92 | % | | | 1.53 | % | | | –7.75 | % | | | — | |
Class B | | | 13.07 | | | | –2.09 | | | | –14.38 | | | | — | |
Class C | | | 13.17 | | | | –2.00 | | | | –14.30 | | | | — | |
Class L | | | 13.74 | | | | N/A | | | | N/A | | | | –14.96% (3/19/07) | |
Class M | | | 13.17 | | | | N/A | | | | N/A | | | | –16.48 (3/19/07) | |
Class X | | | 13.91 | | | | N/A | | | | N/A | | | | –13.90 (3/19/07) | |
Class Z | | | 14.09 | | | | 2.84 | | | | –5.45 | | | | — | |
S&P 500 Index | | | 16.54 | | | | 8.99 | | | | –0.14 | | | | — | |
Lipper Average | | | 14.47 | | | | 7.98 | | | | 5.39 | | | | — | |
| | | | | | | | | | | | | | | | |
Average Annual Total Returns (With Sales Charges) as of 9/30/10 | |
| | | One Year | | | Five Years | | | Ten Years | | | Since Inception | |
Class A | | | 1.36 | % | | | –1.91 | % | | | –1.83 | % | | | — | |
Class B | | | 1.55 | | | | –1.72 | | | | –2.00 | | | | — | |
Class C | | | 5.66 | | | | –1.50 | | | | –1.99 | | | | — | |
Class L | | | 0.92 | | | | N/A | | | | N/A | | | | –7.09% (3/19/07) | |
Class M | | | 0.66 | | | | N/A | | | | N/A | | | | –6.78 (3/19/07) | |
Class X | | | 1.46 | | | | N/A | | | | N/A | | | | –6.24 (3/19/07) | |
Class Z | | | 7.62 | | | | –0.54 | | | | –1.02 | | | | — | |
S&P 500 Index | | | 10.18 | | | | 0.64 | | | | –0.43 | | | | — | |
Lipper Average | | | 7.93 | | | | 0.28 | | | | –0.23 | | | | — | |
| | |
| 2 | | Visit our website at www.prudentialfunds.com |
| | | | | | | | | | | | | | | | |
Average Annual Total Returns (With Sales Charges) as of 10/31/10 | |
| | | One Year | | | Five Years | | | Ten Years | | | Since Inception | |
Class A | | | 7.65 | % | | | –0.82 | % | | | –1.36 | % | | | — | |
Class B | | | 8.07 | | | | –0.62 | | | | –1.54 | | | | — | |
Class C | | | 12.17 | | | | –0.40 | | | | –1.53 | | | | — | |
Class L | | | 7.20 | | | | N/A | | | | N/A | | | | –5.93% (3/19/07) | |
Class M | | | 7.17 | | | | N/A | | | | N/A | | | | –5.64 (3/19/07) | |
Class X | | | 7.91 | | | | N/A | | | | N/A | | | | –5.10 (3/19/07) | |
Class Z | | | 14.09 | | | | 0.56 | | | | –0.56 | | | | — | |
| | | | | | | | | | | | | | | | |
Average Annual Total Returns (Without Sales Charges) as of 10/31/10 | |
| | | One Year | | | Five Years | | | Ten Years | | | Since Inception | |
Class A | | | 13.92 | % | | | 0.30 | % | | | –0.80 | % | | | — | |
Class B | | | 13.07 | | | | –0.42 | | | | –1.54 | | | | — | |
Class C | | | 13.17 | | | | –0.40 | | | | –1.53 | | | | — | |
Class L | | | 13.74 | | | | N/A | | | | N/A | | | | –4.37% (3/19/07) | |
Class M | | | 13.17 | | | | N/A | | | | N/A | | | | –4.85 (3/19/07) | |
Class X | | | 13.91 | | | | N/A | | | | N/A | | | | –4.05 (3/19/07) | |
Class Z | | | 14.09 | | | | 0.56 | | | | –0.56 | | | | — | |
Growth of a $10,000 Investment
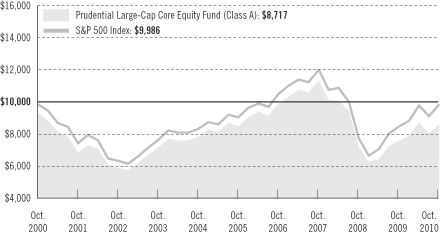
The graph compares a $10,000 investment in the Prudential Large-Cap Core Equity Fund (Class A shares) with a similar investment in the S&P 500 Index by portraying the initial account values at the beginning of the 10-year period for Class A shares (October 31, 2000) and the account values at the end of the current fiscal year
| | | | |
| Prudential Large-Cap Core Equity Fund | | | 3 | |
Your Fund’s Performance (continued)
(October 31, 2010) as measured on a quarterly basis. The S&P 500 Index data is measured from the closest month-end to inception date and not from the Fund’s actual inception date. For purposes of the graph, and unless otherwise indicated, it has been assumed that (a) the maximum applicable front-end sales charge was deducted from the initial $10,000 investment in Class A shares; (b) all recurring fees (including management fees) were deducted; and (c) all dividends and distributions were reinvested. The line graph provides information for Class A shares only. As indicated in the tables provided earlier, performance for Class B, Class C, Class L, Class M, Class X, and Class Z shares will vary due to the differing charges and expenses applicable to each share class (as indicated in the following paragraphs).
Source: Prudential Investments LLC and Lipper Inc. Performance figures may reflect fee waivers and/or expense reimbursements. In the absence of such fee waivers and/or expense reimbursements, total returns would be lower.
Inception returns are provided for any share class with less than 10 calendar years of returns. The Since Inception returns for the S&P 500 Index and the Lipper Large-Cap Core Funds Average (Lipper Average) are measured from the closest month-end to inception date, and not from the Fund’s actual inception date.
The average annual total returns take into account applicable sales charges. Class A and Class L shares are subject to a maximum front-end sales charge of 5.50% and 5.75%, respectively, a 12b-1 fee of up to 0.30% and 0.50%, respectively, annually, and investors who purchase Class A shares in an amount of $1 million or more and sell these shares within 12 months of purchase are subject to a contingent deferred sales charge (CDSC) of 1% in certain circumstances. Class B shares are subject to a declining CDSC of 5%, 4%, 3%, 2%, 1%, and 1%, respectively, for the first six years after purchase and a 12b-1 fee of 1% annually. Approximately seven years after purchase, Class B shares will automatically convert to Class A shares on a quarterly basis. Class C shares are not subject to a front-end sales charge, but are subject to a CDSC of 1% for Class C shares sold within 12 months from the date of purchase, and an annual 12b-1 fee of 1%. Class M shares are subject to a CDSC of 6%, which decreases by 1% annually to 2% in the fifth and sixth years and 1% in the seventh year, and a 12b-1 fee of 1% annually. Class M shares automatically convert to Class A shares approximately eight years after purchase. Class X shares are subject to a CDSC of 6%, which decreases by 1% annually to 4% in the third and fourth years, by 1% annually to 2% in the sixth and seventh years, and 1% in the eighth year, and a 12b-1 fee of 1% annually. Class L, Class M, and Class X shares are not offered to new purchasers and are available only through exchanges from the same share class of certain other Prudential Investments mutual funds. Class Z shares are not subject to a sales charge or 12b-1 fees. The returns in the graph and tables reflect the share class expense structure in effect at the close of the fiscal period.
Benchmark Definitions
S&P 500 Index
The S&P 500 Index is an unmanaged index of 500 stocks of large U.S. public companies. It gives a broad look at how U.S. stock prices have performed. S&P 500 Index Closest Month-End to Inception cumulative total return as of 10/31/10 is –9.91% for Class L, Class M, and Class X. S&P 500 Index Closest Month-End to Inception average annual total return as of 9/30/10 is –3.97% for Class L, Class M, and Class X.
Lipper Average
The Lipper Average represents returns based on an average return of all funds in the Lipper Large-Cap Core Funds category for the periods noted. Funds in the Lipper Average invest at least 75% of their equity assets in companies with market capitalizations (on a three-year weighted basis) greater than 300% of the dollar-
| | |
| 4 | | Visit our website at www.prudentialfunds.com |
weighted median market capitalization of the middle 1,000 securities of the S&P SuperComposite 1500 Index. Large-cap core funds have wide latitude in the companies in which they invest. These funds typically have a below-average price-to-earnings ratio, price-to-book ratio, and three-year sales-per-share growth value compared with the S&P 500 Index. Lipper Average Closest Month-End to Inception cumulative total return as of 10/31/10 is –9.82% for Class L, Class M, and Class X. Lipper Average Closest Month-End to Inception average annual total return as of 9/30/10 is –4.12% for Class L, Class M, and Class X.
Investors cannot invest directly in an index or average. The returns for the S&P 500 Index would be lower if they included the effects of sales charges, operating expenses of a mutual fund, or taxes. Returns for the Lipper Average reflect the deduction of operating expenses of a mutual fund, but not sales charges or taxes.
| | | | |
Five Largest Holdings* expressed as a percentage of net assets as of 10/31/10 | | | | |
Exxon Mobil Corp., Oil, Gas & Consumable Fuels | | | 3.0 | % |
Apple, Inc., Computers & Peripherals | | | 2.7 | |
Microsoft Corp., Software | | | 2.2 | |
Chevron Corp., Oil, Gas & Consumable Fuels | | | 2.0 | |
Wells Fargo & Co., Commercial Banks | | | 1.7 | |
*Excludes securities purchased with cash received as a result of securities on loan.
Holdings are subject to change.
| | | | |
Five Largest Sectors expressed as a percentage of net assets as of 10/31/10 | | | | |
Information Technology | | | 19.2 | % |
Financials | | | 13.7 | |
Healthcare | | | 12.6 | |
Industrials | | | 11.7 | |
Energy | | | 11.5 | |
Industry weightings are subject to change.
| | | | |
| Prudential Large-Cap Core Equity Fund | | | 5 | |
Strategy and Performance Overview
How did the Fund perform?
The Prudential Large-Cap Core Equity Fund’s Class A shares gained 13.92% for the 12-month reporting period ended October 31, 2010, underperforming the 16.54% gain of the benchmark S&P 500 Index and the 14.47% gain of the Lipper Large-Cap Core Funds Average.
How is the Fund managed?
Quantitative Management Associates LLC (QMA) tries to outperform the S&P 500 Index by actively managing the Fund via a quantitative process that evaluates about 5,000 stocks daily. Investing in both slowly and rapidly growing companies limits the Fund’s exposure to any particular style of investing and may reduce its volatility relative to the S&P 500 Index.
When selecting stocks of slowly growing companies, QMA emphasizes attractive valuations and invests more heavily in stocks that it believes are inexpensively priced relative to their firms’ earnings prospects and book values. When investing in stocks of more rapidly growing companies, QMA places a heavier emphasis on “news,” or signals about their future growth prospects. For example, upward revisions in earnings forecasts by Wall Street analysts are used as an indication of good news. While striving to achieve its performance objective through this quantitative process, QMA also considers the tax implications of its trading in an attempt to minimize taxable distributions to the Fund.
As part of its strategy, the Fund seeks to remain fully invested. In order to accomplish this and to efficiently manage the Fund, QMA utilizes futures contracts based on the S&P 500 Index to provide liquidity for the Fund. The futures contracts are used to equitize cash that has accrued, enabling the Fund to efficiently process large cash flows without requiring it to maintain large cash positions. During the reporting period, the Fund’s exposure to futures contracts did not have a material impact on its performance.
What were conditions like in the U.S. stock market?
The stock market in the United States went on a roller coaster ride that left it up 16.54% when the reporting period ended on October 31, 2010, based on the S&P 500 Index. Market volatility reflected several factors, not the least of which was a mixed bag of economic data in the United States that left investors wondering whether the world’s largest economy was headed for slow but steady growth or a double-dip recession.
| | |
| 6 | | Visit our website at www.prudentialfunds.com |
Among the other key factors that drove stock prices were largely upbeat corporate earnings reports, uncertainty about proposed financial reform legislation in the United States, an ongoing sovereign-debt crisis in Europe, and concern that the global economic recovery could falter if growth slowed too much in China. The financial reform legislation, which was finally signed into law by President Obama during the summer of 2010, was in response to a near collapse of the global financial system in late 2008.
Stocks posted gains for eight months of the reporting period and losses for the remaining four. The worst monthly loss was in May, when both a computer-driven “flash crash” in stock prices and a flare-up in the European sovereign-debt crisis sent investors fleeing from riskier assets to safe havens such as gold. The equity market posted its best monthly gain for the period in September, as fears of a double-dip recession in the United States began to subside, reflecting signs of stability in data such as durable goods orders and retail sales. There was also hope that companies, which generally have a lot of cash on their balance sheets, will use more of that money to buy back their shares from investors or to increase dividends paid to shareholders. Both could help underpin share prices.
Another positive for the stock market occurred in late September when the Federal Reserve (the Fed) stated that it was prepared to provide further help to the U.S. economy if needed. Stock prices continued to rally in October as investors correctly anticipated that the Fed would announce, shortly after the reporting period ended, a new round of quantitative easing in which it would buy $600 billon of longer-term U.S. Treasury securities. The purchases could help the economy if they boost prices of longer-term Treasury securities and drive down their yields, which influence rates on some business and consumer loans. A string of mostly bullish corporate earnings reports for the third quarter of 2010 was an additional key factor that helped fuel the continued rally in stock prices during October.
How did the sectors of the S&P 500 Index perform?
All 10 sectors of the S&P 500 Index ended the reporting period in the black. Eight posted double-digit gains, including the consumer discretionary, industrials, materials, telecommunications services, information technology, utilities, consumer staples, and healthcare sectors. The remaining two sectors, energy and financials, only posted modest single-digit gains.
Among slowly growing companies, which stocks or related-group of stocks contributed the most and detracted the most from the Fund’s return?
Valuation factors for slowly-growing companies, such as earnings/price and book value/price, often failed to accurately identify stocks that were undervalued.
| | | | |
| Prudential Large-Cap Core Equity Fund | | | 7 | |
Strategy and Performance Overview (continued)
Therefore, stocks that the Fund held because they had been deemed attractively valued by the quantitative process, on average, underperformed the S&P 500 Index for the reporting period. Conversely, some stocks that the Fund avoided because they were deemed expensive outperformed the S&P 500 Index. However, there were exceptions. Shares of Dr. Pepper Snapple and Verizon Communications, which the Fund held for their attractive valuations, outperformed the S&P 500 Index for the reporting period.
Among rapidly growing companies, which stocks or related-group of stocks contributed the most and detracted the most from the Fund’s return?
Technology stocks, and certain consumer discretionary stocks such as Amazon.com and priceline.com that perform in a similar fashion to technology stocks, figured prominently among fast growing companies that detracted from the Fund’s performance versus the S&P 500 Index. The Fund had an underweight exposure to these shares as these types of companies experienced a considerable volume of insider selling, which refers to the lawful selling of a company’s stock by its high-ranking employees. Insider selling, which is generally a negative signal, performed poorly as these stocks gained more than the S&P 500 Index for the reporting period.
On the other hand, the Fund benefited from having larger exposures than the S&P 500 Index to certain stocks in the consumer discretionary sector. These shares performed better than expected as economic activity in the United States was not as weak as anticipated and appeared to be strengthening, albeit moderately.
How did the Fund’s tax management strategy affect its performance?
Although difficult to quantify, the tax management objective affected performance over the course of the reporting period. Trading in the portfolio is not dictated by tax concerns, but the potential impact that trading can have on taxes is factored in to investment decisions. Tax management may lead to more momentum in the portfolio, as losers are sold to realize tax losses and winners are held to avoid tax gains. Over the past year, momentum strategies have not performed well.
Also, in a market environment characterized by the poor performance of lower-quality names, as was the case in the earlier part of the reporting period, underperformance can be amplified. This could occur because the Fund is less likely to hold lower-quality names as these stocks are more likely to have been sold to realize tax losses.
| | |
| 8 | | Visit our website at www.prudentialfunds.com |
Fees and Expenses (Unaudited)
As a shareholder of the Fund, you incur two types of costs: (1) transaction costs, including sales charges (loads) on purchase payments and redemptions, as applicable, and (2) ongoing costs, including management fees, distribution and/or service (12b-1) fees, and other Fund expenses, as applicable. This example is intended to help you understand your ongoing costs (in dollars) of investing in the Fund and to compare these costs with the ongoing costs of investing in other mutual funds.
The example is based on an investment of $1,000 invested on May 1, 2010, at the beginning of the period, and held through the six-month period ended October 31, 2010. The example is for illustrative purposes only; you should consult the Prospectus for information on initial and subsequent minimum investment requirements.
The Fund’s transfer agent may charge additional fees to holders of certain accounts that are not included in the expenses shown in the table on the following page. These fees apply to individual retirement accounts (IRAs) and Section 403(b) accounts. As of the close of the six-month period covered by the table, IRA fees included an annual maintenance fee of $15 per account (subject to a maximum annual maintenance fee of $25 for all accounts held by the same shareholder). Section 403(b) accounts are charged an annual $25 fiduciary maintenance fee. Some of the fees may vary in amount, or may be waived, based on your total account balance or the number of Prudential Investments funds, including the Fund, that you own. You should consider the additional fees that were charged to your Fund account over the six-month period when you estimate the total ongoing expenses paid over the period and the impact of these fees on your ending account value, as these additional expenses are not reflected in the information provided in the expense table. Additional fees have the effect of reducing investment returns.
Actual Expenses
The first line for each share class in the table on the following page provides information about actual account values and actual expenses. You may use the information on this line, together with the amount you invested, to estimate the expenses that you paid over the period. Simply divide your account value by $1,000 (for example, an $8,600 account value ÷ $1,000 = 8.6), then multiply the result by the number on the first line under the heading “Expenses Paid During the Six-Month Period” to estimate the expenses you paid on your account during this period.
Hypothetical Example for Comparison Purposes
The second line for each share class in the table on the following page provides information about hypothetical account values and hypothetical expenses based on the Fund’s actual expense ratio and an assumed rate of return of 5% per year before expenses, which is not the Fund’s actual return. The hypothetical account values and
| | | | |
| Prudential Large-Cap Core Equity Fund | | | 9 | |
Fees and Expenses (continued)
expenses may not be used to estimate the actual ending account balance or expenses you paid for the period. You may use this information to compare the ongoing costs of investing in the Fund and other funds. To do so, compare this 5% hypothetical example with the 5% hypothetical examples that appear in the shareholder reports of the other funds.
Please note that the expenses shown in the table are meant to highlight your ongoing costs only and do not reflect any transactional costs such as sales charges (loads). Therefore, the second line for each share class in the table is useful in comparing ongoing costs only and will not help you determine the relative total costs of owning different funds. In addition, if these transactional costs were included, your costs would have been higher.
| | | | | | | | | | | | | | | | | | |
Prudential Large-Cap
Core Equity Fund | | Beginning Account
Value
May 1, 2010 | | | Ending Account
Value
October 31, 2010 | | | Annualized
Expense Ratio
Based on the
Six-Month Period | | | Expenses Paid
During the
Six-Month Period* | |
| | | | | | | | | | | | | | | | | | |
| Class A | | Actual | | $ | 1,000.00 | | | $ | 989.20 | | | | 1.77 | % | | $ | 8.87 | |
| | | Hypothetical | | $ | 1,000.00 | | | $ | 1,016.28 | | | | 1.77 | % | | $ | 9.00 | |
| | | | | | | | | | | | | | | | | | |
| Class B | | Actual | | $ | 1,000.00 | | | $ | 985.90 | | | | 2.47 | % | | $ | 12.36 | |
| | | Hypothetical | | $ | 1,000.00 | | | $ | 1,012.75 | | | | 2.47 | % | | $ | 12.53 | |
| | | | | | | | | | | | | | | | | | |
| Class C | | Actual | | $ | 1,000.00 | | | $ | 985.90 | | | | 2.47 | % | | $ | 12.36 | |
| | | Hypothetical | | $ | 1,000.00 | | | $ | 1,012.75 | | | | 2.47 | % | | $ | 12.53 | |
| | | | | | | | | | | | | | | | | | |
| Class L | | Actual | | $ | 1,000.00 | | | $ | 988.30 | | | | 1.97 | % | | $ | 9.87 | |
| | | Hypothetical | | $ | 1,000.00 | | | $ | 1,015.27 | | | | 1.97 | % | | $ | 10.01 | |
| | | | | | | | | | | | | | | | | | |
| Class M | | Actual | | $ | 1,000.00 | | | $ | 985.90 | | | | 2.47 | % | | $ | 12.36 | |
| | | Hypothetical | | $ | 1,000.00 | | | $ | 1,012.75 | | | | 2.47 | % | | $ | 12.53 | |
| | | | | | | | | | | | | | | | | | |
| Class X | | Actual | | $ | 1,000.00 | | | $ | 989.80 | | | | 1.72 | % | | $ | 8.63 | |
| | | Hypothetical | | $ | 1,000.00 | | | $ | 1,016.53 | | | | 1.72 | % | | $ | 8.74 | |
| | | | | | | | | | | | | | | | | | |
| Class Z | | Actual | | $ | 1,000.00 | | | $ | 990.30 | | | | 1.47 | % | | $ | 7.37 | |
| | | Hypothetical | | $ | 1,000.00 | | | $ | 1,017.80 | | | | 1.47 | % | | $ | 7.48 | |
* Fund expenses (net of fee waivers or subsidies, if any) for each share class are equal to the annualized expense ratio for each share class (provided in the table), multiplied by the average account value over the period, multiplied by the 184 days in the six-month period ended October 31, 2010, and divided by the 365 days in the Fund’s fiscal year ended October 31, 2010 (to reflect the six-month period). Expenses presented in the table include the expenses of any underlying portfolios in which the Fund may invest.
| | |
| 10 | | Visit our website at www.prudentialfunds.com |
Portfolio of Investments
as of October 31, 2010
| | | | | | |
| Shares | | Description | | Value (Note 1) | |
| | | | | | |
LONG-TERM INVESTMENTS 98.2% | |
COMMON STOCKS | |
CONSUMER DISCRETIONARY 10.7% | |
|
Auto Components 1.0% | |
| 3,000 | | Autoliv, Inc. | | $ | 213,900 | |
| 2,200 | | Drew Industries, Inc.(a) | | | 46,354 | |
| 12,200 | | Goodyear Tire & Rubber Co. (The)(a) | | | 124,684 | |
| 45,600 | | Johnson Controls, Inc. | | | 1,601,472 | |
| 10,500 | | TRW Automotive Holdings Corp.(a) | | | 479,745 | |
| | | | | | |
| | | | | 2,466,155 | |
|
Automobiles 0.2% | |
| 31,300 | | Ford Motor Co.(a)(b) | | | 442,269 | |
| 2,800 | | Thor Industries, Inc. | | | 88,172 | |
| | | | | | |
| | | | | 530,441 | |
|
Distributors 0.1% | |
| 2,700 | | Genuine Parts Co. | | | 129,222 | |
| 4,500 | | LKQ Corp.(a) | | | 97,830 | |
| | | | | | |
| | | | | 227,052 | |
|
Hotels, Restaurants & Leisure 1.3% | |
| 28,500 | | Carnival Corp. | | | 1,230,345 | |
| 1,000 | | International Speedway Corp. (Class A Stock) | | | 22,840 | |
| 20,300 | | McDonald’s Corp. | | | 1,578,731 | |
| 15,600 | | Starbucks Corp. | | | 444,288 | |
| | | | | | |
| | | | | 3,276,204 | |
|
Household Durables 0.4% | |
| 23,900 | | American Greetings Corp. (Class A Stock) | | | 462,943 | |
| 2,100 | | iRobot Corp.(a) | | | 43,848 | |
| 14,600 | | Leggett & Platt, Inc. | | | 297,548 | |
| 3,300 | | Tempur-Pedic International, Inc.(a) | | | 113,850 | |
| 1,100 | | Whirlpool Corp. | | | 83,413 | |
| | | | | | |
| | | | | 1,001,602 | |
|
Internet & Catalog Retail | |
| 6,800 | | Liberty Media Corp. - Interactive(a) | | | 100,368 | |
See Notes to Financial Statements.
| | | | |
| Prudential Large-Cap Core Equity Fund | | | 11 | |
Portfolio of Investments
as of October 31, 2010 continued
| | | | | | |
| Shares | | Description | | Value (Note 1) | |
| | | | | | |
CONSUMER DISCRETIONARY (Continued) | |
|
Media 3.1% | |
| 103,300 | | Comcast Corp. (Class A Stock) | | $ | 2,125,914 | |
| 4,400 | | DIRECTV (Class A Stock)(a)(b) | | | 191,224 | |
| 58,700 | | Gannett Co., Inc. | | | 695,595 | |
| 7,500 | | Liberty Media Corp. - Starz(a) | | | 491,400 | |
| 124,300 | | News Corp. (Class A Stock) | | | 1,797,378 | |
| 37,666 | | Time Warner, Inc. | | | 1,224,522 | |
| 19,600 | | Viacom, Inc. (Class B Stock) | | | 756,364 | |
| 5,760 | | Walt Disney Co. (The) | | | 207,993 | |
| | | | | | |
| | | | | 7,490,390 | |
|
Multiline Retail 1.1% | |
| 3,700 | | Big Lots, Inc.(a) | | | 116,069 | |
| 8,900 | | Family Dollar Stores, Inc. | | | 410,913 | |
| 28,800 | | Macy’s, Inc. | | | 680,832 | |
| 26,400 | | Target Corp. | | | 1,371,216 | |
| | | | | | |
| | | | | 2,579,030 | |
|
Specialty Retail 1.5% | |
| 6,000 | | Best Buy Co., Inc. | | | 257,880 | |
| 43,700 | | Gap, Inc. (The) | | | 830,737 | |
| 18,700 | | Home Depot, Inc. (The) | | | 577,456 | |
| 11,200 | | Limited Brands, Inc. | | | 329,168 | |
| 14,700 | | Ross Stores, Inc. | | | 867,153 | |
| 19,500 | | TJX Cos., Inc. | | | 894,855 | |
| | | | | | |
| | | | | 3,757,249 | |
|
Textiles, Apparel & Luxury Goods 2.0% | |
| 42,200 | | Coach, Inc. | | | 2,110,000 | |
| 2,300 | | Deckers Outdoor Corp.(a) | | | 133,630 | |
| 6,900 | | Fossil, Inc.(a) | | | 407,031 | |
| 17,800 | | Nike, Inc. (Class B Stock) | | | 1,449,632 | |
| 1,300 | | Timberland Co. (The)(Class A Stock)(a) | | | 27,274 | |
| 9,300 | | VF Corp. | | | 774,132 | |
| 1,600 | | Warnaco Group, Inc. (The)(a) | | | 84,976 | |
| | | | | | |
| | | | | 4,986,675 | |
CONSUMER STAPLES 10.0% | |
|
Beverages 2.5% | |
| 56,500 | | Coca-Cola Co. (The) | | | 3,464,580 | |
| 3,300 | | Constellation Brands, Inc. (Class A Stock)(a) | | | 65,109 | |
See Notes to Financial Statements.
| | |
| 12 | | Visit our website at www.prudentialfunds.com |
| | | | | | |
| Shares | | Description | | Value (Note 1) | |
| | | | | | |
CONSUMER STAPLES (Continued) | |
| |
Beverages (cont’d.) | | | | |
| 4,900 | | Dr. Pepper Snapple Group, Inc. | | $ | 179,095 | |
| 12,500 | | Molson Coors Brewing Co. (Class B Stock) | | | 590,375 | |
| 28,794 | | PepsiCo, Inc. | | | 1,880,248 | |
| | | | | | |
| | | | | 6,179,407 | |
|
Food & Staples Retailing 2.1% | |
| 20,200 | | CVS Caremark Corp. | | | 608,424 | |
| 56,400 | | Kroger Co. (The) | | | 1,240,800 | |
| 2,200 | | Susser Holdings Corp.(a) | | | 30,074 | |
| 58,970 | | Wal-Mart Stores, Inc. | | | 3,194,405 | |
| | | | | | |
| | | | | 5,073,703 | |
|
Food Products 1.4% | |
| 7,538 | | Archer-Daniels-Midland Co. | | | 251,166 | |
| 12,200 | | ConAgra Foods, Inc. | | | 274,378 | |
| 4,300 | | Corn Products International, Inc. | | | 182,965 | |
| 41,700 | | Dean Foods Co.(a) | | | 433,680 | |
| 30,300 | | Del Monte Foods Co. | | | 434,502 | |
| 47,400 | | Sara Lee Corp. | | | 679,242 | |
| 5,600 | | Smithfield Foods, Inc.(a) | | | 93,800 | |
| 63,100 | | Tyson Foods, Inc. (Class A Stock) | | | 981,205 | |
| | | | | | |
| | | | | 3,330,938 | |
| |
Household Products 2.0% | | | | |
| 5,870 | | Colgate-Palmolive Co. | | | 452,694 | |
| 14,900 | | Kimberly-Clark Corp. | | | 943,766 | |
| 53,564 | | Procter & Gamble Co. (The) | | | 3,405,064 | |
| | | | | | |
| | | | | 4,801,524 | |
| |
Personal Products | | | | |
| 16,400 | | Prestige Brands Holdings, Inc.(a) | | | 176,300 | |
| |
Tobacco 2.0% | | | | |
| 68,000 | | Altria Group, Inc. | | | 1,728,560 | |
| 34,800 | | Philip Morris International, Inc. | | | 2,035,800 | |
| 15,300 | | Reynolds American, Inc. | | | 992,970 | |
| | | | | | |
| | | | | 4,757,330 | |
See Notes to Financial Statements.
| | | | |
| Prudential Large-Cap Core Equity Fund | | | 13 | |
Portfolio of Investments
as of October 31, 2010 continued
| | | | | | |
| Shares | | Description | | Value (Note 1) | |
| | | | | | |
ENERGY 11.5% | | | | |
| |
Energy Equipment & Services 3.1% | | | | |
| 55,900 | | Halliburton Co. | | $ | 1,780,974 | |
| 17,600 | | Helmerich & Payne, Inc. | | | 752,928 | |
| 36,700 | | Nabors Industries Ltd.(a) | | | 767,030 | |
| 12,700 | | National Oilwell Varco, Inc. | | | 682,752 | |
| 8,500 | | Oil States International, Inc.(a) | | | 434,520 | |
| 9,100 | | RPC, Inc. | | | 200,291 | |
| 39,400 | | Schlumberger Ltd. | | | 2,753,666 | |
| 8,300 | | Weatherford International Ltd.(a) | | | 139,523 | |
| | | | | | |
| | | | | 7,511,684 | |
| |
Oil, Gas & Consumable Fuels 8.4% | | | | |
| 2,900 | | Apache Corp. | | | 292,958 | |
| 14,400 | | Chesapeake Energy Corp. | | | 312,480 | |
| 58,184 | | Chevron Corp. | | | 4,806,580 | |
| 35,600 | | ConocoPhillips | | | 2,114,640 | |
| 21,400 | | Devon Energy Corp. | | | 1,391,428 | |
| 109,774 | | Exxon Mobil Corp. | | | 7,296,678 | |
| 2,800 | | Hess Corp. | | | 176,484 | |
| 1,700 | | Holly Corp. | | | 55,641 | |
| 50,400 | | Marathon Oil Corp. | | | 1,792,728 | |
| 14,500 | | Occidental Petroleum Corp. | | | 1,140,135 | |
| 3,800 | | Southern Union Co. | | | 95,494 | |
| 7,400 | | Southwestern Energy Co.(a) | | | 250,490 | |
| 38,400 | | Valero Energy Corp. | | | 689,280 | |
| 4,200 | | Williams Cos., Inc. (The) | | | 90,384 | |
| | | | | | |
| | | | | 20,505,400 | |
FINANCIALS 13.7% | | | | |
| |
Capital Markets 1.9% | | | | |
| 9,100 | | Ameriprise Financial, Inc. | | | 470,379 | |
| 23,400 | | Bank of New York Mellon Corp. (The) | | | 586,404 | |
| 1,800 | | Franklin Resources, Inc. | | | 206,460 | |
| 10,080 | | Goldman Sachs Group, Inc. (The) | | | 1,622,376 | |
| 24,400 | | Morgan Stanley | | | 606,828 | |
| 3,900 | | Piper Jaffray Cos., Inc.(a) | | | 120,783 | |
| 23,500 | | State Street Corp. | | | 981,360 | |
| 7,900 | | TICC Capital Corp. | | | 81,686 | |
| | | | | | |
| | | | | 4,676,276 | |
See Notes to Financial Statements.
| | |
| 14 | | Visit our website at www.prudentialfunds.com |
| | | | | | |
| Shares | | Description | | Value (Note 1) | |
| | | | | | |
FINANCIALS (Continued) | |
| |
Commercial Banks 3.4% | | | | |
| 700 | | Bancorp Rhode Island, Inc. | | $ | 20,363 | |
| 2,900 | | BB&T Corp. | | | 67,889 | |
| 46,800 | | Fulton Financial Corp. | | | 437,112 | |
| 34,000 | | PNC Financial Services Group, Inc. | | | 1,832,600 | |
| 1,100 | | SunTrust Banks, Inc. | | | 27,522 | |
| 67,391 | | U.S. Bancorp | | | 1,629,515 | |
| 159,064 | | Wells Fargo & Co. | | | 4,148,389 | |
| | | | | | |
| | | | | 8,163,390 | |
| |
Consumer Finance 0.6% | | | | |
| 27,800 | | American Express Co. | | | 1,152,588 | |
| 8,900 | | Capital One Financial Corp. | | | 331,703 | |
| | | | | | |
| | | | | 1,484,291 | |
| |
Diversified Financial Services 3.8% | | | | |
| 305,868 | | Bank of America Corp. | | | 3,499,130 | |
| 494,400 | | Citigroup, Inc.(a) | | | 2,061,648 | |
| 97,900 | | JPMorgan Chase & Co. | | | 3,683,977 | |
| | | | | | |
| | | | | 9,244,755 | |
| |
Insurance 2.7% | | | | |
| 11,500 | | Allstate Corp. (The) | | | 350,635 | |
| 38,900 | | Berkshire Hathaway, Inc. (Class B Stock)(a) | | | 3,094,884 | |
| 4,400 | | Chubb Corp. | | | 255,288 | |
| 30,200 | | Hartford Financial Services Group, Inc.(b) | | | 724,196 | |
| 16,300 | | Lincoln National Corp. | | | 399,024 | |
| 30,300 | | MetLife, Inc. | | | 1,221,999 | |
| 25,400 | | Unum Group | | | 569,468 | |
| | | | | | |
| | | | | 6,615,494 | |
| |
Real Estate Investment Trusts 1.1% | | | | |
| 2,600 | | Agree Realty Corp. | | | 66,300 | |
| 25,800 | | Brandywine Realty Trust(b) | | | 308,826 | |
| 60,600 | | Chimera Investment Corp. | | | 248,460 | |
| 9,600 | | CommonWealth REIT | | | 244,320 | |
| 25,100 | | Hospitality Properties Trust | | | 572,531 | |
| 21,900 | | Invesco Mortgage Capital, Inc. | | | 472,821 | |
| 16,800 | | MFA Financial, Inc. | | | 132,888 | |
| 700 | | Public Storage | | | 69,454 | |
| 29,600 | | Resource Capital Corp. | | | 187,368 | |
See Notes to Financial Statements.
| | | | |
| Prudential Large-Cap Core Equity Fund | | | 15 | |
Portfolio of Investments
as of October 31, 2010 continued
| | | | | | |
| Shares | | Description | | Value (Note 1) | |
| | | | | | |
FINANCIALS (Continued) | |
| |
Real Estate Investment Trusts (cont’d.) | | | | |
| 3,600 | | Simon Property Group, Inc. | | $ | 345,672 | |
| 2,200 | | Winthrop Realty Trust | | | 29,920 | |
| | | | | | |
| | | | | 2,678,560 | |
|
Real Estate Management & Development 0.1% | |
| 3,900 | | Jones Lang LaSalle, Inc. | | | 304,434 | |
|
Thrifts & Mortgage Finance 0.1% | |
| 12,800 | | Washington Federal, Inc. | | | 192,384 | |
HEALTHCARE 12.6% | |
|
Biotechnology 1.2% | |
| 21,800 | | Amgen, Inc.(a) | | | 1,246,742 | |
| 2,700 | | Biogen Idec, Inc.(a)(b) | | | 169,317 | |
| 22,800 | | Celgene Corp.(a) | | | 1,415,196 | |
| | | | | | |
| | | | | 2,831,255 | |
|
Healthcare Equipment & Supplies 2.0% | |
| 12,600 | | Becton Dickinson & Co. | | | 951,552 | |
| 15,400 | | CareFusion Corp.(a) | | | 371,756 | |
| 22,900 | | Covidien PLC | | | 913,023 | |
| 2,000 | | Cyberonics, Inc.(a) | | | 55,020 | |
| 1,400 | | Immucor, Inc.(a) | | | 24,360 | |
| 4,700 | | Intuitive Surgical, Inc.(a) | | | 1,235,865 | |
| 3,300 | | Invacare Corp. | | | 89,100 | |
| 6,000 | | Medtronic, Inc. | | | 211,260 | |
| 9,100 | | Sirona Dental Systems, Inc.(a) | | | 342,615 | |
| 7,300 | | St Jude Medical, Inc.(a) | | | 279,590 | |
| 1,100 | | Stryker Corp.(b) | | | 54,439 | |
| 5,000 | | Zimmer Holdings, Inc.(a) | | | 237,200 | |
| | | | | | |
| | | | | 4,765,780 | |
|
Healthcare Providers & Services 2.6% | |
| 24,700 | | Aetna, Inc. | | | 737,542 | |
| 8,200 | | Cardinal Health, Inc. | | | 284,458 | |
| 30,000 | | Coventry Health Care, Inc.(a) | | | 702,600 | |
| 10,500 | | Humana, Inc.(a) | | | 612,045 | |
| 27,000 | | Medco Health Solutions, Inc.(a) | | | 1,418,310 | |
| 52,700 | | UnitedHealth Group, Inc. | | | 1,899,835 | |
| 14,600 | | WellPoint, Inc.(a) | | | 793,364 | |
| | | | | | |
| | | | | 6,448,154 | |
See Notes to Financial Statements.
| | |
| 16 | | Visit our website at www.prudentialfunds.com |
| | | | | | |
| Shares | | Description | | Value (Note 1) | |
| | | | | | |
HEALTHCARE (Continued) | |
|
Healthcare Technology | |
| 500 | | Cerner Corp.(a) | | $ | 43,915 | |
| 5,400 | | SXC Health Solutions Corp. (Canada)(a) | | | 210,384 | |
| | | | | | |
| | | | | 254,299 | |
|
Life Sciences Tools & Services 1.3% | |
| 25,400 | | Bruker Corp.(a) | | | 380,746 | |
| 6,000 | | Life Technologies Corp.(a) | | | 301,080 | |
| 35,400 | | Thermo Fisher Scientific, Inc.(a) | | | 1,820,268 | |
| 9,300 | | Waters Corp.(a) | | | 689,409 | |
| | | | | | |
| | | | | 3,191,503 | |
|
Pharmaceuticals 5.5% | |
| 44,200 | | Abbott Laboratories | | | 2,268,344 | |
| 22,100 | | Allergan, Inc. | | | 1,600,261 | |
| 39,000 | | Bristol-Myers Squibb Co. | | | 1,049,100 | |
| 6,000 | | Eli Lilly & Co. | | | 211,200 | |
| 2,700 | | ENDO Pharmaceuticals Holdings, Inc.(a) | | | 99,198 | |
| 23,100 | | Impax Laboratories, Inc.(a) | | | 435,204 | |
| 40,099 | | Johnson & Johnson | | | 2,553,103 | |
| 17,300 | | Medicines Co. (The)(a) | | | 220,921 | |
| 54,700 | | Merck & Co., Inc. | | | 1,984,516 | |
| 7,700 | | Par Pharmaceutical Cos., Inc.(a) | | | 250,327 | |
| 152,734 | | Pfizer, Inc. | | | 2,657,572 | |
| | | | | | |
| | | | | 13,329,746 | |
INDUSTRIALS 11.7% | |
|
Aerospace & Defense 2.4% | |
| 1,700 | | Cubic Corp. | | | 74,069 | |
| 26,000 | | General Dynamics Corp. | | | 1,771,120 | |
| 25,700 | | Honeywell International, Inc. | | | 1,210,727 | |
| 2,500 | | L-3 Communications Holdings, Inc. | | | 180,475 | |
| 5,800 | | Lockheed Martin Corp. | | | 413,482 | |
| 16,800 | | Northrop Grumman Corp. | | | 1,061,928 | |
| 4,200 | | Raytheon Co. | | | 193,536 | |
| 12,300 | | United Technologies Corp. | | | 919,671 | |
| | | | | | |
| | | | | 5,825,008 | |
See Notes to Financial Statements.
| | | | |
| Prudential Large-Cap Core Equity Fund | | | 17 | |
Portfolio of Investments
as of October 31, 2010 continued
| | | | | | |
| Shares | | Description | | Value (Note 1) | |
| | | | | | |
INDUSTRIALS (Continued) | |
|
Air Freight & Logistics 1.0% | |
| 2,700 | | Atlas Air Worldwide Holdings, Inc.(a) | | $ | 141,102 | |
| 7,500 | | FedEx Corp. | | | 657,900 | |
| 25,700 | | United Parcel Service, Inc. (Class B Stock) | | | 1,730,638 | |
| | | | | | |
| | | | | 2,529,640 | |
|
Building Products | |
| 3,900 | | Armstrong World Industries, Inc.(a) | | | 162,825 | |
|
Commercial Services & Supplies 0.2% | |
| 3,200 | | Copart, Inc.(a)(b) | | | 108,352 | |
| 20,600 | | RR Donnelley & Sons Co. | | | 380,070 | |
| | | | | | |
| | | | | 488,422 | |
| |
Electrical Equipment 0.9% | | | | |
| 5,200 | | AMETEK, Inc. | | | 281,060 | |
| 5,100 | | Cooper Industries PLC (Class A Stock) | | | 267,342 | |
| 6,300 | | Emerson Electric Co.(b) | | | 345,870 | |
| 2,500 | | Franklin Electric Co., Inc. | | | 90,275 | |
| 4,700 | | Polypore International, Inc.(a) | | | 156,369 | |
| 400 | | Regal-Beloit Corp. | | | 23,084 | |
| 12,900 | | Rockwell Automation, Inc. | | | 804,573 | |
| 2,600 | | Roper Industries, Inc. | | | 180,518 | |
| | | | | | |
| | | | | 2,149,091 | |
| |
Industrial Conglomerates 2.5% | | | | |
| 21,500 | | 3M Co. | | | 1,810,730 | |
| 225,100 | | General Electric Co. | | | 3,606,102 | |
| 17,700 | | Tyco International Ltd. | | | 677,556 | |
| | | | | | |
| | | | | 6,094,388 | |
| |
Machinery 3.4% | | | | |
| 8,700 | | Colfax Corp.(a) | | | 139,809 | |
| 6,700 | | Cummins, Inc. | | | 590,270 | |
| 25,400 | | Danaher Corp. | | | 1,101,344 | |
| 23,900 | | Deere & Co. | | | 1,835,520 | |
| 8,800 | | Dover Corp. | | | 467,280 | |
| 15,600 | | Eaton Corp. | | | 1,385,748 | |
| 500 | | Gardner Denver, Inc. | | | 28,910 | |
| 23,100 | | Illinois Tool Works, Inc. | | | 1,055,670 | |
| 3,600 | | Kennametal, Inc. | | | 122,904 | |
See Notes to Financial Statements.
| | |
| 18 | | Visit our website at www.prudentialfunds.com |
| | | | | | |
| Shares | | Description | | Value (Note 1) | |
| | | | | | |
INDUSTRIALS (Continued) | |
| |
Machinery (cont’d.) | | | | |
| 2,100 | | Nacco Industries, Inc. (Class A Stock) | | $ | 208,446 | |
| 12,100 | | Parker Hannifin Corp. | | | 926,255 | |
| 700 | | SPX Corp. | | | 46,942 | |
| 1,200 | | Timken Co. | | | 49,704 | |
| 7,000 | | Wabco Holdings, Inc.(a) | | | 324,940 | |
| | | | | | |
| | | | | 8,283,742 | |
| |
Road & Rail 1.3% | | | | |
| 19,100 | | CSX Corp. | | | 1,173,695 | |
| 23,300 | | Norfolk Southern Corp. | | | 1,432,717 | |
| 5,400 | | Union Pacific Corp. | | | 473,472 | |
| | | | | | |
| | | | | 3,079,884 | |
INFORMATION TECHNOLOGY 19.2% | | | | |
| |
Communications Equipment 2.3% | | | | |
| 4,800 | | Acme Packet, Inc.(a) | | | 189,840 | |
| 4,200 | | Arris Group, Inc.(a) | | | 39,102 | |
| 82,250 | | Cisco Systems, Inc.(a) | | | 1,877,767 | |
| 3,300 | | Comtech Telecommunications Corp. | | | 101,706 | |
| 4,400 | | EchoStar Corp. (Class A Stock)(a) | | | 93,280 | |
| 2,100 | | F5 Networks, Inc.(a) | | | 247,170 | |
| 22,400 | | Harris Corp. | | | 1,012,256 | |
| 19,600 | | JDS Uniphase Corp.(a) | | | 205,996 | |
| 28,500 | | Juniper Networks, Inc.(a) | | | 923,115 | |
| 37,600 | | Motorola, Inc.(a) | | | 306,440 | |
| 5,200 | | Plantronics, Inc. | | | 186,576 | |
| 8,900 | | QUALCOMM, Inc. | | | 401,657 | |
| | | | | | |
| | | | | 5,584,905 | |
| |
Computers & Peripherals 5.0% | | | | |
| 21,790 | | Apple, Inc.(a) | | | 6,555,957 | |
| 2,700 | | Electronics For Imaging, Inc.(a) | | | 36,963 | |
| 71,500 | | EMC Corp.(a) | | | 1,502,215 | |
| 71,425 | | Hewlett-Packard Co. | | | 3,004,136 | |
| 4,900 | | Isilon Systems, Inc.(a) | | | 139,503 | |
| 10,100 | | NetApp, Inc.(a) | | | 537,825 | |
| 11,200 | | SanDisk Corp.(a) | | | 420,896 | |
| | | | | | |
| | | | | 12,197,495 | |
See Notes to Financial Statements.
| | | | |
| Prudential Large-Cap Core Equity Fund | | | 19 | |
Portfolio of Investments
as of October 31, 2010 continued
| | | | | | |
| Shares | | Description | | Value (Note 1) | |
| | | | | | |
INFORMATION TECHNOLOGY (Continued) | |
| |
Electronic Equipment, Instruments & Components 1.0% | | | | |
| 6,900 | | Agilent Technologies, Inc.(a) | | $ | 240,120 | |
| 3,300 | | Avnet, Inc.(a) | | | 98,274 | |
| 7,900 | | AVX Corp. | | | 113,286 | |
| 46,000 | | Corning, Inc. | | | 840,880 | |
| 2,200 | | Dolby Laboratories, Inc. (Class A Stock)(a) | | | 135,696 | |
| 7,600 | | Ingram Micro, Inc. (Class A Stock)(a) | | | 134,216 | |
| 1,900 | | IPG Photonics Corp.(a) | | | 42,750 | |
| 5,800 | | Itron, Inc.(a) | | | 352,466 | |
| 28,600 | | Jabil Circuit, Inc.(b) | | | 438,724 | |
| 1,100 | | Multi-Fineline Electronix, Inc.(a) | | | 26,928 | |
| | | | | | |
| | | | | 2,423,340 | |
| |
Internet Software & Services 1.0% | | | | |
| 23,500 | | AOL, Inc.(a) | | | 626,980 | |
| 3,000 | | Google, Inc. (Class A Stock)(a) | | | 1,838,970 | |
| 3,600 | | Yahoo!, Inc.(a) | | | 59,436 | |
| | | | | | |
| | | | | 2,525,386 | |
| |
IT Services 2.6% | | | | |
| 900 | | Amdocs Ltd.(a) | | | 27,612 | |
| 12,300 | | Computer Sciences Corp. | | | 603,315 | |
| 23,770 | | International Business Machines Corp. | | | 3,413,372 | |
| 15,200 | | SAIC, Inc.(a) | | | 236,208 | |
| 20,300 | | Visa, Inc. (Class A Stock) | | | 1,586,851 | |
| 22,300 | | Western Union Co. (The) | | | 392,480 | |
| | | | | | |
| | | | | 6,259,838 | |
| |
Office Electronics 0.5% | | | | |
| 79,200 | | Xerox Corp. | | | 926,640 | |
| 6,600 | | Zebra Technologies Corp. (Class A Stock)(a) | | | 236,148 | |
| | | | | | |
| | | | | 1,162,788 | |
| |
Semiconductors & Semiconductor Equipment 3.1% | | | | |
| 49,100 | | Applied Materials, Inc. | | | 606,876 | |
| 33,400 | | Broadcom Corp. (Class A Stock) | | | 1,360,716 | |
| 700 | | Hittite Microwave Corp.(a) | | | 36,169 | |
| 106,600 | | Intel Corp. | | | 2,139,462 | |
| 5,600 | | LAM Research Corp.(a) | | | 256,424 | |
| 21,000 | | LSI Corp.(a) | | | 110,040 | |
| 12,400 | | Marvell Technology Group Ltd.(a) | | | 239,444 | |
See Notes to Financial Statements.
| | |
| 20 | | Visit our website at www.prudentialfunds.com |
| | | | | | |
| Shares | | Description | | Value (Note 1) | |
| | | | | | |
INFORMATION TECHNOLOGY (Continued) | |
| |
Semiconductors & Semiconductor Equipment (cont’d.) | | | | |
| 16,300 | | Novellus Systems, Inc.(a) | | $ | 476,123 | |
| 74,900 | | Texas Instruments, Inc. | | | 2,214,793 | |
| | | | | | |
| | | | | 7,440,047 | |
| |
Software 3.7% | | | | |
| 5,100 | | Activision Blizzard, Inc. | | | 58,497 | |
| 21,800 | | Autodesk, Inc.(a)(b) | | | 788,724 | |
| 2,300 | | FactSet Research Systems, Inc. | | | 201,894 | |
| 20,100 | | Intuit, Inc.(a) | | | 964,800 | |
| 700 | | MICROS Systems, Inc.(a) | | | 31,773 | |
| 199,300 | | Microsoft Corp. | | | 5,309,352 | |
| 36,700 | | Oracle Corp. | | | 1,078,980 | |
| 13,800 | | Red Hat, Inc.(a) | | | 583,188 | |
| 4,400 | | Synopsys, Inc.(a) | | | 112,552 | |
| | | | | | |
| | | | | 9,129,760 | |
MATERIALS 3.2% | | | | |
| |
Chemicals 2.2% | | | | |
| 11,000 | | Air Products & Chemicals, Inc. | | | 934,670 | |
| 4,800 | | Cabot Corp. | | | 163,296 | |
| 13,000 | | Celanese Corp. (Class A Stock) | | | 463,450 | |
| 900 | | Cytec Industries, Inc. | | | 44,568 | |
| 14,000 | | Ecolab, Inc. | | | 690,480 | |
| 11,700 | | E.I. du Pont de Nemours & Co. | | | 553,176 | |
| 8,500 | | International Flavors & Fragrances, Inc. | | | 426,360 | |
| 3,700 | | Lubrizol Corp. | | | 379,213 | |
| 17,200 | | Nalco Holding Co. | | | 484,696 | |
| 11,800 | | Praxair, Inc. | | | 1,077,812 | |
| 1,800 | | Zep, Inc. | | | 32,652 | |
| | | | | | |
| | | | | 5,250,373 | |
| |
Metals & Mining 1.0% | | | | |
| 51,900 | | Alcoa, Inc. | | | 681,447 | |
| 6,200 | | Commercial Metals Co. | | | 86,056 | |
| 7,400 | | Freeport-McMoRan Copper & Gold, Inc. | | | 700,632 | |
| 20,600 | | Southern Copper Corp. | | | 881,680 | |
| 8,300 | | Steel Dynamics, Inc. | | | 120,516 | |
| | | | | | |
| | | | | 2,470,331 | |
See Notes to Financial Statements.
| | | | |
| Prudential Large-Cap Core Equity Fund | | | 21 | |
Portfolio of Investments
as of October 31, 2010 continued
| | | | | | |
| Shares | | Description | | Value (Note 1) | |
| | | | | | |
TELECOMMUNICATION SERVICES 2.9% | | | | |
| |
Diversified Telecommunication Services 2.8% | | | | |
| 1,600 | | AboveNet, Inc.(a) | | $ | 91,024 | |
| 126,868 | | AT&T, Inc. | | | 3,615,738 | |
| 97,000 | | Verizon Communications, Inc. | | | 3,149,590 | |
| | | | | | |
| | | | | 6,856,352 | |
| |
Wireless Telecommunication Services 0.1% | | | | |
| 900 | | American Tower Corp. (Class A Stock)(a) | | | 46,449 | |
| 3,800 | | USA Mobility, Inc. | | | 63,954 | |
| | | | | | |
| | | | | 110,403 | |
UTILITIES 2.7% | | | | |
| |
Electric Utilities 1.7% | | | | |
| 10,600 | | DPL, Inc. | | | 276,660 | |
| 38,300 | | Duke Energy Corp. | | | 697,443 | |
| 16,300 | | Edison International | | | 601,470 | |
| 9,200 | | Entergy Corp. | | | 685,676 | |
| 16,400 | | Exelon Corp. | | | 669,448 | |
| 20,000 | | NextEra Energy, Inc. | | | 1,100,800 | |
| 6,100 | | Portland General Electric Co. | | | 127,490 | |
| | | | | | |
| | | | | 4,158,987 | |
| |
Gas Utilities 0.5% | | | | |
| 10,600 | | AGL Resources, Inc. | | | 416,156 | |
| 10,100 | | Energen Corp. | | | 450,864 | |
| 5,900 | | Oneok, Inc. | | | 293,938 | |
| | | | | | |
| | | | | 1,160,958 | |
| |
Independent Power Producers & Energy Traders 0.1% | | | | |
| 6,000 | | AES Corp. (The)(a) | | | 71,640 | |
| 4,700 | | Constellation Energy Group, Inc. | | | 142,128 | |
| | | | | | |
| | | | | 213,768 | |
| |
Multi-Utilities 0.3% | | | | |
| 2,000 | | Alliant Energy Corp. | | | 73,060 | |
| 3,600 | | NiSource, Inc. | | | 62,316 | |
| 3,800 | | Public Service Enterprise Group, Inc.(b) | | | 122,930 | |
| 27,400 | | TECO Energy, Inc. | | | 481,966 | |
| | | | | | |
| | | | | 740,272 | |
See Notes to Financial Statements.
| | |
| 22 | | Visit our website at www.prudentialfunds.com |
| | | | | | |
| Shares | | Description | | Value (Note 1) | |
| | | | | | |
UTILITIES (Continued) | |
| |
Water Utilities 0.1% | | | | |
| 7,700 | | American Water Works Co., Inc. | | $ | 183,876 | |
| | | | | | |
| | Total long-term investments (cost $194,398,081) | | | 239,413,652 | |
| | | | | | |
| |
Principal
Amount (000) | | | |
SHORT-TERM INVESTMENTS 3.2% | | | | |
|
United States Government Security 0.3% | |
| $700 | | United States Treasury Bill, 0.150%, 12/16/10(c)(d)
(cost $699,869) | | | 699,882 | |
| | | | | | |
| | |
| Shares | | | | | |
| |
Affiliated Money Market Mutual Fund 2.9% | | | | |
| 7,046,082 | | Prudential Investment Portfolios-2 Prudential Core Taxable Money Market Fund
(cost $7,046,082; includes $3,146,476 of cash collateral received for securities on loan) (Note 3)(e)(f) | | | 7,046,082 | |
| | | | | | |
| | Total short-term investments
(cost $7,745,951) | | | 7,745,964 | |
| | | | | | |
| | Total Investments 101.4%
(cost $202,144,032; Note 5) | | | 247,159,616 | |
| | Liabilities in excess of other assets(g) (1.4%) | | | (3,361,236 | ) |
| | | | | | |
| | Net Assets 100.0% | | $ | 243,798,380 | |
| | | | | | |
| (a) | Non-income producing security. |
| (b) | All or portion of security is on loan. The aggregate market value of such securities, including those sold and pending settlement, is $3,042,604; cash collateral of $3,146,476 (included in liabilities) was received with which the Fund purchased highly liquid short-term investments. |
| (c) | All or a portion of security segregated as collateral for financial futures contracts. |
| (d) | Rate quoted represents yield-to-maturity as of purchase date. |
| (e) | Prudential Investments LLC, the manager of the Fund, also serves as manager of the Prudential Investment Portfolios 2-Prudential Core Taxable Money Market Fund. |
| (f) | Represents security, or a portion thereof, purchased with cash collateral received for securities on loan. |
See Notes to Financial Statements.
| | | | |
| Prudential Large-Cap Core Equity Fund | | | 23 | |
Portfolio of Investments
as of October 31, 2010 continued
| (g) | Liabilities in excess of other assets include net unrealized appreciation on financial futures as follows: |
Open future contracts outstanding at October 31, 2010:
| | | | | | | | | | | | | | | | | | |
Number of
Contracts | | Type | | Expiration
Date | | | Value at
Trade
Date | | | Value at
October 31,
2010 | | | Unrealized
Appreciation | |
| | Long Position: | | | | | | | | | | | | | | | | |
| 64 | | S&P 500 Mini Index Futures | | | Dec. 2010 | | | $ | 3,599,785 | | | $ | 3,775,040 | | | $ | 175,255 | |
| | | | | | | | | | | | | | | | | | |
Various inputs are used in determining the value of the Fund’s investments. These inputs are summarized in the three broad levels listed below.
Level 1—quoted prices in active markets for identical securities, generally for stocks and mutual funds with daily NAVs
Level 2—other significant observable inputs (including quoted prices for similar securities, interest rates, prepayment speeds, credit risk, etc., and amortized cost), generally for foreign stocks priced through vendor modeling tools and debt securities
Level 3—significant unobservable inputs (including the Fund’s own assumptions in determining the fair value of investments)
The following is a summary of the inputs used as of October 31, 2010 in valuing the Fund’s assets carried at fair value:
| | | | | | | | | | | | |
| | | Level 1 | | | Level 2 | | | Level 3 | |
Investments in Securities | | | | | | | | | | | | |
Common Stocks | | $ | 239,413,652 | | | $ | — | | | $ | — | |
United States Government Security | | | — | | | | 699,882 | | | | — | |
Affiliated Money Market Mutual Fund | | | 7,046,082 | | | | — | | | | — | |
Other Financial Instruments* | | | | | | | | | | | | |
Futures | | | 175,255 | | | | — | | | | — | |
| | | | | | | | | | | | |
Total | | $ | 246,634,989 | | | $ | 699,882 | | | $ | — | |
| | | | | | | | | | | | |
| * | Other financial instruments are derivative instruments not reflected in the Portfolio of Investments, such as futures, forwards and swap contracts, which are valued at the unrealized appreciation/depreciation on the instrument. |
See Notes to Financial Statements.
| | |
| 24 | | Visit our website at www.prudentialfunds.com |
The industry classification of portfolio holdings and liabilities in excess of other assets shown as a percentage of net assets as of October 31, 2010 were as follows:
| | | | |
Information Technology | | | 19.2 | % |
Financials | | | 13.7 | |
Healthcare | | | 12.6 | |
Industrials | | | 11.7 | |
Energy | | | 11.5 | |
Consumer Discretionary | | | 10.7 | |
Consumer Staples | | | 10.0 | |
Materials | | | 3.2 | |
Affiliated Money Market Mutual Fund (including 1.3% of collateral received for securities on loan) | | | 2.9 | |
Telecommunication Services | | | 2.9 | |
Utilities | | | 2.7 | |
United States Government Security | | | 0.3 | |
| | | | |
| | | 101.4 | |
Liabilities in excess of other assets | | | (1.4 | ) |
| | | | |
| | | 100.0 | % |
| | | | |
The Fund invested in derivative instruments during the reporting period. The primary type of risk associated with these derivative instruments is equity risk. The effect of such derivative instruments on the Fund’s financial position and financial performance as reflected in the Statement of Assets and Liabilities and Statement of Operations is presented in the summary below.
Fair values of derivative Instruments as of October 31, 2010 as presented in the Statement of Assets and Liabilities:
| | | | | | | | | | | | |
Derivatives not designated
as hedging instruments,
carried at fair value | | Asset Derivatives | | | Liability Derivatives | |
| | Balance
Sheet Location | | Fair
Value | | | Balance
Sheet Location | | Fair
Value | |
| Equity contracts | | Due from broker— variation margin | | $ | 175,255 | * | | — | | $ | — | |
| | | | | | | | | | | | |
| * | Includes cumulative appreciation/depreciation on futures contracts as reported in the Portfolio of Investments. Only unsettled variation margin receivable (payable) is reported within the Statement of Assets and Liabilities. |
See Notes to Financial Statements.
| | | | |
| Prudential Large-Cap Core Equity Fund | | | 25 | |
Portfolio of Investments
as of October 31, 2010 continued
The effects of derivative instruments on the Statement of Operations for the year ended October 31, 2010 are as follows:
| | | | |
Amount of Realized Gain or (Loss) on Derivatives Recognized in Income | |
Derivatives not designated as hedging
instruments, carried at fair value | | Futures | |
Equity contracts | | $ | 313,664 | |
| | | | |
Change in Unrealized Appreciation or (Depreciation) on Derivatives Recognized in Income | |
Derivatives not designated as hedging
instruments, carried at fair value | | Futures | |
Equity contracts | | $ | 179,080 | |
For the year ended October 31, 2010, the Fund’s average value at trade date for futures long position was $6,338,717.
See Notes to Financial Statements.
| | |
| 26 | | Visit our website at www.prudentialfunds.com |
Financial Statements
| | |
| OCTOBER 31, 2010 | | ANNUAL REPORT |
Prudential Large-Cap Core Equity Fund
Statement of Assets and Liabilities
as of October 31, 2010
| | | | |
Assets | | | | |
Investments at value, including securities on loan of $3,042,604: | | | | |
Unaffiliated Investments (cost $195,097,950) | | $ | 240,113,534 | |
Affiliated Investments (cost $7,046,082) | | | 7,046,082 | |
Receivable for Fund shares sold | | | 497,905 | |
Dividends and interest receivable | | | 282,243 | |
Prepaid expenses | | | 4,012 | |
Due from broker—variation margin | | | 1,807 | |
| | | | |
Total Assets | | | 247,945,583 | |
| | | | |
| |
Liabilities | | | | |
Payable to broker for collateral for securities on loan | | | 3,146,476 | |
Payable for Fund shares reacquired | | | 470,734 | |
Accrued expenses | | | 291,512 | |
Management fee payable | | | 128,052 | |
Affiliated transfer agent fee payable | | | 59,804 | |
Distribution fee payable | | | 45,412 | |
Deferred trustees’ fees | | | 5,213 | |
| | | | |
Total liabilities | | | 4,147,203 | |
| | | | |
| |
Net Assets | | $ | 243,798,380 | |
| | | | |
| | | | | |
Net assets were comprised of: | | | | |
Shares of beneficial interest, at par | | $ | 22,100 | |
Paid-in capital in excess of par | | | 239,387,640 | |
| | | | |
| | | 239,409,740 | |
Undistributed net investment income | | | 534,275 | |
Accumulated net realized loss on investment and financial futures transactions | | | (41,336,474 | ) |
Net unrealized appreciation on investments | | | 45,190,839 | |
| | | | |
Net assets, October 31, 2010 | | $ | 243,798,380 | |
| | | | |
See Notes to Financial Statements.
| | |
| 28 | | Visit our website at www.prudentialfunds.com |
| | | | |
Class A | | | | |
Net asset value and redemption price per share
($64,472,492 ÷ 5,856,404 shares of beneficial interest issued and outstanding) | | $ | 11.01 | |
Maximum sales charge (5.50% of offering price) | | | 0.64 | |
| | | | |
Maximum offering price to public | | $ | 11.65 | |
| | | | |
| |
Class B | | | | |
Net asset value, offering price and redemption price per share
($5,316,989 ÷ 507,735 shares of beneficial interest issued and outstanding) | | $ | 10.47 | |
| | | | |
| |
Class C | | | | |
Net asset value, offering price and redemption price per share
($22,496,227 ÷ 2,147,567 shares of beneficial interest issued and outstanding) | | $ | 10.48 | |
| | | | |
| |
Class L | | | | |
Net asset value, offering price and redemption price per share
($4,222,338 ÷ 383,999 shares of beneficial interest issued and outstanding) | | $ | 11.00 | |
| | | | |
| |
Class M | | | | |
Net asset value, offering price and redemption price per share
($4,103,329 ÷ 391,655 shares of beneficial interest issued and outstanding) | | $ | 10.48 | |
| | | | |
| |
Class X | | | | |
Net asset value, offering price and redemption price per share
($1,394,261 ÷ 130,904 shares of beneficial interest issued and outstanding) | | $ | 10.65 | |
| | | | |
| |
Class Z | | | | |
Net asset value, offering price and redemption price per share
($141,792,744 ÷ 12,681,629 shares of beneficial interest issued and outstanding) | | $ | 11.18 | |
| | | | |
See Notes to Financial Statements.
| | | | |
| Prudential Large-Cap Core Equity Fund | | | 29 | |
Statement of Operations
Year Ended October 31, 2010
| | | | |
Net Investment Income | | | | |
Income | | | | |
Unaffiliated dividends | | $ | 4,808,661 | |
Interest | | | 33,738 | |
Affiliated income from securities loaned, net | | | 20,287 | |
Affiliated dividend income | | | 15,264 | |
| | | | |
Total income | | | 4,877,950 | |
| | | | |
| |
Expenses | | | | |
Management fee | | | 1,636,904 | |
Distribution fee—Class A | | | 193,692 | |
Distribution fee—Class B | | | 59,042 | |
Distribution fee—Class C | | | 239,352 | |
Distribution fee—Class L | | | 23,125 | |
Distribution fee—Class M | | | 59,184 | |
Distribution fee—Class X | | | 4,221 | |
Transfer agent’s fees and expenses (including affiliated expense of $278,000) (Note 3) | | | 1,018,000 | |
Registration fees | | | 80,000 | |
Custodian’s fees and expenses | | | 73,000 | |
Reports to shareholders | | | 67,000 | |
Legal fees and expenses | | | 31,000 | |
Audit fee | | | 22,000 | |
Trustees’ fees | | | 19,000 | |
Insurance | | | 6,000 | |
Miscellaneous | | | 13,166 | |
| | | | |
Total expenses | | | 3,544,686 | |
| | | | |
Net investment income | | | 1,333,264 | |
| | | | |
| |
Realized And Unrealized Gain (Loss) On Investments | | | | |
Net realized gain on: | | | | |
Investment transactions | | | 40,711,343 | |
Financial futures transactions | | | 313,664 | |
| | | | |
| | | 41,025,007 | |
| | | | |
Net change in unrealized appreciation (depreciation) on: | | | | |
Investments | | | (9,376,530 | ) |
Financial futures contracts | | | 179,080 | |
| | | | |
| | | (9,197,450 | ) |
| | | | |
Net gain on investments | | | 31,827,557 | |
| | | | |
Net Increase In Net Assets Resulting From Operations | | $ | 33,160,821 | |
| | | | |
See Notes to Financial Statements.
| | |
| 30 | | Visit our website at www.prudentialfunds.com |
Statement of Changes in Net Assets
| | | | | | | | |
| | | Year Ended October 31, | |
| | | 2010 | | | 2009 | |
Increase (Decrease) In Net Assets | | | | | | | | |
Operations | | | | | | | | |
Net investment income | | $ | 1,333,264 | | | $ | 1,782,538 | |
Net realized gain (loss) on investment transactions | | | 41,025,007 | | | | (44,837,938 | ) |
Net change in unrealized appreciation (depreciation) on investments | | | (9,197,450 | ) | | | 62,882,458 | |
| | | | | | | | |
Net increase in net assets resulting from operations | | | 33,160,821 | | | | 19,827,058 | |
| | | | | | | | |
| | |
Dividends from net investment income (Note 1) | | | | | | | | |
Class A | | | (306,462 | ) | | | (702,987 | ) |
Class B | | | — | | | | (21,934 | ) |
Class C | | | — | | | | (71,581 | ) |
Class L | | | (14,916 | ) | | | (48,001 | ) |
Class M | | | — | | | | (34,939 | ) |
Class X | | | (11,620 | ) | | | (28,874 | ) |
Class Z | | | (1,683,947 | ) | | | (603,191 | ) |
| | | | | | | | |
| | | (2,016,945 | ) | | | (1,511,507 | ) |
| | | | | | | | |
| | |
Fund share transactions (Net of share conversions) (Note 6) | | | | | | | | |
Net proceeds from shares sold | | | 153,410,690 | | | | 186,704,787 | |
Net asset value of shares issued in reinvestment of dividends | | | 460,243 | | | | 886,798 | |
Cost of shares reacquired | | | (253,061,019 | ) | | | (62,504,238 | ) |
| | | | | | | | |
Net increase (decrease) in net assets from Fund share transactions | | | (99,190,086 | ) | | | 125,087,347 | |
| | | | | | | | |
| | |
Capital Contributions | | | | | | | | |
Class X (Note 2) | | | 667 | | | | 2,969 | |
| | | | | | | | |
Total increase (decrease) | | | (68,045,543 | ) | | | 143,405,867 | |
| | |
Net Assets | | | | | | | | |
Beginning of year | | | 311,843,923 | | | | 168,438,056 | |
| | | | | | | | |
End of year(a) | | $ | 243,798,380 | | | $ | 311,843,923 | |
| | | | | | | | |
(a) Includes undistributed net investment income of: | | $ | 534,275 | | | $ | 1,217,956 | |
| | | | | | | | |
See Notes to Financial Statements.
| | | | |
| Prudential Large-Cap Core Equity Fund | | | 31 | |
Notes to Financial Statements
Prudential Large-Cap Core Equity Fund (the “Fund”) is a series of Prudential Investment Portfolios 9 (the “Trust”), which is registered under the Investment Company Act of 1940, as amended, as a diversified, open-end management investment company. The Trust was organized as a business trust in Delaware on September 18, 1998. The Fund commenced investment operations on March 3, 1999.
The Fund’s investment objective is to seek long-term after-tax growth of capital. It invests in a portfolio of equity-related securities, such as common stock and convertible securities of U.S. companies.
Note 1. Accounting Policies
The following is a summary of significant accounting policies followed by the Fund in the preparation of its financial statements.
Securities Valuation: Securities listed on a securities exchange (other than options on securities and indices) are valued at the last sale price on such exchange on the day of valuation or, if there was no sale on such day, at the mean between the last reported bid and asked prices, or at the last bid price on such day in the absence of an asked price. Securities traded via NASDAQ are valued at the NASDAQ official closing price (“NOCP”) on the day of valuation, or if there was no NOCP, at the last sale price. Securities that are actively traded in the over-the-counter market, including listed securities for which the primary market is believed by Prudential Investments LLC (“PI” or “Manager”), in consultation with the subadvisers, to be over-the-counter, are valued at market value using prices provided by an independent pricing agent or principal market maker. Options on securities and indices traded on an exchange are valued at the last sale price as of the close of trading on the applicable exchange or, if there was no sale, at the mean between the most recently quoted bid and asked prices on such exchange. Futures contracts and options thereon traded on a commodities exchange or board of trade are valued at the last sale price at the close of trading on such exchange or board of trade or, if there was no sale on the applicable commodities exchange or board of trade on such day, at the mean between the most recently quoted bid and asked prices on such exchange or board of trade or at the last bid price in the absence of an asked price. Prices may be obtained from independent pricing services which use information provided by market makers or estimates of market values obtained from yield data relating to investments or securities with similar characteristics. Securities for which reliable market quotations
| | |
| 32 | | Visit our website at www.prudentialfunds.com |
are not readily available, or whose values have been affected by events occurring after the close of the security’s foreign market and before the Funds’ normal pricing time, are valued at fair value in accordance with the Board of Trustees approved fair valuation procedures. When determining the fair valuation of securities some of the factors influencing the valuation include, the nature of any restrictions on disposition of the securities; assessment of the general liquidity of the securities; the issuer’s financial condition and the markets in which it does business; the cost of the investment; the size of the holding and the capitalization of issuer; the prices of any recent transactions or bids/offers for such securities or any comparable securities; any available analyst media or other reports or information deemed reliable by the investment adviser regarding the issuer or the markets or industry in which it operates. Using fair value to price securities may result in a value that is different from a security’s most recent closing price and from the price used by other mutual funds to calculate their net asset values.
Investments in open end, non exchange-traded mutual funds are valued at their net asset value as of the close of the New York Stock Exchange on the date of valuation.
Short-term debt securities of sufficient credit quality, which mature in sixty days or less, are valued at amortized cost, which approximates fair value. The amortized cost method includes valuing a security at its cost on the date of purchase and thereafter assuming a constant amortization to maturity of the difference between the principal amount due at maturity and cost. Short-term debt securities, which mature in more than sixty days, are valued at fair value.
Securities Lending: The Fund may lend its portfolio securities to broker-dealers. The loans are secured by collateral at least equal at all times to the market value of the securities loaned. Loans are subject to termination at the option of the borrower or the Fund. Upon termination of the loan, the borrower will return to the Fund securities identical to the loaned securities. Should the borrower of the securities fail financially, the Fund has the right to repurchase the securities using the collateral in the open market. The Fund recognizes income, net of any rebate and securities lending agent fees, for lending its securities in the form of fees or interest on the investment of any cash received as collateral. The Fund also continues to receive interest and dividends or amounts equivalent thereto, on the securities loaned and recognizes any unrealized gain or loss in the market price of the securities loaned that may occur during the term of the loan.
Financial Futures Contracts: A financial futures contract is an agreement to purchase (long) or sell (short) an agreed amount of securities at a set price for delivery on a future date. Upon entering into a financial futures contract, the Fund is required to
| | | | |
| Prudential Large-Cap Core Equity Fund | | | 33 | |
Notes to Financial Statements
continued
pledge to the broker an amount of cash and/or other assets equal to a certain percentage of the contract amount. This amount is known as the “initial margin”.
Subsequent payments, known as “variation margin”, are made or received by the Fund each day, depending on the daily fluctuations in the value of the underlying security. Such variation margin is recorded for financial statement purposes on a daily basis as unrealized gain or loss. When the contract expires or is closed, the gain or loss is realized and is presented in the Statement of Operations as net realized gain or loss on financial futures transactions.
The Fund invests in financial futures contracts in order to hedge its existing portfolio securities, or securities the Fund intends to purchase, against fluctuations in value caused by changes in value of equities. The use of futures transactions involves the risk of imperfect correlation in movements in the price of futures contracts and the underlying hedged assets. Financial futures contracts involve elements of both market and credit risk in excess of the amounts reflected on the Statement of Assets and Liabilities.
Securities Transactions and Net Investment Income: Securities transactions are recorded on the trade date. Realized gains or losses on sales of securities are calculated on an identified cost basis. Dividend income is recorded on the ex-dividend date and interest income, including amortization of premium and accretion of discount on debt securities, as required, is recorded on an accrual basis. Expenses are recorded on the accrual basis. Net investment income or loss (other than distribution fees which are charged directly to the respective class) and unrealized and realized gains or losses are allocated daily to each class of shares based upon the relative proportion of net assets of each class at the beginning of the day.
Dividends and Distributions: The Fund expects to pay dividends of net investment income and distributions of net realized capital gains, if any, annually. Dividends and distributions to shareholders, which are determined in accordance with federal income tax regulations and which may differ from generally accepted accounting principles, are recorded on the ex-dividend date. Permanent book/tax differences relating to income and gains are reclassified amongst undistributed net investment income, accumulated net realized gain or loss and paid-capital in excess of par, as appropriate.
Taxes: For federal income tax purposes, it is the Fund’s policy to continue to meet the requirements of the Internal Revenue Code applicable to regulated investment
| | |
| 34 | | Visit our website at www.prudentialfunds.com |
companies and to distribute all of its taxable net investment income and capital gains, if any, to shareholders. Therefore, no federal income tax provision is required.
Withholding taxes on foreign dividends are recorded net of reclaimable amounts, at the time related income is earned.
Estimates: The preparation of the financial statements requires management to make estimates and assumptions that affect the reported amounts and disclosures in the financial statements. Actual results could differ from those estimates.
Note 2. Agreements
The Trust has a management agreement for the Fund with PI. Pursuant to this agreement, PI has responsibility for all investment advisory services and supervises the subadviser’s performance of such services. PI has entered into a subadvisory agreement with Quantitative Management Associates LLC (“QMA”). The subadvisory agreement provides that QMA furnishes investment advisory services in connection with the management of the Fund. PI pays for the services of QMA, the cost of compensation of officers of the Fund, occupancy and certain clerical and bookkeeping costs of the Fund. The Fund bears all other costs and expenses.
The management fee paid to PI is computed daily and payable monthly at an annual rate of .65 of 1% of the average daily net assets of the Fund up to and including $500 million and .60 of 1% of such assets in excess of $500 million. The effective management fee rate was .65 of 1% for the year ended October 31, 2010.
The Fund has a distribution agreement with Prudential Investment Management Services LLC (“PIMS”) and Prudential Annuities Distributors, Inc. (“PAD”) who act as the distributors of the Class A, Class B, Class C, Class L, Class M, Class X and Class Z shares. The Fund compensates PIMS for distributing and servicing the Fund’s Class A, Class B, Class C and Class L and PAD for distributing and servicing the Fund’s Class M and Class X shares, pursuant to plans of distribution (the “Class A, B, C, L, M and X Plans”), regardless of expenses actually incurred. The distribution fees are accrued daily and payable monthly. No distribution or service fees are paid to PIMS as distributor of the Class Z shares of the fund.
Management has received the maximum allowable amount of sales charges for Class X in accordance with regulatory limits. As such, any contingent deferred sales charges received by the manager are contributed back into the Fund and included in the Statement of Changes in Net Assets and Financial Highlights as a contribution to capital.
| | | | |
| Prudential Large-Cap Core Equity Fund | | | 35 | |
Notes to Financial Statements
continued
During the year ended October 31, 2008, management determined that Class X shareholders had been charged sales charges in excess of regulatory limits. The manager has paid this class for the overcharge which is reflected in the Financial Highlights for the years ended October 31, 2008 and October 31, 2007.
Pursuant to the Class A, B, C, L, M, and X Plans, the Fund compensates PIMS for distribution related activities at an annual rate of up to .30 of 1%, 1%, 1%, .50 of 1%, 1% and 1% of the average daily net assets of the Class A, B, C, L, M and X shares, respectively.
PIMS has advised the Fund that it received $18,075 in front-end sales charges resulting from sales of Class A shares during the year ended October 31, 2010. From these fees, PIMS paid such sales charges to affiliated broker-dealers, which in turn paid commissions to salespersons and incurred other distribution costs.
PIMS has advised the Fund that for the year ended October 31, 2010, it received $339, $13,091, $3,252 and $4,911 in contingent deferred sales charges imposed upon certain redemptions by Class A, B, C and M shareholders, respectively.
PI, QMA, PAD and PIMS are indirect, wholly-owned subsidiaries of Prudential Financial, Inc. (“Prudential”).
Note 3. Other Transactions with Affiliates
Prudential Mutual Fund Services LLC (“PMFS”), an affiliate of PI and an indirect, wholly-owned subsidiary of Prudential, serves as the Fund’s transfer agent. Transfer agent fees and expenses in the Statement of Operations include certain out-of-pocket expenses paid to non-affiliates, where applicable.
The Fund pays networking fees to affiliated and unaffiliated broker/dealers including fees relating to the services of Wells Fargo Advisors, LLC (“Wells Fargo”) an affiliate of PI through December 31, 2009. These networking fees are payments made to broker/dealers that clear mutual fund transactions through a national clearing system. For the year ended October 31, 2010, the Fund incurred approximately $537,300 in total networking fees of which $6,600 was paid to Wells Fargo. These amounts are included in transfer agent’s fees and expenses in the Statement of Operations.
| | |
| 36 | | Visit our website at www.prudentialfunds.com |
Prudential Investment Management, Inc., (“PIM”), an indirect, wholly-owned subsidiary of Prudential, is the Fund’s security lending agent. For the year ended October 31, 2010, PIM has been compensated in the amount of approximately $7,100 for these services.
The Fund invests in the Prudential Core Taxable Money Market Fund (the “Core Fund”), a portfolio of the Prudential Investment Portfolios 2 registered under the Investment Company Act of 1940, as amended, and managed by PI. Earnings from the Core Fund are disclosed on the Statement of Operations as affiliated dividend income.
Note 4. Portfolio Securities
Purchases and sales of investment securities, other than short-term investments, for the year ended October 31, 2010 were $290,727,007 and $388,879,531, respectively.
Note 5. Distributions and Tax Information
Distributions to shareholders, which are determined in accordance with federal income tax regulations and which may differ from generally accepted accounting principles, are recorded on the ex-dividend date.
For the years ended October 31, 2010 and October 31, 2009, the tax character of dividends paid as reflected in the Statement of Changes in Net Assets were $2,016,945 and $1,511,507 from ordinary income, respectively.
As of October 31, 2010, the accumulated undistributed income on a tax basis was $539,489 of ordinary income. This differs from the amount on the Statement of Assets and Liabilities primarily due to cumulative timing differences between financial and tax reporting.
The United States federal income tax basis of the Fund’s investments and the net unrealized appreciation as of October 31, 2010 were as follows:
| | | | | | |
Tax Basis of
Investments | | Appreciation | | Depreciation | | Net
Unrealized Appreciation |
| $202,865,380 | | $45,319,361 | | $(1,025,125) | | $44,294,236 |
The difference between book basis and tax basis is primarily attributable to deferred losses on wash sales.
| | | | |
| Prudential Large-Cap Core Equity Fund | | | 37 | |
Notes to Financial Statements
continued
For federal income tax purposes, the Fund had a capital loss carryforward as of October 31, 2010 of approximately $40,440,000 which expires in 2017. The Fund utilized capital loss carryforward to offset net taxable capital gains realized in the year ended October 31, 2010 of approximately $40,395,000. No capital gain distributions are expected to be paid to shareholders until net gains have been realized in excess of such carryforward. It is uncertain whether the Fund will be able to realize the full benefit prior to the expiration dates.
Management has analyzed the Fund’s tax positions taken on federal income tax returns for all open tax years and has concluded that as of October 31 2010, no provision for income tax would be required in the Fund’s financial statements. The Fund’s federal and state income and federal excise tax returns for tax years for which the applicable statutes of limitations have not expired are subject to examination by the Internal Revenue Service and state departments of revenue.
Note 6. Capital
The Fund offers Class A, Class B, Class C, Class L, Class M, Class X and Class Z shares. Class A and Class L shares are sold with a front-end sales charge of up to 5.50% and 5.75%, respectively. All investors who purchase Class A or Class L shares in an amount of $1 million or more and sell these shares within 12 months of purchase are subject to a contingent deferred sales charge (CDSC) of 1%, including investors who purchase their shares through broker-dealers affiliated with Prudential. Class B shares are sold with a contingent deferred sales charge which declines from 5% to zero depending on the period of time the shares are held. Class M and Class X shares are sold with a contingent deferred sales charge which declines from 6% to zero depending on the period of time the shares are held. Class C shares are sold with a contingent deferred sales charge of 1% during the first 12 months. Class B shares automatically convert to Class A shares on a quarterly basis approximately seven years after purchase. A special exchange privilege is also available for shareholders who qualified to purchase Class A shares at net asset value. Class M and Class X shares will automatically convert to Class A shares approximately eight and ten years after purchase, respectively. Class L shares are closed to most new purchases (with the exception of reinvested dividends). Class M and Class X shares are closed to new initial purchases. Class L, Class M and Class X shares are only available through exchanges from the same class of shares of certain other Prudential Investment. Class Z shares are not subject to any sales or redemption charge and are offered
| | |
| 38 | | Visit our website at www.prudentialfunds.com |
exclusively for sale to a limited group of investors. The Fund has authorized an unlimited number of shares of beneficial interest at $.001 par value.
| | | | | | | | |
Class A | | Shares | | | Amount | |
Year ended October 31, 2010: | | | | | | | | |
Shares sold | | | 469,101 | | | $ | 4,918,480 | |
Shares issued in reinvestment of dividends | | | 28,657 | | | | 293,450 | |
Shares reacquired | | | (1,550,323 | ) | | | (16,217,452 | ) |
| | | | | | | | |
Net increase (decrease) in shares outstanding before conversion | | | (1,052,565 | ) | | | (11,005,522 | ) |
Shares issued upon conversion from Class B, M, X | | | 450,243 | | | | 4,761,625 | |
| | | | | | | | |
Net increase (decrease) in shares outstanding | | | (602,322 | ) | | $ | (6,243,897 | ) |
| | | | | | | | |
Year ended October 31, 2009: | | | | | | | | |
Shares sold | | | 649,572 | | | $ | 5,564,553 | |
Shares issued in reinvestment of dividends | | | 74,467 | | | | 637,441 | |
Shares reacquired | | | (2,285,489 | ) | | | (19,500,105 | ) |
| | | | | | | | |
Net increase (decrease) in shares outstanding before conversion | | | (1,561,450 | ) | | | (13,298,111 | ) |
Shares issued upon conversion from Class B, M, X | | | 719,778 | | | | 6,148,121 | |
| | | | | | | | |
Net increase (decrease) in shares outstanding | | | (841,672 | ) | | $ | (7,149,990 | ) |
| | | | | | | | |
Class B | | | | | | |
Year ended October 31, 2010: | | | | | | | | |
Shares sold | | | 48,796 | | | $ | 490,660 | |
Shares reacquired | | | (211,780 | ) | | | (2,125,053 | ) |
| | | | | | | | |
Net increase (decrease) in shares outstanding before conversion | | | (162,984 | ) | | | (1,634,393 | ) |
Shares reacquired upon conversion into Class A | | | (37,008 | ) | | | (366,457 | ) |
| | | | | | | | |
Net increase (decrease) in shares outstanding | | | (199,992 | ) | | $ | (2,000,850 | ) |
| | | | | | | | |
Year ended October 31, 2009: | | | | | | | | |
Shares sold | | | 82,213 | | | $ | 663,044 | |
Shares issued in reinvestment of dividends | | | 2,538 | | | | 20,841 | |
Shares reacquired | | | (208,151 | ) | | | (1,669,565 | ) |
| | | | | | | | |
Net increase (decrease) in shares outstanding before conversion | | | (123,400 | ) | | | (985,680 | ) |
Shares reacquired upon conversion into Class A | | | (214,223 | ) | | | (1,694,731 | ) |
| | | | | | | | |
Net increase (decrease) in shares outstanding | | | (337,623 | ) | | $ | (2,680,411 | ) |
| | | | | | | | |
| | | | |
| Prudential Large-Cap Core Equity Fund | | | 39 | |
Notes to Financial Statements
continued
| | | | | | | | |
Class C | | Shares | | | Amount | |
Year ended October 31, 2010: | | | | | | | | |
Shares sold | | | 65,898 | | | $ | 653,393 | |
Shares reacquired | | | (573,791 | ) | | | (5,733,429 | ) |
| | | | | | | | |
Net increase (decrease) in shares outstanding | | | (507,893 | ) | | $ | (5,080,036 | ) |
| | | | | | | | |
Year ended October 31, 2009: | | | | | | | | |
Shares sold | | | 188,910 | | | $ | 1,527,872 | |
Shares issued in reinvestment of dividends | | | 7,895 | | | | 64,819 | |
Shares reacquired | | | (951,339 | ) | | | (7,588,854 | ) |
| | | | | | | | |
Net increase (decrease) in shares outstanding | | | (754,534 | ) | | $ | (5,996,163 | ) |
| | | | | | | | |
Class L | | | | | | |
Year ended October 31, 2010: | | | | | | | | |
Shares sold | | | 6,212 | | | $ | 62,655 | |
Shares issued in reinvestment of dividends | | | 1,420 | | | | 14,541 | |
Shares reacquired | | | (124,408 | ) | | | (1,292,185 | ) |
| | | | | | | | |
Net increase (decrease) in shares outstanding | | | (116,776 | ) | | $ | (1,214,989 | ) |
| | | | | | | | |
Year ended October 31, 2009: | | | | | | | | |
Shares sold | | | 7,051 | | | $ | 61,947 | |
Shares issued in reinvestment of dividends | | | 5,408 | | | | 46,348 | |
Shares reacquired | | | (168,942 | ) | | | (1,435,389 | ) |
| | | | | | | | |
Net increase (decrease) in shares outstanding | | | (156,483 | ) | | $ | (1,327,094 | ) |
| | | | | | | | |
Class M | | | | | | |
Year ended October 31, 2010: | | | | | | | | |
Shares sold | | | 4,459 | | | $ | 43,364 | |
Shares reacquired | | | (138,228 | ) | | | (1,385,341 | ) |
| | | | | | | | |
Net increase (decrease) in shares outstanding before conversion | | | (133,769 | ) | | | (1,341,977 | ) |
Shares reacquired upon conversion into Class A | | | (343,723 | ) | | | (3,468,763 | ) |
| | | | | | | | |
Net increase (decrease) in shares outstanding | | | (477,492 | ) | | $ | (4,810,740 | ) |
| | | | | | | | |
Year ended October 31, 2009: | | | | | | | | |
Shares sold | | | 7,059 | | | $ | 58,453 | |
Shares issued in reinvestment of dividends | | | 3,198 | | | | 26,251 | |
Shares reacquired | | | (375,385 | ) | | | (2,989,689 | ) |
| | | | | | | | |
Net increase (decrease) in shares outstanding before conversion | | | (365,128 | ) | | | (2,904,985 | ) |
Shares reacquired upon conversion into Class A | | | (504,673 | ) | | | (4,177,643 | ) |
| | | | | | | | |
Net increase (decrease) in shares outstanding | | | (869,801 | ) | | $ | (7,082,628 | ) |
| | | | | | | | |
| | |
| 40 | | Visit our website at www.prudentialfunds.com |
| | | | | | | | |
Class X | | Shares | | | Amount | |
Year ended October 31, 2010: | | | | | | | | |
Shares sold | | | 22,073 | | | $ | 218,933 | |
Shares issued in reinvestment of dividends | | | 1,168 | | | | 11,547 | |
Shares reacquired | | | (25,866 | ) | | | (261,341 | ) |
| | | | | | | | |
Net increase (decrease) in shares outstanding before conversion | | | (2,625 | ) | | | (30,861 | ) |
Shares reacquired upon conversion into Class A | | | (89,544 | ) | | | (926,405 | ) |
| | | | | | | | |
Net increase (decrease) in shares outstanding | | | (92,169 | ) | | $ | (957,266 | ) |
| | | | | | | | |
Year ended October 31, 2009: | | | | | | | | |
Shares sold | | | 9,732 | | | $ | 76,415 | |
Shares issued in reinvestment of dividends | | | 3,482 | | | | 28,688 | |
Shares reacquired | | | (65,407 | ) | | | (545,468 | ) |
| | | | | | | | |
Net increase (decrease) in shares outstanding before conversion | | | (52,193 | ) | | | (440,365 | ) |
Shares reacquired upon conversion into Class A | | | (33,005 | ) | | | (275,747 | ) |
| | | | | | | | |
Net increase (decrease) in shares outstanding | | | (85,198 | ) | | $ | (716,112 | ) |
| | | | | | | | |
Class Z | | | | | | |
Year ended October 31, 2010: | | | | | | | | |
Shares sold | | | 13,879,842 | | | $ | 147,023,205 | |
Shares issued in reinvestment of dividends | | | 13,568 | | | | 140,705 | |
Shares reacquired | | | (21,780,541 | ) | | | (226,046,218 | ) |
| | | | | | | | |
Net increase (decrease) in shares outstanding | | | (7,887,131 | ) | | $ | (78,882,308 | ) |
| | | | | | | | |
Year ended October 31, 2009: | | | | | | | | |
Shares sold | | | 19,894,736 | | | $ | 178,752,503 | |
Shares issued in reinvestment of dividends | | | 7,198 | | | | 62,410 | |
Shares reacquired | | | (3,197,194 | ) | | | (28,775,168 | ) |
| | | | | | | | |
Net increase (decrease) in shares outstanding | | | 16,704,740 | | | $ | 150,039,745 | |
| | | | | | | | |
Note 7. Borrowings
The Fund, along with other affiliated registered investment companies (the “Funds”), is a party to a Syndicated Credit Agreement (“SCA”) with two banks. The SCA provides for a commitment of $500 million. Interest on any borrowings under the SCA would be incurred at contracted market rates and a commitment fee for the unused amount is accrued daily and paid quarterly. The Funds pay an annualized commitment fee of 0.15% of the unused portion of the SCA. The expiration date of the SCA has been extended from October 20, 2010 to December 17, 2010 under the same terms. Effective December 17, 2010 the Fund, along with the Funds entered into a new Syndicated Credit Agreement (“New SCA”) with a group of banks. The New SCA provides for a commitment of $750 million. The Funds will pay an annualized commitment fee of 0.10% of the unused portion of the New SCA. The expiration date of the New SCA is December 16, 2011. Interest on any borrowings under the New SCA
| | | | |
| Prudential Large-Cap Core Equity Fund | | | 41 | |
Notes to Financial Statements
continued
will be incurred at contracted market rates and a commitment fee for the unused amount is accrued daily and paid quarterly. The purpose of the SCA is to provide an alternative source of temporary funding for capital share redemptions. The Fund did not borrow any amounts pursuant to the SCA during the year ended October 31, 2010.
Note 8. Dividends to Shareholders
Subsequent to the fiscal year end, the Fund declared ordinary income dividends on December 1, 2010 to shareholders of record on December 2, 2010. The ex-dividend date was December 3, 2010. The per share amounts declared were as follows:
| | | | |
Class A | | $ | 0.01863 | |
Class X | | $ | 0.02423 | |
Class Z | | $ | 0.04761 | |
Note 9. New Accounting Pronouncement
In January 2010, the Financial Accounting Standards Board issued Accounting Standards Update (“ASU”) No. 2010-06 “Improving Disclosures about Fair Value Measurements”. ASU 2010-06 will require reporting entities to make new disclosures about purchases, sales, issuances, and settlements in the roll forward of activity in Level 3 fair value measurements. The new and revised disclosures are effective for interim and annual reporting periods beginning after December 15, 2010. At this time, management is evaluating the implications of ASU No. 2010-06 and its impact on the financial statements has not been determined.
| | |
| 42 | | Visit our website at www.prudentialfunds.com |
Financial Highlights
| | | | | | | | | | | | | | | | | | | | |
| Class A Shares | |
| | | Year Ended October 31, | |
| | | 2010(a) | | | 2009(a) | | | 2008(a) | | | 2007 | | | 2006 | |
| Per Share Operating Performance: | | | | | | | | | | | | | | | | | | | | |
| Net Asset Value, Beginning Of Year | | | $9.71 | | | | $9.32 | | | | $14.85 | | | | $13.01 | | | | $11.20 | |
| Income (loss) from investment operations: | | | | | | | | | | | | | | | | | | | | |
| Net investment income | | | .05 | | | | .09 | | | | .12 | | | | .09 | | | | .08 | (a) |
Net realized and unrealized gain (loss) on
investment transactions | | | 1.30 | | | | .40 | | | | (5.54 | ) | | | 1.82 | | | | 1.77 | |
| Total from investment operations | | | 1.35 | | | | .49 | | | | (5.42 | ) | | | 1.91 | | | | 1.85 | |
| Less Dividends: | | | | | | | | | | | | | | | | | | | | |
| Dividends from net investment income | | | (.05 | ) | | | (.10 | ) | | | (.11 | ) | | | (.07 | ) | | | (.04 | ) |
| Net asset value, end of year | | | $11.01 | | | | $9.71 | | | | $9.32 | | | | $14.85 | | | | $13.01 | |
| Total Return(b): | | | 13.92% | | | | 5.40% | | | | (36.75)% | | | | 14.72% | | | | 16.54% | |
| |
| Ratios/Supplemental Data: | | | | | | | | | | | | | | | |
| Net assets, end of year (000) | | | $64,473 | | | | $62,739 | | | | $68,021 | | | | $109,231 | | | | $75,578 | |
| Average net assets (000) | | | $64,562 | | | | $58,578 | | | | $93,917 | | | | $95,001 | | | | $64,957 | |
| Ratios to average net assets(c): | | | | | | | | | | | | | | | | | | | | |
Expenses, including distribution and
service (12b-1) fees | | | 1.48% | | | | 1.55% | | | | 1.34% | | | | 1.16% | | | | 1.22% | |
Expenses, excluding distribution and
service (12b-1) fees | | | 1.18% | | | | 1.25% | | | | 1.06% | | | | .91% | | | | .97% | |
| Net investment income | | | .45% | | | | 1.10% | | | | .94% | | | | .67% | | | | .68% | |
| For Class A, B, C, L, M, X and Z shares: | | | | | | | | | | | | | | | | | | | | |
| Portfolio turnover rate | | | 116% | | | | 116% | | | | 96% | | | | 90% | | | | 72% | |
(a) Calculated based on average shares outstanding during the year.
(b) Total return does not consider the effects of sales loads. Total return is calculated assuming a purchase of a share on the first day and a sale on the last day of each year reported and includes reinvestment of dividends and distributions. Total return may reflect adjustments to conform to generally accepted accounting principles.
(c) Does not include the expenses of the underlying funds in which the Fund invests.
See Notes to Financial Statements.
| | | | |
| Prudential Large-Cap Core Equity Fund | | | 43 | |
Financial Highlights
continued
| | | | | | | | | | | | | | | | | | | | |
| Class B Shares | |
| | | Year Ended October 31, | |
| | | 2010(a) | | | 2009(a) | | | 2008(a) | | | 2007 | | | 2006 | |
| Per Share Operating Performance: | | | | | | | | | | | | | | | | | | | | |
| Net Asset Value, Beginning Of Year | | | $9.26 | | | | $8.87 | | | | $14.14 | | | | $12.42 | | | | $10.73 | |
| Income (loss) from investment operations: | | | | | | | | | | | | | | | | | | | | |
| Net investment income (loss) | | | (.02 | ) | | | .04 | | | | .03 | | | | .01 | | | | .01 | (a) |
Net realized and unrealized gain (loss) on
investment transactions | | | 1.23 | | | | .37 | | | | (5.29 | ) | | | 1.71 | | | | 1.68 | |
| Total from investment operations | | | 1.21 | | | | .41 | | | | (5.26 | ) | | | 1.72 | | | | 1.69 | |
| Less Dividends: | | | | | | | | | | | | | | | | | | | | |
| Dividends from net investment income | | | - | | | | (.02 | ) | | | (.01 | ) | | | - | | | | - | |
| Net asset value, end of year | | | $10.47 | | | | $9.26 | | | | $8.87 | | | | $14.14 | | | | $12.42 | |
| Total Return(b): | | | 13.07% | | | | 4.67% | | | | (37.22)% | | | | 13.85% | | | | 15.75% | |
| |
| Ratios/Supplemental Data: | | | | | | | | | | | | | | | |
| Net assets, end of year (000) | | | $5,317 | | | | $6,555 | | | | $9,269 | | | | $24,883 | | | | $34,293 | |
| Average net assets (000) | | | $5,904 | | | | $6,912 | | | | $16,689 | | | | $28,960 | | | | $52,013 | |
| Ratios to average net assets(c): | | | | | | | | | | | | | | | | | | | | |
Expenses, including distribution and
service (12b-1) fees | | | 2.18% | | | | 2.25% | | | | 2.06% | | | | 1.91% | | | | 1.97% | |
Expenses, excluding distribution and
service (12b-1) fees | | | 1.18% | | | | 1.25% | | | | 1.06% | | | | .91% | | | | .97% | |
| Net investment income (loss) | | | (.22)% | | | | .48% | | | | .25% | | | | (.03)% | | | | .08% | |
(a) Calculated based on average shares outstanding during the year.
(b) Total return does not consider the effects of sales loads. Total return is calculated assuming a purchase of a share on the first day and a sale on the last day of each year reported, and includes reinvestment of dividends and distributions. Total return may reflect adjustments to conform to generally accepted accounting principles.
(c) Does not include the expenses of the underlying funds in which the Fund invests.
See Notes to Financial Statements.
| | |
| 44 | | Visit our website at www.prudentialfunds.com |
| | | | | | | | | | | | | | | | | | | | |
| Class C Shares | |
| | | Year Ended October 31, | |
| | | 2010(a) | | | 2009(a) | | | 2008(a) | | | 2007 | | | 2006 | |
| Per Share Operating Performance: | | | | | | | | | | | | | | | | | | | | |
| Net Asset Value, Beginning Of Year | | | $9.26 | | | | $8.87 | | | | $14.14 | | | | $12.42 | | | | $10.73 | |
| Income (loss) from investment operations: | | | | | | | | | | | | | | | | | | | | |
| Net investment income (loss) | | | (.02 | ) | | | .04 | | | | .03 | | | | (.01 | ) | | | - | (a)(b) |
| Net realized and unrealized gain (loss) on investment transactions | | | 1.24 | | | | .37 | | | | (5.29 | ) | | | 1.73 | | | | 1.69 | |
| Total from investment operations | | | 1.22 | | | | .41 | | | | (5.26 | ) | | | 1.72 | | | | 1.69 | |
| Less Dividends: | | | | | | | | | | | | | | | | | | | | |
| Dividends from net investment income | | | - | | | | (.02 | ) | | | (.01 | ) | | | - | | | | - | |
| Net asset value, end of year | | | $10.48 | | | | $9.26 | | | | $8.87 | | | | $14.14 | | | | $12.42 | |
| Total Return(c): | | | 13.17% | | | | 4.67% | | | | (37.22)% | | | | 13.85% | | | | 15.75% | |
| |
| Ratios/Supplemental Data: | |
| Net assets, end of year (000) | | | $22,496 | | | | $24,601 | | | | $30,243 | | | | $57,391 | | | | $39,368 | |
| Average net assets (000) | | | $23,934 | | | | $24,715 | | | | $45,712 | | | | $50,597 | | | | $40,441 | |
| Ratios to average net assets(d): | | | | | | | | | | | | | | | | | | | | |
| Expenses, including distribution and service (12b-1) fees | | | 2.18% | | | | 2.25% | | | | 2.06% | | | | 1.91% | | | | 1.97% | |
| Expenses, excluding distribution and service (12b-1) fees | | | 1.18% | | | | 1.25% | | | | 1.06% | | | | .91% | | | | .97% | |
| Net investment income (loss) | | | (.24)% | | | | .44% | | | | .23% | | | | (.08)% | | | | - | (b) |
(a) Calculated based on average shares outstanding during the year.
(b) Less than $.005 per share or 0.005%.
(c) Total return does not consider the effects of sales loads. Total return is calculated assuming a purchase of a share on the first day and a sale on the last day of each year reported, and includes reinvestment of dividends and distributions. Total return may reflect adjustments to conform to generally accepted accounting principles.
(d) Does not include the expenses of the underlying funds in which the Fund invests.
See Notes to Financial Statements.
| | | | |
| Prudential Large-Cap Core Equity Fund | | | 45 | |
Financial Highlights
continued
| | | | | | | | | | | | | | | | |
| Class L Shares | |
| | | Year Ended October 31, | | | March 16,
2007(a)
through
October 31, | |
| | | 2010(e) | | | 2009(e) | | | 2008(e) | | | 2007 | |
| Per Share Operating Performance: | | | | | | | | | | | | | | | | |
| Net Asset Value, Beginning Of Period | | | $9.70 | | | | $9.30 | | | | $14.83 | | | | $13.16 | |
| Income (loss) from investment operations: | | | | | | | | | | | | | | | | |
| Net investment income | | | .03 | | | | .08 | | | | .09 | | | | .03 | |
| Net realized and unrealized gain (loss) on investment transactions | | | 1.30 | | | | .39 | | | | (5.54 | ) | | | 1.64 | |
| Total from investment operations | | | 1.33 | | | | .47 | | | | (5.45 | ) | | | 1.67 | |
| Less Dividends: | | | | | | | | | | | | | | | | |
| Dividends from net investment income | | | (.03 | ) | | | (.07 | ) | | | (.08 | ) | | | - | |
| Net asset value, end of period | | | $11.00 | | | | $9.70 | | | | $9.30 | | | | $14.83 | |
| Total Return(b) | | | 13.74% | | | | 5.21% | | | | (36.94)% | | | | 12.69% | |
| |
| Ratios/Supplemental Data: | | | | | | | | | | | | |
| Net assets, end of period (000) | | | $4,222 | | | | $4,860 | | | | $6,113 | | | | $12,962 | |
| Average net assets (000) | | | $4,625 | | | | $4,965 | | | | $9,856 | | | | $8,583 | |
| Ratios to average net assets(c): | | | | | | | | | | | | | | | | |
| Expenses, including distribution and service (12b-1) fees | | | 1.68% | | | | 1.75% | | | | 1.56% | | | | 1.41% | (d) |
| Expenses, excluding distribution and service (12b-1) fees | | | 1.18% | | | | 1.25% | | | | 1.06% | | | | .91% | (d) |
| Net investment income | | | .27% | | | | .94% | | | | .73% | | | | .31% | (d) |
(a) Inception date of Class L shares.
(b) Total return does not consider the effects of sales loads. Total return is calculated assuming a purchase of a share on the first day and a sale on the last day of each period reported, and includes reinvestment of dividends and distributions. Total return may reflect adjustments to conform to generally accepted accounting principles. Total returns for periods less than a full year are not annualized.
(c) Does not include the expenses of the underlying funds in which the Fund invests.
(d) Annualized.
(e) Calculated based on average shares outstanding during the period.
See Notes to Financial Statements.
| | |
| 46 | | Visit our website at www.prudentialfunds.com |
| | | | | | | | | | | | | | | | |
| Class M Shares | |
| | | Year Ended October 31, | | | March 16,
2007(a)
through
October 31, | |
| | | 2010(e) | | | 2009(e) | | | 2008(e) | | | 2007 | |
| Per Share Operating Performance: | | | | | | | | | | | | | | | | |
| Net Asset Value, Beginning Of Period | | | $9.26 | | | | $8.87 | | | | $14.14 | | | | $12.59 | |
| Income (loss) from investment operations: | | | | | | | | | | | | | | | | |
| Net investment income (loss) | | | (.02 | ) | | | .04 | | | | .03 | | | | (.02 | ) |
| Net realized and unrealized gain (loss) on investment transactions | | | 1.24 | | | | .37 | | | | (5.29 | ) | | | 1.57 | |
| Total from investment operations | | | 1.22 | | | | .41 | | | | (5.26 | ) | | | 1.55 | |
| Less Dividends: | | | | | | | | | | | | | | | | |
| Dividends from net investment income | | | - | | | | (.02 | ) | | | (.01 | ) | | | - | |
| Net asset value, end of period | | | $10.48 | | | | $9.26 | | | | $8.87 | | | | $14.14 | |
| Total Return(b): | | | 13.17% | | | | 4.67% | | | | (37.22)% | | | | 12.31% | |
| |
| Ratios/Supplemental Data: | |
| Net assets, end of period (000) | | | $4,103 | | | | $8,052 | | | | $15,423 | | | | $42,909 | |
| Average net assets (000) | | | $5,918 | | | | $10,385 | | | | $29,289 | | | | $29,146 | |
| Ratios to average net assets(c): | | | | | | | | | | | | | | | | |
| Expenses, including distribution and service (12b-1) fees | | | 2.18% | | | | 2.25% | | | | 2.06% | | | | 1.91% | (d) |
| Expenses, excluding distribution and service (12b-1) fees | | | 1.18% | | | | 1.25% | | | | 1.06% | | | | .91% | (d) |
| Net investment income (loss) | | | (.15)% | | | | .55% | | | | .24% | | | | (.19)% | (d) |
(a) Inception date of Class M shares.
(b) Total return does not consider the effects of sales loads. Total return is calculated assuming a purchase of a share on the first day and a sale on the last day of each period reported, and includes reinvestment of dividends and distributions. Total return may reflect adjustments to conform to generally accepted accounting principles. Total returns for periods less than a full year are not annualized.
(c) Does not include the expenses of the underlying funds in which the Fund invests.
(d) Annualized.
(e) Calculated based on average shares outstanding during the period.
See Notes to Financial Statements.
| | | | |
| Prudential Large-Cap Core Equity Fund | | | 47 | |
Financial Highlights
continued
| | | | | | | | | | | | | | | | |
| Class X Shares | |
| | | Year Ended October 31, | | | March 16,
2007(a)
through
October 31, | |
| | | 2010(f) | | | 2009(f) | | | 2008(f) | | | 2007(d) | |
| Per Share Operating Performance: | | | | | | | | | | | | | | | | |
| Net Asset Value, Beginning Of Period | | | $9.40 | | | | $8.97 | | | | $14.16 | | | | $12.60 | |
| Income (loss) from investment operations: | | | | | | | | | | | | | | | | |
| Net investment income | | | .06 | | | | .12 | | | | .13 | | | | .04 | |
| Net realized and unrealized gain (loss) on investment transactions | | | 1.24 | | | | .40 | | | | (5.28 | ) | | | 1.56 | |
| Total from investment operations | | | 1.30 | | | | .52 | | | | (5.15 | ) | | | 1.60 | |
| Less Dividends: | | | | | | | | | | | | | | | | |
| Dividends from net investment income | | | (.05 | ) | | | (.10 | ) | | | (.06 | ) | | | (.07 | ) |
| Capital Contributions | | | - | (h) | | | .01 | | | | .02 | | | | .03 | |
| Net asset value, end of period | | | $10.65 | | | | $9.40 | | | | $8.97 | | | | $14.16 | |
| Total Return(b): | | | 13.91% | | | | 6.00% | | | | (36.25)% | | | | 12.93% | (g) |
| |
| Ratios/Supplemental Data: | |
| Net assets, end of period (000) | | | $1,394 | | | | $2,096 | | | | $2,767 | | | | $6,283 | |
| Average net assets (000) | | | $1,689 | | | | $2,245 | | | | $4,698 | | | | $3,939 | |
| Ratios to average net assets(c): | | | | | | | | | | | | | | | | |
| Expenses, including distribution and service (12b-1) fees | | | 1.43% | | | | 1.50% | | | | 1.38% | | | | 1.29% | (e) |
| Expenses, excluding distribution and service (12b-1) fees | | | 1.18% | | | | 1.25% | | | | 1.06% | | | | .91% | (e) |
| Net investment income | | | .56% | | | | 1.46% | | | | 1.08% | | | | .42% | (e) |
(a) Inception date of Class X shares.
(b) Total return does not consider the effects of sales loads. Total return is calculated assuming a purchase of a share on the first day and a sale on the last day of each period reported, and includes reinvestment of dividends and distributions. Total return may reflect adjustments to conform to generally accepted accounting principles. Total returns for periods less than a full year are not annualized.
(c) Does not include the expenses of the underlying funds in which the Fund invests.
(d) Certain information has been adjusted to reflect a manager payment for sales charges incurred by shareholders in excess of regulatory limits.
(e) Annualized.
(f) Calculated based on average shares outstanding during the period.
(g) Total return has been adjusted to reflect the manager payment for sales charges in excess of regulatory limits.
(h) Less than $.005 per share.
See Notes to Financial Statements.
| | |
| 48 | | Visit our website at www.prudentialfunds.com |
| | | | | | | | | | | | | | | | | | | | |
| Class Z Shares | |
| | | Year Ended October 31, | |
| | | 2010(a) | | | 2009(a) | | | 2008(a) | | | 2007 | | | 2006 | |
| Per Share Operating Performance: | | | | | | | | | | | | | | | | | | | | |
| Net Asset Value, Beginning Of Year | | | $9.87 | | | | $9.47 | | | | $15.09 | | | | $13.21 | | | | $11.37 | |
| Income (loss) from investment operations: | | | | | | | | | | | | | | | | | | | | |
| Net investment income | | | .08 | | | | .08 | | | | .15 | | | | .13 | | | | .12 | (a) |
Net realized and unrealized gain (loss) on
investment transactions | | | 1.30 | | | | .45 | | | | (5.63 | ) | | | 1.85 | | | | 1.79 | |
| Total from investment operations | | | 1.38 | | | | .53 | | | | (5.48 | ) | | | 1.98 | | | | 1.91 | |
| Less Dividends: | | | | | | | | | | | | | | | | | | | | |
| Dividends from net investment income | | | (.07 | ) | | | (.13 | ) | | | (.14 | ) | | | (.10 | ) | | | (.07 | ) |
| Net asset value, end of year | | | $11.18 | | | | $9.87 | | | | $9.47 | | | | $15.09 | | | | $13.21 | |
| Total Return(b): | | | 14.09% | | | | 5.83% | | | | (36.64)% | | | | 15.06% | | | | 16.83% | |
| |
| Ratios/Supplemental Data: | | | | | | | | | | | | | | | |
| Net assets, end of year (000) | | | $141,793 | | | | $202,941 | | | | $36,602 | | | | $23,950 | | | | $17,764 | |
| Average net assets (000) | | | $145,193 | | | | $90,113 | | | | $20,386 | | | | $21,053 | | | | $15,784 | |
| Ratios to average net assets(c): | | | | | | | | | | | | | | | | | | | | |
Expenses, including distribution and
service (12b-1) fees | | | 1.18% | | | | 1.25% | | | | 1.06% | | | | .91% | | | | .97% | |
Expenses, excluding distribution and
service (12b-1) fees | | | 1.18% | | | | 1.25% | | | | 1.06% | | | | .91% | | | | .97% | |
| Net investment income | | | .76% | | | | .96% | | | | 1.25% | | | | .93% | | | | .97% | |
(a) Calculated based on average shares outstanding during the year.
(b) Total return is calculated assuming a purchase of a share on the first day and a sale on the last day of each year reported, and includes reinvestment of dividends and distributions. Total return may reflect adjustments to conform to generally accepted accounting principles.
(c) Does not include the expenses of the underlying funds in which the Fund invests.
See Notes to Financial Statements.
| | | | |
| Prudential Large-Cap Core Equity Fund | | | 49 | |
Report of Independent Registered Public
Accounting Firm
The Board of Trustees and Shareholders
Prudential Investment Portfolios 9:
We have audited the accompanying statement of assets and liabilities of Prudential Large-Cap Core Equity Fund (formerly Dryden Large-Cap Core Equity Fund) a series of Prudential Investment Portfolios 9 (formerly Dryden Tax-Managed Funds) (hereafter referred to as the “Fund”), including the portfolio of investments, as of October 31, 2010, and the related statement of operations for the year then ended, the statement of changes in net assets for each of the years in the two-year period then ended and the financial highlights for each of the years in the five-year period then ended. These financial statements and financial highlights are the responsibility of the Fund’s management. Our responsibility is to express an opinion on these financial statements and financial highlights based on our audits.
We conducted our audits in accordance with the standards of the Public Company Accounting Oversight Board (United States). Those standards require that we plan and perform the audit to obtain reasonable assurance about whether the financial statements and financial highlights are free of material misstatement. An audit includes examining, on a test basis, evidence supporting the amounts and disclosures in the financial statements. Our procedures included confirmation of securities owned as of October 31, 2010, by correspondence with the custodian, transfer agent and brokers or by other appropriate auditing procedures when replies from brokers were not received. An audit also includes assessing the accounting principles used and significant estimates made by management, as well as evaluating the overall financial statement presentation. We believe that our audits provide a reasonable basis for our opinion.
In our opinion, the financial statements and financial highlights referred to above present fairly, in all material respects, the financial position of the Fund as of October 31, 2010, and the results of its operations for the year then ended, the changes in its net assets for each of the years in the two-year period then ended and the financial highlights for each of the years in the five-year period then ended, in conformity with U.S. generally accepted accounting principles.
New York, New York
December 20, 2010
| | |
| 50 | | Visit our website at www.prudentialfunds.com |
Tax Information
(Unaudited)
We are required by the Internal Revenue Code of 1986, as amended (“the Code”) to advise you within 60 days of the Fund’s fiscal year end (October 31, 2010) as to the federal income tax status of dividends paid by the Fund during such fiscal year. We are advising you that during its fiscal year ended October 31, 2010, the Fund paid ordinary income dividends for Class A, Class L, Class X and Class Z shares of $0.05 per share, $0.03 per share, $0.05 per share and $0.07 per share, respectively.
For the fiscal year ended October 31, 2010, the Fund designates the maximum amount allowable, but not less than 100% of the ordinary income dividend paid during the year as eligible for the corporate dividends received deduction in accordance with Section 854 of the Internal Revenue Code.
For the fiscal year ended October 31, 2010, the Fund designates the maximum amount allowable, but not less than 100% of the ordinary income dividends paid during the year as qualified dividend income in accordance with Section 854 of the Internal Revenue Code.
In January 2011, you will be advised on IRS 1099 DIV or substitute 1099 DIV as to the federal tax status of the distributions received by you in calendar year 2010.
| | | | |
| Prudential Large-Cap Core Equity Fund | | | 51 | |
Results of Proxy Voting
(Unaudited)
At a special meeting of shareholders held on March 9, 2010, Fund shareholders approved a proposal to elect Trustees.
The individuals listed in the table below were elected as trustees of the Fund. All trustees, with the exception of Mr. Benjamin, served as trustees to the Fund prior to the shareholder meeting.
| | | | | | | | |
Trustee | | For | | | Withheld | |
Kevin J. Bannon | | | 30,287,495.637 | | | | 107,354.327 | |
| | |
Linda W. Bynoe | | | 8,159,701.775 | | | | 22,235,148.189 | |
| | |
Michael S. Hyland | | | 30,277,431.103 | | | | 117,418.861 | |
| | |
Douglas H. McCorkindale | | | 30,274,388.140 | | | | 120,461.824 | |
| | |
Stephen P. Munn | | | 30,285,406.815 | | | | 109,443.149 | |
| | |
Richard A. Redeker | | | 30,286,410.218 | | | | 108,439.746 | |
| | |
Robin B. Smith | | | 30,283,022.893 | | | | 111,827.071 | |
| | |
Stephen G. Stoneburn | | | 30,283,891.506 | | | | 110,958.458 | |
| | |
Judy A. Rice | | | 30,284,301.678 | | | | 110,548.286 | |
| | |
Scott E. Benjamin | | | 30,288,064.852 | | | | 106,785.112 | |
| | |
| 52 | | Visit our website at www.prudentialfunds.com |
MANAGEMENT OF THE FUND
(Unaudited)
Information about Fund Directors/Trustees (referred to herein as “Board Members”) and Fund Officers is set forth below. Board Members who are not deemed to be “interested persons,” as defined in the 1940 Act, are referred to as “Independent Board Members.” Board Members who are deemed to be “interested persons” are referred to as “Interested Board Members.” The Board Members are responsible for the overall supervision of the operations of the Fund and perform the various duties imposed on the directors or trustees of investment companies by the 1940 Act.
| | | | |
| Independent Board Members (1) |
Name, Address, Age Position(s) Portfolios Overseen | | Principal Occupation(s) During Past Five Years | | Other Directorships Held |
Kevin J. Bannon (58) Board Member Portfolios Overseen: 58 | | Managing Director (since April 2008) and Chief Investment Officer (since October 2008) of Highmount Capital LLC (registered investment adviser); formerly Executive Vice President and Chief Investment Officer (April 1993-August 2007) of Bank of New York Company; President (May 2003-May 2007) of BNY Hamilton Family of Mutual Funds. | | Director of Urstadt Biddle Properties (since September 2008). |
Linda W. Bynoe (58) Board Member Portfolios Overseen: 58 | | President and Chief Executive Officer (since March 1995) and formerly Chief Operating Officer (December 1989- February 1995) of Telemat Ltd. (management consulting); formerly Vice President (January 1985-June 1989) at Morgan Stanley & Co (broker-dealer). | | Director of Simon Property Group, Inc. (retail real estate) (since May 2003); Anixter International, Inc. (communication products distributor) (since January 2006); Director of Northern Trust Corporation (financial services) (since April 2006); Trustee of Equity Residential (residential real estate) (since December 2009); formerly Director of Dynegy Inc. (power generation) (September 2002-May 2006), CitiStreet Funds, Inc. (mutual funds) (May 1993-February 2005), AM- CH, Inc. (restaurant holding company) (November 2004-February 2005). |
Michael S. Hyland, CFA (65) Board Member Portfolios Overseen: 58 | | Independent Consultant (since February 2005); formerly Senior Managing Director (July 2001-February 2005) of Bear Stearns & Co, Inc.; Global Partner, INVESCO (1999-2001); Managing Director and President of Salomon Brothers Asset Management (1989-1999). | | None. |
Prudential Large-Cap Core Equity Fund
| | | | |
Douglas H. McCorkindale (71) Board Member Portfolios Overseen: 58 | | Formerly Chairman (February 2001-June 2006), Chief Executive Officer (June 2000-July 2005), President (September 1997-July 2005) and Vice Chairman (March 1984-May 2000) of Gannett Co. Inc. (publishing and media). | | Director of Continental Airlines, Inc. (since May 1993); Director of Lockheed Martin Corp. (aerospace and defense) (since May 2001). |
Stephen P. Munn (68) Board Member Portfolios Overseen: 58 | | Lead Director (since 2007) and formerly Chairman (1993-2007) of Carlisle Companies Incorporated (manufacturer of industrial products). | | Lead Director (since 2007) of Carlisle Companies Incorporated (manufacturer of industrial products). |
Richard A. Redeker (67) Board Member Portfolios Overseen: 58 | | Retired Mutual Fund Senior Executive (42 years); Management Consultant; Independent Directors Council (organization of 2,800 Independent Mutual Fund Directors)-Executive Committee, Chair of Policy Steering Committee, Governing Council. | | None. |
Robin B. Smith (71) Board Member & Independent Chair Portfolios Overseen: 58 | | Chairman of the Board (since January 2003) of Publishers Clearing House (direct marketing); formerly Chairman and Chief Executive Officer (August 1996-January 2003) of Publishers Clearing House. | | Formerly Director of BellSouth Corporation (telecommunications) (1992-2006). |
Stephen G. Stoneburn (67) Board Member Portfolios Overseen: 58 | | President and Chief Executive Officer (since June 1996) of Quadrant Media Corp. (publishing company); formerly President (June 1995-June 1996) of Argus Integrated Media, Inc.; Senior Vice President and Managing Director (January 1993-1995) of Cowles Business Media; Senior Vice President of Fairchild Publications, Inc (1975-1989). | | None. |
Visit our website at www.prudentialfunds.com
| | | | |
| Interested Board Members (1) |
Name, Address, Age Position(s) Portfolios Overseen | | Principal Occupation(s) During Past Five Years | | Other Directorships Held |
Judy A. Rice (62) Board Member & President Portfolios Overseen: 58 | | President, Chief Executive Officer, Chief Operating Officer and Officer-In-Charge (since February 2003) of Prudential Investments LLC; President, Chief Executive Officer and Officer-In-Charge (since April 2003) of Prudential Mutual Fund Services LLC; Executive Vice President (since December 2008) of Prudential Investment Management Services LLC; Member of the Board of Directors of Jennison Associates LLC (since November 2010); formerly Vice President (February 1999-April 2006) of Prudential Investment Management Services LLC; formerly President, Chief Executive Officer, Chief Operating Officer and Officer-In-Charge (May 2003-June 2005) and Director (May 2003-March 2006) and Executive Vice President (June 2005-March 2006) of AST Investment Services, Inc.; Member of Board of Governors of the Investment Company Institute. | | None. |
Scott E. Benjamin (37) Board Member & Vice President Portfolios Overseen: 58 | | Executive Vice President (since June 2009) of Prudential Investments LLC and Prudential Investment Management Services LLC; Executive Vice President (since September 2009) of AST Investment Services, Inc.; Senior Vice President of Product Development and Marketing, Prudential Investments (since February 2006); Vice President of Product Development and Product Management, Prudential Investments (2003-2006). | | None. |
| (1) | The year that each individual joined the Fund's Board is as follows: |
Linda W. Bynoe, 2005; Douglas H. McCorkindale, 1998; Richard A. Redeker, 1998; Robin B. Smith, 1998; Stephen G. Stoneburn, 2003; Kevin J. Bannon, 2008; Michael S. Hyland, 2008; Stephen P. Munn, 2008; Judy A. Rice, Board Member since 2000 and President since 2003; Scott E. Benjamin, Board Member since 2010 and Vice President since 2009.
Prudential Large-Cap Core Equity Fund
| | |
| Fund Officers (a)(1) |
Name, Address and Age
Position with Fund | | Principal Occupation(s) During Past Five Years |
Kathryn L. Quirk (58) Chief Legal Officer | | Vice President and Corporate Counsel (since September 2004) of Prudential; Executive Vice President, Chief Legal Officer and Secretary (since July 2005) of PI and Prudential Mutual Fund Services LLC; Vice President and Corporate Counsel (since June 2005) and Secretary (since February 2006) of AST Investment Services, Inc.; formerly Senior Vice President and Assistant Secretary (November 2004-August 2005) of PI; formerly Assistant Secretary (June 2005-February 2006) of AST Investment Services, Inc.; formerly Managing Director, General Counsel, Chief Compliance Officer, Chief Risk Officer and Corporate Secretary (1997-2002) of Zurich Scudder Investments, Inc. |
Deborah A. Docs (52) Secretary | | Vice President and Corporate Counsel (since January 2001) of Prudential; Vice President (since December 1996) and Assistant Secretary (since March 1999) of PI; formerly Vice President and Assistant Secretary (May 2003-June 2005) of AST Investment Services, Inc. |
Jonathan D. Shain (52) Assistant Secretary | | Vice President and Corporate Counsel (since August 1998) of Prudential; Vice President and Assistant Secretary (since May 2001) of PI; Vice President and Assistant Secretary (since February 2001) of PMFS; formerly Vice President and Assistant Secretary (May 2003-June 2005) of AST Investment Services, Inc. |
Claudia DiGiacomo (36) Assistant Secretary | | Vice President and Corporate Counsel (since January 2005) of Prudential; Vice President and Assistant Secretary of PI (since December 2005); Associate at Sidley Austin Brown & Wood LLP (1999-2004). |
John P. Schwartz (39) Assistant Secretary | | Vice President and Corporate Counsel (since April 2005) of Prudential; Vice President and Assistant Secretary of PI (since December 2005); Associate at Sidley Austin Brown & Wood LLP (1997-2005). |
Andrew R. French (48) Assistant Secretary | | Vice President and Corporate Counsel (since February 2010) of Prudential; formerly Director and Corporate Counsel (2006-2010) of Prudential; Vice President and Assistant Secretary (since January 2007) of PI; Vice President and Assistant Secretary (since January 2007) of PMFS; formerly Senior Legal Analyst of Prudential Mutual Fund Law Department (1997-2006). |
Timothy J. Knierim (51) Chief Compliance Officer | | Chief Compliance Officer of Prudential Investment Management, Inc. (since July 2007); formerly Chief Risk Officer of PIM and PI (2002-2007) and formerly Chief Ethics Officer of PIM and PI (2006-2007). |
Valerie M. Simpson (52) Deputy Chief Compliance Officer | | Chief Compliance Officer (since April 2007) of PI and AST Investment Services, Inc.; formerly Vice President-Financial Reporting (June 1999-March 2006) for Prudential Life and Annuities Finance. |
Theresa C. Thompson (48) Deputy Chief Compliance Officer | | Vice President, Compliance, PI (since April 2004); and Director, Compliance, PI (2001-2004). |
Visit our website at www.prudentialfunds.com
| | |
Noreen M. Fierro (46) Anti-Money Laundering Compliance Officer | | Vice President, Corporate Compliance (since May 2006) of Prudential; formerly Corporate Vice President, Associate General Counsel (April 2002-May 2005) of UBS Financial Services, Inc., in their Money Laundering Prevention Group; Senior Manager (May 2005-May 2006) of Deloitte Financial Advisory Services, LLP, in their Forensic and Dispute Services, Anti-Money Laundering Group. |
Grace C. Torres (51) Treasurer and Principal Financial and Accounting Officer | | Assistant Treasurer (since March 1999) and Senior Vice President (since September 1999) of PI; Assistant Treasurer (since May 2003) and Vice President (since June 2005) of AST Investment Services, Inc.; Senior Vice President and Assistant Treasurer (since May 2003) of Prudential Annuities Advisory Services, Inc.; formerly Senior Vice President (May 2003-June 2005) of AST Investment Services, Inc. |
M. Sadiq Peshimam (46) Assistant Treasurer | | Vice President (since 2005) of Prudential Investments LLC. |
Peter Parrella (52) Assistant Treasurer | | Vice President (since 2007) and Director (2004-2007) within Prudential Mutual Fund Administration; formerly Tax Manager at SSB Citi Fund Management LLC (1997-2004). |
| (a) | Excludes Ms. Rice and Mr. Benjamin, interested Board Members who also serve as President and Vice President, respectively. |
| (1) | The year that each individual became an Officer of the Fund is as follows: |
Kathryn L. Quirk, 2005; Deborah A. Docs, 2005; Jonathan D. Shain, 2005; Claudia DiGiacomo, 2005; John P. Schwartz, 2006; Andrew R. French, 2006; Timothy J. Knierim, 2007; Valerie M. Simpson 2007; Theresa C. Thompson, 2008; Noreen M. Fierro, 2006, Grace C. Torres, 1998; M. Sadiq Peshimam, 2006; Peter Parrella, 2007.
Explanatory Notes to Tables:
| | • | | Board Members are deemed to be “Interested,” as defined in the 1940 Act, by reason of their affiliation with Prudential Investments LLC and/or an affiliate of Prudential Investments LLC. |
| | • | | Unless otherwise noted, the address of all Board Members and Officers is c/o Prudential Investments LLC, Gateway Center Three, 100 Mulberry Street, Newark, New Jersey 07102-4077. |
| | • | | There is no set term of office for Board Members or Officers. The Board Members have adopted a retirement policy, which calls for the retirement of Board Members on December 31 of the year in which they reach the age of 75. |
| | • | | “Other Directorships Held” includes only directorships of companies required to register or file reports with the Commission under the Securities Exchange Act of 1934, as amended (the “Exchange Act”) (that is, “public companies”) or other investment companies registered under the 1940 Act. |
| | • | | “Portfolios Overseen” includes all investment companies managed by Prudential Investments LLC. The investment companies for which PI serves as manager include the Prudential Investments Mutual Funds, The Prudential Variable Contract Accounts, Target Mutual Funds, The Prudential Series Fund, Prudential’s Gibraltar Fund, Inc. and the Advanced Series Trust. |
Prudential Large-Cap Core Equity Fund
Approval of Advisory Agreements
The Fund’s Board of Trustees
The Board of Trustees (the “Board”) of Prudential Large-Cap Core Equity Fund (the “Fund”)1 consists of 10 individuals, eight of whom are not “interested persons” of the Fund, as defined in the Investment Company Act of 1940, as amended (the “1940 Act”) (the “Independent Trustees”). The Board is responsible for the oversight of the Fund and its operations, and performs the various duties imposed on the directors of investment companies by the 1940 Act. The Independent Trustees have retained independent legal counsel to assist them in connection with their duties. The Chair of the Board is an Independent Trustee. The Board has established three standing committees: the Audit Committee, the Nominating and Governance Committee, and the Investment Committee. Each committee is chaired by, and composed of, Independent Trustees.
Annual Approval of the Fund’s Advisory Agreements
As required under the 1940 Act, the Board determines annually whether to renew the Fund’s management agreement with Prudential Investments LLC (“PI”) and the Fund’s subadvisory agreement with Quantitative Management Associates LLC (“QMA”). In considering the renewal of the agreements, the Board, including all of the Independent Trustees, met on June 21-23, 2010 and approved the renewal of the agreements through July 31, 2011, after concluding that the renewal of the agreements was in the best interests of the Fund and its shareholders.
In advance of the meetings, the Board received materials relating to the agreements, and had the opportunity to ask questions and request further information in connection with its consideration. Among other things, the Board considered comparative fee information from PI and QMA. Also, the Board considered comparisons with other mutual funds in relevant Peer Universes and Peer Groups. The mutual funds included in each Peer Universe or Peer Group were objectively determined by Lipper Inc. (“Lipper”), an independent provider of mutual fund data. The comparisons placed the Fund in various quartiles over the one-, three-, five- and 10-year periods ending December 31, 2009, with the first quartile being the best 25% of the mutual funds (for performance, the best performing mutual funds and, for expenses, the lowest cost mutual funds). The Board also considered specific information provided by Lipper and QMA at the meetings, as well as additional materials relating to the performance and fees of the Fund.
In approving the agreements, the Board, including the Independent Trustees advised by independent legal counsel, considered the factors it deemed relevant, including
| 1 | Prudential Large-Cap Core Equity Fund is a series of Prudential Investment Portfolios 9. |
Prudential Large-Cap Core Equity Fund
Approval of Advisory Agreements (continued)
the nature, quality and extent of services provided by PI and the subadviser, the performance of the Fund, the profitability of PI and its affiliates, expenses and fees, and the potential for economies of scale that may be shared with the Fund and its shareholders as the Fund’s assets grow. In their deliberations, the Trustees did not identify any single factor which alone was responsible for the Board’s decision to approve the agreements with respect to the Fund. In connection with its deliberations, the Board considered information provided by PI throughout the year at regular Board meetings, presentations from portfolio managers and other information, as well as information furnished at or in advance of the meetings on June 21-23, 2010.
The Trustees determined that the overall arrangements between the Fund and PI, which serves as the Fund’s investment manager pursuant to a management agreement, and between PI and QMA, which serves as the Fund’s subadviser pursuant to the terms of a subadvisory agreement with PI, are in the interest of the Fund and its shareholders in light of the services performed, fees charged and such other matters as the Trustees considered relevant in the exercise of their business judgment.
The material factors and conclusions that formed the basis for the Trustees’ reaching their determinations to approve the continuance of the agreements are separately discussed below.
Nature, Quality, and Extent of Services
The Board received and considered information regarding the nature, quality and extent of services provided to the Fund by PI and QMA. The Board considered the services provided by PI, including but not limited to the oversight of the subadviser for the Fund, as well as the provision of fund recordkeeping, compliance, and other services to the Fund. With respect to PI’s oversight of the subadviser, the Board noted that PI’s Strategic Investment Research Group (“SIRG”), which is a business unit of PI, is responsible for monitoring and reporting to PI’s senior management on the performance and operations of the subadviser. The Board also considered that PI pays the salaries of all of the officers and non-independent Trustees of the Fund. The Board also considered the investment subadvisory services provided by QMA, as well as adherence to the Fund’s investment restrictions and compliance with applicable Fund policies and procedures. The Board considered PI’s evaluation of the subadviser, as well as PI’s recommendation, based on its review of the subadviser, to renew the subadvisory agreement.
The Board reviewed the qualifications, backgrounds and responsibilities of PI’s senior management responsible for the oversight of the Fund and QMA, and also reviewed
Visit our website at www.prudentialfunds.com
the qualifications, backgrounds and responsibilities of QMA’s portfolio managers who are responsible for the day-to-day management of the Fund’s portfolio. The Board was provided with information pertaining to PI’s and QMA’s organizational structure, senior management, investment operations, and other relevant information pertaining to both PI and QMA. The Board also noted that it received favorable compliance reports from the Fund’s Chief Compliance Officer (“CCO”) as to both PI and QMA. The Board noted that QMA is affiliated with PI.
The Board concluded that it was satisfied with the nature, extent and quality of the investment management services provided by PI and the subadvisory services provided to the Fund by QMA, and that there was a reasonable basis on which to conclude that the Fund benefits from the services provided by PI and QMA under the management and subadvisory agreements.
Performance of the Fund
The Board received and considered information about the Fund’s historical performance. The Board considered that the Fund’s gross performance in relation to its Peer Universe (the Lipper Large-Cap Core Funds Performance Universe) was in the third quartile over the five- and 10-year periods, and in the fourth quartile over the one- and three-year periods. The Board also noted that the Fund outperformed its benchmark index over the five- and 10-year periods, though it underperformed its benchmark index over the one- and three-year periods. The Board noted PI’s explanation that the Fund’s underperformance was attributable to the fact that, during the volatile market environment of the past several years, quantitative investment styles had struggled. The Board concluded that, in light of the foregoing, it would be in the interest of the Fund and its shareholders for the Fund to renew the agreements.
Fees and Expenses
The Board considered that the Fund’s actual management fee (which reflects any subsidies, expense caps or waivers) ranked in the Expense Group’s second quartile, and that the Fund’s total expenses ranked in the Expense Group’s fourth quartile. The Board considered PI’s explanation that relatively high transfer agency and other fees unrelated to the management fee were the primary factors in the Fund’s fourth quartile ranking for total expenses. The Board concluded that the management fees and total expenses were reasonable in light of the services provided.
Costs of Services and Profits Realized by PI
The Board was provided with information on the profitability of PI and its affiliates in serving as the Fund’s investment manager. The Board discussed with PI the
Prudential Large-Cap Core Equity Fund
Approval of Advisory Agreements (continued)
methodology utilized in assembling the information regarding profitability and considered its reasonableness. The Board recognized that it is difficult to make comparisons of profitability from fund management contracts because comparative information is not generally publicly available and is affected by numerous factors, including the structure of the particular adviser, the types of funds it manages, its business mix, numerous assumptions regarding allocations and the adviser’s capital structure and cost of capital. The Board did not separately consider the profitability of the subadviser, an affiliate of PI, as its profitability was reflected in the profitability report for PI. Taking these factors into account, the Board concluded that the profitability of PI and its affiliates in relation to the services rendered was not unreasonable.
Economies of Scale
The Board received and discussed information concerning whether PI realizes economies of scale as the Fund’s assets grow beyond current levels. The Board noted that the management fee schedule for the Fund includes breakpoints, which have the effect of decreasing the fee rate as assets increase, but at the current level of assets the Fund does not realize the effect of those rate reductions. The Board took note that the Fund’s fee structure would result in benefits to Fund shareholders when (and if) assets reach the levels at which the fee rate is reduced. These benefits will accrue whether or not PI is then realizing any economies of scale.
Other Benefits to PI and QMA
The Board considered potential ancillary benefits that might be received by PI and QMA and their affiliates as a result of their relationship with the Fund. The Board concluded that potential benefits to be derived by PI included brokerage commissions received by affiliates of PI, transfer agency fees received by the Fund’s transfer agent (which is affiliated with PI), and benefits to the reputation as well as other intangible benefits resulting from PI’s association with the Fund. The Board concluded that the potential benefits to be derived by QMA included its ability to use soft dollar credits, brokerage commissions received by affiliates of QMA, as well as the potential benefits consistent with those generally resulting from an increase in assets under management, specifically, potential access to additional research resources and benefits to the reputation. The Board concluded that the benefits derived by PI and QMA were consistent with the types of benefits generally derived by investment managers and subadvisers to mutual funds.
After full consideration of these factors, the Board concluded that approval of the agreements was in the best interest of the Fund and its shareholders.
Visit our website at www.prudentialfunds.com
| | | | |
| n MAIL | | n TELEPHONE | | n WEBSITE |
Gateway Center Three 100 Mulberry Street Newark, NJ 07102 | | (800) 225-1852 | | www.prudentialfunds.com |
|
| PROXY VOTING |
| The Board of Trustees of the Fund has delegated to the Fund’s investment subadviser the responsibility for voting any proxies and maintaining proxy recordkeeping with respect to the Fund. A description of these proxy voting policies and procedures is available without charge, upon request, by calling (800) 225-1852 or by visiting the Securities and Exchange Commission’s website at www.sec.gov. Information regarding how the Fund voted proxies relating to portfolio securities during the most recent 12-month period ended June 30 is available on the Fund’s website and on the Commission’s website. |
|
| TRUSTEES |
| Kevin J. Bannon • Scott E. Benjamin • Linda W. Bynoe • Michael S. Hyland • Douglas H. McCorkindale • Stephen P. Munn • Richard A. Redeker • Judy A. Rice • Robin B. Smith • Stephen G. Stoneburn |
|
| OFFICERS |
| Judy A. Rice, President • Scott E. Benjamin, Vice President • Grace C. Torres, Treasurer and Principal Financial and Accounting Officer • Kathryn L. Quirk, Chief Legal Officer • Deborah A. Docs, Secretary • Timothy J. Knierim, Chief Compliance Officer • Valerie M. Simpson, Deputy Chief Compliance Officer • Theresa C. Thompson, Deputy Chief Compliance Officer • Noreen M. Fierro, Anti-Money Laundering Compliance Officer • Jonathan D. Shain, Assistant Secretary • Claudia DiGiacomo, Assistant Secretary • John P. Schwartz, Assistant Secretary • Andrew R. French, Assistant Secretary • M. Sadiq Peshimam, Assistant Treasurer • Peter Parrella, Assistant Treasurer |
| | | | |
| MANAGER | | Prudential Investments LLC | | Gateway Center Three
100 Mulberry Street
Newark, NJ 07102 |
|
| INVESTMENT SUBADVISER | | Quantitative Management
Associates LLC | | Gateway Center Two
100 Mulberry Street
Newark, NJ 07102 |
|
| DISTRIBUTOR | | Prudential Investment
Management Services LLC | | Gateway Center Three
100 Mulberry Street
Newark, NJ 07102 |
|
| CUSTODIAN | | The Bank of New York Mellon | | One Wall Street
New York, NY 10286 |
|
| TRANSFER AGENT | | Prudential Mutual Fund
Services LLC | | PO Box 9658
Providence, RI 02940 |
|
INDEPENDENT REGISTERED
PUBLIC ACCOUNTING FIRM | | KPMG LLP | | 345 Park Avenue
New York, NY 10154 |
|
| FUND COUNSEL | | Willkie Farr & Gallagher LLP | | 787 Seventh Avenue
New York, NY 10019 |
|
| An investor should consider the investment objectives, risks, charges, and expenses of the Fund carefully before investing. The prospectus for the Fund contains this and other information about the Fund. An investor may obtain a prospectus by visiting our website at www.prudentialfunds.com or by calling (800) 225-1852. The prospectus should be read carefully before investing. |
|
| E-DELIVERY |
| To receive your mutual fund documents online, go to www.prudentialfunds.com/edelivery and enroll. Instead of receiving printed documents by mail, you will receive notification via e-mail when new materials are available. You can cancel your enrollment or change your e-mail address at any time by visiting the website address above. |
|
| SHAREHOLDER COMMUNICATIONS WITH TRUSTEES |
| Shareholders can communicate directly with the Board of Trustees by writing to the Chair of the Board, Prudential Large-Cap Core Equity Fund, Prudential Investments, Attn: Board of Trustees, 100 Mulberry Street, Gateway Center Three, Newark, NJ 07102. Shareholders can communicate directly with an individual Trustee by writing to the same address. Communications are not screened before being delivered to the addressee. |
|
| AVAILABILITY OF PORTFOLIO SCHEDULE |
| The Fund files its complete schedule of portfolio holdings with the Securities and Exchange Commission for the first and third quarters of each fiscal year on Form N-Q. The Fund’s Forms N-Q are available on the Commission’s website at www.sec.gov. The Fund’s Forms N-Q may also be reviewed and copied at the Commission’s Public Reference Room in Washington, D.C. Information on the operation and location of the Public Reference Room may be obtained by calling (202) 551-8090. The Fund’s schedule of portfolio holdings is also available on the Fund’s website as of the end of each fiscal quarter. |
|
| The Fund’s Statement of Additional Information contains additional information about the Fund’s Trustees and is available without charge, upon request, by calling (800) 225-1852. |
Mutual Funds:
| | | | |
ARE NOT INSURED BY THE FDIC OR ANY
FEDERAL GOVERNMENT AGENCY | | MAY LOSE VALUE | | ARE NOT A DEPOSIT OF OR GUARANTEED
BY ANY BANK OR ANY BANK AFFILIATE |

| | | | | | | | | | | | | | | | | | |
| | | Prudential Large-Cap Core Equity Fund | | | | | | | | | | | | |
| | | Share Class | | A | | B | | C | | L | | M | | X | | Z | | |
| | NASDAQ | | PTMAX | | PTMBX | | PTMCX | | N/A | | N/A | | N/A | | PTEZX | | |
| | CUSIP | | 74441J100 | | 74441J209 | | 74441J308 | | 74441J506 | | 74441J605 | | 74441J704 | | 74441J407 | | |
| | | | | | | | | | | | | | | | | | |
MF187E 0192544-00001-00
Item 2 – Code of Ethics – See Exhibit (a)
As of the end of the period covered by this report, the registrant has adopted a code of ethics (the “Section 406 Standards for Investment Companies – Ethical Standards for Principal Executive and Financial Officers”) that applies to the registrant’s Principal Executive Officer and Principal Financial Officer; the registrant’s Principal Financial Officer also serves as the Principal Accounting Officer.
The registrant hereby undertakes to provide any person, without charge, upon request, a copy of the code of ethics. To request a copy of the code of ethics, contact the registrant 800-225-1852, and ask for a copy of the Section 406 Standards for Investment Companies – Ethical Standards for Principal Executive and Financial Officers.
Item 3 – Audit Committee Financial Expert –
The registrant’s Board has determined that Mr. Stephen P. Munn, member of the Board’s Audit Committee is an “audit committee financial expert,” and that he is “independent,” for purposes of this Item.
Item 4 – Principal Accountant Fees and Services –
(a) Audit Fees
For the fiscal years ended October 31, 2010 and October 31, 2009, KPMG LLP (“KPMG”), the Registrant’s principal accountant, billed the Registrant $22,000 and $20,869, respectively, for professional services rendered for the audit of the Registrant’s annual financial statements or services that are normally provided in connection with statutory and regulatory filings.
(b) Audit-Related Fees
Not applicable for the fiscal year ended October 31, 2010. During the fiscal year ended October 31, 2009, KPMG, the Registrant’s principal accountant, billed the Registrant $1,558 for professional services rendered in connection with agreed upon procedures performed related to a custody conversion.
(c) Tax Fees
None.
(d) All Other Fees
None.
(e) (1) Audit Committee Pre-Approval Policies and Procedures
THE PRUDENTIAL MUTUAL FUNDS
AUDIT COMMITTEE POLICY
on
Pre-Approval of Services Provided by the Independent Accountants
The Audit Committee of each Prudential Mutual Fund is charged with the responsibility to monitor the independence of the Fund’s independent accountants. As part of this responsibility, the Audit Committee must pre-approve any independent accounting firm’s engagement to render audit and/or permissible non-audit services, as required by law. In evaluating a proposed engagement of the independent accountants, the Audit Committee will assess the effect that the engagement might reasonably be expected to have on the accountant’s independence. The Committee’s evaluation will be based on:
| | • | | a review of the nature of the professional services expected to be provided, |
| | • | | a review of the safeguards put into place by the accounting firm to safeguard independence, and |
| | • | | periodic meetings with the accounting firm. |
Policy for Audit and Non-Audit Services Provided to the Funds
On an annual basis, the scope of audits for each Fund, audit fees and expenses, and audit-related and non-audit services (and fees proposed in respect thereof) proposed to be performed by the Fund’s independent accountants will be presented by the Treasurer and the independent accountants to the Audit Committee for review and, as appropriate, approval prior to the initiation of such services. Such presentation shall be accompanied by confirmation by both the Treasurer and the independent accountants that the proposed services will not adversely affect the independence of the independent accountants. Proposed services shall be described in sufficient detail to enable the Audit Committee to assess the appropriateness of such services and fees, and the compatibility of the provision of such services with the auditor’s independence. The Committee shall receive periodic reports on the progress of the audit and other services which are approved by the Committee or by the Committee Chair pursuant to authority delegated in this Policy.
The categories of services enumerated under “Audit Services”, “Audit-related Services”, and “Tax Services” are intended to provide guidance to the Treasurer and the independent accountants as to those categories of services which the Committee believes are generally consistent with the independence of the independent accountants and which the Committee (or the Committee Chair) would expect upon the presentation of specific proposals to pre-approve. The enumerated categories are not intended as an exclusive list of audit, audit-related or tax services, which the Committee (or the Committee Chair) would consider for pre-approval.
Audit Services
The following categories of audit services are considered to be consistent with the role of the Fund’s independent accountants:
| | • | | Annual Fund financial statement audits |
| | • | | Seed audits (related to new product filings, as required) |
| | • | | SEC and regulatory filings and consents |
Audit-related Services
The following categories of audit-related services are considered to be consistent with the role of the Fund’s independent accountants:
| | • | | Accounting consultations |
| | • | | Fund merger support services |
| | • | | Agreed Upon Procedure Reports |
| | • | | Other Internal Control Reports |
Individual audit-related services that fall within one of these categories and are not presented to the Audit Committee as part of the annual pre-approval process will be subject to pre-approval by the Committee Chair (or any other Committee member on whom this responsibility has been delegated) so long as the estimated fee for those services does not exceed $50,000.
Tax Services
The following categories of tax services are considered to be consistent with the role of the Fund’s independent accountants:
| | • | | Tax compliance services related to the filing or amendment of the following: |
| | • | | Federal, state and local income tax compliance; and, |
| | • | | Sales and use tax compliance |
| | • | | Timely RIC qualification reviews |
| | • | | Tax distribution analysis and planning |
| | • | | Tax authority examination services |
| | • | | Tax appeals support services |
| | • | | Accounting methods studies |
| | • | | Fund merger support services |
| | • | | Tax consulting services and related projects |
Individual tax services that fall within one of these categories and are not presented to the Audit Committee as part of the annual pre-approval process will be subject to pre-approval by the Committee Chair (or any other Committee member on whom this responsibility has been delegated) so long as the estimated fee for those services does not exceed $50,000.
Other Non-audit Services
Certain non-audit services that the independent accountants are legally permitted to render will be subject to pre-approval by the Committee or by one or more Committee members to whom the Committee has delegated this authority and who will report to the full Committee any pre-approval
decisions made pursuant to this Policy. Non-audit services presented for pre-approval pursuant to this paragraph will be accompanied by a confirmation from both the Treasurer and the independent accountants that the proposed services will not adversely affect the independence of the independent accountants.
Proscribed Services
The Fund’s independent accountants will not render services in the following categories of non-audit services:
| | • | | Bookkeeping or other services related to the accounting records or financial statements of the Fund |
| | • | | Financial information systems design and implementation |
| | • | | Appraisal or valuation services, fairness opinions, or contribution-in-kind reports |
| | • | | Internal audit outsourcing services |
| | • | | Management functions or human resources |
| | • | | Broker or dealer, investment adviser, or investment banking services |
| | • | | Legal services and expert services unrelated to the audit |
| | • | | Any other service that the Public Company Accounting Oversight Board determines, by regulation, is impermissible. |
Pre-approval of Non-Audit Services Provided to Other Entities Within the Prudential Fund Complex
Certain non-audit services provided to Prudential Investments LLC or any of its affiliates that also provide ongoing services to the Prudential Mutual Funds will be subject to pre-approval by the Audit Committee. The only non-audit services provided to these entities that will require pre-approval are those related directly to the operations and financial reporting of the Funds. Individual projects that are not presented to the Audit Committee as part of the annual pre-approval process will be subject to pre-approval by the Committee Chair (or any other Committee member on whom this responsibility has been delegated) so long as the estimated fee for those services does not exceed $50,000. Services presented for pre-approval pursuant to this paragraph will be accompanied by a confirmation from both the Treasurer and the independent accountants that the proposed services will not adversely affect the independence of the independent accountants.
Although the Audit Committee will not pre-approve all services provided to Prudential Investments LLC and its affiliates, the Committee will receive an annual report from the Fund’s independent accounting firm showing the aggregate fees for all services provided to Prudential Investments and its affiliates.
(e) (2) Percentage of services referred to in 4(b) – 4(d) that were approved by the audit committee –
One hundred percent of the services described in Item 4(b) was approved by the audit committee.
(f) Percentage of hours expended attributable to work performed by other than full time employees of principal accountant if greater than 50%.
The percentage of hours expended on the principal accountant’s engagement to audit the registrant’s financial statements for the most recent fiscal year that were attributed to work performed by persons other than the principal accountant’s full-time, permanent employees was 0%.
(g) Non-Audit Fees
Not applicable to Registrant for the fiscal years 2010 and 2009. The aggregate non-audit fees billed by KPMG for services rendered to the registrant’s investment adviser and any entity controlling, controlled by, or under common control with the investment adviser that provides ongoing services to the registrant for the fiscal years 2010 and 2009 was $0 and $0, respectively.
(h) Principal Accountant’s Independence
Not applicable as KPMG has not provided non-audit services to the registrant’s investment adviser and any entity controlling, controlled by, or under common control with the investment adviser that provides ongoing services to the registrant that were not pre-approved pursuant to Rule 2-01(c)(7)(ii) of Regulation S-X.
Item 5 – Audit Committee of Listed Registrants – Not applicable.
Item 6 – Schedule of Investments – The schedule is included as part of the report to shareholders filed under Item 1 of this Form.
Item 7 – Disclosure of Proxy Voting Policies and Procedures for Closed-End Management Investment Companies – Not applicable.
Item 8 – Portfolio Managers of Closed-End Management Investment Companies – Not applicable.
Item 9 – Purchases of Equity Securities by Closed-End Management Investment Company and Affiliated Purchasers – Not applicable.
Item 10 – Submission of Matters to a Vote of Security Holders – Not applicable.
Item 11 – Controls and Procedures
| | (a) | It is the conclusion of the registrant’s principal executive officer and principal financial officer that the effectiveness of the registrant’s current disclosure controls and procedures (such disclosure controls and procedures having been evaluated within 90 days of the date of this filing) provide reasonable assurance that the information required to be disclosed by the registrant has been recorded, processed, summarized and reported within the time period specified in the Commission’s rules and forms and that the information required to be disclosed by the registrant has been accumulated and communicated to the registrant’s principal executive officer and principal financial officer in order to allow timely decisions regarding required disclosure. |
| | (b) | There has been no significant change in the registrant’s internal control over financial reporting that occurred during the registrant’s most recent fiscal quarter of the period covered by this report that has materially affected, or is likely to materially affect, the registrant’s internal control over financial reporting. |
Item 12 – Exhibits
(a) (1) Code of Ethics – Attached hereto as Exhibit EX-99.CODE-ETH
(2) Certifications pursuant to Section 302 of the Sarbanes-Oxley Act – Attached hereto as Exhibit EX-99.CERT.
(3) Any written solicitation to purchase securities under Rule 23c-1. – Not applicable.
(b) Certifications pursuant to Section 906 of the Sarbanes-Oxley Act – Attached hereto as Exhibit EX-99.906CERT.
SIGNATURES
Pursuant to the requirements of the Securities Exchange Act of 1934 and the Investment Company Act of 1940, the registrant has duly caused this report to be signed on its behalf by the undersigned, thereunto duly authorized.
| | |
| Registrant: Prudential Investment Portfolios 9 |
| |
| By: | | /S/ DEBORAH A. DOCS |
| | Deborah A. Docs |
| | Secretary |
| |
| Date: | | December 21, 2010 |
Pursuant to the requirements of the Securities Exchange Act of 1934 and the Investment Company Act of 1940, this report has been signed below by the following persons on behalf of the registrant and in the capacities and on the dates indicated.
| | |
| By: | | /S/ JUDY A. RICE |
| | Judy A. Rice |
| | President and Principal Executive Officer |
| |
| Date: | | December 21, 2010 |
| |
| By: | | /S/ GRACE C. TORRES |
| | Grace C. Torres |
| | Treasurer and Principal Financial Officer |
| |
| Date: | | December 21, 2010 |