UNITED STATES
SECURITIES AND EXCHANGE COMMISSION
Washington, D.C. 20549
FORM N-CSR
CERTIFIED SHAREHOLDER REPORT OF REGISTERED
MANAGEMENT INVESTMENT COMPANIES
Investment Company Act file number: 811-09101
Dryden Tax-Managed Funds
Exact name of registrant as specified in charter:
Gateway Center 3,
100 Mulberry Street,
Newark, New Jersey 07102
Address of principal executive offices:
Deborah A. Docs
Gateway Center 3,
100 Mulberry Street,
Newark, New Jersey 07102
Name and address of agent for service:
Registrant’s telephone number, including area code: 800-225-1852
Date of fiscal year end: 10/31/2009
Date of reporting period: 10/31/2009
Item 1 – Reports to Stockholders


| | |
| OCTOBER 31, 2009 | | ANNUAL REPORT |
Dryden Large-Cap Core Equity Fund
FUND TYPE
Large-cap stock
OBJECTIVE
Long-term after-tax growth of capital
This report is not authorized for distribution to prospective investors unless preceded or accompanied by a current prospectus.
The views expressed in this report and information about the Fund’s portfolio holdings are for the period covered by this report and are subject to change thereafter.
JennisonDryden, Dryden, Prudential Financial and the Rock Prudential logo are registered service marks of The Prudential Insurance Company of America, Newark, NJ, and its affiliates.

December 15, 2009
Dear Shareholder:
On December 11, 2009, the Board of Directors approved the renaming of JennisonDryden, Prudential Financial’s mutual fund family, to Prudential Investments, effective on or about February 16, 2010. As a result of this change, each of our Funds will be renamed to feature “Prudential” as part of its new name. The name of your Fund will change from Dryden Large-Cap Core Equity Fund to Prudential Large-Cap Core Equity Fund.
While the name of your Fund will change, its investment objectives and portfolio management team will remain the same. No action is required on your part. If you participate in an automatic investment plan, your account will continue to be invested in the Fund under its new name.
Featuring the Prudential name in our Funds will create an immediate connection to the experience and heritage of Prudential, a name recognized by millions for helping people grow and protect their wealth.
On the following pages, you will find your Fund’s annual report, including an analysis of its performance over the fiscal year in addition to other data. If you have questions about this information or the renaming of our mutual fund family, please contact your financial professional or visit our website at www.jennisondryden.com.
Sincerely,

Judy A. Rice, President
Dryden Large-Cap Core Equity Fund
| | |
| Dryden Large-Cap Core Equity Fund | | 1 |
Your Fund’s Performance
Fund objective
The investment objective of the Dryden Large-Cap Core Equity Fund is long-term after-tax growth of capital. There can be no assurance that the Fund will achieve its investment objective.
Performance data quoted represent past performance. Past performance does not guarantee future results. The investment return and principal value of an investment will fluctuate, so that an investor’s shares, when redeemed, may be worth more or less than their original cost. Current performance may be lower or higher than the past performance data quoted. An investor may obtain performance data as of the most recent month-end by visiting our website at www.jennisondryden.com or by calling (800) 225-1852. Class A and Class L shares have a maximum initial sales charge of 5.50% and 5.75%, respectively. Gross operating expenses: Class A, 1.55%; Class B, 2.25%; Class C, 2.25%; Class L, 1.75%; Class M, 2.25%; Class X, 1.50%; Class Z, 1.25%. Net operating expenses apply to: Class A, 1.55%; Class B, 2.25%; Class C, 2.25%; Class L, 1.75%; Class M, 2.25%; Class X, 1.50%; Class Z, 1.25%.
| | | | | | | | | | | |
| Cumulative Total Returns as of 10/31/09 | | | |
| | | One Year | | | Five Years | | | Ten Years | | | Since Inception1 |
Class A | | 5.40 | % | | –3.00 | % | | –10.83 | % | | — |
Class B | | 4.67 | | | –6.52 | | | –17.19 | | | — |
Class C | | 4.67 | | | –6.52 | | | –17.19 | | | — |
Class L | | 5.21 | | | N/A | | | N/A | | | –25.23% (3/19/07) |
Class M | | 4.67 | | | N/A | | | N/A | | | –26.20 (3/19/07) |
Class X | | 6.00 | | | N/A | | | N/A | | | –24.42 (3/19/07) |
Class Z | | 5.83 | | | –1.69 | | | –8.47 | | | — |
S&P 500 Index2 | | 9.80 | | | 1.67 | | | –9.10 | | | ** |
Lipper Average3 | | 10.85 | | | 2.90 | | | –0.88 | | | *** |
| | |
| 2 | | Visit our website at www.jennisondryden.com |
| | | | | | | | | | | |
| Average Annual Total Returns4 as of 9/30/09 | | | | | | | | | |
| | | One Year | | | Five Years | | | Ten Years | | | Since Inception1 |
Class A | | –15.48 | % | | –1.09 | % | | –0.88 | % | | — |
Class B | | –15.62 | | | –0.94 | | | –1.06 | | | — |
Class C | | –12.16 | | | –0.74 | | | –1.06 | | | — |
Class L | | –15.88 | | | N/A | | | N/A | | | –12.14% (3/19/07) |
Class M | | –16.59 | | | N/A | | | N/A | | | –11.95 (3/19/07) |
Class X | | –15.19 | | | N/A | | | N/A | | | –11.16 (3/19/07) |
Class Z | | –10.31 | | | 0.27 | | | –0.06 | | | — |
S&P 500 Index2 | | –6.91 | | | 1.01 | | | –0.15 | | | ** |
Lipper Average3 | | –5.89 | | | 1.13 | | | 0.20 | | | *** |
The cumulative total returns do not reflect the deduction of applicable sales charges. If reflected, the applicable sales charges would reduce the cumulative total returns performance quoted. The average annual total returns assume the payment of the maximum applicable sales charge. Class A shares and Class L shares are subject to a maximum front-end sales charge of 5.50% and 5.75%, respectively. Under certain circumstances, Class A shares may be subject to a contingent deferred sales charge (CDSC) of 1%. Class B, Class C, Class L, Class M, and Class X shares are subject to a maximum CDSC of 5%, 1%, 1%, 6%, and 6%, respectively. Class Z shares are not subject to a sales charge.
Source: Prudential Investments LLC and Lipper Inc. Performance figures may reflect fee waivers and/or expense reimbursements. In the absence of such fee waivers and/or expense reimbursements, total returns would be lower.
1Inception returns are provided for any share class with less than 10 calendar years of returns. The Since Inception returns for the S&P 500 Index and the Lipper Large-Cap Core Funds Average (Lipper Average) are measured from the closest month-end to inception date, and not from the Fund’s actual inception date.
2The S&P 500 Index is an unmanaged index of 500 stocks of large U.S. public companies. It gives a broad look at how U.S. stock prices have performed.
3The Lipper Average represents returns based on an average return of all funds in the Lipper Large-Cap Core Funds category for the periods noted. Funds in the Lipper Average invest at least 75% of their equity assets in companies with market capitalizations (on a three-year weighted basis) greater than 300% of the dollar-weighted median market capitalization of the middle 1,000 securities of the S&P SuperComposite 1500 Index. Large-cap core funds have wide latitude in the companies in which they invest. These funds typically have a below-average price-to-earnings ratio, price-to-book ratio, and three-year sales-per-share growth value compared with the S&P 500 Index.
4The average annual total returns take into account applicable sales charges. Class A, Class B, Class C, Class L, Class M, and Class X shares are subject to an annual distribution and service (12b-1) fee of up to 0.30%, 1.00%, 1.00%, 0.50%, 1.00%, and 1.00%, respectively. Approximately seven years after purchase, Class B shares will automatically convert to Class A shares on a quarterly basis. Class Z shares are not subject to a 12b-1 fee. The returns in the tables do not reflect the deduction of taxes that a shareholder would pay on Fund distributions or following the redemption of Fund shares.
| | |
| Dryden Large-Cap Core Equity Fund | | 3 |
Your Fund’s Performance (continued)
**S&P 500 Index Closest Month-End to Inception cumulative total return as of 10/31/09 is –22.69% for Class L, Class M, and Class X. S&P 500 Index Closest Month-End to Inception average annual total return as of 9/30/09 is –9.10% for Class L, Class M, and Class X.
***Lipper Average Closest Month-End to Inception cumulative total return as of 10/31/09 is –21.48% for Class L, Class M, and Class X. Lipper Average Closest Month-End to Inception average annual total return as of 9/30/09 is –8.58% for Class L, Class M, and Class X.
Investors cannot invest directly in an index. The returns for the S&P 500 Index and the Lipper Average would be lower if they included the effects of sales charges, operating expenses of a mutual fund, or taxes. Returns for the Lipper Average reflect the deduction of operating expenses of a mutual fund, but not sales charges or taxes.
| | | |
| Five Largest Holdings* expressed as a percentage of net assets as of 10/31/09 | | | |
Exxon Mobil Corp., Oil, Gas & Consumable Fuels | | 3.6 | % |
JPMorgan Chase & Co., Diversified Financial Services | | 2.1 | |
International Business Machines Corp., Computers & Peripherals | | 2.0 | |
Apple, Inc., Computer & Peripherals | | 2.0 | |
Chevron Corp., Oil, Gas & Consumable Fuels | | 1.9 | |
* Excludes securities purchased with cash received as a result of securities on loan.
Holdings are subject to change.
| | | |
| Five Largest Sectors expressed as a percentage of net assets as of 10/31/09 | | | |
Information Technology | | 20.2 | % |
Healthcare | | 13.9 | |
Financials | | 12.9 | |
Energy | | 12.0 | |
Consumer Staples | | 11.3 | |
Industry weightings are subject to change.
| | |
| 4 | | Visit our website at www.jennisondryden.com |
Strategy and Performance Overview
How did the Fund perform?
The Dryden Large-Cap Core Equity Fund Class A shares gained 5.4% for the 12-month reporting period ended October 31, 2009, which underperformed the 9.8% of the benchmark S&P 500 Index (the Index) and also trailed the 10.85% of the Lipper Large-Cap Core Funds Average.
How is the Fund managed?
Quantitative Management Associates LLC (QMA) tries to outperform the Index by actively managing the Fund via a quantitative process that evaluates about 5,000 stocks daily. Investing in both rapidly and slowly growing companies limits the Fund’s exposure to any particular style of investing and may reduce its volatility relative to the Index. When selecting stocks of more rapidly growing companies, QMA places a heavier emphasis on “news,” or signals about their future growth prospects. For example, upward revisions in earnings forecasts by Wall Street analysts are used as an indication of good news. For slowly growing companies, QMA emphasizes attractive valuations, and invests more heavily in stocks that are priced cheaply relative to their firms’ earnings prospects and book values. While striving to achieve its performance objective through this quantitative process, QMA also considers the tax implications of its trading in an attempt to minimize taxable distributions to the Fund.
What were conditions like in the U.S. stock market?
The first half of the reporting period was marked by severe economic and market turmoil, but the second half experienced a sharp rebound. The credit crisis that began in 2007 escalated in September 2008, and continued to wreak havoc on stocks in the S&P 500 Index and all sectors at the beginning of the Fund’s fiscal year. The credit crisis prompted unprecedented coordination between the U.S Department of the Treasury and the U.S. Federal Reserve Bank in efforts to resuscitate credit markets and stabilize the financial system. Inflation concerns abated, as slumping demand in the U.S. and the weakening global economy hit commodities prices. The ongoing housing correction, debt deflation, rising unemployment, and stalled production and consumption all contributed to the most severe recession in recent history. Corporations announced workforce reductions and capital expenditure cuts.
In early March 2009, the effects of the credit crisis punished equities across all sectors, sinking stocks to their lowest levels in decades. Some of the worst-hit stocks were in banks and in companies carrying high levels of debt. The market decline also pulled down share prices of more solid companies and potential growth companies. In late March, the U.S. Treasury Department announced broad-based plans to form a public-private investment partnership that was promoted to stimulate credit markets and stabilize the financial system. In May the federal government released results of
| | |
| Dryden Large-Cap Core Equity Fund | | 5 |
Strategy and Performance Overview (continued)
“stress tests” it conducted on major banks. The results of these tests determined that 10 of the 19 largest banks in the U.S. required additional capital. Investors responded positively to this news, readjusted their exposure to risk, and sparked a powerful rally. This upsurge in equities maintained its momentum through the third quarter and into the fourth quarter of 2009.
How did the sectors of the S&P 500 Index perform?
All but one sector in the Index ended the Fund’s fiscal year in positive territory. The three top-performing sectors in the Index achieved double-digit gains during the reporting period. This group consisted of cyclical sectors, which are comprised of stocks in companies that tend to outperform during an upward or expansive phase of the business cycle. Information technology, the most heavily weighted sector in the Index, led the group on higher business demand for computer hardware, software, and related items. The consumer discretionary sector reflected rising demand for specialty-retailing, autos, and other big-ticket items. Materials posted a solid return on resurgent demand for construction activity and infrastructure projects in developing countries, especially China.
The middle range of sector performance was dominated by defensive stocks, which are in companies that usually perform consistently through most phases of the business cycle. This group was led by consumer staples, which includes producers of household and personal items. Healthcare recorded gains despite political uncertainty surrounding legislative efforts to broaden health insurance availability and rein in medical costs. Telecommunications services ended the fiscal year on a positive note, as firm but selective consumer demand buoyed stocks of mobile phone companies. Energy was the lone cyclical sector in this performance range, as it struggled against lower global demand during the recession.
In the lowest tier of performance, weak demand for manufactured goods hit the industrials sector. Correspondingly, the utilities sector was hurt by a lull in industrial demand. The financials sector recorded the only decline in the Index. While financials reversed direction and staged a spectacular rally later in the year, when policy initiatives helped restore investor confidence, gains in this sector did not offset previous losses attributed to the severe effects of the credit crisis.
How have recent market events affected the performance of the fund?
In the post-crisis period that began after market lows in March, lower-quality stocks outperformed during the rally as investors became more comfortable holding risk in their portfolios. Particularly, stocks that had declined the most prior to the market downturn outperformed during the rally. Less profitable companies and even non-earners outperformed, as did stocks with negative earnings momentum. This caused the Fund’s
| | |
| 6 | | Visit our website at www.jennisondryden.com |
emphasis on “news,” or signals about its future growth prospects to perform perversely, as bad-news stocks outperformed good-news stocks. The Fund’s investment philosophy favors stocks with more attractive fundamentals and prospects for good news, and therefore it is underweight in lower-quality stocks. While having a larger position in lower-quality stocks would have helped performance in this market environment, the investment team believes that it is not a sound long-term investment strategy.
Among rapidly growing companies, which stocks or related-group of stocks contributed the most and detracted the most from the Fund’s return?
The Fund’s news factor did not perform well over this time period. However, this underperformance was concentrated during the post-crisis period when stocks that disappointed investors were punished. For example, Liz Claiborne was overweight in the portfolio and declined sharply. However, stocks that exceeded investors’ expectations were rewarded. The Fund was underweight in Ford Motor, which soared. However, stocks with solidly good news, such as Liberty Media and Synaptics, which advanced very strongly were overweight in the portfolio and helped performance.
Among slowly growing companies, which stocks or related-group of stocks contributed the most and detracted the most from the Fund’s return?
The fund’s holdings in financial stocks hurt portfolio performance, particularly during the downturn. Holdings in this sector were concentrated among stocks that appeared attractively valued. However, cheap financial stocks became cheaper as the financial crisis deepened. Valuations rose during the post-crisis period, and attractively valued stocks were rewarded. The fund was overweight in Wyeth Corp., which appreciated significantly on a takeover bid.
Has the fund’s tax management strategy affected recent performance?
Although difficult to quantify, the tax management objective detracted somewhat from performance in this recent market environment. While trading in the portfolio is not dictated by tax concerns, the potential tax impact of trading is included in the investment decision. Tax management may lead to more momentum in the portfolio, as lagging stocks are sold to realize tax losses and leading stocks are held to avoid tax gains. During a market environment marked by the outperformance of lower-quality stocks, this effect may amplify the underperformance of the Fund’s strategy, since previous laggards have been sold off to realize tax losses. Also, the fund is less likely to hold lower-priced and lower-quality stocks, as these stocks are more likely to have been sold to realize tax losses. Conversely, leading stocks may be held longer in an effort to minimize realized gains.
| | |
| Dryden Large-Cap Core Equity Fund | | 7 |
Fees and Expenses (Unaudited)
As a shareholder of the Fund, you incur two types of costs: (1) transaction costs, including sales charges (loads) on purchase payments and redemptions, as applicable, and (2) ongoing costs, including management fees, distribution and/or service (12b-1) fees, and other Fund expenses, as applicable. This example is intended to help you understand your ongoing costs (in dollars) of investing in the Fund and to compare these costs with the ongoing costs of investing in other mutual funds.
The example is based on an investment of $1,000 invested on May 1, 2009, at the beginning of the period, and held through the six-month period ended October 31, 2009. The example is for illustrative purposes only; you should consult the Prospectus for information on initial and subsequent minimum investment requirements.
The Fund’s transfer agent may charge additional fees to holders of certain accounts that are not included in the expenses shown in the table on the following page. These fees apply to individual retirement accounts (IRAs) and Section 403(b) accounts. As of the close of the six-month period covered by the table, IRA fees included an annual maintenance fee of $15 per account (subject to a maximum annual maintenance fee of $25 for all accounts held by the same shareholder). Section 403(b) accounts are charged an annual $25 fiduciary maintenance fee. Some of the fees may vary in amount, or may be waived, based on your total account balance or the number of JennisonDryden funds, including the Fund, that you own. You should consider the additional fees that were charged to your Fund account over the six-month period when you estimate the total ongoing expenses paid over the period and the impact of these fees on your ending account value, as these additional expenses are not reflected in the information provided in the expense table. Additional fees have the effect of reducing investment returns.
Actual Expenses
The first line for each share class in the table on the following page provides information about actual account values and actual expenses. You may use the information on this line, together with the amount you invested, to estimate the expenses that you paid over the period. Simply divide your account value by $1,000 (for example, an $8,600 account value ÷ $1,000 = 8.6), then multiply the result by the number on the first line under the heading “Expenses Paid During the Six-Month Period” to estimate the expenses you paid on your account during this period.
Hypothetical Example for Comparison Purposes
The second line for each share class in the table on the following page provides information about hypothetical account values and hypothetical expenses based on the Fund’s actual expense ratio and an assumed rate of return of 5% per year before
| | |
| 8 | | Visit our website at www.jennisondryden.com |
expenses, which is not the Fund’s actual return. The hypothetical account values and expenses may not be used to estimate the actual ending account balance or expenses you paid for the period. You may use this information to compare the ongoing costs of investing in the Fund and other funds. To do so, compare this 5% hypothetical example with the 5% hypothetical examples that appear in the shareholder reports of the other funds.
Please note that the expenses shown in the table are meant to highlight your ongoing costs only and do not reflect any transactional costs such as sales charges (loads). Therefore, the second line for each share class in the table is useful in comparing ongoing costs only and will not help you determine the relative total costs of owning different funds. In addition, if these transactional costs were included, your costs would have been higher.
| | | | | | | | | | | | | | |
Dryden Large-Cap Core
Equity Fund | | Beginning Account
Value
May 1, 2009 | | Ending Account
Value
October 31, 2009 | | Annualized
Expense Ratio
Based on the
Six-Month Period | | | Expenses Paid
During the
Six-Month Period* |
| | | | | | | | | | | | | | |
Class A | | Actual | | $ | 1,000.00 | | $ | 1,179.80 | | 1.59 | % | | $ | 8.74 |
| | | Hypothetical | | $ | 1,000.00 | | $ | 1,017.19 | | 1.59 | % | | $ | 8.08 |
| | | | | | | | | | | | | | |
Class B | | Actual | | $ | 1,000.00 | | $ | 1,176.60 | | 2.29 | % | | $ | 12.56 |
| | | Hypothetical | | $ | 1,000.00 | | $ | 1,013.66 | | 2.29 | % | | $ | 11.62 |
| | | | | | | | | | | | | | |
| Class C | | Actual | | $ | 1,000.00 | | $ | 1,176.60 | | 2.29 | % | | $ | 12.56 |
| | | Hypothetical | | $ | 1,000.00 | | $ | 1,013.66 | | 2.29 | % | | $ | 11.62 |
| | | | | | | | | | | | | | |
Class L | | Actual | | $ | 1,000.00 | | $ | 1,178.60 | | 1.79 | % | | $ | 9.83 |
| | | Hypothetical | | $ | 1,000.00 | | $ | 1,016.18 | | 1.79 | % | | $ | 9.10 |
| | | | | | | | | | | | | | |
Class M | | Actual | | $ | 1,000.00 | | $ | 1,176.60 | | 2.29 | % | | $ | 12.56 |
| | | Hypothetical | | $ | 1,000.00 | | $ | 1,013.66 | | 2.29 | % | | $ | 11.62 |
| | | | | | | | | | | | | | |
Class X | | Actual | | $ | 1,000.00 | | $ | 1,182.40 | | 1.54 | % | | $ | 8.47 |
| | | Hypothetical | | $ | 1,000.00 | | $ | 1,017.44 | | 1.54 | % | | $ | 7.83 |
| | | | | | | | | | | | | | |
Class Z | | Actual | | $ | 1,000.00 | | $ | 1,183.50 | | 1.29 | % | | $ | 7.10 |
| | | Hypothetical | | $ | 1,000.00 | | $ | 1,018.70 | | 1.29 | % | | $ | 6.56 |
* Fund expenses (net of fee waivers or subsidies, if any) for each share class are equal to the annualized expense ratio for each share class (provided in the table), multiplied by the average account value over the period, multiplied by the 184 days in the six-month period ended October 31, 2009, and divided by the 365 days in the Fund’s fiscal year ended October 31, 2009 (to reflect the six-month period). Expenses presented in the table include the expenses of any underlying portfolios in which the Fund may invest.
| | |
| Dryden Large-Cap Core Equity Fund | | 9 |
Portfolio of Investments
as of October 31, 2009
| | | | | |
| Shares | | Description | | Value (Note 1) |
| | | | | |
LONG-TERM INVESTMENTS 98.4% |
COMMON STOCKS |
CONSUMER DISCRETIONARY 9.8% |
|
Auto Components 0.2% |
| 21,100 | | Johnson Controls, Inc.(b) | | $ | 504,712 |
|
Automobiles 0.3% |
| 112,900 | | Ford Motor Co.(a) | | | 790,300 |
|
Diversified Consumer Services |
| 2,100 | | Universal Technical Institute, Inc.(a) | | | 37,779 |
|
Hotels, Restaurants & Leisure 0.8% |
| 19,900 | | McDonald’s Corp. | | | 1,166,339 |
| 38,000 | | Yum! Brands, Inc. | | | 1,252,100 |
| | | | | |
| | | | | 2,418,439 |
|
Household Durables 0.4% |
| 23,900 | | American Greetings Corp. (Class A Stock) | | | 486,126 |
| 6,000 | | Fortune Brands, Inc. | | | 233,700 |
| 14,600 | | Leggett & Platt, Inc.(b) | | | 282,218 |
| 16,100 | | Tempur-Pedic International, Inc.(a) | | | 311,857 |
| | | | | |
| | | | | 1,313,901 |
|
Internet & Catalog Retail 0.2% |
| 25,900 | | Expedia, Inc.(a)(b) | | | 587,153 |
|
Leisure Equipment & Products 0.1% |
| 8,900 | | Hasbro, Inc. | | | 242,703 |
|
Media 2.8% |
| 201,500 | | Comcast Corp. (Class A Stock) | | | 2,921,750 |
| 45,600 | | DIRECTV Group, Inc. (The)(a)(b) | | | 1,199,280 |
| 171,500 | | News Corp., Inc. (Class A Stock) | | | 1,975,680 |
| 1,400 | | Omnicom Group, Inc. | | | 47,992 |
| 43,766 | | Time Warner, Inc. | | | 1,318,232 |
| 1,272 | | Time Warner Cable, Inc. | | | 50,168 |
| 32,000 | | Viacom, Inc. (Class B Stock)(a) | | | 882,880 |
| 14,460 | | Walt Disney Co. (The) | | | 395,770 |
| | | | | |
| | | | | 8,791,752 |
See Notes to Financial Statements.
| | |
| Dryden Large-Cap Core Equity Fund | | 11 |
Portfolio of Investments
as of October 31, 2009 continued
| | | | | |
| Shares | | Description | | Value (Note 1) |
| | | | | |
CONSUMER DISCRETIONARY (Continued) |
|
Multiline Retail 1.7% |
| 9,900 | | Big Lots, Inc.(a) | | $ | 247,995 |
| 54,800 | | Family Dollar Stores, Inc.(b) | | | 1,550,840 |
| 12,300 | | Kohl’s Corp.(a) | | | 703,806 |
| 19,600 | | Macy’s, Inc. | | | 344,372 |
| 53,000 | | Target Corp. | | | 2,566,790 |
| | | | | |
| | | | | 5,413,803 |
|
Specialty Retail 2.5% |
| 3,700 | | Asbury Automotive Group, Inc.(a) | | | 36,038 |
| 2,700 | | AutoNation, Inc.(a) | | | 46,548 |
| 48,200 | | Best Buy Co., Inc. | | | 1,840,276 |
| 30,500 | | Chico’s FAS, Inc.(a) | | | 364,475 |
| 44,700 | | Gap, Inc. (The) | | | 953,898 |
| 86,000 | | Home Depot, Inc. | | | 2,157,740 |
| 5,900 | | Jos. A. Bank Clothiers, Inc.(a) | | | 241,782 |
| 11,200 | | Limited Brands, Inc. | | | 197,120 |
| 2,500 | | Rent-A-Center, Inc.(a) | | | 45,900 |
| 10,500 | | Ross Stores, Inc. | | | 462,105 |
| 18,000 | | Sally Beauty Holdings, Inc.(a)(b) | | | 121,500 |
| 17,200 | | Sonic Automotive, Inc. (Class A Stock) | | | 153,768 |
| 22,700 | | TJX Cos., Inc.(b) | | | 847,845 |
| 8,400 | | Tractor Supply Co.(a)(b) | | | 375,480 |
| | | | | |
| | | | | 7,844,475 |
|
Textiles, Apparel & Luxury Goods 0.8% |
| 58,600 | | Coach, Inc. | | | 1,932,042 |
| 14,000 | | Hanesbrands, Inc.(a) | | | 302,680 |
| 2,700 | | Steven Madden Ltd.(a) | | | 109,350 |
| | | | | |
| | | | | 2,344,072 |
CONSUMER STAPLES 11.3% |
|
Beverages 3.1% |
| 73,300 | | Coca-Cola Co. (The) | | | 3,907,623 |
| 29,000 | | Coca-Cola Enterprises, Inc. | | | 553,030 |
| 3,300 | | Constellation Brands, Inc. (Class A Stock)(a) | | | 52,206 |
| 18,500 | | Dr. Pepper Snapple Group, Inc.(a) | | | 504,310 |
| 75,694 | | PepsiCo, Inc. | | | 4,583,272 |
| | | | | |
| | | | | 9,600,441 |
See Notes to Financial Statements.
| | |
| 12 | | Visit our website at www.jennisondryden.com |
| | | | | |
| Shares | | Description | | Value (Note 1) |
| | | | | |
CONSUMER STAPLES (Continued) |
|
Food & Staples Retailing 2.0% |
| 24,800 | | Costco Wholesale Corp. | | $ | 1,409,880 |
| 6,000 | | CVS Caremark Corp. | | | 211,800 |
| 85,770 | | Wal-Mart Stores, Inc. | | | 4,261,054 |
| 10,200 | | Whole Foods Market, Inc.(a)(b) | | | 327,012 |
| | | | | |
| | | | | 6,209,746 |
|
Food Products 2.0% |
| 4,400 | | American Italian Pasta Co. (Class A Stock)(a) | | | 119,548 |
| 15,238 | | Archer-Daniels-Midland Co. | | | 458,969 |
| 38,600 | | Chiquita Brands International, Inc.(a)(b) | | | 624,934 |
| 4,500 | | ConAgra Foods, Inc. | | | 94,500 |
| 36,000 | | Del Monte Foods Co. | | | 388,800 |
| 8,100 | | General Mills, Inc. | | | 533,952 |
| 25,300 | | Kellogg Co. | | | 1,303,962 |
| 63,130 | | Kraft Foods, Inc. (Class A Stock) | | | 1,737,337 |
| 49,600 | | Sara Lee Corp. | | | 559,984 |
| 20,900 | | Tyson Foods, Inc. (Class A Stock) | | | 261,668 |
| | | | | |
| | | | | 6,083,654 |
|
Household Products 2.4% |
| 6,000 | | Clorox Co. | | | 355,380 |
| 8,270 | | Colgate-Palmolive Co. | | | 650,270 |
| 17,700 | | Kimberly-Clark Corp. | | | 1,082,532 |
| 90,964 | | Procter & Gamble Co. | | | 5,275,912 |
| | | | | |
| | | | | 7,364,094 |
|
Personal Products 0.2% |
| 11,500 | | Avon Products, Inc. | | | 368,575 |
| 16,400 | | Prestige Brands Holdings, Inc.(a) | | | 110,864 |
| | | | | |
| | | | | 479,439 |
|
Tobacco 1.6% |
| 64,400 | | Altria Group, Inc. | | | 1,166,284 |
| 2,500 | | Lorillard, Inc. | | | 194,300 |
| 50,300 | | Philip Morris International, Inc. | | | 2,382,208 |
| 27,400 | | Reynolds American, Inc. | | | 1,328,352 |
| | | | | |
| | | | | 5,071,144 |
See Notes to Financial Statements.
| | |
| Dryden Large-Cap Core Equity Fund | | 13 |
Portfolio of Investments
as of October 31, 2009 continued
| | | | | |
| Shares | | Description | | Value (Note 1) |
| | | | | |
ENERGY 12.0% |
|
Energy Equipment & Services 0.9% |
| 6,200 | | Diamond Offshore Drilling, Inc. | | $ | 590,550 |
| 13,800 | | FMC Technologies, Inc.(a) | | | 725,880 |
| 2,700 | | Halliburton Co. | | | 78,867 |
| 26,400 | | Helix Energy Solutions Group, Inc.(a) | | | 362,472 |
| 3,900 | | National Oilwell Varco, Inc.(a) | | | 159,861 |
| 16,400 | | Schlumberger Ltd. | | | 1,020,080 |
| | | | | |
| | | | | 2,937,710 |
|
Oil, Gas & Consumable Fuels 11.1% |
| 28,700 | | Anadarko Petroleum Corp.(b) | | | 1,748,691 |
| 2,900 | | Apache Corp. | | | 272,948 |
| 8,900 | | Berry Petroleum Co. (Class A Stock) | | | 225,704 |
| 73,200 | | Chesapeake Energy Corp. | | | 1,793,400 |
| 77,784 | | Chevron Corp. | | | 5,953,587 |
| 56,100 | | ConocoPhillips | | | 2,815,098 |
| 3,200 | | Consol Energy, Inc. | | | 136,992 |
| 21,100 | | Devon Energy Corp. | | | 1,365,381 |
| 11,700 | | El Paso Corp. | | | 114,777 |
| 156,674 | | Exxon Mobil Corp. | | | 11,228,826 |
| 10,200 | | Hess Corp. | | | 558,348 |
| 67,800 | | Marathon Oil Corp. | | | 2,167,566 |
| 19,000 | | Murphy Oil Corp. | | | 1,161,660 |
| 23,900 | | Occidental Petroleum Corp. | | | 1,813,532 |
| 12,900 | | Peabody Energy Corp. | | | 510,711 |
| 14,500 | | Southwestern Energy Co.(a) | | | 631,910 |
| 65,000 | | Spectra Energy Corp. | | | 1,242,800 |
| 19,000 | | Williams Cos., Inc. (The) | | | 358,150 |
| 2,200 | | World Fuel Services Corp. | | | 111,870 |
| 9,600 | | XTO Energy, Inc. | | | 398,976 |
| | | | | |
| | | | | 34,610,927 |
FINANCIALS 12.9% |
|
Capital Markets 2.7% |
| 20,200 | | Ameriprise Financial, Inc. | | | 700,334 |
| 2,600 | | Fifth Street Finance Corp. | | | 25,558 |
| 4,200 | | Franklin Resources, Inc. | | | 439,446 |
| 22,380 | | Goldman Sachs Group, Inc. (The) | | | 3,808,405 |
| 11,200 | | Invesco Ltd.(b) | | | 236,880 |
| 42,800 | | Janus Capital Group, Inc.(b) | | | 561,536 |
| 36,500 | | Morgan Stanley | | | 1,172,380 |
See Notes to Financial Statements.
| | |
| 14 | | Visit our website at www.jennisondryden.com |
| | | | | |
| Shares | | Description | | Value (Note 1) |
| | | | | |
FINANCIALS (Continued) |
|
Capital Markets (cont’d.) |
| 7,000 | | PennantPark Investment Corp. | | $ | 54,110 |
| 23,800 | | State Street Corp. | | | 999,124 |
| 10,300 | | T. Rowe Price Group, Inc. | | | 501,919 |
| | | | | |
| | | | | 8,499,692 |
|
Commercial Banks 1.4% |
| 8,400 | | BB&T Corp. | | | 200,844 |
| 77,700 | | Huntington Bancshares, Inc.(b) | | | 296,037 |
| 13,200 | | PNC Financial Services Group, Inc.(b) | | | 646,008 |
| 31,900 | | Regions Financial Corp. | | | 154,396 |
| 5,191 | | U.S. Bancorp | | | 120,535 |
| 102,564 | | Wells Fargo & Co. | | | 2,822,561 |
| | | | | |
| | | | | 4,240,381 |
|
Consumer Finance 1.2% |
| 70,800 | | American Express Co. | | | 2,466,672 |
| 31,300 | | Capital One Financial Corp. | | | 1,145,580 |
| 3,300 | | World Acceptance Corp.(a)(b) | | | 82,797 |
| | | | | |
| | | | | 3,695,049 |
|
Diversified Financial Services 4.0% |
| 280,168 | | Bank of America Corp. | | | 4,084,850 |
| 450,100 | | Citigroup, Inc. | | | 1,840,909 |
| 157,500 | | JPMorgan Chase & Co. | | | 6,578,775 |
| 6,700 | | PHH Corp.(a) | | | 108,272 |
| | | | | |
| | | | | 12,612,806 |
|
Insurance 2.9% |
| 24,200 | | Aflac, Inc. | | | 1,004,058 |
| 2,600 | | Allied World Assurance Co. Holdings Ltd. | | | 116,376 |
| 24,000 | | Allstate Corp. (The) | | | 709,680 |
| 14,500 | | American Equity Investment Life Holding Co. | | | 95,265 |
| 2,300 | | Argo Group International Holdings Ltd.(a) | | | 78,108 |
| 15,800 | | Chubb Corp. (The) | | | 766,616 |
| 14,400 | | Delphi Financial Group, Inc. (Class A Stock) | | | 312,480 |
| 9,300 | | Endurance Specialty Holdings Ltd. | | | 334,707 |
| 5,400 | | Flagstone Reinsurance Holdings Ltd. | | | 59,130 |
| 30,200 | | Hartford Financial Services Group, Inc. | | | 740,504 |
| 17,100 | | Lincoln National Corp. | | | 407,493 |
| 36,500 | | MetLife, Inc. | | | 1,242,095 |
See Notes to Financial Statements.
| | |
| Dryden Large-Cap Core Equity Fund | | 15 |
Portfolio of Investments
as of October 31, 2009 continued
| | | | | |
| Shares | | Description | | Value (Note 1) |
| | | | | |
FINANCIALS (Continued) |
|
Insurance (cont’d.) |
| 9,400 | | Montpelier Re Holdings Ltd. | | $ | 151,904 |
| 8,100 | | Principal Financial Group, Inc. | | | 202,824 |
| 19,100 | | Protective Life Corp. | | | 367,675 |
| 1,800 | | Torchmark Corp. | | | 73,080 |
| 22,797 | | Travelers Cos., Inc. (The) | | | 1,135,063 |
| 68,700 | | Unum Group | | | 1,370,565 |
| | | | | |
| | | | | 9,167,623 |
|
Real Estate Investment Trusts 0.6% |
| 8,500 | | Annaly Capital Management, Inc. | | | 143,735 |
| 45,100 | | CBL & Associates Properties, Inc. | | | 368,016 |
| 33,200 | | Colonial Properties Trust(b) | | | 349,596 |
| 51,000 | | Host Hotels & Resorts, Inc.(b) | | | 515,610 |
| 77,000 | | MFA Financial, Inc. | | | 571,340 |
| 3,100 | | ProLogis(b) | | | 35,123 |
| | | | | |
| | | | | 1,983,420 |
|
Thrifts & Mortgage Finance 0.1% |
| 12,900 | | Astoria Financial Corp.(b) | | | 128,742 |
| 7,700 | | Dime Community Bancshares, Inc. | | | 84,623 |
| | | | | |
| | | | | 213,365 |
HEALTHCARE 13.9% |
|
Biotechnology 0.8% |
| 30,100 | | Amgen, Inc.(a) | | | 1,617,273 |
| 17,400 | | Biogen Idec, Inc.(a) | | | 733,062 |
| | | | | |
| | | | | 2,350,335 |
|
Healthcare Equipment & Supplies 3.0% |
| 26,700 | | American Medical Systems Holdings, Inc.(a)(b) | | | 411,714 |
| 12,300 | | Baxter International, Inc. | | | 664,938 |
| 12,600 | | Becton Dickinson and Co. | | | 861,336 |
| 1,600 | | C.R. Bard, Inc. | | | 120,112 |
| 67,400 | | CareFusion Corp.(a) | | | 1,507,738 |
| 24,800 | | Hospira, Inc.(a) | | | 1,107,072 |
| 7,300 | | Intuitive Surgical, Inc.(a) | | | 1,798,355 |
| 80,900 | | Medtronic, Inc. | | | 2,888,130 |
| 5,100 | | Quidel Corp.(a) | | | 72,930 |
| 1,500 | | STERIS Corp. | | | 43,890 |
| | | | | |
| | | | | 9,476,215 |
See Notes to Financial Statements.
| | |
| 16 | | Visit our website at www.jennisondryden.com |
| | | | | |
| Shares | | Description | | Value (Note 1) |
| | | | | |
HEALTHCARE (Continued) |
|
Healthcare Providers & Services 2.6% |
| 7,300 | | Aetna, Inc. | | $ | 190,019 |
| 24,000 | | Coventry Health Care, Inc.(a) | | | 475,920 |
| 5,900 | | Express Scripts, Inc.(a) | | | 471,528 |
| 4,100 | | Lincare Holdings, Inc.(a)(b) | | | 128,781 |
| 27,000 | | Medco Health Solutions, Inc.(a) | | | 1,515,240 |
| 15,300 | | Quest Diagnostics, Inc. | | | 855,729 |
| 85,600 | | UnitedHealth Group, Inc. | | | 2,221,320 |
| 50,400 | | WellPoint, Inc.(a) | | | 2,356,704 |
| | | | | |
| | | | | 8,215,241 |
|
Healthcare Technology |
| 1,300 | | Computer Programs & Systems, Inc. | | | 54,912 |
|
Life Sciences Tools & Services 1.2% |
| 4,300 | | Mettler-Toledo International, Inc.(a) | | | 419,250 |
| 5,200 | | Millipore Corp.(a)(b) | | | 348,452 |
| 47,700 | | Thermo Fisher Scientific, Inc.(a) | | | 2,146,500 |
| 12,200 | | Waters Corp.(a) | | | 700,646 |
| | | | | |
| | | | | 3,614,848 |
|
Pharmaceuticals 6.3% |
| 24,300 | | Abbott Laboratories | | | 1,228,851 |
| 39,200 | | Allergan, Inc. | | | 2,205,000 |
| 135,500 | | Bristol-Myers Squibb Co. | | | 2,953,900 |
| 26,100 | | Eli Lilly & Co. | | | 887,661 |
| 9,900 | | Forest Laboratories, Inc.(a) | | | 273,933 |
| 93,599 | | Johnson & Johnson | | | 5,527,021 |
| 47,400 | | Merck & Co., Inc.(b) | | | 1,466,082 |
| 70,400 | | Mylan, Inc.(a)(b) | | | 1,143,296 |
| 195,234 | | Pfizer, Inc. | | | 3,324,835 |
| 15,700 | | Watson Pharmaceuticals, Inc.(a)(b) | | | 540,394 |
| | | | | |
| | | | | 19,550,973 |
INDUSTRIALS 9.0% |
|
Aerospace & Defense 3.2% |
| 7,300 | | Alliant Techsystems, Inc.(a)(b) | | | 567,794 |
| 10,600 | | Boeing Co. (The) | | | 506,680 |
| 10,900 | | DynCorp International, Inc. (Class A Stock)(a) | | | 185,300 |
| 34,200 | | General Dynamics Corp. | | | 2,144,340 |
See Notes to Financial Statements.
| | |
| Dryden Large-Cap Core Equity Fund | | 17 |
Portfolio of Investments
as of October 31, 2009 continued
| | | | | |
| Shares | | Description | | Value (Note 1) |
| | | | | |
INDUSTRIALS (Continued) |
|
Aerospace & Defense (cont’d.) |
| 13,600 | | Honeywell International, Inc. | | $ | 488,104 |
| 12,100 | | L-3 Communications Holdings, Inc. | | | 874,709 |
| 7,900 | | Lockheed Martin Corp. | | | 543,441 |
| 35,100 | | Northrop Grumman Corp. | | | 1,759,563 |
| 47,400 | | Raytheon Co. | | | 2,146,272 |
| 6,400 | | Teledyne Technologies, Inc.(a) | | | 218,624 |
| 10,200 | | United Technologies Corp. | | | 626,790 |
| | | | | |
| | | | | 10,061,617 |
|
Air Freight & Logistics 1.6% |
| 16,200 | | C.H. Robinson Worldwide, Inc. | | | 892,782 |
| 22,700 | | FedEx Corp.(b) | | | 1,650,063 |
| 47,300 | | United Parcel Service, Inc. (Class B Stock) | | | 2,539,064 |
| | | | | |
| | | | | 5,081,909 |
|
Airlines |
| 10,400 | | Hawaiian Holdings, Inc.(a) | | | 73,736 |
|
Commercial Services & Supplies 0.3% |
| 3,200 | | Avery Dennison Corp. | | | 114,080 |
| 24,600 | | Waste Management, Inc.(b) | | | 735,048 |
| | | | | |
| | | | | 849,128 |
|
Electrical Equipment 0.1% |
| 10,000 | | Emerson Electric Co. | | | 377,500 |
|
Industrial Conglomerates 2.0% |
| 30,900 | | 3M Co. | | | 2,273,313 |
| 270,800 | | General Electric Co. | | | 3,861,608 |
| 6,700 | | McDermott International, Inc.(a) | | | 148,941 |
| | | | | |
| | | | | 6,283,862 |
|
Machinery 0.8% |
| 8,700 | | Colfax Corp.(a) | | | 94,656 |
| 15,400 | | Danaher Corp. | | | 1,050,742 |
| 2,500 | | Dover Corp. | | | 94,200 |
| 4,100 | | Flowserve Corp. | | | 402,661 |
| 18,800 | | Illinois Tool Works, Inc. | | | 863,296 |
| 3,500 | | Oshkosh Corp. | | | 109,410 |
| | | | | |
| | | | | 2,614,965 |
See Notes to Financial Statements.
| | |
| 18 | | Visit our website at www.jennisondryden.com |
| | | | | |
| Shares | | Description | | Value (Note 1) |
| | | | | |
INDUSTRIALS (Continued) |
|
Professional Services |
| 5,200 | | Equifax, Inc. | | $ | 142,376 |
|
Road & Rail 0.7% |
| 16,900 | | CSX Corp. | | | 712,842 |
| 7,800 | | Ryder System, Inc. | | | 316,290 |
| 20,300 | | Union Pacific Corp. | | | 1,119,342 |
| | | | | |
| | | | | 2,148,474 |
|
Trading Companies & Distributors 0.3% |
| 7,100 | | W.W. Grainger, Inc.(b) | | | 665,483 |
| 12,400 | | WESCO International, Inc.(a) | | | 316,944 |
| | | | | |
| | | | | 982,427 |
INFORMATION TECHNOLOGY 20.2% |
|
Communications Equipment 2.2% |
| 237,050 | | Cisco Systems, Inc.(a) | | | 5,416,593 |
| 7,100 | | Harris Corp. | | | 296,212 |
| 40,300 | | Motorola, Inc. | | | 345,371 |
| 16,000 | | QUALCOMM, Inc. | | | 662,560 |
| | | | | |
| | | | | 6,720,736 |
|
Computers & Peripherals 7.1% |
| 32,790 | | Apple, Inc.(a) | | | 6,180,914 |
| 66,100 | | Dell, Inc.(a) | | | 957,789 |
| 128,700 | | EMC Corp.(a) | | | 2,119,689 |
| 87,325 | | Hewlett-Packard Co. | | | 4,144,444 |
| 51,470 | | International Business Machines Corp. | | | 6,207,796 |
| 2,400 | | NetApp, Inc.(a) | | | 64,920 |
| 5,800 | | Novatel Wireless, Inc.(a) | | | 51,736 |
| 40,900 | | Seagate Technology | | | 570,555 |
| 50,900 | | Western Digital Corp.(a)(b) | | | 1,714,312 |
| | | | | |
| | | | | 22,012,155 |
|
Electronic Equipment & Instruments 0.8% |
| 74,700 | | Corning, Inc. | | | 1,091,367 |
| 107,800 | | Jabil Circuit, Inc. | | | 1,442,364 |
| 2,500 | | Tech Data Corp.(a) | | | 96,075 |
| | | | | |
| | | | | 2,629,806 |
See Notes to Financial Statements.
| | |
| Dryden Large-Cap Core Equity Fund | | 19 |
Portfolio of Investments
as of October 31, 2009 continued
| | | | | |
| Shares | | Description | | Value (Note 1) |
| | | | | |
INFORMATION TECHNOLOGY (Continued) |
|
Internet Software & Services 2.0% |
| 4,200 | | DealerTrack Holdings, Inc.(a) | | $ | 69,216 |
| 76,500 | | eBay, Inc.(a) | | | 1,703,655 |
| 8,000 | | Google, Inc. (Class A Stock)(a) | | | 4,288,960 |
| 6,100 | | j2 Global Communications, Inc.(a) | | | 124,745 |
| | | | | |
| | | | | 6,186,576 |
|
IT Services 1.6% |
| 600 | | Computer Sciences Corp.(a) | | | 30,426 |
| 64,000 | | Convergys Corp.(a) | | | 694,400 |
| 1,300 | | DST Systems, Inc.(a) | | | 54,223 |
| 9,300 | | Fiserv, Inc.(a) | | | 426,591 |
| 9,300 | | Mastercard, Inc. (Class A Stock)(b) | | | 2,036,886 |
| 95,100 | | Western Union Co. (The) | | | 1,727,967 |
| | | | | |
| | | | | 4,970,493 |
|
Semiconductors & Semiconductor Equipment 3.4% |
| 26,300 | | Broadcom Corp. (Class A Stock)(a)(b) | | | 699,843 |
| 269,000 | | Intel Corp. | | | 5,140,590 |
| 30,600 | | Linear Technology Corp. | | | 791,928 |
| 17,400 | | Marvell Technology Group Ltd.(a) | | | 238,728 |
| 75,400 | | NVIDIA Corp.(a) | | | 901,784 |
| 11,800 | | Semtech Corp.(a) | | | 182,546 |
| 109,000 | | Texas Instruments, Inc. | | | 2,556,050 |
| | | | | |
| | | | | 10,511,469 |
|
Software 3.1% |
| 46,700 | | Adobe Systems, Inc.(a) | | | 1,538,298 |
| 38,700 | | Autodesk, Inc.(a) | | | 964,791 |
| 5,500 | | BMC Software, Inc.(a) | | | 204,380 |
| 3,600 | | CA, Inc. | | | 75,312 |
| 6,300 | | Interactive Intelligence, Inc.(a) | | | 105,651 |
| 12,600 | | McAfee, Inc.(a) | | | 527,688 |
| 180,700 | | Microsoft Corp. | | | 5,010,811 |
| 12,800 | | Novell, Inc.(a) | | | 52,352 |
| 52,800 | | Oracle Corp. | | | 1,114,080 |
| 8,200 | | Symantec Corp.(a) | | | 144,156 |
| | | | | |
| | | | | 9,737,519 |
See Notes to Financial Statements.
| | |
| 20 | | Visit our website at www.jennisondryden.com |
| | | | | |
| Shares | | Description | | Value (Note 1) |
| | | | | |
MATERIALS 3.5% |
|
Chemicals 1.2% |
| 12,300 | | Air Products & Chemicals, Inc. | | $ | 948,699 |
| 36,700 | | E.I. du Pont de Nemours & Co. | | | 1,167,794 |
| 10,500 | | Eastman Chemical Co. | | | 551,355 |
| 5,100 | | Ecolab, Inc. | | | 224,196 |
| 3,700 | | Mosaic Co. (The) | | | 172,901 |
| 6,200 | | Praxair, Inc. | | | 492,528 |
| 3,400 | | Spartech Corp. | | | 32,538 |
| | | | | |
| | | | | 3,590,011 |
|
Containers & Packaging 0.5% |
| 1,400 | | Owens-Illinois, Inc.(a) | | | 44,632 |
| 60,700 | | Pactiv Corp.(a) | | | 1,401,563 |
| | | | | |
| | | | | 1,446,195 |
|
Metals & Mining 1.4% |
| 34,500 | | Freeport-McMoRan Copper & Gold, Inc.(a) | | | 2,530,920 |
| 11,600 | | Newmont Mining Corp. | | | 504,136 |
| 33,500 | | Southern Copper Corp. | | | 1,055,250 |
| 6,800 | | Walter Energy, Inc. | | | 397,800 |
| | | | | |
| | | | | 4,488,106 |
|
Paper & Forest Products 0.4% |
| 54,100 | | MeadWestvaco Corp. | | | 1,235,103 |
TELECOMMUNICATION SERVICES 3.1% |
|
Diversified Telecommunication Services 3.1% |
| 229,868 | | AT&T, Inc. | | | 5,900,712 |
| 35,200 | | CenturyTel, Inc. | | | 1,142,592 |
| 86,800 | | Verizon Communications, Inc. | | | 2,568,412 |
| 18,500 | | Windstream Corp. | | | 178,340 |
| | | | | |
| | | | | 9,790,056 |
|
Wireless Telecommunication Services |
| 4,000 | | NII Holdings, Inc.(a) | | | 107,720 |
UTILITIES 2.7% |
|
Electric Utilities 1.4% |
| 43,700 | | American Electric Power Co., Inc. | | | 1,320,614 |
| 37,300 | | Duke Energy Corp.(b) | | | 590,086 |
See Notes to Financial Statements.
| | |
| Dryden Large-Cap Core Equity Fund | | 21 |
Portfolio of Investments
as of October 31, 2009 continued
| | | | | |
| Shares | | Description | | Value (Note 1) |
| | | | | |
UTILITIES (Continued) |
|
Electric Utilities (cont’d.) |
| 36,900 | | Edison International | | $ | 1,174,158 |
| 6,100 | | Exelon Corp. | | | 286,456 |
| 11,700 | | FPL Group, Inc. | | | 574,470 |
| 22,000 | | Pepco Holdings, Inc. | | | 328,460 |
| 4,100 | | Pinnacle West Capital Corp. | | | 128,412 |
| | | | | |
| | | | | 4,402,656 |
|
Gas Utilities 0.1% |
| 14,400 | | UGI Corp. | | | 343,872 |
|
Independent Power Producers & Energy Traders 0.5% |
| 6,000 | | AES Corp. (The)(a) | | | 78,420 |
| 50,500 | | Constellation Energy Group, Inc. | | | 1,561,460 |
| | | | | |
| | | | | 1,639,880 |
|
Multi-Utilities 0.6% |
| 10,200 | | CMS Energy Corp.(b) | | | 135,660 |
| 9,700 | | Integrys Energy Group, Inc. | | | 335,620 |
| 28,700 | | Public Service Enterprise Group, Inc. | | | 855,260 |
| 8,600 | | Sempra Energy | | | 442,470 |
| | | | | |
| | | | | 1,769,010 |
|
Water Utilities 0.1% |
| 14,100 | | American Water Works Co., Inc. | | | 267,477 |
| | | | | |
| | Total long-term investments
(cost $252,394,046) | | | 306,785,938 |
| | | | | |
| |
Principal
Amount (000) | | |
SHORT-TERM INVESTMENTS 10.4% |
|
United States Government Security 0.3% |
| $941 | | United States Treasury Bill,
0.23%, 12/17/09(c)(d)
(cost $940,731) | | | 940,953 |
| | | | | |
See Notes to Financial Statements.
| | |
| 22 | | Visit our website at www.jennisondryden.com |
| | | | | | |
| Shares | | Description | | Value (Note 1) | |
| | | | | | |
SHORT-TERM INVESTMENTS (Continued) | | | | |
|
Affiliated Money Market Mutual Fund 10.1% | |
| 31,455,639 | | Dryden Core Investment Fund—Taxable Money Market Series
(cost $31,455,639; includes $22,565,273 of cash collateral received for securities on loan) (Note 3)(e)(f) | | $ | 31,455,639 | |
| | | | | | |
| | Total short-term investments
(cost $32,396,370) | | | 32,396,592 | |
| | | | | | |
| | Total Investments 108.8%
(cost $284,790,416; Note 5) | | | 339,182,530 | |
| | Liabilities in excess of other assets(g) (8.8%) | | | (27,338,607 | ) |
| | | | | | |
| | Net Assets 100.0% | | $ | 311,843,923 | |
| | | | | | |
| (a) | Non-income producing security. |
| (b) | All or a portion of a security on loan. The aggregate market value of such securities is $21,234,713; cash collateral of $22,565,273 (included in liabilities) was received with which the Fund purchased highly liquid short-term investments. |
| (c) | All or a portion of security segregated as collateral for financial futures contracts. |
| (d) | Rate quoted represents yield-to-maturity as of purchase date. |
| (e) | Represents security, or portion thereof, purchased with the cash collateral received for securities on loan. |
| (f) | Prudential Investments LLC, the manager of the Fund, also serves as manager of the Dryden Core Investment Fund—Taxable Money Market Series. |
| (g) | Liabilities in excess of other assets include net unrealized depreciation of financial futures as follows: |
Open futures contracts outstanding at October 31, 2009:
| | | | | | | | | | | | | | |
Number of
Contracts | | Type | | Expiration
Date | | Value at
October 31,
2009 | | Value at
Trade
Date | | Unrealized
Depreciation | |
| | Long Position: | | | | | | | | | | | | |
| 12 | | S&P 500 Index | | Dec. 2009 | | $ | 3,099,000 | | $ | 3,102,825 | | $ | (3,825 | ) |
| | | | | | | | | | | | | | |
Various inputs are used in determining the value of the Fund’s investments. These inputs are summarized in the three broad levels listed below.
Level 1—quoted prices in active markets for identical securities
Level 2—other significant observable inputs (including quoted prices for similar securities, interest rates, prepayment speeds, credit risk, etc.)
Level 3—significant unobservable inputs (including the Fund’s own assumptions in determining the fair value of investments)
See Notes to Financial Statements.
| | |
| Dryden Large-Cap Core Equity Fund | | 23 |
Portfolio of Investments
as of October 31, 2009 continued
The following is a summary of the inputs used as of October 31, 2009 in valuing the Fund’s assets carried at fair value:
| | | | | | | | | | |
| | | Level 1 | | | Level 2 | | Level 3 |
Investments in Securities | | | | | | | | | | |
Common Stocks | | $ | 306,785,938 | | | $ | — | | $ | — |
United States Government Security | | | — | | | | 940,953 | | | — |
Affiliated Money Market Mutual Fund | | | 31,455,639 | | | | — | | | — |
| | | | | | | | | | |
| | | 338,241,577 | | | | 940,953 | | | — |
Other Financial Instruments* | | | (3,825 | ) | | | — | | | — |
| | | | | | | | | | |
Total | | $ | 338,237,752 | | | $ | 940,953 | | $ | — |
| | | | | | | | | | |
| * | Other financial instruments are derivative instruments not reflected in the Portfolio of Investments, such as futures, forwards and swap contracts, which are valued at the unrealized appreciation/depreciation on the instrument. |
As of October 31, 2008 and October 31, 2009, the Fund did not use any significant unobservable inputs (Level 3) in determining the value of investments.
The industry classification of portfolio holdings and liabilities in excess of other assets shown as a percentage of net assets as of October 31, 2009 was as follows:
| | | |
Information Technology | | 20.2 | % |
Healthcare | | 13.9 | |
Financials | | 12.9 | |
Energy | | 12.0 | |
Consumer Staples | | 11.3 | |
Affiliated Money Market Mutual Fund (including 7.2% of collateral received for securities on loan) | | 10.1 | |
Consumer Discretionary | | 9.8 | |
Industrials | | 9.0 | |
Materials | | 3.5 | |
Telecommunication Services | | 3.1 | |
Utilities | | 2.7 | |
United States Government Security | | 0.3 | |
| | | |
| | 108.8 | |
Liabilities in excess of other assets | | (8.8 | ) |
| | | |
| | 100.0 | % |
| | | |
See Notes to Financial Statements.
| | |
| 24 | | Visit our website at www.jennisondryden.com |
The Fund invested in derivative instruments during the reporting period. The primary types of risk associated with these derivative instruments are commodity risk, credit risk, equity risk, foreign exchange risk and interest rate risk. The effect of such derivative instruments on the Fund's financial position and financial performance as reflected in the Statement of Assets and Liabilities and Statement of Operations is presented in the summary below.
Fair values of derivative instruments as of October 31, 2009 as presented in the Statement of Assets and Liabilities:
| | | | | | | | | | | |
Derivatives not designated as hedging
instruments, carried at fair value | | Asset Derivatives | | Liability Derivatives | |
| | Balance
Sheet Location | | Fair Value | | Balance
Sheet Location | | Fair Value | |
Equity contracts | | — | | $ | — | | Due to broker-
variation margin | | $ | 3,825 | * |
| | | | | | | | | | | |
| * | Includes cumulative appreciation/depreciation on futures contracts as reported in the Portfolio of Investments. Only unsettled variation margin receivable (payable) is reported within the Statement of Assets and Liabilities. |
The effects of derivative instruments on the Statement of Operations for the year ended October 31, 2009 are as follows:
| | | |
Amount of Realized Gain or (Loss) on Derivatives Recognized in Income |
Derivatives not designated as hedging instruments, carried at fair value | | Futures |
Equity contracts | | $ | 644,280 |
| | | |
| | | | |
Change in Unrealized Appreciation or (Depreciation) on Derivatives Recognized in Income | |
Derivatives not designated as hedging instruments, carried at fair value | | Futures | |
Equity contracts | | $ | (188,450 | ) |
| | | | |
For the year ended October 31, 2009, the Fund’s average volume of derivative activities is as follows:
| | | |
| | | Futures
Long Position |
| | $ | 2,811,760 |
| | | |
See Notes to Financial Statements.
| | |
| Dryden Large-Cap Core Equity Fund | | 25 |
Statement of Assets and Liabilities
as of October 31, 2009
| | | | |
Assets | | | | |
Investments at value, including securities on loan of $21,234,713: | | | | |
Unaffiliated investments (cost $253,334,777) | | $ | 307,726,891 | |
Affiliated investments (cost $31,455,639) | | | 31,455,639 | |
Cash | | | 161,089 | |
Receivable for investments sold | | | 11,304,984 | |
Receivable for Fund shares sold | | | 1,333,779 | |
Dividends and interest receivable | | | 342,669 | |
Prepaid expenses | | | 4,500 | |
| | | | |
Total assets | | | 352,329,551 | |
| | | | |
| |
Liabilities | | | | |
Payable to broker for collateral for securities on loan (Note 3) | | | 22,565,273 | |
Payable for investments purchased | | | 17,013,472 | |
Payable for Fund shares reacquired | | | 282,328 | |
Accrued expenses | | | 271,199 | |
Management fee payable | | | 171,090 | |
Due to broker—variation margin | | | 81,900 | |
Distribution fee payable | | | 54,136 | |
Affiliated transfer agent fee payable | | | 41,021 | |
Deferred trustees’ fees | | | 5,209 | |
| | | | |
Total liabilities | | | 40,485,628 | |
| | | | |
| |
Net Assets | | $ | 311,843,923 | |
| | | | |
| | | | | |
Net assets were comprised of: | | | | |
Shares of beneficial interest, at par | | $ | 31,984 | |
Paid-in capital in excess of par | | | 338,567,175 | |
| | | | |
| | | 338,599,159 | |
Undistributed net investment income | | | 1,217,956 | |
Accumulated net realized loss on investment and financial futures transactions | | | (82,361,481 | ) |
Net unrealized appreciation on investments | | | 54,388,289 | |
| | | | |
Net assets, October 31, 2009 | | $ | 311,843,923 | |
| | | | |
See Notes to Financial Statements.
| | |
| 26 | | Visit our website at www.jennisondryden.com |
| | | |
Class A | | | |
Net asset value and redemption price per share
($62,739,047 ÷ 6,458,726 shares of beneficial interest issued and outstanding) | | $ | 9.71 |
Maximum sales charge (5.50% of offering price) | | | .57 |
| | | |
Maximum offering price to public | | $ | 10.28 |
| | | |
| |
Class B | | | |
Net asset value, offering price and redemption price per share
($6,555,202 ÷ 707,727 shares of beneficial interest issued and outstanding) | | $ | 9.26 |
| | | |
| |
Class C | | | |
Net asset value, offering price and redemption price per share
($24,600,903 ÷ 2,655,460 shares of beneficial interest issued and outstanding) | | $ | 9.26 |
| | | |
| |
Class L | | | |
Net asset value, offering price and redemption price per share
($4,859,834 ÷ 500,775 shares of beneficial interest issued and outstanding) | | $ | 9.70 |
| | | |
| |
Class M | | | |
Net asset value, offering price and redemption price per share
($8,052,320÷ 869,147 shares of beneficial interest issued and outstanding) | | $ | 9.26 |
| | | |
| |
Class X | | | |
Net asset value, offering price and redemption price per share
($2,096,134 ÷ 223,073 shares of beneficial interest issued and outstanding) | | $ | 9.40 |
| | | |
| |
Class Z | | | |
Net asset value, offering price and redemption price per share
($202,940,483 ÷ 20,568,760 shares of beneficial interest issued and outstanding) | | $ | 9.87 |
| | | |
See Notes to Financial Statements.
| | |
| Dryden Large-Cap Core Equity Fund | | 27 |
Statement of Operations
Year Ended October 31, 2009
| | | | |
Net Investment Income | | | | |
Income | | | | |
Unaffiliated dividends (net of foreign withholding taxes of $330) | | $ | 4,736,339 | |
Affiliated income from securities loaned, net | | | 106,028 | |
Affiliated dividend income | | | 40,269 | |
Interest | | | 1,517 | |
| | | | |
Total income | | | 4,884,153 | |
| | | | |
| |
Expenses | | | | |
Management fee | | | 1,286,366 | |
Distribution fee—Class A | | | 175,726 | |
Distribution fee—Class B | | | 69,114 | |
Distribution fee—Class C | | | 247,138 | |
Distribution fee—Class L | | | 24,825 | |
Distribution fee—Class M | | | 103,848 | |
Distribution fee—Class X | | | 5,613 | |
Transfer agent’s fees and expenses (including affiliated expenses of $165,700) (Note 3) | | | 497,000 | |
Legal fees and expenses | | | 370,000 | |
Registration fees | | | 110,000 | |
Custodian’s fees and expenses | | | 75,000 | |
Reports to shareholders | | | 64,000 | |
Audit fee | | | 21,000 | |
Trustees’ fees | | | 19,000 | |
Insurance | | | 5,000 | |
Miscellaneous | | | 27,985 | |
| | | | |
Total expenses | | | 3,101,615 | |
| | | | |
Net investment income | | | 1,782,538 | |
| | | | |
| |
Realized And Unrealized Gain (Loss) On Investments | | | | |
Net realized gain (loss) on: | | | | |
Investment transactions | | | (45,482,218 | ) |
Financial futures transactions | | | 644,280 | |
| | | | |
| | | (44,837,938 | ) |
| | | | |
Net change in unrealized appreciation (depreciation) on: | | | | |
Investments | | | 63,070,908 | |
Financial futures contracts | | | (188,450 | ) |
| | | | |
| | | 62,882,458 | |
| | | | |
Net gain on investments | | | 18,044,520 | |
| | | | |
Net Increase In Net Assets Resulting From Operations | | $ | 19,827,058 | |
| | | | |
See Notes to Financial Statements.
| | |
| 28 | | Visit our website at www.jennisondryden.com |
Statement of Changes in Net Assets
| | | | | | | | |
| | | Year Ended October 31, | |
| | | 2009 | | | 2008 | |
Increase (Decrease) In Net Assets | | | | | | | | |
Operations | | | | | | | | |
Net investment income | | $ | 1,782,538 | | | $ | 1,474,307 | |
Net realized loss on investment transactions | | | (44,837,938 | ) | | | (16,530,832 | ) |
Net change in unrealized appreciation (depreciation) on investments | | | 62,882,458 | | | | (81,524,411 | ) |
| | | | | | | | |
Net increase (decrease) in net assets resulting from operations | | | 19,827,058 | | | | (96,580,936 | ) |
| | | | | | | | |
| | |
Dividends from net investment income (Note 1) | | | | | | | | |
Class A | | | (702,987 | ) | | | (822,096 | ) |
Class B | | | (21,934 | ) | | | (17,208 | ) |
Class C | | | (71,581 | ) | | | (43,824 | ) |
Class L | | | (48,001 | ) | | | (68,350 | ) |
Class M | | | (34,939 | ) | | | (31,326 | ) |
Class X | | | (28,874 | ) | | | (21,753 | ) |
Class Z | | | (603,191 | ) | | | (227,524 | ) |
| | | | | | | | |
| | | (1,511,507 | ) | | | (1,232,081 | ) |
| | | | | | | | |
| | |
Capital contributions | | | | | | | | |
Class X | | | 2,969 | | | | 6,011 | |
| | | | | | | | |
| | |
Fund share transactions (Net of share conversions) (Note 6) | | | | | | | | |
Net proceeds from shares sold | | | 186,704,787 | | | | 57,343,679 | |
Net asset value of shares issued in reinvestment of dividends | | | 886,798 | | | | 1,123,511 | |
Cost of shares reacquired | | | (62,504,238 | ) | | | (69,840,426 | ) |
| | | | | | | | |
Net increase (decrease) in net assets from Fund share transactions | | | 125,087,347 | | | | (11,373,236 | ) |
| | | | | | | | |
Total increase (decrease) | | | 143,405,867 | | | | (109,180,242 | ) |
| | |
Net Assets | | | | | | | | |
Beginning of year | | | 168,438,056 | | | | 277,618,298 | |
| | | | | | | | |
End of year(a) | | $ | 311,843,923 | | | $ | 168,438,056 | |
| | | | | | | | |
(a) Includes undistributed net investment income of: | | $ | 1,217,956 | | | $ | 946,925 | |
| | | | | | | | |
See Notes to Financial Statements.
| | |
| Dryden Large-Cap Core Equity Fund | | 29 |
Notes to Financial Statements
Dryden Large-Cap Core Equity Fund (the “Fund”) is a series of Dryden Tax-Managed Funds (the “Trust”), which is registered under the Investment Company Act of 1940, as amended, as a diversified, open-end management investment company. The Trust was organized as a business trust in Delaware on September 18, 1998. The Fund commenced investment operations on March 3, 1999.
The Fund’s investment objective is to seek long-term after-tax growth of capital. It invests in a portfolio of equity-related securities, such as common stock and convertible securities of U.S. companies.
Note 1. Accounting Policies
The following is a summary of significant accounting policies followed by the Fund in the preparation of its financial statements.
Securities Valuation: Securities listed on a securities exchange (other than options on securities and indices) are valued at the last sale price on such exchange on the day of valuation or, if there was no sale on such day, at the mean between the last reported bid and asked prices, or at the last bid price on such day in the absence of an asked price. Securities traded via Nasdaq are valued at the Nasdaq official closing price (NOCP) on the day of valuation, or if there was no NOCP, at the last sale price. Securities that are actively traded in the over-the-counter market, including listed securities for which the primary market is believed by Prudential Investments LLC (“PI” or “Manager”), in consultation with the subadvisers, to be over-the-counter, are valued at market value using prices provided by an independent pricing agent or principal market maker. Options on securities and indices traded on an exchange are valued at the last sale price as of the close of trading on the applicable exchange or, if there was no sale, at the mean between the most recently quoted bid and asked prices on such exchange. Futures contracts and options thereon traded on a commodities exchange or board of trade are valued at the last sale price at the close of trading on such exchange or board of trade or, if there was no sale on the applicable commodities exchange or board of trade on such day, at the mean between the most recently quoted bid and asked prices on such exchange or board of trade or at the last bid price in the absence of an asked price. Prices may be obtained from independent pricing services which use information provided by market makers or estimates of market values obtained from yield data relating to investments or securities with similar characteristics. Securities for which reliable market quotations
| | |
| 30 | | Visit our website at www.jennisondryden.com |
are not readily available, or whose values have been affected by events occurring after the close of the security’s foreign market and before the Funds’ normal pricing time, are valued at fair value in accordance with the Board of Trustees approved fair valuation procedures. When determining the fair valuation of securities some of the factors influencing the valuation include, the nature of any restrictions on disposition of the securities; assessment of the general liquidity of the securities; the issuer’s financial condition and the markets in which it does business; the cost of the investment; the size of the holding and the capitalization of issuer; the prices of any recent transactions or bids/offers for such securities or any comparable securities; any available analyst media or other reports or information deemed reliable by the investment adviser regarding the issuer or the markets or industry in which it operates. Using fair value to price securities may result in a value that is different from a security’s most recent closing price and from the price used by other mutual funds to calculate their net asset values.
Investments in mutual funds are valued at their net asset value as of the close of the New York Stock Exchange on the date of valuation.
Short-term debt securities which mature in 60 days or less are valued at amortized cost, which approximates market value. The amortized cost method includes valuing a security at its cost on the date of purchase and thereafter assuming a constant amortization to maturity of the difference between the principal amount due at maturity and cost. Short-term debt securities which mature in more than 60 days are valued at current market quotations.
Securities Lending: The Fund may lend its portfolio securities to broker-dealers. The loans are secured by collateral at least equal at all times to the market value of the securities loaned. Loans are subject to termination at the option of the borrower or the Fund. Upon termination of the loan, the borrower will return to the Fund securities identical to the loaned securities. Should the borrower of the securities fail financially, the Fund has the right to repurchase the securities using the collateral in the open market. The Fund recognizes income, net of any rebate and securities lending agent fees, for lending its securities in the form of fees or interest on the investment of any cash received as collateral. The Fund also continues to receive interest and dividends or amounts equivalent thereto, on the securities loaned and recognizes any unrealized gain or loss in the market price of the securities loaned that may occur during the term of the loan.
Financial Futures Contracts: A financial futures contract is an agreement to purchase (long) or sell (short) an agreed amount of securities at a set price for delivery on a future date. Upon entering into a financial futures contract, the Fund is required to
| | |
| Dryden Large-Cap Core Equity Fund | | 31 |
Notes to Financial Statements
continued
pledge to the broker an amount of cash and/or other assets equal to a certain percentage of the contract amount. This amount is known as the “initial margin”. Subsequent payments, known as “variation margin”, are made or received by the Fund each day, depending on the daily fluctuations in the value of the underlying security. Such variation margin is recorded for financial statement purposes on a daily basis as unrealized gain or loss. When the contract expires or is closed, the gain or loss is realized and is presented in the Statement of Operations as net realized gain or loss on financial futures transactions.
The Fund invests in financial futures contracts in order to hedge its existing portfolio securities, or securities the Fund intends to purchase, against fluctuations in value caused by changes in prevailing interest rates, value of equities or foreign currency exchange rates. Should interest rates move unexpectedly, the Fund may not achieve the anticipated benefits of the financial futures contracts and may realize a loss. The use of futures transactions involves the risk of imperfect correlation in movements in the price of futures contracts, interest rates and the underlying hedged assets. Financial futures contracts involve elements of risk in excess of the amounts reflected on the Statement of Assets and Liabilities.
Securities Transactions and Net Investment Income: Securities transactions are recorded on the trade date. Realized gains or losses on sales of securities are calculated on an identified cost basis. Dividend income is recorded on the ex-dividend date and interest income, including amortization of premium and accretion of discount on debt securities, as required, is recorded on an accrual basis. Expenses are recorded on the accrual basis. Net investment income or loss (other than distribution fees which are charged directly to the respective class) and unrealized and realized gains or losses are allocated daily to each class of shares based upon the relative proportion of net assets of each class at the beginning of the day.
Dividends and Distributions: The Fund expects to pay dividends of net investment income and distributions of net realized capital gains, if any, annually. Dividends and distributions to shareholders, which are determined in accordance with federal income tax regulations and which may differ from generally accepted accounting principles, are recorded on the ex-dividend date. Permanent book/tax differences relating to income and gains are reclassified amongst undistributed net investment income, accumulated net realized gain or loss and paid-capital in excess of par, as appropriate.
| | |
| 32 | | Visit our website at www.jennisondryden.com |
Taxes: For federal income tax purposes, it is the Fund’s policy to continue to meet the requirements of the Internal Revenue Code applicable to regulated investment companies and to distribute all of its taxable net investment income and capital gains, if any, to shareholders. Therefore, no federal income tax provision is required.
Withholding taxes on foreign dividends are recorded net of reclaimable amounts, at the time related income is earned.
Estimates: The preparation of the financial statements requires management to make estimates and assumptions that affect the reported amounts and disclosures in the financial statements. Actual results could differ from those estimates.
Note 2. Agreements
The Trust has a management agreement for the Fund with PI. Pursuant to this agreement, PI has responsibility for all investment advisory services and supervises the subadviser’s performance of such services. PI has entered into a subadvisory agreement with Quantitative Management Associates LLC (“QMA”). The subadvisory agreement provides that QMA furnishes investment advisory services in connection with the management of the Fund. PI pays for the services of QMA, the cost of compensation of officers of the Fund, occupancy and certain clerical and bookkeeping costs of the Fund. The Fund bears all other costs and expenses.
The management fee paid to PI is computed daily and payable monthly at an annual rate of .65 of 1% of the average daily net assets of the Fund up to and including $500 million and .60 of 1% of such assets in excess of $500 million. The effective management fee rate was .65 of 1% for the year ended October 31, 2009.
The Fund has a distribution agreement with Prudential Investment Management Services LLC (“PIMS”), which acts as the distributor of the Class A, Class B, Class C, Class L, Class M, Class X and Class Z shares. The Fund compensates PIMS for distributing and servicing the Fund’s Class A, Class B, Class C, Class L, Class M, and Class X shares, pursuant to plans of distribution (the “Class A, B, C, L, M and X Plans”), regardless of expenses actually incurred. The distribution fees are accrued daily and payable monthly. No distribution or service fees are paid to PIMS as distributor of the Class Z shares of the fund.
Management has received the maximum allowable amount of sales charges for Class X in accordance with regulatory limits. As such, any contingent deferred sales charges received by the manager are contributed back into the Fund and included in the Statement of Changes and Financial Highlights as a contribution to capital.
| | |
| Dryden Large-Cap Core Equity Fund | | 33 |
Notes to Financial Statements
continued
During the year ended October 31, 2008, management determined that Class X shareholders had been charged sales charges in excess of regulatory limits. The manager has paid these classes for the overcharge which is reflected as an increase in net investment income, an increase in distributions from net investment income related to Class X, and capital contributions to Class X in the Statement of Changes for the years ended October 31, 2008 and October 31, 2007. The impact is also reflected in the Financial Highlights for the years ended October 31, 2008 and October 31, 2007.
Pursuant to the Class A, B, C, L, M, and X Plans, the Fund compensates PIMS for distribution related activities at an annual rate of up to .30 of 1%, 1%, 1%, .50 of 1%, 1% and 1% of the average daily net assets of the Class A, B, C, L, M and X shares, respectively.
PIMS has advised the Fund that it received $20,120 in front-end sales charges resulting from sales of Class A shares during the year ended October 31, 2009. From these fees, PIMS paid such sales charges to affiliated broker-dealers, which in turn paid commissions to salespersons and incurred other distribution costs.
PIMS has advised the Fund that for the year ended October 31, 2009, it received $75, $17,708, $1,144 and $20,660 in contingent deferred sales charges imposed upon certain redemptions by Class A, B, C and M shareholders, respectively.
PI, QMA and PIMS are indirect, wholly-owned subsidiaries of Prudential Financial, Inc. (“Prudential”).
Note 3. Other Transactions with Affiliates
Prudential Mutual Fund Services LLC (“PMFS”), an affiliate of PI and an indirect, wholly-owned subsidiary of Prudential, serves as the Fund’s transfer agent. Transfer agent fees and expenses in the Statement of Operations include certain out-of-pocket expenses paid to non-affiliates, where applicable.
The Fund pays networking fees to affiliated and unaffiliated broker/dealers including fees relating to the services of Wells Fargo Advisors, LLC (“Wells Fargo”) and First Clearing, LLC (“First Clearing”), affiliates of PI. These networking fees are payments made to broker/dealers that clear mutual fund transactions through a national clearing system. For the year ended October 31, 2009, the Fund incurred approximately $182,700 in total
| | |
| 34 | | Visit our website at www.jennisondryden.com |
networking fees of which $29,200 was paid to First Clearing. These amounts are included in transfer agent’s fees and expenses in the Statement of Operations.
Prudential Investment Management, Inc., (“PIM”), an indirect, wholly-owned subsidiary of Prudential, is the Fund’s security lending agent. For the year ended October 31, 2009, PIM has been compensated in the amount of approximately $44,200 for these services.
The Fund invests in the Taxable Money Market Series (the “Portfolio”), a portfolio of Dryden Core Investment Fund. The Portfolio is a money market mutual fund registered under the Investment Company Act of 1940, as amended, and managed by PI.
Note 4. Portfolio Securities
Purchases and sales of investment securities, other than short-term investments, for the year ended October 31, 2009 were $353,567,598 and $228,037,706, respectively.
Note 5. Distributions and Tax Information
Distributions to shareholders, which are determined in accordance with federal income tax regulations and which may differ from generally accepted accounting principles, are recorded on the ex-dividend date. In order to present undistributed net investment income, accumulated net realized loss on investment and financial futures transactions and paid-in capital in excess of par on the Statement of Assets and Liabilities that more closely represent their tax character, certain adjustments have been made to accumulated net realized loss on investment and financial futures transactions and paid-in-capital in excess of par. For the fiscal year ended October 31, 2009 the adjustments were to decrease accumulated net realized loss on investments and financial futures transactions and to decrease paid-in-capital in excess of par by $3,977,793 due to expiration of capital loss carryforward. Net investment income, net realized loss and net assets were not affected by this change.
For the years ended October 31, 2009 and October 31, 2008, the tax character of dividends paid as reflected in the Statement of Changes in Net Assets were $1,511,507 and $1,215,145 from ordinary income, respectively.
As of October 31, 2009, the accumulated undistributed income on a tax basis was $1,223,165 of ordinary income. This differs from the amount on the Statement of Assets and Liabilities primarily due to cumulative timing differences.
| | |
| Dryden Large-Cap Core Equity Fund | | 35 |
Notes to Financial Statements
continued
The United States federal income tax basis of the Fund’s investments and the net unrealized appreciation as of October 31, 2009 were as follows:
| | | | | | |
Tax Basis of
Investments | | Appreciation | | Depreciation | | Net
Unrealized Appreciation |
| $286,320,658 | | $54,998,081 | | $(2,136,209) | | $52,861,872 |
The difference between book basis and tax basis is primarily attributable to deferred losses on wash sales.
As of October 31, 2009, the Fund had a capital loss carryforward for tax purposes of approximately $80,835,000 of which $10,798,000 expires in 2010, $9,526,000 expires in 2011, $14,601,000 expires in 2016 and $45,910,000 expires in 2017. As of October 31, 2009, approximately $3,978,000 of the capital loss carryforward was written off unused due to expiration. No capital gain distributions are expected to be paid to shareholders until net gains have been realized in excess of such carryforward. It is uncertain whether the Fund will be able to realize the full benefit prior to the expiration dates.
Management has analyzed the Fund’s tax positions taken on federal income tax returns for all open tax years and has concluded that as of October 31 2009, no provision for income tax would be required in the Fund’s financial statements. The Fund’s federal and state income and federal excise tax returns for tax years for which the applicable statutes of limitations have not expired are subject to examination by the Internal Revenue Service and state departments of revenue.
Note 6. Capital
The Fund offers Class A, Class B, Class C, Class L, Class M, Class X and Class Z shares. Class A and Class L shares are sold with a front-end sales charge of up to 5.50% and 5.75%, respectively. All investors who purchase Class A or Class L shares in an amount of $1 million or more and sell these shares within 12 months of purchase are subject to a contingent deferred sales charge (CDSC) of 1%, including investors who purchase their shares through broker-dealers affiliated with Prudential.
| | |
| 36 | | Visit our website at www.jennisondryden.com |
Class B shares are sold with a contingent deferred sales charge which declines from 5% to zero depending on the period of time the shares are held. Class M and Class X shares are sold with a contingent deferred sales charge which declines from 6% to zero depending on the period of time the shares are held. Class C shares are sold with a contingent deferred sales charge of 1% during the first 12 months. Class B shares automatically convert to Class A shares on a quarterly basis approximately seven years after purchase. A special exchange privilege is also available for shareholders who qualified to purchase Class A shares at net asset value. Class M and Class X shares will automatically convert to Class A shares approximately eight and ten years after purchase, respectively. Class L shares are closed to most new purchases (with the exception of reinvested dividends). Class M and Class X shares are closed to new initial purchases. Class L, Class M and Class X shares are only available through exchanges from the same class of shares of certain other JennisonDryden funds. Class Z shares are not subject to any sales or redemption charge and are offered exclusively for sale to a limited group of investors. The Fund has authorized an unlimited number of shares of beneficial interest at $.001 par value.
| | | | | | | |
Class A | | Shares | | | Amount | |
Year ended October 31, 2009: | | | | | | | |
Shares sold | | 649,572 | | | $ | 5,564,553 | |
Shares issued in reinvestment of dividends | | 74,467 | | | | 637,441 | |
Shares reacquired | | (2,285,489 | ) | | | (19,500,105 | ) |
| | | | | | | |
Net increase (decrease) in shares outstanding before conversion | | (1,561,450 | ) | | | (13,298,111 | ) |
Shares issued upon conversion from Class B, M, X | | 719,778 | | | | 6,148,121 | |
| | | | | | | |
Net increase (decrease) in shares outstanding | | (841,672 | ) | | $ | (7,149,990 | ) |
| | | | | | | |
Year ended October 31, 2008: | | | | | | | |
Shares sold | | 640,405 | | | $ | 7,836,999 | |
Shares issued in reinvestment of dividends | | 52,403 | | | | 747,266 | |
Shares reacquired | | (1,716,167 | ) | | | (21,260,802 | ) |
| | | | | | | |
Net increase (decrease) in shares outstanding before conversion | | (1,023,359 | ) | | | (12,676,537 | ) |
Shares issued upon conversion from Class B, M, X | | 968,613 | | | | 12,470,671 | |
| | | | | | | |
Net increase (decrease) in shares outstanding | | (54,746 | ) | | $ | (205,866 | ) |
| | | | | | | |
Class B | | | | | | |
Year ended October 31, 2009: | | | | | | | |
Shares sold | | 82,213 | | | $ | 663,044 | |
Shares issued in reinvestment of dividends | | 2,538 | | | | 20,841 | |
Shares reacquired | | (208,151 | ) | | | (1,669,565 | ) |
| | | | | | | |
Net increase (decrease) in shares outstanding before conversion | | (123,400 | ) | | | (985,680 | ) |
Shares reacquired upon conversion into Class A | | (214,223 | ) | | | (1,694,731 | ) |
| | | | | | | |
Net increase (decrease) in shares outstanding | | (337,623 | ) | | $ | (2,680,411 | ) |
| | | | | | | |
| | |
| Dryden Large-Cap Core Equity Fund | | 37 |
Notes to Financial Statements
continued
| | | | | | | |
Class B (continued) | | Shares | | | Amount | |
Year ended October 31, 2008: | | | | �� | | | |
Shares sold | | 105,932 | | | $ | 1,250,364 | |
Shares issued in reinvestment of dividends | | 1,184 | | | | 16,163 | |
Shares reacquired | | (316,494 | ) | | | (3,752,853 | ) |
| | | | | | | |
Net increase (decrease) in shares outstanding before conversion | | (209,378 | ) | | | (2,486,326 | ) |
Shares reacquired upon conversion into Class A | | (505,228 | ) | | | (6,288,027 | ) |
| | | | | | | |
Net increase (decrease) in shares outstanding | | (714,606 | ) | | $ | (8,774,353 | ) |
| | | | | | | |
Class C | | | | | | |
Year ended October 31, 2009: | | | | | | | |
Shares sold | | 188,910 | | | $ | 1,527,872 | |
Shares issued in reinvestment of dividends | | 7,895 | | | | 64,819 | |
Shares reacquired | | (951,339 | ) | | | (7,588,854 | ) |
| | | | | | | |
Net increase (decrease) in shares outstanding | | (754,534 | ) | | $ | (5,996,163 | ) |
| | | | | | | |
Year ended October 31, 2008: | | | | | | | |
Shares sold | | 135,120 | | | $ | 1,539,107 | |
Shares issued in reinvestment of dividends | | 2,995 | | | | 40,883 | |
Shares reacquired | | (786,590 | ) | | | (9,281,100 | ) |
| | | | | | | |
Net increase (decrease) in shares outstanding | | (648,475 | ) | | $ | (7,701,110 | ) |
| | | | | | | |
Class L | | | | | | |
Year ended October 31, 2009: | | | | | | | |
Shares sold | | 7,051 | | | $ | 61,947 | |
Shares issued in reinvestment of dividends | | 5,408 | | | | 46,348 | |
Shares reacquired | | (168,942 | ) | | | (1,435,389 | ) |
| | | | | | | |
Net increase (decrease) in shares outstanding | | (156,483 | ) | | $ | (1,327,094 | ) |
| | | | | | | |
Year ended October 31, 2008: | | | | | | | |
Shares sold | | 5,006 | | | $ | 64,752 | |
Shares issued in reinvestment of dividends | | 4,635 | | | | 66,100 | |
Shares reacquired | | (226,564 | ) | | | (2,846,577 | ) |
| | | | | | | |
Net increase (decrease) in shares outstanding | | (216,923 | ) | | $ | (2,715,725 | ) |
| | | | | | | |
Class M | | | | | | |
Year ended October 31, 2009: | | | | | | | |
Shares sold | | 7,059 | | | $ | 58,453 | |
Shares issued in reinvestment of dividends | | 3,198 | | | | 26,251 | |
Shares reacquired | | (375,385 | ) | | | (2,989,689 | ) |
| | | | | | | |
Net increase (decrease) in shares outstanding before conversion | | (365,128 | ) | | $ | (2,904,985 | ) |
Shares reacquired upon conversion into Class A | | (504,673 | ) | | | (4,177,643 | ) |
| | | | | | | |
Net increase (decrease) in shares outstanding | | (869,801 | ) | | $ | (7,082,628 | ) |
| | | | | | | |
| | |
| 38 | | Visit our website at www.jennisondryden.com |
| | | | | | | |
Class M (continued) | | Shares | | | Amount | |
Year ended October 31, 2008: | | | | | | | |
Shares sold | | 33,336 | | | $ | 426,150 | |
Shares issued in reinvestment of dividends | | 1,737 | | | | 23,711 | |
Shares reacquired | | (824,322 | ) | | | (9,893,962 | ) |
| | | | | | | |
Net increase (decrease) in shares outstanding before conversion | | (789,249 | ) | | $ | (9,444,101 | ) |
Shares reacquired upon conversion into Class A | | (506,567 | ) | | | (6,139,481 | ) |
| | | | | | | |
Net increase (decrease) in shares outstanding | | (1,295,816 | ) | | $ | (15,583,582 | ) |
| | | | | | | |
Class X | | | | | | |
Year ended October 31, 2009: | | | | | | | |
Shares sold | | 9,732 | | | $ | 76,415 | |
Shares issued in reinvestment of dividends | | 3,482 | | | | 28,688 | |
Shares reacquired | | (65,407 | ) | | | (545,468 | ) |
| | | | | | | |
Net increase (decrease) in shares outstanding before conversion | | (52,193 | ) | | $ | (440,365 | ) |
Shares reacquired upon conversion into Class A | | (33,005 | ) | | | (275,747 | ) |
| | | | | | | |
Net increase (decrease) in shares outstanding | | (85,198 | ) | | $ | (716,112 | ) |
| | | | | | | |
Year ended October 31, 2008: | | | | | | | |
Shares sold | | 6,932 | | | $ | 109,549 | |
Shares issued in reinvestment of dividends | | 350 | | | | 4,781 | |
Shares reacquired | | (139,626 | ) | | | (1,698,250 | ) |
| | | | | | | |
Net increase (decrease) in shares outstanding before conversion | | (132,344 | ) | | $ | (1,583,920 | ) |
Shares reacquired upon conversion into Class A | | (3,678 | ) | | | (43,163 | ) |
| | | | | | | |
Net increase (decrease) in shares outstanding | | (136,022 | ) | | $ | (1,627,083 | ) |
| | | | | | | |
Class Z | | | | | | |
Year ended October 31, 2009: | | | | | | | |
Shares sold | | 19,894,736 | | | $ | 178,752,503 | |
Shares issued in reinvestment of dividends | | 7,198 | | | | 62,410 | |
Shares reacquired | | (3,197,194 | ) | | | (28,775,168 | ) |
| | | | | | | |
Net increase (decrease) in shares outstanding | | 16,704,740 | | | $ | 150,039,745 | |
| | | | | | | |
Year ended October 31, 2008: | | | | | | | |
Shares sold | | 3,954,028 | | | $ | 46,116,758 | |
Shares issued in reinvestment of dividends | | 15,533 | | | | 224,607 | |
Shares reacquired | | (1,692,540 | ) | | | (21,106,882 | ) |
| | | | | | | |
Net increase (decrease) in shares outstanding | | 2,277,021 | | | $ | 25,234,483 | |
| | | | | | | |
Note 7. Borrowings
The Fund, along with other affiliated registered investment companies (the “Funds”), is a party to a Syndicated Credit Agreement (“SCA”) with two banks. The SCA provides for a commitment of $500 million. Interest on any borrowings under the
| | |
| Dryden Large-Cap Core Equity Fund | | 39 |
Notes to Financial Statements
continued
SCA is incurred at contracted market rates and a commitment fee for the unused amount is accrued daily and paid quarterly. Effective October 22, 2009, the Funds renewed the SCA with the banks. The commitment under the renewed SCA continues to be $500 million. The Funds pay a commitment fee of .15 of 1% of the unused portion of the renewed SCA. The expiration date of the renewed SCA will be October 20, 2010. For the period from October 24, 2008 through October 21, 2009, the Funds paid a commitment fee of .13 of 1% of the unused portion of the agreement. The purpose of the SCA is to provide an alternative source of temporary funding for capital share redemptions.
The Fund did not borrow any amounts pursuant to the SCA during the year ended October 31, 2009.
Note 8. Subsequent Events
Management has evaluated the impact of all subsequent events on the Fund through December 23, 2009, the date the financial statements were issued, and has determined that except for the following, there were no subsequent events requiring recognition or disclosure in the financial statements.
On November 25, 2009, the Fund declared dividends from net investment income for Class A, Class L, Class X and Class Z shares of $0.04796 per share, $0.03035 per share, $0.05331 per share and $0.07472 per share, respectively. The dividends were paid to shareholders of record November 27, 2009. The ex-dividend date was November 30, 2009.
| | |
| 40 | | Visit our website at www.jennisondryden.com |
Financial Highlights
| | |
| OCTOBER 31, 2009 | | ANNUAL REPORT |
Dryden Large-Cap Core Equity Fund
Financial Highlights
| | | | |
| | | Class A | |
| | | Year Ended
October 31, 2009(a) | |
Per Share Operating Performance: | | | | |
Net Asset Value, Beginning Of Year | | $ | 9.32 | |
| | | | |
Income (loss) from investment operations: | | | | |
Net investment income | | | .09 | |
Net realized and unrealized gain (loss) on investment transactions | | | .40 | |
| | | | |
Total from investment operations | | | .49 | |
| | | | |
Less Dividends: | | | | |
Dividends from net investment income | | | (.10 | ) |
| | | | |
Net asset value, end of year | | $ | 9.71 | |
| | | | |
Total Return(b): | | | 5.40 | % |
Ratios/Supplemental Data: | | | | |
Net assets, end of year (000) | | $ | 62,739 | |
Average net assets (000) | | $ | 58,578 | |
Ratios to average net assets(c): | | | | |
Expenses, including distribution and service (12b-1) fees | | | 1.55 | % |
Expenses, excluding distribution and service (12b-1) fees | | | 1.25 | % |
Net investment income | | | 1.10 | % |
For Class A, B, C, L, M, X and Z shares: | | | | |
Portfolio turnover rate | | | 116 | % |
| (a) | Calculated based upon average shares outstanding during the year. |
| (b) | Total return does not consider the effects of sales loads. Total return is calculated assuming a purchase of a share on the first day and a sale on the last day of each year reported, and includes reinvestment of dividends and distributions. Total return may reflect adjustments to conform to generally accepted accounting principles. |
| (c) | Does not include the expenses of the underlying funds in which the Fund invests. |
See Notes to Financial Statements.
| | |
| 42 | | Visit our website at www.jennisondryden.com |
| | | | | | | | | | | | | | |
| Class A | |
| Year Ended October 31, | |
| 2008(a) | | | 2007 | | | 2006 | | | 2005 | |
| | | | | | | | | | | | | | |
| $ | 14.85 | | | $ | 13.01 | | | $ | 11.20 | | | $ | 10.36 | |
| | | | | | | | | | | | | | | |
| | | | | | | | | | | | | | |
| | .12 | | | | .09 | | | | .08 | (a) | | | .08 | |
| | (5.54 | ) | | | 1.82 | | | | 1.77 | | | | .83 | |
| | | | | | | | | | | | | | | |
| | (5.42 | ) | | | 1.91 | | | | 1.85 | | | | .91 | |
| | | | | | | | | | | | | | | |
| | | | | | | | | | | | | | |
| | (.11 | ) | | | (.07 | ) | | | (.04 | ) | | | (.07 | ) |
| | | | | | | | | | | | | | | |
| $ | 9.32 | | | $ | 14.85 | | | $ | 13.01 | | | $ | 11.20 | |
| | | | | | | | | | | | | | | |
| | (36.75 | )% | | | 14.72 | % | | | 16.54 | % | | | 8.84 | % |
| | | | | | | | | | | | | | |
| $ | 68,021 | | | $ | 109,231 | | | $ | 75,578 | | | $ | 50,856 | |
| $ | 93,917 | | | $ | 95,001 | | | $ | 64,957 | | | $ | 52,404 | |
| | | | | | | | | | | | | | |
| | 1.34 | % | | | 1.16 | % | | | 1.22 | % | | | 1.22 | % |
| | 1.06 | % | | | .91 | % | | | .97 | % | | | .97 | % |
| | .94 | % | | | .67 | % | | | .68 | % | | | .75 | % |
| | | | | | | | | | | | | | |
| | 96 | % | | | 90 | % | | | 72 | % | | | 74 | % |
See Notes to Financial Statements.
| | |
| Dryden Large-Cap Core Equity Fund | | 43 |
Financial Highlights
continued
| | | | |
| | | Class B | |
| | | Year Ended
October 31, 2009(a) | |
Per Share Operating Performance: | | | | |
Net Asset Value, Beginning Of Year | | $ | 8.87 | |
| | | | |
Income (loss) from investment operations: | | | | |
Net investment income | | | .04 | |
Net realized and unrealized gain (loss) on investment transactions | | | .37 | |
| | | | |
Total from investment operations | | | .41 | |
| | | | |
Less Dividends: | | | | |
Dividends from net investment income | | | (.02 | ) |
| | | | |
Net asset value, end of year | | $ | 9.26 | |
| | | | |
Total Return(c): | | | 4.67 | % |
Ratios/Supplemental Data: | | | | |
Net assets, end of year (000) | | $ | 6,555 | |
Average net assets (000) | | $ | 6,912 | |
Ratios to average net assets(d): | | | | |
Expenses, including distribution and service (12b-1) fees | | | 2.25 | % |
Expenses, excluding distribution and service (12b-1) fees | | | 1.25 | % |
Net investment income (loss) | | | .48 | % |
| (a) | Calculated based upon average shares outstanding during the year. |
| (b) | Less than $.005 per share. |
| (c) | Total return does not consider the effects of sales loads. Total return is calculated assuming a purchase of a share on the first day and a sale on the last day of each year reported, and includes reinvestment of dividends and distributions. Total return may reflect adjustments to conform to generally accepted accounting principles. |
| (d) | Does not include the expenses of the underlying funds in which the Fund invests. |
See Notes to Financial Statements.
| | |
| 44 | | Visit our website at www.jennisondryden.com |
| | | | | | | | | | | | | | |
| Class B | |
| Year Ended October 31, | |
| 2008(a) | | | 2007 | | | 2006 | | | 2005 | |
| | | | | | | | | | | | | | |
| $ | 14.14 | | | $ | 12.42 | | | $ | 10.73 | | | $ | 9.94 | |
| | | | | | | | | | | | | | | |
| | | | | | | | | | | | | | |
| | .03 | | | | .01 | | | | .01 | (a) | | | — | (b) |
| | (5.29 | ) | | | 1.71 | | | | 1.68 | | | | .79 | |
| | | | | | | | | | | | | | | |
| | (5.26 | ) | | | 1.72 | | | | 1.69 | | | | .79 | |
| | | | | | | | | | | | | | | |
| | | | | | | | | | | | | | |
| | (.01 | ) | | | — | | | | — | | | | — | |
| | | | | | | | | | | | | | | |
| $ | 8.87 | | | $ | 14.14 | | | $ | 12.42 | | | $ | 10.73 | |
| | | | | | | | | | | | | | | |
| | (37.22 | )% | | | 13.85 | % | | | 15.75 | % | | | 7.95 | % |
| | | | | | | | | | | | | | |
| $ | 9,269 | | | $ | 24,883 | | | $ | 34,293 | | | $ | 71,436 | |
| $ | 16,689 | | | $ | 28,960 | | | $ | 52,013 | | | $ | 83,027 | |
| | | | | | | | | | | | | | |
| | 2.06 | % | | | 1.91 | % | | | 1.97 | % | | | 1.97 | % |
| | 1.06 | % | | | .91 | % | | | .97 | % | | | .97 | % |
| | .25 | % | | | (.03 | )% | | | .08 | % | | | .04 | % |
See Notes to Financial Statements.
| | |
| Dryden Large-Cap Core Equity Fund | | 45 |
Financial Highlights
continued
| | | | |
| | | Class C | |
| | | Year Ended
October 31, 2009(a) | |
Per Share Operating Performance: | | | | |
Net Asset Value, Beginning Of Year | | $ | 8.87 | |
| | | | |
Income (loss) from investment operations: | | | | |
Net investment income (loss) | | | .04 | |
Net realized and unrealized gain (loss) on investment transactions | | | .37 | |
| | | | |
Total from investment operations | | | .41 | |
| | | | |
Less Dividends: | | | | |
Dividends from net investment income | | | (.02 | ) |
| | | | |
Net asset value, end of year | | $ | 9.26 | |
| | | | |
Total Return(c): | | | 4.67 | % |
Ratios/Supplemental Data: | | | | |
Net assets, end of year (000) | | $ | 24,601 | |
Average net assets (000) | | $ | 24,715 | |
Ratios to average net assets(d): | | | | |
Expenses, including distribution and service (12b-1) fees | | | 2.25 | % |
Expenses, excluding distribution and service (12b-1) fees | | | 1.25 | % |
Net investment income (loss) | | | .44 | % |
| (a) | Calculated based upon average shares outstanding during the year. |
| (b) | Less than $.005 per share or 0.005%. |
| (c) | Total return does not consider the effects of sales loads. Total return is calculated assuming a purchase of a share on the first day and a sale on the last day of each year reported, and includes reinvestment of dividends and distributions. Total return may reflect adjustments to conform to generally accepted accounting principles. |
| (d) | Does not include the expenses of the underlying funds in which the Fund invests. |
See Notes to Financial Statements.
| | |
| 46 | | Visit our website at www.jennisondryden.com |
| | | | | | | | | | | | | | |
| Class C | |
| Year Ended October 31, | |
| 2008(a) | | | 2007 | | | 2006 | | | 2005 | |
| | | | | | | | | | | | | | |
| $ | 14.14 | | | $ | 12.42 | | | $ | 10.73 | | | $ | 9.94 | |
| | | | | | | | | | | | | | | |
| | | | | | | | | | | | | | |
| | .03 | | | | (.01 | ) | | | — | (a)(b) | | | — | (b) |
| | (5.29 | ) | | | 1.73 | | | | 1.69 | | | | .79 | |
| | | | | | | | | | | | | | | |
| | (5.26 | ) | | | 1.72 | | | | 1.69 | | | | .79 | |
| | | | | | | | | | | | | | | |
| | | | | | | | | | | | | | |
| | (.01 | ) | | | — | | | | — | | | | — | |
| | | | | | | | | | | | | | | |
| $ | 8.87 | | | $ | 14.14 | | | $ | 12.42 | | | $ | 10.73 | |
| | | | | | | | | | | | | | | |
| | (37.22 | )% | | | 13.85 | % | | | 15.75 | % | | | 7.95 | % |
| | | | | | | | | | | | | | |
| $ | 30,243 | | | $ | 57,391 | | | $ | 39,368 | | | $ | 42,422 | |
| $ | 45,712 | | | $ | 50,597 | | | $ | 40,441 | | | $ | 47,629 | |
| | | | | | | | | | | | | | |
| | 2.06 | % | | | 1.91 | % | | | 1.97 | % | | | 1.97 | % |
| | 1.06 | % | | | .91 | % | | | .97 | % | | | .97 | % |
| | .23 | % | | | (.08 | )% | | | — | (b) | | | .03 | % |
See Notes to Financial Statements.
| | |
| Dryden Large-Cap Core Equity Fund | | 47 |
Financial Highlights
continued
| | | | |
| | | Class L | |
| |
| | | Year Ended
October 31, 2009(e) | |
Per Share Operating Performance: | | | | |
Net Asset Value, Beginning Of Period | | $ | 9.30 | |
| | | | |
Income (loss) from investment operations: | | | | |
Net investment income | | | .08 | |
Net realized and unrealized gain (loss) on investment transactions | | | .39 | |
| | | | |
Total from investment operations | | | .47 | |
| | | | |
Less Dividends: | | | | |
Dividends from net investment income | | | (.07 | ) |
| | | | |
Net asset value, end of period | | $ | 9.70 | |
| | | | |
Total Return(b): | | | 5.21 | % |
Ratios/Supplemental Data: | | | | |
Net assets, end of period (000) | | $ | 4,860 | |
Average net assets (000) | | $ | 4,965 | |
Ratios to average net assets(c): | | | | |
Expenses, including distribution and service (12b-1) fees | | | 1.75 | % |
Expenses, excluding distribution and service (12b-1) fees | | | 1.25 | % |
Net investment income | | | .94 | % |
| (a) | Inception date of Class L shares. |
| (b) | Total return does not consider the effects of sales loads. Total return is calculated assuming a purchase of a share on the first day and a sale on the last day of each period reported, and includes reinvestment of dividends and distributions. Total return may reflect adjustments to conform to generally accepted accounting principles. Total returns for periods less than a full year are not annualized. |
| (c) | Does not include the expenses of the underlying funds in which the Fund invests. |
| (e) | Calculated based upon average shares outstanding during the period. |
See Notes to Financial Statements.
| | |
| 48 | | Visit our website at www.jennisondryden.com |
| | | | | | |
| Class L | |
Year Ended
October 31, 2008(e) | | | March 16, 2007(a)
through
October 31, 2007 | |
| | | | | | |
| $ | 14.83 | | | $ | 13.16 | |
| | | | | | | |
| | | | | | |
| | .09 | | | | .03 | |
| | (5.54 | ) | | | 1.64 | |
| | | | | | | |
| | (5.45 | ) | | | 1.67 | |
| | | | | | | |
| | | | | | |
| | (.08 | ) | | | — | |
| | | | | | | |
| $ | 9.30 | | | $ | 14.83 | |
| | | | | | | |
| | (36.94 | )% | | | 12.69 | % |
| | | | | | |
| $ | 6,113 | | | $ | 12,962 | |
| $ | 9,856 | | | $ | 8,583 | |
| | | | | | |
| | 1.56 | % | | | 1.41 | %(d) |
| | 1.06 | % | | | .91 | %(d) |
| | .73 | % | | | .31 | %(d) |
See Notes to Financial Statements.
| | |
| Dryden Large-Cap Core Equity Fund | | 49 |
Financial Highlights
continued
| | | | |
| | | Class M | |
| |
| | | Year Ended
October 31, 2009(e) | |
Per Share Operating Performance: | | | | |
Net Asset Value, Beginning Of Period | | $ | 8.87 | |
| | | | |
Income (loss) from investment operations: | | | | |
Net investment income (loss) | | | .04 | |
Net realized and unrealized gain (loss) on investment transactions | | | .37 | |
| | | | |
Total from investment operations | | | .41 | |
| | | | |
Less Dividends: | | | | |
Dividends from net investment income | | | (.02 | ) |
| | | | |
Net asset value, end of period | | $ | 9.26 | |
| | | | |
Total Return(b): | | | 4.67 | % |
Ratios/Supplemental Data: | | | | |
Net assets, end of period (000) | | $ | 8,052 | |
Average net assets (000) | | $ | 10,385 | |
Ratios to average net assets(c): | | | | |
Expenses, including distribution and service (12b-1) fees | | | 2.25 | % |
Expenses, excluding distribution and service (12b-1) fees | | | 1.25 | % |
Net investment income (loss) | | | .55 | % |
| (a) | Inception date of Class M shares. |
| (b) | Total return does not consider the effects of sales loads. Total return is calculated assuming a purchase of a share on the first day and a sale on the last day of each period reported, and includes reinvestment of dividends and distributions. Total return may reflect adjustments to conform to generally accepted accounting principles. Total returns for periods less than a full year are not annualized. |
| (c) | Does not include the expenses of the underlying funds in which the Fund invests. |
| (e) | Calculated based upon average shares outstanding during the period. |
See Notes to Financial Statements.
| | |
| 50 | | Visit our website at www.jennisondryden.com |
| | | | | | |
| Class M | |
Year Ended
October 31, 2008(e) | | | March 16, 2007(a)
through
October 31, 2007 | |
| | | | | | |
| $ | 14.14 | | | $ | 12.59 | |
| | | | | | | |
| | | | | | |
| | .03 | | | | (.02 | ) |
| | (5.29 | ) | | | 1.57 | |
| | | | | | | |
| | (5.26 | ) | | | 1.55 | |
| | | | | | | |
| | | | | | |
| | (.01 | ) | | | — | |
| | | | | | | |
| $ | 8.87 | | | $ | 14.14 | |
| | | | | | | |
| | (37.22 | )% | | | 12.31 | % |
| | | | | | |
| $ | 15,423 | | | $ | 42,909 | |
| $ | 29,289 | | | $ | 29,146 | |
| | | | | | |
| | 2.06 | % | | | 1.91 | %(d) |
| | 1.06 | % | | | .91 | %(d) |
| | .24 | % | | | (.19 | )%(d) |
See Notes to Financial Statements.
| | |
| Dryden Large-Cap Core Equity Fund | | 51 |
Financial Highlights
continued
| | | | |
| | | Class X | |
| |
| | | Year Ended
October 31, 2009(f) | |
Per Share Operating Performance: | | | | |
Net Asset Value, Beginning Of Period | | $ | 8.97 | |
| | | | |
Income (loss) from investment operations: | | | | |
Net investment income | | | .12 | |
Net realized and unrealized gain (loss) on investment transactions | | | .40 | |
| | | | |
Total from investment operations | | | .52 | |
| | | | |
Less Dividends: | | | | |
Dividends from net investment income | | | (.10 | ) |
Capital contribution | | | .01 | |
| | | | |
Net asset value, end of period | | $ | 9.40 | |
| | | | |
Total Return(b): | | | 6.00 | % |
Ratios/Supplemental Data: | | | | |
Net assets, end of period (000) | | $ | 2,096 | |
Average net assets (000) | | $ | 2,245 | |
Ratios to average net assets(c): | | | | |
Expenses, including distribution and service (12b-1) fees | | | 1.50 | % |
Expenses, excluding distribution and service (12b-1) fees | | | 1.25 | % |
Net investment income | | | 1.46 | % |
| (a) | Inception date of Class X shares. |
| (b) | Total return does not consider the effects of sales loads. Total return is calculated assuming a purchase of a share on the first day and a sale on the last day of each period reported, and includes reinvestment of dividends and distributions. Total return may reflect adjustments to conform to generally accepted accounting principles. Total returns for periods less than a full year are not annualized. |
| (c) | Does not include the expenses of the underlying funds in which the Fund invests. |
| (d) | Certain information has been adjusted to reflect a manager payment for sales charges incurred by shareholders in excess of regulatory limits. |
| (f) | Calculated based upon average shares outstanding during the period. |
| (g) | Total return has been adjusted to reflect the manager payment for sales charges in excess of regulatory limits. |
See Notes to Financial Statements.
| | |
| 52 | | Visit our website at www.jennisondryden.com |
| | | | | | |
| Class X | |
Year Ended
October 31, 2008(f) | | | March 16, 2007(a)
through
October 31, 2007(d) | |
| | | | | | |
| $ | 14.16 | | | $ | 12.60 | |
| | | | | | | |
| | | | | | |
| | .13 | | | | .04 | |
| | (5.28 | ) | | | 1.56 | |
| | | | | | | |
| | (5.15 | ) | | | 1.60 | |
| | | | | | | |
| | | | | | |
| | (.06 | ) | | | (.07 | ) |
| | .02 | | | | .03 | |
| | | | | | | |
| $ | 8.97 | | | $ | 14.16 | |
| | | | | | | |
| | (36.25 | )% | | | 12.93 | %(g) |
| | | | | | |
| $ | 2,767 | | | $ | 6,283 | |
| $ | 4,698 | | | $ | 3,939 | |
| | | | | | |
| | 1.38 | % | | | 1.29 | %(e) |
| | 1.06 | % | | | .91 | %(e) |
| | 1.08 | % | | | .42 | %(e) |
See Notes to Financial Statements.
| | |
| Dryden Large-Cap Core Equity Fund | | 53 |
Financial Highlights
continued
| | | | |
| | | Class Z | |
| | | Year Ended
October 31, 2009(a) | |
Per Share Operating Performance: | | | | |
Net Asset Value, Beginning Of Year | | $ | 9.47 | |
| | | | |
Income (loss) from investment operations: | | | | |
Net investment income | | | .08 | |
Net realized and unrealized gain (loss) on investment transactions | | | .45 | |
| | | | |
Total from investment operations | | | .53 | |
| | | | |
Less Dividends: | | | | |
Dividends from net investment income | | | (.13 | ) |
| | | | |
Net asset value, end of year | | $ | 9.87 | |
| | | | |
Total Return(b): | | | 5.83 | % |
Ratios/Supplemental Data: | | | | |
Net assets, end of year (000) | | $ | 202,941 | |
Average net assets (000) | | $ | 90,113 | |
Ratios to average net assets(c): | | | | |
Expenses, including distribution and service (12b-1) fees | | | 1.25 | % |
Expenses, excluding distribution and service (12b-1) fees | | | 1.25 | % |
Net investment income | | | .96 | % |
| (a) | Calculated based upon average shares outstanding during the year. |
| (b) | Total return is calculated assuming a purchase of a share on the first day and a sale on the last day of each year reported, and includes reinvestment of dividends and distributions. Total return may reflect adjustments to conform to generally accepted accounting principles. |
| (c) | Does not include the expenses of the underlying funds in which the Fund invests. |
See Notes to Financial Statements.
| | |
| 54 | | Visit our website at www.jennisondryden.com |
| | | | | | | | | | | | | | |
| Class Z | |
| Year Ended October 31, | |
| 2008(a) | | | 2007 | | | 2006 | | | 2005 | |
| | | | | | | | | | | | | | |
| $ | 15.09 | | | $ | 13.21 | | | $ | 11.37 | | | $ | 10.52 | |
| | | | | | | | | | | | | | | |
| | | | | | | | | | | | | | |
| | .15 | | | | .13 | | | | .12 | (a) | | | .11 | |
| | (5.63 | ) | | | 1.85 | | | | 1.79 | | | | .84 | |
| | | | | | | | | | | | | | | |
| | (5.48 | ) | | | 1.98 | | | | 1.91 | | | | .95 | |
| | | | | | | | | | | | | | | |
| | | | | | | | | | | | | | |
| | (.14 | ) | | | (.10 | ) | | | (.07 | ) | | | (.10 | ) |
| | | | | | | | | | | | | | | |
| $ | 9.47 | | | $ | 15.09 | | | $ | 13.21 | | | $ | 11.37 | |
| | | | | | | | | | | | | | | |
| | (36.64 | )% | | | 15.06 | % | | | 16.83 | % | | | 9.06 | % |
| | | | | | | | | | | | | | |
| $ | 36,602 | | | $ | 23,950 | | | $ | 17,764 | | | $ | 13,713 | |
| $ | 20,386 | | | $ | 21,053 | | | $ | 15,784 | | | $ | 13,218 | |
| | | | | | | | | | | | | | |
| | 1.06 | % | | | .91 | % | | | .97 | % | | | .97 | % |
| | 1.06 | % | | | .91 | % | | | .97 | % | | | .97 | % |
| | 1.25 | % | | | .93 | % | | | .97 | % | | | .96 | % |
See Notes to Financial Statements.
| | |
| Dryden Large-Cap Core Equity Fund | | 55 |
Report of Independent Registered Public Accounting Firm
The Board of Trustees and Shareholders
Dryden Tax-Managed Funds:
We have audited the accompanying statement of assets and liabilities of Dryden Large-Cap Core Equity Fund, a series of Dryden Tax-Managed Funds (hereafter referred to as the “Fund”), including the portfolio of investments, as of October 31, 2009, and the related statement of operations for the year then ended, the statement of changes in net assets for each of the years in the two-year period then ended and the financial highlights for each of the years in the five-year period then ended. These financial statements and financial highlights are the responsibility of the Fund’s management. Our responsibility is to express an opinion on these financial statements and financial highlights based on our audits.
We conducted our audits in accordance with the standards of the Public Company Accounting Oversight Board (United States). Those standards require that we plan and perform the audit to obtain reasonable assurance about whether the financial statements and financial highlights are free of material misstatement. An audit includes examining, on a test basis, evidence supporting the amounts and disclosures in the financial statements. Our procedures included confirmation of securities owned as of October 31, 2009, by correspondence with the custodian, transfer agent and brokers or by other appropriate auditing procedures where replies from brokers were not received. An audit also includes assessing the accounting principles used and significant estimates made by management, as well as evaluating the overall financial statement presentation. We believe that our audits provide a reasonable basis for our opinion.
In our opinion, the financial statements and financial highlights referred to above present fairly, in all material respects, the financial position of the Fund as of October 31, 2009, and the results of its operations for the year then ended, the changes in its net assets for each of the years in the two-year period then ended and the financial highlights for each of the years in the five-year period then ended, in conformity with U.S. generally accepted accounting principles.

New York, New York
December 23, 2009
| | |
| 56 | | Visit our website at www.jennisondryden.com |
Tax Information
(Unaudited)
We are required by the Internal Revenue Code of 1986, as amended (“the Code”), to advise you within 60 days of the Fund’s fiscal year end (October 31, 2009) as to the federal income tax status of dividends paid by the Fund during such fiscal year. We are advising you that during its fiscal year ended October 31, 2009, the Fund paid ordinary income dividends for Class A, Class B, Class C, Class L, Class M, Class X and Class Z shares of $0.100 per share, $0.021 per share, $0.021 per share, $0.075 per share, $0.021 per share, $0.095 per share and $0.134 per share, respectively.
For the fiscal year ended October 31, 2009, the Fund designates the maximum amount allowable, but not less than 100% of the ordinary income dividends paid during the year as eligible for the corporate dividends received deduction in accordance with Section 854 of the Internal Revenue Code.
For the fiscal year ended October 31, 2009, the Fund designates the maximum amount allowable, but not less than 100% of the ordinary income dividends paid during the year as qualified dividend income in accordance with Section 854 of the Internal Revenue Code.
In January 2010, you will be advised on IRS 1099 DIV or substitute 1099 DIV as to the federal tax status of the distributions received by you in calendar year 2009.
| | |
| Dryden Large-Cap Core Equity Fund | | 57 |
MANAGEMENT OF THE FUND
(Unaudited)
Information about Fund Directors/Trustees (referred to herein as “Board Members”) and Fund Officers is set forth below. Board Members who are not deemed to be “interested persons,” as defined in the 1940 Act, are referred to as “Independent Board Members.” Board Members who are deemed to be “interested persons” are referred to as “Interested Board Members.” The Board Members are responsible for the overall supervision of the operations of the Fund and perform the various duties imposed on the directors or trustees of investment companies by the 1940 Act.
| | | | | | |
| Independent Board Members (1) |
Name, Address, Age Position(s) Portfolios Overseen | | Principal Occupation(s) During Past Five Years | | | | Other Directorships Held |
Kevin J. Bannon (57) Board Member Portfolios Overseen: 57 | | Managing Director (since April 2008) of Highmount Capital LLC (registered investment adviser); formerly Executive Vice President and Chief Investment Officer (April 1993-August 2007) of Bank of New York Company; President (May 2003-May 2007) of BNY Hamilton Family of Mutual Funds. | | | | Director of Urstadt Biddle Properties (since September 2008). |
Linda W. Bynoe (57) Board Member Portfolios Overseen: 57 | | President and Chief Executive Officer (since March 1995) of Telemat Ltd. (management consulting); formerly Vice President at Morgan Stanley & Co (broker-dealer). | | | | Director of Simon Property Group, Inc. (real estate investment trust) (since May 2003); Anixter International (communication products distributor) (since January 2006); Director of Northern Trust Corporation (banking) (since April 2006). |
David E.A. Carson (75) Board Member Portfolios Overseen: 57 | | Director (since May 2008) of Liberty Bank; Director (since October 2007) of ICI Mutual Insurance Company; formerly President, Chairman and Chief Executive Officer of People’s Bank (1987 – 2000). | | | | None. |
Michael S. Hyland, CFA (64) Board Member Portfolios Overseen: 57 | | Independent Consultant (since February 2005); formerly Senior Managing Director (July 2001-February 2005) of Bear Stearns & Co, Inc.; Global Partner, INVESCO (1999-2001); Managing Director and President Salomon Brothers Asset Management (1989-1999). | | | | None. |
Robert E. La Blanc (75) Board Member Portfolios Overseen: 57 | | President (since 1981) of Robert E. La Blanc Associates, Inc. (telecommunications). | | | | Director of CA, Inc. (since 2002) (software company); FiberNet Telecom Group, Inc. (since 2003) (telecom company). |
Visit our website at www.jennisondryden.com
| | | | | | |
Douglas H. McCorkindale (70) Board Member Portfolios Overseen: 57 | | Formerly Chairman (February 2001-June 2006), Chief Executive Officer (June 2000-July 2005), President (September 1997-July 2005) and Vice Chairman (March 1984-May 2000) of Gannett Co. Inc. (publishing and media). | | | | Director of Continental Airlines, Inc. (since May 1993); Director of Lockheed Martin Corp. (aerospace and defense) (since May 2001). |
Stephen P. Munn (67) Board Member Portfolios Overseen: 57 | | Lead Director (since 2007) and formerly Chairman (1993-2007) of Carlisle Companies Incorporated (manufacturer of industrial products). | | | | None. |
Richard A. Redeker (66) Board Member Portfolios Overseen: 57 | | Retired Mutual Fund Executive (36 years); Management Consultant; Director of Penn Tank Lines, Inc. (since 1999). | | | | None. |
Robin B. Smith (70) Board Member & Independent Chair Portfolios Overseen: 57 | | Chairman of the Board (since January 2003) of Publishers Clearing House (direct marketing); formerly Chairman and Chief Executive Officer (August 1996-January 2003) of Publishers Clearing House. | | | | Formerly Director of BellSouth Corporation (telecommunications) (1992-2006). |
Stephen G. Stoneburn (66) Board Member Portfolios Overseen: 57 | | President and Chief Executive Officer (since June 1996) of Quadrant Media Corp. (publishing company); formerly President (June 1995-June 1996) of Argus Integrated Media, Inc.; Senior Vice President and Managing Director (January 1993-1995) of Cowles Business Media; Senior Vice President of Fairchild Publications, Inc (1975-1989). | | | | None. |
| | | | | | |
| Interested Board Member (1) |
Judy A. Rice (61) Board Member & President Portfolios Overseen: 57 | | President, Chief Executive Officer, Chief Operating Officer and Officer-In-Charge (since February 2003) of Prudential Investments LLC; President, Chief Executive Officer and Officer-In-Charge (since April 2003) of Prudential Mutual Fund Services LLC; Executive Vice President (since December 2008) of Prudential Investment Management Services LLC; formerly Vice President (February 1999-April 2006) of Prudential Investment Management Services LLC; formerly President, Chief Executive Officer, Chief Operating Officer and Officer-In-Charge (May 2003-June 2005) and Director (May 2003-March 2006) and Executive Vice President (June 2005- March 2006) of AST Investment Services, Inc.; Member of Board of Governors of the Investment Company Institute. | | | | None. |
Dryden Large-Cap Core Equity Fund
| 1 | The year that each individual joined the Fund’s Board is as follows: |
Linda W. Bynoe, 2005; David E.A. Carson, 2003; Robert E. La Blanc, 2003; Douglas H. McCorkindale, 1998; Richard A. Redeker, 1998; Robin B. Smith, 1998; Stephen G. Stoneburn, 2003; Kevin J. Bannon, 2008; Michael S. Hyland, 2008; Stephen P. Munn, 2008; Judy A. Rice, Board Member since 2000 and President since 2003.
Visit our website at www.jennisondryden.com
| | |
| Fund Officers (a)(1) | | |
Name, Address and Age Position with Fund | | Principal Occupation(s) During Past Five Years |
Scott E. Benjamin (36) Vice President | | Executive Vice President (since June 2009) of Prudential Investments LLC and Prudential Investment Management Services LLC; Senior Vice President Product Development and Marketing, Prudential Investments (since February 2006); Vice President Product Development and Product Management, Prudential Investments (2003-2006). |
Kathryn L. Quirk (57) Chief Legal Officer | | Vice President and Corporate Counsel (since September 2004) of Prudential; Executive Vice President, Chief Legal Officer and Secretary (since July 2005) of PI and Prudential Mutual Fund Services LLC; Vice President and Corporate Counsel (since June 2005) and Secretary (since February 2006) of AST Investment Services, Inc.; formerly Senior Vice President and Assistant Secretary (November 2004-August 2005) of PI; formerly Assistant Secretary (June 2005-February 2006) of AST Investment Services, Inc.; formerly Managing Director, General Counsel, Chief Compliance Officer, Chief Risk Officer and Corporate Secretary (1997-2002) of Zurich Scudder Investments, Inc. |
Deborah A. Docs (51) Secretary | | Vice President and Corporate Counsel (since January 2001) of Prudential; Vice President (since December 1996) and Assistant Secretary (since March 1999) of PI; formerly Vice President and Assistant Secretary (May 2003-June 2005) of AST Investment Services, Inc. |
Jonathan D. Shain (51) Assistant Secretary | | Vice President and Corporate Counsel (since August 1998) of Prudential; Vice President and Assistant Secretary (since May 2001) of PI; Vice President and Assistant Secretary (since February 2001) of PMFS; formerly Vice President and Assistant Secretary (May 2003-June 2005) of AST Investment Services, Inc. |
Claudia DiGiacomo (35) Assistant Secretary | | Vice President and Corporate Counsel (since January 2005) of Prudential; Vice President and Assistant Secretary of PI (since December 2005); Associate at Sidley Austin Brown & Wood LLP (1999-2004). |
John P. Schwartz (38) Assistant Secretary | | Vice President and Corporate Counsel (since April 2005) of Prudential; Vice President and Assistant Secretary of PI (since December 2005); Associate at Sidley Austin Brown & Wood LLP (1997-2005). |
Andrew R. French (47) Assistant Secretary | | Director and Corporate Counsel (since May 2006) of Prudential; Vice President and Assistant Secretary (since January 2007) of PI; Vice President and Assistant Secretary (since January 2007) of PMFS; formerly Senior Legal Analyst of Prudential Mutual Fund Law Department (1997-2006). |
Timothy J. Knierim (50) Chief Compliance Officer | | Chief Compliance Officer of Prudential Investment Management, Inc. (since July 2007); formerly Chief Risk Officer of PIM and PI (2002-2007) and formerly Chief Ethics Officer of PIM and PI (2006-2007). |
Valerie M. Simpson (51) Deputy Chief Compliance
Officer | | Chief Compliance Officer (since April 2007) of PI and AST Investment Services, Inc.; formerly Vice President-Financial Reporting (June 1999-March 2006) for Prudential Life and Annuities Finance. |
Dryden Large-Cap Core Equity Fund
| | |
Theresa C. Thompson (47) Deputy Chief Compliance
Officer | | Vice President, Compliance, PI (since April 2004); and Director, Compliance, PI (2001-2004). |
Noreen M. Fierro (45) Anti-Money Laundering
Compliance Officer | | Vice President, Corporate Compliance (since May 2006) of Prudential; formerly Corporate Vice President, Associate General Counsel (April 2002-May 2005) of UBS Financial Services, Inc., in their Money Laundering Prevention Group; Senior Manager (May 2005-May 2006) of Deloitte Financial Advisory Services, LLP, in their Forensic and Dispute Services, Anti-Money Laundering Group. |
Grace C. Torres (50) Treasurer and Principal
Financial and Accounting
Officer | | Assistant Treasurer (since March 1999) and Senior Vice President (since September 1999) of PI; Assistant Treasurer (since May 2003) and Vice President (since June 2005) of AST Investment Services, Inc.; Senior Vice President and Assistant Treasurer (since May 2003) of Prudential Annuities Advisory Services, Inc.; formerly Senior Vice President (May 2003-June 2005) of AST Investment Services, Inc. |
M. Sadiq Peshimam (45) Assistant Treasurer | | Vice President (since 2005) and Director (2000-2005) within Prudential Mutual Fund Administration. |
Peter Parrella (51) Assistant Treasurer | | Vice President (since 2007) and Director (2004-2007) within Prudential Mutual Fund Administration; formerly Tax Manager at SSB Citi Fund Management LLC (1997-2004). |
| (a) | Excludes the interested Board Member who also serve as President. |
| 1 | The year that each individual became an Officer of the Fund is as follows: |
Scott E. Benjamin, 2009; Kathryn L. Quirk, 2005; Deborah A. Docs, 2005; Jonathan D. Shain, 2005; Claudia DiGiacomo, 2005; John P. Schwartz, 2006; Andrew R. French, 2006; Timothy J. Knierim, 2007; Valerie M. Simpson 2007; Theresa C. Thompson, 2008; Noreen M. Fierro, 2006, Grace C. Torres, 1998; M. Sadiq Peshimam, 2006; Peter Parrella, 2007.
Explanatory Notes
| • | | Board Members are deemed to be “Interested,” as defined in the 1940 Act, by reason of their affiliation with Prudential Investments LLC and/or an affiliate of Prudential Investments LLC. |
| • | | Unless otherwise noted, the address of all Board Members and Officers is c/o Prudential Investments LLC, Gateway Center Three, 100 Mulberry Street, Newark, New Jersey 07102. |
| • | | There is no set term of office for Board Members or Officers. The Board Members have adopted a retirement policy, which calls for the retirement of Board Members on December 31st of the year in which they reach the age of 75. |
| • | | “Other Directorships Held” includes only directorships of companies required to register or file reports with the SEC under the Securities Exchange Act of 1934 (that is, “public companies”) or other investment companies registered under the 1940 Act. |
| • | | “Portfolios Overseen” includes all investment companies managed by Prudential Investments LLC. The investment companies for which PI serves as manager include the JennisonDryden Funds, Strategic Partners Funds, The Prudential Variable Contract Accounts, The Target Portfolio Trust, The Prudential Series Fund, Prudential’s Gibraltar Fund, Inc. and the Advanced Series Trust. |
Visit our website at www.jennisondryden.com
Approval of Advisory Agreements
The Fund’s Board of Trustees
The Board of Trustees (the “Board”) of Dryden Large-Cap Core Equity Fund (the “Fund”) 1 consists of 11 individuals, 10 of whom are not “interested persons” of the Fund, as defined in the Investment Company Act of 1940, as amended (the “1940 Act”) (the “Independent Trustees”). The Board is responsible for the oversight of the Fund and its operations, and performs the various duties imposed on the directors of investment companies by the 1940 Act. The Independent Trustees have retained independent legal counsel to assist them in connection with their duties. The Chair of the Board is an Independent Trustee. The Board has established three standing committees: the Audit Committee, the Nominating and Governance Committee, and the JennisonDryden Investment Committee. Each committee is chaired by, and composed of, Independent Trustees.
Annual Approval of the Fund’s Advisory Agreements
As required under the 1940 Act, the Board determines annually whether to renew the Fund’s management agreement with Prudential Investments LLC (“PI”) and the Fund’s subadvisory agreement with Prudential Investment Management, Inc. (“PIM”). In considering the renewal of the agreements, the Board, including all of the Independent Trustees, met on June 2-4, 2009 and approved the renewal of the agreements through July 31, 2010, after concluding that renewal of the agreements was in the best interests of the Fund and its shareholders.
In advance of the meetings, the Board received materials relating to the agreements, and had the opportunity to ask questions and request further information in connection with its consideration. Among other things, the Board considered comparisons with other mutual funds in relevant Peer Universes and Peer Groups. The mutual funds included in each Peer Universe or Peer Group were objectively determined by Lipper Inc., an independent provider of mutual fund data. The comparisons placed the Fund in various quartiles over the one-, three- and five-year periods ending December 31, 2008, with the first quartile being the best 25% of the mutual funds (for performance, the best performing mutual funds and, for expenses, the lowest cost mutual funds). The Board also considered specific information provided by Lipper and QMA at the meetings, as well as additional materials relating to the performance and fees of the Fund.
In approving the agreements, the Board, including the Independent Trustees advised by independent legal counsel, considered the factors it deemed relevant, including
1 Dryden Large-Cap Core Equity Fund is a series of Dryden Tax-Managed Funds.
| | |
| Dryden Large-Cap Core Equity Fund | | |
Approval of Advisory Agreements (continued)
the nature, quality and extent of services provided by PI and the subadviser, the performance of the Fund, the profitability of PI and its affiliates, expenses and fees, and the potential for economies of scale that may be shared with the Fund and its shareholders. In their deliberations, the Trustees did not identify any single factor which alone was responsible for the Board’s decision to approve the agreements with respect to the Fund. In connection with its deliberations, the Board considered information provided by PI throughout the year at regular Board meetings, presentations from portfolio managers and other information, as well as information furnished at or in advance of the meetings on June 2-4, 2009.
The Trustees determined that the overall arrangements between the Fund and PI, which serves as the Fund’s investment manager pursuant to a management agreement, and between PI and QMA, which serves as the Fund’s subadviser pursuant to the terms of a subadvisory agreement with PI, are fair and reasonable in light of the services performed, fees charged and such other matters as the Trustees considered relevant in the exercise of their business judgment.
The material factors and conclusions that formed the basis for the Trustees’ reaching their determinations to approve the continuance of the agreements are separately discussed below.
Nature, Quality, and Extent of Services
The Board received and considered information regarding the nature, quality and extent of services provided to the Fund by PI and QMA. The Board considered the services provided by PI, including but not limited to the oversight of the subadviser for the Fund, as well as the provision of fund recordkeeping, compliance, and other services to the Fund. With respect to PI’s oversight of the subadviser, the Board noted that PI’s Strategic Investment Research Group (“SIRG”), which is a business unit of PI, is responsible for monitoring and reporting to PI’s senior management on the performance and operations of the subadviser. The Board also considered that PI pays the salaries of all of the officers and non-independent Trustees of the Fund. The Board also considered the investment subadvisory services provided by QMA, as well as adherence to the Fund’s investment restrictions and compliance with applicable Fund policies and procedures. The Board considered PI’s evaluation of the subadviser, as well as PI’s recommendation, based on its review of the subadviser, to renew the subadvisory agreement.
The Board reviewed the qualifications, backgrounds and responsibilities of PI’s senior management responsible for the oversight of the Fund and QMA, and also reviewed the qualifications, backgrounds and responsibilities of QMA’s portfolio managers who
| | |
| | Visit our website at www.jennisondryden.com |
are responsible for the day-to-day management of the Fund’s portfolio. The Board was provided with information pertaining to PI’s and QMA’s organizational structure, senior management, investment operations, and other relevant information pertaining to both PI and QMA. The Board also noted that it received favorable compliance reports from the Fund’s Chief Compliance Officer (“CCO”) as to both PI and QMA. The Board noted that QMA is affiliated with PI.
The Board concluded that it was satisfied with the nature, extent and quality of the investment management services provided by PI and the subadvisory services provided to the Fund by QMA, and that there was a reasonable basis on which to conclude that the Fund benefits from the services provided by PI and QMA under the management and subadvisory agreements.
Performance of the Fund
The Board received and considered information about the Fund’s historical performance. The Board considered that the Fund’s gross performance in relation to its Peer Universe (the Lipper Large-Cap Core Funds Performance Universe) was in the second quartile over the three- and five-year periods, and in the third quartile over the one-year period. The Board also noted that the Fund outperformed its benchmark index over all periods ending December 31, 2008. The Board concluded that, in light of the Fund’s competitive performance vis-à-vis its benchmark index, it would be in the interest of the Fund and its shareholders for the Fund to renew the agreements.
Fees and Expenses
The Board considered that the Fund’s actual management fee (which reflects any subsidies, expense caps or waivers) ranked in the Expense Group’s first quartile, and that the Fund’s total expenses ranked in the Expense Group’s fourth quartile. The Board considered PI’s explanation that relatively high transfer agency and other fees unrelated to the management fee were the primary factors in the Fund’s fourth quartile ranking for total expenses. The Board concluded that the management fees and total expenses were reasonable in light of the services provided.
Costs of Services and Profits Realized by PI
The Board was provided with information on the profitability of PI and its affiliates in serving as the Fund’s investment manager. The Board discussed with PI the methodology utilized in assembling the information regarding profitability and considered its reasonableness. The Board recognized that it is difficult to make comparisons of
| | |
| Dryden Large-Cap Core Equity Fund | | |
Approval of Advisory Agreements (continued)
profitability from fund management contracts because comparative information is not generally publicly available and is affected by numerous factors, including the structure of the particular adviser, the types of funds it manages, its business mix, numerous assumptions regarding allocations and the adviser’s capital structure and cost of capital. The Board did not separately consider the profitability of the subadviser, an affiliate of PI, as its profitability was reflected in the profitability report for PI. Taking these factors into account, the Board concluded that the profitability of PI and its affiliates in relation to the services rendered was not unreasonable.
Economies of Scale
The Board received and discussed information concerning whether PI realizes economies of scale as the Fund’s assets grow beyond current levels. The Board noted that the management fee schedule for the Fund includes breakpoints, which have the effect of decreasing the fee rate as assets increase, but at the current level of assets the Fund does not realize the effect of those rate reductions. The Board took note that the Fund’s fee structure would result in benefits to Fund shareholders when (and if) assets reach the levels at which the fee rate is reduced. These benefits will accrue whether or not PI is then realizing any economies of scale.
Other Benefits to PI and QMA
The Board considered potential ancillary benefits that might be received by PI and QMA and their affiliates as a result of their relationship with the Fund. The Board concluded that potential benefits to be derived by PI included brokerage commissions received by affiliates of PI, transfer agency fees received by the Fund’s transfer agent (which is affiliated with PI), and benefits to the reputation as well as other intangible benefits resulting from PI’s association with the Fund. The Board concluded that the potential benefits to be derived by QMA included its ability to use soft dollar credits, brokerage commissions received by affiliates of QMA, as well as the potential benefits consistent with those generally resulting from an increase in assets under management, specifically, potential access to additional research resources and benefits to the reputation. The Board concluded that the benefits derived by PI and QMA were consistent with the types of benefits generally derived by investment managers and subadvisers to mutual funds.
After full consideration of these factors, the Board concluded that approval of the agreements was in the best interest of the Fund and its shareholders.
| | |
| | Visit our website at www.jennisondryden.com |
Growth of a $10,000 Investment
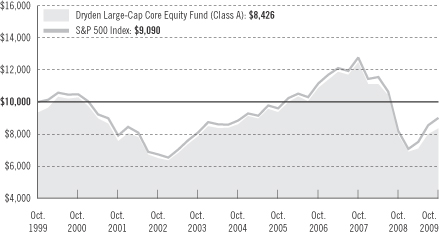
| | | | | | | | | | | |
| Average Annual Total Returns (With Sales Charges) as of 10/31/09 |
| | | One Year | | | Five Years | | | Ten Years | | | Since Inception |
Class A | | –0.40 | % | | –1.73 | % | | –1.70 | % | | — |
Class B | | –0.33 | | | –1.54 | | | –1.87 | | | — |
Class C | | 3.67 | | | –1.34 | | | –1.87 | | | — |
Class L | | –0.84 | | | N/A | | | N/A | | | –12.49% (3/19/07) |
Class M | | –1.33 | | | N/A | | | N/A | | | –12.31 (3/19/07) |
Class X | | 0.00 | | | N/A | | | N/A | | | –11.49 (3/19/07) |
Class Z | | 5.83 | | | –0.34 | | | –0.88 | | | — |
| | | | | | | | | | | |
| Average Annual Total Returns (Without Sales Charges) as of 10/31/09 |
| | | One Year | | | Five Years | | | Ten Years | | | Since Inception |
Class A | | 5.40 | % | | –0.61 | % | | –1.14 | % | | — |
Class B | | 4.67 | | | –1.34 | | | –1.87 | | | — |
Class C | | 4.67 | | | –1.34 | | | –1.87 | | | — |
Class L | | 5.21 | | | N/A | | | N/A | | | –10.49% (3/19/07) |
Class M | | 4.67 | | | N/A | | | N/A | | | –10.94 (3/19/07) |
Class X | | 6.00 | | | N/A | | | N/A | | | –10.12 (3/19/07) |
Class Z | | 5.83 | | | –0.34 | | | –0.88 | | | — |
Performance data quoted represent past performance. Past performance does not guarantee future results. The investment return and principal value of an investment will fluctuate, so that an investor’s shares, when redeemed, may be worth more or less than their original cost. Current performance may be lower or higher than the
| | |
| | Visit our website at www.jennisondryden.com |
past performance data quoted. An investor may obtain performance data as of the most recent month-end by visiting our website at www.jennisondryden.com or by calling (800) 225-1852. Class A and Class L shares have a maximum initial sales charge of 5.50% and 5.75%, respectively. Gross operating expenses: Class A, 1.55%; Class B, 2.25%; Class C, 2.25%; Class L, 1.75%; Class M, 2.25%; Class X, 1.50%; Class Z, 1.25%. Net operating expenses apply to: Class A, 1.55%; Class B, 2.25%; Class C, 2.25%; Class L, 1.75%; Class M, 2.25%; Class X, 1.50%; Class Z, 1.25%.
The returns in the graph and the tables do not reflect the deduction of taxes that a shareholder would pay on Fund distributions or following the redemption of Fund shares.
Source: Prudential Investments LLC and Lipper Inc.
Inception returns are provided for any share class with less than 10 calendar years of returns.
The graph compares a $10,000 investment in the Dryden Large-Cap Core Equity Fund (Class A shares) with a similar investment in the S&P 500 Index by portraying the initial account values at the beginning of the 10-year period for Class A shares (October 31, 1999) and the account values at the end of the current fiscal year (October 31, 2009) as measured on a quarterly basis. The S&P 500 Index data is measured from the closest month-end to inception date and not from the Fund’s actual inception date. For purposes of the graph, and unless otherwise indicated, it has been assumed that (a) the maximum applicable front-end sales charge was deducted from the initial $10,000 investment in Class A shares; (b) all recurring fees (including management fees) were deducted; and (c) all dividends and distributions were reinvested. The line graph provides information for Class A shares only. As indicated in the tables provided earlier, performance for Class B, Class C, Class L, Class M, Class X, and Class Z shares will vary due to the differing charges and expenses applicable to each share class (as indicated in the following paragraphs).
The S&P 500 Index is an unmanaged index of 500 stocks of large U.S. companies. It gives a broad look at how stock prices in the United States have performed. The S&P 500 Index’s total returns include the reinvestment of all dividends, but do not include the effects of sales charges, operating expenses of a mutual fund, or taxes. These returns would be lower if they included the effects of sales charges, operating expenses, or taxes. The securities that comprise the S&P 500 Index may differ substantially from the securities in the Fund. The S&P 500 Index is not the only index that may be used to characterize performance of large-capitalization stock funds. Other indexes may portray different comparative performance. Investors cannot invest directly in an index.
Class A and Class L shares are subject to a maximum front-end sales charge of 5.50%, and 5.75%, respectively, a 12b-1 fee of up to 0.30% and 0.50%, respectively, annually, and investors who purchase Class A shares in an amount of $1 million or more and sell these shares within 12 months of purchase are subject to a contingent deferred sales charge (CDSC) of 1% in certain circumstances. Class B shares are subject to a declining CDSC of 5%, 4%, 3%, 2%, 1%, and 1%, respectively, for the first six years after purchase and a 12b-1 fee of 1% annually. Approximately seven years after purchase, Class B shares will automatically convert to Class A shares on a quarterly basis. Class C shares are not subject to a front-end sales charge, but are subject to a CDSC of 1% for Class C shares sold within 12 months from the date of purchase, and an annual 12b-1 fee of 1%. Class M shares are subject to a CDSC of 6%, which decreases by 1% annually to 2% in the fifth and sixth years and 1% in the seventh year, a 12b-1 fee of 1% annually. Class M shares automatically convert to Class A shares approximately eight years after purchase. Class X shares are subject to a CDSC of 6%, which decreases by 1% annually to 4% in the third and fourth years, by 1% annually to 2% in the sixth and seventh years, and 1% in the eighth year, and a 12b-1 fee of 1% annually. Class Z shares are not subject to a sales charge or 12b-1 fees. The returns in the graph and tables reflect the share class expense structure in effect at the close of the fiscal period.
| | |
| Dryden Large-Cap Core Equity Fund | | |
| | | | |
| n MAIL | | n TELEPHONE | | n WEBSITE |
Gateway Center Three 100 Mulberry Street Newark, NJ 07102 | | (800) 225-1852 | | www.jennisondryden.com |
|
| PROXY VOTING |
| The Board of Trustees of the Fund has delegated to the Fund’s investment subadviser the responsibility for voting any proxies and maintaining proxy recordkeeping with respect to the Fund. A description of these proxy voting policies and procedures is available without charge, upon request, by calling (800) 225-1852 or by visiting the Securities and Exchange Commission’s website at www.sec.gov. Information regarding how the Fund voted proxies relating to portfolio securities during the most recent 12-month period ended June 30 is available on the Fund’s website and on the Commission’s website. |
|
| TRUSTEES |
| Kevin J. Bannon • Linda W. Bynoe • David E.A. Carson • Michael S. Hyland • Robert E. La Blanc • Douglas H. McCorkindale • Stephen P. Munn • Richard A. Redeker • Judy A. Rice • Robin B. Smith • Stephen G. Stoneburn |
|
| OFFICERS |
| Judy A. Rice, President • Scott E. Benjamin, Vice President • Grace C. Torres, Treasurer and Principal Financial and Accounting Officer • Kathryn L. Quirk, Chief Legal Officer • Deborah A. Docs, Secretary • Timothy J. Knierim, Chief Compliance Officer • Valerie M. Simpson, Deputy Chief Compliance Officer • Theresa C. Thompson, Deputy Chief Compliance Officer • Noreen M. Fierro, Anti-Money Laundering Compliance Officer • Jonathan D. Shain, Assistant Secretary • Claudia DiGiacomo, Assistant Secretary • John P. Schwartz, Assistant Secretary • Andrew R. French, Assistant Secretary • M. Sadiq Peshimam, Assistant Treasurer • Peter Parrella, Assistant Treasurer |
| | | | |
| MANAGER | | Prudential Investments LLC | | Gateway Center Three
100 Mulberry Street
Newark, NJ 07102 |
|
| INVESTMENT SUBADVISER | | Quantitative Management
Associates LLC | | Gateway Center Two
100 Mulberry Street
Newark, NJ 07102 |
|
| DISTRIBUTOR | | Prudential Investment
Management Services LLC | | Gateway Center Three
100 Mulberry Street
Newark, NJ 07102 |
|
| CUSTODIAN | | The Bank of New York Mellon | | One Wall Street
New York, NY 10286 |
|
| TRANSFER AGENT | | Prudential Mutual Fund
Services LLC | | PO Box 9658
Providence, RI 02940 |
|
INDEPENDENT REGISTERED
PUBLIC ACCOUNTING FIRM | | KPMG LLP | | 345 Park Avenue
New York, NY 10154 |
|
| FUND COUNSEL | | Willkie Farr & Gallagher LLP | | 787 Seventh Avenue
New York, NY 10019 |
|
| An investor should consider the investment objectives, risks, charges, and expenses of the Fund carefully before investing. The prospectus for the Fund contains this and other information about the Fund. An investor may obtain a prospectus by visiting our website at www.jennisondryden.com or by calling (800) 225-1852. The prospectus should be read carefully before investing. |
|
| E-DELIVERY |
| To receive your mutual fund documents online, go to www.prudential.com/edelivery/mutualfunds and enroll. Instead of receiving printed documents by mail, you will receive notification via e-mail when new materials are available. You can cancel your enrollment or change your e-mail address at any time by visiting the website address above. |
|
| SHAREHOLDER COMMUNICATIONS WITH TRUSTEES |
| Shareholders can communicate directly with the Board of Trustees by writing to the Chair of the Board, Dryden Large-Cap Core Equity Fund, Prudential Investments, Attn: Board of Trustees, 100 Mulberry Street, Gateway Center Three, Newark, NJ 07102. Shareholders can communicate directly with an individual Trustee by writing to the same address. Communications are not screened before being delivered to the addressee. |
|
| AVAILABILITY OF PORTFOLIO SCHEDULE |
| The Fund files its complete schedule of portfolio holdings with the Securities and Exchange Commission for the first and third quarters of each fiscal year on Form N-Q. The Fund’s Forms N-Q are available on the Commission’s website at www.sec.gov. The Fund’s Forms N-Q may also be reviewed and copied at the Commission’s Public Reference Room in Washington, D.C. Information on the operation and location of the Public Reference Room may be obtained by calling (202) 551-8090. The Fund’s schedule of portfolio holdings is also available on the Fund’s website as of the end of each fiscal quarter. |
|
| The Fund’s Statement of Additional Information contains additional information about the Fund’s Trustees and is available without charge, upon request, by calling (800) 225-1852. |
Mutual Funds:
| | | | |
ARE NOT INSURED BY THE FDIC OR ANY
FEDERAL GOVERNMENT AGENCY | | MAY LOSE VALUE | | ARE NOT A DEPOSIT OF OR GUARANTEED
BY ANY BANK OR ANY BANK AFFILIATE |

| | | | | | | | | | | | | | | | | | |
Dryden Large-Cap Core Equity Fund | | | | | | | | |
| | | Share Class | | A | | B | | C | | L | | M | | X | | Z | | |
| | NASDAQ | | PTMAX | | PTMBX | | PTMCX | | N/A | | N/A | | N/A | | PTEZX | | |
| | CUSIP | | 26248W106 | | 26248W205 | | 26248W304 | | 26248W502 | | 26248W601 | | 26248W700 | | 26248W403 | | |
| | | | | | | | | | | | | | | | | | |
MF187E 0168476-00001-00

Item 2 – Code of Ethics – – See Exhibit (a)
As of the end of the period covered by this report, the registrant has adopted a code of ethics (the “Section 406 Standards for Investment Companies – Ethical Standards for Principal Executive and Financial Officers”) that applies to the registrant’s Principal Executive Officer and Principal Financial Officer; the registrant’s Principal Financial Officer also serves as the Principal Accounting Officer.
The registrant hereby undertakes to provide any person, without charge, upon request, a copy of the code of ethics. To request a copy of the code of ethics, contact the registrant 800-225-1852, and ask for a copy of the Section 406 Standards for Investment Companies – Ethical Standards for Principal Executive and Financial Officers.
Item 3 – Audit Committee Financial Expert –
The registrant’s Board has determined that Mr. David E. A. Carson, member of the Board’s Audit Committee is an “audit committee financial expert,” and that he is “independent,” for purposes of this Item.
Item 4 – Principal Accountant Fees and Services –
(a) Audit Fees
For the fiscal years ended October 31, 2009 and October 31, 2008, KPMG LLP (“KPMG”), the Registrant’s principal accountant, billed the Registrant $20,869 and $20,869, respectively, for professional services rendered for the audit of the Registrant’s annual financial statements or services that are normally provided in connection with statutory and regulatory filings.
(b) Audit-Related Fees
During the fiscal year ended October 31, 2009, KPMG, the Registrant’s principal accountant, billed the Registrant $1,558 for professional services rendered in connection with agreed upon procedures performed related to a custody conversion. Not applicable for the fiscal year ended October 31, 2008.
(c) Tax Fees
None.
(d) All Other Fees
None.
(e) (1) Audit Committee Pre-Approval Policies and Procedures
THE PRUDENTIAL MUTUAL FUNDS
AUDIT COMMITTEE POLICY
on
Pre-Approval of Services Provided by the Independent Accountants
The Audit Committee of each Prudential Mutual Fund is charged with the responsibility to monitor the independence of the Fund’s independent accountants. As part of this responsibility, the Audit Committee must pre-approve any independent accounting firm’s engagement to render audit and/or permissible non-audit services, as required by law. In evaluating a proposed engagement of the independent accountants, the Audit Committee will assess the effect that the engagement might reasonably be expected to have on the accountant’s independence. The Committee’s evaluation will be based on:
| | • | | a review of the nature of the professional services expected to be provided, |
| | • | | a review of the safeguards put into place by the accounting firm to safeguard independence, and |
| | • | | periodic meetings with the accounting firm. |
Policy for Audit and Non-Audit Services Provided to the Funds
On an annual basis, the scope of audits for each Fund, audit fees and expenses, and audit-related and non-audit services (and fees proposed in respect thereof) proposed to be performed by the Fund’s independent accountants will be presented by the Treasurer and the independent accountants to the Audit Committee for review and, as appropriate, approval prior to the initiation of such services. Such presentation shall be accompanied by confirmation by both the Treasurer and the independent accountants that the proposed services will not adversely affect the independence of the independent accountants. Proposed services shall be described in sufficient detail to enable the Audit Committee to assess the appropriateness of such services and fees, and the compatibility of the provision of such services with the auditor’s independence. The Committee shall receive periodic reports on the progress of the audit and other services which are approved by the Committee or by the Committee Chair pursuant to authority delegated in this Policy.
The categories of services enumerated under “Audit Services”, “Audit-related Services”, and “Tax Services” are intended to provide guidance to the Treasurer and the independent accountants as to those categories of services which the Committee believes are generally consistent with the independence of the independent accountants and which the Committee (or the Committee Chair) would expect upon the presentation of specific proposals to pre-approve. The enumerated categories are not intended as an exclusive list of audit, audit-related or tax services, which the Committee (or the Committee Chair) would consider for pre-approval.
Audit Services
The following categories of audit services are considered to be consistent with the role of the Fund’s independent accountants:
| | • | | Annual Fund financial statement audits |
| | • | | Seed audits (related to new product filings, as required) |
| | • | | SEC and regulatory filings and consents |
Audit-related Services
The following categories of audit-related services are considered to be consistent with the role of the Fund’s independent accountants:
| | • | | Accounting consultations |
| | • | | Fund merger support services |
| | • | | Agreed Upon Procedure Reports |
| | • | | Other Internal Control Reports |
Individual audit-related services that fall within one of these categories and are not presented to the Audit Committee as part of the annual pre-approval process will be subject to pre-approval by the Committee Chair (or any other Committee member on whom this responsibility has been delegated) so long as the estimated fee for those services does not exceed $50,000.
Tax Services
The following categories of tax services are considered to be consistent with the role of the Fund’s independent accountants:
| | • | | Tax compliance services related to the filing or amendment of the following: |
| | • | | Federal, state and local income tax compliance; and, |
| | • | | Sales and use tax compliance |
| | • | | Timely RIC qualification reviews |
| | • | | Tax distribution analysis and planning |
| | • | | Tax authority examination services |
| | • | | Tax appeals support services |
| | • | | Accounting methods studies |
| | • | | Fund merger support services |
| | • | | Tax consulting services and related projects |
Individual tax services that fall within one of these categories and are not presented to the Audit Committee as part of the annual pre-approval process will be subject to pre-approval by the Committee Chair (or any other Committee member on whom this responsibility has been delegated) so long as the estimated fee for those services does not exceed $50,000.
Other Non-audit Services
Certain non-audit services that the independent accountants are legally permitted to render will be subject to pre-approval by the Committee or by one or more Committee members to whom the Committee has delegated this authority and who will report to the full Committee any pre-approval
decisions made pursuant to this Policy. Non-audit services presented for pre-approval pursuant to this paragraph will be accompanied by a confirmation from both the Treasurer and the independent accountants that the proposed services will not adversely affect the independence of the independent accountants.
Proscribed Services
The Fund’s independent accountants will not render services in the following categories of non-audit services:
| | • | | Bookkeeping or other services related to the accounting records or financial statements of the Fund |
| | • | | Financial information systems design and implementation |
| | • | | Appraisal or valuation services, fairness opinions, or contribution-in-kind reports |
| | • | | Internal audit outsourcing services |
| | • | | Management functions or human resources |
| | • | | Broker or dealer, investment adviser, or investment banking services |
| | • | | Legal services and expert services unrelated to the audit |
| | • | | Any other service that the Public Company Accounting Oversight Board determines, by regulation, is impermissible. |
Pre-approval of Non-Audit Services Provided to Other Entities Within the Prudential Fund Complex
Certain non-audit services provided to Prudential Investments LLC or any of its affiliates that also provide ongoing services to the Prudential Mutual Funds will be subject to pre-approval by the Audit Committee. The only non-audit services provided to these entities that will require pre-approval are those related directly to the operations and financial reporting of the Funds. Individual projects that are not presented to the Audit Committee as part of the annual pre-approval process will be subject to pre-approval by the Committee Chair (or any other Committee member on whom this responsibility has been delegated) so long as the estimated fee for those services does not exceed $50,000. Services presented for pre-approval pursuant to this paragraph will be accompanied by a confirmation from both the Treasurer and the independent accountants that the proposed services will not adversely affect the independence of the independent accountants.
Although the Audit Committee will not pre-approve all services provided to Prudential Investments LLC and its affiliates, the Committee will receive an annual report from the Fund’s independent accounting firm showing the aggregate fees for all services provided to Prudential Investments and its affiliates.
(e) (2) Percentage of services referred to in 4(b) – 4(d) that were approved by the audit committee –
One hundred percent of the services described in Item 4(b) was approved by the audit committee.
(f) Percentage of hours expended attributable to work performed by other than full time employees of principal accountant if greater than 50%.
The percentage of hours expended on the principal accountant’s engagement to audit the registrant’s financial statements for the most recent fiscal year that were attributed to work performed by persons other than the principal accountant’s full-time, permanent employees was 0%.
(g) Non-Audit Fees
Not applicable to Registrant for the fiscal years 2009 and 2008. The aggregate non-audit fees billed by KPMG for services rendered to the registrant’s investment adviser and any entity controlling, controlled by, or under common control with the investment adviser that provides ongoing services to the registrant for the fiscal years 2009 and 2008 was $0 and $0, respectively.
(h) Principal Accountant’s Independence
Not applicable as KPMG has not provided non-audit services to the registrant’s investment adviser and any entity controlling, controlled by, or under common control with the investment adviser that provides ongoing services to the registrant that were not pre-approved pursuant to Rule 2-01(c)(7)(ii) of Regulation S-X.
Item 5 – Audit Committee of Listed Registrants – Not applicable.
Item 6 – Schedule of Investments – The schedule is included as part of the report to shareholders filed under Item 1 of this Form.
Item 7 – Disclosure of Proxy Voting Policies and Procedures for Closed-End Management Investment Companies – Not applicable.
Item 8 – Portfolio Managers of Closed-End Management Investment Companies – Not applicable.
Item 9 – Purchases of Equity Securities by Closed-End Management Investment Company and Affiliated Purchasers – Not applicable.
Item 10 – Submission of Matters to a Vote of Security Holders – Not applicable.
Item 11 – Controls and Procedures
| | (a) | It is the conclusion of the registrant’s principal executive officer and principal financial officer that the effectiveness of the registrant’s current disclosure controls and procedures (such disclosure controls and procedures having been evaluated within 90 days of the date of this filing) provide reasonable assurance that the information required to be disclosed by the registrant has been recorded, processed, summarized and reported within the time period specified in the Commission’s rules and forms and that the information required to be disclosed by the registrant has been accumulated and communicated to the registrant’s principal executive officer and principal financial officer in order to allow timely decisions regarding required disclosure. |
| | (b) | There has been no significant change in the registrant’s internal control over financial reporting that occurred during the registrant’s most recent fiscal quarter of the period covered by this report that has materially affected, or is likely to materially affect, the registrant’s internal control over financial reporting. |
Item 12 – Exhibits
| | | | |
| (a) | | (1) | | Code of Ethics – Attached hereto as Exhibit EX-99.CODE-ETH |
| | |
| | (2) | | Certifications pursuant to Section 302 of the Sarbanes-Oxley Act – Attached hereto as Exhibit EX-99.CERT. |
| | |
| | (3) | | Any written solicitation to purchase securities under Rule 23c-1. – Not applicable. |
| |
| (b) | | Certifications pursuant to Section 906 of the Sarbanes-Oxley Act – Attached hereto as Exhibit EX-99.906CERT. |
SIGNATURES
Pursuant to the requirements of the Securities Exchange Act of 1934 and the Investment Company Act of 1940, the registrant has duly caused this report to be signed on its behalf by the undersigned, thereunto duly authorized.
(Registrant) Dryden Tax-Managed Funds
| | | | |
| By (Signature and Title)* | | /S/ DEBORAH A. DOCS | | |
| | Deborah A. Docs | | |
| | Secretary | | |
Date December 22, 2009
Pursuant to the requirements of the Securities Exchange Act of 1934 and the Investment Company Act of 1940, this report has been signed below by the following persons on behalf of the registrant and in the capacities and on the dates indicated.
| | | | |
| By (Signature and Title)* | | /S/ JUDY A. RICE | | |
| | Judy A. Rice | | |
| | President and Principal Executive Officer | | |
Date December 22, 2009
| | | | |
| By (Signature and Title)* | | /S/ GRACE C. TORRES | | |
| | Grace C. Torres | | |
| | Treasurer and Principal Financial Officer | | |
Date December 22, 2009
| * | Print the name and title of each signing officer under his or her signature. |